File No. 333-
AS FILED WITH THE SECURITIES AND EXCHANGE COMMISSION ON FEBRUARY 26, 2014
SECURITIES AND EXCHANGE COMMISSION
WASHINGTON, D.C. 20549
FORM N-14
REGISTRATION STATEMENT UNDER THE SECURITIES ACT OF 1933 [X]
Pre-Effective Amendment No. [ ]
Post-Effective Amendment No. [ ]
EQ Advisors Trust
(Exact Name of Registrant as Specified in Charter)
1290 Avenue of the Americas
New York, New York 10104
(Address of Principal Executive Offices)
(212) 554-1234
(Registrant’s Area Code and Telephone Number)
STEVEN M. JOENK
AXA Equitable Funds Management Group, LLC
1290 Avenue of the Americas
New York, New York 10104
(Name and Address of Agent for Service)
With copies to:
PATRICIA LOUIE, ESQ. AXA Equitable Funds Management Group, LLC 1290 Avenue of the Americas New York, New York 10104 | CLIFFORD J. ALEXANDER, ESQ. MARK C. AMOROSI, ESQ. K&L Gates LLP 1601 K Street, N.W. Washington, DC 20006 |
Approximate Date of Proposed Public Offering:
As soon as practicable after this Registration Statement becomes effective.
It is proposed that this Registration Statement will become effective on the 30th day after filing pursuant to Rule 488 under the Securities Act of 1933, as amended.
Title of securities being registered: Class IA, Class IB and Class K shares of beneficial interest in the series of the registrant designated as the EQ/Invesco Comstock Portfolio and the EQ/Large Cap Growth PLUS Portfolio.
No filing fee is required because the registrant is relying on Section 24(f) of the Investment Company Act of 1940, as amended, pursuant to which it has previously registered an indefinite number of shares (File Nos. 333-17217 and 811-07953).
EQ ADVISORS TRUST
CONTENTS OF REGISTRATION STATEMENT
This Registration Statement contains the following papers and documents:
Cover Sheet
Contents of Registration Statement
Letter to Shareholders
Notice of Special Meeting
Contractholder Voting Instructions
Part A - Proxy Statement/Prospectus
Part B - Statement of Additional Information
Part C - Other Information
Signature Page
Exhibits
AXA EQUITABLE LIFE INSURANCE COMPANY
1290 Avenue of the Americas
New York, New York 10104
, 2014
Dear Contractholder:
Enclosed is a notice and Combined Proxy Statement and Prospectus relating to a Special Meeting of Shareholders of each of the following Portfolios:
| • | EQ/Davis New York Venture Portfolio (the “Davis New York Venture Portfolio”), |
| • | EQ/Lord Abbett Large Cap Core Portfolio (the “Lord Abbett Large Cap Core Portfolio”), and |
| • | EQ/Equity Growth PLUS Portfolio (the “Equity Growth PLUS Portfolio” and together, the “Acquired Portfolios”). |
Each Acquired Portfolio is a series of EQ Advisors Trust (the “Trust”). The Special Meeting of Shareholders of the Acquired Portfolios is scheduled to be held at the Trust’s offices, 1290 Avenue of the Americas, New York, New York 10104, on May 21, 2014 at , Eastern time (the “Meeting”). At the Meeting, the shareholders of the Acquired Portfolios who are entitled to vote at the Meeting will be asked to approve the proposals described below.
The Trust’s Board of Trustees (the “Board”) has called the Meeting to request shareholder approval of the reorganization of each Acquired Portfolio into a corresponding series of the Trust (an “Acquiring Portfolio”) (a “Reorganization”) as set forth below:
| • | the Davis New York Venture Portfolio into the EQ/Invesco Comstock Portfolio, |
| • | the Lord Abbett Large Cap Core Portfolio into the EQ/Invesco Comstock Portfolio, and |
| • | the Equity Growth PLUS Portfolio into the EQ/Large Cap Growth PLUS Portfolio. |
The Board has approved these proposals and recommends that you vote “FOR” the relevant proposals. Although the Board has determined that a vote “FOR” the proposals is in your best interest, the final decision is yours.
Each Portfolio is managed by AXA Equitable Funds Management Group, LLC and is sub-advised by one or more investment sub-advisers. In each case, if a Reorganization is approved and implemented, each Contractholder that invests indirectly in an Acquired Portfolio will automatically become a Contractholder that invests indirectly in the corresponding Acquiring Portfolio.
As an owner of a variable life insurance policy and/or a variable annuity contract or certificate that participates in one or more of the Acquired Portfolios through the investment divisions of a separate account or accounts established by AXA Equitable Life Insurance Company (“AXA Equitable”), you are entitled to instruct AXA Equitable how to vote the Acquired Portfolio shares related to your interest in those accounts as of the close of business on February 28, 2014. The attached Notice of Special Meeting of Shareholders and Combined Proxy Statement and Prospectus concerning the Meeting describe the matters to be considered at the Meeting.
You are cordially invited to attend the Meeting. Since it is important that your vote be represented whether or not you are able to attend, you are urged to consider these matters and to exercise your voting instructions by completing, dating, and signing the enclosed voting instruction card and returning it in the accompanying return envelope at your earliest convenience or by relaying your voting instructions via telephone or the Internet by following the enclosed instructions. For further information on how to instruct an insurance company, please see the Contractholder Voting Instructions included herein. Of course, we hope that you will be able to attend the Meeting, and if you wish, you may provide voting instructions in person, even though you may have already returned a voting instruction card or submitted your voting instructions via telephone or the Internet. Please respond promptly in order to save additional costs of proxy solicitation and in order to make sure you are represented.
Very truly yours,
Steven M. Joenk Managing Director AXA Equitable Life Insurance Company |
EQ ADVISORS TRUST
EQ/Davis New York Venture Portfolio
EQ/Lord Abbett Large Cap Core Portfolio
EQ/Equity Growth PLUS Portfolio
1290 Avenue of the Americas
New York, New York 10104
NOTICE OF SPECIAL MEETING OF SHAREHOLDERS
TO BE HELD ON , 2014
To the Shareholders:
NOTICE IS HEREBY GIVEN that a Special Meeting of Shareholders of each of the following Portfolios, each of which is a series of EQ Advisors Trust (the “Trust”), will be held on May 21, 2014, at , Eastern time, at the offices of the Trust, located at 1290 Avenue of the Americas, New York, New York 10104 (the “Meeting”):
| • | EQ/Davis New York Venture Portfolio (the “Davis New York Venture Portfolio”), |
| • | EQ/Lord Abbett Large Cap Core Portfolio (the “Lord Abbett Large Cap Core Portfolio”), and |
| • | EQ/Equity Growth PLUS Portfolio (the “Equity Growth PLUS Portfolio” and together, the “Acquired Portfolios”). |
The Meeting will be held to act on the following proposals:
1. To approve the Plan of Reorganization and Termination adopted by the Board of Trustees of the Trust (the “Board”) (the “Plan of Reorganization”), with respect to the reorganization of the Davis New York Venture Portfolio into the EQ/Invesco Comstock Portfolio, also a series of the Trust.
2. To approve the Plan of Reorganization, with respect to the reorganization of the Lord Abbett Large Cap Core Portfolio into the EQ/Invesco Comstock Portfolio, also a series of the Trust.
3. To approve the Plan of Reorganization, with respect to the reorganization of the Equity Growth PLUS Portfolio into the EQ/Large Cap Growth PLUS Portfolio, also a series of the Trust.
4. To transact other business that may properly come before the Meeting or any adjournments thereof.
The Board unanimously recommends that you vote in favor of the relevant proposal(s).
i
Please note that owners of variable life insurance policies and/or variable annuity contracts or certificates (the “Contractholders”) issued by AXA Equitable Life Insurance Company, MONY Life Insurance Company, MONY Life Insurance Company of America or another insurance company (each, an “Insurance Company”) who have
invested in shares of one or more of the Acquired Portfolios through the investment divisions of a separate account or accounts of an Insurance Company will be given the opportunity, to the extent required by law, to provide the applicable Insurance Company with voting instructions on the above proposals.
You should read the Combined Proxy Statement and Prospectus attached to this notice prior to completing your proxy or voting instruction card. The record date for determining the number of shares outstanding, the shareholders entitled to vote and the Contractholders entitled to provide voting instructions at the Meeting and any adjournments or postponements thereof has been fixed as the close of business on February 28, 2014. If you attend the Meeting, you may vote or provide your voting instructions in person.
YOUR VOTE IS IMPORTANT
Please return your proxy or voting instruction card promptly
Regardless of whether you plan to attend the Meeting, you should vote or provide voting instructions by promptly completing, dating, and signing the enclosed proxy or voting instruction card for the Portfolio in which you directly or indirectly own shares and returning it in the enclosed postage-paid envelope. You also can vote or provide voting instructions through the Internet or by telephone using the 12-digit control number that appears on the enclosed proxy or voting instruction card and following the simple instructions. If you are present at the Meeting, you may change your vote or voting instructions, if desired, at that time. The Board recommends that you vote or provide voting instructions to vote “FOR” the proposals.
By order of the Board,
Patricia Louie Vice President and Secretary |
Dated: , 2014
New York, New York
ii
AXA EQUITABLE LIFE INSURANCE COMPANY
MONY LIFE INSURANCE COMPANY
MONY LIFE INSURANCE COMPANY OF AMERICA
CONTRACTHOLDER VOTING INSTRUCTIONS
REGARDING A SPECIAL MEETING OF SHAREHOLDERS OF
EQ/DAVIS NEW YORK VENTURE PORTFOLIO,
EQ/LORD ABBETT LARGE CAP CORE PORTFOLIO, AND
EQ/EQUITY GROWTH PLUS PORTFOLIO,
EACH A SERIES OF EQ ADVISORS TRUST
TO BE HELD ON MAY 21, 2014
Dated: , 2014
GENERAL
These Contractholder Voting Instructions are being furnished by AXA Equitable Life Insurance Company (“AXA Equitable”), MONY Life Insurance Company (“MONY”), MONY Life Insurance Company of America (“MLOA”) or another insurance company (each, an “Insurance Company” and together, the “Insurance Companies”) to owners of their variable life insurance policies or variable annuity contracts or certificates (the “Contracts”) (the “Contractholders”) who, as of February 28, 2014 (the “Record Date”), had net premiums or contributions allocated to the investment divisions of their separate account or accounts (the “Separate Accounts”) that are invested in shares of one or more of the following Portfolios:
| • | EQ/Davis New York Venture Portfolio (the “Davis New York Venture Portfolio”), |
| • | EQ/Lord Abbett Large Cap Core Portfolio (the “Lord Abbett Large Cap Core Portfolio”), and |
| • | EQ/Equity Growth PLUS Portfolio (the “Equity Growth PLUS Portfolio” and together, the “Acquired Portfolios”). |
Each Acquired Portfolio is a series of EQ Advisors Trust (the “Trust”), a Delaware statutory trust that is registered with the Securities and Exchange Commission as an open-end management investment company.
To the extent required by applicable law, each Insurance Company will offer Contractholders the opportunity to instruct it, as the record owner of all of the shares of beneficial interest in the Acquired Portfolios (the “Shares”) held by its Separate Accounts, as to how it should vote on the reorganization proposals (the “Proposals”) that will be considered at the Special Meeting of Shareholders of the Acquired Portfolios referred to in the preceding Notice and at any adjournments or postponements (the “Meeting”). The enclosed Combined Proxy Statement and Prospectus, which you should retain for future reference, sets forth concisely information about the proposed reorganizations involving the Acquired Portfolios and corresponding series of the Trust that a Contractholder should know before completing the enclosed voting instruction card.
i
AXA Equitable Financial Services Company, LLC, a wholly owned subsidiary of AXA Financial, Inc., is the parent company of each named Insurance Company other than MONY. AXA Financial, Inc. is a wholly owned subsidiary of AXA, a French insurance holding company. The principal executive offices of AXA Equitable Financial Services Company, LLC and AXA Financial, Inc. are located at 1290 Avenue of the Americas, New York, New York 10104. Protective Life Insurance Company is the parent company of MONY. The principal executive office of Protective Life Insurance Company is located at 2801 Highway 280 South, Birmingham, Alabama 35223.
These Contractholder Voting Instructions and the accompanying voting instruction card, together with the enclosed proxy materials, are being mailed to Contractholders on or about , 2014.
HOW TO INSTRUCT AN INSURANCE COMPANY
To instruct an Insurance Company as to how to vote the Shares held in the investment divisions of its Separate Accounts, Contractholders are asked to promptly complete their voting instructions on the enclosed voting instruction card(s), sign and date the voting instruction card(s), and mail the voting instruction card(s) in the accompanying postage-paid envelope. Contractholders also may provide voting instructions by telephone at 1-800-690-6903 or by Internet at our website at www.proxyvote.com.
If a voting instruction card is not marked to indicate voting instructions but is signed and timely returned, it will be treated as an instruction to vote the Shares in favor of the Proposal(s).
The number of Shares held in the investment division of a Separate Account corresponding to an Acquired Portfolio for which a Contractholder may provide voting instructions was determined as of the Record Date by dividing (i) a Contract’s account value (minus any Contract indebtedness) allocable to that investment division by (ii) the net asset value of one Share of the corresponding Acquired Portfolio. Each whole share of an Acquired Portfolio is entitled to one vote as to each matter with respect to which it is entitled to vote and each fractional share is entitled to a proportionate fractional vote. At any time prior to an Insurance Company’s voting at the Meeting, a Contractholder may revoke his or her voting instructions with respect to that investment division by providing the Insurance Company with a properly executed written revocation of such voting instructions, properly executing later-dated voting instructions by a voting instruction card, telephone or the Internet, or appearing and providing voting instructions in person at the Meeting.
HOW AN INSURANCE COMPANY WILL VOTE
An Insurance Company will vote the Shares for which it receives timely voting instructions from Contractholders in accordance with those instructions. Shares in each investment division of a Separate Account for which an Insurance Company
ii
receives a voting instruction card that is signed and timely returned but is not marked to indicate voting instructions will be treated as an instruction to vote the Shares “FOR” the applicable Proposal. Shares in each investment division of a Separate Account for which an Insurance Company receives no timely voting instructions from Contractholders, or that are attributable to amounts retained by an Insurance Company as surplus or seed money, will be voted by the applicable Insurance Company either “FOR” or “AGAINST” the applicable Proposals, or as an abstention, in the same proportion as the Shares for which Contractholders have provided voting instructions to the Insurance Company. As a result of such proportional voting by the Insurance Companies, it is possible that a small number of Contractholders could determine whether the Proposals are approved.
OTHER MATTERS
The Insurance Companies are not aware of any matters, other than the specified Proposals, to be acted on at the Meeting. If any other matters come before the Meeting, an Insurance Company will vote the Shares upon such matters in its discretion. Voting instruction cards may be solicited by directors, officers and employees of AXA Equitable Funds Management Group, LLC, the investment manager of the Trust, or its affiliates as well as officers and agents of the Trust. The principal solicitation will be by mail but voting instructions may also be solicited by telephone, fax, personal interview, the Internet or other permissible means.
If the quorum necessary to transact business is not established or the vote required to approve a Proposal is not obtained at the Meeting, the persons named as proxies may propose one or more adjournments or postponements of the Meeting in accordance with applicable law to permit further solicitation of voting instructions. The persons named as proxies will vote in their discretion on any such adjournment or postponement.
It is important that your Contract be represented. Please promptly mark your voting instructions on the enclosed voting instruction card; then sign and date the voting instruction card and mail it in the accompanying postage-paid envelope. You may also provide your voting instructions by telephone at 1-800-690-6903 or by Internet at our website at www.proxyvote.com.
iii
PROXY STATEMENT
for
EQ/Davis New York Venture Portfolio,
EQ/Lord Abbett Large Cap Core Portfolio and
EQ/Equity Growth PLUS Portfolio,
each a series of EQ Advisors Trust
and
PROSPECTUS
for
EQ/Invesco Comstock Portfolio and
EQ/Large Cap Growth PLUS Portfolio,
each a series of EQ Advisors Trust
Dated , 2014
1290 Avenue of the Americas
New York, New York 10104
1-877-222-2144
This Combined Proxy Statement and Prospectus (the “Proxy Statement/Prospectus”) is being furnished to owners of variable life insurance policies and/or variable annuity contracts or certificates (the “Contracts”) (the “Contractholders”) issued by AXA Equitable Life Insurance Company (“AXA Equitable”), MONY Life Insurance Company, MONY Life Insurance Company of America or another insurance company (each, an “Insurance Company” and together, the “Insurance Companies”) who, as of February 28, 2014, had net premiums or contributions allocated to the investment divisions of an Insurance Company’s separate account or accounts (the “Separate Accounts”) that are invested in shares of beneficial interest in one or more of the following Portfolios:
| • | EQ/Davis New York Venture Portfolio (the “Davis New York Venture Portfolio”), |
| • | EQ/Lord Abbett Large Cap Core Portfolio (the “Lord Abbett Large Cap Core Portfolio”), and |
| • | EQ/Equity Growth PLUS Portfolio (the “Equity Growth PLUS Portfolio”). |
THE SECURITIES AND EXCHANGE COMMISSION AND THE COMMODITY FUTURES TRADING COMMISSION HAVE NOT APPROVED OR DISAPPROVED THESE SECURITIES OR PASSED UPON THE ADEQUACY OF THIS PROXY STATEMENT/PROSPECTUS. ANY REPRESENTATION TO THE CONTRARY IS A CRIMINAL OFFENSE.
Each of the Davis New York Venture, the Lord Abbett Large Cap Core, and the Equity Growth PLUS Portfolios is referred to herein as an “Acquired Portfolio” and together as the “Acquired Portfolios.” Each Acquired Portfolio is a series of EQ Advisors Trust (the “Trust”), an open-end management investment company registered with the Securities and Exchange Commission (“SEC”). This Proxy Statement/Prospectus also is being furnished to the Insurance Companies as the record owners of shares and to other shareholders that were invested in one or more of the Acquired Portfolios as of February 28, 2014. Contractholders are being provided the opportunity to instruct the applicable Insurance Company to approve or disapprove the proposals contained in this Proxy Statement/Prospectus in connection with the solicitation by the Board of Trustees of the Trust (the “Board”) of proxies to be used at the Special Meeting of Shareholders of the Acquired Portfolios to be held at 1290 Avenue of the Americas, New York, New York 10104, on May 21, 2014, at , Eastern time, or any adjournment or Postponement thereof (the “Meeting”).
The proposals described in this Proxy Statement/Prospectus are as follows:
| Proposal | Shareholders Entitled to Vote on the Proposal | |
| 1. To approve the Plan of Reorganization and Termination adopted by the Board (the “Plan of Reorganization”), with respect to the reorganization of the Davis New York Venture Portfolio into the EQ/Invesco Comstock Portfolio, also a series of the Trust. | Shareholders of the Davis New York Venture Portfolio. | |
| 2. To approve the Plan of Reorganization, with respect to the reorganization of the Lord Abbett Large Cap Core Portfolio into the EQ/Invesco Comstock Portfolio, also a series of the Trust. | Shareholders of the Lord Abbett Large Cap Core Portfolio. | |
| 3. To approve the Plan of Reorganization, with respect to the reorganization of the Equity Growth PLUS Portfolio into the EQ/Large Cap Growth PLUS Portfolio, also a series of the Trust. | Shareholders of the Equity Growth PLUS Portfolio. |
Each reorganization referred to in Proposals 1 – 3 above is referred to herein as a “Reorganization” and together as the “Reorganizations.” Each of the EQ/Invesco Comstock Portfolio (the “Invesco Comstock Portfolio”) and the EQ/Large Cap Growth PLUS Portfolio (the “Large Cap Growth PLUS Portfolio”) is referred to herein as an “Acquiring Portfolio” and together as the “Acquiring Portfolios.”
Each Reorganization is intended to qualify for federal income tax purposes as a tax-free reorganization under section 368(a) of the Internal Revenue Code of 1986, as amended.
This Proxy Statement/Prospectus, which you should retain for future reference, contains important information regarding the proposals that you should know before
ii
voting or providing voting instructions. Additional information about the Trust has been filed with the SEC and is available upon oral or written request. This Proxy Statement/Prospectus is being provided to the Insurance Companies and mailed to Contractholders and other shareholders on or about , 2014. This Proxy Statement/Prospectus and a proxy or voting instruction card also will be available at www.proxyvote.com on or about , 2014. It is expected that one or more representatives of each Insurance Company will attend the Meeting in person or by proxy and will vote shares held by the Insurance Company in accordance with voting instructions received from its Contractholders and in accordance with voting procedures established by the Trust.
The Prospectus, dated May 1, 2013, as supplemented, with respect to the Acquired Portfolios has been filed with the SEC (File Nos. 333-17217 and 811-07953) and is incorporated by reference into this Proxy Statement/Prospectus. The Statement of Additional Information dated , 2014, relating to the Reorganizations has been filed with the SEC (File No. 333- ) and is incorporated by reference into this Proxy Statement/Prospectus. The Annual Report to Shareholders of the Trust with respect to the Acquiring Portfolios and the Acquired Portfolios for the fiscal year ended December 31, 2013, has been filed with the SEC (File Nos. 333-17217 and 811-07953). For a free copy of any of these documents, please call 1-877-522-5035 or write the Trust at the address above.
The Trust is subject to the informational requirements of the Securities Exchange Act of 1934, as amended. Accordingly, it must file certain reports and other information with the SEC. You can copy and review information about the Trust at the SEC’s Public Reference Room in Washington, DC, and at certain of the following SEC Regional Offices: New York Regional Office, 3 World Financial Center, Suite 400, New York, New York 10281; Miami Regional Office, 801 Brickell Avenue, Suite 1800, Miami, Florida 33131; Chicago Regional Office, 175 W. Jackson Boulevard, Suite 900, Chicago, Illinois 60604; Denver Regional Office, 1801 California Street, Suite 1500, Denver, Colorado 80202; Los Angeles Regional Office, 5670 Wilshire Boulevard, 11th Floor, Los Angeles, California 90036; Boston Regional Office, 33 Arch Street, 23rd Floor, Boston, MA 02110; Philadelphia Regional Office, The Mellon Independence Center, 701 Market Street, Philadelphia, PA 19106; Atlanta Regional Office, 3475 Lenox Road, N.E., Suite 1000, Atlanta, GA 30326; Fort Worth Regional Office, Burnett Plaza, Suite 1900, 801 Cherry Street, Unit 18, Fort Worth, TX 76102; Salt Lake Regional Office, 15 W. South Temple Street, Suite 1800, Salt Lake City, UT 84101; San Francisco Regional Office, 44 Montgomery Street, Suite 2600, San Francisco, CA 94104. You may obtain information on the operation of the Public Reference Room by calling the SEC at (202) 551-8090. Reports and other information about the Trust are available on the IDEA Database on the SEC’s Internet site at http://www.sec.gov. You may obtain copies of this information from the SEC’s Public Reference Branch, Office of Consumer Affairs and Information Services, Washington, DC 20549, at prescribed rates.
iii
| 1 | ||||
| 1 | ||||
| 2 | ||||
| 5 | ||||
| 7 | ||||
Comparison of Investment Objectives, Policies, and Strategies | 8 | |||
| 10 | ||||
| 10 | ||||
| 12 | ||||
| 13 | ||||
| 16 | ||||
| 18 | ||||
Comparison of Investment Objectives, Policies, and Strategies | 19 | |||
| 21 | ||||
| 21 | ||||
| 23 | ||||
| 23 | ||||
| 27 | ||||
| 27 | ||||
Comparison of Investment Objectives, Policies, and Strategies | 28 | |||
| 32 | ||||
| 32 | ||||
| 34 | ||||
| 35 | ||||
| 35 | ||||
| 36 | ||||
| 37 | ||||
Potential Benefits of the Reorganizations to FMG LLC and its Affiliates | 39 | |||
| 40 | ||||
| 46 | ||||
| 48 | ||||
| 48 | ||||
| 48 | ||||
| 48 |
iv
| 50 | ||||
| 52 | ||||
| 57 | ||||
| 59 | ||||
| 59 | ||||
Payments to Broker-Dealers and Other Financial Intermediaries | 60 | |||
| 60 | ||||
| 63 | ||||
| 65 | ||||
| 65 | ||||
| 66 | ||||
| 73 | ||||
| 73 | ||||
| 74 | ||||
| 75 | ||||
Adjournment or Postponement | 75 | |||
| 76 | ||||
| A-1 | ||||
APPENDIX B – More Information on Strategies and Risk Factors | B-1 | |||
APPENDIX C – Security Ownership of Certain Beneficial Owners | C-1 | |||
| D-1 | ||||
| E-1 |
v
You should read this entire Proxy Statement/Prospectus carefully. For additional information, you should consult the Plan of Reorganization, a copy of the form of which is attached hereto as Appendix A (the “Plan of Reorganization”).
This Proxy Statement/Prospectus is soliciting shareholders with amounts invested in one or more of the Acquired Portfolios as of February 28, 2014, to approve the Plan of Reorganization (with respect to the Acquired Portfolio in which they are invested), whereby each Acquired Portfolio will be reorganized into the corresponding Acquiring Portfolio. (Each Acquired Portfolio and each Acquiring Portfolio is sometimes referred to herein as a “Portfolio.”)
Each Acquired Portfolio’s shares are divided into three classes, designated Class IA, Class IB, and Class K shares (the “Acquired Portfolio Shares”). Each Acquiring Portfolio’s shares also are divided into three classes, designated Class IA, Class IB, and Class K shares (the “Acquiring Portfolio Shares”). The rights and preferences of each class of Acquiring Portfolio Shares are identical to the rights and preferences of the corresponding class of Acquired Portfolio Shares.
The Plan of Reorganization provides, with respect to each Reorganization, for:
| • | the transfer of all of the assets of the Acquired Portfolio to the corresponding Acquiring Portfolio in exchange solely for Acquiring Portfolio Shares having an aggregate net asset value equal to the Acquired Portfolio’s net assets and the Acquiring Portfolio’s assumption of all the liabilities of the Acquired Portfolio; |
| • | the distribution to the shareholders (for the benefit of the Separate Accounts, as applicable, and thus the Contractholders) of those Acquiring Portfolio Shares; and |
| • | the complete termination of the Acquired Portfolio. |
A comparison of the investment objective(s), policies, and strategies and principal risks of each Acquired Portfolio and its corresponding Acquiring Portfolio is included in “Comparison of Investment Objectives, Policies, and Strategies” and “Comparison of Principal Risk Factors” below. The Portfolios have identical distribution procedures, purchase procedures, exchange rights and redemption procedures, which are discussed in “Additional Information about the Acquiring Portfolios” below. Each Portfolio offers its shares to Separate Accounts and certain other eligible investors. Shares of each Portfolio are offered and redeemed at their net asset value without any sales load. You will not incur any sales loads or similar transaction charges as a result of a Reorganization.
Subject to shareholder approval, each Reorganization is expected to be effective at the close of business on , 2014, or on a later date the Trust decides upon (the
1
“Closing Date”). As a result of each Reorganization, each shareholder invested in shares of one or more of the Acquired Portfolios would become an owner of shares of the corresponding Acquiring Portfolio. Each such shareholder would hold, immediately after the Closing Date, Class IA, Class IB, or Class K shares of the applicable Acquiring Portfolio having an aggregate value equal to the aggregate value of the Class IA, Class IB, or Class K Acquired Portfolio Shares, as applicable, that were held by the shareholder as of the Closing Date. Similarly, each Contractholder whose Contract values are invested in shares of one or more of the Acquired Portfolios would become an indirect owner of shares of the corresponding Acquiring Portfolio. Each such Contractholder would indirectly hold, immediately after the Closing Date, Class IA, Class IB, or Class K shares of the applicable Acquiring Portfolio having an aggregate value equal to the aggregate value of the Class IA, Class IB, or Class K Acquired Portfolio Shares, as applicable, that were indirectly held by the Contractholder as of the Closing Date. The consummation of any one Reorganization is not contingent on the consummation of any other Reorganization. The Trust believes that there will be no adverse tax consequences to shareholders or Contractholders as a direct result of the Reorganizations. Please see “Additional Information about the Reorganizations — Federal Income Tax Consequences of the Reorganizations” below for further information.
The Board has unanimously approved the Plan of Reorganization with respect to each Portfolio. Accordingly, the Board is submitting the Plan of Reorganization for approval by the respective Acquired Portfolio’s shareholders. In considering whether to approve a proposal (a “Proposal”), you should review the Proposal for the Acquired Portfolio(s) in which you were a direct or indirect holder on the Record Date (as defined under “Voting Information”). In addition, you should review the information in this Proxy Statement/Prospectus that relates to all of the Proposals and the Plan of Reorganization generally. The Board recommends that you vote “FOR” the Proposals to approve the Plan of Reorganization.
PROPOSAL 1: APPROVAL OF THE PLAN OF REORGANIZATION WITH RESPECT TO THE REORGANIZATION OF THE DAVIS NEW YORK VENTURE PORTFOLIO INTO THE INVESCO COMSTOCK PORTFOLIO.
This Proposal 1 requests your approval of the Plan of Reorganization, pursuant to which the Davis New York Venture Portfolio will be reorganized into the Invesco Comstock Portfolio.
In considering whether you should approve this Proposal, you should note that:
| • | The Portfolios have similar investment objectives. Each Portfolio seeks growth of capital. The Invesco Comstock Portfolio, however, also seeks income. |
| • | The Portfolios have similar investment policies. Each Portfolio invests primarily in equity securities and also may invest in foreign securities. Each Portfolio relies on its respective sub-adviser (“Adviser”) to identify and evaluate companies that represent the best potential investments. |
2
There are, however, differences in the Portfolios’ primary investment policies and strategies of which you should be aware. For example, the Invesco Comstock Portfolio may invest in issuers of any capitalization range, while the Davis New York Venture Portfolio invests a majority of its assets in issuers with large market capitalizations. The Invesco Comstock Portfolio emphasizes a value style of investing, while the Davis New York Venture Portfolio does not. Also, while each Portfolio may invest in foreign securities and depositary receipts, the Invesco Comstock Portfolio may invest up to 25% of its total assets in securities of foreign issuers, including emerging market securities and depositary receipts, while the Davis New York Venture Portfolio does not have a stated limit with respect to investments in foreign securities, including depositary receipts. In addition, the Invesco Comstock Portfolio may enter into foreign currency transactions, including currency forward transactions, which are a type of derivative.
Also, the Invesco Comstock Portfolio generally holds up to 10% of its total assets in high-quality short-term debt securities and investment grade corporate debt securities as temporary investments and may invest up to 10% of its total assets in real estate investment trusts (“REITs”). Unlike the Invesco Comstock Portfolio, the Davis New York Venture Portfolio generally does not invest in debt securities or REITs, but has the flexibility to invest in companies whose shares may be subject to controversy and may invest a significant portion of its assets in the financial services sector. For a detailed comparison of the Portfolios’ investment policies and strategies, see “Comparison of Investment Objectives, Policies, and Strategies” below.
| • | The Portfolios have comparable risk profiles, although there are differences of which you should be aware. Each Portfolio’s principal risks include equity risk, foreign securities risk, currency risk, depositary receipts risk and large-cap company risk. The Davis New York Venture Portfolio, however, also is subject to financial services sector risk, headline risk, and special situations risk, while the Invesco Comstock Portfolio generally is not. In addition, the principal risks of investing in the Invesco Comstock Portfolio also include credit risk, derivatives risk, emerging markets risk, investment style risk, interest rate risk, investment grade securities risk, mid-cap and small-cap company risk, and real estate investing risk, which are not principal risks of investing in the Davis New York Venture Portfolio. For a detailed comparison of the Portfolios’ risks, see “Comparison of Principal Risk Factors” below. |
| • | AXA Equitable Funds Management Group, LLC (“FMG LLC” or the “Manager”) serves as the investment manager and administrator for each Portfolio and would continue to manage and administer the Invesco Comstock Portfolio after the Reorganization. FMG LLC has received an exemptive order from the SEC that generally permits FMG LLC and the Board to appoint, dismiss and replace each Portfolio’s Adviser(s) and to |
3
amend the advisory agreements between FMG LLC and the Advisers without obtaining shareholder approval (except with respect to Affiliated Advisers (as defined herein)). FMG LLC has appointed Davis Selected Advisers, L.P. to manage the assets of the Davis New York Venture Portfolio. FMG LLC has appointed Invesco Advisers, Inc. (“Invesco”) to manage the assets of the Invesco Comstock Portfolio and it is anticipated that Invesco will continue to advise the Invesco Comstock Portfolio after the Reorganization. For a detailed description of the Manager and the Adviser to the Invesco Comstock Portfolio, please see “Additional Information about the Acquiring Portfolios — The Manager” and “ — The Advisers” below. |
| • | The Davis New York Venture Portfolio and the Invesco Comstock Portfolio had net assets of approximately $76.6 million and $67.2 million, respectively, as of December 31, 2013. Thus, if the Reorganization of the Davis New York Venture Portfolio into the Invesco Comstock Portfolio had been in effect on that date, the combined Portfolio would have had net assets of approximately $143.8 million. |
In addition, as discussed in connection with Proposal 2, the Lord Abbett Large Cap Core Portfolio had net assets of approximately $77.6 million as of December 31, 2013. Thus, if the Reorganizations of both the Davis New York Venture Portfolio and the Lord Abbett Large Cap Core Portfolio into the Invesco Comstock Portfolio had been in effect on that date, the combined Portfolio would have had net assets of approximately $221.4 million.
| • | Class IA shareholders of the Davis New York Venture Portfolio will receive Class IA shares of the Invesco Comstock Portfolio, Class IB shareholders of the Davis New York Venture Portfolio will receive Class IB shares of the Invesco Comstock Portfolio, and Class K shareholders of the Davis New York Venture Portfolio will receive Class K shares of the Invesco Comstock Portfolio pursuant to the Reorganization. Shareholders will not pay any sales charges in connection with the Reorganization. Please see “Comparative Fee and Expense Tables,” “Additional Information about the Reorganizations” and “Additional Information about the Acquiring Portfolios” below for more information. |
| • | It is estimated that the annual operating expense ratios for the Invesco Comstock Portfolio’s Class IA, Class IB, and Class K shares, for the fiscal year following the Reorganization, will be lower than those of the Davis New York Venture Portfolio’s Class IA, Class IB, and Class K shares, respectively, for the fiscal year ended December 31, 2013. For a more detailed comparison of the fees and expenses of the Portfolios, please see “Comparative Fee and Expense Tables” and “Additional Information about the Acquiring Portfolios” below. |
| • | The maximum management fee for the Davis New York Venture Portfolio is equal to an annual rate of 0.85% of its average daily net assets, while the maximum management fee for the Invesco Comstock Portfolio is equal to an |
4
annual rate of 0.65% of its average daily net assets. Both Portfolios are subject to the same administration fee schedule. Each Portfolio pays its proportionate share of an asset-based administration fee for the Trust, which is equal to an annual rate of 0.12% of the first $3 billion of total Trust average daily net assets (exclusive of certain of the Trust’s portfolios), 0.11% of the next $3 billion, 0.105% of the next $4 billion, 0.10% of the next $20 billion, and 0.0975% thereafter, plus an annual fee of $30,000 per Portfolio whose total average net assets are less than $5 billion. For a more detailed description of the fees and expenses of the Portfolios, please see “Comparative Fee and Expense Tables” and “Additional Information about the Acquiring Portfolios” below. |
| • | Following the Reorganization, the combined Portfolio will be managed in accordance with the investment objective, policies and strategies (“Investment Criteria”) of the Invesco Comstock Portfolio. It is not expected that the Invesco Comstock Portfolio will revise any of its investment policies following the Reorganization to reflect those of the Davis New York Venture Portfolio. FMG LLC has reviewed each of those Portfolio’s current portfolio holdings and determined that the Davis New York Venture Portfolio’s holdings are generally consistent and compatible with the Invesco Comstock Portfolio’s Investment Criteria and thus, if the Reorganization is approved, a large majority of the Davis New York Venture Portfolio’s Assets could be transferred to and held by the Invesco Comstock Portfolio. However, it is expected that some of those holdings may not remain at the time of the Reorganization due to normal portfolio turnover. In addition, if the Reorganization is approved, the Manager will liquidate the Davis New York Venture Portfolio’s holdings that, based on market conditions and an assessment by the Manager and Invesco, are not compatible with the Invesco Comstock Portfolio’s current portfolio composition or Investment Criteria. It is currently anticipated that a majority of the Davis New York Venture Portfolio’s assets would be liquidated in connection with the Reorganization. The proceeds of such liquidation will be held in temporary investments or reinvested in assets that are consistent with the Invesco Comstock Portfolio’s Investment Criteria. Although any sale of portfolio investments in connection with the Reorganization would be conducted in an orderly manner, the need for the Portfolio to sell such investments may result in its selling securities at a disadvantageous time and price and could result in the Portfolio’s realizing gains (or losses) that otherwise would not have been realized and incurring transaction costs that otherwise would not have been incurred. |
| • | The Davis New York Venture Portfolio will bear its proportionate share (based on the fraction that its shareholder accounts will bear to the shareholder accounts of all the Acquired Portfolios at the Valuation Time) of the expenses of the Reorganizations described in this Proxy Statement/Prospectus. |
5
Comparative Fee and Expense Tables
The following tables show the fees and expenses of each class of shares of each Portfolio and the estimated pro forma fees and expenses of each class of shares of the Acquiring Portfolio after giving effect to the proposed Reorganization. Fees and expenses for each Portfolio are based on those incurred by each class of its shares for the fiscal year ended December 31, 2013. The pro forma fees and expenses of the Acquiring Portfolio Shares assume that the Reorganization has been in effect for the year ended December 31, 2013. The tables below do not reflect any Contract-related fees and expenses, which would increase overall fees and expenses. See a Contract prospectus for a description of those fees and expenses.
Shareholder Fees
(fees paid directly from your investment)
Davis New York | Invesco Comstock Portfolio | Pro Forma Invesco Comstock | ||
Not applicable. | Not applicable. | Not applicable. |
Annual Operating Expenses
(expenses that you may pay each year as a percentage of the value of your investment)
| Davis New York Venture Portfolio | Invesco Comstock Portfolio | Pro Forma Invesco Comstock Portfolio (assuming the Reorganizations are approved)** | ||||||||||||||||||||||||||||||||||
| Class IA | Class IB | Class K | Class IA | Class IB | Class K | Class IA | Class IB | Class K* | ||||||||||||||||||||||||||||
Management Fee | 0.85 | % | 0.85 | % | 0.85 | % | 0.65 | % | 0.65 | % | 0.65 | % | 0.65 | % | 0.65 | % | 0.65 | % | ||||||||||||||||||
Distribution and/or Service Fees | 0.25 | % | 0.25 | % | 0.00 | % | 0.25 | % | 0.25 | % | 0.00 | % | 0.25 | % | 0.25 | % | 0.00 | % | ||||||||||||||||||
Other Expenses | 0.18 | % | 0.18 | % | 0.18 | % | 0.21 | % | 0.16 | % | 0.28 | % | 0.13 | % | 0.13 | % | 0.13 | % | ||||||||||||||||||
Total Annual Portfolio Operating Expenses | 1.28 | % | 1.28 | % | 1.03 | % | 1.11 | % | 1.06 | % | 0.93 | % | 1.03 | % | 1.03 | % | 0.78 | % | ||||||||||||||||||
Fee Waiver and/or Expense Reim- | -0.13 | % | -0.13 | % | -0.13 | % | -0.11 | % | -0.06 | % | -0.18 | % | -0.03 | % | -0.03 | % | -0.03 | % | ||||||||||||||||||
Total Annual Portfolio Operating Expenses After Fee Waiver and/or Expense Reimbursement | 1.15 | % | 1.15 | % | 0.90 | % | 1.00 | % | 1.00 | % | 0.75 | % | 1.00 | % | 1.00 | % | 0.75 | % | ||||||||||||||||||
| * | Based on estimated amounts for the current fiscal year. |
6
| ** | Assumes both the Reorganization described in this Proposal 1 and the Reorganization described in Proposal 2 are approved. See Appendix D for the pro forma fees and expenses of the Acquiring Portfolio Shares assuming that only the Reorganization described in this Proposal 1 is approved. |
| † | Pursuant to a contract, FMG LLC has agreed to make payments or waive its management, administrative and other fees to limit the expenses of the Davis New York Venture Portfolio through April 30, 2015 (unless the Trust’s Board consents to an earlier revision or termination of this arrangement) (“Expense Limitation Arrangement”) so that the annual operating expenses of the Davis New York Venture Portfolio (exclusive of taxes, interest, brokerage commissions, capitalized expenses, fees and expenses of other investment companies in which the Davis New York Venture Portfolio invests, dividend and interest expenses on securities sold short, and extraordinary expenses) do not exceed an annual rate of average daily net assets of 1.15% for Class IA and IB shares and 0.90% for Class K shares of the Davis New York Venture Portfolio. The Expense Limitation Arrangement may be terminated by FMG LLC at any time after April 30, 2015. |
| †† | Pursuant to a contract, FMG LLC has agreed to make payments or waive its management, administrative and other fees to limit the expenses of the Invesco Comstock Portfolio through April 30, 2015 (unless the Trust’s Board consents to an earlier revision or termination of this arrangement) (“Expense Limitation Arrangement”) so that the annual operating expenses of the Invesco Comstock Portfolio (exclusive of taxes, interest, brokerage commissions, capitalized expenses, fees and expenses of other investment companies in which the Invesco Comstock Portfolio invests, dividend and interest expenses on securities sold short, and extraordinary expenses) do not exceed an annual rate of average daily net assets of 1.00% for Class IA and IB shares and 0.75% for Class K shares of the Invesco Comstock Portfolio. The Expense Limitation Arrangement may be terminated by FMG LLC at any time after April 30, 2015. |
This example is intended to help you compare the costs of investing in the Portfolios with the cost of investing in other investment options. The example assumes that:
| • | You invest $10,000 in a Portfolio for the time periods indicated; |
| • | Your investment has a 5% return each year; |
| • | The Portfolio’s operating expenses remain the same; and |
| • | The Expense Limitation Arrangement is not renewed. |
This example does not reflect any Contract-related fees and expenses, including redemption fees (if any) at the Contract level. If such fees and expenses were reflected, the total expenses would be higher. Although your actual costs may be higher or lower, based on these assumptions your costs would be:
| 1 Year | 3 Years | 5 Years | 10 Years | |||||||||||||
Davis New York Venture Portfolio | ||||||||||||||||
Class IA | $ | 117 | $ | 393 | $ | 690 | $ | 1,534 | ||||||||
Class IB | $ | 117 | $ | 393 | $ | 690 | $ | 1,534 | ||||||||
Class K | $ | 92 | $ | 315 | $ | 556 | $ | 1,248 | ||||||||
Invesco Comstock Portfolio | ||||||||||||||||
Class IA | $ | 102 | $ | 342 | $ | 601 | $ | 1,342 | ||||||||
Class IB | $ | 102 | $ | 331 | $ | 579 | $ | 1,289 | ||||||||
Class K | $ | 77 | $ | 278 | $ | 497 | $ | 1,127 | ||||||||
Pro Forma Invesco Comstock Portfolio (assuming the Reorganizations are approved)* | ||||||||||||||||
Class IA | $ | 102 | $ | 325 | $ | 566 | $ | 1,257 | ||||||||
Class IB | $ | 102 | $ | 325 | $ | 566 | $ | 1,257 | ||||||||
Class K | $ | 77 | $ | 246 | $ | 430 | $ | 963 | ||||||||
7
| * | Assumes both the Reorganization described in this Proposal 1 and the Reorganization described in Proposal 2 are approved. See Appendix D for the pro forma fees and expenses of the Acquiring Portfolio Shares assuming that only the Reorganization described in this Proposal 1 is approved. |
Portfolio Turnover
Each Portfolio pays transaction costs, such as commissions, when it buys and sells securities (or “turns over” its portfolio). A higher portfolio turnover rate may indicate higher transaction costs. These costs, which are not reflected in annual fund operating expenses or in the example, affect a Portfolio’s performance. During the fiscal year ended December 31, 2013, the portfolio turnover rates for each of the Davis New York Venture Portfolio and the Invesco Comstock Portfolio were 11% and 15%, respectively, of the average value of the Portfolio.
Comparison of Investment Objectives, Policies, and Strategies
The following table compares the investment objectives and principal investment policies and strategies of the Davis New York Venture Portfolio with those of the Invesco Comstock Portfolio. The Board may change the investment objective of a Portfolio without a vote of the Portfolio’s shareholders. For more detailed information about each Portfolio’s investment strategies and risks, see Appendix B.
| Acquiring Portfolio | Acquired Portfolio | |||
| Invesco Comstock Portfolio | Davis New York Venture Portfolio | |||
Investment Objectives | Seeks to achieve capital growth and income. | Seeks to achieve long-term growth of capital. | ||
Principal Investment Strategies | Under normal market conditions, the Portfolio invests at least 80% of its net assets, plus borrowings for investment purposes, in common stocks. The Portfolio may invest in issuers of any capitalization range. The Portfolio may invest in other types of equity securities. | Under normal circumstances, the Portfolio invests a majority of its assets in equity securities issued by large-cap companies with market capitalizations of at least $10 billion. | ||
| No corresponding strategy. | The Portfolio also may invest a significant portion of its assets in the financial services sector. |
8
| Acquiring Portfolio | Acquired Portfolio | |||
| Invesco Comstock Portfolio | Davis New York Venture Portfolio | |||
| The Adviser emphasizes a value style of investing, seeking well established, undervalued companies believed by the Adviser to possess the potential for capital growth and income. The Adviser typically sells portfolio securities when its assessments of capital growth and income potential of such securities materially change. | The Adviser conducts extensive research to identify well managed companies with durable business models that are attractive to the Adviser based on its assessment of a company’s worth. In selecting investments, the Adviser searches for companies that demonstrate a majority or, in the Adviser’s opinion, an appropriate mix of the following characteristics:
• First class management evidenced by a proven track record, significant alignment of interest in business, intelligent allocation of capital and smart application of technology to improve business and lower costs;
• Strong financial condition and satisfactory profitability evidenced by a strong balance sheet, low cost structure, high returns on capital;
• Strong competitive positioning evidenced by non-obsolescent products and/or services, dominant or growing market share, participation in a growing market and global presence and brand names.
The Adviser also analyzes each company’s common stock, seeking to purchase those that are attractive to the Adviser based on its assessment of a company’s worth. The Adviser seeks to invest in companies for the long term and may sell a security for a variety of reasons, including if the ratio of the risks and rewards of continuing to own the company is no longer attractive. | |||
| No corresponding strategy. | The Portfolio also may invest in a company when it becomes the center of controversy due to adverse media attention. The company may be involved in litigation, the company’s financial reports or corporate governance may be challenged, the company’s annual report may disclose a weakness in internal controls, investors may question the company’s published financial reports, greater government regulation may be contemplated or other adverse events may threaten the company’s future. |
9
| Acquiring Portfolio | Acquired Portfolio | |||
| Invesco Comstock Portfolio | Davis New York Venture Portfolio | |||
| The Portfolio may invest up to 25% of its total assets in securities of foreign issuers, including emerging market securities and depositary receipts. With respect to investments in foreign issuers, the Portfolio may enter into foreign currency transactions, including currency forward transactions, which are a type of derivative. | The Portfolio also has the flexibility to invest in foreign securities, including depositary receipts. | |||
| The Portfolio generally holds up to 10% of its total assets in high-quality short-term debt securities and investment grade corporate debt securities as temporary investments. The Portfolio may invest up to 10% of its total assets in REITs. | No corresponding strategy. |
Comparison of Principal Risk Factors
An investment in a Portfolio is not a deposit of a bank and is not insured or guaranteed by the Federal Deposit Insurance Corporation or any other government agency. You may lose money by investing in a Portfolio. The following table compares the principal risks of an investment in each Portfolio. For an explanation of each such risk, see “Additional Information about the Reorganizations — Description of Risk Factors” below.
Risks | Invesco Comstock Portfolio | Davis New York Venture Portfolio | ||||||
Credit Risk | X | |||||||
Derivatives Risk | X | |||||||
Equity Risk | X | X | ||||||
Financial Services Sector Risk | X | |||||||
Foreign Securities Risk | X | X | ||||||
Currency Risk | X | X | ||||||
Depositary Receipts Risk | X | X | ||||||
Emerging Markets Risk | X | |||||||
Headline Risk | X | |||||||
Interest Rate Risk | X | |||||||
Investment Grade Securities Risk | X | |||||||
Investment Style Risk | X | |||||||
Large-Cap Company Risk | X | X | ||||||
Mid-Cap and Small-Cap Company Risk | X | |||||||
Real Estate Investing Risk | X | |||||||
Special Situations Risk | X | |||||||
Comparative Performance Information
The bar charts and tables below provide some indication of the risks of investing in each Portfolio by showing changes in the Portfolio’s performance from year to year and by showing how the Portfolio’s average annual total returns for the past one year, five
10
years and since inception through December 31, 2013, compared to the returns of a broad-based market index. Past performance is not an indication of future performance.
The performance results do not reflect any Contract-related fees and expenses, which would reduce the performance results.
Davis New York Venture Portfolio - Calendar Year Total Returns (Class IB)
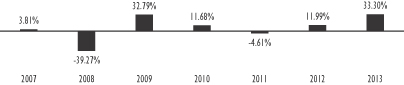
Best Quarter (% and time period) 21.49% (2009 2nd Quarter) | Worst Quarter (% and time period) -23.88% (2008 4th Quarter) | |||||||||||||
Invesco Comstock Portfolio - Calendar Year Total Returns (Class IB)

Best Quarter (% and time period) 19.12% (2009 3rd Quarter) | Worst Quarter (% and time period) -23.30% (2008 4th Quarter) | |||||||||||||
Davis New York Venture Portfolio
Average Annual Total Returns (For the periods ended December 31, 2013) | One Year | Five Years | Since Inception | |||||||||
Davis New York Venture Portfolio — Class IA | 33.43% | 16.30% | 5.30% | |||||||||
Davis New York Venture Portfolio — Class IB | 33.30% | 16.12% | 5.10% | |||||||||
Davis New York Venture Portfolio — Class K | 33.76% | N/A | 21.73% | |||||||||
S&P 500 Index* | 32.39% | 17.94% | 7.15% | ** | ||||||||
11
Invesco Comstock Portfolio
Average Annual Total Returns (For the periods ended December 31, 2013) | One Year | Five Years | Since Inception | |||||||||
Invesco Comstock Portfolio — Class IA | 35.10% | 18.51% | 6.79% | |||||||||
Invesco Comstock Portfolio — Class IB | 35.06% | 18.31% | 6.58% | |||||||||
Invesco Comstock Portfolio — Class K | N/A | N/A | 6.27% | |||||||||
Russell 1000® Value Index† | 32.53% | 16.67% | 7.11% | ‡ | ||||||||
| * | The S&P 500 Index is a weighted index of common stocks of 500 leading companies in leading industries of the U.S. economy, capturing 75% coverage of U.S. equities. The index is capitalization weighted, thereby giving greater weight to companies with the largest market capitalizations. |
| ** | Since August 31, 2006. |
| † | The Russell 1000® Value Index is an unmanaged index of common stocks that measures the performance of those Russell 1000® Index companies with lower price to book ratios and lower forecasted growth values. The Russell 1000® Index is an unmanaged index of common stocks that measures the performance of approximately 1,000 of the largest companies in the Russell 3000® Index, and represents approximately 92% of the total market capitalization of the Russell 3000® Index. |
| ‡ | Since April 29, 2005. |
The following table shows the capitalization of each Portfolio as of December 31, 2013, and of the Invesco Comstock Portfolio on a pro forma combined basis as of December 31, 2013, after giving effect to the proposed Reorganization. Pro forma net assets may not total and net asset values per share may not recalculate due to rounding of net assets.
| Net Assets (in millions) | Net Asset Value Per Share | Shares Outstanding | ||||||||||
Davis New York Venture Portfolio — Class IA | $ | 22.8 | $ | 13.52 | 1,689,177 | |||||||
Invesco Comstock Portfolio — Class IA | $ | 10.9 | $ | 14.01 | 780,354 | |||||||
Adjustments* | $ | — | $ | — | (82,185 | ) | ||||||
Pro forma Invesco Comstock Portfolio — Class IA (assuming the Reorganizations are approved)** | $ | 43.1 | $ | 14.01 | 3,073,069 | |||||||
Davis New York Venture Portfolio — Class IB | $ | 38.5 | $ | 13.52 | 2,850,701 | |||||||
Invesco Comstock Portfolio — Class IB | $ | 53.1 | $ | 14.02 | 3,786,410 | |||||||
Adjustments* | $ | — | $ | — | (264,287 | ) | ||||||
Pro forma Invesco Comstock Portfolio — Class IB (assuming the Reorganizations are approved)** | $ | 159.8 | $ | 14.02 | 11,397,329 | |||||||
Davis New York Venture Portfolio — Class K | $ | 15.2 | $ | 13.52 | 1,126,091 | |||||||
Invesco Comstock Portfolio — Class K | $ | 3.2 | $ | 13.98 | 228,690 | |||||||
Adjustments* | $ | — | $ | — | (37,566 | ) | ||||||
Pro forma Invesco Comstock Portfolio — Class K (assuming the Reorganizations are approved)** | $ | 18.4 | $ | 13.98 | 1,317,215 | |||||||
| * | Reflects adjustment for retired shares of the Acquired Portfolios. |
| ** | Assumes both the Reorganization described in this Proposal 1 and the Reorganization described in Proposal 2 are approved. See Appendix D for the capitalization of the Invesco Comstock Portfolio on a pro forma combined basis assuming that only the Reorganization described in this Proposal 1 is approved |
12
AFTER CAREFUL CONSIDERATION, THE BOARD UNANIMOUSLY APPROVED THE PLAN OF REORGANIZATION WITH RESPECT TO THE DAVIS NEW YORK VENTURE PORTFOLIO. ACCORDINGLY, THE BOARD HAS SUBMITTED THE PLAN OF REORGANIZATION FOR APPROVAL BY THIS PORTFOLIO’S SHAREHOLDERS. THE BOARD RECOMMENDS THAT YOU VOTE “FOR” PROPOSAL 1.
PROPOSAL 2: APPROVAL OF THE PLAN OF REORGANIZATION WITH RESPECT TO THE REORGANIZATION OF THE LORD ABBETT LARGE CAP CORE PORTFOLIO INTO THE INVESCO COMSTOCK PORTFOLIO.
This Proposal 2 requests your approval of the Plan of Reorganization, pursuant to which the Lord Abbett Large Cap Core Portfolio will be reorganized into the Invesco Comstock Portfolio.
In considering whether you should approve this Proposal, you should note that:
| • | The Portfolios have substantially similar investment objectives. Each Portfolio seeks growth of capital and income. |
| • | The Portfolios have similar investment policies. Each Portfolio invests primarily in equity securities and also may invest in foreign securities. Each Portfolio relies on its respective sub-adviser (“Adviser”) to identify and evaluate companies that represent the best potential investments. |
There are, however, differences in the Portfolios’ primary investment policies and strategies of which you should be aware. For example, the Invesco Comstock Portfolio may invest in issuers of any capitalization range, while the Lord Abbett Large Cap Core Portfolio invests primarily in issuers with large market capitalizations. The Invesco Comstock Portfolio emphasizes a value style of investing, while the Lord Abbett Large Cap Core Portfolio combines both value and growth investment styles. Also, while each Portfolio may invest in foreign securities and depositary receipts, the Invesco Comstock Portfolio may invest up to 25% of its total assets in securities of foreign issuers, including emerging market securities and depositary receipts, while the Lord Abbett Large Cap Core Portfolio limits its investments in foreign securities that are primarily traded outside of the United States to 10% of its net assets, but may invest without limit in depositary receipts. In addition, the Invesco Comstock Portfolio may enter into foreign currency transactions, including currency forward transactions, which are a type of derivative.
Also, the Invesco Comstock Portfolio generally holds up to 10% of its total assets in high-quality short-term debt securities and investment grade corporate debt securities as temporary investments and may invest up to 10% of its total assets in real estate investment trusts (“REITs”); the Lord Abbett Large Cap Core Portfolio generally does not invest in debt securities or REITs. For a detailed comparison of the Portfolios’ investment policies and strategies, see “Comparison of Investment Objectives, Policies, and Strategies” below.
13
| • | The Portfolios have comparable risk profiles, although there are differences of which you should be aware. Each Portfolio’s principal risks include equity risk, foreign securities risk, currency risk, depositary receipts risk and large-cap company risk. The Invesco Comstock Portfolio, however, also is subject to credit risk, derivatives risk, emerging markets risk, investment style risk, interest rate risk, investment grade securities risk, mid-cap and small-cap company risk, and real estate investing risk, while the Lord Abbett Large Cap Core Portfolio generally is not. For a detailed comparison of the Portfolios’ risks, see “Comparison of Principal Risk Factors” below. |
| • | AXA Equitable Funds Management Group, LLC (“FMG LLC” or the “Manager”) serves as the investment manager and administrator for each Portfolio and would continue to manage and administer the Invesco Comstock Portfolio after the Reorganization. FMG LLC has received an exemptive order from the SEC that generally permits FMG LLC and the Board to appoint, dismiss and replace each Portfolio’s Adviser(s) and to amend the advisory agreements between FMG LLC and the Advisers without obtaining shareholder approval (except with respect to Affiliated Advisers (as defined herein)). FMG LLC has appointed Lord, Abbett & Co. LLC to manage the assets of the Lord Abbett Large Cap Core Portfolio. FMG LLC has appointed Invesco Advisers, Inc. (“Invesco”) to manage the assets of the Invesco Comstock Portfolio and it is anticipated that Invesco will continue to advise the Invesco Comstock Portfolio after the Reorganization. For a detailed description of the Manager and the Adviser to the Invesco Comstock Portfolio, please see “Additional Information about the Acquiring Portfolios — The Manager” and “ — The Advisers” below. |
| • | The Lord Abbett Large Cap Core Portfolio and the Invesco Comstock Portfolio had net assets of approximately $77.6 million and $67.2 million, respectively, as of December 31, 2013. Thus, if the Reorganization of the Lord Abbett Large Cap Core Portfolio into the Invesco Comstock Portfolio had been in effect on that date, the combined Portfolio would have had net assets of approximately $144.8 million. |
In addition, as discussed in connection with Proposal 1, the Davis New York Venture Portfolio had net assets of approximately $76.6 million as of December 31, 2013. Thus, if the Reorganizations of both the Lord Abbett Large Cap Core Portfolio and the Davis New York Venture Portfolio into the Invesco Comstock Portfolio had been in effect on that date, the combined Portfolio would have had net assets of approximately $221.4 million.
| • | Class IA shareholders of the Lord Abbett Large Cap Core Portfolio will receive Class IA shares of the Invesco Comstock Portfolio and Class IB shareholders of the Lord Abbett Large Cap Core Portfolio will receive Class IB shares of the Invesco Comstock Portfolio pursuant to the Reorganization. Shareholders will not pay any sales charges in connection with the Reorganization. Please see “Comparative Fee and Expense Tables,” |
14
“Additional Information about the Reorganizations” and “Additional Information about the Acquiring Portfolios” below for more information. |
| • | It is estimated that the annual operating expense ratios for the Invesco Comstock Portfolio’s Class IA and Class IB shares, for the fiscal year following the Reorganization, will be the same as those of the Lord Abbett Large Cap Core Portfolio’s Class IA and Class IB shares, respectively, for the fiscal year ended December 31, 2013. For a more detailed comparison of the fees and expenses of the Portfolios, please see “Comparative Fee and Expense Tables” and “Additional Information about the Acquiring Portfolios” below. |
| • | The maximum management fee for the Lord Abbett Large Cap Core Portfolio is equal to an annual rate of 0.65% of its average daily net assets. The maximum management fee for the Invesco Comstock Portfolio is equal to an annual rate of 0.65% of its average daily net assets. Both Portfolios are subject to the same administration fee schedule. Each Portfolio pays its proportionate share of an asset-based administration fee for the Trust, which is equal to an annual rate of 0.12% of the first $3 billion of total Trust average daily net assets (exclusive of certain of the Trust’s portfolios), 0.11% of the next $3 billion, 0.105% of the next $4 billion, 0.10% of the next $20 billion, and 0.0975% thereafter, plus an annual fee of $30,000 per Portfolio whose total average net assets are less than $5 billion. For a more detailed description of the fees and expenses of the Portfolios, please see “Comparative Fee and Expense Tables” and “Additional Information about the Acquiring Portfolios” below. |
| • | Following the Reorganization, the combined Portfolio will be managed in accordance with the investment objective, policies and strategies (“Investment Criteria”) of the Invesco Comstock Portfolio. It is not expected that the Invesco Comstock Portfolio will revise any of its investment policies following the Reorganization to reflect those of the Lord Abbett Large Cap Core Portfolio. FMG LLC has reviewed each of those Portfolio’s current portfolio holdings and determined that the Lord Abbett Large Cap Core Portfolio’s holdings are generally consistent and compatible with the Invesco Comstock Portfolio’s Investment Criteria and thus, if the Reorganization is approved, a large majority of the Lord Abbett Large Cap Core Portfolio’s Assets could be transferred to and held by the Invesco Comstock Portfolio. However, it is expected that some of those holdings may not remain at the time of the Reorganization due to normal portfolio turnover. In addition, if the Reorganization is approved, the Manager will liquidate the Lord Abbett Large Cap Core Portfolio’s holdings that, based on market conditions and an assessment by the Manager and Invesco, are not compatible with the Invesco Comstock Portfolio’s current portfolio composition or Investment Criteria. It is currently anticipated that a majority of the Lord Abbett Large Cap Core Portfolio’s assets would be liquidated in connection with the Reorganization. The proceeds of such liquidation will be held in temporary investments or reinvested in assets that are consistent with the Invesco Comstock Portfolio’s Investment Criteria. Although any sale of portfolio investments in connection with the Reorganization would be conducted in |
15
an orderly manner, the need for the Portfolio to sell such investments may result in its selling securities at a disadvantageous time and price and could result in the Portfolio’s realizing gains (or losses) that otherwise would not have been realized and incurring transaction costs that otherwise would not have been incurred. |
| • | The Lord Abbett Large Cap Core Portfolio will bear its proportionate share (based on the fraction that its shareholder accounts will bear to the shareholder accounts of all the Acquired Portfolios at the Valuation Time) of the expenses of the Reorganizations described in this Proxy Statement/Prospectus. |
Comparative Fee and Expense Tables
The following tables show the fees and expenses of each class of shares of each Portfolio and the estimated pro forma fees and expenses of each class of shares of the Acquiring Portfolio after giving effect to the proposed Reorganization. Fees and expenses for each Portfolio are based on those incurred by each class of its shares for the fiscal year ended December 31, 2013. The pro forma fees and expenses of the Acquiring Portfolio Shares assume that the Reorganization has been in effect for the year ended December 31, 2013. The tables below do not reflect any Contract-related fees and expenses, which would increase overall fees and expenses. See a Contract prospectus for a description of those fees and expenses.
Shareholder Fees
(fees paid directly from your investment)
Lord Abbett Large Cap | Invesco Comstock | Pro Forma Invesco Comstock | ||
Not applicable. | Not applicable. | Not applicable. |
16
Annual Operating Expenses
(expenses that you may pay each year as a percentage of the value of your investment)
| Lord Abbett Large Cap Core Portfolio | Invesco Comstock Portfolio | Pro Forma Invesco Comstock Portfolio (assuming the Reorganizations are approved)** | ||||||||||||||||||||||||||||||||||
| Class IA | Class IB | Class K# | Class IA | Class IB | Class K | Class IA | Class IB | Class K* | ||||||||||||||||||||||||||||
Management Fee | 0.65 | % | 0.65 | % | N/A | 0.65 | % | 0.65 | % | 0.65 | % | 0.65 | % | 0.65 | % | 0.65 | % | |||||||||||||||||||
Distribution and/or Service Fees (12b-1 fees) | 0.25 | % | 0.25 | % | N/A | 0.25 | % | 0.25 | % | 0.00 | % | 0.25 | % | 0.25 | % | 0.00 | % | |||||||||||||||||||
Other Expenses | 0.17 | % | 0.17 | % | N/A | 0.21 | % | 0.16 | % | 0.28 | % | 0.13 | % | 0.13 | % | 0.13 | % | |||||||||||||||||||
Total Annual Portfolio Operating Expenses | 1.07 | % | 1.07 | % | N/A | 1.11 | % | 1.06 | % | 0.93 | % | 1.03 | % | 1.03 | % | 0.78 | % | |||||||||||||||||||
Fee Waiver and/or Expense Reimbu- | -0.07 | % | -0.07 | % | N/A | -0.11 | % | -0.06 | % | -0.18 | % | -0.03 | % | -0.03 | % | -0.03 | % | |||||||||||||||||||
Total Annual Portfolio Operating Expenses After Fee Waiver and/or Expense Reimbursement | 1.00 | % | 1.00 | % | N/A | 1.00 | % | 1.00 | % | 0.75 | % | 1.00 | % | 1.00 | % | 0.75 | % | |||||||||||||||||||
| * | Based on estimated amounts for the current fiscal year. |
| ** | Assumes both the Reorganization described in this Proposal 2 and the Reorganization described in Proposal 1 are approved. See Appendix E for the pro forma fees and expenses of the Acquiring Portfolio Shares assuming that only the Reorganization described in this Proposal 2 is approved. |
| † | Pursuant to a contract, FMG LLC has agreed to make payments or waive its management, administrative and other fees to limit the expenses of the Lord Abbett Large Cap Core Portfolio through April 30, 2015 (unless the Trust’s Board consents to an earlier revision or termination of this arrangement) (“Expense Limitation Arrangement”) so that the annual operating expenses of the Lord Abbett Large Cap Core Portfolio (exclusive of taxes, interest, brokerage commissions, capitalized expenses, fees and expenses of other investment companies in which the Lord Abbett Large Cap Core Portfolio invests, dividend and interest expenses on securities sold short, and extraordinary expenses) do not exceed an annual rate of average daily net assets of 1.00% for Class IA and IB shares and 0.75% for Class K shares of the Lord Abbett Large Cap Core Portfolio. The Expense Limitation Arrangement may be terminated by FMG LLC at any time after April 30, 2015. |
| †† | Pursuant to a contract, FMG LLC has agreed to make payments or waive its management, administrative and other fees to limit the expenses of the Invesco Comstock Portfolio through April 30, 2015 (unless the Trust’s Board consents to an earlier revision or termination of this arrangement) (“Expense Limitation Arrangement”) so that the annual operating expenses of the Invesco Comstock Portfolio (exclusive of taxes, interest, brokerage commissions, capitalized expenses, fees and expenses of other investment companies in which the Invesco Comstock Portfolio invests, dividend and interest expenses on securities sold short, and extraordinary expenses) do not exceed an annual rate of average daily net assets of 1.00% for Class IA and IB shares and 0.75% for Class K shares of the Invesco Comstock Portfolio. The Expense Limitation Arrangement may be terminated by FMG LLC at any time after April 30, 2015. |
| # | Class K shares of the Lord Abbett Large Cap Core Portfolio were not operational for the fiscal year ended December 31, 2013. |
17
This example is intended to help you compare the costs of investing in the Portfolios with the cost of investing in other investment options. The example assumes that:
| • | You invest $10,000 in a Portfolio for the time periods indicated; |
| • | Your investment has a 5% return each year; |
| • | The Portfolio’s operating expenses remain the same; and |
| • | The Expense Limitation Arrangement is not renewed. |
This example does not reflect any Contract-related fees and expenses, including redemption fees (if any) at the Contract level. If such fees and expenses were reflected, the total expenses would be higher. Although your actual costs may be higher or lower, based on these assumptions your costs would be:
| 1 Year | 3 Years | 5 Years | 10 Years | |||||||||||||
Lord Abbett Large Cap Core Portfolio | ||||||||||||||||
Class IA | $ | 102 | $ | 333 | $ | 583 | $ | 1,299 | ||||||||
Class IB | $ | 102 | $ | 333 | $ | 583 | $ | 1,299 | ||||||||
Class K# | N/A | N/A | N/A | N/A | ||||||||||||
Invesco Comstock Portfolio | ||||||||||||||||
Class IA | $ | 102 | $ | 342 | $ | 601 | $ | 1,342 | ||||||||
Class IB | $ | 102 | $ | 331 | $ | 579 | $ | 1,289 | ||||||||
Class K | $ | 77 | $ | 278 | $ | 497 | $ | 1,127 | ||||||||
Pro Forma Invesco Comstock Portfolio (assuming the Reorganizations are approved)* | ||||||||||||||||
Class IA | $ | 102 | $ | 325 | $ | 566 | $ | 1,257 | ||||||||
Class IB | $ | 102 | $ | 325 | $ | 566 | $ | 1,257 | ||||||||
Class K | $ | 77 | $ | 246 | $ | 430 | $ | 963 | ||||||||
| * | Assumes both the Reorganization described in this Proposal 2 and the Reorganization described in Proposal 1 are approved. See Appendix E for the pro forma fees and expenses of the Acquiring Portfolio Shares assuming that only the Reorganization described in this Proposal 2 is approved. |
| # | Class K shares of the Lord Abbett Large Cap Core Portfolio were not operational for the fiscal year ended December 31, 2013. |
Portfolio Turnover
Each Portfolio pays transaction costs, such as commissions, when it buys and sells securities (or “turns over” its portfolio). A higher portfolio turnover rate may indicate higher transaction costs. These costs, which are not reflected in annual fund operating expenses or in the example affect a Portfolio’s performance. During the fiscal year ended December 31, 2013, the portfolio turnover rates for each of the Lord Abbett Large Cap Core Portfolio and the Invesco Comstock Portfolio were 30% and 15%, respectively, of the average value of the Portfolio.
18
Comparison of Investment Objectives, Policies, and Strategies
The following table compares the investment objectives and principal investment policies and strategies of the Lord Abbett Large Cap Core Portfolio with those of the Invesco Comstock Portfolio. The Board may change the investment objective of a Portfolio without a vote of the Portfolio’s shareholders. For more detailed information about each Portfolio’s investment strategies and risks, see Appendix B.
| Acquiring Portfolio | Acquired Portfolio | |||
| Invesco Comstock Portfolio | Lord Abbett Large Cap Core Portfolio | |||
Investment Objectives | Seeks to achieve capital growth and income. | Seeks to achieve capital appreciation and growth of income with reasonable risk. | ||
Principal Investment Strategies | Under normal market conditions, the Portfolio invests at least 80% of its net assets, plus borrowings for investment purposes, in common stocks. The Portfolio may invest in issuers of any capitalization range. The Portfolio may invest in other types of equity securities. | Under normal circumstances, the Portfolio invests at least 80% of its net assets, plus the amount of any borrowings for investment purposes, in equity securities of large, seasoned U.S. and multinational companies. A large company is defined as a company having a market capitalization at the time of purchase that falls within the market capitalization range of companies in the Russell 1000® Index. As of December 31, 2012, the market capitalization range of the Russell 1000® Index was $319.35 million to $500.5 billion. This range varies daily. Equity securities in which the Portfolio may invest may include common stocks, preferred stocks, warrants, and similar instruments. |
19
| Acquiring Portfolio | Acquired Portfolio | |||
| Invesco Comstock Portfolio | Lord Abbett Large Cap Core Portfolio | |||
| The Adviser emphasizes a value style of investing, seeking well established, undervalued companies believed by the Adviser to possess the potential for capital growth and income. The Adviser typically sells portfolio securities when its assessments of capital growth and income potential of such securities materially change. | The Adviser invests in the full spectrum of large companies, including those with value or growth characteristics. In selecting investments, the Adviser uses a bottom-up investment research approach that combines both value and growth investment styles. The Adviser attempts to identify individual stocks that are attractively priced and present strong long-term investment opportunities based on fundamental research and company characteristics. The Adviser focuses on securities that are selling at reasonable prices in relation to its assessment of their potential value and on securities that it believes have expected earnings growth potential and consistency that may not be recognized by the market at large. The Adviser will normally sell a stock when it thinks that it no longer offers significant capital appreciation potential due to an elevated valuation or has reached the Adviser’s valuation target, its fundamentals are falling short of the Adviser’s expectations or it seems less likely to benefit from the current market and economic environment. | |||
| The Portfolio may invest up to 25% of its total assets in securities of foreign issuers, including emerging market securities and depositary receipts. With respect to investments in foreign issuers, the Portfolio may enter into foreign currency transactions, including currency forward transactions, which are a type of derivative. | The Portfolio may invest, without limit, in American Depositary Receipts and similar depositary receipts. The Portfolio limits its investments in foreign securities that are primarily traded outside of the U.S. to 10% of its net assets. | |||
| The Portfolio generally holds up to 10% of its total assets in high-quality short-term debt securities and investment grade corporate debt securities as temporary investments. The Portfolio may invest up to 10% of its total assets in real estate investment trusts (“REITs”). | No corresponding strategy. |
20
Comparison of Principal Risk Factors
An investment in a Portfolio is not a deposit of a bank and is not insured or guaranteed by the Federal Deposit Insurance Corporation or any other government agency. You may lose money by investing in a Portfolio. The following table compares the principal risks of an investment in each Portfolio. For an explanation of each such risk, see “Additional Information about the Reorganizations – Description of Risk Factors” below.
Risks | Invesco Comstock Portfolio | Lord Abbett Large Cap Core Portfolio | ||||||
Credit Risk | X | |||||||
Derivatives Risk | X | |||||||
Equity Risk | X | X | ||||||
Foreign Securities Risk | X | X | ||||||
Currency Risk | X | X | ||||||
Depositary Receipts Risk | X | X | ||||||
Emerging Markets Risk | X | |||||||
Interest Rate Risk | X | |||||||
Investment Grade Securities Risk | X | |||||||
Investment Style Risk | X | |||||||
Large-Cap Company Risk | X | X | ||||||
Mid-Cap and Small-Cap Company Risk | X | |||||||
Real Estate Investing Risk | X | |||||||
Comparative Performance Information
The bar charts and tables below provide some indication of the risks of investing in each Portfolio by showing changes in the Portfolio’s performance from year to year and by showing how the Portfolio’s average annual total returns for the past one year, five years and since inception through December 31, 2013, compared to the returns of a broad-based market index. Past performance is not an indication of future performance.
The performance results do not reflect any Contract-related fees and expenses, which would reduce the performance results.
Lord Abbett Large Cap Core Portfolio - Calendar Year Total Returns (Class IB)

Best Quarter (% and time period) 14.57% (2009 3rd Quarter) | Worst Quarter (% and time period) -19.80% (2008 4th Quarter) |
21
Invesco Comstock Portfolio - Calendar Year Total Returns (Class IB)
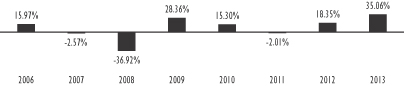
Best Quarter (% and time period) 19.12% (2009 3rd Quarter) | Worst Quarter (% and time period) -23.30% (2008 4th Quarter) | |||||||||||||
Lord Abbett Large Cap Core Portfolio
Average Annual Total Returns | One Year | Five Years | Since Inception | |||||||||
Lord Abbett Large Cap Core Portfolio – Class IA | 29.96% | 14.59% | 7.30% | |||||||||
Lord Abbett Large Cap Core Portfolio – Class IB | 29.91% | 14.42% | 7.10% | |||||||||
Lord Abbett Large Cap Core Portfolio – Class K# | N/A | N/A | N/A | |||||||||
Russell 1000® Index * | 33.11% | 18.59% | 8.15% | ** | ||||||||
Invesco Comstock Portfolio
Average Annual Total Returns (For the periods ended December 31, 2013) | One Year | Five Years | Since Inception | |||||||||
Invesco Comstock Portfolio — Class IA | 35.10% | 18.51% | 6.79% | |||||||||
Invesco Comstock Portfolio — Class IB | 35.06% | 18.31% | 6.58% | |||||||||
Invesco Comstock Portfolio — Class K | N/A | N/A | 6.27% | |||||||||
Russell 1000® Value Index† | 32.53% | 16.67% | 7.11% | ** | ||||||||
| * | The Russell 1000® Index is an unmanaged index of common stocks that measures the performance of approximately 1,000 of the largest companies in the Russell 3000® Index, and represents approximately 92% of the total market capitalization of the Russell 3000® Index. |
| ** | Since April 29, 2005. |
| † | The Russell 1000® Value Index is an unmanaged index of common stocks that measures the performance of those Russell 1000® Index companies with lower price to book ratios and lower forecasted growth values. The Russell 1000® Index is an unmanaged index of common stocks that measures the performance of approximately 1,000 of the largest companies in the Russell 3000® Index, and represents approximately 92% of the total market capitalization of the Russell 3000® Index. |
| # | Class K shares of the Lord Abbett Large Cap Core Portfolio were not operational for the fiscal year ended December 31, 2013. |
22
The following table shows the capitalization of each Portfolio as of December 31, 2013, and of the Invesco Comstock Portfolio on a pro forma combined basis as of December 31, 2013, after giving effect to the proposed Reorganization. Pro forma net assets may not total and net asset values per share may not recalculate due to rounding of net assets.
| Net Assets (in millions) | Net Asset Value Per Share | Shares Outstanding | ||||||||||
Lord Abbett Large Cap Core Portfolio —Class IA | $ | 9.3 | $ | 13.56 | 685,723 | |||||||
Invesco Comstock Portfolio — Class IA | $ | 10.9 | $ | 14.01 | 780,354 | |||||||
Adjustments* | $ | — | $ | — | (82,185 | ) | ||||||
Pro forma Invesco Comstock Portfolio — Class IA (assuming the Reorganizations are approved)** | $ | 43.1 | $ | 14.01 | 3,073,069 | |||||||
Lord Abbett Large Cap Core Portfolio —Class IB | $ | 68.3 | $ | 13.58 | 5,024,505 | |||||||
Invesco Comstock Portfolio — Class IB | $ | 53.1 | $ | 14.02 | 3,786,410 | |||||||
Adjustments* | $ | — | $ | — | (264,287 | ) | ||||||
Pro forma Invesco Comstock Portfolio — Class IB (assuming the Reorganizations are approved)** | $ | 159.8 | $ | 14.02 | 11,397,329 | |||||||
Lord Abbett Large Cap Core Portfolio — Class K# | N/A | N/A | N/A | |||||||||
Invesco Comstock Portfolio — Class K | $ | 3.2 | $ | 13.98 | 228,690 | |||||||
Adjustments* | $ | — | $ | — | (37,566 | ) | ||||||
Pro forma Invesco Comstock Portfolio — Class K (assuming the Reorganizations are approved)** | $ | 18.4 | $ | 13.98 | 1,317,215 | |||||||
| * | Reflects adjustment for retired shares of the Acquired Portfolios. |
| ** | Assumes both the Reorganization described in this Proposal 2 and the Reorganization described in Proposal 1 are approved. See Appendix E for the capitalization of the Invesco Comstock Portfolio on a pro forma combined basis assuming that only the Reorganization described in this Proposal 2 is approved |
| # | Class K shares of the Lord Abbett Large Cap Core Portfolio were not operational for the fiscal year ended December 31, 2013. |
AFTER CAREFUL CONSIDERATION, THE BOARD UNANIMOUSLY APPROVED THE PLAN OF REORGANIZATION WITH RESPECT TO THE LORD ABBETT LARGE CAP CORE PORTFOLIO. ACCORDINGLY, THE BOARD HAS SUBMITTED THE PLAN OF REORGANIZATION FOR APPROVAL BY THIS PORTFOLIO’S SHAREHOLDERS. THE BOARD RECOMMENDS THAT YOU VOTE “FOR” PROPOSAL 2.
PROPOSAL 3: APPROVAL OF THE PLAN OF REORGANIZATION WITH RESPECT TO THE REORGANIZATION OF THE EQUITY GROWTH PLUS PORTFOLIO INTO THE LARGE CAP GROWTH PLUS PORTFOLIO.
This Proposal 3 requests your approval of the Plan of Reorganization, pursuant to which the Equity Growth PLUS Portfolio will be reorganized into the Large Cap Growth PLUS Portfolio.
In considering whether you should approve this Proposal, you should note that:
| • | The Portfolios have identical investment objectives. Each Portfolio seeks to achieve long-term growth of capital with an emphasis on risk-adjusted returns and managing volatility in the Portfolio. |
23
| • | The Portfolios have substantially similar investment policies. Each Portfolio invests primarily in equity securities of growth companies. Each Portfolio’s assets are allocated among two or more investment sub-advisers (each an “Adviser”), each of which manages its portion of the Portfolio using a different but complementary investment strategy. One portion of each Portfolio is actively managed by an Adviser (the “Active Allocated Portion”), one portion of each Portfolio seeks to track the performance of the Russell 1000® Growth Index (the “Index Allocated Portion”), and each Portfolio may invest up to 10% of its net assets in underlying exchange-traded funds (“ETFs”) that meet the investment criteria of the Portfolio. Under normal circumstances, the Active Allocated Portion and the Index Allocated Portion of the Equity Growth PLUS Portfolio consist of approximately 25-35% and 65-75%, respectively, of the Portfolio’s net assets. Similarly, under normal circumstances, the Active Allocated Portion and the Index Allocated Portion of the Large Cap Growth PLUS Portfolio consist of approximately 30% and 60%, respectively, of the Portfolio’s net assets. In addition, each Portfolio may invest up to 25% of its assets in derivatives, such as exchange-traded futures and options contracts on securities indices, to manage its equity exposure. There are, however, differences in the Portfolios’ primary investment policies and strategies of which you should be aware. For example, the Active Allocated Portion of the Large Cap Growth PLUS Portfolio may invest up to 25% of its total assets in securities of foreign companies, including companies based in developing countries. For a detailed comparison of the Portfolios’ investment policies and strategies, see “Comparison of Investment Objectives, Policies, and Strategies” below. |
| • | The Portfolios have comparable risk profiles, although there are differences of which you should be aware. Each Portfolio’s principal risks include cash management risk, custom benchmark risk, derivatives risk, equity risk, exchange-traded funds risk, futures contract risk, index strategy risk, investment style risk, large-cap company risk, leveraging risk, short position risk, and volatility management risk. The Equity Growth PLUS Portfolio, however, also is subject to mid-cap company risk, while the Large Cap Growth PLUS Portfolio generally is not. In addition, the principal risks of investing in the Large Cap Growth PLUS Portfolio also include foreign securities risk, currency risk, emerging markets risk, and portfolio turnover risk, which are not principal risks of investing in the Equity Growth PLUS Portfolio. For a detailed comparison of the Portfolios’ risks, see “Comparison of Principal Risk Factors” below. |
| • | AXA Equitable Funds Management Group, LLC (“FMG LLC” or the “Manager”) serves as the investment manager and administrator for each Portfolio and would continue to manage and administer the Large Cap Growth PLUS Portfolio after the Reorganization. FMG LLC has received an exemptive order from the SEC that generally permits FMG LLC and the Board to appoint, dismiss and replace each Portfolio’s Adviser(s) and to |
24
amend the advisory agreements between FMG LLC and the Advisers without obtaining shareholder approval (except with respect to Affiliated Advisers (as defined herein)). FMG LLC has appointed two Advisers to manage distinct portions of the assets of the Equity Growth PLUS Portfolio. In particular, BlackRock Capital Management, Inc. manages the Active Allocated Portion and BlackRock Investment Management, LLC manages the Index Allocated Portion of the Equity Growth PLUS Portfolio. FMG LLC has appointed four Advisers to manage distinct portions of the assets of the Large Cap Growth PLUS Portfolio. In particular, Marsico Capital Management, LLC, T. Rowe Price Associates, Inc., and Wells Capital Management, Inc. manage portions of the Active Allocated Portion of the Large Cap Growth PLUS Portfolio and BlackRock Investment Management, LLC manages the Index Allocated Portion of the Large Cap Growth PLUS Portfolio, and it is anticipated that they will continue to advise their respective portions of the Large Cap Growth PLUS Portfolio after the Reorganization. In addition, FMG LLC manages the Large Cap Growth PLUS Portfolio’s ETF Allocated Portion, and it is anticipated that FMG LLC would continue to manage the ETF Allocated Portion of the Large Cap Growth PLUS Portfolio after the Reorganization. For a detailed description of the Manager and the Advisers to the Large Cap Growth PLUS Portfolio, please see “Additional Information about the Acquiring Portfolios — The Manager” and “— The Advisers” below. |
| • | The Equity Growth PLUS Portfolio and the Large Cap Growth PLUS Portfolio had net assets of approximately $585.9 million and $5.4 billion, respectively, as of December 31, 2013. Thus, if the Reorganization had been in effect on that date, the combined Portfolio would have had net assets of approximately $6.0 billion. |
| • | Class IA shareholders of the Equity Growth PLUS Portfolio will receive Class IA shares of the Large Cap Growth PLUS Portfolio, Class IB shareholders of the Equity Growth PLUS Portfolio will receive Class IB shares of the Large Cap Growth PLUS Portfolio, and Class K shareholders of the Equity Growth PLUS Portfolio will receive Class K shares of the Large Cap Growth PLUS Portfolio pursuant to the Reorganization. Shareholders will not pay any sales charges in connection with the Reorganization. Please see “Comparative Fee and Expense Tables,” “Additional Information about the Reorganizations” and “Additional Information about the Acquiring Portfolios” below for more information. |
| • | It is estimated that the annual operating expense ratios for the Large Cap Growth PLUS Portfolio’s Class IA, Class IB, and Class K shares, for the fiscal year following the Reorganization, will be lower than those of the Equity Growth PLUS Portfolio’s Class IA, Class IB, and Class K shares, respectively, for the fiscal year ended December 31, 2013. For a more detailed comparison of the fees and expenses of the Portfolios, please see “Comparative Fee and Expense Tables” and “Additional Information about the Acquiring Portfolios” below. |
25
| • | The maximum management fee for the Equity Growth PLUS Portfolio is equal to an annual rate of 0.50% of its average daily net assets. The maximum management fee for the Large Cap Growth PLUS Portfolio is equal to an annual rate of 0.50% of its average daily net assets. Both Portfolios are subject to the same administration fee schedule. Each Portfolio pays its proportionate share of an asset-based administration fee for the Portfolio and certain other of the Trust’s portfolios, which is equal to an annual rate of 0.15% of the first $20 billion of these portfolios’ aggregate average daily net assets, 0.110% of the next $5 billion of these portfolios’ aggregate average daily net assets, and 0.10% of these portfolios’ aggregate average daily net assets thereafter, plus an annual fee of $32,500 per Portfolio whose total average net assets are less than $5 billion. For a more detailed description of the fees and expenses of the Portfolios, please see “Comparative Fee and Expense Tables” and “Additional Information about the Acquiring Portfolios” below. |
| • | Following the Reorganization, the combined Portfolio will be managed in accordance with the investment objective, policies and strategies (“Investment Criteria”) of the Large Cap Growth PLUS Portfolio. It is not expected that the Large Cap Growth PLUS Portfolio will revise any of its investment policies following the Reorganization to reflect those of the Equity Growth PLUS Portfolio. FMG LLC has reviewed each of those Portfolio’s current portfolio holdings and determined that the Equity Growth PLUS Portfolio’s holdings are generally consistent and compatible with the Large Cap Growth PLUS Portfolio’s Investment Criteria and thus, if the Reorganization is approved, a large majority of the Equity Growth Plus Portfolio’s Assets could be transferred to and held by the Large Cap Growth PLUS Portfolio. However, it is expected that some of those holdings may not remain at the time of the Reorganization due to normal portfolio turnover. If the Reorganization is approved, the Manager will liquidate the Equity Growth PLUS Portfolio’s holdings that, based on market conditions and an assessment by the Manager and the Large Cap Growth PLUS Portfolio’s Advisers, are not compatible with the Large Cap Growth PLUS Portfolio’s current portfolio composition or Investment Criteria. The proceeds of such liquidation will be held in temporary investments or reinvested in assets that are consistent with the Large Cap Growth PLUS Portfolio’s Investment Criteria. Although any sale of portfolio investments in connection with the Reorganization would be conducted in an orderly manner, the need for the Portfolio to sell such investments may result in its selling securities at a disadvantageous time and price and could result in the Portfolio’s realizing gains (or losses) that otherwise would not have been realized and incurring transaction costs that otherwise would not have been incurred. |
| • | The Equity Growth PLUS Portfolio will bear its proportionate share (based on the fraction that its net asset value will bear to the net asset values of all the Acquired Portfolios at the Valuation Time) of the expenses of the Reorganizations described in this Proxy Statement/Prospectus. |
26
Comparative Fee and Expense Tables
The following tables show the fees and expenses of each class of shares of each Portfolio and the estimated pro forma fees and expenses of each class of shares of the Acquiring Portfolio after giving effect to the proposed Reorganization. Fees and expenses for each Portfolio are based on those incurred by each class of its shares for the fiscal year ended December 31, 2013. The pro forma fees and expenses of the Acquiring Portfolio Shares assume that the Reorganization has been in effect for the year ended December 31, 2013. The tables below do not reflect any Contract-related fees and expenses, which would increase overall fees and expenses. See a Contract prospectus for a description of those fees and expenses.
Shareholder Fees
(fees paid directly from your investment)
Equity Growth PLUS Portfolio | Large Cap Growth | Pro Forma Large Cap Growth PLUS Portfolio (assuming the | ||
| Not applicable. | Not applicable. | Not applicable. |
Annual Operating Expenses
(expenses that you may pay each year as a percentage of the value of your investment)
| Equity Growth PLUS Portfolio | Large Cap Growth PLUS Portfolio | Pro Forma Large Cap Growth PLUS Portfolio (assuming the Reorganization is approved) | ||||||||||||||||||||||||||||||||||
| Class IA | Class IB | Class K | Class IA | Class IB | Class K | Class IA | Class IB | Class K | ||||||||||||||||||||||||||||
Management Fee | 0.50 | % | 0.50 | % | 0.50 | % | 0.47 | % | 0.47 | % | 0.47 | % | 0.46 | % | 0.46 | % | 0.46 | % | ||||||||||||||||||
Distribution and/or Service Fees | 0.25 | % | 0.25 | % | 0.00 | % | 0.25 | % | 0.25 | % | 0.00 | % | 0.25 | % | 0.25 | % | 0.00 | % | ||||||||||||||||||
Other Expenses | 0.18 | % | 0.18 | % | 0.18 | % | 0.18 | % | 0.18 | % | 0.18 | % | 0.16 | % | 0.16 | % | 0.16 | % | ||||||||||||||||||
Total Annual Portfolio Operating Expenses | 0.93 | % | 0.93 | % | 0.68 | % | 0.90 | % | 0.90 | % | 0.65 | % | 0.87 | % | 0.87 | % | 0.62 | % | ||||||||||||||||||
This example is intended to help you compare the costs of investing in the Portfolios with the cost of investing in other investment options. The example assumes that:
| • | You invest $10,000 in a Portfolio for the time periods indicated; |
| • | Your investment has a 5% return each year; and |
| • | The Portfolio’s operating expenses remain the same. |
27
This example does not reflect any Contract-related fees and expenses, including redemption fees (if any) at the Contract level. If such fees and expenses were reflected, the total expenses would be higher. Although your actual costs may be higher or lower, based on these assumptions your costs would be:
| 1 Year | 3 Years | 5 Years | 10 Years | |||||||||||||
Equity Growth PLUS Portfolio | ||||||||||||||||
Class IA | $ | 95 | $ | 296 | $ | 515 | $ | 1,143 | ||||||||
Class IB | $ | 95 | $ | 296 | $ | 515 | $ | 1,143 | ||||||||
Class K | $ | 69 | $ | 218 | $ | 379 | $ | 847 | ||||||||
Large Cap Growth PLUS Portfolio | ||||||||||||||||
Class IA | $ | 92 | $ | 287 | $ | 498 | $ | 1,108 | ||||||||
Class IB | $ | 92 | $ | 287 | $ | 498 | $ | 1,108 | ||||||||
Class K | $ | 66 | $ | 208 | $ | 362 | $ | 810 | ||||||||
Pro Forma Large Cap Growth PLUS Portfolio (assuming the Reorganization is approved) | ||||||||||||||||
Class IA | $ | 89 | $ | 278 | $ | 482 | $ | 1,073 | ||||||||
Class IB | $ | 89 | $ | 278 | $ | 482 | $ | 1,073 | ||||||||
Class K | $ | 63 | $ | 199 | $ | 346 | $ | 774 | ||||||||
Portfolio Turnover
Each Portfolio pays transaction costs, such as commissions, when it buys and sells securities (or “turns over” its portfolio). A higher portfolio turnover rate may indicate higher transaction costs. These costs, which are not reflected in annual fund operating expenses or in the example, affect a Portfolio’s performance. During the fiscal year ended December 31, 2013, the portfolio turnover rates for each of the Equity Growth PLUS Portfolio and the Large Cap Growth PLUS Portfolio were 75% and 40%, respectively, of the average value of the Portfolio.
Comparison of Investment Objectives, Policies, and Strategies
The following table compares the investment objectives and principal investment policies and strategies of the Equity Growth PLUS Portfolio with those of the Large Cap Growth PLUS Portfolio. The Board may change the investment objective of a Portfolio without a vote of the Portfolio’s shareholders. For more detailed information about each Portfolio’s investment strategies and risks, see Appendix B.
| Acquiring Portfolio | Acquired Portfolio | |||
| Large Cap Growth PLUS Portfolio | Equity Growth PLUS Portfolio | |||
Investment Objectives | Seeks to provide long-term capital growth with an emphasis on risk-adjusted returns and managing volatility in the Portfolio. | Seeks to achieve long-term growth of capital with an emphasis on risk-adjusted returns and managing volatility in the Portfolio. |
28
| Acquiring Portfolio | Acquired Portfolio | |||
| Large Cap Growth PLUS Portfolio | Equity Growth PLUS Portfolio | |||
Principal Investment Strategies | Under normal circumstances, the Portfolio intends to invest at least 80% of its net assets, plus borrowings for investment purposes, in securities of large-cap companies (or other financial instruments that derive their value from the securities of such companies). | Under normal circumstances, the Portfolio invests at least 80% of its net assets, plus borrowings for investment purposes, in equity securities. The Portfolio’s investments in equity securities may include common stocks, preferred stocks, warrants, and other equity securities, and financial instruments that derive their value from such securities. | ||
| The Portfolio’s assets normally are allocated among three Advisers, each of which manages its portion of the Portfolio using a different but complementary investment strategy. One portion of the Portfolio is actively managed by an Adviser (“Active Allocated Portion”); one portion of the Portfolio seeks to track the performance of a particular index (“Index Allocated Portion”); and one portion of the Portfolio invests in ETFs (“ETF Allocated Portion”). Under normal circumstances, the Active Allocated Portion consists of approximately 30% of the Portfolio’s net assets, the Index Allocated Portion consists of approximately 60% of the Portfolio’s net assets and the ETF Allocated Portion consists of approximately 10% of the Portfolio’s net assets. The ETF Allocated Portion invests in ETFs (the “Underlying ETFs”) that meet the investment criteria of the Portfolio as a whole. The Underlying ETFs in which the ETF Allocated Portion may invest may be changed from time to time without notice or shareholder approval. | The Portfolio’s assets normally are allocated among two investment managers, each of which manages its portion of the Portfolio using a different but complementary investment strategy. One portion of the Portfolio is actively managed by an Adviser (“Active Allocated Portion”) and one portion of the Portfolio seeks to track the performance of a particular index (“Index Allocated Portion”). Under normal circumstances, the Active Allocated Portion consists of approximately 25-35% of the Portfolio’s net assets and the Index Allocated Portion consists of approximately 65-75% of the Portfolio’s net assets. Approximately 10% of the Portfolio’s assets may be invested in exchange-traded funds (“Underlying ETFs”) that meet the investment criteria of the Portfolio. The Underlying ETFs in which the Portfolio may invest may be changed from time to time without notice or shareholder approval. |
29
| Acquiring Portfolio | Acquired Portfolio | |||
| Large Cap Growth PLUS Portfolio | Equity Growth PLUS Portfolio | |||
The Active Allocated Portion invests primarily in equity securities of companies whose above-average prospective earnings growth is not fully reflected, in the view of the Advisers, in current market valuations. The Active Allocated Portion may invest up to 25% of its total assets in securities of foreign companies, including companies based in developing countries. An Adviser may sell a security for a variety of reasons, such as to make other investments believed by an Adviser to offer superior investment opportunities.
For this Portfolio, large-cap companies mean those companies with market capitalizations within the range of at least one of the following indices at the time of purchase: S&P 500 Index (market capitalization range of approximately $1.65 billion - $500.5 billion as of December 31, 2012), Russell 1000® Index (market capitalization range of approximately $319.35 million - $500.5 billion as of December 31, 2012), S&P 100 Index (market capitalization range of approximately $17.6 billion - $500.5 billion as of December 31, 2012) Morningstar Large Core Index (market capitalization range of approximately $11.05 billion - $228.25 billion as of December 31, 2012), NYSE 100 Index (market capitalization $21.08 billion - $389.65 billion as of December 31, 2012). | The Adviser to the Active Allocated Portion favors companies that appear to offer higher potential for long term growth. The Adviser to the Active Allocated Portion looks for companies in which the duration and magnitude of growth is underestimated by the market. In doing so, the Adviser to the Active Allocated portion looks to allocate investments in the Active Allocated Portion between ‘superior growth,’ ‘durable growth’ and ‘periodic’ growth companies by utilizing a bottom-up stock selection process that uncovers securities that are believed to generate excess return. The Adviser to the Active Allocated Portion’s bottom-up fundamental research process is applied to a growth stock universe of 500-600 securities which is comprised of securities in the Russell 1000® Growth Index (“Russell 1000® Growth”) universe with market capitalizations above $2 billion. The Adviser to the Active Allocated Portion may, when consistent with the Portfolio’s investment objective, buy or sell options or futures on a security or an index of securities (commonly known as derivatives). | |||
| The Index Allocated Portion of the Portfolio seeks to track the performance (before fees and expenses) of the Russell 1000® Growth with minimal tracking error. This strategy is commonly referred to as an indexing strategy. Generally, the Index Allocated Portion uses a full replication technique, although in certain instances a sampling approach may be utilized for a portion of the Index Allocated Portion. The Index Allocated Portion also may invest in other instruments, such as futures and options contracts, that provide comparable exposure as the index without buying the underlying securities comprising the index. | Same. |
30
| Acquiring Portfolio | Acquired Portfolio | |||
| Large Cap Growth PLUS Portfolio | Equity Growth PLUS Portfolio | |||
| The Manager also may utilize futures and options, such as exchange-traded futures and options contracts on securities indices, to manage equity exposure. Futures and options can provide exposure to the performance of a securities index without buying the underlying securities comprising the index. They also provide a means to manage the Portfolio’s equity exposure without having to buy or sell securities. When market volatility is increasing above specific thresholds set for the Portfolio, the Manager may limit equity exposure either by reducing investments in securities, shorting or selling long futures and options positions on an index, increasing cash levels, and/or shorting an index. During such times, the Portfolio’s exposure to equity securities may be significantly less than that of a traditional equity portfolio. Although these actions are intended to reduce the overall risk of investing in the Portfolio, they may result in periods of underperformance. The Portfolio may invest up to 25% of its assets in derivatives. It is anticipated that the Portfolio’s derivative instruments will consist primarily of exchange-traded futures and options contracts on securities indices, but the Portfolio also may utilize other types of derivatives. The Portfolio’s investments in derivatives may be deemed to involve the use of leverage because the Portfolio is not required to invest the full market value of the contract upon entering into the contract but participates in gains and losses on the full contract price. The use of derivatives also may be deemed to involve the use of leverage because the heightened price sensitivity of some derivatives to market changes may magnify the Portfolio’s gain or loss. It is not generally expected, however, that the Portfolio will be leveraged by borrowing money for investment purposes. In addition, the Portfolio generally does not intend to use leverage to increase its net investment exposure above approximately 100% of the Portfolio’s net asset value or below 0%. The Portfolio may maintain a significant percentage of its assets in cash and cash equivalent instruments, some of which may serve as margin or collateral for the Portfolio’s obligations under derivative transactions. | Same. |
31
Comparison of Principal Risk Factors
An investment in a Portfolio is not a deposit of a bank and is not insured or guaranteed by the Federal Deposit Insurance Corporation or any other government agency. You may lose money by investing in a Portfolio. The following table compares the principal risks of an investment in each Portfolio. For an explanation of each such risk, see “Additional Information about the Reorganizations – Description of Risk Factors” below.
Risks | Large Cap Growth PLUS | Equity Growth PLUS Portfolio | ||
Cash Management Risk | X | X | ||
Custom Benchmark Risk | X | X | ||
Derivatives Risk | X | X | ||
Equity Risk | X | X | ||
Exchange Traded Funds Risk | X | X | ||
Foreign Securities Risk | X | |||
Currency Risk | X | |||
Emerging Markets Risk | X | |||
Futures Contract Risk | X | X | ||
Index Strategy Risk | X | X | ||
Investment Style Risk | X | X | ||
Large-Cap Company Risk | X | X | ||
Leveraging Risk | X | X | ||
Mid-Cap Company Risk | X | |||
Portfolio Turnover Risk | X | |||
Short Position Risk | X | X | ||
Volatility Management Risk | X | X |
Comparative Performance Information
The bar charts and tables below provide some indication of the risks of investing in each Portfolio by showing changes in the Portfolio’s performance from year to year and by showing how the Portfolio’s average annual total returns for the past one year, five years and since inception through December 31, 2013, compared to the returns of a broad-based market index. The additional broad-based market index shows how each Portfolio’s performance compared to the returns of a volatility managed index. Past performance is not an indication of future performance.
The performance results do not reflect any Contract-related fees and expenses, which would reduce the performance results.
32
Equity Growth PLUS Portfolio - Calendar Year Total Returns (Class IB)
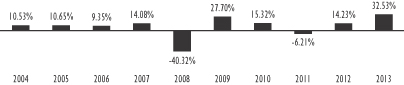
Best Quarter (% and time period) 14.74% (2012 1st Quarter) | Worst Quarter (% and time period) -23.61% (2008 4th Quarter) | |||||||||||||||||
Large Cap Growth PLUS Portfolio - Calendar Year Total Returns (Class IB)
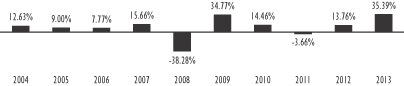
Best Quarter (% and time period) 16.31% (2003 2nd Quarter) | Worst Quarter (% and time period) -21.65% (2008 4th Quarter) | |||||||||||||||||
Equity Growth PLUS Portfolio
Average Annual Total Returns (For the periods ended December 31, 2013) | One Year | Five Years | Ten Years/ Since Inception | |||||||||
Equity Growth PLUS Portfolio — Class IA | 32.58% | 16.02% | 6.84% | |||||||||
Equity Growth PLUS Portfolio — Class IB | 32.53% | 15.92% | 6.66% | |||||||||
Equity Growth PLUS Portfolio — Class K | 32.89% | N/A | 21.09% | |||||||||
Russell 1000® Growth Index* | 33.48% | 20.39% | 7.83% | ** | ||||||||
Volatility Managed Index — Large Cap Growth*** | 32.94% | 17.48% | 9.44% | ** | ||||||||
Large Cap Growth PLUS Portfolio
Average Annual Total Returns (For the periods ended December 31, 2013) | One Year | Five Years | Ten Years/ Since Inception | |||||||||
Large Cap Growth PLUS Portfolio — Class IA | 35.36% | 17.93% | 8.25% | |||||||||
Large Cap Growth PLUS Portfolio — Class IB | 35.39% | 18.03% | 8.02% | |||||||||
Large Cap Growth PLUS Portfolio — Class K | 35.70% | N/A | 22.45% | |||||||||
Russell 1000® Growth Index* | 33.48% | 20.39% | 7.83% | ** | ||||||||
Volatility Managed Index — Large Cap Growth*** | 32.94% | 17.48% | 9.44% | ** | ||||||||
| * | The Russell 1000® Growth Index measures the performance of those Russell 1000® Index companies with higher price-to-book ratios and higher forecasted growth values. The Russell 1000® Index |
33
measures the performance of approximately 1,000 of the largest companies in the Russell 3000® Index, and represents approximately 92% of the total market capitalization of the Russell 3000® Index. |
| ** | Average annual total returns for past ten years. |
| *** | The Volatility Managed Index — Large Cap Growth is an index that applies a formula to a blend of the S&P 500 Index and the Russell 1000® Growth Index adjusting the equity exposure of the S&P 500 Index when certain volatility levels are reached. The S&P 500 Index is a weighted index of common stocks of 500 leading companies in leading industries of the U.S. economy, capturing 75% coverage of U.S. equities. The index is capitalization weighted, thereby giving greater weight to companies with the largest market capitalizations. |
The following table shows the capitalization of each Portfolio as of December 31, 2013, and of the Large Cap Growth PLUS Portfolio on a pro forma combined basis as of December 31, 2013, after giving effect to the proposed Reorganization. Pro forma net assets may not total and net asset values per share may not recalculate due to rounding of net assets.
| Net Assets (in millions) | Net Asset Value Per Share | Shares Outstanding | ||||||||||
Equity Growth PLUS Portfolio — Class IA | $ | 38.5 | $ | 21.04 | 1,831,520 | |||||||
Large Cap Growth PLUS Portfolio — Class IA | $ | 13.3 | $ | 24.95 | 531,654 | |||||||
Adjustments* | $ | — | $ | — | (287,097 | ) | ||||||
Pro forma Large Cap Growth PLUS Portfolio — Class IA | $ | 51.8 | $ | 24.95 | 2,076,077 | |||||||
Equity Growth PLUS Portfolio — Class IB | $ | 518.8 | $ | 20.94 | 24,776,879 | |||||||
Large Cap Growth PLUS Portfolio — Class IB | $ | 4,223.7 | $ | 24.40 | 173,110,415 | |||||||
Adjustments* | $ | — | $ | — | (3,512,949 | ) | ||||||
Pro forma Large Cap Growth PLUS Portfolio — Class IB | $ | 4,742.6 | $ | 24.40 | 194,374,345 | |||||||
Equity Growth PLUS Portfolio — Class K | $ | 28.5 | $ | 21.05 | 1,355,113 | |||||||
Large Cap Growth PLUS Portfolio — Class K | $ | 1,154.9 | $ | 24.95 | 46,286,871 | |||||||
Adjustments* | $ | — | $ | — | (211,789 | ) | ||||||
Pro forma Large Cap Growth PLUS Portfolio — Class K | $ | 1,183.4 | $ | 24.95 | 47,430,195 | |||||||
| * | Reflects adjustment for retired shares of the Acquired Portfolio. |
AFTER CAREFUL CONSIDERATION, THE BOARD UNANIMOUSLY APPROVED THE PLAN OF REORGANIZATION WITH RESPECT TO THE EQUITY GROWTH PLUS PORTFOLIO. ACCORDINGLY, THE BOARD HAS SUBMITTED THE PLAN OF REORGANIZATION FOR APPROVAL BY THIS PORTFOLIO’S SHAREHOLDERS. THE BOARD RECOMMENDS THAT YOU VOTE “FOR” PROPOSAL 3.
34
ADDITIONAL INFORMATION ABOUT THE REORGANIZATIONS
Terms of the Plan of Reorganization
The terms and conditions under which the Reorganizations would be completed are contained in the Plan of Reorganization. The following summary thereof is qualified in its entirety by reference to the Plan of Reorganization, a copy of the form of which is attached to this Proxy Statement/Prospectus as Appendix A.
Each Reorganization will involve an Acquiring Portfolio’s acquiring all the assets of the corresponding Acquired Portfolio in exchange solely for Acquiring Portfolio Shares and the Acquiring Portfolio’s assumption of the Acquired Portfolio’s liabilities. The Plan of Reorganization further provides that, on or as promptly as reasonably practicable after the Closing Date, each Acquired Portfolio will distribute the Acquiring Portfolio Shares it receives in the Reorganization to its shareholders, for the benefit of the Separate Accounts, as applicable, and thus the Contractholders, by class. The number of full and fractional Acquiring Portfolio Shares each shareholder will receive (for the benefit of each Separate Account, as applicable) will be equal in net asset value (as determined in accordance with the Trust’s normal valuation procedures), as of immediately after the close of business (generally 4:00 p.m., Eastern time) on the Closing Date, to the corresponding Acquired Portfolio Shares the shareholder holds at that time (for the benefit thereof, as applicable). After such distribution, the Trust will take all necessary steps under its Amended and Restated Declaration of Trust, as amended (the “Declaration of Trust”), and Delaware and any other applicable law to effect a complete termination of each Acquired Portfolio.
The Board may terminate or delay the Plan of Reorganization with respect to, and abandon or postpone, any Reorganization or all Reorganizations at any time prior to the Closing Date, before or after approval by the relevant Acquired Portfolio’s shareholders, if circumstances develop that, in the Board’s opinion, make proceeding with a Reorganization inadvisable for a Portfolio. The consummation of each Reorganization also is subject to various conditions, including approval of the Reorganization by the applicable Acquired Portfolio’s shareholders, completion of all filings with, and receipt of all necessary approvals from, the SEC, delivery of a legal opinion regarding the federal income tax consequences of the Reorganization (see below) and other customary corporate and securities matters. Subject to the satisfaction of those conditions, each Reorganization will take place immediately after the close of business on the Closing Date.
The Board, including the Trustees who are not “interested persons” (as defined in the Investment Company Act of 1940, as amended (the “1940 Act”)) of the Trust (the “Independent Trustees”), have determined, with respect to each Portfolio, that the interests of the Portfolio’s existing shareholders will not be diluted as a result of the Reorganization and that participation in the Reorganization is in the best interests of the Portfolio.
The following expenses of the Reorganizations (generally referred to in the Plan of Reorganization as the “Identified Expenses”) shall be borne by the Acquired
35
Portfolios in proportion to their respective shareholder accounts at the Valuation Time: (1) costs associated with obtaining any necessary order of exemption from the 1940 Act, preparing the Proxy Statement/Prospectus, and printing and distributing each Acquiring Portfolio’s prospectus and each Acquired Portfolio’s proxy materials, (2) legal and accounting fees in connection with the Reorganizations, and (3) expenses of holding the Meeting (including any adjournment or postponement thereof). Notwithstanding the foregoing, (a) all expenses other than Identified Expenses shall be borne by the Portfolio that directly incurs them, and (b) expenses shall be paid by the Portfolio directly incurring them if and to the extent that the payment thereof by another person would result in that Portfolio’s disqualification as a “regulated investment company” or would prevent the Reorganization in which it participates from qualifying as a tax-free reorganization.
Approval of the Plan of Reorganization with respect to each Acquired Portfolio will require a majority vote of its shareholders. Such majority is defined in the 1940 Act as the lesser of (i) 67% or more of the voting securities of the Portfolio present at a meeting, if the holders of more than 50% of its outstanding voting securities are present or represented by proxy, or (ii) more than 50% of its outstanding voting securities. If the Plan of Reorganization is not approved with respect to an Acquired Portfolio by its shareholders or its Reorganization is not consummated for any other reason, the Board will consider other possible courses of action. The consummation of any one Reorganization is not contingent on the consummation of any other Reorganization. Please see “Voting Information” below for more information.
Description of the Securities to Be Issued
The shareholders of each Acquired Portfolio will receive Class IA, Class IB, or Class K shares of the corresponding Acquiring Portfolio in accordance with the procedures provided for in the Plan of Reorganization. Each such share will be fully paid and non-assessable by the Trust when issued and will have no preemptive or conversion rights.
The Trust may issue an unlimited number of authorized shares of beneficial interest, par value $0.001 per share. The Declaration of Trust authorizes the Board to issue shares in different series and classes. In addition, the Declaration of Trust authorizes the Board to create new series and to name the rights and preferences of the shareholders of each series. The Board does not need additional shareholder action to divide the shares into separate series or classes or to name the shareholders’ rights and preferences. Each Acquiring Portfolio is a series of the Trust.
The Trust currently offers three classes of shares – Class IA, Class IB, and Class K shares. The Trust has adopted, in the manner prescribed under Rule 12b-1 under the 1940 Act, a plan of distribution pertaining to the Class IA and IB shares of the Acquiring Portfolios. The maximum distribution and/or service (12b-1) fee for each Acquiring Portfolio’s Class IA and IB shares is equal to an annual rate of 0.25% of the average daily net assets attributable to those shares. Because these distribution/service fees are paid out of an Acquiring Portfolio’s assets on an ongoing basis, over time these fees will increase your cost of investing and may cost more than paying other types of charges.
36
At a meeting of the Board held on December 10-11, 2013, FMG LLC recommended that each Acquired Portfolio be reorganized into its corresponding Acquiring Portfolio. FMG LLC noted that, in addition to evaluating regularly the performance of each Adviser to a portfolio of the Trust, it continually reviews the overall line-up of investment options and conducts in-depth analysis to identify potentially duplicative portfolios and to provide recommendations to the Board to strengthen the Trust’s line-up. FMG LLC also noted that this process is supplemented by FMG LLC’s Adviser monitoring process, through which organizational and personnel changes occurring at the Advisers are scrutinized to ascertain their impact on the Trust’s portfolios. FMG LLC noted that it was recommending the Reorganizations to streamline and strengthen the Trust’s line-up by eliminating duplicative portfolios and to address underperformance issues and certain other developments with respect to each Acquired Portfolio.
FMG LLC discussed each Acquired Portfolio’s past underperformance and noted that the Board had requested that FMG LLC continue to monitor closely each Acquired Portfolio’s performance. FMG LLC also reminded the Board that each Acquired Portfolio and the Invesco Comstock Portfolio had been the subject of a redemption request by separate accounts of AXA Equitable in a substitution transaction that had been effected earlier that year and that, as a result of that transaction, each Acquired Portfolio and the Invesco Comstock Portfolio had experienced a significant redemption of assets.
FMG LLC noted that each Acquired Portfolio has similar or identical investment objectives, similar or substantially similar investment policies, and the same fundamental and non-fundamental investment restrictions as its corresponding Acquiring Portfolio. With respect to each of the Davis New York Venture Portfolio and the Lord Abbett Large Cap Core Portfolio, FMG LLC noted that, given each Portfolio’s performance, the impact of the substitution transaction on each Portfolio’s assets, and each Portfolio’s lack of potential asset growth, FMG LLC believed it would be appropriate to reorganize each of the Portfolios into the Invesco Comstock Portfolio. In addition, with respect to the Davis New York Venture Portfolio, FMG LLC noted that, in connection with the annual renewal of the investment advisory agreement between FMG LLC and Davis Selected Advisers, L.P. at a meeting of the Board held on July 8-9, 2013, the Board had informed FMG LLC that its decision to approve the investment advisory agreement was based in part on FMG LLC’s agreement to provide, at a future meeting, options for potential changes to the Davis New York Venture Portfolio to address its performance. With respect to the Equity Growth PLUS Portfolio, FMG LLC noted that it believed it would be appropriate to reorganize the Portfolio into the Large Cap Growth PLUS Portfolio to streamline the Trust’s large cap growth investment options by eliminating a duplicative portfolio that has not met performance expectations. FMG LLC also noted that it believed the Reorganizations would be beneficial to the shareholders invested in the Acquired Portfolios because each Reorganization would provide a means by which Contractholders with amounts
37
allocated to an Acquired Portfolio could pursue similar or identical investment objectives in the context of a larger fund with better growth prospects and the potential for lower expenses through greater economies of scale.
In determining whether to approve the Plan of Reorganization with respect to the Acquired Portfolios and recommend its approval to shareholders, the Board, including the Independent Trustees, with the advice and assistance of independent legal counsel, inquired into a number of matters and considered the following factors, among others: (1) the potential benefits of the Reorganizations to shareholders, including the greater potential to increase the assets of the Acquired Portfolios and to realize economies of scale in the Acquired Portfolios’ expenses and portfolio management as a result of asset growth; (2) comparisons of the Portfolios’ investment objectives, policies, strategies and risks; (3) the effect of a Reorganization on an Acquired Portfolio’s annual operating expenses and shareholder costs; (4) the relative historical performance records of the Portfolios; (5) the direct or indirect federal income tax consequences of the Reorganizations to shareholders and Contractholders; (6) the terms and conditions of the Plan of Reorganization and whether the Reorganizations would result in dilution of shareholder interests; (7) the potential benefits of the Reorganizations to other persons, including FMG LLC and its affiliates, as discussed below in the section entitled “Potential Benefits of the Reorganizations to FMG LLC and its Affiliates;” and (8) possible alternatives to the Reorganizations, including the potential benefits and detriments of maintaining the current structure.
In connection with the Board’s consideration of the proposed Reorganizations, the Independent Trustees requested, and FMG LLC provided to the Board, information regarding the factors set forth above as well as other information relating to the Reorganizations.
In reaching the decision to recommend approval of the Reorganizations, the Board, including the Independent Trustees, concluded that each Portfolio’s participation in the relevant Reorganization is in its best interests and that the interests of existing shareholders of that Portfolio would not be diluted as a result of the Reorganization. The Board’s conclusion was based on a number of factors, including the following:
| • | The Reorganizations will permit shareholders invested in each Acquired Portfolio to continue to allocate amounts to a Portfolio that pursues a similar or identical investment objective and similar or substantially similar investment policies, and that is part of a larger combined portfolio with better growth prospects and the potential for lower expenses through greater economies of scale. |
| • | The annual operating expense ratios for the Class IA, Class IB, and Class K shares of each Acquiring Portfolio are expected to be the same as, or lower than, those of the corresponding classes of shares of the corresponding Acquired Portfolio for the previous fiscal year. |
38
| • | FMG LLC will continue to serve as the investment manager and administrator of the Acquiring Portfolios following the Reorganizations, and the current Advisers to the Acquiring Portfolios will continue to serve as the Advisers to those Portfolios. |
| • | As a result of the Reorganizations, each shareholder of Class IA, Class IB, or Class K shares of an Acquired Portfolio would hold, immediately after the Closing Date, Class IA, Class IB, or Class K shares of the corresponding Acquiring Portfolio, as applicable, having an aggregate value equal to the aggregate value of the relevant Acquired Portfolio Shares such shareholder holds as of the Closing Date. |
| • | The Reorganizations will be effected on the basis of each participating Portfolio’s net asset value, which will be determined in connection with each Reorganization in accordance with the Trust’s normal valuation procedures, which are identical for all of the Trust’s Portfolios. |
| • | Shareholders will not pay sales charges in connection with the Reorganizations. |
| • | The Reorganizations are not expected to have any adverse tax results to Contractholders. |
On the basis of the information provided to it and its evaluation of that information, the Board, including the Independent Trustees, voted unanimously to approve the Plan of Reorganization and to recommend that the shareholders of each Acquired Portfolio also approve the relevant Plan of Reorganization.
Potential Benefits of the Reorganizations to FMG LLC and its Affiliates
FMG LLC may realize benefits in connection with the Reorganizations. For example, the profitability from the fees payable to FMG LLC and its affiliates in connection with the Acquiring Portfolios may be higher than the profits derived from the fees paid by the corresponding Acquired Portfolios. In addition, the Portfolios are offered and sold through Contracts issued by AXA Equitable and its affiliates that may provide certain death benefit, income benefit or other guarantees to Contractholders. In providing these guarantees, AXA Equitable assumes the risk that Contractholder account values will not be sufficient to pay the guaranteed amounts when due, and therefore that AXA Equitable will have to use its own resources to cover any shortfall. AXA Equitable may enter into hedging transactions from time to time that are intended to help manage its risks under these guarantees. The Reorganizations described in this Proxy Statement/Prospectus may enhance AXA Equitable’s ability to manage this risk, for example, by eliminating a Portfolio that has underperformed expectations. This could have a positive impact on AXA Equitable’s profitability and/or financial position.
39
A Portfolio’s performance may be affected by one or more of the following risks, which are described in detail in Appendix B “More Information on Risk Factors.”
Cash Management Risk: Upon entering into certain derivatives contracts, such as futures contracts, and to maintain open positions in certain derivatives contracts, a Portfolio may be required to post collateral for the contract, the amount of which may vary. As such, a Portfolio may maintain cash balances, including foreign currency balances, which may be significant, with counterparties such as the Trust’s custodian or its affiliates. A Portfolio is thus subject to counterparty risk and credit risk with respect to these arrangements.
Credit Risk: The risk that the issuer or the guarantor of a fixed income security, or the counterparty to a derivatives contract, repurchase agreement, loan of portfolio securities or other transaction, is unable or unwilling, or is perceived (whether by market participants, ratings agencies, pricing services or otherwise) as unable or unwilling, to make timely principal and/or interest payments, or otherwise honor its obligations. Securities are subject to varying degrees of credit risk, which are often reflected in their credit ratings.
Custom Benchmark Risk: One of the benchmarks against which each of the Equity Growth PLUS Portfolio’s and the Large Cap Growth PLUS Portfolio’s performance is measured, the Volatility Managed Index — Large Cap Growth, was created by the Manager to show how the Portfolio’s performance compares with the returns of a volatility managed index. There is no guarantee that a Portfolio will outperform this or any benchmark.
Derivatives Risk: A Portfolio’s investment in derivatives may rise or fall more rapidly than other investments. Changes in the value of the derivative may not correlate perfectly with the underlying asset, rate or index, and a Portfolio could lose more than the principal amount invested. In addition, it may be difficult or impossible for a Portfolio to purchase or sell certain derivatives in sufficient amounts to achieve the desired level of exposure, which may result in a loss or may be costly to the Portfolio. Derivatives also may be subject to certain other risks such as leveraging risk, interest rate risk, credit risk, the risk that a counterparty may be unable or unwilling to honor its obligations, and the risk of mispricing or improper valuation. Derivatives also may not behave as anticipated by a Portfolio, especially in abnormal market conditions.
Equity Risk: In general, stocks and other equity security values fluctuate, and sometimes widely fluctuate, in response to changes in a company’s financial condition as well as general market, economic, and political conditions and other factors.
ETF Risk: A Portfolio that invests in ETFs will indirectly bear fees and expenses charged by those ETFs, in addition to the Portfolio’s direct fees and expenses. The cost of investing in the Portfolio, therefore, may be higher than the cost of investing in a mutual fund that invests directly in individual stocks and bonds. In addition, the Portfolio’s net asset value will be subject to fluctuations in the market values of
40
the ETFs in which it invests. The Portfolio is also subject to the risks associated with the securities in which the ETFs invest and the ability of the Portfolio to meet its investment objective will directly depend on the ability of the ETFs to meet their investment objectives. The Portfolio and ETFs are subject to certain general investment risks, including market risk, asset class risk, issuer-specific risk, investment style risk and portfolio management risk. In addition, to the extent a Portfolio invests in ETFs that invest in equity securities, fixed income securities and/or foreign securities, the Portfolio is subject to the risks associated with investing in such securities such as equity risk, market capitalization risk, investment grade securities risk, interest rate risk, credit/default risk, foreign and emerging markets securities risk and lower-rated securities risk. ETFs may change their investment objectives or policies without the approval of the Portfolio. If that were to occur, the Portfolio might be forced to sell its investment in an ETF at a time and price that is unfavorable to the Portfolio. Shares of ETFs are listed and traded on securities exchanges and in over-the-counter markets, and the purchase and sale of these shares involve transaction fees and commissions. Even though the market price of an ETF is derived from the securities it owns, such price at any given time may be at, below or above the ETF’s net asset value. In addition, many ETFs invest in securities included in, or representative of, underlying indexes regardless of investment merit or market trends and, therefore, these ETFs do not change their investment strategies to respond to changes in the economy, which means that an ETF may be particularly susceptible to a general decline in the market segment relating to the relevant index. There is also the risk that an ETF’s performance may not match that of the relevant index. It is also possible that an active trading market for an ETF may not develop or be maintained, in which case the liquidity and value of the Portfolio’s investment in the ETF could be substantially and adversely affected.
Financial Services Sector Risk: To the extent a Portfolio invests in the financial services sector, the value of the Portfolio’s shares may be particularly vulnerable to factors affecting that sector, such as the availability and cost of capital funds, changes in interest rates, the rate of corporate and consumer debt defaults, extensive government regulation and price competition. The value of a Portfolio’s shares could experience significantly greater volatility than Portfolios investing more broadly.
Foreign Securities Risk: Investments in foreign securities, including depositary receipts, involve risks not associated with investing in U.S. securities. Foreign markets, particularly emerging markets, may be less liquid, more volatile and subject to less government supervision than domestic markets. Security values also may be negatively affected by changes in the exchange rates between the U.S. dollar and foreign currencies. Differences between U.S. and foreign legal, political and economic systems, regulatory regimes and market practices also may impact security values and it may take more time to clear and settle trades involving foreign securities.
Currency Risk: Investments in foreign currencies and in securities that trade in, or receive revenues in, foreign currencies are subject to the risk that those currencies will decline in value relative to the U.S. dollar. Any such decline may
41
erode or reverse any potential gains from an investment in securities denominated in foreign currency or may widen existing loss. Currency rates may fluctuate significantly over short periods of time for a number of reasons, including changes in interest rates, intervention by governments, central banks or supranational entities, or by the imposition of currency controls or other political developments in the U.S. or abroad.
Depositary Receipts Risk: Investments in depositary receipts (including American Depositary Receipts, European Depositary Receipts and Global Depositary Receipts) are generally subject to the same risks of investing in the foreign securities that they evidence or into which they may be converted. In addition, issuers underlying unsponsored depositary receipts may not provide as much information as U.S. issuers and issuers underlying sponsored depositary receipts. Unsponsored depositary receipts also may not carry the same voting privileges as sponsored depositary receipts.
Emerging Markets Risk: There are greater risks involved in investing in emerging market countries and/or their securities markets. Investments in these countries and/or markets may present market, credit, currency, liquidity, legal, political, technical and other risks different from, or greater than, the risks of investing in developed countries. In addition, the risks associated with investing in a narrowly defined geographic area are generally more pronounced with respect to investments in emerging market countries.
Futures Contract Risk: The primary risks associated with the use of futures contracts are (a) the imperfect correlation between the change in market value of the instruments held by a Portfolio and the price of the futures contract; (b) liquidity risks, including the possible absence of a liquid secondary market for a futures contract and the resulting inability to close a futures contract when desired; (c) losses (potentially unlimited) caused by unanticipated market movements; (d) an adviser’s inability to predict correctly the direction of securities prices, interest rates, currency exchange rates and other economic factors; (e) the possibility that a counterparty will default in the performance of its obligations; (f) if a Portfolio has insufficient cash, it may have to sell securities from its portfolio to meet daily variation margin requirements, and the Portfolio may have to sell securities at a time when it may be disadvantageous to do so; and (g) transaction costs associated with investments in futures contracts may be significant, which could cause or increase losses or reduce gains.
Headline Risk: A Portfolio may invest in a company when the company becomes the center of controversy after receiving adverse media attention concerning its operations, long-term prospects, or management or for other reasons. While the Adviser researches companies subject to such contingencies, it cannot be correct every time, and the company’s stock may never recover or may become worthless.
Index Strategy Risk: A Portfolio that employs an index strategy generally invests in the securities included in the relevant index or a representative sample of such securities regardless of market trends. Such a portfolio generally will not modify its
42
index strategy to respond to changes in the economy, which means that it may be particularly susceptible to a general decline in the market segment relating to the relevant index. In addition, although the index strategy attempts to closely track its benchmark index, the Portfolio may not invest in all of the securities in the index. Also, the Portfolio’s fees and expenses will reduce the Portfolio’s returns, unlike those of the benchmark index. Cash flow into and out of the Portfolio, portfolio transaction costs, changes in the securities that comprise the index, and the Portfolio’s valuation procedures also may affect the Portfolio’s performance. Therefore, there can be no assurance that the performance of the index strategy will match that of the benchmark index.
Interest Rate Risk: The risk that fixed income securities will decline in value because of changes in interest rates. When interest rates decline, the value of a Portfolio’s debt securities generally rises. Conversely, when interest rates rise, the value of a Portfolio’s debt securities generally declines. A Portfolio with a longer average duration will be more sensitive to changes in interest rates than a fund with a shorter average duration.
Investment Grade Securities Risk: Debt securities commonly are rated by national bond ratings agencies. Investment grade securities are securities rated BBB or higher by S&P or Fitch or Baa or higher by Moody’s. Securities rated in the lower investment grade rating categories (e.g., BBB or Baa) are considered investment grade securities, but are somewhat riskier than higher rated obligations because they are regarded as having only an adequate capacity to pay principal and interest, and are considered to lack outstanding investment characteristics.
Investment Style Risk: An Adviser may use a particular style or set of styles — in this case “growth” or “value” styles — to select investments. Those styles may be out of favor or may not produce the best results over short or longer time periods.
Growth stocks may be more sensitive to changes in current or expected earnings than the prices of other stocks. Growth investing also is subject to the risk that the stock price of one or more companies will fall or will fail to appreciate as anticipated, regardless of movements in the securities market. Growth stocks also tend to be more volatile than value stocks, so in a declining market their prices may decrease more than value stocks in general. They also may increase the volatility of the Portfolio’s share price.
Value stocks are subject to the risks that notwithstanding that a stock is selling at a discount to a its perceived true worth, the market will never fully recognize their intrinsic value. In addition, there is the risk that a stock judged to be undervalued may actually be appropriately priced.
Large-Cap Company Risk: Larger more established companies may be unable to respond quickly to new competitive challenges such as changes in technology and consumer tastes. Many larger companies also may not be able to attain the high growth rate of successful smaller companies, especially during extended periods of economic expansion.
43
Leveraging Risk: When a Portfolio leverages its holdings, the value of an investment in that Portfolio will be more volatile and all other risks will tend to be compounded. For example, a Portfolio may take on leveraging risk when it engages in derivatives transactions, invests in collateral from securities loans or borrows money. A Portfolio may experience leveraging risk in connection with investments in derivatives because its investments in derivatives may be purchased with a fraction of the assets that would be needed to purchase the securities directly, so that the remainder of the assets may be invested in other investments. Such investments may have the effect of leveraging a Portfolio because the Portfolio may experience gains or losses not only on its investments in derivatives, but also on the investments purchased with the remainder of the assets. If the value of a Portfolio’s investments in derivatives is increasing, this could be offset by declining values of the Portfolio’s other investments. Conversely, it is possible that the rise in the value of a Portfolio’s non-derivative investments could be offset by a decline in the value of the Portfolio’s investments in derivatives. In either scenario, a Portfolio may experience losses. In a market where the value of a Portfolio’s investments in derivatives is declining and the value of its other investments is declining, the Portfolio may experience substantial losses.
Mid-Cap and Small-Cap Company Risk: Investments in mid- and small-cap companies may involve greater risks than investments in larger, more established issuers because they generally are more vulnerable than larger companies to adverse business or economic developments. Such companies generally have narrower product lines, more limited financial resources and more limited markets for their stock as compared with larger companies. As a result, the value of such securities may be more volatile than the securities of larger companies, and a Portfolio may experience difficulty in purchasing or selling such securities at the desired time and price or in the desired amount. In general, these risks are greater for small-cap companies than for mid-cap companies.
Portfolio Turnover Risk: High portfolio turnover (generally, turnover, in excess of 100% in any given fiscal year) may result in increased transaction costs to a Portfolio, which may result in higher fund expenses and lower total return.
Real Estate Investing Risk: Investing in REITs exposes investors to the risks of owning real estate directly, as well as to risks that relate specifically to the way in which REITs are organized and operated. Real estate is a cyclical business, highly sensitive to general and local economic developments and characterized by intense competition and periodic overbuilding. Real estate income and values also may be greatly affected by demographic trends, such as population shifts or changing tastes and values. Government actions, such as tax increases, zoning law changes or environmental regulations, also may have a major impact on real estate. Changing interest rates and credit quality requirements also will affect the cash flow of real estate companies and their ability to meet capital needs. REITs generally invest directly in real estate (equity REITs), in mortgages secured by interests in real estate (mortgage REITs) or in some combination of the two (hybrid REITs). Operating REITs requires specialized management skills, and a Portfolio or portion thereof indirectly bears
44
REIT management and administration expenses along with the direct expenses of the Portfolio. Individual REITs may own a limited number of properties and may concentrate in a particular region or property type. REITs also must satisfy specific Internal Revenue Code requirements in order to qualify for the tax-free pass through of income and net realized gains.
Short Position Risk: A Portfolio may engage in short sales and may enter into derivative contracts that have a similar economic effect (e.g., taking a short position in a futures contract). A Portfolio will incur a loss as a result of a short position if the price of the asset sold short increases in value between the date of the short position sale and the date on which an offsetting position is purchased. Short positions may be considered speculative transactions and involve special risks that could cause or increase losses or reduce gains, including greater reliance on the investment adviser’s ability to accurately anticipate the future value of a security or instrument, potentially higher transaction costs, and imperfect correlation between the actual and desired level of exposure. Because a Portfolio’s potential loss on a short position arises from increases in the value of the asset sold short, the extent of such loss, like the price of the asset sold short, is theoretically unlimited.
Special Situations Risk: A Portfolio may use aggressive investment techniques, including seeking to benefit from “special situations,” such as mergers, consolidations, liquidations, reorganizations, restructurings, tender or exchange offers or other unusual events expected to affect a particular issuer. In general, securities of companies which are the subject of a tender or exchange offer or a merger, consolidation, liquidation, restructuring or reorganization proposal sell at a premium to their historic market price immediately prior to the announcement of an offer for the company. However, it is possible that the value of securities of a company involved in such a transaction will not rise and in fact may fall, in which case a Portfolio would lose money. It is also possible that an Adviser’s assessment that a particular company is likely to be acquired or acquired during a specific time frame may be incorrect, in which case a Portfolio may not realize any premium on its investment and could lose money if the value of the securities declines during the Portfolio’s holding period.
Volatility Management Risk: The Manager from time to time employs various volatility management techniques, including the use of futures and options to manage equity exposure. The success of a Portfolio’s volatility management strategy will be subject to the Manager’s ability to correctly assess the degree of correlation between the performance of the relevant market index and the metrics used by the Manager to measure market volatility. Since the characteristics of many securities change as markets change or time passes, the success of a Portfolio’s volatility management strategy also will be subject to the Manager’s ability to continually recalculate, readjust, and execute volatility management techniques (such as options and futures transactions) in an efficient manner. In addition, because market conditions change, sometimes rapidly and unpredictably, the success of the volatility management strategy will be subject to the Manager’s ability to execute the strategy in a timely manner. Moreover, volatility management strategies may increase portfolio transaction costs, which could cause or
45
increase losses or reduce gains. For a variety of reasons, the Manager may not seek to establish a perfect correlation between the relevant market index and the metrics that the Manager uses to measure market volatility. In addition, it is not possible to manage volatility fully or perfectly. Any one or more of these factors may prevent a Portfolio from achieving the intended volatility management or could cause the Portfolio to underperform or experience losses.
Federal Income Tax Consequences of the Reorganizations
Each Reorganization is intended to qualify for federal income tax purposes as a tax-free reorganization under section 368(a)(1)(D) of the Internal Revenue Code of 1986, as amended (the “Code”).
As a condition to consummation of each Reorganization, the Trust will receive an opinion from K&L Gates LLP (“Counsel”), with respect to the Reorganization and the Portfolios participating therein and their shareholders, substantially to the effect that, based on the facts and assumptions stated therein and conditioned on certain representations of the Trust being true and complete on the Closing Date and consummation of the Reorganization in accordance with the Plan of Reorganization (without the waiver or modification of any terms or conditions thereof and without taking into account any amendment thereof that Counsel has not approved), for federal income tax purposes: (1) the Reorganization will qualify as a “reorganization” (as defined in section 368(a)(1)(D) of the Code), and each Portfolio will be a “party to a reorganization” (within the meaning of section 368(b) of the Code); (2) neither Portfolio will recognize any gain or loss on the Reorganization; (3) an Acquired Portfolio shareholder will not recognize any gain or loss on the exchange of its Acquired Portfolio Shares for Acquiring Portfolio Shares; (4) an Acquired Portfolio shareholder’s aggregate tax basis in the Acquiring Portfolio Shares it receives pursuant to the Reorganization will be the same as the aggregate tax basis in its Acquired Portfolio Shares it actually or constructively surrenders in exchange for those Acquiring Portfolio shares, and its holding period for those Acquiring Portfolio shares will include, in each instance, its holding period for those Acquired Portfolio shares, provided the shareholder holds the latter as capital assets on the Closing Date; and (5) the Acquiring Portfolio’s tax basis in each asset the Acquired Portfolio transfers to it will be the same as the Acquired Portfolio’s tax basis therein immediately before the Reorganization, and the Acquiring Portfolio’s holding period for each such asset will include the Acquired Portfolio’s holding period therefor (except where the Acquiring Portfolio’s investment activities have the effect of reducing or eliminating an asset’s holding period). Notwithstanding clauses (2) and (5), such opinion may state that no opinion is expressed as to the effect of a Reorganization on the Portfolios participating therein or the participating Acquired Portfolio’s shareholders with respect to any transferred asset as to which any unrealized gain or loss is required to be recognized for federal income tax purposes at the end of a taxable year (or on the termination or transfer thereof) under a mark-to-market system of accounting.
46
Contractholders who had premiums or contributions allocated to the investment divisions of the Separate Accounts that are invested in Acquired Portfolio Shares generally will not recognize any gain or loss as a result of the Reorganizations. If an Acquired Portfolio sells securities before its Reorganization, it may recognize gains or losses on those sales. Any net gains recognized on those sales would increase the amount of any distribution that such an Acquired Portfolio must make to its shareholders before consummating its Reorganization.
As a result of the Reorganizations, each Acquiring Portfolio will succeed to certain tax attributes of the corresponding Acquired Portfolio, except that the amount of the latter’s accumulated capital loss carryovers that the former may use to offset capital gains it recognizes after its Reorganization — generally in no more than the eight succeeding taxable years for losses incurred in taxable years ended before January 1, 2011 — will be subject to an annual limitation under sections 382 and 383 of the Code. Under the Regulated Investment Company Modernization Act of 2010, an Acquiring Portfolio may carry over (and use subject to the sections 382/383 limitation) capital losses the corresponding Acquired Portfolio incurred in subsequent taxable years, including any net capital loss that Acquired Portfolio sustains during its taxable year ending on the Closing Date and any net unrealized built-in loss that Acquired Portfolio has on that date, for an unlimited period. However, any losses incurred during future years must be utilized before the losses incurred in pre-2011 taxable years. As a result of this ordering rule, pre-2011 capital loss carryovers may be more likely to expire unused. Additionally, post-2010 capital losses that are carried forward will retain their character as either short-term or long-term capital losses rather than being considered all short-term as under previous law.
In general, the limitation applicable to an Acquiring Portfolio for each taxable year will equal the sum of (1) the product of the net asset value of the corresponding Acquired Portfolio as of the Closing Date (the “Acquired Portfolio’s NAV”) multiplied by the “long-term tax-exempt rate” (which is a market-based rate published by the Internal Revenue Service (the “Service”) each month, currently 3.49%) for the month in which the Closing Date occurs plus (2) the amount of any net unrealized built-in gain of that Acquired Portfolio as of the Closing Date that that Acquiring Portfolio recognizes in any taxable year all or part of which is in the period through the fifth anniversary of the Closing Date (as long as the amount of that net unrealized built-in gain is greater than the lesser of (i) 15% of that Acquired Portfolio’s NAV or (ii) $10,000,000). The annual limitation will be proportionately reduced for the portion of an Acquiring Portfolio’s current taxable year after the Closing Date and for any subsequent short taxable year.
If a Reorganization fails to meet the requirements of Code section 368(a)(1)(D), a Separate Account that is invested in shares of the Acquired Portfolio involved therein could realize a gain or loss on the transaction equal to the difference between its tax basis in those shares and the fair market value of the Acquiring Portfolio Shares it receives.
The Trust has not sought a tax ruling from the Service but instead is acting in reliance on the opinion of Counsel discussed above. That opinion is not binding on the
47
Service or the courts and does not preclude the Service from adopting a contrary position. Contractholders are urged to consult their tax advisers as to the specific consequences to them of the Reorganizations, including the applicability and effect of state, local, foreign and other taxes.
ADDITIONAL INFORMATION ABOUT THE ACQUIRING PORTFOLIOS
This section gives you information about the Trust, the Manager and the Advisers for the Acquiring Portfolios.
The Trust is organized as a Delaware statutory trust and is registered with the SEC as an open-end management investment company. The Trust’s Board is responsible for the overall management of the Trust and each of its series (the “portfolios”), including the Acquiring Portfolios. The Trust issues shares of beneficial interest that are currently divided among eighty-six (86) portfolios, sixty-eight (68) of which have authorized Class IA, Class IB and Class K shares and the remaining eighteen (18) of which are authorized to issue only Class IB and Class K shares. This Proxy Statement/Prospectus describes the Class IA, Class IB, and Class K shares on behalf of the Acquiring Portfolios. Each Acquiring Portfolio has its own investment objective, investment strategies and risks, which have been previously described in this Proxy Statement/Prospectus. The Trust has adopted a Distribution Plan pursuant to Rule 12b-1 under the 1940 Act for the Trust’s Class IA and Class IB shares.
FMG LLC, 1290 Avenue of the Americas, New York, New York 10104, is the Manager to each Portfolio. FMG LLC is registered with the SEC as an investment adviser under the 1940 Act. FMG LLC also is registered with the Commodity Futures Trading Commission (“CFTC”) as a commodity pool operator (“CPO”) under the Commodity Exchange Act, as amended, and serves as a CPO with respect to the Large Cap Growth PLUS Portfolio. FMG LLC currently claims an exclusion (under CFTC Rule 4.5) from registration as a CPO with respect to the Invesco Comstock Portfolio. Being subject to dual regulation by the SEC and the CFTC may increase compliance costs and may affect Portfolio returns. FMG LLC is an indirect, wholly owned subsidiary of AXA Equitable. AXA Equitable is a wholly-owned subsidiary of AXA Financial, Inc., a subsidiary of AXA, a French insurance holding company. The address for AXA Equitable and AXA Financial, Inc. is 1290 Avenue of the Americas, New York, New York 10104. The address for AXA is 25 Avenue Matignon, 75008, Paris France. FMG LLC serves as the investment adviser to mutual funds and other pooled investment vehicles and, as of December 31, 2013, had $103.0 billion in assets under management.
48
The Manager has a variety of responsibilities for the general management and administration of the Trust and the portfolios. With respect to the Large Cap Growth PLUS Portfolio, the Manager is responsible for, among other things, determining the asset allocation range for the Portfolio, selecting and monitoring the Advisers for the Portfolio, advising the ETF Allocated Portions of a Portfolio (including selecting Underlying ETFs in which the Portfolio invests) and ensuring that asset allocations are consistent with the guidelines that have been approved by the Board. The Manager also is responsible for developing and overseeing the proprietary research model used to manage the equity exposure of the Portfolio. With respect to the Invesco Comstock Portfolio, the Manager’s management responsibilities include, among other things, the selection and monitoring of Advisers for the Portfolio.
The Manager plays an active role in monitoring each Portfolio (or portion thereof) and Adviser and uses portfolio analytics systems to strengthen its evaluation of performance, style, risk levels, diversification and other criteria. The Manager also monitors each Adviser’s portfolio management team to determine whether its investment activities remain consistent with the Portfolios’ (or portions’ thereof) investment style and objectives.
Beyond performance analysis, the Manager monitors significant changes that may impact the Adviser’s overall business. The Manager monitors continuity in the Adviser’s operations and changes in investment personnel and senior management. The Manager performs due diligence reviews with each Adviser no less frequently than annually.
The Manager obtains detailed, comprehensive information concerning Portfolio (or portion thereof) and Adviser performance and Portfolio (or portion thereof) operations that is used to supervise and monitor the Advisers and the Portfolio (or portion thereof) operations. A team is responsible for conducting ongoing investment reviews with each Adviser and for developing the criteria by which Portfolio (or portion thereof) performance is measured.
The Manager selects Advisers from a pool of candidates, including its affiliates, to manage the Portfolios (or portions thereof). The Manager may appoint, dismiss and replace Advisers and amend advisory agreements subject to the approval of the Trust’s Board. The Manager also may allocate a Portfolio’s assets to additional Advisers subject to the approval of the Trust’s Board and has discretion to allocate each Portfolio’s assets among a Portfolio’s current Advisers. The Manager recommends Advisers for each Portfolio to the Trust’s Board based upon its continuing quantitative and qualitative evaluation of each Adviser’s skills in managing assets pursuant to specific investment styles and strategies. Short-term investment performance, by itself, is not a significant factor in selecting or terminating an Adviser, and the Manager does not expect to recommend frequent changes of Advisers.
If the Manager appoints, dismisses or replaces an Adviser to a Portfolio or adjusts the asset allocation among Advisers in a Portfolio the affected Portfolio may experience a period of transition during which the securities held in the Portfolio may be
49
repositioned in connection with the change in Adviser(s). A Portfolio may not pursue its principal investment strategies during such a transition period and may incur increased brokerage commissions and other transaction costs in connection with the change(s). Generally, transitions may be implemented before or after the effective date of the new Adviser’s appointment as an adviser to the Portfolio, and may be completed in several days to several weeks, depending on the particular circumstances of the transition. In addition, the past performance of a Portfolio is not necessarily an indication of future performance. This may be particularly true for any portfolios that have undergone Adviser changes and/or changes to the investment objectives or policies of the portfolio.
The Manager is responsible for overseeing Advisers and recommending their hiring, termination and replacement to the Board.
A committee of FMG LLC investment personnel (“Investment Committee”) (i) is primarily responsible for the selection, monitoring and oversight of each Portfolio’s Adviser(s); and (ii) manages the ETF Allocated Portion of and the models used to manage the ETF Allocated Portion of the Large Cap Growth PLUS Portfolio. The Investment Committee is responsible for determining the allocation of assets between the actively and passively managed portions of the Large Cap Growth PLUS Portfolio, overseeing the models used to manage the Portfolio, selecting and monitoring the Advisers for the Portfolio, and ensuring that asset allocations are consistent with the guidelines that have been approved by the Trust’s Board.
The Manager has received an exemptive order from the SEC to permit it and the Trust’s Board to appoint, dismiss and replace Advisers and to amend the advisory agreements between the Manager and the Advisers without obtaining shareholder approval. Accordingly, the Manager is able, subject to the approval of the Trust’s Board, to appoint, dismiss and replace Advisers and to amend advisory agreements without obtaining shareholder approval. If a new Adviser is retained for a portfolio, shareholders will receive notice of such action. However, the Manager may not enter into an advisory agreement with an “affiliated person” of the Manager (as that term is defined in the 1940 Act) (the “Affiliated Adviser”), such as AllianceBernstein L.P., AXA Investment Managers, Inc., and AXA Rosenberg Investment Management LLC, unless the advisory agreement with the Affiliated Adviser, including compensation, is also approved by the affected portfolio’s shareholders.
Management and Administrative Fees
Each Acquiring Portfolio pays a fee to FMG LLC for management services. The table below shows the annual rate of the management fees (as a percentage of each Acquiring Portfolio’s average daily net assets) that the Manager received in 2013 for managing each Acquiring Portfolio and the rate of the management fees waived by the Manager in 2013 in accordance with the provisions of the Expense Limitation Agreement, as defined below, between the Manager and the Trust with respect to each Acquiring Portfolio.
50
Acquiring Portfolio | Annual Rate Received | Rate of Fees Waived and Expenses Reimbursed | ||||||
Invesco Comstock Portfolio | 0.65 | % | 0.06 | % | ||||
Large Cap Growth PLUS Portfolio | 0.47 | % | 0.00 | % | ||||
The Advisers to the Acquiring Portfolios are paid by the Manager. Changes to the advisory fees may be negotiated, which could result in an increase or a decrease in the amount of the management fee retained by the Manager, without shareholder approval. A discussion of the basis for the decision by the Trust’s Board to approve the investment management and advisory agreements with respect to the Portfolios is available in the Trust’s Semi-Annual or Annual Reports to Shareholders for the periods ended June 30 and December 31.
FMG LLC also currently serves as the Administrator of the Trust. The administrative services provided to the Trust by FMG LLC include, among others, coordination of the Trust’s audit, financial statements and tax returns; expense management and budgeting; legal administrative services and compliance monitoring; portfolio accounting services, including daily net asset value accounting; operational risk management; and oversight of the Trust’s proxy voting policies and procedures and anti-money laundering program.
For administrative services, in addition to the management fee, the Invesco Comstock Portfolio pays FMG LLC its proportionate share of an asset-based administration fee for the Trust, which is equal to an annual rate of 0.12% of the first $3 billion of total Trust average daily net assets (exclusive of certain of the Trust’s portfolios noted below) 0.11% of the next $3 billion, 0.105% of the next $4 billion, 0.10% of the next $20 billion, and 0.0975% thereafter, plus an annual fee of $30,000 per portfolio whose total average net assets are less than $5 billion. The excluded portfolios are: the All Asset Allocation Portfolios, the EQ/AllianceBernstein Dynamic Wealth Strategies Portfolio, the EQ/Franklin Templeton Allocation Portfolio, the Strategic Allocation Portfolios, the AXA Tactical Manager Portfolios, the EQ/AllianceBernstein Small Cap Growth Portfolio, the EQ/Franklin Core Balanced Portfolio, the EQ/AXA Franklin Small Cap Value Core Portfolio, the EQ/Mutual Large Cap Equity Portfolio, the EQ/Templeton Global Equity Portfolio, the EQ/Global Multi-Sector Equity Portfolio, the EQ/High Yield Bond Portfolio, the EQ/Convertible Securities Portfolio and the EQ/Emerging Markets Equity PLUS, EQ/Equity Growth PLUS, EQ/International Core PLUS, EQ/International Value PLUS, EQ/Large Cap Core PLUS, EQ/Large Cap Growth PLUS, EQ/Large Cap Value PLUS, EQ/Mid Cap Value PLUS, EQ/Natural Resources PLUS, EQ/Real Estate PLUS, EQ/Global Bond PLUS, and EQ/Quality Bond PLUS Portfolios (the “PLUS Portfolios”).
For administrative services, in addition to the management fee, the Large Cap Growth PLUS Portfolio pays FMG LLC its proportionate share of an asset-based administration fee for the PLUS Portfolios and certain other of the Trust’s portfolios (noted below), which is equal to an annual rate of 0.15% of the first $20 billion of these portfolios’ aggregate average daily net assets, 0.110% of the next $5 billion of these portfolios’ aggregate average daily net assets, and 0.10% of these portfolios’
51
aggregate average daily net assets thereafter, plus an annual fee of $32,500 per portfolio whose total average net assets are less than $5 billion. The included portfolios are: the EQ/AllianceBernstein Small Cap Growth Portfolio, the EQ/Franklin Core Balanced Portfolio, the EQ/AXA Franklin Small Cap Value Core Portfolio, the EQ/Mutual Large Cap Equity Portfolio, the EQ/Templeton Global Equity Portfolio, the EQ/Global Multi-Sector Equity Portfolio, the EQ/High Yield Bond Portfolio, the EQ/Convertible Securities Portfolio and the PLUS Portfolios.
Expense Limitation Agreement
In the interest of limiting through April 30, 2015 (unless the Trust’s Board consents to an earlier revision or termination of this arrangement) the expenses of each Acquiring Portfolio, the Manager has entered into an expense limitation agreement with the Trust with respect to the Acquiring Portfolios (“Expense Limitation Agreement”). Pursuant to that Expense Limitation Agreement, the Manager has agreed to make payments or waive its management, administrative and other fees to limit the expenses of the Acquiring Portfolios so that the annual operating expenses of each Acquiring Portfolio (other than interest, taxes, brokerage commissions, fees and expenses of other investment companies in which an Acquiring Portfolio invests, dividend and interest expenses on securities sold short, other expenditures that are capitalized in accordance with generally accepted accounting principles, and other extraordinary expenses not incurred in the ordinary course of each Acquiring Portfolio’s business) as a percentage of average daily net assets do not exceed the following respective expense ratios:
Acquiring Portfolios | Total Expenses Limited to (% of daily net assets) | |||||||||||
| Class IA Shares | Class IB Shares | Class K Shares | ||||||||||
Invesco Comstock Portfolio | 1.00 | % | 1.00 | % | 0.75 | % | ||||||
Large Cap Growth PLUS Portfolio | 1.00 | % | 1.00 | % | 0.75 | % | ||||||
The Manager may be reimbursed the amount of any such payments and waivers in the future provided that the payments or waivers are reimbursed within three years of the payment or waiver being made and the combination of the Acquiring Portfolio’s expense ratio and such reimbursements do not exceed the Acquiring Portfolio’s expense cap. If the actual expense ratio is less than the expense cap and the Manager has recouped any eligible previous payments made, the Acquiring Portfolio will be charged such lower expenses.
Each Acquiring Portfolio’s investments are selected by one or more Advisers, which act independently of one another. The following table describes each Acquiring Portfolio’s Adviser(s) and portfolio managers and each portfolio manager’s business experience. Information about the portfolio managers’ compensation, other accounts they manage and their ownership of securities of the Acquiring Portfolios is available in the Trust’s Statement of Additional Information dated May 1, 2013, as supplemented.
52
Acquiring Portfolio | Adviser and | Business Experience | ||
| Invesco Comstock Portfolio | FMG LLC 1290 Avenue of the Americas New York, New York 10104
Portfolio Managers Kenneth T. Kozlowski Alwi Chan Xavier Poutas | Kenneth T. Kozlowski, Alwi Chan, and Xavier Poutas are primarily responsible for the selection, monitoring and oversight of the Invesco Comstock Portfolio’s Adviser.
Kenneth T. Kozlowski, CFP®, CHFC, CLU has served as Executive Vice President and Chief Investment Officer of FMG LLC since June 2012 and as Managing Director of AXA Equitable since September 2011. He was Senior Vice President of FMG LLC from May 2011 to June 2012 and a Vice President of AXA Equitable from February 2001 to August 2011. He has served as Vice President of the Trust from June 2010 to present. Since 2003, Mr. Kozlowski has had primary responsibility for the asset allocation, fund selection and rebalancing of the funds of funds currently managed by FMG LLC and for the ETF Allocated Portions since May 25, 2007. Mr. Kozlowski served as Chief Financial Officer and Treasurer of the Trust from 2002 to 2007. He has been managing the Invesco Comstock Portfolio since May 2011.
| ||
| Alwi Chan, CFA® has served as Senior Vice President and Deputy Chief Investment Officer of FMG LLC since June 2012 and as Lead Director of AXA Equitable since February 2007. He served as Vice President of FMG LLC from May 2011 to June 2012. Prior to that, he served as an Assistant Vice President (2005-2007) and Senior Investment Analyst (2002-2005) of AXA Equitable. He also has served as a Vice President of the Trust since 2007. He has been managing the Invesco Comstock Portfolio since May 2009. | ||||
| Xavier Poutas, CFA® has served as an Assistant Portfolio Manager of FMG LLC since May 2011 and as Director of AXA Equitable since November 2008. He joined AXA Equitable’s Funds Management Group in October 2004 as a Fund Administrator and was involved in the implementation of the asset allocation strategy for the funds of funds currently managed by FMG LLC. He has been managing the Invesco Comstock Portfolio since May 2011. | ||||
53
Acquiring Portfolio | Adviser and | Business Experience | ||
Invesco Advisers, Inc. 1555 Peachtree Street, N.E., Atlanta, Georgia 30309 Portfolio Managers Jason S. Leder Kevin C. Holt Devin E. Armstrong James N. Warwick Matthew Seinsheimer | Jason S. Leder, Kevin C. Holt, Devin E. Armstrong, James N. Warwick, and Matthew Seinsheimer are jointly and primarily responsible for the management of the Invesco Comstock Portfolio.
Jason S. Leder, has been a Portfolio Manager of Invesco since June 2010. Prior thereto, he was a Managing Director and Portfolio Manager with Van Kampen Asset Management and/or its affiliates (“VKAS”) since 1995 and a portfolio manager of the Invesco Comstock Portfolio since April 2005.
Kevin C. Holt, has been a Lead Portfolio Manager of Invesco since June 2010. Prior thereto, he was a Managing Director and Portfolio Manager with VKAS since 1999 and a portfolio manager of the Invesco Comstock Portfolio since April 2005.
Devin E. Armstrong, has been a Portfolio Manager of Invesco since June 2010. Prior thereto he was Vice President and Portfolio Manager at VKAS since August 2004, and research analyst from August 2004 to July 2007. He has been a portfolio manager of the Invesco Comstock Portfolio since July 2007.
| |||
James N. Warwick, has been a Portfolio Manager of Invesco since June 2010. Prior thereto he was an Executive Director and Portfolio Manager at VKAS since May 2002 and a Portfolio Manager of the Invesco Comstock Portfolio since July 2007.
Matthew Seinsheimer, has been Portfolio Manager of Invesco, who has been associated with Invesco and/or its affiliates in an investment management capacity since 1998 and a portfolio manager of the Invesco Comstock Portfolio since June 2010. | ||||
54
Acquiring Portfolio | Adviser and | Business Experience | ||
| Large Cap Growth PLUS Portfolio | FMG LLC 1290 Avenue of the Americas New York, New York 10104
Portfolio Managers Kenneth T. Kozlowski Alwi Chan Xavier Poutas | Kenneth T. Kozlowski, Alwi Chan, and Xavier Poutas are jointly and primarily responsible for (i) the selection, monitoring and oversight of the Large Cap Growth PLUS Portfolio’s Advisers, (ii) allocating assets among the Large Cap Growth PLUS Portfolio’s Allocated Portions, (iii) managing the Large Cap Growth PLUS Portfolio’s equity exposure, and (iv) the selection of investments in ETFs for the Large Cap Growth PLUS Portfolio’s ETF Allocated Portion.
Kenneth T. Kozlowski, CFP®, CHFC, CLU has served as Executive Vice President and Chief Investment Officer of FMG LLC since June 2012 and as Managing Director of AXA Equitable since September 2011. He was Senior Vice President of FMG LLC from May 2011 to June 2012 and a Vice President of AXA Equitable from February 2001 to August 2011. He has served as Vice President of the Trust from June 2010 to present. Since 2003, Mr. Kozlowski has had primary responsibility for the asset allocation, fund selection and rebalancing of the funds of funds currently managed by FMG LLC and for the ETF Allocated Portions since May 25, 2007. Mr. Kozlowski served as Chief Financial Officer and Treasurer of the Trust from 2002 to 2007. He has been managing the Large Cap Growth PLUS Portfolio since May 2007.
Alwi Chan, CFA® has served as Senior Vice President and Deputy Chief Investment Officer of FMG LLC since June 2012 and as Lead Director of AXA Equitable since February 2007. He served as Vice President of FMG LLC from May 2011 to June 2012. Prior to that, he served as an Assistant Vice President (2005-2007) and Senior Investment Analyst (2002-2005) of AXA Equitable. He also has served as a Vice President of the Trust since 2007. He has been managing the Large Cap Growth PLUS Portfolio since May 2009.
| ||
| Xavier Poutas, CFA® has served as an Assistant Portfolio Manager of FMG LLC since May 2011 and as Director of AXA Equitable since November 2008. He joined AXA Equitable’s Funds Management Group in October 2004 as a Fund Administrator and was involved in the implementation of the asset allocation strategy for the funds of funds currently managed by FMG LLC. He has been managing the Large Cap Growth PLUS Portfolio since May 2011. |
55
Acquiring Portfolio | Adviser and | Business Experience | ||
Marsico Capital Management, LLC 1200 17th Street, Suite 1600, Denver, Colorado 80202
Portfolio Managers Thomas F. Marsico Coralie Witter | Thomas F. Marsico and Coralie Witter are jointly and primarily responsible for the management of a portion of the Active Allocated Portion of the Large Cap Growth PLUS Portfolio.
Thomas F. Marsico has been a co-manager of the Active Allocated Portion of the Large Cap Growth PLUS Portfolio since May 2007. Mr. Marsico, Chief Investment Officer of Marsico has over 30 years of experience as a securities analyst and portfolio manager.
Coralie Witter, CFA, has been a co-manager of the Active Allocated Portion of the Large Cap Growth PLUS Portfolio since May 2011. Ms. Witter is a senior analyst and portfolio manager. She has been associated with Marsico as an investment professional since 2004 and has over 15 years experience in the financial services industry. | |||
T. Rowe Price Associates, Inc. 100 East Pratt Street, Baltimore, Maryland 21202
Portfolio Manager P. Robert Bartolo | P. Robert Bartolo has been primarily responsible for the management of a portion of the Active Allocated Portion of the Large Cap Growth PLUS Portfolio since June 2013. Mr. Bartolo is portfolio manager for the T. Rowe Price Growth Stock Fund. Mr. Bartolo is also a Vice President of T. Rowe Price Associates, Inc. (“T. Rowe Price”) and its affiliate T. Rowe Price Group, Inc. and his investment experience dates from 1997. Mr. Bartolo has been with T. Rowe Price since August 2002. He is also a portfolio manager in the Equity Division and serves on several of the Investment Advisory Committees for the firm. Mr. Bartolo has fifteen years of investment experience, nine of which have been at T. Rowe Price. | |||
Wells Capital Management, Inc. 525 Market Street, San Francisco, California 94105
Portfolio Managers Thomas J. Pence Michael T. Smith | Thomas J. Pence and Michael T. Smith have been jointly and primarily responsible for the management of a portion of the Active Allocation Portion of the Large Cap Growth PLUS Portfolio since June 2013.
Thomas J. Pence, CFA has been a Portfolio Manager with Wells Capital Management or an affiliate since 2005.
| |||
| Michael T. Smith, CFA has been a Portfolio Manager and Investment Analyst with Wells Capital Management or an affiliate since 2005. | ||||
56
Acquiring Portfolio | Adviser and | Business Experience | ||
BlackRock Investment Management, LLC P.O. Box 9011,
Portfolio Managers Edward Corallo Christopher Bliss Greg Savage | Edward Corallo, Christopher Bliss, and Greg Savage are jointly and primarily responsible for the management of the Index Allocated Portion of the Large Cap Growth PLUS Portfolio.
Edward Corallo is a Managing Director of BlackRock, Inc. since 2009. He was a principal of Barclay’s Global Investors (“BGI”) from 1997 to 2009. Mr. Corallo has more than five years of portfolio management responsibility. He has been managing the Large Cap Growth PLUS Portfolio since May 2010.
Christopher Bliss, Managing Director and portfolio manager, is a member of BlackRock’s Institutional Index Equity team. He focuses on emerging and frontier market strategies. He has been with BlackRock Investment Management, LLC (“BlackRock”) since 2009. From 2004 to 2009 he served at BGI heading a team responsible for a variety of index and enhanced index emerging market products. Mr. Bliss has more than five year’s portfolio management responsibility. He has been managing the Large Cap Growth PLUS Portfolio since May 2011.
Greg Savage is Managing Director and Head of iShares Portfolio Management with BlackRock’s Index Equity team. He has been with the firm as a portfolio manager since 2009. From 1999 to 2009 he served at BGI as a senior portfolio manager and team leader in the iShares Index Equity Portfolio Management group and previously as a transition manager in the Transition Management Group. He has been managing the Large Cap Growth PLUS Portfolio since May 2012. |
In July 2011, a lawsuit was filed in the United States District Court of the District of New Jersey, entitled Mary Ann Sivolella v. AXA Equitable Life Insurance Company and AXA Equitable Funds Management Group, LLC (“Sivolella Litigation”). The lawsuit was filed derivatively on behalf of eight portfolios of the Trust: EQ/Common Stock Index Portfolio; EQ/ Equity Growth PLUS Portfolio; EQ/Equity 500 Index Portfolio; EQ/Large Cap Value PLUS Portfolio; EQ/Global Multi-Sector Equity Portfolio; EQ/ Mid Cap Value PLUS Portfolio; EQ/Intermediate Government Bond Index Portfolio; and EQ/GAMCO Small Company Value Portfolio (the “Sivolella Portfolios”). The lawsuit seeks recovery under Section 36(b) of the 1940 Act, for alleged excessive fees paid to FMG LLC and AXA Equitable (the “Defendants”) for investment management services. The Plaintiff seeks recovery of
57
the alleged overpayments, or alternatively, rescission of the contracts and restitution of all fees paid, interest, costs and fees. In October 2011, FMG LLC and AXA Equitable filed a motion to dismiss the complaint. In November 2011, the Plaintiff filed an Amended Complaint seeking the same relief, but adding new claims under (1) Section 26(f) of the 1940 Act alleging that the variable annuity contracts sold by the Defendants charged excessive management fees, and seeking restitution and rescission of those contracts under Section 47(b) of the 1940 Act; and (2) a claim for unjust enrichment. The Defendants filed a motion to dismiss the Amended Complaint in December 2011. In May 2012, Plaintiff voluntarily dismissed the Section 26(f) claim seeking restitution and rescission under Section 47(b). In September 2012, the United States District Court for the District of New Jersey denied the motion to dismiss the Amended Complaint as it related to the Section 36(b) claim and granted the motion as it related to the unjust enrichment claim.
In January 2013, a second lawsuit against FMG LLC was filed in the United States District Court for the District of New Jersey by a group of Plaintiffs asserting substantially similar claims under Section 36(b) and seeking substantially similar damages as in the Sivolella Litigation. The lawsuit, entitled Glenn D. Sanford, et al. v. AXA Equitable Funds Management Group, LLC (“Sanford Litigation”), was filed derivatively on behalf of the EQ/PIMCO Ultra Short Bond Portfolio, the EQ/T. Rowe Price Growth Stock Portfolio, the EQ/Global Bond PLUS Portfolio, and the EQ/Core Bond Index Portfolio, in addition to four of the Sivolella Portfolios. In light of the similarities of the allegations in the Sivolella and Sanford Litigations, the court consolidated the two lawsuits.
In April 2013, the Plaintiffs in the Sivolella and Sanford Litigations amended the complaints to add additional claims under Section 36(b) of the 1940 Act for recovery of alleged excessive fees paid to FMG LLC in its capacity as the Administrator of the Trust. The Plaintiffs seek recovery of the alleged overpayments, or alternatively, rescission of the contract and restitution of the excessive fees paid, interest, costs, and fees.
No liability for litigation relating to these matters has been accrued in the financial statements of the Portfolios because any potential damages would be the responsibility of the Defendants.
On November 1, 2010, the Trust and several of its portfolios (but not the portfolios described in this Proxy Statement/Prospectus), were named as defendants and putative members of the proposed defendant class of shareholders in a lawsuit brought by The Official Committee of Unsecured Creditors of Tribune Company (the “Committee”) in the United States Bankruptcy Court for the District of Delaware regarding Tribune Company’s Chapter 11 bankruptcy proceeding (In re Tribune Company). The lawsuit relates to amounts paid to the Trust, and several of its portfolios (but not the portfolios described in this Proxy Statement/Prospectus), as holders of publicly-traded shares of Tribune Company, which were components of certain broad-based securities market indices, for which there were public tender offers during 2007. The suit seeks return of the share price received by Tribune Company shareholders in the tender offers plus interest and attorneys’ fees and expenses.
58
On July 1, 2011, retiree participants in certain Tribune-defined compensation plans (the “Retirees”) initiated a lawsuit in the United States District Court for the Southern District of New York against certain Tribune Company shareholders who sold their shares as part of the 2007 public tender offers (the “Retiree Suit”). This Retiree Suit also seeks return of the share price received by Tribune Company shareholders in connection with the tender offers plus interest and attorneys’ fees and expenses.
On August 24, 2011, the trustees of certain trusts that hold notes issued by Tribune Company (the “Noteholders”) initiated a separate lawsuit in the United States District Court for the Southern District of New York against certain Tribune Company shareholders who sold their shares as part of the 2007 public tender offers (the “Noteholder Suit”). This Noteholder Suit also seeks return of the share price received by Tribune Company shareholders in connection with the tender offers plus interest and attorneys’ fees and expenses.
The Committee’s suit, the Retiree Suit, and the Noteholder Suit have each been consolidated with a number of related lawsuits into a single multidistrict litigation proceeding now pending in the United States District Court for the Southern District of New York (In re: Tribune Company Fraudulent Conveyance Litigation).
The lawsuits do not allege any misconduct by the Trust or its portfolios. The portfolios cannot predict the outcome of these lawsuits. If the lawsuits were to be decided or settled in a manner adverse to the portfolios, the payment of such judgments or settlements could have an adverse effect on each portfolio’s net asset value.
Fund Distribution Arrangements
The Trust offers three classes of shares on behalf of each Acquiring Portfolio: Class IA, Class IB and Class K shares. AXA Distributors, LLC (“AXA Distributors”) serves as the distributor for the Class IA, Class IB and Class K shares of the Trust. Each class of shares is offered and redeemed at its net asset value without any sales load. AXA Distributors is an affiliate of FMG LLC. AXA Distributors is registered as a broker-dealer under the Securities Exchange Act of 1934, as amended, and is a member of the Financial Industry Regulatory Authority (“FINRA”).
The Trust has adopted a Distribution Plan pursuant to Rule 12b-1 under the 1940 Act for the Trust’s Class IA and Class IB shares. Under the Distribution Plan, the Class IA and Class IB shares of the Trust are charged an annual fee to compensate AXA Distributors for promoting, selling and servicing shares of the Portfolios. The maximum annual distribution and/or service (12b-1) fee for each Acquiring Portfolio’s Class IA and Class IB shares is 0.25% of the average daily net assets attributable to Class IA and Class IB shares. Because these fees are paid out of an Acquiring Portfolio’s assets on an on going basis, over time, the fees for Class IA and IB shares will increase your cost of investing and may cost you more than other types of charges.
59
The distributor may receive payments from certain Advisers of the Acquiring Portfolios or their affiliates to help defray expenses for sales meetings or seminar sponsorships that may relate to the Contracts and/or the Advisers’ respective Acquiring Portfolios. These sales meetings or seminar sponsorships may provide the Advisers with increased access to persons involved in the distribution of the Contracts. The distributor also may receive marketing support from the Advisers in connection with the distribution of the Contracts.
Payments to Broker-Dealers and Other Financial Intermediaries
The Acquiring Portfolios are not sold directly to the general public but instead are offered as underlying investment options for Contracts and retirement plans and to other eligible investors. The Acquiring Portfolios and their related companies may make payments to a sponsoring insurance company (or its affiliates) or other financial intermediary for distribution and/or other services. These payments may create a conflict of interest by influencing the insurance company or other financial intermediary and your financial adviser to recommend the Portfolio over another investment or by influencing an insurance company to include the Portfolio as an underlying investment option in the Contract. The prospectus (or other offering document) for your Contract may contain additional information about these payments.
The Acquiring Portfolios’ shares are currently sold only to insurance company separate accounts in connection with Contracts issued by AXA Equitable, AXA Life and Annuity Company, and other affiliated or unaffiliated insurance companies and to The AXA Equitable 401(k) Plan. The Acquiring Portfolios’ shares also may be sold to other tax-qualified retirement plans, to other portfolios managed by FMG LLC that currently sell their shares to such accounts and plans and other investors eligible under applicable tax regulations. Class K shares of the Acquiring Portfolios are sold only to other portfolios of the Trust, portfolios of the AXA Premier VIP Trust and certain group annuity and retirement plans.
The Acquiring Portfolios do not have minimum initial or subsequent investment requirements. Shares of the Acquiring Portfolios are redeemable on any business day upon receipt of a request. All redemption requests will be processed and payment with respect thereto will normally be made within seven days after tender. Please refer to your Contract prospectus for more information on purchasing and redeeming shares of the Acquiring Portfolios.
All shares are purchased and sold at their net asset value without any sales load. All redemption requests will be processed and payment with respect thereto will normally be made within seven days after tender. The Acquiring Portfolios reserve the right to suspend or change the terms of purchasing or selling shares.
The Trust may suspend the right of redemption for any period or postpone payment for more than seven days when the New York Stock Exchange is closed (other than a
60
weekend or holiday) or when trading is restricted by the SEC or the SEC declares that an emergency exists. Redemptions may also be suspended and payments may be postponed for more than seven days during other periods permitted by the SEC. An Acquiring Portfolio may pay the redemption price in whole or part by a distribution in kind of readily marketable securities in lieu of cash or may take up to seven days to pay a redemption request in order to raise capital, when it is detrimental for a Portfolio to make cash payments as determined in the sole discretion of FMG LLC.
Frequent transfers or purchases and redemptions of Acquiring Portfolio shares, including market timing and other program trading or short-term trading strategies, may be disruptive to the Acquiring Portfolios. Excessive purchases and redemptions of shares of an Acquiring Portfolio may adversely affect that Acquiring Portfolio’s performance and the interests of long-term investors by requiring the Acquiring Portfolio to maintain larger amounts of cash or to liquidate portfolio holdings at a disadvantageous time or price. For example, when market timing occurs, an Acquiring Portfolio may have to sell its holdings to have the cash necessary to redeem the market timer’s shares. This can happen when it is not advantageous to sell any securities, so the Acquiring Portfolio’s performance may be hurt. When large dollar amounts are involved, market timing can also make it difficult to use long-term investment strategies because an Acquiring Portfolio cannot predict how much cash it will have to invest. In addition, disruptive transfers or purchases and redemptions of Acquiring Portfolio shares may impede efficient portfolio management and impose increased transaction costs, such as brokerage costs, by requiring the portfolio manager to affect more frequent purchases and sales of portfolio securities. Similarly, an Acquiring Portfolio may bear increased administrative costs as a result of the asset level and investment volatility that accompanies patterns of excessive or short-term trading. Acquiring Portfolios (or Underlying ETFs in which an Acquiring Portfolio invests) that invest a significant portion of their assets in foreign securities, in securities of small- and mid-cap companies, or in high-yield securities tend to be subject to the risks associated with market timing and short-term trading strategies to a greater extent than funds that do not. Securities trading in overseas markets present time zone arbitrage opportunities when events affecting portfolio securities values occur after the close of the overseas market but prior to the close of the U.S. market. Securities of small- and mid-cap companies and high-yield securities also present arbitrage opportunities because the market for such securities may be less liquid than the market for the securities of larger companies and higher quality bonds which could result in pricing inefficiencies.
The Trust’s Board has adopted policies and procedures regarding disruptive transfer activity. The Trust and the Acquiring Portfolios discourage frequent purchases and redemptions of portfolio shares by Contractholders and will not make special arrangements to accommodate such transactions in Acquiring Portfolio shares. As a general matter, each Acquiring Portfolio and the Trust reserve the right to reject a transfer that they believe, in their sole discretion is disruptive (or potentially disruptive) to the management of the Acquiring Portfolio.
61
The Trust’s policies and procedures seek to discourage what it considers to be disruptive trading activity. The Trust seeks to apply its policies and procedures to all Contractholders uniformly, including omnibus accounts. It should be recognized, however, that such policies and procedures are subject to limitations:
| • | They do not eliminate the possibility that disruptive transfer activity, including market timing, will occur or that portfolio performance will be affected by such activity. |
| • | The design of such policies and procedures involves inherently subjective judgments, which FMG LLC and its affiliates, on behalf of the Trust, seek to make in a fair and reasonable manner consistent with the interests of all Contractholders. |
| • | The limits on the ability to monitor certain potentially disruptive transfer activity means that some Contractholders may be treated differently than others, resulting in the risk that some Contractholders may be able to engage in frequent transfer activity while others will bear the effect of that frequent transfer activity. |
If FMG LLC, on behalf of the Trust, determines that a Contractholder’s transfer patterns among the Trust’s portfolios are disruptive to the Trust’s portfolios, FMG LLC or an affiliate may, among other things, restrict the availability of personal telephone requests, facsimile transmissions, automated telephone services, internet services or any electronic transfer services. FMG LLC or an affiliate may also refuse to act on transfer instructions of an agent acting under a power of attorney who is acting on behalf of more than one owner. In making these determinations, FMG LLC or an affiliate may consider the combined transfer activity of Contracts that it believes are under common ownership, control or direction.
The Trust currently considers transfers into and out of (or vice versa) the same portfolio within a five-business day period as potentially disruptive transfer activity. In order to reduce disruptive activity, it monitors the frequency of transfers, including the size of transfers in relation to portfolio assets, in each portfolio. The Trust aggregates inflows and outflows for each portfolio on a daily basis. When a potentially disruptive transfer into or out of a portfolio occurs on a day when the portfolio’s net inflows and outflows exceed an established monitoring threshold, FMG LLC or an affiliate sends a letter to the Contractholder explaining that there is a policy against disruptive transfer activity and that if such activity continues, FMG LLC or an affiliate may take action to restrict the availability of voice, fax and automated transaction services. If such Contractholder is identified a second time as engaging in potentially disruptive transfer activity, FMG LLC or an affiliate currently will restrict the availability of voice, fax and automated transaction services. FMG LLC or an affiliate currently will apply such action for the remaining life of each affected Contract. Because FMG LLC or an affiliate exercises discretion in determining whether or not to take the actions discussed above, some Contractholders may be treated differently than others, resulting in the risk that some Contractholders may be able to engage in frequent transfer activity while others will bear the
62
effect of the frequent transfer activity. Although Contractholders who have engaged in disruptive transfer activity currently receive letters notifying them of FMG LLC or an affiliate’s intention to restrict access to communication services, such letters may not continue to be provided in the future. Consistent with seeking to discourage potentially disruptive transfer activity, FMG LLC, or an affiliate thereof or the Trust also may in its sole discretion and without further notice, change what it considers potentially disruptive transfer activity and its monitoring procedures and thresholds, as well as change its procedures to restrict this activity. You should consult the Contract prospectus that accompanies this Proxy Statement/Prospectus for information on other specific limitations on the transfer privilege.
The above policies and procedures with respect to frequent transfers or purchases and redemptions of portfolio shares also apply to retirement plan participants. The above policies and procedures do not apply to transfers, purchases and redemptions of shares of Portfolios of the Trust by funds of funds managed by FMG LLC.
Notwithstanding our efforts, we may be unable to detect or deter market timing activity by certain persons, which can lead to disruption of management of, and excess costs to, a particular Acquiring Portfolio.
How Portfolio Shares Are Priced
“Net asset value” is the price of one share of a portfolio of the Trust, including an Acquiring Portfolio, without a sales charge, and is calculated each business day using the following formula:
| Net Asset Value | = | Total market value of securities | + | Cash and other assets | – | Liabilities | ||||||
| Number of outstanding shares | ||||||||||||
The net asset value of portfolio shares is determined according to this schedule:
| • | A share’s net asset value is determined as of the close of regular trading on the NYSE on the days it is open for trading. This is normally 4:00 p.m. Eastern time. |
| • | The price for purchasing or redeeming a share will be based upon the net asset value next calculated after an order is received and accepted by a portfolio or its designated agent. |
| • | A portfolio heavily invested in foreign securities may have net asset value changes on days when shares cannot be purchase or sold because foreign securities sometimes trade on days when a portfolio’s shares are not priced. |
Generally, portfolio securities are valued as follows:
| • | Equity securities (including securities issued by ETFs) — most recent sales price or official closing price or if there is no sale or official closing price, latest available bid price. |
63
| • | Debt securities — based upon pricing service valuations. |
| • | Convertible bonds and unlisted convertible preferred stocks — valued at prices obtained from a pricing service for such instruments or, if a pricing service price is not available, at bid prices obtained from one or more of the major dealers in such bonds or stocks. Where there is a discrepancy between dealers, values may be adjusted based on recent premium spreads to the underlying common stocks. Convertible bonds may be matrix-priced based upon the conversion value to the underlying common stocks and market premiums. |
| • | Securities traded on foreign exchanges — most recent sales or bid price on the foreign exchange or market, unless a significant event or circumstance occurs after the close of that market or exchange that will materially affect its value. In that case, fair value as determined by or under the direction of the Trust’s Board of Trustees at the close of regular trading on the NYSE. Foreign currency is converted into U.S. dollar equivalent daily at current exchange rates. |
| • | Options — for exchange traded options, last sales price or, if not available, previous day’s sales price. If the bid price is higher or the asked price is lower than the last sale price, the higher bid or lower asked price may be used. Options not traded on an exchange or actively traded are valued according to fair value methods. |
| • | Futures — last sales price or, if there is no sale, latest available bid price. |
| • | Investment Company Securities — shares of open-end mutual funds (other than ETFs) held by a portfolio will be valued at the net asset value of the shares of such funds as described in these funds’ prospectuses. |
Securities and assets for which market quotations are not readily available, for which valuation cannot be provided or for which events or circumstances occurring after the close of the relevant market or exchange materially affect their value are valued pursuant to the fair value procedures in good faith by or under the direction of the Board of Trustees of the Trust. For example, a security whose trading has been halted during the trading day may be fair valued based on the available information at the time of the close of the trading market. Similarly, securities for which there is no ready market (e.g., securities of certain small capitalization issuers, high yield securities and securities of certain issuers located in emerging markets) also may be fair valued. Some methods for valuing these securities may include: fundamental analysis (earnings multiple, etc.), matrix pricing, discounts from market prices of similar securities, or discounts applied due to the nature and duration of restrictions on the disposition of the securities.
Events or circumstances affecting the values of portfolio securities that occur between the closing of their principal markets and the time the net asset value is determined, such as foreign securities trading on foreign exchanges that close before the
64
time the net asset value of portfolio shares is determined, may be reflected in the Trust’s calculations of net asset values for each applicable portfolio when the Trust deems that the particular event or circumstance would materially affect such portfolio’s net asset value. Such events or circumstances may be company specific, such as an earning reports, country or region specific, such as a natural disaster, or global in nature. Such events or circumstances also may include price movements in the U.S. securities markets.
The effect of fair value pricing as described above is that securities may not be priced on the basis of quotations from the primary market in which they are traded, but rather may be priced by another method that the Trust’s Board of Trustees believes will reflect fair value. As such, fair value pricing is based on subjective judgments and it is possible that fair value may differ materially from the value realized on a sale. This policy is intended to assure that the portfolio’s net asset value fairly reflects security values as of the time of pricing. Also, fair valuation of a portfolio’s securities can serve to reduce arbitrage opportunities available to short-term traders, but there is no assurance that fair value pricing policies will prevent dilution of the portfolio’s net asset value by those traders.
Each business day, the Portfolios’ net asset values are transmitted electronically to insurance companies that use the Portfolios as underlying investment options for Contracts.
Dividends and Other Distributions
The Acquiring Portfolios generally distribute most or all of their net investment income and their net realized gains, if any, annually. Dividends and other distributions by an Acquiring Portfolio are automatically reinvested at net asset value in shares of the distributing class of that Acquiring Portfolio.
Federal Income Tax Considerations
Each Acquiring Portfolio currently sells its shares only to insurance company separate accounts, qualified plans and other investors eligible under applicable tax regulations. Accordingly, distributions each Acquiring Portfolio makes of its net investment income and net realized gains — most or all of which it intends to distribute annually — and gains realized on redemptions or exchanges of the Acquiring Portfolio shares generally will not be taxable to its shareholders (or to the holders of underlying Contracts or plan participants or beneficiaries). See the prospectus for your Contract for further tax information.
Each Acquiring Portfolio is treated as a separate corporation, and intends to continue to qualify each taxable year to be treated as a “regulated investment company” (a “RIC”), for federal tax purposes. An Acquiring Portfolio will be so treated if it meets specified federal income tax rules, including requirements regarding types of investments, diversification limits on investments, types of income, and distributions. To comply with all these requirements may, from time to time, necessitate an Acquiring Portfolio’s disposition of one or more investments when it might not otherwise do so.
65
A RIC that satisfies the federal tax requirements is not taxed at the entity (portfolio) level to the extent it passes through its net income and net realized gains to its shareholders by making distributions. Although the Trust intends that each Acquiring Portfolio will be operated to have no federal tax liability, if an Acquiring Portfolio does have any federal tax liability, that would hurt its investment performance. Also, to the extent that an Acquiring Portfolio invests in foreign securities or holds foreign currencies, it could be subject to foreign taxes that would reduce its investment performance.
It is important for each Acquiring Portfolio to maintain its RIC status (and to satisfy certain other requirements), because the shareholders of a Portfolio that are insurance company separate accounts will then be able to use a “look-through” rule in determining whether the Contracts indirectly funded by the Acquiring Portfolio meet the investment diversification rules for separate accounts. If an Acquiring Portfolio failed to meet those diversification rules, owners of non-pension plan Contracts funded through that Acquiring Portfolio would be taxed immediately on the accumulated investment earnings under their Contracts and would lose any benefit of tax deferral. FMG LLC, in its capacity as the Manager and the administrator of the Trust, therefore carefully monitors each Acquiring Portfolio’s compliance with all of the RIC rules and separate account investment diversification rules.
Contractholders seeking to more fully understand the tax consequences of their investment should consult with their tax advisers or the insurance company that issued their Contract or refer to their Contract prospectus.
The following financial highlights tables are intended to help you understand the financial performance of each Acquiring Portfolio’s Class IA, Class IB, and Class K shares, as applicable. The financial information in the tables is for the past five years (or, if shorter, the period of the Portfolio’s operations). The financial information below for the Class IA, Class IB, and Class K shares, as applicable, of each Acquiring Portfolio has been derived from the financial statements of each Acquiring Portfolio, which have been audited by PricewaterhouseCoopers LLP (“PwC”), an independent registered public accounting firm. PwC’s report on each Acquiring Portfolio’s financial statements as of December 31, 2013 and the financial statements themselves appear in the Trust’s Statement of Additional Information relating to this Proxy Statement/Prospectus.
Certain information reflects financial results for a single share. The total returns in the tables represent the rate that a shareholder would have earned (or lost) on an investment in each Acquiring Portfolio (assuming reinvestment of all dividends and other distributions). The total return figures shown below do not reflect any Separate Account or Contract fees and charges. The total return figures would be lower if they did reflect such fees and charges. The information should be read in conjunction with the financial statements that appear in the Trust’s Statement of Additional Information relating to this Proxy Statement/Prospectus.
66
EQ/Invesco Comstock Portfolio
| Year Ended December 31, | ||||||||||||||||||||
Class IA | 2013 | 2012 | 2011 | 2010 | 2009 | |||||||||||||||
Net asset value, beginning of year | $ | 10.78 | $ | 9.22 | $ | 9.55 | $ | 8.38 | $ | 6.61 | ||||||||||
|
|
|
|
|
|
|
|
|
| |||||||||||
Income (loss) from investment operations: | ||||||||||||||||||||
Net investment income (loss) | 0.14 | (e) | 0.15 | (e) | 0.16 | (e) | 0.13 | (e) | 0.12 | (e) | ||||||||||
Net realized and unrealized gain (loss) on investments and foreign currency transactions | 3.63 | 1.54 | (0.33 | ) | 1.17 | 1.78 | ||||||||||||||
|
|
|
|
|
|
|
|
|
| |||||||||||
Total from investment operations | 3.77 | 1.69 | (0.17 | ) | 1.30 | 1.90 | ||||||||||||||
|
|
|
|
|
|
|
|
|
| |||||||||||
Less distributions: | ||||||||||||||||||||
Dividends from net investment income | (0.54 | ) | (0.13 | ) | (0.16 | ) | (0.13 | ) | (0.13 | ) | ||||||||||
|
|
|
|
|
|
|
|
|
| |||||||||||
Net asset value, end of year | $ | 14.01 | $ | 10.78 | $ | 9.22 | $ | 9.55 | $ | 8.38 | ||||||||||
|
|
|
|
|
|
|
|
|
| |||||||||||
Total return | 35.10 | % | 18.37 | % | (1.77 | )% | 15.61 | % | 28.73 | % | ||||||||||
|
|
|
|
|
|
|
|
|
| |||||||||||
Ratios/Supplemental Data: | ||||||||||||||||||||
Net assets, end of year (000’s) | $ | 10,933 | $ | 6,325 | $ | 4,494 | $ | 2,934 | $ | 1,294 | ||||||||||
Ratio of expenses to average net assets: | ||||||||||||||||||||
After waivers | 1.00 | % | 1.00 | % | 0.75 | % | 0.75 | % | 0.75 | % | ||||||||||
After waivers and fees paid indirectly | 1.00 | % | 0.99 | % | 0.74 | % | 0.74 | % | 0.73 | % | ||||||||||
Before waivers and fees paid indirectly | 1.11 | % | 1.05 | % | 0.78 | % | 0.80 | % | 0.82 | % | ||||||||||
Ratio of net investment income (loss) to average net assets: | ||||||||||||||||||||
After waivers | 1.08 | % | 1.48 | % | 1.63 | % | 1.43 | % | 1.72 | % | ||||||||||
After waivers and fees paid indirectly | 1.09 | % | 1.48 | % | 1.64 | % | 1.44 | % | 1.74 | % | ||||||||||
Before waiver and fees paid indirectly | 0.98 | % | 1.43 | % | 1.60 | % | 1.38 | % | 1.65 | % | ||||||||||
Portfolio turnover rate | 15 | % | 17 | % | 25 | % | 21 | % | 27 | % | ||||||||||
67
EQ/Invesco Comstock Portfolio
| Year Ended December 31, | ||||||||||||||||||||
Class IB | 2013 | 2012 | 2011 | 2010 | 2009 | |||||||||||||||
Net asset value, beginning of year | $ | 10.79 | $ | 9.23 | $ | 9.56 | $ | 8.39 | $ | 6.62 | ||||||||||
|
|
|
|
|
|
|
|
|
| |||||||||||
Income (loss) from investment operations: | ||||||||||||||||||||
Net investment income (loss) | 0.14 | (e) | 0.15 | (e) | 0.13 | (e) | 0.10 | (e) | 0.10 | (e) | ||||||||||
Net realized and unrealized gain (loss) on investments and foreign currency transactions | 3.63 | 1.54 | (0.33 | ) | 1.18 | 1.78 | ||||||||||||||
|
|
|
|
|
|
|
|
|
| |||||||||||
Total from investment operations | 3.77 | 1.69 | (0.20 | ) | 1.28 | 1.88 | ||||||||||||||
|
|
|
|
|
|
|
|
|
| |||||||||||
Less distributions: | ||||||||||||||||||||
Dividends from net investment income | (0.54 | ) | (0.13 | ) | (0.13 | ) | (0.11 | ) | (0.11 | ) | ||||||||||
|
|
|
|
|
|
|
|
|
| |||||||||||
Net asset value, end of year | $ | 14.02 | $ | 10.79 | $ | 9.23 | $ | 9.56 | $ | 8.39 | ||||||||||
|
|
|
|
|
|
|
|
|
| |||||||||||
Total return | 35.06 | % | 18.35 | % | (2.01 | )% | 15.30 | % | 28.36 | % | ||||||||||
|
|
|
|
|
|
|
|
|
| |||||||||||
Ratios/Supplemental Data: | ||||||||||||||||||||
Net assets, end of year (000’s) | $ | 53,095 | $ | 299,775 | $ | 269,909 | $ | 270,858 | $ | 245,914 | ||||||||||
Ratio of expenses to average net assets: | ||||||||||||||||||||
After waivers | 1.00 | % | 1.00 | % | 1.00 | % | 1.00 | % | 1.00 | % | ||||||||||
After waivers and fees paid indirectly | 1.00 | % | 0.99 | % | 0.99 | % | 0.99 | % | 0.98 | % | ||||||||||
Before waivers and fees paid indirectly | 1.06 | % | 1.05 | % | 1.03 | % | 1.05 | % | 1.07 | % | ||||||||||
Ratio of net investment income (loss) to average net assets: | ||||||||||||||||||||
After waivers | 1.10 | % | 1.47 | % | 1.36 | % | 1.20 | % | 1.47 | % | ||||||||||
After waivers and fees paid indirectly | 1.10 | % | 1.48 | % | 1.37 | % | 1.20 | % | 1.49 | % | ||||||||||
Before waivers and fees paid indirectly | 1.04 | % | 1.42 | % | 1.33 | % | 1.14 | % | 1.40 | % | ||||||||||
Portfolio turnover rate | 15 | % | 17 | % | 25 | % | 21 | % | 27 | % | ||||||||||
68
EQ/Invesco Comstock Portfolio
Class K | October 29, 2013* to December 31, 2013 | |||
Net asset value, beginning of period | $ | 13.71 | ||
|
| |||
Income (loss) from investment operations: | ||||
Net investment income (loss) | 0.04 | (e) | ||
Net realized and unrealized gain (loss) on investments and foreign currency transactions | 0.80 | |||
|
| |||
Total from investment operations | 0.84 | |||
|
| |||
Less distributions: | ||||
Dividends from net investment income | (0.57 | ) | ||
|
| |||
Net asset value, end of period | $ | 13.98 | ||
|
| |||
Total return (b) | 6.27 | % | ||
|
| |||
Ratios/Supplemental Data: | ||||
Net assets, end of period (000’s) | $ | 3,197 | ||
Ratio of expenses to average net assets: | ||||
After waivers (a) | 0.75 | % | ||
After waivers and fees paid indirectly (a) | 0.75 | % | ||
Before waivers and fees paid indirectly (a) | 0.93 | % | ||
Ratio of net investment income (loss) to average net assets: | ||||
After waivers (a) | 1.57 | % | ||
After waivers and fees paid indirectly (a) | 1.57 | % | ||
Before waivers and fees paid indirectly (a) | 1.39 | % | ||
Portfolio turnover rate | 15 | % | ||
| * | Commencement of Operations. |
| (a) | Ratios for periods less than one year are annualized. |
| (b) | Total returns for periods less than one year are not annualized. |
| (e) | Net investment income (loss) per share is based on average shares outstanding. |
69
EQ/Large Cap Growth PLUS Portfolio
| Year Ended December 31, | ||||||||||||||||||||
Class IA | 2013 | 2012 | 2011 | 2010 | 2009 | |||||||||||||||
Net asset value, beginning of year | $ | 18.46 | $ | 16.33 | $ | 17.00 | $ | 14.95 | $ | 11.32 | ||||||||||
|
|
|
|
|
|
|
|
|
| |||||||||||
Income (loss) from investment operations: | ||||||||||||||||||||
Net investment income (loss) | 0.05 | (e) | 0.10 | (e) | 0.11 | (e) | 0.10 | (e) | 0.13 | (e) | ||||||||||
Net realized and unrealized gain (loss) on investments, futures and foreign currency transactions | 6.48 | 2.14 | (0.67 | ) | 2.05 | 3.71 | ||||||||||||||
|
|
|
|
|
|
|
|
|
| |||||||||||
Total from investment operations | 6.53 | 2.24 | (0.56 | ) | 2.15 | 3.84 | ||||||||||||||
|
|
|
|
|
|
|
|
|
| |||||||||||
Less distributions: | ||||||||||||||||||||
Dividends from net investment income | (0.04 | ) | (0.11 | ) | (0.11 | ) | (0.10 | ) | (0.21 | ) | ||||||||||
|
|
|
|
|
|
|
|
|
| |||||||||||
Net asset value, end of year | $ | 24.95 | $ | 18.46 | $ | 16.33 | $ | 17.00 | $ | 14.95 | ||||||||||
|
|
|
|
|
|
|
|
|
| |||||||||||
Total return | 35.36 | % | 13.70 | % | (3.27 | )% | 14.40 | % | 33.93 | % | ||||||||||
|
|
|
|
|
|
|
|
|
| |||||||||||
Ratios/Supplemental Data: | ||||||||||||||||||||
Net assets, end of year (000’s) | $ | 13,266 | $ | 9,305 | $ | 8,697 | $ | 1,097,259 | $ | 939,856 | ||||||||||
Ratio of expenses to average net assets: | ||||||||||||||||||||
After waivers and reimbursements (f) | 0.90 | % | 0.93 | % | 0.67 | % | 0.68 | % | 0.70 | % | ||||||||||
After waivers, reimbursements and fees paid indirectly (f) | 0.89 | % | 0.93 | % | 0.67 | % | 0.68 | % | 0.69 | % | ||||||||||
Before waivers, reimbursements and fees paid indirectly (f) | 0.90 | % | 0.93 | % | 0.68 | % | 0.69 | % | 0.70 | % | ||||||||||
Ratio of net investment income (loss) to average net assets: | ||||||||||||||||||||
After waivers and reimbursements (f) | 0.24 | % | 0.54 | % | 0.61 | % | 0.65 | % | 1.10 | % | ||||||||||
After waivers, reimbursements and fees paid indirectly (f) | 0.24 | % | 0.54 | % | 0.61 | % | 0.65 | % | 1.10 | % | ||||||||||
Before waivers, reimbursements and fees paid indirectly (f) | 0.24 | % | 0.54 | % | 0.61 | % | 0.64 | % | 1.10 | % | ||||||||||
Portfolio turnover rate | 40 | % | 28 | % | 39 | % | 39 | % | 43 | % | ||||||||||
70
EQ/Large Cap Growth PLUS Portfolio
| Year Ended December 31, | ||||||||||||||||||||
Class IB | 2013 | 2012 | 2011 | 2010 | 2009 | |||||||||||||||
Net asset value, beginning of year | $ | 18.05 | $ | 15.96 | $ | 16.64 | $ | 14.59 | $ | 10.95 | ||||||||||
|
|
|
|
|
|
|
|
|
| |||||||||||
Income (loss) from investment operations: | ||||||||||||||||||||
Net investment income (loss) | 0.05 | (e) | 0.10 | (e) | 0.06 | (e) | 0.06 | (e) | 0.12 | (e) | ||||||||||
Net realized and unrealized gain (loss) on investments, futures and foreign currency transactions | 6.34 | 2.10 | (0.67 | ) | 2.05 | 3.68 | ||||||||||||||
|
|
|
|
|
|
|
|
|
| |||||||||||
Total from investment operations | 6.39 | 2.20 | (0.61 | ) | 2.11 | 3.80 | ||||||||||||||
|
|
|
|
|
|
|
|
|
| |||||||||||
Less distributions: | ||||||||||||||||||||
Dividends from net investment income | (0.04 | ) | (0.11 | ) | (0.07 | ) | (0.06 | ) | (0.16 | ) | ||||||||||
|
|
|
|
|
|
|
|
|
| |||||||||||
Net asset value, end of year | $ | 24.40 | $ | 18.05 | $ | 15.96 | $ | 16.64 | $ | 14.59 | ||||||||||
|
|
|
|
|
|
|
|
|
| |||||||||||
Total return | 35.39 | % | 13.76 | % | (3.66 | )% | 14.46 | % | 34.77 | % | ||||||||||
|
|
|
|
|
|
|
|
|
| |||||||||||
Ratios/Supplemental Data: | ||||||||||||||||||||
Net assets, end of year (000’s) | $ | 4,223,748 | $ | 926,855 | $ | 911,391 | $ | 699,946 | $ | 679,158 | ||||||||||
Ratio of expenses to average net assets: | ||||||||||||||||||||
After waivers and reimbursements (f) | 0.90 | % | 0.93 | % | 0.92 | % | 0.93 | %(c) | 0.95 | %(c) | ||||||||||
After waivers, reimbursements and fees paid indirectly (f) | 0.89 | % | 0.93 | % | 0.92 | % | 0.93 | %(c) | 0.94 | % | ||||||||||
Before waivers, reimbursements and fees paid indirectly (f) | 0.90 | % | 0.93 | % | 0.93 | % | 0.94 | % | 0.95 | %(c) | ||||||||||
Ratio of net investment income (loss) to average net assets: | ||||||||||||||||||||
After waivers and reimbursements (f) | 0.22 | % | 0.54 | % | 0.35 | % | 0.43 | % | 0.94 | % | ||||||||||
After waivers, reimbursements and fees paid indirectly (f) | 0.22 | % | 0.54 | % | 0.35 | % | 0.43 | % | 0.95 | % | ||||||||||
Before waivers, reimbursements and fees paid indirectly (f) | 0.22 | % | 0.54 | % | 0.34 | % | 0.42 | % | 0.94 | % | ||||||||||
Portfolio turnover rate | 40 | % | 28 | % | 39 | % | 39 | % | 43 | % | ||||||||||
71
EQ/Large Cap Growth PLUS Portfolio
| Year Ended December 31, | ||||||||||||
Class K | 2013 | 2012 | August 26, 2011* to December 31, 2011 | |||||||||
Net asset value, beginning of period | $ | 18.46 | $ | 16.32 | $ | 15.80 | ||||||
|
|
|
|
|
| |||||||
Income (loss) from investment operations: | ||||||||||||
Net investment income (loss) | 0.11 | (e) | 0.14 | (e) | 0.06 | (e) | ||||||
Net realized and unrealized gain (loss) on investments, futures and foreign currency transactions | 6.48 | 2.16 | 0.57 | |||||||||
|
|
|
|
|
| |||||||
Total from investment operations | 6.59 | 2.30 | 0.63 | |||||||||
|
|
|
|
|
| |||||||
Less distributions: | ||||||||||||
Dividends from net investment income | (0.10 | ) | (0.16 | ) | (0.11 | ) | ||||||
|
|
|
|
|
| |||||||
Net asset value, end of period | $ | 24.95 | $ | 18.46 | $ | 16.32 | ||||||
|
|
|
|
|
| |||||||
Total return (b) | 35.70 | % | 14.06 | % | 4.00 | % | ||||||
|
|
|
|
|
| |||||||
Ratios/Supplemental Data: | ||||||||||||
Net assets, end of period (000’s) | $ | 1,154,919 | $ | 976,222 | $ | 1,097,001 | ||||||
Ratio of expenses to average net assets: | ||||||||||||
After waivers and reimbursements (a)(f) | 0.65 | % | 0.68 | % | 0.68 | % | ||||||
After waivers, reimbursements and fees paid indirectly (a)(f) | 0.64 | % | 0.68 | % | 0.68 | % | ||||||
Before waivers, reimbursements and fees paid indirectly (a)(f) | 0.65 | % | 0.68 | % | 0.68 | % | ||||||
Ratio of net investment income (loss) to average net assets: | ||||||||||||
After waivers and reimbursements (a)(f) | 0.49 | % | 0.78 | % | 1.06 | % | ||||||
After waivers, reimbursements and fees paid indirectly (a)(f) | 0.49 | % | 0.78 | % | 1.07 | % | ||||||
Before waivers, reimbursements and fees paid indirectly (a)(f) | 0.49 | % | 0.78 | % | 1.06 | % | ||||||
Portfolio turnover rate | 40 | % | 28 | % | 39 | % | ||||||
| * | Commencement of Operations. |
| (a) | Ratios for periods less than one year are annualized. |
| (b) | Total returns for periods less than one year are not annualized. |
| (c) | Reflects overall fund ratios for non-class specific expenses. |
| (e) | Net investment income (loss) per share is based on average shares outstanding. |
| (f) | Expenses do not include the expenses of the underlying funds (“indirect expenses”). |
72
The following information applies to the Reorganization of each Acquired Portfolio for which you are entitled to vote.
Shareholders with amounts invested in shares of the Acquired Portfolios at the close of business on February 28, 2014 (the “Record Date”) will be entitled to be present and vote or provide voting instructions for the applicable Acquired Portfolio at the Meeting with respect to their shares or shares attributable to their Contracts as of the Record Date.
Each whole share of an Acquired Portfolio is entitled to one vote as to each matter with respect to which it is entitled to vote, as described above, and each fractional share is entitled to a proportionate fractional vote. Votes cast by proxy or in person by a shareholder at the Meeting will be counted by persons appointed as inspectors of election for the Meeting. The table below shows the number of outstanding shares of the Acquired Portfolios as of the Record Date that are entitled to vote at the Meeting. Together, the Insurance Companies owned of record more than 95% of those shares.
Acquired Portfolio | Total Number | Number of Class IA | Number of Class IB | Number of Class K | ||||
Davis New York Venture Portfolio | ||||||||
Lord Abbett Large Cap Core Portfolio | ||||||||
Equity Growth PLUS Portfolio |
All properly executed and unrevoked proxies received in time for the Meeting will be voted as instructed by shareholders. If a shareholder executes a proxy but gives no voting instructions, that shareholder’s shares that are represented by proxy will be voted “FOR” each Proposal and “FOR” or “AGAINST” any other business which may properly arise at the Meeting, in the proxies’ discretion. Any person giving a proxy has the power to revoke it at any time prior to its exercise by executing a superseding proxy or by submitting a written notice of revocation to the Trust. To be effective, such revocation must be received by the Trust prior to the Meeting. In addition, although mere attendance at the Meeting will not revoke a proxy, a shareholder present at the Meeting may withdraw his or her proxy by voting in person. If a shareholder abstains from voting as to any matter, the shares represented by the abstention or broker “non-vote” will be deemed present at the Meeting for purposes of determining a quorum but will not be voted and, therefore, will have the effect of a vote against the Proposals.
Contractholders with amounts allocated to an Acquired Portfolio on the Record Date will be entitled to be present and provide voting instructions for the Acquired Portfolio at the Meeting with respect to shares held indirectly as of the Record Date, to the extent required by applicable law. Voting instructions may be solicited, and such instructions may be provided, in the same manner as proxies as described herein. An
73
Insurance Company will vote the shares for which it receives timely voting instructions from Contractholders in accordance with those instructions. Shares in each investment division of a Separate Account that is invested in an Acquired Portfolio for which an Insurance Company receives a voting instruction card that is signed and timely returned but is not marked to indicate voting instructions will be treated as an instruction to vote the shares “FOR” the applicable Proposal, and the Insurance Company may vote in its discretion with respect to other matters not now known that may be presented at the Meeting. An Insurance Company will vote in its discretion on any proposal to adjourn or postpone the Meeting. Shares in each investment division of a Separate Account for which an Insurance Company receives no timely voting instructions from Contractholders, or which are attributable to amounts retained by an Insurance Company as surplus or seed money, will be voted by the applicable Insurance Company “FOR” or “AGAINST” approval of the applicable Proposal, or as an abstention, in the same proportion as the shares for which Contractholders have provided voting instructions to the Insurance Company. As a result of such proportional voting by the Insurance Companies, it is possible that a small number of Contractholders could determine whether the Proposals are approved.
Voting instructions executed by a Contractholder may be revoked at any time prior to an Insurance Company voting the shares represented thereby by the Contractholder providing the Insurance Company with a properly executed written revocation of such voting instructions, or by the Contractholder providing the Insurance Company with proper later-dated voting instructions by voting instruction card, telephone or the Internet. In addition, any Contractholder who attends the Meeting in person may provide voting instructions by a voting instruction card at the Meeting, thereby canceling any voting instruction previously given. Proxies executed by an Insurance Company may be revoked at any time before they are exercised by a written revocation duly received, by properly executing a later-dated proxy or by an Insurance Company representative attending the Meeting and voting in person.
Approval of a Plan with respect to a Reorganization involving an Acquired Portfolio will require the affirmative vote of (i) 67% or more of the voting securities of the Portfolio present at the Meeting, if the holders of more than 50% of its outstanding voting securities are present or represented by proxy, or (ii) more than 50% of its outstanding voting securities, whichever is less. “Voting securities” refers to the shares of an Acquired Portfolio.
The presence, in person or by proxy, of at least one-third of the shares of an Acquired Portfolio entitled to vote at the Meeting will constitute a quorum for the transaction of business at the Meeting with respect to that Acquired Portfolio.
To the knowledge of the Trust, as of the Record Date, the officers and Trustees owned, as a group, less than 1% of the shares of each Portfolio.
74
Each Insurance Company may be deemed to be a control person of each Portfolio by virtue of its direct or indirect ownership of more than 25% of the shares of each Portfolio. In addition, AXA Equitable may be deemed to be a control person of the Trust by virtue of its direct or indirect ownership of more than 95% of the Trust’s shares. Shareholders owning more than 25% of the outstanding shares of an Acquired Portfolio may be able to determine the outcome of most issues that are submitted to shareholders for a vote. As of the Record Date, except as set forth in Appendix C, to the Trust’s knowledge, (1) no person, other than AXA Equitable, owned beneficially or of record 5% or more of the outstanding Class IA, Class IB, or Class K shares of an Acquired Portfolio, and (2) no Contractholder owned Contracts entitling such Contractholder to provide voting instructions regarding 5% or more of the outstanding Class IA, Class IB, or Class K shares of an Acquired Portfolio.
Solicitation of Proxies and Voting Instructions
Solicitation of proxies and voting instructions is being made by the Trust primarily by the mailing of this Notice and Proxy Statement/Prospectus with its enclosures on or about , 2014. The principal solicitation will be by mail, but proxies and voting instructions also may be solicited by telephone, fax, personal interview by directors, officers, employees or agents of FMG LLC or its affiliates or the Trust or its affiliates, without additional compensation, through the Internet, or other permissible means. Shareholders can vote proxies: (1) by Internet at our website at www.proxyvote.com; (2) by telephone at 1-800-690-6903; or (3) by mail, with the enclosed proxy card. Contractholders can provide voting instructions: (1) by Internet at our website at www.proxyvote.com; (2) by telephone at 1-800-690-6903; or (3) by mail, with the enclosed voting instruction card. In lieu of executing a proxy card or voting instruction card, you may attend the Meeting in person. The cost of the Meeting, including the cost of solicitation of proxies and voting instructions, will be borne by the Acquired Portfolios in proportion to their respective shareholder accounts at the Valuation Time.
If a quorum is not established at the Meeting or if sufficient votes in favor of a proposal are not received by the time scheduled for the Meeting, the persons named as proxies may propose one or more adjournments or postponements of the Meeting to permit further solicitation of proxies. Any adjournment or postponement of the Meeting will require the affirmative vote of a majority of the shares represented in person or by proxy at the session of the Meeting to be adjourned. The persons named as proxies will vote in their discretion on any such adjournment or postponement.
75
The Trust does not know of any matters to be presented at the Meeting other than those described in this Proxy Statement/Prospectus. If other business properly comes before the Meeting, the proxyholders will vote thereon in accordance with their best judgment.
The Trust is not required to hold regular shareholder meetings and, in order to minimize its costs, does not intend to hold meetings of shareholders unless so required by applicable law, regulation or regulatory policy or if otherwise deemed advisable by the Trust’s management. Therefore, it is not practicable to specify a date by which proposals must be received in order to be incorporated in an upcoming proxy statement for a meeting of shareholders. Shareholders will be given notice of any meeting of shareholders not less than ten days, and not more than ninety days, before the date of the meeting.
Prompt execution and return of the enclosed voting instruction card is requested. A self-addressed, postage-paid envelope is enclosed for your convenience. If executed but unmarked voting instructions are received, an Insurance Company will vote those unmarked voting instructions in favor of the proposal.
* * * * *
Copies of the Trust’s most recent annual and semi-annual reports, including financial statements, previously have been delivered to Contractholders. Contractholders may request additional copies of the Trust’s annual or semi-annual reports, free of charge, by writing to the Trust at 1290 Avenue of the Americas, New York, New York 10104 or by calling 1-877-522-5035.
WE NEED YOUR VOTE. IT IS IMPORTANT THAT YOU EXECUTE AND RETURN ALL OF YOUR PROXY OR VOTING INSTRUCTION CARDS PROMPTLY.
76
FORM OF PLAN OF REORGANIZATION AND TERMINATION
THIS PLAN OF REORGANIZATION AND TERMINATION (“Plan”) is adopted by EQ ADVISORS TRUST, a Delaware statutory trust (“Trust”), on behalf of each of its segregated portfolios of assets (“series”) listed on Schedule A to this Plan (“Schedule A”). (Each series listed under the heading “Targets” on Schedule A is referred to herein as a “Target”; each series listed under the heading “Acquiring Portfolios” thereon is referred to herein as an “Acquiring Portfolio”); and each Target and Acquiring Portfolio is sometimes referred to herein as a “Portfolio.”) Notwithstanding anything to the contrary contained herein, (1) all agreements, covenants, actions, and obligations (collectively, “Obligations”) of and by each Portfolio contained herein shall be deemed to be Obligations of, and all rights and benefits created hereunder in favor of each Portfolio shall inure to and be enforceable by, the Trust acting on its behalf, and (2) in no event shall any other series of the Trust or the assets thereof be held liable with respect to the breach or other default by an obligated Portfolio or the Trust of its Obligations set forth herein.
The Trust (1) is a statutory trust that is duly organized, validly existing, and in good standing under the laws of the State of Delaware, (2) is duly registered under the Investment Company Act of 1940, as amended (“1940 Act”), as an open-end management investment company, which registration is in full force and effect, and (3) has the power to own all its properties and assets and to carry on its business described in its current registration statement on Form N-1A. Each Portfolio is a duly established and designated series thereof.
The Trust currently sells voting shares of beneficial interest in the Portfolios, $0.001 par value per share (“shares”), to (1) separate accounts of AXA Equitable Life Insurance Company (“AXA Equitable”), AXA Life and Annuity Company, and other affiliated or unaffiliated insurance companies in connection with certain variable annuity certificates and contracts and variable life insurance policies (collectively, “Contracts”) issued thereby and (2) The AXA Equitable 401(k) Plan. Shares in each Portfolio also may be sold to (3) other tax-qualified retirement plans, (4) other portfolios managed by AXA Equitable Funds Management Group, LLC (“FMG LLC”) that currently sell their shares to those accounts and plans, and (5) and other investors eligible under applicable Regulations (as defined below). At the date of adoption hereof, some shares in certain Portfolios are held by one or more shareholders other than separate accounts of AXA Equitable (collectively, “Other Shareholders”) and the balance of the shares in those Portfolios and all the shares in each other Portfolio are held by AXA Equitable for separate accounts thereof. Class K shares are sold only to other series of the Trust, series of AXA Premier VIP Trust, a separate registered investment company managed by FMG LLC, and certain group annuity and retirement plans. The Portfolios are underlying investment options for those separate accounts to fund Contracts. Under applicable law, the assets of all those separate accounts (i.e., the shares in the Portfolios) are the property of AXA Equitable, which is the owner of record of those shares, and are held for the benefit of the Contract holders.
A-1
The Trust wishes to effect three separate reorganizations, each described in section 368(a)(1)(D) of the Internal Revenue Code of 1986, as amended (“Code”) (all “section” references are to the Code, unless otherwise noted), and intends this Plan to be, and adopts it as, a “plan of reorganization” (within the meaning of the regulations under the Code (“Regulations”)). Each reorganization will consist of (1) the transfer of all of a Target’s assets to the Acquiring Portfolio listed on Schedule A opposite its name (“corresponding Acquiring Portfolio”) in exchange solely for shares in that Acquiring Portfolio and that Acquiring Portfolio’s assumption of all of that Target’s liabilities, (2) the distribution of those shares pro rata to that Target’s shareholders in exchange for their shares therein and in complete liquidation thereof, and (3) that Target’s termination (all the foregoing transactions involving each Target and its corresponding Acquiring Portfolio being referred to herein collectively as a “Reorganization”), all on the terms and conditions set forth herein. The consummation of one Reorganization shall not be contingent on the consummation of any other Reorganization. (For convenience, the balance hereof, except paragraphs 1.3 and 5, refers only to a single Reorganization, one Target, and one Acquiring Portfolio, but the terms and conditions hereof shall apply separately to each Reorganization and the Portfolios participating therein.)
The Trust’s Amended and Restated Declaration of Trust, as amended (“Declaration”), permits it to vary its shareholders’ investment. The Trust does not have a fixed pool of assets — each series thereof (including each Portfolio) is a managed portfolio of securities, and FMG LLC and each investment sub-adviser thereof have the authority to buy and sell securities for it. The Trust believes, based on its review of each Portfolio’s investment portfolio, that Target’s portfolio holdings are generally consistent and compatible with Acquiring Portfolio’s investment objective(s) and policies and that, as a result, a large majority of Target’s assets can be transferred to and held by Acquiring Portfolio.
The Trust’s Board of Trustees (“Board”), including a majority of its members who are not “interested persons” (as that term is defined in the 1940 Act) thereof, (1) has duly adopted and approved this Plan and the transactions contemplated hereby and has duly authorized its performance hereof on each Portfolio’s behalf by all necessary Board action and (2) has determined that participation in the Reorganization is in the best interests of each Portfolio and that the interests of the existing shareholders thereof will not be diluted as a result of the Reorganization.
Target offers three classes of shares, designated Class IA, Class IB, and Class K shares (“Class IA Target Shares,” “Class IB Target Shares,” and “Class K Target Shares,” respectively, and collectively, “Target Shares”). Acquiring Portfolio also offers three classes of shares, also designated Class IA, Class IB, and Class K shares (“Class IA Acquiring Portfolio Shares,” “Class IB Acquiring Portfolio Shares,” and “Class K Acquiring Portfolio Shares,” respectively, and collectively, “Acquiring Portfolio Shares”). The Portfolios’ identically designated classes of shares have identical characteristics, rights, and preferences.
A-2
1. PLAN OF REORGANIZATION AND TERMINATION
1.1 Subject to the requisite approval of Target’s shareholders and the terms and conditions set forth herein, Target shall assign, sell, convey, transfer, and deliver all of its assets described in paragraph 1.2 (“Assets”) to Acquiring Portfolio. In exchange therefor, Acquiring Portfolio shall —
(a) issue and deliver to Target the number of full and fractional (all references herein to “fractional” shares meaning fractions rounded to the eighth decimal place) (1) Class IA Acquiring Portfolio Shares determined by dividing Target’s net value (computed as set forth in paragraph 2.1) (“Target Value”) attributable to the Class IA Target Shares by the net asset value (computed as set forth in paragraph 2.2) (“NAV”) of a Class IA Acquiring Portfolio Share, (2) Class IB Acquiring Portfolio Shares determined by dividing the Target Value attributable to the Class IB Target Shares by the NAV of a Class IB Acquiring Portfolio Share, and (3) Class K Acquiring Portfolio Shares determined by dividing the Target Value attributable to the Class K Target Shares by the NAV of a Class K Acquiring Portfolio Share, and
(b) assume all of Target’s liabilities described in paragraph 1.3 (“Liabilities”).
Those transactions shall take place at the Closing (as defined in paragraph 3.1).
1.2 The Assets shall consist of all assets and property of every kind and nature — including all cash, cash equivalents, securities, commodities, futures interests, receivables (including interest and dividends receivable), claims and rights of action, rights to register shares under applicable securities laws, goodwill, and books and records — Target owns at the Valuation Time (as defined in paragraph 2.1) and any deferred and prepaid expenses (other than unamortized organizational expenses) shown as assets on Target’s books at that time.
1.3 The Liabilities shall consist of all of Target’s liabilities, debts, obligations, and duties of whatever kind or nature existing at the Valuation Time, whether absolute, accrued, contingent, or otherwise, whether known or unknown, whether or not arising in the ordinary course of business, whether or not determinable at the Effective Time (as defined in paragraph 3.1), and whether or not specifically referred to herein, except Reorganization Expenses (as defined in paragraph 4.3(j)) borne by another Target pursuant to paragraph 5. Notwithstanding the foregoing, Target shall use its best efforts to discharge all its known liabilities, debts, obligations, and duties before the Effective Time.
1.4 If the dividends and/or other distributions Target has paid through the Effective Time for its current taxable year do not equal or exceed the sum of its (a) “investment company taxable income” (within the meaning of section 852(b)(2)), computed without regard to any deduction for dividends paid, plus (b) “net capital gain” (as defined in section 1222(11)), after reduction by any capital loss carryovers, for that
year through that time, then at or as soon as practicable before that time, Target shall
A-3
declare and pay to its shareholders of record one or more dividends and/or other distributions so that it will have distributed substantially all of that income and gain — and in no event less than the sum of 98% of its “ordinary income” plus 98.2% of its “capital gain net income,” as those terms are defined in section 4982(e)(1) and (2), respectively — for all federal income and excise tax periods ending at or before the Effective Time, and treating its current taxable year as ending at that time, such that Target will have no tax liability under sections 852 or 4982 for the current and any prior tax periods.
1.5 At the Effective Time (or as soon thereafter as is reasonably practicable), Target shall distribute the Acquiring Portfolio Shares it receives pursuant to paragraph 1.1(a) to the separate accounts for which AXA Equitable holds Target Shares, and Other Shareholders, of record at the Effective Time (each, a “Shareholder”), in proportion to their Target Shares then so held and in constructive exchange therefor, and shall completely liquidate. That distribution shall be accomplished by the Trust’s transfer agent’s opening accounts on Acquiring Portfolio’s shareholder records in the names of the Shareholders (except Shareholders in whose names accounts thereon already exist) and transferring those Acquiring Portfolio Shares to those newly opened and existing accounts. Pursuant to that transfer, each Shareholder’s account shall be credited with the respective pro rata number of full and fractional Acquiring Portfolio Shares due that Shareholder, by class (i.e., the account for each Shareholder that holds Class IA Target Shares shall be credited with the respective pro rata number of full and fractional Class IA Acquiring Portfolio Shares due that Shareholder, the account for each Shareholder that holds Class IB Target Shares shall be credited with the respective pro rata number of full and fractional Class IB Acquiring Portfolio Shares due that Shareholder, and the account for each Shareholder that holds Class K Target Shares shall be credited with the respective pro rata number of full and fractional Class K Acquiring Portfolio Shares due that Shareholder). The aggregate NAV of Acquiring Portfolio Shares of each class to be so credited to each Shareholder’s account shall equal the aggregate NAV of the Target Shares of the corresponding class that Shareholder holds at the Effective Time. All issued and outstanding Target Shares, including any represented by certificates, shall simultaneously be canceled on Target’s shareholder records. Acquiring Portfolio shall not issue certificates representing the Acquiring Portfolio Shares issued in connection with the Reorganization.
1.6 After the Effective Time, Target shall not conduct any business except in connection with its termination. As soon as reasonably practicable after distribution of the Acquiring Portfolio Shares pursuant to paragraph 1.5, all actions required to terminate Target as a series of the Trust shall be taken — and in all events Target shall have been terminated as such within six months after the Effective Time — and Trust shall make all filings and take all other actions in connection therewith required by applicable law or necessary and proper to effect that termination.
1.7 Any reporting responsibility of Target to a public authority, including the responsibility for filing regulatory reports, tax returns, and other documents with the Securities and Exchange Commission (“Commission”), any state securities commission, any
A-4
federal, state, and local tax authorities, and any other relevant regulatory authority, is and shall remain its responsibility up to and including the date on which it is terminated. In furtherance of the foregoing, after the Effective Time, the Trust shall or shall cause its agents to prepare any federal, state, and local tax returns, including any Forms 1099, required to be filed by it with respect to Target’s final taxable year ending with its complete liquidation and for any prior periods or taxable years and shall cause those tax returns and Forms 1099 to be duly filed with the appropriate taxing authorities.
2. VALUATION
2.1 For purposes of paragraph 1.1(a), Target’s net value shall be (a) the value of the Assets computed immediately after the close of regular trading on the New York Stock Exchange and Target’s declaration of dividends and/or other distributions, if any, on the date of the Closing (“Valuation Time”), using the valuation procedures set forth in the Trust’s then- current prospectus and statement of additional information for Target and valuation procedures established by the Board (collectively, “Valuation Procedures”), less (b) the amount of the Liabilities at the Valuation Time.
2.2 For purposes of paragraph 1.1(a), the NAV per share of each class of Acquiring Portfolio Shares shall be computed at the Valuation Time, using the Valuation Procedures.
2.3 All computations pursuant to paragraphs 2.1 and 2.2 shall be made (a) by FMG LLC, in its capacity as the Trust’s administrator, or (b) in the case of securities subject to fair valuation, in accordance with the Valuation Procedures.
3. CLOSING AND EFFECTIVE TIME
3.1 Unless the Trust determines otherwise, all acts necessary to consummate the Reorganization (“Closing”) shall be deemed to occur simultaneously at the close of business (4:00 p.m., Eastern Time) on , 2014, or a later date the Trust determines (“Effective Time”). If, at or immediately before the Valuation Time, (a) the New York Stock Exchange or another primary trading market for portfolio securities of either Portfolio (each, an “Exchange”) is closed to trading or trading thereon is restricted or (b) trading or the reporting of trading on an Exchange or elsewhere is disrupted so that, in the Board’s judgment, accurate appraisal of the value of either Portfolio’s net assets and/or the NAV per share of any class of Acquiring Portfolio Shares is impracticable, the date of the Closing (and, therefore, the Valuation Time and the Effective Time) shall be postponed until the first business day on which that Exchange is open for regular trading after the day when that trading has been fully resumed and that reporting has been restored. The Closing shall be held at the Trust’s offices or at another place the Trust determines.
3.2 The Trust shall direct the custodian of the Portfolios’ assets to deliver at the Closing a certificate of an authorized officer (“Certificate”) stating that (a) the Assets it holds will be transferred to Acquiring Portfolio at the Effective Time, (b) all necessary taxes in connection with the delivery of the Assets, including all applicable
A-5
federal and state stock transfer stamps, if any, have been paid or provision for payment has been made, and (c) the information (including adjusted basis and holding period, by lot) concerning the Assets, including all portfolio securities, transferred by Target to Acquiring Portfolio, as reflected on Acquiring Portfolio’s books immediately after the Closing, does or will conform to that information on Target’s books immediately before the Closing.
3.3 The Trust shall direct its transfer agent to deliver at the Closing a Certificate stating that its records contain (a) the name, address, and taxpayer identification number of each Shareholder, (b) the number of full and fractional shares in each outstanding class of Target Shares each Shareholder owns, and (c) the dividend reinvestment elections, if any, applicable to each Shareholder, all at the Effective Time.
3.4. The Trust shall direct its transfer agent to deliver (a) at the Closing, a confirmation, or other evidence satisfactory to the Trust, that the Acquiring Portfolio Shares to be issued to Target pursuant to paragraph 1.1(a) have been credited to Target’s account on Acquiring Portfolio’s shareholder records and (b) at or as soon as reasonably practicable after the Closing, a Certificate as to the opening of accounts on those records in the names of the Shareholders (except Shareholders in whose names accounts thereon already exist).
4. CONDITIONS PRECEDENT
4.1 The Trust’s obligation to implement this Plan on Acquiring Portfolio’s behalf shall be subject to satisfaction of the following conditions at or before (and continuing through) the Effective Time:
(a) At the Effective Time, the Trust, on Target’s behalf, will have good and marketable title to the Assets and full right, power, and authority to sell, assign, transfer, and deliver the Assets hereunder free of any liens or other encumbrances (except securities that are subject to “securities loans,” as referred to in section 851(b)(2), or are restricted to resale by their terms); and on delivery and payment for the Assets, the Trust, on Acquiring Portfolio’s behalf, will acquire good and marketable title thereto, subject to no restrictions on the full transfer thereof, including restrictions that might arise under the Securities Act of 1933, as amended (“1933 Act”);
(b) The Trust, with respect to Target, is not currently engaged in, and its adoption and performance hereof and consummation of the Reorganization will not result in, (1) a conflict with or material violation of any provision of Delaware law, the Declaration or the Trust’s By-Laws (collectively, “Governing Documents”), or any agreement, indenture, instrument, contract, lease, or other undertaking (each, an “Undertaking”) to which the Trust, with respect to Target or on its behalf, is a party or by which it is bound or (2) the acceleration of any obligation, or the imposition of any penalty, under any Undertaking, judgment, or decree to which the Trust, with respect to Target or on its behalf, is a party or by which it is bound;
A-6
(c) At or before the Effective Time, either (1) all material contracts and other commitments of or applicable to Target (other than this Plan and certain investment contracts, including options, futures, forward contracts, and swap agreements) will terminate or (2) provision for discharge, and/or Acquiring Portfolio’s assumption, of any liabilities of Target thereunder will be made, without either Portfolio’s incurring any liability or penalty with respect thereto and without diminishing or releasing any rights the Trust, on Target’s behalf, may have had with respect to actions taken or omitted or to be taken by any other party thereto before the Closing;
(d) No litigation, administrative proceeding, action, or investigation of or before any court, governmental body, or arbitrator is presently pending or, to the Trust’s knowledge, threatened against the Trust, with respect to Target or any of its properties or assets attributable or allocable to Target, that, if adversely determined, would materially and adversely affect Target’s financial condition or the conduct of its business; and the Trust, on Target’s behalf, knows of no facts that might form the basis for the institution of any such litigation, proceeding, action, or investigation and is not a party to or subject to the provisions of any order, decree, judgment, or award of any court, governmental body, or arbitrator that materially and adversely affects Target’s business or the Trust’s ability to consummate the transactions contemplated hereby;
(e) Target’s Statement of Assets and Liabilities, Portfolio of Investments, Statement of Operations, and Statement of Changes in Net Assets (each, a “Statement”) at and for the fiscal year (in the case of the last Statement, for the two fiscal years) ended December 31, 2013, have been audited by PricewaterhouseCoopers LLP, an independent registered public accounting firm (“PwC”), and are in accordance with generally accepted accounting principles consistently applied in the United States (“GAAP”); those Statements present fairly, in all material respects, Target’s financial condition at that date in accordance with GAAP and the results of its operations and changes in its net assets for the period(s) then ended; and, to the Trust’s management’s best knowledge and belief, there are no known contingent liabilities of Target required to be reflected on a balance sheet (including the notes thereto) in accordance with GAAP at that date that are not disclosed therein;
(f) Since December 31, 2013, there has not been any material adverse change in Target’s financial condition, assets, liabilities, or business, other than changes occurring in the ordinary course of business, or any incurrence by Target of indebtedness maturing more than one year from the date that indebtedness was incurred; for purposes of this subparagraph, a decline in Target’s NAV due to declines in market values of securities Target holds, the discharge of Target liabilities, or the redemption of Target Shares by its shareholders will not constitute a material adverse change;
A-7
(g) All federal, state, and local tax returns, dividend reporting forms, and other tax-related reports (collectively, “Returns”) of Target required by law to have been filed by the Effective Time (including any properly and timely filed extensions of time to file) will have been timely filed and are or will be correct in all material respects, and all federal and other taxes shown as due or required to be shown as due on those Returns will have been paid or provision will have been made for the payment thereof (except for amounts that alone or in the aggregate would not reasonably be expected to have a material adverse effect); to the best of the Trust’s knowledge, no such Return is currently under audit and no assessment has been asserted with respect to those Returns; and Target (1) is in compliance in all material respects with all applicable Regulations pertaining to (i) the reporting of dividends and other distributions on and redemptions of its shares, (ii) withholding in respect thereof, and (iii) shareholder basis reporting, (2) has withheld in respect of dividends and other distributions and paid to the proper taxing authorities all taxes required to be withheld, and (3) is not liable for any material penalties that could be imposed thereunder;
(h) Target is not classified as a partnership, and instead is classified as an association that is taxable as a corporation, for federal tax purposes and either has elected the latter classification by filing Form 8832 with the Internal Revenue Service (“IRS”) or is a “publicly traded partnership” (as defined in section 7704(b)) that is treated as a corporation; Target is an “investment company” (as defined in section 368(a)(2)(F)(iii)) and a “fund” (as defined in section 851(g)(2), eligible for treatment under section 851(g)(1)); Target has elected to be a “regulated investment company” under Part I of Subchapter M of Chapter 1 of Subtitle A of the Code (“Subchapter M”) (“RIC”); for each taxable year of its operation (including the taxable year that will end at the Effective Time (“current year”)), Target has met (and for the current year will meet) the requirements of Subchapter M for qualification and treatment as a RIC and has been (and for the current year will be) eligible to and has computed (and for the current year will compute) its federal income tax under section 852; Target has declared and paid to its shareholders the dividend(s) and/or other distribution(s), if any, required to be declared and paid pursuant to paragraph 1.4; and Target has no earnings and profits accumulated in any taxable year in which the provisions of Subchapter M did not apply to it;
(i) Target is in the same line of business as Acquiring Portfolio is in, for purposes of section 1.368-1(d)(2) of the Regulations, and did not enter into that line of business as part of the plan of reorganization; from the time the Board approved the transactions contemplated hereby (“Approval Time”) through the Effective Time, Target has invested and will invest its assets in a manner that ensures its compliance with the foregoing and paragraph 4.1(h); from the time it commenced operations through the Effective Time, Target has conducted and will conduct its “historic business” (within the meaning of that section) in a substantially unchanged manner; from the Approval Time through the Effective Time, Target has not changed, and will not change, its historic investment policies in connection with the Reorganization;
A-8
(j) At the Effective Time, (1) at least 33 1/3% of Target’s portfolio assets will meet Acquiring Portfolio’s investment objective(s), strategies, policies, risks, and restrictions (collectively, “Investment Criteria”), (2) Target will not have altered its portfolio in connection with the Reorganization to meet that 33 1/3% threshold, and (3) Target will not have modified any of its Investment Criteria as part of the plan of reorganization, for purposes of section 1.368-1(d)(2) of the Regulations;
(k) To the best of the Trust’s management’s knowledge, there is no plan or intention by its shareholders to redeem, sell, exchange, or otherwise dispose of a number of Target Shares (or Acquiring Portfolio Shares to be received in the Reorganization), in connection with the Reorganization, that would reduce their ownership of the Target Shares (or the equivalent Acquiring Portfolio Shares) to a number of shares that is less than 50% of the current number of Target Shares outstanding;
(l) During the five-year period ending at the Effective Time, neither Target nor any person “related” (within the meaning of section 1.368-1(e)(4) of the Regulations (“Related”), without regard to section 1.368-1(e)(4)(i)(A) thereof) to it will have (1) acquired Target Shares with consideration other than Acquiring Portfolio Shares or Target Shares, except for shares redeemed in the ordinary course of Target’s business as a series of an open-end investment company pursuant to section 22(e) of the 1940 Act, or (2) made distributions with respect to Target Shares except for (i) normal, regular dividend distributions made pursuant to Target’s historic dividend-paying practice and (ii) other dividends and distributions declared and paid to ensure Target’s continuing qualification as a RIC and to avoid the imposition of fund-level tax;
(m) All issued and outstanding Target Shares are, and at the Effective Time will be, duly and validly issued and outstanding, fully paid, and non-assessable by the Trust and have been offered and sold in every state and the District of Columbia in compliance in all material respects with applicable registration requirements of the 1933 Act and state securities laws; all issued and outstanding Target Shares will, at the Effective Time, be held by the persons and in the amounts set forth on Target’s shareholder records (as provided in the Certificate to be delivered pursuant to paragraph 3.3); and Target does not have outstanding any options, warrants, or other rights to subscribe for or purchase any Target Shares, nor are there outstanding any securities convertible into any Target Shares;
(n) Target incurred the Liabilities, which are associated with the Assets, in the ordinary course of its business;
(o) Target is not under the jurisdiction of a court in a “title 11 or similar case” (as defined in section 368(a)(3)(A)); and
(p) Not more than 25% of the value of Target’s total assets (excluding cash, cash items, and Government securities) is invested in the stock and securities of
A-9
any one issuer, and not more than 50% of the value of those assets is invested in the stock and securities of five or fewer issuers.
4.2 The Trust’s obligation to implement this Plan on Target’s behalf shall be subject to satisfaction of the following conditions at or before (and continuing through) the Effective Time:
(a) No consideration other than Acquiring Portfolio Shares (and Acquiring Portfolio’s assumption of the Liabilities) will be issued in exchange for the Assets in the Reorganization;
(b) The Trust, with respect to Acquiring Portfolio, is not currently engaged in, and its adoption and performance hereof and consummation of the Reorganization will not result in, (1) a conflict with or material violation of any provision of Delaware law, the Governing Documents, or any Undertaking to which the Trust, with respect to Acquiring Portfolio or on its behalf, is a party or by which it is bound or (2) the acceleration of any obligation, or the imposition of any penalty, under any Undertaking, judgment, or decree to which the Trust, with respect to Acquiring Portfolio or on its behalf, is a party or by which it is bound;
(c) No litigation, administrative proceeding, action, or investigation of or before any court, governmental body, or arbitrator is presently pending or, to the Trust’s knowledge, threatened against the Trust, with respect to Acquiring Portfolio or any of its properties or assets attributable or allocable to Acquiring Portfolio, that, if adversely determined, would materially and adversely affect Acquiring Portfolio’s financial condition or the conduct of its business; and the Trust, on Acquiring Portfolio’s behalf, knows of no facts that might form the basis for the institution of any such litigation, proceeding, action, or investigation and is not a party to or subject to the provisions of any order, decree, judgment, or award of any court, governmental body, or arbitrator that materially and adversely affects Acquiring Portfolio’s business or the Trust’s ability to consummate the transactions contemplated hereby;
(d) Acquiring Portfolio’s Statements at and for the fiscal year (in the case of the Statement of Changes in Net Assets, for the two fiscal years) ended December 31, 2013, have been audited by PwC and are in accordance with GAAP; those Statements present fairly, in all material respects, Acquiring Portfolio’s financial condition at that date in accordance with GAAP and the results of its operations and changes in its net assets for the period(s) then ended; and, to the Trust’s management’s best knowledge and belief, there are no known contingent liabilities of Acquiring Portfolio required to be reflected on a balance sheet (including the notes thereto) in accordance with GAAP at that date that are not disclosed therein;
(e) Since December 31, 2013, there has not been any material adverse change in Acquiring Portfolio’s financial condition, assets, liabilities, or business, other than changes occurring in the ordinary course of business, or any incurrence by Acquiring Portfolio of indebtedness maturing more than one year from the date
A-10
that indebtedness was incurred; for purposes of this subparagraph, a decline in Acquiring Portfolio’s NAV due to declines in market values of securities Acquiring Portfolio holds, the discharge of Acquiring Portfolio’s liabilities, or the redemption of Acquiring Portfolio Shares by its shareholders will not constitute a material adverse change;
(f) All Returns of Acquiring Portfolio required by law to have been filed by the Effective Time (including any properly and timely filed extensions of time to file) will have been timely filed and are or will be correct in all material respects, and all federal and other taxes shown as due or required to be shown as due on those Returns will have been paid or provision will have been made for the payment thereof (except for amounts that alone or in the aggregate would not reasonably be expected to have a material adverse effect); to the best of the Trust’s knowledge, no such Return is currently under audit and no assessment has been asserted with respect to those Returns; and Acquiring Portfolio (1) is in compliance in all material respects with all applicable Regulations pertaining to (i) the reporting of dividends and other distributions on and redemptions of its shares, (ii) withholding in respect thereof, and (iii) shareholder basis reporting, (2) has withheld in respect of dividends and other distributions and paid to the proper taxing authorities all taxes required to be withheld, and (3) is not liable for any material penalties that could be imposed thereunder;
(g) Acquiring Portfolio is not classified as a partnership, and instead is classified as an association that is taxable as a corporation, for federal tax purposes and either has elected the latter classification by filing Form 8832 with the IRS or is a “publicly traded partnership” (as defined in section 7704(b)) that is treated as a corporation; Acquiring Portfolio is an “investment company” (as defined in section 368(a)(2)(F)(iii)) and a “fund” (as defined in section 851(g)(2), eligible for treatment under section 851(g)(1)); Acquiring Portfolio has elected to be a RIC; for each taxable year of its operation (including the taxable year that includes the Effective Time (“current year”)), Acquiring Portfolio has met (and for the current year will meet) the requirements of Subchapter M for qualification and treatment as a RIC and has been (and for the current year will be) eligible to and has computed (and for the current year will compute) its federal income tax under section 852; Acquiring Portfolio will continue to meet all those requirements for the current year and intends to continue to do so, and to continue to be eligible to and to so compute its federal income tax, for succeeding taxable years; and Acquiring Portfolio has no earnings and profits accumulated in any taxable year in which the provisions of Subchapter M did not apply to it;
(h) Acquiring Portfolio is in the same line of business as Target was in preceding the Reorganization, for purposes of section 1.368-1(d)(2) of the Regulations, and did not enter into that line of business as part of the plan of reorganization; and following the Reorganization, Acquiring Portfolio will continue, and has no plan or intention to change, that line of business;
A-11
(i) At the Effective Time, Acquiring Portfolio (1) will not have modified any of its Investment Criteria as part of the plan of reorganization and (2) will not have any plan or intention to change any of its Investment Criteria after the Reorganization;
(j) Following the Reorganization, Acquiring Portfolio will (1) continue Target’s “historic business” (within the meaning of section 1.368-1(d)(2) of the Regulations) and (2) use a significant portion of Target’s “historic business assets” (within the meaning of section 1.368-1(d)(3) of the Regulations) in a business; moreover, Acquiring Portfolio (3) has no plan or intention to sell or otherwise dispose of a significant part of the Assets, except for dispositions made in the ordinary course of that business and dispositions necessary to maintain its status as a RIC, and (4) expects to retain substantially all the Assets in the same form as it receives them in the Reorganization, unless and until subsequent investment circumstances suggest the desirability of change or it becomes necessary to make dispositions thereof to maintain that status;
(k) Acquiring Portfolio does not directly or indirectly own, nor at the Effective Time will it directly or indirectly own, nor has it directly or indirectly owned at any time during the past five years, any Target Shares;
(l) Acquiring Portfolio has no plan or intention to issue additional Acquiring Portfolio Shares following the Reorganization, except for shares issued in the ordinary course of its business as a series of an open-end investment company; nor will Acquiring Portfolio or any person Related to it have any plan or intention at the Effective Time to acquire or redeem any Acquiring Portfolio Shares issued in the Reorganization — either directly or through any transaction, agreement, or arrangement with any other person — except for redemptions Acquiring Portfolio will make as such a series pursuant to section 22(e) of the 1940 Act;
(m) Before or in the Reorganization, neither Acquiring Portfolio nor any person Related to it will have acquired, directly or through any transaction, agreement, or arrangement with any other person, Target Shares with consideration other than Acquiring Portfolio Shares;
(n) Acquiring Portfolio is not under the jurisdiction of a court in a “title 11 or similar case” (as defined in section 368(a)(3)(A));
(o) There is no plan or intention for Acquiring Portfolio to be terminated, dissolved, or merged into another statutory or business trust or a corporation or any “fund” thereof (as defined in section 851(g)(2)) following the Reorganization;
(p) Assuming satisfaction of the condition in paragraph 4.1(p), immediately after the Reorganization (1) not more than 25% of the value of Acquiring Portfolio’s total assets (excluding cash, cash items, and Government securities) will be invested in the stock and securities of any one issuer and (2) not more than 50% of the value of those assets will be invested in the stock and securities of five or fewer issuers; and
A-12
(q) All issued and outstanding Acquiring Portfolio Shares are, and at the Effective Time will be, duly and validly issued and outstanding, fully paid, and non-assessable by the Trust and have been offered and sold in every state and the District of Columbia in compliance in all material respects with applicable registration requirements of the 1933 Act and state securities laws; Acquiring Portfolio does not have outstanding any options, warrants, or other rights to subscribe for or purchase any Acquiring Portfolio Shares, nor are there outstanding any securities convertible into any Acquiring Portfolio Shares; and the Acquiring Portfolio Shares to be issued and delivered to Target, for the Shareholders’ accounts, pursuant to the terms hereof, (1) will have been duly authorized by the Trust and duly registered under the federal securities laws (and appropriate notices respecting them will have been duly filed under applicable state securities laws) at the Effective Time and (2) when so issued and delivered, will be duly and validly issued and outstanding Acquiring Portfolio Shares, fully paid and non-assessable by the Trust.
4.3 The Trust’s obligation to implement this Plan on each Portfolio’s behalf shall be subject to satisfaction of the following conditions at or before (and continuing through) the Effective Time:
(a) No governmental consents, approvals, or authorizations (collectively, “consents”) or filings are required under the 1933 Act, the Securities Exchange Act of 1934, as amended, the 1940 Act, or state securities laws, and no consents or orders of any court are required, for the Trust’s adoption and performance hereof, on either Portfolio’s behalf, except for (1) the Trust’s filing with the Commission of a registration statement on Form N-14 relating to the Acquiring Portfolio Shares issuable hereunder, and any supplement or amendment thereto, including therein a prospectus and proxy statement (“Registration Statement”), and a post-effective amendment to its registration statement on Form N-1A and (2) consents, filings, and orders that have been made or received or may be required after the Effective Time;
(b) The fair market value of the Acquiring Portfolio Shares each Shareholder receives will be approximately equal to the fair market value of its Target Shares it actually or constructively surrenders in exchange therefor;
(c) The Trust’s management (1) is unaware of any plan or intention of Shareholders to redeem, sell, or otherwise dispose of (i) any portion of their Target Shares before the Reorganization to any person Related to either Portfolio or (ii) any portion of the Acquiring Portfolio Shares they receive in the Reorganization to any person Related to Acquiring Portfolio, (2) does not anticipate dispositions of those Acquiring Portfolio Shares at the time of or soon after the Reorganization to exceed the usual rate and frequency of dispositions of shares in Target as a series of an open-end investment company, (3) expects that the percentage of shareholder interests, if any, that will be disposed of as a result, or at the time, of the Reorganization will be de minimis, and (4) does not anticipate that there will be extraordinary redemptions of Acquiring Portfolio Shares immediately following the Reorganization;
A-13
(d) Target’s shareholders will pay their own expenses (such as fees of personal investment or tax advisers for advice concerning the Reorganization), if any, incurred in connection with the Reorganization;
(e) The fair market value and “adjusted basis” (within the meaning of section 1011) of the Assets will equal or exceed the Liabilities to be assumed by Acquiring Portfolio and those to which the Assets are subject;
(f) At the Effective Time, there will be no intercompany indebtedness existing between the Portfolios that was issued, acquired, or settled at a discount;
(g) Pursuant to the Reorganization, Target will transfer to Acquiring Portfolio, and Acquiring Portfolio will acquire, at least 90% of the fair market value of the net assets, and at least 70% of the fair market value of the gross assets, Target held immediately before the Reorganization; for the purposes of the foregoing, any amounts Target uses to pay its Reorganization expenses and to make redemptions and distributions immediately before the Reorganization (except (1) redemptions pursuant to section 22(e) of the 1940 Act and (2) dividends and other distributions declared and paid to ensure Target’s continuing qualification as a RIC and to avoid the imposition of fund-level tax) will be included as assets it held immediately before the Reorganization;
(h) None of the compensation AXA Equitable or any affiliate thereof receives as a service provider to Target will be separate consideration for, or allocable to, any of the Target Shares that AXA Equitable (on any Shareholder’s behalf) holds; none of the Acquiring Portfolio Shares AXA Equitable (on any Shareholder’s behalf) receives in the Reorganization will be separate consideration for, or allocable to, any employment agreement, investment advisory agreement, or other service agreement; and the compensation paid to AXA Equitable or any affiliate thereof will be for services actually rendered and will be commensurate with amounts paid to third parties bargaining at arm’s-length for similar services;
(i) Immediately after the Reorganization, AXA Equitable (through its separate accounts) will own shares constituting “control” (within the meaning of section 368(a)(2)(H)(i), i.e., as defined in section 304(c)) of Acquiring Portfolio;
(j) No expenses incurred by Target or on its behalf in connection with the Reorganization will be paid or assumed by Acquiring Portfolio, AXA Equitable or any affiliate thereof (including FMG LLC), or any other third party unless those expenses are solely and directly related to the Reorganization (determined in accordance with the guidelines set forth in Rev. Rul. 73-54, 1973-1 C.B. 187) (“Reorganization Expenses”), and no cash or property other than Acquiring Portfolio Shares will be transferred to Target or any of its shareholders with the intention that such cash or property be used to pay any expenses (even Reorganization Expenses) thereof;
(k) There will be no dissenters to the Reorganization under the applicable provisions of Delaware law, and Acquiring Portfolio will not pay cash in lieu of fractional Acquiring Portfolio Shares in connection with the Reorganization;
A-14
(l) The Reorganization is being undertaken for bona fide business purposes (and not a purpose to avoid federal income tax);
(m) The principal purpose of Acquiring Portfolio’s assumption of the Liabilities is not avoidance of federal income tax on the transaction;
(n) The Trust shall have called and held a meeting of Target’s shareholders to consider and act on this Plan and to take all other action necessary to obtain approval of the transactions contemplated hereby; and this Plan shall have been approved at that meeting (including any adjournments thereof);
(o) All necessary filings shall have been made with the Commission and state securities authorities, and no order or directive shall have been received that any other or further action is required to permit the Trust to carry out the transactions contemplated hereby; the Registration Statement shall have become effective under the 1933 Act, no stop orders suspending the effectiveness thereof shall have been issued, and, to the Trust’s best knowledge, no investigation or proceeding for that purpose shall have been instituted or shall be pending, threatened, or contemplated under the 1933 Act or the 1940 Act; the Commission shall not have issued an unfavorable report with respect to the Reorganization under section 25(b) of the 1940 Act nor instituted any proceedings seeking to enjoin consummation of the transactions contemplated hereby under section 25(c) of the 1940 Act; and all consents, orders, and permits of federal, state, and local regulatory authorities (including the Commission and state securities authorities) the Trust deems necessary to permit consummation, in all material respects, of the transactions contemplated hereby shall have been obtained, except where failure to obtain same would not involve a risk of a material adverse effect on either Portfolio’s assets or properties;
(p) At the Effective Time, no action, suit, or other proceeding shall be pending (or, to the Trust’s best knowledge, threatened to be commenced) before any court, governmental agency, or arbitrator in which it is sought to enjoin the performance of, restrain, prohibit, affect the enforceability of, or obtain damages or other relief in connection with, the transactions contemplated hereby; and
(q) The Trust shall have received an opinion of K&L Gates LLP (“Counsel”) as to the federal income tax consequences mentioned below (“Tax Opinion”). In rendering the Tax Opinion, Counsel may assume satisfaction of all the conditions set forth in this paragraph 4, may treat them as representations and warranties the Trust made to Counsel, and may rely as to factual matters, exclusively and without independent verification, on those representations and warranties and, if Counsel requests, on representations and warranties made in a separate letter addressed to Counsel (collectively, “Representations”). The Tax Opinion shall be substantially to the effect that — based on the facts and assumptions stated therein and conditioned on the Representations’ being true and complete at the Effective Time and consummation of the Reorganization in accordance herewith (without the waiver or modification of any terms or conditions hereof and without taking into account any amendment hereof that Counsel has not approved) — for federal income tax purposes:
A-15
(1) Target’s transfer of the Assets to Acquiring Portfolio in exchange solely for Acquiring Portfolio Shares and Acquiring Portfolio’s assumption of the Liabilities, followed by Target’s distribution of those shares pro rata to the Shareholders actually or constructively in exchange for their Target Shares and in complete liquidation of Target, will qualify as a “reorganization” (as defined in section 368(a)(1)(D)), and each Portfolio will be “a party to a reorganization” (within the meaning of section 368(b));
(2) Target will recognize no gain or loss on the transfer of the Assets to Acquiring Portfolio in exchange solely for Acquiring Portfolio Shares and Acquiring Portfolio’s assumption of the Liabilities or on the subsequent distribution of those shares to the Shareholders in exchange for their Target Shares;
(3) Acquiring Portfolio will recognize no gain or loss on its receipt of the Assets in exchange solely for Acquiring Portfolio Shares and its assumption of the Liabilities;
(4) Acquiring Portfolio’s basis in each Asset will be the same as Target’s basis therein immediately before the Reorganization, and Acquiring Portfolio’s holding period for each Asset will include Target’s holding period therefor (except where Acquiring Portfolio’s investment activities have the effect of reducing or eliminating an Asset’s holding period);
(5) A Shareholder will recognize no gain or loss on the exchange of all its Target Shares solely for Acquiring Portfolio Shares pursuant to the Reorganization; and
(6) A Shareholder’s aggregate basis in the Acquiring Portfolio Shares it receives in the Reorganization will be the same as the aggregate basis in its Target Shares it actually or constructively surrenders in exchange for those Acquiring Portfolio Shares, and its holding period for those Acquiring Portfolio Shares will include, in each instance, its holding period for those Target Shares, provided the Shareholder holds the latter as capital assets at the Effective Time.
Notwithstanding subparagraphs (2) and (4), the Tax Opinion may state that no opinion is expressed as to the effect of the Reorganization on Target with respect to any Asset as to which any unrealized gain or loss is required to be recognized for federal income tax purposes at the end of a taxable year (or on the termination or transfer thereof) under a mark-to-market system of accounting.
5. EXPENSES
Subject to satisfaction of the condition contained in paragraph 4.3(j), the Reorganization Expenses described in the following sentence for all the Reorganizations (collectively, “Identified Expenses”) shall be borne by all the Targets in proportion to their respective NAVs at the Valuation Time. Identified Expenses consist of the following: (1) costs associated with obtaining any necessary order of exemption from the
A-16
1940 Act, preparing the Registration Statement, and printing and distributing each Acquiring Portfolio’s prospectus and each Target’s proxy materials, (2) legal and accounting fees in connection with the Reorganizations, and (3) expenses of holding the Shareholders Meeting (including any adjournment or postponement thereof). Notwithstanding the foregoing, (a) all expenses other than Identified Expenses shall be borne by the Portfolio that directly incurs them, and (b) expenses shall be paid by the Portfolio directly incurring them if and to the extent that the payment thereof by another person would result in that Portfolio’s disqualification as a RIC or would prevent the Reorganization in which it participates from qualifying as a tax-free reorganization.
6. TERMINATION
The Board may terminate or delay this Plan and abandon or postpone the transactions contemplated hereby, at any time before the Effective Time, if circumstances develop that, in its opinion, make proceeding with the Reorganization inadvisable for either Portfolio.
7. AMENDMENTS
The Board may amend, modify, or supplement this Plan at any time in any manner, notwithstanding Target’s shareholders’ approval hereof; provided that, following that approval, no such amendment, modification, or supplement shall have a material adverse effect on the Shareholders’ interests.
8. MISCELLANEOUS
8.1 This Plan shall be governed by and construed in accordance with the internal laws of the State of Delaware, without giving effect to principles of conflicts of laws; provided that, in the case of any conflict between those laws and the federal securities laws, the latter shall govern.
8.2 Nothing expressed or implied herein is intended or shall be construed to confer on or give any person, firm, trust, or corporation other than the Trust (on the Portfolios’ behalf) and its successors and assigns any rights or remedies under or by reason hereof.
8.3 Notice is hereby given that this instrument is adopted on behalf of the Trust’s trustees solely in their capacities as trustees, and not individually, and that the Trust’s obligations under this instrument are not binding on or enforceable against any of its trustees, officers, shareholders, or series other than the Portfolios but are only binding on and enforceable against the Trust’s property attributable to and held for the benefit of each respective Portfolio (“Portfolio’s Property”) and not its property attributable to and held for the benefit of any other series thereof. The Trust, in asserting any rights or claims hereunder on either Portfolio’s behalf, shall look only to the other Portfolio’s Property in settlement of those rights or claims and not to the property of any other series of the Trust or to those trustees, officers, or shareholders.
A-17
8.4 Any term or provision hereof that is invalid or unenforceable in any jurisdiction shall, as to that jurisdiction, be ineffective to the extent of that invalidity or unenforceability without rendering invalid or unenforceable the remaining terms and provisions hereof or affecting the validity or enforceability of any of the terms and provisions hereof in any other jurisdiction.
A-18
SCHEDULE A
Targets | Acquiring Portfolios | |
EQ/DavisNew York Venture Portfolio | EQ/InvescoComstock Portfolio | |
EQ/LordAbbett Large Cap Core Portfolio | EQ/InvescoComstock Portfolio | |
EQ/EquityGrowth PLUS Portfolio | EQ/LargeCap Growth PLUS Portfolio | |
A-19
More Information on Strategies and Risk Factors
Strategies
Changes in Investment Objectives and Principal Investment Strategies
Each Portfolio has its own investment objective(s), policies and strategies. There is no assurance that a Portfolio will achieve its investment objective. The investment objective of each Portfolio may be changed without prior notice or shareholder approval. All investment policies and strategies that are not specifically designated as fundamental also may be changed without prior notice or shareholder approval. In addition, to the extent a Portfolio is new or is undergoing a transition (such as a rebalancing or experiencing large inflows or outflows) or takes a temporary defense position, it may not be pursuing its investment objective or executing its principal investment strategies.
80% Policies
Each of Equity Growth PLUS Portfolio, Invesco Comstock Portfolio, Large Cap Growth PLUS Portfolio, and Lord Abbett Large Cap Core Portfolio has a policy that it will invest at least 80% of its net assets, plus borrowings for investment purposes, in a particular type of investment connoted by its name. Each such policy is subject to change only upon at least sixty (60) days’ prior notice to shareholders of the affected Portfolio.
Indexing Strategies (Equity Growth PLUS Portfolio and Large Cap Growth PLUS Portfolio)
One or more Index Allocated Portions of the Portfolios seeks to track the total return performance (before fees and expenses) of a particular index. The following provides additional information regarding the management strategies employed by the sub-advisers of these Index Allocated Portions in pursuing these objectives. The sub-adviser to an Index Allocated Portion does not utilize customary economic, financial or market analyses or other traditional investment techniques to manage the portion. Rather, the sub-adviser may employ a full replication technique or sampling technique in seeking to track the total return performance (before fees and expenses) of the index. A full replication technique generally involves holding each security in a particular index in approximately the same weight that the security represents in the index. Conversely, a sampling technique strives to match the characteristics of a particular index without having to purchase every stock in that index by selecting a representative sample of securities for the Index Allocated Portion based on the characteristics of the index and the particular securities included therein. Such characteristics may include, with respect to equity indexes, industry weightings, market capitalizations and fundamental characteristics and, with respect to fixed income indexes, interest rate sensitivity, credit quality and sector diversification.
B-1
Allocation Strategies (Equity Growth PLUS Portfolio and Large Cap Growth PLUS Portfolio)
The Manager generally allocates a Portfolio’s assets among multiple sub-advisers, each of which manages its portion of a Portfolio using different yet complementary investment strategies.
PLUS Portfolios
Each allocation percentage for each Portfolio is an asset allocation target established by FMG LLC to achieve the Portfolio’s investment objective and may be changed without shareholder approval. Actual allocations among the distinct portions of a Portfolio may vary from the amounts shown above by up to 15% of the Portfolio’s net assets. Each portion of a Portfolio may deviate temporarily from its asset allocation target for defensive purposes, in response to large inflows or outflows of assets to and from the Portfolio (e.g., in connection with asset allocation rebalancing transactions, reorganization transactions and separate account substitution transactions), or as a result of appreciation or depreciation of its holdings. FMG LLC rebalances each portion of the Portfolio as it deems appropriate. To the extent that a Portfolio is being rebalanced, experiences large inflows or outflows, or takes a temporary defensive position, it may not be pursuing its investment goal or executing its principal investment strategy.
Active Management Strategies
Each Adviser has complete discretion to select portfolio securities for its portion of a Portfolio’s assets, subject to the Portfolio’s investment objectives, restrictions and policies and other parameters that may be developed from time to time by the Manager. In selecting investments, the Advisers use their proprietary investment strategies, which are summarized above in the section “Investments, Risks and Performance” for each portfolio. The following is an additional general description of certain common types of active management strategies that may be used by the Advisers to the Portfolios.
Growth investing generally focuses on companies that, due to their strong earnings and revenue potential, offer above-average prospects for capital growth, with less emphasis on dividend income. Earnings predictability and confidence in earnings forecasts are an important part of the selection process. An Adviser using this approach generally seeks out companies experiencing some or all of the following: high sales growth, high unit growth, high or improving returns on assets and equity, and a strong balance sheet. Such an Adviser also prefers companies with a competitive advantage such as unique management, marketing or research and development. Value investing attempts to identify strong companies selling at a discount from their perceived true worth. An Adviser using this approach generally selects stocks at prices that, in its view, are temporarily low relative to the company’s earnings, assets, cash flow and dividends.
Value investing generally emphasizes companies that, considering their assets and earnings history, are attractively priced and may provide dividend income.
B-2
Core investing is an investment style that includes both the strategies used when seeking either growth companies (those with strong earnings growth) or value companies (those that may be temporarily out of favor or have earnings or assets not fully reflected in their stock price).
Fundamental analysis generally involves the analysis of the balance sheet and income statements of a company in order to forecast its future stock price movements. Fundamental analysis considers past records of assets, earnings, sales, products, management and markets in predicting future trends in these indicators of a company’s success or failure. By appraising a company’s prospects, analysts using such an approach assess whether a particular stock or group of stocks is undervalued or overvalued at its current market price.
Additional Strategies
The following provides additional information regarding the principal investment strategies discussed in “Comparison of Investment Objectives, Policies, and Strategies” and additional investment strategies that the Portfolios may employ. Each strategy may apply to all of the Portfolios. For further information about investment strategies, please see the Portfolios’ Statement of Additional Information (the “SAI”).
Cash Management. A Portfolio may invest its uninvested cash in high-quality, short-term debt securities, including repurchase agreements and high-quality money market instruments, and also may invest uninvested cash in money market funds, including money market funds managed by the Manager. To the extent a Portfolio invests in a money market fund, it generally is not subject to the limits placed on investments in other investment companies, as discussed in “Additional Strategies — Securities of Other Investment Companies.” Generally, these securities offer less potential for gains than other types of securities.
Currency. A Portfolio may enter into foreign currency transactions for hedging and non-hedging purposes on a spot (i.e., cash) basis or through the use of derivatives. Forward foreign currency exchange contracts (“forward contract”) are a type of derivative that may be utilized by a Portfolio. A forward contract involves an obligation to purchase or sell a specific currency at a future date, which may be any fixed number of days from the date of the contract agreed upon by the parties, at a price set at the time of the contract. These contracts are principally traded in the interbank market conducted directly between currency traders (usually large, commercial banks) and their customers. A forward contract generally has no margin deposit requirement and no commissions are charged at any stage for trades. Investments in foreign currencies are subject to the risk that those currencies will decline in value relative to the U.S. dollar.
Derivatives. A Portfolio may use “derivative” instruments to hedge its portfolio against market, economic, currency, issuer and other risks, to gain or manage exposure to the markets, sectors and securities in which the Portfolio may invest and to other economic factors that affect the Portfolio’s performance (such as interest rate movements), to increase total return or income, to reduce transaction costs, to manage
B-3
cash, and for other portfolio management purposes. Derivatives are financial instruments whose value depends upon, or is derived from, the value of something else, such as one or more underlying investments, indexes or currencies. Certain derivative securities may have the effect of creating financial leverage by multiplying a change in the value of the asset underlying the derivative to produce a greater change in the value of the derivative security. This creates an opportunity for increased return but, at the same time, creates the possibility for greater loss (including the likelihood of greater volatility in the net asset value of the shares of a Portfolio). Futures and options contracts (including futures and options on individual securities and equity and bond market indexes and options on futures contracts), swaps and forward contracts, including forward currency contracts, and structured securities, are examples of derivatives in which a Portfolio may invest. A Portfolio that engages in derivatives transactions may maintain a significant percentage of its assets in cash and cash equivalent instruments, which may serve as margin or collateral for the Portfolio’s obligations under derivative transactions.
Equity Securities. Equity securities may be bought on stock exchanges or in the over-the-counter market. Equity securities generally include common stock, preferred stock, warrants, securities convertible into common stock, securities of other investment companies and securities of real estate investment trusts.
ETFs. A Portfolio may invest in shares of ETFs that are designed to provide investment results corresponding to an index of securities. An ETF is an open-end investment company which generally invests in a broad sample of securities corresponding to a particular index. ETFs are traded on a securities exchange at prices quoted by the exchange throughout its trading day. ETFs may trade at relatively modest discounts and premiums to their net asset values. However, some ETFs have a limited operating history, and information is lacking regarding the actual performance and trading liquidity of these ETFs for extended periods or over complete market cycles. In addition, there is no assurance that the listing requirements of the various exchanges on which ETFs trade will be met to continue listing on that exchange. If substantial market or other disruptions affecting ETFs occur in the future, the liquidity and value of the assets of the Portfolio, and thus the value of the Portfolio’s shares, also could be substantially and adversely affected if a shareholder sells his or her shares in the Portfolio.
Fixed Income Securities. A Portfolio may invest in short- and long-term fixed income securities in pursuing its investment objective and for other portfolio management purposes, such as to manage cash. Fixed income securities are debt securities such as bonds, notes, debentures and commercial paper. Domestic and foreign governments, banks and companies raise cash by issuing or selling debt securities to investors. Most debt securities pay fixed or adjustable rates of interest at regular intervals until they mature, at which point investors receive their principal back.
Foreign Securities. Certain Portfolios may invest in foreign securities, including securities of companies in emerging markets. Generally, foreign securities are issued by companies organized outside the U.S. or by foreign governments or international
B-4
organizations, are traded primarily in markets outside the U.S., and are denominated in a foreign currency. Foreign securities may include securities of issuers in developing countries or emerging markets, which generally involve greater risk because the economic structures of these countries and markets are less developed and their political systems are less stable. In addition, foreign securities may include depositary receipts of foreign companies. American Depositary Receipts are receipts typically issued by an American bank or trust company that evidence underlying securities issued by a foreign corporation. European Depositary Receipts (issued in Europe) and Global Depositary Receipts (issued throughout the world) each evidence a similar ownership arrangement. Depositary receipts also may be convertible into securities of foreign issuers. These securities may not necessarily be denominated in the same currency as the securities into which they may be converted.
Futures. A Portfolio may purchase or sell futures contracts on individual securities or securities indexes. In purchasing a futures contract, the buyer agrees to purchase a specified underlying instrument at a specified future date. In selling a futures contract, the seller agrees to sell a specified underlying instrument at a specified future date. The price at which the purchase and sale will take place is fixed when the buyer and seller enter into the contract. Futures can be held until their delivery dates, or can be closed out before then if a liquid market is available. The value of a futures contract tends to increase and decrease in tandem with the value of its underlying instrument. Therefore, purchasing futures contracts will tend to increase a fund’s exposure to positive and negative price fluctuations in the underlying instrument, much as if it had purchased the underlying instrument directly. When a fund sells a futures contract, by contrast, the value of its futures position will tend to move in a direction contrary to the market. Selling futures contracts, therefore, will tend to offset both positive and negative market price changes, much as if the underlying instrument had been sold. Futures contracts in which the Portfolio will invest are highly standardized contracts that typically trade on futures exchanges.
There is no assurance that a liquid market will exist for any particular futures contract at any particular time. Exchanges may establish daily price fluctuation limits for futures contracts, and may halt trading if a contract’s price moves upward or downward more than the limit in a given day. On volatile trading days when the price fluctuation limit is reached or a trading halt is imposed, it may be impossible to enter into new positions or close out existing positions. If the market for a contract is not liquid because of price fluctuation limits or other market conditions, it could prevent prompt liquidation of unfavorable positions, and potentially could require a fund to continue to hold a position until delivery or expiration regardless of changes in its value. As a result, a fund’s access to other assets held to cover its futures positions could also be impaired.
The use of futures contracts and similar instruments may be deemed to involve the use of leverage because the Portfolio is not required to invest the full market value of the futures contract upon entering into the contract. Instead, the Portfolio, upon entering into a futures contract (and to maintain its open position in a futures contract), is
B-5
required to post collateral for the contract, known as “initial margin” and “variation margin,” the amount of which may vary but which generally equals a relatively small percentage (e.g., less than 5%) of the value of the contract being traded. While the use of futures contracts may involve the use of leverage, the Portfolio generally does not intend to use leverage to increase its net exposure to debt securities above approximately 100% of the Portfolio’s net asset value or below 0%.
Illiquid Securities. A Portfolio may invest up to 15% of its net assets in illiquid securities. Illiquid securities are securities that have no ready market.
Initial Public Offerings (“IPOs”). Each of the Portfolios may participate in the IPO market and a significant portion of the Portfolios’ returns may be attributable to their investment in IPOs, which have a magnified impact on Portfolios with small asset bases. An IPO is generally the first sale of stock by a company to the public. Companies offering an IPO are sometimes new, young companies or sometimes companies which have been around for many years but are deciding to go public. Prior to an IPO, there is generally no public market for an issuer’s common stock and there can be no assurance that an active trading market will develop or be sustained following the IPO. Therefore, the market price for the securities may be subject to significant fluctuations and a Portfolio may be affected by such fluctuations.
Investment Grade Securities. A Portfolio may invest in investment grade debt securities. Investment grade securities are rated in one of the four highest rating categories by Moody’s or S&P, comparably rated by another rating agency or, if unrated, determined by the applicable Adviser to be of comparable quality. Securities with lower investment grade ratings, while normally exhibiting adequate protection parameters, have speculative characteristics. This means that changes in economic conditions or other circumstances are more likely to lead to a weakened capacity to make principal and interest payments than is the case for higher rated debt securities.
Large-Cap Companies. A Portfolio may invest in the securities of large-cap companies. These companies are typically larger, more established companies that are well-known in the market. They are a generally less vulnerable than mid- and small-cap companies to adverse business or economic developments; however, unlike mid-and small-cap companies, they may be unable to respond quickly to new competitive challenges such as changes in technology and consumer tastes.
Mid-Cap and Small-Cap Companies. A Portfolio may invest in the securities of mid-, small- companies. A Portfolio may also invest in and micro-cap companies. Mid- and small-cap companies are more likely than larger companies to have limited product lines, markets or financial resources or to depend on a small, inexperienced management group. Generally, they are more vulnerable than larger companies to adverse business or economic developments and their securities may be less well-known, trade less frequently and in more limited volume than the securities of larger more established companies.
B-6
Portfolio Turnover. The Portfolios do not restrict the frequency of trading to limit expenses. The Portfolios may engage in active and frequent trading of portfolio securities to achieve their investment objectives. Frequent trading can result in a portfolio turnover in excess of 100% (high portfolio turnover).
Real Estate Investment Trusts (“REITs”). Certain Portfolios may invest in REITs, which are pooled vehicles that invest primarily in income-producing real estate or loans related to real estate. REITs also may include, among other businesses, real estate developers, brokers and operating companies whose products and services are significantly related to the real estate industry such as building suppliers and mortgage lenders.
Securities of Other Investment Companies. A Portfolio may invest in the securities of other investment companies, including ETFs, to the extent permitted by applicable law. Generally, a Portfolio’s investments in other investment companies are subject to statutory limitations in the 1940 Act, including in certain circumstances a prohibition against acquiring shares of another investment company if, immediately after such acquisition, the Portfolio and its affiliated persons (i) would hold more than 3% of such other investment company’s total outstanding voting shares, (ii) would have invested more than 5% of its total assets in such other investment company, or (iii) would have invested more than 10% of its total assets in investment companies. However, there are statutory and regulatory exemptions from these restrictions under the 1940 Act on which the Portfolios may rely to invest in other investment companies in excess of these limits, subject to certain conditions. In addition, many ETFs have obtained exemptive relief from the SEC to permit unaffiliated funds (such as the Portfolios) to invest in their shares beyond the statutory limits, subject to certain conditions and pursuant to contractual arrangements between the ETFs and the investing funds. A Portfolio may rely on these exemptive orders in investing in ETFs. A Portfolio that invests in other investment companies indirectly bears the fees and expenses of that investment company.
Short Sales or Short Positions. A Portfolio may engage in short sales and may enter into derivative contracts that have a similar economic effect (e.g., taking a short position in a futures contract). A “short sale” is the sale by a portfolio of a security that has been borrowed from a third party on the expectation that the market price will drop. If the price of the security drops, the Portfolio will make a profit by purchasing the security in the open market at a lower price than at which it sold the security. If the price of the security rises, the Portfolio may have to cover short positions at a higher price than the short sale price, resulting in a loss. In addition, because a Portfolio’s potential loss on a short sale arises from increases in the value of the security sold short, the extent of such loss, like the price of the security sold short, is theoretically unlimited.
Temporary Defensive Investments. For temporary defensive purposes in response to adverse market, economic, political or other conditions, each Portfolio may invest, without limit, in cash, money market instruments or high quality short-term debt securities, including repurchase agreements. To the extent a Portfolio is invested
B-7
in these instruments, the Portfolio will not be pursuing its investment goal. In addition, each PLUS Portfolio may vary from its asset allocation targets and target investment percentages for defensive purposes.
U.S. Government Securities. A Portfolio may invest in U.S. government securities, which include direct obligations of the U.S. Treasury (such as Treasury bills, notes or bonds) and obligations issued or guaranteed as to principal and interest (but not as to market value) by the U.S. government, its agencies or its instrumentalities. U.S. government securities include mortgage-backed securities issued or guaranteed by government agencies or government-sponsored enterprises. Other U.S. government securities may be backed by the full faith and credit of the U.S. government or supported primarily or solely by the creditworthiness of the government-related issuer or, in the case of mortgage-backed securities, by pools of assets.
In August 2011, S&P downgraded its long-term sovereign credit rating on the U.S. from “AAA” to “AA+”. The downgrade by S&P could lead to subsequent downgrades by S&P or downgrades by other credit rating agencies. Both Fitch and Moody’s, which currently have assigned their highest credit ratings to the U.S., have a negative outlook for those credit ratings. These developments, and the government’s credit concerns in general, could cause an increase in interest rates and borrowing costs, which may negatively impact both the perception of credit risk associated with the debt securities issued by the U.S. and the country’s ability to access the debt markets on favorable terms. In addition, these developments could create broader financial turmoil and uncertainty, which could increase volatility in both stock and bond markets. These events could result in significant adverse impacts on issuers of securities held by a Portfolio.
Risks
Risk is the chance that you will lose money on your investment or that it will not earn as much as you expect. In general, the greater the risk, the more money your investment can earn for you and the more you can lose. Like other investment companies, the value of each Portfolio’s shares may be affected by the Portfolio’s investment objective(s), principal investment strategies and particular risk factors. Consequently, each Portfolio may be subject to different risks. Some of the risks, including principal risks, of investing in the Portfolios are discussed below. However, other factors may also affect each Portfolio’s investment results. There is no guarantee that a Portfolio will achieve its investment objective(s) or that it will not lose value.
General Investment Risks: Each Portfolio is subject to the following risks:
Adviser Selection Risk: The risk that the Manager’s process for selecting or replacing an Adviser and its decision to select or replace an Adviser does not produce the intended results.
Asset Class Risk: There is the risk that the returns from the types of securities in which a portfolio invests will underperform the general securities markets or different
B-8
asset classes. Different types of securities and asset classes tend to go through cycles of outperformance and underperformance in comparison to the general securities markets.
Initial Public Offering (“IPO”) Risk: Securities issued in IPOs have no trading history, and information about the companies may be available for very limited periods. In addition, the prices of securities sold in IPOs may be highly volatile. At any particular time or from time to time, a Portfolio may not be able to invest in securities issued in IPOs, or invest to the extent desired, because, for example, only a small portion (if any) of the securities being offered in an IPO may be made available to the Portfolio. In addition, under certain market conditions, a relatively small number of companies may issue securities in IPOs. Similarly, as the number of Portfolios to which IPO securities are allocated increases, the number of securities issued to any one Portfolio may decrease. To the extent a Portfolio invests in IPOs, a significant portion of its returns may be attributable to its investments in IPOs, which have a magnified impact on Portfolios with small asset bases. There is no guarantee that as a Portfolio’s assets grow it will continue to experience substantially similar performance by investing in IPOs.
Issuer-Specific Risk: The value of an individual security or particular type of security can be more volatile than the market as a whole and can perform differently from the market as a whole. Certain unanticipated events, such as natural disasters, can have a dramatic adverse effect on the value of an issuer’s securities.
Large Shareholder Risk: A significant percentage of a Portfolio’s shares may be owned or controlled by the Manager and its affiliates, other Portfolios that are advised by the Manager (including funds of funds), or other large shareholders, including primarily insurance company separate accounts and qualified plans. Accordingly, a Portfolio is subject to the potential for large scale inflows and outflows as a result of purchases and redemptions of its shares by such shareholders, including in connection with substitution an other transactions by affiliates of the Manager. These inflows and outflows may be frequent and could negatively affect a Portfolio’s net asset value and performance and could cause a Portfolio to purchase or sell securities at a time when it would not normally do so. It would be particularly disadvantageous for a Portfolio if it experiences outflows and needs to sell securities at a time of volatility in the markets, when values could be falling. These inflows and outflows also could negatively affect a Portfolio’s ability to meet shareholder redemption requests or could limit a Portfolio’s ability to pay redemption proceeds within the time period stated in its prospectus because of unusual market conditions, an unusually high volume of redemption requests, or other reasons. In addition, these inflows and outflows could increase a Portfolio’s brokerage or other transaction costs, and large-scale outflows could cause a Portfolio’s actual expenses to increase, or could result in a Portfolio’s current expenses being allocated over a smaller asset base, leading to an increase in the Portfolio’s expense ratio.
B-9
Market Risk: The risk that the securities markets will move down, sometimes rapidly and unpredictably based on overall economic conditions and other factors. Changes in the financial condition of a single issuer can impact a market as a whole. In addition, markets and market-participants are increasingly reliant upon both publicly available and proprietary information data systems. Data imprecision, software or other technology malfunctions, programming inaccuracies, unauthorized use or access, and similar circumstances may impair the performance of these systems and may have an adverse impact upon a single issuer, a group of issuers, or the market at-large. In certain cases, an exchange or market may close or issue trading halts on either specific securities or even the entire market, which may result in a Portfolio being, among other things, unable to buy or sell certain securities or financial instruments or accurately price its investments.
Multiple Adviser Risk: A Portfolio may have multiple Advisers, each of which is responsible for investing a specific allocated portion of the Portfolio’s assets. Because each Adviser manages its allocated portion of the Portfolio independently from another Adviser, the same security may be held in different portions of the Portfolio, or may be acquired for one portion of the Portfolio at a time when an Adviser to another portion deems it appropriate to dispose of the security from that other portion. Similarly, under some market conditions, one Adviser may believe that temporary, defensive investments in short-term instruments or cash are appropriate when another Adviser believes continued exposure to the equity or debt markets is appropriate for its allocated portion of the Portfolio. Because each Adviser directs the trading for its own portion of the Portfolio, and does not aggregate its transactions with those of the other Adviser, the Portfolio may incur higher brokerage costs than would be the case if a single Adviser were managing the entire Portfolio. In addition, while the Manager seeks to allocate a Portfolio’s assets among the Portfolio’s Advisers in a manner that it believes is consistent with achieving the Portfolio’s investment objective, the Manager may be subject to potential conflicts of interest in allocating the Portfolio’s assets among Advisers because the Manager pays different fees to the Advisers and due to other factors that could impact the Manager’s revenues and profits.
Portfolio Management Risk: The risk that strategies used by the Manager or the Advisers and their securities selections fail to produce the intended results. In addition, the Portfolios are available through Contracts offered by insurance company affiliates of the Manager, and the Portfolios may be used to fund all or a portion of certain benefits available under the Contracts. To the extent the assets in a Portfolio are insufficient to fund those benefits, the Manager’s insurance company affiliates might otherwise be obligated to fulfill them out of their own resources. The Manager may be subject to potential conflicts of interest in connection with providing advice to, or developing strategies and models used to manage, a Portfolio (e.g., with respect to the allocation of assets among Underlying Portfolios or between passively and actively managed portions of a Portfolio and the development and implementation of the models used to manage a Portfolio). The performance of Portfolios managed or designed by the Manager may impact the obligations and financial exposure of its insurance company affiliates under any death benefit, income benefit and other
B-10
guarantees provided through Contracts that offer the Portfolio as an investment option and the ability of an insurance company affiliate to manage (e.g., through the use of various hedging techniques) the risks associated with these guarantees. The Manager’s investment decisions and the design of the Portfolios may be influenced by these factors. For example, the Portfolios or the models and strategies may be managed or designed in a manner (e.g., using more conservative or less volatile investment styles) that could reduce potential losses and/or mitigate financial risks to insurance companies affiliates that provide the guarantees and offer the Portfolios as investment options in their products, and also could facilitate such an insurance company’s ability to provide guarantees under its Contracts, including by making more predictable the costs of the guarantees and by reducing the regulatory capital needed to provide them. Consistent with its fiduciary duties, the Manager seeks to implement each Portfolio’s investment program in a manner that is in the best interests of the Portfolio and that is consistent with the Portfolio’s investment objective, policies and strategies described in detail in this Proxy Statement/Prospectus.
Recent Market Conditions Risk: The financial crisis in the U.S. and many foreign economies over the past several years, including the European sovereign debt and banking crises, has resulted, and may continue to result, in an unusually high degree of volatility in the financial markets, both domestic and foreign, and in the net asset values of many mutual funds, including the Portfolios. Both domestic and international equity and fixed income markets have been experiencing heightened volatility and turmoil, and issuers that have exposure to the real estate, mortgage, and credit markets and the sovereign debt of certain nations or their political subdivisions have been particularly affected. During times of market turmoil, investors tend to look to the safety of securities issued or backed by the U.S. Treasury, causing the prices of these securities to rise and the yields to decline. These market conditions have resulted in fixed income instruments experiencing unusual liquidity issues, increased price volatility, and, in some cases, credit downgrades and increased likelihood of default. The reduced liquidity in fixed income and credit markets may negatively affect many issuers worldwide.
In addition, global economies and financial markets are becoming increasingly interconnected, which increases the possibilities that conditions in one country or region might adversely impact issuers in a different country or region. Because the situation is widespread and largely unprecedented, it may be unusually difficult to identify both risks and opportunities using past models of the interplay of market forces, or to predict the duration of these market conditions. The severity or duration of these conditions also may be affected by policy changes made by governments or quasi-governmental organizations. These conditions could negatively impact the value and liquidity of a Portfolio’s investments and cause it to lose money.
The situation in the financial markets has resulted in calls for increased regulation. In particular, the Dodd-Frank Wall Street Reform and Consumer Protection Act (“Dodd-Frank Act”) has initiated a revision of the U.S. financial regulatory framework and covers a broad range of topics, including (among many others) a reorganization of
B-11
federal financial regulators; new rules for derivatives trading; and the registration and additional regulation of hedge and private equity fund managers. The regulators that have been charged with the responsibility for implementing the Dodd- Frank Act (e.g., the Securities and Exchange Commission (“SEC”) and the CFTC) have been active in proposing and adopting regulations and guidelines on the use of derivatives by market participants, including mutual funds. In 2012, the CFTC adopted a revision to one of its rules that either restricts the use of derivatives by mutual funds or requires a mutual fund’s adviser to register as a commodity pool operator. The SEC is reviewing its current guidelines on the use of derivatives by mutual funds and may issue new guidelines. It is not clear whether or when such new guidelines will be published or what the content of such guidelines may be. Instruments in which a Portfolio may invest, or the issuers of such instruments, may be negatively affected by the new legislation and regulation in ways that are unforeseeable. Although a portion of the implementing regulations have been finalized, the ultimate impact of the Dodd-Frank Act is not yet certain.
The U.S. federal government and certain foreign central banks have taken actions to support financial markets and increase confidence in the U.S. and world economies. Certain of these entities have injected liquidity into the markets and taken other steps in an effort to stabilize the markets and grow the economy. Others have opted for austerity, which may limit growth, at least in the short to medium term. The ultimate effect of these efforts is only beginning to reveal itself. Where economic conditions are recovering, they are nevertheless perceived as still fragile. Changes in government policies may exacerbate the markets’ difficulties and withdrawal of this support, or other policy changes by governments or central banks, could adversely impact the value and liquidity of certain securities. In addition, political events within the U.S. and abroad, such as the U.S. government’s recent inability to agree on a long-term budget and deficit reduction plan, the federal government shutdown and threats to not increase the federal government’s debt limit, may affect investor and consumer confidence and may adversely impact financial markets and the broader economy, perhaps suddenly and to a significant degree.
As indicated in “Comparison of Principal Risk Factors,” a Portfolio may be subject to the following as principal risks. In addition, to the extent a Portfolio invests in a particular type of investment, it will be subject to the risks of such investment as described below:
Cash Management Risk. Upon entering into certain derivatives contracts, such as futures contracts, and to maintain open positions in certain derivatives contracts, the Portfolio may be required to post collateral for the contract, the amount of which may vary. As such, the Portfolio may maintain cash balances, including foreign currency balances, which may be significant, with counterparties such as the Trust’s custodian or its affiliates. The Portfolio is thus subject to counterparty risk and credit risk with respect to these arrangements.
Credit Risk. The risk that the issuer or the guarantor of a fixed income security, or the counterparty to a derivatives contract, repurchase agreement, loan of portfolio securities or other transaction, is unable or unwilling, or is perceived (whether by
B-12
market participants, ratings agencies, pricing services or otherwise) as unable or unwilling, to make timely principal and/or interest payments, or otherwise honor its obligations. Securities are subject to varying degrees of credit risk, which may be reflected in their credit ratings. Securities rated below investment grade (e.g., “junk bonds”) may include a substantial risk of default. U.S. government securities held by a portfolio are supported by varying degrees of credit, and their value may fluctuate in response to political, market or economic developments. U.S. government securities, especially those that are not backed by the full faith and credit of the U.S. Treasury, such as securities supported only by the credit of the issuing governmental agency or government sponsored enterprise, carry at least some risk of nonpayment, and the maximum potential liability of the issuers of such securities may greatly exceed their current resources. There is no assurance that the U.S. government would provide financial support to the issuing entity if not obligated to do so by law. Further, any government guarantees on U.S. government securities that a portfolio owns do not extend to shares of the Portfolio themselves.
Custom Benchmark Risk. Certain of the Portfolios’ benchmarks were created by the Manager to show how the Portfolio’s performance compares with the returns of a volatility managed index. There is no guarantee that the Portfolio will outperform these or any benchmarks.
Derivatives Risk. A derivative instrument is an investment contract the value of which is linked (or is derived from) in whole or in part, the value of an underlying asset, reference rate or index (e.g., stocks, bonds, commodities, currencies, interest rates and market indexes). Derivatives include options, swaps, futures, options on futures, forward contracts and structured securities. Investing in derivatives involves investment techniques and risks different from those associated with ordinary mutual fund securities transactions and may involve increased transaction costs. The successful use of derivatives will usually depend on the Manager’s or an Adviser’s ability to accurately forecast movements in the market relating to the underlying reference asset, rate or index. If the Manager or an Adviser does not predict correctly the direction of securities prices, interest rates and other economic factors, a portfolio’s derivatives position could lose value. A portfolio’s investment in derivatives may rise or fall more rapidly than other investments and may reduce the Portfolio’s returns. Changes in the value of the derivative may not correlate perfectly with the underlying asset, rate or index, and a portfolio could lose more than the principal amount invested. Derivatives are also subject to a number of risks such as leverage risk, liquidity risk, market risk, interest rate risk, counterparty risk, credit risk and also involve the risk of mispricing or improper valuation. Derivatives also may not behave as anticipated by a Portfolio, especially in abnormal market conditions. The use of derivatives may increase the volatility of a portfolio’s net asset value. Derivatives may be leveraged such that a small investment in derivative securities can have a significant impact on a portfolio’s exposure to stock market values, interest rates, currency exchange rates or other investments. As a result, a relatively small price movement in a derivatives contract may cause an immediate and substantial loss or gain. It may be difficult or impossible for a Portfolio to purchase or sell certain derivatives in sufficient amounts to achieve the desired level of exposure,
B-13
which may result in a loss or may be costly to the Portfolio. In addition, the possible lack of a liquid secondary market for certain derivatives and the resulting inability of a Portfolio to sell or otherwise close a derivatives position could expose a portfolio to losses and could make such derivatives more difficult for the Portfolio to value accurately. Some derivatives are more sensitive to market price fluctuations and to interest rate changes than other investments. A Portfolio also could suffer losses related to its derivatives positions as a result of undervalued market movements, which losses are potentially unlimited. A Portfolio also may be exposed to losses if the counterparty in the transaction does not fulfill its contractual obligation. In addition, certain over-the-counter derivatives do not have liquidity beyond the counterparty to the transaction, and because they may not be traded on exchanges, they may not offer the protections provided by exchanges in the event that the counterparty is unable to fulfill its contractual obligation. Such over-the-counter derivatives therefore involve greater counterparty and credit risk and may be more difficult to value than exchange-traded derivatives. When a derivative is used as a hedge against a position that a portfolio holds, any loss generated by the derivative generally should be substantially offset by gains on the hedged instrument, and vice versa. While hedging can reduce or eliminate losses, it also can reduce or eliminate gains. Hedges are sometimes subject to imperfect matching between the derivative and the hedged investment, and there can be no assurance that a Portfolio’s hedging transactions will be effective.
There have been numerous recent legislative and regulatory initiatives to implement a new regulatory framework for the derivatives markets. New rules may limit the availability of certain, may make the use of derivatives by portfolios more costly, and may otherwise adversely impact the performance and value of derivatives.
Equity Risk. In general, stocks and other equity security values fluctuate and sometimes widely fluctuate, in response to changes in a company’s financial condition as well as general market, economic and political conditions and other factors.
ETF Risk. A Portfolio that invests in ETFs will indirectly bear fees and expenses charged by those ETFs, in addition to the Portfolio’s direct fees and expenses. The cost of investing in the Portfolio, therefore, may be higher than the cost of investing in a mutual fund that invests directly in individual stocks and bonds. In addition, the Portfolio’s net asset value will be subject to fluctuations in the market values of the ETFs in which it invests. The Portfolio is also subject to the risks associated with the securities in which the ETFs invest and the ability of the Portfolio to meet its investment objective will directly depend on the ability of the ETFs to meet their investment objectives. The Portfolio and the ETFs are subject to certain general investment risks, including market risk, asset class risk, issuer-specific risk, investment style risk and portfolio management risk. In addition, to the extent a Portfolio invests in ETFs that invest in equity securities, fixed income securities and/or foreign securities, the Portfolio is subject to the risks associated with investing in such securities such as equity risk, market capitalization risk, investment grade securities risk, interest rate risk, credit/default risk, foreign and emerging markets securities risk and lower-rated securities risk. ETFs may change their investment objectives or policies
B-14
without the approval of the Portfolio. If that were to occur, the Portfolio might be forced to sell its investment in an ETF at a time and price that is unfavorable to the Portfolio. In addition, many ETFs invest in securities included in, or representative of, underlying indexes regardless of investment merit or market trends and, therefore, these ETFs do not change their investment strategies to respond to changes in the economy, which means that an ETF may be particularly susceptible to a general decline in the market segment relating to the relevant index. Imperfect correlation between an ETF’s securities and those in the index it seeks to track, rounding of prices, changes to the indices and regulatory policies may cause an ETF’s performance to not match the performance of its index. An ETF’s use of a representative sampling approach will result in it holding a smaller number of securities than are in the index it seeks to track. As a result, an adverse development respecting an issuer of securities held by the ETF could result in a greater decline in net asset value than would be the case if the ETF held all of the securities in the index. To the extent the assets in the ETF are smaller, these risks will be greater. No ETF fully replicates its index and an ETF may hold securities not included in its index. Therefore, there is a risk that the investment strategy of the ETF manager may not produce the intended results. Moreover, there is the risk that an ETF may value certain securities at a higher price than it can sell them for. Secondary market trading in shares of ETFs may be halted by a national securities exchange because of market conditions or for other reasons. In addition, trading in these shares is subject to trading halts caused by extraordinary market volatility pursuant to “circuit breaker” rules. There can be no assurance that the requirements necessary to maintain the listing of the shares will continue to be met or will remain unchanged. In addition, although ETFs are listed for trading on national securities exchanges, certain foreign exchanges and in over-the- counter markets, there can be no assurance that an active trading market for such shares will develop or be maintained, in which case the liquidity and value of a Portfolio’s investment in the ETFs could be substantially and adversely affected. In addition, because ETFs are traded on these exchanges and in these markets, the purchase and sale of their shares involve transaction fees and commissions. The market price of an ETF may be different from the net asset value of such ETF (i.e., an ETF may trade at a discount or premium to its net asset value). The performance of a Portfolio that invests in such an ETF could be adversely impacted.
Financial Services Sector Risk. To the extent a Portfolio invests in the financial services sector, the value of the Portfolio’s shares may be particularly vulnerable to factors affecting that sector, such as the availability and cost of capital funds, changes in interest rates, the rate of corporate and consumer debt defaults, extensive government regulation and price competition. The value of a Portfolio’s shares could experience significantly greater volatility than Portfolios investing more broadly.
Foreign Securities Risk. Investments in foreign securities, including depositary receipts, involve risks not associated with investing in U.S. securities. Foreign markets, particularly emerging markets, may be less liquid, more volatile and subject to less government supervision than domestic markets. Security values also may be
B-15
negatively affected by changes in the exchange rates between the U.S. dollar and foreign currencies. Differences between U.S. and foreign legal, political and economic systems, regulatory regimes and market practices also may impact security values and it may take more time to clear and settle trades involving foreign securities.
Currency Risk: Investments in foreign currencies and in securities that trade in, or receive revenues in, foreign currencies are subject to the risk that those currencies will decline in value relative to the U.S. dollar. Any such decline may erode or reverse any potential gains from an investment in securities denominated in foreign currency or may widen existing loss. Currency rates may fluctuate significantly over short periods of time for a number of reasons, including changes in interest rates, intervention by governments, central banks or supranational entities, or by the imposition of currency controls or other political developments in the U.S. or abroad.
Depositary Receipts Risk: Investments in depositary receipts (including American Depositary Receipts, European Depositary Receipts and Global Depositary Receipts) are generally subject to the same risks of investing in the foreign securities that they evidence or into which they may be converted. In addition, issuers underlying unsponsored depositary receipts may not provide as much information as U.S. issuers and issuers underlying sponsored depositary receipts. Unsponsored depositary receipts also may not carry the same voting privileges as sponsored depositary receipts.
Emerging Markets Risk: Emerging market countries generally are located in Asia, the Middle East, Eastern Europe, Central and South America and Africa. There are greater risks involved in investing in emerging market countries and/or their securities markets. Investments in these countries and/or markets may present market, credit, currency, liquidity, legal, political, technical and other risks different from, or greater than, the risks of investing in developed countries. For instance, these countries may be more likely than developed countries to experience rapid and significant developments in their political or economic structures. Some emerging market countries restrict foreign investments, impose withholding or other taxes on foreign investments, or may nationalize or expropriate the assets of private countries. Therefore, a Portfolio may be limited in its ability to make direct or additional investments in an emerging markets country. Such restrictions also may have negative impacts on transaction costs, market price, investment returns and the legal rights and remedies of a Portfolio. In addition, the securities markets of emerging markets countries generally are smaller, less liquid and more volatile than those of developed countries. Emerging market countries often have less uniformity in accounting and reporting requirements and less reliable settlement, registration and custodial procedures. Emerging market countries also may be subject to high inflation and rapid currency devaluations and may be heavily dependent on international trade, which can materially affect their securities markets. The risks associated with investing in a narrowly defined geographic area also generally are more pronounced with respect to investments in emerging market countries.
B-16
European Economic Risk: The European Union’s (the “EU”) Economic and Monetary Union (the “EMU”) requires Euro zone countries to comply with restrictions on interest rates, deficits, debt levels, and inflation rates, and other factors, each of which may significantly impact every European country and their economic partners. The economies of EU member countries and their trading partners may be adversely affected by changes in the euro’s exchange rate, changes in EU or governmental regulations on trade and other areas, and the threat of default or default by an EU member country on its sovereign debt, which could negatively impact a Portfolio’s investments and cause it to lose money. Recently, the European financial markets have been negatively impacted by rising government debt levels; possible default on or restructuring of sovereign debt in several European countries, including Cyprus, Greece, Ireland, Italy, Portugal and Spain; and economic downturns. European country’s default or debt restructuring would adversely affect the holders of the country’s debt and sellers of credit default swaps linked to the country’s creditworthiness and could negatively impact global markets more generally. Recent events in Europe have affected the euro’s exchange rate and value and may continue to impact the economies of every European country and their economic partners.
Geographic Risk: A Portfolio that may invest a significant portion of its assets in securities of companies domiciled, or exercising the predominant part of their economic activity, in one country or geographic region assumes the risk that economic, political, social and environmental conditions in that particular country or region will have a significant impact on the Portfolio’s investment performance and that the Portfolio’s performance will be more volatile than the performance of more geographically diversified funds. The economies and financial markets of certain regions can be highly interdependent and may decline all at the same time. In addition, certain areas are prone to natural disasters such as earthquakes, volcanoes, droughts or tsunamis and are economically sensitive to environmental events.
International Fair Value Pricing Risk: A Portfolio that invests in foreign securities is subject to the risk that its share price may be exposed to arbitrage attempts by investors seeking to capitalize on differences in the values of foreign securities trading on foreign exchanges that may close before the time the Portfolio’s net asset value is determined. If such arbitrage attempts are successful, the Portfolio’s net asset value might be diluted. A Portfolio’s use of fair value pricing in certain circumstances (by adjusting the closing market prices of foreign securities to reflect what the Boards of Trustees believe to be their fair value) may help deter such arbitrage activities. The effect of such fair value pricing is that foreign securities may not be priced on the basis of quotations from the primary foreign securities market in which they are traded, but rather may be priced by another method that the Boards believe reflects fair value. As such, fair value pricing is based on subjective judgment and it is possible that fair value may differ materially from the value realized on a sale of a foreign security. It is also possible that use of fair value pricing will limit an investment adviser’s ability to
B-17
implement a Portfolio’s investment strategy (e.g., reducing the volatility of the Portfolio’s share price) or achieve its investment objective.
Political/Economic Risk: Changes in economic and tax policies, government instability, war or other political or economic actions or factors may have an adverse effect on a Portfolio’s foreign investments.
Regulatory Risk: Less information may be available about foreign companies. In general, foreign companies are not subject to uniform accounting, auditing and financial reporting standards or to other regulatory practices and requirements as are U.S. companies.
Settlement Risk: Settlement and clearance procedures in certain foreign markets differ significantly from those in the United States. Foreign settlement and clearance procedures and trade regulations also may involve certain risks (such as delays in payment for or delivery of securities) not typically associated with the settlement of U.S. investments. At times, settlements in certain foreign countries have not kept pace with the number of securities transactions. These problems may make it difficult for a Portfolio to carry out transactions. If a Portfolio cannot settle or is delayed in settling a purchase of securities, it may miss attractive investment opportunities and certain of its assets may be uninvested with no return earned thereon for some period. If a Portfolio cannot settle or is delayed in settling a sale of securities, it may lose money if the value of the security then declines or, if it has contracted to sell the security to another party, the Portfolio could be liable for any losses incurred.
Transaction Costs Risk: The costs of buying and selling foreign securities, including tax, brokerage and custody costs, generally are higher than those involving domestic transactions.
Futures Contract Risk. The primary risks associated with the use of futures contracts are (a) the imperfect correlation between the change in market value of the instruments held by a Portfolio and the price of the futures contract; (b) liquidity risks, including the possible absence of a liquid secondary market for a futures contract and the resulting inability to close a futures contract when desired; (c) losses (potentially unlimited) caused by unanticipated market movements; (d) an adviser’s inability to predict correctly the direction of securities prices, interest rates, currency exchange rates and other economic factors; (e) the possibility that a counterparty will default in the performance of its obligations; (f) if a Portfolio has insufficient cash, it may have to sell securities from its portfolio to meet daily variation margin requirements, and the Portfolio may have to sell securities at a time when it may be disadvantageous to do so; and (g) transaction costs associated with investments in futures contracts may be significant, which could cause or increase losses or reduce gains.
Headline Risk. A Portfolio seeks to acquire companies with durable business models that can be purchased at attractive valuations relative to what the Portfolio’s Adviser believes to be the companies’ intrinsic values. Advisers may make such investments when a company becomes the center of controversy after receiving adverse media attention. The company may be involved in litigation, the company’s financial
B-18
reports or corporate governance may be challenged, the company’s public filings may disclose a weakness in internal controls, greater government regulation may be contemplated, or other adverse events may threaten the company’s future. While Advisers research companies subject to such contingencies, an Adviser cannot be correct every time, and the company’s stock may never recover or may become worthless.
Index Strategy Risk. A Portfolio that employs an index strategy generally invests in the securities included in the relevant index or a representative sample of such securities regardless of market trends to track the performance of an unmanaged index of securities, whereas actively managed portfolios typically seek to outperform a benchmark index. Such a portfolio generally will not modify its index strategy to respond to changes in the economy, which means that it may be particularly susceptible to a general decline in the market segment relating to the relevant index. In addition, although the index strategy attempts to closely track its benchmark index, the Portfolio may not invest in all of the securities in the index. Also, the Portfolio’s fees and expenses will reduce the Portfolio’s returns, unlike those of the benchmark index. Cash flow into and out of the Portfolio, portfolio transaction costs, changes in the securities that comprise the index, and the Portfolio’s valuation procedures also may affect the Portfolio’s performance. Therefore, there can be no assurance that the performance of the index strategy will match that of the benchmark index.
Interest Rate Risk. The risk that fixed income securities will decline in value because of changes in interest rates. When interest rates decline, the value of a Portfolio’s debt securities generally rises. Conversely, when interest rates rise, the value of a Portfolio’s debt securities generally declines. A Portfolio with a longer average duration will be more sensitive to changes in interest rates than a fund with a shorter average duration. During periods of falling interest rates, an issuer of a callable bond may “call” or repay a security before its stated maturity and a Portfolio may have to reinvest the proceeds at lower interest rates, resulting in a decline in Portfolio income. Inflation-indexed bonds, including Treasury Inflation-Protected Securities (“TIPS”), decline in value when real interest rates rise. In certain interest rate environments, such as when real interest rates are rising faster than nominal interest rates, inflation-indexed bonds may experience greater losses than other fixed income securities with similar durations. Interest rates have been unusually low in recent years.
Investment Grade Securities Risk. Debt securities commonly are rated by national bond rating agencies. A Portfolio considers securities to be investment grade if they are rated BBB or higher by S&P or Fitch and Baa or higher by Moody’s or, if unrated, are deemed to be of comparable quality by an Adviser. Securities rated in the lower investment grade rating categories (e.g., BBB or Baa) are considered investment grade securities, but are somewhat riskier than higher rated obligations because they are regarded as having only an adequate capacity to pay principal and interest, and are considered to lack outstanding investment characteristics.
B-19
Investment Style Risk. An Adviser may use a particular style or set of styles, for example, growth, value, momentum or quantitative investing styles, to select investments. Those styles may be out of favor or may not produce the best results over short or longer time periods. They may also increase the volatility of the Portfolio’s share price.
Growth investing generally focuses on companies that, due to their strong earnings and revenue potential, offer above-average prospects for capital growth, with less emphasis on dividend income. Earnings predictability and confidence in earnings forecasts are an important part of the selection process. As a result, the price of growth stocks may be more sensitive to changes in current or expected earnings than the prices of other stocks. An Adviser using this approach generally seeks out companies experiencing some or all of the following: high sales growth, high unit growth, high or improving returns on assets and equity, and a strong balance sheet. Such an Adviser also prefers companies with a competitive advantage such as unique management, marketing or research and development. Growth investing is also subject to the risk that the stock price of one or more companies will fall or will fail to appreciate as anticipated by the Adviser, regardless of movements in the securities market. Growth stocks tend to be more volatile than value stocks, so in a declining market, their prices may decrease more than value stocks in general.
Value investing attempts to identify strong companies selling at a discount from their perceived true worth. An Adviser using this approach generally selects stocks at prices that, in its view, are temporarily low relative to the company’s earnings, assets, cash flow and dividends. Value investing is subject to the risk that a stock’s intrinsic value may never be fully recognized or realized by the market, or its price may go down. In addition, there is the risk that a stock judged to be undervalued may actually be appropriately priced. Value investing generally emphasizes companies that, considering their assets and earnings history, are attractively priced and may provide dividend income.
Large-Cap Company Risk. Larger more established companies may be unable to respond quickly to new competitive challenges such as changes in technology and consumer tastes. Many larger companies also may not be able to attain the high growth rate of successful smaller companies, especially during extended periods of economic expansion.
Leveraging Risk. When a Portfolio leverages its holdings, the value of an investment in that Portfolio will be more volatile and all other risks will tend to be compounded. For example, a Portfolio may take on leveraging risk when it engages in derivatives transactions, invests in collateral from securities loans or borrows money. Leveraged holdings generally require corresponding holdings of cash and cash equivalents, which may impede a portfolio’s ability to pursue its objectives. A Portfolio may experience leveraging risk in connection with investments in derivatives because its investments in derivatives may be purchased with a fraction of the assets that would be needed to purchase the securities directly, so that the remainder of the assets may be invested in other investments. Such investments may have the effect of leveraging a Portfolio because the Portfolio may experience gains or losses not only on its
B-20
investments in derivatives, but also on the investments purchased with the remainder of the assets. If the value of a Portfolio’s investments in derivatives is increasing, this could be offset by declining values of the Portfolio’s other investments. Conversely, it is possible that the rise in the value of a Portfolio’s non-derivative investments could be offset by a decline in the value of the Portfolio’s investments in derivatives. In either scenario, a Portfolio may experience losses. In a market where the value of a Portfolio’s investments in derivatives is declining and the value of its other investments is declining, the Portfolio may experience substantial losses.
Mid-Cap and Small-Cap Company Risk. A Portfolio’s investments in mid- and small-cap companies may involve greater risks than investments in larger, more established issuers because they generally are more vulnerable than larger companies to adverse business or economic developments. Such companies generally have narrower product lines, more limited financial resources and more limited markets for their stock as compared with larger companies. Their securities may be less well-known and trade less frequently and in limited volume compared with the securities of larger, more established companies. As a result, the value of such securities may be more volatile than the securities of larger companies, and the Portfolio may experience difficulty in purchasing or selling such securities at the desired time and price or in the desired amount. Mid- and small-cap companies also are typically subject to greater changes in earnings and business prospects than larger companies. Consequently, the prices of mid- and small-cap company stocks tend to rise and fall in value more frequently than the stocks of larger companies. Although investing in mid- and small-cap companies offers potential for above-average returns, the companies may not succeed and the value of their stock could decline significantly. In general, these risks are greater for small-cap companies than for mid-cap companies.
Portfolio Turnover Risk. High portfolio turnover (generally, turnover in excess of 100% in any given fiscal year) may result in increased transaction costs to a Portfolio, which may result in higher fund expenses and lower total return.
Real Estate Investing Risk. Investing in REITs exposes investors to the risks of owning real estate directly, as well as to risks that relate specifically to the way in which REITs are organized and operated. Real estate is a cyclical business, highly sensitive to general and local economic developments and characterized by intense competition and periodic overbuilding. Real estate income and values also may be greatly affected by demographic trends, such as population shifts or changing tastes and values. Government actions, such as tax increases, zoning law changes or environmental regulations, also may have a major impact on real estate. Changing interest rates and credit quality requirements also will affect the cash flow of real estate companies and their ability to meet capital needs. REITs generally invest directly in real estate (equity REITs), in mortgages (mortgage REITs) or in some combination of the two (hybrid REITs). Operating REITs requires specialized management skills and a Portfolio or portion thereof indirectly bears REIT management and administration expenses along with the direct expenses of the Portfolio. Individual REITs may own a limited number of properties and may concentrate in a particular region or property
B-21
type. REITs also must satisfy specific Internal Revenue Code requirements in order to qualify for the tax-free pass through of income and net realized gains.
Short Position Risk. A Portfolio may engage in short sales and may enter into derivative contracts that have a similar economic effect (e.g., taking a short position in a futures contract). A Portfolio will incur a loss as a result of a short position if the price of the asset sold short increases in value between the date of the short position sale and the date on which an offsetting position is purchased. Short positions may be considered speculative transactions and involve special risks that could cause or increase losses or reduce gains, including greater reliance on the investment adviser’s ability to accurately anticipate the future value of a security or instrument, potentially higher transaction costs, and imperfect correlation between the actual and desired level of exposure. Because a Portfolio’s potential loss on a short position arises from increases in the value of the asset sold short, the extent of such loss, like the price of the asset sold short, is theoretically unlimited. A Portfolio’s long positions could decline in value at the same time that the value of the short positions increase, thereby increasing the Portfolio’s overall potential for loss. Market factors may prevent a Portfolio from closing out a short position at the most desirable time or at a favorable price.
Special Situations Risk. A Portfolio may use aggressive investment techniques, including seeking to benefit from “special situations,” such as mergers, consolidations, liquidations, reorganizations, restructurings, tender or exchange offers or other unusual events expected to affect a particular issuer. In general, securities of companies which are the subject of a tender or exchange offer or a merger, consolidation, restructuring or reorganization proposal sell at a premium to their historic market price immediately prior to the announcement of an offer for the company. However, it is possible that the value of securities of a company involved in such a transaction will not rise and in fact may fall, in which case a Portfolio would lose money. It is also possible that a sub-adviser’s assessment that a particular company is likely to be acquired or acquired during a specific time frame may be incorrect, in which case a Portfolio may not realize any premium on its investment and could lose money if the value of the securities declines during the Portfolio’s holding period. A Portfolio’s return also could be adversely impacted to the extent that a sub-adviser’s strategies fail to identify companies for investment by the Portfolio that become the subject of a merger or similar transaction that results in an increase in the value of the securities of those companies. Moreover, publicly announced mergers and similar types of transactions may be renegotiated or terminated, in which case a Portfolio may lose money. In addition, if a transaction takes longer time to close than a sub-adviser originally anticipated, a Portfolio may realize a lower-than-expected rate of return.
Volatility Management Risk. The Manager from time to time employs various volatility management techniques, including the use of futures and options to manage equity exposure. The success of a Portfolio’s volatility management strategy will be subject to the Manager’s ability to correctly assess the degree of correlation between the performance of the relevant market index and the metrics used by the Manager to measure market volatility. Since the characteristics of many securities change as
B-22
markets change or time passes, the success of a Portfolio’s volatility management strategy also will be subject to the Manager’s ability to continually recalculate, readjust, and execute volatility management techniques (such as options and futures transactions) in an efficient manner. In addition, because market conditions change, sometimes rapidly and unpredictably, the success of the volatility management strategy will be subject to the Manager’s ability to execute the strategy in a timely manner. Moreover, volatility management strategies may increase portfolio transaction costs, which could cause or increase losses or reduce gains. For a variety of reasons, the Manager may not seek to establish a perfect correlation between the relevant market index and the metrics that the Manager uses to measure market volatility. In addition, it is not possible to manage volatility fully or perfectly. Any one or more of these factors may prevent a Portfolio from achieving the intended volatility management or could cause the Portfolio to underperform or experience losses.
B-23
SECURITY OWNERSHIP OF CERTAIN BENEFICIAL OWNERS
As of the Record Date, to the Trust’s knowledge, the following persons owned beneficially or of record 5% or more of the Class IA, Class IB, or Class K shares of a Portfolio.
Shareholder’s or Contractholder’s | Percent Beneficial Ownership of Shares of the Portfolio | Percent Beneficial Ownership of Shares of the Combined Portfolio (assuming the Reorganizations occur) |
C-1
The information that follows assumes only the Reorganization described in Proposal 1 (and not also the Reorganization described in Proposal 2) is approved.
Proposal 1: Comparative Fee and Expense Tables
The following tables show the fees and expenses of each class of shares of each Portfolio and the estimated pro forma fees and expenses of each class of shares of the Acquiring Portfolio after giving effect to the proposed Reorganization. Fees and expenses for each Portfolio are based on those incurred by each class of its shares for the fiscal year ended December 31, 2013. The pro forma fees and expenses of the Acquiring Portfolio Shares assume that the Reorganization has been in effect for the year ended December 31, 2013. The tables below do not reflect any Contract-related fees and expenses, which would increase overall fees and expenses. See a Contract prospectus for a description of those fees and expenses.
Shareholder Fees
(fees paid directly from your investment)
Davis New York Venture Portfolio | Invesco Comstock Portfolio | Pro Forma Invesco Comstock | ||
Not applicable. | Not applicable. | Not applicable. |
Annual Operating Expenses
(expenses that you may pay each year as a percentage of the value of your investment)
| Davis New York Venture Portfolio | Invesco Comstock Portfolio | Pro Forma Invesco Comstock Portfolio (assuming the Reorganization is approved)** | ||||||||||||||||||||||||||||||||||
| Class IA | Class IB | Class K | Class IA | Class IB | Class K | Class IA | Class IB | Class K* | ||||||||||||||||||||||||||||
Management Fee | 0.85 | % | 0.85 | % | 0.85 | % | 0.65 | % | 0.65 | % | 0.65 | % | 0.65 | % | 0.65 | % | 0.65 | % | ||||||||||||||||||
Distribution and/or Service Fees (12b-1 fees) | 0.25 | % | 0.25 | % | 0.00 | % | 0.25 | % | 0.25 | % | 0.00 | % | 0.25 | % | 0.25 | % | 0.00 | % | ||||||||||||||||||
Other Expenses | 0.18 | % | 0.18 | % | 0.18 | % | 0.21 | % | 0.16 | % | 0.28 | % | 0.14 | % | 0.14 | % | 0.14 | % | ||||||||||||||||||
Total Annual Portfolio Operating Expenses | 1.28 | % | 1.28 | % | 1.03 | % | 1.11 | % | 1.06 | % | 0.93 | % | 1.04 | % | 1.04 | % | 0.79 | % | ||||||||||||||||||
Fee Waiver and/or Expense Reimbursement †, †† | -0.13 | % | -0.13 | % | -0.13 | % | -0.11 | % | -0.06 | % | -0.18 | % | -0.04 | % | -0.04 | % | -0.04 | % | ||||||||||||||||||
D-1
| Davis New York Venture Portfolio | Invesco Comstock Portfolio | Pro Forma Invesco Comstock Portfolio (assuming the Reorganization is approved)** | ||||||||||||||||||||||||||||||||||
| Class IA | Class IB | Class K | Class IA | Class IB | Class K | Class IA | Class IB | Class K* | ||||||||||||||||||||||||||||
Total Annual Portfolio Operating Expenses After Fee Waiver and/or Expense Reimbursement | 1.15 | % | 1.15 | % | 0.90 | % | 1.00 | % | 1.00 | % | 0.75 | % | 1.00 | % | 1.00 | % | 0.75 | % | ||||||||||||||||||
| * | Based on estimated amounts for the current fiscal year. |
| ** | Assumes only the Reorganization described in Proposal 1 is approved. |
| † | Pursuant to a contract, FMG LLC has agreed to make payments or waive its management, administrative and other fees to limit the expenses of the Davis New York Venture Portfolio through April 30, 2015 (unless the Trust’s Board consents to an earlier revision or termination of this arrangement) (“Expense Limitation Arrangement”) so that the annual operating expenses of the Davis New York Venture Portfolio (exclusive of taxes, interest, brokerage commissions, capitalized expenses, fees and expenses of other investment companies in which the Davis New York Venture Portfolio invests, dividend and interest expenses on securities sold short, and extraordinary expenses) do not exceed an annual rate of average daily net assets of 1.15% for Class IA and IB shares and 0.90% for Class K shares of the Davis New York Venture Portfolio. The Expense Limitation Arrangement may be terminated by FMG LLC at any time after April 30, 2015. |
| †† | Pursuant to a contract, FMG LLC has agreed to make payments or waive its management, administrative and other fees to limit the expenses of the Invesco Comstock Portfolio through April 30, 2015 (unless the Trust’s Board consents to an earlier revision or termination of this arrangement) (“Expense Limitation Arrangement”) so that the annual operating expenses of the Invesco Comstock Portfolio (exclusive of taxes, interest, brokerage commissions, capitalized expenses, fees and expenses of other investment companies in which the Invesco Comstock Portfolio invests, dividend and interest expenses on securities sold short, and extraordinary expenses) do not exceed an annual rate of average daily net assets of 1.00% for Class IA and IB shares and 0.75% for Class K shares of the Invesco Comstock Portfolio. The Expense Limitation Arrangement may be terminated by FMG LLC at any time after April 30, 2015. |
Example of Portfolio Expenses
This example is intended to help you compare the costs of investing in the Portfolios with the cost of investing in other investment options. The example assumes that:
| • | You invest $10,000 in a Portfolio for the time periods indicated; |
| • | Your investment has a 5% return each year; |
| • | The Portfolio’s operating expenses remain the same; and |
| • | The Expense Limitation Arrangement is not renewed. |
D-2
This example does not reflect any Contract-related fees and expenses, including redemption fees (if any) at the Contract level. If such fees and expenses were reflected, the total expenses would be higher. Although your actual costs may be higher or lower, based on these assumptions your costs would be:
| 1 Year | 3 Years | 5 Years | 10 Years | |||||||||||||
Davis New York Venture Portfolio | ||||||||||||||||
Class IA | $ | 117 | $ | 393 | $ | 690 | $ | 1,534 | ||||||||
Class IB | $ | 117 | $ | 393 | $ | 690 | $ | 1,534 | ||||||||
Class K | $ | 92 | $ | 315 | $ | 556 | $ | 1,248 | ||||||||
Invesco Comstock Portfolio | ||||||||||||||||
Class IA | $ | 102 | $ | 342 | $ | 601 | $ | 1,342 | ||||||||
Class IB | $ | 102 | $ | 331 | $ | 579 | $ | 1,289 | ||||||||
Class K | $ | 77 | $ | 278 | $ | 497 | $ | 1,127 | ||||||||
Pro Forma Invesco Comstock Portfolio (assuming the Reorganization is approved)* | ||||||||||||||||
Class IA | $ | 102 | $ | 327 | $ | 570 | $ | 1,267 | ||||||||
Class IB | $ | 102 | $ | 327 | $ | 570 | $ | 1,267 | ||||||||
Class K | $ | 77 | $ | 248 | $ | 435 | $ | 974 | ||||||||
| * | Assumes only the Reorganization described in Proposal 1 is approved. |
Proposal 1: Capitalization
The following table shows the capitalization of each Portfolio as of December 31, 2013, and of the Invesco Comstock Portfolio on a pro forma combined basis as of December 31, 2013, after giving effect to the proposed Reorganization. Pro forma net assets may not total and net asset values per share may not recalculate due to rounding of net assets.
| Net Assets (in millions) | Net Asset Value Per Share | Shares Outstanding | ||||||||||
Davis New York Venture Portfolio — Class IA | $ | 22.8 | $ | 13.52 | 1,689,177 | |||||||
Invesco Comstock Portfolio — Class IA | $ | 10.9 | $ | 14.01 | 780,354 | |||||||
Adjustments* | $ | — | $ | — | (59,851 | ) | ||||||
Pro forma Invesco Comstock Portfolio — Class IA (assuming the Reorganization is approved)** | $ | 33.8 | $ | 14.01 | 2,409,680 | |||||||
Davis New York Venture Portfolio — Class IB | $ | 38.5 | $ | 13.52 | 2,850,701 | |||||||
Invesco Comstock Portfolio — Class IB | $ | 53.1 | $ | 14.02 | 3,786,410 | |||||||
Adjustments* | $ | — | $ | — | (104,788 | ) | ||||||
Pro forma Invesco Comstock Portfolio — Class IB (assuming the Reorganization is approved)** | $ | 91.6 | $ | 14.02 | 6,532,323 | |||||||
Davis New York Venture Portfolio — Class K | $ | 15.2 | $ | 13.52 | 1,126,091 | |||||||
Invesco Comstock Portfolio — Class K | $ | 3.2 | $ | 13.98 | 228,690 | |||||||
Adjustments* | $ | — | $ | — | (37,447 | ) | ||||||
Pro forma Invesco Comstock Portfolio — Class K (assuming the Reorganization is approved)** | $ | 18.4 | $ | 13.98 | 1,317,334 | |||||||
| * | Reflects adjustment for retired shares of the Acquired Portfolio. |
| ** | Assumes only the Reorganization described in Proposal 1 is approved |
D-3
The information that follows assumes only the Reorganization described in Proposal 2 (and not also the Reorganization described in Proposal 1) is approved.
Proposal 2: Comparative Fee and Expense Tables
The following tables show the fees and expenses of each class of shares of each Portfolio and the estimated pro forma fees and expenses of each class of shares of the Acquiring Portfolio after giving effect to the proposed Reorganization(s). Fees and expenses for each Portfolio are based on those incurred by each class of its shares for the fiscal year ended December 31, 2013. The pro forma fees and expenses of the Acquiring Portfolio Shares assume that the Reorganization has been in effect for the year ended December 31, 2013. The tables below do not reflect any Contract-related fees and expenses, which would increase overall fees and expenses. See a Contract prospectus for a description of those fees and expenses.
Shareholder Fees
(fees paid directly from your investment)
Lord Abbett Large Cap | Invesco Comstock Portfolio | Pro Forma Invesco Comstock | ||
Not applicable. | Not applicable. | Not applicable. |
Annual Operating Expenses
(expenses that you may pay each year as a percentage of the value of your investment)
| Lord Abbett Large Cap Core Portfolio | Invesco Comstock Portfolio | Pro Forma Invesco Comstock Portfolio (assuming the Reorganization is approved)** | ||||||||||||||||||||||||||||||||||
| Class IA | Class IB | Class K# | Class IA | Class IB | Class K | Class IA | Class IB | Class K* | ||||||||||||||||||||||||||||
Management Fee | 0.65 | % | 0.65 | % | N/A | 0.65 | % | 0.65 | % | 0.65 | % | 0.65 | % | 0.65 | % | 0.65 | % | |||||||||||||||||||
Distribution and/or Service Fees (12b-1 fees) | 0.25 | % | 0.25 | % | N/A | 0.25 | % | 0.25 | % | 0.00 | % | 0.25 | % | 0.25 | % | 0.00 | % | |||||||||||||||||||
Other Expenses | 0.17 | % | 0.17 | % | N/A | 0.21 | % | 0.16 | % | 0.28 | % | 0.14 | % | 0.14 | % | 0.14 | % | |||||||||||||||||||
Total Annual Portfolio Operating Expenses | 1.07 | % | 1.07 | % | N/A | 1.11 | % | 1.06 | % | 0.93 | % | 1.04 | % | 1.04 | % | 0.79 | % | |||||||||||||||||||
Fee Waiver and/or Expense Reimbursement †, †† | -0.07 | % | -0.07 | % | N/A | -0.11 | % | -0.06 | % | -0.18 | % | -0.04 | % | -0.04 | % | -0.04 | % | |||||||||||||||||||
E-1
| Lord Abbett Large Cap Core Portfolio | Invesco Comstock Portfolio | Pro Forma Invesco Comstock Portfolio (assuming the Reorganization is approved)** | ||||||||||||||||||||||||||||||||||
| Class IA | Class IB | Class K# | Class IA | Class IB | Class K | Class IA | Class IB | Class K* | ||||||||||||||||||||||||||||
Total Annual Portfolio Operating Expenses After Fee Waiver and/or Expense Reimbursement | 1.00 | % | 1.00 | % | N/A | 1.00 | % | 1.00 | % | 0.75 | % | 1.00 | % | 1.00 | % | 0.75 | % | |||||||||||||||||||
| * | Based on estimated amounts for the current fiscal year. |
| ** | Assumes only the Reorganization described in Proposal 2 is approved. |
| † | Pursuant to a contract, FMG LLC has agreed to make payments or waive its management, administrative and other fees to limit the expenses of the Lord Abbett Large Cap Core Portfolio through April 30, 2015 (unless the Trust’s Board consents to an earlier revision or termination of this arrangement) (“Expense Limitation Arrangement”) so that the annual operating expenses of the Lord Abbett Large Cap Core Portfolio (exclusive of taxes, interest, brokerage commissions, capitalized expenses, fees and expenses of other investment companies in which the Lord Abbett Large Cap Core Portfolio invests, dividend and interest expenses on securities sold short, and extraordinary expenses) do not exceed an annual rate of average daily net assets of 1.00% for Class IA and IB shares and 0.75% for Class K shares of the Lord Abbett Large Cap Core Portfolio. The Expense Limitation Arrangement may be terminated by FMG LLC at any time after April 30, 2015. |
| †† | Pursuant to a contract, FMG LLC has agreed to make payments or waive its management, administrative and other fees to limit the expenses of the Invesco Comstock Portfolio through April 30, 2015 (unless the Trust’s Board consents to an earlier revision or termination of this arrangement) (“Expense Limitation Arrangement”) so that the annual operating expenses of the Invesco Comstock Portfolio (exclusive of taxes, interest, brokerage commissions, capitalized expenses, fees and expenses of other investment companies in which the Invesco Comstock Portfolio invests, dividend and interest expenses on securities sold short, and extraordinary expenses) do not exceed an annual rate of average daily net assets of 1.00% for Class IA and IB shares and 0.75% for Class K shares of the Invesco Comstock Portfolio. The Expense Limitation Arrangement may be terminated by FMG LLC at any time after April 30, 2015. |
| # | Class K shares of the Lord Abbett Large Cap Core Portfolio were not operational for the fiscal year ended December 31, 2013. |
Example of Portfolio Expenses
This example is intended to help you compare the costs of investing in the Portfolios with the cost of investing in other investment options. The example assumes that:
| • | You invest $10,000 in a Portfolio for the time periods indicated; |
| • | Your investment has a 5% return each year; |
| • | The Portfolio’s operating expenses remain the same; and |
| • | The Expense Limitation Arrangement is not renewed. |
E-2
This example does not reflect any Contract-related fees and expenses, including redemption fees (if any) at the Contract level. If such fees and expenses were reflected, the total expenses would be higher. Although your actual costs may be higher or lower, based on these assumptions your costs would be:
| 1 Year | 3 Years | 5 Years | 10 Years | |||||||||||||
Lord Abbett Large Cap Core Portfolio | ||||||||||||||||
Class IA | $ | 102 | $ | 333 | $ | 583 | $ | 1,299 | ||||||||
Class IB | $ | 102 | $ | 333 | $ | 583 | $ | 1,299 | ||||||||
Class K# | N/A | N/A | N/A | N/A | ||||||||||||
Invesco Comstock Portfolio | ||||||||||||||||
Class IA | $ | 102 | $ | 342 | $ | 601 | $ | 1,342 | ||||||||
Class IB | $ | 102 | $ | 331 | $ | 579 | $ | 1,289 | ||||||||
Class K | $ | 77 | $ | 278 | $ | 497 | $ | 1,127 | ||||||||
Pro Forma Invesco Comstock Portfolio (assuming the Reorganization is approved)* | ||||||||||||||||
Class IA | $ | 102 | $ | 327 | $ | 570 | $ | 1,267 | ||||||||
Class IB | $ | 102 | $ | 327 | $ | 570 | $ | 1,267 | ||||||||
Class K | $ | 77 | $ | 248 | $ | 435 | $ | 974 | ||||||||
| * | Assumes only the Reorganization described in Proposal 2 is approved. |
| # | Class K shares of the Lord Abbett Large Cap Core Portfolio were not operational for the fiscal year ended December 31, 2013. |
Proposal 2: Capitalization
The following table shows the capitalization of each Portfolio as of December 31, 2013, and of the Invesco Comstock Portfolio on a pro forma combined basis as of December 31, 2013, after giving effect to the proposed Reorganization. Pro forma net assets may not total and net asset values per share may not recalculate due to rounding of net assets.
| Net Assets (in millions) | Net Asset Value Per Share | Shares Outstanding | ||||||||||
Lord Abbett Large Cap Core Portfolio — Class IA | $ | 9.3 | $ | 13.56 | 685,723 | |||||||
Invesco Comstock Portfolio — Class IA | $ | 10.9 | $ | 14.01 | 780,354 | |||||||
Adjustments* | $ | — | $ | — | (22,286 | ) | ||||||
Pro forma Invesco Comstock Portfolio — Class IA (assuming the Reorganization is approved)** | $ | 20.2 | $ | 14.01 | 1,443,791 | |||||||
Lord Abbett Large Cap Core Portfolio — Class IB | $ | 68.3 | $ | 13.58 | 5,024,505 | |||||||
Invesco Comstock Portfolio — Class IB | $ | 53.1 | $ | 14.02 | 3,786,410 | |||||||
Adjustments* | $ | — | $ | — | (159,599 | ) | ||||||
Pro forma Invesco Comstock Portfolio — Class IB (assuming the Reorganization is approved)** | $ | 121.3 | $ | 14.02 | 8,651,316 | |||||||
Lord Abbett Large Cap Core Portfolio — Class K# | N/A | N/A | N/A | |||||||||
Invesco Comstock Portfolio — Class K | $ | 3.2 | $ | 13.98 | 228,690 | |||||||
Adjustments* | $ | — | $ | — | (66 | ) | ||||||
Pro forma Invesco Comstock Portfolio — Class K (assuming the Reorganization is approved)** | $ | 3.2 | $ | 13.98 | 228,624 | |||||||
| * | Reflects adjustment for retired shares of the Acquired Portfolio. |
| ** | Assumes only the Reorganization described in Proposal 2 is approved |
| # | Class K shares of the Lord Abbett Large Cap Core Portfolio were not operational for the fiscal year ended December 31, 2013. |
E-3
STATEMENT OF ADDITIONAL INFORMATION
, 2014
EQ ADVISORS TRUST
EQ/Davis New York Venture Portfolio,
EQ/Lord Abbett Large Cap Core Portfolio and
EQ/Equity Growth PLUS Portfolio,
(each, a series of EQ Advisors Trust)
(each, an “Acquired Portfolio” and together, the “Acquired Portfolios”)
AND
EQ/Invesco Comstock Portfolio and
EQ/Large Cap Growth PLUS Portfolio,
(each a series of EQ Advisors Trust)
(each, an “Acquiring Portfolio” and together, the “Acquiring Portfolios”)
1290 Avenue of the Americas
New York, New York 10104
(877) 222-2144
Acquisition of the assets and assumption of the liabilities of: | By and in exchange for shares of: | |
EQ/Davis New York Venture Portfolio | EQ/Invesco Comstock Portfolio | |
EQ/Lord Abbett Large Cap Core Portfolio | EQ/Invesco Comstock Portfolio | |
EQ/Equity Growth PLUS Portfolio | EQ/Large Cap Growth PLUS Portfolio |
This Statement of Additional Information (the “SAI”) relates specifically to the proposed reorganization of each Acquired Portfolio into the corresponding Acquiring Portfolio under which the Acquiring Portfolio would acquire all of the assets of the Acquired Portfolio in exchange solely for shares of the Acquiring Portfolio and that Acquiring Portfolio’s assumption of all of the corresponding Acquired Portfolio’s liabilities (the “Reorganizations”). This SAI is available to owners of and participants in variable life insurance contracts and variable annuity contracts and certificates (the “Contracts”) with amounts allocated to an Acquired Portfolio and to other shareholders of the Acquired Portfolios as of February 28, 2014.
This SAI is not a prospectus. A Combined Proxy Statement and Prospectus dated , 2014 relating to the Reorganizations (the “Proxy Statement/Prospectus”) may be obtained, without charge, by writing to the Trust at 1290 Avenue of the Americas, New York, New York 10104 or calling . This SAI should be read in conjunction with the Proxy Statement/Prospectus.
Contents of the SAI
Statement of Additional Information of the Trust dated May 1, 2013, as supplemented, with respect to the Acquiring Portfolios and the Acquired Portfolios. The Statement of Additional Information includes information about the Trust’s other portfolios that is not relevant to the Reorganizations. Please disregard that information.
Audited Financial Statements of the Trust for the fiscal year ended December 31, 2013, with respect to the Acquiring Portfolios and the Acquired Portfolios.
Pro Forma Financial Statements relating to each Reorganization.
Information Incorporated by Reference
This SAI incorporates by reference the following document as filed with the Securities and Exchange Commission (File Nos. 333-17217 and 811-07953):
Statement of Additional Information of the Trust dated May 1, 2013, as supplemented, with respect to the Acquiring Portfolios and the Acquired Portfolios.
2
EQ Advisors Trust
Annual Report
December 31, 2013
EQ Advisors Trust Annual Report
December 31, 2013
| 4 | ||
Portfolios | ||
| 5 | ||
| 14 | ||
| 31 | ||
| 42 | ||
| 60 | ||
| 69 | ||
| 87 | ||
| 88 | ||
| 89 | ||
| 95 | ||
2013 Market Overview
Economy
The employment picture in the U.S. continued to brighten in 2013. Three of the final four months of the year showed non-farm payroll gains of more than 200,000, and the unemployment rate dropped to 7.0%, a rate last seen in 2008. Housing continued to show a meaningful recovery in most markets and the automobile sector showed its best year since 2007. Nonetheless, the economy showed some worrisome trends, namely the increasing dependence of retailers on major markdowns in order to move merchandise, and the fact that much of the upward revision to the fourth quarter’s GDP report was tied to inventory growth, rather than to legitimate consumer demand.
At its final meeting of 2013, the Federal Reserve decided to begin to reduce the $85 billion per month it had been buying in longer-term Treasury and mortgage securities. While this move was long expected, it was the first sign that the Fed itself felt confident enough in the strength of the economy to begin unwinding its unprecedented easing posture.
Fixed Income
In the first half of the year, Japan flooded the global financial markets with liquidity, which served to buoy all assets, including the very expensive risk-free rates in the beginning of the year. In the spring, interest rates rose sharply when markets reacted to the announcement that Fed might consider tapering its quantitative easing program in the fourth quarter. The uncertainty and resulting volatility also had an impact on credit markets, which witnessed spread widening across all sectors including corporate credit and structured products.
By mid-year, two events led to an uptick in risk sentiment within fixed-income markets. Larry Summers withdrew from the race for the Chairmanship of the Federal Reserve, and the Fed surprised markets by deciding to refrain from tapering its quantitative easing program due to a perceived tightening of financial conditions. However, volatility returned to the markets towards the end of September due to the U.S. government shut down and prolonged political wrangling over the debt ceiling issue.
At the end of the year, U.S. Treasury rates generally rose across the yield curve. In light of stronger U.S. economic data, consistent labor market improvement, and reduced political risk, the Fed announced that it would slow the pace of purchases beginning in January 2014 by $10bn per month, split evenly between agency mortgage-backed securities and Treasuries.
US Equity
In 2013, U.S. equities, as represented by the S&P 500 Index, posted an impressive gain of 32.4% for the year, as the world’s largest central banks continued stimulus measures and corporate profits benefited from slow-but-positive economic growth. Mid-cap U.S. equities, as represented by the S&P MidCap 400 Index, posted an impressive gain of 33.5% in 2013, as mid-cap company profits benefited from the growth environment. Small companies benefited even more, as the Russell 2000® Index of U.S. small-cap stocks gained 38.8% for the year.
The U.S. equity markets began 2013 with a powerful relief rally after the United States averted the worst of its potential fiscal crisis with a last-minute tax deal. Moving into spring, the ascent of equities persevered as increased global liquidity kept interest rates low and investors turned to riskier asset classes in search of yield. As the year progressed, the direction of stock markets became increasingly dominated by speculation around the future of monetary policy. Sluggish U.S. growth, ironically, was often conducive to positive stock market performance as weak economic data reinforced investors’ expectations that the U.S. Federal Reserve would maintain its accommodative stance. Additionally, the U.S. recovery was strong enough to support corporate revenues while nearly stagnant wage growth kept costs low.
The waning months of the year brought another sharp rally as the Fed defied market expectations with its September decision to delay tapering its asset purchases. Turmoil in Egypt and Syria subsided and the re-election of Angela Merkel as Chancellor of Germany was welcomed as a continuation of the status quo. As economic indicators improved later in the fall, investors grappled with rising uncertainty around the timing of the anticipated Fed taper, ultimately commencing in mid-December. Investors reacted positively to this policy move as it signaled the Fed’s perception of real improvement in U.S. growth. Sentiment was also buoyed by the extension of the Fed’s expected time horizon for maintaining low short-term interest rates.
International Equity
International equities, as represented by the MSCI EAFE Index, posted an impressive gain of 22.8% (in US dollar terms) for the 12-month period ended December 31, 2013 as the world’s largest central banks continued to shore up their economies with stimulus measures.
Building on a year of gains that followed roughly in step with the U.S. stock market, world equity markets closed the year on a strong note, fuelled by signs that the global economy continued to improve, but at a pace sufficiently modest to allow most major central banks to maintain accommodative policies. With conditions in the periphery having stabilized and Germany continuing to motor along, the Eurozone emerged from recession. However, the fragile recovery, combined with a lack of inflationary pressures, prompted a surprise rate cut by the
2
European Central Bank. The Bank of England kept interest rates and its asset purchase target unchanged despite the U.K. having racked up three straight quarters of gross domestic product (GDP) growth. Japan appears to be responding, at least partially, to policymakers’ attempts to reflate the economy. Economic growth has slowed in recent months, but remains positive. The Bank of Japan’s asset purchase program continued to put pressure on the yen, helping boost the profitability of export-oriented corporations even as year-over-year consumer price index readings rose to their highest levels since 2008.
In contrast to strength exhibited in developed markets, emerging market equities generally posted weak returns. In particular, countries with high deficits have been hurt by the U.S. Federal Reserve’s steps to begin to unwind its monetary stimulus and the potential for higher interest rates. For the 12-month period, the MSCI Emerging Markets GR Index sagged -2.3%
Source: AXA Equitable Funds Management Group, LLC. As of 12/31/2013.
This information is provided for general information only and is not intended to provide specific advice or recommendations for any individual investor. The S&P 500 Index is a widely recognized index that is considered representative of the performance of the large-cap sector of the U.S. stock market. The S&P MidCap 400 Index is a widely recognized index that is considered representative of the performance of the mid-cap sector of the U.S. stock market. The Russell 2000® Index measures the performance of the small-cap segment of the U.S. equity universe. The MSCI EAFE Index measures equity performance in foreign developed markets. The MSCI Emerging Markets Index measures equity performance in global emerging market countries.
PAST PERFORMANCE IS NO GUARANTEE OF FUTURE RESULTS. No investment is risk-free. International securities carry additional risks including currency exchange fluctuation and different government regulations, economic conditions or accounting standards. Smaller company stocks involve a greater risk than is customarily associated with more established companies. Bond investments are subject to interest rate risk so that when interest rates rise, the prices of bonds can decrease and the investor can lose principal value. High yield bonds are subject to a high degree of credit and market risk. Index performance is shown for illustrative purposes only. You cannot invest directly in an index.
AXA Equitable Life Insurance Company (New York, NY). Distributors: AXA Distributors, LLC.
AXA Equitable Funds Management Group, LLC is a wholly owned subsidiary of AXA Equitable Life Insurance Company.
AXA Equitable Life Insurance Company, AXA Advisors and AXA Distributors are affiliated companies.
GE 91457 (2/14) (Exp. 2/16)
3
NOTES ON PERFORMANCE (Unaudited)
Total Returns
Performance of the EQ Advisors Trust Portfolios as shown on the following pages compares each Portfolio’s performance to that of a broad-based securities index. Each of the Portfolio’s annualized rates of return is net of investment management fees and expenses of the Portfolio. Rates of return are not representative of the actual return you would receive under your variable life insurance policy or annuity contract. No policyholder or contractholder can invest directly in the EQ Advisors Trust Portfolios. Changes in policy values depend not only on the investment performance of the EQ Advisors Trust Portfolios, but also on the insurance and administrative charges, applicable sales charges, and the mortality and expense risk charge applicable under a policy. These policy charges effectively reduce the dollar amount of any net gains and increase the dollar amount of any net losses. Each of the EQ Advisors Trust Portfolios has a separate investment objective it seeks to achieve by following a separate investment policy. There is no guarantee that these objectives will be attained. The objectives and policies of each Portfolio will affect its return and its risk. Keep in mind that past performance is not an indication of future results.
Growth of $10,000 Investment
The charts shown on the following pages illustrate the total value of an assumed investment in Class IA, Class IB and/or Class K shares of each Portfolio of the EQ Advisors Trust. The periods illustrated are from the inception dates shown, or for a ten year period if the inception date is prior to December 31, 2003, through December 31, 2013. These results assume reinvestment of dividends and capital gains. The total value shown for each Portfolio reflects management fees and operating expenses of the Portfolios and 12b-1 fees which are applicable to Class IB shares. Effective January 1, 2012, 12b-1 fees are applicable to Class IA shares. 12b-1 fees are not applicable to Class K shares. The values have not been adjusted for insurance-related charges and expenses associated with life insurance policies or annuity contracts, which would lower the total values shown. Results should not be considered representative of future gains or losses.
The Benchmarks
Broad-based securities indices are unmanaged and are not subject to fees and expenses typically associated with actively-managed funds. An investment cannot be made directly in a broad-based securities index. Comparisons with these benchmarks, therefore, are of limited use. They are included because they are widely known and may help you to understand the universe of securities from which each Portfolio is likely to select its holdings.
Russell 1000® Index
An unmanaged index of common stocks that measures the performance of the 1,000 largest companies in the Russell 3000® Index, representing approximately 92% of the total market capitalization of the Russell 3000® Index.
Russell 1000® Growth Index
An unmanaged index which contains those Russell 1000 securities (1,000 largest securities in the Russell 3000® Index) with a greater than-average growth orientation. Securities in this index tend to exhibit higher price-to-book and price-to-earnings ratios, lower dividend yields and higher forecasted growth values than the value universe.
Russell 1000® Value Index
An unmanaged index which contains those Russell 1000 securities (1,000 largest securities in the Russell 3000® Index) with a less-than average growth orientation. It represents the universe of stocks from which value managers typically select. Securities in this index tend to exhibit lower price-to-book and price-to-earnings ratios,
higher dividend yields and lower forecasted growth values than the growth universe.
Standard & Poor’s (S&P) 500 Index
An unmanaged index which contains 500 of the largest U.S. industrial, transportation, utility and financial companies deemed by Standard and Poor’s to be representative of the larger capitalization portion of the U.S. stock market.
Volatility Managed Index — Large Cap Growth (“VMI — LCG”)
An index that utilizes a blend of the S&P 500 Index and the Russell 1000® Growth Index methodologies with an overlying formulaic adjustment that dynamically modifies the S&P 500 Index equity exposure of the index based on observed historic volatility.
4
EQ/DAVIS NEW YORK VENTURE PORTFOLIO (Unaudited)
PORTFOLIO ADVISERS
| Ø | Davis Selected Advisers, L.P. |
PERFORMANCE RESULTS
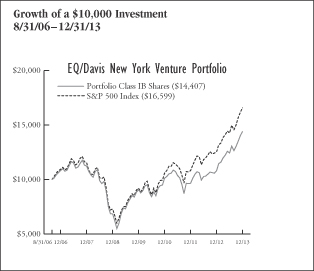
| Annualized Total Returns as of 12/31/13 | ||||||||||||
| 1 Year | 5 Years | Since Incept. | ||||||||||
Portfolio – Class IA Shares* | 33.43 | % | 16.30 | % | 5.30 | % | ||||||
Portfolio – Class IB Shares* | 33.30 | 16.12 | 5.10 | |||||||||
Portfolio – Class K Shares** | 33.76 | N/A | 21.73 | |||||||||
S&P 500 Index | 32.39 | 17.94 | 7.15 | |||||||||
* Date of inception 8/31/06.
** Date of inception 8/26/11.
Returns for periods greater than one year are annualized. |
| |||||||||||
Past performance is not indicative of future results.
PERFORMANCE SUMMARY
The Portfolio’s Class IA shares returned 33.43% for the year ended December 31, 2013. The Portfolio’s benchmark, the S&P 500 Index, returned 32.39% over the same period.
Portfolio Highlights
For the year ended December 31, 2013
What helped performance during the year:
| • | Information Technology companies were the most important contributor to the Portfolio’s performance relative to the benchmark. The contribution was largely a result of the Portfolio’s strong stock selection. Google was among the most important contributors to the Portfolio’s performance. |
| • | Financial companies were another important contributor to the Portfolio’s performance relative to the benchmark. The Portfolio benefited from its large over-weighting in this stronger performing sector. The Portfolio’s Financial companies were also the most important contributor to the Portfolio’s performance on an absolute basis. American Express, Bank of New York Mellon, Wells Fargo, Berkshire Hathaway, and Progressive were all among the top contributors to the Portfolio’s performance. |
| • | Consumer Discretionary companies were another important contributor to the Portfolio’s performance on both an absolute and relative basis. Bed Bath & Beyond and Netflix were among the most important contributors to performance. |
What hurt performance during the year:
| • | The Portfolio’s Health Care companies underperformed the corresponding sector within the benchmark and the Portfolio had a lower relative average weighting in this stronger performing sector. Laboratory Corporation of America was among the most important detractors from performance. |
| • | The Portfolio’s Industrial companies underperformed the corresponding sector within the benchmark and had a lower average weighting in this stronger performing sector. |
| • | Other important detractors from performance included three Materials companies, Rio Tinto (United Kingdom), BHP Billiton (United Kingdom), and Potash (Canada). |
| • | IBM, Hang Lung Group and Brookfield Property Partners were among the top detractors from the Portfolio’s performance. |
| • | The Portfolio was hurt by being underweight in the strong performing Consumer Discretionary sector relative to the benchmark. |
Portfolio Positioning and Outlook
The Portfolio’s investment strategy is to perform extensive research to buy durable companies at a discount to their intrinsic values and to hold them for the long term. We focus deliberately on the future, considering each company’s long-term business fundamentals.
| Sector Weightings as of December 31, 2013 | % of Net Assets | |||
Financials | 38.0 | % | ||
Information Technology | 13.3 | |||
Consumer Staples | 11.5 | |||
Consumer Discretionary | 11.5 | |||
Health Care | 7.3 | |||
Materials | 5.9 | |||
Industrials | 5.8 | |||
Energy | 4.9 | |||
Cash and Other | 1.8 | |||
|
| |||
| 100.0 | % | |||
|
| |||
5
EQ/DAVIS NEW YORK VENTURE PORTFOLIO (Unaudited)
UNDERSTANDING YOUR EXPENSES:
As a shareholder of the Portfolio, you incur two types of costs:
(1) transaction costs, including applicable sales charges and redemption fees; and (2) ongoing costs, including management fees, distribution (12b-1) fees (in the case of Class IA and Class IB shares of the Trust), and other Portfolio expenses. These examples are intended to help you understand your ongoing costs (in dollars) of investing in the Portfolio and to compare these costs with the ongoing costs of investing in other mutual funds.
The examples are based on an investment of $1,000 invested at the beginning of the six-month period ended December 31, 2013 and held for the entire six-month period.
Actual Expenses
The first line of the table to the right provides information about actual account values and actual expenses. You may use the information in this line, together with the amount you invested, to estimate the expenses that you paid over the period. Simply divide your account value by $1,000 (for example, an $8,600 account value divided by $1,000 = 8.6), then multiply the result by the number in the first line under the heading entitled “Expenses Paid During Period” to estimate the expenses you paid on your account during this period.
Hypothetical Example for Comparison Purposes
The second line of the table below provides information about hypothetical account values and hypothetical expenses based on the Portfolio’s actual expense ratio and an assumed rate of return of 5% per year before expenses, which is not the Portfolio’s actual return. The hypothetical account values and expenses may not be used to estimate the actual ending account balance or expenses you paid for the period. You may use this information to compare the ongoing costs of investing in the Portfolio and other funds. To do so, compare this 5% hypothetical example with the 5% hypothetical examples that appear in the shareholder reports of the other funds.
Please note that the expenses shown in the table are meant to highlight your ongoing costs only and do not reflect any transactional costs, such as sales charges (loads), redemption fees, or exchange fees. Therefore, the second line of the table is useful in comparing ongoing costs only, and will not help you determine the relative total costs of owning different funds. In addition, if these transactional costs were included, your costs would have been higher. Also note that the table does not reflect any variable life insurance or variable annuity contract-related fees and expenses, which would increase overall fees and expenses.
EXAMPLE
| Beginning Account Value 7/1/13 | Ending Account Value 12/31/13 | Expenses Paid During Period* 7/1/13 - 12/31/13 | ||||||||||
Class IA | ||||||||||||
Actual | $1,000.00 | $1,157.21 | $6.26 | |||||||||
Hypothetical (5% average annual return before expenses) | 1,000.00 | 1,019.41 | 5.86 | |||||||||
Class IB | ||||||||||||
Actual | 1,000.00 | 1,158.19 | 6.26 | |||||||||
Hypothetical (5% average annual return before expenses) | 1,000.00 | 1,019.41 | 5.86 | |||||||||
Class K | ||||||||||||
Actual | 1,000.00 | 1,159.13 | 4.90 | |||||||||
Hypothetical (5% average annual return before expenses) | 1,000.00 | 1,020.67 | 4.59 | |||||||||
* Expenses are equal to the Portfolio’s Class IA, Class IB and Class K shares annualized expense ratios of 1.15%, 1.15% and 0.90%, respectively, multiplied by the average account value over the period, and multiplied by 184/365 (to reflect the one-half year period). |
| |||||||||||
6
EQ ADVISORS TRUST
EQ/DAVIS NEW YORK VENTURE PORTFOLIO
PORTFOLIO OF INVESTMENTS
December 31, 2013
| Number of Shares | Value (Note 1) | |||||||
COMMON STOCKS: | ||||||||
Consumer Discretionary (11.5%) | ||||||||
Automobiles (0.4%) | ||||||||
Harley-Davidson, Inc. | 4,452 | $ | 308,256 | |||||
|
| |||||||
Household Durables (0.2%) | ||||||||
Hunter Douglas N.V. | 2,641 | 119,533 | ||||||
|
| |||||||
Internet & Catalog Retail (2.8%) | ||||||||
Liberty Interactive Corp.* | 22,185 | 651,130 | ||||||
Liberty Ventures* | 1,507 | 184,743 | ||||||
Netflix, Inc.* | 1,045 | 384,738 | ||||||
priceline.com, Inc.* | 770 | 895,048 | ||||||
|
| |||||||
| 2,115,659 | ||||||||
|
| |||||||
Media (2.5%) | ||||||||
Liberty Global plc* | 16,295 | 1,373,994 | ||||||
Walt Disney Co. | 7,639 | 583,620 | ||||||
|
| |||||||
| 1,957,614 | ||||||||
|
| |||||||
Specialty Retail (5.3%) | ||||||||
Bed Bath & Beyond, Inc.* | 37,919 | 3,044,896 | ||||||
CarMax, Inc.* | 21,132 | 993,626 | ||||||
|
| |||||||
| 4,038,522 | ||||||||
|
| |||||||
Textiles, Apparel & Luxury Goods (0.3%) |
| |||||||
Cie Financiere Richemont S.A. (Registered), Class A | 2,642 | 263,001 | ||||||
|
| |||||||
Total Consumer Discretionary | 8,802,585 | |||||||
|
| |||||||
Consumer Staples (11.5%) | ||||||||
Beverages (2.6%) | ||||||||
Coca-Cola Co. | 15,331 | 633,324 | ||||||
Diageo plc (ADR) | 4,541 | 601,319 | ||||||
Heineken Holding N.V. | 11,607 | 734,277 | ||||||
|
| |||||||
| 1,968,920 | ||||||||
|
| |||||||
Food & Staples Retailing (8.0%) | ||||||||
Costco Wholesale Corp. | 18,646 | 2,219,060 | ||||||
CVS Caremark Corp. | 54,174 | 3,877,233 | ||||||
|
| |||||||
| 6,096,293 | ||||||||
|
| |||||||
Food Products (0.2%) | ||||||||
Nestle S.A. (Registered) | 2,556 | 187,105 | ||||||
|
| |||||||
Tobacco (0.7%) | ||||||||
Philip Morris International, Inc. | 6,468 | 563,557 | ||||||
|
| |||||||
Total Consumer Staples | 8,815,875 | |||||||
|
| |||||||
Energy (4.9%) | ||||||||
Energy Equipment & Services (0.7%) | ||||||||
Schlumberger Ltd. | 5,967 | 537,686 | ||||||
|
| |||||||
Oil, Gas & Consumable Fuels (4.2%) |
| |||||||
Canadian Natural Resources Ltd. | 59,602 | 2,016,932 | ||||||
EOG Resources, Inc. | 4,089 | 686,298 | ||||||
Occidental Petroleum Corp. | 5,566 | 529,326 | ||||||
|
| |||||||
| 3,232,556 | ||||||||
|
| |||||||
Total Energy | 3,770,242 | |||||||
|
| |||||||
Financials (38.0%) | ||||||||
Capital Markets (11.0%) | ||||||||
Ameriprise Financial, Inc. | 4,225 | 486,086 | ||||||
Bank of New York Mellon Corp. | 161,329 | 5,636,835 | ||||||
Charles Schwab Corp. | 38,811 | 1,009,086 | ||||||
Goldman Sachs Group, Inc. | 1,057 | 187,364 | ||||||
Julius Baer Group Ltd.* | 23,471 | 1,127,177 | ||||||
|
| |||||||
| 8,446,548 | ||||||||
|
| |||||||
Commercial Banks (5.9%) | ||||||||
Wells Fargo & Co. | 100,392 | 4,557,797 | ||||||
|
| |||||||
Consumer Finance (7.0%) | ||||||||
American Express Co. | 58,958 | 5,349,259 | ||||||
|
| |||||||
Diversified Financial Services (1.0%) | ||||||||
JPMorgan Chase & Co. | 13,571 | 793,632 | ||||||
|
| |||||||
Insurance (11.4%) | ||||||||
ACE Ltd. | 6,840 | 708,145 | ||||||
Alleghany Corp.* | 2,215 | 885,911 | ||||||
Berkshire Hathaway, Inc., Class B* | 28,841 | 3,419,389 | ||||||
Everest Reinsurance Group Ltd. | 2,354 | 366,918 | ||||||
Fairfax Financial Holdings Ltd. | 1,557 | 622,582 | ||||||
Loews Corp. | 22,869 | 1,103,201 | ||||||
Markel Corp.* | 290 | 168,301 | ||||||
Progressive Corp. | 52,556 | 1,433,202 | ||||||
|
| |||||||
| 8,707,649 | ||||||||
|
| |||||||
Real Estate Management & Development (1.7%) |
| |||||||
Brookfield Asset Management, Inc., Class A | 14,811 | 575,111 | ||||||
Brookfield Property Partners LP | 850 | 16,949 | ||||||
Hang Lung Group Ltd. | 133,354 | 673,279 | ||||||
|
| |||||||
| 1,265,339 | ||||||||
|
| |||||||
Total Financials | 29,120,224 | |||||||
|
| |||||||
Health Care (7.3%) | ||||||||
Health Care Providers & Services (6.8%) |
| |||||||
Express Scripts Holding Co.* | 24,496 | 1,720,599 | ||||||
Laboratory Corp. of America Holdings* | 17,429 | 1,592,488 | ||||||
UnitedHealth Group, Inc. | 25,779 | 1,941,159 | ||||||
|
| |||||||
| 5,254,246 | ||||||||
|
| |||||||
Life Sciences Tools & Services (0.5%) | ||||||||
Agilent Technologies, Inc. | 6,249 | 357,380 | ||||||
|
| |||||||
Total Health Care | 5,611,626 | |||||||
|
| |||||||
Industrials (5.8%) | ||||||||
Aerospace & Defense (0.6%) | ||||||||
Textron, Inc. | 12,050 | 442,958 | ||||||
|
| |||||||
Commercial Services & Supplies (0.5%) |
| |||||||
Iron Mountain, Inc. | 13,593 | 412,547 | ||||||
|
| |||||||
Construction & Engineering (0.4%) | ||||||||
OCI* | 6,400 | 288,215 | ||||||
|
| |||||||
Machinery (1.4%) | ||||||||
PACCAR, Inc. | 17,454 | 1,032,753 | ||||||
|
| |||||||
Marine (1.4%) | ||||||||
Kuehne + Nagel International AG (Registered) | 8,349 | 1,095,979 | ||||||
|
| |||||||
See Notes to Financial Statements.
7
EQ ADVISORS TRUST
EQ/DAVIS NEW YORK VENTURE PORTFOLIO
PORTFOLIO OF INVESTMENTS (Continued)
December 31, 2013
| Number of Shares | Value (Note 1) | |||||||
Professional Services (0.3%) | ||||||||
Experian plc | 11,250 | $ | 207,532 | |||||
|
| |||||||
Transportation Infrastructure (1.2%) |
| |||||||
China Merchants Holdings International Co., Ltd. | 225,438 | 822,756 | ||||||
Wesco Aircraft Holdings, Inc.* | 5,640 | 123,629 | ||||||
|
| |||||||
| 946,385 | ||||||||
|
| |||||||
Total Industrials | 4,426,369 | |||||||
|
| |||||||
Information Technology (13.3%) | ||||||||
Computers & Peripherals (0.4%) |
| |||||||
Hewlett-Packard Co. | 10,226 | 286,124 | ||||||
|
| |||||||
Internet Software & Services (7.7%) |
| |||||||
Google, Inc., Class A* | 4,790 | 5,368,201 | ||||||
Qihoo 360 Technology Co., Ltd. (ADR)* | 3,010 | 246,970 | ||||||
Twitter, Inc.* | 3,840 | 244,416 | ||||||
|
| |||||||
| 5,859,587 | ||||||||
|
| |||||||
IT Services (1.1%) |
| |||||||
Visa, Inc., Class A | 3,802 | 846,629 | ||||||
|
| |||||||
Semiconductors & Semiconductor Equipment (1.2%) |
| |||||||
Texas Instruments, Inc. | 21,095 | 926,282 | ||||||
|
| |||||||
Software (2.9%) | ||||||||
Activision Blizzard, Inc. | 42,455 | 756,972 | ||||||
Microsoft Corp. | 19,862 | 743,435 | ||||||
Oracle Corp. | 19,072 | 729,695 | ||||||
|
| |||||||
| 2,230,102 | ||||||||
|
| |||||||
Total Information Technology | 10,148,724 | |||||||
|
| |||||||
Materials (5.7%) | ||||||||
Chemicals (4.7%) |
| |||||||
Air Products and Chemicals, Inc. | 11,924 | 1,332,865 | ||||||
Ecolab, Inc. | 9,846 | 1,026,642 | ||||||
Monsanto Co. | 4,838 | 563,869 | ||||||
Praxair, Inc. | 5,256 | 683,438 | ||||||
|
| |||||||
| 3,606,814 | ||||||||
|
| |||||||
Construction Materials (0.9%) |
| |||||||
Lafarge S.A. | 6,490 | 486,324 | ||||||
Martin Marietta Materials, Inc. | 2,032 | 203,078 | ||||||
|
| |||||||
| 689,402 | ||||||||
|
| |||||||
Paper & Forest Products (0.1%) |
| |||||||
Emerald Plantation Holdings Ltd.* | 253,285 | 37,993 | ||||||
|
| |||||||
Total Materials | 4,334,209 | |||||||
|
| |||||||
Total Common Stocks (98.0%) | 75,029,854 | |||||||
|
| |||||||
| Principal Amount | Value (Note 1) | |||||||
LONG-TERM DEBT SECURITIES: |
| |||||||
Corporate Bond (0.2%) | ||||||||
Materials (0.2%) |
| |||||||
Paper & Forest Products (0.2%) | ||||||||
Emerald Plantation Holdings Ltd. | 283,010 | 191,201 | ||||||
|
| |||||||
Total Materials | 191,201 | |||||||
|
| |||||||
Total Corporate Bonds | 191,201 | |||||||
|
| |||||||
Total Long-Term Debt Securities (0.2%) | 191,201 | |||||||
|
| |||||||
Total Investments (98.2%) | 75,221,055 | |||||||
Other Assets Less Liabilities (1.8%) | 1,372,944 | |||||||
|
| |||||||
Net Assets (100%) | $ | 76,593,999 | ||||||
|
| |||||||
| * | Non-income producing. |
| (b) | Illiquid Security. |
Glossary:
| ADR | — American Depositary Receipt |
| PIK | — Payment-in Kind Security |
See Notes to Financial Statements.
8
EQ ADVISORS TRUST
EQ/DAVIS NEW YORK VENTURE PORTFOLIO
PORTFOLIO OF INVESTMENTS (Continued)
December 31, 2013
The following is a summary of the inputs used to value the Portfolio’s assets and liabilities carried at fair value as of December 31, 2013:
The inputs or methodology used for valuing securities are not necessarily an indication of the risk associated with investing in those securities.
Various inputs are used in determining the value of the Portfolio’s investments. These inputs are summarized in the three broad levels listed below:
| Investment Type | Level 1 Quoted Prices in Active Markets for Identical Securities | Level 2 Significant Other Observable Inputs (including quoted prices for similar securities, interest rates, prepayment speeds, credit risk, etc.) | Level 3 Significant Unobservable Inputs (including the Portfolio’s own assumptions in determining the fair value of investments) | Total | ||||||||||||
Assets: | ||||||||||||||||
Common Stocks | ||||||||||||||||
Consumer Discretionary | $ | 8,420,051 | $ | 382,534 | $ | — | $ | 8,802,585 | ||||||||
Consumer Staples | 7,894,493 | 921,382 | — | 8,815,875 | ||||||||||||
Energy | 3,770,242 | — | — | 3,770,242 | ||||||||||||
Financials | 27,319,768 | 1,800,456 | — | 29,120,224 | ||||||||||||
Health Care | 5,611,626 | — | — | 5,611,626 | ||||||||||||
Industrials | 2,011,887 | 2,414,482 | — | 4,426,369 | ||||||||||||
Information Technology | 10,148,724 | — | — | 10,148,724 | ||||||||||||
Materials | 3,847,885 | 486,324 | — | 4,334,209 | ||||||||||||
Corporate Bonds | ||||||||||||||||
Materials | — | 191,201 | — | 191,201 | ||||||||||||
|
|
|
|
|
|
|
| |||||||||
Total Assets | $ | 69,024,676 | $ | 6,196,379 | $ | — | $ | 75,221,055 | ||||||||
|
|
|
|
|
|
|
| |||||||||
Total Liabilities | $ | — | — | $ | — | $ | — | |||||||||
|
|
|
|
|
|
|
| |||||||||
Total | $ | 69,024,676 | $ | 6,196,379 | $ | — | $ | 75,221,055 | ||||||||
|
|
|
|
|
|
|
| |||||||||
There were no transfers between Levels 1, 2 or 3 during the year ended December 31, 2013.
The Portfolio held no derivatives contracts during the year ended December 31, 2013.
Investment security transactions for the year ended December 31, 2013 were as follows:
Cost of Purchases: | ||||
Long-term investments other than U.S. government debt securities | $ | 24,053,196 | ||
Net Proceeds of Sales and Redemptions: | ||||
Long-term investments other than U.S. government debt securities | $ | 80,850,070 |
As of December 31, 2013, the gross unrealized appreciation (depreciation) of investments based on the aggregate cost of investments for Federal income tax purposes was as follows:
Aggregate gross unrealized appreciation | $ | 30,505,487 | ||
Aggregate gross unrealized depreciation | (226,300 | ) | ||
|
| |||
Net unrealized appreciation | $ | 30,279,187 | ||
|
| |||
Federal income tax cost of investments | $ | 44,941,868 | ||
|
|
For the year ended December 31, 2013, the Portfolio incurred approximately $1,357 as brokerage commissions with Sanford C. Bernstein & Co., LLC, an affiliated broker/dealer.
The Portfolio has a net capital loss carryforward of $543,789,588 of which $10,365,820 expires in the year 2016 and $533,423,768 expires in the year 2017. The Portfolio utilized net capital loss carryforward of $8,240,213 during 2013.
See Notes to Financial Statements.
9
EQ ADVISORS TRUST
EQ/DAVIS NEW YORK VENTURE PORTFOLIO
STATEMENT OF ASSETS AND LIABILITIES
December 31, 2013
ASSETS | ||||
Investments at value (Cost $42,601,067) | $ | 75,221,055 | ||
Cash | 1,586,448 | |||
Dividends, interest and other receivables | 192,253 | |||
Receivable from Separate Accounts for Trust shares sold | 19,614 | |||
Other assets | 1,717 | |||
|
| |||
Total assets | 77,021,087 | |||
|
| |||
LIABILITIES | ||||
Payable to Separate Accounts for Trust shares redeemed | 257,493 | |||
Investment management fees payable | 48,575 | |||
Administrative fees payable | 16,985 | |||
Distribution fees payable - Class IB | 7,966 | |||
Distribution fees payable - Class IA | 4,768 | |||
Payable for securities purchased | 799 | |||
Accrued expenses | 90,502 | |||
|
| |||
Total liabilities | 427,088 | |||
|
| |||
NET ASSETS | $ | 76,593,999 | ||
|
| |||
Net assets were comprised of: | ||||
Paid in capital | $ | 590,097,355 | ||
Accumulated undistributed net investment income (loss) | 13,980 | |||
Accumulated undistributed net realized gain (loss) on investments and foreign currency transactions | (546,143,513 | ) | ||
Net unrealized appreciation (depreciation) on investments and foreign currency translations | 32,626,177 | |||
|
| |||
Net assets | $ | 76,593,999 | ||
|
| |||
Class IA | ||||
Net asset value, offering and redemption price per share, $22,837,820 / 1,689,177 shares outstanding (unlimited amount authorized: $0.01 par value) | $ | 13.52 | ||
|
| |||
Class IB | ||||
Net asset value, offering and redemption price per share, $38,530,317 / 2,850,701 shares outstanding (unlimited amount authorized: $0.01 par value) | $ | 13.52 | ||
|
| |||
Class K | ||||
Net asset value, offering and redemption price per share, $15,225,862 / 1,126,091 shares outstanding (unlimited amount authorized: $0.01 par value) | $ | 13.52 | ||
|
|
STATEMENT OF OPERATIONS
For the Year Ended December 31, 2013
INVESTMENT INCOME | ||||
Dividends (net of $92,172 foreign withholding tax) | $ | 3,684,433 | ||
Interest | 40,073 | |||
|
| |||
Total income | 3,724,506 | |||
|
| |||
EXPENSES | ||||
Investment management fees | 2,028,956 | |||
Distribution fees - Class IB | 475,367 | |||
Administrative fees | 272,177 | |||
Distribution fees - Class IA | 51,964 | |||
Professional fees | 42,778 | |||
Custodian fees | 33,999 | |||
Printing and mailing expenses | 18,702 | |||
Trustees’ fees | 8,582 | |||
Miscellaneous | 11,282 | |||
|
| |||
Gross expenses | 2,943,807 | |||
Less: Waiver from investment manager | (265,988 | ) | ||
Fees paid indirectly | (10,423 | ) | ||
|
| |||
Net expenses | 2,667,396 | |||
|
| |||
NET INVESTMENT INCOME (LOSS) | 1,057,110 | |||
|
| |||
REALIZED AND UNREALIZED GAIN (LOSS) | ||||
Realized gain (loss) on: | ||||
Investments | 108,493,792 | |||
Foreign currency transactions | (3,367 | ) | ||
|
| |||
Net realized gain (loss) | 108,490,425 | |||
|
| |||
Change in unrealized appreciation (depreciation) on: | ||||
Investments | (42,552,360 | ) | ||
Foreign currency translations | 4,961 | |||
|
| |||
Net change in unrealized appreciation (depreciation) | (42,547,399 | ) | ||
|
| |||
NET REALIZED AND UNREALIZED GAIN (LOSS) | 65,943,026 | |||
|
| |||
NET INCREASE (DECREASE) IN NET ASSETS RESULTING FROM OPERATIONS | $ | 67,000,136 | ||
|
|
See Notes to Financial Statements.
10
EQ ADVISORS TRUST
EQ/DAVIS NEW YORK VENTURE PORTFOLIO
STATEMENT OF CHANGES IN NET ASSETS
| Year Ended December 31, | ||||||||
| 2013 | 2012 | |||||||
INCREASE (DECREASE) IN NET ASSETS FROM OPERATIONS: | ||||||||
Net investment income (loss) | $ | 1,057,110 | $ | 3,816,457 | ||||
Net realized gain (loss) on investments and foreign currency transactions | 108,490,425 | 12,843,776 | ||||||
Net change in unrealized appreciation (depreciation) on investments and foreign currency translations | (42,547,399 | ) | 27,971,764 | |||||
|
|
|
| |||||
NET INCREASE (DECREASE) IN NET ASSETS RESULTING FROM OPERATIONS | 67,000,136 | 44,631,997 | ||||||
|
|
|
| |||||
DIVIDENDS: | ||||||||
Dividends from net investment income | ||||||||
Class IA | (277,884 | ) | (153,882 | ) | ||||
Class IB | (464,311 | ) | (2,905,474 | ) | ||||
Class K | (326,683 | ) | (395,969 | ) | ||||
|
|
|
| |||||
TOTAL DIVIDENDS | (1,068,878 | ) | (3,455,325 | ) | ||||
|
|
|
| |||||
CAPITAL SHARES TRANSACTIONS: | ||||||||
Class IA | ||||||||
Capital shares sold [527,918 and 436,087 shares, respectively] | 6,333,847 | 4,344,337 | ||||||
Capital shares issued in reinvestment of dividends [21,146 and 14,957 shares, respectively] | 277,884 | 153,882 | ||||||
Capital shares repurchased [(586,480) and (439,361) shares, respectively] | (7,131,816 | ) | (4,372,538 | ) | ||||
|
|
|
| |||||
Total Class IA transactions | (520,085 | ) | 125,681 | |||||
|
|
|
| |||||
Class IB | ||||||||
Capital shares sold [690,170 and 1,684,432 shares, respectively] | 7,984,992 | 16,868,597 | ||||||
Capital shares issued in reinvestment of dividends [35,341 and 282,369 shares, respectively] | 464,311 | 2,905,474 | ||||||
Capital shares repurchased [(3,508,705) and (5,491,452) shares, respectively] | (40,320,290 | ) | (54,793,746 | ) | ||||
Capital shares repurchased in-kind (Note 9)[(27,235,283) and 0 shares, respectively] | (319,294,949 | ) | — | |||||
|
|
|
| |||||
Total Class IB transactions | (351,165,936 | ) | (35,019,675 | ) | ||||
|
|
|
| |||||
Class K | ||||||||
Capital shares sold [197,033 and 171,880 shares, respectively] | 2,364,044 | 1,710,076 | ||||||
Capital shares issued in reinvestment of dividends [24,865 and 38,492 shares, respectively] | 326,683 | 395,969 | ||||||
Capital shares repurchased [(2,567,985) and (440,705) shares, respectively] | (31,104,218 | ) | (4,411,876 | ) | ||||
Capital shares repurchased in-kind (Note 9)[ (11) and 0 shares, respectively] | (130 | ) | — | |||||
|
|
|
| |||||
Total Class K transactions | (28,413,621 | ) | (2,305,831 | ) | ||||
|
|
|
| |||||
NET INCREASE (DECREASE) IN NET ASSETS RESULTING FROM CAPITAL SHARE TRANSACTIONS | (380,099,642 | ) | (37,199,825 | ) | ||||
|
|
|
| |||||
TOTAL INCREASE (DECREASE) IN NET ASSETS | (314,168,384 | ) | 3,976,847 | |||||
NET ASSETS: | ||||||||
Beginning of year | 390,762,383 | 386,785,536 | ||||||
|
|
|
| |||||
End of year (a) | $ | 76,593,999 | $ | 390,762,383 | ||||
|
|
|
|
| ||||
(a) Includes accumulated undistributed (overdistributed) net investment income (loss) of | $ | 13,980 | $ | 29,115 | ||||
|
|
|
| |||||
See Notes to Financial Statements.
11
EQ ADVISORS TRUST
EQ/DAVIS NEW YORK VENTURE PORTFOLIO
FINANCIAL HIGHLIGHTS
| Year Ended December 31, | ||||||||||||||||||||
| Class IA | 2013 | 2012 | 2011 | 2010 | 2009 | |||||||||||||||
Net asset value, beginning of year | $ | 10.26 | $ | 9.25 | $ | 9.73 | $ | 8.78 | $ | 6.71 | ||||||||||
|
|
|
|
|
|
|
|
|
| |||||||||||
Income (loss) from investment operations: | ||||||||||||||||||||
Net investment income (loss) | 0.05 | (e) | 0.10 | (e) | 0.07 | (e) | 0.07 | (e) | 0.09 | (e) | ||||||||||
Net realized and unrealized gain (loss) on investments and foreign currency transactions | 3.38 | 1.00 | (0.50 | ) | 0.98 | 2.13 | † | |||||||||||||
|
|
|
|
|
|
|
|
|
| |||||||||||
Total from investment operations | 3.43 | 1.10 | (0.43 | ) | 1.05 | 2.22 | ||||||||||||||
|
|
|
|
|
|
|
|
|
| |||||||||||
Less distributions: | ||||||||||||||||||||
Dividends from net investment income | (0.17 | ) | (0.09 | ) | (0.05 | ) | (0.10 | ) | (0.15 | ) | ||||||||||
|
|
|
|
|
|
|
|
|
| |||||||||||
Net asset value, end of year | $ | 13.52 | $ | 10.26 | $ | 9.25 | $ | 9.73 | $ | 8.78 | ||||||||||
|
|
|
|
|
|
|
|
|
| |||||||||||
Total return | 33.43 | % | 11.88 | % | (4.37 | )% | 11.96 | % | 33.13 | % | ||||||||||
|
|
|
|
|
|
|
|
|
| |||||||||||
Ratios/Supplemental Data: | ||||||||||||||||||||
Net assets, end of year (000’s) | $ | 22,838 | $ | 17,719 | $ | 15,862 | $ | 39,869 | $ | 30,527 | ||||||||||
Ratio of expenses to average net assets: | ||||||||||||||||||||
After waivers | 1.15 | % | 1.22 | % | 0.99 | % | 0.99 | % | 1.02 | % | ||||||||||
After waivers and fees paid indirectly | 1.15 | % | 1.21 | % | 0.99 | % | 0.99 | % | 1.00 | % | ||||||||||
Before waivers and fees paid indirectly | 1.28 | % | 1.25 | % | 0.99 | % | 0.99 | % | 1.02 | % | ||||||||||
Ratio of net investment income (loss) to average net assets: | ||||||||||||||||||||
After waivers | 0.43 | % | 0.95 | % | 0.74 | % | 0.79 | % | 1.36 | % | ||||||||||
After waivers and fees paid indirectly | 0.43 | % | 0.95 | % | 0.74 | % | 0.79 | % | 1.38 | % | ||||||||||
Before waivers and fees paid indirectly | 0.29 | % | 0.91 | % | 0.74 | % | 0.79 | % | 1.36 | % | ||||||||||
Portfolio turnover rate | 11 | % | 21 | % | 14 | % | 17 | % | 27 | % | ||||||||||
| Year Ended December 31, | ||||||||||||||||||||
| Class IB | 2013 | 2012 | 2011 | 2010 | 2009 | |||||||||||||||
Net asset value, beginning of year | $ | 10.27 | $ | 9.25 | $ | 9.73 | $ | 8.78 | $ | 6.71 | ||||||||||
|
|
|
|
|
|
|
|
|
| |||||||||||
Income (loss) from investment operations: | ||||||||||||||||||||
Net investment income (loss) | 0.05 | (e) | 0.09 | (e) | 0.05 | (e) | 0.05 | (e) | 0.10 | (e) | ||||||||||
Net realized and unrealized gain (loss) on investments and foreign currency transactions | 3.36 | 1.02 | (0.50 | ) | 0.97 | 2.10 | † | |||||||||||||
|
|
|
|
|
|
|
|
|
| |||||||||||
Total from investment operations | 3.41 | 1.11 | (0.45 | ) | 1.02 | 2.20 | ||||||||||||||
|
|
|
|
|
|
|
|
|
| |||||||||||
Less distributions: | ||||||||||||||||||||
Dividends from net investment income | (0.16 | ) | (0.09 | ) | (0.03 | ) | (0.07 | ) | (0.13 | ) | ||||||||||
|
|
|
|
|
|
|
|
|
| |||||||||||
Net asset value, end of year | $ | 13.52 | $ | 10.27 | $ | 9.25 | $ | 9.73 | $ | 8.78 | ||||||||||
|
|
|
|
|
|
|
|
|
| |||||||||||
Total return | 33.30 | % | 11.99 | % | (4.61 | )% | 11.68 | % | 32.79 | % | ||||||||||
|
|
|
|
|
|
|
|
|
| |||||||||||
Ratios/Supplemental Data: | ||||||||||||||||||||
Net assets, end of year (000’s) | $ | 38,530 | $ | 337,407 | $ | 336,677 | $ | 392,007 | $ | 367,431 | ||||||||||
Ratio of expenses to average net assets: | ||||||||||||||||||||
After waivers | 1.15 | % | 1.22 | % | 1.24 | % | 1.24 | % | 1.27 | %(c) | ||||||||||
After waivers and fees paid indirectly | 1.15 | % | 1.21 | % | 1.24 | % | 1.24 | % | 1.19 | % | ||||||||||
Before waivers and fees paid indirectly | 1.28 | % | 1.25 | % | 1.24 | % | 1.24 | % | 1.27 | %(c) | ||||||||||
Ratio of net investment income (loss) to average net assets: | ||||||||||||||||||||
After waivers | 0.40 | % | 0.93 | % | 0.50 | % | 0.53 | % | 1.31 | % | ||||||||||
After waivers and fees paid indirectly | 0.40 | % | 0.93 | % | 0.50 | % | 0.53 | % | 1.40 | % | ||||||||||
Before waivers and fees paid indirectly | 0.29 | % | 0.89 | % | 0.50 | % | 0.53 | % | 1.31 | % | ||||||||||
Portfolio turnover rate | 11 | % | 21 | % | 14 | % | 17 | % | 27 | % | ||||||||||
See Notes to Financial Statements.
12
EQ ADVISORS TRUST
EQ/DAVIS NEW YORK VENTURE PORTFOLIO
FINANCIAL HIGHLIGHTS (Continued)
| Year Ended December 31, | August 26, 2011* to December 31, 2011 | |||||||||||
| Class K | 2013 | 2012 | ||||||||||
Net asset value, beginning of period | $ | 10.26 | $ | 9.25 | $ | 8.79 | ||||||
Income (loss) from investment operations: | ||||||||||||
Net investment income (loss) | 0.08 | (e) | 0.12 | (e) | 0.03 | (e) | ||||||
Net realized and unrealized gain (loss) on investments and foreign currency transactions | 3.38 | 1.01 | 0.48 | |||||||||
|
|
|
|
|
| |||||||
Total from investment operations | 3.46 | 1.13 | 0.51 | |||||||||
|
|
|
|
|
| |||||||
Less distributions: | ||||||||||||
Dividends from net investment income | (0.20 | ) | (0.12 | ) | (0.05 | ) | ||||||
|
|
|
|
|
| |||||||
Net asset value, end of period | $ | 13.52 | $ | 10.26 | $ | 9.25 | ||||||
|
|
|
|
|
| |||||||
Total return (b) | 33.76 | % | 12.16 | % | 5.82 | % | ||||||
|
|
|
|
|
| |||||||
Ratios/Supplemental Data: | ||||||||||||
Net assets, end of period (000’s) | $ | 15,226 | $ | 35,636 | $ | 34,247 | ||||||
Ratio of expenses to average net assets: | ||||||||||||
After waivers (a) | 0.90 | % | 0.97 | % | 0.99 | % | ||||||
After waivers and fees paid indirectly (a) | 0.90 | % | 0.96 | % | 0.98 | % | ||||||
Before waivers and fees paid indirectly (a) | 1.03 | % | 1.00 | % | 0.99 | % | ||||||
Ratio of net investment income (loss) to average net assets: | ||||||||||||
After waivers (a) | 0.71 | % | 1.18 | % | 0.80 | % | ||||||
After waivers and fees paid indirectly (a) | 0.71 | % | 1.18 | % | 0.81 | % | ||||||
Before waivers and fees paid indirectly (a) | 0.58 | % | 1.14 | % | 0.80 | % | ||||||
Portfolio turnover rate | 11 | % | 21 | % | 14 | % | ||||||
| * | Commencement of Operations. |
| † | The amount shown for a share outstanding throughout the period does not accord with the aggregate net income and/or gain on investments for that period because of the timing of sales and repurchases of the Portfolio shares in relation to fluctuating market value of the investments in the Portfolio. |
| (a) | Ratios for periods less than one year are annualized. |
| (b) | Total returns for periods less than one year are not annualized. |
| (c) | Reflects overall fund ratios for non-class specific expenses. |
| (e) | Net investment income (loss) per share is based on average shares outstanding. |
See Notes to Financial Statements.
13
EQ/EQUITY GROWTH PLUS PORTFOLIO (Unaudited)
PORTFOLIO ADVISERS
| Ø | AXA Equitable Funds Management Group, LLC |
| Ø | BlackRock Capital Management, Inc. |
| Ø | BlackRock Investment Management, LLC |
PERFORMANCE RESULTS
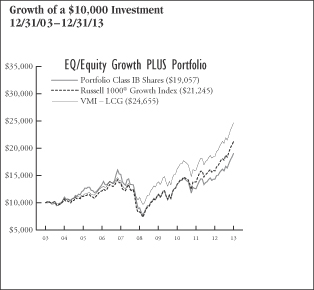
| Annualized Total Returns as of 12/31/13 | ||||||||||||
| 1 Year | 5 Years | 10 Years/ Since Incept. | ||||||||||
Portfolio – Class IA Shares** | 32.58 | % | 16.02 | % | 6.84 | % | ||||||
Portfolio – Class IB Shares* | 32.53 | 15.92 | 6.66 | |||||||||
Portfolio – Class K Shares*** | 32.89 | N/A | 21.09 | |||||||||
Russell 1000® Growth Index | 33.48 | 20.39 | 7.83 | |||||||||
VMI – LCG | 32.94 | 17.48 | 9.44 | |||||||||
* Date of inception 8/31/01.
** Date of inception 10/2/02.
*** Date of inception 8/26/11.
Returns for periods greater than one year are annualized. |
| |||||||||||
Past performance is not indicative of future results.
PERFORMANCE SUMMARY
The Portfolio’s Class IA shares returned 32.58% for the year ended December 31, 2013. The Portfolio’s benchmarks, the Russell 1000® Growth Index, returned 33.48% and the VMI — LCG returned 32.94% over the same period.
The following commentary describes key factors (such as stock selection and sector allocation decisions) that helped or hurt the Portfolio’s performance relative to its primary benchmark.
Portfolio Highlights
For the year ended December 31, 2013
What helped performance during the year:
| • | An underweight position within Consumer Staples was the primary contributor to performance as the sector lagged the benchmark as a whole during the year. A lack of exposure to tobacco companies was the largest contributor to performance within the sector. |
| • | Stock Selection within Information Technology added to performance as the sector provided some of the year’s biggest winners. A significant overweight and selection to Internet Software & Services was the dominant driver of returns in the sector. A position in Yahoo! Inc. was a top performer in the industry. Individual contributors also included data analytics software maker Splunk, Inc. and underweight positions in Apple Inc. and International Business Machines Corp. |
| • | In the Health Care sector, United Therapeutics and Valeant Pharmaceuticals International, Inc. were also notable contributors. |
What hurt performance during the year:
| • | Positioning within the Health Care sector was the largest detractor from performance, with a relative overweight in pharmacy benefit manager Catamaran Corp. and a relative underweight in Celgene Corporation accounting for the majority of the disappointment within the sector. |
| • | Relative underweights in holdings Microsoft, Facebook and Boeing Industrials detracted from performance for the period. |
| • | Relative overweights in Information Technology holdings Teradata, Citrix Systems Inc. and Salesforce.com, Inc. were also detrimental. |
Portfolio Positioning and Outlook – BlackRock Capital Management, Inc.
Economic data bolsters our belief that the U.S. recovery is accelerating, and we feel the trend bodes well for economic and corporate earnings growth in 2014. Historically, when the U.S. economy accelerates, growth stocks tend to outperform the broader market. A run-up in U.S. stocks for 2013 has naturally given way to worries about stretched valuations and the sustainability of the bull market rally. Though pockets of overvaluation may exist, we take a longer-term view of the investments we make, in particular focusing on businesses for which we believe the magnitude and/or duration of future growth prospects are underestimated by the market.
14
EQ/EQUITY GROWTH PLUS PORTFOLIO (Unaudited)
At period end, the Portfolio maintained a diversified mix of Durable and Superior Growth holdings, supplemented by a small number of Periodic Growth names. The Portfolio’s largest overweight relative to the benchmark was in the Consumer Discretionary sector, while the most notable underweight was in Consumer Staples.
| Sector Weightings as of December 31, 2013 | % of Net Assets | |||
Information Technology | 23.6 | % | ||
Consumer Discretionary | 19.8 | |||
Industrials | 10.5 | |||
Health Care | 10.3 | |||
Consumer Staples | 7.0 | |||
Financials | 3.8 | |||
Energy | 3.4 | |||
Materials | 2.9 | |||
Telecommunication Services | 1.8 | |||
Utilities | 0.1 | |||
Cash and Other | 16.8 | |||
|
| |||
| 100.0 | % | |||
|
| |||
UNDERSTANDING YOUR EXPENSES:
As a shareholder of the Portfolio, you incur two types of costs:
(1) transaction costs, including applicable sales charges and redemption fees; and (2) ongoing costs, including management fees, distribution (12b-1) fees (in the case of Class IA and Class IB shares of the Trust), and other Portfolio expenses. These examples are intended to help you understand your ongoing costs (in dollars) of investing in the Portfolio and to compare these costs with the ongoing costs of investing in other mutual funds.
The examples are based on an investment of $1,000 invested at the beginning of the six-month period ended December 31, 2013 and held for the entire six-month period.
Actual Expenses
The first line of the table to the right provides information about actual account values and actual expenses. You may use the information in this line, together with the amount you invested, to estimate the expenses that you paid over the period. Simply divide your account value by $1,000 (for example, an $8,600 account value divided by $1,000 = 8.6), then multiply the result by the number in the first line under the heading entitled “Expenses Paid During Period” to estimate the expenses you paid on your account during this period.
Hypothetical Example for Comparison Purposes
The second line of the table below provides information about hypothetical account values and hypothetical expenses based on the Portfolio’s actual expense ratio and an assumed rate of return of 5% per year before expenses, which is not the Portfolio’s actual return. The hypothetical account values and expenses may not be used to estimate the actual ending account balance or expenses you paid for the period. You may use this information to compare the ongoing costs of investing in the Portfolio and other funds. To do so, compare this 5% hypothetical example with the 5% hypothetical examples that appear in the shareholder reports of the other funds.
Please note that the expenses shown in the table are meant to highlight your ongoing costs only and do not reflect any transactional costs, such as sales charges (loads), redemption fees, or exchange fees. Therefore, the second line of the table is useful in comparing ongoing costs only, and will not help you determine the relative total costs of owning different funds. In addition, if these transactional costs were included, your costs would have been higher. Also note that the table does not reflect any variable life insurance or variable annuity contract-related fees and expenses, which would increase overall fees and expenses.
EXAMPLE
| Beginning Account Value 7/1/13 | Ending Account Value 12/31/13 | Expenses Paid During Period* 7/1/13 - 12/31/13 | ||||||||||
Class IA | ||||||||||||
Actual | $1,000.00 | $1,198.73 | $5.20 | |||||||||
Hypothetical (5% average annual return before expenses) | 1,000.00 | 1,020.48 | 4.77 | |||||||||
Class IB | ||||||||||||
Actual | 1,000.00 | 1,199.14 | 5.18 | |||||||||
Hypothetical (5% average annual return before expenses) | 1,000.00 | 1,020.49 | 4.76 | |||||||||
Class K | ||||||||||||
Actual | 1,000.00 | 1,200.25 | 3.81 | |||||||||
Hypothetical (5% average annual return before expenses) | 1,000.00 | 1,021.74 | 3.50 | |||||||||
* Expenses are equal to the Portfolio’s Class IA, Class IB and Class K shares annualized expense ratios of 0.94%, 0.94% and 0.69%, respectively, multiplied by the average account value over the period, and multiplied by 184/365 (to reflect the one-half year period). |
| |||||||||||
15
EQ ADVISORS TRUST
EQ/EQUITY GROWTH PLUS PORTFOLIO
PORTFOLIO OF INVESTMENTS
December 31, 2013
| Number of Shares | Value (Note 1) | |||||||
COMMON STOCKS: | ||||||||
Consumer Discretionary (19.8%) | ||||||||
Auto Components (0.5%) | ||||||||
Allison Transmission Holdings, Inc. | 153 | $ | 4,224 | |||||
BorgWarner, Inc. | 7,450 | 416,530 | ||||||
Delphi Automotive plc | 36,782 | 2,211,702 | ||||||
Gentex Corp. | 2,662 | 87,819 | ||||||
Goodyear Tire & Rubber Co. | 7,919 | 188,868 | ||||||
Lear Corp. | 294 | 23,805 | ||||||
Visteon Corp.* | 1,604 | 131,352 | ||||||
|
| |||||||
| 3,064,300 | ||||||||
|
| |||||||
Automobiles (0.3%) | ||||||||
Ford Motor Co. | 43,670 | 673,828 | ||||||
Harley-Davidson, Inc. | 7,224 | 500,190 | ||||||
Tesla Motors, Inc.* | 2,695 | 405,274 | ||||||
Thor Industries, Inc. | 1,424 | 78,647 | ||||||
|
| |||||||
| 1,657,939 | ||||||||
|
| |||||||
Distributors (0.1%) | ||||||||
Genuine Parts Co. | 4,720 | 392,657 | ||||||
LKQ Corp.* | 9,624 | 316,629 | ||||||
|
| |||||||
| 709,286 | ||||||||
|
| |||||||
Diversified Consumer Services (0.1%) |
| |||||||
H&R Block, Inc. | 8,777 | 254,884 | ||||||
Service Corp. International | 5,329 | 96,615 | ||||||
Weight Watchers International, Inc. | 474 | 15,609 | ||||||
|
| |||||||
| 367,108 | ||||||||
|
| |||||||
Hotels, Restaurants & Leisure (3.0%) |
| |||||||
Bally Technologies, Inc.* | 1,245 | 97,670 | ||||||
Brinker International, Inc. | 2,133 | 98,843 | ||||||
Burger King Worldwide, Inc. | 3,236 | 73,975 | ||||||
Chipotle Mexican Grill, Inc.* | 996 | 530,649 | ||||||
Choice Hotels International, Inc. | 46 | 2,259 | ||||||
Darden Restaurants, Inc. | 2,732 | 148,539 | ||||||
Domino’s Pizza, Inc. | 1,813 | 126,275 | ||||||
Dunkin’ Brands Group, Inc. | 3,436 | 165,615 | ||||||
International Game Technology | 8,394 | 152,435 | ||||||
Las Vegas Sands Corp. | 12,598 | 993,604 | ||||||
Marriott International, Inc., Class A | 6,628 | 327,158 | ||||||
McDonald’s Corp. | 32,343 | 3,138,241 | ||||||
Melco Crown Entertainment Ltd. (ADR)* | 37,743 | 1,480,281 | ||||||
Norwegian Cruise Line Holdings Ltd.* | 818 | 29,015 | ||||||
Panera Bread Co., Class A* | 906 | 160,081 | ||||||
SeaWorld Entertainment, Inc. | 983 | 28,281 | ||||||
Six Flags Entertainment Corp. | 2,130 | 78,427 | ||||||
Starbucks Corp. | 63,683 | 4,992,110 | ||||||
Starwood Hotels & Resorts Worldwide, Inc. | 2,665 | 211,734 | ||||||
Wyndham Worldwide Corp. | 4,379 | 322,689 | ||||||
Wynn Resorts Ltd. | 16,343 | 3,173,974 | ||||||
Yum! Brands, Inc. | 14,498 | 1,096,194 | ||||||
|
| |||||||
| 17,428,049 | ||||||||
|
| |||||||
Household Durables (0.2%) | ||||||||
Jarden Corp.* | 4,095 | $ | 251,228 | |||||
Newell Rubbermaid, Inc. | 5,384 | 174,495 | ||||||
NVR, Inc.* | 126 | 129,277 | ||||||
PulteGroup, Inc. | 12,490 | 254,421 | ||||||
Taylor Morrison Home Corp., Class A* | 901 | 20,228 | ||||||
Tempur Sealy International, Inc.* | 1,946 | 105,006 | ||||||
Tupperware Brands Corp. | 1,705 | 161,174 | ||||||
Whirlpool Corp. | 179 | 28,078 | ||||||
|
| |||||||
| 1,123,907 | ||||||||
|
| |||||||
Internet & Catalog Retail (3.7%) | ||||||||
Amazon.com, Inc.* | 28,352 | 11,306,494 | ||||||
Expedia, Inc. | 41,222 | 2,871,525 | ||||||
Groupon, Inc.* | 13,533 | 159,283 | ||||||
HomeAway, Inc.* | 1,971 | 80,574 | ||||||
Liberty Interactive Corp.* | 1,384 | 40,620 | ||||||
Liberty Ventures* | 1,186 | 145,392 | ||||||
Netflix, Inc.* | 1,619 | 596,067 | ||||||
priceline.com, Inc.* | 5,099 | 5,927,078 | ||||||
TripAdvisor, Inc.* | 3,612 | 299,182 | ||||||
zulily, Inc., Class A* | 264 | 10,938 | ||||||
|
| |||||||
| 21,437,153 | ||||||||
|
| |||||||
Leisure Equipment & Products (0.2%) |
| |||||||
Hasbro, Inc. | 3,148 | 173,171 | ||||||
Mattel, Inc. | 11,132 | 529,661 | ||||||
Polaris Industries, Inc. | 2,087 | 303,951 | ||||||
|
| |||||||
| 1,006,783 | ||||||||
|
| |||||||
Media (6.8%) | ||||||||
AMC Networks, Inc., Class A* | 1,936 | 131,861 | ||||||
Cablevision Systems Corp. — New York Group, Class A | 6,281 | 112,618 | ||||||
CBS Corp. (Non-Voting), Class B | 18,114 | 1,154,586 | ||||||
Charter Communications, Inc., Class A* | 2,133 | 291,709 | ||||||
Cinemark Holdings, Inc. | 3,717 | 123,888 | ||||||
Clear Channel Outdoor Holdings, Inc., Class A | 1,368 | 13,872 | ||||||
Comcast Corp., Class A | 181,557 | 9,434,610 | ||||||
DIRECTV* | 15,836 | 1,094,109 | ||||||
Discovery Communications, Inc., Class A* | 7,887 | 713,143 | ||||||
DISH Network Corp., Class A* | 6,720 | 389,222 | ||||||
Interpublic Group of Cos., Inc. | 6,283 | 111,209 | ||||||
Lamar Advertising Co., Class A* | 2,540 | 132,715 | ||||||
Liberty Global plc, Class A* | 61,574 | 5,479,470 | ||||||
Lions Gate Entertainment Corp. | 2,604 | 82,443 | ||||||
Madison Square Garden Co., Class A* | 1,971 | 113,490 | ||||||
Morningstar, Inc. | 667 | 52,086 | ||||||
News Corp., Class A* | 11,802 | 212,672 | ||||||
Omnicom Group, Inc. | 8,334 | 619,800 | ||||||
Regal Entertainment Group, Class A | 584 | 11,359 | ||||||
Scripps Networks Interactive, Inc., Class A | 3,534 | 305,373 | ||||||
Sirius XM Holdings, Inc.* | 1,132,753 | 3,953,308 | ||||||
Starz, Class A* | 3,081 | 90,088 | ||||||
See Notes to Financial Statements.
16
EQ ADVISORS TRUST
EQ/EQUITY GROWTH PLUS PORTFOLIO
PORTFOLIO OF INVESTMENTS (Continued)
December 31, 2013
| Number of Shares | Value (Note 1) | |||||||
Time Warner Cable, Inc. | 9,377 | $ | 1,270,584 | |||||
Time Warner, Inc. | 69,909 | 4,874,055 | ||||||
Twenty-First Century Fox, Inc., Class A | 47,203 | 1,660,602 | ||||||
Viacom, Inc., Class B | 24,559 | 2,144,983 | ||||||
Walt Disney Co. | 66,896 | 5,110,854 | ||||||
|
| |||||||
| 39,684,709 | ||||||||
|
| |||||||
Multiline Retail (0.5%) | ||||||||
Big Lots, Inc.* | 498 | 16,080 | ||||||
Dillard’s, Inc., Class A | 586 | 56,965 | ||||||
Dollar General Corp.* | 10,546 | 636,135 | ||||||
Dollar Tree, Inc.* | 6,710 | 378,578 | ||||||
Family Dollar Stores, Inc. | 3,103 | 201,602 | ||||||
Macy’s, Inc. | 9,584 | 511,786 | ||||||
Nordstrom, Inc. | 4,674 | 288,853 | ||||||
Target Corp. | 16,214 | 1,025,860 | ||||||
|
| |||||||
| 3,115,859 | ||||||||
|
| |||||||
Specialty Retail (2.6%) | ||||||||
Aaron’s, Inc. | 370 | 10,878 | ||||||
Abercrombie & Fitch Co., Class A | 296 | 9,741 | ||||||
Advance Auto Parts, Inc. | 2,352 | 260,319 | ||||||
American Eagle Outfitters, Inc. | 4,001 | 57,614 | ||||||
Ascena Retail Group, Inc.* | 594 | 12,569 | ||||||
AutoNation, Inc.* | 1,638 | 81,392 | ||||||
AutoZone, Inc.* | 1,143 | 546,285 | ||||||
Bed Bath & Beyond, Inc.* | 7,045 | 565,713 | ||||||
Best Buy Co., Inc. | 2,351 | 93,758 | ||||||
Cabela’s, Inc.* | 1,532 | 102,123 | ||||||
CarMax, Inc.* | 35,105 | 1,650,637 | ||||||
Chico’s FAS, Inc. | 4,895 | 92,222 | ||||||
Dick’s Sporting Goods, Inc. | 3,185 | 185,049 | ||||||
DSW, Inc., Class A | 2,092 | 89,391 | ||||||
Foot Locker, Inc. | 572 | 23,704 | ||||||
Gap, Inc. | 8,998 | 351,642 | ||||||
GNC Holdings, Inc., Class A | 3,169 | 185,228 | ||||||
Home Depot, Inc. | 47,118 | 3,879,696 | ||||||
L Brands, Inc. | 7,736 | 478,472 | ||||||
Lowe’s Cos., Inc. | 35,082 | 1,738,313 | ||||||
Lumber Liquidators Holdings, Inc.* | 8,998 | 925,804 | ||||||
O’Reilly Automotive, Inc.* | 3,560 | 458,208 | ||||||
PetSmart, Inc. | 3,330 | 242,257 | ||||||
Ross Stores, Inc. | 7,084 | 530,804 | ||||||
Sally Beauty Holdings, Inc.* | 5,473 | 165,449 | ||||||
Signet Jewelers Ltd. | 227 | 17,865 | ||||||
Tiffany & Co. | 3,601 | 334,101 | ||||||
TJX Cos., Inc. | 23,198 | 1,478,409 | ||||||
Tractor Supply Co. | 4,498 | 348,955 | ||||||
Ulta Salon Cosmetics & Fragrance, Inc.* | 2,052 | 198,059 | ||||||
Urban Outfitters, Inc.* | 3,470 | 128,737 | ||||||
Williams-Sonoma, Inc. | 3,149 | 183,524 | ||||||
|
| |||||||
| 15,426,918 | ||||||||
|
| |||||||
Textiles, Apparel & Luxury Goods (1.8%) |
| |||||||
Carter’s, Inc. | 1,758 | 126,207 | ||||||
Coach, Inc. | 9,056 | 508,313 | ||||||
Deckers Outdoor Corp.* | 488 | 41,216 | ||||||
Fossil Group, Inc.* | 1,560 | 187,106 | ||||||
Hanesbrands, Inc. | 3,176 | $ | 223,178 | |||||
Michael Kors Holdings Ltd.* | 27,983 | 2,271,940 | ||||||
NIKE, Inc., Class B | 74,095 | 5,826,831 | ||||||
PVH Corp. | 2,314 | 314,750 | ||||||
Ralph Lauren Corp. | 1,934 | 341,486 | ||||||
Under Armour, Inc., Class A* | 2,699 | 235,623 | ||||||
VF Corp. | 11,288 | 703,694 | ||||||
|
| |||||||
| 10,780,344 | ||||||||
|
| |||||||
Total Consumer Discretionary | 115,802,355 | |||||||
|
| |||||||
Consumer Staples (7.0%) | ||||||||
Beverages (1.9%) | ||||||||
Brown-Forman Corp., Class B | 4,875 | 368,404 | ||||||
Coca-Cola Co. | 123,347 | 5,095,465 | ||||||
Coca-Cola Enterprises, Inc. | 8,372 | 369,456 | ||||||
Constellation Brands, Inc., Class A* | 4,664 | 328,252 | ||||||
Dr. Pepper Snapple Group, Inc. | 6,577 | 320,432 | ||||||
Monster Beverage Corp.* | 4,325 | 293,105 | ||||||
PepsiCo, Inc. | 49,877 | 4,136,798 | ||||||
|
| |||||||
| 10,911,912 | ||||||||
|
| |||||||
Food & Staples Retailing (1.3%) | ||||||||
Costco Wholesale Corp. | 14,064 | 1,673,757 | ||||||
CVS Caremark Corp. | 4,538 | 324,785 | ||||||
Fresh Market, Inc.* | 1,324 | 53,622 | ||||||
Kroger Co. | 16,761 | 662,562 | ||||||
Safeway, Inc. | 607 | 19,770 | ||||||
Sprouts Farmers Market, Inc.* | 462 | 17,755 | ||||||
Sysco Corp. | 6,619 | 238,946 | ||||||
Walgreen Co. | 22,994 | 1,320,775 | ||||||
Wal-Mart Stores, Inc. | 34,448 | 2,710,713 | ||||||
Whole Foods Market, Inc. | 11,954 | 691,300 | ||||||
|
| |||||||
| 7,713,985 | ||||||||
|
| |||||||
Food Products (1.2%) | ||||||||
Archer-Daniels-Midland Co. | 1,615 | 70,091 | ||||||
Campbell Soup Co. | 3,726 | 161,261 | ||||||
ConAgra Foods, Inc. | 12,426 | 418,756 | ||||||
Flowers Foods, Inc. | 5,512 | 118,343 | ||||||
General Mills, Inc. | 20,777 | 1,036,980 | ||||||
Green Mountain Coffee Roasters, Inc.* | 4,808 | 363,389 | ||||||
Hershey Co. | 4,834 | 470,010 | ||||||
Hillshire Brands Co. | 3,967 | 132,657 | ||||||
Hormel Foods Corp. | 4,322 | 195,225 | ||||||
Ingredion, Inc. | 305 | 20,880 | ||||||
J.M. Smucker Co. | 453 | 46,940 | ||||||
Kellogg Co. | 7,720 | 471,460 | ||||||
Kraft Foods Group, Inc. | 19,159 | 1,033,053 | ||||||
McCormick & Co., Inc. (Non-Voting) | 4,251 | 292,979 | ||||||
Mead Johnson Nutrition Co. | 6,526 | 546,618 | ||||||
Mondelez International, Inc., Class A | 51,954 | 1,833,976 | ||||||
Pinnacle Foods, Inc. | 622 | 17,080 | ||||||
WhiteWave Foods Co., Class A* | 4,468 | 102,496 | ||||||
|
| |||||||
| 7,332,194 | ||||||||
|
| |||||||
Household Products (0.6%) | ||||||||
Church & Dwight Co., Inc. | 4,454 | 295,211 | ||||||
See Notes to Financial Statements.
17
EQ ADVISORS TRUST
EQ/EQUITY GROWTH PLUS PORTFOLIO
PORTFOLIO OF INVESTMENTS (Continued)
December 31, 2013
| Number of Shares | Value (Note 1) | |||||||
Clorox Co. | 3,548 | $ | 329,112 | |||||
Colgate-Palmolive Co. | 30,061 | 1,960,278 | ||||||
Kimberly-Clark Corp. | 10,363 | 1,082,519 | ||||||
|
| |||||||
| 3,667,120 | ||||||||
|
| |||||||
Personal Products (0.6%) | ||||||||
Avon Products, Inc. | 13,959 | 240,374 | ||||||
Coty, Inc., Class A | 1,220 | 18,605 | ||||||
Estee Lauder Cos., Inc., Class A | 37,157 | 2,798,665 | ||||||
Herbalife Ltd. | 2,748 | 216,268 | ||||||
Nu Skin Enterprises, Inc., Class A | 1,883 | 260,268 | ||||||
|
| |||||||
| 3,534,180 | ||||||||
|
| |||||||
Tobacco (1.4%) | ||||||||
Altria Group, Inc. | 64,818 | 2,488,363 | ||||||
Lorillard, Inc. | 12,175 | 617,029 | ||||||
Philip Morris International, Inc. | 52,746 | 4,595,759 | ||||||
Reynolds American, Inc. | 7,690 | 384,423 | ||||||
|
| |||||||
| 8,085,574 | ||||||||
|
| |||||||
Total Consumer Staples | 41,244,965 | |||||||
|
| |||||||
Energy (3.4%) | ||||||||
Energy Equipment & Services (1.5%) |
| |||||||
Atwood Oceanics, Inc.* | 344 | 18,366 | ||||||
Baker Hughes, Inc. | 898 | 49,623 | ||||||
Cameron International Corp.* | 5,037 | 299,853 | ||||||
Dresser-Rand Group, Inc.* | 2,455 | 146,392 | ||||||
Dril-Quip, Inc.* | 1,308 | 143,788 | ||||||
FMC Technologies, Inc.* | 40,134 | 2,095,396 | ||||||
Frank’s International N.V. | 496 | 13,392 | ||||||
Halliburton Co. | 27,350 | 1,388,013 | ||||||
Oceaneering International, Inc. | 3,487 | 275,055 | ||||||
RPC, Inc. | 1,632 | 29,131 | ||||||
Schlumberger Ltd. | 42,882 | 3,864,097 | ||||||
Seadrill Ltd. | 11,390 | 467,901 | ||||||
|
| |||||||
| 8,791,007 | ||||||||
|
| |||||||
Oil, Gas & Consumable Fuels (1.9%) |
| |||||||
Anadarko Petroleum Corp. | 889 | 70,515 | ||||||
Antero Resources Corp.* | 562 | 35,653 | ||||||
Cabot Oil & Gas Corp. | 48,798 | 1,891,410 | ||||||
Cheniere Energy, Inc.* | 7,778 | 335,387 | ||||||
Cobalt International Energy, Inc.* | 8,139 | 133,887 | ||||||
Concho Resources, Inc.* | 14,548 | 1,571,184 | ||||||
Continental Resources, Inc.* | 1,377 | 154,940 | ||||||
CVR Energy, Inc. | 504 | 21,889 | ||||||
EOG Resources, Inc. | 8,208 | 1,377,631 | ||||||
EQT Corp. | 4,436 | 398,264 | ||||||
Gulfport Energy Corp.* | 2,244 | 141,709 | ||||||
Kinder Morgan, Inc. | 19,552 | 703,872 | ||||||
Kosmos Energy Ltd.* | 3,260 | 36,447 | ||||||
Laredo Petroleum Holdings, Inc.* | 58,032 | 1,606,906 | ||||||
Noble Energy, Inc. | 1,468 | 99,986 | ||||||
Oasis Petroleum, Inc.* | 3,258 | 153,028 | ||||||
Pioneer Natural Resources Co. | 3,249 | 598,043 | ||||||
QEP Resources, Inc. | 584 | 17,900 | ||||||
Range Resources Corp. | 5,256 | 443,133 | ||||||
SM Energy Co. | 2,136 | 177,523 | ||||||
Southwestern Energy Co.* | 11,330 | 445,609 | ||||||
Whiting Petroleum Corp.* | 304 | 18,808 | ||||||
Williams Cos., Inc. | 12,080 | 465,926 | ||||||
World Fuel Services Corp. | 443 | $ | 19,120 | |||||
|
| |||||||
| 10,918,770 | ||||||||
|
| |||||||
Total Energy | 19,709,777 | |||||||
|
| |||||||
Financials (3.8%) | ||||||||
Capital Markets (0.6%) | ||||||||
Affiliated Managers Group, Inc.* | 1,700 | 368,696 | ||||||
Ameriprise Financial, Inc. | 2,072 | 238,384 | ||||||
Artisan Partners Asset Management, Inc., Class A | 172 | 11,213 | ||||||
BlackRock, Inc. | 1,486 | 470,274 | ||||||
Charles Schwab Corp. | 4,813 | 125,138 | ||||||
Eaton Vance Corp. | 3,869 | 165,554 | ||||||
Federated Investors, Inc., Class B | 2,205 | 63,504 | ||||||
Franklin Resources, Inc. | 13,241 | 764,403 | ||||||
Lazard Ltd., Class A | 4,130 | 187,172 | ||||||
LPL Financial Holdings, Inc. | 1,433 | 67,394 | ||||||
SEI Investments Co. | 4,396 | 152,673 | ||||||
T. Rowe Price Group, Inc. | 8,358 | 700,150 | ||||||
Waddell & Reed Financial, Inc., Class A | 2,770 | 180,382 | ||||||
|
| |||||||
| 3,494,937 | ||||||||
|
| |||||||
Commercial Banks (0.0%) | ||||||||
Signature Bank/New York* | 148 | 15,898 | ||||||
|
| |||||||
Consumer Finance (0.7%) | ||||||||
American Express Co. | 30,572 | 2,773,798 | ||||||
Discover Financial Services | 27,536 | 1,540,639 | ||||||
|
| |||||||
| 4,314,437 | ||||||||
|
| |||||||
Diversified Financial Services (1.0%) |
| |||||||
CBOE Holdings, Inc. | 2,813 | 146,163 | ||||||
IntercontinentalExchange Group, Inc. | 10,704 | 2,407,544 | ||||||
Leucadia National Corp. | 1,288 | 36,502 | ||||||
McGraw Hill Financial, Inc. | 4,170 | 326,094 | ||||||
Moody’s Corp. | 35,214 | 2,763,243 | ||||||
MSCI, Inc.* | 1,631 | 71,307 | ||||||
|
| |||||||
| 5,750,853 | ||||||||
|
| |||||||
Insurance (0.5%) | ||||||||
Allied World Assurance Co. Holdings AG | 369 | 41,627 | ||||||
American Financial Group, Inc./Ohio | 341 | 19,682 | ||||||
Aon plc | 7,682 | 644,443 | ||||||
Arch Capital Group Ltd.* | 271 | 16,176 | ||||||
Arthur J. Gallagher & Co. | 4,086 | 191,756 | ||||||
Axis Capital Holdings Ltd. | 980 | 46,619 | ||||||
Brown & Brown, Inc. | 1,741 | 54,650 | ||||||
Chubb Corp. | 1,195 | 115,473 | ||||||
Endurance Specialty Holdings Ltd. | 474 | 27,810 | ||||||
Erie Indemnity Co., Class A | 801 | 58,569 | ||||||
Hanover Insurance Group, Inc. | 406 | 24,242 | ||||||
Loews Corp. | 792 | 38,206 | ||||||
Marsh & McLennan Cos., Inc. | 11,869 | 573,985 | ||||||
Progressive Corp. | 15,630 | 426,230 | ||||||
Prudential Financial, Inc. | 5,743 | 529,619 | ||||||
Travelers Cos., Inc. | 3,276 | 296,609 | ||||||
See Notes to Financial Statements.
18
EQ ADVISORS TRUST
EQ/EQUITY GROWTH PLUS PORTFOLIO
PORTFOLIO OF INVESTMENTS (Continued)
December 31, 2013
| Number of Shares | Value (Note 1) | |||||||
Validus Holdings Ltd. | 290 | $ | 11,684 | |||||
|
| |||||||
| 3,117,380 | ||||||||
|
| |||||||
Real Estate Investment Trusts (REITs) (0.9%) |
| |||||||
American Homes 4 Rent (REIT), Class A | 315 | 5,103 | ||||||
American Tower Corp. (REIT) | 12,746 | 1,017,386 | ||||||
Apartment Investment & Management Co. (REIT), Class A | 2,582 | 66,900 | ||||||
Boston Properties, Inc. (REIT) | 465 | 46,672 | ||||||
Brixmor Property Group, Inc. (REIT)* | 320 | 6,506 | ||||||
CBL & Associates Properties, Inc. (REIT) | 1,720 | 30,891 | ||||||
Corrections Corp. of America (REIT) | 2,351 | 75,397 | ||||||
Digital Realty Trust, Inc. (REIT) | 3,253 | 159,787 | ||||||
Equity Lifestyle Properties, Inc. (REIT) | 1,942 | 70,359 | ||||||
Extra Space Storage, Inc. (REIT) | 287 | 12,091 | ||||||
Federal Realty Investment Trust (REIT) | 1,382 | 140,149 | ||||||
Omega Healthcare Investors, Inc. (REIT) | 3,937 | 117,323 | ||||||
Plum Creek Timber Co., Inc. (REIT) | 5,715 | 265,805 | ||||||
Public Storage (REIT) | 4,301 | 647,387 | ||||||
Rayonier, Inc. (REIT) | 4,062 | 171,010 | ||||||
Regency Centers Corp. (REIT) | 1,238 | 57,319 | ||||||
Senior Housing Properties Trust (REIT) | 444 | 9,870 | ||||||
Simon Property Group, Inc. (REIT) | 7,464 | 1,135,722 | ||||||
Spirit Realty Capital, Inc. (REIT) | 2,305 | 22,658 | ||||||
Tanger Factory Outlet Centers (REIT) | 3,044 | 97,469 | ||||||
Taubman Centers, Inc. (REIT) | 376 | 24,034 | ||||||
Ventas, Inc. (REIT) | 4,262 | 244,127 | ||||||
Vornado Realty Trust (REIT) | 1,169 | 103,795 | ||||||
Weyerhaeuser Co. (REIT) | 18,767 | 592,474 | ||||||
|
| |||||||
| 5,120,234 | ||||||||
|
| |||||||
Real Estate Management & Development (0.1%) |
| |||||||
CBRE Group, Inc., Class A* | 8,994 | 236,542 | ||||||
Realogy Holdings Corp.* | 3,454 | 170,870 | ||||||
St. Joe Co.* | 143 | 2,744 | ||||||
|
| |||||||
| 410,156 | ||||||||
|
| |||||||
Thrifts & Mortgage Finance (0.0%) | ||||||||
Nationstar Mortgage Holdings, Inc.* | 691 | 25,539 | ||||||
Ocwen Financial Corp.* | 3,340 | 185,203 | ||||||
|
| |||||||
| 210,742 | ||||||||
|
| |||||||
Total Financials | 22,434,637 | |||||||
|
| |||||||
Health Care (10.3%) | ||||||||
Biotechnology (4.3%) | ||||||||
Alexion Pharmaceuticals, Inc.* | 6,289 | 836,814 | ||||||
Alkermes plc* | 4,075 | 165,689 | ||||||
Amgen, Inc. | 24,199 | 2,762,558 | ||||||
ARIAD Pharmaceuticals, Inc.* | 5,953 | $ | 40,599 | |||||
Biogen Idec, Inc.* | 7,662 | 2,143,445 | ||||||
BioMarin Pharmaceutical, Inc.* | 4,480 | 314,810 | ||||||
Celgene Corp.* | 13,462 | 2,274,540 | ||||||
Cubist Pharmaceuticals, Inc.* | 2,102 | 144,765 | ||||||
Gilead Sciences, Inc.* | 99,062 | 7,444,509 | ||||||
Incyte Corp.* | 3,317 | 167,940 | ||||||
Medivation, Inc.* | 2,417 | 154,253 | ||||||
Myriad Genetics, Inc.* | 2,410 | 50,562 | ||||||
Pharmacyclics, Inc.* | 1,884 | 199,290 | ||||||
Quintiles Transnational Holdings, Inc.* | 395 | 18,304 | ||||||
Regeneron Pharmaceuticals, Inc.* | 13,735 | 3,780,421 | ||||||
Seattle Genetics, Inc.* | 3,236 | 129,084 | ||||||
Theravance, Inc.* | 2,553 | 91,014 | ||||||
United Therapeutics Corp.* | 34,819 | 3,937,333 | ||||||
Vertex Pharmaceuticals, Inc.* | 7,503 | 557,473 | ||||||
|
| |||||||
| 25,213,403 | ||||||||
|
| |||||||
Health Care Equipment & Supplies (1.3%) |
| |||||||
Baxter International, Inc. | 17,467 | 1,214,830 | ||||||
Becton, Dickinson and Co. | 6,261 | 691,778 | ||||||
C.R. Bard, Inc. | 2,594 | 347,440 | ||||||
Cooper Cos., Inc. | 1,154 | 142,911 | ||||||
DENTSPLY International, Inc. | 1,289 | 62,491 | ||||||
Edwards Lifesciences Corp.* | 3,641 | 239,432 | ||||||
Hologic, Inc.* | 2,544 | 56,858 | ||||||
IDEXX Laboratories, Inc.* | 1,744 | 185,509 | ||||||
Intuitive Surgical, Inc.* | 9,237 | 3,547,747 | ||||||
ResMed, Inc. | 4,592 | 216,191 | ||||||
Sirona Dental Systems, Inc.* | 1,771 | 124,324 | ||||||
St. Jude Medical, Inc. | 5,809 | 359,868 | ||||||
Stryker Corp. | 6,226 | 467,822 | ||||||
Varian Medical Systems, Inc.* | 3,495 | 271,527 | ||||||
Zimmer Holdings, Inc. | 304 | 28,330 | ||||||
|
| |||||||
| 7,957,058 | ||||||||
|
| |||||||
Health Care Providers & Services (1.0%) |
| |||||||
Aetna, Inc. | 3,243 | 222,437 | ||||||
AmerisourceBergen Corp. | 7,442 | 523,247 | ||||||
Brookdale Senior Living, Inc.* | 3,204 | 87,085 | ||||||
Catamaran Corp.* | 6,637 | 315,125 | ||||||
Cigna Corp. | 534 | 46,714 | ||||||
Community Health Systems, Inc.* | 238 | 9,346 | ||||||
DaVita HealthCare Partners, Inc.* | 5,937 | 376,228 | ||||||
Envision Healthcare Holdings, Inc.* | 1,005 | 35,697 | ||||||
Express Scripts Holding Co.* | 23,028 | 1,617,487 | ||||||
HCA Holdings, Inc.* | 630 | 30,057 | ||||||
Health Management Associates, Inc., Class A* | 8,360 | 109,516 | ||||||
Henry Schein, Inc.* | 2,808 | 320,842 | ||||||
Laboratory Corp. of America Holdings* | 2,818 | 257,481 | ||||||
McKesson Corp. | 7,304 | 1,178,866 | ||||||
MEDNAX, Inc.* | 2,098 | 111,991 | ||||||
Patterson Cos., Inc. | 2,522 | 103,906 | ||||||
Premier, Inc., Class A* | 689 | 25,328 | ||||||
Quest Diagnostics, Inc. | 337 | 18,043 | ||||||
Tenet Healthcare Corp.* | 3,336 | 140,512 | ||||||
See Notes to Financial Statements.
19
EQ ADVISORS TRUST
EQ/EQUITY GROWTH PLUS PORTFOLIO
PORTFOLIO OF INVESTMENTS (Continued)
December 31, 2013
| Number of Shares | Value (Note 1) | |||||||
Universal Health Services, Inc., Class B | 1,968 | $ | 159,920 | |||||
|
| |||||||
| 5,689,828 | ||||||||
|
| |||||||
Health Care Technology (0.1%) | ||||||||
Cerner Corp.* | 9,558 | 532,763 | ||||||
Veeva Systems, Inc., Class A* | 327 | 10,497 | ||||||
|
| |||||||
| 543,260 | ||||||||
|
| |||||||
Life Sciences Tools & Services (0.3%) |
| |||||||
Agilent Technologies, Inc. | 1,310 | 74,919 | ||||||
Bruker Corp.* | 3,528 | 69,748 | ||||||
Charles River Laboratories International, Inc.* | 713 | 37,817 | ||||||
Covance, Inc.* | 1,801 | 158,596 | ||||||
Illumina, Inc.* | 4,009 | 443,476 | ||||||
Life Technologies Corp.* | 3,611 | 273,714 | ||||||
Mettler-Toledo International, Inc.* | 973 | 236,040 | ||||||
Techne Corp. | 552 | 52,258 | ||||||
Waters Corp.* | 2,762 | 276,200 | ||||||
|
| |||||||
| 1,622,768 | ||||||||
|
| |||||||
Pharmaceuticals (3.3%) | ||||||||
AbbVie, Inc. | 120,771 | 6,377,917 | ||||||
Actavis plc* | 5,596 | 940,128 | ||||||
Allergan, Inc. | 25,753 | 2,860,643 | ||||||
Bristol-Myers Squibb Co. | 45,638 | 2,425,660 | ||||||
Eli Lilly and Co. | 6,997 | 356,847 | ||||||
Endo Health Solutions, Inc.* | 3,618 | 244,070 | ||||||
Jazz Pharmaceuticals plc* | 1,672 | 211,608 | ||||||
Johnson & Johnson | 11,678 | 1,069,588 | ||||||
Mylan, Inc.* | 12,283 | 533,082 | ||||||
Perrigo Co. plc | 4,060 | 623,048 | ||||||
Salix Pharmaceuticals Ltd.* | 1,976 | 177,721 | ||||||
Valeant Pharmaceuticals International, Inc.* | 25,471 | 2,990,295 | ||||||
Zoetis, Inc. | 16,114 | 526,767 | ||||||
|
| |||||||
| 19,337,374 | ||||||||
|
| |||||||
Total Health Care | 60,363,691 | |||||||
|
| |||||||
Industrials (10.5%) | ||||||||
Aerospace & Defense (3.7%) | ||||||||
B/E Aerospace, Inc.* | 2,979 | 259,263 | ||||||
Boeing Co. | 24,474 | 3,340,456 | ||||||
Hexcel Corp.* | 3,232 | 144,438 | ||||||
Honeywell International, Inc. | 25,392 | 2,320,067 | ||||||
Huntington Ingalls Industries, Inc. | 1,616 | 145,456 | ||||||
Lockheed Martin Corp. | 8,367 | 1,243,838 | ||||||
Precision Castparts Corp. | 26,271 | 7,074,780 | ||||||
Rockwell Collins, Inc. | 3,896 | 287,992 | ||||||
Spirit AeroSystems Holdings, Inc., Class A* | 501 | 17,074 | ||||||
TransDigm Group, Inc. | 1,689 | 271,963 | ||||||
Triumph Group, Inc. | 338 | 25,712 | ||||||
United Technologies Corp. | 58,202 | 6,623,388 | ||||||
|
| |||||||
| 21,754,427 | ||||||||
|
| |||||||
Air Freight & Logistics (0.5%) | ||||||||
C.H. Robinson Worldwide, Inc. | 4,889 | 285,224 | ||||||
Expeditors International of Washington, Inc. | 6,659 | $ | 294,661 | |||||
United Parcel Service, Inc., Class B | 23,375 | 2,456,245 | ||||||
|
| |||||||
| 3,036,130 | ||||||||
|
| |||||||
Airlines (0.2%) | ||||||||
Alaska Air Group, Inc. | 2,092 | 153,490 | ||||||
American Airlines Group, Inc.* | 3,688 | 93,122 | ||||||
Copa Holdings S.A., Class A | 1,072 | 171,638 | ||||||
Delta Air Lines, Inc. | 12,642 | 347,276 | ||||||
Southwest Airlines Co. | 2,562 | 48,268 | ||||||
United Continental Holdings, Inc.* | 11,471 | 433,948 | ||||||
|
| |||||||
| 1,247,742 | ||||||||
|
| |||||||
Building Products (0.1%) | ||||||||
A.O. Smith Corp. | 1,067 | 57,554 | ||||||
Allegion plc* | 2,286 | 101,033 | ||||||
Armstrong World Industries, Inc.* | 811 | 46,722 | ||||||
Fortune Brands Home & Security, Inc. | 4,675 | 213,647 | ||||||
Lennox International, Inc. | 1,624 | 138,137 | ||||||
Masco Corp. | 11,502 | 261,901 | ||||||
|
| |||||||
| 818,994 | ||||||||
|
| |||||||
Commercial Services & Supplies (0.2%) |
| |||||||
Cintas Corp. | 934 | 55,657 | ||||||
Clean Harbors, Inc.* | 1,951 | 116,982 | ||||||
Copart, Inc.* | 3,600 | 131,940 | ||||||
Iron Mountain, Inc. | 4,943 | 150,020 | ||||||
KAR Auction Services, Inc. | 916 | 27,068 | ||||||
Pitney Bowes, Inc. | 2,819 | 65,683 | ||||||
R.R. Donnelley & Sons Co. | 3,172 | 64,328 | ||||||
Rollins, Inc. | 2,053 | 62,185 | ||||||
Stericycle, Inc.* | 2,781 | 323,069 | ||||||
Waste Connections, Inc. | 3,755 | 163,831 | ||||||
Waste Management, Inc. | 1,205 | 54,068 | ||||||
|
| |||||||
| 1,214,831 | ||||||||
|
| |||||||
Construction & Engineering (0.1%) | ||||||||
AECOM Technology Corp.* | 320 | 9,418 | ||||||
Chicago Bridge & Iron Co. N.V. (N.Y. Shares) | 3,242 | 269,540 | ||||||
Fluor Corp. | 3,145 | 252,512 | ||||||
Quanta Services, Inc.* | 1,416 | 44,689 | ||||||
|
| |||||||
| 576,159 | ||||||||
|
| |||||||
Electrical Equipment (1.7%) | ||||||||
AMETEK, Inc. | 7,849 | 413,407 | ||||||
Babcock & Wilcox Co. | 2,496 | 85,338 | ||||||
Eaton Corp. plc | 45,215 | 3,441,766 | ||||||
Emerson Electric Co. | 17,330 | 1,216,219 | ||||||
Hubbell, Inc., Class B | 1,387 | 151,044 | ||||||
Rockwell Automation, Inc. | 4,501 | 531,838 | ||||||
Roper Industries, Inc. | 16,354 | 2,267,973 | ||||||
SolarCity Corp.* | 26,570 | 1,509,708 | ||||||
|
| |||||||
| 9,617,293 | ||||||||
|
| |||||||
Industrial Conglomerates (0.5%) | ||||||||
3M Co. | 18,842 | 2,642,591 | ||||||
See Notes to Financial Statements.
20
EQ ADVISORS TRUST
EQ/EQUITY GROWTH PLUS PORTFOLIO
PORTFOLIO OF INVESTMENTS (Continued)
December 31, 2013
| Number of Shares | Value (Note 1) | |||||||
Carlisle Cos., Inc. | 105 | $ | 8,337 | |||||
Danaher Corp. | 3,917 | 302,392 | ||||||
|
| |||||||
| 2,953,320 | ||||||||
|
| |||||||
Machinery (1.1%) | ||||||||
Caterpillar, Inc. | 3,837 | 348,438 | ||||||
Colfax Corp.* | 2,760 | 175,784 | ||||||
Crane Co. | 1,443 | 97,042 | ||||||
Cummins, Inc. | 5,014 | 706,824 | ||||||
Deere & Co. | 12,506 | 1,142,173 | ||||||
Donaldson Co., Inc. | 4,362 | 189,573 | ||||||
Dover Corp. | 4,070 | 392,918 | ||||||
Flowserve Corp. | 4,609 | 363,328 | ||||||
Graco, Inc. | 1,975 | 154,287 | ||||||
Harsco Corp. | 180 | 5,045 | ||||||
IDEX Corp. | 2,470 | 182,410 | ||||||
Illinois Tool Works, Inc. | 4,529 | 380,798 | ||||||
Ingersoll-Rand plc | 6,859 | 422,514 | ||||||
ITT Corp. | 2,898 | 125,831 | ||||||
Lincoln Electric Holdings, Inc. | 2,678 | 191,049 | ||||||
Manitowoc Co., Inc. | 4,304 | 100,369 | ||||||
Navistar International Corp.* | 238 | 9,089 | ||||||
Nordson Corp. | 2,070 | 153,801 | ||||||
PACCAR, Inc. | 1,471 | 87,039 | ||||||
Pall Corp. | 3,587 | 306,150 | ||||||
Snap-on, Inc. | 212 | 23,218 | ||||||
Stanley Black & Decker, Inc. | 459 | 37,037 | ||||||
Toro Co. | 1,865 | 118,614 | ||||||
Valmont Industries, Inc. | 862 | 128,541 | ||||||
WABCO Holdings, Inc.* | 1,882 | 175,798 | ||||||
Wabtec Corp. | 3,101 | 230,311 | ||||||
Xylem, Inc. | 365 | 12,629 | ||||||
|
| |||||||
| 6,260,610 | ||||||||
|
| |||||||
Marine (0.0%) | ||||||||
Kirby Corp.* | 1,081 | 107,289 | ||||||
|
| |||||||
Professional Services (0.5%) | ||||||||
Dun & Bradstreet Corp. | 1,192 | 146,318 | ||||||
Equifax, Inc. | 3,885 | 268,415 | ||||||
IHS, Inc., Class A* | 2,119 | 253,644 | ||||||
Nielsen Holdings N.V. | 1,014 | 46,532 | ||||||
Robert Half International, Inc. | 4,498 | 188,871 | ||||||
Verisk Analytics, Inc., Class A* | 33,983 | 2,233,363 | ||||||
|
| |||||||
| 3,137,143 | ||||||||
|
| |||||||
Road & Rail (1.6%) | ||||||||
Amerco, Inc.* | 129 | 30,681 | ||||||
Avis Budget Group, Inc.* | 3,473 | 140,379 | ||||||
Con-way, Inc. | 665 | 26,407 | ||||||
CSX Corp. | 16,436 | 472,864 | ||||||
Genesee & Wyoming, Inc., Class A* | 611 | 58,687 | ||||||
Hertz Global Holdings, Inc.* | 11,162 | 319,456 | ||||||
J.B. Hunt Transport Services, Inc. | 2,947 | 227,803 | ||||||
Kansas City Southern | 3,551 | 439,720 | ||||||
Landstar System, Inc. | 1,501 | 86,232 | ||||||
Norfolk Southern Corp. | 1,838 | 170,622 | ||||||
Old Dominion Freight Line, Inc.* | 2,288 | 121,310 | ||||||
Union Pacific Corp. | 42,788 | 7,188,384 | ||||||
|
| |||||||
| 9,282,545 | ||||||||
|
| |||||||
Trading Companies & Distributors (0.3%) |
| |||||||
Fastenal Co. | 9,561 | $ | 454,243 | |||||
HD Supply Holdings, Inc.* | 1,248 | 29,964 | ||||||
MRC Global, Inc.* | 1,149 | 37,067 | ||||||
MSC Industrial Direct Co., Inc., Class A | 1,524 | 123,246 | ||||||
United Rentals, Inc.* | 5,528 | 430,908 | ||||||
W.W. Grainger, Inc. | 1,901 | 485,553 | ||||||
|
| |||||||
| 1,560,981 | ||||||||
|
| |||||||
Total Industrials | 61,567,464 | |||||||
|
| |||||||
Information Technology (23.6%) | ||||||||
Communications Equipment (0.9%) | ||||||||
CommScope Holding Co., Inc.* | 803 | 15,193 | ||||||
F5 Networks, Inc.* | 2,540 | 230,785 | ||||||
Harris Corp. | 615 | 42,933 | ||||||
JDS Uniphase Corp.* | 5,743 | 74,544 | ||||||
Juniper Networks, Inc.* | 3,020 | 68,161 | ||||||
Motorola Solutions, Inc. | 7,382 | 498,285 | ||||||
Palo Alto Networks, Inc.* | 1,075 | 61,780 | ||||||
QUALCOMM, Inc. | 55,728 | 4,137,804 | ||||||
Riverbed Technology, Inc.* | 4,979 | 90,020 | ||||||
|
| |||||||
| 5,219,505 | ||||||||
|
| |||||||
Computers & Peripherals (2.6%) | ||||||||
3D Systems Corp.* | 3,243 | 301,372 | ||||||
Apple, Inc. | 22,912 | 12,856,152 | ||||||
EMC Corp. | 33,854 | 851,428 | ||||||
NCR Corp.* | 5,299 | 180,484 | ||||||
NetApp, Inc. | 10,954 | 450,648 | ||||||
SanDisk Corp. | 3,305 | 233,135 | ||||||
Stratasys Ltd.* | 633 | 85,265 | ||||||
|
| |||||||
| 14,958,484 | ||||||||
|
| |||||||
Electronic Equipment, Instruments & Components (0.2%) |
| |||||||
Amphenol Corp., Class A | 5,151 | 459,366 | ||||||
CDW Corp. | 307 | 7,172 | ||||||
Dolby Laboratories, Inc., Class A* | 580 | 22,365 | ||||||
FLIR Systems, Inc. | 3,188 | 95,959 | ||||||
IPG Photonics Corp.* | 1,045 | 81,102 | ||||||
National Instruments Corp. | 3,104 | 99,390 | ||||||
Trimble Navigation Ltd.* | 8,245 | 286,101 | ||||||
|
| |||||||
| 1,051,455 | ||||||||
|
| |||||||
Internet Software & Services (8.4%) | ||||||||
Akamai Technologies, Inc.* | 5,727 | 270,200 | ||||||
AOL, Inc.* | 28,602 | 1,333,425 | ||||||
eBay, Inc.* | 81,863 | 4,493,460 | ||||||
Equinix, Inc.* | 1,591 | 282,323 | ||||||
Facebook, Inc., Class A* | 77,043 | 4,211,170 | ||||||
Google, Inc., Class A* | 16,189 | 18,143,174 | ||||||
IAC/InterActiveCorp | 2,407 | 165,337 | ||||||
LinkedIn Corp., Class A* | 20,375 | 4,417,911 | ||||||
Pandora Media, Inc.* | 4,568 | 121,509 | ||||||
Rackspace Hosting, Inc.* | 3,641 | 142,472 | ||||||
SINA Corp.* | 35,112 | 2,958,186 | ||||||
Twitter, Inc.* | 1,948 | 123,990 | ||||||
VeriSign, Inc.* | 4,180 | 249,881 | ||||||
Yahoo!, Inc.* | 176,421 | 7,134,465 | ||||||
Yandex N.V., Class A* | 41,200 | 1,777,780 | ||||||
See Notes to Financial Statements.
21
EQ ADVISORS TRUST
EQ/EQUITY GROWTH PLUS PORTFOLIO
PORTFOLIO OF INVESTMENTS (Continued)
December 31, 2013
| Number of Shares | Value (Note 1) | |||||||
Yelp, Inc.* | 46,285 | $ | 3,191,351 | |||||
Youku Tudou, Inc. (ADR)* | 15,782 | 478,195 | ||||||
|
| |||||||
| 49,494,829 | ||||||||
|
| |||||||
IT Services (5.6%) | ||||||||
Accenture plc, Class A | 20,712 | 1,702,941 | ||||||
Alliance Data Systems Corp.* | 11,869 | 3,120,716 | ||||||
Automatic Data Processing, Inc. | 15,638 | 1,263,707 | ||||||
Booz Allen Hamilton Holding Corp. | 935 | 17,905 | ||||||
Broadridge Financial Solutions, Inc. | 3,908 | 154,444 | ||||||
Cognizant Technology Solutions Corp., Class A* | 9,721 | 981,627 | ||||||
DST Systems, Inc. | 894 | 81,122 | ||||||
Fidelity National Information Services, Inc. | 936 | 50,244 | ||||||
Fiserv, Inc.* | 8,584 | 506,885 | ||||||
FleetCor Technologies, Inc.* | 2,188 | 256,368 | ||||||
Gartner, Inc.* | 3,022 | 214,713 | ||||||
Genpact Ltd.* | 5,418 | 99,529 | ||||||
Global Payments, Inc. | 2,457 | 159,680 | ||||||
International Business Machines Corp. | 33,569 | 6,296,537 | ||||||
Jack Henry & Associates, Inc. | 2,776 | 164,367 | ||||||
Lender Processing Services, Inc. | 2,364 | 88,366 | ||||||
MasterCard, Inc., Class A | 6,425 | 5,367,831 | ||||||
NeuStar, Inc., Class A* | 2,121 | 105,753 | ||||||
Paychex, Inc. | 9,437 | 429,667 | ||||||
Teradata Corp.* | 5,267 | 239,596 | ||||||
Total System Services, Inc. | 4,087 | 136,015 | ||||||
Vantiv, Inc., Class A* | 2,819 | 91,928 | ||||||
Visa, Inc., Class A | 49,656 | 11,057,398 | ||||||
Western Union Co. | 17,956 | 309,741 | ||||||
|
| |||||||
| 32,897,080 | ||||||||
|
| |||||||
Office Electronics (0.0%) | ||||||||
Zebra Technologies Corp., Class A* | 147 | 7,950 | ||||||
|
| |||||||
Semiconductors & Semiconductor Equipment (0.9%) |
| |||||||
Advanced Micro Devices, Inc.* | 19,535 | 75,600 | ||||||
Altera Corp. | 3,560 | 115,807 | ||||||
Analog Devices, Inc. | 4,291 | 218,541 | ||||||
Applied Materials, Inc. | 25,599 | 452,846 | ||||||
Atmel Corp.* | 13,817 | 108,187 | ||||||
Avago Technologies Ltd. | 7,266 | 384,299 | ||||||
Broadcom Corp., Class A | 8,043 | 238,475 | ||||||
Cree, Inc.* | 3,801 | 237,828 | ||||||
Freescale Semiconductor Ltd.* | 818 | 13,129 | ||||||
Intel Corp. | 10,415 | 270,373 | ||||||
Lam Research Corp.* | 1,228 | 66,865 | ||||||
Linear Technology Corp. | 7,518 | 342,445 | ||||||
LSI Corp. | 2,058 | 22,679 | ||||||
Maxim Integrated Products, Inc. | 9,382 | 261,852 | ||||||
Microchip Technology, Inc. | 6,354 | 284,341 | ||||||
ON Semiconductor Corp.* | 13,804 | 113,745 | ||||||
Silicon Laboratories, Inc.* | 1,187 | 51,409 | ||||||
Skyworks Solutions, Inc.* | 5,121 | 146,256 | ||||||
Texas Instruments, Inc. | 35,747 | 1,569,651 | ||||||
Xilinx, Inc. | 8,504 | 390,504 | ||||||
|
| |||||||
| 5,364,832 | ||||||||
|
| |||||||
Software (5.0%) | ||||||||
Adobe Systems, Inc.* | 6,309 | $ | 377,783 | |||||
ANSYS, Inc.* | 3,004 | 261,949 | ||||||
Autodesk, Inc.* | 92,541 | 4,657,589 | ||||||
Cadence Design Systems, Inc.* | 9,122 | 127,890 | ||||||
Citrix Systems, Inc.* | 6,031 | 381,461 | ||||||
Concur Technologies, Inc.* | 1,504 | 155,183 | ||||||
Electronic Arts, Inc.* | 7,492 | 171,866 | ||||||
FactSet Research Systems, Inc. | 1,418 | 153,966 | ||||||
FireEye, Inc.* | 433 | 18,883 | ||||||
Fortinet, Inc.* | 4,373 | 83,656 | ||||||
Informatica Corp.* | 3,484 | 144,586 | ||||||
Intuit, Inc. | 9,570 | 730,382 | ||||||
MICROS Systems, Inc.* | 378 | 21,686 | ||||||
Microsoft Corp. | 269,282 | 10,079,225 | ||||||
NetSuite, Inc.* | 1,129 | 116,310 | ||||||
Oracle Corp. | 114,515 | 4,381,344 | ||||||
Red Hat, Inc.* | 6,111 | 342,460 | ||||||
Rovi Corp.* | 391 | 7,699 | ||||||
Salesforce.com, Inc.* | 19,013 | 1,049,327 | ||||||
ServiceNow, Inc.* | 2,545 | 142,545 | ||||||
SolarWinds, Inc.* | 2,111 | 79,859 | ||||||
Solera Holdings, Inc. | 2,221 | 157,158 | ||||||
Splunk, Inc.* | 39,790 | 2,732,379 | ||||||
Symantec Corp. | 16,346 | 385,439 | ||||||
Tableau Software, Inc., Class A* | 304 | 20,955 | ||||||
TIBCO Software, Inc.* | 5,289 | 118,897 | ||||||
VMware, Inc., Class A* | 24,049 | 2,157,436 | ||||||
Workday, Inc., Class A* | 1,194 | 99,293 | ||||||
|
| |||||||
| 29,157,206 | ||||||||
|
| |||||||
Total Information Technology | 138,151,341 | |||||||
|
| |||||||
Materials (2.9%) | ||||||||
Chemicals (2.5%) | ||||||||
Airgas, Inc. | 2,111 | 236,115 | ||||||
Albemarle Corp. | 997 | 63,200 | ||||||
Celanese Corp. | 5,146 | 284,625 | ||||||
Dow Chemical Co. | 5,107 | 226,751 | ||||||
E.I. du Pont de Nemours & Co. | 29,666 | 1,927,400 | ||||||
Eastman Chemical Co. | 12,658 | 1,021,501 | ||||||
Ecolab, Inc. | 8,451 | 881,186 | ||||||
FMC Corp. | 4,388 | 331,118 | ||||||
International Flavors & Fragrances, Inc. | 2,627 | 225,869 | ||||||
LyondellBasell Industries N.V., Class A | 13,084 | 1,050,384 | ||||||
Monsanto Co. | 39,902 | 4,650,578 | ||||||
NewMarket Corp. | 306 | 102,250 | ||||||
PPG Industries, Inc. | 4,184 | 793,537 | ||||||
Praxair, Inc. | 9,532 | 1,239,446 | ||||||
Rockwood Holdings, Inc. | 1,713 | 123,199 | ||||||
RPM International, Inc. | 3,998 | 165,957 | ||||||
Scotts Miracle-Gro Co., Class A | 1,385 | 86,175 | ||||||
Sherwin-Williams Co. | 2,855 | 523,892 | ||||||
Sigma-Aldrich Corp. | 3,661 | 344,171 | ||||||
Valspar Corp. | 2,872 | 204,745 | ||||||
W.R. Grace & Co.* | 2,132 | 210,791 | ||||||
Westlake Chemical Corp. | 566 | 69,092 | ||||||
|
| |||||||
| 14,761,982 | ||||||||
|
| |||||||
See Notes to Financial Statements.
22
EQ ADVISORS TRUST
EQ/EQUITY GROWTH PLUS PORTFOLIO
PORTFOLIO OF INVESTMENTS (Continued)
December 31, 2013
| Number of Shares | Value (Note 1) | |||||||
Construction Materials (0.1%) | ||||||||
Eagle Materials, Inc. | 1,596 | $ | 123,578 | |||||
Martin Marietta Materials, Inc. | 1,485 | 148,411 | ||||||
|
| |||||||
| 271,989 | ||||||||
|
| |||||||
Containers & Packaging (0.2%) | ||||||||
AptarGroup, Inc. | 1,507 | 102,190 | ||||||
Avery Dennison Corp. | 1,018 | 51,093 | ||||||
Ball Corp. | 4,795 | 247,710 | ||||||
Bemis Co., Inc. | 1,456 | 59,638 | ||||||
Crown Holdings, Inc.* | 3,955 | 176,274 | ||||||
Greif, Inc., Class A | 203 | 10,637 | ||||||
Owens-Illinois, Inc.* | 3,118 | 111,562 | ||||||
Packaging Corp. of America | 3,161 | 200,028 | ||||||
Rock-Tenn Co., Class A | 1,670 | 175,367 | ||||||
Sealed Air Corp. | 6,312 | 214,924 | ||||||
Silgan Holdings, Inc. | 1,421 | 68,236 | ||||||
|
| |||||||
| 1,417,659 | ||||||||
|
| |||||||
Metals & Mining (0.0%) | ||||||||
Compass Minerals International, Inc. | 1,074 | 85,974 | ||||||
Royal Gold, Inc. | 526 | 24,233 | ||||||
Southern Copper Corp. | 5,088 | 146,076 | ||||||
Tahoe Resources, Inc.* | 352 | 5,857 | ||||||
|
| |||||||
| 262,140 | ||||||||
|
| |||||||
Paper & Forest Products (0.1%) | ||||||||
International Paper Co. | 12,330 | 604,540 | ||||||
|
| |||||||
Total Materials | 17,318,310 | |||||||
|
| |||||||
Telecommunication Services (1.8%) | ||||||||
Diversified Telecommunication Services (0.9%) |
| |||||||
Intelsat S.A.* | 45 | 1,014 | ||||||
Level 3 Communications, Inc.* | 1,753 | 58,147 | ||||||
tw telecom, Inc.* | 4,845 | 147,627 | ||||||
Verizon Communications, Inc. | 92,270 | 4,534,148 | ||||||
Vivendi S.A. | 13,712 | 361,332 | ||||||
Windstream Holdings, Inc. | 18,056 | 144,087 | ||||||
|
| |||||||
| 5,246,355 | ||||||||
|
| |||||||
Wireless Telecommunication Services (0.9%) |
| |||||||
Crown Castle International Corp.* | 10,767 | $ | 790,621 | |||||
SBA Communications Corp., Class A* | 4,113 | 369,512 | ||||||
SoftBank Corp. | 45,100 | 3,939,986 | ||||||
Sprint Corp.* | 5,049 | 54,277 | ||||||
|
| |||||||
| 5,154,396 | ||||||||
|
| |||||||
Total Telecommunication Services | 10,400,751 | |||||||
|
| |||||||
Utilities (0.1%) | ||||||||
Electric Utilities (0.0%) | ||||||||
ITC Holdings Corp. | 1,687 | 161,648 | ||||||
|
| |||||||
Gas Utilities (0.1%) | ||||||||
ONEOK, Inc. | 6,244 | 388,252 | ||||||
Questar Corp. | 729 | 16,760 | ||||||
|
| |||||||
| 405,012 | ||||||||
|
| |||||||
Independent Power Producers & Energy Traders (0.0%) |
| |||||||
Calpine Corp.* | 1,464 | 28,563 | ||||||
|
| |||||||
Water Utilities (0.0%) | ||||||||
Aqua America, Inc. | 4,968 | 117,195 | ||||||
|
| |||||||
Total Utilities | 712,418 | |||||||
|
| |||||||
Total Investments (83.2%) | 487,705,709 | |||||||
Other Assets Less Liabilities (16.8%) | 98,180,185 | |||||||
|
| |||||||
Net Assets (100%) | $ | 585,885,894 | ||||||
|
| |||||||
| * | Non-income producing. |
Glossary:
| ADR | — American Depositary Receipt |
At December 31, 2013, the Portfolio had the following futures contracts open: (Note 1)
Purchases | Number of Contracts | Expiration Date | Original Value | Value at 12/31/2013 | Unrealized Appreciation/ (Depreciation) | |||||||||||||||
NASDAQ 100 E-Mini Index | 282 | March-14 | $ | 19,804,567 | $ | 20,212,350 | $ | 407,783 | ||||||||||||
S&P 500 E-Mini Index | 852 | March-14 | 76,556,376 | 78,430,860 | 1,874,484 | |||||||||||||||
|
| |||||||||||||||||||
| $ | 2,282,267 | |||||||||||||||||||
|
| |||||||||||||||||||
See Notes to Financial Statements.
23
EQ ADVISORS TRUST
EQ/EQUITY GROWTH PLUS PORTFOLIO
PORTFOLIO OF INVESTMENTS (Continued)
December 31, 2013
The following is a summary of the inputs used to value the Portfolio’s assets and liabilities carried at fair value as of December 31, 2013:
The inputs or methodology used for valuing securities are not necessarily an indication of the risk associated with investing in those securities.
Various inputs are used in determining the value of the Portfolio’s investments. These inputs are summarized in the three broad levels listed below:
| Investment Type | Level 1 Quoted Prices in Active Markets for Identical Securities | Level 2 Significant Other Observable Inputs (including quoted prices for similar securities, interest rates, prepayment speeds, credit risk, etc.)(a) | Level 3 Significant Unobservable Inputs (including the Portfolio’s own assumptions in determining the fair value of investments) | Total | ||||||||||||
Assets: | ||||||||||||||||
Common Stocks | ||||||||||||||||
Consumer Discretionary | $ | 115,802,355 | $ | — | | $ | — | $ | 115,802,355 | |||||||
Consumer Staples | 40,876,561 | 368,404 | — | 41,244,965 | ||||||||||||
Energy | 19,709,777 | — | — | 19,709,777 | ||||||||||||
Financials | 22,434,637 | — | — | 22,434,637 | ||||||||||||
Health Care | 60,363,691 | — | — | 60,363,691 | ||||||||||||
Industrials | 61,567,464 | — | — | 61,567,464 | ||||||||||||
Information Technology | 138,151,341 | — | — | 138,151,341 | ||||||||||||
Materials | 17,318,310 | — | — | 17,318,310 | ||||||||||||
Telecommunication Services | 6,099,433 | 4,301,318 | — | 10,400,751 | ||||||||||||
Utilities | 712,418 | — | — | 712,418 | ||||||||||||
Futures | 2,282,267 | — | — | 2,282,267 | ||||||||||||
|
|
|
|
|
|
|
| |||||||||
Total Assets | $ | 485,318,254 | $ | 4,669,722 | $ | — | $ | 489,987,976 | ||||||||
|
|
|
|
|
|
|
| |||||||||
Total Liabilities | $ | — | $ | — | $ | — | $ | — | ||||||||
|
|
|
|
|
|
|
| |||||||||
Total | $ | 485,318,254 | $ | 4,669,722 | $ | — | $ | 489,987,976 | ||||||||
|
|
|
|
|
|
|
| |||||||||
(a) A security with a market value of $368,404 transferred from Level 1 to Level 2 during the year ended December 31, 2013 due to inactive trading.
There were no additional transfers between Levels 1, 2 or 3 during the year ended December 31, 2013.
Fair Values of Derivative Instruments as of December 31, 2013:
Statement of Assets and Liabilities | ||||||
Derivatives Not Accounted for as | Asset Derivatives | Fair Value | ||||
Interest rate contracts | Receivables, Net assets - Unrealized appreciation | $ | — | * | ||
Foreign exchange contracts | Receivables | — | ||||
Credit contracts | Receivables | — | ||||
Equity contracts | Receivables, Net assets - Unrealized appreciation | 2,282,267 | * | |||
Commodity contracts | Receivables | — | ||||
Other contracts | Receivables | — | ||||
|
| |||||
Total | $ | 2,282,267 | ||||
|
| |||||
Liability Derivatives | ||||||
Interest rate contracts | Payables, Net assets - Unrealized depreciation | $ | — | * | ||
Foreign exchange contracts | Payables | — | ||||
Credit contracts | Payables | — | ||||
Equity contracts | Payables, Net assets - Unrealized depreciation | — | * | |||
Commodity contracts | Payables | — | ||||
Other contracts | Payables | — | ||||
|
| |||||
Total | $ | — | ||||
|
| |||||
| * | Includes cumulative appreciation/depreciation of futures contracts as reported in the Portfolio of Investments. Only current day’s variation margin is reported within the Statement of Assets & Liabilities. |
See Notes to Financial Statements.
24
EQ ADVISORS TRUST
EQ/EQUITY GROWTH PLUS PORTFOLIO
PORTFOLIO OF INVESTMENTS (Continued)
December 31, 2013
The effect of Derivative Instruments on the Statement of Operations for the year ended December 31, 2013:
| Amount of Realized Gain or (Loss) on Derivatives Recognized in Income | ||||||||||||||||||||
Derivatives Not Accounted for as Hedging Instruments^ | Options | Futures | Forward Currency Contracts | Swaps | Total | |||||||||||||||
Interest rate contracts | $ | — | $ | — | $ | — | $ | — | $ | — | ||||||||||
Foreign exchange contracts | — | — | — | — | — | |||||||||||||||
Credit contracts | — | — | — | — | — | |||||||||||||||
Equity contracts | — | 54,074,704 | — | — | 54,074,704 | |||||||||||||||
Commodity contracts | — | — | — | — | — | |||||||||||||||
Other contracts | — | — | — | — | — | |||||||||||||||
|
|
|
|
|
|
|
|
|
| |||||||||||
Total | $ | — | $ | 54,074,704 | $ | — | $ | — | | $ | 54,074,704 | |||||||||
|
|
|
|
|
|
|
|
|
| |||||||||||
| Amount of Unrealized Appreciation or (Depreciation) on Derivatives Recognized in Income | ||||||||||||||||||||
Derivatives Not Accounted for as Hedging Instruments^ | Options | Futures | Forward Currency Contracts | Swaps | Total | |||||||||||||||
Interest rate contracts | $ | — | $ | — | $ | — | $ | — | $ | — | ||||||||||
Foreign exchange contracts | — | — | — | — | — | |||||||||||||||
Credit contracts | — | — | — | — | — | |||||||||||||||
Equity contracts | — | 3,236,250 | — | — | 3,236,250 | |||||||||||||||
Commodity contracts | — | — | — | — | — | |||||||||||||||
Other contracts | — | — | — | — | — | |||||||||||||||
|
|
|
|
|
|
|
|
|
| |||||||||||
Total | $ | — | | $ | 3,236,250 | $ | — | $ | — | $ | 3,236,250 | |||||||||
|
|
|
|
|
|
|
|
|
| |||||||||||
^ This Portfolio held futures contracts as a substitute for investing in conventional securities, hedging and in an attempt to enhance returns.
The Portfolio held futures contracts with an average notional balance of approximately $194,727,000 during the year ended December 31, 2013.
The following table presents the Portfolio’s gross derivative assets and liabilities by counterparty net of amounts available for offset under netting arrangements and any related collateral received or pledged by the Portfolio as of December 31, 2013:
Counterparty | Gross Amount of Derivative Assets Presented in the Statement of Assets and Liabilities (a) | Derivatives Available for Offset | Collateral Received | Net Amount Due from Counterparty | ||||||||||||
Exchange Traded Futures & Options Contracts (b) | $ | 2,282,267 | (c) | $ | — | $ | — | $ | 2,282,267 | |||||||
|
|
|
|
|
|
|
| |||||||||
| (a) | For financial reporting purposes the Portfolio does not offset derivative assets and derivative liabilities subject to master netting arrangements in the Statement of Assets and Liabilities. |
| (b) | These derivatives are traded on an exchange, therefore they are not subject to master netting arrangements. |
| (c) | This amount represents the cumulative appreciation (depreciation) of futures contracts as reported in the Portfolio of Investments. The Statement of Assets and Liabilities only reflects the current day variation margin receivable/payable to brokers for futures contracts. |
Investment security transactions for the year ended December 31, 2013 were as follows:
Cost of Purchases: | ||||
Long-term investments other than U.S. government debt securities | $ | 688,566,865 | ||
Net Proceeds of Sales and Redemptions: | ||||
Long-term investments other than U.S. government debt securities | $ | 815,036,719 |
See Notes to Financial Statements.
25
EQ ADVISORS TRUST
EQ/EQUITY GROWTH PLUS PORTFOLIO
PORTFOLIO OF INVESTMENTS (Continued)
December 31, 2013
As of December 31, 2013, the gross unrealized appreciation (depreciation) of investments based on the aggregate cost of investments for Federal income tax purposes was as follows:
Aggregate gross unrealized appreciation | $ | 201,514,288 | ||
Aggregate gross unrealized depreciation | (911,984 | ) | ||
|
| |||
Net unrealized appreciation | $ | 200,602,304 | ||
|
| |||
Federal income tax cost of investments | $ | 287,103,405 | ||
|
|
For the year ended December 31, 2013, the Portfolio incurred approximately $3,734 as brokerage commissions with Sanford C. Bernstein & Co., LLC, an affiliated broker/dealer.
The Portfolio has a net capital loss carryforward of $305,117,353, which expires in the year 2017. The Portfolio utilized net capital loss carryforward of $208,922,804 during 2013.
See Notes to Financial Statements.
26
EQ ADVISORS TRUST
EQ/EQUITY GROWTH PLUS PORTFOLIO
STATEMENT OF ASSETS AND LIABILITIES
December 31, 2013
ASSETS | ||||
Investments at value (Cost $285,995,117) | $ | 487,705,709 | ||
Cash | 94,056,062 | |||
Foreign cash (Cost $432) | 435 | |||
Cash held as collateral at broker | 4,530,000 | |||
Receivable for securities sold | 1,350,995 | |||
Dividends, interest and other receivables | 434,812 | |||
Due from broker for futures variation margin | 374,160 | |||
Receivable from Separate Accounts for Trust shares sold | 52,126 | |||
Other assets | 6,639 | |||
|
| |||
Total assets | 588,510,938 | |||
|
| |||
LIABILITIES | ||||
Payable for securities purchased | 1,455,870 | |||
Payable to Separate Accounts for Trust shares redeemed | 702,024 | |||
Investment management fees payable | 242,721 | |||
Distribution fees payable - Class IB | 107,458 | |||
Administrative fees payable | 76,649 | |||
Distribution fees payable - Class IA | 8,008 | |||
Trustees’ fees payable | 1,821 | |||
Accrued expenses | 30,493 | |||
|
| |||
Total liabilities | 2,625,044 | |||
|
| |||
NET ASSETS | $ | 585,885,894 | ||
|
| |||
Net assets were comprised of: | ||||
Paid in capital | $ | 721,249,889 | ||
Accumulated undistributed net investment income (loss) | 97,026 | |||
Accumulated undistributed net realized gain (loss) on investments, futures and foreign currency transactions | (339,453,883 | ) | ||
Net unrealized appreciation (depreciation) on investments, futures and foreign currency translations | 203,992,862 | |||
|
| |||
Net assets | $ | 585,885,894 | ||
|
| |||
Class IA | ||||
Net asset value, offering and redemption price per share, $38,536,445 / 1,831,520 shares outstanding (unlimited amount authorized: $0.01 par value) | $ | 21.04 | ||
|
| |||
Class IB | ||||
Net asset value, offering and redemption price per share, $518,821,979 / 24,776,879 shares outstanding (unlimited amount authorized: $0.01 par value) | $ | 20.94 | ||
|
| |||
Class K | ||||
Net asset value, offering and redemption price per share, $28,527,470 / 1,355,113 shares outstanding (unlimited amount authorized: $0.01 par value) | $ | 21.05 | ||
|
|
STATEMENT OF OPERATIONS
For the Year Ended December 31, 2013
INVESTMENT INCOME | ||||
Dividends (net of $1,034 foreign withholding tax) | $ | 12,817,317 | ||
Interest | 186,931 | |||
|
| |||
Total income | 13,004,248 | |||
|
| |||
EXPENSES | ||||
Investment management fees | 5,591,331 | |||
Distribution fees - Class IB | 2,647,366 | |||
Administrative fees | 1,719,386 | |||
Printing and mailing expenses | 116,897 | |||
Distribution fees - Class IA | 86,710 | |||
Professional fees | 70,800 | |||
Custodian fees | 60,500 | |||
Trustees’ fees | 36,096 | |||
Miscellaneous | 43,671 | |||
|
| |||
Total expenses | 10,372,757 | |||
|
| |||
NET INVESTMENT INCOME (LOSS) | 2,631,491 | |||
|
| |||
REALIZED AND UNREALIZED GAIN (LOSS) | ||||
Realized gain (loss) on: | ||||
Investments | 461,630,296 | |||
Futures | 54,074,704 | |||
Foreign currency transactions | 560 | |||
|
| |||
Net realized gain (loss) | 515,705,560 | |||
|
| |||
Change in unrealized appreciation (depreciation) on: | ||||
Investments | (205,439,098 | ) | ||
Futures | 3,236,250 | |||
Foreign currency translations | 3 | |||
|
| |||
Net change in unrealized appreciation (depreciation) | (202,202,845 | ) | ||
|
| |||
NET REALIZED AND UNREALIZED GAIN (LOSS) | 313,502,715 | |||
|
| |||
NET INCREASE (DECREASE) IN NET ASSETS RESULTING FROM OPERATIONS | $ | 316,134,206 | ||
|
|
See Notes to Financial Statements.
27
EQ ADVISORS TRUST
EQ/EQUITY GROWTH PLUS PORTFOLIO
STATEMENT OF CHANGES IN NET ASSETS
| Year Ended December 31, | ||||||||
| 2013 | 2012 | |||||||
INCREASE (DECREASE) IN NET ASSETS FROM OPERATIONS: | ||||||||
Net investment income (loss) | $ | 2,631,491 | $ | 9,537,421 | ||||
Net realized gain (loss) on investments, futures and foreign currency transactions | 515,705,560 | 139,653,775 | ||||||
Net change in unrealized appreciation (depreciation) on investments, futures and foreign currency translations | (202,202,845 | ) | 64,535,118 | |||||
|
|
|
| |||||
NET INCREASE (DECREASE) IN NET ASSETS RESULTING FROM OPERATIONS | 316,134,206 | 213,726,314 | ||||||
|
|
|
| |||||
DIVIDENDS: | ||||||||
Dividends from net investment income | ||||||||
Class IA | (166,962 | ) | (199,661 | ) | ||||
Class IB | (2,239,892 | ) | (9,289,436 | ) | ||||
Class K | (191,955 | ) | (187,087 | ) | ||||
|
|
|
| |||||
TOTAL DIVIDENDS | (2,598,809 | ) | (9,676,184 | ) | ||||
|
|
|
| |||||
CAPITAL SHARES TRANSACTIONS: | ||||||||
Class IA | ||||||||
Capital shares sold [ 69,416 and 202,851 shares, respectively ] | 1,310,075 | 3,110,278 | ||||||
Capital shares issued in reinvestment of dividends [ 8,133 and 12,486 shares, respectively ] | 166,962 | 199,661 | ||||||
Capital shares repurchased [ (228,902) and (1,938,846) shares, respectively ] | (4,213,637 | ) | (30,869,100 | ) | ||||
|
|
|
| |||||
Total Class IA transactions | (2,736,600 | ) | (27,559,161 | ) | ||||
|
|
|
| |||||
Class IB | ||||||||
Capital shares sold [ 1,055,091 and 1,695,907 shares, respectively ] | 18,775,640 | 25,962,422 | ||||||
Capital shares issued in reinvestment of dividends [ 109,640 and 583,854 shares, respectively ] | 2,239,892 | 9,289,436 | ||||||
Capital shares repurchased [ (8,980,703) and (14,861,424) shares, respectively ] | (157,701,030 | ) | (230,400,275 | ) | ||||
Capital shares repurchased in-kind (Note 9)[ (61,237,584) and 0 shares, respectively ] | (1,130,474,399 | ) | — | |||||
|
|
|
| |||||
Total Class IB transactions | (1,267,159,897 | ) | (195,148,417 | ) | ||||
|
|
|
| |||||
Class K | ||||||||
Capital shares sold [ 252,109 and 1,559,100 shares, respectively ] | 4,604,403 | 24,991,730 | ||||||
Capital shares issued in reinvestment of dividends [ 9,347 and 11,699 shares, respectively ] | 191,955 | 187,087 | ||||||
Capital shares repurchased [ (261,475) and (515,486) shares, respectively ] | (4,766,182 | ) | (7,877,626 | ) | ||||
Capital shares repurchased in-kind (Note 9)[ (7) and 0 shares, respectively ] | (121 | ) | — | |||||
|
|
|
| |||||
Total Class K transactions | 30,055 | 17,301,191 | ||||||
|
|
|
| |||||
NET INCREASE (DECREASE) IN NET ASSETS RESULTING FROM CAPITAL SHARE TRANSACTIONS | (1,269,866,442 | ) | (205,406,387 | ) | ||||
|
|
|
| |||||
TOTAL INCREASE (DECREASE) IN NET ASSETS | (956,331,045 | ) | (1,356,257 | ) | ||||
NET ASSETS: | ||||||||
Beginning of year | 1,542,216,939 | 1,543,573,196 | ||||||
|
|
|
| |||||
End of year (a) | $ | 585,885,894 | $ | 1,542,216,939 | ||||
|
|
|
|
| ||||
(a) Includes accumulated undistributed (overdistributed) net investment income (loss) of | $ | 97,026 | $ | 170,064 | ||||
|
|
|
| |||||
See Notes to Financial Statements.
28
EQ ADVISORS TRUST
EQ/EQUITY GROWTH PLUS PORTFOLIO
FINANCIAL HIGHLIGHTS
| Year Ended December 31, | ||||||||||||||||||||
| Class IA | 2013 | 2012 | 2011 | 2010 | 2009 | |||||||||||||||
Net asset value, beginning of year | $ | 15.94 | $ | 14.05 | $ | 15.02 | $ | 13.07 | $ | 10.34 | ||||||||||
|
|
|
|
|
|
|
|
|
| |||||||||||
Income (loss) from investment operations: | ||||||||||||||||||||
Net investment income (loss) | 0.04 | (e) | 0.08 | (e) | 0.08 | (e) | 0.07 | (e) | 0.13 | (e) | ||||||||||
Net realized and unrealized gain (loss) on investments, futures and foreign currency transactions | 5.15 | 1.91 | (0.97 | ) | 1.96 | 2.73 | ||||||||||||||
|
|
|
|
|
|
|
|
|
| |||||||||||
Total from investment operations | 5.19 | 1.99 | (0.89 | ) | 2.03 | 2.86 | ||||||||||||||
|
|
|
|
|
|
|
|
|
| |||||||||||
Less distributions: | ||||||||||||||||||||
Dividends from net investment income | (0.09 | ) | (0.10 | ) | (0.08 | ) | (0.08 | ) | (0.13 | ) | ||||||||||
|
|
|
|
|
|
|
|
|
| |||||||||||
Net asset value, end of year | $ | 21.04 | $ | 15.94 | $ | 14.05 | $ | 15.02 | $ | 13.07 | ||||||||||
|
|
|
|
|
|
|
|
|
| |||||||||||
Total return | 32.58 | % | 14.16 | % | (5.94 | )% | 15.53 | % | 27.71 | % | ||||||||||
|
|
|
|
|
|
|
|
|
| |||||||||||
Ratios/Supplemental Data: | ||||||||||||||||||||
Net assets, end of year (000’s) | $ | 38,536 | $ | 31,616 | $ | 52,067 | $ | 66,946 | $ | 64,128 | ||||||||||
Ratio of expenses to average net assets: | ||||||||||||||||||||
After waivers and reimbursements | 0.93 | % | 0.96 | % | 0.74 | % | 0.74 | % | 0.80 | % | ||||||||||
After waivers, reimbursements and fees paid indirectly | 0.93 | % | 0.96 | % | 0.74 | % | 0.74 | % | 0.72 | % | ||||||||||
Before waivers, reimbursements and fees paid indirectly | 0.93 | % | 0.96 | % | 0.75 | % | 0.75 | % | 0.80 | % | ||||||||||
Ratio of net investment income (loss) to average net assets: | ||||||||||||||||||||
After waivers and reimbursements | 0.22 | % | 0.53 | % | 0.51 | % | 0.50 | % | 1.09 | % | ||||||||||
After waivers, reimbursements and fees paid indirectly | 0.22 | % | 0.53 | % | 0.51 | % | 0.50 | % | 1.17 | % | ||||||||||
Before waivers, reimbursements and fees paid indirectly | 0.22 | % | 0.53 | % | 0.51 | % | 0.49 | % | 1.08 | % | ||||||||||
Portfolio turnover rate | 75 | % | 29 | % | 38 | % | 41 | % | 157 | % | ||||||||||
| Year Ended December 31, | ||||||||||||||||||||
| Class IB | 2013 | 2012 | 2011 | 2010 | 2009 | |||||||||||||||
Net asset value, beginning of year | $ | 15.87 | $ | 13.98 | $ | 14.95 | $ | 13.00 | $ | 10.26 | ||||||||||
|
|
|
|
|
|
|
|
|
| |||||||||||
Income (loss) from investment operations: | ||||||||||||||||||||
Net investment income (loss) | 0.04 | (e) | 0.09 | (e) | 0.04 | (e) | 0.03 | (e) | 0.10 | (e) | ||||||||||
Net realized and unrealized gain (loss) on investments, futures and foreign currency transactions | 5.12 | 1.90 | (0.97 | ) | 1.96 | 2.74 | ||||||||||||||
|
|
|
|
|
|
|
|
|
| |||||||||||
Total from investment operations | 5.16 | 1.99 | (0.93 | ) | 1.99 | 2.84 | ||||||||||||||
|
|
|
|
|
|
|
|
|
| |||||||||||
Less distributions: | ||||||||||||||||||||
Dividends from net investment income | (0.09 | ) | (0.10 | ) | (0.04 | ) | (0.04 | ) | (0.10 | ) | ||||||||||
|
|
|
|
|
|
|
|
|
| |||||||||||
Net asset value, end of year | $ | 20.94 | $ | 15.87 | $ | 13.98 | $ | 14.95 | $ | 13.00 | ||||||||||
|
|
|
|
|
|
|
|
|
| |||||||||||
Total return | 32.53 | % | 14.23 | % | (6.21 | )% | 15.32 | % | 27.70 | % | ||||||||||
|
|
|
|
|
|
|
|
|
| |||||||||||
Ratios/Supplemental Data: | ||||||||||||||||||||
Net assets, end of year (000’s) | $ | 518,822 | $ | 1,488,983 | $ | 1,487,294 | $ | 1,836,680 | $ | 1,856,981 | ||||||||||
Ratio of expenses to average net assets: | ||||||||||||||||||||
After waivers and reimbursements | 0.93 | % | 0.96 | % | 0.99 | % | 0.99 | % | 1.05 | %(c) | ||||||||||
After waivers, reimbursements and fees paid indirectly | 0.93 | % | 0.96 | % | 0.99 | % | 0.99 | % | 0.97 | %(c) | ||||||||||
Before waivers, reimbursements and fees paid indirectly | 0.93 | % | 0.96 | % | 1.00 | % | 1.00 | % | 1.05 | %(c) | ||||||||||
Ratio of net investment income (loss) to average net assets: | ||||||||||||||||||||
After waivers and reimbursements | 0.23 | % | 0.59 | % | 0.27 | % | 0.26 | % | 0.84 | % | ||||||||||
After waivers, reimbursements and fees paid indirectly | 0.23 | % | 0.59 | % | 0.27 | % | 0.26 | % | 0.92 | % | ||||||||||
Before waivers, reimbursements and fees paid indirectly | 0.23 | % | 0.59 | % | 0.26 | % | 0.25 | % | 0.83 | % | ||||||||||
Portfolio turnover rate | 75 | % | 29 | % | 38 | % | 41 | % | 157 | % | ||||||||||
See Notes to Financial Statements.
29
EQ ADVISORS TRUST
EQ/EQUITY GROWTH PLUS PORTFOLIO
FINANCIAL HIGHLIGHTS (Continued)
| Year Ended December 31, | August 26, 2011* to December 31, 2011 | |||||||||||
| Class K | 2013 | 2012 | ||||||||||
Net asset value, beginning of period | $ | 15.95 | $ | 14.05 | $ | 13.71 | ||||||
|
|
|
|
|
| |||||||
Income (loss) from investment operations: | ||||||||||||
Net investment income (loss) | 0.09 | (e) | 0.15 | (e) | 0.04 | (e) | ||||||
Net realized and unrealized gain (loss) on investments, futures and foreign currency transactions | 5.15 | 1.89 | 0.37 | |||||||||
|
|
|
|
|
| |||||||
Total from investment operations | 5.24 | 2.04 | 0.41 | |||||||||
|
|
|
|
|
| |||||||
Less distributions: | ||||||||||||
Dividends from net investment income | (0.14 | ) | (0.14 | ) | (0.07 | ) | ||||||
|
|
|
|
|
| |||||||
Net asset value, end of period | $ | 21.05 | $ | 15.95 | $ | 14.05 | ||||||
|
|
|
|
|
| |||||||
Total return (b) | 32.89 | % | 14.52 | % | 3.04 | % | ||||||
|
|
|
|
|
| |||||||
Ratios/Supplemental Data: | ||||||||||||
Net assets, end of period (000’s) | $ | 28,527 | $ | 21,618 | $ | 4,212 | ||||||
Ratio of expenses to average net assets: | ||||||||||||
After waivers and reimbursements (a) | 0.68 | % | 0.71 | % | 0.76 | % | ||||||
After waivers, reimbursements and fees paid indirectly (a) | 0.68 | % | �� | 0.71 | % | 0.76 | % | |||||
Before waivers, reimbursements and fees paid indirectly (a) | 0.68 | % | 0.71 | % | 0.76 | % | ||||||
Ratio of net investment income (loss) to average net assets: | ||||||||||||
After waivers and reimbursements (a) | 0.47 | % | 0.96 | % | 0.76 | % | ||||||
After waivers, reimbursements and fees paid indirectly (a) | 0.47 | % | 0.96 | % | 0.76 | % | ||||||
Before waivers, reimbursements and fees paid indirectly (a) | 0.47 | % | 0.96 | % | 0.76 | % | ||||||
Portfolio turnover rate | 75 | % | 29 | % | 38 | % | ||||||
| * | Commencement of Operations. |
| (a) | Ratios for periods less than one year are annualized. |
| (b) | Total returns for periods less than one year are not annualized. |
| (c) | Reflects overall fund ratios for non-class specific expenses. |
| (e) | Net investment income (loss) per share is based on average shares outstanding. |
See Notes to Financial Statements.
30
EQ/INVESCO COMSTOCK PORTFOLIO (Unaudited)
PORTFOLIO ADVISER
| Ø | Invesco Advisers, Inc. |
PERFORMANCE RESULTS
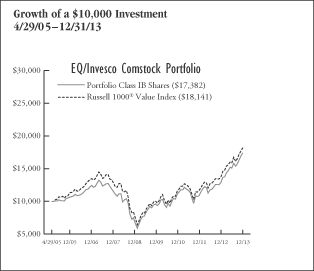
| Annualized Total Returns as of 12/31/13 | ||||||||||||
| 1 Year | 5 Year | Since Incept. | ||||||||||
Portfolio – Class IA Shares* | 35.10 | % | 18.51 | % | 6.79 | % | ||||||
Portfolio – Class IB Shares* | 35.06 | 18.31 | 6.58 | |||||||||
Portfolio – Class K Shares** | N/A | N/A | 6.27 | |||||||||
Russell 1000® Value Index | 32.53 | 16.67 | 7.11 | |||||||||
* Date of inception 4/29/05.
** Date of inception 10/29/13.
Returns for periods greater than one year are annualized. |
| |||||||||||
Past performance is not indicative of future results.
PERFORMANCE SUMMARY
The Portfolio’s Class IA shares returned 35.10% for the year ended December 31, 2013. The Portfolio’s benchmark, the Russell 1000® Value Index, returned 32.53% over the same period.
Portfolio Highlights
For the year ended December 31, 2013
What helped performance during the year:
| • | On the positive side of sector performance, strong stock selection within Financials, mainly having no exposure to Real Estate Investment Trusts (REITs), was one of the strongest contributors to relative performance. Real estate was one of the worst performing industries in the benchmark, posting flat returns in a strong stock market. |
| • | An overweight position and contributions from select stocks in the Consumer Discretionary sector were large contributors to Portfolio performance. The Portfolio’s main Consumer Discretionary exposure was in the media industry, with holdings such as Viacom and Twenty-First Century Fox contributing the most within this industry. |
| • | Favorable stock selection and an overweight in the Information Technology sector boosted performance as well. Within the software and services industry, Microsoft Corp. and Yahoo! Inc. and within the hardware and equipment industry, Hewlett-Packard were the clear contributors. |
| • | Also, a material underweight to Utilities enhanced relative performance, as this was the second worst performing sector in the benchmark. |
| • | Stock selection and an underweight to Energy assisted with performance. The largest relative contributor within the sector was not owning Exxon Mobil Corp., as the company performed poorly on a relative basis. |
| • | Favorable stock selection in the Consumer Staples sector also helped Portfolio performance. |
| • | Bristol-Myers Squibb Co., a large pharmaceuticals provider, had strong returns during the period, with improving earnings and presenting important new clinical data for immune-oncology and diabetes treatments. |
What hurt performance during the year:
| • | An underweight to Industrials was a slight detractor to relative performance, offsetting strong stock selection within the sector. |
| • | Individual holdings detracting from performance included eBay Inc., Royal Dutch Shell plc (ADR) and QEP Resources, Inc. |
Portfolio Positioning and Outlook
During the fiscal year, trading activity for the portfolio remained muted. Towards the end of the reporting period, managers increased positions in Health Care, Energy and select Consumer Staples companies. Conversely, we continued to trim select insurance and technology stocks. The majority of activity occurred in the Consumer Discretionary sector, where we continued to reduce media and select retail companies that have performed well.
| Sector Weightings as of December 31, 2013 | % of Net Assets | |||
Financials | 23.8 | % | ||
Consumer Discretionary | 15.0 | |||
Energy | 14.6 | |||
Health Care | 14.3 | |||
Information Technology | 9.5 | |||
Industrials | 7.0 | |||
Consumer Staples | 5.2 | |||
Utilities | 2.2 | |||
Telecommunication Services | 2.2 | |||
Materials | 2.1 | |||
Cash and Other | 4.1 | |||
|
| |||
| 100.0 | % | |||
|
| |||
31
EQ/INVESCO COMSTOCK PORTFOLIO (Unaudited)
UNDERSTANDING YOUR EXPENSES:
As a shareholder of the Portfolio, you incur two types of costs:
(1)transaction costs, including applicable sales charges and redemption fees; and (2)ongoing costs, including management fees, distribution (12b-1) fees (in the case of Class IA and Class IB shares of the Trust), and other Portfolio expenses. These examples are intended to help you understand your ongoing costs (in dollars) of investing in the Portfolio and to compare these costs with the ongoing costs of investing in other mutual funds.
The examples are based on an investment of $1,000 invested at the beginning of the six-month period ended December 31, 2013 and held for the entire six-month period.
Actual Expenses
The first line of the table to the right provides information about actual account values and actual expenses. You may use the information in this line, together with the amount you invested, to estimate the expenses that you paid over the period. Simply divide your account value by $1,000 (for example, an $8,600 account value divided by $1,000 = 8.6), then multiply the result by the number in the first line under the heading entitled ‘‘Expenses Paid During Period’’ to estimate the expenses you paid on your account during this period.
Hypothetical Example for Comparison Purposes
The second line of the table below provides information about hypothetical account values and hypothetical expenses based on the Portfolio’s actual expense ratio and an assumed rate of return of 5% per year before expenses, which is not the Portfolio’s actual return. The hypothetical account values and expenses may not be used to estimate the actual ending account balance or expenses you paid for the period. You may use this information to compare the ongoing costs of investing in the Portfolio and other funds. To do so, compare this 5% hypothetical example with the 5% hypothetical examples that appear in the shareholder reports of the other funds.
Please note that the expenses shown in the table are meant to highlight your ongoing costs only and do not reflect any transactional costs, such as sales charges (loads), redemption fees, or exchange fees. Therefore, the second line of the table is useful in comparing ongoing costs only, and will not help you determine the relative total costs of owning different funds. In addition, if these transactional costs were included, your costs would have been higher. Also note that the table does not reflect any variable life insurance or variable annuity contract-related fees and expenses, which would increase overall fees and expenses.
Please note that while Class K commenced operations on October 29, 2013, the ‘Hypothetical Expenses Paid during the Period’ reflect projected activity for the full six months for the purpose of comparability.
EXAMPLE
| Beginning Account Value 7/1/13 | Ending Account Value 12/31/13 | Expenses Paid During Period* 7/1/13 - 12/31/13 | ||||||||||
Class IA | ||||||||||||
Actual | $1,000.00 | $1,154.00 | $5.43 | |||||||||
Hypothetical (5% average annual return before expenses) | 1,000.00 | 1,020.16 | 5.09 | |||||||||
Class IB | ||||||||||||
Actual | 1,000.00 | 1,153.86 | 5.43 | |||||||||
Hypothetical (5% average annual return before expenses) | 1,000.00 | 1,020.16 | 5.09 | |||||||||
Class K | ||||||||||||
Actual | 1,000.00 | 1,062.70 | 1.36 | |||||||||
Hypothetical (5% average annual return before expenses) | 1,000.00 | 1,021.42 | 3.83 | |||||||||
* Expenses are equal to the Portfolio’s Class IA, Class IB and Class K shares annualized expense ratios of 1.00%, 1.00% and 0.75%, respectively, multiplied by the average account value over the period, and multiplied by 184/365 for Class IA and Class IB and the hypothetical example (to reflect the one-half year period), and multiplied by 64/365 for Class K (to reflect the actual number of days in the period). |
| |||||||||||
32
EQ ADVISORS TRUST
EQ/INVESCO COMSTOCK PORTFOLIO
PORTFOLIO OF INVESTMENTS
December 31, 2013
| Number of Shares | Value (Note 1) | |||||||
COMMON STOCKS: | ||||||||
Consumer Discretionary (15.0%) |
| |||||||
Auto Components (1.1%) |
| |||||||
Johnson Controls, Inc. | 15,091 | $ | 774,168 | |||||
|
| |||||||
Automobiles (2.2%) | ||||||||
General Motors Co.* | 36,542 | 1,493,471 | ||||||
|
| |||||||
Hotels, Restaurants & Leisure (1.6%) |
| |||||||
Carnival Corp. | 26,495 | 1,064,304 | ||||||
|
| |||||||
Household Durables (0.7%) |
| |||||||
Newell Rubbermaid, Inc. | 13,531 | 438,540 | ||||||
|
| |||||||
Media (7.7%) |
| |||||||
Comcast Corp., Class A | 20,631 | 1,072,090 | ||||||
Time Warner Cable, Inc. | 7,349 | 995,790 | ||||||
Time Warner, Inc. | 6,936 | 483,578 | ||||||
Twenty-First Century Fox, Inc., Class B | 28,127 | 973,194 | ||||||
Viacom, Inc., Class B | 18,718 | 1,634,830 | ||||||
|
| |||||||
| 5,159,482 | ||||||||
|
| |||||||
Multiline Retail (1.7%) |
| |||||||
Kohl’s Corp. | 11,541 | 654,952 | ||||||
Target Corp. | 7,512 | 475,284 | ||||||
|
| |||||||
| 1,130,236 | ||||||||
|
| |||||||
Total Consumer Discretionary | 10,060,201 | |||||||
|
| |||||||
Consumer Staples (5.2%) |
| |||||||
Food & Staples Retailing (1.6%) |
| |||||||
CVS Caremark Corp. | 15,490 | 1,108,619 | ||||||
|
| |||||||
Food Products (3.6%) |
| |||||||
ConAgra Foods, Inc. | 25,445 | 857,497 | ||||||
Mondelez International, Inc., Class A | 17,317 | 611,290 | ||||||
Tyson Foods, Inc., Class A | 11,638 | 389,407 | ||||||
Unilever N.V. (N.Y. Shares) | 13,386 | 538,519 | ||||||
|
| |||||||
| 2,396,713 | ||||||||
|
| |||||||
Total Consumer Staples | 3,505,332 | |||||||
|
| |||||||
Energy (14.6%) | ||||||||
Energy Equipment & Services (4.8%) |
| |||||||
Halliburton Co. | 27,714 | 1,406,485 | ||||||
Noble Corp. plc | 7,317 | 274,168 | ||||||
Weatherford International Ltd.* | 99,432 | 1,540,202 | ||||||
|
| |||||||
| 3,220,855 | ||||||||
|
| |||||||
Oil, Gas & Consumable Fuels (9.8%) |
| |||||||
BP plc (ADR) | 27,954 | 1,358,844 | ||||||
Chevron Corp. | 6,183 | 772,319 | ||||||
Murphy Oil Corp. | 13,566 | 880,162 | ||||||
Occidental Petroleum Corp. | 8,232 | 782,863 | ||||||
QEP Resources, Inc. | 23,431 | 718,160 | ||||||
Royal Dutch Shell plc (ADR), | 18,166 | 1,294,691 | ||||||
Suncor Energy, Inc. | 21,657 | 759,078 | ||||||
|
| |||||||
| 6,566,117 | ||||||||
|
| |||||||
Total Energy | 9,786,972 | |||||||
|
| |||||||
Financials (23.8%) | ||||||||
Capital Markets (5.7%) | ||||||||
Bank of New York Mellon Corp. | 43,320 | 1,513,601 | ||||||
Goldman Sachs Group, Inc. | 3,884 | 688,478 | ||||||
Morgan Stanley | 34,365 | $ | 1,077,686 | |||||
State Street Corp. | 7,247 | 531,857 | ||||||
|
| |||||||
| 3,811,622 | ||||||||
|
| |||||||
Commercial Banks (5.1%) |
| |||||||
Fifth Third Bancorp | 33,632 | 707,281 | ||||||
PNC Financial Services Group, Inc. | 12,603 | 977,741 | ||||||
U.S. Bancorp/Minnesota | 8,341 | 336,976 | ||||||
Wells Fargo & Co. | 31,227 | 1,417,706 | ||||||
|
| |||||||
| 3,439,704 | ||||||||
|
| |||||||
Diversified Financial Services (8.8%) |
| |||||||
Bank of America Corp. | 70,989 | 1,105,299 | ||||||
Citigroup, Inc. | 51,574 | 2,687,521 | ||||||
JPMorgan Chase & Co. | 36,632 | 2,142,239 | ||||||
|
| |||||||
| 5,935,059 | ||||||||
|
| |||||||
Insurance (4.2%) | ||||||||
Aflac, Inc. | 6,549 | 437,473 | ||||||
Allstate Corp. | 23,100 | 1,259,874 | ||||||
MetLife, Inc. | 16,577 | 893,832 | ||||||
Travelers Cos., Inc. | 2,842 | 257,315 | ||||||
|
| |||||||
| 2,848,494 | ||||||||
|
| |||||||
Total Financials | 16,034,879 | |||||||
|
| |||||||
Health Care (14.3%) | ||||||||
Health Care Providers & Services (4.4%) |
| |||||||
Cardinal Health, Inc. | 7,159 | 478,293 | ||||||
Express Scripts Holding Co.* | 5,777 | 405,776 | ||||||
UnitedHealth Group, Inc. | 17,105 | 1,288,006 | ||||||
WellPoint, Inc. | 8,412 | 777,185 | ||||||
|
| |||||||
| 2,949,260 | ||||||||
|
| |||||||
Pharmaceuticals (9.9%) | ||||||||
Bristol-Myers Squibb Co. | 18,260 | 970,519 | ||||||
GlaxoSmithKline plc (ADR) | 11,614 | 620,072 | ||||||
Merck & Co., Inc. | 27,757 | 1,389,238 | ||||||
Novartis AG (ADR) | 12,045 | 968,177 | ||||||
Pfizer, Inc. | 37,227 | 1,140,263 | ||||||
Roche Holding AG (ADR) | 8,877 | 623,165 | ||||||
Sanofi S.A. (ADR) | 17,409 | 933,645 | ||||||
|
| |||||||
| 6,645,079 | ||||||||
|
| |||||||
Total Health Care | 9,594,339 | |||||||
|
| |||||||
Industrials (7.0%) | ||||||||
Aerospace & Defense (2.0%) |
| |||||||
Honeywell International, Inc. | 5,755 | 525,834 | ||||||
Textron, Inc. | 21,580 | 793,281 | ||||||
|
| |||||||
| 1,319,115 | ||||||||
|
| |||||||
Building Products (0.2%) |
| |||||||
Allegion plc* | 2,591 | 114,481 | ||||||
|
| |||||||
Electrical Equipment (1.2%) |
| |||||||
Emerson Electric Co. | 11,453 | 803,772 | ||||||
|
| |||||||
Industrial Conglomerates (2.2%) |
| |||||||
General Electric Co. | 52,815 | 1,480,405 | ||||||
|
| |||||||
Machinery (1.4%) | ||||||||
Ingersoll-Rand plc | 15,932 | 981,411 | ||||||
|
| |||||||
Total Industrials | 4,699,184 | |||||||
|
| |||||||
See Notes to Financial Statements.
33
EQ ADVISORS TRUST
EQ/INVESCO COMSTOCK PORTFOLIO
PORTFOLIO OF INVESTMENTS (Continued)
December 31, 2013
| Number of Shares | Value (Note 1) | |||||||
Information Technology (9.5%) |
| |||||||
Communications Equipment (1.2%) |
| |||||||
Cisco Systems, Inc. | 34,892 | $ | 783,325 | |||||
|
| |||||||
Computers & Peripherals (1.9%) |
| |||||||
Hewlett-Packard Co. | 44,684 | 1,250,258 | ||||||
|
| |||||||
Electronic Equipment, Instruments & Components (1.2%) |
| |||||||
Corning, Inc. | 45,078 | 803,290 | ||||||
|
| |||||||
Internet Software & Services (2.0%) |
| |||||||
eBay, Inc.* | 16,713 | 917,377 | ||||||
Yahoo!, Inc.* | 11,550 | 467,082 | ||||||
|
| |||||||
| 1,384,459 | ||||||||
|
| |||||||
Semiconductors & Semiconductor Equipment (0.8%) |
| |||||||
Intel Corp. | 21,053 | 546,536 | ||||||
|
| |||||||
Software (2.4%) | ||||||||
Autodesk, Inc.* | 8,498 | 427,704 | ||||||
Microsoft Corp. | 32,250 | 1,207,118 | ||||||
|
| |||||||
| 1,634,822 | ||||||||
|
| |||||||
Total Information Technology | 6,402,690 | |||||||
|
| |||||||
Materials (2.1%) | ||||||||
Metals & Mining (1.0%) | ||||||||
Alcoa, Inc. | 62,120 | 660,336 | ||||||
|
| |||||||
Paper & Forest Products (1.1%) | ||||||||
International Paper Co. | 14,800 | 725,644 | ||||||
|
| |||||||
Total Materials | 1,385,980 | |||||||
|
| |||||||
Telecommunication Services (2.2%) |
| |||||||
Diversified Telecommunication Services (1.3%) |
| |||||||
AT&T, Inc. | 7,368 | $ | 259,059 | |||||
Verizon Communications, Inc. | 7,994 | 392,825 | ||||||
Vivendi S.A. | 8,015 | 211,208 | ||||||
|
| |||||||
| 863,092 | ||||||||
|
| |||||||
Wireless Telecommunication Services (0.9%) |
| |||||||
Vodafone Group plc (ADR) | 15,698 | 617,088 | ||||||
|
| |||||||
Total Telecommunication Services | 1,480,180 | |||||||
|
| |||||||
Utilities (2.2%) | ||||||||
Electric Utilities (1.6%) | ||||||||
FirstEnergy Corp. | 9,586 | 316,146 | ||||||
PPL Corp. | 24,729 | 744,096 | ||||||
|
| |||||||
| 1,060,242 | ||||||||
|
| |||||||
Multi-Utilities (0.6%) | ||||||||
PG&E Corp. | 11,133 | 448,437 | ||||||
|
| |||||||
Total Utilities | 1,508,679 | |||||||
|
| |||||||
Total Investments (95.9%) | 64,458,436 | |||||||
|
| |||||||
Other Assets Less Liabilities (4.1%) | 2,767,394 | |||||||
|
| |||||||
Net Assets (100%) | $ | 67,225,830 | ||||||
|
| |||||||
| * | Non-income producing. |
Glossary:
| ADR | — American Depositary Receipt |
At December 31, 2013, the Portfolio had outstanding foreign currency contracts to buy/sell foreign currencies as follows: (Note 1)
Foreign Currency Sell Contracts | Counterparty | Local Contract Sell Amount (000’s) | U.S. $ Settlement Value | U.S. $ Current Value | Unrealized Appreciation/ (Depreciation) | |||||||||||||
British Pound vs. U.S. Dollar, expiring 1/17/14 | Bank of New York Mellon Corp. | 326 | $ | 536,237 | $ | 540,511 | $ | (4,274 | ) | |||||||||
British Pound vs. U.S. Dollar, expiring 1/17/14 | CIBC World Markets, Inc. | 326 | 536,263 | 540,510 | (4,247 | ) | ||||||||||||
British Pound vs. U.S. Dollar, expiring 1/17/14 | Citibank N.A. | 291 | 478,046 | 481,767 | (3,721 | ) | ||||||||||||
British Pound vs. U.S. Dollar, expiring 1/17/14 | State Street Bank & Trust | 326 | 536,227 | 540,510 | (4,283 | ) | ||||||||||||
Canadian Dollar vs. U.S. Dollar, expiring 1/17/14 | CIBC World Markets, Inc. | 642 | 603,069 | 604,163 | (1,094 | ) | ||||||||||||
European Union Euro vs. U.S. Dollar, | Bank of New York Mellon Corp. | 420 | 577,313 | 578,083 | (770 | ) | ||||||||||||
European Union Euro vs. U.S. Dollar, | CIBC World Markets, Inc. | 420 | 577,240 | 578,083 | (843 | ) | ||||||||||||
European Union Euro vs. U.S. Dollar, | Citibank N.A. | 420 | 577,321 | 578,083 | (762 | ) | ||||||||||||
European Union Euro vs. U.S. Dollar, | State Street Bank & Trust | 425 | 583,635 | 584,448 | (813 | ) | ||||||||||||
Swiss Franc vs. U.S. Dollar, expiring 1/17/14 | Bank of New York Mellon Corp. | 396 | 445,527 | 444,355 | 1,172 | |||||||||||||
Swiss Franc vs. U.S. Dollar, expiring 1/17/14 | Citibank N.A. | 362 | 406,662 | 405,602 | 1,060 | |||||||||||||
Swiss Franc vs. U.S. Dollar, expiring 1/17/14 | State Street Bank & Trust | 396 | 445,426 | 444,355 | 1,071 | |||||||||||||
|
| |||||||||||||||||
| $ | (17,504 | ) | ||||||||||||||||
|
| |||||||||||||||||
The following is a summary of the inputs used to value the Portfolio’s assets and liabilities carried at fair value as of December 31, 2013:
See Notes to Financial Statements.
34
EQ ADVISORS TRUST
EQ/INVESCO COMSTOCK PORTFOLIO
PORTFOLIO OF INVESTMENTS (Continued)
December 31, 2013
The inputs or methodology used for valuing securities are not necessarily an indication of the risk associated with investing in those securities.
Various inputs are used in determining the value of the Portfolio’s investments. These inputs are summarized in the three broad levels listed below:
| Investment Type | Level 1 Quoted Prices in Active Markets for Identical Securities | Level 2 Significant Other Observable Inputs (including quoted prices for similar securities, interest rates, prepayment speeds, credit risk, etc.) | Level 3 Significant Unobservable Inputs (including the Portfolio’s own assumptions in determining the fair value of investments) | Total | ||||||||||||
Assets: | ||||||||||||||||
Common Stocks | ||||||||||||||||
Consumer Discretionary | $ | 10,060,201 | $ | — | $ | — | $ | 10,060,201 | ||||||||
Consumer Staples | 3,505,332 | — | — | 3,505,332 | ||||||||||||
Energy | 9,786,972 | — | — | 9,786,972 | ||||||||||||
Financials | 16,034,879 | — | — | 16,034,879 | ||||||||||||
Health Care | 9,594,339 | — | — | 9,594,339 | ||||||||||||
Industrials | 4,699,184 | — | — | 4,699,184 | ||||||||||||
Information Technology | 6,402,690 | — | — | 6,402,690 | ||||||||||||
Materials | 1,385,980 | — | — | 1,385,980 | ||||||||||||
Telecommunication Services | 1,268,972 | 211,208 | — | 1,480,180 | ||||||||||||
Utilities | 1,508,679 | — | — | 1,508,679 | ||||||||||||
Forward Currency Contracts | — | 3,303 | — | 3,303 | ||||||||||||
|
|
|
|
|
|
|
| |||||||||
Total Assets | $ | 64,247,228 | $ | 214,511 | $ | — | $ | 64,461,739 | ||||||||
|
|
|
|
|
|
|
| |||||||||
Liabilities: | ||||||||||||||||
Forward Currency Contracts | $ | — | $ | (20,807 | ) | $ | — | $ | (20,807 | ) | ||||||
|
|
|
|
|
|
|
| |||||||||
Total Liabilities | $ | — | $ | (20,807 | ) | $ | — | $ | (20,807 | ) | ||||||
|
|
|
|
|
|
|
| |||||||||
Total | $ | 64,247,228 | $ | 193,704 | $ | — | $ | 64,440,932 | ||||||||
|
|
|
|
|
|
|
| |||||||||
There were no transfers between Levels 1, 2 or 3 during the year ended December 31, 2013.
Fair Values of Derivative Instruments as of December 31, 2013:
Statement of Assets and Liabilities | ||||||
Derivatives Not Accounted for as | Asset Derivatives | Fair Value | ||||
Interest rate contracts | Receivables, Net assets - Unrealized appreciation | $ | — | * | ||
Foreign exchange contracts | Receivables | 3,303 | ||||
Credit contracts | Receivables | — | ||||
Equity contracts | Receivables, Net assets - Unrealized appreciation | — | * | |||
Commodity contracts | Receivables | — | ||||
Other contracts | Receivables | — | ||||
|
| |||||
Total | $ | 3,303 | ||||
|
| |||||
Liability Derivatives | ||||||
Interest rate contracts | Payables, Net assets - Unrealized depreciation | $ | — | * | ||
Foreign exchange contracts | Payables | (20,807 | ) | |||
Credit contracts | Payables | — | ||||
Equity contracts | Payables, Net assets - Unrealized depreciation | — | * | |||
Commodity contracts | Payables | — | ||||
Other contracts | Payables | — | ||||
|
| |||||
Total | $ | (20,807 | ) | |||
|
| |||||
| * | Includes cumulative appreciation/depreciation of futures contracts as reported in the Portfolio of Investments. Only current day’s variation margin is reported within the Statement of Assets & Liabilities. |
See Notes to Financial Statements.
35
EQ ADVISORS TRUST
EQ/INVESCO COMSTOCK PORTFOLIO
PORTFOLIO OF INVESTMENTS (Continued)
December 31, 2013
The effect of Derivative Instruments on the Statement of Operations for the year ended December 31, 2013:
| Amount of Realized Gain or (Loss) on Derivatives Recognized in Income | ||||||||||||||||||||
Derivatives Not Accounted for as Hedging Instruments^ | Options | Futures | Forward Currency Contracts | Swaps | Total | |||||||||||||||
Interest rate contracts | $ | — | $ | — | $ | — | $ | — | $ | — | ||||||||||
Foreign exchange contracts | — | — | (834,951 | ) | — | (834,951 | ) | |||||||||||||
Credit contracts | — | — | — | — | — | |||||||||||||||
Equity contracts | — | — | — | — | — | |||||||||||||||
Commodity contracts | — | — | — | — | — | |||||||||||||||
Other contracts | — | — | — | — | — | |||||||||||||||
|
|
|
|
|
|
|
|
|
| |||||||||||
Total | $ | — | $ | — | $ | (834,951 | ) | $ | — | $ | (834,951 | ) | ||||||||
|
|
|
|
|
|
|
|
|
| |||||||||||
| Amount of Unrealized Appreciation or (Depreciation) on Derivatives Recognized in Income | ||||||||||||||||||||
Derivatives Not Accounted for as Hedging Instruments^ | Options | Futures | Forward Currency Contracts | Swaps | Total | |||||||||||||||
Interest rate contracts | $ | — | $ | — | $ | — | $ | — | $ | — | ||||||||||
Foreign exchange contracts | — | — | 461,890 | — | 461,890 | |||||||||||||||
Credit contracts | — | — | — | — | — | |||||||||||||||
Equity contracts | — | — | — | — | — | |||||||||||||||
Commodity contracts | — | — | — | — | — | |||||||||||||||
Other contracts | — | — | — | — | — | |||||||||||||||
|
|
|
|
|
|
|
|
|
| |||||||||||
Total | $ | — | $ | — | $ | 461,890 | $ | — | $ | 461,890 | ||||||||||
|
|
|
|
|
|
|
|
|
| |||||||||||
^ This Portfolio held forward foreign currency contracts as hedging.
The Portfolio held forward foreign currency contracts with an average settlement value of approximately $23,005,000 during the year ended December 31, 2013.
The following table presents the Portfolio’s gross derivative assets and liabilities by counterparty net of amounts available for offset under netting arrangements and any related collateral received or pledged by the Portfolio as of December 31, 2013:
Counterparty | Gross Amount of Derivative Assets Presented in the Statement of Assets and Liabilities (a) | Derivatives Available for Offset | Collateral Received | Net Amount Due from Counterparty | ||||||||||||
Bank of New York Mellon Corp. | $ | 1,172 | $ | (1,172 | ) | $ | — | $ | — | |||||||
Citibank N.A. | 1,060 | (1,060 | ) | — | — | |||||||||||
State Street Bank & Trust | 1,071 | (1,071 | ) | — | — | |||||||||||
|
|
|
|
|
|
|
| |||||||||
| $ | 3,303 | $ | (3,303 | ) | $ | — | $ | — | ||||||||
|
|
|
|
|
|
|
| |||||||||
Counterparty | Gross Amount of Derivative Liabilities Presented in the Statement of Assets and Liabilities (a) | Derivatives Available for Offset | Collateral Pledged | Net Amount Due to Counterparty | ||||||||||||
Bank of New York Mellon Corp. | $ | 5,044 | $ | (1,172 | ) | $ | — | $ | 3,872 | |||||||
Citibank N.A. | 4,483 | (1,060 | ) | — | 3,423 | |||||||||||
State Street Bank & Trust | 5,096 | (1,071 | ) | — | 4,025 | |||||||||||
CIBC World Markets, Inc. | 6,184 | — | — | 6,184 | ||||||||||||
|
|
|
|
|
|
|
| |||||||||
| $ | 20,807 | $ | (3,303 | ) | $ | — | $ | 17,504 | ||||||||
|
|
|
|
|
|
|
| |||||||||
| (a) | For financial reporting purposes the Portfolio does not offset derivative assets and derivative liabilities subject to master netting arrangements in the Statement of Assets and Liabilities. |
See Notes to Financial Statements.
36
EQ ADVISORS TRUST
EQ/INVESCO COMSTOCK PORTFOLIO
PORTFOLIO OF INVESTMENTS (Continued)
December 31, 2013
Investment security transactions for the year ended December 31, 2013 were as follows:
Cost of Purchases: | ||||
Long-term investments other than U.S. government debt securities | $ | 41,404,342 | ||
Net Proceeds of Sales and Redemptions: | ||||
Long-term investments other than U.S. government debt securities | $ | 30,715,596 |
As of December 31, 2013, the gross unrealized appreciation (depreciation) of investments based on the aggregate cost of investments for Federal income tax purposes was as follows:
Aggregate gross unrealized appreciation | $ | 19,578,886 | ||
Aggregate gross unrealized depreciation | (611,259 | ) | ||
|
| |||
Net unrealized appreciation | $ | 18,967,627 | ||
|
| |||
Federal income tax cost of investments | $ | 45,490,809 | ||
|
|
For the year ended December 31, 2013, the Portfolio incurred approximately $741 as brokerage commissions with Sanford C. Bernstein & Co. LLC, an affiliated broker/dealer.
The Portfolio has a net capital loss carryforward of $33,389,278, which expires in the year 2017. The Portfolio utilized net capital loss carryforward of $10,219,374 during 2013.
See Notes to Financial Statements.
37
EQ ADVISORS TRUST
EQ/INVESCO COMSTOCK PORTFOLIO
STATEMENT OF ASSETS AND LIABILITIES December 31, 2013
ASSETS | ||||
Investments at value (Cost $44,983,899) | $ | 64,458,436 | ||
Cash | 2,599,812 | |||
Foreign cash (Cost $268) | 288 | |||
Receivable from Separate Accounts for Trust shares sold | 172,349 | |||
Receivable for securities sold | 135,489 | |||
Dividends, interest and other receivables | 96,249 | |||
Unrealized appreciation on forward foreign currency contracts | 3,303 | |||
Other assets | 1,412 | |||
|
| |||
Total assets | 67,467,338 | |||
|
| |||
LIABILITIES | ||||
Payable for securities purchased | 95,658 | |||
Payable to Separate Accounts for Trust shares redeemed | 61,157 | |||
Investment management fees payable | 23,302 | |||
Unrealized depreciation on forward foreign currency contracts | 20,807 | |||
Administrative fees payable | 15,655 | |||
Distribution fees payable - Class IB | 10,918 | |||
Distribution fees payable - Class IA | 2,297 | |||
Accrued expenses | 11,714 | |||
|
| |||
Total liabilities | 241,508 | |||
|
| |||
NET ASSETS | $ | 67,225,830 | ||
|
| |||
Net assets were comprised of: | ||||
Paid in capital | $ | 81,763,178 | ||
Accumulated undistributed net investment income (loss) | (82,245 | ) | ||
Accumulated undistributed net realized gain (loss) on investments and foreign currency transactions | (33,912,157 | ) | ||
Net unrealized appreciation (depreciation) on investments and foreign currency translations | 19,457,054 | |||
|
| |||
Net assets | $ | 67,225,830 | ||
|
| |||
Class IA | ||||
Net asset value, offering and redemption price per share, $10,933,468 / 780,354 shares outstanding (unlimited amount authorized: $0.01 par value) | $ | 14.01 | ||
|
| |||
Class IB | ||||
Net asset value, offering and redemption price per share, $53,094,973 / 3,786,410 shares outstanding (unlimited amount authorized: $0.01 par value) | $ | 14.02 | ||
|
| |||
Class K | ||||
Net asset value, offering and redemption price per share, $3,197,389 / 228,690 shares outstanding (unlimited amount authorized: $0.01 par value) | $ | 13.98 | ||
|
|
STATEMENT OF OPERATIONS
For the Year Ended December 31, 2013
INVESTMENT INCOME | ||||
Dividends (net of $53,913 foreign withholding tax) | $ | 4,787,663 | ||
Interest | 12,060 | |||
|
| |||
Total income | 4,799,723 | |||
|
| |||
EXPENSES | ||||
Investment management fees | 1,484,562 | |||
Distribution fees - Class IB | 547,478 | |||
Administrative fees | 261,652 | |||
Professional fees | 43,062 | |||
Printing and mailing expenses | 24,501 | |||
Distribution fees - Class IA | 22,224 | |||
Custodian fees | 21,500 | |||
Trustees’ fees | 7,212 | |||
Miscellaneous | 7,489 | |||
|
| |||
Gross expenses | 2,419,680 | |||
Less: Waiver from investment manager | (134,793 | ) | ||
Fees paid indirectly | (9,680 | ) | ||
|
| |||
Net expenses | 2,275,207 | |||
|
| |||
NET INVESTMENT INCOME (LOSS) | 2,524,516 | |||
|
| |||
REALIZED AND UNREALIZED GAIN (LOSS) | ||||
Realized gain (loss) on: | ||||
Investments | 102,841,408 | |||
Foreign currency transactions | (265,515 | ) | ||
|
| |||
Net realized gain (loss) | 102,575,893 | |||
|
| |||
Change in unrealized appreciation | ||||
Investments | (26,228,999 | ) | ||
Foreign currency translations | 461,904 | |||
|
| |||
Net change in unrealized appreciation (depreciation) | (25,767,095 | ) | ||
|
| |||
NET REALIZED AND UNREALIZED GAIN (LOSS) | 76,808,798 | |||
|
| |||
NET INCREASE (DECREASE) IN NET ASSETS RESULTING FROM OPERATIONS | $ | 79,333,314 | ||
|
|
See Notes to Financial Statements.
38
EQ ADVISORS TRUST
EQ/INVESCO COMSTOCK PORTFOLIO
STATEMENT OF CHANGES IN NET ASSETS
| Year Ended December 31, | ||||||||
| 2013 | 2012 | |||||||
INCREASE (DECREASE) IN NET ASSETS FROM OPERATIONS: | ||||||||
Net investment income (loss) | $ | 2,524,516 | $ | 4,380,703 | ||||
Net realized gain (loss) on investments and foreign currency transactions | 102,575,893 | 12,808,821 | ||||||
Net change in unrealized appreciation (depreciation) on investments and foreign currency translations | (25,767,095 | ) | 32,150,925 | |||||
|
|
|
| |||||
NET INCREASE (DECREASE) IN NET ASSETS RESULTING FROM OPERATIONS | 79,333,314 | 49,340,449 | ||||||
|
|
|
| |||||
DIVIDENDS: | ||||||||
Dividends from net investment income | ||||||||
Class IA | (411,741 | ) | (77,518 | ) | ||||
Class IB | (1,954,494 | ) | (3,683,909 | ) | ||||
Class K† | (124,988 | ) | — | |||||
|
|
|
| |||||
TOTAL DIVIDENDS | (2,491,223 | ) | (3,761,427 | ) | ||||
|
|
|
| |||||
CAPITAL SHARES TRANSACTIONS: | ||||||||
Class IA | ||||||||
Capital shares sold [ 484,036 and 324,476 shares, respectively ] | 6,157,322 | 3,269,542 | ||||||
Capital shares issued in reinvestment of dividends [ 30,136 and 7,189 shares, respectively ] | 411,741 | 77,518 | ||||||
Capital shares repurchased [ (320,450) and (232,613) shares, respectively ] | (4,119,864 | ) | (2,352,059 | ) | ||||
|
|
|
| |||||
Total Class IA transactions | 2,449,199 | 995,001 | ||||||
|
|
|
| |||||
Class IB | ||||||||
Capital shares sold [ 4,482,889 and 3,113,207 shares, respectively ] | 55,399,141 | 31,651,482 | ||||||
Capital shares issued in reinvestment of dividends [ 142,940 and 341,245 shares, respectively ] | 1,954,494 | 3,683,909 | ||||||
Capital shares repurchased [ (3,076,487) and (4,931,701) shares, respectively ] | (37,972,564 | ) | (50,212,455 | ) | ||||
Capital shares repurchased in-kind (Note 9)[ (25,535,585) and 0 shares, respectively ] | (340,684,665 | ) | — | |||||
|
|
|
| |||||
Total Class IB transactions | (321,303,594 | ) | (14,877,064 | ) | ||||
|
|
|
| |||||
Class K † | ||||||||
Capital shares sold [ 222,309 and 0 shares, respectively ] | 3,051,832 | — | ||||||
Capital shares issued in reinvestment of dividends and distributions [ 9,168 and 0 shares, | 124,988 | — | ||||||
Capital shares repurchased [ (2,787) and 0 shares, respectively ] | (38,732 | ) | — | |||||
|
|
|
| |||||
Total Class K transactions | 3,138,088 | — | ||||||
|
|
|
| |||||
NET INCREASE (DECREASE) IN NET ASSETS RESULTING FROM CAPITAL SHARE TRANSACTIONS | (315,716,307 | ) | (13,882,063 | ) | ||||
|
|
|
| |||||
TOTAL INCREASE (DECREASE) IN NET ASSETS | (238,874,216 | ) | 31,696,959 | |||||
NET ASSETS: | ||||||||
Beginning of year | 306,100,046 | 274,403,087 | ||||||
|
|
|
| |||||
End of year (a) | $ | 67,225,830 | $ | 306,100,046 | ||||
|
|
|
|
| ||||
(a) Includes accumulated undistributed (overdistributed) net investment income (loss) of | $ | (82,245 | ) | $ | 187,367 | |||
|
|
|
| |||||
† Class K commenced operations on October 29, 2013. | ||||||||
See Notes to Financial Statements.
39
EQ ADVISORS TRUST
EQ/INVESCO COMSTOCK PORTFOLIO
FINANCIAL HIGHLIGHTS
| Year Ended December 31, | ||||||||||||||||||||
| Class IA | 2013 | 2012 | 2011 | 2010 | 2009 | |||||||||||||||
Net asset value, beginning of year | $ | 10.78 | $ | 9.22 | $ | 9.55 | $ | 8.38 | $ | 6.61 | ||||||||||
|
|
|
|
|
|
|
|
|
| |||||||||||
Income (loss) from investment operations: | ||||||||||||||||||||
Net investment income (loss) | 0.14 | (e) | 0.15 | (e) | 0.16 | (e) | 0.13 | (e) | 0.12 | (e) | ||||||||||
Net realized and unrealized gain (loss) on investments and foreign currency transactions | 3.63 | 1.54 | (0.33 | ) | 1.17 | 1.78 | ||||||||||||||
|
|
|
|
|
|
|
|
|
| |||||||||||
Total from investment operations | 3.77 | 1.69 | (0.17 | ) | 1.30 | 1.90 | ||||||||||||||
|
|
|
|
|
|
|
|
|
| |||||||||||
Less distributions: | ||||||||||||||||||||
Dividends from net investment income | (0.54 | ) | (0.13 | ) | (0.16 | ) | (0.13 | ) | (0.13 | ) | ||||||||||
|
|
|
|
|
|
|
|
|
| |||||||||||
Net asset value, end of year | $ | 14.01 | $ | 10.78 | $ | 9.22 | $ | 9.55 | $ | 8.38 | ||||||||||
|
|
|
|
|
|
|
|
|
| |||||||||||
Total return | 35.10 | % | 18.37 | % | (1.77 | )% | 15.61 | % | 28.73 | % | ||||||||||
|
|
|
|
|
|
|
|
|
| |||||||||||
Ratios/Supplemental Data: | ||||||||||||||||||||
Net assets, end of year (000’s) | $ | 10,933 | $ | 6,325 | $ | 4,494 | $ | 2,934 | $ | 1,294 | ||||||||||
Ratio of expenses to average net assets: | ||||||||||||||||||||
After waivers | 1.00 | % | 1.00 | % | 0.75 | % | 0.75 | % | 0.75 | % | ||||||||||
After waivers and fees paid indirectly | 1.00 | % | 0.99 | % | 0.74 | % | 0.74 | % | 0.73 | % | ||||||||||
Before waivers and fees paid indirectly | 1.11 | % | 1.05 | % | 0.78 | % | 0.80 | % | 0.82 | % | ||||||||||
Ratio of net investment income (loss) to average net assets: | ||||||||||||||||||||
After waivers | 1.08 | % | 1.48 | % | 1.63 | % | 1.43 | % | 1.72 | % | ||||||||||
After waivers and fees paid indirectly | 1.09 | % | 1.48 | % | 1.64 | % | 1.44 | % | 1.74 | % | ||||||||||
Before waivers and fees paid indirectly | 0.98 | 1.43 | % | 1.60 | % | 1.38 | % | 1.65 | % | |||||||||||
Portfolio turnover rate | 15 | % | 17 | % | 25 | % | 21 | % | 27 | % | ||||||||||
| Year Ended December 31, | ||||||||||||||||||||
| Class IB | 2013 | 2012 | 2011 | 2010 | 2009 | |||||||||||||||
Net asset value, beginning of year | $ | 10.79 | $ | 9.23 | $ | 9.56 | $ | 8.39 | $ | 6.62 | ||||||||||
|
|
|
|
|
|
|
|
|
| |||||||||||
Income (loss) from investment operations: | ||||||||||||||||||||
Net investment income (loss) | 0.14 | (e) | 0.15 | (e) | 0.13 | (e) | 0.10 | (e) | 0.10 | (e) | ||||||||||
Net realized and unrealized gain (loss) on investments and foreign currency transactions | 3.63 | 1.54 | (0.33 | ) | 1.18 | 1.78 | ||||||||||||||
|
|
|
|
|
|
|
|
|
| |||||||||||
Total from investment operations | 3.77 | 1.69 | (0.20 | ) | 1.28 | 1.88 | ||||||||||||||
|
|
|
|
|
|
|
|
|
| |||||||||||
Less distributions: | ||||||||||||||||||||
Dividends from net investment income | (0.54 | ) | (0.13 | ) | (0.13 | ) | (0.11 | ) | (0.11 | ) | ||||||||||
|
|
|
|
|
|
|
|
|
| |||||||||||
Net asset value, end of year | $ | 14.02 | $ | 10.79 | $ | 9.23 | $ | 9.56 | $ | 8.39 | ||||||||||
|
|
|
|
|
|
|
|
|
| |||||||||||
Total return | 35.06 | % | 18.35 | % | (2.01 | )% | 15.30 | % | 28.36 | % | ||||||||||
|
|
|
|
|
|
|
|
|
| |||||||||||
Ratios/Supplemental Data: | ||||||||||||||||||||
Net assets, end of year (000’s) | $ | 53,095 | $ | 299,775 | $ | 269,909 | $ | 270,858 | $ | 245,914 | ||||||||||
Ratio of expenses to average net assets: | ||||||||||||||||||||
After waivers | 1.00 | % | 1.00 | % | 1.00 | % | 1.00 | % | 1.00 | % | ||||||||||
After waivers and fees paid indirectly | 1.00 | % | 0.99 | % | 0.99 | % | 0.99 | % | 0.98 | % | ||||||||||
Before waivers and fees paid indirectly | 1.06 | % | 1.05 | % | 1.03 | % | 1.05 | % | 1.07 | % | ||||||||||
Ratio of net investment income (loss) to average net assets: | ||||||||||||||||||||
After waivers | 1.10 | % | 1.47 | % | 1.36 | % | 1.20 | % | 1.47 | % | ||||||||||
After waivers and fees paid indirectly | 1.10 | % | 1.48 | % | 1.37 | % | 1.20 | % | 1.49 | % | ||||||||||
Before waivers and fees paid indirectly | 1.04 | % | 1.42 | % | 1.33 | % | 1.14 | % | 1.40 | % | ||||||||||
Portfolio turnover rate | 15 | % | 17 | % | 25 | % | 21 | % | 27 | % | ||||||||||
See Notes to Financial Statements.
40
EQ ADVISORS TRUST
EQ/INVESCO COMSTOCK PORTFOLIO
FINANCIAL HIGHLIGHTS (Continued)
| Class K | October 29, 2013* to December 31, 2013 | |||
Net asset value, beginning of period | $ | 13.71 | ||
|
| |||
Income (loss) from investment operations: | ||||
Net investment income (loss) | 0.04 | (e) | ||
Net realized and unrealized gain (loss) on investments and foreign currency transactions | 0.80 | |||
|
| |||
Total from investment operations | 0.84 | |||
|
| |||
Less distributions: | ||||
Dividends from net investment income | (0.57 | ) | ||
|
| |||
Net asset value, end of period | $ | 13.98 | ||
|
| |||
Total return (b) | 6.27 | % | ||
|
| |||
Ratios/Supplemental Data: | ||||
Net assets, end of period (000’s) | $ | 3,197 | ||
Ratio of expenses to average net assets: | ||||
After waivers (a) | 0.75 | % | ||
After waivers and fees paid indirectly (a) | 0.75 | % | ||
Before waivers and fees paid indirectly (a) | 0.93 | % | ||
Ratio of net investment income (loss) to average net assets: | ||||
After waivers (a) | 1.57 | % | ||
After waivers and fees paid indirectly (a) | 1.57 | % | ||
Before waivers and fees paid indirectly (a) | 1.39 | % | ||
Portfolio turnover rate | 15 | % | ||
| * | Commencement of Operations. |
| (a) | Ratios for periods less than one year are annualized. |
| (b) | Total returns for periods less than one year are not annualized. |
| (e) | Net investment income (loss) per share is based on average shares outstanding. |
See Notes to Financial Statements.
41
EQ/LARGE CAP GROWTH PLUS PORTFOLIO (Unaudited)
PORTFOLIO ADVISERS
| Ø | AXA Equitable Funds Management Group, LLC |
| Ø | BlackRock Investment Management, LLC |
| Ø | Marsico Capital Management, LLC |
| Ø | T. Rowe Price Associates, Inc. |
| Ø | Wells Capital Management, Inc. |
PERFORMANCE RESULTS
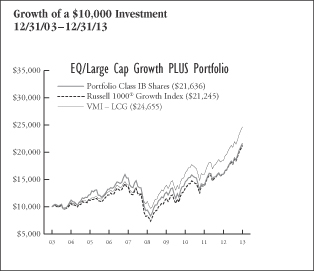
| Annualized Total Returns as of 12/31/13 | ||||||||||||
| 1 Year | 5 Years | 10 Years/ Since Incept. | ||||||||||
Portfolio – Class IA Shares** | 35.36 | % | 17.93 | % | 8.25 | % | ||||||
Portfolio – Class IB Shares* | 35.39 | 18.03 | 8.02 | |||||||||
Portfolio – Class K Shares*** | 35.70 | N/A | 22.45 | |||||||||
Russell 1000® Growth Index | 33.48 | 20.39 | 7.83 | |||||||||
VMI – LCG | 32.94 | 17.48 | 9.44 | |||||||||
* Date of inception 5/1/97.
** Date of inception 11/28/98.
***Date of inception 8/26/11.
Returnsfor periods greater than one year are annualized. |
| |||||||||||
Past performance is not indicative of future results.
PERFORMANCE SUMMARY
The Portfolio’s Class IA shares returned 35.36% for the year ended December 31, 2013. The Portfolio’s benchmarks, the Russell 1000® Growth Index, returned 33.48% and the VMI — LCG returned 32.94% over the same period.
The following commentary describes key factors (such as stock selection and sector allocation decisions) that helped or hurt the Portfolio’s performance relative to its primary benchmark.
Portfolio Highlights
For the year ended December 31, 2013
What helped performance during the year:
| • | Stock selection was strong in the Health Care sector. A number of the Portfolio’s Health Care holdings performed very well in the period, particularly Gilead Sciences, Inc. and Biogen Idec Inc. |
| • | From a sector allocation standpoint, the Portfolio was positioned well by having an underweight allocation to the Information Technology sector, as the sector did not keep pace with the overall return of the benchmark. An underweight in Apple, Inc. and IBM were notable contributors relative to the benchmark. |
| • | The Portfolio also benefited from a relative underweight in Consumer Staples positions, as Consumer Staples was another weak-performing sector. |
| • | Stock selection in the Information Technology, Financials and Consumer Discretionary sectors benefited relative performance. |
What hurt performance during the year:
| • | Stock selection in the Industrials, Energy and Materials sectors contributed to relative underperformance. |
| • | From a sector allocation perspective, underweights in Health Care and Consumer Discretionary detracted from performance. |
| • | Individual holdings detracting from performance include eBay Inc. and Belgian holding Anheuser-Busch InBev N.V. Relative underweight positions in Boeing Co. and Celgene Corporation were also detrimental to performance. |
| Sector Weightings as of December 31, 2013 | % of Net Assets | |||
Information Technology | 20.1 | % | ||
Consumer Discretionary | 17.7 | |||
Health Care | 10.7 | |||
Industrials | 9.7 | |||
Consumer Staples | 5.7 | |||
Financials | 4.7 | |||
Exchange Traded Funds | 4.4 | |||
Energy | 3.7 | |||
Materials | 3.6 | |||
Telecommunication Services | 1.4 | |||
Utilities | 0.1 | |||
Cash and Other | 18.2 | |||
|
| |||
| 100.0 | % | |||
|
| |||
42
EQ/LARGE CAP GROWTH PLUS PORTFOLIO (Unaudited)
UNDERSTANDING YOUR EXPENSES:
As a shareholder of the Portfolio, you incur two types of costs:
(1)transaction costs, including applicable sales charges and redemption fees; and (2)ongoing costs, including management fees, distribution (12b-1) fees (in the case of Class IA and Class IB shares of the Trust), and other Portfolio expenses. These examples are intended to help you understand your ongoing costs (in dollars) of investing in the Portfolio and to compare these costs with the ongoing costs of investing in other mutual funds.
The examples are based on an investment of $1,000 invested at the beginning of the six-month period ended December 31, 2013 and held for the entire six-month period.
Actual Expenses
The first line of the table to the right provides information about actual account values and actual expenses. You may use the information in this line, together with the amount you invested, to estimate the expenses that you paid over the period. Simply divide your account value by $1,000 (for example, an $8,600 account value divided by $1,000 = 8.6), then multiply the result by the number in the first line under the heading entitled ‘‘Expenses Paid During Period’’ to estimate the expenses you paid on your account during this period.
Hypothetical Example for Comparison Purposes
The second line of the table below provides information about hypothetical account values and hypothetical expenses based on the Portfolio’s actual expense ratio and an assumed rate of return of 5% per year before expenses, which is not the Portfolio’s actual return. The hypothetical account values and expenses may not be used to estimate the actual ending account balance or expenses you paid for the period. You may use this information to compare the ongoing costs of investing in the Portfolio and other funds. To do so, compare this 5% hypothetical example with the 5% hypothetical examples that appear in the shareholder reports of the other funds.
Please note that the expenses shown in the table are meant to highlight your ongoing costs only and do not reflect any transactional costs, such as sales charges (loads), redemption fees, or exchange fees. Therefore, the second line of the table is useful in comparing ongoing costs only, and will not help you determine the relative total costs of owning different funds. In addition, if these transactional costs were included, your costs would have been higher. Also note that the table does not reflect any variable life insurance or variable annuity contract-related fees and expenses, which would increase overall fees and expenses.
EXAMPLE
| Beginning Account Value 7/1/13 | Ending Account Value 12/31/13 | Expenses Paid During Period* 7/1/13 - 12/31/13 | ||||||||||
Class IA | ||||||||||||
Actual | $1,000.00 | $1,199.04 | $4.82 | |||||||||
Hypothetical (5% average annual return before expenses) | 1,000.00 | 1,020.82 | 4.43 | |||||||||
Class IB | ||||||||||||
Actual | 1,000.00 | 1,199.09 | 4.81 | |||||||||
Hypothetical (5% average annual return before expenses) | 1,000.00 | 1,020.83 | 4.42 | |||||||||
Class K | ||||||||||||
Actual | 1,000.00 | 1,200.28 | 3.44 | |||||||||
Hypothetical (5% average annual return before expenses) | 1,000.00 | 1,022.08 | 3.16 | |||||||||
* Expenses are equal to the Portfolio’s Class IA, Class IB and Class K shares annualized expense ratios of 0.87%, 0.87% and 0.62%, respectively, multiplied by the average account value over the period, and multiplied by 184/365 (to reflect the one-half year period). |
| |||||||||||
43
EQ ADVISORS TRUST
EQ/LARGE CAP GROWTH PLUS PORTFOLIO
PORTFOLIO OF INVESTMENTS
December 31, 2013
| Number of Shares | Value (Note 1) | |||||||
COMMON STOCKS: | ||||||||
Consumer Discretionary (17.7%) | ||||||||
Auto Components (0.3%) | ||||||||
Allison Transmission Holdings, Inc. | 1,154 | $ | 31,862 | |||||
BorgWarner, Inc. | 54,340 | 3,038,149 | ||||||
Delphi Automotive plc | 204,459 | 12,294,120 | ||||||
Gentex Corp. | 19,438 | 641,260 | ||||||
Goodyear Tire & Rubber Co. | 57,787 | 1,378,220 | ||||||
Lear Corp. | 2,155 | 174,490 | ||||||
Visteon Corp.* | 11,709 | 958,850 | ||||||
|
| |||||||
| 18,516,951 | ||||||||
|
| |||||||
Automobiles (0.3%) | ||||||||
Ford Motor Co. | 318,580 | 4,915,690 | ||||||
Harley-Davidson, Inc. | 85,422 | 5,914,619 | ||||||
Tesla Motors, Inc.* | 34,592 | 5,201,945 | ||||||
Thor Industries, Inc. | 10,397 | 574,226 | ||||||
|
| |||||||
| 16,606,480 | ||||||||
|
| |||||||
Distributors (0.3%) | ||||||||
Genuine Parts Co. | 34,432 | 2,864,398 | ||||||
LKQ Corp.* | 349,533 | 11,499,636 | ||||||
|
| |||||||
| 14,364,034 | ||||||||
|
| |||||||
Diversified Consumer Services (0.0%) |
| |||||||
H&R Block, Inc. | 64,034 | 1,859,547 | ||||||
Service Corp. International | 38,911 | �� | 705,457 | |||||
Weight Watchers International, Inc. | 3,488 | 114,860 | ||||||
|
| |||||||
| 2,679,864 | ||||||||
|
| |||||||
Hotels, Restaurants & Leisure (3.7%) |
| |||||||
Bally Technologies, Inc.* | 9,092 | 713,267 | ||||||
Brinker International, Inc. | 15,587 | 722,302 | ||||||
Burger King Worldwide, Inc. | 23,639 | 540,387 | ||||||
Carnival plc | 64,019 | 2,651,367 | ||||||
Chipotle Mexican Grill, Inc.* | 44,550 | 23,735,349 | ||||||
Choice Hotels International, Inc. | 355 | 17,434 | ||||||
Darden Restaurants, Inc. | 19,942 | 1,084,246 | ||||||
Domino’s Pizza, Inc. | 13,235 | 921,818 | ||||||
Dunkin’ Brands Group, Inc. | 25,075 | 1,208,615 | ||||||
International Game Technology | 61,258 | 1,112,445 | ||||||
Las Vegas Sands Corp. | 180,539 | 14,239,111 | ||||||
Marriott International, Inc., Class A | 85,174 | 4,204,189 | ||||||
McDonald’s Corp. | 235,719 | 22,871,814 | ||||||
MGM Resorts International* | 138,784 | 3,264,200 | ||||||
Norwegian Cruise Line Holdings Ltd.* | 5,993 | 212,572 | ||||||
Panera Bread Co., Class A* | 6,611 | 1,168,098 | ||||||
SeaWorld Entertainment, Inc. | 7,198 | 207,086 | ||||||
Six Flags Entertainment Corp. | 15,554 | 572,698 | ||||||
Starbucks Corp. | 626,382 | 49,102,085 | ||||||
Starwood Hotels & Resorts Worldwide, Inc. | 379,564 | 30,156,360 | ||||||
Wyndham Worldwide Corp. | 31,946 | 2,354,101 | ||||||
Wynn Macau Ltd. | 582,000 | 2,638,188 | ||||||
Wynn Resorts Ltd. | 136,627 | 26,534,330 | ||||||
Yum! Brands, Inc. | 105,766 | 7,996,967 | ||||||
|
| |||||||
| 198,229,029 | ||||||||
|
| |||||||
Household Durables (0.2%) | ||||||||
D.R. Horton, Inc.* | 99,777 | $ | 2,227,023 | |||||
Jarden Corp.* | 29,894 | 1,833,997 | ||||||
Lennar Corp., Class A | 56,853 | 2,249,105 | ||||||
Newell Rubbermaid, Inc. | 39,290 | 1,273,389 | ||||||
NVR, Inc.* | 923 | 947,007 | ||||||
PulteGroup, Inc. | 91,126 | 1,856,236 | ||||||
Taylor Morrison Home Corp., Class A* | 6,620 | 148,619 | ||||||
Tempur Sealy International, Inc.* | 14,204 | 766,448 | ||||||
Tupperware Brands Corp. | 12,441 | 1,176,048 | ||||||
Whirlpool Corp. | 1,310 | 205,486 | ||||||
|
| |||||||
| 12,683,358 | ||||||||
|
| |||||||
Internet & Catalog Retail (3.5%) | ||||||||
Amazon.com, Inc.* | 217,707 | 86,819,374 | ||||||
Ctrip.com International Ltd. (ADR)* | 46,105 | 2,287,730 | ||||||
Expedia, Inc. | 25,064 | 1,745,958 | ||||||
Groupon, Inc.* | 98,767 | 1,162,488 | ||||||
HomeAway, Inc.* | 14,274 | 583,521 | ||||||
Liberty Interactive Corp.* | 10,123 | 297,110 | ||||||
Liberty Ventures* | 8,654 | 1,060,894 | ||||||
Netflix, Inc.* | 53,981 | 19,874,185 | ||||||
priceline.com, Inc.* | 58,639 | 68,161,974 | ||||||
TripAdvisor, Inc.* | 57,810 | 4,788,402 | ||||||
zulily, Inc., Class A* | 1,835 | 76,024 | ||||||
|
| |||||||
| 186,857,660 | ||||||||
|
| |||||||
Leisure Equipment & Products (0.1%) |
| |||||||
Hasbro, Inc. | 22,972 | 1,263,689 | ||||||
Mattel, Inc. | 81,210 | 3,863,972 | ||||||
Polaris Industries, Inc. | 15,228 | 2,217,806 | ||||||
|
| |||||||
| 7,345,467 | ||||||||
|
| |||||||
Media (4.0%) | ||||||||
AMC Networks, Inc., Class A* | 161,614 | 11,007,530 | ||||||
Cablevision Systems Corp. - New York Group, Class A | 45,859 | 822,252 | ||||||
CBS Corp. (Non-Voting), Class B | 132,148 | 8,423,114 | ||||||
Charter Communications, Inc., Class A* | 27,476 | 3,757,618 | ||||||
Cinemark Holdings, Inc. | 27,133 | 904,343 | ||||||
Clear Channel Outdoor Holdings, Inc., Class A | 10,072 | 102,130 | ||||||
Comcast Corp., Class A | 979,249 | 50,886,674 | ||||||
DIRECTV* | 115,679 | 7,992,262 | ||||||
Discovery Communications, Inc., Class A* | 57,537 | 5,202,496 | ||||||
Discovery Communications, Inc., Class C* | 156,514 | 13,125,264 | ||||||
DISH Network Corp., Class A* | 49,023 | 2,839,412 | ||||||
Interpublic Group of Cos., Inc. | 45,873 | 811,952 | ||||||
Lamar Advertising Co., Class A* | 18,538 | 968,610 | ||||||
Liberty Global plc* | 118,963 | 10,030,960 | ||||||
Liberty Global plc, Class A* | 128,070 | 11,396,949 | ||||||
Lions Gate Entertainment Corp. | 19,019 | 602,142 | ||||||
See Notes to Financial Statements.
44
EQ ADVISORS TRUST
EQ/LARGE CAP GROWTH PLUS PORTFOLIO
PORTFOLIO OF INVESTMENTS (Continued)
December 31, 2013
| Number of Shares | Value (Note 1) | |||||||
Madison Square Garden Co., Class A* | 14,390 | $ | 828,576 | |||||
Morningstar, Inc. | 4,873 | 380,533 | ||||||
News Corp., Class A* | 86,109 | 1,551,684 | ||||||
Omnicom Group, Inc. | 60,798 | 4,521,547 | ||||||
Regal Entertainment Group, Class A | 4,303 | 83,693 | ||||||
Scripps Networks Interactive, Inc., Class A | 25,783 | 2,227,909 | ||||||
Sirius XM Holdings, Inc.* | 2,422,447 | 8,454,340 | ||||||
Starz, Class A* | 22,953 | 671,146 | ||||||
Time Warner Cable, Inc. | 68,411 | 9,269,691 | ||||||
Twenty-First Century Fox, Inc., Class A | 445,991 | 15,689,963 | ||||||
Viacom, Inc., Class B | 105,020 | 9,172,447 | ||||||
Walt Disney Co. | 434,518 | 33,197,175 | ||||||
|
| |||||||
| 214,922,412 | ||||||||
|
| |||||||
Multiline Retail (0.5%) | ||||||||
Big Lots, Inc.* | 3,661 | 118,214 | ||||||
Dillard’s, Inc., Class A | 4,282 | 416,253 | ||||||
Dollar General Corp.* | 76,934 | 4,640,659 | ||||||
Dollar Tree, Inc.* | 75,915 | 4,283,124 | ||||||
Family Dollar Stores, Inc. | 22,642 | 1,471,051 | ||||||
Macy’s, Inc. | 69,917 | 3,733,568 | ||||||
Nordstrom, Inc. | 34,099 | 2,107,318 | ||||||
Target Corp. | 118,288 | 7,484,082 | ||||||
|
| |||||||
| 24,254,269 | ||||||||
|
| |||||||
Specialty Retail (3.7%) | ||||||||
Aaron’s, Inc. | 2,729 | 80,233 | ||||||
Abercrombie & Fitch Co., Class A | 2,187 | 71,974 | ||||||
Advance Auto Parts, Inc. | 17,156 | 1,898,826 | ||||||
American Eagle Outfitters, Inc. | 29,238 | 421,027 | ||||||
Ascena Retail Group, Inc.* | 4,375 | 92,575 | ||||||
AutoNation, Inc.* | 184,924 | 9,188,873 | ||||||
AutoZone, Inc.* | 18,326 | 8,758,728 | ||||||
Bed Bath & Beyond, Inc.* | 51,394 | 4,126,938 | ||||||
Best Buy Co., Inc. | 242,412 | 9,667,390 | ||||||
Cabela’s, Inc.* | 11,188 | 745,792 | ||||||
CarMax, Inc.* | 123,631 | 5,813,130 | ||||||
Chico’s FAS, Inc. | 35,745 | 673,436 | ||||||
Dick’s Sporting Goods, Inc. | 23,238 | 1,350,128 | ||||||
DSW, Inc., Class A | 15,269 | 652,444 | ||||||
Foot Locker, Inc. | 4,192 | 173,716 | ||||||
Gap, Inc. | 65,642 | 2,565,289 | ||||||
GNC Holdings, Inc., Class A | 23,124 | 1,351,598 | ||||||
Home Depot, Inc. | 570,239 | 46,953,479 | ||||||
L Brands, Inc. | 56,434 | 3,490,443 | ||||||
Lowe’s Cos., Inc. | 355,634 | 17,621,665 | ||||||
O’Reilly Automotive, Inc.* | 25,974 | 3,343,113 | ||||||
PetSmart, Inc. | 24,294 | 1,767,388 | ||||||
Restoration Hardware Holdings, Inc.* | 103,342 | 6,954,917 | ||||||
Ross Stores, Inc. | 88,018 | 6,595,189 | ||||||
Sally Beauty Holdings, Inc.* | 39,938 | 1,207,326 | ||||||
Signet Jewelers Ltd. | 1,668 | 131,272 | ||||||
Tiffany & Co. | 26,265 | 2,436,867 | ||||||
TJX Cos., Inc. | 782,431 | 49,864,328 | ||||||
Tractor Supply Co. | 85,059 | 6,598,877 | ||||||
Ulta Salon Cosmetics & Fragrance, Inc.* | 14,975 | $ | 1,445,387 | |||||
Urban Outfitters, Inc.* | 25,326 | 939,595 | ||||||
Williams-Sonoma, Inc. | 22,977 | 1,339,100 | ||||||
|
| |||||||
| 198,321,043 | ||||||||
|
| |||||||
Textiles, Apparel & Luxury Goods (1.1%) |
| |||||||
Carter’s, Inc. | 13,009 | 933,916 | ||||||
Coach, Inc. | 66,067 | 3,708,341 | ||||||
Deckers Outdoor Corp.* | 3,568 | 301,353 | ||||||
Fossil Group, Inc.* | 11,488 | 1,377,871 | ||||||
Hanesbrands, Inc. | 23,174 | 1,628,437 | ||||||
Lululemon Athletica, Inc.* | 6,247 | 368,761 | ||||||
Michael Kors Holdings Ltd.* | 143,907 | 11,683,809 | ||||||
NIKE, Inc., Class B | 208,038 | 16,360,108 | ||||||
Prada S.p.A. | 184,000 | 1,637,285 | ||||||
PVH Corp. | 16,883 | 2,296,426 | ||||||
Ralph Lauren Corp. | 14,105 | 2,490,520 | ||||||
Under Armour, Inc., Class A* | 126,861 | 11,074,965 | ||||||
VF Corp. | 82,348 | 5,133,574 | ||||||
|
| |||||||
| 58,995,366 | ||||||||
|
| |||||||
Total Consumer Discretionary | 953,775,933 | |||||||
|
| |||||||
Consumer Staples (5.7%) | ||||||||
Beverages (1.8%) | ||||||||
Brown-Forman Corp., Class B | 35,561 | 2,687,345 | ||||||
Coca-Cola Co. | 899,297 | 37,149,959 | ||||||
Coca-Cola Enterprises, Inc. | 61,367 | 2,708,126 | ||||||
Constellation Brands, Inc., Class A* | 235,580 | 16,580,120 | ||||||
Dr. Pepper Snapple Group, Inc. | 47,977 | 2,337,440 | ||||||
Monster Beverage Corp.* | 55,917 | 3,789,495 | ||||||
PepsiCo, Inc. | 394,860 | 32,749,688 | ||||||
|
| |||||||
| 98,002,173 | ||||||||
|
| |||||||
Food & Staples Retailing (1.3%) | ||||||||
Costco Wholesale Corp. | 134,589 | 16,017,437 | ||||||
CVS Caremark Corp. | 116,510 | 8,338,621 | ||||||
Fresh Market, Inc.* | 9,677 | 391,918 | ||||||
Kroger Co. | 122,277 | 4,833,610 | ||||||
Safeway, Inc. | 4,451 | 144,969 | ||||||
Sprouts Farmers Market, Inc.* | 3,402 | 130,739 | ||||||
Sysco Corp. | 48,287 | 1,743,161 | ||||||
Walgreen Co. | 167,747 | 9,635,387 | ||||||
Wal-Mart Stores, Inc. | 251,026 | 19,753,236 | ||||||
Whole Foods Market, Inc. | 173,224 | 10,017,544 | ||||||
|
| |||||||
| 71,006,622 | ||||||||
|
| |||||||
Food Products (0.8%) | ||||||||
Archer-Daniels-Midland Co. | 11,798 | 512,033 | ||||||
Campbell Soup Co. | 27,193 | 1,176,913 | ||||||
ConAgra Foods, Inc. | 90,649 | 3,054,871 | ||||||
Flowers Foods, Inc. | 40,235 | 863,845 | ||||||
General Mills, Inc. | 151,571 | 7,564,909 | ||||||
Green Mountain Coffee Roasters, Inc.* | 51,984 | 3,928,951 | ||||||
Hershey Co. | 35,266 | 3,428,913 | ||||||
Hillshire Brands Co. | 28,956 | 968,289 | ||||||
Hormel Foods Corp. | 31,536 | 1,424,481 | ||||||
Ingredion, Inc. | 2,238 | 153,214 | ||||||
J.M. Smucker Co. | 3,313 | 343,293 | ||||||
See Notes to Financial Statements.
45
EQ ADVISORS TRUST
EQ/LARGE CAP GROWTH PLUS PORTFOLIO
PORTFOLIO OF INVESTMENTS (Continued)
December 31, 2013
| Number of Shares | Value (Note 1) | |||||||
Kellogg Co. | 56,319 | $ | 3,439,401 | |||||
Kraft Foods Group, Inc. | 139,772 | 7,536,506 | ||||||
McCormick & Co., Inc. (Non-Voting) | 31,014 | 2,137,485 | ||||||
Mead Johnson Nutrition Co. | 47,606 | 3,987,479 | ||||||
Nestle S.A. (Registered) | 24,107 | 1,764,685 | ||||||
Pinnacle Foods, Inc. | 4,569 | 125,465 | ||||||
WhiteWave Foods Co., Class A* | 32,616 | 748,211 | ||||||
|
| |||||||
| 43,158,944 | ||||||||
|
| |||||||
Household Products (0.5%) | ||||||||
Church & Dwight Co., Inc. | 32,491 | 2,153,503 | ||||||
Clorox Co. | 25,880 | 2,400,629 | ||||||
Colgate-Palmolive Co. | 219,305 | 14,300,879 | ||||||
Kimberly-Clark Corp. | 75,598 | 7,896,967 | ||||||
Procter & Gamble Co. | 18,941 | 1,541,987 | ||||||
|
| |||||||
| 28,293,965 | ||||||||
|
| |||||||
Personal Products (0.2%) | ||||||||
Avon Products, Inc. | 101,845 | 1,753,771 | ||||||
Coty, Inc., Class A | 8,975 | 136,869 | ||||||
Estee Lauder Cos., Inc., Class A | 54,455 | 4,101,550 | ||||||
Herbalife Ltd. | 20,049 | 1,577,856 | ||||||
Nu Skin Enterprises, Inc., Class A | 13,735 | 1,898,452 | ||||||
|
| |||||||
| 9,468,498 | ||||||||
|
| |||||||
Tobacco (1.1%) | ||||||||
Altria Group, Inc. | 472,275 | 18,130,637 | ||||||
Lorillard, Inc. | 88,817 | 4,501,246 | ||||||
Philip Morris International, Inc. | 384,539 | 33,504,883 | ||||||
Reynolds American, Inc. | 56,096 | 2,804,239 | ||||||
|
| |||||||
| 58,941,005 | ||||||||
|
| |||||||
Total Consumer Staples | 308,871,207 | |||||||
|
| |||||||
Energy (3.7%) | ||||||||
Energy Equipment & Services (1.5%) |
| |||||||
Atwood Oceanics, Inc.* | 2,526 | 134,863 | ||||||
Baker Hughes, Inc. | 6,562 | 362,616 | ||||||
Cameron International Corp.* | 36,743 | 2,187,311 | ||||||
Dresser-Rand Group, Inc.* | 17,919 | 1,068,510 | ||||||
Dril-Quip, Inc.* | 9,548 | 1,049,612 | ||||||
FMC Technologies, Inc.* | 96,885 | 5,058,366 | ||||||
Frank’s International N.V. | 3,658 | 98,766 | ||||||
Halliburton Co. | 199,704 | 10,134,978 | ||||||
Oceaneering International, Inc. | 25,441 | 2,006,786 | ||||||
RPC, Inc. | 11,953 | 213,361 | ||||||
Schlumberger Ltd. | 614,302 | 55,354,753 | ||||||
Seadrill Ltd. | 83,092 | 3,413,419 | ||||||
|
| |||||||
| 81,083,341 | ||||||||
|
| |||||||
Oil, Gas & Consumable Fuels (2.2%) |
| |||||||
Anadarko Petroleum Corp. | 6,495 | 515,183 | ||||||
Antero Resources Corp.* | 105,058 | 6,664,879 | ||||||
Cabot Oil & Gas Corp. | 189,887 | 7,360,020 | ||||||
Cheniere Energy, Inc.* | 56,739 | 2,446,586 | ||||||
Cobalt International Energy, Inc.* | 59,407 | 977,245 | ||||||
Concho Resources, Inc.* | 93,869 | 10,137,852 | ||||||
Continental Resources, Inc.* | 124,599 | 14,019,879 | ||||||
CVR Energy, Inc. | 3,703 | 160,821 | ||||||
EOG Resources, Inc. | 75,083 | $ | 12,601,931 | |||||
EQT Corp. | 59,944 | 5,381,772 | ||||||
Gulfport Energy Corp.* | 103,446 | 6,532,615 | ||||||
Kinder Morgan, Inc. | 142,638 | 5,134,968 | ||||||
Kosmos Energy Ltd.* | 23,855 | 266,699 | ||||||
Laredo Petroleum Holdings, Inc.* | 8,908 | 246,663 | ||||||
Marathon Petroleum Corp. | 59,500 | 5,457,935 | ||||||
Noble Energy, Inc. | 10,719 | 730,071 | ||||||
Oasis Petroleum, Inc.* | 23,676 | 1,112,062 | ||||||
Pioneer Natural Resources Co. | 108,608 | 19,991,475 | ||||||
QEP Resources, Inc. | 4,292 | 131,550 | ||||||
Range Resources Corp. | 93,181 | 7,856,090 | ||||||
SM Energy Co. | 15,588 | 1,295,519 | ||||||
Southwestern Energy Co.* | 82,650 | 3,250,624 | ||||||
Whiting Petroleum Corp.* | 2,234 | 138,218 | ||||||
Williams Cos., Inc. | 88,122 | 3,398,866 | ||||||
World Fuel Services Corp. | 3,252 | 140,356 | ||||||
|
| |||||||
| 115,949,879 | ||||||||
|
| |||||||
Total Energy | 197,033,220 | |||||||
|
| |||||||
Financials (4.7%) | ||||||||
Capital Markets (0.9%) | ||||||||
Affiliated Managers Group, Inc.* | 72,570 | 15,738,982 | ||||||
Ameriprise Financial, Inc. | 15,118 | 1,739,326 | ||||||
Artisan Partners Asset Management, Inc., Class A | 1,266 | 82,531 | ||||||
BlackRock, Inc. | 20,535 | 6,498,711 | ||||||
Charles Schwab Corp. | 35,133 | 913,458 | ||||||
Eaton Vance Corp. | 28,232 | 1,208,047 | ||||||
Federated Investors, Inc., Class B | 16,113 | 464,054 | ||||||
Franklin Resources, Inc. | 132,810 | 7,667,121 | ||||||
Invesco Ltd. | 81,803 | 2,977,629 | ||||||
Lazard Ltd., Class A | 30,133 | 1,365,628 | ||||||
LPL Financial Holdings, Inc. | 10,473 | 492,545 | ||||||
SEI Investments Co. | 32,079 | 1,114,104 | ||||||
T. Rowe Price Group, Inc. | 60,976 | 5,107,960 | ||||||
TD Ameritrade Holding Corp. | 82,682 | 2,533,377 | ||||||
Waddell & Reed Financial, Inc., Class A | 20,212 | 1,316,205 | ||||||
|
| |||||||
| 49,219,678 | ||||||||
|
| |||||||
Commercial Banks (0.0%) | ||||||||
Signature Bank/New York* | 1,088 | 116,873 | ||||||
|
| |||||||
Consumer Finance (1.0%) | ||||||||
American Express Co. | 617,079 | 55,987,578 | ||||||
|
| |||||||
Diversified Financial Services (1.0%) |
| |||||||
CBOE Holdings, Inc. | 20,530 | 1,066,739 | ||||||
Citigroup, Inc. | 504,182 | 26,272,924 | ||||||
IntercontinentalExchange Group, Inc. | 93,601 | 21,052,737 | ||||||
Leucadia National Corp. | 9,426 | 267,133 | ||||||
McGraw Hill Financial, Inc. | 30,419 | 2,378,766 | ||||||
Moody’s Corp. | 45,722 | 3,587,805 | ||||||
MSCI, Inc.* | 11,912 | 520,792 | ||||||
|
| |||||||
| 55,146,896 | ||||||||
|
| |||||||
See Notes to Financial Statements.
46
EQ ADVISORS TRUST
EQ/LARGE CAP GROWTH PLUS PORTFOLIO
PORTFOLIO OF INVESTMENTS (Continued)
December 31, 2013
| Number of Shares | Value (Note 1) | |||||||
Insurance (0.8%) | ||||||||
Allied World Assurance Co. Holdings AG | 2,700 | $ | 304,587 | |||||
American Financial Group, Inc./Ohio | 2,503 | 144,473 | ||||||
American International Group, Inc. | 298,807 | 15,254,097 | ||||||
Aon plc | 56,038 | 4,701,028 | ||||||
Arch Capital Group Ltd.* | 1,989 | 118,723 | ||||||
Arthur J. Gallagher & Co. | 29,811 | 1,399,030 | ||||||
Axis Capital Holdings Ltd. | 7,167 | 340,934 | ||||||
Brown & Brown, Inc. | 12,725 | 399,438 | ||||||
Chubb Corp. | 8,722 | 842,807 | ||||||
eHealth, Inc.* | 97,160 | 4,516,968 | ||||||
Endurance Specialty Holdings Ltd. | 3,472 | 203,702 | ||||||
Erie Indemnity Co., Class A | 5,852 | 427,898 | ||||||
Hanover Insurance Group, Inc. | 2,977 | 177,757 | ||||||
Loews Corp. | 5,797 | 279,647 | ||||||
Marsh & McLennan Cos., Inc. | 86,585 | 4,187,251 | ||||||
Progressive Corp. | 114,021 | 3,109,353 | ||||||
Prudential Financial, Inc. | 41,893 | 3,863,373 | ||||||
Travelers Cos., Inc. | 23,896 | 2,163,544 | ||||||
Validus Holdings Ltd. | 2,137 | 86,100 | ||||||
|
| |||||||
| 42,520,710 | ||||||||
|
| |||||||
Real Estate Investment Trusts (REITs) (0.9%) |
| |||||||
American Homes 4 Rent (REIT), Class A | 2,370 | 38,394 | ||||||
American Tower Corp. (REIT) | 225,429 | 17,993,743 | ||||||
Apartment Investment & Management Co. (REIT), Class A | 18,868 | 488,870 | ||||||
Boston Properties, Inc. (REIT) | 3,399 | 341,158 | ||||||
Brixmor Property Group, Inc. (REIT)* | 2,153 | 43,771 | ||||||
CBL & Associates Properties, Inc. (REIT) | 12,596 | 226,224 | ||||||
Corrections Corp. of America (REIT) | 17,170 | 550,642 | ||||||
Digital Realty Trust, Inc. (REIT) | 23,744 | 1,166,305 | ||||||
Equity Lifestyle Properties, Inc. (REIT) | 14,165 | 513,198 | ||||||
Extra Space Storage, Inc. (REIT) | 2,114 | 89,063 | ||||||
Federal Realty Investment Trust (REIT) | 10,085 | 1,022,720 | ||||||
Omega Healthcare Investors, Inc. (REIT) | 28,741 | 856,482 | ||||||
Plum Creek Timber Co., Inc. (REIT) | 41,595 | 1,934,583 | ||||||
Public Storage (REIT) | 31,375 | 4,722,565 | ||||||
Rayonier, Inc. (REIT) | 29,642 | 1,247,928 | ||||||
Regency Centers Corp. (REIT) | 9,044 | 418,737 | ||||||
Senior Housing Properties Trust (REIT) | 3,277 | 72,848 | ||||||
Simon Property Group, Inc. (REIT) | 54,455 | 8,285,873 | ||||||
Spirit Realty Capital, Inc. (REIT) | 16,905 | 166,176 | ||||||
Tanger Factory Outlet Centers (REIT) | 22,222 | $ | 711,548 | |||||
Taubman Centers, Inc. (REIT) | 2,744 | 175,396 | ||||||
Ventas, Inc. (REIT) | 31,091 | 1,780,892 | ||||||
Vornado Realty Trust (REIT) | 8,535 | 757,823 | ||||||
Weyerhaeuser Co. (REIT) | 136,904 | 4,322,059 | ||||||
|
| |||||||
| 47,926,998 | ||||||||
|
| |||||||
Real Estate Management & Development (0.1%) |
| |||||||
CBRE Group, Inc., Class A* | 65,616 | 1,725,701 | ||||||
Realogy Holdings Corp.* | 25,202 | 1,246,743 | ||||||
St. Joe Co.* | 444 | 8,520 | ||||||
|
| |||||||
| 2,980,964 | ||||||||
|
| |||||||
Thrifts & Mortgage Finance (0.0%) |
| |||||||
Nationstar Mortgage Holdings, Inc.* | 5,060 | 187,017 | ||||||
Ocwen Financial Corp.* | 24,373 | 1,351,483 | ||||||
|
| |||||||
| 1,538,500 | ||||||||
|
| |||||||
Total Financials | 255,438,197 | |||||||
|
| |||||||
Health Care (10.7%) | ||||||||
Biotechnology (5.6%) | ||||||||
Alexion Pharmaceuticals, Inc.* | 163,931 | 21,812,659 | ||||||
Alkermes plc* | 29,735 | 1,209,025 | ||||||
Amgen, Inc. | 176,334 | 20,130,289 | ||||||
ARIAD Pharmaceuticals, Inc.* | 43,678 | 297,884 | ||||||
Biogen Idec, Inc.* | 253,018 | 70,781,785 | ||||||
BioMarin Pharmaceutical, Inc.* | 32,684 | 2,296,705 | ||||||
Celgene Corp.* | 354,679 | 59,926,564 | ||||||
Cubist Pharmaceuticals, Inc.* | 15,341 | 1,056,535 | ||||||
Gilead Sciences, Inc.* | 1,313,355 | 98,698,628 | ||||||
Incyte Corp.* | 60,207 | 3,048,280 | ||||||
Medivation, Inc.* | 17,637 | 1,125,593 | ||||||
Myriad Genetics, Inc.* | 18,130 | 380,367 | ||||||
Pharmacyclics, Inc.* | 30,625 | 3,239,512 | ||||||
Quintiles Transnational Holdings, Inc.* | 2,899 | 134,340 | ||||||
Regeneron Pharmaceuticals, Inc.* | 28,428 | 7,824,523 | ||||||
Seattle Genetics, Inc.* | 23,621 | 942,242 | ||||||
Theravance, Inc.* | 18,512 | 659,953 | ||||||
United Therapeutics Corp.* | 10,944 | 1,237,548 | ||||||
Vertex Pharmaceuticals, Inc.* | 79,942 | 5,939,691 | ||||||
|
| |||||||
| 300,742,123 | ||||||||
|
| |||||||
Health Care Equipment & Supplies (0.9%) |
| |||||||
Baxter International, Inc. | 127,423 | 8,862,270 | ||||||
Becton, Dickinson and Co. | 45,672 | 5,046,299 | ||||||
Boston Scientific Corp.* | 740,860 | 8,905,137 | ||||||
C.R. Bard, Inc. | 18,923 | 2,534,547 | ||||||
Cooper Cos., Inc. | 8,423 | 1,043,104 | ||||||
DENTSPLY International, Inc. | 9,417 | 456,536 | ||||||
Edwards Lifesciences Corp.* | 26,564 | 1,746,849 | ||||||
Hologic, Inc.* | 18,594 | 415,576 | ||||||
IDEXX Laboratories, Inc.* | 37,004 | 3,936,116 | ||||||
Intuitive Surgical, Inc.* | 8,950 | 3,437,516 | ||||||
ResMed, Inc. | 33,504 | 1,577,368 | ||||||
Sirona Dental Systems, Inc.* | 12,927 | 907,475 | ||||||
St. Jude Medical, Inc. | 42,373 | 2,625,007 | ||||||
See Notes to Financial Statements.
47
EQ ADVISORS TRUST
EQ/LARGE CAP GROWTH PLUS PORTFOLIO
PORTFOLIO OF INVESTMENTS (Continued)
December 31, 2013
| Number of Shares | Value (Note 1) | |||||||
Stryker Corp. | 65,928 | $ | 4,953,830 | |||||
Varian Medical Systems, Inc.* | 25,495 | 1,980,707 | ||||||
Zimmer Holdings, Inc. | 2,228 | 207,627 | ||||||
|
| |||||||
| 48,635,964 | ||||||||
|
| |||||||
Health Care Providers & Services (1.7%) |
| |||||||
Aetna, Inc. | 23,661 | 1,622,908 | ||||||
AmerisourceBergen Corp. | 54,291 | 3,817,200 | ||||||
Brookdale Senior Living, Inc.* | 23,398 | 635,958 | ||||||
Cardinal Health, Inc. | 71,501 | 4,776,982 | ||||||
Catamaran Corp.* | 48,413 | 2,298,649 | ||||||
Cigna Corp. | 3,902 | 341,347 | ||||||
Community Health Systems, Inc.* | 1,756 | 68,958 | ||||||
DaVita HealthCare Partners, Inc.* | 43,309 | 2,744,491 | ||||||
Envision Healthcare Holdings, Inc.* | 197,752 | 7,024,151 | ||||||
Express Scripts Holding Co.* | 167,998 | 11,800,179 | ||||||
HCA Holdings, Inc.* | 4,615 | 220,182 | ||||||
Health Management Associates, Inc., Class A* | 61,028 | 799,467 | ||||||
Henry Schein, Inc.* | 20,487 | 2,340,845 | ||||||
Laboratory Corp. of America Holdings* | 20,698 | 1,891,176 | ||||||
McKesson Corp. | 160,069 | 25,835,137 | ||||||
MEDNAX, Inc.* | 15,314 | 817,461 | ||||||
Patterson Cos., Inc. | 18,416 | 758,739 | ||||||
Premier, Inc., Class A* | 4,918 | 180,786 | ||||||
Quest Diagnostics, Inc. | 2,472 | 132,351 | ||||||
Team Health Holdings, Inc.* | 84,021 | 3,827,157 | ||||||
Tenet Healthcare Corp.* | 24,350 | 1,025,622 | ||||||
UnitedHealth Group, Inc. | 253,441 | 19,084,107 | ||||||
Universal Health Services, Inc., Class B | 14,362 | 1,167,056 | ||||||
|
| |||||||
| 93,210,909 | ||||||||
|
| |||||||
Health Care Technology (0.1%) | ||||||||
Cerner Corp.* | 69,725 | 3,886,471 | ||||||
Veeva Systems, Inc., Class A* | 2,279 | 73,156 | ||||||
|
| |||||||
| 3,959,627 | ||||||||
|
| |||||||
Life Sciences Tools & Services (0.2%) |
| |||||||
Agilent Technologies, Inc. | 9,565 | 547,022 | ||||||
Bruker Corp.* | 25,776 | 509,592 | ||||||
Charles River Laboratories International, Inc.* | 5,218 | 276,763 | ||||||
Covance, Inc.* | 13,145 | 1,157,549 | ||||||
Illumina, Inc.* | 29,244 | 3,234,971 | ||||||
Life Technologies Corp.* | 26,340 | 1,996,572 | ||||||
Mettler-Toledo International, Inc.* | 7,098 | 1,721,904 | ||||||
Techne Corp. | 4,038 | 382,277 | ||||||
Waters Corp.* | 20,148 | 2,014,800 | ||||||
|
| |||||||
| 11,841,450 | ||||||||
|
| |||||||
Pharmaceuticals (2.2%) | ||||||||
AbbVie, Inc. | 500,625 | 26,438,006 | ||||||
Actavis plc* | 94,852 | 15,935,136 | ||||||
Allergan, Inc. | 69,689 | 7,741,054 | ||||||
Bristol-Myers Squibb Co. | 510,735 | 27,145,565 | ||||||
Eli Lilly and Co. | 51,041 | 2,603,091 | ||||||
Endo Health Solutions, Inc.* | 26,394 | $ | 1,780,539 | |||||
Forest Laboratories, Inc. (Contingent Value Shares)*† (b) | 306 | — | ||||||
Jazz Pharmaceuticals plc* | 12,196 | 1,543,526 | ||||||
Johnson & Johnson | 85,195 | 7,803,010 | ||||||
Mylan, Inc.* | 89,602 | 3,888,727 | ||||||
Novo Nordisk A/S, Class B | 8,479 | 1,554,216 | ||||||
Perrigo Co. plc | 29,640 | 4,548,555 | ||||||
Salix Pharmaceuticals Ltd.* | 14,420 | 1,296,935 | ||||||
Shire plc (ADR) | 37,090 | 5,240,446 | ||||||
Valeant Pharmaceuticals International, Inc.* | 44,445 | 5,217,843 | ||||||
Zoetis, Inc. | 117,549 | 3,842,677 | ||||||
|
| |||||||
| 116,579,326 | ||||||||
|
| |||||||
Total Health Care | 574,969,399 | |||||||
|
| |||||||
Industrials (9.7%) | ||||||||
Aerospace & Defense (3.0%) | ||||||||
B/E Aerospace, Inc.* | 147,760 | 12,859,553 | ||||||
Boeing Co. | 243,684 | 33,260,429 | ||||||
Hexcel Corp.* | 23,586 | 1,054,058 | ||||||
Honeywell International, Inc. | 184,988 | 16,902,354 | ||||||
Huntington Ingalls Industries, Inc. | 11,798 | 1,061,938 | ||||||
Lockheed Martin Corp. | 61,038 | 9,073,909 | ||||||
Precision Castparts Corp. | 118,274 | 31,851,188 | ||||||
Rockwell Collins, Inc. | 28,423 | 2,101,028 | ||||||
Rolls-Royce Holdings plc* | 1,294,777 | 27,337,097 | ||||||
Rolls-Royce Holdings plc (Preference)*† (b) | 111,350,822 | 184,391 | ||||||
Spirit AeroSystems Holdings, Inc., Class A* | 3,683 | 125,517 | ||||||
TransDigm Group, Inc. | 12,321 | 1,983,928 | ||||||
Triumph Group, Inc. | 2,476 | 188,349 | ||||||
United Technologies Corp. | 202,528 | 23,047,686 | ||||||
|
| |||||||
| 161,031,425 | ||||||||
|
| |||||||
Air Freight & Logistics (0.5%) | ||||||||
C.H. Robinson Worldwide, Inc. | 35,888 | 2,093,706 | ||||||
Expeditors International of Washington, Inc. | 48,579 | 2,149,620 | ||||||
United Parcel Service, Inc., Class B | 208,823 | 21,943,121 | ||||||
|
| |||||||
| 26,186,447 | ||||||||
|
| |||||||
Airlines (0.7%) | ||||||||
Alaska Air Group, Inc. | 15,267 | 1,120,140 | ||||||
American Airlines Group, Inc.* | 26,938 | 680,185 | ||||||
Copa Holdings S.A., Class A | 73,518 | 11,770,967 | ||||||
Delta Air Lines, Inc. | 571,586 | 15,701,467 | ||||||
Southwest Airlines Co. | 18,730 | 352,873 | ||||||
United Continental Holdings, Inc.* | 150,083 | 5,677,640 | ||||||
|
| |||||||
| 35,303,272 | ||||||||
|
| |||||||
Building Products (0.3%) | ||||||||
A.O. Smith Corp. | 7,801 | 420,786 | ||||||
Allegion plc* | 16,696 | 737,810 | ||||||
Armstrong World Industries, Inc.* | 5,941 | 342,261 | ||||||
See Notes to Financial Statements.
48
EQ ADVISORS TRUST
EQ/LARGE CAP GROWTH PLUS PORTFOLIO
PORTFOLIO OF INVESTMENTS (Continued)
December 31, 2013
| Number of Shares | Value (Note 1) | |||||||
Fortune Brands Home & Security, Inc. | 232,993 | $ | 10,647,780 | |||||
Lennox International, Inc. | 11,856 | 1,008,471 | ||||||
Masco Corp. | 83,915 | 1,910,745 | ||||||
|
| |||||||
| 15,067,853 | ||||||||
|
| |||||||
Commercial Services & Supplies (0.2%) |
| |||||||
Cintas Corp. | 6,824 | 406,642 | ||||||
Clean Harbors, Inc.* | 14,245 | 854,130 | ||||||
Copart, Inc.* | 26,280 | 963,162 | ||||||
Iron Mountain, Inc. | 36,071 | 1,094,755 | ||||||
KAR Auction Services, Inc. | 6,712 | 198,340 | ||||||
Pitney Bowes, Inc. | 20,599 | 479,957 | ||||||
R.R. Donnelley & Sons Co. | 23,177 | 470,029 | ||||||
Rollins, Inc. | 14,999 | 454,320 | ||||||
Stericycle, Inc.* | 20,286 | 2,356,625 | ||||||
Waste Connections, Inc. | 27,405 | �� | 1,195,680 | |||||
Waste Management, Inc. | 8,805 | 395,080 | ||||||
|
| |||||||
| 8,868,720 | ||||||||
|
| |||||||
Construction & Engineering (0.2%) |
| |||||||
AECOM Technology Corp.* | 2,365 | 69,602 | ||||||
Chicago Bridge & Iron Co. N.V. (N.Y. Shares) | 23,651 | 1,966,344 | ||||||
Fluor Corp. | 22,942 | 1,842,013 | ||||||
Quanta Services, Inc.* | 179,426 | 5,662,685 | ||||||
|
| |||||||
| 9,540,644 | ||||||||
|
| |||||||
Electrical Equipment (0.7%) | ||||||||
AMETEK, Inc. | 57,260 | 3,015,884 | ||||||
Babcock & Wilcox Co. | 18,228 | 623,215 | ||||||
Eaton Corp. plc | 139,145 | 10,591,718 | ||||||
Emerson Electric Co. | 126,426 | 8,872,577 | ||||||
Hubbell, Inc., Class B | 10,123 | 1,102,395 | ||||||
Rockwell Automation, Inc. | 32,837 | 3,880,020 | ||||||
Roper Industries, Inc. | 63,675 | 8,830,449 | ||||||
SolarCity Corp.* | 5,526 | 313,987 | ||||||
|
| |||||||
| 37,230,245 | ||||||||
|
| |||||||
Industrial Conglomerates (0.6%) | ||||||||
3M Co. | 137,287 | 19,254,501 | ||||||
Carlisle Cos., Inc. | 777 | 61,694 | ||||||
Danaher Corp. | 192,139 | 14,833,131 | ||||||
|
| |||||||
| 34,149,326 | ||||||||
|
| |||||||
Machinery (1.2%) | ||||||||
Caterpillar, Inc. | 27,989 | 2,541,681 | ||||||
Colfax Corp.* | 20,138 | 1,282,589 | ||||||
Crane Co. | 10,537 | 708,613 | ||||||
Cummins, Inc. | 163,129 | 22,996,295 | ||||||
Deere & Co. | 91,237 | 8,332,675 | ||||||
Donaldson Co., Inc. | 31,828 | 1,383,245 | ||||||
Dover Corp. | 29,690 | 2,866,273 | ||||||
Flowserve Corp. | 58,018 | 4,573,559 | ||||||
Graco, Inc. | 14,411 | 1,125,787 | ||||||
Harsco Corp. | 1,350 | 37,841 | ||||||
IDEX Corp. | 18,026 | 1,331,220 | ||||||
Illinois Tool Works, Inc. | 33,036 | 2,777,667 | ||||||
Ingersoll-Rand plc | 50,036 | 3,082,218 | ||||||
ITT Corp. | 21,153 | 918,463 | ||||||
Lincoln Electric Holdings, Inc. | 19,537 | $ | 1,393,770 | |||||
Manitowoc Co., Inc. | 31,425 | 732,831 | ||||||
Navistar International Corp.* | 1,760 | 67,214 | ||||||
Nordson Corp. | 15,106 | 1,122,376 | ||||||
PACCAR, Inc. | 10,743 | 635,663 | ||||||
Pall Corp. | 26,167 | 2,233,353 | ||||||
Snap-on, Inc. | 1,558 | 170,632 | ||||||
Stanley Black & Decker, Inc. | 3,362 | 271,280 | ||||||
Toro Co. | 13,616 | 865,978 | ||||||
Valmont Industries, Inc. | 6,296 | 938,860 | ||||||
WABCO Holdings, Inc.* | 13,732 | 1,282,706 | ||||||
Wabtec Corp. | 46,923 | 3,484,971 | ||||||
Xylem, Inc. | 2,689 | 93,039 | ||||||
|
| |||||||
| 67,250,799 | ||||||||
|
| |||||||
Marine (0.0%) | ||||||||
Kirby Corp.* | 7,895 | 783,579 | ||||||
|
| |||||||
Professional Services (0.3%) | ||||||||
Advisory Board Co.* | 98,317 | 6,259,843 | ||||||
Dun & Bradstreet Corp. | 8,702 | 1,068,171 | ||||||
Equifax, Inc. | 28,343 | 1,958,218 | ||||||
IHS, Inc., Class A* | 15,457 | 1,850,203 | ||||||
Nielsen Holdings N.V. | 7,417 | 340,366 | ||||||
Robert Half International, Inc. | 32,821 | 1,378,154 | ||||||
Verisk Analytics, Inc., Class A* | 64,734 | 4,254,318 | ||||||
|
| |||||||
| 17,109,273 | ||||||||
|
| |||||||
Road & Rail (1.5%) | ||||||||
Amerco, Inc.* | 945 | 224,759 | ||||||
Avis Budget Group, Inc.* | 25,350 | 1,024,647 | ||||||
Canadian Pacific Railway Ltd. | 139,837 | 21,160,135 | ||||||
Con-way, Inc. | 4,874 | 193,546 | ||||||
CSX Corp. | 119,901 | 3,449,552 | ||||||
Genesee & Wyoming, Inc., Class A* | 4,467 | 429,055 | ||||||
Hertz Global Holdings, Inc.* | 81,429 | 2,330,498 | ||||||
J.B. Hunt Transport Services, Inc. | 42,027 | 3,248,687 | ||||||
Kansas City Southern | 215,173 | 26,644,873 | ||||||
Landstar System, Inc. | 10,962 | 629,767 | ||||||
Norfolk Southern Corp. | 13,415 | 1,245,314 | ||||||
Old Dominion Freight Line, Inc.* | 16,702 | 885,540 | ||||||
Union Pacific Corp. | 125,921 | 21,154,728 | ||||||
|
| |||||||
| 82,621,101 | ||||||||
|
| |||||||
Trading Companies & Distributors (0.5%) |
| |||||||
Fastenal Co. | 190,868 | 9,068,139 | ||||||
HD Supply Holdings, Inc.* | 9,153 | 219,764 | ||||||
MRC Global, Inc.* | 8,404 |
| 271,113 |
| ||||
MSC Industrial Direct Co., Inc., Class A | 11,124 | 899,598 | ||||||
United Rentals, Inc.* | 135,234 | 10,541,490 | ||||||
W.W. Grainger, Inc. | 19,253 | 4,917,601 | ||||||
|
| |||||||
| 25,917,705 | ||||||||
|
| |||||||
Total Industrials | 521,060,389 | |||||||
|
| |||||||
See Notes to Financial Statements.
49
EQ ADVISORS TRUST
EQ/LARGE CAP GROWTH PLUS PORTFOLIO
PORTFOLIO OF INVESTMENTS (Continued)
December 31, 2013
| Number of Shares | Value (Note 1) | |||||||
Information Technology (20.1%) | ||||||||
Communications Equipment (0.9%) |
| |||||||
CommScope Holding Co., Inc.* | 5,616 | $ | 106,255 | |||||
F5 Networks, Inc.* | 18,531 | 1,683,727 | ||||||
Harris Corp. | 4,498 | 314,005 | ||||||
JDS Uniphase Corp.* | 41,960 | 544,641 | ||||||
Juniper Networks, Inc.* | 86,569 | 1,953,862 | ||||||
Motorola Solutions, Inc. | 53,851 | 3,634,942 | ||||||
Palo Alto Networks, Inc.* | 7,855 | 451,427 | ||||||
QUALCOMM, Inc. | 502,431 | 37,305,502 | ||||||
Riverbed Technology, Inc.* | 36,358 | 657,353 | ||||||
|
| |||||||
| 46,651,714 | ||||||||
|
| |||||||
Computers & Peripherals (2.8%) | ||||||||
3D Systems Corp.* | 23,653 | 2,198,073 | ||||||
Apple, Inc. | 231,058 | 129,648,955 | ||||||
EMC Corp. | 246,974 | 6,211,396 | ||||||
NCR Corp.* | 38,668 | 1,317,032 | ||||||
NetApp, Inc. | 79,963 | 3,289,678 | ||||||
SanDisk Corp. | 24,117 | 1,701,213 | ||||||
Stratasys Ltd.* | 61,501 | 8,284,185 | ||||||
|
| |||||||
| 152,650,532 | ||||||||
|
| |||||||
Electronic Equipment, Instruments & Components (0.2%) |
| |||||||
Amphenol Corp., Class A | 37,577 | 3,351,117 | ||||||
CDW Corp. | 2,286 | 53,401 | ||||||
Cognex Corp.* | 124,900 | 4,768,682 | ||||||
Dolby Laboratories, Inc., Class A* | 4,256 | 164,111 | ||||||
FLIR Systems, Inc. | 23,279 | 700,698 | ||||||
IPG Photonics Corp.* | 7,632 | 592,320 | ||||||
National Instruments Corp. | 22,661 | 725,605 | ||||||
Trimble Navigation Ltd.* | 60,147 | 2,087,101 | ||||||
|
| |||||||
| 12,443,035 | ||||||||
|
| |||||||
Internet Software & Services (5.7%) |
| |||||||
Akamai Technologies, Inc.* | 76,896 | 3,627,953 | ||||||
Baidu, Inc. (ADR)* | 38,764 | 6,895,340 | ||||||
eBay, Inc.* | 430,762 | 23,644,526 | ||||||
Equinix, Inc.* | 11,605 | 2,059,307 | ||||||
Facebook, Inc., Class A* | 1,141,078 | 62,371,324 | ||||||
Google, Inc., Class A* | 161,416 | 180,900,525 | ||||||
IAC/InterActiveCorp. | 17,567 | 1,206,677 | ||||||
LinkedIn Corp., Class A* | 81,774 | 17,731,057 | ||||||
NAVER Corp.* | 5,268 | 3,613,997 | ||||||
Pandora Media, Inc.* | 33,372 | 887,695 | ||||||
Rackspace Hosting, Inc.* | 26,578 | 1,039,997 | ||||||
Tencent Holdings Ltd. | 32,000 | 2,041,087 | ||||||
Twitter, Inc.* | 30,176 | 1,920,703 | ||||||
VeriSign, Inc.* | 30,711 | 1,835,904 | ||||||
|
| |||||||
| 309,776,092 | ||||||||
|
| |||||||
IT Services (5.3%) | ||||||||
Accenture plc, Class A | 151,100 | 12,423,442 | ||||||
Alliance Data Systems Corp.* | 82,224 | 21,619,156 | ||||||
Automatic Data Processing, Inc. | 114,085 | 9,219,209 | ||||||
Booz Allen Hamilton Holding Corp. | 6,870 | 131,560 | ||||||
Broadridge Financial Solutions, Inc. | 28,517 | 1,126,992 | ||||||
Cognizant Technology Solutions Corp., Class A* | 120,209 | 12,138,705 | ||||||
DST Systems, Inc. | 6,529 | $ | 592,441 | |||||
Fidelity National Information | 6,841 | 367,225 | ||||||
Fiserv, Inc.* | 101,112 | 5,970,664 | ||||||
FleetCor Technologies, Inc.* | 15,965 | 1,870,619 | ||||||
Gartner, Inc.* | 22,048 | 1,566,510 | ||||||
Genpact Ltd.* | 39,559 | 726,699 | ||||||
Global Payments, Inc. | 17,932 | 1,165,401 | ||||||
International Business | 244,764 | 45,910,383 | ||||||
Jack Henry & Associates, Inc. | 20,256 | 1,199,358 | ||||||
Lender Processing Services, Inc. | 17,266 | 645,403 | ||||||
MasterCard, Inc., Class A | 60,112 | 50,221,172 | ||||||
NeuStar, Inc., Class A* | 6,642 | 331,170 | ||||||
Paychex, Inc. | 68,840 | 3,134,285 | ||||||
Teradata Corp.* | 38,427 | 1,748,044 | ||||||
Total System Services, Inc. | 29,828 | 992,676 | ||||||
Vantiv, Inc., Class A* | 414,686 | 13,522,910 | ||||||
Visa, Inc., Class A | 430,167 | 95,789,588 | ||||||
Western Union Co. | 130,988 | 2,259,543 | ||||||
|
| |||||||
| 284,673,155 | ||||||||
|
| |||||||
Office Electronics (0.0%) | ||||||||
Zebra Technologies Corp., Class A* | 1,087 | 58,785 | ||||||
|
| |||||||
Semiconductors & Semiconductor Equipment (1.4%) |
| |||||||
Advanced Micro Devices, Inc.* | 142,699 | 552,245 | ||||||
Altera Corp. | 25,991 | 845,487 | ||||||
Analog Devices, Inc. | 31,308 | 1,594,516 | ||||||
Applied Materials, Inc. | 186,746 | 3,303,537 | ||||||
ARM Holdings plc (ADR) | 182,790 | 10,005,925 | ||||||
ASML Holding N.V. | 292,337 | 27,391,977 | ||||||
Atmel Corp.* | 100,878 | 789,875 | ||||||
Avago Technologies Ltd. | 53,000 | 2,803,170 | ||||||
Broadcom Corp., Class A | 58,678 | 1,739,803 | ||||||
Cree, Inc.* | 27,732 | 1,735,191 | ||||||
Freescale Semiconductor Ltd.* | 6,032 | 96,814 | ||||||
Intel Corp. | 75,977 | 1,972,363 | ||||||
Lam Research Corp.* | 8,970 | 488,416 | ||||||
Linear Technology Corp. | 54,843 | 2,498,099 | ||||||
LSI Corp. | 15,121 | 166,633 | ||||||
Maxim Integrated Products, Inc. | 68,442 | 1,910,216 | ||||||
Microchip Technology, Inc. | 46,354 | 2,074,341 | ||||||
ON Semiconductor Corp.* | 100,781 | 830,435 | ||||||
Silicon Laboratories, Inc.* | 8,676 | 375,758 | ||||||
Skyworks Solutions, Inc.* | 37,377 | 1,067,487 | ||||||
Texas Instruments, Inc. | 260,783 | 11,450,982 | ||||||
Xilinx, Inc. | 62,039 | 2,848,831 | ||||||
|
| |||||||
| 76,542,101 | ||||||||
|
| |||||||
Software (3.8%) | ||||||||
Adobe Systems, Inc.* | 46,026 | 2,756,037 | ||||||
ANSYS, Inc.* | 21,917 | 1,911,162 | ||||||
Autodesk, Inc.* | 41,895 | 2,108,575 | ||||||
Cadence Design Systems, Inc.* | 66,586 | 933,536 | ||||||
Citrix Systems, Inc.* | 43,997 | 2,782,810 | ||||||
CommVault Systems, Inc.* | 142,123 | 10,642,170 | ||||||
Concur Technologies, Inc.* | 26,978 | 2,783,590 | ||||||
Electronic Arts, Inc.* | 54,672 | 1,254,176 | ||||||
FactSet Research Systems, Inc. | 10,345 | 1,123,260 | ||||||
FireEye, Inc.* | 3,065 | 133,665 | ||||||
See Notes to Financial Statements.
50
EQ ADVISORS TRUST
EQ/LARGE CAP GROWTH PLUS PORTFOLIO
PORTFOLIO OF INVESTMENTS (Continued)
December 31, 2013
| Number of Shares | Value (Note 1) | |||||||
FleetMatics Group plc* | 92,870 | $ | 4,016,627 | |||||
Fortinet, Inc.* | 31,942 | 611,050 | ||||||
Guidewire Software, Inc.* | 74,493 | 3,655,372 | ||||||
Informatica Corp.* | 25,427 | 1,055,220 | ||||||
Intuit, Inc. | 69,813 | 5,328,128 | ||||||
MICROS Systems, Inc.* | 2,775 | 159,202 | ||||||
Microsoft Corp. | 1,963,506 | 73,494,030 | ||||||
NetSuite, Inc.* | 24,356 | 2,509,155 | ||||||
Oracle Corp. | 834,775 | 31,938,491 | ||||||
Red Hat, Inc.* | 84,348 | 4,726,862 | ||||||
Rovi Corp.* | 2,908 | 57,259 | ||||||
Salesforce.com, Inc.* | 461,479 | 25,469,026 | ||||||
ServiceNow, Inc.* | 209,504 | 11,734,319 | ||||||
SolarWinds, Inc.* | 15,424 | 583,490 | ||||||
Solera Holdings, Inc. | 16,206 | 1,146,737 | ||||||
Splunk, Inc.* | 24,132 | 1,657,144 | ||||||
Symantec Corp. | 119,241 | 2,811,703 | ||||||
Tableau Software, Inc., Class A* | 2,233 | 153,921 | ||||||
TIBCO Software, Inc.* | 38,609 | 867,930 | ||||||
VMware, Inc., Class A* | 20,107 | 1,803,799 | ||||||
Workday, Inc., Class A* | 30,516 | 2,537,711 | ||||||
|
| |||||||
| 202,746,157 | ||||||||
|
| |||||||
Total Information Technology | 1,085,541,571 | |||||||
|
| |||||||
Materials (3.6%) | ||||||||
Chemicals (3.2%) | ||||||||
Airgas, Inc. | 15,402 | 1,722,714 | ||||||
Albemarle Corp. | 7,283 | 461,669 | ||||||
Celanese Corp. | 37,538 | 2,076,227 | ||||||
Dow Chemical Co. | 37,264 | 1,654,521 | ||||||
E.I. du Pont de Nemours & Co. | 216,419 | 14,060,742 | ||||||
Eastman Chemical Co. | 36,407 | 2,938,045 | ||||||
Ecolab, Inc. | 119,073 | 12,415,742 | ||||||
FMC Corp. | 58,364 | 4,404,147 | ||||||
International Flavors & Fragrances, Inc. | 19,164 | 1,647,721 | ||||||
LyondellBasell Industries N.V., Class A | 95,449 | 7,662,646 | ||||||
Monsanto Co. | 562,917 | 65,607,976 | ||||||
NewMarket Corp. | 2,231 | 745,489 | ||||||
PPG Industries, Inc. | 30,520 | 5,788,423 | ||||||
Praxair, Inc. | 105,360 | 13,699,961 | ||||||
Rockwood Holdings, Inc. | 12,677 | 911,730 | ||||||
RPM International, Inc. | 29,174 | 1,211,013 | ||||||
Scotts Miracle-Gro Co., Class A | 10,112 | 629,169 | ||||||
Sherwin-Williams Co. | 162,535 | 29,825,172 | ||||||
Sigma-Aldrich Corp. | 26,709 | 2,510,913 | ||||||
Valspar Corp. | 20,958 | 1,494,096 | ||||||
W.R. Grace & Co.* | 15,555 | 1,537,923 | ||||||
Westlake Chemical Corp. | 4,132 | 504,393 | ||||||
|
| |||||||
| 173,510,432 | ||||||||
|
| |||||||
Construction Materials (0.1%) | ||||||||
Eagle Materials, Inc. | 11,649 | 901,982 | ||||||
Martin Marietta Materials, Inc. | 24,319 | 2,430,441 | ||||||
|
| |||||||
| 3,332,423 | ||||||||
|
| |||||||
Containers & Packaging (0.2%) | ||||||||
AptarGroup, Inc. | 11,005 | 746,249 | ||||||
Avery Dennison Corp. | 7,442 | 373,514 | ||||||
Ball Corp. | 34,981 | $ | 1,807,119 | |||||
Bemis Co., Inc. | 10,643 | 435,937 | ||||||
Crown Holdings, Inc.* | 28,859 | 1,286,246 | ||||||
Greif, Inc., Class A | 1,496 | 78,390 | ||||||
Owens-Illinois, Inc.* | 22,763 | 814,460 | ||||||
Packaging Corp. of America | 23,062 | 1,459,363 | ||||||
Rock-Tenn Co., Class A | 12,184 | 1,279,442 | ||||||
Sealed Air Corp. | 46,057 | 1,568,241 | ||||||
Silgan Holdings, Inc. | 10,379 | 498,400 | ||||||
|
| |||||||
| 10,347,361 | ||||||||
|
| |||||||
Metals & Mining (0.0%) | ||||||||
Compass Minerals International, Inc. | 7,842 | 627,752 | ||||||
Royal Gold, Inc. | 3,857 | 177,692 | ||||||
Southern Copper Corp. | 37,137 | 1,066,203 | ||||||
Tahoe Resources, Inc.* | 2,625 | 43,680 | ||||||
|
| |||||||
| 1,915,327 | ||||||||
|
| |||||||
Paper & Forest Products (0.1%) | ||||||||
International Paper Co. | 89,950 | 4,410,249 | ||||||
|
| |||||||
Total Materials | 193,515,792 | |||||||
|
| |||||||
Telecommunication Services (1.4%) |
| |||||||
Diversified Telecommunication Services (0.6%) |
| |||||||
Intelsat S.A.* | 373 | 8,407 | ||||||
Level 3 Communications, Inc.* | 12,813 | 425,007 | ||||||
tw telecom, Inc.* | 35,364 | 1,077,541 | ||||||
Verizon Communications, Inc. | 672,676 | 33,055,299 | ||||||
Windstream Holdings, Inc. | 131,776 | 1,051,573 | ||||||
|
| |||||||
| 35,617,827 | ||||||||
|
| |||||||
Wireless Telecommunication Services (0.8%) |
| |||||||
Crown Castle International Corp.* | 255,873 | 18,788,754 | ||||||
SBA Communications Corp., Class A* | 220,994 | 19,854,101 | ||||||
SoftBank Corp. (ADR) | 60,000 | 2,628,600 | ||||||
Sprint Corp.* | 36,411 | 391,418 | ||||||
|
| |||||||
| 41,662,873 | ||||||||
|
| |||||||
Total Telecommunication Services | 77,280,700 | |||||||
|
| |||||||
Utilities (0.1%) | ||||||||
Electric Utilities (0.0%) | ||||||||
ITC Holdings Corp. | 12,310 | 1,179,544 | ||||||
|
| |||||||
Gas Utilities (0.1%) | ||||||||
ONEOK, Inc. | 45,552 | 2,832,423 | ||||||
Questar Corp. | 5,356 | 123,135 | ||||||
|
| |||||||
| 2,955,558 | ||||||||
|
| |||||||
Independent Power Producers & Energy Traders (0.0%) |
| |||||||
Calpine Corp.* | 10,724 | 209,225 | ||||||
|
| |||||||
Water Utilities (0.0%) | ||||||||
Aqua America, Inc. | 36,264 | 855,468 | ||||||
|
| |||||||
Total Utilities | 5,199,795 | |||||||
|
| |||||||
Total Common Stocks (77.4%) | 4,172,686,203 | |||||||
|
| |||||||
See Notes to Financial Statements.
51
EQ ADVISORS TRUST
EQ/LARGE CAP GROWTH PLUS PORTFOLIO
PORTFOLIO OF INVESTMENTS (Continued)
December 31, 2013
| Number of Shares | Value (Note 1) | |||||||
INVESTMENT COMPANIES: | ||||||||
Exchange Traded Funds (ETFs)(4.4%) |
| |||||||
iShares® Core S&P 500 ETF | 5,579 | $ | 1,035,741 | |||||
iShares® Morningstar Large-Cap ETF | 5,123 | 552,464 | ||||||
iShares® Morningstar Large-Cap Growth ETF‡ | 498,665 | 49,861,513 | ||||||
iShares® Morningstar Large-Cap Value ETF | 29,168 | 2,345,107 | ||||||
iShares® NYSE 100 ETF | 5,794 | 490,740 | ||||||
iShares® Russell 1000 ETF | 3,225 | 332,723 | ||||||
iShares® Russell 1000 Growth ETF | 842,573 | 72,419,149 | ||||||
iShares® Russell 1000 Value ETF | 40,090 | 3,774,875 | ||||||
iShares® S&P 100 ETF | 2,587 | 213,040 | ||||||
iShares® S&P 500 Growth ETF | 520,850 | 51,423,521 | ||||||
iShares® S&P 500 Value ETF | 23,904 | 2,042,836 | ||||||
Vanguard Growth ETF | 545,722 | 50,779,432 | ||||||
Vanguard Large-Cap ETF | 600 | $ | 50,880 | |||||
Vanguard Value ETF | 27,800 | 2,123,642 | ||||||
|
| |||||||
Total Investment Companies (4.4%) |
| 237,445,663 |
| |||||
|
| |||||||
Total Investments (81.8%) | 4,410,131,866 | |||||||
Other Assets Less Liabilities (18.2%) | 981,801,538 | |||||||
|
| |||||||
Net Assets (100%) | $ | 5,391,933,404 | ||||||
|
| |||||||
| * | Non-income producing. |
| † | Securities (totaling $184,391 or 0.0% of net assets) at fair value by management |
| ‡ | Affiliated company as defined under the Investment Company Act of 1940. |
| (b) | Illiquid security. |
Glossary:
| ADR | — American Depositary Receipt |
Investments in companies which were affiliates for the year ended December 31, 2013, were as follows:
Securities | Value December 31, 2012 | Purchases at Cost | Sales at Cost | Value December 31, 2013 | Dividend Income | Realized Gain (Loss) † | ||||||||||||||||||
iShares® Morningstar Large-Cap Growth ETF (a) | $ | 52,361,571 | $ | 8,899,925 | $ | 15,678,601 | $ | 49,861,513 | $ | 464,375 | $ | 7,476,656 | ||||||||||||
|
|
|
|
|
|
|
|
|
|
|
| |||||||||||||
| † | When applicable, realized gain includes net distributions of realized gain received from Underlying Portfolios. |
| (a) | Formerly known as iShares® Morningstar Large Cap Growth Index Fund. |
At December 31, 2013, the Portfolio had the following futures contracts open: (Note 1)
Purchases | Number of Contracts | Expiration Date | Original Value | Value at 12/31/2013 | Unrealized Appreciation/ (Depreciation) | |||||||||||||||
NASDAQ 100 E-Mini Index | 2,757 | March-14 | $ | 193,374,186 | $ | 197,607,975 | $ | 4,233,789 | ||||||||||||
S&P 500 E-Mini Index | 8,407 | March-14 | 754,500,879 | 773,906,385 | 19,405,506 | |||||||||||||||
|
| |||||||||||||||||||
| $ | 23,639,295 | |||||||||||||||||||
|
| |||||||||||||||||||
See Notes to Financial Statements.
52
EQ ADVISORS TRUST
EQ/LARGE CAP GROWTH PLUS PORTFOLIO
PORTFOLIO OF INVESTMENTS (Continued)
December 31, 2013
The following is a summary of the inputs used to value the Portfolio’s assets and liabilities carried at fair value as of December 31, 2013:
The inputs or methodology used for valuing securities are not necessarily an indication of the risk associated with investing in those securities.
Various inputs are used in determining the value of the Portfolio’s investments. These inputs are summarized in the three broad levels listed below:
| Investment Type | Level 1 Quoted Prices in Active Markets for Identical Securities | Level 2 Significant Other Observable Inputs (including quoted prices for similar securities, interest rates, prepayment speeds, credit risk, etc.) (a) | Level 3 Significant Unobservable Inputs (including the Portfolio’s own assumptions in determining the fair value of investments) | Total | ||||||||||||
Assets: | ||||||||||||||||
Common Stocks | ||||||||||||||||
Consumer Discretionary | $ | 946,849,093 | $ | 6,926,840 | $ | — | $ | 953,775,933 | ||||||||
Consumer Staples | 304,419,177 | 4,452,030 | — | 308,871,207 | ||||||||||||
Energy | 197,033,220 | — | — | 197,033,220 | ||||||||||||
Financials | 255,438,197 | — | — | 255,438,197 | ||||||||||||
Health Care | 573,415,183 | 1,554,216 | — | (b) | 574,969,399 | |||||||||||
Industrials | 493,538,901 | 27,337,097 | 184,391 | 521,060,389 | ||||||||||||
Information Technology | 1,079,886,487 | 5,655,084 | — | 1,085,541,571 | ||||||||||||
Materials | 193,515,792 | — | — | 193,515,792 | ||||||||||||
Telecommunication Services | 77,280,700 | — | — | 77,280,700 | ||||||||||||
Utilities | 5,199,795 | — | — | 5,199,795 | ||||||||||||
Futures | 23,639,295 | — | — | 23,639,295 | ||||||||||||
Investment Companies | ||||||||||||||||
Exchange Traded Funds (ETFs) | 237,445,663 | — | — | 237,445,663 | ||||||||||||
|
|
|
|
|
|
|
| |||||||||
Total Assets | $ | 4,387,661,503 | $ | 45,925,267 | $ | 184,391 | $ | 4,433,771,161 | ||||||||
|
|
|
|
|
|
|
| |||||||||
Total Liabilities | $ | — | $ | — | $ | — | $ | — | ||||||||
|
|
|
|
|
|
|
| |||||||||
Total | $ | 4,387,661,503 | $ | 45,925,267 | $ | 184,391 | $ | 4,433,771,161 | ||||||||
|
|
|
|
|
|
|
| |||||||||
(a) A security with a market value of $2,687,345 transferred from Level 1 to Level 2 during the year ended December 31, 2013 due to inactive trading.
(b) Value is zero.
There were no additional transfers between levels 1, 2 or 3 during the year ended December 31, 2013.
Fair Values of Derivative Instruments as of December 31, 2013:
Statement of Assets and Liabilities | ||||||
Derivatives Not Accounted for as Hedging Instrument^ | Asset Derivatives | Fair Value | ||||
Interest rate contracts | Receivables, Net assets - Unrealized appreciation | $ | — | * | ||
Foreign exchange contracts | Receivables | — | ||||
Credit contracts | Receivables | — | ||||
Equity contracts | Receivables, Net assets - Unrealized appreciation | 23,639,295 | * | |||
Commodity contracts | Receivables | — | ||||
Other contracts | Receivables | — | ||||
|
| |||||
Total | $ | 23,639,295 | ||||
|
| |||||
Liability Derivatives | ||||||
Interest rate contracts | Payables, Net assets - Unrealized depreciation | $ | — | * | ||
Foreign exchange contracts | Payables | — | ||||
Credit contracts | Payables | — | ||||
Equity contracts | Payables, Net assets - Unrealized depreciation | — | * | |||
Commodity contracts | Payables | — | ||||
Other contracts | Payables | — | ||||
|
| |||||
Total | $ | — | ||||
|
| |||||
| * | Includes cumulative appreciation/depreciation of futures contracts as reported in the Portfolio of Investments. Only current day’s variation margin is reported within the Statement of Assets & Liabilities. |
See Notes to Financial Statements.
53
EQ ADVISORS TRUST
EQ/LARGE CAP GROWTH PLUS PORTFOLIO
PORTFOLIO OF INVESTMENTS (Continued)
December 31, 2013
The effect of Derivative Instruments on the Statement of Operations for the year ended December 31, 2013:
| Amount of Realized Gain or (Loss) on Derivatives Recognized in Income | ||||||||||||||||||||
Derivatives Not Accounted for as Hedging Instruments^ | Options | Futures | Forward Currency Contracts | Swaps | Total | |||||||||||||||
Interest rate contracts | $ | — | $ | — | $ | — | $ | — | $ | — | ||||||||||
Foreign exchange contracts | — | — | — | — | — | |||||||||||||||
Credit contracts | — | — | — | — | — | |||||||||||||||
Equity contracts | — | 138,707,727 | — | — | 138,707,727 | |||||||||||||||
Commodity contracts | — | — | — | — | — | |||||||||||||||
Other contracts | — | — | — | — | — | |||||||||||||||
|
|
|
|
|
|
|
|
|
| |||||||||||
Total | $ | — | $ | 138,707,727 | $ | — | $ | — | $ | 138,707,727 | ||||||||||
|
|
|
|
|
|
|
|
|
| |||||||||||
| Amount of Unrealized Appreciation or (Depreciation) on Derivatives Recognized in Income | ||||||||||||||||||||
Derivatives Not Accounted for as Hedging Instruments^ | Options | Futures | Forward Currency Contracts | Swaps | Total | |||||||||||||||
Interest rate contracts | $ | — | $ | — | $ | — | $ | — | $ | — | ||||||||||
Foreign exchange contracts | — | — | — | — | — | |||||||||||||||
Credit contracts | — | — | — | — | — | |||||||||||||||
Equity contracts | — | 24,922,267 | — | — | 24,922,267 | |||||||||||||||
Commodity contracts | — | — | — | — | — | |||||||||||||||
Other contracts | — | — | — | — | — | |||||||||||||||
|
|
|
|
|
|
|
|
|
| |||||||||||
Total | $ | — | $ | 24,922,267 | $ | — | $ | — | $ | 24,922,267 | ||||||||||
|
|
|
|
|
|
|
|
|
| |||||||||||
^ This Portfolio held futures contracts as a substitute for investing in conventional securities, hedging and in an attempt to enhance returns.
The Portfolio held futures contracts with an average notional balance of approximately $612,155,000 during the year ended December 31, 2013.
The following table presents the Portfolio’s gross derivative assets and liabilities by counterparty net of amounts available for offset undernetting arrangements and any related collateral received or pledged by the Portfolio as of December 31, 2013:
Counterparty | Gross Amount of Derivative Assets Presented in the Statement of Assets and Liabilities (a) | Derivatives Available for Offset | Collateral Received | Net Amount Due from Counterparty | ||||||||||||
Exchange Traded Futures & Options Contracts (b) | $ | 23,639,295 | (c) | $ | — | $ | — | $ | 23,639,295 | |||||||
|
|
|
|
|
|
|
| |||||||||
| (a) | For financial reporting purposes the Portfolio does not offset derivative assets and derivative liabilities subject to master netting arrangements in the Statement of Assets and Liabilities. |
| (b) | These derivatives are traded on an exchange, therefore they are not subject to master netting arrangements. |
| (c) | This amount represents the cumulative appreciation (depreciation) of futures contracts as reported in the Portfolio of Investments. The Statement of Assets and Liabilities only reflects the current day variation margin receivable/payable to brokers for futures contracts. |
Investment security transactions for the year ended December 31, 2013 were as follows:
Cost of Purchases: | ||
Long-term investments other than U.S. government debt securities | $ 1,177,345,285 | |
Net Proceeds of Sales and Redemptions: | ||
Long-term investments other than U.S. government debt securities | $ 1,567,619,973 |
See Notes to Financial Statements.
54
EQ ADVISORS TRUST
EQ/LARGE CAP GROWTH PLUS PORTFOLIO
PORTFOLIO OF INVESTMENTS (Continued)
December 31, 2013
As of December 31, 2013, the gross unrealized appreciation (depreciation) of investments based on the aggregate cost of investments for Federal income tax purposes was as follows:
Aggregate gross unrealized appreciation | $ | 1,158,300,633 | ||
Aggregate gross unrealized depreciation | (8,312,195 | ) | ||
|
| |||
Net unrealized appreciation | $ | 1,149,988,438 | ||
|
| |||
Federal income tax cost of investments | $ | 3,260,143,428 | ||
|
|
For the year ended December 31, 2013, the Portfolio incurred approximately $6,670 as brokerage commissions with Sanford C. Bernstein & Co., LLC, an affiliated broker/dealer.
The Portfolio has a net capital loss carryforward of $186,172,317, which expires in the year 2017. The Portfolio utilized net capital loss carryforward of $365,770,393 during 2013.
55
EQ ADVISORS TRUST
EQ/LARGE CAP GROWTH PLUS PORTFOLIO
STATEMENT OF ASSETS AND LIABILITIES
December 31, 2013
ASSETS | ||||
Investments at value: | ||||
Affiliated Issuers (Cost $27,749,909) | $ | 49,861,513 | ||
Unaffiliated Issuers (Cost $3,204,929,207) | 4,360,270,353 | |||
Cash | 940,721,975 | |||
Foreign cash (Cost $15) | 15 | |||
Cash held as collateral at broker | 42,925,000 | |||
Receivable for securities sold | 12,390,843 | |||
Due from broker for futures variation margin | 3,692,066 | |||
Dividends, interest and other receivables | 3,201,612 | |||
Receivable from Separate Accounts for Trust shares sold | 164,870 | |||
Other assets | 8,232 | |||
|
| |||
Total assets | 5,413,236,479 | |||
|
| |||
LIABILITIES | ||||
Payable for securities purchased | 12,793,925 | |||
Payable to Separate Accounts for Trust shares redeemed | 4,566,494 | |||
Investment management fees payable | 2,063,419 | |||
Distribution fees payable - Class IB | 882,443 | |||
Administrative fees payable | 621,421 | |||
Trustees’ fees payable | 4,174 | |||
Distribution fees payable - Class IA | 2,751 | |||
Accrued expenses | 368,448 | |||
|
| |||
Total liabilities | 21,303,075 | |||
|
| |||
NET ASSETS | $ | 5,391,933,404 | ||
|
| |||
Net assets were comprised of: | ||||
Paid in capital | $ | 4,448,050,522 | ||
Accumulated undistributed net investment income (loss) | 819,458 | |||
Accumulated undistributed net realized gain | ||||
(loss) on investments, futures and foreign currency transactions | (258,028,780 | ) | ||
Net unrealized appreciation (depreciation) on investments, futures and foreign currency translations | 1,201,092,204 | |||
|
| |||
Net assets | $ | 5,391,933,404 | ||
|
| |||
Class IA | ||||
Net asset value, offering and redemption price per share, $13,265,832 / 531,654 shares outstanding (unlimited amount authorized: $0.01 par value) | $ | 24.95 | ||
|
| |||
Class IB | ||||
Net asset value, offering and redemption price per share, $4,223,748,264 / 173,110,415 shares outstanding (unlimited amount authorized: $0.01 par value) | $ | 24.40 | ||
|
| |||
Class K Net asset value, offering and redemption price per share, $1,154,919,308 / 46,286,871 shares outstanding (unlimited amount authorized: $0.01 par value) | $ | 24.95 | ||
|
|
STATEMENT OF OPERATIONS
For the Year Ended December 31, 2013
INVESTMENT INCOME | ||||
Dividends ($464,375 of dividend income received from affiliates) (net of $26,132 foreign withholding tax) | $ | 39,130,807 | ||
Interest | 607,066 | |||
|
| |||
Total income | 39,737,873 | |||
|
| |||
EXPENSES | ||||
Investment management fees | 16,836,669 | |||
Distribution fees - Class IB | 6,242,719 | |||
Administrative fees | 5,179,909 | |||
Printing and mailing expenses | 372,780 | |||
Professional fees | 147,919 | |||
Custodian fees | 115,000 | |||
Trustees’ fees | 79,624 | |||
Distribution fees - Class IA | 27,898 | |||
Miscellaneous | 47,912 | |||
|
| |||
Gross expenses | 29,050,430 | |||
Less: Feespaid indirectly | (57,798 | ) | ||
|
| |||
Net expenses | 28,992,632 | |||
|
| |||
NET INVESTMENT INCOME (LOSS) | 10,745,241 | |||
|
| |||
REALIZED AND UNREALIZED GAIN (LOSS) | ||||
Realized gain (loss) on: | ||||
Investments ($7,476,656 of realized gain (loss) from affiliates) | 203,038,543 | |||
Futures | 138,707,727 | |||
Foreign currency transactions | (14,943 | ) | ||
|
| |||
Net realized gain (loss) | 341,731,327 | |||
|
| |||
Change in unrealized appreciation (depreciation) on: | ||||
Investments ($4,278,618 of change in unrealized appreciation (depreciation) from affiliates) | 732,027,097 | |||
Futures | 24,922,267 | |||
Foreign currency translations | 159 | |||
|
| |||
Net change in unrealized appreciation (depreciation) | 756,949,523 | |||
|
| |||
NET REALIZED AND UNREALIZED GAIN (LOSS) | 1,098,680,850 | |||
|
| |||
NET INCREASE (DECREASE) IN NET ASSETS RESULTING FROM OPERATIONS | $ | 1,109,426,091 | ||
|
|
See Notes to Financial Statements.
56
EQ ADVISORS TRUST
EQ/LARGE CAP GROWTH PLUS PORTFOLIO
STATEMENT OF CHANGES IN NET ASSETS
| Year Ended December 31, | ||||||||
| 2013 | 2012 | |||||||
INCREASE (DECREASE) IN NET ASSETS FROM OPERATIONS: | ||||||||
Net investment income (loss) | $ | 10,745,241 | $ | 13,726,073 | ||||
Net realized gain (loss) on investments, futures and foreign currency transactions | 341,731,327 | 189,140,170 | ||||||
Net change in unrealized appreciation (depreciation) on investments, futures and foreign currency translations | 756,949,523 | 71,257,692 | ||||||
|
|
|
| |||||
NET INCREASE (DECREASE) IN NET ASSETS RESULTING FROM OPERATIONS | 1,109,426,091 | 274,123,935 | ||||||
|
|
|
| |||||
DIVIDENDS: | ||||||||
Dividends from net investment income | ||||||||
Class IA | (19,678 | ) | (54,020 | ) | ||||
Class IB | (6,387,750 | ) | (5,419,393 | ) | ||||
Class K | (4,523,945 | ) | (8,160,525 | ) | ||||
|
|
|
| |||||
TOTAL DIVIDENDS | (10,931,373 | ) | (13,633,938 | ) | ||||
|
|
|
| |||||
CAPITAL SHARES TRANSACTIONS: | ||||||||
Class IA | ||||||||
Capital shares sold [ 159,271 and 61,983 shares, respectively ] | 3,547,989 | 1,128,671 | ||||||
Capital shares issued in reinvestment of dividends [ 807 and 2,921 shares, respectively ] | 19,678 | 54,020 | ||||||
Capital shares repurchased [ (132,528) and (93,475) shares, respectively ] | (2,965,553 | ) | (1,698,563 | ) | ||||
|
|
|
| |||||
Total Class IA transactions | 602,114 | (515,872 | ) | |||||
|
|
|
| |||||
Class IB | ||||||||
Capital shares sold [ 3,246,288 and 2,572,863 shares, respectively ] | 67,580,193 | 45,381,550 | ||||||
Capital shares sold in-kind (Note 9)[ 142,273,135 and 0 shares, respectively ] | 2,976,866,788 | — | ||||||
Capital shares issued in reinvestment of dividends [ 267,876 and 299,664 shares, respectively ] | 6,387,750 | 5,419,393 | ||||||
Capital shares repurchased [ (24,029,057) and (8,619,283) shares, respectively ] | (527,183,638 | ) | (153,384,159 | ) | ||||
|
|
|
| |||||
Total Class IB transactions | 2,523,651,093 | (102,583,216 | ) | |||||
|
|
|
| |||||
Class K | ||||||||
Capital shares sold [ 400,812 and 652,551 shares, respectively ] | 8,553,643 | 11,770,427 | ||||||
Capital shares sold in-kind (Note 9)[ 29 and 0 shares, respectively ] | 598 | — | ||||||
Capital shares issued in reinvestment of dividends [ 185,534 and 441,283 shares, respectively ] | 4,523,945 | 8,160,525 | ||||||
Capital shares repurchased [ (7,189,605) and (15,409,145) shares, respectively ] | (156,274,506 | ) | (282,029,646 | ) | ||||
|
|
|
| |||||
Total Class K transactions | (143,196,320 | ) | (262,098,694 | ) | ||||
|
|
|
| |||||
NET INCREASE (DECREASE) IN NET ASSETS RESULTING FROM CAPITAL SHARE TRANSACTIONS | 2,381,056,887 | (365,197,782 | ) | |||||
|
|
|
| |||||
TOTAL INCREASE (DECREASE) IN NET ASSETS | 3,479,551,605 | (104,707,785 | ) | |||||
NET ASSETS: | ||||||||
Beginning of year | 1,912,381,799 | 2,017,089,584 | ||||||
|
|
|
| |||||
End of year (a) | $ | 5,391,933,404 | $ | 1,912,381,799 | ||||
|
|
|
|
| ||||
(a) Includes accumulated undistributed (overdistributed) net investment income (loss) of | $ | 819,458 | $ | 226,577 | ||||
|
|
|
| |||||
See Notes to Financial Statements.
57
EQ ADVISORS TRUST
EQ/LARGE CAP GROWTH PLUS PORTFOLIO
FINANCIAL HIGHLIGHTS
| Year Ended December 31, | ||||||||||||||||||||
| Class IA | 2013 | 2012 | 2011 | 2010 | 2009 | |||||||||||||||
Net asset value, beginning of year | $ | 18.46 | $ | 16.33 | $ | 17.00 | $ | 14.95 | $ | 11.32 | ||||||||||
|
|
|
|
|
|
|
|
|
| |||||||||||
Income (loss) from investment operations: | ||||||||||||||||||||
Net investment income (loss) | 0.05 | (e) | 0.10 | (e) | 0.11 | (e) | 0.10 | (e) | 0.13 | (e) | ||||||||||
Net realized and unrealized gain (loss) on investments, futures and foreign currency transactions | 6.48 | 2.14 | (0.67 | ) | 2.05 | 3.71 | ||||||||||||||
|
|
|
|
|
|
|
|
|
| |||||||||||
Total from investment operations | 6.53 | 2.24 | (0.56 | ) | 2.15 | 3.84 | ||||||||||||||
|
|
|
|
|
|
|
|
|
| |||||||||||
Less distributions: | ||||||||||||||||||||
Dividends from net investment income | (0.04 | ) | (0.11 | ) | (0.11 | ) | (0.10 | ) | (0.21 | ) | ||||||||||
|
|
|
|
|
|
|
|
|
| |||||||||||
Net asset value, end of year | $ | 24.95 | $ | 18.46 | $ | 16.33 | $ | 17.00 | $ | 14.95 | ||||||||||
|
|
|
|
|
|
|
|
|
| |||||||||||
Total return | 35.36 | % | 13.70 | % | (3.27 | )% | 14.40 | % | 33.93 | % | ||||||||||
|
|
|
|
|
|
|
|
|
| |||||||||||
Ratios/Supplemental Data: | ||||||||||||||||||||
Net assets, end of year (000’s) | $ | 13,266 | $ | 9,305 | $ | 8,697 | $ | 1,097,259 | $ | 939,856 | ||||||||||
Ratio of expenses to average net assets: | ||||||||||||||||||||
After waivers and reimbursements (f) | 0.90 | % | 0.93 | % | 0.67 | % | 0.68 | % | 0.70 | % | ||||||||||
After waivers, reimbursements and fees paid indirectly (f) | 0.89 | % | 0.93 | % | 0.67 | % | 0.68 | % | 0.69 | % | ||||||||||
Before waivers, reimbursements and fees paid indirectly (f) | 0.90 | % | 0.93 | % | 0.68 | % | 0.69 | % | 0.70 | % | ||||||||||
Ratio of net investment income (loss) to average net assets: | ||||||||||||||||||||
After waivers and reimbursements (f) | 0.24 | % | 0.54 | % | 0.61 | % | 0.65 | % | 1.10 | % | ||||||||||
After waivers, reimbursements and fees paid indirectly (f) | 0.24 | % | 0.54 | % | 0.61 | % | 0.65 | % | 1.10 | % | ||||||||||
Before waivers, reimbursements and fees paid | 0.24 | % | 0.54 | % | 0.61 | % | 0.64 | % | 1.10 | % | ||||||||||
Portfolio turnover rate | 40 | % | 28 | % | 39 | % | 39 | % | 43 | % | ||||||||||
| Year Ended December 31, | ||||||||||||||||||||
| Class IB | 2013 | 2012 | 2011 | 2010 | 2009 | |||||||||||||||
Net asset value, beginning of year | $ | 18.05 | $ | 15.96 | $ | 16.64 | $ | 14.59 | $ | 10.95 | ||||||||||
|
|
|
|
|
|
|
|
|
| |||||||||||
Income (loss) from investment operations: | ||||||||||||||||||||
Net investment income (loss) | 0.05 | (e) | 0.10 | (e) | 0.06 | (e) | 0.06 | (e) | 0.12 | (e) | ||||||||||
Net realized and unrealized gain (loss) on investments, futures and foreign currency transactions | 6.34 | 2.10 | (0.67 | ) | 2.05 | 3.68 | ||||||||||||||
|
|
|
|
|
|
|
|
|
| |||||||||||
Total from investment operations | 6.39 | 2.20 | (0.61 | ) | 2.11 | 3.80 | ||||||||||||||
|
|
|
|
|
|
|
|
|
| |||||||||||
Less distributions: | ||||||||||||||||||||
Dividends from net investment income | (0.04 | ) | (0.11 | ) | (0.07 | ) | (0.06 | ) | (0.16 | ) | ||||||||||
|
|
|
|
|
|
|
|
|
| |||||||||||
Net asset value, end of year | $ | 24.40 | $ | 18.05 | $ | 15.96 | $ | 16.64 | $ | 14.59 | ||||||||||
|
|
|
|
|
|
|
|
|
| |||||||||||
Total return | 35.39 | % | 13.76 | % | (3.66 | )% | 14.46 | % | 34.77 | % | ||||||||||
|
|
|
|
|
|
|
|
|
| |||||||||||
Ratios/Supplemental Data: | ||||||||||||||||||||
Net assets, end of year (000’s) | $ | 4,223,748 | $ | 926,855 | $ | 911,391 | $ | 699,946 | $ | 679,158 | ||||||||||
Ratio of expenses to average net assets: | ||||||||||||||||||||
After waivers and reimbursements (f) | 0.90 | % | 0.93 | % | 0.92 | % | 0.93 | %(c) | 0.95 | %(c) | ||||||||||
After waivers, reimbursements and fees paid indirectly (f) | 0.89 | % | 0.93 | % | 0.92 | % | 0.93 | %(c) | 0.94 | % | ||||||||||
Before waivers, reimbursements and fees paid indirectly (f) | 0.90 | % | 0.93 | % | 0.93 | % | 0.94 | % | 0.95 | %(c) | ||||||||||
Ratio of net investment income (loss) to average net assets: | ||||||||||||||||||||
After waivers and reimbursements (f) | 0.22 | % | 0.54 | % | 0.35 | % | 0.43 | % | 0.94 | % | ||||||||||
After waivers, reimbursements and fees paid indirectly (f) | 0.22 | % | 0.54 | % | 0.35 | % | 0.43 | % | 0.95 | % | ||||||||||
Before waivers, reimbursements and fees paid | 0.22 | % | 0.54 | % | 0.34 | % | 0.42 | % | 0.94 | % | ||||||||||
Portfolio turnover rate | 40 | % | 28 | % | 39 | % | 39 | % | 43 | % | ||||||||||
See Notes to Financial Statements.
58
EQ ADVISORS TRUST
EQ/LARGE CAP GROWTH PLUS PORTFOLIO
FINANCIAL HIGHLIGHTS (Continued)
| Year Ended December 31, | August 26, 2011* to December 31, 2011 | |||||||||||
| Class K | 2013 | 2012 | ||||||||||
Net asset value, beginning of period | $ | 18.46 | $ | 16.32 | $ | 15.80 | ||||||
|
|
|
|
|
| |||||||
Income (loss) from investment operations: | ||||||||||||
Net investment income (loss) | 0.11 | (e) | 0.14 | (e) | 0.06 | (e) | ||||||
Net realized and unrealized gain (loss) on investments, futures and foreign currency transactions | 6.48 | 2.16 | 0.57 | |||||||||
|
|
|
|
|
| |||||||
Total from investment operations | 6.59 | 2.30 | 0.63 | |||||||||
|
|
|
|
|
| |||||||
Less distributions: | ||||||||||||
Dividends from net investment income | (0.10 | ) | (0.16 | ) | (0.11 | ) | ||||||
|
|
|
|
|
| |||||||
Net asset value, end of period | $ | 24.95 | $ | 18.46 | $ | 16.32 | ||||||
|
|
|
|
|
| |||||||
Total return (b) | 35.70 | % | 14.06 | % | 4.00 | % | ||||||
|
|
|
|
|
| |||||||
Ratios/Supplemental Data: | ||||||||||||
Net assets, end of period (000’s) | $ | 1,154,919 | $ | 976,222 | $ | 1,097,001 | ||||||
Ratio of expenses to average net assets: | ||||||||||||
After waivers and reimbursements (a)(f) | 0.65 | % | 0.68 | % | 0.68 | % | ||||||
After waivers, reimbursements and fees paid indirectly (a)(f) | 0.64 | % | 0.68 | % | 0.68 | % | ||||||
Before waivers, reimbursements and fees paid indirectly (a)(f) | 0.65 | % | 0.68 | % | 0.68 | % | ||||||
Ratio of net investment income (loss) to average net assets: | ||||||||||||
After waivers and reimbursements (a)(f) | 0.49 | % | 0.78 | % | 1.06 | % | ||||||
After waivers, reimbursements and fees paid indirectly (a)(f) | 0.49 | % | 0.78 | % | 1.07 | % | ||||||
Before waivers, reimbursements and fees paid indirectly (a)(f) | 0.49 | % | 0.78 | % | 1.06 | % | ||||||
Portfolio turnover rate | 40 | % | 28 | % | 39 | % | ||||||
| * | Commencement of Operations. |
| (a) | Ratios for periods less than one year are annualized. |
| (b) | Total returns for periods less than one year are not annualized. |
| (c) | Reflects overall fund ratios for non-class specific expenses. |
| (e) | Net investment income (loss) per share is based on average shares outstanding. |
| (f) | Expenses do not include the expenses of the underlying funds (“indirect expenses”). |
See Notes to Financial Statements.
59
EQ/LORD ABBETT LARGE CAP CORE PORTFOLIO (Unaudited)
PORTFOLIO ADVISER
| Ø | Lord, Abbett & Co. LLC |
PERFORMANCE RESULTS
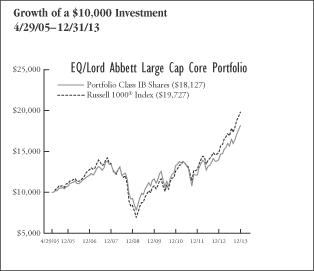
| Annualized Total Returns as of 12/31/13 | ||||||||||||
| 1 Year | 5 Years | Since Incept. | ||||||||||
Portfolio – Class IA Shares* | 29.96 | % | 14.59 | % | 7.30 | % | ||||||
Portfolio – Class IB Shares* | 29.91 | 14.42 | 7.10 | |||||||||
Russell 1000® Index | 33.11 | 18.59 | 8.15 | |||||||||
* Date of inception 4/29/05.
Returns for periods greater than one year are annualized. |
| |||||||||||
Past performance is not indicative of future results.
PERFORMANCE SUMMARY
The Portfolio’s Class IA shares returned 29.96% for the year ended December 31, 2013. The Portfolio’s benchmark, the Russell 1000® Index, returned 33.11% over the same period.
Portfolio Highlights
For the year ended December 31, 2013
What helped performance during the year:
| • | Strong stock selection within the Financials sector contributed to relative performance for the period, including Prudential Financial, Inc. and Hartford Financial Services Group, Inc. An underweight within real estate investment trusts also helped performance within the sector. |
| • | An underweight within the Utilities sector also contributed to relative performance as this sector was one of the worst performing sectors in the benchmark for the period. |
| • | Stock selection within the Energy sector also contributed to relative performance, particularly holdings in Hess Corp. and EOG Resources, Inc. |
What hurt performance during the year:
| • | Stock selection within the Information Technology sector detracted from relative performance, including Apple, Inc. and NCR Corp. |
| • | Stock selection as well as an underweight within the Consumer Discretionary sector detracted from performance. Holdings in Abercrombie & Fitch Co. and Target Corp. detracted the most within the sector. |
| • | Industrials sector holdings KBR, Inc. and Fluor Corp. also detracted from relative performance. |
Portfolio Positioning and Outlook
We expect the U.S. economy will continue to modestly expand in 2014. We believe that strengthening employment, improving consumer confidence and diminished investors’ fears about the U.S. budget should support the progression. We remain aware of the potential impact of changes to Federal Reserve policy regarding tapering, the status of global economic conditions, as well U.S. equity market valuation concerns.
Information Technology remains the Portfolio’s largest overweight sector at the end of the period. The largest overweight within the sector is the Internet software & services industry. The Portfolio was also overweight in the Financials sector relative to its benchmark at year end. We are focused on companies that we believe should benefit from a slow rise in interest rates over the next few years. The Consumer Discretionary sector is the largest underweight at period end, although there is an overweight within multi-line retail companies and hotels. The Utilities and Consumer Staples sectors remain significant underweights relative to its benchmark, as we continue to find more compelling investment opportunities in other segments of the market.
Sector Weightings as of December 31, 2013 | % of Net Assets | |||
Information Technology | 21.8 | % | ||
Financials | 18.9 | |||
Health Care | 11.7 | |||
Consumer Discretionary | 11.1 | |||
Energy | 10.9 | |||
Industrials | 10.6 | |||
Consumer Staples | 7.1 | |||
Materials | 3.8 | |||
Utilities | 1.0 | |||
Telecommunication Services | 0.7 | |||
Cash and Other | 2.4 | |||
|
| |||
| 100.0 | % | |||
|
| |||
60
EQ/LORD ABBETT LARGE CAP CORE PORTFOLIO (Unaudited)
UNDERSTANDING YOUR EXPENSES:
As a shareholder of the Portfolio, you incur two types of costs:
(1)transaction costs, including applicable sales charges and redemption fees; and (2)ongoing costs, including management fees, distribution (12b-1) fees (in the case of Class IA and Class IB shares of the Trust), and other Portfolio expenses. These examples are intended to help you understand your ongoing costs (in dollars) of investing in the Portfolio and to compare these costs with the ongoing costs of investing in other mutual funds.
The examples are based on an investment of $1,000 invested at the beginning of the six-month period ended December 31, 2013 and held for the entire six-month period.
Actual Expenses
The first line of the table to the right provides information about actual account values and actual expenses. You may use the information in this line, together with the amount you invested, to estimate the expenses that you paid over the period. Simply divide your account value by $1,000 (for example, an $8,600 account value divided by $1,000 = 8.6), then multiply the result by the number in the first line under the heading entitled ‘‘Expenses Paid During Period’’ to estimate the expenses you paid on your account during this period.
Hypothetical Example for Comparison Purposes
The second line of the table below provides information about hypothetical account values and hypothetical expenses based on the Portfolio’s actual expense ratio and an assumed rate of return of 5% per year before expenses, which is not the Portfolio’s actual return. The hypothetical account values and expenses may not be used to estimate the actual ending account balance or expenses you paid for the period. You may use this information to compare the ongoing costs of investing in the Portfolio and other funds. To do so, compare this 5% hypothetical example with the 5% hypothetical examples that appear in the shareholder reports of the other funds.
Please note that the expenses shown in the table are meant to highlight your ongoing costs only and do not reflect any transactional costs, such as sales charges (loads), redemption fees, or exchange fees. Therefore, the second line of the table is useful in comparing ongoing costs only, and will not help you determine the relative total costs of owning different funds. In addition, if these transactional costs were included, your costs would have been higher. Also note that the table does not reflect any variable life insurance or variable annuity contract-related fees and expenses, which would increase overall fees and expenses.
EXAMPLE
Beginning Account Value 7/1/13 | Ending Account Value 12/31/13 | Expenses Paid During Period* 7/1/13 - 12/31/13 | ||||||||||
Class IA | ||||||||||||
Actual | $1,000.00 | $1,160.40 | $5.45 | |||||||||
Hypothetical (5% average annual return before expenses) | 1,000.00 | 1,020.16 | 5.09 | |||||||||
Class IB | ||||||||||||
Actual | 1,000.00 | 1,160.21 | 5.45 | |||||||||
Hypothetical (5% average annual return before expenses) | 1,000.00 | 1,020.16 | 5.09 | |||||||||
* Expenses are equal to the Portfolio’s Class IA and Class IB shares annualized expense ratios of 1.00% and 1.00%, respectively, multiplied by the average account value over the period, and multiplied by 184/365 (to reflect the one-half year period). |
| |||||||||||
61
EQ ADVISORS TRUST
EQ/LORD ABBETT LARGE CAP CORE PORTFOLIO
PORTFOLIO OF INVESTMENTS
December 31, 2013
| Number of Shares | Value (Note 1) | |||||||
COMMON STOCKS: | ||||||||
Consumer Discretionary (11.1%) | ||||||||
Auto Components (0.5%) | ||||||||
BorgWarner, Inc. | 7,006 | $ | 391,706 | |||||
|
| |||||||
Automobiles (0.7%) | ||||||||
Ford Motor Co. | 37,066 | 571,928 | ||||||
|
| |||||||
Hotels, Restaurants & Leisure (2.8%) | ||||||||
Hyatt Hotels Corp., Class A* | 4,836 | 239,188 | ||||||
MGM Resorts International* | 33,415 | 785,921 | ||||||
Starwood Hotels & Resorts Worldwide, Inc. | 8,684 | 689,944 | ||||||
Wynn Resorts Ltd. | 2,206 | 428,427 | ||||||
|
| |||||||
| 2,143,480 | ||||||||
|
| |||||||
Internet & Catalog Retail (0.2%) | ||||||||
Amazon.com, Inc.* | 447 | 178,259 | ||||||
|
| |||||||
Media (2.3%) | ||||||||
Time Warner, Inc. | 6,427 | 448,090 | ||||||
Twenty-First Century Fox, Inc., Class A | 9,827 | 345,714 | ||||||
Walt Disney Co. | 12,834 | 980,518 | ||||||
|
| |||||||
| 1,774,322 | ||||||||
|
| |||||||
Multiline Retail (1.7%) | ||||||||
Kohl’s Corp. | 8,995 | 510,466 | ||||||
Macy’s, Inc. | 14,794 | 790,000 | ||||||
|
| |||||||
| 1,300,466 | ||||||||
|
| |||||||
Specialty Retail (1.7%) | ||||||||
AutoZone, Inc.* | 732 | 349,852 | ||||||
Dick’s Sporting Goods, Inc. | 11,998 | 697,084 | ||||||
Home Depot, Inc. | 3,583 | 295,024 | ||||||
|
| |||||||
| 1,341,960 | ||||||||
|
| |||||||
Textiles, Apparel & Luxury Goods (1.2%) |
| |||||||
PVH Corp. | 3,467 | 471,581 | ||||||
Ralph Lauren Corp. | 2,582 | 455,904 | ||||||
|
| |||||||
| 927,485 | ||||||||
|
| |||||||
Total Consumer Discretionary | 8,629,606 | |||||||
|
| |||||||
Consumer Staples (7.1%) | ||||||||
Beverages (2.4%) | ||||||||
Coca-Cola Co. | 22,132 | 914,273 | ||||||
PepsiCo, Inc. | 11,045 | 916,072 | ||||||
|
| |||||||
| 1,830,345 | ||||||||
|
| |||||||
Food & Staples Retailing (1.7%) | ||||||||
CVS Caremark Corp. | 12,068 | 863,707 | ||||||
Wal-Mart Stores, Inc. | 6,161 | 484,809 | ||||||
|
| |||||||
| 1,348,516 | ||||||||
|
| |||||||
Food Products (1.0%) | ||||||||
Mondelez International, Inc., Class A | 22,476 | 793,403 | ||||||
|
| |||||||
Household Products (1.6%) | ||||||||
Colgate-Palmolive Co. | 13,214 | 861,685 | ||||||
Procter & Gamble Co. | 4,385 | 356,983 | ||||||
|
| |||||||
| 1,218,668 | ||||||||
|
| |||||||
Tobacco (0.4%) | ||||||||
Philip Morris International, Inc. | 3,649 | $ | 317,937 | |||||
|
| |||||||
Total Consumer Staples | 5,508,869 | |||||||
|
| |||||||
Energy (10.9%) | ||||||||
Energy Equipment & Services (1.8%) | ||||||||
Halliburton Co. | 11,129 | 564,797 | ||||||
Schlumberger Ltd. | 9,537 | 859,379 | ||||||
|
| |||||||
| 1,424,176 | ||||||||
|
| |||||||
Oil, Gas & Consumable Fuels (9.1%) |
| |||||||
Anadarko Petroleum Corp. | 7,781 | 617,189 | ||||||
Cabot Oil & Gas Corp. | 1,003 | 38,876 | ||||||
Chevron Corp. | 5,994 | 748,711 | ||||||
EOG Resources, Inc. | 5,949 | 998,480 | ||||||
EQT Corp. | 2,257 | 202,633 | ||||||
Exxon Mobil Corp. | 10,718 | 1,084,662 | ||||||
Hess Corp. | 9,183 | 762,189 | ||||||
Marathon Petroleum Corp. | 3,353 | 307,571 | ||||||
Occidental Petroleum Corp. | 10,025 | 953,378 | ||||||
Pioneer Natural Resources Co. | 3,435 | 632,280 | ||||||
Range Resources Corp. | 2,331 | 196,527 | ||||||
Valero Energy Corp. | 9,646 | 486,158 | ||||||
|
| |||||||
| 7,028,654 | ||||||||
|
| |||||||
Total Energy | 8,452,830 | |||||||
|
| |||||||
Financials (18.9%) | ||||||||
Capital Markets (4.0%) | ||||||||
Goldman Sachs Group, Inc. | 7,694 | 1,363,839 | ||||||
Invesco Ltd. | 11,993 | 436,545 | ||||||
Morgan Stanley | 23,259 | 729,402 | ||||||
State Street Corp. | 1,601 | 117,497 | ||||||
TD Ameritrade Holding Corp. | 14,964 | 458,497 | ||||||
|
| |||||||
| 3,105,780 | ||||||||
|
| |||||||
Commercial Banks (4.6%) | ||||||||
Comerica, Inc. | 14,327 | 681,106 | ||||||
Fifth Third Bancorp | 7,352 | 154,613 | ||||||
PNC Financial Services Group, Inc. | 5,555 | 430,957 | ||||||
Regions Financial Corp. | 41,763 | 413,036 | ||||||
SunTrust Banks, Inc. | 11,398 | 419,560 | ||||||
U.S. Bancorp/Minnesota | 14,006 | 565,842 | ||||||
Wells Fargo & Co. | 20,057 | 910,588 | ||||||
|
| |||||||
| 3,575,702 | ||||||||
|
| |||||||
Consumer Finance (1.6%) | ||||||||
Capital One Financial Corp. | 15,931 | 1,220,474 | ||||||
|
| |||||||
Diversified Financial Services (4.3%) |
| |||||||
Bank of America Corp. | 27,073 | 421,527 | ||||||
Citigroup, Inc. | 22,219 | 1,157,832 | ||||||
JPMorgan Chase & Co. | 30,219 | 1,767,207 | ||||||
|
| |||||||
| 3,346,566 | ||||||||
|
| |||||||
Insurance (3.9%) | ||||||||
Chubb Corp. | 3,014 | 291,243 | ||||||
Hartford Financial Services Group, Inc. | 30,158 | 1,092,624 | ||||||
Lincoln National Corp. | 16,363 | 844,658 | ||||||
Prudential Financial, Inc. | 9,000 | 829,980 | ||||||
|
| |||||||
| 3,058,505 | ||||||||
|
| |||||||
See Notes to Financial Statements.
62
EQ ADVISORS TRUST
EQ/LORD ABBETT LARGE CAP CORE PORTFOLIO
PORTFOLIO OF INVESTMENTS (Continued)
December 31, 2013
| Number of Shares | Value (Note 1) | |||||||
Real Estate Investment Trusts (REITs) (0.5%) |
| |||||||
Host Hotels & Resorts, Inc. (REIT) | 17,736 | $ | 344,788 | |||||
|
| |||||||
Total Financials | 14,651,815 | |||||||
|
| |||||||
Health Care (11.7%) | ||||||||
Biotechnology (3.2%) | ||||||||
Celgene Corp.* | 3,736 | 631,234 | ||||||
Gilead Sciences, Inc.* | 11,498 | 864,075 | ||||||
Medivation, Inc.* | 9,362 | 597,483 | ||||||
Vertex Pharmaceuticals, Inc.* | 5,361 | 398,322 | ||||||
|
| |||||||
| 2,491,114 | ||||||||
|
| |||||||
Health Care Equipment & Supplies (0.9%) |
| |||||||
Covidien plc | 10,216 | 695,710 | ||||||
|
| |||||||
Health Care Providers & Services (3.1%) |
| |||||||
Express Scripts Holding Co.* | 19,014 | 1,335,543 | ||||||
HCA Holdings, Inc.* | 8,422 | 401,814 | ||||||
UnitedHealth Group, Inc. | 8,718 | 656,465 | ||||||
|
| |||||||
| 2,393,822 | ||||||||
|
| |||||||
Pharmaceuticals (4.5%) | ||||||||
Bristol-Myers Squibb Co. | 21,718 | 1,154,312 | ||||||
Eli Lilly and Co. | 11,561 | 589,611 | ||||||
Johnson & Johnson | 4,015 | 367,734 | ||||||
Merck & Co., Inc. | 2,947 | 147,497 | ||||||
Pfizer, Inc. | 41,784 | 1,279,844 | ||||||
|
| |||||||
| 3,538,998 | ||||||||
|
| |||||||
Total Health Care | 9,119,644 | |||||||
|
| |||||||
Industrials (10.6%) | ||||||||
Aerospace & Defense (3.8%) | ||||||||
B/E Aerospace, Inc.* | 6,103 | 531,144 | ||||||
Boeing Co. | 5,629 | 768,302 | ||||||
Honeywell International, Inc. | 7,574 | 692,036 | ||||||
United Technologies Corp. | 8,677 | 987,443 | ||||||
|
| |||||||
| 2,978,925 | ||||||||
|
| |||||||
Construction & Engineering (0.6%) | ||||||||
Fluor Corp. | 5,917 | 475,076 | ||||||
|
| |||||||
Electrical Equipment (2.2%) | ||||||||
Eaton Corp. plc | 8,897 | 677,240 | ||||||
Emerson Electric Co. | 14,561 | 1,021,891 | ||||||
|
| |||||||
| 1,699,131 | ||||||||
|
| |||||||
Industrial Conglomerates (1.3%) | ||||||||
General Electric Co. | 35,515 | 995,485 | ||||||
|
| |||||||
Machinery (1.1%) | ||||||||
Caterpillar, Inc. | 3,152 | 286,233 | ||||||
PACCAR, Inc. | 9,962 | 589,452 | ||||||
|
| |||||||
| 875,685 | ||||||||
|
| |||||||
Road & Rail (1.3%) | ||||||||
Union Pacific Corp. | 6,040 | 1,014,720 | ||||||
|
| |||||||
Trading Companies & Distributors (0.3%) |
| |||||||
W.W. Grainger, Inc. | 844 | 215,574 | ||||||
|
| |||||||
Total Industrials | 8,254,596 | |||||||
|
| |||||||
Information Technology (21.8%) | ||||||||
Communications Equipment (2.3%) | ||||||||
Cisco Systems, Inc. | 43,421 | $ | 974,802 | |||||
QUALCOMM, Inc. | 11,293 | 838,505 | ||||||
|
| |||||||
| 1,813,307 | ||||||||
|
| |||||||
Computers & Peripherals (6.3%) | ||||||||
Apple, Inc. | 4,870 | 2,732,606 | ||||||
EMC Corp. | 30,836 | 775,525 | ||||||
Hewlett-Packard Co. | 6,840 | 191,383 | ||||||
NCR Corp.* | 27,625 | 940,908 | ||||||
NetApp, Inc. | 6,708 | 275,967 | ||||||
|
| |||||||
| 4,916,389 | ||||||||
|
| |||||||
Internet Software & Services (6.2%) | ||||||||
eBay, Inc.* | 6,989 | 383,626 | ||||||
Google, Inc., Class A* | 2,211 | 2,477,890 | ||||||
Monster Worldwide, Inc.* | 58,146 | 414,581 | ||||||
Pandora Media, Inc.* | 23,651 | 629,117 | ||||||
Twitter, Inc.* | 110 | 7,001 | ||||||
Yahoo!, Inc.* | 21,317 | 862,059 | ||||||
|
| |||||||
| 4,774,274 | ||||||||
|
| |||||||
IT Services (1.7%) | ||||||||
International Business Machines Corp. | 4,278 | 802,425 | ||||||
Vantiv, Inc., Class A* | 15,443 | 503,596 | ||||||
|
| |||||||
| 1,306,021 | ||||||||
|
| |||||||
Semiconductors & Semiconductor Equipment (2.1%) |
| |||||||
Intel Corp. | 18,522 | 480,831 | ||||||
Micron Technology, Inc.* | 24,483 | 532,750 | ||||||
Texas Instruments, Inc. | 13,418 | 589,185 | ||||||
|
| |||||||
| 1,602,766 | ||||||||
|
| |||||||
Software (3.2%) | ||||||||
Informatica Corp.* | 10,131 | 420,436 | ||||||
Microsoft Corp. | 24,346 | 911,271 | ||||||
Oracle Corp. | 23,525 | 900,066 | ||||||
VMware, Inc., Class A* | 2,587 | 232,080 | ||||||
|
| |||||||
| 2,463,853 | ||||||||
|
| |||||||
Total Information Technology | 16,876,610 | |||||||
|
| |||||||
Materials (3.8%) | ||||||||
Chemicals (1.6%) | ||||||||
Celanese Corp. | 4,703 | 260,123 | ||||||
Dow Chemical Co. | 9,544 | 423,754 | ||||||
E.I. du Pont de Nemours & Co. | 1,923 | 124,937 | ||||||
LyondellBasell Industries N.V., Class A | 5,395 | 433,110 | ||||||
Monsanto Co. | 347 | 40,443 | ||||||
|
| |||||||
| 1,282,367 | ||||||||
|
| |||||||
Containers & Packaging (0.7%) | ||||||||
Rock-Tenn Co., Class A | 4,953 | 520,115 | ||||||
|
| |||||||
Metals & Mining (1.5%) | ||||||||
Freeport-McMoRan Copper & Gold, Inc. | 14,074 | 531,153 | ||||||
Reliance Steel & Aluminum Co. | 4,304 | 326,415 | ||||||
See Notes to Financial Statements.
63
EQ ADVISORS TRUST
EQ/LORD ABBETT LARGE CAP CORE PORTFOLIO
PORTFOLIO OF INVESTMENTS (Continued)
December 31, 2013
| Number of Shares | Value (Note 1) | |||||||
United States Steel Corp. | 9,642 | $ | 284,439 | |||||
|
| |||||||
| 1,142,007 | ||||||||
|
| |||||||
Total Materials | 2,944,489 | |||||||
|
| |||||||
Telecommunication Services (0.7%) | ||||||||
Diversified Telecommunication Services (0.7%) |
| |||||||
Verizon Communications, Inc. | 10,423 | 512,186 | ||||||
|
| |||||||
Total Telecommunication Services | 512,186 | |||||||
|
| |||||||
Utilities (1.0%) | ||||||||
Electric Utilities (0.5%) | ||||||||
Duke Energy Corp. | 2,870 | 198,059 | ||||||
NextEra Energy, Inc. | 2,364 | 202,405 | ||||||
|
| |||||||
| 400,464 | ||||||||
|
| |||||||
Multi-Utilities (0.5%) | ||||||||
Dominion Resources, Inc. | 2,507 | $ | 162,178 | |||||
PG&E Corp. | 4,539 | 182,831 | ||||||
|
| |||||||
| 345,009 | ||||||||
|
| |||||||
Total Utilities | 745,473 | |||||||
|
| |||||||
Total Investments (97.6%) | 75,696,118 | |||||||
Other Assets Less Liabilities (2.4%) | 1,858,355 | |||||||
|
| |||||||
Net Assets (100%) | $ | 77,554,473 | ||||||
|
| |||||||
| * | Non-income producing. |
The following is a summary of the inputs used to value the Portfolio’s assets and liabilities carried at fair value as of December 31, 2013:
The inputs or methodology used for valuing securities are not necessarily an indication of the risk associated with investing in those securities.
Various inputs are used in determining the value of the Portfolio’s investments. These inputs are summarized in the three broad levels listed below:
| Investment Type | Level 1 Quoted Prices in Active Markets for Identical Securities | Level 2 interest rates, prepayment speeds, | Level 3 Significant Unobservable Inputs (including the Portfolio’s own assumptions in determining the fair value of investments) | Total | ||||||||||||
Assets: | ||||||||||||||||
Common Stocks | ||||||||||||||||
Consumer Discretionary | $ | 8,629,606 | $ | — | $ | — | $ | 8,629,606 | ||||||||
Consumer Staples | 5,508,869 | — | — | 5,508,869 | ||||||||||||
Energy | 8,452,830 | — | — | 8,452,830 | ||||||||||||
Financials | 14,651,815 | — | — | 14,651,815 | ||||||||||||
Health Care | 9,119,644 | — | — | 9,119,644 | ||||||||||||
Industrials | 8,254,596 | — | — | 8,254,596 | ||||||||||||
Information Technology | 16,876,610 | — | — | 16,876,610 | ||||||||||||
Materials | 2,944,489 | — | — | 2,944,489 | ||||||||||||
Telecommunication Services | 512,186 | — | — | 512,186 | ||||||||||||
Utilities | 745,473 | — | — | 745,473 | ||||||||||||
|
|
|
|
|
|
|
| |||||||||
Total Assets | $ | 75,696,118 | $ | — | $ | — | $ | 75,696,118 | ||||||||
|
|
|
|
|
|
|
| |||||||||
Total Liabilities | $ | — | $ | — | $ | — | $ | — | ||||||||
|
|
|
|
|
|
|
| |||||||||
Total | $ | 75,696,118 | $ | — | $ | — | $ | 75,696,118 | ||||||||
|
|
|
|
|
|
|
| |||||||||
There were no transfers between Levels 1, 2 or 3 during the year ended December 31, 2013.
See Notes to Financial Statements.
64
EQ ADVISORS TRUST
EQ/LORD ABBETT LARGE CAP CORE PORTFOLIO
PORTFOLIO OF INVESTMENTS (Continued)
December 31, 2013
The Portfolio held no derivatives contracts during the year ended December 31, 2013.
Investment security transactions for the year ended December 31, 2013 were as follows:
Cost of Purchases: | ||||
Long-term investments other than U.S. government debt securities | $ | 45,448,469 | ||
Net Proceeds of Sales and Redemptions: | ||||
Long-term investments other than U.S. government debt securities | $ | 67,347,239 |
As of December 31, 2013, the gross unrealized appreciation (depreciation) of investments based on the aggregate cost of investments for Federal income tax purposes was as follows:
Aggregate gross unrealized appreciation | $ | 24,901,238 | ||
Aggregate gross unrealized depreciation | (1,327,964 | ) | ||
|
| |||
Net unrealized appreciation | $ | 23,573,274 | ||
|
| |||
Federal income tax cost of investments | $ | 52,122,844 | ||
|
|
The Portfolio utilized net capital loss carryforward of $2,931,792 during 2013.
See Notes to Financial Statements.
65
EQ ADVISORS TRUST
EQ/LORD ABBETT LARGE CAP CORE PORTFOLIO
STATEMENT OF ASSETS AND LIABILITIES
December 31, 2013
ASSETS | ||||
Investments at value (Cost $51,862,485) | $ | 75,696,118 | ||
Cash | 2,025,575 | |||
Dividends, interest and other receivables | 95,356 | |||
Receivable from Separate Accounts for Trust shares sold | 20,504 | |||
Other assets | 1,025 | |||
|
| |||
Total assets | 77,838,578 | |||
|
| |||
LIABILITIES | ||||
Payable to Separate Accounts for Trust shares redeemed | 209,192 | |||
Investment management fees payable | 32,377 | |||
Administrative fees payable | 16,560 | |||
Distribution fees payable - Class IB | 14,117 | |||
Distribution fees payable - Class IA | 1,984 | |||
Accrued expenses | 9,875 | |||
|
| |||
Total liabilities | 284,105 | |||
|
| |||
NET ASSETS | $ | 77,554,473 | ||
|
| |||
Net assets were comprised of: | ||||
Paid in capital | $ | 52,138,594 | ||
Accumulated undistributed net investment income (loss) | 50,430 | |||
Accumulated undistributed net realized gain (loss) on investments | 1,531,816 | |||
Net unrealized appreciation (depreciation) on investments | 23,833,633 | |||
|
| |||
Net assets | $ | 77,554,473 | ||
|
| |||
Class IA | ||||
Net asset value, offering and redemption price per share, $9,301,199 / 685,723 shares outstanding (unlimited amount authorized: $0.01 par value) | $ | 13.56 | ||
|
| |||
Class IB | ||||
Net asset value, offering and redemption price per share, $68,253,274 / 5,024,505 shares outstanding (unlimited amount authorized: $0.01 par value) | $ | 13.58 | ||
|
|
STATEMENT OF OPERATIONS
For the Year Ended December 31, 2013
INVESTMENT INCOME | ||||
Dividends (net of $7,132 foreign withholding tax) | $ | 3,056,156 | ||
Interest | 2,176 | |||
|
| |||
Total income | 3,058,332 | |||
|
| |||
EXPENSES | ||||
Investment management fees | 1,025,521 | |||
Distribution fees - Class IB | 372,043 | |||
Administrative fees | 190,070 | |||
Professional fees | 45,109 | |||
Distribution fees - Class IA | 22,388 | |||
Custodian fees | 16,000 | |||
Printing and mailing expenses | 13,344 | |||
Trustees’ fees | 5,498 | |||
Miscellaneous | 5,972 | |||
|
| |||
Gross expenses | 1,695,945 | |||
Less: Waiver from investment manager | (117,372 | ) | ||
Feespaid indirectly | (8,539 | ) | ||
|
| |||
Net expenses | 1,570,034 | |||
|
| |||
NET INVESTMENT INCOME (LOSS) | 1,488,298 | |||
|
| |||
REALIZED AND UNREALIZED GAIN (LOSS) |
| |||
Net realized gain (loss) on investments | 60,321,045 | |||
Net change in unrealized appreciation (depreciation) on investments | (23,747,805 | ) | ||
|
| |||
NET REALIZED AND UNREALIZED GAIN (LOSS) | 36,573,240 | |||
|
| |||
NET INCREASE (DECREASE) IN NET ASSETS RESULTING FROM OPERATIONS | $ | 38,061,538 | ||
|
| |||
See Notes to Financial Statements.
66
EQ ADVISORS TRUST
EQ/LORD ABBETT LARGE CAP CORE PORTFOLIO
STATEMENT OF CHANGES IN NET ASSETS
| Year Ended December 31, | ||||||||
| 2013 | 2012 | |||||||
INCREASE (DECREASE) IN NET ASSETS FROM OPERATIONS: | ||||||||
Net investment income (loss) | $ | 1,488,298 | $ | 2,792,436 | ||||
Net realized gain (loss) on investments | 60,321,045 | 7,776,132 | ||||||
Net change in unrealized appreciation (depreciation) on investments | (23,747,805 | ) | 26,114,846 | |||||
|
|
|
| |||||
NET INCREASE (DECREASE) IN NET ASSETS RESULTING FROM OPERATIONS | 38,061,538 | 36,683,414 | ||||||
|
|
|
| |||||
DIVIDENDS AND DISTRIBUTIONS: | ||||||||
Dividends from net investment income | ||||||||
Class IA | (182,966 | ) | (97,184 | ) | ||||
Class IB | (1,300,213 | ) | (2,739,335 | ) | ||||
|
|
|
| |||||
| (1,483,179 | ) | (2,836,519 | ) | |||||
|
|
|
| |||||
Distributions from net realized capital gains | ||||||||
Class IA | (1,371,540 | ) | — | |||||
Class IB | (9,734,002 | ) | — | |||||
|
|
|
| |||||
| (11,105,542 | ) | — | ||||||
|
|
|
| |||||
TOTAL DIVIDENDS AND DISTRIBUTIONS | (12,588,721 | ) | (2,836,519 | ) | ||||
|
|
|
| |||||
CAPITAL SHARES TRANSACTIONS: | ||||||||
Class IA | ||||||||
Capital shares sold [ 106,992 and 118,905 shares, respectively ] | 1,525,849 | 1,437,689 | ||||||
Capital shares issued in reinvestment of dividends and distributions [ 117,426 and 7,752 shares, respectively ] | 1,554,506 | 97,184 | ||||||
Capital shares repurchased [ (186,480) and (705,078) shares, respectively ] | (2,655,967 | ) | (8,730,940 | ) | ||||
|
|
|
| |||||
Total Class IA transactions | 424,388 | (7,196,067 | ) | |||||
|
|
|
| |||||
Class IB | ||||||||
Capital shares sold [ 673,973 and 1,933,913 shares, respectively ] | 9,397,672 | 23,806,254 | ||||||
Capital shares issued in reinvestment of dividends and distributions [ 832,374 and 218,262 shares, respectively ] | 11,034,215 | 2,739,335 | ||||||
Capital shares repurchased [ (2,342,597) and (5,202,267) shares, respectively ] | (32,397,110 | ) | (63,527,740 | ) | ||||
Capital shares repurchased in-kind (Note 9)[ (12,616,341) and 0 shares, | (175,945,507 | ) | — | |||||
|
|
|
| |||||
Total Class IB transactions | (187,910,730 | ) | (36,982,151 | ) | ||||
|
|
|
| |||||
NET INCREASE (DECREASE) IN NET ASSETS RESULTING FROM CAPITAL SHARE TRANSACTIONS | (187,486,342 | ) | (44,178,218 | ) | ||||
|
|
|
| |||||
TOTAL INCREASE (DECREASE) IN NET ASSETS | (162,013,525 | ) | (10,331,323 | ) | ||||
NET ASSETS: | ||||||||
Beginning of year | 239,567,998 | 249,899,321 | ||||||
|
|
|
| |||||
End of year (a) | $ | 77,554,473 | $ | 239,567,998 | ||||
|
|
|
|
| ||||
(a) Includes accumulated undistributed (overdistributed) net investment income (loss) of | $ | 50,430 | $ | 130,432 | ||||
|
|
|
| |||||
See Notes to Financial Statements.
67
EQ ADVISORS TRUST
EQ/LORD ABBETT LARGE CAP CORE PORTFOLIO
FINANCIAL HIGHLIGHTS
| Year Ended December 31, | ||||||||||||||||||||
| Class IA | 2013 | 2012 | 2011 | 2010 | 2009 | |||||||||||||||
Net asset value, beginning of year | $ | 12.51 | $ | 10.97 | $ | 12.09 | $ | 10.65 | $ | 8.53 | ||||||||||
|
|
|
|
|
|
|
|
|
| |||||||||||
Income (loss) from investment operations: | ||||||||||||||||||||
Net investment income (loss) | 0.13 | (e) | 0.13 | (e) | 0.11 | (e) | 0.07 | (e) | 0.10 | (e) | ||||||||||
Net realized and unrealized gain (loss) on investments | 3.55 | 1.56 | (1.12 | ) | 1.44 | 2.10 | ||||||||||||||
|
|
|
|
|
|
|
|
|
| |||||||||||
Total from investment operations | 3.68 | 1.69 | (1.01 | ) | 1.51 | 2.20 | ||||||||||||||
|
|
|
|
|
|
|
|
|
| |||||||||||
Less distributions: | ||||||||||||||||||||
Dividends from net investment income | (0.31 | ) | (0.15 | ) | (0.11 | ) | (0.07 | ) | (0.08 | ) | ||||||||||
Distributions from net realized gains | (2.32 | ) | — | — | — | — | ||||||||||||||
|
|
|
|
|
|
|
|
|
| |||||||||||
Total dividends and distributions | (2.63 | ) | (0.15 | ) | (0.11 | ) | (0.07 | ) | (0.08 | ) | ||||||||||
|
|
|
|
|
|
|
|
|
| |||||||||||
Net asset value, end of year | $ | 13.56 | $ | 12.51 | $ | 10.97 | $ | 12.09 | $ | 10.65 | ||||||||||
|
|
|
|
|
|
|
|
|
| |||||||||||
Total return | 29.96 | % | 15.36 | % | (8.31 | )% | 14.22 | % | 25.86 | % | ||||||||||
|
|
|
|
|
|
|
|
|
| |||||||||||
Ratios/Supplemental Data: | ||||||||||||||||||||
Net assets, end of year (000’s) | $ | 9,301 | $ | 8,104 | $ | 13,455 | $ | 17,470 | $ | 6,803 | ||||||||||
Ratio of expenses to average net assets: | ||||||||||||||||||||
After waivers | 1.00 | % | 1.00 | % | 0.75 | % | 0.75 | % | 0.75 | % | ||||||||||
After waivers and fees paid indirectly | 0.99 | % | 1.00 | % | 0.74 | % | 0.74 | % | 0.74 | % | ||||||||||
Before waivers and fees paid indirectly | 1.10 | % | 1.06 | % | 0.79 | % | 0.80 | % | 0.84 | % | ||||||||||
Ratio of net investment income (loss) to average net assets: | ||||||||||||||||||||
After waivers | 0.91 | % | 1.06 | % | 0.92 | % | 0.68 | % | 1.03 | % | ||||||||||
After waivers and fees paid indirectly | 0.92 | % | 1.06 | % | 0.92 | % | 0.68 | % | 1.04 | % | ||||||||||
Before waivers and fees paid indirectly | 0.81 | % | 1.00 | % | 0.88 | % | 0.63 | % | 0.95 | % | ||||||||||
Portfolio turnover rate | 30 | % | 15 | % | 33 | % | 20 | % | 46 | % | ||||||||||
| Year Ended December 31, | ||||||||||||||||||||
| Class IB | 2013 | 2012 | 2011 | 2010 | 2009 | |||||||||||||||
Net asset value, beginning of year | $ | 12.53 | $ | 10.98 | $ | 12.10 | $ | 10.66 | $ | 8.54 | ||||||||||
|
|
|
|
|
|
|
|
|
| |||||||||||
Income (loss) from investment operations: | ||||||||||||||||||||
Net investment income (loss) | 0.13 | (e) | 0.13 | (e) | 0.08 | (e) | 0.04 | (e) | 0.07 | (e) | ||||||||||
Net realized and unrealized gain (loss) on investments | 3.55 | 1.57 | (1.12 | ) | 1.44 | 2.11 | ||||||||||||||
|
|
|
|
|
|
|
|
|
| |||||||||||
Total from investment operations | 3.68 | 1.70 | (1.04 | ) | 1.48 | 2.18 | ||||||||||||||
|
|
|
|
|
|
|
|
|
| |||||||||||
Less distributions: | ||||||||||||||||||||
Dividends from net investment income | (0.31 | ) | (0.15 | ) | (0.08 | ) | (0.04 | ) | (0.06 | ) | ||||||||||
Distributions from net realized gains | (2.32 | ) | — | — | — | — | ||||||||||||||
|
|
|
|
|
|
|
|
|
| |||||||||||
Total dividends and distributions | (2.63 | ) | (0.15 | ) | (0.08 | ) | (0.04 | ) | (0.06 | ) | ||||||||||
|
|
|
|
|
|
|
|
|
| |||||||||||
Net asset value, end of year | $ | 13.58 | $ | 12.53 | $ | 10.98 | $ | 12.10 | $ | 10.66 | ||||||||||
|
|
|
|
|
|
|
|
|
| |||||||||||
Total return | 29.91 | % | 15.44 | % | (8.53 | )% | 13.92 | % | 25.51 | % | ||||||||||
|
|
|
|
|
|
|
|
|
| |||||||||||
Ratios/Supplemental Data: | ||||||||||||||||||||
Net assets, end of year (000’s) | $ | 68,253 | $ | 231,464 | $ | 236,444 | $ | 248,215 | $ | 190,644 | ||||||||||
Ratio of expenses to average net assets: | ||||||||||||||||||||
After waivers | 1.00 | % | 1.00 | % | 1.00 | % | 1.00 | % | 1.00 | % | ||||||||||
After waivers and fees paid indirectly | 0.99 | % | 1.00 | % | 0.99 | % | 0.99 | % | 0.99 | % | ||||||||||
Before waivers and fees paid indirectly | 1.07 | % | 1.06 | % | 1.04 | % | 1.05 | % | 1.09 | % | ||||||||||
Ratio of net investment income (loss) to average net assets: | ||||||||||||||||||||
After waivers | 0.94 | % | 1.07 | % | 0.69 | % | 0.37 | % | 0.79 | % | ||||||||||
After waivers and fees paid indirectly | 0.94 | % | 1.07 | % | 0.69 | % | 0.38 | % | 0.80 | % | ||||||||||
Before waivers and fees paid indirectly | 0.87 | % | 1.01 | % | 0.65 | % | 0.33 | % | 0.70 | % | ||||||||||
Portfolio turnover rate | 30 | % | 15 | % | 33 | % | 20 | % | 46 | % | ||||||||||
| (e) | Net investment income (loss) per share is based on average shares outstanding. |
See Notes to Financial Statements.
68
EQ ADVISORS TRUST
December 31, 2013
| Note 1 | Organization and Significant Accounting Policies |
EQ Advisors Trust (the “Trust”) was organized as a Delaware statutory trust on October 31, 1996 and is registered under the Investment Company Act of 1940, as amended (the “1940 Act”), as an open-end management investment company with seventy-four diversified portfolios and three non-diversified portfolios (each a “Portfolio”). These financial statements present five of the diversified portfolios: EQ/Davis New York Venture Portfolio, EQ/Equity Growth PLUS Portfolio, EQ/Invesco Comstock Portfolio (formerly EQ/Van Kampen Comstock), EQ/Large Cap Growth PLUS Portfolio and EQ/Lord Abbett Large Cap Core Portfolio. The investment manager to each Portfolio is AXA Equitable Funds Management Group, LLC (“FMG LLC” or the “Manager”), a wholly-owned subsidiary of AXA Equitable Life Insurance Company (“AXA Equitable”).
Under the Trust’s organizational documents, its officers and trustees are indemnified against certain liabilities arising out of the performance of their duties to the Trust. In addition, in the normal course of business, the Trust enters into contracts with vendors and others that provide for general indemnifications. The Trust’s maximum exposure under these arrangements is unknown as this would involve future claims that may be made against the Trust. However, based on experience, the Trust and management expect the risk of loss to be remote.
Each of the investment sub-advisers (each an “Adviser”) independently chooses and maintains a portfolio of securities for its Portfolios.
The EQ/Large Cap Growth PLUS Portfolio and EQ/Equity Growth PLUS Portfolio (each a “PLUS Portfolio”; together, the “PLUS Portfolios”), employ multiple Advisers (each a “Multiadviser Portfolio”; together the “Multiadviser Portfolios”). Each of the Advisers independently chooses and maintains a portfolio of securities for the Multiadviser Portfolio and each is responsible for investing a specific allocated portion of the Multiadviser Portfolio’s assets. Because each Adviser will be managing its allocated portion of the Multiadviser Portfolio independently from the other Advisers, the same security may be held in different portions of the Multiadviser Portfolio, or may be acquired for one portion of the Multiadviser Portfolio at a time when the Adviser of another portion deems it appropriate to dispose of the security. Similarly, under some market conditions, one Adviser may believe that temporary defensive investments in short-term instruments or cash are appropriate when the other Adviser or Advisers believe continued exposure to the equity or fixed income markets is appropriate for their portions of the Multiadviser Portfolio. Because each Adviser directs the trading for its own portion of the Multiadviser Portfolio, and does not aggregate its transactions with those of the other Advisers, the Multiadviser Portfolio may incur higher brokerage costs, and have higher portfolio turnover, than would be the case if a single Adviser were managing the entire Multiadviser Portfolio.
The Trust issues three classes of shares, Class IA, Class IB and Class K. As of and during the year ended December 31, 2013, the Trust had Class IB shares outstanding for each of the five Portfolios presented in these financial statements. During the year ended December 31, 2013, the Trust had Class IA shares outstanding for certain Portfolios as shown in the respective Statements of Assets and Liabilities. In addition, during a portion of the year ended December 31, 2013, the Trust had Class K shares outstanding for certain Portfolios as shown in the Statement of Assets and Liabilities. The Class IA and Class IB shares are subject to distribution fees imposed under a distribution plan (“Distribution Plan”) adopted pursuant to Rule 12b-1 under the 1940 Act. Under the Trust’s multiple class distribution system, all three classes of shares have identical voting, dividend, liquidation and other rights, other than the payment of distribution fees under the applicable Distribution Plan. The Trust’s shares are currently sold only to insurance company separate accounts in connection with variable life insurance contracts and variable annuity certificates and contracts issued by AXA Equitable, AXA Life and Annuity Company, other affiliated or unaffiliated insurance companies and to the AXA Equitable 401(k) Plan. Shares also may be sold to other tax-qualified retirement plans, to other series of the Trust and to series of AXA Premier VIP Trust, a separate registered investment company managed by FMG LLC. The AXA Equitable 401(k) Plan is the primary shareholder of Class K for EQ/Equity Growth PLUS Portfolio.
69
EQ ADVISORS TRUST
NOTES TO FINANCIAL STATEMENTS (Continued)
December 31, 2013
The investment objectives of each Portfolio are as follows:
EQ/Davis New York Venture Portfolio (advised by Davis Selected Advisers, L.P.) — Seeks to achieve long-term growth of capital.
EQ/Equity Growth PLUS Portfolio (advised by FMG LLC, BlackRock Capital Management, Inc. and BlackRock Investment Management, LLC (“BlackRock”)) — Seeks to achieve long-term growth of capital with an emphasis on risk-adjusted returns and managing volatility in the Portfolio.
EQ/Invesco Comstock Portfolio (formerly EQ/Van Kampen Comstock Portfolio, name change effective August 14, 2013) (advised by Invesco Advisers, Inc.) — Seeks to achieve capital growth and income.
EQ/Large Cap Growth PLUS Portfolio (advised by FMG LLC, BlackRock, Marsico Capital Management, LLC, T.Rowe Price Associates, Inc. and Wells Capital Management, Inc.) — Seeks to provide long-term capital growth with an emphasis on risk-adjusted returns and managing volatility in the Portfolio.
EQ/Lord Abbett Large Cap Core Portfolio (advised by Lord Abbett & Co. LLC) — Seeks to achieve capital appreciation and growth of income with reasonable risk.
The following is a summary of the significant accounting policies of the Trust:
The preparation of financial statements in accordance with accounting principles generally accepted in the United States of America requires management to make estimates and assumptions that affect the reported amounts and disclosures. Actual results could differ from those estimates.
Valuation:
Equity securities (including securities issued by Exchange Traded Funds (“ETFs”)) listed on national securities exchanges are valued at the last sale price or official closing price on the date of valuation or, if there is no sale or official closing price, at the latest available bid price. Securities listed on the NASDAQ stock market will be valued using the NASDAQ Official Closing Price (“NOCP”). Generally, the NOCP will be the last sale price unless the reported trade for the security is outside the range of the bid/ask price. In such cases, the NOCP will be normalized to the nearer of the bid or ask price. Other unlisted stocks are valued at their last sale price or official closing price, or if there is no such price, at a bid price estimated by a broker.
Convertible preferred stocks listed on national securities exchanges are valued as of their last sale price or, if there is no sale, at the latest available bid price.
Convertible bonds and unlisted convertible preferred stocks are valued at bid prices obtained from one or more of the major dealers in such bonds or stocks. Where there is a discrepancy between dealers, values may be adjusted based on recent premium spreads to the underlying common stocks. Convertible bonds may be matrix-priced based upon the conversion value to the underlying common stocks and market premiums.
Mortgage-backed and asset-backed securities are valued at prices obtained from a bond pricing service where available, or at a bid price obtained from one or more of the major dealers in such securities. The pricing service may utilize data such as issuer type, coupon, cash flows, collateral performance, mortgage prepayment projection tables and Adjustable Rate Mortgage evaluations that incorporate index data, periodic and life caps, the next coupon reset date and the convertibility of the bond in making evaluations. If a quoted price is unavailable, an equivalent yield or yield spread quotes will be obtained from a broker and converted to a price.
Options that are traded on an exchange are valued at their last sale price. Options not traded on an exchange or actively traded are valued according to fair value methods. The market value of a put or call option will usually reflect, among other factors, the market price of the underlying security.
70
EQ ADVISORS TRUST
NOTES TO FINANCIAL STATEMENTS (Continued)
December 31, 2013
Corporate and Municipal bonds and notes may be valued on the basis of prices provided by a pricing service when such prices are believed to reflect the fair value of such securities. The pricing service may utilize many factors in making evaluations, trading in similar groups of securities and any developments related to specific securities. However, when such prices are not available, such bonds and notes are valued at a bid price estimated by a broker.
U.S. Treasury securities and other obligations issued or guaranteed by the U.S. Government, its agencies or instrumentalities, are valued at prices obtained from a bond pricing service where available. The pricing service may utilize data received from active market makers and broker-dealers, yield curves and the spread over comparable U.S. Treasury issues in making evaluations.
Foreign securities, including foreign government securities, not traded directly in the U.S., or traded in American Depositary Receipt (“ADR”) or similar form, are valued at representative quoted prices from the primary exchange in the currency of the country of origin. Foreign currency is converted into U.S. dollar equivalent at current exchange rates.
Investments in shares of open-end mutual funds (other than ETFs) held by a Portfolio will be valued at the net asset value of the shares of such funds as described in these funds’ prospectuses.
Futures contracts are valued at their last settlement price or, if there is no sale, at the latest available bid price.
Forward foreign exchange contracts are valued by interpolating between the forward and spot currency rates as quoted by a pricing service as of a designated hour on the valuation date. The pricing service may utilize data such as actual trading information and foreign currency exchange rates gathered from leading market makers and foreign currency exchange trading centers throughout the world in making evaluations.
During the year ended December 31, 2013, the EQ/Invesco Comstock Portfolio held forward foreign currency contracts to either gain exposure to certain currencies, or enter into an economic hedge against changes in the values of securities held in the Portfolio, that do not qualify for hedge accounting under Accounting Standards Codification (“ASC”) 815. The Statement of Operations for the Portfolio reflects realized gains or losses, if any, in forward currency transactions and unrealized gains or losses in forward currency exchange transactions. Further information on the impact of these positions on the Portfolio’s financial statements can be found in the Statement of Operations and Portfolio of Investments for the Portfolio.
If market quotations are not readily available for a security or other financial instruments, such securities and instruments shall be referred to the Trust’s Valuation Committee (“Committee”), who will value the assets in good faith pursuant to procedures adopted by the Board of Trustees (“Pricing Procedures”) of the Trust (the “Board”).
The Board is responsible for ensuring that appropriate valuation methods are used to price securities for the Trust’s Portfolios. The Board has delegated the responsibility of calculating the NAVs of the Trust’s Portfolios and classes pursuant to these Pricing Procedures to the Trust’s administrator, FMG LLC (in its capacity as administrator, the “Administrator”). The Administrator has entered into a sub-administration agreement with JPMorgan Investor Services Co. (the “Sub-Administrator”) to assist in performing certain of the duties described herein. The Committee, established by the Board, determines the value of the Trust’s securities and assets for which market quotations are not readily available or for which valuation cannot otherwise be provided in accordance with procedures adopted by the Board. The Committee is comprised of senior employees from FMG LLC.
Due to the inherent uncertainty of valuations of such securities, the fair value may differ significantly from the values that would have been used had a ready market for such securities existed.
Various inputs are used in determining the value of the Trust’s assets or liabilities carried at fair value. These inputs are summarized in three broad levels below:
| • | Level 1 - quoted prices in active markets for identical assets |
71
EQ ADVISORS TRUST
NOTES TO FINANCIAL STATEMENTS (Continued)
December 31, 2013
| • | Level 2 - other significant observable inputs (including quoted prices of similar securities, interest rates, prepayment speeds, credit risk, etc.) |
| • | Level 3 - significant unobservable inputs (including the Portfolio’s own assumptions in determining the fair value of investments) |
A summary of inputs used to value each Portfolio’s assets and liabilities carried at fair value as of December 31, 2013 is included in the Portfolio of Investments. Changes in valuation techniques may result in transfers in or out of an investment’s assigned level. Transfers into, or out of, each level are reported using values as of the end of the year.
The Portfolios’ policy is to recognize transfers into and transfers out of the valuation levels as of the end of the reporting period. Transfers between levels are included after the Summary of Level 1, Level 2 and Level 3 inputs, following the Portfolio of Investments for each Portfolio. Transfers between levels may be due to a decline or an increase in market activity (e.g., frequency of trades), which may result in a lack of, or increase in, available market inputs to determine price. Transfers into and transfers out of Level 3 are included in the Level 3 reconciliation following the Portfolio of Investments for each Portfolio.
The inputs or methodology used to value securities are not necessarily an indication of the risk associated with investing in those securities. An investment’s level within the fair value hierarchy is based on the lowest level of any input, both individually and in aggregate, that is significant to the fair value measurement.
The Committee meets and reviews reports based on the valuation technique used to value each particular Level 3 security. In connection with this review, the Committee obtains, when available, updates from its pricing vendors and Advisers for each fair valued security. For example, with respect to model driven prices, the Committee receives a report regarding a review and recalculation of pricing models and related discounts. For securities valued based on broker quotes, the Committee evaluates variances between existing broker quotes and any alternative broker quotes provided by an Adviser or other pricing source.
To substantiate unobservable inputs used in fair valuation, the Secretary of the Committee performs an independent verification and additional research for all fair value notifications received from its pricing agent. Among other factors, particular areas of focus include: description of security, historical pricing, intra-day price movement, last trade information, corporate actions, related securities, any available company news and announcements, any available trade data and actions taken by other clients of the pricing vendor. The Committee also notes the materiality of holdings and price changes on portfolio NAV.
The Committee reviews and considers changes in value for all fair valued securities that have occurred since the last review.
The significant unobservable inputs used in the fair value measurement of the Portfolios’ investments in Common Stocks is the discount for lack of marketability. The significant unobservable inputs used in the fair value measurement of the Portfolio’s investments in Asset-Backed Securities is comparability analysis. Significant changes in any of those inputs in isolation may result in either a higher or lower fair value measurement.
Pursuant to procedures approved by the Board, events or circumstances affecting the values of portfolio securities that occur between the closing of their principal markets and the time the net asset value is determined may be reflected in the Trust’s calculation of net asset values for each applicable Portfolio when the Trust’s Manager deems that the particular event or circumstance would materially affect such Portfolio’s net asset value. At December 31, 2013, none of the Portfolios applied these procedures.
72
EQ ADVISORS TRUST
NOTES TO FINANCIAL STATEMENTS (Continued)
December 31, 2013
Security Transactions and Investment Income:
Securities transactions are recorded on the trade date net of brokerage fees, commissions, and transfer fees. Dividend income (net of withholding tax) and distributions to shareholders are recorded on the ex-dividend date, except that certain dividends from foreign securities, if any, are recognized as soon as the fund is informed of the ex-dividend date. Interest income (including amortization of premium and accretion of discount on long-term securities using the effective yield method) and interest expense are accrued daily. The Trust records paydown gains and losses realized on prepayments received on mortgage-backed securities as an adjustment to interest income.
The Portfolios record distributions received in excess of income from underlying investments as a reduction of cost of investments and/or realized gain. Such amounts are based on estimates if actual amounts are not available and actual amounts of income, realized gain and return of capital may differ from the estimated amounts. The Portfolios adjust the estimated amounts of components of distributions (and consequently its net investment income) as necessary once the issuers provide information about the actual composition of the distributions.
Realized gains and losses on the sale of investments are computed on the basis of the specific identified cost of the investments sold. Unrealized appreciation (depreciation) on investments and foreign currency denominated assets and liabilities, if any, is presented net of deferred taxes on unrealized gains in the Statement of Assets and Liabilities.
Capital Gains Taxes:
Certain Portfolios may be subject to capital gains and repatriation taxes imposed by certain countries in which they invest. These Portfolios have recorded a deferred tax liability with respect to unrealized appreciation on foreign securities for potential capital gains and repatriation taxes at December 31, 2013. The accrual for capital gains and repatriation taxes is included in net unrealized appreciation (depreciation) on investments in the Statements of Assets and Liabilities for the Portfolios. The amounts related to capital gain taxes for securities that have been sold are included in the net realized gain (loss) on investments in the Statements of Operations for the Portfolios.
Allocation of Expenses and Income:
Expenses attributable to a single Portfolio or class are charged to that Portfolio or class. Expenses of the Trust not attributable to a single Portfolio or class are charged to each Portfolio or class in proportion to the average net assets of each Portfolio or other appropriate allocation methods.
All income earned and expenses incurred by each Portfolio are borne on a pro-rata basis by each outstanding class of shares, based on the proportionate interest in the Portfolio represented by the daily net assets of such class, except for distribution fees which are charged on a class specific basis.
Foreign Currency Valuation:
The books and records of the Trust are kept in U.S. dollars. Foreign currency amounts are translated into U.S. dollars at current exchange rates at the following dates:
(i) market value of investment securities, other assets and liabilities — at the valuation date.
(ii) purchases and sales of investment securities, income and expenses — at the date of such transactions.
The Portfolios do not isolate that portion of the results of operations resulting from changes in foreign exchange rates on investments from the fluctuations arising from changes in market prices of securities held. Such fluctuations are included with the net realized and unrealized gain or loss on investments.
Net currency gains or losses realized and unrealized as a result of differences between interest or dividends, withholding taxes, security payables/receivables, forward foreign currency exchange
73
EQ ADVISORS TRUST
NOTES TO FINANCIAL STATEMENTS (Continued)
December 31, 2013
contracts and foreign cash recorded on the Portfolio’s books and the U.S. dollar equivalent amount actually received or paid are presented under foreign currency transactions and foreign currency translations in the realized and unrealized gains and losses section, respectively, of the Statements of Operations. Net realized gains (losses) on foreign currency transactions represent net foreign exchange gains (losses) from forward foreign currency contracts, disposition of foreign currencies, currency gains or losses realized between the trade and settlement dates on securities transactions, and the difference between the amount of investment income and foreign withholding taxes recorded on a Portfolio’s books and the U.S. dollar equivalent of amounts actually received or paid.
Taxes:
The Trust intends to comply with the requirements of the Internal Revenue Code of 1986, as amended applicable to regulated investment companies (“RICs”) and to distribute substantially all of its net investment income and net realized capital gains to shareholders of each Portfolio. Therefore, no Federal income tax provision is required.
The Portfolios are not aware of any tax positions for which it is reasonably possible that the total amounts of unrecognized tax benefits will significantly change in the next twelve months. However, the Portfolios’ conclusions may be subject to future review based on changes in, or the interpretation of, the accounting standards or tax laws and regulations. The Portfolios recognize interest and penalties, if any, related to uncertain tax positions as income tax expense in the Statements of Operations. During the year, the Portfolios did not incur any interest or penalties. Each of the tax years in the four year period ended December 31, 2013 remains subject to examination by the Internal Revenue Service and state taxing authorities.
Dividends from net investment income, if any, are declared and distributed at least annually for all Portfolios. Dividends from net realized short-term and long-term capital gains are declared and distributed at least annually to the shareholders of the Portfolios to which such gains are attributable. All dividends are reinvested in additional full and fractional shares of the related Portfolios. All distributions are calculated on a tax basis and, as such, the amounts may differ from financial statement investment income and realized gains. Those differences which are significant to the Portfolios are primarily due to differing book and tax treatments for losses due to wash sales transactions (on all Portfolios) and straddle loss deferrals (EQ/Equity Growth PLUS Portfolio) In addition, short-term capital gains and foreign currency gains are treated as capital gains for accounting purposes but are considered ordinary income for tax purposes. Capital and net specified losses incurred after October 31 and within the taxable year are deemed to arise on the first business day of the Portfolio’s next taxable year. The tax composition of distributed and undistributed income and gains for the years ended December 31, 2013 and December 31, 2012, were as follows:
| Year Ended December 31, 2013 | Year Ended December 31, 2012 | |||||||||||||||||||||||||||||||
| Distributed Ordinary Income | Distributed Long Term Gains | Accumulated Undistributed Ordinary Income | Accumulated Undistributed Long Term Gains | Distributed Ordinary Income | Distributed Long Term Gains | Accumulated Undistributed Ordinary Income | Accumulated Undistributed Long Term Gains | |||||||||||||||||||||||||
EQ/Davis New York Venture | $ | 1,068,878 | $ | — | $ | 1,309 | $ | — | $ | 3,455,325 | $ | — | $ | 31,060 | $ | — | ||||||||||||||||
EQ/Equity Growth PLUS | 2,598,809 | — | — | — | 9,676,184 | — | — | — | ||||||||||||||||||||||||
EQ/Invesco Comstock | 2,491,223 | — | 2,853 | — | 3,761,427 | — | — | — | ||||||||||||||||||||||||
EQ/Large Cap Growth PLUS | 10,931,373 | — | — | — | 13,633,938 | — | 58,250 | — | ||||||||||||||||||||||||
EQ/Lord Abbett Large Cap Core | 1,483,179 | 11,105,542 | 5,119 | 1,837,486 | 2,836,519 | — | — | — | ||||||||||||||||||||||||
74
EQ ADVISORS TRUST
NOTES TO FINANCIAL STATEMENTS (Continued)
December 31, 2013
Permanent book and tax basis differences relating to shareholder distributions resulted in reclassifications to undistributed (overdistributed) net investment income (loss), accumulated net realized gain (loss) and paid-in capital at December 31, 2013 as follows:
Portfolios: | Undistributed Net Investment Income (Loss) | Accumulated Net Realized Gain (Loss) | Paid In Capital | |||||||||
EQ/Davis New York Venture | $ | (3,367 | ) | $ | (89,054,975 | ) | $ | 89,058,342 | ||||
EQ/Equity Growth PLUS | (105,720 | ) | (319,418,466 | ) | 319,524,186 | |||||||
EQ/Invesco Comstock | (302,905 | ) | (88,607,288 | ) | 88,910,193 | |||||||
EQ/Large Cap Growth PLUS | 779,013 | 862,428 | (1,641,441 | ) | ||||||||
EQ/Lord Abbett Large Cap Core | (85,121 | ) | (43,065,168 | ) | 43,150,289 | |||||||
The significant permanent book and tax differences related to the adjustments above are related to redemptions in-kind (EQ/Davis New York Venture Portfolio, EQ/Equity Growth PLUS Portfolio, EQ/Invesco Comstock Portfolio and EQ/Lord Abbett Large Cap Core Portfolio).
Net Capital losses and net specified gains/losses incurred after October 31, and within the taxable year are deemed to arise on the first business day of the Portfolios’ next taxable year. For the year ended December 31, 2013, the Portfolios deferred to January 1, 2014 post-October losses of:
Portfolios: | Specified Loss | Short-Term Capital Loss | Long-Term Capital Loss | |||||||||
EQ/Davis New York Venture | $ | 453 | $ | — | $ | — | ||||||
EQ/Equity Growth PLUS | 868 | 13,964,982 | — | |||||||||
EQ/Invesco Comstock | 118,571 | — | — | |||||||||
EQ/Large Cap Growth PLUS | 8,450 | — | — | |||||||||
EQ/Lord Abbett Large Cap Core | — | — | — | |||||||||
Under the Regulated Investment Company Modernization Act of 2010 (the “RIC Mod Act”), net capital losses recognized by the Portfolios after December 31, 2010, may get carried forward indefinitely, and retain their character as short-term and/or long term. Prior to the RIC Mod Act, net capital losses incurred by the Portfolios were carried forward for up to eight years and treated as 100% short-term. The RIC Mod Act requires that post-enactment net capital losses be used before pre-enactment net capital losses, therefore some net capital loss carryforwards that would have been utilized under prior law may expire unused. Pre-enactment and post-enactment net capital losses that will be carried forward, if any, are presented in the Portfolios of Investments.
Fees Paid Indirectly:
For all Portfolios, the Board has approved the payment of certain Trust expenses using brokerage recapture arrangements. These payments are reflected on the Statements of Operations. Effective October 31, 2013, brokerage recapture arrangements were terminated.
Short Sales Against the Box:
Certain Portfolios may enter into a “short sale” of securities in circumstances in which, at the time the short position is open, the Portfolio owns at least an equal amount of the securities sold short or owns preferred stocks or debt securities, convertible or exchangeable without payment of further consideration, into at least an equal number of securities sold short. This kind of short sale, which is referred to as one “against the box,” may be entered into by the Portfolio to, for example, lock in a sale price for a security the Portfolio does not wish to sell immediately. The Portfolio will designate the segregation, either on its records or with the Trust’s custodian, of the securities sold short or convertible or exchangeable preferred stocks or debt securities sold in connection with short sales against the box. Liabilities for securities sold short are reported at market value in the financial
75
EQ ADVISORS TRUST
NOTES TO FINANCIAL STATEMENTS (Continued)
December 31, 2013
statements. Such liabilities are subject to off-balance sheet risk to the extent of any future increases in market value of the securities sold short. The ultimate liability for securities sold short could exceed the liabilities recorded in the Portfolio’s financial statements. The Portfolio bears the risk of potential inability of the brokers to meet their obligation to perform.
Accounting for Derivative Instruments:
Following is a description of how and why the Portfolios use derivative instruments, the type of derivatives utilized by the Portfolios during the reporting period, as well as the primary underlying risk exposures related to each instrument type. Derivatives accounted for as hedging instruments must be disclosed separately from those that do not qualify for hedge accounting. Even though the Portfolios may use derivatives in an attempt to achieve an economic hedge, the Portfolio’s derivatives are not accounted for as hedging instruments because the Portfolios account for their derivatives at fair value and record any changes in fair value in current period earnings. All open derivative positions at period end are reflected on each respective Portfolio’s Portfolio of Investments. The volume of derivative activity, based on month-end notional amounts during the period is also noted in each respective Portfolio’s Portfolio of Investments.
Options:
Certain Portfolios write (sell) covered options as a hedge to provide protection against adverse movements in the price of securities in the Portfolio or to enhance investment performance. Certain Portfolios purchase and sell exchange traded options on foreign currencies. When a Portfolio writes an option, an amount equal to the premium received by the Portfolio is recorded as a liability and is subsequently adjusted on a daily basis to the current market price of the option written. Premiums received from writing options that expire unexercised are recognized as gains on the expiration date. Premiums received from writing options that are exercised or are cancelled in closing purchase transactions are offset against the cost of any securities purchased or added to the proceeds or netted against the amount paid on the transaction to determine the realized gain or loss. In writing options, a Portfolio must assume that the option may be exercised at any time prior to the expiration of its obligation as a writer, and that in such circumstances the net proceeds of the sale (or cost of) purchase of the underlying securities and currencies pursuant to the call or put option may be substantially below or above the prevailing market price. A Portfolio also has the additional risk of not being able to enter into a closing purchase transaction if a liquid secondary market does not exist and bears the risk of unfavorable changes in the price of the financial instruments underlying the options.
Certain Portfolios may purchase put options on securities to increase the Portfolio’s total investment return or to protect its holdings against a substantial decline in market value. The purchase of put options on securities will enable a Portfolio to preserve, at least partially, unrealized gains in an appreciated security in its portfolio without actually selling the security. In addition, the Portfolios will continue to receive interest or dividend income on the security. The Portfolios may also purchase call options on securities to protect against substantial increases in prices of securities that Portfolios intend to purchase pending their ability to invest in an orderly manner in those securities. The Portfolios may sell put or call options they have previously purchased, which could result in a net gain or loss depending on whether the amount received on the sale is more or less than the premium and other transaction costs paid on the put or call option which was bought.
Futures Contracts, Options on Futures Contracts, Forward Commitments and Foreign Currency Exchange Contracts:
The futures contracts used by the Portfolios are agreements to buy or sell a financial instrument for a set price in the future. Options on futures contracts used by the Portfolios are rights to buy, or sell a futures contract for a set price in the future. Certain Portfolios buy or sell futures contracts for the purpose of protecting their portfolio securities against future changes in interest rates and indices which might adversely affect the value of the Portfolios’ securities or the price of securities that they intend to purchase at a later date. Initial margin deposits are made upon entering into futures contracts and can be
76
EQ ADVISORS TRUST
NOTES TO FINANCIAL STATEMENTS (Continued)
December 31, 2013
in cash, certain money market instruments, treasury securities or other liquid, high grade debt securities. During the period the futures contracts are open, changes in the market price of the contracts are recognized as unrealized gains or losses by “marking-to-market” at the end of each trading day. Variation margin payments on futures contracts are received or made, depending upon whether unrealized gains or losses are incurred. When the contract is closed, the Portfolio records a realized gain or loss equal to the difference between the proceeds from or cost of the closing transactions and the Portfolio’s basis in the contract. Should interest rates or indices move unexpectedly, the Portfolio may not achieve the anticipated benefits of the futures contracts and may incur a loss. The use of futures contracts transactions involves the risk of imperfect correlation in movements in the price of futures contracts, interest rates and the underlying hedged assets. Use of long futures contracts subjects the Portfolios to risk of loss in excess of the amounts shown on the Statement of Assets and Liabilities, up to the notional value of the futures contracts. Use of short futures contracts subjects the Portfolios to unlimited risk of loss. The Portfolios enter into futures contracts only on exchanges or boards of trade. The exchange or board of trade acts as the counterparty to each futures transaction; therefore, a Portfolio’s credit risk is limited to failure of the exchange or board of trade.
Each of the EQ/Equity Growth PLUS Portfolio and EQ/Large Cap Growth PLUS Portfolio used futures contracts during the year ended December 31, 2013 to equitize cash or to increase or decrease the level of equity exposure during periods when market volatility differed from specific thresholds set for each Portfolio. Information on the impact of these positions on the Portfolios’ financial statements can be found in the Statement of Operations and Portfolio of Investments for each Portfolio. The market value of investments pledged and/or cash pledged to cover margin requirements can be found in the Portfolio of Investments and/or Statement of Assets and Liabilities for each Portfolio. Further information on the impact of these positions on the Portfolios’ financial statements can be found in the Statement of Operations and Portfolio of Investments for each Portfolio.
Certain Portfolios make contracts to purchase or sell securities for a fixed price at a future date beyond customary settlement time (“forward commitments”). Portfolios may designate the segregation, either on their records or with the Trust’s custodian, of cash or other liquid securities in an amount sufficient to meet the purchase price, or may enter into offsetting contracts for the forward sale of other securities they own. These commitments are reported at market value in the financial statements. Forward commitments may be considered securities in themselves and involve a risk of loss if the value of the security to be purchased declines or if the value of the security to be sold increases prior to the settlement date, which is a risk in addition to the risk of decline in value of the Portfolio’s other assets. Where such purchases or sales are made through dealers, a Portfolio relies on the dealer to consummate the sale. The dealer’s failure to do so may result in the loss to a Portfolio of an advantageous yield or price. Market risk exists on these commitments to the same extent as if the securities were owned on a settled basis and gains and losses are recorded and reported in the same manner. However, during the commitment period, these investments earn no interest or dividends. The use of forward commitments may result in market risk to the Portfolios that is greater than if the Portfolios had engaged solely in transactions that settle in the customary time.
The Portfolios may be exposed to foreign currency risks associated with portfolio investments. During the reporting period, the Portfolios entered into certain forward foreign currency exchange contracts for the purchase or sale of a specific foreign currency at a fixed price on a future date to hedge or otherwise manage these exposures. Unrealized gains or losses on forward foreign currency exchange contracts are recorded by the Portfolios on a daily basis and realized gains or losses are recorded on the settlement date of a contract.
Certain Portfolios purchase foreign currency on a spot (or cash) basis. In addition, certain Portfolios enter into contracts to purchase or sell foreign currencies at a future date (“forward contracts”). A forward foreign currency exchange contract is a commitment to purchase or sell a foreign currency at a future date at a negotiated forward rate. Daily fluctuations in the value of such contracts are recognized as unrealized appreciation or depreciation by “marking to market.” The gain or loss arising from the difference between the original contracts and the closing of such contracts is included in realized gains or losses from foreign currency transactions in the Statement of Operations.
77
EQ ADVISORS TRUST
NOTES TO FINANCIAL STATEMENTS (Continued)
December 31, 2013
The Advisers may engage in these forward contracts to protect against uncertainty in the level of future exchange rates in connection with the purchase and sale of Portfolio securities (“transaction hedging”) and to protect the value of specific portfolio positions (“position hedging”). The Portfolios also buy forward foreign currency exchange contracts to gain exposure to currencies. The Portfolios are subject to off-balance sheet risk to the extent of the value of the contracts for purchase of foreign currency and in an unlimited amount for sales of foreign currency.
Market and Credit Risk:
Written options, futures contracts, forward commitments and forward foreign currency exchange contracts involve elements of both market and credit risk in excess of the amounts reflected in the Statements of Assets and Liabilities. The risk involved in writing an option on a security is that, if the option is exercised, the underlying security is then purchased or sold by the Portfolio at the contract price, which could be disadvantageous relative to the market price. The Portfolio bears the market risk, which arises from any changes in security values. The credit risk for futures contracts and exchange traded options is limited to failure of the exchange or board of trade which acts as the counterparty to the Portfolio’s futures transactions. Forward commitments, forward foreign currency exchange contracts and over-the-counter options are executed directly with the counterparty and not through an exchange and can be terminated only by agreement of both parties to such contracts. With respect to such transactions there is no daily margin settlement and the Portfolio is exposed to the risk of default by the counterparty.
Offsetting Assets and Liabilities:
During the fiscal year the Portfolios adopted Accounting Standards Update (“ASU”) No. 2011-11: Disclosures about Offsetting Assets and Liabilities (“netting”) on the Statements of Assets and Liabilities that are subject to master netting arrangements or similar agreements. ASU 2011-11 was amended by ASU No. 2013-01, clarifying which investments and transactions are subject to the netting disclosure. The scope of the disclosure requirements is limited to derivative instruments, repurchase agreements and reverse repurchase agreements, and securities borrowing and securities lending transactions. This information will enable users of the Portfolios’ financial statements to evaluate the effect or potential effect of netting arrangements on the Portfolios’ financial position.
For financial reporting purposes, the Portfolios do not offset financial assets and financial liabilities that are subject to master netting arrangements or similar agreements on the Statement of Assets and Liabilities.
| Note 2 | Management of the Trust |
The Trust has entered into three separate investment management agreements (the “Management Agreements”) with FMG LLC. The Management Agreements state that the Manager will, among other things: (i) have overall supervisory responsibility for the general management and investment of each Portfolio’s assets; (ii) select and contract with the Advisers to manage the investment operations and composition of each and every Portfolio; (iii) monitor the Advisers’ investment programs and results; (iv) oversee compliance by the Trust with various federal and state statutes; and (v) carry out the directives of the Board. For the year ended December 31, 2013, for its services under the Management Agreements, the Manager was entitled to receive an annual fee as a percentage of average daily net assets, for each of the following Portfolios, calculated daily and payable monthly as follows:
| (as a percentage of average daily net assets) | ||||||||||||||||||||
Portfolios: | First $1 Billion | Next $1 Billion | Next $3 Billion | Next $5 Billion | Thereafter | |||||||||||||||
EQ/Davis New York Venture | 0.850 | % | 0.800 | % | 0.775 | % | 0.750 | % | 0.725 | % | ||||||||||
EQ/Invesco Comstock | 0.650 | % | 0.600 | % | 0.575 | % | 0.550 | % | 0.525 | % | ||||||||||
EQ/Lord Abbett Large Cap Core | 0.650 | % | 0.600 | % | 0.575 | % | 0.550 | % | 0.525 | % | ||||||||||
78
EQ ADVISORS TRUST
NOTES TO FINANCIAL STATEMENTS (Continued)
December 31, 2013
| (as a percentage of average daily net assets) | ||||||||||||||||||||
Portfolios: | First $2 Billion | Next $1 Billion | Next $3 Billion | Next $5 Billion | Thereafter | |||||||||||||||
EQ/Equity Growth PLUS | 0.500 | % | 0.450 | % | 0.425 | % | 0.400 | % | 0.375 | % | ||||||||||
EQ/Large Cap Growth PLUS | 0.500 | % | 0.450 | % | 0.425 | % | 0.400 | % | 0.375 | % | ||||||||||
On behalf of the Trust, the Manager has entered into an investment advisory agreement (“Advisory Agreements”) with each of the Advisers for the Trust’s Portfolios. Each of the Advisory Agreements obligates the Advisers for the respective Portfolios to: (i) continuously furnish investment programs for the Portfolios; (ii) place all orders for the purchase and sale of investments for the Portfolios with brokers or dealers selected by the Manager or the respective Advisers; and (iii) perform certain limited related administrative functions in connection therewith. The Manager pays the expenses of providing investment advisory services to the Portfolios, including the fees of the Advisers of each Portfolio.
| Note 3 | Administrative Fees |
FMG LLC serves as Administrator to the Trust. As Administrator, FMG LLC provides the Trust with necessary administrative, fund accounting, and compliance services. FMG LLC may carry out its responsibilities either directly or through sub-contracting with third party providers. For these services, the Trust pays FMG LLC an annual fee payable monthly as follows:
Each Multiadviser Portfolio pays an annual fixed charge of $32,500, which only applies to those Portfolios with total average net assets of less than $5 billion, plus:
Total aggregated Average Daily Net Asset Charge of the Multiadviser Portfolios (including Multiadviser Portfolios of the Trust not presented in these financial statements)
0.15% on the first $20 billion
0.11% on the next $5 billion
0.10% in excess of $25 billion
For all other Portfolios:
All other Portfolios each pay an annual fixed charge of $30,000, if the Portfolio’s average net assets are less than $5 billion, plus:
Total Trust Average Daily Net Asset Charge for all other Portfolios (including Portfolios of the Trust not presented in these financial statements)*
0.12% on the first $3 billion
0.11% on the next $3 billion
0.105% on the next $4 billion
0.10% on the next $20 billion
0.0975% in excess of $30 billion
Prior to September 1, 2013, the administration fee was the following:
Each Multiadviser Portfolio (including Multiadviser Portfolios of the Trust not presented in these financial statements) paid an annual fixed charge of $32,500 for each Multiadviser Portfolio and for each portion of the Multiadviser Portfolio for which separate administrative services are provided, (i.e., each adviser in the multi-advised structure) plus:
Total aggregated Average Daily Net Asset Charge of the Multiadviser Portfolios (including Multiadviser Portfolios of the Trust not presented in these financial statements)
0.15% on the first $20 billion
0.125% on the next $5 billion
0.10% in excess of $25 billion
79
EQ ADVISORS TRUST
NOTES TO FINANCIAL STATEMENTS (Continued)
December 31, 2013
All other Portfolios each paid an annual fixed charge of $30,000, plus:
Total Trust Average Daily Net Asset Charge for all other Portfolios (including Portfolios of the Trust not presented in these financial statements)*
0.12% on the first $3 billion
0.11% on the next $3 billion
0.105% on the next $4 billion
0.10% on the next $20 billion
0.0975% in excess of $30 billion
| * | With the exception of the All Asset Portfolios, EQ/Franklin Templeton Allocation Portfolio, EQ/AllianceBernstein Dynamic Wealth Strategies Portfolio, AXA Strategy Portfolios, Tactical Portfolios and the Multiadviser Portfolios of the Trust, Portfolios which are not presented in these financial statements. |
Pursuant to a sub-administration arrangement with FMG LLC, JPMorgan Investor Services Co. (“Sub-administrator”) provides the Trust with administrative services, including monitoring of portfolio compliance and portfolio accounting services.
| Note 4 | Custody Fees |
The Trust has entered into a Custody Agreement with JPMorgan Chase, an affiliate of the sub-administrator. The Custody Agreement provides for an annual fee based on the amount of assets under custody plus transaction charges. JPMorgan Chase serves as custodian of the Trust’s portfolio securities and other assets. Under the terms of the Custody Agreement between the Trust and JPMorgan Chase, JPMorgan Chase maintains and deposits in each Portfolio’s account, cash, securities and other assets of the Portfolios. JPMorgan Chase is also required, upon the order of the Trust, to deliver securities held by JPMorgan Chase, and to make payments for securities purchased by the Trust. JPMorgan Chase has also entered into sub-custodian agreements with a number of foreign banks and clearing agencies, pursuant to which portfolio securities purchased outside the United States are maintained in the custody of these entities.
| Note 5 | Concentration of Credit Risk |
At December 31, 2013, certain Portfolios maintained significant cash balances or significant foreign currency balances with JPMorgan Chase Bank or its affiliates. Additionally, at December 31, 2013, certain Portfolios held significant collateral balances with limited brokers or Goldman Sachs & Co. The Portfolios are subject to credit risk should JPMorgan Chase Bank or its affiliates or Goldman Sachs & Co. be unable to fulfill their obligations.
| Note 6 | Distribution Plans |
The Trust has entered into distribution agreements with AXA Distributors, LLC (“AXA Distributors”), an indirect wholly-owned subsidiary of AXA Equitable ( the “Distributor”), pursuant to which the Distributor serves as the principal underwriter of the Class IA, Class IB and Class K shares of the Trust. The Trust has adopted in the manner prescribed under Rule 12b-1 under the 1940 Act a plan of distribution pertaining to each of Class IA and Class IB shares of the Trust (“Distribution Plans”). The Distribution Plans provide that the Distributor will be entitled to receive a maximum distribution fee at the annual rate of 0.25% of the average daily net assets attributable to the Trust’s Class IA and Class IB shares for which it provides service.
| Note 7 | Expense Limitation |
The Manager has contractually agreed to limit the expenses of certain Portfolios (exclusive of taxes, interest, brokerage commissions, capitalized expenses, fees and expenses of other investment companies in which a Portfolio invests and extraordinary expenses) through April 30, 2014 (unless
80
EQ ADVISORS TRUST
NOTES TO FINANCIAL STATEMENTS (Continued)
December 31, 2013
the Board consents to an earlier revision or termination of this arrangement) (“Expense Limitation Agreement”), pursuant to which the Manager has agreed to waive or limit its fees and to assume other expenses so that the total annual operating expenses of such Portfolios’ Class K Shares (Class IA and Class IB shares would be 0.25% higher due to the annual fee under the Trust’s Distribution Plans) are limited to:
0.75% of average daily net assets of the
EQ/Equity Growth PLUS Portfolio
EQ/Invesco Comstock Portfolio
EQ/Large Cap Growth PLUS Portfolio
EQ/Lord Abbett Large Cap Core Portfolio
0.90% of average daily net assets of the
EQ/Davis New York Venture Portfolio
Prior to May 1, 2013, the following Portfolio currently subject to an expense limitation was not subject to an expense limitation:
EQ/Davis New York Venture Portfolio
The Manager first waives its management fees, then waives its administration fees, and then reimburses the Portfolio’s expenses out of its own resources. Each Portfolio may at a later date reimburse to the Manager the management fees waived or other expenses assumed and paid for by the Manager pursuant to the Expense Limitation Agreement within the prior three fiscal years, provided such Portfolio has reached a sufficient asset size to permit such reimbursement to be made without causing the total annual expense ratio of each Portfolio to exceed the percentage limits mentioned above for the respective period. Consequently, no reimbursement by a Portfolio will be made unless: (i) the Portfolio’s total annual expense ratio is less than the respective percentages stated above for the respective period; and (ii) the payment of such reimbursement has been approved by the Board. Any reimbursement, called recoupment fees on the Statement of Operations, will be based on the earliest fees waived or assumed by the Manager. During the year ended December 31, 2013, the Manager received a total of $474,230 in recoupment for all of the Portfolios within the Trust. At December 31, 2013, under the Expense Limitation Agreement, the amount that would be recoverable from each Portfolio is as follows:
Portfolios: | 2014 | 2015 | 2016 | Total Eligible For Reimbursement | ||||||||||||
EQ/Davis New York Venture | $ | — | $ | — | $ | 131,106 | $ | 131,106 | ||||||||
EQ/Invesco Comstock | 94,020 | 151,518 | 134,793 | 380,331 | ||||||||||||
EQ/Lord Abbett Large Cap Core | 106,933 | 149,007 | 117,372 | 373,312 | ||||||||||||
Prior to May 1, 2013, the Manager voluntarily waived Investment Management fees for this Portfolio. The amount is as follows and is not eligible for recoupment:
Portfolio: | Voluntary Waiver | |
EQ/Davis New York Venture Portfolio | $134,882 |
| Note 8 | Percentage of Ownership by Affiliates |
Shares of some of the Portfolios are held by the All Asset Moderate Growth-Alt 15 Portfolio, the All Asset Growth-Alt 20 Portfolio, the All Asset Aggressive-Alt 25 Portfolio, the All Asset Aggressive-Alt 50 Portfolio and the All Asset Aggressive-Alt 75 Portfolio (each an “All Asset Portfolio”; together, the “All Asset Portfolios”) and the AXA Allocation Portfolios, and Charter Allocation Portfolios of the AXA Premier VIP Trust, an entity also advised by FMG LLC. The following tables represent the percentage of ownership that the All Asset Portfolios and each AXA Allocation Portfolio and Charter Allocation Portfolio has in each respective underlying investment company’s net assets as of December 31, 2013.
81
EQ ADVISORS TRUST
NOTES TO FINANCIAL STATEMENTS (Continued)
December 31, 2013
| All Asset Moderate Growth- Alt 15 | All Asset Growth-Alt 20 | All Asset Aggressive-Alt 25 | All Asset Aggressive-Alt 50 | All Asset Aggressive-Alt 75 | ||||||||||||||||
EQ/Invesco Comstock Portfolio | 0.04 | % | 3.16 | % | 0.08 | % | 0.24 | % | 0.11 | % | ||||||||||
| AXA Conservative Allocation | AXA Conservative- Plus Allocation | AXA Moderate Allocation | AXA Moderate- Plus Allocation | AXA Aggressive Allocation | ||||||||||||||||
EQ/Large Cap Growth PLUS Portfolio | 0.60 | % | 0.99 | % | 6.70 | % | 9.06 | % | 3.26 | % | ||||||||||
Portfolios | CharterSM Fixed Income | CharterSM Conservative | CharterSM Moderate | CharterSM Moderate Growth | CharterSM Growth | CharterSM Aggressive Growth | CharterSM Equity | CharterSM International Conservative | ||||||||||||||||||||||||
EQ/Invesco Comstock Portfolio | — | % | 0.08 | % | 0.12 | % | 0.16 | % | 0.25 | % | 0.21 | % | 0.31 | % | — | % | ||||||||||||||||
Portfolios | CharterSM | CharterSM International Growth | CharterSM Income Strategies | CharterSM Interest Rate Strategies | CharterSM Real Assets | CharterSM Alternative 100 Conservative Plus | CharterSM Alternative 100 Moderate | CharterSM Alternative 100 Growth | ||||||||||||||||||||||||
EQ/Invesco Comstock Portfolio | — | % | — | % | — | % | — | % | — | % | — | % | — | % | — | % | ||||||||||||||||
| Note 9 | Substitution, Reorganization and In-Kind Transactions |
At a meeting held on March 5-6, 2013, the Board approved a redemption in-kind from the Portfolios listed below and a subscription in-kind to EQ/Large Cap Core PLUS Portfolio (“LCCP”). On June 24, 2013, shareholders of the Portfolios listed below redeemed shares through an in-kind redemption of securities and currency and contributed the securities and currency to LCCP. Valuation of these securities at the time of the redemption and subscription in-kind was in accordance with the Portfolios’ valuation policy. For GAAP purposes, the transaction was treated as a sale on the date of the redemption in-kind and the resulting gains based on the values of the securities are listed in the table below.
Portfolios | Value of securities and currency transferred | Realized Gain/(Loss) | ||||||
EQ/Davis New York Venture Portfolio | $ | 319,295,079 | $ | 98,658,571 | ||||
EQ/Lord Abbett Large Cap Core Portfolio | 175,945,507 | 44,320,269 | ||||||
|
| |||||||
Total | $ | 495,240,586 | ||||||
|
| |||||||
The realized gain is recorded in Net Realized Gain on Investments on the redeeming Portfolios’ Statements of Operations. For tax purposes, the gain is not recognized by the redeeming Portfolios. Additionally, the value of securities redeemed in-kind and contributed in-kind is excluded from the respective Portfolios’ portfolio turnover calculation and excluded from cost of purchases and net proceeds of sales and redemptions.
82
EQ ADVISORS TRUST
NOTES TO FINANCIAL STATEMENTS (Continued)
December 31, 2013
At a meeting held on March 5-6, 2013, the Board approved a redemption in-kind from the Portfolios listed below and a subscription in-kind to EQ/Large Cap Growth PLUS Portfolio (“LCGP”). On June 24, 2013, shareholders of the Portfolios listed below redeemed shares through an in-kind redemption of securities and currency and contributed the securities and currency to LCGP. Valuation of these securities at the time of the redemption and subscription in-kind was in accordance with the Portfolios’ valuation policy. For GAAP purposes, the transaction was treated as a sale on the date of the redemption in-kind and the resulting gains based on the values of the securities are listed in the table below.
Portfolios | Value of securities and currency transferred | Realized Gain/(Loss) | ||||||
EQ/T. Rowe Price Growth Stock Portfolio | $ | 483,112,196 | $ | 156,350,736 | ||||
EQ/Wells Fargo Omega Growth Portfolio | 645,225,243 | 127,106,221 | ||||||
|
| |||||||
Total | $ | 1,128,337,439 | ||||||
|
| |||||||
The realized gain is recorded in Net Realized Gain on Investments on the redeeming Portfolios’ Statements of Operations. For tax purposes, the gain is not recognized by the redeeming Portfolios. Additionally, the value of securities redeemed in-kind and contributed in-kind is excluded from the respective Portfolios’ portfolio turnover calculation and excluded from cost of purchases and net proceeds of sales and redemptions.
At a meeting held on March 5-6, 2013, the Board approved a redemption in-kind from the Portfolios listed below and a subscription in-kind to EQ/Large Cap Growth PLUS Portfolio (“LCGP”). On July 15, 2013, shareholders of the Portfolios listed below redeemed shares through an in-kind redemption of securities and currency and contributed the securities and currency to LCGP. Valuation of these securities at the time of the redemption and subscription in-kind was in accordance with the Portfolios’ valuation policy. For GAAP purposes, the transaction was treated as a sale on the date of the redemption in-kind and the resulting gains based on the values of the securities are listed in the table below.
Portfolios | Value of securities and currency transferred | Realized Gain/(Loss) | ||||||
EQ/Equity Growth PLUS Portfolio | $ | 1,130,474,520 | $ | 322,593,511 | ||||
EQ/Montag & Caldwell Growth Portfolio | 173,621,344 | 44,569,556 | ||||||
Multimanager Aggressive Equity Portfolio (a) | 544,434,083 | 162,708,424 | ||||||
|
| |||||||
Total | $ | 1,848,529,947 | ||||||
|
| |||||||
| (a) | A portfolio of AXA Premier VIP Trust. |
The realized gain is recorded in Net Realized Gain on Investments on the redeeming Portfolios’ Statements of Operations. For tax purposes, the gain is not recognized by the redeeming Portfolios. Additionally, the value of securities redeemed in-kind and contributed in-kind is excluded from the respective Portfolios’ portfolio turnover calculation and excluded from cost of purchases and net proceeds of sales and redemptions.
83
EQ ADVISORS TRUST
NOTES TO FINANCIAL STATEMENTS (Continued)
December 31, 2013
At a meeting held on March 5-6, 2013, the Board approved a redemption in-kind from the Portfolio listed below and a subscription in-kind to EQ/Large Cap Value PLUS Portfolio (“LCVP”). On July 29, 2013, shareholders of the Portfolio listed below redeemed shares through an in-kind redemption of securities and currency and contributed the securities and currency to LCVP. Valuation of these securities at the time of the redemption and subscription in-kind was in accordance with the Portfolio’s valuation policy. For GAAP purposes, the transaction was treated as a sale on the date of the redemption in-kind and the resulting gains based on the values of the securities are listed in the table below.
Portfolio | Value of securities and currency transferred | Realized Gain/(Loss) | ||||||
EQ/Invesco Comstock Portfolio | $ | 340,684,665 | $ | 92,549,166 | ||||
|
| |||||||
The realized gain is recorded in Net Realized Gain on Securities on the redeeming Portfolio’s Statements of Operations. For tax purposes, the gain is not recognized by the redeeming Portfolio. Additionally, the value of securities redeemed in-kind and contributed in-kind is excluded from the respective Portfolio’s portfolio turnover calculation and excluded from cost of purchases and net proceeds of sales and redemptions.
Note 10 Subsequent Events
The Manager evaluated subsequent events from December 31, 2013, the date of these financial statements, through the date these financial statements were issued and available. The subsequent events include the following:
At a meeting held on December 10-11, 2013 the Board approved a Plan of Reorganization and Termination, relating to the following Portfolios of the Trust:
| Proposed Acquired Portfolio | Proposed Acquiring Portfolio | |
EQ/Davis New York Venture Portfolio EQ/Lord Abbett Large Cap Core Portfolio EQ/Equity Growth PLUS Portfolio (each an “Acquired Portfolio”) | EQ/Invesco Comstock Portfolio EQ/Invesco Comstock Portfolio EQ/Large Cap Growth PLUS Portfolio (each, an “Acquiring Portfolio”) |
Each of the reorganizations requires the approval of shareholders of the Acquired Portfolio. Pending shareholder approval, it is anticipated that the reorganizations will occur on or about June 20, 2014.
At that same meeting, the Board approved the following name changes which will be effective on or about May 1, 2014.
| Current Name | New Name | |
| EQ/Large Cap Growth PLUS Portfolio | AXA Large Cap Growth Managed Volatility Portfolio |
Note 11 Pending Legal Proceedings
In July 2011, a lawsuit was filed in the United States District Court of the District of New Jersey, entitled Mary Ann Sivolella v. AXA Equitable Life Insurance Company and AXA Equitable Funds Management Group, LLC (“Sivolella Litigation”). The lawsuit was filed derivatively on behalf of eight Portfolios of the Trust: EQ/Common Stock Index Portfolio; EQ/Equity Growth PLUS Portfolio; EQ/Equity 500 Index Portfolio; EQ/Large Cap Value PLUS Portfolio; EQ/Global Multi-Sector Equity Portfolio; EQ/Mid Cap Value PLUS Portfolio; EQ/Intermediate Government Bond Index Portfolio; and EQ/GAMCO Small Company Value Portfolio (the “Sivolella Portfolios”). The lawsuit seeks recovery
84
EQ ADVISORS TRUST
NOTES TO FINANCIAL STATEMENTS (Continued)
December 31, 2013
under Section 36(b) of the 1940 Act, for alleged excessive fees paid to FMG LLC and AXA Equitable (the “Defendants”) for investment management services. The Plaintiff seeks recovery of the alleged overpayments, or alternatively, rescission of the contracts and restitution of all fees paid, interest, costs, and fees. In October 2011, FMG LLC and AXA Equitable filed a motion to dismiss the complaint. In November 2011, the Plaintiff filed an Amended Complaint seeking the same relief, but adding new claims under (1) Section 26(f) of the 1940 Act alleging that the variable annuity contracts sold by the Defendants charged excessive management fees, and seeking restitution and rescission of those contracts under Section 47(b) of the 1940 Act; and (2) a claim for unjust enrichment. The Defendants filed a motion to dismiss the Amended Complaint in December 2011. In May 2012, Plaintiff voluntarily dismissed the Section 26(f) claim seeking restitution and rescission under Section 47(b). In September 2012, the United States District Court for the District of New Jersey denied the motion to dismiss as it related to the unjust enrichment claim.
In January 2013, a second lawsuit against FMG LLC was filed in the United States District Court for the District of New Jersey by a group of plaintiffs asserting substantially similar claims under Section 36(b) and seeking substantially similar damages as in the Sivolella Litigation. The lawsuit, entitled Glenn D. Sanford, et al. v. AXA Equitable Funds Management Group, LLC (“Sanford Litigation”), was filed derivatively on behalf of the EQ/PIMCO Ultra Short Bond Portfolio, the EQ/T. Rowe Price Growth Stock, the EQ/Global Bond PLUS Portfolio, and the EQ/Core Bond Index Portfolio, in addition to the Sivolella Portfolios. In light of the similarities of the allegations in the Sivolella and Sanford Litigations, the parties and court agreed to consolidate the two lawsuits.
In April 2013, the Plaintiffs in the Sivolella and Sanford Litigations amended the complaints to add additional claims under Section 36(b) of the 1940 Act for recovery of alleged excessive fees paid to FMG LLC in its capacity as the Administrator of the Trust. The Plaintiffs seek recovery of the alleged overpayments, or alternatively, rescission of the contract and restitution of the excessive fees paid, interest, costs, and fees.
No liability for litigation relating to these matters have been accrued in the financial statements of the Portfolios because any potential damages would be the responsibility of the Defendants.
On November 1, 2010, the Trust and AXA Premier VIP Trust, and several of their respective portfolios, were named as defendants and putative members of the proposed defendant class of shareholders in a lawsuit brought by The Official Committee of Unsecured Creditors of Tribune Company (the “Committee”) in the United States Bankruptcy Court for the District of Delaware regarding Tribune Company’s Chapter 11 bankruptcy proceeding (In re Tribune Company). The lawsuit relates to amounts paid to the Trust and AXA Premier VIP Trust, and several of their respective portfolios, as holders of publicly-traded shares of Tribune Company, which were components of certain broad-based securities market indices, for which there were public tender offers during 2007. The suit seeks return of the share price received by Tribune Company shareholders in the tender offers plus interest and attorneys’ fees and expenses.
On July 1, 2011, retiree participants in certain Tribune-defined compensation plans (the “Retirees”) initiated a lawsuit in the United States District Court for the Southern District of New York against certain Tribune Company shareholders who sold their shares as part of the 2007 public tender offers (the “Retiree Suit”). This Retiree Suit also seeks return of the share price received by Tribune Company shareholders in connection with the tender offers plus interest and attorneys’ fees and expenses.
On August 24, 2011, the trustees of certain trusts that hold notes issued by Tribune Company (the “Noteholders”) initiated a separate lawsuit in the United States District Court for the Southern District of New York against certain Tribune Company shareholders who sold their shares as part of the 2007 public tender offers (the “Noteholder Suit”). This Noteholder Suit also seeks return of the share price received by Tribune Company shareholders in connection with the tender offers plus interest and attorneys’ fees and expenses.
85
EQ ADVISORS TRUST
NOTES TO FINANCIAL STATEMENTS (Continued)
December 31, 2013
The Committee’s suit, the Retiree Suit, and the Noteholder Suit have each been consolidated with a number of related lawsuits filed by the Noteholders and Retirees around the United States into a single multi-district litigation proceeding now pending in the United States District Court for the Southern District of New York (In re: Tribune Company Fraudulent Conveyance Litigation).
With respect to the Trust, the EQ/Equity 500 Index Portfolio, the EQ/GAMCO Mergers and Acquisitions Portfolio and the EQ/Mid Cap Value PLUS Portfolio are named as defendants in the Noteholder Suit and the Retiree Suit. The EQ/Equity 500 Index Portfolio, the EQ/GAMCO Mergers and Acquisitions Portfolio, the EQ/Mid Cap Value PLUS Portfolio, the EQ/Large Cap Core PLUS Portfolio, the EQ/Small Company Index II Portfolio, the EQ/Common Stock Index II Portfolio, and EQ Advisors Trust are all putative members of the proposed defendant class of shareholders in the Committee’s suit. The EQ/Equity 500 Index Portfolio, the EQ/GAMCO Mergers and Acquisition Portfolio, the EQ/Large Cap Core PLUS Portfolio, and EQ Advisors Trust are also named separately in the Committee’s suit, in the event it is not certified as a class action. The amounts paid to the above six portfolios in connection with the public tender offers were approximately: (i) the EQ/Equity 500 Index Portfolio – $1,740,800; (ii) the EQ/GAMCO Mergers and Acquisitions Portfolio – $1,122,000; (iii) the EQ/Mid Cap Value PLUS Portfolio – $2,992,000; (iv) the EQ/Large Cap Core PLUS Portfolio – $64,600; (v) the EQ/Small Company Index II Portfolio – $61,200; and (vi) the EQ/Common Stock Index II Portfolio – $18,360.
The lawsuits do not allege any misconduct by the Trust or its Portfolios. Motions to dismiss the suits filed by the Noteholders and the Retirees based on certain limited defenses are currently pending before the United States District Court for the Southern District of New York. The Portfolios cannot predict the outcome of these lawsuits. If the lawsuits were to be decided or settled in a manner adverse to the portfolios, the payment of such judgments or settlements could have an adverse effect on each Portfolio’s net asset value. However, no liability for litigation relating to this matter has been accrued in the financial statements of the Portfolios, as the Manager believes a loss is not probable.
86
Report of Independent Registered Public Accounting Firm
To the Board of Trustees and Shareholders of EQ Advisors Trust
In our opinion, the accompanying statements of assets and liabilities, including the portfolios of investments, and the related statements of operations and of changes in net assets and the financial highlights (hereafter referred to as “financial statements”) present fairly, in all material respects, the financial position of each of the portfolios of EQ Advisors Trust listed in the Table of Contents to the Annual Report in which these financial statements appear (collectively referred to as the “Trust”) at December 31, 2013, and the results of each of their operations, the changes in each of their net assets and the financial highlights for each of the periods presented, in conformity with accounting principles generally accepted in the United States of America. These financial statements and financial highlights are the responsibility of the Trust’s management. Our responsibility is to express an opinion on these financial statements based on our audits. We conducted our audits of these financial statements in accordance with the standards of the Public Company Accounting Oversight Board (United States). Those standards require that we plan and perform the audit to obtain reasonable assurance about whether the financial statements are free of material misstatement. An audit includes examining, on a test basis, evidence supporting the amounts and disclosures in the financial statements, assessing the accounting principles used and significant estimates made by management, and evaluating the overall financial statement presentation. We believe that our audits, which included confirmation of securities at December 31, 2013 by correspondence with the custodian, transfer agents and brokers, provide a reasonable basis for our opinion.
PricewaterhouseCoopers LLP
New York, New York
February 19, 2014
87
Federal Income Tax Information (Unaudited)
For the year ended December 31, 2013, the percentage of dividends paid that qualify for the 70% dividends received deductions for corporate shareholders, foreign taxes which are expected to be passed through to shareholders for foreign tax credits, gross income derived from sources within foreign countries, and long-term capital gain dividends for the purpose of the dividend paid deduction on its Federal income tax return were as follows:
| 70% Dividend Received Deduction | Foreign Taxes | Foreign Source Income | Long Term Capital Gain | |||||||||||||
EQ/Davis New York Venture | 100.00 | % | $ | — | $ | — | $ | — | ||||||||
EQ/Equity Growth PLUS | 100.00 | — | — | — | ||||||||||||
EQ/Invesco Comstock | 100.00 | — | — | — | ||||||||||||
EQ/Large Cap Growth PLUS | 100.00 | — | — | — | ||||||||||||
EQ/Lord Abbett Large Cap Core | 100.00 | — | — | 11,105,542 | ||||||||||||
88
MANAGEMENT OF THE TRUST (UNAUDITED)
The Trust’s Board is responsible for the overall management of the Trust and the Portfolios, including general supervision and review of the Portfolios’ investment activities and their conformity with federal and state law as well as the stated policies of the Portfolios. The Board elects the officers of the Trust who are responsible for administering the Trust’s day-to-day operations. The Trustees of the Trust are identified in the table below along with information as to their principal business occupations held during the last five years and certain other information are shown below.
The Trustees
| Name, Address and Age | Position(s) Held With Fund | Term of Office** and Length of Time Served | Principal Occupation(s) During Past 5 Years | Number of by Trustee† | Other Directorships During Past 5 Years | |||||
| Interested Trustees | ||||||||||
Steven M. Joenk* 1290 Avenue of the Americas, New York, New York | Trustee, Chairman, President and Chief Executive Officer | Trustee and Chairman from September 2004 to present, Chief Executive Officer, President from December 2002 to present | From May 2011 to present, Director, President, Chief Executive Officer and Chairman, FMG LLC; from September 1999 to present, Managing Director, AXA Equitable; from September 2004 to April 2011, President, AXA Equitable’s Funds Management Group (“FMG”) unit; from July 2004 to October 1, 2013, Senior Vice President, MONY Life Insurance Company; from July 2004 to present, Senior Vice President MONY Life Insurance Company of America and Director, MONY Capital Management, Inc., Director and President, 1740 Advisers, Inc.; Director, Chairman of the Board and President, MONY Asset Management, Inc. and Enterprise Capital Management (from July 2004 to January 2011); from January 2005 to January 2011, Director, MONY Financial Resources of Americas Limited; and from November 2005 to present, Director MONY International Holdings, LLC. | 113 | None | |||||
| * | Affiliated with the Manager and/or the Distributor. |
| ** | Each Trustee serves until his or her resignation or retirement. |
| † | The registered investment companies in the fund complex include AXA Premier VIP Trust and the Trust. Mr. Joenk serves as Trustee, President and Chief Executive Officer for each of the registered investment companies in the fund complex, as well as Chairman for each such company. |
89
| Name, Address and Age | Position(s) Held With Fund | Term of Office** and Length of Time Served | Principal Occupation(s) During Past 5 Years | Number of by Trustee† | Other Directorships Held by Trustee | |||||
| Independent Trustees | ||||||||||
Theodossios Athanassiades c/o EQ Advisors Trust 1290 Avenue of the Americas New York, New York 10104 (74) | Trustee | From March 2000 to present | Retired. 1996, Vice Chairman, Metropolitan Life Insurance Company; From 1993 to 1995, President and Chief Operating Officer Metropolitan Life Insurance Company. | 77 | From 1994 to 2006, Director of Atlantic Bank of New York. | |||||
Jettie M. Edwards c/o EQ Advisors Trust 1290 Avenue of the Americas New York, New York 10104 (67) | Trustee | From March 1997 to present | Retired. From 1986 to 2001, Partner and Consultant, Syrus Associates (business and marketing consulting firm). | 77 | From 1997 to 2010, Director, Old Mutual Funds II (12 portfolios); from 2008 to 2009, Director, Old Mutual Funds III (13 portfolios). | |||||
Donald E. Foley c/o EQ Advisors Trust 1290 Avenue of the Americas New York, New York 10104 (61) | Trustee | From January 1, 2014 to present | Retired. From 2010 to 2011, Chairman of the Board and Chief Executive Officer, Wilmington Trust Corporation; from 1996 to 2010, Senior Vice President, Treasurer and Director of Tax ITT Corporation; 1989- 1996, Assistant Treasurer, International Paper Company. | 77 | 2011-2012, Director, and from 2012 to present Advisory Committee Member M&T Corporation; from 2007-2011, Director and member of the Audit Committee and Compensation Committee, Wilmington Trust Corporation; Advisory Board member Northern Trust Company and Goldman Sachs Management Groups 2008-2010. | |||||
William M. Kearns, Jr c/o EQ Advisors Trust 1290 Avenue of the Americas New York, New York 10104 (78) | Trustee | From March 1997 to present | From 1994 to present, President, W.M. Kearns & Co., Inc. (private investment company); from 2002 to June 2007, Chairman, Keefe Managers, Inc. (money management firm); and from 2008 to present, Chairman, Keefe Ventures, LLC. | 77 | Lead Director from 2008 to present and from 1991 to present, Director, Transistor Devices, Inc. From 1999 to 2010, Advisory Director, Alexander Proudfoot (consulting firm). From 2001 to 2011, Advisory Director, Gridley & Company LLC. From 2002 to 2009, Director, United States Shipping Partners LLC. From 2005 to 2009, Lead Director, and from 1975 to 2009, Director, Selective Insurance Group, Inc. | |||||
90
| Name, Address and Age | Position(s) Held With Fund | Term of Office** and Length of Time Served | Principal Occupation(s) During Past 5 Years | Number of by Trustee† | Other Directorships Held by Trustee | |||||
| Independent Trustees | ||||||||||
Christopher P.A. Komisarjevsky c/o EQ Advisors Trust 1290 Avenue of the Americas New York, New York 10104 (68) | Trustee | From March 1997 to present | From 2006 to 2008, Senior Counselor for APCO Worldwide® (global communications consulting) and a member of its International Advisory Council. From 1998 to 2005, President and Chief Executive Officer, Burson-Marsteller Worldwide (public relations). From 1996 to 1998, President and Chief Executive Officer of Burson-Marsteller U.S.A. | 77 | None | |||||
H. Thomas McMeekin c/o EQ Advisors Trust 1290 Avenue of the Americas New York, New York 10104 (60) | Trustee | From January 1, 2014 to present | Retired. From 2000 to present, Managing Partner and Founder of Griffin Investments, LLC a private equity firm; from 2009 to 2012 Chief Investment Officer, Sun America Financial Group and United Guaranty Corporation and Senior Managing Director of AIG Asset Management; from 2001 to 2008, Managing Director, Institutional Client Relations of Prudential Investment Management, Inc. Financial Group and United Guaranty Corporation and Senior Managing Director of AIG Asset Management; from 2001 to 2008, Managing Director, Institutional Client Relations of Prudential Investment Management, Inc. | 77 | 2012 to present, Director, Achaean Financial Group; 2011 to 2012, Director US Life Insurance Company in the City of New York | |||||
Harvey Rosenthal c/o EQ Advisors Trust 1290 Avenue of the Americas New York, New York 10104 71 | Trustee | From March 1997 to present | Retired. From 1994 to 1996, President and Chief Operating Officer of Melville Corporation. From 1984-1994 President and Chief Executive Officer of the CVS Division of Melville Corporation. | 77 | From 1997 to 2012, Director, LoJack Corporation. | |||||
91
| Name, Address and Age | Position(s) Held With Fund | Term of Office** and Length of Time Served | Principal Occupation(s) During Past 5 Years | Number of Portfolios in Fund Complex Overseen by Trustee† | Other Directorships Held by Trustee | |||||
| Independent Trustees (Continued) | ||||||||||
Gary S. Schpero c/o EQ Advisors Trust 1290 Avenue of the Americas New York, New York 10104 (60) | Lead Independent Trustee | Trustee from May 2000 to present; from October 2011 to present, Lead Independent Trustee | Retired. Prior to January 1, 2000, Partner of Simpson Thacher & Bartlett (law firm) and Managing Partner of the Investment Management and Investment Company Practice Group. | 77 | From May 2012 to present, Trustee, Blackstone/GSO Senior Floating Rate Term Fund and Blackstone/GSO Long-Short Credit Income Fund. From October 2012 to present, Trustee, Blackstone/GSO Strategic Credit Fund. | |||||
Kenneth L. Walker c/o EQ Advisors Trust 1290 Avenue of the Americas New York, New York 10104 (62) | Trustee | From January 2012 | From May 2002 to present, Partner, The Capital Management Corporation (investment advisory firm). | 77 | None. | |||||
Caroline L. Williams c/o EQ Advisors Trust 1290 Avenue of the Americas New York, New York 10104 (67) | Trustee | From January 2012 | From July 2010 to December 2012, Executive Vice President, May 2005 to December 2007, Consultant and from May 2001 to May 2005, Chief Financial and Investment Officer, Nathan Cummings Foundation (non-profit organization); from 1988 to 1992, Managing Director, from 1982 to 1988, Senior Vice President, from 1978 to 1982, Vice President and from 1971 to 1976, Associate, Donaldson, Lufkin & Jenrette Securities Corporation (investment bank). | 77 | From 1997 to 2009, Director, Hearst-Argyle Television. | |||||
| ** | Each Trustee serves until his or her resignation or retirement. |
| † | The registered investment companies in the fund complex include AXA Premier VIP Trust and the Trust. Mr. Joenk serves as Trustee, President and Chief Executive Officer for each of the registered investment companies in the fund complex, as well as Chairman for each such company. |
92
The Trust’s Officers
No officer of the Trust receives any compensation paid by the Trust. Each officer of the Trust is an employee of AXA Equitable, AXA Advisors, LLC (“AXA Advisors”) or AXA Distributors, LLC (“AXA Distributors”). The Trust’s principal officers are:
| Name, Address and Age | Position(s) Held With Fund* | Term of Office and Length of Time Served** | Principal Occupation(s) During Past 5 Years | |||
Steven M. Joenk 1290 Avenue of the Americas, New York, New York 10104 (55) | Trustee, Chairman, President and Chief Executive Officer | From September 2004 to present, Trustee and Chairman and from December 2002 to present, Chief Executive Officer and President. | From May 2011 to present, Director, President, Chief Executive Officer and Chairman, FMG LLC; from September 1999 to present, Managing Director, AXA Equitable; from September 2004 to April 2011, President, AXA Equitable’s FMG; from July 2004 to October 1, 2013, Senior Vice President, MONY Life Insurance Company; from July 2004 to present, Senior Vice President MONY Life Insurance Company of America and Director, MONY Capital Management, Inc., Director and President, 1740 Advisers, Inc.; Director, Chairman of the Board and President, MONY Asset Management, Inc. and Enterprise Capital Management (from July 2004 to January 2011); from January 2005 to January 2011, Director, MONY Financial Resources of Americas Limited; and from November 2005 to present, Director MONY International Holdings, LLC. | |||
Patricia Louie, Esq. 1290 Avenue of the Americas, New York, New York 10104 (58) | Vice President and Secretary | From July 1999 to Present | From June 2012 to present, Executive Vice President and General Counsel of FMG LLC; from May 2011 to June 2012, Senior Vice President and Corporate Counsel of FMG LLC; from February 2011 to present Managing Director and Associate General Counsel of AXA Financial and AXA Equitable; from May 2003 to February 2011, Vice President and Associate General Counsel of AXA Financial and AXA Equitable. | |||
Brian Walsh 525 Washington Boulevard, Jersey City, New Jersey 07310 (46) | Chief Financial Officer and Treasurer | From June 2007 to present | From May 2011 to present, Senior Vice President of FMG LLC; from February 2003 to present, Lead Director of AXA Financial and AXA Equitable. | |||
Kenneth Kozlowski 1290 Avenue of the Americas New York, New York 10104 (52) | Vice President | From to present | From June 2012 to present, Executive Vice President and Chief Investment Officer of FMG LLC; from May 2011 to June 2012, Senior Vice President of FMG LLC; from September 2011 to present, Managing Director of AXA Financial and AXA Equitable; from February 2001 to September 2011, Vice President AXA Financial and AXA Equitable; from July 2004 to January 2011, Director, Enterprise Capital Management, Inc. | |||
Alwi Chan 1290 Avenue of the Americas, New York, New York 10104 (39) | Vice President | From June 2007 to present | From June 2012 to present, Senior Vice President and Deputy Chief Investment Officer of FMG LLC; from May 2011 to June 2012, Vice President of FMG LLC; from February 2007 to present, Lead Director of AXA Financial and AXA Equitable. | |||
James Kelly 525 Washington Boulevard, Jersey City, New Jersey 07310 (45) | Controller | From June 2007 to present | From May 2011 to present, Vice President of FMG LLC; from September 2008 to present, Senior Director of AXA Equitable. | |||
Mary E. Cantwell 1290 Avenue of the Americas, New York, New York 10104 (52) | Vice President | From July 1999 to Present | From June 2012 to present, Senior Vice President of FMG LLC; from May 2011 to June 2012, Vice President of FMG LLC; from February 2001 to present, Lead Director of AXA Equitable; from July 2004 to January 2011, a Director of Enterprise Capital Management, Inc. | |||
Roselle Ibanga 525 Washington Boulevard, Jersey City, New Jersey 07310 (35) | Assistant Controller | From March 2009 to present | From February 2009 to present, Director of AXA Equitable; from December 2008 to February 2009, Director of AXA Equitable’s FMG. | |||
Lisa Perrelli 525 Washington Boulevard, Jersey City, New Jersey 07310 (39) | Assistant Controller | From March 2009 to present | From November 2012 to present, Senior Director of AXA Equitable; from September 2008 to November 2012, Assistant Vice President of AXA Equitable; from February 2008 to September 2008, Director of AXA Equitable’s FMG. |
93
| Name, Address and Age | Position(s) Held With Fund* | Term of Office and Length of Time Served** | Principal Occupation(s) During Past 5 Years | |||
William MacGregor 1290 Avenue of the Americas, New York, New York 10104 (38) | Vice President and Assistant Secretary | From September 2006 to present | From June 2012 to present, Senior Vice President, Secretary and Associate General Counsel of FMG LLC; from May 2011 to June 2012, Vice President and Associate Corporate Counsel of FMG LLC; from May 2008 to present, Lead Director and Associate General Counsel of AXA Equitable. | |||
Gariel Nahoum 1290 Avenue of the Americas, New York, New York 10104 (30) | Vice President and Assistant Secretary | From December 2011 to present | From June 2012 to present, Vice President, Assistant Secretary and Associate General Counsel of FMG LLC; from September 2011 to June 2012, Vice President and Secretary of FMG LLC; from August 2011 to present, Senior Director and Counsel of AXA Equitable; from September 2008 to August 2011, Associate, Kramer Levin Naftalis & Frankel LLP. | |||
Joseph J. Paolo 1290 Avenue of the Americas, New York, New York 10104 (43) | Chief Compliance Officer, Vice President and Anti-Money Laundering Compliance Officer | Chief Compliance Officer from May 2007, Vice President and Anti-Money Laundering Compliance Officer from November 2005 to Present | From May 2011 to present, Senior Vice President and Chief Compliance Officer of FMG LLC; from June 2007 to present, Lead Director of AXA Equitable and Chief Compliance Officer of AXA Equitable’s FMG. | |||
Richard Guinnessey 1290 Avenue of the Americas, New York, New York 10104 (50) | Vice President | From March 2011 to present | From June 2012 to present, Vice President FMG LLC, from September 2010 to present, Senior Director of AXA Equitable; from November 2005 to September 2010 Assistant Vice President of AXA Equitable. | |||
Jennifer Mastronardi 1290 Avenue of the Americas, New York, New York 10104 (28) | Assistant Vice President | From March 2012 to present | From February 2009 to present, Director of AXA Equitable; from June 2007 to February 2009, Operations Associate in Managed Futures Department, Morgan Stanley. | |||
Paraskevou Charalambous 1290 Avenue of the Americas, New York, New York 10104 (51) | Assistant Secretary | From November 2005 to present | From March 2000 to present, Lead Manager/Senior Legal Assistant for AXA Equitable. | |||
Helen Espaillat 1290 Avenue of the Americas, New York, New York 10104 (50) | Assistant Secretary | From March 2009 to present | From July 2004 to present, Lead Manager/Senior Legal Assistant for AXA Equitable. |
| * | The officers in the table above (except Ms. Charalambous and Ms. Espaillat) hold similar positions with one other registered investment company in the fund complex. The registered investment companies in the fund complex include AXA Premier VIP Trust and the Trust. |
| ** | Each officer is elected on an annual basis. |
CONTROL PERSON AND PRINCIPAL HOLDERS OF SECURITIES
Shares of the Trust are offered to separate accounts of insurance companies in connection with the Contracts and may be offered to tax-qualified retirement plans and other qualified investors. AXA Equitable may be deemed to be a control person with respect to the Trust by virtue of its record ownership of more than 95% of the Trust’s shares as of March 31, 2011. Shareholders owning more than 25% of the outstanding shares of a portfolio may take actions without the approval of other investors in the portfolio.
94
PROXY VOTING POLICIES AND PROCEDURES (UNAUDITED)
A description of the policies and procedures that the Portfolios use to determine how to vote proxies relating to portfolio securities is available (i) without charge, upon request, by calling a toll-free number at 1-877-222-2144 and (ii) on the Securities and Exchange Commission’s website at http://www.sec.gov. Information regarding how the Portfolios voted proxies relating to portfolio securities during the most recent 12-month period ended June 30 is available without charge (i) on the Trust’s website at www.axa-equitablefunds.com and (ii) on the Securities and Exchange Commission’s website at http://www.sec.gov.
QUARTERLY PORTFOLIO HOLDINGS INFORMATION (UNAUDITED)
The Portfolios file their complete schedule of portfolio holdings with the Securities and Exchange Commission for the first and third quarters of each fiscal year on Form N-Q. The Portfolios’ Forms N-Q are available on the Securities and Exchange Commission’s website at http://www.sec.gov. You may also review and obtain copies at the Securities and Exchange Commission’s Public Reference Room in Washington, D.C. Information about the Public Reference Room may be obtained by calling 1-800-SEC-0330.
95
PRO FORMA FINANCIAL STATEMENTS (Unaudited)
The following tables set forth the pro forma combined Portfolio of Investments as of December 31, 2013, the pro forma combined Statement of Assets and Liabilities as of December 31, 2013, and the pro forma combined Statement of Operations for the twelve-month period ended December 31, 2013, for the Acquired Portfolios and the Acquiring Portfolios, as adjusted giving effect to the Reorganizations.
The pro forma combined Portfolio of Investments contains information about the securities holdings of the combined Portfolios as of December 31, 2013, which has, and will continue to, change over time due to normal portfolio turnover in response to changes in market conditions. Thus, it is expected that some of an Acquired Portfolio’s holdings may not remain at the time of the Reorganizations. It is also expected that, if a Reorganization is approved, AXA Equitable Funds Management Group, LLC (the “Manager”) will liquidate an Acquired Portfolio’s holdings that, based on market conditions and an assessment by the Manager and the investment advisers to the corresponding Acquiring Portfolio, are not compatible with the Acquiring Portfolio’s current portfolio composition, investment objective and policies, or investment strategies. The proceeds of such liquidation will be held in temporary investments or reinvested in assets that are consistent with the Acquiring Portfolio’s investment objective, policies and strategies. Although any sale of portfolio investments in connection with a Reorganization will be conducted in an orderly manner, the need for a Portfolio to sell investments may result in its selling securities at a disadvantageous time and price and could result in the Portfolio realizing gains (or losses) that otherwise would not have been realized and incurring transaction costs that otherwise would not have been incurred.
3
EQ ADVISORS TRUST
PORTFOLIO OF INVESTMENTS
December 31, 2013
| Number of Shares | Value ($) (Note 1) | |||||||||||||||||||||||||||||||
| EQ/Davis New York Venture | EQ/Lord Abbett Large Cap Core | EQ/Invesco Comstock | Combined Pro-forma | EQ/Davis New York Venture | EQ/Lord Abbett Large Cap Core | EQ/Invesco Comstock | Combined Pro-forma | |||||||||||||||||||||||||
COMMON STOCKS: | ||||||||||||||||||||||||||||||||
Consumer Discretionary (12.4%) | ||||||||||||||||||||||||||||||||
Auto Components (0.5%) | ||||||||||||||||||||||||||||||||
BorgWarner, Inc. | — | 7,006 | — | 7,006 | — | 391,706 | — | 391,706 | ||||||||||||||||||||||||
Johnson Controls, Inc. | — | — | 15,091 | 15,091 | — | — | 774,168 | 774,168 | ||||||||||||||||||||||||
|
|
|
|
|
|
|
| |||||||||||||||||||||||||
| — | 391,706 | 774,168 | 1,165,874 | |||||||||||||||||||||||||||||
|
|
|
|
|
|
|
| |||||||||||||||||||||||||
Automobiles (1.1%) | ||||||||||||||||||||||||||||||||
Ford Motor Co. | — | 37,066 | — | 37,066 | — | 571,928 | — | 571,928 | ||||||||||||||||||||||||
General Motors Co.* | — | — | 36,542 | 36,542 | — | — | 1,493,471 | 1,493,471 | ||||||||||||||||||||||||
Harley-Davidson, Inc. | 4,452 | — | — | 4,452 | 308,256 | — | — | 308,256 | ||||||||||||||||||||||||
|
|
|
|
|
|
|
| |||||||||||||||||||||||||
| 308,256 | 571,928 | 1,493,471 | 2,373,655 | |||||||||||||||||||||||||||||
|
|
|
|
|
|
|
| |||||||||||||||||||||||||
Hotels, Restaurants & Leisure (1.5%) | ||||||||||||||||||||||||||||||||
Carnival Corp. | — | — | 26,495 | 26,495 | — | — | 1,064,304 | 1,064,304 | ||||||||||||||||||||||||
Hyatt Hotels Corp., Class A* | — | 4,836 | — | 4,836 | — | 239,188 | — | 239,188 | ||||||||||||||||||||||||
MGM Resorts International* | — | 33,415 | — | 33,415 | — | 785,921 | — | 785,921 | ||||||||||||||||||||||||
Starwood Hotels & Resorts Worldwide, Inc. | — | 8,684 | — | 8,684 | — | 689,944 | — | 689,944 | ||||||||||||||||||||||||
Wynn Resorts Ltd. | — | 2,206 | — | 2,206 | — | 428,427 | — | 428,427 | ||||||||||||||||||||||||
|
|
|
|
|
|
|
| |||||||||||||||||||||||||
| — | 2,143,480 | 1,064,304 | 3,207,784 | |||||||||||||||||||||||||||||
|
|
|
|
|
|
|
| |||||||||||||||||||||||||
Household Durables (0.3%) | ||||||||||||||||||||||||||||||||
Hunter Douglas N.V. | 2,641 | — | — | 2,641 | 119,533 | — | — | 119,533 | ||||||||||||||||||||||||
Newell Rubbermaid, Inc. | — | — | 13,531 | 13,531 | — | — | 438,540 | 438,540 | ||||||||||||||||||||||||
|
|
|
|
|
|
|
| |||||||||||||||||||||||||
| 119,533 | — | 438,540 | 558,073 | |||||||||||||||||||||||||||||
|
|
|
|
|
|
|
| |||||||||||||||||||||||||
Internet & Catalog Retail (1.0%) | ||||||||||||||||||||||||||||||||
Amazon.com, Inc.* | — | 447 | — | 447 | — | 178,259 | — | 178,259 | ||||||||||||||||||||||||
Liberty Interactive Corp.* | 22,185 | — | — | 22,185 | 651,130 | — | — | 651,130 | ||||||||||||||||||||||||
Liberty Ventures* | 1,507 | — | — | 1,507 | 184,743 | — | — | 184,743 | ||||||||||||||||||||||||
Netflix, Inc.* | 1,045 | — | — | 1,045 | 384,738 | — | — | 384,738 | ||||||||||||||||||||||||
priceline.com, Inc.* | 770 | — | — | 770 | 895,048 | — | — | 895,048 | ||||||||||||||||||||||||
|
|
|
|
|
|
|
| |||||||||||||||||||||||||
| 2,115,659 | 178,259 | — | 2,293,918 | |||||||||||||||||||||||||||||
|
|
|
|
|
|
|
| |||||||||||||||||||||||||
Media (4.0%) | ||||||||||||||||||||||||||||||||
Comcast Corp., Class A | — | — | 20,631 | 20,631 | — | — | 1,072,090 | 1,072,090 | ||||||||||||||||||||||||
Liberty Global plc* | 16,295 | — | — | 16,295 | 1,373,994 | — | — | 1,373,994 | ||||||||||||||||||||||||
Time Warner Cable, Inc. | — | — | 7,349 | 7,349 | — | — | 995,790 | 995,790 | ||||||||||||||||||||||||
Time Warner, Inc. | — | 6,427 | 6,936 | 13,363 | — | 448,090 | 483,578 | 931,668 | ||||||||||||||||||||||||
Twenty-First Century Fox, Inc., Class A | — | 9,827 | — | 9,827 | — | 345,714 | — | 345,714 | ||||||||||||||||||||||||
Twenty-First Century Fox, Inc., Class B | — | — | 28,127 | 28,127 | — | — | 973,194 | 973,194 | ||||||||||||||||||||||||
Viacom, Inc., Class B | — | — | 18,718 | 18,718 | — | — | 1,634,830 | 1,634,830 | ||||||||||||||||||||||||
Walt Disney Co. | 7,639 | 12,834 | — | 20,473 | 583,620 | 980,518 | — | 1,564,138 | ||||||||||||||||||||||||
|
|
|
|
|
|
|
| |||||||||||||||||||||||||
| 1,957,614 | 1,774,322 | 5,159,482 | 8,891,418 | |||||||||||||||||||||||||||||
|
|
|
|
|
|
|
| |||||||||||||||||||||||||
Multiline Retail (1.1%) | ||||||||||||||||||||||||||||||||
Kohl’s Corp. | — | 8,995 | 11,541 | 20,536 | — | 510,466 | 654,952 | 1,165,418 | ||||||||||||||||||||||||
Macy’s, Inc. | — | 14,794 | — | 14,794 | — | 790,000 | — | 790,000 | ||||||||||||||||||||||||
Target Corp. | — | — | 7,512 | 7,512 | — | — | 475,284 | 475,284 | ||||||||||||||||||||||||
|
|
|
|
|
|
|
| |||||||||||||||||||||||||
| — | 1,300,466 | 1,130,236 | 2,430,702 | |||||||||||||||||||||||||||||
|
|
|
|
|
|
|
| |||||||||||||||||||||||||
Specialty Retail (2.4%) | ||||||||||||||||||||||||||||||||
AutoZone, Inc.* | — | 732 | — | 732 | — | 349,852 | — | 349,852 | ||||||||||||||||||||||||
Bed Bath & Beyond, Inc.* | 37,919 | — | — | 37,919 | 3,044,896 | — | — | 3,044,896 | ||||||||||||||||||||||||
CarMax, Inc.* | 21,132 | — | — | 21,132 | 993,626 | — | — | 993,626 | ||||||||||||||||||||||||
Dick’s Sporting Goods, Inc. | — | 11,998 | — | 11,998 | — | 697,084 | — | 697,084 | ||||||||||||||||||||||||
Home Depot, Inc. | — | 3,583 | — | 3,583 | — | 295,024 | — | 295,024 | ||||||||||||||||||||||||
|
|
|
|
|
|
|
| |||||||||||||||||||||||||
| 4,038,522 | 1,341,960 | — | 5,380,482 | |||||||||||||||||||||||||||||
|
|
|
|
|
|
|
| |||||||||||||||||||||||||
Textiles, Apparel & Luxury Goods (0.5%) | ||||||||||||||||||||||||||||||||
Cie Financiere Richemont S.A. (Registered), Class A | 2,642 | — | — | 2,642 | 263,001 | — | — | 263,001 | ||||||||||||||||||||||||
PVH Corp. | — | 3,467 | — | 3,467 | — | 471,581 | — | 471,581 | ||||||||||||||||||||||||
Ralph Lauren Corp. | — | 2,582 | — | 2,582 | — | 455,904 | — | 455,904 | ||||||||||||||||||||||||
|
|
|
|
|
|
|
| |||||||||||||||||||||||||
| 263,001 | 927,485 | — | 1,190,486 | |||||||||||||||||||||||||||||
|
|
|
|
|
|
|
| |||||||||||||||||||||||||
Total Consumer Discretionary | 8,802,585 | 8,629,606 | 10,060,201 | 27,492,392 | ||||||||||||||||||||||||||||
|
|
|
|
|
|
|
| |||||||||||||||||||||||||
Consumer Staples (8.1%) | ||||||||||||||||||||||||||||||||
Beverages (1.7%) | ||||||||||||||||||||||||||||||||
Coca-Cola Co. | 15,331 | 22,132 | — | 37,463 | 633,324 | 914,273 | — | 1,547,597 | ||||||||||||||||||||||||
Diageo plc (ADR) | 4,541 | — | — | 4,541 | 601,319 | — | — | 601,319 | ||||||||||||||||||||||||
Heineken Holding N.V. | 11,607 | — | — | 11,607 | 734,277 | — | — | 734,277 | ||||||||||||||||||||||||
PepsiCo, Inc. | — | 11,045 | — | 11,045 | — | 916,072 | — | 916,072 | ||||||||||||||||||||||||
|
|
|
|
|
|
|
| |||||||||||||||||||||||||
| 1,968,920 | 1,830,345 | — | 3,799,265 | |||||||||||||||||||||||||||||
|
|
|
|
|
|
|
| |||||||||||||||||||||||||
Food & Staples Retailing (3.9%) | ||||||||||||||||||||||||||||||||
Costco Wholesale Corp. | 18,646 | — | — | 18,646 | 2,219,060 | — | — | 2,219,060 | ||||||||||||||||||||||||
CVS Caremark Corp. | 54,174 | 12,068 | 15,490 | 81,732 | 3,877,233 | 863,707 | 1,108,619 | 5,849,559 | ||||||||||||||||||||||||
Wal-Mart Stores, Inc. | — | 6,161 | — | 6,161 | — | 484,809 | — | 484,809 | ||||||||||||||||||||||||
|
|
|
|
|
|
|
| |||||||||||||||||||||||||
| 6,096,293 | 1,348,516 | 1,108,619 | 8,553,428 | |||||||||||||||||||||||||||||
|
|
|
|
|
|
|
| |||||||||||||||||||||||||
See notes to pro-forma combined financial statements.
4
EQ ADVISORS TRUST
PORTFOLIO OF INVESTMENTS
December 31, 2013
| Number of Shares | Value ($) (Note 1) | |||||||||||||||||||||||||||||||
| EQ/Davis New York Venture | EQ/Lord Abbett Large Cap Core | EQ/Invesco Comstock | Combined Pro-forma | EQ/Davis New York Venture | EQ/Lord Abbett Large Cap Core | EQ/Invesco Comstock | Combined Pro-forma | |||||||||||||||||||||||||
Food Products (1.5%) | ||||||||||||||||||||||||||||||||
ConAgra Foods, Inc. | — | — | 25,445 | 25,445 | — | — | 857,497 | 857,497 | ||||||||||||||||||||||||
Mondelez International, Inc., Class A | — | 22,476 | 17,317 | 39,793 | — | 793,403 | 611,290 | 1,404,693 | ||||||||||||||||||||||||
Nestle S.A. (Registered) | 2,556 | — | — | 2,556 | 187,105 | — | — | 187,105 | ||||||||||||||||||||||||
Tyson Foods, Inc., Class A | — | — | 11,638 | 11,638 | — | — | 389,407 | 389,407 | ||||||||||||||||||||||||
Unilever N.V. (N.Y. Shares) | — | — | 13,386 | 13,386 | — | — | 538,519 | 538,519 | ||||||||||||||||||||||||
|
|
|
|
|
|
|
| |||||||||||||||||||||||||
| 187,105 | 793,403 | 2,396,713 | 3,377,221 | |||||||||||||||||||||||||||||
|
|
|
|
|
|
|
| |||||||||||||||||||||||||
Household Products (0.6%) | ||||||||||||||||||||||||||||||||
Colgate-Palmolive Co. | — | 13,214 | — | 13,214 | — | 861,685 | — | 861,685 | ||||||||||||||||||||||||
Procter & Gamble Co. | — | 4,385 | — | 4,385 | — | 356,983 | — | 356,983 | ||||||||||||||||||||||||
|
|
|
|
|
|
|
| |||||||||||||||||||||||||
| — | 1,218,668 | — | 1,218,668 | |||||||||||||||||||||||||||||
|
|
|
|
|
|
|
| |||||||||||||||||||||||||
Tobacco (0.4%) | ||||||||||||||||||||||||||||||||
Philip Morris International, Inc. | 6,468 | 3,649 | — | 10,117 | 563,557 | 317,937 | — | 881,494 | ||||||||||||||||||||||||
|
|
|
|
|
|
|
| |||||||||||||||||||||||||
Total Consumer Staples | 8,815,875 | 5,508,869 | 3,505,332 | 17,830,076 | ||||||||||||||||||||||||||||
|
|
|
|
|
|
|
| |||||||||||||||||||||||||
Energy (9.9%) | ||||||||||||||||||||||||||||||||
Energy Equipment & Services (2.3%) | ||||||||||||||||||||||||||||||||
Halliburton Co. | — | 11,129 | 27,714 | 38,843 | — | 564,797 | 1,406,485 | 1,971,282 | ||||||||||||||||||||||||
Noble Corp. plc | — | — | 7,317 | 7,317 | — | — | 274,168 | 274,168 | ||||||||||||||||||||||||
Schlumberger Ltd. | 5,967 | 9,537 | — | 15,504 | 537,686 | 859,379 | — | 1,397,065 | ||||||||||||||||||||||||
Weatherford International Ltd.* | — | — | 99,432 | 99,432 | — | — | 1,540,202 | 1,540,202 | ||||||||||||||||||||||||
|
|
|
|
|
|
|
| |||||||||||||||||||||||||
| 537,686 | 1,424,176 | 3,220,855 | 5,182,717 | |||||||||||||||||||||||||||||
|
|
|
|
|
|
|
| |||||||||||||||||||||||||
Oil, Gas & Consumable Fuels (7.6%) | ||||||||||||||||||||||||||||||||
Anadarko Petroleum Corp. | — | 7,781 | — | 7,781 | — | 617,189 | — | 617,189 | ||||||||||||||||||||||||
BP plc (ADR) | — | — | 27,954 | 27,954 | — | — | 1,358,844 | 1,358,844 | ||||||||||||||||||||||||
Cabot Oil & Gas Corp. | — | 1,003 | — | 1,003 | — | 38,876 | — | 38,876 | ||||||||||||||||||||||||
Canadian Natural Resources Ltd. | 59,602 | — | — | 59,602 | 2,016,932 | — | — | 2,016,932 | ||||||||||||||||||||||||
Chevron Corp. | — | 5,994 | 6,183 | 12,177 | — | 748,711 | 772,319 | 1,521,030 | ||||||||||||||||||||||||
EOG Resources, Inc. | 4,089 | 5,949 | — | 10,038 | 686,298 | 998,480 | — | 1,684,778 | ||||||||||||||||||||||||
EQT Corp. | — | 2,257 | — | 2,257 | — | 202,633 | — | 202,633 | ||||||||||||||||||||||||
Exxon Mobil Corp. | — | 10,718 | — | 10,718 | — | 1,084,662 | — | 1,084,662 | ||||||||||||||||||||||||
Hess Corp. | — | 9,183 | — | 9,183 | — | 762,189 | — | 762,189 | ||||||||||||||||||||||||
Marathon Petroleum Corp. | — | 3,353 | — | 3,353 | — | 307,571 | — | 307,571 | ||||||||||||||||||||||||
Murphy Oil Corp. | — | — | 13,566 | 13,566 | — | — | 880,162 | 880,162 | ||||||||||||||||||||||||
Occidental Petroleum Corp. | 5,566 | 10,025 | 8,232 | 23,823 | 529,326 | 953,378 | 782,863 | 2,265,567 | ||||||||||||||||||||||||
Pioneer Natural Resources Co. | — | 3,435 | — | 3,435 | — | 632,280 | — | 632,280 | ||||||||||||||||||||||||
QEP Resources, Inc. | — | — | 23,431 | 23,431 | — | — | 718,160 | 718,160 | ||||||||||||||||||||||||
Range Resources Corp. | — | 2,331 | — | 2,331 | — | 196,527 | — | 196,527 | ||||||||||||||||||||||||
Royal Dutch Shell plc (ADR), Class A | — | — | 18,166 | 18,166 | — | — | 1,294,691 | 1,294,691 | ||||||||||||||||||||||||
Suncor Energy, Inc. | — | — | 21,657 | 21,657 | — | — | 759,078 | 759,078 | ||||||||||||||||||||||||
Valero Energy Corp. | — | 9,646 | — | 9,646 | — | 486,158 | — | 486,158 | ||||||||||||||||||||||||
|
|
|
|
|
|
|
| |||||||||||||||||||||||||
| 3,232,556 | 7,028,654 | 6,566,117 | 16,827,327 | |||||||||||||||||||||||||||||
|
|
|
|
|
|
|
| |||||||||||||||||||||||||
Total Energy | 3,770,242 | 8,452,830 | 9,786,972 | 22,010,044 | ||||||||||||||||||||||||||||
|
|
|
|
|
|
|
| |||||||||||||||||||||||||
Financials (27.0%) | ||||||||||||||||||||||||||||||||
Capital Markets (6.9%) | ||||||||||||||||||||||||||||||||
Ameriprise Financial, Inc. | 4,225 | — | — | 4,225 | 486,086 | — | — | 486,086 | ||||||||||||||||||||||||
Bank of New York Mellon Corp. | 161,329 | — | 43,320 | 204,649 | 5,636,835 | — | 1,513,601 | 7,150,436 | ||||||||||||||||||||||||
Charles Schwab Corp. | 38,811 | — | — | 38,811 | 1,009,086 | — | — | 1,009,086 | ||||||||||||||||||||||||
Goldman Sachs Group, Inc. | 1,057 | 7,694 | 3,884 | 12,635 | 187,364 | 1,363,839 | 688,478 | 2,239,681 | ||||||||||||||||||||||||
Invesco Ltd. | — | 11,993 | — | 11,993 | — | 436,545 | — | 436,545 | ||||||||||||||||||||||||
Julius Baer Group Ltd.* | 23,471 | — | — | 23,471 | 1,127,177 | — | — | 1,127,177 | ||||||||||||||||||||||||
Morgan Stanley | — | 23,259 | 34,365 | 57,624 | — | 729,402 | 1,077,686 | 1,807,088 | ||||||||||||||||||||||||
State Street Corp. | — | 1,601 | 7,247 | 8,848 | — | 117,497 | 531,857 | 649,354 | ||||||||||||||||||||||||
TD Ameritrade Holding Corp. | — | 14,964 | — | 14,964 | — | 458,497 | — | 458,497 | ||||||||||||||||||||||||
|
|
|
|
|
|
|
| |||||||||||||||||||||||||
| 8,446,548 | 3,105,780 | 3,811,622 | 15,363,950 | |||||||||||||||||||||||||||||
|
|
|
|
|
|
|
| |||||||||||||||||||||||||
Commercial Banks (5.2%) | ||||||||||||||||||||||||||||||||
Comerica, Inc. | — | 14,327 | — | 14,327 | — | 681,106 | — | 681,106 | ||||||||||||||||||||||||
Fifth Third Bancorp | — | 7,352 | 33,632 | 40,984 | — | 154,613 | 707,281 | 861,894 | ||||||||||||||||||||||||
PNC Financial Services Group, Inc. | — | 5,555 | 12,603 | 18,158 | — | 430,957 | 977,741 | 1,408,698 | ||||||||||||||||||||||||
Regions Financial Corp. | — | 41,763 | — | 41,763 | — | 413,036 | — | 413,036 | ||||||||||||||||||||||||
SunTrust Banks, Inc. | — | 11,398 | — | 11,398 | — | 419,560 | — | 419,560 | ||||||||||||||||||||||||
U.S. Bancorp/Minnesota | — | 14,006 | 8,341 | 22,347 | — | 565,842 | 336,976 | 902,818 | ||||||||||||||||||||||||
Wells Fargo & Co. | 100,392 | 20,057 | 31,227 | 151,676 | 4,557,797 | 910,588 | 1,417,706 | 6,886,091 | ||||||||||||||||||||||||
|
|
|
|
|
|
|
| |||||||||||||||||||||||||
| 4,557,797 | 3,575,702 | 3,439,704 | 11,573,203 | |||||||||||||||||||||||||||||
|
|
|
|
|
|
|
| |||||||||||||||||||||||||
Consumer Finance (3.0%) | ||||||||||||||||||||||||||||||||
American Express Co. | 58,958 | — | — | 58,958 | 5,349,259 | — | — | 5,349,259 | ||||||||||||||||||||||||
Capital One Financial Corp. | — | 15,931 | — | 15,931 | — | 1,220,474 | — | 1,220,474 | ||||||||||||||||||||||||
|
|
|
|
|
|
|
| |||||||||||||||||||||||||
| 5,349,259 | 1,220,474 | — | 6,569,733 | |||||||||||||||||||||||||||||
|
|
|
|
|
|
|
| |||||||||||||||||||||||||
Diversified Financial Services (4.5%) | ||||||||||||||||||||||||||||||||
Bank of America Corp. | — | 27,073 | 70,989 | 98,062 | — | 421,527 | 1,105,299 | 1,526,826 | ||||||||||||||||||||||||
Citigroup, Inc. | — | 22,219 | 51,574 | 73,793 | — | 1,157,832 | 2,687,521 | 3,845,353 | ||||||||||||||||||||||||
JPMorgan Chase & Co. | 13,571 | 30,219 | 36,632 | 80,422 | 793,632 | 1,767,207 | 2,142,239 | 4,703,078 | ||||||||||||||||||||||||
|
|
|
|
|
|
|
| |||||||||||||||||||||||||
| 793,632 | 3,346,566 | 5,935,059 | 10,075,257 | |||||||||||||||||||||||||||||
|
|
|
|
|
|
|
| |||||||||||||||||||||||||
See notes to pro-forma combined financial statements.
5
EQ ADVISORS TRUST
PORTFOLIO OF INVESTMENTS
December 31, 2013
| Number of Shares | Value ($) (Note 1) | |||||||||||||||||||||||||||||||
| EQ/Davis New York Venture | EQ/Lord Abbett Large Cap Core | EQ/Invesco Comstock | Combined Pro-forma | EQ/Davis New York Venture | EQ/Lord Abbett Large Cap Core | EQ/Invesco Comstock | Combined Pro-forma | |||||||||||||||||||||||||
Insurance (6.6%) | ||||||||||||||||||||||||||||||||
ACE Ltd. | 6,840 | — | — | 6,840 | 708,145 | — | — | 708,145 | ||||||||||||||||||||||||
Aflac, Inc. | — | — | 6,549 | 6,549 | — | — | 437,473 | 437,473 | ||||||||||||||||||||||||
Alleghany Corp.* | 2,215 | — | — | 2,215 | 885,911 | — | — | 885,911 | ||||||||||||||||||||||||
Allstate Corp. | — | — | 23,100 | 23,100 | — | — | 1,259,874 | 1,259,874 | ||||||||||||||||||||||||
Berkshire Hathaway, Inc., Class B* | 28,841 | — | — | 28,841 | 3,419,389 | — | — | 3,419,389 | ||||||||||||||||||||||||
Chubb Corp. | — | 3,014 | — | 3,014 | — | 291,243 | — | 291,243 | ||||||||||||||||||||||||
Everest Reinsurance Group Ltd. | 2,354 | — | — | 2,354 | 366,918 | — | — | 366,918 | ||||||||||||||||||||||||
Fairfax Financial Holdings Ltd. | 1,557 | — | — | 1,557 | 622,582 | — | — | 622,582 | ||||||||||||||||||||||||
Hartford Financial Services Group, Inc. | — | 30,158 | — | 30,158 | — | 1,092,624 | — | 1,092,624 | ||||||||||||||||||||||||
Lincoln National Corp. | — | 16,363 | — | 16,363 | — | 844,658 | — | 844,658 | ||||||||||||||||||||||||
Loews Corp. | 22,869 | — | — | 22,869 | 1,103,201 | — | — | 1,103,201 | ||||||||||||||||||||||||
Markel Corp.* | 290 | — | — | 290 | 168,301 | — | — | 168,301 | ||||||||||||||||||||||||
MetLife, Inc. | — | — | 16,577 | 16,577 | — | — | 893,832 | 893,832 | ||||||||||||||||||||||||
Progressive Corp. | 52,556 | — | — | 52,556 | 1,433,202 | — | — | 1,433,202 | ||||||||||||||||||||||||
Prudential Financial, Inc. | — | 9,000 | — | 9,000 | — | 829,980 | — | 829,980 | ||||||||||||||||||||||||
Travelers Cos., Inc. | — | — | 2,842 | 2,842 | — | — | 257,315 | 257,315 | ||||||||||||||||||||||||
|
|
|
|
|
|
|
| |||||||||||||||||||||||||
| 8,707,649 | 3,058,505 | 2,848,494 | 14,614,648 | |||||||||||||||||||||||||||||
|
|
|
|
|
|
|
| |||||||||||||||||||||||||
Real Estate Investment Trusts (REITs) (0.2%) | ||||||||||||||||||||||||||||||||
Host Hotels & Resorts, Inc. (REIT) | — | 17,736 | — | 17,736 | — | 344,788 | — | 344,788 | ||||||||||||||||||||||||
|
|
|
|
|
|
|
| |||||||||||||||||||||||||
Real Estate Management & Development (0.6%) | ||||||||||||||||||||||||||||||||
Brookfield Asset Management, Inc., Class A | 14,811 | — | — | 14,811 | 575,111 | — | — | 575,111 | ||||||||||||||||||||||||
Brookfield Property Partners LP | 850 | — | — | 850 | 16,949 | — | — | 16,949 | ||||||||||||||||||||||||
Hang Lung Group Ltd. | 133,354 | — | — | 133,354 | 673,279 | — | — | 673,279 | ||||||||||||||||||||||||
|
|
|
|
|
|
|
| |||||||||||||||||||||||||
| 1,265,339 | — | — | 1,265,339 | |||||||||||||||||||||||||||||
|
|
|
|
|
|
|
| |||||||||||||||||||||||||
Total Financials | 29,120,224 | 14,651,815 | 16,034,879 | 59,806,918 | ||||||||||||||||||||||||||||
|
|
|
|
|
|
|
| |||||||||||||||||||||||||
Health Care (11.0%) | ||||||||||||||||||||||||||||||||
Biotechnology (1.1%) | ||||||||||||||||||||||||||||||||
Celgene Corp.* | — | 3,736 | — | 3,736 | — | 631,234 | — | 631,234 | ||||||||||||||||||||||||
Gilead Sciences, Inc.* | — | 11,498 | — | 11,498 | — | 864,075 | — | 864,075 | ||||||||||||||||||||||||
Medivation, Inc.* | — | 9,362 | — | 9,362 | — | 597,483 | — | 597,483 | ||||||||||||||||||||||||
Vertex Pharmaceuticals, Inc.* | — | 5,361 | — | 5,361 | — | 398,322 | — | 398,322 | ||||||||||||||||||||||||
|
|
|
|
|
|
|
| |||||||||||||||||||||||||
| — | 2,491,114 | — | 2,491,114 | |||||||||||||||||||||||||||||
|
|
|
|
|
|
|
| |||||||||||||||||||||||||
Health Care Equipment & Supplies (0.3%) | ||||||||||||||||||||||||||||||||
Covidien plc | — | 10,216 | — | 10,216 | — | 695,710 | — | 695,710 | ||||||||||||||||||||||||
|
|
|
|
|
|
|
| |||||||||||||||||||||||||
Health Care Providers & Services (4.8%) | ||||||||||||||||||||||||||||||||
Cardinal Health, Inc. | — | — | 7,159 | 7,159 | — | — | 478,293 | 478,293 | ||||||||||||||||||||||||
Express Scripts Holding Co.* | 24,496 | 19,014 | 5,777 | 49,287 | 1,720,599 | 1,335,543 | 405,776 | 3,461,918 | ||||||||||||||||||||||||
HCA Holdings, Inc.* | — | 8,422 | — | 8,422 | — | 401,814 | — | 401,814 | ||||||||||||||||||||||||
Laboratory Corp. of America Holdings* | 17,429 | — | — | 17,429 | 1,592,488 | — | — | 1,592,488 | ||||||||||||||||||||||||
UnitedHealth Group, Inc. | 25,779 | 8,718 | 17,105 | 51,602 | 1,941,159 | 656,465 | 1,288,006 | 3,885,630 | ||||||||||||||||||||||||
WellPoint, Inc. | — | — | 8,412 | 8,412 | — | — | 777,185 | 777,185 | ||||||||||||||||||||||||
|
|
|
|
|
|
|
| |||||||||||||||||||||||||
| 5,254,246 | 2,393,822 | 2,949,260 | 10,597,328 | |||||||||||||||||||||||||||||
|
|
|
|
|
|
|
| |||||||||||||||||||||||||
Life Sciences Tools & Services (0.2%) | ||||||||||||||||||||||||||||||||
Agilent Technologies, Inc. | 6,249 | — | — | 6,249 | 357,380 | — | — | 357,380 | ||||||||||||||||||||||||
|
|
|
|
|
|
|
| |||||||||||||||||||||||||
Pharmaceuticals (4.6%) | ||||||||||||||||||||||||||||||||
Bristol-Myers Squibb Co. | — | 21,718 | 18,260 | 39,978 | — | 1,154,312 | 970,519 | 2,124,831 | ||||||||||||||||||||||||
Eli Lilly and Co. | — | 11,561 | — | 11,561 | — | 589,611 | — | 589,611 | ||||||||||||||||||||||||
GlaxoSmithKline plc (ADR) | — | — | 11,614 | 11,614 | — | — | 620,072 | 620,072 | ||||||||||||||||||||||||
Johnson & Johnson | — | 4,015 | — | 4,015 | — | 367,734 | — | 367,734 | ||||||||||||||||||||||||
Merck & Co., Inc. | — | 2,947 | 27,757 | 30,704 | — | 147,497 | 1,389,238 | 1,536,735 | ||||||||||||||||||||||||
Novartis AG (ADR) | — | — | 12,045 | 12,045 | — | — | 968,177 | 968,177 | ||||||||||||||||||||||||
Pfizer, Inc. | — | 41,784 | 37,227 | 79,011 | — | 1,279,844 | 1,140,263 | 2,420,107 | ||||||||||||||||||||||||
Roche Holding AG (ADR) | — | — | 8,877 | 8,877 | — | — | 623,165 | 623,165 | ||||||||||||||||||||||||
Sanofi S.A. (ADR) | — | — | 17,409 | 17,409 | — | — | 933,645 | 933,645 | ||||||||||||||||||||||||
|
|
|
|
|
|
|
| |||||||||||||||||||||||||
| — | 3,538,998 | 6,645,079 | 10,184,077 | |||||||||||||||||||||||||||||
|
|
|
|
|
|
|
| |||||||||||||||||||||||||
Total Health Care | 5,611,626 | 9,119,644 | 9,594,339 | 24,325,609 | ||||||||||||||||||||||||||||
|
|
|
|
|
|
|
| |||||||||||||||||||||||||
Industrials (7.9%) | ||||||||||||||||||||||||||||||||
Aerospace & Defense (2.1%) | ||||||||||||||||||||||||||||||||
B/E Aerospace, Inc.* | — | 6,103 | — | 6,103 | — | 531,144 | — | 531,144 | ||||||||||||||||||||||||
Boeing Co. | — | 5,629 | — | 5,629 | — | 768,302 | — | 768,302 | ||||||||||||||||||||||||
Honeywell International, Inc. | — | 7,574 | 5,755 | 13,329 | — | 692,036 | 525,834 | 1,217,870 | ||||||||||||||||||||||||
Textron, Inc. | 12,050 | — | 21,580 | 33,630 | 442,958 | — | 793,281 | 1,236,239 | ||||||||||||||||||||||||
United Technologies Corp. | — | 8,677 | — | 8,677 | — | 987,443 | — | 987,443 | ||||||||||||||||||||||||
|
|
|
|
|
|
|
| |||||||||||||||||||||||||
| 442,958 | 2,978,925 | 1,319,115 | 4,740,998 | |||||||||||||||||||||||||||||
|
|
|
|
|
|
|
| |||||||||||||||||||||||||
Building Products (0.1%) | ||||||||||||||||||||||||||||||||
Allegion plc* | — | — | 2,591 | 2,591 | — | — | 114,481 | 114,481 | ||||||||||||||||||||||||
|
|
|
|
|
|
|
| |||||||||||||||||||||||||
Commercial Services & Supplies (0.2%) | ||||||||||||||||||||||||||||||||
Iron Mountain, Inc. | 13,593 | — | — | 13,593 | 412,547 | — | — | 412,547 | ||||||||||||||||||||||||
|
|
|
|
|
|
|
| |||||||||||||||||||||||||
See notes to pro-forma combined financial statements.
6
EQ ADVISORS TRUST
PORTFOLIO OF INVESTMENTS
December 31, 2013
| Number of Shares | Value ($) (Note 1) | |||||||||||||||||||||||||||||||
| EQ/Davis New York Venture | EQ/Lord Abbett Large Cap Core | EQ/Invesco Comstock | Combined Pro-forma | EQ/Davis New York Venture | EQ/Lord Abbett Large Cap Core | EQ/Invesco Comstock | Combined Pro-forma | |||||||||||||||||||||||||
Construction & Engineering (0.4%) | ||||||||||||||||||||||||||||||||
Fluor Corp. | — | 5,917 | — | 5,917 | — | 475,076 | — | 475,076 | ||||||||||||||||||||||||
OCI* | 6,400 | — | — | 6,400 | 288,215 | — | — | 288,215 | ||||||||||||||||||||||||
|
|
|
|
|
|
|
| |||||||||||||||||||||||||
| 288,215 | 475,076 | — | 763,291 | |||||||||||||||||||||||||||||
|
|
|
|
|
|
|
| |||||||||||||||||||||||||
Electrical Equipment (1.1%) | ||||||||||||||||||||||||||||||||
Eaton Corp. plc | — | 8,897 | — | 8,897 | — | 677,240 | — | 677,240 | ||||||||||||||||||||||||
Emerson Electric Co. | — | 14,561 | 11,453 | 26,014 | — | 1,021,891 | 803,772 | 1,825,663 | ||||||||||||||||||||||||
|
|
|
|
|
|
|
| |||||||||||||||||||||||||
| — | 1,699,131 | 803,772 | 2,502,903 | |||||||||||||||||||||||||||||
|
|
|
|
|
|
|
| |||||||||||||||||||||||||
Industrial Conglomerates (1.1%) | ||||||||||||||||||||||||||||||||
General Electric Co. | — | 35,515 | 52,815 | 88,330 | — | 995,485 | 1,480,405 | 2,475,890 | ||||||||||||||||||||||||
|
|
|
|
|
|
|
| |||||||||||||||||||||||||
Machinery (1.3%) | ||||||||||||||||||||||||||||||||
Caterpillar, Inc. | — | 3,152 | — | 3,152 | — | 286,233 | — | 286,233 | ||||||||||||||||||||||||
Ingersoll-Rand plc | — | — | 15,932 | 15,932 | — | — | 981,411 | 981,411 | ||||||||||||||||||||||||
PACCAR, Inc. | 17,454 | 9,962 | — | 27,416 | 1,032,753 | 589,452 | — | 1,622,205 | ||||||||||||||||||||||||
|
|
|
|
|
|
|
| |||||||||||||||||||||||||
| 1,032,753 | 875,685 | 981,411 | 2,889,849 | |||||||||||||||||||||||||||||
|
|
|
|
|
|
|
| |||||||||||||||||||||||||
Marine (0.5%) | ||||||||||||||||||||||||||||||||
Kuehne + Nagel International AG (Registered) | 8,349 | — | — | 8,349 | 1,095,979 | — | — | 1,095,979 | ||||||||||||||||||||||||
|
|
|
|
|
|
|
| |||||||||||||||||||||||||
Professional Services (0.1%) | ||||||||||||||||||||||||||||||||
Experian plc | 11,250 | — | — | 11,250 | 207,532 | — | — | 207,532 | ||||||||||||||||||||||||
|
|
|
|
|
|
|
| |||||||||||||||||||||||||
Road & Rail (0.5%) | ||||||||||||||||||||||||||||||||
Union Pacific Corp. | — | 6,040 | — | 6,040 | — | 1,014,720 | — | 1,014,720 | ||||||||||||||||||||||||
|
|
|
|
|
|
|
| |||||||||||||||||||||||||
Trading Companies & Distributors (0.1%) | ||||||||||||||||||||||||||||||||
W.W. Grainger, Inc. | — | 844 | — | 844 | — | 215,574 | — | 215,574 | ||||||||||||||||||||||||
|
|
|
|
|
|
|
| |||||||||||||||||||||||||
Transportation Infrastructure (0.4%) | ||||||||||||||||||||||||||||||||
China Merchants Holdings International Co., Ltd. | 225,438 | — | — | 225,438 | 822,756 | — | — | 822,756 | ||||||||||||||||||||||||
Wesco Aircraft Holdings, Inc.* | 5,640 | — | — | 5,640 | 123,629 | — | — | 123,629 | ||||||||||||||||||||||||
|
|
|
|
|
|
|
| |||||||||||||||||||||||||
| 946,385 | — | — | 946,385 | |||||||||||||||||||||||||||||
|
|
|
|
|
|
|
| |||||||||||||||||||||||||
Total Industrials | 4,426,369 | 8,254,596 | 4,699,184 | 17,380,149 | ||||||||||||||||||||||||||||
|
|
|
|
|
|
|
| |||||||||||||||||||||||||
Information Technology (15.1%) | ||||||||||||||||||||||||||||||||
Communications Equipment (1.2%) | ||||||||||||||||||||||||||||||||
Cisco Systems, Inc. | — | 43,421 | 34,892 | 78,313 | — | 974,802 | 783,325 | 1,758,127 | ||||||||||||||||||||||||
QUALCOMM, Inc. | — | 11,293 | — | 11,293 | — | 838,505 | — | 838,505 | ||||||||||||||||||||||||
|
|
|
|
|
|
|
| |||||||||||||||||||||||||
| — | 1,813,307 | 783,325 | 2,596,632 | |||||||||||||||||||||||||||||
|
|
|
|
|
|
|
| |||||||||||||||||||||||||
Computers & Peripherals (2.9%) | ||||||||||||||||||||||||||||||||
Apple, Inc. | — | 4,870 | — | 4,870 | — | 2,732,606 | — | 2,732,606 | ||||||||||||||||||||||||
EMC Corp. | — | 30,836 | — | 30,836 | — | 775,525 | — | 775,525 | ||||||||||||||||||||||||
Hewlett-Packard Co. | 10,226 | 6,840 | 44,684 | 61,750 | 286,124 | 191,383 | 1,250,258 | 1,727,765 | ||||||||||||||||||||||||
NCR Corp.* | — | 27,625 | — | 27,625 | — | 940,908 | — | 940,908 | ||||||||||||||||||||||||
NetApp, Inc. | — | 6,708 | — | 6,708 | — | 275,967 | — | 275,967 | ||||||||||||||||||||||||
|
|
|
|
|
|
|
| |||||||||||||||||||||||||
| 286,124 | 4,916,389 | 1,250,258 | 6,452,771 | |||||||||||||||||||||||||||||
|
|
|
|
|
|
|
| |||||||||||||||||||||||||
Electronic Equipment, Instruments & | ||||||||||||||||||||||||||||||||
Corning, Inc. | — | — | 45,078 | 45,078 | — | — | 803,290 | 803,290 | ||||||||||||||||||||||||
|
|
|
|
|
|
|
| |||||||||||||||||||||||||
Internet Software & Services (5.4%) | ||||||||||||||||||||||||||||||||
eBay, Inc.* | — | 6,989 | 16,713 | 23,702 | — | 383,626 | 917,377 | 1,301,003 | ||||||||||||||||||||||||
Google, Inc., Class A* | 4,790 | 2,211 | — | 7,001 | 5,368,201 | 2,477,890 | — | 7,846,091 | ||||||||||||||||||||||||
Monster Worldwide, Inc.* | — | 58,146 | — | 58,146 | — | 414,581 | — | 414,581 | ||||||||||||||||||||||||
Pandora Media, Inc.* | — | 23,651 | — | 23,651 | — | 629,117 | — | 629,117 | ||||||||||||||||||||||||
Qihoo 360 Technology Co., Ltd. (ADR)* | 3,010 | — | — | 3,010 | 246,970 | — | — | 246,970 | ||||||||||||||||||||||||
Twitter, Inc.* | 3,840 | 110 | — | 3,950 | 244,416 | 7,001 | — | 251,417 | ||||||||||||||||||||||||
Yahoo!, Inc.* | — | 21,317 | 11,550 | 32,867 | — | 862,059 | 467,082 | 1,329,141 | ||||||||||||||||||||||||
|
|
|
|
|
|
|
| |||||||||||||||||||||||||
| 5,859,587 | 4,774,274 | 1,384,459 | 12,018,320 | |||||||||||||||||||||||||||||
|
|
|
|
|
|
|
| |||||||||||||||||||||||||
IT Services (1.0%) | ||||||||||||||||||||||||||||||||
International Business Machines Corp. | — | 4,278 | — | 4,278 | — | 802,425 | — | 802,425 | ||||||||||||||||||||||||
Vantiv, Inc., Class A* | — | 15,443 | — | 15,443 | — | 503,596 | — | 503,596 | ||||||||||||||||||||||||
Visa, Inc., Class A | 3,802 | — | — | 3,802 | 846,629 | — | — | 846,629 | ||||||||||||||||||||||||
|
|
|
|
|
|
|
| |||||||||||||||||||||||||
| 846,629 | 1,306,021 | — | 2,152,650 | |||||||||||||||||||||||||||||
|
|
|
|
|
|
|
| |||||||||||||||||||||||||
Semiconductors & Semiconductor Equipment (1.4%) | ||||||||||||||||||||||||||||||||
Intel Corp. | — | 18,522 | 21,053 | 39,575 | — | 480,831 | 546,536 | 1,027,367 | ||||||||||||||||||||||||
Micron Technology, Inc.* | — | 24,483 | — | 24,483 | — | 532,750 | — | 532,750 | ||||||||||||||||||||||||
Texas Instruments, Inc. | 21,095 | 13,418 | — | 34,513 | 926,282 | 589,185 | — | 1,515,467 | ||||||||||||||||||||||||
|
|
|
|
|
|
|
| |||||||||||||||||||||||||
| 926,282 | 1,602,766 | 546,536 | 3,075,584 | |||||||||||||||||||||||||||||
|
|
|
|
|
|
|
| |||||||||||||||||||||||||
Software (2.8%) | ||||||||||||||||||||||||||||||||
Activision Blizzard, Inc. | 42,455 | — | — | 42,455 | 756,972 | — | — | 756,972 | ||||||||||||||||||||||||
Autodesk, Inc.* | — | — | 8,498 | 8,498 | — | — | 427,704 | 427,704 | ||||||||||||||||||||||||
Informatica Corp.* | — | 10,131 | — | 10,131 | — | 420,436 | — | 420,436 | ||||||||||||||||||||||||
Microsoft Corp. | 19,862 | 24,346 | 32,250 | 76,458 | 743,435 | 911,271 | 1,207,118 | 2,861,824 | ||||||||||||||||||||||||
Oracle Corp. | 19,072 | 23,525 | — | 42,597 | 729,695 | 900,066 | — | 1,629,761 | ||||||||||||||||||||||||
VMware, Inc., Class A* | — | 2,587 | — | 2,587 | — | 232,080 | — | 232,080 | ||||||||||||||||||||||||
|
|
|
|
|
|
|
| |||||||||||||||||||||||||
| 2,230,102 | 2,463,853 | 1,634,822 | 6,328,777 | |||||||||||||||||||||||||||||
|
|
|
|
|
|
|
| |||||||||||||||||||||||||
Total Information Technology | 10,148,724 | 16,876,610 | 6,402,690 | 33,428,024 | ||||||||||||||||||||||||||||
|
|
|
|
|
|
|
| |||||||||||||||||||||||||
See notes to pro-forma combined financial statements.
7
EQ ADVISORS TRUST
PORTFOLIO OF INVESTMENTS
December 31, 2013
| Number of Shares | Value ($) (Note 1) | |||||||||||||||||||||||||||||||
| EQ/Davis New York Venture | EQ/Lord Abbett Large Cap Core | EQ/Invesco Comstock | Combined Pro-forma | EQ/Davis New York Venture | EQ/Lord Abbett Large Cap Core | EQ/Invesco Comstock | Combined Pro-forma | |||||||||||||||||||||||||
Materials (3.8%) | ||||||||||||||||||||||||||||||||
Chemicals (2.2%) | ||||||||||||||||||||||||||||||||
Air Products and Chemicals, Inc. | 11,924 | — | — | 11,924 | 1,332,865 | — | — | 1,332,865 | ||||||||||||||||||||||||
Celanese Corp. | — | 4,703 | — | 4,703 | — | 260,123 | — | 260,123 | ||||||||||||||||||||||||
Dow Chemical Co. | — | 9,544 | — | 9,544 | — | 423,754 | — | 423,754 | ||||||||||||||||||||||||
E.I. du Pont de Nemours & Co. | — | 1,923 | — | 1,923 | — | 124,937 | — | 124,937 | ||||||||||||||||||||||||
Ecolab, Inc. | 9,846 | — | — | 9,846 | 1,026,642 | — | — | 1,026,642 | ||||||||||||||||||||||||
LyondellBasell Industries N.V., Class A | — | 5,395 | — | 5,395 | — | 433,110 | — | 433,110 | ||||||||||||||||||||||||
Monsanto Co. | 4,838 | 347 | — | 5,185 | 563,869 | 40,443 | — | 604,312 | ||||||||||||||||||||||||
Praxair, Inc. | 5,256 | — | — | 5,256 | 683,438 | — | — | 683,438 | ||||||||||||||||||||||||
|
|
|
|
|
|
|
| |||||||||||||||||||||||||
| 3,606,814 | 1,282,367 | — | 4,889,181 | |||||||||||||||||||||||||||||
|
|
|
|
|
|
|
| |||||||||||||||||||||||||
Construction Materials (0.3%) | ||||||||||||||||||||||||||||||||
Lafarge S.A. | 6,490 | — | — | 6,490 | 486,324 | — | — | 486,324 | ||||||||||||||||||||||||
Martin Marietta Materials, Inc. | 2,032 | — | — | 2,032 | 203,078 | — | — | 203,078 | ||||||||||||||||||||||||
|
|
|
|
|
|
|
| |||||||||||||||||||||||||
| 689,402 | — | — | 689,402 | |||||||||||||||||||||||||||||
|
|
|
|
|
|
|
| |||||||||||||||||||||||||
Containers & Packaging (0.2%) | ||||||||||||||||||||||||||||||||
Rock-Tenn Co., Class A | — | 4,953 | — | 4,953 | — | 520,115 | — | 520,115 | ||||||||||||||||||||||||
|
|
|
|
|
|
|
| |||||||||||||||||||||||||
Metals & Mining (0.8%) | ||||||||||||||||||||||||||||||||
Alcoa, Inc. | — | — | 62,120 | 62,120 | — | — | 660,336 | 660,336 | ||||||||||||||||||||||||
Freeport-McMoRan Copper & Gold, Inc. | — | 14,074 | — | 14,074 | — | 531,153 | — | 531,153 | ||||||||||||||||||||||||
Reliance Steel & Aluminum Co. | — | 4,304 | — | 4,304 | — | 326,415 | — | 326,415 | ||||||||||||||||||||||||
United States Steel Corp. | — | 9,642 | — | 9,642 | — | 284,439 | — | 284,439 | ||||||||||||||||||||||||
|
|
|
|
|
|
|
| |||||||||||||||||||||||||
| — | 1,142,007 | 660,336 | 1,802,343 | |||||||||||||||||||||||||||||
|
|
|
|
|
|
|
| |||||||||||||||||||||||||
Paper & Forest Products (0.3%) | ||||||||||||||||||||||||||||||||
Emerald Plantation Holdings Ltd.* | 253,285 | — | — | 253,285 | 37,993 | — | — | 37,993 | ||||||||||||||||||||||||
International Paper Co. | — | — | 14,800 | 14,800 | — | — | 725,644 | 725,644 | ||||||||||||||||||||||||
|
|
|
|
|
|
|
| |||||||||||||||||||||||||
| 37,993 | — | 725,644 | 763,637 | |||||||||||||||||||||||||||||
|
|
|
|
|
|
|
| |||||||||||||||||||||||||
Total Materials | 4,334,209 | 2,944,489 | 1,385,980 | 8,664,678 | ||||||||||||||||||||||||||||
|
|
|
|
|
|
|
| |||||||||||||||||||||||||
Telecommunication Services (0.9%) | ||||||||||||||||||||||||||||||||
Diversified Telecommunication Services (0.6%) | ||||||||||||||||||||||||||||||||
AT&T, Inc. | — | — | 7,368 | 7,368 | — | — | 259,059 | 259,059 | ||||||||||||||||||||||||
Verizon Communications, Inc. | — | 10,423 | 7,994 | 18,417 | — | 512,186 | 392,825 | 905,011 | ||||||||||||||||||||||||
Vivendi S.A. | — | — | 8,015 | 8,015 | — | — | 211,208 | 211,208 | ||||||||||||||||||||||||
|
|
|
|
|
|
|
| |||||||||||||||||||||||||
| — | 512,186 | 863,092 | 1,375,278 | |||||||||||||||||||||||||||||
|
|
|
|
|
|
|
| |||||||||||||||||||||||||
Wireless Telecommunication Services (0.3%) | ||||||||||||||||||||||||||||||||
Vodafone Group plc (ADR) | — | — | 15,698 | 15,698 | — | — | 617,088 | 617,088 | ||||||||||||||||||||||||
|
|
|
|
|
|
|
| |||||||||||||||||||||||||
Total Telecommunication Services | — | 512,186 | 1,480,180 | 1,992,366 | ||||||||||||||||||||||||||||
|
|
|
|
|
|
|
| |||||||||||||||||||||||||
Utilities (1.1%) | ||||||||||||||||||||||||||||||||
Electric Utilities (0.7%) | ||||||||||||||||||||||||||||||||
Duke Energy Corp. | — | 2,870 | — | 2,870 | — | 198,059 | — | 198,059 | ||||||||||||||||||||||||
FirstEnergy Corp. | — | — | 9,586 | 9,586 | — | — | 316,146 | 316,146 | ||||||||||||||||||||||||
NextEra Energy, Inc. | — | 2,364 | — | 2,364 | — | 202,405 | — | 202,405 | ||||||||||||||||||||||||
PPL Corp. | — | — | 24,729 | 24,729 | — | — | 744,096 | 744,096 | ||||||||||||||||||||||||
|
|
|
|
|
|
|
| |||||||||||||||||||||||||
| — | 400,464 | 1,060,242 | 1,460,706 | |||||||||||||||||||||||||||||
|
|
|
|
|
|
|
| |||||||||||||||||||||||||
Multi-Utilities (0.4%) | ||||||||||||||||||||||||||||||||
Dominion Resources, Inc. | — | 2,507 | — | 2,507 | — | 162,178 | — | 162,178 | ||||||||||||||||||||||||
PG&E Corp. | — | 4,539 | 11,133 | 15,672 | — | 182,831 | 448,437 | 631,268 | ||||||||||||||||||||||||
|
|
|
|
|
|
|
| |||||||||||||||||||||||||
| — | 345,009 | 448,437 | 793,446 | |||||||||||||||||||||||||||||
|
|
|
|
|
|
|
| |||||||||||||||||||||||||
Total Utilities | — | 745,473 | 1,508,679 | 2,254,152 | ||||||||||||||||||||||||||||
|
|
|
|
|
|
|
| |||||||||||||||||||||||||
Total Common Stocks (97.2%) | 75,029,854 | 75,696,118 | 64,458,436 | 215,184,408 | ||||||||||||||||||||||||||||
|
|
|
|
|
|
|
| |||||||||||||||||||||||||
LONG-TERM DEBT SECURITIES | ||||||||||||||||||||||||||||||||
CORPORATE BONDS (0.1%) | ||||||||||||||||||||||||||||||||
Materials (0.1%) | ||||||||||||||||||||||||||||||||
Paper & Forest Products (0.1%) | ||||||||||||||||||||||||||||||||
Emerald Plantation Holdings Ltd., | 283,010 | — | — | 283,010 | 191,201 | — | — | 191,201 | ||||||||||||||||||||||||
|
|
|
|
|
|
|
| |||||||||||||||||||||||||
Total Materials | 191,201 | — | — | 191,201 | ||||||||||||||||||||||||||||
|
|
|
|
|
|
|
| |||||||||||||||||||||||||
See notes to pro-forma combined financial statements.
8
EQ ADVISORS TRUST
PORTFOLIO OF INVESTMENTS
December 31, 2013
| Number of Shares | Value ($) (Note 1) | |||||||||||||||||||||||
| EQ/Davis New York Venture | EQ/Lord Abbett Large Cap Core | EQ/Invesco Comstock | Combined Pro-forma | EQ/Davis New York Venture | EQ/Lord Abbett Large Cap Core | EQ/Invesco Comstock | Combined Pro-forma | |||||||||||||||||
Total Corporate Bonds | ||||||||||||||||||||||||
Total Long-Term Debt Securities (0.1%) | 191,201 | — | — | 191,201 | ||||||||||||||||||||
|
|
|
|
|
|
|
| |||||||||||||||||
Total Investments (97.3%) | 75,221,055 | 75,696,118 | 64,458,436 | 215,375,609 | ||||||||||||||||||||
Other Assets Less Liabilities (2.7%) | 1,372,944 | 1,858,355 | 2,767,394 | 5,998,693 | ||||||||||||||||||||
|
|
|
|
|
|
|
| |||||||||||||||||
Net Assets (100%) | $ | 76,593,999 | $ | 77,554,473 | $ | 67,225,830 | $ | 221,374,302 | ||||||||||||||||
|
|
|
|
|
|
|
| |||||||||||||||||
| * | Non-income producing. |
| (b) | Illiquid Security. |
Glossary
ADR — American Depositary Receipt
PIK — Payment-in-Kind Security
See notes to pro-forma combined financial statements.
9
At December 31, 2013 the Portfolio had the following outstanding foreign currency contracts to buy/sell foreign currencies as follows: (Note 1)
EQ/Invesco Comstock/Combined Pro-forma
Foreign Currency Sell Contracts | Counterparty | Local Contract Sell Amount (000’s) | U.S. $ Settlement Value | U.S. $ Current Value | Unrealized Appreciation/ (Depreciation) | |||||||||||||
British Pound vs. U.S. Dollar, | Bank of New York Mellon Corp. | 326 | $ | 536,237 | $ | 540,511 | $ | (4,274 | ) | |||||||||
British Pound vs. U.S. Dollar, | CIBC World Markets, Inc. | 326 | 536,263 | 540,510 | (4,247 | ) | ||||||||||||
British Pound vs. U.S. Dollar, | Citibank N.A. | 291 | 478,046 | 481,767 | (3,721 | ) | ||||||||||||
British Pound vs. U.S. Dollar, | State Street Bank & Trust | 326 | 536,227 | 540,510 | (4,283 | ) | ||||||||||||
Canadian Dollar vs U.S. Dollar, | CIBC World Markets, Inc. | 642 | 603,069 | 604,163 | (1,094 | ) | ||||||||||||
European Union Euro vs. U.S. Dollar, | Bank of New York Mellon Corp. | 420 | 577,313 | 578,083 | (770 | ) | ||||||||||||
European Union Euro vs. U.S. Dollar, | CIBC World Markets, Inc. | 420 | 577,240 | 578,083 | (843 | ) | ||||||||||||
European Union Euro vs. U.S. Dollar, | Citibank N.A. | 420 | 577,321 | 578,083 | (762 | ) | ||||||||||||
European Union Euro vs. U.S. Dollar, | State Street Bank & Trust | 425 | 583,635 | 584,448 | (813 | ) | ||||||||||||
Swiss Franc vs U.S. Dollar, | Bank of New York Mellon Corp. | 396 | 445,527 | 444,355 | 1,172 | |||||||||||||
Swiss Franc vs U.S. Dollar, | Citibank N.A. | 362 | 406,662 | 405,602 | 1,060 | |||||||||||||
Swiss Franc vs U.S. Dollar, | State Street Bank & Trust | 396 | 445,426 | 444,355 | 1,071 | |||||||||||||
|
| |||||||||||||||||
| $ | (17,504 | ) | ||||||||||||||||
|
| |||||||||||||||||
10
The following is a summary of the inputs used to value the Portfolio’s net assets as of December 31, 2013 :
The inputs or methodology used for valuing securities are not necessarily an indication of the risk associated with investing in those securities.
Various inputs are used in determining the value of the Portfolio’s investments. These inputs are summarized in the three broad levels listed below:
| • | Level 1 - Quoted prices in active markets for identical securities |
| • | Level 2 - Significant other observable inputs (including quoted prices for similar securities, interest rates, prepayment speeds, credit risk, etc.) |
| • | Level 3 - Significant unobservable inputs (including the Portfolio’s own assumptions in determining the fair value of investments) |
Description | Quoted Prices in Active Markets for Identical Securities (Level 1) | Significant Other Observable Inputs (Level 2) | Significant Unobservable Inputs (Level 3) | Total | ||||||||||||||||||||||||||||||||||||||||||||||||||||||||||||||||||||||||||||
| EQ/Davis New York Venture | EQ/Lord Abbett Large Cap Core | EQ/Invesco Comstock | Combined Pro-forma | EQ/Davis New York Venture | EQ/Lord Abbett Large Cap Core | EQ/Invesco Comstock | Combined Pro-forma | EQ/Davis New York Venture | EQ/Lord Abbett Large Cap Core | EQ/Invesco Comstock | Combined Pro-forma | EQ/Davis New York Venture | EQ/Lord Abbett Large Cap Core | EQ/Invesco Comstock | Combined Pro-forma | |||||||||||||||||||||||||||||||||||||||||||||||||||||||||||||||||
Assets | ||||||||||||||||||||||||||||||||||||||||||||||||||||||||||||||||||||||||||||||||
Investments in Securities | $ | 69,024,676 | $ | 75,696,118 | $ | 64,247,228 | $ | 208,968,022 | $ | 6,196,379 | $ | — | $ | 211,208 | $ | 6,407,587 | $ | — | $ | — | $ | — | $ | — | $ | 75,221,055 | $ | 75,696,118 | $ | 64,458,436 | $ | 215,375,609 | ||||||||||||||||||||||||||||||||||||||||||||||||
Other Investments* | — | — | — | — | — | — | 3,303 | 3,303 | — | — | — | — | — | — | 3,303 | 3,303 | ||||||||||||||||||||||||||||||||||||||||||||||||||||||||||||||||
|
|
|
|
|
|
|
|
|
|
|
|
|
|
|
|
|
|
|
|
|
|
|
|
|
|
|
|
|
|
|
| |||||||||||||||||||||||||||||||||||||||||||||||||
Total | $ | 69,024,676 | $ | 75,696,118 | $ | 64,247,228 | $ | 208,968,022 | $ | 6,196,379 | $ | — | $ | 214,511 | $ | 6,410,890 | $ | — | $ | — | $ | — | $ | — | $ | 75,221,055 | $ | 75,696,118 | $ | 64,461,739 | $ | 215,378,912 | ||||||||||||||||||||||||||||||||||||||||||||||||
|
|
|
|
|
|
|
|
|
|
|
|
|
|
|
|
|
|
|
|
|
|
|
|
|
|
|
|
|
|
|
| |||||||||||||||||||||||||||||||||||||||||||||||||
Liabilities | ||||||||||||||||||||||||||||||||||||||||||||||||||||||||||||||||||||||||||||||||
Investments in Securities | $ | — | $ | — | $ | — | $ | — | $ | — | $ | — | $ | — | $ | — | $ | — | $ | — | $ | — | $ | — | $ | — | $ | — | $ | — | $ | — | ||||||||||||||||||||||||||||||||||||||||||||||||
Other Investments* | — | — | — | — | — | — | (20,807 | ) | (20,807 | ) | — | — | — | — | — | — | (20,807 | ) | (20,807 | ) | ||||||||||||||||||||||||||||||||||||||||||||||||||||||||||||
|
|
|
|
|
|
|
|
|
|
|
|
|
|
|
|
|
|
|
|
|
|
|
|
|
|
|
|
|
|
|
| |||||||||||||||||||||||||||||||||||||||||||||||||
Total | $ | — | $ | — | $ | — | $ | — | $ | — | $ | — | $ | (20,807 | ) | $ | (20,807 | ) | $ | — | $ | — | $ | — | $ | — | $ | — | $ | — | $ | (20,807 | ) | $ | (20,807 | ) | ||||||||||||||||||||||||||||||||||||||||||||
|
|
|
|
|
|
|
|
|
|
|
|
|
|
|
|
|
|
|
|
|
|
|
|
|
|
|
|
|
|
|
| |||||||||||||||||||||||||||||||||||||||||||||||||
Total Assets and Liabilities | $ | 69,024,676 | $ | 75,696,118 | $ | 64,247,228 | $ | 208,968,022 | $ | 6,196,379 | $ | — | $ | 193,704 | $ | 6,390,083 | $ | — | $ | — | $ | — | $ | — | $ | 75,221,055 | $ | 75,696,118 | $ | 64,440,932 | $ | 215,358,105 | ||||||||||||||||||||||||||||||||||||||||||||||||
|
|
|
|
|
|
|
|
|
|
|
|
|
|
|
|
|
|
|
|
|
|
|
|
|
|
|
|
|
|
|
| |||||||||||||||||||||||||||||||||||||||||||||||||
| * | Other investments are derivative instruments, such as futures, forwards and written options, which are valued at the unrealized appreciation/depreciation on the instrument. |
There were no transfers between Levels 1, 2 or 3 during the year ended December 31, 2013.
Fair Values of Derivative Instruments as of December 31, 2013:
EQ/Invesco Comstock/Combined Pro-forma
Statement of Assets and Liabilities | ||||||
Derivatives Not Accounted for as Hedging Instruments^ | Asset Derivatives | Fair Value | ||||
Interest rate contracts | Receivables, Net Assets- | |||||
| Unrealized appreciation | $ | — | * | |||
Foreign exchange contracts | Receivables | 3,303 | ||||
Credit contracts | Receivables | — | ||||
Equity contracts | Receivables, Net Assets- | — | ||||
| Unrealized appreciation | — | * | ||||
Commodity contracts | Receivables | — | ||||
Other contracts | Receivables | — | ||||
|
| |||||
Total | $ | 3,303 | ||||
|
| |||||
Liability Derivatives | ||||||
Interest rate contracts | Payables, Net Assets- | |||||
| Unrealized depreciation | $ | — | * | |||
Foreign exchange contracts | Payables | (20,807 | ) | |||
Credit contracts | Payables | — | ||||
Equity contracts | Payables, Net Assets- | — | ||||
| Unrealized depreciation | — | * | ||||
Commodity contracts | Payables | — | ||||
Other contracts | Payables | — | ||||
|
| |||||
Total | $ | (20,807 | ) | |||
|
| |||||
| * | Includes cumulative appreciation/depreciation of futures contracts as reported in the Portfolio of Investments. Only current day’s variation margin is reported within the Statement of Assets & Liabilities. |
The effect of Derivative Instruments on the Statement of Operations for the year ended December 31, 2013:
Amount of Realized Gain or (Loss) on Derivatives Recognized in Income | ||||||||||||||||||||
Derivatives Not Accounted for as Hedging Instruments^ | Options | Futures | Forward Currency Contracts | Swaps | Total | |||||||||||||||
Interest rate contracts | $ | — | $ | — | $ | — | $ | — | $ | — | ||||||||||
Foreign exchange contracts | — | — | (834,951 | ) | — | (834,951 | ) | |||||||||||||
Credit contracts | — | — | — | — | — | |||||||||||||||
Equity contracts | — | — | — | — | — | |||||||||||||||
Commodity contracts | — | — | — | — | — | |||||||||||||||
Other contracts | — | — | — | — | — | |||||||||||||||
|
|
|
|
|
|
|
|
|
| |||||||||||
Total | $ | — | $ | — | $ | (834,951 | ) | $ | — | $ | (834,951 | ) | ||||||||
|
|
|
|
|
|
|
|
|
| |||||||||||
Amount of Unrealized Appreciation or (Depreciation) on Derivatives Recognized in Income | ||||||||||||||||||||
Derivatives Not Accounted for as Hedging Instruments^ | Options | Futures | Forward Currency Contracts | Swaps | Total | |||||||||||||||
Interest rate contracts | $ | — | $ | — | $ | — | $ | — | $ | — | ||||||||||
Foreign exchange contracts | — | — | 461,890 | — | 461,890 | |||||||||||||||
Credit contracts | — | — | — | — | — | |||||||||||||||
Equity contracts | — | — | — | — | — | |||||||||||||||
Commodity contracts | — | — | — | — | — | |||||||||||||||
Other contracts | — | — | — | — | — | |||||||||||||||
|
|
|
|
|
|
|
|
|
| |||||||||||
Total | $ | — | $ | — | $ | 461,890 | $ | — | $ | 461,890 | ||||||||||
|
|
|
|
|
|
|
|
|
| |||||||||||
| ^ | The Portfolio held forward foreign currency contracts as a substitute for investing in conventional securities, hedging and in an attempt to enhance returns. |
The Portfolio held forward foreign currency contracts with an average settlement value of approximately $23,005,000 during the year ended December 31, 2013.
12
EQ/Invesco Comstock/Combined Pro-forma
The following table presents the Portfolio’s gross derivative assets and liabilities by counterparty net of amounts available for offset under netting arrangements and any related collateral received or pledged by the Portfolio as of December 31, 2013:
Counterparty | Gross Amount of Derivative Assets Presented in the Statement of Assets and Liabilities (a) | Derivatives Available for Offset | Collateral Received | Net Amount Due from Counterparty | ||||||||||||
Bank of New York Mellon Corp. | $ | 1,172 | $ | (1,172 | ) | $ | — | $ | — | |||||||
Citibank N.A. | 1,060 | (1,060 | ) | — | — | |||||||||||
State Street Bank & Trust | 1,071 | (1,071 | ) | — | — | |||||||||||
|
|
|
|
|
|
|
| |||||||||
| $ | 3,303 | $ | (3,303 | ) | $ | — | $ | — | ||||||||
|
|
|
|
|
|
|
| |||||||||
Counterparty | Gross Amount of Derivative Liabilities Presented in the Statement of Assets and Liabilities (a) | Derivatives Available for Offset | Collateral Pledged | Net Amount Due to Counterparty | ||||||||||||
Bank of New York Mellon Corp. | $ | 5,044 | $ | (1,172 | ) | $ | — | $ | 3,872 | |||||||
Citibank N.A. | 4,483 | (1,060 | ) | — | 3,423 | |||||||||||
State Street Bank & Trust | 5,096 | (1,071 | ) | — | 4,025 | |||||||||||
CIBC World Markets, Inc. | 6,184 | — | — | 6,184 | ||||||||||||
|
|
|
|
|
|
|
| |||||||||
| $ | 20,807 | $ | (3,303 | ) | $ | — | $ | 17,504 | ||||||||
|
|
|
|
|
|
|
| |||||||||
| (a) | For financial reporting purposes the Portfolio does not offset derivative assets and derivative liabilities subject to master netting arrangements in the Statement of Assets and Liabilities. |
Investment security transactions for the year ended December 31, 2013 were as follows:
| EQ/Davis New York Venture | EQ/Lord Abbett Large Cap Core | EQ/Invesco Comstock | Combined Pro-forma | |||||||||||||
Cost of Purchases: | ||||||||||||||||
Long-term investments other than U.S. government debt securities | $ | 24,053,196 | $ | 45,448,469 | $ | 41,404,342 | $ | 110,906,007 | ||||||||
Net Proceeds of Sales and Redemptions: | ||||||||||||||||
Long-term investments other than U.S. government debt securities | $ | 80,850,070 | $ | 67,347,239 | $ | 30,715,596 | $ | 178,912,905 | ||||||||
14
As of December 31, 2013, the gross unrealized appreciation (depreciation) of investments based on the aggregate cost of investments for federal income tax purposes was as follows:
| EQ/Davis New York Venture | EQ/Lord Abbett Large Cap Core | EQ/Invesco Comstock | Combined Pro-forma | |||||||||||||
Aggregate gross unrealized appreciation | $ | 30,505,487 | $ | 24,901,238 | $ | 19,578,886 | $ | 74,985,611 | ||||||||
Aggregate gross unrealized depreciation | (226,300 | ) | (1,327,964 | ) | (611,259 | ) | (2,165,523 | ) | ||||||||
|
|
|
|
|
|
|
| |||||||||
Net unrealized appreciation | $ | 30,279,187 | $ | 23,573,274 | $ | 18,967,627 | $ | 72,820,088 | ||||||||
|
|
|
|
|
|
|
| |||||||||
Federal income tax cost of | $ | 44,941,868 | $ | 52,122,844 | $ | 45,490,809 | $ | 142,555,521 | ||||||||
|
|
|
|
|
|
|
| |||||||||
Affiliated Broker Dealer
EQ/Davis New York Venture
For the year ended December 31, 2013, the Portfolio incurred approximately $1,357 as brokerage commissions with Sanford C. Bernstein & Co., LLC, an affiliated broker/dealer.
EQ/Invesco Comstock
For the year ended December 31, 2013, the Portfolio incurred approximately $741 as brokerage commissions with Sanford C. Bernstein & Co., LLC, an affiliated broker/dealer.
Combined Pro-forma
For the year ended December 31, 2013, the Portfolio incurred approximately $2,098 as brokerage commissions with Sanford C. Bernstein & Co., LLC, an affiliated broker/dealer.
Capital Loss Carryforward
EQ/Davis New York Venture
The Portfolio has a net capital loss carryforward of $543,789,588 of which $10,365,820 expires in the year 2016 and $533,423,768 expires in the year 2017. The Portfolio utilized net capital loss carryforward of $8,240,213 during 2013.
EQ/Lord Abbett Large Cap Core
The Portfolio utilized net capital loss carryforward of $2,931,792 during 2013.
EQ/Invesco Comstock
The Portfolio has a net capital loss carryforward of $33,389,278, which expires in the year 2017. The Portfolio utilized net capital loss carryforward of $10,219,374 during 2013.
Combined Pro-forma
The Portfolio has a net capital loss carryforward of $577,178,866 of which $10,365,820 expires in the year 2016 and $566,813,046 expires in the year 2017. The Portfolio utilized net capital loss carryforward of $21,391,379 during 2013.
Certain capital loss carryforwards may be subject to limitations on use pursuant to applicable U.S. Federal Income Tax Law. Therefore, it is possible not all of these capital losses will be available for use.
15
STATEMENT OF ASSETS AND LIABILITIES
December 31, 2013
| EQ/Davis New York Venture | EQ/Lord Abbett Large Cap Core | EQ/Invesco Comstock | Pro-forma Adjustment | Combined Pro-forma | ||||||||||||||||
Investments at cost | $ | 42,601,067 | $ | 51,862,485 | $ | 44,983,899 | $ | 139,447,451 | ||||||||||||
Foreign cash at cost | $ | — | $ | — | $ | 268 | $ | 268 | ||||||||||||
ASSETS | ||||||||||||||||||||
Investments at value | $ | 75,221,055 | $ | 75,696,118 | $ | 64,458,436 | $ | 215,375,609 | ||||||||||||
Cash | 1,586,448 | 2,025,575 | 2,599,812 | 6,211,835 | ||||||||||||||||
Foreign cash | — | — | 288 | 288 | ||||||||||||||||
Dividends, interest, and other receivables | 192,253 | 95,356 | 96,249 | 383,858 | ||||||||||||||||
Receivable from Separate Accounts for Trust shares sold | 19,614 | 20,504 | 172,349 | 212,467 | ||||||||||||||||
Receivable for securities sold | — | — | 135,489 | 135,489 | ||||||||||||||||
Unrealized appreciation on forward foreign currency | — | — | 3,303 | 3,303 | ||||||||||||||||
Other assets | 1,717 | 1,025 | 1,412 | 4,154 | ||||||||||||||||
|
|
|
|
|
|
|
|
|
| |||||||||||
Total assets | 77,021,087 | 77,838,578 | 67,467,338 | — | 222,327,003 | |||||||||||||||
|
|
|
|
|
|
|
|
|
| |||||||||||
LIABILITIES | ||||||||||||||||||||
Payable to Separate Accounts for Trust shares redeemed | 257,493 | 209,192 | 61,157 | 527,842 | ||||||||||||||||
Investment management fees payable | 48,575 | 32,377 | 23,302 | 104,254 | ||||||||||||||||
Payable for securities purchased | 799 | — | 95,658 | 96,457 | ||||||||||||||||
Administrative fees payable | 16,985 | 16,560 | 15,655 | 49,200 | ||||||||||||||||
Distribution fees payable - Class IB | 7,966 | 14,117 | 10,918 | 33,001 | ||||||||||||||||
Unrealized depreciation on forward foreign currency contracts | — | — | 20,807 | 20,807 | ||||||||||||||||
Distribution fees payable - Class IA | 4,768 | 1,984 | 2,297 | 9,049 | ||||||||||||||||
Accrued expenses | 90,502 | 9,875 | 11,714 | 82,240 | (b) | 194,331 | ||||||||||||||
|
|
|
|
|
|
|
|
|
| |||||||||||
Total liabilities | 427,088 | 284,105 | 241,508 | 82,240 | 1,034,941 | |||||||||||||||
|
|
|
|
|
|
|
|
|
| |||||||||||
NET ASSETS | 76,593,999 | 77,554,473 | 67,225,830 | (82,240 | ) | 221,292,062 | ||||||||||||||
|
|
|
|
|
|
|
|
|
| |||||||||||
Net assets were comprised of: | ||||||||||||||||||||
Paid in capital | 590,097,355 | 52,138,594 | $ | 81,763,178 | 723,999,127 | |||||||||||||||
Accumulated undistributed net investment income (loss) | 13,980 | 50,430 | (82,245 | ) | (82,240 | )(b) | (100,075 | ) | ||||||||||||
Accumulated undistributed net realized gain (loss) on investments and foreign currency transactions | (546,143,513 | ) | 1,531,816 | (33,912,157 | ) | (578,523,854 | ) | |||||||||||||
Net unrealized appreciaiton (depreciation) on investments and foreign currency translations | 32,626,177 | 23,833,633 | 19,457,054 | 75,916,864 | ||||||||||||||||
|
|
|
|
|
|
|
|
|
| |||||||||||
Net Assets | $ | 76,593,999 | $ | 77,554,473 | $ | 67,225,830 | $ | (82,240 | ) | $ | 221,292,062 | |||||||||
|
|
|
|
|
|
|
|
|
| |||||||||||
Class IA Shares: | ||||||||||||||||||||
Net Assets | 22,837,820 | 9,301,199 | 10,933,468 | (16,001 | )(b) | 43,056,486 | ||||||||||||||
Shares outstanding | 1,689,177 | 685,723 | 780,354 | (82,185 | )(a) | 3,073,069 | ||||||||||||||
|
|
|
|
|
|
|
|
|
| |||||||||||
Net asset value, offering and redemption price per share | $ | 13.52 | $ | 13.56 | $ | 14.01 | $ | 14.01 | ||||||||||||
|
|
|
|
|
|
|
|
|
| |||||||||||
Class IB Shares: | ||||||||||||||||||||
Net Assets | 38,530,317 | 68,253,274 | 53,094,973 | (59,395 | )(b) | 159,819,169 | ||||||||||||||
Shares outstanding | 2,850,701 | 5,024,505 | 3,786,410 | (264,287 | )(a) | 11,397,329 | ||||||||||||||
|
|
|
|
|
|
|
|
|
| |||||||||||
Net asset value, offering and redemption price per share | $ | 13.52 | $ | 13.58 | $ | 14.02 | $ | 14.02 | ||||||||||||
|
|
|
|
|
|
|
|
|
| |||||||||||
Class K Shares: | ||||||||||||||||||||
Net Assets | 15,225,862 | 3,197,389 | (6,844 | )(b) | 18,416,407 | |||||||||||||||
Shares outstanding | 1,126,091 | — | 228,690 | (37,566 | )(a) | 1,317,215 | ||||||||||||||
|
|
|
|
|
|
|
|
|
| |||||||||||
Net asset value, offering and redemption price per share | $ | 13.52 | N/A | $ | 13.98 | $ | 13.98 | |||||||||||||
|
|
|
|
|
|
|
|
|
| |||||||||||
| (a) | Reflects retired shares of the acquired portfolios. |
| (b) | Reflects adjustment due to proxy costs associated with the reorganization. |
16
STATEMENT OF OPERATIONS
For the Year Ended December 31, 2013
| EQ/Davis New York Venture | EQ/Lord Abbett Large Cap Core | EQ/Invesco Comstock | Pro-forma Adjustment | Combined Pro-forma | ||||||||||||||||
Dividend foreign withholding tax | $ | 92,172 | $ | 7,132 | $ | 53,913 | $ | 153,217 | ||||||||||||
INVESTMENT INCOME | ||||||||||||||||||||
Dividends | $ | 3,684,433 | $ | 3,056,156 | $ | 4,787,663 | $ | 11,528,252 | ||||||||||||
Interest | 40,073 | 2,176 | 12,060 | 54,309 | ||||||||||||||||
|
|
|
|
|
|
|
|
|
| |||||||||||
Total income | 3,724,506 | 3,058,332 | 4,799,723 | — | 11,582,561 | |||||||||||||||
|
|
|
|
|
|
|
|
|
| |||||||||||
EXPENSES | ||||||||||||||||||||
Investment management fees | 2,028,956 | 1,025,521 | 1,484,562 | (474,401 | )(a) | 4,064,638 | ||||||||||||||
Distribution fees - Class IB | 475,367 | 372,043 | 547,478 | 1,394,888 | ||||||||||||||||
Administrative fees | 272,177 | 190,070 | 261,652 | (59,816 | )(b) | 664,083 | ||||||||||||||
Distribution fees - Class IA | 51,964 | 22,388 | 22,224 | 96,576 | ||||||||||||||||
Printing and mailing expenses | 18,702 | 13,344 | 24,501 | 56,547 | ||||||||||||||||
Professional fees | 42,778 | 45,109 | 43,062 | (82,700 | )(b) | 48,249 | ||||||||||||||
Trustees’ fees | 8,582 | 5,498 | 7,212 | 21,292 | ||||||||||||||||
Custodian fees | 33,999 | 16,000 | 21,500 | (51,499 | )(b) | 20,000 | ||||||||||||||
Miscellaneous | 11,282 | 5,972 | 7,489 | (17,254 | )(b) | 7,489 | ||||||||||||||
|
|
|
|
|
|
|
|
|
| |||||||||||
Gross expenses | 2,943,807 | 1,695,945 | 2,419,680 | (685,670 | ) | 6,373,762 | ||||||||||||||
|
|
|
|
|
|
|
|
|
| |||||||||||
Less:Waiver from investment manager | (265,988 | ) | (117,372 | ) | (134,793 | ) | 325,821 | (d) | (192,332 | ) | ||||||||||
Fees paid indirectly | (10,423 | ) | (8,539 | ) | (9,680 | ) | 28,642 | (c) | — | |||||||||||
|
|
|
|
|
|
|
|
|
| |||||||||||
Net expenses | 2,667,396 | 1,570,034 | 2,275,207 | (331,207 | ) | 6,181,430 | ||||||||||||||
|
|
|
|
|
|
|
|
|
| |||||||||||
NET INVESTMENT INCOME (LOSS) | 1,057,110 | 1,488,298 | 2,524,516 | 331,207 | 5,401,131 | |||||||||||||||
|
|
|
|
|
|
|
|
|
| |||||||||||
REALIZED AND UNREALIZED GAIN (LOSS) | ||||||||||||||||||||
Realized gain (loss) on: | ||||||||||||||||||||
Investments | 108,493,792 | 60,321,045 | 102,841,408 | 271,656,245 | ||||||||||||||||
Foreign currency transactions | (3,367 | ) | — | (265,515 | ) | (268,882 | ) | |||||||||||||
|
|
|
|
|
|
|
|
|
| |||||||||||
Net realized gain (loss) | 108,490,425 | 60,321,045 | 102,575,893 | — | 271,387,363 | |||||||||||||||
|
|
|
|
|
|
|
|
|
| |||||||||||
Change in unrealized appreciation (depreciation) on: | ||||||||||||||||||||
Investments | (42,552,360 | ) | (23,747,805 | ) | (26,228,999 | ) | (92,529,164 | ) | ||||||||||||
Foreign currency translations | 4,961 | — | 461,904 | 466,865 | ||||||||||||||||
|
|
|
|
|
|
|
|
|
| |||||||||||
Net change in unrealized appreciation (depreciation) | (42,547,399 | ) | (23,747,805 | ) | (25,767,095 | ) | — | (92,062,299 | ) | |||||||||||
|
|
|
|
|
|
|
|
|
| |||||||||||
NET REALIZED AND UNREALIZED GAIN (LOSS) | 65,943,026 | 36,573,240 | 76,808,798 | — | 179,325,064 | |||||||||||||||
|
|
|
|
|
|
|
|
|
| |||||||||||
NET INCREASE (DECREASE) IN NET ASSETS RESULTING FROM OPERATIONS | $ | 67,000,136 | $ | 38,061,538 | $ | 79,333,314 | $ | 331,207 | $ | 184,726,195 | ||||||||||
|
|
|
|
|
|
|
|
|
| |||||||||||
| (a) | Reflects adjustment in expenses due to effects of the new contract rate for the Acquiring Portfolio. |
| (b) | Reflects adjustment in expenses due to elimination of duplicative expenses. |
| (c) | Reflects adjustment due to termination of the brokerage recapture program. |
| (d) | Reflects decrease in waiver due to expense adjustment. |
17
NOTES TO PRO FORMA COMBINED FINANCIAL STATEMENTS
As of December 31, 2013
NOTE 1 – BASIS OF COMBINATION AND SIGNIFICANT ACCOUNTING POLICIES:
EQ Advisors Trust (the “Trust”) was organized as a Delaware statutory trust on October 31, 1996, and is registered under the Investment Company Act of 1940, as amended, as an open-end management investment company with numerous portfolios.
On December 10-11, 2013, the Board of Trustees of the Trust approved a proposed Plan of Reorganization and Termination (“Reorganization Plan”) that provides for the transfer of all of the assets of the EQ/Davis New York Venture Portfolio (“Davis Portfolio”) and the EQ/Lord Abbett Large Cap Core Portfolio (“Large Cap Core Portfolio”) to the EQ/Invesco Comstock Portfolio (“Invesco Portfolio”), each a series of the Trust, and the assumption by the Invesco Portfolio of all of the liabilities of the Davis Portfolio and Large Cap Core Portfolio in exchange for shares of the Invesco Portfolio having an aggregate value equal to the combined net assets of the Davis Portfolio and the Large Cap Core Portfolio, the distribution of the Invesco Portfolio shares to the Davis Portfolio and Large Cap Core Portfolio shareholders of record determined immediately after the close of business on the closing date, and the subsequent liquidation of the Davis Portfolio and Large Cap Core Portfolio.
The Davis Portfolio’s annual contractual management fee rate equals 0.850% of average daily net assets for the first $1 billion, 0.800% of average daily net assets for the next $1 billion, 0.775% for the next $3 billion, 0.750% for the next $5 billion, and 0.725% of average daily net assets thereafter. The Large Cap Core Portfolio’s annual contractual management fee rate equals 0.650% of average daily net assets for the first $1 billion, 0.600% of average daily net assets for the next $1 billion, 0.575% for the next $3 billion, 0.550% for the next $5 billion, and 0.525% of average daily net assets thereafter. The Invesco Portfolio’s annual contractual management fee rate equals 0.650% of average daily net assets for the first $1 billion, 0.600% of average daily net assets for the next $1 billion, 0.575% for the next $3 billion, 0.550% for the next $5 billion, and 0.525% of average daily net assets thereafter. The Reorganization Plan is subject to shareholder approval of the Davis Portfolio and Large Cap Core Portfolio, respectively. A special meeting of these shareholders will be held on or about May 21, 2014.
Each Reorganization will be accounted for as a tax-free reorganization of investment companies. The unaudited pro forma combined financial statements are presented for the information of the reader and may not necessarily be representative of what the actual combined financial statements would have been had the Reorganization occurred at December 31, 2013. The unaudited pro forma combined portfolio of investments and statement of assets and liabilities reflect the financial position of the Davis Portfolio, Large Cap Core Portfolio and Invesco Portfolio at December 31, 2013. The unaudited pro forma combined statement of operations reflects the results of operations of the Invesco Portfolio as if it had acquired each of the Davis Portfolio and Large Cap Core Portfolio at the beginning of the year ended December 31, 2013. These statements have been derived from the Portfolios’ respective books and records utilized in calculating daily net asset value at the dates indicated above for each Portfolio under accounting principles generally accepted in the United States of America. The historical cost of investment securities will be carried forward to the surviving entity and results of operations of the Invesco Portfolio for pre-combination periods will not be restated.
The unaudited pro forma combined portfolio of investments and statements of assets and liabilities and operations should be read in conjunction with the historical financial statements of the Portfolios included in the Trust’s Statement of Additional Information. Each of the Portfolios has substantially the same significant accounting policies as detailed in the historical financial statements. The preparation of financial statements in accordance with accounting principles generally accepted in the United States of America requires management to make estimates and assumptions that affect the reported amounts and disclosures. Actual results could differ from those estimates.
18
NOTES TO PRO FORMA COMBINED FINANCIAL STATEMENTS—(Continued)
As of December 31, 2013
Following the Reorganization, the Invesco Portfolio will be the “accounting survivor.”
NOTE 2 – SHARES:
The unaudited pro forma net asset value per share assumes common shares of beneficial interest retired for Class IA, and additional common shares of beneficial interest issued for Class IB and Class K, respectively, in connection with the proposed acquisition of the Davis Portfolio and Large Cap Core Portfolio by the Invesco Portfolio as of December 31, 2013. The number of shares retired and additional shares issued were calculated based on the net assets of the Davis Portfolio and Large Cap Core Portfolio and net asset value per share of the Invesco Portfolio at December 31, 2013.
19
NOTES TO PRO FORMA COMBINED FINANCIAL STATEMENTS—(Continued)
As of December 31, 2013
NOTE 3 – TAXES
Each Portfolio, as well as the Acquiring Portfolio after the Reorganization, intends to comply with the requirements of the Internal Revenue Code of 1986, as amended, applicable to regulated investment companies (“RICs”) and to distribute substantially all of its net investment income and net realized capital gains to shareholders of each Portfolio. Therefore, no Federal income tax provision is required.
NOTE 4 – UNAUDITED PRO FORMA COMBINED ADJUSTMENTS:
The accompanying unaudited pro forma combined financial statements reflect changes in the Invesco Portfolio’s shares as if the merger had taken place on December 31, 2013. The Davis Portfolio and Large Cap Portfolio will bear the expenses, based on the fraction that its shareholder accounts will bear to the shareholder accounts of all the Acquired Portfolios at the merger date, of the Reorganization (i.e., the costs associated with preparing, printing and distributing the prospectus and proxy materials, legal and accounting fees in connection with the Reorganization, and expenses of holding the shareholders meeting), such expenses, which are not reflected in the unaudited pro forma combined statement of operations, are estimated to be approximately $82,200.
20
EQ ADVISORS TRUST
PORTFOLIO OF INVESTMENTS
December 31, 2013
| Number of Shares | Value (Note 1) | |||||||||||||||||||||||
| EQ/Davis New York Venture | EQ/Invesco Comstock | Combined Pro-forma | EQ/Davis New York Venture | EQ/Invesco Comstock | Combined Pro-forma | |||||||||||||||||||
COMMON STOCKS: | ||||||||||||||||||||||||
Consumer Discretionary (13.1%) | ||||||||||||||||||||||||
Auto Components (0.5%) | ||||||||||||||||||||||||
Johnson Controls, Inc. | — | 15,091 | 15,091 | $ | — | $ | 774,168 | $ | 774,168 | |||||||||||||||
|
|
|
|
|
| |||||||||||||||||||
Automobiles (1.3%) | ||||||||||||||||||||||||
General Motors Co.* | — | 36,542 | 36,542 | — | 1,493,471 | 1,493,471 | ||||||||||||||||||
Harley-Davidson, Inc. | 4,452 | — | 4,452 | 308,256 | — | 308,256 | ||||||||||||||||||
|
|
|
|
|
| |||||||||||||||||||
| 308,256 | 1,493,471 | 1,801,727 | ||||||||||||||||||||||
|
|
|
|
|
| |||||||||||||||||||
Hotels, Restaurants & Leisure (0.7%) | ||||||||||||||||||||||||
Carnival Corp. | — | 26,495 | 26,495 | — | 1,064,304 | 1,064,304 | ||||||||||||||||||
|
|
|
|
|
| |||||||||||||||||||
Household Durables (0.4%) | ||||||||||||||||||||||||
Hunter Douglas N.V. | 2,641 | — | 2,641 | 119,533 | — | 119,533 | ||||||||||||||||||
Newell Rubbermaid, Inc. | — | 13,531 | 13,531 | — | 438,540 | 438,540 | ||||||||||||||||||
|
|
|
|
|
| |||||||||||||||||||
| 119,533 | 438,540 | 558,073 | ||||||||||||||||||||||
|
|
|
|
|
| |||||||||||||||||||
Internet & Catalog Retail (1.5%) | ||||||||||||||||||||||||
Liberty Interactive Corp.* | 22,185 | — | 22,185 | 651,130 | — | 651,130 | ||||||||||||||||||
Liberty Ventures* | 1,507 | — | 1,507 | 184,743 | — | 184,743 | ||||||||||||||||||
Netflix, Inc.* | 1,045 | — | 1,045 | 384,738 | — | 384,738 | ||||||||||||||||||
priceline.com, Inc.* | 770 | — | 770 | 895,048 | — | 895,048 | ||||||||||||||||||
|
|
|
|
|
| |||||||||||||||||||
| 2,115,659 | — | 2,115,659 | ||||||||||||||||||||||
|
|
|
|
|
| |||||||||||||||||||
Media (4.9%) | ||||||||||||||||||||||||
Comcast Corp., Class A | — | 20,631 | 20,631 | — | 1,072,090 | 1,072,090 | ||||||||||||||||||
Liberty Global plc* | 16,295 | — | 16,295 | 1,373,994 | — | 1,373,994 | ||||||||||||||||||
Time Warner Cable, Inc. | — | 7,349 | 7,349 | — | 995,790 | 995,790 | ||||||||||||||||||
Time Warner, Inc. | — | 6,936 | 6,936 | — | 483,578 | 483,578 | ||||||||||||||||||
Twenty-First Century Fox, Inc., Class B | — | 28,127 | 28,127 | — | 973,194 | 973,194 | ||||||||||||||||||
Viacom, Inc., Class B | — | 18,718 | 18,718 | — | 1,634,830 | 1,634,830 | ||||||||||||||||||
Walt Disney Co. | 7,639 | — | 7,639 | 583,620 | — | 583,620 | ||||||||||||||||||
|
|
|
|
|
| |||||||||||||||||||
| 1,957,614 | 5,159,482 | 7,117,096 | ||||||||||||||||||||||
|
|
|
|
|
| |||||||||||||||||||
Multiline Retail (0.8%) | ||||||||||||||||||||||||
Kohl’s Corp. | — | 11,541 | 11,541 | — | 654,952 | 654,952 | ||||||||||||||||||
Target Corp. | — | 7,512 | 7,512 | — | 475,284 | 475,284 | ||||||||||||||||||
|
|
|
|
|
| |||||||||||||||||||
| — | 1,130,236 | 1,130,236 | ||||||||||||||||||||||
|
|
|
|
|
| |||||||||||||||||||
Specialty Retail (2.8%) | ||||||||||||||||||||||||
Bed Bath & Beyond, Inc.* | 37,919 | — | 37,919 | 3,044,896 | — | 3,044,896 | ||||||||||||||||||
CarMax, Inc.* | 21,132 | — | 21,132 | 993,626 | — | 993,626 | ||||||||||||||||||
|
|
|
|
|
| |||||||||||||||||||
| 4,038,522 | — | 4,038,522 | ||||||||||||||||||||||
|
|
|
|
|
| |||||||||||||||||||
Textiles, Apparel & Luxury Goods (0.2%) | ||||||||||||||||||||||||
Cie Financiere Richemont S.A. (Registered) Class A | 2,642 | — | 2,642 | 263,001 | — | 263,001 | ||||||||||||||||||
|
|
|
|
|
| |||||||||||||||||||
Total Consumer Discretionary | 8,802,585 | 10,060,201 | 18,862,786 | |||||||||||||||||||||
|
|
|
|
|
| |||||||||||||||||||
Consumer Staples (8.6%) | ||||||||||||||||||||||||
Beverages (1.4%) | ||||||||||||||||||||||||
Coca-Cola Co. | 15,331 | — | 15,331 | 633,324 | — | 633,324 | ||||||||||||||||||
Diageo plc (ADR) | 4,541 | — | 4,541 | 601,319 | — | 601,319 | ||||||||||||||||||
Heineken Holding N.V. | 11,607 | — | 11,607 | 734,277 | — | 734,277 | ||||||||||||||||||
|
|
|
|
|
| |||||||||||||||||||
| 1,968,920 | — | 1,968,920 | ||||||||||||||||||||||
|
|
|
|
|
| |||||||||||||||||||
Food & Staples Retailing (5.0%) | ||||||||||||||||||||||||
Costco Wholesale Corp. | 18,646 | — | 18,646 | 2,219,060 | — | 2,219,060 | ||||||||||||||||||
CVS Caremark Corp. | 54,174 | 15,490 | 69,664 | 3,877,233 | 1,108,619 | 4,985,852 | ||||||||||||||||||
|
|
|
|
|
| |||||||||||||||||||
| 6,096,293 | 1,108,619 | 7,204,912 | ||||||||||||||||||||||
|
|
|
|
|
| |||||||||||||||||||
Food Products (1.8%) | ||||||||||||||||||||||||
ConAgra Foods, Inc. | — | 25,445 | 25,445 | — | 857,497 | 857,497 | ||||||||||||||||||
Mondelez International, Inc., Class A | — | 17,317 | 17,317 | — | 611,290 | 611,290 | ||||||||||||||||||
Nestle S.A. (Registered) | 2,556 | — | 2,556 | 187,105 | — | 187,105 | ||||||||||||||||||
Tyson Foods, Inc., Class A | — | 11,638 | 11,638 | — | 389,407 | 389,407 | ||||||||||||||||||
Unilever N.V. (N.Y. Shares) | — | 13,386 | 13,386 | — | 538,519 | 538,519 | ||||||||||||||||||
|
|
|
|
|
| |||||||||||||||||||
| 187,105 | 2,396,713 | 2,583,818 | ||||||||||||||||||||||
|
|
|
|
|
| |||||||||||||||||||
See notes to pro-forma combined financial statements.
21
EQ ADVISORS TRUST
PORTFOLIO OF INVESTMENTS
December 31, 2013
| Number of Shares | Value ($) (Note 1) | |||||||||||||||||||||||
| EQ/Davis New York Venture | EQ/Invesco Comstock | Combined Pro-forma | EQ/Davis New York Venture | EQ/Invesco Comstock | Combined Pro-forma | |||||||||||||||||||
Tobacco (0.4%) | ||||||||||||||||||||||||
Philip Morris International, Inc. | 6,468 | — | 6,468 | 563,557 | — | 563,557 | ||||||||||||||||||
|
|
|
|
|
| |||||||||||||||||||
Total Consumer Staples | 8,815,875 | 3,505,332 | 12,321,207 | |||||||||||||||||||||
|
|
|
|
|
| |||||||||||||||||||
Energy (9.4%) | ||||||||||||||||||||||||
Energy Equipment & Services (2.6%) | ||||||||||||||||||||||||
Halliburton Co. | — | 27,714 | 27,714 | — | 1,406,485 | 1,406,485 | ||||||||||||||||||
Noble Corp. plc | — | 7,317 | 7,317 | — | 274,168 | 274,168 | ||||||||||||||||||
Schlumberger Ltd. | 5,967 | — | 5,967 | 537,686 | — | 537,686 | ||||||||||||||||||
Weatherford International Ltd.* | — | 99,432 | 99,432 | — | 1,540,202 | 1,540,202 | ||||||||||||||||||
|
|
|
|
|
| |||||||||||||||||||
| 537,686 | 3,220,855 | 3,758,541 | ||||||||||||||||||||||
|
|
|
|
|
| |||||||||||||||||||
Oil, Gas & Consumable Fuels (6.8%) | ||||||||||||||||||||||||
BP plc (ADR) | — | 27,954 | 27,954 | — | 1,358,844 | 1,358,844 | ||||||||||||||||||
Canadian Natural Resources Ltd. | 59,602 | — | 59,602 | 2,016,932 | — | 2,016,932 | ||||||||||||||||||
Chevron Corp. | — | 6,183 | 6,183 | — | 772,319 | 772,319 | ||||||||||||||||||
EOG Resources, Inc. | 4,089 | — | 4,089 | 686,298 | — | 686,298 | ||||||||||||||||||
Murphy Oil Corp. | — | 13,566 | 13,566 | — | 880,162 | 880,162 | ||||||||||||||||||
Occidental Petroleum Corp. | 5,566 | 8,232 | 13,798 | 529,326 | 782,863 | 1,312,189 | ||||||||||||||||||
QEP Resources, Inc. | — | 23,431 | 23,431 | — | 718,160 | 718,160 | ||||||||||||||||||
Royal Dutch Shell plc (ADR), Class A | — | 18,166 | 18,166 | — | 1,294,691 | 1,294,691 | ||||||||||||||||||
Suncor Energy, Inc. | — | 21,657 | 21,657 | — | 759,078 | 759,078 | ||||||||||||||||||
|
|
|
|
|
| |||||||||||||||||||
| 3,232,556 | 6,566,117 | 9,798,673 | ||||||||||||||||||||||
|
|
|
|
|
| |||||||||||||||||||
Total Energy | 3,770,242 | 9,786,972 | 13,557,214 | |||||||||||||||||||||
|
|
|
|
|
| |||||||||||||||||||
Financials (31.4%) | ||||||||||||||||||||||||
Capital Markets (8.5%) | ||||||||||||||||||||||||
Ameriprise Financial, Inc. | 4,225 | — | 4,225 | 486,086 | — | 486,086 | ||||||||||||||||||
Bank of New York Mellon Corp. | 161,329 | 43,320 | 204,649 | 5,636,835 | 1,513,601 | 7,150,436 | ||||||||||||||||||
Charles Schwab Corp. | 38,811 | — | 38,811 | 1,009,086 | — | 1,009,086 | ||||||||||||||||||
Goldman Sachs Group, Inc. | 1,057 | 3,884 | 4,941 | 187,364 | 688,478 | 875,842 | ||||||||||||||||||
Julius Baer Group Ltd.* | 23,471 | — | 23,471 | 1,127,177 | — | 1,127,177 | ||||||||||||||||||
Morgan Stanley | — | 34,365 | 34,365 | — | 1,077,686 | 1,077,686 | ||||||||||||||||||
State Street Corp. | — | 7,247 | 7,247 | — | 531,857 | 531,857 | ||||||||||||||||||
|
|
|
|
|
| |||||||||||||||||||
| 8,446,548 | 3,811,622 | 12,258,170 | ||||||||||||||||||||||
|
|
|
|
|
| |||||||||||||||||||
Commercial Banks (5.6%) | ||||||||||||||||||||||||
Fifth Third Bancorp | — | 33,632 | 33,632 | — | 707,281 | 707,281 | ||||||||||||||||||
PNC Financial Services Group, Inc. | — | 12,603 | 12,603 | — | 977,741 | 977,741 | ||||||||||||||||||
U.S. Bancorp/Minnesota | — | 8,341 | 8,341 | — | 336,976 | 336,976 | ||||||||||||||||||
Wells Fargo & Co. | 100,392 | 31,227 | 131,619 | 4,557,797 | 1,417,706 | 5,975,503 | ||||||||||||||||||
|
|
|
|
|
| |||||||||||||||||||
| 4,557,797 | 3,439,704 | 7,997,501 | ||||||||||||||||||||||
|
|
|
|
|
| |||||||||||||||||||
Consumer Finance (3.7%) | ||||||||||||||||||||||||
American Express Co. | 58,958 | — | 58,958 | 5,349,259 | — | 5,349,259 | ||||||||||||||||||
|
|
|
|
|
| |||||||||||||||||||
Diversified Financial Services (4.7%) | ||||||||||||||||||||||||
Bank of America Corp. | — | 70,989 | 70,989 | — | 1,105,299 | 1,105,299 | ||||||||||||||||||
Citigroup, Inc. | — | 51,574 | 51,574 | — | 2,687,521 | 2,687,521 | ||||||||||||||||||
JPMorgan Chase & Co. | 13,571 | 36,632 | 50,203 | 793,632 | 2,142,239 | 2,935,871 | ||||||||||||||||||
|
|
|
|
|
| |||||||||||||||||||
| 793,632 | 5,935,059 | 6,728,691 | ||||||||||||||||||||||
|
|
|
|
|
| |||||||||||||||||||
Insurance (8.0%) | ||||||||||||||||||||||||
ACE Ltd. | 6,840 | — | 6,840 | 708,145 | — | 708,145 | ||||||||||||||||||
Aflac, Inc. | — | 6,549 | 6,549 | — | 437,473 | 437,473 | ||||||||||||||||||
Alleghany Corp.* | 2,215 | — | 2,215 | 885,911 | — | 885,911 | ||||||||||||||||||
Allstate Corp. | — | 23,100 | 23,100 | — | 1,259,874 | 1,259,874 | ||||||||||||||||||
Berkshire Hathaway, Inc., Class B* | 28,841 | — | 28,841 | 3,419,389 | — | 3,419,389 | ||||||||||||||||||
Everest Reinsurance Group Ltd. | 2,354 | — | 2,354 | 366,918 | — | 366,918 | ||||||||||||||||||
Fairfax Financial Holdings Ltd. | 1,557 | — | 1,557 | 622,582 | — | 622,582 | ||||||||||||||||||
Loews Corp. | 22,869 | — | 22,869 | 1,103,201 | — | 1,103,201 | ||||||||||||||||||
Markel Corp.* | 290 | — | 290 | 168,301 | — | 168,301 | ||||||||||||||||||
MetLife, Inc. | — | 16,577 | 16,577 | — | 893,832 | 893,832 | ||||||||||||||||||
See notes to pro-forma combined financial statements.
22
EQ ADVISORS TRUST
PORTFOLIO OF INVESTMENTS
December 31, 2013
| Number of Shares | Value ($) (Note 1) | |||||||||||||||||||||||
| EQ/Davis New York Venture | EQ/Invesco Comstock | Combined Pro-forma | EQ/Davis New York Venture | EQ/Invesco Comstock | Combined Pro-forma | |||||||||||||||||||
Progressive Corp. | 52,556 | — | 52,556 | 1,433,202 | — | 1,433,202 | ||||||||||||||||||
Travelers Cos., Inc. | — | 2,842 | 2,842 | — | 257,315 | 257,315 | ||||||||||||||||||
|
|
|
|
|
| |||||||||||||||||||
| 8,707,649 | 2,848,494 | 11,556,143 | ||||||||||||||||||||||
|
|
|
|
|
| |||||||||||||||||||
Real Estate Management & Development (0.9%) | ||||||||||||||||||||||||
Brookfield Asset Management, Inc., Class A | 14,811 | — | 14,811 | 575,111 | — | 575,111 | ||||||||||||||||||
Brookfield Property Partners LP | 850 | — | 850 | 16,949 | — | 16,949 | ||||||||||||||||||
Hang Lung Group Ltd. | 133,354 | — | 133,354 | 673,279 | — | 673,279 | ||||||||||||||||||
|
|
|
|
|
| |||||||||||||||||||
| 1,265,339 | — | 1,265,339 | ||||||||||||||||||||||
|
|
|
|
|
| |||||||||||||||||||
Total Financials | 29,120,224 | 16,034,879 | 45,155,103 | |||||||||||||||||||||
|
|
|
|
|
| |||||||||||||||||||
Health Care (10.6%) | ||||||||||||||||||||||||
Health Care Providers & Services (5.7%) | ||||||||||||||||||||||||
Cardinal Health, Inc. | — | 7,159 | 7,159 | — | 478,293 | 478,293 | ||||||||||||||||||
Express Scripts Holding Co.* | 24,496 | 5,777 | 30,273 | 1,720,599 | 405,776 | 2,126,375 | ||||||||||||||||||
Laboratory Corp. of America Holdings* | 17,429 | — | 17,429 | 1,592,488 | — | 1,592,488 | ||||||||||||||||||
UnitedHealth Group, Inc. | 25,779 | 17,105 | 42,884 | 1,941,159 | 1,288,006 | 3,229,165 | ||||||||||||||||||
WellPoint, Inc. | — | 8,412 | 8,412 | — | 777,185 | 777,185 | ||||||||||||||||||
|
|
|
|
|
| |||||||||||||||||||
| 5,254,246 | 2,949,260 | 8,203,506 | ||||||||||||||||||||||
|
|
|
|
|
| |||||||||||||||||||
Life Sciences Tools & Services (0.3%) | ||||||||||||||||||||||||
Agilent Technologies, Inc. | 6,249 | — | 6,249 | 357,380 | — | 357,380 | ||||||||||||||||||
|
|
|
|
|
| |||||||||||||||||||
Pharmaceuticals (4.6%) | ||||||||||||||||||||||||
Bristol-Myers Squibb Co. | — | 18,260 | 18,260 | — | 970,519 | 970,519 | ||||||||||||||||||
GlaxoSmithKline plc (ADR) | — | 11,614 | 11,614 | — | 620,072 | 620,072 | ||||||||||||||||||
Merck & Co., Inc. | — | 27,757 | 27,757 | — | 1,389,238 | 1,389,238 | ||||||||||||||||||
Novartis AG (ADR) | — | 12,045 | 12,045 | — | 968,177 | 968,177 | ||||||||||||||||||
Pfizer, Inc. | — | 37,227 | 37,227 | — | 1,140,263 | 1,140,263 | ||||||||||||||||||
Roche Holding AG (ADR) | — | 8,877 | 8,877 | — | 623,165 | 623,165 | ||||||||||||||||||
Sanofi S.A. (ADR) | — | 17,409 | 17,409 | — | 933,645 | 933,645 | ||||||||||||||||||
|
|
|
|
|
| |||||||||||||||||||
| — | 6,645,079 | 6,645,079 | ||||||||||||||||||||||
|
|
|
|
|
| |||||||||||||||||||
Total Health Care | 5,611,626 | 9,594,339 | 15,205,965 | |||||||||||||||||||||
|
|
|
|
|
| |||||||||||||||||||
Industrials (6.4%) | ||||||||||||||||||||||||
Aerospace & Defense (1.2%) | ||||||||||||||||||||||||
Honeywell International, Inc. | — | 5,755 | 5,755 | — | 525,834 | 525,834 | ||||||||||||||||||
Textron, Inc. | 12,050 | 21,580 | 33,630 | 442,958 | 793,281 | 1,236,239 | ||||||||||||||||||
|
|
|
|
|
| |||||||||||||||||||
| 442,958 | 1,319,115 | 1,762,073 | ||||||||||||||||||||||
|
|
|
|
|
| |||||||||||||||||||
Building Products (0.1%) | ||||||||||||||||||||||||
Allegion plc* | — | 2,591 | 2,591 | — | 114,481 | 114,481 | ||||||||||||||||||
|
|
|
|
|
| |||||||||||||||||||
Commercial Services & Supplies (0.3%) | ||||||||||||||||||||||||
Iron Mountain, Inc. | 13,593 | — | 13,593 | 412,547 | — | 412,547 | ||||||||||||||||||
|
|
|
|
|
| |||||||||||||||||||
Construction & Engineering (0.2%) | ||||||||||||||||||||||||
OCI* | 6,400 | — | 6,400 | 288,215 | — | 288,215 | ||||||||||||||||||
|
|
|
|
|
| |||||||||||||||||||
Electrical Equipment (0.6%) | ||||||||||||||||||||||||
Emerson Electric Co. | — | 11,453 | 11,453 | — | 803,772 | 803,772 | ||||||||||||||||||
|
|
|
|
|
| |||||||||||||||||||
Industrial Conglomerates (1.0%) | ||||||||||||||||||||||||
General Electric Co. | — | 52,815 | 52,815 | — | 1,480,405 | 1,480,405 | ||||||||||||||||||
|
|
|
|
|
| |||||||||||||||||||
Machinery (1.4%) | ||||||||||||||||||||||||
Ingersoll-Rand plc | — | 15,932 | 15,932 | — | 981,411 | 981,411 | ||||||||||||||||||
PACCAR, Inc. | 17,454 | — | 17,454 | 1,032,753 | — | 1,032,753 | ||||||||||||||||||
|
|
|
|
|
| |||||||||||||||||||
| 1,032,753 | 981,411 | 2,014,164 | ||||||||||||||||||||||
|
|
|
|
|
| |||||||||||||||||||
Marine (0.8%) | ||||||||||||||||||||||||
Kuehne + Nagel International AG (Registered) | 8,349 | — | 8,349 | 1,095,979 | — | 1,095,979 | ||||||||||||||||||
|
|
|
|
|
| |||||||||||||||||||
Professional Services (0.1%) | ||||||||||||||||||||||||
Experian plc | 11,250 | — | 11,250 | 207,532 | — | 207,532 | ||||||||||||||||||
|
|
|
|
|
| |||||||||||||||||||
See notes to pro-forma combined financial statements.
23
EQ ADVISORS TRUST
PORTFOLIO OF INVESTMENTS
December 31, 2013
| Number of Shares | Value ($) (Note 1) | |||||||||||||||||||||||
| EQ/Davis New York Venture | EQ/Invesco Comstock | Combined Pro-forma | EQ/Davis New York Venture | EQ/Invesco Comstock | Combined Pro-forma | |||||||||||||||||||
Transportation Infrastructure (0.7%) | ||||||||||||||||||||||||
China Merchants Holdings International Co., Ltd. | 225,438 | — | 225,438 | 822,756 | — | 822,756 | ||||||||||||||||||
Wesco Aircraft Holdings, Inc.* | 5,640 | — | 5,640 | 123,629 | — | 123,629 | ||||||||||||||||||
|
|
|
|
|
| |||||||||||||||||||
| 946,385 | — | 946,385 | ||||||||||||||||||||||
|
|
|
|
|
| |||||||||||||||||||
Total Industrials | 4,426,369 | 4,699,184 | 9,125,553 | |||||||||||||||||||||
|
|
|
|
|
| |||||||||||||||||||
Information Technology (11.5%) | ||||||||||||||||||||||||
Communications Equipment (0.5%) | ||||||||||||||||||||||||
Cisco Systems, Inc. | — | 34,892 | 34,892 | — | 783,325 | 783,325 | ||||||||||||||||||
|
|
|
|
|
| |||||||||||||||||||
Computers & Peripherals (1.1%) | ||||||||||||||||||||||||
Hewlett-Packard Co. | 10,226 | 44,684 | 54,910 | 286,124 | 1,250,258 | 1,536,382 | ||||||||||||||||||
|
|
|
|
|
| |||||||||||||||||||
Electronic Equipment, Instruments & Components (0.6%) | ||||||||||||||||||||||||
Corning, Inc. | — | 45,078 | 45,078 | — | 803,290 | 803,290 | ||||||||||||||||||
|
|
|
|
|
| |||||||||||||||||||
Internet Software & Services (5.0%) | ||||||||||||||||||||||||
eBay, Inc.* | — | 16,713 | 16,713 | — | 917,377 | 917,377 | ||||||||||||||||||
Google, Inc., Class A* | 4,790 | — | 4,790 | 5,368,201 | — | 5,368,201 | ||||||||||||||||||
Qihoo 360 Technology Co., Ltd. (ADR)* | 3,010 | — | 3,010 | 246,970 | — | 246,970 | ||||||||||||||||||
Twitter, Inc.* | 3,840 | — | 3,840 | 244,416 | — | 244,416 | ||||||||||||||||||
Yahoo!, Inc.* | — | 11,550 | 11,550 | — | 467,082 | 467,082 | ||||||||||||||||||
|
|
|
|
|
| |||||||||||||||||||
| 5,859,587 | 1,384,459 | 7,244,046 | ||||||||||||||||||||||
|
|
|
|
|
| |||||||||||||||||||
IT Services (0.6%) | ||||||||||||||||||||||||
Visa, Inc., Class A | 3,802 | — | 3,802 | 846,629 | — | 846,629 | ||||||||||||||||||
|
|
|
|
|
| |||||||||||||||||||
Semiconductors & Semiconductor Equipment (1.0%) | ||||||||||||||||||||||||
Intel Corp. | — | 21,053 | 21,053 | — | 546,536 | 546,536 | ||||||||||||||||||
Texas Instruments, Inc. | 21,095 | — | 21,095 | 926,282 | — | 926,282 | ||||||||||||||||||
|
|
|
|
|
| |||||||||||||||||||
| 926,282 | 546,536 | 1,472,818 | ||||||||||||||||||||||
|
|
|
|
|
| |||||||||||||||||||
Software (2.7%) | ||||||||||||||||||||||||
Activision Blizzard, Inc. | 42,455 | — | 42,455 | 756,972 | — | 756,972 | ||||||||||||||||||
Autodesk, Inc.* | — | 8,498 | 8,498 | — | 427,704 | 427,704 | ||||||||||||||||||
Microsoft Corp. | 19,862 | 32,250 | 52,112 | 743,435 | 1,207,118 | 1,950,553 | ||||||||||||||||||
Oracle Corp. | 19,072 | — | 19,072 | 729,695 | — | 729,695 | ||||||||||||||||||
|
|
|
|
|
| |||||||||||||||||||
| 2,230,102 | 1,634,822 | 3,864,924 | ||||||||||||||||||||||
|
|
|
|
|
| |||||||||||||||||||
Total Information Technology | 10,148,724 | 6,402,690 | 16,551,414 | |||||||||||||||||||||
|
|
|
|
|
| |||||||||||||||||||
Materials (4.0%) | ||||||||||||||||||||||||
Chemicals (2.5%) | ||||||||||||||||||||||||
Air Products and Chemicals, Inc. | 11,924 | — | 11,924 | 1,332,865 | — | 1,332,865 | ||||||||||||||||||
Ecolab, Inc. | 9,846 | — | 9,846 | 1,026,642 | — | 1,026,642 | ||||||||||||||||||
Monsanto Co. | 4,838 | — | 4,838 | 563,869 | — | 563,869 | ||||||||||||||||||
Praxair, Inc. | 5,256 | — | 5,256 | 683,438 | — | 683,438 | ||||||||||||||||||
|
|
|
|
|
| |||||||||||||||||||
| 3,606,814 | — | 3,606,814 | ||||||||||||||||||||||
|
|
|
|
|
| |||||||||||||||||||
Construction Materials (0.5%) | ||||||||||||||||||||||||
Lafarge S.A. | 6,490 | — | 6,490 | 486,324 | — | 486,324 | ||||||||||||||||||
Martin Marietta Materials, Inc. | 2,032 | — | 2,032 | 203,078 | — | 203,078 | ||||||||||||||||||
|
|
|
|
|
| |||||||||||||||||||
| 689,402 | — | 689,402 | ||||||||||||||||||||||
|
|
|
|
|
| |||||||||||||||||||
Metals & Mining (0.5%) | ||||||||||||||||||||||||
Alcoa, Inc. | — | 62,120 | 62,120 | — | 660,336 | 660,336 | ||||||||||||||||||
|
|
|
|
|
| |||||||||||||||||||
Paper & Forest Products (0.5%) | ||||||||||||||||||||||||
Emerald Plantation Holdings Ltd.* | 253,285 | — | 253,285 | 37,993 | — | 37,993 | ||||||||||||||||||
International Paper Co. | — | 14,800 | 14,800 | — | 725,644 | 725,644 | ||||||||||||||||||
|
|
|
|
|
| |||||||||||||||||||
| 37,993 | 725,644 | 763,637 | ||||||||||||||||||||||
|
|
|
|
|
| |||||||||||||||||||
Total Materials | 4,334,209 | 1,385,980 | 5,720,189 | |||||||||||||||||||||
|
|
|
|
|
| |||||||||||||||||||
See notes to pro-forma combined financial statements.
24
EQ ADVISORS TRUST
PORTFOLIO OF INVESTMENTS
December 31, 2013
| Number of Shares | Value ($) (Note 1) | |||||||||||||||||||||||
| EQ/Davis New York Venture | EQ/Invesco Comstock | Combined Pro-forma | EQ/Davis New York Venture | EQ/Invesco Comstock | Combined Pro-forma | |||||||||||||||||||
Telecommunication Services (1.0%) | ||||||||||||||||||||||||
Diversified Telecommunication | ||||||||||||||||||||||||
AT&T, Inc. | — | 7,368 | 7,368 | — | 259,059 | 259,059 | ||||||||||||||||||
Verizon Communications, Inc. | — | 7,994 | 7,994 | — | 392,825 | 392,825 | ||||||||||||||||||
Vivendi S.A. | — | 8,015 | 8,015 | — | 211,208 | 211,208 | ||||||||||||||||||
|
|
|
|
|
| |||||||||||||||||||
| — | 863,092 | 863,092 | ||||||||||||||||||||||
|
|
|
|
|
| |||||||||||||||||||
Wireless Telecommunication Services (0.4%) | ||||||||||||||||||||||||
Vodafone Group plc (ADR) | — | 15,698 | 15,698 | — | 617,088 | 617,088 | ||||||||||||||||||
|
|
|
|
|
| |||||||||||||||||||
Total Telecommunication Services | — | 1,480,180 | 1,480,180 | |||||||||||||||||||||
|
|
|
|
|
| |||||||||||||||||||
Utilities (1.0%) | ||||||||||||||||||||||||
Electric Utilities (0.7%) | ||||||||||||||||||||||||
FirstEnergy Corp. | — | 9,586 | 9,586 | — | 316,146 | 316,146 | ||||||||||||||||||
PPL Corp. | — | 24,729 | 24,729 | — | 744,096 | 744,096 | ||||||||||||||||||
|
|
|
|
|
| |||||||||||||||||||
| — | 1,060,242 | 1,060,242 | ||||||||||||||||||||||
|
|
|
|
|
| |||||||||||||||||||
Multi-Utilities (0.3%) | ||||||||||||||||||||||||
PG&E Corp. | — | 11,133 | 11,133 | — | 448,437 | 448,437 | ||||||||||||||||||
|
|
|
|
|
| |||||||||||||||||||
Total Utilities | — | 1,508,679 | 1,508,679 | |||||||||||||||||||||
|
|
|
|
|
| |||||||||||||||||||
Total Common Stocks (97.0%) | 75,029,854 | 64,458,436 | 139,488,290 | |||||||||||||||||||||
|
|
|
|
|
| |||||||||||||||||||
LONG-TERM DEBT SECURITIES | ||||||||||||||||||||||||
CORPORATE BONDS | ||||||||||||||||||||||||
Materials (0.1%) | ||||||||||||||||||||||||
Paper & Forest Products (0.1%) | ||||||||||||||||||||||||
Emerald Plantation Holdings Ltd., | 283,010 | — | 283,010 | 191,201 | — | 191,201 | ||||||||||||||||||
|
|
|
|
|
| |||||||||||||||||||
Total Materials | 191,201 | — | 191,201 | |||||||||||||||||||||
|
|
|
|
|
| |||||||||||||||||||
Total Corporate Bonds | ||||||||||||||||||||||||
Total Long-Term Debt Securities (0.1%) | 191,201 | — | 191,201 | |||||||||||||||||||||
|
|
|
|
|
| |||||||||||||||||||
Total Investments (97.1%) | 75,221,055 | 64,458,436 | 139,679,491 | |||||||||||||||||||||
Other Assets Less Liabilities (2.9%) | 1,372,944 | 2,767,394 | 4,140,338 | |||||||||||||||||||||
|
|
|
|
|
| |||||||||||||||||||
Net Assets (100%) | $ | 76,593,999 | $ | 67,225,830 | $ | 143,819,829 | ||||||||||||||||||
|
|
|
|
|
| |||||||||||||||||||
| * | Non-income producing. |
| (b) | Illiquid Security. |
Glossary
ADR — American Depositary Receipt
PIK — Payment-in-Kind Security
See notes to pro-forma combined financial statements.
25
At December 31, 2013 the Portfolio had the following outstanding foreign currency contracts to buy/sell foreign currencies as follows: (Note 1)
EQ/Invesco Comstock/Combined Pro-forma
Foreign Currency Sell Contracts | Counterparty | Local Contract Sell Amount (000’s) | U.S. $ Settlement Value | U.S. $ Current Value | Unrealized Appreciation/ (Depreciation) | |||||||||||||
British Pound vs. U.S. Dollar, | Bank of New York Mellon Corp. | 326 | $ | 536,237 | $ | 540,511 | $ | (4,274 | ) | |||||||||
British Pound vs. U.S. Dollar, | CIBC World Markets, Inc. | 326 | 536,263 | 540,510 | (4,247 | ) | ||||||||||||
British Pound vs. U.S. Dollar, | Citibank N.A. | 291 | 478,046 | 481,767 | (3,721 | ) | ||||||||||||
British Pound vs. U.S. Dollar, | State Street Bank & Trust | 326 | 536,227 | 540,510 | (4,283 | ) | ||||||||||||
Canadian Dollar vs U.S. Dollar, | CIBC World Markets, Inc. | 642 | 603,069 | 604,163 | (1,094 | ) | ||||||||||||
European Union Euro vs. U.S. Dollar, | Bank of New York Mellon Corp. | 420 | 577,313 | 578,083 | (770 | ) | ||||||||||||
European Union Euro vs. U.S. Dollar, | CIBC World Markets, Inc. | 420 | 577,240 | 578,083 | (843 | ) | ||||||||||||
European Union Euro vs. U.S. Dollar, | Citibank N.A. | 420 | 577,321 | 578,083 | (762 | ) | ||||||||||||
European Union Euro vs. U.S. Dollar, | State Street Bank & Trust | 425 | 583,635 | 584,448 | (813 | ) | ||||||||||||
Swiss Franc vs U.S. Dollar, | Bank of New York Mellon Corp. | 396 | 445,527 | 444,355 | 1,172 | |||||||||||||
Swiss Franc vs U.S. Dollar, | Citibank N.A. | 362 | 406,662 | 405,602 | 1,060 | |||||||||||||
Swiss Franc vs U.S. Dollar, | State Street Bank & Trust | 396 | 445,426 | 444,355 | 1,071 | |||||||||||||
|
| |||||||||||||||||
| $ | (17,504 | ) | ||||||||||||||||
|
| |||||||||||||||||
26
The following is a summary of the inputs used to value the Portfolio’s net assets as of December 31, 2013 :
The inputs or methodology used for valuing securities are not necessarily an indication of the risk associated with investing in those securities.
Various inputs are used in determining the value of the Portfolio’s investments. These inputs are summarized in the three broad levels listed below:
| • | Level 1 - Quoted prices in active markets for identical securities |
| • | Level 2 - Significant other observable inputs (including quoted prices for similar securities, interest rates, prepayment speeds, credit risk, etc.) |
| • | Level 3 - Significant unobservable inputs (including the Portfolio’s own assumptions in determining the fair value of investments) |
Description | Quoted Prices in Active Markets for Identical Securities (Level 1) | Significant Other Observable Inputs (Level 2) | Significant Unobservable Inputs (Level 3) | Total | ||||||||||||||||||||||||||||||||||||||||||||
| EQ/Davs New York Venture | EQ/Invesco Comstock | Combined Pro-forma | EQ/Davis New York Venture | EQ/ Invesco Comstock | Combined Pro-forma | EQ/Davis New York Venture | EQ/ Invesco Comstock | Combined Pro-forma | EQ/Davis New York Venture | EQ/Invesco Comstock | Combined Pro-forma | |||||||||||||||||||||||||||||||||||||
Assets | ||||||||||||||||||||||||||||||||||||||||||||||||
Investments in | $ | 69,024,676 | $ | 64,247,228 | $ | 133,271,904 | $ | 6,196,379 | $ | 211,208 | $ | 6,407,587 | $ | — | $ | — | $ | — | $ | 75,221,055 | $ | 64,458,436 | $ | 139,679,491 | ||||||||||||||||||||||||
Other Investments* | — | — | — | 3,303 | 3,303 | — | — | — | — | 3,303 | 3,303 | |||||||||||||||||||||||||||||||||||||
|
|
|
|
|
|
|
|
|
|
|
|
|
|
|
|
|
|
|
|
|
|
|
| |||||||||||||||||||||||||
Total | $ | 69,024,676 | $ | 64,247,228 | $ | 133,271,904 | $ | 6,196,379 | $ | 214,511 | $ | 6,410,890 | $ | — | $ | — | $ | — | $ | 75,221,055 | $ | 64,461,739 | $ | 139,682,794 | ||||||||||||||||||||||||
|
|
|
|
|
|
|
|
|
|
|
|
|
|
|
|
|
|
|
|
|
|
|
| |||||||||||||||||||||||||
Liabilities | ||||||||||||||||||||||||||||||||||||||||||||||||
Investments in Securities | $ | — | $ | — | $ | — | $ | — | $ | — | $ | — | $ | — | $ | — | $ | — | $ | — | $ | — | $ | — | ||||||||||||||||||||||||
Other Investments* | — | — | — | (20,807 | ) | (20,807 | ) | — | — | — | — | (20,807 | ) | (20,807 | ) | |||||||||||||||||||||||||||||||||
|
|
|
|
|
|
|
|
|
|
|
|
|
|
|
|
|
|
|
|
|
|
|
| |||||||||||||||||||||||||
Total | $ | — | $ | — | $ | — | $ | — | $ | (20,807 | ) | $ | (20,807 | ) | $ | — | $ | — | $ | — | $ | — | $ | (20,807 | ) | $ | (20,807 | ) | ||||||||||||||||||||
|
|
|
|
|
|
|
|
|
|
|
|
|
|
|
|
|
|
|
|
|
|
|
| |||||||||||||||||||||||||
Total Assets and Liabilities | $ | 69,024,676 | $ | 64,247,228 | $ | 133,271,904 | $ | 6,196,379 | $ | 193,704 | $ | 6,390,083 | $ | — | $ | — | $ | — | $ | 75,221,055 | $ | 64,440,932 | $ | 139,661,987 | ||||||||||||||||||||||||
|
|
|
|
|
|
|
|
|
|
|
|
|
|
|
|
|
|
|
|
|
|
|
| |||||||||||||||||||||||||
| * | Other investments are derivative instruments, such as futures, forwards and written options, which are valued at the unrealized appreciation/depreciation on the instrument. |
There were no transfers between Levels 1, 2 or 3 during the year ended December 31, 2013.
Fair Values of Derivative Instruments as of December 31, 2013:
EQ/Invesco Comstock/Combined Pro-forma
Statement of Assets and Liabilities | ||||||
Derivatives Not Accounted for as Hedging Instruments^ | Asset Derivatives | Fair Value | ||||
Interest rate contracts | Receivables, Net Assets- | $ | — | |||
| Unrealized appreciation | — | * | ||||
Foreign exchange contracts | Receivables | 3,303 | ||||
Credit contracts | Receivables | — | ||||
Equity contracts | Receivables, Net Assets- | — | ||||
| Unrealized appreciation | — | * | ||||
Commodity contracts | Receivables | — | ||||
Other contracts | Receivables | — | ||||
|
| |||||
Total | $ | 3,303 | ||||
|
| |||||
Liability Derivatives | ||||||
Interest rate contracts | Payables, Net Assets- | $ | — | |||
| Unrealized depreciation | — | * | ||||
Foreign exchange contracts | Payables | (20,807 | ) | |||
Credit contracts | Payables | — | ||||
Equity contracts | Payables, Net Assets- | — | ||||
| Unrealized depreciation | — | * | ||||
Commodity contracts | Payables | — | ||||
Other contracts | Payables | — | ||||
|
| |||||
Total | $ | (20,807 | ) | |||
|
| |||||
| * | Includes cumulative appreciation/depreciation of futures contracts as reported in the Portfolio of Investments. Only current day’s variation margin is reported within the Statement of Assets & Liabilities. |
The effect of Derivative Instruments on the Statement of Operations for the year ended December 31, 2013:
Amount of Realized Gain or (Loss) on Derivatives Recognized in Income | ||||||||||||||||||||
Derivatives Not Accounted for as Hedging Instruments^ | Options | Futures | Forward Currency Contracts | Swaps | Total | |||||||||||||||
Interest rate contracts | $ | — | $ | — | $ | — | $ | — | $ | — | ||||||||||
Foreign exchange contracts | — | — | (834,951 | ) | — | (834,951 | ) | |||||||||||||
Credit contracts | — | — | — | — | — | |||||||||||||||
Equity contracts | — | — | — | — | — | |||||||||||||||
Commodity contracts | — | — | — | — | — | |||||||||||||||
Other contracts | — | — | — | — | — | |||||||||||||||
|
|
|
|
|
|
|
|
|
| |||||||||||
Total | $ | — | $ | — | $ | (834,951 | ) | $ | — | $ | (834,951 | ) | ||||||||
|
|
|
|
|
|
|
|
|
| |||||||||||
Amount of Unrealized Appreciation or (Depreciation) on Derivatives Recognized in Income | ||||||||||||||||||||
Derivatives Not Accounted for as Hedging Instruments^ | Options | Futures | Forward Currency Contracts | Swaps | Total | |||||||||||||||
Interest rate contracts | $ | — | $ | — | $ | — | $ | — | $ | — | ||||||||||
Foreign exchange contracts | — | — | 461,890 | — | 461,890 | |||||||||||||||
Credit contracts | — | — | — | — | — | |||||||||||||||
Equity contracts | — | — | — | — | — | |||||||||||||||
Commodity contracts | — | — | — | — | — | |||||||||||||||
Other contracts | — | — | — | — | — | |||||||||||||||
|
|
|
|
|
|
|
|
|
| |||||||||||
Total | $ | — | $ | — | $ | 461,890 | $ | — | $ | 461,890 | ||||||||||
|
|
|
|
|
|
|
|
|
| |||||||||||
| ^ | The Portfolio held forward foreign currency contracts as a substitute for investing in conventional securities, hedging and in an attempt to enhance returns. |
The Portfolio held forward foreign currency contracts with an average settlement value of approximately $23,005,000 during the year
ended December 31, 2013.
EQ/Invesco Comstock/Combined Pro-forma
The following table presents the Portfolio’s gross derivative assets and liabilities by counterparty net of amounts available for offset under netting arrangements and any related collateral received or pledged by the Portfolio as of December 31, 2013:
Counterparty | Gross Amount of Derivative Assets Presented in the Statement of Assets and Liabilities (a) | Derivatives Available for Offset | Collateral Received | Net Amount Due from Counterparty | ||||||||||||
Bank of New York Mellon Corp. | $ | 1,172 | $ | (1,172 | ) | $ | — | $ | — | |||||||
Citibank N.A. | 1,060 | (1,060 | ) | — | — | |||||||||||
State Street Bank & Trust | 1,071 | (1,071 | ) | — | — | |||||||||||
|
|
|
|
|
|
|
| |||||||||
| $ | 3,303 | $ | (3,303 | ) | $ | — | $ | — | ||||||||
|
|
|
|
|
|
|
| |||||||||
Counterparty | Gross Amount of Derivative Liabilities Presented in the Statement of Assets and Liabilities (a) | Derivatives Available for Offset | Collateral Pledged | Net Amount Due to Counterparty | ||||||||||||
Bank of New York Mellon Corp. | $ | 5,044 | $ | (1,172 | ) | $ | — | $ | 3,872 | |||||||
Citibank N.A. | 4,483 | (1,060 | ) | — | 3,423 | |||||||||||
State Street Bank & Trust | 5,096 | (1,071 | ) | — | 4,025 | |||||||||||
CIBC World Markets, Inc. | 6,184 | — | — | 6,184 | ||||||||||||
|
|
|
|
|
|
|
| |||||||||
| $ | 20,807 | $ | (3,303 | ) | $ | — | $ | 17,504 | ||||||||
|
|
|
|
|
|
|
| |||||||||
| (a) | For financial reporting purposes the Portfolio does not offset derivative assets and derivative liabilities subject to master netting arrangements in the Statement of Assets and Liabilities. |
Investment security transactions for the year ended December 31, 2013 were as follows:
| EQ/Davis New York Venture | EQ/Invesco Comstock | Combined Pro Forma | ||||||||||
Cost of Purchases: | ||||||||||||
Long-term investments other than U.S. government debt securities | $ | 24,053,196 | $ | 41,404,342 | $ | 65,457,538 | ||||||
Net Proceeds of Sales and Redemptions: | ||||||||||||
Long-term investments other than U.S. government debt securities | $ | 80,850,070 | $ | 30,715,596 | $ | 111,565,666 | ||||||
30
As of December 31, 2013, the gross unrealized appreciation (depreciation) of investments based on the aggregate cost of investments for federal income tax purposes was as follows:
| EQ/Davis New York Venture | EQ/Invesco Comstock | Combined Pro-forma | ||||||||||
Aggregate gross unrealized appreciation | $ | 30,505,487 | $ | 19,578,886 | $ | 50,084,373 | ||||||
Aggregate gross unrealized depreciation | (226,300 | ) | (611,259 | ) | (837,559 | ) | ||||||
|
|
|
|
|
| |||||||
Net unrealized appreciation | $ | 30,279,187 | $ | 18,967,627 | $ | 49,246,814 | ||||||
|
|
|
|
|
| |||||||
Federal income tax cost of investments | $ | 44,941,868 | $ | 45,490,809 | $ | 90,432,677 | ||||||
|
|
|
|
|
| |||||||
Affiliated Broker Dealer
EQ/Davis New York Venture
For the year ended December 31, 2013, the Portfolio incurred approximately $1,357 as brokerage commissions with
Sanford C. Bernstein & Co., LLC, an affiliated broker/dealer.
EQ/Invesco Comstock
For the year ended December 31, 2013, the Portfolio incurred approximately $741 as brokerage commissions with
Sanford C. Bernstein & Co., LLC, an affiliated broker/dealer.
Combined Pro-forma
For the year ended December 31, 2013, the Portfolio incurred approximately $2,098 as brokerage commissions with
Sanford C. Bernstein & Co., LLC, an affiliated broker/dealer.
Capital Loss Carryforward
EQ/Davis New York Venture
The Portfolio has a net capital loss carryforward of $543,789,588 of which $10,365,820 expires in the year 2016 and $533,423,768 expires in the year 2017. The Portfolio utilized net capital loss carryforward of $8,240,213 during 2013.
EQ/Invesco Comstock
The Portfolio has a net capital loss carryforward of $33,389,278, which expires in the year 2017. The Portfolio utilized net capital loss carryforward of $10,219,374 during 2013.
Combined Pro-forma
The Portfolio has a net capital loss carryforward of $577,178,866 of which $10,365,820 expires in the year 2016 and $566,813,046 expires in the year 2017. The Portfolio utilized net capital loss carryforward of $18,459,587 during 2013.
Certain capital loss carryforwards may be subject to limitations on use pursuant to applicable U.S. Federal Income Tax Law. Therefore, it is possible not all of these capital losses will be available for use.
31
STATEMENT OF ASSETS AND LIABILITIES
December 31, 2013
| EQ/Davis New York Venture | EQ/Invesco Comstock | Pro Forma Adjustment | Pro Forma Combined | |||||||||||||
Investments at cost | $ | 42,601,067 | $ | 44,983,899 | $ | 87,584,966 | ||||||||||
Foreign cash at cost | $ | — | $ | 268 | $ | 268 | ||||||||||
ASSETS | ||||||||||||||||
Investments at value | $ | 75,221,055 | $ | 64,458,436 | $ | 139,679,491 | ||||||||||
Cash | 1,586,448 | 2,599,812 | 4,186,260 | |||||||||||||
Foreign cash | — | 288 | 288 | |||||||||||||
Dividends, interest, and other receivables | 192,253 | 96,249 | 288,502 | |||||||||||||
Receivable from Separate Accounts for Trust shares sold | 19,614 | 172,349 | 191,963 | |||||||||||||
Receivable for securities sold | — | 135,489 | 135,489 | |||||||||||||
Unrealized appreciation on forward foreign currency | — | 3,303 | 3,303 | |||||||||||||
Other assets | 1,717 | 1,412 | 3,129 | |||||||||||||
|
|
|
|
|
|
|
| |||||||||
Total assets | 77,021,087 | 67,467,338 | — | 144,488,425 | ||||||||||||
|
|
|
|
|
|
|
| |||||||||
LIABILITIES | ||||||||||||||||
Payable to Separate Accounts for Trust shares redeemed | 257,493 | 61,157 | 318,650 | |||||||||||||
Payable for securities purchased | 799 | 95,658 | 96,457 | |||||||||||||
Investment management fees payable | 48,575 | 23,302 | 71,877 | |||||||||||||
Administrative fees payable | 16,985 | 15,655 | 32,640 | |||||||||||||
Unrealized depreciation on forward foreign currency contracts | — | 20,807 | 20,807 | |||||||||||||
Distribution fees payable - Class IB | 7,966 | 10,918 | 18,884 | |||||||||||||
Distribution fees payable - Class IA | 4,768 | 2,297 | 7,065 | |||||||||||||
Accrued expenses | 90,502 | 11,714 | 40,379 | (b) | 142,595 | |||||||||||
|
|
|
|
|
|
|
| |||||||||
Total liabilities | 427,088 | 241,508 | 40,379 | 708,975 | ||||||||||||
|
|
|
|
|
|
|
| |||||||||
NET ASSETS | 76,593,999 | 67,225,830 | (40,379 | ) | 143,779,450 | |||||||||||
|
|
|
|
|
|
|
| |||||||||
Net assets were comprised of: | ||||||||||||||||
Paid in capital | 590,097,355 | 81,763,178 | 671,860,533 | |||||||||||||
Accumulated undistributed net investment income (loss) | 13,980 | (82,245 | ) | (40,379 | )(b) | (108,644 | ) | |||||||||
Accumulated undistributed net realized gain (loss) on investments and foreign currency transactions | (546,143,513 | ) | (33,912,157 | ) | (580,055,670 | ) | ||||||||||
Net unrealized appreciaiton (depreciation) on investments and foreign currency translations | 32,626,177 | 19,457,054 | 52,083,231 | |||||||||||||
|
|
|
|
|
|
|
| |||||||||
Net Assets | $ | 76,593,999 | $ | 67,225,830 | (40,379 | ) | $ | 143,779,450 | ||||||||
|
|
|
|
|
|
|
| |||||||||
Class IA Shares: | ||||||||||||||||
Net Assets | 22,837,820 | 10,933,468 | (9,482 | )(b) | 33,761,806 | |||||||||||
Shares outstanding | 1,689,177 | 780,354 | (59,851 | )(a) | 2,409,680 | |||||||||||
|
|
|
|
|
|
|
| |||||||||
Net asset value, offering and redemption price per share | $ | 13.52 | $ | 14.01 | $ | 14.01 | ||||||||||
|
|
|
|
|
|
|
| |||||||||
Class IB Shares: | ||||||||||||||||
Net Assets | 38,530,317 | 53,094,973 | (25,725 | )(b) | 91,599,565 | |||||||||||
Shares outstanding | 2,850,701 | 3,786,410 | (104,788 | )(a) | 6,532,323 | |||||||||||
|
|
|
|
|
|
|
| |||||||||
Net asset value, offering and redemption price per share | $ | 13.52 | $ | 14.02 | $ | 14.02 | ||||||||||
|
|
|
|
|
|
|
| |||||||||
Class K Shares: | ||||||||||||||||
Net Assets | 15,225,862 | 3,197,389 | (5,172 | )(b) | 18,418,079 | |||||||||||
Shares outstanding | 1,126,091 | 228,690 | (37,447 | )(a) | 1,317,334 | |||||||||||
|
|
|
|
|
|
|
| |||||||||
Net asset value, offering and redemption price per share | $ | 13.52 | $ | 13.98 | $ | 13.98 | ||||||||||
|
|
|
|
|
|
|
| |||||||||
| (a) | Reflects retired shares of the acquired portfolio. |
| (b) | Reflects adjustment due to proxy costs associated with the reorganization. |
32
STATEMENT OF OPERATIONS
For the Year Ended December 31, 2013
| EQ/Davis New York Venture | EQ/Invesco Comstock | Pro Forma Adjustment | Pro Forma Combined | |||||||||||||
Dividend foreign withholding tax | $ | 92,172 | $ | 53,913 | $ | 146,085 | ||||||||||
INVESTMENT INCOME | ||||||||||||||||
Dividends | $ | 3,684,433 | $ | 4,787,663 | $ | 8,472,096 | ||||||||||
Interest | 40,073 | 12,060 | 52,133 | |||||||||||||
|
|
|
|
|
|
|
| |||||||||
Total income | 3,724,506 | 4,799,723 | — | 8,524,229 | ||||||||||||
|
|
|
|
|
|
|
| |||||||||
EXPENSES | ||||||||||||||||
Investment management fees | 2,028,956 | 1,484,562 | (474,858 | )(a) | 3,038,660 | |||||||||||
Distribution fees - Class IB | 475,367 | 547,478 | 1,022,845 | |||||||||||||
Administrative fees | 272,177 | 261,652 | (29,798 | )(b) | 504,031 | |||||||||||
Distribution fees - Class IA | 51,964 | 22,224 | 74,188 | |||||||||||||
Professional fees | 42,778 | 43,062 | (40,403 | )(b) | 45,437 | |||||||||||
Printing and mailing expenses | 18,702 | 24,501 | 43,203 | |||||||||||||
Custodian fees | 33,999 | 21,500 | (35,499 | )(b) | 20,000 | |||||||||||
Trustees’ fees | 8,582 | 7,212 | 15,794 | |||||||||||||
Miscellaneous | 11,282 | 7,489 | (11,282 | )(b) | 7,489 | |||||||||||
|
|
|
|
|
|
|
| |||||||||
Gross expenses | 2,943,807 | 2,419,680 | (591,840 | ) | 4,771,647 | |||||||||||
|
|
|
|
|
|
|
| |||||||||
Less:Waiver from investment manager | (265,988 | ) | (134,793 | ) | 232,314 | (d) | (168,467 | ) | ||||||||
Fees paid indirectly | (10,423 | ) | (9,680 | ) | 20,103 | (c) | — | |||||||||
|
|
|
|
|
|
|
| |||||||||
Net expenses | 2,667,396 | 2,275,207 | (339,423 | ) | 4,603,180 | |||||||||||
|
|
|
|
|
|
|
| |||||||||
NET INVESTMENT INCOME (LOSS) | 1,057,110 | 2,524,516 | 339,423 | 3,921,049 | ||||||||||||
|
|
|
|
|
|
|
| |||||||||
REALIZED AND UNREALIZED GAIN (LOSS) | ||||||||||||||||
Realized gain (loss) on: | ||||||||||||||||
Investments | 108,493,792 | 102,841,408 | 211,335,200 | |||||||||||||
Foreign currency transactions | (3,367 | ) | (265,515 | ) | (268,882 | ) | ||||||||||
|
|
|
|
|
|
|
| |||||||||
Net realized gain (loss) | 108,490,425 | 102,575,893 | — | 211,066,318 | ||||||||||||
|
|
|
|
|
|
|
| |||||||||
Change in unrealized appreciation (depreciation) on: | ||||||||||||||||
Investments | (42,552,360 | ) | (26,228,999 | ) | (68,781,359 | ) | ||||||||||
Foreign currency translations | 4,961 | 461,904 | 466,865 | |||||||||||||
|
|
|
|
|
|
|
| |||||||||
Net change in unrealized appreciation (depreciation) | (42,547,399 | ) | (25,767,095 | ) | — | (68,314,494 | ) | |||||||||
|
|
|
|
|
|
|
| |||||||||
NET REALIZED AND UNREALIZED GAIN (LOSS) | 65,943,026 | 76,808,798 | — | 142,751,824 | ||||||||||||
|
|
|
|
|
|
|
| |||||||||
NET INCREASE (DECREASE) IN NET ASSETS RESULTING FROM OPERATIONS | $ | 67,000,136 | $ | 79,333,314 | $ | 339,423 | $ | 146,672,873 | ||||||||
|
|
|
|
|
|
|
| |||||||||
| (a) | Reflects adjustment in expenses due to effects of the new contract rate for the Acquiring Portfolio. |
| (b) | Reflects adjustment in expenses due to elimination of duplicative expenses. |
| (c) | Reflects adjustment due to the termination of the brokerage recapture program. |
| (d) | Reflects decrease in waiver due to expense adjustment. |
33
NOTES TO PRO FORMA COMBINED FINANCIAL STATEMENTS
As of December 31, 2013
NOTE 1 – BASIS OF COMBINATION AND SIGNIFICANT ACCOUNTING POLICIES:
EQ Advisors Trust (the “Trust”) was organized as a Delaware statutory trust on October 31, 1996, and is registered under the Investment Company Act of 1940, as amended, as an open-end management investment company with numerous portfolios.
On December 10-11, 2013, the Board of Trustees of the Trust approved a proposed Plan of Reorganization and Termination (“Reorganization Plan”) that provides for the transfer of all of the assets of the EQ/Davis New York Venture Portfolio (“Davis Portfolio”) to the EQ/Invesco Comstock Portfolio (“Invesco Portfolio”), each a series of the Trust, and the assumption by the Invesco Portfolio of all of the liabilities of the Davis Portfolio in exchange for shares of the Invesco Portfolio having an aggregate value equal to the net assets of the Davis Portfolio, the distribution of the Invesco Portfolio shares to the Davis Portfolio shareholders of record determined immediately after the close of business on the closing date, and the subsequent liquidation of the Davis Portfolio.
The Davis Portfolio’s annual contractual management fee rate equals 0.850% of average daily net assets for the first $1 billion, 0.800% of average daily net assets for the next $1 billion, 0.775% for the next $3 billion, 0.750% for the next $5 billion, and 0.725% of average daily net assets thereafter. The Invesco Portfolio’s annual contractual management fee rate equals 0.650% of average daily net assets for the first $1 billion, 0.600% of average daily net assets for the next $1 billion, 0.575% for the next $3 billion, 0.550% for the next $5 billion, and 0.525% of average daily net assets thereafter. The Reorganization Plan is subject to shareholder approval of the Davis Portfolio. A special meeting of these shareholders will be held on or about May 21, 2014.
The Reorganization will be accounted for as a tax-free reorganization of investment companies. The unaudited pro forma combined financial statements are presented for the information of the reader and may not necessarily be representative of what the actual combined financial statements would have been had the Reorganization occurred at December 31, 2013. The unaudited pro forma combined portfolio of investments and statement of assets and liabilities reflect the financial position of the Davis Portfolio and the Invesco Portfolio at December 31, 2013. The unaudited pro forma combined statement of operations reflects the results of operations of the Invesco Portfolio as if it had acquired the Davis Portfolio at the beginning of the year ended December 31, 2013. These statements have been derived from the Portfolios’ respective books and records utilized in calculating daily net asset value at the dates indicated above for each Portfolio under accounting principles generally accepted in the United States of America. The historical cost of investment securities will be carried forward to the surviving entity and results of operations of the Invesco Portfolio for pre-combination periods will not be restated.
The unaudited pro forma combined portfolio of investments and statements of assets and liabilities and operations should be read in conjunction with the historical financial statements of the Portfolios included in the Trust’s Statement of Additional Information. Each of the Portfolios has substantially the same significant accounting policies as detailed in the historical financial statements. The preparation of financial statements in accordance with accounting principles generally accepted in the United States of America requires management to make estimates and assumptions that affect the reported amounts and disclosures. Actual results could differ from those estimates.
34
NOTES TO PRO FORMA COMBINED FINANCIAL STATEMENTS—(Continued)
As of December 31, 2013
Following the Reorganization, the Invesco Portfolio will be the “accounting survivor.”
NOTE 2 – SHARES:
The unaudited pro forma net asset value per share assumes common shares of beneficial interest retired for Class IA, and additional common shares of beneficial interest issued for Class IB and Class K, respectively, in connection with the proposed acquisition of the Davis Portfolio by the Invesco Portfolio as of December 31, 2013. The number of shares retired and additional shares issued were calculated based on the net assets of the Davis Portfolio and net asset value per share of the Invesco Portfolio at December 31, 2013.
35
NOTES TO PRO FORMA COMBINED FINANCIAL STATEMENTS—(Continued)
As of December 31, 2013
NOTE 3 – TAXES
Each Portfolio, as well as the Acquiring Portfolio after the Reorganization, intends to comply with the requirements of the Internal Revenue Code of 1986, as amended, applicable to regulated investment companies (“RICs”) and to distribute substantially all of its net investment income and net realized capital gains to shareholders of each Portfolio. Therefore, no Federal income tax provision is required.
NOTE 4 – UNAUDITED PRO FORMA COMBINED ADJUSTMENTS:
The accompanying unaudited pro forma combined financial statements reflect changes in the Invesco Portfolio’s shares as if the merger had taken place on December 31, 2013. The Davis Portfolio will bear the expenses, based on the fraction that its shareholder accounts will bear to the shareholder accounts of all the Acquired Portfolios at the merger date, of the Reorganization (i.e., the costs associated with preparing, printing and distributing the prospectus and proxy materials, legal and accounting fees in connection with the Reorganization, and expenses of holding the shareholders meeting), such expenses, which are not reflected in the unaudited pro forma combined statement of operations, are estimated to be approximately $40,400.
36
EQ ADVISORS TRUST
PORTFOLIO OF INVESTMENTS
December 31, 2013
| Number of Shares | Value ($) (Note 1) | |||||||||||||||||||||||
| EQ/Lord Abbett Large Cap Core | EQ/Invesco Comstock | Combined Pro-forma | EQ/Lord Abbett Large Cap Core | EQ/Invesco Comstock | Combined Pro-forma | |||||||||||||||||||
COMMON STOCKS: | ||||||||||||||||||||||||
Consumer Discretionary (12.9%) | ||||||||||||||||||||||||
Auto Components (0.8%) | ||||||||||||||||||||||||
BorgWarner, Inc. | 7,006 | — | 7,006 | 391,706 | — | 391,706 | ||||||||||||||||||
Johnson Controls, Inc. | — | 15,091 | 15,091 | — | 774,168 | 774,168 | ||||||||||||||||||
|
|
|
|
|
| |||||||||||||||||||
| 391,706 | 774,168 | 1,165,874 | ||||||||||||||||||||||
|
|
|
|
|
| |||||||||||||||||||
Automobiles (1.4%) | ||||||||||||||||||||||||
Ford Motor Co. | 37,066 | — | 37,066 | 571,928 | — | 571,928 | ||||||||||||||||||
General Motors Co.* | — | 36,542 | 36,542 | — | 1,493,471 | 1,493,471 | ||||||||||||||||||
|
|
|
|
|
| |||||||||||||||||||
| 571,928 | 1,493,471 | 2,065,399 | ||||||||||||||||||||||
|
|
|
|
|
| |||||||||||||||||||
Hotels, Restaurants & Leisure (2.2%) | ||||||||||||||||||||||||
Carnival Corp. | — | 26,495 | 26,495 | — | 1,064,304 | 1,064,304 | ||||||||||||||||||
Hyatt Hotels Corp., Class A* | 4,836 | — | 4,836 | 239,188 | — | 239,188 | ||||||||||||||||||
MGM Resorts International* | 33,415 | — | 33,415 | 785,921 | — | 785,921 | ||||||||||||||||||
Starwood Hotels & Resorts Worldwide, Inc. | 8,684 | — | 8,684 | 689,944 | — | 689,944 | ||||||||||||||||||
Wynn Resorts Ltd. | 2,206 | — | 2,206 | 428,427 | — | 428,427 | ||||||||||||||||||
|
|
|
|
|
| |||||||||||||||||||
| 2,143,480 | 1,064,304 | 3,207,784 | ||||||||||||||||||||||
|
|
|
|
|
| |||||||||||||||||||
Household Durables (0.3%) | ||||||||||||||||||||||||
Newell Rubbermaid, Inc. | — | 13,531 | 13,531 | — | 438,540 | 438,540 | ||||||||||||||||||
|
|
|
|
|
| |||||||||||||||||||
Internet & Catalog Retail (0.1%) | ||||||||||||||||||||||||
Amazon.com, Inc.* | 447 | — | 447 | 178,259 | — | 178,259 | ||||||||||||||||||
|
|
|
|
|
| |||||||||||||||||||
Media (4.8%) | ||||||||||||||||||||||||
Comcast Corp., Class A | — | 20,631 | 20,631 | — | 1,072,090 | 1,072,090 | ||||||||||||||||||
Time Warner Cable, Inc. | — | 7,349 | 7,349 | — | 995,790 | 995,790 | ||||||||||||||||||
Time Warner, Inc. | 6,427 | 6,936 | 13,363 | 448,090 | 483,578 | 931,668 | ||||||||||||||||||
Twenty-First Century Fox, Inc., Class A | 9,827 | — | 9,827 | 345,714 | — | 345,714 | ||||||||||||||||||
Twenty-First Century Fox, Inc., Class B | — | 28,127 | 28,127 | — | 973,194 | 973,194 | ||||||||||||||||||
Viacom, Inc., Class B | — | 18,718 | 18,718 | — | 1,634,830 | 1,634,830 | ||||||||||||||||||
Walt Disney Co. | 12,834 | — | 12,834 | 980,518 | — | 980,518 | ||||||||||||||||||
|
|
|
|
|
| |||||||||||||||||||
| 1,774,322 | 5,159,482 | 6,933,804 | ||||||||||||||||||||||
|
|
|
|
|
| |||||||||||||||||||
Multiline Retail (1.7%) | ||||||||||||||||||||||||
Kohl’s Corp. | 8,995 | 11,541 | 20,536 | 510,466 | 654,952 | 1,165,418 | ||||||||||||||||||
Macy’s, Inc. | 14,794 | — | 14,794 | 790,000 | — | 790,000 | ||||||||||||||||||
Target Corp. | — | 7,512 | 7,512 | — | 475,284 | 475,284 | ||||||||||||||||||
|
|
|
|
|
| |||||||||||||||||||
| 1,300,466 | 1,130,236 | 2,430,702 | ||||||||||||||||||||||
|
|
|
|
|
| |||||||||||||||||||
Specialty Retail (0.9%) | ||||||||||||||||||||||||
AutoZone, Inc.* | 732 | — | 732 | 349,852 | — | 349,852 | ||||||||||||||||||
Dick’s Sporting Goods, Inc. | 11,998 | — | 11,998 | 697,084 | — | 697,084 | ||||||||||||||||||
Home Depot, Inc. | 3,583 | — | 3,583 | 295,024 | — | 295,024 | ||||||||||||||||||
|
|
|
|
|
| |||||||||||||||||||
| 1,341,960 | — | 1,341,960 | ||||||||||||||||||||||
|
|
|
|
|
| |||||||||||||||||||
See notes to pro-forma combined financial statements.
37
EQ ADVISORS TRUST
PORTFOLIO OF INVESTMENTS
December 31, 2013
| Number of Shares | Value ($) (Note 1) | |||||||||||||||||||||||
| EQ/Lord Abbett Large Cap Core | EQ/Invesco Comstock | Combined Pro-forma | EQ/Lord Abbett Large Cap Core | EQ/Invesco Comstock | Combined Pro-forma | |||||||||||||||||||
Textiles, Apparel & Luxury Goods (0.7%) | ||||||||||||||||||||||||
PVH Corp. | 3,467 | — | 3,467 | 471,581 | — | 471,581 | ||||||||||||||||||
Ralph Lauren Corp. | 2,582 | — | 2,582 | 455,904 | — | 455,904 | ||||||||||||||||||
|
|
|
|
|
| |||||||||||||||||||
| 927,485 | — | 927,485 | ||||||||||||||||||||||
|
|
|
|
|
| |||||||||||||||||||
Total Consumer Discretionary | 8,629,606 | 10,060,201 | 18,689,807 | |||||||||||||||||||||
|
|
|
|
|
| |||||||||||||||||||
Consumer Staples (6.2%) | ||||||||||||||||||||||||
Beverages (1.3%) | ||||||||||||||||||||||||
Coca-Cola Co. | 22,132 | — | 22,132 | 914,273 | — | 914,273 | ||||||||||||||||||
PepsiCo, Inc. | 11,045 | — | 11,045 | 916,072 | — | 916,072 | ||||||||||||||||||
|
|
|
|
|
| |||||||||||||||||||
| 1,830,345 | — | 1,830,345 | ||||||||||||||||||||||
|
|
|
|
|
| |||||||||||||||||||
Food & Staples Retailing (1.7%) | ||||||||||||||||||||||||
CVS Caremark Corp. | 12,068 | 15,490 | 27,558 | 863,707 | 1,108,619 | 1,972,326 | ||||||||||||||||||
Wal-Mart Stores, Inc. | 6,161 | — | 6,161 | 484,809 | — | 484,809 | ||||||||||||||||||
|
|
|
|
|
| |||||||||||||||||||
| 1,348,516 | 1,108,619 | 2,457,135 | ||||||||||||||||||||||
|
|
|
|
|
| |||||||||||||||||||
Food Products (2.2%) | ||||||||||||||||||||||||
ConAgra Foods, Inc. | — | 25,445 | 25,445 | — | 857,497 | 857,497 | ||||||||||||||||||
Mondelez International, Inc., Class A | 22,476 | 17,317 | 39,793 | 793,403 | 611,290 | 1,404,693 | ||||||||||||||||||
Tyson Foods, Inc., Class A | — | 11,638 | 11,638 | — | 389,407 | 389,407 | ||||||||||||||||||
Unilever N.V. (N.Y. Shares) | — | 13,386 | 13,386 | — | 538,519 | 538,519 | ||||||||||||||||||
|
|
|
|
|
| |||||||||||||||||||
| 793,403 | 2,396,713 | 3,190,116 | ||||||||||||||||||||||
|
|
|
|
|
| |||||||||||||||||||
Household Products (0.8%) | ||||||||||||||||||||||||
Colgate-Palmolive Co. | 13,214 | — | 13,214 | 861,685 | — | 861,685 | ||||||||||||||||||
Procter & Gamble Co. | 4,385 | — | 4,385 | 356,983 | — | 356,983 | ||||||||||||||||||
|
|
|
|
|
| |||||||||||||||||||
| 1,218,668 | — | 1,218,668 | ||||||||||||||||||||||
|
|
|
|
|
| |||||||||||||||||||
Tobacco (0.2%) | ||||||||||||||||||||||||
Philip Morris International, Inc. | 3,649 | — | 3,649 | 317,937 | — | 317,937 | ||||||||||||||||||
|
|
|
|
|
| |||||||||||||||||||
Total Consumer Staples | 5,508,869 | 3,505,332 | 9,014,201 | |||||||||||||||||||||
|
|
|
|
|
| |||||||||||||||||||
Energy (12.6%) | ||||||||||||||||||||||||
Energy Equipment & Services (3.2%) | ||||||||||||||||||||||||
Halliburton Co. | 11,129 | 27,714 | 38,843 | 564,797 | 1,406,485 | 1,971,282 | ||||||||||||||||||
Noble Corp. plc | — | 7,317 | 7,317 | — | 274,168 | 274,168 | ||||||||||||||||||
Schlumberger Ltd. | 9,537 | — | 9,537 | 859,379 | — | 859,379 | ||||||||||||||||||
Weatherford International Ltd.* | — | 99,432 | 99,432 | — | 1,540,202 | 1,540,202 | ||||||||||||||||||
|
|
|
|
|
| |||||||||||||||||||
| 1,424,176 | 3,220,855 | 4,645,031 | ||||||||||||||||||||||
|
|
|
|
|
| |||||||||||||||||||
Oil, Gas & Consumable Fuels (9.4%) | ||||||||||||||||||||||||
Anadarko Petroleum Corp. | 7,781 | — | 7,781 | 617,189 | — | 617,189 | ||||||||||||||||||
BP plc (ADR) | — | 27,954 | 27,954 | — | 1,358,844 | 1,358,844 | ||||||||||||||||||
Cabot Oil & Gas Corp. | 1,003 | — | 1,003 | 38,876 | — | 38,876 | ||||||||||||||||||
Chevron Corp. | 5,994 | 6,183 | 12,177 | 748,711 | 772,319 | 1,521,030 | ||||||||||||||||||
EOG Resources, Inc. | 5,949 | — | 5,949 | 998,480 | — | 998,480 | ||||||||||||||||||
EQT Corp. | 2,257 | — | 2,257 | 202,633 | — | 202,633 | ||||||||||||||||||
Exxon Mobil Corp. | 10,718 | — | 10,718 | 1,084,662 | — | 1,084,662 | ||||||||||||||||||
Hess Corp. | 9,183 | — | 9,183 | 762,189 | — | 762,189 | ||||||||||||||||||
Marathon Petroleum Corp. | 3,353 | — | 3,353 | 307,571 | — | 307,571 | ||||||||||||||||||
Murphy Oil Corp. | — | 13,566 | 13,566 | — | 880,162 | 880,162 | ||||||||||||||||||
Occidental Petroleum Corp. | 10,025 | 8,232 | 18,257 | 953,378 | 782,863 | 1,736,241 | ||||||||||||||||||
Pioneer Natural Resources Co. | 3,435 | — | 3,435 | 632,280 | — | 632,280 | ||||||||||||||||||
QEP Resources, Inc. | — | 23,431 | 23,431 | — | 718,160 | 718,160 | ||||||||||||||||||
Range Resources Corp. | 2,331 | — | 2,331 | 196,527 | — | 196,527 | ||||||||||||||||||
See notes to pro-forma combined financial statements.
38
EQ ADVISORS TRUST
PORTFOLIO OF INVESTMENTS
December 31, 2013
| Number of Shares | Value ($) (Note 1) | |||||||||||||||||||||||
| EQ/Lord Abbett Large Cap Core | EQ/Invesco Comstock | Combined Pro-forma | EQ/Lord Abbett Large Cap Core | EQ/Invesco Comstock | Combined Pro-forma | |||||||||||||||||||
Royal Dutch Shell plc (ADR), Class A | — | 18,166 | 18,166 | — | 1,294,691 | 1,294,691 | ||||||||||||||||||
Suncor Energy, Inc. | — | 21,657 | 21,657 | — | 759,078 | 759,078 | ||||||||||||||||||
Valero Energy Corp. | 9,646 | — | 9,646 | 486,158 | — | 486,158 | ||||||||||||||||||
|
|
|
|
|
| |||||||||||||||||||
| 7,028,654 | 6,566,117 | 13,594,771 | ||||||||||||||||||||||
|
|
|
|
|
| |||||||||||||||||||
Total Energy | 8,452,830 | 9,786,972 | 18,239,802 | |||||||||||||||||||||
|
|
|
|
|
| |||||||||||||||||||
Financials (21.2%) | ||||||||||||||||||||||||
Capital Markets (4.8%) | ||||||||||||||||||||||||
Bank of New York Mellon Corp. | �� | — | 43,320 | 43,320 | — | 1,513,601 | 1,513,601 | |||||||||||||||||
Goldman Sachs Group, Inc. | 7,694 | 3,884 | 11,578 | 1,363,839 | 688,478 | 2,052,317 | ||||||||||||||||||
Invesco Ltd. | 11,993 | — | 11,993 | 436,545 | — | 436,545 | ||||||||||||||||||
Morgan Stanley | 23,259 | 34,365 | 57,624 | 729,402 | 1,077,686 | 1,807,088 | ||||||||||||||||||
State Street Corp. | 1,601 | 7,247 | 8,848 | 117,497 | 531,857 | 649,354 | ||||||||||||||||||
TD Ameritrade Holding Corp. | 14,964 | — | 14,964 | 458,497 | — | 458,497 | ||||||||||||||||||
|
|
|
|
|
| |||||||||||||||||||
| 3,105,780 | 3,811,622 | 6,917,402 | ||||||||||||||||||||||
|
|
|
|
|
| |||||||||||||||||||
Commercial Banks (4.9%) | ||||||||||||||||||||||||
Comerica, Inc. | 14,327 | — | 14,327 | 681,106 | — | 681,106 | ||||||||||||||||||
Fifth Third Bancorp | 7,352 | 33,632 | 40,984 | 154,613 | 707,281 | 861,894 | ||||||||||||||||||
PNC Financial Services Group, Inc. | 5,555 | 12,603 | 18,158 | 430,957 | 977,741 | 1,408,698 | ||||||||||||||||||
Regions Financial Corp. | 41,763 | — | 41,763 | 413,036 | — | 413,036 | ||||||||||||||||||
SunTrust Banks, Inc. | 11,398 | — | 11,398 | 419,560 | — | 419,560 | ||||||||||||||||||
U.S. Bancorp/Minnesota | 14,006 | 8,341 | 22,347 | 565,842 | 336,976 | 902,818 | ||||||||||||||||||
Wells Fargo & Co. | 20,057 | 31,227 | 51,284 | 910,588 | 1,417,706 | 2,328,294 | ||||||||||||||||||
|
|
|
|
|
| |||||||||||||||||||
| 3,575,702 | 3,439,704 | 7,015,406 | ||||||||||||||||||||||
|
|
|
|
|
| |||||||||||||||||||
Consumer Finance (0.8%) | ||||||||||||||||||||||||
Capital One Financial Corp. | 15,931 | — | 15,931 | 1,220,474 | — | 1,220,474 | ||||||||||||||||||
|
|
|
|
|
| |||||||||||||||||||
Diversified Financial Services (6.4%) | ||||||||||||||||||||||||
Bank of America Corp. | 27,073 | 70,989 | 98,062 | 421,527 | 1,105,299 | 1,526,826 | ||||||||||||||||||
Citigroup, Inc. | 22,219 | 51,574 | 73,793 | 1,157,832 | 2,687,521 | 3,845,353 | ||||||||||||||||||
JPMorgan Chase & Co. | 30,219 | 36,632 | 66,851 | 1,767,207 | 2,142,239 | 3,909,446 | ||||||||||||||||||
|
|
|
|
|
| |||||||||||||||||||
| 3,346,566 | 5,935,059 | 9,281,625 | ||||||||||||||||||||||
|
|
|
|
|
| |||||||||||||||||||
Insurance (4.1%) | ||||||||||||||||||||||||
Aflac, Inc. | — | 6,549 | 6,549 | — | 437,473 | 437,473 | ||||||||||||||||||
Allstate Corp. | — | 23,100 | 23,100 | — | 1,259,874 | 1,259,874 | ||||||||||||||||||
Chubb Corp. | 3,014 | — | 3,014 | 291,243 | — | 291,243 | ||||||||||||||||||
Hartford Financial Services Group, Inc. | 30,158 | — | 30,158 | 1,092,624 | — | 1,092,624 | ||||||||||||||||||
Lincoln National Corp. | 16,363 | — | 16,363 | 844,658 | — | 844,658 | ||||||||||||||||||
MetLife, Inc. | — | 16,577 | 16,577 | — | 893,832 | 893,832 | ||||||||||||||||||
Prudential Financial, Inc. | 9,000 | — | 9,000 | 829,980 | — | 829,980 | ||||||||||||||||||
Travelers Cos., Inc. | — | 2,842 | 2,842 | — | 257,315 | 257,315 | ||||||||||||||||||
|
|
|
|
|
| |||||||||||||||||||
| 3,058,505 | 2,848,494 | 5,906,999 | ||||||||||||||||||||||
|
|
|
|
|
| |||||||||||||||||||
Real Estate Investment Trusts (REITs) (0.2%) | ||||||||||||||||||||||||
Host Hotels & Resorts, Inc. (REIT) | 17,736 | — | 17,736 | 344,788 | — | 344,788 | ||||||||||||||||||
|
|
|
|
|
| |||||||||||||||||||
Total Financials | 14,651,815 | 16,034,879 | 30,686,694 | |||||||||||||||||||||
|
|
|
|
|
| |||||||||||||||||||
Health Care (12.9%) | ||||||||||||||||||||||||
Biotechnology (1.7%) | ||||||||||||||||||||||||
Celgene Corp.* | 3,736 | — | 3,736 | 631,234 | — | 631,234 | ||||||||||||||||||
Gilead Sciences, Inc.* | 11,498 | — | 11,498 | 864,075 | — | 864,075 | ||||||||||||||||||
Medivation, Inc.* | 9,362 | — | 9,362 | 597,483 | — | 597,483 | ||||||||||||||||||
Vertex Pharmaceuticals, Inc.* | 5,361 | — | 5,361 | 398,322 | — | 398,322 | ||||||||||||||||||
|
|
|
|
|
| |||||||||||||||||||
| 2,491,114 | — | 2,491,114 | ||||||||||||||||||||||
|
|
|
|
|
| |||||||||||||||||||
See notes to pro-forma combined financial statements.
39
EQ ADVISORS TRUST
PORTFOLIO OF INVESTMENTS
December 31, 2013
| Number of Shares | Value ($) (Note 1) | |||||||||||||||||||||||
| EQ/Lord Abbett Large Cap Core | EQ/Invesco Comstock | Combined Pro-forma | EQ/Lord Abbett Large Cap Core | EQ/Invesco Comstock | Combined Pro-forma | |||||||||||||||||||
Health Care Equipment & Supplies (0.5%) | ||||||||||||||||||||||||
Covidien plc | 10,216 | — | 10,216 | 695,710 | — | 695,710 | ||||||||||||||||||
|
|
|
|
|
| |||||||||||||||||||
Health Care Providers & Services (3.7%) | ||||||||||||||||||||||||
Cardinal Health, Inc. | — | 7,159 | 7,159 | — | 478,293 | 478,293 | ||||||||||||||||||
Express Scripts Holding Co.* | 19,014 | 5,777 | 24,791 | 1,335,543 | 405,776 | 1,741,319 | ||||||||||||||||||
HCA Holdings, Inc.* | 8,422 | — | 8,422 | 401,814 | — | 401,814 | ||||||||||||||||||
UnitedHealth Group, Inc. | 8,718 | 17,105 | 25,823 | 656,465 | 1,288,006 | 1,944,471 | ||||||||||||||||||
WellPoint, Inc. | — | 8,412 | 8,412 | — | 777,185 | 777,185 | ||||||||||||||||||
|
|
|
|
|
| |||||||||||||||||||
| 2,393,822 | 2,949,260 | 5,343,082 | ||||||||||||||||||||||
|
|
|
|
|
| |||||||||||||||||||
Pharmaceuticals (7.0%) | ||||||||||||||||||||||||
Bristol-Myers Squibb Co. | 21,718 | 18,260 | 39,978 | 1,154,312 | 970,519 | 2,124,831 | ||||||||||||||||||
Eli Lilly and Co. | 11,561 | — | 11,561 | 589,611 | — | 589,611 | ||||||||||||||||||
GlaxoSmithKline plc (ADR) | — | 11,614 | 11,614 | — | 620,072 | 620,072 | ||||||||||||||||||
Johnson & Johnson | 4,015 | — | 4,015 | 367,734 | — | 367,734 | ||||||||||||||||||
Merck & Co., Inc. | 2,947 | 27,757 | 30,704 | 147,497 | 1,389,238 | 1,536,735 | ||||||||||||||||||
Novartis AG (ADR) | — | 12,045 | 12,045 | — | 968,177 | 968,177 | ||||||||||||||||||
Pfizer, Inc. | 41,784 | 37,227 | 79,011 | 1,279,844 | 1,140,263 | 2,420,107 | ||||||||||||||||||
Roche Holding AG (ADR) | — | 8,877 | 8,877 | — | 623,165 | 623,165 | ||||||||||||||||||
Sanofi S.A. (ADR) | — | 17,409 | 17,409 | — | 933,645 | 933,645 | ||||||||||||||||||
|
|
|
|
|
| |||||||||||||||||||
| 3,538,998 | 6,645,079 | 10,184,077 | ||||||||||||||||||||||
|
|
|
|
|
| |||||||||||||||||||
Total Health Care | 9,119,644 | 9,594,339 | 18,713,983 | |||||||||||||||||||||
|
|
|
|
|
| |||||||||||||||||||
See notes to pro-forma combined financial statements.
40
EQ ADVISORS TRUST
PORTFOLIO OF INVESTMENTS
December 31, 2013
| Number of Shares | Value ($) (Note 1) | |||||||||||||||||||||||
| EQ/Lord Abbett Large Cap Core | EQ/Invesco Comstock | Combined Pro-forma | EQ/Lord Abbett Large Cap Core | EQ/Invesco Comstock | Combined Pro-forma | |||||||||||||||||||
Industrials (8.9%) | ||||||||||||||||||||||||
Aerospace & Defense (3.0%) | ||||||||||||||||||||||||
B/E Aerospace, Inc.* | 6,103 | — | 6,103 | 531,144 | — | 531,144 | ||||||||||||||||||
Boeing Co. | 5,629 | — | 5,629 | 768,302 | — | 768,302 | ||||||||||||||||||
Honeywell International, Inc. | 7,574 | 5,755 | 13,329 | 692,036 | 525,834 | 1,217,870 | ||||||||||||||||||
Textron, Inc. | — | 21,580 | 21,580 | — | 793,281 | 793,281 | ||||||||||||||||||
United Technologies Corp. | 8,677 | — | 8,677 | 987,443 | — | 987,443 | ||||||||||||||||||
|
|
|
|
|
| |||||||||||||||||||
| 2,978,925 | 1,319,115 | 4,298,040 | ||||||||||||||||||||||
|
|
|
|
|
| |||||||||||||||||||
Building Products (0.1%) | ||||||||||||||||||||||||
Allegion plc* | — | 2,591 | 2,591 | — | 114,481 | 114,481 | ||||||||||||||||||
|
|
|
|
|
| |||||||||||||||||||
Construction & Engineering (0.3%) | ||||||||||||||||||||||||
Fluor Corp. | 5,917 | — | 5,917 | 475,076 | — | 475,076 | ||||||||||||||||||
|
|
|
|
|
| |||||||||||||||||||
Electrical Equipment (1.7%) | ||||||||||||||||||||||||
Eaton Corp. plc | 8,897 | — | 8,897 | 677,240 | — | 677,240 | ||||||||||||||||||
Emerson Electric Co. | 14,561 | 11,453 | 26,014 | 1,021,891 | 803,772 | 1,825,663 | ||||||||||||||||||
|
|
|
|
|
| |||||||||||||||||||
| 1,699,131 | 803,772 | 2,502,903 | ||||||||||||||||||||||
|
|
|
|
|
| |||||||||||||||||||
Industrial Conglomerates (1.7%) | ||||||||||||||||||||||||
General Electric Co. | 35,515 | 52,815 | 88,330 | 995,485 | 1,480,405 | 2,475,890 | ||||||||||||||||||
|
|
|
|
|
| |||||||||||||||||||
Machinery (1.3%) | ||||||||||||||||||||||||
Caterpillar, Inc. | 3,152 | — | 3,152 | 286,233 | — | 286,233 | ||||||||||||||||||
Ingersoll-Rand plc | — | 15,932 | 15,932 | — | 981,411 | 981,411 | ||||||||||||||||||
PACCAR, Inc. | 9,962 | — | 9,962 | 589,452 | — | 589,452 | ||||||||||||||||||
|
|
|
|
|
| |||||||||||||||||||
| 875,685 | 981,411 | 1,857,096 | ||||||||||||||||||||||
|
|
|
|
|
| |||||||||||||||||||
Road & Rail (0.7%) | ||||||||||||||||||||||||
Union Pacific Corp. | 6,040 | — | 6,040 | 1,014,720 | — | 1,014,720 | ||||||||||||||||||
|
|
|
|
|
| |||||||||||||||||||
Trading Companies & Distributors (0.1%) | ||||||||||||||||||||||||
W.W. Grainger, Inc. | 844 | — | 844 | 215,574 | — | 215,574 | ||||||||||||||||||
|
|
|
|
|
| |||||||||||||||||||
Total Industrials | 8,254,596 | 4,699,184 | 12,953,780 | |||||||||||||||||||||
|
|
|
|
|
| |||||||||||||||||||
Information Technology (16.1%) | ||||||||||||||||||||||||
Communications Equipment (1.8%) | ||||||||||||||||||||||||
Cisco Systems, Inc. | 43,421 | 34,892 | 78,313 | 974,802 | 783,325 | 1,758,127 | ||||||||||||||||||
QUALCOMM, Inc. | 11,293 | — | 11,293 | 838,505 | — | 838,505 | ||||||||||||||||||
|
|
|
|
|
| |||||||||||||||||||
| 1,813,307 | 783,325 | 2,596,632 | ||||||||||||||||||||||
|
|
|
|
|
| |||||||||||||||||||
Computers & Peripherals (4.3%) | ||||||||||||||||||||||||
Apple, Inc. | 4,870 | — | 4,870 | 2,732,606 | — | 2,732,606 | ||||||||||||||||||
EMC Corp. | 30,836 | — | 30,836 | 775,525 | — | 775,525 | ||||||||||||||||||
Hewlett-Packard Co. | 6,840 | 44,684 | 51,524 | 191,383 | 1,250,258 | 1,441,641 | ||||||||||||||||||
NCR Corp.* | 27,625 | — | 27,625 | 940,908 | — | 940,908 | ||||||||||||||||||
NetApp, Inc. | 6,708 | — | 6,708 | 275,967 | — | 275,967 | ||||||||||||||||||
|
|
|
|
|
| |||||||||||||||||||
| 4,916,389 | 1,250,258 | 6,166,647 | ||||||||||||||||||||||
|
|
|
|
|
| |||||||||||||||||||
Electronic Equipment, Instruments & Components (0.5%) | ||||||||||||||||||||||||
Corning, Inc. | — | 45,078 | 45,078 | — | 803,290 | 803,290 | ||||||||||||||||||
|
|
|
|
|
| |||||||||||||||||||
Internet Software & Services (4.3%) | ||||||||||||||||||||||||
eBay, Inc.* | 6,989 | 16,713 | 23,702 | 383,626 | 917,377 | 1,301,003 | ||||||||||||||||||
Google, Inc., Class A* | 2,211 | — | 2,211 | 2,477,890 | — | 2,477,890 | ||||||||||||||||||
See notes to pro-forma combined financial statements.
41
EQ ADVISORS TRUST
PORTFOLIO OF INVESTMENTS
December 31, 2013
| Number of Shares | Value ($) (Note 1) | |||||||||||||||||||||||
| EQ/Lord Abbett Large Cap Core | EQ/Invesco Comstock | Combined Pro-forma | EQ/Lord Abbett Large Cap Core | EQ/Invesco Comstock | Combined Pro-forma | |||||||||||||||||||
Monster Worldwide, Inc.* | 58,146 | — | 58,146 | 414,581 | — | 414,581 | ||||||||||||||||||
Pandora Media, Inc.* | 23,651 | — | 23,651 | 629,117 | — | 629,117 | ||||||||||||||||||
Twitter, Inc.* | 110 | — | 110 | 7,001 | — | 7,001 | ||||||||||||||||||
Yahoo!, Inc.* | 21,317 | 11,550 | 32,867 | 862,059 | 467,082 | 1,329,141 | ||||||||||||||||||
|
|
|
|
|
| |||||||||||||||||||
| 4,774,274 | 1,384,459 | 6,158,733 | ||||||||||||||||||||||
|
|
|
|
|
| |||||||||||||||||||
IT Services (0.9%) | ||||||||||||||||||||||||
International Business Machines Corp. | 4,278 | — | 4,278 | 802,425 | — | 802,425 | ||||||||||||||||||
Vantiv, Inc., Class A* | 15,443 | — | 15,443 | 503,596 | — | 503,596 | ||||||||||||||||||
|
|
|
|
|
| |||||||||||||||||||
| 1,306,021 | — | 1,306,021 | ||||||||||||||||||||||
|
|
|
|
|
| |||||||||||||||||||
Semiconductors & Semiconductor Equipment (1.5%) |
| |||||||||||||||||||||||
Intel Corp. | 18,522 | 21,053 | 39,575 | 480,831 | 546,536 | 1,027,367 | ||||||||||||||||||
Micron Technology, Inc.* | 24,483 | — | 24,483 | 532,750 | — | 532,750 | ||||||||||||||||||
Texas Instruments, Inc. | 13,418 | — | 13,418 | 589,185 | — | 589,185 | ||||||||||||||||||
|
|
|
|
|
| |||||||||||||||||||
| 1,602,766 | 546,536 | 2,149,302 | ||||||||||||||||||||||
|
|
|
|
|
| |||||||||||||||||||
Software (2.8%) | ||||||||||||||||||||||||
Autodesk, Inc.* | — | 8,498 | 8,498 | — | 427,704 | 427,704 | ||||||||||||||||||
Informatica Corp.* | 10,131 | — | 10,131 | 420,436 | — | 420,436 | ||||||||||||||||||
Microsoft Corp. | 24,346 | 32,250 | 56,596 | 911,271 | 1,207,118 | 2,118,389 | ||||||||||||||||||
Oracle Corp. | 23,525 | — | 23,525 | 900,066 | — | 900,066 | ||||||||||||||||||
VMware, Inc., Class A* | 2,587 | — | 2,587 | 232,080 | — | 232,080 | ||||||||||||||||||
|
|
|
|
|
| |||||||||||||||||||
| 2,463,853 | 1,634,822 | 4,098,675 | ||||||||||||||||||||||
|
|
|
|
|
| |||||||||||||||||||
Total Information Technology | 16,876,610 | 6,402,690 | 23,279,300 | |||||||||||||||||||||
|
|
|
|
|
| |||||||||||||||||||
Materials (3.0%) | ||||||||||||||||||||||||
Chemicals (0.9%) | ||||||||||||||||||||||||
Celanese Corp. | 4,703 | — | 4,703 | 260,123 | — | 260,123 | ||||||||||||||||||
Dow Chemical Co. | 9,544 | — | 9,544 | 423,754 | — | 423,754 | ||||||||||||||||||
E.I. du Pont de Nemours & Co. | 1,923 | — | 1,923 | 124,937 | — | 124,937 | ||||||||||||||||||
LyondellBasell Industries N.V., Class A | 5,395 | — | 5,395 | 433,110 | — | 433,110 | ||||||||||||||||||
Monsanto Co. | 347 | — | 347 | 40,443 | — | 40,443 | ||||||||||||||||||
|
|
|
|
|
| |||||||||||||||||||
| 1,282,367 | — | 1,282,367 | ||||||||||||||||||||||
|
|
|
|
|
| |||||||||||||||||||
Containers & Packaging (0.4%) | ||||||||||||||||||||||||
Rock-Tenn Co., Class A | 4,953 | — | 4,953 | 520,115 | — | 520,115 | ||||||||||||||||||
|
|
|
|
|
| |||||||||||||||||||
Metals & Mining (1.2%) | ||||||||||||||||||||||||
Alcoa, Inc. | — | 62,120 | 62,120 | — | 660,336 | 660,336 | ||||||||||||||||||
Freeport-McMoRan Copper & Gold, Inc. | 14,074 | — | 14,074 | 531,153 | — | 531,153 | ||||||||||||||||||
Reliance Steel & Aluminum Co. | 4,304 | — | 4,304 | 326,415 | — | 326,415 | ||||||||||||||||||
United States Steel Corp. | 9,642 | — | 9,642 | 284,439 | — | 284,439 | ||||||||||||||||||
|
|
|
|
|
| |||||||||||||||||||
| 1,142,007 | 660,336 | 1,802,343 | ||||||||||||||||||||||
|
|
|
|
|
| |||||||||||||||||||
Paper & Forest Products (0.5%) | ||||||||||||||||||||||||
International Paper Co. | — | 14,800 | 14,800 | — | 725,644 | 725,644 | ||||||||||||||||||
|
|
|
|
|
| |||||||||||||||||||
Total Materials | 2,944,489 | 1,385,980 | 4,330,469 | |||||||||||||||||||||
|
|
|
|
|
| |||||||||||||||||||
Telecommunication Services (1.4%) | ||||||||||||||||||||||||
Diversified Telecommunication Services (1.0%) |
| |||||||||||||||||||||||
AT&T, Inc. | — | 7,368 | 7,368 | — | 259,059 | 259,059 | ||||||||||||||||||
Verizon Communications, Inc. | 10,423 | 7,994 | 18,417 | 512,186 | 392,825 | 905,011 | ||||||||||||||||||
Vivendi S.A. | — | 8,015 | 8,015 | — | 211,208 | 211,208 | ||||||||||||||||||
|
|
|
|
|
| |||||||||||||||||||
| 512,186 | 863,092 | 1,375,278 | ||||||||||||||||||||||
|
|
|
|
|
| |||||||||||||||||||
See notes to pro-forma combined financial statements.
42
EQ ADVISORS TRUST
PORTFOLIO OF INVESTMENTS
December 31, 2013
| Number of Shares | Value ($) (Note 1) | |||||||||||||||||||||||
| EQ/Lord Abbett Large Cap Core | EQ/Invesco Comstock | Combined Pro-forma | EQ/Lord Abbett Large Cap Core | EQ/Invesco Comstock | Combined Pro-forma | |||||||||||||||||||
Wireless Telecommunication Services (0.4%) |
| |||||||||||||||||||||||
Vodafone Group plc (ADR) | — | 15,698 | 15,698 | — | 617,088 | 617,088 | ||||||||||||||||||
|
|
|
|
|
| |||||||||||||||||||
Total Telecommunication Services | 512,186 | 1,480,180 | 1,992,366 | |||||||||||||||||||||
|
|
|
|
|
| |||||||||||||||||||
Utilities (1.6%) | ||||||||||||||||||||||||
Electric Utilities (1.0%) | ||||||||||||||||||||||||
Duke Energy Corp. | 2,870 | — | 2,870 | 198,059 | — | 198,059 | ||||||||||||||||||
FirstEnergy Corp. | — | 9,586 | 9,586 | — | 316,146 | 316,146 | ||||||||||||||||||
NextEra Energy, Inc. | 2,364 | — | 2,364 | 202,405 | — | 202,405 | ||||||||||||||||||
PPL Corp. | — | 24,729 | 24,729 | — | 744,096 | 744,096 | ||||||||||||||||||
|
|
|
|
|
| |||||||||||||||||||
| 400,464 | 1,060,242 | 1,460,706 | ||||||||||||||||||||||
|
|
|
|
|
| |||||||||||||||||||
Multi-Utilities (0.6%) | ||||||||||||||||||||||||
Dominion Resources, Inc. | 2,507 | — | 2,507 | 162,178 | — | 162,178 | ||||||||||||||||||
PG&E Corp. | 4,539 | 11,133 | 15,672 | 182,831 | 448,437 | 631,268 | ||||||||||||||||||
|
|
|
|
|
| |||||||||||||||||||
| 345,009 | 448,437 | 793,446 | ||||||||||||||||||||||
|
|
|
|
|
| |||||||||||||||||||
Total Utilities | 745,473 | 1,508,679 | 2,254,152 | |||||||||||||||||||||
|
|
|
|
|
| |||||||||||||||||||
Total Investments (96.8%) | 75,696,118 | 64,458,436 | 140,154,554 | |||||||||||||||||||||
Other Assets Less Liabilities (3.2%) | 1,858,355 | 2,767,394 | 4,625,749 | |||||||||||||||||||||
|
|
|
|
|
| |||||||||||||||||||
Net Assets (100%) | $ | 77,554,473 | $ | 67,225,830 | $ | 144,780,303 | ||||||||||||||||||
|
|
|
|
|
| |||||||||||||||||||
| * | Non-income producing. |
| Glossary |
| ADR — American Depositary Receipt |
See notes to pro-forma combined financial statements.
43
At December 31, 2013 the Portfolio had the following outstanding foreign currency contracts to buy/sell foreign currencies as follows: (Note 1)
EQ/Invesco Comstock/Combined Pro-forma
Foreign Currency Sell Contracts | Counterparty | Local Contract Sell Amount (000’s) | U.S. $ Settlement Value | U.S. $ Current Value | Unrealized Appreciation/ (Depreciation) | |||||||||||||
British Pound vs. U.S. Dollar, | Bank of New York Mellon Corp. | 326 | $ | 536,237 | $ | 540,511 | $ | (4,274 | ) | |||||||||
British Pound vs. U.S. Dollar, | CIBC World Markets, Inc. | 326 | 536,263 | 540,510 | (4,247 | ) | ||||||||||||
British Pound vs. U.S. Dollar, | Citibank N.A. | 291 | 478,046 | 481,767 | (3,721 | ) | ||||||||||||
British Pound vs. U.S. Dollar, | State Street Bank & Trust | 326 | 536,227 | 540,510 | (4,283 | ) | ||||||||||||
Canadian Dollar vs U.S. Dollar, | CIBC World Markets, Inc. | 642 | 603,069 | 604,163 | (1,094 | ) | ||||||||||||
European Union Euro vs. U.S. Dollar, expiring 1/17/14 | Bank of New York Mellon Corp. | 420 | 577,313 | 578,083 | (770 | ) | ||||||||||||
European Union Euro vs. U.S. Dollar, expiring 1/17/14 | CIBC World Markets, Inc. | 420 | 577,240 | 578,083 | (843 | ) | ||||||||||||
European Union Euro vs. U.S. Dollar, expiring 1/17/14 | Citibank N.A. | 420 | 577,321 | 578,083 | (762 | ) | ||||||||||||
European Union Euro vs. U.S. Dollar, expiring 1/17/14 | State Street Bank & Trust | 425 | 583,635 | 584,448 | (813 | ) | ||||||||||||
Swiss Franc vs U.S. Dollar, | Bank of New York Mellon Corp. | 396 | 445,527 | 444,355 | 1,172 | |||||||||||||
Swiss Franc vs U.S. Dollar, | Citibank N.A. | 362 | 406,662 | 405,602 | 1,060 | |||||||||||||
Swiss Franc vs U.S. Dollar, | State Street Bank & Trust | 396 | 445,426 | 444,355 | 1,071 | |||||||||||||
|
| |||||||||||||||||
| $ | (17,504 | ) | ||||||||||||||||
|
| |||||||||||||||||
44
The following is a summary of the inputs used to value the Portfolio’s net assets as of December 31, 2013 :
The inputs or methodology used for valuing securities are not necessarily an indication of the risk associated with investing in those securities.
Various inputs are used in determining the value of the Portfolio’s investments. These inputs are summarized in the three broad levels listed below:
| • | Level 1 - Quoted prices in active markets for identical securities |
| • | Level 2 - Significant other observable inputs (including quoted prices for similar securities, interest rates, prepayment speeds, credit risk, etc.) |
| • | Level 3 - Significant unobservable inputs (including the Portfolio’s own assumptions in determining the fair value of investments) |
Description | Quoted Prices in Active Markets for Identical Securities (Level 1) | Significant Other Observable Inputs (Level 2) | Significant Unobservable Inputs (Level 3) | Total | ||||||||||||||||||||||||||||||||||||||||||||
| EQ/ Lord Abbett Large Cap Core | EQ/ Invesco Comstock | Combined Pro-forma | EQ/ Lord Abbett Large Cap Core | EQ/ Invesco Comstock | Combined Pro-forma | EQ/ Lord Abbett Large Cap Core | EQ/ Invesco Comstock | Combined Pro-forma | EQ/ Lord Abbett Large Cap Core | EQ/ Invesco Comstock | Combined Pro-forma | |||||||||||||||||||||||||||||||||||||
Assets | ||||||||||||||||||||||||||||||||||||||||||||||||
Investments in Securities | $ | 75,696,118 | $ | 64,247,228 | $ | 139,943,346 | $ | — | $ | 211,208 | $ | 211,208 | $ | — | $ | — | $ | — | $ | 75,696,118 | $ | 64,458,436 | $ | 140,154,554 | ||||||||||||||||||||||||
Other Investments* | — | — | — | — | 3,303 | 3,303 | — | — | — | — | 3,303 | 3,303 | ||||||||||||||||||||||||||||||||||||
|
|
|
|
|
|
|
|
|
|
|
|
|
|
|
|
|
|
|
|
|
|
|
| |||||||||||||||||||||||||
Total | $ | 75,696,118 | $ | 64,247,228 | $ | 139,943,346 | $ | — | $ | 214,511 | $ | 214,511 | $ | — | $ | — | $ | — | $ | 75,696,118 | $ | 64,461,739 | $ | 140,157,857 | ||||||||||||||||||||||||
|
|
|
|
|
|
|
|
|
|
|
|
|
|
|
|
|
|
|
|
|
|
|
| |||||||||||||||||||||||||
Liabilities | ||||||||||||||||||||||||||||||||||||||||||||||||
Investments in Securities | $ | — | $ | — | $ | — | $ | — | $ | — | $ | — | $ | — | $ | — | $ | — | $ | — | $ | — | $ | — | ||||||||||||||||||||||||
Other Investments* | — | — | — | — | (20,807 | ) | (20,807 | ) | — | — | — | — | (20,807 | ) | (20,807 | ) | ||||||||||||||||||||||||||||||||
|
|
|
|
|
|
|
|
|
|
|
|
|
|
|
|
|
|
|
|
|
|
|
| |||||||||||||||||||||||||
Total | $ | — | $ | — | $ | — | $ | — | $ | (20,807 | ) | $ | (20,807 | ) | $ | — | $ | — | $ | — | $ | — | $ | (20,807 | ) | $ | (20,807 | ) | ||||||||||||||||||||
|
|
|
|
|
|
|
|
|
|
|
|
|
|
|
|
|
|
|
|
|
|
|
| |||||||||||||||||||||||||
Total Assets and Liabilities | $ | 75,696,118 | $ | 64,247,228 | $ | 139,943,346 | $ | — | $ | 193,704 | $ | 193,704 | $ | — | $ | — | $ | — | $ | 75,696,118 | $ | 64,440,932 | $ | 140,137,050 | ||||||||||||||||||||||||
|
|
|
|
|
|
|
|
|
|
|
|
|
|
|
|
|
|
|
|
|
|
|
| |||||||||||||||||||||||||
| * | Other investments are derivative instruments, such as futures, forwards and written options, which are valued at the unrealized appreciation/depreciation on the instrument. |
There were no transfers between Levels 1, 2 or 3 during the year ended December 31, 2013.
Fair Values of Derivative Instruments as of December 31, 2013:
EQ/Invesco Comstock/Combined Pro-forma
Statement of Assets and Liabilities | ||||||
Derivatives Not Accounted for as Hedging Instruments^ | Asset Derivatives | Fair Value | ||||
Interest rate contracts | Receivables, Net Assets- | |||||
| Unrealized appreciation | $ | — | * | |||
Foreign exchange contracts | Receivables | 3,303 | ||||
Credit contracts | Receivables- | — | ||||
Equity contracts | Receivables, Net Assets- | — | ||||
| Unrealized appreciation | — | * | ||||
Commodity contracts | Receivables- | — | ||||
Other contracts | Receivables- | — | ||||
|
| |||||
| Total | $ | 3,303 | ||||
|
| |||||
Liability Derivatives | ||||||
| Interest rate contracts | Payables, Net Assets- | |||||
| Unrealized depreciation | $ | — | * | |||
| Foreign exchange contracts | Payables | (20,807 | ) | |||
| Credit contracts | Payables | — | ||||
| Equity contracts | Payables, Net Assets- | — | ||||
| Unrealized depreciation | — | * | ||||
| Commodity contracts | Payables | — | ||||
| Other contracts | Payables | — | ||||
|
| |||||
Total | $ | (20,807 | ) | |||
|
| |||||
| * | Includes cumulative appreciation/depreciation of futures contracts as reported in the Portfolio of Investments. Only current day’s variation margin is reported within the Statement of Assets & Liabilities. |
The effect of Derivative Instruments on the Statement of Operations for the year ended December 31, 2013:
Amount of Realized Gain or (Loss) on Derivatives Recognized in Income | ||||||||||||||||||||
Derivatives Not Accounted for as Hedging Instruments^ | Options | Futures | Forward Currency Contracts | Swaps | Total | |||||||||||||||
Interest rate contracts | $ | — | $ | — | $ | — | $ | — | $ | — | ||||||||||
Foreign exchange contracts | — | — | (834,951 | ) | — | (834,951 | ) | |||||||||||||
Credit contracts | — | — | — | — | — | |||||||||||||||
Equity contracts | — | — | — | — | — | |||||||||||||||
Commodity contracts | — | — | — | — | — | |||||||||||||||
Other contracts | — | — | — | — | — | |||||||||||||||
|
|
|
|
|
|
|
|
|
| |||||||||||
Total | $ | — | $ | — | $ | (834,951 | ) | $ | — | $ | (834,951 | ) | ||||||||
|
|
|
|
|
|
|
|
|
| |||||||||||
Amount of Unrealized Appreciation or (Depreciation) on Derivatives Recognized in Income | ||||||||||||||||||||
Derivatives Not Accounted for as Hedging Instruments^ | Options | Futures | Forward Currency Contracts | Swaps | Total | |||||||||||||||
Interest rate contracts | $ | — | $ | — | $ | — | $ | — | $ | — | ||||||||||
Foreign exchange contracts | — | — | 461,890 | — | 461,890 | |||||||||||||||
Credit contracts | — | — | — | — | — | |||||||||||||||
Equity contracts | — | — | — | — | — | |||||||||||||||
Commodity contracts | — | — | — | — | — | |||||||||||||||
Other contracts | — | — | — | — | — | |||||||||||||||
|
|
|
|
|
|
|
|
|
| |||||||||||
Total | $ | — | $ | — | $ | 461,890 | $ | — | $ | 461,890 | ||||||||||
|
|
|
|
|
|
|
|
|
| |||||||||||
| ^ | The Portfolio held forward foreign currency contracts as a substitute for investing in conventional securities, hedging and in an attempt to enhance returns. |
The Portfolio held forward foreign currency contracts with an average settlement value of approximately $23,005,000 during the year ended December 31, 2013.
EQ/Invesco Comstock/Combined Pro-forma
The following table presents the Portfolio’s gross derivative assets and liabilities by counterparty net of amounts available for offset under netting arrangements and any related collateral received or pledged by the Portfolio as of December 31, 2013:
Counterparty | Gross Amount of Derivative Assets Presented in the Statement of Assets and Liabilities (a) | Derivatives Available for Offset | Collateral Received | Net Amount Due from Counterparty | ||||||||||||
Bank of New York Mellon Corp. | $ | 1,172 | $ | (1,172 | ) | $ | — | $ | — | |||||||
Citibank N.A. | 1,060 | (1,060 | ) | — | — | |||||||||||
State Street Bank & Trust | 1,071 | (1,071 | ) | — | — | |||||||||||
|
|
|
|
|
|
|
| |||||||||
| $ | 3,303 | $ | (3,303 | ) | $ | — | $ | — | ||||||||
|
|
|
|
|
|
|
| |||||||||
Counterparty | Gross Amount of Derivative Liabilities Presented in the Statement of Assets and Liabilities (a) | Derivatives Available for Offset | Collateral Pledged | Net Amount Due to Counterparty | ||||||||||||
Bank of New York Mellon Corp. | $ | 5,044 | $ | (1,172 | ) | $ | — | $ | 3,872 | |||||||
Citibank N.A. | 4,483 | (1,060 | ) | — | 3,423 | |||||||||||
State Street Bank & Trust | 5,096 | (1,071 | ) | — | 4,025 | |||||||||||
CIBC World Markets, Inc. | 6,184 | — | — | 6,184 | ||||||||||||
|
|
|
|
|
|
|
| |||||||||
| $ | 20,807 | $ | (3,303 | ) | $ | — | $ | 17,504 | ||||||||
|
|
|
|
|
|
|
| |||||||||
| (a) | For financial reporting purposes the Portfolio does not offset derivative assets and derivative liabilities subject to master netting arrangements in the Statement of Assets and Liabilities. |
Investment security transactions for the year ended December 31, 2013 were as follows:
| EQ/Lord Abbett Large Cap Core | EQ/Invesco Comstock | Combined Pro-forma | ||||||||||
Cost of Purchases: | ||||||||||||
Long-term investments other than U.S. government debt securities | $ | 45,448,469 | $ | 41,404,342 | $ | 86,852,811 | ||||||
Net Proceeds of Sales and Redemptions: | ||||||||||||
Long-term investments other than U.S. government debt securities | $ | 67,347,239 | $ | 30,715,596 | $ | 98,062,835 | ||||||
48
As of December 31, 2013, the gross unrealized appreciation (depreciation) of investments based on the aggregate cost of investments for federal income tax purposes was as follows:
| EQ/Lord Abbett Large Cap Core | EQ/Invesco Comstock | Combined Pro-forma | ||||||||||
Aggregate gross unrealized appreciation | $ | 24,901,238 | $ | 19,578,886 | $ | 44,480,124 | ||||||
Aggregate gross unrealized depreciation | (1,327,964 | ) | (611,259 | ) | (1,939,223 | ) | ||||||
|
|
|
|
|
| |||||||
Net unrealized appreciation | $ | 23,573,274 | $ | 18,967,627 | $ | 42,540,901 | ||||||
|
|
|
|
|
| |||||||
Federal income tax cost of investments | $ | 52,122,844 | $ | 45,490,809 | $ | 97,613,653 | ||||||
|
|
|
|
|
| |||||||
Affiliated Broker Dealer
EQ/Invesco Comstock/Combined Pro-forma
For the year ended December 31, 2013, the Portfolio incurred approximately $741 as brokerage commissions with Sanford C. Bernstein & Co., LLC, an affiliated broker/dealer.
Capital Loss Carryforward
EQ/Lord Abbett Large Cap Core
The Portfolio utilized net capital loss carryforward of $2,931,792 during 2013.
EQ/Invesco Comstock
The Portfolio has a net capital loss carryforward of $33,389,278, which expires in the year 2017. The Portfolio utilized net capital loss carryforward of $10,219,374 during 2013.
Combined Pro-forma
The Portfolio has a net capital loss carryforward of $33,389,278, which expires in the year 2017. The Portfolio utilized net capital loss carryforward of $13,151,166 during 2013.
Certain capital loss carryforwards may be subject to limitations on use pursuant to applicable U.S. Federal Income Tax Law. Therefore, it is possible not all of these capital losses will be available for use.
49
STATEMENT OF ASSETS AND LIABILITIES
December 31, 2013
| EQ/Lord Abbett Large Cap Core | EQ/Invesco Comstock | Pro-forma Adjustment | Combined Pro-forma | |||||||||||||
Investments at cost | $ | 51,862,485 | $ | 44,983,899 | $ | 96,846,384 | ||||||||||
Foreign cash at cost | $ | — | $ | 268 | $ | 268 | ||||||||||
ASSETS | ||||||||||||||||
Investments at value | $ | 75,696,118 | $ | 64,458,436 | $ | 140,154,554 | ||||||||||
Cash | 2,025,575 | 2,599,812 | 4,625,387 | |||||||||||||
Foreign cash | — | 288 | 288 | |||||||||||||
Receivable from Separate Accounts for Trust shares sold | 20,504 | 172,349 | 192,853 | |||||||||||||
Dividends, interest, and other receivables | 95,356 | 96,249 | 191,605 | |||||||||||||
Receivable for securities sold | — | 135,489 | 135,489 | |||||||||||||
Unrealized appreciation on forward foreign currency | — | 3,303 | 3,303 | |||||||||||||
Other assets | 1,025 | 1,412 | 2,437 | |||||||||||||
|
|
|
|
|
|
|
| |||||||||
Total assets | 77,838,578 | 67,467,338 | — | 145,305,916 | ||||||||||||
|
|
|
|
|
|
|
| |||||||||
LIABILITIES | ||||||||||||||||
Payable to Separate Accounts for Trust shares redeemed | 209,192 | 61,157 | 270,349 | |||||||||||||
Payable for securities purchased | — | 95,658 | 95,658 | |||||||||||||
Investment management fees payable | 32,377 | 23,302 | 55,679 | |||||||||||||
Administrative fees payable | 16,560 | 15,655 | 32.215 | |||||||||||||
Unrealized depreciation on forward foreign currency contracts | — | 20,807 | 20,807 | |||||||||||||
Distribution fees payable - Class IB | 14,117 | 10,918 | 25,035 | |||||||||||||
Distribution fees payable - Class IA | 1,984 | 2,297 | 4,281 | |||||||||||||
Accrued expenses | 9,875 | 11,714 | 41,861 | (b) | 63,450 | |||||||||||
|
|
|
|
|
|
|
| |||||||||
Total liabilities | 284,105 | 241,508 | 41,861 | 567,474 | ||||||||||||
|
|
|
|
|
|
|
| |||||||||
NET ASSETS | 77,554,473 | 67,225,830 | (41,861 | ) | 144,738,442 | |||||||||||
|
|
|
|
|
|
|
| |||||||||
Net assets were comprised of: | ||||||||||||||||
Paid in capital | 52,138,594 | 81,763,178 | 133,901,772 | |||||||||||||
Accumulated undistributed net investment income (loss) | 50,430 | (82,245 | ) | (41,861 | )(b) | (73,676 | ) | |||||||||
Accumulated undistributed net realized gain (loss) on investments and foreign currency transactions | 1,531,816 | (33,912,157 | ) | (32,380,341 | ) | |||||||||||
Net unrealized appreciaiton (depreciation) on investments and foreign currency translations | 23,833,633 | 19,457,054 | 43,290,687 | |||||||||||||
|
|
|
|
|
|
|
| |||||||||
Net Assets | $ | 77,554,473 | $ | 67,225,830 | $ | (41,861 | ) | $ | 144,738,442 | |||||||
|
|
|
|
|
|
|
| |||||||||
Class IA Shares: | ||||||||||||||||
Net Assets | 9,301,199 | 10,933,468 | (5,851 | )(b) | 20,228,816 | |||||||||||
Shares outstanding | 685,723 | 780,354 | (22,286 | )(a) | 1,443,791 | |||||||||||
|
|
|
|
|
|
|
| |||||||||
Net asset value, offering and redemption price per share | $ | 13.56 | $ | 14.01 | $ | 14.01 | ||||||||||
|
|
|
|
|
|
|
| |||||||||
Class IB Shares: | ||||||||||||||||
Net Assets | 68,253,274 | 53,094,973 | (35,086 | )(b) | 121,313,161 | |||||||||||
Shares outstanding | 5,024,505 | 3,786,410 | (159,599 | )(a) | 8,651,316 | |||||||||||
|
|
|
|
|
|
|
| |||||||||
Net asset value, offering and redemption price per share | $ | 13.58 | $ | 14.02 | $ | 14.02 | ||||||||||
|
|
|
|
|
|
|
| |||||||||
Class K Shares: | ||||||||||||||||
Net Assets | 3,197,389 | (924 | )(b) | 3,196,465 | ||||||||||||
Shares outstanding | — | 228,690 | (66 | )(a) | 228,624 | |||||||||||
|
|
|
|
|
|
|
| |||||||||
Net asset value, offering and redemption price per share | N/A | $ | 13.98 | $ | 13.98 | |||||||||||
|
|
|
|
|
|
|
| |||||||||
| (a) | Reflects retired shares of the Acquired Portfolio. |
| (b) | Reflects adjustment due to proxy costs associated with the reorganization. |
50
STATEMENT OF OPERATIONS
For the Year Ended December 31, 2013
| EQ/Lord Abbett Large Cap Core | EQ/Invesco Comstock | Pro-forma Adjustment | Combined Pro-forma | |||||||||||||
Dividend foreign withholding tax | $ | 7,132 | $ | 53,913 | $ | 61,045 | ||||||||||
INVESTMENT INCOME | ||||||||||||||||
Dividends | $ | 3,056,156 | $ | 4,787,663 | $ | 7,843,819 | ||||||||||
Interest | 2,176 | 12,060 | 14,236 | |||||||||||||
|
|
|
|
|
|
|
| |||||||||
Total income | 3,058,332 | 4,799,723 | — | 7,858,055 | ||||||||||||
|
|
|
|
|
|
|
| |||||||||
EXPENSES | ||||||||||||||||
Investment management fees | 1,025,521 | 1,484,562 | 2,510,083 | |||||||||||||
Distribution fees - Class IB | 372,043 | 547,478 | 919,521 | |||||||||||||
Administrative fees | 190,070 | 261,652 | (29,864 | )(b) | 421,858 | |||||||||||
Distribution fees - Class IA | 22,388 | 22,224 | 44,612 | |||||||||||||
Professional fees | 45,109 | 43,062 | (43,999 | )(b) | 44,172 | |||||||||||
Printing and mailing expenses | 13,344 | 24,501 | 37,845 | |||||||||||||
Custodian fees | 16,000 | 21,500 | (17,500 | )(b) | 20,000 | |||||||||||
Trustees’ fees | 5,498 | 7,212 | 12,710 | |||||||||||||
Miscellaneous | 5,972 | 7,489 | (5,972 | )(b) | 7,489 | |||||||||||
|
|
|
|
|
|
|
| |||||||||
Gross expenses | 1,695,945 | 2,419,680 | (97,335 | ) | 4,018,290 | |||||||||||
|
|
|
|
|
|
|
| |||||||||
Less:Waiver from investment manager | (117,372 | ) | (134,793 | ) | 96,367 | (d) | (155,798 | ) | ||||||||
Fees paid indirectly | (8,539 | ) | (9,680 | ) | 18,219 | (c) | — | |||||||||
|
|
|
|
|
|
|
| |||||||||
Net expenses | 1,570,034 | 2,275,207 | 17,251 | 3,862,492 | ||||||||||||
|
|
|
|
|
|
|
| |||||||||
NET INVESTMENT INCOME (LOSS) | 1,488,298 | 2,524,516 | (17,251 | ) | 3,995,563 | |||||||||||
|
|
|
|
|
|
|
| |||||||||
REALIZED AND UNREALIZED GAIN (LOSS) | ||||||||||||||||
Realized gain (loss) on: | ||||||||||||||||
Investments | 60,321,045 | 102,841,408 | 163,162,453 | |||||||||||||
Foreign currency transactions | — | (265,515 | ) | (265,515 | ) | |||||||||||
|
|
|
|
|
|
|
| |||||||||
Net realized gain (loss) | 60,321,045 | 102,575,893 | — | 162,896,938 | ||||||||||||
|
|
|
|
|
|
|
| |||||||||
Change in unrealized appreciation (depreciation) on: | ||||||||||||||||
Investments | (23,747,805 | ) | (26,228,999 | ) | (49,976,804 | ) | ||||||||||
Foreign currency translations | — | 461,904 | 461,904 | |||||||||||||
|
|
|
|
|
|
|
| |||||||||
Net change in unrealized appreciation (depreciation) | (23,747,805 | ) | (25,767,095 | ) | — | (49,514,900 | ) | |||||||||
|
|
|
|
|
|
|
| |||||||||
NET REALIZED AND UNREALIZED GAIN (LOSS) | 36,573,240 | 76,808,798 | — | 113,382,038 | ||||||||||||
|
|
|
|
|
|
|
| |||||||||
NET INCREASE (DECREASE) IN NET ASSETS RESULTING FROM OPERATIONS | $ | 38,061,538 | $ | 79,333,314 | $ | (17,251 | ) | $ | 117,377,601 | |||||||
|
|
|
|
|
|
|
| |||||||||
| (b) | Reflects adjustment in expenses due to elimination of duplicative expenses. |
| (c) | Reflects adjustment due to termination of the brokerage recapture program. |
| (d) | Reflects decrease in waiver due to expense adjustment. |
51
NOTES TO PRO FORMA COMBINED FINANCIAL STATEMENTS
As of December 31, 2013
NOTE 1 – BASIS OF COMBINATION AND SIGNIFICANT ACCOUNTING POLICIES:
EQ Advisors Trust (the “Trust”) was organized as a Delaware statutory trust on October 31, 1996, and is registered under the Investment Company Act of 1940, as amended, as an open-end management investment company with numerous portfolios.
On December 10-11, 2013, the Board of Trustees of the Trust approved a proposed Plan of Reorganization and Termination (“Reorganization Plan”) that provides for the transfer of all of the assets of the EQ/Lord Abbett Large Cap Core Portfolio (“Large Cap Core Portfolio”) to the EQ/Invesco Comstock Portfolio (“Invesco Portfolio”), each a series of the Trust, and the assumption by the Invesco Portfolio of all of the liabilities of the Large Cap Core Portfolio in exchange for shares of the Invesco Portfolio having an aggregate value equal to the net assets of the Large Cap Core Portfolio, the distribution of the Invesco Portfolio shares to the Large Cap Core Portfolio shareholders of record determined immediately after the close of business on the closing date, and the subsequent liquidation of the Large Cap Core Portfolio.
The Large Cap Core Portfolio’s annual contractual management fee rate equals 0.650% of average daily net assets for the first $1 billion, 0.600% of average daily net assets for the next $1 billion, 0.575% for the next $3 billion, 0.550% for the next $5 billion, and 0.525% of average daily net assets thereafter. The Invesco Portfolio’s annual contractual management fee rate equals 0.650% of average daily net assets for the first $1 billion, 0.600% of average daily net assets for the next $1 billion, 0.575% for the next $3 billion, 0.550% for the next $5 billion, and 0.525% of average daily net assets thereafter. The Reorganization Plan is subject to shareholder approval of the Large Cap Core Portfolio. A special meeting of these shareholders will be held on or about May 21, 2014.
The Reorganization will be accounted for as a tax-free reorganization of investment companies. The unaudited pro forma combined financial statements are presented for the information of the reader and may not necessarily be representative of what the actual combined financial statements would have been had the Reorganization occurred at December 31, 2013. The unaudited pro forma combined portfolio of investments and statement of assets and liabilities reflect the financial position of the Large Cap Core Portfolio and the Invesco Portfolio at December 31, 2013. The unaudited pro forma combined statement of operations reflects the results of operations of the Invesco Portfolio as if it had acquired the Large Cap Core Portfolio at the beginning of the year ended December 31, 2013. These statements have been derived from the Portfolios’ respective books and records utilized in calculating daily net asset value at the dates indicated above for each Portfolio under accounting principles generally accepted in the United States of America. The historical cost of investment securities will be carried forward to the surviving entity and results of operations of the Invesco Portfolio for pre-combination periods will not be restated.
The unaudited pro forma combined portfolio of investments and statements of assets and liabilities and operations should be read in conjunction with the historical financial statements of the Portfolios included in the Trust’s Statement of Additional Information. Each of the Portfolios has substantially the same significant accounting policies as detailed in the historical financial statements. The preparation of financial statements in accordance with accounting principles generally accepted in the United States of America requires management to make estimates and assumptions that affect the reported amounts and disclosures. Actual results could differ from those estimates.
52
NOTES TO PRO FORMA COMBINED FINANCIAL STATEMENTS—(Continued)
As of December 31, 2013
Following the Reorganization, the Invesco Portfolio will be the “accounting survivor.”
NOTE 2 – SHARES:
The unaudited pro forma net asset value per share assumes common shares of beneficial interest retired for Class IA, and additional common shares of beneficial interest issued for Class IB and Class K, respectively, in connection with the proposed acquisition of the Large Cap Core Portfolio by the Invesco Portfolio as of December 31, 2013. The number of shares retired and additional shares issued were calculated based on the net assets of the Large Cap Core Portfolio and net asset value per share of the Invesco Portfolio at December 31, 2013.
53
NOTES TO PRO FORMA COMBINED FINANCIAL STATEMENTS—(Continued)
As of December 31, 2013
NOTE 3 – TAXES
Each Portfolio, as well as the Acquiring Portfolio after the Reorganization, intends to comply with the requirements of the Internal Revenue Code of 1986, as amended, applicable to regulated investment companies (“RICs”) and to distribute substantially all of its net investment income and net realized capital gains to shareholders of each Portfolio. Therefore, no Federal income tax provision is required.
NOTE 4 – UNAUDITED PRO FORMA COMBINED ADJUSTMENTS:
The accompanying unaudited pro forma combined financial statements reflect changes in the Invesco Portfolio’s shares as if the merger had taken place on December 31, 2013. The Large Cap Core Portfolio will bear the expenses, based on the fraction that its shareholder accounts will bear to the shareholder accounts of all the Acquired Portfolios at the merger date, of the Reorganization (i.e., the costs associated with preparing, printing and distributing the prospectus and proxy materials, legal and accounting fees in connection with the Reorganization, and expenses of holding the shareholders meeting), such expenses, which are not reflected in the unaudited pro forma combined statement of operations, are estimated to be approximately $41,900.
54
EQ ADVISORS TRUST
PORTFOLIO OF INVESTMENTS
December 31, 2013
| Number of Shares | Value (Note 1) | |||||||||||||||||||||||
| EQ/Equity Growth PLUS | EQ/Large Cap Growth PLUS | Combined Pro-forma | EQ/Equity Growth PLUS | EQ/Large Cap Growth PLUS | Combined Pro-forma | |||||||||||||||||||
COMMON STOCKS: | ||||||||||||||||||||||||
Consumer Discretionary (17.9%) |
| |||||||||||||||||||||||
Auto Components (0.4%) | ||||||||||||||||||||||||
Allison Transmission Holdings, Inc. | 153 | 1,154 | 1,307 | $ | 4,224 | $ | 31,862 | $ | 36,086 | |||||||||||||||
BorgWarner, Inc. | 7,450 | 54,340 | 61,790 | 416,530 | 3,038,149 | 3,454,679 | ||||||||||||||||||
Delphi Automotive plc | 36,782 | 204,459 | 241,241 | 2,211,702 | 12,294,120 | 14,505,822 | ||||||||||||||||||
Gentex Corp. | 2,662 | 19,438 | 22,100 | 87,819 | 641,260 | 729,079 | ||||||||||||||||||
Goodyear Tire & Rubber Co. | 7,919 | 57,787 | 65,706 | 188,868 | 1,378,220 | 1,567,088 | ||||||||||||||||||
Lear Corp. | | 294 | | 2,155 | 2,449 | 23,805 | 174,490 | 198,295 | ||||||||||||||||
Visteon Corp.* | 1,604 | 11,709 | 13,313 | 131,352 | 958,850 | 1,090,202 | ||||||||||||||||||
|
|
|
|
|
| |||||||||||||||||||
| 3,064,300 | 18,516,951 | 21,581,251 | ||||||||||||||||||||||
|
|
|
|
|
| |||||||||||||||||||
Automobiles (0.3%) | ||||||||||||||||||||||||
Ford Motor Co. | 43,670 | 318,580 | 362,250 | 673,828 | 4,915,690 | 5,589,518 | ||||||||||||||||||
Harley-Davidson, Inc. | 7,224 | 85,422 | 92,646 | 500,190 | 5,914,619 | 6,414,809 | ||||||||||||||||||
Tesla Motors, Inc.* | 2,695 | 34,592 | 37,287 | 405,274 | 5,201,945 | 5,607,219 | ||||||||||||||||||
Thor Industries, Inc. | 1,424 | 10,397 | 11,821 | 78,647 | 574,226 | 652,873 | ||||||||||||||||||
|
|
|
|
|
| |||||||||||||||||||
| 1,657,939 | 16,606,480 | 18,264,419 | ||||||||||||||||||||||
|
|
|
|
|
| |||||||||||||||||||
Distributors (0.2%) | ||||||||||||||||||||||||
Genuine Parts Co. | 4,720 | 34,432 | 39,152 | 392,657 | 2,864,398 | 3,257,055 | ||||||||||||||||||
LKQ Corp.* | 9,624 | 349,533 | 359,157 | 316,629 | 11,499,636 | 11,816,265 | ||||||||||||||||||
|
|
|
|
|
| |||||||||||||||||||
| 709,286 | 14,364,034 | 15,073,320 | ||||||||||||||||||||||
|
|
|
|
|
| |||||||||||||||||||
Diversified Consumer Services (0.1%) |
| |||||||||||||||||||||||
H&R Block, Inc. | 8,777 | 64,034 | 72,811 | 254,884 | 1,859,547 | 2,114,431 | ||||||||||||||||||
Service Corp. International | 5,329 | 38,911 | 44,240 | 96,615 | 705,457 | 802,072 | ||||||||||||||||||
Weight Watchers International, Inc. | 474 | 3,488 | 3,962 | 15,609 | 114,860 | 130,469 | ||||||||||||||||||
|
|
|
|
|
| |||||||||||||||||||
| 367,108 | 2,679,864 | 3,046,972 | ||||||||||||||||||||||
|
|
|
|
|
| |||||||||||||||||||
Hotels, Restaurants & Leisure (3.6%) |
| |||||||||||||||||||||||
Bally Technologies, Inc.* | 1,245 | 9,092 | 10,337 | 97,670 | 713,267 | 810,937 | ||||||||||||||||||
Brinker International, Inc. | 2,133 | 15,587 | 17,720 | 98,843 | 722,302 | 821,145 | ||||||||||||||||||
Burger King Worldwide, Inc. | 3,236 | 23,639 | 26,875 | 73,975 | 540,387 | 614,362 | ||||||||||||||||||
Carnival plc | — | 64,019 | 64,019 | — | 2,651,367 | 2,651,367 | ||||||||||||||||||
Chipotle Mexican Grill, Inc.* | 996 | 44,550 | 45,546 | 530,649 | 23,735,349 | 24,265,998 | ||||||||||||||||||
Choice Hotels International, Inc. | 46 | 355 | 401 | 2,259 | 17,434 | 19,693 | ||||||||||||||||||
Darden Restaurants, Inc. | 2,732 | 19,942 | 22,674 | 148,539 | 1,084,246 | 1,232,785 | ||||||||||||||||||
Domino’s Pizza, Inc. | 1,813 | 13,235 | 15,048 | 126,275 | 921,818 | 1,048,093 | ||||||||||||||||||
Dunkin’ Brands Group, Inc. | 3,436 | 25,075 | 28,511 | 165,615 | 1,208,615 | 1,374,230 | ||||||||||||||||||
International Game Technology | 8,394 | 61,258 | 69,652 | 152,435 | 1,112,445 | 1,264,880 | ||||||||||||||||||
Las Vegas Sands Corp. | 12,598 | 180,539 | 193,137 | 993,604 | 14,239,111 | 15,232,715 | ||||||||||||||||||
Marriott International, Inc., Class A | 6,628 | 85,174 | 91,802 | 327,158 | 4,204,189 | 4,531,347 | ||||||||||||||||||
See notes to pro-forma combined financial statements.
55
EQ ADVISORS TRUST
PORTFOLIO OF INVESTMENTS
December 31, 2013
| Number of Shares | Value ($) (Note 1) | |||||||||||||||||||||||
| EQ/Equity Growth PLUS | EQ/Large Cap Growth PLUS | Combined Pro-forma | EQ/Equity Growth PLUS | EQ/Large Cap Growth PLUS | Combined Pro-forma | |||||||||||||||||||
McDonald’s Corp. | 32,343 | 235,719 | 268,062 | 3,138,241 | 22,871,814 | 26,010,055 | ||||||||||||||||||
Melco Crown Entertainment Ltd. (ADR)* | 37,743 | — | 37,743 | 1,480,281 | — | 1,480,281 | ||||||||||||||||||
MGM Resorts International* | — | 138,784 | 138,784 | — | 3,264,200 | 3,264,200 | ||||||||||||||||||
Norwegian Cruise Line Holdings Ltd.* | 818 | 5,993 | 6,811 | 29,015 | 212,572 | 241,587 | ||||||||||||||||||
Panera Bread Co., Class A* | 906 | 6,611 | 7,517 | 160,081 | 1,168,098 | 1,328,179 | ||||||||||||||||||
SeaWorld Entertainment, Inc. | 983 | 7,198 | 8,181 | 28,281 | 207,086 | 235,367 | ||||||||||||||||||
Six Flags Entertainment Corp. | 2,130 | 15,554 | 17,684 | 78,427 | 572,698 | 651,125 | ||||||||||||||||||
Starbucks Corp. | 63,683 | 626,382 | 690,065 | 4,992,110 | 49,102,085 | 54,094,195 | ||||||||||||||||||
Starwood Hotels & Resorts Worldwide, Inc. | 2,665 | 379,564 | 382,229 | 211,734 | 30,156,360 | 30,368,094 | ||||||||||||||||||
Wyndham Worldwide Corp. | 4,379 | 31,946 | 36,325 | 322,689 | 2,354,101 | 2,676,790 | ||||||||||||||||||
Wynn Macau Ltd. | — | 582,000 | 582,000 | — | 2,638,188 | 2,638,188 | ||||||||||||||||||
Wynn Resorts Ltd. | 16,343 | 136,627 | 152,970 | 3,173,974 | 26,534,330 | 29,708,304 | ||||||||||||||||||
Yum! Brands, Inc. | 14,498 | 105,766 | 120,264 | 1,096,194 | 7,996,967 | 9,093,161 | ||||||||||||||||||
|
|
|
|
|
| |||||||||||||||||||
| 17,428,049 | 198,229,029 | 215,657,078 | ||||||||||||||||||||||
|
|
|
|
|
| |||||||||||||||||||
Household Durables (0.2%) | ||||||||||||||||||||||||
D.R. Horton, Inc.* | — | 99,777 | 99,777 | — | 2,227,023 | 2,227,023 | ||||||||||||||||||
Jarden Corp.* | 4,095 | 29,894 | 33,989 | 251,228 | 1,833,997 | 2,085,225 | ||||||||||||||||||
Lennar Corp., Class A | — | 56,853 | 56,853 | — | 2,249,105 | 2,249,105 | ||||||||||||||||||
Newell Rubbermaid, Inc. | 5,384 | 39,290 | 44,674 | 174,495 | 1,273,389 | 1,447,884 | ||||||||||||||||||
NVR, Inc.* | 126 | 923 | 1,049 | 129,277 | 947,007 | 1,076,284 | ||||||||||||||||||
PulteGroup, Inc. | 12,490 | 91,126 | 103,616 | 254,421 | 1,856,236 | 2,110,657 | ||||||||||||||||||
Taylor Morrison Home Corp., | 901 | 6,620 | 7,521 | 20,228 | 148,619 | 168,847 | ||||||||||||||||||
Tempur Sealy International, Inc.* | 1,946 | 14,204 | 16,150 | 105,006 | 766,448 | 871,454 | ||||||||||||||||||
Tupperware Brands Corp. | 1,705 | 12,441 | 14,146 | 161,174 | 1,176,048 | 1,337,222 | ||||||||||||||||||
Whirlpool Corp. | 179 | 1,310 | 1,489 | 28,078 | 205,486 | 233,564 | ||||||||||||||||||
|
|
|
|
|
| |||||||||||||||||||
| 1,123,907 | 12,683,358 | 13,807,265 | ||||||||||||||||||||||
|
|
|
|
|
| |||||||||||||||||||
Internet & Catalog Retail (3.5%) | ||||||||||||||||||||||||
Amazon.com, Inc.* | 28,352 | 217,707 | 246,059 | 11,306,494 | 86,819,374 | 98,125,868 | ||||||||||||||||||
Ctrip.com International Ltd. (ADR)* | — | 46,105 | 46,105 | — | 2,287,730 | 2,287,730 | ||||||||||||||||||
Expedia, Inc. | 41,222 | 25,064 | 66,286 | 2,871,525 | 1,745,958 | 4,617,483 | ||||||||||||||||||
Groupon, Inc.* | 13,533 | 98,767 | 112,300 | 159,283 | 1,162,488 | 1,321,771 | ||||||||||||||||||
HomeAway, Inc.* | 1,971 | 14,274 | 16,245 | 80,574 | 583,521 | 664,095 | ||||||||||||||||||
Liberty Interactive Corp. | 1,384 | 10,123 | 11,507 | 40,620 | 297,110 | 337,730 | ||||||||||||||||||
Liberty Ventures* | 1,186 | 8,654 | 9,840 | 145,392 | 1,060,894 | 1,206,286 | ||||||||||||||||||
Netflix, Inc.* | 1,619 | 53,981 | 55,600 | 596,067 | 19,874,185 | 20,470,252 | ||||||||||||||||||
priceline.com, Inc.* | 5,099 | 58,639 | 63,738 | 5,927,078 | 68,161,974 | 74,089,052 | ||||||||||||||||||
TripAdvisor, Inc.* | 3,612 | 57,810 | 61,422 | 299,182 | 4,788,402 | 5,087,584 | ||||||||||||||||||
zulily, Inc., Class A* | 264 | 1,835 | 2,099 | 10,938 | 76,024 | 86,962 | ||||||||||||||||||
|
|
|
|
|
| |||||||||||||||||||
| 21,437,153 | 186,857,660 | 208,294,813 | ||||||||||||||||||||||
|
|
|
|
|
| |||||||||||||||||||
Leisure Equipment & Products (0.1%) |
| |||||||||||||||||||||||
Hasbro, Inc. | 3,148 | 22,972 | 26,120 | 173,171 | 1,263,689 | 1,436,860 | ||||||||||||||||||
Mattel, Inc. | 11,132 | 81,210 | 92,342 | 529,661 | 3,863,972 | 4,393,633 | ||||||||||||||||||
Polaris Industries, Inc. | 2,087 | 15,228 | 17,315 | 303,951 | 2,217,806 | 2,521,757 | ||||||||||||||||||
|
|
|
|
|
| |||||||||||||||||||
| 1,006,783 | 7,345,467 | 8,352,250 | ||||||||||||||||||||||
|
|
|
|
|
| |||||||||||||||||||
See notes to pro-forma combined financial statements.
56
EQ ADVISORS TRUST
PORTFOLIO OF INVESTMENTS
December 31, 2013
| Number of Shares | Value ($) (Note 1) | |||||||||||||||||||||||
| EQ/Equity Growth PLUS | EQ/Large Cap Growth PLUS | Combined Pro-forma | EQ/Equity Growth PLUS | EQ/ Large Cap Growth PLUS | Combined Pro-forma | |||||||||||||||||||
Media (4.3%) | ||||||||||||||||||||||||
AMC Networks, Inc., Class A* | 1,936 | 161,614 | 163,550 | 131,861 | 11,007,530 | 11,139,391 | ||||||||||||||||||
Cablevision Systems Corp. - New York Group, Class A | 6,281 | 45,859 | 52,140 | 112,618 | 822,252 | 934,870 | ||||||||||||||||||
CBS Corp. (Non-Voting), Class B | 18,114 | 132,148 | 150,262 | 1,154,586 | 8,423,114 | 9,577,700 | ||||||||||||||||||
Charter Communications, Inc., Class A* | 2,133 | 27,476 | 29,609 | 291,709 | 3,757,618 | 4,049,327 | ||||||||||||||||||
Cinemark Holdings, Inc. | 3,717 | 27,133 | 30,850 | 123,888 | 904,343 | 1,028,231 | ||||||||||||||||||
Clear Channel Outdoor Holdings, Inc., Class A | 1,368 | 10,072 | 11,440 | 13,872 | 102,130 | 116,002 | ||||||||||||||||||
Comcast Corp., Class A | 181,557 | 979,249 | 1,160,806 | 9,434,610 | 50,886,674 | 60,321,284 | ||||||||||||||||||
DIRECTV* | 15,836 | 115,679 | 131,515 | 1,094,109 | 7,992,262 | 9,086,371 | ||||||||||||||||||
Discovery Communications, Inc., Class A* | 7,887 | 57,537 | 65,424 | 713,143 | 5,202,496 | 5,915,639 | ||||||||||||||||||
Discovery Communications, Inc., Class C* | — | 156,514 | 156,514 | — | 13,125,264 | 13,125,264 | ||||||||||||||||||
DISH Network Corp., Class A* | 6,720 | 49,023 | 55,743 | 389,222 | 2,839,412 | 3,228,634 | ||||||||||||||||||
Interpublic Group of Cos., Inc. | 6,283 | 45,873 | 52,156 | 111,209 | 811,952 | 923,161 | ||||||||||||||||||
Lamar Advertising Co., Class A* | 2,540 | 18,538 | 21,078 | 132,715 | 968,610 | 1,101,325 | ||||||||||||||||||
Liberty Global plc, Class A* | 61,574 | 128,070 | 189,644 | 5,479,470 | 11,396,949 | 16,876,419 | ||||||||||||||||||
Liberty Global plc* | — | 118,963 | 118,963 | — | 10,030,960 | 10,030,960 | ||||||||||||||||||
Lions Gate Entertainment Corp. | 2,604 | 19,019 | 21,623 | 82,443 | 602,142 | 684,585 | ||||||||||||||||||
Madison Square Garden Co., Class A* | 1,971 | 14,390 | 16,361 | 113,490 | 828,576 | 942,066 | ||||||||||||||||||
Morningstar, Inc. | 667 | 4,873 | 5,540 | 52,086 | 380,533 | 432,619 | ||||||||||||||||||
News Corp., Class A* | 11,802 | 86,109 | 97,911 | 212,672 | 1,551,684 | 1,764,356 | ||||||||||||||||||
Omnicom Group, Inc. | 8,334 | 60,798 | 69,132 | 619,800 | 4,521,547 | 5,141,347 | ||||||||||||||||||
Regal Entertainment Group, Class A | 584 | 4,303 | 4,887 | 11,359 | 83,693 | 95,052 | ||||||||||||||||||
Scripps Networks Interactive, Inc., Class A | 3,534 | 25,783 | 29,317 | 305,373 | 2,227,909 | 2,533,282 | ||||||||||||||||||
Sirius XM Holdings, Inc.* | 1,132,753 | 2,422,447 | 3,555,200 | 3,953,308 | 8,454,340 | 12,407,648 | ||||||||||||||||||
Starz, Class A* | 3,081 | 22,953 | 26,034 | 90,088 | 671,146 | 761,234 | ||||||||||||||||||
Time Warner Cable, Inc. | 9,377 | 68,411 | 77,788 | 1,270,584 | 9,269,691 | 10,540,275 | ||||||||||||||||||
Time Warner, Inc. | 69,909 | — | 69,909 | 4,874,055 | — | 4,874,055 | ||||||||||||||||||
Twenty-First Century Fox, Inc., Class A | 47,203 | 445,991 | 493,194 | 1,660,602 | 15,689,963 | 17,350,565 | ||||||||||||||||||
Viacom, Inc., Class B | 24,559 | 105,020 | 129,579 | 2,144,983 | 9,172,447 | 11,317,430 | ||||||||||||||||||
Walt Disney Co. | 66,896 | 434,518 | 501,414 | 5,110,854 | 33,197,175 | 38,308,029 | ||||||||||||||||||
|
|
|
|
|
| |||||||||||||||||||
| 39,684,709 | 214,922,412 | 254,607,121 | ||||||||||||||||||||||
|
|
|
|
|
| |||||||||||||||||||
Multiline Retail (0.4%) | ||||||||||||||||||||||||
Big Lots, Inc.* | 498 | 3,661 | 4,159 | 16,080 | 118,214 | 134,294 | ||||||||||||||||||
Dillard’s, Inc., Class A | 586 | 4,282 | 4,868 | 56,965 | 416,253 | 473,218 | ||||||||||||||||||
Dollar General Corp.* | 10,546 | 76,934 | 87,480 | 636,135 | 4,640,659 | 5,276,794 | ||||||||||||||||||
Dollar Tree, Inc.* | 6,710 | 75,915 | 82,625 | 378,578 | 4,283,124 | 4,661,702 | ||||||||||||||||||
Family Dollar Stores, Inc. | 3,103 | 22,642 | 25,745 | 201,602 | 1,471,051 | 1,672,653 | ||||||||||||||||||
Macy’s, Inc. | 9,584 | 69,917 | 79,501 | 511,786 | 3,733,568 | 4,245,354 | ||||||||||||||||||
Nordstrom, Inc. | 4,674 | 34,099 | 38,773 | 288,853 | 2,107,318 | 2,396,171 | ||||||||||||||||||
Target Corp. | 16,214 | 118,288 | 134,502 | 1,025,860 | 7,484,082 | 8,509,942 | ||||||||||||||||||
|
|
|
|
|
| |||||||||||||||||||
| 3,115,859 | 24,254,269 | 27,370,128 | ||||||||||||||||||||||
|
|
|
|
|
| |||||||||||||||||||
See notes to pro-forma combined financial statements.
57
EQ ADVISORS TRUST
PORTFOLIO OF INVESTMENTS
December 31, 2013
| Number of Shares | Value ($) (Note 1) | |||||||||||||||||||||||
| EQ/Equity Growth PLUS | EQ/Large Cap Growth PLUS | Combined Pro-forma | EQ/Equity Growth PLUS | EQ/ Large Cap Growth PLUS | Combined Pro-forma | |||||||||||||||||||
Specialty Retail (3.6%) | ||||||||||||||||||||||||
Aaron’s, Inc. | 370 | 2,729 | 3,099 | 10,878 | 80,233 | 91,111 | ||||||||||||||||||
Abercrombie & Fitch Co., Class A | 296 | 2,187 | 2,483 | 9,741 | 71,974 | 81,715 | ||||||||||||||||||
Advance Auto Parts, Inc. | 2,352 | 17,156 | 19,508 | 260,319 | 1,898,826 | 2,159,145 | ||||||||||||||||||
American Eagle Outfitters, Inc. | 4,001 | 29,238 | 33,239 | 57,614 | 421,027 | 478,641 | ||||||||||||||||||
Ascena Retail Group, Inc.* | 594 | 4,375 | 4,969 | 12,569 | 92,575 | 105,144 | ||||||||||||||||||
AutoNation, Inc.* | 1,638 | 184,924 | 186,562 | 81,392 | 9,188,873 | 9,270,265 | ||||||||||||||||||
AutoZone, Inc.* | 1,143 | 18,326 | 19,469 | 546,285 | 8,758,728 | 9,305,013 | ||||||||||||||||||
Bed Bath & Beyond, Inc.* | 7,045 | 51,394 | 58,439 | 565,713 | 4,126,938 | 4,692,651 | ||||||||||||||||||
Best Buy Co., Inc. | 2,351 | 242,412 | 244,763 | 93,758 | 9,667,390 | 9,761,148 | ||||||||||||||||||
Cabela’s, Inc.* | 1,532 | 11,188 | 12,720 | 102,123 | 745,792 | 847,915 | ||||||||||||||||||
CarMax, Inc.* | 35,105 | 123,631 | 158,736 | 1,650,637 | 5,813,130 | 7,463,767 | ||||||||||||||||||
Chico’s FAS, Inc. | 4,895 | 35,745 | 40,640 | 92,222 | 673,436 | 765,658 | ||||||||||||||||||
Dick’s Sporting Goods, Inc. | 3,185 | 23,238 | 26,423 | 185,049 | 1,350,128 | 1,535,177 | ||||||||||||||||||
DSW, Inc., Class A | 2,092 | 15,269 | 17,361 | 89,391 | 652,444 | 741,835 | ||||||||||||||||||
Foot Locker, Inc. | 572 | 4,192 | 4,764 | 23,704 | 173,716 | 197,420 | ||||||||||||||||||
Gap, Inc. | 8,998 | 65,642 | 74,640 | 351,642 | 2,565,289 | 2,916,931 | ||||||||||||||||||
GNC Holdings, Inc., Class A | 3,169 | 23,124 | 26,293 | 185,228 | 1,351,598 | 1,536,826 | ||||||||||||||||||
Home Depot, Inc. | 47,118 | 570,239 | 617,357 | 3,879,696 | 46,953,479 | 50,833,175 | ||||||||||||||||||
L Brands, Inc. | 7,736 | 56,434 | 64,170 | 478,472 | 3,490,443 | 3,968,915 | ||||||||||||||||||
Lowe’s Cos., Inc. | 35,082 | 355,634 | 390,716 | 1,738,313 | 17,621,665 | 19,359,978 | ||||||||||||||||||
Lumber Liquidators Holdings, Inc.* | 8,998 | — | 8,998 | 925,804 | — | 925,804 | ||||||||||||||||||
O’Reilly Automotive, Inc.* | 3,560 | 25,974 | 29,534 | 458,208 | 3,343,113 | 3,801,321 | ||||||||||||||||||
PetSmart, Inc. | 3,330 | 24,294 | 27,624 | 242,257 | 1,767,388 | 2,009,645 | ||||||||||||||||||
Restoration Hardware Holdings, Inc.* | — | 103,342 | 103,342 | — | 6,954,917 | 6,954,917 | ||||||||||||||||||
Ross Stores, Inc. | 7,084 | 88,018 | 95,102 | 530,804 | 6,595,189 | 7,125,993 | ||||||||||||||||||
Sally Beauty Holdings, Inc.* | 5,473 | 39,938 | 45,411 | 165,449 | 1,207,326 | 1,372,775 | ||||||||||||||||||
Signet Jewelers Ltd. | 227 | 1,668 | 1,895 | 17,865 | 131,272 | 149,137 | ||||||||||||||||||
Tiffany & Co. | 3,601 | 26,265 | 29,866 | 334,101 | 2,436,867 | 2,770,968 | ||||||||||||||||||
TJX Cos., Inc. | 23,198 | 782,431 | 805,629 | 1,478,409 | 49,864,328 | 51,342,737 | ||||||||||||||||||
Tractor Supply Co. | 4,498 | 85,059 | 89,557 | 348,955 | 6,598,877 | 6,947,832 | ||||||||||||||||||
Ulta Salon Cosmetics & Fragrance, Inc.* | 2,052 | 14,975 | 17,027 | 198,059 | 1,445,387 | 1,643,446 | ||||||||||||||||||
Urban Outfitters, Inc.* | 3,470 | 25,326 | 28,796 | 128,737 | 939,595 | 1,068,332 | ||||||||||||||||||
Williams-Sonoma, Inc. | 3,149 | 22,977 | 26,126 | 183,524 | 1,339,100 | 1,522,624 | ||||||||||||||||||
|
|
|
|
|
| |||||||||||||||||||
| 15,426,918 | 198,321,043 | 213,747,961 | ||||||||||||||||||||||
|
|
|
|
|
| |||||||||||||||||||
Textiles, Apparel & Luxury Goods (1.2%) |
| |||||||||||||||||||||||
Carter’s, Inc. | 1,758 | 13,009 | 14,767 | 126,207 | 933,916 | 1,060,123 | ||||||||||||||||||
Coach, Inc. | 9,056 | 66,067 | 75,123 | 508,313 | 3,708,341 | 4,216,654 | ||||||||||||||||||
Deckers Outdoor Corp.* | 488 | 3,568 | 4,056 | 41,216 | 301,353 | 342,569 | ||||||||||||||||||
Fossil Group, Inc.* | 1,560 | 11,488 | 13,048 | 187,106 | 1,377,871 | 1,564,977 | ||||||||||||||||||
Hanesbrands, Inc. | 3,176 | 23,174 | 26,350 | 223,178 | 1,628,437 | 1,851,615 | ||||||||||||||||||
Lululemon Athletica, Inc.* | — | 6,247 | 6,247 | — | 368,761 | 368,761 | ||||||||||||||||||
Michael Kors Holdings Ltd.* | 27,983 | 143,907 | 171,890 | 2,271,940 | 11,683,809 | 13,955,749 | ||||||||||||||||||
NIKE, Inc., Class B | 74,095 | 208,038 | 282,133 | 5,826,831 | 16,360,108 | 22,186,939 | ||||||||||||||||||
Prada S.p.A. | — | 184,000 | 184,000 | — | 1,637,285 | 1,637,285 | ||||||||||||||||||
PVH Corp. | 2,314 | 16,883 | 19,197 | 314,750 | 2,296,426 | 2,611,176 | ||||||||||||||||||
See notes to pro-forma combined financial statements.
58
EQ ADVISORS TRUST
PORTFOLIO OF INVESTMENTS
December 31, 2013
| Number of Shares | Value ($) (Note 1) | |||||||||||||||||||||||
| EQ/Equity Growth PLUS | EQ/Large Cap Growth PLUS | Combined Pro-forma | EQ/ Equity Growth PLUS | EQ/ Large Cap Growth PLUS | Combined Pro-forma | |||||||||||||||||||
Ralph Lauren Corp. | 1,934 | 14,105 | 16,039 | 341,486 | 2,490,520 | 2,832,006 | ||||||||||||||||||
Under Armour, Inc., Class A* | 2,699 | 126,861 | 129,560 | 235,623 | 11,074,965 | 11,310,588 | ||||||||||||||||||
VF Corp. | 11,288 | 82,348 | 93,636 | 703,694 | 5,133,574 | 5,837,268 | ||||||||||||||||||
|
|
|
|
|
| |||||||||||||||||||
| 10,780,344 | 58,995,366 | 69,775,710 | ||||||||||||||||||||||
|
|
|
|
|
| |||||||||||||||||||
Total Consumer Discretionary | 115,802,355 | 953,775,933 | 1,069,578,288 | |||||||||||||||||||||
|
|
|
|
|
| |||||||||||||||||||
Consumer Staples (5.8%) | ||||||||||||||||||||||||
Beverages (1.8%) | ||||||||||||||||||||||||
Brown-Forman Corp., Class B | 4,875 | 35,561 | 40,436 | 368,404 | 2,687,345 | 3,055,749 | ||||||||||||||||||
Coca-Cola Co. | 123,347 | 899,297 | 1,022,644 | 5,095,465 | 37,149,959 | 42,245,424 | ||||||||||||||||||
Coca-Cola Enterprises, Inc. | 8,372 | 61,367 | 69,739 | 369,456 | 2,708,126 | 3,077,582 | ||||||||||||||||||
Constellation Brands, Inc., Class A* | 4,664 | 235,580 | 240,244 | 328,252 | 16,580,120 | 16,908,372 | ||||||||||||||||||
Dr. Pepper Snapple Group, Inc. | 6,577 | 47,977 | 54,554 | 320,432 | 2,337,440 | 2,657,872 | ||||||||||||||||||
Monster Beverage Corp.* | 4,325 | 55,917 | 60,242 | 293,105 | 3,789,495 | 4,082,600 | ||||||||||||||||||
PepsiCo, Inc. | 49,877 | 394,860 | 444,737 | 4,136,798 | 32,749,688 | 36,886,486 | ||||||||||||||||||
|
|
|
|
|
| |||||||||||||||||||
| 10,911,912 | 98,002,173 | 108,914,085 | ||||||||||||||||||||||
|
|
|
|
|
| |||||||||||||||||||
Food & Staples Retailing (1.3%) | ||||||||||||||||||||||||
Costco Wholesale Corp. | 14,064 | 134,589 | 148,653 | 1,673,757 | 16,017,437 | 17,691,194 | ||||||||||||||||||
CVS Caremark Corp. | 4,538 | 116,510 | 121,048 | 324,785 | 8,338,621 | 8,663,406 | ||||||||||||||||||
Fresh Market, Inc.* | 1,324 | 9,677 | 11,001 | 53,622 | 391,918 | 445,540 | ||||||||||||||||||
Kroger Co. | 16,761 | 122,277 | 139,038 | 662,562 | 4,833,610 | 5,496,172 | ||||||||||||||||||
Safeway, Inc. | 607 | 4,451 | 5,058 | 19,770 | 144,969 | 164,739 | ||||||||||||||||||
Sprouts Farmers Market, Inc.* | 462 | 3,402 | 3,864 | 17,755 | 130,739 | 148,494 | ||||||||||||||||||
Sysco Corp. | 6,619 | 48,287 | 54,906 | 238,946 | 1,743,161 | 1,982,107 | ||||||||||||||||||
Walgreen Co. | 22,994 | 167,747 | 190,741 | 1,320,775 | 9,635,387 | 10,956,162 | ||||||||||||||||||
Wal-Mart Stores, Inc. | 34,448 | 251,026 | 285,474 | 2,710,713 | 19,753,236 | 22,463,949 | ||||||||||||||||||
Whole Foods Market, Inc. | 11,954 | 173,224 | 185,178 | 691,300 | 10,017,544 | 10,708,844 | ||||||||||||||||||
|
|
|
|
|
| |||||||||||||||||||
| 7,713,985 | 71,006,622 | 78,720,607 | ||||||||||||||||||||||
|
|
|
|
|
| |||||||||||||||||||
Food Products (0.8%) | ||||||||||||||||||||||||
Archer-Daniels-Midland Co. | 1,615 | 11,798 | 13,413 | 70,091 | 512,033 | 582,124 | ||||||||||||||||||
Campbell Soup Co. | 3,726 | 27,193 | 30,919 | 161,261 | 1,176,913 | 1,338,174 | ||||||||||||||||||
ConAgra Foods, Inc. | 12,426 | 90,649 | 103,075 | 418,756 | 3,054,871 | 3,473,627 | ||||||||||||||||||
Flowers Foods, Inc. | 5,512 | 40,235 | 45,747 | 118,343 | 863,845 | 982,188 | ||||||||||||||||||
General Mills, Inc. | 20,777 | 151,571 | 172,348 | 1,036,980 | 7,564,909 | 8,601,889 | ||||||||||||||||||
Green Mountain Coffee Roasters, Inc.* | 4,808 | 51,984 | 56,792 | 363,389 | 3,928,951 | 4,292,340 | ||||||||||||||||||
Hershey Co. | 4,834 | 35,266 | 40,100 | 470,010 | 3,428,913 | 3,898,923 | ||||||||||||||||||
Hillshire Brands Co. | 3,967 | 28,956 | 32,923 | 132,657 | 968,289 | 1,100,946 | ||||||||||||||||||
Hormel Foods Corp. | 4,322 | 31,536 | 35,858 | 195,225 | 1,424,481 | 1,619,706 | ||||||||||||||||||
Ingredion, Inc. | 305 | 2,238 | 2,543 | 20,880 | 153,214 | 174,094 | ||||||||||||||||||
J.M. Smucker Co. | 453 | 3,313 | 3,766 | 46,940 | 343,293 | 390,233 | ||||||||||||||||||
Kellogg Co. | 7,720 | 56,319 | 64,039 | 471,460 | 3,439,401 | 3,910,861 | ||||||||||||||||||
Kraft Foods Group, Inc. | 19,159 | 139,772 | 158,931 | 1,033,053 | 7,536,506 | 8,569,559 | ||||||||||||||||||
McCormick & Co., Inc. | 4,251 | 31,014 | 35,265 | 292,979 | 2,137,485 | 2,430,464 | ||||||||||||||||||
Mead Johnson Nutrition Co. | 6,526 | 47,606 | 54,132 | 546,618 | 3,987,479 | 4,534,097 | ||||||||||||||||||
See notes to pro-forma combined financial statements.
59
EQ ADVISORS TRUST
PORTFOLIO OF INVESTMENTS
December 31, 2013
| Number of Shares | Value ($) (Note 1) | |||||||||||||||||||||||
| EQ/Equity Growth PLUS | EQ/Large Cap Growth PLUS | Combined Pro-forma | EQ/Equity Growth PLUS | EQ/Large Cap Growth PLUS | Combined Pro-forma | |||||||||||||||||||
Mondelez International, Inc., Class A | 51,954 | — | 51,954 | 1,833,976 | — | 1,833,976 | ||||||||||||||||||
Nestle S.A. (Registered) | — | 24,107 | 24,107 | — | 1,764,685 | 1,764,685 | ||||||||||||||||||
Pinnacle Foods, Inc. | 622 | 4,569 | 5,191 | 17,080 | 125,465 | 142,545 | ||||||||||||||||||
WhiteWave Foods Co., Class A* | 4,468 | 32,616 | 37,084 | 102,496 | 748,211 | 850,707 | ||||||||||||||||||
|
|
|
|
|
| |||||||||||||||||||
| 7,332,194 | 43,158,944 | 50,491,138 | ||||||||||||||||||||||
|
|
|
|
|
| |||||||||||||||||||
Household Products (0.6%) | ||||||||||||||||||||||||
Church & Dwight Co., Inc. | 4,454 | 32,491 | 36,945 | 295,211 | 2,153,503 | 2,448,714 | ||||||||||||||||||
Clorox Co. | 3,548 | 25,880 | 29,428 | 329,112 | 2,400,629 | 2,729,741 | ||||||||||||||||||
Colgate-Palmolive Co. | 30,061 | 219,305 | 249,366 | 1,960,278 | 14,300,879 | 16,261,157 | ||||||||||||||||||
Kimberly-Clark Corp. | 10,363 | 75,598 | 85,961 | 1,082,519 | 7,896,967 | 8,979,486 | ||||||||||||||||||
Procter & Gamble Co. | — | 18,941 | 18,941 | — | 1,541,987 | 1,541,987 | ||||||||||||||||||
|
|
|
|
|
| |||||||||||||||||||
| 3,667,120 | 28,293,965 | 31,961,085 | ||||||||||||||||||||||
|
|
|
|
|
| |||||||||||||||||||
Personal Products (0.2%) | ||||||||||||||||||||||||
Avon Products, Inc. | 13,959 | 101,845 | 115,804 | 240,374 | 1,753,771 | 1,994,145 | ||||||||||||||||||
Coty, Inc., Class A | 1,220 | 8,975 | 10,195 | 18,605 | 136,869 | 155,474 | ||||||||||||||||||
Estee Lauder Cos., Inc., Class A | 37,157 | 54,455 | 91,612 | 2,798,665 | 4,101,550 | 6,900,215 | ||||||||||||||||||
Herbalife Ltd. | 2,748 | 20,049 | 22,797 | 216,268 | 1,577,856 | 1,794,124 | ||||||||||||||||||
Nu Skin Enterprises, Inc., Class A | 1,883 | 13,735 | 15,618 | 260,268 | 1,898,452 | 2,158,720 | ||||||||||||||||||
|
|
|
|
|
| |||||||||||||||||||
| 3,534,180 | 9,468,498 | 13,002,678 | ||||||||||||||||||||||
|
|
|
|
|
| |||||||||||||||||||
Tobacco (1.1%) | ||||||||||||||||||||||||
Altria Group, Inc. | 64,818 | 472,275 | 537,093 | 2,488,363 | 18,130,637 | 20,619,000 | ||||||||||||||||||
Lorillard, Inc. | 12,175 | 88,817 | 100,992 | 617,029 | 4,501,246 | 5,118,275 | ||||||||||||||||||
Philip Morris International, Inc. | 52,746 | 384,539 | 437,285 | 4,595,759 | 33,504,883 | 38,100,642 | ||||||||||||||||||
Reynolds American, Inc. | 7,690 | 56,096 | 63,786 | 384,423 | 2,804,239 | 3,188,662 | ||||||||||||||||||
|
|
|
|
|
| |||||||||||||||||||
| 8,085,574 | 58,941,005 | 67,026,579 | ||||||||||||||||||||||
|
|
|
|
|
| |||||||||||||||||||
Total Consumer Staples | 41,244,965 | 308,871,207 | 350,116,172 | |||||||||||||||||||||
|
|
|
|
|
| |||||||||||||||||||
Energy (3.6%) | ||||||||||||||||||||||||
Energy Equipment & Services (1.5%) | ||||||||||||||||||||||||
Atwood Oceanics, Inc.* | 344 | 2,526 | 2,870 | 18,366 | 134,863 | 153,229 | ||||||||||||||||||
Baker Hughes, Inc. | 898 | 6,562 | 7,460 | 49,623 | 362,616 | 412,239 | ||||||||||||||||||
Cameron International Corp.* | 5,037 | 36,743 | 41,780 | 299,853 | 2,187,311 | 2,487,164 | ||||||||||||||||||
Dresser-Rand Group, Inc.* | 2,455 | 17,919 | 20,374 | 146,392 | 1,068,510 | 1,214,902 | ||||||||||||||||||
Dril-Quip, Inc.* | 1,308 | 9,548 | 10,856 | 143,788 | 1,049,612 | 1,193,400 | ||||||||||||||||||
FMC Technologies, Inc.* | 40,134 | 96,885 | 137,019 | 2,095,396 | 5,058,366 | 7,153,762 | ||||||||||||||||||
Frank’s International N.V. | 496 | 3,658 | 4,154 | 13,392 | 98,766 | 112,158 | ||||||||||||||||||
Halliburton Co. | 27,350 | 199,704 | 227,054 | 1,388,013 | 10,134,978 | 11,522,991 | ||||||||||||||||||
Oceaneering International, Inc. | 3,487 | 25,441 | 28,928 | 275,055 | 2,006,786 | 2,281,841 | ||||||||||||||||||
RPC, Inc. | 1,632 | 11,953 | 13,585 | 29,131 | 213,361 | 242,492 | ||||||||||||||||||
Schlumberger Ltd. | 42,882 | 614,302 | 657,184 | 3,864,097 | 55,354,753 | 59,218,850 | ||||||||||||||||||
Seadrill Ltd. | 11,390 | 83,092 | 94,482 | 467,901 | 3,413,419 | 3,881,320 | ||||||||||||||||||
|
|
|
|
|
| |||||||||||||||||||
| 8,791,007 | 81,083,341 | 89,874,348 | ||||||||||||||||||||||
|
|
|
|
|
| |||||||||||||||||||
See notes to pro-forma combined financial statements.
60
EQ ADVISORS TRUST
PORTFOLIO OF INVESTMENTS
December 31, 2013
| Number of Shares | Value ($) (Note 1) | |||||||||||||||||||||||
| EQ/Equity Growth PLUS | EQ/Large Cap Growth PLUS | Combined Pro-forma | EQ/Equity Growth PLUS | EQ/Large Cap Growth PLUS | Combined Pro-forma | |||||||||||||||||||
Oil, Gas & Consumable Fuels (2.1%) | ||||||||||||||||||||||||
Anadarko Petroleum Corp. | 889 | 6,495 | 7,384 | 70,515 | 515,183 | 585,698 | ||||||||||||||||||
Antero Resources Corp.* | 562 | 105,058 | 105,620 | 35,653 | 6,664,879 | 6,700,532 | ||||||||||||||||||
Cabot Oil & Gas Corp. | 48,798 | 189,887 | 238,685 | 1,891,410 | 7,360,020 | 9,251,430 | ||||||||||||||||||
Cheniere Energy, Inc.* | 7,778 | 56,739 | 64,517 | 335,387 | 2,446,586 | 2,781,973 | ||||||||||||||||||
Cobalt International Energy, Inc.* | 8,139 | 59,407 | 67,546 | 133,887 | 977,245 | 1,111,132 | ||||||||||||||||||
Concho Resources, Inc.* | 14,548 | 93,869 | 108,417 | 1,571,184 | 10,137,852 | 11,709,036 | ||||||||||||||||||
Continental Resources, Inc.* | 1,377 | 124,599 | 125,976 | 154,940 | 14,019,879 | 14,174,819 | ||||||||||||||||||
CVR Energy, Inc. | 504 | 3,703 | 4,207 | 21,889 | 160,821 | 182,710 | ||||||||||||||||||
EOG Resources, Inc. | 8,208 | 75,083 | 83,291 | 1,377,631 | 12,601,931 | 13,979,562 | ||||||||||||||||||
EQT Corp. | 4,436 | 59,944 | 64,380 | 398,264 | 5,381,772 | 5,780,036 | ||||||||||||||||||
Gulfport Energy Corp.* | 2,244 | 103,446 | 105,690 | 141,709 | 6,532,615 | 6,674,324 | ||||||||||||||||||
Kinder Morgan, Inc. | 19,552 | 142,638 | 162,190 | 703,872 | 5,134,968 | 5,838,840 | ||||||||||||||||||
Kosmos Energy Ltd.* | 3,260 | 23,855 | 27,115 | 36,447 | 266,699 | 303,146 | ||||||||||||||||||
Laredo Petroleum Holdings, Inc.* | 58,032 | 8,908 | 66,940 | 1,606,906 | 246,663 | 1,853,569 | ||||||||||||||||||
Marathon Petroleum Corp. | — | 59,500 | 59,500 | — | 5,457,935 | 5,457,935 | ||||||||||||||||||
Noble Energy, Inc. | 1,468 | 10,719 | 12,187 | 99,986 | 730,071 | 830,057 | ||||||||||||||||||
Oasis Petroleum, Inc.* | 3,258 | 23,676 | 26,934 | 153,028 | 1,112,062 | 1,265,090 | ||||||||||||||||||
Pioneer Natural Resources Co. | 3,249 | 108,608 | 111,857 | 598,043 | 19,991,475 | 20,589,518 | ||||||||||||||||||
QEP Resources, Inc. | 584 | 4,292 | 4,876 | 17,900 | 131,550 | 149,450 | ||||||||||||||||||
Range Resources Corp. | 5,256 | 93,181 | 98,437 | 443,133 | 7,856,090 | 8,299,223 | ||||||||||||||||||
SM Energy Co. | 2,136 | 15,588 | 17,724 | 177,523 | 1,295,519 | 1,473,042 | ||||||||||||||||||
Southwestern Energy Co.* | 11,330 | 82,650 | 93,980 | 445,609 | 3,250,624 | 3,696,233 | ||||||||||||||||||
Whiting Petroleum Corp.* | 304 | 2,234 | 2,538 | 18,808 | 138,218 | 157,026 | ||||||||||||||||||
Williams Cos., Inc. | 12,080 | 88,122 | 100,202 | 465,926 | 3,398,866 | 3,864,792 | ||||||||||||||||||
World Fuel Services Corp. | 443 | 3,252 | 3,695 | 19,120 | 140,356 | 159,476 | ||||||||||||||||||
|
|
|
|
|
| |||||||||||||||||||
| 10,918,770 | 115,949,879 | 126,868,649 | ||||||||||||||||||||||
|
|
|
|
|
| |||||||||||||||||||
Total Energy | 19,709,777 | 197,033,220 | 216,742,997 | |||||||||||||||||||||
|
|
|
|
|
| |||||||||||||||||||
Financials (4.7%) | ||||||||||||||||||||||||
Capital Markets (0.9%) | ||||||||||||||||||||||||
Affiliated Managers Group, Inc.* | 1,700 | 72,570 | 74,270 | 368,696 | 15,738,982 | 16,107,678 | ||||||||||||||||||
Ameriprise Financial, Inc. | 2,072 | 15,118 | 17,190 | 238,384 | 1,739,326 | 1,977,710 | ||||||||||||||||||
Artisan Partners Asset Management, Inc., Class A | 172 | 1,266 | 1,438 | 11,213 | 82,531 | 93,744 | ||||||||||||||||||
BlackRock, Inc. | 1,486 | 20,535 | 22,021 | 470,274 | 6,498,711 | 6,968,985 | ||||||||||||||||||
Charles Schwab Corp. | 4,813 | 35,133 | 39,946 | 125,138 | 913,458 | 1,038,596 | ||||||||||||||||||
Eaton Vance Corp. | 3,869 | 28,232 | 32,101 | 165,554 | 1,208,047 | 1,373,601 | ||||||||||||||||||
Federated Investors, Inc., Class B | 2,205 | 16,113 | 18,318 | 63,504 | 464,054 | 527,558 | ||||||||||||||||||
Franklin Resources, Inc. | 13,241 | 132,810 | 146,051 | 764,403 | 7,667,121 | 8,431,524 | ||||||||||||||||||
Invesco Ltd. | — | 81,803 | 81,803 | — | 2,977,629 | 2,977,629 | ||||||||||||||||||
Lazard Ltd., Class A | 4,130 | 30,133 | 34,263 | 187,172 | 1,365,628 | 1,552,800 | ||||||||||||||||||
LPL Financial Holdings, Inc. | 1,433 | 10,473 | 11,906 | 67,394 | 492,545 | 559,939 | ||||||||||||||||||
SEI Investments Co. | 4,396 | 32,079 | 36,475 | 152,673 | 1,114,104 | 1,266,777 | ||||||||||||||||||
T. Rowe Price Group, Inc. | 8,358 | 60,976 | 69,334 | 700,150 | 5,107,960 | 5,808,110 | ||||||||||||||||||
TD Ameritrade Holding Corp. | — | 82,682 | 82,682 | — | 2,533,377 | 2,533,377 | ||||||||||||||||||
Waddell & Reed Financial, Inc., Class A | 2,770 | 20,212 | 22,982 | 180,382 | 1,316,205 | 1,496,587 | ||||||||||||||||||
|
|
|
|
|
| |||||||||||||||||||
| 3,494,937 | 49,219,678 | 52,714,615 | ||||||||||||||||||||||
|
|
|
|
|
| |||||||||||||||||||
See notes to pro-forma combined financial statements.
61
EQ ADVISORS TRUST
PORTFOLIO OF INVESTMENTS
December 31, 2013
| Number of Shares | Value ($) (Note 1) | |||||||||||||||||||||||
| EQ/Equity Growth PLUS | EQ/Large Cap Growth PLUS | Combined Pro-forma | EQ/Equity Growth PLUS | EQ/Large Cap Growth PLUS | Combined Pro-forma | |||||||||||||||||||
Commercial Banks (0.0%) | ||||||||||||||||||||||||
Signature Bank/New York* | 148 | 1,088 | 1,236 | 15,898 | 116,873 | 132,771 | ||||||||||||||||||
|
|
|
|
|
| |||||||||||||||||||
Consumer Finance (1.0%) | ||||||||||||||||||||||||
American Express Co. | 30,572 | 617,079 | 647,651 | 2,773,798 | 55,987,578 | 58,761,376 | ||||||||||||||||||
Discover Financial Services | 27,536 | — | 27,536 | 1,540,639 | — | 1,540,639 | ||||||||||||||||||
|
|
|
|
|
| |||||||||||||||||||
| 4,314,437 | 55,987,578 | 60,302,015 | ||||||||||||||||||||||
|
|
|
|
|
| |||||||||||||||||||
Diversified Financial Services (1.0%) | ||||||||||||||||||||||||
CBOE Holdings, Inc. | 2,813 | 20,530 | 23,343 | 146,163 | 1,066,739 | 1,212,902 | ||||||||||||||||||
Citigroup, Inc. | — | 504,182 | 504,182 | — | 26,272,924 | 26,272,924 | ||||||||||||||||||
IntercontinentalExchange Group, Inc. | 10,704 | 93,601 | 104,305 | 2,407,544 | 21,052,737 | 23,460,281 | ||||||||||||||||||
Leucadia National Corp. | 1,288 | 9,426 | 10,714 | 36,502 | 267,133 | 303,635 | ||||||||||||||||||
McGraw Hill Financial, Inc. | 4,170 | 30,419 | 34,589 | 326,094 | 2,378,766 | 2,704,860 | ||||||||||||||||||
Moody’s Corp. | 35,214 | 45,722 | 80,936 | 2,763,243 | 3,587,805 | 6,351,048 | ||||||||||||||||||
MSCI, Inc.* | 1,631 | 11,912 | 13,543 | 71,307 | 520,792 | 592,099 | ||||||||||||||||||
|
|
|
|
|
| |||||||||||||||||||
| 5,750,853 | 55,146,896 | 60,897,749 | ||||||||||||||||||||||
|
|
|
|
|
| |||||||||||||||||||
Insurance (0.8%) | ||||||||||||||||||||||||
Allied World Assurance Co. Holdings AG | 369 | 2,700 | 3,069 | 41,627 | 304,587 | 346,214 | ||||||||||||||||||
American Financial Group, Inc./Ohio | 341 | 2,503 | 2,844 | 19,682 | 144,473 | 164,155 | ||||||||||||||||||
American International Group, Inc. | — | 298,807 | 298,807 | — | 15,254,097 | 15,254,097 | ||||||||||||||||||
Aon plc | 7,682 | 56,038 | 63,720 | 644,443 | 4,701,028 | 5,345,471 | ||||||||||||||||||
Arch Capital Group Ltd.* | 271 | 1,989 | 2,260 | 16,176 | 118,723 | 134,899 | ||||||||||||||||||
Arthur J. Gallagher & Co. | 4,086 | 29,811 | 33,897 | 191,756 | 1,399,030 | 1,590,786 | ||||||||||||||||||
Axis Capital Holdings Ltd. | 980 | 7,167 | 8,147 | 46,619 | 340,934 | 387,553 | ||||||||||||||||||
Brown & Brown, Inc. | 1,741 | 12,725 | 14,466 | 54,650 | 399,438 | 454,088 | ||||||||||||||||||
Chubb Corp. | 1,195 | 8,722 | 9,917 | 115,473 | 842,807 | 958,280 | ||||||||||||||||||
eHealth, Inc.* | — | 97,160 | 97,160 | — | 4,516,968 | 4,516,968 | ||||||||||||||||||
Endurance Specialty Holdings Ltd. | 474 | 3,472 | 3,946 | 27,810 | 203,702 | 231,512 | ||||||||||||||||||
Erie Indemnity Co., Class A | 801 | 5,852 | 6,653 | 58,569 | 427,898 | 486,467 | ||||||||||||||||||
Hanover Insurance Group, Inc. | 406 | 2,977 | 3,383 | 24,242 | 177,757 | 201,999 | ||||||||||||||||||
Loews Corp. | 792 | 5,797 | 6,589 | 38,206 | 279,647 | 317,853 | ||||||||||||||||||
Marsh & McLennan Cos., Inc. | 11,869 | 86,585 | 98,454 | 573,985 | 4,187,251 | 4,761,236 | ||||||||||||||||||
Progressive Corp. | 15,630 | 114,021 | 129,651 | 426,230 | 3,109,353 | 3,535,583 | ||||||||||||||||||
Prudential Financial, Inc. | 5,743 | 41,893 | 47,636 | 529,619 | 3,863,373 | 4,392,992 | ||||||||||||||||||
Travelers Cos., Inc. | 3,276 | 23,896 | 27,172 | 296,609 | 2,163,544 | 2,460,153 | ||||||||||||||||||
Validus Holdings Ltd. | 290 | 2,137 | 2,427 | 11,684 | 86,100 | 97,784 | ||||||||||||||||||
|
|
|
|
|
| |||||||||||||||||||
| 3,117,380 | 42,520,710 | 45,638,090 | ||||||||||||||||||||||
|
|
|
|
|
| |||||||||||||||||||
Real Estate Investment Trusts (REITs) (0.9%) |
| |||||||||||||||||||||||
American Homes 4 Rent (REIT), Class A | 315 | 2,370 | 2,685 | 5,103 | 38,394 | 43,497 | ||||||||||||||||||
American Tower Corp. (REIT) | 12,746 | 225,429 | 238,175 | 1,017,386 | 17,993,743 | 19,011,129 | ||||||||||||||||||
Apartment Investment & Management Co. (REIT), Class A | 2,582 | 18,868 | 21,450 | 66,900 | 488,870 | 555,770 | ||||||||||||||||||
Boston Properties, Inc. (REIT) | 465 | 3,399 | 3,864 | 46,672 | 341,158 | 387,830 | ||||||||||||||||||
Brixmor Property Group, Inc. (REIT)* | 320 | 2,153 | 2,473 | 6,506 | 43,771 | 50,277 | ||||||||||||||||||
See notes to pro-forma combined financial statements.
62
EQ ADVISORS TRUST
PORTFOLIO OF INVESTMENTS
December 31, 2013
| Number of Shares | Value ($) (Note 1) | |||||||||||||||||||||||
| EQ/Equity Growth PLUS | EQ/Large Cap Growth PLUS | Combined Pro-forma | EQ/Equity Growth PLUS | EQ/Large Cap Growth PLUS | Combined Pro-forma | |||||||||||||||||||
CBL & Associates Properties, Inc. (REIT) | 1,720 | 12,596 | 14,316 | 30,891 | 226,224 | 257,115 | ||||||||||||||||||
Corrections Corp. of America (REIT) | 2,351 | 17,170 | 19,521 | 75,397 | 550,642 | 626,039 | ||||||||||||||||||
Digital Realty Trust, Inc. (REIT) | 3,253 | 23,744 | 26,997 | 159,787 | 1,166,305 | 1,326,092 | ||||||||||||||||||
Equity Lifestyle Properties, Inc. (REIT) | 1,942 | 14,165 | 16,107 | 70,359 | 513,198 | 583,557 | ||||||||||||||||||
Extra Space Storage, Inc. (REIT) | 287 | 2,114 | 2,401 | 12,091 | 89,063 | 101,154 | ||||||||||||||||||
Federal Realty Investment Trust (REIT) | 1,382 | 10,085 | 11,467 | 140,149 | 1,022,720 | 1,162,869 | ||||||||||||||||||
Omega Healthcare Investors, Inc. (REIT) | 3,937 | 28,741 | 32,678 | 117,323 | 856,482 | 973,805 | ||||||||||||||||||
Plum Creek Timber Co., Inc. (REIT) | 5,715 | 41,595 | 47,310 | 265,805 | 1,934,583 | 2,200,388 | ||||||||||||||||||
Public Storage (REIT) | 4,301 | 31,375 | 35,676 | 647,387 | 4,722,565 | 5,369,952 | ||||||||||||||||||
Rayonier, Inc. (REIT) | 4,062 | 29,642 | 33,704 | 171,010 | 1,247,928 | 1,418,938 | ||||||||||||||||||
Regency Centers Corp. (REIT) | 1,238 | 9,044 | 10,282 | 57,319 | 418,737 | 476,056 | ||||||||||||||||||
Senior Housing Properties Trust (REIT) | 444 | 3,277 | 3,721 | 9,870 | 72,848 | 82,718 | ||||||||||||||||||
Simon Property Group, Inc. (REIT) | 7,464 | 54,455 | 61,919 | 1,135,722 | 8,285,873 | 9,421,595 | ||||||||||||||||||
Spirit Realty Capital, Inc. (REIT) | 2,305 | 16,905 | 19,210 | 22,658 | 166,176 | 188,834 | ||||||||||||||||||
Tanger Factory Outlet Centers (REIT) | 3,044 | 22,222 | 25,266 | 97,469 | 711,548 | 809,017 | ||||||||||||||||||
Taubman Centers, Inc. (REIT) | 376 | 2,744 | 3,120 | 24,034 | 175,396 | 199,430 | ||||||||||||||||||
Ventas, Inc. (REIT) | 4,262 | 31,091 | 35,353 | 244,127 | 1,780,892 | 2,025,019 | ||||||||||||||||||
Vornado Realty Trust (REIT) | 1,169 | 8,535 | 9,704 | 103,795 | 757,823 | 861,618 | ||||||||||||||||||
Weyerhaeuser Co. (REIT) | 18,767 | 136,904 | 155,671 | 592,474 | 4,322,059 | 4,914,533 | ||||||||||||||||||
|
|
|
|
|
| |||||||||||||||||||
| 5,120,234 | 47,926,998 | 53,047,232 | ||||||||||||||||||||||
|
|
|
|
|
| |||||||||||||||||||
Real Estate Management & Development (0.1%) |
| |||||||||||||||||||||||
CBRE Group, Inc., Class A* | 8,994 | 65,616 | 74,610 | 236,542 | 1,725,701 | 1,962,243 | ||||||||||||||||||
Realogy Holdings Corp.* | 3,454 | 25,202 | 28,656 | 170,870 | 1,246,743 | 1,417,613 | ||||||||||||||||||
St. Joe Co.* | 143 | 444 | 587 | 2,744 | 8,520 | 11,264 | ||||||||||||||||||
|
|
|
|
|
| |||||||||||||||||||
| 410,156 | 2,980,964 | 3,391,120 | ||||||||||||||||||||||
|
|
|
|
|
| |||||||||||||||||||
Thrifts & Mortgage Finance (0.0%) | ||||||||||||||||||||||||
Nationstar Mortgage Holdings, Inc.* | 691 | 5,060 | 5,751 | 25,539 | 187,017 | 212,556 | ||||||||||||||||||
Ocwen Financial Corp.* | 3,340 | 24,373 | 27,713 | 185,203 | 1,351,483 | 1,536,686 | ||||||||||||||||||
|
|
|
|
|
| |||||||||||||||||||
| 210,742 | 1,538,500 | 1,749,242 | ||||||||||||||||||||||
|
|
|
|
|
| |||||||||||||||||||
Total Financials | 22,434,637 | 255,438,197 | 277,872,834 | |||||||||||||||||||||
|
|
|
|
|
| |||||||||||||||||||
Health Care (10.6%) | ||||||||||||||||||||||||
Biotechnology (5.5%) | ||||||||||||||||||||||||
Alexion Pharmaceuticals, Inc.* | 6,289 | 163,931 | 170,220 | 836,814 | 21,812,659 | 22,649,473 | ||||||||||||||||||
Alkermes plc* | 4,075 | 29,735 | 33,810 | 165,689 | 1,209,025 | 1,374,714 | ||||||||||||||||||
Amgen, Inc. | 24,199 | 176,334 | 200,533 | 2,762,558 | 20,130,289 | 22,892,847 | ||||||||||||||||||
ARIAD Pharmaceuticals, Inc.* | 5,953 | 43,678 | 49,631 | 40,599 | 297,884 | 338,483 | ||||||||||||||||||
Biogen Idec, Inc.* | 7,662 | 253,018 | 260,680 | 2,143,445 | 70,781,785 | 72,925,230 | ||||||||||||||||||
BioMarin Pharmaceutical, Inc.* | 4,480 | 32,684 | 37,164 | 314,810 | 2,296,705 | 2,611,515 | ||||||||||||||||||
Celgene Corp.* | 13,462 | 354,679 | 368,141 | 2,274,540 | 59,926,564 | 62,201,104 | ||||||||||||||||||
Cubist Pharmaceuticals, Inc.* | 2,102 | 15,341 | 17,443 | 144,765 | 1,056,535 | 1,201,300 | ||||||||||||||||||
Gilead Sciences, Inc.* | 99,062 | 1,313,355 | 1,412,417 | 7,444,509 | 98,698,628 | 106,143,137 | ||||||||||||||||||
Incyte Corp.* | 3,317 | 60,207 | 63,524 | 167,940 | 3,048,280 | 3,216,220 | ||||||||||||||||||
Medivation, Inc.* | 2,417 | 17,637 | 20,054 | 154,253 | 1,125,593 | 1,279,846 | ||||||||||||||||||
See notes to pro-forma combined financial statements.
63
EQ ADVISORS TRUST
PORTFOLIO OF INVESTMENTS
December 31, 2013
| Number of Shares | Value ($) (Note 1) | |||||||||||||||||||||||
| EQ/Equity Growth PLUS | EQ/Large Cap Growth PLUS | Combined Pro-forma | EQ/ Equity Growth PLUS | EQ/Large Cap Growth PLUS | Combined Pro-forma | |||||||||||||||||||
Myriad Genetics, Inc.* | 2,410 | 18,130 | 20,540 | 50,562 | 380,367 | 430,929 | ||||||||||||||||||
Pharmacyclics, Inc.* | 1,884 | 30,625 | 32,509 | 199,290 | 3,239,512 | 3,438,802 | ||||||||||||||||||
Quintiles Transnational Holdings, Inc.* | 395 | 2,899 | 3,294 | 18,304 | 134,340 | 152,644 | ||||||||||||||||||
Regeneron Pharmaceuticals, Inc.* | 13,735 | 28,428 | 42,163 | 3,780,421 | 7,824,523 | 11,604,944 | ||||||||||||||||||
Seattle Genetics, Inc.* | 3,236 | 23,621 | 26,857 | 129,084 | 942,242 | 1,071,326 | ||||||||||||||||||
Theravance, Inc.* | 2,553 | 18,512 | 21,065 | 91,014 | 659,953 | 750,967 | ||||||||||||||||||
United Therapeutics Corp.* | 34,819 | 10,944 | 45,763 | 3,937,333 | 1,237,548 | 5,174,881 | ||||||||||||||||||
Vertex Pharmaceuticals, Inc.* | 7,503 | 79,942 | 87,445 | 557,473 | 5,939,691 | 6,497,164 | ||||||||||||||||||
|
|
|
|
|
| |||||||||||||||||||
| 25,213,403 | 300,742,123 | 325,955,526 | ||||||||||||||||||||||
|
|
|
|
|
| |||||||||||||||||||
Health Care Equipment & Supplies (0.9%) |
| |||||||||||||||||||||||
Baxter International, Inc. | 17,467 | 127,423 | 144,890 | 1,214,830 | 8,862,270 | 10,077,100 | ||||||||||||||||||
Becton, Dickinson and Co. | 6,261 | 45,672 | 51,933 | 691,778 | 5,046,299 | 5,738,077 | ||||||||||||||||||
Boston Scientific Corp.* | — | 740,860 | 740,860 | — | 8,905,137 | 8,905,137 | ||||||||||||||||||
C.R. Bard, Inc. | 2,594 | 18,923 | 21,517 | 347,440 | 2,534,547 | 2,881,987 | ||||||||||||||||||
Cooper Cos., Inc. | 1,154 | 8,423 | 9,577 | 142,911 | 1,043,104 | 1,186,015 | ||||||||||||||||||
DENTSPLY International, Inc. | 1,289 | 9,417 | 10,706 | 62,491 | 456,536 | 519,027 | ||||||||||||||||||
Edwards Lifesciences Corp.* | 3,641 | 26,564 | 30,205 | 239,432 | 1,746,849 | 1,986,281 | ||||||||||||||||||
Hologic, Inc.* | 2,544 | 18,594 | 21,138 | 56,858 | 415,576 | 472,434 | ||||||||||||||||||
IDEXX Laboratories, Inc.* | 1,744 | 37,004 | 38,748 | 185,509 | 3,936,116 | 4,121,625 | ||||||||||||||||||
Intuitive Surgical, Inc.* | 9,237 | 8,950 | 18,187 | 3,547,747 | 3,437,516 | 6,985,263 | ||||||||||||||||||
ResMed, Inc. | 4,592 | 33,504 | 38,096 | 216,191 | 1,577,368 | 1,793,559 | ||||||||||||||||||
Sirona Dental Systems, Inc.* | 1,771 | 12,927 | 14,698 | 124,324 | 907,475 | 1,031,799 | ||||||||||||||||||
St. Jude Medical, Inc. | 5,809 | 42,373 | 48,182 | 359,868 | 2,625,007 | 2,984,875 | ||||||||||||||||||
Stryker Corp. | 6,226 | 65,928 | 72,154 | 467,822 | 4,953,830 | 5,421,652 | ||||||||||||||||||
Varian Medical Systems, Inc.* | 3,495 | 25,495 | 28,990 | 271,527 | 1,980,707 | 2,252,234 | ||||||||||||||||||
Zimmer Holdings, Inc. | 304 | 2,228 | 2,532 | 28,330 | 207,627 | 235,957 | ||||||||||||||||||
|
|
|
|
|
| |||||||||||||||||||
| 7,957,058 | 48,635,964 | 56,593,022 | ||||||||||||||||||||||
|
|
|
|
|
| |||||||||||||||||||
Health Care Providers & Services (1.6%) |
| |||||||||||||||||||||||
Aetna, Inc. | 3,243 | 23,661 | 26,904 | 222,437 | 1,622,908 | 1,845,345 | ||||||||||||||||||
AmerisourceBergen Corp. | 7,442 | 54,291 | 61,733 | 523,247 | 3,817,200 | 4,340,447 | ||||||||||||||||||
Brookdale Senior Living, Inc.* | 3,204 | 23,398 | 26,602 | 87,085 | 635,958 | 723,043 | ||||||||||||||||||
Cardinal Health, Inc. | — | 71,501 | 71,501 | — | 4,776,982 | 4,776,982 | ||||||||||||||||||
Catamaran Corp.* | 6,637 | 48,413 | 55,050 | 315,125 | 2,298,649 | 2,613,774 | ||||||||||||||||||
Cigna Corp. | 534 | 3,902 | 4,436 | 46,714 | 341,347 | 388,061 | ||||||||||||||||||
Community Health Systems, Inc.* | 238 | 1,756 | 1,994 | 9,346 | 68,958 | 78,304 | ||||||||||||||||||
DaVita HealthCare Partners, Inc.* | 5,937 | 43,309 | 49,246 | 376,228 | 2,744,491 | 3,120,719 | ||||||||||||||||||
Envision Healthcare Holdings, Inc.* | 1,005 | 197,752 | 198,757 | 35,697 | 7,024,151 | 7,059,848 | ||||||||||||||||||
Express Scripts Holding Co.* | 23,028 | 167,998 | 191,026 | 1,617,487 | 11,800,179 | 13,417,666 | ||||||||||||||||||
HCA Holdings, Inc.* | 630 | 4,615 | 5,245 | 30,057 | 220,182 | 250,239 | ||||||||||||||||||
Health Management Associates, Inc., Class A* | 8,360 | 61,028 | 69,388 | 109,516 | 799,467 | 908,983 | ||||||||||||||||||
Henry Schein, Inc.* | 2,808 | 20,487 | 23,295 | 320,842 | 2,340,845 | 2,661,687 | ||||||||||||||||||
Laboratory Corp. of America Holdings* | 2,818 | 20,698 | 23,516 | 257,481 | 1,891,176 | 2,148,657 | ||||||||||||||||||
McKesson Corp. | 7,304 | 160,069 | 167,373 | 1,178,866 | 25,835,137 | 27,014,003 | ||||||||||||||||||
MEDNAX, Inc.* | 2,098 | 15,314 | 17,412 | 111,991 | 817,461 | 929,452 | ||||||||||||||||||
See notes to pro-forma combined financial statements.
64
EQ ADVISORS TRUST
PORTFOLIO OF INVESTMENTS
December 31, 2013
| Number of Shares | Value ($) (Note 1) | |||||||||||||||||||||||
| EQ/Equity Growth PLUS | EQ/Large Cap Growth PLUS | Combined Pro-forma | EQ/Equity Growth PLUS | EQ/Large Cap Growth PLUS | Combined Pro-forma | |||||||||||||||||||
Patterson Cos., Inc. | 2,522 | 18,416 | 20,938 | 103,906 | 758,739 | 862,645 | ||||||||||||||||||
Premier, Inc., Class A* | 689 | 4,918 | 5,607 | 25,328 | 180,786 | 206,114 | ||||||||||||||||||
Quest Diagnostics, Inc. | 337 | 2,472 | 2,809 | 18,043 | 132,351 | 150,394 | ||||||||||||||||||
Team Health Holdings, Inc.* | — | 84,021 | 84,021 | — | 3,827,157 | 3,827,157 | ||||||||||||||||||
Tenet Healthcare Corp.* | 3,336 | 24,350 | 27,686 | 140,512 | 1,025,622 | 1,166,134 | ||||||||||||||||||
UnitedHealth Group, Inc. | — | 253,441 | 253,441 | — | 19,084,107 | 19,084,107 | ||||||||||||||||||
Universal Health Services, Inc., Class B | 1,968 | 14,362 | 16,330 | 159,920 | 1,167,056 | 1,326,976 | ||||||||||||||||||
|
|
|
|
|
| |||||||||||||||||||
| 5,689,828 | 93,210,909 | 98,900,737 | ||||||||||||||||||||||
|
|
|
|
|
| |||||||||||||||||||
Health Care Technology (0.1%) | ||||||||||||||||||||||||
Cerner Corp.* | 9,558 | 69,725 | 79,283 | 532,763 | 3,886,471 | 4,419,234 | ||||||||||||||||||
Veeva Systems, Inc., Class A* | 327 | 2,279 | 2,606 | 10,497 | 73,156 | 83,653 | ||||||||||||||||||
|
|
|
|
|
| |||||||||||||||||||
| 543,260 | 3,959,627 | 4,502,887 | ||||||||||||||||||||||
|
|
|
|
|
| |||||||||||||||||||
Life Sciences Tools & Services (0.2%) |
| |||||||||||||||||||||||
Agilent Technologies, Inc. | 1,310 | 9,565 | 10,875 | 74,919 | 547,022 | 621,941 | ||||||||||||||||||
Bruker Corp.* | 3,528 | 25,776 | 29,304 | 69,748 | 509,592 | 579,340 | ||||||||||||||||||
Charles River Laboratories International, Inc.* | 713 | 5,218 | 5,931 | 37,817 | 276,763 | 314,580 | ||||||||||||||||||
Covance, Inc.* | 1,801 | 13,145 | 14,946 | 158,596 | 1,157,549 | 1,316,145 | ||||||||||||||||||
Illumina, Inc.* | 4,009 | 29,244 | 33,253 | 443,476 | 3,234,971 | 3,678,447 | ||||||||||||||||||
Life Technologies Corp.* | 3,611 | 26,340 | 29,951 | 273,714 | 1,996,572 | 2,270,286 | ||||||||||||||||||
Mettler-Toledo International, Inc.* | 973 | 7,098 | 8,071 | 236,040 | 1,721,904 | 1,957,944 | ||||||||||||||||||
Techne Corp. | 552 | 4,038 | 4,590 | 52,258 | 382,277 | 434,535 | ||||||||||||||||||
Waters Corp.* | 2,762 | 20,148 | 22,910 | 276,200 | 2,014,800 | 2,291,000 | ||||||||||||||||||
|
|
|
|
|
| |||||||||||||||||||
| 1,622,768 | 11,841,450 | 13,464,218 | ||||||||||||||||||||||
|
|
|
|
|
| |||||||||||||||||||
Pharmaceuticals (2.3%) | ||||||||||||||||||||||||
AbbVie, Inc. | 120,771 | 500,625 | 621,396 | 6,377,917 | 26,438,006 | 32,815,923 | ||||||||||||||||||
Actavis plc* | 5,596 | 94,852 | 100,448 | 940,128 | 15,935,136 | 16,875,264 | ||||||||||||||||||
Allergan, Inc. | 25,753 | 69,689 | 95,442 | 2,860,643 | 7,741,054 | 10,601,697 | ||||||||||||||||||
Bristol-Myers Squibb Co. | 45,638 | 510,735 | 556,373 | 2,425,660 | 27,145,565 | 29,571,225 | ||||||||||||||||||
Eli Lilly and Co. | 6,997 | 51,041 | 58,038 | 356,847 | 2,603,091 | 2,959,938 | ||||||||||||||||||
Endo Health Solutions, Inc.* | 3,618 | 26,394 | 30,012 | 244,070 | 1,780,539 | 2,024,609 | ||||||||||||||||||
Forest Laboratories, Inc. (Contingent Value Shares)*†(b) | — | 306 | 306 | — | — | — | ||||||||||||||||||
Jazz Pharmaceuticals plc* | 1,672 | 12,196 | 13,868 | 211,608 | 1,543,526 | 1,755,134 | ||||||||||||||||||
Johnson & Johnson | 11,678 | 85,195 | 96,873 | 1,069,588 | 7,803,010 | 8,872,598 | ||||||||||||||||||
Mylan, Inc.* | 12,283 | 89,602 | 101,885 | 533,082 | 3,888,727 | 4,421,809 | ||||||||||||||||||
Novo Nordisk A/S, Class B | — | 8,479 | 8,479 | — | 1,554,216 | 1,554,216 | ||||||||||||||||||
Perrigo Co. plc | 4,060 | 29,640 | 33,700 | 623,048 | 4,548,555 | 5,171,603 | ||||||||||||||||||
Salix Pharmaceuticals Ltd.* | 1,976 | 14,420 | 16,396 | 177,721 | 1,296,935 | 1,474,656 | ||||||||||||||||||
Shire plc (ADR) | — | 37,090 | 37,090 | — | 5,240,446 | 5,240,446 | ||||||||||||||||||
Valeant Pharmaceuticals International, Inc.* | 25,471 | 44,445 | 69,916 | 2,990,295 | 5,217,843 | 8,208,138 | ||||||||||||||||||
Zoetis, Inc. | 16,114 | 117,549 | 133,663 | 526,767 | 3,842,677 | 4,369,444 | ||||||||||||||||||
|
|
|
|
|
| |||||||||||||||||||
| 19,337,374 | 116,579,326 | 135,916,700 | ||||||||||||||||||||||
|
|
|
|
|
| |||||||||||||||||||
Total Health Care | 60,363,691 | 574,969,399 | 635,333,090 | |||||||||||||||||||||
|
|
|
|
|
| |||||||||||||||||||
See notes to pro-forma combined financial statements.
65
EQ ADVISORS TRUST
PORTFOLIO OF INVESTMENTS
December 31, 2013
| Number of Shares | Value ($) (Note 1) | |||||||||||||||||||||||
| EQ/Equity Growth PLUS | EQ/Large Cap Growth PLUS | Combined Pro-forma | EQ/Equity Growth PLUS | EQ/Large Cap Growth PLUS | Combined Pro-forma | |||||||||||||||||||
Industrials (9.7%) | ||||||||||||||||||||||||
Aerospace & Defense (3.0%) | ||||||||||||||||||||||||
B/E Aerospace, Inc.* | 2,979 | 147,760 | 150,739 | 259,263 | 12,859,553 | 13,118,816 | ||||||||||||||||||
Boeing Co. | 24,474 | 243,684 | 268,158 | 3,340,456 | 33,260,429 | 36,600,885 | ||||||||||||||||||
Hexcel Corp.* | 3,232 | 23,586 | 26,818 | 144,438 | 1,054,058 | 1,198,496 | ||||||||||||||||||
Honeywell International, Inc. | 25,392 | 184,988 | 210,380 | 2,320,067 | 16,902,354 | 19,222,421 | ||||||||||||||||||
Huntington Ingalls Industries, Inc. | 1,616 | 11,798 | 13,414 | 145,456 | 1,061,938 | 1,207,394 | ||||||||||||||||||
Lockheed Martin Corp. | 8,367 | 61,038 | 69,405 | 1,243,838 | 9,073,909 | 10,317,747 | ||||||||||||||||||
Precision Castparts Corp. | 26,271 | 118,274 | 144,545 | 7,074,780 | 31,851,188 | 38,925,968 | ||||||||||||||||||
Rockwell Collins, Inc. | 3,896 | 28,423 | 32,319 | 287,992 | 2,101,028 | 2,389,020 | ||||||||||||||||||
Rolls-Royce Holdings plc* | — | 1,294,777 | 1,294,777 | — | 27,337,097 | 27,337,097 | ||||||||||||||||||
Rolls-Royce Holdings plc | — | 111,350,822 | 111,350,822 | — | 184,391 | 184,391 | ||||||||||||||||||
Spirit AeroSystems Holdings, Inc., | 501 | 3,683 | 4,184 | 17,074 | 125,517 | 142,591 | ||||||||||||||||||
TransDigm Group, Inc. | 1,689 | 12,321 | 14,010 | 271,963 | 1,983,928 | 2,255,891 | ||||||||||||||||||
Triumph Group, Inc. | 338 | 2,476 | 2,814 | 25,712 | 188,349 | 214,061 | ||||||||||||||||||
United Technologies Corp. | 58,202 | 202,528 | 260,730 | 6,623,388 | 23,047,686 | 29,671,074 | ||||||||||||||||||
|
|
|
|
|
| |||||||||||||||||||
| 21,754,427 | 161,031,425 | 182,785,852 | ||||||||||||||||||||||
|
|
|
|
|
| |||||||||||||||||||
Air Freight & Logistics (0.5%) | ||||||||||||||||||||||||
C.H. Robinson Worldwide, Inc. | 4,889 | 35,888 | 40,777 | 285,224 | 2,093,706 | 2,378,930 | ||||||||||||||||||
Expeditors International of Washington, Inc. | 6,659 | 48,579 | 55,238 | 294,661 | 2,149,620 | 2,444,281 | ||||||||||||||||||
United Parcel Service, Inc., Class B | 23,375 | 208,823 | 232,198 | 2,456,245 | 21,943,121 | 24,399,366 | ||||||||||||||||||
|
|
|
|
|
| |||||||||||||||||||
| 3,036,130 | 26,186,447 | 29,222,577 | ||||||||||||||||||||||
|
|
|
|
|
| |||||||||||||||||||
Airlines (0.6%) | ||||||||||||||||||||||||
Alaska Air Group, Inc. | 2,092 | 15,267 | 17,359 | 153,490 | 1,120,140 | 1,273,630 | ||||||||||||||||||
American Airlines Group, Inc.* | 3,688 | 26,938 | 30,626 | 93,122 | 680,185 | 773,307 | ||||||||||||||||||
Copa Holdings S.A., Class A | 1,072 | 73,518 | 74,590 | 171,638 | 11,770,967 | 11,942,605 | ||||||||||||||||||
Delta Air Lines, Inc. | 12,642 | 571,586 | 584,228 | 347,276 | 15,701,467 | 16,048,743 | ||||||||||||||||||
Southwest Airlines Co. | 2,562 | 18,730 | 21,292 | 48,268 | 352,873 | 401,141 | ||||||||||||||||||
United Continental Holdings, Inc.* | 11,471 | 150,083 | 161,554 | 433,948 | 5,677,640 | 6,111,588 | ||||||||||||||||||
|
|
|
|
|
| |||||||||||||||||||
| 1,247,742 | 35,303,272 | 36,551,014 | ||||||||||||||||||||||
|
|
|
|
|
| |||||||||||||||||||
Building Products (0.3%) | ||||||||||||||||||||||||
A.O. Smith Corp. | 1,067 | 7,801 | 8,868 | 57,554 | 420,786 | 478,340 | ||||||||||||||||||
Allegion plc* | 2,286 | 16,696 | 18,982 | 101,033 | 737,810 | 838,843 | ||||||||||||||||||
Armstrong World Industries, Inc.* | 811 | 5,941 | 6,752 | 46,722 | 342,261 | 388,983 | ||||||||||||||||||
Fortune Brands Home & Security, Inc. | 4,675 | 232,993 | 237,668 | 213,647 | 10,647,780 | 10,861,427 | ||||||||||||||||||
Lennox International, Inc. | 1,624 | 11,856 | 13,480 | 138,137 | 1,008,471 | 1,146,608 | ||||||||||||||||||
Masco Corp. | 11,502 | 83,915 | 95,417 | 261,901 | 1,910,745 | 2,172,646 | ||||||||||||||||||
|
|
|
|
|
| |||||||||||||||||||
| 818,994 | 15,067,853 | 15,886,847 | ||||||||||||||||||||||
|
|
|
|
|
| |||||||||||||||||||
Commercial Services & Supplies (0.2%) |
| |||||||||||||||||||||||
Cintas Corp. | 934 | 6,824 | 7,758 | 55,657 | 406,642 | 462,299 | ||||||||||||||||||
Clean Harbors, Inc.* | 1,951 | 14,245 | 16,196 | 116,982 | 854,130 | 971,112 | ||||||||||||||||||
Copart, Inc.* | 3,600 | 26,280 | 29,880 | 131,940 | 963,162 | 1,095,102 | ||||||||||||||||||
Iron Mountain, Inc. | 4,943 | 36,071 | 41,014 | 150,020 | 1,094,755 | 1,244,775 | ||||||||||||||||||
KAR Auction Services, Inc. | 916 | 6,712 | 7,628 | 27,068 | 198,340 | 225,408 | ||||||||||||||||||
Pitney Bowes, Inc. | 2,819 | 20,599 | 23,418 | 65,683 | 479,957 | 545,640 | ||||||||||||||||||
See notes to pro-forma combined financial statements.
66
EQ ADVISORS TRUST
PORTFOLIO OF INVESTMENTS
December 31, 2013
| Number of Shares | Value ($) (Note 1) | |||||||||||||||||||||||
| EQ/Equity Growth PLUS | EQ/Large Cap Growth PLUS | Combined Pro-forma | EQ/Equity Growth PLUS | EQ/Large Cap Growth PLUS | Combined Pro-forma | |||||||||||||||||||
R.R. Donnelley & Sons Co. | 3,172 | 23,177 | 26,349 | 64,328 | 470,029 | 534,357 | ||||||||||||||||||
Rollins, Inc. | 2,053 | 14,999 | 17,052 | 62,185 | 454,320 | 516,505 | ||||||||||||||||||
Stericycle, Inc.* | 2,781 | 20,286 | 23,067 | 323,069 | 2,356,625 | 2,679,694 | ||||||||||||||||||
Waste Connections, Inc. | 3,755 | 27,405 | 31,160 | 163,831 | 1,195,680 | 1,359,511 | ||||||||||||||||||
Waste Management, Inc. | 1,205 | 8,805 | 10,010 | 54,068 | 395,080 | 449,148 | ||||||||||||||||||
|
|
|
|
|
| |||||||||||||||||||
| 1,214,831 | 8,868,720 | 10,083,551 | ||||||||||||||||||||||
|
|
|
|
|
| |||||||||||||||||||
Construction & Engineering (0.2%) | ||||||||||||||||||||||||
AECOM Technology Corp.* | 320 | 2,365 | 2,685 | 9,418 | 69,602 | 79,020 | ||||||||||||||||||
Chicago Bridge & Iron Co. N.V. | 3,242 | 23,651 | 26,893 | 269,540 | 1,966,344 | 2,235,884 | ||||||||||||||||||
Fluor Corp. | 3,145 | 22,942 | 26,087 | 252,512 | 1,842,013 | 2,094,525 | ||||||||||||||||||
Quanta Services, Inc.* | 1,416 | 179,426 | 180,842 | 44,689 | 5,662,685 | 5,707,374 | ||||||||||||||||||
|
|
|
|
|
| |||||||||||||||||||
| 576,159 | 9,540,644 | 10,116,803 | ||||||||||||||||||||||
|
|
|
|
|
| |||||||||||||||||||
Electrical Equipment (0.8%) | ||||||||||||||||||||||||
AMETEK, Inc. | 7,849 | 57,260 | 65,109 | 413,407 | 3,015,884 | 3,429,291 | ||||||||||||||||||
Babcock & Wilcox Co. | 2,496 | 18,228 | 20,724 | 85,338 | 623,215 | 708,553 | ||||||||||||||||||
Eaton Corp. plc | 45,215 | 139,145 | 184,360 | 3,441,766 | 10,591,718 | 14,033,484 | ||||||||||||||||||
Emerson Electric Co. | 17,330 | 126,426 | 143,756 | 1,216,219 | 8,872,577 | 10,088,796 | ||||||||||||||||||
Hubbell, Inc., Class B | 1,387 | 10,123 | 11,510 | 151,044 | 1,102,395 | 1,253,439 | ||||||||||||||||||
Rockwell Automation, Inc. | 4,501 | 32,837 | 37,338 | 531,838 | 3,880,020 | 4,411,858 | ||||||||||||||||||
Roper Industries, Inc. | 16,354 | 63,675 | 80,029 | 2,267,973 | 8,830,449 | 11,098,422 | ||||||||||||||||||
SolarCity Corp.* | 26,570 | 5,526 | 32,096 | 1,509,708 | 313,987 | 1,823,695 | ||||||||||||||||||
|
|
|
|
|
| |||||||||||||||||||
| 9,617,293 | 37,230,245 | 46,847,538 | ||||||||||||||||||||||
|
|
|
|
|
| |||||||||||||||||||
Industrial Conglomerates (0.6%) | ||||||||||||||||||||||||
3M Co. | 18,842 | 137,287 | 156,129 | 2,642,591 | 19,254,501 | 21,897,092 | ||||||||||||||||||
Carlisle Cos., Inc. | 105 | 777 | 882 | 8,337 | 61,694 | 70,031 | ||||||||||||||||||
Danaher Corp. | 3,917 | 192,139 | 196,056 | �� | 302,392 | 14,833,131 | 15,135,523 | |||||||||||||||||
|
|
|
|
|
| |||||||||||||||||||
| 2,953,320 | 34,149,326 | 37,102,646 | ||||||||||||||||||||||
|
|
|
|
|
| |||||||||||||||||||
Machinery (1.2%) | ||||||||||||||||||||||||
Caterpillar, Inc. | 3,837 | 27,989 | 31,826 | 348,438 | 2,541,681 | 2,890,119 | ||||||||||||||||||
Colfax Corp.* | 2,760 | 20,138 | 22,898 | 175,784 | 1,282,589 | 1,458,373 | ||||||||||||||||||
Crane Co. | 1,443 | 10,537 | 11,980 | 97,042 | 708,613 | 805,655 | ||||||||||||||||||
Cummins, Inc. | 5,014 | 163,129 | 168,143 | 706,824 | 22,996,295 | 23,703,119 | ||||||||||||||||||
Deere & Co. | 12,506 | 91,237 | 103,743 | 1,142,173 | 8,332,675 | 9,474,848 | ||||||||||||||||||
Donaldson Co., Inc. | 4,362 | 31,828 | 36,190 | 189,573 | 1,383,245 | 1,572,818 | ||||||||||||||||||
Dover Corp. | 4,070 | 29,690 | 33,760 | 392,918 | 2,866,273 | 3,259,191 | ||||||||||||||||||
Flowserve Corp. | 4,609 | 58,018 | 62,627 | 363,328 | 4,573,559 | 4,936,887 | ||||||||||||||||||
Graco, Inc. | 1,975 | 14,411 | 16,386 | 154,287 | 1,125,787 | 1,280,074 | ||||||||||||||||||
Harsco Corp. | 180 | 1,350 | 1,530 | 5,045 | 37,841 | 42,886 | ||||||||||||||||||
IDEX Corp. | 2,470 | 18,026 | 20,496 | 182,410 | 1,331,220 | 1,513,630 | ||||||||||||||||||
Illinois Tool Works, Inc. | 4,529 | 33,036 | 37,565 | 380,798 | 2,777,667 | 3,158,465 | ||||||||||||||||||
Ingersoll-Rand plc | 6,859 | 50,036 | 56,895 | 422,514 | 3,082,218 | 3,504,732 | ||||||||||||||||||
ITT Corp. | 2,898 | 21,153 | 24,051 | 125,831 | 918,463 | 1,044,294 | ||||||||||||||||||
Lincoln Electric Holdings, Inc. | 2,678 | 19,537 | 22,215 | 191,049 | 1,393,770 | 1,584,819 | ||||||||||||||||||
Manitowoc Co., Inc. | 4,304 | 31,425 | 35,729 | 100,369 | 732,831 | 833,200 | ||||||||||||||||||
See notes to pro-forma combined financial statements.
67
EQ ADVISORS TRUST
PORTFOLIO OF INVESTMENTS
December 31, 2013
| Number of Shares | Value ($) (Note 1) | |||||||||||||||||||||||
| EQ/Equity Growth PLUS | EQ/Large Cap Growth PLUS | Combined Pro-forma | EQ/Equity Growth PLUS | EQ/Large Cap Growth PLUS | Combined Pro-forma | |||||||||||||||||||
Navistar International Corp.* | 238 | 1,760 | 1,998 | 9,089 | 67,214 | 76,303 | ||||||||||||||||||
Nordson Corp. | 2,070 | 15,106 | 17,176 | 153,801 | 1,122,376 | 1,276,177 | ||||||||||||||||||
PACCAR, Inc. | 1,471 | 10,743 | 12,214 | 87,039 | 635,663 | 722,702 | ||||||||||||||||||
Pall Corp. | 3,587 | 26,167 | 29,754 | 306,150 | 2,233,353 | 2,539,503 | ||||||||||||||||||
Snap-on, Inc. | 212 | 1,558 | 1,770 | 23,218 | 170,632 | 193,850 | ||||||||||||||||||
Stanley Black & Decker, Inc. | 459 | 3,362 | 3,821 | 37,037 | 271,280 | 308,317 | ||||||||||||||||||
Toro Co. | 1,865 | 13,616 | 15,481 | 118,614 | 865,978 | 984,592 | ||||||||||||||||||
Valmont Industries, Inc. | 862 | 6,296 | 7,158 | 128,541 | 938,860 | 1,067,401 | ||||||||||||||||||
WABCO Holdings, Inc.* | 1,882 | 13,732 | 15,614 | 175,798 | 1,282,706 | 1,458,504 | ||||||||||||||||||
Wabtec Corp. | 3,101 | 46,923 | 50,024 | 230,311 | 3,484,971 | 3,715,282 | ||||||||||||||||||
Xylem, Inc. | 365 | 2,689 | 3,054 | 12,629 | 93,039 | 105,668 | ||||||||||||||||||
|
|
|
|
|
| |||||||||||||||||||
| 6,260,610 | 67,250,799 | 73,511,409 | ||||||||||||||||||||||
|
|
|
|
|
| |||||||||||||||||||
Marine (0.0%) | ||||||||||||||||||||||||
Kirby Corp.* | 1,081 | 7,895 | 8,976 | 107,289 | 783,579 | 890,868 | ||||||||||||||||||
|
|
|
|
|
| |||||||||||||||||||
Professional Services (0.3%) | ||||||||||||||||||||||||
Advisory Board Co.* | — | 98,317 | 98,317 | — | 6,259,843 | 6,259,843 | ||||||||||||||||||
Dun & Bradstreet Corp. | 1,192 | 8,702 | 9,894 | 146,318 | 1,068,171 | 1,214,489 | ||||||||||||||||||
Equifax, Inc. | 3,885 | 28,343 | 32,228 | 268,415 | 1,958,218 | 2,226,633 | ||||||||||||||||||
IHS, Inc., Class A* | 2,119 | 15,457 | 17,576 | 253,644 | 1,850,203 | 2,103,847 | ||||||||||||||||||
Nielsen Holdings N.V. | 1,014 | 7,417 | 8,431 | 46,532 | 340,366 | 386,898 | ||||||||||||||||||
Robert Half International, Inc. | 4,498 | 32,821 | 37,319 | 188,871 | 1,378,154 | 1,567,025 | ||||||||||||||||||
Verisk Analytics, Inc., Class A* | 33,983 | 64,734 | 98,717 | 2,233,363 | 4,254,318 | 6,487,681 | ||||||||||||||||||
|
|
|
|
|
| |||||||||||||||||||
| 3,137,143 | 17,109,273 | 20,246,416 | ||||||||||||||||||||||
|
|
|
|
|
| |||||||||||||||||||
Road & Rail (1.5%) | ||||||||||||||||||||||||
Amerco, Inc.* | 129 | 945 | 1,074 | 30,681 | 224,759 | 255,440 | ||||||||||||||||||
Avis Budget Group, Inc.* | 3,473 | 25,350 | 28,823 | 140,379 | 1,024,647 | 1,165,026 | ||||||||||||||||||
Canadian Pacific Railway Ltd. | — | 139,837 | 139,837 | — | 21,160,135 | 21,160,135 | ||||||||||||||||||
Con-way, Inc. | 665 | 4,874 | 5,539 | 26,407 | 193,546 | 219,953 | ||||||||||||||||||
CSX Corp. | 16,436 | 119,901 | 136,337 | 472,864 | 3,449,552 | 3,922,416 | ||||||||||||||||||
Genesee & Wyoming, Inc., Class A* | 611 | 4,467 | 5,078 | 58,687 | 429,055 | 487,742 | ||||||||||||||||||
Hertz Global Holdings, Inc.* | 11,162 | 81,429 | 92,591 | 319,456 | 2,330,498 | 2,649,954 | ||||||||||||||||||
J.B. Hunt Transport Services, Inc. | 2,947 | 42,027 | 44,974 | 227,803 | 3,248,687 | 3,476,490 | ||||||||||||||||||
Kansas City Southern | 3,551 | 215,173 | 218,724 | 439,720 | 26,644,873 | 27,084,593 | ||||||||||||||||||
Landstar System, Inc. | 1,501 | 10,962 | 12,463 | 86,232 | 629,767 | 715,999 | ||||||||||||||||||
Norfolk Southern Corp. | 1,838 | 13,415 | 15,253 | 170,622 | 1,245,314 | 1,415,936 | ||||||||||||||||||
Old Dominion Freight Line, Inc.* | 2,288 | 16,702 | 18,990 | 121,310 | 885,540 | 1,006,850 | ||||||||||||||||||
Union Pacific Corp. | 42,788 | 125,921 | 168,709 | 7,188,384 | 21,154,728 | 28,343,112 | ||||||||||||||||||
|
|
|
|
|
| |||||||||||||||||||
| 9,282,545 | 82,621,101 | 91,903,646 | ||||||||||||||||||||||
|
|
|
|
|
| |||||||||||||||||||
Trading Companies & Distributors (0.5%) |
| |||||||||||||||||||||||
Fastenal Co. | 9,561 | 190,868 | 200,429 | 454,243 | 9,068,139 | 9,522,382 | ||||||||||||||||||
HD Supply Holdings, Inc.* | 1,248 | 9,153 | 10,401 | 29,964 | 219,764 | 249,728 | ||||||||||||||||||
MRC Global, Inc.* | 1,149 | 8,404 | 9,553 | 37,067 | 271,113 | 308,180 | ||||||||||||||||||
MSC Industrial Direct Co., Inc., Class A | 1,524 | 11,124 | 12,648 | 123,246 | 899,598 | 1,022,844 | ||||||||||||||||||
See notes to pro-forma combined financial statements.
68
EQ ADVISORS TRUST
PORTFOLIO OF INVESTMENTS
December 31, 2013
| Number of Shares | Value ($) (Note 1) | |||||||||||||||||||||||
| EQ/Equity Growth PLUS | EQ/Large Cap Growth PLUS | Combined Pro-forma | EQ/Equity Growth PLUS | EQ/Large Cap Growth PLUS | Combined Pro-forma | |||||||||||||||||||
United Rentals, Inc.* | 5,528 | 135,234 | 140,762 | 430,908 | 10,541,490 | 10,972,398 | ||||||||||||||||||
W.W. Grainger, Inc. | 1,901 | 19,253 | 21,154 | 485,553 | 4,917,601 | 5,403,154 | ||||||||||||||||||
|
|
|
|
|
| |||||||||||||||||||
| 1,560,981 | 25,917,705 | 27,478,686 | ||||||||||||||||||||||
|
|
|
|
|
| |||||||||||||||||||
Total Industrials | 61,567,464 | 521,060,389 | 582,627,853 | |||||||||||||||||||||
|
|
|
|
|
| |||||||||||||||||||
Information Technology (20.5%) | ||||||||||||||||||||||||
Communications Equipment (0.9%) | ||||||||||||||||||||||||
CommScope Holding Co., Inc.* | 803 | 5,616 | 6,419 | 15,193 | 106,255 | 121,448 | ||||||||||||||||||
F5 Networks, Inc.* | 2,540 | 18,531 | 21,071 | 230,785 | 1,683,727 | 1,914,512 | ||||||||||||||||||
Harris Corp. | 615 | 4,498 | 5,113 | 42,933 | 314,005 | 356,938 | ||||||||||||||||||
JDS Uniphase Corp.* | 5,743 | 41,960 | 47,703 | 74,544 | 544,641 | 619,185 | ||||||||||||||||||
Juniper Networks, Inc.* | 3,020 | 86,569 | 89,589 | 68,161 | 1,953,862 | 2,022,023 | ||||||||||||||||||
Motorola Solutions, Inc. | 7,382 | 53,851 | 61,233 | 498,285 | 3,634,942 | 4,133,227 | ||||||||||||||||||
Palo Alto Networks, Inc.* | 1,075 | 7,855 | 8,930 | 61,780 | 451,427 | 513,207 | ||||||||||||||||||
QUALCOMM, Inc. | 55,728 | 502,431 | 558,159 | 4,137,804 | 37,305,502 | 41,443,306 | ||||||||||||||||||
Riverbed Technology, Inc.* | 4,979 | 36,358 | 41,337 | 90,020 | 657,353 | 747,373 | ||||||||||||||||||
|
|
|
|
|
| |||||||||||||||||||
| 5,219,505 | 46,651,714 | 51,871,219 | ||||||||||||||||||||||
|
|
|
|
|
| |||||||||||||||||||
Computers & Peripherals (2.8%) | ||||||||||||||||||||||||
3D Systems Corp.* | 3,243 | 23,653 | 26,896 | 301,372 | 2,198,073 | 2,499,445 | ||||||||||||||||||
Apple, Inc. | 22,912 | 231,058 | 253,970 | 12,856,152 | 129,648,955 | 142,505,107 | ||||||||||||||||||
EMC Corp. | 33,854 | 246,974 | 280,828 | 851,428 | 6,211,396 | 7,062,824 | ||||||||||||||||||
NCR Corp.* | 5,299 | 38,668 | 43,967 | 180,484 | 1,317,032 | 1,497,516 | ||||||||||||||||||
NetApp, Inc. | 10,954 | 79,963 | 90,917 | 450,648 | 3,289,678 | 3,740,326 | ||||||||||||||||||
SanDisk Corp. | 3,305 | 24,117 | 27,422 | 233,135 | 1,701,213 | 1,934,348 | ||||||||||||||||||
Stratasys Ltd.* | 633 | 61,501 | 62,134 | 85,265 | 8,284,185 | 8,369,450 | ||||||||||||||||||
|
|
|
|
|
| |||||||||||||||||||
| 14,958,484 | 152,650,532 | 167,609,016 | ||||||||||||||||||||||
|
|
|
|
|
| |||||||||||||||||||
Electronic Equipment, |
| |||||||||||||||||||||||
Amphenol Corp., Class A | 5,151 | 37,577 | 42,728 | 459,366 | 3,351,117 | 3,810,483 | ||||||||||||||||||
CDW Corp. | 307 | 2,286 | 2,593 | 7,172 | 53,401 | 60,573 | ||||||||||||||||||
Cognex Corp.* | — | 124,900 | 124,900 | — | 4,768,682 | 4,768,682 | ||||||||||||||||||
Dolby Laboratories, Inc., Class A* | 580 | 4,256 | 4,836 | 22,365 | 164,111 | 186,476 | ||||||||||||||||||
FLIR Systems, Inc. | 3,188 | 23,279 | 26,467 | 95,959 | 700,698 | 796,657 | ||||||||||||||||||
IPG Photonics Corp.* | 1,045 | 7,632 | 8,677 | 81,102 | 592,320 | 673,422 | ||||||||||||||||||
National Instruments Corp. | 3,104 | 22,661 | 25,765 | 99,390 | 725,605 | 824,995 | ||||||||||||||||||
Trimble Navigation Ltd.* | 8,245 | 60,147 | 68,392 | 286,101 | 2,087,101 | 2,373,202 | ||||||||||||||||||
|
|
|
|
|
| |||||||||||||||||||
| 1,051,455 | 12,443,035 | 13,494,490 | ||||||||||||||||||||||
|
|
|
|
|
| |||||||||||||||||||
Internet Software & Services (6.0%) |
| |||||||||||||||||||||||
Akamai Technologies, Inc.* | 5,727 | 76,896 | 82,623 | 270,200 | 3,627,953 | 3,898,153 | ||||||||||||||||||
AOL, Inc.* | 28,602 | — | 28,602 | 1,333,425 | — | 1,333,425 | ||||||||||||||||||
Baidu, Inc. (ADR)* | — | 38,764 | 38,764 | — | 6,895,340 | 6,895,340 | ||||||||||||||||||
eBay, Inc.* | 81,863 | 430,762 | 512,625 | 4,493,460 | 23,644,526 | 28,137,986 | ||||||||||||||||||
Equinix, Inc.* | 1,591 | 11,605 | 13,196 | 282,323 | 2,059,307 | 2,341,630 | ||||||||||||||||||
Facebook, Inc., Class A* | 77,043 | 1,141,078 | 1,218,121 | 4,211,170 | 62,371,324 | 66,582,494 | ||||||||||||||||||
Google, Inc., Class A* | 16,189 | 161,416 | 177,605 | 18,143,174 | 180,900,525 | 199,043,699 | ||||||||||||||||||
See notes to pro-forma combined financial statements.
69
EQ ADVISORS TRUST
PORTFOLIO OF INVESTMENTS
December 31, 2013
| Number of Shares | Value ($) (Note 1) | |||||||||||||||||||||||
| EQ/Equity Growth PLUS | EQ/Large Cap Growth PLUS | Combined Pro-forma | EQ/Equity Growth PLUS | EQ/Large Cap Growth PLUS | Combined Pro-forma | |||||||||||||||||||
IAC/InterActiveCorp. | 2,407 | 17,567 | 19,974 | 165,337 | 1,206,677 | 1,372,014 | ||||||||||||||||||
LinkedIn Corp., Class A* | 20,375 | 81,774 | 102,149 | 4,417,911 | 17,731,057 | 22,148,968 | ||||||||||||||||||
NAVER Corp.* | — | 5,268 | 5,268 | — | 3,613,997 | 3,613,997 | ||||||||||||||||||
Pandora Media, Inc.* | 4,568 | 33,372 | 37,940 | 121,509 | 887,695 | 1,009,204 | ||||||||||||||||||
Rackspace Hosting, Inc.* | 3,641 | 26,578 | 30,219 | 142,472 | 1,039,997 | 1,182,469 | ||||||||||||||||||
SINA Corp.* | 35,112 | — | 35,112 | 2,958,186 | — | 2,958,186 | ||||||||||||||||||
Tencent Holdings Ltd. | — | 32,000 | 32,000 | — | 2,041,087 | 2,041,087 | ||||||||||||||||||
Twitter, Inc.* | 1,948 | 30,176 | 32,124 | 123,990 | 1,920,703 | 2,044,693 | ||||||||||||||||||
VeriSign, Inc.* | 4,180 | 30,711 | 34,891 | 249,881 | 1,835,904 | 2,085,785 | ||||||||||||||||||
Yahoo!, Inc.* | 176,421 | — | 176,421 | 7,134,465 | — | 7,134,465 | ||||||||||||||||||
Yandex N.V., Class A* | 41,200 | — | 41,200 | 1,777,780 | — | 1,777,780 | ||||||||||||||||||
Yelp, Inc.* | 46,285 | — | 46,285 | 3,191,351 | — | 3,191,351 | ||||||||||||||||||
Youku Tudou, Inc. (ADR)* | 15,782 | — | 15,782 | 478,195 | — | 478,195 | ||||||||||||||||||
|
|
|
|
|
| |||||||||||||||||||
| 49,494,829 | 309,776,092 | 359,270,921 | ||||||||||||||||||||||
|
|
|
|
|
| |||||||||||||||||||
IT Services (5.3%) | ||||||||||||||||||||||||
Accenture plc, Class A | 20,712 | 151,100 | 171,812 | 1,702,941 | 12,423,442 | 14,126,383 | ||||||||||||||||||
Alliance Data Systems Corp.* | 11,869 | 82,224 | 94,093 | 3,120,716 | 21,619,156 | 24,739,872 | ||||||||||||||||||
Automatic Data Processing, Inc. | 15,638 | 114,085 | 129,723 | 1,263,707 | 9,219,209 | 10,482,916 | ||||||||||||||||||
Booz Allen Hamilton Holding Corp. | 935 | 6,870 | 7,805 | 17,905 | 131,560 | 149,465 | ||||||||||||||||||
Broadridge Financial Solutions, Inc. | 3,908 | 28,517 | 32,425 | 154,444 | 1,126,992 | 1,281,436 | ||||||||||||||||||
Cognizant Technology Solutions Corp., Class A* | 9,721 | 120,209 | 129,930 | 981,627 | 12,138,705 | 13,120,332 | ||||||||||||||||||
DST Systems, Inc. | 894 | 6,529 | 7,423 | 81,122 | 592,441 | 673,563 | ||||||||||||||||||
Fidelity National Information Services, Inc. | 936 | 6,841 | 7,777 | 50,244 | 367,225 | 417,469 | ||||||||||||||||||
Fiserv, Inc.* | 8,584 | 101,112 | 109,696 | 506,885 | 5,970,664 | 6,477,549 | ||||||||||||||||||
FleetCor Technologies, Inc.* | 2,188 | 15,965 | 18,153 | 256,368 | 1,870,619 | 2,126,987 | ||||||||||||||||||
Gartner, Inc.* | 3,022 | 22,048 | 25,070 | 214,713 | 1,566,510 | 1,781,223 | ||||||||||||||||||
Genpact Ltd.* | 5,418 | 39,559 | 44,977 | 99,529 | 726,699 | 826,228 | ||||||||||||||||||
Global Payments, Inc. | 2,457 | 17,932 | 20,389 | 159,680 | 1,165,401 | 1,325,081 | ||||||||||||||||||
International Business Machines Corp. | 33,569 | 244,764 | 278,333 | 6,296,537 | 45,910,383 | 52,206,920 | ||||||||||||||||||
Jack Henry & Associates, Inc. | 2,776 | 20,256 | 23,032 | 164,367 | 1,199,358 | 1,363,725 | ||||||||||||||||||
Lender Processing Services, Inc. | 2,364 | 17,266 | 19,630 | 88,366 | 645,403 | 733,769 | ||||||||||||||||||
MasterCard, Inc., Class A | 6,425 | 60,112 | 66,537 | 5,367,831 | 50,221,172 | 55,589,003 | ||||||||||||||||||
NeuStar, Inc., Class A* | 2,121 | 6,642 | 8,763 | 105,753 | 331,170 | 436,923 | ||||||||||||||||||
Paychex, Inc. | 9,437 | 68,840 | 78,277 | 429,667 | 3,134,285 | 3,563,952 | ||||||||||||||||||
Teradata Corp.* | 5,267 | 38,427 | 43,694 | 239,596 | 1,748,044 | 1,987,640 | ||||||||||||||||||
Total System Services, Inc. | 4,087 | 29,828 | 33,915 | 136,015 | 992,676 | 1,128,691 | ||||||||||||||||||
Vantiv, Inc., Class A* | 2,819 | 414,686 | 417,505 | 91,928 | 13,522,910 | 13,614,838 | ||||||||||||||||||
Visa, Inc., Class A | 49,656 | 430,167 | 479,823 | 11,057,398 | 95,789,588 | 106,846,986 | ||||||||||||||||||
Western Union Co. | 17,956 | 130,988 | 148,944 | 309,741 | 2,259,543 | 2,569,284 | ||||||||||||||||||
|
|
|
|
|
| |||||||||||||||||||
| 32,897,080 | 284,673,155 | 317,570,235 | ||||||||||||||||||||||
|
|
|
|
|
| |||||||||||||||||||
Office Electronics (0.0%) | ||||||||||||||||||||||||
Zebra Technologies Corp., Class A* | 147 | 1,087 | 1,234 | 7,950 | 58,785 | 66,735 | ||||||||||||||||||
|
|
|
|
|
| |||||||||||||||||||
See notes to pro-forma combined financial statements.
70
EQ ADVISORS TRUST
PORTFOLIO OF INVESTMENTS
December 31, 2013
| Number of Shares | Value ($) (Note 1) | |||||||||||||||||||||||
| EQ/Equity Growth PLUS | EQ/Large Cap Growth PLUS | Combined Pro-forma | EQ/Equity Growth PLUS | EQ/Large Cap Growth PLUS | Combined Pro-forma | |||||||||||||||||||
Semiconductors & Semiconductor Equipment (1.4%) | ||||||||||||||||||||||||
Advanced Micro Devices, Inc.* | 19,535 | 142,699 | 162,234 | 75,600 | 552,245 | 627,845 | ||||||||||||||||||
Altera Corp. | 3,560 | 25,991 | 29,551 | 115,807 | 845,487 | 961,294 | ||||||||||||||||||
Analog Devices, Inc. | 4,291 | 31,308 | 35,599 | 218,541 | 1,594,516 | 1,813,057 | ||||||||||||||||||
Applied Materials, Inc. | 25,599 | 186,746 | 212,345 | 452,846 | 3,303,537 | 3,756,383 | ||||||||||||||||||
ARM Holdings plc (ADR) | — | 182,790 | 182,790 | — | 10,005,925 | 10,005,925 | ||||||||||||||||||
ASML Holding N.V. | — | 292,337 | 292,337 | — | 27,391,977 | 27,391,977 | ||||||||||||||||||
Atmel Corp.* | 13,817 | 100,878 | 114,695 | 108,187 | 789,875 | 898,062 | ||||||||||||||||||
Avago Technologies Ltd. | 7,266 | 53,000 | 60,266 | 384,299 | 2,803,170 | 3,187,469 | ||||||||||||||||||
Broadcom Corp., Class A | 8,043 | 58,678 | 66,721 | 238,475 | 1,739,803 | 1,978,278 | ||||||||||||||||||
Cree, Inc.* | 3,801 | 27,732 | 31,533 | 237,828 | 1,735,191 | 1,973,019 | ||||||||||||||||||
Freescale Semiconductor Ltd.* | 818 | 6,032 | 6,850 | 13,129 | 96,814 | 109,943 | ||||||||||||||||||
Intel Corp. | 10,415 | 75,977 | 86,392 | 270,373 | 1,972,363 | 2,242,736 | ||||||||||||||||||
Lam Research Corp.* | 1,228 | 8,970 | 10,198 | 66,865 | 488,416 | 555,281 | ||||||||||||||||||
Linear Technology Corp. | 7,518 | 54,843 | 62,361 | 342,445 | 2,498,099 | 2,840,544 | ||||||||||||||||||
LSI Corp. | 2,058 | 15,121 | 17,179 | 22,679 | 166,633 | 189,312 | ||||||||||||||||||
Maxim Integrated Products, Inc. | 9,382 | 68,442 | 77,824 | 261,852 | 1,910,216 | 2,172,068 | ||||||||||||||||||
Microchip Technology, Inc. | 6,354 | 46,354 | 52,708 | 284,341 | 2,074,341 | 2,358,682 | ||||||||||||||||||
ON Semiconductor Corp.* | 13,804 | 100,781 | 114,585 | 113,745 | 830,435 | 944,180 | ||||||||||||||||||
Silicon Laboratories, Inc.* | 1,187 | 8,676 | 9,863 | 51,409 | 375,758 | 427,167 | ||||||||||||||||||
Skyworks Solutions, Inc.* | 5,121 | 37,377 | 42,498 | 146,256 | 1,067,487 | 1,213,743 | ||||||||||||||||||
Texas Instruments, Inc. | 35,747 | 260,783 | 296,530 | 1,569,651 | 11,450,982 | 13,020,633 | ||||||||||||||||||
Xilinx, Inc. | 8,504 | 62,039 | 70,543 | 390,504 | 2,848,831 | 3,239,335 | ||||||||||||||||||
|
|
|
|
|
| |||||||||||||||||||
| 5,364,832 | 76,542,101 | 81,906,933 | ||||||||||||||||||||||
|
|
|
|
|
| |||||||||||||||||||
Software (3.9%) | ||||||||||||||||||||||||
Adobe Systems, Inc.* | 6,309 | 46,026 | 52,335 | 377,783 | 2,756,037 | 3,133,820 | ||||||||||||||||||
ANSYS, Inc.* | 3,004 | 21,917 | 24,921 | 261,949 | 1,911,162 | 2,173,111 | ||||||||||||||||||
Autodesk, Inc.* | 92,541 | 41,895 | 134,436 | 4,657,589 | 2,108,575 | 6,766,164 | ||||||||||||||||||
Cadence Design Systems, Inc.* | 9,122 | 66,586 | 75,708 | 127,890 | 933,536 | 1,061,426 | ||||||||||||||||||
Citrix Systems, Inc.* | 6,031 | 43,997 | 50,028 | 381,461 | 2,782,810 | 3,164,271 | ||||||||||||||||||
CommVault Systems, Inc.* | — | 142,123 | 142,123 | — | 10,642,170 | 10,642,170 | ||||||||||||||||||
Concur Technologies, Inc.* | 1,504 | 26,978 | 28,482 | 155,183 | 2,783,590 | 2,938,773 | ||||||||||||||||||
Electronic Arts, Inc.* | 7,492 | 54,672 | 62,164 | 171,866 | 1,254,176 | 1,426,042 | ||||||||||||||||||
FactSet Research Systems, Inc. | 1,418 | 10,345 | 11,763 | 153,966 | 1,123,260 | 1,277,226 | ||||||||||||||||||
FireEye, Inc.* | 433 | 3,065 | 3,498 | 18,883 | 133,665 | 152,548 | ||||||||||||||||||
FleetMatics Group plc* | — | 92,870 | 92,870 | — | 4,016,627 | 4,016,627 | ||||||||||||||||||
Fortinet, Inc.* | 4,373 | 31,942 | 36,315 | 83,656 | 611,050 | 694,706 | ||||||||||||||||||
Guidewire Software, Inc.* | — | 74,493 | 74,493 | — | 3,655,372 | 3,655,372 | ||||||||||||||||||
Informatica Corp.* | 3,484 | 25,427 | 28,911 | 144,586 | 1,055,220 | 1,199,806 | ||||||||||||||||||
Intuit, Inc. | 9,570 | 69,813 | 79,383 | 730,382 | 5,328,128 | 6,058,510 | ||||||||||||||||||
MICROS Systems, Inc.* | 378 | 2,775 | 3,153 | 21,686 | 159,202 | 180,888 | ||||||||||||||||||
Microsoft Corp. | 269,282 | 1,963,506 | 2,232,788 | 10,079,225 | 73,494,030 | 83,573,255 | ||||||||||||||||||
NetSuite, Inc.* | 1,129 | 24,356 | 25,485 | 116,310 | 2,509,155 | 2,625,465 | ||||||||||||||||||
Oracle Corp. | 114,515 | 834,775 | 949,290 | 4,381,344 | 31,938,491 | 36,319,835 | ||||||||||||||||||
Red Hat, Inc.* | 6,111 | 84,348 | 90,459 | 342,460 | 4,726,862 | 5,069,322 | ||||||||||||||||||
See notes to pro-forma combined financial statements.
71
EQ ADVISORS TRUST
PORTFOLIO OF INVESTMENTS
December 31, 2013
| Number of Shares | Value ($) (Note 1) | |||||||||||||||||||||||
| EQ/Equity Growth PLUS | EQ/Large Cap Growth PLUS | Combined Pro-forma | EQ/Equity Growth PLUS | EQ/Large Cap Growth PLUS | Combined Pro-forma | |||||||||||||||||||
Rovi Corp.* | 391 | 2,908 | 3,299 | 7,699 | 57,259 | 64,958 | ||||||||||||||||||
Salesforce.com, Inc.* | 19,013 | 461,479 | 480,492 | 1,049,327 | 25,469,026 | 26,518,353 | ||||||||||||||||||
ServiceNow, Inc.* | 2,545 | 209,504 | 212,049 | 142,545 | 11,734,319 | 11,876,864 | ||||||||||||||||||
SolarWinds, Inc.* | 2,111 | 15,424 | 17,535 | 79,859 | 583,490 | 663,349 | ||||||||||||||||||
Solera Holdings, Inc. | 2,221 | 16,206 | 18,427 | 157,158 | 1,146,737 | 1,303,895 | ||||||||||||||||||
Splunk, Inc.* | 39,790 | 24,132 | 63,922 | 2,732,379 | 1,657,144 | 4,389,523 | ||||||||||||||||||
Symantec Corp. | 16,346 | 119,241 | 135,587 | 385,439 | 2,811,703 | 3,197,142 | ||||||||||||||||||
Tableau Software, Inc., Class A* | 304 | 2,233 | 2,537 | 20,955 | 153,921 | 174,876 | ||||||||||||||||||
TIBCO Software, Inc.* | 5,289 | 38,609 | 43,898 | 118,897 | 867,930 | 986,827 | ||||||||||||||||||
VMware, Inc., Class A* | 24,049 | 20,107 | 44,156 | 2,157,436 | 1,803,799 | 3,961,235 | ||||||||||||||||||
Workday, Inc., Class A* | 1,194 | 30,516 | 31,710 | 99,293 | 2,537,711 | 2,637,004 | ||||||||||||||||||
|
|
|
|
|
| |||||||||||||||||||
| 29,157,206 | 202,746,157 | 231,903,363 | ||||||||||||||||||||||
|
|
|
|
|
| |||||||||||||||||||
Total Information Technology | 138,151,341 | 1,085,541,571 | 1,223,692,912 | |||||||||||||||||||||
|
|
|
|
|
| |||||||||||||||||||
Materials (3.5%) | ||||||||||||||||||||||||
Chemicals (3.1%) | ||||||||||||||||||||||||
Airgas, Inc. | 2,111 | 15,402 | 17,513 | 236,115 | 1,722,714 | 1,958,829 | ||||||||||||||||||
Albemarle Corp. | 997 | 7,283 | 8,280 | 63,200 | 461,669 | 524,869 | ||||||||||||||||||
Celanese Corp. | 5,146 | 37,538 | 42,684 | 284,625 | 2,076,227 | 2,360,852 | ||||||||||||||||||
Dow Chemical Co. | 5,107 | 37,264 | 42,371 | 226,751 | 1,654,521 | 1,881,272 | ||||||||||||||||||
E.I. du Pont de Nemours & Co. | 29,666 | 216,419 | 246,085 | 1,927,400 | 14,060,742 | 15,988,142 | ||||||||||||||||||
Eastman Chemical Co. | 12,658 | 36,407 | 49,065 | 1,021,501 | 2,938,045 | 3,959,546 | ||||||||||||||||||
Ecolab, Inc. | 8,451 | 119,073 | 127,524 | 881,186 | 12,415,742 | 13,296,928 | ||||||||||||||||||
FMC Corp. | 4,388 | 58,364 | 62,752 | 331,118 | 4,404,147 | 4,735,265 | ||||||||||||||||||
International Flavors & Fragrances, Inc. | 2,627 | 19,164 | 21,791 | 225,869 | 1,647,721 | 1,873,590 | ||||||||||||||||||
LyondellBasell Industries N.V., Class A | 13,084 | 95,449 | 108,533 | 1,050,384 | 7,662,646 | 8,713,030 | ||||||||||||||||||
Monsanto Co. | 39,902 | 562,917 | 602,819 | 4,650,578 | 65,607,976 | 70,258,554 | ||||||||||||||||||
NewMarket Corp. | 306 | 2,231 | 2,537 | 102,250 | 745,489 | 847,739 | ||||||||||||||||||
PPG Industries, Inc. | 4,184 | 30,520 | 34,704 | 793,537 | 5,788,423 | 6,581,960 | ||||||||||||||||||
Praxair, Inc. | 9,532 | 105,360 | 114,892 | 1,239,446 | 13,699,961 | 14,939,407 | ||||||||||||||||||
Rockwood Holdings, Inc. | 1,713 | 12,677 | 14,390 | 123,199 | 911,730 | 1,034,929 | ||||||||||||||||||
RPM International, Inc. | 3,998 | 29,174 | 33,172 | 165,957 | 1,211,013 | 1,376,970 | ||||||||||||||||||
Scotts Miracle-Gro Co., Class A | 1,385 | 10,112 | 11,497 | 86,175 | 629,169 | 715,344 | ||||||||||||||||||
Sherwin-Williams Co. | 2,855 | 162,535 | 165,390 | 523,892 | 29,825,172 | 30,349,064 | ||||||||||||||||||
Sigma-Aldrich Corp. | 3,661 | 26,709 | 30,370 | 344,171 | 2,510,913 | 2,855,084 | ||||||||||||||||||
Valspar Corp. | 2,872 | 20,958 | 23,830 | 204,745 | 1,494,096 | 1,698,841 | ||||||||||||||||||
W.R. Grace & Co.* | 2,132 | 15,555 | 17,687 | 210,791 | 1,537,923 | 1,748,714 | ||||||||||||||||||
Westlake Chemical Corp. | 566 | 4,132 | 4,698 | 69,092 | 504,393 | 573,485 | ||||||||||||||||||
|
|
|
|
|
| |||||||||||||||||||
| 14,761,982 | 173,510,432 | 188,272,414 | ||||||||||||||||||||||
|
|
|
|
|
| |||||||||||||||||||
Construction Materials (0.1%) | ||||||||||||||||||||||||
Eagle Materials, Inc. | 1,596 | 11,649 | 13,245 | 123,578 | 901,982 | 1,025,560 | ||||||||||||||||||
Martin Marietta Materials, Inc. | 1,485 | 24,319 | 25,804 | 148,411 | 2,430,441 | 2,578,852 | ||||||||||||||||||
|
|
|
|
|
| |||||||||||||||||||
| 271,989 | 3,332,423 | 3,604,412 | ||||||||||||||||||||||
|
|
|
|
|
| |||||||||||||||||||
See notes to pro-forma combined financial statements.
72
EQ ADVISORS TRUST
PORTFOLIO OF INVESTMENTS
December 31, 2013
| Number of Shares | Value ($) (Note 1) | |||||||||||||||||||||||
| EQ/Equity Growth PLUS | EQ/Large Cap Growth PLUS | Combined Pro-forma | EQ/Equity Growth PLUS | EQ/Large Cap Growth PLUS | Combined Pro-forma | |||||||||||||||||||
Containers & Packaging (0.2%) | ||||||||||||||||||||||||
AptarGroup, Inc. | 1,507 | 11,005 | 12,512 | 102,190 | 746,249 | 848,439 | ||||||||||||||||||
Avery Dennison Corp. | 1,018 | 7,442 | 8,460 | 51,093 | 373,514 | 424,607 | ||||||||||||||||||
Ball Corp. | 4,795 | 34,981 | 39,776 | 247,710 | 1,807,119 | 2,054,829 | ||||||||||||||||||
Bemis Co., Inc. | 1,456 | 10,643 | 12,099 | 59,638 | 435,937 | 495,575 | ||||||||||||||||||
Crown Holdings, Inc.* | 3,955 | 28,859 | 32,814 | 176,274 | 1,286,246 | 1,462,520 | ||||||||||||||||||
Greif, Inc., Class A | 203 | 1,496 | 1,699 | 10,637 | 78,390 | 89,027 | ||||||||||||||||||
Owens-Illinois, Inc.* | 3,118 | 22,763 | 25,881 | 111,562 | 814,460 | 926,022 | ||||||||||||||||||
Packaging Corp. of America | 3,161 | 23,062 | 26,223 | 200,028 | 1,459,363 | 1,659,391 | ||||||||||||||||||
Rock-Tenn Co., Class A | 1,670 | 12,184 | 13,854 | 175,367 | 1,279,442 | 1,454,809 | ||||||||||||||||||
Sealed Air Corp. | 6,312 | 46,057 | 52,369 | 214,924 | 1,568,241 | 1,783,165 | ||||||||||||||||||
Silgan Holdings, Inc. | 1,421 | 10,379 | 11,800 | 68,236 | 498,400 | 566,636 | ||||||||||||||||||
|
|
|
|
|
| |||||||||||||||||||
| 1,417,659 | 10,347,361 | 11,765,020 | ||||||||||||||||||||||
|
|
|
|
|
| |||||||||||||||||||
Metals & Mining (0.0%) | ||||||||||||||||||||||||
Compass Minerals International, Inc. | 1,074 | 7,842 | 8,916 | 85,974 | 627,752 | 713,726 | ||||||||||||||||||
Royal Gold, Inc. | 526 | 3,857 | 4,383 | 24,233 | 177,692 | 201,925 | ||||||||||||||||||
Southern Copper Corp. | 5,088 | 37,137 | 42,225 | 146,076 | 1,066,203 | 1,212,279 | ||||||||||||||||||
Tahoe Resources, Inc.* | 352 | 2,625 | 2,977 | 5,857 | 43,680 | 49,537 | ||||||||||||||||||
|
|
|
|
|
| |||||||||||||||||||
| 262,140 | 1,915,327 | 2,177,467 | ||||||||||||||||||||||
|
|
|
|
|
| |||||||||||||||||||
Paper & Forest Products (0.1%) | ||||||||||||||||||||||||
International Paper Co. | 12,330 | 89,950 | 102,280 | 604,540 | 4,410,249 | 5,014,789 | ||||||||||||||||||
|
|
|
|
|
| |||||||||||||||||||
Total Materials | 17,318,310 | 193,515,792 | 210,834,102 | |||||||||||||||||||||
|
|
|
|
|
| |||||||||||||||||||
Telecommunication Services (1.5%) |
| |||||||||||||||||||||||
Diversified Telecommunication | ||||||||||||||||||||||||
Intelsat S.A.* | 45 | 373 | 418 | 1,014 | 8,407 | 9,421 | ||||||||||||||||||
Level 3 Communications, Inc.* | 1,753 | 12,813 | 14,566 | 58,147 | 425,007 | 483,154 | ||||||||||||||||||
tw telecom, Inc.* | 4,845 | 35,364 | 40,209 | 147,627 | 1,077,541 | 1,225,168 | ||||||||||||||||||
Verizon Communications, Inc. | 92,270 | 672,676 | 764,946 | 4,534,148 | 33,055,299 | 37,589,447 | ||||||||||||||||||
Vivendi S.A. | 13,712 | — | 13,712 | 361,332 | — | 361,332 | ||||||||||||||||||
Windstream Holdings, Inc. | 18,056 | 131,776 | 149,832 | 144,087 | 1,051,573 | 1,195,660 | ||||||||||||||||||
|
|
|
|
|
| |||||||||||||||||||
| 5,246,355 | 35,617,827 | 40,864,182 | ||||||||||||||||||||||
|
|
|
|
|
| |||||||||||||||||||
Wireless Telecommunication | ||||||||||||||||||||||||
Crown Castle International Corp.* | 10,767 | 255,873 | 266,640 | 790,621 | 18,788,754 | 19,579,375 | ||||||||||||||||||
SBA Communications Corp., | 4,113 | 220,994 | 225,107 | 369,512 | 19,854,101 | 20,223,613 | ||||||||||||||||||
SoftBank Corp. (ADR) | — | 60,000 | 60,000 | — | 2,628,600 | 2,628,600 | ||||||||||||||||||
SoftBank Corp. | 45,100 | — | 45,100 | 3,939,986 | — | 3,939,986 | ||||||||||||||||||
Sprint Corp.* | 5,049 | 36,411 | 41,460 | 54,277 | 391,418 | 445,695 | ||||||||||||||||||
|
|
|
|
|
| |||||||||||||||||||
| 5,154,396 | 41,662,873 | 46,817,269 | ||||||||||||||||||||||
|
|
|
|
|
| |||||||||||||||||||
Total Telecommunication Services | 10,400,751 | 77,280,700 | 87,681,451 | |||||||||||||||||||||
|
|
|
|
|
| |||||||||||||||||||
See notes to pro-forma combined financial statements.
73
EQ ADVISORS TRUST
PORTFOLIO OF INVESTMENTS
December 31, 2013
| Number of Shares | Value ($) (Note 1) | |||||||||||||||||||||||
| EQ/Equity Growth PLUS | EQ/Large Cap Growth PLUS | Combined Pro-forma | EQ/Equity Growth PLUS | EQ/Large Cap Growth PLUS | Combined Pro-forma | |||||||||||||||||||
Utilities (0.1%) | ||||||||||||||||||||||||
Electric Utilities (0.0%) | ||||||||||||||||||||||||
ITC Holdings Corp. | 1,687 | 12,310 | 13,997 | 161,648 | 1,179,544 | 1,341,192 | ||||||||||||||||||
|
|
|
|
|
| |||||||||||||||||||
Gas Utilities (0.1%) | ||||||||||||||||||||||||
ONEOK, Inc. | 6,244 | 45,552 | 51,796 | 388,252 | 2,832,423 | 3,220,675 | ||||||||||||||||||
Questar Corp. | 729 | 5,356 | 6,085 | 16,760 | 123,135 | 139,895 | ||||||||||||||||||
|
|
|
|
|
| |||||||||||||||||||
| 405,012 | 2,955,558 | 3,360,570 | ||||||||||||||||||||||
|
|
|
|
|
| |||||||||||||||||||
Independent Power Producers & Energy Traders (0.0%) | ||||||||||||||||||||||||
Calpine Corp.* | 1,464 | 10,724 | 12,188 | 28,563 | 209,225 | 237,788 | ||||||||||||||||||
|
|
|
|
|
| |||||||||||||||||||
Water Utilities (0.0%) | ||||||||||||||||||||||||
Aqua America, Inc. | 4,968 | 36,264 | 41,232 | 117,195 | 855,468 | 972,663 | ||||||||||||||||||
|
|
|
|
|
| |||||||||||||||||||
Total Utilities | 712,418 | 5,199,795 | 5,912,213 | |||||||||||||||||||||
|
|
|
|
|
| |||||||||||||||||||
Total Common Stock (77.9%) | 487,705,709 | 4,172,686,203 | 4,660,391,912 | |||||||||||||||||||||
|
|
|
|
|
| |||||||||||||||||||
INVESTMENT COMPANIES: | ||||||||||||||||||||||||
Exchange Traded Funds (4.0%) | ||||||||||||||||||||||||
Mutual Funds (4.0%) | ||||||||||||||||||||||||
iShares® Core S&P 500 ETF | — | 5,579 | 5,579 | — | 1,035,741 | 1,035,741 | ||||||||||||||||||
iShares® Morningstar Large-Cap ETF | — | 5,123 | 5,123 | — | 552,464 | �� | 552,464 | |||||||||||||||||
iShares® Morningstar Large-Cap Growth ETF‡ | — | 498,665 | 498,665 | — | 49,861,513 | 49,861,513 | ||||||||||||||||||
iShares® Morningstar Large-Cap Value ETF | — | 29,168 | 29,168 | — | 2,345,107 | 2,345,107 | ||||||||||||||||||
iShares® NYSE 100 ETF | — | 5,794 | 5,794 | — | 490,740 | 490,740 | ||||||||||||||||||
iShares® Russell 1000 ETF | — | 3,225 | 3,225 | — | 332,723 | 332,723 | ||||||||||||||||||
iShares® Russell 1000 Growth ETF | — | 842,573 | 842,573 | — | 72,419,149 | 72,419,149 | ||||||||||||||||||
iShares® Russell 1000 Value ETF | — | 40,090 | 40,090 | — | 3,774,875 | 3,774,875 | ||||||||||||||||||
iShares® S&P 100 ETF | — | 2,587 | 2,587 | — | 213,040 | 213,040 | ||||||||||||||||||
iShares® S&P 500 Growth ETF | — | 520,850 | 520,850 | — | 51,423,521 | 51,423,521 | ||||||||||||||||||
iShares® S&P 500 Value ETF | — | 23,904 | 23,904 | — | 2,042,836 | 2,042,836 | ||||||||||||||||||
Vanguard Growth ETF | — | 545,722 | 545,722 | — | 50,779,432 | 50,779,432 | ||||||||||||||||||
Vanguard Large-Cap ETF | — | 600 | 600 | — | 50,880 | 50,880 | ||||||||||||||||||
Vanguard Value ETF | — | 27,800 | 27,800 | — | 2,123,642 | 2,123,642 | ||||||||||||||||||
|
|
|
|
|
| |||||||||||||||||||
Total Investment Companies (4.0%) |
| — | 237,445,663 | 237,445,663 | ||||||||||||||||||||
|
|
|
|
|
| |||||||||||||||||||
Total Investments (81.9%) | 487,705,709 | 4,410,131,866 | 4,897,837,575 | |||||||||||||||||||||
Other Assets Less Liabilities (18.1%) | 98,180,185 | 981,801,538 | 1,079,981,723 | |||||||||||||||||||||
|
|
|
|
|
| |||||||||||||||||||
Net Assets (100%) | $ | 585,885,894 | $ | 5,391,933,404 | $ | 5,977,819,298 | ||||||||||||||||||
|
|
|
|
|
| |||||||||||||||||||
| * | Non-income producing. |
| † | Securities (totaling $184,391 or 0.0% of net assets) at fair value by management. |
| ‡ | Affiliated company as defined under the Investment Company Act of 1940. |
| (b) | Illiquid Security. |
Glossary
ADR — American Depositary Receipt
See notes to pro-forma combined financial statements.
74
EQ/Large Cap Growth PLUS/Combined Pro-forma
Investments in companies which were affiliates for the year ended December 31, 2013, were as follows:
| Securities: | Value December 31, 2012 | Purchases at Cost | Sales at Cost | Value December 31, 2013 | Dividend Income | Realized Gain (Loss)† | ||||||||||||||||||
iShares® Morningstar Large Growth ETF (a) | $ | 52,361,571 | $ | 8,899,925 | $ | 15,678,601 | $ | 49,861,513 | $ | 464,375 | $ | 7,476,656 | ||||||||||||
|
|
|
|
|
|
|
|
|
|
|
| |||||||||||||
| † | When applicable, realized gain includes net distributions of realized gain received from Underlying Portfolios. |
| (a) | Formerly known as iShares® Morningstar Large Cap Growth Index Fund |
75
At December 31, 2013 the Portfolio had the following futures contracts open
EQ/Equity Growth PLUS
Purchases | Number of Contracts | Expiration Date | Original Value | Value at 12/31/2013 | Unrealized Appreciation/ (Depreciation) | |||||||||||||||
NASDAQ 100 E-Mini Index | 282 | March-14 | $ | 19,804,567 | $ | 20,212,350 | $ | 407,783 | ||||||||||||
S&P 500 E-Mini Index | 852 | March-14 | 76,556,376 | 78,430,860 | 1,874,484 | |||||||||||||||
|
| |||||||||||||||||||
| $ | 2,282,267 | |||||||||||||||||||
|
| |||||||||||||||||||
EQ/Large Cap Growth PLUS
Purchases | Number of Contracts | Expiration Date | Original Value | Value at 12/31/2013 | Unrealized Appreciation/ (Depreciation) | |||||||||||||||
NASDAQ 100 E-Mini Index | 2,757 | March-14 | $ | 193,374,186 | $ | 197,607,975 | $ | 4,233,789 | ||||||||||||
S&P 500 E-Mini Index | 8,407 | March-14 | 754,500,879 | 773,906,385 | 19,405,506 | |||||||||||||||
|
| |||||||||||||||||||
| $ | 23,639,295 | |||||||||||||||||||
|
| |||||||||||||||||||
Combined Pro-Forma
Purchases | Number of Contracts | Expiration Date | Original Value | Value at 12/31/2013 | Unrealized Appreciation/ (Depreciation) | |||||||||||||||
NASDAQ 100 E-Mini Index | 3,039 | March-14 | $ | 213,178,753 | $ | 217,820,325 | $ | 4,641,572 | ||||||||||||
S&P 500 E-Mini Index | 9,259 | March-14 | $ | 831,057,255 | $ | 852,337,245 | $ | 21,279,990 | ||||||||||||
|
| |||||||||||||||||||
| $ | 25,921,562 | |||||||||||||||||||
|
| |||||||||||||||||||
76
The following is a summary of the inputs used to value the Portfolio’s assets and liabilities carried at fair value as of December 31, 2013 :
The inputs or methodology used for valuing securities are not necessarily an indication of the risk associated with investing in those securities.
Various inputs are used in determining the value of the Portfolio’s investments. These inputs are summarized in the three broad levels listed below:
| • | Level 1 - Quoted prices in active markets for identical securities |
| • | Level 2 - Significant other observable inputs (including quoted prices for similar securities, interest rates, prepayment speeds, credit risk, etc.) |
| • | Level 3 - Significant unobservable inputs (including the Portfolio’s own assumptions in determining the fair value of investments) |
Description | Quoted Prices in Active Markets for Identical Securities (Level 1) | Significant Other Observable Inputs (Level 2) (a) | Significant Unobservable Inputs (Level 3) | Total | ||||||||||||||||||||||||||||||||||||||||||||
| EQ/Equity Growth PLUS | EQ/Large Cap Growth PLUS | Combined Pro-forma | EQ/Equity Growth PLUS | EQ/Large Cap Growth PLUS | Combined Pro-forma | EQ/Equity Growth PLUS | EQ/Large Cap Growth PLUS | Combined Pro-forma | EQ/Equity Growth PLUS | EQ/Large Cap Growth PLUS | Combined Pro-forma | |||||||||||||||||||||||||||||||||||||
Assets | ||||||||||||||||||||||||||||||||||||||||||||||||
Investments in Securities | $ | 483,035,987 | $ | 4,364,022,208 | $ | 4,847,058,195 | $ | 4,669,722 | $ | 45,925,267 | $ | 50,594,989 | $ | 184,391 | $ | 184,391 | $ | 487,705,709 | $ | 4,410,131,866 | $ | 4,897,837,575 | ||||||||||||||||||||||||||
Other Investments* | 2,282,267 | 23,639,295 | 25,921,562 | — | — | — | — | — | 2,282,267 | 23,639,295 | 25,921,562 | |||||||||||||||||||||||||||||||||||||
|
|
|
|
|
|
|
|
|
|
|
|
|
|
|
|
|
|
|
|
|
|
|
| |||||||||||||||||||||||||
Total | $ | 485,318,254 | $ | 4,387,661,503 | $ | 4,872,979,757 | $ | 4,669,722 | $ | 45,925,267 | $ | 50,594,989 | $ | — | $ | 184,391 | $ | 184,391 | $ | 489,987,976 | $ | 4,433,771,161 | $ | 4,923,759,137 | ||||||||||||||||||||||||
|
|
|
|
|
|
|
|
|
|
|
|
|
|
|
|
|
|
|
|
|
|
|
| |||||||||||||||||||||||||
Liabilities | ||||||||||||||||||||||||||||||||||||||||||||||||
Investments in Securities | $ | — | $ | — | $ | — | $ | — | $ | — | $ | — | $ | — | $ | — | $ | — | $ | — | $ | — | $ | — | ||||||||||||||||||||||||
Other Investments* | — | — | — | — | — | — | — | — | — | — | — | |||||||||||||||||||||||||||||||||||||
|
|
|
|
|
|
|
|
|
|
|
|
|
|
|
|
|
|
|
|
|
|
|
| |||||||||||||||||||||||||
Total | $ | — | $ | — | $ | — | $ | — | $ | — | $ | — | $ | — | $ | — | $ | — | $ | — | $ | — | $ | — | ||||||||||||||||||||||||
|
|
|
|
|
|
|
|
|
|
|
|
|
|
|
|
|
|
|
|
|
|
|
| |||||||||||||||||||||||||
Total Assets and Liabilities | $ | 485,318,254 | $ | 4,387,661,503 | $ | 4,872,979,757 | $ | 4,669,722 | $ | 45,925,267 | $ | 50,594,989 | $ | — | $ | 184,391 | $ | 184,391 | $ | 489,987,976 | $ | 4,433,771,161 | $ | 4,923,759,137 | ||||||||||||||||||||||||
|
|
|
|
|
|
|
|
|
|
|
|
|
|
|
|
|
|
|
|
|
|
|
| |||||||||||||||||||||||||
| * | Other investments are derivative instruments, such as futures, forwards and written options, which are valued at the unrealized appreciation/depreciation on the instrument. |
EQ/Equity Growth PLUS
(a) A security with a market value of $368,404 transferred from Level 1 to Level 2 during the year ended December 31, 2013 due to inactive trading.
EQ/Large Cap Growth PLUS
(a) A security with a market value of $2,687,345 transferred from Level 1 to Level 2 during the year ended December 31, 2013 due to inactive trading.
Combined Pro-forma
(a) A security with a market value of $3,055,749 transferred from Level 1 to Level 2 during the year ended December 31, 2013 due to inactive trading.
There were no additional transfers between Levels 1, 2 or 3 during the year ended December 31, 2013.
Fair Values of Derivative Instruments as of December 31, 2013:
EQ/Equity Growth PLUS
Statement of Assets and Liabilities | ||||||
Derivatives Not Accounted for as Hedging Instruments^ | Asset Derivatives | Fair Value | ||||
Interest rate contracts | Receivables, Net Assets- | $ | — | |||
| Unrealized appreciation | — | * | ||||
Foreign exchange contracts | Receivables | — | ||||
Credit contracts | Receivables | — | ||||
Equity contracts | Receivables, Net Assets- | — | ||||
| Unrealized appreciation | 2,282,267 | * | ||||
Commodity contracts | Receivables | — | ||||
Other contracts | Receivables | — | ||||
|
| |||||
Total | $ | 2,282,267 | ||||
|
| |||||
Liability Derivatives | ||||||
Interest rate contracts | Payables, Net Assets- | $ | — | |||
| Unrealized depreciation | — | * | ||||
Foreign exchange contracts | Payables | — | ||||
Credit contracts | Payables | — | ||||
Equity contracts | Payables, Net Assets- | — | ||||
| Unrealized depreciation | — | * | ||||
Commodity contracts | Payables | — | ||||
Other contracts | Payables | — | ||||
|
| |||||
Total | $ | — | ||||
|
| |||||
| * | Includes cumulative appreciation/depreciation of futures contracts as reported in the Portfolio of Investments. Only current day’s variation margin is reported within the Statement of Assets & Liabilities. |
The effect of Derivative Instruments on the Statement of Operations for the year ended December 31, 2013:
Amount of Realized Gain or (Loss) on Derivatives Recognized in Income | ||||||||||||||||||||
Derivatives Not Accounted for as Hedging Instruments^ | Options | Futures | Forward Currency Contracts | Swaps | Total | |||||||||||||||
Interest rate contracts | $ | — | $ | — | $ | — | $ | — | $ | — | ||||||||||
Foreign exchange contracts | — | — | — | — | — | |||||||||||||||
Credit contracts | — | — | — | — | — | |||||||||||||||
Equity contracts | — | 54,074,704 | — | — | 54,074,704 | |||||||||||||||
Commodity contracts | — | — | — | — | — | |||||||||||||||
Other contracts | — | — | — | — | — | |||||||||||||||
|
|
|
|
|
|
|
|
|
| |||||||||||
Total | $ | — | $ | 54,074,704 | $ | — | $ | — | $ | 54,074,704 | ||||||||||
|
|
|
|
|
|
|
|
|
| |||||||||||
Amount of Unrealized Appreciation or (Depreciation) on Derivatives Recognized in Income | ||||||||||||||||||||
Derivatives Not Accounted for as Hedging Instruments^ | Options | Futures | Forward Currency Contracts | Swaps | Total | |||||||||||||||
Interest rate contracts | $ | — | $ | — | $ | — | $ | — | $ | — | ||||||||||
Foreign exchange contracts | — | — | — | — | — | |||||||||||||||
Credit contracts | — | — | — | — | — | |||||||||||||||
Equity contracts | — | 3,236,250 | — | — | 3,236,250 | |||||||||||||||
Commodity contracts | — | — | — | — | — | |||||||||||||||
Other contracts | — | — | — | — | — | |||||||||||||||
|
|
|
|
|
|
|
|
|
| |||||||||||
Total | $ | — | $ | 3,236,250 | $ | — | $ | — | $ | 3,236,250 | ||||||||||
|
|
|
|
|
|
|
|
|
| |||||||||||
| ^ | This Portfolio held futures contracts as a substitute for investing in conventional securities, hedging and in an attempt to enhance returns. |
The Portfolio held futures contracts with an average notional balance of approximately $194,727,000 during the year ended December 31, 2013.
EQ/Large Cap Growth PLUS
Statement of Assets and Liabilities | ||||||
Derivatives Not Accounted for as Hedging | Asset Derivatives | Fair Value | ||||
Interest rate contracts | Receivables, Net Assets- | $ | — | |||
| Unrealized appreciation | — | * | ||||
Foreign exchange contracts | Receivables | — | ||||
Credit contracts | Receivables | — | ||||
Equity contracts | Receivables, Net Assets- | — | ||||
| Unrealized appreciation | 23,639,295 | * | ||||
Commodity contracts | Receivables | — | ||||
Other contracts | Receivables | — | ||||
|
| |||||
Total | $ | 23,639,295 | ||||
|
| |||||
Liability Derivatives | ||||||
Interest rate contracts | Payables, Net Assets- | $ | — | |||
| Unrealized depreciation | — | * | ||||
Foreign exchange contracts | Payables | — | ||||
Credit contracts | Payables | — | ||||
Equity contracts | Payables, Net Assets- | — | ||||
| Unrealized depreciation | — | * | ||||
Commodity contracts | Payables | — | ||||
Other contracts | Payables | — | ||||
|
| |||||
Total | $ | — | ||||
|
| |||||
| * | Includes cumulative appreciation/depreciation of futures contracts as reported in the Portfolio of Investments. Only current day’s variation margin is reported within the Statement of Assets & Liabilities. |
The effect of Derivative Instruments on the Statement of Operations for the year ended December 31, 2013:
Amount of Realized Gain or (Loss) on Derivatives Recognized in Income | ||||||||||||||||||||
Derivatives Not Accounted for as Hedging Instruments^ | Options | Futures | Forward Currency Contracts | Swaps | Total | |||||||||||||||
Interest rate contracts | $ | — | $ | — | $ | — | $ | — | $ | — | ||||||||||
Foreign exchange contracts | — | — | — | — | — | |||||||||||||||
Credit contracts | — | — | — | — | — | |||||||||||||||
Equity contracts | — | 138,707,727 | — | — | 138,707,727 | |||||||||||||||
Commodity contracts | — | — | — | — | — | |||||||||||||||
Other contracts | — | — | — | — | — | |||||||||||||||
|
|
|
|
|
|
|
|
|
| |||||||||||
Total | $ | — | $ | 138,707,727 | $ | — | $ | — | $ | 138,707,727 | ||||||||||
|
|
|
|
|
|
|
|
|
| |||||||||||
Amount of Unrealized Appreciation or (Depreciation) on Derivatives Recognized in Income | ||||||||||||||||||||
Derivatives Not Accounted for as Hedging Instruments^ | Options | Futures | Forward Currency Contracts | Swaps | Total | |||||||||||||||
Interest rate contracts | $ | — | $ | — | $ | — | $ | — | $ | — | ||||||||||
Foreign exchange contracts | — | — | — | — | — | |||||||||||||||
Credit contracts | — | — | — | — | — | |||||||||||||||
Equity contracts | — | 24,922,267 | — | — | 24,922,267 | |||||||||||||||
Commodity contracts | — | — | — | — | — | |||||||||||||||
Other contracts | — | — | — | — | — | |||||||||||||||
|
|
|
|
|
|
|
|
|
| |||||||||||
Total | $ | — | $ | 24,922,267 | $ | — | $ | — | $ | 24,922,267 | ||||||||||
|
|
|
|
|
|
|
|
|
| |||||||||||
| ^ | This Portfolio held futures contracts as a substitute for investing in conventional securities, hedging and in an attempt to enchance returns. |
The Portfolio held futures contracts with an average notional balance of approximately $612,155,000 during the year ended December 31, 2013.
Combined Pro-forma
Fair Values of Derivative Instruments as of December 31, 2013:
Statement of Assets and Liabilities | ||||||
Derivatives Not Accounted for as | Asset Derivatives | Fair Value | ||||
Interest rate contracts | Receivables, Net Assets- | $ | — | |||
| Unrealized appreciation | — | * | ||||
Foreign exchange contracts | Receivables | — | ||||
Credit contracts | Receivables | — | ||||
Equity contracts | Receivables, Net Assets- | — | ||||
| Unrealized appreciation | 25,921,562 | * | ||||
Commodity contracts | Receivables | — | ||||
Other contracts | Receivables | — | ||||
|
| |||||
Total | $ | 25,921,562 | ||||
|
| |||||
Liability Derivatives | ||||||
Interest rate contracts | Payables, Net Assets- | $ | — | |||
| Unrealized depreciation | — | * | ||||
Foreign exchange contracts | Payables | — | ||||
Credit contracts | Payables | — | ||||
Equity contracts | Payables, Net Assets- | — | ||||
| Unrealized depreciation | — | * | ||||
Commodity contracts | Payables | — | ||||
Other contracts | Payables | — | ||||
|
| |||||
Total | $ | — | ||||
|
| |||||
| * | Includes cumulative appreciation/depreciation of futures contracts as reported in the Portfolio of Investments. Only current day’s variation margin is reported within the Statement of Assets & Liabilities. |
The effect of Derivative Instruments on the Statement of Operations for the year ended December 31, 2013:
Amount of Realized Gain or (Loss) on Derivatives Recognized in Income | ||||||||||||||||||||
Derivatives Not Accounted for as Hedging Instruments^ | Options | Futures | Forward Currency Contracts | Swaps | Total | |||||||||||||||
Interest rate contracts | $ | — | $ | — | $ | — | $ | — | $ | — | ||||||||||
Foreign exchange contracts | — | — | — | — | — | |||||||||||||||
Credit contracts | — | — | — | — | — | |||||||||||||||
Equity contracts | — | 192,782,431 | — | — | 192,782,431 | |||||||||||||||
Commodity contracts | — | — | — | — | — | |||||||||||||||
Other contracts | — | — | — | — | — | |||||||||||||||
|
|
|
|
|
|
|
|
|
| |||||||||||
Total | $ | — | $ | 192,782,431 | $ | — | $ | — | $ | 192,782,431 | ||||||||||
|
|
|
|
|
|
|
|
|
| |||||||||||
Amount of Unrealized Appreciation or (Depreciation) on Derivatives Recognized in Income | ||||||||||||||||||||
Derivatives Not Accounted for as Hedging Instruments^ | Options | Futures | Forward Currency Contracts | Swaps | Total | |||||||||||||||
Interest rate contracts | $ | — | $ | — | $ | — | $ | — | $ | — | ||||||||||
Foreign exchange contracts | — | — | — | — | — | |||||||||||||||
Credit contracts | — | — | — | — | — | |||||||||||||||
Equity contracts | — | 28,158,517 | — | — | 28,158,517 | |||||||||||||||
Commodity contracts | — | — | — | — | — | |||||||||||||||
Other contracts | — | — | — | — | — | |||||||||||||||
|
|
|
|
|
|
|
|
|
| |||||||||||
Total | $ | — | $ | 28,158,517 | $ | — | $ | — | �� | $ | 28,158,517 | |||||||||
|
|
|
|
|
|
|
|
|
| |||||||||||
| ^ | This Portfolio held futures as a substitute for investing in conventional securities, hedging and in an attempt to enhance returns. |
The Portfolio held futures contracts with an average notional balance of approximately $806,882,000 during the year ended December 31, 2013.
EQ/Equity Growth PLUS
The following table presents the Portfolio’s gross derivative assets and liabilities by counterparty net of amounts available for offset under netting arrangements and any related collateral received or pledged by the Portfolio as of December 31, 2013:
Counterparty | Gross Amount of Derivative Assets Presented in the Statement of Assets and Liabilities (a) | Derivatives Available for Offset | Collateral Received | Net Amount Due from Counterparty | ||||||||||||
Exchange Traded Futures & Options Contracts (b) | $ | 2,282,267 | (c) | $ | — | $ | — | $ | 2,282,267 | |||||||
|
|
|
|
|
|
|
| |||||||||
EQ/Large Cap Growth PLUS
The following table presents the Portfolio’s gross derivative assets and liabilities by counterparty net of amounts available for offset under netting arrangements and any related collateral received or pledged by the Portfolio as of December 31, 2013:
Counterparty | Gross Amount of Derivative Assets Presented in the Statement of Assets and Liabilities (a) | Derivatives Available for Offset | Collateral Received | Net Amount Due from Counterparty | ||||||||||||
Exchange Traded Futures & Options Contracts (b) | $ | 23,639,295 | (c) | $ | — | $ | — | $ | 23,639,295 | |||||||
|
|
|
|
|
|
|
| |||||||||
Combined Pro-forma
The following table presents the Portfolio’s gross derivative assets and liabilities by counterparty net of amounts available for offset under netting arrangements and any related collateral received or pledged by the Portfolio as of December 31, 2013:
Counterparty | Gross Amount of Derivative Assets Presented in the Statement of Assets and Liabilities (a) | Derivatives Available for Offset | Collateral Received | Net Amount Due from Counterparty | ||||||||||||
Exchange Traded Futures & Options Contracts (b) | $ | 25,921,562 | (c) | $ | — | $ | — | $ | 25,921,562 | |||||||
|
|
|
|
|
|
|
| |||||||||
| (a) | For financial reporting purposes the Portfolios do not offset derivative assets and derivative liabilities subject to master netting arrangements in the Statement of Assets and Liabilities. |
| (b) | These derivatives are traded on an exchange, therefore they are not subject to master netting arrangements. |
| (c) | This amount represents the cumulative appreciation (depreciation) of futures contracts as reported in the Portfolio of Investments. The Statement of Assets and Liabilities only reflect the current day variation margin receivable/payable to brokers for futures contracts. |
Investment security transactions for the year ended December 31, 2013 were as follows:
| EQ/Equity Growth PLUS | EQ/Large Cap Growth PLUS | Combined Pro Forma | ||||||||||
Cost of Purchases: | ||||||||||||
Long-term investments other than U.S. government debt securities | $ | 688,566,865 | $ | 1,177,345,285 | $ | 1,865,912,150 | ||||||
Net Proceeds of Sales and Redemptions: | ||||||||||||
Long-term investments other than U.S. government debt securities | $ | 815,036,719 | $ | 1,567,619,973 | $ | 2,382,656,692 | ||||||
82
As of December 31, 2013, the gross unrealized appreciation (depreciation) of investments based on the aggregate cost of investments for federal income tax purposes was as follows:
| EQ/Equity Growth PLUS | EQ/Large Cap Growth PLUS | Combined Pro-forma | ||||||||||
Aggregate gross unrealized appreciation | $ | 201,514,288 | $ | 1,158,300,633 | $ | 1,359,814,921 | ||||||
Aggregate gross unrealized depreciation | (911,984 | ) | (8,312,195 | ) | (9,224,179 | ) | ||||||
|
|
|
|
|
| |||||||
Net unrealized appreciation | $ | 200,602,304 | $ | 1,149,988,438 | $ | 1,350,590,742 | ||||||
|
|
|
|
|
| |||||||
Federal income tax cost of investments | $ | 287,103,405 | $ | 3,260,143,428 | $ | 3,547,246,833 | ||||||
|
|
|
|
|
| |||||||
Affiliated broker/dealer
EQ/Equity Growth PLUS
For the year ended December 31, 2013, the Portfolio incurred approximately $3,734 as brokerage commisions with Sanford C. Bernstein & Co., LLC, an affiliated broker/dealer.
EQ/Large Cap Growth PLUS
For the year ended December 31, 2013, the Portfolio incurred approximately $6,670 as brokerage commisions with Sanford C. Bernstein & Co., LLC, an affiliated broker/dealer.
Combined Pro-forma
For the year ended December 31, 2013, the Portfolio incurred approximately $10,404 as brokerage commisions with Sanford C. Bernstein & Co., LLC, an affiliated broker/dealer.
Capital Loss Carryforward
EQ/Equity Growth PLUS
The Portfolio has a net capital loss carryforward of $305,117,353, which expires in the year 2017. The Portfolio utilized net capital loss carryforward of $208,922,804 during 2013.
EQ/Large Cap Growth PLUS
The Portfolio has a net capital loss carryforward of $186,172,317, which expires in the year 2017. The Portfolio utilized net capital loss carryforward of $365,770,393 during 2013.
Combined Pro-forma
The Portfolio has a net capital loss carryforward of $491,289,670, which expires in the year 2017. The Portfolio utilized net capital loss carryforward of $574,693,197 during 2013.
Certain capital loss carryforwards may be subject to limitations on use pursuant to applicable U.S. Federal Income Tax Law. Therefore, it is possible not all of these capital losses will be available for use.
83
STATEMENT OF ASSETS AND LIABILITIES
December 31, 2013
| EQ/Equity Growth PLUS | EQ/Large Cap Growth PLUS | Pro Forma Adjustment | Pro Forma Combined | |||||||||||||
Investments at cost: Affiliated Issuers | $ | — | $ | 27,749,909 | $ | 27,749,909 | ||||||||||
Investments at cost: Unaffiliated Issuers | $ | 285,995,117 | $ | 3,204,929,207 | $ | 3,490,924,324 | ||||||||||
Foreign cash at cost | $ | 432 | $ | 15 | $ | 447 | ||||||||||
ASSETS | ||||||||||||||||
Investments at value: Affiliated Issuers | $ | — | $ | 49,861,513 | $ | 49,861,513 | ||||||||||
Investments at value: Unaffiliated Issuers | 487,705,709 | 4,360,270,353 | 4,847,976,062 | |||||||||||||
Cash | 94,056,062 | 940,721,975 | 1,034,778,037 | |||||||||||||
Foreign cash | 435 | 15 | 450 | |||||||||||||
Cash held as collateral at broker | 4,530,000 | 42,925,000 | 47,455,000 | |||||||||||||
Receivable for securities sold | 1,350,995 | 12,390,843 | 13,741,838 | |||||||||||||
Due from broker for futures variation margin | 374,160 | 3,692,066 | 4,066,226 | |||||||||||||
Dividends, interest, and other receivables | 434,812 | 3,201,612 | 3,636,424 | |||||||||||||
Receivable from Separate Accounts for Trust shares sold | 52,126 | 164,870 | 216,996 | |||||||||||||
Other assets | 6,639 | 8,232 | 14,871 | |||||||||||||
|
|
|
|
|
|
|
| |||||||||
Total assets | 588,510,938 | 5,413,236,479 | — | 6,001,747,417 | ||||||||||||
|
|
|
|
|
|
|
| |||||||||
LIABILITIES | ||||||||||||||||
Payable for securities purchased | 1,455,870 | 12,793,925 | 14,249,795 | |||||||||||||
Payable to Separate Accounts for Trust shares redeemed | 702,024 | 4,566,494 | 5,268,518 | |||||||||||||
Investment management fees payable | 242,721 | 2,063,419 | 2,306,140 | |||||||||||||
Distribution fees payable - Class IB | 107,458 | 882,443 | 989,901 | |||||||||||||
Administrative fees payable | 76,649 | 621,421 | 698,070 | |||||||||||||
Distribution fees payable - Class IA | 8,008 | 2,751 | 10,759 | |||||||||||||
Trustees’ fee payable | 1,821 | 4,174 | 5,995 | |||||||||||||
Accrued expenses | 30,493 | 368,448 | 398,941 | |||||||||||||
|
|
|
|
|
|
|
| |||||||||
Total liabilities | 2,625,044 | 21,303,075 | — | 23,928,119 | ||||||||||||
|
|
|
|
|
|
|
| |||||||||
NET ASSETS | $ | 585,885,894 | $ | 5,391,933,404 | — | $ | 5,977,819,298 | |||||||||
|
|
|
|
|
|
|
| |||||||||
Net assets were comprised of: | ||||||||||||||||
Paid in capital | 721,249,889 | 4,448,050,522 | 5,169,300,411 | |||||||||||||
Accumulated undistributed net investment income (loss) | 97,026 | 819,458 | 916,484 | |||||||||||||
Accumulated undistributed net realized gain (loss) on investments, futures and foreign currency transactions | (339,453,883 | ) | (258,028,780 | ) | (597,482,663 | ) | ||||||||||
Net unrealized appreciaiton (depreciation) on investments, futures and foreign currency translations | 203,992,862 | 1,201,092,204 | 1,405,085,066 | |||||||||||||
|
|
|
|
|
|
|
| |||||||||
Net Assets | $ | 585,885,894 | $ | 5,391,933,404 | — | $ | 5,977,819,298 | |||||||||
|
|
|
|
|
|
|
| |||||||||
Class IA Shares: | ||||||||||||||||
Net Assets | 38,536,445 | 13,265,832 | 51,802,277 | |||||||||||||
Shares outstanding | 1,831,520 | 531,654 | (287,097 | )(a) | 2,076,077 | |||||||||||
|
|
|
|
|
|
|
| |||||||||
Net asset value, offering and redemption price per share | $ | 21.04 | $ | 24.95 | $ | 24.95 | ||||||||||
|
|
|
|
|
|
|
| |||||||||
Class IB Shares: | ||||||||||||||||
Net Assets | 518,821,979 | 4,223,748,264 | 4,742,570,243 | |||||||||||||
Shares outstanding | 24,776,879 | 173,110,415 | (3,512,949 | )(a) | 194,374,345 | |||||||||||
|
|
|
|
|
|
|
| |||||||||
Net asset value, offering and redemption price per share | $ | 20.94 | $ | 24.40 | $ | 24.40 | ||||||||||
|
|
|
|
|
|
|
| |||||||||
Class K Shares: | ||||||||||||||||
Net Assets | 28,527,470 | 1,154,919,308 | 1,183,446,778 | |||||||||||||
Shares outstanding | 1,355,113 | 46,286,871 | (211,789 | )(a) | 47,430,195 | |||||||||||
|
|
|
|
|
|
|
| |||||||||
Net asset value, offering and redemption price per share | $ | 21.05 | $ | 24.95 | $ | 24.95 | ||||||||||
|
|
|
|
|
|
|
| |||||||||
| (a) | Reflects retired shares of the acquired portfolio. |
84
STATEMENT OF OPERATIONS
For the Year Ended December 31, 2013
| EQ/Equity Growth PLUS | EQ/Large Cap Growth PLUS | Pro Forma Adjustment | Pro Forma Combined | |||||||||||||
Dividend income received from affiliates | $ | — | $ | 464,375 | $ | 464,375 | ||||||||||
Dividend foreign withholding tax | $ | 1,034 | $ | 26,132 | $ | 27,166 | ||||||||||
INVESTMENT INCOME | ||||||||||||||||
Dividends | $ | 12,817,317 | $ | 39,130,807 | $ | 51,948,124 | ||||||||||
Interest | 186,931 | 607,066 | 793,997 | |||||||||||||
|
|
|
|
|
|
|
| |||||||||
Total income | 13,004,248 | 39,737,873 | — | 52,742,121 | ||||||||||||
|
|
|
|
|
|
|
| |||||||||
EXPENSES | ||||||||||||||||
Investment management fees | 5,591,331 | 16,836,669 | (704,857 | )(a) | 21,723,143 | |||||||||||
Distribution fees - Class IB | 2,647,366 | 6,242,719 | 8,890,085 | |||||||||||||
Administrative fees | 1,719,386 | 5,179,909 | (502,647 | )(a)(b) | 6,396,648 | |||||||||||
Printing and mailing expenses | 116,897 | 372,780 | 489,677 | |||||||||||||
Professional fees | 70,800 | 147,919 | (69,403 | )(b) | 149,316 | |||||||||||
Custodian fees | 60,500 | 115,000 | (50,500 | )(b) | 125,000 | |||||||||||
Trustees’ fees | 36,096 | 79,624 | 115,720 | |||||||||||||
Distribution fees - Class IA | 86,710 | 27,898 | 114,608 | |||||||||||||
Miscellaneous | 43,671 | 47,912 | (43,671 | )(b) | 47,912 | |||||||||||
|
|
|
|
|
|
|
| |||||||||
Gross expenses | 10,372,757 | 29,050,430 | (1,371,078 | ) | 38,052,109 | |||||||||||
|
|
|
|
|
|
|
| |||||||||
Less: Fees paid indirectly | — | (57,798 | ) | 57,798 | (c) | — | ||||||||||
|
|
|
|
|
|
|
| |||||||||
Net expenses | 10,372,757 | 28,992,632 | (1,313,280 | ) | 38,052,109 | |||||||||||
|
|
|
|
|
|
|
| |||||||||
NET INVESTMENT INCOME (LOSS) | 2,631,491 | 10,745,241 | 1,313,280 | 14,690,012 | ||||||||||||
|
|
|
|
|
|
|
| |||||||||
Realized gain (loss) from affiliates | — | 7,476,656 | 7,476,656 | |||||||||||||
REALIZED AND UNREALIZED GAIN (LOSS) | ||||||||||||||||
Realized gain (loss) on: | ||||||||||||||||
Investments | 461,630,296 | 203,038,543 | 664,668,839 | |||||||||||||
Futures | 54,074,704 | 138,707,727 | 192,782,431 | |||||||||||||
Foreign currency transactions | 560 | (14,943 | ) | (14,383 | ) | |||||||||||
|
|
|
|
|
|
|
| |||||||||
Net realized gain (loss) | 515,705,560 | 341,731,327 | — | 857,436,887 | ||||||||||||
|
|
|
|
|
|
|
| |||||||||
Change in unrealized appreciation (depreciation) from affiliates | — | 4,278,618 | 4,278,618 | |||||||||||||
Change in unrealized appreciation (depreciation) on: | ||||||||||||||||
Investments | (205,439,098 | ) | 732,027,097 | 526,587,999 | ||||||||||||
Futures | 3,236,250 | 24,922,267 | 28,158,517 | |||||||||||||
Foreign currency translations | 3 | 159 | 162 | |||||||||||||
|
|
|
|
|
|
|
| |||||||||
Net change in unrealized appreciation (depreciation) | (202,202,845 | ) | 756,949,523 | — | 554,746,678 | |||||||||||
|
|
|
|
|
|
|
| |||||||||
NET REALIZED AND UNREALIZED GAIN (LOSS) | 313,502,715 | 1,098,680,850 | — | 1,412,183,565 | ||||||||||||
|
|
|
|
|
|
|
| |||||||||
NET INCREASE (DECREASE) IN NET ASSETS RESULTING FROM OPERATIONS | $ | 316,134,206 | $ | 1,109,426,091 | $ | 1,313,280 | $ | 1,426,873,577 | ||||||||
|
|
|
|
|
|
|
| |||||||||
| (a) | Reflects adjustment in expenses due to effects of the contract rate. |
| (b) | Reflects adjustment in expenses due to elimination of duplicative expenses. |
| (c) | Reflects adjustment due to the termination of the brokerage recapture program. |
85
NOTES TO PRO FORMA COMBINED FINANCIAL STATEMENTS
As of December 31, 2013
NOTE 1 – BASIS OF COMBINATION AND SIGNIFICANT ACCOUNTING POLICIES:
EQ Advisors Trust (the “Trust”) was organized as a Delaware statutory trust on October 31, 1996, and is registered under the Investment Company Act of 1940, as amended, as an open-end management investment company with numerous portfolios.
On December 10-11, 2013, the Board of Trustees of the Trust approved a proposed Plan of Reorganization and Termination (“Reorganization Plan”) that provides for the transfer of all of the assets of the EQ/Equity Growth PLUS Portfolio (“Equity Growth Portfolio”) to the EQ/Large Cap Growth PLUS Portfolio (“Large Cap Growth Portfolio”), each a series of the Trust, and the assumption by the Large Cap Growth Portfolio of all of the liabilities of the Equity Growth Portfolio in exchange for shares of the Large Cap Growth Portfolio having an aggregate value equal to the net assets of the Equity Growth Portfolio, the distribution of the Large Cap Growth Portfolio shares to the Equity Growth Portfolio shareholders of record determined immediately after the close of business on the closing date, and the subsequent liquidation of the Equity Growth Portfolio.
The Equity Growth Portfolio’s annual contractual management fee rate equals 0.500% of average daily net assets for the first $2 billion, 0.450% of average daily net assets for the next $1 billion, 0.425% for the next $3 billion, 0.400% for the next $5 billion, and 0.375% of average daily net assets thereafter. The Large Cap Growth Portfolio’s annual contractual management fee rate equals 0.500% of average daily net assets for the first $2 billion, 0.450% of average daily net assets for the next $1 billion, 0.425% for the next $3 billion, 0.400% for the next $5 billion, and 0.375% of average daily net assets thereafter. The Reorganization Plan is subject to the approval of the Equity Growth Portfolio’s shareholders. A special meeting of shareholders of the Equity Growth Portfolio will be held on or about May 21, 2014.
The Reorganization will be accounted for as a tax-free reorganization of investment companies. The unaudited pro forma combined financial statements are presented for the information of the reader and may not necessarily be representative of what the actual combined financial statements would have been had the Reorganization occurred at December 31, 2013. The unaudited pro forma combined portfolio of investments and statement of assets and liabilities reflect the financial position of the Equity Growth Portfolio and the Large Cap Growth Portfolio at December 31, 2013. The unaudited pro forma combined statement of operations reflects the results of operations of the Large Cap Growth Portfolio as if it had acquired the Equity Growth Portfolio at the beginning of the year ended December 31, 2013. These statements have been derived from the Portfolios’ respective books and records utilized in calculating daily net asset value at the dates indicated above for each Portfolio under accounting principles generally accepted in the United States of America. The historical cost of investment securities will be carried forward to the surviving entity and results of operations of the Large Cap Growth Portfolio for pre-combination periods will not be restated.
The unaudited pro forma combined portfolio of investments and statements of assets and liabilities and operations should be read in conjunction with the historical financial statements of the Portfolios included in the Trust’s Statement of Additional Information. Each of the Portfolios has substantially the same significant accounting policies as detailed in the historical financial statements. The preparation of financial statements in accordance with accounting principles generally accepted in the United States of America requires management to make estimates and assumptions that affect the reported amounts and disclosures. Actual results could differ from those estimates.
86
NOTES TO PRO FORMA COMBINED FINANCIAL STATEMENTS—(Continued)
As of December 31, 2013
Following the Reorganization, the Large Cap Growth Portfolio will be the “accounting survivor.”
NOTE 2 – SHARES:
The unaudited pro forma net asset value per share assumes common shares of beneficial interest retired in connection with the proposed acquisition of the Equity Growth Portfolio by the Large Cap Growth Portfolio as of December 31, 2013. The number of shares retired was calculated based on the net assets of the Equity Growth Portfolio and net asset value per share of the Large Cap Growth Portfolio at December 31, 2013.
87
NOTES TO PRO FORMA COMBINED FINANCIAL STATEMENTS—(Continued)
As of December 31, 2013
NOTE 3 – TAXES
Each Portfolio, as well as the Acquiring Portfolio after the Reorganization, intends to comply with the requirements of the Internal Revenue Code of 1986, as amended, applicable to regulated investment companies (“RICS”) and to distribute substantially all of its net investment income and net realized capital gains to shareholders of each Portfolio. Therefore, no Federal income tax provision is required.
NOTE 4 – UNAUDITED PRO FORMA COMBINED ADJUSTMENTS:
The accompanying unaudited pro forma combined financial statements reflect changes in the Large Cap Growth Portfolio’s shares as if the merger had taken place on December 31, 2013. The Equity Growth Portfolio will bear the expenses, based on the fraction that its shareholder accounts will bear to the shareholder accounts of all the Acquired Portfolios at the merger date, of the Reorganization (i.e., the costs associated with preparing, printing and distributing the prospectus and proxy materials, legal and accounting fees in connection with the Reorganization, and expenses of holding the shareholders meeting), such expenses, which are not reflected in the unaudited pro forma combined statement of operations, are estimated to be approximately $218,900.
88
PART C
OTHER INFORMATION
| Item 15. | Indemnification |
Registrant’s Amended and Restated Agreement and Declaration of Trust (“Declaration of Trust”) and By-Laws.
Article VII, Section 2 of the Declaration of Trust of EQ Advisors Trust (“Trust”) states, in relevant part, that a “Trustee, when acting in such capacity, shall not be personally liable to any Person, other than the Trust or a Shareholder to the extent provided in this Article VII, for any act, omission or obligation of the Trust, of such Trustee or of any other Trustee. The Trustees shall not be responsible or liable in any event for any neglect or wrongdoing of any officer, agent, employee, Manager, or Principal Underwriter of the Trust. The Trust shall indemnify each Person who is serving or has served at the Trust’s request as a director, officer, trustee, employee, or agent of another organization in which the Trust has any interest as a shareholder, creditor, or otherwise to the extent and in the manner provided in the By-Laws.” Article VII, Section 4 of the Trust’s Declaration of Trust further states, in relevant part, that the “Trustees shall be entitled and empowered to the fullest extent permitted by law to purchase with Trust assets insurance for liability and for all expenses reasonably incurred or paid or expected to be paid by a Trustee, officer, employee, or agent of the Trust in connection with any claim, action, suit, or proceeding in which he or she may become involved by virtue of his or her capacity or former capacity as a Trustee of the Trust.”
Article VI, Section 2 of the Trust’s By-Laws states, in relevant part, that “[s]ubject to the exceptions and limitations contained in Section 3 of this Article VI, every [Trustee, officer, employee or other agent of the Trust] shall be indemnified by the Trust to the fullest extent permitted by law against all liabilities and against all expenses reasonably incurred or paid by him or her in connection with any proceeding in which he or she becomes involved as a party or otherwise by virtue of his or her being or having been an agent.” Article VI, Section 3 of the Trust’s By-Laws further states, in relevant part, that “[n]o indemnification shall be provided hereunder to [a Trustee, officer, employee or other agent of the Trust]: (a) who shall have been adjudicated, by the court or other body before which the proceeding was brought, to be liable to the Trust or its Shareholders by reason of willful misfeasance, bad faith, gross negligence or reckless disregard of the duties involved in the conduct of his or her office (collectively, “disabling conduct”); or (b) with respect to any proceeding disposed of (whether by settlement, pursuant to a consent decree or otherwise) without an adjudication by the court or other body before which the proceeding was brought that such [Trustee, officer, employee or other agent of the Trust] was liable to the Trust or its Shareholders by reason of disabling conduct, unless there has been a determination that such [Trustee, officer, employee or other agent of the Trust] did not engage in disabling conduct: (i) by the court or other body before which the proceeding was brought; (ii) by at least a majority of those Trustees who are neither Interested Persons of the Trust nor are parties to the proceeding based upon a review of readily available facts (as opposed to a full trial-type inquiry); or (iii) by written opinion of independent legal counsel based upon a review of readily available facts (as opposed to a full trial-type inquiry); provided, however, that indemnification shall be provided hereunder to [a Trustee, officer, employee or other agent of the Trust] with respect to any proceeding in the event of (1) a final decision on the merits by the court or other body before which the proceeding was brought that the [Trustee, officer, employee or other agent of the Trust] was not liable by reason of disabling conduct, or (2) the dismissal of the proceeding by the court or other body before which it was brought for insufficiency of evidence of any disabling conduct with which such [Trustee, officer, employee or other agent of the Trust] has been charged.” Article VI, Section 4 of the Trust’s By-Laws also states that the “rights of indemnification herein provided (i) may be insured against by policies maintained by the Trust on behalf of any [Trustee, officer, employee or other agent of the Trust], (ii) shall be severable, (iii) shall not be exclusive of or affect any other rights to which any [Trustee, officer, employee or other agent of the Trust] may now or hereafter be entitled and (iv) shall inure to the benefit of [such party’s] heirs, executors and administrators.”
Registrant’s Investment Management Agreements state:
Limitations on Liability. Manager will exercise its best judgment in rendering its services to the Trust, and the Trust agrees, as an inducement to Manager’s undertaking to do so, that the Manager will not be liable for any error of judgment or mistake of law or for any loss suffered by the Trust in connection with the matters to which this Agreement relates, but will be liable only for willful misconduct, bad faith, gross negligence, reckless disregard of its duties or its failure to exercise due care in rendering its services to
the Trust as specified in this Agreement. Any person, even though an officer, director, employee or agent of Manager, who may be or become an officer, Trustee, employee or agent of the Trust, shall be deemed, when rendering services to the Trust or when acting on any business of the Trust, to be rendering such services to or to be acting solely for the Trust and not as an officer, director, employee or agent, or one under the control or direction of Manager, even though paid by it.
Sections 5(a) and 5(b) of the Registrant’s Investment Advisory Agreements generally state:
| 5. | LIABILITY AND INDEMNIFICATION |
(a) Except as may otherwise be provided by the Investment Company Act or any other federal securities law, neither the Adviser nor any of its officers, members or employees (its “Affiliates”) shall be liable for any losses, claims, damages, liabilities or litigation (including legal and other expenses) incurred or suffered by the Manager or the Trust as a result of any error of judgment or mistake of law by the Adviser or its Affiliates with respect to the services provided to the Portfolio, except that nothing in this Agreement shall operate or purport to operate in any way to exculpate, waive or limit the liability of the Adviser or its Affiliates for, and the Adviser shall indemnify and hold harmless the Trust, the Manager, all affiliated persons thereof (within the meaning of Section 2(a)(3) of the Investment Company Act) and all controlling persons (as described in Section 15 of the Securities Act of 1933, as amended (“1933 Act”)) (collectively, “Manager Indemnitees”) against any and all losses, claims, damages, liabilities or litigation (including reasonable legal and other expenses) to which any of the Manager Indemnitees may become subject under the 1933 Act, the Investment Company Act, the Advisers Act, or under any other statute, at common law or otherwise arising out of or based on (i) any willful misconduct, bad faith, reckless disregard or gross negligence of the Adviser in the performance of any of its duties or obligations hereunder or (ii) any untrue statement of a material fact contained in the Prospectus and SAI, proxy materials, reports, advertisements, sales literature, or other materials pertaining to the Portfolio or the omission to state therein a material fact known to the Adviser which was required to be stated therein or necessary to make the statements therein not misleading, if such statement or omission was made in reliance upon information furnished to the Manager or the Trust by the Adviser Indemnitees (as defined below) for use therein.
(b) Except as may otherwise be provided by the Investment Company Act or any other federal securities law, the Manager and the Trust shall not be liable for any losses, claims, damages, liabilities or litigation (including reasonable legal and other expenses) incurred or suffered by the Adviser as a result of any error of judgment or mistake of law by the Manager with respect to the Portfolio, except that nothing in this Agreement shall operate or purport to operate in any way to exculpate, waive or limit the liability of the Manager for, and the Manager shall indemnify and hold harmless the Adviser, all affiliated persons thereof (within the meaning of Section 2(a)(3) of the Investment Company Act) and all controlling persons (as described in Section 15 of the 1933 Act) (collectively, “Adviser Indemnitees”) against any and all losses, claims, damages, liabilities or litigation (including reasonable legal and other expenses) to which any of the Adviser Indemnities may become subject under the 1933 Act, the Investment Company Act, the Advisers Act, or under any other statute, at common law or otherwise arising out of or based on (i) any willful misconduct, bad faith, reckless disregard or gross negligence of the Manager in the performance of any of its duties or obligations hereunder or (ii) any untrue statement of a material fact contained in the Prospectus and SAI, proxy materials, reports, advertisements, sales literature, or other materials pertaining to the Portfolio or the omission to state therein a material fact known to the Manager which was required to be stated therein or necessary to make the statements therein not misleading, unless such statement or omission was made in reliance upon information furnished to the Manager or the Trust by the Adviser Indemnitees for use therein.
Section 14 of the Registrant’s Distribution Agreements states:
The Trust shall indemnify and hold harmless [the Distributor] from any and all losses, claims, damages or liabilities (or actions in respect thereof) to which [the Distributor] may be subject, insofar as such losses, claims, damages or liabilities (or actions in respect thereof) arise out of or result from negligent, improper, fraudulent or unauthorized acts or omissions by the Trust or its officers, trustees, agents or representatives, other than acts or omissions caused directly or indirectly by [the Distributor].
[The Distributor] will indemnify and hold harmless the Trust, its officers, trustees, agents and representatives against any losses, claims, damages or liabilities, to which the Trust, its officers, trustees, agents and representatives may become subject, insofar as such
losses, claims, damages or liabilities (or actions in respect thereof) arise out of or are based upon: (i) any untrue statement or alleged untrue statement of any material fact contained in the Trust Prospectus and/or SAI or any supplements thereto; (ii) the omission or alleged omission to state any material fact required to be stated in the Trust Prospectus and/or SAI or any supplements thereto or necessary to make the statements therein not misleading; or (iii) other misconduct or negligence of [the Distributor] in its capacity as a principal underwriter of the Trust’s Class [IA, IB and/or K] shares and will reimburse the Trust, its officers, Trustees, agents and representatives for any legal or other expenses reasonably incurred by any of them in connection with investigating or defending against such loss, claim, damage, liability or action; provided, however, that [the Distributor] shall not be liable in any such instance to the extent that any such loss, claim, damage or liability arises out of or is based upon an untrue statement or alleged untrue statement or omission or alleged omission made in the Trust Prospectus and/or SAI or any supplement in good faith reliance upon and in conformity with written information furnished by the Preparing Parties specifically for use in the preparation of the Trust Prospectus and/or SAI.
Section 6 of the Registrant’s Mutual Funds Service Agreement states:
(a) FMG LLC shall not be liable for any error of judgment or mistake of law or for any loss or expense suffered by the Trust, in connection with the matters to which this Agreement relates, except for a loss or expense caused by or resulting from or attributable to willful misfeasance, bad faith or negligence on FMG LLC’s part (or on the part of any third party to whom FMG LLC has delegated any of its duties and obligations pursuant to Section 4(c) hereunder) in the performance of its (or such third party’s) duties or from reckless disregard by FMG LLC (or by such third party) of its obligations and duties under this Agreement (in the case of FMG LLC) or under an agreement with FMG LLC (in the case of such third party) or, subject to Section 10 below, FMG LLC’s (or such third party) refusal or failure to comply with the terms of this Agreement (in the case of FMG LLC) or an agreement with FMG LLC (in the case of such third party) or its breach of any representation or warranty under this Agreement (in the case of FMG LLC) or under an agreement with FMG LLC (in the case of such third party). In no event shall FMG LLC (or such third party) be liable for any indirect, incidental special or consequential losses or damages of any kind whatsoever (including but not limited to lost profits), even if FMG LLC (or such third party) has been advised of the likelihood of such loss or damage and regardless of the form of action.
(b) Except to the extent that FMG LLC may be held liable pursuant to Section 6(a) above, FMG LLC shall not be responsible for, and the Trust shall indemnify and hold FMG LLC harmless from and against any and all losses, damages, costs, reasonable attorneys’ fees and expenses, payments, expenses and liabilities including, but not limited to, those arising out of or attributable to:
(i) any and all actions of FMG LLC or its officers or agents required to be taken pursuant to this Agreement;
(ii) the reliance on or use by FMG LLC or its officers or agents of information, records, or documents which are received by FMG LLC or its officers or agents and furnished to it or them by or on behalf of the Trust, and which have been prepared or maintained by the Trust or any third party on behalf of the Trust;
(iii) the Trust’s refusal or failure to comply with the terms of this Agreement or the Trust’s lack of good faith, or its actions, or lack thereof, involving negligence or willful misfeasance;
(iv) the breach of any representation or warranty of the Trust hereunder;
(v) the reliance on or the carrying out by FMG LLC or its officers or agents of any proper instructions reasonably believed to be duly authorized, or requests of the Trust;
(vi) any delays, inaccuracies, errors in or omissions from information or data provided to FMG LLC by data services, including data services providing information in connection with any third party computer system licensed to FMG LLC, and by any corporate action services, pricing services or securities brokers and dealers;
(vii) the offer or sale of shares by the Trust in violation of any requirement under the Federal securities laws or regulations or the securities laws or regulations of any state, or in violation of any stop order or other determination or ruling by any Federal agency or any state agency with respect to the offer or sale of such shares in such state (1) resulting from activities, actions, or omissions by the Trust or its other service providers and agents, or (2) existing or arising out of activities, actions or omissions by or on behalf of the Trust prior to the effective date of this Agreement;
(viii) any failure of the Trust’s registration statement to comply with the 1933 Act and the 1940 Act (including the rules and regulations thereunder) and any other applicable laws, or any untrue statement of a material fact or omission of a material fact necessary to make any statement therein not misleading in a Trust’s prospectus;
(ix) except as provided for in Schedule B.III., the actions taken by the Trust, its Manager, its investment advisers, and its distributor in compliance with applicable securities, tax, commodities and other laws, rules and regulations, or the failure to so comply, and
(x) all actions, inactions, omissions, or errors caused by third parties to whom FMG LLC or the Trust has assigned any rights and/or delegated any duties under this Agreement at the specific request of or as required by the Trust, its Portfolio, investment advisers, or Trust distributors.
The Trust shall not be liable for any indirect, incidental, special or consequential losses or damages of any kind whatsoever (including, but not limited to, lost profits) even if the Trust has been advised of the likelihood of such loss or damage and regardless of the form of action, except when the Trust is required to indemnify FMG LLC pursuant to this Agreement.
Section 12(a)(iv) of the Registrant’s Global Custody Agreement states:
(A) Customer shall indemnify and hold Bank and its directors, officers, agents and employees (collectively the “Indemnitees”) harmless from and against any and all claims, liabilities, losses, damages, fines, penalties, and expenses, including out-of-pocket and incidental expenses and legal fees (“Losses”) that may be incurred by, or asserted against, the Indemnitees or any of them for following any instructions or other directions upon which Bank is authorized to rely pursuant to the terms of this Agreement. (B) In addition to and not in limitation of the preceding subparagraph, Customer shall also indemnify and hold the Indemnitees and each of them harmless from and against any and all Losses that may be incurred by, or asserted against, the Indemnitees or any of them in connection with or arising out of Bank’s performance under this Agreement, provided the Indemnitees have not acted with negligence or engaged in willful misconduct. (C) In performing its obligations hereunder, Bank may rely on the genuineness of any document which it reasonably believes in good faith to have been validly executed.
Article VIII of the Registrant’s Participation Agreement states:
8.1(a). AXA Equitable Life Insurance Company (for the purposes of this Article, “Equitable”) agrees to indemnify and hold harmless the Trust, each member of the Board, the Distributors, and the directors and officers and each person, if any, who controls any such person within the meaning of Section 15 of the 1933 Act (collectively, the “Indemnified Parties” for purposes of this Section 8.1) against any and all losses, claims, damages, liabilities (including amounts paid in settlement with the written consent of Equitable), investigation of claims or litigation (including legal and other expenses), to which the Indemnified Parties may become subject under any statute, regulation, at common law or otherwise, insofar as such losses, claims, damages, liabilities or expenses (or actions in respect thereof) or settlements are related to the sale or acquisition of the Trust’s shares or the Equitable Contracts or interests in the Accounts and:
(i) arise out of or are based upon any untrue statements or alleged untrue statements of any material fact contained in the registration statement, prospectus, or Statement of Additional Information for the Equitable Contracts or contained in the Equitable Contracts or sales literature for the Equitable Contracts (or any amendment or supplement to any of the foregoing), or arise out of or are based upon the omission or the alleged omission to state therein a material fact required to be stated therein or
necessary to make the statements therein not misleading, provided that this agreement to indemnify shall not apply as to any Indemnified Party if such statement or omission or such alleged statement or omission was made in reliance upon and in conformity with information furnished to Equitable by or on behalf of the Trust for use in the registration statement, prospectus, or Statement of Additional Information for the Equitable Contracts or in the Equitable Contracts or sales literature (or any amendment or supplement) or otherwise for use in connection with the sale of the Equitable Contracts or Trust shares; or
(ii) arise out of or as a result of statements or representations (other than statements or representations contained in the Registration Statement, prospectus or Statement of Additional Information, or sales literature of the Trust not supplied by Equitable or persons under its control) or wrongful conduct of Equitable or persons under its control, with respect to the sale or distribution of the Equitable Contracts or Trust shares; or
(iii) arise out of any untrue statement or alleged untrue statement of a material fact contained in a Registration Statement, prospectus, or Statement of Additional Information, or sales literature of the Trust or any amendment thereof or supplement thereto or the omission or alleged omission to state therein a material fact required to be stated therein or necessary to make the statements therein not misleading if such a statement or omission was made in reliance upon information furnished to the Trust by or on behalf of Equitable; or
(iv) arise as a result of any failure by Equitable to provide the services and furnish the materials required to be provided or furnished by it under the terms of this Agreement; or
(v) arise out of or result from any material breach of any representation and/or warranty made by Equitable in this Agreement or arise out of or result from any other material breach of this Agreement by Equitable;
as limited by and in accordance with the provisions of Sections 8.1(b) and 8.1(c) hereof…
8.2(a). Each of the Distributors agrees to indemnify and hold harmless Equitable, and the Trust and each of their directors and officers and each person, if any, who controls Equitable within the meaning of Section 15 of the 1933 Act (collectively, the “Indemnified Parties” for purposes of this Section 8.2) against any and all losses, claims, damages, liabilities (including amounts paid in settlement with the written consent of the Distributors), investigation of claims or litigation (including legal and other expenses) to which the Indemnified Parties may become subject under any statute, regulation, at common law or otherwise, insofar as such losses, claims, damages, liabilities or expenses (or actions in respect thereof) or settlements are related to the sale or acquisition of the Trust’s shares or the Equitable Contracts or interests in the Accounts and:
(i) arise out of or are based upon any untrue statement or alleged untrue statement of any material fact contained in the Registration Statement, prospectus or Statement of Additional Information, or sales literature of the Trust (or any amendment or supplement to any of the foregoing), or arise out of or are based upon the omission or the alleged omission to state therein a material fact required to be stated therein or necessary to make the statements therein not misleading, provided that this agreement to indemnify shall not apply as to any Indemnified Party if such statement or omission or such alleged statement or omission was made in reliance upon and in conformity with information furnished to the Distributors or Trust by or on behalf of Equitable for use in the Registration Statement, prospectus, or Statement of Additional Information for the Trust, or in sales literature (or any amendment or supplement) or otherwise for use in connection with the sale of the Equitable Contracts or Trust shares; or
(ii) arise out of or as a result of statements or representations (other than statements or representations contained in the registration statement, prospectus or Statement of Additional Information, or sales literature for the Equitable Contracts not supplied by the Distributors or persons under their control) or wrongful conduct of the Distributors or persons under their control, with respect to the sale or distribution of the Equitable Contracts or Trust shares; or
(iii) arise out of any untrue statement or alleged untrue statement of a material fact contained in a registration statement, prospectus, or Statement of Additional Information or sales literature covering the Equitable Contracts, or any amendment
thereof or supplement thereto, or the omission or alleged omission to state therein a material fact required to be stated therein or necessary to make the statement or statements therein not misleading, if such statement or omission was made in reliance upon information furnished to Equitable by or on behalf of the Distributors or the Trust; or
(iv) arise as a result of any failure by the Distributors or the Trust to provide the services and furnish the materials required to be provided or furnished by the Distributors or the Trust under the terms of this Agreement (including a failure, whether unintentional or in good faith or otherwise, to comply with the diversification or other qualification requirements specified in Article VI of this Agreement); or
(v) arise out of or result from any material breach of any representation and/or warranty made by the Distributors in this Agreement or arise out of or result from any other material breach of this Agreement by the Distributors;
as limited by and in accordance with the provisions of Sections 8.2(b) and 8.2(c) hereof…
8.3(a) The Trust agrees to indemnify and hold harmless Equitable and each of its directors and officers and each person, if any, who controls Equitable within the meaning of Section 15 of the 1933 Act (collectively, the “Indemnified Parties” for purposes of this Section 8.3) against any and all losses, claims, damages, liabilities (including amounts paid in settlement with the written consent of the Trust), investigation of claims or litigation (including legal and other expenses) to which the Indemnified Parties may become subject under any statute, regulation, at common law or otherwise, insofar as such losses, claims, damages, liabilities or expenses (or actions in respect thereof) or settlements result from the gross negligence, bad faith or willful misconduct of the Board or any member thereof, are related to the operations of the Trust and:
(i) arise as a result of any failure by the Trust to provide the services and furnish the materials required to be provided or furnished by it under the terms of this Agreement (including a failure to comply with the diversification and other qualification requirements specified in … this Agreement); or
(ii) arise out of or result from any material breach of any representation and/or warranty made by the Trust in this Agreement or arise out of or result from any other material breach of this Agreement by the Trust;
as limited by and in accordance with the provisions of Sections 8.3(b) and 8.3(c) hereof…
Article VII of the Registrant’s Second Amended and Restated Retirement Plan Participation Agreement states:
7.1. Indemnification By the Plan. Except as provided to the contrary in Section 7.4 or 7.5 hereof, AXA Equitable and the Plan shall jointly and severally indemnify and hold harmless the Trust, each member of the Board, the Distributor, the trustees, directors and officers thereof and each person, if any, who controls any such person within the meaning of Section 15 of the 1933 Act (collectively, the “Indemnified Parties” for purposes of this Section 7.1) against any and all losses, claims, damages, liabilities (including amounts paid in settlement with the written consent of AXA Equitable and the Plan), investigation of claims or litigation (including legal and other expenses), to which the Indemnified Parties may become subject under any statute, regulation, at common law or otherwise, insofar as such losses, claims, damages, liabilities or expenses (or actions in respect thereof) or settlements are related to, arise out of or are based upon:
(i) the failure (intentional or otherwise) of the Plan at any time to be or to continue to be a Qualified Plan…;
(ii) the sale or acquisition of the Class K shares of the Designated Portfolios and (1) arise out of or are based upon any untrue statements or alleged untrue statements of any material fact made by AXA Equitable or the Plan or any person under its control or the omission or the alleged omission to state a material fact required to be stated or necessary to make such statements not misleading, unless such statement or omission or alleged statement or omission was made in reliance upon and in conformity with information furnished by the Trust or the Distributor to AXA Equitable or the Plan for use in connection with the sale or distribution of Class K shares of the Designated Portfolios; or (2) arise out of or as a result of warranties or representations (other than warranties or representations contained in a Registration Statement, any SEC Disclosure Materials or sales literature
of the Trust not supplied by the Plan or persons under its control) or wrongful conduct of AXA Equitable or the Plan or any of such, with respect to the sale or distribution of Class K shares of the Designated Portfolios; or (3) arise out of any untrue statement or alleged untrue statement of a material fact contained in a Registration Statement, any SEC Disclosure Materials or sales literature of the Trust or the omission or alleged omission to state therein a material fact required to be stated therein or necessary to make the statements therein not misleading, but only if such a statement or omission was made in reliance upon information furnished to the Trust or the Distributor by AXA Equitable or the Plan or persons under their control; or
(iii) arise as a result of any failure by the Plan to provide the services or furnish the materials required to be provided or furnished by it under the terms of this Agreement; or
(iv) arise out of or result from any material breach of any representation and/or warranty made by AXA Equitable or the Plan in this Agreement or arise out of or result from any other material breach of this Agreement by AXA Equitable or the Plan.
7.2. Indemnification by the Distributor. Except as provided to the contrary in Section 7.4 or 7.5 hereof, the Distributor shall indemnify and hold harmless the Plan, its trustees, the Trust, the Board and their officers and each person, if any, who controls the Plan within the meaning of Section 15 of the 1933 Act (collectively, the “Indemnified Parties” for purposes of this Section 7.2) against any and all losses, claims, damages, liabilities (including amounts paid in settlement with the written consent of the Distributor), investigation of claims or litigation (including legal and other expenses) to which the Indemnified Parties may become subject under any statute, regulation, at common law or otherwise, insofar as such losses, claims, damages, liabilities or expenses (or actions in respect thereof) or settlements are related to, arise out of or are based upon
(i) the sale or acquisition of Class K shares of the Designated Portfolios by the Plan and (1) arise out of or are based upon any untrue statement or alleged untrue statement of any material fact contained in a Registration Statement, any SEC Disclosure Materials or sales literature of the Trust or arise out of or are based upon the omission or the alleged omission to state therein a material fact required to be stated therein or necessary to make the statements therein not misleading, but only if such statement or omission or such alleged statement or omission was made in reliance upon and in conformity with information furnished by the Distributor to the Trust for use in a Registration Statement, any SEC Disclosure Materials or sales literature of the Trust or otherwise for use in connection with the sale or acquisition of Class K shares of the Delegated Portfolios by the Plan; or (2) arise out of any untrue statement or alleged untrue statement of a material fact contained in a Registration Statement, any SEC Disclosure Materials or sales literature of the Trust or the omission or alleged omission to state therein a material fact required to be stated therein or necessary to make the statement or statements therein not misleading, but only if such statement or omission was made in reliance upon information furnished to the Plan or the Trust by the Distributor; or
(ii) any failure by the Distributor to provide the services and furnish the materials required to be provided or furnished by the Distributor under the terms of this Agreement; or
(iii) arise out of or result from any material breach of any representation and/or warranty made by the Distributor in this Agreement or arise out of or result from any other material breach of this Agreement by the Distributor.
7.3. Indemnification By the Trust. Except as provided to the contrary in Section 7.4 or 7.5 hereof, the Trust shall indemnify and hold harmless the Plan and each of its trustees and officers, the Distributor, the directors and officers thereof and each person, if any, who controls any such person within the meaning of Section 15 of the 1933 Act (collectively, the “Indemnified Parties” for purposes of this Section 7.3) against any and all losses, claims, damages, liabilities (including amounts paid in settlement with the written consent of the Trust), investigation of claims or litigation (including legal and other expenses) to which the Indemnified Parties may become subject under any statute, regulation, at common law or otherwise, insofar as such losses, claims, damages, liabilities or expenses (or actions in respect thereof) or settlements result from the gross negligence, bad faith or willful misconduct of the Board or any member thereof, are related to, arise out of or are based upon:
(i) any failure by the Trust to provide the services and furnish the materials required to be provided or furnished by it under the terms of this Agreement (including a failure to comply with the diversification and other qualification requirements specified in … this Agreement); or
(ii) arise out of or result from any material breach of any representation and/or warranty made by the Trust in this Agreement or arise out of or result from any other material breach of this Agreement by the Trust….
| Item 16. | Exhibits |
| (1)(a) | Agreement and Declaration of Trust.1 | |
| (1)(b)(i) | Amended and Restated Agreement and Declaration of Trust.2 | |
| (1)(b)(ii) | Amendment No. 1 to the Amended and Restated Agreement and Declaration of Trust.4 | |
| (1)(b)(iii) | Amendment No. 2 to the Amended and Restated Agreement and Declaration of Trust.6 | |
| (1)(c) | Certificate of Trust.1 | |
| (1)(d) | Certificate of Amendment to the Certificate of Trust.2 | |
| (2) | By-Laws.1 | |
| (3) | None. | |
| (4)(a) | Plan of Reorganization and Termination; filed as Appendix A to the Combined Proxy Statement and Prospectus set forth as Part A to this Registration Statement on Form N-14. | |
| (5) | Provisions of instruments defining the rights of holders of the securities being registered are contained in the Registrant’s Amended and Restated Agreement and Declaration of Trust and By-Laws (Exhibits (1)(b)(i) and (2)). | |
| (6) | Investment Advisory Contracts | |
| (6)(a) | Investment Management Agreement dated as of May 1, 2011 between the Trust and AXA Equitable Funds Management Group, LLC (“FMG LLC” or “AXA FMG”). 24 | |
| (6)(a)(i) | Amendment No. 1 effective as of August 1, 2011 to the Investment Management Agreement dated as of May 1, 2011 between the Trust and FMG LLC. 24 | |
| (6)(a)(ii) | Amendment No. 2 effective as of September 1, 2011 to the Investment Management Agreement dated as of May 1, 2011 between the Trust and FMG LLC. 24 | |
| (6)(a)(iii) | Amendment No. 3 effective as of October 1, 2011 to the Investment Management Agreement dated as of May 1, 2011 between the Trust and FMG LLC.26 | |
| (6)(a)(iv) | Amendment No. 4 effective as of February 8, 2013 to the Investment Management Agreement dated as of May 1, 2011 between the Trust and FMG LLC.30 | |
| (6)(a)(v) | Amendment No. 5 effective as of September 1, 2012 to the Investment Management Agreement dated as of May 1, 2011 between the Trust and FMG LLC. 30 | |
| (6)(a)(vi) | Amendment No. 6 effective as of May 1, 2013 to the Investment Management Agreement dated as of May 1, 2011 between the Trust and FMG LLC. 33 | |
| (6)(a)(vii) | Amendment No. 7 effective as of September 1, 2013 to the Investment Management Agreement dated as of May 1, 2011 between the Trust and FMG LLC. 33 | |
| (6)(a)(viii) | Amendment No. 8 effective as of October 21, 2013 to the Investment Management Agreement dated as of May 1, 2011 between the Trust and FMG LLC.33 | |
| (6)(a)(ix) | Form of Amendment No. 9 effective as of , 2014 to the Investment Management Agreement dated as of May 1, 2011 between the Trust and FMG LLC.34 | |
| (6)(a)(x) | Form of Amendment No. 10 effective as of , 2014 to the Investment Management Agreement dated as of May 1, 2011 between the Trust and FMG LLC.34 | |
| (6)(b) | Investment Advisory Agreement between FMG LLC and T. Rowe Price Associates, Inc. (“T. Rowe Price”) dated as of May 1, 2011.24 | |
| (6)(b)(i) | Amendment No. 1 effective as of June 6, 2013, to the Investment Advisory Agreement between FMG LLC and T. Rowe Price dated as of May 1, 2011.34 | |
| (6)(b)(ii) | Form of Amendment No. 2 effective as of , 2014, to the Investment Advisory Agreement between FMG LLC and T. Rowe Price dated as of May 1, 2011.34 | |
| (6)(c) | Investment Advisory Agreement between FMG LLC and Marsico Capital Management, LLC (“Marsico”) dated as of May 1, 2011.24 | |
| (6)(c)(i) | Form of Amendment No. 1 effective as of , 2014 to the Investment Advisory Agreement between FMG LLC and Marsico dated as of May 1, 2011.34 | |
| (6)(d) | Investment Advisory Agreement between FMG LLC and Wells Capital Management, Inc. (“Wells Capital”) dated as of May 1, 2011.24 | |
| (6)(d)(i) | Amendment No. 1 effective as of June 6, 2013, to the Investment Advisory Agreement between FMG LLC and Wells Capital dated as of May 1, 2011.34 | |
| (6)(e) | Investment Advisory Agreement between FMG LLC and Invesco Advisers, Inc. (“Invesco”) dated as of May 1, 2011.24 | |
| (6)(f) | Investment Advisory Agreement between FMG LLC and BlackRock Investment Management LLC (“BlackRock Investment”) effective as of May 1, 2011.24 | |
| (6)(f)(i) | Amendment No. 1 effective as of July 26, 2013, to the Investment Advisory Agreement between FMG LLC and BlackRock Investment effective as of May 1, 2011.34 | |
| (6)(f)(ii) | Form of Amendment No. 2 effective as of , 2014, to the Investment Advisory Agreement between FMG LLC and BlackRock Investment effective as of May 1, 2011.34 | |
| (6)(f)(iii) | Form of Amendment No. 3 effective as of , 2014, to the Investment Advisory Agreement between FMG LLC and BlackRock Investment effective as of May 1, 2011.34 | |
| (6)(g) | Investment Advisory Agreement between FMG LLC and BlackRock Investment Management LLC (“BlackRock Investment”) effective as of May 1, 2011 with respect to the Tactical Manager Portfolios.25 | |
| (6)(g)(i) | Amended and Restated Investment Advisory Agreement between FMG LLC and BlackRock Investment effective as of August 1, 2011 with respect to the Tactical Manager Portfolios.28 | |
| (7) | Underwriting or Distribution Contracts | |
| (7)(a) | Amended and Restated Distribution Agreement between the Trust and AXA Distributors, LLC (“AXA Distributors”) dated as of July 15, 2002 with respect to Class IB shares.6 | |
| (7)(a)(i) | Amendment No. 1, dated May 2, 2003, to the Amended and Restated Distribution Agreement between the Trust and AXA Distributors, dated as of July 15, 2002 with respect to Class IB shares.7 | |
| (7)(a)(ii) | Amendment No. 2, dated July 8, 2004, to the Amended and Restated Distribution Agreement between the Trust and AXA Distributors, dated as of July 15, 2002 with respect to Class IB shares.8 | |
| (7)(a)(iii) | Amendment No. 3, dated October 1, 2004 to the Amended and Restated Distribution Agreement between the Trust and AXA Distributors, dated as of July 15, 2002 with respect to Class IB shares.8 | |
| (7)(a)(iv) | Amendment No. 4, dated May 1, 2005 to the Amended and Restated Distribution Agreement between the Trust and AXA Distributors dated as of July 15, 2002 with respect to Class IB shares.9 | |
| (7)(a)(v) | Amendment No. 5, dated September 30, 2005 to the Amended and Restated Distribution Agreement between the Trust and AXA Distributors dated as of July 15, 2002 with respect to Class IB shares.10 | |
| (7)(a)(vi) | Amendment No. 6 dated August 1, 2006 to the Amended and Restated Distribution Agreement between the Trust and AXA Distributors dated as of July 15, 2002 with respect to Class IB shares.12 | |
| (7)(a)(vii) | Amendment No. 7 dated May 1, 2007 to the Amended and Restated Distribution Agreement between the Trust and AXA Distributors dated as of July 15, 2002 with respect to Class IB shares.14 | |
| (7)(a)(viii) | Amendment No. 8 dated July 11, 2007 to the Amended and Restated Distribution Agreement between the Trust and AXA Distributors dated as of July 15, 2002 with respect to Class IB shares.15 | |
| (7)(a)(ix) | Amendment No. 9 dated January 1, 2008 to the Amended and Restated Distribution Agreement between the Trust and AXA Distributors dated as of July 15, 2002 with respect to Class IB shares.16 | |
| (7)(a)(x) | Amendment No. 10 dated May 1, 2008 to the Amended and Restated Distribution Agreement between the Trust and AXA Distributors dated as of July 15, 2002 with respect to Class IB shares.17 | |
| (7)(a)(xi) | Amendment No. 11 dated January 1, 2009 to the Amended and Restated Distribution Agreement between the Trust and AXA Distributors dated as of July 15, 2002 with respect to Class IB shares.18 | |
| (7)(a)(xii) | Amendment No. 12 dated May 1, 2009 to the Amended and Restated Distribution Agreement between the Trust and AXA Distributors dated as of July 15, 2002 with respect to Class IB shares.19 | |
| (7)(a)(xiii) | Amendment No. 13 dated September 29, 2009 to the Amended and Restated Distribution Agreement between the Trust and AXA Distributors dated as of July 15, 2002 with respect to Class IB shares.20 | |
| (7)(a)(xiv) | Amendment No. 14 dated as of August 16, 2010 to the Amended and Restated Distribution Agreement between the Trust and AXA Distributors dated as of July 15, 2002 with respect to Class IB shares.22 | |
| (7)(a)(xv) | Amendment No. 15 dated as of December 15, 2010 to the Amended and Restated Distribution Agreement between the Trust and AXA Distributors dated as of July 15, 2002 with respect to Class IB shares.22 | |
| (7)(a)(xvi) | Amendment No. 16 dated as of June 7, 2011 to the Amended and Restated Distribution Agreement between the Trust and AXA Distributors dated as of July 15, 2002 with respect to Class IB shares.25 | |
| (7)(a)(xvii) | Amendment No. 17 dated as of April 12, 2012 to the Amended and Restated Distribution Agreement between the Trust and AXA Distributors dated as of July 15, 2002 with respect to Class IB shares.28 | |
| (7)(a)(xviii) | Amendment No. 18 dated as of August 29, 2012 to the Amended and Restated Distribution Agreement between the Trust and AXA Distributors dated as of July 15, 2002 with respect to Class IB shares.30 | |
| (7)(a)(xix) | Amendment No. 19 dated as of May 1, 2013 to the Amended and Restated Distribution Agreement between the Trust and AXA Distributors dated as of July 15, 2002 with respect to Class IB shares.33 | |
| (7)(a)(xx) | Amendment No. 20 dated as of October 21, 2013 to the Amended and Restated Distribution Agreement between the Trust and AXA Distributors dated as of July 15, 2002 with respect to Class IB shares.33 | |
| (7)(a)(xxi) | Form of Amendment No. 21 dated as of , 2014 to the Amended and Restated Distribution Agreement between the Trust and AXA Distributors dated as of July 15, 2002 with respect to Class IB shares.34 | |
| (7)(a)(xxii) | Form of Amendment No. 22 dated as of , 2014 to the Amended and Restated Distribution Agreement between the Trust and AXA Distributors dated as of July 15, 2002 with respect to the Class IB shares.34 | |
| (7)(b) | Distribution Agreement between the Trust and AXA Distributors dated as of August 1, 2011 with respect to Class K shares.24 | |
| (7)(b)(i) | Amendment No. 1 dated as of April 12, 2012 to the Distribution Agreement between the Trust and AXA Distributors dated as of August 1, 2011 with respect to Class K shares.28 | |
| (7)(b)(ii) | Amendment No. 2 dated as of August 29, 2012 to the Distribution Agreement between the Trust and AXA Distributors dated as of August 1, 2011 with respect to Class K shares.30 | |
| (7)(b)(iii) | Amendment No. 3 dated as of May 1, 2013 to the Distribution Agreement between the Trust and AXA Distributors dated August 1, 2011 with respect to Class K shares.33 | |
| (7)(b)(iv) | Amendment No. 4 dated as of October 21, 2013 to the Distribution Agreement between the Trust and AXA Distributors dated August 1, 2011 with respect to Class K shares.33 | |
| (7)(b)(v) | Form of Amendment No. 5 dated as of , 2014 to the Distribution Agreement between the Trust and AXA Distributors dated August 1, 2011 with respect to Class K shares.34 | |
| (7)(b)(vi) | Form of Amendment No. 6 dated as of , 2014 to the Distribution Agreement between the Trust and AXA Distributors dated as of August 1, 2011 with respect to the Class K shares.34 | |
| (7)(c) | Amended and Restated Distribution Agreement between the Trust and AXA Distributors effective January 1, 2012 with respect to the Class IA shares.29 | |
| (7)(c)(i) | Amendment No. 1 effective as of March 1, 2012 to the Distribution Agreement between the Trust and AXA Distributors effective January 1, 2012 with respect to the Class IA shares.29 | |
| (7)(c)(ii) | Amendment No. 2 dated as of April 30, 2012, to the Distribution Agreement between the Trust and AXA Distributors dated as of January 1, 2012 with respect to the Class IA shares.30 | |
| (7)(c)(iii) | Amendment No. 3 dated as of July 10, 2012, to the Distribution Agreement between the Trust and AXA Distributors dated as of January 1, 2012 with respect to the Class IA shares.30 | |
| (7)(c)(iv) | Form of Amendment No. 4 dated as of , 2014, to the Distribution Agreement between the Trust and AXA Distributors dated as of January 1, 2012 with respect to the Class IA shares.34 | |
| (8) | Form of Deferred Compensation Plan.3 | |
| (9) | Custodian Agreements | |
| (9)(a) | Amended and Restated Global Custody Agreement between the Trust and JPMorgan Chase Bank dated February 1, 2002.5 | |
| (9)(a)(i) | Amendment No. 1, dated May 2, 2003, to the Amended and Restated Global Custody Agreement between the Trust and JP Morgan Chase Bank dated February 1, 2002.7 | |
| (9)(a)(ii) | Amendment No. 2, dated July 8, 2004, to the Amended and Restated Global Custody Agreement between the Trust and JP Morgan Chase Bank dated February 1, 2002.8 | |
| (9)(a)(iii) | Amendment No. 3, dated September 13, 2004, to the Amended and Restated Global Custody Agreement between the Trust and JP Morgan Chase Bank dated February 1, 2002.8 | |
| (9)(a)(iv) | Amendment No. 4 dated May 1, 2005 to the Amended and Restated Global Custody Agreement between the Trust and JP Morgan Chase Bank dated February 1, 2002.9 | |
| (9)(a)(v) | Amendment No. 5 dated September 30, 2005 to the Amended and Restated Global Custody Agreement between the Trust and JP Morgan Chase Bank dated February 1, 2002.10 | |
| (9)(a)(vi) | Amendment No. 6 dated August 1, 2006 to the Amended and Restated Global Custody Agreement between the Trust and JP Morgan Chase Bank dated February 1, 2002.13 | |
| (9)(a)(vii) | Amendment No. 7 dated May 1, 2007 to the Amended and Restated Global Custody Agreement between the Trust and JP Morgan Chase Bank dated February 1, 2002.14 | |
| (9)(a)(viii) | Amendment No. 8 dated April 1, 2007 to the Amended and Restated Global Custody Agreement between the Trust and JP Morgan Chase Bank dated February 1, 2002.15 | |
| (9)(a)(ix) | Amendment No. 9 dated January 1, 2008 to the Amended and Restated Global Custody Agreement between the Trust and JPMorgan Chase Bank dated February 1, 2002. 16 | |
| (9)(a)(x) | Amendment No. 10 dated May 1, 2008 to the Amended and Restated Global Custody Agreement between the Trust and JPMorgan Chase Bank dated February 1, 2002.17 | |
| (9)(a)(xi) | Amendment No. 11 dated July 1, 2008 to the Amended and Restated Global Custody Agreement between the Trust and JPMorgan Chase Bank dated February 1, 2002.17 | |
| (9)(a)(xii) | Amendment No. 12 dated January 1, 2009 to the Amended and Restated Global Custody Agreement between the Trust and JPMorgan Chase Bank dated February 1, 2002.18 | |
| (9)(a)(xiii) | Amendment No. 13 dated May 1, 2009 to the Amended and Restated Global Custody Agreement between the Trust and JPMorgan Chase Bank dated February 1, 2002.19 | |
| (9)(a)(xiv) | Amendment No. 14 dated as of September 29, 2009, to the Amended and Restated Global Custody Agreement between the Trust and JPMorgan Chase Bank dated February 1, 2002.20 | |
| (9)(a)(xv) | Amendment No. 15 dated as of October 1, 2009, to the Amended and Restated Global Custody Agreement between the Trust and JPMorgan Chase Bank dated February 1, 2002.20 | |
| (9)(a)(xvi) | Amendment No. 16 dated as of August 16, 2010 to the Amended and Restated Global Custody Agreement between the Trust and JPMorgan Chase Bank dated February 1, 2002.22 | |
| (9)(a)(xvii) | Amendment No. 17 dated as of December 15, 2010 to the Amended and Restated Global Custody Agreement between the Trust and JPMorgan Chase Bank dated February 1, 2002. 22 | |
| (9)(a)(xviii) | Amendment No. 18 dated as of December 7, 2010 to the Amended and Restated Global Custody Agreement between the Trust and JPMorgan Chase Bank dated February 1, 2002.23 | |
| (9)(a)(xix) | Amendment No. 19 dated as of May 1, 2011 to the Amended and Restated Global Custody Agreement between the Trust and JPMorgan Chase Bank dated February 1, 2002.24 | |
| (9)(a)(xx) | Amendment No. 20 dated as of July 20, 2011 to the Amended and Restated Global Custody Agreement between the Trust and JPMorgan Chase Bank dated February 1, 2002.24 | |
| (9)(a)(xxi) | Amendment No. 21 dated as of April 30, 2012 to the Amended and Restated Global Custody Agreement between the Trust and JPMorgan Chase Bank dated February 1, 2002.28 | |
| (9)(a)(xxii) | Amendment No. 22 dated as of June 1, 2013 to the Amended and Restated Global Custody Agreement between the Trust and JPMorgan Chase Bank dated February 1, 2002.33 | |
| (9)(a)(xxiii) | Amendment No. 23 dated as of October 21, 2013 to the Amended and Restated Global Custody Agreement between the Trust and JPMorgan Chase Bank dated February 1, 2002.33 | |
| (9)(a)(xxiv) | Form of Amendment No. 24 dated as of , 2014 to the Amended and Restated Global Custody Agreement between the Trust and JPMorgan Chase Bank dated February 1, 2002.34 | |
| (10) | Distribution Plan and Multiple Class Plan | |
| (10)(a) | Amended and Restated Distribution Plan pursuant to Rule 12b-1 under the 1940 Act for the Trust’s Class IB shares adopted as of July 14, 2010. 21 | |
| (10)(b) | Shareholder Services and Distribution Plan pursuant to Rule 12b-1 under the 1940 Act for the Trust’s Class IA shares adopted as of July 12, 2011. 27 | |
| (10)(c) | Revised Amended and Restated Plan Pursuant to Rule 18f-3 under the 1940 Act. 24 | |
| (11) | Legal Opinion of K&L Gates LLP regarding the legality of the securities being registered. (filed herewith) | |
| (12) | Opinion of K&L Gates LLP as to tax matters. (to be filed by amendment) | |
| (13) | Other Material Contracts | |
| (13)(a) | Mutual Fund Service Agreement dated May 1, 2011 between the Trust and FMG LLC.24 | |
| (13)(a)(i) | Amendment No. 1 dated June 7, 2011 to the Mutual Fund Service Agreement between the Trust and FMG LLC dated May 1, 2011.25 | |
| (13)(a)(ii) | Amendment No. 2 dated September 1, 2011 to the Mutual Fund Service Agreement dated May 1, 2011 between the Trust and FMG LLC.24 | |
| (13)(a)(iii) | Amendment No. 3 dated as of October 1, 2011 to the Mutual Fund Service Agreement dated May 1, 2011 between the Trust and FMG LLC.26 | |
| (13)(a)(iv) | Amendment No. 4 dated as of April 12, 2012 to the Mutual Fund Service Agreement dated May 1, 2011 between the Trust and FMG LLC.28 | |
| (13)(a)(v) | Amendment No. 5 dated as of September 1, 2012, to the Mutual Fund Service Agreement dated May 1, 2011 between the Trust and FMG LLC.30 | |
| (13)(a)(vi) | Amendment No. 6 dated as of May 1, 2013 to the Mutual Fund Service Agreement dated May 1, 2011 between the Trust and FMG LLC.33 | |
| (13)(a)(vii) | Amendment No. 7 dated as of September 1, 2013 to the Mutual Fund Service Agreement dated May 1, 2011 between the Trust and FMG LLC.33 | |
| (13)(a)(viii) | Amendment No. 8 dated as of October 21, 2013 to the Mutual Fund Service Agreement dated May 1, 2011 between the Trust and FMG LLC.33 | |
| (13)(a)(ix) | Form of Amendment No. 9 dated as of , 2014 to the Mutual Fund Service Agreement dated May 1, 2011 between the Trust and FMG LLC.34 | |
| (13)(a)(x) | Form of Amendment No. 10 dated as of , 2014 to the Mutual Fund Service Agreement dated May 1, 2011 between the Trust and FMG LLC.34 | |
| (13)(b) | Sub-Administration Agreement between FMG LLC and JPMorgan Chase Bank dated May 1, 2011. 24 | |
| (13)(c) | Expense Limitation Agreement dated as of May 1, 2011 between the Trust and FMG LLC.24 | |
| (13)(c)(i) | Amendment No. 1 dated as of June 7, 2011 to the Expense Limitation Agreement between the Trust and FMG LLC dated May 1, 2011.25 | |
| (13)(c)(ii) | Amendment No. 2 dated as of August 19, 2011 to the Expense Limitation Agreement between the Trust and FMG LLC dated May 1, 2011.24 | |
| (13)(c)(iii) | Amendment No. 3 effective as of January 1, 2012 to the Expense Limitation Agreement between the Trust and FMG LLC dated May 1, 2011.26 | |
| (13)(c)(iv) | Amendment No. 4 effective as of April 12, 2012 to the Expense Limitation Agreement between the Trust and FMG LLC dated May 1, 2011.28 | |
| (13)(c)(v) | Amendment No. 5 effective as of May 1, 2013 to the Expense Limitation Agreement between the Trust and FMG LLC dated May 1, 2011.31 | |
| (13)(c)(vi) | Amendment No. 6 effective as of October 21, 2013 to the Expense Limitation Agreement between the Trust and FMG LLC dated May 1, 2011.33 | |
| (13)(c)(vii) | Form of Amendment No. 7 effective as of , 2014 to the Expense Limitation Agreement between the Trust and FMG LLC dated May 1, 2011.34 | |
| (13)(c)(viii) | Form of Amendment No. 8 effective as of , 2014 to the Expense Limitation Agreement between the Trust and FMG LLC dated May 1, 2011.34 | |
| (13)(d) | Amended and Restated Participation Agreement among the Trust, AXA Equitable Life Insurance Company (“AXA Equitable”), AXA Distributors and AXA Advisors dated as of July 15, 2002.6 | |
| (13)(d)(i) | Amendment No. 1, dated May 2, 2003, to the Amended and Restated Participation Agreement among the Trust, AXA Equitable, AXA Distributors and AXA Advisors dated July 15, 2002.7 | |
| (13)(d)(ii) | Amendment No. 2, dated July 9, 2004, to the Amended and Restated Participation Agreement among the Trust, AXA Equitable, AXA Distributors and AXA Advisors dated July 15, 2002.8 | |
| (13)(d)(iii) | Amendment No. 3, dated October 1, 2004, to the Amended and Restated Participation Agreement among the Trust, AXA Equitable, AXA Distributors and AXA Advisors dated July 15, 2002.8 | |
| (13)(d)(iv) | Amendment No. 4 dated May 1, 2005 to the Amended and Restated Participation Agreement among the Trust, AXA Equitable, AXA Distributors and AXA Advisors dated July 15, 2002.9 | |
| (13)(d)(v) | Amendment No. 5 dated September 30, 2005 to the Amended and Restated Participation Agreement among the Trust, AXA Equitable, AXA Distributors and AXA Advisors dated July 15, 2002.11 | |
| (13)(d)(vi) | Amendment No. 6 dated August 1, 2006 to the Amended and Restated Participation Agreement among the Trust, AXA Equitable, AXA Distributors and AXA Advisors dated July 15, 2002.13 | |
| (13)(d)(vii) | Amendment No. 7 dated May 1, 2007 to the Amended and Restated Participation Agreement among the Trust, AXA Equitable, AXA Distributors and AXA Advisors dated July 15, 2002.14 | |
| (13)(d)(viii) | Amendment No. 8 dated January 1, 2008 to the Amended and Restated Participation Agreement among the Trust, AXA Equitable, AXA Distributors and AXA Advisors dated July 15, 2002.16 | |
| (13)(d)(ix) | Amendment No. 9 dated May 1, 2008 to the Amended and Restated Participation Agreement among the Trust, AXA Equitable, AXA Distributors and AXA Advisors dated July 15, 2002.17 | |
| (13)(d)(x) | Amendment No. 10 dated January 1, 2009 to the Amended and Restated Participation Agreement among the Trust, AXA Equitable, AXA Distributors and AXA Advisors dated July 15, 2002.18 | |
| (13)(d)(xi) | Amendment No. 11 dated May 1, 2009 to the Amended and Restated Participation Agreement among the Trust, AXA Equitable, AXA Distributors and AXA Advisors dated July 15, 2002.19 | |
| (13)(d)(xii) | Amendment No. 12 dated September 29, 2009 to the Amended and Restated Participation Agreement among the Trust, AXA Equitable, AXA Distributors and AXA Advisors dated July 15, 2002.20 | |
| (13)(d)(xiii) | Amendment No. 13 dated August 16, 2010 to the Amended and Restated Participation Agreement among the Trust, AXA Equitable, AXA Distributors and AXA Advisors dated July 15, 2002.22 | |
| (13)(d)(xiv) | Amendment No. 14 dated as of December 15, 2010 to the Amended and Restated Participation Agreement among the Trust, AXA Equitable, AXA Distributors and AXA Advisors dated July 15, 2002.22 | |
| (13)(d)(xv) | Amendment No. 15 dated June 7, 2011 to the Amended and Restated Participation Agreement among the Trust, AXA Equitable, AXA Distributors and AXA Advisors dated July 15, 2002.25 | |
| (13)(d)(xvi) | Amendment No. 16 dated as of April 30, 2012 to the Amended and Restated Participation Agreement among the Trust, AXA Equitable and AXA Distributors dated July 15, 2002.30 | |
| (13)(e) | Second Amended and Restated Participation Agreement among the Trust, AXA Equitable, FMG LLC and AXA Distributors dated May 23, 2012.32 | |
| (13)(e)(i) | Amendment No. 1 dated as of June 4, 2013 to the Second Amended and Restated Participation Agreement among the Trust, AXA Equitable, FMG LLC and AXA Distributors dated May 23, 2012.33 | |
| (13)(e)(ii) | Amendment No. 2 dated as of October 21, 2013 to the Second Amended and Restated Participation Agreement among the Trust, AXA Equitable, FMG LLC and AXA Distributors dated May 23, 2012.33 | |
| (13)(e)(iii) | Form of Amendment No. 3 dated as of , 2014 to the Second Amended and Restated Participation Agreement among the Trust, AXA Equitable, FMG LLC and AXA Distributors dated May 23, 2012.34 | |
| (13)(f) | Amended and Restated Retirement Plan Participation Agreement among the Trust, AXA Advisors, the Investment Plan for Employees, Managers and Agents, and AXA Equitable dated July 10, 2002.6 | |
| (13)(g) | Second Amended and Restated Retirement Plan Participation Agreement among the Trust, AXA Distributors, the AXA Equitable 401(k) Plan and AXA Equitable dated April 26, 2012.30 | |
| (13)(h) | Participation Agreement among the Trust, MONY Life Insurance Company (“MONY Life”), and AXA Distributors dated as of May 23, 2012.34 | |
| (13)(h)(i) | Amendment No. 1 dated June 4, 2013 to the Amended and Restated Participation Agreement among the Trust, MONY Life, and AXA Distributors dated as of May 23, 2012.34 | |
| (13)(h)(ii) | Participation Agreement among the Trust, MONY Life Insurance Company (“MONY”) and AXA Distributors effective as of October 1, 2013.34 | |
| (13)(h)(iii) | Form of Amendment No. 1 dated as of , 2014 to the Participation Agreement among the Trust, MONY and AXA Distributors effective as of October 1, 2013.34 | |
| (13)(i) | Amended and Restated Participation Agreement among the Trust, MONY Life Insurance Company of America (“MLOA”) and AXA Distributors dated as of May 23, 2012.34 | |
| (13)(i)(i) | Amendment No. 1 dated as of June 4, 2013 to the Amended and Restated Participation Agreement among the Trust, MLOA and AXA Distributors dated as of May 23, 2012.34 | |
| (13)(i)(ii) | Amendment No. 2 dated as of October 21, 2013 to the Amended and Restated Participation Agreement among the Trust, MLOA and AXA Distributors dated as of May 23, 2012.34 | |
| (13)(i)(iii) | Form of Amendment No. 3 dated as of , 2014 to the Amended and Restated Participation Agreement among the Trust, MLOA and AXA Distributors dated as of May 23, 2012.34 | |
| (14) | Consent of Independent Registered Public Accounting Firm. (filed herewith) | |
| (15) | None. | |
| (16) | Powers of Attorney. (filed herewith) | |
| (17) | Additional Exhibits | |
| (17)(a) | Voting Instruction and Proxy Cards. (filed herewith) | |
| 1. | Incorporated by reference to and/or previously filed with Registrant’s Registration Statement on Form N-1A filed on December 3, 1996 (File No. 333-17217). |
| 2. | Incorporated by reference to and/or previously filed with Pre-Effective Amendment No. 1 to Registrant’s Registration Statement on Form N-1A filed on January 23, 1997 (File No. 333-17217). |
| 3. | Incorporated by reference to and/or previously filed with Pre-Effective Amendment No. 2 to Registrant’s Registration Statement on Form N-1A filed on April 7, 1997 (File No. 333-17217). |
| 4. | Incorporated by reference to and/or previously filed with Post-Effective Amendment No. 18 to Registrant’s Registration Statement on Form N-1A filed on January 23, 2001 (File No. 333-17217). |
| 5. | Incorporated by reference to and/or previously filed with Post-Effective Amendment No. 24 to Registrant’s Registration Statement on Form N-1A filed on April 3, 2002 (File No. 333-17217). |
| 6. | Incorporated by reference to and/or previously filed with Post-Effective Amendment No. 25 to Registrant’s Registration Statement on Form N-1A filed on February 7, 2003 (File No. 333-17217). |
| 7. | Incorporated by reference to and/or previously filed with Post-Effective Amendment No. 28 to Registrant’s Registration Statement on Form N-1A filed on February 10, 2004 (File No. 333-17217). |
| 8. | Incorporated by reference to and/or previously filed with Post-Effective Amendment No. 35 to Registrant’s Registration Statement on Form N-1A filed on October 15, 2004 (File No. 333-17217). |
| 9. | Incorporated by reference to and/or previously filed with Post-Effective Amendment No. 37 to Registrant’s Registration Statement on Form N-1A filed on April 7, 2005 (File No. 333-17217). |
| 10. | Incorporated by reference to and/or previously filed with Post-Effective Amendment No. 42 to Registrant’s Registration Statement on Form N-1A filed on August 24, 2005 (File No. 333-17217). |
| 11. | Incorporated by reference to and/or previously filed with Post-Effective Amendment No. 44 to Registrant’s Registration Statement on Form N-1A filed on April 5, 2006 (File No. 333-17217). |
| 12. | Incorporated by reference to and/or previously filed with Post-Effective Amendment No. 46 to Registrant’s Registration Statement on Form N-1A filed on August 23, 2006 (File No. 333-17217). |
| 13. | Incorporated by reference to Post-Effective Amendment No. 51 to Registrant’s Registration Statement on Form N-1A filed on February 2, 2007 (File No. 333-17217). |
| 14. | Incorporated by reference to and/or previously filed with Post-Effective Amendment No. 53 to Registrant’s Registration Statement on Form N-1A filed on April 27, 2007 (File No. 333-17217). |
| 15. | Incorporated by reference to Post-Effective Amendment No. 54 to Registrant’s Registration Statement on Form N-1A filed on October 4, 2007 (File No. 333-17217). |
| 16. | Incorporated by reference to and/or previously filed with Post-Effective Amendment No. 56 to Registrant’s Registration Statement on Form N-1A filed on December 27, 2007 (File No. 333-17217). |
| 17. | Incorporated by reference to Post-Effective Amendment No. 61 to the Registrant’s Registration Statement on Form N-1A filed on February 13, 2009 (File No. 333-17217). |
| 18. | Incorporated by reference to Post-Effective Amendment No. 64 to the Registrant’s Registration Statement on Form N-1A filed on March 16, 2009 (File No. 333-17217). |
| 19. | Incorporated by reference to and/or previously filed with Post-Effective Amendment No. 67 to the Registrant’s Registration Statement on Form N-1A filed on April 15, 2009 (File No. 333-17217). |
| 20. | Incorporated by reference to and/or previously filed with Post-Effective Amendment No. 70 to the Registrant’s Registration Statement on Form N-1A filed on January 21, 2010 (File No. 333-17217). |
| 21. | Incorporated by reference to and/or previously filed with Post-Effective Amendment No. 75 to the Registrant’s Registration Statement on Form N-1A filed on October 5, 2010 (File No. 333-17217). |
| 22. | Incorporated by reference to and/or previously filed with Post-Effective Amendment No. 77 to the Registrant’s Registration Statement on Form N-1A filed on February 3, 2011 (File No. 333-17217). |
| 23. | Incorporated by reference to and/or previously filed with Post-Effective Amendment No. 79 to the Registrant’s Registration Statement on Form N-1A filed on April 28, 2011 (File No. 333-17217). |
| 24. | Incorporated by reference to and/or previously filed with Post-Effective Amendment No. 83 to the Registrant’s Registration Statement on Form N-1A filed on August 16, 2011 (File No. 333-17217). |
| 25. | Incorporated by reference to and/or previously filed with Post-Effective Amendment No. 84 to the Registrant’s Registration Statement on Form N-1A filed on August 17, 2011 (File No. 333-17217). |
| 26. | Incorporated by reference to and/or previously filed with Post-Effective Amendment No. 87 to the Registrant’s Registration Statement on Form N-1A filed on January 13, 2012 (File No. 333-17217). |
| 27. | Incorporated by reference to and/or previously filed with Post-Effective Amendment No. 89 to the Registrant’s Registration Statement on Form N-1A filed on February 6, 2012 (File No. 333-17217). |
| 28 | Incorporated by reference to and/or previously filed with Post-Effective Amendment No. 91 to the Registrant’s Registration Statement on Form N-1A filed on April 25, 2012 (File No. 333-17217). |
| 29. | Incorporated by reference to and/or previously filed with Post-Effective Amendment No. 92 to the Registrant’s Registration Statement on Form N-1A filed on April 25, 2012. (File No. 333-17217). |
| 30. | Incorporated by reference to and/or previously filed with Post-Effective Amendment No. 96 to the Registrant’s Registration Statement on Form N-1A filed on February 7, 2013. (File No. 333-17217). |
| 31. | Incorporated by reference and/or previously filed with Post-Effective Amendment No. 98 to the Registrant’s Registration Statement filed on April 30, 2013. (File No. 333-17217). |
| 32. | Incorporated by reference and/or previously filed with Post-Effective Amendment No. 100 to the Registrant’s Registration Statement filed on July 22, 2013. (File No. 333-17217). |
| 33. | Incorporated by reference and/or previously filed with Post-Effective Amendment No. 101 to the Registrant’s Registration Statement filed on October 1, 2013. (File No. 333-17217). |
| 34. | Incorporated by reference and/or previously filed with Post-Effective Amendment No. 103 to the Registrant’s Registration Statement filed on January 10, 2014. (File No. 333-17217). |
| Item 17. | Undertakings |
(1) The undersigned Registrant agrees that prior to any public reoffering of the securities registered through the use of a prospectus which is a part of this Registration Statement by any person or party who is deemed to be an underwriter within the meaning of Rule 145(c) under the Securities Act of 1933, as amended (the “1933 Act”), the reoffering prospectus will contain the information called for by the applicable registration form for reofferings by persons who may be deemed underwriters, in addition to the information called for by the other items of the applicable form.
(2) The undersigned Registrant agrees that every prospectus that is filed under paragraph (1) above will be filed as a part of an amendment to the Registration Statement and will not be used until the amendment is effective, and that, in determining any liability under the 1933 Act, each post-effective amendment shall be deemed to be a new registration statement for the securities offered therein, and the offering of the securities at that time shall be deemed to be the initial bona fide offering of them.
(3) The Registrant agrees to file an executed copy of the opinion of counsel supporting the tax consequences of the proposed reorganization as an amendment to this Registration Statement within a reasonable time after receipt of such opinion.
SIGNATURES
As required by the Securities Act of 1933, as amended (the “1933 Act”), this Registration Statement has been signed on behalf of the Registrant, in the City of New York and the State of New York on the 26th day of February 2014.
| EQ ADVISORS TRUST | ||
| By: | /s/ Steven M. Joenk | |
| Name: | Steven M. Joenk | |
| Title: | Trustee, Chairman, President and Chief Executive Officer | |
As required by the 1933 Act, this Registration Statement has been signed by the following persons in the capacities and on the dates indicated.
Signature | Title | Date | ||
/s/ Steven M. Joenk Steven M. Joenk | Trustee, Chairman, President and Chief Executive Officer | February 26, 2014 | ||
/s/ Jettie M. Edwards Jettie M. Edwards | Trustee | February 26, 2014 | ||
/s/ William M. Kearns, Jr. William M. Kearns, Jr. | Trustee | February 26, 2014 | ||
/s/ Christopher P.A. Komisarjevsky Christopher P.A. Komisarjevsky | Trustee | February 26, 2014 | ||
/s/ Gary S. Schpero Gary S. Schpero | Trustee | February 26, 2014 | ||
/s/ Harvey Rosenthal Harvey Rosenthal | Trustee | February 26, 2014 | ||
/s/ Kenneth Walker Kenneth Walker | Trustee | February 26, 2014 | ||
/s/ Caroline L. Williams Caroline L. Williams | Trustee | February 26, 2014 | ||
/s/ Donald E. Foley Donald E. Foley | Trustee | February 26, 2014 | ||
/s/ H. Thomas McMeekin H. Thomas McMeekin | Trustee | February 26, 2014 | ||
/s/ Brian Walsh Brian Walsh | Treasurer and Chief Financial Officer | February 26, 2014 | ||
| * By: | /s/ Steven M. Joenk | |
| Steven M. Joenk | ||
| (Attorney-in-fact) |
EXHIBIT INDEX
Exhibit Number | Description of Exhibit | |
(11) | Legal Opinion of K&L Gates LLP regarding the legality of the securities being registered. | |
(14) | Consent of Independent Registered Public Accounting Firm. | |
(16) | Powers of Attorney. | |
(17) | Voting Instruction and Proxy Cards. | |