File No. 333-
AS FILED WITH THE SECURITIES AND EXCHANGE COMMISSION ON FEBRUARY 20, 2015
SECURITIES AND EXCHANGE COMMISSION
WASHINGTON, D.C. 20549
FORM N-14
REGISTRATION STATEMENT
UNDER
| THE SECURITIES ACT OF 1933 | x | |||
| Pre-Effective Amendment No. | ¨ | |||
| Post-Effective Amendment No. | ¨ |
EQ ADVISORS TRUST
(Exact name of registrant as specified in charter)
1290 Avenue of the Americas
New York, New York 10104
(Address of principal executive offices)
(212) 554-1234
Registrant’s Telephone Number, including area code
STEVEN M. JOENK
AXA Equitable Funds Management Group, LLC
1290 Avenue of the Americas
New York, New York 10104
(Name and address of agent for service)
With copies to:
Patricia Louie, Esq. AXA Equitable Funds Management Group, LLC 1290 Avenue of the Americas New York, NY 10104 | Mark C. Amorosi, Esq. K&L Gates LLP 1601 K Street N.W. Washington, D.C. 20006 |
Approximate Date of Proposed Public Offering: As soon as practicable after this Registration Statement becomes effective.
It is proposed that this Registration Statement will become effective on the 30th day after filing pursuant to Rule 488 under the Securities Act of 1933, as amended.
Title of securities being registered: Class IA and Class K shares of beneficial interest in the series of the registrant designated as the EQ/International Equity Index Portfolio.
No filing fee is required because the registrant is relying on Section 24(f) of the Investment Company Act of 1940, as amended, pursuant to which it has previously registered an indefinite number of shares (File Nos. 333-17217 and 811-07953).
EQ ADVISORS TRUST
CONTENTS OF REGISTRATION STATEMENT
This registration statement is comprised of the following:
Cover Sheet
Contents of Registration Statement
Letter to Shareholders
Notice of Special Meeting
Contractholder Voting Instructions
Part A – Proxy Statement and Prospectus
Part B – Statement of Additional Information
Part C – Other Information
Signature Page
Exhibits
AXA EQUITABLE LIFE INSURANCE COMPANY
1290 Avenue of the Americas
New York, New York 10104
, 2015
Dear Contractholder:
Enclosed is a notice and Combined Proxy Statement and Prospectus relating to a Special Meeting of Shareholders of EQ/International ETF Portfolio (the “ETF Portfolio”).
The ETF Portfolio is a series of EQ Advisors Trust (the “Trust”). The Special Meeting of Shareholders of the ETF Portfolio is scheduled to be held at the Trust’s offices, 1290 Avenue of the Americas, New York, New York 10104, on April 30, 2015 at , Eastern time (the “Meeting”). At the Meeting, the shareholders of the ETF Portfolio who are entitled to vote at the Meeting will be asked to approve the proposal described below.
The Trust’s Board of Trustees (the “Board”) has called the Meeting to request shareholder approval of the reorganization of the ETF Portfolio into the EQ/International Equity Index Portfolio, also a series of the Trust (the “Index Portfolio”) (the “Reorganization”).
The Board has approved the proposal and recommends that you vote “FOR” the proposal. Although the Board has determined that a vote “FOR” the proposal is in your best interest, the final decision is yours.
Each Portfolio is managed by AXA Equitable Funds Management Group, LLC. The Index Portfolio is sub-advised by an investment sub-adviser. If the Reorganization is approved and implemented, each Contractholder that invests indirectly in the ETF Portfolio will automatically become a Contractholder that invests indirectly in the Index Portfolio.
As an owner of a variable life insurance policy and/or a variable annuity contract or certificate that participates in the ETF Portfolio through the investment divisions of a separate account or accounts established by AXA Equitable Life Insurance Company (“AXA Equitable”), you are entitled to instruct AXA Equitable how to vote the ETF Portfolio shares related to your interest in those accounts as of the close of business on February 27, 2015. The attached Notice of Special Meeting of Shareholders and Combined Proxy Statement and Prospectus concerning the Meeting describe the matter to be considered at the Meeting.
You are cordially invited to attend the Meeting. Since it is important that your vote be represented whether or not you are able to attend, you are urged to consider these matters and to exercise your voting instructions by completing, dating, and signing the enclosed voting instruction card and returning it in the accompanying return envelope at your earliest convenience or by relaying your voting instructions via telephone or the Internet by following the enclosed instructions. For further information on how to instruct AXA Equitable, please see the Contractholder Voting Instructions included herein. Of course, we hope that you will be able to attend the Meeting, and if you wish, you may provide voting instructions in person, even though you may have already returned a voting instruction card or submitted your voting instructions via telephone or the Internet. Please respond promptly in order to save additional costs of proxy solicitation and in order to make sure you are represented.
Very truly yours,
Steven M. Joenk Managing Director AXA Equitable Life Insurance Company |
EQ ADVISORS TRUST
EQ/International ETF Portfolio
1290 Avenue of the Americas
New York, New York 10104
NOTICE OF SPECIAL MEETING OF SHAREHOLDERS TO BE HELD ON APRIL 30, 2015
To the Shareholders:
NOTICE IS HEREBY GIVEN that a Special Meeting of Shareholders of the EQ/International ETF Portfolio (the “ETF Portfolio”), a series of EQ Advisors Trust (the “Trust”), will be held on April 30, 2015, at , Eastern time, at the offices of the Trust, located at 1290 Avenue of the Americas, New York, New York 10104 (the “Meeting”).
The Meeting will be held to act on the following proposal:
1. To approve the Plan of Reorganization and Termination adopted by the Board of Trustees of the Trust (the “Board”), with respect to the reorganization of the EQ/International ETF Portfolio, a series of the Trust, into the EQ/International Equity Index Portfolio, also a series of the Trust.
2. To transact other business that may properly come before the Meeting or any adjournments thereof.
The Board unanimously recommends that you vote in favor of the proposal.
Please note that owners of variable life insurance policies and/or variable annuity contracts or certificates (the “Contractholders”) issued by AXA Equitable Life Insurance Company (“AXA Equitable”), who have invested in shares of the ETF Portfolio through the investment divisions of a separate account or accounts of AXA Equitable will be given the opportunity, to the extent required by law, to provide voting instructions on the above proposal.
You should read the Combined Proxy Statement and Prospectus attached to this notice prior to completing your proxy or voting instruction card. The record date for determining the number of shares outstanding, the shareholders entitled to vote and the Contractholders entitled to provide voting instructions at the Meeting and any adjournments or postponements thereof has been fixed as the close of business on February 27, 2015. If you attend the Meeting, you may vote or provide your voting instructions in person.
i
YOUR VOTE IS IMPORTANT
Please return your proxy or voting instruction card promptly
Regardless of whether you plan to attend the Meeting, you should vote or provide voting instructions by promptly completing, dating, and signing the enclosed proxy or voting instruction card and returning it in the enclosed postage-paid envelope. You also can vote or provide voting instructions through the Internet or by telephone using the 16-digit control number that appears on the enclosed proxy or voting instruction card and following the simple instructions. If you are present at the Meeting, you may change your vote or voting instructions, if desired, at that time. The Board recommends that you vote or provide voting instructions to vote “FOR” the proposal.
By order of the Board,
Patricia Louie Vice President and Secretary |
Dated: , 2015
New York, New York
ii
AXA EQUITABLE LIFE INSURANCE COMPANY
CONTRACTHOLDER VOTING INSTRUCTIONS
REGARDING A SPECIAL MEETING OF SHAREHOLDERS OF
EQ/INTERNATIONAL ETF PORTFOLIO,
A SERIES OF EQ ADVISORS TRUST
TO BE HELD ON APRIL 30, 2015
Dated: , 2015
GENERAL
These Contractholder Voting Instructions are being furnished by AXA Equitable Life Insurance Company (“AXA Equitable”) to owners of its variable life insurance policies or variable annuity contracts or certificates (the “Contracts”) (the “Contractholders”) who, as of February 27, 2015 (the “Record Date”), had net premiums or contributions allocated to the investment divisions of its separate account or accounts (the “Separate Accounts”) that are invested in shares of the EQ/International ETF Portfolio (the “ETF Portfolio”).
The ETF Portfolio is a series of EQ Advisors Trust (the “Trust”), a Delaware statutory trust that is registered with the Securities and Exchange Commission as an open-end management investment company.
To the extent required by applicable law, AXA Equitable will offer Contractholders the opportunity to instruct it, as the record owner of all of the shares of beneficial interest in the ETF Portfolio (the “Shares”) held by its Separate Accounts, as to how it should vote on the reorganization proposal (the “Proposal”) that will be considered at the Special Meeting of Shareholders of the ETF Portfolio referred to in the preceding Notice and at any adjournments or postponements (the “Meeting”). The enclosed Combined Proxy Statement and Prospectus, which you should retain for future reference, concisely sets forth information about the proposed reorganization involving the ETF Portfolio and another series of the Trust that a Contractholder should know before completing the enclosed voting instruction card.
AXA Equitable Financial Services Company, LLC, a wholly owned subsidiary of AXA Financial, Inc., is the parent company of AXA Equitable. AXA Financial, Inc. is a wholly owned subsidiary of AXA, a French insurance holding company. The principal executive offices of AXA Equitable Financial Services Company, LLC and AXA Financial, Inc. are located at 1290 Avenue of the Americas, New York, New York 10104.
These Contractholder Voting Instructions and the accompanying voting instruction card, together with the enclosed proxy materials, are being mailed to Contractholders on or about , 2015.
i
HOW TO INSTRUCT AXA EQUITABLE
To instruct AXA Equitable as to how to vote the Shares held in the investment divisions of its Separate Accounts, Contractholders are asked to promptly complete their voting instructions on the enclosed voting instruction card(s), sign and date the voting instruction card(s), and mail the voting instruction card(s) in the accompanying postage-paid envelope. Contractholders also may provide voting instructions by telephone at 1-800-690-6903 or by Internet at our website at www.proxyvote.com.
If a voting instruction card is not marked to indicate voting instructions but is signed and timely returned, it will be treated as an instruction to vote the Shares “For” the Proposal.
The number of Shares held in the investment division of a Separate Account corresponding to the ETF Portfolio for which a Contractholder may provide voting instructions was determined as of the Record Date by dividing (i) a Contract’s account value (minus any Contract indebtedness) allocable to that investment division by (ii) the net asset value of one Share of the ETF Portfolio. Each whole share of the ETF Portfolio is entitled to one vote as to each matter with respect to which it is entitled to vote and each fractional share is entitled to a proportionate fractional vote. At any time prior to AXA Equitable voting at the Meeting, a Contractholder may revoke his or her voting instructions with respect to that investment division by providing AXA Equitable with a properly executed written revocation of such voting instructions, properly executing later-dated voting instructions by a voting instruction card, telephone or the Internet, or appearing and providing voting instructions in person at the Meeting.
HOW AXA EQUITABLE WILL VOTE
AXA Equitable will vote the Shares for which it receives timely voting instructions from Contractholders in accordance with those instructions. Shares in each investment division of a Separate Account for which AXA Equitable receives a voting instruction card that is signed and timely returned but is not marked to indicate voting instructions will be treated as an instruction to vote the Shares “FOR” the Proposal. Shares in each investment division of a Separate Account for which AXA Equitable receives no timely voting instructions from Contractholders, or that are attributable to amounts retained by AXA Equitable as surplus or seed money, will be voted by AXA Equitable either “FOR” or “AGAINST” the Proposal, or as an abstention, in the same proportion as the Shares for which Contractholders have provided voting instructions to AXA Equitable. As a result of such proportional voting by AXA Equitable, it is possible that a small number of Contractholders could determine whether the Proposal is approved.
ii
OTHER MATTERS
AXA Equitable is not aware of any matters, other than the specified Proposal, to be acted on at the Meeting. If any other matters come before the Meeting, AXA Equitable will vote the Shares upon such matters in its discretion. Voting instruction cards may be solicited by directors, officers and employees of AXA Equitable Funds Management Group, LLC, the investment manager of the Trust, or its affiliates as well as officers and agents of the Trust. The principal solicitation will be by mail but voting instructions may also be solicited by telephone, fax, personal interview, the Internet or other permissible means.
If the quorum necessary to transact business is not established or the vote required to approve the Proposal is not obtained at the Meeting, the persons named as proxies may propose one or more adjournments or postponements of the Meeting in accordance with applicable law to permit further solicitation of voting instructions. The persons named as proxies will vote in their discretion on any such adjournment or postponement.
It is important that your Contract be represented. Please promptly mark your voting instructions on the enclosed voting instruction card; then sign and date the voting instruction card and mail it in the accompanying postage-paid envelope. You may also provide your voting instructions by telephone at 1-800-690-6903 or by Internet at our website at www.proxyvote.com.
iii
PROXY STATEMENT
for
EQ/International ETF Portfolio,
a series of EQ Advisors Trust, and
PROSPECTUS
for
EQ/International
Equity Index Portfolio,
a series of EQ Advisors Trust
Dated , 2015
1290 Avenue of the Americas
New York, New York 10104
1-877-222-2144
This Combined Proxy Statement and Prospectus (the “Proxy Statement/Prospectus”) is being furnished to owners of variable life insurance policies and/or variable annuity contracts or certificates (the “Contracts”) (the “Contractholders”) issued by AXA Equitable Life Insurance Company (“AXA Equitable”) who, as of February 27, 2015, had net premiums or contributions allocated to the investment divisions of its separate account or accounts (the “Separate Accounts”) that are invested in shares of beneficial interest in the EQ/International ETF Portfolio.
The EQ/International ETF Portfolio is referred to herein as the “ETF Portfolio.” The ETF Portfolio is a series of EQ Advisors Trust (the “Trust”), an open-end management investment company registered with the Securities and Exchange Commission (“SEC”). This Proxy Statement/Prospectus also is being furnished to AXA Equitable as the record owner of shares and to other shareholders that were invested in the ETF Portfolio as of February 27, 2015. Contractholders are being provided the opportunity to instruct AXA Equitable to approve or disapprove the proposal contained in this Proxy Statement/Prospectus in connection with the solicitation by the Board of Trustees of the Trust (the “Board” or “Board of Trustees”) of proxies to be used at the Special Meeting of Shareholders of the ETF Portfolio to be held at 1290 Avenue of the Americas, New York, New York 10104, on April 30, 2015, at , Eastern time, or any adjournment or postponement thereof (the “Meeting”).
THE SECURITIES AND EXCHANGE COMMISSION HAS NOT APPROVED OR DISAPPROVED THESE SECURITIES OR PASSED UPON THE ADEQUACY OF THIS PROXY STATEMENT/PROSPECTUS. ANY REPRESENTATION TO THE CONTRARY IS A CRIMINAL OFFENSE.
The proposal described in this Proxy Statement/Prospectus (“Proposal”) is:
To approve the Plan of Reorganization and Termination (the “Plan of Reorganization”) adopted by the Board, with respect to the reorganization of the EQ/International ETF Portfolio, a series of the Trust, into the EQ/International Equity Index Portfolio, also a series of the Trust.
The reorganization referred to in the Proposal above is referred to herein as the “Reorganization.” The EQ/International Equity Index Portfolio is referred to herein as the “Index Portfolio.”
This Proxy Statement/Prospectus, which you should retain for future reference, contains important information regarding the Proposal that you should know before voting or providing voting instructions. Additional information about the Trust has been filed with the SEC and is available upon oral or written request. This Proxy Statement/Prospectus is being provided to AXA Equitable and mailed to Contractholders and other shareholders on or about , 2015. This Proxy Statement/Prospectus and a proxy or voting instruction card also will be available at www.proxyvote.com on or about , 2015. It is expected that one or more representatives of AXA Equitable will attend the Meeting in person or by proxy and will vote shares held by AXA Equitable in accordance with voting instructions received from its Contractholders and in accordance with voting procedures established by the Trust.
The following documents have been filed with the SEC and are incorporated by reference into this Proxy Statement/Prospectus:
| 1. | The Prospectus with respect to the ETF Portfolio, dated May 1, 2014, as supplemented (File Nos. 333-17217 and 811-07953); |
| 2. | The Statement of Additional Information dated , 2015, relating to the Reorganization (File No. 333- ). |
For a free copy of any of these documents, please call 1-877-522-5035 or write the Trust at the address above.
The Trust is subject to the informational requirements of the Securities Exchange Act of 1934, as amended. Accordingly, it must file certain reports and other information with the SEC. You can copy and review information about the Trust at the SEC’s Public Reference Room in Washington, DC, and at certain of the following SEC Regional Offices: New York Regional Office, 3 World Financial Center, Suite 400, New York, New York 10281; Miami Regional Office, 801 Brickell Avenue, Suite 1800, Miami, Florida 33131; Chicago Regional Office, 175 W. Jackson Boulevard, Suite 900, Chicago, Illinois 60604; Denver Regional Office, 1801 California Street, Suite 1500, Denver, Colorado 80202; Los Angeles Regional Office, 5670 Wilshire Boulevard, 11th Floor, Los Angeles, California 90036; Boston Regional Office, 33 Arch Street, 23rd Floor, Boston, MA 02110; Philadelphia Regional Office, The Mellon Independence Center, 701 Market Street, Philadelphia, PA 19106; Atlanta Regional Office, 3475 Lenox Road, N.E., Suite 1000, Atlanta, GA 30326; Fort Worth Regional Office, Burnett Plaza, Suite 1900, 801 Cherry Street, Unit 18, Fort Worth, TX 76102;
ii
Salt Lake Regional Office, 15 W. South Temple Street, Suite 1800, Salt Lake City, UT 84101; and San Francisco Regional Office, 44 Montgomery Street, Suite 2600, San Francisco, CA 94104. You may obtain information on the operation of the Public Reference Room by calling the SEC at (202) 551-8090. Reports and other information about the Trust are available on the EDGAR Database on the SEC’s Internet site at http://www.sec.gov. You may obtain copies of this information from the SEC’s Public Reference Branch, Office of Consumer Affairs and Information Services, Washington, DC 20549, at prescribed rates.
iii
| 1 | ||||
| 1 | ||||
PROPOSAL: To approve the Plan of Reorganization adopted by the Board of Trustees with respect to the Reorganization of the EQ/International ETF Portfolio, a series of the Trust, into the EQ/International Equity Index Portfolio, also a series of the Trust. | 2 | |||
| 6 | ||||
| 7 | ||||
| 7 | ||||
Comparison of Investment Objectives, Policies and Strategies | 8 | |||
| 10 | ||||
| 10 | ||||
| 12 | ||||
| 13 | ||||
| 13 | ||||
| 14 | ||||
| 14 | ||||
Potential Benefits of the Reorganization to FMG LLC and its Affiliates | 17 | |||
| 17 | ||||
| 19 | ||||
ADDITIONAL INFORMATION ABOUT THE EQ/INTERNATIONAL EQUITY INDEX PORTFOLIO | 19 | |||
| 19 | ||||
| 20 | ||||
| 20 | ||||
| 22 | ||||
| 24 | ||||
| 25 | ||||
| 27 | ||||
| 27 | ||||
Payments to Broker-Dealers and Other Financial Intermediaries | 28 | |||
| 28 | ||||
| 31 | ||||
| 33 | ||||
| 33 | ||||
| 35 | ||||
| 38 | ||||
| 38 | ||||
| 39 | ||||
| 40 | ||||
| 40 | ||||
| 40 | ||||
| A-1 | ||||
APPENDIX B – More Information on Strategies and Risk Factors | B-1 | |||
APPENDIX C – Security Ownership of Certain Beneficial Owners | C-1 |
i
You should read this entire Proxy Statement/Prospectus carefully. For additional information, you should consult the Plan of Reorganization, a copy of the form of which is attached hereto as Appendix A.
This Proxy Statement/Prospectus is soliciting shareholders with amounts invested in the ETF Portfolio as of February 27, 2015, to approve the Plan of Reorganization, whereby the ETF Portfolio will be reorganized into the Index Portfolio. (Each of the ETF Portfolio and the Index Portfolio is sometimes referred to herein as a “Portfolio,” and together, the “Portfolios”)
The ETF Portfolio’s shares are divided into two classes, designated Class IA and Class K shares (the “ETF Portfolio Shares”). The Index Portfolio’s shares are divided into three classes, designated Class IA, Class IB and Class K shares; only the Index Portfolio’s Class IA and Class K shares (the “Index Portfolio Shares”) are involved in the Reorganization. The rights and preferences of the Class IA and Class K shares of the Index Portfolio Shares are identical to the rights and preferences of the corresponding class of ETF Portfolio Shares.
The Plan of Reorganization provides for:
| • | the transfer of all of the assets of the ETF Portfolio to the Index Portfolio in exchange solely for Index Portfolio Shares having an aggregate net asset value equal to the ETF Portfolio’s net assets and the Index Portfolio’s assumption of all the liabilities of the ETF Portfolio; |
| • | the distribution to the shareholders (for the benefit of the Separate Accounts, as applicable, and thus the Contractholders) of those Index Portfolio Shares; and |
| • | the complete termination of the ETF Portfolio. |
The Board of Trustees is proposing the Reorganization because it believes that the Reorganization will permit shareholders invested in the ETF Portfolio, a small Portfolio with limited prospects for future growth and corresponding limited ability to achieve economies of scale, to continue to invest in the Index Portfolio, a much larger Portfolio that pursues a substantially similar investment objective and has better growth prospects and lower expenses. For a detailed description of the Board’s reasons for proposing the Reorganization, see “Additional Information about the Reorganization — Board Considerations” below.
A comparison of the investment objectives, policies, strategies and principal risks of the ETF Portfolio and the Index Portfolio is included in “Comparison of Investment Objectives, Policies and Strategies” and “Comparison of Principal Risk Factors” below. The Portfolios have identical distribution procedures, purchase procedures, exchange rights and redemption procedures, which are discussed in “Additional Information about the EQ/International Equity Index Portfolio” below. Each Portfolio
1
offers its shares to Separate Accounts and certain other eligible investors. Shares of each Portfolio are offered and redeemed at their net asset value without any sales load. You will not incur any sales loads or similar transaction charges as a result of the Reorganization.
Subject to shareholder approval, the Reorganization is expected to be effective at the close of business on , 2015, or on a later date the Trust decides upon (the “Closing Date”). As a result of the Reorganization, each shareholder invested in shares of the ETF Portfolio would become an owner of shares of the Index Portfolio. Each such shareholder would hold, immediately after the Closing Date, Class IA or Class K shares of the Index Portfolio having an aggregate value equal to the aggregate value of the Class IA or Class K Shares, as applicable, of the ETF Portfolio that were held by the shareholder as of the Closing Date. Similarly, each Contractholder whose Contract values are invested in shares of the ETF Portfolio would become an indirect owner of shares of the Index Portfolio. Each such Contractholder would indirectly hold, immediately after the Closing Date, Class IA or Class K shares of the Index Portfolio having an aggregate value equal to the aggregate value of the Class IA or Class K shares, as applicable, of the ETF Portfolio that were indirectly held by the Contractholder as of the Closing Date. The Trust believes that there will be no adverse tax consequences to shareholders or Contractholders as a result of the Reorganization. Please see “Additional Information about the Reorganization — Federal Income Tax Consequences of the Reorganization” below for further information.
The Board has unanimously approved the Plan of Reorganization with respect to each Portfolio. Accordingly, the Board is submitting the Plan of Reorganization for approval by the ETF Portfolio’s shareholders. In considering whether to approve the Proposal, you should review the discussion of the Proposal set forth below. In addition, you should review the information in this Proxy Statement/Prospectus that relates to the Proposal and the Plan of Reorganization generally. The Board recommends that you vote “FOR” the Proposal to approve the Plan of Reorganization.
PROPOSAL: To approve the Plan of Reorganization adopted by the Board of Trustees with respect to the Reorganization of the EQ/International ETF Portfolio, a series of the Trust, into the EQ/International Equity Index Portfolio, also a series of the Trust.
In considering whether you should approve the Proposal, you should note that:
| • | The Portfolios have substantially similar investment objectives. The ETF Portfolio seeks long-term capital appreciation while the Index Portfolio seeks to achieve a total return (before expenses) that approximates the total return performance of a composite index comprised of 40% DJ EuroSTOXX 50 Index, 25% FTSE 100 Index, 25% TOPIX Index, and 10% S&P/ASX 200 Index, including reinvestment of dividends, at a risk level consistent with that of the composite index. |
2
| • | Both Portfolios provide diversified exposure to equity securities of foreign companies in various geographic regions around the world. There are, however, differences in the Portfolios’ principal investment policies and strategies of which you should be aware. These are set forth immediately below. For a detailed comparison of the Portfolios’ investment policies and strategies, see “Comparison of Investment Objectives, Policies and Strategies” below. |
| • | The ETF Portfolio invests primarily in exchange traded securities of other investment companies (“exchange traded funds” or “ETFs”) that, in turn, invest in equity securities of foreign companies. The Portfolio may invest in ETFs that invest in securities of companies of any size located in developed and emerging markets throughout the world. The Portfolio invests in ETFs in accordance with weightings determined by the Portfolio’s investment manager, and generally will be broadly diversified among various geographic regions. Unlike the Index Portfolio, the ETF Portfolio is actively managed and does not utilize an index investment strategy. |
| • | The Index Portfolio utilizes an index investment strategy and invests primarily in equity securities of companies represented in the DJ EuroSTOXX 50 Index (“EuroSTOXX 50”), FTSE 100 Index (“FTSE 100”), TOPIX Index (“TOPIX”), and S&P/ASX 200 Index (S&P/ASX 200”). The Portfolio intends to allocate its assets approximately 25% to securities in the FTSE 100, 25% to securities in the TOPIX, 40% to securities in the EuroSTOXX 50, and 10% to securities in the S&P/ASX 200. Actual allocations may vary by up to 3%. The EuroSTOXX 50, FTSE 100, TOPIX, and S&P/ASX 200 represent large-capitalization stocks of issuers in the Eurozone, the United Kingdom, Japan and Australia, respectively. The Portfolio invests in stocks selected by a stratified sampling construction process, commonly referred to as an indexing strategy, in which the Portfolio’s investment sub-adviser, selects a subset of the companies represented in each index based on its analysis of key risk factors and other characteristics. Such factors include industry weightings, market capitalizations, return variability and yields. Unlike the ETF Portfolio, the Index Portfolio generally does not invest in ETFs; however, it is permitted to invest in ETFs to a limited extent. |
| • | The Portfolios have comparable risk profiles, although there are differences of which you should be aware. Each Portfolio’s principal risks include equity risk, foreign securities risk, currency risk, and securities lending risk. The ETF Portfolio also is subject to ETF risk and emerging markets risk as principal risks while the Index Portfolio is not. The Index Portfolio is subject to index strategy risk and large-cap company risk as principal risks while the ETF Portfolio is not directly subject to such risks. For a detailed comparison of the Portfolios’ risks, see “Comparison of Principal Risk Factors” below. |
| • | AXA Equitable Funds Management Group, LLC (“FMG LLC” or the “Manager”) manages the assets of the ETF Portfolio. FMG LLC has selected AllianceBernstein L.P. (“AllianceBernstein”) as the sub-adviser (“Adviser”) |
3
to manage the assets of the Index Portfolio and it is anticipated that AllianceBernstein will continue to advise the Index Portfolio after the Reorganization. |
| • | FMG LLC serves as the investment manager and administrator for each Portfolio and would continue to manage and administer the Index Portfolio after the Reorganization. The Manager has been granted relief by the SEC to hire, terminate and replace Advisers and amend advisory agreements subject to the approval of the Board of Trustees and without obtaining shareholder approval. However, FMG LLC may not enter into an advisory agreement on behalf of a Portfolio with an “affiliated person” of the Manager, such as AllianceBernstein, unless the advisory agreement, including compensation, is approved by the Portfolio’s shareholders. For a detailed description of the Manager and the Adviser to the Index Portfolio, please see “Additional Information about the EQ/International Equity Index Portfolio — The Manager” and “ — The Adviser” below. |
| • | The ETF Portfolio and the Index Portfolio had net assets of approximately $62 million and $1.7 billion, respectively, as of January 31, 2015. Thus, if the Reorganization of the ETF Portfolio into the Index Portfolio had been in effect on that date, the combined Portfolio would have had net assets of approximately $1.8 billion. |
| • | Class IA shareholders of the ETF Portfolio will receive Class IA shares of the Index Portfolio and Class K shareholders of the ETF Portfolio will receive Class K shares of the Index Portfolio pursuant to the Reorganization. Shareholders will not pay any sales charges in connection with the Reorganization. Please see “Comparative Fee and Expense Tables,” “Additional Information about the Reorganization” and “Additional Information about the EQ/International Equity Index Portfolio” below for more information. |
| • | It is estimated that the annual operating expense ratios for the Index Portfolio’s Class IA and Class K shares, for the fiscal year following the Reorganization, will be lower than those of the ETF Portfolio’s Class IA and Class K shares, respectively, for the fiscal year ended December 31, 2014. For a more detailed comparison of the fees and expenses of the Portfolios, please see “Comparative Fee and Expense Tables” and “Additional Information about the EQ/International Equity Index Portfolio” below. |
| • | The maximum management fee for both the ETF Portfolio and the Index Portfolio is equal to an annual rate of 0.40% of its average daily net assets. The Portfolios are subject to same administration fee schedule. The ETF Portfolio and the Index Portfolio each pays FMG LLC its proportionate share of an asset-based administration fee for the Single-Advised Portfolios (defined below), which is equal to an annual rate of 0.12% of the first $3 billion of the aggregate average daily net assets of the Single-Advised Portfolios; 0.11% of the next $3 billion; 0.105% of the next $4 billion; 0.10% of the next $20 billion; 0.0975% of the next |
4
$10 billion; and 0.095% thereafter, subject to a minimum annual fee of $30,000. For a more detailed description of the fees and expenses of the Portfolios, please see “Comparative Fee and Expense Tables” and “Additional Information about the EQ/International Equity Index Portfolio” below. |
| • | The ETF Portfolio is subject to an expense limitation arrangement while the Index Portfolio is not. Pursuant to a contract, FMG LLC has agreed to make payments or waive its management, administrative or other fees to limit the expenses of the ETF Portfolio through [April 30, 2016] (unless the Board of Trustees consents to an earlier revision or termination of this arrangement) (“Expense Limitation Arrangement”) so that the annual operating expenses of the Portfolio (exclusive of taxes, interest, brokerage commissions, dividend and interest expenses on securities sold short, capitalized expenses, fees and expenses of other investment companies in which the Portfolio invests, and extraordinary expenses) do not exceed an annual rate of average daily net assets of 0.80% for Class IA shares and 0.55% for Class K shares of the Portfolio. |
| • | The Class IA and Class K shares of the Index Portfolio outperformed the corresponding share classes of the ETF Portfolio for the one-year period ended December 31, 2014. The Class IA shares of the ETF Portfolio outperformed the Class IA shares of the Index Portfolio for the five-year period ended the same date. Since inception through December 31, 2014, the Class K shares of the ETF Portfolio marginally outperformed the Class K shares of the Index Portfolio. Please see “Comparative Performance Information” below. |
| • | Following the Reorganization, the combined Portfolio will be managed in accordance with the investment objective, policies and strategies of the Index Portfolio. It is not expected that the Index Portfolio will revise any of its investment policies following the Reorganization to reflect those of the ETF Portfolio. If the Reorganization is approved, all of the ETF Portfolio’s assets (“Transferred Assets”) on the Closing Date will be transferred to the Index Portfolio. It is anticipated that immediately prior to the Closing Date, the ETF Portfolio will liquidate its securities holdings and hold cash. Therefore, it is anticipated that the Transferred Assets will consist of cash. The sale of portfolio holdings by the ETF Portfolio immediately prior to the Closing Date may result in the ETF Portfolio selling securities at a disadvantageous time and price and could result in it realizing gains (or losses) that would not otherwise have been realized and incurring transaction costs that would not otherwise have been incurred. It is also expected that, over time, the Index Portfolio will use the Transferred Assets to invest in equity securities of companies represented in the EuroSTOXX 50, FTSE 100, TOPIX, and/or the S&P/ASX 200. |
| • | FMG LLC will bear the expenses of the Reorganization described in this Proxy Statement/Prospectus. |
5
Comparative Fee and Expense Tables
The following tables show the fees and expenses of each class of shares of each Portfolio and the estimated pro forma fees and expenses of each class of shares of the Index Portfolio after giving effect to the proposed Reorganization. Fees and expenses for each Portfolio are based on those incurred by each class of its shares for the fiscal year ended December 31, 2014. The pro forma fees and expenses of the Index Portfolio Shares assume that the Reorganization was in effect for the year ended December 31, 2014. The tables below do not reflect any Contract-related fees and expenses, which would increase overall fees and expenses. See a Contract prospectus for a description of those fees and expenses.
Shareholder Fees
(fees paid directly from your investment)
ETF Portfolio | Index Portfolio | Pro Forma Index Portfolio (assuming the | ||
| Not applicable. | Not applicable. | Not applicable. |
Annual Operating Expenses
(expenses that you may pay each year as a percentage of the value of your investment)
| ETF Portfolio | Index Portfolio | Pro Forma Index Portfolio (assuming the Reorganization is approved) | ||||||||||||||||||||||
| Class IA | Class K | Class IA | Class K | Class IA | Class K | |||||||||||||||||||
Management Fee | 0.40 | % | 0.40 | % | 0.40 | % | 0.40 | % | 0.40 | % | 0.40 | % | ||||||||||||
Distribution and/or Service Fees (12b-1 fees) | 0.25 | % | 0.00 | % | 0.25 | % | 0.00 | % | 0.25 | % | 0.00 | % | ||||||||||||
Other Expenses | 0.19 | % | 0.19 | % | 0.14 | % | 0.14 | % | 0.14 | % | 0.14 | % | ||||||||||||
Acquired Fund Fees and Expenses | 0.42 | % | 0.42 | % | N/A | N/A | N/A | N/A | ||||||||||||||||
Total Annual Portfolio Operating Expenses | 1.26 | % | 1.01 | % | 0.79 | % | 0.54 | % | 0.79 | % | 0.54 | % | ||||||||||||
Fee Waiver and/or Expense Reimbursement† | (0.04 | )% | (0.04 | )% | N/A | N/A | N/A | N/A | ||||||||||||||||
Total Annual Portfolio Operating Expenses After Fee Waiver and/ or Expense Reimbursement | 1.22 | % | 0.97 | % | 0.79 | % | 0.54 | % | 0.79 | % | 0.54 | % | ||||||||||||
| † | Pursuant to the Expense Limitation Arrangement, FMG LLC has agreed to make payments or waive its management, administrative or other fees to limit the expenses of the ETF Portfolio through [April 30, 2016] (unless the Board of Trustees consents to an earlier revision or termination of this arrangement) so that the annual operating expenses of the Portfolio (exclusive of taxes, interest, brokerage commissions, dividend and interest expenses on securities sold short, capitalized expenses, fees and expenses of other investment companies in which the Portfolio invests, and extraordinary expenses) do not exceed an annual rate of average daily net assets of 0.80% for Class IA shares and 0.55% for Class K shares of the Portfolio. The Expense Limitation Arrangement may be terminated by FMG LLC at any time after [April 30, 2016]. |
6
This example is intended to help you compare the costs of investing in the Portfolios with the cost of investing in other investment options. The example assumes that:
| • | You invest $10,000 in a Portfolio for the time periods indicated; |
| • | Your investment has a 5% return each year; |
| • | The Portfolio’s operating expenses remain the same; and |
| • | The Expense Limitation Arrangement with respect to the ETF Portfolio is not renewed. |
This example does not reflect any Contract-related fees and expenses, including redemption fees (if any) at the Contract level. If such fees and expenses were reflected, the total expenses would be higher. Although your actual costs may be higher or lower, based on these assumptions your costs would be:
| 1 Year | 3 Years | 5 Years | 10 Years | |||||||||||||
ETF Portfolio | ||||||||||||||||
Class IA | $ | 124 | $ | 396 | $ | 688 | $ | 1,519 | ||||||||
Class K | $ | 99 | $ | 318 | $ | 554 | $ | 1,233 | ||||||||
Index Portfolio | ||||||||||||||||
Class IA | $ | 81 | $ | 252 | $ | 439 | $ | 978 | ||||||||
Class IB | $ | 81 | $ | 252 | $ | 439 | $ | 978 | ||||||||
Class K | $ | 55 | $ | 173 | $ | 302 | $ | 677 | ||||||||
Pro Forma Index Portfolio (assuming the Reorganization is approved) | ||||||||||||||||
Class IA | $ | 81 | $ | 252 | $ | 439 | $ | 978 | ||||||||
Class IB | $ | 81 | $ | 252 | $ | 439 | $ | 978 | ||||||||
Class K | $ | 55 | $ | 173 | $ | 302 | $ | 677 | ||||||||
Each Portfolio pays transaction costs, such as commissions, when it buys and sells securities (or “turns over” its portfolio). A higher portfolio turnover rate may indicate higher transaction costs. These costs, which are not reflected in annual fund operating expenses or in the example, affect a Portfolio’s performance. During the fiscal year ended December 31, 2014, the portfolio turnover rates for each of the ETF Portfolio and the Index Portfolio were 3% and 8%, respectively, of the average value of the Portfolio.
7
Comparison of Investment Objectives, Policies and Strategies
The following table compares the investment objectives and principal investment policies and strategies of the ETF Portfolio with those of the Index Portfolio. The Board may change the investment objective of a Portfolio without a vote of the Portfolio’s shareholders. For more detailed information about each Portfolio’s investment strategies and risks, see Appendix B.
| Acquired Portfolio | Acquiring Portfolio | |||
| ETF Portfolio | Index Portfolio | |||
Investment Objective | Seeks long-term capital appreciation. | Seeks to achieve a total return (before expenses) that approximates the total return performance of a composite index comprised of 40% EuroSTOXX 50, 25% FTSE 100, 25% TOPIX, and 10% S&P/ASX 200, including reinvestment of dividends, at a risk level consistent with that of the composite index. | ||
Principal Investment Strategies | Under normal market conditions, the Portfolio invests at least 80% of its net assets, plus borrowings for investment purposes, in ETFs. The Portfolio invests primarily in ETFs that, in turn, invest substantially all of their assets in equity securities of foreign companies. The Portfolio may invest in ETFs that invest in securities of companies of any size located in developed and emerging markets throughout the world. The Portfolio invests its assets in ETFs in accordance with weightings determined by the Manager, and generally will be broadly diversified among various geographic regions. | Under normal circumstances the Portfolio invests at least 80% of its net assets, plus borrowings for investment purposes, in equity securities of companies represented in the FTSE 100 Index, TOPIX Index, DJ EuroSTOXX 50 Index, and S&P/ASX 200 Index. The Portfolio intends to allocate its assets approximately 25% to securities in the FTSE 100, 25% to securities in the TOPIX, 40% to securities in the EuroSTOXX 50, and 10% to securities in the S&P/ASX 200. Actual allocations may vary by up to 3%. |
8
| Acquired Portfolio | Acquiring Portfolio | |||
| ETF Portfolio | Index Portfolio | |||
| ETFs are investment companies whose shares are listed and traded on U.S. stock exchanges or otherwise traded in the over-the-counter market and may be purchased and sold throughout the trading day based on their market price. Generally, each ETF seeks to track a securities index or a basket of securities that an “index provider” (such as Standard & Poor’s, Russell or Morgan Stanley Capital International) selects as representative of a market, market segment, industry sector, country or geographic region. An ETF portfolio generally holds the same stocks or bonds as the index it tracks (or it may hold a representative sample of such securities). Accordingly, each ETF is designed so that its performance will correspond closely with that of the index it tracks. By investing in the Portfolio, you will indirectly bear fees and expenses charged by the ETFs in which the Portfolio invests in addition to the Portfolio’s direct fees and expenses. The ETFs in which the Portfolio may invest are referred to herein as the “Underlying ETFs”. | The FTSE 100 is a market capitalization-weighted index representing the performance of the 100 largest UK-domiciled blue chip companies. The TOPIX is a capitalization-weighted index of all companies listed on the First Section of the Tokyo Stock Exchange. The EuroSTOXX 50 covers 60% of the free float market capitalization of the EURO STOXX Total Market Index, which in turn covers approximately 95% of the free-float market capitalization of the investable universe in the Eurozone. The S&P/ASX 200 represents the 200 largest and most liquid publicly listed companies in Australia. | |||
| The Manager uses a two-stage asset allocation process to create an investment portfolio of ETFs for the Portfolio. The first stage involves a strategic asset allocation that is intended to provide the Portfolio with broad exposure to international markets. At this stage, the Manager decides what portion of the Portfolio’s investable assets should be invested in various geographic regions. The Manager makes this determination using a proprietary investment process, based on fundamental research regarding the investment characteristics of the various regions, as well as its outlook for international economies and financial markets. The Manager determines, monitors and may periodically adjust asset allocations based on its analysis of data relating to the U.S. and international economies, securities markets and various segments within those markets. | The Portfolio’s investments will be selected by a stratified sampling construction process in which the Adviser selects a subset of the companies represented in each index based on the Adviser’s analysis of key risk factors and other characteristics. Such factors include industry weightings, market capitalizations, return variability, and yields. This strategy is commonly referred to as an indexing strategy. |
9
| Acquired Portfolio | Acquiring Portfolio | |||
| ETF Portfolio | Index Portfolio | |||
| The second stage of this process involves the selection of Underlying ETFs within each of the geographic regions identified as a result of the first stage of the investment process. The Manager seeks to select Underlying ETFs that represent investments in one or more countries that are expected to outperform the Portfolio’s benchmark over the intermediate term. In selecting the Underlying ETFs, the Manager analyzes many factors, including the Underlying ETF’s investment objectives, total return, portfolio holdings, volatility and expenses as well as quantitative and qualitative data regarding the market segments and economies of the country or countries represented in the Underlying ETF’s portfolio of investments. | ||||
| The Portfolio may lend its portfolio securities to earn additional income. | Same. |
Comparison of Principal Risk Factors
An investment in a Portfolio is not a deposit of a bank and is not insured or guaranteed by the Federal Deposit Insurance Corporation or any other government agency. You may lose money by investing in a Portfolio. The following table compares the principal risks of an investment in each Portfolio. For an explanation of each such risk, see “Additional Information about the Reorganization — Description of Risk Factors” below.
Risks | Index Portfolio | ETF Portfolio | ||||||
Equity Risk | X | X | ||||||
ETF Risk | X | |||||||
Foreign Securities Risk | X | X | ||||||
Currency Risk | X | X | ||||||
Emerging Markets Risk | X | |||||||
Index Strategy Risk | X | |||||||
Large-Cap Company Risk | X | |||||||
Securities Lending Risk | X | X | ||||||
Comparative Performance Information
The bar charts and tables below provide some indication of the risks of investing in each Portfolio by showing changes in the Portfolio’s performance from year to year and by showing how the Portfolio’s average annual total returns for the past one-, five- and ten-years (or since inception) through December 31, 2014, compared to the returns of a broad-based market index. With respect to the Index Portfolio, the
10
additional broad-based market index shows how the Portfolio’s performance compared with the returns of another index that has characteristics relevant to the Portfolio’s investment strategy. The return of the broad-based market index (and any additional comparative index) shown in the right hand columns below for each Portfolio is the return of the index for the last 10 years or, if shorter, since inception of the share class with the longest history. Past performance is not an indication of future performance.
The performance results do not reflect any Contract-related fees and expenses, which would reduce the performance results.
ETF Portfolio - Calendar Year Total Returns (Class IA)
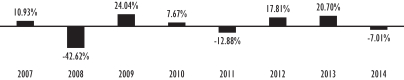
Best quarter (% and time period) 24.81% (2009 2nd Quarter) | Worst quarter (% and time period) -20.89% (2011 3rd Quarter) |
Index Portfolio - Calendar Year Total Returns (Class IB)
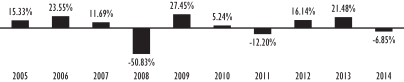
Best quarter (% and time period) 25.05% (2009 2nd Quarter) | Worst quarter (% and time period) -26.12% (2008 4th Quarter) |
ETF Portfolio Average Annual Total Returns
(For the periods ended December 31, 2014)
| One Year | Five Years | Since Inception | ||||||||||
ETF Portfolio — Class IA Shares | -7.01 | % | 4.40 | % | 1.06 | % | ||||||
ETF Portfolio — Class K Shares | -6.90 | % | N/A | 8.26 | % | |||||||
MSCI EAFE Index (reflects no deduction for fees or expenses)* | -4.90 | % | 5.33 | % | 2.26 | % | ||||||
| * | Morgan Stanley Capital International (“MSCI”) EAFE® Index (Europe, Australasia, Far East) is a free float-adjusted market capitalization weighted index that is designed to measure the equity market performance of developed markets, excluding the U.S. and Canada. |
11
Index Portfolio Average Annual Total Returns
(For the periods ended December 31, 2014)
| One Year | Five Years | Ten Years/ Since Inception | ||||||||||
Index Portfolio — Class IA Shares | -6.90 | % | 4.05 | % | 2.10 | % | ||||||
Index Portfolio — Class IB Shares | -6.85 | % | 3.96 | % | 1.93 | % | ||||||
Index Portfolio — Class K Shares | -6.65 | % | N/A | 8.25 | % | |||||||
MSCI EAFE Index | -4.90 | % | 5.33 | % | 4.43 | % | ||||||
40% DJ EuroSTOXX 50/25% FTSE 100/25% TOPIX/10% S&P/ASX 200 | -5.48 | % | 4.55 | % | N/A | |||||||
| * | MSCI EAFE® Index (Europe, Australasia, Far East) is a free float-adjusted market capitalization weighted index that is designed to measure the equity market performance of developed markets, excluding the U.S. and Canada. |
| † | A combination of unmanaged indexes. EuroSTOXX 50 covers 50 stocks from 12 Eurozone countries: Austria, Belgium, Finland, France, Germany, Greece, Ireland, Italy, Luxembourg, the Netherlands, Portugal and Spain. The FTSE 100 represents the performance of the 100 largest blue chip companies listed on the London Stock Exchange. The TOPIX is a free-float adjusted capitalization weighted index that is calculated based on all the domestic common stocks listed on the Tokyo Stock Exchange First Section. The S&P/ASX 200 represents the 200 largest and most liquid publicly listed companies in Australia. |
The following table shows the capitalization of each Portfolio as of December 31, 2014, and of the Index Portfolio on a pro forma combined basis as of December 31, 2014, after giving effect to the proposed Reorganization. Pro forma net assets may not total and net asset values per share may not recalculate due to rounding of net assets.
| Net Assets (in millions) | Net Asset Value Per Share | Shares Outstanding | ||||||||||
ETF Portfolio — Class IA Shares | $ | 4.1 | $ | 2.93 | 1,394,306 | |||||||
Index Portfolio — Class IA Shares | $ | 655.8 | $ | 8.82 | 74,332,022 | |||||||
Adjustments* | $ | — | $ | — | (931,702 | ) | ||||||
Pro forma Index Portfolio — Class IA Shares | $ | 659.9 | $ | 8.82 | 74,794,626 | |||||||
ETF Portfolio — Class IB Share | N/A | N/A | N/A | |||||||||
Index Portfolio — Class IB Shares | $ | 803.7 | $ | 8.69 | 92,498,388 | |||||||
ETF Portfolio — Class K Shares | $ | 91.4 | $ | 2.93 | 31,185,068 | |||||||
Index Portfolio — Class K Shares | $ | 157.2 | $ | 8.82 | 17,819,681 | |||||||
Adjustments* | $ | — | $ | — | (20,828,469 | ) | ||||||
Pro forma Index Portfolio — Class K Shares | $ | 248.6 | $ | 8.82 | 28,176,280 | |||||||
| * | Reflects adjustment for retired shares of the ETF Portfolio. |
12
After careful consideration, the Board unanimously approved the Plan of Reorganization. Accordingly, the Board has submitted the Plan of Reorganization for approval by the ETF Portfolio’s shareholders. The Board recommends that you vote “For” the Proposal.
ADDITIONAL INFORMATION ABOUT THE REORGANIZATION
Terms of the Plan of Reorganization
The terms and conditions under which the Reorganization would be completed are contained in the Plan of Reorganization. The following summary thereof is qualified in its entirety by reference to the Plan of Reorganization, a copy of the form of which is attached to this Proxy Statement/Prospectus as Appendix A.
The Reorganization will involve the Index Portfolio’s acquiring all the assets of the ETF Portfolio in exchange for Index Portfolio Shares and the Index Portfolio’s assuming the ETF Portfolio’s liabilities. The Plan of Reorganization further provides that, on or as promptly as reasonably practicable after the Closing Date, the ETF Portfolio will distribute the Index Portfolio Shares it receives in the Reorganization to its shareholders, for the benefit of the Separate Accounts, as applicable, and thus the Contractholders, by class. The number of full and fractional Index Portfolio Shares each shareholder will receive (for the benefit of each Separate Account, as applicable) will be equal in net asset value (as determined in accordance with the Trust’s normal valuation procedures), as of immediately after the close of business (generally 4:00 p.m., Eastern time) on the Closing Date, to the ETF Portfolio Shares the shareholder holds at that time (for the benefit of each Separate Account, as applicable). After such distribution, the Trust will take all necessary steps under its Amended and Restated Declaration of Trust, as amended (the “Declaration of Trust”), and Delaware and any other applicable law to effect a complete termination of the ETF Portfolio.
The Board may terminate or delay the Plan of Reorganization, and abandon or postpone, the Reorganization at any time prior to the Closing Date, before or after approval by the ETF Portfolio’s shareholders, if circumstances develop that, in the Board’s opinion, make proceeding with the Reorganization inadvisable for a Portfolio. The consummation of the Reorganization also is subject to various conditions, including approval of the Reorganization by the ETF Portfolio’s shareholders, completion of all filings with, and receipt of all necessary approvals, if any, from the SEC, and other customary corporate and securities matters. Subject to the satisfaction of those conditions, the Reorganization will take place immediately after the close of business on the Closing Date.
The Board, including the Trustees who are not “interested persons” (as defined in the Investment Company Act of 1940, as amended (the “1940 Act”)) of the Trust (the “Independent Trustees”), have determined, with respect to each Portfolio, that the interests of the Portfolio’s existing shareholders will not be diluted as a result of the Reorganization and that participation in the Reorganization is in the best interests of the Portfolio.
13
FMG LLC will bear the expenses of the Reorganization described in this Proxy Statement/Prospectus.
Approval of the Plan of Reorganization will require a majority vote of the ETF Portfolio’s shareholders. Such majority is defined in the 1940 Act as the lesser of (i) 67% or more of the voting securities of the Portfolio present at a meeting, if the holders of more than 50% of its outstanding voting securities are present or represented by proxy, or (ii) more than 50% of its outstanding voting securities. If the Plan of Reorganization is not approved by the ETF Portfolio’s shareholders or the Reorganization is not consummated for any other reason, the Board will consider other possible courses of action. Please see “Voting Information” below for more information.
Description of the Securities to Be Issued
The shareholders of the ETF Portfolio will receive Class IA or Class K shares of the Index Portfolio in accordance with the procedures provided for in the Plan of Reorganization. Each such share will be fully paid and non-assessable by the Trust when issued and will have no preemptive or conversion rights.
The Trust may issue an unlimited number of authorized shares of beneficial interest, par value $0.001 per share. The Declaration of Trust authorizes the Board to issue shares in different series and classes. In addition, the Declaration of Trust authorizes the Board to create new series and to name the rights and preferences of the shareholders of each series. The Board does not need additional shareholder action to divide the shares into separate series or classes or to name the shareholders’ rights and preferences. The Index Portfolio is also a series of the Trust.
The Trust currently offers three classes of shares of the Index Portfolio — Class IA, Class IB and Class K shares. The Trust has adopted, in the manner prescribed under Rule 12b-1 under the 1940 Act, a plan of distribution pertaining to the Class IA and Class IB shares of the Index Portfolio. The maximum distribution and/or service (12b-1) fee for the Index Portfolio’s Class IA and Class IB shares is equal to an annual rate of 0.25% of the average daily net assets attributable to such share class. Because these distribution/service fees are paid out of the Index Portfolio’s assets on an ongoing basis, over time these fees will increase your cost of investing and may cost more than paying other types of charges.
At a meeting of the Board held on February 12, 2015, FMG LLC recommended that the ETF Portfolio be reorganized into the Index Portfolio. FMG LLC noted that, in addition to regularly evaluating the performance of each portfolio of the Trust, it continually reviews the overall line-up of investment options and conducts in-depth analysis to provide recommendations to the Board to strengthen the Trust’s lineup. FMG LLC noted that it was recommending the Reorganization because AXA Equitable had determined to cease offering the ETF Portfolio as an investment option in
14
new Contracts because the Portfolio had failed to attract sufficient Contractholder interest. FMG LLC further noted that if AXA Equitable ceased offering the ETF Portfolio as an investment option in new Contracts, the ETF Portfolio’s future growth prospects and its corresponding ability to achieve economies of scale would be limited. FMG LLC also informed the Board that the AXA Allocation Portfolios and Target Allocation Portfolios, which are funds-of-funds of AXA Premier VIP Trust, an affiliated investment company, held approximately 95% of the outstanding shares of the ETF Portfolio as of December 31, 2014. FMG LLC, in its role as investment manager of the AXA Allocation Portfolios and Target Allocation Portfolios, had determined it appropriate to redeem these portfolios’ holdings in the ETF Portfolio and invest in the Index Portfolio. FMG LLC stated that it expected to complete this process in mid-February.
FMG LLC noted that the Index Portfolio has a substantially similar investment objective as the ETF Portfolio and, like the ETF Portfolio, provides diversified exposure to equity securities of foreign companies in various geographic regions around the world. The ETF Portfolio and the Index Portfolio both use the MSCI EAFE Index as their benchmark index (in addition, the Index Portfolio uses the 40% DJ EuroSTOXX 50 Index/25% FTSE 100 Index/25% TOPIX Index/10% S&P/ASX 200 Index, a combination of unmanaged indexes, as a benchmark index). FMG LLC noted that, given the ETF Portfolio’s lack of potential asset growth, FMG LLC believed it would be appropriate to reorganize the ETF Portfolio into the Index Portfolio. FMG LLC also noted that it believed the Reorganization would be beneficial to the shareholders invested in the ETF Portfolio because the Reorganization would provide a means by which Contractholders with amounts allocated to the ETF Portfolio could pursue a substantially similar investment objective in the context of a much larger fund with better growth prospects and lower expenses.
In determining whether to approve the Plan of Reorganization with respect to the ETF Portfolio and recommend its approval to shareholders, the Board, including the Independent Trustees, with the advice and assistance of independent legal counsel, inquired into a number of matters and considered the following factors, among others: (1) the potential benefits of the Reorganization to shareholders, including lower annual operating expenses by reorganizing into a Portfolio with lower annual operating expenses than the ETF Portfolio and greater potential to increase assets and thereby realize economies of scale in the Portfolio’s expenses and portfolio management fees as a result of asset growth; (2) comparisons of the ETF Portfolio’s and Index Portfolio’s investment objectives, policies, strategies, restrictions and risks; (3) the experience and qualifications of the Manager, Adviser and key personnel managing the Index Portfolio; (4) the effect of the Reorganization on the ETF Portfolio’s annual operating expenses and shareholder fees and services; (5) the relative historical performance records of the Portfolios; (6) any change in shareholder rights; (7) the direct or indirect federal income tax consequences of the Reorganization to shareholders and Contractholders; (8) any fees or expenses that will be borne directly or indirectly by the Portfolio in connection with the Reorganization; (9) the terms and conditions of the Plan of Reorganization and whether the Reorganization would result
15
in dilution of shareholder interests; (10) the potential benefits of the Reorganization to other persons, including FMG LLC and its affiliates, as discussed below in the section entitled “Potential Benefits of the Reorganization to FMG LLC and its Affiliates;” and (11) possible alternatives to the Reorganization, including the potential benefits and detriments of maintaining the current structure.
In connection with the Board’s consideration of the proposed Reorganization, the Independent Trustees requested, and FMG LLC provided to the Board, information regarding the factors set forth above as well as other information relating to the Reorganization.
In reaching the decision to recommend approval of the Reorganization, the Board, including the Independent Trustees, concluded that each Portfolio’s participation in the Reorganization is in its best interests and that the interests of existing shareholders of that Portfolio would not be diluted as a result of the Reorganization. The Board’s conclusion was based on a number of factors, including the following:
| • | The Reorganization will permit shareholders invested in the ETF Portfolio to continue to allocate amounts to a much larger Portfolio that pursues a substantially similar investment objective, provides comparable exposure to a diversified portfolio of investments in foreign securities, and has better growth prospects and lower annual operating expense ratios than the ETF Portfolio. |
| • | Following the Reorganization, FMG LLC will continue to serve as the investment manager and administrator of the Index Portfolio and the current Adviser will continue to serve as the Adviser to the Portfolio. |
| • | As a result of the Reorganization, each shareholder of Class IA or Class K shares of the ETF Portfolio would hold, immediately after the Closing Date, Class IA or Class K shares of the Index Portfolio, as applicable, having an aggregate value equal to the aggregate value of the ETF Portfolio shares such shareholder holds as of the Closing Date. |
| • | The Reorganization will be effected on the basis of each participating Portfolio’s net asset value, which will be determined in connection with the Reorganization in accordance with the Trust’s normal valuation procedures, which are identical for all of the Trust’s Portfolios. |
| • | Shareholders will not pay sales charges in connection with the Reorganization. |
| • | The Reorganization is not expected to have any adverse tax results to Contractholders. |
| • | FMG LLC will pay the expenses associated with the Reorganization. |
On the basis of the information provided to it and its evaluation of that information, the Board, including the Independent Trustees, voted unanimously to approve the Plan of Reorganization and to recommend that the shareholders of the ETF Portfolio also approve the Plan of Reorganization.
16
Potential Benefits of the Reorganization to FMG LLC and its Affiliates
FMG LLC may realize benefits in connection with the Reorganization. For example, the Reorganization would eliminate FMG LLC’s obligations under the Expense Limitation Arrangement by reorganizing the ETF Portfolio into the Index Portfolio which is not subject to any expense limitation arrangement.
In addition, the Portfolios are offered and sold through Contracts issued by AXA Equitable that may provide certain death benefit, income benefit or other guarantees to Contractholders. In providing these guarantees, AXA Equitable assumes the risk that Contractholder account values will not be sufficient to pay the guaranteed amounts when due, and therefore that AXA Equitable will have to use its own resources to cover any shortfall. AXA Equitable may enter into hedging transactions from time to time that are intended to help manage its risks under these guarantees. The Reorganization may enhance AXA Equitable’s ability to manage this risk, for example, by eliminating a Portfolio that has underperformed expectations. This could have a positive impact on AXA Equitable’s profitability and/or financial position.
A Portfolio’s performance may be affected by one or more of the following risks, which are described in detail in Appendix B “More Information on Strategies and Risk Factors.”
Equity Risk: In general, stocks and other equity security values fluctuate, and sometimes widely fluctuate, in response to changes in a company’s financial condition as well as general market, economic and political conditions and other factors.
ETF Risk: A Portfolio that invests in ETFs will indirectly bear fees and expenses charged by those ETFs, in addition to the Portfolio’s direct fees and expenses. The cost of investing in the Portfolio, therefore, may be higher than the cost of investing in a mutual fund that invests directly in individual stocks and bonds. In addition, the Portfolio’s net asset value will be subject to fluctuations in the market values of the ETFs in which it invests. The Portfolio is also subject to the risks associated with the securities in which the ETFs invest and the ability of the Portfolio to meet its investment objective will directly depend on the ability of the ETFs to meet their investment objectives. The Portfolio and ETFs are subject to certain general investment risks, including market risk, asset class risk, issuer-specific risk, investment style risk and portfolio management risk. In addition, to the extent a Portfolio invests in ETFs that invest in equity securities, fixed income securities and/or foreign securities, the Portfolio is subject to the risks associated with investing in such securities such as equity risk, market capitalization risk, investment grade securities risk, interest rate risk, credit/default risk, foreign and emerging markets securities risk and lower-rated securities risk. There is also the risk that an ETF’s performance may not match that of the relevant index. It is also possible that an active trading market for an ETF may not develop or be maintained, in which case the liquidity and value of a Portfolio’s investment in the ETF could be substantially and adversely affected. The extent to
17
which the investment performance and risks associated with the Portfolio correlates to those of a particular ETF will depend upon the extent to which the Portfolio’s assets are allocated from time to time for investment in the ETF, which will vary.
Foreign Securities Risk: Investments in foreign securities, including depositary receipts, involve risks not associated with investing in U.S. securities. Foreign markets, particularly emerging markets, may be less liquid, more volatile and subject to less government supervision than domestic markets. Security values also may be negatively affected by changes in the exchange rates between the U.S. dollar and foreign currencies. Differences between U.S. and foreign legal, political and economic systems, regulatory regimes and market practices also may impact security values and it may take more time to clear and settle trades involving foreign securities.
Currency Risk: Investments in foreign currencies and in securities that trade in, or receive revenues in, or in derivatives that provide exposure to foreign currencies are subject to the risk that those currencies will decline in value relative to the U.S. dollar, or, in the case of hedging positions, that the U.S. dollar will decline in value relative to the currency being hedged. Any such decline may erode or reverse any potential gains from an investment in securities denominated in foreign currency or may widen existing loss. Currency rates may fluctuate significantly over short periods of time for a number of reasons, including changes in interest rates, intervention (or the failure to intervene) by governments, central banks or supranational entities, or by the imposition of currency controls or other political developments in the U.S. or abroad.
Emerging Markets Risk: There are greater risks involved in investing in emerging market countries and/or their securities markets. Investments in these countries and/or markets may present market, credit, currency, liquidity, legal, political, technical and other risks different from, or greater than, the risks of investing in developed countries. In addition, the risks associated with investing in a narrowly defined geographic area are generally more pronounced with respect to investments in emerging market countries.
Index Strategy Risk: A Portfolio that employs an index strategy generally invests in the securities included in the relevant index or a representative sample of such securities regardless of market trends. Such a portfolio generally will not modify its index strategy to respond to changes in the economy, which means that it may be particularly susceptible to a general decline in the market segment relating to the relevant index. In addition, although the index strategy attempts to closely track its benchmark index, the Portfolio may not invest in all of the securities in the index. Also, the Portfolio’s fees and expenses will reduce the Portfolio’s returns, unlike those of the benchmark index. Cash flow into and out of the Portfolio, portfolio transaction costs, changes in the securities that comprise the index, and the Portfolio’s valuation procedures also may affect the Portfolio’s performance. Therefore, there can be no assurance that the performance of the index strategy will match that of the benchmark index.
18
Large-Cap Company Risk: Larger more established companies may be unable to respond quickly to new competitive challenges such as changes in technology and consumer tastes. Many larger companies also may not be able to attain the high growth rate of successful smaller companies, especially during extended periods of economic expansion.
Securities Lending Risk: A Portfolio may lend its portfolio securities to seek income. There is a risk that a borrower may default on its obligations to return loaned securities, however, the Portfolio’s securities lending agent may indemnify the Portfolio against that risk. The Portfolio will be responsible for the risks associated with the investment of cash collateral, including any collateral invested in an affiliated money market fund. The Portfolio may lose money on its investment of cash collateral or may fail to earn sufficient income on its investment to meet obligations to the borrower. In addition, delays may occur in the recovery of securities from borrowers, which could interfere with the Portfolio’s ability to vote proxies or to settle transactions.
Federal Income Tax Consequences of the Reorganization
It is anticipated that the Reorganization will not qualify, for federal income tax purposes, as a tax-free reorganization. As a result, gain or loss will be recognized by the ETF Portfolio and its shareholders, but no gain or loss will be recognized by the Contractholders. In addition, (1) each shareholder’s (a) adjusted basis for federal income tax purposes (“adjusted basis”) in the Index Portfolio shares it receives in the Reorganization will be the fair market value thereof at the time the Reorganization is consummated (“Effective Time”) and (b) holding period for those Index Portfolio shares will begin on the following day, and (2) the Index Portfolio’s (a) adjusted basis in the Transferred Assets will be the fair market value thereof at the Effective Time and (b) holding period for the Transferred Assets will begin on the following day.
Contractholders who had premiums or contributions allocated to the investment divisions of the Separate Accounts that are invested in ETF Portfolio Shares will not recognize any gain or loss as a result of the Reorganization. If the ETF Portfolio sells securities before the Reorganization, it may recognize gains or losses (which losses could be significant) on those sales. Any net gains recognized on those sales would increase the amount of any distribution the ETF Portfolio must make to its shareholders before consummating the Reorganization.
ADDITIONAL INFORMATION ABOUT THE EQ/INTERNATIONAL EQUITY INDEX PORTFOLIO
This section gives you information about the Trust, the Manager and the Adviser for the Index Portfolio.
19
The Trust is organized as a Delaware statutory trust and is registered with the SEC as an open-end management investment company. The Board of Trustees is responsible for the overall management of the Trust and each of its series (“portfolios”), including the Index Portfolio. As of February 3, 2015, the Trust issues shares of beneficial interest that are currently divided among eighty-six (86) portfolios, sixty-one (61) of which have authorized Class IA, Class IB and Class K shares, twenty-four (24) of which are only authorized to issue Class IB and Class K shares, and one (1) of which is only authorized to issued Class IA and Class K shares. This Proxy Statement/Prospectus describes the Class IA and Class K shares of the Index Portfolio.
FMG LLC, 1290 Avenue of the Americas, New York, New York 10104, is the Manager to each Portfolio. FMG LLC is registered with the SEC as an investment adviser under the Investment Advisers Act of 1940, as amended. FMG LLC also is registered with the Commodity Futures Trading Commission (“CFTC”) as a commodity pool operator (“CPO”) under the Commodity Exchange Act, as amended, and serves as a CPO with respect to certain portfolios of the Trust. FMG LLC currently claims an exclusion (under CFTC Rule 4.5) from registration as a CPO with respect to other portfolios, including the Index Portfolio. Being subject to dual regulation by the SEC and the CFTC may increase compliance costs and may affect portfolio returns. FMG LLC is a wholly owned subsidiary of AXA Equitable. AXA Equitable is a wholly-owned subsidiary of AXA Financial, Inc., a subsidiary of AXA, a French insurance holding company. FMG LLC serves as the investment adviser to mutual funds and other pooled investment vehicles, and had $103.9 billion in assets under management as of December 31, 2014.
The Manager has a variety of responsibilities for the general management and administration of the Trust and the portfolios. The Manager’s management responsibilities include the selection and monitoring of Advisers for the portfolios. In addition, the Manager may be responsible for the management of the portfolios’ investments in ETFs.
The Manager plays an active role in monitoring each portfolio (or portion thereof) and Adviser and uses portfolio analytics systems to strengthen its evaluation of performance, style, risk levels, diversification and other criteria. The Manager also monitors each Adviser’s portfolio management team to determine whether its investment activities remain consistent with the portfolios’ (or portion thereof’s) investment style and objectives.
Beyond performance analysis, the Manager monitors significant changes that may impact the Adviser’s overall business. The Manager monitors continuity in the Adviser’s operations and changes in investment personnel and senior management. The Manager performs due diligence reviews with each Adviser no less frequently than annually. The Manager obtains detailed, comprehensive information concerning Portfolio (or portion thereof) and Adviser performance and Portfolio (or portion
20
thereof) operations that is used to supervise and monitor the Advisers and the Portfolio (or portion thereof) operations. A team is responsible for conducting ongoing investment reviews with each Adviser and for developing the criteria by which Portfolio (or portion thereof) performance is measured.
The Manager selects Advisers from a pool of candidates, including its affiliates, to manage the Portfolios (or portions thereof). The Manager may appoint, dismiss and replace Advisers and amend advisory agreements subject to the approval of the Board of Trustees. The Manager also may allocate a Portfolio’s assets to additional Advisers subject to the approval of the Trust’s Board of Trustees and has discretion to allocate each Portfolio’s assets among a Portfolio’s current Advisers. The Manager recommends Advisers for each Portfolio to the Trust’s Board of Trustees based upon its continuing quantitative and qualitative evaluation of each Adviser’s skills in managing assets pursuant to specific investment styles and strategies. Short-term investment performance, by itself, is not a significant factor in selecting or terminating an Adviser, and the Manager does not expect to recommend frequent changes of Advisers.
If the Manager appoints, dismisses or replaces an Adviser to a portfolio or adjusts the asset allocation among Advisers in a portfolio the affected portfolio may experience a period of transition during which the securities held in the Portfolio may be repositioned in connection with the change in Adviser(s). A portfolio may not pursue its principal investment strategies during such a transition period and may incur increased brokerage commissions and other transaction costs in connection with the change(s). Generally, transitions may be implemented before or after the effective date of the new Adviser’s appointment as an adviser to the portfolio, and may be completed in several days to several weeks, depending on the particular circumstances of the transition. In addition, as described in “Comparative Performance Information” above, the past performance of a portfolio is not necessarily an indication of future performance. This may be particularly true for any portfolios that have undergone Adviser changes and/or changes to the investment objectives or policies of the Portfolio.
The Manager is responsible for overseeing Advisers and recommending their hiring, termination and replacement to the Board of Trustees. A committee of FMG LLC investment personnel (“Investment Committee”) is primarily responsible for the selection, monitoring and oversight of each Portfolio’s Adviser(s) and performs other duties for portfolios not described in this Proxy Statement/Prospectus.
The Manager has received an exemptive order from the SEC to permit it and the Board of Trustees to appoint, dismiss and replace Advisers and to amend the advisory agreements between the Manager and the Advisers without obtaining shareholder approval. Accordingly, the Manager is able, subject to the approval of the Board of Trustees, to appoint, dismiss and replace Advisers and to amend advisory agreements without obtaining shareholder approval. If a new Adviser is retained for a portfolio, shareholders will receive notice of such action. However, the Manager may not enter into an advisory agreement with an “affiliated person” of the Manager (as that term is defined in the 1940 Act) (the “Affiliated Adviser”), such as AllianceBernstein, AXA Investment Managers, Inc., and AXA Rosenberg Investment Management LLC,
21
unless the advisory agreement with the Affiliated Adviser, including compensation, is also approved by the affected portfolio’s shareholders. However, an amendment to an investment management agreement between FMG LLC and the Trust that would result in an increase in the management fee rate specified in that agreement (i.e., the aggregate management fee) charged to a portfolio will be submitted to shareholders for approval.
Management and Administrative Fees
The Index Portfolio pays a fee to FMG LLC for management services. The table below shows the annual rate of the management fees (as a percentage of the Portfolio’s average daily net assets) that the Manager received in 2014 for managing the Index Portfolio.
| Annual Rate Received | ||||
Index Portfolio | 0.40 | % | ||
The Index Portfolio is not subject to an expense limitation arrangement with the Manager. The current contractual rate of the management fees (as a percentage of the Portfolio’s average daily net assets) payable by the Portfolio is determined as follows:
| First $4 Billion | Next $4 Billion | Next $2 Billion | Thereafter | |||||||||||||
Index Portfolio | 0.40 | % | 0.39 | % | 0.38 | % | 0.37 | % | ||||||||
The Adviser to the Index Portfolio is paid by the Manager. Changes to the advisory fees may be negotiated, which could result in an increase or a decrease in the amount of the management fee retained by the Manager, without shareholder approval. A discussion of the basis for the decision by the Trust’s Board to approve the investment management and advisory agreements with respect to the Index Portfolio is available in the Trust’s Annual Report to Shareholders.
FMG LLC also currently serves as the Administrator of the Trust. The administrative services provided to the Trust by FMG LLC include, among others, coordination of the Trust’s audit, financial statements and tax returns; expense management and budgeting; legal administrative services and compliance monitoring; portfolio accounting services, including daily net asset value accounting; operational risk management; and oversight of the Trust’s proxy voting policies and procedures and anti-money laundering program.
22
For administrative services, in addition to the management fee, the Index Portfolio pays FMG LLC its proportionate share of an asset-based administration fee for the Single-Advised Portfolios (listed below), which is equal to an annual rate of:
Aggregate Average Daily Net Assets | Annual Fee Rate (as a Percentage of the Aggregate Average Daily Net Assets) | |
First $3 billion | 0.12% | |
Next $3 billion | 0.11% | |
Next $4 billion | 0.105% | |
Next $20 billion | 0.10% | |
Next $10 billion | 0.0975% | |
Thereafter | 0.095% |
, subject to a minimum annual fee of $30,000. The Single-Advised Portfolios include the Index Portfolio, the ETF Portfolio, EQ/AllianceBernstein Short Duration Government Bond Portfolio, AXA SmartBeta Equity Portfolio, EQ/BlackRock Basic Value Equity Portfolio, EQ/Boston Advisors Equity Income Portfolio, EQ/Calvert Socially Responsible Portfolio, EQ/Capital Guardian Research Portfolio, EQ/Common Stock Index Portfolio, EQ/Core Bond Index Portfolio, EQ/Equity 500 Index Portfolio, EQ/GAMCO Mergers and Acquisitions Portfolio, EQ/GAMCO Small Company Value Portfolio, EQ/Intermediate Government Bond Portfolio, EQ/Invesco Comstock Portfolio, EQ/JPMorgan Value Opportunities Portfolio, EQ/Large Cap Growth Index Portfolio, EQ/Large Cap Value Index Portfolio, EQ/MFS International Growth Portfolio, EQ/Mid Cap Index Portfolio, EQ/Money Market Portfolio, AXA/Loomis Sayles Growth Portfolio, EQ/Morgan Stanley Mid Cap Growth Portfolio, EQ/Oppenheimer Global Portfolio, EQ/PIMCO Global Real Return Portfolio, EQ/PIMCO Ultra Short Bond Portfolio, EQ/Small Company Index Portfolio, EQ/T. Rowe Price Growth Stock Portfolio, EQ/UBS Growth and Income Portfolio, EQ/Wells Fargo Omega Growth Portfolio, EQ/Energy ETF Portfolio and EQ/Low Volatility Global ETF Portfolio.
23
The Index Portfolio’s investments are selected by the Adviser. The following table describes the Index Portfolio’s Adviser and portfolio managers and each portfolio manager’s business experience. Information about the portfolio managers’ compensation, other accounts they manage and their ownership of securities of the Index Portfolio is available in the Trust’s Statement of Additional Information dated May 1, 2014, as supplemented.
Adviser and Portfolio Managers | Business Experience | |||
| Index Portfolio | FMG LLC 1290 Avenue of the Americas New York, New York 10104
Portfolio Managers Kenneth T. Kozlowski Alwi Chan | Kenneth T. Kozlowski and Alwi Chan are primarily responsible for the selection, monitoring and oversight of the Index Portfolio’s Adviser.
Kenneth T. Kozlowski, CFP®, CHFC, CLU has served as Executive Vice President and Chief Investment Officer of FMG LLC since June 2012 and as Managing Director of AXA Equitable since September 2011. He was Senior Vice President of FMG LLC from May 2011 to June 2012 and a Vice President of AXA Equitable from February 2001 to August 2011. He has served as Vice President of the Trust from June 2010 to present. Since 2003, Mr. Kozlowski has had primary responsibility for the asset allocation, fund selection and rebalancing of the funds of funds currently managed by FMG LLC and for the ETF Allocated Portions since May 25, 2007. Mr. Kozlowski served as Chief Financial Officer and Treasurer of the Trust from 2002 to 2007. He has been managing the Index Portfolio since May 2011.
Alwi Chan, CFA® has served as Senior Vice President and Deputy Chief Investment Officer of FMG LLC since June 2012 and as Lead Director of AXA Equitable since February 2007. He served as Vice President of FMG LLC from May 2011 to June 2012. Prior to that, he served as an Assistant Vice President (2005-2007) and Senior Investment Analyst (2002-2005) of AXA Equitable. He also has served as a Vice President of the Trust since 2007. He has been managing the Index Portfolio since May 2009. |
24
Adviser and Portfolio Managers | Business Experience | |||
AllianceBernstein L.P. 1345 Avenue of the Americas New York, New York 10105
Portfolio Manager Judtih DeVivo | Judith DeVivo is the individual primarily responsible for the management of the Index Portfolio.
Judith DeVivo, a Senior Vice President and Portfolio Manager, joined AllianceBernstein in 1971, joined the Passive Management Group in 1984 and has had portfolio management responsibility since that time. Ms. DeVivo manages equity portfolios benchmarked to a variety of indexes including the S&P 500, S&P MidCap, S&P Small Cap, Russell 2000, FTSE 100, TOPIX, DJ EuroSTOXX 50 and S&P/ASX 200 Indexes in addition to several customized accounts. She has been portfolio manager of the Index Portfolio since December 2010. |
In July 2011, a lawsuit was filed in the United States District Court for the District of New Jersey, entitled Mary Ann Sivolella v. AXA Equitable Life Insurance Company and AXA Equitable Funds Management Group, LLC (“Sivolella Litigation”). The lawsuit was filed derivatively on behalf of eight portfolios of the Trust: EQ/Common Stock Index Portfolio; EQ/Equity Growth PLUS Portfolio; EQ/Equity 500 Index Portfolio; AXA Large Cap Value Managed Volatility Portfolio; AXA Global Equity Managed Volatility Portfolio; AXA Mid Cap Value Managed Volatility Portfolio; EQ/Intermediate Government Bond Index Portfolio; and EQ/GAMCO Small Company Value Portfolio (the “Sivolella Portfolios”). The lawsuit seeks recovery under Section 36(b) of the 1940 Act, for alleged excessive fees paid to FMG LLC and AXA Equitable (the “Defendants”) for investment management services. The Plaintiff seeks recovery of the alleged overpayments, or alternatively, rescission of the contracts and restitution of all fees paid, interest, costs and fees. In October 2011, FMG LLC and AXA Equitable filed a motion to dismiss the complaint. In November 2011, the Plaintiff filed an Amended Complaint seeking the same relief, but adding new claims under (1) Section 26(f) of the 1940 Act alleging that the variable annuity contracts sold by the Defendants charged excessive management fees, and seeking restitution and rescission of those contracts under Section 47(b) of the 1940 Act; and (2) a claim for unjust enrichment. The Defendants filed a motion to dismiss the Amended Complaint in December 2011. In May 2012, Plaintiff voluntarily dismissed the Section 26(f) claim seeking restitution and rescission under Section 47(b). In September 2012, the United States District Court for the District of New Jersey denied the motion to dismiss the Amended Complaint as it related to the Section 36(b) claim and granted the motion as it related to the unjust enrichment claim.
In January 2013, a second lawsuit against FMG LLC was filed in the United States District Court for the District of New Jersey by a group of Plaintiffs asserting
25
substantially similar claims under Section 36(b) and seeking substantially similar damages as in the Sivolella Litigation. The lawsuit, entitled Glenn D. Sanford, et al. v. AXA Equitable Funds Management Group, LLC (“Sanford Litigation”), was filed derivatively on behalf of the EQ/PIMCO Ultra Short Bond Portfolio, the EQ/T. Rowe Price Growth Stock Portfolio, the EQ/Global Bond PLUS Portfolio, and the EQ/Core Bond Index Portfolio, in addition to four of the Sivolella Portfolios. In light of the similarities of the allegations in the Sivolella and Sanford Litigations, the court consolidated the two lawsuits.
In April 2013, the Plaintiffs in the Sivolella and Sanford Litigations amended the complaints to add additional claims under Section 36(b) of the 1940 Act for recovery of alleged excessive fees paid to FMG LLC in its capacity as the Administrator of the Trust. The Plaintiffs seek recovery of the alleged overpayments, or alternatively, rescission of the contract and restitution of the excessive fees paid, interest, costs, and fees. In January 2015, Defendants filed a motion for summary judgment as well as various motions to strike certain of the Plaintiffs’ experts in the Sivolella and Sanford Litigations. Also in January 2015, two Plaintiffs in the Sanford Litigations filed a motion for partial summary judgment relating to the EQ/Core Bond Index Portfolio as well as motions in limine to bar admission of certain documents and preclude the testimony of one of Defendant’s experts.
On November 1, 2010, the Trust, and several of its portfolios, were named as defendants and putative members of the proposed defendant class of shareholders in a lawsuit brought by The Official Committee of Unsecured Creditors of Tribune Company (the “Committee”) in the United States Bankruptcy Court for the District of Delaware regarding Tribune Company’s Chapter 11 bankruptcy proceeding (In re Tribune Company). The lawsuit relates to amounts paid to the Trust, and several of its portfolios, as holders of publicly-traded shares of Tribune Company, which were components of certain broad-based securities market indices, for which there were public tender offers during 2007. The suit seeks return of the share price received by Tribune Company shareholders in the tender offers plus interest and attorneys’ fees and expenses.
On July 1, 2011, retiree participants in certain Tribune-defined compensation plans (the “Retirees”) initiated a lawsuit in the United States District Court for the Southern District of New York against certain Tribune Company shareholders who sold their shares as part of the 2007 public tender offers (the “Retiree Suit”). This Retiree Suit also seeks return of the share price received by Tribune Company shareholders in connection with the tender offers plus interest and attorneys’ fees and expenses.
On August 24, 2011, the trustees of certain trusts that hold notes issued by Tribune Company (the “Noteholders”) initiated a separate lawsuit in the United States District Court for the Southern District of New York against certain Tribune Company shareholders who sold their shares as part of the 2007 public tender offers (the “Noteholder Suit”).
This Noteholder Suit also seeks return of the share price received by Tribune Company shareholders in connection with the tender offers plus interest and attorneys’ fees and expenses. The Committee’s suit, the Retiree Suit, and the Noteholder Suit have each been consolidated with a number of related lawsuits filed by the Noteholders and Retirees around the United States into a single multidistrict litigation proceeding now pending in the United States District Court for the Southern District of New York (In re: Tribune Company Fraudulent Conveyance Litigation).
26
The EQ/Equity 500 Index Portfolio, the EQ/GAMCO Mergers and Acquisitions Portfolio and the AXA Mid Cap Value Managed Volatility Portfolio are named as defendants in the Noteholder Suit and the Retiree Suit. The EQ/Equity 500 Index Portfolio, the EQ/GAMCO Mergers and Acquisitions Portfolio, the AXA Mid Cap Value Managed Volatility Portfolio, the AXA Large Cap Core Managed Volatility Portfolio, the EQ/Small Company Index II Portfolio, the EQ/Common Stock Index II Portfolio, and EQ Advisors Trust are all putative members of the proposed defendant class of shareholders in the Committee’s suit. The EQ/Equity 500 Index Portfolio, the EQ/GAMCO Mergers and Acquisition Portfolio, the AXA Large Cap Core Managed Volatility Portfolio, and EQ Advisors Trust are also named separately in the Committee’s suit, in the event it is not certified as a class action. The amounts paid to the above six Portfolios in connection with the public tender offers were approximately: (i) the EQ/Equity 500 Index Portfolio – $1,740,800; (ii) the EQ/GAMCO Mergers and Acquisitions Portfolio – $1,122,000; (iii) the AXA Mid Cap Value Managed Volatility Portfolio – $2,992,000; (iv) the AXA Large Cap Core Managed Volatility Portfolio – $64,600; (v) the EQ/Small Company Index II Portfolio – $61,200; and (vi) the EQ/Common Stock Index II Portfolio – $18,360.
The lawsuits do not allege any misconduct by the Trust or its portfolios. The portfolios cannot predict the outcome of these lawsuits. If the lawsuits were to be decided or settled in a manner adverse to the portfolios, the payment of such judgments or settlements could have an adverse effect on each portfolio’s net asset value.
Fund Distribution Arrangements
The Trust offers three classes of shares on behalf of the Index Portfolio: Class IA, Class IB and Class K shares. AXA Distributors, LLC (“AXA Distributors”) serves as the distributor for the Class IA, Class IB and Class K shares of the Trust. Each class of shares is offered and redeemed at its net asset value without any sales load. AXA Distributors is an affiliate of FMG LLC. AXA Distributors is registered as a broker-dealer under the Securities Exchange Act of 1934, as amended, and is a member of the Financial Industry Regulatory Authority.
The Trust has adopted a Distribution Plan pursuant to Rule 12b-1 under the 1940 Act for the Trust’s Class IA and Class IB shares. Under the Distribution Plan, the Class IA and Class IB shares of the Trust are charged an annual fee to compensate AXA Distributors for promoting, selling and servicing shares of the Portfolios. The maximum annual distribution and/or service (12b-1) fee for the Index Portfolio’s Class IA and Class IB shares is 0.25% of the average daily net assets attributable to such share class. Because these fees are paid out of the Index Portfolio’s assets on an on going basis, over time, the fees for Class IA and Class IB shares will increase your cost of investing and may cost you more than other types of charges.
The distributor may receive payments from the Adviser of the Index Portfolio or its affiliates to help defray expenses for sales meetings or seminar sponsorships that may relate to the Contracts and/or the Portfolio. These sales meetings or seminar
27
sponsorships may provide the Adviser with increased access to persons involved in the distribution of the Contracts. The distributor also may receive marketing support from the Adviser in connection with the distribution of the Contracts.
Payments to Broker-Dealers and Other Financial Intermediaries
The Index Portfolio is not sold directly to the general public but instead is offered as an underlying investment option for Contracts and retirement plans and to other eligible investors. The Index Portfolio and its related companies may make payments to a sponsoring insurance company (or its affiliates) or other financial intermediary for distribution and/or other services. These payments may create a conflict of interest by influencing the insurance company or other financial intermediary and your financial adviser to recommend the Portfolio over another investment or by influencing an insurance company to include the Portfolio as an underlying investment option in the Contract. The prospectus (or other offering document) for your Contract may contain additional information about these payments.
The Index Portfolio’s shares are currently sold only to insurance company separate accounts in connection with Contracts issued by AXA Equitable and other affiliated or unaffiliated insurance companies and to The AXA Equitable 401(k) Plan. The Index Portfolio’s shares also may be sold to other tax-qualified retirement plans, to other portfolios managed by FMG LLC that currently sell their shares to such accounts and plans and other investors eligible under applicable tax regulations. Class K shares of the Index Portfolio are sold only to other portfolios of the Trust, portfolios of the AXA Premier VIP Trust and certain group annuity and retirement plans.
The Index Portfolio does not have minimum initial or subsequent investment requirements. Shares of the Index Portfolio are redeemable on any business day upon receipt of a request. Please refer to your Contract prospectus for more information on purchasing and redeeming shares of the Index Portfolio.
All shares are purchased and sold at their net asset value without any sales load. All redemption requests will be processed and payment with respect thereto will normally be made within seven days after tender. The Index Portfolio reserves the right to suspend or change the terms of purchasing or selling shares.
The Trust may suspend the right of redemption for any period or postpone payment for more than seven days when the New York Stock Exchange is closed (other than a weekend or holiday) or when trading is restricted by the SEC or the SEC declares that an emergency exists. Redemptions may also be suspended and payments may be postponed for more than seven days during other periods permitted by the SEC. The Index Portfolio may pay the redemption price in whole or part by a distribution in kind of readily marketable securities in lieu of cash or may take up to seven days to pay a redemption request in order to raise capital, when it is detrimental for the Portfolio to make cash payments as determined in the sole discretion of FMG LLC.
28
Frequent transfers or purchases and redemptions of Index Portfolio shares, including market timing and other program trading or short-term trading strategies, may be disruptive to the Portfolio. Excessive purchases and redemptions of shares of the Index Portfolio may adversely affect the Portfolio’s performance and the interests of long-term investors by requiring the Portfolio to maintain larger amounts of cash or to liquidate portfolio holdings at a disadvantageous time or price. For example, when market timing occurs, the Portfolio may have to sell its holdings to have the cash necessary to redeem the market timer’s shares. This can happen when it is not advantageous to sell any securities, so the Portfolio’s performance may be hurt. When large dollar amounts are involved, market timing can also make it difficult to use long-term investment strategies because the Index Portfolio cannot predict how much cash it will have to invest. In addition, disruptive transfers or purchases and redemptions of Index Portfolio shares may impede efficient portfolio management and impose increased transaction costs, such as brokerage costs, by requiring the portfolio manager to affect more frequent purchases and sales of portfolio securities. Similarly, the Index Portfolio may bear increased administrative costs as a result of the asset level and investment volatility that accompanies patterns of excessive or short-term trading. Because the Index Portfolio invests in foreign securities the Portfolio tends to be subject to the risks associated with market timing and short-term trading strategies to a greater extent than funds that do not. Securities trading in overseas markets present time zone arbitrage opportunities when events affecting portfolio securities values occur after the close of the overseas market but prior to the close of the U.S. market.
The Board of Trustees has adopted policies and procedures regarding disruptive transfer activity. The Trust and the Index Portfolio discourage frequent purchases and redemptions of portfolio shares by Contractholders and will not make special arrangements to accommodate such transactions in Index Portfolio shares. As a general matter, the Index Portfolio and the Trust reserve the right to reject a transfer that they believe, in their sole discretion is disruptive (or potentially disruptive) to the management of the Portfolio.
The Trust’s policies and procedures seek to discourage what it considers to be disruptive trading activity. The Trust seeks to apply its policies and procedures to all Contractholders uniformly, including omnibus accounts. It should be recognized, however, that such policies and procedures are subject to limitations:
| • | They do not eliminate the possibility that disruptive transfer activity, including market timing, will occur or that portfolio performance will be affected by such activity. |
| • | The design of such policies and procedures involves inherently subjective judgments, which FMG LLC and its affiliates, on behalf of the Trust, seek to make in a fair and reasonable manner consistent with the interests of all Contractholders. |
| • | The limits on the ability to monitor certain potentially disruptive transfer activity means that some Contractholders may be treated differently than others, |
29
resulting in the risk that some Contractholders may be able to engage in frequent transfer activity while others will bear the effect of that frequent transfer activity. |
If FMG LLC, on behalf of the Trust, determines that a Contractholder’s transfer patterns among the Trust’s portfolios are disruptive to the Trust’s portfolios, FMG LLC or an affiliate may, among other things, restrict the availability of personal telephone requests, facsimile transmissions, automated telephone services, internet services or any electronic transfer services. FMG LLC or an affiliate may also refuse to act on transfer instructions of an agent acting under a power of attorney who is acting on behalf of more than one owner. In making these determinations, FMG LLC or an affiliate may consider the combined transfer activity of Contracts that it believes are under common ownership, control or direction.
The Trust currently considers transfers into and out of (or vice versa) the same portfolio within a five-business day period as potentially disruptive transfer activity. In order to reduce disruptive activity, it monitors the frequency of transfers, including the size of transfers in relation to portfolio assets, in each portfolio. The Trust aggregates inflows and outflows for each portfolio on a daily basis. When a potentially disruptive transfer into or out of a portfolio occurs on a day when the portfolio’s net inflows and outflows exceed an established monitoring threshold, FMG LLC or an affiliate sends a letter to the Contractholder explaining that there is a policy against disruptive transfer activity and that if such activity continues, FMG LLC or an affiliate may take action to restrict the availability of voice, fax and automated transaction services. If such Contractholder is identified a second time as engaging in potentially disruptive transfer activity, FMG LLC or an affiliate currently will restrict the availability of voice, fax and automated transaction services. FMG LLC or an affiliate currently will apply such action for the remaining life of each affected Contract. Because FMG LLC or an affiliate exercises discretion in determining whether or not to take the actions discussed above, some Contractholders may be treated differently than others, resulting in the risk that some Contractholders may be able to engage in frequent transfer activity while others will bear the effect of the frequent transfer activity. Although Contractholders who have engaged in disruptive transfer activity currently receive letters notifying them of FMG LLC or an affiliate’s intention to restrict access to communication services, such letters may not continue to be provided in the future. Consistent with seeking to discourage potentially disruptive transfer activity, FMG LLC, or an affiliate thereof or the Trust also may in its sole discretion and without further notice, change what it considers potentially disruptive transfer activity and its monitoring procedures and thresholds, as well as change its procedures to restrict this activity. You should consult your Contract prospectus for information on other specific limitations on the transfer privilege.
The above policies and procedures with respect to frequent transfers or purchases and redemptions of portfolio shares also apply to retirement plan participants. The above policies and procedures do not apply to transfers, purchases and redemptions of shares of portfolios of the Trust by funds of funds managed by FMG LLC.
30
Notwithstanding our efforts, we may be unable to detect or deter market timing activity by certain persons, which can lead to disruption of management of, and excess costs to, the portfolios, including the Index Portfolio.
How Portfolio Shares Are Priced
“Net asset value” is the price of one share of a portfolio of the Trust, including the Index Portfolio, without a sales charge, and is calculated each business day using the following formula:
| Net Asset Value | = | Total market value of securities | + | Cash and other assets | – | Liabilities | ||||||
| Number of outstanding shares | ||||||||||||
The net asset value of portfolio shares is determined according to this schedule:
| • | A share’s net asset value is determined as of the close of regular trading on the NYSE on the days it is open for trading. This is normally 4:00 p.m. Eastern time. |
| • | The price for purchasing or redeeming a share will be based upon the net asset value next calculated after an order is received and accepted by a portfolio or its designated agent. |
| • | A portfolio heavily invested in foreign securities may have net asset value changes on days when shares cannot be purchased or sold because foreign securities sometimes trade on days when a portfolio’s shares are not priced. |
Generally, portfolio securities are valued as follows:
| • | Equity securities (including securities issued by ETFs) — most recent sales price or official closing price or if there is no sale or official closing price, latest available bid price. |
| • | Securities traded on foreign exchanges — most recent sales or bid price on the foreign exchange or market, unless a significant event or circumstance occurs after the close of that market or exchange that will materially affect its value. In that case, fair value as determined by or under the direction of the Trust’s Board of Trustees at the close of regular trading on the NYSE. Foreign currency is converted into U.S. dollar equivalent daily at current exchange rates. |
| • | Debt securities — based upon pricing service valuations. |
| • | Convertible bonds and unlisted convertible preferred stocks — valued at prices obtained from a pricing service for such instruments or, if a pricing service price is not available, at bid prices obtained from one or more of the major dealers in such bonds or stocks. Where there is a discrepancy between dealers, values may be adjusted based on recent premium spreads to the underlying common stocks. Convertible bonds may be matrix-priced based upon the conversion value to the underlying common stocks and market premiums. |
31
| • | Options — for exchange traded options, last sales price or, if not available, previous day’s sales price. If the bid price is higher or the asked price is lower than the last sale price, the higher bid or lower asked price may be used. Options not traded on an exchange or actively traded are valued according to fair value methods. |
| • | Futures — last sales price or, if there is no sale, latest available bid price. |
| • | Investment Company Securities — shares of open-end mutual funds (other than ETFs) held by a portfolio will be valued at the net asset value of the shares of such funds as described in these funds’ prospectuses. |
Securities and assets for which market quotations are not readily available, for which valuation cannot be provided or for which events or circumstances occurring after the close of the relevant market or exchange materially affect their value are valued pursuant to the fair value procedures in good faith by or under the direction of the Board of Trustees. For example, a security whose trading has been halted during the trading day may be fair valued based on the available information at the time of the close of the trading market. Similarly, securities for which there is no ready market (e.g., securities of certain small capitalization issuers, high yield securities and securities of certain issuers located in emerging markets) also may be fair valued. Some methods for valuing these securities may include: fundamental analysis (earnings multiple, etc.), matrix pricing, discounts from market prices of similar securities, or discounts applied due to the nature and duration of restrictions on the disposition of the securities.
Events or circumstances affecting the values of portfolio securities that occur between the closing of their principal markets and the time the net asset value is determined, such as foreign securities trading on foreign exchanges that close before the time the net asset value of portfolio shares is determined, may be reflected in the Trust’s calculations of net asset values for each applicable portfolio when the Trust deems that the particular event or circumstance would materially affect such portfolio’s net asset value. Such events or circumstances may be company specific, such as an earning reports, country or region specific, such as a natural disaster, or global in nature. Such events or circumstances also may include price movements in the U.S. securities markets.
The effect of fair value pricing as described above is that securities may not be priced on the basis of quotations from the primary market in which they are traded, but rather may be priced by another method that the Trust’s Board of Trustees believes will reflect fair value. As such, fair value pricing is based on subjective judgments and it is possible that fair value may differ materially from the value realized on a sale. This policy is intended to assure that the portfolio’s net asset value fairly reflects security values as of the time of pricing. Also, fair valuation of a portfolio’s securities can serve to reduce arbitrage opportunities available to short-term traders, but there is no assurance that fair value pricing policies will prevent dilution of the portfolio’s net asset value by those traders.
32
Each business day, the portfolios’ net asset values, including the net asset values of the Index Portfolio, are transmitted electronically to insurance companies that use the portfolios as underlying investment options for Contracts.
Dividends and Other Distributions
The Index Portfolio generally distributes most or all of its net investment income and net realized gains (collectively, “Taxable Income”), if any, annually. Dividends and other distributions by the Index Portfolio are automatically reinvested at net asset value in shares of the distributing class of the Portfolio.
Federal Income Tax Considerations
The Index Portfolio currently sells its shares only to insurance company separate accounts, qualified plans and other investors eligible under applicable tax regulations. Accordingly, distributions the Index Portfolio makes of its Taxable Income — most or all of which it intends to distribute annually — and gains realized on redemptions or exchanges of Index Portfolio shares generally will not be taxable to its shareholders (or to the holders of underlying Contracts or plan participants or beneficiaries). See the prospectus for your Contract for further tax information.
The Index Portfolio is treated as a separate corporation, and intends to continue to qualify each taxable year to be treated as a “regulated investment company” (a “RIC”), for federal tax purposes. The Index Portfolio will be so treated if it meets specified federal income tax rules, including requirements regarding types of investments, diversification limits on investments, types of income, and distributions. To comply with all these requirements may, from time to time, necessitate the Index Portfolio’s disposition of one or more investments when it might not otherwise do so.
A RIC that satisfies the federal tax requirements is not taxed at the entity (portfolio) level to the extent it passes through its Taxable Income to its shareholders by making distributions. Although the Trust intends that the Index Portfolio will be operated to have no federal tax liability, if the Portfolio does have any federal tax liability, that would hurt its investment performance. Also, to the extent that the Index Portfolio invests in foreign securities or holds foreign currencies, it could be subject to foreign taxes that would reduce its investment performance.
It is important for the Index Portfolio to maintain its RIC status (and to satisfy certain other requirements), because each shareholder of the Portfolio that is an insurance company separate account will then be able to use a “look-through” rule in determining whether the account meets the investment diversification rules for separate accounts. If the Index Portfolio failed to meet those diversification rules, owners of non-pension plan Contracts funded through the Index Portfolio would be taxed immediately on the accumulated investment earnings under their Contracts and would lose any benefit of tax deferral. FMG LLC, in its capacity as the Manager and the administrator of the Trust, therefore carefully monitors the Index Portfolio’s compliance with all of the RIC rules and separate account investment diversification rules.
33
Contractholders seeking to more fully understand the tax consequences of their investment should consult with their tax advisers or the insurance company that issued their Contract or refer to their Contract prospectus.
34
The following financial highlights tables are intended to help you understand the financial performance of the Index Portfolio’s Class IA, Class IB and Class K shares. The financial information in the tables is for the past five years (or, if shorter, the period of operations). The financial information below for the Class IA, Class IB and Class K shares of the Index Portfolio has been derived from the financial statements of the Portfolio for the fiscal year ended December 31, 2014, which have been audited by PricewaterhouseCoopers LLP (“PwC”), an independent registered public accounting firm. PwC’s report on the Index Portfolio’s financial statements for the fiscal year ended December 31, 2014 and the financial statements themselves as of December 31, 2014 are incorporated by reference into the Statement of Additional Information relating to this Proxy Statement/Prospectus. The information should be read in conjunction with these financial statement documents.
Certain information reflects financial results for a single share. The total returns in the table represent the rate that a shareholder would have earned (or lost) on an investment in the Index Portfolio (assuming reinvestment of all dividends and other distributions). The total return figures shown below do not reflect any Separate Account or Contract fees and charges. The total return figures would be lower if they did reflect such fees and charges.
35
EQ ADVISORS TRUST
EQ/INTERNATIONAL EQUITY INDEX PORTFOLIO
FINANCIAL HIGHLIGHTS
| Year Ended December 31, | ||||||||||||||||||||
| Class IA | 2014 | 2013 | 2012 | 2011 | 2010 | |||||||||||||||
Net asset value, beginning of year | $ | 9.79 | $ | 8.24 | $ | 7.30 | $ | 8.60 | $ | 8.36 | ||||||||||
|
|
|
|
|
|
|
|
|
| |||||||||||
Income (loss) from investment operations: | ||||||||||||||||||||
Net investment income (loss) (e) | 0.30 | 0.20 | ## | 0.21 | 0.26 | 0.16 | ||||||||||||||
Net realized and unrealized gain (loss) on investments, futures and foreign currency transactions | (0.97 | ) | 1.56 | 0.97 | (1.30 | ) | 0.29 | |||||||||||||
|
|
|
|
|
|
|
|
|
| |||||||||||
Total from investment operations | (0.67 | ) | 1.76 | 1.18 | (1.04 | ) | 0.45 | |||||||||||||
|
|
|
|
|
|
|
|
|
| |||||||||||
Less distributions: | ||||||||||||||||||||
Dividends from net investment income | (0.30 | ) | (0.21 | ) | (0.24 | ) | (0.26 | ) | (0.21 | ) | ||||||||||
|
|
|
|
|
|
|
|
|
| |||||||||||
Net asset value, end of year | $ | 8.82 | $ | 9.79 | $ | 8.24 | $ | 7.30 | $ | 8.60 | ||||||||||
|
|
|
|
|
|
|
|
|
| |||||||||||
Total return | (6.90 | )% | 21.43 | % | 16.22 | % | (11.98 | )% | 5.46 | % | ||||||||||
|
|
|
|
|
|
|
|
|
| |||||||||||
Ratios/Supplemental Data: | ||||||||||||||||||||
Net assets, end of year (000’s) | $ | 655,835 | $ | 750,077 | $ | 672,396 | $ | 659,391 | $ | 1,134,210 | ||||||||||
Ratio of expenses to average net assets | 0.79 | % | 0.79 | % | 0.79 | % | 0.53 | % | 0.83 | % | ||||||||||
Ratio of net investment income (loss) to average net assets | 3.05 | % | 2.18 | %(aa) | 2.74 | % | 3.06 | % | 1.93 | % | ||||||||||
Portfolio turnover rate^ | 8 | % | 9 | % | 5 | % | 65 | % | 61 | % | ||||||||||
| Year Ended December 31, | ||||||||||||||||||||
| Class IB | 2014 | 2013 | 2012 | 2011 | 2010 | |||||||||||||||
Net asset value, beginning of year | $ | 9.64 | $ | 8.11 | $ | 7.19 | $ | 8.47 | $ | 8.23 | ||||||||||
|
|
|
|
|
|
|
|
|
| |||||||||||
Income (loss) from investment operations: | ||||||||||||||||||||
Net investment income (loss) (e) | 0.29 | 0.19 | ## | 0.21 | 0.23 | 0.13 | ||||||||||||||
Net realized and unrealized gain (loss) on investments, futures and foreign currency transactions | (0.95 | ) | 1.54 | 0.95 | (1.27 | ) | 0.30 | |||||||||||||
|
|
|
|
|
|
|
|
|
| |||||||||||
Total from investment operations | (0.66 | ) | 1.73 | 1.16 | (1.04 | ) | 0.43 | |||||||||||||
|
|
|
|
|
|
|
|
|
| |||||||||||
Less distributions: | ||||||||||||||||||||
Dividends from net investment income | (0.29 | ) | (0.20 | ) | (0.24 | ) | (0.24 | ) | (0.19 | ) | ||||||||||
|
|
|
|
|
|
|
|
|
| |||||||||||
Net asset value, end of year | $ | 8.69 | $ | 9.64 | $ | 8.11 | $ | 7.19 | $ | 8.47 | ||||||||||
|
|
|
|
|
|
|
|
|
| |||||||||||
Total return | (6.85 | )% | 21.48 | % | 16.14 | % | (12.20 | )% | 5.24 | % | ||||||||||
|
|
|
|
|
|
|
|
|
| |||||||||||
Ratios/Supplemental Data: | ||||||||||||||||||||
Net assets, end of year (000’s) | $ | 803,688 | $ | 879,975 | $ | 715,496 | $ | 681,113 | $ | 871,872 | ||||||||||
Ratio of expenses to average net assets | 0.79 | % | 0.79 | % | 0.79 | % | 0.78 | % | 1.08 | % | ||||||||||
Ratio of net investment income (loss) to average net assets | 3.04 | % | 2.15 | %(bb) | 2.75 | % | 2.75 | % | 1.69 | % | ||||||||||
Portfolio turnover rate^ | 8 | % | 9 | % | 5 | % | 65 | % | 61 | % | ||||||||||
See Notes to Financial Statements.
36
EQ ADVISORS TRUST
EQ/INTERNATIONAL EQUITY INDEX PORTFOLIO
FINANCIAL HIGHLIGHTS (Continued)
| Year Ended December 31, | August 26, 2011* to December 31, 2011 | |||||||||||||||
| Class K | 2014 | 2013 | 2012 | |||||||||||||
Net asset value, beginning of period | $ | 9.79 | $ | 8.24 | $ | 7.30 | $ | 7.68 | ||||||||
|
|
|
|
|
|
|
| |||||||||
Income (loss) from investment operations: | ||||||||||||||||
Net investment income (loss) (e) | 0.32 | 0.22 | ## | 0.24 | 0.06 | |||||||||||
Net realized and unrealized gain (loss) on investments, futures and foreign currency transactions | (0.97 | ) | 1.56 | 0.97 | (0.18 | ) | ||||||||||
|
|
|
|
|
|
|
| |||||||||
Total from investment operations | (0.65 | ) | 1.78 | 1.21 | (0.12 | ) | ||||||||||
|
|
|
|
|
|
|
| |||||||||
Less distributions: | ||||||||||||||||
Dividends from net investment income | (0.32 | ) | (0.23 | ) | (0.27 | ) | (0.26 | ) | ||||||||
|
|
|
|
|
|
|
| |||||||||
Net asset value, end of period | $ | 8.82 | $ | 9.79 | $ | 8.24 | $ | 7.30 | ||||||||
|
|
|
|
|
|
|
| |||||||||
Total return (b) | (6.65 | )% | 21.73 | % | 16.52 | % | (1.49 | )% | ||||||||
|
|
|
|
|
|
|
| |||||||||
Ratios/Supplemental Data: | ||||||||||||||||
Net assets, end of period (000’s) | $ | 157,184 | $ | 142,652 | $ | 140,323 | $ | 226,542 | ||||||||
Ratio of expenses to average net assets (a) | 0.54 | % | 0.54 | % | 0.54 | % | 0.54 | % | ||||||||
Ratio of net investment income (loss) to average net assets (a) | 3.29 | % | 2.43 | %(cc) | 3.09 | % | 2.38 | % | ||||||||
Portfolio turnover rate^ | 8 | % | 9 | % | 5 | % | 65 | % | ||||||||
| * | Commencement of Operations. |
| ## | Includes income resulting from a special dividend. Without this dividend, the per share income amounts would be $0.16, $0.15 and $0.18 for Class IA ,Class IB and K respectively. |
| ^ | Portfolio turnover rate excludes derivatives, if any. |
| (a) | Ratios for periods less than one year are annualized. |
| (b) | Total returns for periods less than one year are not annualized. |
| (e) | Net investment income (loss) per share is based on average shares outstanding. |
| (aa) | Includes income resulting from a special dividend, Without this dividend, the ratios for Class IA would be 1.75% for income after waivers and reimbursements, 1.75% after waivers, reimbursements, and fees paid indirectly, and 1.75% before waivers, reimbursements, and fees paid indirectly. |
| (bb) | Includes income resulting from a special dividend. Without this dividend, the ratios for Class IB would 1.72% for income after waiver and reimbursement, 1.72% after waivers, reimbursements, and fees paid indirectly, and 1.72% before waivers, reimbursemments, and fees paid indirectly. |
| (cc) | Includes income resulting from a special dividend, Without this dividend, the ratios for Class C would be 2.00% for income after waivers and reimbursements, 2.00% after waivers, reimbursements, and fees paid indirectly, and 2% before waivers, reimbursements, and fees paid indirectly. |
See Notes to Financial Statements.
37
The following information applies to the Reorganization of the ETF Portfolio for which you are entitled to vote.
Shareholders with amounts invested in shares of the ETF Portfolio at the close of business on February 27, 2015 (the “Record Date”) will be entitled to be present and vote or provide voting instructions for the ETF Portfolio at the Meeting with respect to their shares or shares attributable to their Contracts as of the Record Date.
Each whole share of the ETF Portfolio is entitled to one vote as to each matter with respect to which it is entitled to vote, as described above, and each fractional share is entitled to a proportionate fractional vote. Votes cast by proxy or in person by a shareholder at the Meeting will be counted by persons appointed as inspectors of election for the Meeting. The table below shows the number of outstanding shares of the ETF Portfolio as of the Record Date that are entitled to vote at the Meeting. AXA Equitable owned of record more than 95% of those shares.
| Total Number | Number of Class IA | Number of Class K | ||||
ETF Portfolio |
All properly executed and unrevoked proxies received in time for the Meeting will be voted as instructed by shareholders. If a shareholder executes a proxy but gives no voting instructions, that shareholder’s shares that are represented by proxy will be voted “FOR” the Proposal and “FOR” or “AGAINST” any other business which may properly arise at the Meeting, in the proxies’ discretion. Any person giving a proxy has the power to revoke it at any time prior to its exercise by executing a superseding proxy or by submitting a written notice of revocation to the Trust. To be effective, such revocation must be received by the Trust prior to the Meeting. In addition, although mere attendance at the Meeting will not revoke a proxy, a shareholder present at the Meeting may withdraw his or her proxy by voting in person. If a shareholder abstains from voting as to any matter, the shares represented by the abstention or broker “non-vote” will be deemed present at the Meeting for purposes of determining a quorum but will not be voted and, therefore, will have the effect of a vote against the Proposal.
Contractholders with amounts allocated to the ETF Portfolio on the Record Date will be entitled to be present and provide voting instructions for the Portfolio at the Meeting with respect to shares held indirectly as of the Record Date, to the extent required by applicable law. Voting instructions may be solicited, and such instructions may be provided, in the same manner as proxies as described herein. AXA Equitable will vote the shares for which it receives timely voting instructions from Contractholders in accordance with those instructions. Shares in each investment division of a Separate Account that is invested in the ETF Portfolio for which AXA Equitable receives a voting instruction card that is signed and timely returned but is not marked
38
to indicate voting instructions will be treated as an instruction to vote the shares “FOR” the Proposal, and AXA Equitable may vote in its discretion with respect to other matters not now known that may be presented at the Meeting. AXA Equitable will vote in its discretion on any proposal to adjourn or postpone the Meeting. Shares in each investment division of a Separate Account for which AXA Equitable receives no timely voting instructions from Contractholders, or which are attributable to amounts retained by AXA Equitable as surplus or seed money, will be voted by AXA Equitable “FOR” or “AGAINST” approval of the Proposal, or as an abstention, in the same proportion as the shares for which Contractholders have provided voting instructions to AXA Equitable. As a result of such proportional voting by AXA Equitable, it is possible that a small number of Contractholders could determine whether the Proposal is approved.
Voting instructions executed by a Contractholder may be revoked at any time prior to AXA Equitable voting the shares represented thereby by the Contractholder providing AXA Equitable with a properly executed written revocation of such voting instructions, or by the Contractholder providing AXA Equitable with proper later-dated voting instructions by voting instruction card, telephone or the Internet. In addition, any Contractholder who attends the Meeting in person may provide voting instructions by a voting instruction card at the Meeting, thereby canceling any voting instruction previously given. Proxies executed by AXA Equitable may be revoked at any time before they are exercised by a written revocation duly received, by properly executing a later-dated proxy or by AXA Equitable representative attending the Meeting and voting in person.
Approval of the Plan of Reorganization with respect to the Reorganization of the ETF Portfolio will require the affirmative vote of (i) 67% or more of the voting securities of the Portfolio present at the Meeting, if the holders of more than 50% of its outstanding voting securities are present or represented by proxy, or (ii) more than 50% of its outstanding voting securities, whichever is less. “Voting securities” refers to the shares of the ETF Portfolio.
The presence, in person or by proxy, of at least one-third of the shares of the ETF Portfolio entitled to vote at the Meeting will constitute a quorum for the transaction of business at the Meeting.
To the knowledge of the Trust, as of the Record Date, the officers and Trustees owned, as a group, less than 1% of the shares of each Portfolio.
AXA Equitable may be deemed to be a control person of the Trust by virtue of its direct or indirect ownership of more than 95% of the Trust’s shares. Shareholders owning more than 25% of the outstanding shares of the ETF Portfolio may be able to determine the outcome of most issues that are submitted to shareholders for a vote. As of the Record Date, except as set forth in Appendix C, to the Trust’s knowledge, (1) no person, other than AXA Equitable, owned beneficially or of record 5% or more
39
of the outstanding Class IA or Class K shares of the ETF Portfolio, and (2) no Contractholder owned Contracts entitling such Contractholder to provide voting instructions regarding 5% or more of the outstanding Class IA or Class K shares of the ETF Portfolio.
Solicitation of Proxies and Voting Instructions
Solicitation of proxies and voting instructions is being made by the Trust primarily by the mailing of this Notice and Proxy Statement/Prospectus with its enclosures on or about , 2015. The principal solicitation will be by mail, but proxies and voting instructions also may be solicited by telephone, fax, personal interview by directors, officers, employees or agents of FMG LLC or its affiliates or the Trust or its affiliates, without additional compensation, through the Internet, or other permissible means. Shareholders can vote proxies: (1) by Internet at our website at www.proxyvote.com; (2) by telephone at 1-800-690-6903; or (3) by mail, with the enclosed proxy card. Contractholders can provide voting instructions: (1) by Internet at our website at www.proxyvote.com; (2) by telephone at 1-800-690-6903; or (3) by mail, with the enclosed voting instruction card. In lieu of executing a proxy card or voting instruction card, you may attend the Meeting in person. The cost of the Meeting, including the cost of solicitation of proxies and voting instructions, will be borne by FMG LLC.
If a quorum is not established at the Meeting or if sufficient votes in favor of the Proposal are not received by the time scheduled for the Meeting, the persons named as proxies may propose one or more adjournments or postponements of the Meeting to permit further solicitation of proxies. Any adjournment or postponement of the Meeting will require the affirmative vote of a majority of the shares represented in person or by proxy at the session of the Meeting to be adjourned. The persons named as proxies will vote in their discretion on any such adjournment or postponement.
The Trust does not know of any matters to be presented at the Meeting other than those described in this Proxy Statement/Prospectus. If other business properly comes before the Meeting, the proxyholders will vote thereon in accordance with their best judgment.
The Trust is not required to hold regular shareholder meetings and, in order to minimize its costs, does not intend to hold meetings of shareholders unless so required by applicable law, regulation or regulatory policy or if otherwise deemed advisable by the Trust’s management. Therefore, it is not practicable to specify a date by which proposals must be received in order to be incorporated in an upcoming proxy statement for a meeting of shareholders. Shareholders will be given notice of any meeting
40
of shareholders not less than ten days, and not more than ninety days, before the date of the meeting.
Prompt execution and return of the enclosed voting instruction card is requested. A self-addressed, postage-paid envelope is enclosed for your convenience. If executed but unmarked voting instructions are received, AXA Equitable will vote those unmarked voting instructions in favor of the Proposal.
* * * * *
Copies of the Trust’s most recent annual and semi-annual reports, including financial statements, previously have been delivered to Contractholders. Contractholders may request additional copies of the Trust’s annual or semi-annual reports, free of charge, by writing to the Trust at 1290 Avenue of the Americas, New York, New York 10104 or by calling 1-877-522-5035.
We need your vote. It is important that you execute and return all of your
proxy or voting instruction cards promptly.
41
FORM OF PLAN OF REORGANIZATION AND TERMINATION
THIS PLAN OF REORGANIZATION AND TERMINATION (“Plan”) is adopted by EQ ADVISORS TRUST, a Delaware statutory trust (“Trust”), on behalf of EQ/International ETF Portfolio (“Target”) and EQ/International Equity Index Portfolio (“Acquiring Portfolio”), each a segregated portfolio of assets (“series”) thereof (each a “Portfolio”). Notwithstanding anything to the contrary contained herein, (1) all agreements, covenants, actions, and obligations (collectively, “Obligations”) of and by each Portfolio contained herein shall be deemed to be Obligations of, and all rights and benefits created hereunder in favor of each Portfolio shall inure to and be enforceable by, the Trust acting on its behalf, and (2) in no event shall any other series of the Trust or the assets thereof be held liable with respect to the breach or other default by an obligated Portfolio or the Trust of its Obligations set forth herein.
The Trust (1) is a statutory trust that is duly organized, validly existing, and in good standing under the laws of the State of Delaware, (2) is duly registered under the Investment Company Act of 1940, as amended (“1940 Act”), as an open-end management investment company, which registration is in full force and effect, and (3) has the power to own all its properties and assets and to carry on its business described in its current registration statement on Form N-1A. Each Portfolio is a duly established and designated series thereof.
The Trust currently sells voting shares of beneficial interest in the Portfolios, $0.001 par value per share (“shares”), to (1) separate accounts of AXA Equitable Life Insurance Company (“AXA Equitable”) in connection with certain variable annuity certificates and contracts and variable life insurance policies (collectively, “Contracts”) issued thereby and (2) The AXA Equitable 401(k) Plan. Shares in each Portfolio also may be sold to (3) other tax-qualified retirement plans, (4) other portfolios managed by AXA Equitable Funds Management Group, LLC (“FMG LLC”) that currently sell their shares to those accounts and plans, and (5) other investors eligible under applicable regulations under the Internal Revenue Code of 1986, as amended (“Code”) (“Regulations”). At the date of adoption hereof, some shares in one or both Portfolios are held by one or more shareholders other than separate accounts of AXA Equitable (collectively, “Other Shareholders”) and the balance of the shares in those Portfolios are held by AXA Equitable for separate accounts thereof. Class K shares are sold only to other series of the Trust, series of AXA Premier VIP Trust, a separate registered investment company managed by FMG LLC, and certain group annuity and retirement plans. The Portfolios are underlying investment options for those separate accounts to fund Contracts. Under applicable law, the assets of all those separate accounts (i.e., the shares in the Portfolios) are the property of AXA Equitable, which is the owner of record of those shares, and are held for the benefit of the Contractholders.
The Trust wishes to effect a reorganization consisting of (1) the transfer of all of Target’s assets to Acquiring Portfolio in exchange for shares in Acquiring Portfolio
A-1
and Acquiring Portfolio’s assumption of all of Target’s liabilities, (2) the distribution of those shares pro rata to Target’s shareholders in exchange for their shares therein and in complete liquidation thereof, and (3) Target’s termination (collectively, “Reorganization”), all on the terms and conditions set forth herein.
The Trust’s Amended and Restated Declaration of Trust, as amended (“Declaration”), permits it to vary its shareholders’ investment. The Trust does not have a fixed pool of assets — each series thereof (including each Portfolio) is a managed portfolio of securities, and FMG LLC and each investment sub-adviser thereof have the authority to buy and sell securities for it.
The Trust’s Board of Trustees (“Board”), including a majority of its members who are not “interested persons” (as that term is defined in the 1940 Act) thereof, (1) has duly adopted and approved this Plan and the transactions contemplated hereby and has duly authorized its performance hereof on each Portfolio’s behalf by all necessary Board action and (2) has determined that participation in the Reorganization is in the best interests of each Portfolio and that the interests of the existing shareholders thereof will not be diluted as a result of the Reorganization.
Target offers two classes of shares, designated Class IA and Class K shares (“Class IA Target Shares” and “Class K Target Shares,” respectively, and collectively, “Target Shares”). Acquiring Portfolio also offers Class IA and Class K shares (“Class IA Acquiring Portfolio Shares” and “Class K Acquiring Portfolio Shares,” respectively, and collectively, “Acquiring Portfolio Shares”); it also offers Class IB shares, but they will not be involved in the Reorganization and are not included in the term “Acquiring Portfolio Shares.” The Portfolios’ identically designated classes of shares have identical characteristics, rights, and preferences.
1. THE REORGANIZATION
1.1 Subject to the requisite approval of Target’s shareholders and the terms and conditions set forth herein, Target shall assign, sell, convey, transfer, and deliver all of its assets described in paragraph 1.2 (“Assets”) to Acquiring Portfolio. In exchange therefor, Acquiring Portfolio shall —
(a) issue and deliver to Target the number of full and fractional (all references herein to “fractional” shares meaning fractions rounded to the eighth decimal place) (1) Class IA Acquiring Portfolio Shares determined by dividing Target’s net value (computed as set forth in paragraph 2.1) (“Target Value”) attributable to the Class IA Target Shares by the net asset value (computed as set forth in paragraph 2.2) (“NAV”) of a Class IA Acquiring Portfolio Share and (2) Class K Acquiring Portfolio Shares determined by dividing the Target Value attributable to the Class K Target Shares by the NAV of a Class K Acquiring Portfolio Share, and
(b) assume all of Target’s liabilities described in paragraph 1.3 (“Liabilities”).
A-2
Those transactions shall take place at the Closing (as defined in paragraph 3.1).
1.2 The Assets shall consist of all assets and property of every kind and nature — including all cash, cash equivalents, securities, commodities, futures interests, receivables (including interest and dividends receivable), claims and rights of action, rights to register shares under applicable securities laws, goodwill, and books and records — Target owns at the Valuation Time (as defined in paragraph 2.1) and any deferred and prepaid expenses (other than unamortized organizational expenses) shown as assets on Target’s books at that time.
1.3 The Liabilities shall consist of all of Target’s liabilities, debts, obligations, and duties of whatever kind or nature existing at the Valuation Time, whether absolute, accrued, contingent, or otherwise, whether known or unknown, whether or not arising in the ordinary course of business, whether or not determinable at the Effective Time (as defined in paragraph 3.1), and whether or not specifically referred to herein. Notwithstanding the foregoing, Target shall use its best efforts to discharge all its known liabilities, debts, obligations, and duties before the Effective Time.
1.4 If the dividends and/or other distributions Target has paid through the Effective Time for its current taxable year do not equal or exceed the sum of its (a) “investment company taxable income” (within the meaning of section 852(b)(2)) (all “section” references are to the Code, unless otherwise noted), computed without regard to any deduction for dividends paid, plus (b) “net capital gain” (as defined in section 1222(11)), after reduction by any capital loss carryovers, for that year through that time, then at or as soon as practicable before that time, Target shall declare and pay to its shareholders of record one or more dividends and/or other distributions so that it will have distributed substantially all of that income and gain — and in no event less than the sum of 98% of its “ordinary income” plus 98.2% of its “capital gain net income,” as those terms are defined in section 4982(e)(1) and (2), respectively — for all federal income and excise tax periods ending at or before the Effective Time, such that Target will have no tax liability under sections 852 or 4982 for the current and any prior tax periods.
1.5 At the Effective Time (or as soon thereafter as is reasonably practicable), Target shall distribute the Acquiring Portfolio Shares it receives pursuant to paragraph 1.1(a) to the separate accounts for which AXA Equitable holds Target Shares, and Other Shareholders, of record at the Effective Time (each, a “Shareholder”), in proportion to their Target Shares then so held and in constructive exchange therefor, and shall completely liquidate. That distribution shall be accomplished by the Trust’s transfer agent’s opening accounts on Acquiring Portfolio’s shareholder records in the names of the Shareholders (except Shareholders in whose names accounts thereon already exist) and transferring those Acquiring Portfolio Shares to those newly opened and existing accounts. Pursuant to that transfer, each Shareholder’s account shall be credited with the respective pro rata number of full and fractional Acquiring Portfolio Shares due that Shareholder, by class (i.e., the account for each Shareholder that holds Class IA Target Shares shall be credited with the respective pro rata number of full and fractional Class IA Acquiring Portfolio Shares due that Shareholder, and the
A-3
account for each Shareholder that holds Class K Target Shares shall be credited with the respective pro rata number of full and fractional Class K Acquiring Portfolio Shares due that Shareholder). The aggregate NAV of Acquiring Portfolio Shares of each class to be so credited to each Shareholder’s account shall equal the aggregate NAV of the Target Shares of the corresponding class that Shareholder holds at the Effective Time. All issued and outstanding Target Shares, including any represented by certificates, shall simultaneously be canceled on Target’s shareholder records. Acquiring Portfolio shall not issue certificates representing the Acquiring Portfolio Shares issued in connection with the Reorganization.
1.6 After the Effective Time, Target shall not conduct any business except in connection with its termination. As soon as reasonably practicable after distribution of the Acquiring Portfolio Shares pursuant to paragraph 1.5, all actions required to terminate Target as a series of the Trust shall be taken — and in all events Target shall have been terminated as such within six months after the Effective Time — and Trust shall make all filings and take all other actions in connection therewith required by applicable law or necessary and proper to effect that termination.
1.7 Any reporting responsibility of Target to a public authority, including the responsibility for filing regulatory reports, tax returns, and other documents with the Securities and Exchange Commission (“Commission”), any state securities commission, any federal, state, and local tax authorities, and any other relevant regulatory authority, is and shall remain its responsibility up to and including the date on which it is terminated. In furtherance of the foregoing, after the Effective Time, the Trust shall or shall cause its agents to prepare any federal, state, and local tax returns, including any Forms 1099, required to be filed by it with respect to Target’s final taxable year ending with its complete liquidation and for any prior periods or taxable years and shall cause those tax returns and Forms 1099 to be duly filed with the appropriate taxing authorities.
2. VALUATION
2.1 For purposes of paragraph 1.1(a), Target’s net value shall be (a) the value of the Assets computed immediately after the close of regular trading on the New York Stock Exchange and Target’s declaration of dividends and/or other distributions, if any, on the date of the Closing (“Valuation Time”), using the valuation procedures set forth in the Trust’s then-current prospectus and statement of additional information for Target and valuation procedures established by the Board (collectively, “Valuation Procedures”), less (b) the amount of the Liabilities at the Valuation Time.
2.2 For purposes of paragraph 1.1(a), the NAV per share of each class of Acquiring Portfolio Shares shall be computed at the Valuation Time, using the Valuation Procedures.
2.3 All computations pursuant to paragraphs 2.1 and 2.2 shall be made (a) by FMG LLC, in its capacity as the Trust’s administrator, or (b) in the case of securities subject to fair valuation, in accordance with the Valuation Procedures.
A-4
3. CLOSING AND EFFECTIVE TIME
3.1 Unless the Trust determines otherwise, all acts necessary to consummate the Reorganization (“Closing”) shall be deemed to occur simultaneously at the close of business (4:00 p.m., Eastern Time) on May 22, 2015, or a later date the Trust determines (“Effective Time”). If, at or immediately before the Valuation Time, (a) the New York Stock Exchange or another primary trading market for portfolio securities of either Portfolio (each, an “Exchange”) is closed to trading or trading thereon is restricted or (b) trading or the reporting of trading on an Exchange or elsewhere is disrupted so that, in the Board’s judgment, accurate appraisal of the value of either Portfolio’s net assets and/or the NAV per share of either class of Acquiring Portfolio Shares is impracticable, the date of the Closing (and, therefore, the Valuation Time and the Effective Time) shall be postponed until the first business day on which that Exchange is open for regular trading after the day when that trading has been fully resumed and that reporting has been restored. The Closing shall be held at the Trust’s offices or at another place the Trust determines.
3.2 The Trust shall direct the custodian of the Portfolios’ assets to deliver at the Closing a certificate of an authorized officer (“Certificate”) stating that (a) the Assets it holds will be transferred to Acquiring Portfolio at the Effective Time and (b) all necessary taxes in connection with the delivery of the Assets, including all applicable federal and state stock transfer stamps, if any, have been paid or provision for payment has been made.
3.3 The Trust shall direct its transfer agent to deliver at the Closing a Certificate stating that its records contain (a) the name, address, and taxpayer identification number of each Shareholder, (b) the number of full and fractional shares in each outstanding class of Target Shares each Shareholder owns, and (c) the dividend reinvestment elections, if any, applicable to each Shareholder, all at the Effective Time.
3.4. The Trust shall direct its transfer agent to deliver (a) at the Closing, a confirmation, or other evidence satisfactory to the Trust, that the Acquiring Portfolio Shares to be issued to Target pursuant to paragraph 1.1(a) have been credited to Target’s account on Acquiring Portfolio’s shareholder records and (b) at or as soon as reasonably practicable after the Closing, a Certificate as to the opening of accounts on those records in the names of the Shareholders (except Shareholders in whose names accounts thereon already exist).
4. CONDITIONS PRECEDENT
4.1 The Trust’s obligation to implement this Plan on Acquiring Portfolio’s behalf shall be subject to satisfaction of the following conditions at or before (and continuing through) the Effective Time:
(a) At the Effective Time, the Trust, on Target’s behalf, will have good and marketable title to the Assets and full right, power, and authority to sell, assign, transfer, and deliver the Assets hereunder free of any liens or other encumbrances (except securities that are subject to “securities loans,” as referred to in
A-5
section 851(b)(2), or are restricted to resale by their terms); and on delivery and payment for the Assets, the Trust, on Acquiring Portfolio’s behalf, will acquire good and marketable title thereto, subject to no restrictions on the full transfer thereof, including restrictions that might arise under the Securities Act of 1933, as amended (“1933 Act”);
(b) The Trust, with respect to Target, is not currently engaged in, and its adoption and performance hereof and consummation of the Reorganization will not result in, (1) a conflict with or material violation of any provision of Delaware law, the Declaration or the Trust’s By-Laws (collectively, “Governing Documents”), or any agreement, indenture, instrument, contract, lease, or other undertaking (each, an “Undertaking”) to which the Trust, with respect to Target or on its behalf, is a party or by which it is bound or (2) the acceleration of any obligation, or the imposition of any penalty, under any Undertaking, judgment, or decree to which the Trust, with respect to Target or on its behalf, is a party or by which it is bound;
(c) At or before the Effective Time, either (1) all material contracts and other commitments of or applicable to Target (other than this Plan and certain investment contracts, including options, futures, forward contracts, and swap agreements) will terminate or (2) provision for discharge, and/or Acquiring Portfolio’s assumption, of any liabilities of Target thereunder will be made, without either Portfolio’s incurring any liability or penalty with respect thereto and without diminishing or releasing any rights the Trust, on Target’s behalf, may have had with respect to actions taken or omitted or to be taken by any other party thereto before the Closing;
(d) No litigation, administrative proceeding, action, or investigation of or before any court, governmental body, or arbitrator is presently pending or, to the Trust’s knowledge, threatened against the Trust, with respect to Target or any of its properties or assets attributable or allocable to Target, that, if adversely determined, would materially and adversely affect Target’s financial condition or the conduct of its business; and the Trust, on Target’s behalf, knows of no facts that might form the basis for the institution of any such litigation, proceeding, action, or investigation and is not a party to or subject to the provisions of any order, decree, judgment, or award of any court, governmental body, or arbitrator that materially and adversely affects Target’s business or the Trust’s ability to consummate the transactions contemplated hereby;
(e) Target’s Statement of Assets and Liabilities, Portfolio of Investments, Statement of Operations, and Statement of Changes in Net Assets (each, a “Statement”) at and for the fiscal year (in the case of the last Statement, for the two fiscal years) ended December 31, 2014, have been audited by PricewaterhouseCoopers LLP, an independent registered public accounting firm (“PwC”), and are in accordance with generally accepted accounting principles consistently applied in the United States (“GAAP”); those Statements present fairly, in all material respects, Target’s financial condition at that date in
A-6
accordance with GAAP and the results of its operations and changes in its net assets for the period(s) then ended; and, to the Trust’s management’s best knowledge and belief, there are no known contingent liabilities of Target required to be reflected on a balance sheet (including the notes thereto) in accordance with GAAP at that date that are not disclosed therein;
(f) Since December 31, 2014, there has not been any material adverse change in Target’s financial condition, assets, liabilities, or business, other than changes occurring in the ordinary course of business, or any incurrence by Target of indebtedness maturing more than one year from the date that indebtedness was incurred; for purposes of this subparagraph, a decline in Target’s NAV due to declines in market values of securities Target holds, the discharge of Target liabilities, or the redemption of Target Shares by its shareholders will not constitute a material adverse change;
(g) All federal, state, and local tax returns, dividend reporting forms, and other tax-related reports (collectively, “Returns”) of Target required by law to have been filed by the Effective Time (including any properly and timely filed extensions of time to file) will have been timely filed and are or will be correct in all material respects, and all federal and other taxes shown as due or required to be shown as due on those Returns will have been paid or provision will have been made for the payment thereof (except for amounts that alone or in the aggregate would not reasonably be expected to have a material adverse effect); to the best of the Trust’s knowledge, no such Return is currently under audit and no assessment has been asserted with respect to those Returns; and Target (1) is in compliance in all material respects with all applicable Regulations pertaining to (i) the reporting of dividends and other distributions on and redemptions of its shares, (ii) withholding in respect thereof, and (iii) shareholder basis reporting, (2) has withheld in respect of dividends and other distributions and paid to the proper taxing authorities all taxes required to be withheld, and (3) is not liable for any material penalties that could be imposed thereunder;
(h) Target is not classified as a partnership, and instead is classified as an association that is taxable as a corporation, for federal tax purposes and either has elected the latter classification by filing Form 8832 with the Internal Revenue Service (“IRS”) or is a “publicly traded partnership” (as defined in section 7704(b)) that is treated as a corporation; Target is a “fund” (as defined in section 851(g)(2), eligible for treatment under section 851(g)(1)); Target has elected to be a “regulated investment company” under Part I of Subchapter M of Chapter 1 of Subtitle A of the Code (“Subchapter M”) (“RIC”); for each taxable year of its operation (including its current taxable year (“current year”)), Target has met (and for the current year will meet) the requirements of Subchapter M for qualification and treatment as a RIC and has been (and for the current year will be) eligible to and has computed (and for the current year will compute) its federal income tax under section 852; Target has declared and paid to its shareholders the dividend(s) and/or other distribution(s), if any, required to be declared and
A-7
paid pursuant to paragraph 1.4; and Target has no earnings and profits accumulated in any taxable year in which the provisions of Subchapter M did not apply to it; and
(i) All issued and outstanding Target Shares are, and at the Effective Time will be, duly and validly issued and outstanding, fully paid, and non-assessable by the Trust and have been offered and sold in every state and the District of Columbia in compliance in all material respects with applicable registration requirements of the 1933 Act and state securities laws; all issued and outstanding Target Shares will, at the Effective Time, be held by the persons and in the amounts set forth on Target’s shareholder records (as provided in the Certificate to be delivered pursuant to paragraph 3.3); and Target does not have outstanding any options, warrants, or other rights to subscribe for or purchase any Target Shares, nor are there outstanding any securities convertible into any Target Shares.
4.2 The Trust’s obligation to implement this Plan on Target’s behalf shall be subject to satisfaction of the following conditions at or before (and continuing through) the Effective Time:
(a) The Trust, with respect to Acquiring Portfolio, is not currently engaged in, and its adoption and performance hereof and consummation of the Reorganization will not result in, (1) a conflict with or material violation of any provision of Delaware law, the Governing Documents, or any Undertaking to which the Trust, with respect to Acquiring Portfolio or on its behalf, is a party or by which it is bound or (2) the acceleration of any obligation, or the imposition of any penalty, under any Undertaking, judgment, or decree to which the Trust, with respect to Acquiring Portfolio or on its behalf, is a party or by which it is bound;
(b) No litigation, administrative proceeding, action, or investigation of or before any court, governmental body, or arbitrator is presently pending or, to the Trust’s knowledge, threatened against the Trust, with respect to Acquiring Portfolio or any of its properties or assets attributable or allocable to Acquiring Portfolio, that, if adversely determined, would materially and adversely affect Acquiring Portfolio’s financial condition or the conduct of its business; and the Trust, on Acquiring Portfolio’s behalf, knows of no facts that might form the basis for the institution of any such litigation, proceeding, action, or investigation and is not a party to or subject to the provisions of any order, decree, judgment, or award of any court, governmental body, or arbitrator that materially and adversely affects Acquiring Portfolio’s business or the Trust’s ability to consummate the transactions contemplated hereby;
(c) Acquiring Portfolio’s Statements at and for the fiscal year (in the case of the Statement of Changes in Net Assets, for the two fiscal years) ended December 31, 2014, have been audited by PwC and are in accordance with GAAP; those Statements present fairly, in all material respects, Acquiring Portfolio’s financial condition at that date in accordance with GAAP and the
A-8
results of its operations and changes in its net assets for the period(s) then ended; and, to the Trust’s management’s best knowledge and belief, there are no known contingent liabilities of Acquiring Portfolio required to be reflected on a balance sheet (including the notes thereto) in accordance with GAAP at that date that are not disclosed therein;
(d) Since December 31, 2014, there has not been any material adverse change in Acquiring Portfolio’s financial condition, assets, liabilities, or business, other than changes occurring in the ordinary course of business, or any incurrence by Acquiring Portfolio of indebtedness maturing more than one year from the date that indebtedness was incurred; for purposes of this subparagraph, a decline in Acquiring Portfolio’s NAV due to declines in market values of securities Acquiring Portfolio holds, the discharge of Acquiring Portfolio’s liabilities, or the redemption of Acquiring Portfolio Shares by its shareholders will not constitute a material adverse change;
(e) All Returns of Acquiring Portfolio required by law to have been filed by the Effective Time (including any properly and timely filed extensions of time to file) will have been timely filed and are or will be correct in all material respects, and all federal and other taxes shown as due or required to be shown as due on those Returns will have been paid or provision will have been made for the payment thereof (except for amounts that alone or in the aggregate would not reasonably be expected to have a material adverse effect); to the best of the Trust’s knowledge, no such Return is currently under audit and no assessment has been asserted with respect to those Returns; and Acquiring Portfolio (1) is in compliance in all material respects with all applicable Regulations pertaining to (i) the reporting of dividends and other distributions on and redemptions of its shares, (ii) withholding in respect thereof, and (iii) shareholder basis reporting, (2) has withheld in respect of dividends and other distributions and paid to the proper taxing authorities all taxes required to be withheld, and (3) is not liable for any material penalties that could be imposed thereunder;
(f) Acquiring Portfolio is not classified as a partnership, and instead is classified as an association that is taxable as a corporation, for federal tax purposes and either has elected the latter classification by filing Form 8832 with the IRS or is a “publicly traded partnership” (as defined in section 7704(b)) that is treated as a corporation; Acquiring Portfolio is a “fund” (as defined in section 851(g)(2), eligible for treatment under section 851(g)(1)); Acquiring Portfolio has elected to be a RIC; for each taxable year of its operation (including its current taxable year (“current year”)), Acquiring Portfolio has met (and for the current year will meet) the requirements of Subchapter M for qualification and treatment as a RIC and has been (and for the current year will be) eligible to and has computed (and for the current year will compute) its federal income tax under section 852; Acquiring Portfolio will continue to meet all those requirements for the current year and intends to continue to do so, and to continue to be eligible to and to so compute its federal income tax, for succeeding taxable years; and
A-9
Acquiring Portfolio has no earnings and profits accumulated in any taxable year in which the provisions of Subchapter M did not apply to it; and
(g) All issued and outstanding Acquiring Portfolio Shares are, and at the Effective Time will be, duly and validly issued and outstanding, fully paid, and non-assessable by the Trust and have been offered and sold in every state and the District of Columbia in compliance in all material respects with applicable registration requirements of the 1933 Act and state securities laws; Acquiring Portfolio does not have outstanding any options, warrants, or other rights to subscribe for or purchase any Acquiring Portfolio Shares, nor are there outstanding any securities convertible into any Acquiring Portfolio Shares; and the Acquiring Portfolio Shares to be issued and delivered to Target, for the Shareholders’ accounts, pursuant to the terms hereof, (1) will have been duly authorized by the Trust and duly registered under the federal securities laws (and appropriate notices respecting them will have been duly filed under applicable state securities laws) at the Effective Time and (2) when so issued and delivered, will be duly and validly issued and outstanding Acquiring Portfolio Shares, fully paid and non-assessable by the Trust.
4.3 The Trust’s obligation to implement this Plan on each Portfolio’s behalf shall be subject to satisfaction of the following conditions at or before (and continuing through) the Effective Time:
(a) No governmental consents, approvals, or authorizations (collectively, “consents”) or filings are required under the 1933 Act, the Securities Exchange Act of 1934, as amended, the 1940 Act, or state securities laws, and no consents or orders of any court are required, for the Trust’s adoption and performance hereof, on either Portfolio’s behalf, except for (1) the Trust’s filing with the Commission of a registration statement on Form N-14 relating to the Acquiring Portfolio Shares issuable hereunder, and any supplement or amendment thereto, including therein a prospectus and proxy statement (“Registration Statement”), and a post-effective amendment to its registration statement on Form N-1A and (2) consents, filings, and orders that have been made or received or may be required after the Effective Time;
(b) The fair market value of the Acquiring Portfolio Shares each Shareholder receives will be approximately equal to the fair market value of its Target Shares it actually or constructively surrenders in exchange therefor;
(c) The Trust shall have called and held a meeting of Target’s shareholders to consider and act on this Plan and to take all other action necessary to obtain approval of the transactions contemplated hereby (“Shareholders Meeting”); and this Plan shall have been approved at that meeting (including any adjournments or postponements thereof);
(d) All necessary filings shall have been made with the Commission and state securities authorities, and no order or directive shall have been received that any other or further action is required to permit the Trust to carry out the
A-10
transactions contemplated hereby; the Registration Statement shall have become effective under the 1933 Act, no stop orders suspending the effectiveness thereof shall have been issued, and, to the Trust’s best knowledge, no investigation or proceeding for that purpose shall have been instituted or shall be pending, threatened, or contemplated under the 1933 Act or the 1940 Act; the Commission shall not have issued an unfavorable report with respect to the Reorganization under section 25(b) of the 1940 Act nor instituted any proceedings seeking to enjoin consummation of the transactions contemplated hereby under section 25(c) of the 1940 Act; and all consents, orders, and permits of federal, state, and local regulatory authorities (including the Commission and state securities authorities) the Trust deems necessary to permit consummation, in all material respects, of the transactions contemplated hereby shall have been obtained, except where failure to obtain same would not involve a risk of a material adverse effect on either Portfolio’s assets or properties; and
(e) At the Effective Time, no action, suit, or other proceeding shall be pending (or, to the Trust’s best knowledge, threatened to be commenced) before any court, governmental agency, or arbitrator in which it is sought to enjoin the performance of, restrain, prohibit, affect the enforceability of, or obtain damages or other relief in connection with, the transactions contemplated hereby.
5. EXPENSES
FMG LLC shall bear all the expenses of the Reorganization. Notwithstanding the foregoing, expenses shall be paid by the Portfolio directly incurring them if and to the extent that the payment thereof by another person would result in that Portfolio’s disqualification as a RIC.
6. TERMINATION
The Board may terminate or delay this Plan and abandon or postpone the transactions contemplated hereby, at any time before the Effective Time, if circumstances develop that, in its opinion, make proceeding with the Reorganization inadvisable for either Portfolio.
7. AMENDMENTS
The Board may amend, modify, or supplement this Plan at any time in any manner, notwithstanding Target’s shareholders’ approval hereof; provided that, following that approval, no such amendment, modification, or supplement shall have a material adverse effect on the Shareholders’ interests.
A-11
8. MISCELLANEOUS
8.1 This Plan shall be governed by and construed in accordance with the internal laws of the State of Delaware, without giving effect to principles of conflicts of laws; provided that, in the case of any conflict between those laws and the federal securities laws, the latter shall govern.
8.2 Nothing expressed or implied herein is intended or shall be construed to confer on or give any person, firm, trust, or corporation other than the Trust (on the Portfolios’ behalf) and its successors and assigns any rights or remedies under or by reason hereof.
8.3 Notice is hereby given that this instrument is adopted on behalf of the Trust’s trustees solely in their capacities as trustees, and not individually, and that the Trust’s obligations under this instrument are not binding on or enforceable against any of its trustees, officers, shareholders, or series other than the Portfolios but are only binding on and enforceable against the Trust’s property attributable to and held for the benefit of each respective Portfolio (“Portfolio’s Property”) and not its property attributable to and held for the benefit of any other series thereof. The Trust, in asserting any rights or claims hereunder on either Portfolio’s behalf, shall look only to the other Portfolio’s Property in settlement of those rights or claims and not to the property of any other series of the Trust or to those trustees, officers, or shareholders.
8.4 Any term or provision hereof that is invalid or unenforceable in any jurisdiction shall, as to that jurisdiction, be ineffective to the extent of that invalidity or unenforceability without rendering invalid or unenforceable the remaining terms and provisions hereof or affecting the validity or enforceability of any of the terms and provisions hereof in any other jurisdiction.
A-12
MORE INFORMATION ON STRATEGIES AND RISK FACTORS
Strategies
Changes in Investment Objectives and Principal Investment Strategies
Each Portfolio has its own investment objective(s), policies and strategies. There is no assurance that a Portfolio will achieve its investment objective. The investment objective of each Portfolio may be changed without shareholder approval. Except as otherwise noted, the investment policies and strategies of a Portfolio are not fundamental policies and may be changed without a shareholder vote. In addition, to the extent a Portfolio is new or is undergoing a transition (such as a rebalancing, or experiences large inflows or outflows) or takes a temporary defense position, it may not be pursuing its investment objective or executing its principal investment strategies.
80% Policies
Each Portfolio has a policy that it will invest at least 80% of its net assets, plus borrowings for investment purposes, in a particular type of investment connoted by its name. Each such policy is subject to change only upon at least sixty (60) days prior notice to shareholders of the affected Portfolio.
Indexing Strategy
The Index Portfolio seeks to track the total return performance (before fees and expenses) of a particular index. The Adviser to the Portfolio seeks to track the total return performance (before fees and expenses) of a particular index and does not utilize customary economic, financial or market analyses or other traditional investment techniques to manage the Portfolio. Rather, the Adviser employs a sampling technique in seeking to track the total return performance (before fees and expenses) of the index. A sampling technique strives to match the characteristics of a particular index without having to purchase every stock in that index by selecting a representative sample of securities for the Portfolio based on the characteristics of the index and the particular securities included therein. Such characteristics may include, industry weightings, market capitalizations return variability, and yields.
Underlying ETFs
The ETF Portfolio invests primarily in securities issued by ETFs. Accordingly, the ETF Portfolio’s performance depends upon a favorable allocation by the Manager among the Underlying ETFs as well as the ability of the Underlying ETFs to generate favorable performance. In general, ETFs are designed to provide investment results corresponding to an index of securities. ETFs may trade at relatively modest discounts and premiums to their net asset values. However, some ETFs have a limited operating history, and information is lacking regarding the actual performance and trading liquidity of these ETFs for extended periods or over complete market cycles. In
B-1
addition, there is no assurance that the listing requirements of the various exchanges on which ETFs trade will be met to continue listing on that exchange. If substantial market or other disruptions affecting ETFs occur in the future, the liquidity and value of the assets of the ETF Portfolio, and thus the value of the ETF Portfolio’s shares, also could be substantially and adversely affected.
Generally, a Portfolio’s investments in other investment companies are subject to statutory limitations in the 1940 Act, including in certain circumstances a prohibition against acquiring shares of another investment company if, immediately after such acquisition, the Portfolio and its affiliated persons (i) would hold more than 3% of such other investment company’s total outstanding shares, (ii) would have invested more than 5% of its total assets in such other investment company, or (iii) would have invested more than 10% of its total assets in investment companies. However, many ETFs have obtained exemptive relief from the SEC to permit other investment companies (such as the ETF Portfolio) to invest in their shares beyond the statutory limits, subject to certain conditions and pursuant to contractual arrangements between the ETFs and the investing funds. The ETF Portfolio may rely on these exemptive orders in investing in ETFs.
Additional Strategies
The following provides additional information regarding the principal investment strategies discussed in “Comparison of Investment Objectives, Policies and Strategies,” in the Proxy Statement/Prospectus and additional investment strategies that a Portfolio may employ in pursuing its investment objective. For further information about investment strategies, please see the Portfolios’ Statement of Additional Information.
Cash Management. A Portfolio may invest its uninvested cash in high-quality, short-term debt securities, including repurchase agreements and high-quality money market instruments, and also may invest uninvested cash in money market funds, including money market funds managed by the Manager. To the extent a Portfolio invests in a money market fund, it generally is not subject to the limits placed on investments in other investment companies. Generally, these securities offer less potential for gains than other types of securities.
Currency. A Portfolio may enter into foreign currency transactions for hedging and non-hedging purposes on a spot (i.e., cash) basis or through the use of derivatives. Forward foreign currency exchange contracts (“forward contract”) are a type of derivative that may be utilized by a Portfolio. A forward contract involves an obligation to purchase or sell a specific currency at a future date, which may be any fixed number of days from the date of the contract agreed upon by the parties, at a price set at the time of the contract. These contracts are principally traded in the interbank market conducted directly between currency traders (usually large, commercial banks) and their customers. A forward contract generally has no margin deposit requirement and no commissions are charged at any stage for trades. Investments in foreign currencies are subject to the risk that those currencies will decline in value relative to the U.S. dollar.
B-2
Derivatives. A Portfolio may use “derivative” instruments to hedge its portfolio against market, economic, currency, issuer and other risks, to gain or manage exposure to the markets, sectors and securities in which the Portfolio may invest and to other economic factors that affect the Portfolio’s performance (such as interest rate movements), to increase total return or income, to reduce transaction costs, to manage cash, and for other portfolio management purposes. In general terms, a derivative instrument is an investment contract the value of which is linked to (or is derived from), in whole or in part, the value of an underlying asset, reference rate or index (e.g., stocks, bonds, commodities, currencies, interest rates and market indexes). Certain derivative securities may have the effect of creating financial leverage by multiplying a change in the value of the asset underlying the derivative to produce a greater change in the value of the derivative security. This creates an opportunity for increased return but, at the same time, creates the possibility for greater loss (including the likelihood of greater volatility in the net asset value of the shares of a Portfolio). Futures and options contracts (including futures and options on individual securities and equity and bond market indexes and options on futures contracts), swaps and forward contracts, and structured securities, including forward currency contracts, are examples of derivatives in which a Portfolio may invest. A Portfolio that engages in derivatives transactions may maintain a significant percentage of its assets in cash and cash equivalent instruments, which may serve as margin or collateral for the Portfolio’s obligations under derivative transactions.
Equity Securities. A Portfolio may invest in equity securities. Equity securities may be bought on stock exchanges or in the over-the-counter market. Equity securities generally include common stock, preferred stock, warrants, securities convertible into common stock, securities of other investment companies and securities of real estate investment trusts.
Exchange Traded Funds. A Portfolio may invest in ETFs. ETFs are investment companies or other investment vehicles whose shares are listed and traded on U.S. stock exchanges or otherwise traded in the over-the-counter market and may be purchased and sold throughout the trading day based on their market price. Generally, each ETF seeks to track a securities index or a basket of securities that an “index provider” (such as Standard & Poor’s, Dow Jones, Russell or Morgan Stanley Capital International) selects as representative of a market, market segment, industry sector, country or geographic region. An ETF generally holds the same stocks or bonds as the index it tracks (or it may hold a representative sample of such securities). Accordingly, each ETF is designed so that its performance, before fees and expenses, will correspond closely with that of the index it tracks. By investing in a Portfolio that invests in ETFs, you will indirectly bear fees and expenses charged by the ETFs in which the Portfolio invests in addition to the Portfolio’s direct fees and expenses.
Generally, a Portfolio’s investments in other investment companies are subject to statutory limitations in the 1940 Act, including in certain circumstances a prohibition against acquiring shares of another investment company if, immediately after such acquisition, the Portfolio and its affiliated persons (i) would hold more than 3% of
B-3
such other investment company’s total outstanding shares, (ii) would have invested more than 5% of its total assets in such other investment company, or (iii) would have invested more than 10% of its total assets in investment companies. However, many ETFs have obtained exemptive relief from the SEC to permit other investment companies (such as the Portfolios) to invest in their shares beyond the statutory limits, subject to certain conditions and pursuant to contractual arrangements between the ETFs and the investing funds. A Portfolio may rely on these exemptive orders in investing in ETFs.
Foreign Securities. A Portfolio may invest in foreign securities, including securities of companies in emerging markets. Generally, foreign securities are issued by companies organized outside the U.S. or by foreign governments or international organizations, are traded primarily in markets outside the U.S., and are denominated in a foreign currency. Foreign securities may include securities of issuers in developing countries or emerging markets, which generally involve greater risk because the economic structures of these countries and markets are less developed and their political systems are less stable. In addition, foreign securities may include depositary receipts of foreign companies. American Depositary Receipts are receipts typically issued by an American bank or trust company that evidence underlying securities issued by a foreign corporation. European Depositary Receipts (issued in Europe) and Global Depositary Receipts (issued throughout the world) each evidence a similar ownership arrangement. Depositary receipts also may be convertible into securities of foreign issuers. These securities may not necessarily be denominated in the same currency as the securities into which they may be converted.
Futures. A Portfolio may purchase or sell futures contracts on individual securities or securities indexes. In purchasing a futures contract, the buyer agrees to purchase a specified underlying instrument at a specified future date. In selling a futures contract, the seller agrees to sell a specified underlying instrument at a specified future date. The price at which the purchase and sale will take place is fixed when the buyer and seller enter into the contract. Futures can be held until their delivery dates, or can be closed out before then if a liquid market is available. The value of a futures contract tends to increase and decrease in tandem with the value of its underlying instrument. Therefore, purchasing futures contracts will tend to increase a fund’s exposure to positive and negative price fluctuations in the underlying instrument, much as if it had purchased the underlying instrument directly. When a fund sells a futures contract, by contrast, the value of its futures position will tend to move in a direction contrary to the market. Selling futures contracts, therefore, will tend to offset both positive and negative market price changes, much as if the underlying instrument had been sold. Futures contracts in which the Portfolio will invest are highly standardized contracts that typically trade on futures exchanges.
There is no assurance that a liquid market will exist for any particular futures contract at any particular time. Exchanges may establish daily price fluctuation limits for futures contracts, and may halt trading if a contract’s price moves upward or downward more than the limit in a given day. On volatile trading days when the price
B-4
fluctuation limit is reached or a trading halt is imposed, it may be impossible to enter into new positions or close out existing positions. If the market for a contract is not liquid because of price fluctuation limits or other market conditions, it could prevent prompt liquidation of unfavorable positions, and potentially could require a fund to continue to hold a position until delivery or expiration regardless of changes in its value. As a result, a fund’s access to other assets held to cover its futures positions could also be impaired.
The use of futures contracts and similar instruments may be deemed to involve the use of leverage because the Portfolio is not required to invest the full market value of the futures contract upon entering into the contract. Instead, the Portfolio, upon entering into a futures contract (and to maintain its open position in a futures contract), is required to post collateral for the contract, known as “initial margin” and “variation margin,” the amount of which may vary but which generally equals a relatively small percentage (e.g., less than 5%) of the value of the contract being traded.
Illiquid Securities. A Portfolio may invest up to 15% of its net assets in illiquid securities. Illiquid securities are securities that have no ready market.
Large-Cap Companies. A Portfolio may invest in the securities of large-cap companies. These companies may be unable to respond quickly to new competitive challenges such as changes in technology and consumer tastes.
Mid-Cap, Small-Cap and Micro-cap Companies. A Portfolio may invest in the securities of mid-, small- and micro-cap companies. These companies are more likely than larger companies to have limited product lines, markets or financial resources or to depend on a small, inexperienced management group. Generally, they are more vulnerable than larger companies to adverse business or economic developments and their securities may be less well-known, trade less frequently and in more limited volume than the securities of larger more established companies.
Options. A Portfolio may write and purchase put and call options, including exchange-traded or over-the-counter put and call options on securities indices and put and call options on ETFs tracking certain securities indices, for hedging and non-hedging purposes and for the purpose of achieving its objective. In general, options give the purchaser the right, but not the obligation, to buy or sell in the future an asset at a predetermined price during the term of the option. A securities index option and an ETF option are option contracts whose values are based on the value of a securities index at some future point in time. A securities index fluctuates with changes in the market values of the securities included in the index. The effectiveness of purchasing or writing securities index options will depend upon the extent to which price movements in the Portfolio’s investment portfolio correlate with price movements of the securities index. By writing (selling) a call option, the Portfolio forgoes, in exchange for the premium less the commission, the opportunity to profit during the option period from an increase in the market value of an index above the exercise price. By writing (selling) a put option, the Portfolio, in exchange for the net premium received, accepts the risk of a decline in the market value of the index below the exercise price.
B-5
Portfolio Turnover. The Portfolios do not restrict the frequency of trading to limit expenses. The Portfolios may engage in active and frequent trading of portfolio securities to achieve their investment objectives. Frequent trading can result in a portfolio turnover in excess of 100% (high portfolio turnover).
Short Sales. A Portfolio may engage in short sales and may enter into derivative contracts that have a similar economic effect (e.g., taking a short position in a futures contract). A “short sale” is the sale by a portfolio of a security that has been borrowed from a third party on the expectation that the market price will drop. If the price of the security drops, the Portfolio will make a profit by purchasing the security in the open market at a lower price than at which it sold the security. If the price of the security rises, the Portfolio may have to cover short positions at a higher price than the short sale price, resulting in a loss. In addition, because a Portfolio’s potential loss on a short sale arises from increases in the value of the security sold short, the extent of such loss, like the price of the security sold short, is theoretically unlimited.
Swaps. A Portfolio may engage in swap transactions. Swap contracts are derivatives in the form of a contract or other similar instrument that is an agreement to exchange the return generated by one instrument for the return generated by another instrument. The payment streams are calculated by reference to a specified security or index and agreed upon notional amount. The term “specified index” includes, but is not limited to, currencies, fixed interest rates, prices and total return on interest rate indices, fixed income indices, total return on equity securities, stock indices and commodity indices (as well as amounts derived from arithmetic operations on these indices).
Temporary Defensive Investments. For temporary defensive purposes in response to adverse market, economic, political or other conditions the ETF Portfolio may invest, without limit, in cash, money market instruments or high quality short-term debt securities, including repurchase agreements. To the extent the ETF Portfolio is invested in these instruments, the Portfolio will not be pursuing its investment goal.
U.S. Government Securities. A Portfolio may invest in U.S. government securities, which include direct obligations of the U.S. Treasury (such as Treasury bills, notes or bonds) and obligations issued or guaranteed as to principal and interest (but not as to market value) by the U.S. government, its agencies or its instrumentalities. U.S. government securities include mortgage-backed securities issued or guaranteed by government agencies or government-sponsored enterprises. Other U.S. government securities may be backed by the full faith and credit of the U.S. government or supported primarily or solely by the creditworthiness of the government-related issuer or, in the case of mortgage-backed securities, by pools of assets.
In August 2011, S&P downgraded its long-term sovereign credit rating on the U.S. from “AAA” to “AA+”. The downgrade by S&P could lead to subsequent downgrades by S&P or downgrades by other credit rating agencies. Both Fitch and Moody’s, which currently have assigned their highest credit ratings to the U.S., have a negative outlook for those credit ratings. These developments, and the government’s
B-6
credit concerns in general, could cause an increase in interest rates and borrowing costs, which may negatively impact both the perception of credit risk associated with the debt securities issued by the U.S. and the country’s ability to access the debt markets on favorable terms. In addition, these developments could create broader financial turmoil and uncertainty, which could increase volatility in both stock and bond markets. These events could result in significant adverse impacts on issuers of securities held by a Portfolio.
Risks
Risk is the chance that you will lose money on your investment or that it will not earn as much as you expect. In general, the greater the risk, the more money your investment can earn for you and the more you can lose. Like other investment companies, the value of a Portfolio’s shares may be affected by the Portfolio’s investment objective(s), principal investment strategies and particular risk factors. Consequently, each Portfolio may be subject to different risks. Some of the risks, including principal risks, of investing in the Portfolios are discussed below. However, other factors may also affect a Portfolio’s investment results. There is no guarantee that a Portfolio will achieve its investment objective(s) or that it will not lose value.
General Investment Risks: Each Portfolio is subject to the following risks:
Adviser Selection Risk: The risk that the Manager’s process for selecting or replacing an Adviser and its decision to select or replace an Adviser does not produce the intended results.
Asset Class Risk: There is the risk that the returns from the asset classes, or types of securities in which a Portfolio invests will underperform the general securities markets or different asset classes. Different asset classes tend to go through cycles of outperformance and underperformance in comparison to each other and to the general securities markets.
Insurance Fund Risk: The Portfolios are available through Contracts offered by insurance company affiliates of the Manager, and the Portfolios may be used to fund all or a portion of certain benefits and guarantees available under the Contracts. To the extent the assets in a Portfolio are insufficient to fund those benefits and guarantees, the Manager’s insurance company affiliates might otherwise be obligated to fulfill them out of their own resources. The Manager may be subject to potential conflicts of interest in connection with providing advice to, or developing strategies and models used to manage, a Portfolio (e.g., with respect to the allocation of assets among Underlying Portfolios or between passively and actively managed portions of a Portfolio and the development and implementation of the models used to manage a Portfolio). The performance of a Portfolio may impact the obligations and financial exposure of the Manager’s insurance company affiliates under any death benefit, income benefit and other
B-7
guarantees provided through Contracts that offer the Portfolio as an investment option and the ability of an insurance company affiliate to manage (e.g., through the use of various hedging techniques) the risks associated with these benefits and guarantees. The Manager’s investment decisions and the design of the Portfolios may be influenced by these factors. For example, the Portfolios or models and strategies may be managed or designed in a manner (e.g., using more conservative or less volatile investment styles, including volatility management strategies) that could reduce potential losses and/or mitigate financial risks to insurance company affiliates that provide the benefits and guarantees and offer the Portfolios as investment options in their products, and also could facilitate such an insurance company’s ability to provide benefits and guarantees under its Contracts, including by making more predictable the costs of the benefits and guarantees and by reducing the regulatory capital needed to provide them. The performance of a Portfolio also may adversely impact the value of Contracts that offer the Portfolio as an investment option and could suppress the value of the benefits and guarantees offered under a Contract. Please refer to your Contract prospectus for more information about any benefits and guarantees offered under the Contract. Consistent with its fiduciary duties, the Manager seeks to implement each Portfolio’s investment program in a manner that is in the best interests of the Portfolio and that is consistent with the Portfolio’s investment objective, policies and strategies described in detail in this Prospectus.
Issuer-Specific Risk: The value of an individual security or particular type of security can be more volatile than the market as a whole and can perform differently from the market as a whole. The value of a security may decline for a number of reasons which directly relate to the issuer, such as management performance, financial leverage and reduced demand for the issuer’s goods or services, as well as the historical and prospective earnings of the issuer and the value of its assets. A change in the financial condition of a single issuer may affect securities markets as a whole. Certain unanticipated events, such as natural disasters, can have a dramatic adverse effect on the value of an issuer’s securities.
Large Shareholder Risk: A significant percentage of a Portfolio’s shares may be owned or controlled by the Manager and its affiliates, other Portfolios that are advised by the Manager (including funds of funds), or other large shareholders, including primarily insurance company separate accounts and qualified plans. Accordingly, a Portfolio is subject to the potential for large-scale inflows and outflows as a result of purchases and redemptions of its shares by such shareholders, including in connection with substitution and other transactions by affiliates of the Manager. These inflows and outflows may be frequent and could negatively affect a Portfolio’s net asset value and performance and could cause a Portfolio to purchase or sell securities at a time when it would not normally do so. It would be particularly disadvantageous for a Portfolio if it experiences outflows and
B-8
needs to sell securities at a time of volatility in the markets, when values could be falling. These inflows and outflows also could negatively affect a Portfolio’s ability to meet shareholder redemption requests or could limit a Portfolio’s ability to pay redemption proceeds within the time period stated in its prospectus because of unusual market conditions, an unusually high volume of redemption requests, or other reasons. In addition, these inflows and outflows could increase a Portfolio’s brokerage or other transaction costs, and large-scale outflows could cause a Portfolio’s actual expenses to increase, or could result in a Portfolio’s current expenses being allocated over a smaller asset base, leading to an increase in the Portfolio’s expense ratio.
Market Risk: The risk that the securities markets will move down, sometimes rapidly and unpredictably based on overall economic conditions and other factors. The value of a security may decline due to general market conditions which are not specifically related to a particular company, such as real or perceived adverse economic conditions, changes in the general outlook for corporate earnings, changes in interest or currency rates or adverse investment sentiment generally. Changes in the financial condition of a single issuer can impact a market as a whole. The value of a security may also decline due to factors which affect a particular industry or industries, such as labor shortages or increased production costs and competitive conditions within an industry. During a general downturn in the securities markets, multiple asset classes may decline in value simultaneously. Terrorism and related geo-political risks have led, and may in the future lead, to increased short-term market volatility and may have adverse long-term effects on world economies and markets generally. In addition, markets and market-participants are increasingly reliant upon both publicly available and proprietary information data systems. Data imprecision, software or other technology malfunctions, programming inaccuracies, unauthorized use or access, and similar circumstances may impair the performance of these systems and may have an adverse impact upon a single issuer, a group of issuers, or the market at-large. In certain cases, an exchange or market may close or issue trading halts on either specific securities or even the entire market, which may result in a Portfolio being, among other things, unable to buy or sell certain securities or financial instruments or accurately price its investments.
Portfolio Management Risk: The risk that strategies used by the Manager or the Adviser and their securities selections fail to produce the intended results.
Recent Market Conditions Risk: The financial crisis in the U.S. and many foreign economies over the past several years, including the European sovereign debt and banking crises, has resulted, and may continue to result, in an unusually high degree of volatility in the financial markets, both domestic and foreign, and in the net asset values of many mutual funds,
B-9
including to some extent the Portfolios. The values of some sovereign debt and of securities of issuers that hold that sovereign debt have fallen. Conditions in the U.S. and many foreign economies have resulted, and may continue to result, in fixed income instruments experiencing unusual liquidity issues, increased price volatility and, in some cases, credit downgrades and increased likelihood of default. These events have reduced the willingness and ability of some lenders to extend credit, and have made it more difficult for borrowers to obtain financing on attractive terms, if at all. In some cases, traditional market participants have been less willing to make a market in some types of debt instruments, which has affected the liquidity of those instruments. As a result, the values of many types of securities, including, but not limited to, mortgage-backed, asset-backed, and corporate debt securities, have been reduced. During times of market turmoil, investors tend to look to the safety of securities issued or backed by the U.S. Treasury, causing the prices of these securities to rise and the yields to decline.
The reduced liquidity in fixed income and credit markets may negatively affect many issuers worldwide. In addition, global economies and financial markets are becoming increasingly interconnected, which increases the possibilities that conditions in one country or region might adversely impact issuers in a different country or region. In response to the crisis, the U.S. and other governments and the Federal Reserve and certain foreign central banks have taken steps to support financial markets. Where economic conditions are recovering, they are nevertheless perceived as still fragile. Withdrawal of government support, failure of efforts in response to the crisis, or investor perception that such efforts are not succeeding, could adversely impact the value and liquidity of certain securities. The severity or duration of adverse economic conditions may also be affected by policy changes made by governments or quasi-governmental organizations, including changes in tax laws. In particular, the impact of U.S. financial regulation legislation on the markets and the practical implications for market participants may not be fully known for some time. In addition, political events within the U.S. and abroad, such as the U.S. government’s recent inability to agree on a long-term budget and deficit reduction plan, the federal government shutdown and threats to not increase the federal government’s debt limit, may affect investor and consumer confidence and may adversely impact financial markets and the broader economy, perhaps suddenly and to a significant degree. High public debt in the U.S. and other countries creates ongoing systemic and market risks and policymaking uncertainty. Although the U.S. government has honored its credit obligations, it remains possible that the United States could default on its obligations. While it is impossible to predict the consequences of such an unprecedented event, it is likely that a default by the United States would be highly disruptive to the United States and global securities markets and could significantly impair the value of a Portfolio’s investments. Uncertainty surrounding the sovereign debt of a number of
B-10
European Union countries and the viability of the European Union have disrupted and may continue to disrupt markets in the U.S. and around the world. If one or more countries leave the European Union or the European Union dissolves, the world’s securities markets likely will be significantly disrupted. Because the situation in the markets is widespread, it may be difficult to identify both risks and opportunities using past models of the interplay of market forces, or to predict the duration of these market conditions. Changes in market conditions will not have the same impact on all types of securities.
As indicated in “Comparison of Principal Risk Factors,” a Portfolio may be subject to the following as principal risks. In addition, to the extent a Portfolio invests in a particular type of investment, it will be subject to the risks of such investment as described below:
Cash Management Risk: Upon entering into certain derivatives contracts, such as futures contracts, and to maintain open positions in certain derivatives contracts, the Portfolio may be required to post collateral for the contract, the amount of which may vary. As such, the Portfolio may maintain cash balances, including foreign currency balances, which may be significant, with counterparties such as the Trust’s custodian or its affiliates. The Portfolio is thus subject to counterparty risk and credit risk with respect to these arrangements.
Derivatives Risk: A derivative instrument is an investment contract the value of which is linked to (or is derived from), in whole or in part, the value of an underlying asset, reference rate, index or event (e.g., stocks, bonds, commodities, currencies, interest rates and market indexes). Derivatives include options, swaps, futures, options on futures, forward contracts and structured securities. Investing in derivatives involves investment techniques and risks different from those associated with ordinary mutual fund securities transactions and may involve increased transaction costs. The successful use of derivatives will usually depend on the Manager’s or an Adviser’s ability to accurately forecast movements in the market relating to the underlying asset, reference rate, index or event. If the Manager or an Adviser does not predict correctly the direction of securities prices, interest rates and other economic factors, a Portfolio’s derivatives position could lose value. A Portfolio’s investment in derivatives may rise or fall more rapidly in value than other investments and may reduce the Portfolio’s returns. Changes in the value of the derivative may not correlate perfectly, or at all, with the underlying asset, reference rate or index, and a Portfolio could lose more than the principal amount invested. Derivatives also may be subject to certain other risks such as leveraging risk, liquidity risk, interest rate risk, market risk, credit risk, the risk that a counterparty may be unable or unwilling to honor its obligations, management risk and the risk of mispricing or improper valuation. Derivatives also may not behave as anticipated by a Portfolio, especially in abnormal market conditions. The use of derivatives may increase the volatility of a Portfolio’s net asset value. Derivatives may be leveraged such that a small investment in derivative securities can have a significant impact on a Portfolio’s exposure to stock market values, interest
B-11
rates, currency exchange rates or other investments. As a result, a relatively small price movement in a derivatives contract may cause an immediate and substantial loss or gain. It may be difficult or impossible for a Portfolio to purchase or sell certain derivatives in sufficient amounts to achieve the desired level of exposure, which may result in a loss or may be costly to the Portfolio. In addition, the possible lack of a liquid secondary market for certain derivatives and the resulting inability of a Portfolio to sell or otherwise close-out a derivatives position could expose the Portfolio to losses and could make such derivatives more difficult for the Portfolio to value accurately. Assets segregated to cover these transactions may decline in value and may become illiquid. Some derivatives are more sensitive to market price fluctuations and to interest rate changes than other investments. A Portfolio also could suffer losses related to its derivatives positions as a result of unanticipated market movements, which losses are potentially unlimited. A Portfolio also may be exposed to losses if the counterparty in the transaction does not fulfill its contractual obligation. In addition, derivatives traded over-the-counter do not benefit from the protections provided by exchanges in the event that a counterparty is unable to fulfill its contractual obligation. Such over-the-counter derivatives therefore involve greater counterparty and credit risk and may be more difficult to value than exchange-traded derivatives. When a derivative is used as a hedge against a position that a Portfolio holds, any loss generated by the derivative should generally be offset by gains on the hedged instrument, and vice versa. While hedging can reduce or eliminate losses, it also can reduce or eliminate gains. Hedges are sometimes subject to imperfect matching between the derivative and the hedged investment, and there can be no assurance that a Portfolio’s hedging transactions will be effective. Also, suitable derivative transactions may not be available in all circumstances. There can be no assurance that a Portfolio will engage in derivative transactions to reduce exposure to other risks when that might be beneficial. The federal income tax treatment of a derivative may not be as favorable as a direct investment in an underlying asset and may adversely affect the timing, character and amount of income a Portfolio realizes from its investments. As a result, a larger portion of a Portfolio’s distributions may be treated as ordinary income rather than capital gains. In addition, certain derivatives are subject to mark-to-market or straddle provisions of the Internal Revenue Code. If such provisions are applicable, there could be an increase (or decrease) in the amount of taxable dividends paid by a Portfolio. There have been numerous recent legislative and regulatory initiatives to implement a new regulatory framework for the derivatives markets. The Dodd-Frank Wall Street Reform and Consumer Protection Act (“Dodd-Frank Act”) substantially increased regulation of the over-the-counter derivatives market and participants in that market, imposing various requirements on transactions involving instruments that fall within the Dodd-Frank Act’s definition of “swap” and “security-based swap.” In particular, the Dodd-Frank Act may limit the availability of certain derivatives, may make the use of derivatives by a Portfolio more costly, and may otherwise adversely impact the performance and value of derivatives. Under the Dodd-Frank Act, a Portfolio also may be subject to additional recordkeeping and reporting requirements. In addition, the tax treatment of certain derivatives, such as swaps, is unsettled and may be subject to future legislation, regulation or administrative pronouncements issued by
B-12
the Internal Revenue Service. Other future regulatory developments may also impact a Portfolio’s ability to invest or remain invested in certain derivatives. Legislation or regulation may also change the way in which a Portfolio itself is regulated. The Manager cannot predict the effects of any new governmental regulation that may be implemented on the ability of a Portfolio to use swaps or any other financial derivative product, and there can be no assurance that any new governmental regulation will not adversely affect a Portfolio’s ability to achieve its investment objective.
Dividend Risk: Dividends a Portfolio receives on common stocks are not fixed but are declared at the discretion of an issuer’s board of directors. There is no guarantee that the companies in which a Portfolio invests will declare dividends in the future or that if declared they will remain at current levels or increase over time. A portion of the distributions that a Portfolio receives may be a return of capital.
Equity Risk: In general, stocks and other equity security values fluctuate, and sometimes widely fluctuate, in response to changes in a company’s financial condition as well as general market, economic and political conditions and other factors. Equity securities generally have greater price volatility than fixed-income securities.
Exchange Traded Funds Risk: A Portfolio that invests in ETFs will indirectly bear fees and expenses charged by those ETFs, in addition to the Portfolio’s direct fees and expenses. The cost of investing in the Portfolio, therefore, may be higher than the cost of investing in a mutual fund that invests directly in individual stocks and bonds. In addition, the Portfolio’s net asset value will be subject to fluctuations in the market values of the ETFs in which it invests. The Portfolio is also subject to the risks associated with the securities in which the ETFs invest and the ability of the Portfolio to meet its investment objective will directly depend on the ability of the ETFs to meet their investment objectives. The Portfolio and the ETFs are subject to certain general investment risks, including market risk, asset class risk, issuer-specific risk, investment style risk and portfolio management risk. In addition, to the extent a Portfolio invests in ETFs that invest in equity securities, fixed income securities and/or foreign securities, the Portfolio is subject to the risks associated with investing in such securities such as equity risk, market capitalization risk, investment grade securities risk, interest rate risk, credit/default risk, foreign and emerging markets securities risk and lower-rated securities risk. The extent to which the investment performance and risks associated with the Portfolio correlates to those of a particular ETF will depend upon the extent to which the Portfolio’s assets are allocated from time to time for investment in the ETF, which will vary. ETFs may change their investment objectives or policies without the approval of the Portfolio. If that were to occur, the Portfolio might be forced to sell its investment in an ETF at a time and price that is unfavorable to the Portfolio. In addition, many ETFs invest in securities included in, or representative of, underlying indexes regardless of investment merit or market trends and, therefore, these ETFs do not change their investment strategies to respond to changes in the economy, which means that an ETF may be particularly susceptible to a general decline in the market segment relating to the relevant index. Imperfect correlation between an ETF’s securities and those in the index it seeks to
B-13
track, rounding of prices, changes to the indices and regulatory policies may cause an ETF’s performance to not match the performance of its index. An ETF’s use of a representative sampling approach will result in it holding a smaller number of securities than are in the index it seeks to track. As a result, an adverse development respecting an issuer of securities held by the ETF could result in a greater decline in net asset value than would be the case if the ETF held all of the securities in the index. To the extent the assets in the ETF are smaller, these risks will be greater. No ETF fully replicates its index and an ETF may hold securities not included in its index. Therefore, there is a risk that the investment strategy of the ETF manager may not produce the intended results. Moreover, there is the risk that an ETF may value certain securities at a higher price than it can sell them for. Secondary market trading in shares of ETFs may be halted by a national securities exchange because of market conditions or for other reasons. In addition, trading in these shares is subject to trading halts caused by extraordinary market volatility pursuant to “circuit breaker” rules. There can be no assurance that the requirements necessary to maintain the listing of the shares will continue to be met or will remain unchanged. In addition, although ETFs are listed for trading on national securities exchanges, certain foreign exchanges and in over-the-counter markets, there can be no assurance that an active trading market for such shares will develop or be maintained, in which case the liquidity and value of a Portfolio’s investment in the ETFs could be substantially and adversely affected. In addition, because ETFs are traded on these exchanges and in these markets, the purchase and sale of their shares involve transaction fees and commissions. The market price of an ETF may be different from the net asset value of such ETF (i.e., an ETF may trade at a discount or premium to its net asset value). The performance of a Portfolio that invests in such an ETF could be adversely impacted.
Foreign Securities Risk: Investments in foreign securities, including depositary receipts, involve risks not associated with, or more prevalent than those that may be associated with, investing in U.S. securities. The economies of certain foreign markets may not compare favorably with the economy of the United States with respect to such issues as growth of gross national product, reinvestment of capital, resources and balance of payments position. Over a given period of time, foreign securities may underperform U.S. securities — sometimes for years. A Portfolio could also underperform if it invests in countries or regions whose economic performance falls short. Foreign markets, particularly emerging markets, may be less liquid, more volatile and subject to less government supervision and regulation than domestic markets. Security values also may be negatively affected by changes in the exchange rates between the U.S. dollar and foreign currencies. Differences between U.S. and foreign legal, political and economic systems, regulatory regimes and market practices also may impact security values and it may take more time to clear and settle trades involving foreign securities. Securities issued by U.S. entities with substantial foreign operations can involve risks relating to conditions in foreign countries.
Currency Risk: Investments in foreign currencies and in securities that trade in, or receive revenues in, or in derivatives that provide exposure to foreign currencies are subject to the risk that those currencies will decline in
B-14
value relative to the U.S. dollar. Any such decline may erode or reverse any potential gains from an investment in securities denominated in foreign currency or may widen existing loss. In the case of hedging positions, there is the risk that the U.S. dollar will decline in value relative to the currency being hedged. Currency rates may fluctuate significantly over short periods of time for a number of reasons, including changes in interest rates, intervention (or the failure to intervene) by governments, central banks or supranational entities, or by the imposition of currency controls or other political developments in the U.S. or abroad.
Depositary Receipts Risk: Investments in depositary receipts (including American Depositary Receipts, European Depositary Receipts and Global Depositary Receipts) are generally subject to the same risks of investing in the foreign securities that they evidence or into which they may be converted. In addition, issuers underlying unsponsored depositary receipts may not provide as much information as U.S. issuers and issuers underlying sponsored depositary receipts. Unsponsored depositary receipts also may not carry the same voting privileges as sponsored depositary receipts.
Emerging Markets Risk: Emerging market countries generally are located in Asia, the Middle East, Eastern Europe, Central and South America and Africa. There are greater risks involved in investing in emerging market countries and/or their securities markets. Investments in these countries and/or markets may present market, credit, currency, liquidity, legal, political, technical and other risks different from, or greater than, the risks of investing in developed countries. For instance, these countries may be more likely than developed countries to experience rapid and significant adverse developments in their political or economic structures. Some emerging market countries restrict foreign investments, impose high withholding or other taxes on foreign investments, impose restrictive exchange control regulations, or may nationalize or expropriate the assets of private countries. Therefore, a Portfolio may be limited in its ability to make direct or additional investments in an emerging markets country or could lose the entire value of its investment in the affected market. Such restrictions also may have negative impacts on transaction costs, market price, investment returns and the legal rights and remedies of a Portfolio. In addition, the securities markets of emerging markets countries generally are smaller, less liquid and more volatile than those of developed countries. Emerging market countries often have less uniformity in accounting and reporting requirements and less reliable clearance and settlement, registration and custodial procedures which could result in ownership registration being completely lost. There are generally higher commission rates on foreign portfolio transactions, transfer taxes, and higher custodial costs. A Portfolio may not know the identity of trading counterparties, which may increase the possibility of the Portfolio not receiving payment or delivery of securities in a transaction. Emerging market countries also may be subject to high inflation and rapid
B-15
currency devaluations and currency-hedging techniques may be unavailable in certain emerging market countries. In addition, some emerging market countries may be heavily dependent on international trade, which can materially affect their securities markets. The risks associated with investing in a narrowly defined geographic area also generally are more pronounced with respect to investments in emerging market countries. Investments in frontier markets may be subject to greater levels of these risks than investments in more developed and traditional emerging markets.
European Economic Risk: The European Union’s (the “EU”) Economic and Monetary Union (the “EMU”) requires Euro zone countries to comply with restrictions on interest rates, deficits, debt levels, and inflation rates, and other factors, each of which may significantly impact every European country and their economic partners. The economies of EU member countries and their trading partners may be adversely affected by changes in the euro’s exchange rate, changes in EU or governmental regulations on trade and other areas, and the threat of default or default by an EU member country on its sovereign debt, which could negatively impact a Portfolio’s investments and cause it to lose money. Recently, the European financial markets have been negatively impacted by rising government debt levels; possible default on or restructuring of sovereign debt in several European countries, including Cyprus, Greece, Ireland, Italy, Portugal and Spain; and economic downturns. European country’s default or debt restructuring would adversely affect the holders of the country’s debt and sellers of credit default swaps linked to the country’s creditworthiness and could negatively impact global markets more generally. Recent events in Europe may adversely affect the euro’s exchange rate and value and may continue to impact the economies of every European country and their economic partners. In addition, one or more countries may abandon the euro, the common currency of the European Union, and/or withdraw from the European Union. The impact of these actions, especially if they occur in a disorderly fashion, is not clear but could be significant and far reaching.
Geographic Concentration Risk: A Portfolio that invests a significant portion of its assets in securities of companies domiciled, or exercising the predominant part of their economic activity, in one country or geographic region assumes the risk that economic, political, social and environmental conditions in that particular country or region will have a significant impact on the Portfolio’s investment performance and that the Portfolio’s performance will be more volatile than the performance of more geographically diversified funds. The economies and financial markets of certain regions can be highly interdependent and may decline all at the same time. In addition, certain areas are prone to natural disasters such as earthquakes, volcanoes, droughts or tsunamis and are economically sensitive to environmental events.
International Fair Value Pricing Risk: A Portfolio that invests in foreign securities is subject to the risk that its share price may be exposed to arbitrage attempts by investors seeking to capitalize on differences in the
B-16
values of foreign securities trading on foreign exchanges that may close before the time the Portfolio’s net asset value is determined. If such arbitrage attempts are successful, the Portfolio’s net asset value might be diluted. A Portfolio’s use of fair value pricing in certain circumstances (by adjusting the closing market prices of foreign securities to reflect what the Board of Trustees believes to be their fair value) may help deter such arbitrage activities. The effect of such fair value pricing is that foreign securities may not be priced on the basis of quotations from the primary foreign securities market in which they are traded, but rather may be priced by another method that the Board of Trustees believes reflects fair value. As such, fair value pricing is based on subjective judgment and it is possible that fair value may differ materially from the value realized on a sale of a foreign security. It is also possible that use of fair value pricing will limit an investment adviser’s ability to implement a Portfolio’s investment strategy (e.g., reducing the volatility of the Portfolio’s share price) or achieve its investment objective.
Political/Economic Risk: Changes in economic and tax policies, government instability, war or other political or economic actions or factors may have an adverse effect on a Portfolio’s foreign investments.
Regulatory Risk: Less information may be available about foreign companies. In general, foreign companies are not subject to uniform accounting, auditing and financial reporting standards or to other regulatory practices and requirements as are U.S. companies. Many foreign governments do not supervise and regulate stock exchanges, brokers and the sale of securities to the same extent as does the United States and may not have laws to protect investors that are comparable to U.S. securities laws. In addition, some countries may have legal systems that may make it difficult for the Portfolio to vote proxies, exercise shareholder rights, and pursue legal remedies with respect to its foreign investments.
Settlement Risk: Settlement and clearance procedures in certain foreign markets differ significantly from those in the United States. Foreign settlement and clearance procedures and trade regulations also may involve certain risks (such as delays in payment for or delivery of securities) not typically associated with the settlement of U.S. investments. At times, settlements in certain foreign countries have not kept pace with the number of securities transactions. These problems may make it difficult for a Portfolio to carry out transactions. If a Portfolio cannot settle or is delayed in settling a purchase of securities, it may miss attractive investment opportunities and certain of its assets may be uninvested with no return earned thereon for some period. If a Portfolio cannot settle or is delayed in settling a sale of securities, it may lose money if the value of the security then declines or, if it has contracted to sell the security to another party, the Portfolio could be liable for any losses incurred.
B-17
Transaction Costs Risk: The costs of buying and selling foreign securities, including tax, brokerage and custody costs, generally are higher than those involving domestic transactions.
Futures Contract Risk: The primary risks associated with the use of futures contracts are (a) the imperfect correlation between the change in market value of the instruments held by a Portfolio and the price of the futures contract; (b) liquidity risks, including the possible absence of a liquid secondary market for a futures contract and the resulting inability to close a futures contract when desired; (c) losses (potentially unlimited) caused by unanticipated market movements; (d) an adviser’s inability to predict correctly the direction of securities prices, interest rates, currency exchange rates and other economic factors; (e) the possibility that a counterparty, clearing member or clearinghouse will default in the performance of its obligations; (f) if a Portfolio has insufficient cash, it may have to sell securities from its portfolio to meet daily variation margin requirements, and the Portfolio may have to sell securities at a time when it may be disadvantageous to do so; and (g) transaction costs associated with investments in futures contracts may be significant, which could cause or increase losses or reduce gains.
Index Strategy Risk: A Portfolio that employs an index strategy generally invests in the securities included in the relevant index or a representative sample of such securities regardless of market trends to track the performance of an unmanaged index of securities, whereas actively managed portfolios typically seek to outperform a benchmark index. Such a Portfolio generally will not modify its index strategy to respond to changes in the economy, which means that it may be particularly susceptible to a general decline in the market segment relating to the relevant index. In addition, although the index strategy attempts to closely track its benchmark index, the Portfolio may not invest in all of the securities in the index. Also, the Portfolio’s fees and expenses will reduce the Portfolio’s returns, unlike those of the benchmark index. Cash flow into and out of the Portfolio, portfolio transaction costs, changes in the securities that comprise the index, and the Portfolio’s valuation procedures also may affect the Portfolio’s performance. Therefore, there can be no assurance that the performance of the index strategy will match that of the benchmark index.
Large-Cap Company Risk: Larger more established companies may be unable to respond quickly to new competitive challenges such as changes in technology and consumer tastes. Many larger companies also may not be able to attain the high growth rate of successful smaller companies, especially during extended periods of economic expansion.
Leveraging Risk: When a Portfolio leverages its holdings, the value of an investment in that Portfolio will be more volatile and all other risks will tend to be compounded. For example, a Portfolio may take on leveraging risk when it takes a short position, engages in derivatives transactions, invests collateral from securities loans or borrows money. Leveraged holdings generally require corresponding holdings of cash and cash equivalents, which may impair a Portfolio’s ability to pursue its objectives.
B-18
A Portfolio may experience leveraging risk in connection with investments in derivatives because its investments in derivatives may be purchased with a fraction of the assets that would be needed to purchase the securities directly, so that the remainder of the assets may be invested in other investments. Such investments may have the effect of leveraging a Portfolio because the Portfolio may experience gains or losses not only on its investments in derivatives, but also on the investments purchased with the remainder of the assets. If the value of a Portfolio’s investments in derivatives is increasing, this could be offset by declining values of the Portfolio’s other investments. Conversely, it is possible that the rise in the value of a Portfolio’s non-derivative investments could be offset by a decline in the value of the Portfolio’s investments in derivatives. In either scenario, a Portfolio may experience losses. In a market where the value of a Portfolio’s investments in derivatives is declining and the value of its other investments is declining, the Portfolio may experience substantial losses. The use of leverage may cause a Portfolio to liquidate portfolio positions when it may not be advantageous to do so to satisfy its obligations or to meet any required asset segregation requirements.
Liquidity Risk: The risk that certain investments may be difficult or impossible for a Portfolio to purchase or sell at an advantageous time or price or in sufficient amounts to achieve the desired level of exposure, which may result in a loss or may be costly to the Portfolio. Investments in foreign securities, particularly those of issuers located in emerging markets, tend to have greater exposure to liquidity risk than domestic securities. Judgment plays a greater role in pricing illiquid investments than it does in pricing investments having more active markets and there is a greater risk that the investments may not be sold for the price at which the Portfolio is carrying them. Certain securities that were liquid when purchased may later become illiquid, particularly in times of overall economic distress.
Mid-Cap, Small-Cap and Micro-Cap Company Risk: A Portfolio’s investments in mid-, small- and micro-cap companies may involve greater risks than investments in larger, more established issuers because they generally are more vulnerable than larger companies to adverse business or economic developments. Such companies generally have narrower product lines, more limited financial resources and more limited markets for their stock as compared with larger companies. Their securities may be less well-known and trade less frequently and in limited volume compared with the securities of larger, more established companies. As a result, the value of such securities may be more volatile than the securities of larger companies, and a Portfolio may experience difficulty in purchasing or selling such securities at the desired time and price or in the desired amount. Mid-, small- and micro-cap companies also are typically subject to greater changes in earnings and business prospects than larger companies. Consequently, the prices of mid-, small-and micro-cap company stocks tend to rise and fall in value more frequently than the stocks of larger companies. Although investing in mid- and small-cap companies offers potential for above-average returns, the companies may not succeed and the value of their stock could decline significantly. In general, these risks are greater for small-and micro-cap companies than for mid-cap companies.
B-19
Money Market Risk: Although a money market fund is designed to be a relatively low risk investment, it is not free of risk. Despite the short maturities and high credit quality of a money market portfolio’s investments, increases in interest rates and deteriorations in the credit quality of the instruments the portfolio has purchased may reduce the portfolio’s yield and can cause the price of a money market security to decrease. In addition, a money market portfolio is subject to the risk that the value of an investment may be eroded over time by inflation.
Portfolio Turnover Risk: High portfolio turnover (generally, turnover in excess of 100% in any given fiscal year) may result in increased transaction costs to a Portfolio, which may result in higher fund expenses and lower total return.
Repurchase Agreements Risk: A Portfolio may enter into repurchase agreements under which it purchases a security that a seller has agreed to repurchase from the Portfolio at a later date at the same price plus interest. If a seller defaults and the security declines in value, the Portfolio might incur a loss. If the seller declares bankruptcy, the Portfolio may not be able to sell the security at the desired time.
Risk Management: The Manager and the Adviser undertake certain analyses with the intention of identifying particular types of risks and reducing a Portfolio’s exposure to them. However, risk is an essential part of investing, and the degree of return an investor might expect is often tied to the degree of risk the investor is willing to accept. By its very nature, risk involves exposure to the possibility of adverse events. Accordingly, no risk management program can eliminate a Portfolio’s exposure to such events; at best, it can only reduce the possibility that the Portfolio will be affected by adverse events, and especially those risks that are not intrinsic to the Portfolio’s investment program. While the prospectus describes material risk factors associated with a Portfolio’s investment program, there is no assurance that as a particular situation unfolds in the markets, the Manager or Adviser will identify all of the risks that might affect the Portfolio, rate their probability or potential magnitude correctly, or be able to take appropriate measures to reduce the Portfolio’s exposure to them. Measures taken with the intention of decreasing exposure to identified risks might have the unintended effect of increasing exposure to other risks.
Securities Lending Risk: For purposes of realizing additional income, a Portfolio may lend securities to broker-dealers approved by the Board of Trustees. Generally, any such loan of portfolio securities will be continuously secured by collateral at least equal to the value of the security loaned. Such collateral will be in the form of cash, marketable securities issued or guaranteed by the U.S. Government or its agencies, or a standby letter of credit issued by qualified banks. The risks in lending portfolio securities, as with other extensions of secured credit, consist of possible delay in receiving additional collateral or in the recovery of the securities or possible loss of rights in the collateral should the borrower fail financially. Loans will only be made to firms deemed by the Manager to be of good standing and for Portfolios that have Advisers, will not be made unless, in the judgment of the Adviser, the consideration to be earned from such loans would justify the risk.
B-20
Securities Selection Risk: The securities selected for a Portfolio may not perform as well as other securities that were not selected for a Portfolio. As a result, a Portfolio may underperform the markets, its benchmark index(es) or other funds with the same objective or in the same asset class.
Short Position Risk: A Portfolio may engage in short sales and may enter into derivative contracts that have a similar economic effect (e.g., taking a short position in a futures contract). A Portfolio will incur a loss as a result of a short position if the price of the asset sold short increases in value between the date of the short position sale and the date on which an offsetting position is purchased, plus any premiums or interest paid to the third party. Short positions may be considered speculative transactions and involve special risks that could increase losses or reduce gains. Short sales involve greater reliance on the investment adviser’s ability to accurately anticipate the future value of a security or instrument, potentially higher transaction costs, and imperfect correlation between the actual and desired level of exposure. Because a Portfolio’s potential loss on a short position arises from increases in the value of the asset sold short, the extent of such loss, like the price of the asset sold short, is theoretically unlimited. By investing the proceeds received from selling securities short, a Portfolio could be deemed to be employing a form of leverage, which creates special risks. A Portfolio’s long positions could decline in value at the same time that the value of the short positions increase, thereby increasing the Portfolio’s overall potential for loss more than it would be without the use of leverage. Market factors may prevent a Portfolio from closing out a short position at the most desirable time or at a favorable price. When a Portfolio is selling stocks short, it must maintain a segregated account of cash or high-grade securities equal to the margin requirement. As a result, a Portfolio may maintain high levels of cash or liquid assets (such as U.S. Treasury bills, money market accounts, repurchase agreements, certificates of deposit, high quality commercial paper and long equity positions) or may utilize borrowings or the collateral obtained from securities lending for this cash. The need to maintain cash or other liquid assets in segregated accounts could limit a Portfolio’s ability to pursue other opportunities as they arise.
B-21
SECURITY OWNERSHIP OF CERTAIN BENEFICIAL OWNERS
As of the Record Date, to the Trust’s knowledge, the following persons owned beneficially or of record 5% or more of the Class IA or Class K shares of the ETF Portfolio.
Shareholder’s or Contractholder’s Name/Address | Percent Beneficial Ownership of Shares of the Portfolio | Percent Beneficial Ownership of Shares of the Combined Portfolio (assuming the Reorganization occurs) |
C-1
STATEMENT OF ADDITIONAL INFORMATION
, 2015
EQ ADVISORS TRUST
EQ/International ETF Portfolio
(the “ETF Portfolio”)
AND
EQ/International Equity Index Portfolio
(the “Index Portfolio”)
1290 Avenue of the Americas
New York, New York 10104
(877) 222-2144
Acquisition of the assets and assumption of the liabilities of: | By and in exchange for shares of: | |
EQ/International ETF Portfolio | EQ/International Equity Index Portfolio |
This Statement of Additional Information (the “SAI”) relates specifically to the proposed reorganization of the ETF Portfolio into the Index Portfolio, each a series of the EQ Advisors Trust (the “Trust”), under which the Index Portfolio would acquire all of the assets of the ETF Portfolio in exchange solely for shares of the Index Portfolio and the Index Portfolio’s assumption of all of the ETF Portfolio’s liabilities (the “Reorganization”). This SAI is available to owners of and participants in variable life insurance contracts and variable annuity contracts and certificates (the “Contracts”) with amounts allocated to the ETF Portfolio and to other shareholders of the ETF Portfolio as of , 2015.
This SAI is not a prospectus. A Combined Proxy Statement and Prospectus dated , 2015 relating to the Reorganization (the “Proxy Statement/Prospectus”) may be obtained, without charge, by writing to the Trust at 1290 Avenue of the Americas,
New York, New York 10104 or calling 1-877-522-5035. This SAI should be read in conjunction with the Proxy Statement/Prospectus.
Contents of the SAI
This SAI consists of the cover page, the information set forth below and the following document, which is incorporated by reference herein and accompanies this SAI:
| 1. | Statement of Additional Information of the Trust dated May 1, 2014, as supplemented, with respect to the Index Portfolio and the ETF Portfolio. The Statement of Additional Information includes information about the Trust’s other portfolios that is not relevant to the Reorganization. Please disregard that information. |
Table of Contents
| 2 | ||||
| 3 | ||||
| 10 | ||||
| 30 | ||||
| 45 |
NOTES ON PERFORMANCE (Unaudited)
Total Returns
Performance of the EQ Advisors Trust Portfolios as shown on the following pages compares each Portfolio’s performance to that of a broad-based securities index. Each of the Portfolio’s annualized rates of return is net of investment management fees and expenses of the Portfolio. Rates of return are not representative of the actual return you would receive under your variable life insurance policy or annuity contract. No policyholder or contractholder can invest directly in the EQ Advisors Trust Portfolios. Changes in policy values depend not only on the investment performance of the EQ Advisors Trust Portfolios, but also on the insurance and administrative charges, applicable sales charges, and the mortality and expense risk charge applicable under a policy. These policy charges effectively reduce the dollar amount of any net gains and increase the dollar amount of any net losses. Each of the EQ Advisors Trust Portfolios has a separate investment objective it seeks to achieve by following a separate investment policy. There is no guarantee that these objectives will be attained. The objectives and policies of each Portfolio will affect its return and its risk. Keep in mind that past performance is not an indication of future results.
Growth of $10,000 Investment
The charts shown on the following pages illustrate the total value of an assumed investment in Class IA, Class IB and/or Class K shares of each Portfolio of the EQ Advisors Trust. The periods illustrated are from the inception dates shown, or for a ten year period if the inception date is prior to December 31, 2004, through December 31, 2014. These results assume reinvestment of dividends and capital gains. The total value shown for each Portfolio reflects management fees and operating expenses of the Portfolios and 12b-1 fees which are applicable to Class IB shares. Effective January 1, 2012, 12b-1 fees are applicable to Class IA shares. 12b-1 fees are not applicable to Class K shares. The values have not been adjusted for insurance-related charges and expenses associated with life insurance policies or annuity contracts, which would lower the total values shown. Results should not be considered representative of future gains or losses.
The Benchmarks
Broad-based securities indices are unmanaged and are not subject to fees and expenses typically associated with actively-managed funds. An investment cannot be made directly in a broad-based securities index. Comparisons with these benchmarks, therefore, are of limited use. They are included because they are widely known and may help you to understand the universe of securities from which each Portfolio is likely to select its holdings.
DJ EuroSTOXX 50® Index (“EuroSTOXX 50”)
Europe’s leading blue-chip index for the Eurozone, provides a blue-chip representation of supersector leaders in the Eurozone. The index covers 50 stocks from 12 Eurozone countries: Austria, Belgium, Finland, France, Germany, Greece, Ireland, Italy, Luxembourg, the Netherlands, Portugal and Spain.
FTSE 100 Index (“FTSE 100”)
A market capitalization weighted index representing the performance of the 100 largest blue chip companies, listed on the London Stock Exchange, which meet the FTSE’s size and liquidity screening.
Morgan Stanley Capital International (MSCI) EAFE® Index (“MSCI EAFE”)
A free float-adjusted market capitalization index that is designed to measure the equity market performance of developed markets, excluding the U.S. and Canada. The index consists of the following 21 developed market country indices: Australia, Austria, Belgium, Denmark, Finland, France, Germany, Hong Kong, Ireland, Israel, Italy, Japan, the Netherlands, New Zealand, Norway, Portugal, Singapore, Spain, Sweden, Switzerland, and the United Kingdom.
Standard & Poor’s Australian Security Exchange 200 Index (“S&P/ASX 200”)
An index which is recognized as the primary investable benchmark in Australia. The index represents the 200 largest and most liquid publicly listed companies in Australia and represents approximately 78% of the Australian equity market capitalization.
TOPIX Index (“TOPIX”)
A free-float adjusted capitalization-weighted index that is calculated based on all the domestic common stocks listed on the Tokyo Stock Exchange First Section.
2
EQ/INTERNATIONAL ETF PORTFOLIO (Unaudited)
INVESTMENT MANAGER
| Ø | AXA Equitable Funds Management Group, LLC |
PERFORMANCE RESULTS
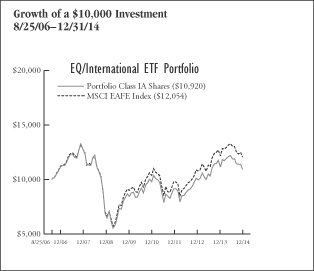
| Annualized Total Returns as of 12/31/14 | ||||||||||||
| 1 Year | 5 Years | Since Incept. | ||||||||||
Portfolio – Class IA Shares* | (7.01 | )% | 4.40 | % | 1.06 | % | ||||||
Portfolio – Class K Shares** | (6.90 | ) | N/A | 8.26 | ||||||||
MSCI EAFE Index | (4.90 | ) | 5.33 | 2.26 | ||||||||
* Date of inception 8/25/06.
** Date of inception 8/26/11.
Returns for periods greater than one year are annualized. |
| |||||||||||
Past performance is not indicative of future results.
PERFORMANCE SUMMARY
The Portfolio’s Class IA shares returned (7.01)% for the year ended December 31, 2014. The Portfolio’s benchmark over the same period: the MSCI EAFE Index, returned (4.90)%.
Portfolio Highlights
For the year ended December 31, 2014
In the international markets, oil prices tumbled, the U.S. dollar strengthened significantly and geopolitical risks from Russia to the Middle East added new threats. As a result, non-U.S. developed market stocks fell during the year. The Portfolio’s holdings in non-U.S. developed stocks, and Europe in particular, produced most of the negative return as the Portfolio underperformed its benchmark.
| Portfolio Allocation (as a percentage of Total Investment Companies) | ||||
| As of December 31, 2014 | ||||
Vanguard FTSE Developed Markets ETF | 22.2 | % | ||
iShares® MSCI EAFE ETF | 19.8 | |||
iShares® Europe ETF | 19.2 | |||
iShares® MSCI EAFE Growth ETF | 12.0 | |||
iShares® MSCI EAFE Value ETF | 11.6 | |||
iShares® MSCI Japan ETF | 6.4 | |||
iShares® MSCI Pacific ex-Japan ETF | 4.4 | |||
iShares® Core MSCI EAFE ETF | 2.3 | |||
iShares® MSCI United Kingdom ETF | 1.1 | |||
iShares® MSCI Germany ETF | 0.5 | |||
iShares® MSCI Switzerland Capped ETF | 0.5 | |||
3
EQ/INTERNATIONAL ETF PORTFOLIO (Unaudited)
UNDERSTANDING YOUR EXPENSES:
As a shareholder of the Portfolio, you incur two types of costs:
(1) transaction costs, including applicable sales charges and redemption fees; and (2) ongoing costs, including management fees, distribution and/or service (12b-1) fees (in the case of Class IA and Class IB shares of the Trust), and other Portfolio expenses. These examples are intended to help you understand your ongoing costs (in dollars) of investing in the Portfolio and to compare these costs with the ongoing costs of investing in other mutual funds.
The examples are based on an investment of $1,000 invested at the beginning of the six-month period ended December 31, 2014 and held for the entire six-month period.
Actual Expenses
The first line of the following table provides information about actual account values and actual expenses. You may use the information in this line, together with the amount you invested, to estimate the expenses that you paid over the period. Simply divide your account value by $1,000 (for example, an $8,600 account value divided by $1,000 = 8.6), then multiply the result by the number in the first line under the heading entitled "Expenses Paid During Period" to estimate the expenses you paid on your account during this period.
Hypothetical Example for Comparison Purposes
The second line of the following table provides information about hypothetical account values and hypothetical expenses based on the Portfolio’s actual expense ratio and an assumed rate of return of 5% per year before expenses, which is not the Portfolio’s actual return. The hypothetical account values and expenses may not be used to estimate the actual ending account balance or expenses you paid for the period. You may use this information to compare the ongoing costs of investing in the Portfolio and other funds. To do so, compare this 5% hypothetical example with the 5% hypothetical examples that appear in the shareholder reports of the other funds.
Please note that the expenses shown in the table are meant to highlight your ongoing costs only and do not reflect any transactional costs, such as sales charges (loads), redemption fees, or exchange fees. Therefore, the second line of the table is useful in comparing ongoing costs only, and will not help you determine the relative total costs of owning different funds. In addition, if these transactional costs were included, your costs would have been higher. Also note that the table does not reflect any variable life insurance or variable annuity contract-related fees and expenses, which would increase overall fees and expenses.
EXAMPLE
| Beginning Account Value 7/1/14 | Ending Account Value 12/31/14 | Expenses Paid During Period* 7/1/14 - 12/31/14 | ||||||||||
Class IA | ||||||||||||
Actual | $1,000.00 | $895.60 | $3.82 | |||||||||
Hypothetical (5% average annual return before expenses) | 1,000.00 | 1,021.17 | 4.08 | |||||||||
Class K | ||||||||||||
Actual | 1,000.00 | 895.39 | 2.63 | |||||||||
Hypothetical (5% average annual return before expenses) | 1,000.00 | 1,022.43 | 2.80 | |||||||||
* Expenses are equal to the Portfolio’s Class IA and Class K shares annualized expense ratios of 0.80% and 0.55%, respectively, multiplied by the average account value over the period, and multiplied by 184/365 (to reflect the one-half year period). |
| |||||||||||
4
EQ ADVISORS TRUST
EQ/INTERNATIONAL ETF PORTFOLIO
PORTFOLIO OF INVESTMENTS
December 31, 2014
| Number of Shares | Value (Note 1) | |||||||
INVESTMENT COMPANIES: | ||||||||
iShares® Core MSCI EAFE ETF | 39,500 | $ | 2,185,140 | |||||
iShares® Europe ETF | 430,834 | 18,323,370 | ||||||
iShares® MSCI EAFE ETF | 309,341 | 18,820,307 | ||||||
iShares® MSCI EAFE Growth ETF | 174,009 | 11,449,792 | ||||||
iShares® MSCI EAFE Value ETF | 215,810 | 11,012,784 | ||||||
iShares® MSCI Germany ETF | 19,200 | 526,272 | ||||||
iShares® MSCI Japan ETF | 538,232 | 6,049,728 | ||||||
iShares® MSCI Pacific ex-Japan ETF | 95,456 | 4,195,291 | ||||||
iShares® MSCI Switzerland Capped ETF | 14,700 | $ | 465,843 | |||||
iShares® MSCI United Kingdom ETF | 55,900 | 1,007,877 | ||||||
Vanguard FTSE Developed Markets ETF | 559,300 | 21,186,284 | ||||||
|
| |||||||
Total Investments (99.8%) | 95,222,688 | |||||||
Other Assets Less Liabilities (0.2%) | 212,595 | |||||||
|
| |||||||
Net Assets (100%) | $ | 95,435,283 | ||||||
|
| |||||||
The following is a summary of the inputs used to value the Portfolio’s assets and liabilities carried at fair value as of December 31, 2014:
The inputs or methodology used for valuing securities are not necessarily an indication of the risk associated with investing in those securities.
Various inputs are used in determining the value of the Portfolio’s investments. These inputs are summarized in the three broad levels listed below:
| Investment Type | Level 1 Quoted Prices in Active Markets for Identical Securities | Level 2 Significant Other Observable Inputs (including quoted prices for similar securities, interest rates, prepayment speeds, credit risk, etc.) | Level 3 Significant Unobservable Inputs (including the Portfolio’s own assumptions in determining the fair value of investments) | Total | ||||||||||||
Assets: | ||||||||||||||||
Investment Companies | ||||||||||||||||
Exchange Traded Funds (ETFs) | $ | 95,222,688 | $ | — | $ | — | $ | 95,222,688 | ||||||||
|
|
|
|
|
|
|
| |||||||||
Total Assets | $ | 95,222,688 | $ | — | $ | — | $ | 95,222,688 | ||||||||
|
|
|
|
|
|
|
| |||||||||
Total Liabilities | $ | — | $ | — | $ | — | $ | — | ||||||||
|
|
|
|
|
|
|
| |||||||||
Total | $ | 95,222,688 | $ | — | $ | — | $ | 95,222,688 | ||||||||
|
|
|
|
|
|
|
| |||||||||
There were no transfers between Levels 1, 2 or 3 during the year ended December 31, 2014.
The Portfolio held no derivatives contracts during the year ended December 31, 2014.
Investment security transactions for the year ended December 31, 2014 were as follows:
Cost of Purchases: | ||||
Long-term investments other than U.S. government debt securities | $ | 3,234,684 | ||
Net Proceeds of Sales and Redemptions: | ||||
Long-term investments other than U.S. government debt securities | $ | 17,015,503 |
As of December 31, 2014, the gross unrealized appreciation (depreciation) of investments based on the aggregate cost of investments for Federal income tax purposes was as follows:
Aggregate gross unrealized appreciation | $ | 26,061,097 | ||
Aggregate gross unrealized depreciation | (167,065 | ) | ||
|
| |||
Net unrealized appreciation | $ | 25,894,032 | ||
|
| |||
Federal income tax cost of investments | $ | 69,328,656 | ||
|
|
See Notes to Financial Statements.
5
EQ ADVISORS TRUST
EQ/INTERNATIONAL ETF PORTFOLIO
STATEMENT OF ASSETS AND LIABILITIES
December 31, 2014
ASSETS | ||||
Investments at value (Cost $69,328,656) | $ | 95,222,688 | ||
Cash | 281,554 | |||
Dividends, interest and other receivables | 11 | |||
Other assets | 343 | |||
|
| |||
Total assets | 95,504,596 | |||
|
| |||
LIABILITIES | ||||
Investment management fees payable | 37,571 | |||
Administrative fees payable | 8,339 | |||
Distribution fees payable – Class IA | 886 | |||
Payable to Separate Accounts for Trust shares redeemed | 160 | |||
Trustees’ fees payable | 54 | |||
Accrued expenses | 22,303 | |||
|
| |||
Total liabilities | 69,313 | |||
|
| |||
NET ASSETS | $ | 95,435,283 | ||
|
| |||
Net assets were comprised of: | ||||
Paid in capital | $ | 69,541,251 | ||
Accumulated undistributed net investment income (loss) | — | |||
Accumulated undistributed net realized gain (loss) on investments | — | |||
Net unrealized appreciation (depreciation) on investments | 25,894,032 | |||
|
| |||
Net assets | $ | 95,435,283 | ||
|
| |||
Class IA | ||||
Net asset value, offering and redemption price per share, $4,081,573 / 1,394,306 shares outstanding (unlimited amount authorized: $0.01 par value) | $ | 2.93 | ||
|
| |||
Class K | ||||
Net asset value, offering and redemption price per share, $91,353,710 / 31,185,068 shares outstanding (unlimited amount authorized: $0.01 par value) | $ | 2.93 | ||
|
| |||
STATEMENT OF OPERATIONS
For the Year Ended December 31, 2014
INVESTMENT INCOME | ||||
Dividends | $ | 3,357,342 | ||
Interest | 269 | |||
|
| |||
Total income | 3,357,611 | |||
|
| |||
EXPENSES | ||||
Investment management fees | 418,677 | |||
Administrative fees | 125,914 | |||
Professional fees | 38,837 | |||
Printing and mailing expenses | 14,957 | |||
Distribution fees – Class IA | 11,301 | |||
Custodian fees | 6,500 | |||
Trustees’ fees | 3,131 | |||
Miscellaneous | 3,871 | |||
|
| |||
Gross expenses | 623,188 | |||
Less: Waiver from investment manager | (37,187 | ) | ||
|
| |||
Net expenses | 586,001 | |||
|
| |||
NET INVESTMENT INCOME (LOSS) | 2,771,610 | |||
|
| |||
REALIZED AND UNREALIZED GAIN (LOSS) | ||||
Net realized gain (loss) on investments | 4,588,711 | |||
Net change in unrealized appreciation (depreciation) on investments | (14,433,470 | ) | ||
|
| |||
NET REALIZED AND UNREALIZED GAIN (LOSS) | (9,844,759 | ) | ||
|
| |||
NET INCREASE (DECREASE) IN NET ASSETS RESULTING FROM OPERATIONS | $ | (7,073,149 | ) | |
|
| |||
See Notes to Financial Statements.
6
EQ ADVISORS TRUST
EQ/INTERNATIONAL ETF PORTFOLIO
STATEMENT OF CHANGES IN NET ASSETS
| Year Ended December 31, | ||||||||
| 2014 | 2013 | |||||||
INCREASE (DECREASE) IN NET ASSETS FROM OPERATIONS: | ||||||||
Net investment income (loss) | $ | 2,771,610 | $ | 4,226,541 | ||||
Net realized gain (loss) on investments | 4,588,711 | 62,490,002 | ||||||
Net change in unrealized appreciation (depreciation) on investments | (14,433,470 | ) | (20,977,413 | ) | ||||
|
|
|
| |||||
NET INCREASE (DECREASE) IN NET ASSETS RESULTING FROM OPERATIONS | (7,073,149 | ) | 45,739,130 | |||||
|
|
|
| |||||
DIVIDENDS AND DISTRIBUTIONS: | ||||||||
Dividends from net investment income | ||||||||
Class IA | (110,379 | ) | (158,786 | ) | ||||
Class K | (2,693,778 | ) | (4,170,653 | ) | ||||
|
|
|
| |||||
| (2,804,157 | ) | (4,329,439 | ) | |||||
|
|
|
| |||||
Distributions from net realized capital gains | ||||||||
Class IA | (2,412,419 | ) | (513,155 | ) | ||||
Class K | (52,097,265 | ) | (13,478,708 | ) | ||||
|
|
|
| |||||
| (54,509,684 | ) | (13,991,863 | ) | |||||
|
|
|
| |||||
Return of capital | ||||||||
Class IA | (3,422 | ) | — | |||||
Class K | (83,516 | ) | — | |||||
|
|
|
| |||||
| (86,938 | ) | — | ||||||
|
|
|
| |||||
TOTAL DIVIDENDS AND DISTRIBUTIONS | (57,400,779 | ) | (18,321,302 | ) | ||||
|
|
|
| |||||
CAPITAL SHARES TRANSACTIONS: | ||||||||
Class IA | ||||||||
Capital shares sold [ 59,615 and 112,462 shares, respectively ] | 340,211 | 747,742 | ||||||
Capital shares issued in reinvestment of dividends and distributions [ 741,633 and 106,900 shares, respectively ] | 2,526,220 | 671,941 | ||||||
Capital shares repurchased [ (123,166) and (265,581) shares, respectively ] | (620,196 | ) | (1,743,957 | ) | ||||
|
|
|
| |||||
Total Class IA transactions | 2,246,235 | (324,274 | ) | |||||
|
|
|
| |||||
Class IB | ||||||||
Capital shares sold [ 0 and 564 shares, respectively ] | — | 3,671 | ||||||
Capital shares repurchased [ 0 and (171,198) shares, respectively ] | — | (1,114,502 | ) | |||||
|
|
|
| |||||
Total Class IB transactions | — | (1,110,831 | ) | |||||
|
|
|
| |||||
Class K | ||||||||
Capital shares sold [ 142,379 and 956,756 shares, respectively ] | 450,000 | 6,552,772 | ||||||
Capital shares issued in reinvestment of dividends and distributions [ 16,094,963 and 2,798,490 shares, respectively ] | 54,874,559 | 17,649,361 | ||||||
Capital shares repurchased [ (2,622,469) and (26,965,462) shares, respectively ] | (17,002,000 | ) | (196,259,058 | ) | ||||
|
|
|
| |||||
Total Class K transactions | 38,322,559 | (172,056,925 | ) | |||||
|
|
|
| |||||
NET INCREASE (DECREASE) IN NET ASSETS RESULTING FROM CAPITAL SHARE TRANSACTIONS | 40,568,794 | (173,492,030 | ) | |||||
|
|
|
| |||||
TOTAL INCREASE (DECREASE) IN NET ASSETS | (23,905,134 | ) | (146,074,202 | ) | ||||
NET ASSETS: | ||||||||
Beginning of year | 119,340,417 | 265,414,619 | ||||||
|
|
|
| |||||
End of year (a) | $ | 95,435,283 | $ | 119,340,417 | ||||
|
|
|
|
| ||||
(a) Includes accumulated undistributed (overdistributed) net investment income (loss) of | $ | — | $ | — | ||||
|
|
|
| |||||
See Notes to Financial Statements.
7
EQ ADVISORS TRUST
EQ/INTERNATIONAL ETF PORTFOLIO
FINANCIAL HIGHLIGHTS
| Year Ended December 31, | ||||||||||||||||||||
| Class IA | 2014 | 2013 | 2012 | 2011 | 2010 | |||||||||||||||
Net asset value, beginning of year | $ | 6.53 | $ | 6.36 | $ | 5.80 | $ | 7.15 | $ | 6.93 | ||||||||||
|
|
|
|
|
|
|
|
|
| |||||||||||
Income (loss) from investment operations: | ||||||||||||||||||||
Net investment income (loss) (e)(x) | 0.12 | 0.12 | 0.16 | 0.14 | 0.14 | |||||||||||||||
Net realized and unrealized gain (loss) on investments | (0.28 | ) | 1.15 | 0.87 | (1.07 | ) | 0.39 | |||||||||||||
|
|
|
|
|
|
|
|
|
| |||||||||||
Total from investment operations | (0.16 | ) | 1.27 | 1.03 | (0.93 | ) | 0.53 | |||||||||||||
|
|
|
|
|
|
|
|
|
| |||||||||||
Less distributions: | ||||||||||||||||||||
Dividends from net investment income | (0.09 | ) | (0.26 | ) | (0.18 | ) | (0.16 | ) | (0.14 | ) | ||||||||||
Distributions from net realized gains | (3.35 | ) | (0.84 | ) | (0.29 | ) | (0.26 | ) | (0.17 | ) | ||||||||||
Return of capital | — | # | — | — | — | — | ||||||||||||||
|
|
|
|
|
|
|
|
|
| |||||||||||
Total dividends and distributions | (3.44 | ) | (1.10 | ) | (0.47 | ) | (0.42 | ) | (0.31 | ) | ||||||||||
|
|
|
|
|
|
|
|
|
| |||||||||||
Net asset value, end of year | $ | 2.93 | $ | 6.53 | $ | 6.36 | $ | 5.80 | $ | 7.15 | ||||||||||
|
|
|
|
|
|
|
|
|
| |||||||||||
Total return | (7.01 | )% | 20.70 | % | 17.81 | % | (12.88 | )% | 7.67 | % | ||||||||||
|
|
|
|
|
|
|
|
|
| |||||||||||
Ratios/Supplemental Data: | ||||||||||||||||||||
Net assets, end of year (000’s) | $ | 4,082 | $ | 4,676 | $ | 4,853 | $ | 3,229 | $ | 328,326 | ||||||||||
Ratio of expenses to average net assets: | ||||||||||||||||||||
After waivers and reimbursements (f) | 0.80 | % | 0.80 | % | 0.80 | % | 0.53 | % | 0.55 | % | ||||||||||
After waivers, reimbursements and fees paid indirectly (f) | 0.80 | % | 0.80 | % | 0.80 | % | 0.53 | % | 0.55 | % | ||||||||||
Before waivers, reimbursements and fees paid indirectly (f) | 0.84 | % | 0.81 | % | 0.81 | % | 0.53 | % | 0.56 | % | ||||||||||
Ratio of net investment income (loss) to average net assets: | ||||||||||||||||||||
After waivers and reimbursements (f)(x) | 2.50 | % | 1.71 | % | 2.60 | % | 1.99 | % | 2.04 | % | ||||||||||
After waivers, reimbursements and fees paid indirectly (f)(x) | 2.50 | % | 1.71 | % | 2.60 | % | 1.99 | % | 2.04 | % | ||||||||||
Before waivers, reimbursements and fees paid indirectly (f)(x) | 2.46 | % | 1.71 | % | 2.59 | % | 1.99 | % | 2.03 | % | ||||||||||
Portfolio turnover rate^ | 3 | % | 2 | % | 2 | % | 9 | % | 9 | % | ||||||||||
See Notes to Financial Statements.
8
EQ ADVISORS TRUST
EQ/INTERNATIONAL ETF PORTFOLIO
FINANCIAL HIGHLIGHTS (Continued)
| Year Ended December 31, | ||||||||||||||||
| Class K | 2014 | 2013 | 2012 | August 26, 2011* to December 31, 2011 | ||||||||||||
Net asset value, beginning of period | $ | 6.53 | $ | 6.36 | $ | 5.80 | $ | 6.32 | ||||||||
|
|
|
|
|
|
|
| |||||||||
Income (loss) from investment operations: | ||||||||||||||||
Net investment income (loss) (e)(x) | 0.13 | 0.12 | 0.16 | 0.08 | ||||||||||||
Net realized and unrealized gain (loss) on investments | (0.28 | ) | 1.17 | 0.88 | (0.21 | ) | ||||||||||
|
|
|
|
|
|
|
| |||||||||
Total from investment operations | (0.15 | ) | 1.29 | 1.04 | (0.13 | ) | ||||||||||
|
|
|
|
|
|
|
| |||||||||
Less distributions: | ||||||||||||||||
Dividends from net investment income | (0.10 | ) | (0.28 | ) | (0.19 | ) | (0.16 | ) | ||||||||
Distributions from net realized gains | (3.35 | ) | (0.84 | ) | (0.29 | ) | (0.23 | ) | ||||||||
Return of capital | — | # | — | — | — | |||||||||||
|
|
|
|
|
|
|
| |||||||||
Total dividends and distributions | (3.45 | ) | (1.12 | ) | (0.48 | ) | (0.39 | ) | ||||||||
|
|
|
|
|
|
|
| |||||||||
Net asset value, end of period | $ | 2.93 | $ | 6.53 | $ | 6.36 | $ | 5.80 | ||||||||
|
|
|
|
|
|
|
| |||||||||
Total return (b) | (6.90 | )% | 21.01 | % | 18.11 | % | (1.96 | )% | ||||||||
|
|
|
|
|
|
|
| |||||||||
Ratios/Supplemental Data: | ||||||||||||||||
Net assets, end of period (000’s) | $ | 91,354 | $ | 114,664 | $ | 259,475 | $ | 268,279 | ||||||||
Ratio of expenses to average net assets: | ||||||||||||||||
After waivers and reimbursements (a)(f) | 0.55 | % | 0.55 | % | 0.55 | % | 0.55 | % | ||||||||
After waivers, reimbursements and fees paid indirectly (a)(f) | 0.55 | % | 0.55 | % | 0.55 | % | 0.55 | % | ||||||||
Before waivers, reimbursements and fees paid indirectly (a)(f) | 0.59 | % | 0.56 | % | 0.56 | % | 0.55 | % | ||||||||
Ratio of net investment income (loss) to average net assets: | ||||||||||||||||
After waivers and reimbursements (a)(f)(x) | 2.66 | % | 1.70 | % | 2.58 | % | 3.66 | %(l) | ||||||||
After waivers, reimbursements and fees paid indirectly (a)(f)(x) | 2.66 | % | 1.70 | % | 2.58 | % | 3.66 | %(l) | ||||||||
Before waivers, reimbursements and fees paid indirectly (a)(f)(x) | 2.62 | % | 1.69 | % | 2.57 | % | 3.66 | %(l) | ||||||||
Portfolio turnover rate^ | 3 | % | 2 | % | 2 | % | 9 | % | ||||||||
| * | Commencement of Operations. |
| ^ | Portfolio turnover rate excludes derivatives, if any. |
| # | Per share amount is less than $0.005. |
| (a) | Ratios for periods less than one year are annualized. |
| (b) | Total returns for periods less than one year are not annualized. |
| (e) | Net investment income (loss) per share is based on average shares outstanding. |
| (f) | Expenses do not include the expenses of the underlying funds (“indirect expenses”). |
| (l) | The annualized ratio of net investment income to average net assets may not be indicative of operating results for a full year. |
| (x) | Recognition of net investment income is affected by the timing of dividend declarations by the underlying funds in which the Portfolio invests. |
See Notes to Financial Statements.
9
EQ/INTERNATIONAL EQUITY INDEX PORTFOLIO (Unaudited)
INVESTMENT MANAGER
| Ø | AXA Equitable Funds Management Group, LLC |
INVESTMENT SUB-ADVISER
| Ø | AllianceBernstein L.P. |
PERFORMANCE RESULTS
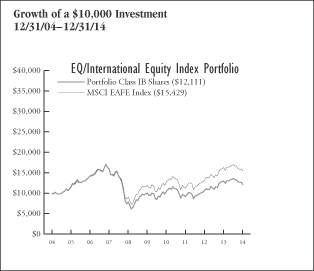
| Annualized Total Returns as of 12/31/14 | ||||||||||||
| 1 Year | 5 Years | 10 Years/ Since Incept. | ||||||||||
Portfolio – Class IA Shares | (6.90 | )% | 4.05 | % | 2.10 | % | ||||||
Portfolio – Class IB Shares | (6.85 | ) | 3.96 | 1.93 | ||||||||
Portfolio – Class K Shares*** | (6.65 | ) | N/A | 8.25 | ||||||||
MSCI EAFE Index | (4.90 | ) | 5.33 | 4.43 | ||||||||
40% EuroSTOXX 50/25% FTSE 100/ 25% TOPIX/10% S&P/ASX 200 | (5.48 | ) | 4.55 | N/A | ||||||||
*** Date of inception 8/26/11.
Returns for periods greater than one year are annualized. |
| |||||||||||
Past performance is not indicative of future results.
PERFORMANCE SUMMARY
The Portfolio’s Class IB shares returned (6.85)% for the year ended December 31, 2014. The Portfolio’s benchmarks, MSCI EAFE Index and the 40% EuroSTOXX 50/25% FTSE 100/25% TOPIX/10% S&P/ASX200 returned (4.90)% and (5.48)%, respectively, over the same period.
Portfolio Highlights
For the year ended December 31, 2014
What helped performance during the year:
| • | The sectors that contributed most to index performance for the year ended December 31, 2014 were Utilities, Health Care, Information Technology, Consumer Discretionary and Consumer Staples. |
| • | The top five stocks that provided the most positive impact to index performance for the year ended December 31, 2014 were Orange, Astrazeneca, Anheuser-Busch Inbev, Intesa Sanpaolo S.P.A. and Shire. |
What hurt performance during the year:
| • | The most negative sector contributors to performance for the year ended December 31, 2014 were Financials, Energy, Industrials, Materials and Telecommunication Services. |
| • | The five stocks that had the least impact on performance in the index for the year ended December 31, 2014 were BNP Paribas, BASF SE, Siemens AG, Total and Societe Generale. |
| Sector Weightings as of December 31, 2014 | Market Value | % of Net Assets | ||||||
Financials | $403,660,639 | 25.0 | % | |||||
Industrials | 199,745,436 | 12.3 | ||||||
Consumer Discretionary | 193,376,927 | 12.0 | ||||||
Consumer Staples | 172,958,866 | 10.7 | ||||||
Health Care | 137,541,534 | 8.5 | ||||||
Energy | 121,130,181 | 7.5 | ||||||
Materials | 119,647,890 | 7.4 | ||||||
Telecommunication Services | 96,456,232 | 6.0 | ||||||
Information Technology | 87,385,293 | 5.4 | ||||||
Utilities | 70,126,099 | 4.3 | ||||||
Cash and Other | 14,678,240 | 0.9 | ||||||
|
| |||||||
| 100.0 | % | |||||||
|
| |||||||
10
EQ/INTERNATIONAL EQUITY INDEX PORTFOLIO (Unaudited)
UNDERSTANDING YOUR EXPENSES:
As a shareholder of the Portfolio, you incur two types of costs:
(1) transaction costs, including applicable sales charges and redemption fees; and (2) ongoing costs, including management fees, distribution and/or service (12b-1) fees (in the case of Class IA and Class IB shares of the Trust), and other Portfolio expenses. These examples are intended to help you understand your ongoing costs (in dollars) of investing in the Portfolio and to compare these costs with the ongoing costs of investing in other mutual funds.
The examples are based on an investment of $1,000 invested at the beginning of the six-month period ended December 31, 2014 and held for the entire six-month period.
Actual Expenses
The first line of the following table provides information about actual account values and actual expenses. You may use the information in this line, together with the amount you invested, to estimate the expenses that you paid over the period. Simply divide your account value by $1,000 (for example, an $8,600 account value divided by $1,000 = 8.6), then multiply the result by the number in the first line under the heading entitled “Expenses Paid During Period” to estimate the expenses you paid on your account during this period.
Hypothetical Example for Comparison Purposes
The second line of the following table provides information about hypothetical account values and hypothetical expenses based on the Portfolio’s actual expense ratio and an assumed rate of return of 5% per year before expenses, which is not the Portfolio’s actual return. The hypothetical account values and expenses may not be used to estimate the actual ending account balance or expenses you paid for the period. You may use this information to compare the ongoing costs of investing in the Portfolio and other funds. To do so, compare this 5% hypothetical example with the 5% hypothetical examples that appear in the shareholder reports of the other funds.
Please note that the expenses shown in the table are meant to highlight your ongoing costs only and do not reflect any transactional costs, such as sales charges (loads), redemption fees, or exchange fees. Therefore, the second line of the table is useful in comparing ongoing costs only, and will not help you determine the relative total costs of owning different funds. In addition, if these transactional costs were included, your costs would have been higher. Also note that the table does not reflect any variable life insurance or variable annuity contract-related fees and expenses, which would increase overall fees and expenses.
EXAMPLE
| Beginning Account Value 7/1/14 | Ending Account Value 12/31/14 | Expenses Paid During Period* 7/1/14 - 12/31/14 | ||||||||||
Class IA | ||||||||||||
Actual | $1,000.00 | $889.23 | $3.75 | |||||||||
Hypothetical (5% average annual return before expenses) | 1,000.00 | 1,021.23 | 4.02 | |||||||||
Class IB | ||||||||||||
Actual | 1,000.00 | 889.11 | 3.75 | |||||||||
Hypothetical (5% average annual return before expenses) | 1,000.00 | 1,021.23 | 4.02 | |||||||||
Class K | ||||||||||||
Actual | 1,000.00 | 889.83 | 2.56 | |||||||||
Hypothetical (5% average annual return before expenses) | 1,000.00 | 1,022.49 | 2.74 | |||||||||
* Expenses are equal to the Portfolio’s Class IA, Class IB and Class K shares annualized expense ratios of 0.79%, 0.79% and 0.54%, respectively, multiplied by the average account value over the period, and multiplied by 184/365 (to reflect the one-half year period). |
| |||||||||||
11
EQ ADVISORS TRUST
EQ/INTERNATIONAL EQUITY INDEX PORTFOLIO
PORTFOLIO OF INVESTMENTS
December 31, 2014
| Number of Shares | Value (Note 1) | |||||||
COMMON STOCKS: | ||||||||
Australia (9.9%) | ||||||||
Abacus Property Group (REIT) | 35,618 | $ | 85,951 | |||||
Adelaide Brighton Ltd. | 63,716 | 184,672 | ||||||
AGL Energy Ltd.* | 97,525 | 1,060,198 | ||||||
Ainsworth Game Technology | 15,268 | 29,194 | ||||||
ALS Ltd. | 57,489 | 248,760 | ||||||
Alumina Ltd.* | 358,146 | 519,005 | ||||||
Amcor Ltd. | 174,804 | 1,923,631 | ||||||
AMP Ltd. | 426,202 | 1,896,599 | ||||||
Ansell Ltd. | 22,267 | 406,492 | ||||||
APA Group | 161,426 | 982,882 | ||||||
APN News & Media Ltd.* | 101,218 | 68,645 | ||||||
ARB Corp. Ltd. | 9,140 | 84,297 | ||||||
Ardent Leisure Group | 61,177 | 144,829 | ||||||
Aristocrat Leisure Ltd. | 84,768 | 451,921 | ||||||
Arrium Ltd. | 367,535 | 63,719 | ||||||
Asaleo Care Ltd.* | 57,053 | 76,752 | ||||||
Asciano Ltd. | 141,294 | 691,780 | ||||||
ASX Ltd. | 28,042 | 837,043 | ||||||
Atlas Iron Ltd. | 119,226 | 15,908 | ||||||
Aurizon Holdings Ltd. | 311,717 | 1,167,901 | ||||||
AusNet Services | 239,411 | 258,638 | ||||||
Australia & New Zealand Banking Group Ltd. | 399,150 | 10,383,005 | ||||||
Automotive Holdings Group Ltd. | 33,520 | 103,495 | ||||||
Aveo Group | 48,575 | 85,118 | ||||||
AWE Ltd.* | 75,352 | 79,244 | ||||||
Bank of Queensland Ltd. | 51,674 | 510,646 | ||||||
BC Iron Ltd. | 27,215 | 11,563 | ||||||
Beach Energy Ltd. | 184,790 | 158,107 | ||||||
Beadell Resources Ltd.* | 106,325 | 19,575 | ||||||
Bega Cheese Ltd. | 19,805 | 82,833 | ||||||
Bendigo & Adelaide Bank Ltd. | 64,884 | 674,338 | ||||||
BHP Billiton Ltd. | 464,890 | 11,031,171 | ||||||
BHP Billiton plc | 327,283 | 7,000,518 | ||||||
BlueScope Steel Ltd.* | 78,776 | 356,724 | ||||||
Boral Ltd. | 111,019 | 476,209 | ||||||
Bradken Ltd. | 24,662 | 94,116 | ||||||
Brambles Ltd. | 226,489 | 1,950,494 | ||||||
Breville Group Ltd. | 13,867 | 72,510 | ||||||
BWP Trust (REIT) | 70,028 | 158,721 | ||||||
Cabcharge Australia Ltd. | 15,687 | 58,050 | ||||||
Caltex Australia Ltd. | 19,697 | 545,065 | ||||||
Cardno Ltd. | 23,401 | 64,780 | ||||||
carsales.com Ltd. | 30,894 | 261,213 | ||||||
Challenger Ltd. | 81,712 | 430,461 | ||||||
Charter Hall Group (REIT) | 39,951 | 146,553 | ||||||
Charter Hall Retail REIT (REIT) | 44,853 | 150,201 | ||||||
Coca-Cola Amatil Ltd. | 76,522 | 579,076 | ||||||
Cochlear Ltd. | 8,191 | 516,959 | ||||||
Commonwealth Bank of Australia | 236,130 | 16,399,296 | ||||||
Computershare Ltd. | 73,765 | 705,469 | ||||||
Cover-More Group Ltd. | 44,953 | 69,135 | ||||||
Cromwell Property Group (REIT) | 185,867 | 156,007 | ||||||
Crown Resorts Ltd. | 54,869 | 563,686 | ||||||
CSL Ltd. | 68,750 | 4,840,762 | ||||||
CSR Ltd. | 75,193 | $ | 236,974 | |||||
Dexus Property Group (REIT) | 131,176 | 741,765 | ||||||
Domino’s Pizza Enterprises Ltd. | 8,803 | 179,472 | ||||||
Downer EDI Ltd. | 62,977 | 241,076 | ||||||
Drillsearch Energy Ltd.* | 60,524 | 40,176 | ||||||
DUET Group | 196,251 | 385,316 | ||||||
DuluxGroup Ltd. | 55,384 | 260,685 | ||||||
Echo Entertainment Group Ltd. | 113,110 | 346,439 | ||||||
Evolution Mining Ltd. | 60,001 | 31,667 | ||||||
Fairfax Media Ltd. | 303,028 | 214,575 | ||||||
Federation Centres (REIT) | 206,775 | 481,241 | ||||||
FlexiGroup Ltd. | 31,832 | 77,503 | ||||||
Flight Centre Travel Group Ltd. | 8,287 | 219,184 | ||||||
Forge Group Ltd. (b)*† | 11,894 | — | ||||||
Fortescue Metals Group Ltd. | 246,462 | 543,125 | ||||||
G8 Education Ltd. | 50,635 | 171,229 | ||||||
Genworth Mortgage Insurance Australia Ltd. | 31,559 | 92,771 | ||||||
Goodman Fielder Ltd. | 235,368 | 122,997 | ||||||
Goodman Group (REIT) | 222,772 | 1,026,972 | ||||||
GPT Group (REIT) | 245,526 | 867,435 | ||||||
GrainCorp Ltd., Class A | 26,498 | 177,628 | ||||||
Greencross Ltd. | 14,279 | 92,315 | ||||||
GUD Holdings Ltd. | 10,035 | 58,814 | ||||||
GWA Group Ltd. | 43,100 | 103,960 | ||||||
Harvey Norman Holdings Ltd. | 86,575 | 236,069 | ||||||
Healthscope Ltd.* | 155,568 | 344,446 | ||||||
Horizon Oil Ltd.* | 148,416 | 19,444 | ||||||
iiNET Ltd. | 22,960 | 146,613 | ||||||
Iluka Resources Ltd. | 60,876 | 292,641 | ||||||
Incitec Pivot Ltd. | 235,942 | 610,118 | ||||||
Independence Group NL | 34,496 | 123,636 | ||||||
Insurance Australia Group Ltd. | 339,213 | 1,719,779 | ||||||
Investa Office Fund (REIT) | 88,952 | 262,734 | ||||||
Invocare Ltd. | 15,942 | 156,661 | ||||||
IOOF Holdings Ltd. | 38,261 | 275,937 | ||||||
Iress Ltd. | 18,676 | 162,260 | ||||||
Japara Healthcare Ltd.* | 35,084 | 58,520 | ||||||
JB Hi-Fi Ltd. | 14,390 | 184,420 | ||||||
Karoon Gas Australia Ltd.* | 28,034 | 54,956 | ||||||
Leighton Holdings Ltd. | 14,595 | 265,549 | ||||||
Lend Lease Group | 76,827 | 1,022,933 | ||||||
Liquefied Natural Gas Ltd.* | 66,840 | 132,956 | ||||||
Lynas Corp., Ltd.* | 488,317 | 27,086 | ||||||
M2 Group Ltd. | 26,116 | 172,267 | ||||||
Macquarie Atlas Roads Group | 54,801 | 142,177 | ||||||
Macquarie Group Ltd. | 46,606 | 2,199,740 | ||||||
Magellan Financial Group Ltd. | 18,285 | 243,816 | ||||||
McMillan Shakespeare Ltd. | 8,642 | 73,629 | ||||||
Mesoblast Ltd.* | 28,177 | 100,071 | ||||||
Metcash Ltd. | 130,984 | 196,972 | ||||||
Mineral Resources Ltd. | 23,040 | 141,020 | ||||||
Mirvac Group (REIT) | 529,037 | 764,037 | ||||||
MMA Offshore Ltd. | 50,956 | 51,137 | ||||||
Monadelphous Group Ltd. | 13,425 | 102,069 | ||||||
Mount Gibson Iron Ltd. | 86,125 | 17,065 | ||||||
Myer Holdings Ltd. | 80,281 | 91,277 | ||||||
National Australia Bank Ltd. | 352,125 | 9,594,448 | ||||||
Navitas Ltd. | 44,416 | 182,315 | ||||||
Newcrest Mining Ltd.* | 110,579 | 984,666 | ||||||
Nine Entertainment Co. Holdings Ltd. | 85,814 | 132,995 | ||||||
See Notes to Financial Statements.
12
EQ ADVISORS TRUST
EQ/INTERNATIONAL EQUITY INDEX PORTFOLIO
PORTFOLIO OF INVESTMENTS (Continued)
December 31, 2014
| Number of Shares | Value (Note 1) | |||||||
Northern Star Resources Ltd. | 81,022 | $ | 98,811 | |||||
Novion Property Group (REIT) | 344,668 | 593,379 | ||||||
Nufarm Ltd. | 25,701 | 98,965 | ||||||
Oil Search Ltd. | 169,900 | 1,097,695 | ||||||
Orica Ltd. | 53,339 | 817,461 | ||||||
Origin Energy Ltd. | 159,754 | 1,507,608 | ||||||
Orora Ltd. | 174,803 | 275,853 | ||||||
OZ Minerals Ltd. | 46,013 | 129,276 | ||||||
OzForex Group Ltd. | 31,509 | 72,353 | ||||||
Pacific Brands Ltd. | 125,103 | 54,862 | ||||||
Pact Group Holdings Ltd. | 25,035 | 88,551 | ||||||
Paladin Energy Ltd.* | 191,350 | 55,633 | ||||||
PanAust Ltd. | 68,601 | 78,250 | ||||||
Perpetual Ltd. | 6,839 | 256,171 | ||||||
Platinum Asset Management Ltd. | 31,433 | 184,573 | ||||||
Premier Investments Ltd. | 13,806 | 110,266 | ||||||
Primary Health Care Ltd. | 72,701 | 277,911 | ||||||
Qantas Airways Ltd.* | 317,294 | 615,234 | ||||||
QBE Insurance Group Ltd. | 197,730 | 1,793,490 | ||||||
Qube Holdings Ltd. | 100,502 | 198,192 | ||||||
Ramsay Health Care Ltd. | 18,677 | 866,072 | ||||||
REA Group Ltd. | 6,952 | 255,417 | ||||||
Recall Holdings Ltd. | 45,066 | 263,155 | ||||||
Regis Resources Ltd.* | 56,612 | 89,328 | ||||||
Retail Food Group Ltd. | 16,686 | 77,952 | ||||||
SAI Global Ltd. | 30,939 | 100,372 | ||||||
Sandfire Resources NL | 14,785 | 54,310 | ||||||
Santos Ltd. | 141,757 | 957,751 | ||||||
Scentre Group (REIT)* | 771,291 | 2,193,198 | ||||||
Seek Ltd. | 48,834 | 681,523 | ||||||
Senex Energy Ltd.* | 126,297 | 33,130 | ||||||
Seven Group Holdings Ltd. | 13,961 | 65,895 | ||||||
Seven West Media Ltd. | 87,255 | 95,603 | ||||||
Shopping Centres Australasia Property Group (REIT) | 93,548 | 141,183 | ||||||
Sigma Pharmaceuticals Ltd. | 158,386 | 94,985 | ||||||
Sirius Resources NL* | 40,669 | 83,395 | ||||||
Sirtex Medical Ltd. | 7,965 | 183,322 | ||||||
SKILLED Group Ltd. | 27,380 | 33,266 | ||||||
Slater & Gordon Ltd. | 27,555 | 142,782 | ||||||
Sonic Healthcare Ltd. | 57,374 | 861,618 | ||||||
Southern Cross Media Group Ltd. | 77,474 | 70,490 | ||||||
Spark Infrastructure Group§ | 193,876 | 335,578 | ||||||
Spotless Group Holdings Ltd.* | 105,006 | 162,732 | ||||||
Steadfast Group Ltd. | 66,481 | 83,303 | ||||||
Stockland Corp., Ltd. (REIT) | 340,245 | 1,136,610 | ||||||
STW Communications Group Ltd. | 44,616 | 35,106 | ||||||
Suncorp Group Ltd. | 186,381 | 2,123,841 | ||||||
Sundance Energy Australia Ltd.* | 72,465 | 31,225 | ||||||
Super Retail Group Ltd. | 20,529 | 118,922 | ||||||
Sydney Airport | 317,875 | 1,214,949 | ||||||
Tabcorp Holdings Ltd. | 110,524 | 372,858 | ||||||
Tassal Group Ltd. | 21,773 | 69,084 | ||||||
Tatts Group Ltd. | 207,847 | 584,731 | ||||||
Technology One Ltd. | 28,240 | 73,141 | ||||||
Telstra Corp., Ltd. | 1,771,038 | 8,600,525 | ||||||
Ten Network Holdings Ltd.* | 247,594 | 45,184 | ||||||
Toll Holdings Ltd. | 98,245 | 467,609 | ||||||
TPG Telecom Ltd. | 42,615 | $ | 232,602 | |||||
Transfield Services Ltd.* | 73,052 | 97,027 | ||||||
Transpacific Industries Group | 228,620 | 160,103 | ||||||
Transurban Group | 274,715 | 1,920,408 | ||||||
Treasury Wine Estates Ltd. | 93,050 | 361,978 | ||||||
UGL Ltd.* | 23,314 | 41,445 | ||||||
Veda Group Ltd. | 98,007 | 182,030 | ||||||
Village Roadshow Ltd. | 11,451 | 55,989 | ||||||
Virgin Australia International Holdings Pty Ltd. (b)*† | 190,064 | — | ||||||
Virtus Health Ltd. | 9,286 | 59,226 | ||||||
Vocus Communications Ltd. | 14,419 | 74,904 | ||||||
Wesfarmers Ltd. | 162,819 | 5,511,920 | ||||||
Western Areas Ltd. | 31,817 | 95,995 | ||||||
Westfield Corp. (REIT) | 276,924 | 2,024,653 | ||||||
Westpac Banking Corp. | 453,194 | 12,183,544 | ||||||
Whitehaven Coal Ltd.* | 83,025 | 93,851 | ||||||
Woodside Petroleum Ltd. | 102,645 | 3,191,037 | ||||||
Woolworths Ltd. | 182,604 | 4,549,638 | ||||||
WorleyParsons Ltd. | 31,993 | 263,888 | ||||||
|
| |||||||
| 160,238,612 | ||||||||
|
| |||||||
Belgium (1.4%) | ||||||||
Anheuser-Busch InBev N.V. | 203,040 | 22,848,841 | ||||||
|
| |||||||
Finland (0.5%) | ||||||||
Nokia Oyj | 989,115 | 7,784,865 | ||||||
|
| |||||||
France (13.7%) | ||||||||
Air Liquide S.A. | 91,034 | 11,232,555 | ||||||
Airbus Group N.V. | 151,625 | 7,530,790 | ||||||
BNP Paribas S.A. | 438,079 | 25,743,396 | ||||||
Carrefour S.A. | 165,261 | 5,020,964 | ||||||
Cie de Saint-Gobain | 132,235 | 5,566,997 | ||||||
Danone S.A. | 158,016 | 10,395,316 | ||||||
Essilor International S.A. | 56,811 | 6,324,010 | ||||||
GDF Suez S.A. | 423,150 | 9,882,794 | ||||||
L’Oreal S.A. | 64,370 | 10,806,891 | ||||||
LVMH Moet Hennessy Louis Vuitton S.A. | 72,023 | 11,389,288 | ||||||
Orange S.A. | 511,144 | 8,692,654 | ||||||
Sanofi S.A. | 319,077 | 29,079,373 | ||||||
Schneider Electric SE | 154,131 | 11,199,443 | ||||||
Societe Generale S.A. | 315,480 | 13,256,879 | ||||||
Total S.A. | 628,168 | 32,387,850 | ||||||
Unibail-Rodamco SE (REIT) | 25,895 | 6,618,439 | ||||||
Vinci S.A. | 136,197 | 7,452,792 | ||||||
Vivendi S.A.* | 338,219 | 8,436,925 | ||||||
|
| |||||||
| 221,017,356 | ||||||||
|
| |||||||
Germany (12.7%) | ||||||||
Allianz SE (Registered) | 120,703 | 20,055,246 | ||||||
BASF SE | 242,588 | 20,506,858 | ||||||
Bayer AG (Registered) | 218,413 | 29,859,109 | ||||||
Bayerische Motoren Werke (BMW) AG | 84,747 | 9,203,847 | ||||||
Daimler AG (Registered) | 263,238 | 21,962,107 | ||||||
Deutsche Bank AG (Registered) | 343,054 | 10,369,065 | ||||||
Deutsche Post AG (Registered) | 252,435 | 8,259,329 | ||||||
Deutsche Telekom AG (Registered) | 818,188 | 13,114,140 | ||||||
See Notes to Financial Statements.
13
EQ ADVISORS TRUST
EQ/INTERNATIONAL EQUITY INDEX PORTFOLIO
PORTFOLIO OF INVESTMENTS (Continued)
December 31, 2014
| Number of Shares | Value (Note 1) | |||||||
E.ON SE | 528,503 | $ | 9,075,438 | |||||
Muenchener Rueckversicherungs-Gesellschaft AG in Muenchen (Registered) | 40,379 | 8,089,600 | ||||||
RWE AG | 127,507 | 3,991,977 | ||||||
SAP SE | 251,628 | 17,791,478 | ||||||
Siemens AG (Registered) | 207,931 | 23,581,496 | ||||||
TUI AG* | 60,714 | 993,555 | ||||||
Volkswagen AG (Preference) (q) | 40,750 | 9,102,402 | ||||||
|
| |||||||
| 205,955,647 | ||||||||
|
| |||||||
Ireland (0.8%) | ||||||||
CRH plc | 114,512 | 2,719,882 | ||||||
Experian plc | 153,777 | 2,593,866 | ||||||
James Hardie Industries plc (CDI) | 64,231 | 683,919 | ||||||
Shire plc | 91,089 | 6,444,840 | ||||||
|
| |||||||
| 12,442,507 | ||||||||
|
| |||||||
Italy (2.9%) | ||||||||
Assicurazioni Generali S.p.A. | 356,758 | 7,290,511 | ||||||
Enel S.p.A. | 1,707,732 | 7,635,688 | ||||||
Eni S.p.A. | 712,600 | 12,445,707 | ||||||
Intesa Sanpaolo S.p.A. | 3,700,435 | 10,704,771 | ||||||
UniCredit S.p.A. | 1,470,880 | 9,374,665 | ||||||
|
| |||||||
| 47,451,342 | ||||||||
|
| |||||||
Japan (25.4%) | ||||||||
77 Bank Ltd. | 54,000 | 284,741 | ||||||
ABC-Mart, Inc. | 3,700 | 179,291 | ||||||
Accordia Golf Co., Ltd. | 9,300 | 83,707 | ||||||
Acom Co., Ltd.* | 62,600 | 190,471 | ||||||
ADEKA Corp. | 11,400 | 135,102 | ||||||
Advantest Corp. | 22,300 | 277,846 | ||||||
Aeon Co., Ltd. | 108,063 | 1,087,701 | ||||||
Aeon Delight Co., Ltd. | 4,300 | 99,802 | ||||||
AEON Financial Service Co., | 15,900 | 310,831 | ||||||
Aeon Mall Co., Ltd. | 15,320 | 270,916 | ||||||
Aica Kogyo Co., Ltd. | 9,600 | 198,564 | ||||||
Aichi Bank Ltd. | 1,100 | 54,463 | ||||||
Aichi Corp. | 16,500 | 77,976 | ||||||
Aichi Steel Corp. | 20,102 | 70,803 | ||||||
Aida Engineering Ltd. | 10,453 | 94,492 | ||||||
Aiful Corp.* | 43,800 | 146,725 | ||||||
Ain Pharmaciez, Inc. | 2,920 | 83,412 | ||||||
Air Water, Inc. | 21,000 | 332,904 | ||||||
Aisan Industry Co., Ltd. | 7,700 | 65,827 | ||||||
Aisin Seiki Co., Ltd. | 23,600 | 848,248 | ||||||
Ajinomoto Co., Inc. | 62,000 | 1,148,843 | ||||||
Akebono Brake Industry Co., Ltd. | 14,800 | 51,732 | ||||||
Alfresa Holdings Corp. | 30,400 | 367,397 | ||||||
Alpen Co., Ltd. | 4,000 | 56,170 | ||||||
Alpine Electronics, Inc. | 6,300 | 103,601 | ||||||
Alps Electric Co., Ltd. | 17,700 | 336,458 | ||||||
Amada Co., Ltd. | 48,000 | 411,544 | ||||||
ANA Holdings, Inc. | 524,303 | 1,290,507 | ||||||
Anritsu Corp. | 14,100 | 98,157 | ||||||
AOKI Holdings, Inc. | 6,358 | 64,269 | ||||||
Aoyama Trading Co., Ltd. | 8,200 | 179,911 | ||||||
Aozora Bank Ltd. | 132,000 | 409,668 | ||||||
Aplus Financial Co., Ltd.* | 68,412 | $ | 75,066 | |||||
Ariake Japan Co., Ltd. | 3,950 | 96,206 | ||||||
Asahi Glass Co., Ltd. | 138,000 | 673,870 | ||||||
Asahi Group Holdings Ltd. | 54,700 | 1,688,382 | ||||||
Asahi Kasei Corp. | 162,760 | 1,491,593 | ||||||
Asatsu-DK, Inc. | 4,800 | 114,139 | ||||||
Ashikaga Holdings Co., Ltd. | 23,276 | 94,010 | ||||||
Asics Corp. | 27,000 | 645,240 | ||||||
ASKUL Corp. | 3,500 | 62,081 | ||||||
Astellas Pharma, Inc. | 289,500 | 4,029,148 | ||||||
Autobacs Seven Co., Ltd. | 12,300 | 175,130 | ||||||
Avex Group Holdings, Inc. | 5,735 | 93,976 | ||||||
Awa Bank Ltd. | 21,392 | 114,319 | ||||||
Azbil Corp. | 9,000 | 208,100 | ||||||
Bandai Namco Holdings, Inc. | 29,600 | 628,272 | ||||||
Bando Chemical Industries Ltd. | 17,100 | 61,621 | ||||||
Bank of Iwate Ltd. | 1,900 | 81,818 | ||||||
Bank of Kyoto Ltd. | 47,000 | 393,121 | ||||||
Bank of Saga Ltd. | 25,300 | 57,562 | ||||||
Bank of the Ryukyus Ltd. | 4,185 | 58,528 | ||||||
Bank of Yokohama Ltd. | 173,000 | 938,955 | ||||||
Belluna Co., Ltd. | 22,437 | 93,967 | ||||||
Benesse Holdings, Inc. | 8,700 | 258,439 | ||||||
Bic Camera, Inc. | 10,045 | 115,618 | ||||||
Bridgestone Corp. | 81,900 | 2,846,097 | ||||||
Brother Industries Ltd. | 31,500 | 571,497 | ||||||
Calbee, Inc. | 10,696 | 369,234 | ||||||
Canon Electronics, Inc. | 2,833 | 44,856 | ||||||
Canon Marketing Japan, Inc. | 7,800 | 131,018 | ||||||
Canon, Inc. | 142,234 | 4,517,619 | ||||||
Capcom Co., Ltd. | 6,158 | 92,815 | ||||||
Casio Computer Co., Ltd. | 24,600 | 377,787 | ||||||
Cawachi Ltd. | 3,400 | 50,330 | ||||||
Central Japan Railway Co. | 22,464 | 3,370,090 | ||||||
Century Tokyo Leasing Corp. | 7,500 | 185,692 | ||||||
Chiba Bank Ltd. | 95,338 | 625,731 | ||||||
Chiyoda Co., Ltd. | 3,062 | 60,265 | ||||||
Chiyoda Corp. | 24,000 | 197,397 | ||||||
Chofu Seisakusho Co., Ltd. | 3,200 | 81,836 | ||||||
Chubu Electric Power Co., Inc.* | 86,200 | 1,014,094 | ||||||
Chudenko Corp. | 5,900 | 91,465 | ||||||
Chugai Pharmaceutical Co., Ltd. | 24,800 | 609,629 | ||||||
Chugai Ro Co., Ltd. | 19,300 | 43,849 | ||||||
Chugoku Bank Ltd. | 21,000 | 286,741 | ||||||
Chugoku Electric Power Co., Inc. | 35,320 | 462,543 | ||||||
Citizen Holdings Co., Ltd. | 35,300 | 271,575 | ||||||
CKD Corp. | 9,000 | 85,104 | ||||||
Cleanup Corp. | 10,500 | 76,186 | ||||||
CMK Corp. | 31,223 | 82,054 | ||||||
Coca-Cola Central Japan Co., Ltd. | 8,738 | 133,988 | ||||||
Coca-Cola West Co., Ltd. | 11,100 | 152,703 | ||||||
Cocokara fine, Inc. | 3,771 | 93,155 | ||||||
COLOPL, Inc. | 4,411 | 98,731 | ||||||
Colowide Co., Ltd. | 5,764 | 80,629 | ||||||
COMSYS Holdings Corp. | 17,500 | 238,462 | ||||||
COOKPAD, Inc. | 1,632 | 55,115 | ||||||
Cosel Co., Ltd. | 4,700 | 48,127 | ||||||
Cosmo Oil Co., Ltd. | 94,000 | 133,200 | ||||||
Cosmos Pharmaceutical Corp. | 1,165 | 159,143 | ||||||
Credit Saison Co., Ltd. | 20,400 | 379,557 | ||||||
See Notes to Financial Statements.
14
EQ ADVISORS TRUST
EQ/INTERNATIONAL EQUITY INDEX PORTFOLIO
PORTFOLIO OF INVESTMENTS (Continued)
December 31, 2014
| Number of Shares | Value (Note 1) | |||||||
Dai Nippon Printing Co., Ltd. | 77,000 | $ | 694,941 | |||||
Daibiru Corp. | 6,400 | 60,153 | ||||||
Daicel Corp. | 31,000 | 362,956 | ||||||
Daido Steel Co., Ltd. | 39,000 | 147,642 | ||||||
Daifuku Co., Ltd. | 14,100 | 157,861 | ||||||
Daihatsu Motor Co., Ltd. | 28,000 | 367,282 | ||||||
Daihen Corp. | 17,500 | 88,208 | ||||||
Dai-ichi Life Insurance Co., Ltd. | 148,211 | 2,249,059 | ||||||
Daiichi Sankyo Co., Ltd. | 80,900 | 1,131,021 | ||||||
Dai-ichi Seiko Co., Ltd. | 2,258 | 45,156 | ||||||
Daikin Industries Ltd. | 33,700 | 2,173,559 | ||||||
Daikyo, Inc. | 44,931 | 69,579 | ||||||
Dainichiseika Color & Chemicals Manufacturing Co., Ltd. | 112 | 595 | ||||||
Dainippon Screen Manufacturing Co., Ltd. | 25,000 | 147,640 | ||||||
Daio Paper Corp. | 10,000 | 81,803 | ||||||
Daiseki Co., Ltd. | 5,400 | 93,671 | ||||||
Daishi Bank Ltd. | 32,000 | 106,335 | ||||||
Daito Trust Construction Co., Ltd. | 10,900 | 1,234,158 | ||||||
Daiwa House Industry Co., Ltd. | 77,000 | 1,458,051 | ||||||
Daiwa Securities Group, Inc. | 245,518 | 1,911,999 | ||||||
Daiwabo Holdings Co., Ltd. | 29,000 | 50,402 | ||||||
DCM Holdings Co., Ltd. | 13,400 | 85,784 | ||||||
DeNA Co., Ltd. | 13,013 | 155,470 | ||||||
Denki Kagaku Kogyo KK | 71,000 | 261,362 | ||||||
Denki Kogyo Co., Ltd. | 14,500 | 63,584 | ||||||
Denso Corp. | 61,600 | 2,870,905 | ||||||
Dentsu, Inc. | 25,800 | 1,085,754 | ||||||
DIC Corp. | 89,000 | 214,156 | ||||||
Disco Corp. | 3,400 | 270,993 | ||||||
Don Quijote Holdings Co., Ltd. | 9,300 | 635,227 | ||||||
Doutor Nichires Holdings Co., Ltd. | 5,500 | 78,746 | ||||||
Dowa Holdings Co., Ltd. | 28,000 | 223,472 | ||||||
Dr. Ci:Labo Co., Ltd. | 2,500 | 85,415 | ||||||
Duskin Co., Ltd. | 9,300 | 136,675 | ||||||
Earth Chemical Co., Ltd. | 2,912 | 97,151 | ||||||
East Japan Railway Co. | 45,698 | 3,423,723 | ||||||
Ebara Corp. | 59,000 | 239,704 | ||||||
Eisai Co., Ltd. | 31,400 | 1,216,682 | ||||||
Eizo Corp. | 3,000 | 58,189 | ||||||
Electric Power Development Co., Ltd. | 17,000 | 575,414 | ||||||
Enplas Corp. | 1,027 | 34,539 | ||||||
Exedy Corp. | 3,600 | 86,766 | ||||||
Ezaki Glico Co., Ltd. | 6,500 | 229,022 | ||||||
FamilyMart Co., Ltd. | 8,100 | 302,386 | ||||||
FANUC Corp. | 27,870 | 4,599,627 | ||||||
Fast Retailing Co., Ltd. | 4,900 | 1,785,226 | ||||||
FCC Co., Ltd. | 4,261 | 73,185 | ||||||
FP Corp. | 2,400 | 76,906 | ||||||
Fuji Co., Ltd. | 3,400 | 61,560 | ||||||
Fuji Electric Co., Ltd. | 67,000 | 267,277 | ||||||
Fuji Heavy Industries Ltd. | 82,000 | 2,887,634 | ||||||
Fuji Machine Manufacturing Co., Ltd. | 11,402 | 104,808 | ||||||
Fuji Media Holdings, Inc. | 27,600 | 339,489 | ||||||
Fuji Oil Co., Ltd. | 7,800 | 99,951 | ||||||
Fuji Seal International, Inc. | 3,200 | 93,561 | ||||||
Fujicco Co., Ltd. | 5,900 | $ | 98,471 | |||||
Fujifilm Holdings Corp. | 56,468 | 1,704,136 | ||||||
Fujikura Ltd. | 51,000 | 208,211 | ||||||
Fujita Kanko, Inc. | 15,600 | 47,898 | ||||||
Fujitec Co., Ltd. | 2,840 | 30,240 | ||||||
Fujitsu Ltd. | 247,000 | 1,315,735 | ||||||
Fukuoka Financial Group, Inc. | 106,000 | 547,275 | ||||||
Furukawa Co., Ltd. | 47,469 | 81,319 | ||||||
Furukawa Electric Co., Ltd. | 108,000 | 178,483 | ||||||
Futaba Corp. | 6,500 | 94,619 | ||||||
Futaba Industrial Co., Ltd. | 9,500 | 44,450 | ||||||
Fuyo General Lease Co., Ltd. | 2,579 | 89,346 | ||||||
Geo Holdings Corp. | 9,028 | 72,509 | ||||||
Glory Ltd. | 8,900 | 237,854 | ||||||
GMO Internet, Inc. | 8,424 | 71,627 | ||||||
Goldcrest Co., Ltd. | 3,120 | 57,822 | ||||||
Gree, Inc. | 14,234 | 85,790 | ||||||
GS Yuasa Corp. | 61,000 | 259,472 | ||||||
Gunma Bank Ltd. | 54,000 | 350,278 | ||||||
Gunze Ltd. | 24,000 | 61,876 | ||||||
H2O Retailing Corp. | 9,500 | 149,083 | ||||||
Hachijuni Bank Ltd. | 60,000 | 386,215 | ||||||
Hakuhodo DY Holdings, Inc. | 35,770 | 342,853 | ||||||
Hamamatsu Photonics KK | 11,130 | 531,843 | ||||||
Hankyu Hanshin Holdings, Inc. | 181,000 | 973,782 | ||||||
Haseko Corp. | 45,300 | 364,294 | ||||||
Hazama Ando Corp. | 19,377 | 124,951 | ||||||
Heiwa Corp. | 5,400 | 107,835 | ||||||
Heiwa Real Estate Co., Ltd. | 4,651 | 70,608 | ||||||
Higo Bank Ltd. | 21,000 | 111,621 | ||||||
Hikari Tsushin, Inc. | 2,400 | 146,086 | ||||||
Hino Motors Ltd. | 32,439 | 424,369 | ||||||
Hirose Electric Co., Ltd. | 4,400 | 512,232 | ||||||
Hiroshima Bank Ltd. | 73,000 | 346,989 | ||||||
HIS Co., Ltd. | 4,670 | 131,683 | ||||||
Hisaka Works Ltd. | 5,400 | 43,704 | ||||||
Hisamitsu Pharmaceutical Co., Inc. | 9,400 | 295,096 | ||||||
Hitachi Capital Corp. | 4,800 | 106,022 | ||||||
Hitachi Chemical Co., Ltd. | 14,700 | 260,400 | ||||||
Hitachi Construction Machinery Co., Ltd. | 15,400 | 326,508 | ||||||
Hitachi High-Technologies Corp. | 9,800 | 282,761 | ||||||
Hitachi Koki Co., Ltd. | 8,500 | 64,253 | ||||||
Hitachi Kokusai Electric, Inc. | 7,500 | 105,466 | ||||||
Hitachi Ltd. | 607,778 | 4,447,269 | ||||||
Hitachi Metals Ltd. | 22,990 | 391,514 | ||||||
Hitachi Transport System Ltd. | 6,300 | 77,403 | ||||||
Hitachi Zosen Corp. | 19,500 | 112,210 | ||||||
Hodogaya Chemical Co., Ltd. | 16,300 | 25,622 | ||||||
Hokkaido Electric Power Co., Inc.* | 26,200 | 209,588 | ||||||
Hokuetsu Kishu Paper Co., Ltd. | 22,000 | 93,696 | ||||||
Hokuhoku Financial Group, Inc. | 177,000 | 357,737 | ||||||
Hokuriku Electric Power Co. | 27,019 | 345,043 | ||||||
Hokuto Corp. | 3,600 | 59,849 | ||||||
Honda Motor Co., Ltd. | 224,028 | 6,514,666 | ||||||
Horiba Ltd. | 5,500 | 182,759 | ||||||
Hoshizaki Electric Co., Ltd. | 6,600 | 316,764 | ||||||
Hosiden Corp. | 18,200 | 100,793 | ||||||
See Notes to Financial Statements.
15
EQ ADVISORS TRUST
EQ/INTERNATIONAL EQUITY INDEX PORTFOLIO
PORTFOLIO OF INVESTMENTS (Continued)
December 31, 2014
| Number of Shares | Value (Note 1) | |||||||
House Foods Group, Inc. | 13,200 | $ | 228,487 | |||||
Hoya Corp. | 61,600 | 2,062,428 | ||||||
Hulic Co., Ltd. | 44,679 | 444,168 | ||||||
Ibiden Co., Ltd. | 13,900 | 204,274 | ||||||
IBJ Leasing Co., Ltd. | 4,188 | 83,298 | ||||||
Ichiyoshi Securities Co., Ltd. | 5,248 | 56,603 | ||||||
Icom, Inc. | 2,600 | 62,543 | ||||||
Idec Corp. | 7,600 | 65,151 | ||||||
Idemitsu Kosan Co., Ltd. | 16,000 | 265,120 | ||||||
IHI Corp. | 183,000 | 929,152 | ||||||
Iida Group Holdings Co., Ltd. | 12,653 | 153,671 | ||||||
Inaba Denki Sangyo Co., Ltd. | 3,588 | 116,259 | ||||||
Inabata & Co., Ltd. | 10,984 | 99,315 | ||||||
Inageya Co., Ltd. | 6,500 | 65,746 | ||||||
INPEX Corp. | 142,780 | 1,584,193 | ||||||
Internet Initiative Japan, Inc. | 3,198 | 65,230 | ||||||
Iseki & Co., Ltd. | 41,000 | 77,776 | ||||||
Isetan Mitsukoshi Holdings Ltd. | 52,700 | 646,064 | ||||||
Isuzu Motors Ltd. | 76,500 | 933,348 | ||||||
IT Holdings Corp. | 9,100 | 137,244 | ||||||
Ito En Ltd. | 9,000 | 162,150 | ||||||
ITOCHU Corp. | 199,400 | 2,131,917 | ||||||
Itochu Enex, Co., Ltd. | 1,900 | 13,305 | ||||||
ITOCHU Techno-Solutions Corp. | 4,700 | 166,540 | ||||||
Itoham Foods, Inc. | 17,655 | 92,959 | ||||||
Iwatani Corp. | 26,988 | 176,812 | ||||||
Iyo Bank Ltd. | 34,000 | 368,535 | ||||||
Izumi Co., Ltd. | 5,300 | 186,533 | ||||||
J. Front Retailing Co., Ltd. | 29,000 | 337,714 | ||||||
Jaccs Co., Ltd. | 15,528 | 78,734 | ||||||
Jafco Co., Ltd. | 3,600 | 123,181 | ||||||
Japan Airlines Co., Ltd. | 44,136 | 1,289,238 | ||||||
Japan Airport Terminal Co., Ltd. | 10,100 | 397,584 | ||||||
Japan Aviation Electronics Industry Ltd. | 10,685 | 234,307 | ||||||
Japan Cash Machine Co., Ltd. | 6,102 | 88,856 | ||||||
Japan Digital Laboratory Co., Ltd. | 6,400 | 86,047 | ||||||
Japan Display, Inc.* | 45,302 | 138,563 | ||||||
Japan Exchange Group, Inc. | 38,976 | 908,077 | ||||||
Japan Petroleum Exploration Co., Ltd. | 5,700 | 178,602 | ||||||
Japan Pulp & Paper Co., Ltd. | 20,100 | 55,366 | ||||||
Japan Radio Co., Ltd.* | 23,400 | 71,675 | ||||||
Japan Securities Finance Co., Ltd. | 3,205 | 16,148 | ||||||
Japan Steel Works Ltd. | 52,000 | 184,647 | ||||||
Japan Tobacco, Inc. | 154,788 | 4,250,182 | ||||||
Japan Wool Textile Co., Ltd. | 14,419 | 94,691 | ||||||
JFE Holdings, Inc. | 70,600 | 1,571,448 | ||||||
JGC Corp. | 30,000 | 618,272 | ||||||
Jin Co., Ltd. | 2,774 | 69,241 | ||||||
J-Oil Mills, Inc. | 23,100 | 75,124 | ||||||
Joshin Denki Co., Ltd. | 7,400 | 60,192 | ||||||
Joyo Bank Ltd. | 101,000 | 501,203 | ||||||
JSR Corp. | 23,500 | 403,538 | ||||||
JTEKT Corp. | 25,700 | 435,279 | ||||||
Juroku Bank Ltd. | 41,000 | 145,135 | ||||||
JVC Kenwood Corp.* | 19,300 | 41,936 | ||||||
JX Holdings, Inc. | 303,000 | 1,180,454 | ||||||
kabu.com Securities Co., Ltd. | 136 | $ | 669 | |||||
Kadokawa Dwango* | 6,440 | 101,438 | ||||||
Kaga Electronics Co., Ltd. | 5,500 | 68,527 | ||||||
Kagome Co., Ltd. | 12,800 | 194,837 | ||||||
Kajima Corp. | 131,000 | 541,401 | ||||||
Kakaku.com, Inc. | 17,876 | 257,002 | ||||||
Kaken Pharmaceutical Co., Ltd. | 9,000 | 173,375 | ||||||
Kamigumi Co., Ltd. | 36,000 | 320,169 | ||||||
Kanagawa Chuo Kotsu Co., Ltd. | 14,700 | 70,700 | ||||||
Kanamoto Co., Ltd. | 3,968 | 107,609 | ||||||
Kandenko Co., Ltd. | 16,000 | 91,974 | ||||||
Kaneka Corp. | 42,000 | 225,838 | ||||||
Kanematsu Corp. | 67,103 | 95,344 | ||||||
Kansai Electric Power Co., Inc.* | 103,466 | 984,345 | ||||||
Kansai Paint Co., Ltd. | 34,000 | 525,456 | ||||||
Kao Corp. | 70,200 | 2,769,361 | ||||||
Kappa Create Holdings Co., Ltd. | 5,800 | 55,006 | ||||||
Katakura Industries Co., Ltd. | 7,200 | 75,613 | ||||||
Kawasaki Heavy Industries Ltd. | 211,000 | 963,574 | ||||||
Kawasaki Kisen Kaisha Ltd. | 100,000 | 268,229 | ||||||
KDDI Corp. | 75,930 | 4,750,957 | ||||||
Keihan Electric Railway Co., Ltd. | 72,000 | 384,545 | ||||||
Keihin Corp. | 5,700 | 84,624 | ||||||
Keikyu Corp. | 69,000 | 511,041 | ||||||
Keio Corp. | 71,000 | 509,552 | ||||||
Keisei Electric Railway Co., Ltd. | 40,000 | 487,771 | ||||||
Kenedix, Inc. | 26,600 | 121,173 | ||||||
Kewpie Corp. | 18,400 | 342,486 | ||||||
Key Coffee, Inc. | 4,000 | 55,737 | ||||||
Keyence Corp. | 5,540 | 2,453,876 | ||||||
Kikkoman Corp. | 23,371 | 573,379 | ||||||
Kinden Corp. | 24,000 | 243,026 | ||||||
Kinki Sharyo Co., Ltd. | 13,400 | 36,403 | ||||||
Kintetsu Corp. | 260,000 | 857,546 | ||||||
Kintetsu Department Store Co., Ltd.* | 28,164 | 72,719 | ||||||
Kirin Holdings Co., Ltd. | 120,000 | 1,486,457 | ||||||
Kisoji Co., Ltd. | 20 | 328 | ||||||
Kissei Pharmaceutical Co., Ltd. | 5,000 | 131,187 | ||||||
Kitz Corp. | 19,319 | 79,024 | ||||||
Kiyo Bank Ltd. | 12,600 | 159,520 | ||||||
Koa Corp. | 5,800 | 54,677 | ||||||
Kobayashi Pharmaceutical Co., Ltd. | 4,700 | 274,251 | ||||||
Kobe Steel Ltd. | 452,000 | 781,887 | ||||||
Koei Tecmo Holdings Co., Ltd. | 7,261 | 106,083 | ||||||
Koito Manufacturing Co., Ltd. | 16,000 | 487,994 | ||||||
Kokuyo Co., Ltd. | 13,400 | 99,714 | ||||||
Komatsu Ltd. | 123,700 | 2,742,371 | ||||||
Komeri Co., Ltd. | 4,300 | 93,618 | ||||||
Komori Corp. | 7,900 | 89,882 | ||||||
Konami Corp. | 14,900 | 274,732 | ||||||
Konica Minolta, Inc. | 63,500 | 684,947 | ||||||
Kose Corp. | 6,000 | 234,694 | ||||||
Krosaki Harima Corp. | 17,100 | 34,890 | ||||||
K’s Holdings Corp. | 7,200 | 189,535 | ||||||
Kubota Corp. | 134,000 | 1,945,848 | ||||||
Kumagai Gumi Co., Ltd.* | 40,351 | 129,411 | ||||||
Kumiai Chemical Industry Co., Ltd. | 16,155 | 107,764 | ||||||
See Notes to Financial Statements.
16
EQ ADVISORS TRUST
EQ/INTERNATIONAL EQUITY INDEX PORTFOLIO
PORTFOLIO OF INVESTMENTS (Continued)
December 31, 2014
| Number of Shares | Value (Note 1) | |||||||
Kurabo Industries Ltd. | 39,100 | $ | 60,704 | |||||
Kuraray Co., Ltd. | 44,000 | 501,649 | ||||||
Kurita Water Industries Ltd. | 16,300 | 340,529 | ||||||
Kuroda Electric Co., Ltd. | 5,100 | 70,512 | ||||||
KYB Co., Ltd. | 19,231 | 81,661 | ||||||
Kyocera Corp. | 43,900 | 2,012,104 | ||||||
Kyoei Steel Ltd. | 5,000 | 86,159 | ||||||
Kyokuto Kaihatsu Kogyo Co., Ltd. | 7,569 | 90,428 | ||||||
KYORIN Holdings, Inc. | 9,000 | 166,674 | ||||||
Kyosan Electric Manufacturing Co., Ltd. | 129 | 401 | ||||||
Kyowa Exeo Corp. | 9,800 | 104,698 | ||||||
Kyowa Hakko Kirin Co., Ltd. | 38,000 | 357,700 | ||||||
Kyushu Electric Power Co., Inc.* | 58,100 | 581,877 | ||||||
Lawson, Inc. | 11,000 | 665,152 | ||||||
Leopalace21 Corp.* | 22,700 | 143,153 | ||||||
Life Corp. | 5,900 | 82,520 | ||||||
Lintec Corp. | 5,800 | 128,477 | ||||||
Lion Corp. | 39,000 | 203,920 | ||||||
LIXIL Group Corp. | 38,500 | 814,200 | ||||||
M3, Inc. | 19,221 | 319,629 | ||||||
Mabuchi Motor Co., Ltd. | 9,200 | 362,563 | ||||||
Macnica, Inc. | 2,900 | 80,848 | ||||||
Maeda Corp. | 18,502 | 151,663 | ||||||
Maeda Kosen Co., Ltd. | 7,188 | 73,396 | ||||||
Maeda Road Construction Co., Ltd. | 10,000 | 148,658 | ||||||
Makino Milling Machine Co., Ltd. | 13,507 | 100,335 | ||||||
Makita Corp. | 17,500 | 791,763 | ||||||
Mandom Corp. | 3,039 | 99,818 | ||||||
Marubeni Corp. | 215,000 | 1,288,772 | ||||||
Marudai Food Co., Ltd. | 21,900 | 75,309 | ||||||
Maruetsu, Inc. | 17,900 | 78,024 | ||||||
Marui Group Co., Ltd. | 32,800 | 296,639 | ||||||
Maruichi Steel Tube Ltd. | 11,400 | 242,850 | ||||||
Maruwa Co., Ltd. | 2,900 | 84,068 | ||||||
Maruzen Showa Unyu Co., Ltd. | 22,000 | 71,006 | ||||||
Matsuda Sangyo Co., Ltd. | 4,000 | 43,357 | ||||||
Matsui Securities Co., Ltd. | 14,000 | 121,672 | ||||||
Matsumotokiyoshi Holdings Co., Ltd. | 5,900 | 168,045 | ||||||
Matsuya Foods Co., Ltd. | 4,300 | 90,275 | ||||||
Max Co., Ltd. | 6,000 | 61,443 | ||||||
Mazda Motor Corp. | 76,800 | 1,843,517 | ||||||
Medipal Holdings Corp. | 29,500 | 342,582 | ||||||
MEIJI Holdings Co., Ltd. | 8,300 | 755,924 | ||||||
Meitec Corp. | 2,601 | 76,774 | ||||||
Mie Bank Ltd. | 26,100 | 59,282 | ||||||
Minebea Co., Ltd. | 33,000 | 483,019 | ||||||
Miraca Holdings, Inc. | 8,000 | 344,756 | ||||||
MISUMI Group, Inc. | 10,600 | 348,182 | ||||||
Mitsuba Corp. | 3,235 | 57,738 | ||||||
Mitsubishi Chemical Holdings Corp. | 169,000 | 822,981 | ||||||
Mitsubishi Corp. | 185,516 | 3,402,340 | ||||||
Mitsubishi Electric Corp. | 248,000 | 2,952,696 | ||||||
Mitsubishi Estate Co., Ltd. | 172,957 | 3,660,523 | ||||||
Mitsubishi Gas Chemical Co., Inc. | 53,000 | 266,244 | ||||||
Mitsubishi Heavy Industries Ltd. | 437,000 | $ | 2,416,248 | |||||
Mitsubishi Logistics Corp. | 18,000 | 260,236 | ||||||
Mitsubishi Materials Corp. | 176,000 | 585,065 | ||||||
Mitsubishi Motors Corp. | 96,000 | 879,459 | ||||||
Mitsubishi Paper Mills Ltd.* | 61,000 | 43,976 | ||||||
Mitsubishi Research Institute, Inc. | 3,100 | 73,138 | ||||||
Mitsubishi Shokuhin Co., Ltd. | 2,500 | 54,614 | ||||||
Mitsubishi Tanabe Pharma Corp. | 23,000 | 337,044 | ||||||
Mitsubishi UFJ Financial Group, Inc. | 1,840,683 | 10,089,047 | ||||||
Mitsubishi UFJ Lease & Finance Co., Ltd. | 61,180 | 289,107 | ||||||
Mitsuboshi Belting Co., Ltd. | 12,100 | 89,005 | ||||||
Mitsui & Co., Ltd. | 219,220 | 2,930,570 | ||||||
Mitsui Chemicals, Inc. | 119,000 | 338,018 | ||||||
Mitsui Engineering & Shipbuilding Co., Ltd. | 128,000 | 224,654 | ||||||
Mitsui Fudosan Co., Ltd. | 129,823 | 3,491,657 | ||||||
Mitsui Home Co., Ltd. | 13,400 | 55,689 | ||||||
Mitsui Matsushima Co., Ltd. | 32,100 | 33,876 | ||||||
Mitsui Mining & Smelting Co., Ltd. | 97,000 | 233,670 | ||||||
Mitsui O.S.K. Lines Ltd. | 139,863 | 415,453 | ||||||
Mitsui Sugar Co., Ltd. | 19,300 | 63,604 | ||||||
Mitsumi Electric Co., Ltd. | 11,968 | 94,938 | ||||||
Miura Co., Ltd. | 11,508 | 115,013 | ||||||
Miyazaki Bank Ltd. | 26,800 | 83,633 | ||||||
Mizuho Financial Group, Inc. | 3,201,030 | 5,378,686 | ||||||
Mizuno Corp. | 15,800 | 77,303 | ||||||
Mochida Pharmaceutical Co., Ltd. | 2,600 | 141,046 | ||||||
Modec, Inc. | 3,840 | 64,619 | ||||||
Monex Group, Inc. | 24,700 | 58,404 | ||||||
MonotaRO Co., Ltd. | 4,022 | 80,689 | ||||||
Mori Seiki Co., Ltd. | 17,900 | 222,418 | ||||||
Morinaga & Co., Ltd. | 35,100 | 91,890 | ||||||
Morinaga Milk Industry Co., Ltd. | 29,000 | 100,285 | ||||||
MOS Food Services, Inc. | 4,100 | 75,686 | ||||||
Moshi Moshi Hotline, Inc. | 6,150 | 56,094 | ||||||
MS&AD Insurance Group Holdings, Inc. | 74,004 | 1,757,733 | ||||||
Murata Manufacturing Co., Ltd. | 26,400 | 2,883,765 | ||||||
Musashi Seimitsu Industry Co., Ltd. | 3,100 | 58,749 | ||||||
Musashino Bank Ltd. | 5,200 | 171,642 | ||||||
Nabtesco Corp. | 14,000 | 336,101 | ||||||
Nachi-Fujikoshi Corp. | 25,458 | 156,736 | ||||||
Nagase & Co., Ltd. | 18,000 | 215,426 | ||||||
Nagoya Railroad Co., Ltd. | 112,000 | 417,017 | ||||||
Namura Shipbuilding Co., Ltd. | 4,480 | 48,016 | ||||||
Nankai Electric Railway Co., Ltd. | 67,000 | 257,868 | ||||||
NEC Corp. | 345,000 | 1,005,779 | ||||||
NEC Networks & System Integration Corp. | 2,159 | 44,733 | ||||||
NET One Systems Co., Ltd. | 14,580 | 85,882 | ||||||
Nexon Co., Ltd. | 24,571 | 229,105 | ||||||
Next Co., Ltd. | 12,125 | 98,580 | ||||||
NGK Insulators Ltd. | 34,000 | 700,242 | ||||||
NGK Spark Plug Co., Ltd. | 22,000 | 664,340 | ||||||
See Notes to Financial Statements.
17
EQ ADVISORS TRUST
EQ/INTERNATIONAL EQUITY INDEX PORTFOLIO
PORTFOLIO OF INVESTMENTS (Continued)
December 31, 2014
| Number of Shares | Value (Note 1) | |||||||
NH Foods Ltd. | 19,000 | $ | 415,590 | |||||
NHK Spring Co., Ltd. | 25,000 | 218,117 | ||||||
Nichias Corp. | 14,969 | 85,290 | ||||||
Nichicon Corp. | 10,400 | 81,507 | ||||||
Nichii Gakkan Co. | 11,354 | 90,186 | ||||||
Nichi-iko Pharmaceutical Co., Ltd. | 6,232 | 96,837 | ||||||
Nichirei Corp. | 40,000 | 181,453 | ||||||
Nidec Corp. | 27,986 | 1,815,242 | ||||||
Nifco, Inc. | 6,400 | 207,543 | ||||||
Nihon Kohden Corp. | 5,900 | 290,394 | ||||||
Nihon M&A Center, Inc. | 3,987 | 120,963 | ||||||
Nihon Nohyaku Co., Ltd. | 8,530 | 98,382 | ||||||
Nihon Parkerizing Co., Ltd. | 7,359 | 168,047 | ||||||
Nihon Trim Co., Ltd. | 1,921 | 41,036 | ||||||
Nihon Unisys Ltd. | 10,500 | 93,702 | ||||||
Nikon Corp. | 50,100 | 665,229 | ||||||
Nintendo Co., Ltd. | 15,284 | 1,592,918 | ||||||
Nippo Corp. | 7,000 | 113,566 | ||||||
Nippon Carbon Co., Ltd. | 22,500 | 42,665 | ||||||
Nippon Chemi-Con Corp.* | 35,035 | 99,967 | ||||||
Nippon Coke & Engineering Co., Ltd. | 10,046 | 9,406 | ||||||
Nippon Electric Glass Co., Ltd. | 54,000 | 243,435 | ||||||
Nippon Express Co., Ltd. | 103,000 | 523,839 | ||||||
Nippon Kayaku Co., Ltd. | 24,000 | 296,986 | ||||||
Nippon Konpo Unyu Soko Co., Ltd. | 9,000 | 132,099 | ||||||
Nippon Light Metal Holdings Co., Ltd. | 52,529 | 74,741 | ||||||
Nippon Paint Holdings Co., Ltd. | 22,000 | 638,560 | ||||||
Nippon Paper Industries Co., Ltd. | 16,100 | 230,617 | ||||||
Nippon Sharyo Ltd. | 14,000 | 41,209 | ||||||
Nippon Sheet Glass Co., Ltd.* | 148,000 | 139,333 | ||||||
Nippon Shinyaku Co., Ltd. | 6,000 | 193,797 | ||||||
Nippon Shokubai Co., Ltd. | 20,000 | 262,492 | ||||||
Nippon Signal Co., Ltd. | 8,900 | 93,667 | ||||||
Nippon Steel & Sumikin Bussan Corp. | 27,116 | 93,480 | ||||||
Nippon Steel & Sumitomo Metal Corp. | 1,117,617 | 2,773,606 | ||||||
Nippon Synthetic Chemical Industry Co., Ltd. | 6,785 | 40,318 | ||||||
Nippon Telegraph & Telephone Corp. | 95,542 | 4,916,402 | ||||||
Nippon Television Holdings, Inc. | 27,400 | 403,167 | ||||||
Nippon Thompson Co., Ltd. | 11,000 | 53,755 | ||||||
Nippon Valqua Industries Ltd. | 22,000 | 58,717 | ||||||
Nippon Yusen KK | 216,000 | 610,945 | ||||||
Nipro Corp. | 13,900 | 120,338 | ||||||
Nishimatsu Construction Co., Ltd. | 34,106 | 139,276 | ||||||
Nishimatsuya Chain Co., Ltd. | 7,500 | 60,533 | ||||||
Nishi-Nippon City Bank Ltd. | 114,000 | 329,211 | ||||||
Nishi-Nippon Railroad Co., Ltd. | 42,000 | 170,940 | ||||||
Nissan Chemical Industries Ltd. | 18,000 | 324,600 | ||||||
Nissan Motor Co., Ltd. | 348,080 | 3,031,861 | ||||||
Nissan Shatai Co., Ltd. | 13,000 | 158,132 | ||||||
Nissha Printing Co., Ltd. | 6,558 | 108,885 | ||||||
Nisshin Seifun Group, Inc. | 39,325 | 381,031 | ||||||
Nisshin Steel Holdings Co., Ltd. | 10,951 | $ | 104,172 | |||||
Nisshinbo Holdings, Inc. | 22,000 | 227,879 | ||||||
Nissin Electric Co., Ltd. | 11,000 | 58,544 | ||||||
Nissin Foods Holdings Co., Ltd. | 10,700 | 512,049 | ||||||
Nissin Kogyo Co., Ltd. | 4,986 | 69,418 | ||||||
Nitori Holdings Co., Ltd. | 10,500 | 564,254 | ||||||
Nitta Corp. | 3,600 | 81,634 | ||||||
Nittetsu Mining Co., Ltd. | 14,300 | 50,469 | ||||||
Nitto Boseki Co., Ltd. | 20,312 | 73,035 | ||||||
Nitto Denko Corp. | 23,200 | 1,297,425 | ||||||
Nitto Kogyo Corp. | 5,056 | 98,424 | ||||||
Nitto Kohki Co., Ltd. | 2,800 | 50,552 | ||||||
Noevir Holdings Co., Ltd. | 2,811 | 49,006 | ||||||
NOF Corp. | 21,020 | 133,393 | ||||||
NOK Corp. | 15,700 | 398,740 | ||||||
Nomura Holdings, Inc. | 517,602 | 2,945,457 | ||||||
Nomura Real Estate Holdings, Inc. | 15,900 | 273,225 | ||||||
Nomura Research Institute Ltd. | 14,517 | 445,758 | ||||||
Noritake Co., Ltd. | 19,900 | 44,011 | ||||||
Noritz Corp. | 5,338 | 87,401 | ||||||
North Pacific Bank Ltd. | 48,800 | 188,856 | ||||||
NS Solutions Corp. | 3,300 | 88,565 | ||||||
NS United Kaiun Kaisha Ltd. | 28,700 | 81,723 | ||||||
NSD Co., Ltd. | 6,300 | 92,278 | ||||||
NSK Ltd. | 59,000 | 698,763 | ||||||
NTN Corp. | 74,000 | 327,350 | ||||||
NTT Data Corp. | 18,802 | 702,856 | ||||||
NTT DOCOMO, Inc. | 197,946 | 2,897,563 | ||||||
NTT Urban Development Corp. | 15,400 | 154,484 | ||||||
Obayashi Corp. | 90,000 | 578,430 | ||||||
OBIC Business Consultants Ltd. | 2,700 | 74,765 | ||||||
Obic Co., Ltd. | 11,000 | 352,934 | ||||||
Odakyu Electric Railway Co., Ltd. | 86,000 | 763,145 | ||||||
Ohara, Inc. | 5,000 | 23,675 | ||||||
Ohsho Food Service Corp. | 2,130 | 77,186 | ||||||
Oiles Corp. | 4,560 | 77,363 | ||||||
Oita Bank Ltd. | 21,000 | 74,212 | ||||||
Oji Holdings Corp. | 124,000 | 444,988 | ||||||
Okabe Co., Ltd. | 7,367 | 66,891 | ||||||
Okasan Securities Group, Inc. | 23,000 | 173,242 | ||||||
Oki Electric Industry Co., Ltd. | 108,244 | 207,755 | ||||||
OKUMA Corp. | 22,400 | 176,860 | ||||||
Okumura Corp. | 25,000 | 112,398 | ||||||
Olympus Corp.* | 35,900 | 1,264,969 | ||||||
Omron Corp. | 29,300 | 1,313,239 | ||||||
Ono Pharmaceutical Co., Ltd. | 11,577 | 1,025,862 | ||||||
Onward Holdings Co., Ltd. | 23,000 | 138,392 | ||||||
Oracle Corp. Japan | 5,000 | 203,711 | ||||||
Organo Corp. | 9,300 | 37,011 | ||||||
Orient Corp.* | 50,508 | 82,524 | ||||||
Oriental Land Co., Ltd. | 6,800 | 1,559,374 | ||||||
ORIX Corp. | 159,116 | 1,989,092 | ||||||
Osaka Gas Co., Ltd. | 263,000 | 982,991 | ||||||
OSG Corp. | 14,700 | 237,409 | ||||||
Otsuka Corp. | 7,800 | 246,849 | ||||||
Otsuka Holdings Co., Ltd. | 51,838 | 1,554,722 | ||||||
Pack Corp. | 4,000 | 75,491 | ||||||
PanaHome Corp. | 11,000 | 69,968 | ||||||
Panasonic Corp. | 284,970 | 3,348,019 | ||||||
See Notes to Financial Statements.
18
EQ ADVISORS TRUST
EQ/INTERNATIONAL EQUITY INDEX PORTFOLIO
PORTFOLIO OF INVESTMENTS (Continued)
December 31, 2014
| Number of Shares | Value (Note 1) | |||||||
Panasonic Industrial Devices SUNX Co., Ltd. | 11,800 | $ | 76,940 | |||||
Parco Co., Ltd. | 8,506 | 69,405 | ||||||
Paris Miki Holdings, Inc. | 7,300 | 28,794 | ||||||
Park24 Co., Ltd. | 14,800 | 217,949 | ||||||
Penta-Ocean Construction Co., Ltd. | 34,091 | 116,528 | ||||||
PGM Holdings KK | 10,000 | 94,614 | ||||||
Pigeon Corp. | 5,280 | 308,095 | ||||||
Pilot Corp. | 2,350 | 134,626 | ||||||
Plenus Co., Ltd. | 4,700 | 83,326 | ||||||
Pocket Card Co., Ltd. | 14,360 | 68,982 | ||||||
Pola Orbis Holdings, Inc. | 2,748 | 109,801 | ||||||
Raito Kogyo Co., Ltd. | 11,775 | 101,749 | ||||||
Rakuten, Inc. | 119,118 | 1,658,433 | ||||||
Renesas Electronics Corp.* | 8,900 | 60,441 | ||||||
Rengo Co., Ltd. | 21,000 | 86,659 | ||||||
Resona Holdings, Inc. | 234,500 | 1,183,548 | ||||||
Resorttrust, Inc. | 10,200 | 224,255 | ||||||
Ricoh Co., Ltd. | 82,000 | 833,004 | ||||||
Ricoh Leasing Co., Ltd. | 2,500 | 64,502 | ||||||
Riken Corp. | 16,000 | 60,308 | ||||||
Rinnai Corp. | 4,000 | 269,349 | ||||||
Rohm Co., Ltd. | 13,200 | 800,827 | ||||||
Rohto Pharmaceutical Co., Ltd. | 15,000 | 186,870 | ||||||
Round One Corp. | 11,100 | 64,855 | ||||||
Ryobi Ltd. | 18,700 | 50,670 | ||||||
Ryohin Keikaku Co., Ltd. | 2,500 | 308,909 | ||||||
Ryosan Co., Ltd. | 5,100 | 111,196 | ||||||
Saizeriya Co., Ltd. | 4,200 | 55,327 | ||||||
Sakai Chemical Industry Co., Ltd. | 14,100 | 44,379 | ||||||
Sakata Seed Corp. | 5,300 | 88,448 | ||||||
Sanden Corp. | 18,200 | 97,617 | ||||||
Sangetsu Co., Ltd. | 5,600 | 135,163 | ||||||
San-In Godo Bank Ltd. | 15,000 | 112,916 | ||||||
Sanken Electric Co., Ltd. | 14,951 | 119,726 | ||||||
Sanki Engineering Co., Ltd. | 99 | 663 | ||||||
Sankyo Co., Ltd. | 7,700 | 265,375 | ||||||
Sankyo Tateyama, Inc. | 2,211 | 40,617 | ||||||
Sankyu, Inc. | 40,000 | 163,114 | ||||||
Sanoh Industrial Co., Ltd. | 7,800 | 49,117 | ||||||
Sanrio Co., Ltd. | 6,400 | 159,182 | ||||||
Santen Pharmaceutical Co., Ltd. | 10,400 | 556,565 | ||||||
Sanwa Holdings Corp. | 31,000 | 216,018 | ||||||
Sanyo Chemical Industries Ltd. | 9,400 | 67,962 | ||||||
Sanyo Electric Railway Co., Ltd. | 24,625 | 90,358 | ||||||
Sanyo Shokai Ltd. | 18,600 | 45,104 | ||||||
Sanyo Special Steel Co., Ltd. | 15,123 | 50,557 | ||||||
Sapporo Holdings Ltd. | 52,000 | 220,935 | ||||||
Sawai Pharmaceutical Co., Ltd. | 4,400 | 253,487 | ||||||
SBI Holdings, Inc. | 29,097 | 315,951 | ||||||
SCSK Corp. | 6,300 | 157,976 | ||||||
Secom Co., Ltd. | 26,800 | 1,539,716 | ||||||
Sega Sammy Holdings, Inc. | 27,471 | 352,437 | ||||||
Seibu Holdings, Inc. | 21,536 | 439,377 | ||||||
Seikagaku Corp. | 8,415 | 135,978 | ||||||
Seiko Epson Corp. | 18,600 | 781,264 | ||||||
Seiko Holdings Corp. | 20,162 | 112,827 | ||||||
Seino Holdings Co., Ltd. | 25,000 | 251,480 | ||||||
Seiren Co., Ltd. | 9,500 | 73,603 | ||||||
Sekisui Chemical Co., Ltd. | 59,000 | 710,272 | ||||||
Sekisui House Ltd. | 80,000 | $ | 1,047,824 | |||||
Sekisui Jushi Corp. | 7,100 | 94,864 | ||||||
Sekisui Plastics Co., Ltd. | 16,100 | 61,494 | ||||||
Senshu Ikeda Holdings, Inc. | 18,340 | 82,935 | ||||||
Seven & i Holdings Co., Ltd. | 102,979 | 3,714,526 | ||||||
Seven Bank Ltd. | 99,354 | 418,158 | ||||||
Sharp Corp.* | 192,000 | 425,496 | ||||||
Shiga Bank Ltd. | 30,000 | 160,078 | ||||||
Shikoku Chemicals Corp. | 12,000 | 82,059 | ||||||
Shikoku Electric Power Co., Inc.* | 20,885 | 253,179 | ||||||
Shima Seiki Manufacturing Ltd. | 5,392 | 98,093 | ||||||
Shimachu Co., Ltd. | 6,100 | 148,206 | ||||||
Shimadzu Corp. | 39,000 | 396,905 | ||||||
Shimamura Co., Ltd. | 3,300 | 284,322 | ||||||
Shimano, Inc. | 11,000 | 1,422,852 | ||||||
Shimizu Corp. | 91,000 | 619,637 | ||||||
Shimojima Co., Ltd. | 5,300 | 44,826 | ||||||
Shinagawa Refractories Co., Ltd. | 21,703 | 48,587 | ||||||
Shindengen Electric Manufacturing Co., Ltd. | 13,600 | 78,223 | ||||||
Shin-Etsu Chemical Co., Ltd. | 47,214 | 3,071,612 | ||||||
Shin-Etsu Polymer Co., Ltd. | 11,000 | 45,290 | ||||||
Shinko Electric Industries Co., | 8,500 | 57,846 | ||||||
Shinsei Bank Ltd. | 228,000 | 398,045 | ||||||
Shionogi & Co., Ltd. | 42,300 | 1,095,799 | ||||||
Ship Healthcare Holdings, Inc. | 822 | 18,677 | ||||||
Shiroki Corp. | 18,800 | 51,700 | ||||||
Shiseido Co., Ltd. | 49,800 | 697,369 | ||||||
Shizuoka Bank Ltd. | 78,000 | 713,471 | ||||||
Shochiku Co., Ltd. | 19,000 | 184,685 | ||||||
Showa Corp. | 3,734 | 34,539 | ||||||
Showa Denko KK | 175,000 | 216,166 | ||||||
Showa Sangyo Co., Ltd. | 24,500 | 98,164 | ||||||
Showa Shell Sekiyu KK | 30,300 | 298,625 | ||||||
Sintokogio Ltd. | 7,500 | 51,152 | ||||||
SKY Perfect JSAT Holdings, Inc. | 20,100 | 119,084 | ||||||
SMC Corp. | 7,600 | 1,979,094 | ||||||
SMK Corp. | 16,209 | 64,934 | ||||||
SoftBank Corp. | 122,049 | 7,263,409 | ||||||
Sohgo Security Services Co., Ltd. | 12,200 | 293,307 | ||||||
Sojitz Corp. | 154,100 | 215,930 | ||||||
Sompo Japan Nipponkoa Holdings, Inc. | 54,500 | 1,369,586 | ||||||
Sony Corp. | 143,272 | 2,916,849 | ||||||
Sony Financial Holdings, Inc. | 24,977 | 368,311 | ||||||
Sotetsu Holdings, Inc. | 50,000 | 205,882 | ||||||
Square Enix Holdings Co., Ltd. | 10,400 | 216,175 | ||||||
St. Marc Holdings Co., Ltd. | 1,474 | 84,450 | ||||||
Stanley Electric Co., Ltd. | 21,700 | 469,046 | ||||||
Star Micronics Co., Ltd. | 6,600 | 83,602 | ||||||
Start Today Co., Ltd. | 6,669 | 139,145 | ||||||
Sugi Holdings Co., Ltd. | 5,000 | 204,034 | ||||||
Sumco Corp. | 21,300 | 306,290 | ||||||
Sumitomo Chemical Co., Ltd. | 208,000 | 823,524 | ||||||
Sumitomo Corp. | 147,800 | 1,518,053 | ||||||
Sumitomo Dainippon Pharma Co., Ltd. | 21,398 | 207,982 | ||||||
See Notes to Financial Statements.
19
EQ ADVISORS TRUST
EQ/INTERNATIONAL EQUITY INDEX PORTFOLIO
PORTFOLIO OF INVESTMENTS (Continued)
December 31, 2014
| Number of Shares | Value (Note 1) | |||||||
Sumitomo Electric Industries Ltd. | 97,891 | $ | 1,221,369 | |||||
Sumitomo Forestry Co., Ltd. | 25,100 | 245,950 | ||||||
Sumitomo Heavy Industries Ltd. | 66,000 | 354,690 | ||||||
Sumitomo Metal Mining Co., | 65,000 | 969,919 | ||||||
Sumitomo Mitsui Construction Co., Ltd.* | 79,018 | 99,576 | ||||||
Sumitomo Mitsui Financial Group, Inc. | 182,013 | 6,576,585 | ||||||
Sumitomo Mitsui Trust Holdings, Inc. | 489,630 | 1,868,616 | ||||||
Sumitomo Osaka Cement Co., | 65,000 | 185,652 | ||||||
Sumitomo Real Estate Sales Co., Ltd. | 3,040 | 68,214 | ||||||
Sumitomo Realty & Development Co., Ltd. | 60,880 | 2,073,905 | ||||||
Sumitomo Riko Co., Ltd. | 5,200 | 39,169 | ||||||
Sumitomo Rubber Industries Ltd. | 23,600 | 351,378 | ||||||
Sumitomo Seika Chemicals Co., Ltd. | 17,166 | 114,460 | ||||||
Sumitomo Warehouse Co., Ltd. | 17,000 | 91,312 | ||||||
Sundrug Co., Ltd. | 6,000 | 242,849 | ||||||
Suntory Beverage & Food Ltd. | 17,124 | 591,254 | ||||||
Suruga Bank Ltd. | 26,000 | 476,380 | ||||||
Suzuken Co., Ltd. | 10,200 | 281,898 | ||||||
Suzuki Motor Corp. | 54,500 | 1,638,324 | ||||||
SWCC Showa Holdings Co., Ltd.* | 60,300 | 50,658 | ||||||
Sysmex Corp. | 20,100 | 891,701 | ||||||
T Hasegawa Co., Ltd. | 7,045 | 98,935 | ||||||
T&D Holdings, Inc. | 90,100 | 1,083,938 | ||||||
T.RAD Co., Ltd. | 17,200 | 35,975 | ||||||
Tadano Ltd. | 15,552 | 192,624 | ||||||
Taihei Dengyo Kaisha Ltd. | 8,600 | 65,827 | ||||||
Taihei Kogyo Co., Ltd. | 14,800 | 69,517 | ||||||
Taiheiyo Cement Corp. | 158,000 | 497,175 | ||||||
Taisei Corp. | 143,000 | 813,990 | ||||||
Taisho Pharmaceutical Holdings Co., Ltd. | 6,768 | 412,869 | ||||||
Taiyo Holdings Co., Ltd. | 3,134 | 111,321 | ||||||
Taiyo Nippon Sanso Corp. | 33,000 | 364,138 | ||||||
Taiyo Yuden Co., Ltd. | 15,000 | 175,351 | ||||||
Takara Holdings, Inc. | 30,000 | 193,776 | ||||||
Takara Standard Co., Ltd. | 12,000 | 86,922 | ||||||
Takasago International Corp. | 51 | 230 | ||||||
Takashimaya Co., Ltd. | 33,000 | 264,655 | ||||||
Takeda Pharmaceutical Co., Ltd. | 98,564 | 4,089,981 | ||||||
Takuma Co., Ltd. | 12,205 | 80,913 | ||||||
Tamron Co., Ltd. | 2,969 | 58,730 | ||||||
TDK Corp. | 15,400 | 907,363 | ||||||
Teijin Ltd. | 132,000 | 351,530 | ||||||
Temp Holdings Co., Ltd. | 6,022 | 187,154 | ||||||
Tenma Corp. | 6,500 | 85,894 | ||||||
Terumo Corp. | 40,600 | 924,652 | ||||||
T-Gaia Corp. | 10,184 | 100,647 | ||||||
THK Co., Ltd. | 16,300 | 393,538 | ||||||
TKC Corp. | 5,390 | 88,767 | ||||||
Toagosei Co., Ltd. | 34,000 | 134,123 | ||||||
Tobu Railway Co., Ltd. | 153,000 | $ | 653,837 | |||||
TOC Co., Ltd. | 13,669 | 76,777 | ||||||
Tocalo Co., Ltd. | 3,700 | 63,281 | ||||||
Tochigi Bank Ltd. | 46 | 204 | ||||||
Toda Corp. | 32,000 | 126,372 | ||||||
Toei Co., Ltd. | 18,574 | 106,437 | ||||||
Toenec Corp. | 19,751 | 92,889 | ||||||
Toho Co., Ltd. | 20,600 | 467,423 | ||||||
Toho Gas Co., Ltd. | 67,000 | 328,342 | ||||||
Toho Holdings Co., Ltd. | 9,200 | 133,981 | ||||||
Toho Titanium Co., Ltd.* | 5,100 | 33,319 | ||||||
Tohoku Electric Power Co., Inc. | 61,600 | 715,573 | ||||||
Tokai Carbon Co., Ltd. | 32,000 | 93,312 | ||||||
Tokai Rika Co., Ltd. | 7,500 | 157,549 | ||||||
Tokai Tokyo Financial Holdings, Inc. | 34,000 | 232,634 | ||||||
Token Corp. | 2,181 | 88,169 | ||||||
Tokio Marine Holdings, Inc. | 96,700 | 3,140,309 | ||||||
Tokuyama Corp. | 38,000 | 76,946 | ||||||
Tokyo Broadcasting System Holdings, Inc. | 17,000 | 199,683 | ||||||
Tokyo Dome Corp. | 19,769 | 86,960 | ||||||
Tokyo Electric Power Co., Inc.* | 215,437 | 877,880 | ||||||
Tokyo Electron Ltd. | 22,000 | 1,669,513 | ||||||
Tokyo Gas Co., Ltd. | 287,093 | 1,549,201 | ||||||
Tokyo Ohka Kogyo Co., Ltd. | 5,100 | 156,056 | ||||||
Tokyo Seimitsu Co., Ltd. | 5,267 | 106,058 | ||||||
Tokyo Steel Manufacturing Co., Ltd. | 18,700 | 115,142 | ||||||
Tokyo Tatemono Co., Ltd. | 55,000 | 400,546 | ||||||
Tokyotokeiba Co., Ltd. | 20,593 | 50,833 | ||||||
Tokyu Corp. | 158,000 | 980,194 | ||||||
Tokyu Fudosan Holdings Corp. | 57,534 | 396,430 | ||||||
Tomy Co., Ltd. | 9,500 | 50,036 | ||||||
TonenGeneral Sekiyu KK | 41,000 | 350,486 | ||||||
Topcon Corp. | 6,848 | 145,996 | ||||||
Toppan Forms Co., Ltd. | 7,000 | 70,234 | ||||||
Toppan Printing Co., Ltd. | 75,000 | 488,255 | ||||||
Toray Industries, Inc. | 197,000 | 1,577,769 | ||||||
Torishima Pump Manufacturing Co., Ltd. | 3,900 | 27,815 | ||||||
Toshiba Corp. | 494,000 | 2,091,792 | ||||||
Toshiba Machine Co., Ltd. | 17,105 | 67,894 | ||||||
Toshiba Plant Systems & Services Corp. | 6,000 | 92,093 | ||||||
Tosoh Corp. | 85,000 | 410,832 | ||||||
TOTO Ltd. | 38,000 | 441,987 | ||||||
Towa Pharmaceutical Co., Ltd. | 2,214 | 97,889 | ||||||
Toyo Engineering Corp. | 14,502 | 53,042 | ||||||
Toyo Ink SC Holdings Co., Ltd. | 24,000 | 118,241 | ||||||
Toyo Kohan Co., Ltd. | 17,415 | 92,526 | ||||||
Toyo Seikan Group Holdings Ltd. | 18,400 | 226,991 | ||||||
Toyo Suisan Kaisha Ltd. | 15,000 | 484,338 | ||||||
Toyo Tanso Co., Ltd. | 1,600 | 26,142 | ||||||
Toyo Tire & Rubber Co., Ltd. | 11,244 | 220,513 | ||||||
Toyobo Co., Ltd. | 121,000 | 161,898 | ||||||
Toyoda Gosei Co., Ltd. | 9,300 | 187,790 | ||||||
Toyota Industries Corp. | 24,400 | 1,246,774 | ||||||
Toyota Motor Corp. | 336,475 | 20,982,772 | ||||||
Toyota Tsusho Corp. | 29,500 | 681,820 | ||||||
Trend Micro, Inc. | 13,200 | 361,150 | ||||||
See Notes to Financial Statements.
20
EQ ADVISORS TRUST
EQ/INTERNATIONAL EQUITY INDEX PORTFOLIO
PORTFOLIO OF INVESTMENTS (Continued)
December 31, 2014
| Number of Shares | Value (Note 1) | |||||||
TS Tech Co., Ltd. | 5,200 | $ | 121,793 | |||||
TSI Holdings Co., Ltd. | 12,000 | 70,737 | ||||||
Tsubakimoto Chain Co. | 12,965 | 103,303 | ||||||
Tsumura & Co. | 9,200 | 203,394 | ||||||
Tsuruha Holdings, Inc. | 4,800 | 278,265 | ||||||
Tsutsumi Jewelry Co., Ltd. | 2,800 | 59,191 | ||||||
Tv Tokyo Holdings Corp. | 4,700 | 106,446 | ||||||
UACJ Corp. | 34,970 | 89,361 | ||||||
Ube Industries Ltd. | 141,000 | 210,673 | ||||||
Ulvac, Inc.* | 5,398 | 82,479 | ||||||
Unicharm Corp. | 50,400 | 1,212,857 | ||||||
Unipres Corp. | 4,100 | 67,249 | ||||||
United Arrows Ltd. | 2,708 | 75,732 | ||||||
Unitika Ltd.* | 77,800 | 40,077 | ||||||
UNY Group Holdings Co., Ltd. | 26,100 | 133,052 | ||||||
Ushio, Inc. | 19,600 | 205,026 | ||||||
USS Co., Ltd. | 31,000 | 477,059 | ||||||
Wacoal Holdings Corp. | 20,000 | 201,440 | ||||||
Wakita & Co., Ltd. | 9,405 | 88,581 | ||||||
WATAMI Co., Ltd. | 7,100 | 65,961 | ||||||
West Japan Railway Co. | 23,222 | 1,100,396 | ||||||
Xebio Co., Ltd. | 5,148 | 85,976 | ||||||
Yahoo! Japan Corp. | 186,552 | 673,155 | ||||||
Yakult Honsha Co., Ltd. | 17,700 | 934,090 | ||||||
Yamada Denki Co., Ltd. | 117,100 | 390,845 | ||||||
Yamagata Bank Ltd. | 21,000 | 91,335 | ||||||
Yamaguchi Financial Group, Inc. | 31,000 | 319,358 | ||||||
Yamaha Corp. | 18,200 | 270,329 | ||||||
Yamaha Motor Co., Ltd. | 39,300 | 790,378 | ||||||
Yamato Holdings Co., Ltd. | 48,500 | 954,985 | ||||||
Yamato Kogyo Co., Ltd. | 7,700 | 216,485 | ||||||
Yamazaki Baking Co., Ltd. | 26,000 | 320,804 | ||||||
Yaoko Co., Ltd. | 1,319 | 75,839 | ||||||
Yaskawa Electric Corp. | 27,000 | 345,361 | ||||||
Yodogawa Steel Works Ltd. | 25,160 | 93,647 | ||||||
Yokogawa Electric Corp. | 32,500 | 357,755 | ||||||
Yokohama Rubber Co., Ltd. | 29,640 | 270,792 | ||||||
Yoshinoya Holdings Co., Ltd. | 7,900 | 90,913 | ||||||
Yusen Logistics Co., Ltd. | 9,240 | 101,373 | ||||||
Yushin Precision Equipment Co., Ltd. | 3,893 | 73,741 | ||||||
Zenkoku Hosho Co., Ltd. | 5,062 | 143,523 | ||||||
Zensho Holdings Co., Ltd. | 9,793 | 80,649 | ||||||
Zeon Corp. | 22,000 | 197,523 | ||||||
|
| |||||||
| 410,283,321 | ||||||||
|
| |||||||
Mexico (0.0%) | ||||||||
Fresnillo plc | 26,363 | 312,844 | ||||||
|
| |||||||
Netherlands (4.0%) | ||||||||
ASML Holding N.V. | 98,938 | 10,599,887 | ||||||
ING Groep N.V. (CVA)* | 1,018,988 | 13,193,459 | ||||||
Koninklijke Philips N.V. | 252,672 | 7,336,371 | ||||||
Royal Dutch Shell plc, Class A | 609,909 | 20,216,333 | ||||||
Royal Dutch Shell plc, Class B | 380,048 | 13,056,135 | ||||||
|
| |||||||
| 64,402,185 | ||||||||
|
| |||||||
New Zealand (0.0%) | ||||||||
Fletcher Building Ltd. | 29,242 | 188,079 | ||||||
Kathmandu Holdings Ltd. | 27,393 | 44,778 | ||||||
SKY Network Television Ltd. | 25,481 | 119,030 | ||||||
SKYCITY Entertainment Group Ltd. | 22,991 | $ | 68,962 | |||||
Spark New Zealand Ltd. | 38,261 | 93,055 | ||||||
Trade Me Ltd. | 31,744 | 88,601 | ||||||
|
| |||||||
| 602,505 | ||||||||
|
| |||||||
Singapore (0.0%) | ||||||||
Singapore Telecommunications Ltd. (CDI) | 16,828 | 49,761 | ||||||
|
| |||||||
South Africa (0.1%) | ||||||||
Mondi plc | 56,907 | 917,497 | ||||||
|
| |||||||
Spain (5.0%) | ||||||||
Banco Bilbao Vizcaya Argentaria S.A. | 1,629,972 | 15,340,511 | ||||||
Banco Santander S.A. | 3,323,792 | 27,792,964 | ||||||
Iberdrola S.A. | 1,413,154 | 9,507,947 | ||||||
Inditex S.A. | 277,573 | 7,953,283 | ||||||
Repsol S.A. | 260,057 | 4,833,980 | ||||||
Telefonica S.A. | 1,055,249 | 15,094,243 | ||||||
|
| |||||||
| 80,522,928 | ||||||||
|
| |||||||
Switzerland (0.7%) | ||||||||
Coca-Cola HBC AG (CDI)* | 30,726 | 584,618 | ||||||
Glencore plc* | 1,653,790 | 7,611,972 | ||||||
Wolseley plc | 40,942 | 2,330,760 | ||||||
|
| |||||||
| 10,527,350 | ||||||||
|
| |||||||
United Kingdom (21.8%) | ||||||||
3i Group plc | 149,318 | 1,037,732 | ||||||
Aberdeen Asset Management plc | 152,746 | 1,020,210 | ||||||
Admiral Group plc | 30,428 | 623,124 | ||||||
Aggreko plc | 37,181 | 866,258 | ||||||
Anglo American plc | 202,480 | 3,746,272 | ||||||
Antofagasta plc | 55,073 | 639,413 | ||||||
ARM Holdings plc | 216,431 | 3,332,660 | ||||||
Ashtead Group plc | 77,995 | 1,378,890 | ||||||
Associated British Foods plc | 54,000 | 2,623,624 | ||||||
AstraZeneca plc | 195,549 | 13,756,013 | ||||||
Aviva plc | 456,366 | 3,419,626 | ||||||
Babcock International Group plc | 77,820 | 1,273,208 | ||||||
BAE Systems plc | 490,111 | 3,577,824 | ||||||
Barclays plc | 2,540,518 | 9,551,079 | ||||||
Barratt Developments plc | 152,643 | 1,111,546 | ||||||
BG Group plc | 527,373 | 7,019,717 | ||||||
BP plc | 2,826,022 | 17,944,499 | ||||||
British American Tobacco plc | 288,844 | 15,694,001 | ||||||
British Land Co. plc (REIT) | 156,755 | 1,883,110 | ||||||
BT Group plc | 1,258,885 | 7,814,605 | ||||||
Bunzl plc | 51,448 | 1,402,464 | ||||||
Burberry Group plc | 68,651 | 1,739,521 | ||||||
Capita plc | 103,836 | 1,740,205 | ||||||
Centrica plc | 770,178 | 3,314,813 | ||||||
Compass Group plc | 258,530 | 4,406,468 | ||||||
Diageo plc | 390,295 | 11,194,101 | ||||||
Direct Line Insurance Group plc | 232,436 | 1,048,360 | ||||||
Dixons Carphone plc | 145,307 | 1,046,587 | ||||||
easyJet plc | 38,498 | 993,687 | ||||||
Friends Life Group Ltd. | 210,957 | 1,192,680 | ||||||
G4S plc | 240,431 | 1,034,711 | ||||||
See Notes to Financial Statements.
21
EQ ADVISORS TRUST
EQ/INTERNATIONAL EQUITY INDEX PORTFOLIO
PORTFOLIO OF INVESTMENTS (Continued)
December 31, 2014
| Number of Shares | Value (Note 1) | |||||||
GKN plc | 252,388 | $ | 1,338,709 | |||||
GlaxoSmithKline plc | 753,366 | 16,118,293 | ||||||
Hammerson plc (REIT) | 121,529 | 1,135,870 | ||||||
Hargreaves Lansdown plc | 33,932 | 529,057 | ||||||
Henderson Group plc (CDI) | 99,984 | 326,868 | ||||||
HSBC Holdings plc | 2,955,049 | 27,926,620 | ||||||
Imperial Tobacco Group plc | 149,290 | 6,537,874 | ||||||
InterContinental Hotels Group plc | 36,631 | 1,467,882 | ||||||
International Consolidated Airlines Group S.A.* | 315,490 | 2,357,711 | ||||||
Intertek Group plc | 24,909 | 902,922 | ||||||
Intu Properties plc (REIT) | 141,328 | 730,836 | ||||||
ITV plc | 580,105 | 1,932,540 | ||||||
J Sainsbury plc | 218,834 | 831,951 | ||||||
Johnson Matthey plc | 31,754 | 1,664,672 | ||||||
Kingfisher plc | 367,064 | 1,934,283 | ||||||
Land Securities Group plc (REIT) | 121,905 | 2,181,351 | ||||||
Legal & General Group plc | 920,112 | 3,533,984 | ||||||
Lloyds Banking Group plc* | 8,375,460 | 9,890,305 | ||||||
London Stock Exchange Group | 39,218 | 1,347,388 | ||||||
Marks & Spencer Group plc | 259,369 | 1,914,984 | ||||||
Meggitt plc | 124,826 | 997,778 | ||||||
National Grid plc | 584,506 | 8,332,611 | ||||||
Next plc | 22,817 | 2,406,641 | ||||||
Old Mutual plc | 757,311 | 2,227,187 | ||||||
Pearson plc | 125,997 | 2,317,742 | ||||||
Persimmon plc* | 47,396 | 1,159,397 | ||||||
Prudential plc | 395,403 | 9,099,070 | ||||||
Randgold Resources Ltd. | 14,228 | 962,681 | ||||||
Reckitt Benckiser Group plc | 99,967 | 8,064,472 | ||||||
Reed Elsevier plc | 177,912 | 3,026,887 | ||||||
Rio Tinto Ltd. | 63,126 | 2,961,066 | ||||||
Rio Tinto plc | 193,331 | 8,907,248 | ||||||
Rolls-Royce Holdings plc* | 290,044 | 3,907,199 | ||||||
Rolls-Royce Holdings plc (Preference), Class C*(b)(q)† | 25,936,110 | 40,424 | ||||||
Royal Bank of Scotland Group plc* | 334,322 | 2,029,508 | ||||||
Royal Mail plc | 95,456 | 635,630 | ||||||
RSA Insurance Group plc* | 155,755 | 1,048,215 | ||||||
SABMiller plc | 146,492 | 7,581,293 | ||||||
Sage Group plc | 161,417 | 1,164,041 | ||||||
Schroders plc | 17,520 | 726,124 | ||||||
Severn Trent plc | 36,892 | 1,143,829 | ||||||
Sky plc | 162,489 | 2,261,557 | ||||||
Smith & Nephew plc | 138,945 | 2,550,946 | ||||||
Smiths Group plc | 60,750 | 1,028,199 | ||||||
Sports Direct International plc* | 38,972 | 427,417 | ||||||
SSE plc | 153,006 | 3,841,161 | ||||||
St. James’s Place plc | 79,479 | 998,833 | ||||||
Standard Chartered plc | 313,579 | 4,702,743 | ||||||
Standard Life plc | 370,443 | 2,282,085 | ||||||
Taylor Wimpey plc | 500,603 | 1,066,834 | ||||||
Tesco plc | 1,258,722 | 3,662,782 | ||||||
Travis Perkins plc | 38,254 | 1,101,335 | ||||||
Tullow Oil plc | 140,058 | 886,184 | ||||||
Unilever N.V. (CVA) | 412,495 | 16,203,939 | ||||||
Unilever plc | 186,950 | 7,594,047 | ||||||
United Utilities Group plc | 105,650 | 1,497,159 | ||||||
Vodafone Group plc | 4,116,670 | $ | 14,105,607 | |||||
Weir Group plc | 32,929 | 942,491 | ||||||
Whitbread plc | 27,941 | 2,061,960 | ||||||
WM Morrison Supermarkets plc | 335,388 | 954,503 | ||||||
WPP plc | 205,969 | 4,273,070 | ||||||
|
| |||||||
| 353,213,003 | ||||||||
|
| |||||||
United States (0.1%) | ||||||||
Carnival plc | 28,277 | 1,276,758 | ||||||
News Corp. (CDI), Class B* | 5,262 | 78,733 | ||||||
ResMed, Inc. (CDI) | 109,400 | 614,457 | ||||||
Sims Metal Management Ltd. | 24,188 | 235,840 | ||||||
|
| |||||||
| 2,205,788 | ||||||||
|
| |||||||
Total Common Stocks (99.0%) | 1,600,776,352 | |||||||
|
| |||||||
| Number of Rights | Value (Note 1) | |||||||
RIGHTS: | ||||||||
France (0.1%) | ||||||||
LVMH Moet Hennessy Louis Vuitton S.A., expiring 12/17/15*† | 72,023 | 1,252,745 | ||||||
|
| |||||||
Total Investments (99.1%) | 1,602,029,097 | |||||||
Other Assets Less | 14,678,240 | |||||||
|
| |||||||
Net Assets (100%) | $ | 1,616,707,337 | ||||||
|
| |||||||
| * | Non-income producing. |
| † | Securities (totaling $1,293,169 or 0.1% of net assets) held at fair value by management. |
| § | Securities exempt from registration under Rule 144A of the Securities Act of 1933. These securities may only be resold to qualified institutional buyers. At December 31, 2014, the market value of these securities amounted to $335,578 or 0.0% of net assets. Securities denoted with “§” but without “b” have been determined to be liquid under the guidelines established by the Board of Trustees. To the extent any securities might provide a right to demand registration, such rights have not been relied upon when determining liquidity. |
| (b) | Illiquid security. |
| (q) | Preference Shares are a special type of equity investment that shares in the earnings of the company, has limited voting rights, and receives a greater dividend than applicable Common Shares. |
Glossary:
| CDI | — Chess Depositary Interest |
| CVA | — Dutch Certification |
| REIT | — Real Estate Investment Trust |
See Notes to Financial Statements.
22
EQ ADVISORS TRUST
EQ/INTERNATIONAL EQUITY INDEX PORTFOLIO
PORTFOLIO OF INVESTMENTS (Continued)
December 31, 2014
At December 31, 2014, the Portfolio had the following futures contracts open: (Note 1)
Purchases | Number of Contracts | Expiration Date | Original Value | Value at 12/31/2014 | Unrealized Appreciation/ (Depreciation) | |||||||||||||||
DJ EURO Stoxx 50 Index | 142 | March-15 | $ | 5,253,740 | $ | 5,383,343 | $ | 129,603 | ||||||||||||
FTSE 100 Index | 33 | March-15 | 3,166,893 | 3,354,770 | 187,877 | |||||||||||||||
SPI 200 Index | 10 | March-15 | 1,047,437 | 1,098,670 | 51,233 | |||||||||||||||
TOPIX Index | 18 | March-15 | 2,168,228 | 2,115,128 | (53,100 | ) | ||||||||||||||
| �� |
|
| ||||||||||||||||||
| $ | 315,613 | |||||||||||||||||||
|
| |||||||||||||||||||
Foreign cash on the statement of assets and liabilities is maintained at JPMorgan or its affiliates and is comprised of the following (in USD): AUD 1,118,988, CHF 96,182, EUR 1,785,577, GBP 25,621, MXN 3, JPY 672,553, and SGD 1.
The following is a summary of the inputs used to value the Portfolio’s assets and liabilities carried at fair value as of December 31, 2014:
The inputs or methodology used for valuing securities are not necessarily an indication of the risk associated with investing in those securities.
Various inputs are used in determining the value of the Portfolio’s investments. These inputs are summarized in the three broad levels listed below:
| Investment Type | Level 1 Quoted Prices in Active Markets for Identical Securities | Level 2 Significant Other Observable Inputs for similar securities, interest rates, prepayment speeds, credit risk, etc.) | Level 3 Significant Unobservable Inputs (including the Portfolio’s own assumptions in determining the fair value of investments) (a) | Total | ||||||||||||
Assets: | ||||||||||||||||
Common Stocks | ||||||||||||||||
Consumer Discretionary | $ | — | $ | 192,124,182 | $ | — | $ | 192,124,182 | ||||||||
Consumer Staples | — | 172,958,866 | — | 172,958,866 | ||||||||||||
Energy | — | 121,130,181 | — | 121,130,181 | ||||||||||||
Financials | — | 403,660,639 | — | 403,660,639 | ||||||||||||
Health Care | — | 137,541,534 | — | 137,541,534 | ||||||||||||
Industrials | — | 199,705,012 | 40,424 | 199,745,436 | ||||||||||||
Information Technology | — | 87,385,293 | — | 87,385,293 | ||||||||||||
Materials | — | 119,647,890 | — | 119,647,890 | ||||||||||||
Telecommunication Services | — | 96,456,232 | — | 96,456,232 | ||||||||||||
Utilities | — | 70,126,099 | — | 70,126,099 | ||||||||||||
Futures | 368,713 | — | — | 368,713 | ||||||||||||
Rights | ||||||||||||||||
Consumer Discretionary | — | — | 1,252,745 | 1,252,745 | ||||||||||||
|
|
|
|
|
|
|
| |||||||||
Total Assets | $ | 368,713 | $ | 1,600,735,928 | $ | 1,293,169 | $ | 1,602,397,810 | ||||||||
|
|
|
|
|
|
|
| |||||||||
Liabilities: | ||||||||||||||||
Futures | $ | (53,100 | ) | $ | — | $ | — | $ | (53,100 | ) | ||||||
|
|
|
|
|
|
|
| |||||||||
Total Liabilities | $ | (53,100 | ) | $ | — | $ | — | $ | (53,100 | ) | ||||||
|
|
|
|
|
|
|
| |||||||||
Total | $ | 315,613 | $ | 1,600,735,928 | $ | 1,293,169 | $ | 1,602,344,710 | ||||||||
|
|
|
|
|
|
|
| |||||||||
(a) A security with a market value of $0 transferred from Level 2 to Level 3 at the end of the period due to inactive trading.
There were no additional transfers between Levels 1, 2 or 3 during the year ended December 31, 2014.
See Notes to Financial Statements.
23
EQ ADVISORS TRUST
EQ/INTERNATIONAL EQUITY INDEX PORTFOLIO
PORTFOLIO OF INVESTMENTS (Continued)
December 31, 2014
Fair Values of Derivative Instruments as of December 31, 2014:
Statement of Assets and Liabilities | ||||||
Derivatives Not Accounted for as Hedging Instrument^ | Asset Derivatives | Fair Value | ||||
Equity contracts | Receivables, Net assets – Unrealized appreciation | $ | 368,713 | * | ||
|
| |||||
Liability Derivatives | ||||||
Equity contracts | Payables, Net assets – Unrealized depreciation | $ | (53,100 | )* | ||
|
| |||||
| * | Includes cumulative appreciation/depreciation of futures contracts as reported in the Portfolio of Investments. |
The Effect of Derivative Instruments on the Statement of Operations for the year ended December 31, 2014:
| Amount of Realized Gain or (Loss) on Derivatives Recognized in Income | ||||||||
Derivatives Not Accounted for as Hedging Instruments^ | Futures | Total | ||||||
Equity contracts | $ | 1,685,986 | $ | 1,685,986 | ||||
|
|
|
| |||||
| Amount of Unrealized Appreciation or (Depreciation) on Derivatives Recognized in Income | ||||||||
Derivatives Not Accounted for as Hedging Instruments^ | Futures | Total | ||||||
Equity contracts | $ | (247,428 | ) | $ | (247,428 | ) | ||
|
|
|
| |||||
^ The Portfolio held futures contracts as a substitute for investing in conventional securities.
The Portfolio held futures contracts with an average notional balance of approximately $16,638,000 during the year ended December 31, 2014.
See Notes to Financial Statements.
24
EQ ADVISORS TRUST
EQ/INTERNATIONAL EQUITY INDEX PORTFOLIO
PORTFOLIO OF INVESTMENTS (Continued)
December 31, 2014
Investment security transactions for the year ended December 31, 2014 were as follows:
Cost of Purchases: | ||||
Long-term investments other than U.S. government debt securities | $ | 156,104,218 | ||
Net Proceeds of Sales and Redemptions: | ||||
Long-term investments other than U.S. government debt securities | $ | 137,421,973 |
As of December 31, 2014, the gross unrealized appreciation (depreciation) of investments based on the aggregate cost of investments for Federal income tax purposes was as follows:
Aggregate gross unrealized appreciation | $ | 287,681,457 | ||
Aggregate gross unrealized depreciation | (223,953,551 | ) | ||
|
| |||
Net unrealized appreciation | $ | 63,727,906 | ||
|
| |||
Federal income tax cost of investments | $ | 1,538,301,191 | ||
|
|
See Notes to Financial Statements.
25
EQ ADVISORS TRUST
EQ/INTERNATIONAL EQUITY INDEX PORTFOLIO
STATEMENT OF ASSETS AND LIABILITIES
December 31, 2014
ASSETS | ||||
Investments at value (Cost $1,528,591,733) | $ | 1,602,029,097 | ||
Cash | 11,741,634 | |||
Foreign cash (Cost $3,762,168) | 3,698,925 | |||
Receivable for securities sold | 3,499,762 | |||
Dividends, interest and other receivables | 3,191,438 | |||
Due from broker for futures variation margin | 1,021,551 | |||
Due from custodian | 593,736 | |||
Receivable from Separate Accounts for Trust shares sold | 217,141 | |||
Other assets | 3,733 | |||
|
| |||
Total assets | 1,625,997,017 | |||
|
| |||
LIABILITIES | ||||
Payable for securities purchased | 7,245,305 | |||
Payable to Separate Accounts for Trust shares redeemed | 827,882 | |||
Investment management fees payable | 558,770 | |||
Distribution fees payable – Class IB | 173,362 | |||
Distribution fees payable – Class IA | 142,100 | |||
Administrative fees payable | 141,103 | |||
Trustees’ fees payable | 5,125 | |||
Accrued expenses | 196,033 | |||
|
| |||
Total liabilities | 9,289,680 | |||
|
| |||
NET ASSETS | $ | 1,616,707,337 | ||
|
| |||
Net assets were comprised of: | ||||
Paid in capital | $ | 2,245,691,639 | ||
Accumulated undistributed net investment income (loss) | (5,818,334 | ) | ||
Accumulated undistributed net realized gain (loss) on investments, futures and foreign currency transactions | (696,666,296 | ) | ||
Net unrealized appreciation (depreciation) on investments, futures and foreign currency translations | 73,500,328 | |||
|
| |||
Net assets | $ | 1,616,707,337 | ||
|
| |||
Class IA | ||||
Net asset value, offering and redemption price per share, $655,834,757 / 74,332,022 shares outstanding (unlimited amount authorized: $0.01 par value) | $ | 8.82 | ||
|
| |||
Class IB | ||||
Net asset value, offering and redemption price per share, $803,688,353 / 92,498,388 shares outstanding (unlimited amount authorized: $0.01 par value) | $ | 8.69 | ||
|
| |||
Class K | ||||
Net asset value, offering and redemption price per share, $157,184,227 / 17,819,681 shares outstanding (unlimited amount authorized: $0.01 par value) | $ | 8.82 | ||
|
|
STATEMENT OF OPERATIONS
For the Year Ended December 31, 2014
INVESTMENT INCOME | ||||
Dividends ($14,805 of dividend income received from affiliates) (net of $4,344,831 foreign withholding tax) | $ | 66,407,139 | ||
Interest | 19,052 | |||
|
| |||
Total income | 66,426,191 | |||
|
| |||
EXPENSES | ||||
Investment management fees | 6,936,709 | |||
Distribution fees – Class IB | 2,140,567 | |||
Distribution fees – Class IA | 1,807,521 | |||
Administrative fees | 1,775,141 | |||
Custodian fees | 291,500 | |||
Printing and mailing expenses | 131,230 | |||
Professional fees | 80,246 | |||
Trustees’ fees | 44,554 | |||
Miscellaneous | 58,813 | |||
|
| |||
Total expenses | 13,266,281 | |||
|
| |||
NET INVESTMENT INCOME (LOSS) | 53,159,910 | |||
|
| |||
REALIZED AND UNREALIZED GAIN (LOSS) | ||||
Realized gain (loss) on: | ||||
Investments | 9,399,747 | |||
Futures | 1,685,986 | |||
Foreign currency transactions | (586,818 | ) | ||
|
| |||
Net realized gain (loss) | 10,498,915 | |||
|
| |||
Change in unrealized appreciation (depreciation) on: | ||||
Investments | (182,974,164 | ) | ||
Futures | (247,428 | ) | ||
Foreign currency translations | (341,775 | ) | ||
|
| |||
Net change in unrealized appreciation (depreciation) | (183,563,367 | ) | ||
|
| |||
NET REALIZED AND UNREALIZED GAIN (LOSS) | (173,064,452 | ) | ||
|
| |||
NET INCREASE (DECREASE) IN NET ASSETS RESULTING FROM OPERATIONS | $ | (119,904,542 | ) | |
|
|
See Notes to Financial Statements.
26
EQ ADVISORS TRUST
EQ/INTERNATIONAL EQUITY INDEX PORTFOLIO
STATEMENT OF CHANGES IN NET ASSETS
| Year Ended December 31, | ||||||||
| 2014 | 2013 | |||||||
INCREASE (DECREASE) IN NET ASSETS FROM OPERATIONS: | ||||||||
Net investment income (loss) | $ | 53,159,910 | $ | 35,284,510 | ||||
Net realized gain (loss) on investments, futures and foreign currency transactions | 10,498,915 | 5,979,859 | ||||||
Net change in unrealized appreciation (depreciation) on investments, futures and foreign currency translations | (183,563,367 | ) | 277,474,744 | |||||
|
|
|
| |||||
NET INCREASE (DECREASE) IN NET ASSETS RESULTING FROM OPERATIONS | (119,904,542 | ) | 318,739,113 | |||||
|
|
|
| |||||
DIVIDENDS : | ||||||||
Dividends from net investment income | ||||||||
Class IA | (21,540,125 | ) | (15,560,437 | ) | ||||
Class IB | (26,291,054 | ) | (18,319,838 | ) | ||||
Class K | (5,545,169 | ) | (3,338,293 | ) | ||||
|
|
|
| |||||
TOTAL DIVIDENDS : | (53,376,348 | ) | (37,218,568 | ) | ||||
|
|
|
| |||||
CAPITAL SHARES TRANSACTIONS: | ||||||||
Class IA | ||||||||
Capital shares sold [ 2,424,294 and 2,500,651 shares, respectively ] | 23,671,995 | 22,627,807 | ||||||
Capital shares issued in reinvestment of dividends [ 2,408,224 and 1,646,924 shares, respectively ] | 21,540,125 | 15,560,437 | ||||||
Capital shares repurchased [ (7,090,483) and (9,159,064) shares, respectively ] | (68,867,550 | ) | (82,052,074 | ) | ||||
|
|
|
| |||||
Total Class IA transactions | (23,655,430 | ) | (43,863,830 | ) | ||||
|
|
|
| |||||
Class IB | ||||||||
Capital shares sold [ 8,969,220 and 13,719,262 shares, respectively ] | 85,261,479 | 120,788,406 | ||||||
Capital shares issued in reinvestment of dividends [ 2,984,828 and 1,968,968 shares, respectively ] | 26,291,054 | 18,319,838 | ||||||
Capital shares repurchased [ (10,699,132) and (12,619,310) shares, respectively ] | (102,222,630 | ) | (111,906,368 | ) | ||||
|
|
|
| |||||
Total Class IB transactions | 9,329,903 | 27,201,876 | ||||||
|
|
|
| |||||
Class K | ||||||||
Capital shares sold [ 5,158,520 and 2,254,634 shares, respectively ] | 50,663,125 | 21,973,638 | ||||||
Capital shares issued in reinvestment of dividends [ 620,166 and 353,379 shares, respectively ] | 5,545,169 | 3,338,293 | ||||||
Capital shares repurchased [ (2,526,667) and (5,070,929) shares, respectively ] | (24,598,780 | ) | (45,680,557 | ) | ||||
|
|
|
| |||||
Total Class K transactions | 31,609,514 | (20,368,626 | ) | |||||
|
|
|
| |||||
NET INCREASE (DECREASE) IN NET ASSETS RESULTING FROM CAPITAL SHARE TRANSACTIONS | 17,283,987 | (37,030,580 | ) | |||||
|
|
|
| |||||
TOTAL INCREASE (DECREASE) IN NET ASSETS | (155,996,903 | ) | 244,489,965 | |||||
NET ASSETS: | ||||||||
Beginning of year | 1,772,704,240 | 1,528,214,275 | ||||||
|
|
|
| |||||
End of year (a) | $ | 1,616,707,337 | $ | 1,772,704,240 | ||||
|
|
|
|
| ||||
(a) Includes accumulated undistributed (over distributed) net investment income (loss) of | $ | (5,818,334 | ) | $ | (5,229,367 | ) | ||
|
|
|
| |||||
See Notes to Financial Statements.
27
EQ ADVISORS TRUST
EQ/INTERNATIONAL EQUITY INDEX PORTFOLIO
FINANCIAL HIGHLIGHTS
| Year Ended December 31, | ||||||||||||||||||||
| Class IA | 2014 | 2013 | 2012 | 2011 | 2010 | |||||||||||||||
Net asset value, beginning of year | $ | 9.79 | $ | 8.24 | $ | 7.30 | $ | 8.60 | $ | 8.36 | ||||||||||
|
|
|
|
|
|
|
|
|
| |||||||||||
Income (loss) from investment operations: | ||||||||||||||||||||
Net investment income (loss) (e) | 0.30 | 0.20 | ## | 0.21 | 0.26 | 0.16 | ||||||||||||||
Net realized and unrealized gain (loss) on investments, futures and foreign currency transactions | (0.97 | ) | 1.56 | 0.97 | (1.30 | ) | 0.29 | |||||||||||||
|
|
|
|
|
|
|
|
|
| |||||||||||
Total from investment operations | (0.67 | ) | 1.76 | 1.18 | (1.04 | ) | 0.45 | |||||||||||||
|
|
|
|
|
|
|
|
|
| |||||||||||
Less distributions: | ||||||||||||||||||||
Dividends from net investment income | (0.30 | ) | (0.21 | ) | (0.24 | ) | (0.26 | ) | (0.21 | ) | ||||||||||
|
|
|
|
|
|
|
|
|
| |||||||||||
Net asset value, end of year | $ | 8.82 | $ | 9.79 | $ | 8.24 | $ | 7.30 | $ | 8.60 | ||||||||||
|
|
|
|
|
|
|
|
|
| |||||||||||
Total return | (6.90 | )% | 21.43 | % | 16.22 | % | (11.98 | )% | 5.46 | % | ||||||||||
|
|
|
|
|
|
|
|
|
| |||||||||||
Ratios/Supplemental Data: | ||||||||||||||||||||
Net assets, end of year (000’s) | $ | 655,835 | $ | 750,077 | $ | 672,396 | $ | 659,391 | $ | 1,134,210 | ||||||||||
Ratio of expenses to average net assets | 0.79 | % | 0.79 | % | 0.79 | % | 0.53 | % | 0.83 | % | ||||||||||
Ratio of net investment income (loss) to average net assets | 3.05 | % | 2.18 | %(aa) | 2.74 | % | 3.06 | % | 1.93 | % | ||||||||||
Portfolio turnover rate^ | 8 | % | 9 | % | 5 | % | 65 | % | 61 | % | ||||||||||
| Year Ended December 31, | ||||||||||||||||||||
| Class IB | 2014 | 2013 | 2012 | 2011 | 2010 | |||||||||||||||
Net asset value, beginning of year | $ | 9.64 | $ | 8.11 | $ | 7.19 | $ | 8.47 | $ | 8.23 | ||||||||||
|
|
|
|
|
|
|
|
|
| |||||||||||
Income (loss) from investment operations: | ||||||||||||||||||||
Net investment income (loss) (e) | 0.29 | 0.19 | ## | 0.21 | 0.23 | 0.13 | ||||||||||||||
Net realized and unrealized gain (loss) on investments, futures and foreign currency transactions | (0.95 | ) | 1.54 | 0.95 | (1.27 | ) | 0.30 | |||||||||||||
|
|
|
|
|
|
|
|
|
| |||||||||||
Total from investment operations | (0.66 | ) | 1.73 | 1.16 | (1.04 | ) | 0.43 | |||||||||||||
|
|
|
|
|
|
|
|
|
| |||||||||||
Less distributions: | ||||||||||||||||||||
Dividends from net investment income | (0.29 | ) | (0.20 | ) | (0.24 | ) | (0.24 | ) | (0.19 | ) | ||||||||||
|
|
|
|
|
|
|
|
|
| |||||||||||
Net asset value, end of year | $ | 8.69 | $ | 9.64 | $ | 8.11 | $ | 7.19 | $ | 8.47 | ||||||||||
|
|
|
|
|
|
|
|
|
| |||||||||||
Total return | (6.85 | )% | 21.48 | % | 16.14 | % | (12.20 | )% | 5.24 | % | ||||||||||
|
|
|
|
|
|
|
|
|
| |||||||||||
Ratios/Supplemental Data: | ||||||||||||||||||||
Net assets, end of year (000’s) | $ | 803,688 | $ | 879,975 | $ | 715,496 | $ | 681,113 | $ | 871,872 | ||||||||||
Ratio of expenses to average net assets | 0.79 | % | 0.79 | % | 0.79 | % | 0.78 | % | 1.08 | % | ||||||||||
Ratio of net investment income (loss) to average net assets | 3.04 | % | 2.15 | %(bb) | 2.75 | % | 2.75 | % | 1.69 | % | ||||||||||
Portfolio turnover rate^ | 8 | % | 9 | % | 5 | % | 65 | % | 61 | % | ||||||||||
See Notes to Financial Statements.
28
EQ ADVISORS TRUST
EQ/INTERNATIONAL EQUITY INDEX PORTFOLIO
FINANCIAL HIGHLIGHTS (Continued)
| Year Ended December 31, | August 26, 2011* to December 31, 2011 | |||||||||||||||
| Class K | 2014 | 2013 | 2012 | |||||||||||||
Net asset value, beginning of period | $ | 9.79 | $ | 8.24 | $ | 7.30 | $ | 7.68 | ||||||||
|
|
|
|
|
|
|
| |||||||||
Income (loss) from investment operations: | ||||||||||||||||
Net investment income (loss) (e) | 0.32 | 0.22 | ## | 0.24 | 0.06 | |||||||||||
Net realized and unrealized gain (loss) on investments, futures and foreign currency transactions | (0.97 | ) | 1.56 | 0.97 | (0.18 | ) | ||||||||||
|
|
|
|
|
|
|
| |||||||||
Total from investment operations | (0.65 | ) | 1.78 | 1.21 | (0.12 | ) | ||||||||||
|
|
|
|
|
|
|
| |||||||||
Less distributions: | ||||||||||||||||
Dividends from net investment income | (0.32 | ) | (0.23 | ) | (0.27 | ) | (0.26 | ) | ||||||||
|
|
|
|
|
|
|
| |||||||||
Net asset value, end of period | $ | 8.82 | $ | 9.79 | $ | 8.24 | $ | 7.30 | ||||||||
|
|
|
|
|
|
|
| |||||||||
Total return (b) | (6.65 | )% | 21.73 | % | 16.52 | % | (1.49 | )% | ||||||||
|
|
|
|
|
|
|
| |||||||||
Ratios/Supplemental Data: | ||||||||||||||||
Net assets, end of period (000’s) | $ | 157,184 | $ | 142,652 | $ | 140,323 | $ | 226,542 | ||||||||
Ratio of expenses to average net assets (a) | 0.54 | % | 0.54 | % | 0.54 | % | 0.54 | % | ||||||||
Ratio of net investment income (loss) to average net assets (a) | 3.29 | % | 2.43 | %(cc) | 3.09 | % | 2.38 | % | ||||||||
Portfolio turnover rate^ | 8 | % | 9 | % | 5 | % | 65 | % | ||||||||
| * | Commencement of Operations. |
| ## | Includes income resulting from a special dividend. Without this dividend, the per share income amounts would be $0.16, $0.15 and $0.18 for Class IA ,Class IB and K respectively. |
| ^ | Portfolio turnover rate excludes derivatives, if any. |
| (a) | Ratios for periods less than one year are annualized. |
| (b) | Total returns for periods less than one year are not annualized. |
| (e) | Net investment income (loss) per share is based on average shares outstanding. |
| (aa) | Includes income resulting from a special dividend, Without this dividend, the ratios for Class IA would be 1.75% for income after waivers and reimbursements, 1.75% after waivers, reimbursements, and fees paid indirectly, and 1.75% before waivers, reimbursements, and fees paid indirectly. |
| (bb) | Includes income resulting from a special dividend. Without this dividend, the ratios for Class IB would 1.72% for income after waiver and reimbursement, 1.72% after waivers, reimbursements, and fees paid indirectly, and 1.72% before waivers, reimbursemments, and fees paid indirectly. |
| (cc) | Includes income resulting from a special dividend, Without this dividend, the ratios for Class C would be 2.00% for income after waivers and reimbursements, 2.00% after waivers, reimbursements, and fees paid indirectly, and 2% before waivers, reimbursements, and fees paid indirectly. |
See Notes to Financial Statements.
29
NOTES TO FINANCIAL STATEMENTS
December 31, 2014
| Note 1 | Organization and Significant Accounting Policies |
EQ Advisors Trust (the “Trust”) was organized as a Delaware statutory trust on October 31, 1996, and is registered under the Investment Company Act of 1940, as amended (the “1940 Act”), as an open-end management investment company with seventy-nine diversified portfolios and three non-diversified portfolios (each a “Portfolio”). These financial statements present two of the diversified Portfolios. The investment manager to each Portfolio is AXA Equitable Funds Management Group, LLC (“FMG LLC” or the “Manager”), a wholly-owned subsidiary of AXA Equitable Life Insurance Company (“AXA Equitable”).
Under the Trust’s organizational documents, the Trust’s officers and trustees are indemnified against certain liabilities arising out of the performance of their duties to the Trust. In addition, in the normal course of business, the Trust enters into contracts with vendors and others that provide for general indemnifications. The Trust’s maximum exposure under these arrangements is unknown as this would involve future claims that may be made against the Trust. However, based on experience, the Trust and management expect the risk of loss to be remote.
The investment sub-adviser to the EQ/International Equity Index Portfolio (the Sub-Adviser) independently chooses and maintains a portfolio of securities for the Portfolio.
The EQ/International ETF Portfolio is a type of mutual fund often described as a “fund of funds”. The EQ/International ETF Portfolio pursues its investment objectives by investing exclusively in other unaffiliated investment companies or exchange-traded funds.
The Trust issues three classes of shares, Class IA, Class IB and Class K. As of and during the year ended December 31, 2014, the Trust had Class IB shares outstanding for each Portfolio except for the EQ/International ETF Portfolio. During the year ended December 31, 2014, the Trust had Class IA shares outstanding for certain Portfolios as shown in the respective Statements of Assets and Liabilities. In addition, during the year ended December 31, 2014, the Trust had Class K shares outstanding for certain Portfolios as shown in the Statement of Assets and Liabilities. The Class IA and Class IB shares are subject to distribution fees imposed under a distribution plan (“Distribution Plan”) adopted pursuant to Rule 12b-1 under the 1940 Act. Under the Trust’s multiple class distribution system, all three classes of shares have identical voting, dividend, liquidation and other rights, other than the payment of distribution fees under the applicable Distribution Plan. The Trust’s shares are currently sold only to insurance company separate accounts in connection with variable life insurance contracts and variable annuity certificates and contracts issued by AXA Equitable, AXA Life and Annuity Company, other affiliated or unaffiliated insurance companies and to the AXA Equitable 401(k) Plan. Shares also may be sold to other tax-qualified retirement plans, to other series of the Trust and to series of AXA Premier VIP Trust, a separate registered investment company managed by FMG LLC.
The investment objectives of each Portfolio are as follows:
EQ/International ETF Portfolio — Seeks long-term capital appreciation.
EQ/International Equity Index Portfolio (sub-advised by AllianceBernstein L.P.) — Seeks to achieve a total return (before expenses) that approximates the total return performance of a composite index comprised of 40% EuroSTOXX 50 Index, 25% FTSE 100 Index, 25% TOPIX Index, and 10% S&P/ASX 200 Index, including reinvestment of dividends, at a risk level consistent with that of the composite index.
The following is a summary of the significant accounting policies of the Trust:
The preparation of financial statements in accordance with United States of America generally accepted accounting principles (“U.S. GAAP”) requires management to make estimates and assumptions that affect the reported amounts and disclosures. Actual results could differ from those estimates. The Portfolios are investment companies and, accordingly, follow the investment company accounting and reporting guidance of the Financial Accounting Standards Board Accounting Standards Codification Topic 946 - Investment Companies, which is part of U.S. GAAP.
30
EQ ADVISORS TRUST
NOTES TO FINANCIAL STATEMENTS (Continued)
December 31, 2014
Valuation:
Equity securities (including securities issued by Exchange Traded Funds (“ETFs”)) listed on national securities exchanges are valued at the last sale price or official closing price on the date of valuation or, if there is no sale or official closing price, at the latest available bid price. Securities listed on the NASDAQ stock market will be valued using the NASDAQ Official Closing Price (“NOCP”). Generally, the NOCP will be the last sale price unless the reported trade for the security is outside the range of the bid/ask price. In such cases, the NOCP will be normalized to the nearer of the bid or ask price. Other unlisted stocks are valued at their last sale price or official closing price, or if there is no such price, at a bid price estimated by a broker.
Convertible preferred stocks listed on national securities exchanges are valued as of their last sale price or, if there is no sale, at the latest available bid price.
Convertible bonds and unlisted convertible preferred stocks are valued using prices obtained from a pricing service for such investments or, if a pricing service price is not available, at bid prices obtained from one or more of the major dealers in such bonds or stocks. Where there is a discrepancy between dealers, values may be adjusted based on recent premium spreads to the underlying common stocks. Convertible bonds may be matrix-priced based upon the conversion value to the underlying common stocks and market premiums.
Mortgage-backed and asset-backed securities are valued at prices obtained from a bond pricing service where available, or at a bid price obtained from one or more of the major dealers in such securities. The pricing service may utilize data such as issuer type, coupon, cash flows, collateral performance, mortgage prepayment projection tables and Adjustable Rate Mortgage evaluations that incorporate index data, periodic and life caps, the next coupon reset date and the convertibility of the bond in making evaluations. If a quoted price is unavailable, an equivalent yield or yield spread quotes will be obtained from a broker and converted to a price.
Options that are traded on an exchange are valued at their last sale price. Options not traded on an exchange or actively traded are valued according to fair value methods. The market value of a put or call option will usually reflect, among other factors, the market price of the underlying security.
Corporate and Municipal bonds and notes may be valued on the basis of prices provided by a pricing service when such prices are believed to reflect the fair value of such securities. The pricing service may utilize many factors in making evaluations, trading in similar groups of securities and any developments related to specific securities. However, when such prices are not available, such bonds and notes are valued at a bid price estimated by a broker.
U.S. Treasury securities and other obligations issued or guaranteed by the U.S. Government, its agencies or instrumentalities, are valued at prices obtained from a bond pricing service where available. The pricing service may utilize data received from active market makers and broker-dealers, yield curves and the spread over comparable U.S. Treasury issues in making evaluations.
Foreign securities, including foreign government securities, not traded directly in the U.S., or traded in American Depositary Receipts (“ADR”) or similar form, are valued at representative quoted prices from the primary exchange in the currency of the country of origin. Foreign currency is converted into U.S. dollar equivalent at current exchange rates.
Investments in shares of open-end mutual funds (other than ETFs) held by a Portfolio will be valued at the net asset value of the shares of such funds as described in these funds’ prospectuses.
Futures contracts are valued at their last settlement price or, if there is no sale, at the latest available bid price.
Forward foreign exchange contracts are valued by interpolating between the forward and spot currency rates as quoted by a pricing service as of a designated hour on the valuation date. The pricing service may utilize data such as actual trading information and foreign currency exchange rates gathered from leading market makers and foreign currency exchange trading centers throughout the world in making evaluations.
31
EQ ADVISORS TRUST
NOTES TO FINANCIAL STATEMENTS (Continued)
December 31, 2014
If market quotations are not readily available for a security or other financial instruments, such securities and instruments shall be referred to the Trust’s Valuation Committee (“Committee”), who will value the assets in good faith pursuant to procedures adopted by the Board of Trustees (“Pricing Procedures”) of the Trust (the “Board”).
The Board is responsible for ensuring that appropriate valuation methods are used to price securities for the Trust’s Portfolios. The Board has delegated the responsibility of calculating the net asset values (“NAVs”) of the Trust’s Portfolios and classes pursuant to these Pricing Procedures to the Trust’s administrator, FMG LLC (in its capacity as administrator, the “Administrator”). The Administrator has entered into a sub-administration agreement with JPMorgan Chase Bank, N.A. (the “Sub-Administrator”) to assist in performing certain of the duties described herein. The Committee, established by the Board, determines the value of the Trust’s securities and assets for which market quotations are not readily available or for which valuation cannot otherwise be provided in accordance with procedures adopted by the Board. The Committee is comprised of senior employees from FMG LLC.
Due to the inherent uncertainty of valuations of such securities, the fair value may differ significantly from the values that would have been used had a ready market for such securities existed.
Various inputs are used in determining the value of a Portfolio’s assets or liabilities carried at fair value. These inputs are summarized in three broad levels below:
| • | Level 1 - quoted prices in active markets for identical assets |
| • | Level 2 - other significant observable inputs (including quoted prices of similar securities, interest rates, prepayment speeds, credit risk, etc.) |
| • | Level 3 - significant unobservable inputs (including the Portfolio’s own assumptions in determining the fair value of investments) |
A summary of inputs used to value each Portfolio’s assets and liabilities carried at fair value as of December 31, 2014, is included in the Portfolios of Investments. Changes in valuation techniques may result in transfers in or out of an investment’s assigned level. The Portfolios’ policy is to recognize transfers into and transfers out of the valuation levels as of the end of the reporting period. Transfers between levels are included after the Summary of Level 1, Level 2 and Level 3 inputs, following the Portfolio of Investments for each Portfolio. Transfers between levels may be due to a decline or an increase in market activity (e.g., frequency of trades), which may result in a lack of, or increase in, available market inputs to determine price.
Transfers into and transfers out of Level 3 are included in the Level 3 reconciliation following the Portfolio of Investments for each Portfolio.
The inputs or methodology used to value securities are not necessarily an indication of the risk associated with investing in those securities. An investment’s level within the fair value hierarchy is based on the lowest level of any input, both individually and in aggregate, that is significant to the fair value measurement.
The Committee meets and reviews reports based on the valuation technique used to value each particular Level 3 security. In connection with this review, the Committee obtains, when available, updates from its pricing vendors and Sub- Advisers for each fair valued security. For example, with respect to model driven prices, the Committee receives a report regarding a review and recalculation of pricing models and related discounts. For securities valued based on broker quotes, the Committee evaluates variances between existing broker quotes and any alternative broker quotes provided by an Sub-Adviser or other pricing source.
To substantiate unobservable inputs used in fair valuation, the Secretary of the Committee performs an independent verification and additional research for all fair value notifications received
32
EQ ADVISORS TRUST
NOTES TO FINANCIAL STATEMENTS (Continued)
December 31, 2014
from its pricing agent. Among other factors, particular areas of focus include: description of security, historical pricing, intra-day price movement, last trade information, corporate actions, related securities, any available company news and announcements, any available trade data and actions taken by other clients of the pricing vendor. The Committee also notes the materiality of holdings and price changes on Portfolio NAVs.
The Committee reviews and considers changes in value for all fair valued securities that have occurred since the last review.
Pursuant to procedures approved by the Board, events or circumstances affecting the values of portfolio securities that occur between the closing of their principal markets and the time the net asset value is determined may be reflected in the Trust’s calculation of net asset values for each applicable Portfolio when the Manager deems that the particular event or circumstance would materially affect such Portfolio’s net asset value. The value and percentage, based on Total Investments, of the investments that applied these procedures on December 31, 2014 are as follows:
Portfolio: | Market Value: | Percentage of Total Investments | ||||||
EQ/International Equity Index | $ | 1,600,735,928 | 99.9 | % | ||||
Security Transactions and Investment Income:
Securities transactions are recorded on the trade date net of brokerage fees, commissions, and transfer fees. Dividend income (net of withholding taxes) and distributions to shareholders are recorded on the ex-dividend date, except that certain dividends from foreign securities, if any, are recognized as soon as the Portfolio is informed of the ex-dividend date. Interest income (including amortization of premium and accretion of discount on long-term securities using the effective yield method) and interest expense are accrued daily. The Trust records paydown gains and losses realized on prepayments received on mortgage-backed securities as an adjustment to interest income.
The Portfolios record distributions received in excess of income from underlying investments as a reduction of cost of investments and/or realized gain. Such amounts are based on estimates if actual amounts are not available and actual amounts of income, realized gain and return of capital may differ from the estimated amounts. The Portfolios adjust the estimated amounts of components of distributions (and consequently its net investment income) as necessary once the issuers provide information about the actual composition of the distributions.
Realized gains and losses on the sale of investments are computed on the basis of the specific identified cost of the investments sold. Unrealized appreciation (depreciation) on investments and foreign currency denominated assets and liabilities, if any, is presented net of deferred taxes on unrealized gains in the Statements of Assets and Liabilities.
Capital Gains Taxes:
Certain Portfolios may be subject to capital gains and repatriation taxes imposed by certain countries in which they invest. These Portfolios have recorded a deferred tax liability with respect to unrealized appreciation on foreign securities for potential capital gains and repatriation taxes at December 31, 2014. The accrual for capital gains and repatriation taxes is included in net unrealized appreciation (depreciation) on investments in the Statements of Assets and Liabilities for the Portfolios. The amounts related to capital gain taxes for securities that have been sold are included in the net realized gain (loss) on investments in the Statements of Operations for the Portfolios.
Allocation of Expenses and Income:
Expenses attributable to a single Portfolio or class are charged to that Portfolio or class. Expenses of the Trust not attributable to a single Portfolio or class are charged to each Portfolio or class in proportion to the average net assets of each Portfolio or other appropriate allocation methods.
33
EQ ADVISORS TRUST
NOTES TO FINANCIAL STATEMENTS (Continued)
December 31, 2014
All income earned and expenses incurred by each Portfolio are borne on a pro-rata basis by each outstanding class of shares, based on the proportionate interest in the Portfolio represented by the daily net assets of such class, except for distribution fees which are charged on a class specific basis.
Foreign Currency Valuation:
The books and records of the Trust are kept in U.S. dollars. Foreign currency amounts are translated into U.S. dollars at current exchange rates at the following dates:
(i) market value of investment securities, other assets and liabilities — at the valuation date.
(ii) purchases and sales of investment securities, income and expenses — at the date of such transactions.
The Portfolios do not isolate that portion of the results of operations resulting from changes in foreign exchange rates on investments from the fluctuations arising from changes in market prices of securities held. Such fluctuations are included with the net realized and unrealized gain or loss on investments.
Net currency gains or losses realized and unrealized as a result of differences between interest or dividends, withholding taxes, security payables/receivables, forward foreign currency exchange contracts and foreign cash recorded on the Portfolio’s books and the U.S. dollar equivalent amount actually received or paid are presented under foreign currency transactions and foreign currency translations in the realized and unrealized gains and losses section, respectively, of the Statements of Operations. Net realized gains (losses) on foreign currency transactions represent net foreign exchange gains (losses) from forward foreign currency contracts, disposition of foreign currencies, currency gains or losses realized between the trade and settlement dates on securities transactions, and the difference between the amount of investment income and foreign withholding taxes recorded on a Portfolio’s books and the U.S. dollar equivalent of amounts actually received or paid.
Taxes:
The Trust intends to comply with the requirements of the Internal Revenue Code of 1986, as amended applicable to regulated investment companies (“RICs”) and to distribute substantially all of its net investment income and net realized capital gains to shareholders of each Portfolio. Therefore, no Federal, state and local income tax provisions are required.
The Portfolios are not aware of any tax positions for which it is reasonably possible that the total amounts of unrecognized tax benefits will significantly change in the next twelve months. However, the Portfolios’ conclusions may be subject to future review based on changes in, or the interpretation of, the accounting standards or tax laws and regulations. The Portfolios recognize interest and penalties, if any, related to uncertain tax positions as income tax expense in the Statements of Operations. During the year ended December 31, 2014, the Portfolios did not incur any interest or penalties. Each of the tax years in the four year period ended December 31, 2014 remains subject to examination by the Internal Revenue Service, state and local taxing authorities.
Dividends from net investment income, if any, are declared and distributed at least annually for all Portfolios. Dividends from net realized short-term and long-term capital gains are declared and distributed at least annually to the shareholders of the Portfolios to which such gains are attributable. All dividends are reinvested in additional full and fractional shares of the related Portfolios. All
34
EQ ADVISORS TRUST
NOTES TO FINANCIAL STATEMENTS (Continued)
December 31, 2014
distributions are calculated on a tax basis and, as such, the amounts may differ from financial statement investment income and realized gains. Those differences which are significant to the Portfolios are primarily due to Capital Loss Carryovers (EQ/International Equity Index Portfolio). In addition, short-term capital gains and foreign currency gains are treated as capital gains for U.S. GAAP purposes but are considered ordinary income for tax purposes. Capital and net specified losses incurred after October 31 and within the taxable year are deemed to arise on the first business day of the Portfolio’s next taxable year. The tax composition of distributed and undistributed income and gains for the years ended December 31, 2014 and December 31, 2013, were as follows:
| Year Ended December 31, 2014 | Year Ended December 31, 2013 | |||||||||||||||||||||||||||||||
Portfolios: | Distributed Ordinary Income | Distributed Long Term Gains | Accumulated Undistributed Ordinary Income | Accumulated Undistributed Long Term Gains | Distributed Ordinary Income | Distributed Long Term Gains | Accumulated Undistributed Ordinary Income | Accumulated Undistributed Long Term Gains | ||||||||||||||||||||||||
EQ/International ETF | $ | 2,787,857 | $ | 54,525,984 | $ | — | $ | — | $ | 4,311,080 | $ | 14,010,222 | $ | — | $ | 49,953,520 | ||||||||||||||||
EQ/International Equity Index | 53,376,348 | — | 135,689 | — | 37,218,568 | — | — | — | ||||||||||||||||||||||||
The following Portfolios had a Return of Capital during the year ended December 31, 2014:
Portfolio | Return of Capital | |||
EQ/International ETF | $ | 86,938 | ||
Permanent book and tax differences relating to shareholder distributions resulted in reclassifications to undistributed (overdistributed) net investment income (loss), accumulated net realized gain (loss) and paid-in-capital at December 31, 2014 as follows:
Portfolios: | Undistributed Net Investment Income (Loss) | Accumulated Net Realized Gain (Loss) | Paid In Capital | |||||||||
EQ/International ETF | $ | 32,547 | $ | (32,547 | ) | $ | — | |||||
EQ/International Equity Index | (372,529 | ) | 383,529 | (11,000 | ) | |||||||
Net Capital losses and net specified gains/losses incurred after October 31, and within the taxable year are deemed to arise on the first business day of the Portfolios’ next taxable year. For the year ended December 31, 2014, the Portfolios deferred to January 1, 2015 post-October losses of:
Portfolios: | Specified Loss | Short-Term Capital Loss (gain) | Long-Term Capital Loss (gain) | |||||||||
EQ/International ETF | $ | — | $ | — | $ | — | ||||||
EQ/International Equity Index | 1,061,169 | 2,737,333 | 325,374 | |||||||||
Under the Regulated Investment Company Modernization Act of 2010 (the “RIC Mod Act”), net capital losses recognized by the Portfolios after December 31, 2010, may get carried forward indefinitely, and retain their character as short-term and/or long term losses. Prior to the RIC Mod Act, net capital losses incurred by the Portfolios were carried forward for up to eight years and treated as 100% short-term. The RIC Mod Act requires that post-enactment net capital losses be used before pre-enactment net capital losses, therefore some net capital loss carryforwards that would have been utilized under prior law may expire unused. Pre-enactment and post-enactment net capital losses that will be carried forward, if any, are presented in the table below.
The following Portfolio has capital loss carryforward amounts from prior to the RIC Mod Act available for use and utilized during 2014 as follows:
| Expiring | ||||||||||||||||||||||||
Portfolio: | 2015 | 2016 | 2017 | 2018 | Total | Utilized | ||||||||||||||||||
EQ/International Equity Index | $ | — | $ | — | $ | 685,851,337 | $ | 2,618,169 | $ | 688,469,506 | $ | 3,258,316 | ||||||||||||
35
EQ ADVISORS TRUST
NOTES TO FINANCIAL STATEMENTS (Continued)
December 31, 2014
The following Portfolio utilized net capital loss carryforwards during 2014 and/or has losses incurred that will be carried forward under the provisions of the Regulated Investment Company Modernization Act of 2010 as follows:
| Utilized | Losses Carried Forward | |||||||||||||||
Portfolio: | Short Term | Long Term | Short Term | Long Term | ||||||||||||
EQ/International Equity Index | $ | — | $ | 10,654,775 | $ | — | $ | — | ||||||||
Short Sales Against the Box:
Certain Portfolios may enter into a “short sale” of securities in circumstances in which, at the time the short position is open, the Portfolio owns at least an equal amount of the securities sold short or owns preferred stocks or debt securities, convertible or exchangeable without payment of further consideration, into at least an equal number of securities sold short. This kind of short sale, which is referred to as one “against the box,” may be entered into by the Portfolio to, for example, lock in a sale price for a security the Portfolio does not wish to sell immediately. The Portfolio will designate the segregation, either on its records or with the Trust’s custodian, of the securities sold short or convertible or exchangeable preferred stocks or debt securities sold in connection with short sales against the box. Liabilities for securities sold short are reported at market value in the financial statements. Such liabilities are subject to off-balance sheet risk to the extent of any future increases in market value of the securities sold short. The ultimate liability for securities sold short could exceed the liabilities recorded in the Portfolio’s financial statements. The Portfolio bears the risk of potential inability of the brokers to meet their obligation to perform.
Accounting for Derivative Instruments:
Following is a description of how and why the Portfolios use derivative instruments, the type of derivatives utilized by the Portfolios during the reporting period, as well as the primary underlying risk exposures related to each instrument type. Derivatives accounted for as hedging instruments must be disclosed separately from those that do not qualify for hedge accounting. Even though the Portfolios may use derivatives in an attempt to achieve an economic hedge, the Portfolio’s derivatives are not accounted for as hedging instruments because the Portfolios account for their derivatives at fair value and record any changes in fair value in current period earnings. All open derivative positions at period end are reflected on each respective Portfolio’s Portfolio of Investments. The volume of derivative activity, based on month-end notional amounts during the period is also noted in each respective Portfolio’s Portfolio of Investments.
Options:
Certain Portfolios write (sell) covered options as a hedge to provide protection against adverse movements in the price of securities in the Portfolio or to enhance investment performance. Certain Portfolios purchase and sell exchange traded options on foreign currencies. When a Portfolio writes an option, an amount equal to the premium received by the Portfolio is recorded as a liability and is subsequently adjusted on a daily basis to the current market price of the option written. Premiums received from writing options that expire unexercised are recognized as gains on the expiration date. Premiums received from writing options that are exercised or are cancelled in closing purchase transactions are offset against the cost of any securities purchased or added to the proceeds or netted against the amount paid on the transaction to determine the realized gain or loss. In writing options, a Portfolio must assume that the option may be exercised at any time prior to the expiration of its obligation as a writer, and that in such circumstances the net proceeds of the sale (or cost of) purchase of the underlying securities and currencies pursuant to the call or put option may be substantially below or above the prevailing market price. A Portfolio also has the additional risk of
36
EQ ADVISORS TRUST
NOTES TO FINANCIAL STATEMENTS (Continued)
December 31, 2014
not being able to enter into a closing purchase transaction if a liquid secondary market does not exist and bears the risk of unfavorable changes in the price of the financial instruments underlying the options.
Certain Portfolios may purchase put options on securities to increase the Portfolio’s total investment return or to protect its holdings against a substantial decline in market value. The purchase of put options on securities will enable a Portfolio to preserve, at least partially, unrealized gains in an appreciated security in its portfolio without actually selling the security. In addition, the Portfolios will continue to receive interest or dividend income on the security. The Portfolios may also purchase call options on securities to protect against substantial increases in prices of securities that Portfolios intend to purchase pending their ability to invest in an orderly manner in those securities. The Portfolios may sell put or call options they have previously purchased, which could result in a net gain or loss depending on whether the amount received on the sale is more or less than the premium and other transaction costs paid on the put or call option which was bought.
Futures Contracts, Options on Futures Contracts, Forward Commitments and Foreign Currency Exchange Contracts:
The futures contracts used by the Portfolios are agreements to buy or sell a financial instrument for a set price in the future. Options on futures contracts used by the Portfolios are rights to buy, or sell a futures contract for a set price in the future. Certain Portfolios buy or sell futures contracts for the purpose of protecting their portfolio securities against future changes in interest rates and indices which might adversely affect the value of the Portfolios’ securities or the price of securities that they intend to purchase at a later date. Initial margin deposits are made upon entering into futures contracts and can be in cash, certain money market instruments, treasury securities or other liquid, high grade debt securities. During the period the futures contracts are open, changes in the market price of the contracts are recognized as unrealized gains or losses by “marking-to-market” at the end of each trading day. Variation margin payments on futures contracts are received or made, depending upon whether unrealized gains or losses are incurred. When the contract is closed, the Portfolio records a realized gain or loss equal to the difference between the proceeds from or cost of the closing transactions and the Portfolio’s basis in the contract. Should interest rates or indices move unexpectedly, the Portfolio may not achieve the anticipated benefits of the futures contracts and may incur a loss. The use of futures contracts transactions involves the risk of imperfect correlation in movements in the price of futures contracts, interest rates and the underlying hedged assets. Use of long futures contracts subjects the Portfolios to risk of loss in excess of the amounts shown on the Statements of Assets and Liabilities, up to the notional value of the futures contracts. Use of short futures contracts subjects the Portfolios to unlimited risk of loss. The Portfolios enter into futures contracts only on exchanges or boards of trade. The exchange or board of trade acts as the counterparty to each futures transaction; therefore, a Portfolio’s credit risk is limited to failure of the exchange or board of trade.
Certain Portfolios make contracts to purchase or sell securities for a fixed price at a future date beyond customary settlement time (“forward commitments”). Portfolios may designate the segregation, either on their records or with the Trust’s custodian, of cash or other liquid securities in an amount sufficient to meet the purchase price, or may enter into offsetting contracts for the forward sale of other securities they own. These commitments are reported at market value in the financial statements. Forward commitments may be considered securities in themselves and involve a risk of loss if the value of the security to be purchased declines or if the value of the security to be sold increases prior to the settlement date, which is a risk in addition to the risk of decline in value of the Portfolio’s other assets. Where such purchases or sales are made through dealers, a Portfolio relies on the dealer to consummate the sale. The dealer’s failure to do so may result in the loss to a Portfolio of an advantageous yield or price. Market risk exists on these commitments to the same extent as if the securities were owned on a settled basis and gains and losses are recorded and reported in the same manner. However, during the commitment period, these investments earn no interest or dividends. The use of forward commitments may result in market risk to the Portfolios that is greater than if the Portfolios had engaged solely in transactions that settle in the customary time.
37
EQ ADVISORS TRUST
NOTES TO FINANCIAL STATEMENTS (Continued)
December 31, 2014
The Portfolios may be exposed to foreign currency risks associated with portfolio investments. Unrealized gains or losses on forward foreign currency exchange contracts are recorded by the Portfolios on a daily basis and realized gains or losses are recorded on the settlement date of a contract.
Certain Portfolios purchase foreign currency on a spot (or cash) basis. In addition, certain Portfolios enter into contracts to purchase or sell foreign currencies at a future date (“forward contracts”). A forward foreign currency exchange contract is a commitment to purchase or sell a foreign currency at a future date at a negotiated forward rate. Daily fluctuations in the value of such contracts are recognized as unrealized appreciation or depreciation by “marking to market.” The gain or loss arising from the difference between the original contracts and the closing of such contracts is included in realized gains or losses from foreign currency transactions in the Statements of Operations. The Portfolios may engage in these forward contracts to protect against uncertainty in the level of future exchange rates in connection with the purchase and sale of Portfolio securities (“transaction hedging”) and to protect the value of specific portfolio positions (“position hedging”). The Portfolios also buy forward foreign currency exchange contracts to gain exposure to currencies. The Portfolios are subject to off-balance sheet risk to the extent of the value of the contracts for purchase of foreign currency and in an unlimited amount for sales of foreign currency.
Market and Credit Risk:
Written options, futures contracts, forward commitments and forward foreign currency exchange contracts involve elements of both market and credit risk in excess of the amounts reflected in the Statements of Assets and Liabilities. The risk involved in writing an option on a security is that, if the option is exercised, the underlying security is then purchased or sold by the Portfolio at the contract price, which could be disadvantageous relative to the market price. The Portfolio bears the market risk, which arises from any changes in security values. The credit risk for futures contracts and exchange traded options is limited to failure of the exchange or board of trade which acts as the counterparty to the Portfolio’s futures transactions. Forward commitments, forward foreign currency exchange contracts and over-the-counter options are executed directly with the counterparty and not through an exchange and can be terminated only by agreement of both parties to such contracts. With respect to such transactions there is no daily margin settlement and the Portfolio is exposed to the risk of default by the counterparty.
Offsetting Assets and Liabilities:
The Portfolios adopted Accounting Standards Update (“ASU”) No. 2011-11: Disclosures about Offsetting Assets and Liabilities (“netting”) on the Statements of Assets and Liabilities that are subject to master netting arrangements or similar agreements. ASU 2011-11 was amended by ASU No. 2013-01, clarifying which investments and transactions are subject to the netting disclosure. The scope of the disclosure requirements is limited to derivative instruments, repurchase agreements and reverse repurchase agreements, and securities borrowing and securities lending transactions. This information enables users of the Portfolios’ financial statements to evaluate the effect or potential effect of netting arrangements on the Portfolios’ financial position.
For U.S. GAAP purposes, the Portfolios do not offset financial assets and financial liabilities that are subject to master netting arrangements or similar agreements on the Statements of Assets and Liabilities.
Recent Accounting Standard:
In June 2014, the Financial Accounting Standards Board (“FASB”) issued Accounting Standards Update (“ASU”) No. 2014-11, Transfers and Servicing (Topic 860): Repurchase-to-Maturity Transactions, Repurchase Financings, and Disclosures. The amendments in this ASU impacts the
38
EQ ADVISORS TRUST
NOTES TO FINANCIAL STATEMENTS (Continued)
December 31, 2014
accounting for certain repurchase agreements and expands disclosure requirements related to repurchase agreements, securities lending, repurchase-to-maturity and similar transactions. This ASU is effective for interim and annual reporting periods beginning after December 15, 2014.
| Note 2 | Management of the Trust |
The Trust has entered into three separate investment management agreements (the “Management Agreements”) with FMG LLC. The Management Agreements state that the Manager will, among other things: (i) have overall supervisory responsibility for the general management and investment of each Portfolio’s assets; (ii) select and contract with the Sub-Advisers to manage the investment operations and composition of each and every Portfolio; (iii) monitor the Sub-Advisers’ investment programs and results; (iv) oversee compliance by the Trust with various federal and state statutes; and (v) carry out the directives of the Board. For the year ended December 31, 2014, for its services under the Management Agreements, the Manager was entitled to receive an annual fee as a percentage of average daily net assets, for each of the following Portfolios, calculated daily and payable monthly as follows:
| (as a percentage of average daily net assets) | ||||||||||||||||
Portfolios: | First $4 Billion | Next $4 Billion | Next $2 Billion | Thereafter | ||||||||||||
EQ/International ETF | 0.400 | % | 0.390 | % | 0.380 | % | 0.370 | % | ||||||||
EQ/International Equity Index | 0.400 | % | 0.390 | % | 0.380 | % | 0.370 | % | ||||||||
On behalf of the EQ/International Equity Index Portfolio the Manager has entered into an investment advisory agreement (“Sub-Advisory Agreement”) with the Sub-Adviser. The Sub-Advisory Agreement obligates the Sub-Adviser for the EQ/International Equity Index Portfolio to: (i) continuously furnish investment programs for the Portfolio; (ii) place all orders for the purchase and sale of investments for the Portfolio with brokers or dealers selected by the Manager or the Sub-Adviser; and (iii) perform certain limited related administrative functions in connection therewith. The Manager pays the expenses of providing investment sub-advisory services to the EQ/International Equity Index Portfolio, including the fees of the Sub-Adviser.
| Note 3 | Administrative Fees |
FMG LLC serves as Administrator to the Trust. As Administrator, FMG LLC provides the Trust with necessary administrative, fund accounting, and compliance services. FMG LLC may carry out its responsibilities either directly or through sub-contracting with third party providers. For these services, the Trust pays FMG LLC an annual fee payable monthly as follows:
All Portfolios each pay the greater of $30,000 per Portfolio, or its proportionate share of an asset based fee:
Total aggregated average daily net asset charge for all other Portfolios*
0.12% on the first $3 billion
0.11% on the next $3 billion
0.105% on the next $4 billion
0.10% on the next $20 billion
0.0975% on the next $10 billion
0.095% on assets thereafter
| * | With the exception of the All Asset Portfolios, AXA/Franklin Templeton Allocation Managed Volatility Portfolio, EQ/AllianceBernstein Dynamic Wealth Strategies Portfolio, AXA Strategy Portfolios, Tactical Portfolios and the Multiadviser Portfolios, including Portfolios of the Trust not presented in these financial statements. |
39
EQ ADVISORS TRUST
NOTES TO FINANCIAL STATEMENTS (Continued)
December 31, 2014
Prior to September 1, 2014, the Administrative fee was the following:
All Portfolios each pay an annual fixed charge of $30,000, if the Portfolio’s average net assets are less than $5 billion, plus:
Total Trust average daily net asset charge for all other Portfolios*
0.12% on the first $3 billion
0.11% on the next $3 billion
0.105% on the next $4 billion
0.10% on the next $20 billion
0.0975% in excess of $30 billion
| * | With the exception of the All Asset Portfolios, AXA/Franklin Templeton Allocation Managed Volatility Portfolio, EQ/AllianceBernstein Dynamic Wealth Strategies Portfolio, AXA Strategy Portfolios, Tactical Portfolios and the Multiadviser Portfolios, including Portfolios of the Trust not presented in these financial statements. |
Pursuant to a sub-administration arrangement with FMG LLC, the Sub-Administrator provides the Trust with administrative services, including monitoring of portfolio compliance and portfolio accounting services.
| Note 4 | Custody Fees |
The Trust has entered into a Custody Agreement with JPMorgan Chase Bank, N.A. (in this capacity, the “Custodian”). The Custody Agreement provides for an annual fee based on the amount of assets under custody plus transaction charges. The Custodian serves as custodian of the Trust’s portfolio securities and other assets. Under the terms of the Custody Agreement between the Trust and the Custodian, the Custodian maintains and deposits in each Portfolio’s account, cash, securities and other assets of the Portfolios. The Custodian is also required, upon the order of the Trust, to deliver securities held by the Custodian, and to make payments for securities purchased by the Trust. The Custodian has also entered into sub-custodian agreements with a number of foreign banks and clearing agencies, pursuant to which portfolio securities purchased outside the United States are maintained in the custody of these entities.
| Note 5 | Distribution Plans |
The Trust has entered into distribution agreements with AXA Distributors, LLC (“AXA Distributors” or the “Distributor”), an indirect wholly-owned subsidiary of AXA Equitable and an affiliate of FMG LLC, pursuant to which the Distributor serves as the principal underwriter of the Class IA, Class IB and Class K shares of the Trust. The Trust has adopted in the manner prescribed under Rule 12b-1 under the 1940 Act a plan of distribution pertaining to each of Class IA and Class IB shares of the Trust (“Distribution Plans”). The Distribution Plans provide that the Distributor will be entitled to receive a maximum distribution fee at the annual rate of 0.25% of the average daily net assets attributable to the Trust’s Class IA and Class IB shares for which it provides service.
| Note 6 | Expense Limitation |
FMG LLC has contractually agreed to limit the expenses of certain Portfolios (exclusive of taxes, interest, brokerage commissions, capitalized expenses, fees and expenses of other investment companies in which a Portfolio invests and extraordinary expenses) through April 30, 2015 (unless the Board consents to an earlier revision or termination of this arrangement) (“Expense Limitation Agreement”), pursuant to which FMG LLC has agreed to waive or limit its fees and to assume other expenses so that the total annual operating expenses do not exceed the following annual rates:
Portfolio: | Maximum Annual Operating Expense Limit | |||||||||||
| Class K | Class IA+ | Class IB+ | ||||||||||
EQ/International ETF | 0.55 | % | 0.80 | % | 0.80 | % | ||||||
| + | Includes amounts payable pursuant to Rule 12b-1 of the Investment Company Act of 1940. |
40
EQ ADVISORS TRUST
NOTES TO FINANCIAL STATEMENTS (Continued)
December 31, 2014
FMG LLC first waives its management fees, then waives its administration fees, and then reimburses the Portfolio’s expenses out of its own resources. Each Portfolio may at a later date reimburse to FMG LLC the management fees waived or other expenses assumed and paid for by FMG LLC pursuant to the Expense Limitation Agreement within the prior three fiscal years, provided such Portfolio has reached a sufficient asset size to permit such reimbursement to be made without causing the total annual expense ratio of each Portfolio to exceed the percentage limits mentioned above for the respective period. Consequently, no reimbursement by a Portfolio will be made unless: (i) the Portfolio’s total annual expense ratio is less than the respective percentages stated above for the respective period; and (ii) the payment of such reimbursement has been approved by the Board. Any reimbursement, called recoupment fees on the Statement of Operations, will be based on the earliest fees waived or assumed by FMG LLC. During the year ended December 31, 2014, FMG LLC received total recoupments of $1,608,273, including recoupments of portfolios of the trust not included in these financial statements, of which $244 was recouped from the EQ/International ETF Portfolio.
At December 31, 2014, under the Expense Limitation Agreement, the amount that would be recoverable from the Portfolio is as follows:
Portfolio: | 2015 | 2016 | 2017 | Total Eligible For Reimbursement | ||||||||||||
EQ/International ETF | $ | 22,055 | $ | 14,319 | $ | 41,734 | $ | 78,108 | ||||||||
| Note 7 | Percentage of Ownership by Affiliates |
Shares of the Portfolios may be held as underlying investments by the All Asset Portfolios of the Trust and the AXA Allocation Portfolios, the Charter Allocation Portfolios and the Target Allocation Portfolios of the AXA Premier VIP Trust, a separate registered investment company managed by FMG LLC. The following tables represent the percentage of ownership that each of the All Asset Portfolios, AXA Allocation Portfolios, Charter Allocation Portfolios and Target Allocation Portfolios has in each respective Portfolio’s net assets as of December 31, 2014.
Portfolio: | All Asset Moderate Growth- Alt 15 | All Asset Growth- Alt 20 | All Asset Aggressive- Alt 25 | All Asset Aggressive- Alt 50 | All Asset Aggressive- Alt 75 | AXA/Franklin Templeton Allocation Managed Volatility | ||||||||||||||||||
EQ/International Equity Index | 0.03 | % | 0.67 | % | 0.04 | % | 0.01 | % | — | #% | — | % | ||||||||||||
Portfolios: | AXA Conservative Allocation | AXA Conservative- Plus Allocation | AXA Moderate Allocation | AXA Moderate- Plus Allocation | AXA Aggressive Allocation | |||||||||||||||
EQ/International ETF | — | % | — | % | 10.60 | % | 46.72 | % | 17.83 | % | ||||||||||
EQ/International Equity Index | 0.04 | 0.19 | 0.81 | 2.38 | 3.40 | |||||||||||||||
Portfolio: | CharterSM Fixed Income | CharterSM Conservative | CharterSM Moderate | CharterSM Moderate Growth | CharterSM Growth | CharterSM Aggressive Growth | CharterSM Equity | CharterSM Inter- national Conservative | CharterSM Inter- national Moderate | CharterSM Inter- national Growth | ||||||||||||||||||||||||||||||
EQ/International Equity Index | — | % | 0.02 | % | 0.04 | % | 0.04 | % | 0.06 | % | 0.03 | % | 0.04 | % | 0.01 | % | 0.02 | % | 0.03 | % | ||||||||||||||||||||
Portfolios: | CharterSM Income Strategies | CharterSM Interest Rate Strategies | CharterSM Multi- Sector Bond | CharterSM Real Assets | CharterSM Small Cap Growth | CharterSM Small Cap Value | CharterSM Alternative 100 Conservative Plus | CharterSM Alternative 100 Moderate | CharterSM Alternative 100 Growth | |||||||||||||||||||||||||||
EQ/International Equity Index | — | % | — | % | — | % | — | % | — | % | %— | — | % | — | % | — | % | |||||||||||||||||||
41
EQ ADVISORS TRUST
NOTES TO FINANCIAL STATEMENTS (Continued)
December 31, 2014
Portfolios: | Target 2015 Allocation | Target 2025 Allocation | Target 2035 Allocation | Target 2045 Allocation | ||||||||||||
EQ/International ETF | 3.58 | % | 7.43 | % | 5.50 | % | 4.07 | % | ||||||||
EQ/International Equity Index | 0.32 | 0.65 | 0.50 | 0.39 | ||||||||||||
| Note 8 | Subsequent Events |
The Manager evaluated subsequent events from December 31, 2014, the date of these financial statements, through the date these financial statements were issued and available. The subsequent events include the following:
At a meeting held on February 12, 2015, the Board approved a proposed merger for submission to shareholders of EQ/International ETF Portfolio. Pending shareholder approval, EQ/International ETF Portfolio is expected to merge into EQ/International Equity Index Portfolio in the second quarter of 2015.
| Note 9 | Pending Legal Proceedings |
In July 2011, a lawsuit was filed in the United States District Court for the District of New Jersey, entitled Mary Ann Sivolella v. AXA Equitable Life Insurance Company and AXA Equitable Funds Management Group, LLC (“Sivolella Litigation”). The lawsuit was filed derivatively on behalf of eight Portfolios of the Trust: EQ/Common Stock Index Portfolio; EQ/Equity Growth PLUS Portfolio; EQ/Equity 500 Index Portfolio; AXA Large Cap Value Managed Volatility Portfolio; AXA Global Equity Managed Volatility Portfolio; AXA Mid Cap Value Managed Volatility Portfolio; EQ/Intermediate Government Bond Index Portfolio; and EQ/GAMCO Small Company Value Portfolio (the “Sivolella Portfolios”). Note, in June 2014, the EQ/Equity Growth PLUS Portfolio was reorganized into the AXA Large Cap Growth Managed Volatility Portfolio. The lawsuit seeks recovery under Section 36(b) of the 1940 Act, for alleged excessive fees paid to FMG LLC and AXA Equitable (the “Defendants”) for investment management services. The Plaintiff seeks recovery of the alleged overpayments, or alternatively, rescission of the contracts and restitution of all fees paid, interest, costs, and fees. In October 2011, FMG LLC and AXA Equitable filed a motion to dismiss the complaint. In November 2011, the Plaintiff filed an Amended Complaint seeking the same relief, but adding new claims under: (1) Section 26(f) of the 1940 Act alleging that the variable annuity contracts sold by the Defendants charged excessive management fees, and seeking restitution and rescission of those contracts under Section 47(b) of the 1940 Act; and (2) a claim for unjust enrichment. The Defendants filed a motion to dismiss the Amended Complaint in December 2011. In May 2012, Plaintiff voluntarily dismissed the Section 26(f) claim seeking restitution and rescission under Section 47(b). In September 2012, the United States District Court for the District of New Jersey denied the motion to dismiss the Amended Complaint as it related to the Section 36(b) claim and granted the motion to dismiss as it related to the unjust enrichment claim.
In January 2013, a second lawsuit against FMG LLC was filed in the United States District Court for the District of New Jersey by a group of plaintiffs asserting substantially similar claims under Section 36(b) and seeking substantially similar damages as in the Sivolella Litigation. The lawsuit, entitled Glenn D. Sanford, et al. v. AXA Equitable Funds Management Group, LLC (“Sanford Litigation”), was filed derivatively on behalf of the EQ/PIMCO Ultra Short Bond Portfolio, the EQ/ T. Rowe Price Growth Stock Portfolio, the EQ/Global Bond PLUS Portfolio, and the EQ/Core Bond Index Portfolio, in addition to four of the Sivolella Portfolios. In light of the similarities of the allegations in the Sivolella and Sanford Litigations, the parties and Court agreed to consolidate the two lawsuits.
In April 2013, the Plaintiffs in the Sivolella and Sanford Litigations amended the complaints to add additional claims under Section 36(b) of the 1940 Act for recovery of alleged excessive fees paid to FMG LLC in its capacity as the Administrator of the Trust. The Plaintiffs seek recovery of the alleged overpayments, or alternatively, rescission of the contract and restitution of the excessive fees
42
EQ ADVISORS TRUST
NOTES TO FINANCIAL STATEMENTS (Continued)
December 31, 2014
paid, interest, costs, and fees. In January 2015, Defendants filed a motion for summary judgment as well as various motions to strike certain of the plaintiffs experts in the Sivolella and Sanford litigations. Also in January 2015, two plaintiffs in the Sanford litigation filed a motion for partial summary judgment relating to the EQ/Core Bond index Portfolio as well as motions in limine to bar admission of certain documents and preclude the testimony of one of the Defendant’s experts.
No liability for litigation relating to these matters have been accrued in the financial statements of the Portfolios because any potential damages would be the responsibility of the Defendants.
On November 1, 2010, the Trust and AXA Premier VIP Trust, and several of their respective portfolios, were named as defendants and putative members of the proposed defendant class of shareholders in a lawsuit brought by The Official Committee of Unsecured Creditors of Tribune Company (the “Committee”) in the United States Bankruptcy Court for the District of Delaware regarding Tribune Company’s Chapter 11 bankruptcy proceeding (In re Tribune Company). The lawsuit relates to amounts paid to the Trust and AXA Premier VIP Trust, and several of their respective portfolios, as holders of publicly-traded shares of Tribune Company, which were components of certain broad-based securities market indices, for which there were public tender offers during 2007. The suit seeks return of the share price received by Tribune Company shareholders in the tender offers plus interest and attorneys’ fees and expenses.
On July 1, 2011, retiree participants in certain Tribune-defined compensation plans (the “Retirees”) initiated a lawsuit in the United States District Court for the Southern District of New York against certain Tribune Company shareholders who sold their shares as part of the 2007 public tender offers (the “Retiree Suit”). This Retiree Suit also seeks return of the share price received by Tribune Company shareholders in connection with the tender offers plus interest and attorneys’ fees and expenses.
On August 24, 2011, the trustees of certain trusts that hold notes issued by Tribune Company (the “Noteholders”) initiated a separate lawsuit in the United States District Court for the Southern District of New York against certain Tribune Company shareholders who sold their shares as part of the 2007 public tender offers (the “Noteholder Suit”). This Noteholder Suit also seeks return of the share price received by Tribune Company shareholders in connection with the tender offers plus interest and attorneys’ fees and expenses.
The Committee’s suit, the Retiree Suit, and the Noteholder Suit have each been consolidated with a number of related lawsuits filed by the Noteholders and Retirees around the United States into a single multi-district litigation proceeding now pending in the United States District Court for the Southern District of New York (In re: Tribune Company Fraudulent Conveyance Litigation).
With respect to the Trust, the EQ/Equity 500 Index Portfolio, the EQ/GAMCO Mergers and Acquisitions Portfolio and the AXA Mid Cap Value Managed Volatility Portfolio are named as defendants in the Noteholder Suit and the Retiree Suit. The EQ/Equity 500 Index Portfolio, the EQ/GAMCO Mergers and Acquisitions Portfolio, the AXA Mid Cap Value Managed Volatility Portfolio, the AXA Large Cap Core Managed Volatility Portfolio, the EQ/Small Company Index II Portfolio, the EQ/Common Stock Index II Portfolio, AXA Large Cap Value Managed Volatility Portfolio, and EQ Advisors Trust are all putative members of the proposed defendant class of shareholders in the Committee’s suit. The EQ/Equity 500 Index Portfolio, the EQ/GAMCO Mergers and Acquisition Portfolio, the AXA Large Cap Core Managed Volatility Portfolio, and EQ Advisors Trust are also named separately in the Committee’s suit, in the event it is not certified as a class action. The amounts paid to the above seven portfolios in connection with the public tender offers were approximately: (i) the EQ/Equity 500 Index Portfolio — $1,740,800; (ii) the EQ/GAMCO Mergers and Acquisitions Portfolio — $1,122,000; (iii) the AXA Mid Cap Value Managed Volatility Portfolio — $2,992,000; (iv) the Multimanager Large Cap Core Equity Portfolio (now called AXA Large Cap Core Managed Volatility Portfolio) — $1,832,600; (v) the EQ/Small Company Index II Portfolio — $61,200; (vi) the EQ/Common Stock Index II Portfolio — $18,360 and (vii) the Multimanager Large Cap Value Portfolio (now called AXA Large Cap Value Managed Volatility Portfolio) - $3,359,200.
43
EQ ADVISORS TRUST
NOTES TO FINANCIAL STATEMENTS (Continued)
December 31, 2014
The lawsuits do not allege any misconduct by the Trust or its Portfolios. Motions to dismiss the suits filed by the Noteholders and the Retirees based on certain limited defenses are currently pending before the United States District Court for the Southern District of New York. The portfolios cannot predict the outcome of these lawsuits. If the lawsuits were to be decided or settled in a manner adverse to the portfolios, the payment of such judgments or settlements could have an adverse effect on each portfolio’s net asset value. However, no liability for litigation relating to this matter has been accrued in the financial statements of the Portfolios, as the Manager believes a loss is not probable.
44
Report of Independent Registered Public Accounting Firm
To the Board of Trustees and Shareholders of EQ Advisors Trust
In our opinion, the accompanying statements of assets and liabilities, including the portfolios of investments, and the related statements of operations and of changes in net assets and the financial highlights present fairly, in all material respects, the financial position of each of the portfolios of EQ Advisors Trust listed in the Table of Contents to the Annual Report in which these financial statements appear (collectively referred to as the “Trust”) at December 31, 2014, and the results of each of their operations, the changes in each of their net assets and the financial highlights for each of the periods presented, in conformity with accounting principles generally accepted in the United States of America. These financial statements and financial highlights (hereafter referred to as “financial statements”) are the responsibility of the Trust’s management. Our responsibility is to express an opinion on these financial statements based on our audits. We conducted our audits of these financial statements in accordance with the standards of the Public Company Accounting Oversight Board (United States). Those standards require that we plan and perform the audit to obtain reasonable assurance about whether the financial statements are free of material misstatement. An audit includes examining, on a test basis, evidence supporting the amounts and disclosures in the financial statements, assessing the accounting principles used and significant estimates made by management, and evaluating the overall financial statement presentation. We believe that our audits, which included confirmation of securities at December 31, 2014 by correspondence with the custodian, transfer agents and brokers, provide a reasonable basis for our opinion.
PricewaterhouseCoopers LLP
New York, New York
February 19, 2015
45
PART C
OTHER INFORMATION
| Item 15. | Indemnification |
Amended and Restated Agreement and Declaration of Trust (“Declaration of Trust”) and By-Laws.
Article VII, Section 2 of the Declaration of Trust of EQ Advisors Trust (“Trust”) states, in relevant part, that a “Trustee, when acting in such capacity, shall not be personally liable to any Person, other than the Trust or a Shareholder to the extent provided in this Article VII, for any act, omission or obligation of the Trust, of such Trustee or of any other Trustee. The Trustees shall not be responsible or liable in any event for any neglect or wrongdoing of any officer, agent, employee, Manager, or Principal Underwriter of the Trust. The Trust shall indemnify each Person who is serving or has served at the Trust’s request as a director, officer, trustee, employee, or agent of another organization in which the Trust has any interest as a shareholder, creditor, or otherwise to the extent and in the manner provided in the By-Laws.” Article VII, Section 4 of the Trust’s Declaration of Trust further states, in relevant part, that the “Trustees shall be entitled and empowered to the fullest extent permitted by law to purchase with Trust assets insurance for liability and for all expenses reasonably incurred or paid or expected to be paid by a Trustee, officer, employee, or agent of the Trust in connection with any claim, action, suit, or proceeding in which he or she may become involved by virtue of his or her capacity or former capacity as a Trustee of the Trust.”
Article VI, Section 2 of the Trust’s By-Laws states, in relevant part, that “[s]ubject to the exceptions and limitations contained in Section 3 of this Article VI, every [Trustee, officer, employee or other agent of the Trust] shall be indemnified by the Trust to the fullest extent permitted by law against all liabilities and against all expenses reasonably incurred or paid by him or her in connection with any proceeding in which he or she becomes involved as a party or otherwise by virtue of his or her being or having been an agent.” Article VI, Section 3 of the Trust’s By-Laws further states, in relevant part, that “[n]o indemnification shall be provided hereunder to [a Trustee, officer, employee or other agent of the Trust]: (a) who shall have been adjudicated, by the court or other body before which the proceeding was brought, to be liable to the Trust or its Shareholders by reason of willful misfeasance, bad faith, gross negligence or reckless disregard of the duties involved in the conduct of his or her office (collectively, “disabling conduct”); or (b) with respect to any proceeding disposed of (whether by settlement, pursuant to a consent decree or otherwise) without an adjudication by the court or other body before which the proceeding was brought that such [Trustee, officer, employee or other agent of the Trust] was liable to the Trust or its Shareholders by reason of disabling conduct, unless there has been a determination that such [Trustee, officer, employee or other agent of the Trust] did not engage in disabling conduct: (i) by the court or other body before which the proceeding was brought; (ii) by at least a majority of those Trustees who are neither Interested Persons of the Trust nor are parties to the proceeding based upon a review of readily available facts (as opposed to a full trial-type inquiry); or (iii) by written opinion of independent legal counsel based upon a review of readily available facts (as opposed to a full trial-type inquiry); provided, however, that indemnification shall be provided hereunder to [a Trustee, officer, employee or other agent of the Trust] with respect to any proceeding in the event of (1) a final decision on the merits by the court or other body before which the proceeding was brought that the [Trustee, officer, employee or other agent of the Trust] was not liable by reason of disabling conduct, or (2) the dismissal of the proceeding by the court or other body before which it was brought for insufficiency of evidence of any disabling conduct with which such [Trustee, officer, employee or other agent of the Trust] has been charged.” Article VI, Section 4 of the Trust’s By-Laws also states that the “rights of indemnification herein provided (i) may be insured against by policies maintained by the Trust on behalf of any [Trustee, officer, employee or other agent of the Trust], (ii) shall be severable, (iii) shall not be exclusive of or affect any other rights to which any [Trustee, officer, employee or other agent of the Trust] may now or hereafter be entitled and (iv) shall inure to the benefit of [such party’s] heirs, executors and administrators.”
C-1
Registrant’s Investment Management Agreement states:
Limitations on Liability. Manager will exercise its best judgment in rendering its services to the Trust, and the Trust agrees, as an inducement to Manager’s undertaking to do so, that the Manager will not be liable for any error of judgment or mistake of law or for any loss suffered by the Trust in connection with the matters to which this Agreement relates, but will be liable only for willful misconduct, bad faith, gross negligence, reckless disregard of its duties or its failure to exercise due care in rendering its services to the Trust as specified in this Agreement. Any person, even though an officer, director, employee or agent of Manager, who may be or become an officer, Trustee, employee or agent of the Trust, shall be deemed, when rendering services to the Trust or when acting on any business of the Trust, to be rendering such services to or to be acting solely for the Trust and not as an officer, director, employee or agent, or one under the control or direction of Manager, even though paid by it.
Section 4 of the Registrant’s Investment Advisory Agreement states:
| 4. | LIABILITY OF ADVISER |
Except as may otherwise be provided by the Investment Company Act or any other federal securities law, the Adviser shall not be liable for any losses, claims, damages, liabilities or litigation (including legal and other expenses) incurred or suffered by the Manager or the Trust as a result of any error of judgment or mistake of law with respect to the Portfolio, except that nothing in this Agreement shall operate or purport to operate in any way to exculpate, waive or limit the liability of the Adviser for, and the Adviser shall indemnify and hold the Trust, the Manager, all affiliated persons thereof (within the meaning of Section 2(a)(3) of the Investment Company Act) and all controlling persons (as described in Section IS of the Securities Act of 1933) harmless from and against, any and all losses, claims, damages, liabilities or litigation (including legal and other expenses) incurred or suffered by any of such persons arising out of or based on (a) any willful misconduct, bad faith, reckless disregard or gross negligence of the Adviser in the performance of any if its duties or obligations hereunder or (b) any untrue statement of a material fact contained in the Prospectus and SAI, or the omission to state therein a material fact known to the Adviser which was required to be stated therein or necessary to make the statements therein not misleading, if such a statement or omission was made in reliance upon information furnished to the Trust by the Adviser.
Section 14 of each of the Registrant’s Distribution Agreements states:
The Trust shall indemnify and hold harmless [the Distributor] from any and all losses, claims, damages or liabilities (or actions in respect thereof) to which [the Distributor] may be subject, insofar as such losses, claims, damages or liabilities (or actions in respect thereof) arise out of or result from negligent, improper, fraudulent or unauthorized acts or omissions by the Trust or its officers, trustees, agents or representatives, other than acts or omissions caused directly or indirectly by [the Distributor].
[The Distributor] will indemnify and hold harmless the Trust, its officers, trustees, agents and representatives against any losses, claims, damages or liabilities, to which the Trust, its officers, trustees, agents and representatives may become subject, insofar as such losses, claims, damages or liabilities (or actions in respect thereof) arise out of or are based upon: (i) any untrue statement or alleged untrue statement of any material fact contained in the Trust Prospectus and/or SAI or any supplements thereto; (ii) the omission or alleged omission to state any material fact required to be stated in the Trust Prospectus and/or SAI or any supplements thereto or necessary to make the statements therein not misleading; or (iii)
C-2
other misconduct or negligence of [the Distributor] in its capacity as a principal underwriter of the Trust’s Class [IA, IB and/or K] shares and will reimburse the Trust, its officers, Trustees, agents and representatives for any legal or other expenses reasonably incurred by any of them in connection with investigating or defending against such loss, claim, damage, liability or action; provided, however, that [the Distributor] shall not be liable in any such instance to the extent that any such loss, claim, damage or liability arises out of or is based upon an untrue statement or alleged untrue statement or omission or alleged omission made in the Trust Prospectus and/or SAI or any supplement in good faith reliance upon and in conformity with written information furnished by the Preparing Parties specifically for use in the preparation of the Trust Prospectus and/or SAI.
Section 6 of the Registrant’s Mutual Fund Service Agreement states:
(a) FMG LLC shall not be liable for any error of judgment or mistake of law or for any loss or expense suffered by the Trust, in connection with the matters to which this Agreement relates, except for a loss or expense caused by or resulting from or attributable to willful misfeasance, bad faith or negligence on FMG LLC’s part (or on the part of any third party to whom FMG LLC has delegated any of its duties and obligations pursuant to Section 4(c) hereunder) in the performance of its (or such third party’s) duties or from reckless disregard by FMG LLC (or by such third party) of its obligations and duties under this Agreement (in the case of FMG LLC) or under an agreement with FMG LLC (in the case of such third party) or, subject to Section 10 below, FMG LLC’s (or such third party) refusal or failure to comply with the terms of this Agreement (in the case of FMG LLC) or an agreement with FMG LLC (in the case of such third party) or its breach of any representation or warranty under this Agreement (in the case of FMG LLC) or under an agreement with FMG LLC (in the case of such third party). In no event shall FMG LLC (or such third party) be liable for any indirect, incidental special or consequential losses or damages of any kind whatsoever (including but not limited to lost profits), even if FMG LLC (or such third party) has been advised of the likelihood of such loss or damage and regardless of the form of action.
(b) Except to the extent that FMG LLC may be held liable pursuant to Section 6(a) above, FMG LLC shall not be responsible for, and the Trust shall indemnify and hold FMG LLC harmless from and against any and all losses, damages, costs, reasonable attorneys’ fees and expenses, payments, expenses and liabilities including, but not limited to, those arising out of or attributable to:
(i) any and all actions of FMG LLC or its officers or agents required to be taken pursuant to this Agreement;
(ii) the reliance on or use by FMG LLC or its officers or agents of information, records, or documents which are received by FMG LLC or its officers or agents and furnished to it or them by or on behalf of the Trust, and which have been prepared or maintained by the Trust or any third party on behalf of the Trust;
(iii) the Trust’s refusal or failure to comply with the terms of this Agreement or the Trust’s lack of good faith, or its actions, or lack thereof, involving negligence or willful misfeasance;
(iv) the breach of any representation or warranty of the Trust hereunder;
(v) the reliance on or the carrying out by FMG LLC or its officers or agents of any proper instructions reasonably believed to be duly authorized, or requests of the Trust;
(vi) any delays, inaccuracies, errors in or omissions from information or data provided to FMG LLC by data services, including data services providing information in connection with any third party computer system licensed to FMG LLC, and by any corporate action services, pricing services or securities brokers and dealers;
C-3
(vii) the offer or sale of shares by the Trust in violation of any requirement under the Federal securities laws or regulations or the securities laws or regulations of any state, or in violation of any stop order or other determination or ruling by any Federal agency or any state agency with respect to the offer or sale of such shares in such state (1) resulting from activities, actions, or omissions by the Trust or its other service providers and agents, or (2) existing or arising out of activities, actions or omissions by or on behalf of the Trust prior to the effective date of this Agreement;
(viii) any failure of the Trust’s registration statement to comply with the 1933 Act and the 1940 Act (including the rules and regulations thereunder) and any other applicable laws, or any untrue statement of a material fact or omission of a material fact necessary to make any statement therein not misleading in a Trust’s prospectus;
(ix) except as provided for in Schedule B.III., the actions taken by the Trust, its Manager, its investment advisers, and its distributor in compliance with applicable securities, tax, commodities and other laws, rules and regulations, or the failure to so comply, and
(x) all actions, inactions, omissions, or errors caused by third parties to whom FMG LLC or the Trust has assigned any rights and/or delegated any duties under this Agreement at the specific request of or as required by the Trust, its Portfolio, investment advisers, or Trust distributors.
The Trust shall not be liable for any indirect, incidental, special or consequential losses or damages of any kind whatsoever (including, but not limited to, lost profits) even if the Trust has been advised of the likelihood of such loss or damage and regardless of the form of action, except when the Trust is required to indemnify FMG LLC pursuant to this Agreement.
Section 12(a)(iv) of the Registrant’s Global Custody Agreement states:
(A) Customer shall indemnify and hold Bank and its directors, officers, agents and employees (collectively the “Indemnitees”) harmless from and against any and all claims, liabilities, losses, damages, fines, penalties, and expenses, including out-of-pocket and incidental expenses and legal fees (“Losses”) that may be incurred by, or asserted against, the Indemnitees or any of them for following any instructions or other directions upon which Bank is authorized to rely pursuant to the terms of this Agreement. (B) In addition to and not in limitation of the preceding subparagraph, Customer shall also indemnify and hold the Indemnitees and each of them harmless from and against any and all Losses that may be incurred by, or asserted against, the Indemnitees or any of them in connection with or arising out of Bank’s performance under this Agreement, provided the Indemnitees have not acted with negligence or engaged in willful misconduct. (C) In performing its obligations hereunder, Bank may rely on the genuineness of any document which it reasonably believes in good faith to have been validly executed.
Article VIII of the Registrant’s Amended and Restated Participation Agreement states:
8.1(a). AXA Equitable Life Insurance Company (for the purposes of this Article, “Equitable”) agrees to indemnify and hold harmless the Trust, each member of the Board, the Distributors, and the directors and officers and each person, if any, who controls any such person within the meaning of Section 15 of the 1933 Act (collectively, the “Indemnified Parties” for purposes of this Section 8.1) against any and all losses, claims, damages, liabilities (including amounts paid in settlement with the written consent of Equitable), investigation of claims or litigation (including legal and other expenses), to which the Indemnified Parties may become subject under any statute, regulation, at common law or otherwise,
C-4
insofar as such losses, claims, damages, liabilities or expenses (or actions in respect thereof) or settlements are related to the sale or acquisition of the Trust’s shares or the Equitable Contracts or interests in the Accounts and:
(i) arise out of or are based upon any untrue statements or alleged untrue statements of any material fact contained in the registration statement, prospectus, or Statement of Additional Information for the Equitable Contracts or contained in the Equitable Contracts or sales literature for the Equitable Contracts (or any amendment or supplement to any of the foregoing), or arise out of or are based upon the omission or the alleged omission to state therein a material fact required to be stated therein or necessary to make the statements therein not misleading, provided that this agreement to indemnify shall not apply as to any Indemnified Party if such statement or omission or such alleged statement or omission was made in reliance upon and in conformity with information furnished to Equitable by or on behalf of the Trust for use in the registration statement, prospectus, or Statement of Additional Information for the Equitable Contracts or in the Equitable Contracts or sales literature (or any amendment or supplement) or otherwise for use in connection with the sale of the Equitable Contracts or Trust shares; or
(ii) arise out of or as a result of statements or representations (other than statements or representations contained in the Registration Statement, prospectus or Statement of Additional Information, or sales literature of the Trust not supplied by Equitable or persons under its control) or wrongful conduct of Equitable or persons under its control, with respect to the sale or distribution of the Equitable Contracts or Trust shares; or
(iii) arise out of any untrue statement or alleged untrue statement of a material fact contained in a Registration Statement, prospectus, or Statement of Additional Information, or sales literature of the Trust or any amendment thereof or supplement thereto or the omission or alleged omission to state therein a material fact required to be stated therein or necessary to make the statements therein not misleading if such a statement or omission was made in reliance upon information furnished to the Trust by or on behalf of Equitable; or
(iv) arise as a result of any failure by Equitable to provide the services and furnish the materials required to be provided or furnished by it under the terms of this Agreement; or
(v) arise out of or result from any material breach of any representation and/or warranty made by Equitable in this Agreement or arise out of or result from any other material breach of this Agreement by Equitable;
as limited by and in accordance with the provisions of Sections 8.1(b) and 8.1(c) hereof…
8.2(a). Each of the Distributors agrees to indemnify and hold harmless Equitable, and the Trust and each of their directors and officers and each person, if any, who controls Equitable within the meaning of Section 15 of the 1933 Act (collectively, the “Indemnified Parties” for purposes of this Section 8.2) against any and all losses, claims, damages, liabilities (including amounts paid in settlement with the written consent of the Distributors), investigation of claims or litigation (including legal and other expenses) to which the Indemnified Parties may become subject under any statute, regulation, at common law or otherwise, insofar as such losses, claims, damages, liabilities or expenses (or actions in respect thereof) or settlements are related to the sale or acquisition of the Trust’s shares or the Equitable Contracts or interests in the Accounts and:
(i) arise out of or are based upon any untrue statement or alleged untrue statement of any material fact contained in the Registration Statement, prospectus or Statement of Additional Information, or sales literature of the Trust (or any amendment or supplement to any of the foregoing), or arise out of or are
C-5
based upon the omission or the alleged omission to state therein a material fact required to be stated therein or necessary to make the statements therein not misleading, provided that this agreement to indemnify shall not apply as to any Indemnified Party if such statement or omission or such alleged statement or omission was made in reliance upon and in conformity with information furnished to the Distributors or Trust by or on behalf of Equitable for use in the Registration Statement, prospectus, or Statement of Additional Information for the Trust, or in sales literature (or any amendment or supplement) or otherwise for use in connection with the sale of the Equitable Contracts or Trust shares; or
(ii) arise out of or as a result of statements or representations (other than statements or representations contained in the registration statement, prospectus or Statement of Additional Information, or sales literature for the Equitable Contracts not supplied by the Distributors or persons under their control) or wrongful conduct of the Distributors or persons under their control, with respect to the sale or distribution of the Equitable Contracts or Trust shares; or
(iii) arise out of any untrue statement or alleged untrue statement of a material fact contained in a registration statement, prospectus, or Statement of Additional Information or sales literature covering the Equitable Contracts, or any amendment thereof or supplement thereto, or the omission or alleged omission to state therein a material fact required to be stated therein or necessary to make the statement or statements therein not misleading, if such statement or omission was made in reliance upon information furnished to Equitable by or on behalf of the Distributors or the Trust; or
(iv) arise as a result of any failure by the Distributors or the Trust to provide the services and furnish the materials required to be provided or furnished by the Distributors or the Trust under the terms of this Agreement (including a failure, whether unintentional or in good faith or otherwise, to comply with the diversification or other qualification requirements specified in Article VI of this Agreement); or
(v) arise out of or result from any material breach of any representation and/or warranty made by the Distributors in this Agreement or arise out of or result from any other material breach of this Agreement by the Distributors;
as limited by and in accordance with the provisions of Sections 8.2(b) and 8.2(c) hereof…
8.3(a) The Trust agrees to indemnify and hold harmless Equitable and each of its directors and officers and each person, if any, who controls Equitable within the meaning of Section 15 of the 1933 Act (collectively, the “Indemnified Parties” for purposes of this Section 8.3) against any and all losses, claims, damages, liabilities (including amounts paid in settlement with the written consent of the Trust), investigation of claims or litigation (including legal and other expenses) to which the Indemnified Parties may become subject under any statute, regulation, at common law or otherwise, insofar as such losses, claims, damages, liabilities or expenses (or actions in respect thereof) or settlements result from the gross negligence, bad faith or willful misconduct of the Board or any member thereof, are related to the operations of the Trust and:
(i) arise as a result of any failure by the Trust to provide the services and furnish the materials required to be provided or furnished by it under the terms of this Agreement (including a failure to comply with the diversification and other qualification requirements specified in … this Agreement); or
(ii) arise out of or result from any material breach of any representation and/or warranty made by the Trust in this Agreement or arise out of or result from any other material breach of this Agreement by the Trust;
as limited by and in accordance with the provisions of Sections 8.3(b) and 8.3(c) hereof…
C-6
Article VIII of the Registrant’s Second Amended and Restated Participation Agreement states:
8.1(a). AXA Equitable Life Insurance Company (for the purposes of this Article, “Equitable”) agrees to indemnify and hold harmless the Trust, each member of the Board, the Distributor, and the directors and officers and each person, if any, who controls any such person within the meaning of Section 15 of the 1933 Act (collectively, the “Indemnified Parties” for purposes of this Section 8.1) against any and all losses, claims, damages, liabilities (including amounts paid in settlement with the written consent of Equitable), investigation of claims or litigation (including legal and other expenses), to which the Indemnified Parties may become subject under any statute, regulation, at common law or otherwise, insofar as such losses, claims, damages, liabilities or expenses (or actions in respect thereof) or settlements are related to the sale or acquisition of the Trust’s shares or the Equitable Contracts or interests in the Accounts and:
(i) arise out of or are based upon any untrue statements or alleged untrue statements of any material fact contained in the registration statement, prospectus, or Statement of Additional Information for the Equitable Contracts or contained in the Equitable Contracts or sales literature for the Equitable Contracts (or any amendment or supplement to any of the foregoing), or arise out of or are based upon the omission or the alleged omission to state therein a material fact required to be stated therein or necessary to make the statements therein not misleading, provided that this agreement to indemnify shall not apply as to any Indemnified Party if such statement or omission or such alleged statement or omission was made in reliance upon and in conformity with information furnished to Equitable by or on behalf of the Trust for use in the registration statement, prospectus, or Statement of Additional Information for the Equitable Contracts or in the Equitable Contracts or sales literature (or any amendment or supplement) or otherwise for use in connection with the sale of the Equitable Contracts or Trust shares; or
(ii) arise out of or as a result of statements or representations (other than statements or representations contained in the Registration Statement, prospectus or Statement of Additional Information, or sales literature of the Trust not supplied by Equitable or persons under its control) or wrongful conduct of Equitable or persons under its control, with respect to the sale or distribution of the Equitable Contracts or Trust shares; or
(iii) arise out of any untrue statement or alleged untrue statement of a material fact contained in a Registration Statement, prospectus, or Statement of Additional Information, or sales literature of the Trust or any amendment thereof or supplement thereto or the omission or alleged omission to state therein a material fact required to be stated therein or necessary to make the statements therein not misleading if such a statement or omission was made in reliance upon information furnished to the Trust by or on behalf of Equitable; or
(iv) arise as a result of any failure by Equitable to provide the services and furnish the materials required to be provided or furnished by it under the terms of this Agreement; or
(v) arise out of or result from any material breach of any representation and/or warranty made by Equitable in this Agreement or arise out of or result from any other material breach of this Agreement by Equitable;
as limited by and in accordance with the provisions of Sections 8.1(b) and 8.1(c) hereof…
8.2(a). The Distributor agrees to indemnify and hold harmless Equitable, and the Trust and each of their directors and officers and each person, if any, who controls Equitable within the meaning of Section 15 of the 1933 Act (collectively, the “Indemnified Parties” for purposes of this Section 8.2) against any and all
C-7
losses, claims, damages, liabilities (including amounts paid in settlement with the written consent of the Distributor), investigation of claims or litigation (including legal and other expenses) to which the Indemnified Parties may become subject under any statute, regulation, at common law or otherwise, insofar as such losses, claims, damages, liabilities or expenses (or actions in respect thereof) or settlements are related to the sale or acquisition of the Trust’s shares or the Equitable Contracts or interests in the Accounts and:
(i) arise out of or are based upon any untrue statement or alleged untrue statement of any material fact contained in the Registration Statement, prospectus or Statement of Additional Information, or sales literature of the Trust (or any amendment or supplement to any of the foregoing), or arise out of or are based upon the omission or the alleged omission to state therein a material fact required to be stated therein or necessary to make the statements therein not misleading, provided that this agreement to indemnify shall not apply as to any Indemnified Party if such statement or omission or such alleged statement or omission was made in reliance upon and in conformity with information furnished to the Distributor or Trust by or on behalf of Equitable for use in the Registration Statement, prospectus, or Statement of Additional Information for the Trust, or in sales literature (or any amendment or supplement) or otherwise for use in connection with the sale of the Equitable Contracts or Trust shares; or
(ii) arise out of or as a result of statements or representations (other than statements or representations contained in the registration statement, prospectus or Statement of Additional Information, or sales literature for the Equitable Contracts not supplied by the Distributor or persons under their control) or wrongful conduct of the Distributor or persons under their control, with respect to the sale or distribution of the Equitable Contracts or Trust shares; or
(iii) arise out of any untrue statement or alleged untrue statement of a material fact contained in a registration statement, prospectus, or Statement of Additional Information or sales literature covering the Equitable Contracts, or any amendment thereof or supplement thereto, or the omission or alleged omission to state therein a material fact required to be stated therein or necessary to make the statement or statements therein not misleading, if such statement or omission was made in reliance upon information furnished to Equitable by or on behalf of the Distributor or the Trust; or
(iv) arise as a result of any failure by the Distributor or the Trust to provide the services and furnish the materials required to be provided or furnished by the Distributor or the Trust under the terms of this Agreement (including a failure, whether unintentional or in good faith or otherwise, to comply with the diversification or other qualification requirements specified in Article VI of this Agreement); or
(v) arise out of or result from any material breach of any representation and/or warranty made by the Distributor in this Agreement or arise out of or result from any other material breach of this Agreement by the Distributor;
as limited by and in accordance with the provisions of Sections 8.2(b) and 8.2(c) hereof…
C-8
8.3(a) The Trust agrees to indemnify and hold harmless Equitable and each of its directors and officers and each person, if any, who controls Equitable within the meaning of Section 15 of the 1933 Act (collectively, the “Indemnified Parties” for purposes of this Section 8.3) against any and all losses, claims, damages, liabilities (including amounts paid in settlement with the written consent of the Trust), investigation of claims or litigation (including legal and other expenses) to which the Indemnified Parties may become subject under any statute, regulation, at common law or otherwise, insofar as such losses, claims, damages, liabilities or expenses (or actions in respect thereof) or settlements result from the gross negligence, bad faith or willful misconduct of the Board or any member thereof, are related to the operations of the Trust and:
(i) arise as a result of any failure by the Trust to provide the services and furnish the materials required to be provided or furnished by it under the terms of this Agreement (including a failure to comply with the diversification and other qualification requirements specified in … this Agreement); or
(ii) arise out of or result from any material breach of any representation and/or warranty made by the Trust in this Agreement or arise out of or result from any other material breach of this Agreement by the Trust;
as limited by and in accordance with the provisions of Sections 8.3(b) and 8.3(c) hereof…
| Item 16. Exhibits |
| (1) (a) | Agreement and Declaration of Trust.1 | |
| (1) (b)(i) | Amended and Restated Agreement and Declaration of Trust.2 | |
| (1) (b)(ii) | Amendment No. 1 to Amended and Restated Agreement and Declaration of Trust.4 | |
| (1) (b)(iii) | Amendment No. 2 to Amended and Restated Agreement and Declaration of Trust. 6 | |
| (1) (c) | Certificate of Trust.1 | |
| (1) (d) | Certificate of Amendment to the Certificate of Trust.2 | |
| (2) | By-Laws of the Trust.1 | |
| (3) | None | |
| (4) (a) | Plan of Reorganization and Termination by EQ Advisors Trust, on behalf of EQ/International ETF Portfolio, a separate series of the Trust, and EQ/International Equity Index Portfolio, another separate series of the Trust. (filed herein as Appendix A to the combined Proxy Statement and Prospectus) | |
| (5) | Provisions of instruments defining the rights of holders of the securities being registered are contained in the Registrant’s Amended and Restated Agreement and Declaration of Trust and By-Laws (Exhibits 1(b) and (2)). | |
| (6) | Investment Advisory Contracts | |
| (6) (a) | Investment Management Agreement dated as of May 1, 2011 between EQ Advisors Trust (the “Trust”) and AXA Equitable Funds Management Group, LLC (“FMG LLC” or “AXA FMG”).25 | |
| (6) (a)(i) | Amendment No. 1 effective as of August 1, 2011 to the Investment Management Agreement dated as of May 1, 2011 between the Trust and FMG LLC.25 | |
| (6) (a)(ii) | Amendment No. 2 effective as of September 1, 2011 to the Investment Management Agreement dated as of May 1, 2011 between the Trust and FMG LLC.25 | |
| (6) (a)(iii) | Amendment No. 3 effective as of October 1, 2011 to the Investment Management Agreement dated as of May 1, 2011 between the Trust and FMG LLC. 27 | |
C-9
| (6) (a)(iv) | Amendment No. 4 effective as of February 8, 2013 to the Investment Management Agreement dated as of May 1, 2011 between the Trust and FMG LLC.31 | |
| (6) (a)(v) | Amendment No. 5 effective as of September 1, 2012 to the Investment Management Agreement dated as of May 1, 2011 between the Trust and FMG LLC.31 | |
| (6) (a)(vi) | Amendment No. 6 effective as of May 1, 2013 to the Investment Management Agreement dated as of May 1, 2011 between the Trust and FMG LLC.34 | |
| (6) (a)(vii) | Amendment No. 7 effective as of September 1, 2013 to the Investment Management Agreement dated as of May 1, 2011 between the Trust and FMG LLC.34 | |
| (6) (a)(viii) | Amendment No. 8 effective as of October 21, 2013 to the Investment Management Agreement dated as of May 1, 2011 between the Trust and FMG LLC.34 | |
| (6) (a)(ix) | Amendment No. 9 effective as of April 4, 2014 to the Investment Management Agreement dated as of May 1, 2011 between the Trust and FMG LLC.37 | |
| (6) (a)(x) | Amendment No. 10 effective as of June 1, 2014 to the Investment Management Agreement dated as of May 1, 2011 between the Trust and FMG LLC.37 | |
| (6) (a)(xi) | Amendment No. 11 effective as of July 16, 2014 to the Investment Management Agreement dated as of May 1, 2011 between the Trust and FMG LLC.38 | |
| (6) (a)(xii) | Amendment No. 12 effective as of January 20, 2015 to the Investment Management Agreement dated as of May 1, 2011 between the Trust and FMG LLC.38 | |
| (6) (b)(i) | Investment Advisory Agreement between FMG LLC and AllianceBernstein L.P. (“AllianceBernstein”) effective as of May 1, 2011.25 | |
| (6) (b)(ii) | Amendment No. 1 effective as of September 1, 2011 to the Investment Advisory Agreement between FMG LLC and AllianceBernstein effective as of May 1, 2011.27 | |
| (6) (b)(iii) | Amendment No. 2 effective as of August 1, 2012 to the Investment Advisory Agreement between FMG LLC and AllianceBernstein effective as of May 1, 2011.31 | |
| (6) (b)(iv) | Amendment No. 3 effective as of September 1, 2012, to the Investment Advisory Agreement between FMG LLC and AllianceBernstein effective as of May 1, 2011.31 | |
| (6) (b)(v) | Amendment No. 4 effective as of June 1, 2014, to the Investment Advisory Agreement between FMG LLC and AllianceBernstein effective as of May 1, 2011.37 | |
| (6) (b)(vi) | Amendment No. 5 effective as of July 16, 2014 to the Investment Advisory Agreement between FMG LLC and AllianceBernstein effective as of May 1, 2011.38 | |
| (7) | Underwriting or Distribution Contracts | |
| (7) (a)(i) | Amended and Restated Distribution Agreement between the Trust and AXA Distributors, LLC (“AXA Distributors”) dated as of July 15, 2002 with respect to Class IB shares.6 | |
| (7) (a)(ii) | Amendment No. 1, dated May 2, 2003, to the Amended and Restated Distribution Agreement between the Trust and AXA Distributors, dated as of July 15, 2002 with respect to Class IB shares.7 | |
C-10
| (7) (a)(iii) | Amendment No. 2, dated July 8, 2004, to the Amended and Restated Distribution Agreement between the Trust and AXA Distributors, dated as of July 15, 2002 with respect to Class IB shares.8 | |
| (7) (a)(iv) | Amendment No. 3, dated October 1, 2004 to the Amended and Restated Distribution Agreement between the Trust and AXA Distributors, dated as of July 15, 2002 with respect to Class IB shares.8 | |
| (7) (a)(v) | Amendment No. 4, dated May 1, 2005 to the Amended and Restated Distribution Agreement between the Trust and AXA Distributors dated as of July 15, 2002 with respect to Class IB shares. 9 | |
| (7) (a)(vi) | Amendment No. 5, dated September 30, 2005 to the Amended and Restated Distribution Agreement between the Trust and AXA Distributors dated as of July 15, 2002 with respect to Class IB shares.10 | |
| (7) (a)(vii) | Amendment No. 6 dated August 1, 2006 to the Amended and Restated Distribution Agreement between the Trust and AXA Distributors dated as of July 15, 2002 with respect to Class IB shares.12 | |
| (7) (a)(viii) | Amendment No. 7 dated May 1, 2007 to the Amended and Restated Distribution Agreement between the Trust and AXA Distributors dated as of July 15, 2002 with respect to Class IB shares.14 | |
| (7) (a)(ix) | Amendment No. 8 dated July 11, 2007 to the Amended and Restated Distribution Agreement between the Trust and AXA Distributors dated as of July 15, 2002 with respect to Class IB shares.15 | |
| (7) (a)(x) | Amendment No. 9 dated January 1, 2008 to the Amended and Restated Distribution Agreement between the Trust and AXA Distributors dated as of July 15, 2002 with respect to Class IB shares.16 | |
| (7) (a)(xi) | Amendment No. 10 dated May 1, 2008 to the Amended and Restated Distribution Agreement between the Trust and AXA Distributors dated as of July 15, 2002 with respect to Class IB shares.18 | |
| (7) (a)(xii) | Amendment No. 11 dated January 1, 2009 to the Amended and Restated Distribution Agreement between the Trust and AXA Distributors dated as of July 15, 2002 with respect to Class IB shares.19 | |
| (7) (a)(xiii) | Amendment No. 12 dated May 1, 2009 to the Amended and Restated Distribution Agreement between the Trust and AXA Distributors dated as of July 15, 2002 with respect to Class IB shares.20 | |
| (7) (a)(xiv) | Amendment No. 13 dated September 29, 2009 to the Amended and Restated Distribution Agreement between the Trust and AXA Distributors dated as of July 15, 2002 with respect to Class IB shares.21 | |
| (7) (a)(xv) | Amendment No. 14 dated as of August 16, 2010 to the Amended and Restated Distribution Agreement between the Trust and AXA Distributors dated as of July 15, 2002 with respect to Class IB shares.23 | |
C-11
| (7) (a)(xvi) | Amendment No. 15 dated as of December 15, 2010 to the Amended and Restated Distribution Agreement between the Trust and AXA Distributors dated as of July 15, 2002 with respect to Class IB shares.23 | |
| (7) (a)(xvii) | Amendment No. 16 dated as of June 7, 2011 to the Amended and Restated Distribution Agreement between the Trust and AXA Distributors dated as of July 15, 2002 with respect to Class IB shares.26 | |
| (7) (a)(xviii) | Amendment No. 17 dated as of April 12, 2012 to the Amended and Restated Distribution Agreement between the Trust and AXA Distributors dated as of July 15, 2002 with respect to Class IB shares.29 | |
| (7) (a)(xix) | Amendment No. 18 dated as of August 29, 2012 to the Amended and Restated Distribution Agreement between the Trust and AXA Distributors dated as of July 15, 2002 with respect to Class IB shares.31 | |
| (7) (a)(xx) | Amendment No. 19 dated as of May 1, 2013 to the Amended and Restated Distribution Agreement between the Trust and AXA Distributors dated as of July 15, 2002 with respect to Class IB shares.34 | |
| (7) (a)(xxi) | Amendment No. 20 dated as of October 21, 2013 to the Amended and Restated Distribution Agreement between the Trust and AXA Distributors dated as of July 15, 2002 with respect to Class IB shares.34 | |
| (7) (a)(xxii) | Amendment No. 21 dated as of April 4, 2014 to the Amended and Restated Distribution Agreement between the Trust and AXA Distributors dated as of July 15, 2002 with respect to Class IB shares.37 | |
| (7) (a)(xxiii) | Amendment No. 22 dated as of June 1, 2014 to the Amended and Restated Distribution Agreement between the Trust and AXA Distributors dated as of July 15, 2002 with respect to the Class IB shares.37 | |
| (7) (a)(xxiv) | Amendment No. 23 dated as of July 16, 2014 to the Amended and Restated Distribution Agreement between the Trust and AXA Distributors dated as of July 15, 2002 with respect to the Class IB shares.38 | |
| (7) (b)(i) | Distribution Agreement between the Trust and AXA Distributors dated as of August 1, 2011 with respect to Class K shares.25 | |
| (7) (b)(ii) | Amendment No. 1 dated as of April 12, 2012 to the Distribution Agreement between the Trust and AXA Distributors dated as of August 1, 2011 with respect to Class K shares.29 | |
| (7) (b)(iii) | Amendment No. 2 dated as of August 29, 2012 to the Distribution Agreement between the Trust and AXA Distributors dated as of August 1, 2011 with respect to Class K shares.31 | |
| (7) (b)(iv) | Amendment No. 3 dated as of May 1, 2013 to the Distribution Agreement between the Trust and AXA Distributors dated August 1, 2011 with respect to Class K shares.34 | |
| (7) (b)(v) | Amendment No. 4 dated as of October 21, 2013 to the Distribution Agreement between the Trust and AXA Distributors dated August 1, 2011 with respect to Class K shares.34 | |
C-12
| (7) (b)(vi) | Amendment No. 5 dated as of April 4, 2014 to the Distribution Agreement between the Trust and AXA Distributors dated August 1, 2011 with respect to Class K shares.37 | |
| (7) (b)(vii) | Amendment No. 6 dated as of June 1, 2014 to the Distribution Agreement between the Trust and AXA Distributors dated August 1, 2011 with respect to Class K shares.37 | |
| (7) (b)(viii) | Amendment No. 7 dated as of July 16, 2014 to the Distribution Agreement between the Trust and AXA Distributors dated August 1, 2011 with respect to Class K shares.38 | |
| (7) (c)(i) | Amended and Restated Distribution Agreement between the Trust and AXA Distributors effective January 1, 2012 with respect to the Class IA shares.30 | |
| (7) (c)(ii) | Amendment No. 1 effective as of March 1, 2012 to the Amended and Restated Distribution Agreement between the Trust and AXA Distributors effective January 1, 2012 with respect to the Class IA shares.30 | |
| (7) (c)(iii) | Amendment No. 2 dated as of April 30, 2012, to the Amended and Restated Distribution Agreement between the Trust and AXA Distributors dated as of January 1, 2012 with respect to the Class IA shares.31 | |
| (7) (c)(iv) | Amendment No. 3 dated as of July 10, 2012, to the Amended and Restated Distribution Agreement between the Trust and AXA Distributors dated as of January 1, 2012 with respect to the Class IA shares.31 | |
| (7) (c)(v) | Amendment No. 4 dated as of June 1, 2014, to the Amended and Restated Distribution Agreement between the Trust and AXA Distributors dated as of January 1, 2012 with respect to the Class IA shares.37 | |
| (7) (c)(vi) | Amendment No. 5 dated as of July 16, 2014 to the Amended and Restated Distribution Agreement between the Trust and AXA Distributors dated as of January 1, 2012 with respect to the Class IA shares.38 | |
| (8) | Form of Deferred Compensation Plan.3 | |
| (9) | Custodian Agreements | |
| (9) (a)(i) | Amended and Restated Global Custody Agreement between the Trust and JPMorgan Chase Bank (“Chase”), dated as of February 1, 2002.5 | |
| (9) (a)(ii) | Amendment No. 1, dated May 2, 2003, to the Amended and Restated Global Custody Agreement between the Trust and JP Morgan Chase Bank dated February 1, 2002.7 | |
| (9) (a)(iii) | Amendment No. 2, dated July 8, 2004, to the Amended and Restated Global Custody Agreement between the Trust and JP Morgan Chase Bank dated February 1, 2002.8 | |
| (9) (a)(iv) | Amendment No. 3, dated September 13, 2004, to the Amended and Restated Global Custody Agreement between the Trust and JP Morgan Chase Bank dated February 1, 2002.8 | |
| (9) (a)(v) | Amendment No. 4 dated May 1, 2005 to the Amended and Restated Global Custody Agreement between the Trust and JP Morgan Chase Bank dated February 1, 2002.9 | |
C-13
| (9) (a)(vi) | Amendment No. 5 dated September 30, 2005 to the Amended and Restated Global Custody Agreement between the Trust and JP Morgan Chase Bank dated February 1, 2002. 10 | |
| (9) (a)(vii) | Amendment No. 6 dated August 1, 2006 to the Amended and Restated Global Custody Agreement between the Trust and JP Morgan Chase Bank dated February 1, 2002.13 | |
| (9) (a)(viii) | Amendment No. 7 dated May 1, 2007 to the Amended and Restated Global Custody Agreement between the Trust and JP Morgan Chase Bank dated February 1, 2002.14 | |
| (9) (a)(ix) | Amendment No. 8 dated April 1, 2007 to the Amended and Restated Global Custody Agreement between the Trust and JP Morgan Chase Bank dated February 1, 2002.15 | |
| (9) (a)(x) | Amendment No. 9 dated January 1, 2008 to the Amended and Restated Global Custody Agreement between the Trust and JPMorgan Chase Bank dated February 1, 2002.16 | |
| (9) (a)(xi) | Amendment No. 10 dated May 1, 2008 to the Amended and Restated Global Custody Agreement between the Trust and JPMorgan Chase Bank dated February 1, 2002.18 | |
| (9) (a)(xii) | Amendment No. 11 dated July 1, 2008 to the Amended and Restated Global Custody Agreement between the Trust and JPMorgan Chase Bank dated February 1, 2002.18 | |
| (9) (a)(xiii) | Amendment No. 12 dated January 1, 2009 to the Amended and Restated Global Custody Agreement between the Trust and JPMorgan Chase Bank dated February 1, 2002.19 | |
| (9) (a)(xiv) | Amendment No. 13 dated May 1, 2009 to the Amended and Restated Global Custody Agreement between the Trust and JPMorgan Chase Bank dated February 1, 2002.20 | |
| (9) (a)(xv) | Amendment No. 14 dated as of September 29, 2009, to the Amended and Restated Global Custody Agreement between the Trust and JPMorgan Chase Bank dated February 1, 2002.21 | |
| (9) (a)(xvi) | Amendment No. 15 dated as of October 1, 2009, to the Amended and Restated Global Custody Agreement between the Trust and JPMorgan Chase Bank dated February 1, 2002.21 | |
| (9) (a)(xvii) | Amendment No. 16 dated as of August 16, 2010 to the Amended and Restated Global Custody Agreement between the Trust and JPMorgan Chase Bank dated February 1, 2002.23 | |
| (9) (a)(xviii) | Amendment No. 17 dated as of December 15, 2010 to the Amended and Restated Global Custody Agreement between the Trust and JPMorgan Chase Bank dated February 1, 2002.23 | |
| (9) (a)(xix) | Amendment No. 18 dated as of December 7, 2010 to the Amended and Restated Global Custody Agreement between the Trust and JPMorgan Chase Bank dated February 1, 2002.24 | |
| (9) (a)(xx) | Amendment No. 19 dated as of May 1, 2011 to the Amended and Restated Global Custody Agreement between the Trust and JPMorgan Chase Bank dated February 1, 2002.25 | |
C-14
| (9) (a)(xxi) | Amendment No. 20 dated as of July 20, 2011 to the Amended and Restated Global Custody Agreement between the Trust and JPMorgan Chase Bank dated February 1, 2002.25 | |
| (9) (a)(xxii) | Amendment No. 21 dated as of April 30, 2012 to the Amended and Restated Global Custody Agreement between the Trust and JPMorgan Chase Bank dated February 1, 2002.29 | |
| (9) (a)(xxiii) | Amendment No. 22 dated as of June 1, 2013 to the Amended and Restated Global Custody Agreement between the Trust and JPMorgan Chase Bank dated February 1, 2002.34 | |
| (9) (a)(xxiv) | Amendment No. 23 dated as of October 21, 2013 to the Amended and Restated Global Custody Agreement between the Trust and JPMorgan Chase Bank dated February 1, 2002.34 | |
| (9) (a)(xxv) | Amendment No. 24 dated as of April 4, 2014 to the Amended and Restated Global Custody Agreement between the Trust and JPMorgan Chase Bank dated February 1, 2002.37 | |
| (9) (a)(xxvi) | Amendment No. 25 dated as of June 1, 2014 to the Amended and Restated Global Custody Agreement between the Trust and JPMorgan Chase Bank dated February 1, 2002.37 | |
| (9) (a)(xxvii) | Amendment No. 26 dated as of July 16, 2014 to the Amended and Restated Global Custody Agreement between the Trust and JPMorgan Chase Bank dated February 1, 2002.38 | |
| (10) | Distribution Plan and Multiple Class Plan | |
| (10) (a) | Amended and Restated Distribution Plan Pursuant to Rule 12b-1 for the Trust’s Class IB shares adopted as of July 14, 2010.22 | |
| (10) (b) | Shareholder Services and Distribution Plan pursuant to Rule 12b-1 under the 1940 Act for the Trust’s Class IA shares adopted as of July 12, 2011.28 | |
| (10) (d) | Revised Amended and Restated Plan Pursuant to Rule 18f-3 under the 1940 Act.25 | |
| (11) | Opinion and Consent of Counsel regarding the legality of the securities being registered with respect to the Reorganization of EQ/International ETF Portfolio into EQ/International Equity Index Portfolio. (filed herewith) | |
| (12) | Not Applicable. | |
| (13) | Other Material Contracts | |
| (13) (a) | Mutual Fund Service Agreement dated May 1, 2011 between the Trust and FMG LLC.25 | |
| (13) (a)(i) | Amendment No. 1 dated June 7, 2011 to the Mutual Fund Service Agreement between the Trust and FMG LLC dated May 1, 2011. 26 | |
| (13) (a)(ii) | Amendment No. 2 dated September 1, 2011 to the Mutual Fund Service Agreement dated May 1, 2011 between the Trust and FMG LLC.25 | |
C-15
| (13) (a)(iii) | Amendment No. 3 dated as of October 1, 2011 to the Mutual Fund Service Agreement dated May 1, 2011 between the Trust and FMG LLC.27 | |
| (13) (a)(iv) | Amendment No. 4 dated as of April 12, 2012 to the Mutual Fund Service Agreement dated May 1, 2011 between the Trust and FMG LLC.29 | |
| (13) (a)(v) | Amendment No. 5 dated as of September 1, 2012, to the Mutual Fund Service Agreement dated May 1, 2011 between the Trust and FMG LLC.31 | |
| (13) (a)(vi) | Amendment No. 6 dated as of May 1, 2013 to the Mutual Fund Service Agreement dated May 1, 2011 between the Trust and FMG LLC.34 | |
| (13) (a)(vii) | Amendment No. 7 dated as of September 1, 2013 to the Mutual Fund Service Agreement dated May 1, 2011 between the Trust and FMG LLC.34 | |
| (13) (a)(viii) | Amendment No. 8 dated as of October 21, 2013 to the Mutual Fund Service Agreement dated May 1, 2011 between the Trust and FMG LLC.34 | |
| (13) (a)(ix) | Amendment No. 9 dated as of April 4, 2014 to the Mutual Fund Service Agreement dated May 1, 2011 between the Trust and FMG LLC.37 | |
| (13) (a)(x) | Amendment No. 10 dated as of June 1, 2014 to the Mutual Fund Service Agreement dated May 1, 2011 between the Trust and FMG LLC.37 | |
| (13) (a)(xi) | Amendment No. 11 dated as of July 16, 2014 to the Mutual Fund Service Agreement dated May 1, 2011 between the Trust and FMG LLC.38 | |
| (13) (a)(xii) | Amendment No. 12 dated as of September 1, 2014 to the Mutual Fund Service Agreement dated May 1, 2011 between the Trust and FMG LLC.38 | |
| (13) (a)(xiii) | Amendment No. 13 dated as of January 20, 2015 to the Mutual Fund Service Agreement dated May 1, 2011 between the Trust and FMG LLC.38 | |
| (13) (b) | Sub-Administration Agreement between FMG LLC and JPMorgan Chase Bank dated May 1, 2011.25 | |
| (13) (d) | Amended and Restated Participation Agreement among the Trust, AXA Equitable Life Insurance Company (“AXA Equitable”), AXA Distributors and AXA Advisors dated as of July 15, 2002.6 | |
| (13) (d)(i) | Amendment No. 1, dated May 2, 2003, to the Amended and Restated Participation Agreement among the Trust, AXA Equitable, AXA Distributors and AXA Advisors dated July 15, 2002.7 | |
| (13) (d)(ii) | Amendment No. 2, dated July 9, 2004, to the Amended and Restated Participation Agreement among the Trust, AXA Equitable, AXA Distributors and AXA Advisors dated July 15, 2002.8 | |
| (13) (d)(iii) | Amendment No. 3, dated October 1, 2004, to the Amended and Restated Participation Agreement among the Trust, AXA Equitable, AXA Distributors and AXA Advisors dated July 15, 2002.8 | |
C-16
| (13) (d)(iv) | Amendment No. 4 dated May 1, 2005 to the Amended and Restated Participation Agreement among the Trust, AXA Equitable, AXA Distributors and AXA Advisors dated July 15, 2002.9 | |
| (13) (d)(v) | Amendment No. 5 dated September 30, 2005 to the Amended and Restated Participation Agreement among the Trust, AXA Equitable, AXA Distributors and AXA Advisors dated July 15, 2002.11 | |
| (13) (d)(vi) | Amendment No. 6 dated August 1, 2006 to the Amended and Restated Participation Agreement among the Trust, AXA Equitable, AXA Distributors and AXA Advisors dated July 15, 2002.13 | |
| (13) (d)(vii) | Amendment No. 7 dated May 1, 2007 to the Amended and Restated Participation Agreement among the Trust, AXA Equitable, AXA Distributors and AXA Advisors dated July 15, 2002.14 | |
| (13) (d)(viii) | Amendment No. 8 dated January 1, 2008 to the Amended and Restated Participation Agreement among the Trust, AXA Equitable, AXA Distributors and AXA Advisors dated July 15, 2002.16 | |
| (13) (d)(ix) | Amendment No. 9 dated May 1, 2008 to the Amended and Restated Participation Agreement among the Trust, AXA Equitable, AXA Distributors and AXA Advisors dated July 15, 2002.18 | |
| (13) (d)(x) | Amendment No. 10 dated January 1, 2009 to the Amended and Restated Participation Agreement among the Trust, AXA Equitable, AXA Distributors and AXA Advisors dated July 15, 2002.19 | |
| (13) (d)(xi) | Amendment No. 11 dated May 1, 2009 to the Amended and Restated Participation Agreement among the Trust, AXA Equitable, AXA Distributors and AXA Advisors dated July 15, 2002.20 | |
| (13) (d)(xii) | Amendment No. 12 dated September 29, 2009 to the Amended and Restated Participation Agreement among the Trust, AXA Equitable, AXA Distributors and AXA Advisors dated July 15, 2002.21 | |
| (13) (d)(xiii) | Amendment No. 13 dated August 16, 2010 to the Amended and Restated Participation Agreement among the Trust, AXA Equitable, AXA Distributors and AXA Advisors dated July 15, 2002.23 | |
| (13) (d)(xiv) | Amendment No. 14 dated as of December 15, 2010 to the Amended and Restated Participation Agreement among the Trust, AXA Equitable, AXA Distributors and AXA Advisors dated July 15, 2002.23 | |
| (13) (d)(xv) | Amendment No. 15 dated June 7, 2011 to the Amended and Restated Participation Agreement among the Trust, AXA Equitable, AXA Distributors and AXA Advisors dated July 15, 2002.26 | |
| (13) (d)(xvi) | Amendment No. 16 dated as of April 30, 2012 to the Amended and Restated Participation Agreement among the Trust, AXA Equitable and AXA Distributors dated July 15, 2002.31 | |
| (13) (e) | Second Amended and Restated Participation Agreement among the Trust, AXA Equitable, FMG LLC and AXA Distributors dated May 23, 2012.33 | |
C-17
| (13) (e)(i) | Amendment No. 1 dated as of June 4, 2013 to the Second Amended and Restated Participation Agreement among the Trust, AXA Equitable, FMG LLC and AXA Distributors dated May 23, 2012.34 | |
| (13) (e)(ii) | Amendment No. 2 dated as of October 21, 2013 to the Second Amended and Restated Participation Agreement among the Trust, AXA Equitable, FMG LLC and AXA Distributors dated May 23, 2012.34 | |
| (13) (e)(iii) | Amendment No. 3 dated as of April 4, 2014 to the Second Amended and Restated Participation Agreement among the Trust, AXA Equitable, FMG LLC and AXA Distributors dated May 23, 2012.37 | |
| (13) (e)(iv) | Amendment No. 4 dated as of June 1, 2014 to the Second Amended and Restated Participation Agreement among the Trust, AXA Equitable, FMG LLC and AXA Distributors dated May 23, 2012.37 | |
| (13) (e)(v) | Amendment No. 5 dated as of July 16, 2014 to the Second Amended and Restated Participation Agreement among the Trust, AXA Equitable, FMG LLC and AXA Distributors dated May 23, 2012.38 | |
| (13) (f) | Participation Agreement among the Trust, MONY Life Insurance Company (“MONY Life”), and AXA Distributors dated as of May 23, 2012.35 | |
| (13) (f)(i) | Amendment No. 1 dated June 4, 2013 to the Amended and Restated Participation Agreement among the Trust, MONY Life, and AXA Distributors dated as of May 23, 2012.35 | |
| (13) (f)(ii) | Participation Agreement among the Trust, MONY Life Insurance Company (“MONY”) and AXA Distributors effective as of October 1, 2013.35 | |
| (13) (f)(iii) | Amendment No. 1 dated as of April 4, 2014 to the Participation Agreement among the Trust, MONY and AXA Distributors effective as of October 1, 2013.37 | |
| (13) (f)(iv) | Amendment No. 2 dated as of June 1, 2014 to the Participation Agreement among the Trust, MONY and AXA Distributors effective as of October 1, 2013.37 | |
| (13) (f)(v) | Amendment No. 3 dated as of July 16, 2014 to the Participation Agreement among the Trust, MONY and AXA distributors effective as of October 1, 2013.38 | |
| (13) (g) | Amended and Restated Participation Agreement among the Trust, MONY Life Insurance Company of America (“MLOA”) and AXA Distributors dated as of May 23, 2012.35 | |
| (13) (g)(i) | Amendment No. 1 dated as of June 4, 2013 to the Amended and Restated Participation Agreement among the Trust, MLOA and AXA Distributors dated as of May 23, 2012.35 | |
| (13) (g)(ii) | Amendment No. 2 dated as of October 21, 2013 to the Amended and Restated Participation Agreement among the Trust, MLOA and AXA Distributors dated as of May 23, 2012.35 | |
| (13) (g)(iii) | Amendment No. 3 dated as of November 1, 2013 to the Amended and Restated Participation Agreement among the Trust, MLOA and AXA Distributors dated as of May 23, 2012.36 | |
C-18
| (13) (g)(iv) | Amendment No. 4 dated as of April 4, 2014 to the Amended and Restated Participation Agreement among the Trust, MLOA and AXA Distributors dated as of May 23, 2012.37 | |
| (13) (g)(v) | Amendment No. 5 dated as of June 1, 2014 to the Amended and Restated Participation Agreement among the Trust, MLOA and AXA Distributors dated as of May 23, 2012.37 | |
| (13) (g)(vi) | Amendment No. 6 dated as of July 16, 2014 to the Amended and Restated Participation Agreement among the Trust, MLOA and AXA Distributors dated as of May 23, 2012.38 | |
| (14) | Consent of Independent Public Accountants. (filed herewith) | |
| (15) | Not Applicable. | |
| (16) | Powers of Attorney. (filed herewith) | |
| (17) | Additional Exhibits | |
| (17) (a) | Forms of Voting Instruction and Proxy Cards (filed herewith) | |
| 1. | Incorporated herein by reference to Registrant’s Registration Statement on Form N-1A filed on December 3, 1996 (File No. 333-17217). |
| 2. | Incorporated herein by reference to Pre-Effective Amendment No. 1 to Registrant’s Registration Statement on Form N-1A filed on January 23, 1997 (File No. 333-17217). |
| 3. | Incorporated herein by reference to Pre-Effective Amendment No. 2 to Registrant’s Registration Statement on Form N-1A filed on April 7, 1997 (File No. 333-17217). |
| 4. | Incorporated by reference to Post-Effective Amendment No. 18 to Registrant’s Registration Statement on Form N-1A filed on January 23, 2001. (File No. 333-17217). |
| 5. | Incorporated by reference to Post-Effective Amendment No. 24 to Registrant’s Registration Statement on Form N-1A filed on April 3, 2002. (File No. 333-17217). |
| 6. | Incorporated by reference to Post-Effective Amendment No. 25 to Registrant’s Registration Statement on Form N-1A filed on February 7, 2003. (File No. 333-17217). |
| 7. | Incorporated by reference to and/or previously filed with Post-Effective Amendment No. 28 Registrant’s Registration Statement on Form N-1A filed on February 10, 2004 (File No. 333-17217). |
| 8. | Incorporated by reference to and/or previously filed with Post-Effective Amendment No. 35 to Registrant’s Registration Statement on Form N-1A filed on October 15, 2004 (File No. 333-17217). |
| 9. | Incorporated by reference to and/or previously filed with Post-Effective Amendment No. 37 to Registrant’s Registration Statement on Form N-1A filed on April 7, 2005 (File No. 333-17217). |
| 10. | Incorporated by reference to and/or previously filed with Post-Effective Amendment No. 42 to Registrant’s Registration Statement on Form N-1A filed on August 24, 2005 (File No. 333-17217). |
| 11. | Incorporated by reference to and/or previously filed with Post-Effective Amendment No. 44 to Registrant’s Registration Statement on Form N-1A filed on April 5, 2006 (File No. 333-17217). |
| 12. | Incorporated by reference to and/or previously filed with Post-Effective Amendment No. 46 to Registrant’s Registration Statement on Form N-1A filed on August 23, 2006 (File No. 333-17217). |
| 13. | Incorporated by reference to Post-Effective Amendment No. 51 to Registrant’s Registration Statement on Form N-1A filed on February 2, 2007 (File No. 333-17217). |
| 14. | Incorporated by reference to and/or previously filed with Post-Effective Amendment No. 53 to Registrant’s Registration Statement on Form N-1A filed on April 27, 2007 (File No. 333-17217). |
C-19
| 15. | Incorporated by reference to Post-Effective Amendment No. 54 to Registrant’s Registration Statement on Form N-1A filed on October 4, 2007 (File No. 333-17217). |
| 16. | Incorporated by reference to and/or previously filed with Post-Effective Amendment No. 56 to Registrant’s Registration Statement on Form N-1A filed on December 27, 2007 (File No. 333-17217). |
| 17. | Incorporated by reference to Post-Effective Amendment No. 57 to Registrant’s Registration Statement on Form N-1A filed on February 1, 2008 (File No. 333-17217). |
| 18. | Incorporated by reference to Post-Effective Amendment No. 61 to the Registrant’s Registration Statement on Form N-1A filed on February 13, 2009 (File No. 333-17217). |
| 19. | Incorporated by reference to Post-Effective Amendment No. 64 to the Registrant’s Registration Statement on Form N-1A filed on March 16, 2009 (File No. 333-17217). |
| 20. | Incorporated by reference to and/or previously filed with Post-Effective Amendment No. 67 to the Registrant’s Registration Statement on Form N-1A filed on April 15, 2009 (File No. 333-17217). |
| 21. | Incorporated by reference to and/or previously filed with Post-Effective Amendment No. 70 to the Registrant’s Registration Statement on Form N-1A filed on January 21, 2010 (File No. 333-17217). |
| 22. | Incorporated by reference to and/or previously filed with Post-Effective Amendment No. 75 to the Registrant’s Registration Statement on Form N-1A filed on October 5, 2010 (File No. 333-17217). |
| 23. | Incorporated by reference to and/or previously filed with Post-Effective Amendment No. 77 to the Registrant’s Registration Statement on Form N-1A filed on February 3, 2011 (File No. 333-17217). |
| 24. | Incorporated by reference to and/or previously filed with Post-Effective Amendment No. 79 to the Registrant’s Registration Statement on Form N-1A filed on April 28, 2011 (File No. 333-17217). |
| 25. | Incorporated by reference to and/or previously filed with Post-Effective Amendment No. 83 to the Registrant’s Registration Statement on Form N-1A filed on August 16, 2011 (File No. 333-17217). |
| 26. | Incorporated by reference to and/or previously filed with Post-Effective Amendment No. 84 to the Registrant’s Registration Statement on Form N-1A filed on August 17, 2011 (File No. 333-17217). |
| 27. | Incorporated by reference to and/or previously filed with Post-Effective Amendment No. 87 to the Registrant’s Registration Statement on Form N-1A filed on January 13, 2012 (File No. 333-17217). |
| 28. | Incorporated by reference to and/or previously filed with Post-Effective Amendment No. 89 to the Registrant’s Registration Statement on Form N-1A filed on February 6, 2012 (File No. 333-17217). |
| 29. | Incorporated by reference to and/or previously filed with Post-Effective Amendment No. 91 to the Registrant’s Registration Statement on Form N-1A filed on April 25, 2012 (File No. 333-17217). |
| 30. | Incorporated by reference to and/or previously filed with Post-Effective Amendment No. 92 to the Registrant’s Registration Statement on Form N-1A filed on April 25, 2012 (File No. 333-17217). |
| 31. | Incorporated by reference to and/or previously filed with Post-Effective Amendment No. 96 to the Registrant’s Registration Statement on Form N-1A filed on February 7, 2013 (File No. 333-17217). |
| 32. | Incorporated by reference and/or previously filed with Post-Effective Amendment No. 98 to the Registrant’s Registration Statement filed on April 30, 2013 (File No. 333-17217). |
| 33. | Incorporated by reference and/or previously filed with Post-Effective Amendment No. 100 to the Registrant’s Registration Statement filed on July 22, 2013 (File No. 333-17217). |
| 34. | Incorporated by reference and/or previously filed with Post-Effective Amendment No. 101 to the Registrant’s Registration Statement filed on October 1, 2013 (File No. 333-17217). |
| 35. | Incorporated by reference and/or previously filed with Post-Effective Amendment No. 103 to the Registrant’s Registration Statement filed on January 10, 2014. (File No. 333-17217). |
| 36. | Incorporated by reference and/or previously filed with Post-Effective Amendment No. 106 to the Registrant’s Registration Statement filed on April 11, 2014. (File No. 333-17217). |
| 37. | Incorporated by reference and/or previously filed with Post-Effective Amendment No. 108 to the Registrant’s Registration Statement filed on April 30, 2014. (File No. 333-17217). |
| 38. | Incorporated by reference and or/previously filed with Post-Effective amendment No. 112 to the Registrant’s Registration Statement filed on February 5, 2015. (File No. 333-17271). |
C-20
| Item 17. | Undertakings |
(1) The undersigned registrant agrees that prior to any public reoffering of the securities registered through the use of a prospectus which is a part of this registration statement by any person or party who is deemed to be an underwriter within the meaning of Rule 145(c) under the 1933 Act (17 CFR 230.145(c)), the reoffering prospectus will contain the information called for by the applicable registration form for reoffering by persons who may be deemed underwriters, in addition to the information called for by the other items of the applicable form.
(2) The undersigned registrant agrees that every prospectus that is filed under paragraph (1) above will be filed as a part of an amendment to the registration statement and will not be used until the amendment is effective, and that, in determining any liability under the 1933 Act, each post-effective amendment shall be deemed to be a new registration statement for the securities offered therein, and the offering of the securities at that time shall be deemed to be the initial bona fide offering of them.
C-21
SIGNATURES
Pursuant to the requirements of the Securities Act of 1933, as amended, the Registrant has duly caused this Registration Statement on Form N-14 to be signed on its behalf by the undersigned, thereunto duly authorized, in the city of New York and state of New York on the 20th day of February 2015.
EQ ADVISORS TRUST
| By: | /s/ Steven M. Joenk | |||
| Steven M. Joenk | ||||
Trustee, Chairman, President and Chief Executive Officer | ||||
Pursuant to the requirements of the Securities Act of 1933, as amended, this Registration Statement has been signed below by the following persons in the capacities and on the dates indicated.
Signature | Title | Date | ||
/s/ Steven M. Joenk | President | February 20, 2015 | ||
Steven M. Joenk | ||||
/s/ Jettie M. Edwards* | Trustee | February 20, 2015 | ||
Jettie M. Edwards | ||||
/s/ Donald E. Foley* | Trustee | February 20, 2015 | ||
Donald E. Foley | ||||
/s/ Christopher P.A. Komisarjevsky* | Trustee | February 20, 2015 | ||
Christopher P.A. Komisarjevsky | ||||
/s/ H. Thomas McMeekin* | Trustee | February 20, 2015 | ||
H. Thomas McMeekin | ||||
/s/ Harvey Rosenthal* | Trustee | February 20, 2015 | ||
Harvey Rosenthal | ||||
/s/ Gary S. Schpero* | Trustee | February 20, 2015 | ||
Gary S. Schpero | ||||
/s/ Kenneth Walker* | Trustee | February 20, 2015 | ||
Kenneth Walker | ||||
/s/ Caroline L. Williams* | Trustee | February 20, 2015 | ||
Caroline L. Williams | ||||
/s/ Brian Walsh* | Treasurer and Chief Financial Officer | February 20, 2015 | ||
Brian Walsh | ||||
* | By: | /s/ Steven M. Joenk | ||||
| Steven M. Joenk | ||||||
| Attorney-in-Fact |
EXHIBIT INDEX
| (11) | Opinion and Consent of Counsel regarding the legality of the securities being registered with respect to the Reorganization of EQ/International ETF Portfolio into EQ/International Equity Index Portfolio. | |
| (14) | Consent of Independent Public Accountants. | |
| (16) | Powers of Attorney. | |
| (17)(a) | Forms of Voting Instructions and Proxy Cards. | |