Table of Contents
File No. 333-
AS FILED WITH THE SECURITIES AND EXCHANGE COMMISSION ON JUNE 30, 2015
SECURITIES AND EXCHANGE COMMISSION
WASHINGTON, D.C. 20549
FORM N-14
REGISTRATION STATEMENT
UNDER
| THE SECURITIES ACT OF 1933 | x | |||||
| Pre-Effective Amendment No. | ¨ | |||||
| Post-Effective Amendment No. | ¨ |
EQ ADVISORS TRUST
(Exact Name of Registrant as Specified in Charter)
1290 Avenue of the Americas
New York, New York 10104
(Address of Principal Executive Offices)
(212) 554-1234
(Registrant’s Area Code and Telephone Number)
STEVEN M. JOENK
AXA Equitable Funds Management Group, LLC
1290 Avenue of the Americas
New York, New York 10104
(Name and Address of Agent for Service)
With copies to:
| Patricia Louie, Esq. | Mark C. Amorosi, Esq. | |
| AXA Equitable Funds Management Group, LLC | K&L Gates LLP | |
| 1290 Avenue of the Americas | 1601 K Street, N.W. | |
| New York, NY 10104 | Washington, D.C. 20006 |
Approximate Date of Proposed Public Offering:
As soon as practicable after this Registration Statement becomes effective.
It is proposed that this Registration Statement will become effective on the 30th day after filing pursuant to Rule 488 under the Securities Act of 1933, as amended.
Title of securities being registered: Class IB shares of beneficial interest in the series of the Registrant designated EQ/Common Stock Index Portfolio and EQ/Core Bond Index Portfolio.
No filing fee is required because the registrant is relying on Section 24(f) of the Investment Company Act of 1940, as amended, pursuant to which it has previously registered an indefinite number of shares (File No. 333-17217 and 811-07953).
Table of Contents
EQ ADVISORS TRUST
CONTENTS OF REGISTRATION STATEMENT
This Registration Statement contains the following papers and documents:
Cover Sheet | ||
Contents of Registration Statement | ||
Letter to Shareholders | ||
Notice of Special Meeting | ||
Contractholder Voting Instructions | ||
Part A - Proxy Statement/Prospectus | ||
Part B - Statement of Additional Information | ||
Part C - Other Information | ||
Signature Page | ||
Exhibits | ||
Table of Contents
AXA EQUITABLE LIFE INSURANCE COMPANY
1290 Avenue of the Americas
New York, New York 10104
[ ], 2015
Dear Contractholder:
Enclosed is a notice and Combined Proxy Statement and Prospectus relating to a Special Meeting of Shareholders of the CharterSM Equity Portfolio and the CharterSM Fixed Income Portfolio (each an “Acquired Portfolio” and together the “Acquired Portfolios”).
Each Acquired Portfolio is a series of AXA Premier VIP Trust (the “Trust”). The Special Meeting of Shareholders of the Acquired Portfolios is scheduled to be held at the Trust’s offices, 1290 Avenue of the Americas, New York, New York 10104, on September 17, 2015 at 2:00 p.m., Eastern time (the “Meeting”). At the Meeting, the shareholders of the Acquired Portfolios who are entitled to vote at the Meeting will be asked to approve the proposals described below.
The Trust’s Board of Trustees (the “Board”) has called the Meeting to request shareholder approval of the reorganization of each Acquired Portfolio into a corresponding series of EQ Advisors Trust (an “Acquiring Portfolio”) (each, a “Reorganization”) as set forth below:
| • | the CharterSM Equity Portfolio into the EQ/Common Stock Index Portfolio, a series of EQ Advisors Trust; and |
| • | the CharterSM Fixed Income Portfolio into the EQ/Core Bond Index Portfolio, a series of EQ Advisors Trust. |
The Board has approved the proposals and recommends that you vote “FOR” the proposal relating to the Acquired Portfolio in which you own shares. Although the Board has determined that a vote “FOR” the proposal is in your best interest, the final decision is yours.
Each Portfolio is managed by AXA Equitable Funds Management Group, LLC. Each Acquiring Portfolio is sub-advised by an investment sub-adviser. In each case, if the Reorganization involving an Acquired Portfolio is approved and implemented, each Contractholder that invests indirectly in the Acquired Portfolio will automatically become a Contractholder that invests indirectly in the corresponding Acquiring Portfolio.
As an owner of a variable life insurance policy and/or a variable annuity contract or certificate that participates in an Acquired Portfolio through the investment divisions of a separate account or accounts established by AXA Equitable Life Insurance Company (“AXA Equitable”), you are entitled to instruct AXA Equitable how to vote the Acquired Portfolio shares related to your interest in those accounts as of the close of business on June 30, 2015. The attached Notice of Special Meeting of Shareholders and Combined Proxy Statement and Prospectus concerning the
Table of Contents
Meeting describe the matters to be considered at the Meeting. You should read the Combined Proxy Statement and Prospectus prior to completing your voting instruction card.
You are cordially invited to attend the Meeting. Since it is important that your vote be represented whether or not you are able to attend, you are urged to consider these matters and to exercise your voting instructions by completing, dating, and signing the enclosed voting instruction card and returning it in the accompanying return envelope at your earliest convenience or by relaying your voting instructions via telephone or the Internet by following the enclosed instructions. For further information on how to instruct AXA Equitable, please see the Contractholder Voting Instructions included herein. Of course, we hope that you will be able to attend the Meeting, and if you wish, you may provide voting instructions in person, even though you may have already returned a voting instruction card or submitted your voting instructions via telephone or the Internet. Please respond promptly in order to save additional costs of proxy solicitation and in order to make sure you are represented.
Very truly yours,
Steven M. Joenk Managing Director AXA Equitable Life Insurance Company |
Table of Contents
AXA PREMIER VIP TRUST
CharterSM Equity Portfolio
CharterSM Fixed Income Portfolio
1290 Avenue of the Americas
New York, New York 10104
NOTICE OF SPECIAL MEETING OF SHAREHOLDERS
TO BE HELD ON SEPTEMBER 17, 2015
To the Shareholders:
NOTICE IS HEREBY GIVEN that a Special Meeting of Shareholders of the CharterSM Equity Portfolio and the CharterSM Fixed Income Portfolio (each an “Acquired Portfolio” and together the “Acquired Portfolios”), each a series of AXA Premier VIP Trust (the “Trust”), will be held on September 17, 2015, at 2:00 p.m., Eastern time, at the offices of the Trust, located at 1290 Avenue of the Americas, New York, New York 10104 (the “Meeting”).
The Meeting will be held to act on the following proposals:
For shareholders of the CharterSM Equity Portfolio only:
1. To approve the Agreement and Plan of Reorganization and Termination (the “Plan of Reorganization”) with respect to the reorganization of the CharterSM Equity Portfolio, a series of the Trust, into the EQ/Common Stock Index Portfolio, a series of EQ Advisors Trust (“EQ Trust”).
For shareholders of the CharterSM Fixed Income Portfolio only:
2. To approve the Plan of Reorganization with respect to the reorganization of the CharterSM Fixed Income Portfolio, a series of the Trust, into the EQ/Core Bond Index Portfolio, a series of EQ Trust.
For shareholders of each Acquired Portfolio:
3. To transact other business that may properly come before the Meeting or any adjournments thereof.
The Board of Trustees of the Trust (the “Board”) unanimously recommends that you vote in favor of the relevant proposal(s).
Please note that owners of variable life insurance policies and/or variable annuity contracts or certificates (the “Contractholders”) issued by AXA Equitable Life Insurance Company (“AXA Equitable”), who have invested in shares of an Acquired Portfolio through the investment divisions of a separate account or accounts of AXA Equitable will be given the opportunity, to the extent required by law, to provide voting instructions on the above proposals.
i
Table of Contents
You should read the Combined Proxy Statement and Prospectus attached to this notice prior to completing your proxy or voting instruction card. The record date for determining the number of shares outstanding, the shareholders entitled to vote and the Contractholders entitled to provide voting instructions at the Meeting and any adjournments or postponements thereof has been fixed as the close of business on June 30, 2015. If you attend the Meeting, you may vote or provide your voting instructions in person.
YOUR VOTE IS IMPORTANT
Please return your proxy or voting instruction card promptly
Regardless of whether you plan to attend the Meeting, you should vote or provide voting instructions by promptly completing, dating, and signing the enclosed proxy or voting instruction card and returning it in the enclosed postage-paid envelope. You also can vote or provide voting instructions through the Internet or by telephone using the 12-digit control number that appears on the enclosed proxy or voting instruction card and following the simple instructions. If you are present at the Meeting, you may change your vote or voting instructions, if desired, at that time. The Board recommends that you vote or provide voting instructions to vote “FOR” each proposal.
By order of the Board,
Patricia Louie Vice President and Secretary |
Dated: [ ], 2015
New York, New York
ii
Table of Contents
AXA EQUITABLE LIFE INSURANCE COMPANY
CONTRACTHOLDER VOTING INSTRUCTIONS
REGARDING A SPECIAL MEETING OF SHAREHOLDERS OF
CHARTERSM EQUITY PORTFOLIO
CHARTERSM FIXED INCOME PORTFOLIO,
EACH A SERIES OF AXA PREMIER VIP TRUST
TO BE HELD ON SEPTEMBER 17, 2015
Dated: [ ], 2015
GENERAL
These Contractholder Voting Instructions are being furnished by AXA Equitable Life Insurance Company (“AXA Equitable”) to owners of its variable life insurance policies or variable annuity contracts or certificates (the “Contracts”) (the “Contractholders”) who, as of June 30, 2015 (the “Record Date”), had net premiums or contributions allocated to the investment divisions of its separate account or accounts (the “Separate Accounts”) that are invested in shares of the CharterSM Equity Portfolio and/or the CharterSM Fixed Income Portfolio (each an “Acquired Portfolio” and together the “Acquired Portfolios”).
Each Acquired Portfolio is a series of AXA Premier VIP Trust (the “Trust”), a Delaware statutory trust that is registered with the Securities and Exchange Commission as an open-end management investment company.
To the extent required by applicable law, AXA Equitable will offer Contractholders the opportunity to instruct it, as the record owner of all of the shares of beneficial interest in an Acquired Portfolio (the “Shares”) held by the Separate Accounts, as to how it should vote on the respective reorganization proposals (the “Proposals”) that will be considered at the Special Meeting of Shareholders of the Acquired Portfolios referred to in the preceding Notice and at any adjournments or postponements (the “Meeting”). The enclosed Combined Proxy Statement and Prospectus, which you should retain for future reference, concisely sets forth information about the proposed reorganization involving each Acquired Portfolio and the corresponding series of EQ Advisors Trust that a Contractholder should know before completing the enclosed voting instruction card.
AXA Equitable Financial Services Company, LLC, a wholly owned subsidiary of AXA Financial, Inc., is the parent company of AXA Equitable. AXA Financial, Inc. is a wholly owned subsidiary of AXA, a French insurance holding company. The principal executive offices of AXA Equitable Financial Services Company, LLC and AXA Financial, Inc. are located at 1290 Avenue of the Americas, New York, New York 10104.
These Contractholder Voting Instructions and the accompanying voting instruction card, together with the enclosed proxy materials, are being mailed to Contractholders on or about [ ], 2015.
i
Table of Contents
HOW TO INSTRUCT AXA EQUITABLE
To instruct AXA Equitable as to how to vote the Shares held in the investment divisions of its Separate Accounts, Contractholders are asked to promptly complete their voting instructions on the enclosed voting instruction card(s), sign and date the voting instruction card(s), and mail the voting instruction card(s) in the accompanying postage-paid envelope. Contractholders also may provide voting instructions by telephone at 1-866-221-8325 or by Internet at our website at https://www.proxypush.com/AXACP.
If a voting instruction card is not marked to indicate voting instructions but is signed and timely returned, it will be treated as an instruction to vote the Shares “For” the applicable Proposal.
The number of Shares held in the investment division of a Separate Account corresponding to the Acquired Portfolio for which a Contractholder may provide voting instructions was determined as of the Record Date by dividing (i) a Contract’s account value allocable to that investment division by (ii) the net asset value of one Share of the Acquired Portfolio. Each whole Share of an Acquired Portfolio is entitled to one vote as to each matter with respect to which it is entitled to vote and each fractional Share is entitled to a proportionate fractional vote. At any time prior to AXA Equitable’s voting at the Meeting, a Contractholder may revoke his or her voting instructions with respect to that investment division by providing AXA Equitable with a properly executed written revocation of such voting instructions, properly executing later-dated voting instructions by a voting instruction card, telephone or the Internet, or appearing and providing voting instructions in person at the Meeting.
HOW AXA EQUITABLE WILL VOTE
AXA Equitable will vote the Shares for which it receives timely voting instructions from Contractholders in accordance with those instructions. Shares in each investment division of a Separate Account for which AXA Equitable receives a voting instruction card that is signed and timely returned but is not marked to indicate voting instructions will be treated as an instruction to vote the Shares “FOR” a Proposal. Shares in each investment division of a Separate Account for which AXA Equitable receives no timely voting instructions from Contractholders, or that are attributable to amounts retained by AXA Equitable as surplus or seed money, will be voted by AXA Equitable either “FOR” or “AGAINST” a Proposal, or as an abstention, in the same proportion as the Shares for which Contractholders have provided voting instructions to AXA Equitable. As a result of such proportional voting by AXA Equitable, it is possible that a small number of Contractholders could determine whether a Proposal is approved.
OTHER MATTERS
AXA Equitable is not aware of any matters, other than the specified Proposals, to be acted on at the Meeting. If any other matters come before the Meeting, AXA Equitable
ii
Table of Contents
will vote the Shares upon such matters in its discretion. Voting instruction cards may be solicited by directors, officers and employees of AXA Equitable Funds Management Group, LLC, the investment manager of the Trust, or its affiliates as well as officers and agents of the Trust. The principal solicitation will be by mail but voting instructions may also be solicited by telephone, fax, personal interview, the Internet or other permissible means.
If the quorum necessary to transact business at the Meeting is not established with respect to an Acquired Portfolio, or the vote required to approve a Proposal is not obtained at the Meeting, the persons named as proxies may propose one or more adjournments or postponements of the Meeting in accordance with applicable law to permit further solicitation of voting instructions. The persons named as proxies will vote in their discretion on any such adjournment or postponement.
It is important that your Contract be represented. Please promptly mark your voting instructions on the enclosed voting instruction card; then sign and date the voting instruction card and mail it in the accompanying postage-paid envelope. You may also provide your voting instructions by telephone at 1-866-221-8325 or by Internet at our website at https://www.proxypush.com/AXACP.
iii
Table of Contents
PROXY STATEMENT
for
CharterSM Equity Portfolio
CharterSM Fixed Income Portfolio,
each a series of AXA Premier VIP Trust and
PROSPECTUS
for
EQ/Common Stock Index Portfolio
EQ/Core Bond Index Portfolio,
each a series of EQ Advisors Trust
Dated [ ], 2015
1290 Avenue of the Americas
New York, New York 10104
1-877-222-2144
This Combined Proxy Statement and Prospectus (the “Proxy Statement/Prospectus”) is being furnished to owners (the “Contractholders”) of variable life insurance policies and/or variable annuity contracts or certificates (the “Contracts”) issued by AXA Equitable Life Insurance Company (“AXA Equitable”) who, as of June 30, 2015, had net premiums or contributions allocated to the investment divisions of its separate account or accounts (the “Separate Accounts”) that are invested in shares of beneficial interest in the CharterSM Equity Portfolio and/or the CharterSM Fixed Income Portfolio.
The CharterSM Equity Portfolio is referred to herein as the “Equity Portfolio,” and the CharterSM Fixed Income Portfolio is referred to herein as the “Fixed Income Portfolio” (each also an “Acquired Portfolio” and together the “Acquired Portfolios”). Each Acquired Portfolio is a series of AXA Premier VIP Trust (the “Trust”), an open-end management investment company registered with the Securities and Exchange Commission (“SEC”). This Proxy Statement/Prospectus also is being furnished to AXA Equitable as the record owner of shares and to other shareholders that were invested in the Acquired Portfolios as of June 30, 2015. Contractholders are being provided the opportunity to instruct AXA Equitable to approve or disapprove the proposals contained in this Proxy Statement/Prospectus (each, a “Proposal”) in connection with the solicitation by the Board of Trustees of the Trust (the “Board” or “Board of the Trust”) of proxies to be used at the Special Meeting of Shareholders of the Acquired Portfolios to be held at 1290 Avenue of the Americas, New York, New York 10104, on September 17, 2015, at 2:00 p.m., Eastern time, or any adjournment or postponement thereof (the “Meeting”).
THE SECURITIES AND EXCHANGE COMMISSION HAS NOT APPROVED OR DISAPPROVED THESE SECURITIES OR PASSED UPON THE ADEQUACY OF THIS PROXY STATEMENT/PROSPECTUS. ANY REPRESENTATION TO THE CONTRARY IS A CRIMINAL OFFENSE.
Table of Contents
The Proposals are:
| Proposal | Shareholders Entitled to Vote on the Proposal | |
| 1. To approve the Agreement and Plan of Reorganization and Termination (the “Plan of Reorganization”) with respect to the reorganization of the Equity Portfolio into the EQ/Common Stock Index Portfolio, a series of EQ Advisors Trust (“EQ Trust”) (the “Stock Index Portfolio”). | Shareholders of the Equity Portfolio. | |
| 2. To approve the Plan of Reorganization with respect to the reorganization of the Fixed Income Portfolio into the EQ/Core Bond Index Portfolio, a series EQ Trust (the “Bond Index Portfolio”). | Shareholders of the Fixed Income Portfolio. |
Each reorganization referred to in Proposals 1-2 above is referred to herein as a “Reorganization” and together as the “Reorganizations.” Each of the Stock Index Portfolio and the Bond Index Portfolio is referred to herein as an “Acquiring Portfolio” and together as the “Acquiring Portfolios.”
This Proxy Statement/Prospectus, which you should retain for future reference, contains important information regarding the Proposals that you should know before voting or providing voting instructions. Additional information about the Trust has been filed with the SEC and is available, without charge, upon oral or written request. This Proxy Statement/Prospectus is being provided to AXA Equitable and mailed to Contractholders and other shareholders on or about [ ], 2015. This Proxy Statement/Prospectus and a proxy or voting instruction card also will be available at https://www.poxydocs.com/AXACP on or about [ ], 2015. It is expected that one or more representatives of AXA Equitable will attend the Meeting in person or by proxy and will vote shares held by AXA Equitable in accordance with voting instructions received from its Contractholders and in accordance with voting procedures established by the Trust.
The following documents have been filed with the SEC and are incorporated by reference into this Proxy Statement/Prospectus:
| 1. | The Prospectus and Statement of Additional Information of the Trust with respect to the Acquired Portfolios, dated May 1, 2015, as supplemented (File Nos. 333-70754 and 811-10509); and |
| 2. | The Statement of Additional Information dated [ ], 2015, relating to the Reorganizations (File No. 333-[ ]). |
For a free copy of any of these documents, please call 1-877-522-5035 or write the Trust at the address above.
Each of the Trust and EQ Trust is subject to the informational requirements of the Securities Exchange Act of 1934, as amended. Accordingly, it must file certain reports and other information with the SEC. You can copy and review information about each of the Trust and EQ Trust, including proxy materials and proxy and information statements, at the SEC’s Public Reference Room in Washington, DC, and at certain of the following SEC Regional Offices: New York Regional Office, 3 World Financial Center, Suite 400, New York, New York 10281;
ii
Table of Contents
Miami Regional Office, 801 Brickell Avenue, Suite 1800, Miami, Florida 33131; Chicago Regional Office, 175 W. Jackson Boulevard, Suite 900, Chicago, Illinois 60604; Denver Regional Office, 1801 California Street, Suite 1500, Denver, Colorado 80202; Los Angeles Regional Office, 5670 Wilshire Boulevard, 11th Floor, Los Angeles, California 90036; Boston Regional Office, 33 Arch Street, 23rd Floor, Boston, MA 02110; Philadelphia Regional Office, The Mellon Independence Center, 701 Market Street, Philadelphia, PA 19106; Atlanta Regional Office, 3475 Lenox Road, N.E., Suite 1000, Atlanta, GA 30326; Fort Worth Regional Office, Burnett Plaza, Suite 1900, 801 Cherry Street, Unit 18, Fort Worth, TX 76102; Salt Lake Regional Office, 15 W. South Temple Street, Suite 1800, Salt Lake City, UT 84101; and San Francisco Regional Office, 44 Montgomery Street, Suite 2600, San Francisco, CA 94104. You may obtain information on the operation of the Public Reference Room by calling the SEC at (202) 551-8090. Reports and other information about the Trust and EQ Trust are available on the EDGAR Database on the SEC’s Internet site at http://www.sec.gov. You may obtain copies of this information from the SEC’s Public Reference Branch, Office of Consumer Affairs and Information Services, Washington, DC 20549, at prescribed rates.
iii
Table of Contents
| Page | ||||
| 1 | ||||
| 2 | ||||
| 6 | ||||
| 7 | ||||
| 8 | ||||
Comparisons of Investment Objectives, Policies and Strategies | 8 | |||
| 9 | ||||
| 10 | ||||
| 11 | ||||
| 12 | ||||
| 15 | ||||
| 16 | ||||
| 17 | ||||
Comparison of Investment Objectives, Policies and Strategies | 17 | |||
| 19 | ||||
| 19 | ||||
| 21 | ||||
| 21 | ||||
| 21 | ||||
| 22 | ||||
| 23 | ||||
Potential Benefits of the Reorganizations to FMG LLC and its Affiliates | 25 | |||
| 26 | ||||
| 35 | ||||
| 36 | ||||
| 36 | ||||
| 36 | ||||
| 36 | ||||
| 38 | ||||
| 41 | ||||
| 42 | ||||
| 45 | ||||
| 45 |
i
Table of Contents
ii
Table of Contents
You should read this entire Proxy Statement/Prospectus carefully. For additional information, you should consult the Plan of Reorganization, a copy of the form of which is attached hereto as Appendix A.
The Proposed Reorganizations
This Proxy Statement/Prospectus is soliciting shareholders with amounts invested in the Acquired Portfolios as of June 30, 2015, to approve the Plan of Reorganization (with respect to the Acquired Portfolio in which they are invested), whereby each Acquired Portfolio will be reorganized into a corresponding Acquiring Portfolio, as described below. (Each Acquired Portfolio and Acquiring Portfolio is sometimes referred to herein as a “Portfolio,” and together, the “Portfolios.”)
Each Acquired Portfolio offers one class of shares, designated Class B shares (the “Acquired Portfolio Shares”). Each Acquiring Portfolio’s shares are divided into three classes, designated Class IA, Class IB and Class K shares. Only the Class IB shares of each Acquiring Portfolio (the “Acquiring Portfolio Shares”) are involved in the Reorganizations. The rights and preferences of the Acquiring Portfolio Shares are identical to the rights and preferences of the Acquired Portfolio Shares.
The Plan of Reorganization provides, with respect to each Reorganization, for:
| • | the transfer of all the assets of the Acquired Portfolio to the corresponding Acquiring Portfolio in exchange solely for Acquiring Portfolio Shares having an aggregate net asset value equal to the Acquired Portfolio’s net assets and the Acquiring Portfolio’s assumption of all the liabilities of the Acquired Portfolio; |
| • | the distribution to the shareholders (for the benefit of the Separate Accounts, as applicable, and thus the Contractholders) of those Acquiring Portfolio Shares; and |
| • | the complete termination of the Acquired Portfolio. |
The Board of the Trust is proposing the Reorganizations because it believes that they will permit shareholders invested in the Acquired Portfolios, which are small and have limited prospects for future growth and corresponding limited ability to achieve economies of scale, to invest in the corresponding Acquiring Portfolios, which in each case will result in a larger combined portfolio with a broadly similar investment objective that invests in the same asset class (i.e., equity securities and fixed income securities, respectively) pursuant to an indexing strategy and that has better prospects for attracting additional assets and lower expenses. For a detailed description of the Board’s reasons for proposing the Reorganizations, see “Additional Information about the Reorganizations — Board Considerations” below.
1
Table of Contents
A comparison of the investment objectives, policies, strategies and principal risks of each Acquired Portfolio and its corresponding Acquiring Portfolio is included in “Comparison of Investment Objectives, Policies and Strategies” and “Comparison of Principal Risk Factors” below. The Portfolios have identical distribution procedures, purchase procedures, exchange rights and redemption procedures, which are discussed in “Additional Information about the Acquiring Portfolios” section below. Each Portfolio offers its shares to Separate Accounts and certain other eligible investors. Shares of each Portfolio are offered and redeemed at their net asset value without any sales load. You will not incur any sales loads or similar transaction charges as a result of a Reorganization.
Subject to shareholder approval, the Reorganizations are expected to be effective at the close of business on September 25, 2015, or on a later date the Trust decides upon (the “Closing Date”). As a result of each Reorganization, each shareholder that owns shares of an Acquired Portfolio would become an owner of shares of the corresponding Acquiring Portfolio. Each such shareholder would hold, immediately after the Closing Date, Class IB shares of the applicable Acquiring Portfolio having an aggregate value equal to the aggregate value of the Class B shares of the Acquired Portfolio that were held by the shareholder as of the Closing Date. Similarly, each Contractholder whose Contract values are invested in shares of an Acquired Portfolio would become an indirect owner of shares of the corresponding Acquiring Portfolio. Each such Contractholder would indirectly hold, immediately after the Closing Date, Class IB shares of applicable Acquiring Portfolio having an aggregate value equal to the aggregate value of the Class B shares of the Acquired Portfolio that were indirectly held by the Contractholder as of the Closing Date. The Trust believes that there will be no adverse tax consequences to shareholders or Contractholders as a result of the Reorganizations. Please see “Additional Information about the Reorganizations — Federal Income Tax Consequences of the Reorganizations” below for further information.
The Board of Trustees of each of the Trust and EQ Trust has unanimously approved the Plan of Reorganization with respect to each Acquired Portfolio and each Acquiring Portfolio, respectively. Accordingly, the Board of the Trust is submitting the Plan of Reorganization for approval by each Acquired Portfolio’s shareholders. In considering whether to approve the Proposals, you should review the discussion of the Proposals set forth below. In addition, you should review the information in this Proxy Statement/Prospectus that relates to each Proposal and the Plan of Reorganization generally. The Board of the Trust recommends that you vote “FOR” the Proposals to approve the Plan of Reorganization.
PROPOSAL 1: TO APPROVE THE PLAN OF REORGANIZATION WITH RESPECT TO THE REORGANIZATION OF THE CHARTERSM EQUITY PORTFOLIO, A SERIES OF THE TRUST, INTO THE EQ/COMMON STOCK INDEX PORTFOLIO, A SERIES OF EQ TRUST.
2
Table of Contents
This Proposal 1 requests your approval of a Plan of Reorganization pursuant to which the Equity Portfolio will be reorganized into the Stock Index Portfolio. In considering whether you should approve the Proposal, you should note that:
| • | The Portfolios have broadly similar investment objectives. The Equity Portfolio seeks long-term capital appreciation, while the Stock Index Portfolio seeks to achieve a total return (before expenses) that approximates the total return performance of the Russell 3000 Index including reinvestment of dividends, at a risk level consistent with that of the Russell 3000 Index. |
| • | Both Portfolios provide diversified exposure to equity securities. There are, however, differences in the Portfolios’ principal investment policies and strategies of which you should be aware. These are set forth immediately below. For a detailed comparison of the Portfolios’ investment policies and strategies, see “Comparisons of Investment Objectives, Policies and Strategies” below. |
| • | The Equity Portfolio invests in securities of other investment companies (“Underlying Portfolios”) and exchange traded funds (“Underlying ETFs”) such that at least 80% of its net assets are invested in equity securities. The Equity Portfolio allocates its assets to Underlying Portfolios and Underlying ETFs that invest among various equity asset categories, as well as non-traditional (alternative) investments. The asset categories and strategies of the Underlying Portfolios and Underlying ETFs in which the Equity Portfolio may invest are as follows (asset categories and strategies that the Manager considers to be non-traditional (alternative) are indicated with an asterisk*): covered call writing*, domestic large cap equity, domestic mid cap equity, domestic small cap equity, domestic micro-cap equity, emerging markets equity, emerging markets small cap, frontier markets, global equity, international developed equity and international/global small cap equity. Unlike the Stock Index Portfolio, the Equity Portfolio does not utilize an index investment strategy. |
| • | The Stock Index Portfolio utilizes an indexing strategy and generally invests at least 80% of its net assets in common stocks of companies represented in the Russell 3000 Index. The Russell 3000 Index is an unmanaged index that measures the performance of the 3000 largest U.S. companies based on total market capitalization, which represents approximately 98% of the investable U.S. equity market. The Stock Index Portfolio invests in stocks selected by a stratified sampling construction process, commonly referred to as an indexing strategy, in which its investment sub-adviser selects a subset of the companies represented in the Russell 3000 Index based on its analysis of key risk factors and other characteristics. Such factors include industry weightings, market capitalizations, return variability, and yield. Unlike the Equity Portfolio, the Stock Index Portfolio does not invest in Underlying Funds or Underlying ETFs. |
3
Table of Contents
| • | Each Portfolio’s principal risks include equity risk, large-cap, mid-cap company risk and small-cap company risk. The Equity Portfolio also is subject to affiliated portfolio risk, derivatives risk, foreign securities risk (including currency risk and emerging markets risk), futures contract risk, liquidity risk, market risk, micro-cap company risk, non-traditional (alternative) investment risk, portfolio management risk and risks related to investments in Underlying Portfolios and Underlying ETFs as principal risks while the Stock Index Portfolio is not. The Stock Index Portfolio is subject to index strategy risk, while the Equity Portfolio is not directly subject to such risk. For a detailed comparison of the Portfolios’ risks, see “Comparisons of Principal Risk Factors” below. |
| • | AXA Equitable Funds Management Group, LLC (“FMG LLC” or the “Manager”) serves as the investment manager and administrator for each Portfolio. FMG LLC manages the assets of the Equity Portfolio. FMG LLC has selected AllianceBernstein L.P. (“AllianceBernstein”) as the sub-adviser (“Sub-Adviser”) to manage the assets of the Stock Index Portfolio. It is anticipated that FMG LLC will continue to manage and administer, and that AllianceBernstein will continue to sub-advise, the Stock Index Portfolio after the Reorganization. |
| • | The Manager has been granted relief by the SEC to hire, terminate and replace Sub-Advisers and amend sub-advisory agreements subject to the approval of the Board of Trustees and without obtaining shareholder approval. However, FMG LLC may not enter into a sub-advisory agreement on behalf of a Portfolio with an “affiliated person” of the Manager, such as AllianceBernstein, unless the sub-advisory agreement, including compensation, is approved by the Portfolio’s shareholders. For a detailed description of the Manager and the Sub-Adviser to the Stock Index Portfolio, please see “Additional Information about the Acquiring Portfolios — The Manager” and “ — The Sub-Adviser” below. |
| • | The Equity Portfolio and the Stock Index Portfolio had net assets of approximately $5.4 million and $5.8 billion, respectively, as of December 31, 2014. Thus, if the Reorganization of the Equity Portfolio into the Stock Index Portfolio had been in effect on that date, the combined Portfolio would have had net assets of approximately $5.8 billion. |
| • | The Class B shareholders of the Equity Portfolio will receive Class IB shares of the Stock Index Portfolio pursuant to the Reorganization. Shareholders will not pay any sales charges in connection with the Reorganization. Please see “Comparative Fee and Expense Tables,” “Additional Information about the Reorganizations” and “Additional Information about the Acquiring Portfolios” below for more information. |
| • | It is estimated that the total annual operating expense ratio (including acquired fund fees and expenses, if any) for the Stock Index Portfolio’s Class IB shares, for the fiscal year following the Reorganization, will be lower than |
4
Table of Contents
that of the Equity Portfolio’s Class B shares for the fiscal year ended December 31, 2014. For a more detailed comparison of the fees and expenses of the Portfolios, please see “Comparative Fee and Expense Tables” and “Additional Information about the Acquiring Portfolios” below. |
| • | The maximum management fee for the Equity Portfolio is equal to an annual rate of 0.15% of its average daily net assets and the maximum management fee for the Stock Index Portfolio is equal to an annual rate of 0.35% of its average daily net assets. The Portfolios pay different administration fees. The Equity Portfolio pays FMG LLC its proportionate share of an asset-based administration fee, subject to a minimum annual fee of $32,500. The asset-based administration fee is equal to an annual rate of 0.15% of the average daily net assets of the 19 portfolios of the Trust designated in the Trust’s prospectus as “CharterSM Allocation Portfolios.” The Stock Index Portfolio pays FMG LLC its proportionate share of an asset-based administration fee for the Single-Advised Portfolios (defined below), which is equal to an annual rate of 0.12% of the first $3 billion of the aggregate average daily net assets of the Single-Advised Portfolios; 0.11% of the next $3 billion; 0.105% of the next $4 billion; 0.10% of the next $20 billion; 0.0975% of the next $10 billion; and 0.095% thereafter, subject to a minimum annual fee of $30,000. For a more detailed description of the fees and expenses of the Portfolios, including a description of the Single-Advised Portfolios, please see “Comparative Fee and Expense Tables” and “Additional Information about the Acquiring Portfolios” below. |
| • | The Equity Portfolio is subject to an expense limitation arrangement while the Stock Index Portfolio is not. Pursuant to a contract, FMG LLC has agreed to make payments or waive its management, administrative or other fees to limit the expenses of the Equity Portfolio through April 30, 2016 (unless the Board of Trustees consents to an earlier revision or termination of this arrangement) (“Expense Limitation Arrangement”) so that the annual operating expenses of the Equity Portfolio (exclusive of taxes, interest, brokerage commissions, dividend and interest expenses on securities sold short, capitalized expenses, fees and expenses of other investment companies in which the Equity Portfolio invests, and extraordinary expenses) do not exceed an annual rate of average daily net assets of 0.65% for Class B shares the Equity Portfolio. |
| • | The Class IB Shares of the Stock Index Portfolio outperformed the Class B Shares of the Equity Portfolio for the one-year period ended December 31, 2014. Please see “Comparative Performance Information” below. |
| • | Following the Reorganization, the combined Portfolio will be managed in accordance with the investment objective, policies and strategies of the Stock Index Portfolio. It is not expected that the Stock Index Portfolio will revise any of its investment policies following the Reorganization to reflect those of the Equity Portfolio. If the Reorganization is approved, all of the Equity Portfolio’s assets (“Transferred Assets”) on the Closing Date will be transferred to the Stock Index Portfolio. It is anticipated that immediately prior to the |
5
Table of Contents
Closing Date, the Equity Portfolio will liquidate its securities holdings and hold cash. Therefore, it is anticipated that the Transferred Assets will consist of cash. The sale of portfolio holdings by the Equity Portfolio in connection with the Reorganization may result in the Equity Portfolio selling securities at a disadvantageous time and price and could result in it realizing gains (or losses) that would not otherwise have been realized and incurring transaction costs that would not otherwise have been incurred. It is also expected that, over time, the Stock Index Portfolio will use the Transferred Assets to invest in equity securities represented in the Russell 3000 Index. |
| • | Except for brokerage costs incurred in connection with the Reorganization, FMG LLC will bear the expenses of the Reorganization described in this Proxy Statement/Prospectus. |
Comparative Fee and Expense Tables
The following tables show the fees and expenses of the Class B Shares of the Equity Portfolio and the Class IB Shares of the Stock Index Portfolio and the estimated pro forma fees and expenses of the Class IB Shares of the Stock Index Portfolio after giving effect to the proposed Reorganization. Fees and expenses for each Portfolio are based on those incurred by relevant class of its shares for the fiscal year ended December 31, 2014. The pro forma fees and expenses of the Stock Index Portfolio Shares assume that the Reorganization was in effect for the year ended December 31, 2014. The tables below do not reflect any Contract-related fees and expenses, which would increase overall fees and expenses. See a Contract prospectus for a description of those fees and expenses.
Shareholder Fees
(fees paid directly from your investment)
Equity Portfolio | Stock Index Portfolio | Pro Forma Stock Index | ||
| Not Applicable. | Not Applicable. | Not Applicable. |
Annual Operating Expenses
(expenses that you may pay each year as a percentage of the value of your investment)
| Equity Portfolio | Stock Index Portfolio | Pro Forma Stock Index Portfolio (assuming the Reorganization is approved) | ||||||||||
| Class B | Class IB | Class IB | ||||||||||
Management Fee | 0.15 | % | 0.35 | % | 0.35 | % | ||||||
Distribution and/or Service Fees (12b-1 fees) | 0.25 | % | 0.25 | % | 0.25 | % | ||||||
Other Expenses | 4.24 | % | 0.12 | % | 0.12 | % | ||||||
Acquired Fund Fees and Expenses | 0.86 | % | N/A | N/A | ||||||||
6
Table of Contents
| Equity Portfolio | Stock Index Portfolio | Pro Forma Stock Index Portfolio (assuming the Reorganization is approved) | ||||||||||
| Class B | Class IB | Class IB | ||||||||||
Total Annual Portfolio Operating Expenses | 5.50 | % | 0.72 | % | 0.72 | % | ||||||
Fee Waiver and/or Expense Reimbursement† | -3.99 | % | N/A | N/A | ||||||||
Total Annual Portfolio Operating Expenses After Fee Waiver and/ or Expense Reimbursement | 1.51 | % | 0.72 | % | 0.72 | % | ||||||
| † | Pursuant to the Expense Limitation Arrangement, FMG LLC has agreed to make payments or waive its management, administrative or other fees to limit the expenses of the Equity Portfolio through April 30, 2016 (unless the Board of Trustees consents to an earlier revision or termination of this arrangement) so that the annual operating expenses of the Portfolio (exclusive of taxes, interest, brokerage commissions, dividend and interest expenses on securities sold short, capitalized expenses, fees and expenses of other investment companies in which the Portfolio invests, and extraordinary expenses) do not exceed an annual rate of average daily net assets of 0.65% for Class B of the Equity Portfolio. The Expense Limitation Arrangement may be terminated by FMG LLC at any time after April 30, 2016. |
This example is intended to help you compare the costs of investing in the Portfolios with the cost of investing in other investment options. The example assumes that:
| • | You invest $10,000 in a Portfolio for the time periods indicated; |
| • | Your investment has a 5% return each year; |
| • | The Portfolio’s operating expenses remain the same; and |
| • | The Expense Limitation Arrangement with respect to the Equity Portfolio is not renewed. |
This example does not reflect any Contract-related fees and expenses, including redemption fees (if any) at the Contract level. If such fees and expenses were reflected, the total expenses would be higher. Although your actual costs may be higher or lower, based on these assumptions your costs would be:
| 1 Year | 3 Years | 5 Years | 10 Years | |||||||||||||
Equity Portfolio | ||||||||||||||||
Class B | $ | 154 | $ | 1,286 | $ | 2,408 | $ | 5,163 | ||||||||
Stock Index Portfolio | ||||||||||||||||
Class IB | $ | 74 | $ | 230 | $ | 401 | $ | 894 | ||||||||
Pro Forma Stock Index Portfolio (assuming the Reorganization is approved) | ||||||||||||||||
Class IB | $ | 74 | $ | 230 | $ | 401 | $ | 894 | ||||||||
7
Table of Contents
Each Portfolio pays transaction costs, such as commissions, when it buys and sells securities (or “turns over” its portfolio). A higher portfolio turnover rate may indicate higher transaction costs. These costs, which are not reflected in annual fund operating expenses or in the example, affect a Portfolio’s performance. During the fiscal year ended December 31, 2014, the portfolio turnover rates for each of the Equity Portfolio and the Stock Index Portfolio were 25% and 4%, respectively, of the average value of the Portfolio.
Comparison of Investment Objectives, Policies and Strategies
The following table compares the investment objectives and principal investment policies and strategies of the Equity Portfolio with those of the Stock Index Portfolio. The Board of the Trust and the Board of EQ Trust may change the investment objective of a respective Portfolio without a vote of that Portfolio’s shareholders. For more detailed information about each Portfolio’s investment strategies and risks, see Appendix B.
| Acquired Portfolio | Acquiring Portfolio | |||
| Equity Portfolio | Stock Index Portfolio | |||
Investment Objective | Seeks long-term capital appreciation. | Seeks to achieve a total return before expenses that approximates the total return performance of the Russell 3000 Index, including reinvestment of dividends, at a risk level consistent with that of the Russell 3000 Index. | ||
Principal Investment Strategies | The Portfolio pursues its investment objective by investing in other mutual funds managed by the Manager and in investment companies managed by investment managers other than the Manager (affiliated and unaffiliated “Underlying Portfolios”) and Underlying ETFs comprising various asset categories and strategies. The Portfolio will invest in Underlying Portfolios and Underlying ETFs such that at least 80% of its assets (net assets plus the amount of any borrowings for investment purposes) are invested in equity securities (which may include derivatives exposure to equity securities).
The Portfolio allocates its assets to Underlying Portfolios and Underlying ETFs that invest among various equity asset categories, as well as non-traditional (alternative) investments. The asset categories and strategies of the Underlying Portfolios and Underlying ETFs in which | The Portfolio generally invests at least 80% of its net assets, plus borrowings for investment purposes, in common stocks of companies represented in the Russell 3000 Index. The Russell 3000 Index is an unmanaged index that measures the performance of the 3,000 largest U.S. companies based on total market capitalization, which represents approximately 98% of the investable U.S. equity market.
The Portfolio’s investments are selected by a stratified sampling construction process in which the Sub-Adviser selects a subset of the 3,000 companies in the Russell 3000 based on the Sub-Adviser’s analysis of key risk factors and other characteristics. Such factors include industry weightings, market capitalizations, return variability, and yield. This strategy is commonly referred to as an indexing strategy. |
8
Table of Contents
| Acquired Portfolio | Acquiring Portfolio | |||
| Equity Portfolio | Stock Index Portfolio | |||
the Portfolio invests are as follows (asset categories and strategies that the Manager considers to be non-traditional (alternative) are indicated with an asterisk*):
• Covered Call Writing* • Domestic Large Cap Equity • Domestic Mid Cap Equity • Domestic Small Cap Equity • Domestic Micro-Cap Equity • Emerging Markets Equity • Emerging Markets Small Cap • Frontier Markets • Global Equity • International Developed Equity • International/Global Small Cap Equity.
Non-traditional (alternative) investments are alternatives to traditional equity (stocks) or fixed income (bonds and cash) investments. Non-traditional (alternative) investments have the potential to enhance portfolio diversification and reduce overall portfolio volatility because these investments may not have a strong correlation (relationship) to one another or to traditional market indexes. This approach may involve, for example, holding both long and short positions in securities or using derivatives or hedging strategies. Many non-traditional (alternative) investments strategies are designed to help reduce the role of overall market direction in determining return.
In addition, the Portfolio may invest in Underlying Portfolios and Underlying ETFs that employ derivatives (including futures contracts) for a variety of purposes, including to reduce risk, to seek enhanced returns from certain asset classes, and to level of exposure to certain asset classes. |
Comparison of Principal Risk Factors
An investment in a Portfolio is not a deposit of a bank and is not insured or guaranteed by the Federal Deposit Insurance Corporation or any other government agency. You may lose money by investing in a Portfolio. The following table compares the principal risks of an investment in the Equity Portfolio and the Stock Index Portfolio.
9
Table of Contents
For an explanation of each such risk, see “Additional Information about the Reorganizations — Descriptions of Risk Factors” below.
Risks | Stock Index Portfolio | Equity Portfolio | ||||||
Affiliated Portfolio Risk | X | |||||||
Derivatives Risk | X | |||||||
Equity Risk | X | X | ||||||
Foreign Securities Risk | X | |||||||
Currency Risk | X | |||||||
Emerging Markets Risk | X | |||||||
Futures Contract Risk | X | |||||||
Index Strategy Risk | X | |||||||
Large-Cap Company Risk | X | X | ||||||
Liquidity Risk | X | |||||||
Market Risk | X | |||||||
Micro-Cap Company Risk | X | |||||||
Mid-Cap and Small-Cap Company Risk | X | X | ||||||
Non-Traditional (Alternative) Investment Risk | X | |||||||
Portfolio Management Risk | X | |||||||
Risks Related to Investments in Underlying Portfolios and Underlying ETFs | X | |||||||
Comparative Performance Information
The bar charts and tables below provide some indication of the risks of investing in each Portfolio by showing changes in the Portfolio’s performance from year to year and by showing how the Stock Index Portfolio’s average annual total returns for the past one-, five- and ten-years, and the Equity Portfolio’s average annual total returns for the past year and since inception, through December 31, 2014, compared to the returns of a broad-based market index. The return of the broad-based market index (and any additional comparative index) shown in the right hand columns below for each Portfolio is the return of the index for the last 10 years or, if shorter, since inception of the share class with the longest history. Past performance is not an indication of future performance.
The performance results do not reflect any Contract-related fees and expenses, which would reduce the performance results.
Equity Portfolio - Calendar Year Total Returns (Class B)

Best quarter (% and time period) 3.71% (2014 2nd Quarter) | Worst quarter (% and time period) -3.34% (2014 3rd Quarter) | |||||||||||||||||
10
Table of Contents
Stock Index Portfolio - Calendar Year Total Returns (Class IB)
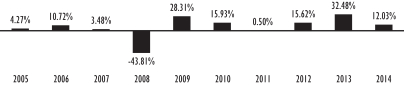
Best quarter (% and time period) 16.68% (2009 2nd Quarter) | Worst quarter (% and time period) -25.39% (2008 4th Quarter) | |||||||||||||||||
Equity Portfolio Average Annual Total Returns
(For the periods ended December 31, 2014)
| One Year | Since Inception | |||||||
Equity Portfolio — Class B Shares | 2.24 | % | 5.05 | % | ||||
MSCI AC World (Net) Index (reflects no deduction for fees and expenses) | 4.16 | % | 5.81 | % | ||||
Stock Index Portfolio Average Annual Total Returns
(For the periods ended December 31, 2014)
| One Year | Five Years | Ten Years/ Since Inception | ||||||||||
Stock Index Portfolio — Class IB Shares | 12.03% | 14.86% | 5.58% | |||||||||
Russell 3000 Index (reflects no deduction for fees and expenses) | 12.56% | 15.63% | 7.94% | |||||||||
The following table shows the capitalization of each Portfolio as of December 31, 2014 and of the Stock Index Portfolio on a pro forma combined basis as of December 31, 2014, after giving effect to the proposed Reorganization. Pro forma net assets may not total and net asset values per share may not recalculate due to rounding of net assets.
| Net Assets (in millions) | Net Asset Value Per Share | Shares Outstanding | ||||||||||
Equity Portfolio — Class IA Shares | N/A | N/A | N/A | |||||||||
Stock Index Portfolio — Class IA Shares | $ | 4,292.8 | $ | 26.27 | 163,395,617 | |||||||
Equity Portfolio — Class B Share | $ | 5.4 | $ | 10.15 | 529,959 | |||||||
Stock Index Portfolio — Class IB Shares | $ | 1,472.9 | $ | 26.13 | 56,367,324 | |||||||
Adjustments(a) | $ | — | $ | — | (324,054 | ) | ||||||
Pro forma Stock Index Portfolio — Class IB Shares | $ | 1,478.3 | $ | 26.13 | 56,573,229 | |||||||
Equity Portfolio — Class K Shares | N/A | N/A | N/A | |||||||||
Stock Index Portfolio — Class K Shares* | N/A | N/A | N/A | |||||||||
| * | Class K shares of the Stock Index Portfolio are not operational. |
| (a) | Reflects adjustment for retired shares of the Equity Portfolio. |
11
Table of Contents
AFTER CAREFUL CONSIDERATION, THE BOARD OF THE TRUST UNANIMOUSLY APPROVED THE PLAN OF REORGANIZATION WITH RESPECT TO THE EQUITY PORTFOLIO. ACCORDINGLY, THE BOARD HAS SUBMITTED THE PLAN OF REORGANIZATION FOR APPROVAL BY THIS PORTFOLIO’S SHAREHOLDERS. THE BOARD RECOMMENDS THAT YOU VOTE “FOR” PROPOSAL 1.
PROPOSAL 2: TO APPROVE THE PLAN OF REORGANIZATION WITH RESPECT TO THE REORGANIZATION OF THE CHARTERSM FIXED INCOME PORTFOLIO, A SERIES OF THE TRUST, INTO THE EQ/CORE BOND INDEX PORTFOLIO, A SERIES OF EQ TRUST.
This Proposal 2 requests your approval of a Plan of Reorganization pursuant to which the Fixed Income Portfolio will be reorganized into the Bond Index Portfolio. In considering whether you should approve the Proposal, you should note that:
| • | The Portfolios have broadly similar investment objectives. The Fixed Income Portfolio seeks a high level of current income, while the Bond Index Portfolio seeks to achieve a total return before expenses that approximates the total return performance of the Barclays Intermediate U.S. Government/Credit Index (the “U.S. Government/Credit Index”), including reinvestment of dividends, at a risk level consistent with that of the U.S. Government/Credit Index. |
| • | Both Portfolios provide diversified exposure to fixed income securities. There are, however, differences in the Portfolios’ principal investment policies and strategies of which you should be aware. These are set forth immediately below. For a detailed comparison of the Portfolios’ investment policies and strategies, see “Comparisons of Investment Objectives, Policies and Strategies” below. |
| • | The Fixed Income Portfolio invests in securities of other investment companies (“Underlying Portfolios”) and exchange traded funds (“Underlying ETFs”) such that at least 80% of its assets are invested in fixed income securities. The Fixed Income Portfolio allocates its assets to Underlying Portfolios and Underlying ETFs that invest among various fixed income asset categories, as well as non-traditional (alternative) investments. The asset categories and strategies of the Underlying Portfolios and Underlying ETFs in which the Fixed Income Portfolio may invest are as follows (asset categories and strategies that the Manager considers to be non-traditional (alternative) are indicated with an asterisk*): convertible securities*, bank loans, emerging market debt securities, floating rate securities, global bond, high yield bond, inflation linked securities, international bond, money market, U.S. government bond, U.S. investment grade bond and U.S. short term investment grade bond. Unlike the Bond Index Portfolio, the Fixed Income Portfolio does not utilize an index investment strategy. |
| • | The Bond Index Portfolio utilizes an indexing strategy and generally invests at least 80% of its net assets in securities that are included in the U.S. Government/Credit Index, which covers the U.S. dollar denominated, |
12
Table of Contents
investment grade, fixed-rate, taxable bond market, including U.S. Treasury and government-related, corporate, credit and agency fixed-rate debt securities. Unlike the Fixed Income Portfolio, only up to 40% of the Bond Index Portfolio’s assets may be invested in ETFs. |
| • | Each Portfolio’s principal risks include credit risk, interest rate risk, investment grade securities risk and liquidity risk. The Fixed Income Portfolio also is subject to affiliated portfolio risk, bank loans risk, convertible securities risk, derivatives risk, floating rate loan risk, foreign securities risk (including currency risk and emerging markets risk), inflation-indexed bonds risk, non-investment grade securities risk, market risk, money market risk, non-traditional (alternative) investment risk, portfolio management risk, risks related to investments in underlying portfolios and underlying ETFs, and U.S. government securities risk as principal risks, while the Bond Index Portfolio is not. The Bond Index Portfolio is subject to ETF risk, index strategy risk, redemption risk and securities lending risk as principal risks, while the Fixed Income Portfolio is not directly subject to such risks. For a detailed comparison of the Portfolios’ risks, see “Comparisons of Principal Risk Factors” below. |
| • | AXA Equitable Funds Management Group, LLC (“FMG LLC” or the “Manager”) serves as the investment manager and administrator for each Portfolio. FMG LLC manages the assets of the Fixed Income Portfolio. FMG LLC has selected SSgA Funds Management, Inc. (“SSgA FM”) as the sub-adviser (“Sub-Adviser”) to manage the assets of the Bond Index Portfolio. It is anticipated that FMG LLC will continue to manage and administer, and that SSgA FM will continue to sub-advise, the Bond Index Portfolio after the Reorganization. |
| • | The Manager has been granted relief by the SEC to hire, terminate and replace Sub-Advisers and amend sub-advisory agreements subject to the approval of the Board of Trustees and without obtaining shareholder approval. However, FMG LLC may not enter into a sub-advisory agreement on behalf of a Portfolio with an “affiliated person” of the Manager, unless the sub-advisory agreement, including compensation, is approved by the Portfolio’s shareholders. For a detailed description of the Manager and the Sub-Adviser to the Bond Index Portfolio, please see “Additional Information about the Acquiring Portfolios — The Manager” and “ — The Sub-Adviser” below. |
| • | The Fixed Income Portfolio and the Bond Index Portfolio had net assets of approximately $5.2 million and $8.6 billion, respectively, as of December 31, 2014. Thus, if the Reorganization had been in effect on that date, the combined Portfolio would have had net assets of approximately $8.6 billion. |
| • | The Class B shareholders of the Fixed Income Portfolio will receive Class IB shares of the Bond Index Portfolio pursuant to the Reorganization. Shareholders will not pay any sales charges in connection with the Reorganization. |
13
Table of Contents
Please see “Comparative Fee and Expense Tables,” “Additional Information about the Reorganization” and “Additional Information about the Acquiring Portfolios” below for more information. |
| • | It is estimated that the total annual operating expense ratio (including acquired fund fees and expenses, if any) for the Bond Index Portfolio’s Class IB shares, for the fiscal year following the Reorganization, will be lower than that of the Fixed Income Portfolio’s Class B shares for the fiscal year ended December 31, 2014. For a more detailed comparison of the fees and expenses of the Portfolios, please see “Comparative Fee and Expense Tables” and “Additional Information about the Acquiring Portfolios” below. |
| • | The maximum management fee for the Fixed Income Portfolio is equal to an annual rate of 0.15% of its average daily net assets and the maximum management fee for the Bond Index Portfolio is equal to an annual rate of 0.35% of its average daily net assets. The Portfolios pay different administration fees. The Fixed Income Portfolio pays FMG LLC its proportionate share of an asset-based administration fee, subject to a minimum annual fee of $32,500. The asset-based administration fee is equal to an annual rate of 0.15% of the average daily net assets of the 19 portfolios of the Trust designated in the Trust’s prospectus as “CharterSM Allocation Portfolios.” The Bond Index Portfolio pays FMG LLC its proportionate share of an asset-based administration fee for the Single-Advised Portfolios (defined below), which is equal to an annual rate of 0.12% of the first $3 billion of the aggregate average daily net assets of the Single-Advised Portfolios; 0.11% of the next $3 billion; 0.105% of the next $4 billion; 0.10% of the next $20 billion; 0.0975% of the next $10 billion; and 0.095% thereafter, subject to a minimum annual fee of $30,000. For a more detailed description of the fees and expenses of the Portfolios, including a description of the Single-Advised Portfolios, please see “Comparative Fee and Expense Tables” and “Additional Information about the Acquiring Portfolios” below. |
| • | Both Portfolios are subject to an expense limitation arrangement (an “Expense Limitation Agreement”). FMG LLC has entered into an Expense Limitation Agreement with the Trust pursuant to which FMG LLC has agreed to make payments or waive its management, administrative or other fees to limit the expenses of the Fixed Income Portfolio through April 30, 2016 (unless the Board of the Trust consents to an earlier revision or termination of this arrangement) so that the annual operating expenses of the Fixed Income Portfolio (other than interest, taxes, brokerage commissions, dividend and interest expenses on securities sold short, expenses of Underlying Portfolios and Underlying ETFs, other expenditures that are capitalized in accordance with generally accepted accounting principles and other extraordinary expenses not incurred in the ordinary course of the Fixed Income Portfolio’s business) do not exceed an annual rate of average daily net assets of 0.65% for Class B shares of the Fixed Income Portfolio. Similarly, FMG LLC has entered into an Expense Limitation Agreement with EQ Trust pursuant to which FMG LLC agreed to make payments or waive its management, administrative and other fees to limit the expenses of the Bond Index Portfolio |
14
Table of Contents
through April 30, 2016 (unless the Board of Trustees of the EQ Trust consents to an earlier revision or termination of this arrangement) so that the annual operating expenses of the Bond Index Portfolio (other than interest, taxes, brokerage commissions, dividend and interest expenses on securities sold short, expenses of other investment companies in which the Bond Index Portfolio invests, other expenditures that are capitalized in accordance with generally accepted accounting principles, and other extraordinary expenses not incurred in the ordinary course of the Bond Index Portfolio’s business) do not exceed an annual rate of average daily net assets of 0.72% for the Class IB shares of the Bond Index Portfolio. |
| • | The Class IB shares of the Bond Index Portfolio outperformed the Class B shares of the Fixed Income Portfolio for the one-year period ended December 31, 2014. Please see “Comparative Performance Information” below. |
| • | Following the Reorganization, the combined Portfolio will be managed in accordance with the investment objective, policies and strategies of the Bond Index Portfolio. It is not expected that the Bond Index Portfolio will revise any of its investment policies following the Reorganization to reflect those of the Fixed Income Portfolio. If the Reorganization is approved, all of the Fixed Income Portfolio’s assets (“Transferred Assets”) on the Closing Date will be transferred to the Bond Index Portfolio. It is anticipated that immediately prior to the Closing Date, the Fixed Income Portfolio will liquidate its securities holdings and hold cash. Therefore, it is anticipated that the Transferred Assets will consist of cash. The sale of portfolio holdings by the Fixed Income Portfolio in connection with the Reorganization may result in the Fixed Income Portfolio selling securities at a disadvantageous time and price and could result in it realizing gains (or losses) that would not otherwise have been realized and incurring transaction costs that would not otherwise have been incurred. It is also expected that, over time, the Bond Index Portfolio will use the Transferred Assets to invest in fixed income securities represented in the U.S. Government/Credit Index. |
| • | Except for brokerage costs incurred in connection with the Reorganization, FMG LLC will bear the expenses of the Reorganization described in this Proxy Statement/Prospectus. |
Comparative Fee and Expense Tables
The following tables show the fees and expenses of the Class B Shares of the Fixed Income Portfolio and the Class IB Shares of the Bond Index Portfolio and the estimated pro forma fees and expenses of the Class IB Shares of the Bond Index Portfolio after giving effect to the proposed Reorganization. The pro forma fees and expenses of the Bond Index Portfolio Shares assume that the Reorganization was in effect for the year ended December 31, 2014. The tables below do not reflect any Contract-related fees and expenses, which would increase overall fees and expenses. See a Contract prospectus for a description of those fees and expenses.
15
Table of Contents
Shareholder Fees
(fees paid directly from your investment)
Fixed Income Portfolio | Bond Index Portfolio | Pro Forma Bond Index | ||
Not Applicable. | Not Applicable. | Not Applicable. |
Annual Operating Expenses
(expenses that you may pay each year as a percentage of the value of your investment)
| Fixed Income Portfolio | Bond Index Portfolio | Pro Forma Bond Index Portfolio (assuming the Reorganization is approved) | ||||||||||
| Class B | Class IB | Class IB | ||||||||||
Management Fee | 0.15 | % | 0.34 | % | 0.34 | % | ||||||
Distribution and/or Service Fees (12b-1 fees) | 0.25 | % | 0.25 | % | 0.25 | % | ||||||
Other Expenses | 3.82 | % | 0.12 | % | 0.12 | % | ||||||
Acquired Fund Fees and Expenses | 0.65 | % | N/A | N/A | ||||||||
Total Annual Portfolio Operating Expenses | 4.87 | % | 0.71 | % | 0.71 | % | ||||||
Fee Waiver and/or Expense Reimbursement† | -3.57 | N/A | N/A | |||||||||
Total Annual Portfolio Operating Expenses After Fee Waiver and/or Expense Reimbursement | 1.30 | % | 0.71 | % | 0.71 | % | ||||||
| † | Pursuant to an Expense Limitation Arrangement with the Trust, FMG LLC has agreed to make payments or waive its management, administrative or other fees to limit the expenses of the Fixed Income Portfolio through April 30, 2016 (unless the Board of the Trust consents to an earlier revision or termination of this arrangement) so that the annual operating expenses of the Fixed Income Portfolio (exclusive of taxes, interest, brokerage commissions, dividend and interest expenses on securities sold short, capitalized expenses, fees and expenses of other investment companies in which the Fixed Income Portfolio invests, and extraordinary expenses) do not exceed an annual rate of average daily net assets of 0.65% for Class B shares of the Fixed Income Portfolio. The Expense Limitation Arrangement with the Trust may be terminated by FMG LLC at any time after April 30, 2016. |
This example is intended to help you compare the costs of investing in the Portfolios with the cost of investing in other investment options. The example assumes that:
| • | You invest $10,000 in a Portfolio for the time periods indicated; |
| • | Your investment has a 5% return each year; |
| • | The Portfolio’s operating expenses remain the same; and |
| • | The Expense Limitation Arrangement with respect to the Fixed Income Portfolio is not renewed. |
16
Table of Contents
This example does not reflect any Contract-related fees and expenses, including redemption fees (if any) at the Contract level. If such fees and expenses were reflected, the total expenses would be higher. Although your actual costs may be higher or lower, based on these assumptions your costs would be:
| 1 Year | 3 Years | 5 Years | 10 Years | |||||||||||||
Fixed Income Portfolio | ||||||||||||||||
Class B | $ | 132 | $ | 1,144 | $ | 2,158 | $ | 4,704 | ||||||||
Bond Index Portfolio | ||||||||||||||||
Class IB | $ | 73 | $ | 227 | $ | 395 | $ | 883 | ||||||||
Pro Forma Bond Index Portfolio (assuming the Reorganization is approved) | ||||||||||||||||
Class IB | $ | 73 | $ | 227 | $ | 395 | $ | 883 | ||||||||
Each Portfolio pays transaction costs, such as commissions, when it buys and sells securities (or “turns over” its portfolio). A higher portfolio turnover rate may indicate higher transaction costs. These costs, which are not reflected in annual fund operating expenses or in the example, affect a Portfolio’s performance. During the fiscal year ended December 31, 2014, the portfolio turnover rates for each of the Fixed Income Portfolio and the Bond Index Portfolio were 19% and 24%, respectively, of the average value of the Portfolio.
Comparison of Investment Objectives, Policies and Strategies
The following table compares the investment objectives and principal investment policies and strategies of the Fixed Income Portfolio with those of the Bond Index Portfolio. The Board of the Trust and the Board of EQ Trust may change the investment objective of a respective Portfolio without a vote of that Portfolio’s shareholders. For more detailed information about each Portfolio’s investment strategies and risks, see Appendix B.
| Acquired Portfolio | Acquiring Portfolio | |||
| Fixed Income Portfolio | Bond Index Portfolio | |||
Investment Objective | Seeks a high level of current income. | Seeks to achieve a total return before expenses that approximates the total return performance of the Barclays Intermediate U.S. Government/Credit Index (“Intermediate Government Credit Index”), including reinvestment of dividends, at a risk level consistent with that of the Intermediate Government Credit Index. |
17
Table of Contents
| Acquired Portfolio | Acquiring Portfolio | |||
| Fixed Income Portfolio | Bond Index Portfolio | |||
Principal Investment Strategies | The Portfolio pursues its investment objective by investing in other mutual funds managed by the Manager and in investment companies managed by investment managers other than the Manager (affiliated and unaffiliated “Underlying Portfolios”) and Underlying ETFs comprising various asset categories and strategies. The Portfolio will invest in Underlying Portfolios and Underlying ETFs such that at least 80% of its assets (net assets plus the amount of any borrowings for investment purposes) are invested in fixed income securities (which may include derivatives exposure to fixed income securities).
The Portfolio allocates its assets to Underlying Portfolios and Underlying ETFs that invest among various fixed income asset categories, as well as non-traditional (alternative) investments. The asset categories and strategies of the Underlying Portfolios and Underlying ETFs in which the Portfolio invests are as follows (asset categories and strategies that the Manager considers to be non-traditional (alternative) are indicated with an asterisk*):
• Convertible Securities* • Bank Loans • Emerging Market Debt Securities • Floating Rate Securities • Global Bond • High Yield Bond • Inflation Linked Securities • International Bond • Money Market • U.S. Government Bond • U.S. Investment Grade Bond • U.S. Short Term Investment Grade Bond
Non-traditional (alternative) investments are alternatives to traditional equity (stocks) or fixed income (bonds and cash) investments. Non-traditional (alternative) investments have the potential to enhance portfolio diversification and reduce overall portfolio volatility because these investments may not have a strong correlation (relationship) to one another or to traditional market indexes.
In addition, the Portfolio may invest in Underlying Portfolios and Underlying ETFs that employ derivatives (including futures contracts) for a variety of purposes, including to reduce risk, to seek enhanced returns from certain asset classes, and to level of exposure to certain asset classes. | Under normal market conditions, the Portfolio invests at least 80% of its net assets, plus borrowings for investment purposes, in securities that are included in the Intermediate Government Credit Index, which covers the U.S. dollar denominated, investment grade, fixed-rate, taxable bond market, including U.S. Treasury and government-related, corporate, credit and agency fixed rate debt securities. The Manager also may invest up to 40% of the Portfolio’s assets in ETFs that invest in securities included in the Intermediate Government Credit Index.
In seeking to achieve the Portfolio’s investment objective, the Sub-Adviser will employ a stratified sample approach to build a portfolio whose broad characteristics match those of the Intermediate Government Credit Index. This strategy is commonly referred to as an indexing strategy. Individual securities holdings may differ from those of the Intermediate Government Credit Index, and the Portfolio may not track the performance of the Intermediate Government Credit Index perfectly due to expenses and transaction costs, the size and frequency of cash flow into and out of the Portfolio, and differences between how and when the Portfolio and the Intermediate Government Credit Index are valued.
The Portfolio also may lend its portfolio securities to earn additional income. |
18
Table of Contents
Comparison of Principal Risk Factors
An investment in a Portfolio is not a deposit of a bank and is not insured or guaranteed by the Federal Deposit Insurance Corporation or any other government agency. You may lose money by investing in a Portfolio. The following table compares the principal risks of an investment in each Portfolio. For an explanation of each such risk, see “Additional Information about the Reorganizations — Descriptions of Risk Factors” below.
Risks | Bond Index Portfolio | Fixed Income Portfolio | ||||||
Affiliated Portfolio Risk | X | |||||||
Bank Loans Risk | X | |||||||
Convertible Securities Risk | X | |||||||
Credit Risk | X | X | ||||||
Derivatives Risk | X | |||||||
ETF Risk | X | |||||||
Floating Rate Loan Risk | X | |||||||
Foreign Securities Risk | X | |||||||
Currency Risk | X | |||||||
Emerging Markets Risk | X | |||||||
Index Strategy Risk | X | |||||||
Inflation-Indexed Bonds Risk | X | |||||||
Interest Rate Risk | X | X | ||||||
Investment Grade Securities Risk | X | X | ||||||
Liquidity Risk | X | X | ||||||
Market Risk | X | |||||||
Money Market Risk | X | |||||||
Non-Investment Grade Risk | X | |||||||
Non-Traditional (Alternative) Investment Risk | X | |||||||
Portfolio Management Risk | X | |||||||
Redemption Risk | X | |||||||
Risks Related to Investments in Underlying Portfolios and Underlying ETFs | X | |||||||
Securities Lending Risk | X | |||||||
U.S. Government Securities Risk | X | |||||||
Comparative Performance Information
The bar charts and tables below provide some indication of the risks of investing in each Portfolio by showing changes in the Portfolio’s performance from year to year and by showing how the Bond Index Portfolio’s average annual total returns for the past one-, five- and ten-years, and the Fixed Income Portfolio’s average annual total returns for one year and since inception, through December 31, 2014, compared to the returns of a broad-based market index. The return of the broad-based market index (and any additional comparative index) shown in the right hand columns below for each Portfolio is the return of the index for the last 10 years or, if shorter, since inception of the share class with the longest history. Past performance is not an indication of future performance.
19
Table of Contents
The performance results do not reflect any Contract-related fees and expenses, which would reduce the performance results.
Fixed Income Portfolio - Calendar Year Total Returns (Class B)

Best quarter (% and time period) 2.11% (2014 2nd Quarter) | Worst quarter (% and time period) -1.48% (2014 3rd Quarter) |
Bond Index Portfolio - Calendar Year Total Returns (Class IB)
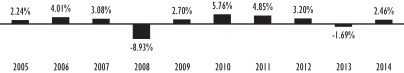
Best quarter (% and time period) 3.48% (2006 3rd Quarter) | Worst quarter (% and time period) -2.89% (2008 3rd Quarter) |
Fixed Income Portfolio Average Annual Total Returns
(For the periods ended December 31, 2014)
| One Year | Since Inception | |||||||
Fixed Income Portfolio — Class B Shares | 1.85 | % | 1.03 | % | ||||
Barclays U.S. Aggregate Bond Index | 5.97 | % | 4.21 | % | ||||
Bond Index Portfolio Average Annual Total Returns (For the periods ended December 31, 2014)
| One Year | Five Years | Ten Years/ Since Inception | ||||||||||
Bond Index Portfolio — Class IB Shares | 2.46 | % | 2.88 | % | 1.68 | % | ||||||
Barclays U.S. Intermediate Government/Credit Bond Index (reflects no deduction for fees, expenses, or taxes) | 3.13 | % | 3.54 | % | 4.10 | % | ||||||
20
Table of Contents
The following table shows the capitalization of each Portfolio as of December 31, 2014 and of the Bond Index Portfolio on a pro forma combined basis as of December 31, 2014, after giving effect to the proposed Reorganization. Pro forma net assets may not total and net asset values per share may not recalculate due to rounding of net assets.
| Net Assets (in millions) | Net Asset Value Per Share | Shares Outstanding | ||||||||||
Fixed Income Portfolio — Class IA Shares | N/A | N/A | N/A | |||||||||
Bond Index Portfolio — Class IA Shares | $ | 88.5 | $ | 9.97 | 8,869,994 | |||||||
Fixed Income Portfolio — Class B Share | $ | 5.2 | $ | 9.75 | 530,484 | |||||||
Bond Index Portfolio — Class IB Shares | $ | 2,251.6 | $ | 9.99 | 225,390,925 | |||||||
Adjustments(a) | $ | — | $ | — | (12,878 | ) | ||||||
Pro forma Bond Index Portfolio — Class IB Shares | $ | 2,256.8 | $ | 9.99 | 225,908,531 | |||||||
Fixed Income Portfolio — Class K Shares | N/A | N/A | N/A | |||||||||
Bond Index Portfolio — Class K Shares | $ | 6,223.0 | $ | 9.97 | 624,047,723 | |||||||
| (a) | Reflects adjustment for retired shares of the Fixed Income Portfolio. |
AFTER CAREFUL CONSIDERATION, THE BOARD OF THE TRUST UNANIMOUSLY APPROVED THE PLAN OF REORGANIZATION WITH RESPECT TO THE FIXED INCOME PORTFOLIO. ACCORDINGLY, THE BOARD HAS SUBMITTED THE PLAN OF REORGANIZATION FOR APPROVAL BY THIS PORTFOLIO’S SHAREHOLDERS. THE BOARD RECOMMENDS THAT YOU VOTE “FOR” PROPOSAL 2.
ADDITIONAL INFORMATION ABOUT THE REORGANIZATIONS
Terms of the Plan of Reorganization
The terms and conditions under which the Reorganizations would be completed are contained in the Plan of Reorganization. The following summary thereof is qualified in its entirety by reference to the Plan of Reorganization, a copy of the form of which is attached to this Proxy Statement/Prospectus as Appendix A.
Each Reorganization will involve an Acquiring Portfolio’s acquiring all the assets of the corresponding Acquired Portfolio in exchange solely for Acquiring Portfolio Shares and the Acquiring Portfolio’s assumption of the Acquired Portfolio’s liabilities. The Plan of Reorganization further provides that, on or as promptly as reasonably practicable after the Closing Date, each Acquired Portfolio will distribute the Acquiring Portfolio Shares it receives in its Reorganization to its shareholders (for the benefit of the Separate Accounts, as applicable, and thus the Contractholders). The number of full and fractional Acquiring Portfolio Shares each shareholder will receive will be equal in net asset value (as determined in accordance with the Trust’s and EQ Trust’s normal valuation procedures), as of immediately after the close of business (generally 4:00 p.m., Eastern time) on the Closing Date, to the Acquired Portfolio Shares the shareholder holds at that time. After that distribution to an Acquired Portfolio’s shareholders, the Trust, on behalf of the Acquired Portfolio, will take all
21
Table of Contents
necessary steps under its Agreement and Declaration of Trust, as amended (the “Declaration of Trust”), and Delaware and any other applicable law to effect a complete termination of the Acquired Portfolio.
Either the Board of the Trust or the Board of Trustees of EQ Trust (the “EQ Trust Board”) may terminate or delay the Plan of Reorganization with respect to, and abandon or postpone, either or both Reorganizations at any time prior to the Closing Date, before or after approval by the relevant Acquired Portfolio’s shareholders, if circumstances develop that, in the Board’s opinion, make proceeding with a Reorganization inadvisable for a Portfolio. The consummation of each Reorganization also is subject to various conditions, including approval of the Reorganization by the applicable Acquired Portfolio’s shareholders, completion of all filings with, and receipt of all necessary approvals, if any, from the SEC, and other customary corporate and securities matters. Subject to the satisfaction of those conditions, the Reorganizations will take place immediately after the close of business on the Closing Date.
The Board of the Trust, including the Trustees who are not “interested persons” (as defined in the Investment Company Act of 1940, as amended (the “1940 Act”)) of the Trust (the “Independent Trustees”), has determined, with respect to each Acquired Portfolio, that the interests of the Acquired Portfolio’s existing shareholders will not be diluted as a result of the Reorganization and that participation in the Reorganization is in the best interests of the Acquired Portfolio. Similarly, the EQ Trust Board, including the Independent Trustees, has determined, with respect to each Acquiring Portfolio, that the interests of the Acquiring Portfolio’s existing shareholders will not be diluted as a result of the Reorganization and that the participation in the Reorganization is in the best interests of the Acquiring Portfolio.
Except for brokerage costs incurred in connection with each Reorganization, FMG LLC will bear the expenses of each Reorganization described in this Proxy Statement/Prospectus.
Approval of the Plan of Reorganization with respect to an Acquired Portfolio will require a majority vote of that Acquired Portfolio’s shareholders. Such majority is defined in the 1940 Act as the lesser of (1) 67% or more of the voting securities of the Acquired Portfolio present at a meeting, if the holders of more than 50% of its outstanding voting securities are present or represented by proxy, or (2) more than 50% of its outstanding voting securities. If the Plan of Reorganization is not approved by an Acquired Portfolio’s shareholders or one or both Reorganizations is not consummated for any other reason, the Board of the Trust will consider other possible courses of action. Please see “Voting Information” below for more information.
Description of the Securities to Be Issued
The shareholders of each Acquired Portfolio will receive Class IB shares of the corresponding Acquiring Portfolio in accordance with the procedures provided for in the Plan of Reorganization. Each such share will be fully paid and non-assessable by EQ Trust when issued and will have no preemptive or conversion rights.
22
Table of Contents
Each Acquiring Portfolio is a series of EQ Trust. EQ Trust may issue an unlimited number of authorized shares of beneficial interest, par value $0.001 per share. The Amended and Restated Agreement and Declaration of Trust of EQ Trust (the “EQ Trust DoT”) authorizes the EQ Trust Board to issue shares in different series and classes. In addition, the EQ Trust DoT authorizes the EQ Trust Board to create new series and to name the rights and preferences of the shareholders of each series. The EQ Trust Board does not need additional shareholder action to divide the shares into separate series or classes or to name the shareholders’ rights and preferences.
EQ Trust currently offers three classes of shares of each Acquiring Portfolio – Class IA, Class IB and Class K shares. EQ Trust has adopted, in the manner prescribed under Rule 12b-1 under the 1940 Act, a plan of distribution pertaining to the Class IA and Class IB shares of the Acquiring Portfolios. The maximum distribution and/or service (12b-1) fee for each Acquiring Portfolio’s Class IA and Class IB shares is equal to an annual rate of 0.25% of the average daily net assets attributable to such share class. Because these distribution/service fees are paid out of each Acquiring Portfolio’s assets on an ongoing basis, over time these fees will increase your cost of investing and may cost more than paying other types of charges. The Class IA and Class K shares of the Acquiring Portfolios are not subject to the Reorganization.
At a meeting of the Board of the Trust held on June 9, 2015, FMG LLC recommended that each Acquired Portfolio be reorganized into its corresponding Acquiring Portfolio. FMG LLC noted that, in addition to regularly evaluating the performance of each portfolio of the Trust, it continually reviews the overall line-up of investment options and conducts in-depth analysis to provide recommendations to the Board of the Trust to strengthen the Trust’s line-up. FMG LLC stated that it was recommending the Reorganizations to streamline and strengthen the Trust’s line-up and to address certain other developments with respect to each Acquired Portfolio, including the failure of each Acquired Portfolio to attract sufficient Contractholder interest and thus achieve a more sustainable asset base.
FMG LLC noted that each Acquiring Portfolio has a broadly similar investment objective and provides diversified exposure pursuant to an indexing strategy to the same asset class as its corresponding Acquired Portfolio (i.e., equity securities, in the case of the Equity Portfolio, and fixed income securities, in the case of the Fixed Income Portfolio). FMG LLC noted that, given each Acquired Portfolio’s failure to attract sufficient Contractholder interest, FMG LLC believed it would be appropriate to reorganize each Acquired Portfolio into its corresponding Acquiring Portfolio. FMG LLC also noted that it believed the Reorganizations would be beneficial to the shareholders invested in the Acquired Portfolios because the Reorganizations would provide a means by which Contractholders with amounts allocated to an Acquired Portfolio could pursue a broadly similar investment objective in the context of a much larger fund with better prospects for attracting additional assets and lower expenses.
23
Table of Contents
In determining whether to approve the Plan of Reorganization with respect to each Acquired Portfolio and recommend its approval to shareholders, the Board of the Trust, including the Independent Trustees, with the advice and assistance of independent legal counsel, inquired into a number of matters and considered the following factors, among others: (1) the potential benefits of each Reorganization to shareholders, including lower total annual operating expenses (including acquired fund fees and expenses, if any) by reorganizing into an Acquiring Portfolio with lower total annual operating expenses (including acquired fund fees and expenses, if any) than the respective Acquired Portfolio and greater potential to increase assets and thereby realize economies of scale in the Portfolio’s expenses and portfolio management fees as a result of asset growth; (2) comparisons of the Acquired Portfolios’ and the corresponding Acquiring Portfolios’ investment objectives, policies, strategies, restrictions and risks; (3) the experience and qualifications of the Manager, Sub-Advisers and key personnel managing each Acquiring Portfolio; (4) the effect of the Reorganization on an Acquired Portfolio’s annual operating expenses and shareholder fees and services; (5) the relative historical performance records of the Portfolios; (6) any change in shareholder rights; (7) the direct or indirect federal income tax consequences of the Reorganizations to shareholders and Contractholders; (8) any fees or expenses that will be borne directly or indirectly by an Acquired Portfolio in connection with its respective Reorganization; (9) the terms and conditions of the Plan of Reorganization and whether a Reorganization would result in dilution of shareholder interests; (10) the potential benefits of the Reorganizations to other persons, including FMG LLC and its affiliates, as discussed below in the section entitled “Potential Benefits of the Reorganizations to FMG LLC and its Affiliates” and (11) possible alternatives to the Reorganizations, including the potential benefits and detriments of maintaining the current structure.
In connection with the Board of the Trust’s consideration of the proposed Reorganizations, the Independent Trustees requested, and FMG LLC provided to the Board, information regarding the factors set forth above as well as other information relating to the Reorganizations.
In reaching the decision to recommend approval of the Reorganizations, the Board of the Trust, including the Independent Trustees, concluded that each Acquired Portfolio’s participation in its respective Reorganization is in its best interests and that the interests of existing shareholders of the Acquired Portfolios would not be diluted as a result of the Reorganizations. The Board of the Trust’s conclusion was based on a number of factors, including the following:
| • | The Reorganizations will permit shareholders invested in each Acquired Portfolio to allocate amounts to a much larger Portfolio that pursues a broadly similar investment objective, provides comparable exposure to a diversified portfolio of investments in equity securities or fixed income securities pursuant to an indexing strategy, as applicable, and has better prospects for attracting additional assets and a lower annual operating expense ratio than the Acquired Portfolio (including acquired fund fees and expenses, if any). |
| • | Following the Reorganizations, FMG LLC will continue to serve as the investment manager and administrator of each Acquiring Portfolio and each Acquiring Portfolio’s current Sub-Adviser will continue to serve as the Sub-Adviser to that Acquiring Portfolio. |
24
Table of Contents
| • | As a result of the Reorganization, each shareholder of Class B shares of an Acquired Portfolio would hold, immediately after the Closing Date, Class IB shares of the corresponding Acquiring Portfolio having an aggregate value equal to the aggregate value of the Acquired Portfolio Shares such shareholder holds as of the Closing Date. |
| • | Each Reorganization will be effected on the basis of each participating Portfolio’s net asset value, which will be determined in connection with each Reorganization in accordance with the Trust’s or EQ Trust’s normal valuation procedures, as applicable, which are identical for all of the Portfolios. |
| • | Shareholders will not pay sales charges in connection with the Reorganizations. |
| • | The Reorganizations are not expected to have any adverse tax results to Contractholders. |
| • | Except for the brokerage costs incurred in connection with each Reorganization, FMG LLC will bear the expenses associated with each Reorganization. |
On the basis of the information provided to it and its evaluation of that information, the Board of the Trust, including the Independent Trustees, voted unanimously to approve the Plan of Reorganization and to recommend that the shareholders of each Acquired Portfolio also approve, respectively, the Plan of Reorganization.
Potential Benefits of the Reorganizations to FMG LLC and its Affiliates
FMG LLC may realize benefits in connection with the Reorganizations. For example, the Reorganizations would eliminate FMG LLC’s obligations under the Expense Limitation Arrangement for the Acquired Portfolios by reorganizing the Acquired Portfolios into the Acquiring Portfolios. The Stock Index Portfolio is not subject to any expense limitation arrangement. The Bond Index Portfolio is subject to an expense limitation arrangement, but FMG LLC was not obligated to reimburse any expenses to the Bond Index Portfolio during its most recent fiscal year.
In addition, the Portfolios are offered and sold through Contracts issued by AXA Equitable that may provide certain death benefit, income benefit or other guarantees to Contractholders. In providing these guarantees, AXA Equitable assumes the risk that Contractholder account values will not be sufficient to pay the guaranteed amounts when due, and therefore that AXA Equitable will have to use its own resources to cover any shortfall. AXA Equitable may enter into hedging transactions from time to time that are intended to help manage its risks under these guarantees. The Reorganizations may enhance AXA Equitable’s ability to manage this risk, for example, by eliminating a Portfolio that has underperformed expectations. This could have a positive impact on AXA Equitable’s profitability and/or financial position.
25
Table of Contents
A Portfolio’s performance may be affected by one or more of the following risks, which are described in detail in Appendix B “More Information on Strategies and Risk Factors.”
Reorganization of CharterSM Equity Portfolio into the EQ/Common Stock Index Portfolio
Affiliated Portfolio Risk: In managing a Portfolio that invests in Underlying Portfolios and Underlying ETFs, the Manager will have the authority to select and substitute the Underlying Portfolios and Underlying ETFs. The Manager may be subject to potential conflicts of interest in allocating the Portfolio’s assets among Underlying Portfolios and Underlying ETFs because it (and in certain cases its affiliates) earn fees for managing and administering the affiliated Underlying Portfolios, but not the unaffiliated Underlying Portfolios or Underlying ETFs. In addition, the Manager may be subject to potential conflicts of interest in allocating the Portfolio’s assets among the various affiliated Underlying Portfolios because the fees payable to it by some of the affiliated Underlying Portfolios are higher than the fees payable by other affiliated Underlying Portfolios and because the Manager is also responsible for managing, administering, and with respect to certain affiliated Underlying Portfolios, its affiliates are responsible for sub-advising, the affiliated Underlying Portfolios.
Derivatives Risk: A portfolio’s investments in derivatives may rise or fall more rapidly than other investments. Changes in the value of the derivative may not correlate perfectly or at all with the underlying asset, rate or index, and a portfolio could lose more than the principal amount invested. In addition, it may be difficult or impossible for a portfolio to purchase or sell certain derivatives in sufficient amounts to achieve the desired level of exposure, which may result in a loss or may be costly to a portfolio. Derivatives also may be subject to certain other risks such as leveraging risk, interest rate risk, credit risk, the risk that a counterparty may be unable or unwilling to honor its obligations, and the risk of mispricing or improper valuation. Derivatives also may not behave as anticipated by a portfolio, especially in abnormal market conditions. Changing regulation may make derivatives more costly, limit their availability, disrupt markets, or otherwise adversely affect their value or performance.
Equity Risk: In general, stocks and other equity security values fluctuate, and sometimes widely fluctuate, in response to changes in a company’s financial condition as well as general market, economic, and political conditions and other factors.
Foreign Securities Risk: Investments in foreign securities, including depositary receipts, involve risks not associated with investing in U.S. securities. Foreign markets, particularly emerging markets, may be less liquid, more volatile and subject to less government supervision than domestic markets. Security values also may be negatively affected by changes in the exchange rates between the U.S. dollar and foreign currencies. Differences between U.S. and foreign legal, political and economic systems, regulatory regimes and market practices also may impact security values and it may take more time to clear and settle trades involving foreign securities.
26
Table of Contents
Currency Risk: Investments in foreign currencies and in securities that trade in, or receive revenues in, or in derivatives that provide exposure to foreign currencies are subject to the risk that those currencies will decline in value relative to the U.S. dollar, or, in the case of hedging positions, that the U.S. dollar will decline in value relative to the currency being hedged. Any such decline may erode or reverse any potential gains from an investment in securities denominated in foreign currency or may widen existing loss. Currency rates may fluctuate significantly over short periods of time for a number of reasons, including changes in interest rates, intervention (or the failure to intervene) by governments, central banks or supranational entities, or by the imposition of currency controls or other political developments in the U.S. or abroad.
Emerging Markets Risk: There are greater risks involved in investing in emerging market countries and/or their securities markets. Investments in these countries and/or markets may present market, credit, currency, liquidity, legal, political, technical and other risks different from, or greater than, the risks of investing in developed countries. In addition, the risks associated with investing in a narrowly defined geographic area are generally more pronounced with respect to investments in emerging market countries.
Futures Contract Risk: The primary risks associated with the use of futures contracts are (a) the imperfect correlation between the change in market value of the instruments held by a portfolio and the price of the futures contract; (b) liquidity risks, including the possible absence of a liquid secondary market for a futures contract and the resulting inability to close a futures contract when desired; (c) losses (potentially unlimited) caused by unanticipated market movements; (d) an adviser’s inability to predict correctly the direction of securities prices, interest rates, currency exchange rates and other economic factors; (e) the possibility that a counterparty, clearing member or clearinghouse will default in the performance of its obligations; (f) if a portfolio has insufficient cash, it may have to sell securities from its portfolio to meet daily variation margin requirements, and the portfolio may have to sell securities at a time when it may be disadvantageous to do so; and (g) transaction costs associated with investments in futures contracts may be significant, which could cause or increase losses or reduce gains. Futures contracts are also subject to the same risks as the underlying investments to which they provide exposure. In addition, futures contracts may subject the Portfolio to leveraging risk.
Index Strategy Risk: A Portfolio that employs an index strategy generally invests in the securities included in the relevant index or a representative sample of such securities regardless of market trends. Such a portfolio generally will not modify its index strategy to respond to changes in the economy, which means that it may be particularly susceptible to a general decline in the market segment relating to the relevant index. In addition, although the index strategy attempts to closely track its benchmark index, the Portfolio may not invest in all of the securities in the index. Also, the Portfolio’s fees and expenses will reduce the Portfolio’s returns, unlike those of the benchmark index. Cash flow into and out of the Portfolio, portfolio transaction costs,
27
Table of Contents
changes in the securities that comprise the index, and the Portfolio’s valuation procedures also may affect the Portfolio’s performance. Therefore, there can be no assurance that the performance of the index strategy will match that of the benchmark index.
Large-Cap Company Risk: Larger more established companies may be unable to respond quickly to new competitive challenges such as changes in technology and consumer tastes. Many larger companies also may not be able to attain the high growth rate of successful smaller companies, especially during extended periods of economic expansion.
Liquidity Risk: The risk that certain investments may be difficult or impossible for a portfolio to purchase or sell at an advantageous time or price or in sufficient amounts to achieve the desired level of exposure, which may result in a loss or may be costly to the portfolio.
Market Risk: The risk that the securities markets will move down, sometimes rapidly and unpredictably based on overall economic conditions and other factors. Changes in the financial condition of a single issuer can impact a market as a whole.
Mid-Cap, Small-Cap and Micro-Cap Company Risk: Investments in mid-, small- and micro-cap companies may involve greater risks than investments in larger, more established issuers because they generally are more vulnerable than larger companies to adverse business or economic developments. Such companies generally have narrower product lines, more limited financial resources and more limited markets for their stock as compared with larger companies. As a result, the value of such securities may be more volatile than the securities of larger companies, and the portfolio may experience difficulty in purchasing or selling such securities at the desired time and price or in the desired amount. In general, these risks are greater for small- and micro-cap companies than for mid-cap companies.
Non-Traditional (Alternative) Investment Risk: To the extent the Portfolio invests in Underlying Portfolios and Underlying ETFs that invest in non-traditional (alternative) investments, the Portfolio will be subject to the risks associated with such investments. Non-traditional (alternative) investments use a different approach to investing than do traditional investments (stocks, bonds, and cash) and, as a result, have different characteristics and risks than do traditional investments. Non-traditional (alternative) investments are often less liquid, particularly in periods of stress, are generally more complex and less transparent, and may have more complicated tax profiles than traditional investments. In addition, the performance of non-traditional (alternative) investments may be dependent primarily on investment manager experience and skill, whereas the performance of traditional investments generally is dependent primarily on market exposure and returns. The use of non-traditional (alternative) investments may not achieve the desired effect.
Portfolio Management Risk: The risk that strategies used by the Manager or the Sub-Adviser(s) and their securities selections fail to produce the intended results.
28
Table of Contents
Risks Related to Investments in Underlying Portfolios and Underlying ETFs: A Portfolio that invests in Underlying Portfolios and Underlying ETFs will indirectly bear fees and expenses charged by those Underlying Portfolios and Underlying ETFs, in addition to the Portfolio’s direct fees and expenses. The cost of investing in the Portfolio, therefore, may be higher than the cost of investing in a mutual fund that invests directly in individual stocks and bonds. The Underlying Portfolios may already be available directly as an investment option in your contract. Therefore, you may be able to realize lower aggregate expenses by investing directly in the Underlying Portfolios of a Portfolio instead of in the Portfolio itself. However, not all Underlying Portfolios may be available as an investment option in your contract. In addition, an investor who chooses to invest directly in the Underlying Portfolios would not receive the asset allocation and rebalancing services provided by the Manager.
The Portfolio’s net asset value is subject to fluctuations in the net asset values of the Underlying Portfolios and the market values of the Underlying ETFs in which it invests. The Portfolio is also subject to the risks associated with the securities in which the Underlying Portfolios and Underlying ETFs invest and the ability of the Portfolio to meet its investment objective will directly depend on the ability of the Underlying Portfolios and Underlying ETFs to meet their investment objectives. The Portfolio, Underlying Portfolios and Underlying ETFs are subject to certain general investment risks, including market risk, asset class risk, issuer-specific risk, investment style risk and portfolio management risk. In addition, to the extent a Portfolio invests in Underlying Portfolios and Underlying ETFs that invest in equity securities, fixed income securities and/or foreign securities, the Portfolio is subject to the risks associated with investing in such securities such as equity risk, market capitalization risk, investment grade securities risk, interest rate risk, credit/default risk, foreign and emerging markets securities risk and non-investment grade securities risk. There is also the risk that an Underlying ETF’s performance may not match that of the relevant index. It is also possible that an active trading market for an Underlying ETF may not develop or be maintained, in which case the liquidity and value of the Portfolio’s investment in the Underlying ETF could be substantially and adversely affected. The extent to which the investment performance and risks associated with the Portfolio correlates to those of a particular Underlying Portfolio or Underlying ETF will depend upon the extent to which the Portfolio’s assets are allocated from time to time for investment in the Underlying Portfolio or Underlying ETF, which will vary.
Reorganization of the CharterSM Fixed Income Portfolio into the EQ/Core Bond Index Portfolio
Affiliated Portfolio Risk: In managing a Portfolio that invests in Underlying Portfolios and Underlying ETFs, the Manager will have the authority to select and substitute the Underlying Portfolios and Underlying ETFs. The Manager may be subject to potential conflicts of interest in allocating the Portfolio’s assets among Underlying Portfolios and Underlying ETFs because it (and in certain cases its affiliates) earn fees for managing and administering the affiliated Underlying Portfolios, but not
29
Table of Contents
the unaffiliated Underlying Portfolios or Underlying ETFs. In addition, the Manager may be subject to potential conflicts of interest in allocating the Portfolio’s assets among the various affiliated Underlying Portfolios because the fees payable to it by some of the affiliated Underlying Portfolios are higher than the fees payable by other affiliated Underlying Portfolios and because the Manager is also responsible for managing, administering, and with respect to certain affiliated Underlying Portfolios, its affiliates are responsible for sub-advising, the affiliated Underlying Portfolios.
Bank Loans Risk: Loans are subject to additional risks including liquidity risk, prepayment risk (the risk that when interest rates fall, debt securities may be repaid more quickly than expected and a portfolio may be required to reinvest in securities with a lower yield), extension risk (the risk that when interest rates rise, debt securities may be repaid more slowly than expected and the value of a portfolio’s holdings may decrease), the risk of subordination to other creditors, restrictions on resale, and the lack of a regular trading market and publicly available information. In addition, liquidity risk may be more pronounced for a portfolio investing in loans because certain loans may have a more limited secondary market. These loans may be difficult to value.
Convertible Securities Risk: The value of convertible securities fluctuates in relation to changes in interest rates and the credit quality of the issuer and, in addition, fluctuates in relation to the underlying common stock. A convertible security may be subject to redemption at the option of the issuer at a price established in the convertible security’s governing instrument, which may be different than the current market price of the security. If a convertible security held by a portfolio is called for redemption, the portfolio will be required to permit the issuer to redeem the security, convert it into underlying common stock or sell it to a third party. Investments by a portfolio in convertible debt securities may not be subject to any ratings restrictions, although in such cases the portfolio’s investment manager may consider such ratings, and any changes in such ratings, in its determination of whether the portfolio should invest in and/or continue to hold the securities. Convertible securities are subject to equity risk, interest rate risk and credit risk, and are often lower-quality securities, which means that they are subject to the same risks as an investment in lower rated debt securities. Since it derives a portion of its value from the common stock into which it may be converted, a convertible security is also subject to the same types of market and issuer-specific risks that apply to the underlying common stock.
Credit Risk: The risk that the issuer or the guarantor (or other obligor, such as a party providing insurance or other credit enhancement) of a fixed income security, or the counterparty to a derivatives contract, repurchase agreement, loan of portfolio securities or other transaction, is unable or unwilling, or is perceived (whether by market participants, ratings agencies, pricing services or otherwise) as unable or unwilling, to make timely principal and/or interest payments, or otherwise honor its obligations. Securities are subject to varying degrees of credit risk, which are often reflected in their credit ratings. The downgrade of the credit rating of a security may decrease its value.
30
Table of Contents
Derivatives Risk: A portfolio’s investments in derivatives may rise or fall more rapidly than other investments. Changes in the value of the derivative may not correlate perfectly or at all with the underlying asset, rate or index, and a portfolio could lose more than the principal amount invested. In addition, it may be difficult or impossible for a portfolio to purchase or sell certain derivatives in sufficient amounts to achieve the desired level of exposure, which may result in a loss or may be costly to a portfolio. Derivatives also may be subject to certain other risks such as leveraging risk, interest rate risk, credit risk, the risk that a counterparty may be unable or unwilling to honor its obligations, and the risk of mispricing or improper valuation. Derivatives also may not behave as anticipated by a portfolio, especially in abnormal market conditions. Changing regulation may make derivatives more costly, limit their availability, disrupt markets, or otherwise adversely affect their value or performance.
ETFs Risk: A Portfolio that invests in ETFs will indirectly bear fees and expenses charged by those ETFs, in addition to the Portfolio’s direct fees and expenses. The cost of investing in the Portfolio, therefore, may be higher than the cost of investing in a mutual fund that invests directly in individual stocks and bonds. In addition, the Portfolio’s net asset value will be subject to fluctuations in the market values of the ETFs in which it invests. The Portfolio is also subject to the risks associated with the securities in which the ETFs invest and the ability of the Portfolio to meet its investment objective will directly depend on the ability of the ETFs to meet their investment objectives. The Portfolio and ETFs are subject to certain general investment risks, including market risk, asset class risk, issuer-specific risk, investment style risk and portfolio management risk. In addition, to the extent a Portfolio invests in ETFs that invest in equity securities, fixed income securities and/or foreign securities, the Portfolio is subject to the risks associated with investing in such securities such as equity risk, market capitalization risk, investment grade securities risk, interest rate risk, credit/default risk, foreign and emerging markets securities risk and non-investment grade securities risk. There is also the risk that an ETF’s performance may not match that of the relevant index. It is also possible that an active trading market for an ETF may not develop or be maintained, in which case the liquidity and value of the Portfolio’s investment in the ETF could be substantially and adversely affected. The extent to which the investment performance and risks associated with the Portfolio correlates to those of a particular ETF will depend upon the extent to which the Portfolio’s assets are allocated from time to time for investment in the ETF, which will vary.
Floating Rate Loan Risk: Floating rate loans generally are subject to restrictions on resale. The liquidity of floating rate loans, including the volume and frequency of secondary market trading in such loans, varies significantly over time and among individual floating rate loans. For example, if the credit quality of a floating rate loan unexpectedly declines significantly, secondary market trading in that floating rate loan can also decline. During periods of infrequent trading, valuing a floating rate loan can be more difficult, and buying and selling a floating rate loan at an acceptable price can be more difficult and delayed. Difficulty in selling a floating rate loan can result in a loss. The value of the collateral securing a floating rate loan can
31
Table of Contents
decline, be insufficient to meet the obligations of the borrower, or be difficult to liquidate. As a result, a floating rate loan may not be fully collateralized, and can decline significantly in value.
Foreign Securities Risk: Investments in foreign securities, including depositary receipts, involve risks not associated with investing in U.S. securities. Foreign markets, particularly emerging markets, may be less liquid, more volatile and subject to less government supervision than domestic markets. Security values also may be negatively affected by changes in the exchange rates between the U.S. dollar and foreign currencies. Differences between U.S. and foreign legal, political and economic systems, regulatory regimes and market practices also may impact security values and it may take more time to clear and settle trades involving foreign securities.
Currency Risk: Investments in foreign currencies and in securities that trade in, or receive revenues in, or in derivatives that provide exposure to foreign currencies are subject to the risk that those currencies will decline in value relative to the U.S. dollar, or, in the case of hedging positions, that the U.S. dollar will decline in value relative to the currency being hedged. Any such decline may erode or reverse any potential gains from an investment in securities denominated in foreign currency or may widen existing loss. Currency rates may fluctuate significantly over short periods of time for a number of reasons, including changes in interest rates, intervention (or the failure to intervene) by governments, central banks or supranational entities, or by the imposition of currency controls or other political developments in the U.S. or abroad.
Emerging Markets Risk: There are greater risks involved in investing in emerging market countries and/or their securities markets. Investments in these countries and/or markets may present market, credit, currency, liquidity, legal, political, technical and other risks different from, or greater than, the risks of investing in developed countries. In addition, the risks associated with investing in a narrowly defined geographic area are generally more pronounced with respect to investments in emerging market countries.
Index Strategy Risk: A Portfolio that employs an index strategy generally invests in the securities included in the relevant index or a representative sample of such securities regardless of market trends. Such a portfolio generally will not modify its index strategy to respond to changes in the economy, which means that it may be particularly susceptible to a general decline in the market segment relating to the relevant index. In addition, although the index strategy attempts to closely track its benchmark index, the Portfolio may not invest in all of the securities in the index. Also, the Portfolio’s fees and expenses will reduce the Portfolio’s returns, unlike those of the benchmark index. Cash flow into and out of the Portfolio, portfolio transaction costs, changes in the securities that comprise the index, and the Portfolio’s valuation procedures also may affect the Portfolio’s performance. Therefore, there can be no assurance that the performance of the index strategy will match that of the benchmark index.
32
Table of Contents
Inflation-Indexed Bonds Risk: Inflation-indexed bonds, including Treasury Inflation-Protected Securities (“TIPS”), decline in value when real interest rates rise. In certain interest rate environments, such as when real interest rates are rising faster than nominal interest rates, inflation-indexed bonds may experience greater losses than other fixed income securities with similar durations. Interest payments on inflation-linked debt securities will vary as the principal and/or interest is adjusted for inflation and can be unpredictable. In periods of deflation, a portfolio may have no income at all from such investments.
Interest Rate Risk: The risk that fixed income securities will decline in value because of changes in interest rates. When interest rates decline, the value of a Portfolio’s debt securities generally rises. Conversely, when interest rates rise, the value of a Portfolio’s debt securities generally declines. A Portfolio with a longer average duration will be more sensitive to changes in interest rates, usually making it more volatile than a fund with a shorter average duration. As of the date of this Prospectus, interest rates in the United States are at or near historic lows, but may rise significantly or rapidly, potentially resulting in losses to a Portfolio.
Investment Grade Securities Risk: Debt securities commonly are rated by national bond ratings agencies. Investment grade securities are securities rated BBB or higher by Standard & Poor’s Ratings Services (“S&P”) or Fitch Ratings Ltd. (“Fitch”) or Baa or higher by Moody’s Investors Service, Inc. (“Moody’s”). Securities rated in the lower investment grade rating categories (e.g., BBB or Baa) are considered investment grade securities, but are somewhat riskier than higher rated obligations because they are regarded as having only an adequate capacity to pay principal and interest, and are considered to lack outstanding investment characteristics.
Liquidity Risk: The risk that certain investments may be difficult or impossible for a Portfolio to purchase or sell at an advantageous time or price or in sufficient amounts to achieve the desired level of exposure, or possibly requiring a Portfolio to dispose of other investments at unfavorable times or prices to satisfy obligations, which may result in a loss or may be costly to the Portfolio.
Market Risk: The risk that the securities markets will move down, sometimes rapidly and unpredictably based on overall economic conditions and other factors. Changes in the financial condition of a single issuer can impact a market as a whole.
Money Market Risk: Although a money market fund is designed to be a relatively low risk investment, it is not free of risk. Despite the short maturities and high credit quality of a money market portfolio’s investments, increases in interest rates and deteriorations in the credit quality of the instruments the portfolio has purchased may reduce the portfolio’s yield and can cause the price of a money market security to decrease. In addition, a money market portfolio is subject to the risk that the value of an investment may be eroded over time by inflation.
Non-Investment Grade Securities Risk: Bonds rated below investment grade (i.e., BB or lower by S&P or Fitch or Ba or lower by Moody’s or, if unrated, are deemed to be of comparable quality by a sub-adviser) are speculative in nature and are subject to
33
Table of Contents
additional risk factors such as increased possibility of default, illiquidity of the security, and changes in value based on changes in interest rates. Non-Investment grade bonds, sometimes referred to as “junk bonds” are usually issued by companies without long track records of sales and earnings, or by those companies with questionable credit strength.
Non-Traditional (Alternative) Investment Risk: To the extent the Portfolio invests in Underlying Portfolios and Underlying ETFs that invest in non-traditional (alternative) investments, the Portfolio will be subject to the risks associated with such investments. Non-traditional (alternative) investments use a different approach to investing than do traditional investments (stocks, bonds, and cash) and, as a result, have different characteristics and risks than do traditional investments. Non-traditional (alternative) investments are often less liquid, particularly in periods of stress, are generally more complex and less transparent, and may have more complicated tax profiles than traditional investments. In addition, the performance of non-traditional (alternative) investments may be dependent primarily on investment manager experience and skill, whereas the performance of traditional investments generally is dependent primarily on market exposure and returns. The use of non-traditional (alternative) investments may not achieve the desired effect.
Portfolio Management Risk: The risk that strategies used by the Manager or the Sub-Adviser(s) and their securities selections fail to produce the intended results.
Redemption Risk: A Portfolio may experience periods of heavy redemptions that could cause the Portfolio to sell assets at inopportune times or at a loss or depressed value. Redemption risk is heightened during periods of declining or illiquid markets. Heavy redemptions could hurt a Portfolio’s performance.
Market developments and other factors, including a general rise in interest rates, have the potential to cause investors to move out of fixed income securities on a large scale, which may increase redemptions from mutual funds that hold large amounts of fixed income securities. Such a move, coupled with a reduction in the ability or willingness of dealers and other institutional investors to buy or hold fixed income securities, may result in decreased liquidity and increased volatility in the fixed income markets.
Risks Related to Investments in Underlying Portfolios and Underlying ETFs: A Portfolio that invests in Underlying Portfolios and Underlying ETFs will indirectly bear fees and expenses charged by those Underlying Portfolios and Underlying ETFs, in addition to the Portfolio’s direct fees and expenses. The cost of investing in the Portfolio, therefore, may be higher than the cost of investing in a mutual fund that invests directly in individual stocks and bonds. The Underlying Portfolios may already be available directly as an investment option in your contract. Therefore, you may be able to realize lower aggregate expenses by investing directly in the Underlying Portfolios of a Portfolio instead of in the Portfolio itself. However, not all Underlying Portfolios may be available as an investment option in your contract. In addition, an investor who chooses to invest directly in the Underlying Portfolios would not receive the asset allocation and rebalancing services provided by the Manager.
34
Table of Contents
The Portfolio’s net asset value is subject to fluctuations in the net asset values of the Underlying Portfolios and the market values of the Underlying ETFs in which it invests. The Portfolio is also subject to the risks associated with the securities in which the Underlying Portfolios and Underlying ETFs invest and the ability of the Portfolio to meet its investment objective will directly depend on the ability of the Underlying Portfolios and Underlying ETFs to meet their investment objectives. The Portfolio, Underlying Portfolios and Underlying ETFs are subject to certain general investment risks, including market risk, asset class risk, issuer-specific risk, investment style risk and portfolio management risk. In addition, to the extent a Portfolio invests in Underlying Portfolios and Underlying ETFs that invest in equity securities, fixed income securities and/or foreign securities, the Portfolio is subject to the risks associated with investing in such securities such as equity risk, market capitalization risk, investment grade securities risk, interest rate risk, credit/default risk, foreign and emerging markets securities risk and non-investment grade securities risk. There is also the risk that an Underlying ETF’s performance may not match that of the relevant index. It is also possible that an active trading market for an Underlying ETF may not develop or be maintained, in which case the liquidity and value of the Portfolio’s investment in the Underlying ETF could be substantially and adversely affected. The extent to which the investment performance and risks associated with the Portfolio correlates to those of a particular Underlying Portfolio or Underlying ETF will depend upon the extent to which the Portfolio’s assets are allocated from time to time for investment in the Underlying Portfolio or Underlying ETF, which will vary.
Securities Lending Risk: The Portfolio may lend its portfolio securities to seek income. There is a risk that a borrower may default on its obligations to return loaned securities, however, the Portfolio’s securities lending agent may indemnify the Portfolio against that risk. The Portfolio will be responsible for the risks associated with the investment of cash collateral, including any collateral invested in an affiliated money market fund. The Portfolio may lose money on its investment of cash collateral or may fail to earn sufficient income on its investment to meet obligations to the borrower. In addition, delays may occur in the recovery of securities from borrowers, which could interfere with the Portfolio’s ability to vote proxies or to settle transactions.
U.S. Government Securities Risk: Although a portfolio may hold securities that carry U.S. government guarantees, these guarantees do not extend to shares of the portfolio itself and do not guarantee the market price of the securities. Furthermore, not all securities issued by the U.S. government and its agencies and instrumentalities are backed by the full faith and credit of the U.S. Treasury.
Federal Income Tax Consequences of the Reorganizations
It is anticipated that each Reorganization will not qualify, for federal income tax purposes, as a tax-free reorganization. Each Acquired Portfolio anticipates selling all its securities (i.e., securities of Underlying Portfolios and Underlying ETFs) before its
35
Table of Contents
Reorganization, as a result of which it may recognize net gains or losses (which losses could be significant). Any net gains recognized on those sales would increase the amount of any distribution an Acquired Portfolio must make to its shareholders (the Separate Accounts) before consummating its Reorganization to preserve its status as a “regulated investment company” for federal tax purposes and to eliminate any federal income tax liability. In addition, (1) each shareholder’s (a) adjusted basis for those purposes (“adjusted basis”) in the Acquiring Portfolio Shares it receives in a Reorganization will be the fair market value thereof at the time the Reorganization is consummated (“Effective Time”) and (b) holding period for those Acquiring Portfolio Shares will begin on the following day, and (2) each Acquiring Portfolio’s (a) adjusted basis in each Transferred Asset will be the fair market value thereof at the Effective Time and (b) holding period for the Transferred Assets will begin on the following day. Notwithstanding the foregoing, however, Contractholders who had premiums or contributions allocated to the investment divisions of the Separate Accounts that are invested in Acquired Portfolio Shares will not recognize any gain or loss as a result of the Reorganizations.
ADDITIONAL INFORMATION ABOUT THE ACQUIRING PORTFOLIOS
This section gives you information about EQ Trust, the Manager and the Sub-Advisers for the Acquiring Portfolios.
EQ Trust is organized as a Delaware statutory trust and is registered with the SEC as an open-end management investment company. The EQ Trust Board is responsible for the overall management of EQ Trust and each of its series (“portfolios”), including the Acquiring Portfolios. As of May 1, 2015, EQ Trust issues shares of beneficial interest that are currently divided among eighty-six (86) portfolios, sixty-one (61) of which have authorized Class IA, Class IB and Class K shares, twenty-four (24) of which are only authorized to issue Class IB and Class K shares, and one (1) of which is authorized to issue Class IA and Class K shares. This Proxy Statement/Prospectus describes the Class IB shares of the Acquiring Portfolios.
FMG LLC, 1290 Avenue of the Americas, New York, New York 10104, is the Manager to each Acquired Portfolio and each Acquiring Portfolio. FMG LLC is registered with the SEC as an investment adviser under the Investment Advisers Act of 1940, as amended. FMG LLC also is registered with the Commodity Futures Trading Commission (“CFTC”) as a commodity pool operator (“CPO”) under the Commodity Exchange Act, as amended, and serves as a CPO with respect to certain portfolios of EQ Trust. FMG LLC currently claims an exclusion (under CFTC Rule 4.5) from registration as a CPO with respect to other portfolios,
36
Table of Contents
including the Acquiring Portfolios. Being subject to dual regulation by the SEC and the CFTC may increase compliance costs and may affect portfolio returns. FMG LLC is a wholly owned subsidiary of AXA Equitable. AXA Equitable is a wholly-owned subsidiary of AXA Financial, Inc., a subsidiary of AXA, a French insurance holding company. FMG LLC serves as the investment adviser to mutual funds and other pooled investment vehicles, and had $103.7 billion in assets under management as of December 31, 2014.
The Manager has a variety of responsibilities for the general management and administration of EQ Trust and the portfolios. The Manager’s management responsibilities include the selection and monitoring of Sub-Advisers for the portfolios. In addition, the Manager may be responsible for the management of the portfolios’ investments in ETFs.
The Manager plays an active role in monitoring each portfolio (or portion thereof) and Sub-Adviser and uses portfolio analytics systems to strengthen its evaluation of performance, style, risk levels, diversification and other criteria. The Manager also monitors each Sub-Adviser’s portfolio management team to determine whether its investment activities remain consistent with the portfolios’ (or portion thereof’s) investment style and objectives.
Beyond performance analysis, the Manager monitors significant changes that may impact the Sub-Adviser’s overall business. The Manager monitors continuity in the Sub-Adviser’s operations and changes in investment personnel and senior management. The Manager performs due diligence reviews with each Sub-Adviser no less frequently than annually. The Manager obtains detailed, comprehensive information concerning portfolio (or portion thereof) and Sub-Adviser performance and portfolio (or portion thereof) operations that is used to supervise and monitor the Sub-Advisers and the portfolio (or portion thereof) operations. A team is responsible for conducting ongoing investment reviews with each Sub-Adviser and for developing the criteria by which portfolio (or portion thereof) performance is measured.
The Manager selects Sub-Advisers from a pool of candidates, including its affiliates, to manage the portfolio (or portions thereof). The Manager may appoint, dismiss and replace Sub-Advisers and amend sub-advisory agreements subject to the approval of the EQ Trust Board. The Manager also may allocate a portfolio’s assets to additional Sub-Advisers subject to the approval of the EQ Trust Board and has discretion to allocate a portfolio’s assets among a portfolio’s current Sub-Advisers. The Manager recommends Sub-Advisers for a portfolio to the EQ Trust Board based upon its continuing quantitative and qualitative evaluation of each Sub-Adviser’s skills in managing assets pursuant to specific investment styles and strategies. Short-term investment performance, by itself, is not a significant factor in selecting or terminating a Sub-Adviser, and the Manager does not expect to recommend frequent changes of Sub-Advisers.
If the Manager appoints, dismisses or replaces a Sub-Adviser to a portfolio or adjusts the asset allocation among Sub-Advisers in a portfolio the affected portfolio
37
Table of Contents
may experience a period of transition during which the securities held in the portfolio may be repositioned in connection with the change in Sub-Adviser(s). A portfolio may not pursue its principal investment strategies during such a transition period and may incur increased brokerage commissions and other transaction costs in connection with the change(s). Generally, transitions may be implemented before or after the effective date of the new Sub-Adviser’s appointment as an adviser to the portfolio, and may be completed in several days to several weeks, depending on the particular circumstances of the transition. In addition, as described in “Comparative Performance Information” above, the past performance of a portfolio is not necessarily an indication of future performance. This may be particularly true for any portfolios that have undergone Sub-Adviser changes and/or changes to the investment objectives or policies of the portfolio.
The Manager is responsible for overseeing Sub-Advisers and recommending their hiring, termination and replacement to the EQ Trust Board. A committee of FMG LLC investment personnel (“Investment Committee”) is primarily responsible for the selection, monitoring and oversight of each portfolio’s Sub-Adviser(s) and performs other duties for portfolios not described in this Proxy Statement/Prospectus.
The Manager has received an exemptive order from the SEC to permit it and the EQ Trust Board to appoint, dismiss and replace Sub-Advisers and to amend the sub-advisory agreements between the Manager and the Sub-Advisers without obtaining shareholder approval. Accordingly, the Manager is able, subject to the approval of the EQ Trust Board, to appoint, dismiss and replace Sub-Advisers and to amend sub-advisory agreements without obtaining shareholder approval. If a new Sub-Adviser is retained for a portfolio, shareholders will receive notice of such action. However, the Manager may not enter into a sub-advisory agreement with an “affiliated person” of the Manager (as that term is defined in the 1940 Act) (the “Affiliated Sub-Adviser”), such as AllianceBernstein, AXA Investment Managers, Inc., and AXA Rosenberg Investment Management LLC, unless the sub-advisory agreement with the Affiliated Sub-Adviser, including compensation, is also approved by the affected portfolio’s shareholders. An amendment to an investment management agreement between FMG LLC and EQ Trust that would result in an increase in the management fee rate specified in that agreement (i.e., the aggregate management fee) charged to a portfolio will also be submitted to shareholders for approval.
Management and Administrative Fees
Each Acquiring Portfolio pays a fee to FMG LLC for management services. The table below shows the annual rate of the management fees (as a percentage of the Acquiring Portfolio’s average daily net assets) that the Manager received from each Acquiring Portfolio in 2014 for managing the Acquiring Portfolio.
| Annual Rate Received | ||||
Stock Index Portfolio | 0.35 | % | ||
Bond Index Portfolio | 0.34 | % | ||
38
Table of Contents
In the interest of limiting through April 30, 2016 (unless the Board of Trustees consents to an earlier revision or termination of this arrangement) the expenses of certain portfolios, the Manager has entered into an expense limitation agreement with EQ Trust with respect to those certain portfolios, including the Bond Index Portfolio (“Expense Limitation Agreement”). Pursuant to that Expense Limitation Agreement, the Manager has agreed to make payments or waive its management, administrative and other fees to limit the expenses of the Bond Index Portfolio so that the annual operating expenses of the Bond Index Portfolio (other than interest, taxes, brokerage commissions, fees and expenses of other investment companies in which the Bond Index Portfolio invests, dividend and interest expenses on securities sold short, other expenditures that are capitalized in accordance with generally accepted accounting principles, and other extraordinary expenses not incurred in the ordinary course of the Bond Index Portfolio’s business) as a percentage of average daily net assets do not exceed 0.72% for the Class IA shares, 0.72% for the Class IB shares, and 0.47% for the Class K shares of the Bond Index Portfolio. The Class IA shares and Class K shares are not subject to the Reorganizations. The Manager may be reimbursed the amount of any such payments and waivers in the future provided that the payments or waivers are reimbursed within three years of the payment or waiver being made and the combination of the Bond Index Portfolio’s expense ratio and such reimbursements do not exceed the Bond Index Portfolio’s expense cap. If the actual expense ratio is less than the expense cap and the Manager has recouped any eligible previous payments made, the Bond Index Portfolio will be charged such lower expenses. The Stock Index Portfolio is not subject to an expense limitation arrangement with the Manager. The current contractual rate of the management fees (as a percentage of the Portfolio’s average daily net assets) payable by each Portfolio is determined as follows:
| First $4 Billion | Next $4 Billion | Next $2 Billion | Thereafter | |||||||||||||
Stock Index Portfolio | 0.35 | % | 0.34 | % | 0.33 | % | 0.32 | % | ||||||||
Bond Index Portfolio | 0.35 | % | 0.34 | % | 0.33 | % | 0.32 | % | ||||||||
Each Sub-Adviser to an Acquiring Portfolio is paid by the Manager. Changes to the advisory fees may be negotiated, which could result in an increase or a decrease in the amount of the management fee retained by the Manager, without shareholder approval. A discussion of the basis for the decision by the EQ Trust Board to approve the investment management and sub-advisory agreements with respect to the Acquiring Portfolios is available in EQ Trust’s Annual Report to Shareholders.
FMG LLC also currently serves as the Administrator of EQ Trust. The administrative services provided to EQ Trust by FMG LLC include, among others, coordination of EQ Trust’s audit, financial statements and tax returns; expense management and budgeting; legal administrative services and compliance monitoring; portfolio accounting services, including daily net asset value accounting; operational risk management; and oversight of EQ Trust’s proxy voting policies and procedures and anti-money laundering program.
39
Table of Contents
For administrative services, in addition to the management fee, each Acquiring Portfolio pays FMG LLC its proportionate share of an asset-based administration fee for the Single-Advised Portfolios listed below which is equal to an annual rate of:
| Annual Fee Rate (as a Percentage of the Aggregate Average Daily Net Assets) | |||
First $3 billion | 0.12 | % | ||
Next $3 billion | 0.11 | % | ||
Next $4 billion | 0.105 | % | ||
Next $20 billion | 0.10 | % | ||
Next $10 billion | 0.0975 | % | ||
Thereafter | 0.095 | % | ||
, subject to a minimum annual fee of $30,000. The Single-Advised Portfolios include the Acquiring Portfolios, AXA/AB Short Duration Government Bond Portfolio, AXA/Loomis Sayles Growth Portfolio, AXA Natural Resources Portfolio, AXA SmartBeta Equity Portfolio, EQ/BlackRock Basic Value Equity Portfolio, EQ/Boston Advisors Equity Income Portfolio, EQ/Calvert Socially Responsible Portfolio, EQ/Capital Guardian Research Portfolio, EQ/Equity 500 Index Portfolio, EQ/GAMCO Mergers and Acquisitions Portfolio, EQ/GAMCO Small Company Value Portfolio, EQ/International Equity Index Portfolio, EQ/Intermediate Government Bond Portfolio, EQ/Invesco Comstock Portfolio, EQ/JPMorgan Value Opportunities Portfolio, EQ/Large Cap Growth Index Portfolio, EQ/Large Cap Value Index Portfolio, EQ/MFS International Growth Portfolio, EQ/Mid Cap Index Portfolio, EQ/Money Market Portfolio, EQ/Morgan Stanley Mid Cap Growth Portfolio, EQ/Oppenheimer Global Portfolio, EQ/PIMCO Global Real Return Portfolio, EQ/PIMCO Ultra Short Bond Portfolio, EQ/Small Company Index Portfolio, EQ/T. Rowe Price Growth Stock Portfolio, EQ/UBS Growth and Income Portfolio, EQ/Wells Fargo Omega Growth Portfolio, EQ/Energy ETF Portfolio, EQ/International ETF Portfolio, EQ/Low Volatility Global ETF Portfolio, and AXA/DoubleLine Opportunistic Core Plus Bond Portfolio.
40
Table of Contents
Each Acquiring Portfolio’s investments are selected by its Sub-Adviser. The following table describes each Acquiring Portfolio’s Sub-Adviser and portfolio managers and each portfolio manager’s business experience. Information about the portfolio managers’ compensation, other accounts they manage and their ownership of securities of each Acquiring Portfolio is available in the EQ Trust’s Statement of Additional Information dated May 1, 2015, as supplemented.
Sub-Adviser and | Business Experience | |||
| Bond Index Portfolio and Stock Index Portfolio | FMG LLC 1290 Avenue of the Americas New York, New York 10104
Portfolio Managers Kenneth T. Kozlowski Alwi Chan | Kenneth T. Kozlowski and Alwi Chan are primarily responsible for the selection, monitoring and oversight of each Acquiring Portfolio’s Sub-Adviser.
Kenneth T. Kozlowski, CFP®, CHFC, CLU has served as Executive Vice President and Chief Investment Officer of FMG LLC since June 2012 and as Managing Director of AXA Equitable since September 2011. He was Senior Vice President of FMG LLC from May 2011 to June 2012 and a Vice President of AXA Equitable from February 2001 to August 2011. He has served as Vice President of the Trust from June 2010 to present. Since 2003, Mr. Kozlowski has had primary responsibility for the asset allocation, fund selection and rebalancing of the funds of funds currently managed by FMG LLC and for the ETF Allocated Portions since May 25, 2007. Mr. Kozlowski served as Chief Financial Officer and Treasurer of the Trust from 2002 to 2007. He has been managing the Stock Index Portfolio since May 2011, and the Bond Index Portfolio since June 2011.
Alwi Chan, CFA® has served as Senior Vice President and Deputy Chief Investment Officer of FMG LLC since June 2012 and as Lead Director of AXA Equitable since February 2007. He served as Vice President of FMG LLC from May 2011 to June 2012. Prior to that, he served as an Assistant Vice President (2005-2007) and Senior Investment Analyst (2002-2005) of AXA Equitable. He also has served as a Vice President of the Trust since 2007. He has been managing the Stock Index Portfolio since May 2009 and the Bond Index Portfolio since June 2011. |
41
Table of Contents
Sub-Adviser and | Business Experience | |||
| Bond Index Portfolio | SSgA Funds Management, Inc. State Street Financial Center, One Lincoln Street Boston, MA 02111
Portfolio Managers Mahesh Jayakumar Michael Brunell | Mahesh Jayakumar and Michael Brunell are jointly and primarily responsible for the day-to-day management of the Bond Index Portfolio.
Mahesh Jayakumar, CFA®, FRM is a Vice President of SSgA FM. He currently is a Portfolio Manager in the Fixed Income, Currency and Cash Investment Team. He is responsible for managing several portfolios spanning diverse areas such as Green Bonds, Global Treasuries/Inflation, Government/Credit, Aggregate and client directed mandates. Mr. Jayakumar has been with SSgA FM since 2008. Prior to joining State Street Corporation, Mr. Jayakumar worked as a software development manager for a large enterprise software provider. Mr. Jayakumar has been managing the Bond Index Portfolio since January 2012.
Michael Brunell, CFA® has been a member of the Fixed Income Index team since 2004. Mr. Brunell is a Vice President of SSgA FM. In his current role as part of the Fixed Income, Currency and Cash Investment Team, Mr. Brunell is responsible for developing and managing funds against a variety of conventional and custom bond index strategies, including fixed income exchange traded funds, which were established in 2007. Prior to joining the investment group, Mr. Brunell was responsible for managing the US Bond Operations team, which he had been a member of since 1997. Mr. Brunell has been managing the Bond Index Portfolio since January 2009. | ||
| Stock Index Portfolio | AllianceBernstein L.P. 1345 Avenue of the Americas, New York, New York 10105.
Portfolio Manager Judith DeVivo | Judith DeVivo, a Senior Vice President and Portfolio Manager, joined AllianceBernstein in 1971, joined the Passive Management Group in 1984 and has had portfolio management responsibility since that time. Ms. DeVivo manages equity portfolios benchmarked to a variety of indexes including the S&P 500, S&P MidCap, S&P Small Cap, Russell 2000, FTSE 100, TOPIX, DJ EuroSTOXX 50 and S&P/ASX 200 Indexes in addition to several customized accounts. Ms. DeVivo has been managing the Stock Index Portfolio since December 2008. | ||
In July 2011, a lawsuit was filed in the United States District Court for the District of New Jersey, entitled Mary Ann Sivolella v. AXA Equitable Life Insurance Company and AXA Equitable Funds Management Group, LLC (“Sivolella
42
Table of Contents
Litigation”). The lawsuit was filed derivatively on behalf of eight portfolios of EQ Trust: EQ/Common Stock Index Portfolio; EQ/Equity Growth PLUS Portfolio; EQ/Equity 500 Index Portfolio; AXA Large Cap Value Managed Volatility Portfolio; AXA Global Equity Managed Volatility Portfolio; AXA Mid Cap Value Managed Volatility Portfolio; EQ/Intermediate Government Bond Index Portfolio; and EQ/GAMCO Small Company Value Portfolio (the “Sivolella Portfolios”). Note, in June 2014, the EQ/Equity Growth PLUS Portfolio was reorganized into the AXA Large Cap Growth Managed Volatility Portfolio. The lawsuit seeks recovery under Section 36(b) of the 1940 Act, for alleged excessive fees paid to FMG LLC and AXA Equitable (the “Defendants”) for investment management services. The Plaintiff seeks recovery of the alleged overpayments, or alternatively, rescission of the contracts and restitution of all fees paid, interest, costs and fees. In October 2011, FMG LLC and AXA Equitable filed a motion to dismiss the complaint. In November 2011, the Plaintiff filed an Amended Complaint seeking the same relief, but adding new claims under (1) Section 26(f) of the 1940 Act alleging that the variable annuity contracts sold by the Defendants charged excessive management fees, and seeking restitution and rescission of those contracts under Section 47(b) of the 1940 Act; and (2) a claim for unjust enrichment. The Defendants filed a motion to dismiss the Amended Complaint in December 2011. In May 2012, Plaintiff voluntarily dismissed the Section 26(f) claim seeking restitution and rescission under Section 47(b). In September 2012, the United States District Court for the District of New Jersey denied the motion to dismiss the Amended Complaint as it related to the Section 36(b) claim and granted the motion to dismiss as it related to the unjust enrichment claim.
In January 2013, a second lawsuit against FMG LLC was filed in the United States District Court for the District of New Jersey by a group of Plaintiffs asserting substantially similar claims under Section 36(b) and seeking substantially similar damages as in the Sivolella Litigation. The lawsuit, entitled Glenn D. Sanford, et al. v. AXA Equitable Funds Management Group, LLC (“Sanford Litigation”), was filed derivatively on behalf of the EQ/PIMCO Ultra Short Bond Portfolio, the EQ/T. Rowe Price Growth Stock Portfolio, the EQ/Global Bond PLUS Portfolio, and the EQ/Core Bond Index Portfolio, in addition to four of the Sivolella Portfolios. In light of the similarities of the allegations in the Sivolella and Sanford Litigations, the Court consolidated the two lawsuits.
In April 2013, the Plaintiffs in the Sivolella and Sanford Litigations amended the complaints to add additional claims under Section 36(b) of the 1940 Act for recovery of alleged excessive fees paid to FMG LLC in its capacity as the Administrator of EQ Trust. The Plaintiffs seek recovery of the alleged overpayments, or alternatively, rescission of the contract and restitution of the excessive fees paid, interest, costs, and fees. In January 2015, Defendants filed a motion for summary judgement as well as various motions to strike certain of the Plaintiffs’ experts in the Sivolella and Sanford Litigations. Also in January 2015, two Plaintiffs in the Sanford Litigation filed a motion for partial summary judgement relating to the EQ/Core Bond Index Portfolio as well as motions in limine to bar admission of certain documents and preclude the testimony of one of the Defendants’ experts.
43
Table of Contents
No liability for litigation relating to these matters has been accrued in the financial statements of the Portfolios because any potential damages would be the responsibility of the Defendants.
On November 1, 2010, EQ Trust, and several of its Portfolios, were named as defendants and putative members of the proposed defendant class of shareholders in a lawsuit brought by The Official Committee of Unsecured Creditors of Tribune Company (the “Committee”) in the United States Bankruptcy Court for the District of Delaware regarding Tribune Company’s Chapter 11 bankruptcy proceeding (In re Tribune Company). The lawsuit relates to amounts paid to EQ Trust, and several of its Portfolios, as holders of publicly-traded shares of Tribune Company, which were components of certain broad-based securities market indices, for which there were public tender offers during 2007. The suit seeks return of the share price received by Tribune Company shareholders in the tender offers plus interest and attorneys’ fees and expenses.
On July 1, 2011, retiree participants in certain Tribune-defined compensation plans (the “Retirees”) initiated a lawsuit in the United States District Court for the Southern District of New York against certain Tribune Company shareholders who sold their shares as part of the 2007 public tender offers (the “Retiree Suit”). This Retiree Suit also seeks return of the share price received by Tribune Company shareholders in connection with the tender offers plus interest and attorneys’ fees and expenses.
On August 24, 2011, the trustees of certain trusts that hold notes issued by Tribune Company (the “Noteholders”) initiated a separate lawsuit in the United States District Court for the Southern District of New York against certain Tribune Company shareholders who sold their shares as part of the 2007 public tender offers (the “Noteholder Suit”). This Noteholder Suit also seeks return of the share price received by Tribune Company shareholders in connection with the tender offers plus interest and attorneys’ fees and expenses.
The Committee’s suit, the Retiree Suit, and the Noteholder Suit have each been consolidated with a number of related lawsuits filed by the Noteholders and Retirees around the United States into a single multi-district litigation proceeding now pending in the United States District Court for the Southern District of New York (In re: Tribune Company Fraudulent Conveyance Litigation).
The EQ/Equity 500 Index Portfolio, the EQ/GAMCO Mergers and Acquisitions Portfolio and the AXA Mid Cap Value Managed Volatility Portfolio are named as defendants in the Noteholder Suit and the Retiree Suit. The EQ/Equity 500 Index Portfolio, the EQ/GAMCO Mergers and Acquisitions Portfolio, the AXA Mid Cap Value Managed Volatility Portfolio, the AXA Large Cap Core Managed Volatility Portfolio, the EQ/Small Company Index II Portfolio, the EQ/Common Stock Index II Portfolio, and EQ Advisors Trust are all putative members of the proposed defendant class of shareholders in the Committee’s suit. The EQ/Equity 500 Index Portfolio, the EQ/GAMCO Mergers and Acquisition Portfolio, the AXA Large Cap Core Managed
44
Table of Contents
Volatility Portfolio, and EQ Advisors Trust are also named separately in the Committee’s suit, in the event it is not certified as a class action. The amounts paid to the above six Portfolios in connection with the public tender offers were approximately: (i) the EQ/Equity 500 Index Portfolio – $1,740,800; (ii) the EQ/GAMCO Mergers and Acquisitions Portfolio – $1,122,000; (iii) the AXA Mid Cap Value Managed Volatility Portfolio – $2,992,000; (iv) the AXA Large Cap Core Managed Volatility Portfolio – $64,600; (v) the EQ/Small Company Index II Portfolio – $61,200; (vi) the EQ/Common Stock Index II Portfolio – $18,360; and (vii) the Multimanager Large Cap Value Portfolio (now called AXA Large Cap Value Managed Volatility Portfolio) – $3,359,200.
The lawsuits do not allege any misconduct by the EQ Trust or its Portfolios. Motions to dismiss the suits filed by the Noteholders and the Retirees based on certain limited defenses are currently pending before the United States District Court for the Southern District of New York. The Portfolios cannot predict the outcome of these lawsuits. If the lawsuits were to be decided or settled in a manner adverse to the Portfolios, the payment of such judgments or settlements could have an adverse effect on each Portfolio’s net asset value. However, no liability for litigation relating to this matter has been accrued in the financial statements of the Portfolios, as the Manager believes a loss is not probable.
Portfolio Distribution Arrangements
EQ Trust offers three classes of shares on behalf of the Acquiring Portfolios: Class IA, Class IB and Class K shares. AXA Distributors, LLC (“AXA Distributors”) serves as the distributor for the Class IA, Class IB and Class K shares of EQ Trust. Each class of shares is offered and redeemed at its net asset value without any sales load. AXA Distributors is an affiliate of FMG LLC. AXA Distributors is registered as a broker-dealer under the Securities Exchange Act of 1934, as amended, and is a member of the Financial Industry Regulatory Authority.
EQ Trust has adopted a Distribution Plan pursuant to Rule 12b-1 under the 1940 Act for EQ Trust’s Class IA and Class IB shares. Under the Distribution Plan, the Class IA and Class IB shares of EQ Trust are charged an annual fee to compensate AXA Distributors for promoting, selling and servicing shares of the Portfolios. The maximum annual distribution and/or service (12b-1) fee for each Acquiring Portfolio’s Class IA and Class IB shares is 0.25% of the average daily net assets attributable to such share class. Because these fees are paid out of the respective Acquiring Portfolio’s assets on an on going basis, over time, the fees for Class IA and Class IB shares will increase your cost of investing and may cost you more than other types of charges. The Acquiring Portfolios’ Class IA shares are not subject to the Reorganizations.
The distributor may receive payments from the Sub-Adviser of each Acquiring Portfolio or its affiliates to help defray expenses for sales meetings or seminar
45
Table of Contents
sponsorships that may relate to the Contracts and/or the Portfolio. These sales meetings or seminar sponsorships may provide the Sub-Adviser with increased access to persons involved in the distribution of the Contracts. The distributor also may receive marketing support from each Sub-Adviser in connection with the distribution of the Contracts.
Payments to Broker-Dealers and Other Financial Intermediaries
The Acquiring Portfolios are not sold directly to the general public but instead are offered as an underlying investment option for Contracts and retirement plans and to other eligible investors. The Acquiring Portfolios and their related companies may make payments to a sponsoring insurance company (or its affiliates) or other financial intermediary for distribution and/or other services. These payments may create a conflict of interest by influencing the insurance company or other financial intermediary and your financial adviser to recommend the Portfolio over another investment or by influencing an insurance company to include the Portfolio as an underlying investment option in the Contract. The prospectus (or other offering document) for your Contract may contain additional information about these payments. Ask your financial adviser or visit your financial intermediary’s website for more information.
The Acquiring Portfolios’ shares are currently sold to insurance company separate accounts in connection with Contracts issued by AXA Equitable. Shares in the Stock Index Portfolio are also sold to other affiliated or unaffiliated insurance companies. The Acquiring Portfolios’ shares also may be sold to other tax-qualified retirement plans, to other portfolios managed by FMG LLC that currently sell their shares to such accounts and plans and other investors eligible under applicable tax regulations. Class K shares of the Acquiring Portfolios are sold only to other portfolios of EQ Trust, portfolios of the Trust and certain group annuity and retirement plans.
The Acquiring Portfolios do not have minimum initial or subsequent investment requirements. Shares of the Acquiring Portfolios are redeemable on any business day upon receipt of a request. Please refer to your Contract prospectus for more information on purchasing and redeeming shares of the Acquiring Portfolios.
All shares are purchased and sold at their net asset value without any sales load. All redemption requests will be processed and payment with respect thereto will normally be made within seven days after tender. Each Acquiring Portfolio reserves the right to suspend or change the terms of purchasing or selling shares.
EQ Trust may suspend the right of redemption for any period or postpone payment for more than seven days when the New York Stock Exchange (“NYSE”) is closed (other than a weekend or holiday) or when trading is restricted by the SEC or the SEC declares that an emergency exists. Redemptions may also be suspended and payments may be postponed for more than seven days during other periods permitted by the SEC. An Acquiring Portfolio may pay the redemption price in whole or
46
Table of Contents
part by a distribution in kind of readily marketable securities in lieu of cash or may take up to seven days to pay a redemption request in order to raise capital, when it is detrimental for the Portfolio to make cash payments as determined in the sole discretion of FMG LLC.
Frequent transfers or purchases and redemptions of Acquiring Portfolio shares, including market timing and other program trading or short-term trading strategies, may be disruptive to the Portfolio. Excessive purchases and redemptions of shares of an Acquiring Portfolio may adversely affect the Portfolio’s performance and the interests of long-term investors by requiring the Portfolio to maintain larger amounts of cash or to liquidate portfolio holdings at a disadvantageous time or price. For example, when market timing occurs, the Portfolio may have to sell its holdings to have the cash necessary to redeem the market timer’s shares. This can happen when it is not advantageous to sell any securities, so the Portfolio’s performance may be hurt. When large dollar amounts are involved, market timing can also make it difficult to use long-term investment strategies because the Acquiring Portfolio cannot predict how much cash it will have to invest. In addition, disruptive transfers or purchases and redemptions of Acquiring Portfolio shares may impede efficient portfolio management and impose increased transaction costs, such as brokerage costs, by requiring the portfolio manager to effect more frequent purchases and sales of portfolio securities. Similarly, an Acquiring Portfolio may bear increased administrative costs as a result of the asset level and investment volatility that accompanies patterns of excessive or short-term trading.
The EQ Trust Board has adopted policies and procedures regarding disruptive transfer activity. EQ Trust and the Acquiring Portfolios discourage frequent purchases and redemptions of portfolio shares by Contractholders and will not make special arrangements to accommodate such transactions in Acquiring Portfolio shares. As a general matter, each Acquiring Portfolio and EQ Trust reserve the right to reject a transfer that they believe, in their sole discretion is disruptive (or potentially disruptive) to the management of the Portfolio.
EQ Trust’s policies and procedures seek to discourage what it considers to be disruptive trading activity. EQ Trust seeks to apply its policies and procedures to all Contractholders uniformly, including omnibus accounts. It should be recognized, however, that such policies and procedures are subject to limitations:
| • | They do not eliminate the possibility that disruptive transfer activity, including market timing, will occur or that portfolio performance will be affected by such activity. |
| • | The design of such policies and procedures involves inherently subjective judgments, which FMG LLC and its affiliates, on behalf of EQ Trust, seek to make in a fair and reasonable manner consistent with the interests of all Contractholders. |
| • | The limits on the ability to monitor certain potentially disruptive transfer activity means that some Contractholders may be treated differently than others, |
47
Table of Contents
resulting in the risk that some Contractholders may be able to engage in frequent transfer activity while others will bear the effect of that frequent transfer activity. |
If FMG LLC, on behalf of EQ Trust, determines that a Contractholder’s transfer patterns among EQ Trust’s portfolios are disruptive to EQ Trust’s portfolios, FMG LLC or an affiliate may, among other things, restrict the availability of personal telephone requests, facsimile transmissions, automated telephone services, internet services or any electronic transfer services. FMG LLC or an affiliate may also refuse to act on transfer instructions of an agent acting under a power of attorney who is acting on behalf of more than one owner. In making these determinations, FMG LLC or an affiliate may consider the combined transfer activity of Contracts that it believes are under common ownership, control or direction.
EQ Trust currently considers transfers into and out of (or vice versa) the same portfolio within a five-business day period as potentially disruptive transfer activity. In order to reduce disruptive activity, it monitors the frequency of transfers, including the size of transfers in relation to portfolio assets, in each portfolio. EQ Trust aggregates inflows and outflows for each portfolio on a daily basis. When a potentially disruptive transfer into or out of a portfolio occurs on a day when the portfolio’s net inflows and outflows exceed an established monitoring threshold, FMG LLC or an affiliate sends a letter to the Contractholder explaining that there is a policy against disruptive transfer activity and that if such activity continues, FMG LLC or an affiliate may take action to restrict the availability of voice, fax and automated transaction services. If such Contractholder is identified a second time as engaging in potentially disruptive transfer activity, FMG LLC or an affiliate currently will restrict the availability of voice, fax and automated transaction services. FMG LLC or an affiliate currently will apply such action for the remaining life of each affected Contract. Because FMG LLC or an affiliate exercises discretion in determining whether or not to take the actions discussed above, some Contractholders may be treated differently than others, resulting in the risk that some Contractholders may be able to engage in frequent transfer activity while others will bear the effect of the frequent transfer activity. Although Contractholders who have engaged in disruptive transfer activity currently receive letters notifying them of FMG LLC or an affiliate’s intention to restrict access to communication services, such letters may not continue to be provided in the future. Consistent with seeking to discourage potentially disruptive transfer activity, FMG LLC, or an affiliate thereof or EQ Trust also may in its sole discretion and without further notice, change what it considers potentially disruptive transfer activity and its monitoring procedures and thresholds, as well as change its procedures to restrict this activity. You should consult your Contract prospectus for information on other specific limitations on the transfer privilege.
The above policies and procedures with respect to frequent transfers or purchases and redemptions of portfolio shares also apply to retirement plan participants. The above policies and procedures do not apply to transfers, purchases and redemptions of shares of portfolios of EQ Trust by funds of funds managed by FMG LLC.
48
Table of Contents
Notwithstanding our efforts, we may be unable to detect or deter market timing activity by certain persons, which can lead to disruption of management of, and excess costs to, the portfolios, including the Acquiring Portfolios.
How Portfolio Shares Are Priced
“Net asset value” is the price of one share of a portfolio of EQ Trust, including the Acquiring Portfolios, without a sales charge, and is calculated each business day using the following formula:
| Net Asset Value | = | Total market value of securities | + | Cash and other assets | – | Liabilities | ||||||
| Number of outstanding shares | ||||||||||||
The net asset value of portfolio shares is determined according to this schedule:
| • | A share’s net asset value is determined as of the close of regular trading on the NYSE on the days it is open for trading. This is normally 4:00 p.m. Eastern time. |
| • | The price for purchasing or redeeming a share will be based upon the net asset value next calculated after an order is received and accepted by a portfolio or its designated agent. |
| • | A portfolio heavily invested in foreign securities may have net asset value changes on days when shares cannot be purchased or sold because foreign securities sometimes trade on days when a portfolio’s shares are not priced. |
Generally, portfolio securities are valued as follows:
| • | Equity securities (including securities issued by ETFs) — most recent sales price or official closing price or if there is no sale or official closing price, latest available bid price. |
| • | Securities traded on foreign exchanges — most recent sales or bid price on the foreign exchange or market, unless a significant event or circumstance occurs after the close of that market or exchange that will materially affect its value. In that case, fair value as determined by or under the direction of EQ Trust’s Board of Trustees at the close of regular trading on the NYSE. Foreign currency is converted into U.S. dollar equivalent daily at current exchange rates. |
| • | Debt securities — based upon pricing service valuations. Debt securities with original or remaining maturities of 60 days or less may be valued at amortized cost. |
| • | Convertible bonds and unlisted convertible preferred stocks — valued at prices obtained from a pricing service for such instruments or, if a pricing service price is not available, at bid prices obtained from one or more of the major dealers in such bonds or stocks. Where there is a discrepancy between |
49
Table of Contents
dealers, values may be adjusted based on recent premium spreads to the underlying common stocks. Convertible bonds may be matrix-priced based upon the conversion value to the underlying common stocks and market premiums. |
| • | Options — for exchange traded options, last sales price or, if not available, previous day’s sales price. If the bid price is higher or the asked price is lower than the last sale price, the higher bid or lower asked price may be used. Options not traded on an exchange or actively traded are valued according to fair value methods. |
| • | Futures — last sales price or, if there is no sale, latest available bid price. |
| • | Investment Company Securities — shares of open-end mutual funds (other than ETFs) held by a portfolio will be valued at the net asset value of the shares of such funds as described in these funds’ prospectuses. |
Securities and assets for which market quotations are not readily available, for which valuation cannot be provided or for which events or circumstances occurring after the close of the relevant market or exchange materially affect their value are valued pursuant to the fair value procedures in good faith by or under the direction of the Board of Trustees. For example, a security whose trading has been halted during the trading day may be fair valued based on the available information at the time of the close of the trading market. Similarly, securities for which there is no ready market (e.g., securities of certain small capitalization issuers, high yield securities and securities of certain issuers located in emerging markets) also may be fair valued. Some methods for valuing these securities may include: fundamental analysis (earnings multiple, etc.), matrix pricing, discounts from market prices of similar securities, or discounts applied due to the nature and duration of restrictions on the disposition of the securities.
Events or circumstances affecting the values of portfolio securities that occur between the closing of their principal markets and the time the net asset value is determined, such as foreign securities trading on foreign exchanges that close before the time the net asset value of portfolio shares is determined, may be reflected in EQ Trust’s calculations of net asset values for each applicable portfolio when EQ Trust deems that the particular event or circumstance would materially affect such portfolio’s net asset value. Such events or circumstances may be company specific, such as an earning report, country or region specific, such as a natural disaster, or global in nature. Such events or circumstances also may include price movements in the U.S. securities markets.
The effect of fair value pricing as described above is that securities may not be priced on the basis of quotations from the primary market in which they are traded, but rather may be priced by another method that the EQ Trust Board believes will reflect fair value. As such, fair value pricing is based on subjective judgments and it is possible that fair value may differ materially from the value realized on a sale. This policy is intended to assure that the portfolio’s net asset value fairly reflects security
50
Table of Contents
values as of the time of pricing. Also, fair valuation of a portfolio’s securities can serve to reduce arbitrage opportunities available to short-term traders, but there is no assurance that fair value pricing policies will prevent dilution of the portfolio’s net asset value by those traders.
Each business day, the portfolios’ net asset values, including the net asset values of any applicable Acquiring Portfolio, are transmitted electronically to insurance companies that use the portfolios as underlying investment options for Contracts.
Dividends and Other Distributions
Each Acquiring Portfolio generally distributes most or all of its net investment income and net realized gains (collectively, “Taxable Income”), if any, annually. Dividends and other distributions by an Acquiring Portfolio are automatically reinvested at net asset value in shares of the distributing class of the Portfolio.
Federal Income Tax Considerations
The Acquiring Portfolios currently sell their shares only to insurance company separate accounts, qualified plans and other investors eligible under applicable tax regulations. Accordingly, distributions an Acquiring Portfolio makes of its Taxable Income and net gains its shareholders realize on redemptions or exchanges of Acquiring Portfolio shares generally will not be taxable to them (or to the holders of underlying Contracts or plan participants or beneficiaries). See the prospectus for your Contract for further tax information.
Each Acquiring Portfolio is treated as a separate corporation, and intends to continue to qualify each taxable year to be treated as a “regulated investment company” (a “RIC”), for federal tax purposes. Each Acquiring Portfolio will be so treated if it meets specified federal income tax rules, including requirements regarding types of investments, diversification limits on investments, types of income, and distributions. To comply with all these requirements may, from time to time, necessitate an Acquiring Portfolio’s disposition of one or more investments when it might not otherwise do so.
An Acquiring Portfolio that satisfies the federal tax requirements to be treated as a RIC is not taxed at the entity (portfolio) level to the extent it passes through all its Taxable Income to its shareholders by making distributions. Although EQ Trust intends that each Acquiring Portfolio will be operated to have no federal tax liability, if an Acquiring Portfolio does have any federal tax liability, that would hurt its investment performance. Also, to the extent that an Acquiring Portfolio invests in foreign securities or holds foreign currencies, it could be subject to foreign taxes that would reduce its investment performance.
It is important for each Acquiring Portfolio to maintain its RIC status (and to satisfy certain other requirements), because each shareholder of a Portfolio that is a Separate Account will then be able to use a “look-through” rule in determining whether the account meets the federal tax investment diversification rules for insurance company
51
Table of Contents
separate accounts. If an Acquiring Portfolio failed to meet those diversification rules, owners of non-pension plan Contracts funded through the Acquiring Portfolio would be taxed immediately on the accumulated investment earnings under their Contracts and would lose any benefit of tax deferral. FMG LLC, in its capacity as the investment manager and the administrator of EQ Trust, therefore carefully monitors the Acquiring Portfolios’ compliance with all of the RIC rules and separate account investment diversification rules.
Contractholders seeking to more fully understand the tax consequences of their investment should consult with their tax advisers or the insurance company that issued their Contract or refer to their Contract prospectus.
The following financial highlights tables are intended to help you understand the financial performance of the Bond Index Portfolio’s Class IA, Class IB and Class K shares and the Stock Index Portfolio’s Class IA and Class IB shares. The financial information in the tables is for the past five years (or, if shorter, the period of operations). The financial information below for the Class IA, Class IB and Class K shares, as applicable, of the respective Acquiring Portfolios has been derived from the financial statements of the Portfolio for the fiscal year ended December 31, 2014, which have been audited by PricewaterhouseCoopers LLP (“PwC”), an independent registered public accounting firm. PwC’s report on each Acquiring Portfolio’s financial statements for the fiscal year ended December 31, 2014 and the financial statements themselves as of December 31, 2014 are included in the Statement of Additional Information relating to this Proxy Statement/Prospectus. The information should be read in conjunction with these financial statement documents.
Certain information reflects financial results for a single share. The total returns in the table represent the rate that a shareholder would have earned (or lost) on an investment in the Acquiring Portfolio (assuming reinvestment of all dividends and other distributions). The total return figures shown below do not reflect any Separate Account or Contract fees and charges. The total return figures would be lower if they did reflect such fees and charges.
52
Table of Contents
EQ/Common Stock Index Portfolio
| Year Ended December 31, | ||||||||||||||||||||
Class IA | 2014 | 2013 | 2012 | 2011 | 2010 | |||||||||||||||
Net asset value, beginning of year | $ | 23.73 | $ | 18.13 | $ | 15.94 | $ | 16.07 | $ | 14.04 | ||||||||||
|
|
|
|
|
|
|
|
|
| |||||||||||
Income (loss) from investment operations: | ||||||||||||||||||||
Net investment income (loss) (e) | 0.31 | 0.27 | 0.27 | 0.25 | 0.22 | |||||||||||||||
Net realized and unrealized gain (loss) on investments and futures | 2.55 | 5.61 | 2.21 | (0.13 | ) | 2.04 | ||||||||||||||
|
|
|
|
|
|
|
|
|
| |||||||||||
Total from investment operations | 2.86 | 5.88 | 2.48 | 0.12 | 2.26 | |||||||||||||||
|
|
|
|
|
|
|
|
|
| |||||||||||
Less distributions: | ||||||||||||||||||||
Dividends from net investment income | (0.32 | ) | (0.28 | ) | (0.29 | ) | (0.25 | ) | (0.23 | ) | ||||||||||
|
|
|
|
|
|
|
|
|
| |||||||||||
Net asset value, end of year | $ | 26.27 | $ | 23.73 | $ | 18.13 | $ | 15.94 | $ | 16.07 | ||||||||||
|
|
|
|
|
|
|
|
|
| |||||||||||
Total return | 12.05 | % | 32.49 | % | 15.54 | % | 0.82 | % | 16.14 | % | ||||||||||
|
|
|
|
|
|
|
|
|
| |||||||||||
Ratios/Supplemental Data: | ||||||||||||||||||||
Net assets, end of year (000’s) | $ | 4,292,750 | $ | 4,204,128 | $ | 3,532,647 | $ | 3,421,651 | $ | 3,823,474 | ||||||||||
Ratio of expenses to average net assets | 0.72 | % | 0.72 | % | 0.72 | % | 0.47 | % | 0.47 | % | ||||||||||
Ratio of net investment income (loss) to average net assets | 1.25 | % | 1.30 | % | 1.54 | % | 1.50 | % | 1.53 | % | ||||||||||
Portfolio turnover rate ^ | 4 | % | 4 | % | 3 | % | 5 | % | 10 | % | ||||||||||
53
Table of Contents
EQ/Common Stock Index Portfolio
| Year Ended December 31, | ||||||||||||||||||||
Class IB | 2014 | 2013 | 2012 | 2011 | 2010 | |||||||||||||||
Net asset value, beginning of year | $ | 23.61 | $ | 18.04 | $ | 15.85 | $ | 15.99 | $ | 13.96 | ||||||||||
|
|
|
|
|
|
|
|
|
| |||||||||||
Income (loss) from investment operations: | ||||||||||||||||||||
Net investment income (loss) (e) | 0.31 | 0.27 | 0.27 | 0.20 | 0.18 | |||||||||||||||
Net realized and unrealized gain (loss) on investments and futures | 2.53 | 5.58 | 2.21 | (0.13 | ) | 2.04 | ||||||||||||||
|
|
|
|
|
|
|
|
|
| |||||||||||
Total from investment operations | 2.84 | 5.85 | 2.48 | 0.07 | 2.22 | |||||||||||||||
|
|
|
|
|
|
|
|
|
| |||||||||||
Less distributions: | ||||||||||||||||||||
Dividends from net investment income | (0.32 | ) | (0.28 | ) | (0.29 | ) | (0.21 | ) | (0.19 | ) | ||||||||||
|
|
|
|
|
|
|
|
|
| |||||||||||
Net asset value, end of year | $ | 26.13 | $ | 23.61 | $ | 18.04 | $ | 15.85 | $ | 15.99 | ||||||||||
|
|
|
|
|
|
|
|
|
| |||||||||||
Total return | 12.03 | % | 32.48 | % | 15.62 | % | 0.50 | % | 15.93 | % | ||||||||||
|
|
|
|
|
|
|
|
|
| |||||||||||
Ratios/Supplemental Data: | ||||||||||||||||||||
Net assets, end of year (000’s) | $ | 1,472,926 | $ | 1,462,407 | $ | 1,194,810 | $ | 1,152,609 | $ | 1,297,833 | ||||||||||
Ratio of expenses to average net assets | 0.72 | % | 0.72 | % | 0.72 | % | 0.72 | % | 0.72 | % | ||||||||||
Ratio of net investment income (loss) to average net assets | 1.25 | % | 1.30 | % | 1.54 | % | 1.25 | % | 1.28 | % | ||||||||||
Portfolio turnover rate ^ | 4 | % | 4 | % | 3 | % | 5 | % | 10 | % | ||||||||||
| ^ | Portfolio turnover rate excludes derivatives, if any. |
| (e) | Net investment income (loss) per share is based on average shares outstanding. |
54
Table of Contents
EQ/Core Bond Index Portfolio
| Year Ended December 31, | ||||||||||||||||||||
Class IA | 2014 | 2013 | 2012 | 2011 | 2010 | |||||||||||||||
Net asset value, beginning of year | $ | 9.87 | $ | 10.15 | $ | 9.98 | $ | 9.71 | $ | 9.39 | ||||||||||
|
|
|
|
|
|
|
|
|
| |||||||||||
Income (loss) from investment operations: | ||||||||||||||||||||
Net investment income (loss) (e) | 0.14 | 0.13 | 0.15 | 0.21 | 0.28 | |||||||||||||||
Net realized and unrealized gain (loss) on investments, securities sold short, futures and foreign currency transactions | 0.09 | (0.29 | ) | 0.17 | 0.28 | 0.28 | ||||||||||||||
|
|
|
|
|
|
|
|
|
| |||||||||||
Total from investment operations | 0.23 | (0.16 | ) | 0.32 | 0.49 | 0.56 | ||||||||||||||
|
|
|
|
|
|
|
|
|
| |||||||||||
Less distributions: | ||||||||||||||||||||
Dividends from net investment income | (0.13 | ) | (0.12 | ) | (0.15 | ) | (0.22 | ) | (0.24 | ) | ||||||||||
|
|
|
|
|
|
|
|
|
| |||||||||||
Net asset value, end of year | $ | 9.97 | $ | 9.87 | $ | 10.15 | $ | 9.98 | $ | 9.71 | ||||||||||
|
|
|
|
|
|
|
|
|
| |||||||||||
Total return | 2.36 | % | (1.59 | )% | 3.20 | % | 5.01 | % | 6.03 | % | ||||||||||
|
|
|
|
|
|
|
|
|
| |||||||||||
Ratios/Supplemental Data: | ||||||||||||||||||||
Net assets, end of year (000’s) | $ | 88,462 | $ | 94,808 | $ | 116,262 | $ | 127,549 | $ | 5,775,848 | ||||||||||
Ratio of expenses to average net assets (f) | 0.71 | % | 0.72 | % | 0.72 | % | 0.47 | % | 0.47 | % | ||||||||||
Ratio of net investment income (loss) to average net assets (f) | 1.35 | % | 1.31 | % | 1.48 | % | 2.11 | % | 2.85 | % | ||||||||||
Portfolio turnover rate ^ | 24 | % | 33 | % | 32 | % | 79 | % | 83 | % | ||||||||||
55
Table of Contents
EQ/Core Bond Index Portfolio
| Year Ended December 31, | ||||||||||||||||||||
Class IB | 2014 | 2013 | 2012 | 2011 | 2010 | |||||||||||||||
Net asset value, beginning of year | $ | 9.88 | $ | 10.17 | $ | 10.00 | $ | 9.72 | $ | 9.40 | ||||||||||
|
|
|
|
|
|
|
|
|
| |||||||||||
Income (loss) from investment operations: | ||||||||||||||||||||
Net investment income (loss) (e) | 0.14 | 0.13 | 0.15 | 0.17 | 0.26 | |||||||||||||||
Net realized and unrealized gain (loss) on investments, securities sold short, futures and foreign currency transactions | 0.10 | (0.30 | ) | 0.17 | 0.30 | 0.28 | ||||||||||||||
|
|
|
|
|
|
|
|
|
| |||||||||||
Total from investment operations | 0.24 | (0.17 | ) | 0.32 | 0.47 | 0.54 | ||||||||||||||
|
|
|
|
|
|
|
|
|
| |||||||||||
Less distributions: | ||||||||||||||||||||
Dividends from net investment income | (0.13 | ) | (0.12 | ) | (0.15 | ) | (0.19 | ) | (0.22 | ) | ||||||||||
|
|
|
|
|
|
|
|
|
| |||||||||||
Net asset value, end of year | $ | 9.99 | $ | 9.88 | $ | 10.17 | $ | 10.00 | $ | 9.72 | ||||||||||
|
|
|
|
|
|
|
|
|
| |||||||||||
Total return | 2.46 | % | (1.69 | )% | 3.20 | % | 4.85 | % | 5.76 | % | ||||||||||
|
|
|
|
|
|
|
|
|
| |||||||||||
Ratios/Supplemental Data: | ||||||||||||||||||||
Net assets, end of year (000’s) | $ | 2,251,635 | $ | 2,402,741 | $ | 1,485,443 | $ | 1,355,385 | $ | 1,308,869 | ||||||||||
Ratio of expenses to average net assets (f) | 0.71 | % | 0.72 | % | 0.72 | % | 0.72 | % | 0.72 | % | ||||||||||
Ratio of net investment income (loss) to average net assets (f) | 1.35 | % | 1.30 | % | 1.47 | % | 1.73 | % | 2.64 | % | ||||||||||
Portfolio turnover rate ^ | 24 | % | 33 | % | 32 | % | 79 | % | 83 | % | ||||||||||
56
Table of Contents
EQ/Core Bond Index Portfolio
| Year Ended December 31, | August 26, 2011* to December 31, 2011 | |||||||||||||||
Class K | 2014 | 2013 | 2012 | |||||||||||||
Net asset value, beginning of period | $ | 9.87 | $ | 10.15 | $ | 9.98 | $ | 10.12 | ||||||||
|
|
|
|
|
|
|
| |||||||||
Income (loss) from investment operations: | ||||||||||||||||
Net investment income (loss) (e) | 0.16 | 0.16 | 0.18 | 0.06 | ||||||||||||
Net realized and unrealized gain (loss) on investments and foreign currency transactions | 0.10 | (0.30 | ) | 0.17 | 0.02 | |||||||||||
|
|
|
|
|
|
|
| |||||||||
Total from investment operations | 0.26 | (0.14 | ) | 0.35 | 0.08 | |||||||||||
|
|
|
|
|
|
|
| |||||||||
Less distributions: | ||||||||||||||||
Dividends from net investment income | (0.16 | ) | (0.14 | ) | (0.18 | ) | (0.22 | ) | ||||||||
|
|
|
|
|
|
|
| |||||||||
Net asset value, end of period | $ | 9.97 | $ | 9.87 | $ | 10.15 | $ | 9.98 | ||||||||
|
|
|
|
|
|
|
| |||||||||
Total return (b) | 2.62 | % | (1.34 | )% | 3.46 | % | 0.75 | % | ||||||||
|
|
|
|
|
|
|
| |||||||||
Ratios/Supplemental Data: | ||||||||||||||||
Net assets, end of period (000’s) | $ | 6,223,006 | $ | 5,438,085 | $ | 4,958,865 | $ | 5,256,236 | ||||||||
Ratio of expenses to average net assets (a)(f) | 0.46 | % | 0.47 | % | 0.47 | % | 0.47 | % | ||||||||
Ratio of net investment income (loss) to average net assets (a)(f) | 1.60 | % | 1.56 | % | 1.72 | % | 1.74 | % | ||||||||
Portfolio turnover rate ^ | 24 | % | 33 | % | 32 | % | 79 | % | ||||||||
| * | Commencement of Operations. |
| ^ | Portfolio turnover rate excludes derivatives, if any. |
| (a) | Ratios for periods less than one year are annualized. |
| (b) | Total returns for periods less than one year are not annualized. |
| (e) | Net investment income (loss) per share is based on average shares outstanding. |
| (f) | Expenses do not include the expenses of the underlying funds (“indirect expenses”). |
57
Table of Contents
The following information applies to the Reorganization of the Acquired Portfolio for which you are entitled to vote.
Shareholders with amounts invested in shares of an Acquired Portfolio at the close of business on June 30, 2015 (the “Record Date”) will be entitled to be present and vote or provide voting instructions for the applicable Acquired Portfolio at the Meeting with respect to their shares or shares attributable to their Contracts as of the Record Date.
Each whole share of an Acquired Portfolio is entitled to one vote as to each matter with respect to which it is entitled to vote, as described above, and each fractional share is entitled to a proportionate fractional vote. Votes cast by proxy or in person by a shareholder at the Meeting will be counted by persons appointed as inspectors of election for the Meeting. [The table below shows the number of outstanding shares of each Acquired Portfolio as of the Record Date that are entitled to vote at the Meeting. AXA Equitable owned of record more than 95% of those shares.]
| Total Number | ||
Equity Portfolio- Class B Shares | ||
Fixed Income Portfolio- Class B Shares |
All properly executed and unrevoked proxies received in time for the Meeting will be voted as instructed by shareholders. If a shareholder executes a proxy but gives no voting instructions, that shareholder’s shares that are represented by proxy will be voted “FOR” the respective Proposal and “FOR” or “AGAINST” any other business which may properly arise at the Meeting, in the proxies’ discretion. Any person giving a proxy has the power to revoke it at any time prior to its exercise by executing a superseding proxy or by submitting a written notice of revocation to the Trust. To be effective, such revocation must be received by the Trust prior to the Meeting. In addition, although mere attendance at the Meeting will not revoke a proxy, a shareholder present at the Meeting may withdraw his or her proxy by voting in person. If a shareholder abstains from voting as to any matter, the shares represented by the abstention or broker “non-vote” will be deemed present at the Meeting for purposes of determining a quorum but will not be voted and, therefore, will have the effect of a vote against the respective Proposal.
Contractholders with amounts allocated to an Acquired Portfolio on its respective Record Date will be entitled to be present and provide voting instructions for the Portfolio at the Meeting with respect to shares held indirectly as of the Record Date, to the extent required by applicable law. Voting instructions may be solicited, and such instructions may be provided, in the same manner as proxies as described herein. AXA Equitable will vote the shares for which it receives timely voting instructions from Contractholders in accordance with those instructions.
58
Table of Contents
Shares in each investment division of a Separate Account that is invested in an Acquired Portfolio for which AXA Equitable receives a voting instruction card that is signed and timely returned but is not marked to indicate voting instructions will be treated as an instruction to vote the shares “FOR” the respective Proposal, and AXA Equitable may vote in its discretion with respect to other matters not now known that may be presented at the Meeting. AXA Equitable will vote in its discretion on any proposal to adjourn or postpone the Meeting. Shares in each investment division of a Separate Account for which AXA Equitable receives no timely voting instructions from Contractholders, or which are attributable to amounts retained by AXA Equitable as surplus or seed money, will be voted by AXA Equitable “FOR” or “AGAINST” approval of the respective Proposal, or as an abstention, in the same proportion as the shares for which Contractholders have provided voting instructions to AXA Equitable. As a result of such proportional voting by AXA Equitable, it is possible that a small number of Contractholders could determine whether a Proposal is approved.
Voting instructions executed by a Contractholder may be revoked at any time prior to AXA Equitable voting the shares represented thereby by the Contractholder providing AXA Equitable with a properly executed written revocation of such voting instructions, or by the Contractholder providing AXA Equitable with proper later-dated voting instructions by voting instruction card, telephone or the Internet. In addition, any Contractholder who attends the Meeting in person may provide voting instructions by a voting instruction card at the Meeting, thereby canceling any voting instruction previously given. Proxies executed by AXA Equitable may be revoked at any time before they are exercised by a written revocation duly received, by properly executing a later-dated proxy or by AXA Equitable representative attending the Meeting and voting in person.
Approval of the Plan of Reorganization with respect to a Reorganization involving an Acquired Portfolio will require the affirmative vote of (1) 67% or more of the voting securities of the Acquired Portfolio present at the Meeting, if the holders of more than 50% of its outstanding voting securities are present or represented by proxy, or (2) more than 50% of its outstanding voting securities, whichever is less. “Voting securities” refers to the shares of an Acquired Portfolio.
The presence, in person or by proxy, of at least one-third of the shares of an Acquired Portfolio entitled to vote at the Meeting will constitute a quorum for the transaction of business, with respect to that Acquired Portfolio, at the Meeting.
To the knowledge of the Trust, as of the Record Date, the officers and Trustees owned, as a group, less than 1% of the shares of each Acquired Portfolio.
AXA Equitable may be deemed to be a control person of the Trust by virtue of its direct or indirect ownership of more than 95% of the Trust’s shares. Shareholders
59
Table of Contents
owning more than 25% of the outstanding shares of an Acquired Portfolio may be able to determine the outcome of most issues that are submitted to shareholders for a vote. [As of the Record Date, except as set forth in Appendix C, to the Trust’s knowledge, (1) no person, other than AXA Equitable, owned beneficially or of record 5% or more of the outstanding Class B shares of each Acquired Portfolio, and (2) no Contractholder owned Contracts entitling such Contractholder to provide voting instructions regarding 5% or more of the outstanding Class B shares of each Acquired Portfolio.]
Solicitation of Proxies and Voting Instructions
Solicitation of proxies and voting instructions is being made by the Trust primarily by the mailing of this Notice and Proxy Statement/Prospectus with its enclosures on or about [ ], 2015. The principal solicitation will be by mail, but proxies and voting instructions also may be solicited by telephone, fax, personal interview by directors, officers, employees or agents of FMG LLC or its affiliates or the Trust or its affiliates, without additional compensation, through the Internet, or other permissible means. Shareholders can vote proxies: (1) by Internet at our website at https://www.proxypush.com/AXACP; (2) by telephone at 1-866-221-8325; or (3) by mail, with the enclosed proxy card. Contractholders can provide voting instructions: (1) by Internet at our website at https://www.proxypush.com/AXACP; (2) by telephone at 1-866-221-8325; or (3) by mail, with the enclosed voting instruction card. In lieu of executing a proxy card or voting instruction card, you may attend the Meeting in person. The cost of the Meeting, including the cost of solicitation of proxies and voting instructions, will be borne by FMG LLC.
If a quorum is not established at the Meeting or if sufficient votes in favor of a Proposal are not received by the time scheduled for the Meeting, the persons named as proxies may propose one or more adjournments or postponements of the Meeting to permit further solicitation of proxies. Any adjournment or postponement of the Meeting will require the affirmative vote of a majority of the shares represented in person or by proxy at the session of the Meeting to be adjourned. The persons named as proxies will vote in their discretion on any such adjournment or postponement.
The Trust does not know of any matters to be presented at the Meeting other than those described in this Proxy Statement/Prospectus. If other business properly comes before the Meeting, the proxyholders will vote thereon in accordance with their best judgment.
60
Table of Contents
The Trust is not required to hold regular shareholder meetings and, in order to minimize its costs, does not intend to hold meetings of shareholders unless so required by applicable law, regulation or regulatory policy or if otherwise deemed advisable by the Trust’s management. Therefore, it is not practicable to specify a date by which proposals must be received in order to be incorporated in an upcoming proxy statement for a meeting of shareholders. Shareholders will be given notice of any meeting of shareholders not less than ten days, and not more than ninety days, before the date of the meeting.
Prompt execution and return of the enclosed voting instruction card is requested. A self-addressed, postage-paid envelope is enclosed for your convenience. If executed but unmarked voting instructions are received, AXA Equitable will vote those unmarked voting instructions in favor of a Proposal.
* * * * *
Copies of the Trust’s most recent annual and semi-annual reports, including financial statements, previously have been delivered to Contractholders. Contractholders may request additional copies of the Trust’s annual or semi-annual reports, free of charge, by writing to the Trust at 1290 Avenue of the Americas, New York, New York 10104 or by calling 1-877-522-5035.
We need your vote. It is important that you execute and return all of your proxy or voting instruction cards promptly.
61
Table of Contents
FORM OF AGREEMENT AND PLAN OF REORGANIZATION AND TERMINATION
THIS AGREEMENT AND PLAN OF REORGANIZATION AND TERMINATION (“Agreement”) is made as of September [ ], 2015, between EQ ADVISORS TRUST, a Delaware statutory trust (“EQAT”), on behalf of each of its segregated portfolios of assets (“series”) listed under the heading “Acquiring Portfolios” on Schedule A to this Agreement (“Schedule A”) (each, an “Acquiring Portfolio”), and AXA PREMIER VIP TRUST, also a Delaware statutory trust (“VIP”), on behalf of each of its series listed under the heading “Targets” on Schedule A (each, a “Target”). (Each Acquiring Portfolio and Target is sometimes referred to herein as a “Portfolio,” and each of EQAT and VIP is sometimes referred to herein as an “Investment Company.”) Notwithstanding anything to the contrary contained herein, (1) all agreements, covenants, representations, warranties, actions, and obligations contained herein (collectively, “Obligations”) of and by each Portfolio, and of and by each Investment Company, as applicable, on its behalf, shall be the Obligations of that Portfolio only, (2) all rights and benefits created hereunder in favor of each Portfolio shall inure to and be enforceable by the Investment Company of which that Portfolio is a series on that Portfolio’s behalf, and (3) in no event shall any other series of an Investment Company or the assets thereof be held liable with respect to the breach or other default by an obligated Portfolio or Investment Company of its Obligations set forth herein.
Each Investment Company currently sells voting shares of beneficial interest in its Portfolios, $0.001 par value per share (“shares”), to separate accounts of AXA Equitable Life Insurance Company (“AXA Equitable”) (“Separate Accounts”) in connection with certain variable annuity certificates and contracts and variable life insurance policies (collectively, “Contracts”) issued thereby; EQAT also currently sells shares in EQ/Common Stock Index Portfolio to AXA Life and Annuity Company and other affiliated or unaffiliated insurance companies in connection with Contracts issued thereby. Shares in each Portfolio also may be sold to (1) tax-qualified retirement plans, including The AXA Equitable 401(k) Plan, and (2) other investors eligible under applicable Regulations (as defined below); and shares in each Acquiring Portfolio also may be sold to other portfolios managed by AXA Equitable Funds Management Group, LLC (“FMG LLC”) that currently sell their shares to those accounts and plans. Class K shares are sold only to other series of the Investment Companies and certain group annuity and retirement plans. The Portfolios are underlying investment options for the Separate Accounts to fund Contracts. Under applicable law, the assets of all the Separate Accounts (i.e., the shares in the Portfolios) are the property of AXA Equitable, which is the owner of record of those shares, and are held for the benefit of the Contract holders.
The Investment Companies wish to effect two separate reorganizations, each consisting of (1) the transfer of all of a Target’s assets to the Acquiring Portfolio listed on Schedule A opposite its name (“corresponding Acquiring Portfolio”) in exchange for shares in that Acquiring Portfolio and that Acquiring Portfolio’s assumption of all of that Target’s liabilities, (2) the distribution of those shares pro rata to that Target’s shareholders in exchange for their shares therein and in complete liquidation thereof, and (3) that Target’s termination (all the foregoing transactions involving each Target and its corresponding Acquiring Portfolio being referred to herein collectively as a “Reorganization”), all on the terms and conditions set forth herein. The consummation of one Reorganization shall not be contingent on the consummation of the other Reorganization. (For convenience, the balance hereof refers only to a single Reorganization, one Target, and one Acquiring Portfolio, but the terms and conditions hereof shall apply separately to each Reorganization and the Portfolios participating therein.)
Each Investment Company’s board of trustees (each, a “Board”), in each case including a majority of its members who are not “interested persons” (as that term is defined in the Investment Company Act of 1940, as amended (“1940 Act”)) of either Investment Company, (1) has duly adopted and approved this Agreement and the transactions contemplated hereby and has duly authorized its performance hereof on its Portfolio’s behalf by all necessary Board action and (2) has determined that participation in the Reorganization is in the best interests of its Portfolio and that the interests of the existing shareholders thereof will not be diluted as a result of the Reorganization.
A-1
Table of Contents
Target offers a single class of shares, designated Class B shares (“Target Shares”). Acquiring Portfolio offers three classes of shares, designated Class IA, Class IB, and Class K shares, but only Acquiring Portfolio’s Class IB shares (“Acquiring Portfolio Shares”) are involved in the Reorganization and included in references herein to “Acquiring Portfolio Shares.” The rights and preferences of the Acquiring Portfolio Shares are identical to the rights and preferences of the Target Shares.
In consideration of the mutual promises contained herein, the parties agree as follows:
| 1. | PLAN OF REORGANIZATION AND TERMINATION |
1.1. Subject to the requisite approval of Target’s shareholders and the terms and conditions set forth herein, Target shall assign, sell, convey, transfer, and deliver all of its assets described in paragraph 1.2 (“Assets”) to Acquiring Portfolio. In exchange therefor, Acquiring Portfolio shall —
(a) issue and deliver to Target the number of full and fractional (all references herein to “fractional” shares meaning fractions rounded to the eighth decimal place) Acquiring Portfolio Shares determined by dividing Target’s net value (computed as set forth in paragraph 2.1) by the net asset value (computed as set forth in paragraph 2.2) (“NAV”) of an Acquiring Portfolio Share, and
(b) assume all of Target’s liabilities described in paragraph 1.3 (“Liabilities”).
Those transactions shall take place at the Closing (as defined in paragraph 3.1).
1.2. The Assets shall consist of all assets and property of every kind and nature — including all cash, cash equivalents, securities, commodities, futures interests, receivables (including interest and dividends receivable), claims and rights of action, rights to register shares under applicable securities laws, goodwill, and books and records — Target owns at the Valuation Time (as defined in paragraph 2.1) and any deferred and prepaid expenses shown as assets on Target’s books at that time; and Target has no unamortized or unpaid organizational fees or expenses that have not previously been disclosed in writing to EQAT.
1.3. The Liabilities shall consist of all of Target’s liabilities, debts, obligations, and duties of whatever kind or nature existing at the Valuation Time, whether absolute, accrued, contingent, or otherwise, whether known or unknown, whether or not arising in the ordinary course of business, whether or not determinable at the Effective Time (as defined in paragraph 3.1), and whether or not specifically referred to herein, except expenses borne by FMG LLC pursuant to paragraph 7.2. Notwithstanding the foregoing, Target shall use its best efforts to discharge all its known liabilities, debts, obligations, and duties before the Effective Time.
1.4. If the dividends and/or other distributions Target has paid through the Effective Time for its current taxable year do not equal or exceed the sum of its (a) “investment company taxable income” (within the meaning of section 852(b)(2)), computed without regard to any deduction for dividends paid, plus (b) “net capital gain” (as defined in section 1222(11)), after reduction by any capital loss carryovers, for that year through that time, then at or as soon as practicable before that time, Target shall declare and pay to its shareholders of record one or more dividends and/or other distributions so that it will have distributed substantially all of that income and gain for all federal income tax periods ending at or before the Effective Time, and treating its current taxable year as ending at that time, such that Target will have no tax liability under section 852 for the current and any prior tax periods.
1.5. At the Effective Time (or as soon thereafter as is reasonably practicable), Target shall distribute the Acquiring Portfolio Shares it receives pursuant to paragraph 1.1(a) to the Separate Accounts for which AXA Equitable holds Target Shares of record at the Effective Time (each, a “Shareholder”), in proportion to their Target Shares then so held and in constructive exchange therefor, and shall completely liquidate. That distribution shall be accomplished by EQAT’s transfer agent’s opening accounts on Acquiring Portfolio’s shareholder records in the names of the Shareholders (except Shareholders in whose names accounts thereon already exist) and transferring those Acquiring Portfolio Shares to those newly opened and existing accounts.
A-2
Table of Contents
Pursuant to that transfer, each Shareholder’s account shall be credited with the respective pro rata number of full and fractional Acquiring Portfolio Shares due that Shareholder. The aggregate NAV of Acquiring Portfolio Shares to be so credited to each Shareholder’s account shall equal the aggregate NAV of the Target Shares that Shareholder holds at the Effective Time. All issued and outstanding Target Shares, including any represented by certificates, shall simultaneously be canceled on Target’s shareholder records. EQAT shall not issue certificates representing the Acquiring Portfolio Shares issued in connection with the Reorganization.
1.6. After the Effective Time, Target shall not conduct any business except in connection with its termination. As soon as reasonably practicable after distribution of the Acquiring Portfolio Shares pursuant to paragraph 1.5, all actions required to terminate Target as a series of VIP shall be taken — and in all events Target shall have been terminated as such within six months after the Effective Time — and VIP shall make all filings and take all other actions in connection therewith required by applicable law or necessary and proper to effect that termination.
1.7. Any reporting responsibility of Target to a public authority, including the responsibility for filing regulatory reports, tax returns, and other documents with the Securities and Exchange Commission (“Commission”), any state securities commission, any federal, state, and local tax authorities, and any other relevant regulatory authority, is and shall remain its responsibility up to and including the date on which it is terminated. In furtherance of the foregoing, after the Effective Time, except as otherwise agreed to by the Investment Companies, VIP shall prepare, or shall cause its agents to prepare, any federal, state, and local tax returns, including any Forms 1099, required to be filed by it with respect to Target’s final taxable year ending with its complete liquidation and for any prior periods or taxable years and shall cause those tax returns and Forms 1099 to be duly filed with the appropriate taxing authorities.
| 2. | VALUATION |
2.1. For purposes of paragraph 1.1(a), Target’s net value shall be (a) the value of the Assets computed immediately after the close of regular trading on the New York Stock Exchange and Target’s declaration of dividends and/or other distributions, if any, on the date of the Closing (“Valuation Time”), using the valuation procedures set forth in VIP’s then-current prospectus and statement of additional information (“Pro/SAI”) including Target and valuation procedures established by its Board (collectively, “Valuation Procedures”), less (b) the amount of the Liabilities at the Valuation Time.
2.2. For purposes of paragraph 1.1(a), the NAV per share of each class of Acquiring Portfolio Shares shall be computed at the Valuation Time, using EQAT’s Valuation Procedures.
2.3. All computations pursuant to paragraphs 2.1 and 2.2 shall be made (a) by FMG LLC, in its capacity as each Investment Company’s administrator, or (b) in the case of securities subject to fair valuation, in accordance with the respective Valuation Procedures.
| 3. | CLOSING AND EFFECTIVE TIME |
3.1. Unless the Investment Companies agree otherwise, all acts necessary to consummate the Reorganization (“Closing”) shall be deemed to occur simultaneously at the close of business (4:00 p.m., Eastern Time) on September 25, 2015, or a later date as to which they agree (“Effective Time��). If, at or immediately before the Valuation Time, (a) the New York Stock Exchange or another primary trading market for portfolio securities of either Portfolio (each, an “Exchange”) is closed to trading or trading thereon is restricted or (b) trading or the reporting of trading on an Exchange or elsewhere is disrupted, so that, in either Board’s judgment, accurate appraisal of the value of either Portfolio’s net assets and/or the NAV per Acquiring Portfolio Share is impracticable, the date of the Closing (and, therefore, the Valuation Time and the Effective Time) shall be postponed until the first business day on which that Exchange is open for regular trading after the day when that trading has been fully resumed and that reporting has been restored. The Closing shall be held at the Investment Companies’ offices or at another place as to which they agree.
A-3
Table of Contents
3.2. The Investment Companies shall direct the custodian of the Portfolios’ assets to deliver at the Closing a certificate of an authorized officer (“Certificate”) stating that (a) the Assets it holds will be transferred to Acquiring Portfolio at the Effective Time and (b) all necessary taxes in connection with the delivery of the Assets, including all applicable federal and state stock transfer stamps, if any, have been paid or provision for payment has been made.
3.3. VIP shall direct its transfer agent to deliver to EQAT at the Closing a Certificate stating that its records contain (a) the name, address, and taxpayer identification number of each Shareholder, (b) the number of full and fractional outstanding Target Shares each Shareholder owns, and (c) the dividend reinvestment elections, if any, applicable to each Shareholder, all at the Effective Time.
3.4. EQAT shall direct its transfer agent to deliver to VIP (a) at the Closing, a confirmation, or other evidence satisfactory to VIP, that the Acquiring Portfolio Shares to be issued to Target pursuant to paragraph 1.1(a) have been credited to Target’s account on Acquiring Portfolio’s shareholder records and (b) at or as soon as reasonably practicable after the Closing, a Certificate as to the opening of accounts on those records in the names of the Shareholders (except Shareholders in whose names accounts thereon already exist).
3.5. Each Investment Company shall deliver to the other at the Closing (a) a Certificate in form and substance satisfactory to the recipient and dated the Effective Time, to the effect that the representations and warranties it made herein are true and correct at the Effective Time except as they may be affected by the transactions contemplated hereby and (b) bills of sale, checks, assignments, share certificates, receipts, and/or other documents the other Investment Company or its counsel reasonably requests.
| 4. | REPRESENTATIONS AND WARRANTIES |
4.1. VIP, on Target’s behalf, represents and warrants to EQAT, on Acquiring Portfolio’s behalf, as follows:
4.1.1. VIP (a) is a statutory trust that is duly organized, validly existing, and in good standing under the laws of the State of Delaware (a “Delaware Statutory Trust”), and its Certificate of Trust has been duly filed in the office of the Secretary of State thereof, (b) is duly registered under the 1940 Act as an open-end management investment company, which registration is in full force and effect, and (c) has the power to own all its properties and assets and to carry on its business described in its current registration statement on Form N-1A;
4.1.2. Target is a duly established and designated series of VIP;
4.1.3. The execution, delivery, and performance hereof have been duly authorized at the date hereof by all necessary action on the part of VIP’s Board, which has made the determinations required by Rule 17a-8(a) under the 1940 Act; and this Agreement constitutes a valid and legally binding obligation of VIP, with respect to Target, enforceable in accordance with its terms, except as they may be limited by bankruptcy, insolvency, fraudulent transfer, reorganization, receivership, moratorium, and similar laws affecting the rights and remedies of creditors generally and by general principles of equity;
4.1.4. At the Effective Time, VIP, on Target’s behalf, will have good and marketable title to the Assets and full right, power, and authority to sell, assign, transfer, and deliver the Assets hereunder free of any liens or other encumbrances (except securities that are subject to “securities loans,” as referred to in section 851(b)(2), or are restricted to resale by their terms); and on delivery and payment for the Assets, EQAT, on Acquiring Portfolio’s behalf, will acquire good and marketable title thereto, subject to no restrictions on the full transfer thereof, including restrictions that might arise under the Securities Act of 1933, as amended (“1933 Act”);
4.1.5. VIP, with respect to Target, is not currently engaged in, and its execution, delivery, and performance hereof and consummation of the Reorganization will not result in, (a) a conflict with or material violation of any provision of Delaware law, VIP’s Agreement and Declaration of Trust, as amended
A-4
Table of Contents
(“VIP Declaration”), or Bylaws, or any agreement, indenture, instrument, contract, lease, or other undertaking (each, an “Undertaking”) to which VIP, with respect to Target or on its behalf, is a party or by which it is bound or (b) the acceleration of any obligation, or the imposition of any penalty, under any Undertaking, judgment, or decree to which VIP, with respect to Target or on its behalf, is a party or by which it is bound;
4.1.6. At or before the Effective Time, either (a) all material contracts and other commitments of or applicable to Target (other than this Agreement and certain investment contracts, including options, futures, forward contracts, and swap agreements) will terminate or (b) provision for discharge, and/or Acquiring Portfolio’s assumption, of any liabilities of Target thereunder will be made, without either Portfolio’s incurring any liability or penalty with respect thereto and without diminishing or releasing any rights VIP, on Target’s behalf, may have had with respect to actions taken or omitted or to be taken by any other party thereto before the Closing;
4.1.7. No litigation, administrative proceeding, action, or investigation of or before any court, governmental body, or arbitrator is presently pending or, to VIP’s knowledge, threatened against VIP, with respect to Target or any of its properties or assets attributable or allocable to Target, that, if adversely determined, would materially and adversely affect Target’s financial condition or the conduct of its business; and VIP, on Target’s behalf, knows of no facts that might form the basis for the institution of any such litigation, proceeding, action, or investigation and is not a party to or subject to the provisions of any order, decree, judgment, or award of any court, governmental body, or arbitrator that materially and adversely affects Target’s business or VIP’s ability to consummate the transactions contemplated hereby;
4.1.8. Target’s Statement of Assets and Liabilities, Portfolio of Investments, Statement of Operations, and Statement of Changes in Net Assets (each, a “Statement”) at and for the fiscal year (in the case of the last Statement, for the two fiscal years) ended December 31, 2014, have been audited by PricewaterhouseCoopers LLP, an independent registered public accounting firm (“PwC”), and are in accordance with generally accepted accounting principles consistently applied in the United States (“GAAP”); those Statements and Target’s unaudited Statements for the six months ended June 30, 2015 (copies of which VIP has furnished to EQAT), present fairly, in all material respects, Target’s financial condition at their respective dates in accordance with GAAP and the results of its operations and changes in its net assets for the periods then ended; and, to VIP’s management’s best knowledge and belief, there are no known contingent liabilities of Target required to be reflected on a balance sheet (including the notes thereto) in accordance with GAAP at those respective dates that are not disclosed therein;
4.1.9. Since December 31, 2014, there has not been any material adverse change in Target’s financial condition, assets, liabilities, or business, other than changes occurring in the ordinary course of business, or any incurrence by Target of indebtedness maturing more than one year from the date that indebtedness was incurred; for purposes of this representation and warranty, a decline in Target’s NAV due to declines in market values of securities Target holds, the discharge of Target’s liabilities, or the redemption of Target Shares by its shareholders will not constitute a material adverse change;
4.1.10. All federal, state, and local tax returns, dividend reporting forms, and other tax-related reports (collectively, “Returns”) of Target required by law to have been filed by the Effective Time (including any properly and timely filed extensions of time to file) will have been timely filed and are or will be correct in all material respects, and all federal and other taxes shown as due or required to be shown as due on those Returns will have been paid or provision will have been made for the payment thereof (except for amounts that alone or in the aggregate would not reasonably be expected to have a material adverse effect); to the best of VIP’s knowledge, no such Return is currently under audit and no assessment has been asserted with respect to those Returns; and Target (a) is in compliance in all material respects with all applicable Regulations pertaining to (1) the reporting of dividends and other distributions on and redemptions of its shares, (2) withholding in respect thereof, and (3) shareholder basis reporting, (b) has withheld in respect of dividends and other distributions and paid to the proper taxing authorities all taxes required to be withheld, and (c) is not liable for any material penalties that could be imposed thereunder;
A-5
Table of Contents
4.1.11. Target is not classified as a partnership, and instead is classified as an association that is taxable as a corporation, for federal tax purposes and either has elected the latter classification by filing Form 8832 with the Internal Revenue Service (“IRS”) or is a “publicly traded partnership” (as defined in section 7704(b)) that is treated as a corporation; Target is an “investment company” (as defined in section 368(a)(2)(F)(iii)) and a “fund” (as defined in section 851(g)(2), eligible for treatment under section 851(g)(1)); Target has elected to be a “regulated investment company” under Part I of Subchapter M of Chapter 1 of Subtitle A of the Code (“Subchapter M”) (“RIC”); for each taxable year of its operation (including the taxable year that will end at the Effective Time (“current year”)), Target has met (and for the current year will meet) the requirements of Subchapter M for qualification and treatment as a RIC and has been (and for the current year will be) eligible to and has computed (and for the current year will compute) its federal income tax under section 852; Target has declared and paid to its shareholders the dividend(s) and/or other distribution(s), if any, required to be declared and paid pursuant to paragraph 1.4; and Target has no earnings and profits accumulated in any taxable year in which the provisions of Subchapter M did not apply to it;
4.1.12. All issued and outstanding Target Shares are, and at the Effective Time will be, duly and validly issued and outstanding, fully paid, and non-assessable by VIP and have been offered and sold in every state and the District of Columbia in compliance in all material respects with applicable registration requirements of the 1933 Act and state securities laws; all issued and outstanding Target Shares will, at the Effective Time, be held by the persons and in the amounts set forth on Target’s shareholder records (as provided in the Certificate to be delivered pursuant to paragraph 3.3); and Target does not have outstanding any options, warrants, or other rights to subscribe for or purchase any Target Shares, nor are there outstanding any securities convertible into any Target Shares;
4.1.13. On the effective date of the Registration Statement (as defined in paragraph 4.3.1), at the time of the Shareholders Meeting (as defined in paragraph 5.2), and at the Effective Time, VIP’s Pro/SAI including Target will (a) conform in all material respects to the applicable requirements of the 1933 Act and the 1940 Act and the rules and regulations of the Commission thereunder and (b) not contain any untrue statement of a material fact or omit to state a material fact required to be stated therein or necessary to make the statements therein, in light of the circumstances under which they were made, not misleading;
4.1.14. The information to be furnished by VIP for use in no-action letters, applications for orders, the Registration Statement, and other documents filed or to be filed with any federal, state, or local regulatory authority (including the Financial Industry Regulatory Authority, Inc. (“FINRA”)) that may be necessary in connection with the transactions contemplated hereby will be accurate and complete in all material respects, will comply in all material respects with federal securities laws and other laws and regulations, and will not contain any untrue statement of a material fact or omit to state a material fact required to be stated therein or necessary to make the statements therein, in light of the circumstances under which they were made, not misleading;
4.1.15. The Acquiring Portfolio Shares to be delivered to Target hereunder are not being acquired for the purpose of making any distribution thereof, other than in accordance with the terms hereof; and
4.1.16. The VIP Declaration permits VIP to vary its shareholders’ investment. VIP does not have a fixed pool of assets — each series thereof (including Target) is a managed portfolio of securities, and FMG LLC and each investment sub-adviser thereof, if any, have the authority to buy and sell securities for it.
4.2. EQAT, on Acquiring Portfolio’s behalf, represents and warrants to VIP, on Target’s behalf, as follows:
4.2.1. EQAT (a) is a Delaware Statutory Trust, and its Certificate of Trust has been duly filed in the office of the Secretary of State of Delaware, (b) is duly registered under the 1940 Act as an open-end management investment company, which registration is in full force and effect, and (c) has the power to own all its properties and assets and to carry on its business described in its current registration statement on Form N-1A;
A-6
Table of Contents
4.2.2. Acquiring Portfolio is a duly established and designated series of EQAT;
4.2.3. The execution, delivery, and performance hereof have been duly authorized at the date hereof by all necessary action on the part of EQAT’s Board, which has made the determinations required by Rule 17a-8(a) under the 1940 Act; and this Agreement constitutes a valid and legally binding obligation of EQAT, with respect to Acquiring Portfolio, enforceable in accordance with its terms, except as they may be limited by bankruptcy, insolvency, fraudulent transfer, reorganization, receivership, moratorium, and similar laws affecting the rights and remedies of creditors generally and general principles of equity;
4.2.4. No consideration other than Acquiring Portfolio Shares (and Acquiring Portfolio’s assumption of the Liabilities) will be issued in exchange for the Assets in the Reorganization;
4.2.5. EQAT, with respect to Acquiring Portfolio, is not currently engaged in, and its execution, delivery, and performance hereof and consummation of the Reorganization will not result in, (a) a conflict with or material violation of any provision of Delaware law, EQAT’s Amended and Restated Agreement and Declaration of Trust, as amended (“EQAT Declaration”), or Bylaws, or any Undertaking to which EQAT, with respect to Acquiring Portfolio or on its behalf, is a party or by which it is bound or (b) the acceleration of any obligation, or the imposition of any penalty, under any Undertaking, judgment, or decree to which EQAT, with respect to Acquiring Portfolio or on its behalf, is a party or by which it is bound;
4.2.6. No litigation, administrative proceeding, action, or investigation of or before any court, governmental body, or arbitrator is presently pending or, to EQAT’s knowledge, threatened against EQAT, with respect to Acquiring Portfolio or any of its properties or assets attributable or allocable to Acquiring Portfolio, that, if adversely determined, would materially and adversely affect Acquiring Portfolio’s financial condition or the conduct of its business; and EQAT, on Acquiring Portfolio’s behalf, knows of no facts that might form the basis for the institution of any such litigation, proceeding, action, or investigation and is not a party to or subject to the provisions of any order, decree, judgment, or award of any court, governmental body, or arbitrator that materially and adversely affects Acquiring Portfolio’s business or EQAT’s ability to consummate the transactions contemplated hereby;
4.2.7. Acquiring Portfolio’s Statements at and for the fiscal year (in the case of the Statement of Changes in Net Assets, for the two fiscal years) ended December 31, 2014, have been audited by PwC and are in accordance with GAAP; those Statements and Acquiring Portfolio’s unaudited Statements for the six months ended June 30, 2015 (copies of which EQAT has furnished to VIP), present fairly, in all material respects, Acquiring Portfolio’s financial condition at their respective dates in accordance with GAAP and the results of its operations and changes in its net assets for the periods then ended; and, to EQAT’s management’s best knowledge and belief, there are no known contingent liabilities of Acquiring Portfolio required to be reflected on a balance sheet (including the notes thereto) in accordance with GAAP at those respective dates that are not disclosed therein;
4.2.8. Since December 31, 2014, there has not been any material adverse change in Acquiring Portfolio’s financial condition, assets, liabilities, or business, other than changes occurring in the ordinary course of business, or any incurrence by Acquiring Portfolio of indebtedness maturing more than one year from the date that indebtedness was incurred; for purposes of this representation and warranty, a decline in Acquiring Portfolio’s NAV due to declines in market values of securities Acquiring Portfolio holds, the discharge of Acquiring Portfolio’s liabilities, or the redemption of Acquiring Portfolio Shares by its shareholders will not constitute a material adverse change;
4.2.9. All Returns of Acquiring Portfolio required by law to have been filed by the Effective Time (including any properly and timely filed extensions of time to file) will have been timely filed and are or will be correct in all material respects, and all federal and other taxes shown as due or required to be shown as due on those Returns will have been paid or provision will have been made for the payment thereof except for amounts that alone or in the aggregate would not reasonably be expected to have a material adverse effect; to the best of EQAT’s knowledge, no such Return is currently under audit and no assessment has been asserted with respect to those Returns; and Acquiring Portfolio (a) is in compliance in all material
A-7
Table of Contents
respects with all applicable Regulations pertaining to (1) the reporting of dividends and other distributions on and redemptions of its shares, (2) withholding in respect thereof, and (3) shareholder basis reporting, (b) has withheld in respect of dividends and other distributions and paid to the proper taxing authorities all taxes required to be withheld, and (c) is not liable for any material penalties that could be imposed thereunder;
4.2.10. Acquiring Portfolio is not classified as a partnership, and instead is classified as an association that is taxable as a corporation, for federal tax purposes and either has elected the latter classification by filing Form 8832 with the IRS or is a “publicly traded partnership” (as defined in section 7704(b)) that is treated as a corporation; Acquiring Portfolio is an “investment company” (as defined in section 368(a)(2)(F)(iii)) and a “fund” (as defined in section 851(g)(2), eligible for treatment under section 851(g)(1)); Acquiring Portfolio has elected to be a RIC; for each taxable year of its operation (including the taxable year that includes the Effective Time (“current year”)), Acquiring Portfolio has met (and for the current year will meet) the requirements of Subchapter M for qualification and treatment as a RIC and has been (and for the current year will be) eligible to and has computed (and for the current year will compute) its federal income tax under section 852; Acquiring Portfolio will continue to meet all those requirements for the current year and intends to continue to do so, and to continue to be eligible to and to so compute its federal income tax, for succeeding taxable years; and Acquiring Portfolio has no earnings and profits accumulated in any taxable year in which the provisions of Subchapter M did not apply to it;
4.2.11. All issued and outstanding Acquiring Portfolio Shares are, and at the Effective Time will be, duly and validly issued and outstanding, fully paid, and non-assessable by EQAT and have been offered and sold in every state and the District of Columbia in compliance in all material respects with applicable registration requirements of the 1933 Act and state securities laws; Acquiring Portfolio does not have outstanding any options, warrants, or other rights to subscribe for or purchase any Acquiring Portfolio Shares, nor are there outstanding any securities convertible into any Acquiring Portfolio Shares; and the Acquiring Portfolio Shares to be issued and delivered to Target, for the Shareholders’ accounts, pursuant to the terms hereof, (a) will have been duly authorized by EQAT and duly registered under the federal securities laws (and appropriate notices respecting them will have been duly filed under applicable state securities laws) at the Effective Time and (b) when so issued and delivered, will be duly and validly issued and outstanding Acquiring Portfolio Shares, fully paid and non-assessable by EQAT;
4.2.12. On the effective date of the Registration Statement, at the time of the Shareholders Meeting, and at the Effective Time, (a) EQAT’s Pro/SAI including Acquiring Portfolio will conform in all material respects to the applicable requirements of the 1933 Act and the 1940 Act and the rules and regulations of the Commission thereunder and (b) that Pro/SAI and the prospectus included in the Registration Statement will not contain any untrue statement of a material fact or omit to state a material fact required to be stated therein or necessary to make the statements therein, in light of the circumstances under which they were made, not misleading; provided that the foregoing will not apply to statements in or omissions from that prospectus made in reliance on and in conformity with information furnished by VIP for use therein;
4.2.13. The information to be furnished by EQAT for use in no-action letters, applications for orders, the Registration Statement, and other documents filed or to be filed with any federal, state, or local regulatory authority (including FINRA) that may be necessary in connection with the transactions contemplated hereby will be accurate and complete in all material respects, will comply in all material respects with federal securities laws and other laws and regulations, and will not contain any untrue statement of a material fact or omit to state a material fact required to be stated therein or necessary to make the statements therein, in light of the circumstances under which they were made, not misleading; and
4.2.14. The EQAT Declaration permits EQAT to vary its shareholders’ investment. EQAT does not have a fixed pool of assets — each series thereof (including Acquiring Portfolio) is a managed portfolio of securities, and FMG LLC and each investment sub-adviser thereof have the authority to buy and sell securities for it.
A-8
Table of Contents
4.3. Each Investment Company, on its Portfolio’s behalf, represents and warrants to the other Investment Company, on its Portfolio’s behalf, as follows:
4.3.1. No governmental consents, approvals, or authorizations (collectively, “consents”) or filings are required under the 1933 Act, the Securities Exchange Act of 1934, as amended, the 1940 Act, or state securities laws, and no consents or orders of any court are required, for its execution, delivery, and performance hereof on its Portfolio’s behalf, except for (a) EQAT’s filing with the Commission of (1) a registration statement on Form N-14 relating to the Acquiring Portfolio Shares issuable hereunder, and any supplement or amendment thereto, including therein a prospectus and proxy statement (“Registration Statement”), and (2) a post-effective amendment to EQAT’s registration statement on Form N-1A and (b) consents, filings, and orders that have been made or received or may be required after the Effective Time;
4.3.2. The fair market value of the Acquiring Portfolio Shares each Shareholder receives will be approximately equal to the fair market value of its Target Shares it actually or constructively surrenders in exchange therefor;
4.3.3. There will be no dissenters to the Reorganization under the applicable provisions of Delaware law, and Acquiring Portfolio will not pay cash in lieu of fractional Acquiring Portfolio Shares in connection with the Reorganization; and
4.3.4. The principal purpose of Acquiring Portfolio’s assumption of the Liabilities is not avoidance of federal income tax on the transaction.
| 5. | COVENANTS |
5.1. Each Investment Company covenants to operate its Portfolio’s business in the ordinary course between the date hereof and the Closing, it being understood that:
(a) such ordinary course will include declaring and paying customary dividends and other distributions and changes in operations contemplated by each Portfolio’s normal business activities; and
(b) each Portfolio will retain exclusive control of the composition of its portfolio until the Closing.
5.2. VIP covenants to call and hold a meeting of Target’s shareholders to consider and act on this Agreement and to take all other action necessary to obtain approval of the transactions contemplated hereby (“Shareholders Meeting”).
5.3. VIP covenants that it will assist EQAT in obtaining information EQAT reasonably requests concerning the beneficial ownership of Target Shares.
5.4. VIP covenants that it will turn over its books and records regarding Target (including all tax books and records and all books and records required to be maintained under the 1940 Act and the rules and regulations thereunder) to EQAT at the Closing.
5.5. Each Investment Company covenants to cooperate with the other in preparing the Registration Statement in compliance with applicable federal and state securities laws.
5.6. Each Investment Company covenants that it will, from time to time, as and when requested by the other Investment Company, execute and deliver or cause to be executed and delivered all assignments and other instruments, and will take or cause to be taken all further action, the other Investment Company deems necessary or desirable in order to vest in, and confirm to, (a) EQAT, on Acquiring Portfolio’s behalf, title to and possession of all the Assets, and (b) VIP, on Target’s behalf, title to and possession of the Acquiring Portfolio Shares to be delivered hereunder, and otherwise to carry out the intent and purpose hereof.
A-9
Table of Contents
5.7. EQAT covenants to use all reasonable efforts to obtain the consents required by the 1933 Act, the 1940 Act, and applicable state securities laws it deems appropriate to continue Acquiring Portfolio’s operations after the Effective Time.
5.8. VIP covenants to distribute all the Acquiring Portfolio Shares it receives in the Reorganization to the Shareholders in complete liquidation of Target.
5.9. Subject to this Agreement, each Investment Company covenants to take or cause to be taken all actions, and to do or cause to be done all things, reasonably necessary, proper, or advisable to consummate and effectuate the transactions contemplated hereby.
| 6. | CONDITIONS PRECEDENT |
Each Investment Company’s obligations hereunder shall be subject to (a) the other Investment Company’s performance of all its obligations to be performed hereunder at or before the Closing, (b) all representations and warranties of the other Investment Company contained herein being true and correct in all material respects at the date hereof and, except as they may be affected by the transactions contemplated hereby, at the Effective Time, with the same force and effect as if made at that time, and (c) the following further conditions that, at or before that time:
6.1. This Agreement and the transactions contemplated hereby shall have been duly adopted and approved by both Boards and by Target’s shareholders at the Shareholders Meeting (including any adjournments or postponements thereof);
6.2. All necessary filings shall have been made with the Commission and state securities authorities, and no order or directive shall have been received that any other or further action is required to permit the Investment Companies to carry out the transactions contemplated hereby; the Registration Statement shall have become effective under the 1933 Act, no stop orders suspending the effectiveness thereof shall have been issued, and, to each Investment Company’s best knowledge, no investigation or proceeding for that purpose shall have been instituted or shall be pending, threatened, or contemplated under the 1933 Act or the 1940 Act; the Commission shall not have issued an unfavorable report with respect to the Reorganization under section 25(b) of the 1940 Act nor instituted any proceedings seeking to enjoin consummation of the transactions contemplated hereby under section 25(c) of the 1940 Act; and all consents, orders, and permits of federal, state, and local regulatory authorities (including the Commission and state securities authorities) either Investment Company deems necessary to permit consummation, in all material respects, of the transactions contemplated hereby shall have been obtained, except where failure to obtain same would not involve a risk of a material adverse effect on either Portfolio’s assets or properties, provided that either Investment Company may for itself waive any of those conditions;
6.3. At the Effective Time, no action, suit, or other proceeding shall be pending (or, to either Investment Company’s best knowledge, threatened to be commenced) before any court, governmental agency, or arbitrator in which it is sought to enjoin the performance of, restrain, prohibit, affect the enforceability of, or obtain damages or other relief in connection with, the transactions contemplated hereby;
6.4. EQAT, on Acquiring Portfolio’s behalf, shall have executed and delivered at or before the Closing a Certificate confirming that EQAT, on Acquiring Portfolio’s behalf, assumes all of the Liabilities; and
6.5. At any time before the Closing, either Investment Company may waive any of the foregoing conditions (except that set forth in paragraph 6.1) if, in the judgment of its Board, that waiver will not have a material adverse effect on its Portfolio’s shareholders’ interests.
A-10
Table of Contents
| 7. | BROKERAGE FEES AND EXPENSES |
7.1. Each Investment Company represents and warrants to the other that there are no brokers or finders entitled to receive any payments in connection with the transactions provided for herein.
7.2. FMG LLC shall bear all the expenses of the Reorganization, except that (a) all brokerage costs incurred in connection with the Reorganization shall be borne by the Portfolio that directly incurs them and (b) expenses shall be paid by the Portfolio directly incurring them if and to the extent that the payment thereof by another person would result in that Portfolio’s disqualification as a RIC.
| 8. | ENTIRE AGREEMENT; NO SURVIVAL |
Neither Investment Company has made any representation, warranty, or covenant not set forth herein, and this Agreement constitutes the entire agreement between the Investment Companies. The representations, warranties, and covenants contained herein or in any document delivered pursuant hereto or in connection herewith shall not survive the Closing (except to the extent provided in paragraph 6.4).
| 9. | TERMINATION OF AGREEMENT |
This Agreement may be terminated at any time at or before the Closing:
9.1. By either Investment Company (a) in the event of the other Investment Company’s material breach of any representation, warranty, or covenant contained herein to be performed at or before the Closing, (b) if a condition to its obligations has not been met and it reasonably appears that that condition will not or cannot be met, (c) if a governmental body issues an order, decree, or ruling having the effect of permanently enjoining, restraining, or otherwise prohibiting consummation of the Reorganization, or (d) if the Closing has not occurred on or before December 31, 2015, or another date to which the Investment Companies agree; or
9.2. By the Investment Companies’ mutual agreement.
In the event of termination under paragraphs 9.1(c) or (d) or 9.2, neither Investment Company (nor its trustees, officers, or shareholders) shall have any liability to the other Investment Company.
| 10. | AMENDMENTS |
The Investment Companies may amend, modify, or supplement this Agreement at any time in any manner they mutually agree on in writing, notwithstanding Target’s shareholders’ approval hereof; provided that, following that approval, no such amendment, modification, or supplement shall have a material adverse effect on the Shareholders’ interests.
| 11. | MISCELLANEOUS |
11.1. This Agreement shall be governed by and construed in accordance with the internal laws of the State of Delaware, without giving effect to principles of conflicts of laws; provided that, in the case of any conflict between those laws and the federal securities laws, the latter shall govern.
11.2. Nothing expressed or implied herein is intended or shall be construed to confer on or give any person, firm, trust, or corporation other than each Investment Company (on its Portfolio’s behalf) and their respective successors and assigns any rights or remedies under or by reason hereof.
11.3 Notice is hereby given that this instrument is executed and delivered on behalf of each Investment Company’s trustees solely in their capacities as trustees, and not individually, and that each Investment
A-11
Table of Contents
Company’s obligations under this instrument are not binding on or enforceable against any of its trustees, officers, shareholders, or series other than its Portfolio but are only binding on and enforceable against its property attributable to and held for the benefit of its Portfolio (“Portfolio’s Property”) and not its property attributable to and held for the benefit of any other series thereof. Each Investment Company, in asserting any rights or claims hereunder on its or its Portfolio’s behalf, shall look only to the other Portfolio’s Property in settlement of those rights or claims and not to the property of any other series of the other Investment Company or to those trustees, officers, or shareholders.
11.4 Any term or provision hereof that is invalid or unenforceable in any jurisdiction shall, as to that jurisdiction, be ineffective to the extent of that invalidity or unenforceability without rendering invalid or unenforceable the remaining terms and provisions hereof or affecting the validity or enforceability of any of the terms and provisions hereof in any other jurisdiction.
11.5. This Agreement may be executed in one or more counterparts, all of which shall be considered one and the same agreement, and shall become effective when one or more counterparts have been executed by each Investment Company and delivered to the other Investment Company. The headings contained herein are for reference purposes only and shall not affect in any way the meaning or interpretation hereof.
[Signatures on following page]
A-12
Table of Contents
IN WITNESS WHEREOF, each party has caused this Agreement to be executed and delivered by its duly authorized officer as of the day and year first written above.
| EQ ADVISORS TRUST, on behalf of its series listed on Schedule A | ||
| By: |
| |
| Name: | Steven M. Joenk | |
| Title: | President and Chief Executive Officer | |
| AXA PREMIER VIP TRUST, on behalf of its series listed on Schedule A | ||
| By: |
| |
| Name: | Brian E. Walsh | |
| Title: | Chief Financial Officer | |
A-13
Table of Contents
SCHEDULE A
TARGETS | ACQUIRING PORTFOLIOS | |
| (series of VIP) | (series of EQAT) | |
| CharterSM Equity Portfolio | EQ/Common Stock Index Portfolio | |
| CharterSM Fixed Income Portfolio | EQ/Core Bond Index Portfolio | |
Table of Contents
MORE INFORMATION ON STRATEGIES AND RISK FACTORS
Strategies
Changes in Investment Objectives and Principal Investment Strategies
Each Portfolio has its own investment objective(s), policies and strategies. There is no assurance that a Portfolio will achieve its investment objective. The investment objective of each Portfolio may be changed without shareholder approval. Except as otherwise noted, the investment policies and strategies of a Portfolio are not fundamental policies and may be changed without a shareholder vote. In addition, to the extent a Portfolio is new or is undergoing a transition (such as a rebalancing, or experiences large inflows or outflows) or takes a temporary defensive position, it may not be pursuing its investment objective or executing its principal investment strategies.
80% Policies
Each Portfolio has a policy that it will invest at least 80% of its net assets, plus borrowings for investment purposes, in a particular type of investment connoted by its name. Each such policy is subject to change only upon at least sixty (60) days prior notice to shareholders of the affected Portfolio.
Indexing Strategy
Each Acquiring Portfolio seeks to track the total return performance (before fees and expenses) of a particular index. The Sub-Adviser to each Acquiring Portfolio seeks to track the total return performance (before fees and expenses) of a particular index and does not utilize customary economic, financial or market analyses or other traditional investment techniques to manage the Portfolio. Rather, the Sub-Adviser employs a sampling technique in seeking to track the total return performance (before fees and expenses) of the index. A sampling technique strives to match the characteristics of a particular index without having to purchase every stock in that index by selecting a representative sample of securities for the Portfolio based on the characteristics of the index and the particular securities included therein. Such characteristics may include, with respect to equity indexes, industry weightings, market capitalizations and fundamental characteristics and, with respect to fixed income indexes, interest rate sensitivity, credit quality and sector diversification.
Underlying Portfolios and ETFs
The Acquired Portfolios invest primarily in securities issued by other investment companies (“Underlying Portfolio(s)”) and ETFs (“Underlying ETF(s)”). Accordingly, an Acquired Portfolio’s performance depends upon a favorable allocation by the Manager among the Underlying Portfolios and the Underlying ETFs as well as the ability of the Underlying Portfolios and Underlying ETFs to generate favorable performance. The Underlying Portfolios are other mutual funds that are managed by the
B-1
Table of Contents
Manager and sub-advised by one or more investment sub-advisers, which may include affiliates of the Manager, and other investment companies (including open-end and closed-end investment companies) that are managed by investment managers other than the Manager. ETFs are investment companies or other investment vehicles whose shares are listed and traded on U.S. stock exchanges or otherwise traded in the over-the-counter market and may be purchased and sold throughout the trading day based on their market price. A passively-managed ETF seeks to track a securities index or a basket of securities that an “index provider” (such as Standard & Poor’s, Russell or Morgan Stanley Capital International (“MSCI”)) selects as representative of a market, market segment, industry sector, country or geographic region. A passively managed ETF generally holds the same stocks, bonds or other instruments as the index it tracks (or it may hold a representative sample of such instruments). Accordingly, such an ETF is designed so that its performance will correspond closely with that of the index it tracks.
Each Acquired Portfolio has target investment percentages (an approximate percentage of the Acquired Portfolio’s assets invested in a particular asset category as represented by the primary holdings, as described in the prospectuses, of the Underlying Portfolios and Underlying ETFs).
Generally, each Acquired Portfolio’s investments in other investment companies are subject to statutory limitations in the 1940 Act, which prohibit the acquisition of shares of other investment companies in excess of certain limits. However, there are statutory and regulatory exemptions from these restrictions under the 1940 Act on which the Acquired Portfolio rely to invest in other investment companies in excess of these limits, subject to certain conditions. In addition, many ETFs have obtained exemptive relief from the SEC to permit unaffiliated funds (such as the Acquired Portfolios) to invest in their shares beyond the statutory limits, subject to certain conditions and pursuant to contractual arrangements between the ETFs and the investing funds. The Acquired Portfolios rely on these exemptive orders in investing in ETFs.
Additional Strategies
The following provides additional information regarding the principal investment strategies discussed in “Comparison of Investment Objectives, Policies and Strategies,” in the Proxy Statement/Prospectus and additional investment strategies that a Portfolio may employ in pursuing its investment objective. The Portfolios may make other types of investments to the extent permitted by applicable law. For further information about investment strategies, please see each Portfolio’s respective Statement of Additional Information.
Acquired Portfolios
Cash and Short-Term Investments. An Acquired Portfolio may hold cash or invest in short-term paper and other short-term investments (instead of being allocated to an Underlying Portfolio or Underlying ETF) as deemed appropriate by the Manager. Short-term paper generally includes any note, draft bill of exchange or banker’s acceptance payable on demand or having a maturity at the time of issuance that does
B-2
Table of Contents
not exceed nine months or any renewal thereof payable on demand or having a maturity that is likewise limited. An Acquired Portfolio also may invest its uninvested cash in high-quality, short-term debt securities, including repurchase agreements and high-quality money market instruments, and also may invest uninvested cash in money market funds, including money market funds managed by the Manager. To the extent an Acquired Portfolio invests in a money market fund, it generally is not subject to the limits placed on investments in other investment companies by the 1940 Act. Generally, these securities offer less potential for gains than other types of securities.
Non-Traditional (Alternative) Investments. Non-traditional (alternative) investments are alternatives to traditional equity (stocks) or fixed income (bonds and cash) investments. Non-traditional (alternative) investments have the potential to enhance portfolio diversification and reduce overall portfolio volatility because these investments may not have a strong correlation (relationship) to one another or to traditional market indexes. Non-traditional (alternative) investments use a different approach to investing than do traditional investments. This approach may involve, for example, seeking excess returns that are not tied to traditional investment benchmarks (absolute return); taking both long and short positions in credit-sensitive securities (e.g., long/short credit); holding private securities instead of publicly traded securities (e.g., listed private equity); taking both long and short positions in futures contracts (e.g., managed futures); seeking to benefit from price movements caused by anticipated corporate events, such as mergers, acquisitions, or other special situations (e.g., merger arbitrage); or using derivatives or hedging strategies. This approach also may involve investing in a variety of non-traditional (alternative) strategies (e.g., multi strategies). Many non-traditional (alternative) investment strategies are designed to help reduce the role of overall market direction in determining return.
Portfolio Turnover. The Acquired Portfolios do not restrict the frequency of trading to limit expenses. An Acquired Portfolio may engage in active and frequent trading of portfolio securities to achieve its investment objectives. Frequent trading can result in a portfolio turnover in excess of 100% (high portfolio turnover).
Temporary Defensive Investments. For temporary defensive purposes in response to adverse market, economic, political or other conditions, an Acquired Portfolio may invest, without limit, in cash, money market instruments or high quality short-term debt securities, including repurchase agreements. To the extent an Acquired Portfolio is invested in these instruments, the Acquired Portfolio will not be pursuing its principal investment strategies and may not achieve its investment objective. In addition, an Acquired Portfolio may deviate from its asset allocation targets and target investment percentages for defensive purposes.
U.S. Government Securities. An Acquired Portfolio may invest in U.S. government securities, which include direct obligations of the U.S. Treasury (such as Treasury bills, notes or bonds) and obligations issued or guaranteed as to principal and interest (but not as to market value) by the U.S. government, its agencies or its instrumentalities. U.S. government securities include mortgage-backed securities issued or guaranteed by government agencies or government-sponsored enterprises. Other
B-3
Table of Contents
U.S. government securities may be backed by the full faith and credit of the U.S. government or supported primarily or solely by the creditworthiness of the government-related issuer or, in the case of mortgage-backed securities, by pools of assets.
In August 2011, S&P downgraded its long-term sovereign credit rating on the U.S. from “AAA” to “AA+”. This development, and the government’s credit concerns in general, could cause an increase in interest rates and borrowing costs, which may negatively impact both the perception of credit risk associated with the debt securities issued by the U.S. and the country’s ability to access the debt markets on favorable terms. In addition, credit concerns could create broader financial turmoil and uncertainty, which could increase volatility in both stock and bond markets. These events could result in significant adverse impacts on issuers of securities held by a Portfolio.
Acquiring Portfolios
Bank Loans. A Portfolio may invest in bank loans. A bank loan represents an interest in a loan or other direct indebtedness that entitles the acquirer of such interest to payments of interest, principal and/or other amounts due under the structure of the loan. A Portfolio may acquire a bank loan through a participation interest, which gives the Portfolio the right to receive payments of principal, interest and/or other amounts only from the lender selling the participation interest and only when the lender receives the payments from the borrower, or through an assignment in which a Portfolio succeeds to the rights of the assigning lender and becomes a lender under the loan agreement. Bank loans are typically borrowers’ senior debt obligations and, as such, are considered to hold a senior position in the borrower’s capital structure. The senior capital structure position generally gives the holders of bank loans a priority claim on some or all of the borrower’s assets in the event of a default. In many situations, the assets or cash flow of the borrowing corporation, partnership or other business entity may serve as collateral for the bank loan. Bank loans may be issued in connection with acquisitions, refinancings and recapitalizations.
Cash Management. Each Portfolio may invest its uninvested cash in high-quality, short-term debt securities, including repurchase agreements and high-quality money market instruments, and also may invest uninvested cash in money market funds, including money market funds managed by the Manager. To the extent a Portfolio invests in a money market fund, it generally is not subject to the limits placed on investments in other investment companies. Generally, these securities offer less potential for gains than other types of securities.
Derivatives. Each Portfolio may use “derivative” instruments to hedge its portfolio against market, economic, currency, issuer and other risks, to gain or manage exposure to the markets, sectors and securities in which the Portfolio may invest and to other economic factors that affect the Portfolio’s performance (such as interest rate movements), to increase total return or income, to reduce transaction costs, to manage cash, and for other portfolio management purposes. In general terms, a derivative instrument is an investment contract the value of which is linked to (or is derived from),
B-4
Table of Contents
in whole or in part, the value of an underlying asset, reference rate or index (e.g., stocks, bonds, commodities, currencies, interest rates and market indexes). Certain derivative securities may have the effect of creating financial leverage by multiplying a change in the value of the asset underlying the derivative to produce a greater change in the value of the derivative security. This creates an opportunity for increased return but, at the same time, creates the possibility for greater loss (including the likelihood of greater volatility in the net asset value of the shares of a Portfolio). Futures and options contracts (including futures and options on individual securities and equity and bond market indexes and options on futures contracts), swaps (including interest rate swaps, total return swaps, currency swaps and credit default swaps) and forward contracts, and structured securities, including forward currency contracts, are examples of derivatives in which a Portfolio may invest. A Portfolio that engages in derivatives transactions may maintain a significant percentage of its assets in cash and cash equivalent instruments, which may serve as margin or collateral for the Portfolio’s obligations under derivative transactions.
Equity Securities. Certain Portfolios, including certain Portfolios that invest primarily in debt securities, may invest in equity securities. Equity securities may be bought on stock exchanges or in the over-the-counter market. Equity securities generally include common stock, preferred stock, warrants, securities convertible into common stock, securities of other investment companies and securities of real estate investment trusts.
Exchange Traded Funds. A Portfolio may invest in ETFs. ETFs are investment companies or other investment vehicles whose shares are listed and traded on U.S. stock exchanges or otherwise traded in the over-the-counter market and may be purchased and sold throughout the trading day based on their market price. Generally, each ETF seeks to track a securities index or a basket of securities that an “index provider” (such as Standard & Poor’s, Dow Jones, Russell or Morgan Stanley Capital International) selects as representative of a market, market segment, industry sector, country or geographic region. An ETF generally holds the same stocks or bonds as the index it tracks (or it may hold a representative sample of such securities). Accordingly, each ETF is designed so that its performance, before fees and expenses, will correspond closely with that of the index it tracks. By investing in a Portfolio that invests in ETFs, you will indirectly bear fees and expenses charged by the ETFs in which the Portfolio invests in addition to the Portfolio’s direct fees and expenses.
Generally, a Portfolio’s investments in other investment companies are subject to statutory limitations in the Investment Company Act of 1940, as amended (“1940 Act”), including in certain circumstances a prohibition against acquiring shares of another investment company if, immediately after such acquisition, the Portfolio and its affiliated persons (i) would hold more than 3% of such other investment company’s total outstanding shares, (ii) would have invested more than 5% of its total assets in such other investment company, or (iii) would have invested more than 10% of its total assets in investment companies. However, many ETFs have obtained exemptive relief from the SEC to permit other investment companies (such as the Portfolios) to invest
B-5
Table of Contents
in their shares beyond the statutory limits, subject to certain conditions and pursuant to contractual arrangements between the ETFs and the investing funds. A Portfolio may rely on these exemptive orders in investing in ETFs.
Fixed Income Securities. Each Portfolio may invest in short- and long-term fixed income securities in pursuing its investment objective and for other portfolio management purposes, such as to manage cash. Fixed income securities are debt securities such as bonds, notes, debentures and commercial paper. Domestic and foreign governments, banks and companies raise cash by issuing or selling debt securities to investors. Most debt securities pay fixed or adjustable rates of interest at regular intervals until they mature, at which point investors receive their principal back.
Foreign Securities. Certain Portfolios may invest in foreign securities, including securities of companies in emerging markets. Generally, foreign securities are issued by companies organized outside the U.S. or by foreign governments or international organizations, are traded primarily in markets outside the U.S., and are denominated in a foreign currency. Foreign securities may include securities of issuers in developing countries or emerging markets, which generally involve greater risk because the economic structures of these countries and markets are less developed and their political systems are less stable. In addition, foreign securities may include depositary receipts of foreign companies. American Depositary Receipts are receipts typically issued by an American bank or trust company that evidence underlying securities issued by a foreign corporation. European Depositary Receipts (issued in Europe) and Global Depositary Receipts (issued throughout the world) each evidence a similar ownership arrangement. Depositary receipts also may be convertible into securities of foreign issuers. These securities may not necessarily be denominated in the same currency as the securities into which they may be converted.
Futures. A Portfolio may purchase or sell futures contracts on individual securities or securities indexes. In purchasing a futures contract, the buyer agrees to purchase a specified underlying instrument at a specified future date. In selling a futures contract, the seller agrees to sell a specified underlying instrument at a specified future date. The price at which the purchase and sale will take place is fixed when the buyer and seller enter into the contract. Futures can be held until their delivery dates, or can be closed out before then if a liquid market is available. The value of a futures contract tends to increase and decrease in tandem with the value of its underlying instrument. Therefore, purchasing futures contracts will tend to increase a fund’s exposure to positive and negative price fluctuations in the underlying instrument, much as if it had purchased the underlying instrument directly. When a fund sells a futures contract, by contrast, the value of its futures position will tend to move in a direction contrary to the market. Selling futures contracts, therefore, will tend to offset both positive and negative market price changes, much as if the underlying instrument had been sold. Futures contracts in which the Portfolio will invest are highly standardized contracts that typically trade on futures exchanges.
There is no assurance that a liquid market will exist for any particular futures contract at any particular time. Exchanges may establish daily price fluctuation limits
B-6
Table of Contents
for futures contracts, and may halt trading if a contract’s price moves upward or downward more than the limit in a given day. On volatile trading days when the price fluctuation limit is reached or a trading halt is imposed, it may be impossible to enter into new positions or close out existing positions. If the market for a contract is not liquid because of price fluctuation limits or other market conditions, it could prevent prompt liquidation of unfavorable positions, and potentially could require a fund to continue to hold a position until delivery or expiration regardless of changes in its value. As a result, a fund’s access to other assets held to cover its futures positions could also be impaired.
The use of futures contracts and similar instruments may be deemed to involve the use of leverage because the Portfolio is not required to invest the full market value of the futures contract upon entering into the contract. Instead, the Portfolio, upon entering into a futures contract (and to maintain its open position in a futures contract), is required to post collateral for the contract, known as “initial margin” and “variation margin,” the amount of which may vary but which generally equals a relatively small percentage (e.g., less than 5%) of the value of the contract being traded. While the use of futures contracts may involve the use of leverage, the Portfolio generally does not intend to use leverage to increase its net exposure to debt securities above approximately 100% of the Portfolio’s net asset value or below 0%.
Illiquid Securities. Each Portfolio may invest up to 15% of its net assets in illiquid securities. Illiquid securities are securities that have no ready market.
Inflation-Indexed Bonds. A Portfolio may invest in inflation-indexed bonds. Inflation-indexed bonds (other than municipal inflation indexed bonds and certain corporate inflation-indexed bonds, which are more fully described below) are fixed income securities whose principal value is periodically adjusted according to the rate of inflation. The U.S. Treasury uses the Consumer Price Index for Urban Consumers as the inflation measure. Inflation-indexed bonds issued by a foreign government are generally adjusted to reflect a comparable inflation index, calculated by that government. If the index measuring inflation falls, the principal value of inflation-indexed bonds (other than municipal inflation-indexed bonds and certain corporate inflation-indexed bonds) will be adjusted downward, and consequently the interest payable on these securities (calculated with respect to a smaller principal amount) will be reduced. Repayment of the original bond principal upon maturity (as adjusted for inflation) is guaranteed in the case of U.S. Treasury inflation-indexed bonds. For bonds that do not provide a similar guarantee, the adjusted principal value of the bond repaid at maturity may be less than the original principal.
With regard to municipal inflation-indexed bonds and certain corporate inflation-indexed bonds, the inflation adjustment is reflected in the semi-annual coupon payment. As a result, the principal value of municipal inflation-indexed bonds and such corporate inflation-indexed bonds does not adjust according to the rate of inflation. The value of inflation-indexed bonds is expected to change in response to changes in real interest rates. Real interest rates are tied to the relationship between nominal interest rates and the rate of inflation. If nominal interest rates increase at a faster rate than inflation, real interest rates may rise, leading to a decrease in value of inflation-indexed bonds. Any increase in the principal amount of an inflation-indexed bond is
B-7
Table of Contents
considered taxable ordinary income to an investing Portfolio, which generally must distribute the amount of that income for federal income tax purposes, even though it does not receive the principal until maturity.
Because market convention for bonds is to use nominal yields to measure duration, duration for real return bonds, which are based on real yields, are converted to nominal durations through a conversion factor. The resulting nominal duration typically can range from 20% and 90% of the respective real duration. All security holdings will be measured in effective (nominal) duration terms. Similarly, the effective duration of the relevant index (e.g., the Barclays World Government Inflation-Linked Index (hedged)) will be calculated using the same conversion factors.
Investment Grade Securities. A Portfolio may invest in investment grade debt securities. Investment grade securities are rated in one of the four highest rating categories by Moody’s or S&P, comparably rated by another rating agency or, if unrated, determined by the applicable Sub-Adviser to be of comparable quality. Securities with lower investment grade ratings, while normally exhibiting adequate protection parameters, and may possess certain speculative characteristics as well. This means that changes in economic conditions or other circumstances are more likely to lead to a weakened capacity to make principal and interest payments than is the case for higher rated debt securities.
Large-Cap Companies. A Portfolio may invest in the securities of large-cap companies. These companies may be unable to respond quickly to new competitive challenges such as changes in technology and consumer tastes.
Mid-Cap, Small-Cap and Micro-cap Companies. Each Portfolio may invest in the securities of mid-, small- and micro-cap companies. These companies are more likely than larger companies to have limited product lines, markets or financial resources or to depend on a small, inexperienced management group. Generally, they are more vulnerable than larger companies to adverse business or economic developments and their securities may be less well-known, trade less frequently and in more limited volume than the securities of larger more established companies.
Portfolio Turnover. The Portfolios do not restrict the frequency of trading to limit expenses. The Portfolios may engage in active and frequent trading of portfolio securities to achieve their investment objectives. Frequent trading can result in a portfolio turnover in excess of 100% (high portfolio turnover).
Swaps. A Portfolio may engage in swap transactions. Swap contracts are derivatives in the form of a contract or other similar instrument that is an agreement to exchange the return generated by one instrument for the return generated by another instrument. The payment streams are calculated by reference to a specified security or index and agreed upon notional amount. The term “specified index” includes, but is not limited to, currencies, fixed interest rates, prices and total return on interest rate indices, fixed income indices, total return on equity securities, stock indices and commodity indices (as well as amounts derived from arithmetic operations on these indices).
B-8
Table of Contents
U.S. Government Securities. A Portfolio may invest in U.S. government securities, which include direct obligations of the U.S. Treasury (such as Treasury bills, notes or bonds) and obligations issued or guaranteed as to principal and interest (but not as to market value) by the U.S. government, its agencies or its instrumentalities. U.S. government securities include mortgage-backed securities issued or guaranteed by government agencies or government-sponsored enterprises. Other U.S. government securities may be backed by the full faith and credit of the U.S. government or supported primarily or solely by the creditworthiness of the government-related issuer or, in the case of mortgage-backed securities, by pools of assets.
In August 2011, S&P downgraded its long-term sovereign credit rating on the U.S. from “AAA” to “AA+”. This development, and the government’s credit concerns in general, could cause an increase in interest rates and borrowing costs, which may negatively impact both the perception of credit risk associated with the debt securities issued by the U.S. and the country’s ability to access the debt markets on favorable terms. In addition, these developments could create broader financial turmoil and uncertainty, which could increase volatility in both stock and bond markets. These events could result in significant adverse impacts on issuers of securities held by a Portfolio.
Risks
Risk is the chance that you will lose money on your investment or that it will not earn as much as you expect. In general, the greater the risk, the more money your investment can earn for you and the more you can lose. Like other investment companies, the value of a Portfolio’s shares may be affected by the Portfolio’s investment objective(s), principal investment strategies and particular risk factors. Consequently, each Portfolio may be subject to different risks. Some of the risks, including principal risks, of investing in the Portfolios are discussed below. However, other factors may also affect a Portfolio’s investment results. There is no guarantee that a Portfolio will achieve its investment objective(s) or that it will not lose value.
Affiliated Portfolio Risk. In managing a Portfolio that invests in Underlying Portfolios, the Manager will have the authority to select and substitute the Underlying Portfolios. The Manager may be subject to potential conflicts of interest in allocating the Portfolio’s assets among the various Underlying Portfolios because the fees payable to it by some of the Underlying Portfolios are higher than the fees payable by other Underlying Portfolios and because the Manager is also responsible for managing, administering, and with respect to certain Underlying Portfolios, its affiliates are responsible for sub-advising, the Underlying Portfolios. A Portfolio investing in Underlying Portfolios may from time to time own or control a significant percentage of an Underlying Portfolio’s shares. Accordingly, an Underlying Portfolio is subject to the potential for large-scale inflows and outflows as a result of purchases and redemptions of its shares by such a Portfolio. These inflows and outflows may be frequent and could negatively affect an Underlying Portfolio’s and, in turn, a Portfolio’s net asset value and performance and could cause an Underlying Portfolio to purchase
B-9
Table of Contents
or sell securities at a time when it would not normally do so. It would be particularly disadvantageous for an Underlying Portfolio if it experiences outflows and needs to sell securities at a time of volatility in the markets, when values could be falling. These inflows and outflows also could negatively affect an Underlying Portfolio’s and, in turn, a Portfolio’s ability to meet shareholder redemption requests or could limit an Underlying Portfolio’s and, in turn, a Portfolio’s ability to pay redemption proceeds within the time period stated in its prospectus because of unusual market conditions, an unusually high volume of redemption requests, or other reasons. During periods of declining or illiquid markets, the Manager also may be subject to potential conflicts of interest in selecting shares of Underlying Portfolios for redemption. In addition, these inflows and outflows could increase an Underlying Portfolio’s and, in turn, a Portfolio’s brokerage or other transaction costs, and large-scale outflows could cause an Underlying Portfolio’s and, in turn, a Portfolio’s, actual expenses to increase, or could result in an Underlying Portfolio’s current expenses being allocated over a smaller asset base, leading to an increase in the Underlying Portfolio’s and, in turn, a Portfolio’s expense ratio. Consistent with its fiduciary duties, the Manager seeks to implement each Portfolio’s and each Underlying Portfolio’s investment program in a manner that is in the best interest of that Portfolio and Underlying Portfolio and that is consistent with its investment objective, policies, and strategies.
Asset Class Risk. There is the risk that the returns from the asset classes, or types of securities in which a Portfolio invests will underperform the general securities markets or different asset classes. Different asset classes tend to go through cycles of outperformance and underperformance in comparison to each other and to the general securities markets.
Bank Loans Risk. Loans are subject to additional risks including liquidity risk, prepayment risk (the risk that when interest rates fall, debt securities may be repaid more quickly than expected and a Portfolio may be required to reinvest in securities with a lower yield), extension risk (the risk that when interest rates rise, debt securities may be repaid more slowly than expected and the value of a Portfolio’s holdings may decrease), the risk of subordination to other creditors, restrictions on resale, and the lack of a regular trading market and publicly available information. In addition, liquidity risk may be more pronounced for a Portfolio investing in loans because certain loans may have a more limited secondary market. These loans may be difficult to value.
A Portfolio’s investments in bank loans are subject to the risk that the Portfolio will not receive payment of interest, principal and other amounts due in connection with these investments and will depend primarily on the financial condition of the borrower. Fully secured bank loans offer a Portfolio more protection than unsecured bank loans in the event of nonpayment of scheduled interest or principal, although there is no assurance that the liquidation of a secured bank loan’s collateral would satisfy the borrower’s obligation or that the collateral could be readily liquidated. In addition, a Portfolio’s access to collateral may be limited by bankruptcy or other insolvency laws. In the event of a default, a Portfolio may not recover its principal, may experience a substantial delay in recovering its investment and may not receive
B-10
Table of Contents
interest during the delay. Unsecured bank loans are subject to a greater risk of default than secured bank loans, especially during periods of deteriorating economic conditions. Unsecured bank loans also have a greater risk of nonpayment in the event of a default than secured bank loans since there is no recourse for the lender to collateral. If a Portfolio acquires a participation interest in a loan, the Portfolio may not be able to control the exercise of any remedies that the lender would have under the loan and likely would not have any rights against the borrower directly. Loans in which a Portfolio may invest may be made to finance highly leveraged corporate transactions. The highly leveraged capital structure of the borrowers in such transactions may make such loans especially vulnerable to adverse changes in economic or market conditions. In addition, bank loan interests may be unrated, and a sub-adviser may be required to rely exclusively on their analysis of the borrower in determining whether to acquire, or to continue to hold, a loan.
Cash Management Risk. Upon entering into certain derivatives contracts, such as futures contracts, and to maintain open positions in certain derivatives contracts, a Portfolio may be required to post collateral for the contract, the amount of which may vary. In addition, a Portfolio may maintain cash and cash equivalent positions to manage the Portfolio’s market exposure and for other portfolio management purposes. As such, a Portfolio may maintain with counterparties, such as a custodian or its affiliates, cash balances, including foreign currency balances, that may be significant. A Portfolio is thus subject to counterparty risk and credit risk with respect to these arrangements.
Counterparty Risk. A Portfolio may sustain a loss as a result of the insolvency or bankruptcy of, or other non-compliance by, another party to a transaction.
Convertible Securities Risk. The value of convertible securities fluctuates in relation to changes in interest rates and the credit quality of the issuer and, in addition, fluctuates in relation to the underlying common stock. A convertible security tends to perform more like a stock when the underlying stock price is high relative to the conversion price (because more of the security’s value resides in the option to convert) and more like a debt security when the underlying stock price is low relative to the conversion price (because the option to convert is less valuable). Because its value can be influenced by many different factors, a convertible security generally is not as sensitive to interest rate changes as a similar non-convertible debt security, and generally has less potential for gain or loss than the underlying stock. A convertible security may be subject to redemption at the option of the issuer at a price established in the convertible security’s governing instrument, which may be less than the current market price of the security. If a convertible security held by a Portfolio is called for redemption, the Portfolio will be required to permit the issuer to redeem the security, convert it into underlying common stock or sell it to a third party. Convertible securities are subject to equity risk, interest rate risk and credit risk and are often lower-quality securities, which means that they are subject to the same risks as an investment in lower rated debt securities. Since it derives a portion of its value from the common stock into which it may be converted, a convertible security is also subject to the same types of market and issuer-specific risks that apply to the underlying common stock. In
B-11
Table of Contents
addition, because companies that issue convertible securities are often small- or mid-cap companies, to the extent a Portfolio invests in convertible securities, it will be subject to the risks of investing in these companies. The stocks of small- and mid-cap companies are often more volatile and less liquid than the stocks of larger companies. Convertible securities are normally “junior” securities which means an issuer usually must pay interest on its non-convertible debt before it can make payments on its convertible securities. If an issuer stops making interest or principal payments, these securities may become worthless and the Portfolio could lose its entire investment. In the event of a liquidation of the issuing company, holders of convertible securities may be paid before the company’s common stockholders but after holders of any senior debt obligations of the company. To the extent a Portfolio invests in securities that may be considered “enhanced” convertible securities, some or all of these risks may be more pronounced.
Credit Risk. The risk that the issuer or the guarantor (or other obligor, such as a party providing insurance or other credit enhancement) of a fixed income security, or the counterparty to a derivatives contract, repurchase agreement, loan of portfolio securities or other transaction, is unable or unwilling, or is perceived (whether by market participants, ratings agencies, pricing services or otherwise) as unable or unwilling, to make timely principal and/or interest payments, or otherwise honor its obligations. Securities are subject to varying degrees of credit risk, which are often reflected in their credit ratings. The downgrade of the credit rating of a security held by a Portfolio may decrease its value. When a fixed-income security is not rated, the Portfolio’s Sub-Adviser may have to assess the risk of the security itself. Securities rated below investment grade (e.g., “junk bonds”) may include a substantial risk of default. U.S. government securities held by a Portfolio are supported by varying degrees of credit, and their value may fluctuate in response to political, market or economic developments. U.S. government securities, especially those that are not backed by the full faith and credit of the U.S. Treasury, such as securities supported only by the credit of the issuing governmental agency or government-sponsored enterprise, carry at least some risk of nonpayment, and the maximum potential liability of the issuers of such securities may greatly exceed their current resources. There is no assurance that the U.S. government would provide financial support to the issuing entity if not obligated to do so by law. Further, any government guarantees on U.S. government securities that a Portfolio owns extend only to the timely payment of interest and the repayment of principal on the securities themselves and do not extend to the market value of the securities or to shares of the Portfolio themselves.
Derivatives Risk. A derivative instrument is an investment contract the value of which is linked to (or is derived from), in whole or in part, the value of an underlying asset, reference rate, index or event (e.g., stocks, bonds, commodities, currencies, interest rates and market indexes). Derivatives include options, swaps, futures, options on futures, forward contracts and structured securities. Investing in derivatives involves investment techniques and risks different from those associated with ordinary mutual fund securities transactions and may involve increased transaction costs. The successful use of derivatives will usually depend on the Manager’s or Sub-Adviser’s ability to
B-12
Table of Contents
accurately forecast movements in the market relating to the underlying asset, reference rate, index or event. If the Manager or a Sub-Adviser does not predict correctly the direction of securities prices, interest rates and other economic factors, a Portfolio’s derivatives position could lose value. A Portfolio’s investment in derivatives may rise or fall more rapidly in value than other investments and may reduce the Portfolio’s returns. Changes in the value of the derivative may not correlate perfectly, or at all, with the underlying asset, reference rate or index, and a Portfolio could lose more than the principal amount invested. Derivatives also may be subject to certain other risks such as leveraging risk, liquidity risk, interest rate risk, market risk, credit risk, the risk that a counterparty may be unable or unwilling to honor its obligations, management risk and the risk of mispricing or improper valuation. Derivatives also may not behave as anticipated by a Portfolio, especially in abnormal market conditions. The use of derivatives may increase the volatility of a Portfolio’s net asset value. Derivatives may be leveraged such that a small investment in derivative securities can have a significant impact on a Portfolio’s exposure to stock market values, interest rates, currency exchange rates or other investments. As a result, a relatively small price movement in a derivatives contract may cause an immediate and substantial loss or gain. It may be difficult or impossible for a Portfolio to purchase or sell certain derivatives in sufficient amounts to achieve the desired level of exposure, which may result in a loss or may be costly to the Portfolio. In addition, the possible lack of a liquid secondary market for certain derivatives and the resulting inability of a Portfolio to sell or otherwise close-out a derivatives position could expose the Portfolio to losses and could make such derivatives more difficult for the Portfolio to value accurately. Assets segregated to cover these transactions may decline in value and may become illiquid. Some derivatives are more sensitive to market price fluctuations and to interest rate changes than other investments. A Portfolio also could suffer losses related to its derivatives positions as a result of unanticipated market movements, which losses are potentially unlimited. A Portfolio also may be exposed to losses if the counterparty in the transaction does not fulfill its contractual obligation. In addition, derivatives traded over-the-counter do not benefit from the protections provided by exchanges in the event that a counterparty is unable to fulfill its contractual obligation. Such over-the-counter derivatives therefore involve greater counterparty and credit risk and may be more difficult to value than exchange-traded derivatives. When a derivative is used as a hedge against a position that a Portfolio holds, any loss generated by the derivative should generally be offset by gains on the hedged instrument, and vice versa. While hedging can reduce or eliminate losses, it also can reduce or eliminate gains. Hedges are sometimes subject to imperfect matching between the derivative and the hedged investment, and there can be no assurance that a Portfolio’s hedging transactions will be effective. Also, suitable derivative transactions may not be available in all circumstances. There can be no assurance that a Portfolio will engage in derivative transactions to reduce exposure to other risks when that might be beneficial. The federal income tax treatment of a derivative may not be as favorable as a direct investment in an underlying asset and may adversely affect the timing, character and amount of income a Portfolio realizes from its investments. As a result, a larger portion of a Portfolio’s distributions may be treated as ordinary income rather than capital gains. In addition, certain derivatives are subject
B-13
Table of Contents
to mark-to-market or straddle provisions of the Internal Revenue Code. If such provisions are applicable, there could be an increase (or decrease) in the amount of taxable dividends paid by a Portfolio. There have been numerous recent legislative and regulatory initiatives to implement a new regulatory framework for the derivatives markets. The Dodd-Frank Wall Street Reform and Consumer Protection Act (“Dodd-Frank Act”) substantially increased regulation of the over-the-counter derivatives market and participants in that market, imposing various requirements on transactions involving instruments that fall within the Dodd-Frank Act’s definition of “swap” and “security-based swap.” In particular, the Dodd-Frank Act may limit the availability of certain derivatives, may make the use of derivatives by a Portfolio more costly, and may otherwise adversely impact the performance and value of derivatives. Under the Dodd-Frank Act, a Portfolio also may be subject to additional recordkeeping and reporting requirements. In addition, the tax treatment of certain derivatives, such as swaps, is unsettled and may be subject to future legislation, regulation or administrative pronouncements issued by the Internal Revenue Service. Other future regulatory developments may also impact a Portfolio’s ability to invest or remain invested in certain derivatives. Legislation or regulation may also change the way in which a Portfolio itself is regulated. The Manager cannot predict the effects of any new governmental regulation that may be implemented on the ability of a Portfolio to use swaps or any other financial derivative product, and there can be no assurance that any new governmental regulation will not adversely affect a Portfolio’s ability to achieve its investment objective.
ETF Risk. A Portfolio that invests in ETFs will indirectly bear fees and expenses charged by those ETFs, in addition to the Portfolio’s direct fees and expenses. The cost of investing in the Portfolio, therefore, may be higher than the cost of investing in a mutual fund that exclusively invests directly in individual stocks and bonds. In addition, the Portfolio’s net asset value will be subject to fluctuations in the market values of the ETFs in which it invests. The Portfolio is also subject to the risks associated with the securities in which the ETFs invest and the ability of the Portfolio to meet its investment objective will directly depend on the ability of the ETFs to meet their investment objectives. The Portfolio and the ETFs are subject to certain general investment risks, including market risk, asset class risk, issuer-specific risk, investment style risk and portfolio management risk. In addition, to the extent a Portfolio invests in ETFs that invest in equity securities, fixed income securities and/or foreign securities, the Portfolio is subject to the risks associated with investing in such securities such as equity risk, market capitalization risk, investment grade securities risk, interest rate risk, credit/default risk, foreign and emerging markets securities risk and non-investment grade securities risk. The extent to which the investment performance and risks associated with the Portfolio correlates to those of a particular ETF will depend upon the extent to which the Portfolio’s assets are allocated from time to time for investment in the ETF, which will vary. ETFs may change their investment objectives or policies without the approval of the Portfolio. If that were to occur, the Portfolio might be forced to sell its investment in an ETF at a time and price that is unfavorable to the Portfolio. In addition, many ETFs invest in securities included in, or representative of, underlying indexes regardless of
B-14
Table of Contents
investment merit or market trends and, therefore, these ETFs do not change their investment strategies to respond to changes in the economy, which means that an ETF may be particularly susceptible to a general decline in the market segment relating to the relevant index. Imperfect correlation between an ETF’s securities and those in the index it seeks to track, rounding of prices, changes to the indices and regulatory policies may cause an ETF’s performance to not match the performance of its index. An ETF’s use of a representative sampling approach will result in it holding a smaller number of securities than are in the index it seeks to track. As a result, an adverse development respecting an issuer of securities held by the ETF could result in a greater decline in net asset value than would be the case if the ETF held all of the securities in the index. To the extent the assets in the ETF are smaller, these risks will be greater. No ETF fully replicates its index and an ETF may hold securities not included in its index. Therefore, there is a risk that the investment strategy of the ETF manager may not produce the intended results. Moreover, there is the risk that an ETF may value certain securities at a higher price than it can sell them for. Secondary market trading in shares of ETFs may be halted by a national securities exchange because of market conditions or for other reasons. In addition, trading in these shares is subject to trading halts caused by extraordinary market volatility pursuant to “circuit breaker” rules. There can be no assurance that the requirements necessary to maintain the listing of the shares will continue to be met or will remain unchanged. In addition, although ETFs are listed for trading on national securities exchanges, certain foreign exchanges and in over-the-counter markets, there can be no assurance that an active trading market for such shares will develop or be maintained, in which case the liquidity and value of a Portfolio’s investment in the ETFs could be substantially and adversely affected. In addition, because ETFs are traded on these exchanges and in these markets, the purchase and sale of their shares involve transaction fees and commissions. The market price of an ETF may be different from the net asset value of such ETF (i.e., an ETF may trade at a discount or premium to its net asset value). The performance of a Portfolio that invests in such an ETF could be adversely impacted.
Equity Risk. In general, stocks and other equity security values fluctuate, and sometimes widely fluctuate, in response to changes in a company’s financial condition as well as general market, economic and political conditions and other factors. Equity securities generally have greater price volatility than fixed-income securities.
Floating Rate Loan Risk. Floating rate loans generally are subject to restrictions on resale. The liquidity of floating rate loans, including the volume and frequency of secondary market trading in such loans, varies significantly over time and among individual floating rate loans. For example, if the credit quality of a floating rate loan unexpectedly declines significantly, secondary market trading in that floating rate loan can also decline. During periods of infrequent trading, valuing a floating rate loan can be more difficult, and buying and selling a floating rate loan at an acceptable price can be more difficult and delayed. Difficulty in selling a floating rate loan can result in a loss. The value of the collateral securing a floating rate loan can decline, be insufficient to meet the obligations of the borrower, or be difficult to liquidate. As a result, a floating rate loan may not be fully collateralized and can decline significantly in value.
B-15
Table of Contents
Foreign Securities Risk. Investments in foreign securities, including depositary receipts, involve risks not associated with, or more prevalent than those that may be associated with, investing in U.S. securities. The economies of certain foreign markets may not compare favorably with the economy of the United States with respect to such issues as growth of gross national product, reinvestment of capital, resources and balance of payments position. Over a given period of time, foreign securities may underperform U.S. securities — sometimes for years. A Portfolio could also underperform if it invests in countries or regions whose economic performance falls short. Foreign markets, particularly emerging markets, may be less liquid, more volatile and subject to less government supervision and regulation than domestic markets. Security values also may be negatively affected by changes in the exchange rates between the U.S. dollar and foreign currencies. Differences between U.S. and foreign legal, political and economic systems, regulatory regimes and market practices also may impact security values and it may take more time to clear and settle trades involving foreign securities. Securities issued by U.S. entities with substantial foreign operations can involve risks relating to conditions in foreign countries. Foreign securities are also subject to the risks associated with the potential imposition of economic or other sanctions against a particular foreign country, its nationals, businesses or industries, which could adversely affect the value of the Portfolio’s investments.
Currency Risk. Investments in foreign currencies and in securities that trade in, or receive revenues in, or in derivatives that provide exposure to foreign currencies are subject to the risk that those currencies will decline in value relative to the U.S. dollar. Any such decline may erode or reverse any potential gains from an investment in securities denominated in foreign currency or may widen existing loss. In the case of hedging positions, there is the risk that the U.S. dollar will decline in value relative to the currency being hedged. Currency rates may fluctuate significantly over short periods of time for a number of reasons, including changes in interest rates, intervention (or the failure to intervene) by governments, central banks or supranational entities, or by the imposition of currency controls or other political developments in the U.S. or abroad.
Emerging Markets Risk. Emerging market countries generally are located in Asia, the Middle East, Eastern Europe, Central and South America and Africa. There are greater risks involved in investing in emerging market countries and/or their securities markets. Investments in these countries and/or markets may present market, credit, currency, liquidity, legal, political, technical and other risks different from, or greater than, the risks of investing in developed countries. For instance, these countries may be more likely than developed countries to experience rapid and significant adverse developments in their political or economic structures. Some emerging market countries restrict foreign investments, impose high withholding or other taxes on foreign investments, impose restrictive exchange control regulations, or may nationalize or expropriate the assets of private companies. Therefore, a Portfolio may be limited in its ability to make direct or additional investments in an emerging markets country or could lose the entire value of its investment in the affected market. Such restrictions also may have
B-16
Table of Contents
negative impacts on transaction costs, market price, investment returns and the legal rights and remedies of a Portfolio. In addition, the securities markets of emerging markets countries generally are smaller, less liquid and more volatile than those of developed countries. Emerging market countries often have less uniformity in accounting and reporting requirements and less reliable clearance and settlement, registration and custodial procedures which could result in ownership registration being completely lost. There are generally higher commission rates on foreign portfolio transactions, transfer taxes, and higher custodial costs. A Portfolio may not know the identity of trading counterparties, which may increase the possibility of the Portfolio not receiving payment or delivery of securities in a transaction. Emerging market countries also may be subject to high inflation and rapid currency devaluations and currency-hedging techniques may be unavailable in certain emerging market countries. In addition, some emerging market countries may be heavily dependent on international trade, which can materially affect their securities markets. The risks associated with investing in a narrowly defined geographic area also generally are more pronounced with respect to investments in emerging market countries. Investments in frontier markets may be subject to greater levels of these risks than investments in more developed and traditional emerging markets.
Futures Contract Risk. The primary risks associated with the use of futures contracts are (a) the imperfect correlation between the change in market value of the instruments held by a Portfolio and the price of the futures contract; (b) liquidity risks, including the possible absence of a liquid secondary market for a futures contract and the resulting inability to close a futures contract when desired; (c) losses (potentially unlimited) caused by unanticipated market movements; (d) a Sub-Adviser’s inability to predict correctly the direction of securities prices, interest rates, currency exchange rates and other economic factors; (e) the possibility that a counterparty, clearing member or clearinghouse will default in the performance of its obligations; (f) if a Portfolio has insufficient cash, it may have to sell securities from its portfolio to meet daily variation margin requirements, and the Portfolio may have to sell securities at a time when it may be disadvantageous to do so; and (g) transaction costs associated with investments in futures contracts may be significant, which could cause or increase losses or reduce gains. Futures contracts are also subject to the same risks as the underlying investments to which they provide exposure. In addition, futures contracts may subject the Portfolio to leveraging risk.
Index Strategy Risk. A Portfolio that employs an index strategy generally invests in the securities included in the relevant index or a representative sample of such securities regardless of market trends to track the performance of an unmanaged index of securities, whereas actively managed portfolios typically seek to outperform a benchmark index. Such a Portfolio generally will not modify its index strategy to respond to changes in the economy, which means that it may be particularly susceptible to a general decline in the market segment relating to the relevant index. In addition, although the index strategy attempts to closely track its benchmark index, the Portfolio may not invest in all of the securities in the index. Also, the Portfolio’s fees and
B-17
Table of Contents
expenses will reduce the Portfolio’s returns, unlike those of the benchmark index. Cash flow into and out of the Portfolio, portfolio transaction costs, changes in the securities that comprise the index, and the Portfolio’s valuation procedures also may affect the Portfolio’s performance. Therefore, there can be no assurance that the performance of the index strategy will match that of the benchmark index.
Inflation-Indexed Bonds Risk. Inflation-indexed bonds decline in value when real interest rates rise. In certain interest rate environments, such as when real interest rates are rising faster than nominal interest rates, inflation-indexed bonds may experience greater losses than other fixed income securities with similar durations. Interest payments on inflation-linked debt securities will vary as the principal and/or interest is adjusted for inflation and can be unpredictable. In periods of deflation, a Portfolio may have no income at all from such investments.
Insurance Fund Risk. The Portfolios are available through Contracts offered by insurance company affiliates of the Manager, and the Portfolios may be used to fund all or a portion of certain benefits and guarantees available under the Contracts. To the extent the assets in a Portfolio are insufficient to fund those benefits and guarantees, the Manager’s insurance company affiliates might otherwise be obligated to fulfill them out of their own resources. The Manager may be subject to potential conflicts of interest in connection with providing advice to, or developing strategies and models used to manage, a Portfolio (e.g., with respect to the allocation of assets among Underlying Portfolios or between passively and actively managed portions of a Portfolio and the development and implementation of the models used to manage a Portfolio). The performance of a Portfolio may impact the obligations and financial exposure of the Manager’s insurance company affiliates under any death benefit, income benefit and other guarantees provided through Contracts that offer the Portfolio as an investment option and the ability of an insurance company affiliate to manage (e.g., through the use of various hedging techniques) the risks associated with these benefits and guarantees. The Manager’s investment decisions and the design of the Portfolios may be influenced by these factors. For example, the Portfolios or models and strategies may be managed or designed in a manner (e.g., using more conservative or less volatile investment styles, including volatility management strategies) that could reduce potential losses and/or mitigate financial risks to insurance company affiliates that provide the benefits and guarantees and offer the Portfolios as investment options in their products, and also could facilitate such an insurance company’s ability to provide benefits and guarantees under its Contracts, including by making more predictable the costs of the benefits and guarantees and by reducing the regulatory capital needed to provide them. The performance of a Portfolio also may adversely impact the value of Contracts that offer the Portfolio as an investment option and could suppress the value of the benefits and guarantees offered under a Contract. Please refer to your Contract prospectus for more information about any benefits and guarantees offered under the Contract. Consistent with its fiduciary duties, the Manager seeks to implement each Portfolio’s investment program in a manner that is in the best interests of the Portfolio and that is consistent with the Portfolio’s investment objective, policies and strategies described in detail in the Portfolio’s Prospectus.
B-18
Table of Contents
Interest Rate Risk. The risk that fixed income securities will decline in value because of changes in interest rates. When interest rates decline, the value of a Portfolio’s debt securities generally rises. Conversely, when interest rates rise, the value of a Portfolio’s debt securities generally declines. A Portfolio with a longer average duration will be more sensitive to changes in interest rates, usually making it more volatile than a fund with a shorter average duration. During periods of falling interest rates, an issuer of a callable bond may “call” or repay a security before its stated maturity and a Portfolio may have to reinvest the proceeds at lower interest rates, resulting in a decline in Portfolio income. Conversely, when interest rates rise, certain obligations will be paid off by the issuer more slowly than anticipated, causing the value of these obligations to fall. Inflation-indexed bonds decline in value when real interest rates rise. In certain interest rate environments, such as when real interest rates are rising faster than nominal interest rates, inflation-indexed bonds may experience greater losses than other fixed income securities with similar durations. Preferred stocks may also be sensitive to changes in interest rates. When interest rates rise, the value of preferred stocks will generally decline. Variable and floating rate securities generally are less sensitive to interest rate changes but may decline in value if their interest rates do not rise as much, or as quickly, as interest rates in general. Conversely, floating rate securities will not generally increase in value if interest rates decline. When a Portfolio holds variable or floating rate securities, a decrease in market interest rates will adversely affect the income received from such securities and the net asset value of the Portfolio’s shares. A wide variety of factors can cause interest rates to rise (e.g., central bank monetary policies, inflation rates, general economic conditions, etc.). When the Federal Reserve raises the federal funds rate, which is expected to occur, interest rates are expected to rise. As of the date of this Prospectus, interest rates in the United States are at or near historic lows, but may rise significantly or rapidly, potentially resulting in losses to a Portfolio.
Investment Grade Securities Risk. Debt securities generally are rated by national bond ratings agencies. A portfolio considers securities to be investment grade if they are rated BBB or higher by S&P or Fitch or Baa or higher by Moody’s or, if unrated, are deemed to be of comparable quality by a Sub-Adviser. Securities rated in the lower investment grade rating categories (e.g., BBB or Baa) are considered investment grade securities, but are somewhat riskier than higher rated obligations because they are regarded as having only an adequate capacity to pay principal and interest, and are considered to lack outstanding investment characteristics and may possess certain speculative characteristics as well.
Issuer-Specific Risk. The value of an individual security or particular type of security can be more volatile than the market as a whole and can perform differently from the market as a whole. The value of a security may decline for a number of reasons which directly relate to the issuer, such as management performance, financial leverage and reduced demand for the issuer’s goods or services, as well as the historical and prospective earnings of the issuer and the value of its assets. A change in the financial condition of a single issuer may affect securities markets as a whole. Certain
B-19
Table of Contents
unanticipated events, such as natural disasters, can have a dramatic adverse effect on the value of an issuer’s securities.
Large-Cap Company Risk. Larger more established companies may be unable to respond quickly to new competitive challenges such as changes in technology and consumer tastes. Many larger companies also may not be able to attain the high growth rate of successful smaller companies, especially during extended periods of economic expansion.
Leveraging Risk. When a Portfolio leverages its holdings, the value of an investment in that Portfolio will be more volatile and all other risks will tend to be compounded. For example, a Portfolio may take on leveraging risk when it takes a short position, engages in derivatives transactions, invests collateral from securities loans or borrows money. Leveraged holdings generally require corresponding holdings of cash and cash equivalents, which may impair a Portfolio’s ability to pursue its objectives. A Portfolio may experience leveraging risk in connection with investments in derivatives because its investments in derivatives may be purchased with a fraction of the assets that would be needed to purchase the securities directly, so that the remainder of the assets may be invested in other investments. Such investments may have the effect of leveraging a Portfolio because the Portfolio may experience gains or losses not only on its investments in derivatives, but also on the investments purchased with the remainder of the assets. If the value of a Portfolio’s investments in derivatives is increasing, this could be offset by declining values of the Portfolio’s other investments. Conversely, it is possible that the rise in the value of a Portfolio’s non-derivative investments could be offset by a decline in the value of the Portfolio’s investments in derivatives. In either scenario, a Portfolio may experience losses. In a market where the value of a Portfolio’s investments in derivatives is declining and the value of its other investments is declining, the Portfolio may experience substantial losses. The use of leverage may cause a Portfolio to liquidate portfolio positions when it may not be advantageous to do so to satisfy its obligations or to meet any required asset segregation requirements.
Liquidity Risk. The risk that certain investments may be difficult or impossible for a Portfolio to purchase or sell at an advantageous time or price or in sufficient amounts to achieve the desired level of exposure, which may require a Portfolio to dispose of other investments at unfavorable times or prices to satisfy obligations and may result in a loss or may be costly to the Portfolio. Investments in foreign securities, particularly those of issuers located in emerging markets, tend to have greater exposure to liquidity risk than domestic securities. Judgment plays a greater role in pricing illiquid investments than it does in pricing investments having more active markets and there is a greater risk that the investments may not be sold for the price at which the Portfolio is carrying them. Certain securities that were liquid when purchased may later become illiquid, particularly in times of overall economic distress.
Market Risk. The risk that the securities markets will move down, sometimes rapidly and unpredictably based on overall economic conditions and other factors. The value of a security may decline due to general market conditions which are not
B-20
Table of Contents
specifically related to a particular company, such as real or perceived adverse economic conditions, changes in the general outlook for corporate earnings, changes in interest or currency rates or adverse investment sentiment generally. Changes in the financial condition of a single issuer can impact a market as a whole. The value of a security may also decline due to factors which affect a particular industry or industries, such as labor shortages or increased production costs and competitive conditions within an industry. During a general downturn in the securities markets, multiple asset classes may decline in value simultaneously. Terrorism and related geo-political risks have led, and may in the future lead, to increased short-term market volatility and may have adverse long-term effects on world economies and markets generally. In addition, markets and market participants are increasingly reliant upon both publicly available and proprietary information data systems. Data imprecision, software or other technology malfunctions, programming inaccuracies, unauthorized use or access, and similar circumstances may impair the performance of these systems and may have an adverse impact upon a single issuer, a group of issuers, or the market at-large. In certain cases, an exchange or market may close or issue trading halts on either specific securities or even the entire market, which may result in a Portfolio being, among other things, unable to buy or sell certain securities or financial instruments or accurately price its investments.
Mid-Cap, Small-Cap and Micro-Cap Company Risk. A Portfolio’s investments in mid-, small- and micro-cap companies may involve greater risks than investments in larger, more established issuers because they generally are more vulnerable than larger companies to adverse business or economic developments. Such companies generally have narrower product lines, more limited financial resources and more limited markets for their stock as compared with larger companies. Their securities may be less well-known and trade less frequently and in limited volume compared with the securities of larger, more established companies. As a result, the value of such securities may be more volatile than the securities of larger companies, and the Portfolio may experience difficulty in purchasing or selling such securities at the desired time and price or in the desired amount. Mid-, small- and microcap companies also are typically subject to greater changes in earnings and business prospects than larger companies. Consequently, the prices of mid-, small-and micro-cap company stocks tend to rise and fall in value more frequently than the stocks of larger companies. Although investing in mid-, small- and micro-cap companies offers potential for above average returns, the companies may not succeed and the value of their stock could decline significantly. In general, these risks are greater for small-and micro-cap companies than for mid-cap companies.
Money Market Risk. Although a money market fund is designed to be a relatively low risk investment, it is not free of risk. Despite the short maturities and high credit quality of a money market fund’s investments, increases in interest rates and deteriorations in the credit quality of the instruments the money market fund has purchased may reduce the money market fund’s yield and can cause the price of a money market security to decrease. In addition, a money market fund is subject to the risk that the value of an investment may be eroded over time by inflation. The Securities
B-21
Table of Contents
and Exchange Commission recently adopted changes to the rules that govern money market funds. These changes will: (1) permit, subject to the discretion of the board of trustees, money market funds to impose a “liquidity fee” (up to 2%) and/or “gates” that temporarily restrict redemptions from the funds, if weekly liquidity levels fall below the required regulatory threshold, and (2) require “institutional” money market funds to operate with a floating NAV rounded to the fourth decimal place. These changes may affect the Portfolio’s investment strategies, operations and/or return potential. As of the date of this Prospectus, FMG LLC is evaluating the potential impact of these changes which have a phase in compliance period ranging from July, 2015 through October, 2016.
Non-Investment Grade Securities Risk. Bonds rated below investment grade (i.e., BB or lower by S&P or Fitch or Ba or lower by Moody’s or, if unrated, are deemed to be of comparable quality by a Sub-Adviser) are speculative in nature, involve greater risk of default by the issuing entity and may be subject to greater market fluctuations than higher rated fixed income securities. Non-investment grade bonds, sometimes referred to as “junk bonds” are usually issued by companies without long track records of sales and earnings, or by those companies with questionable credit strength. The retail secondary market for these “junk bonds” may be less liquid than that of higher rated securities and adverse conditions could make it difficult at times to sell certain securities or could result in lower prices than those used in calculating a Portfolio’s net asset value. A Portfolio investing in “junk bonds” may also be subject to greater credit risk because it may invest in debt securities issued in connection with corporate restructuring by highly leveraged issuers or in debt securities not current in the payment of interest or principal or in default. If the issuer of a security is in default with respect to interest or principal payments, a Portfolio may lose its entire investment. Because of the risks involved in investing in below investment grade securities, an investment in a Portfolio that invests substantially in such securities should be considered speculative. “Junk bonds” may contain redemption or call provisions. If an issuer exercises these provisions in a declining interest rate market, the Portfolio would have to replace the security with a lower yielding security, resulting in a decreased return. Conversely, a junk bond’s value will decrease in a rising interest rate market, as will the value of the Portfolio’s assets. The credit rating of a below investment grade security does not necessarily address its market value risk and may not reflect its actual credit risk. Ratings and market value may change from time to time, positively or negatively, to reflect new developments regarding the issuer.
Portfolio Management Risk. The risk that strategies used by the Manager or the Sub-Adviser(s) and their securities selections fail to produce the intended results.
Portfolio Turnover Risk. High portfolio turnover (generally, turnover in excess of 100% in any given fiscal year) may result in increased transaction costs to a Portfolio, which may result in higher fund expenses and lower total return.
Recent Market Conditions Risk. The financial crisis in the U.S. and many foreign economies over the past several years, including the European sovereign debt and banking crises, continues to affect global economies and financial markets. The crisis
B-22
Table of Contents
and its after effects have resulted, and may continue to result, in an unusually high degree of volatility in the financial markets. Conditions in the U.S. and many foreign economies have resulted, and may continue to result, in fixed income instruments experiencing unusual liquidity issues, increased price volatility and, in some cases, credit downgrades and increased likelihood of default. These events have reduced the willingness and ability of some lenders to extend credit, and have made it more difficult for borrowers to obtain financing on attractive terms, if at all. In some cases, traditional market participants have been less willing to make a market in some types of debt instruments, which has affected the liquidity of those instruments. As a result, investors in many types of securities, including, but not limited to, mortgage-backed, asset-backed, and corporate debt securities, have and may continue to experience losses. During times of market turmoil, investors tend to look to the safety of securities issued or backed by the U.S. Treasury, causing the prices of these securities to rise and the yields to decline.
The reduced liquidity in fixed income and credit markets may negatively affect many issuers worldwide. In addition, global economies and financial markets are becoming increasingly interconnected, which increases the possibilities that conditions in one country or region might adversely impact issuers in a different country or region. Over the past several years and continuing into the present, the U.S. and other governments and the Federal Reserve and certain foreign central banks have taken steps to support financial markets. Certain of these entities have injected liquidity into the markets and taken other steps in an effort to stabilize the markets and grow economies. The ultimate effect of these efforts is not yet known. In some countries where economic conditions are recovering, they are nevertheless perceived as still fragile. A change in or withdrawal of government support, failure of efforts in response to the crisis, or investor perception that such efforts are not succeeding, could adversely impact the value and liquidity of certain securities. The severity or duration of adverse economic conditions may also be affected by policy changes made by governments or quasi-governmental organizations, including changes in tax laws. The Dodd-Frank Act initiated a dramatic revision of the U.S. financial regulatory framework that is expected to continue to unfold over several years. As a result, the impact of U.S. financial regulation and the practical implications for market participants may not be fully known for some time. In addition, political events within the U.S. and abroad, such as the U.S. government’s recent inability to agree on a long-term budget and deficit reduction plan, the federal government shutdown and threats not to increase the federal government’s debt limit, may affect investor and consumer confidence and may adversely impact financial markets and the broader economy, perhaps suddenly and to a significant degree. High public debt in the U.S. and other countries creates ongoing systemic and market risks and policymaking uncertainty. Although the U.S. government has honored its credit obligations, it remains possible that the U.S. could default on its obligations. While it is impossible to predict the consequences of such an unprecedented event, it is likely that a default by the U.S. would be highly disruptive to the U.S. and global securities markets and could significantly impair the value of a Portfolio’s investments. Uncertainty surrounding the sovereign
B-23
Table of Contents
debt of a number of European Union countries and the viability of the European Union has disrupted and may continue to disrupt markets in the U.S. and around the world. If one or more countries leave the European Union or the European Union dissolves, the world’s securities markets likely will be significantly disrupted. Because the impact on the markets has been widespread, it may be difficult to identify both risks and opportunities using past models of the interplay of market forces, or to predict the duration of these market conditions. Changes in market conditions will not have the same impact on all types of securities. Interest rates have been unusually low in recent years in the U.S. and Europe. An increase in interest rates may adversely impact various markets. For example, because investors may buy securities or other investments with borrowed money, an increase in interest rates may result in a decline in such borrowing and purchases and thus in a decline in the markets for those investments. In addition, there is a risk that the prices of goods and services in the U.S. and many foreign economies may decline over time, known as deflation (the opposite of inflation). Deflation may have an adverse effect on stock prices and creditworthiness and may make defaults on debt more likely. If a country’s economy slips into a deflationary pattern, it could last for a prolonged period and may be difficult to reverse.
Redemption Risk. A Portfolio may experience periods of heavy redemptions that could cause the Portfolio to sell assets at inopportune times or at a loss or depressed value. Redemption risk is heightened during periods of declining or illiquid markets. Heavy redemptions could hurt a Portfolio’s performance. Following the financial crisis that began in 2007, the Federal Reserve has attempted to stabilize the economy and support the economic recovery by keeping the federal funds rate (the interest rate at which depository institutions lend reserve balances to other depository institutions overnight) at or near zero percent. In addition, as part of its monetary stimulus program known as quantitative easing, the Federal Reserve has purchased on the open market large quantities of securities issued or guaranteed by the U.S. government, its agencies or instrumentalities. More recently, the Federal Reserve substantially reduced the amount of securities it purchases pursuant to quantitative easing. Given this reduction in market support and the Federal Reserve’s expected increase of the federal funds rate, interest rates may rise significantly or rapidly potentially resulting in losses to a Portfolio. Market developments and other factors, including a general rise in interest rates, have the potential to cause investors to move out of fixed income securities on a large scale, which may increase redemptions from mutual funds that hold large amounts of fixed income securities. Such a move, coupled with a reduction in the ability or willingness of dealers and other institutional investors to buy or hold fixed income securities, may result in decreased liquidity and increased volatility in the fixed income markets.
Risks Related to Investments in Underlying Portfolios and Underlying ETFs. A Portfolio that invests in Underlying Portfolios and Underlying ETFs will indirectly bear fees and expenses charged by those Underlying Portfolios and Underlying ETFs, in addition to the Portfolio’s direct fees and expenses. The cost of investing in the Portfolio, therefore, may be higher than the cost of investing in a mutual fund that exclusively invests directly in individual stocks and bonds. In addition, the Portfolio’s
B-24
Table of Contents
net asset value is subject to fluctuations in the net asset values of the Underlying Portfolios and the market values of the Underlying ETFs in which it invests. The Portfolio is also subject to the risks associated with the securities in which the Underlying Portfolios and Underlying ETFs invest, and the ability of the Portfolio to meet its investment objective will directly depend, on the ability of the Underlying Portfolios and Underlying ETFs to meet their investment objectives. The Portfolio, Underlying Portfolios and Underlying ETFs are subject to certain general investment risks, including market risk, asset class risk, issuer specific risk, investment style risk and portfolio management risk. In addition, to the extent a Portfolio invests in Underlying Portfolios and Underlying ETFs that invest in equity securities, fixed income securities and/or foreign securities, the Portfolio is subject to the risks associated with investing in such securities such as equity risk, market capitalization risk, investment grade securities risk, interest rate risk, credit/default risk, foreign and emerging markets securities risk and non-investment grade securities risk. The extent to which the investment performance and risks associated with the Portfolio correlates to those of a particular Underlying Portfolio or Underlying ETF will depend upon the extent to which the Portfolio’s assets are allocated from time to time for investment in the Underlying Portfolio or Underlying ETF, which will vary. The Underlying Portfolios and Underlying ETFs may change their investment objectives or policies without the approval of the Portfolio. If that were to occur, the Portfolio might be forced to sell its investment in an Underlying Portfolio or Underlying ETF at a time and price that is unfavorable to the Portfolio. In addition, many ETFs invest in securities included in, or representative of, underlying indexes regardless of investment merit or market trends and, therefore, these ETFs do not change their investment strategies to respond to changes in the economy, which means that an Underlying ETF may be particularly susceptible to a general decline in the market segment relating to the relevant index. Imperfect correlation between an Underlying ETF’s securities and those in the index it seeks to track, rounding of prices, changes to the indices and regulatory policies may cause an Underlying ETF’s performance to not match the performance of its index. An Underlying ETF’s use of a representative sampling approach will result in it holding a smaller number of securities than are in the index it seeks to track. As a result, an adverse development respecting an issuer of securities held by the Underlying ETF could result in a greater decline in net asset value than would be the case if the Underlying ETF held all of the securities in the index. To the extent the assets in the Underlying ETF are smaller, these risks will be greater. No ETF fully replicates its index and an Underlying ETF may hold securities not included in its index. Therefore, there is a risk that the investment strategy of the Underlying ETF manager may not produce the intended results. Moreover, there is the risk that an Underlying ETF may value certain securities at a higher price than it can sell them for. Secondary market trading in shares of Underlying ETFs may be halted by a national securities exchange because of market conditions or for other reasons. In addition, trading in these shares is subject to trading halts caused by extraordinary market volatility pursuant to “circuit breaker” rules. There can be no assurance that the requirements necessary to maintain the listing of the shares will continue to be met or will remain unchanged. In addition, although ETFs are listed for trading on national securities exchanges, certain foreign
B-25
Table of Contents
exchanges and in over-the-counter markets, there can be no assurance that an active trading market for such shares will develop or be maintained, in which case the liquidity and value of a Portfolio’s investment in the Underlying ETFs could be substantially and adversely affected. In addition, because Underlying ETFs are traded on these exchanges and in these markets, the purchase and sale of their shares involve transaction fees and commissions. The market price of an Underlying ETF may be different from the net asset value of such ETF (i.e., an Underlying ETF may trade at a discount or premium to its net asset value). The performance of a Portfolio that invests in such an ETF could be adversely impacted.
Securities Lending Risk. For purposes of realizing additional income, certain Portfolios may lend securities to broker-dealers approved by the Board of Trustees. Generally, any such loan of portfolio securities will be continuously secured by collateral at least equal to the value of the security loaned. Such collateral will be in the form of cash, marketable securities issued or guaranteed by the U.S. Government or its agencies, or a standby letter of credit issued by qualified banks. The risks in lending portfolio securities, as with other extensions of secured credit, consist of possible delay in receiving additional collateral or in the recovery of the securities or possible loss of rights in the collateral should the borrower fail financially. Loans will only be made to firms deemed by the Manager to be of good standing and will not be made unless, in the judgment of the Sub-Adviser, the consideration to be earned from such loans would justify the risk.
B-26
Table of Contents
APPENDIX C
SECURITY OWNERSHIP OF CERTAIN BENEFICIAL OWNERS
As of the Record Date, to EQ Trust’s knowledge, the following persons owned beneficially or of record 5% or more of the Class IA, Class IB, or Class K shares of an Acquiring Portfolio.
Shareholder’s or | Percent Beneficial | Percent Beneficial Ownership of Shares of the Combined Portfolio (assuming the Reorganizations occur) | ||
As of the Record Date, to the Trust’s knowledge, the following persons owned beneficially or of record 5% or more of the Class B shares of an Acquired Portfolio.
Shareholder’s or | Percent Beneficial | Percent Beneficial Ownership of Shares of the Combined Portfolio (assuming the Reorganizations occur) | ||
Shareholders indicated above owning more than 25% of a Portfolio may be deemed “control persons” of the Portfolio under the 1940 Act.
C-1
Table of Contents
STATEMENT OF ADDITIONAL INFORMATION
[ ], 2015
AXA PREMIER VIP TRUST
CharterSM Equity Portfolio
CharterSM Fixed Income Portfolio,
(each a series of AXA Premier VIP Trust)
(each, an “Acquired Portfolio” and together, the “Acquired Portfolios”)
AND
EQ ADVISORS TRUST
EQ/Common Stock Index Portfolio
EQ/Core Bond Index Portfolio,
(each a series of EQ Advisors Trust)
(each, an “Acquiring Portfolio” and together, the “Acquiring Portfolios”)
1290 Avenue of the Americas
New York, New York 10104
(877) 222-2144
| Acquisition of the assets and assumption of the liabilities of: | By and in exchange for shares of: | |
| CharterSM Equity Portfolio | EQ/Common Stock Index Portfolio (“Stock Index Portfolio”) | |
| CharterSM Fixed Income Portfolio | EQ/Core Bond Index Portfolio (“Bond Index Portfolio”) |
This Statement of Additional Information (the “SAI”) relates specifically to the proposed reorganization of each Acquired Portfolio into the corresponding Acquiring Portfolio under which the Acquiring Portfolio would acquire all of the assets of the Acquired Portfolio in exchange solely for shares of the Acquiring Portfolio and that Acquiring Portfolio’s assumption of all of the corresponding Acquired Portfolio’s liabilities (the “Reorganizations”). This SAI is available to owners of and participants in variable life insurance contracts and variable annuity contracts and certificates (the “Contracts”) with amounts allocated to an Acquired Portfolio and to other shareholders of the Acquired Portfolios as of June 30, 2015.
This SAI is not a prospectus. A Combined Proxy Statement and Prospectus dated [ ], 2015 relating to the Reorganizations (the “Proxy Statement/Prospectus”) may be obtained, without charge, by writing to EQ Advisors Trust (“EQ Trust”) or AXA Premier VIP Trust (“VIP Trust”) at 1290 Avenue of the Americas, New York, New York 10104 or calling 1-877-522-5035. This SAI should be read in conjunction with the Proxy Statement/Prospectus.
Table of Contents
Contents of the SAI
This SAl consists of the cover page, the information set forth below and the following documents:
The Annual Report to Shareholders of VIP Trust for the fiscal year ended December 31, 2014 with respect to the Acquired Portfolios, which includes Audited Financial Statements of VIP Trust for the fiscal year ended December 31, 2014, with respect to the Acquired Portfolios.
The Annual Report to Shareholders of EQ Trust for the fiscal year ended December 31, 2014 with respect to the Acquiring Portfolios, which includes the Audited Financial Statements of EQ Trust for the fiscal year ended December 31, 2014 with respect to the Acquiring Portfolios.
Information Incorporated by Reference
This SAI incorporates by reference the following documents as filed with the Securities and Exchange Commission:
Statement of Additional Information of EQ Trust dated May 1, 2015, as supplemented, with respect to the EQ/Common Stock Index Portfolio and the EQ/Core Bond Index Portfolio (File Nos. 333-17217 and 811-07953).
Statement of Additional Information of VIP Trust dated May 1, 2015, as supplemented, with respect to the CharterSM Equity Portfolio and the CharterSM Fixed Income Portfolio (File Nos. 333-70754 and 811-10509).
The Statements of Additional Information include information about EQ Trust’s and VIP Trust’s other portfolios that is not relevant to the Reorganizations. Please disregard that information.
Pro Forma Financial Information
CharterSM Equity Portfolio merging into EQ/Common Stock Index Portfolio
In accordance with the instructions to Form N-14, pro forma financial information for the CharterSM Equity Portfolio (“Equity Portfolio”) and the EQ/Common Stock Index Portfolio (“Stock Index Portfolio”) after giving effect to the Reorganization are not required to be included in this SAI because the net assets of the Equity Portfolio within 30 days prior to the date of filing of the proxy statement and prospectus for the Reorganization are less than 10 percent of the net assets of the Stock Index Portfolio.
CharterSM Fixed Income Portfolio merging into EQ/Core Bond Index Portfolio
In accordance with the instructions to Form N-14, pro forma financial information for the CharterSM Fixed Income Portfolio (“Fixed Income Portfolio”) and the EQ/Core Bond Index Portfolio (“Bond Index Portfolio”) after giving effect to the Reorganization are not required to be included in this SAI because the net assets of the Fixed Income Portfolio within 30 days prior to the date of filing of the proxy statement and prospectus for the Reorganization are less than 10 percent of the net assets of the Bond Index Portfolio.
Table of Contents
AXA Premier VIP Trust
Annual Report
December 31, 2014
Table of Contents
AXA Premier VIP Trust Annual Report
December 31, 2014
| 4 | ||
Portfolios | ||
Charter Allocation Portfolios | ||
| 5 | ||
| 12 | ||
| 19 | ||
| 30 | ||
Approvals of Investment Management and Advisory Agreements (Unaudited) | 31 | |
| 41 | ||
| 42 | ||
| 47 | ||
Table of Contents
Overview
2014 Market Overview
Economy
In 2014, unemployment in the U.S. fell as a result of what experts describe as the best hiring stretch since the late 1990s. In addition, the Federal Reserve appeared to signal its belief in the economy’s ability to grow without assistance by concluding its bond purchasing program known as Quantitative Easing (QE), in October 2014. Although investors seem to expect the Fed to raise interest rates sometime in 2015, overall monetary policy remains accommodative. In this environment, manufacturing indicators rose, and unemployment fell from 6.7% at the beginning of the year to 5.6% in December, bolstering consumer confidence and increasing the market’s expectations for a 2015 rate hike.
In the currency markets, investors pointed to relatively better growth levels in the U.S. as a critical support for the dollar, a trend that picked up as the year progressed. Currency volatility remained high as monetary policies worldwide diverged, and emerging market currencies were particularly volatile as lower oil prices weighed on the finances of large exporters.
Market watchers found that global economic growth continued at a slow and uneven pace. The euro-area economy remained stuck in slow or negative growth mode. Participants widely anticipated the European Central Bank to launch a quantitative easing program in early 2015 in an effort to prevent deflation and reignite growth. In Japan, GDP had risen by only 0.3% over the six quarters since the Bank of Japan’s aggressive stimulus program began in April 2013.
In the fourth quarter, a plunge in oil prices appeared to rattle the credit markets, pressured emerging-market currencies and added to deflationary pressures in Europe and Japan.
Fixed Income
Bond markets turned more volatile in 2014, apparently in reaction to growth trends and monetary policies in the world’s biggest economies heading in different directions.
The U.S. Treasury yield curve flattened and the 10-year U.S. Treasury yield ended 2014 roughly 0.86% below where it began the year. The market appeared to assign higher risk to U.S. corporate bonds, as the yield spread (or difference) between corporate and government bonds widened domestically, but narrowed slightly in Europe; globally, most credit sectors underperformed developed-market government debt.
The high yield market posted its sixth consecutive positive, although modest, annual return for full year 2014. Returns were stronger in the first half of the year, followed by negative total returns in the third quarter and fourth quarter. Experts believe that returns in the high yield market were largely impacted by the sharp drop in oil prices in the second half of 2014, as the energy sector, a large proportion of the high-yield market, sharply underperformed the broader market. There were record outflows from high-yield funds in 2014 but new issuance was steady, and defaults would have been historically low, excluding the failure of two long-distressed issuers.
U.S. Equity
For domestic equity investors, the phrase “There’s No Place Like Home” proved to be an accurate summary of market activity in 2014. The U.S. economy was among the few globally that appeared to produce clear, self-sustaining growth. This positive economic data, coupled with strong corporate earnings combined to produce squarely positive U.S. equity returns in 2014.
Experts agree that 2014 was a difficult year for stockpickers. While U.S. stocks outperformed the vast majority of both developed and emerging markets last year, market volatility was a near constant in 2014. Beginning in the first quarter, a series of geopolitical and macro-economic issues appeared to weigh on investor risk tolerances. Concern over the ultimate path of U.S. monetary policy under a new Federal Reserve chair seemed to add to the malaise. Given this heightened uncertainty, it appears that equity investors sought out the perceived safety of larger-capitalization stocks with lower relative valuations and higher dividend yields. Conversely, higher growth stocks with premium valuations were, at times, sold indiscriminately of their underlying fundamentals. Specifically during a six-week period that stretched through the end of April, experts agree that the market had absolutely no appetite for higher growth, higher valuation equities.
Despite a difficult start to the year, small- and mid-cap stocks finished 2014 on a positive note to close the year with small gains. Investors appeared to react to an unexpected decline in bond yields by seeking income in higher-yielding equities. This development helped the utility sector to lead all others in the small/mid-cap space. In contrast, the energy sector posted the worst results as oil prices plunged by nearly 50% in the second half of 2014.
International Equity
Market strategists agree that it was an unpleasant start to the year for international equity investors. Volatility ticked up amid what appeared to be heightened risks in emerging markets, slowing growth in China and softer economic data in the United States, while investors braced for the impact of the U.S. Federal Reserve scaling back on its stimulus program. Equity markets around the world declined sharply in January, but the sell-off was short-lived and international equities rebounded in February, particularly in Europe.
2
Table of Contents
Nonetheless, high valuations and uncertainty around global central bank policies apparently left equities particularly vulnerable to bad news. Consequently, geopolitical risks took a toll on international equity prices as tensions between Russia and Ukraine mounted and the fragmentation of Iraq led to escalating violence and a spike in oil prices during the summer. A ground war in Gaza, the downing of a civilian airliner over Ukraine, and Scotland’s flirtation with independence from the United Kingdom all seemed to add to global headwinds, causing many investors to retreat from riskier assets.
In the latter part of the year, most European developed economies again struggled with sluggish activity and experts agree that equity prices were tossed about between investors’ concerns about geopolitical turmoil and hopes for central bank stimulus. The continuation of the Russia-Ukraine conflict and a Russian currency crisis, as well as Greece’s failure to successfully elect a new president, also apparently drove volatility higher. In the eurozone, market watchers appeared to find inflation dangerously low. Another round of policy easing from the ECB appeared to give international equities a much-needed boost, but the significant depreciation of the euro and other currencies versus the U.S. dollar resulted in falling stock prices for U.S.–based investors.
Similarly, Asian developed market equities performed well in local currency terms, but generated negative results on a U.S. dollar basis. Market strategists agree that, as the Japanese economy struggled to get on its legs, the nation’s equity market benefited from central bank stimulus and positive sentiment toward structural reform. Strong corporate earnings results also appeared to have pushed Japanese stocks higher, as did a surge of domestic inflows due to the reallocation of Japan’s Government Pension Investment Fund. However, a weakening yen versus a strengthening U.S. dollar resulted in Japanese equities having the largest negative effect on the performance of international stocks.
In the latter months of 2014, the divergence in global central bank policies became a major theme in equity markets and the strong appreciation in the U.S. dollar pressured commodity prices. Oil prices in particular plunged as a global supply-and-demand imbalance materialized. While lower prices were harmful to economies that rely heavily on oil exports, most developed markets derived a boost in consumer spending, a positive for equity markets.
Source: AXA Equitable Funds Management Group, LLC. As of 12/31/2014.
This information is provided for general information only and is not intended to provide specific advice or recommendations for any individual investor. PAST PERFORMANCE IS NO GUARANTEE OF FUTURE RESULTS. No investment is risk-free. International securities carry additional risks including currency exchange fluctuation and different government regulations, economic conditions or accounting standards. Smaller company stocks involve a greater risk than is customarily associated with more established companies. Bond investments are subject to interest rate risk so that when interest rates rise, the prices of bonds can decrease and the investor can lose principal value. High yield bonds are subject to a high degree of credit and market risk. Index performance is shown for illustrative purposes only. You cannot invest directly in an index.
AXA Equitable Life Insurance Company (New York, NY). Distributors: AXA Advisors, LLC and AXA Distributors, LLC.
AXA Equitable Funds Management Group, LLC is a wholly owned subsidiary of AXA Equitable Life Insurance Company.
AXA Equitable Life Insurance Company, AXA Advisors and AXA Distributors are affiliated companies.
GE-101091(2/15) (Exp. 2/17)
3
Table of Contents
NOTES ON PERFORMANCE (Unaudited)
Total Returns
Performance of the AXA Premier VIP Trust Portfolios as shown on the following pages compares each Portfolio’s performance to that of a broad-based securities index. Each of the Portfolio’s annualized rates of return is net of investment management fees and expenses of the Portfolio. Rates of return are not representative of the actual return you would receive under your variable life insurance policy or annuity contract. No policyholder or contractholder can invest directly in the AXA Premier VIP Trust Portfolios. Changes in policy values depend not only on the investment performance of the AXA Premier VIP Trust Portfolios, but also on the insurance and administrative charges, applicable sales charges, and the mortality and expense risk charge applicable under a policy. These policy charges effectively reduce the dollar amount of any net gains and increase the dollar amount of any net losses.
Each of the AXA Premier VIP Trust Portfolios has a separate investment objective it seeks to achieve by following a separate investment policy. There is no guarantee that these objectives will be attained. The objectives and policies of each Portfolio will affect its return and its risk. Keep in mind that past performance is not an indication of future results.
Growth of $10,000 Investment
The charts shown on the following pages illustrate the total value of an assumed investment in Class A, Class B and/or Class K shares of each Portfolio of the AXA Premier VIP Trust. The periods illustrated are from the inception dates shown, or for a ten year period if the inception date is prior to December 31, 2004, through December 31, 2014. These results assume reinvestment of dividends and capital gains. The total value shown for each Portfolio reflects management fees and operating expenses of the Portfolios and 12b-1 fees which are applicable to Class B shares. Effective January 1, 2012, 12b-1 fees are applicable to Class A shares. 12b-1 fees are not applicable to Class K shares. The values have not been adjusted for insurance-related charges and expenses associated with life insurance policies or annuity contracts, which would lower the total values shown. Results should not be considered representative of future gains or losses.
The Benchmarks
Broad-based securities indices are unmanaged and are not subject to fees and expenses typically associated with actively-managed funds. An investment cannot be made directly in a broad-based securities index. Comparisons with these benchmarks, therefore, are of limited use. They are included because they are widely known and may help you to understand the universe of securities from which each Portfolio is likely to select its holdings.
Barclays U.S. Aggregate Bond Index (“BAG”)
An index which covers the U.S. dollar denominated investment-grade, fixed-rate, taxable bond market of securities. The index includes bonds from the Treasury, government-related and corporate securities, agency fixed rate and hybrid adjustable mortgage pass throughs, asset-backed securities and commercial mortgage-based securities
Morgan Stanley Capital International (MSCI) AC World (Net) Index (“MSCI ACWI”)
A free float-adjusted market capitalization weighted index that is designed to measure the equity market performance of 23 developed markets and 23 emerging markets (as of June 2, 2014). The index covers approximately 85% of the global investment opportunities.
4
Table of Contents
CHARTERSM FIXED INCOME PORTFOLIO (Unaudited)
INVESTMENT MANAGER
| Ø | AXA Equitable Funds Management Group, LLC |
PERFORMANCE RESULTS
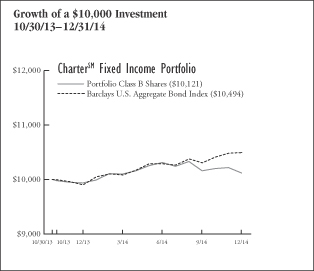
| Annualized Total Returns as of 12/31/14 | ||||||||
| 1 Year | Since Incept. | |||||||
Portfolio – Class B Shares* | 1.85 | % | 1.03 | % | ||||
Barclays U.S. Aggregate Bond Index | 5.97 | 4.21 | ||||||
* Date of inception 10/30/13.
Returns for periods greater than one year are annualized.
Past performance is not indicative of future results. |
| |||||||
PERFORMANCE SUMMARY
The Portfolio’s Class B shares returned 1.85% for the year ended December 31, 2014. This compares to the returns of the following broad market benchmark, the Barclays U.S. Aggregate Bond Index, which returned 5.97% over the same period.
Portfolio Highlights
For the period ended December 31, 2014
| • | As of 12/31/2014, the Portfolio’s allocation consisted of 89.9% fixed income investments and 10.0% non-traditional (alternative) investments. |
| • | As the Federal Reserve wound down its quantitative easing program, and concerns flared about uneven global growth trends, most major fixed-income sectors provided positive returns in 2014, with the U.S. leading the way by a substantial margin. The Portfolio’s holdings in convertible securities, global inflation-linked bonds, and emerging market bonds boosted returns, while sectors including international government bonds and corporate bonds detracted from performance. The Portfolio’s diversification out of U.S. bonds, however, contributed to underperformance versus its benchmark. |
5
Table of Contents
CHARTERSM FIXED INCOME PORTFOLIO (Unaudited)
| Portfolio Allocation (as a percentage of Total Investment Companies) | ||||
| As of December 31, 2014 | ||||
EQ/PIMCO Ultra Short Bond Portfolio | 10.4 | % | ||
EQ/Intermediate Government Bond Portfolio | 10.2 | |||
EQ/Convertible Securities Portfolio | 10.1 | |||
EQ/Global Bond PLUS Portfolio | 9.9 | |||
EQ/PIMCO Global Real Return Portfolio | 8.7 | |||
iShares® International Treasury Bond ETF | 8.6 | |||
iShares® JP Morgan USD Emerging Markets Bond ETF | 6.3 | |||
Multimanager Core Bond Portfolio | 6.2 | |||
iShares® Floating Rate Bond ETF | 5.9 | |||
EQ/High Yield Bond Portfolio | 5.5 | |||
Eaton Vance Floating-Rate Fund, Institutional Class | 4.0 | |||
Van Eck Unconstrained Emerging Markets Bond Fund, Institutional Class | 3.8 | |||
SPDR® Barclays Short Term High Yield Bond ETF | 3.3 | |||
EQ/Core Bond Index Portfolio | 2.9 | |||
PIMCO Foreign Bond Fund Unhedged, Institutional Class | 1.2 | |||
EQ/Quality Bond PLUS Portfolio | 1.0 | |||
Vanguard Short-Term Inflation-Protected Securities ETF | 0.9 | |||
iShares® Global ex USD High Yield Corporate Bond ETF | 0.9 | |||
PowerShares Global Short Term High Yield Bond Portfolio | 0.2 | |||
UNDERSTANDING YOUR EXPENSES:
As a shareholder of the Portfolio, you incur two types of costs:
(1) transaction costs, including applicable sales charges and redemption fees; and (2) ongoing costs, including management fees, distribution and/or service (12b-1) fees (in the case of Class A and Class B shares of the Trust), and other Portfolio expenses. These examples are intended to help you understand your ongoing costs (in dollars) of investing in the Portfolio and to compare these costs with the ongoing costs of investing in other mutual funds.
The examples are based on an investment of $1,000 invested at the beginning of the six-month period ended December 31, 2014 and held for the entire six-month period.
Actual Expenses
The first line of the following table provides information about actual account values and actual expenses. You may use the information in this line, together with the amount you invested, to estimate the expenses that you paid over the period. Simply divide your account value by $1,000 (for example, an $8,600 account value divided by $1,000 = 8.6), then multiply the result by the number in the first line under the heading entitled “Expenses Paid During Period” to estimate the expenses you paid on your account during this period.
Hypothetical Example for Comparison Purposes
The second line of the following table provides information about hypothetical account values and hypothetical expenses based on the Portfolio’s actual expense ratio and an assumed rate of return of 5% per year before expenses, which is not the Portfolio’s actual return. The hypothetical account values and expenses may not be used to estimate the actual ending account balance or expenses you paid for the period. You may use this information to compare the ongoing costs of investing in the Portfolio and other funds. To do so, compare this 5% hypothetical example with the 5% hypothetical examples that appear in the shareholder reports of the other funds.
Please note that the expenses shown in the table are meant to highlight your ongoing costs only and do not reflect any transactional costs, such as sales charges (loads), redemption fees, or exchange fees. Therefore, the second line of the table is useful in comparing ongoing costs only, and will not help you determine the relative total costs of owning different funds. In addition, if these transactional costs were included, your costs would have been higher. Also note that the table does not reflect any variable life insurance or variable annuity contract-related fees and expenses, which would increase overall fees and expenses.
EXAMPLE
| Beginning Account Value 7/1/14 | Ending Account Value 12/31/14 | Expenses Paid During Period* 7/1/14 - 12/31/14 | ||||||||||
Class B | ||||||||||||
Actual | $1,000.00 | $981.37 | $3.25 | |||||||||
Hypothetical (5% average annual return before expenses) | 1,000.00 | 1,021.93 | 3.31 | |||||||||
* Expenses are equal to the Portfolio’s Class B shares annualized expense ratio of 0.65%, multiplied by the average account value over the period, and multiplied by 184/365 (to reflect the one-half year period). |
| |||||||||||
6
Table of Contents
AXA PREMIER VIP TRUST
CHARTERSM FIXED INCOME PORTFOLIO
PORTFOLIO OF INVESTMENTS
December 31, 2014
| Number of Shares | Value (Note 1) | |||||||
INVESTMENT COMPANIES: | ||||||||
Eaton Vance Floating-Rate Fund, Institutional Class | 22,962 | $ | 204,594 | |||||
EQ/Convertible Securities Portfolio‡ | 48,972 | 522,514 | ||||||
EQ/Core Bond Index Portfolio‡ | 15,193 | 151,502 | ||||||
EQ/Global Bond PLUS Portfolio‡ | 55,359 | 511,726 | ||||||
EQ/High Yield Bond Portfolio‡ | 28,623 | 282,421 | ||||||
EQ/Intermediate Government Bond Portfolio‡ | 51,289 | 528,668 | ||||||
EQ/PIMCO Global Real Return Portfolio‡ | 46,590 | 450,518 | ||||||
EQ/PIMCO Ultra Short Bond Portfolio‡ | 54,423 | 535,972 | ||||||
EQ/Quality Bond PLUS Portfolio‡ | 6,018 | 51,373 | ||||||
iShares® Floating Rate Bond ETF | 6,050 | 305,767 | ||||||
iShares® Global ex USD High Yield Corporate Bond ETF | 900 | 45,666 | ||||||
iShares® International Treasury Bond ETF | 4,570 | 442,284 | ||||||
iShares® JP Morgan USD Emerging Markets Bond ETF | 2,950 | 323,644 | ||||||
Multimanager Core Bond | 32,310 | 320,349 | ||||||
PIMCO Foreign Bond Fund Unhedged, Institutional Class | 6,416 | $ | 63,458 | |||||
PowerShares Global Short Term High Yield Bond Portfolio | 320 | 7,482 | ||||||
SPDR® Barclays Short Term High Yield Bond ETF | 5,880 | 169,991 | ||||||
Van Eck Unconstrained Emerging Markets Bond Fund, Institutional Class | 24,059 | 198,008 | ||||||
Vanguard Short-Term Inflation- Protected Securities ETF | 950 | 45,828 | ||||||
|
| |||||||
Total Investments (99.8%) | 5,161,765 | |||||||
Other Assets Less Liabilities (0.2%) | 9,071 | |||||||
|
| |||||||
Net Assets (100%) | $ | 5,170,836 | ||||||
|
| |||||||
| ‡ | Affiliated company as defined under the Investment Company Act of 1940. |
The holdings in affiliated Investment Companies are all Class K shares.
Investments in companies which were affiliates for the year ended December 31, 2014, were as follows:
Securities | Value December 31, 2013 | Purchases at Cost | Sales at Cost | Value December 31, 2014 | Dividend Income | Realized Gain (Loss)† | ||||||||||||||||||
CharterSM Multi-Sector Bond Portfolio (a)(aa)(bb)(cc) | $ | 183,007 | $ | 8,380 | $ | 1,860 | $ | — | $ | — | $ | (5,371 | )(dd) | |||||||||||
EQ/Convertible Securities Portfolio | 372,772 | 225,523 | 93,690 | 522,514 | 9,824 | 10,182 | ||||||||||||||||||
EQ/Core Bond Index Portfolio (aa) | — | 42,007 | 17,091 | 151,502 | 2,369 | (3 | ) | |||||||||||||||||
EQ/Global Bond PLUS Portfolio | 358,149 | 227,587 | 65,324 | 511,726 | 4,798 | 6,639 | ||||||||||||||||||
EQ/High Yield Bond Portfolio (bb) | 192,989 | 127,597 | 52,898 | 282,421 | 11,931 | 99 | ||||||||||||||||||
EQ/Intermediate Government Bond Portfolio | 359,582 | 229,967 | 64,748 | 528,668 | 3,473 | 417 | ||||||||||||||||||
EQ/PIMCO Global Real Return Portfolio | 296,333 | 222,191 | 75,948 | 450,518 | 21,768 | 223 | ||||||||||||||||||
EQ/PIMCO Ultra Short Bond Portfolio | 545,609 | 177,459 | 185,252 | 535,972 | 3,417 | (838 | ) | |||||||||||||||||
EQ/Quality Bond PLUS Portfolio (cc) | — | 15,508 | 6,409 | 51,373 | 643 | (1 | ) | |||||||||||||||||
Multimanager Core Bond Portfolio | 356,877 | 121,676 | 159,668 | 320,349 | 7,367 | 2,642 | ||||||||||||||||||
|
|
|
|
|
|
|
|
|
|
|
| |||||||||||||
| $ | 2,665,318 | $ | 1,397,895 | $ | 722,888 | $ | 3,355,043 | $ | 65,590 | $ | 13,989 | |||||||||||||
|
|
|
|
|
|
|
|
|
|
|
| |||||||||||||
| † | When applicable, realized gain includes net distributions of realized gain received from Underlying Portfolios. |
| (a) | Formerly known as Multimanager Multi-Sector Bond Portfolio. |
| (aa) | On April 21, 2014 the Portfolio exchanged a portion of its Class K shares in CharterSM Multi-Sector Bond Portfolio for Class K shares of the EQ/Core Bond Index Portfolio in the amount of $126,855, representing 32,393 shares of CharterSM Multi-Sector Bond Portfolio and 12,716 shares of EQ/Core Bond Index Portfolio, as a taxable transfer. These amounts are not reflected in the purchases and sales listed above. The amount above includes a portion of CharterSM Multi-Sector Bond Portfolio’s realized gains. |
| (bb) | On April 21, 2014 the Portfolio exchanged a portion of its Class K shares in CharterSM Multi-Sector Bond Portfolio for Class K shares of the EQ/High Yield Bond Portfolio in the amount of $23,732, representing 6,060 shares of CharterSM Multi-Sector Bond Portfolio and 2,286 shares of EQ/High Yield Bond Portfolio, as a taxable transfer. These amounts are not reflected in the purchases and sales listed above. The amount above includes a portion of CharterSM Multi-Sector Bond Portfolio’s realized gains. |
| (cc) | On April 21, 2014 the Portfolio exchanged a portion of its Class K shares in CharterSM Multi-Sector Bond Portfolio for Class K shares of the EQ/Quality Bond PLUS Portfolio in the amount of $41,976, representing 10,719 shares of CharterSM Multi-Sector Bond Portfolio and 4,956 shares of EQ/Quality Bond PLUS Portfolio, as a taxable transfer. These amounts are not reflected in the purchases and sales listed above. The amount above includes a portion of CharterSM Multi-Sector Bond Portfolio’s realized gains. |
| (dd) | $(5,371) of the realized gain (loss) was due to the in-kind transactions noted above. |
See Notes to Financial Statements.
7
Table of Contents
AXA PREMIER VIP TRUST
CHARTERSM FIXED INCOME PORTFOLIO
PORTFOLIO OF INVESTMENTS (Continued)
December 31, 2014
The following is a summary of the inputs used to value the Portfolio’s assets and liabilities carried at fair value as of December 31, 2014:
The inputs or methodology used for valuing securities are not necessarily an indication of the risk associated with investing in those securities.
Various inputs are used in determining the value of the Portfolio’s investments. These inputs are summarized in the three broad levels listed below:
| Investment Type | Level 1 Quoted Prices in | Level 2 Significant Other | Level 3 Significant Unobservable | Total | ||||||||||||
Assets: | ||||||||||||||||
Investment Companies | ||||||||||||||||
Exchange Traded Funds (ETFs) | $ | 1,340,662 | $ | — | $ | — | $ | 1,340,662 | ||||||||
Investment Companies | 466,060 | 3,355,043 | — | 3,821,103 | ||||||||||||
|
|
|
|
|
|
|
| |||||||||
Total Assets | $ | 1,806,722 | $ | 3,355,043 | $ | — | $ | 5,161,765 | ||||||||
|
|
|
|
|
|
|
| |||||||||
Total Liabilities | $ | — | $ | — | $ | — | $ | — | ||||||||
|
|
|
|
|
|
|
| |||||||||
Total | $ | 1,806,722 | $ | 3,355,043 | $ | — | $ | 5,161,765 | ||||||||
|
|
|
|
|
|
|
| |||||||||
There were no transfers between Levels 1, 2 or 3 during the year ended December 31, 2014.
The Portfolio held no derivatives contracts during the year ended December 31, 2014.
Investment security transactions for the year ended December 31, 2014 were as follows:
Cost of Purchases: | ||||
Long-term investments other than U.S. government debt securities | $ | 2,065,806 | ||
Net Proceeds of Sales and Redemptions: | ||||
Long-term investments other than U.S. government debt securities | $ | 859,072 |
As of December 31, 2014, the gross unrealized appreciation (depreciation) of investments based on the aggregate cost of investments for Federal income tax purposes was as follows:
Aggregate gross unrealized appreciation | $ | 25,845 | ||
Aggregate gross unrealized depreciation | (119,896 | ) | ||
|
| |||
Net unrealized depreciation | $ | (94,051 | ) | |
|
| |||
Federal income tax cost of investments | $ | 5,255,816 | ||
|
|
See Notes to Financial Statements.
8
Table of Contents
AXA PREMIER VIP TRUST
CHARTERSM FIXED INCOME PORTFOLIO
STATEMENT OF ASSETS AND LIABILITIES
December 31, 2014
ASSETS | ||||
Investments at value: | ||||
Affiliated Issuers (Cost $3,379,320) | $ | 3,355,043 | ||
Unaffiliated Issuers (Cost $1,876,698) | 1,806,722 | |||
Cash | 50,233 | |||
Receivable from investment manager | 8,139 | |||
Receivable from Separate Accounts for Trust shares sold | 2,759 | |||
Dividends, interest and other receivables | 888 | |||
Receivable for securities sold | 56 | |||
Other assets | 16 | |||
|
| |||
Total assets | 5,223,856 | |||
|
| |||
LIABILITIES | ||||
Distribution fees payable – Class B | 1,091 | |||
Trustees’ fees payable | 117 | |||
Payable for securities purchased | 105 | |||
Payable to Separate Accounts for Trust shares redeemed | 5 | |||
Accrued expenses | 51,702 | |||
|
| |||
Total liabilities | 53,020 | |||
|
| |||
NET ASSETS | $ | 5,170,836 | ||
|
| |||
Net assets were comprised of: | ||||
Paid in capital | $ | 5,273,035 | ||
Accumulated undistributed net investment income (loss) | 3,313 | |||
Accumulated undistributed net realized gain (loss) on investments | (11,259 | ) | ||
Net unrealized appreciation (depreciation) on investments | (94,253 | ) | ||
|
| |||
Net assets | $ | 5,170,836 | ||
|
| |||
Class B | ||||
Net asset value, offering and redemption price per share, $5,170,836 / 530,484 shares outstanding (unlimited amount authorized: $0.001 par value) | $ | 9.75 | ||
|
|
STATEMENT OF OPERATIONS
For the Year Ended December 31, 2014
INVESTMENT INCOME | ||||
Dividends ($65,590 of dividend income received from affiliates) | $ | 112,790 | ||
Interest | 37 | |||
|
| |||
Total income | 112,827 | |||
|
| |||
EXPENSES | ||||
Custodian fees | 75,100 | |||
Professional fees | 47,115 | |||
Administrative fees | 37,499 | |||
Offering costs | 14,593 | |||
Distribution fees – Class B | 11,556 | |||
Investment management fees | 6,934 | |||
Printing and mailing expenses | 1,034 | |||
Trustees’ fees | 241 | |||
Miscellaneous | 938 | |||
|
| |||
Gross expenses | 195,010 | |||
Less: Waiver from investment manager | (44,432 | ) | ||
Reimbursement from investment advisor | (120,534 | ) | ||
|
| |||
Net expenses | 30,044 | |||
|
| |||
NET INVESTMENT INCOME (LOSS) | 82,783 | |||
|
| |||
REALIZED AND UNREALIZED GAIN (LOSS) | ||||
Net realized gain (loss) on investments ($(6,429) of realized gain (loss) from affiliates) | (6,095 | ) | ||
Net distributions of realized gain received from Underlying Portfolios (All realized gains received from affiliates) | 20,418 | |||
|
| |||
Net realized gain (loss) | 14,323 | |||
|
| |||
Net change in unrealized appreciation (depreciation) on investments ($20,089 of change in unrealized appreciation (depreciation) from affiliates) | (33,766 | ) | ||
|
| |||
NET REALIZED AND UNREALIZED GAIN (LOSS) | (19,443 | ) | ||
|
| |||
NET INCREASE (DECREASE) IN NET ASSETS RESULTING FROM OPERATIONS | $ | 63,340 | ||
|
|
See Notes to Financial Statements.
9
Table of Contents
AXA PREMIER VIP TRUST
CHARTERSM FIXED INCOME PORTFOLIO
STATEMENT OF CHANGES IN NET ASSETS
| Year Ended December 31, 2014 | October 30, 2013* to December 31, 2013 | |||||||
INCREASE (DECREASE) IN NET ASSETS FROM OPERATIONS: | ||||||||
Net investment income (loss) | $ | 82,783 | $ | 36,555 | ||||
Net realized gain (loss) on investments and net distributions of realized gain received from Underlying Portfolios | 14,323 | (20 | ) | |||||
Net change in unrealized appreciation (depreciation) on investments | (33,766 | ) | (60,487 | ) | ||||
|
|
|
| |||||
NET INCREASE (DECREASE) IN NET ASSETS RESULTING FROM OPERATIONS | 63,340 | (23,952 | ) | |||||
|
|
|
| |||||
DIVIDENDS AND DISTRIBUTIONS: | ||||||||
Dividends from net investment income | ||||||||
Class B | (114,004 | ) | (45,191 | ) | ||||
Distributions from net realized capital gains | ||||||||
Class B | — | (3,835 | ) | |||||
Return of capital | ||||||||
Class B | — | (10,639 | ) | |||||
|
|
|
| |||||
TOTAL DIVIDENDS AND DISTRIBUTIONS | (114,004 | ) | (59,665 | ) | ||||
|
|
|
| |||||
CAPITAL SHARES TRANSACTIONS: | ||||||||
Class B | ||||||||
Capital shares sold [ 163,708 and 405,613 shares, respectively ] | 1,645,717 | 4,055,764 | ||||||
Capital shares issued in reinvestment of dividends and distributions [ 11,708 and 6,094 shares, respectively ] | 114,004 | 59,665 | ||||||
Capital shares repurchased [ (56,635) and (4) shares, respectively ] | (569,991 | ) | (42 | ) | ||||
|
|
|
| |||||
NET INCREASE (DECREASE) IN NET ASSETS RESULTING FROM CAPITAL SHARE TRANSACTIONS | 1,189,730 | 4,115,387 | ||||||
|
|
|
| |||||
TOTAL INCREASE (DECREASE) IN NET ASSETS | 1,139,066 | 4,031,770 | ||||||
NET ASSETS: | ||||||||
Beginning of period | 4,031,770 | — | ||||||
|
|
|
| |||||
End of period (a) | $ | 5,170,836 | $ | 4,031,770 | ||||
|
|
|
|
| ||||
(a) Includes accumulated undistributed (overdistributed) net investment income (loss) of | $ | 3,313 | $ | — | ||||
|
|
|
| |||||
* The Portfolio commenced operations on October 30, 2013. | ||||||||
See Notes to Financial Statements.
10
Table of Contents
AXA PREMIER VIP TRUST
CHARTERSM FIXED INCOME PORTFOLIO
FINANCIAL HIGHLIGHTS
| Class B | Year Ended December 31, 2014 | October 30, 2013* to December 31, 2013 | ||||||
Net asset value, beginning of period | $ | 9.79 | $ | 10.00 | ||||
|
|
|
| |||||
Income (loss) from investment operations: | ||||||||
Net investment income (loss) (e)(x) | 0.18 | 0.09 | ||||||
Net realized and unrealized gain (loss) on investments | — | # | (0.15 | ) | ||||
|
|
|
| |||||
Total from investment operations | 0.18 | (0.06 | ) | |||||
|
|
|
| |||||
Less distributions: | ||||||||
Dividends from net investment income | (0.22 | ) | (0.11 | ) | ||||
Distributions from net realized gains | — | (0.01 | ) | |||||
Return of capital | — | (0.03 | ) | |||||
|
|
|
| |||||
Total dividends and distributions | (0.22 | ) | (0.15 | ) | ||||
|
|
|
| |||||
Net asset value, end of period | $ | 9.75 | $ | 9.79 | ||||
|
|
|
| |||||
Total return (b) | 1.85 | % | (0.63 | )% | ||||
|
|
|
| |||||
Ratios/Supplemental Data: | ||||||||
Net assets, end of period (000’s) | $ | 5,171 | $ | 4,032 | ||||
Ratio of expenses to average net assets: | ||||||||
After waivers and reimbursements (a)(f) | 0.65 | % | 0.65 | % | ||||
Before waivers and reimbursements (a)(f) | 4.22 | % | 3.83 | % | ||||
Ratio of net investment income (loss) to average net assets: | ||||||||
After waivers and reimbursements (a)(f)(x) | 1.79 | % | 5.39 | %(l) | ||||
Before waivers and reimbursements (a)(f)(x) | (1.78 | )% | 2.21 | %(l) | ||||
Portfolio turnover rate (z)^ | 19 | % | 19 | % | ||||
| * | Commencement of Operations. |
| # | Per share amount is less than $0.005. |
| ^ | Portfolio turnover rate excludes derivatives, if any. |
| (a) | Ratios for periods less than one year are annualized. |
| (b) | Total returns for periods less than one year are not annualized. |
| (e) | Net investment income (loss) per share is based on average shares outstanding. |
| (f) | Expenses do not include the expenses of the underlying funds (“indirect expenses”). |
| (l) | The annualized ratio of net investment income to average net assets may not be indicative of operating results for a full year. |
| (x) | Recognition of net investment income is affected by the timing of dividend declarations by the underlying funds in which the Portfolio invests. |
| (z) | Portfolio turnover rate for periods less than one year is not annualized. |
See Notes to Financial Statements.
11
Table of Contents
CHARTERSM EQUITY PORTFOLIO (Unaudited)
INVESTMENT MANAGER
| Ø | AXA Equitable Funds Management Group, LLC |
PERFORMANCE RESULTS
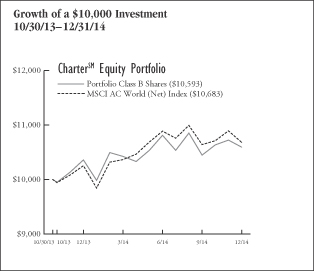
| Annualized Total Returns as of 12/31/14 | ||||||||
| 1 Year | Since Incept. | |||||||
Portfolio – Class B Shares* | 2.24 | % | 5.05 | % | ||||
MSCI AC World (Net) Index | 4.16 | 5.81 | ||||||
* Date of inception 10/30/13.
Returns for periods greater than one year are annualized. |
| |||||||
Past performance is not indicative of future results.
PERFORMANCE SUMMARY
The Portfolio’s Class B shares returned 2.24% for the year ended December 31, 2014. This compares to the returns of the following broad market benchmark, the MSCI AC World (Net) Index, which returned 4.16% over the same period.
Portfolio Highlights
For the year ended December 31, 2014
| • | As of 12/31/2014, the Portfolio’s allocation consisted of 97.7% equity investments and 2.3% non-traditional (alternative) investments. |
| • | As the world’s economies diverged, U.S. economic growth drove stocks to higher levels, while international stocks were hurt by the rising dollar, global political tensions and sputtering economies in Europe and Japan. In this environment, the Portfolio underperformed its benchmark, largely due to investments in several actively managed portfolios in both the U.S. equity and commodities sectors, which underperformed their benchmarks. |
| Portfolio Allocation (as a percentage of Total Investment Companies) | ||||
| As of December 31, 2014 | ||||
EQ/International Equity Index Portfolio | 12.1 | % | ||
EQ/Capital Guardian Research Portfolio | 10.1 | |||
Multimanager Mid Cap Value Portfolio | 7.7 | |||
EQ/Morgan Stanley Mid Cap Growth Portfolio | 7.5 | |||
EQ/MFS International Growth Portfolio | 7.3 | |||
EQ/GAMCO Small Company Value Portfolio | 5.2 | |||
EQ/BlackRock Basic Value Equity Portfolio | 5.2 | |||
EQ/AllianceBernstein Small Cap Growth Portfolio | 5.1 | |||
EQ/T. Rowe Price Growth Stock Portfolio | 5.1 | |||
EQ/Wells Fargo Omega Growth Portfolio | 5.0 | |||
EQ/Invesco Comstock Portfolio | 5.0 | |||
EQ/Emerging Markets Equity PLUS Portfolio | 4.9 | |||
Templeton Global Smaller Companies, Advisor Class | 4.0 | |||
AXA SmartBeta Equity Portfolio | 2.6 | |||
EQ/Low Volatility Global ETF Portfolio | 2.6 | |||
Templeton Emerging Markets Small Cap, Advisor Class | 2.4 | |||
Morgan Stanley Institutional Fund, Inc. - Frontier Emerging Markets Portfolio, Institutional Class | 2.4 | |||
PowerShares S&P 500 BuyWrite Portfolio | 2.3 | |||
AXA/Lord Abbett Micro Cap Portfolio | 2.3 | |||
iShares® MSCI EAFE Small-Cap ETF | 0.7 | |||
iShares® Micro-Cap ETF | 0.5 | |||
12
Table of Contents
CHARTERSM EQUITY PORTFOLIO (Unaudited)
UNDERSTANDING YOUR EXPENSES:
As a shareholder of the Portfolio, you incur two types of costs:
(1) transaction costs, including applicable sales charges and redemption fees; and (2) ongoing costs, including management fees, distribution and/or service (12b-1) fees (in the case of Class A and Class B shares of the Trust), and other Portfolio expenses. These examples are intended to help you understand your ongoing costs (in dollars) of investing in the Portfolio and to compare these costs with the ongoing costs of investing in other mutual funds.
The examples are based on an investment of $1,000 invested at the beginning of the six-month period ended December 31, 2014 and held for the entire six-month period.
Actual Expenses
The first line of the following table provides information about actual account values and actual expenses. You may use the information in this line, together with the amount you invested, to estimate the expenses that you paid over the period. Simply divide your account value by $1,000 (for example, an $8,600 account value divided by $1,000 = 8.6), then multiply the result by the number in the first line under the heading entitled “Expenses Paid During Period” to estimate the expenses you paid on your account during this period.
Hypothetical Example for Comparison Purposes
The second line of the following table provides information about hypothetical account values and hypothetical expenses based on the Portfolio’s actual expense ratio and an assumed rate of return of 5% per year before expenses, which is not the Portfolio’s actual return. The hypothetical account values and expenses may not be used to estimate the actual ending account balance or expenses you paid for the period. You may use this information to compare the ongoing costs of investing in the Portfolio and other funds. To do so, compare this 5% hypothetical example with the 5% hypothetical examples that appear in the shareholder reports of the other funds.
Please note that the expenses shown in the table are meant to highlight your ongoing costs only and do not reflect any transactional costs, such as sales charges (loads), redemption fees, or exchange fees. Therefore, the second line of the table is useful in comparing ongoing costs only, and will not help you determine the relative total costs of owning different funds. In addition, if these transactional costs were included, your costs would have been higher. Also note that the table does not reflect any variable life insurance or variable annuity contract-related fees and expenses, which would increase overall fees and expenses.
EXAMPLE
| Beginning Account Value 7/1/14 | Ending Account Value 12/31/14 | Expenses Paid During Period* 7/1/14 - 12/31/14 | ||||||||||
Class B | ||||||||||||
Actual | $1,000.00 | $980.03 | $3.24 | |||||||||
Hypothetical (5% average annual return before expenses) | 1,000.00 | 1,021.93 | 3.31 | |||||||||
* Expenses are equal to the Portfolio’s Class B shares annualized expense ratio of 0.65%, multiplied by the average account value over the period, and multiplied by 184/365 (to reflect the one-half year period). |
| |||||||||||
13
Table of Contents
AXA PREMIER VIP TRUST
CHARTERSM EQUITY PORTFOLIO
PORTFOLIO OF INVESTMENTS
December 31, 2014
| Number of Shares | Value (Note 1) | |||||||
INVESTMENT COMPANIES: | ||||||||
AXA SmartBeta Equity Portfolio‡ | 13,218 | $ | 141,433 | |||||
AXA/Lord Abbett Micro Cap Portfolio*‡ | 11,240 | 121,088 | ||||||
EQ/AllianceBernstein Small Cap Growth Portfolio‡ | 13,789 | 275,174 | ||||||
EQ/BlackRock Basic Value Equity Portfolio‡ | 12,926 | 278,064 | ||||||
EQ/Capital Guardian Research Portfolio‡ | 26,085 | 541,600 | ||||||
EQ/Emerging Markets Equity PLUS Portfolio‡ | 29,298 | 265,255 | ||||||
EQ/GAMCO Small Company Value Portfolio‡ | 5,054 | 280,890 | ||||||
EQ/International Equity Index Portfolio‡ | 73,812 | 651,096 | ||||||
EQ/Invesco Comstock Portfolio‡ | 17,979 | 270,014 | ||||||
EQ/Low Volatility Global ETF Portfolio‡ | 13,409 | 139,599 | ||||||
EQ/MFS International Growth Portfolio‡ | 59,258 | 394,186 | ||||||
EQ/Morgan Stanley Mid Cap Growth Portfolio*‡ | 22,566 | 405,594 | ||||||
EQ/T. Rowe Price Growth Stock Portfolio*‡ | 7,429 | 271,875 | ||||||
EQ/Wells Fargo Omega Growth Portfolio*‡ | 23,651 | 270,538 | ||||||
iShares® Micro-Cap ETF | 310 | 23,864 | ||||||
iShares® MSCI EAFE Small-Cap ETF | 800 | $ | 37,368 | |||||
Morgan Stanley Institutional Fund, Inc.-Frontier Emerging Markets Portfolio, Institutional Class | 6,683 | 128,043 | ||||||
Multimanager Mid Cap Value Portfolio‡ | 29,092 | 411,668 | ||||||
PowerShares S&P 500 BuyWrite Portfolio | 6,050 | 125,417 | ||||||
Templeton Emerging Markets Small Cap, Advisor Class | 10,406 | 128,416 | ||||||
Templeton Global Smaller Companies, Advisor Class | 25,007 | 216,307 | ||||||
|
| |||||||
Total Investments (99.9%) | 5,377,489 | |||||||
Other Assets Less Liabilities (0.1%) | 2,983 | |||||||
|
| |||||||
Net Assets (100%) | $ | 5,380,472 | ||||||
|
| |||||||
| * | Non-income producing. |
| ‡ | Affiliated company as defined under the Investment Company Act of 1940. |
The holdings in affiliated Investment Companies are all Class K shares.
Investments in companies which were affiliates for the year ended December 31, 2014, were as follows:
Securities | Value December 31, 2013 | Purchases at Cost | Sales at Cost | Value December 31, 2014 | Dividend Income | Realized Gain (Loss)† | ||||||||||||||||||
AXA International Core Managed Volatility Portfolio (a) | $ | 196,354 | $ | 24,249 | $ | 220,430 | $ | — | $ | — | $ | 2,868 | ||||||||||||
AXA International Value Managed Volatility Portfolio (b) | 307,880 | 20,570 | 328,258 | — | — | 3,597 | ||||||||||||||||||
AXA SmartBeta Equity Portfolio | 104,344 | 41,212 | 9,338 | 141,433 | 2,607 | 962 | ||||||||||||||||||
AXA/Lord Abbett Micro Cap Portfolio | — | 111,739 | 6,915 | 121,088 | — | 9 | ||||||||||||||||||
EQ/AllianceBernstein Small Cap Growth Portfolio | 203,508 | 116,283 | 26,935 | 275,174 | 795 | 27,180 | ||||||||||||||||||
EQ/BlackRock Basic Value Equity Portfolio | 204,411 | 80,444 | 26,325 | 278,064 | 3,398 | 148 | ||||||||||||||||||
EQ/Capital Guardian Research Portfolio | 422,939 | 159,844 | 86,957 | 541,600 | 4,782 | 2,117 | ||||||||||||||||||
EQ/Emerging Markets Equity PLUS Portfolio | 189,225 | 116,290 | 32,286 | 265,255 | 2,034 | 697 | ||||||||||||||||||
EQ/GAMCO Small Company Value Portfolio | 206,378 | 95,029 | 19,499 | 280,890 | 1,362 | 8,596 | ||||||||||||||||||
EQ/International Equity Index Portfolio | — | 766,028 | 46,947 | 651,096 | 21,785 | (68 | ) | |||||||||||||||||
EQ/Invesco Comstock Portfolio | 205,658 | 81,189 | 33,749 | 270,014 | 4,143 | 225 | ||||||||||||||||||
EQ/Low Volatility Global ETF Portfolio | 101,599 | 40,864 | 9,341 | 139,599 | 3,216 | 1 | ||||||||||||||||||
EQ/MFS International Growth Portfolio | 305,325 | 168,621 | 42,544 | 394,186 | 4,645 | 15,253 | ||||||||||||||||||
EQ/Morgan Stanley Mid Cap Growth Portfolio | 328,400 | 182,705 | 59,642 | 405,594 | — | 48,035 | ||||||||||||||||||
EQ/T. Rowe Price Growth Stock Portfolio | 204,829 | 81,346 | 35,725 | 271,875 | — | 749 | ||||||||||||||||||
EQ/Wells Fargo Omega Growth Portfolio | 205,424 | 109,723 | 26,942 | 270,538 | — | 28,403 | ||||||||||||||||||
Multimanager Mid Cap Value Portfolio | 316,427 | 117,380 | 39,372 | 411,668 | 2,694 | 186 | ||||||||||||||||||
|
|
|
|
|
|
|
|
|
|
|
| |||||||||||||
| $ | 3,502,701 | $ | 2,313,516 | $ | 1,051,205 | $ | 4,718,074 | $ | 51,461 | $ | 138,958 | |||||||||||||
|
|
|
|
|
|
|
|
|
|
|
| |||||||||||||
| † | When applicable, realized gain includes net distributions of realized gain received from Underlying Portfolios. |
| (a) | Formerly known as EQ/International Core PLUS Portfolio. |
| (b) | Formerly known as EQ/International Value PLUS Portfolio. |
See Notes to Financial Statements.
14
Table of Contents
AXA PREMIER VIP TRUST
CHARTERSM EQUITY PORTFOLIO
PORTFOLIO OF INVESTMENTS (Continued)
December 31, 2014
The following is a summary of the inputs used to value the Portfolio’s assets and liabilities carried at fair value as of December 31, 2014:
The inputs or methodology used for valuing securities are not necessarily an indication of the risk associated with investing in those securities.
Various inputs are used in determining the value of the Portfolio’s investments. These inputs are summarized in the three broad levels listed below:
| Investment Type | Level 1 Quoted Prices in Active Markets for Identical Securities | Level 2 Significant Other Observable Inputs (including quoted prices for similar securities, interest rates, prepayment speeds, credit risk, etc.) | Level 3 Significant Unobservable Inputs (including the Portfolio’s own assumptions in determining the fair value of investments) | Total | ||||||||||||
Assets: | ||||||||||||||||
Investment Companies | ||||||||||||||||
Exchange Traded Funds (ETFs) | $ | 186,649 | $ | — | $ | — | $ | 186,649 | ||||||||
Investment Companies | 472,766 | 4,718,074 | — | 5,190,840 | ||||||||||||
|
|
|
|
|
|
|
| |||||||||
Total Assets | $ | 659,415 | $ | 4,718,074 | $ | — | $ | 5,377,489 | ||||||||
|
|
|
|
|
|
|
| |||||||||
Total Liabilities | $ | — | $ | — | $ | — | $ | — | ||||||||
|
|
|
|
|
|
|
| |||||||||
Total | $ | 659,415 | $ | 4,718,074 | $ | — | $ | 5,377,489 | ||||||||
|
|
|
|
|
|
|
| |||||||||
There were no transfers between Levels 1, 2 or 3 during the year ended December 31, 2014.
The Portfolio held no derivatives contracts during the year ended December 31, 2014.
Investment security transactions for the year ended December 31, 2014 were as follows:
Cost of Purchases: | ||||
Long-term investments other than U.S. government debt securities | $ | 2,492,055 | ||
Net Proceeds of Sales and Redemptions: | ||||
Long-term investments other than U.S. government debt securities | $ | 1,179,499 |
As of December 31, 2014, the gross unrealized appreciation (depreciation) of investments based on the aggregate cost of investments for Federal income tax purposes was as follows:
Aggregate gross unrealized appreciation | $ | 210,192 | ||
Aggregate gross unrealized depreciation | (238,444 | ) | ||
|
| |||
Net unrealized depreciation | $ | (28,252 | ) | |
|
| |||
Federal income tax cost of investments | $ | 5,405,741 | ||
|
|
See Notes to Financial Statements.
15
Table of Contents
AXA PREMIER VIP TRUST
CHARTERSM EQUITY PORTFOLIO
STATEMENT OF ASSETS AND LIABILITIES
December 31, 2014
ASSETS | ||||
Investments at value: | ||||
Affiliated Issuers (Cost $4,755,558) | $ | 4,718,074 | ||
Unaffiliated Issuers (Cost $650,250) | 659,415 | |||
Cash | 41,106 | |||
Receivable from investment manager | 15,022 | |||
Receivable for securities sold | 73 | |||
Dividends, interest and other receivables | 4 | |||
Other assets | 17 | |||
|
| |||
Total assets | 5,433,711 | |||
|
| |||
LIABILITIES | ||||
Distribution fees payable – Class B | 1,103 | |||
Trustees’ fees payable | 113 | |||
Payable to Separate Accounts for Trust shares redeemed | 39 | |||
Accrued expenses | 51,984 | |||
|
| |||
Total liabilities | 53,239 | |||
|
| |||
NET ASSETS | $ | 5,380,472 | ||
|
| |||
Net assets were comprised of: | ||||
Paid in capital | $ | 5,304,302 | ||
Accumulated undistributed net investment income (loss) | 3,166 | |||
Accumulated undistributed net realized gain (loss) on investments | 101,323 | |||
Net unrealized appreciation (depreciation) on investments | (28,319 | ) | ||
|
| |||
Net assets | $ | 5,380,472 | ||
|
| |||
Class B | ||||
Net asset value, offering and redemption price per share, $5,380,472 / 529,959 shares outstanding (unlimited amount authorized: $0.001 par value) | $ | 10.15 | ||
|
|
STATEMENT OF OPERATIONS
For the Year Ended December 31, 2014
INVESTMENT INCOME | ||||
Dividends ($51,461 of dividend income received from affiliates) | $ | 60,601 | ||
Interest | 40 | |||
|
| |||
Total income | 60,641 | |||
|
| |||
EXPENSES | ||||
Custodian fees | 95,600 | |||
Professional fees | 47,115 | |||
Administrative fees | 37,600 | |||
Offering costs | 14,593 | |||
Distribution fees – Class B | 11,619 | |||
Investment management fees | 6,972 | |||
Printing and mailing expenses | 1,032 | |||
Trustees’ fees | 239 | |||
Miscellaneous | 939 | |||
|
| |||
Gross expenses | 215,709 | |||
Less: Waiver from investment manager | (44,572 | ) | ||
Reimbursement from investment manager | (140,928 | ) | ||
|
| |||
Net expenses | 30,209 | |||
|
| |||
NET INVESTMENT INCOME (LOSS) | 30,432 | |||
|
| |||
REALIZED AND UNREALIZED GAIN (LOSS) | ||||
Net realized gain (loss) on investments ($11,194 of realized gain (loss) from affiliates) | 12,491 | |||
Net distributions of realized gain received from Underlying Portfolios ($127,764 received from affiliates) | 130,362 | |||
|
| |||
Net realized gain (loss) | 142,853 | |||
|
| |||
Net change in unrealized appreciation (depreciation) on investments ($(46,938) of change in unrealized appreciation (depreciation) from affiliates) | (59,337 | ) | ||
|
| |||
NET REALIZED AND UNREALIZED GAIN (LOSS) | 83,516 | |||
|
| |||
NET INCREASE (DECREASE) IN NET ASSETS RESULTING FROM OPERATIONS | $ | 113,948 | ||
|
|
See Notes to Financial Statements.
16
Table of Contents
AXA PREMIER VIP TRUST
CHARTERSM EQUITY PORTFOLIO
STATEMENT OF CHANGES IN NET ASSETS
| Year Ended December 31, 2014 | October 30, 2013* to December 31, 2013 | |||||||
INCREASE (DECREASE) IN NET ASSETS FROM OPERATIONS: | ||||||||
Net investment income (loss) | $ | 30,432 | $ | 36,402 | ||||
Net realized gain (loss) on investments and net distributions of realized gain received from Underlying Portfolios | 142,853 | 75,755 | ||||||
Net change in unrealized appreciation (depreciation) on investments | (59,337 | ) | 31,018 | |||||
|
|
|
| |||||
NET INCREASE (DECREASE) IN NET ASSETS RESULTING FROM OPERATIONS | 113,948 | 143,175 | ||||||
|
|
|
| |||||
DIVIDENDS AND DISTRIBUTIONS: | ||||||||
Dividends from net investment income | ||||||||
Class B | (58,631 | ) | (61,734 | ) | ||||
Distributions from net realized capital gains | ||||||||
Class B | (66,937 | ) | (13,706 | ) | ||||
|
|
|
| |||||
TOTAL DIVIDENDS AND DISTRIBUTIONS | (125,568 | ) | (75,440 | ) | ||||
|
|
|
| |||||
CAPITAL SHARES TRANSACTIONS: | ||||||||
Class B | ||||||||
Capital shares sold [ 134,351 and 403,507 shares, respectively ] | 1,376,720 | 4,035,655 | ||||||
Capital shares issued in reinvestment of dividends and distributions [ 12,141 and 7,512 shares, respectively ] | 125,568 | 75,440 | ||||||
Capital shares repurchased [ (27,552) and 0 shares, respectively ] | (289,026 | ) | — | |||||
|
|
|
| |||||
NET INCREASE (DECREASE) IN NET ASSETS RESULTING FROM CAPITAL SHARE TRANSACTIONS | 1,213,262 | 4,111,095 | ||||||
|
|
|
| |||||
TOTAL INCREASE (DECREASE) IN NET ASSETS | 1,201,642 | 4,178,830 | ||||||
NET ASSETS: | ||||||||
Beginning of period | 4,178,830 | — | ||||||
|
|
|
| |||||
End of period (a) | $ | 5,380,472 | $ | 4,178,830 | ||||
|
|
|
|
| ||||
(a) Includes accumulated undistributed (overdistributed) net investment income (loss) of | $ | 3,166 | $ | — | ||||
|
|
|
| |||||
* The Portfolio commenced operations on October 30, 2013. | ||||||||
See Notes to Financial Statements.
17
Table of Contents
AXA PREMIER VIP TRUST
CHARTERSM EQUITY PORTFOLIO
FINANCIAL HIGHLIGHTS
| Class B | Year Ended December 31, 2014 | October 30, 2013* to December 31, 2013 | ||||||
Net asset value, beginning of period | $ | 10.17 | $ | 10.00 | ||||
|
|
|
| |||||
Income (loss) from investment operations: | ||||||||
Net investment income (loss) (e)(x) | 0.07 | 0.09 | ||||||
Net realized and unrealized gain (loss) on investments | 0.16 | 0.26 | ||||||
|
|
|
| |||||
Total from investment operations | 0.23 | 0.35 | ||||||
|
|
|
| |||||
Less distributions: | ||||||||
Dividends from net investment income | (0.11 | ) | (0.15 | ) | ||||
Distributions from net realized gains | (0.14 | ) | (0.03 | ) | ||||
|
|
|
| |||||
Total dividends and distributions | (0.25 | ) | (0.18 | ) | ||||
|
|
|
| |||||
Net asset value, end of period | $ | 10.15 | $ | 10.17 | ||||
|
|
|
| |||||
Total return (b) | 2.24 | % | 3.61 | % | ||||
|
|
|
| |||||
Ratios/Supplemental Data: | ||||||||
Net assets, end of period (000’s) | $ | 5,380 | $ | 4,179 | ||||
Ratio of expenses to average net assets: | ||||||||
After waivers and reimbursements (a)(f) | 0.65 | % | 0.65 | % | ||||
Before waivers and reimbursements (a)(f) | 4.64 | % | 3.81 | % | ||||
Ratio of net investment income (loss) to average net assets: | ||||||||
After waivers and reimbursements (a)(f)(x) | 0.65 | % | 5.32 | %(l) | ||||
Before waivers and reimbursements (a)(f)(x) | (3.34 | )% | 2.17 | %(l) | ||||
Portfolio turnover rate (z)^ | 25 | % | 10 | % | ||||
| * | Commencement of Operations. |
| ^ | Portfolio turnover rate excludes derivatives, if any. |
| (a) | Ratios for periods less than one year are annualized. |
| (b) | Total returns for periods less than one year are not annualized. |
| (e) | Net investment income (loss) per share is based on average shares outstanding. |
| (f) | Expenses do not include the expenses of the underlying funds (“indirect expenses”). |
| (l) | The annualized ratio of net investment income to average net assets may not be indicative of operating results for a full year. |
| (x) | Recognition of net investment income is affected by the timing of dividend declarations by the underlying funds in which the Portfolio invests. |
| (z) | Portfolio turnover rate for periods less than one year is not annualized. |
See Notes to Financial Statements.
18
Table of Contents
NOTES TO FINANCIAL STATEMENTS
December 31, 2014
| Note 1 | Organization and Significant Accounting Policies |
AXA Premier VIP Trust (the “Trust”) was organized as a Delaware statutory trust on October 2, 2001 and is registered under the Investment Company Act of 1940, as amended (the “1940 Act”), as an open-end management investment company with twenty-eight diversified Portfolios (each a “Portfolio” and together “the Portfolios”). These financial statements present two of the Portfolios. The investment manager to each Portfolio is AXA Equitable Funds Management Group, LLC (“FMG LLC” or the “Manager”), a wholly-owned subsidiary of AXA Equitable Life Insurance Company (“AXA Equitable”).
On October 30, 2013, AXA Equitable contributed $4,000,000 in seed capital into Class B shares of each of the Portfolios presented in these financial statements.
Under the Trust’s organizational documents, the Trust’s officers and trustees are indemnified against certain liabilities arising out of the performance of their duties to the Trust. In addition, in the normal course of business, the Trust enters into contracts with certain vendors and others that provide for general indemnifications. The Trust’s maximum exposure under these arrangements is unknown as this would involve future claims that may be made against the Trust. However, based on experience, the Trust and management expect the risk of loss to be remote.
The Portfolios are types of mutual funds often described as “fund-of-funds.” Each of the Portfolios presented in these financial statements (each a “Charter Allocation Portfolio” and together the “Charter Allocation Portfolios”) pursues its investment objective by investing in other affiliated mutual funds within the EQ Advisors Trust, managed by FMG LLC and other unaffiliated investment companies or exchange-traded funds.
The Trust issues three classes of shares, Class A, Class B and Class K. The Class A and Class B shares are each subject to distribution fees imposed under distribution plans (“Distribution Plans”) adopted pursuant to Rule 12b-1 under the 1940 Act. The Portfolios presented in these financial statements only offer Class B Shares. Under the Trust’s multiple class distribution system, each class of shares has identical voting, dividend, liquidation and other rights, other than the payment of distribution fees under the applicable Distribution Plan. The Trust’s shares are currently sold only to insurance company separate accounts in connection with variable life insurance contracts and variable annuity certificates and contracts issued by AXA Equitable, AXA Life and Annuity Company and other affiliated or unaffiliated insurance companies and to the AXA Equitable 401(k) Plan. Shares also may be sold to other tax-qualified retirement plans and to portfolios of EQ Advisors Trust.
The investment objectives of each Portfolio are as follows:
CharterSM Fixed Income Portfolio — Seeks a high level of current income.
CharterSM Equity Portfolio — Seeks long-term capital appreciation.
The following is a summary of the significant accounting policies of the Trust:
The preparation of financial statements in accordance with United States of America generally accepted accounting principles (“U.S. GAAP”) requires management to make estimates and assumptions that affect the reported amounts and disclosures. Actual results could differ from those estimates. The Portfolios are investment companies and, accordingly, follow the investment company accounting and reporting guidance of the Financial Accounting Standards Board Accounting Standards Codification Topic
946 - Investment Companies, which is part of U.S. GAAP.
Valuation:
Equity securities (including securities issued by Exchange Traded Funds (“ETFs”)) listed on national securities exchanges are valued at the last sale price or official closing price on the date of valuation or, if there is no sale or official closing price, at the latest available bid price. Securities listed on the NASDAQ stock market will be valued using the NASDAQ Official Closing Price
19
Table of Contents
AXA PREMIER VIP TRUST
NOTES TO FINANCIAL STATEMENTS (Continued)
December 31, 2014
(“NOCP”). Generally, the NOCP will be the last sale price unless the reported trade for the security is outside the range of the bid/ask price. In such cases, the NOCP will be normalized to the nearer of the bid or ask price. Other unlisted stocks are valued at their last sale price or official closing price, or if there is no such price, at a bid price estimated by a broker.
Investments in shares of open-end mutual funds (other than ETFs) held by a Portfolio will be valued at the net asset value of the shares of such funds as described in these funds’ prospectuses.
If market quotations are not readily available for a security or other financial instruments, such securities and instruments shall be referred to the Trust’s Valuation Committee (“Committee”), who will value the assets in good faith pursuant to procedures adopted by the Board of Trustees (“Pricing Procedures”) of the Trust (the “Board”).
The Board is responsible for ensuring that appropriate valuation methods are used to price securities for the Trust’s Portfolios. The Board has delegated the responsibility of calculating the net asset values (“NAVs”) of the Trust’s Portfolios and classes pursuant to these Pricing Procedures to the Trust’s administrator, FMG LLC (in its capacity as administrator, the “Administrator”). The Administrator has entered into a sub-administration agreement with JPMorgan Chase Bank, N.A. (the “Sub-Administrator”) to assist in performing certain of the duties described herein. The Committee, established by the Board, determines the value of the Trust’s securities and assets for which market quotations are not readily available or for which valuation cannot otherwise be provided in accordance with procedures adopted by the Board. The Committee is comprised of senior employees from FMG LLC.
Due to the inherent uncertainty of valuations of such securities, the fair value may differ significantly from the values that would have been used had a ready market for such securities existed.
Various inputs are used in determining the value of a Portfolio’s assets or liabilities carried at fair value. These inputs are summarized in three broad levels below:
| • | Level 1 - quoted prices in active markets for identical assets |
| • | Level 2 - other significant observable inputs (including quoted prices of similar securities, interest rates, prepayment speeds, credit risk, etc.) |
| • | Level 3 - significant unobservable inputs (including the Portfolio’s own assumptions in determining the fair value of investments) |
A summary of inputs used to value each Portfolio’s assets and liabilities carried at fair value as of December 31, 2014 is included in the Portfolios of Investments. Changes in valuation techniques may result in transfers into or out of an investment’s assigned level. The Portfolios’ policy is to recognize transfers into and transfers out of the valuation levels as of the end of the reporting period. Transfers between levels are included after the Summary of Level 1, Level 2 and Level 3 inputs, following the Portfolio of Investments for each Portfolio. Transfers between levels may be due to a decline or an increase in market activity (e.g., frequency of trades), which may result in a lack of, or increase in, available market inputs to determine price.
Transfers into and transfers out of Level 3, if material, are included in the Level 3 reconciliation following the Portfolio of Investments for each Portfolio.
The inputs or methodology used to value securities are not necessarily an indication of the risk associated with investing in those securities. An investment’s level within the fair value hierarchy is based on the lowest level of any input, both individually and in aggregate, that is significant to the fair value measurement.
The Committee meets and reviews reports based on the valuation technique used to value each particular Level 3 security. In connection with this review, the Committee obtains, when available, updates from its pricing vendors and investment sub-advisers (“Advisers”) for each fair valued
20
Table of Contents
AXA PREMIER VIP TRUST
NOTES TO FINANCIAL STATEMENTS (Continued)
December 31, 2014
security. For example, with respect to model driven prices, the Committee receives a report regarding a review and recalculation of pricing models and related discounts. For securities valued based on broker quotes, the Committee evaluates variances between existing broker quotes and any alternative broker quotes provided by an Adviser or other pricing source.
To substantiate unobservable inputs used in fair valuation, the Secretary of the Committee performs an independent verification and additional research for all fair value notifications received from its pricing agent. Among other factors, particular areas of focus include: description of security, historical pricing, intra-day price movement, last trade information, corporate actions, related securities, any available company news and announcements, any available trade data and actions taken by other clients of the pricing vendor. The Committee also notes the materiality of holdings and price changes on portfolio NAVs.
The Committee reviews and considers changes in value for all fair valued securities that have occurred since the last review.
Pursuant to procedures approved by the Board, events or circumstances affecting the values of portfolio securities that occur between the closing of their principal markets and the time the net asset value is determined may be reflected in the Trust’s calculation of net asset values for each applicable Portfolio when the Manager deems that the particular event or circumstance would materially affect such Portfolio’s net asset value. At December 31, 2014, none of the Portfolios applied these procedures.
Security Transactions and Investment Income:
Securities transactions are recorded on the trade date net of brokerage fees, commissions, and transfer fees. Dividend income (net of withholding tax) and distributions to shareholders are recorded on the ex-dividend date except that certain dividends from foreign securities, if any, are recognized as soon as the Trust is informed of the ex-dividend date. Interest income (including amortization of premium and accretion of discount on long-term securities using the effective yield method) and interest expense are accrued daily. The Trust records paydown gains and losses realized on prepayments received on mortgage-backed securities as an adjustment to interest income.
The Portfolios record distributions received in excess of income from underlying investments as a reduction of cost of investments and/or realized gain. Such amounts are based on estimates if actual amounts are not available and actual amounts of income, realized gain and return of capital may differ from the estimated amounts. The Portfolios adjust the estimated amounts of components of distributions (and consequently its net investment income) as necessary once the issuers provide information about the actual composition of the distributions.
Realized gains and losses on the sale of investments are computed on the basis of the specific identified cost of the investments sold. Unrealized appreciation (depreciation) on investments and foreign currency denominated assets and liabilities, if any, is presented net of deferred taxes on unrealized gains in each Statement of Assets and Liabilities.
Allocation of Expenses and Income:
Expenses attributable to a single Portfolio or class are charged to that Portfolio or class. Expenses of the Trust not attributable to a single Portfolio or class are charged to each Portfolio or class in proportion to the average net assets of each Portfolio or other appropriate allocation methods.
Offering costs incurred during the year ended December 31, 2013 by the Portfolios shown below were:
Portfolios: | Amount | |||
CharterSM Fixed Income | $ | 17,579 | ||
CharterSM Equity | 17,579 | |||
21
Table of Contents
AXA PREMIER VIP TRUST
NOTES TO FINANCIAL STATEMENTS (Continued)
December 31, 2014
Offering costs are amortized by the Portfolios over a twelve-month period on a straight-line basis.
All income earned and expenses incurred by each Portfolio are borne on a pro-rata basis by each outstanding class of shares, based on the proportionate interest in the Portfolio represented by the daily net assets of such class, except for distribution fees which are charged on a class specific basis.
Taxes:
The Trust intends to comply with the requirements of the Internal Revenue Code of 1986, as amended, applicable to regulated investment companies (“RICs”) and to distribute substantially all of its net investment income and net realized capital gains to shareholders of each Portfolio. Therefore, no Federal, state and local income tax provisions is required.
The Portfolios are not aware of any tax positions for which it is reasonably possible that the total amounts of unrecognized tax benefits will significantly change in the next twelve months. However, the Portfolios’ conclusions may be subject to future review based on changes in, or the interpretation of, the accounting standards or tax laws and regulations. The Portfolios recognize interest and penalties, if any, related to uncertain tax positions as income tax expense in the Statements of Operations. During the year ended December 31, 2014, the Portfolios did not incur any interest or penalties. Each of the tax years in the four-year period ended December 31, 2014 remains subject to examination by the Internal Revenue Service, state and local taxing authorities.
Dividends from net investment income, if any, are declared and distributed at least annually for all Portfolios. Dividends from net realized short-term and long-term capital gains are declared and distributed at least annually to the shareholders of the Portfolios to which such gains are attributable. All dividends are reinvested in additional full and fractional shares of the related Portfolios. All distributions are calculated on a tax basis and, as such, the amounts may differ from financial statement investment income and realized gains. In addition, short-term capital gains and foreign currency gains are treated as capital gains for U.S. GAAP purposes but are considered ordinary income for tax purposes. Capital and net specified losses incurred after October 31 and within the taxable year are deemed to arise on the first business day of a Portfolio’s next taxable year. The tax composition of distributed and undistributed income and gains for the years ended December 31, 2014 and December 31, 2013, were as follows:
| Year Ended December 31, 2014 | Year Ended December 31, 2013 | |||||||||||||||||||||||||||||||
Portfolios: | Distributed Ordinary Income | Distributed Long Term Gains | Accumulated Undistributed Ordinary Income | Accumulated Undistributed Long Term Gains | Distributed Ordinary Income | Distributed Long Term Gains | Accumulated Undistributed Ordinary Income | Accumulated Undistributed Long Term Gains | ||||||||||||||||||||||||
CharterSM Fixed Income | $ | 114,004 | $ | — | $ | 1,986 | $ | — | $ | 45,191 | $ | 3,835 | $ | — | $ | — | ||||||||||||||||
CharterSM Equity | 64,198 | 61,370 | 3,898 | 100,524 | 61,734 | 13,706 | — | 47,664 | ||||||||||||||||||||||||
There was no Return of Capital for any Portfolios during the year ended December 31, 2014.
Additionally, the following Portfolio had a Return of Capital during the year ended December 31, 2013.
Portfolio: | Return of Capital | |||
CharterSM Fixed Income | $ | 10,639 | ||
Permanent book and tax basis differences relating to shareholder distributions resulted in reclassifications to undistributed (overdistributed) net investment income (loss), accumulated net realized gain (loss) and paid-in capital at December 31, 2014 as follows:
Portfolios: | Undistributed Net Investment Income (Loss) | Accumulated Net Realized Gain (Loss) | Paid In Capital | |||||||||
CharterSM Fixed Income | $ | 34,534 | $ | (17,773 | ) | $ | (16,761 | ) | ||||
CharterSM Equity | 31,365 | (16,005 | ) | (15,360 | ) | |||||||
22
Table of Contents
AXA PREMIER VIP TRUST
NOTES TO FINANCIAL STATEMENTS (Continued)
December 31, 2014
Under the Regulated Investment Company Modernization Act of 2010 (the “RIC Mod Act”), net capital losses recognized by the Portfolios after December 31, 2010, may get carried forward indefinitely, and retain their character as short-term and/or long term losses. Prior to the RIC Mod Act, net capital losses incurred by the Portfolios were carried forward for up to eight years and treated as 100% short-term. The RIC Mod Act requires that post-enactment net capital losses be used before pre-enactment net capital losses, therefore some net capital loss carryforwards that would have been utilized under prior law may expire unused. Pre-enactment and post-enactment net capital losses that will be carried forward, if any, are presented in the table below.
The following Portfolio utilized net capital loss carryforwards during 2014 and/or have losses incurred that will be carried forward under the provisions of the RIC Mod Act as follows:
| Utilized | Losses Carried Forward | |||||||||||||||
Portfolio: | Short Term | Long Term | Short Term | Long Term | ||||||||||||
CharterSM Fixed Income | $ | — | $ | — | $ | 10,134 | $ | — | ||||||||
| Note 2 | Management of the Trust |
The Trust has entered into an investment management agreement (the “Management Agreement”) with FMG LLC. The Management Agreement for the Portfolios obligates the Manager to, among other things: (i) provide investment management and advisory services; (ii) render investment advice concerning the underlying funds in which to invest and the appropriate allocations for each of the Portfolios; (iii) implement and monitor the investment programs and results; (iv) apprise the Trustees/Trust of developments materially affecting the Portfolios; (v) oversee each Portfolio’s compliance with investment objectives and policies as well as the Trust’s compliance with various federal and state statutes; and (vi) carry out the directives of the Board. For the year ended December 31, 2014, for its services under the Management Agreement, the Manager was entitled to receive an annual fee as a percentage of average daily net assets, for each of the following Portfolios, calculated daily and payable monthly as follows:
Portfolios: | Management Fee | |
CharterSM Fixed Income | 0.150% of average daily net assets | |
CharterSM Equity | 0.150% of average daily net assets |
| Note 3 | Administrative Fees |
Pursuant to an administrative agreement (“Mutual Funds Service Agreement”), the Administrator provides the Trust with necessary administrative, fund accounting, and compliance services. In addition, the Administrator makes available the office space, equipment, personnel and facilities required to provide such administrative services to the Trust. FMG LLC may carry out its responsibilities either directly or through sub-contracting with third party providers. For these services, the Trust pays to FMG LLC, as Administrator, an annual fee in accordance with the following schedule:
Each Charter Allocation Portfolio pays the greater of $32,500 or its proportionate share of an asset-based administration fee. The asset-based administration fee is equal to an annual rate of 0.15% of the aggregate average daily net assets of the Charter Allocation Portfolios (the CharterSM Fixed Income Portfolio, CharterSM Conservative Portfolio, CharterSM Moderate Portfolio, CharterSM Moderate Growth Portfolio, CharterSM Growth Portfolio, CharterSM Aggressive Growth Portfolio, CharterSM Equity Portfolio, CharterSM International Conservative Portfolio, CharterSM International Moderate Portfolio, CharterSM International Growth Portfolio, CharterSM Income Strategies Portfolio, CharterSM Interest Rate Strategies Portfolio, CharterSM Multi-Sector Bond Portfolio (prior to conversion known as Multimanager Multi-Sector Bond Portfolio), CharterSM Real Assets Portfolio, CharterSM Small Cap Growth Portfolio (prior to conversion known as Multimanager Small Cap Growth Portfolio), CharterSM Small Cap Value Portfolio (prior to conversion known as Multimanager Small Cap Growth Portfolio), CharterSM Alternative 100 Conservative Plus Portfolio,
23
Table of Contents
AXA PREMIER VIP TRUST
NOTES TO FINANCIAL STATEMENTS (Continued)
December 31, 2014
CharterSM Alternative 100 Moderate Portfolio, and CharterSM Alternative 100 Growth Portfolio), including Portfolios of the Trust not presented in these financial statements.
Prior to October 1, 2014, the administration fee for the Charter Allocation Portfolios was as follows:
(i) $32,500 for each Charter Allocation Portfolio; plus
(ii) With respect to the Charter Allocation Portfolios:
0.150% of the total average net assets.
To be calculated on a per Portfolio basis.
Pursuant to a sub-administration agreement with FMG LLC, the Sub-Administrator provides the Trust with administrative services, including monitoring of portfolio compliance and portfolio accounting services.
| Note 4 | Custody Fees |
The Trust has entered into a Custody Agreement with JPMorgan Chase Bank, N.A. (in this capacity, the “Custodian”). The Custody Agreement provides for an annual fee based on the amount of assets under custody plus transaction charges. The Custodian serves as custodian of the Trust’s portfolio securities and other assets. Under the terms of the Custody Agreement between the Trust and the Custodian, the Custodian maintains and deposits in each Portfolio’s account, cash, securities and other assets of the Portfolios. The Custodian is also required, upon the order of the Trust, to deliver securities held by the Custodian, and to make payments for securities purchased by the Trust. The Custodian has also entered into sub-custodian agreements with a number of foreign banks and clearing agencies, pursuant to which portfolio securities purchased outside the U.S. are maintained in the custody of these entities.
| Note 5 | Distribution Plans |
The Trust has entered into distribution agreements with AXA Distributors, LLC (“AXA Distributors” or the “Distributor”), an indirect wholly-owned subsidiary of AXA Equitable and an affiliate of FMG LLC, pursuant to which the Distributor serves as the principal underwriter of the Class A, Class B and Class K shares of the Trust. The Trust has adopted in the manner prescribed under Rule 12b-1 under the 1940 Act a plan of distribution pertaining to each of the Class A and Class B shares of the Trust (“Distribution Plans”). The Distribution Plans provide that the Distributor will be entitled to receive a maximum distribution fee at the annual rate of 0.25% of the average daily net assets attributable to each of the Trust’s Class A and Class B shares for which it provides service.
| Note 6 | Expense Limitation |
In the interest of limiting through April 30, 2015 (unless the Board consents to an earlier revision or termination of this arrangement) the expenses of certain Portfolios, FMG LLC has entered into an expense limitation agreement with the Trust (“Expense Limitation Agreement”). Pursuant to that Expense Limitation Agreement, FMG LLC has agreed to make payments or waive its management, administrative and other fees so that the annual operating expenses of each Portfolio (other than interest, taxes, brokerage commissions, dividend and interest expenses on securities sold short, expenses of Underlying Portfolios and Underlying ETFs, other expenditures that are capitalized in accordance with generally accepted accounting principles and other extraordinary expenses not incurred in the ordinary course of each Portfolio’s business), do not exceed the following annualized rates:
24
Table of Contents
AXA PREMIER VIP TRUST
NOTES TO FINANCIAL STATEMENTS (Continued)
December 31, 2014
| Maximum Annual Operating Expense Limit | ||||||||||||
Portfolios: | Class K | Class A+ | Class B+ | |||||||||
CharterSM Fixed Income* | N/A | N/A | 0.65 | % | ||||||||
CharterSM Equity* | N/A | N/A | 0.65 | |||||||||
| + | Includes amounts payable pursuant to Rule 12b-1 |
| * | Portfolio currently only has Class B shares registered |
FMG LLC first waives its management fees, then waives its administration fees, and then reimburses a Portfolio’s expenses out of its own resources. FMG LLC may be reimbursed the amount of any such payments or waivers in the future provided that the payments or waivers are reimbursed within three years of the payments or waivers being made and the combination of the Portfolio’s expense ratio and such reimbursements do not exceed the Portfolio’s expense cap. If the actual expense ratio is less than the expense cap and FMG LLC has recouped any eligible previous payments or waivers made, the Portfolio will be charged such lower expenses. FMG LLC’s selection of Underlying Portfolios and Underlying ETFs may positively or negatively impact its obligations under the Expense Limitation Agreement and its ability to recoup previous payments or waivers made under the Expense Limitation Agreement.
During the year ended December 31, 2014, FMG LLC received total recoupments of $1,252,578 of Portfolios of the Trust not included in these financial statements.
Recoupments in excess of waivers during the period would be presented as Recoupment Fees in the Statement of Operations. At December 31, 2014, under the Expense Limitation Agreement, the amount that would be recoverable from each Portfolio is as follows:
Portfolios: | 2015 | 2016 | 2017 | Total Eligible For Reimbursement | ||||||||||||
CharterSM Fixed Income | $ | — | $ | 59,171 | $ | 164,966 | $ | 224,137 | ||||||||
CharterSM Equity | — | 59,165 | 185,500 | 244,665 | ||||||||||||
| Note 7 | Trustees Deferred Compensation Plan |
A deferred compensation plan (the “Plan”) for the benefit of the Independent Trustees has been adopted by the Trust. Under the Plan, each Trustee may defer payment of all or part of the fees payable for such Trustee’s services. Each Trustee may defer payment of such fees until their retirement as a Trustee or until the earlier attainment of a specified age. Fees deferred under the Plan, together with accrued earnings thereon, will be disbursed to a participating Trustee in monthly installments over a five- to twenty-year period elected by such Trustee. At December 31, 2014, the total amount deferred by the Trustees participating in the Plan was $804,974.
| Note 8 | Percentage of Ownership by Affiliates |
At December 31, 2014, AXA Equitable held investments in each of the Portfolios as follows:
Portfolios: | Percentage of Ownership | |||
CharterSM Fixed Income | 78.27 | % | ||
CharterSM Equity | 78.77 | |||
Shares of affiliated underlying investment companies may be held by the Portfolios. The following tables represent the percentage of ownership that each Portfolio has in each respective affiliated underlying investment company’s net assets as of December 31, 2014, including Portfolios of the Trust not presented in these financial statements.
25
Table of Contents
AXA PREMIER VIP TRUST
NOTES TO FINANCIAL STATEMENTS (Continued)
December 31, 2014
Portfolios: | CharterSM Fixed Income | CharterSM Equity | ||||||
EQ/Energy ETF | — | % | — | % | ||||
EQ/Low Volatility Global ETF | — | 1.95 | ||||||
AXA SmartBeta Equity | — | 1.12 | ||||||
AXA/Lord Abbett Micro Cap | — | 0.10 | ||||||
EQ/AllianceBernstein Small Cap Growth | — | 0.01 | ||||||
EQ/BlackRock Basic Value Equity | — | 0.01 | ||||||
EQ/Capital Guardian Research | — | 0.15 | ||||||
EQ/Convertible Securities | 2.51 | — | ||||||
EQ/Core Bond Index | — | # | — | |||||
EQ/Emerging Markets Equity PLUS | — | 0.57 | ||||||
EQ/GAMCO Small Company Value | — | 0.01 | ||||||
EQ/Global Bond PLUS | 0.15 | — | ||||||
EQ/High Yield Bond | 0.15 | — | ||||||
EQ/Intermediate Government Bond | 0.01 | — | ||||||
EQ/International Equity Index | — | 0.04 | ||||||
EQ/Invesco Comstock | — | 0.12 | ||||||
EQ/MFS International Growth | — | 0.03 | ||||||
EQ/Morgan Stanley Mid Cap Growth | — | 0.04 | ||||||
EQ/PIMCO Global Real Return | 1.35 | — | ||||||
EQ/PIMCO Ultra Short Bond | 0.03 | — | ||||||
EQ/Quality Bond PLUS | — | # | — | |||||
EQ/T. Rowe Price Growth Stock | — | 0.04 | ||||||
EQ/Wells Fargo Omega Growth | — | 0.06 | ||||||
Multimanager Core Bond | 0.05 | — | ||||||
Multimanager Mid Cap Value | — | 0.19 | ||||||
| # | Percentage of ownership is less than 0.005%. |
| Note 9 | Substitution, Reorganization and In-Kind Transactions |
The following transactions occurred during 2014:
At a meeting held on April 10, 2014, the shareholders approved the conversion of CharterSM Multi-Sector Bond Portfolio (“CMSB”), known at the time as Multimanager Multi-Sector Bond Portfolio, into a fund-of-funds structure. The conversion was effected on April 21, 2014.
Simultaneous with the conversion, there was a redemption in-kind by certain of the AXA Allocation Portfolios, Charter Allocation Portfolios and Target Allocation Portfolios (“Allocation Portfolios”) from Class K of CMSB. The redeeming Portfolios then contributed in-kind the securities and currency received from CMSB to EQ/Core Bond Index Portfolio, EQ/High Yield Bond Portfolio and EQ/Quality Bond PLUS Portfolio and received Class K shares of those Portfolios. Valuation of the securities and currency transferred was as of April 17, 2014 and was in accordance with the Portfolios’ valuation policy.
For U.S. GAAP and tax purposes, the transaction was treated as a sale on the conversion date. The resulting gain/loss based on the values of the securities and currency transferred are listed in the table below. The realized gain/loss is recorded in Net Realized Gain on Investments on the redeeming Portfolio’s Statements of Operations.
Portfolio: | Value of CMSB Class K Shares Redeemed | Realized Gain/(Loss) | ||||||
CharterSM Fixed Income | $ | 192,563 | $ | (5,371 | ) | |||
26
Table of Contents
AXA PREMIER VIP TRUST
NOTES TO FINANCIAL STATEMENTS (Continued)
December 31, 2014
The value of the securities and currency contributed in-kind by the Allocation Portfolios to the EQ/Core Bond Index Portfolio, EQ/High Yield Bond Portfolio and EQ/Quality Bond PLUS Portfolio and the corresponding Class K shares issued by those Portfolios was as follows:
Portfolios: | Class K Shares Issued to Allocation Portfolios | Value of Securities and Currency Transferred by Allocation Funds | ||||||
EQ/Core Bond Index (a) | 14,728,410 | $ | 146,930,927 | |||||
EQ/High Yield Bond (a) | 2,647,274 | 27,488,183 | ||||||
EQ/Quality Bond PLUS (a) | 5,739,906 | 48,619,304 | ||||||
| (a) | A portfolio of EQ Advisors Trust. |
The value of shares redeemed in-kind and securities and currency contributed in-kind is excluded from the respective Portfolios’ portfolio turnover calculation and excluded from cost of purchases and net proceeds of sales and redemptions.
At the date of the conversion, CMSB transferred securities and currency to the AXA Allocation Funds in relation to the redemption in-kind. CMSB then transferred its remaining securities and currency into EQ/Core Bond Index Portfolio, EQ/High Yield Bond Portfolio and EQ/Quality Bond PLUS Portfolio in exchange for Class K shares of those portfolios. Valuation of these securities transferred was as of April 17, 2014 and in accordance with the Portfolios’ valuation policy.
The redemption in-kind by the Allocation Portfolios from CMSB was treated as a sale for U.S. GAAP purposes. CMSB recognized a gain of $4,056,345 based on the value of the securities and currency transferred of $223,038,414 on the date of the conversion. The realized gain is recorded in Net Realized Gain on Investments on CMSB’s Statement of Operations. For tax purposes, the gain is not recognized by the Portfolio.
The contribution in-kind to the EQ/Core Bond Index Portfolio, EQ/High Yield Bond Portfolio and EQ/Quality Bond PLUS Portfolio was treated as a sale for U.S. GAAP purposes and accomplished through a taxable transfer. CMSB recognized a gain of $4,556,918 based on the value of the securities and currency transferred of $250,562,433 on the date of the conversion. The realized gain is recognized in Net Realized Gain on Investments on CMSB’s Statement of Operations. The value of the securities and currency contributed in-kind by CMSB to the EQ/Core Bond Index Portfolio, EQ/High Yield Bond Portfolio and EQ/Quality Bond PLUS Portfolio and the corresponding Class K shares issued by those Portfolios was as follows:
Portfolios: | Class K Shares Issued to CMSB | Value of Securities and Currency Transferred by CMSB | ||||||
EQ/Core Bond Index (a) | 16,545,151 | $ | 165,054,782 | |||||
EQ/High Yield Bond (a) | 2,974,905 | 30,890,166 | ||||||
EQ/Quality Bond PLUS (a) | 6,448,041 | 54,617,485 | ||||||
| (a) | A portfolio of EQ Advisors Trust. |
The value of securities and currency transferred by CMSB to Allocation Portfolios and EQ/Core Bond Index Portfolio, EQ/High Yield Bond Portfolio and EQ/Quality Bond PLUS Portfolio is excluded from the respective Portfolios’ portfolio turnover calculation and excluded from cost of purchases and net proceeds of sales and redemptions.
27
Table of Contents
AXA PREMIER VIP TRUST
NOTES TO FINANCIAL STATEMENTS (Continued)
December 31, 2014
| Note 10 | Subsequent Events |
The Manager evaluated subsequent events from December 31, 2014, the date of these financial statements, through the date these financial statements were issued and available. There were no subsequent events to report.
| Note 11 | Pending Legal Proceedings |
In July 2011, a lawsuit was filed in the United States District Court for the District of New Jersey, entitled Mary Ann Sivolella v. AXA Equitable Life Insurance Company and AXA Equitable Funds Management Group, LLC (“Sivolella Litigation”). The lawsuit was filed derivatively on behalf of eight portfolios of EQ Advisors Trust, which is also managed by FMG LLC: EQ/Common Stock Index Portfolio; EQ/Equity Growth PLUS Portfolio; EQ/Equity 500 Index Portfolio; AXA Large Cap Value Managed Volatility Portfolio; AXA Global Equity Managed Volatility Portfolio; AXA Mid Cap Value Managed Volatility Portfolio; EQ/Intermediate Government Bond Index Portfolio; and EQ/GAMCO Small Company Value Portfolio (the “Sivolella Portfolios”). Note, in June 2014, the EQ/Equity Growth PLUS Portfolio was reorganized into the AXA Large Cap Growth Managed Volatility Portfolio. None of the Portfolios involved in the lawsuits are presented in these financial statements. The lawsuit seeks recovery under Section 36(b) of the 1940 Act, for alleged excessive fees paid to FMG LLC and AXA Equitable (the “Defendants”) for investment management services. The Plaintiff seeks recovery of the alleged overpayments, or alternatively, rescission of the contracts and restitution of all fees paid, interest, costs and fees. In October 2011, FMG LLC and AXA Equitable filed a motion to dismiss the complaint. In November 2011, the Plaintiff filed an Amended Complaint seeking the same relief, but adding new claims under: (1) Section 26(f) of the 1940 Act alleging that the variable annuity contracts sold by the Defendants charged excessive management fees, and seeking restitution and rescission of those contracts under Section 47(b) of the 1940 Act; and (2) a claim for unjust enrichment. The Defendants filed a motion to dismiss the Amended Complaint in December 2011. In May 2012, the Plaintiff voluntarily dismissed the Section 26(f) claim seeking restitution and rescission under Section 47(b). In September 2012, the United States District Court for the District of New Jersey denied the motion to dismiss the Amended Complaint as it related to the Section 36(b) claim and granted the motion as it related to the unjust enrichment claim.
In January 2013, a second lawsuit against FMG LLC was filed in the United States District Court for the District of New Jersey by a group of plaintiffs asserting substantially similar claims under Section 36(b) and seeking substantially similar damages as in the Sivolella Litigation. The lawsuit entitled Glenn D. Sanford, et al. v. AXA Equitable Funds Management Group, LLC (“Sanford Litigation”), was filed derivatively on behalf of the EQ/PIMCO Ultra Short Bond Portfolio, the EQ/T. Rowe Price Growth Stock Portfolio, the EQ/Global Bond PLUS Portfolio, and the EQ/Core Bond Index Portfolio, in addition to four of the Sivolella Portfolios. In light of the similarities of the allegations in the Sivolella and Sanford Litigations, the Court consolidated the two lawsuits.
In April 2013, the Plaintiffs in the Sivolella and Sanford Litigations amended the complaints to add additional claims under Section 36(b) of the 1940 Act for recovery of alleged excessive fees paid to FMG LLC in its capacity as the Administrator of EQ Advisors Trust. The Plaintiffs seek recovery of the alleged overpayments, or alternatively, rescission of the contract and restitution of the excessive fees paid, interest, costs, and fees. In January 2015, Defendants filed a motion for summary judgment as well as various motions to strike certain of the Plaintiffs’ experts in the Sivolella and Sanford Litigations. Also in January 2015, two Plaintiffs in the Sanford Litigation filed a motion for partial summary judgment relating to the EQ/Core Bond Index Portfolio as well as motions in limine to bar admission of certain documents and preclude the testimony of one of Defendants’ experts.
No portfolios within the Trust are a party to the Sivolella or Sanford Litigation and any potential damages would be the responsibility of the Defendants. Therefore, no liability for litigation relating to these matters has been accrued in the financial statements of the Portfolios.
28
Table of Contents
AXA PREMIER VIP TRUST
NOTES TO FINANCIAL STATEMENTS (Continued)
December 31, 2014
On November 1, 2010, the Trust and EQ Advisors Trust, and several of their respective portfolios, were named as defendants and putative members of the proposed defendant class of shareholders in a lawsuit brought by The Official Committee of Unsecured Creditors of Tribune Company (the “Committee”) in the United States Bankruptcy Court for the District of Delaware regarding Tribune Company’s Chapter 11 bankruptcy proceeding (In re Tribune Company). The lawsuit relates to amounts paid to the Trust and EQ Advisors Trust, and several of their respective portfolios, as holders of publicly-traded shares of Tribune Company, which were components of certain broad-based securities market indices, for which there were public tender offers during 2007. The suit seeks return of the share price received by Tribune Company shareholders in the tender offers plus interest and attorneys’ fees and expenses.
The Committee’s suit has been consolidated with a number of related lawsuits around the United States into a single multi-district litigation proceeding now pending in the United States District Court for the Southern District of New York (In re: Tribune Company Fraudulent Conveyance Litigation).
The lawsuits do not allege any misconduct by the Trust, or its portfolios. The portfolios cannot predict the outcome of these lawsuits. If the lawsuits were to be decided or settled in a manner adverse to the portfolios, the payment of such judgments or settlements could have an adverse effect on each portfolio’s net asset value. However, no liability for litigation relating to this matter has been accrued in the financial statements of the Portfolios, as FMG LLC believes a loss is not probable.
29
Table of Contents
Report of Independent Registered Public Accounting Firm
To the Board of Trustees and Shareholders of AXA Premier VIP Trust
In our opinion, the accompanying statements of assets and liabilities, including the portfolios of investments, and the related statements of operations and of changes in net assets and the financial highlights present fairly, in all material respects, the financial position of each of the portfolios of AXA Premier VIP Trust listed in the Table of Contents to the Annual Report in which these financial statements appear (collectively referred to as the “Trust”) at December 31, 2014, and the results of each of their operations, the changes in each of their net assets and the financial highlights for each of the periods presented, in conformity with accounting principles generally accepted in the United States of America. These financial statements and financial highlights (hereafter referred to as “financial statements”) are the responsibility of the Trust’s management. Our responsibility is to express an opinion on these financial statements based on our audits. We conducted our audits of these financial statements in accordance with the standards of the Public Company Accounting Oversight Board (United States). Those standards require that we plan and perform the audit to obtain reasonable assurance about whether the financial statements are free of material misstatement. An audit includes examining, on a test basis, evidence supporting the amounts and disclosures in the financial statements, assessing the accounting principles used and significant estimates made by management, and evaluating the overall financial statement presentation. We believe that our audits, which included confirmation of securities at December 31, 2014 by correspondence with the custodian, transfer agents and brokers, provide a reasonable basis for our opinion.
PricewaterhouseCoopers LLP
New York, New York
February 19, 2015
30
Table of Contents
APPROVALS OF INVESTMENT MANAGEMENT AND ADVISORY AGREEMENTS DURING
THE SIX-MONTH PERIOD ENDED DECEMBER 31, 2014 (UNAUDITED)
At a meeting held on September 8-9, 2014, the Board of Trustees (the “Board”) of AXA Premier VIP Trust (the “Trust”), including those Trustees who are not parties to the Agreement (as defined below) or “interested persons” (as that term is defined in the Investment Company Act of 1940, as amended) of such parties or the Trust (the “Independent Trustees”), considered and unanimously approved the extension of the Investment Management Agreement (the “Agreement”) with AXA Equitable Funds Management Group, LLC (“FMG LLC” or the “Manager”) with respect to the Portfolios listed for an additional month (i.e., through September 30, 2015), so that the Agreement with respect to the Portfolios will continue for an additional one-year period through September 30, 2015, as discussed below.
AXA Aggressive Allocation Portfolio
AXA Conservative Allocation Portfolio
AXA Conservative-Plus Allocation Portfolio
AXA Moderate Allocation Portfolio
AXA Moderate-Plus Allocation Portfolio
(collectively, the “AXA Allocation Portfolios”)
Target 2015 Allocation Portfolio
Target 2025 Allocation Portfolio
Target 2035 Allocation Portfolio
Target 2045 Allocation Portfolio
(collectively, the “Target Allocation Portfolios”)
CharterSM Multi-Sector Bond Portfolio
CharterSM Small Cap Growth Portfolio
CharterSM Small Cap Value Portfolio
(collectively, the “Charter Portfolios”)
The Board noted that, at a meeting held on July 8, 2014, it had most recently considered and unanimously approved the renewal of the Agreement with FMG LLC with respect to the Portfolios for an additional one-year period through August 31, 2015. The Board further noted that FMG LLC had requested that the Board approve the extension of the Agreement with respect to the Portfolios for an additional month (i.e., through September 30, 2015) solely for the purposes of shifting the timing of the Board’s consideration of the annual renewal of the Agreement with respect to the Portfolios to its regularly-scheduled meeting typically held in September of each year and adjusting the annual renewal period for the Agreement with respect to the Portfolios to coincide with the annual renewal period for the Agreement with respect to the Trust’s other portfolios.
In reaching its decision to extend the Agreement with respect to each Portfolio through September 30, 2015, the Board considered the overall fairness of the Agreement and whether the Agreement was in the best interests of the Portfolio and its investors. The Board further considered all factors it deemed relevant with respect to each Portfolio, including: (1) the nature, quality and extent of the overall services to be provided to the Portfolio by the Manager and its affiliates; (2) comparative performance information; (3) the level of the Portfolio’s management fee and the Portfolio’s expense ratios relative to those of peer funds; (4) the costs of the services to be provided by and the profits to be realized by the Manager and its affiliates from their relationships with the Portfolio; (5) the anticipated effect of growth and size on the Portfolio’s performance and expenses, including any potential economies of scale; and (6) the “fall out” benefits to be realized by the Manager and its affiliates (i.e., any direct or indirect benefits to be derived by the Manager and its affiliates from their relationships with the Trust).
In connection with its deliberations, the Board took into account information prepared by the Manager, including memoranda and other materials addressing the factors set out above, and provided to the Trustees prior to the meeting. The Board also took into account information provided to the Trustees at prior Board meetings, including its meeting held on July 8, 2014. The information provided to the Trustees described, among other things, the services to be provided by the Manager, as well as the Manager’s investment personnel, proposed management fee, performance information, and other matters. During the meeting, the Trustees met with senior representatives of
31
Table of Contents
the Manager to discuss the Agreement and the information provided. The Independent Trustees met in advance of the meeting and in executive session during the meeting to review the information provided. The Independent Trustees were assisted by independent counsel during the meeting and during their deliberations regarding the Agreement, and also received materials discussing the legal standards applicable to their consideration of the Agreement. The Board also considered that, after extensive discussions and negotiations with the Manager, the Manager had agreed, effective October 1, 2014, to revisions of the Portfolios’ administrative fee rate schedules that may lower the Portfolios’ administrative fees. At current asset levels, the changes effectively reduce the administration fee by up to $32,500 for each Charter Portfolio, but do not currently affect the administration fee for each of the AXA Allocation Portfolios and Target Allocation Portfolios.
In approving the extension of the Agreement with respect to each Portfolio through September 30, 2015, the Board, including the Independent Trustees, determined that the management fee was fair and reasonable and that the extension of the Agreement was in the best interests of the applicable Portfolio and its investors.
32
Table of Contents
APPROVAL OF INVESTMENT MANAGEMENT AGREEMENT DURING THE SIX-MONTH PERIOD ENDED DECEMBER 31, 2014 (UNAUDITED)
At a meeting held on July 8, 2014, the Board of Trustees (the “Board”) of AXA Premier VIP Trust (the “Trust”), including those Trustees who are not parties to the Agreement (as defined below) or “interested persons” (as that term is defined in the Investment Company Act of 1940, as amended) of such parties or the Trust (the “Independent Trustees”), considered and unanimously approved the renewal of the Investment Management Agreement (the “Agreement”) with AXA Equitable Funds Management Group, LLC (“FMG LLC” or the “Manager”) with respect to the Portfolios listed.
AXA Aggressive Allocation Portfolio
AXA Conservative Allocation Portfolio
AXA Conservative-Plus Allocation Portfolio
AXA Moderate Allocation Portfolio
AXA Moderate-Plus Allocation Portfolio
(collectively, the “AXA Allocation Portfolios”)
Target 2015 Allocation Portfolio
Target 2025 Allocation Portfolio
Target 2035 Allocation Portfolio
Target 2045 Allocation Portfolio
(collectively, the “Target Allocation Portfolios”)
CharterSM Multi-Sector Bond Portfolio
CharterSM Small Cap Growth Portfolio
CharterSM Small Cap Value Portfolio
(collectively, the “Charter Portfolios”)
In reaching its decision to renew the Agreement with respect to each Portfolio, the Board considered the overall fairness of the Agreement and whether the Agreement was in the best interests of the Portfolio and its investors. The Board further considered all factors it deemed relevant with respect to each Portfolio, including: (1) the nature, quality and extent of the overall services to be provided to the Portfolio by the Manager and its affiliates; (2) the investment performance of the Portfolio on both an absolute and a relative basis; (3) the level of the Portfolio’s management fee and the Portfolio’s expense ratios relative to those of peer funds; (4) the costs of the services to be provided by and the profits to be realized by the Manager and its affiliates from their relationships with the Portfolio; (5) the anticipated effect of growth and size on the Portfolio’s performance and expenses, including any potential economies of scale; and (6) the “fall out” benefits to be realized by the Manager and its affiliates (i.e., any direct or indirect benefits to be derived by the Manager and its affiliates from their relationships with the Trust). In considering the Agreement, the Board did not identify any single factor or information as all-important or controlling and each Trustee may have attributed different weight to each factor.
In connection with its deliberations, the Board took into account information provided throughout the year at regular and special Board meetings, as well as information provided specifically in connection with the annual renewal process. Information provided and discussed throughout the year included investment performance reports and related financial information for each Portfolio, as well as periodic reports on, among other matters, legal, compliance, shareholder and other services provided by the Manager and its affiliates. Information provided and discussed specifically in connection with the annual renewal process included a report prepared by Lipper, Inc. (“Lipper”), an independent organization, regarding each Portfolio, as well as additional material prepared by management regarding each Portfolio. Each Portfolio’s Lipper report compared that Portfolio’s expenses with those of other mutual funds (or peers) deemed by Lipper to be comparable to the Portfolio. The additional material prepared by management generally included Portfolio-by-Portfolio information showing each Portfolio’s management fees; expense ratios; expense limitation arrangements; investment performance (including performance information prepared by Lipper); and profitability information, including information regarding the profitability of the Manager’s operations on an overall Trust basis, as well as on a Portfolio-by-Portfolio basis. In addition, for each Portfolio, the Manager provided separate materials describing the Portfolio’s investment performance (including the Portfolio’s performance versus benchmark and peers for various time periods) and the services provided and the fees charged with respect to the Portfolio, and discussing whether the Portfolio had performed as expected over time and other matters.
33
Table of Contents
The Independent Trustees met in advance of the meeting at which the Board approved the renewal of the Agreement and in executive sessions during the meeting to review the information provided. Management representatives attended portions of the executive sessions to review and discuss matters relating to the Agreement and to provide additional information requested by the Independent Trustees. At the meeting and during the portions of the executive sessions attended by management, the Independent Trustees and management engaged in extensive discussions regarding the Agreement. The Independent Trustees were assisted by independent counsel during the meeting and during their deliberations regarding the Agreement, and also received materials discussing the legal standards applicable to their consideration of the Agreement. In addition, the Independent Trustees reviewed information and met during the year to discuss information relevant to their annual consideration of the Agreement.
Although the Board approved the renewal of the Agreement for all of the Portfolios at the same Board meeting, the Board considered each Portfolio separately. In approving the renewal of the Agreement with respect to each Portfolio, the Board, including the Independent Trustees, determined that the management fee was fair and reasonable and that the renewal of the Agreement was in the best interests of the applicable Portfolio and its investors. Although the Board gave attention to all information provided, the following discusses some of the primary factors that the Board deemed relevant to its decision to renew the Agreement.
Nature, Quality and Extent of Services. The Board evaluated the nature, quality and extent of the overall services to be provided to each Portfolio and its investors by the Manager and its affiliates. In addition to the investment performance and expense information discussed below, the Board considered the Manager’s responsibilities with respect to each Portfolio and the Manager’s experience in serving as an investment adviser for the Portfolio and for portfolios and accounts similar to the Portfolio. The Board considered that the Manager is responsible for, among other things, developing investment strategies for the Portfolios; making investment decisions for the Portfolios; monitoring and evaluating the performance of the Portfolios; monitoring the investment operations and composition of the Portfolios and, in connection therewith, monitoring compliance with the Portfolios’ investment objectives, policies and restrictions, as well as the Portfolios’ compliance with applicable law; placing all orders for the purchase or sale of investments for the Portfolios; coordinating and managing the flow of information and communications relating to the Portfolios among the applicable parties; and implementing Board directives as they relate to the Portfolios. The Board also considered information regarding the Manager’s process for making investment decisions for the Portfolios, as well as information regarding the backgrounds of the personnel who perform those functions with respect to the Portfolios. The Board also considered that the Manager’s responsibilities include daily monitoring of investment, operational, enterprise, legal, regulatory and compliance risks as they relate to the Portfolios, and considered information regarding the Manager’s ongoing risk management activities.
The Board also considered, among other factors, periodic reports provided to the Board regarding the services provided by the Manager and its affiliates. The Board also considered the Portfolios’ Chief Compliance Officer’s evaluation of the Manager’s compliance program, policies, and procedures. In addition, the Board considered whether there were any pending lawsuits, enforcement proceedings or regulatory investigations involving the Manager and reviewed information regarding the Manager’s financial condition and history of operations and conflicts of interest in managing the Portfolios.
The Board also considered the benefits to investors from participation in an FMG LLC-sponsored mutual fund, including the benefits of investing in a fund that is part of a large family of funds offering a wide range of portfolios, advisers and investment styles. In addition, the Board considered the nature, quality and extent of the administrative, investor servicing and distribution services that the Manager and its affiliates provide to the Portfolios and their shareholders. The Board also noted that, throughout the past year, the Manager and its affiliates had continued or undertaken initiatives intended to improve various aspects of the Trust’s operations and investors’ experience with the FMG LLC-sponsored mutual funds.
The Board also considered strategic and other actions taken by the Manager in response to recent events within the mutual fund industry, including actions taken in response to financial regulatory reform and other regulatory initiatives, as well as other developments within the mutual fund industry. The Board also considered strategic and other actions taken by the Manager in response to recent market conditions and considered the overall performance of the Manager in this context.
34
Table of Contents
Based on its review, the Board determined, with respect to each Portfolio, that the nature, quality and extent of the overall services provided by the Manager and its affiliates were appropriate for the Portfolio in light of its investment objectives and, thus, supported a decision to approve the renewal of the Agreement.
Investment Performance. The Board took into account discussions with the Manager about Portfolio investment performance that occur at Board meetings throughout the year. In this regard, the Board noted that, as part of regularly scheduled Portfolio reviews and other reports to the Board on Portfolio performance, the Board periodically considered information regarding each Portfolio’s short-, intermediate- and long-term performance, as applicable, on both an absolute basis and relative to an appropriate broad-based securities market index (“benchmark”), a peer group of other mutual funds deemed by Lipper to be comparable to the Portfolio (“Lipper peer group”), and/or a custom volatility managed index (“VMI”) developed by the Manager and approved by the Board (which, in the case of certain Portfolios, may be a blended index comprising both broad-based and volatility-managed indexes). The performance information generally included, among other information, annual total returns, average annual total returns, cumulative returns and rolling period total returns. In evaluating the Portfolios’ performance, the Board generally considered long-term performance to be more important than short-term performance.
In addition, the Board received and reviewed information regarding each Portfolio’s performance relative to a benchmark, a Lipper peer group, and/or a VMI for the most recent one-, three-, five- and ten-year periods, as applicable, ended May 31, 2014, as discussed below. The Board noted that this information was provided specifically in connection with the annual renewal process. The Board took into account that the Lipper information reflected the investment performance of Class B shares of each Portfolio. The Board also considered that variations in performance among a Portfolio’s operating classes reflect variations in class expenses, which result in lower performance for higher expense classes. The Board factored into its evaluation of each Portfolio’s performance the limitations inherent in Lipper’s methodology for developing and constructing peer groups and determining which mutual funds should be included in which peer groups. While recognizing these inherent limitations, the Board believed the independent analysis conducted by Lipper remained a useful measure of comparative performance.
AXA Allocation Portfolios
With respect to the performance of the AXA Allocation Portfolios, the Board considered that each Portfolio operates as a fund-of-funds and invests in a combination of other investment companies (underlying portfolios) and recognized, therefore, that each Portfolio’s performance is based, in part, on the total returns of the underlying portfolios in which it invests.
The Board further considered that the underlying portfolios in which each Portfolio invests may employ a tactical volatility management strategy that is intended to reduce the volatility associated with investing in equity securities and to produce more favorable risk-adjusted returns over extended market cycles. The Board also noted that, for each Portfolio, the Manager had developed and implemented a custom VMI as, among other things, an additional analytical tool to be used in evaluating the Portfolio’s performance, and considered the Manager’s explanation that a comparison of a Portfolio’s performance solely to that of a non-volatility managed benchmark fails to take into account the impact of an integral part of the investment strategies of the underlying portfolios, particularly during periods of high volatility. Based on the Manager’s explanation of the comparability of the custom VMI to the tactical volatility management strategies that the underlying portfolios may employ, the Board noted that the Manager generally considers a Portfolio’s performance (especially its short-term performance) relative to its VMI to be more important than its performance relative to its benchmark. The Board also noted that the funds in each Portfolio’s Lipper peer group may or may not employ a tactical volatility management strategy like that employed by the underlying portfolios in which a Portfolio invests.
The Board evaluated the performance of each Portfolio in this context and also considered the following performance results, which supplemented the performance information provided to the Board throughout the year:
AXA Aggressive Allocation, AXA Moderate Allocation and AXA Moderate-Plus Allocation Portfolios. The Board considered that each of the AXA Aggressive Allocation, AXA Moderate Allocation and AXA Moderate-Plus Allocation Portfolios had underperformed its Lipper peer group for the one-, three- and five-year periods ended May 31, 2014. The Board also considered that each Portfolio had underperformed its benchmark and its VMI for the one-, three-, five- and ten-year periods ended May 31, 2014, but the AXA Moderate Allocation Portfolio’s performance was only slightly below that of its VMI for the five-year period. With respect to the benchmark performance comparisons, the Board considered each Portfolio’s performance relative to the S&P 500 Index because each Portfolio had the majority of its assets allocated to equity securities.
35
Table of Contents
AXA Conservative Allocation Portfolio. The Board considered that the Portfolio had underperformed its Lipper peer group for the one-, three- and five-year periods ended May 31, 2014. The Board also considered that the Portfolio had outperformed its benchmark for the one-, three- and five-year periods ended May 31, 2014, and its performance was only slightly below that of its benchmark for the ten-year period ended on that date, and it had underperformed its VMI for the one-, three- and ten-year periods ended May 31, 2014, but its performance was only slightly below that of its VMI for the one-year period, and it had outperformed its VMI for the five-year period ended on that date. With respect to the benchmark performance comparison, the Board considered the Portfolio’s performance relative to the Barclays Intermediate U.S. Government Bond Index because the Portfolio had the majority of its assets allocated to fixed income securities.
AXA Conservative-Plus Allocation Portfolio. The Board considered that the Portfolio had underperformed its Lipper peer group for the three- and five-year periods ended May 31, 2014, but had outperformed its Lipper peer group for the one-year period ended on that date. The Board also considered that the Portfolio had outperformed its benchmark for the one-, three-, five- and ten-year periods ended May 31, 2014, and it had underperformed its VMI for the one-, three-, five- and ten-year periods ended May 31, 2014, but its performance was only slightly below that of its VMI for the five-year period. With respect to the benchmark performance comparison, the Board considered the Portfolio’s performance relative to the Barclays Intermediate U.S. Government Bond Index because the Portfolio had the majority of its assets allocated to fixed income securities.
The Board factored into its evaluation of each AXA Allocation Portfolio’s performance the limitations inherent in comparing the performance of asset allocation funds, such as the Portfolios, which may invest in equity and debt securities, to the performance of a benchmark that consists entirely of equity or debt securities and to the performance of a Lipper peer group that includes funds that may allocate their assets between equity and debt securities in different percentages over time than the Portfolios and among other asset classes.
The Board and the Manager discussed the performance of each AXA Allocation Portfolio in detail, including whether each Portfolio had performed as expected over time. The Board and the Manager also discussed, where applicable, the reasons for a Portfolio’s underperformance for certain periods relative to its Lipper peer group and/or benchmark and/or VMI, as applicable, as well as actions being taken to enhance that Portfolio’s performance. In this regard, the Board noted that performance is only one of the factors that it deems relevant to its consideration of a Portfolio’s Agreement and that, after considering all relevant factors, it can reach a decision to renew the Agreement notwithstanding a Portfolio’s underperformance.
Based on its review and the explanations and undertakings provided by the Manager regarding the performance of each AXA Allocation Portfolio, the Board determined, with respect to each Portfolio, that the Portfolio and its investors would benefit from the Manager’s continued management of the Portfolio.
Target Allocation Portfolios
With respect to the performance of the Target Allocation Portfolios, the Board considered that each Portfolio operates as a fund-of-funds and invests in a combination of other investment companies (underlying portfolios) and recognized, therefore, that each Portfolio’s performance is based, in part, on the total returns of the underlying portfolios in which it invests.
The Board evaluated the performance of each Portfolio in this context and also considered the following performance results, which supplemented the performance information provided to the Board throughout the year:
The Board considered that each Portfolio had underperformed its Lipper peer group and its benchmark for the one-, three- and five-year periods ended May 31, 2014. With respect to the benchmark performance comparisons, the Board considered each Portfolio’s performance relative to the S&P 500 Index because each Portfolio had the majority of its assets allocated to equity securities.
The Board factored into its evaluation of each Target Allocation Portfolio’s performance the limitations inherent in comparing the performance of time-weighted asset allocation funds, such as the Portfolios, which may invest in equity and debt securities, to the performance of a benchmark that consists entirely of equity or debt securities and to the performance of a Lipper peer group that includes funds that may allocate their assets between equity and debt securities in different percentages over time than the Portfolios and among other asset classes. The Board also took note of the relatively small size of each Target Allocation Portfolio and the likely impact that a Portfolio’s size has on its relative expenses and performance.
36
Table of Contents
The Board and the Manager discussed the performance of each Target Allocation Portfolio in detail, including whether each Portfolio had performed as expected over time. The Board and the Manager also discussed, where applicable, the reasons for a Portfolio’s underperformance for certain periods relative to its Lipper peer group and/or benchmark, as well as actions being taken to enhance that Portfolio’s performance. In this regard, the Board noted that performance is only one of the factors that it deems relevant to its consideration of a Portfolio’s Agreement and that, after considering all relevant factors, it can reach a decision to renew the Agreement notwithstanding a Portfolio’s underperformance.
Based on its review and the explanations and undertakings provided by the Manager regarding the performance of each Target Allocation Portfolio, the Board determined, with respect to each Portfolio, that the Portfolio and its investors would benefit from the Manager’s continued management of the Portfolio.
Charter Portfolios
With respect to the performance of the Charter Portfolios, the Board considered that each Portfolio currently operates as a fund-of-funds and invests in a combination of other investment companies (underlying portfolios). The Board noted, however, that prior to April 18, 2014 (the “Conversion Date”) each Portfolio had different investment policies and operated as a multimanager fund by allocating its assets among multiple investment advisers who managed their allocated portions of a Portfolio using different but complimentary investment strategies. The Board noted that the performance information that had been provided to the Board for each Portfolio reflected the Portfolio’s operation as a multimanager fund prior to the Conversion Date and may have been different if the Portfolio had historically been managed as a fund-of-funds using its current investment policies and strategies.
The Board evaluated the performance of each Portfolio in this context and also considered the following performance results, which supplemented the performance information provided to the Board throughout the year:
Charter Multi-Sector Bond Portfolio: The Board considered that the Portfolio had underperformed its Lipper peer group for the one-, three-, five- and ten-year periods ended May 31, 2014. The Board also considered that the Portfolio had underperformed its benchmark for the one- and ten-year periods ended May 31, 2014, but had outperformed its benchmark for the three- and five-year periods ended on that date.
Charter Small Cap Growth Portfolio: The Board considered that the Portfolio had underperformed its Lipper peer group and its benchmark for the one-, three-, five- and ten-year periods ended May 31, 2014.
Charter Small Cap Value Portfolio: The Board considered that the Portfolio had underperformed its Lipper peer group for the five- and ten-year periods ended May 31, 2014, but had outperformed its Lipper peer group for the one- and three-year periods ended on that date. The Board also considered that, although the Portfolio had underperformed its benchmark for the three-, five- and ten-year periods ended May 31, 2014, its performance was only slightly below that of its benchmark for the three- and five-year periods, and it had outperformed its benchmark for the one-year period ended on that date.
The Board and the Manager discussed the performance of each Charter Portfolio in detail, including whether the Portfolio had performed as expected over time. The Board and the Manager also discussed, where applicable, the reasons for a Portfolio’s underperformance for certain periods relative to its Lipper peer group and/or benchmark, as well as actions being taken to enhance that Portfolio’s performance. In this regard, the Board noted that performance is only one of the factors that it deems relevant to its consideration of a Portfolio’s Agreement and that, after considering all relevant factors, it can reach a decision to renew the Agreement notwithstanding a Portfolio’s underperformance.
Based on its review and the explanations and undertakings provided by the Manager regarding the performance of each Charter Portfolio, the Board determined, with respect to each Portfolio, that the Portfolio and its investors would benefit from the Manager’s continued management of the Portfolio.
Expenses. The Board considered each Portfolio’s investment management fee in light of the nature, quality and extent of the overall services provided by the Manager. The Board also reviewed a comparative analysis of the contractual and net management fees and expense ratios of each Portfolio compared with those of peer funds selected by Lipper as constituting the Portfolio’s appropriate Lipper expense group. Lipper provides information on each Portfolio’s contractual investment management fee in comparison with the contractual investment management fee that would have been charged by other funds within the Portfolio’s Lipper expense group assuming the funds were similar in size to the Portfolio, as well as the Portfolio’s actual management fee and expense ratios in
37
Table of Contents
comparison with those of other funds within its expense group. The Lipper investment management fee analysis includes within such fee the separate administrative fees paid to FMG LLC. The Board noted that management had separately provided comparative fee information net of administrative fees. The Lipper expense data was based upon historical information taken from each Portfolio’s annual report for the period ended December 31, 2013, and the Lipper expense ratios were shown for Class A, Class B and Class K shares, as applicable, of the relevant Portfolio. Where contractual investment management fee comparisons were shown for Class A and/or Class B shares of a Portfolio as well as for Class K shares of that Portfolio, the contractual investment management fee information described below reflects the comparisons for only Class A and/or Class B shares of that Portfolio. While recognizing the limitations inherent in Lipper’s methodology and that current expense ratios (prior to any applicable expense limitation arrangement) may increase if assets decline, the Board believed that the independent analysis conducted by Lipper remained a useful measure of comparative expenses. The Board also considered that all fees and expenses of each Portfolio are explicitly disclosed in Portfolio offering documents.
AXA Allocation Portfolios
The Board considered that the contractual management fee for each Portfolio was above (but within five basis points of) the median for the Portfolio’s respective Lipper peer group. The Board also considered that the actual expense ratios (excluding fees and expenses of other investment companies in which the Portfolio invests) for the Class A, Class B and Class K shares of each Portfolio were at (in the case of the Class A and Class B shares of the AXA Aggressive Allocation Portfolio) or above the medians for the Portfolio’s respective Lipper peer group.
The Board further considered that, although the contractual management fee for each Portfolio and the actual expense ratios (excluding fees and expenses of other investment companies in which the Portfolio invests) for the Class A, Class B and Class K shares of each Portfolio were at or above the medians for the Portfolio’s respective Lipper peer group, the management and administrative fee rate schedules for each Portfolio include breakpoints so that the fee rates are reduced as the assets of the Portfolio increase above certain levels. The Board noted that any such reduction in a Portfolio’s effective management or administrative fee would result in corresponding reductions in the Portfolio’s total expense ratios. In addition, the Board noted that the Manager had agreed to make payments or waive all or a portion of its management, administrative and other fees so that each Portfolio’s total expense ratios do not exceed certain levels as set forth in the prospectus. The Board noted that, as a result of these expense limitation arrangements, the actual management fee for each of the AXA Conservative Allocation and AXA Conservative-Plus Allocation Portfolios was lower than the Portfolio’s contractual management fee.
Based on its review, the Board determined, with respect to each AXA Allocation Portfolio, that the Manager’s management fee is fair and reasonable.
Target Allocation Portfolios
The Board considered that the contractual management fee for each Portfolio was above (but within five basis points of) the median for the Portfolio’s respective Lipper peer group. The Board also considered that the actual expense ratios (excluding fees and expenses of other investment companies in which the Portfolio invests) for the Class B and Class K shares of each Portfolio were above the medians for the Portfolio’s respective Lipper peer group. The Board also took note of the relatively small size of each Portfolio and the likely impact that a Portfolio’s size has on its relative expenses.
The Board further considered that, although the contractual management fee for each Portfolio and the actual expense ratios (excluding fees and expenses of other investment companies in which the Portfolio invests) for the Class B and Class K shares of each Portfolio were above the medians for the Portfolio’s respective Lipper peer group, the administrative fee rate schedule for each Portfolio includes breakpoints so that the fee rate is reduced as the assets of the Portfolio increase above certain levels. The Board noted that any such reduction in a Portfolio’s effective administrative fee would result in corresponding reductions in the Portfolio’s total expense ratios. In addition, the Board noted that the Manager had agreed to make payments or waive all or a portion of its management, administrative and other fees so that each Portfolio’s total expense ratios do not exceed certain levels as set forth in the prospectus. The Board noted that, as a result of these expense limitation arrangements, the actual management fee for each Portfolio was lower than the Portfolio’s contractual management fee.
Based on its review, the Board determined, with respect to each Target Allocation Portfolio, that the Manager’s management fee is fair and reasonable.
38
Table of Contents
Charter Portfolios
The Board considered that the contractual management fee for each Portfolio was below the median for the Portfolio’s respective Lipper peer group. The Board also considered that the actual expense ratios (excluding fees and expenses of other investment companies in which the Portfolio invests) for the Class A, Class B and Class K shares of each Portfolio were below the medians for the Portfolio’s respective Lipper peer group. The Board noted that, due to the limited number of comparable funds-of-funds, the Portfolios’ Lipper peer groups comprised funds that do not operate as funds-of-funds. The Board noted that funds, like the Portfolios, that operate as funds-of-funds typically have lower management fees than funds that do not operate as funds-of-funds due to the different services performed by an investment manager in managing funds-of-funds.
The Board further considered that the Manager had agreed to make payments or waive all or a portion of its management, administrative and other fees so that each Portfolio’s total expense ratios do not exceed certain levels as set forth in the prospectus. The Board noted that, as a result of these expense limitation arrangements, the actual management fee for each Portfolio was lower than the Portfolio’s contractual management fee.
Based on its review, the Board determined, with respect to each Charter Portfolio, that the Manager’s management fee is fair and reasonable.
Profitability and Costs. The Board also considered the level of profits realized by the Manager and its affiliates in connection with the operation of each Portfolio. In this respect, the Board reviewed profitability information setting forth the overall profitability of the Trust to the Manager and its affiliates, as well as the Manager’s and its affiliates’ profits in providing management and other services to each of the individual Portfolios during the 12-month period ended December 31, 2013, which was the most recent fiscal year for the Manager.
In reviewing the analysis, attention was given to the methodology followed in allocating costs to each Portfolio, it being recognized that allocation methodologies are inherently subjective and various allocation methodologies may each be reasonable while producing different results. In this respect, the Board noted that, while being continuously refined and reflecting changes in the Manager’s and its affiliates’ cost accounting and other appropriate adjustments, the cost allocation methodology was consistent with that followed in profitability report presentations for the Portfolios made in prior years. In reviewing and discussing such analysis, the Manager discussed with the Board its belief that costs incurred in establishing the infrastructure necessary for the type of mutual fund operations conducted by the Manager and its affiliates may not be fully reflected in the expenses allocated to each Portfolio in determining its profitability, as well as the fact that the level of profits, to a certain extent, reflected operational cost savings and efficiencies initiated by management. The Board also took into account management’s ongoing costs and expenditures in providing and improving services for the Portfolios, as well as the need to meet additional regulatory and compliance requirements resulting from recently adopted rules and other regulations. In addition, the Board considered information prepared by management or from third party sources comparing the profitability of the Manager on an overall basis to the profitability of other publicly held asset managers (including asset managers similar to the Manager).
Based on its consideration of the factors above, the Board determined that the level of profits realized by the Manager from providing services to each Portfolio was not excessive in view of the nature, quality and extent of services provided.
Economies of Scale. The Board also considered whether economies of scale or efficiencies are realized by the Manager as the Portfolios grow larger and the extent to which this is reflected in the level of management and administrative fees charged. While recognizing that any precise determination is inherently subject to assumptions and subjective assessments, the Board considered that any economies of scale or efficiencies may be shared with portfolios and their shareholders in a variety of ways, including: (i) breakpoints in the management fee or other fees so that a portfolio’s effective fee rate declines as the portfolio grows in size, (ii) subsidizing a portfolio’s expenses by making payments or waiving all or a portion of the management fee or other fees so that the portfolio’s total expense ratio does not exceed certain levels, (iii) setting the management fee or other fees so that a portfolio is priced to scale, which assumes that the portfolio has sufficient assets from inception to operate at a competitive fee rate without any fee waiver or expense reimbursement from the manager, and (iv) reinvestment in, and enhancements to, the services that the manager and its affiliates provide to the portfolios and their shareholders. The Board noted that the management and administrative fee schedules for the AXA Allocation Portfolios and the administrative fee schedule for the Target Allocation Portfolios include breakpoints that reduce the fee rate as Portfolio assets increase. The Board also noted that, although the management fees for the Target Allocation
39
Table of Contents
Portfolios and the management and administrative fees for the Charter Portfolios do not include breakpoints, the Manager was subsidizing each of the Portfolios’ expenses by making payments or waiving all or a portion of its management, administrative and other fees so that the Portfolios’ total expense ratios do not exceed certain levels as set forth in their prospectuses. In addition, the Board considered that the Manager shares economies of scale with the Portfolios in other ways, which may include setting the management or other fees for a Portfolio so that they are priced to scale. The Board considered that the effect of this pricing strategy is that the Manager could lose money in the early stages of a Portfolio’s operation (and bear the risk that the Portfolio will never become profitable), while shareholders of the Portfolio receive the benefit of economies of scale that the Manager expects the Portfolio will achieve as it grows. The Board further considered that the Manager shares economies of scale with the Portfolios through reinvestment in, and enhancements to, the services that the Manager and its affiliates provide to the Portfolios and their shareholders, such as hiring additional personnel and providing additional resources in areas relating to management and administration of the Portfolios. Based on its consideration of the factors above, the Board concluded that there was a reasonable sharing of any economies of scale or efficiencies under the management and administrative fee schedules at the present time.
Fall-Out Benefits. The Board also considered the extent to which the Manager and its affiliates derive ancillary benefits from Portfolio operations, including the following. The Board noted that the Manager also serves as the administrator for the Portfolios and receives compensation for acting in this capacity. The Board also recognized that AXA Distributors, LLC, an affiliate of the Manager, serves as the underwriter for the Trust and receives from the Portfolios payments pursuant to Rule 12b-1 plans with respect to their Class A and Class B shares to compensate it for providing shareholder services and selling activities, which could lead to growth in the Trust’s assets and corresponding benefits from such growth, including economies of scale. The Board also recognized that the Portfolios invest in other (underlying) portfolios managed by the Manager and advised by advisers that may be affiliated with the Manager and that these underlying portfolios pay management and administrative fees to the Manager, who may in certain cases pay advisory fees to an affiliated adviser, and pay distribution fees to the Manager’s distribution affiliate. The Board also noted that the Manager’s affiliated insurance companies, as depositors of the insurance company separate accounts investing in the Portfolios, receive certain significant tax benefits associated with such investments as well as other potential benefits. The Board also considered that the Portfolios are offered as investment options through variable insurance contracts offered and sold by the Manager’s affiliated insurance companies and that the performance of each Portfolio may impact, positively or negatively, each insurance company’s ability to hedge the risks associated with guarantees that each insurance company may provide as the issuer of such contracts. The Board also noted that the Manager’s affiliated insurance companies and AXA Distributors, LLC receive compensation, which may include sales charges, separate account fees and charges, and other variable contract fees and charges, from the sale and administration of these variable insurance contracts. The Board also considered that certain Portfolios are subject to certain investment controls that are designed to reduce volatility for investors and that may benefit both investors and the Manager and its affiliates (including by making it easier for the insurance companies to hedge their risks under the guarantees). Based on its review, the Board determined that any “fall-out” benefits that may accrue to the Manager are fair and reasonable.
40
Table of Contents
Federal Income Tax Information (Unaudited)
For the year ended December 31, 2014, the percentage of dividends paid that qualify for the 70% dividends received deductions for corporate shareholders, foreign taxes which are expected to be passed through to shareholders for foreign tax credits, gross income derived from sources within foreign countries, and long-term capital gain dividends for the purpose of the dividend paid deduction on its Federal income tax return were as follows:
Portfolios: | 70% Dividend Received Deduction | Foreign Taxes | Foreign Source Income | Long Term Capital Gain | ||||||||||||
CharterSM Fixed Income | 2.03 | % | $ | — | $ | — | $ | — | ||||||||
CharterSM Equity | 32.76 | 2,299 | 35,929 | 61,370 | ||||||||||||
41
Table of Contents
MANAGEMENT OF THE TRUST (UNAUDITED)
The Trust’s Board is responsible for the overall management of the Trust and the Portfolios, including general supervision and review of the Portfolios’ investment activities and their conformity with federal and state law as well as the stated policies of the Portfolios. The Board elects the officers of the Trust who are responsible for administering the Trust’s day-to-day operations. The Trustees of the Trust are identified in the table below along with information as to their principal business occupations held during the last five years and certain other information.
The Trustees
| Name, Address and Year of Birth | Position(s) Held With Fund | Term of Office** and Length of Time Served | Principal Occupation(s) During Past 5 Years | Number of Portfolios in Fund Complex Overseen by Trustee*** | Other Directorships Held by Trustee | |||||
| Interested Trustee | ||||||||||
Steven M. Joenk* 1290 Avenue of the Americas New York, New York 10104 (1958) | Trustee, Chairman, President and Chief Executive Officer | Trustee and Chairman from September 2004 to present; Chief Executive Officer from December 2002 to present; President from November 2001 to present | From May 2011 to present, Director, President, Chief Executive Officer and Chairman, FMG LLC; from September 1999 to present, Managing Director, AXA Equitable; from September 2004 to April 2011, President, AXA Equitable’s FMG unit; from July 2004 to October 1, 2013, Senior Vice President, MONY Life Insurance Company; from July 2004 to present, Senior Vice President, MONY Life Insurance Company of America and Director, MONY Capital Management, Inc., Director and President, 1740 Advisers, Inc; Director, Chairman of the Board and President, MONY Asset Management, Inc. and Enterprise Capital Management (from July 2004 to January 2011); from January 2005 to January 2011, Director, MONY Financial Resources of Americas Limited; and from November 2005 to present, Director MONY International Holdings, LLC. | 113 | None | |||||
| Independent Trustees | ||||||||||
Gerald C. Crotty c/o AXA Premier VIP Trust 1290 Avenue of the Americas New York, New York 10104 (1951) | Trustee | From November 2001 to present | Since 2001, President of Weichert Enterprise, LLC, a private equity investment firm. | 28 | From 2005 to April 2014, Director of The Jones Group, Inc.; from 2002 to 2011, Director of Cinedigm Digital Cinema Corp. | |||||
42
Table of Contents
| Name, Address and Year of Birth | Position(s) Held With Fund | Term of Office** and Length of Time Served | Principal Occupation(s) During Past 5 Years | Number of Portfolios in Fund Complex Overseen by Trustee*** | Other Directorships Held by Trustee | |||||
Barry Hamerling c/o AXA Premier VIP Trust 1290 Avenue of the Americas New York, New York 10104 (1946) | Trustee | From November 2001 to present | Since 1998, Managing Partner of Premium Ice Cream of America; from 1970 to 1998, President of Ayco Co. L.P., the largest independent financial counseling firm in the United States; and from 1998 to 2013, Chairman of Ayco Charitable Foundation. | 28 | From 2014 to present, Lead Independent Trustee of the Westchester Event Driven Fund; from 2007 to present, Independent Lead Director of The Merger Fund. | |||||
Thomas P. Lemke 1290 Avenue of the Americas New York, New York 10104 (1954) | Trustee | From January 1, 2014 to present | From 2005 to 2013, Executive Vice President, General Counsel, and Head of the Governance Group of Legg Mason, Inc. | 28 | From February 2014 to present, Independent Trustee of the J.P. Morgan Exchange-Traded Fund Trust (4 portfolios); SEI family of funds (from February 2014 to present, Independent Trustee of Advisors’ Inner Circle Fund III (9 portfolios), from May 2014 to present, Independent Trustee of O’Connor Equus and from December 2014 to present, Independent Trustee of Winton Series Trust); from October 2014 to present, Independent Trustee of the Victory Institutional Funds, Victory Portfolios (25 portfolios) and The Victory Variable Insurance Funds. | |||||
Cynthia R. Plouché c/o AXA Premier VIP Trust 1290 Avenue of the Americas New York, New York 10104 (1957) | Lead Independent Trustee | Since March 2010; Trustee from November 2001 to March 2010 | From January 2014 to present, Assessor, Moraine Township (IL); from June 2006 to April 2012, Portfolio Manager at Williams Capital Management, Inc.; from June 2003 to 2006, Managing Director and Chief Investment Officer of Blaylock-Abacus Asset Management, Inc.; prior thereto, Founder, Chief Investment Officer and Managing Director of Abacus Financial Group from May 1991 to 2003, a manager of fixed income portfolios for institutional clients. | 28 | From May 2014 to present, Independent Trustee of the Northern Funds (48 portfolios) and Northern Institutional Funds (8 portfolios). |
43
Table of Contents
| Name, Address and Year of Birth | Position(s) Held With Fund | Term of Office** and Length of Time Served | Principal Occupation(s) During Past 5 Years | Number of Portfolios in Fund Complex Overseen by Trustee*** | Other Directorships Held by Trustee | |||||
Rayman L. Solomon c/o AXA Premier VIP Trust 1290 Avenue of the Americas New York, New York 10104 (1947) | Trustee | From November 2001 to present | From January 2014 to present, Provost of the Camden Campus of Rutgers University; since 1998, Dean and a Professor of Law at Rutgers University School of Law; prior to 1998, an Associate Dean for Academic Affairs at Northwestern University School of Law. | 28 | None |
| * | Affiliated with the portfolios’ investment manager and the distributor. |
| ** | Each Trustee serves until his or her resignation or retirement. |
| *** | The registered investment companies in the fund complex include EQ Advisors Trust and the Trust. Mr. Joenk serves as Trustee, President and Chief Executive Officer for each of the registered investment companies in the fund complex, as well as Chairman for each such company. |
Qualifications and Experience
In addition to the information set forth in the table above, the following sets forth additional information about the qualifications and experience of each of the Trustees.
Interested Trustee
Steven M. Joenk — Mr. Joenk has a background in the financial services industry; senior management experience with multiple insurance companies, investment management firms and investment companies; multiple years of service as an officer, Trustee and Chairman of the Trust and other registered investment companies.
Independent Trustees
Gerald C. Crotty — Mr. Crotty has a background in the financial services industry; business management experience, including chief executive and chief operating officer experience, with multiple years of service as a Trustee of the Trust and as a director of publicly-traded operating companies; multiple years of executive experience with a publicly-traded operating company and private equity investment firm; and legal and governmental experience.
Barry Hamerling — Mr. Hamerling has a background in the financial services industry; business management experience, including chief executive officer experience, with multiple years of service as a Trustee of the Trust and another registered investment company; and prior executive experience with a financial consulting firm.
Thomas P. Lemke — Mr. Lemke has a legal background and served as General Counsel in the financial services industry, experience in senior management positions with financial services firms in addition to multiple years of service with a regulatory agency.
Cynthia R. Plouché — Ms. Plouché has a background in the financial services industry; business management experience with multiple years of service as a Trustee of the Trust; and multiple years of executive experience as a chief investment officer and portfolio manager with investment management firms.
Rayman L. Solomon — Mr. Solomon has a legal and higher education background, including executive management experience as Provost and Dean of the Rutgers School of Law — Camden and Associate Dean of Northwestern University School of Law; and multiple years of service as a Trustee of the Trust.
44
Table of Contents
The Trust’s Officers
No officer of the Trust receives any compensation paid by the Trust. Each officer of the Trust is an employee of AXA Equitable, FMG LLC, and/or AXA Distributors, LLC (“AXA Distributors”). The Trust’s principal officers are:
| Name, Address and Year of Birth | Position(s) Held With Fund* | Term of Office and Length of Time Served** | Principal Occupation(s) During Past 5 Years | |||
Steven M. Joenk 1290 Avenue of the Americas, New York, New York 10104 (1958) | Trustee, Chairman, President and Chief Executive Officer | Trustee and Chairman from September 2004 to present; Chief Executive Officer from December 2002 to present; President from November 2001 to present | From May 2011 to present, Director, President, Chief Executive Officer and Chairman, FMG LLC; from September 1999 to present, Managing Director, AXA Equitable; from September 2004 to April 2011, President, AXA Equitable’s FMG unit; from July 2004 to October 1, 2013, Senior Vice President, MONY Life Insurance Company; from July 2004 to present, Senior Vice President, MONY Life Insurance Company of America and Director, MONY Capital Management, Inc., Director and President, 1740 Advisers, Inc; Director, Chairman of the Board and President, MONY Asset Management, Inc. and Enterprise Capital Management (from July 2004 to January 2011); from January 2005 to January 2011, Director, MONY Financial Resources of Americas Limited; and from November 2005 to present, Director MONY International Holdings, LLC. | |||
Brian E. Walsh 525 Washington Boulevard Jersey City, New Jersey 07310 (1968) | Chief Financial Officer and Treasurer | From June 2007 to present | From May 2011 to present, Senior Vice President of FMG LLC; from February 2003 to present, Lead Director of AXA Financial and AXA Equitable. | |||
Joseph J. Paolo 1290 Avenue of the Americas New York, New York 10104 (1970) | Chief Compliance Officer, Vice President and Anti-Money Laundering (“AML”) Compliance Officer | Chief Compliance Officer from May 2007 to present; Vice President and AML Compliance Officer from December 2005 to present | From May 2011 to present, Senior Vice President and Chief Compliance Officer of FMG LLC; from June 2007 to present, Lead Director of AXA Equitable and Chief Compliance Officer of AXA Equitable FMG. | |||
Patricia Louie, Esq. 1290 Avenue of the Americas, New York, New York 10104 (1955) | Vice President and Secretary | From November 2001 to present | From June 2012 to present, Executive Vice President and General Counsel of FMG LLC; from May 2011 to June 2012, Senior Vice President and Corporate Counsel of FMG LLC; from February 2011 to present Managing Director and Associate General Counsel of AXA Financial and AXA Equitable; from May 2003 to February 2011, Vice President and Associate General Counsel of AXA Financial and AXA Equitable. | |||
Alwi Chan 1290 Avenue of the Americas New York, New York 10104 (1974) | Vice President | From June 2007 to present | From June 2012 to present, Senior Vice President and Deputy Chief Investment Officer of FMG LLC; from May 2011 to June 2012, Vice President of FMG LLC; from February 2007 to present, Lead Director of AXA Financial and AXA Equitable. | |||
Mary E. Cantwell 1290 Avenue of the Americas, New York, New York 10104 (1961) | Vice President | From November 2001 to present | From June 2012 to present, Senior Vice President of FMG LLC; from May 2011 to June 2012, Vice President of FMG LLC; from February 2001 to present, Lead Director of AXA Equitable; from July 2004 to January 2011, a Director of Enterprise Capital Management, Inc. | |||
William T. MacGregor, Esq. 1290 Avenue of the Americas, New York, New York 10104 (1975) | Vice President and Assistant Secretary | From May 2008 to present | From June 2012 to present, Senior Vice President, Secretary and Associate General Counsel of FMG LLC; from May 2011 to June 2012, Vice President and Associate Corporate Counsel of FMG LLC; from May 2008 to present, Lead Director and Associate General Counsel of AXA Equitable. |
45
Table of Contents
Name, Address and Year of Birth | Position(s) Held With Fund* | Term of Office and Length of Time Served** | Principal Occupation(s) During Past 5 Years | |||
Anthony Geron, Esq. 1290 Avenue of the Americas, New York, New York 10104 (1971) | Vice President and Assistant Secretary | From July 2014 to present | From June 2014 to present, Vice President, Assistant Secretary and Associate General Counsel of FMG LLC; from May 2014 to present, Senior Director and Counsel of AXA Equitable; from October 2007 to May 2014 Associate of Wilkie Farr & Gallagher LLP. | |||
Michael Weiner, Esq. 1290 Avenue of the Americas New York, New York 10104 (1982) | Vice President and Assistant Secretary | From July 2014 to present | From June 2014 to present, Vice President, Assistant Secretary and Associate General Counsel of FMG LLC; from May 2014 to present, Senior Director and Counsel of AXA Equitable; from October 2007 to April 2014 Associate of Milbank, Tweed, Hadley & McCloy LLP. | |||
Kenneth T. Kozlowski 1290 Avenue of the Americas New York, New York 10104 (1961) | Vice President | From June 2010 to present | From June 2012 to present, Executive Vice President and Chief Investment Officer of FMG LLC; from May 2011 to June 2012, Senior Vice President of FMG LLC; from September 2011 to present, Managing Director of AXA Financial and AXA Equitable; from February 2001 to September 2011, Vice President, AXA Financial and AXA Equitable; from July 2004 to January 2011, Director, Enterprise Capital Management, Inc. | |||
Richard Guinnessey 1290 Avenue of the Americas New York, New York 10104 (1963) | Vice President | From March 2010 to present | From June 2012 to present, Vice President of FMG LLC, from September 2010 to present, Senior Director of AXA Equitable; from November 2005 to September 2010, Assistant Vice President of AXA Equitable. | |||
James Kelly 525 Washington Boulevard Jersey City, New Jersey 07310 (1968) | Controller | From June 2007 to present | From May 2011 to present, Vice President of FMG LLC; from September 2008 to present, Senior Director of AXA Equitable. | |||
Roselle Ibanga 525 Washington Boulevard Jersey City, New Jersey 07310 (1978) | Assistant Controller | From February 2009 to present | From February 2009 to present, Director of AXA Equitable; from December 2008 to February 2009, Director of AXA Equitable FMG. | |||
Lisa Perrelli 525 Washington Boulevard Jersey City, New Jersey 07310 (1974) | Assistant Controller | From February 2009 to present | From November 2012 to present, Senior Director of AXA Equitable; from September 2008 to November 2012, Assistant Vice President of AXA Equitable; from February 2008 to September 2008, Director of AXA Equitable FMG. | |||
Jennifer Mastronardi 1290 Avenue of the Americas, New York, New York 10104 (1985) | Assistant Vice President | From March 2012 to present | From February 2009 to present, Director of AXA Equitable; from June 2007 to February 2009, Operations Associate in Managed Futures Department, Morgan Stanley. | |||
Lorelei Fajardo 1290 Avenue of the Americas New York, New York 10104 (1978) | Assistant Secretary | From March 2014 to present | From July 2013 to present, Senior Manager/Legal Assistant of AXA Equitable; from July 2008 to June 2013, Lead Associate/Legal Assistant of AXA Equitable. |
| * | Each officer (except Ms. Fajardo) holds a similar position with other funds within the Trust complex. |
| ** | Each officer is elected on an annual basis. |
46
Table of Contents
PROXY VOTING POLICIES AND PROCEDURES (UNAUDITED)
A description of the policies and procedures that the Portfolios use to determine how to vote proxies relating to portfolio securities is available (i) without charge, upon request, by calling a toll-free number at 1-877-222-2144 and (ii) on the Securities and Exchange Commission’s website at http://www.sec.gov. Information regarding how the Portfolios voted proxies relating to portfolio securities during the most recent 12-month period ended June 30 is available without charge (i) on the Trust’s website at
www.axa-equitablefunds.com and (ii) on the Securities and Exchange Commission’s website at http://www.sec.gov.
QUARTERLY PORTFOLIO HOLDINGS INFORMATION (UNAUDITED)
The Portfolios file their complete schedule of portfolio holdings with the Securities and Exchange Commission for the first and third quarters of each fiscal year on Form N-Q. The Portfolios’ Forms N-Q are available on the Securities and Exchange Commission’s website at http://www.sec.gov. You may also review and obtain copies at the Securities and Exchange Commission’s Public Reference Room in Washington, D.C. Information about the Public Reference Room may be obtained by calling 1-800-SEC-0330.
47
Table of Contents
EQ Advisors Trust
Annual Report
December 31, 2014
Table of Contents
EQ Advisors Trust Annual Report
December 31, 2014
Table of Contents
| 4 | ||
| 5 | ||
| 29 | ||
| 72 | ||
| 87 | ||
| 118 | ||
| 119 | ||
Control Person and Principal Holders of Securities (Unaudited) | 124 | |
| 125 | ||
| 125 | ||
Table of Contents
Overview
2014 Market Overview
Economy
In 2014, unemployment in the U.S. fell as a result of what experts describe as the best hiring stretch since the late 1990s. In addition, the Federal Reserve appeared to signal its belief in the economy’s ability to grow without assistance by concluding its bond purchasing program known as Quantitative Easing (QE), in October 2014. Although investors seem to expect the Fed to raise interest rates sometime in 2015, overall monetary policy remains accommodative. In this environment, manufacturing indicators rose, and unemployment fell from 6.7% at the beginning of the year to 5.6% in December, bolstering consumer confidence and increasing the market’s expectations for a 2015 rate hike.
In the currency markets, investors pointed to relatively better growth levels in the U.S. as a critical support for the dollar, a trend that picked up as the year progressed. Currency volatility remained high as monetary policies worldwide diverged, and emerging market currencies were particularly volatile as lower oil prices weighed on the finances of large exporters.
Market watchers found that global economic growth continued at a slow and uneven pace. The euro-area economy remained stuck in slow or negative growth mode. Participants widely anticipated the European Central Bank to launch a quantitative easing program in early 2015 in an effort to prevent deflation and reignite growth. In Japan, GDP had risen by only 0.3% over the six quarters since the Bank of Japan’s aggressive stimulus program began in April 2013.
In the fourth quarter, a plunge in oil prices appeared to rattle the credit markets, pressured emerging-market currencies and added to deflationary pressures in Europe and Japan.
Fixed Income
Bond markets turned more volatile in 2014, apparently in reaction to growth trends and monetary policies in the world’s biggest economies heading in different directions.
The U.S. Treasury yield curve flattened and the 10-year U.S. Treasury yield ended 2014 roughly 0.86% below where it began the year. The market appeared to assign higher risk to U.S. corporate bonds, as the yield spread (or difference) between corporate and government bonds widened domestically, but narrowed slightly in Europe; globally, most credit sectors underperformed developed-market government debt.
The high yield market posted its sixth consecutive positive, although modest, annual return for full year 2014. Returns were stronger in the first half of the year, followed by negative total returns in the third quarter and fourth quarter. Experts believe that returns in the high yield market were largely impacted by the sharp drop in oil prices in the second half of 2014, as the energy sector, a large proportion of the high-yield market, sharply underperformed the broader market. There were record outflows from high-yield funds in 2014 but new issuance was steady, and defaults would have been historically low, excluding the failure of two long-distressed issuers.
U.S. Equity
For domestic equity investors, the phrase “There’s No Place Like Home” proved to be an accurate summary of market activity in 2014. The U.S. economy was among the few globally that appeared to produce clear, self-sustaining growth. This positive economic data, coupled with strong corporate earnings combined to produce squarely positive U.S. equity returns in 2014.
Experts agree that 2014 was a difficult year for stockpickers. While U.S. stocks outperformed the vast majority of both developed and emerging markets last year, market volatility was a near constant in 2014. Beginning in the first quarter, a series of geopolitical and macro-economic issues appeared to weigh on investor risk tolerances. Concern over the ultimate path of U.S. monetary policy under a new Federal Reserve chair seemed to add to the malaise. Given this heightened uncertainty, it appears that equity investors sought out the perceived safety of larger-capitalization stocks with lower relative valuations and higher dividend yields. Conversely, higher growth stocks with premium valuations were, at times, sold indiscriminately of their underlying fundamentals. Specifically during a six-week period that stretched through the end of April, experts agree that the market had absolutely no appetite for higher growth, higher valuation equities.
Despite a difficult start to the year, small- and mid-cap stocks finished 2014 on a positive note to close the year with small gains. Investors appeared to react to an unexpected decline in bond yields by seeking income in higher-yielding equities. This development helped the utility sector to lead all others in the small/mid-cap space. In contrast, the energy sector posted the worst results as oil prices plunged by nearly 50% in the second half of 2014.
International Equity
Market strategists agree that it was an unpleasant start to the year for international equity investors. Volatility ticked up amid what appeared to be heightened risks in emerging markets, slowing growth in China and softer economic data in the United States, while investors braced for the impact of the U.S. Federal Reserve scaling back on its stimulus program. Equity markets around the world declined sharply in January, but the sell-off was short-lived and international equities rebounded in February, particularly in Europe.
2
Table of Contents
Nonetheless, high valuations and uncertainty around global central bank policies apparently left equities particularly vulnerable to bad news. Consequently, geopolitical risks took a toll on international equity prices as tensions between Russia and Ukraine mounted and the fragmentation of Iraq led to escalating violence and a spike in oil prices during the summer. A ground war in Gaza, the downing of a civilian airliner over Ukraine, and Scotland’s flirtation with independence from the United Kingdom all seemed to add to global headwinds, causing many investors to retreat from riskier assets.
In the latter part of the year, most European developed economies again struggled with sluggish activity and experts agree that equity prices were tossed about between investors’ concerns about geopolitical turmoil and hopes for central bank stimulus. The continuation of the Russia-Ukraine conflict and a Russian currency crisis, as well as Greece’s failure to successfully elect a new president, also apparently drove volatility higher. In the eurozone, market watchers appeared to find inflation dangerously low. Another round of policy easing from the ECB appeared to give international equities a much-needed boost, but the significant depreciation of the euro and other currencies versus the U.S. dollar resulted in falling stock prices for U.S.–based investors.
Similarly, Asian developed market equities performed well in local currency terms, but generated negative results on a U.S. dollar basis. Market strategists agree that, as the Japanese economy struggled to get on its legs, the nation’s equity market benefited from central bank stimulus and positive sentiment toward structural reform. Strong corporate earnings results also appeared to have pushed Japanese stocks higher, as did a surge of domestic inflows due to the reallocation of Japan’s Government Pension Investment Fund. However, a weakening yen versus a strengthening U.S. dollar resulted in Japanese equities having the largest negative effect on the performance of international stocks.
In the latter months of 2014, the divergence in global central bank policies became a major theme in equity markets and the strong appreciation in the U.S. dollar pressured commodity prices. Oil prices in particular plunged as a global supply-and-demand imbalance materialized. While lower prices were harmful to economies that rely heavily on oil exports, most developed markets derived a boost in consumer spending, a positive for equity markets.
Source: AXA Equitable Funds Management Group, LLC. As of 12/31/2014.
This information is provided for general information only and is not intended to provide specific advice or recommendations for any individual investor.
PAST PERFORMANCE IS NO GUARANTEE OF FUTURE RESULTS. No investment is risk-free. International securities carry additional risks including currency exchange fluctuation and different government regulations, economic conditions or accounting standards. Smaller company stocks involve a greater risk than is customarily associated with more established companies. Bond investments are subject to interest rate risk so that when interest rates rise, the prices of bonds can decrease and the investor can lose principal value. High yield bonds are subject to a high degree of credit and market risk. Index performance is shown for illustrative purposes only. You cannot invest directly in an index.
AXA Equitable Life Insurance Company (New York, NY). Distributors: AXA Advisors, LLC and AXA Distributors, LLC.
AXA Equitable Funds Management Group, LLC is a wholly owned subsidiary of AXA Equitable Life Insurance Company.
AXA Equitable Life Insurance Company, AXA Advisors and AXA Distributors are affiliated companies.
GE-101091(2/15) (Exp. 2/17)
3
Table of Contents
NOTES ON PERFORMANCE (Unaudited)
Total Returns
Performance of the EQ Advisors Trust Portfolios as shown on the following pages compares each Portfolio’s performance to that of a broad-based securities index. Each of the Portfolio’s annualized rates of return is net of investment management fees and expenses of the Portfolio. Rates of return are not representative of the actual return you would receive under your variable life insurance policy or annuity contract. No policyholder or contractholder can invest directly in the EQ Advisors Trust Portfolios. Changes in policy values depend not only on the investment performance of the EQ Advisors Trust Portfolios, but also on the insurance and administrative charges, applicable sales charges, and the mortality and expense risk charge applicable under a policy. These policy charges effectively reduce the dollar amount of any net gains and increase the dollar amount of any net losses. Each of the EQ Advisors Trust Portfolios has a separate investment objective it seeks to achieve by following a separate investment policy. There is no guarantee that these objectives will be attained. The objectives and policies of each Portfolio will affect its return and its risk. Keep in mind that past performance is not an indication of future results.
Growth of $10,000 Investment
The charts shown on the following pages illustrate the total value of an assumed investment in Class IA, Class IB and/or Class K shares of each Portfolio of the EQ Advisors Trust. The periods illustrated are from the inception dates shown, or for a ten year period if the inception date is prior to December 31, 2004, through December 31, 2014. These results assume reinvestment of dividends and capital gains. The total value shown for each Portfolio reflects management fees and operating expenses of the Portfolios and 12b-1 fees which are applicable to Class IB shares. Effective January 1, 2012, 12b-1 fees are applicable to Class IA shares. 12b-1 fees are not applicable to Class K shares. The values have not been adjusted for insurance-related charges and expenses associated with life insurance policies or annuity contracts, which would lower the total values shown. Results should not be considered representative of future gains or losses.
The Benchmarks
Broad-based securities indices are unmanaged and are not subject to fees and expenses typically associated with actively-managed funds. An investment cannot be made directly in a broad-based securities index. Comparisons with these benchmarks, therefore, are of limited use. They are included because they are widely known and may help you to understand the universe of securities from which each Portfolio is likely to select its holdings.
Barclays U.S. Intermediate Government/Credit Bond Index (“BIG/C”)
An unmanaged, market value weighted index which includes Treasuries, government-related issues (i.e., agency, sovereign, supranational, and local authority debt), and corporates with maturities of one to 10 years.
Russell 3000® Index (“Russell 3000”)
An index which measures the performance of the 3,000 largest U.S. companies based on total market capitalization, which represents approximately 98% of the investable U.S. equity market. It is market-capitalization weighted.
4
Table of Contents
EQ/COMMON STOCK INDEX PORTFOLIO (Unaudited)
INVESTMENT MANAGER
| Ø | AXA Equitable Funds Management Group, LLC |
INVESTMENT SUB-ADVISER
| Ø | AllianceBernstein L.P. |
PERFORMANCE RESULTS
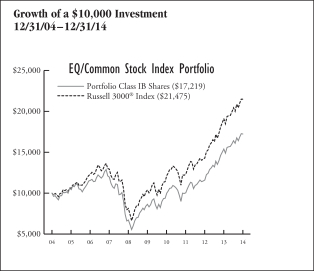
| Annualized Total Returns as of 12/31/14 | ||||||||||||
| 1 Year | 5 Years | 10 Years/ Since Incept. | ||||||||||
Portfolio – Class IA Shares | 12.05 | % | 14.97 | % | 5.77 | % | ||||||
Portfolio – Class IB Shares | 12.03 | 14.86 | 5.58 | |||||||||
Russell 3000® Index | 12.56 | 15.63 | 7.94 | |||||||||
Returns for periods greater than one year are annualized. |
| |||||||||||
Past performance is not indicative of future results.
PERFORMANCE SUMMARY
The Portfolio’s Class IB shares returned 12.03% for the year ended December 31, 2014. The Portfolio’s benchmark, Russell 3000® Index, returned 12.56% over the same period.
Portfolio Highlights
For the year ended December 31, 2014
What helped performance during the year:
| • | The sectors that contributed most to relative performance for the year ended December 31, 2014 were Information Technology, Health Care, Financials, Consumer Staples and Consumer Discretionary. |
| • | The top five stocks that provided the most positive impact to the Russell 3000® Index performance for the year ended December 31, 2014 were Apple Inc., Microsoft Corp., Berkshire Hathaway Inc., Intel Corp., and Wells Fargo & Co. |
What hurt performance during the year:
| • | The most negative sector contributors to performance for year ended December 31, 2014 were Energy, Telecommunication Services, Materials, Utilities and Industrials. |
| • | The five stocks that were most detrimental to performance in the Russell 3000® Index for the year ended December 31, 2014 were Amazon.com Inc., Exxon Mobil Corp., International Business Machines, General Electric Co. and Chevron Corp. |
Sector Weightings as of December 31, 2014 | % of Net Assets | |||
Information Technology | 18.8 | % | ||
Financials | 17.8 | |||
Health Care | 13.9 | |||
Consumer Discretionary | 12.7 | |||
Industrials | 11.3 | |||
Consumer Staples | 8.5 | |||
Energy | 7.5 | |||
Materials | 3.6 | |||
Utilities | 3.2 | |||
Telecommunication Services | 2.0 | |||
Cash and Other | 0.7 | |||
|
| |||
| 100.0 | % | |||
|
| |||
5
Table of Contents
EQ/COMMON STOCK INDEX PORTFOLIO (Unaudited)
UNDERSTANDING YOUR EXPENSES:
As a shareholder of the Portfolio, you incur two types of costs:
(1) transaction costs, including applicable sales charges and redemption fees; and (2) ongoing costs, including management fees, distribution and/or service (12b-1) fees (in the case of Class IA and Class IB shares of the Trust), and other Portfolio expenses. These examples are intended to help you understand your ongoing costs (in dollars) of investing in the Portfolio and to compare these costs with the ongoing costs of investing in other mutual funds.
The examples are based on an investment of $1,000 invested at the beginning of the six-month period ended December 31, 2014 and held for the entire six-month period.
Actual Expenses
The first line of the following table provides information about actual account values and actual expenses. You may use the information in this line, together with the amount you invested, to estimate the expenses that you paid over the period. Simply divide your account value by $1,000 (for example, an $8,600 account value divided by $1,000 = 8.6), then multiply the result by the number in the first line under the heading entitled “Expenses Paid During Period” to estimate the expenses you paid on your account during this period.
Hypothetical Example for Comparison Purposes
The second line of the following table provides information about hypothetical account values and hypothetical expenses based on the Portfolio’s actual expense ratio and an assumed rate of return of 5% per year before expenses, which is not the Portfolio’s actual return. The hypothetical account values and expenses may not be used to estimate the actual ending account balance or expenses you paid for the period. You may use this information to compare the ongoing costs of investing in the Portfolio and other funds. To do so, compare this 5% hypothetical example with the 5% hypothetical examples that appear in the shareholder reports of the other funds.
Please note that the expenses shown in the table are meant to highlight your ongoing costs only and do not reflect any transactional costs, such as sales charges (loads), redemption fees, or exchange fees. Therefore, the second line of the table is useful in comparing ongoing costs only, and will not help you determine the relative total costs of owning different funds. In addition, if these transactional costs were included, your costs would have been higher. Also note that the table does not reflect any variable life insurance or variable annuity contract-related fees and expenses, which would increase overall fees and expenses.
EXAMPLE
| Beginning Account Value 7/1/14 | Ending Account Value 12/31/14 | Expenses Period* 12/31/14 | ||||||||||
Class IA | ||||||||||||
Actual | $1,000.00 | $1,049.72 | $3.68 | |||||||||
Hypothetical (5% average annual return before expenses) | 1,000.00 | 1,021.61 | 3.63 | |||||||||
Class IB | ||||||||||||
Actual | 1,000.00 | 1,050.01 | 3.68 | |||||||||
Hypothetical (5% average annual return before expenses) | 1,000.00 | 1,021.61 | 3.63 | |||||||||
* Expenses are equal to the Portfolio’s Class IA and Class IB shares annualized expense ratios of 0.71% and 0.71%, respectively, multiplied by the average account value over the period, and multiplied by 184/365 (to reflect the one-half year period). |
| |||||||||||
6
Table of Contents
EQ ADVISORS TRUST
EQ/COMMON STOCK INDEX PORTFOLIO
PORTFOLIO OF INVESTMENTS
December 31, 2014
| Number of Shares | Value (Note 1) | |||||||
COMMON STOCKS: | ||||||||
Consumer Discretionary (12.7%) | ||||||||
Auto Components (0.4%) | ||||||||
BorgWarner, Inc. | 65,260 | $ | 3,586,037 | |||||
Cooper Tire & Rubber Co. | 16,700 | 578,655 | ||||||
Dana Holding Corp. | 52,900 | 1,150,046 | ||||||
Federal-Mogul Holdings Corp.* | 32,700 | 526,143 | ||||||
Gentex Corp. | 37,800 | 1,365,714 | ||||||
Gentherm, Inc.* | 9,100 | 333,242 | ||||||
Goodyear Tire & Rubber Co. | 69,700 | 1,991,329 | ||||||
Johnson Controls, Inc. | 173,030 | 8,364,270 | ||||||
Lear Corp. | 21,400 | 2,098,912 | ||||||
Tenneco, Inc.* | 22,600 | 1,279,386 | ||||||
TRW Automotive Holdings Corp.* | 28,800 | 2,962,080 | ||||||
Visteon Corp.* | 12,600 | 1,346,436 | ||||||
|
| |||||||
| 25,582,250 | ||||||||
|
| |||||||
Automobiles (0.7%) | ||||||||
Ford Motor Co. | 991,736 | 15,371,908 | ||||||
General Motors Co. | 402,600 | 14,054,766 | ||||||
Harley-Davidson, Inc. | 55,450 | 3,654,709 | ||||||
Tesla Motors, Inc.* | 24,800 | 5,515,768 | ||||||
Thor Industries, Inc. | 14,600 | 815,702 | ||||||
|
| |||||||
| 39,412,853 | ||||||||
|
| |||||||
Distributors (0.1%) | ||||||||
Genuine Parts Co. | 40,000 | 4,262,800 | ||||||
LKQ Corp.* | 89,000 | 2,502,680 | ||||||
Pool Corp. | 15,900 | 1,008,696 | ||||||
|
| |||||||
| 7,774,176 | ||||||||
|
| |||||||
Diversified Consumer Services (0.2%) |
| |||||||
Apollo Education Group, Inc.* | 26,330 | 898,116 | ||||||
Bright Horizons Family Solutions, Inc.* | 10,700 | 503,007 | ||||||
DeVry Education Group, Inc. | 16,100 | 764,267 | ||||||
Graham Holdings Co., Class B | 1,300 | 1,122,823 | ||||||
Grand Canyon Education, Inc.* | 12,900 | 601,914 | ||||||
H&R Block, Inc. | 69,550 | 2,342,444 | ||||||
Houghton Mifflin Harcourt Co.* | 28,400 | 588,164 | ||||||
Service Corp. International | 56,100 | 1,273,470 | ||||||
Sotheby’s, Inc. | 25,300 | 1,092,454 | ||||||
|
| |||||||
| 9,186,659 | ||||||||
|
| |||||||
Hotels, Restaurants & Leisure (1.9%) |
| |||||||
Aramark | 2,900 | 90,335 | ||||||
Bloomin’ Brands, Inc.* | 19,400 | 480,344 | ||||||
Brinker International, Inc. | 20,490 | 1,202,558 | ||||||
Buffalo Wild Wings, Inc.* | 6,100 | 1,100,318 | ||||||
Carnival Corp. | 106,660 | 4,834,898 | ||||||
Cheesecake Factory, Inc. | 12,800 | 643,968 | ||||||
Chipotle Mexican Grill, Inc.* | 8,000 | 5,476,080 | ||||||
Choice Hotels International, Inc. | 6,000 | 336,120 | ||||||
Cracker Barrel Old Country Store, Inc. | 5,800 | 816,408 | ||||||
Darden Restaurants, Inc. | 33,250 | 1,949,447 | ||||||
Domino’s Pizza, Inc. | 16,400 | 1,544,388 | ||||||
Dunkin’ Brands Group, Inc. | 30,300 | 1,292,295 | ||||||
Hilton Worldwide Holdings, Inc.* | 35,800 | 934,022 | ||||||
Hyatt Hotels Corp., Class A* | 16,500 | $ | 993,465 | |||||
International Game Technology | 81,360 | 1,403,460 | ||||||
Jack in the Box, Inc. | 9,900 | 791,604 | ||||||
La Quinta Holdings, Inc.* | 24,000 | 529,440 | ||||||
Las Vegas Sands Corp. | 98,000 | 5,699,680 | ||||||
Life Time Fitness, Inc.* | 14,000 | 792,680 | ||||||
Marriott International, Inc., Class A | 57,725 | 4,504,282 | ||||||
Marriott Vacations Worldwide Corp. | 7,300 | 544,142 | ||||||
McDonald’s Corp. | 252,440 | 23,653,628 | ||||||
MGM Resorts International* | 101,700 | 2,174,346 | ||||||
Norwegian Cruise Line Holdings Ltd.* | 23,600 | 1,103,536 | ||||||
Panera Bread Co., Class A* | 7,100 | 1,241,080 | ||||||
Restaurant Brands International LP* | 285 | 10,754 | ||||||
Restaurant Brands International, Inc.* | 53,615 | 2,093,130 | ||||||
Royal Caribbean Cruises Ltd. | 41,650 | 3,433,209 | ||||||
SeaWorld Entertainment, Inc. | 4,700 | 84,130 | ||||||
Six Flags Entertainment Corp. | 24,684 | 1,065,115 | ||||||
Starbucks Corp. | 193,850 | 15,905,393 | ||||||
Starwood Hotels & Resorts Worldwide, Inc. | 51,400 | 4,166,998 | ||||||
Texas Roadhouse, Inc. | 18,200 | 614,432 | ||||||
Vail Resorts, Inc. | 10,200 | 929,526 | ||||||
Wendy’s Co. | 84,400 | 762,132 | ||||||
Wyndham Worldwide Corp. | 36,970 | 3,170,547 | ||||||
Wynn Resorts Ltd. | 22,100 | 3,287,596 | ||||||
Yum! Brands, Inc. | 114,940 | 8,373,379 | ||||||
|
| |||||||
| 108,028,865 | ||||||||
|
| |||||||
Household Durables (0.5%) | ||||||||
D.R. Horton, Inc. | 88,100 | 2,228,049 | ||||||
Garmin Ltd. | 35,500 | 1,875,465 | ||||||
Harman International Industries, Inc. | 19,190 | 2,047,765 | ||||||
Helen of Troy Ltd.* | 6,000 | 390,360 | ||||||
Jarden Corp.* | 52,425 | 2,510,109 | ||||||
Leggett & Platt, Inc. | 42,200 | 1,798,142 | ||||||
Lennar Corp., Class A | 49,300 | 2,209,133 | ||||||
Mohawk Industries, Inc.* | 17,000 | 2,641,120 | ||||||
Newell Rubbermaid, Inc. | 80,500 | 3,066,245 | ||||||
NVR, Inc.* | 1,200 | 1,530,396 | ||||||
PulteGroup, Inc. | 104,800 | 2,249,008 | ||||||
Ryland Group, Inc. | 13,600 | 524,416 | ||||||
Standard Pacific Corp.* | 62,400 | 454,896 | ||||||
Taylor Morrison Home Corp., Class A* | 23,000 | 434,470 | ||||||
Tempur Sealy International, Inc.* | 17,200 | 944,452 | ||||||
Toll Brothers, Inc.* | 44,200 | 1,514,734 | ||||||
TRI Pointe Homes, Inc.* | 38,000 | 579,500 | ||||||
Tupperware Brands Corp. | 15,000 | 945,000 | ||||||
Whirlpool Corp. | 20,120 | 3,898,049 | ||||||
|
| |||||||
| 31,841,309 | ||||||||
|
| |||||||
Internet & Catalog Retail (1.1%) |
| |||||||
Amazon.com, Inc.* | 95,280 | 29,570,148 | ||||||
Expedia, Inc. | 27,205 | 2,322,219 | ||||||
FTD Cos., Inc.* | 2,020 | 70,336 | ||||||
See Notes to Financial Statements.
7
Table of Contents
EQ ADVISORS TRUST
EQ/COMMON STOCK INDEX PORTFOLIO
PORTFOLIO OF INVESTMENTS (Continued)
December 31, 2014
| Number of Shares | Value (Note 1) | |||||||
Groupon, Inc.* | 119,200 | $ | 984,592 | |||||
HomeAway, Inc.* | 24,400 | 726,632 | ||||||
HSN, Inc. | 13,200 | 1,003,200 | ||||||
Liberty Interactive Corp.* | 131,830 | 3,878,438 | ||||||
Liberty TripAdvisor Holdings, Inc.* | 17,402 | 468,114 | ||||||
Liberty Ventures* | 36,144 | 1,363,352 | ||||||
Netflix, Inc.* | 15,600 | 5,329,116 | ||||||
Priceline Group, Inc.* | 12,980 | 14,799,926 | ||||||
Shutterfly, Inc.* | 10,000 | 416,950 | ||||||
TripAdvisor, Inc.* | 31,805 | 2,374,561 | ||||||
zulily, Inc., Class A* | 400 | 9,360 | ||||||
|
| |||||||
| 63,316,944 | ||||||||
|
| |||||||
Leisure Products (0.2%) | ||||||||
Brunswick Corp. | 22,600 | 1,158,476 | ||||||
Hasbro, Inc. | 33,900 | 1,864,161 | ||||||
Mattel, Inc. | 94,800 | 2,933,586 | ||||||
Polaris Industries, Inc. | 19,200 | 2,903,808 | ||||||
|
| |||||||
| 8,860,031 | ||||||||
|
| |||||||
Media (3.5%) | ||||||||
AMC Entertainment Holdings, Inc., Class A | 18,500 | 484,330 | ||||||
AMC Networks, Inc., Class A* | 21,212 | 1,352,689 | ||||||
Cablevision Systems Corp. – New York Group, Class A | 61,150 | 1,262,136 | ||||||
CBS Corp. (Non-Voting), Class B | 135,820 | 7,516,279 | ||||||
Charter Communications, Inc., Class A* | 20,700 | 3,449,034 | ||||||
Cinemark Holdings, Inc. | 31,500 | 1,120,770 | ||||||
Clear Channel Outdoor Holdings, Inc., Class A | 69,700 | 738,123 | ||||||
Comcast Corp., Class A | 653,824 | 37,928,330 | ||||||
DIRECTV* | 121,846 | 10,564,048 | ||||||
Discovery Communications, Inc., Class A* | 59,800 | 2,060,110 | ||||||
Discovery Communications, Inc., Class C* | 59,800 | 2,016,456 | ||||||
DISH Network Corp., Class A* | 55,660 | 4,057,057 | ||||||
DreamWorks Animation SKG, Inc., Class A* | 20,600 | 459,998 | ||||||
Gannett Co., Inc. | 69,600 | 2,222,328 | ||||||
Interpublic Group of Cos., Inc. | 119,600 | 2,484,092 | ||||||
John Wiley & Sons, Inc., Class A | 17,000 | 1,007,080 | ||||||
Liberty Broadband Corp.* | 14,322 | 714,055 | ||||||
Liberty Media Corp.* | 74,091 | 2,601,335 | ||||||
Lions Gate Entertainment Corp. | 22,800 | 730,056 | ||||||
Live Nation Entertainment, Inc.* | 33,200 | 866,852 | ||||||
Madison Square Garden Co., Class A* | 17,787 | 1,338,650 | ||||||
Meredith Corp. | 9,100 | 494,312 | ||||||
Morningstar, Inc. | 1,800 | 116,478 | ||||||
New York Times Co., Class A | 38,000 | 502,360 | ||||||
News Corp., Class A* | 141,361 | 2,217,954 | ||||||
Omnicom Group, Inc. | 68,500 | 5,306,695 | ||||||
Regal Entertainment Group, Class A | 20,900 | 446,424 | ||||||
Scripps Networks Interactive, Inc., Class A | 31,100 | $ | 2,340,897 | |||||
Sinclair Broadcast Group, Inc., Class A | 19,400 | 530,784 | ||||||
Sirius XM Holdings, Inc.* | 718,400 | 2,514,400 | ||||||
Starz, Class A* | 32,997 | 980,011 | ||||||
Thomson Reuters Corp. | 89,700 | 3,618,498 | ||||||
Time Warner Cable, Inc. | 72,602 | 11,039,860 | ||||||
Time Warner, Inc. | 221,426 | 18,914,209 | ||||||
Time, Inc. | 29,203 | 718,686 | ||||||
Twenty-First Century Fox, Inc., Class A | 480,726 | 18,462,282 | ||||||
Viacom, Inc., Class B | 111,960 | 8,424,990 | ||||||
Walt Disney Co. | 439,368 | 41,384,072 | ||||||
|
| |||||||
| 202,986,720 | ||||||||
|
| |||||||
Multiline Retail (0.7%) | ||||||||
Big Lots, Inc. | 15,500 | 620,310 | ||||||
Dillard’s, Inc., Class A | 6,600 | 826,188 | ||||||
Dollar General Corp.* | 81,900 | 5,790,330 | ||||||
Dollar Tree, Inc.* | 55,050 | 3,874,419 | ||||||
Family Dollar Stores, Inc. | 24,450 | 1,936,685 | ||||||
J.C. Penney Co., Inc.* | 63,200 | 409,536 | ||||||
Kohl’s Corp. | 54,310 | 3,315,082 | ||||||
Macy’s, Inc. | 95,600 | 6,285,700 | ||||||
Nordstrom, Inc. | 39,390 | 3,127,172 | ||||||
Target Corp. | 165,060 | 12,529,705 | ||||||
|
| |||||||
| 38,715,127 | ||||||||
|
| |||||||
Specialty Retail (2.5%) | ||||||||
Aaron’s, Inc. | 17,500 | 534,975 | ||||||
Abercrombie & Fitch Co., Class A | 18,800 | 538,432 | ||||||
Advance Auto Parts, Inc. | 20,750 | 3,305,060 | ||||||
American Eagle Outfitters, Inc. | 60,700 | 842,516 | ||||||
ANN, Inc.* | 12,600 | 459,648 | ||||||
Asbury Automotive Group, Inc.* | 8,300 | 630,136 | ||||||
Ascena Retail Group, Inc.* | 2,000 | 25,120 | ||||||
AutoNation, Inc.* | 18,900 | 1,141,749 | ||||||
AutoZone, Inc.* | 8,490 | 5,256,244 | ||||||
Bed Bath & Beyond, Inc.* | 46,950 | 3,576,181 | ||||||
Best Buy Co., Inc. | 83,910 | 3,270,812 | ||||||
Buckle, Inc. | 9,900 | 519,948 | ||||||
Cabela’s, Inc.* | 15,800 | 832,818 | ||||||
CarMax, Inc.* | 59,950 | 3,991,471 | ||||||
Chico’s FAS, Inc. | 39,950 | 647,589 | ||||||
CST Brands, Inc. | 18,058 | 787,509 | ||||||
Dick’s Sporting Goods, Inc. | 31,100 | 1,544,115 | ||||||
DSW, Inc., Class A | 15,200 | 566,960 | ||||||
Five Below, Inc.* | 14,100 | 575,703 | ||||||
Foot Locker, Inc. | 40,100 | 2,252,818 | ||||||
GameStop Corp., Class A | 33,700 | 1,139,060 | ||||||
Gap, Inc. | 68,890 | 2,900,958 | ||||||
Genesco, Inc.* | 7,800 | 597,636 | ||||||
GNC Holdings, Inc., Class A | 27,900 | 1,310,184 | ||||||
Group 1 Automotive, Inc. | 5,800 | 519,796 | ||||||
Guess?, Inc. | 17,600 | 371,008 | ||||||
Home Depot, Inc. | 345,205 | 36,236,169 | ||||||
L Brands, Inc. | 63,090 | 5,460,439 | ||||||
Lithia Motors, Inc., Class A | 5,700 | 494,133 | ||||||
See Notes to Financial Statements.
8
Table of Contents
EQ ADVISORS TRUST
EQ/COMMON STOCK INDEX PORTFOLIO
PORTFOLIO OF INVESTMENTS (Continued)
December 31, 2014
| Number of Shares | Value (Note 1) | |||||||
Lowe’s Cos., Inc. | 255,740 | $ | 17,594,912 | |||||
Lumber Liquidators Holdings, Inc.* | 400 | 26,524 | ||||||
Men’s Wearhouse, Inc. | 19,100 | 843,265 | ||||||
Murphy USA, Inc.* | 14,655 | 1,009,143 | ||||||
Office Depot, Inc.* | 132,429 | 1,135,579 | ||||||
O’Reilly Automotive, Inc.* | 27,650 | 5,325,943 | ||||||
Penske Automotive Group, Inc. | 8,900 | 436,723 | ||||||
PetSmart, Inc. | 25,700 | 2,089,282 | ||||||
Restoration Hardware Holdings, Inc.* | 8,200 | 787,282 | ||||||
Ross Stores, Inc. | 55,360 | 5,218,234 | ||||||
Sally Beauty Holdings, Inc.* | 48,300 | 1,484,742 | ||||||
Signet Jewelers Ltd. | 20,880 | 2,747,182 | ||||||
Staples, Inc. | 184,150 | 3,336,798 | ||||||
Tiffany & Co. | 31,700 | 3,387,462 | ||||||
TJX Cos., Inc. | 182,400 | 12,508,992 | ||||||
Tractor Supply Co. | 39,600 | 3,121,272 | ||||||
Ulta Salon Cosmetics & Fragrance, Inc.* | 19,600 | 2,505,664 | ||||||
Urban Outfitters, Inc.* | 35,150 | 1,234,820 | ||||||
Williams-Sonoma, Inc. | 26,900 | 2,035,792 | ||||||
|
| |||||||
| 147,158,798 | ||||||||
|
| |||||||
Textiles, Apparel & Luxury Goods (0.9%) |
| |||||||
Carter’s, Inc. | 15,680 | 1,369,021 | ||||||
Coach, Inc. | 76,820 | 2,885,359 | ||||||
Columbia Sportswear Co. | 7,800 | 347,412 | ||||||
Deckers Outdoor Corp.* | 12,800 | 1,165,312 | ||||||
Fossil Group, Inc.* | 15,800 | 1,749,692 | ||||||
G-III Apparel Group Ltd.* | 4,800 | 484,848 | ||||||
Hanesbrands, Inc. | 25,600 | 2,857,472 | ||||||
Iconix Brand Group, Inc.* | 12,800 | 432,512 | ||||||
Kate Spade & Co.* | 29,900 | 957,099 | ||||||
Michael Kors Holdings Ltd.* | 57,200 | 4,295,720 | ||||||
NIKE, Inc., Class B | 176,360 | 16,957,014 | ||||||
PVH Corp. | 20,781 | 2,663,501 | ||||||
Ralph Lauren Corp. | 15,370 | 2,845,909 | ||||||
Skechers U.S.A., Inc., Class A* | 10,200 | 563,550 | ||||||
Steven Madden Ltd.* | 19,102 | 608,017 | ||||||
Under Armour, Inc., Class A* | 44,900 | 3,048,710 | ||||||
VF Corp. | 89,500 | 6,703,550 | ||||||
Wolverine World Wide, Inc. | 27,700 | 816,319 | ||||||
|
| |||||||
| 50,751,017 | ||||||||
|
| |||||||
Total Consumer Discretionary | 733,614,749 | |||||||
|
| |||||||
Consumer Staples (8.5%) | ||||||||
Beverages (1.7%) | ||||||||
Boston Beer Co., Inc., Class A* | 2,300 | 665,942 | ||||||
Brown-Forman Corp., Class B | 42,400 | 3,724,416 | ||||||
Coca-Cola Co. | 996,540 | 42,073,919 | ||||||
Coca-Cola Enterprises, Inc. | 70,600 | 3,121,932 | ||||||
Constellation Brands, Inc., Class A* | 42,200 | 4,142,774 | ||||||
Dr. Pepper Snapple Group, Inc. | 51,110 | 3,663,565 | ||||||
Molson Coors Brewing Co., Class B | 39,750 | 2,962,170 | ||||||
Monster Beverage Corp.* | 36,700 | 3,976,445 | ||||||
PepsiCo, Inc. | 384,590 | 36,366,830 | ||||||
|
| |||||||
| 100,697,993 | ||||||||
|
| |||||||
Food & Staples Retailing (2.2%) | ||||||||
Andersons, Inc. | 1,550 | $ | 82,367 | |||||
Casey’s General Stores, Inc. | 9,800 | 885,136 | ||||||
Costco Wholesale Corp. | 113,250 | 16,053,187 | ||||||
CVS Health Corp. | 293,510 | 28,267,948 | ||||||
Kroger Co. | 129,310 | 8,302,995 | ||||||
Rite Aid Corp.* | 254,100 | 1,910,832 | ||||||
Safeway, Inc. | 68,840 | 2,417,661 | ||||||
Sprouts Farmers Market, Inc.* | 25,500 | 866,490 | ||||||
SUPERVALU, Inc.* | 52,600 | 510,220 | ||||||
Sysco Corp. | 152,250 | 6,042,803 | ||||||
United Natural Foods, Inc.* | 13,800 | 1,067,085 | ||||||
Walgreens Boots Alliance, Inc. | 239,580 | 18,255,996 | ||||||
Wal-Mart Stores, Inc. | 402,120 | 34,534,066 | ||||||
Whole Foods Market, Inc. | 93,300 | 4,704,186 | ||||||
|
| |||||||
| 123,900,972 | ||||||||
|
| |||||||
Food Products (1.6%) | ||||||||
Archer-Daniels-Midland Co. | 166,060 | 8,635,120 | ||||||
Bunge Ltd. | 40,580 | 3,689,128 | ||||||
Campbell Soup Co. | 49,800 | 2,191,200 | ||||||
ConAgra Foods, Inc. | 112,750 | 4,090,570 | ||||||
Darling Ingredients, Inc.* | 43,000 | 780,880 | ||||||
Flowers Foods, Inc. | 47,400 | 909,606 | ||||||
General Mills, Inc. | 160,100 | 8,538,133 | ||||||
Hain Celestial Group, Inc.* | 25,800 | 1,503,882 | ||||||
Hershey Co. | 40,550 | 4,214,361 | ||||||
Hormel Foods Corp. | 40,000 | 2,084,000 | ||||||
Ingredion, Inc. | 23,600 | 2,002,224 | ||||||
J.M. Smucker Co. | 25,827 | 2,608,010 | ||||||
Kellogg Co. | 66,400 | 4,345,216 | ||||||
Keurig Green Mountain, Inc. | 36,866 | 4,880,874 | ||||||
Kraft Foods Group, Inc. | 155,036 | 9,714,556 | ||||||
McCormick & Co., Inc. (Non-Voting) | 35,050 | 2,604,215 | ||||||
Mead Johnson Nutrition Co. | 51,300 | 5,157,702 | ||||||
Mondelez International, Inc., Class A | 431,910 | 15,689,131 | ||||||
Pilgrim’s Pride Corp.* | 17,800 | 583,662 | ||||||
Pinnacle Foods, Inc. | 14,000 | 494,200 | ||||||
Post Holdings, Inc.* | 11,000 | 460,790 | ||||||
Sanderson Farms, Inc. | 4,600 | 386,515 | ||||||
TreeHouse Foods, Inc.* | 10,000 | 855,300 | ||||||
Tyson Foods, Inc., Class A | 79,200 | 3,175,128 | ||||||
WhiteWave Foods Co.* | 39,703 | 1,389,208 | ||||||
|
| |||||||
| 90,983,611 | ||||||||
|
| |||||||
Household Products (1.7%) | ||||||||
Church & Dwight Co., Inc. | 34,300 | 2,703,183 | ||||||
Clorox Co. | 33,450 | 3,485,825 | ||||||
Colgate-Palmolive Co. | 231,020 | 15,984,274 | ||||||
Energizer Holdings, Inc. | 16,450 | 2,114,812 | ||||||
Harbinger Group, Inc.* | 8,500 | 120,360 | ||||||
Kimberly-Clark Corp. | 98,200 | 11,346,028 | ||||||
Procter & Gamble Co. | 683,080 | 62,221,757 | ||||||
Spectrum Brands Holdings, Inc. | 3,500 | 334,880 | ||||||
|
| |||||||
| 98,311,119 | ||||||||
|
| |||||||
Personal Products (0.1%) | ||||||||
Avon Products, Inc. | 123,850 | 1,162,951 | ||||||
Estee Lauder Cos., Inc., Class A | 61,600 | 4,693,920 | ||||||
See Notes to Financial Statements.
9
Table of Contents
EQ ADVISORS TRUST
EQ/COMMON STOCK INDEX PORTFOLIO
PORTFOLIO OF INVESTMENTS (Continued)
December 31, 2014
| Number of Shares | Value (Note 1) | |||||||
Herbalife Ltd. | 24,100 | $ | 908,570 | |||||
Nu Skin Enterprises, Inc., Class A | 15,500 | 677,350 | ||||||
|
| |||||||
| 7,442,791 | ||||||||
|
| |||||||
Tobacco (1.2%) | ||||||||
Altria Group, Inc. | 498,390 | 24,555,675 | ||||||
Lorillard, Inc. | 92,550 | 5,825,097 | ||||||
Philip Morris International, Inc. | 397,030 | 32,338,094 | ||||||
Reynolds American, Inc. | 79,500 | 5,109,465 | ||||||
|
| |||||||
| 67,828,331 | ||||||||
|
| |||||||
Total Consumer Staples | 489,164,817 | |||||||
|
| |||||||
Energy (7.5%) | ||||||||
Energy Equipment & Services (1.3%) |
| |||||||
Atwood Oceanics, Inc.* | 17,200 | 487,964 | ||||||
Baker Hughes, Inc. | 112,284 | 6,295,764 | ||||||
Bristow Group, Inc. | 11,000 | 723,690 | ||||||
Cameron International Corp.* | 52,750 | 2,634,862 | ||||||
Diamond Offshore Drilling, Inc. | 23,210 | 852,039 | ||||||
Dresser-Rand Group, Inc.* | 19,700 | 1,611,460 | ||||||
Dril-Quip, Inc.* | 12,800 | 982,144 | ||||||
Era Group, Inc.* | 3,200 | 67,680 | ||||||
Exterran Holdings, Inc. | 19,800 | 645,084 | ||||||
FMC Technologies, Inc.* | 62,800 | 2,941,552 | ||||||
Forum Energy Technologies, Inc.* | 4,200 | 87,066 | ||||||
Frank’s International N.V. | 15,300 | 254,439 | ||||||
Halliburton Co. | 220,030 | 8,653,780 | ||||||
Helix Energy Solutions Group, Inc.* | 36,700 | 796,390 | ||||||
Helmerich & Payne, Inc. | 28,600 | 1,928,212 | ||||||
McDermott International, Inc.* | 84,700 | 246,477 | ||||||
Nabors Industries Ltd. | 78,990 | 1,025,290 | ||||||
National Oilwell Varco, Inc. | 114,080 | 7,475,662 | ||||||
North Atlantic Drilling Ltd. | 37,300 | 60,799 | ||||||
Oceaneering International, Inc. | 33,600 | 1,976,016 | ||||||
Oil States International, Inc.* | 18,900 | 924,210 | ||||||
Patterson-UTI Energy, Inc. | 45,900 | 761,481 | ||||||
Rowan Cos., plc, Class A | 43,300 | 1,009,756 | ||||||
Schlumberger Ltd. | 328,255 | 28,036,260 | ||||||
SEACOR Holdings, Inc.* | 3,100 | 228,811 | ||||||
Seadrill Ltd. | 100,300 | 1,197,582 | ||||||
Superior Energy Services, Inc. | 42,271 | 851,761 | ||||||
Tidewater, Inc. | 6,100 | 197,701 | ||||||
Unit Corp.* | 6,900 | 235,290 | ||||||
|
| |||||||
| 73,189,222 | ||||||||
|
| |||||||
Oil, Gas & Consumable Fuels (6.2%) |
| |||||||
Anadarko Petroleum Corp. | 128,180 | 10,574,850 | ||||||
Antero Resources Corp.* | 13,800 | 560,004 | ||||||
Apache Corp. | 100,480 | 6,297,082 | ||||||
Cabot Oil & Gas Corp. | 108,700 | 3,218,607 | ||||||
California Resources Corp.* | 79,744 | 439,389 | ||||||
Cheniere Energy, Inc.* | 61,700 | 4,343,680 | ||||||
Chesapeake Energy Corp. | 137,210 | 2,685,200 | ||||||
Chevron Corp. | 480,500 | 53,902,490 | ||||||
Cimarex Energy Co. | 24,260 | 2,571,560 | ||||||
Cobalt International Energy, Inc.* | 91,500 | 813,435 | ||||||
Concho Resources, Inc.* | 29,200 | 2,912,700 | ||||||
ConocoPhillips Co. | 311,476 | $ | 21,510,533 | |||||
CONSOL Energy, Inc. | 68,950 | 2,331,199 | ||||||
Continental Resources, Inc.* | 23,200 | 889,952 | ||||||
CVR Energy, Inc. | 4,900 | 189,679 | ||||||
Delek U.S. Holdings, Inc. | 9,400 | 256,432 | ||||||
Denbury Resources, Inc. | 91,659 | 745,188 | ||||||
Devon Energy Corp. | 104,730 | 6,410,523 | ||||||
Diamondback Energy, Inc.* | 9,900 | 591,822 | ||||||
Energen Corp. | 20,400 | 1,300,704 | ||||||
EOG Resources, Inc. | 141,300 | 13,009,491 | ||||||
EP Energy Corp., Class A* | 15,200 | 158,688 | ||||||
EQT Corp. | 42,700 | 3,232,390 | ||||||
Exxon Mobil Corp.# | 1,078,065 | 99,667,109 | ||||||
GasLog Ltd. | 300 | 6,105 | ||||||
Gulfport Energy Corp.* | 22,300 | 930,802 | ||||||
Hess Corp. | 72,120 | 5,323,898 | ||||||
HollyFrontier Corp. | 53,732 | 2,013,875 | ||||||
Kinder Morgan, Inc. | 343,971 | 14,553,413 | ||||||
Marathon Oil Corp. | 175,390 | 4,961,783 | ||||||
Marathon Petroleum Corp. | 65,495 | 5,911,579 | ||||||
Matador Resources Co.* | 8,300 | 167,909 | ||||||
Murphy Oil Corp. | 50,920 | 2,572,478 | ||||||
Newfield Exploration Co.* | 35,850 | 972,252 | ||||||
Noble Energy, Inc. | 94,960 | 4,503,953 | ||||||
Oasis Petroleum, Inc.* | 24,900 | 411,846 | ||||||
Occidental Petroleum Corp. | 199,360 | 16,070,410 | ||||||
ONEOK, Inc. | 56,500 | 2,813,135 | ||||||
Peabody Energy Corp. | 78,700 | 609,138 | ||||||
Phillips 66 | 147,388 | 10,567,720 | ||||||
Pioneer Natural Resources Co. | 37,250 | 5,544,662 | ||||||
QEP Resources, Inc. | 53,400 | 1,079,748 | ||||||
Range Resources Corp. | 44,350 | 2,370,507 | ||||||
Rosetta Resources, Inc.* | 19,900 | 443,969 | ||||||
RSP Permian, Inc.* | 8,400 | 211,176 | ||||||
SandRidge Energy, Inc.* | 141,444 | 257,428 | ||||||
Scorpio Tankers, Inc. | 24,200 | 210,298 | ||||||
SemGroup Corp., Class A | 9,800 | 670,222 | ||||||
SM Energy Co. | 20,900 | 806,322 | ||||||
Southwestern Energy Co.* | 95,550 | 2,607,560 | ||||||
Spectra Energy Corp. | 174,700 | 6,341,610 | ||||||
Targa Resources Corp. | 9,000 | 954,450 | ||||||
Teekay Corp. | 10,600 | 539,434 | ||||||
Tesoro Corp. | 33,710 | 2,506,339 | ||||||
Ultra Petroleum Corp.* | 40,500 | 532,980 | ||||||
Valero Energy Corp. | 139,030 | 6,881,985 | ||||||
Western Refining, Inc. | 17,900 | 676,262 | ||||||
Whiting Petroleum Corp.* | 46,995 | 1,550,845 | ||||||
Williams Cos., Inc. | 193,800 | 8,709,372 | ||||||
World Fuel Services Corp. | 27,400 | 1,285,882 | ||||||
WPX Energy, Inc.* | 64,033 | 744,704 | ||||||
|
| |||||||
| 355,928,758 | ||||||||
|
| |||||||
Total Energy | 429,117,980 | |||||||
|
| |||||||
Financials (17.8%) | ||||||||
Banks (5.7%) | ||||||||
Associated Banc-Corp | 40,500 | 754,515 | ||||||
BancorpSouth, Inc. | 31,550 | 710,190 | ||||||
Bank of America Corp. | 2,639,792 | 47,225,879 | ||||||
Bank of Hawaii Corp. | 12,700 | 753,237 | ||||||
Bank of the Ozarks, Inc. | 17,400 | 659,808 | ||||||
BankUnited, Inc. | 26,500 | 767,705 | ||||||
See Notes to Financial Statements.
10
Table of Contents
EQ ADVISORS TRUST
EQ/COMMON STOCK INDEX PORTFOLIO
PORTFOLIO OF INVESTMENTS (Continued)
December 31, 2014
| Number of Shares | Value (Note 1) | |||||||
BB&T Corp. | 187,250 | $ | 7,282,152 | |||||
BOK Financial Corp. | 7,850 | 471,314 | ||||||
Cathay General Bancorp | 21,630 | 553,512 | ||||||
CIT Group, Inc. | 56,100 | 2,683,263 | ||||||
Citigroup, Inc. | 770,672 | 41,701,062 | ||||||
City Holding Co. | 10,030 | 466,696 | ||||||
City National Corp./California | 17,200 | 1,389,932 | ||||||
Comerica, Inc. | 53,000 | 2,482,520 | ||||||
Commerce Bancshares, Inc./Missouri | 22,933 | 997,358 | ||||||
Community Bank System, Inc. | 12,000 | 457,560 | ||||||
Cullen/Frost Bankers, Inc. | 17,300 | 1,222,072 | ||||||
CVB Financial Corp. | 30,200 | 483,804 | ||||||
East West Bancorp, Inc. | 39,500 | 1,529,045 | ||||||
F.N.B. Corp./Pennsylvania | 48,700 | 648,684 | ||||||
Fifth Third Bancorp | 221,550 | 4,514,081 | ||||||
First Busey Corp. | 15,800 | 102,858 | ||||||
First Citizens BancShares, Inc./North Carolina, Class A | 2,200 | 556,138 | ||||||
First Commonwealth Financial Corp. | 17,700 | 163,194 | ||||||
First Financial Bankshares, Inc. | 18,800 | 561,744 | ||||||
First Financial Corp./Indiana | 10,000 | 356,200 | ||||||
First Horizon National Corp. | 68,162 | 925,640 | ||||||
First Midwest Bancorp, Inc./Illinois | 13,900 | 237,829 | ||||||
First Niagara Financial Group, Inc. | 122,945 | 1,036,426 | ||||||
First Republic Bank/California | 31,800 | 1,657,416 | ||||||
FirstMerit Corp. | 47,495 | 897,181 | ||||||
Fulton Financial Corp. | 75,000 | 927,000 | ||||||
Glacier Bancorp, Inc. | 24,600 | 683,142 | ||||||
Hancock Holding Co. | 24,124 | 740,607 | ||||||
Hilltop Holdings, Inc.* | 25,700 | 512,715 | ||||||
Home BancShares, Inc./Arkansas | 12,400 | 398,784 | ||||||
Huntington Bancshares, Inc./Ohio | 223,800 | 2,354,376 | ||||||
Iberiabank Corp. | 8,400 | 544,740 | ||||||
International Bancshares Corp. | 19,700 | 522,838 | ||||||
Investors Bancorp, Inc. | 92,965 | 1,043,532 | ||||||
JPMorgan Chase & Co. | 955,325 | 59,784,238 | ||||||
KeyCorp | 224,100 | 3,114,990 | ||||||
M&T Bank Corp. | 34,457 | 4,328,488 | ||||||
MB Financial, Inc. | 13,100 | 430,466 | ||||||
National Penn Bancshares, Inc. | 37,700 | 396,792 | ||||||
NBT Bancorp, Inc. | 16,500 | 433,455 | ||||||
Old National Bancorp/Indiana | 28,300 | 421,104 | ||||||
PacWest Bancorp | 26,596 | 1,209,054 | ||||||
Pinnacle Financial Partners, Inc. | 12,800 | 506,112 | ||||||
PNC Financial Services Group, Inc. | 135,518 | 12,363,307 | ||||||
Popular, Inc.* | 38,050 | 1,295,603 | ||||||
PrivateBancorp, Inc. | 18,000 | 601,200 | ||||||
Prosperity Bancshares, Inc. | 15,900 | 880,224 | ||||||
Regions Financial Corp. | 355,100 | 3,749,856 | ||||||
S&T Bancorp, Inc. | 12,500 | 372,625 | ||||||
Signature Bank/New York* | 14,900 | 1,876,804 | ||||||
SunTrust Banks, Inc./Georgia | 133,750 | 5,604,125 | ||||||
Susquehanna Bancshares, Inc. | 58,700 | 788,341 | ||||||
SVB Financial Group* | 13,400 | 1,555,338 | ||||||
Synovus Financial Corp. | 42,300 | 1,145,907 | ||||||
TCF Financial Corp. | 56,950 | $ | 904,936 | |||||
Texas Capital Bancshares, Inc.* | 12,000 | 651,960 | ||||||
Tompkins Financial Corp. | 9,239 | 510,917 | ||||||
Towne Bank/Virginia | 17,479 | 264,282 | ||||||
Trustmark Corp. | 15,050 | 369,327 | ||||||
U.S. Bancorp/Minnesota | 435,790 | 19,588,761 | ||||||
UMB Financial Corp. | 10,600 | 603,034 | ||||||
Umpqua Holdings Corp. | 44,690 | 760,177 | ||||||
United Bankshares, Inc./West Virginia | 14,100 | 528,045 | ||||||
Valley National Bancorp | 71,829 | 697,460 | ||||||
Webster Financial Corp. | 25,700 | 836,021 | ||||||
Wells Fargo & Co. | 1,205,519 | 66,086,552 | ||||||
WesBanco, Inc. | 15,000 | 522,000 | ||||||
Western Alliance Bancorp* | 14,200 | 394,760 | ||||||
Wintrust Financial Corp. | 11,500 | 537,740 | ||||||
Zions Bancorp | 49,600 | 1,414,096 | ||||||
|
| |||||||
| 327,504,846 | ||||||||
|
| |||||||
Capital Markets (2.3%) | ||||||||
Affiliated Managers Group, Inc.* | 15,940 | 3,383,106 | ||||||
Ameriprise Financial, Inc. | 50,460 | 6,673,335 | ||||||
Bank of New York Mellon Corp. | 297,050 | 12,051,318 | ||||||
BlackRock, Inc. | 33,210 | 11,874,568 | ||||||
Charles Schwab Corp. | 283,734 | 8,565,929 | ||||||
Cohen & Steers, Inc. | 11,400 | 479,712 | ||||||
E*TRADE Financial Corp.* | 83,210 | 2,018,259 | ||||||
Eaton Vance Corp. | 34,740 | 1,421,908 | ||||||
Evercore Partners, Inc., Class A | 10,600 | 555,122 | ||||||
Federated Investors, Inc., Class B | 36,800 | 1,211,824 | ||||||
Financial Engines, Inc. | 13,900 | 508,045 | ||||||
Franklin Resources, Inc. | 103,390 | 5,724,704 | ||||||
GAMCO Investors, Inc., Class A | 6,700 | 595,898 | ||||||
Goldman Sachs Group, Inc. | 113,500 | 21,999,705 | ||||||
Greenhill & Co., Inc. | 7,500 | 327,000 | ||||||
Interactive Brokers Group, Inc., Class A | 17,040 | 496,886 | ||||||
Invesco Ltd. | 112,700 | 4,453,904 | ||||||
Janus Capital Group, Inc. | 31,300 | 504,869 | ||||||
Lazard Ltd., Class A | 34,700 | 1,736,041 | ||||||
Legg Mason, Inc. | 30,750 | 1,641,128 | ||||||
LPL Financial Holdings, Inc. | 22,800 | 1,015,740 | ||||||
Morgan Stanley | 389,173 | 15,099,912 | ||||||
Northern Trust Corp. | 65,350 | 4,404,590 | ||||||
NorthStar Asset Management Group, Inc. | 48,550 | 1,095,774 | ||||||
Piper Jaffray Cos.* | 7,900 | 458,911 | ||||||
Raymond James Financial, Inc. | 37,500 | 2,148,375 | ||||||
SEI Investments Co. | 42,150 | 1,687,686 | ||||||
State Street Corp. | 109,250 | 8,576,125 | ||||||
Stifel Financial Corp.* | 15,339 | 782,596 | ||||||
T. Rowe Price Group, Inc. | 66,280 | 5,690,801 | ||||||
TD Ameritrade Holding Corp. | 67,936 | 2,430,750 | ||||||
Virtus Investment Partners, Inc. | 491 | 83,711 | ||||||
Waddell & Reed Financial, Inc., Class A | 23,920 | 1,191,694 | ||||||
WisdomTree Investments, Inc. | 27,400 | 429,495 | ||||||
|
| |||||||
| 131,319,421 | ||||||||
|
| |||||||
See Notes to Financial Statements.
11
Table of Contents
EQ ADVISORS TRUST
EQ/COMMON STOCK INDEX PORTFOLIO
PORTFOLIO OF INVESTMENTS (Continued)
December 31, 2014
| Number of Shares | Value (Note 1) | |||||||
Consumer Finance (0.9%) |
| |||||||
Ally Financial, Inc.* | 70,400 | $ | 1,662,848 | |||||
American Express Co. | 230,156 | 21,413,714 | ||||||
Capital One Financial Corp. | 148,870 | 12,289,219 | ||||||
Credit Acceptance Corp.* | 2,800 | 381,948 | ||||||
Discover Financial Services | 121,470 | 7,955,070 | ||||||
Navient Corp. | 117,584 | 2,540,990 | ||||||
Nelnet, Inc., Class A | 2,300 | 106,559 | ||||||
PRA Group, Inc.* | 17,400 | 1,007,982 | ||||||
SLM Corp. | 117,584 | 1,198,181 | ||||||
Springleaf Holdings, Inc.* | 14,300 | 517,231 | ||||||
Synchrony Financial* | 32,800 | 975,800 | ||||||
|
| |||||||
| 50,049,542 | ||||||||
|
| |||||||
Diversified Financial Services (1.8%) |
| |||||||
Berkshire Hathaway, Inc., Class B* | 461,985 | 69,367,048 | ||||||
CBOE Holdings, Inc. | 27,200 | 1,725,024 | ||||||
CME Group, Inc./Illinois | 83,065 | 7,363,712 | ||||||
Intercontinental Exchange, Inc. | 29,178 | 6,398,444 | ||||||
Leucadia National Corp. | 91,388 | 2,048,919 | ||||||
MarketAxess Holdings, Inc. | 10,860 | 778,771 | ||||||
McGraw Hill Financial, Inc. | 69,030 | 6,142,289 | ||||||
Moody’s Corp. | 49,250 | 4,718,642 | ||||||
MSCI, Inc. | 36,334 | 1,723,685 | ||||||
NASDAQ OMX Group, Inc. | 29,600 | 1,419,616 | ||||||
Voya Financial, Inc. | 37,300 | 1,580,774 | ||||||
|
| |||||||
| 103,266,924 | ||||||||
|
| |||||||
Insurance (3.1%) |
| |||||||
ACE Ltd. | 87,300 | 10,029,024 | ||||||
Aflac, Inc. | 116,950 | 7,144,475 | ||||||
Alleghany Corp.* | 4,754 | 2,203,479 | ||||||
Allied World Assurance Co. Holdings AG | 25,640 | 972,269 | ||||||
Allstate Corp. | 114,740 | 8,060,485 | ||||||
American Equity Investment Life Holding Co. | 17,400 | 507,906 | ||||||
American Financial Group, Inc./Ohio | 23,830 | 1,446,958 | ||||||
American International Group, Inc. | 367,036 | 20,557,686 | ||||||
American National Insurance Co. | 4,400 | 502,744 | ||||||
AmTrust Financial Services, Inc. | 1,336 | 75,150 | ||||||
Aon plc | 77,278 | 7,328,273 | ||||||
Arch Capital Group Ltd.* | 35,700 | 2,109,870 | ||||||
Arthur J. Gallagher & Co. | 39,500 | 1,859,660 | ||||||
Aspen Insurance Holdings Ltd. | 18,170 | 795,301 | ||||||
Assurant, Inc. | 24,600 | 1,683,378 | ||||||
Assured Guaranty Ltd. | 49,500 | 1,286,505 | ||||||
Axis Capital Holdings Ltd. | 34,070 | 1,740,636 | ||||||
Brown & Brown, Inc. | 35,300 | 1,161,723 | ||||||
Chubb Corp. | 64,960 | 6,721,411 | ||||||
Cincinnati Financial Corp. | 48,520 | 2,514,792 | ||||||
CNA Financial Corp. | 10,500 | 406,455 | ||||||
CNO Financial Group, Inc. | 59,300 | 1,021,146 | ||||||
Endurance Specialty Holdings Ltd. | 11,700 | 700,128 | ||||||
Enstar Group Ltd.* | 800 | 122,312 | ||||||
Erie Indemnity Co., Class A | 10,800 | 980,316 | ||||||
Everest Reinsurance Group Ltd. | 12,500 | 2,128,750 | ||||||
First American Financial Corp. | 39,300 | $ | 1,332,270 | |||||
FNF Group | 78,189 | 2,693,611 | ||||||
FNFV Group* | 26,060 | 410,184 | ||||||
Genworth Financial, Inc., Class A* | 142,000 | 1,207,000 | ||||||
Hanover Insurance Group, Inc. | 10,690 | 762,411 | ||||||
Hartford Financial Services Group, Inc. | 121,210 | 5,053,245 | ||||||
HCC Insurance Holdings, Inc. | 27,780 | 1,486,786 | ||||||
Kemper Corp. | 14,900 | 538,039 | ||||||
Lincoln National Corp. | 68,750 | 3,964,813 | ||||||
Loews Corp. | 87,192 | 3,663,808 | ||||||
Markel Corp.* | 4,060 | 2,772,330 | ||||||
Marsh & McLennan Cos., Inc. | 143,150 | 8,193,906 | ||||||
Mercury General Corp. | 6,500 | 368,355 | ||||||
MetLife, Inc. | 234,860 | 12,703,577 | ||||||
Old Republic International Corp. | 71,894 | 1,051,809 | ||||||
OneBeacon Insurance Group Ltd., Class A | 21,600 | 349,920 | ||||||
PartnerReinsurance Ltd. | 13,560 | 1,547,603 | ||||||
Phoenix Cos., Inc.* | 2,840 | 195,591 | ||||||
Platinum Underwriters Holdings Ltd. | 7,300 | 535,966 | ||||||
Primerica, Inc. | 14,700 | 797,622 | ||||||
Principal Financial Group, Inc. | 76,600 | 3,978,604 | ||||||
ProAssurance Corp. | 19,000 | 857,850 | ||||||
Progressive Corp. | 151,200 | 4,080,888 | ||||||
Protective Life Corp. | 20,500 | 1,427,825 | ||||||
Prudential Financial, Inc. | 119,831 | 10,839,912 | ||||||
Reinsurance Group of America, Inc. | 19,910 | 1,744,514 | ||||||
RenaissanceReinsurance Holdings Ltd. | 11,000 | 1,069,420 | ||||||
RLI Corp. | 16,280 | 804,232 | ||||||
StanCorp Financial Group, Inc. | 12,780 | 892,811 | ||||||
Symetra Financial Corp. | 21,300 | 490,965 | ||||||
Torchmark Corp. | 40,905 | 2,215,824 | ||||||
Travelers Cos., Inc. | 90,170 | 9,544,495 | ||||||
Unum Group | 72,500 | 2,528,800 | ||||||
Validus Holdings Ltd. | 24,958 | 1,037,254 | ||||||
W. R. Berkley Corp. | 27,100 | 1,389,146 | ||||||
White Mountains Insurance Group Ltd. | 1,700 | 1,071,187 | ||||||
XL Group plc | 73,270 | 2,518,290 | ||||||
|
| |||||||
| 180,181,695 | ||||||||
|
| |||||||
Real Estate Investment Trusts (REITs) (3.6%) |
| |||||||
Acadia Realty Trust (REIT) | 9,800 | 313,894 | ||||||
Alexander’s, Inc. (REIT) | 1,600 | 699,488 | ||||||
Alexandria Real Estate Equities, Inc. (REIT) | 18,480 | 1,639,915 | ||||||
Altisource Residential Corp. (REIT) | 10,700 | 207,580 | ||||||
American Campus Communities, Inc. (REIT) | 28,300 | 1,170,488 | ||||||
American Capital Agency Corp. (REIT) | 95,100 | 2,076,033 | ||||||
American Homes 4 Rent (REIT), Class A | 30,400 | 517,712 | ||||||
American Realty Capital Healthcare Trust, Inc. (REIT) | 44,100 | 524,790 | ||||||
See Notes to Financial Statements.
12
Table of Contents
EQ ADVISORS TRUST
EQ/COMMON STOCK INDEX PORTFOLIO
PORTFOLIO OF INVESTMENTS (Continued)
December 31, 2014
| Number of Shares | Value (Note 1) | |||||||
American Realty Capital Properties, Inc. (REIT) | 236,500 | $ | 2,140,325 | |||||
American Tower Corp. (REIT) | 99,900 | 9,875,115 | ||||||
Annaly Capital Management, Inc. (REIT) | 250,458 | 2,707,451 | ||||||
Apartment Investment & Management Co. (REIT), Class A | 43,188 | 1,604,434 | ||||||
ARMOUR Residential REIT, Inc. (REIT) | 104,400 | 384,192 | ||||||
AvalonBay Communities, Inc. (REIT) | 33,649 | 5,497,910 | ||||||
BioMed Realty Trust, Inc. (REIT) | 49,800 | 1,072,692 | ||||||
Boston Properties, Inc. (REIT) | 41,070 | 5,285,298 | ||||||
Brandywine Realty Trust (REIT) | 51,000 | 814,980 | ||||||
Camden Property Trust (REIT) | 24,880 | 1,837,139 | ||||||
CBL & Associates Properties, Inc. (REIT) | 47,891 | 930,043 | ||||||
Chambers Street Properties (REIT) | 70,700 | 569,842 | ||||||
Chesapeake Lodging Trust (REIT) | 13,900 | 517,219 | ||||||
Chimera Investment Corp. (REIT) | 360,700 | 1,147,026 | ||||||
Colony Financial, Inc. (REIT) | 19,100 | 454,962 | ||||||
Columbia Property Trust, Inc. (REIT) | 32,600 | 826,410 | ||||||
Corporate Office Properties Trust/Maryland (REIT) | 24,809 | 703,831 | ||||||
Corrections Corp. of America (REIT) | 34,743 | 1,262,561 | ||||||
Cousins Properties, Inc. (REIT) | 51,713 | 590,562 | ||||||
Crown Castle International Corp. (REIT) | 86,250 | 6,787,875 | ||||||
CubeSmart (REIT) | 39,700 | 876,179 | ||||||
DCT Industrial Trust, Inc. (REIT) | 22,850 | 814,831 | ||||||
DDR Corp. (REIT) | 84,708 | 1,555,239 | ||||||
DiamondRock Hospitality Co. (REIT) | 58,300 | 866,921 | ||||||
Digital Realty Trust, Inc. (REIT) | 37,589 | 2,492,151 | ||||||
Douglas Emmett, Inc. (REIT) | 37,000 | 1,050,800 | ||||||
Duke Realty Corp. (REIT) | 84,800 | 1,712,960 | ||||||
DuPont Fabros Technology, Inc. (REIT) | 11,800 | 392,232 | ||||||
EastGroup Properties, Inc. (REIT) | 12,100 | 766,172 | ||||||
EPR Properties (REIT) | 14,840 | 855,229 | ||||||
Equity Commonwealth (REIT) | 33,000 | 847,110 | ||||||
Equity LifeStyle Properties, Inc. (REIT) | 21,800 | 1,123,790 | ||||||
Equity One, Inc. (REIT) | 1,500 | 38,040 | ||||||
Equity Residential (REIT) | 94,087 | 6,759,210 | ||||||
Essex Property Trust, Inc. (REIT) | 15,977 | 3,300,848 | ||||||
Extra Space Storage, Inc. (REIT) | 33,000 | 1,935,120 | ||||||
Federal Realty Investment Trust (REIT) | 17,380 | 2,319,535 | ||||||
First Industrial Realty Trust, Inc. (REIT) | 29,500 | $ | 606,520 | |||||
Franklin Street Properties Corp. (REIT) | 600 | 7,362 | ||||||
Gaming and Leisure Properties, Inc. (REIT) | 30,730 | 901,618 | ||||||
General Growth Properties, Inc. (REIT) | 144,807 | 4,073,421 | ||||||
Geo Group, Inc. (REIT) | 24,883 | 1,004,278 | ||||||
Glimcher Realty Trust (REIT) | 44,100 | 605,934 | ||||||
Government Properties Income Trust (REIT) | 16,900 | 388,869 | ||||||
Hatteras Financial Corp. (REIT) | 17,200 | 316,996 | ||||||
HCP, Inc. (REIT) | 114,997 | 5,063,318 | ||||||
Health Care REIT, Inc. (REIT) | 83,317 | 6,304,597 | ||||||
Healthcare Realty Trust, Inc. (REIT) | 23,600 | 644,752 | ||||||
Healthcare Trust of America, Inc. (REIT), Class A | 30,900 | 832,446 | ||||||
Hersha Hospitality Trust (REIT) | 44,800 | 314,944 | ||||||
Highwoods Properties, Inc. (REIT) | 29,530 | 1,307,588 | ||||||
Home Properties, Inc. (REIT) | 13,610 | 892,816 | ||||||
Hospitality Properties Trust (REIT) | 43,400 | 1,345,400 | ||||||
Host Hotels & Resorts, Inc. (REIT) | 199,613 | 4,744,801 | ||||||
Inland Real Estate Corp. (REIT) | 39,600 | 433,620 | ||||||
Invesco Mortgage Capital, Inc. (REIT) | 38,200 | 590,572 | ||||||
Investors Real Estate Trust (REIT) | 21,400 | 174,838 | ||||||
Iron Mountain, Inc. (REIT) | 56,801 | 2,195,927 | ||||||
Kilroy Realty Corp. (REIT) | 21,800 | 1,505,726 | ||||||
Kimco Realty Corp. (REIT) | 118,722 | 2,984,671 | ||||||
Lamar Advertising Co. (REIT), Class A | 21,400 | 1,147,896 | ||||||
LaSalle Hotel Properties (REIT) | 26,100 | 1,056,267 | ||||||
Lexington Realty Trust (REIT) | 45,500 | 499,590 | ||||||
Liberty Property Trust (REIT) | 38,452 | 1,446,949 | ||||||
LTC Properties, Inc. (REIT) | 7,600 | 328,092 | ||||||
Macerich Co. (REIT) | 35,484 | 2,959,720 | ||||||
Mack-Cali Realty Corp. (REIT) | 25,239 | 481,055 | ||||||
Medical Properties Trust, Inc. (REIT) | 42,800 | 589,784 | ||||||
MFA Financial, Inc. (REIT) | 120,050 | 959,200 | ||||||
Mid-America Apartment Communities, Inc. (REIT) | 19,716 | 1,472,391 | ||||||
National Health Investors, Inc. (REIT) | 7,000 | 489,720 | ||||||
National Retail Properties, Inc. (REIT) | 38,290 | 1,507,477 | ||||||
New Residential Investment Corp. (REIT) | 26,550 | 339,044 | ||||||
New York REIT, Inc. (REIT) | 45,900 | 486,081 | ||||||
NorthStar Realty Finance Corp. (REIT) | 48,550 | 853,509 | ||||||
See Notes to Financial Statements.
13
Table of Contents
EQ ADVISORS TRUST
EQ/COMMON STOCK INDEX PORTFOLIO
PORTFOLIO OF INVESTMENTS (Continued)
December 31, 2014
| Number of Shares | Value (Note 1) | |||||||
Omega Healthcare Investors, Inc. (REIT) | 35,140 | $ | 1,372,920 | |||||
Outfront Media, Inc. (REIT) | 31,000 | 832,040 | ||||||
Pebblebrook Hotel Trust (REIT) | 16,400 | 748,332 | ||||||
PennyMac Mortgage Investment Trust (REIT) | 18,000 | 379,620 | ||||||
Piedmont Office Realty Trust, Inc. (REIT), Class A | 58,600 | 1,104,024 | ||||||
Plum Creek Timber Co., Inc. (REIT) | 51,914 | 2,221,400 | ||||||
Post Properties, Inc. (REIT) | 18,200 | 1,069,614 | ||||||
Potlatch Corp. (REIT) | 10,100 | 422,887 | ||||||
Prologis, Inc. (REIT) | 126,164 | 5,428,837 | ||||||
PS Business Parks, Inc. (REIT) | 5,200 | 413,608 | ||||||
Public Storage (REIT) | 36,402 | 6,728,910 | ||||||
Rayonier, Inc. (REIT) | 40,425 | 1,129,475 | ||||||
Realty Income Corp. (REIT) | 60,028 | 2,863,936 | ||||||
Redwood Trust, Inc. (REIT) | 21,900 | 431,430 | ||||||
Regency Centers Corp. (REIT) | 23,586 | 1,504,315 | ||||||
Retail Properties of America, Inc. (REIT), Class A | 61,600 | 1,028,104 | ||||||
RLJ Lodging Trust (REIT) | 33,200 | 1,113,196 | ||||||
Ryman Hospitality Properties, Inc. (REIT) | 10,751 | 567,008 | ||||||
Senior Housing Properties Trust (REIT) | 54,290 | 1,200,352 | ||||||
Silver Bay Realty Trust Corp. (REIT) | 1,008 | 16,692 | ||||||
Simon Property Group, Inc. (REIT) | 79,959 | 14,561,334 | ||||||
SL Green Realty Corp. (REIT) | 24,000 | 2,856,480 | ||||||
Sovran Self Storage, Inc. (REIT) | 6,900 | 601,818 | ||||||
Spirit Realty Capital, Inc. (REIT) | 104,667 | 1,244,491 | ||||||
Strategic Hotels & Resorts, Inc. (REIT)* | 53,000 | 701,190 | ||||||
Sun Communities, Inc. (REIT) | 12,300 | 743,658 | ||||||
Sunstone Hotel Investors, Inc. (REIT) | 53,300 | 879,983 | ||||||
Tanger Factory Outlet Centers, Inc. (REIT) | 29,500 | 1,090,320 | ||||||
Taubman Centers, Inc. (REIT) | 20,600 | 1,574,252 | ||||||
Two Harbors Investment Corp. (REIT) | 86,200 | 863,724 | ||||||
UDR, Inc. (REIT) | 77,036 | 2,374,250 | ||||||
Ventas, Inc. (REIT) | 77,535 | 5,559,260 | ||||||
Vornado Realty Trust (REIT) | 47,847 | 5,632,070 | ||||||
Washington Prime Group, Inc. (REIT) | 41,379 | 712,546 | ||||||
Washington Real Estate Investment Trust (REIT) | 16,270 | 450,028 | ||||||
Weingarten Realty Investors (REIT) | 36,986 | 1,291,551 | ||||||
Weyerhaeuser Co. (REIT) | 136,533 | 4,900,169 | ||||||
WP Carey, Inc. (REIT) | 25,900 | 1,815,590 | ||||||
|
| |||||||
| 210,153,337 | ||||||||
|
| |||||||
Real Estate Management & Development (0.2%) |
| |||||||
Alexander & Baldwin, Inc. | 15,180 | 595,967 | ||||||
Altisource Portfolio Solutions S.A.* | 900 | 30,411 | ||||||
CBRE Group, Inc., Class A* | 79,250 | $ | 2,714,312 | |||||
Forest City Enterprises, Inc., Class A* | 50,700 | 1,079,910 | ||||||
Howard Hughes Corp.* | 11,200 | 1,460,704 | ||||||
Jones Lang LaSalle, Inc. | 12,100 | 1,814,153 | ||||||
Kennedy-Wilson Holdings, Inc. | 17,400 | 440,220 | ||||||
Realogy Holdings Corp.* | 34,100 | 1,517,109 | ||||||
|
| |||||||
| 9,652,786 | ||||||||
|
| |||||||
Thrifts & Mortgage Finance (0.2%) |
| |||||||
Astoria Financial Corp. | 25,900 | 346,024 | ||||||
Bank Mutual Corp. | 33,400 | 229,124 | ||||||
Beneficial Mutual Bancorp, Inc.* | 34,200 | 419,634 | ||||||
Brookline Bancorp, Inc. | 34,700 | 348,041 | ||||||
Capitol Federal Financial, Inc. | 40,986 | 523,801 | ||||||
Dime Community Bancshares, Inc. | 25,700 | 418,396 | ||||||
Essent Group Ltd.* | 18,300 | 470,493 | ||||||
EverBank Financial Corp. | 18,800 | 358,328 | ||||||
Flagstar Bancorp, Inc.* | 100 | 1,573 | ||||||
Home Loan Servicing Solutions Ltd. | 7,600 | 148,352 | ||||||
Hudson City Bancorp, Inc. | 178,590 | 1,807,331 | ||||||
Kearny Financial Corp.* | 36,100 | 496,375 | ||||||
Ladder Capital Corp. (REIT), Class A* | 25,500 | 500,055 | ||||||
MGIC Investment Corp.* | 75,800 | 706,456 | ||||||
New York Community Bancorp, Inc. | 134,950 | 2,159,200 | ||||||
Northwest Bancshares, Inc. | 25,100 | 314,503 | ||||||
Ocwen Financial Corp.* | 32,700 | 493,770 | ||||||
People’s United Financial, Inc. | 101,400 | 1,539,252 | ||||||
Radian Group, Inc. | 50,400 | 842,688 | ||||||
TFS Financial Corp. | 36,000 | 535,860 | ||||||
TrustCo Bank Corp. | 25,600 | 185,856 | ||||||
Washington Federal, Inc. | 42,500 | 941,375 | ||||||
|
| |||||||
| 13,786,487 | ||||||||
|
| |||||||
Total Financials | 1,025,915,038 | |||||||
|
| |||||||
Health Care (13.9%) | ||||||||
Biotechnology (3.0%) | ||||||||
ACADIA Pharmaceuticals, Inc.* | 22,600 | 717,550 | ||||||
Achillion Pharmaceuticals, Inc.* | 16,100 | 197,225 | ||||||
Acorda Therapeutics, Inc.* | 8,500 | 347,395 | ||||||
Aegerion Pharmaceuticals, Inc.* | 8,100 | 169,614 | ||||||
Alexion Pharmaceuticals, Inc.* | 50,200 | 9,288,506 | ||||||
Alkermes plc* | 37,600 | 2,201,856 | ||||||
Alnylam Pharmaceuticals, Inc.* | 15,400 | 1,493,800 | ||||||
Amgen, Inc. | 192,039 | 30,589,892 | ||||||
Arena Pharmaceuticals, Inc.* | 66,800 | 231,796 | ||||||
ARIAD Pharmaceuticals, Inc.* | 49,900 | 342,813 | ||||||
Biogen Idec, Inc.* | 60,160 | 20,421,312 | ||||||
BioMarin Pharmaceutical, Inc.* | 39,500 | 3,570,800 | ||||||
Bluebird Bio, Inc.* | 5,500 | 504,460 | ||||||
Celgene Corp.* | 203,138 | 22,723,017 | ||||||
Celldex Therapeutics, Inc.* | 27,100 | 494,575 | ||||||
Cepheid, Inc.* | 14,400 | 779,616 | ||||||
Clovis Oncology, Inc.* | 6,700 | 375,200 | ||||||
Cubist Pharmaceuticals, Inc.* | 17,600 | 1,771,440 | ||||||
See Notes to Financial Statements.
14
Table of Contents
EQ ADVISORS TRUST
EQ/COMMON STOCK INDEX PORTFOLIO
PORTFOLIO OF INVESTMENTS (Continued)
December 31, 2014
| Number of Shares | Value (Note 1) | |||||||
Dyax Corp.* | 34,100 | $ | 479,446 | |||||
Exact Sciences Corp.* | 29,500 | 809,480 | ||||||
Exelixis, Inc.* | 46,100 | 66,384 | ||||||
Genomic Health, Inc.* | 9,100 | 290,927 | ||||||
Gilead Sciences, Inc.* | 385,500 | 36,337,230 | ||||||
Halozyme Therapeutics, Inc.* | 45,200 | 436,180 | ||||||
ImmunoGen, Inc.* | 10,900 | 66,490 | ||||||
Incyte Corp.* | 37,700 | 2,756,247 | ||||||
Insys Therapeutics, Inc.* | 9,500 | 400,520 | ||||||
Intercept Pharmaceuticals, Inc.* | 3,200 | 499,200 | ||||||
Intrexon Corp.* | 4,300 | 118,379 | ||||||
Ironwood Pharmaceuticals, Inc.* | 22,200 | 340,104 | ||||||
Isis Pharmaceuticals, Inc.* | 31,900 | 1,969,506 | ||||||
Karyopharm Therapeutics, Inc.* | 10,700 | 400,501 | ||||||
Keryx Biopharmaceuticals, Inc.* | 30,700 | 434,405 | ||||||
Lexicon Pharmaceuticals, Inc.* | 6,100 | 5,550 | ||||||
Ligand Pharmaceuticals, Inc.* | 7,500 | 399,075 | ||||||
MannKind Corp.* | 59,400 | 309,771 | ||||||
Medivation, Inc.* | 20,600 | 2,051,966 | ||||||
MiMedx Group, Inc.* | 500 | 5,765 | ||||||
Momenta Pharmaceuticals, Inc.* | 1,100 | 13,244 | ||||||
Myriad Genetics, Inc.* | 25,650 | 873,639 | ||||||
Neurocrine Biosciences, Inc.* | 9,100 | 203,294 | ||||||
NPS Pharmaceuticals, Inc.* | 21,900 | 783,363 | ||||||
Ophthotech Corp.* | 8,900 | 399,343 | ||||||
OPKO Health, Inc.* | 49,000 | 489,510 | ||||||
PDL BioPharma, Inc. | 58,500 | 451,035 | ||||||
Pharmacyclics, Inc.* | 16,500 | 2,017,290 | ||||||
Puma Biotechnology, Inc.* | 6,100 | 1,154,547 | ||||||
Receptos, Inc.* | 4,700 | 575,797 | ||||||
Regeneron Pharmaceuticals, Inc.* | 20,500 | 8,410,125 | ||||||
Sarepta Therapeutics, Inc.* | 10,100 | 146,147 | ||||||
Seattle Genetics, Inc.* | 33,200 | 1,066,716 | ||||||
Synageva BioPharma Corp.* | 5,400 | 501,066 | ||||||
TESARO, Inc.* | 3,400 | 126,446 | ||||||
Ultragenyx Pharmaceutical, Inc.* | 10,200 | 447,576 | ||||||
United Therapeutics Corp.* | 13,000 | 1,683,370 | ||||||
Vertex Pharmaceuticals, Inc.* | 60,700 | 7,211,160 | ||||||
|
| |||||||
| 170,951,661 | ||||||||
|
| |||||||
Health Care Equipment & Supplies (2.3%) |
| |||||||
Abaxis, Inc. | 1,500 | 85,245 | ||||||
Abbott Laboratories | 379,150 | 17,069,333 | ||||||
Alere, Inc.* | 21,250 | 807,500 | ||||||
Align Technology, Inc.* | 21,700 | 1,213,247 | ||||||
Baxter International, Inc. | 140,280 | 10,281,121 | ||||||
Becton, Dickinson and Co. | 50,340 | 7,005,314 | ||||||
Boston Scientific Corp.* | 344,600 | 4,565,950 | ||||||
C.R. Bard, Inc. | 19,480 | 3,245,758 | ||||||
Cantel Medical Corp. | 14,350 | 620,781 | ||||||
CareFusion Corp.* | 52,900 | 3,139,086 | ||||||
CONMED Corp. | 1,900 | 85,424 | ||||||
Cooper Cos., Inc. | 14,400 | 2,334,096 | ||||||
Covidien plc | 117,500 | 12,017,900 | ||||||
Cyberonics, Inc.* | 8,600 | 478,848 | ||||||
DENTSPLY International, Inc. | 37,900 | 2,018,933 | ||||||
DexCom, Inc.* | 20,100 | 1,106,505 | ||||||
Edwards Lifesciences Corp.* | 28,400 | 3,617,592 | ||||||
Endologix, Inc.* | 9,700 | 148,313 | ||||||
Globus Medical, Inc., Class A* | 14,100 | $ | 335,157 | |||||
Greatbatch, Inc.* | 10,500 | 517,650 | ||||||
Haemonetics Corp.* | 21,800 | 815,756 | ||||||
Halyard Health, Inc.* | 12,275 | 558,144 | ||||||
HeartWare International, Inc.* | 4,300 | 315,749 | ||||||
Hill-Rom Holdings, Inc. | 14,830 | 676,545 | ||||||
Hologic, Inc.* | 62,600 | 1,673,924 | ||||||
ICU Medical, Inc.* | 2,100 | 171,990 | ||||||
IDEXX Laboratories, Inc.* | 14,600 | 2,164,742 | ||||||
Insulet Corp.* | 17,800 | 819,868 | ||||||
Integra LifeSciences Holdings Corp.* | 10,300 | 558,569 | ||||||
Intuitive Surgical, Inc.* | 9,300 | 4,919,142 | ||||||
Masimo Corp.* | 25,600 | 674,304 | ||||||
Medtronic, Inc. | 253,440 | 18,298,368 | ||||||
Meridian Bioscience, Inc. | 16,100 | 265,006 | ||||||
Neogen Corp.* | 9,900 | 490,941 | ||||||
NuVasive, Inc.* | 12,950 | 610,722 | ||||||
NxStage Medical, Inc.* | 4,700 | 84,271 | ||||||
Quidel Corp.* | 2,900 | 83,868 | ||||||
ResMed, Inc. | 41,700 | 2,337,702 | ||||||
Sirona Dental Systems, Inc.* | 18,900 | 1,651,293 | ||||||
Spectranetics Corp.* | 4,100 | 141,778 | ||||||
St. Jude Medical, Inc. | 75,600 | 4,916,268 | ||||||
STERIS Corp. | 16,360 | 1,060,946 | ||||||
Stryker Corp. | 84,370 | 7,958,622 | ||||||
Teleflex, Inc. | 10,900 | 1,251,538 | ||||||
Thoratec Corp.* | 23,300 | 756,318 | ||||||
Varian Medical Systems, Inc.* | 27,110 | 2,345,286 | ||||||
West Pharmaceutical Services, Inc. | 23,000 | 1,224,520 | ||||||
Wright Medical Group, Inc.* | 21,200 | 569,644 | ||||||
Zimmer Holdings, Inc. | 42,400 | 4,809,008 | ||||||
|
| |||||||
| 132,898,585 | ||||||||
|
| |||||||
Health Care Providers & Services (2.6%) |
| |||||||
Acadia Healthcare Co., Inc.* | 14,500 | 887,545 | ||||||
Aetna, Inc. | 94,497 | 8,394,169 | ||||||
Air Methods Corp.* | 12,600 | 554,778 | ||||||
AmerisourceBergen Corp. | 57,700 | 5,202,232 | ||||||
AMN Healthcare Services, Inc.* | 4,000 | 78,400 | ||||||
Amsurg Corp.* | 10,200 | 558,246 | ||||||
Anthem, Inc. | 71,380 | 8,970,325 | ||||||
Bio-Reference Laboratories, Inc.* | 3,200 | 102,816 | ||||||
BioScrip, Inc.* | 300 | 2,097 | ||||||
Brookdale Senior Living, Inc.* | 50,735 | 1,860,452 | ||||||
Cardinal Health, Inc. | 90,500 | 7,306,065 | ||||||
Catamaran Corp.* | 55,692 | 2,882,061 | ||||||
Centene Corp.* | 14,900 | 1,547,365 | ||||||
Chemed Corp. | 4,200 | 443,814 | ||||||
Cigna Corp. | 71,040 | 7,310,726 | ||||||
Community Health Systems, Inc.* | 33,267 | 1,793,757 | ||||||
DaVita HealthCare Partners, Inc.* | 45,900 | 3,476,466 | ||||||
Ensign Group, Inc. | 100 | 4,439 | ||||||
Envision Healthcare Holdings, Inc.* | 21,100 | 731,959 | ||||||
Express Scripts Holding Co.* | 194,151 | 16,438,765 | ||||||
HCA Holdings, Inc.* | 85,000 | 6,238,150 | ||||||
Health Net, Inc.* | 20,940 | 1,120,918 | ||||||
See Notes to Financial Statements.
15
Table of Contents
EQ ADVISORS TRUST
EQ/COMMON STOCK INDEX PORTFOLIO
PORTFOLIO OF INVESTMENTS (Continued)
December 31, 2014
| Number of Shares | Value (Note 1) | |||||||
HealthSouth Corp. | 24,800 | $ | 953,808 | |||||
Henry Schein, Inc.* | 22,250 | 3,029,338 | ||||||
Humana, Inc. | 40,300 | 5,788,289 | ||||||
IPC The Hospitalist Co., Inc.* | 100 | 4,589 | ||||||
Kindred Healthcare, Inc. | 27,300 | 496,314 | ||||||
Laboratory Corp. of America Holdings* | 23,750 | 2,562,625 | ||||||
LifePoint Hospitals, Inc.* | 14,250 | 1,024,717 | ||||||
Magellan Health, Inc.* | 9,200 | 552,276 | ||||||
McKesson Corp. | 58,880 | 12,222,310 | ||||||
MEDNAX, Inc.* | 29,640 | 1,959,500 | ||||||
Molina Healthcare, Inc.* | 12,900 | 690,537 | ||||||
MWI Veterinary Supply, Inc.* | 4,000 | 679,640 | ||||||
Omnicare, Inc. | 29,620 | 2,160,187 | ||||||
Owens & Minor, Inc. | 26,850 | 942,703 | ||||||
Patterson Cos., Inc. | 27,600 | 1,327,560 | ||||||
PharMerica Corp.* | 14,270 | 295,532 | ||||||
Premier, Inc., Class A* | 17,800 | 596,834 | ||||||
Quest Diagnostics, Inc. | 38,630 | 2,590,528 | ||||||
Select Medical Holdings Corp. | 28,400 | 408,960 | ||||||
Team Health Holdings, Inc.* | 19,500 | 1,121,835 | ||||||
Tenet Healthcare Corp.* | 31,275 | 1,584,704 | ||||||
Triple-S Management Corp., Class B* | 600 | 14,346 | ||||||
UnitedHealth Group, Inc. | 248,620 | 25,132,996 | ||||||
Universal American Corp.* | 30,800 | 285,824 | ||||||
Universal Health Services, Inc., Class B | 23,080 | 2,567,881 | ||||||
VCA, Inc.* | 23,650 | 1,153,411 | ||||||
WellCare Health Plans, Inc.* | 14,900 | 1,222,694 | ||||||
|
| |||||||
| 147,275,483 | ||||||||
|
| |||||||
Health Care Technology (0.2%) | ||||||||
Allscripts Healthcare Solutions, Inc.* | 64,450 | 823,026 | ||||||
athenahealth, Inc.* | 11,900 | 1,733,830 | ||||||
Castlight Health, Inc., Class B* | 28,700 | 335,790 | ||||||
Cerner Corp.* | 76,700 | 4,959,422 | ||||||
HealthStream, Inc.* | 300 | 8,844 | ||||||
HMS Holdings Corp.* | 28,800 | 608,832 | ||||||
IMS Health Holdings, Inc.* | 19,500 | 499,980 | ||||||
MedAssets, Inc.* | 10,400 | 205,504 | ||||||
Medidata Solutions, Inc.* | 13,600 | 649,400 | ||||||
Quality Systems, Inc. | 9,100 | 141,869 | ||||||
Veeva Systems, Inc., Class A* | 11,500 | 303,715 | ||||||
|
| |||||||
| 10,270,212 | ||||||||
|
| |||||||
Life Sciences Tools & Services (0.6%) |
| |||||||
Agilent Technologies, Inc. | 86,230 | 3,530,256 | ||||||
Bio-Rad Laboratories, Inc., Class A* | 8,500 | 1,024,760 | ||||||
Bio-Techne Corp. | 11,450 | 1,057,980 | ||||||
Bruker Corp.* | 27,900 | 547,398 | ||||||
Charles River Laboratories International, Inc.* | 12,250 | 779,590 | ||||||
Covance, Inc.* | 16,700 | 1,734,128 | ||||||
Illumina, Inc.* | 35,900 | 6,626,422 | ||||||
Luminex Corp.* | 1,300 | 24,388 | ||||||
Mettler-Toledo International, Inc.* | 8,600 | 2,601,156 | ||||||
PAREXEL International Corp.* | 14,570 | 809,509 | ||||||
PerkinElmer, Inc. | 36,100 | $ | 1,578,653 | |||||
QIAGEN N.V.* | 59,200 | 1,388,832 | ||||||
Quintiles Transnational Holdings, Inc.* | 14,700 | 865,389 | ||||||
Thermo Fisher Scientific, Inc. | 100,750 | 12,622,968 | ||||||
Waters Corp.* | 21,500 | 2,423,480 | ||||||
|
| |||||||
| 37,614,909 | ||||||||
|
| |||||||
Pharmaceuticals (5.2%) | ||||||||
AbbVie, Inc. | 399,150 | 26,120,376 | ||||||
Actavis plc* | 63,762 | 16,412,976 | ||||||
Akorn, Inc.* | 16,200 | 586,440 | ||||||
Allergan, Inc. | 74,670 | 15,874,095 | ||||||
Auxilium Pharmaceuticals, Inc.* | 3,500 | 120,347 | ||||||
Avanir Pharmaceuticals, Inc.* | 43,900 | 744,105 | ||||||
Bristol-Myers Squibb Co. | 418,330 | 24,694,020 | ||||||
Catalent, Inc.* | 3,400 | 94,792 | ||||||
Eli Lilly & Co. | 248,310 | 17,130,907 | ||||||
Endo International plc* | 39,700 | 2,863,164 | ||||||
Hospira, Inc.* | 46,750 | 2,863,438 | ||||||
Impax Laboratories, Inc.* | 17,900 | 567,072 | ||||||
Jazz Pharmaceuticals plc* | 15,500 | 2,537,815 | ||||||
Johnson & Johnson | 710,160 | 74,261,431 | ||||||
Lannett Co., Inc.* | 9,600 | 411,648 | ||||||
Mallinckrodt plc* | 32,692 | 3,237,489 | ||||||
Medicines Co.* | 11,200 | 309,904 | ||||||
Merck & Co., Inc. | 733,590 | 41,660,576 | ||||||
Mylan, Inc.* | 97,350 | 5,487,620 | ||||||
Nektar Therapeutics* | 37,000 | 573,500 | ||||||
Pacira Pharmaceuticals, Inc.* | 7,500 | 664,950 | ||||||
Perrigo Co. plc | 34,300 | 5,733,588 | ||||||
Pfizer, Inc. | 1,601,317 | 49,881,025 | ||||||
Prestige Brands Holdings, Inc.* | 14,500 | 503,440 | ||||||
Salix Pharmaceuticals Ltd.* | 16,600 | 1,908,004 | ||||||
Theravance Biopharma, Inc.* | 5,000 | 74,600 | ||||||
Theravance, Inc. | 17,500 | 247,625 | ||||||
Zoetis, Inc. | 127,100 | 5,469,113 | ||||||
|
| |||||||
| 301,034,060 | ||||||||
|
| |||||||
Total Health Care | 800,044,910 | |||||||
|
| |||||||
Industrials (11.3%) | ||||||||
Aerospace & Defense (2.6%) | ||||||||
Alliant Techsystems, Inc. | 9,100 | 1,057,875 | ||||||
American Science & Engineering, Inc. | 4,700 | 243,930 | ||||||
B/E Aerospace, Inc.* | 27,460 | 1,593,229 | ||||||
Boeing Co. | 186,200 | 24,202,276 | ||||||
Cubic Corp. | 4,000 | 210,560 | ||||||
Curtiss-Wright Corp. | 12,700 | 896,493 | ||||||
DigitalGlobe, Inc.* | 15,800 | 489,326 | ||||||
Engility Holdings, Inc.* | 661 | 28,291 | ||||||
Esterline Technologies Corp.* | 11,300 | 1,239,384 | ||||||
Exelis, Inc. | 60,850 | 1,066,700 | ||||||
General Dynamics Corp. | 77,170 | 10,620,135 | ||||||
HEICO Corp. | 21,093 | 1,274,017 | ||||||
Hexcel Corp.* | 29,600 | 1,228,104 | ||||||
Honeywell International, Inc. | 198,700 | 19,854,104 | ||||||
Huntington Ingalls Industries, Inc. | 12,700 | 1,428,242 | ||||||
KLX, Inc.* | 13,730 | 566,362 | ||||||
L-3 Communications Holdings, Inc. | 22,470 | 2,835,939 | ||||||
See Notes to Financial Statements.
16
Table of Contents
EQ ADVISORS TRUST
EQ/COMMON STOCK INDEX PORTFOLIO
PORTFOLIO OF INVESTMENTS (Continued)
December 31, 2014
| Number of Shares | Value (Note 1) | |||||||
Lockheed Martin Corp. | 69,960 | $ | 13,472,197 | |||||
Moog, Inc., Class A* | 12,000 | 888,360 | ||||||
Northrop Grumman Corp. | 51,250 | 7,553,738 | ||||||
Orbital Sciences Corp.* | 10,400 | 279,656 | ||||||
Precision Castparts Corp. | 37,270 | 8,977,598 | ||||||
Raytheon Co. | 80,890 | 8,749,871 | ||||||
Rockwell Collins, Inc. | 37,450 | 3,163,776 | ||||||
Spirit AeroSystems Holdings, Inc., Class A* | 32,900 | 1,416,016 | ||||||
Teledyne Technologies, Inc.* | 13,700 | 1,407,538 | ||||||
Textron, Inc. | 70,800 | 2,981,388 | ||||||
TransDigm Group, Inc. | 15,150 | 2,974,703 | ||||||
Triumph Group, Inc. | 12,400 | 833,528 | ||||||
United Technologies Corp. | 230,140 | 26,466,100 | ||||||
|
| |||||||
| 147,999,436 | ||||||||
|
| |||||||
Air Freight & Logistics (0.7%) | ||||||||
C.H. Robinson Worldwide, Inc. | 41,200 | 3,085,468 | ||||||
Expeditors International of Washington, Inc. | 58,600 | 2,614,146 | ||||||
FedEx Corp. | 74,950 | 13,015,817 | ||||||
Hub Group, Inc., Class A* | 400 | 15,232 | ||||||
United Parcel Service, Inc., Class B | 179,550 | 19,960,573 | ||||||
UTi Worldwide, Inc.* | 16,500 | 199,155 | ||||||
XPO Logistics, Inc.* | 13,500 | 551,880 | ||||||
|
| |||||||
| 39,442,271 | ||||||||
|
| |||||||
Airlines (0.7%) | ||||||||
Alaska Air Group, Inc. | 39,800 | 2,378,448 | ||||||
Allegiant Travel Co. | 4,000 | 601,320 | ||||||
American Airlines Group, Inc. | 187,600 | 10,060,988 | ||||||
Copa Holdings S.A., Class A | 11,600 | 1,202,224 | ||||||
Delta Air Lines, Inc. | 215,150 | 10,583,228 | ||||||
JetBlue Airways Corp.* | 69,900 | 1,108,614 | ||||||
SkyWest, Inc. | 11,300 | 150,064 | ||||||
Southwest Airlines Co. | 180,200 | 7,626,064 | ||||||
Spirit Airlines, Inc.* | 17,100 | 1,292,418 | ||||||
United Continental Holdings, Inc.* | 97,240 | 6,504,384 | ||||||
|
| |||||||
| 41,507,752 | ||||||||
|
| |||||||
Building Products (0.2%) | ||||||||
A.O. Smith Corp. | 19,000 | 1,071,790 | ||||||
Allegion plc | 28,166 | 1,562,086 | ||||||
Armstrong World Industries, Inc.* | 8,100 | 414,072 | ||||||
Fortune Brands Home & Security, Inc. | 46,150 | 2,089,210 | ||||||
Insteel Industries, Inc. | 200 | 4,716 | ||||||
Lennox International, Inc. | 16,510 | 1,569,606 | ||||||
Masco Corp. | 104,600 | 2,635,920 | ||||||
Masonite International Corp.* | 8,200 | 503,972 | ||||||
Owens Corning, Inc. | 35,170 | 1,259,438 | ||||||
Simpson Manufacturing Co., Inc. | 7,600 | 262,960 | ||||||
USG Corp.* | 22,500 | 629,775 | ||||||
|
| |||||||
| 12,003,545 | ||||||||
|
| |||||||
Commercial Services & Supplies (0.6%) |
| |||||||
ABM Industries, Inc. | 6,200 | 177,630 | ||||||
ADT Corp. | 45,350 | 1,643,030 | ||||||
Brady Corp., Class A | 7,500 | $ | 205,050 | |||||
Brink’s Co. | 1,200 | 29,292 | ||||||
Cintas Corp. | 28,800 | 2,259,072 | ||||||
Civeo Corp. | 9,600 | 39,456 | ||||||
Clean Harbors, Inc.* | 16,200 | 778,410 | ||||||
Copart, Inc.* | 37,000 | 1,350,130 | ||||||
Covanta Holding Corp. | 32,000 | 704,320 | ||||||
Deluxe Corp. | 17,000 | 1,058,250 | ||||||
Healthcare Services Group, Inc. | 21,900 | 677,367 | ||||||
Herman Miller, Inc. | 11,700 | 344,331 | ||||||
HNI Corp. | 11,700 | 597,402 | ||||||
Interface, Inc. | 700 | 11,529 | ||||||
KAR Auction Services, Inc. | 36,400 | 1,261,260 | ||||||
Mobile Mini, Inc. | 8,300 | 336,233 | ||||||
MSA Safety, Inc. | 7,100 | 376,939 | ||||||
Pitney Bowes, Inc. | 54,520 | 1,328,652 | ||||||
R.R. Donnelley & Sons Co. | 49,130 | 825,630 | ||||||
Republic Services, Inc. | 76,735 | 3,088,584 | ||||||
Rollins, Inc. | 21,000 | 695,100 | ||||||
Steelcase, Inc., Class A | 12,800 | 229,760 | ||||||
Stericycle, Inc.* | 21,800 | 2,857,544 | ||||||
Tetra Tech, Inc. | 18,300 | 488,610 | ||||||
Tyco International plc | 120,200 | 5,271,972 | ||||||
UniFirst Corp. | 2,000 | 242,900 | ||||||
United Stationers, Inc. | 12,100 | 510,136 | ||||||
Waste Connections, Inc. | 37,550 | 1,651,825 | ||||||
Waste Management, Inc. | 123,450 | 6,335,454 | ||||||
West Corp. | 17,700 | 584,100 | ||||||
|
| |||||||
| 35,959,968 | ||||||||
|
| |||||||
Construction & Engineering (0.2%) |
| |||||||
AECOM Technology Corp.* | 32,802 | 996,197 | ||||||
Chicago Bridge & Iron Co. N.V. (N.Y. Shares) | 31,625 | 1,327,617 | ||||||
EMCOR Group, Inc. | 25,100 | 1,116,699 | ||||||
Fluor Corp. | 45,460 | 2,756,240 | ||||||
Granite Construction, Inc. | 4,900 | 186,298 | ||||||
Jacobs Engineering Group, Inc.* | 37,100 | 1,657,999 | ||||||
KBR, Inc. | 48,800 | 827,160 | ||||||
MasTec, Inc.* | 18,700 | 422,807 | ||||||
Primoris Services Corp. | 700 | 16,268 | ||||||
Quanta Services, Inc.* | 64,850 | 1,841,092 | ||||||
|
| |||||||
| 11,148,377 | ||||||||
|
| |||||||
Electrical Equipment (0.6%) | ||||||||
Acuity Brands, Inc. | 12,200 | 1,708,854 | ||||||
AMETEK, Inc. | 64,975 | 3,419,634 | ||||||
Babcock & Wilcox Co. | 37,600 | 1,139,280 | ||||||
Eaton Corp. plc | 119,697 | 8,134,608 | ||||||
Emerson Electric Co. | 182,810 | 11,284,862 | ||||||
EnerSys, Inc. | 13,300 | 820,876 | ||||||
Franklin Electric Co., Inc. | 13,400 | 502,902 | ||||||
Generac Holdings, Inc.* | 14,600 | 682,696 | ||||||
Hubbell, Inc., Class B | 15,400 | 1,645,182 | ||||||
Polypore International, Inc.* | 12,300 | 578,715 | ||||||
Regal-Beloit Corp. | 13,900 | 1,045,280 | ||||||
Rockwell Automation, Inc. | 38,500 | 4,281,200 | ||||||
SolarCity Corp.* | 11,100 | 593,628 | ||||||
|
| |||||||
| 35,837,717 | ||||||||
|
| |||||||
Industrial Conglomerates (1.9%) | ||||||||
3M Co. | 166,030 | 27,282,050 | ||||||
Carlisle Cos., Inc. | 17,300 | 1,561,152 | ||||||
See Notes to Financial Statements.
17
Table of Contents
EQ ADVISORS TRUST
EQ/COMMON STOCK INDEX PORTFOLIO
PORTFOLIO OF INVESTMENTS (Continued)
December 31, 2014
| Number of Shares | Value (Note 1) | |||||||
Danaher Corp. | 154,160 | $ | 13,213,054 | |||||
General Electric Co. | 2,531,292 | 63,965,749 | ||||||
Raven Industries, Inc. | 2,700 | 67,500 | ||||||
Roper Industries, Inc. | 25,850 | 4,041,647 | ||||||
|
| |||||||
| 110,131,152 | ||||||||
|
| |||||||
Machinery (2.0%) | ||||||||
Actuant Corp., Class A | 23,500 | 640,140 | ||||||
AGCO Corp. | 27,500 | 1,243,000 | ||||||
Allison Transmission Holdings, Inc. | 35,200 | 1,193,280 | ||||||
Barnes Group, Inc. | 15,200 | 562,552 | ||||||
Caterpillar, Inc. | 160,310 | 14,673,174 | ||||||
Chart Industries, Inc.* | 10,080 | 344,736 | ||||||
CLARCOR, Inc. | 14,000 | 932,960 | ||||||
Colfax Corp.* | 27,730 | 1,430,036 | ||||||
Crane Co. | 18,600 | 1,091,820 | ||||||
Cummins, Inc. | 47,360 | 6,827,891 | ||||||
Deere & Co. | 94,740 | 8,381,648 | ||||||
Donaldson Co., Inc. | 36,700 | 1,417,721 | ||||||
Dover Corp. | 43,390 | 3,111,931 | ||||||
Flowserve Corp. | 35,740 | 2,138,324 | ||||||
Graco, Inc. | 17,860 | 1,432,015 | ||||||
Greenbrier Cos., Inc. | 7,600 | 408,348 | ||||||
Harsco Corp. | 18,300 | 345,687 | ||||||
Hillenbrand, Inc. | 9,800 | 338,100 | ||||||
IDEX Corp. | 23,240 | 1,809,002 | ||||||
Illinois Tool Works, Inc. | 89,010 | 8,429,247 | ||||||
Ingersoll-Rand plc | 74,200 | 4,703,538 | ||||||
ITT Corp. | 30,425 | 1,230,995 | ||||||
Joy Global, Inc. | 26,480 | 1,231,850 | ||||||
Kennametal, Inc. | 26,190 | 937,340 | ||||||
Lincoln Electric Holdings, Inc. | 20,960 | 1,448,126 | ||||||
Manitowoc Co., Inc. | 46,900 | 1,036,490 | ||||||
Middleby Corp.* | 18,000 | 1,783,800 | ||||||
Mueller Industries, Inc. | 16,400 | 559,896 | ||||||
Navistar International Corp.* | 15,400 | 515,592 | ||||||
Nordson Corp. | 20,060 | 1,563,878 | ||||||
Oshkosh Corp. | 24,700 | 1,201,655 | ||||||
PACCAR, Inc. | 93,630 | 6,367,776 | ||||||
Pall Corp. | 30,000 | 3,036,300 | ||||||
Parker-Hannifin Corp. | 37,610 | 4,849,809 | ||||||
Pentair plc | 50,387 | 3,346,705 | ||||||
Proto Labs, Inc.* | 5,900 | 396,244 | ||||||
RBC Bearings, Inc. | 3,900 | 251,667 | ||||||
Rexnord Corp.* | 19,600 | 552,916 | ||||||
Snap-on, Inc. | 14,900 | 2,037,426 | ||||||
SPX Corp. | 13,300 | 1,142,736 | ||||||
Stanley Black & Decker, Inc. | 40,635 | 3,904,211 | ||||||
Terex Corp. | 33,030 | 920,876 | ||||||
Timken Co. | 21,240 | 906,523 | ||||||
Toro Co. | 19,440 | 1,240,466 | ||||||
Trinity Industries, Inc. | 48,740 | 1,365,207 | ||||||
Valmont Industries, Inc. | 7,700 | 977,900 | ||||||
WABCO Holdings, Inc.* | 16,570 | 1,736,205 | ||||||
Wabtec Corp. | 25,700 | 2,233,073 | ||||||
Watts Water Technologies, Inc., Class A | 8,000 | 507,520 | ||||||
Woodward, Inc. | 23,030 | 1,133,767 | ||||||
Xylem, Inc. | 47,850 | 1,821,650 | ||||||
|
| |||||||
| 111,693,749 | ||||||||
|
| |||||||
Marine (0.0%) |
| |||||||
Kirby Corp.* | 14,250 | $ | 1,150,545 | |||||
Matson, Inc. | 11,880 | 410,098 | ||||||
|
| |||||||
| 1,560,643 | ||||||||
|
| |||||||
Professional Services (0.4%) |
| |||||||
Advisory Board Co.* | 11,680 | 572,086 | ||||||
CBIZ, Inc.* | 37,720 | 322,883 | ||||||
Corporate Executive Board Co. | 11,800 | 855,854 | ||||||
Dun & Bradstreet Corp. | 9,600 | 1,161,216 | ||||||
Equifax, Inc. | 34,820 | 2,815,893 | ||||||
FTI Consulting, Inc.* | 12,600 | 486,738 | ||||||
IHS, Inc., Class A* | 18,700 | 2,129,556 | ||||||
ManpowerGroup, Inc. | 20,980 | 1,430,207 | ||||||
Nielsen N.V. | 73,400 | 3,283,182 | ||||||
Resources Connection, Inc. | 25,650 | 421,943 | ||||||
Robert Half International, Inc. | 37,260 | 2,175,239 | ||||||
Towers Watson & Co., Class A | 17,900 | 2,025,743 | ||||||
TriNet Group, Inc.* | 12,400 | 387,872 | ||||||
Verisk Analytics, Inc., Class A* | 45,800 | 2,933,490 | ||||||
WageWorks, Inc.* | 9,100 | 587,587 | ||||||
|
| |||||||
| 21,589,489 | ||||||||
|
| |||||||
Road & Rail (1.1%) |
| |||||||
AMERCO | 2,200 | 625,372 | ||||||
Avis Budget Group, Inc.* | 28,490 | 1,889,742 | ||||||
Con-way, Inc. | 19,100 | 939,338 | ||||||
CSX Corp. | 257,950 | 9,345,528 | ||||||
Genesee & Wyoming, Inc., Class A* | 14,700 | 1,321,824 | ||||||
Heartland Express, Inc. | 7,700 | 207,977 | ||||||
Hertz Global Holdings, Inc.* | 116,600 | 2,908,004 | ||||||
J.B. Hunt Transport Services, Inc. | 23,050 | 1,941,962 | ||||||
Kansas City Southern | 28,650 | 3,496,159 | ||||||
Knight Transportation, Inc. | 19,600 | 659,736 | ||||||
Landstar System, Inc. | 15,650 | 1,135,095 | ||||||
Norfolk Southern Corp. | 79,070 | 8,666,863 | ||||||
Old Dominion Freight Line, Inc.* | 15,750 | 1,222,830 | ||||||
Ryder System, Inc. | 16,900 | 1,569,165 | ||||||
Swift Transportation Co.* | 17,600 | 503,888 | ||||||
Union Pacific Corp. | 227,420 | 27,092,545 | ||||||
Werner Enterprises, Inc. | 18,100 | 563,815 | ||||||
|
| |||||||
| 64,089,843 | ||||||||
|
| |||||||
Trading Companies & Distributors (0.3%) |
| |||||||
Air Lease Corp. | 21,000 | 720,510 | ||||||
Applied Industrial Technologies, Inc. | 15,500 | 706,645 | ||||||
Fastenal Co. | 83,300 | 3,961,748 | ||||||
GATX Corp. | 13,700 | 788,298 | ||||||
HD Supply Holdings, Inc.* | 27,600 | 813,924 | ||||||
MRC Global, Inc.* | 23,600 | 357,540 | ||||||
MSC Industrial Direct Co., Inc., Class A | 12,200 | 991,250 | ||||||
NOW, Inc.* | 27,920 | 718,382 | ||||||
TAL International Group, Inc.* | 600 | 26,142 | ||||||
Textainer Group Holdings Ltd. | 11,200 | 384,384 | ||||||
United Rentals, Inc.* | 27,722 | 2,827,921 | ||||||
Veritiv Corp.* | 233 | 12,086 | ||||||
W.W. Grainger, Inc. | 15,650 | 3,989,028 | ||||||
See Notes to Financial Statements.
18
Table of Contents
EQ ADVISORS TRUST
EQ/COMMON STOCK INDEX PORTFOLIO
PORTFOLIO OF INVESTMENTS (Continued)
December 31, 2014
| Number of Shares | Value (Note 1) | |||||||
Watsco, Inc. | 7,310 | $ | 782,170 | |||||
WESCO International, Inc.* | 15,220 | 1,159,916 | ||||||
|
| |||||||
| 18,239,944 | ||||||||
|
| |||||||
Transportation Infrastructure (0.0%) |
| |||||||
Wesco Aircraft Holdings, Inc.* | 20,600 | 287,988 | ||||||
|
| |||||||
Total Industrials | 651,491,874 | |||||||
|
| |||||||
Information Technology (18.8%) | ||||||||
Communications Equipment (1.6%) |
| |||||||
ADTRAN, Inc. | 13,900 | 303,020 | ||||||
ARRIS Group, Inc.* | 41,000 | 1,237,790 | ||||||
Aruba Networks, Inc.* | 27,400 | 498,132 | ||||||
Brocade Communications Systems, Inc. | 132,560 | 1,569,510 | ||||||
Ciena Corp.* | 31,400 | 609,474 | ||||||
Cisco Systems, Inc. | 1,293,070 | 35,966,742 | ||||||
CommScope Holding Co., Inc.* | 19,100 | 436,053 | ||||||
EchoStar Corp., Class A* | 10,500 | 551,250 | ||||||
F5 Networks, Inc.* | 21,200 | 2,765,858 | ||||||
Finisar Corp.* | 27,300 | 529,893 | ||||||
Harris Corp. | 32,840 | 2,358,569 | ||||||
Infinera Corp.* | 18,700 | 275,264 | ||||||
InterDigital, Inc. | 10,700 | 566,030 | ||||||
JDS Uniphase Corp.* | 76,350 | 1,047,522 | ||||||
Juniper Networks, Inc. | 123,400 | 2,754,288 | ||||||
Motorola Solutions, Inc. | 60,421 | 4,053,041 | ||||||
Palo Alto Networks, Inc.* | 13,500 | 1,654,695 | ||||||
Plantronics, Inc. | 17,400 | 922,548 | ||||||
Polycom, Inc.* | 40,400 | 545,400 | ||||||
QUALCOMM, Inc. | 426,080 | 31,670,526 | ||||||
Riverbed Technology, Inc.* | 47,200 | 963,352 | ||||||
ViaSat, Inc.* | 12,200 | 768,966 | ||||||
|
| |||||||
| 92,047,923 | ||||||||
|
| |||||||
Electronic Equipment, Instruments & Components (0.6%) |
| |||||||
Amphenol Corp., Class A | 80,840 | 4,350,000 | ||||||
Anixter International, Inc.* | 7,700 | 681,142 | ||||||
Arrow Electronics, Inc.* | 26,000 | 1,505,140 | ||||||
Avnet, Inc. | 38,720 | 1,665,734 | ||||||
AVX Corp. | 25,300 | 354,200 | ||||||
Belden, Inc. | 10,900 | 859,029 | ||||||
CDW Corp. | 22,600 | 794,842 | ||||||
Cognex Corp.* | 29,800 | 1,231,634 | ||||||
Coherent, Inc.* | 7,000 | 425,040 | ||||||
Corning, Inc. | 345,890 | 7,931,258 | ||||||
Dolby Laboratories, Inc., Class A | 12,700 | 547,624 | ||||||
FEI Co. | 10,800 | 975,780 | ||||||
FLIR Systems, Inc. | 42,200 | 1,363,482 | ||||||
II-VI, Inc.* | 2,700 | 36,855 | ||||||
Ingram Micro, Inc., Class A* | 41,200 | 1,138,768 | ||||||
InvenSense, Inc.* | 21,300 | 346,338 | ||||||
IPG Photonics Corp.* | 9,100 | 681,772 | ||||||
Itron, Inc.* | 6,710 | 283,766 | ||||||
Jabil Circuit, Inc. | 68,100 | 1,486,623 | ||||||
Keysight Technologies, Inc.* | 43,115 | 1,455,994 | ||||||
Knowles Corp.* | 25,045 | 589,810 | ||||||
Littelfuse, Inc. | 6,500 | 628,355 | ||||||
National Instruments Corp. | 35,700 | 1,109,913 | ||||||
Plexus Corp.* | 8,300 | 342,043 | ||||||
Sanmina Corp.* | 14,400 | $ | 338,832 | |||||
SYNNEX Corp. | 7,200 | 562,752 | ||||||
Tech Data Corp.* | 11,200 | 708,176 | ||||||
Trimble Navigation Ltd.* | 77,400 | 2,054,196 | ||||||
Vishay Intertechnology, Inc. | 39,600 | 560,340 | ||||||
Zebra Technologies Corp., Class A* | 16,700 | 1,292,747 | ||||||
|
| |||||||
| 36,302,185 | ||||||||
|
| |||||||
Internet Software & Services (3.1%) |
| |||||||
Akamai Technologies, Inc.* | 45,800 | 2,883,568 | ||||||
AOL, Inc.* | 20,956 | 967,539 | ||||||
Bankrate, Inc.* | 33,000 | 410,190 | ||||||
Cimpress N.V.* | 9,700 | 725,948 | ||||||
Cornerstone OnDemand, Inc.* | 13,300 | 468,160 | ||||||
CoStar Group, Inc.* | 7,535 | 1,383,652 | ||||||
Dealertrack Technologies, Inc.* | 13,300 | 589,323 | ||||||
Demandware, Inc.* | 300 | 17,262 | ||||||
eBay, Inc.* | 321,570 | 18,046,508 | ||||||
Endurance International Group Holdings, Inc.* | 26,800 | 493,924 | ||||||
Equinix, Inc. | 14,739 | 3,341,773 | ||||||
Facebook, Inc., Class A* | 500,900 | 39,080,218 | ||||||
Google, Inc., Class A* | 71,225 | 37,796,258 | ||||||
Google, Inc., Class C* | 72,025 | 37,913,960 | ||||||
GrubHub, Inc.* | 8,200 | 297,824 | ||||||
IAC/InterActiveCorp | 24,850 | 1,510,632 | ||||||
j2 Global, Inc. | 14,600 | 905,200 | ||||||
LinkedIn Corp., Class A* | 27,000 | 6,202,170 | ||||||
NIC, Inc. | 1,500 | 26,985 | ||||||
Pandora Media, Inc.* | 53,500 | 953,905 | ||||||
Rackspace Hosting, Inc.* | 31,500 | 1,474,515 | ||||||
Trulia, Inc.* | 9,600 | 441,888 | ||||||
Twitter, Inc.* | 124,800 | 4,476,576 | ||||||
VeriSign, Inc.* | 35,250 | 2,009,250 | ||||||
Yahoo!, Inc.* | 252,750 | 12,766,403 | ||||||
Yelp, Inc.* | 13,200 | 722,436 | ||||||
Zillow, Inc., Class A* | 7,500 | 794,175 | ||||||
|
| |||||||
| 176,700,242 | ||||||||
|
| |||||||
IT Services (3.2%) | ||||||||
Accenture plc, Class A | 158,800 | 14,182,428 | ||||||
Alliance Data Systems Corp.* | 15,752 | 4,505,860 | ||||||
Amdocs Ltd. | 45,210 | 2,109,272 | ||||||
Automatic Data Processing, Inc. | 125,550 | 10,467,103 | ||||||
Blackhawk Network Holdings, Inc.* | 13,400 | 519,920 | ||||||
Booz Allen Hamilton Holding Corp. | 19,800 | 525,294 | ||||||
Broadridge Financial Solutions, Inc. | 30,410 | 1,404,334 | ||||||
CACI International, Inc., Class A* | 6,000 | 517,080 | ||||||
Cardtronics, Inc.* | 7,000 | 270,060 | ||||||
Cognizant Technology Solutions Corp., Class A* | 152,700 | 8,041,182 | ||||||
Computer Sciences Corp. | 37,740 | 2,379,507 | ||||||
Convergys Corp. | 37,300 | 759,801 | ||||||
CoreLogic, Inc.* | 26,300 | 830,817 | ||||||
DST Systems, Inc. | 11,580 | 1,090,257 | ||||||
EPAM Systems, Inc.* | 7,600 | 362,900 | ||||||
See Notes to Financial Statements.
19
Table of Contents
EQ ADVISORS TRUST
EQ/COMMON STOCK INDEX PORTFOLIO
PORTFOLIO OF INVESTMENTS (Continued)
December 31, 2014
| Number of Shares | Value (Note 1) | |||||||
Euronet Worldwide, Inc.* | 14,700 | $ | 807,030 | |||||
EVERTEC, Inc. | 13,200 | 292,116 | ||||||
Fidelity National Information Services, Inc. | 74,625 | 4,641,675 | ||||||
Fiserv, Inc.* | 66,500 | 4,719,505 | ||||||
FleetCor Technologies, Inc.* | 21,600 | 3,212,136 | ||||||
Gartner, Inc.* | 25,500 | 2,147,355 | ||||||
Genpact Ltd.* | 41,700 | 789,381 | ||||||
Global Payments, Inc. | 21,600 | 1,743,768 | ||||||
Heartland Payment Systems, Inc. | 9,200 | 496,340 | ||||||
iGATE Corp.* | 12,300 | 485,604 | ||||||
International Business Machines Corp. | 240,031 | 38,510,574 | ||||||
Jack Henry & Associates, Inc. | 23,030 | 1,431,084 | ||||||
Leidos Holdings, Inc. | 21,037 | 915,530 | ||||||
ManTech International Corp., Class A | 6,200 | 187,426 | ||||||
MasterCard, Inc., Class A | 255,100 | 21,979,416 | ||||||
MAXIMUS, Inc. | 24,800 | 1,360,032 | ||||||
NeuStar, Inc., Class A* | 17,390 | 483,442 | ||||||
Paychex, Inc. | 83,810 | 3,869,508 | ||||||
Sabre Corp. | 15,600 | 316,212 | ||||||
Sapient Corp.* | 34,200 | 850,896 | ||||||
Science Applications International Corp. | 12,021 | 595,400 | ||||||
Syntel, Inc.* | 9,400 | 422,812 | ||||||
TeleTech Holdings, Inc.* | 18,950 | 448,736 | ||||||
Teradata Corp.* | 49,760 | 2,173,517 | ||||||
Total System Services, Inc. | 46,200 | 1,568,952 | ||||||
Unisys Corp.* | 9,696 | 285,838 | ||||||
Vantiv, Inc., Class A* | 32,500 | 1,102,400 | ||||||
VeriFone Systems, Inc.* | 29,900 | 1,112,280 | ||||||
Visa, Inc., Class A | 125,850 | 32,997,870 | ||||||
Western Union Co. | 139,760 | 2,503,102 | ||||||
WEX, Inc.* | 10,100 | 999,092 | ||||||
Xerox Corp. | 298,131 | 4,132,096 | ||||||
|
| |||||||
| 185,546,940 | ||||||||
|
| |||||||
Semiconductors & Semiconductor Equipment (2.5%) |
| |||||||
Advanced Micro Devices, Inc.* | 188,500 | 503,295 | ||||||
Altera Corp. | 86,250 | 3,186,075 | ||||||
Amkor Technology, Inc.* | 39,100 | 277,610 | ||||||
Analog Devices, Inc. | 80,670 | 4,478,798 | ||||||
Applied Materials, Inc. | 308,820 | 7,695,794 | ||||||
Atmel Corp.* | 109,700 | 920,931 | ||||||
Avago Technologies Ltd. | 66,900 | 6,729,471 | ||||||
Broadcom Corp., Class A | 138,770 | 6,012,904 | ||||||
Cavium, Inc.* | 16,300 | 1,007,666 | ||||||
Cree, Inc.* | 32,700 | 1,053,594 | ||||||
Entegris, Inc.* | 19,240 | 254,160 | ||||||
Fairchild Semiconductor International, Inc.* | 36,000 | 607,680 | ||||||
First Solar, Inc.* | 17,400 | 775,953 | ||||||
Freescale Semiconductor Ltd.* | 27,400 | 691,302 | ||||||
Integrated Device Technology, Inc.* | 34,800 | 682,080 | ||||||
Intel Corp. | 1,249,690 | 45,351,250 | ||||||
International Rectifier Corp.* | 21,300 | 849,870 | ||||||
Intersil Corp., Class A | 33,600 | 486,192 | ||||||
KLA-Tencor Corp. | 47,080 | 3,310,666 | ||||||
Lam Research Corp. | 46,175 | 3,663,525 | ||||||
Linear Technology Corp. | 67,650 | $ | 3,084,840 | |||||
Marvell Technology Group Ltd. | 129,930 | 1,883,985 | ||||||
Maxim Integrated Products, Inc. | 81,250 | 2,589,438 | ||||||
Microchip Technology, Inc. | 55,700 | 2,512,627 | ||||||
Micron Technology, Inc.* | 270,150 | 9,457,952 | ||||||
Microsemi Corp.* | 31,400 | 891,132 | ||||||
MKS Instruments, Inc. | 13,200 | 483,120 | ||||||
Monolithic Power Systems, Inc. | 9,900 | 492,426 | ||||||
NVIDIA Corp. | 161,260 | 3,233,263 | ||||||
ON Semiconductor Corp.* | 113,500 | 1,149,755 | ||||||
PMC-Sierra, Inc.* | 34,200 | 313,272 | ||||||
Power Integrations, Inc. | 6,400 | 331,136 | ||||||
Rambus, Inc.* | 37,500 | 415,875 | ||||||
RF Micro Devices, Inc.* | 74,800 | 1,240,932 | ||||||
Semtech Corp.* | 18,000 | 496,260 | ||||||
Silicon Laboratories, Inc.* | 13,440 | 640,013 | ||||||
Skyworks Solutions, Inc. | 49,400 | 3,591,874 | ||||||
Spansion, Inc., Class A* | 15,200 | 520,144 | ||||||
SunEdison, Inc.* | 73,470 | 1,433,400 | ||||||
SunPower Corp.* | 11,900 | 307,377 | ||||||
Synaptics, Inc.* | 10,300 | 709,052 | ||||||
Teradyne, Inc. | 61,310 | 1,213,325 | ||||||
Tessera Technologies, Inc. | 13,400 | 479,184 | ||||||
Texas Instruments, Inc. | 270,990 | 14,488,480 | ||||||
TriQuint Semiconductor, Inc.* | 37,300 | 1,027,615 | ||||||
Veeco Instruments, Inc.* | 11,300 | 394,144 | ||||||
Xilinx, Inc. | 70,200 | 3,038,958 | ||||||
|
| |||||||
| 144,958,395 | ||||||||
|
| |||||||
Software (3.9%) | ||||||||
ACI Worldwide, Inc.* | 37,500 | 756,375 | ||||||
Activision Blizzard, Inc. | 129,100 | 2,601,365 | ||||||
Adobe Systems, Inc.* | 129,620 | 9,423,374 | ||||||
Advent Software, Inc. | 14,000 | 428,960 | ||||||
ANSYS, Inc.* | 23,300 | 1,910,600 | ||||||
Aspen Technology, Inc.* | 32,500 | 1,138,150 | ||||||
Autodesk, Inc.* | 62,550 | 3,756,753 | ||||||
Blackbaud, Inc. | 13,000 | 562,380 | ||||||
CA, Inc. | 93,050 | 2,833,372 | ||||||
Cadence Design Systems, Inc.* | 82,930 | 1,573,182 | ||||||
CDK Global, Inc. | 41,850 | 1,705,806 | ||||||
Citrix Systems, Inc.* | 43,350 | 2,765,730 | ||||||
CommVault Systems, Inc.* | 15,300 | 790,857 | ||||||
Covisint Corp.* | 11,928 | 31,609 | ||||||
Electronic Arts, Inc.* | 87,900 | 4,132,618 | ||||||
Epiq Systems, Inc. | 27,700 | 473,116 | ||||||
FactSet Research Systems, Inc. | 12,500 | 1,759,375 | ||||||
Fair Isaac Corp. | 13,100 | 947,130 | ||||||
FireEye, Inc.* | 22,300 | 704,234 | ||||||
Fortinet, Inc.* | 40,400 | 1,238,664 | ||||||
Guidewire Software, Inc.* | 13,500 | 683,505 | ||||||
Infoblox, Inc.* | 2,200 | 44,462 | ||||||
Informatica Corp.* | 37,700 | 1,437,689 | ||||||
Intuit, Inc. | 72,950 | 6,725,260 | ||||||
Manhattan Associates, Inc.* | 24,000 | 977,280 | ||||||
Mentor Graphics Corp. | 37,800 | 828,576 | ||||||
Microsoft Corp. | 2,073,650 | 96,321,043 | ||||||
MicroStrategy, Inc., Class A* | 3,000 | 487,200 | ||||||
NetScout Systems, Inc.* | 10,700 | 390,978 | ||||||
NetSuite, Inc.* | 8,900 | 971,613 | ||||||
Nuance Communications, Inc.* | 84,490 | 1,205,672 | ||||||
Oracle Corp. | 829,112 | 37,285,167 | ||||||
See Notes to Financial Statements.
20
Table of Contents
EQ ADVISORS TRUST
EQ/COMMON STOCK INDEX PORTFOLIO
PORTFOLIO OF INVESTMENTS (Continued)
December 31, 2014
| Number of Shares | Value (Note 1) | |||||||
Pegasystems, Inc. | 13,500 | $ | 280,395 | |||||
Progress Software Corp.* | 19,000 | 513,380 | ||||||
PTC, Inc.* | 33,950 | 1,244,268 | ||||||
Qlik Technologies, Inc.* | 23,900 | 738,271 | ||||||
Red Hat, Inc.* | 53,800 | 3,719,732 | ||||||
Rovi Corp.* | 41,550 | 938,615 | ||||||
Salesforce.com, Inc.* | 154,100 | 9,139,671 | ||||||
ServiceNow, Inc.* | 37,500 | 2,544,375 | ||||||
SolarWinds, Inc.* | 19,400 | 966,702 | ||||||
Solera Holdings, Inc. | 21,110 | 1,080,410 | ||||||
Splunk, Inc.* | 29,100 | 1,715,445 | ||||||
SS&C Technologies Holdings, Inc. | 14,100 | 824,709 | ||||||
Symantec Corp. | 178,090 | 4,568,899 | ||||||
Synchronoss Technologies, Inc.* | 10,910 | 456,693 | ||||||
Synopsys, Inc.* | 48,120 | 2,091,776 | ||||||
Tableau Software, Inc., Class A* | 9,900 | 839,124 | ||||||
Take-Two Interactive Software, Inc.* | 25,800 | 723,174 | ||||||
Tyler Technologies, Inc.* | 9,400 | 1,028,736 | ||||||
Ultimate Software Group, Inc.* | 6,600 | 968,979 | ||||||
Verint Systems, Inc.* | 14,800 | 862,544 | ||||||
VMware, Inc., Class A* | 23,100 | 1,906,212 | ||||||
Workday, Inc., Class A* | 24,400 | 1,991,284 | ||||||
Zynga, Inc., Class A* | 123,800 | 329,308 | ||||||
|
| |||||||
| 226,364,797 | ||||||||
|
| |||||||
Technology Hardware, Storage & Peripherals (3.9%) |
| |||||||
3D Systems Corp.* | 28,530 | 937,781 | ||||||
Apple, Inc. | 1,513,695 | 167,081,654 | ||||||
Diebold, Inc. | 16,050 | 555,972 | ||||||
Electronics for Imaging, Inc.* | 12,900 | 552,507 | ||||||
EMC Corp. | 516,790 | 15,369,335 | ||||||
Hewlett-Packard Co. | 480,832 | 19,295,788 | ||||||
Lexmark International, Inc., Class A | 18,690 | 771,336 | ||||||
NCR Corp.* | 45,900 | 1,337,526 | ||||||
NetApp, Inc. | 83,650 | 3,467,293 | ||||||
Nimble Storage, Inc.* | 15,300 | 420,750 | ||||||
SanDisk Corp. | 57,090 | 5,593,678 | ||||||
Stratasys Ltd.* | 12,900 | 1,072,119 | ||||||
Western Digital Corp. | 59,770 | 6,616,539 | ||||||
|
| |||||||
| 223,072,278 | ||||||||
|
| |||||||
Total Information Technology | 1,084,992,760 | |||||||
|
| |||||||
Materials (3.6%) | ||||||||
Chemicals (2.5%) | ||||||||
Air Products and Chemicals, Inc. | 55,380 | 7,987,457 | ||||||
Airgas, Inc. | 17,300 | 1,992,614 | ||||||
Albemarle Corp. | 23,000 | 1,382,990 | ||||||
Ashland, Inc. | 21,064 | 2,522,625 | ||||||
Axiall Corp. | 20,500 | 870,635 | ||||||
Balchem Corp. | 7,700 | 513,128 | ||||||
Cabot Corp. | 19,700 | 864,042 | ||||||
Celanese Corp. | 44,500 | 2,668,220 | ||||||
CF Industries Holdings, Inc. | 14,702 | 4,006,883 | ||||||
Chemtura Corp.* | 31,600 | 781,468 | ||||||
Cytec Industries, Inc. | 23,800 | 1,098,846 | ||||||
Dow Chemical Co. | 303,980 | 13,864,528 | ||||||
E.I. du Pont de Nemours & Co. | 231,840 | 17,142,250 | ||||||
Eastman Chemical Co. | 39,128 | $ | 2,968,250 | |||||
Ecolab, Inc. | 66,888 | 6,991,134 | ||||||
FMC Corp. | 38,600 | 2,201,358 | ||||||
H.B. Fuller Co. | 16,100 | 716,933 | ||||||
Huntsman Corp. | 55,200 | 1,257,456 | ||||||
International Flavors & Fragrances, Inc. | 22,000 | 2,229,920 | ||||||
Kronos Worldwide, Inc. | 20,400 | 265,608 | ||||||
LyondellBasell Industries N.V., Class A | 106,200 | 8,431,218 | ||||||
Minerals Technologies, Inc. | 11,400 | 791,730 | ||||||
Monsanto Co. | 132,300 | 15,805,881 | ||||||
Mosaic Co. | 86,530 | 3,950,094 | ||||||
NewMarket Corp. | 3,300 | 1,331,649 | ||||||
Olin Corp. | 21,500 | 489,555 | ||||||
Platform Specialty Products Corp.* | 22,200 | 515,484 | ||||||
PolyOne Corp. | 31,700 | 1,201,747 | ||||||
PPG Industries, Inc. | 36,000 | 8,321,400 | ||||||
Praxair, Inc. | 76,300 | 9,885,428 | ||||||
Rockwood Holdings, Inc. | 19,730 | 1,554,724 | ||||||
RPM International, Inc. | 37,150 | 1,883,876 | ||||||
Scotts Miracle-Gro Co., Class A | 11,900 | 741,608 | ||||||
Sensient Technologies Corp. | 12,500 | 754,250 | ||||||
Sherwin-Williams Co. | 22,300 | 5,865,792 | ||||||
Sigma-Aldrich Corp. | 30,500 | 4,186,735 | ||||||
Valspar Corp. | 25,300 | 2,187,944 | ||||||
W.R. Grace & Co.* | 22,000 | 2,098,580 | ||||||
Westlake Chemical Corp. | 14,400 | 879,696 | ||||||
|
| |||||||
| 143,203,736 | ||||||||
|
| |||||||
Construction Materials (0.1%) |
| |||||||
Eagle Materials, Inc. | 14,400 | 1,094,832 | ||||||
Martin Marietta Materials, Inc. | 17,730 | 1,955,974 | ||||||
Vulcan Materials Co. | 33,100 | 2,175,663 | ||||||
|
| |||||||
| 5,226,469 | ||||||||
|
| |||||||
Containers & Packaging (0.4%) |
| |||||||
AptarGroup, Inc. | 20,200 | 1,350,168 | ||||||
Avery Dennison Corp. | 26,550 | 1,377,414 | ||||||
Ball Corp. | 37,200 | 2,535,924 | ||||||
Bemis Co., Inc. | 29,800 | 1,347,258 | ||||||
Berry Plastics Group, Inc.* | 23,400 | 738,270 | ||||||
Crown Holdings, Inc.* | 37,150 | 1,890,935 | ||||||
Graphic Packaging Holding Co.* | 85,200 | 1,160,424 | ||||||
Greif, Inc., Class A | 1,400 | 66,122 | ||||||
MeadWestvaco Corp. | 49,400 | 2,192,866 | ||||||
Owens-Illinois, Inc.* | 46,650 | 1,259,083 | ||||||
Packaging Corp. of America | 26,500 | 2,068,325 | ||||||
Rock-Tenn Co., Class A | 38,600 | 2,353,828 | ||||||
Sealed Air Corp. | 55,360 | 2,348,925 | ||||||
Silgan Holdings, Inc. | 11,600 | 621,760 | ||||||
Sonoco Products Co. | 32,660 | 1,427,242 | ||||||
|
| |||||||
| 22,738,544 | ||||||||
|
| |||||||
Metals & Mining (0.5%) |
| |||||||
Alcoa, Inc. | 296,150 | 4,676,208 | ||||||
Allegheny Technologies, Inc. | 35,260 | 1,225,990 | ||||||
Carpenter Technology Corp. | 14,900 | 733,825 | ||||||
Commercial Metals Co. | 49,390 | 804,563 | ||||||
Compass Minerals International, Inc. | 12,400 | 1,076,692 | ||||||
See Notes to Financial Statements.
21
Table of Contents
EQ ADVISORS TRUST
EQ/COMMON STOCK INDEX PORTFOLIO
PORTFOLIO OF INVESTMENTS (Continued)
December 31, 2014
| Number of Shares | Value (Note 1) | |||||||
Freeport-McMoRan, Inc. | 267,494 | $ | 6,248,660 | |||||
Newmont Mining Corp. | 129,300 | 2,443,770 | ||||||
Nucor Corp. | 87,620 | 4,297,761 | ||||||
Reliance Steel & Aluminum Co. | 22,200 | 1,360,194 | ||||||
Royal Gold, Inc. | 18,000 | 1,128,600 | ||||||
Southern Copper Corp. | 50,544 | 1,425,341 | ||||||
Steel Dynamics, Inc. | 71,300 | 1,407,462 | ||||||
Tahoe Resources, Inc. | 14,900 | 206,663 | ||||||
United States Steel Corp. | 37,490 | 1,002,483 | ||||||
Worthington Industries, Inc. | 12,400 | 373,116 | ||||||
|
| |||||||
| 28,411,328 | ||||||||
|
| |||||||
Paper & Forest Products (0.1%) |
| |||||||
Domtar Corp. | 18,480 | 743,266 | ||||||
International Paper Co. | 116,850 | 6,260,823 | ||||||
KapStone Paper and Packaging Corp. | 23,200 | 679,992 | ||||||
Louisiana-Pacific Corp.* | 42,500 | 703,800 | ||||||
|
| |||||||
| 8,387,881 | ||||||||
|
| |||||||
Total Materials | 207,967,958 | |||||||
|
| |||||||
Telecommunication Services (2.0%) |
| |||||||
Diversified Telecommunication Services (1.9%) |
| |||||||
8x8, Inc.* | 1,000 | 9,160 | ||||||
AT&T, Inc. | 1,302,984 | 43,767,232 | ||||||
CenturyLink, Inc. | 152,979 | 6,054,909 | ||||||
Cincinnati Bell, Inc.* | 10,800 | 34,452 | ||||||
Cogent Communications Holdings, Inc. | 8,900 | 314,971 | ||||||
Consolidated Communications Holdings, Inc. | 2,300 | 64,009 | ||||||
FairPoint Communications, Inc.* | 1,500 | 21,315 | ||||||
Frontier Communications Corp. | 280,290 | 1,869,534 | ||||||
General Communication, Inc., Class A* | 2,200 | 30,250 | ||||||
Globalstar, Inc.* | 81,800 | 224,950 | ||||||
Hawaiian Telcom Holdco, Inc.* | 600 | 16,542 | ||||||
IDT Corp., Class B | 2,400 | 48,744 | ||||||
inContact, Inc.* | 6,800 | 59,772 | ||||||
Intelsat S.A.* | 3,600 | 62,496 | ||||||
Iridium Communications, Inc.* | 300 | 2,925 | ||||||
Level 3 Communications, Inc.* | 76,836 | 3,794,162 | ||||||
Lumos Networks Corp. | 100 | 1,682 | ||||||
magicJack VocalTec Ltd.* | 100 | 812 | ||||||
ORBCOMM, Inc.* | 3,100 | 20,274 | ||||||
Premiere Global Services, Inc.* | 1,700 | 18,054 | ||||||
Verizon Communications, Inc. | 1,045,340 | 48,901,005 | ||||||
Windstream Holdings, Inc. | 157,011 | 1,293,771 | ||||||
|
| |||||||
| 106,611,021 | ||||||||
|
| |||||||
Wireless Telecommunication Services (0.1%) |
| |||||||
Boingo Wireless, Inc.* | 3,100 | 23,777 | ||||||
Leap Wireless International, Inc. (b)* | 1,900 | 4,788 | ||||||
NTELOS Holdings Corp. | 3,600 | 15,084 | ||||||
RingCentral, Inc., Class A* | 2,000 | 29,840 | ||||||
SBA Communications Corp., Class A* | 33,300 | 3,688,308 | ||||||
Shenandoah Telecommunications Co. | 300 | 9,375 | ||||||
Spok Holdings, Inc. | 1,900 | $ | 32,984 | |||||
Sprint Corp.* | 240,579 | 998,403 | ||||||
Telephone & Data Systems, Inc. | 28,186 | 711,697 | ||||||
T-Mobile US, Inc.* | 69,200 | 1,864,248 | ||||||
U.S. Cellular Corp.* | 12,100 | 481,943 | ||||||
|
| |||||||
| 7,860,447 | ||||||||
|
| |||||||
Total Telecommunication Services | 114,471,468 | |||||||
|
| |||||||
Utilities (3.2%) | ||||||||
Electric Utilities (1.7%) |
| |||||||
ALLETE, Inc. | 10,500 | 578,970 | ||||||
American Electric Power Co., Inc. | 122,670 | 7,448,522 | ||||||
Cleco Corp. | 16,100 | 878,094 | ||||||
Duke Energy Corp. | 176,085 | 14,710,141 | ||||||
Edison International | 83,360 | 5,458,413 | ||||||
Entergy Corp. | 45,100 | 3,945,348 | ||||||
Exelon Corp. | 223,156 | 8,274,624 | ||||||
FirstEnergy Corp. | 106,804 | 4,164,288 | ||||||
Great Plains Energy, Inc. | 43,600 | 1,238,676 | ||||||
Hawaiian Electric Industries, Inc. | 34,200 | 1,145,016 | ||||||
IDACORP, Inc. | 11,450 | 757,875 | ||||||
ITC Holdings Corp. | 44,400 | 1,795,092 | ||||||
NextEra Energy, Inc. | 111,450 | 11,846,020 | ||||||
Northeast Utilities | 82,209 | 4,399,826 | ||||||
OGE Energy Corp. | 48,600 | 1,724,328 | ||||||
Pepco Holdings, Inc. | 69,250 | 1,864,903 | ||||||
Pinnacle West Capital Corp. | 32,500 | 2,220,075 | ||||||
PNM Resources, Inc. | 28,700 | 850,381 | ||||||
Portland General Electric Co. | 15,800 | 597,714 | ||||||
PPL Corp. | 171,050 | 6,214,246 | ||||||
Southern Co. | 221,750 | 10,890,143 | ||||||
UIL Holdings Corp. | 18,500 | 805,490 | ||||||
Westar Energy, Inc. | 30,000 | 1,237,200 | ||||||
Xcel Energy, Inc. | 122,480 | 4,399,482 | ||||||
|
| |||||||
| 97,444,867 | ||||||||
|
| |||||||
Gas Utilities (0.2%) |
| |||||||
AGL Resources, Inc. | 28,683 | 1,563,510 | ||||||
Atmos Energy Corp. | 25,200 | 1,404,648 | ||||||
Laclede Group, Inc. | 11,200 | 595,840 | ||||||
National Fuel Gas Co. | 21,100 | 1,467,083 | ||||||
New Jersey Resources Corp. | 9,800 | 599,760 | ||||||
ONE Gas, Inc. | 14,125 | 582,232 | ||||||
Piedmont Natural Gas Co., Inc. | 19,900 | 784,259 | ||||||
Questar Corp. | 47,000 | 1,188,160 | ||||||
South Jersey Industries, Inc. | 12,100 | 713,053 | ||||||
Southwest Gas Corp. | 17,200 | 1,063,132 | ||||||
UGI Corp. | 48,675 | 1,848,677 | ||||||
WGL Holdings, Inc. | 19,100 | 1,043,242 | ||||||
|
| |||||||
| 12,853,596 | ||||||||
|
| |||||||
Independent Power and Renewable Electricity Producers (0.1%) |
| |||||||
AES Corp. | 188,995 | 2,602,461 | ||||||
Calpine Corp.* | 110,300 | 2,440,939 | ||||||
Dynegy, Inc.* | 28,400 | 861,940 | ||||||
NRG Energy, Inc. | 87,821 | 2,366,776 | ||||||
|
| |||||||
| 8,272,116 | ||||||||
|
| |||||||
See Notes to Financial Statements.
22
Table of Contents
EQ ADVISORS TRUST
EQ/COMMON STOCK INDEX PORTFOLIO
PORTFOLIO OF INVESTMENTS (Continued)
December 31, 2014
| Number of Shares | Value (Note 1) | |||||||
Multi-Utilities (1.1%) |
| |||||||
Alliant Energy Corp. | 26,900 | $ | 1,786,698 | |||||
Ameren Corp. | 65,000 | 2,998,450 | ||||||
Avista Corp. | 19,200 | 678,720 | ||||||
Black Hills Corp. | 13,000 | 689,520 | ||||||
CenterPoint Energy, Inc. | 116,450 | 2,728,423 | ||||||
CMS Energy Corp. | 71,500 | 2,484,625 | ||||||
Consolidated Edison, Inc. | 74,600 | 4,924,346 | ||||||
Dominion Resources, Inc. | 144,850 | 11,138,965 | ||||||
DTE Energy Co. | 46,500 | 4,016,205 | ||||||
Integrys Energy Group, Inc. | 20,300 | 1,580,355 | ||||||
MDU Resources Group, Inc. | 48,250 | 1,133,875 | ||||||
NiSource, Inc. | 79,300 | 3,363,906 | ||||||
NorthWestern Corp. | 8,700 | 492,246 | ||||||
PG&E Corp. | 121,220 | 6,453,753 | ||||||
Public Service Enterprise Group, Inc. | 128,100 | 5,304,621 | ||||||
SCANA Corp. | 38,550 | 2,328,420 | ||||||
Sempra Energy | 62,290 | 6,936,614 | ||||||
TECO Energy, Inc. | 59,350 | 1,216,082 | ||||||
Vectren Corp. | 18,000 | 832,140 | ||||||
Wisconsin Energy Corp. | 55,100 | 2,905,974 | ||||||
|
| |||||||
| 63,993,938 | ||||||||
|
| |||||||
Water Utilities (0.1%) |
| |||||||
American Water Works Co., Inc. | 44,000 | 2,345,200 | ||||||
Aqua America, Inc. | 50,062 | 1,336,656 | ||||||
|
| |||||||
| 3,681,856 | ||||||||
|
| |||||||
Total Utilities | 186,246,373 | |||||||
|
| |||||||
Total Common Stocks (99.3%) | 5,723,027,927 | |||||||
|
| |||||||
| Number of Rights | Value (Note 1) | |||||||
RIGHTS: | ||||||||
Consumer Discretionary (0.0%) |
| |||||||
Media (0.0%) |
| |||||||
Liberty Broadband Corp., expiring 1/9/15* | 3,707 | $ | 35,216 | |||||
|
| |||||||
Total Consumer Discretionary | 35,216 | |||||||
|
| |||||||
Health Care (0.0%) | ||||||||
Biotechnology (0.0%) | ||||||||
Cubist Pharmaceuticals, Inc., expiring 12/31/49* | 8,800 | 352 | ||||||
|
| |||||||
Total Health Care | 352 | |||||||
|
| |||||||
Total Rights (0.0%) | 35,568 | |||||||
|
| |||||||
Total Investments (99.3%) | 5,723,063,495 | |||||||
Other Assets Less Liabilities (0.7%) | 42,612,773 | |||||||
|
| |||||||
Net Assets (100%) | $ | 5,765,676,268 | ||||||
|
| |||||||
| * | Non-income producing. |
| # | All, or a portion of security held by broker as collateral for financial futures contracts, with a total collateral value of $28,289,700. |
| (b) | Illiquid security. |
At December 31, 2014, the Portfolio had the following futures contracts open: (Note 1)
Purchases | Number of Contracts | Expiration Date | Original Value | Value at 12/31/2014 | Unrealized Appreciation/ (Depreciation) | |||||||||||||||
Russell 2000 Mini Index | 39 | March-15 | $ | 4,537,531 | $ | 4,682,730 | $ | 145,199 | ||||||||||||
S&P 500 E-Mini Index | 313 | March-15 | 31,746,203 | 32,120,060 | 373,857 | |||||||||||||||
|
| |||||||||||||||||||
| $ | 519,056 | |||||||||||||||||||
|
| |||||||||||||||||||
See Notes to Financial Statements.
23
Table of Contents
EQ ADVISORS TRUST
EQ/COMMON STOCK INDEX PORTFOLIO
PORTFOLIO OF INVESTMENTS (Continued)
December 31, 2014
The following is a summary of the inputs used to value the Portfolio’s assets and liabilities carried at fair value as of December 31, 2014:
The inputs or methodology used for valuing securities are not necessarily an indication of the risk associated with investing in those securities.
Various inputs are used in determining the value of the Portfolio’s investments. These inputs are summarized in the three broad levels listed below:
| Investment Type | Level 1 Quoted Prices in Active Markets For Identical Securities (a) | Level 2 Significant Other Observable Inputs (including quoted prices for similar securities, interest rates, prepayment speeds, credit risk, etc.) | Level 3 Significant Unobservable Inputs (including the Portfolio’s own assumptions in determining the fair value of investments) | Total | ||||||||||||
Assets: | ||||||||||||||||
Common Stocks | ||||||||||||||||
Consumer Discretionary | $ | 733,614,749 | $ | — | $ | — | $ | 733,614,749 | ||||||||
Consumer Staples | 489,164,817 | — | — | 489,164,817 | ||||||||||||
Energy | 429,117,980 | — | — | 429,117,980 | ||||||||||||
Financials | 1,025,915,038 | — | — | 1,025,915,038 | ||||||||||||
Health Care | 800,044,910 | — | — | 800,044,910 | ||||||||||||
Industrials | 651,491,874 | — | — | 651,491,874 | ||||||||||||
Information Technology | 1,084,992,760 | — | — | 1,084,992,760 | ||||||||||||
Materials | 207,967,958 | — | — | 207,967,958 | ||||||||||||
Telecommunication Services | 114,466,680 | 4,788 | — | 114,471,468 | ||||||||||||
Utilities | 186,246,373 | — | — | 186,246,373 | ||||||||||||
Futures | 519,056 | — | — | 519,056 | ||||||||||||
Rights | ||||||||||||||||
Consumer Discretionary | 35,216 | — | — | 35,216 | ||||||||||||
Health Care | 352 | — | — | 352 | ||||||||||||
|
|
|
|
|
|
|
| |||||||||
Total Assets | $ | 5,723,577,763 | $ | 4,788 | $ | — | $ | 5,723,582,551 | ||||||||
|
|
|
|
|
|
|
| |||||||||
Total Liabilities | $ | — | $ | — | $ | — | $ | — | ||||||||
|
|
|
|
|
|
|
| |||||||||
Total | $ | 5,723,577,763 | $ | 4,788 | $ | — | $ | 5,723,582,551 | ||||||||
|
|
|
|
|
|
|
| |||||||||
| (a) | A security with a market value of $3,724,416 transferred from Level 2 to Level 1 at the end of the period due to active trading. |
There were no additional transfers between Levels 1, 2 or 3 during the year ended December 31, 2014.
Fair Values of Derivative Instruments as of December 31, 2014:
Statement of Assets and Liabilities | ||||||
Derivatives Not Accounted for as | Asset Derivatives | Fair Value | ||||
Equity contracts | Receivables, Net assets – Unrealized appreciation | $ | 519,056 | * | ||
|
| |||||
| * | Includes cumulative appreciation/depreciation of futures contracts as reported in the Portfolio of Investments. Only current day’s variation margin is reported within the Statement of Assets & Liabilities. |
The Effect of Derivative Instruments on the Statement of Operations for the year ended December 31, 2014:
| Amount of Realized Gain or (Loss) on Derivatives Recognized in Income | ||||||||
Derivatives Not Accounted for as | Futures | Total | ||||||
Equity contracts | $ | 3,104,439 | $ | 3,104,439 | ||||
|
|
|
| |||||
See Notes to Financial Statements.
24
Table of Contents
EQ ADVISORS TRUST
EQ/COMMON STOCK INDEX PORTFOLIO
PORTFOLIO OF INVESTMENTS (Continued)
December 31, 2014
The Effect of Derivative Instruments on the Statement of Operations for the year ended December 31, 2014:
| Amount of Unrealized Appreciation or (Depreciation) on Derivatives Recognized in Income | ||||||||
Derivatives Not Accounted for as | Futures | Total | ||||||
Equity contracts | $ | 74,353 | $ | 74,353 | ||||
|
|
|
| |||||
| ^ | The Portfolio held futures contracts as a substitute for investing in conventional securities. |
The Portfolio held futures contracts with an average notional balance of approximately $40,930,000 during the year ended December 31, 2014.
Investment security transactions for the year ended December 31, 2014 were as follows:
Cost of Purchases: | ||||
Long-term investments other than U.S. government debt securities | $ | 199,699,142 | ||
Net Proceeds of Sales and Redemptions: | ||||
Long-term investments other than U.S. government debt securities | $ | 661,481,810 |
As of December 31, 2014, the gross unrealized appreciation (depreciation) of investments based on the aggregate cost of investments for Federal income tax purposes was as follows:
Aggregate gross unrealized appreciation | $ | 2,982,259,355 | ||
Aggregate gross unrealized depreciation | (252,306,680 | ) | ||
|
| |||
Net unrealized appreciation | $ | 2,729,952,675 | ||
|
| |||
Federal income tax cost of investments | $ | 2,993,110,820 | ||
|
|
See Notes to Financial Statements.
25
Table of Contents
EQ ADVISORS TRUST
EQ/COMMON STOCK INDEX PORTFOLIO
STATEMENT OF ASSETS AND LIABILITIES December 31, 2014
ASSETS | ||||
Investments at value (Cost $2,956,563,194) | $ | 5,723,063,495 | ||
Cash | 40,270,695 | |||
Dividends, interest and other receivables | 7,515,302 | |||
Receivable from Separate Accounts for Trust shares sold | 2,100,800 | |||
Other assets | 11,776 | |||
|
| |||
Total assets | 5,772,962,068 | |||
|
| |||
LIABILITIES | ||||
Payable to Separate Accounts for Trust shares redeemed | 3,180,183 | |||
Investment management fees payable | 1,699,312 | |||
Distribution fees payable – Class IA | 911,619 | |||
Administrative fees payable | 494,754 | |||
Due to broker for futures variation margin | 418,125 | |||
Distribution fees payable – Class IB | 312,895 | |||
Trustees’ fees payable | 21,842 | |||
Accrued expenses | 247,070 | |||
|
| |||
Total liabilities | 7,285,800 | |||
|
| |||
NET ASSETS | $ | 5,765,676,268 | ||
|
| |||
Net assets were comprised of: | ||||
Paid in capital | $ | 4,454,388,638 | ||
Accumulated undistributed net investment income (loss) | 6,883,471 | |||
Accumulated undistributed net realized gain (loss) on investments and futures | (1,462,615,198 | ) | ||
Net unrealized appreciation (depreciation) on investments and futures | 2,767,019,357 | |||
|
| |||
Net assets | $ | 5,765,676,268 | ||
|
| |||
Class IA | ||||
Net asset value, offering and redemption price per share, $4,292,750,480 / 163,395,617 shares outstanding (unlimited amount authorized: $0.01 par value) | $ | 26.27 | ||
|
| |||
Class IB | ||||
Net asset value, offering and redemption price per share, $1,472,925,788 / 56,367,324 shares outstanding (unlimited amount authorized: $0.01 par value) | $ | 26.13 | ||
|
|
STATEMENT OF OPERATIONS
For the Year Ended December 31, 2014
INVESTMENT INCOME | ||||
Dividends (net of $32,994 foreign withholding tax) | $ | 111,119,006 | ||
Interest | 40,141 | |||
|
| |||
Total income | 111,159,147 | |||
|
| |||
EXPENSES | ||||
Investment management fees | 19,655,213 | |||
Distribution fees – Class IA | 10,527,473 | |||
Administrative fees | 5,731,635 | |||
Distribution fees – Class IB | 3,630,770 | |||
Printing and mailing expenses | 427,867 | |||
Professional fees | 162,414 | |||
Custodian fees | 151,500 | |||
Trustees’ fees | 143,710 | |||
Miscellaneous | 144,009 | |||
|
| |||
Total expenses | 40,574,591 | |||
|
| |||
NET INVESTMENT INCOME (LOSS) | 70,584,556 | |||
|
| |||
REALIZED AND UNREALIZED GAIN (LOSS) | ||||
Realized gain (loss) on: | ||||
Investments | 269,491,625 | |||
Futures | 3,104,439 | |||
|
| |||
Net realized gain (loss) | 272,596,064 | |||
|
| |||
Change in unrealized appreciation (depreciation) on: | ||||
Investments | 301,806,406 | |||
Futures | 74,353 | |||
|
| |||
Net change in unrealized appreciation (depreciation) | 301,880,759 | |||
|
| |||
NET REALIZED AND UNREALIZED GAIN (LOSS) | 574,476,823 | |||
|
| |||
NET INCREASE (DECREASE) IN NET ASSETS RESULTING FROM OPERATIONS | $ | 645,061,379 | ||
|
|
See Notes to Financial Statements.
26
Table of Contents
EQ ADVISORS TRUST
EQ/COMMON STOCK INDEX PORTFOLIO
STATEMENT OF CHANGES IN NET ASSETS
| Year Ended December 31, | ||||||||
| 2014 | 2013 | |||||||
INCREASE (DECREASE) IN NET ASSETS FROM OPERATIONS: | ||||||||
Net investment income (loss) | $ | 70,584,556 | $ | 68,233,177 | ||||
Net realized gain (loss) on investments and futures | 272,596,064 | 222,943,858 | ||||||
Net change in unrealized appreciation (depreciation) on investments and futures | 301,880,759 | 1,174,006,009 | ||||||
|
|
|
| |||||
NET INCREASE (DECREASE) IN NET ASSETS RESULTING FROM OPERATIONS | 645,061,379 | 1,465,183,044 | ||||||
|
|
|
| |||||
DIVIDENDS : | ||||||||
Dividends from net investment income | ||||||||
Class IA | (51,658,815 | ) | (50,063,367 | ) | ||||
Class IB | (17,849,224 | ) | (17,454,803 | ) | ||||
|
|
|
| |||||
TOTAL DIVIDENDS : | (69,508,039 | ) | (67,518,170 | ) | ||||
|
|
|
| |||||
CAPITAL SHARES TRANSACTIONS: | ||||||||
Class IA | ||||||||
Capital shares sold [ 2,026,588 and 2,307,638 shares, respectively ] | 50,668,821 | 48,773,350 | ||||||
Capital shares issued in reinvestment of dividends [ 1,968,067 and 2,155,506 shares, | 51,658,815 | 50,063,367 | ||||||
Capital shares repurchased [ (17,757,923) and (22,111,499) shares, respectively ] | (442,333,192 | ) | (466,270,226 | ) | ||||
|
|
|
| |||||
Total Class IA transactions | (340,005,556 | ) | (367,433,509 | ) | ||||
|
|
|
| |||||
Class IB | ||||||||
Capital shares sold [ 2,585,192 and 4,387,904 shares, respectively ] | 63,347,697 | 91,232,820 | ||||||
Capital shares issued in reinvestment of dividends [ 683,686 and 755,531 shares, respectively ] | 17,849,224 | 17,454,803 | ||||||
Capital shares repurchased [ (8,854,542) and (9,429,127) shares, respectively ] | (217,603,296 | ) | (199,841,093 | ) | ||||
|
|
|
| |||||
Total Class IB transactions | (136,406,375 | ) | (91,153,470 | ) | ||||
|
|
|
| |||||
NET INCREASE (DECREASE) IN NET ASSETS RESULTING FROM CAPITAL SHARE TRANSACTIONS | (476,411,931 | ) | (458,586,979 | ) | ||||
|
|
|
| |||||
TOTAL INCREASE (DECREASE) IN NET ASSETS | 99,141,409 | 939,077,895 | ||||||
NET ASSETS: | ||||||||
Beginning of year | 5,666,534,859 | 4,727,456,964 | ||||||
|
|
|
| |||||
End of year (a) | $ | 5,765,676,268 | $ | 5,666,534,859 | ||||
|
|
|
|
| ||||
(a) Includes accumulated undistributed (overdistributed) net investment income (loss) of | $ | 6,883,471 | $ | 5,352,127 | ||||
|
|
|
| |||||
See Notes to Financial Statements.
27
Table of Contents
EQ ADVISORS TRUST
EQ/COMMON STOCK INDEX PORTFOLIO
FINANCIAL HIGHLIGHTS
| Year Ended December 31, | ||||||||||||||||||||
| Class IA | 2014 | 2013 | 2012 | 2011 | 2010 | |||||||||||||||
Net asset value, beginning of year | $ | 23.73 | $ | 18.13 | $ | 15.94 | $ | 16.07 | $ | 14.04 | ||||||||||
|
|
|
|
|
|
|
|
|
| |||||||||||
Income (loss) from investment operations: | ||||||||||||||||||||
Net investment income (loss) (e) | 0.31 | 0.27 | 0.27 | 0.25 | 0.22 | |||||||||||||||
Net realized and unrealized gain (loss) on investments and futures | 2.55 | 5.61 | 2.21 | (0.13 | ) | 2.04 | ||||||||||||||
|
|
|
|
|
|
|
|
|
| |||||||||||
Total from investment operations | 2.86 | 5.88 | 2.48 | 0.12 | 2.26 | |||||||||||||||
|
|
|
|
|
|
|
|
|
| |||||||||||
Less distributions: | ||||||||||||||||||||
Dividends from net investment income | (0.32 | ) | (0.28 | ) | (0.29 | ) | (0.25 | ) | (0.23 | ) | ||||||||||
|
|
|
|
|
|
|
|
|
| |||||||||||
Net asset value, end of year | $ | 26.27 | $ | 23.73 | $ | 18.13 | $ | 15.94 | $ | 16.07 | ||||||||||
|
|
|
|
|
|
|
|
|
| |||||||||||
Total return | 12.05 | % | 32.49 | % | 15.54 | % | 0.82 | % | 16.14 | % | ||||||||||
|
|
|
|
|
|
|
|
|
| |||||||||||
Ratios/Supplemental Data: | ||||||||||||||||||||
Net assets, end of year (000’s) | $ | 4,292,750 | $ | 4,204,128 | $ | 3,532,647 | $ | 3,421,651 | $ | 3,823,474 | ||||||||||
Ratio of expenses to average net assets | 0.72 | % | 0.72 | % | 0.72 | % | 0.47 | % | 0.47 | % | ||||||||||
Ratio of net investment income (loss) to average net assets | 1.25 | % | 1.30 | % | 1.54 | % | 1.50 | % | 1.53 | % | ||||||||||
Portfolio turnover rate^ | 4 | % | 4 | % | 3 | % | 5 | % | 10 | % | ||||||||||
| Year Ended December 31, | ||||||||||||||||||||
| Class IB | 2014 | 2013 | 2012 | 2011 | 2010 | |||||||||||||||
Net asset value, beginning of year | $ | 23.61 | $ | 18.04 | $ | 15.85 | $ | 15.99 | $ | 13.96 | ||||||||||
|
|
|
|
|
|
|
|
|
| |||||||||||
Income (loss) from investment operations: | ||||||||||||||||||||
Net investment income (loss) (e) | 0.31 | 0.27 | 0.27 | 0.20 | 0.18 | |||||||||||||||
Net realized and unrealized gain (loss) on investments and futures | 2.53 | 5.58 | 2.21 | (0.13 | ) | 2.04 | ||||||||||||||
|
|
|
|
|
|
|
|
|
| |||||||||||
Total from investment operations | 2.84 | 5.85 | 2.48 | 0.07 | 2.22 | |||||||||||||||
|
|
|
|
|
|
|
|
|
| |||||||||||
Less distributions: | ||||||||||||||||||||
Dividends from net investment income | (0.32 | ) | (0.28 | ) | (0.29 | ) | (0.21 | ) | (0.19 | ) | ||||||||||
|
|
|
|
|
|
|
|
|
| |||||||||||
Net asset value, end of year | $ | 26.13 | $ | 23.61 | $ | 18.04 | $ | 15.85 | $ | 15.99 | ||||||||||
|
|
|
|
|
|
|
|
|
| |||||||||||
Total return | 12.03 | % | 32.48 | % | 15.62 | % | 0.50 | % | 15.93 | % | ||||||||||
|
|
|
|
|
|
|
|
|
| |||||||||||
Ratios/Supplemental Data: | ||||||||||||||||||||
Net assets, end of year (000’s) | $ | 1,472,926 | $ | 1,462,407 | $ | 1,194,810 | $ | 1,152,609 | $ | 1,297,833 | ||||||||||
Ratio of expenses to average net assets | 0.72 | % | 0.72 | % | 0.72 | % | 0.72 | % | 0.72 | % | ||||||||||
Ratio of net investment income (loss) to average net assets | 1.25 | % | 1.30 | % | 1.54 | % | 1.25 | % | 1.28 | % | ||||||||||
Portfolio turnover rate^ | 4 | % | 4 | % | 3 | % | 5 | % | 10 | % | ||||||||||
| ^ | Portfolio turnover rate excludes derivatives, if any. |
| (e) | Net investment income (loss) per share is based on average shares outstanding. |
See Notes to Financial Statements.
28
Table of Contents
EQ/CORE BOND INDEX PORTFOLIO (Unaudited)
INVESTMENT MANAGER
| Ø | AXA Equitable Funds Management Group, LLC |
INVESTMENT SUB-ADVISER
| Ø | SSgA Funds Management, Inc. |
PERFORMANCE RESULTS
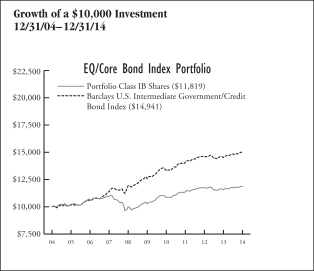
| Annualized Total Returns as of 12/31/14 | ||||||||||||
| 1 Year | 5 Years | 10 Years/ Since Incept. | ||||||||||
Portfolio – Class IA Shares | 2.36 | % | 2.97 | % | 1.86 | % | ||||||
Portfolio – Class IB Shares | 2.46 | 2.88 | 1.68 | |||||||||
Portfolio – Class K Shares*** | 2.62 | N/A | 1.62 | |||||||||
Barclays U.S. Intermediate Government/Credit Bond Index | 3.13 | 3.54 | 4.10 | |||||||||
*** Date of inception 8/26/11.
Returns for periods greater than one year are annualized. |
| |||||||||||
Past performance is not indicative of future results.
PERFORMANCE SUMMARY
The Portfolio’s Class IB shares returned 2.46% for the year ended December 31, 2014. The Portfolio’s benchmark, the Barclays U.S. Intermediate Government/Credit Bond Index, returned 3.13% over the same period.
Portfolio Highlights
For the year ended December 31, 2014
2014 was an unexpected year for U.S. fixed income as treasuries posted their biggest returns since 2011, bolstered by a global slowdown and low inflation, even as the U.S. economy displayed signs of healthy growth from mid-year onward. Conversely, the year didn’t begin as it ended, starting off with weak employment reports and a dismal first quarter gross domestic product (GDP). Things quickly changed, however, with a clearer growth picture showing better GDP and employment prints from second quarter and onward. The Federal Reserve also weighed in on the situation, showing patience with any possible rate increases over the course of the year but notably ending the quantitative easing (QE) program in October that began in 2008.
The annual return information by major components came in as follows: Intermediate U.S. Treasury 2.57%, Intermediate U.S. Agency 2.05%, Intermediate Corporate 4.35% and Intermediate Non-Corporate at 3.46%.
It was a series of geopolitical events and increased volatility in stock and commodity markets over the course of 2014, that provided support for U.S. government bonds as tensions between Russia and Ukraine peaked in the second quarter, the U.S. began airstrikes in Syria to battle ISIS and the Scottish independence referendum caused investor uneasiness in quarter three. The relatively higher yields on U.S. bonds versus other countries such as Germany and Japan also assisted in the rally as spreads between the U.S. generic 10 year Treasury and its G7 peers hit the highest since November 2006 with the soaring U.S. dollar adding to the allure for U.S. denominated assets. Against this backdrop, the Portfolio slightly underperformed its benchmark.
Portfolio Characteristics As of December 31, 2014 | ||||
Weighted Average Life (Years) | 4.17 | |||
Weighted Average Coupon (%) | 2.75 | |||
Weighted Average Modified Duration (Years)* | 3.89 | |||
Weighted Average Rating** | AA3 | |||
* Modified duration is a measure of the price sensitivity of the Portfolio to interest rate movements, taking into account specific features of the securities in which it invests.
** Weighted Average Rating has been provided by the Investment Sub-Adviser. A credit rating is an assessment provided by a nationally recognized statistical rating organization (NRSRO) of the creditworthiness of an issuer with respect to debt obligations, including specific securities, money market instruments or other debts. Ratings are measured on a scale that generally ranges from AAA (highest) to D (lowest); ratings are subject to change without notice. |
| |||
29
Table of Contents
EQ/CORE BOND INDEX PORTFOLIO (Unaudited)
Distribution of Assets by Sector as of December 31, 2014 | % of Net Assets | |||
Government Securities | 61.3 | % | ||
Corporate Bonds | 31.7 | |||
Investment Companies | 6.2 | |||
Preferred Stocks | 0.0 | # | ||
Cash and Other | 0.8 | |||
|
| |||
Total | 100.0 | % | ||
|
| |||
# Less than 0.05% | ||||
UNDERSTANDING YOUR EXPENSES:
As a shareholder of the Portfolio, you incur two types of costs:
(1) transaction costs, including applicable sales charges and redemption fees; and (2) ongoing costs, including management fees, distribution and/or service (12b-1) fees (in the case of Class IA and Class IB shares of the Trust), and other Portfolio expenses. These examples are intended to help you understand your ongoing costs (in dollars) of investing in the Portfolio and to compare these costs with the ongoing costs of investing in other mutual funds.
The examples are based on an investment of $1,000 invested at the beginning of the six-month period ended December 31, 2014 and held for the entire six-month period.
Actual Expenses
The first line of the following table provides information about actual account values and actual expenses. You may use the information in this line, together with the amount you invested, to estimate the expenses that you paid over the period. Simply divide your account value by $1,000 (for example, an $8,600 account value divided by $1,000 = 8.6), then multiply the result by the number in the first line under the heading entitled “Expenses Paid During Period” to estimate the expenses you paid on your account during this period.
Hypothetical Example for Comparison Purposes
The second line of the following table provides information about hypothetical account values and hypothetical expenses based on the Portfolio’s actual expense ratio and an assumed rate of return of 5% per year before expenses, which is not the Portfolio’s actual return. The hypothetical account values and expenses may not be used to estimate the actual ending account balance or expenses you paid for the period. You may use this information to compare the ongoing costs of investing in the Portfolio and other funds. To do so, compare this 5% hypothetical example with the 5% hypothetical examples that appear in the shareholder reports of the other funds.
Please note that the expenses shown in the table are meant to highlight your ongoing costs only and do not reflect any transactional costs, such as sales charges (loads), redemption fees, or exchange fees. Therefore, the second line of the table is useful in comparing ongoing costs only, and will not help you determine the relative total costs of owning different funds. In addition, if these transactional costs were included, your costs would have been higher. Also note that the table does not reflect any variable life insurance or variable annuity contract-related fees and expenses, which would increase overall fees and expenses.
EXAMPLE
| Beginning Account Value 7/1/14 | Ending Account Value 12/31/14 | Expenses 12/31/14 | ||||||||||
Class IA | ||||||||||||
Actual | $1,000.00 | $1,004.31 | $3.59 | |||||||||
Hypothetical (5% average annual return before expenses) | 1,000.00 | 1,021.62 | 3.62 | |||||||||
Class IB | ||||||||||||
Actual | 1,000.00 | 1,005.32 | 3.59 | |||||||||
Hypothetical (5% average annual return before expenses) | 1,000.00 | 1,021.62 | 3.62 | |||||||||
Class K | ||||||||||||
Actual | 1,000.00 | 1,005.85 | 2.33 | |||||||||
Hypothetical (5% average annual return before expenses) | 1,000.00 | 1,022.88 | 2.35 | |||||||||
* Expenses are equal to the Portfolio’s Class IA, Class IB and Class K shares annualized expense ratios of 0.71%, 0.71% and 0.46%, respectively, multiplied by the average account value over the period, and multiplied by 184/365 (to reflect the one-half year period). |
| |||||||||||
30
Table of Contents
EQ ADVISORS TRUST
EQ/CORE BOND INDEX PORTFOLIO
PORTFOLIO OF INVESTMENTS
December 31, 2014
Principal Amount | Value (Note 1) | |||||||
LONG-TERM DEBT SECURITIES: |
| |||||||
Corporate Bonds (31.7%) | ||||||||
Consumer Discretionary (2.0%) | ||||||||
Auto Components (0.1%) | ||||||||
Delphi Corp. | ||||||||
6.125%, 5/15/21 | $ | 1,500,000 | $ | 1,621,875 | ||||
4.150%, 3/15/24 | 865,000 | 886,625 | ||||||
Johnson Controls, Inc. | ||||||||
5.500%, 1/15/16 | 1,000,000 | 1,047,225 | ||||||
1.400%, 11/2/17 | 360,000 | 357,383 | ||||||
5.000%, 3/30/20 | 919,000 | 1,007,272 | ||||||
4.250%, 3/1/21 | 680,000 | 728,512 | ||||||
3.625%, 7/2/24 | 214,000 | 215,447 | ||||||
Magna International, Inc. | ||||||||
3.625%, 6/15/24 | 1,200,000 | 1,205,031 | ||||||
|
| |||||||
| 7,069,370 | ||||||||
|
| |||||||
Diversified Consumer Services (0.0%) |
| |||||||
Graham Holdings Co. | ||||||||
7.250%, 2/1/19 | 500,000 | 562,359 | ||||||
|
| |||||||
Hotels, Restaurants & Leisure (0.2%) |
| |||||||
Brinker International, Inc. | ||||||||
2.600%, 5/15/18 | 175,000 | 174,562 | ||||||
3.875%, 5/15/23 | 250,000 | 249,063 | ||||||
Carnival Corp. | ||||||||
1.875%, 12/15/17 | 600,000 | 595,428 | ||||||
3.950%, 10/15/20 | 666,000 | 694,954 | ||||||
Hyatt Hotels Corp. | ||||||||
3.875%, 8/15/16 | 350,000 | 364,066 | ||||||
5.375%, 8/15/21 | 350,000 | 401,605 | ||||||
International Game Technology |
| |||||||
7.500%, 6/15/19 | 1,202,000 | 1,285,886 | ||||||
5.500%, 6/15/20 | 100,000 | 102,471 | ||||||
Marriott International, Inc. | ||||||||
3.375%, 10/15/20 | 626,000 | 639,552 | ||||||
3.250%, 9/15/22 | 1,700,000 | 1,704,510 | ||||||
McDonald’s Corp. | ||||||||
5.800%, 10/15/17 | 1,000,000 | 1,115,933 | ||||||
5.350%, 3/1/18 | 968,000 | 1,076,038 | ||||||
5.000%, 2/1/19 | 750,000 | 833,698 | ||||||
3.500%, 7/15/20 | 150,000 | 158,628 | ||||||
3.625%, 5/20/21 | 400,000 | 424,609 | ||||||
3.250%, 6/10/24 | 1,000,000 | 1,015,897 | ||||||
Starbucks Corp. | ||||||||
0.875%, 12/5/16 | 286,000 | 284,912 | ||||||
6.250%, 8/15/17 | 600,000 | 673,559 | ||||||
3.850%, 10/1/23 | 850,000 | 904,939 | ||||||
Wyndham Worldwide Corp. | ||||||||
2.500%, 3/1/18 | 950,000 | 950,000 | ||||||
4.250%, 3/1/22 | 1,094,000 | 1,115,880 | ||||||
Yum! Brands, Inc. | ||||||||
5.300%, 9/15/19 | 100,000 | 110,661 | ||||||
3.875%, 11/1/20 | 1,125,000 | 1,186,861 | ||||||
|
| |||||||
| 16,063,712 | ||||||||
|
| |||||||
Household Durables (0.0%) |
| |||||||
Leggett & Platt, Inc. | ||||||||
3.400%, 8/15/22 | 250,000 | 251,924 | ||||||
3.800%, 11/15/24 | 300,000 | 304,630 | ||||||
Mohawk Industries, Inc. | ||||||||
3.850%, 2/1/23 | 1,200,000 | 1,202,384 | ||||||
Newell Rubbermaid, Inc. | ||||||||
2.875%, 12/1/19 | $ | 550,000 | $ | 550,999 | ||||
4.000%, 12/1/24 | 400,000 | 408,037 | ||||||
NVR, Inc. | ||||||||
3.950%, 9/15/22 | 150,000 | 154,286 | ||||||
Tupperware Brands Corp. |
| |||||||
4.750%, 6/1/21 | 500,000 | 536,385 | ||||||
Whirlpool Corp. |
| |||||||
1.650%, 11/1/17 | 175,000 | 174,674 | ||||||
2.400%, 3/1/19 | 900,000 | 893,994 | ||||||
4.850%, 6/15/21 | 400,000 | 440,374 | ||||||
3.700%, 3/1/23 | 250,000 | 254,334 | ||||||
3.700%, 5/1/25 | 500,000 | 506,758 | ||||||
|
| |||||||
| 5,678,779 | ||||||||
|
| |||||||
Internet & Catalog Retail (0.1%) |
| |||||||
Amazon.com, Inc. | ||||||||
1.200%, 11/29/17 | 1,500,000 | 1,481,843 | ||||||
2.600%, 12/5/19 | 450,000 | 454,361 | ||||||
3.300%, 12/5/21 | 1,050,000 | 1,065,432 | ||||||
2.500%, 11/29/22 | 1,200,000 | 1,135,801 | ||||||
3.800%, 12/5/24 | 1,000,000 | 1,024,107 | ||||||
Expedia, Inc. | ||||||||
7.456%, 8/15/18 | 500,000 | 581,075 | ||||||
5.950%, 8/15/20 | 1,394,000 | 1,556,052 | ||||||
QVC, Inc. | ||||||||
3.125%, 4/1/19 | 333,000 | 332,527 | ||||||
5.125%, 7/2/22 | 500,000 | 525,725 | ||||||
4.375%, 3/15/23 | 300,000 | 300,723 | ||||||
4.850%, 4/1/24 | 500,000 | 508,575 | ||||||
4.450%, 2/15/25 | 670,000 | 655,763 | ||||||
|
| |||||||
| 9,621,984 | ||||||||
|
| |||||||
Leisure Products (0.0%) | ||||||||
Hasbro, Inc. | ||||||||
3.150%, 5/15/21 | 500,000 | 499,218 | ||||||
Mattel, Inc. | ||||||||
1.700%, 3/15/18 | 500,000 | 494,477 | ||||||
2.350%, 5/6/19 | 500,000 | 498,158 | ||||||
3.150%, 3/15/23 | 300,000 | 294,953 | ||||||
|
| |||||||
| 1,786,806 | ||||||||
|
| |||||||
Media (1.1%) | ||||||||
21st Century Fox America, Inc. |
| |||||||
8.000%, 10/17/16 | 2,300,000 | 2,567,929 | ||||||
6.900%, 3/1/19 | 596,000 | 702,279 | ||||||
5.650%, 8/15/20 | 594,000 | 680,601 | ||||||
4.500%, 2/15/21 | 500,000 | 547,345 | ||||||
3.000%, 9/15/22 | 1,000,000 | 992,472 | ||||||
CBS Corp. | ||||||||
5.750%, 4/15/20 | 1,256,000 | 1,430,915 | ||||||
3.375%, 3/1/22 | 2,000,000 | 2,008,775 | ||||||
Comcast Cable Communications Holdings, Inc. |
| |||||||
9.455%, 11/15/22 | 62,000 | 89,116 | ||||||
Comcast Corp. | ||||||||
5.900%, 3/15/16 | 2,562,000 | 2,717,271 | ||||||
6.500%, 1/15/17 | 1,841,000 | 2,032,885 | ||||||
5.700%, 7/1/19 | 1,289,000 | 1,477,381 | ||||||
5.150%, 3/1/20 | 2,806,000 | 3,163,686 | ||||||
3.125%, 7/15/22 | 1,050,000 | 1,070,967 | ||||||
2.850%, 1/15/23 | 2,150,000 | 2,147,614 | ||||||
3.600%, 3/1/24 | 2,000,000 | 2,087,794 | ||||||
See Notes to Financial Statements.
31
Table of Contents
EQ ADVISORS TRUST
EQ/CORE BOND INDEX PORTFOLIO
PORTFOLIO OF INVESTMENTS (Continued)
December 31, 2014
Principal Amount | Value (Note 1) | |||||||
DIRECTV Holdings LLC/DIRECTV Financing Co., Inc. |
| |||||||
3.125%, 2/15/16 | $ | 1,062,000 | $ | 1,085,889 | ||||
2.400%, 3/15/17 | 2,000,000 | 2,038,135 | ||||||
1.750%, 1/15/18 | 1,000,000 | 994,190 | ||||||
5.875%, 10/1/19 | 800,000 | 912,008 | ||||||
5.200%, 3/15/20 | 604,000 | 670,311 | ||||||
4.600%, 2/15/21 | 1,312,000 | 1,410,112 | ||||||
5.000%, 3/1/21 | 1,800,000 | 1,975,021 | ||||||
3.800%, 3/15/22 | 850,000 | 867,167 | ||||||
4.450%, 4/1/24 | 1,500,000 | 1,579,465 | ||||||
Discovery Communications LLC |
| |||||||
5.050%, 6/1/20 | 2,262,000 | 2,482,784 | ||||||
4.375%, 6/15/21 | 62,000 | 65,736 | ||||||
3.300%, 5/15/22 | 500,000 | 491,954 | ||||||
3.250%, 4/1/23 | 1,000,000 | 973,034 | ||||||
Grupo Televisa S.A.B. | ||||||||
6.000%, 5/15/18 | 600,000 | 669,360 | ||||||
Historic TW, Inc. | ||||||||
6.875%, 6/15/18 | 62,000 | 71,497 | ||||||
Interpublic Group of Cos., Inc. | ||||||||
2.250%, 11/15/17 | 900,000 | 901,377 | ||||||
4.000%, 3/15/22 | 315,000 | 322,516 | ||||||
NBCUniversal Media LLC | ||||||||
5.150%, 4/30/20 | 1,983,000 | 2,248,415 | ||||||
4.375%, 4/1/21 | 1,971,000 | 2,161,658 | ||||||
2.875%, 1/15/23 | 156,000 | 155,706 | ||||||
Omnicom Group, Inc. | ||||||||
5.900%, 4/15/16 | 62,000 | 65,545 | ||||||
6.250%, 7/15/19 | 673,000 | 780,819 | ||||||
4.450%, 8/15/20 | 1,280,000 | 1,375,234 | ||||||
3.625%, 5/1/22 | 1,281,000 | 1,315,469 | ||||||
3.650%, 11/1/24 | 750,000 | 754,316 | ||||||
Reed Elsevier Capital, Inc. | ||||||||
8.625%, 1/15/19 | 1,691,000 | 2,060,196 | ||||||
Scripps Networks Interactive, Inc. |
| |||||||
2.750%, 11/15/19 | 500,000 | 501,085 | ||||||
3.900%, 11/15/24 | 800,000 | 810,282 | ||||||
Thomson Reuters Corp. | ||||||||
0.875%, 5/23/16 | 1,313,000 | 1,305,676 | ||||||
1.650%, 9/29/17 | 500,000 | 497,541 | ||||||
6.500%, 7/15/18 | 1,058,000 | 1,203,756 | ||||||
4.700%, 10/15/19 | 369,000 | 398,988 | ||||||
4.300%, 11/23/23 | 500,000 | 529,409 | ||||||
Time Warner Cable, Inc. | ||||||||
5.850%, 5/1/17 | 1,706,000 | 1,860,967 | ||||||
6.750%, 7/1/18 | 2,500,000 | 2,863,002 | ||||||
8.750%, 2/14/19 | 1,000,000 | 1,234,699 | ||||||
8.250%, 4/1/19 | 1,846,000 | 2,253,845 | ||||||
5.000%, 2/1/20 | 1,061,000 | 1,164,495 | ||||||
4.000%, 9/1/21 | 1,500,000 | 1,591,473 | ||||||
Time Warner, Inc. | ||||||||
5.875%, 11/15/16 | 1,480,000 | 1,601,921 | ||||||
4.875%, 3/15/20 | 2,700,000 | 2,957,136 | ||||||
4.700%, 1/15/21 | 1,812,000 | 1,972,472 | ||||||
3.400%, 6/15/22 | 500,000 | 504,998 | ||||||
4.050%, 12/15/23 | 1,250,000 | 1,305,694 | ||||||
3.550%, 6/1/24 | 2,000,000 | 2,007,157 | ||||||
Viacom, Inc. | ||||||||
6.250%, 4/30/16 | 1,339,000 | 1,430,253 | ||||||
3.500%, 4/1/17 | 156,000 | 162,527 | ||||||
2.500%, 9/1/18 | $ | 200,000 | $ | 201,626 | ||||
2.200%, 4/1/19 | 600,000 | 591,720 | ||||||
5.625%, 9/15/19 | 1,641,000 | 1,848,897 | ||||||
3.875%, 12/15/21 | 125,000 | 129,522 | ||||||
3.125%, 6/15/22 | 500,000 | 486,701 | ||||||
3.250%, 3/15/23 | 1,000,000 | 964,868 | ||||||
4.250%, 9/1/23 | 1,100,000 | 1,136,311 | ||||||
Walt Disney Co. | ||||||||
6.000%, 7/17/17 | 446,000 | 497,578 | ||||||
1.100%, 12/1/17 | 2,000,000 | 1,981,455 | ||||||
5.500%, 3/15/19 | 500,000 | 570,807 | ||||||
1.850%, 5/30/19 | 1,000,000 | 993,447 | ||||||
3.750%, 6/1/21 | 181,000 | 195,602 | ||||||
2.750%, 8/16/21 | 1,000,000 | 1,017,225 | ||||||
2.550%, 2/15/22 | 2,000,000 | 1,990,536 | ||||||
2.350%, 12/1/22 | 650,000 | 633,440 | ||||||
WPP Finance 2010 | ||||||||
4.750%, 11/21/21 | 160,000 | 175,687 | ||||||
3.750%, 9/19/24 | 1,000,000 | 1,004,670 | ||||||
|
| |||||||
| 94,722,412 | ||||||||
|
| |||||||
Multiline Retail (0.2%) |
| |||||||
Dollar General Corp. | ||||||||
4.125%, 7/15/17 | 1,000,000 | 1,037,374 | ||||||
1.875%, 4/15/18 | 194,000 | 187,102 | ||||||
3.250%, 4/15/23 | 1,150,000 | 1,048,638 | ||||||
Family Dollar Stores, Inc. |
| |||||||
5.000%, 2/1/21 | 300,000 | 313,804 | ||||||
Kohl’s Corp. | ||||||||
6.250%, 12/15/17 | 748,000 | 832,506 | ||||||
4.750%, 12/15/23 | 800,000 | 856,750 | ||||||
Macy’s Retail Holdings, Inc. |
| |||||||
5.900%, 12/1/16 | 1,112,000 | 1,205,130 | ||||||
3.875%, 1/15/22 | 400,000 | 415,500 | ||||||
4.375%, 9/1/23 | 635,000 | 678,656 | ||||||
3.625%, 6/1/24 | 1,000,000 | 1,011,250 | ||||||
Nordstrom, Inc. | ||||||||
6.250%, 1/15/18 | 277,000 | 312,286 | ||||||
4.750%, 5/1/20 | 584,000 | 645,609 | ||||||
4.000%, 10/15/21 | 600,000 | 642,893 | ||||||
Target Corp. | ||||||||
5.875%, 7/15/16 | 1,000,000 | 1,075,714 | ||||||
6.000%, 1/15/18 | 1,550,000 | 1,747,325 | ||||||
2.300%, 6/26/19 | 1,500,000 | 1,515,292 | ||||||
3.875%, 7/15/20 | 1,000,000 | 1,075,666 | ||||||
|
| |||||||
| 14,601,495 | ||||||||
|
| |||||||
Specialty Retail (0.3%) |
| |||||||
Advance Auto Parts, Inc. | ||||||||
4.500%, 1/15/22 | 160,000 | 170,227 | ||||||
4.500%, 12/1/23 | 1,000,000 | 1,066,926 | ||||||
AutoZone, Inc. | ||||||||
4.000%, 11/15/20 | 1,956,000 | �� | 2,067,973 | |||||
3.700%, 4/15/22 | 350,000 | 360,657 | ||||||
Bed Bath & Beyond, Inc. | ||||||||
3.749%, 8/1/24 | 350,000 | 356,358 | ||||||
Gap, Inc. | ||||||||
5.950%, 4/12/21 | 1,094,000 | 1,242,027 | ||||||
Home Depot, Inc. | ||||||||
5.400%, 3/1/16 | 3,758,000 | 3,967,247 | ||||||
2.250%, 9/10/18 | 742,000 | 755,691 | ||||||
See Notes to Financial Statements.
32
Table of Contents
EQ ADVISORS TRUST
EQ/CORE BOND INDEX PORTFOLIO
PORTFOLIO OF INVESTMENTS (Continued)
December 31, 2014
Principal Amount | Value (Note 1) | |||||||
2.000%, 6/15/19 | $ | 1,000,000 | $ | 999,992 | ||||
4.400%, 4/1/21 | 650,000 | 720,496 | ||||||
2.700%, 4/1/23 | 800,000 | 791,152 | ||||||
3.750%, 2/15/24 | 1,000,000 | 1,066,547 | ||||||
Lowe’s Cos., Inc. | ||||||||
2.125%, 4/15/16 | 1,150,000 | 1,167,267 | ||||||
5.400%, 10/15/16 | 94,000 | 100,860 | ||||||
1.625%, 4/15/17 | 250,000 | 251,565 | ||||||
4.625%, 4/15/20 | 1,089,000 | 1,210,883 | ||||||
3.120%, 4/15/22 | 750,000 | 769,334 | ||||||
3.875%, 9/15/23 | 1,000,000 | 1,070,405 | ||||||
3.125%, 9/15/24 | 500,000 | 503,805 | ||||||
O’Reilly Automotive, Inc. | ||||||||
4.875%, 1/14/21 | 285,000 | 315,529 | ||||||
4.625%, 9/15/21 | 300,000 | 328,164 | ||||||
3.800%, 9/1/22 | 300,000 | 310,224 | ||||||
3.850%, 6/15/23 | 250,000 | 259,642 | ||||||
Ross Stores, Inc. | ||||||||
3.375%, 9/15/24 | 300,000 | 299,325 | ||||||
Signet UK Finance plc | ||||||||
4.700%, 6/15/24 | 500,000 | 481,875 | ||||||
Staples, Inc. | ||||||||
2.750%, 1/12/18 | 1,000,000 | 997,431 | ||||||
4.375%, 1/12/23 | 100,000 | 99,688 | ||||||
TJX Cos., Inc. | ||||||||
6.950%, 4/15/19 | 385,000 | 458,231 | ||||||
2.750%, 6/15/21 | 750,000 | 751,341 | ||||||
2.500%, 5/15/23 | 450,000 | 431,559 | ||||||
|
| |||||||
| 23,372,421 | ||||||||
|
| |||||||
Textiles, Apparel & Luxury Goods (0.0%) |
| |||||||
Cintas Corp. No. 2 | ||||||||
2.850%, 6/1/16 | 437,000 | 447,509 | ||||||
6.125%, 12/1/17 | 100,000 | 112,052 | ||||||
NIKE, Inc. | ||||||||
2.250%, 5/1/23 | 450,000 | 436,090 | ||||||
Ralph Lauren Corp. | ||||||||
2.125%, 9/26/18 | 300,000 | 301,932 | ||||||
|
| |||||||
| 1,297,583 | ||||||||
|
| |||||||
Total Consumer Discretionary | 174,776,921 | |||||||
|
| |||||||
Consumer Staples (2.3%) | ||||||||
Beverages (0.8%) | ||||||||
Anheuser-Busch Cos. LLC | ||||||||
5.050%, 10/15/16 | 1,000,000 | 1,067,574 | ||||||
5.000%, 3/1/19 | 62,000 | 68,836 | ||||||
Anheuser-Busch InBev Finance, Inc. |
| |||||||
0.800%, 1/15/16 | 2,000,000 | 2,001,034 | ||||||
1.125%, 1/27/17 | 850,000 | 850,009 | ||||||
1.250%, 1/17/18 | 500,000 | 493,719 | ||||||
2.625%, 1/17/23 | 2,356,000 | 2,288,675 | ||||||
3.700%, 2/1/24 | 2,500,000 | 2,587,025 | ||||||
Anheuser-Busch InBev Worldwide, Inc. |
| |||||||
2.875%, 2/15/16 | 250,000 | 255,663 | ||||||
1.375%, 7/15/17 | 1,414,000 | 1,412,886 | ||||||
7.750%, 1/15/19 | 3,300,000 | 3,994,044 | ||||||
5.375%, 1/15/20 | 2,181,000 | 2,467,795 | ||||||
4.375%, 2/15/21 | 1,158,000 | 1,268,095 | ||||||
2.500%, 7/15/22 | 1,300,000 | 1,265,747 | ||||||
Beam Suntory, Inc. | ||||||||
5.375%, 1/15/16 | $ | 45,000 | $ | 47,008 | ||||
1.750%, 6/15/18 | 500,000 | 495,215 | ||||||
3.250%, 5/15/22 | 250,000 | 248,703 | ||||||
3.250%, 6/15/23 | 500,000 | 490,396 | ||||||
Bottling Group LLC | ||||||||
5.125%, 1/15/19 | 846,000 | 943,069 | ||||||
Brown-Forman Corp. | ||||||||
2.500%, 1/15/16 | 350,000 | 355,501 | ||||||
1.000%, 1/15/18 | 500,000 | 490,171 | ||||||
Coca-Cola Co. | ||||||||
1.800%, 9/1/16 | 1,896,000 | 1,928,256 | ||||||
0.750%, 11/1/16 | 667,000 | 665,389 | ||||||
1.650%, 3/14/18 | 1,800,000 | 1,809,923 | ||||||
1.150%, 4/1/18 | 500,000 | 494,690 | ||||||
2.450%, 11/1/20 | 1,000,000 | 1,005,837 | ||||||
3.150%, 11/15/20 | 2,401,000 | 2,505,435 | ||||||
3.300%, 9/1/21 | 1,000,000 | 1,051,731 | ||||||
2.500%, 4/1/23 | 1,000,000 | 976,508 | ||||||
3.200%, 11/1/23 | 2,650,000 | 2,720,058 | ||||||
Coca-Cola Enterprises, Inc. | ||||||||
2.000%, 8/19/16 | 250,000 | 253,018 | ||||||
3.500%, 9/15/20 | 150,000 | 154,611 | ||||||
3.250%, 8/19/21 | 350,000 | 360,362 | ||||||
Coca-Cola Femsa S.A.B. de C.V. | ||||||||
2.375%, 11/26/18 | 1,450,000 | 1,445,795 | ||||||
3.875%, 11/26/23 | 500,000 | 523,400 | ||||||
Diageo Capital plc | ||||||||
0.625%, 4/29/16 | 2,000,000 | 1,994,027 | ||||||
5.500%, 9/30/16 | 187,000 | 201,143 | ||||||
5.750%, 10/23/17 | 1,700,000 | 1,891,363 | ||||||
1.125%, 4/29/18 | 1,250,000 | 1,219,190 | ||||||
2.625%, 4/29/23 | 1,500,000 | 1,457,068 | ||||||
Diageo Investment Corp. | ||||||||
2.875%, 5/11/22 | 1,000,000 | 996,945 | ||||||
Dr. Pepper Snapple Group, Inc. | ||||||||
2.900%, 1/15/16 | 1,794,000 | 1,830,447 | ||||||
2.600%, 1/15/19 | 300,000 | 303,697 | ||||||
3.200%, 11/15/21 | 300,000 | 305,831 | ||||||
Fomento Economico Mexicano S.A.B. de C.V. |
| |||||||
2.875%, 5/10/23 | 150,000 | 139,485 | ||||||
Molson Coors Brewing Co. | ||||||||
3.500%, 5/1/22 | 500,000 | 502,685 | ||||||
PepsiCo, Inc. | ||||||||
0.700%, 2/26/16 | 1,150,000 | 1,149,516 | ||||||
2.500%, 5/10/16 | 300,000 | 306,643 | ||||||
0.950%, 2/22/17 | 1,036,000 | 1,029,848 | ||||||
1.250%, 8/13/17 | 1,900,000 | 1,890,451 | ||||||
5.000%, 6/1/18 | 156,000 | 172,617 | ||||||
7.900%, 11/1/18 | 1,297,000 | 1,575,148 | ||||||
2.250%, 1/7/19 | 1,000,000 | 1,011,037 | ||||||
4.500%, 1/15/20 | 2,700,000 | 2,977,050 | ||||||
3.125%, 11/1/20 | 250,000 | 258,097 | ||||||
2.750%, 3/5/22 | 1,750,000 | 1,736,696 | ||||||
2.750%, 3/1/23 | 1,000,000 | 983,874 | ||||||
3.600%, 3/1/24 | 1,000,000 | 1,042,086 | ||||||
|
| |||||||
| 63,961,122 | ||||||||
|
| |||||||
Food & Staples Retailing (0.5%) |
| |||||||
Costco Wholesale Corp. | ||||||||
5.500%, 3/15/17 | 1,730,000 | 1,892,725 | ||||||
1.125%, 12/15/17 | 1,000,000 | 992,618 | ||||||
1.700%, 12/15/19 | 1,000,000 | 977,492 | ||||||
See Notes to Financial Statements.
33
Table of Contents
EQ ADVISORS TRUST
EQ/CORE BOND INDEX PORTFOLIO
PORTFOLIO OF INVESTMENTS (Continued)
December 31, 2014
Principal Amount | Value (Note 1) | |||||||
CVS Health Corp. | ||||||||
6.125%, 8/15/16 | $ | 346,000 | $ | 373,091 | ||||
5.750%, 6/1/17 | 1,545,000 | 1,704,636 | ||||||
2.250%, 12/5/18 | 694,000 | 700,484 | ||||||
2.250%, 8/12/19 | 1,500,000 | 1,493,141 | ||||||
4.750%, 5/18/20 | 304,000 | 334,064 | ||||||
2.750%, 12/1/22 | 2,000,000 | 1,942,604 | ||||||
4.000%, 12/5/23 | 1,100,000 | 1,166,490 | ||||||
Delhaize Group S.A. | ||||||||
4.125%, 4/10/19 | 350,000 | 366,926 | ||||||
Kroger Co. | ||||||||
6.400%, 8/15/17 | 100,000 | 111,676 | ||||||
6.150%, 1/15/20 | 1,602,000 | 1,849,937 | ||||||
3.300%, 1/15/21 | 100,000 | 101,546 | ||||||
2.950%, 11/1/21 | 960,000 | 953,589 | ||||||
3.400%, 4/15/22 | 350,000 | 355,993 | ||||||
3.850%, 8/1/23 | 1,250,000 | 1,295,788 | ||||||
4.000%, 2/1/24 | 190,000 | 198,624 | ||||||
Safeway, Inc. | ||||||||
5.000%, 8/15/19 (b) | 568,000 | 577,940 | ||||||
3.950%, 8/15/20 (b) | 1,151,000 | 1,162,510 | ||||||
Sysco Corp. | ||||||||
1.450%, 10/2/17 | 555,000 | 553,874 | ||||||
5.250%, 2/12/18 | 1,139,000 | 1,260,962 | ||||||
3.000%, 10/2/21 | 580,000 | 591,445 | ||||||
Walgreens Boots Alliance, Inc. | ||||||||
1.800%, 9/15/17 | 800,000 | 800,863 | ||||||
1.750%, 11/17/17 | 1,000,000 | 1,002,715 | ||||||
5.250%, 1/15/19 | 650,000 | 720,692 | ||||||
2.700%, 11/18/19 | 1,000,000 | 1,004,400 | ||||||
3.300%, 11/18/21 | 940,000 | 945,288 | ||||||
3.100%, 9/15/22 | 1,281,000 | 1,267,082 | ||||||
3.800%, 11/18/24 | 2,000,000 | 2,038,762 | ||||||
Wal-Mart Stores, Inc. | ||||||||
0.600%, 4/11/16 | 1,000,000 | 1,000,330 | ||||||
2.800%, 4/15/16 | 3,000,000 | 3,084,504 | ||||||
1.000%, 4/21/17 | 1,000,000 | 997,190 | ||||||
5.800%, 2/15/18 | 596,000 | 673,415 | ||||||
1.125%, 4/11/18 | 1,625,000 | 1,606,327 | ||||||
4.125%, 2/1/19 | 1,750,000 | 1,903,602 | ||||||
3.625%, 7/8/20 | 187,000 | 199,733 | ||||||
3.250%, 10/25/20 | 3,037,000 | 3,172,715 | ||||||
2.550%, 4/11/23 | 1,650,000 | 1,626,531 | ||||||
3.300%, 4/22/24 | 2,000,000 | 2,060,951 | ||||||
|
| |||||||
| 45,063,255 | ||||||||
|
| |||||||
Food Products (0.5%) | ||||||||
Archer-Daniels-Midland Co. | ||||||||
5.450%, 3/15/18 | 1,300,000 | 1,441,237 | ||||||
4.479%, 3/1/21 | 250,000 | 275,170 | ||||||
Bunge Ltd. Finance Corp. | ||||||||
4.100%, 3/15/16 | 250,000 | 258,142 | ||||||
8.500%, 6/15/19 | 565,000 | 692,404 | ||||||
Campbell Soup Co. | ||||||||
3.050%, 7/15/17 | 269,000 | 277,335 | ||||||
4.500%, 2/15/19 | 521,000 | 560,674 | ||||||
4.250%, 4/15/21 | 100,000 | 108,043 | ||||||
2.500%, 8/2/22 | 363,000 | 345,463 | ||||||
ConAgra Foods, Inc. | ||||||||
1.300%, 1/25/16 | 1,000,000 | 1,002,257 | ||||||
1.900%, 1/25/18 | 1,375,000 | 1,361,775 | ||||||
7.000%, 4/15/19 | 1,150,000 | 1,348,305 | ||||||
3.200%, 1/25/23 | 2,306,000 | 2,254,666 | ||||||
General Mills, Inc. | ||||||||
5.650%, 2/15/19 | $ | 1,202,000 | $ | 1,357,245 | ||||
2.200%, 10/21/19 | 1,000,000 | 992,275 | ||||||
3.150%, 12/15/21 | 2,000,000 | 2,050,596 | ||||||
Hershey Co. | ||||||||
1.500%, 11/1/16 | 280,000 | 282,545 | ||||||
4.125%, 12/1/20 | 500,000 | 541,300 | ||||||
2.625%, 5/1/23 | 250,000 | 243,922 | ||||||
Hormel Foods Corp. | ||||||||
4.125%, 4/15/21 | 350,000 | 381,723 | ||||||
Ingredion, Inc. | ||||||||
1.800%, 9/25/17 | 250,000 | 249,622 | ||||||
4.625%, 11/1/20 | 269,000 | 288,423 | ||||||
J.M. Smucker Co. | ||||||||
3.500%, 10/15/21 | 750,000 | 783,489 | ||||||
Kellogg Co. | ||||||||
4.450%, 5/30/16 | 620,000 | 647,758 | ||||||
1.750%, 5/17/17 | 1,000,000 | 1,005,016 | ||||||
3.250%, 5/21/18 | 290,000 | 300,925 | ||||||
4.150%, 11/15/19 | 500,000 | 538,955 | ||||||
4.000%, 12/15/20 | 542,000 | 582,525 | ||||||
3.125%, 5/17/22 | 500,000 | 504,341 | ||||||
Kraft Foods Group, Inc. | ||||||||
2.250%, 6/5/17 | 1,000,000 | 1,016,174 | ||||||
6.125%, 8/23/18 | 1,250,000 | 1,425,141 | ||||||
5.375%, 2/10/20 | 1,163,000 | 1,320,715 | ||||||
3.500%, 6/6/22 | 1,700,000 | 1,742,015 | ||||||
McCormick & Co., Inc. | ||||||||
3.900%, 7/15/21 | 250,000 | 270,391 | ||||||
3.500%, 9/1/23 | 357,000 | 373,903 | ||||||
Mead Johnson Nutrition Co. | ||||||||
4.900%, 11/1/19 | 804,000 | 881,602 | ||||||
Mondelez International, Inc. | ||||||||
4.125%, 2/9/16 | 3,154,000 | 3,270,765 | ||||||
6.125%, 2/1/18 | 1,866,000 | 2,095,394 | ||||||
4.000%, 2/1/24 | 2,150,000 | 2,254,428 | ||||||
Tyson Foods, Inc. | ||||||||
2.650%, 8/15/19 | 2,750,000 | 2,783,923 | ||||||
4.500%, 6/15/22 | 1,375,000 | 1,490,185 | ||||||
Unilever Capital Corp. | ||||||||
2.750%, 2/10/16 | 700,000 | 717,816 | ||||||
0.850%, 8/2/17 | 1,500,000 | 1,485,548 | ||||||
4.800%, 2/15/19 | 1,296,000 | 1,438,176 | ||||||
2.200%, 3/6/19 | 500,000 | 505,017 | ||||||
4.250%, 2/10/21 | 350,000 | 385,374 | ||||||
|
| |||||||
| 44,132,698 | ||||||||
|
| |||||||
Household Products (0.2%) | ||||||||
Church & Dwight Co., Inc. | ||||||||
2.450%, 12/15/19 | 500,000 | 496,476 | ||||||
Clorox Co. | ||||||||
3.800%, 11/15/21 | 500,000 | 530,488 | ||||||
3.050%, 9/15/22 | 610,000 | 602,540 | ||||||
3.500%, 12/15/24 | 500,000 | 501,264 | ||||||
Colgate-Palmolive Co. | ||||||||
1.500%, 11/1/18 | 500,000 | 497,782 | ||||||
2.300%, 5/3/22 | 1,000,000 | 982,061 | ||||||
2.100%, 5/1/23 | 1,000,000 | 952,186 | ||||||
3.250%, 3/15/24 | 500,000 | 516,097 | ||||||
Energizer Holdings, Inc. | ||||||||
4.700%, 5/19/21 | 650,000 | 674,515 | ||||||
See Notes to Financial Statements.
34
Table of Contents
EQ ADVISORS TRUST
EQ/CORE BOND INDEX PORTFOLIO
PORTFOLIO OF INVESTMENTS (Continued)
December 31, 2014
Principal Amount | Value (Note 1) | |||||||
Kimberly-Clark Corp. | ||||||||
6.125%, 8/1/17 | $ | 1,858,000 | $ | 2,077,237 | ||||
7.500%, 11/1/18 | 800,000 | 961,818 | ||||||
1.900%, 5/22/19 | 500,000 | 495,166 | ||||||
3.875%, 3/1/21 | 100,000 | 108,316 | ||||||
Procter & Gamble Co. | ||||||||
1.600%, 11/15/18 | 900,000 | 897,755 | ||||||
4.700%, 2/15/19 | 2,465,000 | 2,739,125 | ||||||
3.100%, 8/15/23 | 2,625,000 | 2,694,078 | ||||||
|
| |||||||
| 15,726,904 | ||||||||
|
| |||||||
Tobacco (0.3%) | ||||||||
Altria Group, Inc. | ||||||||
9.700%, 11/10/18 | 913,000 | 1,160,114 | ||||||
9.250%, 8/6/19 | 2,437,000 | 3,129,898 | ||||||
2.625%, 1/14/20 | 1,500,000 | 1,503,690 | ||||||
4.750%, 5/5/21 | 950,000 | 1,051,980 | ||||||
2.850%, 8/9/22 | 1,700,000 | 1,647,039 | ||||||
2.950%, 5/2/23 | 156,000 | 151,111 | ||||||
Lorillard Tobacco Co. | ||||||||
3.500%, 8/4/16 | 355,000 | 365,007 | ||||||
8.125%, 6/23/19 | 572,000 | 693,405 | ||||||
6.875%, 5/1/20 | 1,266,000 | 1,491,037 | ||||||
3.750%, 5/20/23 | 500,000 | 495,448 | ||||||
Philip Morris International, Inc. | ||||||||
2.500%, 5/16/16 | 600,000 | 614,058 | ||||||
1.625%, 3/20/17 | 250,000 | 252,707 | ||||||
1.125%, 8/21/17 | 1,000,000 | 994,298 | ||||||
1.250%, 11/9/17 | 160,000 | 159,084 | ||||||
5.650%, 5/16/18 | 2,689,000 | 3,030,891 | ||||||
1.875%, 1/15/19 | 600,000 | 594,975 | ||||||
4.500%, 3/26/20 | 1,000,000 | 1,099,782 | ||||||
4.125%, 5/17/21 | 300,000 | 326,003 | ||||||
2.500%, 8/22/22 | 1,000,000 | 973,052 | ||||||
2.625%, 3/6/23 | 1,150,000 | 1,121,016 | ||||||
3.600%, 11/15/23 | 600,000 | 625,433 | ||||||
3.250%, 11/10/24 | 500,000 | 500,278 | ||||||
Reynolds American, Inc. | ||||||||
6.750%, 6/15/17 | 900,000 | 1,000,311 | ||||||
3.250%, 11/1/22 | 694,000 | 675,850 | ||||||
4.850%, 9/15/23 | 1,500,000 | 1,610,998 | ||||||
|
| |||||||
| 25,267,465 | ||||||||
|
| |||||||
Total Consumer Staples | 194,151,444 | |||||||
|
| |||||||
Energy (3.3%) | ||||||||
Energy Equipment & Services (0.3%) |
| |||||||
Baker Hughes, Inc. | ||||||||
3.200%, 8/15/21 | 1,000,000 | 1,011,903 | ||||||
Cameron International Corp. | ||||||||
1.150%, 12/15/16 | 468,000 | 461,852 | ||||||
6.375%, 7/15/18 | 300,000 | 336,824 | ||||||
4.500%, 6/1/21 | 350,000 | 366,855 | ||||||
4.000%, 12/15/23 | 750,000 | 756,270 | ||||||
Diamond Offshore Drilling, Inc. | ||||||||
5.875%, 5/1/19 | 915,000 | 992,075 | ||||||
Ensco plc | ||||||||
3.250%, 3/15/16 | 501,000 | 510,265 | ||||||
4.700%, 3/15/21 | 2,166,000 | 2,173,155 | ||||||
FMC Technologies, Inc. | ||||||||
2.000%, 10/1/17 | 250,000 | 248,039 | ||||||
3.450%, 10/1/22 | 400,000 | 385,415 | ||||||
Halliburton Co. | ||||||||
2.000%, 8/1/18 | $ | 250,000 | $ | 248,947 | ||||
6.150%, 9/15/19 | 1,723,000 | 1,989,587 | ||||||
3.250%, 11/15/21 | 350,000 | 354,415 | ||||||
3.500%, 8/1/23 | 800,000 | 806,252 | ||||||
Nabors Industries, Inc. | ||||||||
2.350%, 9/15/16 | 500,000 | 501,952 | ||||||
6.150%, 2/15/18 | 800,000 | 832,001 | ||||||
9.250%, 1/15/19 | 1,300,000 | 1,510,233 | ||||||
5.000%, 9/15/20 | 700,000 | 680,698 | ||||||
4.625%, 9/15/21 | 156,000 | 146,367 | ||||||
National Oilwell Varco, Inc. | ||||||||
1.350%, 12/1/17 | 500,000 | 491,996 | ||||||
2.600%, 12/1/22 | 687,000 | 638,870 | ||||||
Oceaneering International, Inc. | ||||||||
4.650%, 11/15/24 | 500,000 | 489,453 | ||||||
Pride International, Inc. | ||||||||
8.500%, 6/15/19 | 125,000 | 149,045 | ||||||
Rowan Cos., Inc. | ||||||||
7.875%, 8/1/19 | 345,000 | 389,726 | ||||||
4.875%, 6/1/22 | 47,000 | 46,322 | ||||||
4.750%, 1/15/24 | 1,000,000 | 942,783 | ||||||
Transocean, Inc. | ||||||||
2.500%, 10/15/17 | 156,000 | 137,396 | ||||||
6.000%, 3/15/18 | 645,000 | 615,375 | ||||||
6.500%, 11/15/20 | 1,189,000 | 1,122,271 | ||||||
6.375%, 12/15/21 | 150,000 | 137,487 | ||||||
3.800%, 10/15/22 | 1,100,000 | 892,554 | ||||||
Weatherford International Ltd. | ||||||||
5.500%, 2/15/16 | 597,000 | 617,340 | ||||||
6.000%, 3/15/18 | 408,000 | 434,419 | ||||||
9.625%, 3/1/19 | 1,559,000 | 1,835,503 | ||||||
5.125%, 9/15/20 | 1,000,000 | 1,015,714 | ||||||
4.500%, 4/15/22 | 250,000 | 222,912 | ||||||
Western Atlas, Inc. | ||||||||
6.000%, 6/1/18 | 200,000 | 224,502 | ||||||
|
| |||||||
| 24,716,773 | ||||||||
|
| |||||||
Oil, Gas & Consumable Fuels (3.0%) |
| |||||||
Anadarko Petroleum Corp. | ||||||||
5.950%, 9/15/16 | 1,673,000 | 1,787,623 | ||||||
6.375%, 9/15/17 | 1,500,000 | 1,668,647 | ||||||
8.700%, 3/15/19 | 927,000 | 1,139,259 | ||||||
3.450%, 7/15/24 | 800,000 | 778,464 | ||||||
Apache Corp. | ||||||||
5.625%, 1/15/17 | 890,000 | 958,743 | ||||||
1.750%, 4/15/17 | 500,000 | 498,477 | ||||||
3.625%, 2/1/21 | 1,000,000 | 1,009,929 | ||||||
3.250%, 4/15/22 | 362,000 | 355,791 | ||||||
Boardwalk Pipelines LP | ||||||||
5.750%, 9/15/19 | 739,000 | 794,611 | ||||||
BP Capital Markets plc | ||||||||
3.200%, 3/11/16 | 1,250,000 | 1,283,405 | ||||||
1.375%, 11/6/17 | 750,000 | 742,826 | ||||||
1.375%, 5/10/18 | 2,519,000 | 2,473,669 | ||||||
2.241%, 9/26/18 | 1,500,000 | 1,507,688 | ||||||
4.750%, 3/10/19 | 1,121,000 | 1,223,950 | ||||||
2.237%, 5/10/19 | 100,000 | 99,370 | ||||||
2.521%, 1/15/20 | 880,000 | 870,706 | ||||||
4.500%, 10/1/20 | 1,637,000 | 1,763,819 | ||||||
4.742%, 3/11/21 | 1,000,000 | 1,088,851 | ||||||
See Notes to Financial Statements.
35
Table of Contents
EQ ADVISORS TRUST
EQ/CORE BOND INDEX PORTFOLIO
PORTFOLIO OF INVESTMENTS (Continued)
December 31, 2014
Principal Amount | Value (Note 1) | |||||||
3.561%, 11/1/21 | $ | 1,500,000 | $ | 1,531,769 | ||||
3.245%, 5/6/22 | 1,375,000 | 1,351,409 | ||||||
2.500%, 11/6/22 | 1,500,000 | 1,391,056 | ||||||
2.750%, 5/10/23 | 1,000,000 | 937,216 | ||||||
3.994%, 9/26/23 | 500,000 | 514,440 | ||||||
3.814%, 2/10/24 | 1,150,000 | 1,156,814 | ||||||
3.535%, 11/4/24 | 1,150,000 | 1,139,103 | ||||||
Buckeye Partners LP | ||||||||
5.500%, 8/15/19 | 479,000 | 524,452 | ||||||
4.875%, 2/1/21 | 1,420,000 | 1,489,194 | ||||||
Canadian Natural Resources Ltd. | ||||||||
5.700%, 5/15/17 | 2,095,000 | 2,280,223 | ||||||
1.750%, 1/15/18 | 875,000 | 867,563 | ||||||
5.900%, 2/1/18 | 100,000 | 110,602 | ||||||
3.800%, 4/15/24 | 64,000 | 62,967 | ||||||
Cenovus Energy, Inc. | ||||||||
5.700%, 10/15/19 | 1,673,000 | 1,848,696 | ||||||
3.800%, 9/15/23 | 500,000 | 488,359 | ||||||
Chevron Corp. | ||||||||
0.889%, 6/24/16 | 1,000,000 | 1,001,330 | ||||||
1.104%, 12/5/17 | 1,500,000 | 1,490,964 | ||||||
1.718%, 6/24/18 | 2,000,000 | 2,001,810 | ||||||
4.950%, 3/3/19 | 1,346,000 | 1,497,181 | ||||||
2.193%, 11/15/19 | 715,000 | 718,076 | ||||||
2.427%, 6/24/20 | 2,250,000 | 2,265,689 | ||||||
2.355%, 12/5/22 | 1,800,000 | 1,729,355 | ||||||
3.191%, 6/24/23 | 1,425,000 | 1,451,907 | ||||||
CNOOC Finance 2013 Ltd. | ||||||||
1.125%, 5/9/16 | 231,000 | 230,042 | ||||||
1.750%, 5/9/18 | 254,000 | 249,504 | ||||||
3.000%, 5/9/23 | 2,450,000 | 2,315,593 | ||||||
CNOOC Nexen Finance 2014 ULC | ||||||||
1.625%, 4/30/17 | 2,000,000 | 1,985,863 | ||||||
4.250%, 4/30/24 | 1,100,000 | 1,136,575 | ||||||
ConocoPhillips Co. | ||||||||
1.050%, 12/15/17 | 1,750,000 | 1,723,596 | ||||||
5.750%, 2/1/19 | 2,166,000 | 2,462,611 | ||||||
6.000%, 1/15/20 | 1,000,000 | 1,158,675 | ||||||
2.400%, 12/15/22 | 1,806,000 | 1,711,878 | ||||||
3.350%, 11/15/24 | 250,000 | 250,947 | ||||||
Continental Resources, Inc. | ||||||||
4.500%, 4/15/23 | 3,650,000 | 3,402,285 | ||||||
3.800%, 6/1/24 | 685,000 | 606,335 | ||||||
Devon Energy Corp. | ||||||||
2.250%, 12/15/18 | 250,000 | 248,606 | ||||||
6.300%, 1/15/19 | 1,000,000 | 1,143,096 | ||||||
4.000%, 7/15/21 | 837,000 | 864,097 | ||||||
3.250%, 5/15/22 | 750,000 | 733,707 | ||||||
Ecopetrol S.A. | ||||||||
4.250%, 9/18/18 | 1,000,000 | 1,027,500 | ||||||
7.625%, 7/23/19 | 1,859,000 | 2,142,497 | ||||||
El Paso Natural Gas Co. LLC | ||||||||
5.950%, 4/15/17 | 500,000 | 536,883 | ||||||
El Paso Pipeline Partners Operating Co. LLC |
| |||||||
6.500%, 4/1/20 | 375,000 | 423,123 | ||||||
Enable Midstream Partners LP | ||||||||
2.400%, 5/15/19§ | 750,000 | 729,221 | ||||||
3.900%, 5/15/24§ | 750,000 | 728,250 | ||||||
Enbridge Energy Partners LP | ||||||||
9.875%, 3/1/19 | 500,000 | 634,713 | ||||||
5.200%, 3/15/20 | 1,081,000 | 1,177,909 | ||||||
4.200%, 9/15/21 | 500,000 | 517,920 | ||||||
Enbridge, Inc. | ||||||||
5.600%, 4/1/17 | $ | 200,000 | $ | 213,457 | ||||
3.500%, 6/10/24 | 1,000,000 | 919,599 | ||||||
EnCana Corp. | ||||||||
5.900%, 12/1/17 | 1,669,000 | 1,817,376 | ||||||
6.500%, 5/15/19 | 618,000 | 696,982 | ||||||
Energy Transfer Partners LP | ||||||||
6.700%, 7/1/18 | 844,000 | 946,509 | ||||||
9.700%, 3/15/19 | 346,000 | 432,388 | ||||||
9.000%, 4/15/19 | 1,000,000 | 1,228,388 | ||||||
4.150%, 10/1/20 | 800,000 | 819,367 | ||||||
4.650%, 6/1/21 | 250,000 | 260,316 | ||||||
5.200%, 2/1/22 | 1,000,000 | 1,065,568 | ||||||
3.600%, 2/1/23 | 1,150,000 | 1,110,439 | ||||||
EnLink Midstream Partners LP | ||||||||
4.400%, 4/1/24 | 1,000,000 | 1,010,027 | ||||||
Enterprise Products Operating LLC | ||||||||
3.200%, 2/1/16 | 2,000,000 | 2,045,960 | ||||||
6.300%, 9/15/17 | 100,000 | 111,438 | ||||||
6.650%, 4/15/18 | 2,000,000 | 2,274,090 | ||||||
2.550%, 10/15/19 | 750,000 | 740,520 | ||||||
5.250%, 1/31/20 | 200,000 | 220,146 | ||||||
5.200%, 9/1/20 | 1,500,000 | 1,651,707 | ||||||
4.050%, 2/15/22 | 500,000 | 517,022 | ||||||
3.350%, 3/15/23 | 1,356,000 | 1,330,326 | ||||||
3.750%, 2/15/25 | 415,000 | 411,431 | ||||||
EOG Resources, Inc. | ||||||||
5.625%, 6/1/19 | 1,094,000 | 1,233,761 | ||||||
4.100%, 2/1/21 | 1,625,000 | 1,723,243 | ||||||
EQT Corp. | ||||||||
6.500%, 4/1/18 | 500,000 | 559,880 | ||||||
8.125%, 6/1/19 | 1,027,000 | 1,244,800 | ||||||
4.875%, 11/15/21 | 156,000 | 167,057 | ||||||
EQT Midstream Partners LP | ||||||||
4.000%, 8/1/24 | 415,000 | 410,591 | ||||||
Exxon Mobil Corp. | ||||||||
0.921%, 3/15/17 | 3,150,000 | 3,145,348 | ||||||
1.819%, 3/15/19 | 1,500,000 | 1,500,197 | ||||||
3.176%, 3/15/24 | 2,000,000 | 2,052,004 | ||||||
Freeport-McMoran Oil & Gas LLC/FCX Oil & Gas, Inc. |
| |||||||
6.500%, 11/15/20 | 163,000 | 176,370 | ||||||
Gulf South Pipeline Co. LP | ||||||||
4.000%, 6/15/22 | 750,000 | 735,686 | ||||||
Hess Corp. | ||||||||
1.300%, 6/15/17 | 200,000 | 197,409 | ||||||
8.125%, 2/15/19 | 1,140,000 | 1,354,863 | ||||||
Husky Energy, Inc. | ||||||||
7.250%, 12/15/19 | 295,000 | 346,548 | ||||||
3.950%, 4/15/22 | 2,000,000 | 2,002,081 | ||||||
4.000%, 4/15/24 | 125,000 | 122,156 | ||||||
Kinder Morgan Energy Partners LP | ||||||||
6.000%, 2/1/17 | 685,000 | 739,711 | ||||||
2.650%, 2/1/19 | 500,000 | 491,876 | ||||||
9.000%, 2/1/19 | 793,000 | 958,249 | ||||||
6.850%, 2/15/20 | 1,061,000 | 1,215,607 | ||||||
5.300%, 9/15/20 | 202,000 | 217,573 | ||||||
3.500%, 3/1/21 | 2,040,000 | 1,998,866 | ||||||
5.800%, 3/1/21 | 1,000,000 | 1,105,009 | ||||||
4.150%, 3/1/22 | 500,000 | 502,930 | ||||||
See Notes to Financial Statements.
36
Table of Contents
EQ ADVISORS TRUST
EQ/CORE BOND INDEX PORTFOLIO
PORTFOLIO OF INVESTMENTS (Continued)
December 31, 2014
Principal Amount | Value (Note 1) | |||||||
3.950%, 9/1/22 | $ | 750,000 | $ | 739,789 | ||||
3.450%, 2/15/23 | 500,000 | 474,087 | ||||||
3.500%, 9/1/23 | 100,000 | 94,850 | ||||||
4.250%, 9/1/24 | 750,000 | 746,935 | ||||||
Kinder Morgan, Inc. | ||||||||
2.000%, 12/1/17 | 1,110,000 | 1,103,808 | ||||||
Magellan Midstream Partners LP | ||||||||
6.550%, 7/15/19 | 287,000 | 334,542 | ||||||
4.250%, 2/1/21 | 624,000 | 676,223 | ||||||
Marathon Oil Corp. | ||||||||
6.000%, 10/1/17 | 500,000 | 550,649 | ||||||
5.900%, 3/15/18 | 283,000 | 312,508 | ||||||
2.800%, 11/1/22 | 875,000 | 811,817 | ||||||
Marathon Petroleum Corp. | ||||||||
3.500%, 3/1/16 | 1,820,000 | 1,862,794 | ||||||
5.125%, 3/1/21 | 391,000 | 428,694 | ||||||
Murphy Oil Corp. | ||||||||
3.700%, 12/1/22 | 1,125,000 | 995,118 | ||||||
Nexen Energy ULC | ||||||||
6.200%, 7/30/19 | 500,000 | 574,960 | ||||||
Noble Energy, Inc. | ||||||||
8.250%, 3/1/19 | 998,000 | 1,199,144 | ||||||
4.150%, 12/15/21 | 156,000 | 158,944 | ||||||
3.900%, 11/15/24 | 1,500,000 | 1,474,095 | ||||||
Noble Holding International Ltd. | ||||||||
3.050%, 3/1/16 | 100,000 | 100,957 | ||||||
2.500%, 3/15/17 | 400,000 | 381,081 | ||||||
4.900%, 8/1/20 | 677,000 | 637,353 | ||||||
4.625%, 3/1/21 | 1,125,000 | 1,017,919 | ||||||
Occidental Petroleum Corp. | ||||||||
2.500%, 2/1/16 | 400,000 | 406,731 | ||||||
4.125%, 6/1/16 | 873,000 | 912,325 | ||||||
1.750%, 2/15/17 | 400,000 | 402,111 | ||||||
1.500%, 2/15/18 | 500,000 | 494,285 | ||||||
4.100%, 2/1/21 | 1,950,000 | 2,064,586 | ||||||
3.125%, 2/15/22 | 1,500,000 | 1,486,036 | ||||||
2.700%, 2/15/23 | 1,156,000 | 1,098,533 | ||||||
ONEOK Partners LP | ||||||||
3.250%, 2/1/16 | 300,000 | 305,929 | ||||||
3.200%, 9/15/18 | 1,500,000 | 1,509,426 | ||||||
8.625%, 3/1/19 | 1,602,000 | 1,930,108 | ||||||
3.375%, 10/1/22 | 150,000 | 138,500 | ||||||
5.000%, 9/15/23 | 1,000,000 | 1,020,379 | ||||||
Petrobras Global Finance B.V. | ||||||||
2.000%, 5/20/16 | 444,000 | 422,777 | ||||||
3.250%, 3/17/17 | 2,000,000 | 1,865,400 | ||||||
3.000%, 1/15/19 | 2,000,000 | 1,761,840 | ||||||
4.875%, 3/17/20 | 400,000 | 370,240 | ||||||
4.375%, 5/20/23 | 2,800,000 | 2,410,800 | ||||||
6.250%, 3/17/24 | 2,000,000 | 1,896,600 | ||||||
Petrobras International Finance Co. S.A. | ||||||||
3.875%, 1/27/16 | 3,406,000 | 3,333,009 | ||||||
6.125%, 10/6/16 | 846,000 | 848,631 | ||||||
3.500%, 2/6/17 | 1,250,000 | 1,184,375 | ||||||
5.875%, 3/1/18 | 458,000 | 449,761 | ||||||
7.875%, 3/15/19 | 2,239,000 | 2,328,336 | ||||||
5.750%, 1/20/20 | 5,622,000 | 5,422,981 | ||||||
5.375%, 1/27/21 | 3,969,000 | 3,669,341 | ||||||
Petroleos Mexicanos | ||||||||
5.750%, 3/1/18§ | 1,286,000 | 1,388,880 | ||||||
3.500%, 7/18/18 | 1,000,000 | 1,010,000 | ||||||
3.125%, 1/23/19 | 1,500,000 | 1,503,750 | ||||||
8.000%, 5/3/19 | $ | 1,900,000 | $ | 2,246,750 | ||||
6.000%, 3/5/20 | 3,323,000 | 3,730,067 | ||||||
4.875%, 1/24/22 | 1,500,000 | 1,567,500 | ||||||
3.500%, 1/30/23 | 2,381,000 | 2,273,855 | ||||||
4.875%, 1/18/24 | 2,000,000 | 2,085,000 | ||||||
2.378%, 4/15/25 | 1,080,000 | 1,069,157 | ||||||
Phillips 66 | ||||||||
2.950%, 5/1/17 | 1,794,000 | 1,845,963 | ||||||
4.300%, 4/1/22 | 2,250,000 | 2,369,412 | ||||||
Pioneer Natural Resources Co. | ||||||||
6.650%, 3/15/17 | 1,500,000 | 1,635,653 | ||||||
7.500%, 1/15/20 | 250,000 | 292,096 | ||||||
Plains All American Pipeline LP/Plains All American Finance Corp. | ||||||||
6.500%, 5/1/18 | 477,000 | 540,409 | ||||||
8.750%, 5/1/19 | 404,000 | 501,980 | ||||||
2.600%, 12/15/19 | 1,575,000 | 1,560,381 | ||||||
5.000%, 2/1/21 | 1,000,000 | 1,094,299 | ||||||
3.850%, 10/15/23 | 250,000 | 252,104 | ||||||
3.600%, 11/1/24 | 1,250,000 | 1,217,358 | ||||||
Southwestern Energy Co. | ||||||||
4.100%, 3/15/22 | 1,667,000 | 1,632,230 | ||||||
Spectra Energy Capital LLC | ||||||||
6.200%, 4/15/18 | 984,000 | 1,088,455 | ||||||
8.000%, 10/1/19 | 345,000 | 415,806 | ||||||
3.300%, 3/15/23 | 500,000 | 462,424 | ||||||
Spectra Energy Partners LP | ||||||||
2.950%, 9/25/18 | 1,400,000 | 1,429,655 | ||||||
Statoil ASA | ||||||||
3.125%, 8/17/17 | 1,062,000 | 1,106,394 | ||||||
1.250%, 11/9/17 | 1,000,000 | 991,791 | ||||||
1.150%, 5/15/18 | 1,500,000 | 1,468,066 | ||||||
5.250%, 4/15/19 | 1,406,000 | 1,582,383 | ||||||
2.250%, 11/8/19 | 1,000,000 | 1,000,579 | ||||||
2.900%, 11/8/20 | 1,170,000 | 1,185,394 | ||||||
2.750%, 11/10/21 | 1,000,000 | 1,002,219 | ||||||
3.150%, 1/23/22 | 1,000,000 | 1,016,421 | ||||||
2.450%, 1/17/23 | 500,000 | 475,284 | ||||||
2.650%, 1/15/24 | 500,000 | 479,596 | ||||||
3.700%, 3/1/24 | 2,000,000 | 2,083,811 | ||||||
3.250%, 11/10/24 | 600,000 | 603,357 | ||||||
Suncor Energy, Inc. | ||||||||
6.100%, 6/1/18 | 1,925,000 | 2,153,310 | ||||||
Sunoco Logistics Partners Operations LP | ||||||||
3.450%, 1/15/23 | 750,000 | 717,195 | ||||||
4.250%, 4/1/24 | 1,000,000 | 1,006,431 | ||||||
Talisman Energy, Inc. | ||||||||
7.750%, 6/1/19 | 1,412,000 | 1,625,085 | ||||||
Tennessee Gas Pipeline Co. LLC | ||||||||
7.500%, 4/1/17 | 550,000 | 612,042 | ||||||
Total Capital Canada Ltd. | ||||||||
1.450%, 1/15/18 | 1,150,000 | 1,142,947 | ||||||
2.750%, 7/15/23 | 1,000,000 | 963,750 | ||||||
Total Capital International S.A. | ||||||||
0.750%, 1/25/16 | 1,000,000 | 1,000,270 | ||||||
1.000%, 8/12/16 | 1,000,000 | 1,002,292 | ||||||
1.000%, 1/10/17 | 650,000 | 647,437 | ||||||
1.550%, 6/28/17 | 1,000,000 | 1,003,111 | ||||||
2.125%, 1/10/19 | 1,000,000 | 1,003,646 | ||||||
See Notes to Financial Statements.
37
Table of Contents
EQ ADVISORS TRUST
EQ/CORE BOND INDEX PORTFOLIO
PORTFOLIO OF INVESTMENTS (Continued)
December 31, 2014
Principal Amount | Value (Note 1) | |||||||
2.100%, 6/19/19 | $ | 1,000,000 | $ | 998,618 | ||||
2.875%, 2/17/22 | 250,000 | 247,806 | ||||||
2.700%, 1/25/23 | 1,187,000 | 1,145,989 | ||||||
3.750%, 4/10/24 | 2,000,000 | 2,068,711 | ||||||
Total Capital S.A. | ||||||||
2.300%, 3/15/16 | 2,500,000 | 2,544,228 | ||||||
2.125%, 8/10/18 | 1,000,000 | 1,009,221 | ||||||
4.450%, 6/24/20 | 825,000 | 903,864 | ||||||
4.125%, 1/28/21 | 1,100,000 | 1,184,465 | ||||||
4.250%, 12/15/21 | 500,000 | 539,572 | ||||||
TransCanada PipeLines Ltd. | ||||||||
0.750%, 1/15/16 | 500,000 | 498,920 | ||||||
7.125%, 1/15/19 | 1,293,000 | 1,511,054 | ||||||
3.800%, 10/1/20 | 1,298,000 | 1,329,854 | ||||||
2.500%, 8/1/22 | 850,000 | 802,969 | ||||||
6.350%, 5/15/67 (l) | 1,371,000 | 1,329,870 | ||||||
Transcontinental Gas Pipe Line Co. LLC | ||||||||
6.050%, 6/15/18 | 100,000 | 112,154 | ||||||
Valero Energy Corp. | ||||||||
6.125%, 6/15/17 | 500,000 | 548,108 | ||||||
9.375%, 3/15/19 | 554,000 | 684,833 | ||||||
6.125%, 2/1/20 | 1,154,000 | 1,308,089 | ||||||
Western Gas Partners LP | ||||||||
4.000%, 7/1/22 | 500,000 | 504,256 | ||||||
Williams Cos., Inc. | ||||||||
3.700%, 1/15/23 | 500,000 | 444,902 | ||||||
4.550%, 6/24/24 | 2,250,000 | 2,087,116 | ||||||
Williams Partners LP | ||||||||
5.250%, 3/15/20 | 1,640,000 | 1,771,394 | ||||||
4.125%, 11/15/20 | 250,000 | 254,536 | ||||||
4.000%, 11/15/21 | 750,000 | 750,251 | ||||||
3.350%, 8/15/22 | 1,200,000 | 1,158,819 | ||||||
4.500%, 11/15/23 | 1,000,000 | 1,001,188 | ||||||
4.300%, 3/4/24 | 1,000,000 | 996,033 | ||||||
Williams Partners LP/Williams Partners Finance Corp. | ||||||||
7.250%, 2/1/17 | 329,000 | 362,727 | ||||||
XTO Energy, Inc. | ||||||||
6.250%, 8/1/17 | 1,150,000 | 1,287,450 | ||||||
|
| |||||||
| 260,944,599 | ||||||||
|
| |||||||
Total Energy | 285,661,372 | |||||||
|
| |||||||
Financials (13.3%) | ||||||||
Banks (6.6%) | ||||||||
American Express Bank FSB | ||||||||
6.000%, 9/13/17 | 500,000 | 557,686 | ||||||
Associated Banc-Corp | ||||||||
5.125%, 3/28/16 | 500,000 | 521,679 | ||||||
Associated Banc-Corp. | ||||||||
2.750%, 11/15/19 | 550,000 | 547,894 | ||||||
Australia & New Zealand Banking Group Ltd./New York | ||||||||
0.900%, 2/12/16 | 1,000,000 | 1,001,543 | ||||||
1.250%, 1/10/17 | 1,250,000 | 1,249,888 | ||||||
1.250%, 6/13/17 | 1,500,000 | 1,493,886 | ||||||
1.875%, 10/6/17 | 500,000 | 504,439 | ||||||
1.450%, 5/15/18 | 750,000 | 741,579 | ||||||
Banco do Brasil S.A./Cayman Islands | ||||||||
3.875%, 10/10/22 | 1,700,000 | 1,547,000 | ||||||
Bancolombia S.A. | ||||||||
5.950%, 6/3/21 | $ | 500,000 | $ | 533,750 | ||||
Bank of America Corp. | ||||||||
1.250%, 1/11/16 | 2,412,000 | 2,415,011 | ||||||
6.050%, 5/16/16 | 3,053,000 | 3,233,334 | ||||||
3.750%, 7/12/16 | 95,000 | 98,477 | ||||||
6.500%, 8/1/16 | 3,785,000 | 4,087,733 | ||||||
5.625%, 10/14/16 | 2,971,000 | 3,188,274 | ||||||
1.350%, 11/21/16 | 1,000,000 | 997,495 | ||||||
3.875%, 3/22/17 | 1,000,000 | 1,048,110 | ||||||
5.700%, 5/2/17 | 2,400,000 | 2,594,113 | ||||||
1.700%, 8/25/17 | 2,280,000 | 2,275,526 | ||||||
6.400%, 8/28/17 | 2,147,000 | 2,393,245 | ||||||
6.000%, 9/1/17 | 5,060,000 | 5,600,519 | ||||||
5.750%, 12/1/17 | 1,500,000 | 1,658,931 | ||||||
2.000%, 1/11/18 | 1,350,000 | 1,348,995 | ||||||
6.875%, 4/25/18 | 4,624,000 | 5,306,943 | ||||||
5.650%, 5/1/18 | 4,289,000 | 4,768,157 | ||||||
6.875%, 11/15/18 | 130,000 | 151,481 | ||||||
2.600%, 1/15/19 | 1,742,000 | 1,754,437 | ||||||
2.650%, 4/1/19 | 1,133,000 | 1,141,212 | ||||||
7.625%, 6/1/19 | 3,439,000 | 4,181,474 | ||||||
5.625%, 7/1/20 | 5,310,000 | 6,045,642 | ||||||
5.000%, 5/13/21 | 1,500,000 | 1,670,057 | ||||||
5.700%, 1/24/22 | 2,500,000 | 2,893,742 | ||||||
3.300%, 1/11/23 | 4,300,000 | 4,295,525 | ||||||
4.100%, 7/24/23 | 2,000,000 | 2,102,725 | ||||||
4.125%, 1/22/24 | 1,200,000 | 1,261,364 | ||||||
4.000%, 4/1/24 | 5,000,000 | 5,206,190 | ||||||
4.200%, 8/26/24 | 625,000 | 634,629 | ||||||
Bank of America N.A. | ||||||||
1.125%, 11/14/16 | 1,000,000 | 993,505 | ||||||
1.250%, 2/14/17 | 1,000,000 | 995,604 | ||||||
5.300%, 3/15/17 | 1,300,000 | 1,394,903 | ||||||
Bank of Montreal | ||||||||
1.300%, 7/15/16 | 1,500,000 | 1,506,273 | ||||||
2.500%, 1/11/17 | 1,000,000 | 1,024,041 | ||||||
1.300%, 7/14/17 | 1,250,000 | 1,241,901 | ||||||
1.400%, 9/11/17 | 1,700,000 | 1,690,267 | ||||||
1.450%, 4/9/18 | 1,000,000 | 988,242 | ||||||
2.550%, 11/6/22 | 1,300,000 | 1,266,641 | ||||||
Bank of Nova Scotia | ||||||||
0.950%, 3/15/16 | 600,000 | 601,165 | ||||||
2.900%, 3/29/16 | 1,537,000 | 1,576,704 | ||||||
1.375%, 7/15/16 | 2,000,000 | 2,012,758 | ||||||
1.100%, 12/13/16 | 950,000 | 948,420 | ||||||
1.250%, 4/11/17 | 1,250,000 | 1,246,860 | ||||||
1.300%, 7/21/17 | 1,000,000 | 994,359 | ||||||
1.450%, 4/25/18 | 1,150,000 | 1,134,864 | ||||||
2.050%, 6/5/19 | 1,000,000 | 994,467 | ||||||
4.375%, 1/13/21 | 1,150,000 | 1,270,963 | ||||||
2.800%, 7/21/21 | 1,000,000 | 1,000,366 | ||||||
Barclays Bank plc | ||||||||
5.000%, 9/22/16 | 2,150,000 | 2,284,353 | ||||||
2.500%, 2/20/19 | 2,000,000 | 2,016,946 | ||||||
5.125%, 1/8/20 | 1,200,000 | 1,347,876 | ||||||
5.140%, 10/14/20 | 2,269,000 | 2,461,302 | ||||||
3.750%, 5/15/24 | 1,250,000 | 1,283,622 | ||||||
Barclays plc | ||||||||
2.750%, 11/8/19 | 2,250,000 | 2,246,362 | ||||||
See Notes to Financial Statements.
38
Table of Contents
EQ ADVISORS TRUST
EQ/CORE BOND INDEX PORTFOLIO
PORTFOLIO OF INVESTMENTS (Continued)
December 31, 2014
Principal Amount | Value (Note 1) | |||||||
BB&T Corp. | ||||||||
3.200%, 3/15/16 | $ | 1,612,000 | $ | 1,651,724 | ||||
3.950%, 4/29/16 | 954,000 | 993,460 | ||||||
4.900%, 6/30/17 | 693,000 | 747,328 | ||||||
1.600%, 8/15/17 | 1,200,000 | 1,197,491 | ||||||
2.050%, 6/19/18 | 850,000 | 854,184 | ||||||
2.250%, 2/1/19 | 600,000 | 602,171 | ||||||
6.850%, 4/30/19 | 100,000 | 118,221 | ||||||
5.250%, 11/1/19 | 460,000 | 515,403 | ||||||
3.950%, 3/22/22 | 250,000 | 261,859 | ||||||
BNP Paribas S.A. | ||||||||
1.375%, 3/17/17 | 4,000,000 | 3,991,655 | ||||||
2.375%, 9/14/17 | 1,000,000 | 1,017,451 | ||||||
2.700%, 8/20/18 | 2,000,000 | 2,045,325 | ||||||
2.400%, 12/12/18 | 100,000 | 100,951 | ||||||
2.450%, 3/17/19 | 1,700,000 | 1,720,711 | ||||||
5.000%, 1/15/21 | 2,569,000 | 2,899,429 | ||||||
3.250%, 3/3/23 | 650,000 | 661,380 | ||||||
4.250%, 10/15/24 | 1,000,000 | 1,010,449 | ||||||
Branch Banking & Trust Co. | ||||||||
1.450%, 10/3/16 | 1,000,000 | 1,006,459 | ||||||
1.050%, 12/1/16 | 250,000 | 249,593 | ||||||
1.000%, 4/3/17 | 2,000,000 | 1,981,784 | ||||||
2.300%, 10/15/18 | 1,000,000 | 1,009,162 | ||||||
3.800%, 10/30/26 | 300,000 | 306,058 | ||||||
Canadian Imperial Bank of Commerce | ||||||||
1.350%, 7/18/16 | 1,200,000 | 1,205,870 | ||||||
1.550%, 1/23/18 | 100,000 | 99,259 | ||||||
Capital One Bank USA N.A. | ||||||||
1.150%, 11/21/16 | 1,000,000 | 995,668 | ||||||
2.150%, 11/21/18 | 250,000 | 249,659 | ||||||
2.250%, 2/13/19 | 2,000,000 | 1,991,784 | ||||||
8.800%, 7/15/19 | 1,787,000 | 2,239,317 | ||||||
3.375%, 2/15/23 | 1,000,000 | 991,850 | ||||||
Capital One N.A./Virginia | ||||||||
1.500%, 9/5/17 | 3,000,000 | 2,977,503 | ||||||
1.500%, 3/22/18 | 1,000,000 | 984,055 | ||||||
2.950%, 7/23/21 | 1,000,000 | 994,973 | ||||||
Citigroup, Inc. | ||||||||
5.300%, 1/7/16 | 156,000 | 162,583 | ||||||
1.300%, 4/1/16 | 1,062,000 | 1,063,550 | ||||||
3.953%, 6/15/16 | 3,000,000 | 3,113,597 | ||||||
1.700%, 7/25/16 | 1,150,000 | 1,156,905 | ||||||
5.850%, 8/2/16 | 500,000 | 535,228 | ||||||
1.300%, 11/15/16 | 1,200,000 | 1,196,912 | ||||||
5.500%, 2/15/17 | 1,650,000 | 1,774,813 | ||||||
1.550%, 8/14/17 | 5,000,000 | 4,980,905 | ||||||
6.125%, 11/21/17 | 6,517,000 | 7,290,922 | ||||||
1.850%, 11/24/17 | 800,000 | 799,533 | ||||||
1.750%, 5/1/18 | 1,156,000 | 1,145,408 | ||||||
6.125%, 5/15/18 | 2,613,000 | 2,957,200 | ||||||
2.500%, 9/26/18 | 3,000,000 | 3,035,008 | ||||||
8.500%, 5/22/19 | 4,406,000 | 5,490,510 | ||||||
5.375%, 8/9/20 | 2,162,000 | 2,475,040 | ||||||
4.500%, 1/14/22 | 200,000 | 218,776 | ||||||
4.050%, 7/30/22 | 150,000 | 155,233 | ||||||
3.375%, 3/1/23 | 1,150,000 | 1,162,984 | ||||||
3.500%, 5/15/23 | 1,000,000 | 976,084 | ||||||
3.875%, 10/25/23 | 1,550,000 | 1,608,291 | ||||||
3.750%, 6/16/24 | 500,000 | 510,740 | ||||||
4.000%, 8/5/24 | 2,500,000 | 2,498,439 | ||||||
Citizens Bank NA/Providence RI |
| |||||||
2.450%, 12/4/19 | $ | 750,000 | $ | 745,263 | ||||
Comerica Bank | ||||||||
5.750%, 11/21/16 | 250,000 | 270,641 | ||||||
Comerica, Inc. | ||||||||
2.125%, 5/23/19 | 400,000 | 397,277 | ||||||
Commonwealth Bank of Australia/New York |
| |||||||
1.125%, 3/13/17 | 1,000,000 | 995,859 | ||||||
1.900%, 9/18/17 | 1,250,000 | 1,261,772 | ||||||
2.500%, 9/20/18 | 1,000,000 | 1,018,278 | ||||||
2.250%, 3/13/19 | 1,350,000 | 1,354,796 | ||||||
2.300%, 9/6/19 | 1,000,000 | 998,828 | ||||||
Compass Bank | ||||||||
1.850%, 9/29/17 | 500,000 | 497,679 | ||||||
6.400%, 10/1/17 | 300,000 | 329,027 | ||||||
Cooperatieve Centrale Raiffeisen-Boerenleenbank B.A. |
| |||||||
3.375%, 1/19/17 | 1,350,000 | 1,406,165 | ||||||
1.700%, 3/19/18 | 1,000,000 | 996,191 | ||||||
2.250%, 1/14/19 | 3,000,000 | 3,016,352 | ||||||
4.500%, 1/11/21 | 1,500,000 | 1,649,481 | ||||||
3.875%, 2/8/22 | 2,812,000 | 2,991,163 | ||||||
3.950%, 11/9/22 | 1,000,000 | 1,016,915 | ||||||
4.625%, 12/1/23 | 1,000,000 | 1,055,338 | ||||||
Corpbanca S.A. | ||||||||
3.125%, 1/15/18 | 500,000 | 495,650 | ||||||
Discover Bank/Delaware | ||||||||
7.000%, 4/15/20 | 1,200,000 | 1,415,268 | ||||||
3.200%, 8/9/21 | 350,000 | 351,176 | ||||||
4.200%, 8/8/23 | 550,000 | 578,100 | ||||||
Fifth Third Bancorp | ||||||||
3.625%, 1/25/16 | 1,950,000 | 2,002,377 | ||||||
5.450%, 1/15/17 | 100,000 | 107,160 | ||||||
4.500%, 6/1/18 | 1,000,000 | 1,076,648 | ||||||
2.300%, 3/1/19 | 1,000,000 | 998,723 | ||||||
4.300%, 1/16/24 | 700,000 | 732,428 | ||||||
Fifth Third Bank/Ohio | ||||||||
1.150%, 11/18/16 | 1,000,000 | 997,394 | ||||||
1.450%, 2/28/18 | 300,000 | 296,944 | ||||||
2.375%, 4/25/19 | 1,000,000 | 1,005,148 | ||||||
First Republic Bank/California | ||||||||
2.375%, 6/17/19 | 500,000 | 501,901 | ||||||
Glitnir HF | ||||||||
0.000%, 10/15/08 (h)§ | 4,650,000 | 1,395,000 | ||||||
HSBC Bank USA N.A. | ||||||||
6.000%, 8/9/17 | 750,000 | 831,414 | ||||||
4.875%, 8/24/20 | 1,000,000 | 1,101,805 | ||||||
HSBC Holdings plc | ||||||||
5.100%, 4/5/21 | 2,700,000 | 3,063,780 | ||||||
4.875%, 1/14/22 | 750,000 | 840,115 | ||||||
4.000%, 3/30/22 | 1,650,000 | 1,754,242 | ||||||
4.250%, 3/14/24 | 1,700,000 | 1,762,735 | ||||||
Huntington Bancshares, Inc./Ohio | ||||||||
2.600%, 8/2/18 | 750,000 | 762,388 | ||||||
7.000%, 12/15/20 | 80,000 | 95,763 | ||||||
Huntington National Bank | ||||||||
1.300%, 11/20/16 | 515,000 | 513,429 | ||||||
1.375%, 4/24/17 | 2,000,000 | 1,996,227 | ||||||
2.200%, 4/1/19 | 500,000 | 499,623 | ||||||
Industrial & Commercial Bank of China Ltd./New York | ||||||||
2.351%, 11/13/17 | 355,000 | 354,342 | ||||||
3.231%, 11/13/19 | 700,000 | 702,945 | ||||||
See Notes to Financial Statements.
39
Table of Contents
EQ ADVISORS TRUST
EQ/CORE BOND INDEX PORTFOLIO
PORTFOLIO OF INVESTMENTS (Continued)
December 31, 2014
Principal Amount | Value (Note 1) | |||||||
Intesa Sanpaolo S.p.A. | ||||||||
3.125%, 1/15/16 | $ | 1,400,000 | $ | 1,420,682 | ||||
3.875%, 1/16/18 | 1,505,000 | 1,567,056 | ||||||
3.875%, 1/15/19 | 2,400,000 | 2,485,769 | ||||||
5.250%, 1/12/24 | 1,500,000 | 1,640,827 | ||||||
JPMorgan Chase & Co. |
| |||||||
1.125%, 2/26/16 | 312,000 | 312,522 | ||||||
3.450%, 3/1/16 | 2,500,000 | 2,570,183 | ||||||
3.150%, 7/5/16 | 2,719,000 | 2,802,992 | ||||||
1.350%, 2/15/17 | 3,300,000 | 3,300,716 | ||||||
2.000%, 8/15/17 | 1,750,000 | 1,767,943 | ||||||
6.000%, 1/15/18 | 4,043,000 | 4,525,233 | ||||||
1.800%, 1/25/18 | 1,000,000 | 999,273 | ||||||
1.625%, 5/15/18 | 2,156,000 | 2,130,139 | ||||||
2.350%, 1/28/19 | 5,000,000 | 5,030,207 | ||||||
6.300%, 4/23/19 | 7,707,000 | 8,942,545 | ||||||
4.950%, 3/25/20 | 500,000 | 556,286 | ||||||
4.400%, 7/22/20 | 3,230,000 | 3,508,466 | ||||||
4.250%, 10/15/20 | 874,000 | 942,267 | ||||||
4.625%, 5/10/21 | 2,000,000 | 2,200,628 | ||||||
4.350%, 8/15/21 | 300,000 | 325,311 | ||||||
4.500%, 1/24/22 | 2,000,000 | 2,185,066 | ||||||
3.250%, 9/23/22 | 2,849,000 | 2,866,210 | ||||||
3.200%, 1/25/23 | 4,369,000 | 4,366,666 | ||||||
3.375%, 5/1/23 | 2,075,000 | 2,048,364 | ||||||
3.875%, 2/1/24 | 5,000,000 | 5,226,299 | ||||||
3.625%, 5/13/24 | 3,000,000 | 3,072,607 | ||||||
JPMorgan Chase Bank N.A. |
| |||||||
6.000%, 10/1/17 | 3,750,000 | 4,160,788 | ||||||
KeyBank N.A./Ohio | ||||||||
1.100%, 11/25/16 | 269,000 | 268,027 | ||||||
1.650%, 2/1/18 | 2,000,000 | 1,989,747 | ||||||
KeyCorp | ||||||||
5.100%, 3/24/21 | 1,375,000 | 1,553,202 | ||||||
KfW | ||||||||
2.625%, 2/16/16 | 6,050,000 | 6,190,846 | ||||||
5.125%, 3/14/16 | 4,000,000 | 4,217,826 | ||||||
0.500%, 4/19/16 | 6,024,000 | 6,016,309 | ||||||
0.500%, 7/15/16 | 8,000,000 | 7,979,365 | ||||||
0.625%, 12/15/16 | 3,600,000 | 3,584,854 | ||||||
4.875%, 1/17/17 | 2,965,000 | 3,200,444 | ||||||
1.250%, 2/15/17 | 812,000 | 817,311 | ||||||
0.750%, 3/17/17 | 7,000,000 | 6,966,651 | ||||||
0.875%, 9/5/17 | 2,000,000 | 1,982,651 | ||||||
4.375%, 3/15/18 | 3,000,000 | 3,288,186 | ||||||
1.000%, 6/11/18 | 2,000,000 | 1,973,178 | ||||||
4.500%, 7/16/18 | 2,385,000 | 2,635,976 | ||||||
1.875%, 4/1/19 | 3,150,000 | 3,176,786 | ||||||
4.875%, 6/17/19 | 1,900,000 | 2,157,530 | ||||||
4.000%, 1/27/20 | 8,539,000 | 9,408,667 | ||||||
2.750%, 9/8/20 | 2,436,000 | 2,532,965 | ||||||
2.750%, 10/1/20 | 3,150,000 | 3,273,647 | ||||||
2.375%, 8/25/21 | 1,500,000 | 1,537,137 | ||||||
2.625%, 1/25/22 | 3,000,000 | 3,115,479 | ||||||
2.000%, 10/4/22 | 2,312,000 | 2,288,747 | ||||||
2.125%, 1/17/23 | 3,350,000 | 3,334,353 | ||||||
2.500%, 11/20/24 | 1,500,000 | 1,517,870 | ||||||
Landwirtschaftliche Rentenbank |
| |||||||
2.500%, 2/15/16 | 2,400,000 | 2,454,651 | ||||||
2.125%, 7/15/16 | 187,000 | 191,204 | ||||||
5.125%, 2/1/17 | 2,229,000 | 2,421,321 | ||||||
0.875%, 9/12/17 | $ | 1,000,000 | $ | 991,730 | ||||
2.375%, 9/13/17 | 1,000,000 | 1,032,044 | ||||||
1.000%, 4/4/18 | 3,250,000 | 3,209,893 | ||||||
1.750%, 4/15/19 | 2,000,000 | 2,004,109 | ||||||
1.375%, 10/23/19 | 829,000 | 812,808 | ||||||
Lloyds Bank plc | ||||||||
4.200%, 3/28/17 | 1,500,000 | 1,588,305 | ||||||
2.300%, 11/27/18 | 1,200,000 | 1,207,728 | ||||||
2.350%, 9/5/19 | 1,000,000 | 999,708 | ||||||
6.375%, 1/21/21 | 1,000,000 | 1,197,036 | ||||||
Manufacturers & Traders Trust Co. |
| |||||||
6.625%, 12/4/17 | 500,000 | 566,029 | ||||||
1.450%, 3/7/18 | 1,000,000 | 989,658 | ||||||
2.300%, 1/30/19 | 800,000 | 803,601 | ||||||
2.250%, 7/25/19 | 1,100,000 | 1,097,464 | ||||||
MUFG Americas Holdings Corp. |
| |||||||
3.500%, 6/18/22 | 2,200,000 | 2,290,270 | ||||||
MUFG Union Bank N.A. | ||||||||
3.000%, 6/6/16 | 1,000,000 | 1,027,974 | ||||||
1.500%, 9/26/16 | 343,000 | 344,461 | ||||||
2.625%, 9/26/18 | 1,000,000 | 1,019,359 | ||||||
National Australia Bank Ltd./New York |
| |||||||
1.300%, 7/25/16 | 500,000 | 502,396 | ||||||
2.750%, 3/9/17 | 1,800,000 | 1,854,488 | ||||||
2.300%, 7/25/18 | 1,250,000 | 1,265,454 | ||||||
3.000%, 1/20/23 | 1,350,000 | 1,347,426 | ||||||
Oesterreichische Kontrollbank AG |
| |||||||
4.875%, 2/16/16 | 2,468,000 | 2,587,912 | ||||||
5.000%, 4/25/17 | 1,346,000 | 1,467,840 | ||||||
1.125%, 5/29/18 | 2,000,000 | 1,976,901 | ||||||
1.625%, 3/12/19 | 1,000,000 | 998,428 | ||||||
PNC Bank N.A. | ||||||||
1.150%, 11/1/16 | 250,000 | 250,604 | ||||||
1.125%, 1/27/17 | 1,500,000 | 1,499,823 | ||||||
4.875%, 9/21/17 | 1,000,000 | 1,082,025 | ||||||
1.500%, 10/18/17 | 2,000,000 | 1,999,627 | ||||||
2.200%, 1/28/19 | 1,500,000 | 1,504,428 | ||||||
2.950%, 1/30/23 | 250,000 | 243,883 | ||||||
3.800%, 7/25/23 | 1,000,000 | 1,026,324 | ||||||
3.300%, 10/30/24 | 1,000,000 | 1,019,137 | ||||||
PNC Financial Services Group, Inc. |
| |||||||
2.854%, 11/9/22 (e) | 2,000,000 | 1,960,630 | ||||||
3.900%, 4/29/24 | 500,000 | 507,053 | ||||||
PNC Funding Corp. | ||||||||
2.700%, 9/19/16 | 1,050,000 | 1,079,255 | ||||||
5.625%, 2/1/17 | 2,050,000 | 2,212,164 | ||||||
6.700%, 6/10/19 | 500,000 | 592,217 | ||||||
5.125%, 2/8/20 | 981,000 | 1,104,325 | ||||||
4.375%, 8/11/20 | 1,839,000 | 2,007,001 | ||||||
Regions Financial Corp. | ||||||||
2.000%, 5/15/18 | 650,000 | 643,110 | ||||||
Royal Bank of Canada | ||||||||
0.850%, 3/8/16 | 900,000 | 900,319 | ||||||
2.300%, 7/20/16 | 2,500,000 | 2,550,221 | ||||||
1.250%, 6/16/17 | 500,000 | 498,026 | ||||||
1.400%, 10/13/17 | 1,000,000 | 995,725 | ||||||
1.500%, 1/16/18 | 2,000,000 | 1,989,121 | ||||||
2.200%, 7/27/18 | 2,000,000 | 2,021,359 | ||||||
2.150%, 3/15/19 | 750,000 | 751,287 | ||||||
Royal Bank of Scotland Group plc |
| |||||||
1.875%, 3/31/17 | 2,100,000 | 2,097,036 | ||||||
6.400%, 10/21/19 | 1,010,000 | 1,167,198 | ||||||
See Notes to Financial Statements.
40
Table of Contents
EQ ADVISORS TRUST
EQ/CORE BOND INDEX PORTFOLIO
PORTFOLIO OF INVESTMENTS (Continued)
December 31, 2014
Principal Amount | Value (Note 1) | |||||||
Royal Bank of Scotland plc | ||||||||
4.375%, 3/16/16 | $ | 1,500,000 | $ | 1,552,568 | ||||
5.625%, 8/24/20 | 1,406,000 | 1,603,464 | ||||||
6.125%, 1/11/21 | 1,000,000 | 1,177,137 | ||||||
Santander Holdings USA, Inc./Pennsylvania |
| |||||||
4.625%, 4/19/16 | 245,000 | 255,274 | ||||||
Societe Generale S.A. | ||||||||
2.750%, 10/12/17 | 750,000 | 769,163 | ||||||
2.625%, 10/1/18 | 1,000,000 | 1,016,431 | ||||||
Sumitomo Mitsui Banking Corp. |
| |||||||
0.900%, 1/18/16 | 350,000 | 349,373 | ||||||
1.450%, 7/19/16 | 1,000,000 | 1,002,000 | ||||||
1.800%, 7/18/17 | 1,000,000 | 998,944 | ||||||
1.500%, 1/18/18 | 500,000 | 492,941 | ||||||
2.500%, 7/19/18 | 250,000 | 252,614 | ||||||
2.450%, 1/10/19 | 800,000 | 802,438 | ||||||
2.250%, 7/11/19 | 750,000 | 744,195 | ||||||
3.200%, 7/18/22 | 750,000 | 759,532 | ||||||
3.000%, 1/18/23 | 1,000,000 | 993,904 | ||||||
3.950%, 1/10/24 | 2,250,000 | 2,381,274 | ||||||
3.400%, 7/11/24 | 2,000,000 | 2,047,509 | ||||||
SunTrust Banks, Inc./Georgia |
| |||||||
3.600%, 4/15/16 | 1,294,000 | 1,334,403 | ||||||
3.500%, 1/20/17 | 156,000 | 162,213 | ||||||
1.350%, 2/15/17 | 750,000 | 750,163 | ||||||
6.000%, 9/11/17 | 500,000 | 556,520 | ||||||
7.250%, 3/15/18 | 946,000 | 1,099,353 | ||||||
2.350%, 11/1/18 | 350,000 | 352,506 | ||||||
2.500%, 5/1/19 | 1,250,000 | 1,252,462 | ||||||
SVB Financial Group | ||||||||
5.375%, 9/15/20 | 160,000 | 180,167 | ||||||
Svenska Handelsbanken AB |
| |||||||
3.125%, 7/12/16 | 1,450,000 | 1,495,262 | ||||||
1.625%, 3/21/18 | 1,000,000 | 994,786 | ||||||
2.500%, 1/25/19 | 3,000,000 | 3,059,222 | ||||||
Toronto-Dominion Bank |
| |||||||
2.500%, 7/14/16 | 1,650,000 | 1,689,306 | ||||||
1.500%, 9/9/16 | 750,000 | 756,301 | ||||||
2.375%, 10/19/16 | 1,350,000 | 1,381,439 | ||||||
1.125%, 5/2/17 | 1,500,000 | 1,494,118 | ||||||
1.400%, 4/30/18 | 1,000,000 | 987,277 | ||||||
2.625%, 9/10/18 | 1,000,000 | 1,022,587 | ||||||
2.125%, 7/2/19 | 1,000,000 | 997,947 | ||||||
2.250%, 11/5/19 | 1,600,000 | 1,602,596 | ||||||
U.S. Bancorp/Minnesota |
| |||||||
3.442%, 2/1/16 | 1,150,000 | 1,177,627 | ||||||
2.200%, 11/15/16 | 312,000 | 318,457 | ||||||
1.650%, 5/15/17 | 1,500,000 | 1,511,149 | ||||||
4.125%, 5/24/21 | 1,000,000 | 1,092,246 | ||||||
3.000%, 3/15/22 | 750,000 | 764,036 | ||||||
2.950%, 7/15/22 | 2,125,000 | 2,089,418 | ||||||
3.700%, 1/30/24 | 500,000 | 524,558 | ||||||
3.600%, 9/11/24 | 1,000,000 | 1,013,152 | ||||||
U.S. Bank N.A./Ohio | ||||||||
1.100%, 1/30/17 | 1,000,000 | 998,468 | ||||||
1.375%, 9/11/17 | 1,000,000 | 998,325 | ||||||
2.125%, 10/28/19 | 2,500,000 | 2,492,893 | ||||||
Wachovia Corp. | ||||||||
5.625%, 10/15/16 | 1,447,000 | 1,556,705 | ||||||
5.750%, 6/15/17 | 422,000 | 465,731 | ||||||
5.750%, 2/1/18 | 4,146,000 | 4,640,723 | ||||||
Wells Fargo & Co. | ||||||||
1.250%, 7/20/16 | $ | 1,500,000 | $ | 1,504,962 | ||||
5.125%, 9/15/16 | 367,000 | 391,189 | ||||||
2.625%, 12/15/16 | 2,000,000 | 2,055,410 | ||||||
2.100%, 5/8/17 | 200,000 | 203,460 | ||||||
1.400%, 9/8/17 | 1,500,000 | 1,497,713 | ||||||
5.625%, 12/11/17 | 3,647,000 | 4,064,100 | ||||||
1.500%, 1/16/18 | 1,006,000 | 1,000,528 | ||||||
2.150%, 1/15/19 | 1,166,000 | 1,169,675 | ||||||
2.125%, 4/22/19 | 5,000,000 | 4,992,832 | ||||||
3.000%, 1/22/21 | 1,500,000 | 1,532,694 | ||||||
4.600%, 4/1/21 | 2,000,000 | 2,220,388 | ||||||
3.500%, 3/8/22 | 1,844,000 | 1,911,487 | ||||||
3.450%, 2/13/23 | 1,806,000 | 1,828,250 | ||||||
4.125%, 8/15/23 | 3,000,000 | 3,139,087 | ||||||
3.300%, 9/9/24 | 2,000,000 | 2,010,703 | ||||||
Wells Fargo Bank N.A. | ||||||||
6.000%, 11/15/17 | 500,000 | 560,642 | ||||||
Westpac Banking Corp. | ||||||||
0.950%, 1/12/16 | 1,500,000 | 1,505,226 | ||||||
1.200%, 5/19/17 | 788,000 | 785,447 | ||||||
2.000%, 8/14/17 | 1,700,000 | 1,723,480 | ||||||
1.500%, 12/1/17 | 3,000,000 | 2,991,772 | ||||||
1.600%, 1/12/18 | 500,000 | 499,288 | ||||||
4.625%, 6/1/18 | 62,000 | 66,761 | ||||||
2.250%, 1/17/19 | 600,000 | 604,368 | ||||||
4.875%, 11/19/19 | 1,800,000 | 2,005,247 | ||||||
|
| |||||||
| 567,980,527 | ||||||||
|
| |||||||
Capital Markets (2.1%) | ||||||||
Affiliated Managers Group, Inc. | ||||||||
4.250%, 2/15/24 | 350,000 | 367,465 | ||||||
Ameriprise Financial, Inc. | ||||||||
7.300%, 6/28/19 | 1,611,000 | 1,949,310 | ||||||
5.300%, 3/15/20 | 156,000 | 176,719 | ||||||
4.000%, 10/15/23 | 150,000 | 158,699 | ||||||
3.700%, 10/15/24 | 750,000 | 766,118 | ||||||
Ares Capital Corp. | ||||||||
4.875%, 11/30/18 | 500,000 | 524,389 | ||||||
3.875%, 1/15/20 | 300,000 | 298,891 | ||||||
Bank of New York Mellon Corp. | ||||||||
2.500%, 1/15/16 | 300,000 | 305,553 | ||||||
0.700%, 3/4/16 | 1,000,000 | 999,236 | ||||||
1.300%, 1/25/18 | 250,000 | 247,693 | ||||||
2.100%, 1/15/19 | 48,000 | 48,133 | ||||||
2.300%, 9/11/19 | 1,500,000 | 1,504,439 | ||||||
4.150%, 2/1/21 | 2,187,000 | 2,374,448 | ||||||
3.550%, 9/23/21 | 750,000 | 785,091 | ||||||
3.650%, 2/4/24 | 2,100,000 | 2,197,187 | ||||||
BGC Partners, Inc. | ||||||||
5.375%, 12/9/19§ | 300,000 | 294,640 | ||||||
BlackRock, Inc. | ||||||||
5.000%, 12/10/19 | 1,473,000 | 1,661,309 | ||||||
4.250%, 5/24/21 | 1,000,000 | 1,106,452 | ||||||
3.375%, 6/1/22 | 500,000 | 516,331 | ||||||
3.500%, 3/18/24 | 1,400,000 | 1,440,879 | ||||||
Charles Schwab Corp. | ||||||||
4.450%, 7/22/20 | 850,000 | 932,208 | ||||||
3.225%, 9/1/22 | 1,197,000 | 1,212,249 | ||||||
Credit Suisse AG/New York | ||||||||
1.375%, 5/26/17 | 1,000,000 | 997,039 | ||||||
See Notes to Financial Statements.
41
Table of Contents
EQ ADVISORS TRUST
EQ/CORE BOND INDEX PORTFOLIO
PORTFOLIO OF INVESTMENTS (Continued)
December 31, 2014
Principal Amount | Value (Note 1) | |||||||
2.300%, 5/28/19 | $ | 900,000 | $ | 897,522 | ||||
5.300%, 8/13/19 | 1,346,000 | 1,508,958 | ||||||
5.400%, 1/14/20 | 2,000,000 | 2,236,206 | ||||||
4.375%, 8/5/20 | 2,850,000 | 3,080,256 | ||||||
3.000%, 10/29/21 | 850,000 | 843,902 | ||||||
3.625%, 9/9/24 | 3,000,000 | 3,047,751 | ||||||
Credit Suisse USA, Inc. | ||||||||
5.375%, 3/2/16 | 300,000 | 316,720 | ||||||
5.850%, 8/16/16 | 1,318,000 | 1,418,334 | ||||||
Deutsche Bank AG/London | ||||||||
3.250%, 1/11/16 | 2,000,000 | 2,041,622 | ||||||
1.400%, 2/13/17 | 1,250,000 | 1,246,506 | ||||||
1.350%, 5/30/17 | 1,650,000 | 1,638,169 | ||||||
6.000%, 9/1/17 | 2,096,000 | 2,325,665 | ||||||
2.500%, 2/13/19 | 1,600,000 | 1,616,374 | ||||||
3.700%, 5/30/24 | 2,000,000 | 2,042,276 | ||||||
4.296%, 5/24/28 (l) | 1,700,000 | 1,646,118 | ||||||
Eaton Vance Corp. | ||||||||
6.500%, 10/2/17 | 60,000 | 67,387 | ||||||
3.625%, 6/15/23 | 500,000 | 514,779 | ||||||
Fifth Street Finance Corp. | ||||||||
4.875%, 3/1/19 | 250,000 | 260,405 | ||||||
FS Investment Corp. | ||||||||
4.000%, 7/15/19 | 400,000 | 397,797 | ||||||
Goldman Sachs Group, Inc. | ||||||||
5.350%, 1/15/16 | 2,941,000 | 3,068,092 | ||||||
3.625%, 2/7/16 | 3,000,000 | 3,074,243 | ||||||
5.750%, 10/1/16 | 375,000 | 402,162 | ||||||
5.625%, 1/15/17 | 2,543,000 | 2,724,945 | ||||||
6.250%, 9/1/17 | 2,219,000 | 2,464,237 | ||||||
5.950%, 1/18/18 | 6,451,000 | 7,172,052 | ||||||
2.375%, 1/22/18 | 750,000 | 758,219 | ||||||
6.150%, 4/1/18 | 1,318,000 | 1,480,382 | ||||||
2.900%, 7/19/18 | 3,000,000 | 3,073,710 | ||||||
7.500%, 2/15/19 | 2,999,000 | 3,586,963 | ||||||
2.550%, 10/23/19 | 1,000,000 | 994,530 | ||||||
5.375%, 3/15/20 | 3,650,000 | 4,094,114 | ||||||
6.000%, 6/15/20 | 1,428,000 | 1,649,955 | ||||||
5.250%, 7/27/21 | 1,905,000 | 2,147,692 | ||||||
5.750%, 1/24/22 | 4,400,000 | 5,091,742 | ||||||
3.625%, 1/22/23 | 2,244,000 | 2,276,608 | ||||||
4.000%, 3/3/24 | 3,045,000 | 3,158,812 | ||||||
3.850%, 7/8/24 | 2,000,000 | 2,049,845 | ||||||
Invesco Finance plc | ||||||||
3.125%, 11/30/22 | 1,000,000 | 988,381 | ||||||
Jefferies Group LLC | ||||||||
5.125%, 4/13/18 | 525,000 | 554,930 | ||||||
8.500%, 7/15/19 | 1,446,000 | 1,734,109 | ||||||
5.125%, 1/20/23 | 117,000 | 121,073 | ||||||
Lazard Group LLC | ||||||||
4.250%, 11/14/20 | 1,000,000 | 1,052,500 | ||||||
Legg Mason, Inc. | ||||||||
2.700%, 7/15/19 | 375,000 | 376,353 | ||||||
Mellon Funding Corp. | ||||||||
5.500%, 11/15/18 | 1,000,000 | 1,125,174 | ||||||
Morgan Stanley | ||||||||
1.750%, 2/25/16 | 420,000 | 422,951 | ||||||
3.800%, 4/29/16 | 150,000 | 154,723 | ||||||
5.750%, 10/18/16 | 1,500,000 | 1,611,316 | ||||||
4.750%, 3/22/17 | 656,000 | 698,814 | ||||||
5.550%, 4/27/17 | 7,250,000 | 7,868,226 | ||||||
6.625%, 4/1/18 | $ | 2,848,000 | $ | 3,241,896 | ||||
2.125%, 4/25/18 | 4,504,000 | 4,504,019 | ||||||
2.500%, 1/24/19 | 2,000,000 | 2,001,653 | ||||||
7.300%, 5/13/19 | 2,718,000 | 3,239,155 | ||||||
2.375%, 7/23/19 | 3,000,000 | 2,963,662 | ||||||
5.625%, 9/23/19 | 2,039,000 | 2,300,784 | ||||||
5.500%, 1/26/20 | 250,000 | 281,692 | ||||||
5.500%, 7/24/20 | 1,522,000 | 1,723,528 | ||||||
5.750%, 1/25/21 | 4,112,000 | 4,724,779 | ||||||
5.500%, 7/28/21 | 2,130,000 | 2,414,084 | ||||||
4.875%, 11/1/22 | 312,000 | 331,354 | ||||||
3.750%, 2/25/23 | 3,394,000 | 3,483,705 | ||||||
4.100%, 5/22/23 | 2,000,000 | 2,015,768 | ||||||
3.875%, 4/29/24 | 4,000,000 | 4,102,709 | ||||||
3.700%, 10/23/24 | 2,000,000 | 2,028,177 | ||||||
Nomura Holdings, Inc. | ||||||||
4.125%, 1/19/16 | 3,100,000 | 3,186,668 | ||||||
2.000%, 9/13/16 | 100,000 | 100,757 | ||||||
2.750%, 3/19/19 | 1,000,000 | 1,011,915 | ||||||
6.700%, 3/4/20 | 959,000 | 1,140,319 | ||||||
Northern Trust Corp. | ||||||||
3.450%, 11/4/20 | 850,000 | 901,784 | ||||||
3.375%, 8/23/21 | 375,000 | 394,500 | ||||||
2.375%, 8/2/22 | 500,000 | 491,223 | ||||||
PennantPark Investment Corp. | ||||||||
4.500%, 10/1/19 | 400,000 | 400,982 | ||||||
Prospect Capital Corp. | ||||||||
5.000%, 7/15/19 | 350,000 | 355,291 | ||||||
Raymond James Financial, Inc. | ||||||||
4.250%, 4/15/16 | 250,000 | 259,008 | ||||||
8.600%, 8/15/19 | 439,000 | 542,772 | ||||||
Stifel Financial Corp. | ||||||||
4.250%, 7/18/24 | 600,000 | 597,105 | ||||||
TD Ameritrade Holding Corp. | ||||||||
5.600%, 12/1/19 | 100,000 | 114,373 | ||||||
3.625%, 4/1/25 | 1,000,000 | 1,020,956 | ||||||
UBS AG/Connecticut | ||||||||
5.875%, 7/15/16 | 1,000,000 | 1,068,825 | ||||||
1.375%, 8/14/17 | 3,395,000 | 3,364,226 | ||||||
5.875%, 12/20/17 | 2,275,000 | 2,541,185 | ||||||
5.750%, 4/25/18 | 3,000,000 | 3,366,832 | ||||||
2.375%, 8/14/19 | 500,000 | 500,115 | ||||||
4.875%, 8/4/20 | 1,812,000 | 2,013,338 | ||||||
|
| |||||||
| 176,717,217 | ||||||||
|
| |||||||
Consumer Finance (1.3%) | ||||||||
American Express Centurion Bank | ||||||||
6.000%, 9/13/17 | 1,250,000 | 1,394,216 | ||||||
American Express Co. | ||||||||
6.150%, 8/28/17 | 416,000 | 463,899 | ||||||
7.000%, 3/19/18 | 3,922,000 | 4,533,207 | ||||||
1.550%, 5/22/18 | 2,000,000 | 1,969,976 | ||||||
8.125%, 5/20/19 | 1,212,000 | 1,502,094 | ||||||
2.650%, 12/2/22 | 1,487,000 | 1,459,842 | ||||||
3.625%, 12/5/24 | 1,070,000 | 1,077,948 | ||||||
6.800%, 9/1/66 (l) | 150,000 | 157,125 | ||||||
American Express Credit Corp. | ||||||||
2.800%, 9/19/16 | 250,000 | 257,358 | ||||||
2.375%, 3/24/17 | 2,000,000 | 2,046,260 | ||||||
2.125%, 3/18/19 | 750,000 | 750,239 | ||||||
2.250%, 8/15/19 | 2,500,000 | 2,500,700 | ||||||
See Notes to Financial Statements.
42
Table of Contents
EQ ADVISORS TRUST
EQ/CORE BOND INDEX PORTFOLIO
PORTFOLIO OF INVESTMENTS (Continued)
December 31, 2014
Principal Amount | Value (Note 1) | |||||||
American Honda Finance Corp. | ||||||||
1.200%, 7/14/17 | $ | 2,150,000 | $ | 2,139,973 | ||||
1.550%, 12/11/17 | 800,000 | 800,283 | ||||||
2.125%, 10/10/18 | 1,000,000 | 1,003,650 | ||||||
Capital One Financial Corp. | ||||||||
3.150%, 7/15/16 | 300,000 | 308,535 | ||||||
6.150%, 9/1/16 | 669,000 | 718,405 | ||||||
6.750%, 9/15/17 | 1,546,000 | 1,737,961 | ||||||
4.750%, 7/15/21 | 500,000 | 551,481 | ||||||
3.750%, 4/24/24 | 1,000,000 | 1,015,823 | ||||||
Caterpillar Financial Services Corp. | ||||||||
0.700%, 2/26/16 | 1,250,000 | 1,249,474 | ||||||
5.500%, 3/15/16 | 125,000 | 132,060 | ||||||
2.050%, 8/1/16 | 1,700,000 | 1,730,597 | ||||||
1.750%, 3/24/17 | 500,000 | 505,880 | ||||||
1.250%, 8/18/17 | 1,500,000 | 1,494,138 | ||||||
1.250%, 11/6/17 | 250,000 | 248,707 | ||||||
1.300%, 3/1/18 | 1,000,000 | 988,757 | ||||||
5.450%, 4/15/18 | 1,000,000 | 1,118,180 | ||||||
7.150%, 2/15/19 | 2,520,000 | 3,019,743 | ||||||
2.100%, 6/9/19 | 700,000 | 701,308 | ||||||
2.850%, 6/1/22 | 500,000 | 500,822 | ||||||
2.625%, 3/1/23 | 1,000,000 | 979,147 | ||||||
3.300%, 6/9/24 | 700,000 | 716,319 | ||||||
Discover Financial Services | ||||||||
6.450%, 6/12/17 | 498,000 | 550,240 | ||||||
5.200%, 4/27/22 | 100,000 | 109,669 | ||||||
3.850%, 11/21/22 | 1,144,000 | 1,157,291 | ||||||
3.950%, 11/6/24 | 250,000 | 250,625 | ||||||
Ford Motor Credit Co. LLC | ||||||||
2.500%, 1/15/16 | 2,950,000 | 2,987,857 | ||||||
1.700%, 5/9/16 | 1,250,000 | 1,254,744 | ||||||
3.984%, 6/15/16 | 300,000 | 310,659 | ||||||
8.000%, 12/15/16 | 1,250,000 | 1,396,840 | ||||||
1.500%, 1/17/17 | 714,000 | 710,126 | ||||||
4.250%, 2/3/17 | 300,000 | 314,967 | ||||||
3.000%, 6/12/17 | 5,000,000 | 5,126,206 | ||||||
1.684%, 9/8/17 | 1,000,000 | 990,947 | ||||||
1.724%, 12/6/17 | 1,200,000 | 1,186,508 | ||||||
2.375%, 1/16/18 | 1,382,000 | 1,389,663 | ||||||
5.875%, 8/2/21 | 5,850,000 | 6,767,131 | ||||||
4.250%, 9/20/22 | 2,700,000 | 2,864,719 | ||||||
HSBC Finance Corp. | ||||||||
5.500%, 1/19/16 | 2,219,000 | 2,321,010 | ||||||
6.676%, 1/15/21 | 3,826,000 | 4,540,844 | ||||||
HSBC USA, Inc. | ||||||||
1.625%, 1/16/18 | 1,000,000 | 994,526 | ||||||
2.250%, 6/23/19 | 1,250,000 | 1,250,213 | ||||||
5.000%, 9/27/20 | 650,000 | 710,144 | ||||||
3.500%, 6/23/24 | 900,000 | 925,868 | ||||||
John Deere Capital Corp. | ||||||||
1.050%, 12/15/16 | 2,000,000 | 1,998,391 | ||||||
5.500%, 4/13/17 | 208,000 | 227,595 | ||||||
2.800%, 9/18/17 | 1,500,000 | 1,560,432 | ||||||
1.200%, 10/10/17 | 1,000,000 | 994,219 | ||||||
1.300%, 3/12/18 | 1,150,000 | 1,139,080 | ||||||
5.750%, 9/10/18 | 1,108,000 | 1,256,508 | ||||||
1.950%, 12/13/18 | 650,000 | 649,594 | ||||||
2.250%, 4/17/19 | 500,000 | 503,609 | ||||||
2.800%, 3/4/21 | 1,000,000 | 1,011,462 | ||||||
3.900%, 7/12/21 | $ | 350,000 | $ | 379,470 | ||||
3.150%, 10/15/21 | 500,000 | 518,480 | ||||||
2.750%, 3/15/22 | 1,000,000 | 992,337 | ||||||
3.350%, 6/12/24 | 650,000 | 666,707 | ||||||
PACCAR Financial Corp. | ||||||||
1.400%, 11/17/17 | 55,000 | 54,858 | ||||||
PACCAR Financial Corp. | ||||||||
0.800%, 2/8/16 | 1,000,000 | 1,001,474 | ||||||
1.150%, 8/16/16 | 100,000 | 100,369 | ||||||
1.600%, 3/15/17 | 750,000 | 756,428 | ||||||
Synchrony Financial | ||||||||
1.875%, 8/15/17 | 2,000,000 | 2,003,225 | ||||||
3.000%, 8/15/19 | 600,000 | 606,459 | ||||||
4.250%, 8/15/24 | 750,000 | 771,086 | ||||||
Toyota Motor Credit Corp. | ||||||||
2.800%, 1/11/16 | 2,212,000 | 2,259,396 | ||||||
0.800%, 5/17/16 | 1,094,000 | 1,094,399 | ||||||
2.000%, 9/15/16 | 850,000 | 864,863 | ||||||
2.050%, 1/12/17 | 1,000,000 | 1,017,400 | ||||||
1.750%, 5/22/17 | 1,300,000 | 1,314,971 | ||||||
1.250%, 10/5/17 | 1,500,000 | 1,494,358 | ||||||
1.375%, 1/10/18 | 1,000,000 | 996,459 | ||||||
2.000%, 10/24/18 | 200,000 | 200,746 | ||||||
2.125%, 7/18/19 | 1,000,000 | 998,164 | ||||||
4.500%, 6/17/20 | 300,000 | 331,848 | ||||||
4.250%, 1/11/21 | 1,300,000 | 1,432,122 | ||||||
2.750%, 5/17/21 | 750,000 | 758,007 | ||||||
3.400%, 9/15/21 | 1,050,000 | 1,098,729 | ||||||
3.300%, 1/12/22 | 156,000 | 161,963 | ||||||
2.625%, 1/10/23 | 1,150,000 | 1,141,779 | ||||||
|
| |||||||
| 110,241,891 | ||||||||
|
| |||||||
Diversified Financial Services (1.2%) |
| |||||||
Alterra Finance LLC | 500,000 | 582,346 | ||||||
Associates Corp. of North America | 62,000 | 72,569 | ||||||
Bear Stearns Cos. LLC | ||||||||
5.550%, 1/22/17 | 2,721,000 | 2,939,928 | ||||||
6.400%, 10/2/17 | 1,346,000 | 1,508,586 | ||||||
7.250%, 2/1/18 | 2,070,000 | 2,391,639 | ||||||
4.650%, 7/2/18 | 125,000 | 134,686 | ||||||
Berkshire Hathaway, Inc. | ||||||||
0.800%, 2/11/16 | 2,000,000 | 2,003,082 | ||||||
1.900%, 1/31/17 | 1,000,000 | 1,014,409 | ||||||
1.550%, 2/9/18 | 1,000,000 | 998,782 | ||||||
2.100%, 8/14/19 | 1,200,000 | 1,206,893 | ||||||
3.750%, 8/15/21 | 500,000 | 533,888 | ||||||
3.400%, 1/31/22 | 500,000 | 521,342 | ||||||
3.000%, 2/11/23 | 1,250,000 | 1,257,783 | ||||||
Boeing Capital Corp. | ||||||||
2.125%, 8/15/16 | 1,595,000 | 1,625,947 | ||||||
2.900%, 8/15/18 | 156,000 | 162,518 | ||||||
Braskem Finance Ltd. | 1,250,000 | 1,259,375 | ||||||
CME Group, Inc./Illinois | 500,000 | 508,528 | ||||||
ConocoPhillips Canada Funding Co. I | 1,091,000 | 1,178,135 | ||||||
See Notes to Financial Statements.
43
Table of Contents
EQ ADVISORS TRUST
EQ/CORE BOND INDEX PORTFOLIO
PORTFOLIO OF INVESTMENTS (Continued)
December 31, 2014
Principal Amount | Value (Note 1) | |||||||
General Electric Capital Corp. | ||||||||
1.000%, 1/8/16 | $ | 562,000 | $ | 564,190 | ||||
5.000%, 1/8/16 | 62,000 | 64,739 | ||||||
2.950%, 5/9/16 | 3,000,000 | 3,085,524 | ||||||
1.500%, 7/12/16 | 2,312,000 | 2,332,941 | ||||||
2.900%, 1/9/17 | 3,000,000 | 3,102,851 | ||||||
5.400%, 2/15/17 | 5,487,000 | 5,963,515 | ||||||
1.250%, 5/15/17 | 750,000 | 750,442 | ||||||
5.625%, 9/15/17 | 62,000 | 68,862 | ||||||
1.600%, 11/20/17 | 1,000,000 | 1,005,909 | ||||||
1.625%, 4/2/18 | 1,300,000 | 1,300,610 | ||||||
5.625%, 5/1/18 | 4,470,000 | 5,026,124 | ||||||
2.300%, 1/14/19 | 1,500,000 | 1,524,194 | ||||||
6.000%, 8/7/19 | 4,000,000 | 4,662,160 | ||||||
5.500%, 1/8/20 | 1,000,000 | 1,145,116 | ||||||
4.625%, 1/7/21 | 1,750,000 | 1,947,873 | ||||||
5.300%, 2/11/21 | 3,027,000 | 3,462,596 | ||||||
4.650%, 10/17/21 | 2,800,000 | 3,147,222 | ||||||
3.150%, 9/7/22 | 1,800,000 | 1,835,032 | ||||||
3.100%, 1/9/23 | 2,875,000 | 2,910,723 | ||||||
3.450%, 5/15/24 | 1,000,000 | 1,034,854 | ||||||
6.375%, 11/15/67 (b)(l) | 625,000 | 671,875 | ||||||
Intercontinental Exchange, Inc. | 850,000 | 904,173 | ||||||
Leucadia National Corp. | 800,000 | 817,920 | ||||||
McGraw Hill Financial, Inc. | 500,000 | 543,332 | ||||||
Moody’s Corp. | ||||||||
2.750%, 7/15/19 | 500,000 | 503,292 | ||||||
5.500%, 9/1/20 | 500,000 | 566,561 | ||||||
4.500%, 9/1/22 | 31,000 | 33,284 | ||||||
4.875%, 2/15/24 | 500,000 | 549,270 | ||||||
MUFG Capital Finance I Ltd. | 1,500,000 | 1,597,743 | ||||||
Murray Street Investment Trust I | 1,156,000 | 1,220,142 | ||||||
NASDAQ OMX Group, Inc. | ||||||||
5.250%, 1/16/18 | 220,000 | 239,818 | ||||||
5.550%, 1/15/20 | 894,000 | 984,943 | ||||||
National Credit Union Administration Guaranteed Notes | 1,200,000 | 1,233,282 | ||||||
National Rural Utilities Cooperative Finance Corp. | ||||||||
3.050%, 3/1/16 | 1,800,000 | 1,846,488 | ||||||
5.450%, 4/10/17 | 125,000 | 136,293 | ||||||
5.450%, 2/1/18 | 250,000 | 277,102 | ||||||
10.375%, 11/1/18 | 1,000,000 | 1,300,655 | ||||||
2.350%, 6/15/20 | 2,000,000 | 1,981,194 | ||||||
3.400%, 11/15/23 | 1,000,000 | 1,030,027 | ||||||
4.750%, 4/30/43 (l) | 350,000 | 344,750 | ||||||
NYSE Euronext | 1,000,000 | 1,008,093 | ||||||
ORIX Corp. | ||||||||
5.000%, 1/12/16 | 78,000 | 80,812 | ||||||
3.750%, 3/9/17 | 1,000,000 | 1,038,685 | ||||||
Private Export Funding Corp. | ||||||||
1.375%, 2/15/17 | 1,775,000 | 1,784,311 | ||||||
1.875%, 7/15/18 | 400,000 | 403,058 | ||||||
2.250%, 3/15/20 | $ | 2,000,000 | $ | 2,017,400 | ||||
2.050%, 11/15/22 | 1,125,000 | 1,083,277 | ||||||
3.550%, 1/15/24 | 729,000 | 777,213 | ||||||
Sasol Financing International plc | 750,000 | 744,375 | ||||||
Schlumberger Investment S.A. | 1,500,000 | 1,566,855 | ||||||
Shell International Finance B.V. | ||||||||
0.900%, 11/15/16 | 2,600,000 | 2,591,853 | ||||||
1.125%, 8/21/17 | 1,000,000 | 998,412 | ||||||
1.900%, 8/10/18 | 1,000,000 | 1,003,510 | ||||||
4.300%, 9/22/19 | 2,147,000 | 2,336,017 | ||||||
4.375%, 3/25/20 | 1,629,000 | 1,781,672 | ||||||
2.375%, 8/21/22 | 1,175,000 | 1,126,866 | ||||||
3.400%, 8/12/23 | 900,000 | 924,591 | ||||||
Voya Financial, Inc. | ||||||||
2.900%, 2/15/18 | 700,000 | 716,659 | ||||||
5.500%, 7/15/22 | 550,000 | 617,850 | ||||||
XTRA Finance Corp. | 100,000 | 108,169 | ||||||
|
| |||||||
| 104,327,735 | ||||||||
|
| |||||||
Insurance (0.9%) |
| |||||||
ACE INA Holdings, Inc. | ||||||||
5.800%, 3/15/18 | 100,000 | 111,911 | ||||||
5.900%, 6/15/19 | 1,235,000 | 1,416,787 | ||||||
3.350%, 5/15/24 | 600,000 | 608,702 | ||||||
Aflac, Inc. | ||||||||
2.650%, 2/15/17 | 250,000 | 256,848 | ||||||
8.500%, 5/15/19 | 404,000 | 504,287 | ||||||
4.000%, 2/15/22 | 500,000 | 529,281 | ||||||
3.625%, 6/15/23 | 1,150,000 | 1,166,677 | ||||||
3.625%, 11/15/24 | 1,000,000 | 1,014,959 | ||||||
Alleghany Corp. | ||||||||
5.625%, 9/15/20 | 200,000 | 223,890 | ||||||
Allied World Assurance Co. Holdings Ltd. | ||||||||
7.500%, 8/1/16 | 740,000 | 807,215 | ||||||
5.500%, 11/15/20 | 500,000 | 556,887 | ||||||
Allstate Corp. | ||||||||
7.450%, 5/16/19 | 973,000 | 1,175,702 | ||||||
3.150%, 6/15/23 | 156,000 | 156,394 | ||||||
5.750%, 8/15/53 (l) | 500,000 | 524,375 | ||||||
American Financial Group, Inc./Ohio | 169,000 | 216,532 | ||||||
American International Group, Inc. | ||||||||
5.450%, 5/18/17 | 1,375,000 | 1,498,028 | ||||||
5.850%, 1/16/18 | 1,072,000 | 1,200,725 | ||||||
2.300%, 7/16/19 | 1,000,000 | 1,000,224 | ||||||
3.375%, 8/15/20 | 500,000 | 518,914 | ||||||
6.400%, 12/15/20 | 3,100,000 | 3,687,565 | ||||||
4.875%, 6/1/22 | 750,000 | 842,969 | ||||||
Aon Corp. | ||||||||
3.125%, 5/27/16 | 600,000 | 615,959 | ||||||
5.000%, 9/30/20 | 1,287,000 | 1,436,796 | ||||||
Aon plc | 350,000 | 352,596 | ||||||
Aspen Insurance Holdings Ltd. | 500,000 | 572,449 | ||||||
See Notes to Financial Statements.
44
Table of Contents
EQ ADVISORS TRUST
EQ/CORE BOND INDEX PORTFOLIO
PORTFOLIO OF INVESTMENTS (Continued)
December 31, 2014
Principal Amount | Value (Note 1) | |||||||
Assurant, Inc. | ||||||||
2.500%, 3/15/18 | $ | 350,000 | $ | 353,437 | ||||
4.000%, 3/15/23 | 300,000 | 310,839 | ||||||
Assured Guaranty U.S. Holdings, Inc. | 500,000 | 517,874 | ||||||
Axis Specialty Finance LLC | 700,000 | 795,759 | ||||||
Berkshire Hathaway Finance Corp. | ||||||||
1.600%, 5/15/17 | 150,000 | 151,011 | ||||||
1.300%, 5/15/18 | 600,000 | 593,353 | ||||||
5.400%, 5/15/18 | 693,000 | 778,136 | ||||||
2.000%, 8/15/18 | 1,000,000 | 1,011,442 | ||||||
4.250%, 1/15/21 | 1,175,000 | 1,290,413 | ||||||
3.000%, 5/15/22 | 656,000 | 664,580 | ||||||
Brown & Brown, Inc. | 350,000 | 353,539 | ||||||
Chubb Corp. | ||||||||
5.750%, 5/15/18 | 1,266,000 | 1,429,249 | ||||||
6.375%, 3/29/67 (l) | 662,000 | 708,340 | ||||||
CNA Financial Corp. | ||||||||
6.500%, 8/15/16 | 500,000 | 540,320 | ||||||
7.350%, 11/15/19 | 571,000 | 681,448 | ||||||
5.875%, 8/15/20 | 902,000 | 1,025,988 | ||||||
Delphi Financial Group, Inc. | 75,000 | 89,824 | ||||||
Fidelity National Financial, Inc. | ||||||||
6.600%, 5/15/17 | 500,000 | 550,555 | ||||||
5.500%, 9/1/22 | 500,000 | 539,350 | ||||||
First American Financial Corp. | 500,000 | 507,016 | ||||||
Hartford Financial Services Group, Inc. | ||||||||
5.375%, 3/15/17 | 100,000 | 108,077 | ||||||
6.000%, 1/15/19 | 1,000,000 | 1,132,089 | ||||||
5.500%, 3/30/20 | 900,000 | 1,012,818 | ||||||
5.125%, 4/15/22 | 250,000 | 279,421 | ||||||
HCC Insurance Holdings, Inc. | 200,000 | 231,046 | ||||||
Infinity Property & Casualty Corp. | 250,000 | 268,612 | ||||||
Lincoln National Corp. | ||||||||
8.750%, 7/1/19 | 927,000 | 1,157,809 | ||||||
6.250%, 2/15/20 | 485,000 | 564,000 | ||||||
4.850%, 6/24/21 | 334,000 | 367,540 | ||||||
7.000%, 5/17/66 (l) | 100,000 | 100,250 | ||||||
6.050%, 4/20/67 (l) | 1,100,000 | 1,109,625 | ||||||
Loews Corp. | 900,000 | 843,394 | ||||||
Markel Corp. | ||||||||
7.125%, 9/30/19 | 321,000 | 381,596 | ||||||
5.350%, 6/1/21 | 350,000 | 394,932 | ||||||
3.625%, 3/30/23 | 300,000 | 302,246 | ||||||
Marsh & McLennan Cos., Inc. | ||||||||
2.550%, 10/15/18 | 250,000 | 254,437 | ||||||
2.350%, 9/10/19 | 375,000 | 374,793 | ||||||
4.800%, 7/15/21 | 600,000 | 664,108 | ||||||
3.500%, 6/3/24 | 1,000,000 | 1,001,144 | ||||||
MetLife, Inc. | ||||||||
6.750%, 6/1/16 | $ | 2,750,000 | $ | 2,965,480 | ||||
6.817%, 8/15/18 | 112,000 | 130,787 | ||||||
7.717%, 2/15/19 | 508,000 | 617,447 | ||||||
4.750%, 2/8/21 | 1,547,000 | 1,722,791 | ||||||
3.048%, 12/15/22 | 1,000,000 | 997,699 | ||||||
4.368%, 9/15/23 | 667,000 | 728,322 | ||||||
3.600%, 4/10/24 | 500,000 | 514,459 | ||||||
Montpelier Reinsurance Holdings Ltd. | 250,000 | 258,672 | ||||||
Old Republic International Corp. | 400,000 | 416,105 | ||||||
OneBeacon U.S. Holdings, Inc. | 200,000 | 208,381 | ||||||
PartnerReinsurance Finance B LLC | 454,000 | 510,824 | ||||||
Principal Financial Group, Inc. | ||||||||
1.850%, 11/15/17 | 250,000 | 250,537 | ||||||
8.875%, 5/15/19 | 800,000 | 1,005,374 | ||||||
ProAssurance Corp. | 750,000 | 823,724 | ||||||
Progressive Corp. | ||||||||
3.750%, 8/23/21 | 219,000 | 233,982 | ||||||
6.700%, 6/15/37 (l) | 1,000,000 | 1,075,000 | ||||||
Protective Life Corp. | 550,000 | 663,069 | ||||||
Prudential Financial, Inc. | ||||||||
6.000%, 12/1/17 | 1,320,000 | 1,471,843 | ||||||
2.300%, 8/15/18 | 1,000,000 | 1,009,293 | ||||||
7.375%, 6/15/19 | 916,000 | 1,098,149 | ||||||
2.350%, 8/15/19 | 1,000,000 | 994,997 | ||||||
5.375%, 6/21/20 | 1,100,000 | 1,243,965 | ||||||
4.500%, 11/16/21 | 1,000,000 | 1,088,122 | ||||||
8.875%, 6/15/38 (l) | 303,000 | 355,646 | ||||||
5.625%, 6/15/43 (l) | 3,000,000 | 3,082,500 | ||||||
Reinsurance Group of America, Inc. | ||||||||
6.450%, 11/15/19 | 369,000 | 429,097 | ||||||
5.000%, 6/1/21 | 60,000 | 65,929 | ||||||
4.700%, 9/15/23 | 1,500,000 | 1,603,657 | ||||||
RenReinsurance North America Holdings, Inc. | 100,000 | 112,335 | ||||||
StanCorp Financial Group, Inc. | 350,000 | 380,595 | ||||||
Symetra Financial Corp. | 300,000 | 305,364 | ||||||
Torchmark Corp. | ||||||||
9.250%, 6/15/19 | 275,000 | 347,172 | ||||||
3.800%, 9/15/22 | 250,000 | 253,823 | ||||||
Travelers Cos., Inc. | ||||||||
5.750%, 12/15/17 | 187,000 | 208,483 | ||||||
5.800%, 5/15/18 | 1,100,000 | 1,242,528 | ||||||
5.900%, 6/2/19 | 500,000 | 579,854 | ||||||
Trinity Acquisition plc | 250,000 | 258,592 | ||||||
Unum Group | 100,000 | 109,239 | ||||||
5.625%, 9/15/20 | 700,000 | 790,250 | ||||||
4.000%, 3/15/24 | 300,000 | 304,789 | ||||||
See Notes to Financial Statements.
45
Table of Contents
EQ ADVISORS TRUST
EQ/CORE BOND INDEX PORTFOLIO
PORTFOLIO OF INVESTMENTS (Continued)
December 31, 2014
Principal Amount | Value (Note 1) | |||||||
W.R. Berkley Corp. | ||||||||
5.375%, 9/15/20 | $ | 100,000 | $ | 111,332 | ||||
4.625%, 3/15/22 | 750,000 | 804,127 | ||||||
Willis Group Holdings plc | ||||||||
5.750%, 3/15/21 | 500,000 | 557,710 | ||||||
Willis North America, Inc. | ||||||||
6.200%, 3/28/17 | 500,000 | 540,490 | ||||||
XLIT Ltd. | ||||||||
2.300%, 12/15/18 | 750,000 | 747,876 | ||||||
|
| |||||||
| 77,657,492 | ||||||||
|
| |||||||
Real Estate Investment Trusts (REITs) (1.1%) |
| |||||||
Alexandria Real Estate Equities, Inc. | ||||||||
2.750%, 1/15/20 | 250,000 | 246,867 | ||||||
3.900%, 6/15/23 | 1,000,000 | 1,003,939 | ||||||
American Campus Communities Operating Partnership LP |
| |||||||
3.750%, 4/15/23 | 500,000 | 498,869 | ||||||
American Tower Corp. | ||||||||
7.000%, 10/15/17 | 250,000 | 281,857 | ||||||
4.500%, 1/15/18 | 100,000 | 106,218 | ||||||
3.400%, 2/15/19 | 950,000 | 966,116 | ||||||
5.050%, 9/1/20 | 1,058,000 | 1,145,097 | ||||||
3.450%, 9/15/21 | 1,000,000 | 984,585 | ||||||
4.700%, 3/15/22 | 500,000 | 526,195 | ||||||
3.500%, 1/31/23 | 1,150,000 | 1,107,217 | ||||||
5.000%, 2/15/24 | 1,000,000 | 1,057,906 | ||||||
ARC Properties Operating Partnership LP |
| |||||||
4.600%, 2/6/24 | 2,300,000 | 2,121,750 | ||||||
AvalonBay Communities, Inc. | ||||||||
5.700%, 3/15/17 | 539,000 | 587,027 | ||||||
6.100%, 3/15/20 | 139,000 | 161,005 | ||||||
3.625%, 10/1/20 | 1,500,000 | 1,559,904 | ||||||
2.950%, 9/15/22 | 500,000 | 490,169 | ||||||
4.200%, 12/15/23 | 100,000 | 105,924 | ||||||
Boston Properties LP | ||||||||
3.700%, 11/15/18 | 600,000 | 634,982 | ||||||
5.875%, 10/15/19 | 200,000 | 228,989 | ||||||
5.625%, 11/15/20 | 2,015,000 | 2,297,795 | ||||||
3.850%, 2/1/23 | 500,000 | 519,619 | ||||||
3.125%, 9/1/23 | 1,000,000 | 981,044 | ||||||
Brandywine Operating Partnership LP |
| |||||||
4.950%, 4/15/18 | 350,000 | 374,704 | ||||||
4.100%, 10/1/24 | 700,000 | 704,662 | ||||||
Camden Property Trust | ||||||||
4.625%, 6/15/21 | 375,000 | 410,918 | ||||||
2.950%, 12/15/22 | 1,150,000 | 1,123,204 | ||||||
CBL & Associates LP | ||||||||
4.600%, 10/15/24 | 262,000 | 265,648 | ||||||
Corporate Office Properties LP | ||||||||
3.700%, 6/15/21 | 750,000 | 744,737 | ||||||
3.600%, 5/15/23 | 200,000 | 191,988 | ||||||
CubeSmart LP | ||||||||
4.375%, 12/15/23 | 250,000 | 264,459 | ||||||
DDR Corp. | ||||||||
3.500%, 1/15/21 | 550,000 | 552,738 | ||||||
4.625%, 7/15/22 | 1,000,000 | 1,064,802 | ||||||
3.375%, 5/15/23 | 350,000 | 339,991 | ||||||
Digital Realty Trust LP | ||||||||
5.875%, 2/1/20 | $ | 1,000,000 | $ | 1,117,964 | ||||
5.250%, 3/15/21 | 500,000 | 546,723 | ||||||
Duke Realty LP | ||||||||
5.950%, 2/15/17 | 312,000 | 338,224 | ||||||
6.500%, 1/15/18 | 500,000 | 561,304 | ||||||
6.750%, 3/15/20 | 1,665,000 | 1,954,166 | ||||||
Education Realty Operating Partnership LP |
| |||||||
4.600%, 12/1/24 | 250,000 | 255,536 | ||||||
EPR Properties | ||||||||
7.750%, 7/15/20 | 269,000 | 321,436 | ||||||
5.750%, 8/15/22 | 250,000 | 272,080 | ||||||
5.250%, 7/15/23 | 150,000 | 156,036 | ||||||
Equity Commonwealth | ||||||||
6.650%, 1/15/18 | 481,000 | 524,461 | ||||||
5.875%, 9/15/20 | 250,000 | 274,909 | ||||||
ERP Operating LP | ||||||||
5.125%, 3/15/16 | 1,582,000 | 1,657,888 | ||||||
2.375%, 7/1/19 | 800,000 | 798,756 | ||||||
4.750%, 7/15/20 | 450,000 | 491,015 | ||||||
3.000%, 4/15/23 | 1,000,000 | 973,329 | ||||||
Essex Portfolio LP | ||||||||
3.375%, 1/15/23 | 500,000 | 492,536 | ||||||
3.250%, 5/1/23 | 1,000,000 | 974,705 | ||||||
Excel Trust LP | ||||||||
4.625%, 5/15/24 | 400,000 | 412,646 | ||||||
Federal Realty Investment Trust | ||||||||
3.000%, 8/1/22 | 200,000 | 199,558 | ||||||
Government Properties Income Trust |
| |||||||
3.750%, 8/15/19 | 500,000 | 506,659 | ||||||
HCP, Inc. | ||||||||
3.750%, 2/1/16 | 232,000 | 238,531 | ||||||
6.000%, 1/30/17 | 1,020,000 | 1,111,423 | ||||||
5.625%, 5/1/17 | 100,000 | 108,742 | ||||||
3.750%, 2/1/19 | 200,000 | 210,609 | ||||||
2.625%, 2/1/20 | 656,000 | 649,400 | ||||||
5.375%, 2/1/21 | 1,690,000 | 1,898,001 | ||||||
3.150%, 8/1/22 | 250,000 | 245,758 | ||||||
4.250%, 11/15/23 | 1,070,000 | 1,120,574 | ||||||
3.875%, 8/15/24 | 1,000,000 | 1,016,768 | ||||||
Health Care REIT, Inc. | ||||||||
3.625%, 3/15/16 | 1,062,000 | 1,092,039 | ||||||
6.200%, 6/1/16 | 627,000 | 669,296 | ||||||
4.700%, 9/15/17 | 412,000 | 442,706 | ||||||
2.250%, 3/15/18 | 1,000,000 | 1,006,461 | ||||||
4.125%, 4/1/19 | 1,000,000 | 1,063,928 | ||||||
6.125%, 4/15/20 | 385,000 | 441,373 | ||||||
4.950%, 1/15/21 | 1,000,000 | 1,093,047 | ||||||
4.500%, 1/15/24 | 1,000,000 | 1,061,573 | ||||||
Healthcare Realty Trust, Inc. | ||||||||
6.500%, 1/17/17 | 619,000 | 676,541 | ||||||
Healthcare Trust of America Holdings LP | ||||||||
3.375%, 7/15/21 | 350,000 | 349,397 | ||||||
3.700%, 4/15/23 | 250,000 | 246,978 | ||||||
Hospitality Properties Trust | ||||||||
6.300%, 6/15/16 | 660,000 | 691,213 | ||||||
5.625%, 3/15/17 | 350,000 | 374,878 | ||||||
4.500%, 6/15/23 | 1,000,000 | 1,018,104 | ||||||
See Notes to Financial Statements.
46
Table of Contents
EQ ADVISORS TRUST
EQ/CORE BOND INDEX PORTFOLIO
PORTFOLIO OF INVESTMENTS (Continued)
December 31, 2014
Principal Amount | Value (Note 1) | |||||||
Host Hotels & Resorts LP | ||||||||
5.875%, 6/15/19 | $ | 1,000,000 | $ | 1,050,000 | ||||
4.750%, 3/1/23 | 1,100,000 | 1,163,250 | ||||||
Kilroy Realty LP | ||||||||
4.800%, 7/15/18 | 350,000 | 378,579 | ||||||
3.800%, 1/15/23 | 450,000 | 456,994 | ||||||
Kimco Realty Corp. | ||||||||
6.875%, 10/1/19 | 439,000 | 519,863 | ||||||
3.125%, 6/1/23 | 1,000,000 | 978,435 | ||||||
Lexington Realty Trust | ||||||||
4.250%, 6/15/23 | 250,000 | 254,039 | ||||||
Liberty Property LP | ||||||||
6.625%, 10/1/17 | 500,000 | 559,655 | ||||||
4.750%, 10/1/20 | 389,000 | 420,614 | ||||||
4.125%, 6/15/22 | 1,094,000 | 1,135,722 | ||||||
Mack-Cali Realty LP | ||||||||
2.500%, 12/15/17 | 100,000 | 100,216 | ||||||
7.750%, 8/15/19 | 639,000 | 755,360 | ||||||
3.150%, 5/15/23 | 150,000 | 137,532 | ||||||
Mid-America Apartments LP | ||||||||
4.300%, 10/15/23 | 175,000 | 184,713 | ||||||
3.750%, 6/15/24 | 450,000 | 452,942 | ||||||
National Retail Properties, Inc. | ||||||||
3.800%, 10/15/22 | 250,000 | 256,008 | ||||||
3.300%, 4/15/23 | 700,000 | 688,926 | ||||||
3.900%, 6/15/24 | 500,000 | 509,610 | ||||||
Piedmont Operating Partnership LP | ||||||||
4.450%, 3/15/24 | 500,000 | 512,412 | ||||||
Prologis LP | ||||||||
4.500%, 8/15/17 | 62,000 | 66,061 | ||||||
2.750%, 2/15/19 | 214,000 | 216,957 | ||||||
6.875%, 3/15/20 | 244,000 | 288,043 | ||||||
3.350%, 2/1/21 | 1,000,000 | 1,012,965 | ||||||
4.250%, 8/15/23 | 100,000 | 105,718 | ||||||
Realty Income Corp. | ||||||||
6.750%, 8/15/19 | 750,000 | 881,407 | ||||||
5.750%, 1/15/21 | 450,000 | 515,700 | ||||||
3.250%, 10/15/22 | 344,000 | 339,897 | ||||||
4.650%, 8/1/23 | 1,000,000 | 1,079,618 | ||||||
4.125%, 10/15/26 | 225,000 | 230,323 | ||||||
Retail Opportunity Investments Partnership LP | ||||||||
5.000%, 12/15/23 | 250,000 | 271,135 | ||||||
4.000%, 12/15/24 | 200,000 | 200,446 | ||||||
Senior Housing Properties Trust | ||||||||
4.300%, 1/15/16 | 250,000 | 254,950 | ||||||
3.250%, 5/1/19 | 850,000 | 853,880 | ||||||
Simon Property Group LP | ||||||||
2.150%, 9/15/17 | 250,000 | 254,689 | ||||||
6.125%, 5/30/18 | 300,000 | 341,356 | ||||||
2.200%, 2/1/19 | 3,000,000 | 3,016,709 | ||||||
10.350%, 4/1/19 | 1,000,000 | 1,316,697 | ||||||
5.650%, 2/1/20 | 1,985,000 | 2,286,616 | ||||||
4.375%, 3/1/21 | 1,095,000 | 1,203,378 | ||||||
3.750%, 2/1/24 | 1,000,000 | 1,050,731 | ||||||
UDR, Inc. | ||||||||
4.250%, 6/1/18 | 400,000 | 427,665 | ||||||
3.700%, 10/1/20 | 1,500,000 | 1,553,510 | ||||||
4.625%, 1/10/22 | 200,000 | 215,864 | ||||||
Ventas Realty LP | ||||||||
1.550%, 9/26/16 | $ | 1,937,000 | $ | 1,943,750 | ||||
3.750%, 5/1/24 | 50,000 | 50,352 | ||||||
Ventas Realty LP/Ventas Capital Corp. | ||||||||
2.000%, 2/15/18 | 600,000 | 599,704 | ||||||
4.000%, 4/30/19 | 1,000,000 | 1,060,897 | ||||||
2.700%, 4/1/20 | 1,050,000 | 1,041,703 | ||||||
4.250%, 3/1/22 | 662,000 | 696,768 | ||||||
Vornado Realty LP | ||||||||
2.500%, 6/30/19 | 500,000 | 496,129 | ||||||
Washington Real Estate Investment Trust | ||||||||
4.950%, 10/1/20 | 1,000,000 | 1,083,252 | ||||||
3.950%, 10/15/22 | 150,000 | 149,939 | ||||||
Weingarten Realty Investors | ||||||||
3.375%, 10/15/22 | 600,000 | 593,491 | ||||||
Weyerhaeuser Co. | ||||||||
4.625%, 9/15/23 | 1,000,000 | 1,070,311 | ||||||
WP Carey, Inc. | ||||||||
4.600%, 4/1/24 | 300,000 | 313,956 | ||||||
|
| |||||||
| 90,907,633 | ||||||||
|
| |||||||
Real Estate Management & Development (0.0%) |
| |||||||
Jones Lang LaSalle, Inc. | ||||||||
4.400%, 11/15/22 | 200,000 | 207,636 | ||||||
Tanger Properties LP | ||||||||
6.125%, 6/1/20 | 500,000 | 576,255 | ||||||
|
| |||||||
| 783,891 | ||||||||
|
| |||||||
Thrifts & Mortgage Finance (0.1%) |
| |||||||
Abbey National Treasury Services plc/London | ||||||||
4.000%, 4/27/16 | 1,100,000 | 1,139,073 | ||||||
1.375%, 3/13/17 | 1,000,000 | 998,227 | ||||||
3.050%, 8/23/18 | 1,000,000 | 1,034,096 | ||||||
2.350%, 9/10/19 | 670,000 | 670,517 | ||||||
4.000%, 3/13/24 | 1,000,000 | 1,045,315 | ||||||
BPCE S.A. | ||||||||
1.700%, 4/25/16 | 250,000 | 252,105 | ||||||
1.625%, 2/10/17 | 500,000 | 501,227 | ||||||
1.613%, 7/25/17 | 750,000 | 746,311 | ||||||
2.500%, 12/10/18 | 1,100,000 | 1,115,408 | ||||||
2.500%, 7/15/19 | 1,250,000 | 1,259,362 | ||||||
4.000%, 4/15/24 | 1,250,000 | 1,308,767 | ||||||
People’s United Financial, Inc. | ||||||||
3.650%, 12/6/22 | 300,000 | 302,624 | ||||||
Santander Bank N.A. | ||||||||
8.750%, 5/30/18 | 600,000 | 715,701 | ||||||
|
| |||||||
| 11,088,733 | ||||||||
|
| |||||||
Total Financials | 1,139,705,119 | |||||||
|
| |||||||
Health Care (2.5%) | ||||||||
Biotechnology (0.3%) | ||||||||
Amgen, Inc. | ||||||||
2.300%, 6/15/16 | 581,000 | 588,979 | ||||||
2.500%, 11/15/16 | 500,000 | 509,225 | ||||||
2.125%, 5/15/17 | 1,500,000 | 1,515,553 | ||||||
5.850%, 6/1/17 | 1,680,000 | 1,848,713 | ||||||
6.150%, 6/1/18 | 200,000 | 227,946 | ||||||
See Notes to Financial Statements.
47
Table of Contents
EQ ADVISORS TRUST
EQ/CORE BOND INDEX PORTFOLIO
PORTFOLIO OF INVESTMENTS (Continued)
December 31, 2014
Principal Amount | Value (Note 1) | |||||||
5.700%, 2/1/19 | $ | 958,000 | $ | 1,076,512 | ||||
2.200%, 5/22/19 | 750,000 | 746,198 | ||||||
4.500%, 3/15/20 | 315,000 | 342,851 | ||||||
3.450%, 10/1/20 | 1,312,000 | 1,366,241 | ||||||
4.100%, 6/15/21 | 1,000,000 | 1,071,267 | ||||||
3.625%, 5/15/22 | 1,094,000 | 1,129,925 | ||||||
3.625%, 5/22/24 | 2,750,000 | 2,792,008 | ||||||
Biogen Idec, Inc. | ||||||||
6.875%, 3/1/18 | 700,000 | 807,063 | ||||||
Celgene Corp. | ||||||||
2.300%, 8/15/18 | 486,000 | 489,164 | ||||||
3.950%, 10/15/20 | 1,031,000 | 1,089,009 | ||||||
3.250%, 8/15/22 | 850,000 | 855,431 | ||||||
4.000%, 8/15/23 | 850,000 | 892,674 | ||||||
3.625%, 5/15/24 | 2,000,000 | 2,032,302 | ||||||
Gilead Sciences, Inc. | ||||||||
2.050%, 4/1/19 | 1,150,000 | 1,151,276 | ||||||
2.350%, 2/1/20 | 380,000 | 381,189 | ||||||
4.400%, 12/1/21 | 2,187,000 | 2,411,876 | ||||||
3.700%, 4/1/24 | 1,000,000 | 1,049,967 | ||||||
|
| |||||||
| 24,375,369 | ||||||||
|
| |||||||
Health Care Equipment & Supplies (0.4%) |
| |||||||
Abbott Laboratories | ||||||||
5.125%, 4/1/19 | 676,000 | 756,752 | ||||||
4.125%, 5/27/20 | 325,000 | 350,568 | ||||||
Baxter International, Inc. |
| |||||||
0.950%, 6/1/16 | 1,000,000 | 999,020 | ||||||
5.900%, 9/1/16 | 936,000 | 1,008,379 | ||||||
5.375%, 6/1/18 | 187,000 | 207,329 | ||||||
1.850%, 6/15/18 | 1,000,000 | 995,465 | ||||||
4.250%, 3/15/20 | 519,000 | 557,554 | ||||||
2.400%, 8/15/22 | 1,100,000 | 1,047,570 | ||||||
3.200%, 6/15/23 | 1,000,000 | 995,181 | ||||||
Becton Dickinson and Co. |
| |||||||
1.800%, 12/15/17 | 583,000 | 582,805 | ||||||
5.000%, 5/15/19 | 200,000 | 221,227 | ||||||
2.675%, 12/15/19 | 625,000 | 630,755 | ||||||
3.250%, 11/12/20 | 1,300,000 | 1,319,834 | ||||||
3.734%, 12/15/24 | 857,000 | 880,027 | ||||||
BioMed Realty LP |
| |||||||
3.850%, 4/15/16 | 500,000 | 515,153 | ||||||
6.125%, 4/15/20 | 350,000 | 397,516 | ||||||
Boston Scientific Corp. |
| |||||||
6.400%, 6/15/16 | 1,100,000 | 1,177,802 | ||||||
2.650%, 10/1/18 | 500,000 | 499,640 | ||||||
6.000%, 1/15/20 | 1,100,000 | 1,238,186 | ||||||
C.R. Bard, Inc. |
| |||||||
2.875%, 1/15/16 | 350,000 | 357,311 | ||||||
1.375%, 1/15/18 | 500,000 | 493,787 | ||||||
4.400%, 1/15/21 | 190,000 | 208,553 | ||||||
CareFusion Corp. |
| |||||||
6.375%, 8/1/19 | 600,000 | 691,964 | ||||||
3.300%, 3/1/23 | 400,000 | 393,629 | ||||||
3.875%, 5/15/24 | 500,000 | 516,394 | ||||||
Covidien International Finance S.A. |
| |||||||
6.000%, 10/15/17 | 1,422,000 | 1,593,213 | ||||||
4.200%, 6/15/20 | 700,000 | 752,016 | ||||||
2.950%, 6/15/23 | 1,000,000 | 979,823 | ||||||
DENTSPLY International, Inc. |
| |||||||
2.750%, 8/15/16 | 195,000 | 199,126 | ||||||
4.125%, 8/15/21 | 100,000 | 104,847 | ||||||
Edwards Lifesciences Corp. | ||||||||
2.875%, 10/15/18 | $ | 700,000 | $ | 708,767 | ||||
Medtronic, Inc. |
| |||||||
2.625%, 3/15/16 | 1,000,000 | 1,022,511 | ||||||
1.375%, 4/1/18 | 1,500,000 | 1,483,899 | ||||||
2.500%, 3/15/20§ | 1,170,000 | 1,170,760 | ||||||
4.450%, 3/15/20 | 1,794,000 | 1,964,443 | ||||||
4.125%, 3/15/21 | 500,000 | 535,885 | ||||||
3.125%, 3/15/22 | 150,000 | 151,763 | ||||||
3.150%, 3/15/22§ | 3,000,000 | 3,034,908 | ||||||
2.750%, 4/1/23 | 769,000 | 747,413 | ||||||
3.625%, 3/15/24 | 1,000,000 | 1,036,713 | ||||||
St. Jude Medical, Inc. | ||||||||
3.250%, 4/15/23 | 1,150,000 | 1,147,992 | ||||||
Stryker Corp. |
| |||||||
2.000%, 9/30/16 | 1,370,000 | 1,393,050 | ||||||
4.375%, 1/15/20 | 269,000 | 287,696 | ||||||
Zimmer Holdings, Inc. | ||||||||
3.375%, 11/30/21 | 500,000 | 507,830 | ||||||
|
| |||||||
| 35,865,056 | ||||||||
|
| |||||||
Health Care Providers & Services (0.7%) |
| |||||||
Aetna, Inc. | ||||||||
1.500%, 11/15/17 | 1,000,000 | 992,102 | ||||||
2.200%, 3/15/19 | 750,000 | 743,038 | ||||||
3.950%, 9/1/20 | 100,000 | 106,122 | ||||||
2.750%, 11/15/22 | 1,000,000 | 970,255 | ||||||
3.500%, 11/15/24 | 500,000 | 503,219 | ||||||
AmerisourceBergen Corp. |
| |||||||
1.150%, 5/15/17 | 500,000 | 495,466 | ||||||
4.875%, 11/15/19 | 1,150,000 | 1,269,041 | ||||||
3.400%, 5/15/24 | 600,000 | 600,867 | ||||||
Anthem, Inc. |
| |||||||
5.875%, 6/15/17 | 639,000 | 701,495 | ||||||
1.875%, 1/15/18 | 500,000 | 498,778 | ||||||
2.300%, 7/15/18 | 1,000,000 | 1,001,933 | ||||||
7.000%, 2/15/19 | 1,022,000 | 1,200,274 | ||||||
4.350%, 8/15/20 | 1,200,000 | 1,296,895 | ||||||
3.125%, 5/15/22 | 500,000 | 498,453 | ||||||
3.300%, 1/15/23 | 150,000 | 149,732 | ||||||
3.500%, 8/15/24 | 1,000,000 | 1,006,802 | ||||||
Cardinal Health, Inc. |
| |||||||
1.700%, 3/15/18 | 1,143,000 | 1,134,226 | ||||||
4.625%, 12/15/20 | 1,700,000 | 1,850,061 | ||||||
3.200%, 6/15/22 | 125,000 | 125,266 | ||||||
3.200%, 3/15/23 | 1,000,000 | 993,097 | ||||||
Cigna Corp. |
| |||||||
5.375%, 3/15/17 | 25,000 | 27,010 | ||||||
5.125%, 6/15/20 | 1,182,000 | 1,315,301 | ||||||
4.375%, 12/15/20 | 100,000 | 107,688 | ||||||
4.500%, 3/15/21 | 406,000 | 443,475 | ||||||
4.000%, 2/15/22 | 500,000 | 528,036 | ||||||
Coventry Health Care, Inc. |
| |||||||
5.950%, 3/15/17 | 336,000 | 367,080 | ||||||
5.450%, 6/15/21 | 650,000 | 739,375 | ||||||
Dignity Health |
| |||||||
2.637%, 11/1/19 | 425,000 | 427,230 | ||||||
Express Scripts Holding Co. |
| |||||||
3.125%, 5/15/16 | 2,562,000 | 2,628,203 | ||||||
2.650%, 2/15/17 | 1,000,000 | 1,021,810 | ||||||
1.250%, 6/2/17 | 445,000 | 439,985 | ||||||
4.750%, 11/15/21 | 1,350,000 | 1,486,926 | ||||||
See Notes to Financial Statements.
48
Table of Contents
EQ ADVISORS TRUST
EQ/CORE BOND INDEX PORTFOLIO
PORTFOLIO OF INVESTMENTS (Continued)
December 31, 2014
Principal Amount | Value (Note 1) | |||||||
3.900%, 2/15/22 | $ | 2,156,000 | $ | 2,256,249 | ||||
3.500%, 6/15/24 | 1,000,000 | 996,219 | ||||||
Howard Hughes Medical Institute | 1,000,000 | 1,050,494 | ||||||
Humana, Inc. |
| |||||||
7.200%, 6/15/18 | 1,231,000 | 1,435,419 | ||||||
2.625%, 10/1/19 | 1,000,000 | 1,000,755 | ||||||
Kaiser Foundation Hospitals | ||||||||
3.500%, 4/1/22 | 350,000 | 360,745 | ||||||
Laboratory Corp. of America Holdings |
| |||||||
2.200%, 8/23/17 | 67,000 | 67,650 | ||||||
2.500%, 11/1/18 | 500,000 | 497,625 | ||||||
4.625%, 11/15/20 | 1,600,000 | 1,713,234 | ||||||
3.750%, 8/23/22 | 56,000 | 57,320 | ||||||
4.000%, 11/1/23 | 500,000 | 513,439 | ||||||
McKesson Corp. |
| |||||||
3.250%, 3/1/16 | 219,000 | 224,672 | ||||||
5.700%, 3/1/17 | 500,000 | 543,728 | ||||||
1.400%, 3/15/18 | 1,100,000 | 1,084,749 | ||||||
2.284%, 3/15/19 | 1,345,000 | 1,337,525 | ||||||
4.750%, 3/1/21 | 1,100,000 | 1,210,908 | ||||||
2.850%, 3/15/23 | 1,200,000 | 1,155,728 | ||||||
3.796%, 3/15/24 | 2,200,000 | 2,259,235 | ||||||
Medco Health Solutions, Inc. |
| |||||||
7.125%, 3/15/18 | 762,000 | 879,517 | ||||||
4.125%, 9/15/20 | 275,000 | 292,132 | ||||||
Owens & Minor, Inc. | ||||||||
3.875%, 9/15/21 | 250,000 | 253,623 | ||||||
Quest Diagnostics, Inc. |
| |||||||
3.200%, 4/1/16 | 1,312,000 | 1,343,655 | ||||||
6.400%, 7/1/17 | 650,000 | 724,059 | ||||||
2.700%, 4/1/19 | 500,000 | 503,419 | ||||||
4.700%, 4/1/21 | 100,000 | 108,028 | ||||||
UnitedHealth Group, Inc. |
| |||||||
5.375%, 3/15/16 | 325,000 | 342,874 | ||||||
1.875%, 11/15/16 | 1,500,000 | 1,521,055 | ||||||
1.400%, 10/15/17 | 100,000 | 100,020 | ||||||
6.000%, 2/15/18 | 1,824,000 | 2,058,267 | ||||||
1.625%, 3/15/19 | 750,000 | 739,523 | ||||||
2.300%, 12/15/19 | 500,000 | 501,757 | ||||||
4.700%, 2/15/21 | 850,000 | 951,029 | ||||||
2.875%, 3/15/22 | 500,000 | 501,462 | ||||||
2.750%, 2/15/23 | 1,000,000 | 986,270 | ||||||
2.875%, 3/15/23 | 600,000 | 596,787 | ||||||
|
| |||||||
| 55,838,412 | ||||||||
|
| |||||||
Life Sciences Tools & Services (0.1%) |
| |||||||
Agilent Technologies, Inc. |
| |||||||
5.000%, 7/15/20 | 600,000 | 652,316 | ||||||
3.875%, 7/15/23 | 1,094,000 | 1,095,978 | ||||||
Life Technologies Corp. |
| |||||||
3.500%, 1/15/16 | 1,000,000 | 1,021,461 | ||||||
6.000%, 3/1/20 | 1,100,000 | 1,256,387 | ||||||
5.000%, 1/15/21 | 125,000 | 138,452 | ||||||
Thermo Fisher Scientific, Inc. |
| |||||||
3.200%, 3/1/16 | 1,800,000 | 1,841,597 | ||||||
1.850%, 1/15/18 | 750,000 | 745,432 | ||||||
2.400%, 2/1/19 | 1,100,000 | 1,101,581 | ||||||
4.700%, 5/1/20 | 100,000 | 108,993 | ||||||
4.500%, 3/1/21 | $ | 1,000,000 | $ | 1,085,815 | ||||
3.600%, 8/15/21 | 265,000 | 273,345 | ||||||
3.300%, 2/15/22 | 875,000 | 879,833 | ||||||
3.150%, 1/15/23 | 1,000,000 | 977,899 | ||||||
4.150%, 2/1/24 | 1,000,000 | 1,048,172 | ||||||
|
| |||||||
| 12,227,261 | ||||||||
|
| |||||||
Pharmaceuticals (1.0%) | ||||||||
AbbVie, Inc. |
| |||||||
1.750%, 11/6/17 | 3,694,000 | 3,702,309 | ||||||
2.000%, 11/6/18 | 219,000 | 217,204 | ||||||
2.900%, 11/6/22 | 3,519,000 | 3,463,438 | ||||||
Actavis Funding SCS |
| |||||||
1.300%, 6/15/17 | 2,000,000 | 1,964,594 | ||||||
2.450%, 6/15/19 | 535,000 | 526,029 | ||||||
3.850%, 6/15/24 | 1,250,000 | 1,257,144 | ||||||
Actavis, Inc. |
| |||||||
6.125%, 8/15/19 | 388,000 | 439,730 | ||||||
3.250%, 10/1/22 | 1,875,000 | 1,835,155 | ||||||
Allergan, Inc. |
| |||||||
1.350%, 3/15/18 | 425,000 | 412,251 | ||||||
3.375%, 9/15/20 | 1,000,000 | 1,016,259 | ||||||
2.800%, 3/15/23 | 400,000 | 368,784 | ||||||
AstraZeneca plc | 2,125,000 | 2,379,927 | ||||||
Bristol-Myers Squibb Co. |
| |||||||
0.875%, 8/1/17 | 600,000 | 594,755 | ||||||
1.750%, 3/1/19 | 750,000 | 744,268 | ||||||
2.000%, 8/1/22 | 656,000 | 616,808 | ||||||
Eli Lilly & Co. |
| |||||||
5.200%, 3/15/17 | 1,766,000 | 1,919,594 | ||||||
1.950%, 3/15/19 | 500,000 | 501,666 | ||||||
GlaxoSmithKline Capital plc |
| |||||||
1.500%, 5/8/17 | 1,375,000 | 1,380,470 | ||||||
2.850%, 5/8/22 | 3,300,000 | 3,293,305 | ||||||
GlaxoSmithKline Capital, Inc. |
| |||||||
0.700%, 3/18/16 | 1,500,000 | 1,498,186 | ||||||
5.650%, 5/15/18 | 2,956,000 | 3,326,679 | ||||||
2.800%, 3/18/23 | 1,156,000 | 1,141,037 | ||||||
Johnson & Johnson |
| |||||||
2.150%, 5/15/16 | 800,000 | 815,743 | ||||||
5.550%, 8/15/17 | 2,100,000 | 2,339,415 | ||||||
1.125%, 11/21/17 | 1,000,000 | 996,847 | ||||||
5.150%, 7/15/18 | 200,000 | 223,679 | ||||||
3.550%, 5/15/21 | 500,000 | 536,653 | ||||||
2.450%, 12/5/21 | 1,250,000 | 1,255,257 | ||||||
3.375%, 12/5/23 | 500,000 | 534,716 | ||||||
Merck & Co., Inc. |
| |||||||
0.700%, 5/18/16 | 1,000,000 | 999,821 | ||||||
1.100%, 1/31/18 | 1,000,000 | 990,476 | ||||||
1.300%, 5/18/18 | 823,000 | 815,387 | ||||||
5.000%, 6/30/19 | 1,150,000 | 1,295,122 | ||||||
3.875%, 1/15/21 | 1,000,000 | 1,080,663 | ||||||
2.400%, 9/15/22 | 1,200,000 | 1,170,181 | ||||||
2.800%, 5/18/23 | 1,700,000 | 1,691,110 | ||||||
Mylan, Inc. |
| |||||||
1.800%, 6/24/16 | 500,000 | 502,260 | ||||||
1.350%, 11/29/16 | 1,150,000 | 1,143,561 | ||||||
2.600%, 6/24/18 | 500,000 | 505,391 | ||||||
2.550%, 3/28/19 | 412,000 | 410,318 | ||||||
See Notes to Financial Statements.
49
Table of Contents
EQ ADVISORS TRUST
EQ/CORE BOND INDEX PORTFOLIO
PORTFOLIO OF INVESTMENTS (Continued)
December 31, 2014
Principal Amount | Value (Note 1) | |||||||
Novartis Capital Corp. |
| |||||||
4.400%, 4/24/20 | $ | 100,000 | $ | 110,694 | ||||
2.400%, 9/21/22 | 1,200,000 | 1,179,942 | ||||||
3.400%, 5/6/24 | 1,000,000 | 1,037,446 | ||||||
Novartis Securities Investment Ltd. | ||||||||
5.125%, 2/10/19 | 3,710,000 | 4,162,238 | ||||||
Perrigo Co. plc |
| |||||||
1.300%, 11/8/16 | 800,000 | 796,613 | ||||||
4.000%, 11/15/23 | 1,700,000 | 1,740,358 | ||||||
Pfizer, Inc. |
| |||||||
0.900%, 1/15/17 | 1,500,000 | 1,495,469 | ||||||
1.100%, 5/15/17 | 1,500,000 | 1,498,430 | ||||||
4.650%, 3/1/18 | 62,000 | 67,953 | ||||||
1.500%, 6/15/18 | 1,000,000 | 995,690 | ||||||
6.200%, 3/15/19 | 3,056,000 | 3,551,527 | ||||||
3.000%, 6/15/23 | 1,000,000 | 1,007,063 | ||||||
3.400%, 5/15/24 | 1,500,000 | 1,553,654 | ||||||
Sanofi S.A. |
| |||||||
2.625%, 3/29/16 | 1,150,000 | 1,177,123 | ||||||
1.250%, 4/10/18 | 1,638,000 | 1,622,901 | ||||||
4.000%, 3/29/21 | 2,106,000 | 2,283,384 | ||||||
Teva Pharmaceutical Finance Co. B.V. |
| |||||||
2.400%, 11/10/16 | 250,000 | 255,070 | ||||||
2.950%, 12/18/22 | 937,000 | 912,488 | ||||||
Teva Pharmaceutical Finance IV B.V. | ||||||||
3.650%, 11/10/21 | 1,750,000 | 1,794,608 | ||||||
Teva Pharmaceutical Finance IV LLC | ||||||||
2.250%, 3/18/20 | 500,000 | 491,250 | ||||||
Wyeth LLC |
| |||||||
5.500%, 2/15/16 | 1,335,000 | 1,406,937 | ||||||
5.450%, 4/1/17 | 500,000 | 547,967 | ||||||
Zoetis, Inc. |
| |||||||
1.150%, 2/1/16 | 1,000,000 | 999,586 | ||||||
1.875%, 2/1/18 | 600,000 | 594,472 | ||||||
3.250%, 2/1/23 | 1,185,000 | 1,167,513 | ||||||
|
| |||||||
| 82,356,568 | ||||||||
|
| |||||||
Total Health Care | 210,662,666 | |||||||
|
| |||||||
Industrials (1.8%) | ||||||||
Aerospace & Defense (0.4%) | ||||||||
Boeing Co. | ||||||||
0.950%, 5/15/18 | 500,000 | 489,154 | ||||||
6.000%, 3/15/19 | 1,046,000 | 1,208,042 | ||||||
4.875%, 2/15/20 | 886,000 | 993,779 | ||||||
2.850%, 10/30/24 | 300,000 | 297,423 | ||||||
Embraer S.A. | ||||||||
5.150%, 6/15/22 | 47,000 | 49,115 | ||||||
General Dynamics Corp. | ||||||||
2.250%, 7/15/16 | 500,000 | 513,657 | ||||||
1.000%, 11/15/17 | 250,000 | 247,383 | ||||||
3.875%, 7/15/21 | 562,000 | 605,940 | ||||||
2.250%, 11/15/22 | 1,094,000 | 1,049,516 | ||||||
Honeywell International, Inc. | ||||||||
5.400%, 3/15/16 | 360,000 | 379,994 | ||||||
5.300%, 3/1/18 | 1,300,000 | 1,442,257 | ||||||
5.000%, 2/15/19 | 846,000 | 949,100 | ||||||
4.250%, 3/1/21 | 500,000 | 552,693 | ||||||
L-3 Communications Corp. | ||||||||
3.950%, 11/15/16 | $ | 594,000 | $ | 618,524 | ||||
5.200%, 10/15/19 | 1,100,000 | 1,207,248 | ||||||
4.950%, 2/15/21 | 1,194,000 | 1,295,944 | ||||||
3.950%, 5/28/24 | 600,000 | 602,558 | ||||||
Lockheed Martin Corp. | ||||||||
2.125%, 9/15/16 | 500,000 | 508,864 | ||||||
4.250%, 11/15/19 | 1,624,000 | 1,766,945 | ||||||
3.350%, 9/15/21 | 500,000 | 519,213 | ||||||
Northrop Grumman Corp. | ||||||||
1.750%, 6/1/18 | 600,000 | 594,015 | ||||||
3.500%, 3/15/21 | 31,000 | 32,186 | ||||||
3.250%, 8/1/23 | 2,100,000 | 2,094,682 | ||||||
Precision Castparts Corp. | ||||||||
1.250%, 1/15/18 | 900,000 | 888,399 | ||||||
2.500%, 1/15/23 | 562,000 | 542,172 | ||||||
Raytheon Co. | ||||||||
6.400%, 12/15/18 | 208,000 | 242,575 | ||||||
4.400%, 2/15/20 | 1,069,000 | 1,165,639 | ||||||
3.125%, 10/15/20 | 1,156,000 | 1,191,177 | ||||||
2.500%, 12/15/22 | 500,000 | 488,589 | ||||||
Rockwell Collins, Inc. | ||||||||
5.250%, 7/15/19 | 235,000 | 264,286 | ||||||
3.100%, 11/15/21 | 550,000 | 563,844 | ||||||
Textron, Inc. | ||||||||
4.625%, 9/21/16 | 250,000 | 264,178 | ||||||
5.600%, 12/1/17 | 100,000 | 109,644 | ||||||
7.250%, 10/1/19 | 500,000 | 593,170 | ||||||
3.650%, 3/1/21 | 125,000 | 127,651 | ||||||
5.950%, 9/21/21 | 350,000 | 406,939 | ||||||
3.875%, 3/1/25 | 285,000 | 286,021 | ||||||
United Technologies Corp. | ||||||||
1.800%, 6/1/17 | 1,217,000 | 1,235,182 | ||||||
5.375%, 12/15/17 | 1,008,000 | 1,120,060 | ||||||
6.125%, 2/1/19 | 1,825,000 | 2,115,887 | ||||||
4.500%, 4/15/20 | 1,275,000 | 1,409,919 | ||||||
3.100%, 6/1/22 | 1,844,000 | 1,879,276 | ||||||
|
| |||||||
| 32,912,840 | ||||||||
|
| |||||||
Air Freight & Logistics (0.1%) | ||||||||
FedEx Corp. | ||||||||
8.000%, 1/15/19 | 682,000 | 829,591 | ||||||
2.625%, 8/1/22 | 276,000 | 269,290 | ||||||
2.700%, 4/15/23 | 450,000 | 437,777 | ||||||
4.000%, 1/15/24 | 450,000 | 478,017 | ||||||
United Parcel Service, Inc. | ||||||||
1.125%, 10/1/17 | 200,000 | 198,465 | ||||||
5.125%, 4/1/19 | 2,100,000 | 2,357,463 | ||||||
3.125%, 1/15/21 | 1,675,000 | 1,755,355 | ||||||
2.450%, 10/1/22 | 1,000,000 | 978,373 | ||||||
|
| |||||||
| 7,304,331 | ||||||||
|
| |||||||
Airlines (0.1%) | ||||||||
American Airlines, Inc. | ||||||||
Series 2013-2 A | ||||||||
4.950%, 1/15/23 | 1,887,936 | 2,015,372 | ||||||
Continental Airlines, Inc. | ||||||||
Series 2009-1 | ||||||||
9.000%, 7/8/16 | 471,700 | 517,101 | ||||||
Series 2010-1 A | ||||||||
4.750%, 1/12/21 | 1,517,664 | 1,622,960 | ||||||
See Notes to Financial Statements.
50
Table of Contents
EQ ADVISORS TRUST
EQ/CORE BOND INDEX PORTFOLIO
PORTFOLIO OF INVESTMENTS (Continued)
December 31, 2014
Principal Amount | Value (Note 1) | |||||||
Delta Air Lines, Inc. | ||||||||
Series 2009-1 A | ||||||||
7.750%, 12/17/19 | $ | 252,336 | $ | 290,817 | ||||
Series 2010-1 A | ||||||||
6.200%, 7/2/18 | 122,462 | 135,091 | ||||||
Series 2010-2 A | ||||||||
4.950%, 5/23/19 | 862,082 | 922,428 | ||||||
Southwest Airlines Co. | ||||||||
5.750%, 12/15/16 | 461,000 | 498,747 | ||||||
5.125%, 3/1/17 | 62,000 | 66,572 | ||||||
2.750%, 11/6/19 | 750,000 | 752,165 | ||||||
United Airlines, Inc. | ||||||||
Series 2009-2A | ||||||||
9.750%, 1/15/17 | 309,749 | 340,532 | ||||||
|
| |||||||
| 7,161,785 | ||||||||
|
| |||||||
Building Products (0.0%) | ||||||||
Owens Corning | ||||||||
4.200%, 12/1/24 | 300,000 | 295,718 | ||||||
Owens Corning, Inc. | ||||||||
4.200%, 12/15/22 | 1,000,000 | 1,011,250 | ||||||
|
| |||||||
| 1,306,968 | ||||||||
|
| |||||||
Commercial Services & Supplies (0.2%) |
| |||||||
Board of Trustees of the Leland Stanford Junior University |
| |||||||
4.250%, 5/1/16 | 400,000 | 417,782 | ||||||
4.750%, 5/1/19 | 300,000 | 332,958 | ||||||
Cornell University | ||||||||
5.450%, 2/1/19 | 400,000 | 448,666 | ||||||
Pitney Bowes, Inc. | ||||||||
5.750%, 9/15/17 | 127,000 | 137,648 | ||||||
4.750%, 5/15/18 | 62,000 | 65,906 | ||||||
6.250%, 3/15/19 | 1,100,000 | 1,240,466 | ||||||
4.625%, 3/15/24 | 500,000 | 511,360 | ||||||
Republic Services, Inc. | ||||||||
3.800%, 5/15/18 | 500,000 | 528,725 | ||||||
5.500%, 9/15/19 | 1,214,000 | 1,366,536 | ||||||
5.000%, 3/1/20 | 600,000 | 661,714 | ||||||
5.250%, 11/15/21 | 406,000 | 459,486 | ||||||
3.550%, 6/1/22 | 1,000,000 | 1,027,431 | ||||||
4.750%, 5/15/23 | 1,000,000 | 1,102,890 | ||||||
Trustees of Dartmouth College | ||||||||
4.750%, 6/1/19 | 135,000 | 150,241 | ||||||
Vanderbilt University | ||||||||
5.250%, 4/1/19 | 273,000 | 308,093 | ||||||
Waste Management, Inc. | ||||||||
6.100%, 3/15/18 | 446,000 | 502,741 | ||||||
7.375%, 3/11/19 | 902,000 | 1,091,420 | ||||||
4.750%, 6/30/20 | 300,000 | 328,355 | ||||||
4.600%, 3/1/21 | 500,000 | 554,342 | ||||||
2.900%, 9/15/22 | 500,000 | 493,850 | ||||||
3.500%, 5/15/24 | 500,000 | 507,115 | ||||||
Yale University | 300,000 | 301,239 | ||||||
|
| |||||||
| 12,538,964 | ||||||||
|
| |||||||
Construction & Engineering (0.0%) |
| |||||||
ABB Finance USA, Inc. | ||||||||
1.625%, 5/8/17 | 500,000 | 500,694 | ||||||
2.875%, 5/8/22 | 1,306,000 | 1,307,215 | ||||||
Fluor Corp. | ||||||||
3.500%, 12/15/24 | 900,000 | 896,425 | ||||||
|
| |||||||
| 2,704,334 | ||||||||
|
| |||||||
Electrical Equipment (0.1%) | ||||||||
Eaton Corp. | ||||||||
1.500%, 11/2/17 | $ | 500,000 | $ | 497,296 | ||||
6.950%, 3/20/19 | 1,000,000 | 1,173,321 | ||||||
2.750%, 11/2/22 | 1,531,000 | 1,503,630 | ||||||
Emerson Electric Co. | ||||||||
5.125%, 12/1/16 | 500,000 | 538,335 | ||||||
4.875%, 10/15/19 | 1,200,000 | 1,334,546 | ||||||
2.625%, 2/15/23 | 256,000 | 254,171 | ||||||
|
| |||||||
| 5,301,299 | ||||||||
|
| |||||||
Industrial Conglomerates (0.3%) | ||||||||
3M Co. | ||||||||
1.375%, 9/29/16 | 500,000 | 507,031 | ||||||
1.625%, 6/15/19 | 1,000,000 | 987,797 | ||||||
2.000%, 6/26/22 | 1,000,000 | 968,794 | ||||||
Acuity Brands Lighting, Inc. | ||||||||
6.000%, 12/15/19 | 100,000 | 110,562 | ||||||
Carlisle Cos., Inc. | ||||||||
5.125%, 12/15/20 | 250,000 | 272,255 | ||||||
Cooper U.S., Inc. | ||||||||
2.375%, 1/15/16 | 600,000 | 608,541 | ||||||
3.875%, 12/15/20 | 600,000 | 635,687 | ||||||
Danaher Corp. | ||||||||
2.300%, 6/23/16 | 906,000 | 924,602 | ||||||
5.625%, 1/15/18 | 546,000 | 608,373 | ||||||
5.400%, 3/1/19 | 500,000 | 564,324 | ||||||
3.900%, 6/23/21 | 662,000 | 715,702 | ||||||
GE Capital Trust I | ||||||||
6.375%, 11/15/67 (l) | 1,200,000 | 1,290,000 | ||||||
General Electric Co. | ||||||||
5.250%, 12/6/17 | 3,291,000 | 3,646,243 | ||||||
2.700%, 10/9/22 | 3,375,000 | 3,379,382 | ||||||
Ingersoll-Rand Global Holding Co., Ltd. |
| |||||||
6.875%, 8/15/18 | 1,071,000 | 1,238,619 | ||||||
2.875%, 1/15/19 | 750,000 | 762,211 | ||||||
Koninklijke Philips N.V. | ||||||||
5.750%, 3/11/18 | 1,700,000 | 1,886,151 | ||||||
3.750%, 3/15/22 | 406,000 | 420,703 | ||||||
Pentair Finance S.A. | ||||||||
1.875%, 9/15/17 | 1,000,000 | 999,786 | ||||||
2.650%, 12/1/19 | 156,000 | 153,850 | ||||||
5.000%, 5/15/21 | 550,000 | 609,353 | ||||||
3.150%, 9/15/22 | 500,000 | 495,249 | ||||||
Roper Industries, Inc. | ||||||||
2.050%, 10/1/18 | 1,750,000 | 1,733,781 | ||||||
6.250%, 9/1/19 | 500,000 | 577,176 | ||||||
3.125%, 11/15/22 | 625,000 | 609,786 | ||||||
Tyco Electronics Group S.A. | ||||||||
6.550%, 10/1/17 | 1,225,000 | 1,378,552 | ||||||
2.375%, 12/17/18 | 240,000 | 241,858 | ||||||
2.350%, 8/1/19 | 250,000 | 249,680 | ||||||
3.450%, 8/1/24 | 290,000 | 295,368 | ||||||
Tyco International Finance S.A. | ||||||||
8.500%, 1/15/19 | 608,000 | 739,706 | ||||||
|
| |||||||
| 27,611,122 | ||||||||
|
| |||||||
Machinery (0.2%) | ||||||||
Caterpillar, Inc. | ||||||||
3.900%, 5/27/21 | 1,000,000 | 1,080,308 | ||||||
2.600%, 6/26/22 | 844,000 | 834,578 | ||||||
3.400%, 5/15/24 | 715,000 | 737,028 | ||||||
See Notes to Financial Statements.
51
Table of Contents
EQ ADVISORS TRUST
EQ/CORE BOND INDEX PORTFOLIO
PORTFOLIO OF INVESTMENTS (Continued)
December 31, 2014
Principal Amount | Value (Note 1) | |||||||
Crane Co. | ||||||||
2.750%, 12/15/18 | $ | 350,000 | $ | 353,193 | ||||
4.450%, 12/15/23 | 400,000 | 423,394 | ||||||
Cummins, Inc. | ||||||||
3.650%, 10/1/23 | 500,000 | 534,203 | ||||||
Deere & Co. | ||||||||
4.375%, 10/16/19 | 658,000 | 717,105 | ||||||
2.600%, 6/8/22 | 1,312,000 | 1,286,551 | ||||||
Dover Corp. | ||||||||
5.450%, 3/15/18 | 616,000 | 681,915 | ||||||
4.300%, 3/1/21 | 656,000 | 722,314 | ||||||
Flowserve Corp. | ||||||||
4.000%, 11/15/23 | 700,000 | 719,869 | ||||||
IDEX Corp. | ||||||||
4.200%, 12/15/21 | 300,000 | 311,485 | ||||||
Illinois Tool Works, Inc. | ||||||||
0.900%, 2/25/17 | 1,000,000 | 995,629 | ||||||
6.250%, 4/1/19 | 600,000 | 699,382 | ||||||
3.375%, 9/15/21 | 300,000 | 314,971 | ||||||
3.500%, 3/1/24 | 1,000,000 | 1,044,724 | ||||||
Ingersoll-Rand Luxembourg Finance S.A. |
| |||||||
2.625%, 5/1/20 | 500,000 | 497,101 | ||||||
Joy Global, Inc. | ||||||||
5.125%, 10/15/21 | 400,000 | 442,117 | ||||||
Kennametal, Inc. | ||||||||
2.650%, 11/1/19 | 250,000 | 249,048 | ||||||
3.875%, 2/15/22 | 560,000 | 568,790 | ||||||
Pall Corp. | ||||||||
5.000%, 6/15/20 | 300,000 | 328,265 | ||||||
Parker-Hannifin Corp. | ||||||||
5.500%, 5/15/18 | 500,000 | 556,774 | ||||||
3.300%, 11/21/24 | 600,000 | 611,381 | ||||||
Snap-on, Inc. | ||||||||
4.250%, 1/15/18 | 200,000 | 214,198 | ||||||
Stanley Black & Decker, Inc. | ||||||||
2.900%, 11/1/22 | 994,000 | 977,694 | ||||||
5.750%, 12/15/53 (l) | 600,000 | 646,500 | ||||||
Trinity Industries, Inc. | ||||||||
4.550%, 10/1/24 | 450,000 | 436,563 | ||||||
Wabtec Corp. | ||||||||
4.375%, 8/15/23 | 200,000 | 212,566 | ||||||
Xylem, Inc. | ||||||||
3.550%, 9/20/16 | 650,000 | 673,749 | ||||||
|
| |||||||
| 17,871,395 | ||||||||
|
| |||||||
Professional Services (0.0%) | ||||||||
Dun & Bradstreet Corp. | ||||||||
4.375%, 12/1/22 | 500,000 | 517,042 | ||||||
Equifax, Inc. | ||||||||
3.300%, 12/15/22 | 461,000 | 453,533 | ||||||
Verisk Analytics, Inc. | ||||||||
5.800%, 5/1/21 | 600,000 | 676,389 | ||||||
|
| |||||||
| 1,646,964 | ||||||||
|
| |||||||
Road & Rail (0.3%) | ||||||||
Burlington Northern Santa Fe LLC | ||||||||
5.750%, 3/15/18 | 471,000 | 527,929 | ||||||
4.700%, 10/1/19 | 725,000 | 801,232 | ||||||
3.600%, 9/1/20 | 1,500,000 | 1,572,349 | ||||||
3.050%, 3/15/22 | 2,156,000 | 2,166,748 | ||||||
3.850%, 9/1/23 | 750,000 | 790,647 | ||||||
3.750%, 4/1/24 | $ | 250,000 | $ | 261,850 | ||||
3.400%, 9/1/24 | 500,000 | 505,661 | ||||||
Canadian National Railway Co. | ||||||||
5.550%, 5/15/18 | 157,000 | 175,959 | ||||||
5.550%, 3/1/19 | 1,133,000 | 1,284,031 | ||||||
2.250%, 11/15/22 | 900,000 | 870,040 | ||||||
2.950%, 11/21/24 | 250,000 | 247,560 | ||||||
Canadian Pacific Railway Co. | ||||||||
6.500%, 5/15/18 | 159,000 | 184,172 | ||||||
7.250%, 5/15/19 | 645,000 | 771,295 | ||||||
Con-way, Inc. | ||||||||
7.250%, 1/15/18 | 500,000 | 567,811 | ||||||
CSX Corp. | ||||||||
7.900%, 5/1/17 | 250,000 | 287,110 | ||||||
6.250%, 3/15/18 | 460,000 | 522,394 | ||||||
7.375%, 2/1/19 | 1,055,000 | 1,265,273 | ||||||
3.700%, 10/30/20 | 200,000 | 211,123 | ||||||
4.250%, 6/1/21 | 500,000 | 543,336 | ||||||
3.700%, 11/1/23 | 1,000,000 | 1,050,014 | ||||||
JB Hunt Transport Services, Inc. | ||||||||
3.850%, 3/15/24 | 750,000 | 780,560 | ||||||
Kansas City Southern de Mexico S.A. de C.V. | ||||||||
2.350%, 5/15/20 | 400,000 | 383,994 | ||||||
3.000%, 5/15/23 | 121,000 | 117,186 | ||||||
Norfolk Southern Corp. | ||||||||
7.700%, 5/15/17 | 1,329,000 | 1,518,052 | ||||||
5.750%, 4/1/18 | 446,000 | 500,010 | ||||||
5.900%, 6/15/19 | 1,317,000 | 1,511,614 | ||||||
2.903%, 2/15/23 | 1,150,000 | 1,134,489 | ||||||
Ryder System, Inc. | ||||||||
3.600%, 3/1/16 | 689,000 | 708,888 | ||||||
5.850%, 11/1/16 | 699,000 | 750,726 | ||||||
3.500%, 6/1/17 | 125,000 | 130,940 | ||||||
2.500%, 3/1/18 | 250,000 | 258,712 | ||||||
2.450%, 11/15/18 | 600,000 | 600,979 | ||||||
2.350%, 2/26/19 | 250,000 | 248,072 | ||||||
2.550%, 6/1/19 | 310,000 | 309,472 | ||||||
Union Pacific Corp. | ||||||||
2.250%, 2/15/19 | 1,000,000 | 1,012,976 | ||||||
4.000%, 2/1/21 | 170,000 | 184,946 | ||||||
2.950%, 1/15/23 | 500,000 | 503,284 | ||||||
2.750%, 4/15/23 | 1,000,000 | 991,640 | ||||||
3.646%, 2/15/24 | 500,000 | 530,632 | ||||||
|
| |||||||
| 26,783,706 | ||||||||
|
| |||||||
Trading Companies & Distributors (0.1%) |
| |||||||
Air Lease Corp. | ||||||||
3.375%, 1/15/19 | 2,750,000 | 2,791,250 | ||||||
3.875%, 4/1/21 | 125,000 | 125,312 | ||||||
4.250%, 9/15/24 | 1,000,000 | 1,012,500 | ||||||
GATX Corp. | ||||||||
3.500%, 7/15/16 | 350,000 | 361,481 | ||||||
2.375%, 7/30/18 | 388,000 | 389,502 | ||||||
2.500%, 3/15/19 | 700,000 | 699,894 | ||||||
2.500%, 7/30/19 | 500,000 | 496,435 | ||||||
4.850%, 6/1/21 | 100,000 | 110,681 | ||||||
3.900%, 3/30/23 | 151,000 | 157,236 | ||||||
International Lease Finance Corp. | ||||||||
6.750%, 9/1/16§ | 2,000,000 | 2,132,500 | ||||||
|
| |||||||
| 8,276,791 | ||||||||
|
| |||||||
Total Industrials | 151,420,499 | |||||||
|
| |||||||
See Notes to Financial Statements.
52
Table of Contents
EQ ADVISORS TRUST
EQ/CORE BOND INDEX PORTFOLIO
PORTFOLIO OF INVESTMENTS (Continued)
December 31, 2014
Principal Amount | Value (Note 1) | |||||||
Information Technology (1.9%) |
| |||||||
Communications Equipment (0.2%) |
| |||||||
Cisco Systems, Inc. | ||||||||
5.500%, 2/22/16 | $ | 2,900,000 | $ | 3,069,071 | ||||
1.100%, 3/3/17 | 2,000,000 | 1,999,738 | ||||||
3.150%, 3/14/17 | 500,000 | 521,894 | ||||||
4.950%, 2/15/19 | 2,757,000 | 3,081,557 | ||||||
2.125%, 3/1/19 | 1,650,000 | 1,656,741 | ||||||
4.450%, 1/15/20 | 1,312,000 | 1,438,672 | ||||||
2.900%, 3/4/21 | 570,000 | 580,413 | ||||||
3.625%, 3/4/24 | 1,000,000 | 1,045,049 | ||||||
Harris Corp. | ||||||||
6.375%, 6/15/19 | 265,000 | 307,331 | ||||||
4.400%, 12/15/20 | 1,000,000 | 1,066,988 | ||||||
Juniper Networks, Inc. | ||||||||
3.100%, 3/15/16 | 500,000 | 508,722 | ||||||
4.600%, 3/15/21 | 62,000 | 64,602 | ||||||
4.500%, 3/15/24 | 175,000 | 175,327 | ||||||
Motorola Solutions, Inc. | ||||||||
3.500%, 9/1/21 | 1,000,000 | 993,959 | ||||||
3.750%, 5/15/22 | 94,000 | 94,058 | ||||||
3.500%, 3/1/23 | 1,000,000 | 973,689 | ||||||
Telefonaktiebolaget LM Ericsson | ||||||||
4.125%, 5/15/22 | 1,094,000 | 1,148,699 | ||||||
|
| |||||||
| 18,726,510 | ||||||||
|
| |||||||
Electronic Equipment, Instruments & Components (0.1%) |
| |||||||
Amphenol Corp. | ||||||||
2.550%, 1/30/19 | 750,000 | 754,921 | ||||||
3.125%, 9/15/21 | 1,500,000 | 1,501,094 | ||||||
Arrow Electronics, Inc. | ||||||||
3.000%, 3/1/18 | 150,000 | 153,415 | ||||||
6.000%, 4/1/20 | 304,000 | 343,107 | ||||||
Avnet, Inc. | ||||||||
5.875%, 6/15/20 | 1,100,000 | 1,228,430 | ||||||
Corning, Inc. | ||||||||
1.450%, 11/15/17 | 600,000 | 596,920 | ||||||
4.250%, 8/15/20 | 274,000 | 297,575 | ||||||
3.700%, 11/15/23 | 187,000 | 192,686 | ||||||
Ingram Micro, Inc. | ||||||||
5.250%, 9/1/17 | 62,000 | 66,996 | ||||||
5.000%, 8/10/22 | 600,000 | 635,141 | ||||||
4.950%, 12/15/24 | 200,000 | 199,680 | ||||||
Jabil Circuit, Inc. | ||||||||
4.700%, 9/15/22 | 1,000,000 | 995,000 | ||||||
Keysight Technologies, Inc. | ||||||||
3.300%, 10/30/19§ | 600,000 | 595,216 | ||||||
4.550%, 10/30/24§ | 600,000 | 600,375 | ||||||
Tech Data Corp. | ||||||||
3.750%, 9/21/17 | 300,000 | 309,300 | ||||||
Trimble Navigation Ltd. | ||||||||
4.750%, 12/1/24 | 350,000 | 358,821 | ||||||
|
| |||||||
| 8,828,677 | ||||||||
|
| |||||||
Internet Software & Services (0.1%) |
| |||||||
Alibaba Group Holding Ltd. | ||||||||
1.625%, 11/28/17§ | 530,000 | 526,074 | ||||||
2.500%, 11/28/19§ | 1,250,000 | 1,227,899 | ||||||
3.125%, 11/28/21§ | 1,300,000 | 1,281,186 | ||||||
3.600%, 11/28/24§ | 1,000,000 | 990,325 | ||||||
Baidu, Inc. | ||||||||
2.250%, 11/28/17 | 500,000 | 498,769 | ||||||
3.250%, 8/6/18 | $ | 1,226,000 | $ | 1,251,129 | ||||
2.750%, 6/9/19 | 500,000 | 496,915 | ||||||
3.500%, 11/28/22 | 500,000 | 492,510 | ||||||
eBay, Inc. | ||||||||
1.350%, 7/15/17 | 571,000 | 566,038 | ||||||
3.250%, 10/15/20 | 362,000 | 367,451 | ||||||
2.875%, 8/1/21 | 1,150,000 | 1,131,856 | ||||||
2.600%, 7/15/22 | 1,100,000 | 1,037,907 | ||||||
Google, Inc. | ||||||||
2.125%, 5/19/16 | 1,075,000 | 1,097,599 | ||||||
3.625%, 5/19/21 | 950,000 | 1,019,136 | ||||||
3.375%, 2/25/24 | 500,000 | 520,563 | ||||||
|
| |||||||
| 12,505,357 | ||||||||
|
| |||||||
IT Services (0.4%) | ||||||||
Broadridge Financial Solutions, Inc. | ||||||||
3.950%, 9/1/20 | 400,000 | 418,244 | ||||||
Computer Sciences Corp. | ||||||||
6.500%, 3/15/18 | 1,210,000 | 1,348,065 | ||||||
4.450%, 9/15/22 | 200,000 | 204,831 | ||||||
Fidelity National Information Services, Inc. | ||||||||
1.450%, 6/5/17 | 150,000 | 148,926 | ||||||
2.000%, 4/15/18 | 129,000 | 127,990 | ||||||
5.000%, 3/15/22 | 1,000,000 | 1,062,414 | ||||||
3.500%, 4/15/23 | 1,156,000 | 1,147,622 | ||||||
3.875%, 6/5/24 | 1,000,000 | 1,012,564 | ||||||
Fiserv, Inc. | ||||||||
6.800%, 11/20/17 | 600,000 | 679,647 | ||||||
4.750%, 6/15/21 | 94,000 | 102,828 | ||||||
3.500%, 10/1/22 | 500,000 | 502,244 | ||||||
International Business Machines Corp. | ||||||||
0.450%, 5/6/16 | 1,569,000 | 1,564,652 | ||||||
1.950%, 7/22/16 | 950,000 | 968,193 | ||||||
1.250%, 2/6/17 | 1,000,000 | 1,004,091 | ||||||
5.700%, 9/14/17 | 6,688,000 | 7,450,086 | ||||||
1.250%, 2/8/18 | 1,200,000 | 1,188,669 | ||||||
1.625%, 5/15/20 | 2,200,000 | 2,118,230 | ||||||
1.875%, 8/1/22 | 1,750,000 | 1,627,259 | ||||||
3.375%, 8/1/23 | 1,000,000 | 1,018,695 | ||||||
3.625%, 2/12/24 | 1,000,000 | 1,042,007 | ||||||
MasterCard, Inc. | ||||||||
3.375%, 4/1/24 | 1,000,000 | 1,027,412 | ||||||
Total System Services, Inc. | ||||||||
2.375%, 6/1/18 | 320,000 | 317,618 | ||||||
3.750%, 6/1/23 | 450,000 | 444,243 | ||||||
Western Union Co. | ||||||||
5.930%, 10/1/16 | 312,000 | 335,295 | ||||||
2.875%, 12/10/17 | 250,000 | 255,280 | ||||||
5.253%, 4/1/20 | 1,002,000 | 1,094,740 | ||||||
Xerox Corp. | ||||||||
6.750%, 2/1/17 | 1,224,000 | 1,349,755 | ||||||
2.950%, 3/15/17 | 406,000 | 416,996 | ||||||
6.350%, 5/15/18 | 1,115,000 | 1,260,281 | ||||||
2.750%, 3/15/19 | 500,000 | 500,112 | ||||||
5.625%, 12/15/19 | 639,000 | 717,490 | ||||||
2.800%, 5/15/20 | 750,000 | 740,518 | ||||||
4.500%, 5/15/21 | 185,000 | 196,925 | ||||||
3.800%, 5/15/24 | 750,000 | 737,065 | ||||||
|
| |||||||
| 34,130,987 | ||||||||
|
| |||||||
See Notes to Financial Statements.
53
Table of Contents
EQ ADVISORS TRUST
EQ/CORE BOND INDEX PORTFOLIO
PORTFOLIO OF INVESTMENTS (Continued)
December 31, 2014
Principal Amount | Value (Note 1) | |||||||
Semiconductors & Semiconductor Equipment (0.2%) | ||||||||
Altera Corp. | ||||||||
1.750%, 5/15/17 | $ | 500,000 | $ | 501,093 | ||||
2.500%, 11/15/18 | 500,000 | 502,100 | ||||||
4.100%, 11/15/23 | 600,000 | 622,058 | ||||||
Analog Devices, Inc. | ||||||||
3.000%, 4/15/16 | 500,000 | 510,964 | ||||||
2.875%, 6/1/23 | 250,000 | 239,763 | ||||||
Applied Materials, Inc. | ||||||||
2.650%, 6/15/16 | 1,000,000 | 1,021,841 | ||||||
4.300%, 6/15/21 | 625,000 | 680,676 | ||||||
Broadcom Corp. | ||||||||
2.500%, 8/15/22 | 1,100,000 | 1,054,251 | ||||||
3.500%, 8/1/24 | 400,000 | 401,498 | ||||||
Intel Corp. | ||||||||
1.950%, 10/1/16 | 1,600,000 | 1,627,988 | ||||||
1.350%, 12/15/17 | 2,000,000 | 1,993,011 | ||||||
3.300%, 10/1/21 | 1,257,000 | 1,305,904 | ||||||
2.700%, 12/15/22 | 1,875,000 | 1,844,279 | ||||||
KLA-Tencor Corp. | ||||||||
2.375%, 11/1/17 | 500,000 | 503,365 | ||||||
3.375%, 11/1/19 | 1,000,000 | 1,019,398 | ||||||
4.125%, 11/1/21 | 571,000 | 585,192 | ||||||
Maxim Integrated Products, Inc. | ||||||||
2.500%, 11/15/18 | 750,000 | 747,130 | ||||||
3.375%, 3/15/23 | 400,000 | 391,644 | ||||||
Texas Instruments, Inc. | ||||||||
2.375%, 5/16/16 | 950,000 | 971,434 | ||||||
1.000%, 5/1/18 | 500,000 | 490,069 | ||||||
1.650%, 8/3/19 | 350,000 | 342,417 | ||||||
2.750%, 3/12/21 | 1,100,000 | 1,104,348 | ||||||
2.250%, 5/1/23 | 750,000 | 703,849 | ||||||
Xilinx, Inc. | ||||||||
2.125%, 3/15/19 | 500,000 | 494,266 | ||||||
3.000%, 3/15/21 | 500,000 | 498,514 | ||||||
|
| |||||||
| 20,157,052 | ||||||||
|
| |||||||
Software (0.4%) | ||||||||
Adobe Systems, Inc. | ||||||||
4.750%, 2/1/20 | 837,000 | 918,323 | ||||||
Autodesk, Inc. | ||||||||
1.950%, 12/15/17 | 297,000 | 297,493 | ||||||
CA, Inc. | ||||||||
2.875%, 8/15/18 | 500,000 | 507,615 | ||||||
5.375%, 12/1/19 | 800,000 | 884,677 | ||||||
4.500%, 8/15/23 | 250,000 | 261,322 | ||||||
Cadence Design Systems, Inc. | ||||||||
4.375%, 10/15/24 | 175,000 | 176,416 | ||||||
CDK Global, Inc. | ||||||||
3.300%, 10/15/19§ | 400,000 | 397,794 | ||||||
4.500%, 10/15/24§ | 405,000 | 405,980 | ||||||
Intuit, Inc. | ||||||||
5.750%, 3/15/17 | 1,000,000 | 1,088,818 | ||||||
Microsoft Corp. | ||||||||
2.500%, 2/8/16 | 3,000,000 | 3,068,081 | ||||||
1.000%, 5/1/18 | 487,000 | 480,167 | ||||||
1.625%, 12/6/18 | 900,000 | 898,445 | ||||||
4.200%, 6/1/19 | 736,000 | 809,139 | ||||||
3.000%, 10/1/20 | 594,000 | 619,512 | ||||||
4.000%, 2/8/21 | 1,000,000 | 1,092,870 | ||||||
2.125%, 11/15/22 | $ | 500,000 | $ | 482,601 | ||||
2.375%, 5/1/23 | 1,250,000 | 1,223,788 | ||||||
3.625%, 12/15/23 | 800,000 | 855,844 | ||||||
Oracle Corp. | ||||||||
5.250%, 1/15/16 | 3,216,000 | 3,370,894 | ||||||
1.200%, 10/15/17 | 1,000,000 | 993,691 | ||||||
5.750%, 4/15/18 | 1,362,000 | 1,539,650 | ||||||
2.375%, 1/15/19 | 1,500,000 | 1,525,045 | ||||||
5.000%, 7/8/19 | 3,500,000 | 3,931,593 | ||||||
2.250%, 10/8/19 | 750,000 | 754,433 | ||||||
2.800%, 7/8/21 | 585,000 | 588,210 | ||||||
2.500%, 10/15/22 | 1,875,000 | 1,826,321 | ||||||
3.625%, 7/15/23 | 1,000,000 | 1,042,784 | ||||||
Symantec Corp. | ||||||||
4.200%, 9/15/20 | 1,100,000 | 1,131,886 | ||||||
3.950%, 6/15/22 | 1,000,000 | 1,004,838 | ||||||
|
| |||||||
| 32,178,230 | ||||||||
|
| |||||||
Technology Hardware, Storage & Peripherals (0.5%) |
| |||||||
Apple, Inc. | ||||||||
0.450%, 5/3/16 | 1,150,000 | 1,148,424 | ||||||
1.000%, 5/3/18 | 4,256,000 | 4,180,785 | ||||||
2.100%, 5/6/19 | 2,650,000 | 2,673,195 | ||||||
2.850%, 5/6/21 | 935,000 | 955,582 | ||||||
2.400%, 5/3/23 | 4,707,000 | 4,577,917 | ||||||
3.450%, 5/6/24 | 4,000,000 | 4,194,976 | ||||||
EMC Corp. | ||||||||
1.875%, 6/1/18 | 1,600,000 | 1,589,543 | ||||||
2.650%, 6/1/20 | 1,250,000 | 1,238,196 | ||||||
3.375%, 6/1/23 | 1,800,000 | 1,786,013 | ||||||
Hewlett-Packard Co. | ||||||||
2.650%, 6/1/16 | 2,000,000 | 2,038,308 | ||||||
2.600%, 9/15/17 | 1,000,000 | 1,018,063 | ||||||
5.500%, 3/1/18 | 3,075,000 | 3,384,891 | ||||||
2.750%, 1/14/19 | 600,000 | 599,483 | ||||||
3.750%, 12/1/20 | 250,000 | 258,625 | ||||||
4.375%, 9/15/21 | 300,000 | 315,562 | ||||||
4.650%, 12/9/21 | 3,250,000 | 3,462,675 | ||||||
4.050%, 9/15/22 | 1,000,000 | 1,013,144 | ||||||
Lexmark International, Inc. | ||||||||
5.125%, 3/15/20 | 500,000 | 528,159 | ||||||
NetApp, Inc. | ||||||||
2.000%, 12/15/17 | 562,000 | 561,306 | ||||||
3.375%, 6/15/21 | 550,000 | 549,106 | ||||||
Seagate HDD Cayman | ||||||||
3.750%, 11/15/18§ | 3,100,000 | 3,185,062 | ||||||
|
| |||||||
| 39,259,015 | ||||||||
|
| |||||||
Total Information Technology | 165,785,828 | |||||||
|
| |||||||
Materials (1.5%) | ||||||||
Chemicals (0.7%) | ||||||||
Agrium, Inc. |
| |||||||
6.750%, 1/15/19 | 500,000 | 582,821 | ||||||
3.150%, 10/1/22 | 131,000 | 127,078 | ||||||
3.500%, 6/1/23 | 1,000,000 | 982,106 | ||||||
Air Products and Chemicals, Inc. |
| |||||||
2.000%, 8/2/16 | 235,000 | 238,720 | ||||||
4.375%, 8/21/19 | 439,000 | 479,792 | ||||||
2.750%, 2/3/23 | 1,000,000 | 980,808 | ||||||
3.350%, 7/31/24 | 750,000 | 763,946 | ||||||
See Notes to Financial Statements.
54
Table of Contents
EQ ADVISORS TRUST
EQ/CORE BOND INDEX PORTFOLIO
PORTFOLIO OF INVESTMENTS (Continued)
December 31, 2014
Principal Amount | Value (Note 1) | |||||||
Airgas, Inc. |
| |||||||
1.650%, 2/15/18 | $ | 500,000 | $ | 493,704 | ||||
3.650%, 7/15/24 | 450,000 | 460,181 | ||||||
Albemarle Corp. |
| |||||||
3.000%, 12/1/19 | 250,000 | 249,163 | ||||||
4.500%, 12/15/20 | 500,000 | 546,455 | ||||||
4.150%, 12/1/24 | 250,000 | 254,783 | ||||||
Cabot Corp. |
| |||||||
5.000%, 10/1/16 | 439,000 | 464,858 | ||||||
3.700%, 7/15/22 | 500,000 | 508,904 | ||||||
CF Industries, Inc. |
| |||||||
7.125%, 5/1/20 | 1,094,000 | 1,303,088 | ||||||
3.450%, 6/1/23 | 1,000,000 | 988,314 | ||||||
Dow Chemical Co. |
| |||||||
2.500%, 2/15/16 | 2,410,000 | 2,451,926 | ||||||
8.550%, 5/15/19 | 2,642,000 | 3,282,112 | ||||||
4.250%, 11/15/20 | 1,984,000 | 2,121,281 | ||||||
4.125%, 11/15/21 | 100,000 | 105,513 | ||||||
3.000%, 11/15/22 | 1,000,000 | 974,525 | ||||||
E.I. du Pont de Nemours & Co. |
| |||||||
1.950%, 1/15/16 | 1,000,000 | 1,012,578 | ||||||
5.250%, 12/15/16 | 194,000 | 209,130 | ||||||
6.000%, 7/15/18 | 2,203,000 | 2,506,075 | ||||||
5.750%, 3/15/19 | 500,000 | 570,805 | ||||||
3.625%, 1/15/21 | 1,700,000 | 1,799,661 | ||||||
2.800%, 2/15/23 | 1,000,000 | 981,342 | ||||||
Eastman Chemical Co. |
| |||||||
2.400%, 6/1/17 | 150,000 | 152,258 | ||||||
5.500%, 11/15/19 | 472,000 | 533,678 | ||||||
2.700%, 1/15/20 | 1,000,000 | 999,418 | ||||||
3.600%, 8/15/22 | 1,125,000 | 1,139,603 | ||||||
3.800%, 3/15/25 | 1,000,000 | 1,010,800 | ||||||
Ecolab, Inc. |
| |||||||
3.000%, 12/8/16 | 1,500,000 | 1,549,328 | ||||||
4.350%, 12/8/21 | 1,356,000 | 1,477,062 | ||||||
FMC Corp. |
| |||||||
4.100%, 2/1/24 | 1,500,000 | 1,567,672 | ||||||
Lubrizol Corp. |
| |||||||
8.875%, 2/1/19 | 500,000 | 626,102 | ||||||
LYB International Finance B.V. |
| |||||||
4.000%, 7/15/23 | 1,100,000 | 1,117,436 | ||||||
LyondellBasell Industries N.V. |
| |||||||
5.000%, 4/15/19 | 2,000,000 | 2,176,871 | ||||||
6.000%, 11/15/21 | 1,800,000 | 2,075,086 | ||||||
Methanex Corp. |
| |||||||
3.250%, 12/15/19 | 220,000 | 218,358 | ||||||
4.250%, 12/1/24 | 650,000 | 646,494 | ||||||
Monsanto Co. |
| |||||||
1.150%, 6/30/17 | 1,000,000 | 990,897 | ||||||
5.125%, 4/15/18 | 869,000 | 957,930 | ||||||
1.850%, 11/15/18 | 400,000 | 398,144 | ||||||
2.750%, 7/15/21 | 750,000 | 744,146 | ||||||
2.200%, 7/15/22 | 250,000 | 236,603 | ||||||
Mosaic Co. |
| |||||||
4.250%, 11/15/23 | 1,000,000 | 1,038,815 | ||||||
NewMarket Corp. |
| |||||||
4.100%, 12/15/22 | 167,000 | 171,186 | ||||||
Potash Corp. of Saskatchewan, Inc. |
| |||||||
3.250%, 12/1/17 | 843,000 | 877,335 | ||||||
6.500%, 5/15/19 | 860,000 | 1,009,320 | ||||||
4.875%, 3/30/20 | 194,000 | 215,355 | ||||||
3.625%, 3/15/24 | 500,000 | 511,532 | ||||||
PPG Industries, Inc. |
| |||||||
1.900%, 1/15/16 | $ | 800,000 | $ | 807,603 | ||||
3.600%, 11/15/20 | 350,000 | 363,508 | ||||||
Praxair, Inc. |
| |||||||
0.750%, 2/21/16 | 400,000 | 400,327 | ||||||
1.050%, 11/7/17 | 656,000 | 650,608 | ||||||
1.250%, 11/7/18 | 1,400,000 | 1,364,730 | ||||||
4.500%, 8/15/19 | 800,000 | 879,761 | ||||||
4.050%, 3/15/21 | 500,000 | 542,032 | ||||||
3.000%, 9/1/21 | 600,000 | 610,805 | ||||||
2.200%, 8/15/22 | 450,000 | 430,947 | ||||||
2.700%, 2/21/23 | 500,000 | 493,338 | ||||||
RPM International, Inc. |
| |||||||
6.125%, 10/15/19 | 700,000 | 795,399 | ||||||
Sherwin-Williams Co. |
| |||||||
1.350%, 12/15/17 | 550,000 | 546,007 | ||||||
Valspar Corp. |
| |||||||
7.250%, 6/15/19 | 439,000 | 515,682 | ||||||
4.200%, 1/15/22 | 200,000 | 215,005 | ||||||
Westlake Chemical Corp. | ||||||||
3.600%, 7/15/22 | 308,000 | 305,305 | ||||||
|
| |||||||
| 56,802,155 | ||||||||
|
| |||||||
Construction Materials (0.0%) |
| |||||||
CRH America, Inc. | ||||||||
6.000%, 9/30/16 | 3,265,000 | 3,514,042 | ||||||
8.125%, 7/15/18 | 269,000 | 321,716 | ||||||
Martin Marietta Materials, Inc. | ||||||||
6.600%, 4/15/18 | 300,000 | 337,687 | ||||||
4.250%, 7/2/24 | 285,000 | 291,947 | ||||||
|
| |||||||
| 4,465,392 | ||||||||
|
| |||||||
Containers & Packaging (0.0%) |
| |||||||
Avery Dennison Corp. | ||||||||
5.375%, 4/15/20 | 169,000 | 184,488 | ||||||
3.350%, 4/15/23 | 300,000 | 300,770 | ||||||
Bemis Co., Inc. | ||||||||
6.800%, 8/1/19 | 471,000 | 553,190 | ||||||
Packaging Corp of America | ||||||||
3.650%, 9/15/24 | 1,000,000 | 989,218 | ||||||
Packaging Corp. of America | ||||||||
3.900%, 6/15/22 | 500,000 | 509,138 | ||||||
4.500%, 11/1/23 | 200,000 | 210,696 | ||||||
Rock-Tenn Co. | ||||||||
4.900%, 3/1/22 | 1,500,000 | 1,615,429 | ||||||
|
| |||||||
| 4,362,929 | ||||||||
|
| |||||||
Metals & Mining (0.7%) |
| |||||||
Barrick Gold Corp. | ||||||||
6.950%, 4/1/19 | 2,023,000 | 2,299,863 | ||||||
3.850%, 4/1/22 | 2,000,000 | 1,927,094 | ||||||
4.100%, 5/1/23 | 900,000 | 873,367 | ||||||
Barrick North America Finance LLC | ||||||||
4.400%, 5/30/21 | 200,000 | 202,077 | ||||||
BHP Billiton Finance USA Ltd. | ||||||||
7.250%, 3/1/16 | 598,000 | 642,275 | ||||||
1.875%, 11/21/16 | 750,000 | 760,330 | ||||||
1.625%, 2/24/17 | 1,000,000 | 1,007,501 | ||||||
5.400%, 3/29/17 | 139,000 | 151,183 | ||||||
6.500%, 4/1/19 | 2,502,000 | 2,940,935 | ||||||
3.250%, 11/21/21 | 500,000 | 514,222 | ||||||
See Notes to Financial Statements.
55
Table of Contents
EQ ADVISORS TRUST
EQ/CORE BOND INDEX PORTFOLIO
PORTFOLIO OF INVESTMENTS (Continued)
December 31, 2014
Principal Amount | Value (Note 1) | |||||||
2.875%, 2/24/22 | $ | 1,406,000 | $ | 1,404,222 | ||||
3.850%, 9/30/23 | 2,100,000 | 2,214,266 | ||||||
Carpenter Technology Corp. | ||||||||
4.450%, 3/1/23 | 100,000 | 104,418 | ||||||
Celulosa Arauco y Constitucion S.A. | ||||||||
5.000%, 1/21/21 | 1,800,000 | 1,881,000 | ||||||
Freeport-McMoRan, Inc. | ||||||||
2.150%, 3/1/17 | 1,000,000 | 1,001,008 | ||||||
2.375%, 3/15/18 | 5,200,000 | 5,162,898 | ||||||
3.100%, 3/15/20 | 1,656,000 | 1,609,973 | ||||||
3.550%, 3/1/22 | 1,906,000 | 1,806,854 | ||||||
3.875%, 3/15/23 | 1,750,000 | 1,660,675 | ||||||
Glencore Canada Corp. | ||||||||
5.500%, 6/15/17 | 512,000 | 550,660 | ||||||
Goldcorp, Inc. | ||||||||
2.125%, 3/15/18 | 656,000 | 648,906 | ||||||
3.625%, 6/9/21 | 330,000 | 329,940 | ||||||
3.700%, 3/15/23 | 600,000 | 584,673 | ||||||
Kinross Gold Corp. | ||||||||
5.950%, 3/15/24§ | 555,000 | 520,927 | ||||||
Newmont Mining Corp. | ||||||||
5.125%, 10/1/19 | 928,000 | 995,216 | ||||||
3.500%, 3/15/22 | 1,156,000 | 1,084,575 | ||||||
Nucor Corp. | ||||||||
5.750%, 12/1/17 | 808,000 | 892,646 | ||||||
5.850%, 6/1/18 | 800,000 | 894,642 | ||||||
Reliance Steel & Aluminum Co. | ||||||||
4.500%, 4/15/23 | 500,000 | 489,571 | ||||||
Rio Tinto Finance USA Ltd. | ||||||||
6.500%, 7/15/18 | 920,000 | 1,053,654 | ||||||
9.000%, 5/1/19 | 1,087,000 | 1,372,256 | ||||||
3.500%, 11/2/20 | 1,000,000 | 1,037,194 | ||||||
4.125%, 5/20/21 | 1,500,000 | 1,586,276 | ||||||
3.750%, 9/20/21 | 1,000,000 | 1,031,573 | ||||||
Rio Tinto Finance USA plc | ||||||||
1.375%, 6/17/16 | 1,500,000 | 1,505,818 | ||||||
2.000%, 3/22/17 | 500,000 | 505,735 | ||||||
1.625%, 8/21/17 | 1,100,000 | 1,098,826 | ||||||
2.250%, 12/14/18 | 1,500,000 | 1,499,684 | ||||||
3.500%, 3/22/22 | 687,000 | 688,323 | ||||||
2.875%, 8/21/22 | 1,100,000 | 1,054,164 | ||||||
Southern Copper Corp. | ||||||||
5.375%, 4/16/20 | 253,000 | 275,669 | ||||||
3.500%, 11/8/22 | 244,000 | 231,653 | ||||||
Teck Resources Ltd. | ||||||||
3.850%, 8/15/17 | 3,031,000 | 3,097,296 | ||||||
4.500%, 1/15/21 | 225,000 | 220,849 | ||||||
3.750%, 2/1/23 | 200,000 | 179,303 | ||||||
Vale Overseas Ltd. | ||||||||
6.250%, 1/11/16 | 612,000 | 636,113 | ||||||
6.250%, 1/23/17 | 2,426,000 | 2,570,347 | ||||||
4.625%, 9/15/20 | 1,700,000 | 1,698,980 | ||||||
4.375%, 1/11/22 | 1,062,000 | 1,012,829 | ||||||
Worthington Industries, Inc. | ||||||||
4.550%, 4/15/26 | 100,000 | 105,485 | ||||||
Yamana Gold, Inc. | ||||||||
4.950%, 7/15/24 | 250,000 | 243,844 | ||||||
|
| |||||||
| 57,861,788 | ||||||||
|
| |||||||
Paper & Forest Products (0.1%) |
| |||||||
Domtar Corp. | ||||||||
4.400%, 4/1/22 | $ | 2,000,000 | $ | 2,020,000 | ||||
International Paper Co. | ||||||||
7.950%, 6/15/18 | 1,744,000 | 2,053,266 | ||||||
9.375%, 5/15/19 | 800,000 | 1,014,185 | ||||||
7.500%, 8/15/21 | 156,000 | 193,854 | ||||||
4.750%, 2/15/22 | 194,000 | 211,265 | ||||||
3.650%, 6/15/24 | 1,900,000 | 1,888,371 | ||||||
|
| |||||||
| 7,380,941 | ||||||||
|
| |||||||
Total Materials | 130,873,205 | |||||||
|
| |||||||
Telecommunication Services (1.3%) |
| |||||||
Diversified Telecommunication Services (1.1%) |
| |||||||
AT&T, Inc. | ||||||||
0.900%, 2/12/16 | 1,500,000 | 1,499,848 | ||||||
2.950%, 5/15/16 | 1,100,000 | 1,127,944 | ||||||
2.400%, 8/15/16 | 480,000 | 489,004 | ||||||
1.600%, 2/15/17 | 1,000,000 | 1,001,872 | ||||||
1.700%, 6/1/17 | 1,500,000 | 1,501,064 | ||||||
1.400%, 12/1/17 | 1,000,000 | 987,996 | ||||||
5.500%, 2/1/18 | 4,106,000 | 4,534,040 | ||||||
2.375%, 11/27/18 | 1,500,000 | 1,511,577 | ||||||
5.800%, 2/15/19 | 1,901,000 | 2,162,646 | ||||||
2.300%, 3/11/19 | 1,000,000 | 998,772 | ||||||
4.450%, 5/15/21 | 1,500,000 | 1,613,455 | ||||||
3.875%, 8/15/21 | 497,000 | 519,373 | ||||||
3.000%, 2/15/22 | 1,000,000 | 986,569 | ||||||
2.625%, 12/1/22 | 2,156,000 | 2,054,869 | ||||||
3.900%, 3/11/24 | 1,000,000 | 1,026,948 | ||||||
British Telecommunications plc | ||||||||
1.625%, 6/28/16 | 1,090,000 | 1,097,695 | ||||||
5.950%, 1/15/18 | 1,200,000 | 1,337,998 | ||||||
2.350%, 2/14/19 | 1,000,000 | 999,784 | ||||||
CC Holdings GS V LLC/Crown Castle GS III Corp. |
| |||||||
2.381%, 12/15/17 | 500,000 | 503,317 | ||||||
3.849%, 4/15/23 | 500,000 | 497,416 | ||||||
Deutsche Telekom International Finance B.V. |
| |||||||
6.750%, 8/20/18 | 1,650,000 | 1,912,913 | ||||||
6.000%, 7/8/19 | 100,000 | 115,941 | ||||||
Emirates Telecommunications Corp. |
| |||||||
2.375%, 6/18/19 (m) | 1,000,000 | 1,000,000 | ||||||
3.500%, 6/18/24 (m) | 1,000,000 | 1,022,500 | ||||||
Orange S.A. | ||||||||
2.750%, 9/14/16 | 600,000 | 613,013 | ||||||
2.750%, 2/6/19 | 1,000,000 | 1,013,946 | ||||||
5.375%, 7/8/19 | 1,200,000 | 1,349,139 | ||||||
4.125%, 9/14/21 | 1,000,000 | 1,081,015 | ||||||
Qwest Corp. | ||||||||
6.500%, 6/1/17 | 750,000 | 823,125 | ||||||
6.750%, 12/1/21 | 1,200,000 | 1,383,705 | ||||||
Telefonica Emisiones S.A.U. | ||||||||
3.992%, 2/16/16 | 2,455,000 | 2,524,765 | ||||||
6.421%, 6/20/16 | 833,000 | 890,416 | ||||||
6.221%, 7/3/17 | 473,000 | 522,041 | ||||||
3.192%, 4/27/18 | 1,000,000 | 1,030,673 | ||||||
5.877%, 7/15/19 | 570,000 | 647,640 | ||||||
5.134%, 4/27/20 | 629,000 | 693,000 | ||||||
5.462%, 2/16/21 | 2,456,000 | 2,739,428 | ||||||
4.570%, 4/27/23 | 500,000 | 535,416 | ||||||
See Notes to Financial Statements.
56
Table of Contents
EQ ADVISORS TRUST
EQ/CORE BOND INDEX PORTFOLIO
PORTFOLIO OF INVESTMENTS (Continued)
December 31, 2014
Principal Amount | Value (Note 1) | |||||||
Telefonos de Mexico S.A.B. de C.V. |
| |||||||
5.500%, 11/15/19 | $ | 1,100,000 | $ | 1,237,049 | ||||
Verizon Communications, Inc. | ||||||||
2.500%, 9/15/16 | 2,935,000 | 2,997,798 | ||||||
2.000%, 11/1/16 | 1,000,000 | 1,012,670 | ||||||
1.350%, 6/9/17 | 2,500,000 | 2,485,863 | ||||||
1.100%, 11/1/17 | 1,000,000 | 983,180 | ||||||
3.650%, 9/14/18 | 5,450,000 | 5,771,274 | ||||||
6.350%, 4/1/19 | 2,067,000 | 2,386,289 | ||||||
2.550%, 6/17/19 | 1,000,000 | 1,003,656 | ||||||
4.500%, 9/15/20 | 2,228,000 | 2,404,741 | ||||||
3.450%, 3/15/21 | 2,600,000 | 2,655,062 | ||||||
4.600%, 4/1/21 | 1,800,000 | 1,954,521 | ||||||
3.000%, 11/1/21 | 625,000 | 616,524 | ||||||
3.500%, 11/1/21 | 1,000,000 | 1,017,004 | ||||||
2.450%, 11/1/22 | 1,406,000 | 1,314,724 | ||||||
5.150%, 9/15/23 | 9,950,000 | 10,969,704 | ||||||
4.150%, 3/15/24 | 2,000,000 | 2,068,716 | ||||||
3.500%, 11/1/24 | 1,750,000 | 1,707,924 | ||||||
|
| |||||||
| 88,937,562 | ||||||||
|
| |||||||
Wireless Telecommunication Services (0.2%) |
| |||||||
America Movil S.A.B. de C.V. | ||||||||
2.375%, 9/8/16 | 1,300,000 | 1,322,750 | ||||||
5.625%, 11/15/17 | 2,280,000 | 2,523,732 | ||||||
5.000%, 3/30/20 | 2,960,000 | 3,267,840 | ||||||
3.125%, 7/16/22 | 1,200,000 | 1,178,160 | ||||||
Rogers Communications, Inc. | ||||||||
6.800%, 8/15/18 | 1,391,000 | 1,608,769 | ||||||
3.000%, 3/15/23 | 750,000 | 730,967 | ||||||
Vodafone Group plc | ||||||||
5.625%, 2/27/17 | 2,116,000 | 2,293,630 | ||||||
1.625%, 3/20/17 | 250,000 | 249,879 | ||||||
1.250%, 9/26/17 | 1,000,000 | 983,199 | ||||||
1.500%, 2/19/18 | 2,000,000 | 1,969,108 | ||||||
5.450%, 6/10/19 | 1,526,000 | 1,712,108 | ||||||
2.500%, 9/26/22 | 700,000 | 659,168 | ||||||
2.950%, 2/19/23 | 1,306,000 | 1,261,491 | ||||||
|
| |||||||
| 19,760,801 | ||||||||
|
| |||||||
Total Telecommunication Services | 108,698,363 | |||||||
|
| |||||||
Utilities (1.8%) | ||||||||
Electric Utilities (1.1%) | ||||||||
American Electric Power Co., Inc. | ||||||||
1.650%, 12/15/17 | 500,000 | 500,143 | ||||||
2.950%, 12/15/22 | 150,000 | 147,153 | ||||||
Arizona Public Service Co. | ||||||||
8.750%, 3/1/19 | 461,000 | 576,969 | ||||||
3.350%, 6/15/24 | 600,000 | 616,397 | ||||||
Baltimore Gas & Electric Co. | ||||||||
5.900%, 10/1/16 | 156,000 | 169,144 | ||||||
2.800%, 8/15/22 | 300,000 | 299,492 | ||||||
CenterPoint Energy Houston Electric LLC |
| |||||||
2.250%, 8/1/22 | 250,000 | 238,924 | ||||||
Commonwealth Edison Co. | ||||||||
5.950%, 8/15/16 | 500,000 | 538,413 | ||||||
1.950%, 9/1/16 | 175,000 | 177,224 | ||||||
6.150%, 9/15/17 | 940,000 | 1,053,909 | ||||||
2.150%, 1/15/19 | 1,000,000 | 1,003,537 | ||||||
4.000%, 8/1/20 | 431,000 | 461,989 | ||||||
3.400%, 9/1/21 | 250,000 | 259,920 | ||||||
Connecticut Light & Power Co. | ||||||||
5.650%, 5/1/18 | $ | 100,000 | $ | 112,159 | ||||
5.500%, 2/1/19 | 500,000 | 566,336 | ||||||
2.500%, 1/15/23 | 156,000 | 152,595 | ||||||
Dayton Power & Light Co. | ||||||||
1.875%, 9/15/16 | 250,000 | 252,492 | ||||||
Dominion Gas Holdings LLC | ||||||||
1.050%, 11/1/16 | 500,000 | 498,142 | ||||||
DTE Electric Co. | ||||||||
5.600%, 6/15/18 | 250,000 | 281,454 | ||||||
3.900%, 6/1/21 | 500,000 | 533,131 | ||||||
3.650%, 3/15/24 | 245,000 | 257,190 | ||||||
Duke Energy Carolinas LLC | ||||||||
7.000%, 11/15/18 | 446,000 | 527,906 | ||||||
4.300%, 6/15/20 | 250,000 | 271,171 | ||||||
Duke Energy Corp. | ||||||||
1.625%, 8/15/17 | 500,000 | 501,052 | ||||||
2.100%, 6/15/18 | 1,000,000 | 1,007,997 | ||||||
5.050%, 9/15/19 | 655,000 | 727,122 | ||||||
3.050%, 8/15/22 | 1,100,000 | 1,104,844 | ||||||
3.750%, 4/15/24 | 350,000 | 366,863 | ||||||
Duke Energy Florida, Inc. | ||||||||
5.800%, 9/15/17 | 1,000,000 | 1,119,025 | ||||||
5.650%, 6/15/18 | 346,000 | 391,718 | ||||||
4.550%, 4/1/20 | 160,000 | 175,557 | ||||||
Duke Energy Indiana, Inc. | ||||||||
6.050%, 6/15/16 | 500,000 | 534,669 | ||||||
3.750%, 7/15/20 | 1,062,000 | 1,125,345 | ||||||
Duke Energy Ohio, Inc. | ||||||||
5.450%, 4/1/19 | 500,000 | 562,896 | ||||||
3.800%, 9/1/23 | 1,000,000 | 1,051,211 | ||||||
Duke Energy Progress, Inc. | ||||||||
5.300%, 1/15/19 | 1,700,000 | 1,904,386 | ||||||
Edison International | ||||||||
3.750%, 9/15/17 | 531,000 | 561,141 | ||||||
Entergy Arkansas, Inc. | ||||||||
3.750%, 2/15/21 | 1,200,000 | 1,272,626 | ||||||
3.700%, 6/1/24 | 1,000,000 | 1,050,032 | ||||||
Entergy Corp. | ||||||||
4.700%, 1/15/17 | 250,000 | 263,818 | ||||||
5.125%, 9/15/20 | 787,000 | 856,487 | ||||||
Entergy Texas, Inc. | ||||||||
7.125%, 2/1/19 | 600,000 | 710,292 | ||||||
Florida Power & Light Co. | ||||||||
5.550%, 11/1/17 | 500,000 | 555,973 | ||||||
2.750%, 6/1/23 | 250,000 | 247,898 | ||||||
Georgia Power Co. | ||||||||
3.000%, 4/15/16 | 156,000 | 160,305 | ||||||
5.400%, 6/1/18 | 1,000,000 | 1,113,016 | ||||||
4.250%, 12/1/19 | 307,000 | 333,123 | ||||||
2.850%, 5/15/22 | 750,000 | 755,860 | ||||||
Great Plains Energy, Inc. | ||||||||
4.850%, 6/1/21 | 62,000 | 68,623 | ||||||
Hydro-Quebec | ||||||||
7.500%, 4/1/16 | 2,000,000 | 2,152,514 | ||||||
2.000%, 6/30/16 | 1,537,000 | 1,565,874 | ||||||
8.400%, 1/15/22 | 125,000 | 165,298 | ||||||
Indiana Michigan Power Co. | ||||||||
7.000%, 3/15/19 | 1,096,000 | 1,297,476 | ||||||
3.200%, 3/15/23 | 150,000 | 150,117 | ||||||
Interstate Power & Light Co. | ||||||||
3.250%, 12/1/24 | 600,000 | 605,658 | ||||||
See Notes to Financial Statements.
57
Table of Contents
EQ ADVISORS TRUST
EQ/CORE BOND INDEX PORTFOLIO
PORTFOLIO OF INVESTMENTS (Continued)
December 31, 2014
Principal Amount | Value (Note 1) | |||||||
ITC Holdings Corp. | ||||||||
3.650%, 6/15/24 | $ | 325,000 | $ | 331,113 | ||||
Jersey Central Power & Light Co. | ||||||||
5.650%, 6/1/17 | 1,500,000 | 1,636,507 | ||||||
7.350%, 2/1/19 | 100,000 | 118,183 | ||||||
Kansas City Power & Light Co. | ||||||||
5.850%, 6/15/17 | 100,000 | 109,696 | ||||||
6.375%, 3/1/18 | 600,000 | 699,154 | ||||||
7.150%, 4/1/19 | 500,000 | 596,777 | ||||||
3.150%, 3/15/23 | 250,000 | 250,735 | ||||||
LG&E and KU Energy LLC | ||||||||
3.750%, 11/15/20 | 1,275,000 | 1,317,819 | ||||||
Metropolitan Edison Co. | ||||||||
7.700%, 1/15/19 | 500,000 | 598,870 | ||||||
MidAmerican Energy Co. | ||||||||
2.400%, 3/15/19 | 850,000 | 861,580 | ||||||
Nevada Power Co. | ||||||||
6.500%, 8/1/18 | 1,200,000 | 1,387,623 | ||||||
7.125%, 3/15/19 | 500,000 | 597,917 | ||||||
NextEra Energy Capital Holdings, Inc. |
| |||||||
6.000%, 3/1/19 | 946,000 | 1,077,622 | ||||||
2.400%, 9/15/19 | 500,000 | 497,678 | ||||||
2.700%, 9/15/19 | 350,000 | 352,988 | ||||||
4.500%, 6/1/21 | 1,000,000 | 1,086,639 | ||||||
Northeast Utilities | ||||||||
4.500%, 11/15/19 | 419,000 | 455,472 | ||||||
Northern States Power Co. | ||||||||
5.250%, 3/1/18 | 500,000 | 551,678 | ||||||
2.150%, 8/15/22 | 1,000,000 | 957,847 | ||||||
NSTAR Electric Co. | ||||||||
5.625%, 11/15/17 | 750,000 | 830,947 | ||||||
2.375%, 10/15/22 | 1,250,000 | 1,195,983 | ||||||
Ohio Power Co. | ||||||||
6.050%, 5/1/18 | 200,000 | 225,504 | ||||||
Oncor Electric Delivery Co. LLC | ||||||||
5.000%, 9/30/17 | 1,000,000 | 1,085,318 | ||||||
6.800%, 9/1/18 | 700,000 | 817,857 | ||||||
7.000%, 9/1/22 | 750,000 | 946,585 | ||||||
Pacific Gas & Electric Co. | ||||||||
5.625%, 11/30/17 | 1,000,000 | 1,113,848 | ||||||
8.250%, 10/15/18 | 755,000 | 919,438 | ||||||
3.500%, 10/1/20 | 1,344,000 | 1,395,335 | ||||||
3.250%, 6/15/23 | 250,000 | 251,181 | ||||||
3.750%, 2/15/24 | 450,000 | 467,748 | ||||||
3.400%, 8/15/24 | 500,000 | 505,063 | ||||||
PacifiCorp | ||||||||
5.500%, 1/15/19 | 300,000 | 338,455 | ||||||
2.950%, 2/1/22 | 500,000 | 506,041 | ||||||
3.600%, 4/1/24 | 600,000 | 621,392 | ||||||
PECO Energy Co. | ||||||||
1.200%, 10/15/16 | 194,000 | 193,819 | ||||||
5.350%, 3/1/18 | 100,000 | 110,414 | ||||||
2.375%, 9/15/22 | 500,000 | 482,998 | ||||||
Portland General Electric Co. | ||||||||
6.100%, 4/15/19 | 373,000 | 422,983 | ||||||
Potomac Electric Power Co. | ||||||||
3.600%, 3/15/24 | 300,000 | 313,586 | ||||||
PPL Capital Funding, Inc. | ||||||||
1.900%, 6/1/18 | 1,000,000 | 995,261 | ||||||
4.200%, 6/15/22 | 1,078,000 | 1,142,441 | ||||||
3.500%, 12/1/22 | 1,000,000 | 1,013,101 | ||||||
3.400%, 6/1/23 | 250,000 | 250,683 | ||||||
PPL Electric Utilities Corp. | ||||||||
2.500%, 9/1/22 | $ | 200,000 | $ | 193,898 | ||||
Progress Energy, Inc. | ||||||||
5.625%, 1/15/16 | 100,000 | 104,797 | ||||||
7.050%, 3/15/19 | 1,100,000 | 1,296,944 | ||||||
4.400%, 1/15/21 | 156,000 | 169,410 | ||||||
3.150%, 4/1/22 | 1,250,000 | 1,236,362 | ||||||
Public Service Co. of Colorado | ||||||||
5.125%, 6/1/19 | 35,000 | 39,390 | ||||||
3.200%, 11/15/20 | 150,000 | 155,764 | ||||||
2.250%, 9/15/22 | 500,000 | 478,042 | ||||||
Public Service Co. of Oklahoma | ||||||||
5.150%, 12/1/19 | 52,000 | 58,914 | ||||||
4.400%, 2/1/21 | 250,000 | 273,484 | ||||||
Public Service Electric & Gas Co. | ||||||||
5.300%, 5/1/18 | 596,000 | 661,600 | ||||||
2.300%, 9/15/18 | 1,000,000 | 1,014,978 | ||||||
2.000%, 8/15/19 | 700,000 | 698,665 | ||||||
3.500%, 8/15/20 | 100,000 | 105,978 | ||||||
2.375%, 5/15/23 | 500,000 | 480,663 | ||||||
3.050%, 11/15/24 | 200,000 | 200,917 | ||||||
Sierra Pacific Power Co. | ||||||||
6.000%, 5/15/16 | 100,000 | 106,522 | ||||||
South Carolina Electric & Gas Co. | ||||||||
6.500%, 11/1/18 | 500,000 | 587,172 | ||||||
Southern California Edison Co. | ||||||||
1.125%, 5/1/17 | 600,000 | 597,923 | ||||||
5.500%, 8/15/18 | 500,000 | 563,235 | ||||||
3.875%, 6/1/21 | 631,000 | 683,892 | ||||||
3.500%, 10/1/23 | 200,000 | 210,414 | ||||||
Southern Co. | ||||||||
1.950%, 9/1/16 | 310,000 | 314,204 | ||||||
2.450%, 9/1/18 | 90,000 | 92,039 | ||||||
2.150%, 9/1/19 | 1,650,000 | 1,639,806 | ||||||
Southwestern Electric Power Co. | ||||||||
5.550%, 1/15/17 | 120,000 | 129,942 | ||||||
6.450%, 1/15/19 | 344,000 | 397,212 | ||||||
3.550%, 2/15/22 | 2,000,000 | 2,052,732 | ||||||
Southwestern Public Service Co. | ||||||||
8.750%, 12/1/18 | 500,000 | 616,158 | ||||||
Tampa Electric Co. | ||||||||
6.100%, 5/15/18 | 294,000 | 334,746 | ||||||
2.600%, 9/15/22 | 200,000 | 196,843 | ||||||
UIL Holdings Corp. | ||||||||
4.625%, 10/1/20 | 500,000 | 536,925 | ||||||
Union Electric Co. | ||||||||
3.500%, 4/15/24 | 1,000,000 | 1,026,777 | ||||||
Virginia Electric & Power Co. |
| |||||||
5.400%, 1/15/16 | 1,092,000 | 1,144,303 | ||||||
5.400%, 4/30/18 | 500,000 | 558,795 | ||||||
5.000%, 6/30/19 | 665,000 | 743,802 | ||||||
2.750%, 3/15/23 | 650,000 | 643,448 | ||||||
3.450%, 2/15/24 | 1,000,000 | 1,031,093 | ||||||
Westar Energy, Inc. | ||||||||
5.100%, 7/15/20 | 500,000 | 564,906 | ||||||
Wisconsin Electric Power Co. |
| |||||||
4.250%, 12/15/19 | 819,000 | 894,533 | ||||||
2.950%, 9/15/21 | 725,000 | 740,951 | ||||||
Wisconsin Power & Light Co. |
| |||||||
5.000%, 7/15/19 | 319,000 | 355,362 | ||||||
See Notes to Financial Statements.
58
Table of Contents
EQ ADVISORS TRUST
EQ/CORE BOND INDEX PORTFOLIO
PORTFOLIO OF INVESTMENTS (Continued)
December 31, 2014
Principal Amount | Value (Note 1) | |||||||
Xcel Energy, Inc. | ||||||||
0.750%, 5/9/16 | $ | 200,000 | $ | 199,537 | ||||
4.700%, 5/15/20 | 756,000 | 824,056 | ||||||
|
| |||||||
| 88,543,619 | ||||||||
|
| |||||||
Gas Utilities (0.1%) | ||||||||
Atmos Energy Corp. | ||||||||
8.500%, 3/15/19 | 844,000 | 1,051,818 | ||||||
CenterPoint Energy Resources Corp. |
| |||||||
6.000%, 5/15/18 | 346,000 | 389,699 | ||||||
4.500%, 1/15/21 | 1,342,000 | 1,477,331 | ||||||
DCP Midstream Operating LP |
| |||||||
2.700%, 4/1/19 | 335,000 | 329,926 | ||||||
3.875%, 3/15/23 | 1,100,000 | 1,049,947 | ||||||
National Fuel Gas Co. |
| |||||||
3.750%, 3/1/23 | 1,000,000 | 982,784 | ||||||
ONE Gas, Inc. | ||||||||
2.070%, 2/1/19 | 500,000 | 499,093 | ||||||
Panhandle Eastern Pipe Line Co. LP |
| |||||||
6.200%, 11/1/17 | 900,000 | 996,807 | ||||||
Questar Corp. | ||||||||
2.750%, 2/1/16 | 125,000 | 127,111 | ||||||
Southern California Gas Co. | ||||||||
3.150%, 9/15/24 | 550,000 | 563,184 | ||||||
Southern Natural Gas Co. LLC |
| |||||||
5.900%, 4/1/17§ | 846,000 | 909,886 | ||||||
4.400%, 6/15/21 | 150,000 | 155,777 | ||||||
Southwest Gas Corp. | ||||||||
3.875%, 4/1/22 | 500,000 | 525,456 | ||||||
|
| |||||||
| 9,058,819 | ||||||||
|
| |||||||
Independent Power and Renewable Electricity Producers (0.2%) |
| |||||||
Constellation Energy Group, Inc. | ||||||||
5.150%, 12/1/20 | 600,000 | 663,634 | ||||||
Empresa Nacional de Electricidad S.A. |
| |||||||
4.250%, 4/15/24 | 400,000 | 402,000 | ||||||
Exelon Generation Co. LLC |
| |||||||
6.200%, 10/1/17 | 696,000 | 773,966 | ||||||
5.200%, 10/1/19 | 2,000,000 | 2,211,366 | ||||||
PSEG Power LLC | ||||||||
5.125%, 4/15/20 | 1,375,000 | 1,517,236 | ||||||
Tennessee Valley Authority |
| |||||||
5.500%, 7/18/17 | 4,568,000 | 5,074,044 | ||||||
6.250%, 12/15/17 | 62,000 | 71,179 | ||||||
4.500%, 4/1/18 | 156,000 | 171,974 | ||||||
3.875%, 2/15/21 | 2,830,000 | 3,108,723 | ||||||
1.875%, 8/15/22 | 1,000,000 | 961,948 | ||||||
2.875%, 9/15/24 | 2,400,000 | 2,439,607 | ||||||
TransAlta Corp. | ||||||||
1.900%, 6/3/17 | 781,000 | 773,098 | ||||||
Tri-State Generation & Transmission Association, Inc. |
| |||||||
3.700%, 11/1/24§ | 200,000 | 204,136 | ||||||
|
| |||||||
| 18,372,911 | ||||||||
|
| |||||||
Multi-Utilities (0.4%) | ||||||||
AGL Capital Corp. | ||||||||
3.500%, 9/15/21 | 750,000 | 777,666 | ||||||
Ameren Illinois Co. | ||||||||
9.750%, 11/15/18 | 1,000,000 | 1,276,622 | ||||||
2.700%, 9/1/22 | 500,000 | 491,553 | ||||||
Avista Corp. | ||||||||
5.125%, 4/1/22 | 500,000 | 570,228 | ||||||
Berkshire Hathaway Energy Co. |
| |||||||
5.750%, 4/1/18 | $ | 994,000 | $ | 1,114,038 | ||||
2.400%, 2/1/20§ | 750,000 | 744,677 | ||||||
3.750%, 11/15/23 | 2,000,000 | 2,085,625 | ||||||
Black Hills Corp. | ||||||||
4.250%, 11/30/23 | 600,000 | 638,767 | ||||||
CenterPoint Energy, Inc. |
| |||||||
5.950%, 2/1/17 | 100,000 | 108,809 | ||||||
6.500%, 5/1/18 | 500,000 | 573,730 | ||||||
CMS Energy Corp. | ||||||||
5.050%, 3/15/22 | 1,500,000 | 1,677,814 | ||||||
3.875%, 3/1/24 | 1,000,000 | 1,038,765 | ||||||
Consolidated Edison Co. of New York, Inc. |
| |||||||
5.850%, 4/1/18 | 385,000 | 436,463 | ||||||
7.125%, 12/1/18 | 943,000 | 1,126,311 | ||||||
6.650%, 4/1/19 | 600,000 | 710,214 | ||||||
4.450%, 6/15/20 | 500,000 | 547,859 | ||||||
Consumers Energy Co. |
| |||||||
6.700%, 9/15/19 | 2,002,000 | 2,382,503 | ||||||
Delmarva Power & Light Co. |
| |||||||
3.500%, 11/15/23 | 1,000,000 | 1,029,194 | ||||||
Dominion Resources, Inc. | ||||||||
1.250%, 3/15/17 | 415,000 | 412,842 | ||||||
5.200%, 8/15/19 | 316,000 | 354,250 | ||||||
2.500%, 12/1/19 | 1,812,000 | 1,812,199 | ||||||
3.625%, 12/1/24 | 1,250,000 | 1,266,412 | ||||||
7.500%, 6/30/66 (l) | 200,000 | 213,000 | ||||||
DTE Energy Co. | ||||||||
6.350%, 6/1/16 | 156,000 | 167,371 | ||||||
2.400%, 12/1/19 | 350,000 | 349,981 | ||||||
3.500%, 6/1/24 | 1,000,000 | 1,015,827 | ||||||
Integrys Energy Group, Inc. |
| |||||||
6.110%, 12/1/66 (l) | 200,000 | 202,500 | ||||||
National Grid plc | ||||||||
6.300%, 8/1/16 | 523,000 | 563,605 | ||||||
NiSource Finance Corp. |
| |||||||
6.400%, 3/15/18 | 1,350,000 | 1,535,758 | ||||||
6.800%, 1/15/19 | 1,000,000 | 1,169,644 | ||||||
5.450%, 9/15/20 | 100,000 | 112,654 | ||||||
PG&E Corp. | ||||||||
2.400%, 3/1/19 | 500,000 | 500,149 | ||||||
Puget Energy, Inc. | ||||||||
6.000%, 9/1/21 | 1,500,000 | 1,753,410 | ||||||
San Diego Gas & Electric Co. |
| |||||||
3.600%, 9/1/23 | 1,650,000 | 1,738,075 | ||||||
SCANA Corp. | ||||||||
6.250%, 4/1/20 | 300,000 | 342,926 | ||||||
Sempra Energy | ||||||||
6.500%, 6/1/16 | 469,000 | 503,822 | ||||||
2.300%, 4/1/17 | 550,000 | 559,886 | ||||||
6.150%, 6/15/18 | 100,000 | 113,549 | ||||||
9.800%, 2/15/19 | 1,000,000 | 1,288,072 | ||||||
2.875%, 10/1/22 | 563,000 | 555,779 | ||||||
3.550%, 6/15/24 | 250,000 | 254,927 | ||||||
TECO Finance, Inc. | ||||||||
4.000%, 3/15/16 | 562,000 | 581,822 | ||||||
5.150%, 3/15/20 | 922,000 | 1,014,069 | ||||||
Wisconsin Energy Corp. | ||||||||
6.250%, 5/15/67 (l) | 530,000 | 535,300 | ||||||
|
| |||||||
| 36,248,667 | ||||||||
|
| |||||||
See Notes to Financial Statements.
59
Table of Contents
EQ ADVISORS TRUST
EQ/CORE BOND INDEX PORTFOLIO
PORTFOLIO OF INVESTMENTS (Continued)
December 31, 2014
Principal Amount | Value (Note 1) | |||||||
Water Utilities (0.0%) | ||||||||
American Water Capital Corp. |
| |||||||
3.850%, 3/1/24 | $ | 1,000,000 | $ | 1,052,900 | ||||
United Utilities plc | ||||||||
5.375%, 2/1/19 | 500,000 | 548,300 | ||||||
|
| |||||||
| 1,601,200 | ||||||||
|
| |||||||
Total Utilities | 153,825,216 | |||||||
|
| |||||||
Total Corporate Bonds | 2,715,560,633 | |||||||
|
| |||||||
Government Securities (61.3%) |
| |||||||
Foreign Governments (2.8%) |
| |||||||
Asian Development Bank |
| |||||||
2.125% 11/24/21 | 1,500,000 | 1,501,544 | ||||||
Canadian Government Bond |
| |||||||
0.875% 2/14/17 | 3,300,000 | 3,303,475 | ||||||
1.625% 2/27/19 | 3,500,000 | 3,508,445 | ||||||
Council of Europe Development Bank |
| |||||||
1.750% 11/14/19 | 500,000 | 497,307 | ||||||
Development Bank of Japan |
| |||||||
5.125% 2/1/17 | 1,200,000 | 1,300,433 | ||||||
European Bank for Reconstruction & Development |
| |||||||
1.750% 11/26/19 | 1,000,000 | 999,270 | ||||||
Export Development Canada |
| |||||||
1.250% 10/26/16 | 200,000 | 201,742 | ||||||
0.875% 1/30/17 | 1,000,000 | 999,180 | ||||||
1.000% 5/15/17 | 1,000,000 | 999,788 | ||||||
0.750% 12/15/17 | 1,250,000 | 1,232,224 | ||||||
1.750% 8/19/19 | 3,000,000 | 3,005,997 | ||||||
Export-Import Bank of Korea |
| |||||||
4.000% 1/11/17 | 800,000 | 838,419 | ||||||
1.750% 2/27/18 | 1,591,000 | 1,581,515 | ||||||
2.875% 9/17/18 | 1,500,000 | 1,537,012 | ||||||
2.375% 8/12/19 | 1,250,000 | 1,250,460 | ||||||
5.125% 6/29/20 | 500,000 | 562,840 | ||||||
4.000% 1/29/21 | 1,500,000 | 1,604,883 | ||||||
4.375% 9/15/21 | 200,000 | 219,089 | ||||||
5.000% 4/11/22 | 500,000 | 568,296 | ||||||
4.000% 1/14/24 | 500,000 | 538,020 | ||||||
Federative Republic of Brazil |
| |||||||
6.000% 1/17/17 | 2,000,000 | 2,155,000 | ||||||
8.000% 1/15/18 (b) | 1,346,334 | 1,467,504 | ||||||
5.875% 1/15/19 | 1,828,000 | 2,035,478 | ||||||
8.875% 10/14/19 | 654,000 | 814,230 | ||||||
4.875% 1/22/21 | 2,500,000 | 2,662,500 | ||||||
2.625% 1/5/23 | 3,350,000 | 3,065,250 | ||||||
FMS Wertmanagement AoeR |
| |||||||
0.625% 4/18/16 | 2,100,000 | 2,100,823 | ||||||
1.125% 10/14/16 | 1,200,000 | 1,207,286 | ||||||
1.125% 9/5/17 | 3,000,000 | 2,992,503 | ||||||
1.000% 11/21/17 | 1,650,000 | 1,636,217 | ||||||
1.625% 11/20/18 | 1,500,000 | 1,499,668 | ||||||
Inter-American Development Bank |
| |||||||
0.625% 9/12/16 | 1,500,000 | 1,498,153 | ||||||
International Bank for Reconstruction & Development |
| |||||||
1.875% 10/7/19 | 2,500,000 | 2,508,513 | ||||||
Japan Bank for International Cooperation |
| |||||||
2.500% 1/21/16 | 2,500,000 | 2,551,245 | ||||||
2.500% 5/18/16 | 1,200,000 | 1,229,724 | ||||||
2.250% 7/13/16 | 500,000 | 511,382 | ||||||
1.125% 7/19/17 | 3,000,000 | 2,994,239 | ||||||
1.750% 7/31/18 | $ | 2,000,000 | $ | 2,009,342 | ||||
1.750% 11/13/18 | 1,700,000 | 1,701,970 | ||||||
1.750% 5/29/19 | 2,500,000 | 2,489,673 | ||||||
3.375% 7/31/23 | 2,000,000 | 2,146,850 | ||||||
Japan Finance Organization for Municipalities |
| |||||||
5.000% 5/16/17 | 1,300,000 | 1,415,524 | ||||||
4.000% 1/13/21 | 700,000 | 768,066 | ||||||
Korea Development Bank |
| |||||||
1.000% 1/22/16 | 1,500,000 | 1,497,078 | ||||||
3.250% 3/9/16 | 850,000 | 870,375 | ||||||
4.000% 9/9/16 | 1,000,000 | 1,043,820 | ||||||
1.500% 1/22/18 | 1,000,000 | 986,284 | ||||||
3.000% 3/17/19 | 1,000,000 | 1,026,773 | ||||||
2.500% 3/11/20 | 1,000,000 | 992,944 | ||||||
3.000% 9/14/22 | 1,000,000 | 1,002,001 | ||||||
3.750% 1/22/24 | 500,000 | 527,869 | ||||||
Korea Finance Corp. | ||||||||
3.250% 9/20/16 | 650,000 | 669,207 | �� | |||||
2.250% 8/7/17 | 1,000,000 | 1,009,085 | ||||||
4.625% 11/16/21 | 250,000 | 276,315 | ||||||
Province of British Columbia |
| |||||||
2.100% 5/18/16 | 1,000,000 | 1,020,984 | ||||||
1.200% 4/25/17 | 1,500,000 | 1,507,214 | ||||||
2.650% 9/22/21 | 1,000,000 | 1,027,806 | ||||||
2.000% 10/23/22 | 1,300,000 | 1,264,734 | ||||||
Province of Manitoba |
| |||||||
4.900% 12/6/16 | 1,050,000 | 1,131,569 | ||||||
1.125% 6/1/18 | 1,000,000 | 990,335 | ||||||
1.750% 5/30/19 | 1,000,000 | 997,701 | ||||||
2.100% 9/6/22 | 1,468,000 | 1,430,044 | ||||||
3.050% 5/14/24 | 2,000,000 | 2,062,249 | ||||||
Province of New Brunswick |
| |||||||
2.750% 6/15/18 | 1,312,000 | 1,359,459 | ||||||
Province of Nova Scotia |
| |||||||
5.125% 1/26/17 | 1,795,000 | 1,947,853 | ||||||
Province of Ontario |
| |||||||
4.750% 1/19/16 | 125,000 | 130,512 | ||||||
2.300% 5/10/16 | 2,000,000 | 2,043,011 | ||||||
1.000% 7/22/16 | 8,000,000 | 8,025,398 | ||||||
4.950% 11/28/16 | 550,000 | 590,809 | ||||||
1.100% 10/25/17 | 1,950,000 | 1,944,241 | ||||||
1.200% 2/14/18 | 1,000,000 | 989,830 | ||||||
2.000% 9/27/18 | 1,500,000 | 1,515,920 | ||||||
2.000% 1/30/19 | 2,100,000 | 2,103,779 | ||||||
1.650% 9/27/19 | 1,300,000 | 1,277,565 | ||||||
4.000% 10/7/19 | 500,000 | 544,449 | ||||||
4.400% 4/14/20 | 5,000,000 | �� | 5,556,998 | |||||
2.450% 6/29/22 | 1,700,000 | 1,689,978 | ||||||
Province of Quebec | ||||||||
5.125% 11/14/16 | 1,520,000 | 1,638,202 | ||||||
4.625% 5/14/18 | 1,616,000 | 1,785,391 | ||||||
3.500% 7/29/20 | 1,700,000 | 1,820,598 | ||||||
2.750% 8/25/21 | 2,100,000 | 2,132,020 | ||||||
2.625% 2/13/23 | 2,531,000 | 2,529,508 | ||||||
2.875% 10/16/24 | 1,000,000 | 1,004,605 | ||||||
Republic of Chile | ||||||||
3.875% 8/5/20 | 600,000 | 645,000 | ||||||
3.250% 9/14/21 | 1,000,000 | 1,036,000 | ||||||
2.250% 10/30/22 | 500,000 | 480,500 | ||||||
Republic of Colombia | ||||||||
7.375% 1/27/17 | 1,500,000 | 1,661,250 | ||||||
7.375% 3/18/19 | 2,250,000 | 2,643,750 | ||||||
See Notes to Financial Statements.
60
Table of Contents
EQ ADVISORS TRUST
EQ/CORE BOND INDEX PORTFOLIO
PORTFOLIO OF INVESTMENTS (Continued)
December 31, 2014
Principal Amount | Value (Note 1) | |||||||
4.375% 7/12/21 | $ | 2,350,000 | $ | 2,485,125 | ||||
2.625% 3/15/23 | 1,200,000 | 1,114,200 | ||||||
4.000% 2/26/24 | 2,000,000 | 2,045,000 | ||||||
Republic of Italy | ||||||||
4.750% 1/25/16 | 100,000 | 103,966 | ||||||
5.250% 9/20/16 | 2,937,000 | 3,130,743 | ||||||
5.375% 6/12/17 | 2,500,000 | 2,720,291 | ||||||
Republic of Korea | ||||||||
7.125% 4/16/19 | 1,796,000 | 2,170,340 | ||||||
3.875% 9/11/23 | 250,000 | 273,596 | ||||||
Republic of Panama | ||||||||
5.200% 1/30/20 | 1,143,000 | 1,260,157 | ||||||
4.000% 9/22/24 | 390,000 | 400,725 | ||||||
Republic of Peru | ||||||||
8.375% 5/3/16 | 820,000 | 897,080 | ||||||
7.125% 3/30/19 | 1,437,000 | 1,699,253 | ||||||
Republic of Philippines | ||||||||
8.000% 1/15/16 | 700,000 | 752,500 | ||||||
6.500% 1/20/20 | 312,000 | 374,010 | ||||||
4.000% 1/15/21 | 5,750,000 | 6,210,000 | ||||||
4.200% 1/21/24 | 2,400,000 | 2,589,000 | ||||||
Republic of Poland | ||||||||
6.375% 7/15/19 | 2,798,000 | 3,279,256 | ||||||
5.125% 4/21/21 | 1,500,000 | 1,687,635 | ||||||
5.000% 3/23/22 | 2,062,000 | 2,313,172 | ||||||
3.000% 3/17/23 | 1,750,000 | 1,738,763 | ||||||
4.000% 1/22/24 | 4,250,000 | 4,510,312 | ||||||
Republic of South Africa | ||||||||
6.875% 5/27/19 | 1,995,000 | 2,281,781 | ||||||
5.500% 3/9/20 | 1,750,000 | 1,911,875 | ||||||
5.875% 5/30/22 | 1,000,000 | 1,122,500 | ||||||
4.665% 1/17/24 | 1,000,000 | 1,033,750 | ||||||
Republic of Turkey | ||||||||
7.500% 7/14/17 | 11,100,000 | 12,418,125 | ||||||
6.750% 4/3/18 | 312,000 | 348,660 | ||||||
7.500% 11/7/19 | 2,200,000 | 2,590,500 | ||||||
3.250% 3/23/23 | 5,950,000 | 5,645,063 | ||||||
5.750% 3/22/24 | 2,000,000 | 2,235,000 | ||||||
Republic of Uruguay | ||||||||
8.000% 11/18/22 | 1,000,000 | 1,320,000 | ||||||
State of Israel | ||||||||
5.500% 11/9/16 | 564,000 | 609,825 | ||||||
5.125% 3/26/19 | 1,587,000 | 1,793,310 | ||||||
4.000% 6/30/22 | 1,000,000 | 1,085,000 | ||||||
3.150% 6/30/23 | 500,000 | 508,750 | ||||||
Svensk Exportkredit AB | ||||||||
0.625% 5/31/16 | 1,250,000 | 1,249,733 | ||||||
2.125% 7/13/16 | 1,000,000 | 1,021,489 | ||||||
5.125% 3/1/17 | 658,000 | 715,178 | ||||||
1.125% 4/5/18 | 2,000,000 | 1,977,551 | ||||||
1.875% 6/17/19 | 1,000,000 | 1,003,551 | ||||||
United Mexican States | ||||||||
5.625% 1/15/17 | 818,000 | 880,168 | ||||||
5.950% 3/19/19 | 3,000,000 | 3,385,500 | ||||||
5.125% 1/15/20 | 250,000 | 275,875 | ||||||
3.500% 1/21/21 | 2,000,000 | 2,040,000 | ||||||
3.625% 3/15/22 | 10,270,000 | 10,511,345 | ||||||
|
| |||||||
| 237,861,745 | ||||||||
|
| |||||||
Municipal Bonds (0.1%) | ||||||||
Arizona Salt River Project, Agricultural Improvement & Power District, Revenue Bonds, |
| |||||||
4.839% 1/1/41 | $ | 2,000 | $ | 2,401 | ||||
Central Puget Sound Regional Transit Authority, Revenue Bonds, |
| |||||||
5.491% 11/1/39 | 4,000 | 5,068 | ||||||
City & County of Denver, General Obligation Bonds, |
| |||||||
5.650% 8/1/30 | 4,000 | 4,526 | ||||||
City of Chicago, International Airport, Revenue Bonds, |
| |||||||
6.845% 1/1/38 | 2,000 | 2,277 | ||||||
6.395% 1/1/40 | 4,000 | 5,456 | ||||||
City of New York Municipal Water Finance Authority, Water & Sewer System, Revenue Bonds, |
| |||||||
6.011% 6/15/42 | 4,000 | 5,424 | ||||||
City of New York Municipal Water Finance Authority, Water & Sewer System, Revenue Bonds, |
| |||||||
5.724% 6/15/42 | 2,000 | 2,638 | ||||||
City of New York Transitional Finance Authority, Future Tax Secured Bonds, Revenue Bonds, |
| |||||||
5.508% 8/1/37 | 8,000 | 9,963 | ||||||
City of New York, General Obligation Bonds, |
| |||||||
5.206% 10/1/31 | 4,000 | 4,627 | ||||||
Commonwealth of Massachusetts, General Obligation Bonds, |
| |||||||
4.200% 12/1/21 | 155,000 | 170,105 | ||||||
County of Clark Airport System, Revenue Bonds, |
| |||||||
6.881% 7/1/42 | 4,000 | 4,636 | ||||||
County of Los Angeles Community College District, General Obligation Bonds, |
| |||||||
6.750% 8/1/49 | 4,000 | 5,961 | ||||||
County of Nashville & Davidson Convention Center Authority, Revenue Bonds, |
| |||||||
6.731% 7/1/43 | 204,000 | 277,028 | ||||||
County of San Diego Regional Airport Authority, Revenue Bonds, |
| |||||||
6.138% 5/1/49 | 4,000 | 5,409 | ||||||
Florida Hurricane Catastrophe Fund Finance Corp., Revenue Bonds, |
| |||||||
2.107% 7/1/18 | 1,000,000 | 1,006,920 | ||||||
2.995% 7/1/20 | 750,000 | 758,850 | ||||||
See Notes to Financial Statements.
61
Table of Contents
EQ ADVISORS TRUST
EQ/CORE BOND INDEX PORTFOLIO
PORTFOLIO OF INVESTMENTS (Continued)
December 31, 2014
Principal Amount | Value (Note 1) | |||||||
Georgia Municipal Electric Authority, Revenue Bonds, |
| |||||||
6.637% 4/1/57 | $ | 2,000 | $ | 2,651 | ||||
7.055% 4/1/57 | 4,000 | 4,885 | ||||||
New Jersey Economic Development Authority, State Pension Funding Bonds, |
| |||||||
(Zero Coupon), 2/15/19 | 1,000,000 | 888,880 | ||||||
(Zero Coupon), 2/15/23 | 1,000,000 | 715,160 | ||||||
Ohio State University, Revenue Bonds, |
| |||||||
4.910% 6/1/40 | 4,000 | 4,830 | ||||||
Pennsylvania Turnpike Commission, Revenue Bonds, |
| |||||||
5.511% 12/1/45 | 1,000 | 1,233 | ||||||
5.561% 12/1/49 | 3,000 | 3,740 | ||||||
Regents of the University of California, Revenue Bonds, |
| |||||||
1.796% 7/1/19 | 175,000 | 173,502 | ||||||
San Francisco Bay Area Toll Authority, Subordinate Toll Bridge, Revenue Bonds, |
| |||||||
6.793% 4/1/30 | 4,000 | 5,108 | ||||||
7.043% 4/1/50 | 4,000 | 5,948 | ||||||
State of California, Various Purposes, General Obligation Bonds, |
| |||||||
5.950% 4/1/16 | 35,000 | 37,291 | ||||||
5.750% 3/1/17 | 200,000 | 219,662 | ||||||
6.200% 3/1/19 | 200,000 | 229,806 | ||||||
6.200% 10/1/19 | 400,000 | 468,284 | ||||||
State of Illinois, General Obligation Bonds, |
| |||||||
4.961% 3/1/16 | 3,400,000 | 3,541,882 | ||||||
5.365% 3/1/17 | 310,000 | 331,871 | ||||||
5.665% 3/1/18 | 2,500,000 | 2,737,575 | ||||||
5.877% 3/1/19 | 60,000 | 66,247 | ||||||
State of New York Urban Development Corp., Personal Income Tax, Revenue Bonds, |
| |||||||
5.770% 3/15/39 | 2,000 | 2,467 | ||||||
|
| |||||||
| 11,712,311 | ||||||||
|
| |||||||
Supranational (2.8%) | ||||||||
African Development Bank | ||||||||
2.500% 3/15/16 | 2,150,000 | 2,200,850 | ||||||
0.750% 10/18/16 | 2,250,000 | 2,248,615 | ||||||
0.875% 5/15/17 | 1,860,000 | 1,851,780 | ||||||
0.875% 3/15/18 | 2,000,000 | 1,966,091 | ||||||
Asian Development Bank | ||||||||
2.500% 3/15/16 | 2,750,000 | 2,815,373 | ||||||
0.500% 6/20/16 | 2,250,000 | 2,248,030 | ||||||
5.500% 6/27/16 | 3,250,000 | 3,483,284 | ||||||
0.750% 1/11/17 | 1,000,000 | 998,313 | ||||||
1.125% 3/15/17 | 1,000,000 | 1,004,003 | ||||||
1.750% 9/11/18 | 3,100,000 | 3,127,070 | ||||||
1.875% 10/23/18 | 1,900,000 | 1,923,760 | ||||||
1.750% 3/21/19 | 1,350,000 | 1,355,814 | ||||||
1.375% 3/23/20 | 650,000 | 634,390 | ||||||
Corp. Andina de Fomento | ||||||||
3.750% 1/15/16 | $ | 2,250,000 | $ | 2,306,250 | ||||
5.750% 1/12/17 | 346,000 | 374,545 | ||||||
8.125% 6/4/19 | 1,229,000 | 1,530,105 | ||||||
Council of Europe Development Bank |
| |||||||
2.625% 2/16/16 | 1,900,000 | 1,944,526 | ||||||
1.500% 2/22/17 | 1,500,000 | 1,516,473 | ||||||
1.500% 6/19/17 | 200,000 | 201,825 | ||||||
1.000% 3/7/18 | 1,500,000 | 1,482,362 | ||||||
1.125% 5/31/18 | 1,000,000 | 989,003 | ||||||
European Bank for Reconstruction & Development |
| |||||||
2.500% 3/15/16 | 3,500,000 | 3,582,023 | ||||||
1.375% 10/20/16 | 250,000 | 252,751 | ||||||
1.000% 2/16/17 | 1,500,000 | 1,501,424 | ||||||
0.750% 9/1/17 | 2,250,000 | 2,224,984 | ||||||
1.625% 4/10/18 | 1,600,000 | 1,645,178 | ||||||
1.000% 6/15/18 | 2,150,000 | 2,116,430 | ||||||
1.625% 11/15/18 | 100,000 | 99,976 | ||||||
1.750% 6/14/19 | 2,000,000 | 2,004,724 | ||||||
European Investment Bank | ||||||||
4.875% 2/16/16 | 3,305,000 | 3,465,157 | ||||||
2.250% 3/15/16 | 7,000,000 | 7,144,983 | ||||||
0.625% 4/15/16 | 5,250,000 | 5,255,045 | ||||||
2.125% 7/15/16 | 1,000,000 | 1,022,623 | ||||||
0.500% 8/15/16 | 5,750,000 | 5,732,586 | ||||||
5.125% 9/13/16 | 2,125,000 | 2,282,156 | ||||||
1.125% 12/15/16 | 3,000,000 | 3,016,167 | ||||||
4.875% 1/17/17 | 3,021,000 | 3,263,559 | ||||||
0.875% 4/18/17 | 2,200,000 | 2,194,779 | ||||||
5.125% 5/30/17 | 3,401,000 | 3,730,760 | ||||||
1.625% 6/15/17 | 4,000,000 | 4,055,540 | ||||||
1.000% 8/17/17 | 7,000,000 | 6,979,790 | ||||||
1.125% 9/15/17 | 2,415,000 | 2,413,489 | ||||||
1.000% 12/15/17 | 2,824,000 | 2,804,325 | ||||||
1.000% 3/15/18 | 4,000,000 | 3,957,638 | ||||||
1.000% 6/15/18 | 5,500,000 | 5,420,940 | ||||||
1.625% 12/18/18 | 2,500,000 | 2,502,149 | ||||||
1.875% 3/15/19 | 3,000,000 | 3,027,147 | ||||||
1.750% 6/17/19 | 5,000,000 | 5,029,131 | ||||||
2.875% 9/15/20 | 2,750,000 | 2,886,022 | ||||||
4.000% 2/16/21 | 2,200,000 | 2,449,126 | ||||||
2.500% 4/15/21 | 2,000,000 | 2,054,775 | ||||||
3.250% 1/29/24 | 3,100,000 | 3,328,417 | ||||||
2.500% 10/15/24 | 3,000,000 | 3,058,802 | ||||||
Inter-American Development Bank |
| |||||||
5.125% 9/13/16 | 2,883,000 | 3,096,104 | ||||||
1.375% 10/18/16 | 2,250,000 | 2,274,618 | ||||||
0.875% 11/15/16 | 200,000 | 200,311 | ||||||
1.000% 7/14/17 | 2,000,000 | 1,995,103 | ||||||
0.875% 3/15/18 | 500,000 | 492,142 | ||||||
4.250% 9/10/18 | 1,967,000 | 2,154,810 | ||||||
3.875% 9/17/19 | 1,000,000 | 1,094,492 | ||||||
1.750% 10/15/19 | 5,000,000 | 4,994,116 | ||||||
3.875% 2/14/20 | 3,349,000 | 3,677,082 | ||||||
1.375% 7/15/20 | 5,000,000 | 4,850,024 | ||||||
2.125% 11/9/20 | 3,100,000 | 3,115,068 | ||||||
3.000% 2/21/24 | 2,000,000 | 2,111,783 | ||||||
International Bank for Reconstruction & Development |
| |||||||
2.125% 3/15/16 | 7,065,000 | 7,203,677 | ||||||
5.000% 4/1/16 | 916,000 | 966,792 | ||||||
0.500% 4/15/16 | 3,400,000 | 3,399,479 | ||||||
See Notes to Financial Statements.
62
Table of Contents
EQ ADVISORS TRUST
EQ/CORE BOND INDEX PORTFOLIO
PORTFOLIO OF INVESTMENTS (Continued)
December 31, 2014
Principal Amount | Value (Note 1) | |||||||
0.500% 5/16/16 | $ | 3,500,000 | $ | 3,496,657 | ||||
1.000% 9/15/16 | 1,000,000 | 1,005,080 | ||||||
0.625% 10/14/16 | 3,500,000 | 3,492,732 | ||||||
0.750% 12/15/16 | 2,000,000 | 1,997,114 | ||||||
0.875% 4/17/17 | 4,000,000 | 3,991,419 | ||||||
9.250% 7/15/17 | 599,000 | 714,807 | ||||||
1.125% 7/18/17 | 2,500,000 | 2,502,681 | ||||||
1.375% 4/10/18 | 2,000,000 | 2,000,197 | ||||||
1.875% 3/15/19 | 3,700,000 | 3,734,984 | ||||||
2.125% 11/1/20 | 2,150,000 | 2,166,681 | ||||||
2.250% 6/24/21 | 1,000,000 | 1,009,859 | ||||||
7.625% 1/19/23 | 1,000,000 | 1,393,561 | ||||||
2.125% 2/13/23 | 1,319,000 | 1,306,463 | ||||||
International Finance Corp. | ||||||||
2.250% 4/11/16 | 500,000 | 510,657 | ||||||
0.500% 5/16/16 | 1,000,000 | 998,638 | ||||||
0.625% 11/15/16 | 2,250,000 | 2,244,379 | ||||||
1.125% 11/23/16 | 3,000,000 | 3,020,717 | ||||||
2.125% 11/17/17 | 4,250,000 | 4,356,748 | ||||||
0.625% 12/21/17 | 624,000 | 612,163 | ||||||
0.875% 6/15/18 | 2,750,000 | 2,696,232 | ||||||
1.750% 9/4/18 | 3,000,000 | 3,023,478 | ||||||
1.750% 9/16/19 | 2,500,000 | 2,499,766 | ||||||
Nordic Investment Bank | ||||||||
2.250% 3/15/16 | 500,000 | 509,994 | ||||||
0.500% 4/14/16 | 3,500,000 | 3,495,618 | ||||||
5.000% 2/1/17 | 1,817,000 | 1,967,556 | ||||||
1.000% 3/7/17 | 1,000,000 | 1,000,231 | ||||||
0.750% 1/17/18 | 824,000 | 810,286 | ||||||
North American Development Bank | ||||||||
4.375% 2/11/20 | 500,000 | 545,987 | ||||||
2.400% 10/26/22 | 1,150,000 | 1,113,825 | ||||||
|
| |||||||
| 236,549,169 | ||||||||
|
| |||||||
U.S. Government Agencies (5.2%) |
| |||||||
Federal Farm Credit Bank | ||||||||
0.450% 7/12/16 | 500,000 | 498,778 | ||||||
5.125% 8/25/16 | 485,000 | 520,325 | ||||||
0.540% 11/7/16 | 4,000,000 | 3,974,950 | ||||||
4.875% 1/17/17 | 6,232,000 | 6,739,820 | ||||||
1.290% 6/14/19 | 1,000,000 | 982,986 | ||||||
2.500% 6/20/22 | 1,000,000 | 987,717 | ||||||
Federal Home Loan Bank | ||||||||
0.375% 2/19/16 | 4,500,000 | 4,495,634 | ||||||
1.000% 3/11/16 | 5,000,000 | 5,032,711 | ||||||
5.375% 5/18/16 | 6,100,000 | 6,508,565 | ||||||
2.125% 6/10/16 | 5,000,000 | 5,109,590 | ||||||
5.625% 6/13/16 | 2,150,000 | 2,304,132 | ||||||
0.375% 6/24/16 | 5,000,000 | 4,983,976 | ||||||
0.500% 9/28/16 | 4,000,000 | 3,990,339 | ||||||
1.125% 9/28/16 | 5,000,000 | 5,014,497 | ||||||
0.625% 11/23/16 | 2,040,000 | 2,036,034 | ||||||
1.625% 12/9/16 | 5,000,000 | 5,080,084 | ||||||
4.750% 12/16/16 | 11,621,000 | 12,537,559 | ||||||
0.625% 12/28/16 | 2,500,000 | 2,493,392 | ||||||
1.000% 3/27/17 | 5,000,000 | 4,997,859 | ||||||
4.875% 5/17/17 | 3,169,000 | 3,458,959 | ||||||
0.875% 5/24/17 | 5,000,000 | 4,998,729 | ||||||
5.250% 6/5/17 | 3,135,000 | 3,455,494 | ||||||
1.000% 6/21/17 | 7,400,000 | 7,406,501 | ||||||
1.050% 7/26/17 | 250,000 | 249,349 | ||||||
1.000% 8/9/17 | 500,000 | 498,014 | ||||||
0.750% 9/8/17 | $ | 2,000,000 | $ | 1,983,530 | ||||
5.000% 11/17/17 | 7,676,000 | 8,510,482 | ||||||
1.375% 3/9/18 | 2,000,000 | 2,003,519 | ||||||
1.300% 6/5/18 | 5,000,000 | 4,970,928 | ||||||
1.150% 7/25/18 | 1,000,000 | 986,000 | ||||||
1.875% 3/8/19 | 500,000 | 505,490 | ||||||
1.650% 7/18/19 | 250,000 | 248,549 | ||||||
1.875% 3/13/20 | 2,000,000 | 1,999,668 | ||||||
4.125% 3/13/20 | 4,000,000 | 4,442,154 | ||||||
5.500% 7/15/36 | 3,000 | 4,100 | ||||||
Federal Home Loan Mortgage Corp. |
| |||||||
4.750% 1/19/16 | 3,500,000 | 3,656,383 | ||||||
0.500% 5/13/16 | 3,899,000 | 3,898,160 | ||||||
5.500% 7/18/16 | 3,693,000 | 3,969,463 | ||||||
0.650% 7/29/16 | 1,000,000 | 1,000,285 | ||||||
2.000% 8/25/16 | 1,299,000 | 1,328,431 | ||||||
0.700% 9/27/16 | 250,000 | 249,856 | ||||||
0.650% 9/30/16 | 5,000,000 | 4,993,134 | ||||||
0.750% 10/5/16 | 2,000,000 | 1,992,105 | ||||||
0.875% 10/14/16 | 3,000,000 | 3,011,182 | ||||||
5.125% 10/18/16 | 6,053,000 | 6,528,872 | ||||||
0.625% 11/1/16 | 1,280,000 | 1,276,335 | ||||||
0.875% 2/22/17 | 3,160,000 | 3,167,831 | ||||||
1.000% 3/8/17 | 5,000,000 | 5,009,922 | ||||||
5.000% 4/18/17 | 5,577,000 | 6,093,021 | ||||||
1.250% 5/12/17 | 5,000,000 | 5,034,055 | ||||||
1.000% 6/29/17 | 3,500,000 | 3,504,817 | ||||||
1.150% 6/30/17 | 2,000,000 | 1,999,463 | ||||||
1.000% 7/25/17 | 1,000,000 | 999,662 | ||||||
1.000% 7/28/17 | 5,000,000 | 5,001,801 | ||||||
5.500% 8/23/17 | 450,000 | 502,333 | ||||||
1.000% 9/29/17 | 5,750,000 | 5,742,156 | ||||||
5.125% 11/17/17 | 7,687,000 | 8,553,777 | ||||||
1.250% 12/5/17 | 2,000,000 | 1,995,293 | ||||||
1.000% 1/11/18 | 2,000,000 | 1,981,773 | ||||||
0.750% 1/12/18 | 6,000,000 | 5,922,382 | ||||||
0.875% 3/7/18 | 3,000,000 | 2,965,828 | ||||||
1.100% 5/7/18 | 2,000,000 | 1,981,123 | ||||||
1.125% 5/25/18 | 1,000,000 | 990,901 | ||||||
4.875% 6/13/18 | 2,000,000 | 2,240,433 | ||||||
3.750% 3/27/19 | 7,220,000 | 7,841,908 | ||||||
1.750% 5/30/19 | 8,000,000 | 8,035,863 | ||||||
2.000% 7/30/19 | 600,000 | 608,563 | ||||||
1.250% 8/1/19 | 3,500,000 | 3,431,554 | ||||||
1.250% 10/2/19 | 7,500,000 | 7,348,662 | ||||||
1.375% 5/1/20 | 10,350,000 | 10,097,034 | ||||||
2.375% 1/13/22 | 20,947,000 | 21,221,611 | ||||||
Federal National Mortgage Association | ||||||||
0.520% 2/26/16 | 1,500,000 | 1,500,958 | ||||||
5.000% 3/15/16 | 4,636,000 | 4,885,798 | ||||||
2.375% 4/11/16 | 5,000,000 | 5,121,446 | ||||||
0.375% 7/5/16 | 2,000,000 | 1,994,465 | ||||||
0.625% 8/26/16 | 3,000,000 | 3,000,838 | ||||||
5.250% 9/15/16 | 5,100,000 | 5,491,747 | ||||||
1.250% 9/28/16 | 6,000,000 | 6,061,106 | ||||||
0.625% 10/25/16 | 7,000,000 | 6,981,933 | ||||||
4.875% 12/15/16 | 3,400,000 | 3,672,484 | ||||||
1.250% 1/30/17 | 2,000,000 | 2,017,893 | ||||||
5.000% 2/13/17 | 4,000,000 | 4,352,005 | ||||||
0.750% 3/6/17 | 1,000,000 | 995,979 | ||||||
0.750% 4/20/17 | 3,000,000 | 2,992,261 | ||||||
1.125% 4/27/17 | 12,000,000 | 12,051,648 | ||||||
��
See Notes to Financial Statements.
63
Table of Contents
EQ ADVISORS TRUST
EQ/CORE BOND INDEX PORTFOLIO
PORTFOLIO OF INVESTMENTS (Continued)
December 31, 2014
Principal Amount | Value (Note 1) | |||||||
5.000% 5/11/17 | $ | 3,999,000 | $ | 4,373,986 | ||||
2.000% 5/16/17 | 1,000,000 | 1,018,667 | ||||||
(Zero Coupon), 6/1/17 | 3,000,000 | 2,926,655 | ||||||
5.375% 6/12/17 | 6,412,000 | 7,086,125 | ||||||
1.000% 8/21/17 | 500,000 | 497,869 | ||||||
0.950% 8/23/17 | 2,500,000 | 2,486,282 | ||||||
0.875% 8/28/17 | 11,350,000 | 11,303,618 | ||||||
1.000% 9/20/17 | 2,000,000 | 1,992,765 | ||||||
1.000% 9/27/17 | 1,500,000 | 1,496,759 | ||||||
0.875% 10/26/17 | 4,750,000 | 4,721,519 | ||||||
0.900% 11/7/17 | 4,300,000 | 4,259,558 | ||||||
0.875% 12/20/17 | 5,000,000 | 4,955,933 | ||||||
1.000% 12/28/17 | 4,000,000 | 3,955,733 | ||||||
1.030% 1/30/18 | 1,000,000 | 991,201 | ||||||
0.875% 2/8/18 | 3,000,000 | 2,968,763 | ||||||
1.200% 2/28/18 | 1,000,000 | 994,507 | ||||||
0.875% 5/21/18 | 3,812,000 | 3,752,409 | ||||||
1.250% 6/20/18 | 1,000,000 | 993,629 | ||||||
1.500% 8/28/18 | 1,000,000 | 997,590 | ||||||
1.625% 11/27/18 | 10,000,000 | 10,065,456 | ||||||
1.250% 12/28/18 | 250,000 | 246,553 | ||||||
1.750% 1/30/19 | 700,000 | 705,108 | ||||||
1.875% 2/19/19 | 2,000,000 | 2,024,252 | ||||||
1.750% 6/20/19 | 3,000,000 | 3,014,984 | ||||||
1.750% 9/12/19 | 8,000,000 | 8,017,266 | ||||||
1.700% 10/4/19 | 200,000 | 199,008 | ||||||
(Zero Coupon), 10/9/19 | 4,000,000 | 3,596,276 | ||||||
1.500% 10/9/19 | 1,500,000 | 1,484,833 | ||||||
1.550% 10/29/19 | 3,000,000 | 2,973,676 | ||||||
1.750% 3/6/20 | 1,000,000 | 997,050 | ||||||
2.250% 10/17/22 | 2,500,000 | 2,430,993 | ||||||
2.200% 10/25/22 | 325,000 | 315,066 | ||||||
2.500% 3/27/23 | 250,000 | 244,843 | ||||||
2.625% 9/6/24 | 5,000,000 | 5,064,609 | ||||||
Financing Corp. | ||||||||
10.700% 10/6/17 | 1,200,000 | 1,514,737 | ||||||
9.800% 4/6/18 | 250,000 | 318,417 | ||||||
|
| |||||||
| 444,293,642 | ||||||||
|
| |||||||
U.S. Treasuries (50.4%) | ||||||||
U.S. Treasury Bonds | ||||||||
9.250% 2/15/16 | 9,068,000 | 9,963,554 | ||||||
7.250% 5/15/16 | 2,719,000 | 2,968,304 | ||||||
7.500% 11/15/16 | 18,212,000 | 20,513,221 | ||||||
8.750% 5/15/17 | 11,386,000 | 13,495,523 | ||||||
8.875% 8/15/17 | 2,903,000 | 3,495,592 | ||||||
9.125% 5/15/18 | 3,533,000 | 4,451,758 | ||||||
9.000% 11/15/18 | 1,386,000 | 1,784,679 | ||||||
8.875% 2/15/19 | 7,432,000 | 9,643,600 | ||||||
8.125% 8/15/19 | 14,212,000 | 18,364,985 | ||||||
8.500% 2/15/20 | 187,000 | 249,968 | ||||||
8.750% 8/15/20 | 1,880,000 | 2,582,520 | ||||||
7.125% 2/15/23 | 4,312,000 | 5,960,837 | ||||||
6.250% 8/15/23 | 2,000,000 | 2,662,461 | ||||||
U.S. Treasury Notes | ||||||||
0.375% 1/15/16 | 23,000,000 | 23,018,644 | ||||||
0.375% 1/31/16 | 5,700,000 | 5,704,064 | ||||||
2.000% 1/31/16 | 5,000,000 | 5,089,013 | ||||||
0.375% 2/15/16 | 28,250,000 | 28,256,207 | ||||||
4.500% 2/15/16 | 7,000,000 | 7,322,246 | ||||||
0.250% 2/29/16 | 61,000,000 | 60,913,624 | ||||||
2.125% 2/29/16 | 30,000,000 | 30,609,228 | ||||||
2.625% 2/29/16 | 14,157,000 | 14,523,022 | ||||||
0.375% 3/15/16 | $ | 27,500,000 | $ | 27,498,254 | ||||
0.375% 3/31/16 | 1,800,000 | 1,799,552 | ||||||
2.250% 3/31/16 | 3,000,000 | 3,069,433 | ||||||
2.375% 3/31/16 | 10,520,000 | 10,776,785 | ||||||
0.250% 4/15/16 | 20,000,000 | 19,964,550 | ||||||
0.375% 4/30/16 | 25,000,000 | 24,988,283 | ||||||
2.000% 4/30/16 | 8,000,000 | 8,164,023 | ||||||
2.625% 4/30/16 | 8,932,000 | 9,189,318 | ||||||
0.250% 5/15/16 | 32,500,000 | 32,418,275 | ||||||
5.125% 5/15/16 | 22,314,000 | 23,736,953 | ||||||
0.375% 5/31/16 | 25,000,000 | 24,978,637 | ||||||
1.750% 5/31/16 | 14,820,000 | 15,085,646 | ||||||
0.500% 6/15/16 | 31,000,000 | 31,016,802 | ||||||
0.500% 6/30/16 | 75,000,000 | 75,011,355 | ||||||
1.500% 6/30/16 | 10,624,000 | 10,781,129 | ||||||
3.250% 6/30/16 | 12,000,000 | 12,486,914 | ||||||
0.625% 7/15/16 | 92,000,000 | 92,167,560 | ||||||
0.500% 7/31/16 | 25,000,000 | 25,004,883 | ||||||
1.500% 7/31/16 | 30,000,000 | 30,453,075 | ||||||
3.250% 7/31/16 | 10,554,000 | 11,004,039 | ||||||
0.625% 8/15/16 | 52,000,000 | 52,062,462 | ||||||
4.875% 8/15/16 | 14,597,000 | 15,615,227 | ||||||
0.500% 8/31/16 | 30,000,000 | 29,977,440 | ||||||
1.000% 8/31/16 | 2,809,000 | 2,829,080 | ||||||
3.000% 8/31/16 | 17,972,000 | 18,696,146 | ||||||
0.875% 9/15/16 | 30,000,000 | 30,148,827 | ||||||
1.000% 9/30/16 | 28,000,000 | 28,199,884 | ||||||
3.000% 9/30/16 | 28,118,000 | 29,289,812 | ||||||
0.625% 10/15/16 | 2,000,000 | 2,000,332 | ||||||
0.375% 10/31/16 | 40,000,000 | 39,824,804 | ||||||
1.000% 10/31/16 | 35,000,000 | 35,247,460 | ||||||
3.125% 10/31/16 | 23,864,000 | 24,940,443 | ||||||
0.625% 11/15/16 | 2,000,000 | 1,999,688 | ||||||
4.625% 11/15/16 | 15,000,000 | 16,111,743 | ||||||
0.500% 11/30/16 | 25,000,000 | 24,936,400 | ||||||
2.750% 11/30/16 | 49,079,000 | 51,009,567 | ||||||
0.625% 12/15/16 | 16,000,000 | 15,989,219 | ||||||
0.875% 12/31/16 | 17,434,000 | 17,495,122 | ||||||
3.250% 12/31/16 | 22,350,000 | 23,469,464 | ||||||
0.750% 1/15/17 | 20,250,000 | 20,264,436 | ||||||
0.875% 1/31/17 | 10,000,000 | 10,028,613 | ||||||
3.125% 1/31/17 | 6,011,000 | 6,309,026 | ||||||
0.625% 2/15/17 | 850,000 | 847,634 | ||||||
4.625% 2/15/17 | 9,617,000 | 10,401,293 | ||||||
0.875% 2/28/17 | 38,500,000 | 38,587,980 | ||||||
3.000% 2/28/17 | 21,764,000 | 22,803,529 | ||||||
0.750% 3/15/17 | 1,000,000 | 999,590 | ||||||
1.000% 3/31/17 | 28,000,000 | 28,116,757 | ||||||
3.250% 3/31/17 | 15,153,000 | 15,981,236 | ||||||
0.875% 4/30/17 | 27,497,000 | 27,524,926 | ||||||
3.125% 4/30/17 | 19,464,000 | 20,498,404 | ||||||
4.500% 5/15/17 | 20,957,000 | 22,746,531 | ||||||
0.625% 5/31/17 | 1,686,000 | 1,676,072 | ||||||
2.750% 5/31/17 | 19,837,000 | 20,733,733 | ||||||
0.750% 6/30/17 | 30,000,000 | 29,878,125 | ||||||
2.500% 6/30/17 | 37,303,000 | 38,757,235 | ||||||
0.500% 7/31/17 | 15,000,000 | 14,826,563 | ||||||
2.375% 7/31/17 | 13,000,000 | 13,468,711 | ||||||
0.875% 8/15/17 | 30,000,000 | 29,919,141 | ||||||
4.750% 8/15/17 | 25,224,000 | 27,690,731 | ||||||
0.625% 8/31/17 | 45,809,000 | 45,354,043 | ||||||
1.875% 8/31/17 | 21,197,000 | 21,679,522 | ||||||
0.625% 9/30/17 | 30,000,000 | 29,664,843 | ||||||
See Notes to Financial Statements.
64
Table of Contents
EQ ADVISORS TRUST
EQ/CORE BOND INDEX PORTFOLIO
PORTFOLIO OF INVESTMENTS (Continued)
December 31, 2014
Principal Amount | Value (Note 1) | |||||||
1.875% 9/30/17 | $ | 48,759,000 | $ | 49,873,694 | ||||
0.750% 10/31/17 | 29,373,000 | 29,124,878 | ||||||
1.875% 10/31/17 | 3,811,000 | 3,898,757 | ||||||
0.875% 11/15/17 | 15,000,000 | 14,922,070 | ||||||
4.250% 11/15/17 | 13,921,000 | 15,169,948 | ||||||
0.625% 11/30/17 | 28,000,000 | 27,628,127 | ||||||
2.250% 11/30/17 | 36,150,000 | 37,364,412 | ||||||
0.750% 12/31/17 | 42,707,000 | 42,240,725 | ||||||
2.750% 12/31/17 | 3,571,000 | 3,741,913 | ||||||
0.875% 1/31/18 | 27,000,000 | 26,773,243 | ||||||
2.625% 1/31/18 | 2,500,000 | 2,609,375 | ||||||
3.500% 2/15/18 | 30,639,000 | 32,818,138 | ||||||
0.750% 2/28/18 | 29,997,000 | 29,577,510 | ||||||
2.750% 2/28/18 | 31,561,000 | 33,066,002 | ||||||
0.750% 3/31/18 | 15,000,000 | 14,765,772 | ||||||
2.875% 3/31/18 | 20,000,000 | 21,031,446 | ||||||
0.625% 4/30/18 | 49,682,000 | 48,668,954 | ||||||
2.625% 4/30/18 | 9,561,000 | 9,993,393 | ||||||
3.875% 5/15/18 | 7,225,000 | 7,851,896 | ||||||
1.000% 5/31/18 | 30,000,000 | 29,700,000 | ||||||
2.375% 5/31/18 | 17,700,000 | 18,342,489 | ||||||
1.375% 6/30/18 | 50,624,000 | 50,723,866 | ||||||
2.375% 6/30/18 | 10,000,000 | 10,361,426 | ||||||
1.375% 7/31/18 | 60,550,000 | 60,602,037 | ||||||
2.250% 7/31/18 | 32,000,000 | 33,024,688 | ||||||
4.000% 8/15/18 | 10,460,000 | 11,466,672 | ||||||
1.500% 8/31/18 | 18,249,000 | 18,333,117 | ||||||
1.375% 9/30/18 | 95,500,000 | 95,380,625 | ||||||
1.250% 10/31/18 | 2,000,000 | 1,986,914 | ||||||
1.750% 10/31/18 | 20,000,000 | 20,253,516 | ||||||
3.750% 11/15/18 | 26,904,000 | 29,307,757 | ||||||
1.250% 11/30/18 | 40,000,000 | 39,700,392 | ||||||
1.375% 12/31/18 | 17,650,000 | 17,575,194 | ||||||
1.500% 12/31/18 | 26,600,000 | 26,637,405 | ||||||
1.250% 1/31/19 | 25,000,000 | 24,758,545 | ||||||
1.500% 1/31/19 | 21,250,000 | 21,257,055 | ||||||
2.750% 2/15/19 | 29,907,000 | 31,461,054 | ||||||
1.375% 2/28/19 | 15,812,000 | 15,720,124 | ||||||
1.500% 2/28/19 | 45,500,000 | 45,515,998 | ||||||
1.500% 3/31/19 | 5,050,000 | 5,048,520 | ||||||
1.250% 4/30/19 | 2,000,000 | 1,976,582 | ||||||
1.625% 4/30/19 | 43,000,000 | 43,141,092 | ||||||
3.125% 5/15/19 | 37,954,000 | 40,459,556 | ||||||
1.500% 5/31/19 | 25,000,000 | 24,939,698 | ||||||
1.000% 6/30/19 | 4,600,000 | 4,487,965 | ||||||
1.625% 6/30/19 | 5,000,000 | 5,012,597 | ||||||
0.875% 7/31/19 | 1,500,000 | 1,453,374 | ||||||
1.625% 7/31/19 | 40,000,000 | 40,057,812 | ||||||
3.625% 8/15/19 | 38,086,000 | 41,538,286 | ||||||
1.625% 8/31/19 | 30,000,000 | 30,025,488 | ||||||
1.000% 9/30/19 | 5,000,000 | 4,862,109 | ||||||
1.750% 9/30/19 | 50,000,000 | 50,283,690 | ||||||
1.250% 10/31/19 | 1,000,000 | 983,691 | ||||||
1.500% 10/31/19 | 35,000,000 | 34,773,732 | ||||||
3.375% 11/15/19 | 36,223,000 | 39,245,357 | ||||||
1.500% 11/30/19 | 45,000,000 | 44,707,324 | ||||||
1.125% 12/31/19 | 2,000,000 | 1,950,254 | ||||||
1.625% 12/31/19 | 35,000,000 | 34,949,414 | ||||||
1.375% 1/31/20 | 10,000,000 | 9,860,059 | ||||||
3.625% 2/15/20 | $ | 42,855,000 | $ | 46,986,488 | ||||
1.250% 2/29/20 | 2,500,000 | 2,446,948 | ||||||
1.125% 3/31/20 | 7,500,000 | 7,284,302 | ||||||
3.500% 5/15/20 | 41,024,000 | 44,740,196 | ||||||
1.375% 5/31/20 | 16,061,000 | 15,755,150 | ||||||
2.625% 8/15/20 | 50,687,000 | 52,919,899 | ||||||
2.125% 8/31/20 | 36,000,000 | 36,616,288 | ||||||
2.000% 9/30/20 | 1,100,000 | 1,110,667 | ||||||
2.625% 11/15/20 | 44,196,000 | 46,117,059 | ||||||
2.000% 11/30/20 | 1,000,000 | 1,008,418 | ||||||
2.375% 12/31/20 | 16,000,000 | 16,469,219 | ||||||
2.125% 1/31/21 | 41,000,000 | 41,588,174 | ||||||
3.625% 2/15/21 | 52,140,000 | 57,406,953 | ||||||
2.000% 2/28/21 | 1,000,000 | 1,006,582 | ||||||
2.250% 3/31/21 | 1,100,000 | 1,122,666 | ||||||
3.125% 5/15/21 | 51,569,000 | 55,322,862 | ||||||
2.250% 7/31/21 | 15,000,000 | 15,290,625 | ||||||
2.125% 8/15/21 | 50,062,000 | 50,639,866 | ||||||
2.000% 8/31/21 | 15,000,000 | 15,040,137 | ||||||
2.125% 9/30/21 | 25,000,000 | 25,272,217 | ||||||
2.000% 10/31/21 | 25,000,000 | 25,056,640 | ||||||
2.000% 11/15/21 | 37,978,000 | 38,101,132 | ||||||
2.000% 2/15/22 | 42,662,000 | 42,745,323 | ||||||
1.750% 5/15/22 | 17,936,000 | 17,627,375 | ||||||
1.625% 8/15/22 | 38,928,800 | 37,832,028 | ||||||
1.625% 11/15/22 | 35,304,700 | 34,226,943 | ||||||
2.000% 2/15/23 | 93,030,900 | 92,593,004 | ||||||
1.750% 5/15/23 | 70,514,600 | 68,607,124 | ||||||
2.500% 8/15/23 | 6,750,000 | 6,962,520 | ||||||
2.750% 11/15/23 | 30,000,000 | 31,562,694 | ||||||
2.750% 2/15/24 | 22,000,000 | 23,135,880 | ||||||
2.500% 5/15/24 | 50,000,000 | 51,468,260 | ||||||
2.375% 8/15/24 | 45,000,000 | 45,803,758 | ||||||
2.250% 11/15/24 | 35,000,000 | 35,237,205 | ||||||
|
| |||||||
| 4,317,860,639 | ||||||||
|
| |||||||
Total Government Securities | 5,248,277,506 | |||||||
|
| |||||||
Total Long-Term Debt Securities (93.0%) | 7,963,838,139 | |||||||
|
| |||||||
| Number of Shares | Value (Note 1) | |||||||
PREFERRED STOCKS: |
| |||||||
Financials (0.0%) | ||||||||
Thrifts & Mortgage Finance (0.0%) |
| |||||||
Fannie Mae | 22,000 | 85,140 | ||||||
Freddie Mac | 17,000 | 67,150 | ||||||
|
| |||||||
Total Preferred Stocks (0.0%) | 152,290 | |||||||
|
| |||||||
See Notes to Financial Statements.
65
Table of Contents
EQ ADVISORS TRUST
EQ/CORE BOND INDEX PORTFOLIO
PORTFOLIO OF INVESTMENTS (Continued)
December 31, 2014
| Number of Shares | Value (Note 1) | |||||||
INVESTMENT COMPANIES: |
| |||||||
Exchange Traded Funds (ETFs)(6.2%) |
| |||||||
iShares® Barclays 1-3 Year Treasury Bond ETF | 2,420,000 | $ | 204,369,000 | |||||
iShares® Barclays 3-7 Year Treasury Bond ETF | 1,673,449 | 204,679,547 | ||||||
iShares® Barclays 7-10 Year Treasury Bond ETF | 1,125,971 | 119,341,666 | ||||||
|
| |||||||
Total Investment Companies (6.2%) | 528,390,213 | |||||||
|
| |||||||
Total Investments (99.2%) | 8,492,380,642 | |||||||
Other Assets Less Liabilities (0.8%) | 70,723,215 | |||||||
|
| |||||||
Net Assets (100%) | $ | 8,563,103,857 | ||||||
|
| |||||||
| * | Non-income producing. |
| (b) | Illiquid security. |
| § | Securities exempt from registration under Rule 144A of the Securities Act of 1933. These securities may only be resold to qualified institutional buyers. At December 31, 2014, the market value of these securities amounted to $22,463,696 or 0.3% of net assets. Securities denoted with “§” but without “b” have been determined to be liquid under the guidelines established by the Board of Trustees. To the extent any securities might provide a right to demand registration, such rights have not been relied upon when determining liquidity. |
| (e) | Step Bond — Coupon rate increases in increments to maturity. Rate disclosed is as of December 31, 2014. Maturity date disclosed is the ultimate maturity date. |
| (h) | Defaulted security. A security is classified as defaulted if the issuer files for bankruptcy or fails to make a scheduled interest or principal payment within the grace period set forth in the security’s governing documents. |
| (l) | Floating Rate Security. Rate disclosed is as of December 31, 2014. |
| (m) | Regulation S is an exemption for securities offerings that are made outside of the United States and do not involve direct selling efforts in the United States. Resale restrictions may apply for purposes of the Securities Act of 1933. At December 31, 2014, the market value of these securities amounted to $2,022,500 or 0.0% of net assets. |
Glossary:
| AGM | — Insured by Assured Guaranty Municipal Corp. |
The following is a summary of the inputs used to value the Portfolio’s assets and liabilities carried at fair value as of December 31, 2014:
The inputs or methodology used for valuing securities are not necessarily an indication of the risk associated with investing in those securities.
Various inputs are used in determining the value of the Portfolio’s investments. These inputs are summarized in the three broad levels listed below:
| Investment Type | Level 1 Quoted Prices in Active Markets for Identical Securities | Level 2 Significant Other Observable Inputs (including quoted prices for similar securities, interest rates, prepayment speeds, credit risk, etc.) | Level 3 Significant Unobservable Inputs (including the Portfolio’s own assumptions in determining the fair value of investments) | Total | ||||||||||||
Assets: | ||||||||||||||||
Corporate Bonds | ||||||||||||||||
Consumer Discretionary | $ | — | $ | 174,776,921 | $ | — | $ | 174,776,921 | ||||||||
Consumer Staples | — | 194,151,444 | — | 194,151,444 | ||||||||||||
Energy | — | 285,661,372 | — | 285,661,372 | ||||||||||||
Financials | — | 1,139,705,119 | — | 1,139,705,119 | ||||||||||||
Health Care | — | 210,662,666 | — | 210,662,666 | ||||||||||||
Industrials | — | 151,420,499 | — | 151,420,499 | ||||||||||||
Information Technology | — | 165,785,828 | — | 165,785,828 | ||||||||||||
Materials | — | 130,873,205 | — | 130,873,205 | ||||||||||||
Telecommunication Services | — | 108,698,363 | — | 108,698,363 | ||||||||||||
Utilities | — | 153,825,216 | — | 153,825,216 | ||||||||||||
Government Securities | ||||||||||||||||
Foreign Governments | — | 237,861,745 | — | 237,861,745 | ||||||||||||
Municipal Bonds | — | 11,712,311 | — | 11,712,311 | ||||||||||||
Supranational | — | 236,549,169 | — | 236,549,169 | ||||||||||||
U.S. Government Agencies | — | 444,293,642 | — | 444,293,642 | ||||||||||||
U.S. Treasuries | — | 4,317,860,639 | — | 4,317,860,639 | ||||||||||||
Investment Companies | ||||||||||||||||
Exchange Traded Funds (ETFs) | 528,390,213 | — | — | 528,390,213 | ||||||||||||
See Notes to Financial Statements.
66
Table of Contents
EQ ADVISORS TRUST
EQ/CORE BOND INDEX PORTFOLIO
PORTFOLIO OF INVESTMENTS (Continued)
December 31, 2014
| Investment Type | Level 1 Quoted Prices in Active Markets for Identical Securities | Level 2 Significant Other Observable Inputs (including quoted prices for similar securities, interest rates, prepayment speeds, credit risk, etc.) | Level 3 Significant Unobservable Inputs (including the Portfolio’s own assumptions in determining the fair value of investments) | Total | ||||||||||||
Preferred Stocks | ||||||||||||||||
Financials | $ | 152,290 | $ | — | $ | — | $ | 152,290 | ||||||||
|
|
|
|
|
|
|
| |||||||||
Total Assets | $ | 528,542,503 | $ | 7,963,838,139 | $ | — | $ | 8,492,380,642 | ||||||||
|
|
|
|
|
|
|
| |||||||||
Total Liabilities | $ | — | $ | — | $ | — | $ | — | ||||||||
|
|
|
|
|
|
|
| |||||||||
Total | $ | 528,542,503 | $ | 7,963,838,139 | $ | — | $ | 8,492,380,642 | ||||||||
|
|
|
|
|
|
|
| |||||||||
There were no transfers between Levels 1, 2 or 3 during the year ended December 31, 2014.
The Portfolio held no derivative contracts during the year ended December 31, 2014.
Investment security transactions for the year ended December 31, 2014 were as follows:
Cost of Purchases: | ||||
Long-term investments other than U.S. government debt securities | $ | 870,598,898 | ||
Long-term U.S. government debt securities | 1,321,907,924 | |||
|
| |||
| $ | 2,192,506,822 | |||
|
| |||
Net Proceeds of Sales and Redemptions: | ||||
Long-term investments other than U.S. government debt securities | $ | 715,999,007 | ||
Long-term U.S. government debt securities | 1,224,619,694 | |||
|
| |||
| $ | 1,940,618,701 | |||
|
|
As of December 31, 2014, the gross unrealized appreciation (depreciation) of investments based on the aggregate cost of investments for Federal income tax purposes was as follows:
Aggregate gross unrealized appreciation | $ | 177,962,127 | ||
Aggregate gross unrealized depreciation | (22,482,280 | ) | ||
|
| |||
Net unrealized appreciation | $ | 155,479,847 | ||
|
| |||
Federal income tax cost of investments | $ | 8,336,900,795 | ||
|
|
See Notes to Financial Statements.
67
Table of Contents
EQ ADVISORS TRUST
EQ/CORE BOND INDEX PORTFOLIO
STATEMENT OF ASSETS AND LIABILITIES
December 31, 2014
ASSETS | ||||
Investments at value (Cost $8,336,108,850) | $ | 8,492,380,642 | ||
Cash | 122,643,840 | |||
Foreign cash (Cost $491) | 443 | |||
Dividends, interest and other receivables | 53,388,457 | |||
Receivable for securities sold | 14,781,327 | |||
Receivable from Separate Accounts for Trust shares sold | 1,700,880 | |||
Other assets | 18,676 | |||
|
| |||
Total assets | 8,684,914,265 | |||
|
| |||
LIABILITIES | ||||
Payable for securities purchased | 115,813,867 | |||
Investment management fees payable | 2,494,576 | |||
Payable to Separate Accounts for Trust shares redeemed | 1,551,679 | |||
Administrative fees payable | 732,372 | |||
Distribution fees payable – Class IB | 479,936 | |||
Distribution fees payable – Class IA | 18,829 | |||
Trustees’ fees payable | 10,288 | |||
Other liabilities | 87,086 | |||
Accrued expenses | 621,775 | |||
|
| |||
Total liabilities | 121,810,408 | |||
|
| |||
NET ASSETS | $ | 8,563,103,857 | ||
|
| |||
Net assets were comprised of: | ||||
Paid in capital | $ | 8,664,512,082 | ||
Accumulated undistributed net investment income (loss) | — | |||
Accumulated undistributed net realized gain (loss) on investments | (257,679,969 | ) | ||
Net unrealized appreciation (depreciation) on investments and foreign currency translations | 156,271,744 | |||
|
| |||
Net assets | $ | 8,563,103,857 | ||
|
| |||
Class IA | ||||
Net asset value, offering and redemption price per share, $88,462,042 / 8,869,994 shares outstanding (unlimited amount authorized: $0.01 par value) | $ | 9.97 | ||
|
| |||
Class IB | ||||
Net asset value, offering and redemption price per share, $2,251,635,466 / 225,390,925 shares outstanding (unlimited amount authorized: $0.01 par value) | $ | 9.99 | ||
|
| |||
Class K | ||||
Net asset value, offering and redemption price per share, $6,223,006,349 / 624,047,723 shares outstanding (unlimited amount authorized: $0.01 par value) | $ | 9.97 | ||
|
|
STATEMENT OF OPERATIONS
For the Year Ended December 31, 2014
INVESTMENT INCOME | ||||
Interest | $ | 167,969,988 | ||
Dividends | 4,937,906 | |||
|
| |||
Total income | 172,907,894 | |||
|
| |||
EXPENSES | ||||
Investment management fees | 28,819,978 | |||
Administrative fees | 8,470,966 | |||
Distribution fees – Class IB | 5,855,185 | |||
Printing and mailing expenses | 618,178 | |||
Distribution fees – Class IA | 228,926 | |||
Professional fees | 211,402 | |||
Trustees’ fees | 209,128 | |||
Custodian fees | 191,500 | |||
Miscellaneous | 300,024 | |||
|
| |||
Total expenses | 44,905,287 | |||
|
| |||
NET INVESTMENT INCOME (LOSS) | 128,002,607 | |||
|
| |||
REALIZED AND UNREALIZED GAIN (LOSS) | ||||
Net realized gain (loss) on investments | 20,494,408 | |||
Change in unrealized appreciation (depreciation) on: | ||||
Investments | 63,833,178 | |||
Foreign currency translations | (60 | ) | ||
|
| |||
Net change in unrealized appreciation (depreciation) | 63,833,118 | |||
|
| |||
NET REALIZED AND UNREALIZED GAIN (LOSS) | 84,327,526 | |||
|
| |||
NET INCREASE (DECREASE) IN NET ASSETS RESULTING FROM OPERATIONS | $ | 212,330,133 | ||
|
| |||
See Notes to Financial Statements.
68
Table of Contents
EQ ADVISORS TRUST
EQ/CORE BOND INDEX PORTFOLIO
STATEMENT OF CHANGES IN NET ASSETS
| Year Ended December 31, | ||||||||
| 2014 | 2013 | |||||||
INCREASE (DECREASE) IN NET ASSETS FROM OPERATIONS: | ||||||||
Net investment income (loss) | $ | 128,002,607 | $ | 108,590,118 | ||||
Net realized gain (loss) on investments and foreign currency transactions | 20,494,408 | 9,474,329 | ||||||
Net change in unrealized appreciation (depreciation) on investments and foreign currency translations | 63,833,118 | (215,376,266 | ) | |||||
|
|
|
| |||||
NET INCREASE (DECREASE) IN NET ASSETS RESULTING FROM OPERATIONS | 212,330,133 | (97,311,819 | ) | |||||
|
|
|
| |||||
DIVIDENDS: | ||||||||
Dividends from net investment income | ||||||||
Class IA | (1,167,788 | ) | (1,122,014 | ) | ||||
Class IB | (29,756,465 | ) | (28,718,028 | ) | ||||
Class K | (97,450,526 | ) | (78,441,416 | ) | ||||
|
|
|
| |||||
TOTAL DIVIDENDS: | (128,374,779 | ) | (108,281,458 | ) | ||||
|
|
|
| |||||
CAPITAL SHARES TRANSACTIONS: | ||||||||
Class IA | ||||||||
Capital shares sold [ 413,983 and 794,917 shares, respectively ] | 4,150,065 | 7,983,843 | ||||||
Capital shares issued in reinvestment of dividends [ 117,237 and 113,238 shares, respectively ] | 1,167,788 | 1,122,014 | ||||||
Capital shares repurchased [ (1,268,629) and (2,757,604) shares, respectively ] | (12,707,307 | ) | (27,799,295 | ) | ||||
|
|
|
| |||||
Total Class IA transactions | (7,389,454 | ) | (18,693,438 | ) | ||||
|
|
|
| |||||
Class IB | ||||||||
Capital shares sold [ 14,419,790 and 21,295,153 shares, respectively ] | 144,718,352 | 214,592,737 | ||||||
Capital shares sold in-kind (Note 9)[ 0 and 105,095,962 shares, respectively ] | — | 1,052,097,769 | ||||||
Capital shares issued in reinvestment of dividends [ 2,982,331 and 2,893,496 shares, respectively ] | 29,756,465 | 28,718,028 | ||||||
Capital shares repurchased [ (35,085,491) and (32,340,854) shares, respectively ] | (352,382,745 | ) | (325,094,852 | ) | ||||
|
|
|
| |||||
Total Class IB transactions | (177,907,928 | ) | 970,313,682 | |||||
|
|
|
| |||||
Class K | ||||||||
Capital shares sold [ 90,503,819 and 113,105,379 shares, respectively ] | 908,100,698 | 1,140,097,260 | ||||||
Capital shares sold in-kind (Note 9)[ 31,273,561 and 1 shares, respectively ] | 311,985,709 | 7 | ||||||
Capital shares issued in reinvestment of dividends [ 9,785,357 and 7,917,889 shares, respectively ] | 97,450,526 | 78,441,416 | ||||||
Capital shares repurchased [ (58,621,279) and (58,597,385) shares, respectively ] | (588,725,443 | ) | (589,501,131 | ) | ||||
|
|
|
| |||||
Total Class K transactions | 728,811,490 | 629,037,552 | ||||||
|
|
|
| |||||
NET INCREASE (DECREASE) IN NET ASSETS RESULTING FROM CAPITAL SHARE TRANSACTIONS | 543,514,108 | 1,580,657,796 | ||||||
|
|
|
| |||||
TOTAL INCREASE (DECREASE) IN NET ASSETS | 627,469,462 | 1,375,064,519 | ||||||
NET ASSETS: | ||||||||
Beginning of year | 7,935,634,395 | 6,560,569,876 | ||||||
|
|
|
| |||||
End of year (a) | $ | 8,563,103,857 | $ | 7,935,634,395 | ||||
|
|
|
|
| ||||
(a) Includes accumulated undistributed (overdistributed) net investment income (loss) of | $ | — | $ | — | ||||
|
|
|
| |||||
See Notes to Financial Statements.
69
Table of Contents
EQ ADVISORS TRUST
EQ/CORE BOND INDEX PORTFOLIO
FINANCIAL HIGHLIGHTS
| Year Ended December 31, | ||||||||||||||||||||
| Class IA | 2014 | 2013 | 2012 | 2011 | 2010 | |||||||||||||||
Net asset value, beginning of year | $ | 9.87 | $ | 10.15 | $ | 9.98 | $ | 9.71 | $ | 9.39 | ||||||||||
|
|
|
|
|
|
|
|
|
| |||||||||||
Income (loss) from investment operations: | ||||||||||||||||||||
Net investment income (loss) (e) | 0.14 | 0.13 | 0.15 | 0.21 | 0.28 | |||||||||||||||
Net realized and unrealized gain (loss) on investments, securities sold short, futures and foreign currency transactions | 0.09 | (0.29 | ) | 0.17 | 0.28 | 0.28 | ||||||||||||||
|
|
|
|
|
|
|
|
|
| |||||||||||
Total from investment operations | 0.23 | (0.16 | ) | 0.32 | 0.49 | 0.56 | ||||||||||||||
|
|
|
|
|
|
|
|
|
| |||||||||||
Less distributions: | ||||||||||||||||||||
Dividends from net investment income | (0.13 | ) | (0.12 | ) | (0.15 | ) | (0.22 | ) | (0.24 | ) | ||||||||||
|
|
|
|
|
|
|
|
|
| |||||||||||
Net asset value, end of year | $ | 9.97 | $ | 9.87 | $ | 10.15 | $ | 9.98 | $ | 9.71 | ||||||||||
|
|
|
|
|
|
|
|
|
| |||||||||||
Total return | 2.36 | % | (1.59 | )% | 3.20 | % | 5.01 | % | 6.03 | % | ||||||||||
|
|
|
|
|
|
|
|
|
| |||||||||||
Ratios/Supplemental Data: | ||||||||||||||||||||
Net assets, end of year (000’s) | $ | 88,462 | $ | 94,808 | $ | 116,262 | $ | 127,549 | $ | 5,775,848 | ||||||||||
Ratio of expenses to average net assets (f) | 0.71 | % | 0.72 | % | 0.72 | % | 0.47 | % | 0.47 | % | ||||||||||
Ratio of net investment income (loss) to average net assets (f) | 1.35 | % | 1.31 | % | 1.48 | % | 2.11 | % | 2.85 | % | ||||||||||
Portfolio turnover rate^ | 24 | % | 33 | % | 32 | % | 79 | % | 83 | % | ||||||||||
| Year Ended December 31, | ||||||||||||||||||||
| Class IB | 2014 | 2013 | 2012 | 2011 | 2010 | |||||||||||||||
Net asset value, beginning of year | $ | 9.88 | $ | 10.17 | $ | 10.00 | $ | 9.72 | $ | 9.40 | ||||||||||
|
|
|
|
|
|
|
|
|
| |||||||||||
Income (loss) from investment operations: | ||||||||||||||||||||
Net investment income (loss) (e) | 0.14 | 0.13 | 0.15 | 0.17 | 0.26 | |||||||||||||||
Net realized and unrealized gain (loss) on investments, securities sold short, futures and foreign currency transactions | 0.10 | (0.30 | ) | 0.17 | 0.30 | 0.28 | ||||||||||||||
|
|
|
|
|
|
|
|
|
| |||||||||||
Total from investment operations | 0.24 | (0.17 | ) | 0.32 | 0.47 | 0.54 | ||||||||||||||
|
|
|
|
|
|
|
|
|
| |||||||||||
Less distributions: | ||||||||||||||||||||
Dividends from net investment income | (0.13 | ) | (0.12 | ) | (0.15 | ) | (0.19 | ) | (0.22 | ) | ||||||||||
|
|
|
|
|
|
|
|
|
| |||||||||||
Net asset value, end of year | $ | 9.99 | $ | 9.88 | $ | 10.17 | $ | 10.00 | $ | 9.72 | ||||||||||
|
|
|
|
|
|
|
|
|
| |||||||||||
Total return | 2.46 | % | (1.69 | )% | 3.20 | % | 4.85 | % | 5.76 | % | ||||||||||
|
|
|
|
|
|
|
|
|
| |||||||||||
Ratios/Supplemental Data: | ||||||||||||||||||||
Net assets, end of year (000’s) | $ | 2,251,635 | $ | 2,402,741 | $ | 1,485,443 | $ | 1,355,385 | $ | 1,308,869 | ||||||||||
Ratio of expenses to average net assets (f) | 0.71 | % | 0.72 | % | 0.72 | % | 0.72 | % | 0.72 | % | ||||||||||
Ratio of net investment income (loss) to average net assets (f) | 1.35 | % | 1.30 | % | 1.47 | % | 1.73 | % | 2.64 | % | ||||||||||
Portfolio turnover rate^ | 24 | % | 33 | % | 32 | % | 79 | % | 83 | % | ||||||||||
See Notes to Financial Statements.
70
Table of Contents
EQ ADVISORS TRUST
EQ/CORE BOND INDEX PORTFOLIO
FINANCIAL HIGHLIGHTS (Continued)
| Year Ended December 31, | August 26, 2011* to December 31, 2011 | |||||||||||||||
| Class K | 2014 | 2013 | 2012 | |||||||||||||
Net asset value, beginning of period | $ | 9.87 | $ | 10.15 | $ | 9.98 | $ | 10.12 | ||||||||
|
|
|
|
|
|
|
| |||||||||
Income (loss) from investment operations: | ||||||||||||||||
Net investment income (loss) (e) | 0.16 | 0.16 | 0.18 | 0.06 | ||||||||||||
Net realized and unrealized gain (loss) on investments and foreign currency transactions | 0.10 | (0.30 | ) | 0.17 | 0.02 | |||||||||||
|
|
|
|
|
|
|
| |||||||||
Total from investment operations | 0.26 | (0.14 | ) | 0.35 | 0.08 | |||||||||||
|
|
|
|
|
|
|
| |||||||||
Less distributions: | ||||||||||||||||
Dividends from net investment income | (0.16 | ) | (0.14 | ) | (0.18 | ) | (0.22 | ) | ||||||||
|
|
|
|
|
|
|
| |||||||||
Net asset value, end of period | $ | 9.97 | $ | 9.87 | $ | 10.15 | $ | 9.98 | ||||||||
|
|
|
|
|
|
|
| |||||||||
Total return (b) | 2.62 | % | (1.34 | )% | 3.46 | % | 0.75 | % | ||||||||
|
|
|
|
|
|
|
| |||||||||
Ratios/Supplemental Data: | ||||||||||||||||
Net assets, end of period (000’s) | $ | 6,223,006 | $ | 5,438,085 | $ | 4,958,865 | $ | 5,256,236 | ||||||||
Ratio of expenses to average net assets (a)(f) | 0.46 | % | 0.47 | % | 0.47 | % | 0.47 | % | ||||||||
Ratio of net investment income (loss) to average net assets (a)(f) | 1.60 | % | 1.56 | % | 1.72 | % | 1.74 | % | ||||||||
Portfolio turnover rate^ | 24 | % | 33 | % | 32 | % | 79 | % | ||||||||
| * | Commencement of Operations. |
| ^ | Portfolio turnover rate excludes derivatives, if any. |
| (a) | Ratios for periods less than one year are annualized. |
| (b) | Total returns for periods less than one year are not annualized. |
| (e) | Net investment income (loss) per share is based on average shares outstanding. |
| (f) | Expenses do not include the expenses of the underlying funds (“indirect expenses”). |
See Notes to Financial Statements.
71
Table of Contents
EQ ADVISORS TRUST
December 31, 2014
| Note 1 | Organization and Significant Accounting Policies |
EQ Advisors Trust (the “Trust”) was organized as a Delaware statutory trust on October 31, 1996, and is registered under the Investment Company Act of 1940, as amended (the “1940 Act”), as an open-end management investment company with seventy-nine diversified portfolios and three non-diversified portfolios (each a “Portfolio”). These financial statements present two of the diversified Portfolios. The investment manager to each Portfolio is AXA Equitable Funds Management Group, LLC (“FMG LLC” or the “Manager”), a wholly-owned subsidiary of AXA Equitable Life Insurance Company (“AXA Equitable”).
Under the Trust’s organizational documents, the Trust’s officers and trustees are indemnified against certain liabilities arising out of the performance of their duties to the Trust. In addition, in the normal course of business, the Trust enters into contracts with vendors and others that provide for general indemnifications. The Trust’s maximum exposure under these arrangements is unknown as this would involve future claims that may be made against the Trust. However, based on experience, the Trust and management expect the risk of loss to be remote.
Each of the investment sub-advisers (each a Sub-Adviser) independently chooses and maintains a portfolio of securities for its Portfolios.
The Trust issues three classes of shares, Class IA, Class IB and Class K. The Class IA and Class IB shares are subject to distribution fees imposed under a distribution plan (“Distribution Plan”) adopted pursuant to Rule 12b-1 under the 1940 Act. Under the Trust’s multiple class distribution system, all three classes of shares have identical voting, dividend, liquidation and other rights, other than the payment of distribution fees under the applicable Distribution Plan. The Trust’s shares are currently sold only to insurance company separate accounts in connection with variable life insurance contracts and variable annuity certificates and contracts issued by AXA Equitable, AXA Life and Annuity Company, other affiliated or unaffiliated insurance companies and to the AXA Equitable 401(k) Plan. Shares also may be sold to other tax-qualified retirement plans, to other series of the Trust and to series of AXA Premier VIP Trust, a separate registered investment company managed by FMG LLC.
The investment objectives of each Portfolio are as follows:
EQ/Common Stock Index Portfolio (sub-advised by AllianceBernstein L.P. (an affiliate of FMG LLC) — Seeks to achieve a total return before expenses that approximates the total return performance of the Russell 3000® Index, including reinvestment of dividends, at a risk level consistent with that of the Russell 3000® Index.
EQ/Core Bond Index Portfolio (sub-advised by SSgA Funds Management, Inc.) — Seeks to achieve a total return before expenses that approximates the total return performance of the Barclays U.S. Intermediate Government/Credit Bond Index, including reinvestment of dividends, at a risk level consistent with that of the Barclays U.S. Intermediate Government/Credit Bond Index.
The following is a summary of the significant accounting policies of the Trust:
The preparation of financial statements in accordance with United States of America generally accepted accounting principles (“U.S. GAAP”) requires management to make estimates and assumptions that affect the reported amounts and disclosures. Actual results could differ from those estimates. The Portfolios are investment companies and, accordingly, follow the investment company accounting and reporting guidance of the Financial Accounting Standards Board Accounting Standards Codification Topic 946 - Investment Companies, which is part of U.S. GAAP.
Valuation:
Equity securities (including securities issued by Exchange Traded Funds (“ETFs”)) listed on national securities exchanges are valued at the last sale price or official closing price on the date of valuation or, if there is no sale or official closing price, at the latest available bid price. Securities
72
Table of Contents
EQ ADVISORS TRUST
NOTES TO FINANCIAL STATEMENTS (Continued)
December 31, 2014
listed on the NASDAQ stock market will be valued using the NASDAQ Official Closing Price (“NOCP”). Generally, the NOCP will be the last sale price unless the reported trade for the security is outside the range of the bid/ask price. In such cases, the NOCP will be normalized to the nearer of the bid or ask price. Other unlisted stocks are valued at their last sale price or official closing price, or if there is no such price, at a bid price estimated by a broker.
Mortgage-backed and asset-backed securities are valued at prices obtained from a bond pricing service where available, or at a bid price obtained from one or more of the major dealers in such securities. The pricing service may utilize data such as issuer type, coupon, cash flows, collateral performance, mortgage prepayment projection tables and Adjustable Rate Mortgage evaluations that incorporate index data, periodic and life caps, the next coupon reset date and the convertibility of the bond in making evaluations. If a quoted price is unavailable, an equivalent yield or yield spread quotes will be obtained from a broker and converted to a price.
Corporate and Municipal bonds and notes may be valued on the basis of prices provided by a pricing service when such prices are believed to reflect the fair value of such securities. The pricing service may utilize many factors in making evaluations, trading in similar groups of securities and any developments related to specific securities. However, when such prices are not available, such bonds and notes are valued at a bid price estimated by a broker.
U.S. Treasury securities and other obligations issued or guaranteed by the U.S. Government, its agencies or instrumentalities, are valued at prices obtained from a bond pricing service where available. The pricing service may utilize data received from active market makers and broker-dealers, yield curves and the spread over comparable U.S. Treasury issues in making evaluations.
Foreign securities, including foreign government securities, not traded directly in the U.S., or traded in American Depositary Receipts (“ADR”) or similar form, are valued at representative quoted prices from the primary exchange in the currency of the country of origin. Foreign currency is converted into U.S. dollar equivalent at current exchange rates.
Futures contracts are valued at their last settlement price or, if there is no sale, at the latest available bid price.
If market quotations are not readily available for a security or other financial instruments, such securities and instruments shall be referred to the Trust’s Valuation Committee (“Committee”), who will value the assets in good faith pursuant to procedures adopted by the Board of Trustees (“Pricing Procedures”) of the Trust (the “Board”).
The Board is responsible for ensuring that appropriate valuation methods are used to price securities for the Trust’s Portfolios. The Board has delegated the responsibility of calculating the net asset values (“NAVs”) of the Trust’s Portfolios and classes pursuant to these Pricing Procedures to the Trust’s administrator, FMG LLC (in its capacity as administrator, the “Administrator”). The Administrator has entered into a sub-administration agreement with JPMorgan Chase Bank, N.A. (the “Sub-Administrator”) to assist in performing certain of the duties described herein. The Committee, established by the Board, determines the value of the Trust’s securities and assets for which market quotations are not readily available or for which valuation cannot otherwise be provided in accordance with procedures adopted by the Board. The Committee is comprised of senior employees from FMG LLC.
Due to the inherent uncertainty of valuations of such securities, the fair value may differ significantly from the values that would have been used had a ready market for such securities existed.
Various inputs are used in determining the value of a Portfolio’s assets or liabilities carried at fair value. These inputs are summarized in three broad levels below:
| • | Level 1 - quoted prices in active markets for identical assets |
73
Table of Contents
EQ ADVISORS TRUST
NOTES TO FINANCIAL STATEMENTS (Continued)
December 31, 2014
| • | Level 2 - other significant observable inputs (including quoted prices of similar securities, interest rates, prepayment speeds, credit risk, etc.) |
| • | Level 3 - significant unobservable inputs (including the Portfolio’s own assumptions in determining the fair value of investments) |
A summary of inputs used to value each Portfolio’s assets and liabilities carried at fair value as of December 31, 2014, is included in the Portfolios of Investments. Changes in valuation techniques may result in transfers in or out of an investment’s assigned level. The Portfolios’ policy is to recognize transfers into and transfers out of the valuation levels as of the end of the reporting period. Transfers between levels are included after the Summary of Level 1, Level 2 and Level 3 inputs, following the Portfolio of Investments for each Portfolio. Transfers between levels may be due to a decline or an increase in market activity (e.g., frequency of trades), which may result in a lack of, or increase in, available market inputs to determine price.
Transfers into and transfers out of Level 3 are included in the Level 3 reconciliation following the Portfolio of Investments for each Portfolio.
The inputs or methodology used to value securities are not necessarily an indication of the risk associated with investing in those securities. An investment’s level within the fair value hierarchy is based on the lowest level of any input, both individually and in aggregate, that is significant to the fair value measurement.
The Committee meets and reviews reports based on the valuation technique used to value each particular Level 3 security. In connection with this review, the Committee obtains, when available, updates from its pricing vendors and Sub- Advisers for each fair valued security. For example, with respect to model driven prices, the Committee receives a report regarding a review and recalculation of pricing models and related discounts. For securities valued based on broker quotes, the Committee evaluates variances between existing broker quotes and any alternative broker quotes provided by an Sub-Adviser or other pricing source.
To substantiate unobservable inputs used in fair valuation, the Secretary of the Committee performs an independent verification and additional research for all fair value notifications received from its pricing agent. Among other factors, particular areas of focus include: description of security, historical pricing, intra-day price movement, last trade information, corporate actions, related securities, any available company news and announcements, any available trade data and actions taken by other clients of the pricing vendor. The Committee also notes the materiality of holdings and price changes on Portfolio NAVs.
The Committee reviews and considers changes in value for all fair valued securities that have occurred since the last review.
Pursuant to procedures approved by the Board, events or circumstances affecting the values of portfolio securities that occur between the closing of their principal markets and the time the net asset value is determined may be reflected in the Trust’s calculation of net asset values for each applicable Portfolio when the Manager deems that the particular event or circumstance would materially affect such Portfolio’s net asset value. At December 31, 2014, none of the Portfolios applied these procedures.
Security Transactions and Investment Income:
Securities transactions are recorded on the trade date net of brokerage fees, commissions, and transfer fees. Dividend income (net of withholding taxes) and distributions to shareholders are recorded on the ex-dividend date, except that certain dividends from foreign securities, if any, are recognized as soon as the Portfolio is informed of the ex-dividend date. Interest income (including amortization of premium and accretion of discount on long-term securities using the effective yield method) and interest expense are accrued daily. The Trust records paydown gains and losses realized on prepayments received on mortgage-backed securities as an adjustment to interest income.
74
Table of Contents
EQ ADVISORS TRUST
NOTES TO FINANCIAL STATEMENTS (Continued)
December 31, 2014
The Portfolios record distributions received in excess of income from underlying investments as a reduction of cost of investments and/or realized gain. Such amounts are based on estimates if actual amounts are not available and actual amounts of income, realized gain and return of capital may differ from the estimated amounts. The Portfolios adjust the estimated amounts of components of distributions (and consequently its net investment income) as necessary once the issuers provide information about the actual composition of the distributions.
Realized gains and losses on the sale of investments are computed on the basis of the specific identified cost of the investments sold. Unrealized appreciation (depreciation) on investments and foreign currency denominated assets and liabilities, if any, is presented net of deferred taxes on unrealized gains in the Statements of Assets and Liabilities.
Capital Gains Taxes:
Certain Portfolios may be subject to capital gains and repatriation taxes imposed by certain countries in which they invest. These Portfolios have recorded a deferred tax liability with respect to unrealized appreciation on foreign securities for potential capital gains and repatriation taxes at December 31, 2014. The accrual for capital gains and repatriation taxes is included in net unrealized appreciation (depreciation) on investments in the Statements of Assets and Liabilities for the Portfolios. The amounts related to capital gain taxes for securities that have been sold are included in the net realized gain (loss) on investments in the Statements of Operations for the Portfolios.
Allocation of Expenses and Income:
Expenses attributable to a single Portfolio or class are charged to that Portfolio or class. Expenses of the Trust not attributable to a single Portfolio or class are charged to each Portfolio or class in proportion to the average net assets of each Portfolio or other appropriate allocation methods.
All income earned and expenses incurred by each Portfolio are borne on a pro-rata basis by each outstanding class of shares, based on the proportionate interest in the Portfolio represented by the daily net assets of such class, except for distribution fees which are charged on a class specific basis.
Foreign Currency Valuation:
The books and records of the Trust are kept in U.S. dollars. Foreign currency amounts are translated into U.S. dollars at current exchange rates at the following dates:
(i) market value of investment securities, other assets and liabilities — at the valuation date.
(ii) purchases and sales of investment securities, income and expenses — at the date of such transactions.
The Portfolios do not isolate that portion of the results of operations resulting from changes in foreign exchange rates on investments from the fluctuations arising from changes in market prices of securities held. Such fluctuations are included with the net realized and unrealized gain or loss on investments.
Net currency gains or losses realized and unrealized as a result of differences between interest or dividends, withholding taxes, security payables/receivables, forward foreign currency exchange contracts and foreign cash recorded on the Portfolio’s books and the U.S. dollar equivalent amount actually received or paid are presented under foreign currency transactions and foreign currency translations in the realized and unrealized gains and losses section, respectively, of the Statements of Operations. Net realized gains (losses) on foreign currency transactions represent net foreign exchange gains (losses) from forward foreign currency contracts, disposition of foreign currencies, currency gains or losses realized between the trade and settlement dates on securities transactions, and the difference between the amount of investment income and foreign withholding taxes recorded on a Portfolio’s books and the U.S. dollar equivalent of amounts actually received or paid.
75
Table of Contents
EQ ADVISORS TRUST
NOTES TO FINANCIAL STATEMENTS (Continued)
December 31, 2014
Taxes:
The Trust intends to comply with the requirements of the Internal Revenue Code of 1986, as amended applicable to regulated investment companies (“RICs”) and to distribute substantially all of its net investment income and net realized capital gains to shareholders of each Portfolio. Therefore, no Federal, state and local income tax provisions are required.
The Portfolios are not aware of any tax positions for which it is reasonably possible that the total amounts of unrecognized tax benefits will significantly change in the next twelve months. However, the Portfolios’ conclusions may be subject to future review based on changes in, or the interpretation of, the accounting standards or tax laws and regulations. The Portfolios recognize interest and penalties, if any, related to uncertain tax positions as income tax expense in the Statements of Operations. During the year ended December 31, 2014, the Portfolios did not incur any interest or penalties. Each of the tax years in the four year period ended December 31, 2014 remains subject to examination by the Internal Revenue Service, state and local taxing authorities.
Dividends from net investment income, if any, are declared and distributed at least annually for all Portfolios. Dividends from net realized short-term and long-term capital gains are declared and distributed at least annually to the shareholders of the Portfolios to which such gains are attributable. All dividends are reinvested in additional full and fractional shares of the related Portfolios. All distributions are calculated on a tax basis and, as such, the amounts may differ from financial statement investment income and realized gains. Those differences which are significant to the Portfolios are primarily due to Capital Loss Carryovers (EQ/Common Stock Index Portfolio and EQ/Core Bond Index Portfolio) and Wash Sale Loss Deferrals (EQ/Common Stock Index Portfolio). In addition, short-term capital gains and foreign currency gains are treated as capital gains for U.S. GAAP purposes but are considered ordinary income for tax purposes. Capital and net specified losses incurred after October 31 and within the taxable year are deemed to arise on the first business day of the Portfolio’s next taxable year. The tax composition of distributed and undistributed income and gains for the years ended December 31, 2014 and December 31, 2013, were as follows:
| Year Ended December 31, 2014 | Year Ended December 31, 2013 | |||||||||||||||||||||||||||||||
Portfolios: | Distributed Ordinary Income | Distributed Long Term Gains | Accumulated Undistributed Ordinary Income | Accumulated Undistributed Long Term Gains | Distributed Ordinary Income | Distributed Long Term Gains | Accumulated Undistributed Ordinary Income | Accumulated Undistributed Long Term Gains | ||||||||||||||||||||||||
EQ/Common Stock Index | $ | 69,508,039 | $ | — | $ | — | $ | — | $ | 67,518,170 | $ | — | $ | — | $ | — | ||||||||||||||||
EQ/Core Bond Index | 128,374,779 | — | — | — | 108,281,458 | — | — | — | ||||||||||||||||||||||||
Permanent book and tax differences relating to shareholder distributions resulted in reclassifications to undistributed (overdistributed) net investment income (loss), accumulated net realized gain (loss) and paid-in-capital at December 31, 2014 as follows:
Portfolios: | Undistributed Net Investment Income (Loss) | Accumulated Net Realized Gain (Loss) | Paid In Capital | |||||||||
EQ/Common Stock Index | $ | 454,827 | $ | 2,603,162 | $ | (3,057,989 | ) | |||||
EQ/Core Bond Index | 372,172 | (29,786 | ) | (342,386 | ) | |||||||
76
Table of Contents
EQ ADVISORS TRUST
NOTES TO FINANCIAL STATEMENTS (Continued)
December 31, 2014
Net Capital losses and net specified gains/losses incurred after October 31, and within the taxable year are deemed to arise on the first business day of the Portfolios’ next taxable year. For the year ended December 31, 2014, the Portfolios deferred to January 1, 2015 post-October losses of:
Portfolios: | Specified Loss | Short- Term Capital Loss (gain) | Long- Term Capital Loss (gain) | |||||||||
EQ/Common Stock Index | $ | — | $ | — | $ | — | ||||||
EQ/Core Bond Index | — | — | — | |||||||||
Under the Regulated Investment Company Modernization Act of 2010 (the “RIC Mod Act”), net capital losses recognized by the Portfolios after December 31, 2010, may get carried forward indefinitely, and retain their character as short-term and/or long term losses. Prior to the RIC Mod Act, net capital losses incurred by the Portfolios were carried forward for up to eight years and treated as 100% short-term. The RIC Mod Act requires that post-enactment net capital losses be used before pre-enactment net capital losses, therefore some net capital loss carryforwards that would have been utilized under prior law may expire unused. Pre-enactment and post-enactment net capital losses that will be carried forward, if any, are presented in the table below.
The following Portfolios have capital loss carryforward amounts from prior to the RIC Mod Act available for use and utilized during 2014 as follows:
| Expiring | ||||||||||||||||||||||||
Portfolios: | 2015 | 2016 | 2017 | 2018 | Total | Utilized | ||||||||||||||||||
EQ/Common Stock Index | $ | — | $ | — | $ | 1,418,665,046 | $ | — | $ | 1,418,665,046 | $ | 270,523,389 | ||||||||||||
EQ/Core Bond Index | — | 55,362,012 | 201,163,515 | — | 256,525,527 | 8,950,838 | ||||||||||||||||||
Short Sales Against the Box:
Certain Portfolios may enter into a “short sale” of securities in circumstances in which, at the time the short position is open, the Portfolio owns at least an equal amount of the securities sold short or owns preferred stocks or debt securities, convertible or exchangeable without payment of further consideration, into at least an equal number of securities sold short. This kind of short sale, which is referred to as one “against the box,” may be entered into by the Portfolio to, for example, lock in a sale price for a security the Portfolio does not wish to sell immediately. The Portfolio will designate the segregation, either on its records or with the Trust’s custodian, of the securities sold short or convertible or exchangeable preferred stocks or debt securities sold in connection with short sales against the box. Liabilities for securities sold short are reported at market value in the financial statements. Such liabilities are subject to off-balance sheet risk to the extent of any future increases in market value of the securities sold short. The ultimate liability for securities sold short could exceed the liabilities recorded in the Portfolio’s financial statements. The Portfolio bears the risk of potential inability of the brokers to meet their obligation to perform.
Accounting for Derivative Instruments:
Following is a description of how and why the Portfolios use derivative instruments, the type of derivatives utilized by the Portfolios during the reporting period, as well as the primary underlying risk exposures related to each instrument type. Derivatives accounted for as hedging instruments must be disclosed separately from those that do not qualify for hedge accounting. Even though the Portfolios may use derivatives in an attempt to achieve an economic hedge, the Portfolio’s derivatives are not accounted for as hedging instruments because the Portfolios account for their derivatives at fair value and record any changes in fair value in current period earnings. All open derivative positions at period end are reflected on each respective Portfolio’s Portfolio of Investments. The volume of derivative activity, based on month-end notional amounts during the period is also noted in each respective Portfolio’s Portfolio of Investments.
77
Table of Contents
EQ ADVISORS TRUST
NOTES TO FINANCIAL STATEMENTS (Continued)
December 31, 2014
Futures Contracts:
The futures contracts used by the Portfolios are agreements to buy or sell a financial instrument for a set price in the future. Certain Portfolios buy or sell futures contracts for the purpose of protecting their portfolio securities against future changes in interest rates and indices which might adversely affect the value of the Portfolios’ securities or the price of securities that they intend to purchase at a later date. Initial margin deposits are made upon entering into futures contracts and can be in cash, certain money market instruments, treasury securities or other liquid, high grade debt securities. During the period the futures contracts are open, changes in the market price of the contracts are recognized as unrealized gains or losses by “marking-to-market” at the end of each trading day. Variation margin payments on futures contracts are received or made, depending upon whether unrealized gains or losses are incurred. When the contract is closed, the Portfolio records a realized gain or loss equal to the difference between the proceeds from or cost of the closing transactions and the Portfolio’s basis in the contract. Should interest rates or indices move unexpectedly, the Portfolio may not achieve the anticipated benefits of the futures contracts and may incur a loss. The use of futures contracts transactions involves the risk of imperfect correlation in movements in the price of futures contracts, interest rates and the underlying hedged assets. Use of long futures contracts subjects the Portfolios to risk of loss in excess of the amounts shown on the Statements of Assets and Liabilities, up to the notional value of the futures contracts. Use of short futures contracts subjects the Portfolios to unlimited risk of loss. The Portfolios enter into futures contracts only on exchanges or boards of trade. The exchange or board of trade acts as the counterparty to each futures transaction; therefore, a Portfolio’s credit risk is limited to failure of the exchange or board of trade.
The Portfolios may be exposed to foreign currency risks associated with portfolio investments.
Certain Portfolios purchase foreign currency on a spot (or cash) basis. In addition, certain Portfolios enter into contracts to purchase or sell foreign currencies at a future date (“forward contracts”). A forward foreign currency exchange contract is a commitment to purchase or sell a foreign currency at a future date at a negotiated forward rate. Daily fluctuations in the value of such contracts are recognized as unrealized appreciation or depreciation by “marking to market.” The gain or loss arising from the difference between the original contracts and the closing of such contracts is included in realized gains or losses from foreign currency transactions in the Statements of Operations. The Portfolios may engage in these forward contracts to protect against uncertainty in the level of future exchange rates in connection with the purchase and sale of Portfolio securities (“transaction hedging”) and to protect the value of specific portfolio positions (“position hedging”). The Portfolios also buy forward foreign currency exchange contracts to gain exposure to currencies. The Portfolios are subject to off-balance sheet risk to the extent of the value of the contracts for purchase of foreign currency and in an unlimited amount for sales of foreign currency.
Market and Credit Risk:
Futures contracts, involve elements of both market and credit risk in excess of the amounts reflected in the Statements of Assets and Liabilities. The Portfolio bears the market risk, which arises from any changes in security values. The credit risk for futures contracts is limited to failure of the exchange or board of trade which acts as the counterparty to the Portfolio’s futures transactions.
Offsetting Assets and Liabilities:
The Portfolios adopted Accounting Standards Update (“ASU”) No. 2011-11: Disclosures about Offsetting Assets and Liabilities (“netting”) on the Statements of Assets and Liabilities that are subject to master netting arrangements or similar agreements. ASU 2011-11 was amended by ASU No. 2013-01, clarifying which investments and transactions are subject to the netting disclosure. The scope of the disclosure requirements is limited to derivative instruments, repurchase agreements and reverse repurchase agreements, and securities borrowing and securities lending transactions. This information enables users of the Portfolios’ financial statements to evaluate the effect or potential effect of netting arrangements on the Portfolios’ financial position.
78
Table of Contents
EQ ADVISORS TRUST
NOTES TO FINANCIAL STATEMENTS (Continued)
December 31, 2014
For U.S. GAAP purposes, the Portfolios do not offset financial assets and financial liabilities that are subject to master netting arrangements or similar agreements on the Statements of Assets and Liabilities.
Recent Accounting Standard:
In June 2014, the Financial Accounting Standards Board (“FASB”) issued Accounting Standards Update (“ASU”) No. 2014-11, Transfers and Servicing (Topic 860): Repurchase-to-Maturity Transactions, Repurchase Financings, and Disclosures. The amendments in this ASU impacts the accounting for certain repurchase agreements and expands disclosure requirements related to repurchase agreements, securities lending, repurchase-to-maturity and similar transactions. This ASU is effective for interim and annual reporting periods beginning after December 15, 2014.
In July 2014, the Securities and Exchange Commission (“SEC”) passed certain Money Market reforms. This regulation mandates that institutional and prime money market funds move to a floating NAV, provides the ability for a fund’s board of directors to impose certain liquidity fees and redemption gates, and enhances Money Market reporting requirements. Management is currently evaluating the impact of applying this regulation.
| Note 2 | Management of the Trust |
The Trust has entered into three separate investment management agreements (the “Management Agreements”) with FMG LLC. The Management Agreements state that the Manager will, among other things: (i) have overall supervisory responsibility for the general management and investment of each Portfolio’s assets; (ii) select and contract with the Sub-Advisers to manage the investment operations and composition of each and every Portfolio; (iii) monitor the Sub-Advisers’ investment programs and results; (iv) oversee compliance by the Trust with various federal and state statutes; and (v) carry out the directives of the Board. For the year ended December 31, 2014, for its services under the Management Agreements, the Manager was entitled to receive an annual fee as a percentage of average daily net assets, for each of the following Portfolios, calculated daily and payable monthly as follows:
| (as a percentage of average daily net assets) | ||||||||||||||||
Portfolios: | First $4 Billion | Next $4 Billion | Next $2 Billion | Thereafter | ||||||||||||
EQ/Common Stock Index | 0.350 | % | 0.340 | % | 0.330 | % | 0.320 | % | ||||||||
EQ/Core Bond Index | 0.350 | % | 0.340 | % | 0.330 | % | 0.320 | % | ||||||||
On behalf of the Trust, the Manager has entered into an investment advisory agreement (“Sub-Advisory Agreements”) with each of the Sub-Advisers for the Trust’s Portfolios. Each of the Sub-Advisory Agreements obligates the Sub-Advisers for the respective Portfolios to: (i) continuously furnish investment programs for the Portfolios; (ii) place all orders for the purchase and sale of investments for the Portfolios with brokers or dealers selected by the Manager or the respective Sub-Advisers; and (iii) perform certain limited related administrative functions in connection therewith. The Manager pays the expenses of providing investment sub-advisory services to the Portfolios, including the fees of the Sub-Advisers of each Portfolio.
79
Table of Contents
EQ ADVISORS TRUST
NOTES TO FINANCIAL STATEMENTS (Continued)
December 31, 2014
| Note 3 | Administrative Fees |
FMG LLC serves as Administrator to the Trust. As Administrator, FMG LLC provides the Trust with necessary administrative, fund accounting, and compliance services. FMG LLC may carry out its responsibilities either directly or through sub-contracting with third party providers. For these services, the Trust pays FMG LLC an annual fee payable monthly as follows:
For all Portfolios:
All Portfolios each pay the greater of $30,000 per Portfolio, or its proportionate share of an asset based fee:
Total aggregated average daily net asset charge for all Portfolios*
0.12% on the first $3 billion
0.11% on the next $3 billion
0.105% on the next $4 billion
0.10% on the next $20 billion
0.0975% on the next $10 billion
0.095% on assets thereafter
| * | With the exception of the All Asset Portfolios, AXA/Franklin Templeton Allocation Managed Volatility Portfolio, EQ/AllianceBernstein Dynamic Wealth Strategies Portfolio, AXA Strategy Portfolios, Tactical Portfolios and the Multiadviser Portfolios, including Portfolios of the Trust not presented in these financial statements. |
Prior to September 1, 2014, the Administrative fee was the following:
For all Portfolios:
All Portfolios each pay an annual fixed charge of $30,000, if the Portfolio’s average net assets are less than $5 billion, plus:
Total Trust average daily net asset charge for all Portfolios*
0.12% on the first $3 billion
0.11% on the next $3 billion
0.105% on the next $4 billion
0.10% on the next $20 billion
0.0975% in excess of $30 billion
| * | With the exception of the All Asset Portfolios, AXA/Franklin Templeton Allocation Managed Volatility Portfolio, EQ/AllianceBernstein Dynamic Wealth Strategies Portfolio, AXA Strategy Portfolios, Tactical Portfolios and the Multiadviser Portfolios, including Portfolios of the Trust not presented in these financial statements. |
Pursuant to a sub-administration arrangement with FMG LLC, the Sub-Administrator provides the Trust with administrative services, including monitoring of portfolio compliance and portfolio accounting services.
| Note 4 | Custody Fees |
The Trust has entered into a Custody Agreement with JPMorgan Chase Bank, N.A. (in this capacity, the “Custodian”). The Custody Agreement provides for an annual fee based on the amount of assets under custody plus transaction charges. The Custodian serves as custodian of the Trust’s portfolio securities and other assets. Under the terms of the Custody Agreement between the Trust and the Custodian, the Custodian maintains and deposits in each Portfolio’s account, cash, securities and other assets of the Portfolios. The Custodian is also required, upon the order of the Trust, to deliver securities held by the Custodian, and to make payments for securities purchased by the Trust. The Custodian has also entered into sub-custodian agreements with a number of foreign
80
Table of Contents
EQ ADVISORS TRUST
NOTES TO FINANCIAL STATEMENTS (Continued)
December 31, 2014
banks and clearing agencies, pursuant to which portfolio securities purchased outside the United States are maintained in the custody of these entities.
| Note 5 | Distribution Plans |
The Trust has entered into distribution agreements with AXA Distributors, LLC (“AXA Distributors” or the “Distributor”), an indirect wholly-owned subsidiary of AXA Equitable and an affiliate of FMG LLC, pursuant to which the Distributor serves as the principal underwriter of the Class IA, Class IB and Class K shares of the Trust. The Trust has adopted in the manner prescribed under Rule 12b-1 under the 1940 Act a plan of distribution pertaining to each of Class IA and Class IB shares of the Trust (“Distribution Plans”). The Distribution Plans provide that the Distributor will be entitled to receive a maximum distribution fee at the annual rate of 0.25% of the average daily net assets attributable to the Trust’s Class IA and Class IB shares for which it provides service.
| Note 6 | Expense Limitation |
FMG LLC has contractually agreed to limit the expenses of certain Portfolios (exclusive of taxes, interest, brokerage commissions, capitalized expenses, fees and expenses of other investment companies in which a Portfolio invests and extraordinary expenses) through April 30, 2015 (unless the Board consents to an earlier revision or termination of this arrangement) (“Expense Limitation Agreement”), pursuant to which FMG LLC has agreed to waive or limit its fees and to assume other expenses so that the total annual operating expenses do not exceed the following annual rates:
Portfolio: | Maximum Annual Operating Expense Limit | |||||||||||
| Class K | Class IA+ | Class IB+ | ||||||||||
EQ/Core Bond Index | 0.47 | % | 0.72 | % | 0.72 | % | ||||||
| + | Includes amounts payable pursuant to Rule 12b-1 of the Investment Company Act of 1940. |
FMG LLC first waives its management fees, then waives its administration fees, and then reimburses the Portfolio’s expenses out of its own resources. Each Portfolio may at a later date reimburse to FMG LLC the management fees waived or other expenses assumed and paid for by FMG LLC pursuant to the Expense Limitation Agreement within the prior three fiscal years, provided such Portfolio has reached a sufficient asset size to permit such reimbursement to be made without causing the total annual expense ratio of each Portfolio to exceed the percentage limits mentioned above for the respective period. Consequently, no reimbursement by a Portfolio will be made unless: (i) the Portfolio’s total annual expense ratio is less than the respective percentages stated above for the respective period; and (ii) the payment of such reimbursement has been approved by the Board. Any reimbursement, called recoupment fees on the Statement of Operations, will be based on the earliest fees waived or assumed by FMG LLC. During the year ended December 31, 2014, FMG LLC received total recoupments of $1,608,273 from Portfolios of the Trust not included in these financial statements.
At December 31, 2014, under the Expense Limitation Agreement, none of the Portfolios presented in these financial statements had amounts recoverable.
| Note 7 | Percentage of Ownership by Affiliates |
Shares of the Portfolios may be held as underlying investments by the AXA Strategy Portfolios, Portfolios of the Trust not presented in these financial statements, and the AXA Allocation Portfolios, the Charter Allocation Portfolios and the Target Allocation Portfolios of the AXA Premier VIP Trust, a separate registered investment company managed by FMG LLC. The following tables represent the percentage of ownership that each of the AXA Strategy Portfolios, AXA Allocation Portfolios, Charter Allocation Portfolios and Target Allocation Portfolios has in each respective Portfolio’s net assets as of December 31, 2014.
81
Table of Contents
EQ ADVISORS TRUST
NOTES TO FINANCIAL STATEMENTS (Continued)
December 31, 2014
Portfolio: | AXA Ultra Conservative Strategy | AXA Conservative Strategy | AXA Conservative Growth Strategy | AXA Balanced Strategy | AXA Moderate Growth Strategy | AXA Growth Strategy | AXA Aggressive Strategy | |||||||||||||||||||||
EQ/Core Bond Index | — | % | 2.69 | % | 3.58 | % | 6.68 | % | 11.33 | % | 4.56 | % | 1.40 | % | ||||||||||||||
Portfolio: | AXA Conservative Allocation | AXA Conservative- Plus Allocation | AXA Moderate Allocation | AXA Moderate- Plus Allocation | AXA Aggressive Allocation | |||||||||||||||
EQ/Core Bond Index | 4.68 | % | 3.68 | % | 18.01 | % | 12.14 | % | 1.22 | % | ||||||||||
Portfolio: | CharterSM Fixed Income | CharterSM Conservative | CharterSM Moderate | CharterSM Moderate Growth | CharterSM Growth | CharterSM Aggressive Growth | CharterSM Equity | CharterSM Inter- national Conservative | CharterSM Inter- national Moderate | CharterSM Inter- national Growth | ||||||||||||||||||||||||||||||
EQ/Core Bond Index | — | %# | — | % | — | % | — | % | — | % | — | % | — | % | — | % | — | % | — | % | ||||||||||||||||||||
Portfolios: | CharterSM Income Strategies | CharterSM Interest Rate Strategies | CharterSM Multi- Sector Bond | CharterSM Real Assets | CharterSM Small Cap Growth | CharterSM Small Cap Value | CharterSM Alternative 100 Conservative Plus | CharterSM Alternative 100 Moderate | CharterSM Alternative 100 Growth | |||||||||||||||||||||||||||
EQ/Core Bond Index | — | %# | — | % | 1.85 | % | — | % | — | % | — | % | — | % | — | % | — | % | ||||||||||||||||||
| # | Percentage of ownership is less than 0.005%. |
Portfolio: | Target 2015 Allocation | Target 2025 Allocation | Target 2035 Allocation | Target 2045 Allocation | ||||||||||||
EQ/Core Bond Index | 0.20 | % | 0.20 | % | 0.08 | % | 0.03 | % | ||||||||
| Note 8 | Substitution, Reorganization and In-Kind Transactions |
The following transactions occurred during 2013.
At a meeting held on March 5-6, 2013, the Board approved a redemption in-kind from the Portfolios listed below and a subscription in-kind to EQ/Core Bond Index Portfolio (“CBI”). On July 29, 2013, shareholders of the Portfolios listed below redeemed shares through an in-kind redemption of securities and currency and contributed the securities and currency to CBI. Valuation of these securities at the time of the redemption and subscription in-kind was in accordance with the Portfolios’ valuation policy. For U.S. GAAP purposes, the transaction was treated as a sale on the date of the redemption in-kind and the resulting gains based on values of the securities are listed in the table below.
Portfolios: | Value of securities and currency transferred | Realized Gain/(Loss) | ||||||
EQ/Global Bond PLUS Portfolio (b) | $ | 436,410,664 | $ | 8,530,145 | ||||
CharterSM Multi-Sector Bond Portfolio (formerly Multimanager Multi-Sector Bond Portfolio) (a) | 615,687,112 | 13,632,691 | ||||||
|
| |||||||
Total | $ | 1,052,097,776 | ||||||
|
| |||||||
(a) A Portfolio of AXA Premier VIP Trust.
(b) A Portfolio of the Trust not presented in these financial statements
The realized gain is recorded in Net Realized Gain on Investments on the redeeming Portfolios’ Statement of Operations. For tax purposes, the gain is not recognized by the redeeming Portfolios.
82
Table of Contents
EQ ADVISORS TRUST
NOTES TO FINANCIAL STATEMENTS (Continued)
December 31, 2014
Additionally, the value of securities redeemed in-kind and contributed in-kind is excluded from the respective Portfolios’ portfolio turnover calculation and excluded from cost of purchases and net proceeds of sales and redemptions.
At a meeting held on April 10, 2014, shareholders approved the conversion of CharterSM Multi-Sector Bond Portfolio (“CMSB”), known at the time as Multimanager Multi-Sector Bond Portfolio, a portfolio of the AXA Premier VIP Trust, into a fund-of-funds structure. The conversion was effected on April 21, 2014.
Simultaneous with the conversion, there was a redemption in-kind by certain of the AXA Allocation Portfolios, Charter Allocation Portfolios and Target Allocation Portfolios (“Allocation Portfolios”) from Class K of CMSB. The redeeming Portfolios then contributed in-kind the securities and currency received from CMSB to EQ/Core Bond Index Portfolio, EQ/High Yield Bond Portfolio and EQ/Quality Bond PLUS Portfolio and received Class K shares of those Portfolios. Valuation of the securities and currency transferred was as of April 17, 2014 and was in accordance with the Portfolios’ valuation policy.
For U.S. GAAP and tax purposes, the transaction was treated as a sale on the conversion date. The resulting gain/loss based on the values of the securities and currency transferred are listed in the table below. The realized gain/loss is recorded in Net Realized Gain on Investments on the redeeming Portfolios’ Statements of Operations.
Portfolios: | Value of CMSB Class K Shares redeemed | Realized Gain/(Loss) | ||||||
AXA Conservative Allocation (a) | $ | 25,198,613 | $ | 2,856,825 | ||||
AXA Conservative-Plus Allocation (a) | 15,600,690 | (7,021,295 | ) | |||||
AXA Moderate Allocation (a) | 96,245,638 | (34,377,656 | ) | |||||
AXA Moderate-Plus Allocation (a) | 55,612,304 | 710,626 | ||||||
AXA Aggressive Allocation (a) | 5,243,368 | 78,459 | ||||||
CharterSM Fixed Income (a) | 192,563 | (5,371 | ) | |||||
CharterSM Income Strategies (a) | 378,596 | (9,201 | ) | |||||
Target 2015 Allocation (a) | 10,246,723 | (256,012 | ) | |||||
Target 2025 Allocation (a) | 9,305,296 | (344,756 | ) | |||||
Target 2035 Allocation (a) | 4,058,985 | (68,789 | ) | |||||
Target 2045 Allocation (a) | 955,638 | (21,452 | ) | |||||
| (a) | A portfolio of the AXA Premier VIP Trust. |
The value of the securities and currency contributed in–kind by the Allocation Portfolios to the EQ/Core Bond Index Portfolio and the corresponding Class K shares issued by those Portfolios was as follows:
Portfolio: | Class K Shares Issued to Allocation Portfolios | Value of securities and currency transferred by Allocation Funds | ||||||
EQ/Core Bond Index | 14,728,410 | $ | 146,930,927 | |||||
The value of shares redeemed in-kind and securities and currency contributed in-kind is excluded from the respective Portfolios’ portfolio turnover calculation and excluded from cost of purchases and net proceeds of sales and redemptions.
At the date of the conversion, CMSB transferred securities and currency to the AXA Allocation Funds in relation to the redemption in-kind. CMSB then transferred its remaining securities and currency into EQ/Core Bond Index Portfolio, in exchange for Class K shares of those portfolios. Valuation of these securities transferred was as of April 17, 2014 and in accordance with the Portfolios’ valuation policy.
83
Table of Contents
EQ ADVISORS TRUST
NOTES TO FINANCIAL STATEMENTS (Continued)
December 31, 2014
The redemption in-kind by the Allocation Portfolios from CMSB was treated as a sale for U.S. GAAP purposes. CMSB recognized a gain of $4,056,345 based on the value of the securities and currency transferred of $223,038,414 on the date of the conversion. The realized gain is recorded in Net Realized Gain on Investments on CMSB’s Statement of Operations. For tax purposes, the gain is not recognized by the Portfolio.
The contribution in-kind to the EQ/Core Bond Index Portfolio was treated as a sale for U.S. GAAP purposes and accomplished through a taxable transfer. CMSB recognized a gain of $4,556,918 based on the value of the securities and currency transferred of $250,562,433 on the date of the conversion. The realized gain is recognized in Net Realized Gain on Investments on CMSB’s Statement of Operations. The value of the securities and currency contributed in-kind by CMSB to the EQ/Core Bond Index Portfolio and the corresponding Class K shares issued by this Portfolio was as follows:
Portfolio: | Class K Shares Issued to CMSB | Value of securities and currency transferred by CMSB | ||||||
EQ/Core Bond Index | 16,545,151 | $ | 165,054,782 | |||||
The value of securities and currency transferred by CMSB to Allocation Portfolios and EQ/Core Bond Index Portfolio is excluded from the respective Portfolios’ portfolio turnover calculation and excluded from cost of purchases and net proceeds of sales and redemptions.
| Note 9 | Subsequent Events |
The Manager evaluated subsequent events from December 31, 2014, the date of these financial statements, through the date these financial statements were issued and available. The subsequent events include the following:
| Note 10 | Pending Legal Proceedings |
In July 2011, a lawsuit was filed in the United States District Court for the District of New Jersey, entitled Mary Ann Sivolella v. AXA Equitable Life Insurance Company and AXA Equitable Funds Management Group, LLC (“Sivolella Litigation”). The lawsuit was filed derivatively on behalf of eight Portfolios of the Trust: EQ/Common Stock Index Portfolio; EQ/Equity Growth PLUS Portfolio; EQ/Equity 500 Index Portfolio; AXA Large Cap Value Managed Volatility Portfolio; AXA Global Equity Managed Volatility Portfolio; AXA Mid Cap Value Managed Volatility Portfolio; EQ/Intermediate Government Bond Index Portfolio; and EQ/GAMCO Small Company Value Portfolio (the “Sivolella Portfolios”). Note, in June 2014, the EQ/Equity Growth PLUS Portfolio was reorganized into the AXA Large Cap Growth Managed Volatility Portfolio. Of the Portfolios involved in the lawsuits, only EQ/Common Stock Index is presented in these financial statements. The lawsuit seeks recovery under Section 36(b) of the 1940 Act, for alleged excessive fees paid to FMG LLC and AXA Equitable (the “Defendants”) for investment management services. The Plaintiff seeks recovery of the alleged overpayments, or alternatively, rescission of the contracts and restitution of all fees paid, interest, costs, and fees. In October 2011, FMG LLC and AXA Equitable filed a motion to dismiss the complaint. In November 2011, the Plaintiff filed an Amended Complaint seeking the same relief, but adding new claims under: (1) Section 26(f) of the 1940 Act alleging that the variable annuity contracts sold by the Defendants charged excessive management fees, and seeking restitution and rescission of those contracts under Section 47(b) of the 1940 Act; and (2) a claim for unjust enrichment. The Defendants filed a motion to dismiss the Amended Complaint in December 2011. In May 2012, Plaintiff voluntarily dismissed the Section 26(f) claim seeking restitution and rescission under Section 47(b). In September 2012, the United States District Court for the District of New Jersey denied the motion to dismiss the Amended Complaint as it related to the Section 36(b) claim and granted the motion to dismiss as it related to the unjust enrichment claim.
In January 2013, a second lawsuit against FMG LLC was filed in the United States District Court for the District of New Jersey by a group of plaintiffs asserting substantially similar claims under Section 36(b) and seeking substantially similar damages as in the Sivolella Litigation. The lawsuit,
84
Table of Contents
EQ ADVISORS TRUST
NOTES TO FINANCIAL STATEMENTS (Continued)
December 31, 2014
entitled Glenn D. Sanford, et al. v. AXA Equitable Funds Management Group, LLC (“Sanford Litigation”), was filed derivatively on behalf of the EQ/PIMCO Ultra Short Bond Portfolio, the EQ/ T. Rowe Price Growth Stock Portfolio, the EQ/Global Bond PLUS Portfolio, and the EQ/Core Bond Index Portfolio, in addition to four of the Sivolella Portfolios. In light of the similarities of the allegations in the Sivolella and Sanford Litigations, the parties and Court agreed to consolidate the two lawsuits.
In April 2013, the Plaintiffs in the Sivolella and Sanford Litigations amended the complaints to add additional claims under Section 36(b) of the 1940 Act for recovery of alleged excessive fees paid to FMG LLC in its capacity as the Administrator of the Trust. The Plaintiffs seek recovery of the alleged overpayments, or alternatively, rescission of the contract and restitution of the excessive fees paid, interest, costs, and fees. In January 2015, Defendants filed a motion for summary judgement as well as various motions to strike certain of the Plaintiffs’ experts in the Sivolella and Sanford Litigations. Also in January 2015, two Plaintiffs in the Sanford Litigation filed a motion for partial summary judgement relating to the EQ/Core Bond Index Portfolio as well as motions in limine to bar admission of certain documents and preclude the testimony of one of Defendants’ experts.
No liability for litigation relating to these matters have been accrued in the financial statements of the Portfolios because any potential damages would be the responsibility of the Defendants.
On November 1, 2010, the Trust and AXA Premier VIP Trust, and several of their respective portfolios, were named as defendants and putative members of the proposed defendant class of shareholders in a lawsuit brought by The Official Committee of Unsecured Creditors of Tribune Company (the “Committee”) in the United States Bankruptcy Court for the District of Delaware regarding Tribune Company’s Chapter 11 bankruptcy proceeding (In re Tribune Company). The lawsuit relates to amounts paid to the Trust and AXA Premier VIP Trust, and several of their respective portfolios, as holders of publicly-traded shares of Tribune Company, which were components of certain broad-based securities market indices, for which there were public tender offers during 2007. The suit seeks return of the share price received by Tribune Company shareholders in the tender offers plus interest and attorneys’ fees and expenses.
On July 1, 2011, retiree participants in certain Tribune-defined compensation plans (the “Retirees”) initiated a lawsuit in the United States District Court for the Southern District of New York against certain Tribune Company shareholders who sold their shares as part of the 2007 public tender offers (the “Retiree Suit”). This Retiree Suit also seeks return of the share price received by Tribune Company shareholders in connection with the tender offers plus interest and attorneys’ fees and expenses.
On August 24, 2011, the trustees of certain trusts that hold notes issued by Tribune Company (the “Noteholders”) initiated a separate lawsuit in the United States District Court for the Southern District of New York against certain Tribune Company shareholders who sold their shares as part of the 2007 public tender offers (the “Noteholder Suit”). This Noteholder Suit also seeks return of the share price received by Tribune Company shareholders in connection with the tender offers plus interest and attorneys’ fees and expenses.
The Committee’s suit, the Retiree Suit, and the Noteholder Suit have each been consolidated with a number of related lawsuits filed by the Noteholders and Retirees around the United States into a single multi-district litigation proceeding now pending in the United States District Court for the Southern District of New York (In re: Tribune Company Fraudulent Conveyance Litigation).
With respect to the Trust, the EQ/Equity 500 Index Portfolio, the EQ/GAMCO Mergers and Acquisitions Portfolio and the AXA Mid Cap Value Managed Volatility Portfolio are named as defendants in the Noteholder Suit and the Retiree Suit. The EQ/Equity 500 Index Portfolio, the EQ/GAMCO Mergers and Acquisitions Portfolio, the AXA Mid Cap Value Managed Volatility Portfolio, the AXA Large Cap Core Managed Volatility Portfolio, the EQ/Small Company Index II Portfolio, the EQ/Common Stock Index II Portfolio, AXA Large Cap Value Managed Volatility
85
Table of Contents
EQ ADVISORS TRUST
NOTES TO FINANCIAL STATEMENTS (Continued)
December 31, 2014
Portfolio, and EQ Advisors Trust are all putative members of the proposed defendant class of shareholders in the Committee’s suit. The EQ/Equity 500 Index Portfolio, the EQ/GAMCO Mergers and Acquisition Portfolio, the AXA Large Cap Core Managed Volatility Portfolio, and EQ Advisors Trust are also named separately in the Committee’s suit, in the event it is not certified as a class action. The amounts paid to the above seven portfolios in connection with the public tender offers were approximately: (i) the EQ/Equity 500 Index Portfolio — $1,740,800; (ii) the EQ/GAMCO Mergers and Acquisitions Portfolio — $1,122,000; (iii) the AXA Mid Cap Value Managed Volatility Portfolio — $2,992,000; (iv) the Multimanager Large Cap Core Equity Portfolio (now called AXA Large Cap Core Managed Volatility Portfolio) — $1,832,600; (v) the EQ/Small Company Index II Portfolio — $61,200; (vi) the EQ/Common Stock Index II Portfolio — $18,360 and (vii) the Multimanager Large Cap Value Portfolio (now called AXA Large Cap Value Managed Volatility Portfolio) - $3,359,200.
The lawsuits do not allege any misconduct by the Trust or its Portfolios. Motions to dismiss the suits filed by the Noteholders and the Retirees based on certain limited defenses are currently pending before the United States District Court for the Southern District of New York. The portfolios cannot predict the outcome of these lawsuits. If the lawsuits were to be decided or settled in a manner adverse to the portfolios, the payment of such judgments or settlements could have an adverse effect on each portfolio’s net asset value. However, no liability for litigation relating to this matter has been accrued in the financial statements of the Portfolios, as the Manager believes a loss is not probable.
86
Table of Contents
Report of Independent Registered Public Accounting Firm
To the Board of Trustees and Shareholders of EQ Advisors Trust
In our opinion, the accompanying statements of assets and liabilities, including the portfolios of investments, and the related statements of operations and of changes in net assets and the financial highlights present fairly, in all material respects, the financial position of each of the portfolios of EQ Advisors Trust listed in the Table of Contents to the Annual Report in which these financial statements appear (collectively referred to as the “Trust”) at December 31, 2014, and the results of each of their operations, the changes in each of their net assets and the financial highlights for each of the periods presented, in conformity with accounting principles generally accepted in the United States of America. These financial statements and financial highlights (hereafter referred to as “financial statements”) are the responsibility of the Trust’s management. Our responsibility is to express an opinion on these financial statements based on our audits. We conducted our audits of these financial statements in accordance with the standards of the Public Company Accounting Oversight Board (United States). Those standards require that we plan and perform the audit to obtain reasonable assurance about whether the financial statements are free of material misstatement. An audit includes examining, on a test basis, evidence supporting the amounts and disclosures in the financial statements, assessing the accounting principles used and significant estimates made by management, and evaluating the overall financial statement presentation. We believe that our audits, which included confirmation of securities at December 31, 2014 by correspondence with the custodian, transfer agents and brokers, provide a reasonable basis for our opinion.
PricewaterhouseCoopers LLP
New York, New York
February 19, 2015
87
Table of Contents
APPROVALS OF INVESTMENT MANAGEMENT AND INVESTMENT ADVISORY AGREEMENTS DURING THE SIX-MONTH PERIOD ENDED DECEMBER 31, 2014 (UNAUDITED)
At a meeting held on July 14-16, 2014, the Board of Trustees (the “Board”) of EQ Advisors Trust (the “Trust”), including those Trustees who are not parties to any Agreement (as defined below) or “interested persons” (as that term is defined in the Investment Company Act of 1940, as amended) of such parties or the Trust (the “Independent Trustees”), considered and unanimously approved the renewal of the Investment Management Agreements (the “Management Agreements”) with AXA Equitable Funds Management Group, LLC (“FMG LLC” or the “Manager”) and the renewal of the Investment Advisory Agreement(s) (each, an “Advisory Agreement” and together with the Management Agreements, the “Agreements”) with each investment sub-adviser (an “Adviser”) as shown in the table below with respect to the Portfolio(s) listed.
Portfolios | Agreement(s) Renewed by the Trust’s Board with respect to the Portfolio(s) | |
All Asset Aggressive-Alt 25 Portfolio All Asset Growth-Alt 20 Portfolio All Asset Moderate Growth-Alt 15 Portfolio (collectively, the “All Asset Allocation Portfolios”)
AXA Aggressive Strategy Portfolio AXA Balanced Strategy Portfolio AXA Conservative Growth Strategy Portfolio AXA Conservative Strategy Portfolio AXA Growth Strategy Portfolio AXA Moderate Growth Strategy Portfolio AXA Ultra Conservative Strategy Portfolio (collectively, the “Strategic Allocation Portfolios”)
AXA/Franklin Templeton Allocation Managed Volatility Portfolio (formerly EQ/Franklin Templeton Allocation Portfolio) EQ/International ETF Portfolio | Management Agreement with FMG LLC | |
ATM International Managed Volatility Portfolio (formerly ATM International Portfolio) ATM Large Cap Managed Volatility Portfolio (formerly ATM Large Cap Portfolio) ATM Mid Cap Managed Volatility Portfolio (formerly ATM Mid Cap Portfolio) ATM Small Cap Managed Volatility Portfolio (formerly ATM Small Cap Portfolio) AXA 400 Managed Volatility Portfolio (formerly AXA Tactical Manager 400 Portfolio) AXA 500 Managed Volatility Portfolio (formerly AXA Tactical Manager 500 Portfolio) AXA 2000 Managed Volatility Portfolio (formerly AXA Tactical Manager 2000 Portfolio) AXA International Managed Volatility Portfolio (formerly AXA Tactical Manager International Portfolio) (collectively, the “AXA Tactical Manager Portfolios”) | Management Agreement with FMG LLC Advisory Agreement with AllianceBernstein L.P. (“AllianceBernstein”) Advisory Agreement with BlackRock Investment Management, LLC (“BlackRock”) | |
88
Table of Contents
Portfolios | Agreement(s) Renewed by the Trust’s Board with respect to the Portfolio(s) | |
AXA/Franklin Ba lanced Managed Volatility Portfolio (formerly EQ/Franklin Core Balanced Portfolio) | Management Agreement with FMG LLC Advisory Agreement with BlackRock Advisory Agreement with Franklin Advisers, Inc. (“Franklin Advisers”) | |
AXA/Franklin Small Cap Value Managed Volatility Portfolio (formerly EQ/AXA Franklin Small Cap Value Core Portfolio) | Management Agreement with FMG LLC Advisory Agreement with BlackRock Advisory Agreement with Franklin Advisory Services, LLC | |
AXA Global Equity Managed Volatility Portfolio (formerly EQ/Global Multi-Sector Equity Portfolio) | Management Agreement with FMG LLC Advisory Agreement with BlackRock Advisory Agreement with Morgan Stanley Investment Management Inc. (“Morgan Stanley”) Advisory Agreement with OppenheimerFunds, Inc. (“OppenheimerFunds”) | |
AXA International Core Managed Volatility Portfolio (formerly EQ/International Core PLUS Portfolio) | Management Agreement with FMG LLC Advisory Agreement with BlackRock Advisory Agreement with EARNEST Partners, LLC (“EARNEST”) Advisory Agreement with Massachusetts Financial Services Company (dba MFS Investment Management) (“MFS Investment Management”) Advisory Agreement with WHV Investment Management and Hirayama Investments, LLC | |
AXA International Value Managed Volatility Portfolio (formerly EQ/International Value PLUS Portfolio) | Management Agreement with FMG LLC Advisory Agreement with BlackRock Advisory Agreement with Northern Cross, LLC | |
AXA Large Cap Core Managed Volatility Portfolio (formerly EQ/Large Cap Core PLUS Portfolio) | Management Agreement with FMG LLC Advisory Agreement with BlackRock Advisory Agreement with Capital Guardian Trust Company (“Capital Guardian”) Advisory Agreement with Institutional Capital LLC Advisory Agreement with Thornburg Investment Management, Inc. | |
AXA Large Cap Growth Managed Volatility Portfolio (formerly EQ/Large Cap Growth PLUS Portfolio) | Management Agreement with FMG LLC Advisory Agreement with BlackRock Advisory Agreement with Marsico Capital Management, LLC (“Marsico”) Advisory Agreement with T. Rowe Price Associates, Inc. (“T. Rowe”) Advisory Agreement with Wells Capital Management Inc. (“Wells Capital”) | |
AXA Large Cap Value Managed Volatility Portfolio (formerly EQ/Large Cap Value PLUS Portfolio) | Management Agreement with FMG LLC Advisory Agreement with AllianceBernstein Advisory Agreement with BlackRock Advisory Agreement with MFS Investment Management | |
AXA Mid Cap Value Managed Volatility Portfolio (formerly EQ/Mid Cap Value PLUS Portfolio) | Management Agreement with FMG LLC Advisory Agreement with BlackRock Advisory Agreement with Diamond Hill Capital Management, Inc. (“Diamond Hill”) Advisory Agreement with Wellington Management Company, LLP (“Wellington”) | |
89
Table of Contents
Portfolios | Agreement(s) Renewed by the Trust’s Board with respect to the Portfolio(s) | |
AXA/Mutual Large Cap Equity Managed Volatility Portfolio (formerly EQ/Mutual Large Cap Equity Portfolio) | Management Agreement with FMG LLC Advisory Agreement with BlackRock Advisory Agreement with Franklin Mutual Advisers, LLC | |
AXA/Templeton Global Equity Managed Volatility Portfolio (formerly EQ/Templeton Global Equity Portfolio) | Management Agreement with FMG LLC Advisory Agreement with BlackRock Advisory Agreement with Templeton Investment Counsel LLC | |
AXA/Loomis Sayles Growth Portfolio (formerly EQ/Montag & Caldwell Growth Portfolio) | Management Agreement with FMG LLC | |
EQ/AllianceBernstein Dynamic Wealth Strategies Portfolio EQ/AllianceBernstein Short Duration Government Bond Portfolio EQ/AllianceBernstein Small Cap Growth Portfolio EQ/Common Stock Index Portfolio EQ/Equity 500 Index Portfolio EQ/International Equity Index Portfolio EQ/Large Cap Growth Index Portfolio EQ/Small Company Index Portfolio | Management Agreement with FMG LLC Advisory Agreement with AllianceBernstein | |
EQ/BlackRock Basic Value Equity Portfolio | Management Agreement with FMG LLC Advisory Agreement with BlackRock | |
EQ/Boston Advisors Equity Income Portfolio | Management Agreement with FMG LLC Advisory Agreement with Boston Advisors LLC | |
EQ/Calvert Socially Responsible Portfolio | Management Agreement with FMG LLC Advisory Agreement with Calvert Investment Management, Inc. | |
EQ/Capital Guardian Research Portfolio | Management Agreement with FMG LLC Advisory Agreement with Capital Guardian | |
EQ/Core Bond Index Portfolio EQ/Intermediate Government Bond Portfolio EQ/Large Cap Value Index Portfolio EQ/Mid Cap Index Portfolio | Management Agreement with FMG LLC Advisory Agreement with SSgA Funds Management, Inc. (“SSgA”) | |
EQ/Emerging Markets Equity PLUS Portfolio | Management Agreement with FMG LLC Advisory Agreement with AllianceBernstein Advisory Agreement with EARNEST | |
EQ/GAMCO Mergers and Acquisitions Portfolio EQ/GAMCO Small Company Value Portfolio | Management Agreement with FMG LLC Advisory Agreement with GAMCO Asset Management, Inc. | |
EQ/Global Bond PLUS Portfolio | Management Agreement with FMG LLC Advisory Agreement with BlackRock Advisory Agreement with Wells Capital and First International Advisors | |
EQ/High Yield Bond Portfolio | Management Agreement with FMG LLC Advisory Agreement with AXA Investment Managers Inc. Advisory Agreement with Post Advisory Group, LLC | |
EQ/Invesco Comstock Portfolio | Management Agreement with FMG LLC Advisory Agreement with Invesco Advisers, Inc. | |
90
Table of Contents
Portfolios | Agreement(s) Renewed by the Trust’s Board with respect to the Portfolio(s) | |
EQ/JPMorgan Value Opportunities Portfolio | Management Agreement with FMG LLC Advisory Agreement with J.P. Morgan Investment Management Inc. | |
EQ/MFS International Growth Portfolio | Management Agreement with FMG LLC Advisory Agreement with MFS Investment Management | |
EQ/Money Market Portfolio | Management Agreement with FMG LLC Advisory Agreement with The Dreyfus Corporation | |
EQ/Morgan Stanley Mid Cap Growth Portfolio | Management Agreement with FMG LLC Advisory Agreement with Morgan Stanley | |
EQ/Natural Resources PLUS Portfolio | Management Agreement with FMG LLC Advisory Agreement with AllianceBernstein Advisory Agreement with RBC Global Asset Management (U.S.) Inc. | |
EQ/Oppenheimer Global Portfolio | Management Agreement with FMG LLC Advisory Agreement with OppenheimerFunds | |
EQ/PIMCO Global Real Return Portfolio EQ/PIMCO Ultra Short Bond Portfolio | Management Agreement with FMG LLC Advisory Agreement with Pacific Investment Management Company (“PIMCO”) | |
EQ/Quality Bond PLUS Portfolio | Management Agreement with FMG LLC Advisory Agreement with AllianceBernstein Advisory Agreement with PIMCO | |
EQ/Real Estate PLUS Portfolio | Management Agreement with FMG LLC Advisory Agreement with AllianceBernstein Advisory Agreement with PIMCO | |
EQ/T. Rowe Price Growth Stock Portfolio | Management Agreement with FMG LLC Advisory Agreement with T. Rowe | |
EQ/UBS Growth and Income Portfolio | Management Agreement with FMG LLC Advisory Agreement with UBS Global Asset Management (Americas) Inc. | |
EQ/Wells Fargo Omega Growth Portfolio | Management Agreement with FMG LLC Advisory Agreement with Wells Capital | |
Multimanager Aggressive Equity Portfolio | Management Agreement with FMG LLC Advisory Agreement with AllianceBernstein Advisory Agreement with ClearBridge Investments, LLC Advisory Agreement with Marsico Advisory Agreement with Scotia Institutional Asset Management US, Ltd. Advisory Agreement with T. Rowe Advisory Agreement with Westfield Capital Management Company, L.P. | |
Multimanager Core Bond Portfolio | Management Agreement with FMG LLC Advisory Agreement with BlackRock Financial Management, Inc. Advisory Agreement with PIMCO Advisory Agreement with SsgA | |
91
Table of Contents
Portfolios | Agreement(s) Renewed by the Trust’s Board with respect to the Portfolio(s) | |
Multimanager Mid Cap Growth Portfolio | Management Agreement with FMG LLC Advisory Agreement with AllianceBernstein Advisory Agreement with BlackRock Advisory Agreement with Franklin Advisers Advisory Agreement with Wellington | |
Multimanager Mid Cap Value Portfolio | Management Agreement with FMG LLC Advisory Agreement with BlackRock Advisory Agreement with Diamond Hill Advisory Agreement with Knightsbridge Asset Management, LLC Advisory Agreement with Lord, Abbett & Co. Inc. | |
Multimanager Technology Portfolio | Management Agreement with FMG LLC Advisory Agreement with Allianz Global Investors U.S. Advisory Agreement with SSgA Advisory Agreement with Wellington | |
In reaching its decision to renew the Agreement(s) with respect to each Portfolio, the Board considered the overall fairness of the Agreement and whether the Agreement was in the best interests of the Portfolio and its investors. The Board further considered all factors it deemed relevant with respect to each Portfolio, including: (1) the nature, quality and extent of the overall services to be provided to the Portfolio by the Manager, the relevant Adviser(s) and, where applicable, their respective affiliates; (2) the investment performance of the Portfolio (and, where applicable, each allocated portion of the Portfolio advised by a different Adviser) on both an absolute and a relative basis; (3) the level of the Portfolio’s management fee and, where applicable, advisory fee and the Portfolio’s expense ratios relative to those of peer funds; (4) the costs of the services to be provided by and the profits to be realized by the Manager and its affiliates from their relationships with the Portfolio; (5) the anticipated effect of growth and size on the Portfolio’s performance and expenses, including any potential economies of scale; and (6) the “fall out” benefits to be realized by the Manager, the relevant Adviser(s) and their respective affiliates (i.e., any direct or indirect benefits to be derived by the Manager, the relevant Adviser(s) and their respective affiliates from their relationships with the Trust). In considering each Agreement, the Board did not identify any single factor or information as all-important or controlling and each Trustee may have attributed different weight to each factor.
In connection with its deliberations, the Board took into account information provided throughout the year at regular and special Board meetings, as well as information provided specifically in connection with the annual renewal process. Information provided and discussed throughout the year included investment performance reports and related financial information for each Portfolio, as well as periodic reports on, among other matters, brokerage allocation and execution; pricing and valuation; and legal, compliance, shareholder and other services provided by the Manager, the relevant Adviser(s) and their respective affiliates; as well as presentations made to the Board by certain Advisers throughout the year. Information provided and discussed specifically in connection with the annual renewal process included a report prepared by Lipper, Inc. (“Lipper”), an independent organization, regarding each Portfolio, as well as additional material prepared by management regarding each Portfolio. Each Portfolio’s Lipper report compared that Portfolio’s expenses with those of other mutual funds (or peers) deemed by Lipper to be comparable to the Portfolio. The additional material prepared by management generally included Portfolio-by-Portfolio information showing each Portfolio’s management fees and, where applicable, advisory fees; expense ratios; expense limitation arrangements; investment performance (including performance information prepared by Lipper); and profitability information, including information regarding the profitability of the Manager’s operations on an overall Trust basis, as well as on a Portfolio-by-Portfolio basis. In addition, for each Portfolio, the Manager and the relevant Adviser(s) provided separate materials describing the Portfolio’s investment performance (including the Portfolio’s performance versus benchmark and peers for various time periods) and the services provided and the fees charged with respect to the Portfolio, and discussing whether the Portfolio had performed as expected over time and other matters. The Manager also provided supplemental comparative fee data for certain Portfolios.
The Independent Trustees met in advance of the meeting at which the Board approved the renewal of the Agreements and in executive sessions during the meeting to review the information provided. Management
92
Table of Contents
representatives attended portions of the executive sessions to review and discuss matters relating to the Agreements and to provide additional information requested by the Independent Trustees. At the meeting and during the portions of the executive sessions attended by management, the Independent Trustees and management engaged in extensive discussions regarding the Agreements. As noted below, as a result of these extensive discussions, the Manager agreed to implement revisions to the administrative fee rate schedules for all of the Portfolios and to limit the total expense ratios for certain of the Portfolios. The Independent Trustees were assisted by independent counsel during the meeting and during their deliberations regarding the Agreements, and also received materials discussing the legal standards applicable to their consideration of the Agreements. In addition, the Independent Trustees reviewed information and met during the year to discuss information relevant to their annual consideration of the Agreements.
Although the Board approved the renewal of the Agreements for all of the Portfolios at the same Board meeting, the Board considered each Portfolio separately. In approving the renewal of the relevant Agreement(s) with respect to each Portfolio, the Board, including the Independent Trustees, determined that the management fee and, where applicable, advisory fee were fair and reasonable and that the renewal of each Agreement was in the best interests of the applicable Portfolio and its investors. Although the Board gave attention to all information provided, the following discusses some of the primary factors that the Board deemed relevant to its decision to renew the Agreements.
Nature, Quality and Extent of Services. The Board evaluated the nature, quality and extent of the overall services to be provided to each Portfolio and its investors by the Manager, the relevant Adviser(s) and, where applicable, their respective affiliates. In addition to the investment performance and expense information discussed below, the Board considered the Manager’s and each relevant Adviser’s responsibilities with respect to each Portfolio and the Manager’s and each relevant Adviser’s experience in serving as an investment adviser for the Portfolio(s) and for portfolios similar to the Portfolio(s) each advises.
With respect to the Manager, the Board considered that the Manager is responsible for, among other things, developing investment strategies for the Portfolios (and the portions thereof); researching, conducting “due diligence” on, selecting and monitoring the Advisers; overseeing the selection of investments for the Portfolios (or the portions thereof) that the Advisers sub-advise; making investment decisions for the Portfolios (or the portions thereof) that it manages directly; monitoring and evaluating the performance of the Portfolios (or the portions thereof); monitoring the investment operations and composition of the Portfolios (or the portions thereof) and, in connection therewith, monitoring compliance with the Portfolios’ investment objectives, policies and restrictions, as well as the Portfolios’ compliance with applicable law; monitoring brokerage selection, commission and other trading costs, quality of execution, and other brokerage matters; coordinating and managing the flow of information and communications relating to the Portfolios among the Advisers and other applicable parties; and implementing Board directives as they relate to the Portfolios. The Board also considered information regarding the Manager’s process for selecting and monitoring the Advisers and its process for making investment decisions for the Portfolios (or portions thereof) that it manages directly, as well as information regarding the backgrounds of the personnel who perform those functions with respect to the Portfolios. The Board also considered that the Manager’s responsibilities include daily monitoring of investment, operational, enterprise, legal, regulatory and compliance risks as they relate to the Portfolios, and considered information regarding the Manager’s ongoing risk management activities.
With respect to the Advisers, the Board considered that each Adviser is responsible for making investment decisions for the Portfolio(s) (or the portion(s) thereof) that it sub-advises, subject to the oversight of the Manager; placing with brokers or dealers all orders for the purchase and sale of investments for the Portfolio(s) (or the portion(s) thereof) that it sub-advises; and performing certain related administrative functions. The Board also reviewed information regarding each Adviser’s process for selecting investments for the Portfolio(s) (or the portion(s) thereof) that it sub-advises, as well as information regarding the background of each of the Adviser’s portfolio managers who provide services to the Portfolios.
The Board also considered, among other factors, periodic reports provided to the Board regarding the services provided by the Manager, the Advisers and, where applicable, their affiliates. In addition, the Board considered the allocation of Portfolio brokerage, including allocations to brokers affiliated with the Manager or an Adviser, the use of brokerage commission recapture arrangements to pay Portfolio expenses, and the use of “soft” commission dollars to pay for research services. In this regard, the Board also considered the Manager’s and each Adviser’s trading experience, including its policies, processes and procedures aimed at achieving “best execution” on behalf of
93
Table of Contents
a Portfolio, including a report by an independent portfolio trading analytical firm. The Board also considered the Portfolios’ Chief Compliance Officer’s evaluation of the Manager’s and each Adviser’s compliance programs, policies, and procedures. In addition, the Board considered whether there were any pending lawsuits, enforcement proceedings or regulatory investigations involving the Manager and the Advisers and reviewed information regarding the Manager’s and each Adviser’s financial condition and history of operations and conflicts of interest in managing the Portfolios.
The Board also considered the benefits to investors from participation in an FMG LLC-sponsored mutual fund, including the benefits of investing in a fund that is part of a large family of funds offering a wide range of portfolios, advisers and investment styles. In addition, the Board considered the nature, quality and extent of the administrative, investor servicing and distribution services that the Manager and its affiliates provide to the Portfolios and their shareholders. The Board also noted that, throughout the past year, the Manager and its affiliates had continued or undertaken initiatives intended to improve various aspects of the Trust’s operations and investors’ experience with the FMG LLC-sponsored mutual funds.
The Board also considered strategic and other actions taken by the Manager in response to recent events within the mutual fund industry, including actions taken in response to financial regulatory reform and other regulatory initiatives, as well as other developments within the mutual fund industry. The Board also considered strategic and other actions taken by the Manager and the Advisers in response to recent market conditions and considered the overall performance of the Manager and the Advisers in this context.
Based on its review, the Board determined, with respect to each Portfolio, that the nature, quality and extent of the overall services provided by the Manager, the relevant Adviser(s) and, where applicable, their respective affiliates were appropriate for the Portfolio in light of its investment objectives and, thus, supported a decision to approve the renewal of the Agreement(s).
Investment Performance. The Board took into account discussions with the Manager and the relevant Adviser(s) about Portfolio investment performance that occur at Board meetings throughout the year. In this regard, the Board noted that, as part of regularly scheduled Portfolio reviews and other reports to the Board on Portfolio performance, the Board periodically considered information regarding each Portfolio’s short-, intermediate- and long-term performance, as applicable, on both an absolute basis and relative to an appropriate broad-based securities market index (“benchmark”), a peer group of other mutual funds deemed by Lipper to be comparable to the Portfolio (“Lipper peer group”), and/or a custom volatility managed index (“VMI”) developed by the Manager and approved by the Board (which, in the case of certain Portfolios, may be a blended index comprising both broad-based and volatility-managed indexes). The performance information generally included, among other information, annual total returns, average annual total returns, cumulative returns and rolling period total returns. In evaluating the Portfolios’ performance, the Board generally considered long-term performance to be more important than short-term performance.
In addition, the Board received and reviewed information regarding each Portfolio’s performance relative to a benchmark, a Lipper peer group, and/or a VMI for the most recent one-, three-, five- and ten-year periods, as applicable, ended May 31, 2014, as discussed below. The Board noted that this information was provided specifically in connection with the annual renewal process. With respect to the Lipper quartile information, the first quartile comprised the best performers of the peer group and the fourth quartile comprised the worst performers of the peer group. The Board took into account that the Lipper quartile information reflected the investment performance of Class IB shares of each Portfolio, except the ATM Large Cap Managed Volatility, ATM Mid Cap Managed Volatility, ATM Small Cap Managed Volatility, and EQ/International ETF Portfolios, for which the Lipper quartile information reflected the investment performance of Class IA shares, and the ATM International Managed Volatility and EQ/AllianceBernstein Short-Term Bond Portfolios, for which the Lipper quartile information reflected the investment performance of Class K shares. (Except as indicated otherwise, a Portfolio’s performance relative to its benchmark, its Lipper peer group, and/or its VMI, as applicable, is shown for the same class.) The Board also considered that variations in performance among a Portfolio’s operating classes reflect variations in class expenses, which result in lower performance for higher expense classes. The Board factored into its evaluation of each Portfolio’s performance the limitations inherent in Lipper’s methodology for developing and constructing peer groups and determining which mutual funds should be included in which peer groups. While recognizing these inherent limitations, the Board believed the independent analysis conducted by Lipper remained a useful measure of comparative performance.
94
Table of Contents
Fund-of-Funds Portfolios
With respect to the performance of the following Portfolios, the Board considered that each Portfolio operates as a fund-of-funds and invests in a combination of other investment companies (“underlying portfolios”) and recognized, therefore, that each Portfolio’s performance is based, in part, on the total returns of the underlying portfolios in which it invests.
The Board further considered that the underlying portfolios in which each of the Strategic Allocation Portfolios and the AXA/Franklin Templeton Allocation Managed Volatility Portfolio invests may employ a tactical volatility management strategy that is intended to reduce the volatility associated with investing in equity securities and to produce more favorable risk-adjusted returns over extended market cycles. The Board also noted that, for each of the Strategic Allocation Portfolios and the AXA/Franklin Templeton Allocation Managed Volatility Portfolio, the Manager had developed and implemented a custom VMI as, among other things, an additional analytical tool to be used in evaluating the Portfolio’s performance, and considered the Manager’s explanation that a comparison of a Portfolio’s performance solely to that of a non-volatility managed benchmark fails to take into account the impact of an integral part of the investment strategies of the underlying portfolios, particularly during periods of high volatility. Based on the Manager’s explanation of the comparability of the custom VMI to the tactical volatility management strategies that the underlying portfolios may employ, the Board noted that the Manager generally considers a Portfolio’s performance (especially its short-term performance) relative to its VMI to be more indicative than its performance relative to its benchmark. The Board also noted that the funds in each Portfolio’s Lipper peer group may or may not employ a tactical volatility management strategy like that employed by the underlying portfolios in which a Portfolio invests.
The Board evaluated the performance of each Portfolio in this context and also considered the following performance results, which supplemented the performance information provided to the Board throughout the year:
All Asset Aggressive-Alt 25 and All Asset Moderate Growth-Alt 15 Portfolios. The Board noted that each Portfolio had commenced operations on August 29, 2012, and, therefore, had only a short operating history on which to evaluate performance. The Board considered, however, that the All Asset Aggressive-Alt 25 Portfolio’s performance relative to its Lipper peer group was in the third quartile for the one-year period ended May 31, 2014, and that the All Asset Moderate Growth-Alt 15 Portfolio’s performance relative to its Lipper peer group was in the fourth quartile for the one-year period ended May 31, 2014. The Board also considered that each Portfolio had outperformed its benchmark for the one-year period ended May 31, 2014.
All Asset Growth-Alt 20 Portfolio. The Board considered that the Portfolio’s performance relative to its Lipper peer group was in the fourth quartile for the one-, three-, five- and ten-year periods ended May 31, 2014. The Board also considered that the Portfolio had underperformed its benchmark for the three- and ten-year periods ended May 31, 2014, but had outperformed its benchmark for the one- and five-year periods ended on that date.
AXA Aggressive Strategy and AXA Ultra Conservative Strategy Portfolios. The Board noted that the AXA Aggressive Strategy and AXA Ultra Conservative Strategy Portfolios had commenced operations on April 12, 2012 and September 28, 2011, respectively, and, therefore, had only a short operating history on which to evaluate performance. The Board considered, however, that each Portfolio’s performance relative to its Lipper peer group was in the fourth quartile, and that each Portfolio had underperformed its VMI, for the one-year period ended May 31, 2014. With respect to the AXA Ultra Conservative Strategy Portfolio, the Board also considered that the Portfolio is held in connection with insurance company asset transfer programs and may have a small asset base and varying cash flow patterns.
AXA Balanced Strategy and AXA Conservative Growth Strategy Portfolios. The Board considered that the AXA Balanced Strategy Portfolio’s performance relative to its Lipper peer group was in the fourth quartile for the one-, three- and five-year periods ended May 31, 2014, and that the AXA Conservative Growth Strategy Portfolio’s performance relative to its Lipper peer group was in the third quartile for the one-, three- and five-year periods ended May 31, 2014. The Board also considered that each Portfolio had underperformed its VMI for the one-, three- and five-year periods ended May 31, 2014.
AXA Conservative Strategy Portfolio. The Board considered that the Portfolio’s performance relative to its Lipper peer group was in the fourth quartile for the one-, three- and five-year periods ended May 31, 2014. The Board also considered that the Portfolio had underperformed its VMI for the one-, three- and five-year periods ended May 31, 2014, but its performance was only slightly below that of its VMI for the one- and five-year periods.
95
Table of Contents
AXA Growth Strategy and AXA Moderate Growth Strategy Portfolios. The Board considered that the AXA Growth Strategy Portfolio’s performance relative to its Lipper peer group was in the fourth quartile for the three- and five-year periods ended May 31, 2014, and the third quartile for the one-year period ended on that date, and that the AXA Moderate Growth Strategy Portfolio’s performance relative to its Lipper peer group was in the third quartile for the three- and five-year periods ended May 31, 2014, but was in the second quartile for the one-year period ended on that date. The Board also considered that each Portfolio had underperformed its VMI for the one-, three- and five-year periods ended May 31, 2014.
AXA/Franklin Templeton Allocation Managed Volatility Portfolio. The Board considered that the Portfolio’s performance relative to its Lipper peer group was in the second quartile for the three- and five-year periods ended May 31, 2014, and the first quartile for the one-year period ended on that date. The Board also considered that, although the Portfolio had underperformed its VMI for the three- and five-year periods ended May 31, 2014, its performance was only slightly below that of its VMI for the five-year period, and the Portfolio had outperformed its VMI for the one-year period ended on that date.
EQ/International ETF Portfolio. The Board considered that the Portfolio’s performance relative to its Lipper peer group was in the fourth quartile for the three- and five-year periods ended May 31, 2014, but was in the second quartile for the one-year period ended on that date. The Board also considered that the Portfolio had underperformed its benchmark for the one-, three- and five-year periods ended May 31, 2014, but its performance was only slightly below that of its benchmark for the one-year period ended on that date.
The Board and the Manager discussed the performance of each fund-of-funds Portfolio in detail, including whether each Portfolio had performed as expected over time. The Board and the Manager also discussed, where applicable, the reasons for a Portfolio’s underperformance for certain periods relative to its Lipper peer group and/or benchmark and/or VMI, as applicable, and efforts to improve the Portfolio’s performance. Where applicable, the Board also considered steps that the Manager had taken to address a Portfolio’s performance, including any applicable changes to the investment strategies of a Portfolio or to the underlying portfolios in which a Portfolio invests, and the performance results of the Portfolio since the date of such changes. In this regard, the Board noted that performance is only one of the factors that it deems relevant to its consideration of a Portfolio’s Agreement and that, after considering all relevant factors, it can reach a decision to renew an Agreement notwithstanding a Portfolio’s underperformance.
Based on its review and the explanations provided by the Manager regarding the performance of each fund-of-funds Portfolio, the Board determined, with respect to each Portfolio, that the Portfolio and its investors would benefit from the Manager’s continued management of the Portfolio.
AXA Tactical Manager Portfolios
With respect to the performance of the AXA Tactical Manager Portfolios, the Board considered that each Portfolio follows an investment strategy under which the Portfolio is normally divided into two portions, one of which seeks to achieve the total return performance of a particular index and the other of which seeks to tactically manage equity exposure in the Portfolio based on the level of volatility in the market. The Board further considered that each Portfolio’s tactical volatility management strategy is intended to reduce the volatility associated with investing in equity securities and to produce more favorable risk-adjusted returns over extended market cycles. The Board also noted that, for each Portfolio, the Manager had developed and implemented in May 2012 a custom VMI as, among other things, an additional analytical tool to be used in evaluating the Portfolio’s performance, and considered the Manager’s explanation that a comparison of a Portfolio’s performance solely to that of a non-volatility managed benchmark fails to take into account the impact of an integral part of the Portfolio’s investment strategy, particularly during periods of high volatility. Based on the Manager’s explanation of the comparability of the custom VMI to a Portfolio’s tactical volatility management strategy, the Board noted that the Manager generally considers a Portfolio’s performance (especially its short-term performance) relative to its VMI to be more indicative than its performance relative to its benchmark. The Board also noted that the funds in each Portfolio’s Lipper peer group may or may not employ a tactical volatility management strategy like that employed by the Portfolios. The Board further noted that each Portfolio had a relatively short operating history on which to evaluate performance.
The Board evaluated the performance of each AXA Tactical Manager Portfolio in this context and also considered the following performance results, which supplemented the performance information provided to the Board throughout the year:
96
Table of Contents
ATM International Managed Volatility Portfolio. The Board considered that the Portfolio’s performance relative to its Lipper peer group was in the second quartile for the one-year period ended May 31, 2014. The Board also considered that the Portfolio had underperformed its benchmark and its VMI for the one- and three-year periods ended May 31, 2014.
ATM Large Cap Managed Volatility Portfolio. The Board considered that the Portfolio’s performance relative to its Lipper peer group was in the third and fourth quartiles, respectively, for the one- and three-year periods ended May 31, 2014. The Board also considered that the Portfolio (Class K) had underperformed its benchmark and its VMI for the one- and three-year periods ended May 31, 2014.
ATM Mid Cap Managed Volatility and ATM Small Cap Managed Volatility Portfolios. The Board considered that each Portfolio’s performance relative to its Lipper peer group was in the fourth quartile for the one- and three-year periods ended May 31, 2014. The Board also considered that the ATM Mid Cap Managed Volatility Portfolio (Class K) had underperformed its benchmark for the one- and three-year periods ended May 31, 2014, but had outperformed its VMI for the one- and three-year periods ended on that date, and that the ATM Small Cap Managed Volatility Portfolio (Class K) had underperformed its benchmark and its VMI for the one- and three-year periods ended May 31, 2014.
AXA 400 Managed Volatility and AXA 2000 Managed Volatility Portfolios. The Board considered that each Portfolio’s performance relative to its Lipper peer group was in the fourth quartile, and that each Portfolio had underperformed its benchmark and its VMI, for the one- and three-year periods ended May 31, 2014.
AXA 500 Managed Volatility Portfolio. The Board considered that the Portfolio’s performance relative to its Lipper peer group was in the third quartile, and that the Portfolio had underperformed its benchmark and its VMI, for the one- and three-year periods ended May 31, 2014.
AXA International Managed Volatility Portfolio. The Board considered that the Portfolio’s performance relative to its Lipper peer group was in the fourth quartile for the three-year period ended May 31, 2014, but was in the second quartile for the one-year period ended on that date. The Board also considered that the Portfolio had underperformed its benchmark and its VMI-proxy for the one- and three-year periods ended May 31, 2014. The Board noted the Manager’s explanation of the impact of fair value pricing of the Portfolio’s securities on performance versus the VMI-proxy and the benchmark.
The Board and the Manager discussed the performance of each AXA Tactical Manager Portfolio in detail, including whether each Portfolio had performed as expected over time. The Board and the Manager also discussed, where applicable, the reasons for a Portfolio’s underperformance for certain periods relative to its Lipper peer group and/or benchmark and/or VMI, and efforts to improve the Portfolio’s performance. Where applicable, the Board also considered steps that the Manager and the Advisers had taken to address a Portfolio’s performance, including any applicable changes to the investment strategies of a Portfolio, and the performance results of the Portfolio since the date of such changes. In this regard, the Board noted that performance is only one of the factors that it deems relevant to its consideration of a Portfolio’s Agreements and that, after considering all relevant factors, it can reach a decision to renew an Agreement notwithstanding a Portfolio’s underperformance.
Based on its review and the explanations provided by the Manager and the relevant Advisers regarding the performance of each AXA Tactical Manager Portfolio, the Board determined, with respect to each Portfolio, that the Portfolio and its investors would benefit from the Manager’s and each Adviser’s continued management of the Portfolio.
Passive Portfolios
With respect to the performance of the passive Portfolios, the Board considered that each Portfolio (other than the EQ/Calvert Socially Responsible Portfolio) seeks to achieve a total return (before fees and expenses) that approximates the total return performance of its benchmark, and that the EQ/Calvert Socially Responsible Portfolio employs a passive management strategy designed to track, as closely as possible, the performance (before fees and expenses) of a benchmark consisting of a universe of securities that meet certain sustainable and socially responsible investment criteria. The Board noted that each Portfolio’s performance was expected to vary from (and generally was expected to be lower than) that of its benchmark due to fees, management of cash flows, transaction costs, and valuation, which affect the Portfolio, but not the benchmark. The Board also noted that certain of the Portfolios had implemented a passive management strategy relatively recently and, therefore, in each of these cases the Board focused on the performance results of the Portfolio since the date of implementation. The Board also
97
Table of Contents
considered that the passive management strategy for the Portfolios identified below had been implemented, in part, to enhance the performance of the Portfolios. Among other information, the Board considered that, with limited exceptions, the Lipper peer group for each Portfolio included both actively and passively managed funds. The Board also considered the following performance results relative to Lipper peer group, which supplemented the performance information provided to the Board throughout the year:
EQ/Calvert Socially Responsible Portfolio. In evaluating the performance of this Portfolio, the Board took into account that the Portfolio is a specialty portfolio that offers a unique investment strategy and enhances the range of investment options available to investors and that the Lipper peer group in which the Portfolio was placed for comparison purposes includes a wider range of fund types. The Board also noted that the Portfolio had been converted from an actively managed portfolio to a passively managed portfolio in August 2011. Within this context, the Board considered that the Portfolio’s performance relative to its Lipper peer group was in the third quartile for the one-year period ended May 31, 2014, but was in the first quartile for the three-year period ended on that date.
EQ/Common Stock Index Portfolio. The Board noted that the Portfolio had implemented a passive management strategy in December 2008. The Board considered that the Portfolio’s performance relative to its Lipper peer group was in the first quartile for the one-, three- and five-year periods ended May 31, 2014.
EQ/Core Bond Index and EQ/Intermediate Government Bond Portfolios. The Board noted that each Portfolio had implemented a passive management strategy in January 2009. The Board considered that each Portfolio’s performance relative to its Lipper peer group was in the fourth quartile for the one-, three- and five-year periods ended May 31, 2014.
EQ/Equity 500 Index Portfolio. The Board considered that the Portfolio’s performance relative to its Lipper peer group was in the fourth quartile for the one-, three-, five- and ten-year periods ended May 31, 2014.
EQ/International Equity Index Portfolio. The Board noted that the Portfolio had implemented a passive management strategy in February 2011 and that the Portfolio had a relatively short operating history with the passive strategy on which to evaluate performance. The Board considered, however, that the Portfolio’s performance relative to its Lipper peer group was in the third quartile for the three-year period ended May 31, 2014, and was in the second quartile for the one-year period ended on that date.
EQ/Large Cap Growth Index, EQ/Large Cap Value Index, and EQ/Mid Cap Index Portfolios. The Board noted that each of these Portfolios had implemented a passive management strategy in December 2008. The Board considered that the EQ/Large Cap Growth Index Portfolio’s performance relative to its Lipper peer group was in the second quartile for the one-, three- and five-year periods ended May 31, 2014; that the EQ/Large Cap Value Index Portfolio’s performance relative to its Lipper peer group was in the third quartile for the one-year period, but was in the second quartile for the three- and five-year periods, ended May 31, 2014; and that the EQ/Mid Cap Index Portfolio’s performance relative to its Lipper peer group was in the fourth quartile for the one- and three-year periods, and the third quartile for the five-year period, ended May 31, 2014.
EQ/Small Company Index Portfolio. The Board considered that the Portfolio’s performance relative to its Lipper peer group was in the third quartile for the one-, three-, five- and ten-year periods ended May 31, 2014.
The Board and the Manager discussed the performance of each passive Portfolio in detail, including whether each Portfolio had performed as expected over time, and the extent to which each Portfolio had achieved its objective, as described above. In this connection, the Board also considered information on the correlation and tracking error between each Portfolio and its respective benchmark over various periods, as well as the Manager’s and the relevant Adviser’s views and explanations of this information.
Based on its review and the explanations provided by the Manager and the relevant Adviser regarding the performance of each passive Portfolio, the Board determined, with respect to each Portfolio, that the Portfolio and its investors would benefit from the Manager’s and the Adviser’s continued management of the Portfolio.
PLUS Portfolios
With respect to the performance of the PLUS Portfolios, the Board considered that each Portfolio follows an investment strategy under which the Portfolio’s assets normally are allocated among multiple investment advisers, each of which manages its portion of the Portfolio using a different but complementary investment strategy. The Board noted that each Portfolio uses a combination of active and passive investment strategies and has the ability to invest in exchange-traded funds (“ETFs”). The Board also noted that certain of these Portfolios had added the PLUS investment strategy relatively recently and considered this fact in its review of these Portfolios’ performance.
98
Table of Contents
The Board further considered that the PLUS investment strategy had been implemented, in part, to enhance the performance of the Portfolios, reduce volatility, and/or produce more favorable risk-adjusted returns over extended market cycles.
The Board also considered that, in connection with its PLUS investment strategy, each equity Portfolio (other than the EQ/Emerging Markets Equity PLUS Portfolio, the EQ/Natural Resources PLUS Portfolio and the EQ/Real Estate PLUS Portfolio) may employ various volatility management techniques, including the use of futures and options to manage equity exposure. The Board also noted that, for each equity Portfolio (other than the EQ/Emerging Markets Equity PLUS Portfolio, the EQ/Natural Resources PLUS Portfolio and the EQ/Real Estate PLUS Portfolio), the Manager had developed and implemented in May 2012 a custom VMI as, among other things, an additional analytical tool to be used in evaluating the Portfolio’s performance, and considered the Manager’s explanation that a comparison of a Portfolio’s performance solely to that of a non-volatility managed benchmark fails to take into account the impact of an integral part of the Portfolio’s investment strategy, particularly during periods of high volatility. Based on the Manager’s explanation of the comparability of the custom VMI to a Portfolio’s tactical volatility management component, the Board noted that the Manager generally considers an equity Portfolio’s performance (especially its short-term performance) relative to its VMI to be more indicative than its performance relative to its benchmark.
In addition, where applicable, the Board considered the performance of the allocated portions of each Portfolio managed by different Advisers and whether the performance of the portions allocated to each of the Advisers met the Board’s expectations as to the compatibility of the Advisers’ different investment strategies and styles and the contributions of each to the overall Portfolio strategy and performance. The Board also noted that the funds in each Portfolio’s Lipper peer group may or may not employ an investment strategy similar to the Portfolio’s that includes active, passive and ETF components, as well as (in the case of certain equity Portfolios) a tactical volatility management component.
The Board evaluated the performance of each PLUS Portfolio in this context and also considered the following performance results, which supplemented the performance information provided to the Board throughout the year:
AXA International Core Managed Volatility Portfolio. The Board noted that the Portfolio had added the PLUS strategy in May 2007. The Board considered that the Portfolio’s performance relative to its Lipper peer group was in the third quartile for the one-year period ended May 31, 2014, and the fourth quartile for the three-, five- and ten-year periods ended on that date. The Board also considered that the Portfolio had underperformed its benchmark and its VMI-proxy for the one-, three- and five-year periods ended May 31, 2014, and had underperformed its benchmark for the ten-year period ended on that date. The Board noted the Manager’s explanation of the impact of fair value pricing of the Portfolio’s securities on performance versus the VMI-proxy and the benchmark.
AXA International Value Managed Volatility Portfolio. The Board noted that the Portfolio had added the PLUS strategy in February 2011 and that the Portfolio had a relatively short operating history with the enhanced strategy on which to evaluate performance. The Board considered, however, that the Portfolio’s performance relative to its Lipper peer group was in the fourth quartile for the three-, five- and ten-year periods ended May 31, 2014, but was in the second quartile for the one-year period ended on that date. The Board also considered that the Portfolio had underperformed its benchmark and its VMI-proxy for the one-, three-, and five-year periods ended May 31, 2014, and had underperformed its benchmark for the ten-year period ended on that date. The Board noted the Manager’s explanation of the impact of fair value pricing of the Portfolio’s securities on performance versus the VMI-proxy and the benchmark.
AXA Large Cap Core Managed Volatility Portfolio. The Board noted that the Portfolio had added the PLUS strategy in May 2007. The Board considered that the Portfolio’s performance relative to its Lipper peer group was in the third quartile, and that the Portfolio had underperformed its benchmark and its VMI, for the one-, three-, five- and ten-year periods ended May 31, 2014.
AXA Large Cap Growth Managed Volatility Portfolio. The Board noted that the Portfolio had added the PLUS strategy in May 2007. The Board considered that the Portfolio’s performance relative to its Lipper peer group was in the third quartile for the three- and five-year periods ended May 31, 2014, but was in the second quartile for the one- and ten-year periods ended on that date. The Board also considered that the Portfolio had underperformed its benchmark and its VMI for the one-, three-, five- and ten-year periods ended May 31, 2014, but its performance was only slightly below that of its benchmark for the ten-year period and only slightly below that of its VMI for the one-year period.
99
Table of Contents
AXA Large Cap Value Managed Volatility Portfolio. The Board noted that the Portfolio had added the PLUS strategy in December 2008. The Board considered that the Portfolio’s performance relative to its Lipper peer group was in the fourth quartile for the three- and ten-year periods ended May 31, 2014, but was in the second and third quartiles, respectively, for the one- and five-year periods ended on that date. The Board also considered that the Portfolio had underperformed its benchmark and its VMI for the one-, three-, five- and ten-year periods ended May 31, 2014, but its performance was only slightly below that of its benchmark for the one-year period.
AXA Mid Cap Value Managed Volatility Portfolio. The Board noted that the Portfolio had added the PLUS strategy in May 2007. The Board considered that the Portfolio’s performance relative to its Lipper peer group was in the fourth quartile for the three-, five- and ten-year periods ended May 31, 2014, but was in the second quartile for the one-year period ended on that date. The Board also considered that, although the Portfolio had underperformed its benchmark for the one-year period ended May 31, 2014, and had underperformed its benchmark and its VMI for the three-, five- and ten-year periods ended May 31, 2014, its performance was only slightly below that of its VMI for the three- and five-year periods, and the Portfolio had outperformed its VMI for the one-year period ended on that date.
EQ/Emerging Markets Equity PLUS, EQ/Natural Resources PLUS and EQ/Real Estate PLUS Portfolios. The Board noted that each Portfolio had commenced operations on February 8, 2013, and, therefore, had only a short operating history on which to evaluate performance. The Board considered, however, that the EQ/Emerging Markets Equity PLUS Portfolio’s performance relative to its Lipper peer group was in the third quartile for the one-year period ended May 31, 2014; that the EQ/Natural Resources PLUS Portfolio’s performance relative to its Lipper peer group was in the third quartile for the one-year period ended May 31, 2014; and that the EQ/Real Estate PLUS Portfolio’s performance relative to its Lipper peer group was in the fourth quartile for the one-year period ended May 31, 2014. The Board also considered that the EQ/Emerging Markets Equity PLUS Portfolio and the EQ/Real Estate PLUS Portfolio each had underperformed its benchmark for the one-year period ended May 31, 2014, and that the EQ/Natural Resources PLUS Portfolio had outperformed its benchmark for the one-year period ended on that date.
EQ/Global Bond PLUS Portfolio. The Board noted that the Portfolio had added the PLUS strategy in May 2009. The Board considered that the Portfolio’s performance relative to its Lipper peer group was in the third quartile for the one-year period ended May 31, 2014, and the fourth quartile for the three- and five-year periods ended on that date. The Board also considered that the Portfolio had underperformed its benchmark for the one-, three- and five-year periods ended May 31, 2014.
EQ/Quality Bond PLUS Portfolio. The Board noted that the Portfolio had added the PLUS strategy in December 2008. The Board considered that the Portfolio’s performance relative to its Lipper peer group was in the fourth quartile for the one-, three-, five- and ten-year periods ended May 31, 2014. The Board also considered that, although the Portfolio had underperformed its benchmark for the one-, three- and ten-year periods ended May 31, 2014, its performance was only slightly below that of its benchmark for the one-year period, and the Portfolio had outperformed its benchmark for the five-year period ended on that date.
The Board and the Manager discussed the performance of each PLUS Portfolio and each allocated portion thereof in detail, including whether each Portfolio had performed as expected over time. The Board and the Manager also discussed the reasons for a Portfolio’s or an allocated portion’s underperformance for certain periods relative to its Lipper peer group and/or benchmark and/or VMI, as applicable, and efforts to improve that Portfolio’s or allocated portion’s performance. Where applicable, the Board also considered steps that the Manager and the Advisers had taken to address a Portfolio’s or an allocated portion’s performance, including any applicable changes or additions to the Advisers or portfolio managers advising a Portfolio and any applicable changes to the investment strategies of a Portfolio, and the performance results of the Portfolio or allocated portion since the date of such changes. In this regard, the Board noted that performance is only one of the factors that it deems relevant to its consideration of a Portfolio’s Agreements and that, after considering all relevant factors, it can reach a decision to renew an Agreement notwithstanding a Portfolio’s underperformance.
Based on its review and the explanations provided by the Manager and the relevant Advisers regarding the performance of each PLUS Portfolio, the Board determined, with respect to each Portfolio, that the Portfolio and its investors would benefit from the Manager’s and each Adviser’s continued management of the Portfolio.
100
Table of Contents
PACTIVE Portfolios
With respect to the performance of the EQ/High Yield Bond Portfolio, the Board considered that the Portfolio follows an investment strategy under which the Portfolio’s assets normally are allocated between two portions, one of which is actively managed and the other of which is invested in ETFs that are passively managed.
With respect to the performance of the equity PACTIVE Portfolios, the Board considered that each Portfolio follows an investment strategy under which the Portfolio’s assets normally are allocated among multiple investment advisers, each of which manages its portion of the Portfolio using a different but complementary investment strategy. The Board noted that each of these Portfolios uses a combination of active and passive investment strategies. The Board also noted that the Portfolios had added the PACTIVE investment strategy in May 2009 and considered this fact in its review of the Portfolios’ performance. The Board further considered that the PACTIVE investment strategy had been implemented, in part, to enhance the performance of these Portfolios, reduce volatility, and/or produce more favorable risk-adjusted returns over extended market cycles. The Board also considered that, in connection with its PACTIVE investment strategy, each of these Portfolios may employ various volatility management techniques, including the use of futures and options to manage equity exposure. The Board also noted that, for each Portfolio, the Manager had developed and implemented in May 2012 a custom VMI as, among other things, an additional analytical tool to be used in evaluating the Portfolio’s performance, and considered the Manager’s explanation that a comparison of a Portfolio’s performance solely to that of a non-volatility managed benchmark fails to take into account the impact of an integral part of the Portfolio’s investment strategy, particularly during periods of high volatility. Based on the Manager’s explanation of the comparability of the custom VMI to a Portfolio’s tactical volatility management component, the Board noted that the Manager generally considers a Portfolio’s performance (especially its short-term performance) relative to its VMI to be more indicative than its performance relative to its benchmark.
In addition, where applicable, the Board considered the performance of the allocated portions of each Portfolio managed by different Advisers and whether the performance of the portions allocated to each of the Advisers met the Board’s expectations as to the compatibility of the Advisers’ different investment strategies and styles and the contributions of each to the overall Portfolio strategy and performance. The Board also noted that the funds in each Portfolio’s Lipper peer group may or may not employ an investment strategy similar to the Portfolio’s that includes active and passive components, as well as (in the case of each equity Portfolio) a tactical volatility management component.
The Board evaluated the performance of each PACTIVE Portfolio in this context and also considered the following performance results, which supplemented the performance information provided to the Board throughout the year:
AXA/Franklin Balanced Managed Volatility Portfolio. The Board considered that the Portfolio’s performance relative to its Lipper peer group was in the first quartile for the one- and five-year periods ended May 31, 2014, and the second quartile for the three-year period ended on that date. The Board also considered that, although the Portfolio (Class IA) had underperformed its benchmark for the one- and three-year periods ended May 31, 2014, it had outperformed its VMI for the one-year period, , and its performance was only slightly below that of its VMI for the three-year period, ended on that date.
AXA/Franklin Small Cap Value Managed Volatility Portfolio. The Board considered that the Portfolio’s performance relative to its Lipper peer group was in the fourth quartile for the three- and five-year periods ended May 31, 2014, but was in the second quartile for the one-year period ended on that date. The Board also considered that, although the Portfolio had underperformed its benchmark for the one-year period ended May 31, 2014, and had underperformed its benchmark and its VMI for the three- and five-year periods ended May 31, 2014, its performance was only slightly below that of its benchmark for the one-year period and only slightly below that of its VMI for the three- and five-year periods, and the Portfolio had outperformed its VMI for the one-year period ended on that date.
AXA Global Equity Managed Volatility Portfolio. The Board considered that the Portfolio’s performance relative to its Lipper peer group was in the fourth quartile for the one-, three- and five-year periods ended May 31, 2014, but was in the first quartile for the ten-year period ended on that date. The Board also considered that the Portfolio had underperformed its benchmark and its VMI-proxy for the one-, three-, and five-year periods ended May 31, 2014, but had outperformed its benchmark for the ten-year period ended on that date. The Board noted the Manager’s explanation of the impact of fair value pricing of the Portfolio’s securities on performance versus the VMI-proxy and the benchmark.
101
Table of Contents
AXA/Mutual Large Cap Equity Managed Volatility Portfolio. The Board considered that the Portfolio’s performance relative to its Lipper peer group was in the third quartile for the one-year period ended May 31, 2014, and the fourth quartile for the three- and five-year periods ended on that date. The Board also considered that the Portfolio had underperformed its benchmark and its VMI for the one-, three- and five-year periods ended May 31, 2014.
AXA/Templeton Global Equity Managed Volatility Portfolio. The Board considered that the Portfolio’s performance relative to its Lipper peer group was in the third quartile for the three- and five-year periods ended May 31, 2014, but was in the second quartile for the one-year period ended on that date. The Board also considered that, although the Portfolio had underperformed its benchmark and its VMI for the three- and five-year periods ended May 31, 2014, its performance was only slightly below that of its benchmark for the three-year period and only slightly below that of its VMI-proxy for the five-year period, and the Portfolio had outperformed its benchmark and its VMI-proxy for the one-year period ended on that date. The Board noted the Manager’s explanation of the impact of fair value pricing of the Portfolio’s securities on performance versus the VMI-proxy and the benchmark.
EQ/High Yield Bond Portfolio. The Board noted that the Portfolio had commenced operations on February 8, 2013, and, therefore, had only a short operating history on which to evaluate performance. The Board considered, however, that the Portfolio’s performance relative to its Lipper peer group was in the first quartile, and that the Portfolio’s performance was only slightly below that of its benchmark, for the one-year period ended May 31, 2014.
The Board and the Manager discussed the performance of each PACTIVE Portfolio and each allocated portion thereof in detail, including whether each Portfolio had performed as expected over time. The Board and the Manager also discussed the reasons for a Portfolio’s or an allocated portion’s underperformance for certain periods relative to its Lipper peer group and/or benchmark and/or VMI, as applicable, and efforts to improve the Portfolio’s or allocated portion’s performance. Where applicable, the Board also considered steps that the Manager and the Advisers had taken to address a Portfolio’s or an allocated portion’s performance, including any applicable changes or additions to the Advisers or portfolio managers advising a Portfolio and any applicable changes to the investment strategies of a Portfolio, and the performance results of the Portfolio or allocated portion since the date of such changes. In this regard, the Board noted that performance is only one of the factors that it deems relevant to its consideration of a Portfolio’s Agreements and that, after considering all relevant factors, it can reach a decision to renew an Agreement notwithstanding a Portfolio’s underperformance.
Based on its review and the explanations provided by the Manager and the relevant Advisers regarding the performance of each PACTIVE Portfolio, the Board determined, with respect to each Portfolio, that the Portfolio and its investors would benefit from the Manager’s and each Adviser’s continued management of the Portfolio.
Multimanager Portfolios
With respect to the performance of the Multimanager Portfolios, the Board considered that each Portfolio follows an investment strategy under which the Portfolio’s assets normally are allocated among multiple investment advisers, each of which manages its portion of the Portfolio using a different but complimentary investment strategy, whereby one portion of a Portfolio generally seeks to achieve the total return performance of a particular index, one portion of the Multimanager Technology Portfolio has the ability to invest in ETFs, and the other portions of a Portfolio are actively managed by an Adviser.
The Board noted that prior to June 2014 each Portfolio was organized as a series of AXA Premier VIP Trust (the “VIP Trust”), an affiliated investment company of the Trust managed by the Manager, and that, therefore, the performance information that had been provided to the Board, including the most recent performance information for the periods ended May 31, 2014, for each Portfolio was that of its predecessor series. The Board also noted that each Portfolio’s investment objective, strategies and, except as discussed below, policies are substantially identical to those of its predecessor series.
The Board noted that the Manager, in its management of each of the Multimanager Aggressive Equity, Multimanager Mid Cap Growth and Multimanager Mid Cap Value Portfolios’ predecessor series, had employed various volatility management techniques, including the use of futures and options to manage equity exposure, but that in April 2014 the Manager had discontinued the use of these techniques in its management of the predecessor series, and the Manager was not employing these techniques in its management of the Multimanager Aggressive Equity, Multimanager Mid Cap Growth and Multimanager Mid Cap Value Portfolios. In this regard, the Board also noted that, for each of the Multimanager Aggressive Equity, Multimanager Mid Cap Growth and Multimanager
102
Table of Contents
Mid Cap Value Portfolios’ predecessor series, the Manager had developed and implemented in May 2012 a custom VMI as, among other things, an additional analytical tool to be used in evaluating the predecessor series’ performance. Although the Manager was not employing volatility management techniques in its management of the Multimanager Aggressive Equity, Multimanager Mid Cap Growth and Multimanager Mid Cap Value Portfolios, the Board considered these Portfolios’ predecessor series’ performance relative to a VMI and considered the Manager’s explanation that a comparison of a predecessor series’ performance solely to that of a non-volatility managed benchmark failed to take into account the impact of an integral part of the predecessor series’ investment strategy, particularly during periods of high volatility. Based on the Manager’s explanation of the comparability of the custom VMI to a predecessor series’ tactical volatility management component, the Board noted that the Manager generally considered a predecessor series’ performance (especially its short-term performance) relative to its VMI to be more indicative than its performance relative to its benchmark. Furthermore, the Board noted that the performance information that had been provided to the Board, including the most recent performance information for the periods ended May 31, 2014, for each of the Multimanager Aggressive Equity, Multimanager Mid Cap Growth and Multimanager Mid Cap Value Portfolios may have been different if the Portfolio had historically been managed using its current investment strategies and policies.
In addition, the Board considered the performance of the allocated portions of each Portfolio and whether the performance of the portions allocated to each of the Advisers met the Board’s expectations as to the compatibility of the Advisers’ different investment strategies and styles and the contributions of each to the overall Portfolio strategy and performance. The Board also noted that the funds in each Portfolio’s Lipper peer group may or may not employ an investment strategy similar to the Portfolio’s that includes active and index (and, in the case of the Multimanager Technology Portfolio, ETF) components, as well as (in the case of the Multimanager Aggressive Equity, Multimanager Mid Cap Growth and Multimanager Mid Cap Value Portfolios’ predecessor series) a tactical volatility management component.
The Board evaluated the performance of each Multimanager Portfolio in this context and also considered the following performance results, which supplemented the performance information that had been provided to the Board:
Multimanager Aggressive Equity Portfolio: The Board considered that the Portfolio’s performance relative to its Lipper peer group was in the fourth quartile for the ten-year period ended May 31, 2014, and the third quartile for the three- and five-year periods ended May 31, 2014, but was in the second quartile for the one-year period ended on that date.
Multimanager Core Bond Portfolio: The Board considered that the Portfolio’s performance relative to its Lipper peer group was in the third quartile for the three-year period ended May 31, 2014, and the fourth quartile for the one, five- and ten-year periods ended on that date. The Board also considered that the Portfolio (Class IA) had underperformed its benchmark for the one-year period ended May 31, 2014, but had outperformed its benchmark for the three-and five-year periods ended on that date.
Multimanager Mid Cap Growth Portfolio: The Board considered that the Portfolio’s performance relative to its Lipper peer group was in the fourth quartile for the three-year period ended May 31, 2014, and the third quartile for the one- and ten-year periods ended May 31, 2014, but was in the second quartile for the five-year period ended on that date.
Multimanager Mid Cap Value Portfolio: The Board considered that the Portfolio’s performance relative to its Lipper peer group was in the fourth quartile for the one-, three-, five- and ten-year periods ended May 31, 2014.
Multimanager Technology Portfolio: The Board considered that the Portfolio’s performance relative to its Lipper peer group was in the third quartile for the ten-year period ended May 31, 2014, but was in the first quartile for the one-year period, and the second quartile for the three- and five-year periods, ended on that date. The Board also considered that, although the Portfolio (Class IA) had underperformed its benchmark for the three- and five-year periods ended May 31, 2014, its performance was only slightly below that of its benchmark for the five-year period, and it had outperformed its benchmark for the one-year period ended on that date.
The Board and the Manager discussed the performance of each Multimanager Portfolio and each allocated portion thereof in detail, including whether each Portfolio had performed as expected over time. The Board and the Manager also discussed the reasons for a Portfolio’s or an allocated portion’s underperformance for certain periods relative to its Lipper peer group and/or benchmark, as applicable, and efforts to improve that Portfolio’s or allocated portion’s performance. In this regard, the Board noted that performance is only one of the factors that it
103
Table of Contents
deems relevant to its consideration of a Portfolio’s Agreements and that, after considering all relevant factors, it can reach a decision to renew an Agreement notwithstanding a Portfolio’s underperformance.
Based on its review and the explanations provided by the Manager and the relevant Advisers regarding the performance of each Multimanager Portfolio, the Board determined, with respect to each Portfolio, that the Portfolio and its investors would benefit from the Manager’s and each Adviser’s continued management of the Portfolio.
Actively-Managed, Single Adviser Portfolios
With respect to the performance of the following Portfolios, the Board considered that each Portfolio is actively managed and advised by a single Adviser. The Board evaluated the performance of each Portfolio in this context and also considered the following performance results, which supplemented the performance information provided to the Board throughout the year:
AXA/Loomis Sayles Growth Portfolio. The Board considered that the Portfolio’s performance relative to its Lipper peer group was in the fourth quartile for the one- and five-year periods ended May 31, 2014, and the third quartile for the three- and ten-year periods ended on the date. The Board also considered that the Portfolio had underperformed its benchmark for the one-, three-, five- and ten-year periods ended May 31, 2014. The Board noted that the investment advisory agreement between the Manager and Montag & Caldwell, LLC (“Montag”) with respect to the Portfolio would expire on August 31, 2014. The Manager and the Board determined not to renew the investment advisory agreement with Montag. Instead, the Board considered and unanimously approved the Manager’s proposal to add Loomis, Sayles & Company, L.P. (“Loomis Sayles”) as the Adviser to the Portfolio, effective September 1, 2014. In connection with the appointment of Loomis Sayles as the Adviser to the Portfolio, the Board approved a change in the Portfolio’s name to the “AXA/Loomis Sayles Growth Portfolio.”
EQ/AllianceBernstein Dynamic Wealth Strategies Portfolio. The Board noted that the Portfolio had a relatively short operating history on which to evaluate performance. The Board considered, however, that the Portfolio’s performance relative to its Lipper peer group was in the second quartile for the one- and three-year periods ended May 31, 2014. The Board also considered that the Portfolio had underperformed its benchmark for the one- and three-year periods ended May 31, 2014.
EQ/AllianceBernstein Short Duration Government Bond Portfolio. The Board noted that the Portfolio had commenced operations on May 20, 2013, and, therefore, had only a short operating history on which to evaluate performance. The Board considered, however, that the Portfolio’s performance relative to its Lipper peer group was in the fourth quartile for the one-year period ended May 31, 2014. The Board also considered that the Portfolio had underperformed its benchmark for the one-year period ended May 31, 2014.
EQ/AllianceBernstein Small Cap Growth Portfolio. The Board considered that the Portfolio’s performance relative to its Lipper peer group was in the second quartile for the one-, three- and ten-year periods ended May 31, 2014, and the first quartile for the five-year period ended on that date. The Board also considered that the Portfolio had underperformed its benchmark for the one-year period ended May 31, 2014, but had outperformed its benchmark for the three-, five- and ten-year periods ended on that date.
EQ/BlackRock Basic Value Equity Portfolio. The Board considered that the Portfolio’s performance relative to its Lipper peer group was in the third quartile for the ten-year period ended May 31, 2014, but was in the first quartile for the one-year period, and the second quartile for the three- and five-year periods, ended on that date. The Board also considered that the Portfolio had underperformed its benchmark for the three-, five- and ten-year periods ended May 31, 2014, but had outperformed its benchmark for the one-year period ended on that date.
EQ/Boston Advisors Equity Income Portfolio. The Board considered that the Portfolio’s performance relative to its Lipper peer group was in the third quartile for the one-, five- and ten-year periods ended May 31, 2014, but was in the second quartile for the three-year period ended on that date. The Board also considered that the Portfolio had underperformed its benchmark for the one-, three-, five- and ten-year periods ended May 31, 2014.
EQ/Capital Guardian Research Portfolio. The Board considered that the Portfolio’s performance relative to its Lipper peer group was in the fourth quartile for the one- and ten-year periods ended May 31, 2014, but was in the second quartile for the three-year period, and the first quartile for the five-year period, ended on that date. The Board also considered that the Portfolio had underperformed its benchmark for the one-, three- and ten-year periods ended May 31, 2014, but had outperformed its benchmark for the five-year period ended on that date.
104
Table of Contents
EQ/GAMCO Mergers and Acquisitions Portfolio. In evaluating the performance of this Portfolio, the Board took into account that the Portfolio is a specialty portfolio that offers a unique investment strategy and enhances the range of investment options available to investors and that the Lipper peer group in which the Portfolio was placed for comparison purposes includes a wider range of fund types. Within this context, the Board considered that the Portfolio’s performance relative to its Lipper peer group was in the third quartile for the one-, three-, five- and ten-year periods ended May 31, 2014. The Board also considered that the Portfolio had underperformed its benchmark for the one-, three-, five- and ten-year periods ended May 31, 2014.
EQ/GAMCO Small Company Value Portfolio. The Board considered that the Portfolio’s performance relative to its Lipper peer group was in the first quartile for the one-, three-, five- and ten-year periods ended May 31, 2014. The Board also considered that the Portfolio had outperformed its benchmark for the one-, three-, five- and ten-year periods ended May 31, 2014.
EQ/Invesco Comstock Portfolio. The Board considered that the Portfolio’s performance relative to its Lipper peer group was in the second quartile for the one-year period ended May 31, 2014, and the first quartile for the three- and five-year periods ended on that date. The Board also considered that, although the Portfolio had underperformed its benchmark for the one- and three-year periods ended May 31, 2014, its performance was only slightly below that of its benchmark for the three-year period, and it had outperformed its benchmark for the five-year period ended on that date.
EQ/JPMorgan Value Opportunities Portfolio. The Board considered that the Portfolio’s performance relative to its Lipper peer group was in the third quartile for the one-year period, and the fourth quartile for the ten-year period, ended May 31, 2014, but was in the second quartile for the three- and five-year periods ended on that date. The Board also considered that the Portfolio had underperformed its benchmark for the one-, three-, five- and ten-year periods ended May 31, 2014.
EQ/MFS International Growth Portfolio. The Board considered that the Portfolio’s performance relative to its Lipper peer group was in the fourth quartile for the one-year period, and the third quartile for the three-year period, ended May 31, 2014, but was in the second quartile for the five- and ten-year periods ended on that date. The Board also considered that, although the Portfolio had underperformed its benchmark for the one- and ten-year periods ended May 31, 2014, its performance was only slightly below that of its benchmark for the ten-year period, and it had outperformed its benchmark for the three- and five-year periods ended on that date.
EQ/Money Market Portfolio. The Board considered that the Portfolio’s performance relative to its Lipper peer group was in the third quartile for the one-, three-, five- and ten-year periods ended May 31, 2014. The Board also considered that the Portfolio’s performance was only slightly below that of its benchmark for the one-, three-, five- and ten-year periods ended May 31, 2014. The Board also considered the very low interest rate environment and that the Manager had been voluntarily waiving a portion of its management and administrative fees and reimbursing other expenses of the Portfolio to seek to ensure that the Portfolio’s yield did not decline below zero.
EQ/Morgan Stanley Mid Cap Growth Portfolio. The Board considered that the Portfolio’s performance relative to its Lipper peer group was in the fourth quartile for the one-, three- and five-year periods ended May 31, 2014. The Board also considered that the Portfolio had underperformed its benchmark for the one-, three- and five-year periods ended May 31, 2014.
EQ/Oppenheimer Global Portfolio. The Board considered that the Portfolio’s performance relative to its Lipper peer group was in the third quartile for the three-year period ended May 31, 2014, but was in the second quartile for the one- and five-year periods ended on the date. The Board also considered that the Portfolio had outperformed its benchmark for the one-, three- and five-year periods ended May 31, 2014.
EQ/PIMCO Global Real Return Portfolio. The Board noted that the Portfolio had commenced operations on February 8, 2013, and, therefore, had only a short operating history on which to evaluate performance. The Board considered, however, that the Portfolio’s performance relative to its Lipper peer group was in the fourth quartile for the one-year period ended May 31, 2014. The Board also considered that the Portfolio had underperformed its benchmark for the one-year period ended on May 31, 2014.
EQ/PIMCO Ultra Short Bond Portfolio. The Board considered that the Portfolio had modified its investment strategy and changed its benchmark in May 2009 and, therefore, focused on the Portfolio’s performance since that time. The Board considered that the Portfolio’s performance relative to its Lipper peer group was in the fourth quartile for the one-, three- and five-year periods ended May 31, 2014. The Board also considered that the Portfolio had outperformed its benchmark for the one-, three- and five-year periods ended on May 31, 2014.
105
Table of Contents
EQ/T. Rowe Price Growth Stock Portfolio. The Board considered that the Portfolio’s performance relative to its Lipper peer group was in the fourth quartile for the ten-year period ended May 31, 2014, but was in the first quartile for the three- and five-year periods, and the second quartile for the one-year period, ended on that date. The Board also considered that, although the Portfolio had underperformed its benchmark for the five- and ten-year periods ended May 31, 2014, its performance was only slightly below that of its benchmark for the five-year period, and it had outperformed its benchmark for the one- and three-year periods ended on that date.
EQ/UBS Growth and Income Portfolio. The Board considered that the Portfolio’s performance relative to its Lipper peer group was in the third quartile for the three-year period ended May 31, 2014, but was in the second quartile for the one-, five- and ten-year periods ended on that date. The Board also considered that the Portfolio had underperformed its benchmark for the one-, three-, five- and ten-year periods ended May 31, 2014, but its performance was only slightly below that of its benchmark for the one-year period.
EQ/Wells Fargo Omega Growth Portfolio. The Board considered that the Portfolio’s performance relative to its Lipper peer group was in the third quartile for the one- and five-year periods ended May 31, 2014, but was in the second quartile for the three- and ten-year periods ended on that date. The Board also considered that the Portfolio had underperformed its benchmark for the one-, three- and five-year periods ended May 31, 2014, but had outperformed its benchmark for the ten-year period ended on that date.
The Board and the Manager discussed the performance of each actively-managed, single Adviser Portfolio in detail, including whether each Portfolio had performed as expected over time. The Board and the Manager also discussed, where applicable, the reasons for a Portfolio’s underperformance for certain periods relative to its Lipper peer group and/or benchmark and efforts to improve the Portfolio’s performance. Where applicable, the Board also considered steps that the Manager and the Adviser had taken to address a Portfolio’s performance, including any applicable changes to the Adviser or portfolio managers advising a Portfolio and any applicable changes to the investment strategies of a Portfolio, and the performance results of the Portfolio since the date of such changes. In this regard, the Board noted that performance is only one of the factors that it deems relevant to its consideration of a Portfolio’s Agreements and that, after considering all relevant factors, it can reach a decision to renew an Agreement notwithstanding a Portfolio’s underperformance.
Based on its review and the explanations provided by the Manager and the relevant Adviser regarding the performance of each actively-managed, single Adviser Portfolio, the Board determined, with respect to each Portfolio, that the Portfolio and its investors would benefit from the Manager’s and the Adviser’s continued management of the Portfolio.
Expenses. The Board considered each Portfolio’s investment management fee and, where applicable, investment advisory fee(s), in light of the nature, quality and extent of the overall services provided by the Manager and, where applicable, the relevant Adviser(s). The Board also reviewed a comparative analysis of the contractual and net management fees and expense ratios of each Portfolio compared with those of peer funds selected by Lipper as constituting the Portfolio’s appropriate Lipper expense group. Lipper provides information on each Portfolio’s contractual investment management fee in comparison with the contractual investment management fee that would have been charged by other funds within the Portfolio’s Lipper expense group assuming the funds were similar in size to the Portfolio, as well as the Portfolio’s actual management fee and expense ratios in comparison with those of other funds within its expense group. The Lipper investment management fee analysis includes within such fee the separate administrative fees paid to FMG LLC. The Board noted that management had separately provided comparative fee information net of administrative fees. The Board also noted that the funds in each Portfolio’s Lipper peer group may or may not employ multiple and complex strategies like those employed by a number of the Portfolios, particularly the PLUS, PACTIVE and Multimanager Portfolios and the Portfolios employing a tactical volatility management strategy. The Lipper expense data was based upon historical information taken from each Portfolio’s annual report for the period ended December 31, 2013, and the Lipper expense ratios were shown for Class IA, Class IB and Class K shares, as applicable, of the relevant Portfolio. Where contractual investment management fee comparisons were shown for Class IA and/or Class IB shares of a Portfolio as well as for Class K shares of that Portfolio, the contractual investment management fee information described below reflects the comparisons for only Class IA and/or Class IB shares of that Portfolio. The Board noted that the Lipper data for those Portfolios employing a passive strategy (except the EQ/Equity 500 Index Portfolio) comprised funds employing active strategies, and that management had separately provided comparative fee information obtained from Lipper that focused more narrowly on passive funds. While recognizing the limitations inherent in Lipper’s methodology and that current expense ratios (prior to any applicable expense limitation arrangement) may increase if assets decline, the Board believed that the independent analysis conducted by Lipper remained a useful measure
106
Table of Contents
of comparative expenses. The Board also considered that all fees and expenses of each Portfolio are explicitly disclosed in Portfolio offering documents. In addition, with respect to each sub-advised Portfolio, the Board further considered the relative levels of the advisory fee(s) paid to the relevant Adviser(s) and the management fee retained by the Manager in light of, among other factors, the services provided to the Portfolio by the Manager and the relevant Adviser(s), and the information prepared by management regarding the level of profits realized by the Manager in connection with its operation of the Portfolio.
Fund-of-Funds Portfolios
The Board considered that the contractual management fee for the EQ/International ETF Portfolio was below the median for the Portfolio’s Lipper peer group. The Board also considered that the total expense ratio (excluding fees and expenses of the underlying portfolios in which the Portfolio invests) for the Class IA shares of the Portfolio was above (but within five basis points of) the median for the Portfolio’s Lipper peer group and the total expense ratio (excluding fees and expenses of the underlying portfolios in which the Portfolio invests) for the Class K shares of the Portfolio was below the median for the Portfolio’s Lipper peer group.
The Board considered that the contractual management fee for the AXA/Franklin Templeton Allocation Managed Volatility Portfolio was below the median for the Portfolio’s Lipper peer group. The Board also considered that the total expense ratios (excluding fees and expenses of the underlying portfolios in which the Portfolio invests) for the Class IA and Class IB shares of the Portfolio were above the median for the Portfolio’s Lipper peer group.
The Board considered that the contractual management fee for each of the All Asset Aggressive-Alt 25 and All Asset Growth-Alt 20 Portfolios was at the median for the Portfolio’s respective Lipper peer group and the contractual management fee for the All Asset Moderate Growth-Alt 15 Portfolio was above the median for the Portfolio’s Lipper peer group. The Board also considered that the total expense ratios (excluding fees and expenses of the underlying portfolios in which the Portfolio invests) for the Class IA (as applicable), Class IB and Class K shares of each of these Portfolios were above the medians for the Portfolio’s respective Lipper peer group.
The Board considered that the contractual management fee for each of the Strategic Allocation Portfolios was above (but within five basis points of) the median for the Portfolio’s respective Lipper peer group. The Board also considered that the total expense ratio (excluding fees and expenses of the underlying portfolios in which the Portfolio invests) for the Class IB shares of each of these Portfolios (except the AXA Balanced Strategy, AXA Conservative Growth Strategy, AXA Growth Strategy and AXA Moderate Growth Strategy Portfolios) was below the median for the Portfolio’s respective Lipper peer group. The Board noted, however, that the total expense ratio (excluding fees and expenses of the underlying portfolios in which the Portfolio invests) for the Class IB shares of each of the AXA Balanced Strategy, AXA Conservative Growth Strategy and AXA Moderate Growth Strategy Portfolios was within five basis points of the median for the Portfolio’s respective Lipper peer group. The Board also considered that the total expense ratio (excluding fees and expenses of the underlying portfolios in which the Portfolio invests) for the Class IA shares of each of the AXA Balanced Strategy and AXA Growth Strategy Portfolio was above (but, for the AXA Balanced Strategy Portfolio, within five basis points of) the median for the Portfolio’s respective Lipper peer group.
The Board further considered that the management and administrative fee rate schedules for the EQ/International ETF Portfolio and the administrative fee rate schedule for each of the other Portfolios include breakpoints so that the fee rates are reduced as the assets of the Portfolio increase above certain levels. The Board noted that any such reduction in the EQ/International ETF Portfolio’s management or administrative fee or in another Portfolio’s administrative fee would result in corresponding reductions in the Portfolio’s total expense ratios. In addition, the Board noted that the Manager had contractually agreed to make payments or waive all or a portion of its management, administrative and other fees so that each Portfolio’s total expense ratios do not exceed certain levels as set forth in its prospectus. The Board also noted that, as a result of these expense limitation arrangements, the actual management fee for the EQ/International ETF Portfolio, the AXA/Franklin Templeton Allocation Managed Volatility Portfolio, each of the All Asset Allocation Portfolios, and each of the Strategic Allocation Portfolios (except the AXA Aggressive Strategy and AXA Moderate Growth Strategy Portfolios) was lower than the Portfolio’s contractual management fee. The Board also considered that, after extensive discussions and negotiations with the Manager, the Manager had agreed, effective September 1, 2014, to revisions of the Portfolios’ administrative fee rate schedules that are expected to lower the Portfolios’ administrative fees at current or higher asset levels.
107
Table of Contents
Based on its review, the Board determined, with respect to each fund-of-funds Portfolio, that the Manager’s management fee is fair and reasonable.
AXA Tactical Manager Portfolios
The Board considered that the contractual management fee for each Portfolio was below the median for the Portfolio’s respective Lipper peer group. The Board also considered that the total expense ratios for the Class IA (as applicable) and Class IB (as applicable) shares of each Portfolio and the Class K shares of each Portfolio (except the ATM Mid Cap Managed Volatility and AXA 400 Managed Volatility Portfolios) were at or below the medians for the Portfolio’s respective Lipper peer group. The Board noted, however, that the total expense ratio (excluding fees and expenses of the underlying portfolios in which the Portfolio invests) for the Class K shares of each of the ATM Mid Cap Managed Volatility and AXA 400 Managed Volatility Portfolios was within five basis points of the median total expense ratio for the Portfolio’s respective Lipper peer group.
The Board further considered that the management and administrative fee rate schedules for each Portfolio include breakpoints so that the fee rates are reduced as the assets of the Portfolio increase above certain levels. The Board noted that any such reduction in a Portfolio’s management or administrative fee would result in corresponding reductions in the Portfolio’s total expense ratios. In addition, the Board noted that the Manager had contractually agreed to make payments or waive all or a portion of its management, administrative and other fees so that each Portfolio’s total expense ratios do not exceed certain levels as set forth in its prospectus. The Board also considered that, after extensive discussions and negotiations with the Manager, the Manager had agreed, effective September 1, 2014, to revisions of the Portfolios’ administrative fee rate schedule that are expected to lower the Portfolios’ administrative fees at current or higher asset levels.
The Board also considered the advisory fee paid to each Adviser with respect to each Portfolio in light of fees paid by similar portfolios advised by the Adviser.
Based on its review, the Board determined, with respect to each AXA Tactical Manager Portfolio, that the Manager’s management fee and the Advisers’ advisory fees are fair and reasonable.
Passive Portfolios
The Board considered that the contractual management fee for each of the EQ/Calvert Socially Responsible, EQ/Common Stock Index, EQ/Core Bond Index, EQ/Intermediate Government Bond, EQ/International Equity Index, EQ/Large Cap Growth Index, EQ/Large Cap Value Index, EQ/Mid Cap Index and EQ/Small Company Index Portfolios was at or below the median for the Portfolio’s respective Lipper peer group. The Board also considered that the total expense ratios for the Class IA, Class IB and Class K shares (as applicable) of each of these Portfolios were below the medians for the Portfolio’s respective Lipper peer group.
The Board considered that the contractual management fee for the EQ/Equity 500 Index Portfolio was above the median for the Portfolio’s Lipper peer group. The Board also considered that the total expense ratios for the Class IA, Class IB and Class K shares of the Portfolio were above (but, for Class K, within five basis points of) the medians for the Portfolio’s Lipper peer group.
The Board further considered that the management and administrative fee rate schedules for each Portfolio include breakpoints so that the fee rates are reduced as the assets of the Portfolio increase above certain levels. The Board noted that any such reduction in a Portfolio’s management or administrative fee would result in corresponding reductions in the Portfolio’s total expense ratios. The Board also considered that, after extensive discussions and negotiations with the Manager, the Manager had agreed, effective September 1, 2014, to revisions of the Portfolios’ administrative fee rate schedule that are expected to lower the Portfolios’ administrative fees at current or higher asset levels.
The Board also considered the advisory fee paid to the Adviser with respect to each Portfolio in light of fees paid by similar portfolios advised by the Adviser.
Based on its review, the Board determined, with respect to each passive Portfolio, that the Manager’s management fee and the Adviser’s advisory fee are fair and reasonable.
PLUS Portfolios
The Board considered that the contractual management fee for each of the AXA International Core Managed Volatility, AXA International Value Managed Volatility, AXA Large Cap Core Managed Volatility, AXA Large
108
Table of Contents
Cap Growth Managed Volatility, AXA Large Cap Value Managed Volatility, EQ/Emerging Markets Equity PLUS, EQ/Natural Resources PLUS, EQ/Quality Bond PLUS and EQ/Real Estate PLUS Portfolios was below the median for the Portfolio’s respective Lipper peer group. The Board also considered that the total expense ratios (excluding fees and expenses of other investment companies in which the Portfolio invests) for the Class IA (as applicable) and Class IB shares of each of these Portfolios (except the EQ/Real Estate PLUS Portfolio) and the Class K shares (as applicable) of each of these Portfolios (except the EQ/Natural Resources PLUS Portfolio) were at or below the medians for the Portfolio’s respective Lipper peer group. The Board noted, however, that the total expense ratios (excluding fees and expenses of other investment companies in which the Portfolio invests) for the Class IB shares of the EQ/Real Estate PLUS Portfolio and the Class K shares of the EQ/Natural Resources PLUS Portfolio were within five basis points of the median total expense ratios for the Portfolio’s respective Lipper peer group.
The Board considered that the contractual management fee for the AXA Mid Cap Value Managed Volatility Portfolio was above (but within five basis points of) the median for the Portfolio’s Lipper peer group. The Board also considered that the total expense ratios (excluding fees and expenses of other investment companies in which the Portfolio invests) for the Class IA and Class IB shares of the Portfolio were below, and for the Class K shares of the Portfolio were above, the medians for the Portfolio’s Lipper peer group.
The Board considered that the contractual management fee for the EQ/Global Bond PLUS Portfolio was above (but within five basis points of) the median for the Portfolio’s Lipper peer group. The Board also considered that the total expense ratios for the Class IA, Class IB and Class K shares of the Portfolio were above (but within five basis points of) the medians for the Portfolio’s Lipper peer group.
The Board further considered that the management and administrative fee rate schedules for each Portfolio include breakpoints so that the fee rates are reduced as the assets of the Portfolio increase above certain levels. The Board noted that any such reduction in a Portfolio’s management or administrative fee would result in corresponding reductions in the Portfolio’s total expense ratios. In addition, the Board noted that the Manager had contractually agreed to make payments or waive all or a portion of its management, administrative and other fees so that each Portfolio’s total expense ratios do not exceed certain levels as set forth in its prospectus. The Board also noted that, as a result of these expense limitation arrangements, the actual management fee for each of the EQ/Emerging Markets Equity PLUS, EQ/Global Bond PLUS, EQ/Natural Resources PLUS and EQ/Real Estate PLUS Portfolios was lower than the Portfolio’s contractual management fee. The Board also considered that, after extensive discussions and negotiations with the Manager, the Manager had agreed, effective September 1, 2014, to revisions of the Portfolios’ administrative fee rate schedule that are expected to lower the Portfolios’ administrative fees at current or higher asset levels.
The Board also considered the advisory fee paid to each Adviser with respect to each Portfolio in light of fees paid by similar portfolios advised by the Adviser.
Based on its review, the Board determined, with respect to each PLUS Portfolio, that the Manager’s management fee and the Advisers’ advisory fees are fair and reasonable.
PACTIVE Portfolios
The Board considered that the contractual management fee for each Portfolio was above the median for the Portfolio’s respective Lipper peer group. The Board also considered that the total expense ratios for the Class IA and Class IB shares of each Portfolio (except the AXA/Franklin Small Cap Value Managed Volatility, AXA Global Equity Managed Volatility and EQ/High Yield Bond Portfolios) were at or below the medians for the Portfolio’s respective Lipper peer group. The Board noted, however, that the total expense ratios for the Class IA and Class IB shares of the AXA/Franklin Small Cap Value Managed Volatility and AXA Global Equity Managed Volatility Portfolios were within five basis points of the median total expense ratios for the Portfolio’s respective Lipper peer group. The Board also considered that the total expense ratio for the Class K shares of each Portfolio was above (but, for the AXA/Franklin Balanced Managed Volatility Portfolio, within five basis points of) the median for the Portfolio’s respective Lipper peer group.
The Board further considered that, although the contractual management fee for each Portfolio was above the median for the Portfolio’s respective Lipper peer group and the total expense ratios for the Class IA, Class IB and/or Class K shares (as applicable) of certain Portfolios were above the medians for the Portfolio’s respective Lipper peer group, the management and administrative fee rate schedules for each Portfolio include breakpoints so that the fee rates are reduced as the assets of the Portfolio increase above certain levels. The Board noted that any such reduction in a Portfolio’s management or administrative fee would result in corresponding reductions in the
109
Table of Contents
Portfolio’s total expense ratios. In addition, the Board noted that, for each Portfolio (except the AXA Global Equity Managed Volatility Portfolio), the Manager had contractually agreed to make payments or waive all or a portion of its management, administrative and other fees so that each of these Portfolios’ total expense ratios do not exceed certain levels as set forth in its prospectus. The Board also noted that, as a result of these expense limitation arrangements, the actual management fee for the EQ/High Yield Bond Portfolio was lower than the Portfolio’s contractual management fee. The Board also considered that, after extensive discussions and negotiations with the Manager, the Manager had agreed, effective September 1, 2014, to revisions of the Portfolios’ administrative fee rate schedule that are expected to lower the Portfolios’ administrative fees at current or higher asset levels.
The Board also considered the advisory fee paid to each Adviser with respect to each Portfolio in light of fees paid by similar portfolios advised by each Adviser.
Based on its review, the Board determined, with respect to each PACTIVE Portfolio, that the Manager’s management fee and the Advisers’ advisory fees are fair and reasonable.
Multimanager Portfolios
The Board considered that the contractual management fee for each Portfolio was above (but, for the Multimanager Aggressive Equity Portfolio, within five basis points of) the median for the Portfolio’s respective Lipper peer group. The Board also considered that the total expense ratios for the Class IA, Class IB and Class K shares of each Portfolio were above (but, for the Multimanager Aggressive Equity Portfolio, within five basis points of) the medians for the Portfolio’s respective Lipper peer group.
The Board further considered that, although the contractual management fee for each Portfolio was above the median for the Portfolio’s respective Lipper peer group and the total expense ratios for the Class IA, Class IB and Class K shares of each Portfolio were above the medians for the Portfolio’s respective Lipper peer group, the management and administrative fee rate schedules for each Portfolio include breakpoints so that the fee rates are reduced as the assets of the Portfolio increase above certain levels. The Board noted that any such reduction in a Portfolio’s effective management or administrative fee would result in corresponding reductions in the Portfolio’s total expense ratios. In addition, the Board noted that the Manager had contractually agreed to make payments or waive all or a portion of its management, administrative and other fees so that each Portfolio’s total expense ratios do not exceed certain levels as set forth in the prospectus. The Board noted that, as a result of these expense limitation arrangements, the actual management fee for each of the Multimanager Mid Cap Growth and Multimanager Mid Cap Value Portfolios was lower than the Portfolio’s contractual management fee. The Board also considered that, after extensive discussions and negotiations with the Manager, the Manager (i) had agreed, effective September 1, 2014, to revisions of the Portfolios’ administrative fee rate schedule that are expected to lower the Portfolios’ administrative fees at current or higher asset levels, and (ii) had agreed to implement, effective September 1, 2014, for each of the Multimanager Mid Cap Growth, Multimanager Mid Cap Value and Multimanager Technology Portfolios, voluntary expense limitations that would limit the Portfolio’s total expense ratios to levels lower than the contractual levels noted above.
The Board also considered the advisory fee paid to each Adviser with respect to each Portfolio in light of fees paid by similar portfolios and accounts advised by the Adviser.
Based on its review, the Board determined, with respect to each Multimanager Portfolio, that the Manager’s management fee is fair and reasonable.
Actively-Managed, Single Adviser Portfolios
The Board considered that the contractual management fee for the EQ/AllianceBernstein Small Cap Growth Portfolio was below the median for the Portfolio’s Lipper peer group. The Board also considered that the total expense ratios for the Class IA, Class IB and Class K shares of the Portfolio were below the medians for the Portfolio’s Lipper peer group.
The Board considered that the contractual management fee for each of the EQ/BlackRock Basic Value Equity, EQ/Capital Guardian Research, EQ/GAMCO Small Company Value, EQ/Invesco Comstock, EQ/JPMorgan Value Opportunities, EQ/Money Market, EQ/Morgan Stanley Mid Cap Growth and EQ/Wells Fargo Omega Growth Portfolios was above, but within five basis points of, the median for the Portfolio’s respective Lipper peer group. The Board also considered that the total expense ratios for the Class IA and Class IB shares of each of these Portfolios (except the EQ/Invesco Comstock, EQ/JPMorgan Value Opportunities, EQ/Money Market, and EQ/Wells Fargo Omega Growth Portfolios) and the Class K shares (as applicable) of each of these Portfolios (except
110
Table of Contents
the EQ/Wells Fargo Omega Growth Portfolio) were at or below the medians for the Portfolio’s respective Lipper peer group. The Board noted, however, that the total expense ratios for the Class IA and Class IB shares of each of the EQ/Invesco Comstock, EQ/JPMorgan Value Opportunities and EQ/Wells Fargo Omega Growth Portfolios and the Class K shares of the EQ/Wells Fargo Omega Growth Portfolio were within five basis points of the median total expense ratios for the Portfolio’s respective Lipper peer group.
The Board also considered that the contractual management fee for each of the AXA/Loomis Sayles Growth, EQ/AllianceBernstein Dynamic Wealth Strategies, EQ/AllianceBernstein Short Duration Government Bond, EQ/Boston Advisors Equity Income, EQ/GAMCO Mergers and Acquisitions, EQ/MFS International Growth, EQ/Oppenheimer Global, EQ/PIMCO Global Real Return, EQ/PIMCO Ultra Short Bond, EQ/T. Rowe Price Growth Stock and EQ/UBS Growth and Income Portfolios was above the median for the Portfolio’s respective Lipper peer group. The Board also considered that the total expense ratios for the Class IA (as applicable) and Class IB (as applicable) shares of each of these Portfolios (except the EQ/GAMCO Mergers and Acquisitions Portfolio) were above the median for the Portfolio’s respective Lipper peer group. The Board noted, however, that the total expense ratio for the Class IB shares of the EQ/AllianceBernstein Short Duration Government Bond Portfolio was within five basis points of the median total expense ratio for the Portfolio’s Lipper peer group. The Board also considered that the total expense ratio for the Class K shares (as applicable) of each of these Portfolios (except the EQ/MFS International Growth Portfolio) was above the median for the Portfolio’s respective Lipper peer group. The Board noted, however, that the total expense ratio for the Class K shares of each of the EQ/AllianceBernstein Short Duration Government Bond, EQ/Boston Advisers Equity Income and EQ/PIMCO Ultra Short Bond Portfolios was within five basis points of the median total expense ratio for the Portfolio’s respective Lipper peer group.
The Board further considered that, although the management fee for each Portfolio (except the EQ/AllianceBernstein Small Cap Growth Portfolio) was above the median for the Portfolio’s respective Lipper peer group and the total expense ratios for the Class IA, Class IB and/or Class K shares (as applicable) of certain Portfolios were above the medians for the Portfolio’s respective Lipper peer group, the management and administrative fee rate schedules for each Portfolio include breakpoints so that the fee rates are reduced as the assets of the Portfolio increase above certain levels. The Board noted that any such reduction in a Portfolio’s management or administrative fee would result in corresponding reductions in the Portfolio’s total expense ratios. In addition, the Board noted that, for each Portfolio (except the EQ/AllianceBernstein Small Cap Growth, EQ/GAMCO Mergers and Acquisitions, EQ/GAMCO Small Company Value and EQ/Money Market Portfolios), the Manager had contractually agreed to make payments or waive all or a portion of its management, administrative and other fees so that each of these Portfolio’s total expense ratios do not exceed certain levels as set forth in its prospectus. The Board noted that, as a result of these expense limitation arrangements, the actual management fee for each of the EQ/AllianceBernstein Dynamic Wealth Strategies, EQ/Boston Advisors Equity Income, EQ/Capital Guardian Research, EQ/Invesco Comstock, EQ/JPMorgan Value Opportunities, EQ/Oppenheimer Global, EQ/PIMCO Global Real Return, EQ/T. Rowe Price Growth Stock and EQ/UBS Growth and Income Portfolios was lower than the Portfolio’s contractual management fee. The Board also considered that, after extensive discussions and negotiations with the Manager, the Manager had agreed, effective September 1, 2014, to revisions of the Portfolios’ administrative fee rate schedule that are expected to lower the Portfolios’ administrative fees at current or higher asset levels. The Board also considered that the Manager had been voluntarily waiving a portion of its management and administrative fees and reimbursing other expenses of the EQ/Money Market Portfolio to seek to ensure that the Portfolio’s yield did not decline below zero.
The Board also considered the advisory fee paid to the Adviser with respect to each Portfolio in light of fees paid by similar portfolios advised by the Adviser.
Based on its review, the Board determined, with respect to each actively-managed, single Adviser Portfolio, that the Manager’s management fee and the Adviser’s advisory fee are fair and reasonable.
Profitability and Costs. The Board also considered the level of profits realized by the Manager and its affiliates in connection with the operation of each Portfolio. In this respect, the Board reviewed profitability information setting forth the overall profitability of the Trust to the Manager and its affiliates, as well as the Manager’s and its affiliates’ profits in providing management and other services to each of the individual Portfolios during the 12-month period ended December 31, 2013, which was the most recent fiscal year for the Manager.
In reviewing the analysis, attention was given to the methodology followed in allocating costs to each Portfolio, it being recognized that allocation methodologies are inherently subjective and various allocation methodologies
111
Table of Contents
may each be reasonable while producing different results. In this respect, the Board noted that, while being continuously refined and reflecting changes in the Manager’s and its affiliates’ cost accounting and other appropriate adjustments, the cost allocation methodology was consistent with that followed in profitability report presentations for the Portfolios made in prior years. In reviewing and discussing such analysis, the Manager discussed with the Board its belief that costs incurred in establishing the infrastructure necessary for the type of mutual fund operations conducted by the Manager and its affiliates may not be fully reflected in the expenses allocated to each Portfolio in determining its profitability, as well as the fact that the level of profits, to a certain extent, reflected operational cost savings and efficiencies initiated by management. The Board also took into account management’s ongoing costs and expenditures in providing and improving services for the Portfolios, as well as the need to meet additional regulatory and compliance requirements resulting from recently adopted rules and other regulations. In addition, the Board considered information prepared by management or from third party sources comparing the profitability of the Manager on an overall basis to the profitability of other publicly held asset managers (including asset managers similar to the Manager).
The Board also noted that the Manager generally is aware of the fees charged by the Advisers to other clients, and that the Manager believes that the fees agreed upon with the Advisers are reasonable in light of the quality of the investment advisory services provided. The Manager advised the Board that it does not regard Adviser profitability as meaningful to its evaluation of the Advisory Agreements. The Board acknowledged the Manager’s view of Adviser profitability, noting the Board’s findings as to the reasonableness of the aggregate advisory fees and that the fees paid to the Advisers are the product of negotiations with the Manager and reflect levels of profitability acceptable to the Manager and the Advisers based on the particular circumstances in each case for each of them. The Board further noted that each Adviser’s fee is paid by the Manager and not the Portfolio. The Board also noted that, with respect to AllianceBernstein, which is an affiliate of the Manager, profitability is addressed separately.
Based on its consideration of the factors above, the Board determined that the level of profits realized by the Manager from providing services to each Portfolio was not excessive in view of the nature, quality and extent of services provided.
Economies of Scale. The Board also considered whether economies of scale or efficiencies are realized by the Manager as the Portfolios grow larger and the extent to which this is reflected in the level of management and administrative fees charged. While recognizing that any precise determination is inherently subject to assumptions and subjective assessments, the Board considered that any economies of scale or efficiencies may be shared with portfolios and their shareholders in a variety of ways, including: (i) breakpoints in the management fee or other fees so that a portfolio’s effective fee rate declines as the portfolio grows in size, (ii) subsidizing a portfolio’s expenses by making payments or waiving all or a portion of the management fee or other fees so that the portfolio’s total expense ratio does not exceed certain levels, (iii) setting the management fee or other fees so that a portfolio is priced to scale, which assumes that the portfolio has sufficient assets from inception to operate at a competitive fee rate without any fee waiver or expense reimbursement from the manager, and (iv) reinvestment in, and enhancements to, the services that the manager and its affiliates provide to the portfolios and their shareholders. The Board noted that the management and/or administrative fee schedules for certain Portfolios include breakpoints that reduce the fee rate as Portfolio assets increase. In this connection, the Board considered that, after extensive discussions and negotiations with the Manager, the Manager had agreed, effective September 1, 2014, to implement revisions to the administrative fee rate schedules for all of the Portfolios, as noted above. The Board also noted that, although the management and/or administrative fees for some Portfolios do not include breakpoints, the Manager was subsidizing certain Portfolios’ expenses by making payments or waiving all or a portion of its management, administrative and other fees so that the Portfolios’ total expense ratios do not exceed certain contractual levels (or, in the case of certain Portfolios, lower voluntary levels) as set forth in their prospectuses. In addition, the Board considered that the Manager shares economies of scale with the Portfolios in other ways, which may include setting the management or other fees for a Portfolio so that they are priced to scale. The Board considered that the effect of this pricing strategy is that the Manager could lose money in the early stages of a Portfolio’s operation (and bear the risk that the Portfolio will never become profitable), while shareholders of the Portfolio receive the benefit of economies of scale that the Manager expects the Portfolio will achieve as it grows. The Board further considered that the Manager shares economies of scale with the Portfolios through reinvestment in, and enhancements to, the services that the Manager and its affiliates provide to the Portfolios and their shareholders, such as hiring additional personnel and providing additional resources in areas relating to management and administration of the Portfolios. In addition, the Board noted that the advisory fee schedules for certain Advisers include breakpoints that would reduce the advisory fee rate as applicable Portfolio assets under the
112
Table of Contents
Adviser’s management increase. The Board also noted that the advisory fee schedules for certain Advisers aggregate the assets managed by the Adviser in a Portfolio and in one or more other Portfolios for which the Manager serves as investment manager and the Adviser serves as investment sub-adviser. Based on its consideration of the factors above, the Board concluded that there was a reasonable sharing of any economies of scale or efficiencies under the management, administrative and advisory fee schedules at the present time.
Fall-Out Benefits. The Board also considered the extent to which the Manager and its affiliates derive ancillary benefits from Portfolio operations, including the following. The Board noted that the Manager also serves as the administrator for the Portfolios and receives compensation for acting in this capacity. In addition, the Board recognized that AllianceBernstein, an affiliate of the Manager, serves as an Adviser to certain Portfolios and receives advisory fees that are paid by the Manager out of the fees that it earns from those Portfolios. The Board also recognized that AXA Distributors, LLC, also an affiliate of the Manager, serves as the underwriter for the Trust and receives from the Portfolios payments pursuant to Rule 12b-1 plans with respect to their Class IA and Class IB shares to compensate it for providing shareholder services and selling activities, which could lead to growth in the Trust’s assets and corresponding benefits from such growth, including economies of scale. Further, the Board considered that Sanford C. Bernstein & Co., LLC, a registered broker-dealer, is an affiliate of the Manager and may, from time to time, receive brokerage commissions from the Portfolios in connection with the purchase and sale of portfolio securities; provided, however, that those transactions, among other things, must be consistent with seeking best execution. The Board also recognized that the All Asset Allocation Portfolios, the Strategic Allocation Portfolios and the AXA/Franklin Templeton Allocation Managed Volatility Portfolio invest in other (underlying) portfolios managed by the Manager and advised by Advisers that may be affiliated with the Manager and that these underlying portfolios pay management and administrative fees to the Manager, who may in certain cases pay advisory fees to an affiliated Adviser, and pay distribution fees to the Manager’s distribution affiliate. The Board also noted that the Manager’s affiliated insurance companies, as depositors of the insurance company separate accounts investing in the Portfolios, receive certain significant tax benefits associated with such investments as well as other potential benefits. The Board also considered that the Portfolios are offered as investment options through variable insurance contracts offered and sold by the Manager’s affiliated insurance companies and that the performance of each Portfolio may impact, positively or negatively, each insurance company’s ability to hedge the risks associated with guarantees that each insurance company may provide as the issuer of such contracts. The Board also noted that the Manager’s affiliated insurance companies and AXA Distributors, LLC receive compensation, which may include sales charges, separate account fees and charges, and other variable contract fees and charges, from the sale and administration of these variable insurance contracts. The Board also considered that certain Portfolios are subject to certain investment controls that are designed to reduce volatility for investors and that may benefit both investors and the Manager and its affiliates (including by making it easier for the insurance companies to hedge their risks under the guarantees). Based on its review, the Board determined that any “fall-out” benefits that may accrue to the Manager are fair and reasonable.
The Board also noted that each Adviser may derive ancillary benefits from Portfolio operations. For example, each Adviser, through its position as an Adviser to its Portfolio(s), may engage in soft dollar transactions. The Board received information regarding each Adviser’s procedures for executing portfolio transactions for the Portfolio(s) (or the portion(s) thereof) that it sub-advises and information regarding each Adviser’s policies and procedures for selecting brokers and dealers and obtaining research from those brokers and dealers. In addition, the Board considered that each Adviser may be affiliated with registered broker-dealers who may, from time to time, receive brokerage commissions from the Portfolios in connection with the purchase and sale of portfolio securities; provided, however, that those transactions, among other things, must be consistent with seeking best execution. In addition, the Board recognized that AllianceBernstein, an affiliate of the Manager, serves as the Adviser to certain of the Portfolios. The Board also recognized that affiliates of the Advisers may sell, and earn sales commissions and/or other compensation with respect to, insurance products issued by the Manager’s affiliated insurance companies and that the proceeds of those sales may be invested in the Portfolios. Based on its review, the Board determined that any “fall-out” benefits that may accrue to each Adviser are fair and reasonable.
113
Table of Contents
EQ ADVISORS TRUST
DISCLOSURE REGARDING ADVISORY CONTRACT APPROVAL
APPROVAL OF INVESTMENT ADVISORY AGREEMENT DURING THE SIX-MONTH PERIOD ENDED DECEMBER 31, 2014 (UNAUDITED)
At a meeting held on July 14-16, 2014, the Board of Trustees (the “Board”) of EQ Advisors Trust (the “Trust”), including those Trustees who are not parties to any Agreement (as defined below) or “interested persons” (as that term is defined in the Investment Company Act of 1940, as amended) of such parties or the Trust (the “Independent Trustees”), considered and unanimously approved an Investment Advisory Agreement (the “Agreement”) between AXA Equitable Funds Management Group, LLC (“AXA FMG” or the “Manager”), which serves as the Trust’s investment manager, and Loomis, Sayles & Company, L.P. (“Loomis Sayles” or the “Adviser”) with respect to the EQ/Montag & Caldwell Growth Portfolio (the “Portfolio”), effective September 1, 2014.
The Board noted that the current investment advisory agreement between the Manager and Montag & Caldwell, LLC (“Montag”) with respect to the Portfolio will expire on August 31, 2014. In considering the factors listed below, including comparative total return information, the Manager and the Board determined not to renew the investment advisory agreement with Montag. In connection with the appointment of Loomis Sayles as the Adviser to the Portfolio, the Board approved a change in the Portfolio’s name to the “AXA/Loomis Sayles Growth Portfolio” and modifications to the Portfolio’s principal investment strategies and risks to reflect Loomis Sayles’s investment process.
In reaching its decision to approve the Agreement between the Manager and Loomis Sayles, the Board considered the overall fairness of the Agreement and whether the Agreement was in the best interests of the Portfolio and its investors. The Board further considered all factors it deemed relevant with respect to the consideration of the Agreement, including: (1) the nature, quality and extent of the overall services to be provided to the Portfolio by the proposed Adviser; (2) comparative performance information; (3) the level of the proposed advisory fee; (4) economies of scale that may be realized by the proposed Adviser and whether fee levels reflect these economies of scale for the benefit of the Portfolio; and (5) the “fall out” benefits to be realized by the proposed Adviser and its affiliates (i.e., any direct or indirect benefits to be derived by the proposed Adviser and its affiliates from their relationships with the Trust). In considering the Agreement, the Board did not identify any single factor or information as all-important or controlling and each Trustee may have attributed different weight to each factor.
In connection with its deliberations, the Board took into account information prepared by the Manager and the proposed Adviser, including memoranda and other materials addressing the factors set out above, and provided to the Trustees prior to the meeting. The information provided to the Trustees described, among other things, the services to be provided by the proposed Adviser, as well as the proposed Adviser’s investment personnel, proposed advisory fee, performance information, and other matters. The Board also took into account information provided to the Trustees at prior Board meetings. During the relevant meeting, the Trustees met with senior representatives of the Manager to discuss the Agreement and the information provided. The Independent Trustees met in executive session during the meeting to review the information provided. The Independent Trustees were assisted by independent counsel during the meeting and during their deliberations regarding the Agreement, and also received materials discussing the legal standards applicable to their consideration of the Agreement. In approving the Agreement, the Board, including the Independent Trustees, determined that the proposed advisory fee was fair and reasonable and that the approval of the Agreement was in the best interests of the Portfolio and its investors. Although the Board gave attention to all information provided, the following discusses some of the primary factors that the Board deemed relevant to its decision to approve the Agreement.
Nature, Quality and Extent of Services. The Board evaluated the nature, quality and extent of the overall services to be provided to the Portfolio and its investors by the proposed Adviser. In addition to the investment performance information discussed below, the Board considered the proposed Adviser’s responsibilities with respect to the Portfolio pursuant to the Agreement and the proposed Adviser’s experience in serving as an investment adviser or sub-adviser for funds and/or accounts similar to the Portfolio. The Board considered that the proposed Adviser would be responsible for making investment decisions for the Portfolio, subject to the oversight of the Manager; placing with brokers or dealers all orders for the purchase and sale of investments for the Portfolio; and performing related trading functions. The Board also reviewed information regarding the proposed Adviser’s process for selecting investments for the Portfolio, as well as information regarding the background of the proposed Adviser’s portfolio manager who would provide services to the Portfolio. In addition, the Board considered the proposed
114
Table of Contents
Adviser’s trading experience, including its policies, processes and procedures aimed at achieving ‘best execution’ on behalf of the Portfolio. The Board also considered the Portfolio’s Chief Compliance Officer’s evaluation of the proposed Adviser’s compliance program, policies, and procedures, and certification that they were consistent with applicable legal standards. The Board also considered whether there were any pending lawsuits, enforcement proceedings or regulatory investigations involving the proposed Adviser and reviewed information regarding the proposed Adviser’s financial condition and history of operations and conflicts of interest in managing the Portfolio. The Board’s conclusion regarding the nature, quality and extent of the overall services to be provided by the proposed Adviser was also based, in part, on the Board’s experience and familiarity with the proposed Adviser’s portfolio manager having formerly served as a portfolio manager for a sub-adviser to another Trust portfolio. Based on its review, the Board determined, with respect to the Portfolio, that the nature, quality and extent of the overall services to be provided by the proposed Adviser were appropriate for the Portfolio in light of its investment objectives and, thus, supported a decision to approve the Agreement.
Investment Performance. The Board received and reviewed the proposed Adviser’s performance data in managing other funds and/or accounts, as compared to an appropriate benchmark and the Portfolio. The Board generally considered long-term performance to be more important than short-term performance. The Board also considered the proposed Adviser’s expertise, resources, proposed investment strategy, and personnel for advising the Portfolio. Based on its review, the Board determined, with respect to the Portfolio, that the performance data and related information supported a decision to approve the Agreement.
Expenses. The Board considered the proposed advisory fee for the proposed Adviser in light of the nature, quality and extent of the overall services to be provided by the proposed Adviser. In addition, the Board considered the relative levels of the advisory fee to be paid to the proposed Adviser and the management fee to be retained by the Manager in light of, among other factors, the services provided to the Portfolio by the Manager and the proposed Adviser. The Board also considered the proposed advisory fee in light of the fees that the proposed Adviser charges under other advisory agreements with other clients. The Board noted that the advisory fee to be paid to the proposed Adviser is higher than the fee paid to Montag. The Board further noted that the Manager, and not the Portfolio, would pay the proposed Adviser and that the proposed advisory fee was negotiated between the proposed Adviser and the Manager. Moreover, the Board noted that the Manager generally is aware of the fees charged by sub-advisers to other clients and that the Manager believes that the fees agreed upon with the proposed Adviser are reasonable in light of the quality of the investment advisory services to be provided. Based on its review, the Board determined, with respect to the Portfolio, that the proposed advisory fee for the proposed Adviser is fair and reasonable.
Profitability and Costs. The Board also considered the estimated impact of the proposed advisory fee on the profitability of the Manager, noting that the fee payable to the proposed Adviser is higher than the fee payable to Montag. The Manager advised the Board that it does not regard Adviser profitability as meaningful to its evaluation of the Agreement. The Board acknowledged the Manager’s view of Adviser profitability, noting the Board’s findings as to the reasonableness of the advisory fee and that the fee paid to the proposed Adviser is the product of negotiations with the Manager and reflects levels of profitability acceptable to the Manager and the proposed Adviser based on the particular circumstances in each case for each of them. The Board further noted that the proposed Adviser’s fee is paid by the Manager and not the Portfolio.
Economies of Scale. The Board also considered whether economies of scale would be realized as the Portfolio grows larger and the extent to which this is reflected in the proposed advisory fee schedule with respect to the Portfolio. While recognizing that any precise determination is inherently subject to assumptions and subjective assessments, the Board noted that the proposed flat advisory fee rate is competitive with the advisory fee rate charged by the proposed Adviser to comparable clients. The Board considered these factors, and the relationship they bear to the fee structure charged to the Portfolio by the Manager, and concluded that there would be a reasonable sharing of benefits from any economies of scale with the Portfolio.
Fall-Out Benefits. The Board also noted that the proposed Adviser may derive ancillary benefits from Portfolio operations. For example, the proposed Adviser, through its position as an Adviser to the Portfolio, may engage in soft dollar transactions. The Board considered information regarding the proposed Adviser’s procedures for executing portfolio transactions for the Portfolio. In addition, the Board considered that the proposed Adviser may be affiliated with registered broker-dealers who may, from time to time, receive brokerage commissions from the Portfolio in connection with the purchase and sale of portfolio securities; provided, however, that those transactions, among other things, must be consistent with seeking best execution. The Board also recognized that affiliates of the proposed Adviser may sell, and earn sales commissions and/or other compensation with respect to, insurance products issued by the Manager’s affiliated insurance companies and that the proceeds of those sales may be invested in the Portfolio. Based on its review, the Board determined that any “fall-out” benefits that may accrue to the proposed Adviser are fair and reasonable.
115
Table of Contents
EQ ADVISORS TRUST
DISCLOSURE REGARDING ADVISORY CONTRACT APPROVAL
At a meeting held on December 2-3, 2014, the Board of Trustees (the “Board”) of EQ Advisors Trust (the “Trust”), including those Trustees who are not parties to any Agreement (as defined below) or “interested persons” (as that term is defined in the Investment Company Act of 1940, as amended) of such parties or the Trust (the “Independent Trustees”), considered and unanimously approved an Investment Advisory Agreement (the “Agreement”) between AXA Equitable Funds Management Group, LLC (“AXA FMG” or the “Manager”), which serves as the Trust’s investment manager, and DoubleLine Capital LP (“DoubleLine” or the “Adviser”) with respect to the Multimanager Core Bond Portfolio (the “Portfolio”), effective January 20, 2015.
The Board noted that the Manager proposed to appoint DoubleLine as an additional Adviser to the active allocated portion of the Portfolio. The Board recognized that BlackRock Financial Management, Inc. and Pacific Investment Management Company LLC are the other Advisers to the Portfolio’s active allocated portion, and SSgA Funds Management, Inc. is the Adviser to the Portfolio’s index allocated portion. The Board also noted that AXA FMG will generally allocate the Portfolio’s assets among the four abovementioned Advisers, and each will manage its portion of the Portfolio using different yet complementary investment strategies. The Board took into account that the Manager’s proposal was based on certain factors, including but not limited to, the Manager’s desire to reduce Adviser concentration in the Portfolio’s active allocated portion. In connection with the appointment of DoubleLine as the Adviser to the Portfolio, the Board approved certain modifications to the Portfolio’s principal investment strategies to reflect DoubleLine’s investment process.
In reaching its decision to approve the Agreement between the Manager and DoubleLine, the Board considered the overall fairness of the Agreement and whether the Agreement was in the best interests of the Portfolio and its investors. The Board further considered all factors it deemed relevant with respect to the consideration of the Agreement, including: (1) the nature, quality and extent of the overall services to be provided to the Portfolio by the proposed Adviser; (2) comparative performance information; (3) the level of the proposed advisory fee; (4) economies of scale that may be realized by the proposed Adviser and whether fee levels reflect these economies of scale for the benefit of the Portfolio; and (5) the “fall out” benefits to be realized by the proposed Adviser and its affiliates (i.e., any direct or indirect benefits to be derived by the proposed Adviser and its affiliates from their relationships with the Trust). In considering the Agreement, the Board did not identify any single factor or information as all-important or controlling and each Trustee may have attributed different weight to each factor.
In connection with its deliberations, the Board took into account information prepared by the Manager and the proposed Adviser, including memoranda and other materials addressing the factors set out above, and provided to the Trustees prior to the meeting. The information provided to the Trustees described, among other things, the services to be provided by the proposed Adviser, as well as the proposed Adviser’s investment personnel, proposed advisory fee, performance information, and other matters. The Board also took into account information provided to the Trustees at prior Board meetings. During the relevant meeting, the Trustees met with senior representatives of the Manager to discuss the Agreement and the information provided. The Independent Trustees met in executive session during the meeting to review the information provided. The Independent Trustees were assisted by independent counsel during the meeting and during their deliberations regarding the Agreement, and also received materials discussing the legal standards applicable to their consideration of the Agreement. In approving the Agreement, the Board, including the Independent Trustees, determined that the proposed advisory fee was fair and reasonable and that the approval of the Agreement was in the best interests of the Portfolio and its investors. Although the Board gave attention to all information provided, the following discusses some primary factors that the Board deemed relevant to its decision to approve the Agreement.
Nature, Quality and Extent of Services. The Board evaluated the nature, quality and extent of the overall services to be provided to the Portfolio and its investors by the proposed Adviser. In addition to the investment performance information discussed below, the Board considered the proposed Adviser’s responsibilities with respect to the Portfolio pursuant to the Agreement and the proposed Adviser’s experience in serving as an investment adviser or sub-adviser for funds and/or accounts similar to the Portfolio. The Board considered that, subject to the oversight of the Manager, the proposed Adviser would be responsible for making investment decisions for the Portfolio; placing with brokers or dealers all orders for the purchase and sale of investments for its portion of the Portfolio; and performing related trading functions. The Board also reviewed information regarding the proposed Adviser’s process for selecting investments for the Portfolio, as well as information regarding the background of the proposed Adviser’s portfolio managers who would provide services to the Portfolio. In addition, the Board considered the
116
Table of Contents
proposed Adviser’s trading experience, including its policies, processes and procedures aimed at achieving ‘best execution’ on behalf of the Portfolio. The Board also considered the Portfolio’s Chief Compliance Officer’s evaluation of the proposed Adviser’s compliance program, policies, and procedures, and certification that they were consistent with applicable legal standards. The Board also considered whether there were any pending lawsuits, enforcement proceedings or regulatory investigations involving the proposed Adviser and reviewed information regarding the proposed Adviser’s financial condition and history of operations and conflicts of interest in managing the Portfolio. Based on its review, the Board determined, with respect to the Portfolio, that the nature, quality and extent of the overall services to be provided by the proposed Adviser were appropriate for the Portfolio in light of its investment objectives and, thus, supported a decision to approve the Agreement.
Investment Performance. The Board received and reviewed the proposed Adviser’s performance data in managing other funds and/or accounts with a similar investment mandate as its active allocated portion of the Portfolio, as compared to an appropriate benchmark. The Board generally considered long-term performance to be more important than short-term performance. The Board also considered the Adviser’s expertise, resources, proposed investment strategy, and personnel for advising the Portfolio. Based on its review, the Board determined, with respect to the Portfolio, that the performance data and related information supported a decision to approve the Agreement.
Expenses. The Board considered the proposed advisory fee for the proposed Adviser in light of the nature, quality and extent of the overall services to be provided by the proposed Adviser. In addition, the Board considered the relative levels of the advisory fee to be paid to the proposed Adviser and the management fee to be retained by the Manager in light of, among other factors, the services provided to the Portfolio by the Manager and the proposed Adviser. The Board also considered the proposed advisory fee in light of the fees that the proposed Adviser charges under other advisory agreements with other clients. The Board further noted that the Manager, and not the Portfolio, would pay the proposed Adviser and that the proposed advisory fee was negotiated between the proposed Adviser and the Manager. Moreover, the Board noted that the Manager generally is aware of the fees charged by sub-advisers to other clients and that the Manager believes that the fees agreed upon with the proposed Adviser are reasonable in light of the quality of the investment advisory services to be provided. Based on its review, the Board determined, with respect to the Portfolio, that the proposed advisory fee for the proposed Adviser is fair and reasonable.
Profitability and Costs. The Board also considered the estimated impact of the proposed advisory fee on the profitability of the Manager. The Board noted that the investment management fee schedule paid by the Portfolio to the Manager would not change as a result of the Advisory Agreement. The Manager advised the Board that it does not regard Adviser profitability as meaningful to its evaluation of the Agreement. The Board acknowledged the Manager’s view of Adviser profitability, noting the Board’s findings as to the reasonableness of the advisory fee and that the fee paid to the proposed Adviser is the product of negotiations with the Manager and reflects levels of profitability acceptable to the Manager and the proposed Adviser based on the particular circumstances in each case for each of them. The Board further noted that the proposed Adviser’s fee is paid by the Manager and not the Portfolio.
Economies of Scale. The Board also considered whether economies of scale would be realized as the Portfolio grows larger and the extent to which this is reflected in the proposed advisory fee schedule with respect to the Portfolio. While recognizing that any precise determination is inherently subject to assumptions and subjective assessments, the Board noted that the proposed advisory fee schedule includes breakpoints that would reduce the advisory fee rate as applicable Portfolio assets under the Adviser’s management increase. The Board again noted that the advisory fees are paid by the Manager out of its assets and not from the Portfolio’s assets. The Board considered these factors, and the relationship they bear to the fee structure charged to the Portfolio by the Manager, and concluded that there would be a reasonable sharing of benefits from any economies of scale with the Portfolio.
Fall-Out Benefits. The Board also noted that the proposed Adviser may derive ancillary benefits from Portfolio operations. For example, the Board noted that the proposed Adviser may benefit from greater exposure in the marketplace with respect to the proposed Adviser’s investment process and expanding its level of assets under management. In addition, the proposed Adviser may derive benefits from its association with the Manager and other Advisers to the Portfolio. The Board noted that the proposed Adviser does not utilize any soft-dollar arrangements with respect to its fixed income line of business. The Board noted that the proposed Advisor does not maintain any soft-dollar arrangements. Based on its review, the Board determined that any “fall-out” benefits that may accrue to the proposed Adviser are fair and reasonable.
117
Table of Contents
Federal Income Tax Information (Unaudited)
For the year ended December 31, 2014, the percentage of dividends paid that qualify for the 70% dividends received deductions for corporate shareholders, foreign taxes which are expected to be passed through to shareholders for foreign tax credits, gross income derived from sources within foreign countries, and long-term capital gain dividends for the purpose of the dividend paid deduction on its Federal income tax return were as follows:
Portfolios: | 70% Dividend Received Deduction | Foreign Taxes | Foreign Source Income | Long Term Capital Gain | ||||||||||||
EQ/Common Stock Index | 100.00 | % | $ | — | $ | — | $ | — | ||||||||
EQ/Core Bond Index | 0.00 | — | — | — | ||||||||||||
118
Table of Contents
MANAGEMENT OF THE TRUST (UNAUDITED)
The Trust’s Board is responsible for the overall management of the Trust and the Portfolios, including general supervision and review of the Portfolios’ investment activities and their conformity with federal and state law as well as the stated policies of the Portfolios. The Board elects the officers of the Trust who are responsible for administering the Trust’s day-to-day operations. The Trustees of the Trust are identified in the table below along with information as to their principal business occupations held during the last five years and certain other information are shown below.
The Trustees
| Name, Address and Year of Birth | Position(s) Held With Fund | Term of Office** and Length of Time Served | Principal Occupation(s) During Past 5 Years | Number of by Trustee† | Other Directorships During Past 5 Years | |||||
| Interested Trustees | ||||||||||
Steven M. Joenk* 1290 Avenue of the Americas, New York, New York | Trustee, Chairman, President and Chief Executive Officer | Trustee and Chairman from September 2004 to present, Chief Executive Officer, President from December 2002 to present | From May 2011 to present, Director, President, Chief Executive Officer and Chairman, FMG LLC; from September 1999 to present, Managing Director, AXA Equitable; from September 2004 to April 2011, President, AXA Equitable’s Funds Management Group (“FMG”) unit; from July 2004 to October 1, 2013, Senior Vice President, MONY Life Insurance Company; from July 2004 to present, Senior Vice President MONY Life Insurance Company of America and Director, MONY Capital Management, Inc., Director and President, 1740 Advisers, Inc.; Director, Chairman of the Board and President, MONY Asset Management, Inc. and Enterprise Capital Management (from July 2004 to January 2011); from January 2005 to January 2011, Director, MONY Financial Resources of Americas Limited; and from November 2005 to present, Director MONY International Holdings, LLC. | 113 | None | |||||
| * | Affiliated with the Manager and/or the Distributor. |
| ** | Each Trustee serves until his or her resignation or retirement. |
| † | The registered investment companies in the fund complex include AXA Premier VIP Trust, 1290 Funds and the Trust. Mr. Joenk serves as Trustee, President and Chief Executive Officer for each of the registered investment companies in the fund complex, as well as Chairman for each such company. |
119
Table of Contents
| Name, Address and Year of Birth | Position(s) Held With Fund | Term of Office** and Length of Time Served | Principal Occupation(s) During Past 5 Years | Number of by Trustee† | Other Directorships Held by Trustee | |||||
| Independent Trustees | ||||||||||
Jettie M. Edwards c/o EQ Advisors Trust 1290 Avenue of the Americas New York, New York 10104 (1946) | Trustee | From March 1997 to present | Retired. From 1986 to 2001, Partner and Consultant, Syrus Associates (business and marketing consulting firm). | 85 | From 1997 to 2010, Director, Old Mutual Funds II (12 portfolios); from 2008 to 2009, Director, Old Mutual Funds III (13 portfolios). | |||||
Donald E. Foley c/o EQ Advisors Trust 1290 Avenue of the Americas New York, New York 10104 (1951) | Trustee | From January 1, 2014 to present | Retired. From 2010 to 2011, Chairman of the Board and Chief Executive Officer, Wilmington Trust Corporation; from 1996 to 2010, Senior Vice President, Treasurer and Director of Tax ITT Corporation; from 1989 to 1996, Assistant Treasurer, International Paper Company. | 85 | From 2011 to 2012, Director, and from 2012 to present Advisory Committee Member, M&T Corporation; from 2007 to 2011, Director and member of the Audit Committee and Compensation Committee, from 2008 to 2010, Wilmington Trust Corporation; Advisory Board member Northern Trust Company and Goldman Sachs Management Groups. | |||||
Christopher P.A. Komisarjevsky c/o EQ Advisors Trust 1290 Avenue of the Americas New York, New York 10104 (1945) | Trustee | From March 1997 to present | From 2006 to 2008, Senior Counselor for APCO Worldwide® (global communications consulting) and a member of its International Advisory Council, from 1998 to 2005, President and Chief Executive Officer, Burson-Marsteller Worldwide (public relations), from 1996 to 1998, President and Chief Executive Officer of Burson-Marsteller U.S.A. | 85 | None | |||||
120
Table of Contents
| Name, Address and Year of Birth | Position(s) Held With Fund | Term of Office** and Length of Time Served | Principal Occupation(s) During Past 5 Years | Number of by Trustee† | Other Directorships Held by Trustee | |||||
| Independent Trustees | ||||||||||
H. Thomas McMeekin c/o EQ Advisors Trust 1290 Avenue of the Americas New York, New York 10104 (1953) | Trustee | From January 1, 2014 to present | Retired. From 2000 to present, Managing Partner and Founder of Griffin Investments, LLC a private equity firm; from 2009 to 2012 Chief Investment Officer, Sun America Financial Group and United Guaranty Corporation and Senior Managing Director of AIG Asset Management; from 2001 to 2008, Managing Director, Institutional Client Relations of Prudential Investment Management, Inc. | 85 | From 2012 to present, Director, Achaean Financial Group; from 2011 to 2012, Director US Life Insurance Company in the City of New York | |||||
Harvey Rosenthal c/o EQ Advisors Trust 1290 Avenue of the Americas New York, New York 10104 (1942) | Trustee | From March 1997 to present | Retired. From 1994 to 1996, President and Chief Operating Officer of Melville Corporation. From 1984 to 1994 President and Chief Executive Officer of the CVS Division of Melville Corporation. | 85 | From 1997 to 2012, Director, LoJack Corporation. | |||||
Gary S. Schpero c/o EQ Advisors Trust 1290 Avenue of the Americas New York, New York 10104 (1953) | Lead Independent Trustee | Trustee from May 2000 to present; from October 2011 to present, Lead Independent Trustee | Retired. Prior to January 1, 2000, Partner of Simpson Thacher & Bartlett (law firm) and Managing Partner of the Investment Management and Investment Company Practice Group. | 85 | From May 2012 to present, Trustee, Blackstone/GSO Senior Floating Rate Term Fund and Blackstone/GSO Long-Short Credit Income Fund; from October 2012 to present, Trustee, Blackstone/GSO Strategic Credit Fund. | |||||
Kenneth L. Walker c/o EQ Advisors Trust 1290 Avenue of the Americas New York, New York 10104 (1952) | Trustee | From January 2012 | From May 2002 to present, Partner, The Capital Management Corporation (investment advisory firm). | 85 | None. | |||||
121
Table of Contents
| Name, Address and Year of Birth | Position(s) Held With Fund | Term of Office** and Length of Time Served | Principal Occupation(s) During Past 5 Years | Number of by Trustee† | Other Directorships Held by Trustee | |||||
| Independent Trustees | ||||||||||
Caroline L. Williams c/o EQ Advisors Trust 1290 Avenue of the Americas New York, New York 10104 (1946) | Trustee | From January 2012 | From July 2010 to December 2012, Executive Vice President, May 2005 to December 2007, Consultant and from May 2001 to May 2005, Chief Financial and Investment Officer, Nathan Cummings Foundation (non-profit organization); from 1988 to 1992, Managing Director, from 1982 to 1988, Senior Vice President, from 1978 to 1982, Vice President and from 1971 to 1976, Associate, Donaldson, Lufkin & Jenrette Securities Corporation (investment bank). | 85 | From 1997 to 2009, Director, Hearst-Argyle Television. | |||||
| ** | Each Trustee serves until his or her resignation or retirement. |
| † | The registered investment companies in the fund complex include AXA Premier VIP Trust, 1290 Funds and the Trust. Mr. Joenk serves as Trustee, President and Chief Executive Officer for each of the registered investment companies in the fund complex, as well as Chairman for each such company. |
Additional information about the Trustees is available in the Portfolios’ Statement of Additional Information, which can be obtained, without charge, by calling 1-877-222-2144.
122
Table of Contents
The Trust’s Officers
No officer of the Trust receives any compensation paid by the Trust. Each officer of the Trust is an employee of AXA Equitable, AXA Advisors, LLC (“AXA Advisors”) or AXA Distributors, LLC (“AXA Distributors”). The Trust’s principal officers are:
| Name, Address and Year of Birth | Position(s) Held With Fund* | Term of Office and Length of Time Served** | Principal Occupation(s) During Past 5 Years | |||
Steven M. Joenk 1290 Avenue of the Americas, New York, New York 10104 (1958) | Trustee, Chairman, President and Chief Executive Officer | From September 2004 to present, Trustee and Chairman and from December 2002 to present, Chief Executive Officer and President. | From May 2011 to present, Director, President, Chief Executive Officer and Chairman, FMG LLC; from September 1999 to present, Managing Director, AXA Equitable; from September 2004 to April 2011, President, AXA Equitable’s FMG; from July 2004 to October 1, 2013, Senior Vice President, MONY Life Insurance Company; from July 2004 to present, Senior Vice President MONY Life Insurance Company of America and Director, MONY Capital Management, Inc., Director and President, 1740 Advisers, Inc.; Director, Chairman of the Board and President, MONY Asset Management, Inc. and Enterprise Capital Management (from July 2004 to January 2011); from January 2005 to January 2011, Director, MONY Financial Resources of Americas Limited; and from November 2005 to present, Director MONY International Holdings, LLC. | |||
Patricia Louie, Esq. 1290 Avenue of the Americas, New York, New York 10104 (1955) | Vice President and Secretary | From July 1999 to Present | From June 2012 to present, Executive Vice President and General Counsel of FMG LLC; from May 2011 to June 2012, Senior Vice President and Corporate Counsel of FMG LLC; from February 2011 to present Managing Director and Associate General Counsel of AXA Financial and AXA Equitable; from May 2003 to February 2011, Vice President and Associate General Counsel of AXA Financial and AXA Equitable. | |||
Brian Walsh 525 Washington Boulevard, Jersey City, New Jersey 07310 (1968) | Chief Financial Officer and Treasurer | From June 2007 to present | From May 2011 to present, Senior Vice President of FMG LLC; from February 2003 to present, Lead Director of AXA Financial and AXA Equitable. | |||
Kenneth Kozlowski 1290 Avenue of the Americas New York, New York 10104 (1961) | Vice President | From to present | From June 2012 to present, Executive Vice President and Chief Investment Officer of FMG LLC; from May 2011 to June 2012, Senior Vice President of FMG LLC; from September 2011 to present, Managing Director of AXA Financial and AXA Equitable; from February 2001 to September 2011, Vice President AXA Financial and AXA Equitable; from July 2004 to January 2011, Director, Enterprise Capital Management, Inc. | |||
Alwi Chan 1290 Avenue of the Americas, New York, New York 10104 (1974) | Vice President | From June 2007 to present | From June 2012 to present, Senior Vice President and Deputy Chief Investment Officer of FMG LLC; from May 2011 to June 2012, Vice President of FMG LLC; from February 2007 to present, Lead Director of AXA Financial and AXA Equitable. | |||
James Kelly 525 Washington Boulevard, Jersey City, New Jersey 07310 (1968) | Controller | From June 2007 to present | From May 2011 to present, Vice President of FMG LLC; from September 2008 to present, Senior Director of AXA Equitable. | |||
Mary E. Cantwell 1290 Avenue of the Americas, New York, New York 10104 (1961) | Vice President | From July 1999 to Present | From June 2012 to present, Senior Vice President of FMG LLC; from May 2011 to June 2012, Vice President of FMG LLC; from February 2001 to present, Lead Director of AXA Equitable; from July 2004 to January 2011, a Director of Enterprise Capital Management, Inc. | |||
Roselle Ibanga 525 Washington Boulevard, Jersey City, New Jersey 07310 (1978) | Assistant Controller | From March 2009 to present | From February 2009 to present, Director of AXA Equitable. | |||
Lisa Perrelli 525 Washington Boulevard, Jersey City, New Jersey 07310 (1974) | Assistant Controller | From March 2009 to present | From November 2012 to present, Senior Director of AXA Equitable; from September 2008 to November 2012, Assistant Vice President of AXA Equitable. |
123
Table of Contents
| Name, Address and Year of Birth | Position(s) Held With Fund* | Term of Office and Length of Time Served** | Principal Occupation(s) During Past 5 Years | |||
William MacGregor 1290 Avenue of the Americas, New York, New York 10104 (1975) | Vice President and Assistant Secretary | From September 2006 to present | From June 2012 to present, Senior Vice President, Secretary and Associate General Counsel of FMG LLC; from May 2011 to June 2012, Vice President and Associate Corporate Counsel of FMG LLC; from May 2008 to present, Lead Director and Associate General Counsel of AXA Equitable. | |||
Anthony Geron, Esq. 1290 Avenue of the Americas, New York, New York 10104 (1971) | Vice President and Assistant Secretary | From July, 2014 to present | From June 2014 to present, Vice President, Assistant Secretary and Associate General Counsel of FMG LLC; from May 2014 to present, Senior Director and Counsel of AXA Equitable; from October 2007 to May 2014 Associate of Willkie Farr & Gallagher LLP. | |||
Michael Weiner, Esq. 1290 Avenue of the Americas, New York, New York 10104 (1982) | Vice President and Assistant Secretary | From July, 2014 to present | From June 2014 to present, Vice President, Assistant Secretary and Associate General Counsel of FMG LLC; from May 2014 to present, Senior Director and Counsel of AXA Equitable; from October 2007 to April 2014 Associate of Milbank, Tweed, Hadley & McCloy LLP. | |||
Joseph J. Paolo 1290 Avenue of the Americas, New York, New York 10104 (1970) | Chief Compliance Officer, Vice President and Anti-Money Laundering Compliance Officer | Chief Compliance Officer from May 2007, Vice President and Anti-Money Laundering Compliance Officer from November 2005 to Present | From May 2011 to present, Senior Vice President and Chief Compliance Officer of FMG LLC; from June 2007 to present, Lead Director of AXA Equitable and Chief Compliance Officer of AXA Equitable’s FMG. | |||
Richard Guinnessey 1290 Avenue of the Americas, New York, New York 10104 (1963) | Vice President | From March 2011 to present | From June 2012 to present, Vice President FMG LLC, from September 2010 to present, Senior Director of AXA Equitable | |||
Jennifer Mastronardi 1290 Avenue of the Americas, New York, New York 10104 (1985) | Assistant Vice President | From March 2012 to present | From February 2009 to present, Director of AXA Equitable; from June 2007 to February 2009, Operations Associate in Managed Futures Department, Morgan Stanley. | |||
Paraskevou Charalambous 1290 Avenue of the Americas, New York, New York 10104 (1962) | Assistant Secretary | From November 2005 to present | From March 2000 to present, Lead Manager/Senior Legal Assistant for AXA Equitable. | |||
Helen Espaillat 1290 Avenue of the Americas, New York, New York 10104 (1963) | Assistant Secretary | From March 2009 to present | From July 2004 to present, Lead Manager/Senior Legal Assistant for AXA Equitable. |
| * | The officers in the table above (except Ms. Charalambous and Ms. Espaillat) hold similar positions with two other registered investment companies in the fund complex. The registered investment companies in the fund complex include AXA Premier VIP Trust, 1290 Funds and the Trust. |
| ** | Each officer is elected on an annual basis. |
CONTROL PERSON AND PRINCIPAL HOLDERS OF SECURITIES (Unaudited)
Shares of the Trust are offered to separate accounts of insurance companies in connection with the Contracts and may be offered to tax-qualified retirement plans and other qualified investors. AXA Equitable may be deemed to be a control person with respect to the Trust by virtue of its record ownership of more than 95% of the Trust’s shares as of March 31, 2011. Shareholders owning more than 25% of the outstanding shares of a portfolio may take actions without the approval of other investors in the portfolio.
124
Table of Contents
PROXY VOTING POLICIES AND PROCEDURES (UNAUDITED)
A description of the policies and procedures that the Portfolios use to determine how to vote proxies relating to portfolio securities is available (i) without charge, upon request, by calling a toll-free number at 1-877-222-2144 and (ii) on the Securities and Exchange Commission’s website at http://www.sec.gov. Information regarding how the Portfolios voted proxies relating to portfolio securities during the most recent 12-month period ended June 30 is available without charge (i) on the Trust’s website at www.axa-equitablefunds.com and (ii) on the Securities and Exchange Commission’s website at http://www.sec.gov.
QUARTERLY PORTFOLIO HOLDINGS INFORMATION (UNAUDITED)
The Portfolios file their complete schedules of portfolio holdings with the Securities and Exchange Commission for the first and third quarters of each fiscal year on Form N-Q. The Portfolios’ Forms N-Q are available on the Securities and Exchange Commission’s website at http://www.sec.gov. You may also review and obtain copies at the Securities and Exchange Commission’s Public Reference Room in Washington, D.C. Information about the Public Reference Room may be obtained by calling 1-800-SEC-0330.
125
Table of Contents
PART C
OTHER INFORMATION
| Item 15. | Indemnification |
Amended and Restated Agreement and Declaration of Trust (“Declaration of Trust”) and By-Laws.
Article VII, Section 2 of the Declaration of Trust of EQ Advisors Trust (“Trust”) states, in relevant part, that a “Trustee, when acting in such capacity, shall not be personally liable to any Person, other than the Trust or a Shareholder to the extent provided in this Article VII, for any act, omission or obligation of the Trust, of such Trustee or of any other Trustee. The Trustees shall not be responsible or liable in any event for any neglect or wrongdoing of any officer, agent, employee, Manager, or Principal Underwriter of the Trust. The Trust shall indemnify each Person who is serving or has served at the Trust’s request as a director, officer, trustee, employee, or agent of another organization in which the Trust has any interest as a shareholder, creditor, or otherwise to the extent and in the manner provided in the By-Laws.” Article VII, Section 4 of the Trust’s Declaration of Trust further states, in relevant part, that the “Trustees shall be entitled and empowered to the fullest extent permitted by law to purchase with Trust assets insurance for liability and for all expenses reasonably incurred or paid or expected to be paid by a Trustee, officer, employee, or agent of the Trust in connection with any claim, action, suit, or proceeding in which he or she may become involved by virtue of his or her capacity or former capacity as a Trustee of the Trust.”
Article VI, Section 2 of the Trust’s By-Laws states, in relevant part, that “[s]ubject to the exceptions and limitations contained in Section 3 of this Article VI, every [Trustee, officer, employee or other agent of the Trust] shall be indemnified by the Trust to the fullest extent permitted by law against all liabilities and against all expenses reasonably incurred or paid by him or her in connection with any proceeding in which he or she becomes involved as a party or otherwise by virtue of his or her being or having been an agent.” Article VI, Section 3 of the Trust’s By-Laws further states, in relevant part, that “[n]o indemnification shall be provided hereunder to [a Trustee, officer, employee or other agent of the Trust]: (a) who shall have been adjudicated, by the court or other body before which the proceeding was brought, to be liable to the Trust or its Shareholders by reason of willful misfeasance, bad faith, gross negligence or reckless disregard of the duties involved in the conduct of his or her office (collectively, “disabling conduct”); or (b) with respect to any proceeding disposed of (whether by settlement, pursuant to a consent decree or otherwise) without an adjudication by the court or other body before which the proceeding was brought that such [Trustee, officer, employee or other agent of the Trust] was liable to the Trust or its Shareholders by reason of disabling conduct, unless there has been a determination that such [Trustee, officer, employee or other agent of the Trust] did not engage in disabling conduct: (i) by the court or other body before which the proceeding was brought; (ii) by at least a majority of those Trustees who are neither Interested Persons of the Trust nor are parties to the proceeding based upon a review of readily available facts (as opposed to a full trial-type inquiry); or (iii) by written opinion of independent legal counsel based upon a review of readily available facts (as opposed to a full trial-type inquiry); provided, however, that indemnification shall be provided hereunder to [a Trustee, officer, employee or other agent of the Trust] with respect to any proceeding in the event of (1) a final decision on the merits by the court or other body before which the proceeding was brought that the [Trustee, officer, employee or other agent of the Trust] was not liable by reason of disabling conduct, or (2) the dismissal of the proceeding by the court or other body before which it was brought for insufficiency of evidence of any disabling conduct with which such [Trustee, officer, employee or other agent of the Trust] has been charged.” Article VI, Section 4 of the Trust’s By-Laws also states that the “rights of indemnification herein provided (i) may be insured against by policies maintained by the Trust on behalf of any [Trustee, officer, employee or other agent of the Trust], (ii) shall be severable, (iii) shall not be exclusive of or affect any other rights to which any [Trustee, officer, employee or other agent of the Trust] may now or hereafter be entitled and (iv) shall inure to the benefit of [such party’s] heirs, executors and administrators.”
C-1
Table of Contents
Registrant’s Investment Management Agreement states:
Limitations on Liability. Manager will exercise its best judgment in rendering its services to the Trust, and the Trust agrees, as an inducement to Manager’s undertaking to do so, that the Manager will not be liable for any error of judgment or mistake of law or for any loss suffered by the Trust in connection with the matters to which this Agreement relates, but will be liable only for willful misconduct, bad faith, gross negligence, reckless disregard of its duties or its failure to exercise due care in rendering its services to the Trust as specified in this Agreement. Any person, even though an officer, director, employee or agent of Manager, who may be or become an officer, Trustee, employee or agent of the Trust, shall be deemed, when rendering services to the Trust or when acting on any business of the Trust, to be rendering such services to or to be acting solely for the Trust and not as an officer, director, employee or agent, or one under the control or direction of Manager, even though paid by it.
The Registrant’s Investment Advisory Agreements generally state:
Except as may otherwise be provided by the Investment Company Act or any other federal securities law, neither the Adviser nor any of its officers, members or employees (its “Affiliates”) shall be liable for any losses, claims, damages, liabilities or litigation (including legal and other expenses) incurred or suffered by the Manager or the Trust as a result of any error of judgment or mistake of law by the Adviser or its Affiliates with respect to the services provided to the Portfolio, except that nothing in this Agreement shall operate or purport to operate in any way to exculpate, waive or limit the liability of the Adviser or its Affiliates for, and the Adviser shall indemnify and hold harmless the Trust, the Manager, all affiliated persons thereof (within the meaning of Section 2(a)(3) of the Investment Company Act) and all controlling persons (as described in Section 15 of the Securities Act of 1933, as amended (“1933 Act”)) (collectively, “Manager Indemnitees”) against any and all losses, claims, damages, liabilities or litigation (including reasonable legal and other expenses) to which any of the Manager Indemnitees may become subject under the 1933 Act, the Investment Company Act, the Advisers Act, or under any other statute, at common law or otherwise arising out of or based on (i) any willful misconduct, bad faith, reckless disregard or gross negligence of the Adviser in the performance of any of its duties or obligations hereunder or (ii) any untrue statement of a material fact contained in the Prospectus and SAI, proxy materials, reports, advertisements, sales literature, or other materials pertaining to the Portfolio or the omission to state therein a material fact known to the Adviser which was required to be stated therein or necessary to make the statements therein not misleading, if such statement or omission was made in reliance upon information furnished to the Manager or the Trust by the Adviser Indemnitees (as defined below) for use therein.
Except as may otherwise be provided by the Investment Company Act or any other federal securities law, the Manager and the Trust shall not be liable for any losses, claims, damages, liabilities or litigation (including reasonable legal and other expenses) incurred or suffered by the Adviser as a result of any error of judgment or mistake of law by the Manager with respect to the Portfolio, except that nothing in this Agreement shall operate or purport to operate in any way to exculpate, waive or limit the liability of the Manager for, and the Manager shall indemnify and hold harmless the Adviser, all affiliated persons thereof (within the meaning of Section 2(a)(3) of the Investment Company Act) and all controlling persons (as described in Section 15 of the 1933 Act) (collectively, “Adviser Indemnitees”) against any and all losses, claims, damages, liabilities or litigation (including reasonable legal and other expenses) to which any of the Adviser Indemnities may become subject under the 1933 Act, the Investment Company Act, the Advisers Act, or under any other statute, at common law or otherwise arising out of or based on (i) any willful misconduct, bad faith, reckless disregard or gross negligence of the Manager in the
C-2
Table of Contents
performance of any of its duties or obligations hereunder or (ii) any untrue statement of a material fact contained in the Prospectus and SAI, proxy materials, reports, advertisements, sales literature, or other materials pertaining to the Portfolio or the omission to state therein a material fact known to the Manager which was required to be stated therein or necessary to make the statements therein not misleading, unless such statement or omission was made in reliance upon information furnished to the Manager or the Trust by the Adviser Indemnitees for use therein.
Section 14 of each of the Registrant’s Distribution Agreements states:
The Trust shall indemnify and hold harmless [the Distributor] from any and all losses, claims, damages or liabilities (or actions in respect thereof) to which [the Distributor] may be subject, insofar as such losses, claims, damages or liabilities (or actions in respect thereof) arise out of or result from negligent, improper, fraudulent or unauthorized acts or omissions by the Trust or its officers, trustees, agents or representatives, other than acts or omissions caused directly or indirectly by [the Distributor].
[The Distributor] will indemnify and hold harmless the Trust, its officers, trustees, agents and representatives against any losses, claims, damages or liabilities, to which the Trust, its officers, trustees, agents and representatives may become subject, insofar as such losses, claims, damages or liabilities (or actions in respect thereof) arise out of or are based upon: (i) any untrue statement or alleged untrue statement of any material fact contained in the Trust Prospectus and/or SAI or any supplements thereto; (ii) the omission or alleged omission to state any material fact required to be stated in the Trust Prospectus and/or SAI or any supplements thereto or necessary to make the statements therein not misleading; or (iii) other misconduct or negligence of [the Distributor] in its capacity as a principal underwriter of the Trust’s Class [IA, IB and/or K] shares and will reimburse the Trust, its officers, Trustees, agents and representatives for any legal or other expenses reasonably incurred by any of them in connection with investigating or defending against such loss, claim, damage, liability or action; provided, however, that [the Distributor] shall not be liable in any such instance to the extent that any such loss, claim, damage or liability arises out of or is based upon an untrue statement or alleged untrue statement or omission or alleged omission made in the Trust Prospectus and/or SAI or any supplement in good faith reliance upon and in conformity with written information furnished by the Preparing Parties specifically for use in the preparation of the Trust Prospectus and/or SAI.
Section 6 of the Registrant’s Amended and Restated Mutual Fund Service Agreement states:
(a) FMG LLC shall not be liable for any error of judgment or mistake of law or for any loss or expense suffered by the Trust, in connection with the matters to which this Agreement relates, except for a loss or expense caused by or resulting from or attributable to willful misfeasance, bad faith or gross negligence on FMG LLC’s part (or on the part of any third party to whom FMG LLC has delegated any of its duties and obligations pursuant to Section 4(c) hereunder) in the performance of its (or such third party’s) duties or from reckless disregard by FMG LLC (or by such third party) of its obligations and duties under this Agreement (in the case of FMG LLC) or under an agreement with FMG LLC (in the case of such third party) or, subject to Section 10 below, FMG LLC’s (or such third party) refusal or failure to comply with the terms of this Agreement (in the case of FMG LLC) or an agreement with FMG LLC (in the case of such third party) or its breach of any representation or warranty under this Agreement (in the case of FMG LLC) or under an agreement with FMG LLC (in the case of such third party). In no event shall FMG LLC (or such third party) be liable for any indirect, incidental special or consequential losses or damages of any kind whatsoever (including but not limited to lost profits), even if FMG LLC (or such third party) has been advised of the likelihood of such loss or damage and regardless of the form of action.
C-3
Table of Contents
(b) Except to the extent that FMG LLC may be held liable pursuant to Section 6(a) above, FMG LLC shall not be responsible for, and the Trust shall indemnify and hold FMG LLC harmless from and against any and all losses, damages, costs, reasonable attorneys’ fees and expenses, payments, expenses and liabilities including, but not limited to, those arising out of or attributable to:
(i) any and all actions of FMG LLC or its officers or agents required to be taken pursuant to this Agreement;
(ii) the reliance on or use by FMG LLC or its officers or agents of information, records, or documents which are received by FMG LLC or its officers or agents and furnished to it or them by or on behalf of the Trust, and which have been prepared or maintained by the Trust or any third party on behalf of the Trust;
(iii) the Trust’s refusal or failure to comply with the terms of this Agreement or the Trust’s lack of good faith, or its actions, or lack thereof, involving gross negligence or willful misfeasance;
(iv) the breach of any representation or warranty of the Trust hereunder;
(v) the reliance on or the carrying out by FMG LLC or its officers or agents of any proper instructions reasonably believed to be duly authorized, or requests of the Trust;
(vi) any delays, inaccuracies, errors in or omissions from information or data provided to FMG LLC by data services, including data services providing information in connection with any third party computer system licensed to FMG LLC, and by any corporate action services, pricing services or securities brokers and dealers;
(vii) the offer or sale of shares by the Trust in violation of any requirement under the Federal securities laws or regulations or the securities laws or regulations of any state, or in violation of any stop order or other determination or ruling by any Federal agency or any state agency with respect to the offer or sale of such shares in such state (1) resulting from activities, actions, or omissions by the Trust or its other service providers and agents, or (2) existing or arising out of activities, actions or omissions by or on behalf of the Trust prior to the effective date of this Agreement;
(viii) any failure of the Trust’s Registration Statement to comply with the 1933 Act and the 1940 Act (including the rules and regulations thereunder) and any other applicable laws, or any untrue statement of a material fact or omission of a material fact necessary to make any statement therein not misleading in a Trust’s prospectus;
(ix) except as provided for in Schedule B.III., the actions taken by the Trust, its Manager, its investment advisers, and its distributor in compliance with applicable securities, tax, commodities and other laws, rules and regulations, or the failure to so comply, and
(x) all actions, inactions, omissions, or errors caused by third parties to whom FMG LLC or the Trust has assigned any rights and/or delegated any duties under this Agreement at the specific request of or as required by the Trust, its Portfolio, investment advisers, or Trust distributors.
The Trust shall not be liable for any indirect, incidental, special or consequential losses or damages of any kind whatsoever (including, but not limited to, lost profits) even if the Trust has been advised of the likelihood of such loss or damage and regardless of the form of action, except when the Trust is required to indemnify FMG LLC pursuant to this Agreement.
C-4
Table of Contents
Section 12(a)(iv) of the Registrant’s Global Custody Agreement states:
(A) Customer shall indemnify and hold Bank and its directors, officers, agents and employees (collectively the “Indemnitees”) harmless from and against any and all claims, liabilities, losses, damages, fines, penalties, and expenses, including out-of-pocket and incidental expenses and legal fees (“Losses”) that may be incurred by, or asserted against, the Indemnitees or any of them for following any instructions or other directions upon which Bank is authorized to rely pursuant to the terms of this Agreement. (B) In addition to and not in limitation of the preceding subparagraph, Customer shall also indemnify and hold the Indemnitees and each of them harmless from and against any and all Losses that may be incurred by, or asserted against, the Indemnitees or any of them in connection with or arising out of Bank’s performance under this Agreement, provided the Indemnitees have not acted with negligence or engaged in willful misconduct. (C) In performing its obligations hereunder, Bank may rely on the genuineness of any document which it reasonably believes in good faith to have been validly executed.
Article VIII of the Registrant’s Participation Agreements generally state:
8.1(a). AXA Equitable Life Insurance Company (for the purposes of this Article, “Equitable”) agrees to indemnify and hold harmless the Trust, each member of the Board, the Distributors, and the directors and officers and each person, if any, who controls any such person within the meaning of Section 15 of the 1933 Act (collectively, the “Indemnified Parties” for purposes of this Section 8.1) against any and all losses, claims, damages, liabilities (including amounts paid in settlement with the written consent of Equitable), investigation of claims or litigation (including legal and other expenses), to which the Indemnified Parties may become subject under any statute, regulation, at common law or otherwise, insofar as such losses, claims, damages, liabilities or expenses (or actions in respect thereof) or settlements are related to the sale or acquisition of the Trust’s shares or the Equitable Contracts or interests in the Accounts and:
(i) arise out of or are based upon any untrue statements or alleged untrue statements of any material fact contained in the registration statement, prospectus, or Statement of Additional Information for the Equitable Contracts or contained in the Equitable Contracts or sales literature for the Equitable Contracts (or any amendment or supplement to any of the foregoing), or arise out of or are based upon the omission or the alleged omission to state therein a material fact required to be stated therein or necessary to make the statements therein not misleading, provided that this agreement to indemnify shall not apply as to any Indemnified Party if such statement or omission or such alleged statement or omission was made in reliance upon and in conformity with information furnished to Equitable by or on behalf of the Trust for use in the registration statement, prospectus, or Statement of Additional Information for the Equitable Contracts or in the Equitable Contracts or sales literature (or any amendment or supplement) or otherwise for use in connection with the sale of the Equitable Contracts or Trust shares; or
(ii) arise out of or as a result of statements or representations (other than statements or representations contained in the Registration Statement, prospectus or Statement of Additional Information, or sales literature of the Trust not supplied by Equitable or persons under its control) or wrongful conduct of Equitable or persons under its control, with respect to the sale or distribution of the Equitable Contracts or Trust shares; or
(iii) arise out of any untrue statement or alleged untrue statement of a material fact contained in a Registration Statement, prospectus, or Statement of Additional Information, or sales literature of the Trust or any amendment thereof or supplement thereto or the omission or alleged omission to state therein a material fact required to be stated therein or necessary to make the statements therein not misleading if such a statement or omission was made in reliance upon information furnished to the Trust by or on behalf of Equitable; or
C-5
Table of Contents
(iv) arise as a result of any failure by Equitable to provide the services and furnish the materials required to be provided or furnished by it under the terms of this Agreement; or
(v) arise out of or result from any material breach of any representation and/or warranty made by Equitable in this Agreement or arise out of or result from any other material breach of this Agreement by Equitable;
as limited by and in accordance with the provisions of Sections 8.1(b) and 8.1(c) hereof…
8.2(a). Each of the Distributors agrees to indemnify and hold harmless Equitable, and the Trust and each of their directors and officers and each person, if any, who controls Equitable within the meaning of Section 15 of the 1933 Act (collectively, the “Indemnified Parties” for purposes of this Section 8.2) against any and all losses, claims, damages, liabilities (including amounts paid in settlement with the written consent of the Distributors), investigation of claims or litigation (including legal and other expenses) to which the Indemnified Parties may become subject under any statute, regulation, at common law or otherwise, insofar as such losses, claims, damages, liabilities or expenses (or actions in respect thereof) or settlements are related to the sale or acquisition of the Trust’s shares or the Equitable Contracts or interests in the Accounts and:
(i) arise out of or are based upon any untrue statement or alleged untrue statement of any material fact contained in the Registration Statement, prospectus or Statement of Additional Information, or sales literature of the Trust (or any amendment or supplement to any of the foregoing), or arise out of or are based upon the omission or the alleged omission to state therein a material fact required to be stated therein or necessary to make the statements therein not misleading, provided that this agreement to indemnify shall not apply as to any Indemnified Party if such statement or omission or such alleged statement or omission was made in reliance upon and in conformity with information furnished to the Distributors or Trust by or on behalf of Equitable for use in the Registration Statement, prospectus, or Statement of Additional Information for the Trust, or in sales literature (or any amendment or supplement) or otherwise for use in connection with the sale of the Equitable Contracts or Trust shares; or
(ii) arise out of or as a result of statements or representations (other than statements or representations contained in the registration statement, prospectus or Statement of Additional Information, or sales literature for the Equitable Contracts not supplied by the Distributors or persons under their control) or wrongful conduct of the Distributors or persons under their control, with respect to the sale or distribution of the Equitable Contracts or Trust shares; or
(iii) arise out of any untrue statement or alleged untrue statement of a material fact contained in a registration statement, prospectus, or Statement of Additional Information or sales literature covering the Equitable Contracts, or any amendment thereof or supplement thereto, or the omission or alleged omission to state therein a material fact required to be stated therein or necessary to make the statement or statements therein not misleading, if such statement or omission was made in reliance upon information furnished to Equitable by or on behalf of the Distributors or the Trust; or
(iv) arise as a result of any failure by the Distributors or the Trust to provide the services and furnish the materials required to be provided or furnished by the Distributors or the Trust under the terms of this Agreement (including a failure, whether unintentional or in good faith or otherwise, to comply with the diversification or other qualification requirements specified in Article VI of this Agreement); or
C-6
Table of Contents
(v) arise out of or result from any material breach of any representation and/or warranty made by the Distributors in this Agreement or arise out of or result from any other material breach of this Agreement by the Distributors;
as limited by and in accordance with the provisions of Sections 8.2(b) and 8.2(c) hereof…
8.3(a) The Trust agrees to indemnify and hold harmless Equitable and each of its directors and officers and each person, if any, who controls Equitable within the meaning of Section 15 of the 1933 Act (collectively, the “Indemnified Parties” for purposes of this Section 8.3) against any and all losses, claims, damages, liabilities (including amounts paid in settlement with the written consent of the Trust), investigation of claims or litigation (including legal and other expenses) to which the Indemnified Parties may become subject under any statute, regulation, at common law or otherwise, insofar as such losses, claims, damages, liabilities or expenses (or actions in respect thereof) or settlements result from the gross negligence, bad faith or willful misconduct of the Board or any member thereof, are related to the operations of the Trust and:
(i) arise as a result of any failure by the Trust to provide the services and furnish the materials required to be provided or furnished by it under the terms of this Agreement (including a failure to comply with the diversification and other qualification requirements specified in … this Agreement); or
(ii) arise out of or result from any material breach of any representation and/or warranty made by the Trust in this Agreement or arise out of or result from any other material breach of this Agreement by the Trust;
as limited by and in accordance with the provisions of Sections 8.3(b) and 8.3(c) hereof…
| Item 16. | Exhibits |
| (1) (a) | Agreement and Declaration of Trust.1 | |
| (1) (b)(i) | Amended and Restated Agreement and Declaration of Trust.2 | |
| (1) (b)(ii) | Amendment No. 1 to Amended and Restated Agreement and Declaration of Trust.4 | |
| (1) (b)(iii) | Amendment No. 2 to Amended and Restated Agreement and Declaration of Trust. 6 | |
| (1) (c) | Certificate of Trust.1 | |
| (1) (d) | Certificate of Amendment to the Certificate of Trust.2 | |
(2) | By-Laws of the Trust.1 | |
(3) | None. | |
| (4) (a) | Agreement and Plan of Reorganization and Termination between EQ Advisors Trust, on behalf of its separate series, EQ/Common Stock Index Portfolio and EQ/Core Bond Index Portfolio, and AXA Premier VIP Trust, on behalf of its separate series, CharterSM Equity Portfolio and CharterSM Fixed Income Portfolio. (filed herein as Appendix A to the combined Proxy Statement and Prospectus) | |
C-7
Table of Contents
(5) | Provisions of instruments defining the rights of holders of the securities being registered are contained in the Registrant’s Amended and Restated Agreement and Declaration of Trust and By-Laws (Exhibits 1(b) and (2)). | |
(6) | Investment Advisory Contracts | |
(6) (a) | Investment Management Agreement dated as of May 1, 2011 between EQ Advisors Trust (the “Trust”) and AXA Equitable Funds Management Group, LLC (“FMG LLC” or “AXA FMG”).25 | |
(6) (a)(i) | Amendment No. 1 effective as of August 1, 2011 to the Investment Management Agreement dated as of May 1, 2011 between the Trust and FMG LLC.25 | |
(6) (a)(ii) | Amendment No. 2 effective as of September 1, 2011 to the Investment Management Agreement dated as of May 1, 2011 between the Trust and FMG LLC.25 | |
(6) (a)(iii) | Amendment No. 3 effective as of October 1, 2011 to the Investment Management Agreement dated as of May 1, 2011 between the Trust and FMG LLC. 27 | |
(6) (a)(iv) | Amendment No. 4 effective as of February 8, 2013 to the Investment Management Agreement dated as of May 1, 2011 between the Trust and FMG LLC.31 | |
(6) (a)(v) | Amendment No. 5 effective as of September 1, 2012 to the Investment Management Agreement dated as of May 1, 2011 between the Trust and FMG LLC.31 | |
(6) (a)(vi) | Amendment No. 6 effective as of May 1, 2013 to the Investment Management Agreement dated as of May 1, 2011 between the Trust and FMG LLC.34 | |
(6) (a)(vii) | Amendment No. 7 effective as of September 1, 2013 to the Investment Management Agreement dated as of May 1, 2011 between the Trust and FMG LLC.34 | |
(6) (a)(viii) | Amendment No. 8 effective as of October 21, 2013 to the Investment Management Agreement dated as of May 1, 2011 between the Trust and FMG LLC.34 | |
(6) (a)(ix) | Amendment No. 9 effective as of April 4, 2014 to the Investment Management Agreement dated as of May 1, 2011 between the Trust and FMG LLC.37 | |
(6) (a)(x) | Amendment No. 10 effective as of June 1, 2014 to the Investment Management Agreement dated as of May 1, 2011 between the Trust and FMG LLC.37 | |
(6) (a)(xi) | Amendment No. 11 effective as of July 16, 2014 to the Investment Management Agreement dated as of May 1, 2011 between the Trust and FMG LLC.38 | |
(6) (a)(xii) | Amendment No. 12 effective as of January 20, 2015 to the Investment Management Agreement dated as of May 1, 2011 between the Trust and FMG LLC.38 | |
(6) (a)(xiii) | Amendment No. 13 effective as of April 30, 2015 to the Investment Management Agreement dated as of May 1, 2011 between the Trust and FMG LLC.39 | |
(6) (b)(i) | Investment Advisory Agreement between FMG LLC and AllianceBernstein L.P. (“AllianceBernstein”) effective as of May 1, 2011.25 | |
(6) (b)(ii) | Amendment No. 1 effective as of September 1, 2011 to the Investment Advisory Agreement between FMG LLC and AllianceBernstein effective as of May 1, 2011.27 | |
C-8
Table of Contents
(6) (b)(iii) | Amendment No. 2 effective as of August 1, 2012 to the Investment Advisory Agreement between FMG LLC and AllianceBernstein effective as of May 1, 2011.31 | |
(6) (b)(iv) | Amendment No. 3 effective as of September 1, 2012, to the Investment Advisory Agreement between FMG LLC and AllianceBernstein effective as of May 1, 2011.31 | |
(6) (b)(v) | Amendment No. 4 effective as of June 1, 2014, to the Investment Advisory Agreement between FMG LLC and AllianceBernstein effective as of May 1, 2011.37 | |
(6) (b)(vi) | Amendment No. 5 effective as of July 16, 2014 to the Investment Advisory Agreement between FMG LLC and AllianceBernstein effective as of May 1, 2011.38 | |
(6) (b)(vii) | Amendment No. 6 effective as of April 30, 2015, to the Investment Advisory Agreement between FMG LLC and AllianceBernstein effective as of May 1, 2011.39 | |
(6) (c)(i) | Investment Advisory Agreement between FMG LLC and SSgA Funds Management, Inc. (“SSgA FM”) dated as of May 1, 2011.25 | |
(6) (c)(ii) | Amendment No. 1 effective as of July 10, 2012 to the Investment Advisory Agreement between FMG LLC and SSgA FM dated as of May 1, 2011.31 | |
(6) (c)(iii) | Amendment No. 2 effective as of June 1, 2014 to the Investment Advisory Agreement between FMG LLC and SSgA FM dated as of May 1, 2011.37 | |
(7) | Underwriting or Distribution Contracts | |
(7) (a)(i) | Amended and Restated Distribution Agreement between the Trust and AXA Distributors, LLC (“AXA Distributors”) dated as of July 15, 2002 with respect to Class IB shares.6 | |
(7) (a)(ii) | Amendment No. 1, dated May 2, 2003, to the Amended and Restated Distribution Agreement between the Trust and AXA Distributors, dated as of July 15, 2002 with respect to Class IB shares.7 | |
(7) (a)(iii) | Amendment No. 2, dated July 8, 2004, to the Amended and Restated Distribution Agreement between the Trust and AXA Distributors, dated as of July 15, 2002 with respect to Class IB shares.8 | |
(7) (a)(iv) | Amendment No. 3, dated October 1, 2004 to the Amended and Restated Distribution Agreement between the Trust and AXA Distributors, dated as of July 15, 2002 with respect to Class IB shares.8 | |
(7) (a)(v) | Amendment No. 4, dated May 1, 2005 to the Amended and Restated Distribution Agreement between the Trust and AXA Distributors dated as of July 15, 2002 with respect to Class IB shares. 9 | |
(7) (a)(vi) | Amendment No. 5, dated September 30, 2005 to the Amended and Restated Distribution Agreement between the Trust and AXA Distributors dated as of July 15, 2002 with respect to Class IB shares.10 | |
(7) (a)(vii) | Amendment No. 6, dated August 1, 2006 to the Amended and Restated Distribution Agreement between the Trust and AXA Distributors dated as of July 15, 2002 with respect to Class IB shares.12 | |
C-9
Table of Contents
(7) (a)(viii) | Amendment No. 7, dated May 1, 2007 to the Amended and Restated Distribution Agreement between the Trust and AXA Distributors dated as of July 15, 2002 with respect to Class IB shares.14 | |
(7) (a)(ix) | Amendment No. 8, dated July 11, 2007 to the Amended and Restated Distribution Agreement between the Trust and AXA Distributors dated as of July 15, 2002 with respect to Class IB shares.15 | |
(7) (a)(x) | Amendment No. 9, dated January 1, 2008 to the Amended and Restated Distribution Agreement between the Trust and AXA Distributors dated as of July 15, 2002 with respect to Class IB shares.16 | |
(7) (a)(xi) | Amendment No. 10, dated May 1, 2008 to the Amended and Restated Distribution Agreement between the Trust and AXA Distributors dated as of July 15, 2002 with respect to Class IB shares.18 | |
(7) (a)(xii) | Amendment No. 11, dated January 1, 2009 to the Amended and Restated Distribution Agreement between the Trust and AXA Distributors dated as of July 15, 2002 with respect to Class IB shares.19 | |
(7) (a)(xiii) | Amendment No. 12, dated May 1, 2009 to the Amended and Restated Distribution Agreement between the Trust and AXA Distributors dated as of July 15, 2002 with respect to Class IB shares.20 | |
(7) (a)(xiv) | Amendment No. 13, dated September 29, 2009 to the Amended and Restated Distribution Agreement between the Trust and AXA Distributors dated as of July 15, 2002 with respect to Class IB shares.21 | |
(7) (a)(xv) | Amendment No. 14, dated as of August 16, 2010 to the Amended and Restated Distribution Agreement between the Trust and AXA Distributors dated as of July 15, 2002 with respect to Class IB shares.23 | |
(7) (a)(xvi) | Amendment No. 15, dated as of December 15, 2010 to the Amended and Restated Distribution Agreement between the Trust and AXA Distributors dated as of July 15, 2002 with respect to Class IB shares.23 | |
(7) (a)(xvii) | Amendment No. 16, dated as of June 7, 2011 to the Amended and Restated Distribution Agreement between the Trust and AXA Distributors dated as of July 15, 2002 with respect to Class IB shares.26 | |
(7) (a)(xviii) | Amendment No. 17, dated as of April 12, 2012 to the Amended and Restated Distribution Agreement between the Trust and AXA Distributors dated as of July 15, 2002 with respect to Class IB shares.29 | |
(7) (a)(xix) | Amendment No. 18, dated as of August 29, 2012 to the Amended and Restated Distribution Agreement between the Trust and AXA Distributors dated as of July 15, 2002 with respect to Class IB shares.31 | |
(7) (a)(xx) | Amendment No. 19, dated as of May 1, 2013 to the Amended and Restated Distribution Agreement between the Trust and AXA Distributors dated as of July 15, 2002 with respect to Class IB shares.34 | |
C-10
Table of Contents
(7) (a)(xxi) | Amendment No. 20, dated as of October 21, 2013 to the Amended and Restated Distribution Agreement between the Trust and AXA Distributors dated as of July 15, 2002 with respect to Class IB shares.34 | |
(7) (a)(xxii) | Amendment No. 21, dated as of April 4, 2014 to the Amended and Restated Distribution Agreement between the Trust and AXA Distributors dated as of July 15, 2002 with respect to Class IB shares.37 | |
(7) (a)(xxiii) | Amendment No. 22, dated as of June 1, 2014 to the Amended and Restated Distribution Agreement between the Trust and AXA Distributors dated as of July 15, 2002 with respect to the Class IB shares.37 | |
(7) (a)(xxiv) | Amendment No. 23, dated as of July 16, 2014 to the Amended and Restated Distribution Agreement between the Trust and AXA Distributors dated as of July 15, 2002 with respect to the Class IB shares.38 | |
(7) (a)(xxv) | Amendment No. 24, dated as of April 30, 2015 to the Amended and Restated Distribution Agreement between the Trust and AXA Distributors dated as of July 15, 2002 with respect to the Class IB shares.39 | |
(8) | Form of Deferred Compensation Plan.3 | |
(9) | Custodian Agreements | |
(9) (a)(i) | Amended and Restated Global Custody Agreement between the Trust and JPMorgan Chase Bank dated as of February 1, 2002.5 | |
(9) (a)(ii) | Amendment No. 1, dated May 2, 2003, to the Amended and Restated Global Custody Agreement between the Trust and JP Morgan Chase Bank dated February 1, 2002.7 | |
(9) (a)(iii) | Amendment No. 2, dated July 8, 2004, to the Amended and Restated Global Custody Agreement between the Trust and JP Morgan Chase Bank dated February 1, 2002.8 | |
(9) (a)(iv) | Amendment No. 3, dated September 13, 2004, to the Amended and Restated Global Custody Agreement between the Trust and JP Morgan Chase Bank dated February 1, 2002.8 | |
(9) (a)(v) | Amendment No. 4 dated May 1, 2005 to the Amended and Restated Global Custody Agreement between the Trust and JP Morgan Chase Bank dated February 1, 2002.9 | |
(9) (a)(vi) | Amendment No. 5 dated September 30, 2005 to the Amended and Restated Global Custody Agreement between the Trust and JP Morgan Chase Bank dated February 1, 2002. 10 | |
(9) (a)(vii) | Amendment No. 6 dated August 1, 2006 to the Amended and Restated Global Custody Agreement between the Trust and JP Morgan Chase Bank dated February 1, 2002.13 | |
(9) (a)(viii) | Amendment No. 7 dated May 1, 2007 to the Amended and Restated Global Custody Agreement between the Trust and JP Morgan Chase Bank dated February 1, 2002.14 | |
(9) (a)(ix) | Amendment No. 8 dated April 1, 2007 to the Amended and Restated Global Custody Agreement between the Trust and JP Morgan Chase Bank dated February 1, 2002.15 | |
C-11
Table of Contents
(9) (a)(x) | Amendment No. 9 dated January 1, 2008 to the Amended and Restated Global Custody Agreement between the Trust and JPMorgan Chase Bank dated February 1, 2002.16 | |
(9) (a)(xi) | Amendment No. 10 dated May 1, 2008 to the Amended and Restated Global Custody Agreement between the Trust and JPMorgan Chase Bank dated February 1, 2002.18 | |
(9) (a)(xii) | Amendment No. 11 dated July 1, 2008 to the Amended and Restated Global Custody Agreement between the Trust and JPMorgan Chase Bank dated February 1, 2002.18 | |
(9) (a)(xiii) | Amendment No. 12 dated January 1, 2009 to the Amended and Restated Global Custody Agreement between the Trust and JPMorgan Chase Bank dated February 1, 2002.19 | |
(9) (a)(xiv) | Amendment No. 13 dated May 1, 2009 to the Amended and Restated Global Custody Agreement between the Trust and JPMorgan Chase Bank dated February 1, 2002.20 | |
(9) (a)(xv) | Amendment No. 14 dated as of September 29, 2009, to the Amended and Restated Global Custody Agreement between the Trust and JPMorgan Chase Bank dated February 1, 2002.21 | |
(9) (a)(xvi) | Amendment No. 15 dated as of October 1, 2009, to the Amended and Restated Global Custody Agreement between the Trust and JPMorgan Chase Bank dated February 1, 2002.21 | |
(9) (a)(xvii) | Amendment No. 16 dated as of August 16, 2010 to the Amended and Restated Global Custody Agreement between the Trust and JPMorgan Chase Bank dated February 1, 2002.23 | |
(9) (a)(xviii) | Amendment No. 17 dated as of December 15, 2010 to the Amended and Restated Global Custody Agreement between the Trust and JPMorgan Chase Bank dated February 1, 2002.23 | |
(9) (a)(xix) | Amendment No. 18 dated as of December 7, 2010 to the Amended and Restated Global Custody Agreement between the Trust and JPMorgan Chase Bank dated February 1, 2002.24 | |
(9) (a)(xx) | Amendment No. 19 dated as of May 1, 2011 to the Amended and Restated Global Custody Agreement between the Trust and JPMorgan Chase Bank dated February 1, 2002.25 | |
(9) (a)(xxi) | Amendment No. 20 dated as of July 20, 2011 to the Amended and Restated Global Custody Agreement between the Trust and JPMorgan Chase Bank dated February 1, 2002.25 | |
(9) (a)(xxii) | Amendment No. 21 dated as of April 30, 2012 to the Amended and Restated Global Custody Agreement between the Trust and JPMorgan Chase Bank dated February 1, 2002.29 | |
(9) (a)(xxiii) | Amendment No. 22 dated as of June 1, 2013 to the Amended and Restated Global Custody Agreement between the Trust and JPMorgan Chase Bank dated February 1, 2002.34 | |
C-12
Table of Contents
(9) (a)(xxiv) | Amendment No. 23 dated as of October 21, 2013 to the Amended and Restated Global Custody Agreement between the Trust and JPMorgan Chase Bank dated February 1, 2002.34 | |
(9) (a)(xxv) | Amendment No. 24 dated as of April 4, 2014 to the Amended and Restated Global Custody Agreement between the Trust and JPMorgan Chase Bank dated February 1, 2002.37 | |
(9) (a)(xxvi) | Amendment No. 25 dated as of June 1, 2014 to the Amended and Restated Global Custody Agreement between the Trust and JPMorgan Chase Bank dated February 1, 2002.37 | |
(9) (a)(xxvii) | Amendment No. 26 dated as of July 16, 2014 to the Amended and Restated Global Custody Agreement between the Trust and JPMorgan Chase Bank dated February 1, 2002.38 | |
(9) (a)(xxviii) | Amendment No. 27 dated as of April 30, 2015 to the Amended and Restated Global Custody Agreement between the Trust and JPMorgan Chase Bank dated February 1, 2002.40 | |
(10) | Distribution Plan and Multiple Class Plan | |
(10) (a) | Amended and Restated Distribution Plan pursuant to Rule 12b-1 for the Trust’s Class IB shares adopted as of July 14, 2010.22 | |
(10) (d) | Revised Amended and Restated Plan Pursuant to Rule 18f-3 under the 1940 Act.25 | |
(11) | Opinion and Consent of Counsel regarding the legality of the securities being registered. (filed herewith) | |
(12) | Not Applicable. | |
(13) | Other Material Contracts | |
(13) (a) | Amended and Restated Mutual Fund Service Agreement dated April 1, 2015 between the Trust and FMG LLC.39 | |
(13) (b) | Sub-Administration Agreement between FMG LLC and JPMorgan Chase Bank dated April 1, 2015.40 | |
(13) (c) | Expense Limitation Agreement dated as of May 1, 2011 between the Trust and FMG LLC.25 | |
(13) (c)(i) | Amendment No. 1 dated as of June 7, 2011 to the Expense Limitation Agreement between the Trust and FMG LLC dated May 1, 2011.26 | |
(13) (c)(ii) | Amendment No. 2 dated as of August 19, 2011 to the Expense Limitation Agreement between the Trust and FMG LLC dated May 1, 2011. 25 | |
(13) (c)(iii) | Amendment No. 3 dated as of January 1, 2012 to the Expense Limitation Agreement between the Trust and FMG LLC dated May 1, 2011.27 | |
(13) (c)(iv) | Amendment No. 4 dated as of April 12, 2012 to the Expense Limitation Agreement between the Trust and FMG LLC dated May 1, 2011.29 | |
C-13
Table of Contents
(13) (c)(v) | Amendment No. 5 dated as of May 1, 2013 to the Expense Limitation Agreement between the Trust and FMG LLC dated May 1, 2011.32 | |
(13) (c)(vi) | Amendment No. 6 dated as of May 1, 2013 to the Expense Limitation Agreement between the Trust and FMG LLC dated May 1, 2011.32 | |
(13) (c)(vii) | Amendment No 7 dated as of April 11, 2014 to the Expense Limitation Agreement between the Trust and FMG LLC dated May 1, 2011.37 | |
(13) (c)(viii) | Amendment No. 8 dated as of May 1, 2014 to the Expense Limitation Agreement between the Trust and FMG LLC dated May 1, 2011.37 | |
(13) (c)(ix) | Amendment No. 9 dated as of June 1, 2014 to the Expense Limitation Agreement between the Trust and FMG LLC dated May 1, 2011.37 | |
(13) (c)(x) | Amendment No. 10 dated as of July 16, 2014 to the Expense Limitation Agreement between the Trust and FMG LLC dated May 1, 2011.38 | |
(13) (c)(xi) | Amendment No. 11 dated as of September 1, 2014 to the Expense Limitation Agreement between the Trust and FMG LLC dated May 1, 2011.38 | |
(13) (c)(xii) | Amendment No. 12 dated as of April 30, 2015 to the Expense Limitation Agreement between the Trust and FMG LLC dated May 1, 2011.39 | |
(13) (d) | Amended and Restated Participation Agreement among the Trust, AXA Equitable Life Insurance Company (“AXA Equitable”), AXA Distributors and AXA Advisors dated as of July 15, 2002.6 | |
(13) (d)(i) | Amendment No. 1, dated May 2, 2003, to the Amended and Restated Participation Agreement among the Trust, AXA Equitable, AXA Distributors and AXA Advisors dated July 15, 2002.7 | |
(13) (d)(ii) | Amendment No. 2, dated July 9, 2004, to the Amended and Restated Participation Agreement among the Trust, AXA Equitable, AXA Distributors and AXA Advisors dated July 15, 2002.8 | |
(13) (d)(iii) | Amendment No. 3, dated October 1, 2004, to the Amended and Restated Participation Agreement among the Trust, AXA Equitable, AXA Distributors and AXA Advisors dated July 15, 2002.8 | |
(13) (d)(iv) | Amendment No. 4 dated May 1, 2005 to the Amended and Restated Participation Agreement among the Trust, AXA Equitable, AXA Distributors and AXA Advisors dated July 15, 2002.9 | |
(13) (d)(v) | Amendment No. 5 dated September 30, 2005 to the Amended and Restated Participation Agreement among the Trust, AXA Equitable, AXA Distributors and AXA Advisors dated July 15, 2002.11 | |
(13) (d)(vi) | Amendment No. 6 dated August 1, 2006 to the Amended and Restated Participation Agreement among the Trust, AXA Equitable, AXA Distributors and AXA Advisors dated July 15, 2002.13 | |
C-14
Table of Contents
(13) (d)(vii) | Amendment No. 7 dated May 1, 2007 to the Amended and Restated Participation Agreement among the Trust, AXA Equitable, AXA Distributors and AXA Advisors dated July 15, 2002.14 | |
(13) (d)(viii) | Amendment No. 8 dated January 1, 2008 to the Amended and Restated Participation Agreement among the Trust, AXA Equitable, AXA Distributors and AXA Advisors dated July 15, 2002.16 | |
(13) (d)(ix) | Amendment No. 9 dated May 1, 2008 to the Amended and Restated Participation Agreement among the Trust, AXA Equitable, AXA Distributors and AXA Advisors dated July 15, 2002.18 | |
(13) (d)(x) | Amendment No. 10 dated January 1, 2009 to the Amended and Restated Participation Agreement among the Trust, AXA Equitable, AXA Distributors and AXA Advisors dated July 15, 2002.19 | |
(13) (d)(xi) | Amendment No. 11 dated May 1, 2009 to the Amended and Restated Participation Agreement among the Trust, AXA Equitable, AXA Distributors and AXA Advisors dated July 15, 2002.20 | |
(13) (d)(xii) | Amendment No. 12 dated September 29, 2009 to the Amended and Restated Participation Agreement among the Trust, AXA Equitable, AXA Distributors and AXA Advisors dated July 15, 2002.21 | |
(13) (d)(xiii) | Amendment No. 13 dated August 16, 2010 to the Amended and Restated Participation Agreement among the Trust, AXA Equitable, AXA Distributors and AXA Advisors dated July 15, 2002.23 | |
(13) (d)(xiv) | Amendment No. 14 dated as of December 15, 2010 to the Amended and Restated Participation Agreement among the Trust, AXA Equitable, AXA Distributors and AXA Advisors dated July 15, 2002.23 | |
(13) (d)(xv) | Amendment No. 15 dated June 7, 2011 to the Amended and Restated Participation Agreement among the Trust, AXA Equitable, AXA Distributors and AXA Advisors dated July 15, 2002.26 | |
(13) (d)(xvi) | Amendment No. 16 dated as of April 30, 2012 to the Amended and Restated Participation Agreement among the Trust, AXA Equitable and AXA Distributors dated July 15, 2002.31 | |
(13) (e) | Second Amended and Restated Participation Agreement among the Trust, AXA Equitable, FMG LLC and AXA Distributors dated May 23, 2012.33 | |
(13) (e)(i) | Amendment No. 1 dated as of June 4, 2013 to the Second Amended and Restated Participation Agreement among the Trust, AXA Equitable, FMG LLC and AXA Distributors dated May 23, 2012.34 | |
(13) (e)(ii) | Amendment No. 2 dated as of October 21, 2013 to the Second Amended and Restated Participation Agreement among the Trust, AXA Equitable, FMG LLC and AXA Distributors dated May 23, 2012.34 | |
(13) (e)(iii) | Amendment No. 3 dated as of April 4, 2014 to the Second Amended and Restated Participation Agreement among the Trust, AXA Equitable, FMG LLC and AXA Distributors dated May 23, 2012.37 | |
C-15
Table of Contents
(13) (e)(iv) | Amendment No. 4 dated as of June 1, 2014 to the Second Amended and Restated Participation Agreement among the Trust, AXA Equitable, FMG LLC and AXA Distributors dated May 23, 2012.37 | |
(13) (e)(v) | Amendment No. 5 dated as of July 16, 2014 to the Second Amended and Restated Participation Agreement among the Trust, AXA Equitable, FMG LLC and AXA Distributors dated May 23, 2012.38 | |
(13) (e)(vi) | Amendment No. 6 dated as of April 30, 2015 to the Second Amended and Restated Participation Agreement among the Trust, AXA Equitable, FMG LLC and AXA Distributors dated May 23, 2012.39 | |
(13) (f) | Participation Agreement among the Trust, MONY Life Insurance Company (“MONY Life”), and AXA Distributors dated as of May 23, 2012.35 | |
(13) (f)(i) | Amendment No. 1 dated June 4, 2013 to the Amended and Restated Participation Agreement among the Trust, MONY Life, and AXA Distributors dated as of May 23, 2012.35 | |
(13) (f)(ii) | Participation Agreement among the Trust, MONY Life Insurance Company (“MONY”) and AXA Distributors effective as of October 1, 2013.35 | |
(13) (f)(iii) | Amendment No. 1 dated as of April 4, 2014 to the Participation Agreement among the Trust, MONY and AXA Distributors effective as of October 1, 2013.37 | |
(13) (f)(iv) | Amendment No. 2 dated as of June 1, 2014 to the Participation Agreement among the Trust, MONY and AXA Distributors effective as of October 1, 2013.37 | |
(13) (f)(v) | Amendment No. 3 dated as of July 16, 2014 to the Participation Agreement among the Trust, MONY and AXA distributors effective as of October 1, 2013.38 | |
(13) (g) | Amended and Restated Participation Agreement among the Trust, MONY Life Insurance Company of America (“MLOA”) and AXA Distributors dated as of May 23, 2012.35 | |
(13) (g)(i) | Amendment No. 1 dated as of June 4, 2013 to the Amended and Restated Participation Agreement among the Trust, MLOA and AXA Distributors dated as of May 23, 2012.35 | |
(13) (g)(ii) | Amendment No. 2 dated as of October 21, 2013 to the Amended and Restated Participation Agreement among the Trust, MLOA and AXA Distributors dated as of May 23, 2012.35 | |
(13) (g)(iii) | Amendment No. 3 dated as of November 1, 2013 to the Amended and Restated Participation Agreement among the Trust, MLOA and AXA Distributors dated as of May 23, 2012.36 | |
(13) (g)(iv) | Amendment No. 4 dated as of April 4, 2014 to the Amended and Restated Participation Agreement among the Trust, MLOA and AXA Distributors dated as of May 23, 2012.37 | |
(13) (g)(v) | Amendment No. 5 dated as of June 1, 2014 to the Amended and Restated Participation Agreement among the Trust, MLOA and AXA Distributors dated as of May 23, 2012.37 | |
C-16
Table of Contents
(13) (g)(vi) | Amendment No. 6 dated as of July 16, 2014 to the Amended and Restated Participation Agreement among the Trust, MLOA and AXA Distributors dated as of May 23, 2012.38 | |
(13) (g)(vii) | Amendment No. 7 dated as of April 30, 2015 to the Amended and Restated Participation Agreement among the Trust, MLOA and AXA Distributors dated as of May 23, 2012.39 | |
(14) | Consent of Independent Public Accountants. (filed herewith) | |
(15) | Not Applicable. | |
(16) | Powers of Attorney. (filed herewith) | |
(17) | Forms of Voting Instruction and Proxy Cards. (filed herewith) | |
| 1. | Incorporated herein by reference to Registrant’s Registration Statement on Form N-1A filed on December 3, 1996 (File No. 333-17217). |
| 2. | Incorporated herein by reference to Pre-Effective Amendment No. 1 to Registrant’s Registration Statement on Form N-1A filed on January 23, 1997 (File No. 333-17217). |
| 3. | Incorporated herein by reference to Pre-Effective Amendment No. 2 to Registrant’s Registration Statement on Form N-1A filed on April 7, 1997 (File No. 333-17217). |
| 4 | Incorporated by reference to Post-Effective Amendment No. 18 to Registrant’s Registration Statement on Form N-1A filed on January 23, 2001. (File No. 333-17217). |
| 5. | Incorporated by reference to Post-Effective Amendment No. 24 to Registrant’s Registration Statement on Form N-1A filed on April 3, 2002. (File No. 333-17217). |
| 6. | Incorporated by reference to Post-Effective Amendment No. 25 to Registrant’s Registration Statement on Form N-1A filed on February 7, 2003. (File No. 333-17217). |
| 7. | Incorporated by reference to and/or previously filed with Post-Effective Amendment No. 28 Registrant’s Registration Statement on Form N-1A filed on February 10, 2004 (File No. 333-17217). |
| 8. | Incorporated by reference to and/or previously filed with Post-Effective Amendment No. 35 to Registrant’s Registration Statement on Form N-1A filed on October 15, 2004 (File No. 333-17217). |
| 9. | Incorporated by reference to and/or previously filed with Post-Effective Amendment No. 37 to Registrant’s Registration Statement on Form N-1A filed on April 7, 2005 (File No. 333-17217). |
| 10. | Incorporated by reference to and/or previously filed with Post-Effective Amendment No. 42 to Registrant’s Registration Statement on Form N-1A filed on August 24, 2005 (File No. 333-17217). |
| 11. | Incorporated by reference to and/or previously filed with Post-Effective Amendment No. 44 to Registrant’s Registration Statement on Form N-1A filed on April 5, 2006 (File No. 333-17217). |
| 12 | Incorporated by reference to and/or previously filed with Post-Effective Amendment No. 46 to Registrant’s Registration Statement on Form N-1A filed on August 23, 2006 (File No. 333-17217). |
| 13 | Incorporated by reference to Post-Effective Amendment No. 51 to Registrant’s Registration Statement on Form N-1A filed on February 2, 2007 (File No. 333-17217). |
| 14 | Incorporated by reference to and/or previously filed with Post-Effective Amendment No. 53 to Registrant’s Registration Statement on Form N-1A filed on April 27, 2007 (File No. 333-17217). |
| 15 | Incorporated by reference to Post-Effective Amendment No. 54 to Registrant’s Registration Statement on Form N-1A filed on October 4, 2007 (File No. 333-17217). |
| 16 | Incorporated by reference to and/or previously filed with Post-Effective Amendment No. 56 to Registrant’s Registration Statement on Form N-1A filed on December 27, 2007 (File No. 333-17217). |
| 17 | Incorporated by reference to Post-Effective Amendment No. 57 to Registrant’s Registration Statement on Form N-1A filed on February 1, 2008 (File No. 333-17217). |
C-17
Table of Contents
| 18 | Incorporated by reference to Post-Effective Amendment No. 61 to the Registrant’s Registration Statement on Form N-1A filed on February 13, 2009 (File No. 333-17217). |
| 19 | Incorporated by reference to Post-Effective Amendment No. 64 to the Registrant’s Registration Statement on Form N-1A filed on March 16, 2009 (File No. 333-17217). |
| 20 | Incorporated by reference to and/or previously filed with Post-Effective Amendment No. 67 to the Registrant’s Registration Statement on Form N-1A filed on April 15, 2009 (File No. 333-17217). |
| 21 | Incorporated by reference to and/or previously filed with Post-Effective Amendment No. 70 to the Registrant’s Registration Statement on Form N-1A filed on January 21, 2010 (File No. 333-17217). |
| 22 | Incorporated by reference to and/or previously filed with Post-Effective Amendment No. 75 to the Registrant’s Registration Statement on Form N-1A filed on October 5, 2010 (File No. 333-17217). |
| 23 | Incorporated by reference to and/or previously filed with Post-Effective Amendment No. 77 to the Registrant’s Registration Statement on Form N-1A filed on February 3, 2011 (File No. 333-17217). |
| 24 | Incorporated by reference to and/or previously filed with Post-Effective Amendment No. 79 to the Registrant’s Registration Statement on Form N-1A filed on April 28, 2011 (File No. 333-17217). |
| 25 | Incorporated by reference to and/or previously filed with Post-Effective Amendment No. 83 to the Registrant’s Registration Statement on Form N-1A filed on August 16, 2011 (File No. 333-17217). |
| 26 | Incorporated by reference to and/or previously filed with Post-Effective Amendment No. 84 to the Registrant’s Registration Statement on Form N-1A filed on August 17, 2011 (File No. 333-17217). |
| 27 | Incorporated by reference to and/or previously filed with Post-Effective Amendment No. 87 to the Registrant’s Registration Statement on Form N-1A filed on January 13, 2012 (File No. 333-17217). |
| 28 | Incorporated by reference to and/or previously filed with Post-Effective Amendment No. 89 to the Registrant’s Registration Statement on Form N-1A filed on February 6, 2012 (File No. 333-17217). |
| 29 | Incorporated by reference to and/or previously filed with Post-Effective Amendment No. 91 to the Registrant’s Registration Statement on Form N-1A filed on April 25, 2012 (File No. 333-17217). |
| 30 | Incorporated by reference to and/or previously filed with Post-Effective Amendment No. 92 to the Registrant’s Registration Statement on Form N-1A filed on April 25, 2012 (File No. 333-17217). |
| 31 | Incorporated by reference to and/or previously filed with Post-Effective Amendment No. 96 to the Registrant’s Registration Statement on Form N-1A filed on February 7, 2013 (File No. 333-17217). |
| 32 | Incorporated by reference and/or previously filed with Post-Effective Amendment No. 98 to the Registrant’s Registration Statement filed on April 30, 2013 (File No. 333-17217). |
| 33 | Incorporated by reference and/or previously filed with Post-Effective Amendment No. 100 to the Registrant’s Registration Statement filed on July 22, 2013 (File No. 333-17217). |
| 34 | Incorporated by reference and/or previously filed with Post-Effective Amendment No. 101 to the Registrant’s Registration Statement filed on October 1, 2013 (File No. 333-17217). |
| 35 | Incorporated by reference and/or previously filed with Post-Effective Amendment No. 103 to the Registrant’s Registration Statement filed on January 10, 2014. (File No. 333-17217). |
| 36 | Incorporated by reference and/or previously filed with Post-Effective Amendment No. 106 to the Registrant’s Registration Statement filed on April 11, 2014. (File No. 333-17217). |
| 37 | Incorporated by reference and/or previously filed with Post-Effective Amendment No. 108 to the Registrant’s Registration Statement filed on April 30, 2014. (File No. 333-17217). |
| 38 | Incorporated by reference and or/previously filed with Post-Effective Amendment No. 112 to the Registrant’s Registration Statement filed on February 5, 2015. (File No. 333-17217). |
| 39 | Incorporated by reference and/or previously filed with Post-Effective Amendment No. 113 to the Registrant’s Registration Statement filed on April 17, 2015. (File 333-17217). |
| 40 | Incorporated by reference and/or previously filed with Post-Effective Amendment No. 114 to the Registrant’s Registration Statement filed on April 24, 2015. (File 333-17217). |
C-18
Table of Contents
| Item 17. | Undertakings |
(1) The undersigned registrant agrees that prior to any public reoffering of the securities registered through the use of a prospectus which is a part of this registration statement by any person or party who is deemed to be an underwriter within the meaning of Rule 145(c) under the 1933 Act (17 CFR 230.145(c)), the reoffering prospectus will contain the information called for by the applicable registration form for reoffering by persons who may be deemed underwriters, in addition to the information called for by the other items of the applicable form.
(2) The undersigned registrant agrees that every prospectus that is filed under paragraph (1) above will be filed as a part of an amendment to the registration statement and will not be used until the amendment is effective, and that, in determining any liability under the 1933 Act, each post-effective amendment shall be deemed to be a new registration statement for the securities offered therein, and the offering of the securities at that time shall be deemed to be the initial bona fide offering of them.
C-19
Table of Contents
SIGNATURES
Pursuant to the requirements of the Securities Act of 1933, as amended, the Registrant has duly caused this Registration Statement on Form N-14 to be signed on its behalf by the undersigned, thereunto duly authorized, in the city of New York and state of New York on the 30th day of June 2015.
EQ ADVISORS TRUST
| By: | /s/ Steven M. Joenk | |
| Steven M. Joenk | ||
Trustee, Chairman, President and Chief Executive Officer |
Pursuant to the requirements of the Securities Act of 1933, as amended, this Registration Statement has been signed below by the following persons in the capacities and on the dates indicated.
Signature | Title | Date | ||
/s/ Steven M. Joenk Steven M. Joenk | President | June 30, 2015 | ||
/s/Donald E. Foley* Donald E. Foley | Trustee | June 30, 2015 | ||
/s/ Christopher P.A. Komisarjevsky* Christopher P.A. Komisarjevsky | Trustee | June 30, 2015 | ||
/s/ H. Thomas McMeekin* H. Thomas McMeekin | Trustee | June 30, 2015 | ||
/s/ Harvey Rosenthal* Harvey Rosenthal | Trustee | June 30, 2015 | ||
/s/ Gary S. Schpero* Gary S. Schpero | Trustee | June 30, 2015 | ||
/s/ Kenneth Walker* Kenneth Walker | Trustee | June 30, 2015 | ||
/s/ Caroline L. Williams* Caroline L. Williams | Trustee | June 30, 2015 | ||
/s/ Brian Walsh* Brian Walsh | Treasurer and Chief Financial Officer | June 30, 2015 | ||
| * | By: | /s/ Steven M. Joenk | ||
| Steven M. Joenk | ||||
| Attorney-in-Fact |
Table of Contents
EXHIBIT INDEX
| (11) | Opinion and Consent of Counsel regarding the legality of the securities being registered. | |
| (14) | Consent of Independent Public Accountants. | |
| (16) | Powers of Attorney. | |
| (17) | Forms of Voting Instructions and Proxy Cards. | |