UNITED STATES
SECURITIES AND EXCHANGE COMMISSION
Washington, D.C. 20549
SECURITIES AND EXCHANGE COMMISSION
Washington, D.C. 20549
FORM N-CSR
CERTIFIED SHAREHOLDER REPORT OF REGISTERED
MANAGEMENT INVESTMENT COMPANIES
Investment Company Act file number 811-07959
Advisors Series Trust
(Exact name of registrant as specified in charter)
(Exact name of registrant as specified in charter)
615 East Michigan Street
Milwaukee, Wisconsin 53202
(Address of principal executive offices) (Zip code)
(Address of principal executive offices) (Zip code)
Jeffrey T. Rauman, President/Chief Executive Officer
Advisors Series Trust
c/o U.S. Bancorp Fund Services, LLC
777 East Wisconsin Avenue, 5th Floor
Milwaukee, Wisconsin 53202
(Name and address of agent for service)
(Name and address of agent for service)
(Registrant's telephone number, including area code): (626) 914-7363
Date of fiscal year end: October 31, 2022
Date of reporting period: October 31, 2022
Item 1. Reports to Stockholders.
ANNUAL REPORT
October 31, 2022
FORT PITT CAPITAL TOTAL RETURN FUND
c/o U.S. Bank Global Fund Services
P.O. Box 701
Milwaukee, WI 53201-0701
1-866-688-8775
Fort Pitt Capital Total Return Fund
Dear Fellow Shareholders,
As of October 31, 2022, the net asset value (“NAV”) of the Fort Pitt Capital Total Return Fund (the “Fund”) was $26.81 per share. Total return for the fiscal year ended October 31, 2022 (including a $2.34 per share dividend paid in December 2021), was -16.87%. This compares with a total return of -17.76% for the unmanaged Wilshire 5000 Total Market IndexSM (“Wilshire 5000”) and -14.61% for the S&P 500® Index (“S&P 500”) for the same period.
The Advisor has determined that it is no longer reasonable to include performance of a secondary broad-based index based on increased costs. For this reason returns for the Wilshire 5000 Total Market IndexSM will no longer be included in Fund related publications.
It turns out there really is no such thing as a free lunch. And 2022 ushered in the consequences phase for policymakers’ fiscal and monetary responses to the pandemic. The $8 trillion stimulus spending spree, which included an unprecedented +25% year-over-year increase in the money supply, has resulted in inflation spiking to 40-year highs. And contrary to the Federal Reserve’s forecasts (hopes?) at the beginning of the year, inflationary pressures have proven to be more complex than working through supply chain logjams. The Fed has clearly been behind the curve in starting the process of normalizing interest rates and must now play catchup with their fastest tightening pace in 40 years. Stubbornly high inflation and the Fed’s unambiguously hawkish stance have sent bond yields soaring to 15-year highs and could result in 2022 going down in history as the worst year ever for a wide range of fixed income indices. Equity fundamentals have been pressured as measurably higher interest rates have lowered the present value of future earnings streams and taken a bite out of valuation multiples. The outlook for economic and corporate earnings growth in 2023 has clearly dimmed as the delayed effects of higher interest rates work their way through the economy.
Ultra-long duration assets such as highly valued technology and growth-oriented stocks felt the most pain from the surge in interest rates, inflation levels, and discount rates. For the calendar year, the Nasdaq declined 29%, the components of the “FAANG” complex dropped by an average of 40%, and many of the highflying and unprofitable pandemic darlings were taken behind the woodshed to use a technical term. Value stocks held up reasonably well in a challenging environment, with investors showing a strong preference for companies with solid cash flow profiles and the defensive characteristics of the consumer staples, utilities, and healthcare sectors. Energy was far and away the top-performing sector, advancing by 63% as the group benefited from the spike in oil and gas prices as well as supply concerns.
Our top five performing holdings for the fiscal year were Bristol-Myers Squibb Company, Deere & Company, Merck & Co., Inc., Constellation Brands, Inc., and Arthur J. Gallagher & Co. Bristol-Myers’ core pharmaceutical products lineup performed as anticipated while results from their new launch portfolio gradually improved after a slow start to 2022. The company’s limited economic sensitivity, double-digit free cash flow yield, focus on debt reduction, and undemanding valuation multiples were highly desired attributes in an uncertain macro environment. Deere & Company has been a relatively new addition to the portfolio, and it seems like we’re off to a good start. Deere continued to make impressive strides towards their goal of revolutionizing the agriculture industry with technology and automation that help farmers save on operating costs while also increasing crop yields. Merck & Co., Inc. (also a new addition in 2022) benefited from the continued success of Keytruda, their blockbuster oncology drug, which registered 30% year-over-year sales growth in the fiscal second quarter. The company also expects a $5.0-$5.5 billion
Fort Pitt Capital Total Return Fund
revenue contribution in 2022 from their Molnupiravir COVID-19 antiviral, which received FDA approval in late 2021. Constellation Brands, Inc. has benefited from strong demand for its premium, high-end beer portfolio anchored by its Corona and Modelo brands. We’re also encouraged by Constellation’s ongoing divestiture of lower-quality wine & spirits brands in order to focus on its “high growth, high margin” long-term strategy. Arthur J. Gallagher & Co. benefited from a favorable property & casualty pricing environment as the company continued to raise insurance premiums throughout the year.
Our bottom five performers were GXO Logistics, Inc., Advanced Micro Devices, Inc. (“AMD”), Coherent Corp., Walt Disney Co., and Target Corporation. While GXO Logistics experienced strong demand for their outsourced logistics and warehouse automation solutions, shares fell due to investor concern over the company’s heavy exposure to the European economy and the translation impact of weak European currencies. Advanced Micro Devices suffered from the inevitable normalization in PC demand following recent years of the COVID-19-induced “everything-from-home” environment. Nevertheless, the firm’s data center business continued to show strength and AMD has been successful in taking market share from chief rival Intel. Coherent (formerly II-VI Incorporated) shares were weak throughout 2022 due to their heavy exposure to China, a slowdown in the smartphone and electronics end markets, and a measurable debt load resulting from their Coherent acquisition, which closed in July. Disney shares were pressured by Netflix’s announcement of subscriber losses, renewed park closures in China, and the company’s well-publicized political battles in the state of Florida. We exited our Disney position due to increased competition in the streaming space and expectations that the company will need to continue to fund losses in this segment beyond fiscal 2024. Like many other retailers, Target Corporation got caught with too much inventory this summer as deliveries finally caught up with orders and consumer spending preferences shifted amid surging inflation. However, Target prevented this from becoming a longer-lasting problem by aggressively clearing excess inventory through markdowns.
The Fund’s annualized total return for the three years ended October 31, 2022, was 4.67%, compared to 9.49% for the Wilshire 5000 and 10.22% for the S&P 500. Over the five-year period ended October 31, 2022, the Fund’s annualized total return was 6.16%, while the Wilshire 5000’s annualized return was 9.60% and the S&P 500’s annualized return was 10.44%. Over the ten-year period ended October 31, 2022, the Fund’s annualized total return was 9.79%, while the Wilshire 5000’s annualized return was 12.24% and the S&P 500’s annualized return was 12.79%. Since inception on December 31, 2001, through October 31, 2022, the Fund has produced a total return of 7.95% annualized (392.02% cumulative), compared to 8.34% annualized (430.85% cumulative) for the Wilshire 5000 and 8.11% annualized (407.65% cumulative) for the S&P 500. The annual gross operating expense ratio for the Fund is 1.11% (1.00% net), as indicated in its most recently filed prospectus.
Performance data quoted represents past performance and does not guarantee future results. The investment return and principal value of an investment will fluctuate so that an investor’s shares, when redeemed, may be worth more or less than their original cost. Current performance of the Fund may be lower or higher than the performance quoted. Performance data current to the most recent month end may be obtained by calling 1-866-688-8775. Performance data quoted does not reflect any redemption fees for shares purchased prior to the elimination of the Fund’s short-term redemption fees. If reflected, total returns would be reduced. Performance figures reflect fee waivers in effect. In the absence of waivers, total returns would be lower.
3
Fort Pitt Capital Total Return Fund
Inflation is likely to be the linchpin for outcomes in 2023. While U.S. inflation peaked in June, the subsequent declines have been disappointingly slow. Progress from here matters a lot and will determine how far into restrictive territory the Fed will need to raise interest rates in order to balance the supply and demand dynamic.
We see clear evidence of fading price pressures on the goods side of the inflation equation. Supply chain stresses are easing, many commodity prices have rolled over, retailers are offering discounts to clear excess inventory stockpiles, shipping/transportation costs have plummeted from peak levels, used car prices have recently recorded some the largest price declines on record, and semiconductor capacity has been freed up due to reduced demand for PCs and smartphones. While this progress is encouraging, goods only represent about 30% of the inflation calculation.
There has been less observable progress within services inflation. And that’s a problem since services account for more than 70% of core inflation. Rental inflation is the big problem here, with rents representing approximately 40% of the overall inflation basket. It’s no surprise rental prices have skyrocketed given the massive appreciation in real estate assets driven by the post-pandemic stretch of near-zero interest rates and unprecedented government stimulus. This explains the Fed’s recent comments about the need for a correction in the housing market. Housing prices peaked this spring and have since registered some of the largest month-over-month declines since the financial crisis. Mortgage rates above 7% have the desired effect in the real estate market. It will take some time for weakening home prices to filter down to relief in rental prices and be picked up in the official inflation readings. However, more real-time sources (Zillow, Apartment List, Redfin) have shown measurable month-over-month declines in new lease prices. This provides a good indication that the main contributor to inflation is headed in the right direction.
The inflation problem won’t be solved in a vacuum. It will come with a rising unemployment rate, a weaker consumer, and a slowdown in economic activity as the impact of higher interest rates works through the system. All of which will translate into pressure on corporate earnings in 2023. Consensus earnings estimates for next year have declined since the summertime but still show expectations for 6% earnings growth in 2023. Too optimistic in our view, given a deteriorating economic environment. Earnings estimates will likely continue to decline into negative growth territory as the economy and labor market show clearer signs of weakening. We view the recalibration of earnings estimates to be an important component of the bottoming process for equity markets. The real question is will 2023 be the trough year for earnings or is there a greater price to pay for our fiscal and monetary experiment? As always, we expect the market to reach a conclusion before the analysts, strategists, and pundits.
Thank you for your continued support of our Fund.

Dan Eye
Portfolio Manager
Mutual fund investing involves risk; principal loss is possible. Investments in debt securities typically decrease in value when interest rates rise. This risk is usually greater for longer-term debt securities. Small and medium-capitalization companies tend to have limited liquidity and greater price volatility than large capitalization
4
Fort Pitt Capital Total Return Fund
companies. The Fund invests in foreign securities which involve greater volatility and political, economic and currency risks and differences in accounting methods. Growth stocks typically are more volatile than value stocks; however, value stocks have a lower expected growth rate in earnings and sales.
The opinions expressed are those of Dan Eye through the end of the period for this report, are subject to change, and are not intended to be a forecast of future events, a guarantee of future results, nor investment advice.
Diversification does not assure a profit nor protect against loss in a declining market.
The contributors/detractors listed above do not represent all securities purchased or sold during the period. To obtain a list showing the contribution of each holding to overall performance and the calculation methodology, please call 412-921-1822.
The S&P 500® Index is a broad based unmanaged index of 500 stocks, which is widely recognized as representative of the equity market in general. The Wilshire 5000 Total Market IndexSM is a capitalization weighted index of all U.S. headquartered companies, which provides the broadest measure of U.S. stock market performance. It is not possible to invest directly in an index.
This information is intended for the shareholders of the Fund and is not for distribution to prospective investors unless preceded or accompanied by a current prospectus.
Fund holdings and sector allocations are subject to change and should not be considered a recommendation to buy or sell any security.
For a complete list of Fund holdings, please refer to the schedule of investments section of this report.
Fort Pitt Capital Group, LLC is the Advisor to the Fort Pitt Capital Total Return Fund, which is distributed by Quasar Distributors, LLC.
5
Fort Pitt Capital Total Return Fund
Growth of Hypothetical $10,000 Investment at October 31, 2022
vs.
Wilshire 5000 Total Market IndexSM & S&P 500® Index
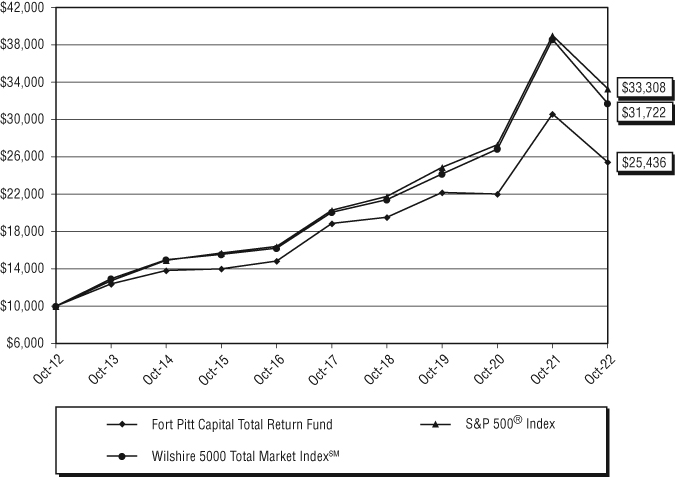
Average Annual Total Return1 | ||||
| Since | ||||
| Inception | ||||
One Year | Five Year | Ten Year | 12/31/01 | |
Fort Pitt Capital Total Return Fund | -16.87% | 6.16% | 9.79% | 7.95% |
Wilshire 5000 Total Market IndexSM2 | -17.76% | 9.60% | 12.24% | 8.34% |
S&P 500® Index | -14.61% | 10.44% | 12.79% | 8.11% |
Performance data quoted represents past performance and does not guarantee future results. The investment return and principal value of an investment will fluctuate, so that an investor’s shares, when redeemed, may be worth more or less than their original cost. Current performance of the Fund may be lower or higher than the performance quoted. Performance data current to the most recent month end may be obtained by calling 1-866-688-8775.
Returns reflect reinvestment of dividends and capital gains distributions. Fee waivers are in effect. In the absence of fee waivers, returns would be reduced. The performance data and graph do not reflect the deduction of taxes that a shareholder may pay on dividends, capital gains distributions, or redemption of Fund shares. Indices do not incur expenses and are not available for investment. If it did, total returns would be reduced.
1 | Average Annual Total Return represents the average change in account value over the periods indicated. |
2 | The Fund will no longer use the Wilshire 5000 Total Market IndexSM as a secondary benchmark going forward due to increased costs. |
The Wilshire 5000 Total Market IndexSM is a capitalization weighted index of all U.S. headquartered companies which provides the broadest measure of U.S. stock market performance.
The S&P 500® Index is a broad based unmanaged index of 500 stocks, which is widely recognized as representative of the equity market in general.
6
Fort Pitt Capital Total Return Fund
| ALLOCATION OF PORTFOLIO INVESTMENTS |
| at October 31, 2022 (Unaudited) |
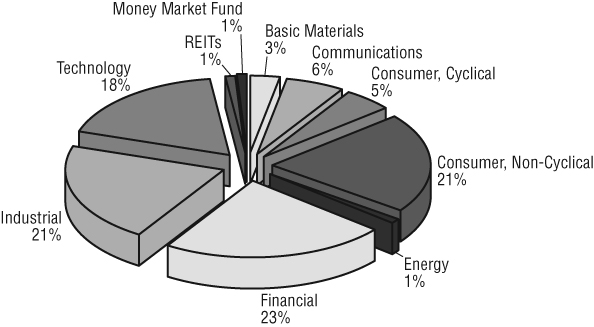
Percentages represent market value as a percentage of total investments.
| EXPENSE EXAMPLE |
| at October 31, 2022 (Unaudited) |
As a shareholder of a mutual fund, you incur two types of costs: (1) transaction costs, including redemption fees and exchange fees; and (2) ongoing costs, including management fees; distribution and/or service fees; and other fund expenses. This Example is intended to help you understand your ongoing costs (in dollars) of investing in the Fund and to compare these costs with the ongoing costs of investing in other mutual funds. The Example is based on an investment of $1,000 invested at the beginning of the period and held for the entire period (5/1/22 – 10/31/22).
Actual Expenses
The first line of the following table provides information about actual account values and actual expenses. Although the Fund charges no sales loads or transaction fees, you will be assessed fees for outgoing wire transfers, returned checks, and stop payment orders at prevailing rates charged by U.S. Bancorp Fund Services, LLC, the Fund’s transfer agent. To the extent the Fund invests in shares of other investment companies as part of its investment strategy, you will indirectly bear your proportionate share of any fees and expenses charged by the underlying funds in which the Fund invests in addition to the expenses of the Fund. Actual expenses of the underlying funds are expected to vary among the various underlying funds. These expenses are not included in the example below. The Example below includes, but is not limited to, management fees, fund accounting, custody and transfer agent fees. You may use the information in this line, together with the amount you invested, to estimate the expenses that you paid over the period. Simply divide your account value by $1,000 (for example, an $8,600 account value divided by $1,000 = 8.6), then multiply the result by the number in the first line under the heading entitled “Expenses Paid During Period” to estimate the expenses you paid on your account during this period.
7
Fort Pitt Capital Total Return Fund
| EXPENSE EXAMPLE (Continued) |
| at October 31, 2022 (Unaudited) |
Hypothetical Example for Comparison Purposes
The second line of the table below provides information about hypothetical account values and hypothetical expenses based on the Fund’s actual expense ratio and an assumed rate of return of 5% per year before expenses, which is not the Fund’s actual return. The hypothetical account values and expenses may not be used to estimate the actual ending account balance or expenses you paid for the period. You may use this information to compare the ongoing costs of investing in the Fund and other funds. To do so, compare this 5% hypothetical example with the 5% hypothetical examples that appear in the shareholder reports of the other funds. Please note that the expenses shown in the table are meant to highlight your ongoing costs only and do not reflect any transactional costs, such as redemption fees or exchange fees. Therefore, the second line of the table is useful in comparing ongoing costs only and will not help you determine the relative total costs of owning different funds. In addition, if these transactional costs were included, your costs would have been higher.
| Beginning | Ending | Expenses Paid | |
| Account Value | Account Value | During Period* | |
5/1/22 | 10/31/22 | 5/1/22 – 10/31/22 | |
Actual | $1,000.00 | $ 927.40 | $4.86 |
Hypothetical | $1,000.00 | $1,020.16 | $5.09 |
(5% return before expenses) |
| * | Expenses are equal to the Fund’s annualized expense ratio of 1.00%, multiplied by the average account value over the period, multiplied by 184 (days in most recent fiscal half-year)/365 days to reflect the one-half year expense. |
8
Fort Pitt Capital Total Return Fund
| SCHEDULE OF INVESTMENTS |
| at October 31, 2022 |
| COMMON STOCKS – 98.94% | Shares | Value | ||||||
| Aerospace/Defense – 1.30% | ||||||||
Raytheon Technologies Corp. | 8,844 | $ | 838,588 | |||||
| Applications Software – 6.11% | ||||||||
Microsoft Corp. | 17,000 | 3,946,210 | ||||||
| Brewery – 1.98% | ||||||||
Constellation Brands, Inc. – Class A | 5,179 | 1,279,627 | ||||||
| Broadcasting (except Internet) – 2.84% | ||||||||
Westlake Corp. | 19,001 | 1,836,447 | ||||||
| Commercial Services – 0.07% | ||||||||
GXO Logistics, Inc.* | 1,226 | 44,798 | ||||||
| Computers – 2.07% | ||||||||
Apple, Inc. | 8,730 | 1,338,658 | ||||||
| Consumer Products – Miscellaneous – 3.31% | ||||||||
Kimberly-Clark Corp. | 17,203 | 2,141,085 | ||||||
| Diagnostic Equipment – 3.37% | ||||||||
Danaher Corp. | 695 | 174,911 | ||||||
Thermo Fisher Scientific, Inc. | 3,900 | 2,004,483 | ||||||
2,179,394 | ||||||||
| Diversified Manufacturing – 5.83% | ||||||||
Parker-Hannifin Corp. | 12,950 | 3,763,529 | ||||||
| Electronic Components – Semiconductor – 9.50% | ||||||||
Advanced Micro Devices, Inc.* | 43,085 | 2,587,685 | ||||||
Broadcom, Inc. | 381 | 179,116 | ||||||
Texas Instruments, Inc. | 21,000 | 3,373,230 | ||||||
6,140,031 | ||||||||
| Fiduciary Banks – 0.63% | ||||||||
Bank of New York Mellon Corp. | 9,655 | 406,572 | ||||||
| Finance – Investment Banker/Broker – 6.46% | ||||||||
Charles Schwab Corp. | 52,400 | 4,174,708 | ||||||
| Industrial Automation/Robot – 6.34% | ||||||||
Rockwell Automation, Inc. | 16,050 | 4,097,565 | ||||||
| Instruments – Controls – 5.78% | ||||||||
Honeywell International, Inc. | 18,300 | 3,733,566 | ||||||
The accompanying notes are an integral part of these financial statements.
9
Fort Pitt Capital Total Return Fund
| SCHEDULE OF INVESTMENTS (Continued) |
| at October 31, 2022 |
| COMMON STOCKS – 98.94% (Continued) | Shares | Value | ||||||
| Insurance Brokers – 8.11% | ||||||||
Arthur J. Gallagher & Co. | 28,000 | $ | 5,238,240 | |||||
| Investment Management/Advisor Services – 1.51% | ||||||||
Apollo Global Management, Inc. | 17,678 | 978,654 | ||||||
| Lasers – Systems/Components – 2.24% | ||||||||
Coherent Corp.* | 43,150 | 1,450,272 | ||||||
| Machinery-Farm – 0.46% | ||||||||
Deere & Co. | 750 | 296,865 | ||||||
| Medical – Drugs – 4.08% | ||||||||
Bristol-Myers Squibb Co. | 23,303 | 1,805,284 | ||||||
Merck & Co, Inc. | 8,222 | 832,066 | ||||||
2,637,350 | ||||||||
| Medical Instruments – 3.49% | ||||||||
Medtronic PLC# | 25,779 | 2,251,538 | ||||||
| Medical Products – 4.90% | ||||||||
Abbott Laboratories | 32,000 | 3,166,080 | ||||||
| Pipelines – 0.73% | ||||||||
Kinder Morgan, Inc. | 26,025 | 471,573 | ||||||
| Private Equity – 1.46% | ||||||||
Blackstone, Inc. | 10,319 | 940,474 | ||||||
| Retail – Apparel/Shoes – 1.05% | ||||||||
Lululemon Athletica, Inc.* | 2,055 | 676,177 | ||||||
| Retail – Building Products – 1.43% | ||||||||
Lowe’s Cos., Inc. | 4,754 | 926,792 | ||||||
| Retail – Discount – 2.21% | ||||||||
Target Corp. | 8,700 | 1,428,975 | ||||||
| Retail – Restaurants – 0.18% | ||||||||
Starbucks Corp. | 1,357 | 117,503 | ||||||
| Semiconductor Equipment – 0.31% | ||||||||
Lam Research Corp. | 488 | 197,532 | ||||||
| Super-Regional Banks – U.S. – 5.14% | ||||||||
PNC Financial Services Group, Inc. | 20,500 | 3,317,515 | ||||||
The accompanying notes are an integral part of these financial statements.
10
Fort Pitt Capital Total Return Fund
| SCHEDULE OF INVESTMENTS (Continued) |
| at October 31, 2022 |
| COMMON STOCKS – 98.94% (Continued) | Shares | Value | ||||||
| Telecommunication Equipment – 3.11% | ||||||||
Ciena Corp.* | 41,893 | $ | 2,006,675 | |||||
| Telephone – Integrated – 1.89% | ||||||||
Verizon Communications, Inc. | 32,600 | 1,218,262 | ||||||
| Web Portals/ISP – 1.05% | ||||||||
Alphabet, Inc. – Class A* | 7,151 | 675,841 | ||||||
TOTAL COMMON STOCKS | ||||||||
(Cost $30,035,470) | 63,917,096 | |||||||
| REIT: 0.60% | ||||||||
| Real Estate – 0.60% | ||||||||
Digital Realty Trust, Inc. | 3,825 | 383,456 | ||||||
TOTAL REIT | ||||||||
(Cost $494,708) | 383,456 | |||||||
| MONEY MARKET FUND – 0.54% | ||||||||
| Money Market Fund – 0.54% | ||||||||
Invesco STIT-Government & Agency Portfolio – | ||||||||
Institutional Class, 3.045%† | 350,624 | 350,624 | ||||||
TOTAL MONEY MARKET FUND | ||||||||
(Cost $350,624) | 350,624 | |||||||
Total Investments | ||||||||
(Cost $30,880,802) – 100.08% | 64,651,176 | |||||||
Liabilities in Excess of Other Assets – (0.08)% | (50,525 | ) | ||||||
TOTAL NET ASSETS – 100.00% | $ | 64,600,651 | ||||||
* | Non-income producing security. |
# | U.S. traded security of a foreign issuer. |
† | Rate shown is the 7-day annualized yield at October 31, 2022. |
REIT – Real Estate Investment Trust
The accompanying notes are an integral part of these financial statements.
11
Fort Pitt Capital Total Return Fund
| STATEMENT OF ASSETS AND LIABILITIES |
| at October 31, 2022 |
| ASSETS | ||||
| Investments, at market value (cost $30,880,802) | $ | 64,651,176 | ||
| Receivables: | ||||
| Fund shares sold | 5,502 | |||
| Dividends and interest | 133,660 | |||
| Prepaid expenses | 8,714 | |||
| Total assets | 64,799,052 | |||
| LIABILITIES | ||||
| Due to advisor | 29,996 | |||
| Fund shares redeemed | 100,000 | |||
| Administration and fund accounting fees | 13,315 | |||
| Audit fees | 21,000 | |||
| Transfer agent fees and expenses | 9,930 | |||
| Legal fees | 542 | |||
| Custody fees | 3,682 | |||
| Shareholder reporting fees | 15,685 | |||
| Chief Compliance Officer fee | 2,500 | |||
| Trustee fees and expenses | 880 | |||
| Accrued expenses | 871 | |||
| Total liabilities | 198,401 | |||
| NET ASSETS | $ | 64,600,651 | ||
| COMPONENTS OF NET ASSETS | ||||
| Paid-in capital | $ | 25,515,804 | ||
| Total distributable earnings | 39,084,847 | |||
| Total net assets | $ | 64,600,651 | ||
| Shares outstanding | ||||
| (unlimited number of shares authorized, par value $0.01) | 2,409,470 | |||
| Net Asset Value, Redemption Price and Offering Price Per Share | $ | 26.81 | ||
The accompanying notes are an integral part of these financial statements.
12
Fort Pitt Capital Total Return Fund
| STATEMENT OF OPERATIONS |
| For the year ended October 31, 2022 |
| INVESTMENT INCOME | ||||
| Income | ||||
| Dividends | $ | 1,241,581 | ||
| Interest | 10,364 | |||
| Total investment income | 1,251,945 | |||
| Expenses | ||||
| Advisory fees (Note 4) | 572,603 | |||
| Administration and fund accounting fees (Note 4) | 95,519 | |||
| Transfer agent fees and expenses (Note 4) | 65,057 | |||
| Registration fees | 22,316 | |||
| Audit fees | 21,000 | |||
| Custody fees (Note 4) | 18,407 | |||
| Shareholder reporting | 15,192 | |||
| Chief Compliance Officer fees (Note 4) | 15,000 | |||
| Trustee fees and expenses | 13,744 | |||
| Legal fees | 9,330 | |||
| Miscellaneous expense | 4,793 | |||
| Insurance expense | 3,212 | |||
| Total expenses before fee waiver | 856,173 | |||
| Less: fee waiver from Advisor (Note 4) | (102,748 | ) | ||
| Net expenses | 753,425 | |||
| Net investment income | 498,520 | |||
| REALIZED AND UNREALIZED GAIN/(LOSS) ON INVESTMENTS | ||||
| Net realized gain on investments | 4,869,792 | |||
| Change in unrealized appreciation/(depreciation) on investments | (19,079,745 | ) | ||
| Net realized and unrealized loss on investments | (14,209,953 | ) | ||
| Net decrease in net assets resulting from operations | $ | (13,711,433 | ) | |
The accompanying notes are an integral part of these financial statements.
13
Fort Pitt Capital Total Return Fund
| STATEMENTS OF CHANGES IN NET ASSETS |
| For the | For the | |||||||
| Year Ended | Year Ended | |||||||
| October 31, 2022 | October 31, 2021 | |||||||
| OPERATIONS | ||||||||
| Net investment income | $ | 498,520 | $ | 493,460 | ||||
| Net realized gain on investments | 4,869,792 | 5,481,556 | ||||||
| Change in unrealized appreciation/(depreciation) | ||||||||
| on investments | (19,079,745 | ) | 20,215,866 | |||||
| Net increase/(decrease) in net assets | ||||||||
| resulting from operations | (13,711,433 | ) | 26,190,882 | |||||
| DISTRIBUTIONS TO SHAREHOLDERS | ||||||||
| Net dividends and distributions to shareholders | (5,815,540 | ) | (703,713 | ) | ||||
| Total distributions | (5,815,540 | ) | (703,713 | ) | ||||
| CAPITAL SHARE TRANSACTIONS | ||||||||
| Proceeds from shares sold | 1,923,188 | 2,443,283 | ||||||
| Proceeds from shares issued in reinvestment of dividends | 5,803,571 | 702,277 | ||||||
| Cost of shares redeemed | (10,610,432 | ) | (11,007,932 | ) | ||||
| Net decrease in net assets resulting from | ||||||||
| capital share transactions | (2,883,673 | ) | (7,862,372 | ) | ||||
| Total increase/(decrease) in net assets | (22,410,646 | ) | 17,624,797 | |||||
| NET ASSETS | ||||||||
| Beginning of year | 87,011,297 | 69,386,500 | ||||||
| End of year | $ | 64,600,651 | $ | 87,011,297 | ||||
| CHANGES IN SHARES OUTSTANDING | ||||||||
| Shares sold | 64,326 | 79,198 | ||||||
| Shares issued in reinvestment of dividends | 175,334 | 24,084 | ||||||
| Shares redeemed | (349,954 | ) | (352,381 | ) | ||||
| Net decrease in Fund shares outstanding | (110,294 | ) | (249,099 | ) | ||||
| Shares outstanding, beginning of year | 2,519,764 | 2,768,863 | ||||||
| Shares outstanding, end of year | 2,409,470 | 2,519,764 | ||||||
The accompanying notes are an integral part of these financial statements.
14
Fort Pitt Capital Total Return Fund
| FINANCIAL HIGHLIGHTS |
For a share outstanding throughout each year
| For the Year Ended October 31, | ||||||||||||||||||||
| 2022 | 2021 | 2020 | 2019 | 2018 | ||||||||||||||||
| Net asset value, | ||||||||||||||||||||
| beginning of year | $ | 34.53 | $ | 25.06 | $ | 27.35 | $ | 25.81 | $ | 25.47 | ||||||||||
| Income from | ||||||||||||||||||||
| investment operations: | ||||||||||||||||||||
Net investment income | 0.21 | 0.20 | 0.28 | 0.29 | 0.26 | |||||||||||||||
Net realized and unrealized | ||||||||||||||||||||
gain/(loss) on investments | (5.59 | ) | 9.53 | (0.34 | ) | 2.89 | 0.65 | |||||||||||||
| Total from | ||||||||||||||||||||
| investment operations | (5.38 | ) | 9.73 | (0.06 | ) | 3.18 | 0.91 | |||||||||||||
| Less dividends: | ||||||||||||||||||||
Dividends from | ||||||||||||||||||||
net investment income | (0.20 | ) | (0.26 | ) | (0.28 | ) | (0.26 | ) | (0.24 | ) | ||||||||||
Dividends from | ||||||||||||||||||||
net realized gains | (2.14 | ) | — | (1.95 | ) | (1.38 | ) | (0.33 | ) | |||||||||||
| Total dividends | (2.34 | ) | (0.26 | ) | (2.23 | ) | (1.64 | ) | (0.57 | ) | ||||||||||
| Redemption fees | — | — | 0.00 | # | $ | 0.00 | # | 0.00 | # | |||||||||||
| Net asset value, end of year | $ | 26.81 | $ | 34.53 | $ | 25.06 | $ | 27.35 | $ | 25.81 | ||||||||||
Total return1 | -16.87 | % | 39.00 | % | -0.76 | % | 13.60 | % | 3.51 | % | ||||||||||
| Supplemental data | ||||||||||||||||||||
| and ratios: | �� | |||||||||||||||||||
Net assets, end of year | $ | 64,600,651 | $ | 87,011,297 | $ | 69,386,500 | $ | 73,606,705 | $ | 66,904,051 | ||||||||||
Ratio of net expenses | ||||||||||||||||||||
to average net assets: | ||||||||||||||||||||
| Before fee waivers | 1.14 | % | 1.15 | % | 1.39 | % | 1.38 | % | 1.35 | % | ||||||||||
| After fee waivers | 1.00 | % | 1.04 | % | 1.24 | % | 1.24 | % | 1.24 | % | ||||||||||
Ratio of net investment income | ||||||||||||||||||||
to average net assets: | ||||||||||||||||||||
| Before fee waivers | 0.53 | % | 0.48 | % | 0.93 | % | 0.96 | % | 0.83 | % | ||||||||||
| After fee waivers | 0.67 | % | 0.59 | % | 1.08 | % | 1.10 | % | 0.94 | % | ||||||||||
Portfolio turnover rate | 14 | % | 4 | % | 8 | % | 13 | % | 4 | % | ||||||||||
# | Amount is less than $0.01 per share. |
1 | Total return reflects reinvested dividends but does not reflect the impact of taxes. |
The accompanying notes are an integral part of these financial statements.
15
Fort Pitt Capital Total Return Fund
| NOTES TO FINANCIAL STATEMENTS |
| at October 31, 2022 |
NOTE 1 – ORGANIZATION
The Fort Pitt Capital Total Return Fund (the “Fund”) is a diversified series of Advisors Series Trust (the “Trust”), which is registered under the Investment Company Act of 1940 (the “1940 Act”), as amended, as an open-end management investment company. The Fund follows the investment company accounting and reporting guidance of the Financial Accounting Standards Board (“FASB”) Accounting Standard Codification Topic 946 “Financial Services – Investment Companies.” The Fund began operations on December 31, 2001.
The investment goal of the Fund is to seek to realize a combination of long-term capital appreciation and income that will produce maximum total return. The Fund seeks to achieve its goal by investing primarily in a diversified portfolio of common stocks of domestic (U.S.) companies and fixed income investments.
NOTE 2 – SIGNIFICANT ACCOUNTING POLICIES
The following is a summary of significant accounting policies consistently followed by the Fund. These policies are in conformity with accounting principles generally accepted in the United States of America.
| A. | Security Valuation: All investments in securities are recorded at their estimated fair value, as described in Note 3. |
| B. | Federal Income Taxes: It is the Fund’s policy to comply with the requirements of Subchapter M of the Internal Revenue Code applicable to regulated investment companies and to distribute substantially all of its taxable income to its shareholders. Therefore, no Federal income or excise tax provision is required. |
| The Fund recognizes the tax benefits of uncertain tax positions only where the position is “more likely than not” to be sustained assuming examination by tax authorities. The tax returns of the Fund’s prior three fiscal years are open for examination. Management has reviewed all open tax years in major jurisdictions and concluded that there is no impact on the Fund’s net assets and no tax liability resulting from unrecognized tax events relating to uncertain income tax positions taken or expected to be taken on a tax return. The Fund identifies its major tax jurisdictions as U.S. Federal and the state of Wisconsin. The Fund is not aware of any tax positions for which it is reasonably possible that the total amounts of unrecognized tax benefits will change materially in the next twelve months. | |
| C. | Securities Transactions, Income and Distributions: Securities transactions are accounted for on the trade date. Realized gains and losses on securities sold are determined on the basis of identified cost. Interest income is recorded on an accrual basis. Dividend income and distributions to shareholders are recorded on the ex-dividend date. Withholding taxes on foreign dividends have been provided for in accordance with the Fund’s understanding of the applicable country’s tax rules and rates. |
| Common expenses of the Trust are typically allocated among the funds in the Trust based on a fund’s respective net assets, or by other equitable means. | |
| The Fund distributes substantially all net investment income, if any, and net realized capital gains, if any, annually. Distributions from net realized gains for book purposes may include short-term capital gains. All short-term capital gains are included in ordinary income for tax purposes. The amount of dividends and distributions to shareholders from net investment income and net realized capital gains is determined in accordance with Federal income tax regulations which differ from accounting principles generally accepted in the United States of America. To the extent these book/tax differences are permanent, such amounts are reclassified with the capital accounts based on their Federal tax treatment. |
16
Fort Pitt Capital Total Return Fund
| NOTES TO FINANCIAL STATEMENTS (Continued) |
| D. | Reclassification of Capital Accounts: Accounting principles generally accepted in the United States of America require that certain components of net assets relating to permanent differences be reclassified between financial and tax reporting. These reclassifications have no effect on net assets or net asset value per share. For the year ended October 31, 2022, the Fund made the following permanent tax adjustments on the statement of assets and liabilities: |
Total Distributable Earnings | Paid-in Capital | ||
| $(14,852) | $14,852 |
| E. | Use of Estimates: The preparation of financial statements in conformity with accounting principles generally accepted in the United States of America requires management to make estimates and assumptions that affect the reported amounts of assets and liabilities at the date of the financial statements and the reported amounts of increases and decreases in net assets during the reporting period. Actual results could differ from those estimates. |
| F. | REITs: The Fund has made certain investments in real estate investment trusts (“REITs”) which pay dividends to their shareholders based upon available funds from operations. It is quite common for these dividends to exceed the REITs’ taxable earnings and profits resulting in the excess portion being designated as a return of capital. The Fund intends to include the gross dividends from such REITs in their annual distribution to its shareholders and, accordingly, a portion of the Fund’s distributions may also be designated as a return of capital. |
| G. | Events Subsequent to the Fiscal Year End: In preparing the financial statements as of October 31, 2022, management considered the impact of subsequent events for potential recognition or disclosure in the financial statements. Management has determined there were no subsequent events that would need to be disclosed in the Fund’s financial statements. |
NOTE 3 – SECURITIES VALUATION
The Fund has adopted authoritative fair value accounting standards which establish an authoritative definition of fair value and set out a hierarchy for measuring fair value. These standards require additional disclosures about the various inputs and valuation techniques used to develop the measurements of fair value, a discussion in changes in valuation techniques and related inputs during the period and expanded disclosure of valuation levels for major security types. These inputs are summarized in the three broad levels listed below:
| Level 1 – | Unadjusted quoted prices in active markets for identical assets or liabilities that the Fund has the ability to access. |
| Level 2 – | Observable inputs other than quoted prices included in level 1 that are observable for the asset or liability, either directly or indirectly. These inputs may include quoted prices for the identical instrument on an inactive market, prices for similar instruments, interest rates, prepayment speeds, credit risk, yield curves, default rates and similar data. |
| Level 3 – | Unobservable inputs for the asset or liability, to the extent relevant observable inputs are not available, representing the Fund’s own assumptions about the assumptions a market participant would use in valuing the asset or liability, and would be based on the best information available. |
Following is a description of the valuation techniques applied to the Fund’s major categories of assets and liabilities measured at fair value on a recurring basis.
The Fund determines the fair value of its investments and computes its net asset value per share as of the close of regular trading on the New York Stock Exchange (4:00 pm EST).
Equity Securities: The Fund’s investments are carried at fair value. Equity securities, including common stocks and real estate investment trusts, that are primarily traded on a national securities exchange shall be
17
Fort Pitt Capital Total Return Fund
| NOTES TO FINANCIAL STATEMENTS (Continued) |
valued at the last sale price on the exchange on which they are primarily traded on the day of valuation or, if there has been no sale on such day, at the mean between the bid and asked prices. Securities primarily traded in the NASDAQ Global Market System for which market quotations are readily available shall be valued using the NASDAQ Official Closing Price (“NOCP”). If the NOCP is not available, such securities shall be valued at the last sale price on the day of valuation, or if there has been no sale on such day, at the mean between the bid and asked prices. Over-the-counter securities which are not traded in the NASDAQ Global Market System shall be valued at the most recent sales price. To the extent these securities are actively traded and valuation adjustments are not applied, they are categorized in level 1 of the fair value hierarchy.
Investment Companies: Investments in open-end mutual funds, including money market funds, are generally priced at their net asset value per share provided by the service agent of the funds and will be classified in level 1 of the fair value hierarchy.
Short-Term Securities: Short-term debt securities, including those securities having a maturity of 60 days or less, are valued at the evaluated mean between the bid and asked prices. To the extent the inputs are observable and timely, these securities would be classified in level 2 of the fair value hierarchy.
Prior to the effectiveness of Rule 2a-5, on September 8, 2022, the Board of Trustees (“Board”) had delegated day-to-day valuation issues to a Valuation Committee of the Trust which was comprised of representatives from the Fund’s administrator, U.S. Bancorp Fund Services, LLC, doing business as U.S. Bank Global Fund Services (“Fund Services”). The function of the Valuation Committee was to value securities where current and reliable market quotations were not readily available, or the closing price did not represent fair value by following procedures approved by the Board. These procedures considered many factors, including the type of security, size of holding, trading volume and news events. All actions taken by the Valuation Committee were subsequently reviewed and ratified by the Board. The Valuation Committee served through September 7, 2022. Effective September 8, 2022, the Board of Trustees approved Fort Pitt Capital Group, LLC (the “Advisor”), as the Fund’s valuation designee under Rule 2a-5.
Depending on the relative significance of the valuation inputs, fair valued securities may be classified in either level 2 or level 3 of the fair value hierarchy.
The inputs or methodology used for valuing securities is not an indication of the risk associated with investing in those securities. The following is a summary of the inputs used to value the Fund’s securities as of October 31, 2022:
| Level 1 | Level 2 | Level 3 | Total | ||||||||||||||
| Common Stocks | |||||||||||||||||
Basic Materials | $ | 1,836,447 | $ | — | $ | — | $ | 1,836,447 | |||||||||
Communications | 3,900,778 | — | — | 3,900,778 | |||||||||||||
Consumer, Cyclical | 3,149,447 | — | — | 3,149,447 | |||||||||||||
Consumer, Non-cyclical | 13,699,872 | — | — | 13,699,872 | |||||||||||||
Energy | 471,573 | — | — | 471,573 | |||||||||||||
Financial | 15,056,163 | — | — | 15,056,163 | |||||||||||||
Industrial | 14,180,384 | — | — | 14,180,384 | |||||||||||||
Technology | 11,622,432 | — | — | 11,622,432 | |||||||||||||
| Total Common Stocks | 63,917,096 | — | — | 63,917,096 | |||||||||||||
| REITs | 383,456 | — | — | 383,456 | |||||||||||||
| Money Market Fund | 350,624 | — | — | 350,624 | |||||||||||||
| Total Investments | $ | 64,651,176 | $ | — | $ | — | $ | 64,651,176 | |||||||||
Refer to the Fund’s schedule of investments for a detailed break-out of securities by industry classification.
18
Fort Pitt Capital Total Return Fund
| NOTES TO FINANCIAL STATEMENTS (Continued) |
In October 2020, the Securities and Exchange Commission (the “SEC”) adopted new regulations governing the use of derivatives by registered investment companies (“Rule 18f-4”). The Fund was required to implement and comply with Rule 18f-4 by August 19, 2022. Rule 18f-4 imposes limits on the amount of derivatives a fund can enter into, eliminates the asset segregation framework currently used by funds to comply with Section 18 of the 1940 Act, treats derivatives as senior securities and requires funds whose use of derivatives is more than a limited specified exposure amount to establish and maintain a comprehensive derivatives risk management program and appoint a derivatives risk manager. The Fund does not enter into derivatives transactions.
In December 2020, the SEC adopted a new rule providing a framework for fund valuation practices (“Rule 2a-5”). Rule 2a-5 establishes requirements for determining fair value in good faith for purposes of the 1940 Act. Rule 2a-5 permits fund boards to designate certain parties to perform fair value determinations, subject to board oversight and certain other conditions. Rule 2a-5 also defines when market quotations are “readily available” for purposes of the 1940 Act and the threshold for determining whether a fund must fair value a security. In connection with Rule 2a-5, the SEC also adopted related recordkeeping requirements and rescinded previously issued guidance, including with respect to the role of a board in determining fair value and the accounting and auditing of fund investments. The Fund is in compliance with Rule 2a-5, which had a compliance date of September 8, 2022.
The global outbreak of COVID-19 (commonly referred to as “coronavirus”) has disrupted economic markets and the prolonged economic impact is uncertain. Although vaccines for COVID-19 are becoming more widely available, the ultimate economic fallout from the pandemic, amid the spread of COVID-19 variants, and the long-term impact on economies, markets, industries and individual companies are not known. The operational and financial performance of individual companies and the market in general depends on future developments, including the duration and spread of any future outbreaks and the pace of recovery which may vary from market to market, and such uncertainty may in turn adversely affect the value and liquidity of the Fund’s investments, impair the Fund’s ability to satisfy redemption requests, and negatively impact the Fund’s performance.
NOTE 4 – INVESTMENT ADVISORY FEE AND OTHER TRANSACTIONS WITH AFFILIATES
The Advisor provides the Fund with investment management services under an investment advisory agreement. The Advisor furnishes all investment advice, office space, facilities, and provides most of the personnel needed by the Fund. As compensation for its services, the Advisor is entitled to a monthly fee at the annual rate of 0.76%, based upon the average daily net assets of the Fund. For the year ended October 31, 2022, the Fund incurred $572,603 in advisory fees.
The Fund is responsible for its own operating expenses. The Advisor has agreed to contractually reduce fees payable to it by the Fund and to pay Fund operating expenses to the extent necessary to limit the Fund’s aggregate annual operating expenses (excluding acquired fund fees and expenses, interest, taxes, brokerage commissions, and extraordinary expenses) to 1.00% of average daily net assets. Any such reduction made by the Advisor in its fees or payment of expenses which are the Fund’s obligation are subject to reimbursement by the Fund to the Advisor, if so requested by the Advisor, in any subsequent month in the 36-month period from the date of the management fee reduction and expense payment if the aggregate amount actually paid by the Fund toward the operating expenses for such fiscal year (taking into account the reimbursement) will not cause the Fund to exceed the lesser of: (1) the expense limitation in place at the time of the management fee reduction and expense payment; or (2) the expense limitation in place at the time of the reimbursement. Any such reimbursement is also contingent upon Board of Trustees review and approval. Such reimbursement may not be paid prior to a Fund’s payment of current ordinary operating expenses. For the
19
Fort Pitt Capital Total Return Fund
| NOTES TO FINANCIAL STATEMENTS (Continued) |
year ended October 31, 2022, the Advisor reduced its fees in the amount of $102,748; no amounts were reimbursed to the Advisor. The Advisor may recapture portions of the amounts shown below no later than the corresponding dates:
Date | Amount | ||||
| 10/31/2023 | $ | 106,116 | |||
| 10/31/2024 | 93,290 | ||||
| 10/31/2025 | 102,748 | ||||
$ | 302,154 | ||||
Fund Services serves as the Fund’s administrator, fund accountant and transfer agent. U.S. Bank N.A. serves as custodian (the “Custodian”) to the Fund. The Custodian is an affiliate of Fund Services. Fund Services maintains the Fund’s books and records, calculates the Fund’s NAV, prepares various federal and state regulatory filings, coordinates the payment of fund expenses, reviews expense accruals and prepares materials supplied to the Board of Trustees. The officers of the Trust, including the Chief Compliance Officer, are employees of Fund Services. Fees paid by the Fund for administration and accounting, transfer agency, custody and compliance services for the year ended October 31, 2022, are disclosed in the statement of operations.
The Fund has entered into agreements with various brokers, dealers and financial intermediaries to compensate them for transfer agent services that would otherwise be executed by Fund Services. These sub-transfer agent services include pre-processing and quality control of new accounts, maintaining detailed shareholder account records, shareholder correspondence, answering customer inquiries regarding account status, and facilitating shareholder telephone transactions. The Fund expensed $16,585 of sub-transfer agent fees during the year ended October 31, 2022. These fees are included in the transfer agent fees and expenses amount disclosed in the statement of operations.
Quasar Distributors, LLC (“Quasar”) acts as the Fund’s principal underwriter in a continuous public offering of the Fund’s shares. Quasar is a wholly-owned broker-dealer subsidiary of Foreside Financial Group, LLC.
NOTE 5 – PURCHASES AND SALES OF SECURITIES
For the year ended October 31, 2022, the cost of purchases and the proceeds from sales of securities, excluding short-term securities, were $10,401,026 and $17,725,035, respectively. There were no purchases and sales of U.S. government securities during the year ended October 31, 2022.
NOTE 6 – INCOME TAXES AND DISTRIBUTIONS TO SHAREHOLDERS
The tax character of distributions paid during the years ended October 31, 2022 and October 31, 2021 was as follows:
| October 31, 2022 | October 31, 2021 | |||||||
| Ordinary income | $ | 509,247 | $ | 703,713 | ||||
| Long-term capital gains | 5,306,293 | — | ||||||
20
Fort Pitt Capital Total Return Fund
| NOTES TO FINANCIAL STATEMENTS (Continued) |
As of October 31, 2022, the components of accumulated earnings/(losses) on a tax basis were as follows:
| Cost of investments (a) | $ | 30,880,802 | ||
| Gross tax unrealized appreciation | 34,299,700 | |||
| Gross tax unrealized depreciation | (529,326 | ) | ||
| Net tax unrealized appreciation (a) | 33,770,374 | |||
| Undistributed ordinary income | 459,558 | |||
| Undistributed long-term capital gain | 4,854,915 | |||
| Total distributable earnings | 5,314,473 | |||
| Other accumulated gains/(losses) | — | |||
| Total accumulated earnings/(losses) | $ | 39,084,847 |
| (a) | The book-basis and tax-basis net unrealized appreciation are the same. |
NOTE 7 – PRINCIPAL RISKS
Below is a summary of some, but not all, of the principal risks of investing in the Fund, each of which may adversely affect the Fund’s net asset value and total return. The Fund’s most recent prospectus provides further descriptions of the Fund’s investment objective, principal investment strategies and principal risks.
| • | General Market Risk. Economies and financial markets throughout the world are becoming increasingly interconnected, which increases the likelihood that events or conditions in one country or region will adversely impact markets or issuers in other countries or regions. Securities in the Fund’s portfolio may underperform in comparison to securities in general financial markets, a particular financial market or other asset classes due to a number of factors, including inflation (or expectations for inflation), deflation (or expectations for deflation), interest rates, global demand for particular products or resources, market instability, debt crises and downgrades, embargoes, tariffs, sanctions and other trade barriers, regulatory events, other governmental trade or market control programs and related geopolitical events. In addition, the value of the Fund’s investments may be negatively affected by the occurrence of global events such as war, terrorism, environmental disasters, natural disasters or events, country instability, and infectious disease epidemics or pandemics. For example, the outbreak of COVID-19, a novel coronavirus disease, has negatively affected economies, markets and individual companies throughout the world, including those in which the Fund invests. The effects of this pandemic to public health and business and market conditions, including exchange trading suspensions and closures, may continue to have a significant negative impact on the performance of the Fund’s investments, increase the Fund’s volatility, negatively impact the Fund’s arbitrage and pricing mechanisms, exacerbate pre-existing political, social and economic risks to the Fund, and negatively impact broad segments of businesses and populations. The Fund’s operations may be interrupted as a result, which may contribute to the negative impact on investment performance. In addition, governments, their regulatory agencies, or self-regulatory organizations may take actions in response to the pandemic that affect the instruments in which the Fund invests, or the issuers of such instruments, in ways that could have a significant negative impact on the Fund’s investment performance. The full impact of the COVID-19 pandemic, or other future epidemics or pandemics, is currently unknown. |
| • | Sector Emphasis Risks: Securities of companies in the same or related businesses, if comprising a significant portion of the Fund’s portfolio, could react in some circumstances negatively to market conditions, interest rates and economic, regulatory or financial developments and adversely affect the value of the portfolio to a greater extent than if such business comprised a lesser portion of the Fund’s portfolio. |
| • | Equity Securities Risks: The price of equity securities may rise or fall because of economic or political changes or changes in a company’s financial condition, sometimes rapidly or unpredictably. In addition, as noted below, certain sectors of the market may be “out of favor” during a particular time period |
21
Fort Pitt Capital Total Return Fund
| NOTES TO FINANCIAL STATEMENTS (Continued) |
| which can result in volatility in equity price movements. These price movements may result from factors affecting individual companies, sectors or industries selected for the Fund’s portfolio or the securities market as a whole, such as changes in economic or political conditions. | |
| • | Large Capitalization Company Risks: Larger, more established companies may be unable to respond quickly to new competitive challenges like changes in consumer tastes or innovative smaller competitors. In addition, large-cap companies are sometimes unable to attain the high growth rates of successful, smaller companies, especially during extended periods of economic expansion. |
| • | Small- and Medium-Capitalization Company Risks: The risks associated with investing in small and medium capitalization companies, which have securities that may trade less frequently and in smaller volumes than securities of larger companies. |
| • | American Depositary Receipts Risks: Investing in ADRs may involve risks in addition to the risks in domestic investments, including less regulatory oversight and less publicly-available information, less stable governments and economies, and non-uniform accounting, auditing and financial reporting standards. |
| • | Investment Company Risks: When the Fund invests in an ETF or mutual fund, it will bear additional expenses based on its pro rata share of the ETF’s or mutual fund’s operating expenses, including the potential duplication of management fees. The risk of owning an ETF or mutual fund generally reflects the risks of owning the underlying securities the ETF or mutual fund holds. The Fund also will incur brokerage costs when it purchases ETFs. |
NOTE 8 – CONTROL OWNERSHIP
The beneficial ownership, either directly or indirectly, of more than 25% of the voting securities of a fund creates a presumption of control of the fund, under Section 2(a)(9) of the 1940 Act. As of October 31, 2022, Charles Schwab & Co., for the benefit of their customers, owned 69.75% of the outstanding shares of the Fund.
NOTE 9 – TRUSTEES AND OFFICERS
Mr. Joe Redwine became the Audit Chairman of the Board effective January 1, 2022. Ms. Michele Rackey was approved by the Board as an Independent Trustee effective January 1, 2023. Mr. Kevin Hayden was approved by the Board as Vice President, Treasurer and Ms. Cheryl King was approved as Assistant Treasurer effective January 1, 2023. Mr. Ryan Charles resigned as Assistant Secretary effective January 1, 2023.
NOTE 10 – OTHER TAX INFORMATION (Unaudited)
The Fund declared a distribution to be paid, on December 14, 2022, to shareholders of record on December 13, 2022 as follows:
Ordinary Income | Long-Term Capital Gains | ||
| $0.22020524 | $2.03629 |
22
Fort Pitt Capital Total Return Fund
| REPORT OF INDEPENDENT REGISTERED PUBLIC ACCOUNTING FIRM |
To the Board of Trustees Advisors Series Trust and
Shareholders of Fort Pitt Capital Total Return Fund
Opinion on the Financial Statements
We have audited the accompanying statement of assets and liabilities of Fort Pitt Capital Total Return Fund (the “Fund”), a series of Advisors Series Trust (the “Trust”), including the schedule of investments, as of October 31, 2022, the related statement of operations for the year then ended, the statements of changes in net assets for each of the two years in the period then ended, financial highlights for each of the five years in the period then ended, and the related notes (collectively referred to as the “financial statements”). In our opinion, the financial statements present fairly, in all material respects, the financial position of the Fund as of October 31, 2022, the results of its operations for the year then ended, the changes in its net assets for each of the two years in the period then ended, and the financial highlights for each of the five years in the period then ended, in conformity with accounting principles generally accepted in the United States of America.
Basis for Opinion
These financial statements are the responsibility of the Fund’s management. Our responsibility is to express an opinion on the Fund’s financial statements based on our audits. We are a public accounting firm registered with the Public Company Accounting Oversight Board (United States) (“PCAOB”) and are required to be independent with respect to the Fund in accordance with the U.S. federal securities laws and the applicable rules and regulations of the Securities and Exchange Commission and the PCAOB. We have served as the auditor of one or more funds in the trust since 2003.
We conducted our audits in accordance with the standards of the PCAOB. Those standards require that we plan and perform the audit to obtain reasonable assurance about whether the financial statements are free of material misstatement, whether due to error or fraud. The Fund is not required to have, nor were we engaged to perform, an audit of its internal control over financial reporting. As part of our audits we are required to obtain an understanding of internal control over financial reporting, but not for the purpose of expressing an opinion on the effectiveness of the Fund’s internal control over financial reporting. Accordingly, we express no such opinion.
Our audits included performing procedures to assess the risks of material misstatement of the financial statements, whether due to error or fraud, and performing procedures that respond to those risks. Such procedures included examining, on a test basis, evidence regarding the amounts and disclosures in the financial statements. Our audits also included evaluating the accounting principles used and significant estimates made by management, as well as evaluating the overall presentation of the financial statements. Our procedures included confirmation of securities owned as of October 31, 2022 by correspondence with the custodian. We believe that our audits provide a reasonable basis for our opinion.
TAIT, WELLER & BAKER LLP
Philadelphia, Pennsylvania
December 30, 2022
23
Fort Pitt Capital Total Return Fund
| NOTICE TO SHAREHOLDERS at October 31, 2022 (Unaudited) |
For the year ended October 31, 2022, the Fund designated $509,247 as ordinary income and $5,306,293 as long-term capital gains for purposes of the dividends paid deduction.
For the year ended October 31, 2022, certain dividends paid by the Fund may be subject to a maximum tax rate of 23.8%, as provided by the Jobs and Growth Tax Relief Reconciliation Act of 2003. The percentage of dividends declared from net investment income designated as qualified dividend income was 100%.
For corporate shareholders in the Fund, the percent of ordinary income distributions qualifying for the corporate dividends received deduction for the year ended October 31, 2022 was 100%.
| STATEMENT REGARDING LIQUIDITY RISK MANAGEMENT PROGRAM |
| (Unaudited) |
The Fund has adopted a liquidity risk management program (the “program”). The Board has designated a committee at the Advisor to serve as the administrator of the program. The Advisor’s committee conducts the day-to-day operation of the program pursuant to policies and procedures administered by the committee.
Under the program, the Advisor’s committee manages the Fund’s liquidity risk, which is the risk that the Fund could not meet shareholder redemption requests without significant dilution of remaining shareholders’ interests in the Fund. This risk is managed by monitoring the degree of liquidity of the Fund’s investments, limiting the amount of the Fund’s illiquid investments, and utilizing various risk management tools and facilities available to the Fund for meeting shareholder redemptions, among other means. The committee’s process of determining the degree of liquidity of the Fund’s investments is supported by one or more third-party liquidity assessment vendors.
The Board reviewed a report prepared by the committee regarding the operation and effectiveness of the program for the period July 1, 2021 through June 30, 2022. No significant liquidity events impacting the Fund were noted in the report. In addition, the committee provided its assessment that the program had been effective in managing the Fund’s liquidity risk.
24
Fort Pitt Capital Total Return Fund
| INFORMATION ABOUT TRUSTEES AND OFFICERS (Unaudited) |
This chart provides information about the Trustees and Officers who oversee the Fund. Officers elected by the Trustees manage the day-to-day operations of the Fund and execute policies formulated by the Trustees.
Independent Trustees(1)
Number of | |||||
Portfolios | Other | ||||
in Fund | Directorships | ||||
Term of Office | Complex | Held | |||
Position Held | and Length of | Principal Occupation | Overseen by | During Past | |
Name, Address and Age | with the Trust | Time Served* | During Past Five Years | Trustee(2) | Five Years(3) |
David G. Mertens | Trustee | Indefinite | Partner and Head of Business | 1 | Trustee, |
(age 62) | term; | Development Ballast | Advisors | ||
615 E. Michigan Street | since | Equity Management, LLC | Series Trust | ||
Milwaukee, WI 53202 | March | (a privately-held investment | (for series | ||
2017. | advisory firm) (February 2019 | not affiliated | |||
to present); Managing Director | with the | ||||
and Vice President, Jensen | Fund). | ||||
Investment Management, Inc. | |||||
(a privately-held investment | |||||
advisory firm) (2002 to 2017). | |||||
Joe D. Redwine | Trustee | Indefinite | Retired; formerly Manager, | 1 | Trustee, |
(age 75) | term; | President, CEO, U.S. Bancorp | Advisors | ||
615 E. Michigan Street | since | Fund Services, LLC and | Series Trust | ||
Milwaukee, WI 53202 | September | its predecessors | (for series | ||
2008. | (May 1991 to July 2017). | not affiliated | |||
with the | |||||
Fund). | |||||
Raymond B. Woolson | Chairman | Indefinite | President, Apogee Group, Inc. | 1 | Trustee, |
(age 63) | of the | term; | (financial consulting firm) | Advisors | |
615 E. Michigan Street | Board | since | (1998 to present). | Series Trust | |
Milwaukee, WI 53202 | January | (for series | |||
2020. | not affiliated | ||||
Trustee | Indefinite | with the | |||
term; | Fund); | ||||
since | Independent | ||||
January | Trustee, | ||||
2016. | DoubleLine | ||||
Funds Trust | |||||
(an open-end | |||||
investment | |||||
company | |||||
with 20 | |||||
portfolios), | |||||
DoubleLine | |||||
Opportunistic | |||||
Credit Fund, | |||||
DoubleLine | |||||
Selective | |||||
Credit Fund | |||||
and | |||||
DoubleLine | |||||
Income | |||||
Solutions | |||||
Fund, from | |||||
2010 to | |||||
present. |
25
Fort Pitt Capital Total Return Fund
| INFORMATION ABOUT TRUSTEES AND OFFICERS (Unaudited) |
| (Continued) |
Officers
Term of Office | |||
Position Held | and Length of | Principal Occupation | |
Name, Address and Age | with the Trust | Time Served | During Past Five Years |
Jeffrey T. Rauman | President, | Indefinite | Senior Vice President, Compliance and Administration, |
(age 53) | Chief | term; | U.S. Bank Global Fund Services (February 1996 to present). |
615 E. Michigan Street | Executive | since | |
Milwaukee, WI 53202 | Officer and | December | |
Principal | 2018. | ||
Executive | |||
Officer | |||
Cheryl L. King | Vice | Indefinite | Vice President, Compliance and Administration, |
(age 61) | President, | term; | U.S. Bank Global Fund Services (October 1998 to present). |
615 E. Michigan Street | Treasurer | since | |
Milwaukee, WI 53202 | and Principal | December | |
Financial | 2007. | ||
Officer | |||
Kevin J. Hayden | Assistant | Indefinite | Vice President, Compliance and Administration, |
(age 51) | Treasurer | term; | U.S. Bank Global Fund Services (June 2005 to present). |
615 E. Michigan Street | since | ||
Milwaukee, WI 53202 | September | ||
2013. | |||
Richard R. Conner | Assistant | Indefinite | Assistant Vice President, Compliance and Administration, |
(age 40) | Treasurer | term; | U.S. Bank Global Fund Services (July 2010 to present). |
615 E. Michigan Street | since | ||
Milwaukee, WI 53202 | December | ||
2018. | |||
Michael L. Ceccato | Vice | Indefinite | Senior Vice President, U.S. Bank Global Fund Services and |
(age 65) | President, | term; | Vice President, U.S. Bank N.A. (February 2008 to present). |
615 E. Michigan Street | Chief | since | |
Milwaukee, WI 53202 | Compliance | September | |
Officer and | 2009. | ||
AML Officer | |||
Elaine E. Richards | Vice | Indefinite | Senior Vice President, U.S. Bank Global Fund Services |
(age 54) | President | term; | (July 2007 to present). |
2020 East Financial Way, | and | since | |
Suite 100 | Secretary | September | |
Glendora, CA 91741 | 2019. |
26
Fort Pitt Capital Total Return Fund
| INFORMATION ABOUT TRUSTEES AND OFFICERS (Unaudited) |
| (Continued) |
Term of Office | |||
Position Held | and Length of | Principal Occupation | |
Name, Address and Age | with the Trust | Time Served | During Past Five Years |
Ryan Charles | Assistant | Indefinite | Assistant Vice President, U.S. Bank Global Fund Services |
(age 44) | Secretary | term; | (May 2021 to present); Chief Legal Officer and Secretary |
2020 East Financial Way, | since | Davis Selected Advisers, L.P. (2004 to 2021). | |
Suite 100 | January | ||
Glendora, CA 91741 | 2022. |
| * | The Trustees have designated a mandatory retirement age of 75, such that each Trustee, serving as such on the date he or she reaches the age of 75, shall submit his or her resignation not later than the last day of the calendar year in which his or her 75th birthday occurs (“Retiring Trustee”). Upon request, the Board may, by vote of a majority of Trustees eligible to vote on such matter, determine whether or not to extend such Retiring Trustee’s term and on the length of a one-time extension of up to three additional years. |
| (1) | The Trustees of the Trust who are not “interested persons” of the Trust as defined under the 1940 Act (“Independent Trustees”). |
| (2) | As of October 31, 2022, the Trust was comprised of 34 active portfolios managed by unaffiliated investment advisers. The term “Fund Complex” applies only to the Fund. The Fund does not hold itself out as related to any other series within the Trust for investment purposes, nor does it share the same investment adviser with any other series. |
| (3) | “Other Directorships Held” includes only directorships of companies required to register or file reports with the SEC under the Securities Exchange Act of 1934, as amended, (that is, “public companies”) or other investment companies registered under the 1940 Act. |
The Statement of Additional Information includes additional information about the Fund’s Trustees and Officers and is available, without charge, upon request by calling 1-866-688-8775.
27
Fort Pitt Capital Total Return Fund
| HOUSEHOLDING |
In an effort to decrease costs, the Fund will reduce the number of duplicate prospectuses, supplements, and certain other shareholder documents that you receive by sending only one copy of each to those addresses shown by two or more accounts. Please call the Fund’s transfer agent toll free at 1-866-688-8775 to request individual copies of these documents. The Fund will begin sending individual copies 30 days after receiving your request. This policy does not apply to account statements.
28
Fort Pitt Capital Total Return Fund
| PRIVACY POLICY |
The Fund collects non-public information about you from the following sources:
| • | Information we receive about you on applications or other forms; |
| • | Information you give us orally; and/or |
| • | Information about your transactions with us or others. |
We do not disclose any non-public personal information about our customers or former customers without the customer’s authorization, except as permitted by law or in response to inquiries from governmental authorities. We may share information with affiliated and unaffiliated third parties with whom we have contracts for servicing the Fund. We will provide unaffiliated third parties with only the information necessary to carry out their assigned responsibilities. We maintain physical, electronic and procedural safeguards to guard your non-public personal information and require third parties to treat your personal information with the same high degree of confidentiality.
In the event that you hold shares of the Fund through a financial intermediary, including, but not limited to, a broker-dealer, bank, or trust company, the privacy policy of your financial intermediary would govern how your non-public personal information would be shared by those entities with unaffiliated third parties.
29
(This Page Intentionally Left Blank.)
FORT PITT CAPITAL TOTAL RETURN FUND
c/o U.S. Bank Global Fund Services
P.O. Box 701
Milwaukee, WI 53201-0701
1-866-688-8775
INVESTMENT ADVISOR
Fort Pitt Capital Group, LLC
680 Andersen Drive
Foster Plaza Ten, Suite 350
Pittsburgh, Pennsylvania 15220
DISTRIBUTOR
Quasar Distributors, LLC
111 East Kilbourn Avenue, Suite 2200
Milwaukee, Wisconsin 53202
CUSTODIAN
U.S. Bank N.A.
1555 North RiverCenter Drive, Suite 302
Milwaukee, Wisconsin 53212
TRANSFER AGENT
U.S. Bank Global Fund Services
615 East Michigan Street
Milwaukee, Wisconsin 53202
1-866-688-8775
INDEPENDENT REGISTERED PUBLIC ACCOUNTING FIRM
Tait, Weller & Baker LLP
Two Liberty Place
50 South 16th Street, Suite 2900
Philadelphia, Pennsylvania 19102
LEGAL COUNSEL
Sullivan & Worcester LLP
1633 Broadway, 32nd Floor
New York, New York 10019
This report has been prepared for shareholders and may be
distributed to others only if preceded or accompanied by a current prospectus.
The Fund’s Proxy Voting Policies and Procedures are available without charge upon
request by calling 1-866-688-8775. Information regarding how the Fund voted proxies
relating to portfolio securities during the 12-month period ended June 30 is available by
calling 1-866-688-8775 and on the SEC’s website at www.sec.gov.
The Fund files its complete schedule of portfolio holdings with the SEC for the first and
third quarters of each fiscal year on Part F of Form N-PORT. The Fund’s Form N-PORT
is available on the SEC’s website at www.sec.gov. Information included in the Fund’s
Form N-PORT is also available, upon request, by calling 1-866-688-8775.
(b) Not Applicable
Item 2. Code of Ethics.
The registrant has adopted a code of ethics that applies to the registrant’s principal executive officer and principal financial officer. The registrant has not made any substantive amendments to its code of ethics during the period covered by this report. The registrant has not granted any waivers from any provisions of the code of ethics during the period covered by this report.
A copy of the registrant’s Code of Ethics is filed herewith.
Item 3. Audit Committee Financial Expert.
The registrant’s Board of Trustees has determined that there is at least one audit committee financial expert serving on its audit committee. Mr. Joe D. Redwine is the “audit committee financial expert” and is considered to be “independent” as each term is defined in Item 3 of Form N‑CSR.
Item 4. Principal Accountant Fees and Services.
The registrant has engaged its principal accountant to perform audit services, audit-related services, tax services and other services during the past two fiscal years. “Audit services” refer to performing an audit of the registrant's annual financial statements or services that are normally provided by the accountant in connection with statutory and regulatory filings or engagements for those fiscal years. “Audit-related services” refer to the assurance and related services by the principal accountant that are reasonably related to the performance of the audit. “Tax services” refer to professional services rendered by the principal accountant including the review of federal income tax returns, review of federal excise tax returns, review of state tax returns, if any, and assistance with calculation of required income, capital gain and excise distributions. There were no “other services” provided by the principal accountant. The following table details the aggregate fees billed or expected to be billed for each of the last two fiscal years for audit fees, audit-related fees, tax fees and other fees by the principal accountant.
FYE 10/31/2022 | FYE 10/31/2021 | |
Audit Fees | $17,400 | $17,400 |
Audit-Related Fees | N/A | N/A |
Tax Fees | $3,600 | $3,600 |
All Other Fees | N/A | N/A |
(e)(1) The audit committee has adopted pre-approval policies and procedures that require the audit committee to pre‑approve all audit and non‑audit services of the registrant, including services provided to any entity affiliated with the registrant.
(e)(2) The percentage of fees billed by Tait, Weller, & Baker LLP applicable to non-audit services pursuant to waiver of pre-approval requirement were as follows:
FYE 10/31/2022 | FYE 10/31/2021 | |
Audit-Related Fees | 0% | 0% |
Tax Fees | 0% | 0% |
All Other Fees | 0% | 0% |
(f) All of the principal accountant’s hours spent on auditing the registrant’s financial statements were attributed to work performed by full‑time permanent employees of the principal accountant.
(g) The following table indicates the non-audit fees billed or expected to be billed by the registrant’s accountant for services to the registrant and to the registrant’s investment adviser (and any other controlling entity, etc.—not sub-adviser) for the last two years.
Non-Audit Related Fees | FYE 10/31/2022 | FYE 10/31/2021 |
Registrant | N/A | N/A |
Registrant’s Investment Adviser | N/A | N/A |
(h) The audit committee of the board of trustees/directors has considered whether the provision of non-audit services that were rendered to the registrant's investment adviser is compatible with maintaining the principal accountant's independence and has concluded that the provision of such non-audit services by the accountant has not compromised the accountant’s independence.
The registrant has not been identified by the U.S. Securities and Exchange Commission as having filed an annual report issued by a registered public accounting firm branch or office that is located in a foreign jurisdiction where the Public Company Accounting Oversight Board is unable to inspect or completely investigate because of a position taken by an authority in that jurisdiction.
The registrant is not a foreign issuer.
Item 5. Audit Committee of Listed Registrants.
(a) Not applicable to registrants who are not listed issuers (as defined in Rule 10A-3 under the Securities Exchange Act of 1934).
(b) Not Applicable.
Item 6. Investments.
| (a) | Schedule of Investments is included as part of the report to shareholders filed under Item 1 of this Form. |
(b) Not Applicable.
Item 7. Disclosure of Proxy Voting Policies and Procedures for Closed-End Management Investment Companies.
Not applicable to open-end investment companies.
Item 8. Portfolio Managers of Closed-End Management Investment Companies.
Not applicable to open-end investment companies.
Item 9. Purchases of Equity Securities by Closed‑End Management Investment Company and Affiliated Purchasers.
Not applicable to open-end investment companies.
Item 10. Submission of Matters to a Vote of Security Holders.
There have been no material changes to the procedures by which shareholders may recommend nominees to the Registrant’s Board of Trustees.
Item 11. Controls and Procedures.
| (a) | The Registrant’s President/Chief Executive Officer/Principal Executive Officer and Vice President/Treasurer/Principal Financial Officer have reviewed the Registrant's disclosure controls and procedures (as defined in Rule 30a-3(c) under the Investment Company Act of 1940, as amended, (the “Act”)) as of a date within 90 days of the filing of this report, as required by Rule 30a-3(b) under the Act and Rules 13a-15(b) or 15d‑15(b) under the Securities Exchange Act of 1934. Based on their review, such officers have concluded that the disclosure controls and procedures are effective in ensuring that information required to be disclosed in this report is appropriately recorded, processed, summarized and reported and made known to them by others within the Registrant and by the Registrant’s service provider. |
| (b) | There were no changes in the Registrant's internal control over financial reporting (as defined in Rule 30a-3(d) under the Act) that occurred during the period covered by this report that has materially affected, or is reasonably likely to materially affect, the Registrant's internal control over financial reporting. |
Item 12. Disclosure of Securities Lending Activities for Closed-End Management Investment Companies.
Not applicable to open-end investment companies.
Item 13. Exhibits.
(3) Any written solicitation to purchase securities under Rule 23c‑1 under the Act sent or given during the period covered by the report by or on behalf of the registrant to 10 or more persons. Not applicable to open-end investment companies.
| (4) | Change in the registrant’s independent public accountant. There was no change in the registrant’s independent public accountant for the period covered by this report. |
SIGNATURES
Pursuant to the requirements of the Securities Exchange Act of 1934 and the Investment Company Act of 1940, the registrant has duly caused this report to be signed on its behalf by the undersigned, thereunto duly authorized.
(Registrant) Advisors Series Trust
By (Signature and Title)* /s/ Jeffrey T. Rauman
Jeffrey T. Rauman, President/Chief Executive
Officer/Principal Executive Officer
Officer/Principal Executive Officer
Date 1/5/23
Pursuant to the requirements of the Securities Exchange Act of 1934 and the Investment Company Act of 1940, this report has been signed below by the following persons on behalf of the registrant and in the capacities and on the dates indicated.
By (Signature and Title)* /s/ Jeffrey T. Rauman
Jeffrey T. Rauman, President/Chief Executive
Officer/Principal Executive Officer
Date 1/5/23
By (Signature and Title)* /s/ Kevin J. Hayden
Kevin J. Hayden, Vice President/Treasurer/Principal
Financial Officer
Date 1/6/23
* Print the name and title of each signing officer under his or her signature.