UNITED STATES
SECURITIES AND EXCHANGE COMMISSION
Washington, D.C. 20549
FORM N-CSR
CERTIFIED SHAREHOLDER REPORT OF REGISTERED
MANAGEMENT INVESTMENT COMPANIES
Investment Company Act file number: 811-08039
|
Third Avenue Trust |
(Exact name of registrant as specified in charter) |
|
|
|
622 Third Avenue, 32nd Floor, New York, NY |
| 10017 |
| ||
(Address of principal executive offices) |
| (Zip code) |
|
W. James Hall III, General Counsel, 622 Third Avenue, New York, NY 10017 |
(Name and address of agent for service) |
Registrant’s telephone number, including area code: 800-443-1021
Date of fiscal year end: October 31, 2012
Date of reporting period: April 30, 2012
Form N-CSR is to be used by management investment companies to file reports with the Commission not later than 10 days after the transmission to stockholders of any report that is required to be transmitted to stockholders under Rule 30e-1 under the Investment Company Act of 1940 (17 CFR 270.30e-1). The Commission may use the information provided on Form N-CSR in its regulatory, disclosure review, inspection, and policymaking roles.
A registrant is required to disclose the information specified by Form N-CSR, and the Commission will make this information public. A registrant is not required to respond to the collection of information contained in Form N-CSR unless the Form displays a currently valid Office of Management and Budget (“OMB”) control number. Please direct comments concerning the accuracy of the information collection burden estimate and any suggestions for reducing the burden to Secretary, Securities and Exchange Commission, 100 F Street, NW, Washington, DC 20549-0609. The OMB has reviewed this collection of information under the clearance requirements of 44 U.S.C. § 3507.
Item 1. Reports to Stockholders.
The Trust’s semi-annual report transmitted to shareholders pursuant to Rule 30e-1 under the Investment Company Act of 1940, as amended (the “1940 Act”) is as follows:

Third Avenue Value Fund
Third Avenue Small-Cap Value Fund
Third Avenue Real Estate Value Fund
Third Avenue International Value Fund
Third Avenue Focused Credit Fund
|
SEMI-ANNUAL REPORT |
|
April 30, 2012 |
THIRD AVENUE FUNDS
Privacy Policy
Third Avenue Funds (the “Funds”) respect your right to privacy. We also know that you expect us to conduct and process your business in an accurate and efficient manner. To do so, we must collect and maintain certain personal information about you. This is the information we collect from you on applications or other forms and from the transactions you make with us, our affiliates, or third parties. We do not disclose any information about you or any of our former customers to anyone, except to our affiliates (which may include the Funds’ affiliated money management entities) and service providers, or as otherwise permitted by law. To protect your personal information, we permit access only by authorized employees. Be assured that we maintain physical, electronic and procedural safeguards that comply with federal standards to guard your personal information.
Proxy Voting Policies and Procedures
The Funds have delegated the voting of proxies relating to their voting securities to the Funds’ investment adviser pursuant to the adviser’s proxy voting guidelines. A description of these proxy voting guidelines and procedures, as well as information relating to how a Fund voted proxies relating to portfolio securities during the most recent 12-month period ended June 30, is available by August 31, each year (i) without charge, upon request, by calling (800) 443-1021, (ii) on the website of the Securities and Exchange Commission (“SEC”) at http://www.sec.gov, and (iii) on the Funds’ website www.thirdave.com.
Schedule of Portfolio Holdings—Form N-Q
The Funds file their complete schedule of portfolio holdings with the SEC for the first and third quarters of each fiscal year on Form N-Q. The Funds’ Form N-Q is available on the SEC’s website at http://www.sec.gov, and may be reviewed and copied at the SEC’s Public Reference Room in Washington, DC. Information on the operation of the Public Reference Room may be obtained by calling 1-800-SEC-0330.
|
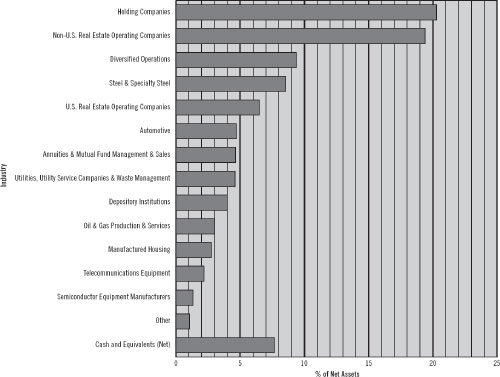
Third Avenue Trust |
Third Avenue Value Fund |
Industry Diversification |
(Unaudited) |
|
The summary of the Fund’s investments as of April 30, 2012 is as follows: |
|
The accompanying notes are an integral part of the financial statements. |
|
1 |
Third Avenue Trust
Third Avenue Value Fund
Portfolio of Investments
at April 30, 2012
(Unaudited)
|
|
|
|
|
|
|
Principal |
| Security† |
| Value |
| |
Corporate Bonds & Notes - 0.15% |
|
|
|
| ||
|
| Consumer Products - 0.15% |
|
|
|
|
18,550,467 |
| Home Products International, Inc., |
| $ | 4,568,980 |
|
|
|
|
|
| ||
|
| Total Corporate Bonds & Notes |
|
| 4,568,980 |
|
|
|
|
|
| ||
|
|
|
|
|
|
|
Shares |
|
|
|
|
|
|
Preferred Stocks - 0.01% |
|
|
|
| ||
|
| Insurance & Reinsurance - 0.01% |
|
|
|
|
4,626 |
| Ecclesiastical Insurance, 8.625% |
|
| 8,634 |
|
1,022,245 |
| RS Holdings Corp., Convertible, |
|
| 194,023 |
|
|
|
|
|
| ||
|
| Total Preferred Stocks |
|
| 202,657 |
|
|
|
|
|
| ||
Common Stocks - 92.18% |
|
|
|
| ||
|
| Annuities & Mutual Fund |
|
|
|
|
5,812,879 |
| Bank of New York Mellon Corp. (The) |
|
| 137,474,588 |
|
|
|
|
|
| ||
|
| Auto Supply - 0.00% |
|
|
|
|
191,736 |
| ISE, Ltd.1 (a) (b) |
|
| — |
|
460,467 |
| ISE, Ltd. Restricted Voting |
|
| — |
|
|
|
|
|
| ||
|
|
|
|
| — |
|
|
|
|
|
| ||
|
| Automotive - 4.70% |
|
|
|
|
4,946,400 |
| Toyota Industries Corp. (Japan) |
|
| 139,715,406 |
|
|
|
|
|
| ||
|
| Consumer Products - 0.00%# |
|
|
|
|
526,368 |
| Home Products International, |
|
| 26,318 |
|
|
|
|
|
| ||
|
|
|
|
|
|
|
Shares |
| Security† |
| Value |
| |
|
| Depository Institutions - 4.01% |
|
|
|
|
5,459 |
| Carver Bancorp, Inc. (a) |
| $ | 26,476 |
|
10,393,450 |
| Chong Hing Bank, Ltd. (Hong Kong) |
|
| 18,861,500 |
|
490,000 |
| Comerica, Inc. |
|
| 15,689,800 |
|
10,538,132 |
| KeyCorp |
|
| 84,726,581 |
|
|
|
|
|
| ||
|
|
|
|
| 119,304,357 |
|
|
|
|
|
| ||
|
| Diversified Operations - 9.36% |
|
|
|
|
4,375,734 |
| Brookfield Asset Management, |
|
| 144,311,707 |
|
9,353,000 |
| Hutchison Whampoa, Ltd. |
|
| 89,990,069 |
|
7,402,822 |
| Wharf (Holdings), Ltd. (The) |
|
| 44,176,585 |
|
|
|
|
|
| ||
|
|
|
|
| 278,478,361 |
|
|
|
|
|
| ||
|
| Financial Insurance - 0.02% |
|
|
|
|
37 |
| Manifold Capital Holdings, |
|
| 555,000 |
|
|
|
|
|
| ||
|
| Holding Companies - 20.28% |
|
|
|
|
80,770 |
| Capital Southwest Corp. |
|
| 7,731,304 |
|
17,667,000 |
| Cheung Kong Holdings, Ltd. |
|
| 234,993,768 |
|
7,493,209 |
| Investor AB, Class A (Sweden) |
|
| 147,159,566 |
|
155,010,000 |
| Lai Sun Garment International, |
|
| 12,586,764 |
|
1,231,142 |
| RHJ International (Belgium) (a) |
|
| 6,453,449 |
|
1,982,750 |
| RHJ International (Belgium) (a) (d) |
|
| 10,393,257 |
|
54,464,500 |
| Wheelock & Co., Ltd. (Hong Kong) |
|
| 183,919,870 |
|
|
|
|
|
| ||
|
|
|
|
| 603,237,978 |
|
|
|
|
|
| ||
|
| Insurance & Reinsurance - 0.84% |
|
|
|
|
39,898 |
| Alleghany Corp. (a) |
|
| 13,681,024 |
|
127,500 |
| Olympus Re Holdings, Ltd. |
|
| 140,250 |
|
9,337 |
| RS Holdings Corp., |
|
| 1,772 |
|
|
The accompanying notes are an integral part of the financial statements. |
|
2 |
Third Avenue Trust
Third Avenue Value Fund
Portfolio of Investments (continued)
at April 30, 2012
(Unaudited)
|
|
|
|
|
|
|
Shares |
| Security† |
| Value |
| |
Common Stocks (continued) |
|
|
|
| ||
|
| Insurance & Reinsurance (continued) |
|
|
|
|
21,628 |
| White Mountains Insurance |
| $ | 11,311,444 |
|
|
|
|
|
| ||
|
|
|
|
| 25,134,490 |
|
|
|
|
|
| ||
|
| Manufactured Housing - 2.77% |
|
|
|
|
983 |
| Fleetwood Homes, Inc. (a) (b) (c) (d) |
|
| 82,570,207 |
|
|
|
|
|
| ||
|
| Mutual Holding Companies - 0.02% |
|
|
|
|
203,928 |
| SFSB, Inc. (a) (c) |
|
| 484,329 |
|
|
|
|
|
| ||
|
| Non-U.S. Real Estate Operating |
|
|
|
|
22,179,000 |
| Hang Lung Group, Ltd. (Hong Kong) |
|
| 139,214,593 |
|
19,167,000 |
| Hang Lung Properties, Ltd. |
|
| 70,900,595 |
|
64,413,054 |
| Henderson Land Development Co., |
|
| 366,952,625 |
|
|
|
|
|
| ||
|
|
|
|
| 577,067,813 |
|
|
|
|
|
| ||
|
| Oil & Gas Production |
|
|
|
|
752,574 |
| Cenovus Energy, Inc. (Canada) |
|
| 27,280,808 |
|
518,149 |
| Devon Energy Corp. |
|
| 36,192,708 |
|
1,263,624 |
| EnCana Corp. (Canada) |
|
| 26,460,287 |
|
|
|
|
|
| ||
|
|
|
|
| 89,933,803 |
|
|
|
|
|
| ||
|
| Semiconductor Equipment |
|
|
|
|
3,309,207 |
| Applied Materials, Inc. |
|
| 39,677,392 |
|
|
|
|
|
| ||
|
| Steel & Specialty Steel - 8.54% |
|
|
|
|
3,051,972 |
| POSCO, ADR (South Korea) |
|
| 254,076,669 |
|
|
|
|
|
| ||
|
| Telecommunications |
|
|
|
|
1,813,484 |
| Sycamore Networks, Inc. (a) (c) |
|
| 28,272,216 |
|
9,696,318 |
| Tellabs, Inc. |
|
| 36,555,119 |
|
|
|
|
|
| ||
|
|
|
|
| 64,827,335 |
|
|
|
|
|
| ||
|
|
|
|
|
|
|
Shares |
| Security† |
| Value |
| |
|
| U.S. Real Estate Operating |
|
|
|
|
9,487,910 |
| FNC Realty Corp. (a) (b) (c) |
| $ | 6,641,537 |
|
8,240,875 |
| Forest City Enterprises, Inc., |
|
| 131,441,956 |
|
21,798 |
| Forest City Enterprises, Inc., |
|
| 345,934 |
|
1,816,627 |
| Tejon Ranch Co. (a) (c) |
|
| 54,244,482 |
|
|
|
|
|
| ||
|
|
|
|
| 192,673,909 |
|
|
|
|
|
| ||
|
| Utilities, Utility Service Companies |
|
|
|
|
8,541,918 |
| Covanta Holding Corp. (c) |
|
| 137,097,784 |
|
|
|
|
|
| ||
|
| Total Common Stocks |
|
| 2,742,335,739 |
|
|
|
|
|
| ||
|
|
|
|
|
|
|
Investment |
|
|
|
|
|
|
Limited Partnerships - 0.01% |
|
|
|
| ||
|
| Insurance & Reinsurance - 0.01% |
|
|
|
|
1,805,000 |
| Insurance Partners II Equity Fund, |
|
| 353,635 |
|
|
|
|
|
| ||
|
| Total Limited Partnerships |
|
| 353,635 |
|
|
|
|
|
| ||
|
| Total Investment Portfolio - 92.35% |
|
| 2,747,461,011 |
|
|
| Other Assets less |
|
| 227,597,728 |
|
|
|
|
|
| ||
|
| NET ASSETS - 100.00% |
| $ | 2,975,058,739 |
|
|
|
|
|
| ||
|
The accompanying notes are an integral part of the financial statements. |
|
3 |
Third Avenue Trust
Third Avenue Value Fund
Portfolio of Investments (continued)
at April 30, 2012
(Unaudited)
|
|
Notes: |
|
|
|
ADR: | American Depositary Receipt |
|
|
PIK: | Payment-in-kind |
|
|
(a) | Non-income producing security. |
|
|
(b) | Fair-valued security. |
|
|
(c) | Affiliated issuers—as defined under the Investment Company Act of 1940 (ownership of 5% or more of the outstanding voting securities of these issuers). |
|
|
(d) | Restricted security subject to restrictions on resale. |
|
|
|
|
|
|
|
|
|
|
|
|
|
Shares/ |
| Issuer |
| Acquisition |
| Acquisition |
| Carrying |
| |||
|
|
|
|
| ||||||||
| 983 |
| Fleetwood Homes, Inc. |
| 8/14/09-4/29/11 |
| $ | 68,785,900 |
| $ | 83,998.18 |
|
| 526,368 |
| Home Products International, Inc. |
| 5/30/07 |
|
| 54,667,471 |
|
| 0.05 |
|
$ | 18,550,467 |
| Home Products International, Inc., |
| 3/16/07-4/10/12 |
|
| 18,550,467 |
|
| 24.63 |
|
| 460,467 |
| ISE, Ltd. Restricted Voting Shares |
| 3/8/06 - 4/11/08 |
|
| 4,280,822 |
|
| — |
|
| 37 |
| Manifold Capital Holdings, Inc. |
| 9/24/97-11/10/06 |
|
| 42,781,514 |
|
| 15,000.00 |
|
| 127,500 |
| Olympus Re Holdings, Ltd. |
| 12/20/01 |
|
| 12,019,608 |
|
| 1.10 |
|
| 1,982,750 |
| RHJ International |
| 3/29/05-3/14/07 |
|
| 50,259,540 |
|
| 5.24 |
|
| 9,337 |
| RS Holdings Corp., Class A |
| 5/9/03 |
|
| 9,105 |
|
| 0.19 |
|
| 1,022,245 |
| RS Holdings Corp., Convertible, |
|
|
|
|
|
|
|
|
|
|
|
| Class A Pfd. |
| 3/18/02-4/20/04 |
|
| 1,013,140 |
|
| 0.19 |
|
|
|
| At April 30, 2012, these restricted securities had a total market value of $98,449,807 or 3.31% of net assets of the Fund. |
|
|
† | U.S. unless otherwise noted. |
|
|
# | Amount represents less than 0.01% of total net assets. |
|
|
1 | Incorporated in Cayman Islands. |
|
|
2 | Incorporated in Bermuda. |
Country Concentration
|
|
|
|
|
|
| % of |
| |
|
|
| ||
Hong Kong |
|
| 39.04 | % |
United States |
|
| 27.89 |
|
South Korea |
|
| 8.54 |
|
Canada |
|
| 6.66 |
|
Sweden |
|
| 4.95 |
|
Japan |
|
| 4.70 |
|
Belgium |
|
| 0.57 |
|
Bermuda |
|
| 0.00 | # |
United Kingdom |
|
| 0.00 | # |
|
|
| ||
Total |
|
| 92.35 | % |
|
|
| ||
|
|
# | Amount represents less than 0.01% of total net assets. |
|
The accompanying notes are an integral part of the financial statements. |
|
4 |
Third Avenue Trust
Third Avenue Value Fund
Statement of Assets and Liabilities
April 30, 2012
(Unaudited)
|
|
|
|
|
Assets: |
|
|
|
|
Investments at value (Notes 1 and 5): |
|
|
|
|
Unaffiliated issuers (cost of $1,948,790,034) |
| $ | 2,288,429,709 |
|
Affiliated issuers (cost of $584,623,826) |
|
| 459,031,302 |
|
|
|
| ||
Total investments (cost of $2,533,413,860) |
|
| 2,747,461,011 |
|
Cash |
|
| 220,117,080 |
|
Receivable for securities sold |
|
| 14,574,493 |
|
Dividends and interest receivable |
|
| 10,982,201 |
|
Receivable for fund shares sold |
|
| 566,753 |
|
Tax receivable |
|
| 545,965 |
|
Other assets |
|
| 65,090 |
|
Other receivables |
|
| 43,479 |
|
|
|
| ||
Total assets |
|
| 2,994,356,072 |
|
|
|
| ||
Liabilities: |
|
|
|
|
Payable for fund shares redeemed |
|
| 11,568,706 |
|
Payable for securities purchased |
|
| 3,426,386 |
|
Payable to investment adviser (Note 3) |
|
| 2,297,960 |
|
Accrued expenses |
|
| 983,858 |
|
Payable for shareholder servicing fees (Note 3) |
|
| 957,161 |
|
Distribution fees payable (Note 6) |
|
| 36,964 |
|
Payable to trustees and officers |
|
| 26,298 |
|
|
|
| ||
Total liabilities |
|
| 19,297,333 |
|
|
|
| ||
Net assets |
| $ | 2,975,058,739 |
|
|
|
| ||
|
|
|
|
|
Summary of net assets: |
|
|
|
|
Capital stock, $0.001 par value |
| $ | 3,168,012,635 |
|
Accumulated distributions in excess of net investment income |
|
| (83,744,057 | ) |
Accumulated net realized losses on investments and foreign currency transactions |
|
| (323,373,084 | ) |
Net unrealized appreciation of investments and translation of foreign currency denominated assets and liabilities |
|
| 214,163,245 |
|
|
|
| ||
Net assets applicable to capital shares outstanding |
| $ | 2,975,058,739 |
|
|
|
| ||
|
|
|
|
|
Investor Class: |
|
|
|
|
Net assets applicable to 536,757 shares outstanding, unlimited number of shares authorized |
| $ | 24,524,053 |
|
|
|
| ||
Net asset value, offering and redemption price per share |
| $ | 45.69 |
|
|
|
| ||
|
|
|
|
|
Institutional Class: |
|
|
|
|
Net assets applicable to 64,571,269 shares outstanding, unlimited number of shares authorized |
| $ | 2,950,534,686 |
|
|
|
| ||
Net asset value, offering and redemption price per share |
| $ | 45.69 |
|
|
|
|
|
The accompanying notes are an integral part of the financial statements. |
|
5 |
Third Avenue Trust
Third Avenue Value Fund
Statement of Operations
For the Six Months Ended April 30, 2012
(Unaudited)
|
|
|
|
|
Investment Income: |
|
|
|
|
Interest - unaffiliated issuers |
| $ | 2,729,885 |
|
Interest - affiliated issuers (Note 5) |
|
| 539,789 |
|
Dividends - unaffiliated issuers (net of foreign withholding tax of $2,400,497) |
|
| 19,078,280 |
|
Dividends - affiliated issuers (Note 5) |
|
| 1,942,554 |
|
Other income |
|
| 219,418 |
|
|
|
| ||
Total investment income |
|
| 24,509,926 |
|
|
|
| ||
Expenses: |
|
|
|
|
Investment advisory fees (Note 3) |
|
| 14,194,240 |
|
Shareholder servicing fees (Note 3) |
|
| 1,896,534 |
|
Transfer agent fees |
|
| 533,542 |
|
Reports to shareholders |
|
| 385,779 |
|
Custodian fees |
|
| 309,406 |
|
Trustees’ and officers’ fees and expenses |
|
| 249,449 |
|
Auditing fees |
|
| 96,728 |
|
Administration fees (Note 3) |
|
| 86,743 |
|
Legal fees |
|
| 83,245 |
|
Accounting fees |
|
| 73,092 |
|
Insurance expenses |
|
| 53,550 |
|
Distribution fees (Note 6) |
|
| 30,654 |
|
Registration and filing fees |
|
| 27,200 |
|
Miscellaneous expenses |
|
| 36,722 |
|
|
|
| ||
Total expenses |
|
| 18,056,884 |
|
Recovery of expenses previously waived (Note 3) |
|
| 146,487 |
|
Expenses reduced by custodian fee expense offset arrangement (Note 3) |
|
| (35,632 | ) |
|
|
| ||
Net expenses |
|
| 18,167,739 |
|
|
|
| ||
Net investment income |
|
| 6,342,187 |
|
|
|
| ||
Realized and unrealized gain/(loss) on investments, redemption-in-kind, and foreign currency transactions: |
|
|
|
|
Net realized gain on investments - unaffiliated issuers |
|
| 48,138,923 |
|
Net realized gain on investments - affiliated issuers |
|
| 17,894,532 |
|
Net realized gain on redemption-in-kind transaction (Note 2) |
|
| 19,193,298 |
|
Net realized loss on foreign currency transactions |
|
| (111,762 | ) |
Net change in unrealized appreciation/(depreciation) on investments |
|
| 89,313,239 |
|
Net change in unrealized appreciation/(depreciation) on translation of other assets and liabilities denominated in foreign currency |
|
| 291,602 |
|
|
|
| ||
Net gain on investments and foreign currency transactions |
|
| 174,719,832 |
|
|
|
| ||
Net increase in net assets resulting from operations |
| $ | 181,062,019 |
|
|
|
|
|
The accompanying notes are an integral part of the financial statements. |
|
6 |
Third Avenue Trust
Third Avenue Value Fund
Statement of Changes in Net Assets
|
|
|
|
|
|
|
|
|
| For the |
| For the Year |
| ||
|
|
|
| ||||
Operations: |
|
|
|
|
|
|
|
Net investment income |
| $ | 6,342,187 |
| $ | 39,379,109 |
|
Net realized gain on investments - unaffiliated issuers |
|
| 48,138,923 |
|
| 351,324,048 |
|
Net realized gain/(loss) on investments - affiliated issuers |
|
| 17,894,532 |
|
| (1,007,059 | ) |
Net realized gain on redemption-in-kind transaction |
|
| 19,193,298 |
|
| — |
|
Net realized gain/(loss) on foreign currency transactions |
|
| (111,762 | ) |
| 190,953 |
|
Net change in unrealized appreciation/(depreciation) on investments |
|
| 89,313,239 |
|
| (790,476,704 | ) |
Net change in unrealized appreciation/(depreciation) on translation of other assets and liabilities denominated in foreign currency |
|
| 291,602 |
|
| (366,684 | ) |
|
|
|
| ||||
Net increase/(decrease) in net assets resulting from operations |
|
| 181,062,019 |
|
| (400,956,337 | ) |
|
|
|
| ||||
Dividends and Distributions to Shareholders from: |
|
|
|
|
|
|
|
Net investment income: |
|
|
|
|
|
|
|
Investor Class |
|
| (448,508 | ) |
| (380,280 | ) |
Institutional Class |
|
| (67,360,806 | ) |
| (93,625,411 | ) |
|
|
|
| ||||
Decrease in net assets from dividends and distributions |
|
| (67,809,314 | ) |
| (94,005,691 | ) |
|
|
|
| ||||
Capital Share Transactions: |
|
|
|
|
|
|
|
Proceeds from sale of shares |
|
| 84,340,324 |
|
| 281,493,639 |
|
Net asset value of shares issued in reinvestment of dividends and distributions |
|
| 64,227,070 |
|
| 89,053,928 |
|
Redemption fees |
|
| 24,702 |
|
| 46,631 |
|
Cost of shares redeemed |
|
| (657,724,624 | ) |
| (1,457,099,508 | ) |
Cost of shares transferred out for redemption-in-kind transaction |
|
| (106,255,348 | ) |
| — |
|
|
|
|
| ||||
Net decrease in net assets resulting from capital share transactions |
|
| (615,387,876 | ) |
| (1,086,505,310 | ) |
|
|
|
| ||||
Net decrease in net assets |
|
| (502,135,171 | ) |
| (1,581,467,338 | ) |
Net assets at beginning of period |
|
| 3,477,193,910 |
|
| 5,058,661,248 |
|
|
|
|
| ||||
Net assets at end of period |
| $ | 2,975,058,739 |
| $ | 3,477,193,910 |
|
|
|
|
| ||||
|
The accompanying notes are an integral part of the financial statements. |
|
7 |
Third Avenue Trust
Third Avenue Value Fund
Financial Highlights
Selected data (for a share outstanding throughout each period) and ratios are as follows:
|
|
|
|
|
|
|
|
|
|
|
|
Investor Class: |
|
| For the Six |
| For the Year |
| For the Period |
| |||
|
|
|
|
| |||||||
Net asset value, beginning of period |
| $ | 44.00 |
| $ | 50.09 |
| $ | 46.32 |
| |
|
|
|
|
| |||||||
Income/(loss) from investment operations: |
|
|
|
|
|
|
|
|
|
| |
Net investment income@ |
|
| 0.04 |
|
| 0.37 |
|
| 0.59 |
| |
Net gain/(loss) on investment transactions (both realized and unrealized) |
|
| 2.44 | 2 |
| (5.56 | )2 |
| 3.18 | 1 | |
|
|
|
|
| |||||||
Total from investment operations |
|
| 2.48 |
|
| (5.19 | ) |
| 3.77 |
| |
|
|
|
|
| |||||||
Less dividends and distributions to shareholders: |
|
|
|
|
|
|
|
|
|
| |
Dividends from net investment income |
|
| (0.79 | ) |
| (0.90 | ) |
| — |
| |
|
|
|
|
| |||||||
Total dividends and distributions |
|
| (0.79 | ) |
| (0.90 | ) |
| — |
| |
|
|
|
|
| |||||||
Net asset value, end of period |
| $ | 45.69 |
| $ | 44.00 |
| $ | 50.09 |
| |
|
|
|
|
| |||||||
|
|
|
|
|
|
|
|
|
|
| |
Total return3 |
|
| 5.92 | %4 |
| (10.62 | )% |
| 8.16 | %4 | |
Ratios/Supplemental Data: |
|
|
|
|
|
|
|
|
|
| |
Net assets, end of period (in thousands) |
| $ | 24,524 |
| $ | 25,547 |
| $ | 18,553 |
| |
Ratio of expenses to average net assets |
|
|
|
|
|
|
|
|
|
| |
Before fee waivers/expense offset arrangement/recovery |
|
| 1.39 | %5 |
| 1.38 | % |
| 1.46 | %5 | |
After fee waivers/expense offset arrangement/recovery6 |
|
| 1.40 | %5† |
| 1.40 | %† |
| 1.40 | %5# | |
Ratio of net investment income to average net assets |
|
| 0.18 | %5 |
| 0.75 | % |
| 1.54 | %5 | |
Portfolio turnover rate |
|
| 3 | %4 |
| 6 | % |
| 2 | %4 | |
|
|
1 | Includes redemption fees of $0.04 per share. |
|
|
2 | Includes redemption fees of $0.01 per share |
|
|
3 | Performance figures may reflect fee waivers, expense offset arrangement and/or recovery of previously waived fees. Past performance is no guarantee of future results. Total return would have been lower if the Adviser had not waived certain expenses. Conversely, total return would have been higher if the adviser had not recovered previously waived expenses. |
|
|
4 | Not annualized. |
|
|
5 | Annualized. |
|
|
6 | As a result of an expense limitation, the ratio of expenses (exclusive of taxes, interest, brokerage commissions, acquired fund fees and expenses, and extraordinary items) to average net assets will not exceed 1.40%. |
|
|
† | The investment adviser recovered a portion of its previously waived fees. |
|
|
# | The investment adviser waived a portion of its fees. |
|
|
* | Period from December 31, 2009 (commencement of operations) to October 31, 2010. |
|
|
@ | Calculated based on the average number of shares outstanding during the period. |
|
|
The accompanying notes are an integral part of the financial statements. |
|
8 |
Third Avenue Trust
Third Avenue Value Fund
Financial Highlights (continued)
Selected data (for a share outstanding throughout each period) and ratios are as follows:
|
|
|
|
|
|
|
|
|
|
|
|
|
|
|
|
|
|
|
|
|
| For the Six |
|
|
|
|
|
|
|
|
|
|
|
|
|
|
|
| |
|
|
|
|
|
|
|
|
|
|
|
|
|
|
|
|
|
| ||
|
|
| Years Ended October 31, |
| |||||||||||||||
|
|
|
| ||||||||||||||||
Institutional Class: |
|
| 2011 |
| 2010 |
| 2009 |
| 2008 |
| 2007 |
| |||||||
|
|
|
|
|
|
| |||||||||||||
Net asset value, beginning of period |
| $ | 44.08 |
| $ | 50.13 |
| $ | 44.60 |
| $ | 35.16 |
| $ | 68.04 |
| $ | 60.29 |
|
|
|
|
|
|
|
|
| ||||||||||||
Income/(loss) from investment operations: |
|
|
|
|
|
|
|
|
|
|
|
|
|
|
|
|
|
|
|
Net investment income |
|
| 0.09 | @ |
| 0.43 | @ |
| 0.71 | @ |
| 0.81 | @ |
| 1.01 | @ |
| 1.52 |
|
Net gain/(loss) on investment transactions (both realized and unrealized)1 |
|
| 2.42 |
|
| (5.51 | ) |
| 5.96 |
|
| 8.81 |
|
| (31.80 | ) |
| 9.57 |
|
|
|
|
|
|
|
|
| ||||||||||||
Total from investment operations |
|
| 2.51 |
|
| (5.08 | ) |
| 6.67 |
|
| 9.62 |
|
| (30.79 | ) |
| 11.09 |
|
|
|
|
|
|
|
|
| ||||||||||||
Less dividends and distributions to shareholders: |
|
|
|
|
|
|
|
|
|
|
|
|
|
|
|
|
|
|
|
Dividends from net investment income |
|
| (0.90 | ) |
| (0.97 | ) |
| (1.14 | ) |
| (0.18 | ) |
| (1.63 | ) |
| (3.24 | ) |
Distributions from realized gains |
|
| — |
|
| — |
|
| — |
|
| (0.00 | )* |
| (0.46 | ) |
| (0.10 | ) |
|
|
|
|
|
|
|
| ||||||||||||
Total dividends and distributions |
|
| (0.90 | ) |
| (0.97 | ) |
| (1.14 | ) |
| (0.18 | ) |
| (2.09 | ) |
| (3.34 | ) |
|
|
|
|
|
|
|
| ||||||||||||
Net asset value, end of period |
| $ | 45.69 |
| $ | 44.08 |
| $ | 50.13 |
| $ | 44.60 |
| $ | 35.16 |
| $ | 68.04 |
|
|
|
|
|
|
|
|
| ||||||||||||
|
|
|
|
|
|
|
|
|
|
|
|
|
|
|
|
|
|
|
|
Total return2 |
|
| 6.02 | %4 |
| (10.42 | )% |
| 15.25 | % |
| 27.59 | % |
| (46.52 | )% |
| 19.25 | % |
Ratios/Supplemental Data: |
|
|
|
|
|
|
|
|
|
|
|
|
|
|
|
|
|
|
|
Net assets, end of period (in thousands) |
| $ | 2,950,535 |
| $ | 3,451,647 |
| $ | 5,040,109 |
| $ | 5,688,276 |
| $ | 5,372,294 |
| $ | 12,124,948 |
|
Ratio of expenses to average net assets |
|
|
|
|
|
|
|
|
|
|
|
|
|
|
|
|
|
|
|
Before fee waivers/expense offset arrangement/recovery |
|
| 1.14 | %5 |
| 1.13 | % |
| 1.19 | % |
| 1.17 | % |
| 1.11 | % |
| 1.08 | % |
After fee waivers/expense offset arrangement/recovery3 |
|
| 1.15 | %5† |
| 1.15 | %† |
| 1.15 | %# |
| 1.17 | % |
| 1.11 | % |
| 1.08 | % |
Ratio of net investment income to average net assets |
|
| 0.40 | %5 |
| 0.86 | % |
| 1.55 | % |
| 2.23 | % |
| 1.89 | % |
| 1.32 | % |
Portfolio turnover rate |
|
| 3 | %4 |
| 6 | % |
| 2 | % |
| 5 | % |
| 17 | % |
| 5 | % |
|
|
1 | Includes redemption fees of less than $0.01 per share. |
|
|
2 | Performance figures may reflect fee waivers, expense offset arrangement and/or recovery of previously waived fees. Past performance is no guarantee of future results. Total return would have been lower if the Adviser had not waived certain expenses. Conversely, total return would have been higher if the adviser had not recovered previously waived expenses. |
|
|
3 | As a result of an expense limitation, the ratio of expenses (exclusive of taxes, interest, brokerage commissions, acquired fund fees and expenses, and extraordinary items) to average net assets will not exceed 1.15% effective December 31, 2009. |
|
|
4 | Not annualized. |
|
|
5 | Annualized. |
|
|
† | The investment adviser recovered a portion of its previously waived fees. |
|
|
# | The investment adviser waived a portion of its fees. |
|
|
* | Amount is less than $0.01. |
|
|
@ | Calculated based on the average number of shares outstanding during the period. |
|
The accompanying notes are an integral part of the financial statements. |
|
9 |
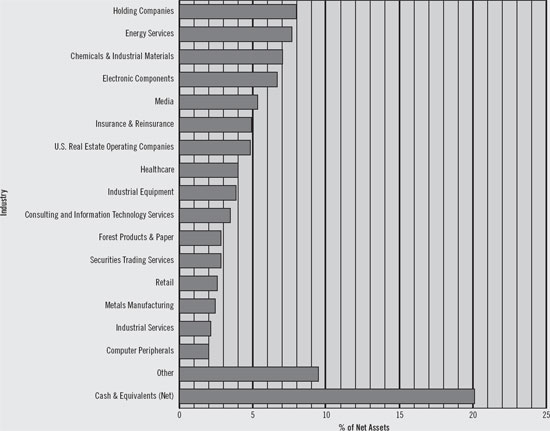
Third Avenue Trust
Third Avenue Small-Cap Value Fund
Industry Diversification
(Unaudited)
The summary of the Fund’s investments as of April 30, 2012 is as follows:
|
The accompanying notes are an integral part of the financial statements. |
|
10 |
Third Avenue Trust
Third Avenue Small-Cap Value Fund
Portfolio of Investments
at April 30, 2012
(Unaudited)
|
|
|
|
|
|
|
Shares |
| Security† |
|
| Value |
|
Preferred Stocks - 0.25% |
|
|
|
| ||
|
|
|
|
|
|
|
|
| U.S. Real Estate Investment |
|
|
|
|
74,250 |
| Excel Trust, Inc., 8.125% |
| $ | 1,875,555 |
|
|
|
|
|
| ||
|
| Total Preferred Stocks |
|
| 1,875,555 |
|
|
|
|
|
| ||
Common Stocks - 78.36% |
|
|
|
| ||
|
|
|
|
|
|
|
|
| Agriculture - 0.51% |
|
|
|
|
232,087 |
| Viterra, Inc. (Canada) |
|
| 3,737,920 |
|
|
|
|
|
| ||
|
| Auto Supply - 0.94% |
|
|
|
|
405,530 |
| Superior Industries |
|
| 6,938,618 |
|
|
|
|
|
| ||
|
| Chemicals & Industrial |
|
|
|
|
135,417 |
| Compass Minerals International, Inc. |
|
| 10,362,109 |
|
158,859 |
| Lanxess AG (Germany) |
|
| 12,648,411 |
|
123,126 |
| Minerals Technologies, Inc. |
|
| 8,261,755 |
|
240,721 |
| Sensient Technologies Corp. |
|
| 8,942,785 |
|
60,514 |
| Stepan Co. |
|
| 5,498,302 |
|
91,296 |
| Westlake Chemical Corp. |
|
| 5,838,379 |
|
|
|
|
|
| ||
|
|
|
|
| 51,551,741 |
|
|
|
|
|
| ||
|
| Computer Peripherals - 1.99% |
|
|
|
|
485,487 |
| Lexmark International, Inc., |
|
| 14,613,159 |
|
|
|
|
|
| ||
|
| Consulting and Information |
|
|
|
|
375,670 |
| ICF International, Inc. (a) |
|
| 9,369,210 |
|
510,456 |
| ManTech International Corp., |
|
| 16,038,528 |
|
|
|
|
|
| ||
|
|
|
|
| 25,407,738 |
|
|
|
|
|
| ||
|
| Consumer Products - 1.61% |
|
|
|
|
325,862 |
| JAKKS Pacific, Inc. |
|
| 6,214,188 |
|
101,155 |
| J&J Snack Foods Corp. |
|
| 5,670,749 |
|
|
|
|
|
| ||
|
|
|
|
| 11,884,937 |
|
|
|
|
|
| ||
|
|
|
|
|
|
|
Shares |
| Security† |
| Value |
| |
|
| Electronic Components - 6.66% |
|
|
|
|
655,492 |
| Bel Fuse, Inc., Class B (c) |
|
| $11,661,203 |
|
405,684 |
| Electronics for Imaging, Inc. (a) |
|
| 7,241,459 |
|
1,134,929 |
| Ingram Micro, Inc., Class A (a) |
|
| 22,085,718 |
|
857,266 |
| MEMC Electronic Materials, Inc. (a) |
|
| 3,077,585 |
|
169,817 |
| Park Electrochemical Corp. |
|
| 4,899,220 |
|
|
|
|
|
| ||
|
|
|
|
| 48,965,185 |
|
|
|
|
|
| ||
|
| Energy Services - 7.67% |
|
|
|
|
269,138 |
| Bristow Group, Inc. |
|
| 13,147,391 |
|
954,304 |
| Pioneer Drilling Co. (a) |
|
| 7,519,916 |
|
211,228 |
| SEACOR Holdings, Inc. (a) |
|
| 19,629,418 |
|
506,920 |
| SemGroup Corp., Class A (a) |
|
| 16,120,056 |
|
|
|
|
|
| ||
|
|
|
|
| 56,416,781 |
|
|
|
|
|
| ||
|
| Forest Products & Paper - 2.82% |
|
|
|
|
633,800 |
| Canfor Corp. (Canada) (a) |
|
| 6,942,062 |
|
885,166 |
| P.H. Glatfelter Co. |
|
| 13,790,886 |
|
|
|
|
|
| ||
|
|
|
|
| 20,732,948 |
|
|
|
|
|
| ||
|
| Healthcare - 4.00% |
|
|
|
|
1,055,640 |
| Cross Country Healthcare, Inc. (a) |
|
| 4,866,500 |
|
96,270 |
| Haemonetics Corp. (a) |
|
| 6,890,044 |
|
281,712 |
| Teleflex, Inc. |
|
| 17,654,891 |
|
|
|
|
|
| ||
|
|
|
|
| 29,411,435 |
|
|
|
|
|
| ||
|
| Holding Companies - 6.66% |
|
|
|
|
182,855 |
| Ackermans & van Haaren |
|
| 15,674,807 |
|
731,866 |
| JZ Capital Partners, Ltd. |
|
| 4,240,257 |
|
1,590,916 |
| JZ Capital Partners, Ltd. Limited |
|
| 9,217,388 |
|
308,007 |
| Leucadia National Corp. |
|
| 7,657,054 |
|
473,984,230 |
| PYI Corp., Ltd. (Hong Kong)1 (c) |
|
| 12,218,214 |
|
|
|
|
|
| ||
|
|
|
|
| 49,007,720 |
|
|
|
|
|
| ||
|
The accompanying notes are an integral part of the financial statements. |
|
11 |
Third Avenue Trust
Third Avenue Small-Cap Value Fund
Portfolio of Investments (continued)
at April 30, 2012
(Unaudited)
|
|
|
|
|
|
|
Shares |
| Security† |
| Value |
| |
Common Stocks (continued) |
|
|
|
| ||
|
|
|
|
|
|
|
|
| Industrial Capital Equipment |
|
|
|
|
473,977 |
| Electro Scientific Industries, Inc. |
| $ | 6,758,912 |
|
45,464 |
| Rofin-Sinar Technologies, Inc. (a) |
|
| 1,145,693 |
|
|
|
|
|
| ||
|
|
|
|
| 7,904,605 |
|
|
|
|
|
| ||
|
| Industrial Equipment - 3.86% |
|
|
|
|
133,849 |
| Alamo Group, Inc. |
|
| 4,508,034 |
|
569,485 |
| Oshkosh Corp. (a) |
|
| 13,001,343 |
|
657,945 |
| Wacker Neuson SE (Germany) |
|
| 10,864,723 |
|
|
|
|
|
| ||
|
|
|
|
| 28,374,100 |
|
|
|
|
|
| ||
|
| Industrial Services - 2.13% |
|
|
|
|
246,350 |
| EMCOR Group, Inc. |
|
| 7,222,982 |
|
138,759 |
| UniFirst Corp. |
|
| 8,430,997 |
|
|
|
|
|
| ||
|
|
|
|
| 15,653,979 |
|
|
|
|
|
| ||
|
| Insurance & Reinsurance - 4.92% |
|
|
|
|
42,329 |
| Alleghany Corp. (a) |
|
| 14,514,614 |
|
194,536 |
| Arch Capital Group, Ltd. |
|
| 7,641,374 |
|
9,824 |
| E-L Financial Corp., Ltd. (Canada) |
|
| 4,201,691 |
|
306,831 |
| HCC Insurance Holdings, Inc. |
|
| 9,806,319 |
|
|
|
|
|
| ||
|
|
|
|
| 36,163,998 |
|
|
|
|
|
| ||
|
| Media - 5.33% |
|
|
|
|
186,124 |
| Liberty Media Corp. - Liberty |
|
| 16,274,683 |
|
636,678 |
| Madison Square Garden, Co. |
|
| 22,901,308 |
|
|
|
|
|
| ||
|
|
|
|
| 39,175,991 |
|
|
|
|
|
| ||
|
| Metals Manufacturing - 2.43% |
|
|
|
|
238,008 |
| Encore Wire Corp. |
|
| 6,066,824 |
|
224,070 |
| Kaiser Aluminum Corp. |
|
| 11,779,360 |
|
|
|
|
|
| ||
|
|
|
|
| 17,846,184 |
|
|
|
|
|
| ||
|
|
|
|
|
|
|
Shares |
| Security† |
| Value |
| |
|
| Mining - 1.23% |
|
|
|
|
587,680 |
| Cloud Peak Energy, Inc. (a) |
| $ | 9,044,395 |
|
|
|
|
|
| ||
|
| Non-U.S. Real Estate |
|
|
|
|
3,302,250 |
| SEGRO PLC (United Kingdom) |
|
| 11,849,256 |
|
|
|
|
|
| ||
|
| Oil & Gas Production & |
|
|
|
|
46,137 |
| Cimarex Energy Co. |
|
| 3,188,528 |
|
|
|
|
|
| ||
|
| Retail - 2.57% |
|
|
|
|
164,639 |
| Aéropostale, Inc. (a) |
|
| 3,651,693 |
|
545,456 |
| American Eagle Outfitters, Inc. |
|
| 9,823,663 |
|
114,365 |
| Jos. A. Bank Clothiers, Inc. (a) |
|
| 5,438,056 |
|
|
|
|
|
| ||
|
|
|
|
| 18,913,412 |
|
|
|
|
|
| ||
|
| Securities Trading Services - 2.81% |
|
|
|
|
596,785 |
| Broadridge Financial Solutions, Inc. |
|
| 13,851,380 |
|
667,088 |
| Investment Technology Group, Inc. (a) |
|
| 6,804,298 |
|
|
|
|
|
| ||
|
|
|
|
| 20,655,678 |
|
|
|
|
|
| ||
|
| Telecommunications |
|
|
|
|
144,867 |
| Sycamore Networks, Inc. (a) |
|
| 2,258,477 |
|
2,260,907 |
| Tellabs, Inc. |
|
| 8,523,619 |
|
|
|
|
|
| ||
|
|
|
|
| 10,782,096 |
|
|
|
|
|
| ||
|
| U.S. Real Estate Investment |
|
|
|
|
214,223 |
| Excel Trust, Inc. |
|
| 2,568,534 |
|
|
|
|
|
| ||
|
| U.S. Real Estate Operating |
|
|
|
|
182,302 |
| Alexander & Baldwin, Inc. |
|
| 9,326,570 |
|
228,891 |
| Alico, Inc. |
|
| 5,204,981 |
|
514,448 |
| Vail Resorts, Inc. |
|
| 20,979,189 |
|
|
|
|
|
| ||
|
|
|
|
| 35,510,740 |
|
|
|
|
|
| ||
|
| Total Common Stocks |
|
| 576,299,678 |
|
|
|
|
|
| ||
|
The accompanying notes are an integral part of the financial statements. |
|
12 |
Third Avenue Trust
Third Avenue Small-Cap Value Fund
Portfolio of Investments (continued)
at April 30, 2012
(Unaudited)
|
|
|
|
|
|
|
Units |
| Security† |
| Value |
| |
Limited Partnerships - 1.30% |
|
|
|
| ||
|
|
|
|
|
|
|
|
| Holding Companies - 1.30% |
|
|
|
|
1,000,000 |
| AP Alternative Assets, L.P. |
| $ | 9,547,500 |
|
|
|
|
|
| ||
|
| Total Limited Partnerships |
|
| 9,547,500 |
|
|
|
|
|
| ||
|
|
|
|
|
|
|
Principal |
|
|
|
|
|
|
Short Term Investments - 12.23% |
|
|
|
| ||
|
|
|
|
|
|
|
|
| U.S. Government Obligations - 12.23% |
|
|
|
|
90,000,000 |
| U.S. Treasury Bills, 0.04%-0.13%‡, |
|
| 89,964,436 |
|
|
|
|
|
| ||
|
| Total Short Term Investments |
|
| 89,964,436 |
|
|
|
|
|
| ||
|
| Total Investment |
|
| 677,687,169 |
|
|
| Other Assets less |
|
| 57,794,909 |
|
|
|
|
|
| ||
|
| NET ASSETS - 100.00% |
| $ | 735,482,078 |
|
|
|
|
|
| ||
Notes:
|
|
(a) | Non-income producing security. |
|
|
(b) | Fair-valued security. |
|
|
(c) | Affiliated issuers—as defined under the Investment Company Act of 1940 (ownership of 5% or more of the outstanding voting securities of these issuers). |
|
|
(d) | Restricted security subject to restrictions on resale. |
|
|
|
|
|
|
|
|
|
|
|
|
Shares/ |
| Issuer |
| Acquisition |
| Acquisition |
| Carrying |
| ||
|
|
|
|
| |||||||
1,000,000 |
| AP Alternative Assets, L.P. |
| 6/8/06 |
| $ | 20,000,000 |
| $ | 9.55 |
|
1,590,916 |
| JZ Capital Partners, Ltd. Limited Voting Shares |
| 6/16/09-6/19/09 |
|
| 5,409,402 |
|
| 5.79 |
|
|
|
| At April 30, 2012, these restricted securities had a total market value of $18,764,888 or 2.55% of net assets of the Fund. |
|
|
† | U.S. unless otherwise noted. |
|
|
‡ | Annualized yield at date of purchase. |
|
|
1 | Incorporated in Bermuda. |
Country Concentration
|
|
|
|
|
|
|
|
|
|
|
| % of |
| |
|
|
| ||
United States * |
|
| 77.35 | % |
Germany |
|
| 3.20 |
|
Guernsey |
|
| 3.13 |
|
Belgium |
|
| 2.13 |
|
Canada |
|
| 2.02 |
|
Hong Kong |
|
| 1.66 |
|
United Kingdom |
|
| 1.61 |
|
Bermuda |
|
| 1.04 |
|
|
|
| ||
Total |
|
| 92.14 | % |
|
|
| ||
* Includes cash equivalents.
|
The accompanying notes are an integral part of the financial statements. |
|
13 |
Third Avenue Trust
Third Avenue Small-Cap Value Fund
Statement of Assets and Liabilities
April 30, 2012
(Unaudited)
|
|
|
|
|
Assets: |
|
|
|
|
Investments at value (Notes 1 and 5): |
|
|
|
|
Unaffiliated issuers (cost of $577,450,362) |
| $ | 653,807,752 |
|
Affiliated issuers (cost of $38,772,310) |
|
| 23,879,417 |
|
|
|
| ||
Total investments (cost of $616,222,672) |
|
| 677,687,169 |
|
Cash |
|
| 54,886,604 |
|
Receivable for securities sold |
|
| 4,515,967 |
|
Dividends and interest receivable |
|
| 904,126 |
|
Receivable for fund shares sold |
|
| 156,996 |
|
Other assets |
|
| 35,603 |
|
|
|
| ||
Total assets |
|
| 738,186,465 |
|
|
|
| ||
| ||||
Liabilities: |
|
|
|
|
Payable for fund shares redeemed |
|
| 854,008 |
|
Payable for securities purchased |
|
| 835,395 |
|
Payable to investment adviser (Note 3) |
|
| 558,397 |
|
Accrued expenses |
|
| 215,851 |
|
Payable for shareholder servicing fees (Note 3) |
|
| 213,801 |
|
Distribution fees payable (Note 6) |
|
| 19,196 |
|
Payable to trustees and officers |
|
| 7,739 |
|
|
|
| ||
Total liabilities |
|
| 2,704,387 |
|
|
|
| ||
Net assets |
| $ | 735,482,078 |
|
|
|
| ||
|
|
|
|
|
Summary of net assets: |
|
|
|
|
Capital stock, $0.001 par value |
| $ | 687,059,362 |
|
Accumulated distributions in excess of net investment income |
|
| (7,441,197 | ) |
Accumulated net realized losses on investments and foreign currency transactions |
|
| (5,613,226 | ) |
Net unrealized appreciation of investments and translation of foreign currency denominated assets and liabilities |
|
| 61,477,139 |
|
|
|
| ||
Net assets applicable to capital shares outstanding |
| $ | 735,482,078 |
|
|
|
| ||
|
|
|
|
|
Investor Class: |
|
|
|
|
Net assets applicable to 412,014 shares outstanding, unlimited number of shares authorized |
| $ | 8,895,929 |
|
|
|
| ||
Net asset value, offering and redemption price per share |
| $ | 21.59 |
|
|
|
| ||
|
|
|
|
|
Institutional Class: |
|
|
|
|
Net assets applicable to 33,621,398 shares outstanding, unlimited number of shares authorized |
| $ | 726,586,149 |
|
|
|
| ||
Net asset value, offering and redemption price per share |
| $ | 21.61 |
|
|
|
|
|
The accompanying notes are an integral part of the financial statements. |
|
14 |
Third Avenue Trust
Third Avenue Small-Cap Value Fund
Statement of Operations
For the Six Months Ended April 30, 2012
(Unaudited)
|
|
|
|
|
Investment Income: |
|
|
|
|
Interest |
| $ | 32,652 |
|
Dividends - unaffiliated issuers (net of foreign withholding tax of $65,041) |
|
| 3,495,744 |
|
Dividends - affiliated issuers (Note 5) |
|
| 91,769 |
|
Other income |
|
| 18 |
|
|
|
| ||
Total investment income |
|
| 3,620,183 |
|
|
|
| ||
| ||||
Expenses: |
|
|
|
|
Investment advisory fees (Note 3) |
|
| 3,413,057 |
|
Shareholder servicing fees (Note 3) |
|
| 422,291 |
|
Transfer agent fees |
|
| 176,397 |
|
Reports to shareholders |
|
| 87,881 |
|
Trustees’ and officers’ fees and expenses |
|
| 54,717 |
|
Auditing fees |
|
| 42,384 |
|
Accounting fees |
|
| 38,986 |
|
Custodian fees |
|
| 32,770 |
|
Administration fees (Note 3) |
|
| 20,858 |
|
Legal fees |
|
| 19,891 |
|
Registration and filing fees |
|
| 17,991 |
|
Insurance expenses |
|
| 12,023 |
|
Distribution fees (Note 6) |
|
| 10,669 |
|
Miscellaneous expenses |
|
| 11,527 |
|
|
|
| ||
Total expenses |
|
| 4,361,442 |
|
Recovery of expenses previously waived (Note 3) |
|
| 24,680 |
|
Expenses reduced by custodian fee expense offset arrangement (Note 3) |
|
| (14,335 | ) |
|
|
| ||
Net expenses |
|
| 4,371,787 |
|
|
|
| ||
Net investment loss |
|
| (751,604 | ) |
|
|
| ||
Realized and unrealized gain/(loss) on investments and foreign currency transactions: |
|
|
|
|
Net realized loss on investments - unaffiliated issuers |
|
| (5,418,431 | ) |
Net realized loss on investments - affiliated issuers |
|
| (1,478,064 | ) |
Net realized loss on foreign currency transactions |
|
| (101,710 | ) |
Net change in unrealized appreciation/(depreciation) on investments |
|
| 59,198,354 |
|
Net change in unrealized appreciation/(depreciation) on translation of other assets and liabilities denominated in foreign currency |
|
| (5,892 | ) |
|
|
| ||
Net gain on investments and foreign currency transactions |
|
| 52,194,257 |
|
|
|
| ||
Net increase in net assets resulting from operations |
| $ | 51,442,653 |
|
|
|
|
|
The accompanying notes are an integral part of the financial statements. |
|
15 |
Third Avenue Trust
Third Avenue Small-Cap Value Fund
Statement of Changes in Net Assets
|
|
|
|
|
|
|
|
|
| For the |
| For the Year |
| ||
|
|
|
| ||||
Operations: |
|
|
|
|
|
|
|
Net investment income/(loss) |
| $ | (751,604 | ) | $ | 1,488,843 |
|
Net realized gain/(loss) on investments - unaffiliated issuers |
|
| (5,418,431 | ) |
| 71,449,324 |
|
Net realized loss on investments - affiliated issuers |
|
| (1,478,064 | ) |
| (12,504,239 | ) |
Net realized gain on written options |
|
| — |
|
| 110,141 |
|
Net realized gain/(loss) on foreign currency transactions |
|
| (101,710 | ) |
| 492,541 |
|
Net change in unrealized appreciation/(depreciation) on investments and unfunded commitments |
|
| 59,198,354 |
|
| 6,748,687 |
|
Net change in unrealized appreciation/(depreciation) on translation of other assets and liabilities denominated in foreign currency |
|
| (5,892 | ) |
| (20,068 | ) |
|
|
|
| ||||
Net increase in net assets resulting from operations |
|
| 51,442,653 |
|
| 67,765,229 |
|
|
|
|
| ||||
Dividends and Distributions to Shareholders from: |
|
|
|
|
|
|
|
Net investment income: |
|
|
|
|
|
|
|
Investor Class |
|
| (8,103 | ) |
| (48,442 | ) |
Institutional Class |
|
| (2,494,214 | ) |
| (10,950,536 | ) |
Net realized gains: |
|
|
|
|
|
|
|
Investor Class |
|
| (24,878 | ) |
| — |
|
Institutional Class |
|
| (2,505,656 | ) |
| — |
|
|
|
|
| ||||
Decrease in net assets from dividends and distributions |
|
| (5,032,851 | ) |
| (10,998,978 | ) |
|
|
|
| ||||
Capital Share Transactions: |
|
|
|
|
|
|
|
Proceeds from sale of shares |
|
| 23,693,828 |
|
| 68,970,537 |
|
Net asset value of shares issued in reinvestment of dividends and distributions |
|
| 4,827,340 |
|
| 10,514,067 |
|
Redemption fees |
|
| 2,841 |
|
| 15,504 |
|
Cost of shares redeemed |
|
| (141,436,222 | ) |
| (388,960,587 | ) |
|
|
|
| ||||
Net decrease in net assets resulting from capital share transactions |
|
| (112,912,213 | ) |
| (309,460,479 | ) |
|
|
|
| ||||
Net decrease in net assets |
|
| (66,502,411 | ) |
| (252,694,228 | ) |
Net assets at beginning of period |
|
| 801,984,489 |
|
| 1,054,678,717 |
|
|
|
|
| ||||
Net assets at end of period (including accumulated distributions in excess of net investment income of $(7,441,197) and $(4,187,276), respectively) |
| $ | 735,482,078 |
| $ | 801,984,489 |
|
|
|
|
| ||||
|
The accompanying notes are an integral part of the financial statements. |
|
16 |
Third Avenue Trust
Third Avenue Small-Cap Value Fund
Financial Highlights
Selected data (for a share outstanding throughout each period) and ratios are as follows:
|
|
|
|
|
|
|
|
|
|
|
Investor Class: |
| For the Six |
| For the Year |
| For the Period |
| |||
|
|
|
| |||||||
Net asset value, beginning of period |
| $ | 20.25 |
| $ | 19.35 |
| $ | 18.19 |
|
|
|
|
|
| ||||||
Income/(loss) from investment operations: |
|
|
|
|
|
|
|
|
|
|
Net investment income/(loss)@ |
|
| (0.05 | ) |
| (0.01 | ) |
| 0.02 |
|
Net gain on investment transactions (both realized and unrealized) |
|
| 1.48 | 2 |
| 1.10 | 1 |
| 1.14 | 2 |
|
|
|
|
| ||||||
Total from investment operations |
|
| 1.43 |
|
| 1.09 |
|
| 1.16 |
|
|
|
|
|
| ||||||
Less dividends and distributions to shareholders: |
|
|
|
|
|
|
|
|
|
|
Dividends from net investment income |
|
| (0.02 | ) |
| (0.19 | ) |
| — |
|
Distributions from realized gains |
|
| (0.07 | ) |
| — |
|
| — |
|
|
|
|
|
| ||||||
Total dividends and distributions |
|
| (0.09 | ) |
| (0.19 | ) |
| — |
|
|
|
|
|
| ||||||
Net asset value, end of period |
| $ | 21.59 |
| $ | 20.25 |
| $ | 19.35 |
|
|
|
|
|
| ||||||
Total return3 |
|
| 7.09 | %4 |
| 5.58 | % |
| 6.38 | %4 |
Ratios/Supplemental Data: |
|
|
|
|
|
|
|
|
|
|
Net assets, end of period (in thousands) |
| $ | 8,896 |
| $ | 7,490 |
| $ | 4,505 |
|
Ratio of expenses to average net assets |
|
|
|
|
|
|
|
|
|
|
Before fee waivers/expense offset arrangement/recovery |
|
| 1.40 | %5 |
| 1.39 | % |
| 1.42 | %5 |
After fee waivers/expense offset arrangement/recovery6 |
|
| 1.40 | %5† |
| 1.40 | %† |
| 1.40 | %5# |
Ratio of net investment income/(loss) to average net assets |
|
| (0.45 | )%5 |
| (0.07 | )% |
| 0.10 | %5 |
Portfolio turnover rate |
|
| 13 | %4 |
| 34 | % |
| 9 | %4 |
|
|
1 | Includes redemption fees of $0.02 per share. |
|
|
2 | Includes redemption fees of less than $0.01 per share. |
|
|
3 | Performance figures may reflect fee waivers, expense offset arrangement and/or recovery of previously waived fees. Past performance is no guarantee of future results. Total return would have been lower if the Adviser had not waived certain expenses. Conversely, total return would have been higher if the adviser had not recovered previously waived expenses. |
|
|
4 | Not annualized. |
|
|
5 | Annualized. |
|
|
6 | As a result of an expense limitation, the ratio of expenses (exclusive of taxes, interest, brokerage commissions, acquired fund fees and expenses, and extraordinary items) to average net assets will not exceed 1.40%. |
|
|
† | The investment adviser recovered a portion of its previously waived fees. |
|
|
# | The investment adviser waived a portion of its fees. |
|
|
* | Period from December 31, 2009 (commencement of operations) to October 31, 2010. |
|
|
@ | Calculated based on the average number of shares outstanding during the period. |
|
The accompanying notes are an integral part of the financial statements. |
|
17 |
Third Avenue Trust
Third Avenue Small-Cap Value Fund
Financial Highlights (continued)
Selected data (for a share outstanding throughout each period) and ratios are as follows:
|
|
|
|
|
|
|
|
|
|
|
|
|
|
|
|
|
|
|
|
|
| For the Six |
|
|
| ||||||||||||||
|
|
| Years Ended October 31, |
| |||||||||||||||
|
|
|
| ||||||||||||||||
Institutional Class: |
|
| 2011 |
| 2010 |
| 2009 |
| 2008 |
| 2007 |
| |||||||
|
|
|
|
|
|
| |||||||||||||
Net asset value, beginning of period |
| $ | 20.30 |
| $ | 19.38 |
| $ | 17.17 |
| $ | 16.45 |
| $ | 27.66 |
| $ | 26.54 |
|
|
|
|
|
|
|
|
| ||||||||||||
Income/(loss) from investment operations: |
|
|
|
|
|
|
|
|
|
|
|
|
|
|
|
|
|
|
|
Net investment income/(loss) |
|
| (0.02 | )@ |
| 0.03 | @ |
| 0.12 | @ |
| 0.19 | @ |
| 0.09 | @ |
| 0.27 |
|
Net gain/(loss) on investment transactions (both realized and unrealized)1 |
|
| 1.47 |
|
| 1.10 |
|
| 2.23 |
|
| 1.18 |
|
| (8.58 | ) |
| 2.27 |
|
|
|
|
|
|
|
|
| ||||||||||||
Total from investment operations |
|
| 1.45 |
|
| 1.13 |
|
| 2.35 |
|
| 1.37 |
|
| (8.49 | ) |
| 2.54 |
|
|
|
|
|
|
|
|
| ||||||||||||
Less dividends and distributions to shareholders: |
|
|
|
|
|
|
|
|
|
|
|
|
|
|
|
|
|
|
|
Dividends from net investment income |
|
| (0.07 | ) |
| (0.21 | ) |
| (0.14 | ) |
| (0.12 | ) |
| (0.23 | ) |
| (0.43 | ) |
Distributions from realized gains |
|
| (0.07 | ) |
| — |
|
| — |
|
| (0.53 | ) |
| (2.49 | ) |
| (0.99 | ) |
|
|
|
|
|
|
|
| ||||||||||||
Total dividends and distributions |
|
| (0.14 | ) |
| (0.21 | ) |
| (0.14 | ) |
| (0.65 | ) |
| (2.72 | ) |
| (1.42 | ) |
|
|
|
|
|
|
|
| ||||||||||||
Net asset value, end of period |
| $ | 21.61 |
| $ | 20.30 |
| $ | 19.38 |
| $ | 17.17 |
| $ | 16.45 |
| $ | 27.66 |
|
|
|
|
|
|
|
|
| ||||||||||||
Total return2 |
|
| 7.16 | %3 |
| 5.80 | % |
| 13.73 | % |
| 9.34 | % |
| (33.50 | )% |
| 9.93 | % |
Ratios/Supplemental Data: |
|
|
|
|
|
|
|
|
|
|
|
|
|
|
|
|
|
|
|
Net assets, end of period (in thousands) |
| $ | 726,586 |
| $ | 794,495 |
| $ | 1,050,173 |
| $ | 1,217,827 |
| $ | 1,372,740 |
| $ | 2,245,342 |
|
Ratio of expenses to average net assets |
|
|
|
|
|
|
|
|
|
|
|
|
|
|
|
|
|
|
|
Before fee waivers/expense offset arrangement/recovery |
|
| 1.15 | %4 |
| 1.14 | % |
| 1.16 | % |
| 1.13 | % |
| 1.10 | % |
| 1.09 | % |
After fee waivers/expense offset arrangement/recovery5 |
|
| 1.15 | %4† |
| 1.15 | %† |
| 1.14 | %# |
| 1.13 | % |
| 1.10 | % |
| 1.09 | % |
Ratio of net investment income/(loss) to average net assets |
|
| (0.20 | )%4 |
| 0.15 | % |
| 0.65 | % |
| 1.29 | % |
| 0.40 | % |
| 0.95 | % |
Portfolio turnover rate |
|
| 13 | %3 |
| 34 | % |
| 9 | % |
| 15 | % |
| 46 | % |
| 27 | % |
|
|
1 | Includes redemption fees of less than $0.01 per share. |
|
|
2 | Performance figures may reflect fee waivers, expense offset arrangement and/or recovery of previously waived fees. Past performance is no guarantee of future results. Total return would have been lower if the Adviser had not waived certain expenses. Conversely, total return would have been higher if the adviser had not recovered previously waived expenses. |
|
|
3 | Not annualized. |
|
|
4 | Annualized. |
|
|
5 | As a result of an expense limitation, the ratio of expenses (exclusive of taxes, interest, brokerage commissions, acquired fund fees and expenses, and extraordinary items) to average net assets will not exceed 1.15% effective December 31, 2009. |
|
|
† | The investment adviser recovered a portion of its previously waived fees. |
|
|
# | The investment adviser waived a portion of its fees. |
|
|
@ | Calculated based on the average number of shares outstanding during the period. |
|
The accompanying notes are an integral part of the financial statements. |
|
18 |
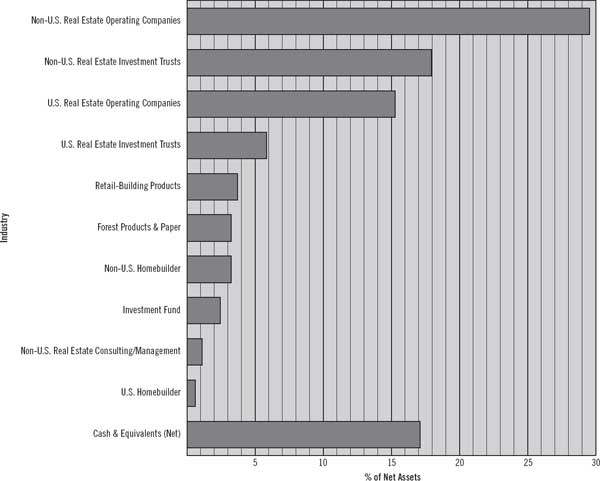
Third Avenue Trust
Third Avenue Real Estate Value Fund
Industry Diversification
(Unaudited)
The summary of the Fund’s investments as of April 30, 2012 is as follows:
|
The accompanying notes are an integral part of the financial statements. |
|
19 |
Third Avenue Trust
Third Avenue Real Estate Value Fund
Portfolio of Investments
at April 30, 2012
(Unaudited)
|
|
|
|
|
|
|
Principal |
| Security† |
| Value |
| |
Corporate Bonds & Notes - 0.59% |
|
|
|
| ||
| ||||||
|
| U.S. Homebuilder - 0.59% |
|
|
|
|
11,320,000 |
| K. Hovnanian Enterprises, Inc., |
| $ | 10,244,600 |
|
|
|
|
|
| ||
|
| Total Corporate Bonds & Notes |
|
| 10,244,600 |
|
|
|
|
|
| ||
|
|
|
|
|
|
|
Shares |
|
|
|
|
|
|
Common Stocks - 79.87% |
|
|
|
| ||
| ||||||
|
| Forest Products & Paper - 3.24% |
|
|
|
|
2,751,058 |
| Weyerhaeuser Co. (d) |
|
| 56,011,541 |
|
|
|
|
|
| ||
|
| Non-U.S. Homebuilder - 3.24% |
|
|
|
|
68,711,973 |
| Taylor Wimpey PLC (United Kingdom) |
|
| 56,035,195 |
|
|
|
|
|
| ||
|
| Non-U.S. Real Estate |
|
|
|
|
3,309,535 |
| Savills PLC (United Kingdom) |
|
| 19,206,883 |
|
|
|
|
|
| ||
|
| Non-U.S. Real Estate |
|
|
|
|
9,661,263 |
| Centro Retail Australia |
|
| 18,623,105 |
|
7,717,855 |
| Centro Retail Australia, |
|
| — |
|
29,880,091 |
| Commonwealth Property Office |
|
| 32,378,872 |
|
673,655 |
| Derwent London PLC (United Kingdom) |
|
| 19,044,873 |
|
41,415,719 |
| Dexus Property Group (Australia) |
|
| 40,348,118 |
|
12,457,812 |
| Hammerson PLC (United Kingdom) |
|
| 84,429,587 |
|
24,713,436 |
| Mirvac Group (Australia) |
|
| 33,346,431 |
|
8,839,052 |
| SEGRO PLC (United Kingdom) |
|
| 31,716,615 |
|
5,240,298 |
| Westfield Group (Australia) |
|
| 50,451,539 |
|
|
|
|
|
| ||
|
|
|
|
| 310,339,140 |
|
|
|
|
|
| ||
|
|
|
|
|
|
|
Shares |
| Security† |
| Value |
| |
|
| Non-U.S. Real Estate Operating |
|
|
|
|
2,746,126 |
| Brookfield Asset Management, Inc., |
| $ | 90,567,235 |
|
10,079,500 |
| CapitaLand, Ltd. (Singapore) |
|
| 23,946,448 |
|
5,727,000 |
| Cheung Kong Holdings, Ltd. |
|
| 76,176,448 |
|
3,389,950 |
| City Developments Ltd. (Singapore) |
|
| 27,777,045 |
|
3,362,300 |
| Daibiru Corp. (Japan) |
|
| 26,454,452 |
|
8,377,000 |
| Hang Lung Properties Ltd. (Hong Kong) |
|
| 30,987,338 |
|
8,570,637 |
| Henderson Land Development Co., Ltd. |
|
| 48,825,783 |
|
2,940,095 |
| Hongkong Land Holdings, Ltd. |
|
| 18,257,990 |
|
11,373,967 |
| Hysan Development Co., Ltd. |
|
| 51,528,931 |
|
21,869,072 |
| Quintain Estates & Development PLC |
|
| 13,575,449 |
|
22,721,694 |
| Songbird Estates PLC |
|
| 43,143,857 |
|
17,902,500 |
| Wheelock & Co., Ltd. (Hong Kong) |
|
| 60,454,525 |
|
|
|
|
|
| ||
|
|
|
|
| 511,695,501 |
|
|
|
|
|
| ||
|
| Retail-Building Products - 3.71% |
|
|
|
|
2,042,230 |
| Lowe’s Cos., Inc. |
|
| 64,268,978 |
|
|
|
|
|
| ||
| ||||||
|
| U.S. Real Estate Investment |
|
|
|
|
3,723,831 |
| First Industrial Realty Trust, Inc. (a) |
|
| 45,952,075 |
|
641,794 |
| Vornado Realty Trust |
|
| 55,091,597 |
|
|
|
|
|
| ||
|
|
|
|
| 101,043,672 |
|
|
|
|
|
| ||
|
The accompanying notes are an integral part of the financial statements. |
|
20 |
Third Avenue Trust
Third Avenue Real Estate Value Fund
Portfolio of Investments (continued)
at April 30, 2012
(Unaudited)
|
|
|
|
|
|
|
Shares |
| Security† |
| Value |
| |
Common Stocks (continued) |
|
|
|
| ||
| ||||||
|
| U.S. Real Estate Operating |
|
|
|
|
500,500 |
| Consolidated-Tomoka Land Co. (c) |
| $ | 14,714,700 |
|
6,490,864 |
| FNC Realty Corp. (a) (b) |
|
| 4,543,605 |
|
8,846,798 |
| Forest City Enterprises, Inc., |
|
| 141,106,428 |
|
29,513,141 |
| Newhall Holding Co. LLC, |
|
| 39,842,740 |
|
941,627 |
| Tejon Ranch Co. (a) |
|
| 28,116,982 |
|
7,354,979 |
| Thomas Properties Group, Inc. (c) |
|
| 35,892,298 |
|
|
|
|
|
| ||
|
|
|
|
| 264,216,753 |
|
|
|
|
|
| ||
|
| Total Common Stocks |
|
| 1,382,817,663 |
|
|
|
|
|
| ||
|
|
|
|
|
|
|
Investment |
|
|
|
|
|
|
Limited Partnerships - 2.44% |
|
|
|
| ||
| ||||||
|
| Investment Fund - 2.44% |
|
|
|
|
37,000,000 |
| Alliance Bernstein Legacy Securities |
|
| 42,311,864 |
|
|
|
|
|
| ||
|
| Total Limited Partnerships |
|
| 42,311,864 |
|
|
|
|
|
| ||
|
|
|
|
|
|
|
Notional |
| Security† |
|
| Value |
|
Purchased Options - 0.05% |
|
|
|
| ||
| ||||||
|
| Foreign Currency Put |
|
|
|
|
50,000,000 |
| Australian Currency, strike |
| $ | 305,322 |
|
50,000,000 |
| Australian Currency, strike |
|
| 316,233 |
|
35,000,000 |
| Australian Currency, strike |
|
| 278,421 |
|
|
|
|
|
| ||
|
| Total Purchased Options |
|
| 899,976 |
|
|
|
|
|
| ||
|
| Total Investment |
|
| 1,436,274,103 |
|
|
| Other Assets less |
|
| 295,274,626 |
|
|
|
|
|
| ||
|
| NET ASSETS - 100.00% |
| $ | 1,731,548,729 |
|
|
|
|
|
| ||
|
|
Notes: | |
| |
AUD: Australian Dollar | |
|
|
(a) | Non-income producing security. |
|
|
(b) | Fair-valued security. |
|
|
(c) | Affiliated issuers—as defined under the Investment Company Act of 1940 (ownership of 5% or more of the outstanding voting securities of these issuers). |
|
|
(d) | Security is a Real Estate Investment Trust. |
|
|
(e) | Class Action True-up Securities were issued to Centro Retail Australia holders who were not exposed to related shareholder class action suits against certain pre-aggregation Centro entities on behalf of existing group members. |
|
|
(f) | A portion of this security is segregated for future fund commitment. |
|
|
(g) | Includes $5,090,000 of cash restricted as collateral for forward foreign currency contracts to broker. |
|
|
† | U.S. unless otherwise noted. |
|
|
1 | Incorporated in Bermuda. |
|
|
2 | Cayman Islands exempted limited partnership. |
|
The accompanying notes are an integral part of the financial statements. |
|
21 |
Third Avenue Trust
Third Avenue Real Estate Value Fund
Portfolio of Investments (continued)
at April 30, 2012
(Unaudited)
|
|
|
|
|
Country Concentration |
|
|
|
|
|
|
|
|
|
|
| % of |
| |
|
|
| ||
United States |
|
| 31.13 | % |
Hong Kong |
|
| 16.53 |
|
United Kingdom |
|
| 15.43 |
|
Australia |
|
| 10.11 |
|
Canada |
|
| 5.23 |
|
Singapore |
|
| 2.99 |
|
Japan |
|
| 1.53 |
|
|
|
| ||
Total |
|
| 82.95 | % |
|
|
| ||
Schedule of Written Options
|
|
|
|
|
|
|
|
|
|
|
Notional Amount ($) |
| Security |
| Expiration Date |
| Strike Price |
|
| Value |
|
50,000,000 |
| Australian Currency, Call |
| 6/6/12 |
| 1.0578 AUD |
| $ | (201,758 | ) |
50,000,000 |
| Australian Currency, Call |
| 6/6/12 |
| 1.0590 AUD |
|
| (185,321 | ) |
35,000,000 |
| Australian Currency, Call |
| 8/6/12 |
| 1.0375 AUD |
|
| (693,802 | ) |
|
|
|
|
|
|
|
|
| ||
|
| (Premiums received $2,359,386) |
|
|
|
|
| $ | (1,080,881 | ) |
|
|
|
|
|
|
|
|
|
AUD: Australian Dollar
Schedule of Forward Foreign Currency Contracts
|
|
|
|
|
|
|
|
|
|
|
|
|
|
|
|
|
Contracts to Buy |
| Currency |
| Counterparty |
| Settlement Date |
| Settlement Value |
| Value at 4/30/12 |
| Unrealized |
| |||
9,613,426,595 |
| JPY |
| JPMorgan Chase Bank, N.A. |
| 10/29/12 |
| $ | 125,297,166 |
| $ | 120,691,599 |
| $ | (4,605,567 | ) |
|
|
|
|
|
|
|
|
|
|
|
|
|
|
|
|
|
Contracts to Sell |
| Currency |
| Counterparty |
| Settlement Date |
| Settlement Value |
| Value at 4/30/12 |
| Unrealized |
| |||
11,628,710,000 |
| JPY |
| JPMorgan Chase Bank, N.A. |
| 10/29/12 |
| $ | 145,000,000 |
| $ | 145,992,439 |
| $ | (992,439 | ) |
JPY: Japanese Yen
|
The accompanying notes are an integral part of the financial statements. |
|
22 |
Third Avenue Trust
Third Avenue Real Estate Value Fund
Statement of Assets and Liabilities
April 30, 2012
(Unaudited)
|
|
|
|
|
Assets: |
|
|
|
|
Investments at value (Notes 1 and 5): |
|
|
|
|
Unaffiliated issuers (cost of $1,029,160,221) |
| $ | 1,204,717,937 |
|
Affiliated issuers (cost of $255,865,498) |
|
| 231,556,166 |
|
|
|
| ||
Total investments (cost of $1,285,025,719) |
|
| 1,436,274,103 |
|
Cash |
|
| 309,179,757 |
|
Restricted cash pledged to counterparty for collateral management |
|
| 5,090,000 |
|
Foreign currency at value (cost of $1,030) |
|
| 1,031 |
|
Dividends and interest receivable |
|
| 6,599,108 |
|
Receivable for fund shares sold |
|
| 3,423,580 |
|
Other assets |
|
| 45,358 |
|
|
|
| ||
Total assets |
|
| 1,760,612,937 |
|
|
|
| ||
| ||||
Liabilities: |
|
|
|
|
Payable for securities purchased |
|
| 15,944,524 |
|
Unrealized depreciation on forward foreign currency contracts |
|
| 5,598,006 |
|
Payable for fund shares redeemed |
|
| 4,328,418 |
|
Payable to investment adviser (Note 3) |
|
| 1,266,674 |
|
Written options at value (premiums received $2,359,386) |
|
| 1,080,881 |
|
Payable for shareholder servicing fees (Note 3) |
|
| 428,301 |
|
Accrued expenses |
|
| 328,549 |
|
Distribution fees payable (Note 6) |
|
| 76,887 |
|
Payable to trustees and officers |
|
| 11,968 |
|
|
|
| ||
Total liabilities |
|
| 29,064,208 |
|
|
|
| ||
Net assets |
| $ | 1,731,548,729 |
|
|
|
| ||
|
|
|
|
|
Summary of net assets: |
|
|
|
|
Capital stock, $0.001 par value |
| $ | 1,547,454,065 |
|
Accumulated distribution in excess of net investment income |
|
| (1,106,924 | ) |
Accumulated net realized gains on investments and foreign currency transactions |
|
| 38,402,569 |
|
Net unrealized appreciation of investments and translation of foreign currency denominated assets and liabilities |
|
| 146,799,019 |
|
|
|
| ||
Net assets applicable to capital shares outstanding |
| $ | 1,731,548,729 |
|
|
|
| ||
|
|
|
|
|
Investor Class: |
|
|
|
|
Net assets applicable to 2,005,932 shares outstanding, unlimited number of shares authorized |
| $ | 48,881,344 |
|
|
|
| ||
Net asset value, offering and redemption price per share |
| $ | 24.37 |
|
|
|
| ||
|
|
|
|
|
Institutional Class: |
|
|
|
|
Net assets applicable to 68,803,730 shares outstanding, unlimited number of shares authorized |
| $ | 1,682,667,385 |
|
|
|
| ||
Net asset value, offering and redemption price per share |
| $ | 24.46 |
|
|
|
|
|
The accompanying notes are an integral part of the financial statements. |
|
23 |
Third Avenue Trust
Third Avenue Real Estate Value Fund
Statement of Operations
For the Six Months Ended April 30, 2012
(Unaudited)
|
|
|
|
|
Investment Income: |
|
|
|
|
Interest |
| $ | 1,666,226 |
|
Dividends - unaffiliated issuers (net of foreign withholding tax of $529,163) |
|
| 14,518,683 |
|
Dividends - affiliated issuers (Note 5) |
|
| 230,659 |
|
Other income |
|
| 6,969 |
|
|
|
| ||
Total investment income |
|
| 16,422,537 |
|
|
|
| ||
|
|
|
|
|
Expenses: |
|
|
|
|
Investment advisory fees (Note 3) |
|
| 7,201,036 |
|
Shareholder servicing fees (Note 3) |
|
| 783,851 |
|
Transfer agent fees |
|
| 288,414 |
|
Reports to shareholders |
|
| 147,191 |
|
Custodian fees |
|
| 119,765 |
|
Trustees’ and officers’ fees and expenses |
|
| 107,201 |
|
Accounting fees |
|
| 68,412 |
|
Distribution fees (Note 6) |
|
| 56,188 |
|
Administration fees (Note 3) |
|
| 44,006 |
|
Auditing fees |
|
| 40,195 |
|
Registration and filing fees |
|
| 28,936 |
|
Insurance expenses |
|
| 22,930 |
|
Legal fees |
|
| 15,709 |
|
Miscellaneous expenses |
|
| 33,721 |
|
|
|
| ||
Total expenses |
|
| 8,957,555 |
|
Expenses reduced by custodian fee expense offset arrangement (Note 3) |
|
| (31,237 | ) |
|
|
| ||
Net expenses |
|
| 8,926,318 |
|
|
|
| ||
Net investment income |
|
| 7,496,219 |
|
|
|
| ||
|
|
|
|
|
Realized and unrealized gain/(loss) on investments and foreign currency transactions: |
|
|
|
|
Net realized gain on investments - unaffiliated issuers |
|
| 53,197,610 |
|
Net realized gain on written options |
|
| 292,849 |
|
Net realized loss on foreign currency transactions |
|
| (480,188 | ) |
Net change in unrealized appreciation/(depreciation) on investments |
|
| 146,159,081 |
|
Net change in unrealized appreciation/(depreciation) on written options |
|
| 1,278,505 |
|
Net change in unrealized appreciation/(depreciation) on translation of other assets and liabilities denominated |
|
|
|
|
in foreign currency |
|
| 716,142 |
|
|
|
| ||
Net gain on investments and foreign currency transactions |
|
| 201,163,999 |
|
|
|
| ||
Net increase in net assets resulting from operations |
| $ | 208,660,218 |
|
|
|
|
|
The accompanying notes are an integral part of the financial statements. |
|
24 |
Third Avenue Trust
Third Avenue Real Estate Value Fund
Statement of Changes in Net Assets
|
|
|
|
|
|
|
|
|
| For the |
| For the Year |
| ||
|
|
|
| ||||
Operations: |
|
|
|
|
|
|
|
Net investment income |
| $ | 7,496,219 |
| $ | 4,618,750 |
|
Net realized gain on investments - unaffiliated issuers |
|
| 53,197,610 |
|
| 96,186,234 |
|
Net realized gain on investments - affiliated issuers |
|
| — |
|
| 3,885,219 |
|
Net realized gain on written options |
|
| 292,849 |
|
| 2,775,546 |
|
Net realized loss on foreign currency transactions |
|
| (480,188 | ) |
| (1,189,398 | ) |
Net change in unrealized appreciation/(depreciation) on investments |
|
| 146,159,081 |
|
| (153,158,956 | ) |
Net change in unrealized appreciation/(depreciation) on written options |
|
| 1,278,505 |
|
| (474,703 | ) |
Net change in unrealized appreciation/(depreciation) on translation of other assets and liabilities denominated in foreign currency |
|
| 716,142 |
|
| (6,240,818 | ) |
|
|
|
| ||||
Net increase/(decrease) in net assets resulting from operations |
|
| 208,660,218 |
|
| (53,598,126 | ) |
|
|
|
| ||||
|
|
|
|
|
|
|
|
Dividends and Distributions to Shareholders from: |
|
|
|
|
|
|
|
Net Investment income: |
|
|
|
|
|
|
|
Investor Class |
|
| — |
|
| (1,201,582 | ) |
Institutional Class |
|
| — |
|
| (66,294,990 | ) |
|
|
|
| ||||
Decrease in net assets from dividends and distributions |
|
| — |
|
| (67,496,572 | ) |
|
|
|
| ||||
|
|
|
|
|
|
|
|
Capital Share Transactions: |
|
|
|
|
|
|
|
Proceeds from sale of shares |
|
| 180,068,785 |
|
| 395,952,018 |
|
Net asset value of shares issued in reinvestment of dividends and distributions |
|
| — |
|
| 60,964,262 |
|
Redemption fees |
|
| 29,458 |
|
| 54,729 |
|
Cost of shares redeemed |
|
| (284,657,364 | ) |
| (389,669,216 | ) |
|
|
|
| ||||
Net increase/(decrease) in net assets resulting from capital share transactions |
|
| (104,559,121 | ) |
| 67,301,793 |
|
|
|
|
| ||||
Net increase/(decrease) in net assets |
|
| 104,101,097 |
|
| (53,792,905 | ) |
Net assets at beginning of period |
|
| 1,627,447,632 |
|
| 1,681,240,537 |
|
|
|
|
| ||||
Net assets at end of period |
|
|
|
|
|
|
|
(including accumulated distributions in excess of net investment income of $(1,106,924) and $(8,603,143) respectively) |
| $ | 1,731,548,729 |
| $ | 1,627,447,632 |
|
|
|
|
| ||||
|
The accompanying notes are an integral part of the financial statements. |
|
25 |
Third Avenue Trust
Third Avenue Real Estate Value Fund
Financial Highlights
Selected data (for a share outstanding throughout each period) and ratios are as follows:
|
|
|
|
|
|
|
|
|
|
| |
Investor Class: |
|
| For the Six |
| For the Year |
| For the Period |
| |||
|
|
|
|
| |||||||
Net asset value, beginning of period |
| $ | 21.40 |
| $ | 22.90 |
| $ | 20.47 |
| |
|
|
|
|
| |||||||
Income/(loss) from investment operations: |
|
|
|
|
|
|
|
|
|
| |
Net investment income@ |
|
| 0.08 |
|
| 0.02 |
|
| 0.40 |
| |
Net gain/(loss) on investment transactions (both realized and unrealized)1 |
|
| 2.89 |
|
| (0.63 | ) |
| 2.03 |
| |
|
|
|
|
| |||||||
Total from investment operations |
|
| 2.97 |
|
| (0.61 | ) |
| 2.43 |
| |
|
|
|
|
| |||||||
Less dividends and distributions to shareholders: |
|
|
|
|
|
|
|
|
|
| |
Dividends from net investment income |
|
| — |
|
| (0.89 | ) |
| — |
| |
|
|
|
|
| |||||||
Total dividends and distributions |
|
| — |
|
| (0.89 | ) |
| — |
| |
|
|
|
|
| |||||||
Net asset value, end of period |
| $ | 24.37 |
| $ | 21.40 |
| $ | 22.90 | �� | |
|
|
|
|
| |||||||
|
|
|
|
|
|
|
|
|
|
| |
Total return2 |
|
| 13.88 | %3 |
| (2.89 | )% |
| 11.87 | %3 | |
Ratios/Supplemental Data: |
|
|
|
|
|
|
|
|
|
| |
Net assets, end of period (in thousands) |
| $ | 48,881 |
| $ | 48,327 |
| $ | 28,594 |
| |
Ratio of expenses to average net assets |
|
|
|
|
|
|
|
|
|
| |
Before fee waivers/expense offset arrangement/recovery |
|
| 1.36 | %4 |
| 1.38 | % |
| 1.44 | %4 | |
After fee waivers/expense offset arrangement/recovery5 |
|
| 1.36 | %4 |
| 1.40 | %† |
| 1.40 | %4# | |
Ratio of net investment income to average net assets |
|
| 0.69 | %4 |
| 0.11 | % |
| 2.27 | %4 | |
Portfolio turnover rate |
|
| 2 | %3 |
| 32 | % |
| 26 | %3 | |
|
|
1 | Includes redemption fees of less than $0.01 per share. |
|
|
2 | Performance figures may reflect fee waivers, expense offset arrangement and/or recovery of previously waived fees. Past performance is no guarantee of future results. Total return would have been lower if the Adviser had not waived certain expenses. Conversely, total return would have been higher if the adviser had not recovered previously waived expenses. |
|
|
3 | Not annualized. |
|
|
4 | Annualized. |
|
|
5 | As a result of an expense limitation, the ratio of expenses (exclusive of taxes, interest, brokerage commissions, acquired fund fees and expenses, and extraordinary items) to average net assets will not exceed 1.40%. |
|
|
† | The investment adviser recovered previously waived fees. |
|
|
# | The investment adviser waived a portion of its fees. |
|
|
* | Period from December 31, 2009 (commencement of operations) to October 31, 2010. |
|
|
@ | Calculated based on the average number of shares outstanding during the period. |
|
The accompanying notes are an integral part of the financial statements. |
|
26 |
Third Avenue Trust
Third Avenue Real Estate Value Fund
Financial Highlights (continued)
Selected data (for a share outstanding throughout each period) and ratios are as follows:
|
|
|
|
|
|
|
|
|
|
|
|
|
|
|
|
|
|
|
|
|
| For the Six |
|
|
|
|
|
|
|
|
|
|
|
|
|
|
|
| |
|
|
| Years Ended October 31, |
| |||||||||||||||
|
|
|
| ||||||||||||||||
Institutional Class: |
|
| 2011 |
| 2010 |
| 2009 |
| 2008 |
| 2007 |
| |||||||
|
|
|
|
|
|
| |||||||||||||
Net asset value, beginning of period |
| $ | 21.45 |
| $ | 22.93 |
| $ | 19.86 |
| $ | 16.21 |
| $ | 35.47 |
| $ | 36.34 |
|
|
|
|
|
|
|
|
| ||||||||||||
Income/(loss) from investment operations: |
|
|
|
|
|
|
|
|
|
|
|
|
|
|
|
|
|
|
|
Net investment income |
|
| 0.10 | @ |
| 0.06 | @ |
| 0.44 | @ |
| 0.63 | @ |
| 0.31 | @ |
| 0.85 |
|
Net gain/(loss) on investment transactions (both realized and unrealized) |
|
| 2.91 | 3 |
| (0.62 | )3 |
| 2.89 | 3 |
| 3.45 | 1 |
| (15.72 | )1 |
| 1.80 | 2 |
|
|
|
|
|
|
|
| ||||||||||||
Total from investment operations |
|
| 3.01 |
|
| (0.56 | ) |
| 3.33 |
|
| 4.08 |
|
| (15.41 | ) |
| 2.65 |
|
|
|
|
|
|
|
|
| ||||||||||||
Less dividends and distributions to shareholders: |
|
|
|
|
|
|
|
|
|
|
|
|
|
|
|
|
|
|
|
Dividends from net investment income |
|
| — |
|
| (0.92 | ) |
| (0.26 | ) |
| (0.43 | ) |
| (0.60 | ) |
| (0.89 | ) |
Distributions from realized gains |
|
| — |
|
| — |
|
| — |
|
| — |
|
| (3.25 | ) |
| (2.63 | ) |
|
|
|
|
|
|
|
| ||||||||||||
Total dividends and distributions |
|
| — |
|
| (0.92 | ) |
| (0.26 | ) |
| (0.43 | ) |
| (3.85 | ) |
| (3.52 | ) |
|
|
|
|
|
|
|
| ||||||||||||
Net asset value, end of period |
| $ | 24.46 |
| $ | 21.45 |
| $ | 22.93 |
| $ | 19.86 |
| $ | 16.21 |
| $ | 35.47 |
|
|
|
|
|
|
|
|
| ||||||||||||
|
|
|
|
|
|
|
|
|
|
|
|
|
|
|
|
|
|
|
|
Total return4 |
|
| 14.03 | %5 |
| (2.66 | )% |
| 16.94 | % |
| 26.16 | % |
| (47.87 | )% |
| 7.68 | % |
Ratios/Supplemental Data: |
|
|
|
|
|
|
|
|
|
|
|
|
|
|
|
|
|
|
|
Net assets, end of period (in thousands) |
| $ | 1,682,667 |
| $ | 1,579,121 |
| $ | 1,652,647 |
| $ | 1,381,313 |
| $ | 1,255,630 |
| $ | 2,934,708 |
|
Ratio of expenses to average net assets |
|
|
|
|
|
|
|
|
|
|
|
|
|
|
|
|
|
|
|
Before fee waivers/expense offset arrangement/recovery |
|
| 1.11 | %6 |
| 1.13 | % |
| 1.18 | % |
| 1.18 | % |
| 1.12 | % |
| 1.10 | % |
After fee waivers/expense offset arrangement/recovery7 |
|
| 1.11 | %6 |
| 1.15 | %† |
| 1.14 | %# |
| 1.18 | % |
| 1.12 | % |
| 1.10 | % |
Ratio of net investment income to average net assets |
|
| 0.94 | %6 |
| 0.26 | % |
| 2.09 | % |
| 4.00 | % |
| 1.22 | % |
| 1.14 | % |
Portfolio turnover rate |
|
| 2 | %5 |
| 32 | % |
| 26 | % |
| 24 | % |
| 34 | % |
| 19 | % |
|
|
1 | Includes redemption fees of $0.01 per share. |
|
|
2 | Includes redemption fees of $0.02 per share. |
|
|
3 | Includes redemption fees of less than $0.01 per share. |
|
|
4 | Performance figures may reflect fee waivers, expense offset arrangement and/or recovery of previously waived fees. Past performance is no guarantee of future results. Total return would have been lower if the Adviser had not waived certain expenses. Conversely, total return would have been higher if the adviser had not recovered previously waived expenses. |
|
|
5 | Not annualized. |
|
|
6 | Annualized. |
|
|
7 | As a result of an expense limitation, the ratio of expenses (exclusive of taxes, interest, brokerage commissions, acquired fund fees and expenses, and extraordinary items) to average net assets will not exceed 1.15% effective December 31, 2009. |
|
|
† | The investment adviser recovered previously waived fees. |
|
|
# | The investment adviser waived a portion of its fees. |
|
|
@ | Calculated based on the average number of shares outstanding during the period. |
|
The accompanying notes are an integral part of the financial statements. |
|
27 |
Third Avenue Trust
Third Avenue International Value Fund
Industry Diversification
(Unaudited)
The summary of the Fund’s investments as of April 30, 2012 is as follows:
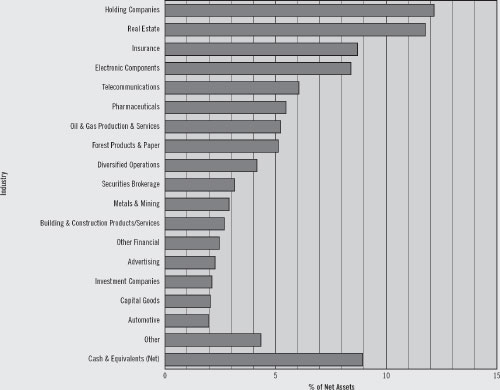
|
The accompanying notes are an integral part of the financial statements. |
|
28 |
Third Avenue Trust
Third Avenue International Value Fund
Portfolio of Investments
at April 30, 2012
(Unaudited)
|
|
|
|
|
|
|
Shares |
| Security† |
| Value |
| |
Common Stocks and Warrants - 91.07% |
|
|
|
| ||
| ||||||
|
| Advertising - 2.27% |
|
|
|
|
958,400 |
| Asatsu-DK, Inc. (Japan) |
| $ | 27,719,176 |
|
|
|
|
|
| ||
|
| Agriculture - 1.44% |
|
|
|
|
1,088,114 |
| Viterra, Inc. (Canada) (c) |
|
| 17,524,820 |
|
|
|
|
|
| ||
|
| Automotive - 1.99% |
|
|
|
|
439,290 |
| Daimler AG (Germany) |
|
| 24,285,795 |
|
|
|
|
|
| ||
|
| Building & Construction |
|
|
|
|
10,482,120 |
| Tenon, Ltd. (New Zealand) (a) (b) |
|
| 6,343,082 |
|
1,358,262 |
| Titan Cement Co. S.A. (Greece) |
|
| 26,339,632 |
|
|
|
|
|
| ||
|
|
|
|
| 32,682,714 |
|
|
|
|
|
| ||
|
| Capital Goods - 2.06% |
|
|
|
|
503,196 |
| Nexans S.A. (France) |
|
| 25,154,471 |
|
|
|
|
|
| ||
|
| Corporate Services - 0.78% |
|
|
|
|
22,522,784 |
| Boardroom, Ltd. (Singapore) (b) |
|
| 9,555,120 |
|
|
|
|
|
| ||
|
| Diversified Operations - 4.16% |
|
|
|
|
1,204,745 |
| Antarchile S.A. (Chile) |
|
| 21,479,776 |
|
3,039,200 |
| Hutchison Whampoa, Ltd. |
|
| 29,241,721 |
|
|
|
|
|
| ||
|
|
|
|
| 50,721,497 |
|
|
|
|
|
| ||
|
| Electronic Components - 8.41% |
|
|
|
|
37,050,140 |
| WBL Corp., Ltd. (Singapore) (b) |
|
| 102,692,509 |
|
|
|
|
|
| ||
|
| Forest Products & Paper - 5.12% |
|
|
|
|
51,395,523 |
| Rubicon, Ltd. (New Zealand) (a) (b) |
|
| 16,391,149 |
|
2,265,983 |
| Weyerhaeuser Co. (d) |
|
| 46,135,414 |
|
|
|
|
|
| ||
|
|
|
|
| 62,526,563 |
|
|
|
|
|
| ||
|
|
|
|
|
|
|
Shares |
| Security† |
| Value |
| |
|
| Holding Companies - 12.17% |
|
|
|
|
7,939,408 |
| GP Investments, Ltd., BDR |
| $ | 18,326,677 |
|
3,305,400 |
| Guoco Group, Ltd. (Hong Kong)1 |
|
| 27,691,802 |
|
1,644,208 |
| Leucadia National Corp. |
|
| 40,875,011 |
|
592,505 |
| LG Corp. (South Korea) |
|
| 30,198,684 |
|
469,645 |
| Pargesa Holding S.A. (Switzerland) |
|
| 31,433,850 |
|
|
|
|
|
| ||
|
|
|
|
| 148,526,024 |
|
|
|
|
|
| ||
|
| Insurance - 8.71% |
|
|
|
|
284,772 |
| Allianz SE (Germany) |
|
| 31,731,802 |
|
230,350 |
| Munich Re (Germany) |
|
| 33,433,772 |
|
78,722 |
| White Mountains Insurance |
|
| 41,171,606 |
|
|
|
|
|
| ||
|
|
|
|
| 106,337,180 |
|
|
|
|
|
| ||
|
| Investment Companies - 2.12% |
|
|
|
|
7,136,445 |
| Resolution, Ltd. (Guernsey) |
|
| 25,919,965 |
|
|
|
|
|
| ||
|
| Investment Technology |
|
|
|
|
80,906 |
| OTSUKA Corp. (Japan) |
|
| 6,506,936 |
|
|
|
|
|
| ||
|
| Media - 0.16% |
|
|
|
|
296,740 |
| Alma Media Corp. (Finland) |
|
| 2,007,176 |
|
|
|
|
|
| ||
|
| Metals & Mining - 2.91% |
|
|
|
|
200,900 |
| Dundee Precious Metals, Inc. |
|
| 1,563,923 |
|
500,400 |
| Dundee Precious Metals, Inc. |
|
| 2,533 |
|
1,672,046 |
| Kinross Gold Corp. (Canada) |
|
| 14,979,609 |
|
22,869 |
| Kinross Gold Corp. Warrants, |
|
| 13,890 |
|
397,186 |
| Newmont Mining Corp. |
|
| 18,925,913 |
|
|
|
|
|
| ||
|
|
|
|
| 35,485,868 |
|
|
|
|
|
| ||
|
The accompanying notes are an integral part of the financial statements. |
|
29 |
Third Avenue Trust
Third Avenue International Value Fund
Portfolio of Investments (continued)
at April 30, 2012
(Unaudited)
|
|
|
|
|
|
|
Shares |
| Security† |
| Value |
| |
Common Stocks and Warrant (continued) |
|
|
|
| ||
| ||||||
|
| Oil & Gas Production & |
|
|
|
|
993,802 |
| EnCana Corp. (Canada) |
| $ | 20,810,214 |
|
1,647,210 |
| Petroleum Geo-Services ASA (Norway) |
|
| 24,853,718 |
|
1,976,600 |
| Precision Drilling Corp. (Canada) (a) |
|
| 18,208,291 |
|
|
|
|
|
| ||
|
|
|
|
| 63,872,223 |
|
|
|
|
|
| ||
|
| Other Financial - 2.46% |
|
|
|
|
62,589,892 |
| Yuanta Financial Holding Co., Ltd. |
|
| 30,000,119 |
|
|
|
|
|
| ||
|
| Pharmaceuticals - 5.47% |
|
|
|
|
1,104,214 |
| GlaxoSmithKline PLC |
|
| 25,536,450 |
|
540,537 |
| Sanofi (France) |
|
| 41,256,140 |
|
|
|
|
|
| ||
|
|
|
|
| 66,792,590 |
|
|
|
|
|
| ||
|
| Real Estate - 11.77% |
|
|
|
|
6,417,961 |
| Atrium European Real Estate Ltd. |
|
| 31,263,199 |
|
1,750,000 |
| Mitsui Fudosan Co., Ltd. (Japan) |
|
| 32,054,419 |
|
8,490,300 |
| SEGRO PLC (United Kingdom) |
|
| 30,465,210 |
|
61,235,872 |
| Taylor Wimpey PLC |
|
| 49,938,371 |
|
|
|
|
|
| ||
|
|
|
|
| 143,721,199 |
|
|
|
|
|
| ||
|
| Securities Brokerage - 3.16% |
|
|
|
|
10,205,000 |
| Daiwa Securities Group, Inc. |
|
| 38,564,799 |
|
|
|
|
|
| ||
|
| Telecommunications - 6.05% |
|
|
|
|
38,601,902 |
| Netia S.A. (Poland) (a) (b) |
|
| 73,817,737 |
|
|
|
|
|
| ||
|
| Transportation - 1.42% |
|
|
|
|
2,504,000 |
| Seino Holdings Co., Ltd. (Japan) |
|
| 17,345,378 |
|
|
|
|
|
| ||
|
| Total Common Stocks |
|
| 1,111,759,859 |
|
|
|
|
|
| ||
|
|
|
|
|
|
|
Notional |
| Security† |
| Value |
| |
Purchased Options - 0.74% |
|
|
|
| ||
| ||||||
|
| Foreign Currency |
|
|
|
|
106,185,000 |
| Euro Currency, strike 1.366 Euro, |
| $ | 3,384,647 |
|
136,315,000 |
| Euro Currency, strike 1.366 Euro, |
|
| 4,382,514 |
|
61,500,000 |
| Japan Currency, strike 87.94 Yen, |
|
| 604,237 |
|
61,500,000 |
| Japan Currency, strike 87.94 Yen, |
|
| 611,326 |
|
|
|
|
|
| ||
|
| Total Purchased Options |
|
| 8,982,724 |
|
|
|
|
|
| ||
|
| Total Investment |
|
| 1,120,742,583 |
|
|
| Other Assets less |
|
| 99,999,654 |
|
|
|
|
|
| ||
|
| NET ASSETS - 100.00% |
| $ | 1,220,742,237 |
|
|
|
|
|
| ||
|
|
Notes: | |
|
|
BDR: | Brazilian Depositary Receipt. |
|
|
(a) | Non-income producing security. |
|
|
(b) | Affiliated issuers - as defined under the Investment Company Act of 1940 (ownership of 5% or more of the outstanding voting securities of these issuers). |
|
|
(c) | Security is exempt from registration under Rule 144A of the Securities Act of 1933. This security may be resold in transactions that are exempt from registration, normally to qualified institutional buyers. |
|
|
(d) | Security is a Real Estate Investment Trust. |
|
|
† | U.S. unless otherwise noted. |
|
|
1 | Incorporated in Bermuda. |
|
The accompanying notes are an integral part of the financial statements. |
|
30 |
Third Avenue Trust
Third Avenue International Value Fund
Portfolio of Investments (continued)
at April 30, 2012
(Unaudited)
Country Concentration
|
|
|
|
|
|
| % of |
| |
|
|
| ||
United States |
|
| 12.69 | % |
Japan |
|
| 10.11 |
|
Singapore |
|
| 9.20 |
|
United Kingdom |
|
| 8.68 |
|
Germany |
|
| 7.33 |
|
Poland |
|
| 6.05 |
|
Canada |
|
| 5.99 |
|
France |
|
| 5.44 |
|
Hong Kong |
|
| 4.66 |
|
Switzerland |
|
| 2.57 |
|
Jersey |
|
| 2.56 |
|
South Korea |
|
| 2.47 |
|
Taiwan |
|
| 2.46 |
|
Greece |
|
| 2.16 |
|
Guernsey |
|
| 2.12 |
|
Norway |
|
| 2.04 |
|
New Zealand |
|
| 1.86 |
|
Chile |
|
| 1.76 |
|
Brazil |
|
| 1.50 |
|
Finland |
|
| 0.16 |
|
|
|
| ||
Total |
|
| 91.81 | % |
|
|
| ||
|
The accompanying notes are an integral part of the financial statements. |
|
31 |
Third Avenue Trust
Third Avenue International Value Fund
Statement of Assets and Liabilities
April 30, 2012
(Unaudited)
|
|
|
|
|
Assets: |
|
|
|
|
Investments at value (Notes 1 and 5): |
|
|
|
|
Unaffiliated issuers (cost of $946,107,830) |
| $ | 893,616,309 |
|
Affiliated issuers (cost of $204,465,864) |
|
| 227,126,274 |
|
|
|
| ||
Total investments (cost of $1,150,573,694) |
|
| 1,120,742,583 |
|
Cash |
|
| 83,790,121 |
|
Foreign currency at value (cost of $3,483,818) |
|
| 3,483,459 |
|
Receivable for securities sold |
|
| 9,215,204 |
|
Dividends and interest receivable |
|
| 9,008,421 |
|
Receivable for fund shares sold |
|
| 1,166,644 |
|
Other assets |
|
| 38,554 |
|
|
|
| ||
Total assets |
|
| 1,227,444,986 |
|
|
|
| ||
|
|
|
|
|
Liabilities: |
|
|
|
|
Payable for securities purchased |
|
| 3,063,595 |
|
Payable for fund shares redeemed |
|
| 1,837,741 |
|
Payable to investment adviser (Note 3) |
|
| 1,248,737 |
|
Accrued expenses |
|
| 326,453 |
|
Payable for shareholder servicing fees (Note 3) |
|
| 189,159 |
|
Distribution fees payable (Note 6) |
|
| 27,845 |
|
Payable to trustees and officers |
|
| 9,219 |
|
|
|
| ||
Total liabilities |
|
| 6,702,749 |
|
|
|
| ||
Net assets |
| $ | 1,220,742,237 |
|
|
|
| ||
|
|
|
|
|
Summary of net assets: |
|
|
|
|
Capital stock, $0.001 par value |
| $ | 1,459,569,001 |
|
Accumulated distributions in excess of net investment income |
|
| (5,003,149 | ) |
Accumulated net realized losses on investments and foreign currency transactions |
|
| (204,051,655 | ) |
Net unrealized depreciation of investments and translation of foreign currency denominated assets and liabilities |
|
| (29,771,960 | ) |
|
|
| ||
Net assets applicable to capital shares outstanding |
| $ | 1,220,742,237 |
|
|
|
| ||
|
|
|
|
|
Investor Class: |
|
|
|
|
Net assets applicable to 1,018,593 shares outstanding, unlimited number of shares authorized |
| $ | 15,840,791 |
|
|
|
| ||
Net asset value, offering and redemption price per share |
| $ | 15.55 |
|
|
|
| ||
|
|
|
|
|
Institutional Class: |
|
|
|
|
Net assets applicable to 77,438,204 shares outstanding, unlimited number of shares authorized |
| $ | 1,204,901,446 |
|
|
|
| ||
Net asset value, offering and redemption price per share |
| $ | 15.56 |
|
|
|
|
|
The accompanying notes are an integral part of the financial statements. |
|
32 |
Third Avenue Trust
Third Avenue International Value Fund
Statement of Operations
For the Six Months Ended April 30, 2012
(Unaudited)
|
|
|
|
|
Investment Income: |
|
|
|
|
Interest |
| $ | 317 |
|
Dividends - unaffiliated issuers (net of foreign withholding tax of $947,698) |
|
| 11,251,300 |
|
Dividends - affiliated issuers (Note 5) |
|
| 1,621,489 |
|
|
|
| ||
Total investment income |
|
| 12,873,106 |
|
|
|
| ||
|
|
|
|
|
Expenses: |
|
|
|
|
Investment advisory fees (Note 3) |
|
| 7,577,267 |
|
Shareholder servicing fees (Note 3) |
|
| 388,769 |
|
Custodian fees |
|
| 214,935 |
|
Transfer agent fees |
|
| 152,197 |
|
Reports to shareholders |
|
| 99,454 |
|
Trustees’ and officers’ fees and expenses |
|
| 83,449 |
|
Accounting fees |
|
| 63,881 |
|
Auditing fees |
|
| 47,434 |
|
Administration fees (Note 3) |
|
| 33,340 |
|
Registration and filing fees |
|
| 26,757 |
|
Legal fees |
|
| 23,778 |
|
Insurance expenses |
|
| 18,546 |
|
Distribution fees (Note 6) |
|
| 18,263 |
|
Miscellaneous expenses |
|
| 23,077 |
|
|
|
| ||
Total expenses |
|
| 8,771,147 |
|
Less: Expenses waived (Note 3) |
|
| (249,922 | ) |
Expenses reduced by custodian fee expense offset arrangement (Note 3) |
|
| (16,423 | ) |
|
|
| ||
Net expenses |
|
| 8,504,802 |
|
|
|
| ||
Net investment income |
|
| 4,368,304 |
|
|
|
| ||
|
|
|
|
|
Realized and unrealized gain/(loss) on investments and foreign currency transactions: |
|
|
|
|
Net realized loss on investments - unaffiliated issuers |
|
| (84,475,495 | ) |
Net realized gain on investments - affiliated issuers |
|
| 3,556,422 |
|
Net realized gain on swap agreements |
|
| 311,652 |
|
Net realized loss on foreign currency transactions |
|
| (10,520 | ) |
Net change in unrealized appreciation/(depreciation) on investments |
|
| 110,787,565 |
|
Net change in unrealized appreciation/(depreciation) on translation of other assets and liabilities denominated in foreign currency |
|
| (62,441 | ) |
|
|
| ||
Net gain on investments and foreign currency transactions |
|
| 30,107,183 |
|
|
|
| ||
Net increase in net assets resulting from operations |
| $ | 34,475,487 |
|
|
|
|
|
The accompanying notes are an integral part of the financial statements. |
|
33 |
Third Avenue Trust
Third Avenue International Value Fund
Statement of Changes in Net Assets
|
|
|
|
|
|
|
|
|
| For the |
| For the Year |
| ||
|
|
|
| ||||
Operations: |
|
|
|
|
|
|
|
Net investment income |
| $ | 4,368,304 |
| $ | 8,795,699 |
|
Net realized gain/(loss) on investments - unaffiliated issuers |
|
| (84,475,495 | ) |
| 114,659,830 |
|
Net realized gain on investments - affiliated issuers |
|
| 3,556,422 |
|
| 7,520,595 |
|
Net realized gain on swap agreements |
|
| 311,652 |
|
| — |
|
Net realized loss on foreign currency transactions |
|
| (10,520 | ) |
| (1,011,298 | ) |
Net change in unrealized appreciation/(depreciation) on investments |
|
| 110,787,565 |
|
| (185,973,301 | ) |
Net change in unrealized appreciation/(depreciation) on translation of other assets and liabilities denominated in foreign currency |
|
| (62,441 | ) |
| 53,679 |
|
|
|
|
| ||||
Net increase/(decrease) in net assets resulting from operations |
|
| 34,475,487 |
|
| (55,954,796 | ) |
|
|
|
| ||||
|
|
|
|
|
|
|
|
Dividends and Distributions to Shareholders from: |
|
|
|
|
|
|
|
Net investment income: |
|
|
|
|
|
|
|
Investor Class |
|
| (194,814 | ) |
| (114,939 | ) |
Institutional Class |
|
| (20,012,018 | ) |
| (26,082,360 | ) |
|
|
|
| ||||
Decrease in net assets from dividends and distributions |
|
| (20,206,832 | ) |
| (26,197,299 | ) |
|
|
|
| ||||
|
|
|
|
|
|
|
|
Capital Share Transactions: |
|
|
|
|
|
|
|
Proceeds from sale of shares |
|
| 102,980,287 |
|
| 213,311,078 |
|
Net asset value of shares issued in reinvestment of dividends and distributions |
|
| 19,051,749 |
|
| 24,295,567 |
|
Redemption fees |
|
| 8,280 |
|
| 9,022 |
|
Cost of shares redeemed |
|
| (207,238,072 | ) |
| (388,008,022 | ) |
|
|
|
| ||||
Net decrease in net assets resulting from capital share transactions |
|
| (85,197,756 | ) |
| (150,392,355 | ) |
|
|
|
| ||||
Net decrease in net assets |
|
| (70,929,101 | ) |
| (232,544,450 | ) |
Net assets at beginning of period |
|
| 1,291,671,338 |
|
| 1,524,215,788 |
|
|
|
|
| ||||
Net assets at end of period |
|
|
|
|
|
|
|
(including accumulated distributions in excess of net investment income and accumulated undistributed net investment income of $(5,003,149) and $10,835,379, respectively) |
| $ | 1,220,742,237 |
| $ | 1,291,671,338 |
|
|
|
|
| ||||
|
The accompanying notes are an integral part of the financial statements. |
|
34 |
Third Avenue Trust
Third Avenue International Value Fund
Financial Highlights
Selected data (for a share outstanding throughout each period) and ratios are as follows:
|
|
|
|
|
|
|
|
|
|
|
Investor Class: |
| For the Six |
| For the Year |
| For the Period |
| |||
|
|
|
| |||||||
Net asset value, beginning of period |
| $ | 15.29 |
| $ | 16.31 |
| $ | 15.51 |
|
|
|
|
|
| ||||||
Income/(loss) from investment operations: |
|
|
|
|
|
|
|
|
|
|
Net investment income@ |
|
| 0.04 |
|
| 0.09 |
|
| 0.32 |
|
Net gain/(loss) on investment transactions (both realized and unrealized)1 |
|
| 0.44 |
|
| (0.85 | ) |
| 0.48 |
|
|
|
|
|
| ||||||
Total from investment operations |
|
| 0.48 |
|
| (0.76 | ) |
| 0.80 |
|
|
|
|
|
| ||||||
Less dividends and distributions to shareholders: |
|
|
|
|
|
|
|
|
|
|
Dividends from net investment income |
|
| (0.22 | ) |
| (0.26 | ) |
| — |
|
|
|
|
|
| ||||||
Total dividends and distributions |
|
| (0.22 | ) |
| (0.26 | ) |
| — |
|
|
|
|
|
| ||||||
Net asset value, end of period |
| $ | 15.55 |
| $ | 15.29 |
| $ | 16.31 |
|
|
|
|
|
| ||||||
Total return2 |
|
| 3.29 | %4 |
| (4.76 | )% |
| 5.16 | %4 |
Ratios/Supplemental Data: |
|
|
|
|
|
|
|
|
|
|
Net assets, end of period (in thousands) |
| $ | 15,841 |
| $ | 13,997 |
| $ | 6,920 |
|
Ratio of expenses to average net assets |
|
|
|
|
|
|
|
|
|
|
Before fee waivers and expense offset arrangement |
|
| 1.69 | %5 |
| 1.69 | % |
| 1.77 | %5 |
After fee waivers and expense offset arrangement3# |
|
| 1.65 | %5 |
| 1.65 | % |
| 1.65 | %5 |
Ratio of net investment income to average net assets |
|
| 0.53 | %5 |
| 0.56 | % |
| 2.55 | %5 |
Portfolio turnover rate |
|
| 12 | %4 |
| 24 | % |
| 13 | %4 |
|
|
1 | Includes redemption fees of less than $0.01 per share. |
|
|
2 | Performance figures may reflect fee waivers and/or expense offset arrangement. Past performance is no guarantee of future results. In the absence of fee waivers and/or expense offset arrangement, the total return would have been lower. |
|
|
3 | As a result of an expense limitation, the ratio of expenses (exclusive of taxes, interest, brokerage commissions, acquired fund fees and expenses, and extraordinary items) to average net assets will not exceed 1.65%. |
|
|
4 | Not annualized. |
|
|
5 | Annualized. |
|
|
# | The investment adviser waived a portion of its fees. |
|
|
* | Period from December 31, 2009 (commencement of operations) to October 31, 2010. |
|
|
@ | Calculated based on the average number of shares outstanding during the period. |
|
The accompanying notes are an integral part of the financial statements. |
|
35 |
Third Avenue Trust
Third Avenue International Value Fund
Financial Highlights (continued)
Selected data (for a share outstanding throughout each period) and ratios are as follows:
|
|
|
|
|
|
|
|
|
|
|
|
|
|
|
|
|
|
|
|
|
|
|
| For the Six |
|
|
|
|
|
|
|
|
|
|
| ||||||
|
|
|
| Years Ended October 31, |
| |||||||||||||||
|
|
|
|
| ||||||||||||||||
Institutional Class: |
|
|
| 2011 |
| 2010 |
| 2009 |
| 2008 |
| 2007 |
| |||||||
|
|
|
|
|
|
|
| |||||||||||||
Net asset value, beginning of period |
| $ | 15.33 |
| $ | 16.33 |
| $ | 15.18 |
| $ | 11.51 |
| $ | 25.01 |
| $ | 23.77 |
| |
|
|
|
|
|
|
|
| |||||||||||||
Income/(loss) from investment operations: |
|
|
|
|
|
|
|
|
|
|
|
|
|
|
|
|
|
|
| |
Net investment income |
|
| 0.05 | @ |
| 0.10 | @ |
| 0.24 | @ |
| 0.11 | @ |
| 0.10 | @ |
| 0.37 |
| |
Net gain/(loss) on investment transactions (both realized and unrealized) |
|
| 0.44 | 1 |
| (0.81 | )1 |
| 1.09 | 1 |
| 3.73 | 2 |
| (9.76 | )2 |
| 3.69 | 1 | |
|
|
|
|
|
|
|
| |||||||||||||
Total from investment operations |
|
| 0.49 |
|
| (0.71 | ) |
| 1.33 |
|
| 3.84 |
|
| (9.66 | ) |
| 4.06 |
| |
|
|
|
|
|
|
|
| |||||||||||||
Less dividends and distributions to shareholders: |
|
|
|
|
|
|
|
|
|
|
|
|
|
|
|
|
|
|
| |
Dividends from net investment income |
|
| (0.26 | ) |
| (0.29 | ) |
| (0.18 | ) |
| (0.03 | ) |
| (0.78 | ) |
| (1.08 | ) | |
Distributions from realized gains |
|
| — |
|
| — |
|
| — |
|
| (0.14 | ) |
| (3.06 | ) |
| (1.74 | ) | |
|
|
|
|
|
|
|
| |||||||||||||
Total dividends and distributions |
|
| (0.26 | ) |
| (0.29 | ) |
| (0.18 | ) |
| (0.17 | ) |
| (3.84 | ) |
| (2.82 | ) | |
|
|
|
|
|
|
|
| |||||||||||||
Net asset value, end of period |
| $ | 15.56 |
| $ | 15.33 |
| $ | 16.33 |
| $ | 15.18 |
| $ | 11.51 |
| $ | 25.01 |
| |
|
|
|
|
|
|
|
| |||||||||||||
Total return3 |
|
| 3.40 | %4 |
| (4.51 | )% |
| 8.84 | % |
| 33.87 | % |
| (44.31 | )% |
| 18.86 | % | |
Ratios/Supplemental Data: |
|
|
|
|
|
|
|
|
|
|
|
|
|
|
|
|
|
|
| |
Net assets, end of period (in thousands) |
| $ | 1,204,901 |
| $ | 1,277,674 |
| $ | 1,517,296 |
| $ | 1,332,360 |
| $ | 1,069,308 |
| $ | 2,328,583 |
| |
Ratio of expenses to average net assets |
|
|
|
|
|
|
|
|
|
|
|
|
|
|
|
|
|
|
| |
Before fee waivers and expense offset arrangement |
|
| 1.44 | %5 |
| 1.44 | % |
| 1.51 | % |
| 1.51 | % |
| 1.48 | % |
| 1.45 | % | |
After fee waivers and expense offset arrangement6 |
|
| 1.40 | %5# |
| 1.40 | %# |
| 1.40 | %# |
| 1.47 | %# |
| 1.48 | % |
| 1.45 | % | |
Ratio of net investment income to average net assets |
|
| 0.72 | %5 |
| 0.58 | % |
| 1.58 | % |
| 0.89 | % |
| 0.57 | % |
| 1.48 | % | |
Portfolio turnover rate |
|
| 12 | %4 |
| 24 | % |
| 13 | % |
| 16 | % |
| 30 | % |
| 23 | % | |
|
|
1 | Includes redemption fees of less than $0.01 per share. |
|
|
2 | Includes redemption fees of $0.01 per share. |
|
|
3 | Performance figures may reflect fee waivers and/or expense offset arrangement. Past performance is no guarantee of future results. In the absence of fee waivers and/or expense offset arrangement, the total return would have been lower. |
|
|
4 | Not annualized. |
|
|
5 | Annualized. |
|
|
6 | As a result of an expense limitation, effective July 1, 2009, the ratio of expenses (exclusive of taxes, interest, brokerage commissions, acquired fund fees and expenses, and extraordinary items) to average net assets will not exceed 1.40%. Effective March 1, 2011, the expense limitation period has been extended to February 29, 2012. Prior to July 1, 2009, the expense limitation was 1.75%. |
|
|
# | The investment adviser waived a portion of its fees. |
|
|
@ | Calculated based on the average number of shares outstanding during the period. |
|
The accompanying notes are an integral part of the financial statements. |
|
36 |
Third Avenue Trust
Third Avenue Focused Credit Fund
Industry Diversification
(Unaudited)
The summary of the Fund’s investments as of April 30, 2012 is as follows:
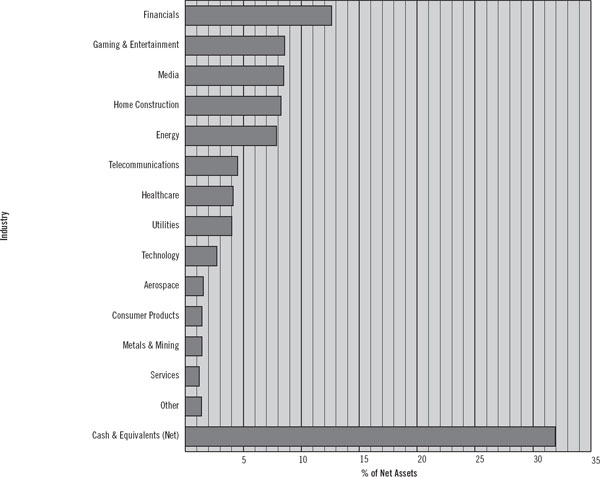
|
The accompanying notes are an integral part of the financial statements. |
|
37 |
Third Avenue Trust
Third Avenue Focused Credit Fund
Portfolio of Investments
at April 30, 2012
(Unaudited)
|
|
|
|
|
|
|
Principal |
| Security† |
| Value |
| |
Corporate Bonds & Notes - 58.33% |
|
|
|
| ||
|
|
|
|
|
|
|
|
| Consumer Products - 1.42% |
|
|
|
|
17,750,000 |
| Armored Autogroup, Inc., 9.250%, |
| $ | 14,954,375 |
|
|
|
|
|
| ||
|
| Energy - 6.96% |
|
|
|
|
|
| Energy XXI Gulf Coast, Inc.: |
|
|
|
|
12,000,000 |
| 9.250%, due 12/15/17 |
|
| 13,230,000 |
|
10,000,000 |
| 7.750%, due 6/15/19 |
|
| 10,375,000 |
|
9,000,000 |
| GMX Resources, Inc., PIK, 11.000%, |
|
| 7,695,000 |
|
|
| Hercules Offshore, Inc.: |
|
|
|
|
17,068,000 |
| 10.500%, due 10/15/17 (a) |
|
| 17,921,400 |
|
14,500,000 |
| 10.250%, due 4/1/19 (a) |
|
| 14,463,750 |
|
|
| Platinum Energy Solutions, Inc.: |
|
|
|
|
5,000,000 |
| 1st Lien, 14.250%, due 3/1/15 |
|
| 4,812,500 |
|
5,169,354 |
| 2nd Lien, 14.250%, due 3/1/15 |
|
| 4,975,503 |
|
|
|
|
|
| ||
|
|
|
|
| 73,473,153 |
|
|
|
|
|
| ||
|
| Financials - 8.54% |
|
|
|
|
|
| Lehman Brothers Holdings, Inc.*: |
|
|
|
|
31,000,000 |
| due 9/26/08 |
|
| 7,672,500 |
|
25,000,000 |
| due 11/24/08 |
|
| 6,187,500 |
|
12,205,000 |
| due 12/23/08 |
|
| 3,020,738 |
|
97,000,000 |
| due 3/23/09 |
|
| 24,007,500 |
|
10,000,000 |
| due 1/24/13 |
|
| 2,537,500 |
|
50,000,000 |
| due 9/26/14 |
|
| 12,812,500 |
|
10,000,000 |
| due 5/2/18 |
|
| 2,575,000 |
|
12,000,000 |
| Marsico Holdings LLC/Marsico Co. |
|
| 2,460,000 |
|
27,800,000 |
| Nuveen Investments, Inc., 10.500%, |
|
| 28,842,500 |
|
|
|
|
|
| ||
|
|
|
|
| 90,115,738 |
|
|
|
|
|
| ||
|
| Food & Beverage - 0.98% |
|
|
|
|
9,945,000 |
| Harmony Foods Corp., 10.000%, |
|
| 10,342,800 |
|
|
|
|
|
| ||
|
|
|
|
|
|
|
Principal |
| Security† |
| Value |
| |
|
| Gaming & Entertainment - 7.72% |
|
|
|
|
38,511,000 |
| Caesars Entertainment |
| $ | 32,975,044 |
|
|
| CityCenter Holdings LLC/CityCenter |
|
|
|
|
28,787,265 |
| 10.750%, due 1/15/17 |
|
| 32,097,800 |
|
880 |
| 10.750%, due 1/15/17 (a) |
|
| 981 |
|
6,850,000 |
| Marina District Finance Co., Inc., |
|
| 6,610,250 |
|
13,399,000 |
| Shingle Springs Tribal |
|
| 9,814,768 |
|
|
|
|
|
| ||
|
|
|
|
| 81,498,843 |
|
|
|
|
|
| ||
|
| Healthcare - 4.12% |
|
|
|
|
10,000,000 |
| InVentiv Health, Inc., 10.000%, |
|
| 8,975,000 |
|
4,000,000 |
| Kindred Healthcare, Inc., 8.250%, |
|
| 3,550,000 |
|
4,910,000 |
| Multiplan, Inc., 9.875%, |
|
| 5,351,900 |
|
|
| Radiation Therapy Services, Inc.: |
|
|
|
|
2,000,000 |
| 8.875%, due 1/15/17 (a) |
|
| 1,990,000 |
|
18,275,000 |
| 9.875%, due 4/15/17 |
|
| 14,757,062 |
|
8,808,000 |
| Rotech Healthcare, Inc., 10.750%, |
|
| 8,929,110 |
|
|
|
|
|
| ||
|
|
|
|
| 43,553,072 |
|
|
|
|
|
| ||
|
| Home Construction - 8.24% |
|
|
|
|
30,022,825 |
| Ainsworth Lumber Co., Ltd., |
|
| 24,168,374 |
|
24,717,000 |
| CEMEX España Luxembourg, 9.250%, |
|
| 22,381,243 |
|
6,500,000 | EUR | CEMEX Finance LLC, 9.625%, |
|
| 8,109,298 |
|
|
The accompanying notes are an integral part of the financial statements. |
|
38 |
Third Avenue Trust
Third Avenue Focused Credit Fund
Portfolio of Investments (continued)
at April 30, 2012
(Unaudited)
|
|
|
|
|
|
|
Principal |
| Security† |
| Value |
| |
Corporate Bonds & Notes (continued) |
|
|
|
| ||
|
|
|
|
|
|
|
|
| Home Construction (continued) |
|
|
|
|
5,410,000 |
| K. Hovnanian Enterprises, Inc., |
| $ | 4,896,050 |
|
9,600,000 |
| New Enterprise Stone & Lime Co., |
|
| 9,888,000 |
|
16,591,000 |
| Nortek, Inc., 10.000%, due 12/1/18 |
|
| 17,586,460 |
|
|
|
|
|
| ||
|
|
|
|
| 87,029,425 |
|
|
|
|
|
| ||
|
| Media - 8.47% |
|
|
|
|
|
| Clear Channel Communications, Inc.: |
|
|
|
|
10,000,000 |
| 9.000%, due 3/1/21 |
|
| 9,100,000 |
|
32,367,289 |
| PIK, 11.000%, due 8/1/16 |
|
| 23,709,039 |
|
7,519,000 |
| Cumulus Media Holdings, Inc., |
|
| 7,152,449 |
|
38,450,000 |
| Intelsat Luxembourg SA, 11.250%, |
|
| 39,988,000 |
|
9,000,000 |
| Spanish Broadcasting System, Inc., |
|
| 9,450,000 |
|
|
|
|
|
| ||
|
|
|
|
| 89,399,488 |
|
|
|
|
|
| ||
|
| Metals & Mining - 1.42% |
|
|
|
|
15,750,000 |
| Murray Energy Corp., 10.250%, |
|
| 15,041,250 |
|
|
|
|
|
| ||
|
| Paper & Packaging - 0.10% |
|
|
|
|
1,000,000 |
| Reynolds Group Issuer Inc. / |
|
| 1,010,000 |
|
|
|
|
|
| ||
|
| Services - 1.21% |
|
|
|
|
12,294,000 |
| EnergySolutions, Inc. / |
|
| 12,816,495 |
|
|
|
|
|
| ||
|
|
|
|
|
|
|
Principal |
| Security† |
| Value |
| |
|
| Technology - 2.70% |
|
|
|
|
16,250,000 |
| EVERTEC, Inc., 11.000%, |
| $ | 17,712,500 |
|
10,000,000 |
| TransUnion Holding Co., Inc., |
|
| 10,775,000 |
|
|
|
|
|
| ||
|
|
|
|
| 28,487,500 |
|
|
|
|
|
| ||
|
| Telecommunications - 3.04% |
|
|
|
|
1,409,000 |
| Digicel Group, Ltd., 10.500%, |
|
| 1,558,636 |
|
40,600,000 |
| Sprint Capital Corp., 6.875%, |
|
| 30,551,500 |
|
|
|
|
|
| ||
|
|
|
|
| 32,110,136 |
|
|
|
|
|
| ||
|
| Transportation Services - 0.07% |
|
|
|
|
26,145,000 |
| General Maritime Corp., |
|
| 784,350 |
|
|
|
|
|
| ||
|
| Utilities - 3.34% |
|
|
|
|
5,060,000 |
| Dynegy Holdings LLC, due 2/15/12* |
|
| 3,390,200 |
|
|
| Energy Future Holdings Corp.: |
|
|
|
|
6,750,000 |
| 10.875%, due 11/1/17 |
|
| 5,703,750 |
|
6,120,000 |
| PIK, 11.250%, due 11/1/17 |
|
| 5,293,800 |
|
20,000,000 |
| Energy Future Intermediate |
|
| 20,850,000 |
|
|
|
|
|
| ||
|
|
|
|
| 35,237,750 |
|
|
|
|
|
| ||
|
| Total Corporate Bonds & Notes |
|
| 615,854,375 |
|
|
|
|
|
| ||
|
The accompanying notes are an integral part of the financial statements. |
|
39 |
Third Avenue Trust
Third Avenue Focused Credit Fund
Portfolio of Investments (continued)
at April 30, 2012
(Unaudited)
|
|
|
|
|
|
|
Principal |
| Security† |
| Value |
| |
Term Loans - 5.44% |
|
|
|
| ||
| ||||||
|
| Aerospace - 1.53% |
|
|
|
|
|
| Aveos Fleet Performance, Inc. |
|
|
|
|
2,574,468 |
| Revolving Credit, |
| $ | 2,381,383 |
|
3,180,308 |
| Term Loan, due 3/12/13 |
|
| 3,005,391 |
|
6,985,729 |
| Term Loan B, PIK, |
|
| 5,309,154 |
|
7,167,231 |
| Term Loan B2, PIK, |
|
| 5,447,095 |
|
|
|
|
|
| ||
|
|
|
|
| 16,143,023 |
|
|
|
|
|
| ||
|
| Financials - 1.86% |
|
|
|
|
|
| Marsico Parent Co. LLC, |
|
|
|
|
578,258 |
| 5.250%, due 12/14/14 (c) |
|
| 234,917 |
|
47,780,501 |
| 5.500%, due 12/14/14 (c) |
|
| 19,410,829 |
|
|
|
|
|
| ||
|
|
|
|
| 19,645,746 |
|
�� |
|
|
|
| ||
|
| Gaming & Entertainment - 0.58% |
|
|
|
|
|
| Dallas Stars L.P., Term Loan: |
|
|
|
|
2,384,050 |
| 3.490%, due 10/19/16 (c) |
|
| 2,252,927 |
|
1,536,458 |
| due 10/19/16 (h) |
|
| 1,451,953 |
|
8,596,651 |
| Hicks Sport Group LLC, Term Loan B, |
|
| 2,450,046 |
|
|
|
|
|
| ||
|
|
|
|
| 6,154,926 |
|
|
|
|
|
| ||
|
| Telecommunications - 1.47% |
|
|
|
|
15,000,000 |
| Lonestar Intermediate Super |
|
| 15,453,750 |
|
|
|
|
|
| ||
|
| Total Term Loans |
|
| 57,397,445 |
|
|
|
|
|
| ||
|
|
|
|
|
|
|
Principal |
| Security† |
| Value |
| |
Municipal Bonds - 0.25% |
|
|
|
| ||
| ||||||
|
| Gaming & Entertainment - 0.25% |
|
|
|
|
5,200,000 |
| New York City, NY, Industrial |
| $ | 2,640,456 |
|
|
|
|
|
| ||
|
| Total Municipal Bonds |
|
| 2,640,456 |
|
|
|
|
|
| ||
|
|
|
|
|
|
|
Shares |
|
|
|
|
|
|
Preferred Stocks - 1.34% |
|
|
|
| ||
| ||||||
|
| Financials - 1.34% |
|
|
|
|
280,000 |
| Ally Financial Inc., Series A, |
|
| 6,272,000 |
|
500,000 |
| Federal Home Loan Mortgage Corp., |
|
| 651,250 |
|
208,000 |
| Federal National Mortgage |
|
| 387,400 |
|
417,000 |
| Federal National Mortgage |
|
| 859,020 |
|
500,000 |
| Federal National Mortgage |
|
| 646,250 |
|
1,000,000 |
| Federal National Mortgage |
|
| 1,300,000 |
|
170,000 |
| GMAC Capital Trust I, |
|
| 4,071,500 |
|
|
|
|
|
| ||
|
| Total Preferred Stocks |
|
| 14,187,420 |
|
|
|
|
|
| ||
|
The accompanying notes are an integral part of the financial statements. |
|
40 |
Third Avenue Trust
Third Avenue Focused Credit Fund
Portfolio of Investments (continued)
at April 30, 2012
(Unaudited)
|
|
|
|
|
|
|
Shares |
| Security† |
| Value |
| |
Private Equities - 0.80% |
|
|
|
| ||
| ||||||
|
| Aerospace - 0.01% |
|
|
|
|
284,571 |
| Aveos Holding Co. |
| $ | 88,928 |
|
|
|
|
|
| ||
|
| Financials - 0.14% |
|
|
|
|
4,568,957 |
| Cerberus CG Investor I LLC (d) |
|
| 605,387 |
|
4,568,918 |
| Cerberus CG Investor II LLC (d) |
|
| 605,381 |
|
2,284,632 |
| Cerberus CG Investor III LLC (d) |
|
| 302,714 |
|
|
|
|
|
| ||
|
|
|
|
| 1,513,482 |
|
|
|
|
|
| ||
|
| Utilities - 0.65% |
|
|
|
|
14,956 |
| Bosque Power Co., LLC |
|
| 6,879,760 |
|
|
|
|
|
| ||
|
| Total Private Equities |
|
| 8,482,170 |
|
|
|
|
|
| ||
|
|
|
|
|
|
|
Shares |
|
|
|
|
|
|
Common Stocks & Warrants - 1.91% |
|
|
|
| ||
| ||||||
|
| Energy - 0.92% |
|
|
|
|
45,681 |
| Compton Petroleum Corp., |
|
| 35,144 |
|
25 |
| Platinum Energy Solutions, Inc. |
|
| 8,685,600 |
|
8,000 |
| Platinum Energy Solutions, Inc., |
|
| 974,320 |
|
|
|
|
|
| ||
|
|
|
|
| 9,695,064 |
|
|
|
|
|
| ||
|
| Financials - 0.75% |
|
|
|
|
4,091,292 |
| Centro Retail Australia |
|
| 7,886,398 |
|
3,268,312 |
| Centro Retail Australia, |
|
| — |
|
|
|
|
|
| ||
|
|
|
|
| 7,886,398 |
|
|
|
|
|
| ||
|
|
|
|
|
|
|
Shares |
| Security† |
| Value |
| |
|
| Transportation Services - 0.24% |
|
|
|
|
374,795 |
| Scorpio Tankers, Inc. (Monaco)2 (d) |
| $ | 2,537,362 |
|
|
|
|
|
| ||
|
| Total Common Stocks & Warrants |
|
| 20,118,824 |
|
|
|
|
|
| ||
|
|
|
|
|
|
|
Number of |
|
|
|
|
|
|
Purchased Options - 0.03% |
|
|
|
| ||
| ||||||
|
| Equity Put Options - 0.03% (d) |
|
|
|
|
1,000 |
| Overseas Shipping Group, |
|
| 300,000 |
|
|
|
|
|
| ||
|
| Total Purchased Options |
|
| 300,000 |
|
|
|
|
|
| ||
|
| Total Investment Portfolio - 68.10% |
|
| 718,980,690 |
|
|
| Other Assets less |
|
| 336,786,406 |
|
|
|
|
|
| ||
|
| NET ASSETS - 100.00% |
| $ | 1,055,767,096 |
|
|
|
|
|
| ||
|
|
Notes: |
|
|
|
EUR: | Euro. |
|
|
PIK: | Payment-in-kind. |
|
|
OID: | Original Issue Discount. |
|
|
(a) | Security is exempt from registration under Rule 144A of the Securities Act of 1933. This security may be resold in transactions that are exempt from registration, normally to qualified institutional buyers. |
|
|
(b) | Fair-valued security. |
|
|
(c) | Variable rate security. The rate disclosed is in effect as of April 30, 2012. |
|
|
(d) | Non-income producing security. |
|
|
(e) | Includes $340,000 of cash restricted as collateral for forward foreign currency contracts to broker. |
|
The accompanying notes are an integral part of the financial statements. |
|
41 |
Third Avenue Trust
Third Avenue Focused Credit Fund
Portfolio of Investments (continued)
at April 30, 2012
(Unaudited)
|
|
(f) | Restricted security subject to restrictions on resale. |
|
|
|
|
|
|
|
|
|
|
Units |
| Issuer | Acquisition |
| Acquisition |
| Carrying | ||
|
|
| |||||||
25 |
| Platinum Energy Solutiuons, Inc. Units | 2/28/11 |
| $ | 2,500,000 |
| $ | 347,424.00 |
At April 30, 2012, the restricted security had a total market value of $8,685,600 or 0.82% of net assets of the Fund.
|
|
(g) | Includes 6,185,600 shares of common stock and 2,500 shares of preferred stock. |
|
|
(h) | Unsettled security. Coupon rate is undetermined at April 30, 2012. |
|
|
(i) | Class Action True-up Securities were issued to Centro Retail Australia holders who were not exposed to related shareholder class action suits against certain pre-aggregation Centro entities on behalf of existing group members. |
|
|
* | Issuer in default. |
|
|
† | U.S. unless otherwise noted. |
|
|
‡ | Denominated in U.S. Dollars unless otherwise noted. |
|
|
1 | Incorporated in Bermuda. |
|
|
2 | Incorporated in Marshall Islands. |
|
|
3 | Incorporated in Spain. |
Country Concentration
|
|
|
|
|
|
| % of |
| |
|
|
| ||
United States |
|
| 57.23 | % |
Luxembourg |
|
| 5.90 |
|
Canada |
|
| 2.29 |
|
Cayman Islands |
|
| 1.54 |
|
Australia |
|
| 0.75 |
|
Monaco |
|
| 0.24 |
|
Jamaica |
|
| 0.15 |
|
|
|
| ||
Total |
|
| 68.10 | % |
|
|
| ||
Schedule of Forward Foreign Currency Contracts
|
|
|
|
|
|
|
|
|
|
|
|
|
|
|
|
|
Contracts to Sell |
| Currency |
| Counterparty |
| Settlement Date |
| Settlement Value |
| Value at 4/30/12 |
| Unrealized |
| |||
4,000,000 |
| Euro |
| JPMorgan Chase Bank, N.A. |
| 10/3/12 |
| $ | 5,422,400 |
| $ | 5,301,513 |
| $ | 120,887 |
|
1,000,000 |
| Euro |
| JPMorgan Chase Bank, N.A. |
| 10/9/12 |
| $ | 1,336,400 |
| $ | 1,325,466 |
| $ | 10,934 |
|
|
|
|
|
|
|
|
|
|
|
|
|
|
|
| ||
|
|
|
|
|
|
|
|
|
|
|
|
|
| $ | 131,821 |
|
|
|
|
|
|
|
|
|
|
|
|
|
|
|
| ||
|
The accompanying notes are an integral part of the financial statements. |
|
42 |
Third Avenue Trust
Third Avenue Focused Credit Fund
Statement of Assets and Liabilities
April 30, 2012
(Unaudited)
|
|
|
|
Assets: |
|
|
|
Investments at value (cost of $772,868,940) (Notes 1 and 5) | $ | 718,980,690 |
|
Cash |
| 279,749,278 |
|
Restricted cash pledged to counterparty for collateral management |
| 340,000 |
|
Foreign currency at value (cost of $10,330) |
| 10,128 |
|
Receivable for securities sold |
| 63,816,324 |
|
Dividends and interest receivable |
| 16,945,552 |
|
Receivable for fund shares sold |
| 2,520,129 |
|
Unrealized appreciation on forward foreign currency contracts |
| 131,821 |
|
Other assets |
| 44,767 |
|
|
| ||
Total assets |
| 1,082,538,689 |
|
|
| ||
|
|
|
|
Liabilities: |
|
|
|
Payable for securities purchased |
| 23,886,189 |
|
Payable for fund shares redeemed |
| 1,066,864 |
|
Distribution fees payable (Note 6) |
| 785,227 |
|
Payable to investment adviser (Note 3) |
| 647,056 |
|
Accrued expenses |
| 218,755 |
|
Payable for shareholder servicing fees (Note 3) |
| 158,303 |
|
Payable to trustees and officers |
| 9,199 |
|
|
| ||
Total liabilities |
| 26,771,593 |
|
|
| ||
Net assets | $ | 1,055,767,096 |
|
|
| ||
|
|
|
|
Summary of net assets: |
|
|
|
Capital stock, $0.001 par value | $ | 1,122,400,095 |
|
Accumulated undistributed net investment income |
| 24,669,261 |
|
Accumulated net realized losses on investments and foreign currency transactions |
| (37,548,696 | ) |
Net unrealized depreciation of investments and translation of foreign currency denominated assets and liabilities |
| (53,753,564 | ) |
|
| ||
Net assets applicable to capital shares outstanding | $ | 1,055,767,096 |
|
|
| ||
|
|
|
|
Investor Class: |
|
|
|
Net assets applicable to 32,433,575 shares outstanding, unlimited number of shares authorized | $ | 325,900,811 |
|
|
| ||
Net asset value, offering and redemption price per share | $ | 10.05 |
|
|
| ||
|
|
|
|
Institutional Class: |
|
|
|
Net assets applicable to 72,706,336 shares outstanding, unlimited number of shares authorized | $ | 729,866,285 |
|
|
| ||
Net asset value, offering and redemption price per share | $ | 10.04 |
|
|
|
|
The accompanying notes are an integral part of the financial statements. |
|
43 |
Third Avenue Trust
Third Avenue Focused Credit Fund
Statement of Operations
For the Six Months Ended April 30, 2012
(Unaudited)
|
|
|
|
Investment Income: |
|
|
|
Interest | $ | 50,075,581 |
|
Dividends |
| 718,998 |
|
Other income |
| 297 |
|
|
| ||
Total investment income |
| 50,794,876 |
|
|
| ||
|
|
|
|
Expenses: |
|
|
|
Investment advisory fees (Note 3) |
| 3,808,202 |
|
Distribution fees (Note 6) |
| 384,289 |
|
Transfer agent fees |
| 155,954 |
|
Legal fees |
| 132,569 |
|
Shareholder servicing fees (Note 3) |
| 111,383 |
|
Auditing fees |
| 80,986 |
|
Accounting fees |
| 76,482 |
|
Trustees’ and officers’ fees and expenses |
| 71,725 |
|
Reports to shareholders |
| 67,628 |
|
Registration and filing fees |
| 49,647 |
|
Administration fees (Note 3) |
| 27,927 |
|
Custodian fees |
| 19,179 |
|
Insurance expenses |
| 14,920 |
|
Miscellaneous expenses |
| 28,935 |
|
|
| ||
Total expenses |
| 5,029,826 |
|
Expenses reduced by custodian fee expense offset arrangement (Note 3) |
| (9,408 | ) |
|
| ||
Net expenses |
| 5,020,418 |
|
|
| ||
Net investment income |
| 45,774,458 |
|
|
| ||
|
|
|
|
Realized and unrealized gain/(loss) on investments and foreign currency transactions: |
|
|
|
Net realized loss on investments - unaffiliated issuers |
| (34,621,989 | ) |
Net realized loss on foreign currency transactions |
| (61,259 | ) |
Net change in unrealized appreciation/(depreciation) on investments |
| 27,296,607 |
|
Net change in unrealized appreciation/(depreciation) on translation of other assets and liabilities denominated in foreign currency |
| 283,280 |
|
|
| ||
Net loss on investments and foreign currency transactions |
| (7,103,361 | ) |
|
| ||
Net increase in net assets resulting from operations | $ | 38,671,097 |
|
|
|
|
The accompanying notes are an integral part of the financial statements. |
|
44 |
Third Avenue Trust
Third Avenue Focused Credit Fund
Statement of Changes in Net Assets
|
|
|
|
|
|
|
|
|
| For the |
| For the Year |
| ||
|
|
|
| ||||
Operations: |
|
|
|
|
|
|
|
Net investment income |
| $ | 45,774,458 |
| $ | 87,188,378 |
|
Net realized gain/(loss) on investments - unaffiliated issuers |
|
| (34,621,989 | ) |
| 41,773,493 |
|
Net realized loss on investments - affiliated issuers |
|
| — |
|
| (229,000 | ) |
Net realized loss on foreign currency transactions |
|
| (61,259 | ) |
| (402,941 | ) |
Net change in unrealized appreciation/(depreciation) on investments and unfunded commitments |
|
| 27,296,607 |
|
| (133,019,229 | ) |
Net change in unrealized appreciation/(depreciation) on translation of other assets and liabilities denominated in foreign currency |
|
| 283,280 |
|
| (145,458 | ) |
|
|
|
| ||||
Net increase/(decrease) in net assets resulting from operations |
|
| 38,671,097 |
|
| (4,834,757 | ) |
|
|
|
| ||||
|
|
|
|
|
|
|
|
Dividends and Distributions to Shareholders from: |
|
|
|
|
|
|
|
Net investment income: |
|
|
|
|
|
|
|
Investor Class |
|
| (12,283,967 | ) |
| (22,349,140 | ) |
Institutional Class |
|
| (29,062,057 | ) |
| (57,219,166 | ) |
Net realized gains: |
|
|
|
|
|
|
|
Investor Class |
|
| (13,523,752 | ) |
| (2,378,123 | ) |
Institutional Class |
|
| (30,842,555 | ) |
| (7,065,161 | ) |
|
|
|
| ||||
Decrease in net assets from dividends and distributions |
|
| (85,712,331 | ) |
| (89,011,590 | ) |
|
|
|
| ||||
Capital Share Transactions: |
|
|
|
|
|
|
|
Proceeds from sale of shares |
|
| 206,563,907 |
|
| 615,362,700 |
|
Net asset value of shares issued in reinvestment of dividends and distributions |
|
| 70,997,622 |
|
| 75,295,393 |
|
Redemption fees |
|
| 60,311 |
|
| 289,629 |
|
Cost of shares redeemed |
|
| (278,377,752 | ) |
| (502,178,413 | ) |
|
|
|
| ||||
Net increase/(decrease) in net assets resulting from capital share transactions |
|
| (755,912 | ) |
| 188,769,309 |
|
|
|
|
| ||||
Net increase/(decrease) in net assets |
|
| (47,797,146 | ) |
| 94,922,962 |
|
Net assets at beginning of period |
|
| 1,103,564,242 |
|
| 1,008,641,280 |
|
|
|
|
| ||||
Net assets at end of period |
|
|
|
|
|
|
|
(including accumulated undistributed net investment income of $24,669,261and $20,240,827, respectively) |
| $ | 1,055,767,096 |
| $ | 1,103,564,242 |
|
|
|
|
| ||||
|
The accompanying notes are an integral part of the financial statements. |
|
45 |
Third Avenue Trust
Third Avenue Focused Credit Fund
Financial Highlights
Selected data (for a share outstanding throughout each period) and ratios are as follows:
|
|
|
|
|
|
|
|
|
|
|
|
|
|
Investor Class: |
| For the Six |
| For the Year |
| For the Year |
| For the Period |
| ||||
|
|
|
|
| |||||||||
Net asset value, beginning of period |
| $ | 10.51 |
| $ | 11.36 |
| $ | 10.25 |
| $ | 10.00 |
|
|
|
|
|
|
| ||||||||
Income/(loss) from investment operations: |
|
|
|
|
|
|
|
|
|
|
|
|
|
Net investment income@ |
|
| 0.44 |
|
| 0.85 |
|
| 0.83 |
|
| 0.07 |
|
Net gain/(loss) on investment transactions (both realized and unrealized) |
|
| (0.05 | )1 |
| (0.81 | )2 |
| 0.89 | 3 |
| 0.18 | 1 |
|
|
|
|
|
| ||||||||
Total from investment operations |
|
| 0.39 |
|
| 0.04 |
|
| 1.72 |
|
| 0.25 |
|
|
|
|
|
|
| ||||||||
Less dividends and distributions to shareholders: |
|
|
|
|
|
|
|
|
|
|
|
|
|
Dividends from net investment income |
|
| (0.40 | ) |
| (0.79 | ) |
| (0.60 | ) |
| — |
|
Distributions from realized gains |
|
| (0.45 | ) |
| (0.10 | ) |
| (0.01 | ) |
| — |
|
|
|
|
|
|
| ||||||||
Total dividends and distributions |
|
| (0.85 | ) |
| (0.89 | ) |
| (0.61 | ) |
| — |
|
|
|
|
|
|
| ||||||||
Net asset value, end of period |
| $ | 10.05 |
| $ | 10.51 |
| $ | 11.36 |
| $ | 10.25 |
|
|
|
|
|
|
| ||||||||
| |||||||||||||
Total return4 |
|
| 4.33 | %5 |
| 0.24 | % |
| 17.19 | % |
| 2.50 | %5 |
Ratios/Supplemental Data: |
|
|
|
|
|
|
|
|
|
|
|
|
|
Net assets, end of period (in thousands) |
| $ | 325,901 |
| $ | 338,098 |
| $ | 248,975 |
| $ | 90,913 |
|
Ratio of expenses to average net assets |
|
|
|
|
|
|
|
|
|
|
|
|
|
Before fee waivers/expense offset arrangement/recovery |
|
| 1.16 | %6 |
| 1.18 | % |
| 1.20 | % |
| 1.53 | %6 |
After fee waivers/expense offset arrangement/recovery7 |
|
| 1.16 | %6 |
| 1.18 | % |
| 1.21 | %† |
| 1.40 | %6# |
Ratio of net investment income to average net assets |
|
| 8.81 | %6 |
| 7.64 | % |
| 7.69 | % |
| 4.18 | %6 |
Portfolio turnover rate |
|
| 21 | %5 |
| 105 | % |
| 129 | % |
| 12 | %5 |
|
|
1 | Includes redemption fees of less than $0.01 per share. |
|
|
2 | Includes redemption fees of $0.01 per share. |
|
|
3 | Includes redemption fees of $0.02 per share. |
|
|
4 | Performance figures may reflect fee waivers, expense offset arrangement and/or recovery of previously waived fees. Past performance is no guarantee of future results. Total return would have been lower if the Adviser had not waived certain expenses. Conversely, total return would have been higher if the adviser had not recovered previously waived expenses. |
|
|
5 | Not annualized. |
|
|
6 | Annualized. |
|
|
7 | As a result of an expense limitation, the ratio of expenses (exclusive of taxes, interest, brokerage commissions, acquired fund fees and expenses, and extraordinary items) to average net assets will not exceed 1.40%. Effective March 1, 2011, the expense limitation has been reduced to 1.20%. |
|
|
† | The investment adviser recovered previously waived fees. |
|
|
# | The investment adviser waived a portion of its fees. |
|
|
* | Period from August 31, 2009 (commencement of operations) to October 31, 2009. |
|
|
@ | Calculated based on the average number of shares outstanding during the period. |
|
The accompanying notes are an integral part of the financial statements. |
|
46 |
Third Avenue Trust
Third Avenue Focused Credit Fund
Financial Highlights (continued)
Selected data (for a share outstanding throughout each period) and ratios are as follows:
|
|
|
|
|
|
|
|
|
|
|
|
|
|
Institutional Class: |
| For the Six |
| For the Year |
| For the Year |
| For the Period |
| ||||
|
|
|
|
| |||||||||
Net asset value, beginning of period |
| $ | 10.50 |
| $ | 11.36 |
| $ | 10.26 |
| $ | 10.00 |
|
|
|
|
|
|
| ||||||||
Income/(loss) from investment operations: |
|
|
|
|
|
|
|
|
|
|
|
|
|
Net investment income@ |
|
| 0.45 |
|
| 0.88 |
|
| 0.86 |
|
| 0.08 |
|
Net gain/(loss) on investment transactions (both realized and unrealized) |
|
| (0.04 | )1 |
| (0.83 | )1 |
| 0.87 | 1 |
| 0.18 |
|
|
|
|
|
|
| ||||||||
Total from investment operations |
|
| 0.41 |
|
| 0.05 |
|
| 1.73 |
|
| 0.26 |
|
|
|
|
|
|
| ||||||||
Less dividends and distributions to shareholders: |
|
|
|
|
|
|
|
|
|
|
|
|
|
Dividends from net investment income |
|
| (0.42 | ) |
| (0.81 | ) |
| (0.62 | ) |
| — |
|
Distributions from realized gains |
|
| (0.45 | ) |
| (0.10 | ) |
| (0.01 | ) |
| — |
|
|
|
|
|
|
| ||||||||
Total dividends and distributions |
|
| (0.87 | ) |
| (0.91 | ) |
| (0.63 | ) |
| — |
|
|
|
|
|
|
| ||||||||
Net asset value, end of period |
| $ | 10.04 |
| $ | 10.50 |
| $ | 11.36 |
| $ | 10.26 |
|
|
|
|
|
|
| ||||||||
| |||||||||||||
Total return2 |
|
| 4.47 | %3 |
| 0.37 | % |
| 17.38 | % |
| 2.60 | %3 |
Ratios/Supplemental Data: |
|
|
|
|
|
|
|
|
|
|
|
|
|
Net assets, end of period (in thousands) |
| $ | 729,866 |
| $ | 765,467 |
| $ | 759,666 |
| $ | 191,926 |
|
Ratio of expenses to average net assets |
|
|
|
|
|
|
|
|
|
|
|
|
|
Before fee waivers/expense offset arrangement/recovery |
|
| 0.91 | %4 |
| 0.92 | % |
| 0.93 | % |
| 1.18 | %4 |
After fee waivers/expense offset arrangement/recovery5 |
|
| 0.91 | %4 |
| 0.92 | % |
| 0.94 | %† |
| 0.95 | %4# |
Ratio of net investment income to average net assets |
|
| 9.10 | %4 |
| 7.87 | % |
| 7.99 | % |
| 4.59 | %4 |
Portfolio turnover rate |
|
| 21 | %3 |
| 105 | % |
| 129 | % |
| 12 | %3 |
|
|
1 | Includes redemption fees of less than $0.01 per share. |
|
|
2 | Performance figures may reflect fee waivers, expense offset arrangement and/or recovery of previously waived fees. Past performance is no guarantee of future results. Total return would have been lower if the Adviser had not waived certain expenses. Conversely, total return would have been higher if the adviser had not recovered previously waived expenses. |
|
|
3 | Not annualized. |
|
|
4 | Annualized. |
|
|
5 | As a result of an expense limitation, the ratio of expenses (exclusive of taxes, interest, brokerage commissions, acquired fund fees and expenses, and extraordinary items) to average net assets will not exceed 0.95%. |
|
|
† | The investment adviser recovered previously waived fees. |
|
|
# | The investment adviser waived a portion of its fees. |
|
|
* | Period from August 31, 2009 (commencement of operations) to October 31, 2009. |
|
|
@ | Calculated based on the average number of shares outstanding during the period. |
|
The accompanying notes are an integral part of the financial statements. |
|
47 |
Third Avenue Trust
Notes to Financial Statements
April 30, 2012
(Unaudited)
1. SUMMARY OF ORGANIZATION AND SIGNIFICANT ACCOUNTING POLICIES
Organization:
Third Avenue Trust (the “Trust”) is an open-end, management investment company organized as a Delaware business trust pursuant to a Trust Instrument dated October 31, 1996. The Trust currently consists of five non-diversified (within the meaning of Section 5(b)(2) of the Investment Company Act), separate investment series: Third Avenue Value Fund, Third Avenue Small-Cap Value Fund, Third Avenue Real Estate Value Fund, Third Avenue International Value Fund and Third Avenue Focused Credit Fund (each a “Fund” and, collectively, the “Funds”). Third Avenue Management LLC (the “Adviser”) provides investment advisory services to each of the Funds in the Trust. The Funds seek to achieve their investment objectives by adhering to a strict value discipline when selecting securities. Each Fund has a distinct investment approach.
Third Avenue Value Fund seeks to achieve its objective mainly by acquiring common stocks of well-financed companies (meaning companies with high quality assets and conservative levels of liabilities) at a discount to what the Adviser believes is their intrinsic value. The Fund may invest in companies of any market capitalization. The Fund may also acquire senior securities, such as preferred stocks and debt instruments (including high-yield and distressed securities that may be in default and may have any or no credit rating), that the Adviser believes are undervalued. The Fund invests in both domestic and foreign securities.
Third Avenue Small-Cap Value Fund seeks to achieve its objective mainly by acquiring equity securities, including common stocks and convertible securities, of well-financed small companies (meaning companies with high quality assets and conservative levels of liabilities) at a discount to what the Adviser believes is their intrinsic value. The Fund may also acquire senior securities, such as preferred stocks and debt instruments (including high-yield and distressed securities that may be in default and may have any or no credit rating), that the Adviser believes are undervalued. Under normal circumstances, the Fund expects to invest at least 80% of its assets (plus the amount of any borrowing for investment purposes) in securities of companies that are considered small. The Fund considers a “small company” to be one whose market capitalization is within the range of capitalizations during the most recent 12-month period of companies in the Russell 2000 Index, the S&P Small Cap 600 Index or the Dow Jones Wilshire U.S. Small-Cap Index at the time of investment (based on month-end data). The Fund invests in both domestic and foreign securities.
Third Avenue Real Estate Value Fund, under normal circumstances, seeks to achieve its objective mainly by investing at least 80% of its assets (plus the amount of any borrowing for investment purposes) in securities of real estate and real estate-related companies, or in companies which own significant real estate assets at the time of investment (“real estate companies”). These securities will primarily be equity securities including common stocks and convertible securities, of well-financed real estate companies (meaning companies with high quality assets and conservative levels of liabilities) of any market capitalization. The Fund seeks to acquire these securities at a discount to what the Adviser believes is their intrinsic value. The Fund may also acquire senior securities, such as preferred stocks and debt instruments (including
|
48 |
Third Avenue Trust
Notes to Financial Statements (continued)
April 30, 2012
(Unaudited)
high-yield and distressed securities that may be in default and may have any or no credit rating), that the Adviser believes are undervalued. The Fund invests in both domestic and foreign securities.
Third Avenue International Value Fund seeks to achieve its objective mainly by acquiring equity securities, including common stocks and convertible securities, of well-financed companies (meaning companies with high quality assets and conservative levels of liabilities) located outside of the United States. While the Fund may invest in companies located anywhere in the world, it currently expects that most of its assets will be invested in the more developed countries and, under normal circumstances, at least 80% of its assets (plus the amount of any borrowing for investment purposes) will be invested in securities of issuers located outside of the United States at the time of investment. The Fund may also acquire senior securities, such as preferred stocks and debt instruments (including high-yield and distressed securities that may be in default and may have any or no credit rating), that the Adviser believes are undervalued.
Third Avenue Focused Credit Fund, under normal circumstances, seeks to achieve its objective mainly by investing at least 80% of the Fund’s net assets (plus the amount of any borrowing for investment purposes) in bonds and other types of credit instruments. The Fund intends to invest a substantial amount of its assets in credit instruments that are rated below investment grade by some or all relevant independent rating agencies, including Moody’s Investors Service, Inc., Standard & Poor’s Rating Group and Fitch Ratings. Credit instruments include high-yield bonds (commonly known as “junk bonds” or “junk debt”), bank debt, convertible bonds or preferred stock, loans made to bankrupt companies (including debtor-in-possession loans), loans made to refinance distressed companies and other types of debt instruments. In making these investments, the Adviser will seek to purchase instruments that the Adviser believes are undervalued. The Fund may have significant investments in distressed and defaulted securities and intends to focus on a relatively small number of issuers. The Fund may also purchase equity securities or hold positions in equity or other assets that the Fund receives as part of a reorganization process, and may hold those assets until such time as the Adviser believes that a disposition is most advantageous.
Because of the Funds’ disciplined and deliberate investing approach, there may be times when the Funds will have significant cash positions. A substantial cash position can adversely impact Fund performance in certain market conditions, and may make it more difficult for a Fund to achieve its investment objective.
Accounting policies:
The policies described below are followed consistently by the Funds in the preparation of their financial statements in conformity with accounting principles generally accepted in the United States of America (“U.S. GAAP”).
The preparation of financial statements in accordance with U.S. GAAP requires management to make estimates and assumptions that affect the reported amounts and disclosures. Actual results could differ from those estimates.
|
49 |
Third Avenue Trust
Notes to Financial Statements (continued)
April 30, 2012
(Unaudited)
Security valuation:
Generally, the Funds’ investments are valued at market value. Securities traded on a principal stock exchange, including The NASDAQ Stock Market, Inc. (“NASDAQ”), are valued at the last quoted sales price, the NASDAQ official closing price, or in the absence of closing sales prices on that day, securities are valued at the mean between the closing bid and asked price. In accordance with procedures approved by the Trust’s Board of Trustees (the “Board”), the Funds have retained a third party provider that, under certain circumstances, applies a statistical model to provide fair value pricing for foreign equity securities with principal markets that are no longer open when a Fund calculates its net asset value (“NAV”), and certain events have occurred after the principal markets have closed but prior to the time as of which the Funds compute their NAVs. Debt instruments with maturities greater than 60 days, including floating rate loan securities, are valued on the basis of prices obtained from a pricing service approved as reliable by the Board or otherwise pursuant to policies and procedures approved by the Board. Temporary cash investments are valued at cost, plus accrued interest, which approximates market value. Short-term debt securities with 60 days or less to maturity may be valued at amortized cost.
Each Fund may invest up to 15% of its total net assets in securities which are not readily marketable, including those which are restricted as to disposition under applicable securities laws (“restricted securities”). Restricted securities and other securities and assets for which market quotations are not readily available are valued at “fair value”, as determined in good faith by the Trust’s Valuation Committee as authorized by the Board of the Trust, under procedures established by the Board. At April 30, 2012, such securities had a total fair value of $95,051,722 or 3.19% of net assets of Third Avenue Value Fund, $9,547,500 or 1.30% of net assets of Third Avenue Small-Cap Value Fund, $46,855,469 or 2.71% of net assets of Third Avenue Real Estate Value Fund and $9,659,920 or 0.91% of net assets of Third Avenue Focused Credit Fund. There were no fair valued securities for Third Avenue International Value Fund at April 30, 2012. Among the factors that may be considered by the Trust’s Valuation Committee in determining fair value are: the type of security, trading in unrestricted securities of the same issuer, the financial condition of the issuer, the percentage of the Fund’s beneficial ownership of the issuer’s common stocks and debt securities, the operating results of the issuer and the discount from market value of any similar unrestricted securities of the issuer at the time of purchase and liquidation values of the issuer. The fair values determined in accordance with these procedures may differ significantly from the amounts which would be realized upon disposition of the securities. Restricted securities often have costs associated with subsequent registration. The restricted securities currently held by the Funds are not expected to incur any material future registration costs.
Fair value measurements:
In accordance with Financial Accounting Standards Board Accounting Standard Codification (“FASB ASC”) FASB ASC 820-10, Fair Value Measurements and Disclosures, the Funds disclose the fair value of their investments in a hierarchy that prioritizes the inputs to valuation techniques used to measure the fair value. Fair value is defined as the price that a Fund would receive upon selling an investment in an orderly transaction to an independent buyer in the principal or most advantageous market for the investment under current market conditions. The hierarchy gives the highest priority
|
50 |
Third Avenue Trust
Notes to Financial Statements (continued)
April 30, 2012
(Unaudited)
to valuations based upon unadjusted quoted prices in active markets for identical assets or liabilities (Level 1 measurement) and the lowest priority to valuations based upon unobservable inputs that are significant to the valuation (Level 3 measurements). The three levels of the fair value hierarchy are as follows:
|
|
|
| • | Level 1 – Inputs that reflect unadjusted quoted prices in active markets for identical assets or liabilities that the Fund has the ability to access at the measurement date; |
| ||
| • | Level 2 – Inputs other than quoted prices that are observable for the asset or liability either directly or indirectly, including inputs in markets that are not considered to be active; |
| ||
| • | Level 3 – Significant unobservable inputs (including the Fund’s own assumptions in determining the fair value of investments) |
A financial instrument’s level within the fair value hierarchy is based on the lowest level of any input both individually and in aggregate that is significant to the fair value measurement. However, the determination of what constitutes “observable” requires significant judgment by the Fund. The Fund considers observable data to be market data which is readily available, regularly distributed or updated, reliable and verifiable, not proprietary, and provided by independent sources that are actively involved in the relevant market. The inputs or methodology used for valuing securities are not necessarily an indication of the risk associated with investing in those securities.
The Fund uses valuation techniques to measure fair value that are consistent with the market approach and/or income approach, depending on the type of security and the particular circumstance. The market approach uses prices and other relevant information generated by market transactions involving identical or comparable securities. The income approach uses valuation techniques to discount estimated future cash flows to present value.
The following are certain inputs and techniques that the Funds generally use to evaluate how to classify each major category of assets and liabilities for Level 2 and Level 3, in accordance with U.S. GAAP.
Equity Securities (Common and Preferred Stocks)—Equity securities traded in inactive markets and certain foreign equity securities are valued using inputs which include broker-dealer quotes, recently executed transactions adjusted for changes in the benchmark index, or evaluated price quotes received from independent pricing services that take into account the integrity of the market sector and issuer, the individual characteristics of the security, and information received from broker-dealers and other market sources pertaining to the issuer or security. To the extent that these inputs are observable, the values of equity securities are categorized as Level 2. To the extent that these inputs are unobservable, the values are categorized as Level 3.
U.S. Treasury Obligations—U.S. Treasury obligations are valued by independent pricing services based on pricing models that evaluate the mean between the most recently quoted bid and ask price. The models also take into consideration
|
51 |
Third Avenue Trust
Notes to Financial Statements (continued)
April 30, 2012
(Unaudited)
data received from active market makers and broker-dealers, yield curves, and the spread over comparable U.S. Treasury issues. The spreads change daily in response to market conditions and are generally obtained from the new issue market and broker-dealer sources. To the extent that these inputs are observable, the values of U.S. Treasury obligations are categorized as Level 2. To the extent that these inputs are unobservable, the values are categorized as Level 3.
Corporate Bonds & Notes—Corporate bonds and notes are generally comprised of two main categories: investment grade bonds and high yield bonds. Investment grade bonds are valued by independent pricing services using various inputs and techniques, which include broker-dealer quotations, live trading levels, recently executed transactions in securities of the issuer or comparable issuers, and option adjusted spread models that include base curve and spread curve inputs. Adjustments to individual bonds can be applied to recognize trading differences compared to other bonds issued by the same issuer. High yield bonds are valued by independent pricing services based primarily on broker-dealer quotations from relevant market makers and recently executed transactions in securities of the issuer or comparable issuers. The broker-dealer quotations received are supported by credit analysis of the issuer that takes into consideration credit quality assessments, daily trading activity, and the activity of the underlying equities, listed bonds and sector specific trends. To the extent that these inputs are observable, the values of corporate bonds and notes are categorized as Level 2. To the extent that these inputs are unobservable, the values are categorized as Level 3.
Forward Foreign Currency Contracts—Forward foreign currency contracts are valued by independent pricing services using various inputs and techniques, which include broker-dealer quotations, actual trading information and foreign currency exchange rates gathered from leading market makers and foreign currency exchange trading centers throughout the world. To the extent that these inputs are observable, the values of forward foreign currency contracts are categorized as Level 2. To the extent that these inputs are unobservable, the values are categorized as Level 3.
Term Loans—Term Loans are valued by independent pricing services based on the average of quoted prices received from multiple dealers or valued relative to other benchmark securities when broker-dealer quotes are unavailable. To the extent that these inputs are observable, the values of Term Loans are categorized as Level 2. To the extent that these inputs are unobservable, the values are categorized as Level 3.
Municipal Bonds—Municipal bonds are valued by independent pricing services based on pricing models that take into account, among other factors, information received from market makers and broker-dealers, current trades, bid-ask lists, offerings, market movements, the callability of the bond, state of issuance, benchmark yield curves, and bond insurance. To the extent that these inputs are observable, the values of municipal bonds are categorized as Level 2. To the extent that these inputs are unobservable, the values are categorized as Level 3.
Options—Options are valued by independent pricing services or by brokers based on pricing models that take into account, among other factors, changes in the price of the underlying securities, time until expiration, and volatility of
|
52 |
Third Avenue Trust
Notes to Financial Statements (continued)
April 30, 2012
(Unaudited)
the underlying security. To the extent that these inputs are observable, the values of options are categorized as Level 2. To the extent that these inputs are unobservable, the values are categorized as Level 3.
Equity Swaps—Equity Swap values are based on the performance of the underlying security which is valued by independent pricing services. The performance is based on the change in the price of the underlying securities. To the extent that this input is observable, the value of the equity swap is categorized as Level 2. To the extent that this input is unobservable, the value is categorized as Level 3.
The following is a summary by level of inputs used to value the Funds’ investments as of April 30, 2012:
|
|
|
|
|
|
|
|
|
|
|
|
|
|
|
|
|
|
| Third Avenue |
| Third Avenue |
| Third Avenue |
| Third Avenue |
| Third Avenue |
| |||||
|
|
|
|
|
|
| ||||||||||
Level 1: Quoted Prices† |
|
|
|
|
|
|
|
|
|
|
|
|
|
|
|
|
Investments in Securities: |
|
|
|
|
|
|
|
|
|
|
|
|
|
|
|
|
Common Stocks & Warrants: |
|
|
|
|
|
|
|
|
|
|
|
|
|
|
|
|
Auto Supply |
| $ | — |
| $ | 6,938,618 |
| $ | — |
| $ | — |
| $ | — |
|
Consumer Products |
|
| — |
|
| 11,884,937 |
|
| — |
|
| — |
|
| — |
|
Energy |
|
| — |
|
| — |
|
| — |
|
| — |
|
| 35,144 |
|
Financials |
|
| — |
|
| — |
|
| — |
|
| — |
|
| 7,886,398 |
|
Insurance & Reinsurance |
|
| 24,992,468 |
|
| 36,163,998 |
|
| — |
|
| — |
|
| — |
|
Non-U.S. Real Estate Investment Trusts |
|
| — |
|
| 11,849,256 |
|
| 310,339,140 |
|
| — |
|
| — |
|
U.S. Real Estate Operating Companies |
|
| 186,032,372 |
|
| 35,510,740 |
|
| 219,830,408 |
|
| — |
|
| — |
|
Others# |
|
| 2,301,660,409 |
|
| 473,952,129 |
|
| 781,807,318 |
|
| 989,569,151 |
|
| 2,537,362 |
|
Purchased Options – |
|
|
|
|
|
|
|
|
|
|
|
|
|
|
|
|
Equity Put Options |
|
| — |
|
| — |
|
| — |
|
| — |
|
| 300,000 |
|
Preferred Stocks: |
|
|
|
|
|
|
|
|
|
|
|
|
|
|
|
|
Insurance & Reinsurance |
|
| 8,634 |
|
| — |
|
| — |
|
| — |
|
| — |
|
Others# |
|
| — |
|
| 1,875,555 |
|
| — |
|
| — |
|
| 14,187,420 |
|
|
|
|
|
|
|
| ||||||||||
Total for Level 1 Securities |
|
| 2,512,693,883 |
|
| 578,175,233 |
|
| 1,311,976,866 |
|
| 989,569,151 |
|
| 24,946,324 |
|
|
|
|
|
|
|
| ||||||||||
Level 2: Other Significant Observable Inputs† |
|
|
|
|
|
|
|
|
|
|
|
|
|
|
|
|
Investments in Securities: |
|
|
|
|
|
|
|
|
|
|
|
|
|
|
|
|
Common Stocks: |
|
|
|
|
|
|
|
|
|
|
|
|
|
|
|
|
U.S. Real Estate Operating Companies |
|
| — |
|
| — |
|
| 39,842,740 |
|
| — |
|
| — |
|
Others# |
|
| 139,715,406 |
|
| — |
|
| 26,454,452 |
|
| 122,190,708 |
|
| — |
|
|
53 |
Third Avenue Trust
Notes to Financial Statements (continued)
April 30, 2012
(Unaudited)
Summary of level of inputs (continued)
|
|
|
|
|
|
|
|
|
|
|
|
|
|
|
|
|
|
| Third Avenue |
| Third Avenue |
| Third Avenue |
| Third Avenue |
| Third Avenue |
| |||||
|
|
|
|
|
|
| ||||||||||
Level 2 (continued) |
|
|
|
|
|
|
|
|
|
|
|
|
|
|
|
|
Debt Securities issued by the U.S. Treasury and other government corporations and agencies: |
|
|
|
|
|
|
|
|
|
|
|
|
|
|
|
|
Municipal Bonds# |
| $ | — |
| $ | — |
| $ | — |
| $ | — |
| $ | 2,640,456 |
|
Corporate Bonds & Notes# |
|
| — |
|
| — |
|
| 10,244,600 |
|
| — |
|
| 606,404,375 |
|
Term Loans# |
|
| — |
|
| — |
|
| — |
|
| — |
|
| 48,861,136 |
|
Private Equities# |
|
| — |
|
| — |
|
| — |
|
| — |
|
| 8,393,242 |
|
Purchased Options – |
|
|
|
|
|
|
|
|
|
|
|
|
|
|
|
|
Foreign Currency Put Options |
|
| — |
|
| — |
|
| 899,976 |
|
| 8,982,724 |
|
| — |
|
Short Term Investments – |
|
|
|
|
|
|
|
|
|
|
|
|
|
|
|
|
U.S. Government Obligations |
|
| — |
|
| 89,964,436 |
|
| — |
|
| — |
|
| — |
|
|
|
|
|
|
|
| ||||||||||
Total for Level 2 Securities |
|
| 139,715,406 |
|
| 89,964,436 |
|
| 77,441,768 |
|
| 131,173,432 |
|
| 666,299,209 |
|
|
|
|
|
|
|
| ||||||||||
Level 3: Significant Unobservable Inputs |
|
|
|
|
|
|
|
|
|
|
|
|
|
|
|
|
Investments in Securities: |
|
|
|
|
|
|
|
|
|
|
|
|
|
|
|
|
Common Stocks & Warrants: |
|
|
|
|
|
|
|
|
|
|
|
|
|
|
|
|
Auto Supply |
|
| — | * |
| — |
|
| — |
|
| — |
|
| — |
|
Consumer Products |
|
| 26,318 |
|
| — |
|
| — |
|
| — |
|
| — |
|
Energy |
|
| — |
|
| — |
|
| — |
|
| — |
|
| 9,659,920 |
|
Financial Insurance |
|
| 555,000 |
|
| — |
|
| — |
|
| — |
|
| — |
|
Financials |
|
| — |
|
| — |
|
| — |
|
| — |
|
| — | * |
Insurance & Reinsurance |
|
| 142,022 |
|
| — |
|
| — |
|
| — |
|
| — |
|
Manufactured Housing |
|
| 82,570,207 |
|
| — |
|
| — |
|
| — |
|
| — |
|
Non-U.S. Real Estate Investment Trusts |
|
| — |
|
| — |
|
| — | * |
| — |
|
| — |
|
U.S. Real Estate Operating Companies |
|
| 6,641,537 |
|
| — |
|
| 4,543,605 |
|
| — |
|
| — |
|
Limited Partnerships: |
|
|
|
|
|
|
|
|
|
|
|
|
|
|
|
|
Holding Companies |
|
| — |
|
| 9,547,500 |
|
| — |
|
| — |
|
| — |
|
Insurance & Reinsurance |
|
| 353,635 |
|
| — |
|
| — |
|
| — |
|
| — |
|
Investment Fund |
|
| — |
|
| — |
|
| 42,311,864 |
|
| — |
|
| — |
|
Preferred Stocks – |
|
|
|
|
|
|
|
|
|
|
|
|
|
|
|
|
Insurance & Reinsurance |
|
| 194,023 |
|
| — |
|
| — |
|
| — |
|
| — |
|
Corporate Bonds & Notes# |
|
| 4,568,980 |
|
| — |
|
| — |
|
| — |
|
| 9,450,000 |
|
Term Loans# |
|
| — |
|
| — |
|
| — |
|
| — |
|
| 8,536,309 |
|
|
54 |
Third Avenue Trust
Notes to Financial Statements (continued)
April 30, 2012
(Unaudited)
Summary of level of inputs (continued)
|
|
|
|
|
|
|
|
|
|
|
|
|
|
|
|
|
|
| Third Avenue |
| Third Avenue |
| Third Avenue |
| Third Avenue |
| Third Avenue |
| |||||
|
|
|
|
|
|
| ||||||||||
Level 3 (continued) |
|
|
|
|
|
|
|
|
|
|
|
|
|
|
|
|
Private Equities – Aerospace |
| $ | — |
| $ | — |
| $ | — |
| $ | — |
| $ | 88,928 |
|
|
|
|
|
|
|
| ||||||||||
Total for Level 3 Securities |
|
| 95,051,722 |
|
| 9,547,500 |
|
| 46,855,469 |
|
| — |
|
| 27,735,157 |
|
|
|
|
|
|
|
| ||||||||||
Total Value of Investments |
| $ | 2,747,461,011 |
| $ | 677,687,169 |
| $ | 1,436,274,103 |
| $ | 1,120,742,583 |
| $ | 718,980,690 |
|
|
|
|
|
|
|
| ||||||||||
|
|
|
|
|
|
|
|
|
|
|
|
|
|
|
|
|
Investments in Other Financial Instruments: |
|
|
|
|
|
|
|
|
|
|
|
|
|
|
|
|
Level 2: Other Significant Observable Inputs |
|
|
|
|
|
|
|
|
|
|
|
|
|
|
|
|
Call Options Written |
| $ | — |
| $ | — |
| $ | (1,080,881 | ) | $ | — |
| $ | — |
|
Forward Foreign Currency Contracts |
|
| — |
|
| — |
|
| (5,598,006 | ) |
| — |
|
| 131,821 |
|
|
|
|
|
|
|
| ||||||||||
Total Appreciation/(Depreciation) of Other Financial Instruments |
| $ | — |
| $ | — |
| $ | (6,678,887 | ) | $ | — |
| $ | 131,821 |
|
|
|
|
|
|
|
| ||||||||||
|
|
† | Transfers between Level 1 and Level 2 included securities valued at $1,784,515,205, $94,718,250, $844,389,470, $787,998,239 at October 31, 2011 for Third Avenue Value Fund, Third Avenue Small-Cap Value Fund, Third Avenue Real Estate Value Fund and Third Avenue International Value Fund respectively which are currently included in Level 1 at April 30, 2012 that had previously been included in Level 2 at October 31, 2011. These changes were primarily the result of certain securities trading outside the U.S. whose values were adjusted by the application of fair value factors as a result of significant market movements following the close of local trading at October 31, 2011. |
|
|
# | Please refer to the Portfolios of Investments for industry specifics of the portfolio holdings. |
|
|
* | Securities have zero value. |
Transfers from Level 1 to Level 2, or from Level 2 to Level 1 are valued utilizing values as of the beginning of the period.
|
55 |
Third Avenue Trust
Notes to Financial Statements (continued)
April 30, 2012
(Unaudited)
Following is a reconciliation of Level 3 investments for which significant unobservable inputs were used to determine fair value:
|
|
|
|
|
|
|
|
|
|
|
|
|
|
|
|
|
|
|
|
|
|
|
|
| Balance |
| Net |
| Net |
| Payment- |
| Realized |
| Balance |
| Net change |
| |||||||
|
|
|
|
|
|
|
|
| ||||||||||||||
Third Avenue Value Fund |
|
|
|
|
|
|
|
|
|
|
|
|
|
|
|
|
|
|
|
|
|
|
Common Stocks: |
|
|
|
|
|
|
|
|
|
|
|
|
|
|
|
|
|
|
|
|
|
|
Auto Supply |
| $ | — | * | $ | — |
| $ | — |
| $ | — |
| $ | — |
| $ | — | * | $ | — |
|
Consumer Products |
|
| 26,318 |
|
| — |
|
| — |
|
| — |
|
| — |
|
| 26,318 |
|
| — |
|
Financial Insurance |
|
| 555,000 |
|
| — |
|
| — |
|
| — |
|
| — |
|
| 555,000 |
|
| — |
|
Insurance & Reinsurance |
|
| 145,847 |
|
| (3,825 | ) |
| — |
|
| — |
|
| — |
|
| 142,022 |
|
| (3,825 | ) |
Manufactured Housing |
|
| 80,843,000 |
|
| 3,941,307 |
|
| (2,657,793 | )† |
| — |
|
| 443,693 |
|
| 82,570,207 |
|
| 4,248,256 |
|
U.S. Real Estate |
|
| 6,641,537 |
|
| — |
|
| — |
|
| — |
|
| — |
|
| 6,641,537 |
|
| — |
|
Corporate Bonds & Notes# |
|
| 1,593,899 |
|
| 2,434,776 |
|
| — |
|
| 540,305 |
|
| — |
|
| 4,568,980 |
|
| 2,434,776 |
|
Limited Partnerships – |
|
|
|
|
|
|
|
|
|
|
|
|
|
|
|
|
|
|
|
|
|
|
Insurance & Reinsurance |
|
| 534,952 |
|
| (181,317 | ) |
| — |
|
| — |
|
| — |
|
| 353,635 |
|
| (181,317 | ) |
Preferred Stocks – |
|
|
|
|
|
|
|
|
|
|
|
|
|
|
|
|
|
|
|
|
|
|
Insurance & Reinsurance |
|
| 194,023 |
|
| — |
|
| — |
|
| — |
|
| — |
|
| 194,023 |
|
| — |
|
|
|
|
|
|
|
|
|
| ||||||||||||||
Total |
| $ | 90,534,576 |
| $ | 6,190,941 |
| $ | (2,657,793 | ) | $ | 540,305 |
| $ | 443,693 |
| $ | 95,051,722 |
| $ | 6,497,890 |
|
|
|
|
|
|
|
|
|
| ||||||||||||||
|
|
|
|
|
|
|
|
|
|
|
|
|
|
|
|
|
|
|
|
|
|
|
Third Avenue Small-Cap Value Fund |
|
|
|
|
|
|
|
|
|
|
|
|
|
|
|
|
|
|
|
|
|
|
Common Stocks – |
|
|
|
|
|
|
|
|
|
|
|
|
|
|
|
|
|
|
|
|
|
|
Forest Products & Paper |
| $ | 1,375,955 |
| $ | 41,392,353 |
| $ | (2,153 | ) | $ | — |
| $ | (42,766,155 | ) | $ | — |
| $ | — |
|
Limited Partnerships – |
|
|
|
|
|
|
|
|
|
|
|
|
|
|
|
|
|
|
|
|
|
|
Holding Companies |
|
| 9,167,500 |
|
| 380,000 |
|
| — |
|
| — |
|
| — |
|
| 9,547,500 |
|
| 380,000 |
|
|
|
|
|
|
|
|
|
| ||||||||||||||
Total |
| $ | 10,543,455 |
| $ | 41,772,353 |
| $ | (2,153 | ) | $ | — |
| $ | (42,766,155 | ) | $ | 9,547,500 |
| $ | 380,000 |
|
|
|
|
|
|
|
|
|
| ||||||||||||||
|
|
* | Securities have zero values. |
|
|
† | Redemption-in-kind transaction. |
|
|
# | Please refer to the Portfolios of Investments for industry specifics of the portfolio holdings. |
|
56 |
Third Avenue Trust
Notes to Financial Statements (continued)
April 30, 2012
(Unaudited)
|
|
|
|
|
|
|
|
|
|
|
|
|
|
|
|
|
|
|
|
|
|
|
|
| Balance |
| Net |
| Net |
| Realized |
| Transfer |
| Balance |
| Net change |
| |||||||
|
|
|
|
|
|
|
|
| ||||||||||||||
Third Avenue Real Estate Value Fund |
|
|
|
|
|
|
|
|
|
|
|
|
|
|
|
|
|
|
|
|
|
|
Common Stocks: |
|
|
|
|
|
|
|
|
|
|
|
|
|
|
|
|
|
|
|
|
|
|
Non-U.S. Real Estate Investment Trusts |
| $ | — |
| $ | — |
| $ | — | ** | $ | — |
| $ | — |
| $ | — | * | $ | — |
|
U.S. Real Estate Operating Companies |
|
| 4,543,605 |
|
| — |
|
| — |
|
| — |
|
| — |
|
| 4,543,605 |
|
| — |
|
Limited Partnerships – |
|
|
|
|
|
|
|
|
|
|
|
|
|
|
|
|
|
|
|
|
|
|
Investment Fund |
|
| 37,324,299 |
|
| 3,987,565 |
|
| 1,000,000 |
|
| — |
|
| — |
|
| 42,311,864 |
|
| 3,987,565 |
|
|
|
|
|
|
|
|
|
| ||||||||||||||
Total |
| $ | 41,867,904 |
| $ | 3,987,565 |
| $ | 1,000,000 |
| $ | — |
| $ | — |
| $ | 46,855,469 |
| $ | 3,987,565 |
|
|
|
|
|
|
|
|
|
| ||||||||||||||
Third Avenue International Value Fund |
|
|
|
|
|
|
|
|
|
|
|
|
|
|
|
|
|
|
|
|
|
|
Common Stocks – |
|
|
|
|
|
|
|
|
|
|
|
|
|
|
|
|
|
|
|
|
|
|
Forest Products & Paper |
| $ | 4,618,680 |
| $ | 132,027,855 |
| $ | (7,227 | ) | $ | (136,639,308 | ) | $ | — |
| $ | — |
| $ | — |
|
Third Avenue Focused Credit Fund |
|
|
|
|
|
|
|
|
|
|
|
|
|
|
|
|
|
|
|
|
|
|
Common Stocks & Warrants: |
|
|
|
|
|
|
|
|
|
|
|
|
|
|
|
|
|
|
|
|
|
|
Energy |
| $ | 13,119,000 |
| $ | (3,459,080 | ) | $ | (125,000 | ) | $ | 125,000 |
|
| — |
| $ | 9,659,920 |
| $ | (3,369,080 | ) |
Financials |
|
| — |
|
| — |
|
| — | ** |
| — |
|
| — |
|
| — | * |
| — |
|
Services |
|
| — | * |
| — |
|
| — | † |
| — |
|
| — |
|
| — |
|
| — |
|
Corporate Bonds & Notes# |
|
| — |
|
| 683,009 |
|
| 8,766,991 | ‡ |
| — |
|
| — |
|
| 9,450,000 |
|
| 683,009 |
|
Private Equities: |
|
|
|
|
|
|
|
|
|
|
|
|
|
|
|
|
|
|
|
|
|
|
Aerospace |
|
| 10,891,763 |
|
| (6,305,201 | ) |
| (1,443,400 | ) |
| (3,054,234 | ) |
| — |
|
| 88,928 |
|
| (5,317,915 | ) |
Financials |
|
| 1,599,151 |
|
| — |
|
| — |
|
| — |
|
| (1,599,151 | ) |
| — |
|
| — |
|
Utilities |
|
| 5,065,900 |
|
| — |
|
| — |
|
| — |
|
| (5,065,900 | ) |
| — |
|
| — |
|
Term Loans# |
|
| 27,607,381 |
|
| (2,719,356 | ) |
| (255,161 | )± |
| 491,320 |
|
| (16,587,875 | ) |
| 8,536,309 |
|
| (3,555,223 | ) |
|
|
|
|
|
|
|
|
| ||||||||||||||
Total |
| $ | 58,283,195 |
| $ | (11,800,628 | ) | $ | 6,943,430 |
| $ | (2,437,914 | ) | $ | (23,252,926 | ) | $ | 27,735,157 |
| $ | (11,559,209 | ) |
|
|
|
|
|
|
|
|
| ||||||||||||||
|
|
* | Securities have zero values. |
|
|
** | Security received through corporate action with zero cost. |
|
|
† | Securities sold with $0 proceeds. |
|
|
‡ | Includes amortization discount of $11,991. |
|
|
± | Includes amortization discount of $140,213. |
|
|
# | Please refer to the Portfolios of Investments for industry specifics of the portfolio holdings. |
Transfers into, and out of, Level 3 are valued utilizing values as of the beginning of the period.
|
57 |
Third Avenue Trust
Notes to Financial Statements (continued)
April 30, 2012
(Unaudited)
Transfers from Level 2 to Level 3 are due to the lack of quoted prices or other observable inputs. Transfers from Level 3 to Level 2 are due to the availability of quoted prices or other observable inputs.
In May 2011, the Financial Accounting Standards Board issued Accounting Standards Update (“ASU”) No. 2011-04 “Amendments to Achieve Common Fair Value Measurement and Disclosure Requirements in U.S. GAAP and International Financial Reporting Standards (“IFRS”)”. ASU 2011-04 includes common requirements for measurement of and disclosure about fair value between U.S. GAAP and IFRS. ASU 2011-04 will require reporting entities to disclose the following information for fair value measurements categorized within Level 3 of the fair value hierarchy: quantitative information about the unobservable inputs used in the fair value measurement, the valuation processes used by the reporting entity and a narrative description of the sensitivity of the fair value measurement to changes in unobservable inputs and the interrelationships between those unobservable inputs. In addition, ASU 2011-04 will require reporting entities to make disclosures about amounts and reasons for all transfers in and out of Level 1 and Level 2 fair value measurements. The new and revised disclosures are effective for interim and annual reporting periods beginning after December 15, 2011. At this time, management is evaluating the implications of ASU No. 2011-04 and its impact on the financial statements.
Security transactions and investment income:
Security transactions are accounted for on a trade date basis. Dividend income is recorded on the ex-dividend date or, for certain foreign dividends, as soon as the Funds become aware of the dividends. Interest income, including, where applicable, amortization of premium and accretion of discount on investments, is recorded daily on the accrual basis, except when collection is not expected. Payments received from certain investments held by the Funds may be comprised of dividends, capital gains and return of capital. The Funds originally estimate the expected classification of such payments. These amounts may subsequently be reclassified upon receipt of information from the issuer. Realized gains and losses from securities transactions are recorded on an identified cost basis.
Foreign currency translation and foreign investments:
The books and records of the Funds are maintained in U.S. dollars. Foreign currency amounts are translated into U.S. dollars as follows:
|
|
|
| • | Investments and assets and liabilities denominated in foreign currencies: At the prevailing rates of exchange on the valuation date. |
|
|
|
| • | Investment transactions and investment income: At the prevailing rates of exchange on the date of such transactions. |
|
58 |
Third Avenue Trust
Notes to Financial Statements (continued)
April 30, 2012
(Unaudited)
The net assets of the Funds are presented at market values using the foreign exchange rates at the close of the period. The Funds do not generally isolate that portion of the results of operations arising as a result of changes in the foreign exchange rates from the fluctuations arising from changes in the market prices of the securities held.
Similarly, the Funds do not isolate the effect of changes in foreign exchange rates from the fluctuations arising from changes in the market prices of securities sold during the period. Accordingly, realized and unrealized foreign currency gains/(losses) are included in the reported net realized gain/(loss) and unrealized appreciation/(depreciation) on investments transactions and balances.
Net realized gains/(losses) on foreign currency transactions represent net foreign exchange gains/(losses) from foreign currency exchange contracts, disposition of foreign currencies, currency gains or losses realized between the trade and settlement dates on securities transactions, and the difference between the amount of investment income and foreign withholding taxes recorded on the Funds’ books and the U.S. dollar equivalent amounts actually received or paid. Net unrealized currency gains (losses) from valuing foreign currency denominated assets and liabilities at period end exchange rates are reflected as a component of net unrealized appreciation/(depreciation) on the Statement of Assets and Liabilities. The change in net unrealized currency gains/(losses) for the period is reflected on the Statement of Operations.
Pursuant to U.S. federal income tax regulations, gains and losses from certain foreign currency transactions and the foreign currency portion of gains and losses realized on sales and maturities of foreign denominated debt securities are generally treated as ordinary income for U.S. federal income tax purposes.
Term loans:
The Funds typically invest in loans which are structured and administered by a third party entity (the “Agent”) that acts on behalf of a group of lenders that make or hold interests in the loan. These securities generally pay interest at rates which are periodically pre-determined by reference to a base lending rate plus a premium. These base lending rates are generally either the lending rate offered by one or more major European banks, such as the London Interbank Offered Rate (“LIBOR”) or the prime rate offered by one or more major United States banks, or the certificate of deposit rate. These securities are generally considered to be restricted, as the Funds are ordinarily contractually obligated to receive approval from the Agent bank and/or borrower prior to disposition. Remaining maturities of term loans may be less than the stated maturities shown as a result of contractual or optional payments by the borrower. Such prepayments cannot be predicted with certainty. The interest rate disclosed reflects the rate in effect on April 30, 2012.
Forward foreign currency contracts:
The Funds may be exposed to foreign currency risks associated with portfolio investments and therefore may use forward foreign currency contracts to hedge or manage these exposures. The Funds also may buy forward foreign currency con-
|
59 |
Third Avenue Trust
Notes to Financial Statements (continued)
April 30, 2012
(Unaudited)
tracts to gain exposure to currencies. Forward foreign currency contracts are valued at the forward rate and are marked-to-market daily. The change in market value is included in unrealized appreciation/(depreciation) on investments and foreign currency translations. When the contract is closed, the Funds record a realized gain or loss equal to the difference between the value of the contract at the time it was opened and the value at the time it was closed.
The use of forward foreign currency contracts does not eliminate fluctuations in the underlying prices of the Funds’ portfolio securities, but it does establish a rate of exchange that can be achieved in the future. Although forward foreign currency contracts limit the risk of loss due to a decline in the value of the hedged currency, they also limit any potential gain that might result should the value of the currency increase. In addition, the Funds could be exposed to risks if the counterparties to the contracts are unable to meet the terms of their contracts.
During the six months ended April 30, 2012, Third Avenue Real Estate Value Fund and Third Avenue Focused Credit Fund used forward foreign currency contracts for hedging against foreign currency risks.
Option contracts:
The Funds may purchase and sell (“write”) put and call options on various instruments including securities and foreign currency to manage and hedge exchange rate risks within their portfolios and also to gain long or short exposure to the underlying instruments.
An option contract gives the buyer the right, but not the obligation, to buy (call) or sell (put) an underlying item at a fixed exercise price on a certain date or during a specified period. The cost of securities acquired through the exercise of a call option is increased by the premiums paid. The proceeds from securities sold through the exercise of a purchased put option are decreased by the premiums paid. Investments in over-the-counter option contracts require the Funds to fair value or mark-to market the options on a daily basis, which reflects the change in the market value of the contracts at the close of each day’s trading. The cost of purchased options that expire unexercised are treated by the Funds, on expiration date, as realized losses on investments.
When the Funds write an option, an amount equal to the premium received by the Funds is recorded as a liability and is subsequently adjusted to the current fair value of the option written. Premiums received from writing options that expire unexercised are treated by the Funds, on the expiration date, as realized gains on written options. The difference between the premium and the amount paid on effecting a closing purchase transaction, including brokerage commissions, is also treated as a realized gain, or, if the premium is less than the amount paid for the closing purchase transaction, as a realized loss. If a call option is exercised, the premium is added to the proceeds from the sale of the underlying security or currency in determining whether the Funds have a realized gain or loss. If a put option is exercised, the premium reduces the cost basis of the security or currency purchased by the Funds. In purchasing and writing options, the Funds bear the market risk of an unfavorable change in the price of the underlying security or the risk that the Funds may not
|
60 |
Third Avenue Trust
Notes to Financial Statements (continued)
April 30, 2012
(Unaudited)
be able to enter into a closing transaction due to an illiquid market. Exercise of a written option could result in the Funds purchasing a security or currency at a price different from the current market value. The Funds may execute transactions in both listed and over-the-counter options. Listed options involve minimal counter-party risk since listed options are guaranteed against default by the exchange on which they trade. When purchasing over-the-counter options, the Funds bear the risk of economic loss from counterparty default, equal to the market value of the option.
During the six months ended April 30, 2012, Third Avenue Small-Cap Value Fund, Third Avenue Real Estate Value Fund, Third Avenue International Value Fund and Third Avenue Focused Credit Fund used purchased options on equity, index and foreign currency to gain long exposure to the underlying instruments and/or to protect against losses in foreign currencies. As of April 30, 2012, Third Avenue Small-Cap Value Fund and Third Avenue Real Estate Value Fund no longer held any purchased options on foreign currency and purchased options on index respectively.
During the six months ended April 30, 2012, Third Avenue Real Estate Value Fund used written put options on foreign currency for hedging against foreign currency risks.
Swap Agreements:
The Funds may enter into total return, interest rate, equity and other swap agreements. Interest rate swap agreements generally involve the agreement by a fund to pay a counterparty a fixed or floating rate on a fixed notional amount and to receive a fixed or floating rate on a fixed notional amount, but may also include an agreement to pay or receive payments derived from changes in interest rates. Periodic payments are generally made during the life of the swap agreement according to the terms and conditions of the agreement and at termination or maturity. Total return swap agreements involve the commitments to pay or receive an amount generally determined by reference to a security, index or other measure in exchange for a specific market linked return, based on notional amounts. To the extent that the total return of the security, index or other measure underlying the transaction exceeds or falls short of the offsetting interest rate-based obligation, the fund will receive or make a payment to the counterparty. Interim payments or receipts are recorded as interest expense and interest income in the Statements of Operations. Payments received or made by a Fund at the expiration or other termination of the swap agreements are recorded in the Statements of Operations as realized gains or losses, respectively. Swap agreements are marked-to-market daily based on dealer-supplied valuations, and changes in value, including the periodic amounts of interest to be paid or received on swaps, are recorded as unrealized appreciation/(depreciation). Risks may exceed amounts recognized on the Statements of Assets and Liabilities. These risks include changes in the returns of the underlying instruments, failure of the counterparties to perform under the contracts’ terms and the possible lack of liquidity with respect to the swap agreements.
During the six months ended April 30, 2012, Third Avenue International Value Fund used equity swaps to gain exposure to the underlying investments. As of April 30, 2012, the Fund no longer had any swap agreement.
|
61 |
Third Avenue Trust
Notes to Financial Statements (continued)
April 30, 2012
(Unaudited)
Swaptions:
The Funds may purchase or write swap options (“swaptions”) in an attempt to gain additional protection against the effects of interest rate fluctuations. Swaptions are similar to options on securities except that instead of selling or purchasing the right to buy or sell a security, the writer or purchaser of the swap option is granting or buying the right to enter into an interest rate swap agreement at or before the expiration date of the option, determined by the style of the swaption (see Note 9). In purchasing and writing swaptions, the Funds bear the risk of an unfavorable change in the price of the underlying interest rate swap or the risk that the Funds may not be able to enter into a closing transaction due to an illiquid market. The Funds execute transactions in over-the-counter swaptions. Transactions in over-the-counter swaptions may expose the Funds to the risk of default by the counterparty to the transaction. In the event of default by the counterparty, the Funds’ maximum amount of loss is the premium paid (as purchaser) or the unrealized gain of the contract (as writer).
Changes in the value of the swaption are reported as unrealized gains or losses in the Statements of Assets and Liabilities and Statements of Operations. Gain or loss is recognized when the swaption contract expires or is closed. Premiums received or paid from writing or purchasing swaptions that expire or are exercised are treated by the Funds as realized gains or losses from investments. The difference between the premium and the amount paid on effecting a closing purchase transaction is also treated as a realized gain or, if the premium is less than the amount paid for the closing purchase, as a realized loss.
During the six months ended April 30, 2012, Third Avenue Small-Cap Value Fund used purchased swaptions to gain additional protection against the effects of interest rate fluctuations. At April 30, 2012, the Fund no longer held any swaptions.
Summary of derivatives information:
The following tables present the value of derivatives held as of April 30, 2012, by their primary underlying risk exposure and respective location on the Statements of Assets and Liabilities:
Fair Values of Derivative Instruments as of April 30, 2012 for the Third Avenue Real Estate Value Fund:
|
|
|
|
|
|
|
|
Derivative Contracts |
|
| Statement of Assets and |
| Fair Value |
| |
|
|
|
| ||||
Foreign Currency Put Options |
| Assets, Investments at value |
| $ | 899,976 |
| |
Foreign Currency - Written Call Options |
| Liabilities, Written options at value |
|
| (1,080,881 | ) | |
Forward Foreign Currency Contracts |
| Liabilities, Unrealized depreciation on forward foreign currency contracts |
|
| (5,598,006 | ) | |
|
|
|
|
| |||
Total |
|
|
| $ | (5,778,911 | ) | |
|
|
|
|
| |||
|
62 |
Third Avenue Trust
Notes to Financial Statements (continued)
April 30, 2012
(Unaudited)
Fair Values of Derivative Instruments as of April 30, 2012 for the Third Avenue International Value Fund:
|
|
|
|
|
|
|
|
Derivative Contracts |
|
| Statement of Assets and |
| Fair Value |
| |
|
|
|
| ||||
Foreign Currency Put Options |
| Assets, Investments at value |
| $ | 8,982,724 |
| |
Fair Values of Derivative Instruments as of April 30, 2012 for the Third Avenue Focused Credit Fund:
|
|
|
|
|
|
|
|
Derivative Contracts |
|
| Statement of Assets and |
| Fair Value |
| |
|
|
|
| ||||
Equity Put Options |
| Assets, Investments at value |
| $ | 300,000 |
| |
Forward Foreign Currency Contracts |
| Assets, Unrealized appreciation on forward foreign currency contracts |
|
| 131,821 |
| |
|
|
|
|
| |||
Total |
|
|
| $ | 431,821 |
| |
|
|
|
|
| |||
The following tables present the effect of derivatives on the Statement of Operations during the six months ended April 30, 2012, by primary risk exposure:
Effect of Derivative Instruments on the Statement of Operations during the six months ended April 30, 2012 for the Third Avenue Small-Cap Value Fund:
|
|
|
|
|
|
|
|
|
|
|
|
|
Derivative Contracts |
|
| Realized Gain/(Loss) |
| Change in Unrealized |
| ||||||
|
|
|
| |||||||||
Foreign Currency Put Options |
|
| $ | (3,258,750 | ) |
|
| $ | 2,820,857 |
|
| |
Foreign Currency Swaptions |
|
|
| (1,191,706 | ) |
|
|
| 1,174,770 |
|
| |
|
|
|
|
|
|
|
| |||||
Total |
|
| $ | (4,450,456 | ) |
|
| $ | 3,995,627 |
|
| |
|
|
|
|
|
|
|
| |||||
Effect of Derivative Instruments on the Statement of Operations during the six months ended April 30, 2012 for the Third Avenue Real Estate Value Fund:
|
|
|
|
|
|
|
|
|
|
|
|
|
Derivative Contracts |
|
| Realized Gain/(Loss) |
| Change in Unrealized |
| ||||||
|
|
|
| |||||||||
Equity Contracts - Written Call Options |
|
| $ | 292,849 |
|
|
| $ | 1,278,505 |
|
| |
Foreign Currency Put Options |
|
|
| (3,516,724 | ) |
|
|
| (1,459,410 | ) |
| |
Forward Foreign Currency Contracts |
|
|
| — |
|
|
|
| 728,359 |
|
| |
Index Call Options |
|
|
| 13,184,938 |
|
|
|
| (7,479,367 | ) |
| |
|
|
|
|
|
|
|
| |||||
Total |
|
| $ | 9,961,063 |
|
|
| $ | (6,931,913 | ) |
| |
|
|
|
|
|
|
|
| |||||
|
63 |
Third Avenue Trust
Notes to Financial Statements (continued)
April 30, 2012
(Unaudited)
Effect of Derivative Instruments on the Statement of Operations during the six months ended April 30, 2012 for the Third Avenue International Value Fund:
|
|
|
|
|
|
|
|
|
|
|
|
|
Derivative Contracts |
|
| Realized Gain/(Loss) |
| Change in Unrealized |
| ||||||
|
|
|
| |||||||||
Foreign Currency Put Options |
|
| $ | (9,589,497 | ) |
|
| $ | 5,342,552 |
|
| |
Swap Agreements |
|
|
| 311,652 |
|
|
|
| — |
|
| |
|
|
|
|
|
|
|
| |||||
Total |
|
| $ | (9,277,845 | ) |
|
| $ | 5,342,552 |
|
| |
|
|
|
|
|
|
|
| |||||
Effect of Derivative Instruments on the Statement of Operations during the six months ended April 30, 2012 for the Third Avenue Focused Credit Fund:
|
|
|
|
|
|
|
|
|
|
|
|
|
Derivative Contracts |
|
| Realized Gain/(Loss) |
| Change in Unrealized |
| ||||||
|
|
|
| |||||||||
Equity Put Options |
|
| $ | (3,190,331 | ) |
|
| $ | (2,252,937 | ) |
| |
Forward Foreign Currency Contracts |
|
|
| — |
|
|
|
| 286,457 |
|
| |
|
|
|
|
|
|
|
| |||||
Total |
|
| $ | (3,190,331 | ) |
|
| $ | (1,966,480 | ) |
| |
|
|
|
|
|
|
|
| |||||
Derivative volume:
The tables below disclose the volume of the Funds’ forward foreign currency contracts, options and swaps activities during the period ended April 30, 2012 (amounts denominated in U.S. Dollars unless otherwise noted, except number of contracts). Please refer to the tables in the Summary of derivatives information for derivative-related gains and losses associated with volume activity.
|
|
|
|
|
|
|
|
|
|
|
|
|
|
|
| Third Avenue |
| Third Avenue |
| Third Avenue |
| Third Avenue |
| ||||
|
|
|
|
|
| ||||||||
Forward Foreign Currency Contracts: |
|
|
|
|
|
|
|
|
|
|
|
|
|
Average Settlement Value Purchased |
|
| — |
|
| 110,299,945 |
|
| — |
|
| — |
|
Average Settlement Value Sold |
|
| — |
|
| 145,000,000 |
|
| — |
|
| 6,758,800 |
|
Ending Value Purchased |
|
| — |
|
| 125,297,166 |
|
| — |
|
| — |
|
Ending Value Sold |
|
| — |
|
| 145,000,000 |
|
| — |
|
| 6,758,800 |
|
Exchanged-Traded Options: |
|
|
|
|
|
|
|
|
|
|
|
|
|
Average Number of Contracts Purchased |
|
| — |
|
| 23,544 |
|
| — |
|
| 7,971 |
|
Average Number of Contracts Written |
|
| — |
|
| — |
|
| — |
|
| — |
|
Ending Number of Contracts Purchased |
|
| — |
|
| — |
|
| — |
|
| 1,000 |
|
Ending Number of Contracts Written |
|
| — |
|
| — |
|
| — |
|
| — |
|
|
64 |
Third Avenue Trust
Notes to Financial Statements (continued)
April 30, 2012
(Unaudited)
|
|
|
|
|
|
|
|
|
|
|
|
|
|
|
| Third Avenue |
| Third Avenue |
| Third Avenue |
| Third Avenue |
| ||||
|
|
|
|
|
| ||||||||
OTC Options: |
|
|
|
|
|
|
|
|
|
|
|
|
|
Average Notional Balance Purchased |
|
| 67,857,143 |
|
| 94,285,714 |
|
| 544,428,571 |
|
| — |
|
Average Notional Balance Written |
|
| — |
|
| 94,285,714 |
|
| — |
|
| — |
|
Ending Notional Balance Purchased |
|
| — |
|
| 135,000,000 |
|
| 365,500,000 |
|
| — |
|
Ending Notional Balance Written |
|
| — |
|
| 135,000,000 |
|
| — |
|
| — |
|
Swaptions: |
|
|
|
|
|
|
|
|
|
|
|
|
|
Average Notional Balance Purchased |
|
| 14,319,578,286 | JPY |
| — |
|
| — |
|
| — |
|
Average Notional Balance Written |
|
| — |
|
| — |
|
| — |
|
| — |
|
Ending Notional Balance Purchased |
|
| — |
|
| — |
|
| — |
|
| — |
|
Ending Notional Balance Written |
|
| — |
|
| — |
|
| — |
|
| — |
|
Equity Swaps: |
|
|
|
|
|
|
|
|
|
|
|
|
|
Average Notional Balance - Pays Variable Rate |
|
| — |
|
| — |
|
| 3,553,578 |
|
| — |
|
Average Notional Balance - Receives Variable Rate |
|
| — |
|
| — |
|
| — |
|
| — |
|
Ending Notional Balance - Pays Variable Rate |
|
| — |
|
| — |
|
| — |
|
| — |
|
Ending Notional Balance - Receives Variable Rate |
|
| — |
|
| — |
|
| — |
|
| — |
|
JPY: Japanese Yen
Floating rate obligations:
The Funds may invest in debt securities with interest payments or maturity values that are not fixed, but float in conjunction with an underlying index or price. These securities may be backed by corporate issuers. The indices and prices upon which such securities can be based include interest rates and currency rates. Floating rate securities pay interest according to a coupon which is reset periodically.
Dividends and distributions to shareholders:
The amount of dividends and distributions paid to shareholders from net investment income and realized capital gains on sales of securities, respectively are determined in accordance with federal income tax law and regulations which may differ from U.S. GAAP. Such dividends and distributions are recorded on the ex-dividend date. The majority of dividends and capital gains distributions from a Fund may be automatically reinvested into additional shares of that Fund, based upon the discretion of the Fund’s shareholders.
Income tax information:
The Funds have complied and intend to continue to comply with the requirements of the Internal Revenue Code applicable to regulated investment companies, and each Fund intends to distribute all of its taxable investment income and realized gains to its shareholders. Therefore, no provision for U.S. federal income taxes is included on the accompanying financial statements.
|
65 |
Third Avenue Trust
Notes to Financial Statements (continued)
April 30, 2012
(Unaudited)
Income, including gains, from investments in foreign securities received by the Funds may be subject to income, withholding or other taxes imposed by foreign countries.
Management has analyzed the tax positions taken on the Funds’ U.S. federal income tax returns for all open tax years (current and prior three tax years), and has concluded that no provision for U.S. federal income tax is required in the Funds’ financial statements. This conclusion may be subject to future review and adjustment at a later date based upon factors including, but not limited to, on-going analyses of and changes to tax laws, regulations and interpretations thereof. The Funds’ U.S. federal, state and local income and federal excise tax returns for tax years for which the applicable statutes of limitations have not expired are subject to possible examination by the Internal Revenue Service as well as by state and local taxing authorities.
Expense allocation:
Expenses attributable to a specific Fund are charged to that Fund. Expenses attributable to the Trust are generally allocated using the ratio of each Fund’s average net assets relative to the total average net assets of the Trust. Certain expenses are shared with Third Avenue Variable Series Trust, an affiliated fund group. Such costs are allocated using the ratio of the Funds’ average net assets relative to the total average net assets of the Funds and Third Avenue Variable Series Trust.
Share class accounting:
Investment income, common expenses and realized/unrealized gains/(losses) on investments are allocated to the two classes of shares of each Fund on the basis of daily net assets of each class. Fees relating to a specific class are charged directly to that share class.
Trustees’ and officers’ fees:
The Trust does not pay any fees to its officers for their services as such, except for the Chief Compliance Officer, to whom the Trust paid $195,570 for the six months ended April 30, 2012. The Trust does pay, together with Third Avenue Variable Series Trust, Trustees who are not affiliated with the Adviser a fee of $5,000 for each meeting of the Board that each Trustee attends, in addition to reimbursing all Trustees for travel and incidental expenses incurred by them in connection with their attendance at meetings. If a special meeting is required, Trustees will each receive $2,500. The Trust, together with Third Avenue Variable Series Trust, also pays each independent Trustee an annual retainer of $65,000 (the lead independent Trustee receives an additional retainer of $12,000). The Trustees on the Audit Committee each receive $2,000 for each audit committee meeting and the audit committee chairman receives an annual retainer of $6,000.
|
66 |
Third Avenue Trust
Notes to Financial Statements (continued)
April 30, 2012
(Unaudited)
2. INVESTMENTS
Purchases and sales/conversions:
The aggregate cost of purchases and aggregate proceeds from sales and conversions of investments, excluding short-term investments, from unaffiliated and affiliated issuers (as defined in the Investment Company Act of 1940 as ownership of 5% or more of the outstanding voting securities of these issuers) for the six months ended April 30, 2012 were as follows:
|
|
|
|
|
|
|
|
|
| Purchases |
| Sales |
| ||
|
|
|
| ||||
Third Avenue Value Fund: |
|
|
|
|
|
|
|
Affiliated |
| $ | 540,305 |
| $ | 55,571,442 | † |
Unaffiliated |
|
| 98,083,611 |
|
| 798,355,407 | † |
Third Avenue Small-Cap Value Fund: |
|
|
|
|
|
|
|
Affiliated |
|
| — |
|
| 1,675,390 |
|
Unaffiliated |
|
| 80,276,883 |
|
| 202,875,584 |
|
Third Avenue Real Estate Value Fund: |
|
|
|
|
|
|
|
Unaffiliated |
|
| 33,396,668 |
|
| 290,408,663 |
|
Third Avenue International Value Fund: |
|
|
|
|
|
|
|
Affiliated |
|
| 21,172,573 |
|
| 6,582,093 |
|
Unaffiliated |
|
| 110,542,348 |
|
| 228,509,473 |
|
Third Avenue Focused Credit Fund: |
|
|
|
|
|
|
|
Unaffiliated |
|
| 183,740,904 |
|
| 405,310,558 |
|
|
|
† | Includes $14,412,179 and $88,697,801 from redemption-in-kind transaction for affiliated and unaffiliated issuers, respectively, resulting in realized gains of $19,193,298. |
Unrealized appreciation/(depreciation):
The following information is based upon the book basis of investment securities as of April 30, 2012:
|
|
|
|
|
|
|
|
|
|
|
|
|
|
|
|
|
|
| Value Fund |
| Small-Cap |
| Real Estate |
| International |
| Focused |
| |||||
|
|
|
|
|
|
| ||||||||||
Gross unrealized appreciation |
| $ | 724,647,659 |
| $ | 119,959,992 |
| $ | 270,607,117 |
| $ | 106,831,267 |
| $ | 34,022,694 |
|
Gross unrealized depreciation |
|
| (510,600,508 | ) |
| (58,495,495 | ) |
| (119,358,733 | ) |
| (136,662,378 | ) |
| (87,910,944 | ) |
|
|
|
|
|
|
| ||||||||||
Net unrealized appreciation/(depreciation) |
| $ | 214,047,151 |
| $ | 61,464,497 |
| $ | 151,248,384 |
| $ | (29,831,111 | ) | $ | (53,888,250 | ) |
|
|
|
|
|
|
| ||||||||||
Aggregate book cost |
| $ | 2,533,413,860 |
| $ | 616,222,672 |
| $ | 1,285,025,719 |
| $ | 1,150,573,694 |
| $ | 772,868,940 |
|
|
|
|
|
|
|
| ||||||||||
|
67 |
Third Avenue Trust
Notes to Financial Statements (continued)
April 30, 2012
(Unaudited)
Written options transactions during the period are summarized as follows:
|
|
|
|
|
|
|
|
Third Avenue Real Estate Value Fund |
|
|
|
|
|
|
|
|
| Call Options Written |
| ||||
|
| Number of |
| Premiums |
| ||
|
|
|
| ||||
Options outstanding at October 31, 2011 |
|
| — |
| $ | — |
|
|
|
|
| ||||
Options written |
|
| 300,000,000 |
|
| 6,236,110 |
|
Options terminated in closing purchase transactions |
|
| (165,000,000 | ) |
| (3,876,724 | ) |
|
|
|
| ||||
Options outstanding at April 30, 2012 |
|
| 135,000,000 |
| $ | 2,359,386 |
|
|
|
|
| ||||
3. INVESTMENT ADVISORY SERVICES, ADMINISTRATION AND SERVICE FEE AGREEMENTS AND EXPENSE OFFSET ARRANGEMENT
Each Fund has an Investment Advisory Agreement with the Adviser for investment advice and certain management functions. The terms of the Investment Advisory Agreements provide the annual advisory fees based on the total average daily net assets for the Funds which are indicated as below. These fees are calculated daily and paid monthly.
|
|
|
|
|
|
Fund |
|
| Annual |
| |
|
|
| |||
Third Avenue Value Fund |
| 0.90 | % |
| |
Third Avenue Small-Cap Value Fund |
| 0.90 | % |
| |
Third Avenue Real Estate Value Fund |
| 0.90 | % |
| |
Third Avenue International Value Fund |
| 1.25 | % |
| |
Third Avenue Focused Credit Fund |
| 0.75 | % |
| |
Additionally, the Adviser pays certain expenses on behalf of the Funds which are partially reimbursed by the Funds, including service fees due to third parties, the compensation expense for the Funds’ Chief Compliance Officer and other miscellaneous expenses. At April 30, 2012, Third Avenue Value Fund, Third Avenue Small-Cap Value Fund, Third Avenue Real Estate Value Fund, Third Avenue International Value Fund and Third Avenue Focused Credit Fund had amounts payable to the Adviser of $428,358, $112,580, $221,873, $119,936 and $83,442 respectively, for reimbursement of expenses paid by the Adviser.
Under current arrangements, whenever, in any fiscal year, each Fund’s normal operating expenses, including the investment advisory fee, but excluding taxes, interest, brokerage commissions, acquired fund fees and expenses, and extraordinary items, exceeds the expense limitation based on each Fund’s average daily net assets, the Adviser has agreed to
|
68 |
Third Avenue Trust
Notes to Financial Statements (continued)
April 30, 2012
(Unaudited)
waive a portion of its advisory fees and/or reimburse each Fund in an amount equal to that excess. Below are the expense limitations and corresponding contingent liabilities to the Adviser in effect for each Fund:
|
|
|
|
|
|
|
|
|
|
|
|
|
|
|
|
|
|
|
|
|
|
|
|
|
|
|
|
|
| Expenses Waived through |
| ||||||||||||||||||
|
|
|
|
| October 31, |
| October 31, |
| October 31, |
| April 30, |
| ||||||||||||
|
|
|
|
|
|
|
|
| ||||||||||||||||
|
|
|
|
| Subject to Repayment until October 31, |
| ||||||||||||||||||
Fund |
|
| Expiration |
|
| 2012 |
|
|
| 2013 |
|
|
| 2014 |
|
|
| 2015 |
|
| ||||
|
|
|
|
|
|
|
|
|
|
|
|
|
|
| ||||||||||
Third Avenue Value Fund |
| 2/28/2013 |
|
| $ | — |
|
|
| $ | 1,382,280 |
|
|
| $ | — |
|
|
| $ | — |
|
| |
Third Avenue Small-Cap |
| 2/28/2013 |
|
|
| — |
|
|
|
| — |
|
|
|
| — |
|
|
|
| — |
|
| |
Third Avenue Real Estate |
| 2/28/2013 |
|
|
| — |
|
|
|
| — |
|
|
|
| — |
|
|
|
| — |
|
| |
Third Avenue International |
| 2/28/2013 |
|
|
| 427,922 |
|
|
|
| 1,525,043 |
|
|
|
| 582,479 |
|
|
|
| 249,922 |
|
| |
Third Avenue Focused |
| 2/28/2013 |
|
|
| — |
|
|
|
| — |
|
|
|
| — |
|
|
|
| — |
|
| |
The waived fees and reimbursed expenses may be paid to the Adviser during the following three-year period after the end of the fiscal year in which an expense is waived or reimbursed by the Adviser, to the extent that the payment of such fees and expenses would not cause the Funds to exceed the preceding limitations. These expense limitations can be terminated at any time. The Adviser recovered previously waived fees of $146,487 and $24,680 for Third Avenue Value Fund and Third Avenue Small-Cap Value Fund, respectively, for the six months ended April 30, 2012.
The Trust has entered into an Administration Agreement with the Adviser pursuant to which the Adviser, as administrator, is responsible for providing various administrative services to the Trust. The Adviser has in turn entered into a Sub-Administration Agreement with BNY Mellon Investment Servicing (U.S.) Inc. (“BNY Mellon”) pursuant to which BNY Mellon provides certain of these administrative services on behalf of the Adviser. Each Fund pays the Adviser a fee calculated at an annual rate of 0.0055% of the average daily net assets of each respective Fund for such services. The Adviser pays BNY Mellon an annual sub-administration fee for sub-administration services provided to the Trust equal to $200,819.
Both the Trust and the Adviser have entered into agreements with financial intermediaries to provide recordkeeping, processing, shareholder communications and other services to customers of the intermediaries investing in the Funds and have agreed to compensate the intermediaries for providing those services. Certain of those services would be provided by the Funds if the shares of each customer were registered directly with the Funds’ transfer agent. Accordingly, the Funds have agreed to reimburse a portion of the intermediary fees paid by the Adviser pursuant to provisions adopted by the Board. Each Fund pays a portion of the intermediary fees attributable to shares of the Fund not exceeding the
|
69 |
Third Avenue Trust
Notes to Financial Statements (continued)
April 30, 2012
(Unaudited)
estimated expense the Fund would have paid its transfer agent had each customer’s shares been registered directly with the transfer agent instead of held through the intermediary accounts. The Adviser pays the remainder of the fees. The fees incurred by the Funds are reflected as shareholder servicing fees in the Statements of Operations. For the six months ended April 30, 2012, such fees amounted to $1,896,534 for Third Avenue Value Fund, $422,291 for Third Avenue Small-Cap Value Fund, $783,851 for Third Avenue Real Estate Value Fund, $388,769 for Third Avenue International Value Fund and $111,383 for Third Avenue Focused Credit Fund.
The Funds have an expense offset arrangement in connection with their custodian contract. Credits realized as a result of uninvested cash balances are used to reduce a portion of the Funds’ custodian expenses. The following amounts are the reduction of expenses due to this arrangement for the six months ended April 30, 2012. These amounts are reflected as “Expenses reduced by custodian fee expense offset arrangement” in the Statements of Operations.
|
|
|
|
|
|
|
Fund |
|
| Custody Credit |
| ||
|
|
| ||||
Third Avenue Value Fund |
| $ | 35,632 |
|
| |
Third Avenue Small-Cap Value Fund |
|
| 14,335 |
|
| |
Third Avenue Real Estate Value Fund |
|
| 31,237 |
|
| |
Third Avenue International Value Fund |
|
| 16,423 |
|
| |
Third Avenue Focused Credit Fund |
|
| 9,408 |
|
| |
4. LINE OF CREDIT
Each Fund and Third Avenue Variable Series Trust are participants in a single committed, unsecured $100,000,000 line of credit with The Bank of Nova Scotia, to be used only for temporary or emergency purposes. The interest on the loan is calculated at a variable rate based on the Overnight London Interbank Offered, Federal Funds or Prime Rates. A commitment fee of 0.10% per annum of the available line of credit is charged, of which each participating Fund pays its pro rata share, based on the ratio of its individual net assets to the net assets of all participants at the time the fee is due and payable. The fee is paid quarterly in arrears. Because all of the Funds in Third Avenue Trust and Third Avenue Variable Series Trust participate, there is no assurance that an individual Fund will have access to all or any part of the $100,000,000 at any particular time. During the six months ending April 30, 2012, there were no loans outstanding under the line of credit.
5. RELATED PARTY TRANSACTIONS
Brokerage commissions:
M.J. Whitman LLC, a registered broker-dealer, operates under common control with the Adviser. For the six months ended April 30, 2012, the Funds paid no brokerage commissions to M.J. Whitman LLC.
|
70 |
Third Avenue Trust
Notes to Financial Statements (continued)
April 30, 2012
(Unaudited)
Investments in affiliates:
A summary of the Funds’ transactions in securities of affiliated issuers for the six months ended April 30, 2012 is set forth below:
Third Avenue Value Fund
|
|
|
|
|
|
|
|
|
|
|
|
|
|
|
|
|
|
|
|
|
Name of Issuer: |
|
| Shares/ |
| Gross |
| Gross |
| Shares/ |
| Value at |
| Investment |
| ||||||
|
|
|
|
|
|
|
| |||||||||||||
Carver Bancorp, Inc. * |
|
| 218,500 |
|
| — |
|
| 213,041 | 2 |
| 5,459 |
| $ | 26,476 |
| $ | — |
| |
Covanta Holding Corp. |
|
| 8,816,889 |
|
| — |
|
| 274,971 |
|
| 8,541,918 |
|
| 137,097,784 |
|
| 1,942,554 |
| |
FedFirst Financial Corp. * |
|
| 232,032 |
|
| — |
|
| 232,032 |
|
| — |
|
| — |
|
| — |
| |
Fleetwood Homes, Inc. |
|
| 1,014 |
|
| — |
|
| 31 |
|
| 983 |
|
| 82,570,207 |
|
| — |
| |
FNC Realty Corp. |
|
| 9,487,910 |
|
| — |
|
| — |
|
| 9,487,910 |
|
| 6,641,537 |
|
| — |
| |
Forest City Enterprises, Inc., Class A |
|
| 8,764,203 |
|
| — |
|
| 523,328 |
|
| 8,240,875 |
|
| 131,441,956 |
|
| — |
| |
Forest City Enterprises, Inc., Class B |
|
| 22,500 |
|
| — |
|
| 702 |
|
| 21,798 |
|
| 345,934 |
|
| — |
| |
Gouverneur Bancorp, Inc. * |
|
| 205,511 |
|
| — |
|
| 205,511 |
|
| — |
|
| — |
|
| — |
| |
Home Federal Bancorp, Inc. * |
|
| 249,757 |
|
| — |
|
| 249,757 |
|
| — |
|
| — |
|
| — |
| |
Home Products International, Inc. |
|
| 526,368 |
|
| — |
|
| — |
|
| 526,368 |
|
| 26,318 |
|
| — |
| |
Home Products International, Inc., |
|
| 18,010,162 |
|
| 540,305 | 3 |
| — |
|
| 18,550,467 |
|
| 4,568,980 |
|
| 539,789 | 3 | |
Lai Sun Garment International, Ltd. |
|
| 160,000,000 |
|
| — |
|
| 4,990,000 |
|
| 155,010,000 |
|
| 12,586,764 |
|
| — |
| |
Manifold Capital Holdings, Inc. |
|
| 37 |
|
| — |
|
| — |
|
| 37 |
|
| 555,000 |
|
| — |
| |
RS Holdings Corp., Class A |
|
| 9,337 |
|
| — |
|
| — |
|
| 9,337 |
|
| 1,772 |
|
| — |
| |
RS Holdings Corp., Convertible Pfd., Class A |
|
| 1,022,245 |
|
| — |
|
| — |
|
| 1,022,245 |
|
| 194,023 |
|
| — |
| |
SFSB, Inc. |
|
| 242,800 |
|
| — |
|
| 38,872 |
|
| 203,928 |
|
| 484,329 |
|
| — |
| |
Sycamore Networks, Inc. |
|
| 1,871,861 |
|
| — |
|
| 58,377 |
|
| 1,813,484 |
|
| 28,272,216 |
|
| — |
| |
Tejon Ranch Co. |
|
| 3,420,106 |
|
| — |
|
| 1,603,479 |
|
| 1,816,627 |
|
| 54,244,482 |
|
| — |
| |
|
|
|
|
|
|
|
|
|
|
|
|
|
|
|
| |||||
Total Affiliates |
|
|
|
|
|
|
|
|
|
|
|
|
| $ | 459,057,778 |
| $ | 2,482,343 |
| |
|
|
|
|
|
|
|
|
|
|
|
|
|
|
|
| |||||
|
|
PIK: Payment-in-kind | |
| |
1. | Includes transactions from redemption-in-kind. |
|
|
2. | Share reduction of 203,933 due to reverse stock split. |
|
|
3. | Payment-in-kind interest. |
|
|
* | As of April 30, 2012, no longer an affiliate. |
|
71 |
Third Avenue Trust
Notes to Financial Statements (continued)
April 30, 2012
(Unaudited)
|
|
|
|
|
|
|
|
|
|
|
|
|
|
|
|
|
|
|
|
Third Avenue Small-Cap Value Fund | |||||||||||||||||||
|
|
|
|
|
|
|
|
|
|
|
|
|
| ||||||
Name of Issuer: |
| Shares |
| Gross |
| Gross |
| Shares |
| Value at |
| Investment |
| ||||||
|
|
|
|
|
|
| |||||||||||||
Bel Fuse, Inc., Class B |
|
| 741,242 |
|
| — |
|
| 85,750 |
|
| 655,492 |
| $ | 11,661,203 |
| $ | 91,769 |
|
Catalyst Paper Corp. * |
|
| 21,530,352 |
|
| — |
|
| 21,530,352 |
|
| — |
|
| — |
|
| — |
|
Cross Country Healthcare, Inc. * |
|
| 1,762,844 |
|
| — |
|
| 707,204 |
|
| 1,055,640 |
|
| 4,866,500 |
|
| — |
|
PYI Corp., Ltd. |
|
| 475,780,230 |
|
| — |
|
| 1,796,000 |
|
| 473,984,230 |
|
| 12,218,214 |
|
| — |
|
|
|
|
|
|
|
|
|
|
|
|
|
|
|
|
| ||||
Total Affiliates |
|
|
|
|
|
|
|
|
|
|
|
|
| $ | 28,745,917 |
| $ | 91,769 |
|
|
|
|
|
|
|
|
|
|
|
|
|
|
|
|
| ||||
|
|
* | As of April 30, 2012, no longer an affiliate. |
|
|
|
|
|
|
|
|
|
|
|
|
|
|
|
|
|
|
|
|
Third Avenue Real Estate Value Fund | |||||||||||||||||||
|
|
|
|
|
|
|
|
|
|
|
|
|
|
|
|
|
|
|
|
Name of Issuer: |
| Shares/Investment |
| Gross |
| Gross |
| Shares/Investment |
| Value at |
| Investment |
| ||||||
|
|
|
|
|
|
| |||||||||||||
Alliance Bernstein Legacy Securities (C1) L.P. * |
|
| 36,000,000 |
|
| 1,000,000 |
|
| — |
|
| 37,000,000 |
| $ | 42,311,864 |
| $ | — |
|
Consolidated-Tomoka Land Co. |
|
| 500,500 |
|
| — |
|
| — |
|
| 500,500 |
|
| 14,714,700 |
|
| 10,010 |
|
Forest City Enterprises, Inc., Class A |
|
| 8,846,798 |
|
| — |
|
| — |
|
| 8,846,798 |
|
| 141,106,428 |
|
| — |
|
Newhall Holding Co. LLC, Class A Units |
|
| 29,513,141 |
|
| — |
|
| — |
|
| 29,513,141 |
|
| 39,842,740 |
|
| — |
|
Thomas Properties Group, Inc. |
|
| 7,354,979 |
|
| — |
|
| — |
|
| 7,354,979 |
|
| 35,892,298 |
|
| 220,649 |
|
|
|
|
|
|
|
|
|
|
|
|
|
|
|
|
| ||||
Total Affiliates |
|
|
|
|
|
|
|
|
|
|
|
|
| $ | 273,868,030 |
| $ | 230,659 |
|
|
|
|
|
|
|
|
|
|
|
|
|
|
|
|
| ||||
|
|
* | As of April 30, 2012, no longer an affiliate. |
|
|
|
|
|
|
|
|
|
|
|
|
|
|
|
|
|
|
|
|
Third Avenue International Value Fund | |||||||||||||||||||
|
|
|
|
|
|
|
|
|
|
|
|
|
| ||||||
Name of Issuer: |
| Shares |
| Gross |
| Gross |
| Shares |
| Value at |
| Investment |
| ||||||
|
|
|
|
|
|
| |||||||||||||
Boardroom, Ltd. |
|
| 22,522,784 |
|
| — |
|
| — |
|
| 22,522,784 |
| $ | 9,555,120 |
| $ | 179,400 |
|
Catalyst Paper Corp. * |
|
| 72,271,095 |
|
| — |
|
| 72,271,095 |
|
| — |
|
| — |
|
| — |
|
GP Investments, Ltd., BDR |
|
| — |
|
| 7,939,408 |
|
| — |
|
| 7,939,408 |
|
| 18,326,677 |
|
| — |
|
Netia S.A. |
|
| 42,909,495 |
|
| — |
|
| 4,307,593 |
|
| 38,601,902 |
|
| 73,817,737 |
|
| — |
|
Rubicon, Ltd. |
|
| 51,395,523 |
|
| — |
|
| — |
|
| 51,395,523 |
|
| 16,391,149 |
|
| — |
|
Tenon, Ltd. |
|
| 10,482,120 |
|
| — |
|
| — |
|
| 10,482,120 |
|
| 6,343,082 |
|
| — |
|
WBL Corp., Ltd. |
|
| 37,050,140 |
|
| — |
|
| — |
|
| 37,050,140 |
|
| 102,692,509 |
|
| 1,442,089 |
|
|
|
|
|
|
|
|
|
|
|
|
|
|
|
|
| ||||
Total Affiliates |
|
|
|
|
|
|
|
|
|
|
|
|
| $ | 227,126,274 |
| $ | 1,621,489 |
|
|
|
|
|
|
|
|
|
|
|
|
|
|
|
|
| ||||
|
|
BDR: Brazilian Depositary Receipt | |
| |
* | As of April 30, 2012, no longer an affiliate. |
|
72 |
Third Avenue Trust
Notes to Financial Statements (continued)
April 30, 2012
(Unaudited)
|
|
|
|
|
|
|
|
|
|
|
|
|
|
|
|
|
|
|
|
Third Avenue Focused Credit Fund | |||||||||||||||||||
|
|
|
|
|
|
|
|
|
|
|
|
|
| ||||||
Name of Issuer: |
| Shares/ |
| Gross |
| Gross |
| Shares/ |
| Value at |
| Investment |
| ||||||
|
|
|
|
|
|
| |||||||||||||
Aveos Fleet Performance, Inc.: |
|
|
|
|
|
|
|
|
|
|
|
|
|
|
|
|
|
|
|
Revolving Credit, due 3/12/13 * |
|
| 2,574,468 |
|
| — |
|
| — |
|
| 2,574,468 |
| $ | 2,381,383 |
| $ | — |
|
Term Loan, due 3/12/13 * |
|
| 3,180,308 |
|
| — |
|
| — |
|
| 3,180,308 |
|
| 3,005,391 |
|
| — |
|
Term Loan B, PIK, due 3/12/15 * |
|
| 6,800,924 |
|
| 184,805 | † |
| — |
|
| 6,985,729 |
|
| 5,309,154 |
|
| — |
|
Term Loan B2, PIK, due 3/12/15 * |
|
| 6,977,623 |
|
| 189,608 | † |
| — |
|
| 7,167,231 |
|
| 5,447,095 |
|
| — |
|
Aveos Holding Co. * |
|
| 573,251 |
|
| — |
|
| 288,680 |
|
| 284,571 |
|
| 88,928 |
|
| — |
|
|
|
|
|
|
|
|
|
|
|
|
|
|
|
|
| ||||
Total Affiliates |
|
|
|
|
|
|
|
|
|
|
|
|
| $ | 16,231,951 |
| $ | — |
|
|
|
|
|
|
|
|
|
|
|
|
|
|
|
|
| ||||
|
|
PIK: Payment-in-kind | |
| |
† | Includes payment-in-kind interest. |
| |
* | As of April 30, 2012, no longer an affiliate. |
Certain employees of the Adviser serve as members of the board of directors of companies in which the Funds have investments. As a result of such service, for the six months ended April 30, 2012, the Funds received the following board member fees from these companies that board members employed by the Adviser agreed to have paid directly to the benefit of the Funds. These fees are included in “Other Income” on the accompanying Statements of Operations.
|
|
|
|
|
Fund |
| Fees |
| |
|
| |||
Third Avenue Value Fund |
| $ | 39,194 |
|
Third Avenue Small-Cap Value Fund |
|
| 6 |
|
Third Avenue Real Estate Value Fund |
|
| 5,937 |
|
On February 29, 2012, Third Avenue Value Fund processed in-kind redemptions totalling $106,255,348 from certain investors affiliated with the Advisor. The investors contributed the redeemed securities to a newly created fund affiliated with the Adviser. The investments redeemed in-kind have been valued in accordance with the valuation methods set forth in the Fund documents and the policies described in these financial statements.
6. DISTRIBUTION EXPENSES
The Board has adopted a distribution plan (the “Plan”) pursuant to Rule 12b-1 under the Investment Company Act. The Plan provides that, as compensation for distribution and related services provided to Third Avenue Value Fund Investor Class (“TVFVX”), Third Avenue Small-Cap Value Fund Investor Class (“TVSVX”), Third Avenue Real Estate Value Fund Investor Class (“TVRVX”), Third Avenue International Value Fund Investor Class (“TVIVX”), and Third
|
73 |
Third Avenue Trust
Notes to Financial Statements (continued)
April 30, 2012
(Unaudited)
Avenue Focused Credit Fund Investor Class (“TFCVX”), each Fund’s Investor Class accrues a fee calculated at the annual rate of 0.25% of average daily net assets of the class. Such fees may be paid to institutions that provide distribution services. The amount of fees paid during any period may be more or less than the cost of distribution and other services provided. Financial Industry Regulatory Authority (“FINRA”) rules impose a ceiling on the cumulative distribution fees paid. The Plan complies with those rules.
For the six months ended April 30, 2012, distribution expenses were as follows:
|
|
|
|
|
|
|
|
Fund |
|
| Distribution Fees |
| |||
|
|
| |||||
Third Avenue Value Fund |
|
| $ | 30,654 |
|
| |
Third Avenue Small-Cap Value Fund |
|
|
| 10,669 |
|
| |
Third Avenue Real Estate Value Fund |
|
|
| 56,188 |
|
| |
Third Avenue International Value Fund |
|
|
| 18,263 |
|
| |
Third Avenue Focused Credit Fund |
|
|
| 384,289 |
|
| |
7. CAPITAL SHARE TRANSACTIONS
Each Fund is authorized to issue an unlimited number of shares of each class of beneficial interest with $0.001 par value.
Transactions in capital stock of each class were as follows:
Third Avenue Value Fund:
|
|
|
|
|
|
|
|
|
|
|
|
|
|
|
| For the Six Months Ended |
| For the Year Ended |
| ||||||||
|
|
|
| ||||||||||
|
| Investor Class |
| Investor Class |
| ||||||||
|
|
|
| ||||||||||
|
| Shares |
| Amount |
| Shares |
| Amount |
| ||||
|
|
|
|
|
| ||||||||
Shares sold |
|
| 127,452 |
| $ | 5,600,201 |
|
| 446,995 |
| $ | 22,587,661 |
|
Shares issued upon reinvestment of dividends and distributions |
|
| 11,053 |
|
| 437,197 |
|
| 7,214 |
|
| 367,337 |
|
Shares redeemed* |
|
| (182,354 | ) |
| (8,191,705 | ) |
| (243,977 | ) |
| (12,237,560 | ) |
|
|
|
|
|
| ||||||||
Net increase/(decrease) |
|
| (43,849 | ) | $ | (2,154,307 | ) |
| 210,232 |
| $ | 10,717,438 |
|
|
|
|
|
|
| ||||||||
|
74 |
Third Avenue Trust
Notes to Financial Statements (continued)
April 30, 2012
(Unaudited)
|
|
|
|
|
|
|
|
|
|
|
|
|
|
|
| For the Six Months Ended |
| For the Year Ended |
| ||||||||
|
|
|
| ||||||||||
|
| Institutional Class |
| Institutional Class |
| ||||||||
|
|
|
| ||||||||||
|
| Shares |
| Amount |
| Shares |
| Amount |
| ||||
|
|
|
|
|
| ||||||||
Shares sold |
|
| 1,818,200 |
| $ | 78,740,123 |
|
| 5,127,067 |
| $ | 258,905,978 |
|
Shares issued upon reinvestment of dividends and distributions |
|
| 1,613,300 |
|
| 63,789,873 |
|
| 1,741,956 |
|
| 88,686,591 |
|
Shares redeemed* |
|
| (14,926,617 | ) |
| (649,508,217 | ) |
| (29,108,672 | ) |
| (1,444,815,317 | ) |
Shares redeemed-in-kind |
|
| (2,230,381 | ) |
| (106,255,348 | ) |
| — |
|
| — |
|
|
|
|
|
|
| ||||||||
Net decrease |
|
| (13,725,498 | ) | $ | (613,233,569 | ) |
| (22,239,649 | ) | $ | (1,097,222,748 | ) |
|
|
|
|
|
| ||||||||
|
|
|
|
|
|
|
|
|
|
|
|
|
|
Third Avenue Small-Cap Value Fund: |
|
|
|
|
|
|
|
|
|
|
|
|
|
|
|
|
|
|
|
|
|
|
|
|
|
|
|
|
| For the Six Months Ended |
| For the Year Ended |
| ||||||||
|
|
|
| ||||||||||
|
| Investor Class |
| Investor Class |
| ||||||||
|
|
|
| ||||||||||
|
| Shares |
| Amount |
| Shares |
| Amount |
| ||||
|
|
|
|
|
| ||||||||
Shares sold |
|
| 103,261 |
| $ | 2,121,537 |
|
| 241,849 |
| $ | 5,127,535 |
|
Shares issued upon reinvestment of dividends and distributions |
|
| 1,666 |
|
| 32,863 |
|
| 2,292 |
|
| 47,738 |
|
Shares redeemed* |
|
| (62,679 | ) |
| (1,327,730 | ) |
| (107,234 | ) |
| (2,297,147 | ) |
|
|
|
|
|
| ||||||||
Net increase |
|
| 42,248 |
| $ | 826,670 |
|
| 136,907 |
| $ | 2,878,126 |
|
|
|
|
|
|
| ||||||||
|
|
|
|
|
|
|
|
|
|
|
|
|
|
|
| For the Six Months Ended |
| For the Year Ended |
| ||||||||
|
|
|
| ||||||||||
|
| Institutional Class |
| Institutional Class |
| ||||||||
|
|
|
| ||||||||||
|
| Shares |
| Amount |
| Shares |
| Amount |
| ||||
|
|
|
|
|
| ||||||||
Shares sold |
|
| 1,048,593 |
| $ | 21,572,291 |
|
| 3,017,774 |
| $ | 63,843,002 |
|
Shares issued upon reinvestment of dividends and distributions |
|
| 243,004 |
|
| 4,794,477 |
|
| 502,224 |
|
| 10,466,329 |
|
Shares redeemed* |
|
| (6,813,848 | ) |
| (140,105,651 | ) |
| (18,578,333 | ) |
| (386,647,936 | ) |
|
|
|
|
|
| ||||||||
Net decrease |
|
| (5,522,251 | ) | $ | (113,738,883 | ) |
| (15,058,335 | ) | $ | (312,338,605 | ) |
|
|
|
|
|
| ||||||||
|
75 |
Third Avenue Trust
Notes to Financial Statements (continued)
April 30, 2012
(Unaudited)
Third Avenue Real Estate Value Fund:
|
|
|
|
|
|
|
|
|
|
|
|
|
|
|
| For the Six Months Ended |
| For the Year Ended |
| ||||||||
|
|
|
| ||||||||||
|
| Investor Class |
| Investor Class |
| ||||||||
|
|
|
| ||||||||||
|
| Shares |
| Amount |
| Shares |
| Amount |
| ||||
|
|
|
|
|
| ||||||||
Shares sold |
|
| 630,231 |
| $ | 14,209,994 |
|
| 1,468,101 |
| $ | 34,437,218 |
|
Shares issued upon reinvestment of dividends and distributions |
|
| — |
|
| — |
|
| 48,263 |
|
| 1,098,477 |
|
Shares redeemed* |
|
| (882,501 | ) |
| (18,967,771 | ) |
| (506,653 | ) |
| (11,266,051 | ) |
|
|
|
|
|
| ||||||||
Net increase/(decrease) |
|
| (252,270 | ) | $ | (4,757,777 | ) |
| 1,009,711 |
| $ | 24,269,644 |
|
|
|
|
|
|
| ||||||||
|
|
|
|
|
|
|
|
|
|
|
|
|
|
|
| For the Six Months Ended |
| For the Year Ended |
| ||||||||
|
|
|
| ||||||||||
|
| Institutional Class |
| Institutional Class |
| ||||||||
|
|
|
| ||||||||||
|
| Shares |
| Amount |
| Shares |
| Amount |
| ||||
|
|
|
|
|
| ||||||||
Shares sold |
|
| 7,404,073 |
| $ | 165,858,791 |
|
| 15,516,901 |
| $ | 361,514,800 |
|
Shares issued upon reinvestment of dividends and distributions |
|
| — |
|
| — |
|
| 2,629,170 |
|
| 59,865,785 |
|
Shares redeemed* |
|
| (12,206,773 | ) |
| (265,660,135 | ) |
| (16,604,692 | ) |
| (378,348,436 | ) |
|
|
|
|
|
| ||||||||
Net increase/(decrease) |
|
| (4,802,700 | ) | $ | (99,801,344 | ) |
| 1,541,379 |
| $ | 43,032,149 |
|
|
|
|
|
|
| ||||||||
|
|
|
|
|
|
|
|
|
|
|
|
|
|
Third Avenue International Value Fund: |
|
|
|
|
|
|
|
|
|
|
|
|
|
|
|
|
|
|
|
|
|
|
|
|
|
|
|
|
| For the Six Months Ended |
| For the Year Ended |
| ||||||||
|
|
|
| ||||||||||
|
| Investor Class |
| Investor Class |
| ||||||||
|
|
|
| ||||||||||
|
| Shares |
| Amount |
| Shares |
| Amount |
| ||||
|
|
|
|
|
| ||||||||
Shares sold |
|
| 266,708 |
| $ | 4,069,928 |
|
| 1,280,048 |
| $ | 22,864,723 |
|
Shares issued upon reinvestment of dividends and distributions |
|
| 13,771 |
|
| 191,418 |
|
| 6,877 |
|
| 114,010 |
|
Shares redeemed* |
|
| (177,406 | ) |
| (2,657,014 | ) |
| (795,698 | ) |
| (13,235,091 | ) |
|
|
|
|
|
| ||||||||
Net increase |
|
| 103,073 |
| $ | 1,604,332 |
|
| 491,227 |
| $ | 9,743,642 |
|
|
|
|
|
|
| ||||||||
|
76 |
Third Avenue Trust
Notes to Financial Statements (continued)
April 30, 2012
(Unaudited)
|
|
|
|
|
|
|
|
|
|
|
|
|
|
|
| For the Six Months Ended |
| For the Year Ended |
| ||||||||
|
|
|
| ||||||||||
|
| Institutional Class |
| Institutional Class |
| ||||||||
|
|
|
| ||||||||||
|
| Shares |
| Amount |
| Shares |
| Amount |
| ||||
|
|
|
|
|
| ||||||||
Shares sold |
|
| 6,546,403 |
| $ | 98,910,359 |
|
| 11,130,629 |
| $ | 190,446,355 |
|
Shares issued upon reinvestment of dividends and distributions |
|
| 1,357,835 |
|
| 18,860,331 |
|
| 1,457,602 |
|
| 24,181,557 |
|
Shares redeemed* |
|
| (13,835,310 | ) |
| (204,572,778 | ) |
| (22,122,812 | ) |
| (374,763,909 | ) |
|
|
|
|
|
| ||||||||
Net decrease |
|
| (5,931,072 | ) | $ | (86,802,088 | ) |
| (9,534,581 | ) | $ | (160,135,997 | ) |
|
|
|
|
|
| ||||||||
|
|
|
|
|
|
|
|
|
|
|
|
|
|
Third Avenue Focused Credit Fund: |
|
|
|
|
|
|
|
|
|
|
|
|
|
|
|
|
|
|
|
|
|
|
|
|
|
|
|
|
| For the Six Months Ended |
| For the Year Ended |
| ||||||||
|
|
|
| ||||||||||
|
| Investor Class |
| Investor Class |
| ||||||||
|
|
|
| ||||||||||
|
| Shares |
| Amount |
| Shares |
| Amount |
| ||||
|
|
|
|
|
| ||||||||
Shares sold |
|
| 8,148,523 |
| $ | 81,402,693 |
|
| 23,917,225 |
| $ | 267,034,377 |
|
Shares issued upon reinvestment of dividends and distributions |
|
| 2,330,344 |
|
| 22,280,770 |
|
| 1,971,089 |
|
| 21,672,598 |
|
Shares redeemed* |
|
| (10,212,799 | ) |
| (101,837,576 | ) |
| (15,637,023 | ) |
| (169,794,805 | ) |
|
|
|
|
|
| ||||||||
Net increase |
|
| 266,068 |
| $ | 1,845,887 |
|
| 10,251,291 |
| $ | 118,912,170 |
|
|
|
|
|
|
| ||||||||
|
|
|
|
|
|
|
|
|
|
|
|
|
|
|
| For the Six Months Ended |
| For the Year Ended |
| ||||||||
|
|
|
| ||||||||||
|
| Institutional Class |
| Institutional Class |
| ||||||||
|
|
|
| ||||||||||
|
| Shares |
| Amount |
| Shares |
| Amount |
| ||||
|
|
|
|
|
| ||||||||
Shares sold |
|
| 12,549,794 |
| $ | 125,161,214 |
|
| 31,012,475 |
| $ | 348,328,323 |
|
Shares issued upon reinvestment of dividends and distributions |
|
| 5,099,682 |
|
| 48,716,852 |
|
| 4,877,322 |
|
| 53,622,795 |
|
Shares redeemed* |
|
| (17,825,235 | ) |
| (176,479,865 | ) |
| (29,901,735 | ) |
| (332,093,979 | ) |
|
|
|
|
|
| ||||||||
Net increase/(decrease) |
|
| (175,759 | ) | $ | (2,601,799 | ) |
| 5,988,062 |
| $ | 69,857,139 |
|
|
|
|
|
|
| ||||||||
|
|
* | Redemption fees are netted with redemption amounts. |
Third Avenue Value Fund, Third Avenue Small-Cap Value Fund, Third Avenue Real Estate Value Fund, Third Avenue International Value Fund, and Third Avenue Focused Credit Fund charge a redemption fee of 1%, 1%, 1%, 2%, and 2%, respectively, for shares redeemed or exchanged for shares of another Fund within 60 days or less of the purchase date.
|
77 |
Third Avenue Trust
Notes to Financial Statements (continued)
April 30, 2012
(Unaudited)
8. COMMITMENTS AND CONTINGENCIES
At April 30, 2012, Third Avenue Real Estate Value Fund had the following commitment and contingency:
|
|
|
|
|
|
|
|
|
|
Issuer |
| Type |
| Amount of |
| Funded |
| Value of |
|
|
|
|
|
| |||||
Alliance Bernstein Legacy Securities (C1) L.P. |
| Limited Partnership |
| $40,000,000 |
| $37,000,000 |
| $3,000,000 |
|
In the normal course of business, the Funds enter into contracts that contain a variety of representations and warranties and which provide general indemnifications. The Funds’ maximum exposure under these arrangements is unknown, as this would involve future claims that may be made against the Funds that have not yet occurred. However, based on experience, the Funds expect the risk of loss to be remote.
9. RISKS RELATING TO CERTAIN INVESTMENTS
Foreign securities:
Investments in the securities of foreign issuers may involve investment risks different from those of U.S. issuers including possible political or economic instability of the country of the issuer, the difficulty of predicting international trade patterns, the possibility of currency exchange controls, the possible imposition of foreign taxes on income from and transactions in such instruments, the possible establishment of foreign controls, the possible seizure or nationalization of foreign deposits or assets, or the adoption of other foreign government restrictions that might adversely affect the foreign securities held by the Funds. Foreign securities may also be subject to greater fluctuations in price than securities of domestic corporations or the U.S. Government.
High yield debt:
The Funds may invest in high yield, lower grade debt (sometimes referred to as “junk bonds”). The market values of these higher yielding debt securities tend to be more sensitive to economic conditions and individual corporate developments than those of higher rated securities. In addition, the secondary market for these bonds is generally less liquid.
Credit and interest rate risk:
The market value of debt securities is affected by changes in prevailing interest rates and the perceived credit quality of the issuer. When prevailing interest rates fall or perceived credit quality improves, the market value of the affected debt securities generally rises. Conversely, when interest rates rise or perceived credit quality weakens, the market value of the affected debt securities generally declines.
|
78 |
Third Avenue Trust
Notes to Financial Statements (continued)
April 30, 2012
(Unaudited)
Market risk:
Prices of securities (and stocks in particular) have historically fluctuated. The value of the Fund will similarly fluctuate and you could lose money.
Counterparty risk:
The Funds are exposed to counterparty risk, or the risk that an institution or other entity with which the Funds have unsettled or open transactions will default. The potential loss to the Funds could exceed the value of the financial assets recorded in the Funds’ financial statements. Financial assets, which potentially expose the Funds to counterparty risk, consist principally of cash due from counterparties and investments. The Adviser seeks to minimize the Funds’ counterparty risk by performing reviews of each counterparty and by minimizing concentration of counterparty risk by undertaking transactions with multiple customers and counterparties on recognized and reputable exchanges. Delivery of securities sold is only made once the Funds have received payment. Payment is made on a purchase once the securities have been delivered by the counterparty. The trade will fail if either party fails to meet its obligation. At April 30, 2012, the Funds had counterparty concentration of credit risk primarily with JPMorgan Chase Bank, N.A., Macquarie Bank Ltd. and Morgan Stanley Capital Services LLC.
The Funds are party to International Swaps and Derivatives Association, Inc. Master Agreements (“ISDA Master Agreements”) with select counterparties that govern transactions, over-the-counter derivatives and foreign exchange contracts entered into by the Funds and those counterparties. The ISDA Master Agreements contain provisions for general obligations, representations, agreements, collateral and events of default or termination. Events of termination include conditions that may entitle counterparties to elect to terminate early and cause settlement of all outstanding transactions under the applicable ISDA Master Agreement. Any election to terminate early could be material to the financial statements of the Funds.
The considerations and factors surrounding the settlement of certain purchases and sales made on a delayed-delivery basis are governed by Master Securities Forward Transaction Agreements (“Master Forward Agreements”) between the Funds and select counterparties. The Master Forward Agreements maintain provisions for, among other things, initiation and confirmation, payment and transfer, events of default, termination, and maintenance of collateral.
The counterparty risk associated with certain contracts may be reduced by master netting arrangements to the extent that if an event of default occurs, all amounts with the counterparty are terminated and settled on a net basis. The Funds’ overall exposure to counterparty risk with respect to transactions subject to master netting arrangements can change substantially within a short period, as it is affected by each transaction subject to the arrangement.
|
79 |
Third Avenue Trust
Notes to Financial Statements (continued)
April 30, 2012
(Unaudited)
Loans and other direct debt instruments:
The Funds may invest in loans and other direct debt instruments issued by corporate borrowers. These loans represent amounts owed to lenders or lending syndicates (loans and loan participations) or to other parties. Direct debt instruments may involve a risk of loss in case of default or insolvency of the borrower and may offer less legal protection to the Fund in the event of fraud or misrepresentation. In addition, loan participations involve a risk of insolvency of the lending bank or other financial intermediary. The markets in loans are not regulated by federal securities laws or the SEC.
Cash concentration:
The Funds’ cash balances are held at a major regional U.S. bank. The Funds’ cash balances, which typically exceed Federal Deposit Insurance Corporation insurance coverage, subject the Funds to a concentration of credit risk. The Funds regularly monitor the credit ratings of this financial institution in order to mitigate the credit risk that exists with the balances in excess of insured amounts.
Off-balance sheet risk:
The Fund enters into derivatives which may represent off-balance sheet risk. Off-balance sheet risk exists when the maximum potential loss on a particular investment is greater than the value of such investment as reflected in the Statement of Assets and Liabilities.
Fund concentration:
The Funds hold relatively concentrated portfolios that may contain fewer securities or industries than the portfolios of other mutual funds. Holding a relatively concentrated portfolio may increase the risk that the value of a Fund could decrease because of the poor performance of one or a few investments. Additionally, the Funds may encounter some difficulty in liquidating securities of concentrated positions.
10. FEDERAL INCOME TAXES
The difference between book and tax basis total unrealized appreciation/(depreciation) is primarily attributable to mark-to-market treatment of investments in certain passive foreign investment companies, investments in REITs and partnerships, differences in the treatment of amortization of discount on certain debt instruments, deferred losses on wash sales and other timing differences. Other cost basis adjustments are primarily attributable to unrealized appreciation/(depreciation) on foreign currencies.
|
80 |
Third Avenue Trust
Notes to Financial Statements (continued)
April 30, 2012
(Unaudited)
As of October 31, 2011, certain Funds have capital loss carryforwards which should be available to offset certain gains generated in future years prior to their expiration date as follows:
|
|
|
|
|
|
|
|
|
|
|
Expiration Date |
| Third Avenue |
| Third Avenue |
| Third Avenue |
| |||
|
|
|
| |||||||
10/31/2017 |
| $ | 407,198,562 |
| $ | 14,589,926 |
| $ | 67,126,072 |
|
10/31/2018 |
|
| — |
|
| — |
|
| 56,307,639 |
|
|
|
|
|
| ||||||
|
| $ | 407,198,562 |
| $ | 14,589,926 |
| $ | 123,433,711 |
|
|
|
|
|
| ||||||
Therefore, no distributions of capital gains are expected to be paid to shareholders of the above Funds until either capital gains in excess of such carryforwards are recognized or such carryforwards expire. It is uncertain whether the Funds will be able to realize the full benefit of such carryforwards prior to their expiration date.
The Regulated Investment Company Modernization Act of 2010 generally allows capital losses incurred in a taxable year beginning after December 22, 2010 (“post-enactment year”) to be carried forward for an unlimited period to the extent not utilized. However, any capital loss carryforward generated in a post-enactment year must be carried forward to offset subsequent year net capital gains before any capital loss carryforward from a pre-enactment year can be used. This may increase the risk that a capital loss generated in a pre-enactment year will expire unutilized. Additionally, post-enactment capital loss carryforwards will retain their character as either short-term or long-term capital losses.
11. SUBSEQUENT EVENTS
The Adviser has notified The Bank of Nova Scotia that the Funds’ have elected not to renew the line of credit. Accordingly, the commitment will terminate on June 28, 2012.
The Adviser has evaluated the impact of all other subsequent events on the Funds through the date the financial statements were issued, and has determined that there were no additional subsequent events requiring recognition or disclosure in the financial statements.
|
81 |
Third Avenue Trust
Schedule of Shareholder Expenses
(Unaudited)
As a shareholder of a Fund, you incur two types of costs: (1) transaction costs, such as redemption fees; and (2) ongoing costs, including management fees, shareholder servicing fees, distribution fees (if applicable) and other Fund expenses. This example is intended to help you understand your ongoing costs (in dollars) of investing in the Fund and to compare these costs with the ongoing costs of investing in other mutual funds.
The example is based on an investment of $1,000 invested at the beginning of the period, November 1, 2011, and held for the six month period ended April 30, 2012.
Actual Expenses
For each Class of each Fund in the table below, the first line provides information about actual account values and actual expenses. You may use the information in this line, together with the amount you invested, to estimate the expenses that you paid over the period. Simply divide your account value by $1,000 (for example, an $8,600 account value divided by $1,000 = 8.6), then multiply the result by the number in the first line under the heading entitled “Expenses Paid During the Period” to estimate the expenses you paid on your account during this period.
Hypothetical Example for Comparison Purposes
The second line of each Class in the table below provides information about hypothetical account values and hypothetical expenses based on the Class’ actual expense ratio and an assumed rate of return of 5% per year before expenses, which is not the Class’ actual return. The hypothetical account values and expenses may not be used to estimate the actual ending account balance or expenses you paid for the period. You may use this information to compare the ongoing costs of investing in the Class of the Fund and other funds. To do so, compare this 5% hypothetical example with the 5% hypothetical examples that appear in the shareholder reports of the other funds.
Please note that the expenses shown in the table are meant to highlight your ongoing costs only and do not reflect any transactional costs, such as redemption fees. Therefore, the second line of each Class in the table is useful in comparing ongoing costs only, and will not help you determine the relative total costs of owning different funds. In addition, if these transactional costs were included, your costs would have been higher. The examples also assume all dividends and distributions have been reinvested.
|
82 |
Third Avenue Trust
Schedule of Shareholder Expenses (continued)
(Unaudited)
|
|
|
|
|
|
|
|
|
|
|
|
|
|
|
|
|
|
|
|
|
|
|
| Beginning |
| Ending |
| Expenses Paid |
|
|
| ||||||||||||
|
|
|
|
|
| ||||||||||||||||
Third Avenue Value Fund |
|
|
|
|
|
|
|
|
|
|
|
|
| ||||||||
Investor Class |
|
|
|
|
|
|
|
|
|
|
|
|
| ||||||||
Actual |
|
| $ | 1,000.00 |
|
|
| $ | 1,059.20 |
|
|
| $ | 7.17 |
|
|
|
| 1.40 | % |
|
Hypothetical |
|
| $ | 1,000.00 |
|
|
| $ | 1,017.90 |
|
|
| $ | 7.02 |
|
|
|
| 1.40 | % |
|
Institutional Class |
|
|
|
|
|
|
|
|
|
|
|
|
|
|
|
|
|
|
|
|
|
Actual |
|
| $ | 1,000.00 |
|
|
| $ | 1,060.20 |
|
|
| $ | 5.89 |
|
|
|
| 1.15 | % |
|
Hypothetical |
|
| $ | 1,000.00 |
|
|
| $ | 1,019.14 |
|
|
| $ | 5.77 |
|
|
|
| 1.15 | % |
|
Third Avenue Small-Cap Value Fund |
|
|
|
|
|
|
|
|
|
|
|
|
|
|
|
|
|
|
|
|
|
Investor Class |
|
|
|
|
|
|
|
|
|
|
|
|
|
|
|
|
|
|
|
|
|
Actual |
|
| $ | 1,000.00 |
|
|
| $ | 1,070.90 |
|
|
| $ | 7.21 |
|
|
|
| 1.40 | % |
|
Hypothetical |
|
| $ | 1,000.00 |
|
|
| $ | 1,017.90 |
|
|
| $ | 7.02 |
|
|
|
| 1.40 | % |
|
Institutional Class |
|
|
|
|
|
|
|
|
|
|
|
|
|
|
|
|
|
|
|
|
|
Actual |
|
| $ | 1,000.00 |
|
|
| $ | 1,071.60 |
|
|
| $ | 5.92 |
|
|
|
| 1.15 | % |
|
Hypothetical |
|
| $ | 1,000.00 |
|
|
| $ | 1,019.14 |
|
|
| $ | 5.77 |
|
|
|
| 1.15 | % |
|
Third Avenue Real Estate Value Fund |
|
|
|
|
|
|
|
|
|
|
|
|
|
|
|
|
|
|
|
|
|
Investor Class |
|
|
|
|
|
|
|
|
|
|
|
|
|
|
|
|
|
|
|
|
|
Actual |
|
| $ | 1,000.00 |
|
|
| $ | 1,138.80 |
|
|
| $ | 7.23 |
|
|
|
| 1.36 | % |
|
Hypothetical |
|
| $ | 1,000.00 |
|
|
| $ | 1,018.10 |
|
|
| $ | 6.82 |
|
|
|
| 1.36 | % |
|
Institutional Class |
|
|
|
|
|
|
|
|
|
|
|
|
|
|
|
|
|
|
|
|
|
Actual |
|
| $ | 1,000.00 |
|
|
| $ | 1,140.30 |
|
|
| $ | 5.91 |
|
|
|
| 1.11 | % |
|
Hypothetical |
|
| $ | 1,000.00 |
|
|
| $ | 1,019.34 |
|
|
| $ | 5.57 |
|
|
|
| 1.11 | % |
|
Third Avenue International Value Fund |
|
|
|
|
|
|
|
|
|
|
|
|
|
|
|
|
|
|
|
|
|
Investor Class |
|
|
|
|
|
|
|
|
|
|
|
|
|
|
|
|
|
|
|
|
|
Actual |
|
| $ | 1,000.00 |
|
|
| $ | 1,032.90 |
|
|
| $ | 8.34 |
|
|
|
| 1.65 | % |
|
Hypothetical |
|
| $ | 1,000.00 |
|
|
| $ | 1,016.66 |
|
|
| $ | 8.27 |
|
|
|
| 1.65 | % |
|
Institutional Class |
|
|
|
|
|
|
|
|
|
|
|
|
|
|
|
|
|
|
|
|
|
Actual |
|
| $ | 1,000.00 |
|
|
| $ | 1,034.00 |
|
|
| $ | 7.08 |
|
|
|
| 1.40 | % |
|
Hypothetical |
|
| $ | 1,000.00 |
|
|
| $ | 1,017.90 |
|
|
| $ | 7.02 |
|
|
|
| 1.40 | % |
|
Third Avenue Focused Credit Fund |
|
|
|
|
|
|
|
|
|
|
|
|
|
|
|
|
|
|
|
|
|
Investor Class |
|
|
|
|
|
|
|
|
|
|
|
|
|
|
|
|
|
|
|
|
|
Actual |
|
| $ | 1,000.00 |
|
|
| $ | 1,043.30 |
|
|
| $ | 5.89 |
|
|
|
| 1.16 | % |
|
Hypothetical |
|
| $ | 1,000.00 |
|
|
| $ | 1,019.10 |
|
|
| $ | 5.82 |
|
|
|
| 1.16 | % |
|
Institutional Class |
|
|
|
|
|
|
|
|
|
|
|
|
|
|
|
|
|
|
|
|
|
Actual |
|
| $ | 1,000.00 |
|
|
| $ | 1,044.70 |
|
|
| $ | 4.63 |
|
|
|
| 0.91 | % |
|
Hypothetical |
|
| $ | 1,000.00 |
|
|
| $ | 1,020.34 |
|
|
| $ | 4.57 |
|
|
|
| 0.91 | % |
|
|
|
* | Expenses (net of fee waivers, expense offset arrangement and/or expense recovery) are equal to the Class’ annualized expense ratio, multiplied by the average account value over the period, multiplied by the number of days in the most recent fiscal year (182) divided by 366. |
|
83 |
|
Jack W. Aber |
David M. Barse |
William E. Chapman, II |
Lucinda Franks |
Edward J. Kaier |
Marvin Moser |
Eric Rakowski |
Martin Shubik |
Charles C. Walden |
Martin J. Whitman |
|
OFFICERS |
Martin J. Whitman — Chairman of the Board |
David M. Barse — President, Chief Executive Officer |
Vincent J. Dugan — Chief Financial Officer, Treasurer |
Michael A. Buono — Controller |
W. James Hall — General Counsel, Secretary |
Joseph J. Reardon — Chief Compliance Officer |
Tara Dempsey — Assistant Secretary |
TRANSFER AGENT |
BNY Mellon Investment Servicing (U.S.) Inc. |
P.O. Box 9802 |
Providence, RI 02940-8002 |
610-239-4600 |
800-443-1021 (toll-free) |
INVESTMENT ADVISER |
Third Avenue Management LLC |
622 Third Avenue |
New York, NY 10017 |
INDEPENDENT REGISTERED PUBLIC ACCOUNTING FIRM |
PricewaterhouseCoopers LLP |
300 Madison Avenue |
New York, NY 10017 |
CUSTODIAN |
JPMorgan Chase Bank, N.A. |
14201 Dallas Parkway, 2nd Floor |
Dallas, TX 75254 |
|
|
|
Third Avenue Funds |
622 Third Avenue |
New York, NY 10017 |
Phone 212-888-5222 |
Toll Free 800-443-1021 |
Fax 212-888-6757 |
www.thirdave.com |

Item 2. Code of Ethics.
Not applicable for semi-annual reports.
Item 3. Audit Committee Financial Expert.
Not applicable for semi-annual reports.
Item 4. Principal Accountant Fees and Services.
Not applicable for semi-annual reports.
Item 5. Audit Committee of Listed Registrants.
Not applicable.
Item 6. Schedule of Investments.
The Schedule of Investments is included as part of the report to shareholders filed under Item 1 of this Form.
Item 7. Disclosure of Proxy Voting Policies and Procedures for Closed-End Management Investment Companies.
Not applicable.
Item 8. Portfolio Managers of Closed-End Management Investment Companies.
Not applicable.
Item 9. Purchase of Equity Securities by Closed-End Management Investment Company and Affiliated Purchasers.
Not applicable.
Item 10. Submission of Matters to a Vote of Security Holders.
Not applicable.
Item 11. Controls and Procedures.
(a) The Trust’s principal executive officer and principal financial officer have evaluated the Trust’s disclosure controls and procedures within 90 days of this filing and have concluded that the Trust’s disclosure controls and procedures were effective, as of that date, in ensuring that information required to be disclosed by the Trust in this Form N-CSR was recorded, processed, summarized, and reported timely.
(b) The Trust’s principal executive officer and principal financial officer are aware of no changes in the Trust’s internal control over financial reporting that occurred during the second fiscal quarter of the period covered by this report that have materially affected, or are reasonably likely to materially affect, the Trust’s internal control over financial reporting.
Item 12. Exhibits.
|
|
(a)(1) | Not applicable. |
|
|
(a)(2) | Certifications pursuant to Rule 30a-2(a) under the 1940 Act. |
|
|
(a)(3) | Not applicable. |
|
|
(b) | Certifications pursuant to Rule 30a-2(b) under the 1940 Act. |
SIGNATURES
Pursuant to the requirements of the Securities Exchange Act of 1934 and the 1940 Act, the registrant has duly caused this report to be signed on its behalf by the undersigned, thereunto duly authorized.
(Registrant) Third Avenue Trust
|
|
|
By: | /s/ David M. Barse |
|
Name: | David M. Barse |
|
Title: | Principal Executive Officer |
|
Date: | June 22, 2012 |
|
Pursuant to the requirements of the Securities Exchange Act of 1934 and the 1940 Act, this report has been signed by the following persons on behalf of the registrant and in the capacities and on the dates indicated.
|
|
|
By: | /s/ David M. Barse |
|
Name: | David M. Barse |
|
Title: | Principal Executive Officer |
|
Date: | June 22, 2012 |
|
|
|
|
By: | /s/ Vincent J. Dugan |
|
Name: | Vincent J. Dugan |
|
Title: | Principal Financial Officer |
|
Date: | June 22, 2012 |
|