UNITED STATES
SECURITIES AND EXCHANGE COMMISSION
Washington, D.C. 20549
FORM N-CSR
CERTIFIED SHAREHOLDER REPORT OF REGISTERED MANAGEMENT
INVESTMENT COMPANIES
Investment Company Act file number 811-08039
Third Avenue Trust
(Exact name of registrant as specified in charter)
622 Third Avenue, 32nd Floor, New York, NY 10017
(Address of principal executive offices) (Zip code)
Joel L. Weiss
JW Fund Management LLC
100 Springdale Rd., Suite A3-416
Cherry Hill, NJ 08003
(Name and address of agent for service)
Registrant’s telephone number, including area code: (800) 443-1021
Date of fiscal year end: October 31
Date of reporting period: October 31, 2020
Form N-CSR is to be used by management investment companies to file reports with the Commission not later than 10 days after the transmission to stockholders of any report that is required to be transmitted to stockholders under Rule 30e-1 under the Investment Company Act of 1940 (17 CFR 270.30e-1). The Commission may use the information provided on Form N-CSR in its regulatory, disclosure review, inspection, and policymaking roles.
A registrant is required to disclose the information specified by Form N-CSR, and the Commission will make this information public. A registrant is not required to respond to the collection of information contained in Form N-CSR unless the Form displays a currently valid Office of Management and Budget (“OMB”) control number. Please direct comments concerning the accuracy of the information collection burden estimate and any suggestions for reducing the burden to Secretary, Securities and Exchange Commission, 450 Fifth Street, NW, Washington, DC 20549-0609. The OMB has reviewed this collection of information under the clearance requirements of 44 U.S.C. § 3507.
Item 1. Reports to Stockholders.
The Report to Shareholders is attached herewith.

Third Avenue Value Fund
Third Avenue Small-Cap
Value Fund
Third Avenue Real Estate
Value Fund
ANNUAL REPORT
OCTOBER 31, 2020
Beginning on January 1, 2021, as permitted by regulations adopted by the Securities and Exchange Commission, paper copies of the Funds’ shareholder reports like this one will no longer be sent by mail, unless you specifically request paper copies of the reports from the Funds or from your financial intermediary, such as a broker-dealer or bank. Instead, the reports will be made available on Third Avenue’s website (thirdave.com/fund-literature), and you will be notified by mail each time a report is posted and provided with a website link to access the report.
If you already elected to receive shareholder reports electronically, you will not be affected by this change and you need not take any action. If you are a direct investor, you may elect to receive shareholder reports and other communications from the Funds electronically by signing up for paperless delivery at www.icsdelivery.com/thirdavenue. If you own these shares through a financial intermediary, you may contact your financial intermediary.
You may elect to receive all future reports in paper free of charge. If you invest through a financial intermediary, you can contact your financial intermediary to request to continue to receive paper copies of your shareholder reports or you can follow instructions included with this disclosure. If you invest directly with a Fund, you can inform the Fund that you wish to continue receiving paper copies of your shareholder reports by contacting 800-443-1021 or following instructions included with this disclosure. Your election to receive reports in paper will apply to all funds held with Third Avenue.
The Funds are distributed by Foreside Fund Services, LLC. This report is not authorized for distribution to prospective investors unless preceded or accompanied by a current prospectus of the Funds. The prospectus and additional information about the Funds can be found at www.thirdave.com and should be read carefully.
To read the latest calendar quarter Portfolio Manager Commentary, please visit
www.thirdave.com
THIRD AVENUE FUNDS
Privacy Policy
Third Avenue Funds (the “Funds”) respect your right to privacy. We also know that you expect us to conduct and process your business in an accurate and efficient manner. To do so, we must collect and maintain certain personal information about you. This is the information we collect from you on applications or other forms and from the transactions you make with us, our affiliates, or third parties. We do not disclose any information about you or any of our former customers to anyone, except to our affiliates (which may include the Funds’ affiliated money management entities) and service providers, or as otherwise permitted by law. To protect your personal information, we permit access only to authorized employees. Be assured that we maintain physical, electronic and procedural safeguards that comply with federal standards to guard your personal information.
Proxy Voting Policies and Procedures
The Funds have delegated the voting of proxies relating to their voting securities to the Funds’ investment adviser pursuant to the adviser’s proxy voting guidelines. A description of these proxy voting guidelines and procedures, as well as information relating to how a Fund voted proxies relating to portfolio securities during the most recent 12-month period ended June 30, is available by August 31 each year (i) without charge, upon request, by calling (800) 443-1021, (ii) at the website of the Securities and Exchange Commission (the “SEC”) at http://www.sec.gov, and (iii) on the Funds’ website www.thirdave.com.
Schedule of Portfolio Holdings—Form N-PORT
The Funds file their complete schedule of portfolio holdings with the SEC for the first and third quarters of each fiscal year on Form N-PORT. The Funds’ Form N-PORT reports are available on the SEC’s website at http://www.sec.gov.
Table of Contents
| Page 2 | ||
| Page 15 | ||
| Page 27 | ||
| Page 41 | ||
| Page 43 | ||
| Page 45 | ||
| Page 47 | ||
| Page 57 | ||
| Page 94 | ||
| Page 95 | ||
| Page 99 | ||
| Page 101 | ||
Third Avenue Trust
Portfolio Management Discussion
October 31, 2020 (Unaudited)
| Average Annual Returns for the Periods Ended October 31, 2020 | ||||||||||||||||||||
| One Year ended 10/31/20 | Three Year | Five Year | Ten Year | Since Inception Z Class * | ||||||||||||||||
Third Avenue Value Fund Investor Class† | (13.89 | %) | (9.83 | %) | (2.51 | %) | 1.00 | % | N/A | |||||||||||
Third Avenue Value Fund Institutional Class^ | (13.66 | %) | (9.60 | %) | (2.26 | %) | 1.25 | % | N/A | |||||||||||
Third Avenue Value Fund Z Class# | (13.59 | %) | N/A | N/A | N/A | (11.46 | %) | |||||||||||||
MSCI World Index | 4.91 | % | 6.55 | % | 8.73 | % | 9.25 | % | 5.58 | % | ||||||||||
* The date used to calculate the Since Inception performance for the index is the inception date of the Z Class. | ||||||||||
† Investor Class commenced investment operations on December 31, 2009. | ||||||||||
^ Institutional Class commenced investment operations on November 1, 1990. | ||||||||||
# Z Class commenced investment operations on March 1, 2018. | ||||||||||
Third Avenue Value Fund (the “Fund”) has “Total Annual Fund Operating Expenses” of 1.51%, 1.23% and 1.12% for the Investor, Institutional and Z share classes, respectively. The Fund’s “Net Annual Fund Operating Expenses” are 1.40%, 1.15% and 1.05% for the Investor, Institutional and Z share classes, respectively. These ratios are stated in the current prospectus dated March 1, 2020 and may differ from the actual expenses incurred by the Fund for the period covered by this report. Until March 1, 2021 (subject to renewal), whenever the Fund’s normal operating expenses, including the investment advisory fee and most other operating expenses, but excluding taxes, interest, brokerage commissions, acquired fund fees and expenses, and extraordinary items, exceeds the expense limitation of 1.40%, 1.15% and 1.05% for the Investor, Institutional and Z share classes, respectively, based on each share class’ average daily net assets, Third Avenue Management LLC (the “Adviser”) has agreed to waive a portion of its advisory fees and/or reimburse the Fund in an amount equal to that excess. The waived fees and reimbursed expenses may be paid to the Adviser during the following thirty-six month period after the applicable month in which a fee is waived or expense reimbursed by the Adviser, to the extent that the payment of such fees and expenses would not cause the Fund to exceed the expense limitations.
The Fund is offered by prospectus only. The prospectus contains more complete information on advisory fees, distribution charges, and other expenses and should be read carefully before investing or sending money. Past performance is no guarantee of future results. Investment return and principal value will fluctuate so that an investor’s shares, when redeemed, may be worth more or less than original cost. The Fund’s returns should be viewed in light of its investment objectives, policies and strategies and the periods selected.
Distributed by Foreside Fund Services, LLC.
If you should have any questions, or for updated information (including performance data current to the most recent month-end) or a copy of our prospectus, please call 1-800-443-1021 or go to our website at www.thirdave.com. Current performance may be lower or higher than performance quoted
2
Third Avenue Trust
Third Avenue Value Fund
Portfolio Management Discussion (continued)
October 31, 2020 (Unaudited)
The Fund generated returns of -13.89%, -13.66% and -13.59% for the Investor, Institutional and Z share classes over the last fiscal year, respectively. The Fund’s benchmark, the MSCI World Index, returned 4.91% over the same period.
This year marked yet another period in which growth strategies continued to outperform value strategies, particularly so in the case of the largest market capitalizations. For comparative purposes, the MSCI World Value Index returned -11.95%, trailing the broader MSCI World Index by roughly 16.9%. To the extent that the performance of broad market indices are positively influenced in a considerable way by a small subset of relatively expensive mega-cap companies, it is extremely difficult for strategies seeking undervalued securities to perform well, relatively speaking.
Furthermore, there is no crystal ball useful in predicting when this mega-cap growth supremacy will fade or reverse but the facts are that broad U.S. market indices are, by most measures, unusually expensive today, an important portion of which is attributable to their heavy weighting of mega-cap growth companies. We would remind readers of episodes such as the U.S. housing bubble, which did not collapse instantly under its own excess as our memories may seem to suggest. Rather there was a rigorous debate among investors, economists, housing specialists and Federal Reserve Chairs that carried on for years prior to the actual collapse. It is often the case (dare we say always) that episodes of exuberance, which appear patently ridiculous in retrospect, had sophisticated and vociferous defenders in the moment who appeared to be validated by the feedback loop of ever rising prices. Yet, in the parlance of Marty Whitman, our firm founder, buying what is popular, when it is popular, has historically been a recipe for disaster. While recent years have been frustrating, we are unbent in our belief that investing must ultimately rely upon first principles and that capital flows will, over time, seek opportunities providing more attractive pricing and attractive economic returns (as distinct from speculative returns). In this regard, we believe the Fund to be extremely well-positioned today by virtue of its focus on well-capitalized companies trading at unusually attractive valuations.
During the fiscal year, leading contributors to Fund performance included two copper mining companies, Capstone Mining Corp. and Lundin Mining Corp., as well FedEx Corp., Deutsche Bank AG and Interfor Corp. The largest negative contributions to Fund performance during the fiscal year resulted from investments in Bank of Ireland plc, Tidewater Inc., Hawaiian Holdings, Inc., CK Hutchison Holdings Ltd. and Borr Drilling Ltd.
THE INFORMATION IN THE PORTFOLIO MANAGEMENT DISCUSSION REPRESENTS A FACTUAL OVERVIEW OF THE FUND’S PERFORMANCE AND IS NOT INTENDED TO BE A FORECAST OF FUTURE EVENTS, A GUARANTEE OF FUTURE RESULTS NOR INVESTMENT ADVICE. VIEWS EXPRESSED ARE THOSE OF THE INVESTMENT TEAM AND MAY DIFFER FROM THOSE OF OTHER INVESTMENT TEAMS OR THE FIRM AS A WHOLE. ALSO, PLEASE NOTE THAT ANY DISCUSSION OF THE PORTFOLIO’S HOLDINGS, THE FUND’S PERFORMANCE, AND THE INVESTMENT TEAM’S VIEWS ARE AS OF OCTOBER 31, 2020, AND ARE SUBJECT TO CHANGE.
The Fund’s performance may be influenced by a foreign country’s political, social and economic situation. Other risks include currency fluctuations, less liquidity, lack of efficient trading markets, and
3
Third Avenue Trust
Third Avenue Value Fund
Portfolio Management Discussion (continued)
October 31, 2020 (Unaudited)
different auditing and legal standards. These risks may result in more volatility for the Fund. These and other risks are described more fully in the Fund’s prospectus.
The MSCI World Index is a free float-adjusted market capitalization weighted index that is designed to measure the equity market performance of 23 of the world’s most developed markets. The MSCI World Index is not a security that can be purchased or sold, and its total returns are reflective of unmanaged portfolios. The returns include reinvestment of all distributions.
4
Third Avenue Trust
Third Avenue Value Fund—Investor Class
Comparison of a $10,000 Investment
(Unaudited)
Performance Illustration
COMPARISON OF CHANGE IN VALUE OF A $10,000 INVESTMENT IN THIRD AVENUE VALUE FUND – INVESTOR CLASS (TVFVX)
AND THE MSCI WORLD INDEX
FOR THE TEN YEARS ENDED OCTOBER 31, 2020
Average Annual Total Return
| 1 Year | 3 Year | 5 Year | 10 Year | |||
| (13.89%) | (9.83%) | (2.51%) | 1.00% |
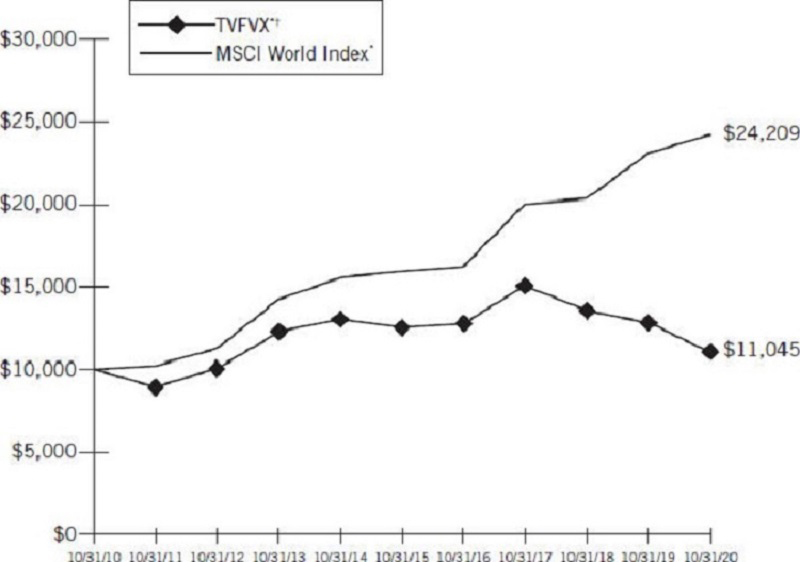
| * | Assumes reinvestment of all distributions. |
| † | Includes the use of derivatives. |
Past performance does not indicate future results. Performance reflects fee waivers, expense offset arrangement and/or recovery of previously waived fees, when applicable. Total return would have been
5
Third Avenue Trust
Third Avenue Value Fund—Investor Class
Comparison of a $10,000 Investment (continued)
(Unaudited)
lower if the Adviser had not waived certain expenses. Conversely, total return would have been higher if the Adviser had not recovered previously waived expenses. Also, the returns shown in the graph and table do not reflect the deduction of taxes that a shareholder would pay on fund distributions or the redemption of fund shares.
6
Third Avenue Trust
Third Avenue Value Fund—Institutional Class
Comparison of a $100,000 Investment
(Unaudited)
Performance Illustration
COMPARISON OF CHANGE IN VALUE OFA $100,000 INVESTMENT IN THIRD AVENUE VALUE FUND – INSTITUTIONAL CLASS (TAVFX)
AND THE MSCI WORLD INDEX
FOR THE TEN YEARS ENDED OCTOBER 31, 2020
Average Annual Total Return
| 1 Year | 3 Year | 5 Year | 10 Year | |||
| (13.66%) | (9.60%) | (2.26%) | 1.25% |
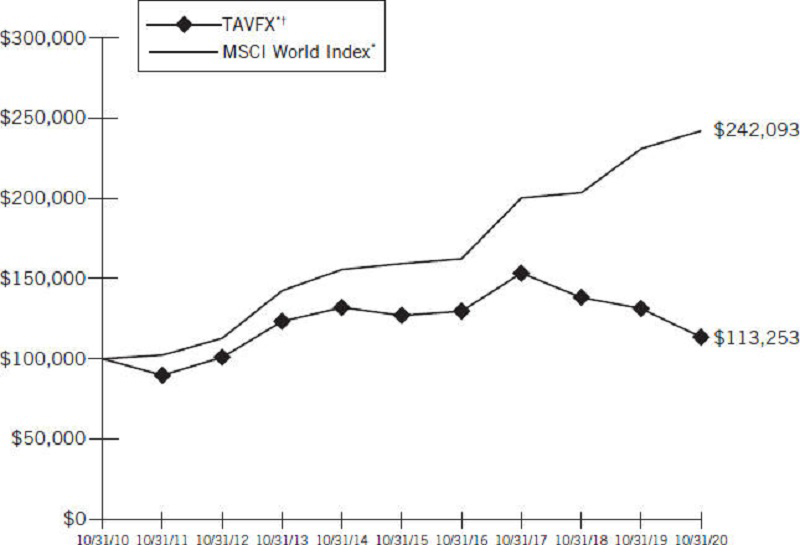
| * | Assumes reinvestment of all distributions. |
| † | Includes the use of derivatives. |
Past performance does not indicate future results. Performance reflects fee waivers, expense offset arrangement and/or recovery of previously waived fees, when applicable. Total return would have been lower if the Adviser had not waived certain expenses. Conversely, total return would have been higher
7
Third Avenue Trust
Third Avenue Value Fund—Institutional Class
Comparison of a $100,000 Investment (continued)
(Unaudited)
if the Adviser had not recovered previously waived expenses. Also, the returns shown in the graph and table do not reflect the deduction of taxes that a shareholder would pay on fund distributions or the redemption of fund shares.
8
Third Avenue Trust
Third Avenue Value Fund—Z Class
Comparison of a $50,000 Investment
(Unaudited)
Performance Illustration
COMPARISON OF CHANGE IN VALUE OF A $50,000 INVESTMENT IN THIRD AVENUE VALUE FUND – Z CLASS (TAVZX)
AND THE MSCI WORLD INDEX
FOR THE PERIOD FROM MARCH 1, 2018 (COMMENCEMENT OF INVESTMENT OPERATIONS) THROUGH OCTOBER 31, 2020
Average Annual Total Return
| 1 Year | Since Inception (3/1/18) | |
| (13.59%) | (11.46%) |
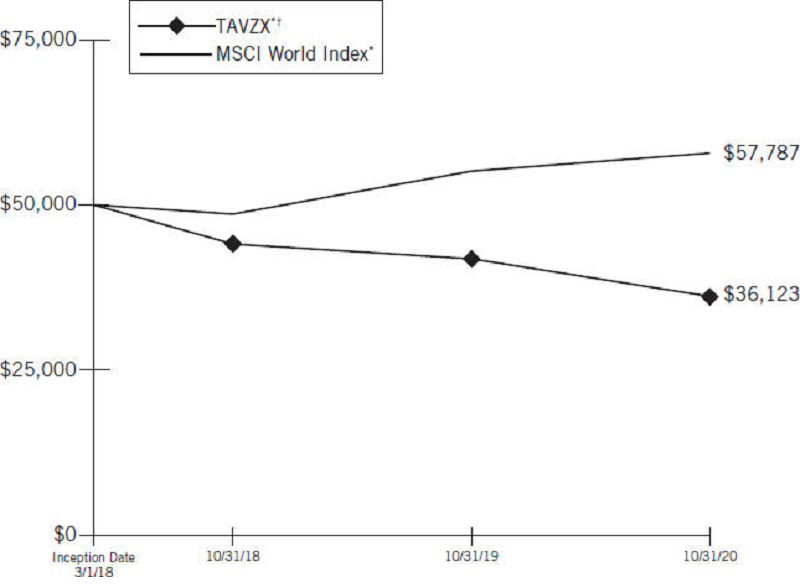
| * | Assumes reinvestment of all distributions. |
| † | Includes the use of derivatives. |
9
Third Avenue Trust
Third Avenue Value Fund—Z Class
Comparison of a $50,000 Investment (continued)
(Unaudited)
Past performance does not indicate future results. Performance reflects fee waivers, expense offset arrangement and/or recovery of previously waived fees, when applicable. Total return would have been lower if the Adviser had not waived certain expenses. Also, the returns shown in the graph and table do not reflect the deduction of taxes that a shareholder would pay on fund distributions or the redemption of fund shares.
10
Third Avenue Trust
Third Avenue Value Fund
Portfolio of Investments
at October 31, 2020
| Principal Amount($) | Security† | Value (Note 1) | ||||||
Corporate Bonds - 0.55% | ||||||||
Oil & Gas Production & Services - 0.55% | ||||||||
| 2,400,914 | Tidewater, Inc., 8.000%, due 8/1/22. | $ | 2,301,312 | |||||
|
| |||||||
Total Corporate Bonds | 2,301,312 | |||||||
|
| |||||||
| Shares | ||||||||
Common Stocks - 96.19% | ||||||||
Aerospace & Defense - 2.43% | ||||||||
| 12,061 | Dassault Aviation S.A. (France) (a) | 10,090,880 | ||||||
|
| |||||||
Automotive - 7.39% | ||||||||
| 275,995 | Bayerische Motoren Werke AG (Germany) | 18,861,096 | ||||||
| 228,416 | Daimler AG (Germany) | 11,806,440 | ||||||
|
| |||||||
| 30,667,536 | ||||||||
|
| |||||||
Banks - 13.91% | ||||||||
| 9,560,438 | Bank of Ireland Group PLC (Ireland) (a) | 23,721,740 | ||||||
| 291,492 | Comerica, Inc. | 13,265,801 | ||||||
| 2,243,031 | Deutsche Bank AG (Germany) (a) | 20,728,088 | ||||||
|
| |||||||
| 57,715,629 | ||||||||
|
| |||||||
Building Products - 11.19% | ||||||||
| 786,738 | Buzzi Unicem SpA (Italy) | 17,023,212 | ||||||
| 175,870 | Eagle Materials, Inc. | 14,992,918 | ||||||
| 139,576 | Mohawk Industries, Inc. (a) | 14,402,847 | ||||||
|
| |||||||
| 46,418,977 | ||||||||
|
| |||||||
Business Services - 2.36% | ||||||||
| 324,786 | Korn Ferry | 9,805,289 | ||||||
|
| |||||||
Diversified Holding Companies - 5.24% | ||||||||
| 2,874,039 | CK Hutchison Holdings, Ltd. (Cayman Islands) | 17,359,142 | ||||||
| 3,318,103 | Quinenco S.A. (Chile) | 4,372,790 | ||||||
|
| |||||||
| 21,731,932 | ||||||||
|
| |||||||
Engineering & Construction - 2.95% | ||||||||
| 609,070 | Boskalis Westminster (Netherlands) (a) | 12,247,522 | ||||||
|
| |||||||
Forest Products & Paper - 9.01% | ||||||||
| 2,269,109 | Interfor Corp. (Canada) (a) | 25,564,307 | ||||||
| 433,775 | Weyerhaeuser Co., REIT | 11,837,720 | ||||||
|
| |||||||
| 37,402,027 | ||||||||
|
| |||||||
The accompanying notes are an integral part of the financial statements.
11
Third Avenue Trust
Third Avenue Value Fund
Portfolio of Investments (continued)
at October 31, 2020
| Shares | Security† | Value (Note 1) | ||||||
Common Stocks (continued) | ||||||||
Insurance - 3.78% | ||||||||
| 962,406 | Old Republic International Corp. | $ | 15,667,970 | |||||
|
| |||||||
Metals & Mining - 16.41% | ||||||||
| 17,288,567 | Capstone Mining Corp. (Canada) (a) | 21,670,725 | ||||||
| 4,799,689 | Lundin Mining Corp. (Canada) | 29,000,598 | ||||||
| 1,160,915 | Warrior Met Coal, Inc. | 17,413,725 | ||||||
|
| |||||||
| 68,085,048 | ||||||||
|
| |||||||
Non-U.S. Real Estate Operating Companies - 2.34% | ||||||||
| 2,088,569 | CK Asset Holdings, Ltd. (Cayman Islands) | 9,698,252 | ||||||
|
| |||||||
Oil & Gas Production & Services - 6.08% | ||||||||
| 203,421 | Drilling Co. of 1972 A/S (The) (Denmark) (a) | 3,842,749 | ||||||
| 4,240,835 | PGS ASA (Norway) (a) | 1,054,628 | ||||||
| 1,509,953 | Subsea 7, S.A. (Luxembourg) (a) | 10,028,279 | ||||||
| 1,757,090 | Tidewater, Inc. (a) | 10,296,548 | ||||||
|
| |||||||
| 25,222,204 | ||||||||
|
| |||||||
Retail - 0.96% | ||||||||
| 130,300 | Seven & i Holdings Co., Ltd. (Japan) | 3,960,427 | ||||||
|
| |||||||
Transportation Infrastructure - 5.48% | ||||||||
| 15,441 | FedEx Corp. | 4,006,476 | ||||||
| 891,480 | Hawaiian Holdings, Inc. | 12,346,998 | ||||||
| 44,038,127 | Hutchison Port Holdings Trust (Singapore) | 6,390,681 | ||||||
|
| |||||||
| 22,744,155 | ||||||||
|
| |||||||
U.S. Homebuilder - 1.74% | ||||||||
| 127,126 | Lennar Corp., Class B | 7,232,198 | ||||||
|
| |||||||
U.S. Real Estate Investment Trusts - 2.51% | ||||||||
| 356,349 | Macerich Co. (The) | 2,480,189 | ||||||
| 258,031 | Vornado Realty Trust | 7,929,293 | ||||||
|
| |||||||
| 10,409,482 | ||||||||
|
| |||||||
U.S. Real Estate Operating Companies - 2.41% | ||||||||
| 2,385,547 | Five Point Holdings, LLC, Class A (a) | 9,995,442 | ||||||
|
| |||||||
Total Common Stocks | 399,094,970 | |||||||
|
| |||||||
The accompanying notes are an integral part of the financial statements.
12
Third Avenue Trust
Third Avenue Value Fund
Portfolio of Investments (continued)
at October 31, 2020
| Shares | Security† | Value (Note 1) | ||||||
Preferred Stocks—0.00% | ||||||||
Consumer Products - 0.00% | ||||||||
| 12,839,145 | Home Products International, Inc., Series A, Convertible, 8.000% (a)(b)(c)(d)(e) | $ | — | |||||
|
| |||||||
Total Preferred Stocks | — | |||||||
|
| |||||||
Purchased Options - 1.03% | ||||||||
Total Purchased Options (see below for details) | 4,259,482 | |||||||
|
| |||||||
Total Investment Portfolio - 97.77% | 405,655,764 | |||||||
Other Assets less Liabilities - 2.23% | 9,262,335 | |||||||
|
| |||||||
NET ASSETS - 100.00%. | $414,918,099 | |||||||
|
| |||||||
Notes:
| (a) | Non-income producing security. |
| (b) | Security is fair valued by the valuation committee in accordance with the policies established by the Board of Trustees. |
| (c) | Affiliated issuer—An affiliated person as defined in the Investment Company Act of 1940, includes, among other things, ownership of 5% or more of the outstanding voting securities of such person. |
| (d) | Security subject to restrictions on resale. |
| Shares | Issuer | Acquisition Date | Cost | Market Value Per Unit | ||||||||||
| 12,839,145 | Home Products International, Inc., Series A, Convertible Preferred Stock, 8.000% | 3/16/07-10/2/17 | $ | — | $ | 0.00 | ||||||||
At October 31, 2020, the restricted security was valued at $0. | ||||||||||||||
| (e) | Security is valued using significant unobservable inputs and is classified as Level 3 in the fair value hierarchy. |
| † | U.S. issuer unless otherwise noted. |
REIT: Real Estate Investment Trust.
The accompanying notes are an integral part of the financial statements.
13
Third Avenue Trust
Third Avenue Value Trust
Portfolio of Investments (continued)
at October 31, 2020
Summary of Investments by Industry | %of Net Assets | |||
Metals & Mining | 16.41 | % | ||
Banks | 13.91 | |||
Building Products | 11.19 | |||
Forest Products & Paper | 9.01 | |||
Automotive | 7.39 | |||
Oil & Gas Production & Services | 6.63 | |||
Transportation Infrastructure | 5.48 | |||
Diversified Holding Companies | 5.24 | |||
Insurance | 3.78 | |||
Engineering & Construction | 2.95 | |||
U.S. Real Estate Investment Trusts | 2.51 | |||
Aerospace & Defense | 2.43 | |||
U.S. Real Estate Operating Companies | 2.41 | |||
Business Services | 2.36 | |||
Non-U.S. Real Estate Operating Companies | 2.34 | |||
U.S. Homebuilder | 1.74 | |||
Retail | 0.96 | |||
Consumer Products | 0.00 | |||
Purchased Options | 1.03 | |||
Other Assets less Liabilities | 2.23 | |||
|
| |||
Total | 100.00 | % | ||
|
| |||
Country Concentration | %of Net Assets | |||
United States | 38.14 | % | ||
Canada | 18.37 | |||
Germany | 12.39 | |||
Cayman Islands | 6.52 | |||
Ireland | 5.72 | |||
Italy | 4.10 | |||
Netherlands | 2.95 | |||
France | 2.43 | |||
Luxembourg | 2.42 | |||
Singapore | 1.54 | |||
Chile | 1.05 | |||
Japan | 0.96 | |||
Denmark | 0.93 | |||
Norway | 0.25 | |||
|
| |||
Total | 97.77 | % | ||
|
| |||
Purchased Options
Description | Counterparty | Number of Contracts | Notional Amount | Exercise Price | Expiration Date | Value | ||||||||||||||||
SPDR S&P 500 ETF Trust, Put | Goldman Sachs & Co. | 5,000 | $ | 163,270,000 | 303.0000 USD | 12/18/20 | $ | 4,259,482 | ||||||||||||||
|
|
|
|
|
|
|
|
|
|
| ||||||||||||
Total Purchased Options (Cost $4,810,000) | $ | 4,259,482 |
| |||||||||||||||||||
|
| |||||||||||||||||||||
ETF: Exchange Traded Fund. | ||||||||||||||||||||||
The accompanying notes are an integral part of the financial statements.
14
Third Avenue Trust
Third Avenue Small-Cap Value Fund
Portfolio Management Discussion
October 31, 2020 (Unaudited)
| Average Annual Returns for the Periods Ended October 31, 2020 | ||||||||||||||||||
| One Year Ended 10/31/20 | Three Year | Five Year | Ten Year | Since Inception Z Class* | ||||||||||||||
Third Avenue Small-Cap Value Fund Investor Class† | (14.33%) | (3.85 | %) | 3.00 | % | 6.34 | % | N/A | ||||||||||
Third Avenue Small-Cap Value Fund Institutional Class^ | (14.15%) | (3.61 | %) | 3.26 | % | 6.59 | % | N/A | ||||||||||
Third Avenue Small-Cap Value Fund Z Class# | (14.03%) | N/A | N/A | N/A | (3.63 | %) | ||||||||||||
Russell 2000 Value Index | (13.92%) | (4.05 | %) | 3.71 | % | 7.06 | % | (3.83 | %) | |||||||||
| * | The date used to calculate the Since Inception performance for the index is the inception date of the Z Class. |
| † | Investor Class commenced investment operations on December 31, 2009. |
| ^ | Institutional Class commenced investment operations on April 1, 1997. |
| # | Z Class commenced investment operations on March 1, 2018. |
Third Avenue Small-Cap Value Fund (the “Fund”) has “Total Annual Fund Operating Expenses” of 1.64%, 1.34% and 1.24% for the Investor, Institutional and Z share classes, respectively. The Fund’s “Net Annual Fund Operating Expenses” are 1.40%, 1.15% and 1.05% for the Investor, Institutional and Z share classes, respectively. These ratios are stated in the current prospectus dated March 1, 2020 and may differ from the actual expenses incurred by the Fund for the period covered by this report. Until March 1, 2021 (subject to renewal), whenever the Fund’s normal operating expenses, including the investment advisory fee and most other operating expenses, but excluding taxes, interest, brokerage commissions, acquired fund fees and expenses, and extraordinary items, exceeds the expense limitation of 1.40%, 1.15% and 1.05% for the Investor, Institutional and Z share classes, respectively, based on each share class’ average daily net assets, Third Avenue Management LLC (the “Adviser”) has agreed to waive a portion of its advisory fees and/or reimburse the Fund in an amount equal to that excess. The waived fees and reimbursed expenses may be paid to the Adviser during the following thirty-six month period after the applicable month in which a fee is waived or expense reimbursed by the Adviser, to the extent that the payment of such fees and expenses would not cause the Fund to exceed the expense limitations.
The Fund is offered by prospectus only. The prospectus contains more complete information on advisory fees, distribution charges, and other expenses and should be read carefully before investing or sending money. Past performance is no guarantee of future results. Investment return and principal value will fluctuate so that an investor’s shares, when redeemed, may be worth more or less than original cost. The Fund’s returns should be viewed in light of its investment objectives, policies and strategies and the periods selected.
Distributed by Foreside Fund Services, LLC.
If you should have any questions, or for updated information (including performance data current to the most recent month-end) or a copy of our prospectus, please call 1-800-443-1021 or go to our website at www.thirdave.com. Current performance may be lower or higher than performance quoted.
15
Third Avenue Trust
Third Avenue Small-Cap Value Fund
Portfolio Management Discussion (continued)
October 31, 2020 (Unaudited)
The Fund generated returns of -14.33%, -14.15%, and -14.03% for the Investor, Institutional and Z share classes over the last fiscal year, respectively. The Fund’s benchmark, the Russell 2000 Value Index, returned -13.92% over the same period.
Fund Management has maintained a commitment to shareholders by positioning the portfolio within the context of the deep-value roots instilled by Third Avenue’s late founder, Marty Whitman. As such, the Fund finds itself more concentrated among companies that trade at substantial discounts to what Fund Management deems to be their intrinsic net asset value. We remain committed to a concentrated portfolio of companies with what we believe are healthy balance sheets that are misunderstood by the market.
The top performers for the Fund during the fiscal year were MYR Group, Inc. (“MYRG”) and Cooper Tire and Rubber Co. (“CTB”). MYRG is an engineering and construction company dedicated to serving the electric utility industry and other commercial markets. CTB is tire manufacturer which caters predominantly to the replacement market. Both companies maintain strong balance sheets and illustrated the resiliency of their business models by delivering strong performance in 2020 despite the COVID-19 pandemic (“COVID-19”). The strong absolute performance exceeded the indices and their respective sectors (MYRG: Industrials, CTB: Consumer Discretionary).
The overall performance on the Fund was dragged down by the energy and materials positions. Tidewater, Inc. (“Tidewater”) and Seacor Marine Holdings, Inc. (“Seacor”) provide offshore marine transport services to the energy industry. The energy sector overall was hit hard in 2020 due to a combination of COVID-19 and an oil price war between Saudi Arabia and Russia. Offshore service companies such as Tidewater and Seacor underperformed the indices and the sector. Given the capital intensity of offshore projects, many projects were postponed or cancelled putting pressure on operating results. The Seacor position was exited and the proceeds were deployed into Tidewater bonds maturing in 2022. The bonds were trading at a highly attractive price when purchased. The Fund maintains a position in the Tidewater equity as well.
Another underperformer was the materials position, Kaiser Aluminum Corp. (“Kaiser”). Kaiser is an aluminum manufacturer focused on the auto and aerospace industries. Both industries struggled this year due to COVID-19. Given the end-market exposures, Kaiser lagged materials sector performance by a wide margin. The auto industry is recovering and although a recovery in aerospace will take time, we remain optimistic about Kaiser’s long-term prospects. The position size was increased during the year.
Fund Management remains optimistic about the Fund’s positioning.
THE INFORMATION IN THE PORTFOLIO MANAGEMENT DISCUSSION REPRESENTS A FACTUAL OVERVIEW OF THE FUND’S PERFORMANCE AND IS NOT INTENDED TO BE A FORECAST OF FUTURE EVENTS, A GUARANTEE OF FUTURE RESULTS NOR INVESTMENT ADVICE. VIEWS EXPRESSED ARE THOSE OF THE INVESTMENT TEAM AND MAY DIFFER FROM THOSE OF OTHER INVESTMENT TEAMS OR THE FIRM AS A WHOLE. ALSO, PLEASE NOTE THAT ANY DISCUSSION OF THE PORTFOLIO’S
16
Third Avenue Trust
Third Avenue Small-Cap Value Fund
Portfolio Management Discussion (continued)
October 31, 2020 (Unaudited)
HOLDINGS, THE FUND’S PERFORMANCE, AND THE INVESTMENT TEAM’S VIEWS ARE AS OF OCTOBER 31, 2020, AND ARE SUBJECT TO CHANGE.
Small-cap companies carry additional risks because their share prices may be more volatile, and their securities may be less liquid than larger, more established companies. Such investments may increase the risk of greater price fluctuations. These and other risks are described more fully in the Fund’s prospectus.
The Russell 2000 Value Index measures the performance of those Russell 2000 companies with lower price-to-book ratios and lower forecasted growth values. The Russell 2000 Value Index is not a security that can be purchased or sold, and its total returns are reflective of unmanaged portfolios. The returns include reinvestment of all distributions.
17
Third Avenue Trust
Third Avenue Small-Cap Value Fund—Investor Class
Comparison of a $10,000 Investment
(Unaudited)
Performance Illustration
COMPARISON OF CHANGE IN VALUE OF A $10,000 INVESTMENT IN THIRD AVENUE
SMALL-CAP VALUE FUND – INVESTOR CLASS (TVSVX)
AND THE RUSSELL 2000 VALUE INDEX
FOR THE TEN YEARS ENDED OCTOBER 31, 2020
| Average Annual Total Return | ||||||||||||||
| 1 Year | 3 Year | 5 Year | 10 Year | |||||||||||
| (14.33%) | (3.85%) | 3.00% | 6.34% | |||||||||||
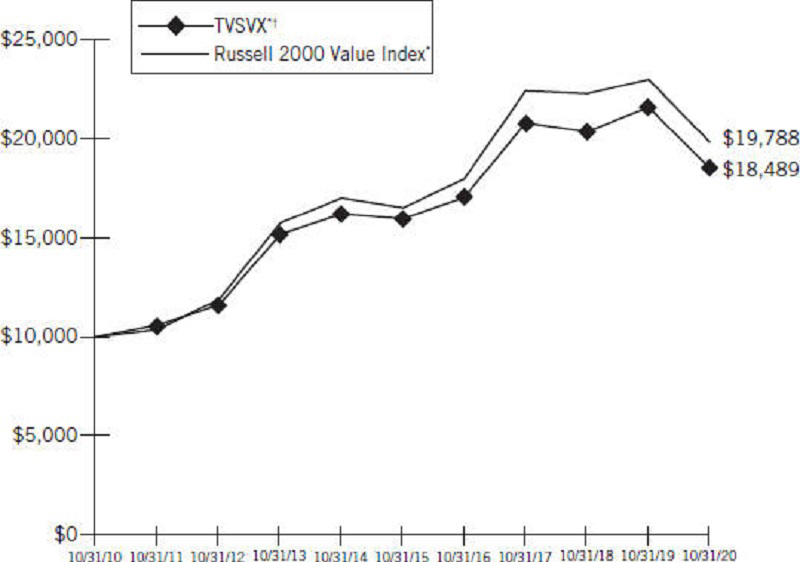
* Assumes reinvestment of all distributions.
† Includes the use of derivatives.
Past performance does not indicate future results. Performance reflects fee waivers, expense offset arrangement and/or recovery of previously waived fees, when applicable. Total return would have been
18
Third Avenue Trust
Third Avenue Small-Cap Value Fund—Investor Class
Comparison of a $10,000 Investment (continued)
(Unaudited)
lower if the Adviser had not waived certain expenses. Conversely, total return would have been higher if the Adviser had not recovered previously waived expenses. Also, the returns shown in the graph and table do not reflect the deduction of taxes that a shareholder would pay on fund distributions or the redemption of fund shares.
19
Third Avenue Trust
Third Avenue Small-Cap Value Fund—Institutional Class
Comparison of a $100,000 Investment
(Unaudited)
Performance Illustration
COMPARISON OF CHANGE IN VALUE OF A $100,000 INVESTMENT IN THIRD AVENUE
SMALL-CAP VALUE FUND – INSTITUTIONAL CLASS (TASCX)
AND THE RUSSELL 2000 VALUE INDEX
FOR THE TEN YEARS ENDED OCTOBER 31, 2020
| Average Annual Total Return | ||||||||||||||
| 1 Year | 3 Year | 5 Year | 10 Year | |||||||||||
| (14.15%) | (3.61%) | 3.26% | 6.59% | |||||||||||
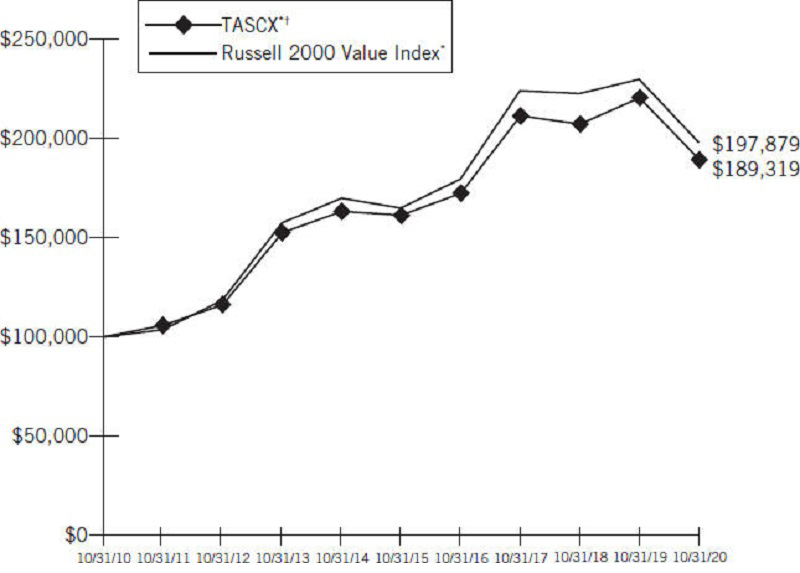
* Assumes reinvestment of all distributions.
† Includes the use of derivatives.
Past performance does not indicate future results. Performance reflects fee waivers, expense offset arrangement and/or recovery of previously waived fees, when applicable. Total return would have been
20
Third Avenue Trust
Third Avenue Small-Cap Value Fund—Institutional Class
Comparison of a $100,000 Investment
(Unaudited)
lower if the Adviser had not waived certain expenses. Conversely, total return would have been higher if the Adviser had not recovered previously waived expenses. Also, the returns shown in the graph and table do not reflect the deduction of taxes that a shareholder would pay on fund distributions or the redemption of fund shares.
21
Third Avenue Trust
Third Avenue Small-Cap Value Fund—Z Class
Comparison of a $50,000 Investment
(Unaudited)
Performance Illustration
COMPARISON OF CHANGE IN VALUE OF A $50,000 INVESTMENT IN THIRD AVENUE
SMALL-CAP VALUE FUND – Z CLASS (TASZX)
AND THE RUSSELL 2000 VALUE INDEX
FOR THE PERIOD FROM MARCH 1, 2018 (COMMENCEMENT OF INVESTMENT
OPERATIONS) THROUGH OCTOBER 31, 2020
| Average Annual Total Return | ||||||||||
| 1 Year | Since Inception (3/1/18) | |||||||||
| (14.03%) | (3.63%) | |||||||||
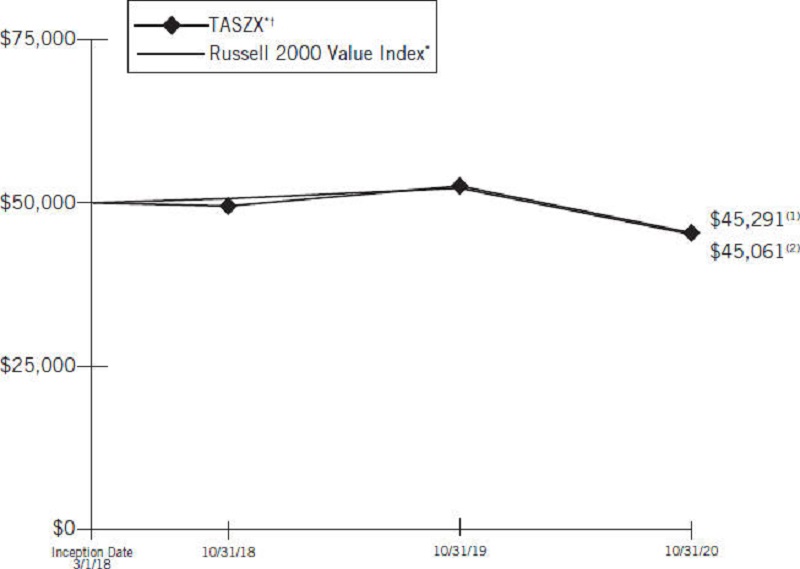
* Assumes reinvestment of all distributions.
† Includes the use of derivatives.
(1) Represents TASZX.
(2) Represents Russell 2000 Value Index.
22
Third Avenue Trust
Third Avenue Small-Cap Value Fund—Z Class
Comparison of a $50,000 Investment (continued)
(Unaudited)
Past performance does not indicate future results. Performance reflects fee waivers, expense offset arrangement and/or recovery of previously waived fees, when applicable. Total return would have been lower if the Adviser had not waived certain expenses. Also, the returns shown in the graph and table do not reflect the deduction of taxes that a shareholder would pay on fund distributions or the redemption of fund shares.
23
Third Avenue Trust
Third Avenue Small-Cap Value Fund
Portfolio of Investments
at October 31, 2020
Principal Amount($) | Security† | Value (Note 1) | ||||
Corporate Bonds - 1.18% | ||||||
Oil & Gas Production & Services - 1.18% | ||||||
| 1,656,549 | Tidewater, Inc., 8.000%, due 8/1/22. | $ | 1,587,827 | |||
|
| |||||
Total Corporate Bonds | 1,587,827 | |||||
|
| |||||
Shares | ||||||
Common Stocks - 91.33% | ||||||
Auto Parts & Services - 11.69% | ||||||
| 252,060 | Cooper Tire & Rubber Co. | 8,668,344 | ||||
| 26,078 | Dorman Products, Inc. (a) | 2,327,983 | ||||
| 53,220 | Visteon Corp. (a) | 4,771,173 | ||||
|
| |||||
| 15,767,500 | ||||||
|
| |||||
Bank & Thrifts - 22.26% | ||||||
| 169,972 | Carter Bank & Trust | 1,181,305 | ||||
| 42,331 | Cullen/Frost Bankers, Inc. | 2,974,599 | ||||
| 107,928 | Prosperity Bancshares, Inc. | 5,947,912 | ||||
| 180,778 | Southside Bancshares, Inc. | 4,873,775 | ||||
| 145,792 | UMB Financial Corp. | 8,874,359 | ||||
| 182,346 | Washington Trust Bancorp, Inc. | 6,157,825 | ||||
|
| |||||
| 30,009,775 | ||||||
|
| |||||
Conglomerates - 5.09% | ||||||
| 1,993 | Seaboard Corp. | 6,865,885 | ||||
|
| |||||
Consulting & Information Technology Services - 4.04% | ||||||
| 83,391 | ICF International, Inc. | 5,452,938 | ||||
|
| |||||
Consumer Discretionary - 3.38% | ||||||
| 91,148 | Hamilton Beach Brands Holding Co. | 2,009,813 | ||||
| 122,715 | Liberty Media Corp.-Liberty Braves, Class A (a) | 2,540,201 | ||||
|
| |||||
| 4,550,014 | ||||||
|
| |||||
Consumer Staples - 4.24% | ||||||
| 148,980 | Cal-Maine Foods, Inc. (a) | 5,713,383 | ||||
|
| |||||
Financials - 2.04% | ||||||
| 1,566,718 | Westaim Corp. (The) (Canada) (a) | 2,751,723 | ||||
|
| |||||
Home Building - 2.83% | ||||||
| 232,252 | TRI Pointe Group, Inc. (a) | 3,815,900 | ||||
|
| |||||
Industrial Equipment - 4.17% | ||||||
| 46,706 | Alamo Group, Inc. | 5,620,133 | ||||
|
| |||||
The accompanying notes are an integral part of the financial statements.
24
Third Avenue Trust
Third Avenue Small-Cap Value Fund
Portfolio of Investments (continued)
at October 31, 2020
| Shares | Security† | Value (Note 1) | ||||
Common Stocks (continued) | ||||||
Industrial Services - 14.42% | ||||||
| 52,390 | Comfort Systems USA, Inc. | $ | 2,399,462 | |||
| 45,788 | EMCOR Group, Inc. | 3,122,284 | ||||
| 268,555 | MYR Group, Inc. (a) | 11,480,726 | ||||
| 14,863 | UniFirst Corp. | 2,434,708 | ||||
|
| |||||
| 19,437,180 | ||||||
|
| |||||
Insurance & Reinsurance - 3.20% | ||||||
| 279,230 | ProAssurance Corp. | 4,308,519 | ||||
|
| |||||
Metals Manufacturing - 3.22% | ||||||
| 69,023 | Kaiser Aluminum Corp. | 4,343,617 | ||||
|
| |||||
Oil & Gas Production & Services - 2.34% | ||||||
| 538,447 | Tidewater, Inc. (a) | 3,155,299 | ||||
|
| |||||
Real Estate - 2.89% | ||||||
| 96,445 | FRP Holdings, Inc. (a) | 3,902,165 | ||||
|
| |||||
Telecommunications - 2.21% | ||||||
| 66,512 | ATN International, Inc. | 2,973,086 | ||||
|
| |||||
U.S. Real Estate Operating Companies - 3.31% | ||||||
| 115,510 | Alico, Inc | 3,335,929 | ||||
| 269,797 | Five Point Holdings, LLC, Class A (a) | 1,130,449 | ||||
|
| |||||
| 4,466,378 | ||||||
|
| |||||
Total Common Stocks | 123,133,495 | |||||
|
| |||||
Closed-End Fund - 2.32% | ||||||
Financials - 2.32% | ||||||
| 111,210 | Central Securities Corp. | 3,134,454 | ||||
|
| |||||
Total Closed-End Fund | 3,134,454 | |||||
|
| |||||
Total Investment Portfolio - 94.83% | 127,855,776 | |||||
Other Assets less Liabilities - 5.17% | 6,973,680 | |||||
|
| |||||
NET ASSETS - 100.00%. | $ | 134,829,456 | ||||
|
| |||||
Notes: (a)Non-income producing security. † U.S. issuer unless otherwise noted. |
| |||||
The accompanying notes are an integral part of the financial statements.
25
Third Avenue Trust
Third Avenue Small-Cap Value Fund
Portfolio of Investments (continued)
at October 31, 2020
Summary of Investments by Industry | %of Net Assets | |||
Bank & Thrifts | 22.26 | % | ||
Industrial Services | 14.42 | |||
Auto Parts & Services | 11.69 | |||
Conglomerates | 5.09 | |||
Financials | 4.36 | |||
Consumer Staples | 4.24 | |||
Industrial Equipment | 4.17 | |||
Consulting & Information Technology Services | 4.04 | |||
Oil & Gas Production & Services | 3.52 | |||
Consumer Discretionary | 3.38 | |||
U.S. Real Estate Operating Companies | 3.31 | |||
Metals Manufacturing | 3.22 | |||
Insurance & Reinsurance | 3.20 | |||
Real Estate | 2.89 | |||
Home Building | 2.83 | |||
Telecommunications | 2.21 | |||
Other Assets less Liabilities | 5.17 | |||
|
| |||
Total | 100.00 | % | ||
|
| |||
Country Concentration | %of Net Assets | |||
United States | 92.79 | % | ||
Canada | 2.04 | |||
|
| |||
Total | 94.83 | % | ||
|
| |||
The accompanying notes are an integral part of the financial statements.
26
Third Avenue Trust
Third Avenue Real Estate Value Fund
Portfolio Management Discussion
October 31, 2020 (Unaudited)
| Average Annual Returns for the Periods Ended October 31, 2020 | ||||||||||||||||||
| One Year ended 10/31/20 | Three Year | Five Year | Ten Year | Since Inception Z Class* | ||||||||||||||
Third Avenue Real Estate Value Fund Investor Class† | (19.37%) | (7.49 | %) | (1.37 | %) | 4.27 | % | N/A | ||||||||||
Third Avenue Real Estate Value Fund Institutional Class^ | (19.14%) | (7.24 | %) | (1.11 | %) | 4.53 | % | N/A | ||||||||||
Third Avenue Real Estate Value Fund Z Class# | (19.09%) | N/A | N/A | N/A | (8.64 | %) | ||||||||||||
FTSE EPRA/NAREIT Developed Index | (22.18%) | (1.47 | %) | 1.16 | % | 4.83 | % | (0.67 | %) | |||||||||
| * | The date used to calculate the Since Inception performance for the index is the inception date of the Z Class. |
| † | Investor Class commenced investment operations on December 31, 2009. |
| ^ | Institutional Class commenced investment operations on September 17, 1998. |
| # | Z Class commenced investment operations on March 1, 2018. |
Third Avenue Real Estate Value Fund (the “Fund”) has “Total Annual Fund Operating Expenses” of 1.45%, 1.17% and 1.05% for the Investor, Institutional and Z share classes, respectively. The Fund’s “Net Annual Fund Operating Expenses” are 1.40%, 1.15% and 1.05% for the Investor, Institutional and Z share classes, respectively. These ratios are stated in the current prospectus dated March 1, 2020 and may differ from the actual expenses incurred by the Fund for the period covered by this report. Until March 1, 2021 (subject to renewal), whenever the Fund’s normal operating expenses, including the investment advisory fee and most other operating expenses, but excluding taxes, interest, brokerage commissions, acquired fund fees and expenses, and extraordinary items, exceeds the expense limitation of 1.40%, 1.15% and 1.05% for the Investor, Institutional and Z share classes, respectively, based on each share class’ average daily net assets, Third Avenue Management LLC (the “Adviser”) has agreed to waive a portion of its advisory fees and/or reimburse the Fund in an amount equal to that excess. The waived fees and reimbursed expenses may be paid to the Adviser during the following thirty-six month period after the applicable month in which a fee is waived or expense reimbursed by the Adviser, to the extent that the payment of such fees and expenses would not cause the Fund to exceed the expense limitations.
The Fund is offered by prospectus only. The prospectus contains more complete information on advisory fees, distribution charges, and other expenses and should be read carefully before investing or sending money. Past performance is no guarantee of future results. Investment return and principal value will fluctuate so that an investor’s shares, when redeemed, may be worth more or less than original cost. The Fund’s returns should be viewed in light of its investment objectives, policies and strategies and the periods selected.
Distributed by Foreside Fund Services, LLC.
If you should have any questions, or for updated information (including performance data current to the most recent month-end) or a copy of our prospectus, please call 1-800-443-1021 or go to our website at www.thirdave.com. Current performance may be lower or higher than performance quoted.
27
Third Avenue Trust
Third Avenue Real Estate Value Fund
Portfolio Management Discussion (continued)
October 31, 2020 (Unaudited)
The Fund generated returns of -19.37%, -19.14%, and -19.09% for the Investor, Institutional and Z share classes over the last fiscal year, respectively. The Fund’s benchmark, the FTSE EPRA/NAREIT Developed Index, returned -22.18% over the same period.
Top contributors during the 2020 fiscal year included the common stocks of Prologis Inc. (“Prologis”), Lennar Corp. (“Lennar”) and The Lowe’s Companies (“Lowe’s”). Prologis is a US-based REIT that is the largest owner of modern-logistic facilities globally with a platform that spans more than 960 million square feet throughout its key markets of North America, Europe, and Asia. During the year, the company’s operations benefited from an acceleration in demand for industrial properties supporting the surge in e-commerce activity amidst “stay-at-home” orders. Lennar is the largest homebuilder in the US (by revenues), with a focus on first-time and first-time-move-up buyers in its 1.25k active communities. During the year, the company’s new orders (and backlog) increased significantly as demand for newly-constructed homes strengthened alongside historically-low mortgage rates, an increased emphasis on single-family housing relative to multifamily dwellings, and record-low inventory levels. Lowe’s is the second largest home improvement retailer in North America, with a 2,000 store footprint in the Southeast, Mid-Atlantic, California, Florida, and Texas. The company enjoyed record sales during the year with an increased emphasis on home-improvement spending, as well as enhanced margins given an increased focus on operational efficiencies more recently.
The largest detractors to performance during the year included the common stocks of Five Point Holdings, Inc. (“Five Point”) and Seritage Growth Properties (“Seritage”). Five Point is a US-based real estate operating company that is the largest developer of master planned communities in coastal California with plans to build more than 40,000 residential units and nearly 20 million square feet of commercial space at its three key projects in Orange County (Great Park), Los Angeles (Valencia), and San Francisco (Shipyards). While there was significant progress during the year, particularly with initial land sales in Valencia, Five Point is in the early stages of reporting meaningful profits given the long-dated nature of its developments. Seritage is a US-based real estate investment trust (“REIT”) that controls 185 properties that were previously occupied by Sears. With nearly 28 million square feet of space in urban markets (including key holdings in Florida, California, Texas, and New York), the company has a substantial opportunity to add value over time by re-leasing and re-purposing locations that Sears has vacated; however, this progress was disrupted during the year with retailers expansion efforts largely placed on hold during the Covid-19 pandemic.
THE INFORMATION IN THE PORTFOLIO MANAGEMENT DISCUSSION REPRESENTS A FACTUAL OVERVIEW OF THE FUND’S PERFORMANCE AND IS NOT INTENDED TO BE A FORECAST OF FUTURE EVENTS, A GUARANTEE OF FUTURE RESULTS NOR INVESTMENT ADVICE. VIEWS EXPRESSED ARE THOSE OF THE INVESTMENT TEAM AND MAY DIFFER FROM THOSE OF OTHER INVESTMENT TEAMS OR THE FIRM AS A WHOLE. ALSO, PLEASE NOTE THAT ANY DISCUSSION OF THE PORTFOLIO’S HOLDINGS, THE FUND’S PERFORMANCE, AND THE INVESTMENT TEAM’S VIEWS ARE AS OF OCTOBER 31, 2020, AND ARE SUBJECT TO CHANGE.
28
Third Avenue Trust
Third Avenue Real Estate Value Fund
Portfolio Management Discussion (continued)
October 31, 2020 (Unaudited)
Real estate investments may be subject to special risks, including risks related to general and local economic conditions, and changes in real estate values that may have negative effects on issuers related to the real estate industry. The Fund’s investments in small and medium capitalization stocks may experience more volatility than larger capitalization stocks. These and other risks are described more fully in the Fund’s prospectus.
The FTSE EPRA/NAREIT Developed Index is designed to reflect the stock performance of companies engaged in specific aspects of the North American, European and Asian Real Estate markets. The FTSE EPRA/NAREIT Developed Index is not a security that can be purchased or sold, and its total returns are reflective of unmanaged portfolios. The returns include reinvestment of all distributions.
29
Third Avenue Trust
Third Avenue Real Estate Value Fund - Investor Class
Comparison of a $10,000 Investment
(Unaudited)
Performance Illustration
COMPARISON OF CHANGE IN VALUE OF A $10,000 INVESTMENT IN THIRD AVENUE REAL ESTATE VALUE FUND – INVESTOR CLASS (TVRVX)
AND THE FTSE EPRA/NAREIT DEVELOPED INDEX
FOR THE TEN YEARS ENDED OCTOBER 31, 2020
| Average Annual Total Return | ||||||
| 1 Year | 3 Year | 5 Year | 10 Year | |||
| (19.37%) | (7.49%) | (1.37%) | 4.27% | |||
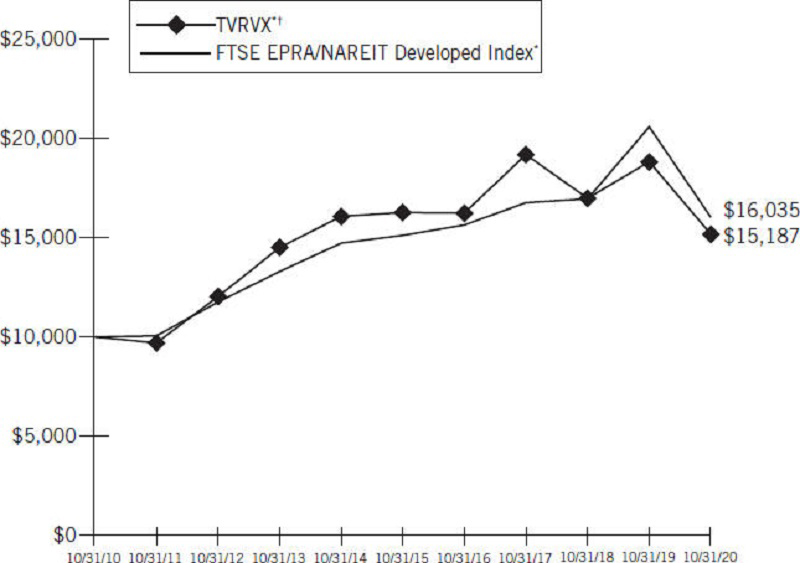
| * | Assumes reinvestment of all distributions. |
| † | Includes the use of derivatives. |
Past performance does not indicate future results. Performance reflects fee waivers, expense offset arrangement and/or recovery of previously waived fees, when applicable. Total return would have been
30
Third Avenue Trust
Third Avenue Real Estate Value Fund - Investor Class
Comparison of a $10,000 Investment (continued)
(Unaudited)
lower if the Adviser had not waived certain expenses. Conversely, total return would have been higher if the Adviser had not recovered previously waived expenses. Also, the returns shown in the graph and table do not reflect the deduction of taxes that a shareholder would pay on fund distributions or the redemption of fund shares.
31
Third Avenue Trust
Third Avenue Real Estate Value Fund - Institutional Class
Comparison of a $100,000 Investment
(Unaudited)
Performance Illustration
COMPARISON OF CHANGE IN VALUE OF A $100,000 INVESTMENT IN THIRD AVENUE REAL ESTATE VALUE FUND – INSTITUTIONAL CLASS (TAREX)
AND THE FTSE EPRA/NAREIT DEVELOPED INDEX
FOR THE TEN YEARS ENDED OCTOBER 31, 2020
| Average Annual Total Return | ||||||
| 1 Year | 3 Year | 5 Year | 10 Year | |||
| (19.14%) | (7.24%) | (1.11%) | 4.53% | |||
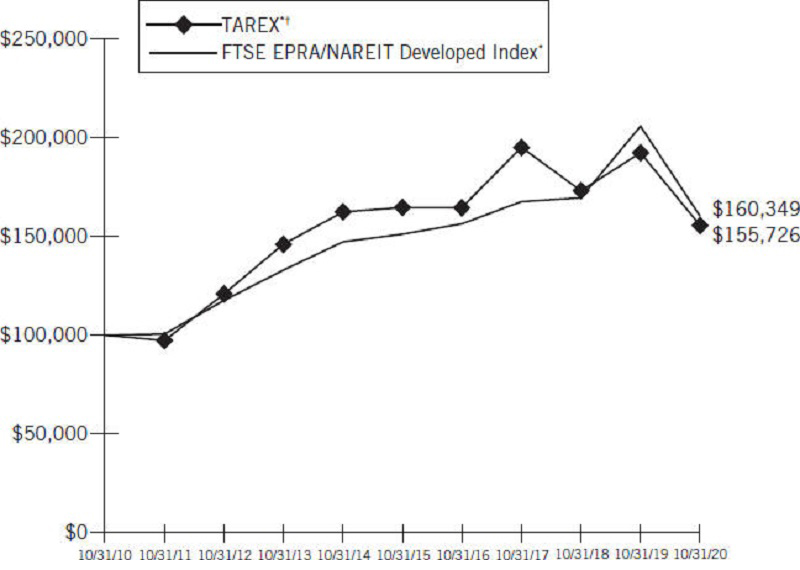
| * | Assumes reinvestment of all distributions. |
| † | Includes the use of derivatives. |
Past performance does not indicate future results. Performance reflects fee waivers, expense offset arrangement and/or recovery of previously waived fees, when applicable. Total return would have been
32
Third Avenue Trust
Third Avenue Real Estate Value Fund - Institutional Class
Comparison of a $100,000 Investment (continued)
(Unaudited)
lower if the Adviser had not waived certain expenses. Conversely, total return would have been higher if the Adviser had not recovered previously waived expenses. Also, the returns shown in the graph and table do not reflect the deduction of taxes that a shareholder would pay on fund distributions or the redemption of fund shares.
33
Third Avenue Trust
Third Avenue Real Estate Value Fund - Z Class
Comparison of a $50,000 Investment
(Unaudited)
Performance Illustration
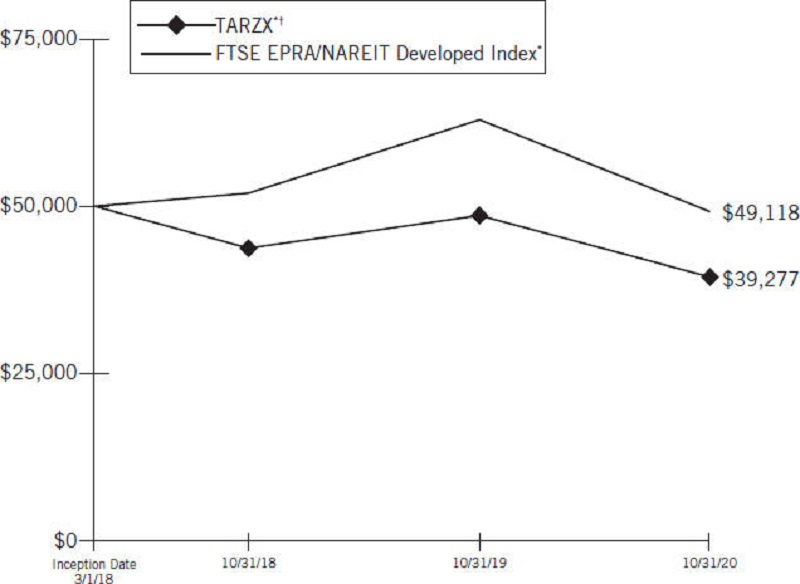
COMPARISON OF CHANGE IN VALUE OF A $50,000 INVESTMENT IN THIRD AVENUE REAL ESTATE VALUE FUND – Z CLASS (TARZX)
AND THE FTSE EPRA/NAREIT DEVELOPED INDEX
FOR THE PERIOD FROM MARCH 1, 2018 (COMMENCEMENT OF INVESTMENT OPERATIONS) THROUGH OCTOBER 31, 2020
| Average Annual Total Return | ||
| 1 Year | Since Inception (3/1/18) | |
| (19.09%) | (8.64%) | |
| * | Assumes reinvestment of all distributions. |
| † | Includes the use of derivatives. |
34
Third Avenue Trust
Third Avenue Real Estate Value Fund - Z Class
Comparison of a $50,000 Investment (continued)
(Unaudited)
Past performance does not indicate future results. Performance reflects fee waivers, expense offset arrangement and/or recovery of previously waived fees, when applicable. Total return would have been lower if the Adviser had not waived certain expenses. Also, the returns shown in the graph and table do not reflect the deduction of taxes that a shareholder would pay on fund distributions or the redemption of fund shares.
35
Third Avenue Trust
Third Avenue Real Estate Value Fund
Portfolio of Investments
at October 31, 2020
Principal Amount‡ | Security† | Value (Note 1) | ||||||||
Term Loans - 0.00% | ||||||||||
Non-U.S. Real Estate Operating Companies - 0.00% | ||||||||||
| 38,617 EUR | Concrete Investment II, L.P. S.A.R.L., Term Loan, Tranche A2, 2.000% Cash or Payment-in-kind Interest, due 10/30/21 (Luxembourg)(a)(b)(c)(d) | $ | — | |||||||
|
| |||||||||
Total Term Loans | — | |||||||||
|
| |||||||||
| Shares | ||||||||||
Common Stocks - 96.03% | ||||||||||
Consulting/Management - 3.39% | ||||||||||
| 160,115 | CBRE Group, Inc., Class A (e) | 8,069,796 | ||||||||
| 248,271 | Fidelity National Financial, Inc. | 7,768,400 | ||||||||
|
| |||||||||
| 15,838,196 | ||||||||||
|
| |||||||||
Forest Products & Paper - 9.26% | ||||||||||
| 818,135 | Rayonier, Inc., REIT | 20,764,266 | ||||||||
| 823,618 | Weyerhaeuser Co., REIT | 22,476,535 | ||||||||
|
| |||||||||
| 43,240,801 | ||||||||||
|
| |||||||||
Industrial Services - 3.34% | ||||||||||
| 44,905 | AMERCO | 15,589,220 | ||||||||
|
| |||||||||
Mortgage Finance - 1.01% | ||||||||||
| 2,518,270 | Federal National Mortgage Association (e) | 4,734,348 | ||||||||
|
| |||||||||
Non-U.S. Homebuilder - 4.81% | ||||||||||
| 427,023 | Berkeley Group Holdings PLC (United Kingdom) | 22,452,233 | ||||||||
|
| |||||||||
Non-U.S. Real Estate Consulting/Management - 1.66% | ||||||||||
| 719,478 | Savills PLC (United Kingdom) (e) | 7,749,018 | ||||||||
|
| |||||||||
Non-U.S. Real Estate Investment Trusts - 10.38% | ||||||||||
| 613,628 | Big Yellow Group PLC (United Kingdom) | 8,744,802 | ||||||||
| 488,293 | Derwent London PLC (United Kingdom) | 16,815,166 | ||||||||
| 1,958,387 | Segro PLC (United Kingdom) | 22,883,256 | ||||||||
|
| |||||||||
| 48,443,224 | ||||||||||
|
| |||||||||
Non-U.S. Real Estate Operating Companies - 26.17% | ||||||||||
| 1,022,065 | Brookfield Asset Management, Inc., Class A (Canada) | 30,437,095 | ||||||||
| 4,504,923 | CK Asset Holdings, Ltd. (Cayman Islands) | 20,918,572 | ||||||||
| 2,184,272 | Grainger PLC (United Kingdom) | 7,913,264 | ||||||||
| 5,053,810 | Henderson Land Development Co., Ltd. (Hong Kong) | 17,850,473 | ||||||||
| 297,429 | PATRIZIA AG (Germany) | 6,769,771 | ||||||||
The accompanying notes are an integral part of the financial statements.
36
Third Avenue Trust
Third Avenue Real Estate Value Fund
Portfolio of Investments (continued)
at October 31, 2020
| Shares | Security† | Value (Note 1) | ||||||||
Common Stocks (continued) | ||||||||||
Non-U.S. Real Estate Operating Companies (continued) | ||||||||||
| 3,633,309 | St. Modwen Properties PLC (United Kingdom) | $ | 15,605,140 | |||||||
| 5,886,776 | Wharf Holdings Ltd. (The) (Hong Kong) | 12,186,187 | ||||||||
| 2,736,776 | Wharf Real Estate Investment Co., Ltd. (Cayman Islands) | 10,533,251 | ||||||||
|
| |||||||||
| 122,213,753 | ||||||||||
|
| |||||||||
Retail-Building Products - 4.27% | ||||||||||
| 126,221 | Lowe’s Cos., Inc. | 19,955,540 | ||||||||
|
| |||||||||
U.S. Homebuilder - 8.22% | ||||||||||
| 253,432 | Lennar Corp., Class A | 17,798,529 | ||||||||
| 361,992 | Lennar Corp., Class B | 20,593,725 | ||||||||
|
| |||||||||
| 38,392,254 | ||||||||||
|
| |||||||||
U.S. Real Estate Investment Trusts - 17.73% | ||||||||||
| 359,637 | American Homes 4 Rent, Class A | 10,166,938 | ||||||||
| 36,357 | Essex Property Trust, Inc. | 7,438,279 | ||||||||
| 202,393 | First Industrial Realty Trust, Inc. | 8,057,265 | ||||||||
| 749,958 | JBG SMITH Properties | 17,511,519 | ||||||||
| 272,029 | Prologis, Inc. | 26,985,277 | ||||||||
| 429,351 | Seritage Growth Properties, Class A (e) | 5,465,638 | ||||||||
| 232,589 | Vornado Realty Trust | 7,147,460 | ||||||||
|
| |||||||||
| 82,772,376 | ||||||||||
|
| |||||||||
U.S. Real Estate Operating Companies - 5.79% | ||||||||||
| 4,757,003 | Five Point Holdings, LLC, Class A (e)(f) | 19,931,843 | ||||||||
| 5,096,285 | Trinity Place Holdings, Inc. (e)(f)(g) | 7,083,836 | ||||||||
| 1 | Trinity Place Holdings, Inc. Special Stock (a)(d)(e)(f)(g) | — | ||||||||
|
| |||||||||
| 27,015,679 | ||||||||||
|
| |||||||||
Total Common Stocks | 448,396,642 | |||||||||
|
| |||||||||
Preferred Stocks - 1.28% | ||||||||||
Mortgage Finance - 1.28% | ||||||||||
| 730,000 | Federal National Mortgage Association, 8.250% (e) | 5,986,000 | ||||||||
|
| |||||||||
Total Preferred Stocks | 5,986,000 | |||||||||
|
| |||||||||
The accompanying notes are an integral part of the financial statements.
37
Third Avenue Trust
Third Avenue Real Estate Value Fund
Portfolio of Investments (continued)
at October 31, 2020
| Security† | Value (Note 1) | |||||||||
Purchased Options - 0.12% | ||||||||||
Total Purchased Options (see below for details) | $ | 540,686 | ||||||||
|
| |||||||||
Total Investment Before Written Options - 97.43% | 454,923,328 | |||||||||
Written Options - (0.14)% | ||||||||||
Total Written Options (see below for details) | (661,753) | |||||||||
|
| |||||||||
Total Investment Portfolio - 97.29% | 454,261,575 | |||||||||
Other Assets less Liabilities - 2.71% | 12,645,841 | |||||||||
|
| |||||||||
NET ASSETS - 100.00%. | $ | 466,907,416 | ||||||||
|
| |||||||||
Notes:
| (a) | Security is fair valued by the valuation committee in accordance with the policies established by the Board of Trustees. |
| (b) | Payment-in-kind security. Income may be paid as additional securities or cash at the discretion of the issuer. |
| (c) | Variable rate security. The rate disclosed is in effect as of October 31, 2020. |
| (d) | Security is valued using significant unobservable inputs and is classified as Level 3 in the fair value hierarchy. |
| (e) | Non-income producing security. |
| (f) | Affiliated issuer - An affiliated person as defined in the Investment Company Act of 1940, includes, among other things, ownership of 5% or more of the outstanding voting securities of such person. |
| (g) | Security subject to restrictions on resale. |
| Shares | Issuer | Acquisition Date | Cost | Market Value Per Unit | ||||||||||
| 5,096,285 | Trinity Place Holdings, Inc. | 10/2/13-6/11/19 | $ | 23,067,824 | $1.39 | |||||||||
| 1 | Trinity Place Holdings, Inc. Special Stock | 11/6/13 | - | 0.00 | ||||||||||
At October 31, 2020, the restricted securities had a total market value of $7,083,836 or 1.52% of net assets. | ||||||||||||||
| ‡ | Denominated in U.S. Dollars unless otherwise noted. |
| † | U.S. issuer unless otherwise noted. |
| EUR: | Euro. |
REIT: Real Estate Investment Trust.
The accompanying notes are an integral part of the financial statements.
38
Third Avenue Trust
Third Avenue Real Estate Value Fund
Portfolio of Investments (continued)
at October 31, 2020
Summary of Investments by Industry | % of Net Assets |
| Country Concentration | % of Net Assets | ||||||||||
Non-U.S. Real Estate Operating Companies | 26.17 | % | United States | 54.27 | % | |||||||||
U.S. Real Estate Investment Trusts | 17.73 | United Kingdom | 21.88 | |||||||||||
Non-U.S. Real Estate Investment Trusts | 10.38 | Cayman Islands | 6.74 | |||||||||||
Forest Products & Paper | 9.26 | Canada | 6.52 | |||||||||||
U.S. Homebuilder | 8.22 | Hong Kong | 6.43 | |||||||||||
U.S. Real Estate Operating Companies | 5.79 | Germany | 1.45 | |||||||||||
Non-U.S. Homebuilder | 4.81 | Luxembourg* | 0.00 | |||||||||||
|
| |||||||||||||
Retail-Building Products | 4.27 | Total | 97.29 | % | ||||||||||
|
| |||||||||||||
Consulting/Management | 3.39 | |||||||||||||
Industrial Services | 3.34 | |||||||||||||
Mortgage Finance | 2.29 | * Amount less than 0.01%. | ||||||||||||
Non-U.S. Real Estate Consulting/Management | 1.66 | |||||||||||||
Purchased Options | 0.12 | |||||||||||||
Written Options | (0.14 | ) | ||||||||||||
Other Assets less Liabilities | 2.71 | |||||||||||||
|
| |||||||||||||
Total | 100.00 | % | ||||||||||||
|
| |||||||||||||
Purchased Options
Description | Counterparty | Number of Contracts | Notional Amount | Exercise Price | Expiration Date | Value | ||||||
GBP versus USD, Put | JPMorgan Chase Bank, N.A. | 93,000,000 | $93,000,000 | 1.1500 USD | 03/15/21 | $ 249,880 | ||||||
Prologis, Inc., Put | Goldman Sachs & Co. | 2,200 | 21,824,000 | 92.0000 USD | 11/20/20 | 288,532 | ||||||
USD versus HKD, Call | JPMorgan Chase Bank, N.A. | 56,000,000 | 56,000,000 | 8.0000 HKD | 02/04/21 | 2,274 | ||||||
| ||||||||||||
Total Purchased Options | $ 540,686 | |||||||||||
| ||||||||||||
GBP: British Pound. HKD: Hong Kong Dollar. USD: United States Dollar. | ||||||||||||
The accompanying notes are an integral part of the financial statements.
39
Third Avenue Trust
Third Avenue Real Estate Value Fund
Portfolio of Investments (continued)
at October 31, 2020
Written Options
Description | Counterparty | Number of Contracts | Notional Amount | Exercise Price | Expiration Date | Value | ||||||
GBP versus USD, Call | JPMorgan Chase Bank, N.A. | (93,000,000) | $(93,000,000) | 1.3700 USD | 03/15/21 | $ (486,718) | ||||||
Lennar Corp., Class A, Call | Goldman Sachs & Co. | (750) | (5,267,250) | 79.0000 USD | 11/20/20 | (57,676) | ||||||
Prologis, Inc., Call | Goldman Sachs & Co. | (2,200) | (21,824,000) | 108.3000 USD | 11/20/20 | (117,359) | ||||||
| ||||||||||||
Total Written Options | $ (661,753) | |||||||||||
| ||||||||||||
GBP: British Pound. USD: United States Dollar. | ||||||||||||
The accompanying notes are an integral part of the financial statements.
40
Third Avenue Trust
Statement of Assets and Liabilities
at October 31, 2020
| Value Fund | Small-Cap Value Fund | Real Estate Value Fund | ||||||||||
Assets: | ||||||||||||
Investments at value (Notes 1 & 4): | ||||||||||||
Unaffiliated issuers† | $ | 401,396,282 | $ | 127,855,776 | $ | 427,366,963 | ||||||
Affiliated issuers‡ | — | — | 27,015,679 | |||||||||
Cash | 12,171,659 | 9,424,424 | 5,409,922 | |||||||||
Cash pledged to counterparty as collateral | — | — | 860,000 | |||||||||
Dividends and interest receivables | 106,064 | 72,037 | 76,682 | |||||||||
Foreign tax reclaims receivable | 1,976,047 | — | 290,027 | |||||||||
Receivable for securities sold | — | 1,668,987 | 8,869,564 | |||||||||
Receivable for fund shares sold | 22,331 | 2,920 | 173,231 | |||||||||
Purchased options at value* | 4,259,482 | — | 540,686 | |||||||||
Other Assets | 59,975 | 40,137 | 83,701 | |||||||||
|
|
|
|
|
| |||||||
Total assets | 419,991,840 | 139,064,281 | 470,686,455 | |||||||||
|
|
|
|
|
| |||||||
Liabilities: | ||||||||||||
Written options at value** | — | — | 661,753 | |||||||||
Cash received from counterparty as collateral | 3,720,000 | — | — | |||||||||
Payable for securities purchased | — | 4,024,784 | 268,752 | |||||||||
Payable for fund shares redeemed | 249,756 | 50,708 | 2,025,163 | |||||||||
Payable to Adviser (Note 3) | 446,581 | 72,534 | 647,684 | |||||||||
Payable for shareholder servicing fees (Note 3) | 28,160 | 7,866 | 42,332 | |||||||||
Distribution fees payable (Note 5) | 1,135 | 469 | 11,112 | |||||||||
Payable for auditing and tax fees | 51,973 | 33,848 | 40,173 | |||||||||
Accrued expenses | 125,946 | 44,616 | 82,070 | |||||||||
Taxes payable | 450,190 | — | — | |||||||||
|
|
|
|
|
| |||||||
Total liabilities | 5,073,741 | 4,234,825 | 3,779,039 | |||||||||
|
|
|
|
|
| |||||||
Net assets | $ | 414,918,099 | $ | 134,829,456 | $ | 466,907,416 | ||||||
|
|
|
|
|
| |||||||
The accompanying notes are an integral part of the financial statements.
41
Third Avenue Trust
Statement of Assets and Liabilities (continued)
at October 31, 2020
| Value Fund | Small-Cap Value Fund | Real Estate Value Fund | ||||||||||
Summary of net assets: | ||||||||||||
Capital stock, $0.001 par value | $ | 573,671,489 | $ | 112,556,885 | $ | 425,696,534 | ||||||
Total distributable earnings. | (158,753,390 | ) | 22,272,571 | 41,210,882 | ||||||||
|
|
|
|
|
| |||||||
Net assets applicable to capital shares outstanding | $ | 414,918,099 | $ | 134,829,456 | $ | 466,907,416 | ||||||
|
|
|
|
|
| |||||||
Investor Class | ||||||||||||
Net assets | $ | 5,237,283 | $ | 2,195,362 | $ | 45,400,728 | ||||||
|
|
|
|
|
| |||||||
Outstanding shares of beneficial interest, unlimited number of shares authorized | 161,472 | 146,926 | 2,316,216 | |||||||||
|
|
|
|
|
| |||||||
Net asset value, offering and redemption price per share | $ | 32.43 | $ | 14.94 | $ | 19.60 | ||||||
|
|
|
|
|
| |||||||
Institutional Class | ||||||||||||
Net assets | $ | 408,448,511 | $ | 132,303,281 | $ | 391,651,241 | ||||||
|
|
|
|
|
| |||||||
Outstanding shares of beneficial interest, unlimited number of shares authorized | 12,606,853 | 8,651,964 | 19,864,033 | |||||||||
|
|
|
|
|
| |||||||
Net asset value, offering and redemption price per share | $ | 32.40 | $ | 15.29 | $ | 19.72 | ||||||
|
|
|
|
|
| |||||||
Z Class | ||||||||||||
Net assets | $ | 1,232,305 | $ | 330,813 | $ | 29,855,447 | ||||||
|
|
|
|
|
| |||||||
Outstanding shares of beneficial interest, unlimited number of shares authorized | 38,029 | 21,574 | 1,515,767 | |||||||||
|
|
|
|
|
| |||||||
Net asset value, offering and redemption price per share | $ | 32.40 | $ | 15.33 | $ | 19.70 | ||||||
|
|
|
|
|
| |||||||
† Cost of unaffiliated issuers | $ | 536,233,663 | $ | 107,082,005 | $ | 323,192,845 | ||||||
‡ Cost of affiliated issuers | $ | — | $ | — | $ | 91,590,680 | ||||||
* Cost of purchased options | $ | 4,810,000 | $ | — | $ | 1,597,347 | ||||||
** Premiums received for written options | $ | — | $ | — | $ | (1,790,251 | ) | |||||
The accompanying notes are an integral part of the financial statements.
42
Third Avenue Trust
For the Year Ended October 31, 2020
| Value Fund | Small-Cap Value Fund | Real Estate Value Fund | ||||||||||
Investment Income: | ||||||||||||
Dividends - unaffiliated issuers* | $ | 6,678,661 | $ | 1,497,222 | $ | 11,659,524 | ||||||
Interest - unaffiliated issuers | 181,751 | 70,451 | 1,433,788 | |||||||||
Other income | 35,825 | 5,773 | 32,481 | |||||||||
|
|
|
|
|
| |||||||
Total investment income | 6,896,237 | 1,573,446 | 13,125,793 | |||||||||
|
|
|
|
|
| |||||||
Expenses: | ||||||||||||
Investment advisory fees (Note 3) | 4,275,136 | 1,371,406 | 6,204,300 | |||||||||
Shareholder servicing fees (Note 3) | 509,625 | 132,948 | 689,958 | |||||||||
Transfer agent fees | 369,698 | 125,299 | 207,826 | |||||||||
Trustees’ and officers’ fees and expenses | 171,928 | 53,890 | 255,817 | |||||||||
Accounting and administration fees | 153,303 | 68,728 | 199,040 | |||||||||
Auditing and tax fees | 128,021 | 36,971 | 42,771 | |||||||||
Insurance | 99,436 | 29,861 | 156,450 | |||||||||
Reports to shareholders. | 98,401 | 47,647 | 108,368 | |||||||||
Legal fees | 62,293 | 21,753 | 77,054 | |||||||||
Registration and filing fees | 61,382 | 43,142 | 65,745 | |||||||||
Custodian fees | 59,848 | 16,251 | 74,070 | |||||||||
Distribution fees (Note 5) | 14,284 | 6,148 | 192,200 | |||||||||
Miscellaneous | 39,917 | 17,316 | 62,043 | |||||||||
|
|
|
|
|
| |||||||
Total expenses. | 6,043,272 | 1,971,360 | 8,335,642 | |||||||||
|
|
|
|
|
| |||||||
Less: Fees waived (Note 3) | (564,761 | ) | (212,531 | ) | (252,422 | ) | ||||||
Expenses reduced by custodian fee expense offset arrangement (Note 3) | (3,275 | ) | (680 | ) | (4,351 | ) | ||||||
|
|
|
|
|
| |||||||
Net expenses | 5,475,236 | 1,758,149 | 8,078,869 | |||||||||
|
|
|
|
|
| |||||||
Net investment income/(loss) | 1,421,001 | (184,703 | ) | 5,046,924 | ||||||||
|
|
|
|
|
| |||||||
Realized and unrealized gain/(loss) on investments, options, and foreign currency transactions: | ||||||||||||
Net realized gain/(loss) on investments - unaffiliated issuers | (2,126,670 | ) | 5,953,186 | 83,092,662 | ||||||||
Net realized loss on investments - affiliated issuers (Note 4) | (6,321,576 | ) | — | (29,372,852 | ) | |||||||
Net realized gain/(loss) on purchased options | 8,071,324 | — | (2,157,460 | ) | ||||||||
Net realized gain on written options | — | — | 679,030 | |||||||||
Net realized gain/(loss) on foreign currency transactions | 71,906 | (259 | ) | 11,365 | ||||||||
Net change in unrealized appreciation/(depreciation) on investments -unaffiliated issuers | (93,068,438 | ) | (32,682,211 | ) | (212,686,483 | ) | ||||||
Net change in unrealized appreciation/(depreciation) on investments - affiliated issuers (Note 4) | 3,960,455 | — | 322,934 | |||||||||
Net change in unrealized appreciation on purchased options | 862,613 | — | 567,802 | |||||||||
Net change in unrealized appreciation on written options | — | — | 1,476,430 | |||||||||
The accompanying notes are an integral part of the financial statements.
43
Third Avenue Trust
Statement of Operations (continued)
For the Year Ended October 31, 2020
| Value Fund | Small-Cap Value Fund | Real Estate Value Fund | ||||||||||
Net change in unrealized appreciation/(depreciation) on translation of other assets and liabilities denominated in foreign currency | $ | 113,887 | $ | — | $ | (4,315 | ) | |||||
|
|
|
|
|
| |||||||
Net loss on investments, options, and foreign currency transactions | (88,436,499 | ) | (26,729,284 | ) | (158,070,887 | ) | ||||||
|
|
|
|
|
| |||||||
Net decrease in net assets resulting from operations | $ | (87,015,498 | ) | $ | (26,913,987 | ) | $ | (153,023,963 | ) | |||
|
|
|
|
|
| |||||||
* Net of foreign withholding taxes of | $ | 409,596 | $ | — | $ | 294,710 | ||||||
The accompanying notes are an integral part of the financial statements.
44
Third Avenue Trust
Statements of Changes in Net Assets
| Value Fund | Small-Cap Value Fund | |||||||||||||||
| For the Year Ended October 31, 2020 | For the Year Ended October 31, 2019 | For the Year Ended October 31, 2020 | For the Year Ended October 31, 2019 | |||||||||||||
Operations: | ||||||||||||||||
Net investment income/(loss) | $ | 1,421,001 | $ | 11,862,266 | $ | (184,703 | ) | $ | (1,007,631 | ) | ||||||
Net realized gain/(loss) | (305,016 | ) | 27,412,792 | 5,952,927 | 14,914,964 | |||||||||||
Net change in unrealized appreciation/(depreciation) | (88,131,483 | ) | (84,342,154 | ) | (32,682,211 | ) | (3,277,190 | ) | ||||||||
|
|
|
|
|
|
|
| |||||||||
Net increase/(decrease) in net assets resulting from operations | (87,015,498 | ) | (45,067,096 | ) | (26,913,987 | ) | 10,630,143 | |||||||||
|
|
|
|
|
|
|
| |||||||||
Dividends and Distributions to Shareholders: | ||||||||||||||||
Net investment income and net realized gains: | ||||||||||||||||
Investor Class | (374,545 | ) | (372,996 | ) | (232,151 | ) | (360,712 | ) | ||||||||
Institutional Class | (36,445,242 | ) | (32,951,026 | ) | (13,926,087 | ) | (23,193,255 | ) | ||||||||
Z Class | (160,993 | ) | (124,935 | ) | (32,040 | ) | (45,478 | ) | ||||||||
|
|
|
|
|
|
|
| |||||||||
Decrease in net assets from dividends and distributions | (36,980,780 | ) | (33,448,957 | ) | (14,190,278 | ) | (23,599,445 | ) | ||||||||
|
|
|
|
|
|
|
| |||||||||
Capital Share Transactions: | ||||||||||||||||
Proceeds from sale of shares | 8,511,831 | 8,364,594 | 6,666,867 | 3,602,488 | ||||||||||||
Net asset value of shares issued in reinvestment of dividends and distributions | 35,614,187 | 32,253,390 | 13,608,909 | 22,848,636 | ||||||||||||
Redemption fees | — | 3,244 | — | 1,478 | ||||||||||||
Cost of shares redeemed | (142,314,307 | ) | (245,903,149 | ) | (39,229,089 | ) | (58,867,472 | ) | ||||||||
|
|
|
|
|
|
|
| |||||||||
Net decrease in net assets resulting from capital share transactions | (98,188,289 | ) | (205,281,921 | ) | (18,953,313 | ) | (32,414,870 | ) | ||||||||
|
|
|
|
|
|
|
| |||||||||
Net decrease in net assets | (222,184,567 | ) | (283,797,974 | ) | (60,057,578 | ) | (45,384,172 | ) | ||||||||
|
|
|
|
|
|
|
| |||||||||
Net assets at beginning of year | 637,102,666 | 920,900,640 | 194,887,034 | 240,271,206 | ||||||||||||
|
|
|
|
|
|
|
| |||||||||
Net assets at end of year | $ | 414,918,099 | $ | 637,102,666 | $ | 134,829,456 | $ | 194,887,034 | ||||||||
|
|
|
|
|
|
|
| |||||||||
The accompanying notes are an integral part of the financial statements.
45
Third Avenue Trust
Statements of Changes in Net Assets (continued)
| Real Estate Value Fund | ||||||||
| For the Year Ended October 31, 2020 | For the Year Ended October 31, 2019 | |||||||
Operations: | ||||||||
Net investment income | $ | 5,046,924 | $ | 7,614,646 | ||||
Net realized gain | 52,252,745 | 142,543,621 | ||||||
Net change in unrealized appreciation/(depreciation) | (210,323,632 | ) | (25,533,355 | ) | ||||
|
|
|
| |||||
Net increase/(decrease) in net assets resulting from operations | (153,023,963 | ) | 124,624,912 | |||||
|
|
|
| |||||
Dividends and Distributions to Shareholders: | ||||||||
Net investment income and net realized gains: | ||||||||
Investor Class | (16,451,632 | ) | (16,402,922 | ) | ||||
Institutional Class | (126,505,648 | ) | (109,148,280 | ) | ||||
Z Class | (8,489,946 | ) | (4,127,186 | ) | ||||
|
|
|
| |||||
Decrease in net assets from dividends and distributions | (151,447,226 | ) | (129,678,388 | ) | ||||
|
|
|
| |||||
Capital Share Transactions: | ||||||||
Proceeds from sale of shares | 67,354,283 | 179,029,986 | ||||||
Net asset value of shares issued in reinvestment of dividends and distributions | 141,580,941 | 123,247,762 | ||||||
Redemption fees | — | 25,173 | ||||||
Cost of shares redeemed | (466,943,504 | ) | (776,000,984 | ) | ||||
|
|
|
| |||||
Net decrease in net assets resulting from capital share transactions | (258,008,280 | ) | (473,698,063 | ) | ||||
|
|
|
| |||||
Net decrease in net assets | (562,479,469 | ) | (478,751,539 | ) | ||||
|
|
|
| |||||
Net assets at beginning of year | 1,029,386,885 | 1,508,138,424 | ||||||
|
|
|
| |||||
Net assets at end of year | $ | 466,907,416 | $ | 1,029,386,885 | ||||
|
|
|
| |||||
The accompanying notes are an integral part of the financial statements.
46
Third Avenue Trust
Selected data (for a share outstanding throughout each period) and ratios are as follows:
| Third Avenue Value Fund | ||||||||||||||||||||
| Years Ended October 31, | ||||||||||||||||||||
| 2020 | 2019 | 2018 | 2017 | 2016 | ||||||||||||||||
Investor Class: | ||||||||||||||||||||
Net asset value, beginning of period | $ | 39.81 | $ | 43.74 | $ | 55.94 | $ | 51.12 | $ | 54.22 | ||||||||||
Income/(loss) from investment operations: | ||||||||||||||||||||
Net investment income/(loss)@ | 0.01 | 0.55 | + | 0.65 | ± | (0.01) | 0.41 | ‡ | ||||||||||||
Net gain/(loss) on investment transactions (both realized and unrealized) | (5.14) | (2.94) | 1 | (5.33) | 1 | 8.83 | 1 | 0.38 | 1 | |||||||||||
|
|
|
|
|
|
|
|
|
| |||||||||||
Total from investment operations | (5.13) | (2.39) | (4.68) | 8.82 | 0.79 | |||||||||||||||
|
|
|
|
|
|
|
|
|
| |||||||||||
Less dividends and distributions to shareholders: | ||||||||||||||||||||
Dividends from net investment income | (0.86) | (0.04) | (1.45) | (0.30) | (0.61) | |||||||||||||||
Distributions from net realized gain | (1.39) | (1.50) | (6.07) | (3.70) | (3.28) | |||||||||||||||
|
|
|
|
|
|
|
|
|
| |||||||||||
Total dividends and distributions | (2.25) | (1.54) | (7.52) | (4.00) | (3.89) | |||||||||||||||
|
|
|
|
|
|
|
|
|
| |||||||||||
Net asset value, end of period | $ | 32.43 | $ | 39.81 | $ | 43.74 | $ | 55.94 | $ | 51.12 | ||||||||||
|
|
|
|
|
|
|
|
|
| |||||||||||
Total return2 | (13.89%) | (5.32%) | (10.06%) | 18.05% | 1.74% | |||||||||||||||
Ratios/Supplemental Data: | ||||||||||||||||||||
Net assets, end of period (in thousands) | $ | 5,237 | $ | 6,966 | $ | 11,506 | $ | 12,680 | $ | 14,415 | ||||||||||
Ratio of expenses to average net assets Before fee waivers/expense offset arrangement | 1.52% | 1.51% | 1.45% | 1.38% | 1.40% | |||||||||||||||
After fee waivers/expense offset arrangement3 | 1.40% | # | 1.40% | # | 1.40% | # | 1.38% | 1.39% | ||||||||||||
Ratio of net investment income/(loss) to average net assets | 0.03% | 1.35% | + | 1.27% | ± | (0.02%) | 0.83% | ‡ | ||||||||||||
Portfolio turnover rate | 22% | 25% | 72% | 18% | 17% | |||||||||||||||
1 | Includes redemption fees of less than $0.01 per share. | |
2 | Performance figures reflect fee waivers, expense offset arrangement and/or recovery of previously waived fees, when applicable. Past performance is no guarantee of future results. Total return would have been lower if the Adviser had not waived certain expenses. Conversely, total return would have been higher if the Adviser had not recovered previously waived expenses. Total return is calculated assuming an initial investment made at the net asset value at the beginning of the period, reinvestment of all dividends and distributions at net asset value during the period and redemption on the last day of the period and is not annualized | |
3 | As a result of an expense limitation, the ratio of expenses (exclusive of taxes, interest, brokerage commissions, acquired fund fees and expenses, and extraordinary items) to average net assets will not exceed 1.40%. | |
@ | Calculated based on the average number of shares outstanding during the period. | |
+ | Investment income per share reflects a special dividend received during the period which amounted to $0.37 per share. Excluding the special dividend, the ratio of net investment income to average net assets would have been 0.44%. | |
± | Investment income per share reflects special dividends received during the period which amounted to $0.46 per share. Excluding the special dividends, the ratio of net investment income to average net assets would have been 0.37%. | |
‡ | Investment income per share reflects a special dividend received during the period which amounted to $0.19 per share. Excluding the special dividend, the ratio of net investment income to average net assets would have been 0.43%. | |
# | The Adviser waived a portion of its fees. |
The accompanying notes are an integral part of the financial statements.
47
Third Avenue Trust
Financial Highlights (continued)
Selected data (for a share outstanding throughout each period) and ratios are as follows:
| Third Avenue Value Fund | ||||||||||||||||||||
| Years Ended October 31, | ||||||||||||||||||||
| 2020 | 2019 | 2018 | 2017 | 2016 | ||||||||||||||||
Institutional Class: | ||||||||||||||||||||
Net asset value, beginning of period | $ | 39.82 | $ | 43.81 | 56.05 | 51.22 | $ | 54.35 | ||||||||||||
|
|
|
|
|
|
|
|
|
| |||||||||||
Income/(loss) from investment operations: | ||||||||||||||||||||
Net investment income@ | 0.10 | 0.64 | + | 0.75 | ± | 0.13 | 0.57 | ‡ | ||||||||||||
Net gain/(loss) on investment transactions (both realized and unrealized) | (5.12) | (2.95) | 1 | (5.31) | 1 | 8.85 | 1 | 0.35 | 1 | |||||||||||
|
|
|
|
|
|
|
|
|
| |||||||||||
Total from investment operations | (5.02) | (2.31) | (4.56) | 8.98 | 0.92 | |||||||||||||||
|
|
|
|
|
|
|
|
|
| |||||||||||
Less dividends and distributions to shareholders: | ||||||||||||||||||||
Dividends from net investment income | (1.01) | (0.18) | (1.61) | (0.45) | (0.77) | |||||||||||||||
Distributions from net realized gain | (1.39) | (1.50) | (6.07) | (3.70) | (3.28) | |||||||||||||||
|
|
|
|
|
|
|
|
|
| |||||||||||
Total dividends and distributions | (2.40) | (1.68) | (7.68) | (4.15) | (4.05) | |||||||||||||||
|
|
|
|
|
|
|
|
|
| |||||||||||
Net asset value, end of period | $ | 32.40 | $ | 39.82 | 43.81 | 56.05 | $ | 51.22 | ||||||||||||
|
|
|
|
|
|
|
|
|
| |||||||||||
Total return2 | (13.66%) | (5.10%) | (9.83%) | 18.38% | 2.00% | |||||||||||||||
Ratios/Supplemental Data: | ||||||||||||||||||||
Net assets, end of period (in thousands) | $ | 408,449 | $ | 627,511 | $ | 906,235 | $ | 1,131,488 | $ | 1,142,249 | ||||||||||
Ratio of expenses to average net assets Before fee waivers/expense offset arrangement | 1.27% | 1.23% | 1.17% | 1.13% | 1.15% | |||||||||||||||
After fee waivers/expense offset arrangement3 | 1.15% | # | 1.15% | # | 1.15% | # | 1.13% | 1.14% | ||||||||||||
Ratio of net investment income to average net assets | 0.30% | 1.57% | + | 1.47% | ± | 0.23% | 1.16% | ‡ | ||||||||||||
Portfolio turnover rate | 22% | 25% | 72% | 18% | 17% | |||||||||||||||
1 | Includes redemption fees of less than $0.01 per share. | |
2 | Performance figures reflect fee waivers, expense offset arrangement and/or recovery of previously waived fees, when applicable. Past performance is no guarantee of future results. Total return would have been lower if the Adviser had not waived certain expenses. Conversely, total return would have been higher if the Adviser had not recovered previously waived expenses. Total return is calculated assuming an initial investment made at the net asset value at the beginning of the period, reinvestment of all dividends and distributions at net asset value during the period and redemption on the last day of the period and is not annualized. | |
3 | As a result of an expense limitation, the ratio of expenses (exclusive of taxes, interest, brokerage commissions, acquired fund fees and expenses, and extraordinary items) to average net assets will not exceed 1.15%. | |
@ | Calculated based on the average number of shares outstanding during the period. | |
+ | Investment income per share reflects a special dividend received during the period which amounted to $0.37 per share. Excluding the special dividend, the ratio of net investment income to average net assets would have been 0.66%. | |
± | Investment income per share reflects special dividends received during the period which amounted to $0.46 per share. Excluding the special dividends, the ratio of net investment income to average net assets would have been 0.57%. | |
‡ | Investment income per share reflects a special dividend received during the period which amounted to $0.19 per share. Excluding the special dividend, the ratio of net investment income to average net assets would have been 0.76%. | |
# | The Adviser waived a portion of its fees. |
The accompanying notes are an integral part of the financial statements.
48
Third Avenue Trust
Financial Highlights (continued)
Selected data (for a share outstanding throughout each period) and ratios are as follows:
| Third Avenue Value Fund | ||||||||||||
| Year Ended October 31, | For the Period from March 1, 2018 (commencement of investment operations) through October 31, | |||||||||||
| 2020 | 2019 | 2018 | ||||||||||
Z Class: | ||||||||||||
Net asset value, beginning of period | $ | 39.84 | $ | 43.84 | $ | 53.23 | ||||||
|
|
|
|
|
| |||||||
Income/(loss) from investment operations: | ||||||||||||
Net investment income@ | 0.10 | 0.70 | ‡ | 0.27 | * | |||||||
Net loss on investment transactions (both realized and unrealized) | (5.09) | (2.96) | 1 | (6.20) | 1 | |||||||
|
|
|
|
|
| |||||||
Total from investment operations | (4.99) | (2.26) | (5.93) | |||||||||
|
|
|
|
|
| |||||||
Less dividends and distributions to shareholders: | ||||||||||||
Dividends from net investment income | (1.06) | (0.24) | — | |||||||||
Distributions from net realized gain | (1.39) | (1.50) | (3.46) | |||||||||
|
|
|
|
|
| |||||||
Total dividends and distributions | (2.45) | (1.74) | (3.46) | |||||||||
|
|
|
|
|
| |||||||
Net asset value, end of period | $ | 32.40 | $ | 39.84 | $ | 43.84 | ||||||
|
|
|
|
|
| |||||||
Total return2 | (13.59%) | (4.99%) | (12.00%) | 3 | ||||||||
Ratios/Supplemental Data: | ||||||||||||
Net assets, end of period (in thousands) | $ | 1,232 | $ | 2,626 | $ | 3,160 | ||||||
Ratio of expenses to average net assets Before fee waivers/expense offset arrangement | 1.15% | 1.12% | 1.09% | 4 | ||||||||
After fee waivers/expense offset arrangement5 | 1.05% | # | 1.05% | # | 1.05% | 4,# | ||||||
Ratio of net investment income to average net assets | 0.31% | 1.71% | ‡ | 0.78% | 4,* | |||||||
Portfolio turnover rate | 22% | 25% | 72% | 3,6 | ||||||||
The accompanying notes are an integral part of the financial statements.
49
Third Avenue Trust
Financial Highlights (continued)
Selected data (for a share outstanding throughout each period) and ratios are as follows:
1 | Includes redemption fees of less than $0.01 per share. | |
2 | Performance figures reflect fee waivers, expense offset arrangement and/or recovery of previously waived fees, when applicable. Past performance is no guarantee of future results. Total return would have been lower if the Adviser had not waived certain expenses. Conversely, total return would have been higher if the Adviser had not recovered previously waived expenses. Total return is calculated assuming an initial investment made at the net asset value at the beginning of the period, reinvestment of all dividends and distributions at net asset value during the period and redemption on the last day of the period and is not annualized. | |
3 | Not annualized. | |
4 | Annualized. | |
5 | As a result of an expense limitation, the ratio of expenses (exclusive of taxes, interest, brokerage commissions, acquired fund fees and expenses, and extraordinary items) to average net assets will not exceed 1.05%. | |
6 | Reflects portfolio turnover of the Fund for the year ended October 31, 2018 | |
@ | Calculated based on the average number of shares outstanding during the period. | |
‡ | Investment income per share reflects a special dividend received during the period which amounted to $0.37 per share. Excluding the special dividend, the ratio of net investment income to average net assets would have been 0.80%. | |
* | Investment income per share reflects a special dividend received during the period which amounted to $0.34 per share. Excluding the special dividend, the ratio of net investment income/ (loss) to average net assets would have been (0.22%). | |
# | The Adviser waived a portion of its fees. |
The accompanying notes are an integral part of the financial statements.
50
Third Avenue Trust
Financial Highlights
Selected data (for a share outstanding throughout each period) and ratios are as follows:
| Third Avenue Small-Cap Value Fund | ||||||||||||||||||||
| Years Ended October 31, | ||||||||||||||||||||
| 2020 | 2019 | 2018 | 2017 | 2016 | ||||||||||||||||
Investor Class: | ||||||||||||||||||||
Net asset value, beginning of period | $ | 18.83 | $ | 20.04 | $ | 23.30 | $ | 20.77 | $ | 22.28 | ||||||||||
|
|
|
|
|
|
|
|
|
| |||||||||||
Income/(loss) from investment operations: | ||||||||||||||||||||
Net investment income/(loss)@ | (0.06) | (0.13) | (0.12) | (0.18) | 0.08 | ‡ | ||||||||||||||
Net gain/(loss) on investment transactions (both realized and unrealized) | (2.40) | 0.97 | 1 | (0.31)1 | 4.63 | 1 | 1.17 | 1 | ||||||||||||
|
|
|
|
|
|
|
|
|
| |||||||||||
Total from investment operations | (2.46) | 0.84 | (0.43) | 4.45 | 1.25 | |||||||||||||||
|
|
|
|
|
|
|
|
|
| |||||||||||
Less dividends and distributions to shareholders: | ||||||||||||||||||||
Dividends from net investment income | — | — | — | (0.06) | — | |||||||||||||||
Distributions from net realized gain | (1.43) | (2.05) | (2.83) | (1.86) | (2.76) | |||||||||||||||
|
|
|
|
|
|
|
|
|
| |||||||||||
Total dividends and distributions | (1.43) | (2.05) | (2.83) | (1.92) | (2.76) | |||||||||||||||
|
|
|
|
|
|
|
|
|
| |||||||||||
Net asset value, end of period | $ | 14.94 | $ | 18.83 | $ | 20.04 | $ | 23.30 | $ | 20.77 | ||||||||||
|
|
|
|
|
|
|
|
|
| |||||||||||
Total return2 | (14.33%) | 6.12% | (2.23%) | 22.22% | 6.71% | |||||||||||||||
Ratios/Supplemental Data: | ||||||||||||||||||||
Net assets, end of period (in thousands) | $ | 2,195 | $ | 3,176 | $ | 3,684 | $ | 4,955 | $ | 5,145 | ||||||||||
Ratio of expenses to average net assets Before fee waivers/expense offset arrangement | 1.58% | 1.64% | 1.53% | 1.45% | 1.45% | |||||||||||||||
After fee waivers/expense offset arrangement3,# | 1.40% | 1.40% | 1.40% | 1.40% | 1.40% | |||||||||||||||
Ratio of net investment income/(loss) to average net assets | (0.37%) | (0.73%) | (0.57%) | (0.81%) | 0.39% | ‡ | ||||||||||||||
Portfolio turnover rate | 37% | 21% | 44% | 32% | 20% | |||||||||||||||
1 | Includes redemption fees of less than $0.01 per share. | |
2 | Performance figures reflect fee waivers, expense offset arrangement and/or recovery of previously waived fees, when applicable. Past performance is no guarantee of future results. Total return would have been lower if the Adviser had not waived certain expenses. Conversely, total return would have been higher if the Adviser had not recovered previously waived expenses. Total return is calculated assuming an initial investment made at the net asset value at the beginning of the period, reinvestment of all dividends and distributions at net asset value during the period and redemption on the last day of the period and is not annualized. | |
3 | As a result of an expense limitation, the ratio of expenses (exclusive of taxes, interest, brokerage commissions, acquired fund fees and expenses, and extraordinary items) to average net assets will not exceed 1.40%. | |
@ | Calculated based on the average number of shares outstanding during the period. | |
‡ | Investment income per share reflects special dividends received during the period which amounted to $0.11 per share. Excluding the special dividends, the ratio of net investment income/(loss) to average net assets would have been (0.17%). | |
# | The Adviser waived a portion of its fees. |
The accompanying notes are an integral part of the financial statements.
51
Third Avenue Trust
Financial Highlights (continued)
Selected data (for a share outstanding throughout each period) and ratios are as follows:
| Third Avenue Small-Cap Value Fund | ||||||||||||||||||||
| Years Ended October 31, | ||||||||||||||||||||
| 2020 | 2019 | 2018 | 2017 | 2016 | ||||||||||||||||
Institutional Class: | ||||||||||||||||||||
Net asset value, beginning of period | $ | 19.20 | $ | 20.34 | $ | 23.55 | $ | 20.97 | $ | 22.42 | ||||||||||
|
|
|
|
|
|
|
|
|
| |||||||||||
Income/(loss) from investment operations: | ||||||||||||||||||||
Net investment income/(loss)@ | (0.02) | (0.09) | (0.07) | (0.12) | 0.13 | † | ||||||||||||||
Net gain/(loss) on investment transactions (both realized and unrealized) | (2.46) | 1.00 | 1 | (0.31) | 1 | 4.69 | 1 | 1.18 | 1 | |||||||||||
|
|
|
|
|
|
|
|
|
| |||||||||||
Total from investment operations | (2.48) | 0.91 | (0.38) | 4.57 | 1.31 | |||||||||||||||
|
|
|
|
|
|
|
|
|
| |||||||||||
Less dividends and distributions to shareholders: | ||||||||||||||||||||
Dividends from net investment income | — | — | — | (0.13) | — | |||||||||||||||
Distributions from net realized gain | (1.43) | (2.05) | (2.83) | (1.86) | (2.76) | |||||||||||||||
|
|
|
|
|
|
|
|
|
| |||||||||||
Total dividends and distributions | (1.43) | (2.05) | (2.83) | (1.99) | (2.76) | |||||||||||||||
|
|
|
|
|
|
|
|
|
| |||||||||||
Net asset value, end of period | $ | 15.29 | $ | 19.20 | $ | 20.34 | $ | 23.55 | $ | 20.97 | ||||||||||
|
|
|
|
|
|
|
|
|
| |||||||||||
Total return2 | (14.15%) | 6.40% | (1.96%) | 22.59% | 6.95% | |||||||||||||||
Ratios/Supplemental Data: | ||||||||||||||||||||
Net assets, end of period (in thousands) | $ | 132,303 | $ | 191,280 | $ | 236,136 | $ | 291,169 | $ | 292,166 | ||||||||||
Ratio of expenses to average net assets Before fee waivers/expense offset arrangement | 1.29% | 1.34% | 1.25% | 1.20% | 1.21% | |||||||||||||||
After fee waivers/expense offset arrangement3,# | 1.15% | 1.15% | 1.15% | 1.15% | 1.15% | |||||||||||||||
Ratio of net investment income/(loss) to average net assets | (0.12%) | (0.48%) | (0.32%) | (0.56%) | 0.65% | † | ||||||||||||||
Portfolio turnover rate | 37% | 21% | 44% | 32% | 20% | |||||||||||||||
1 | Includes redemption fees of less than $0.01 per share. | |
2 | Performance figures reflect fee waivers, expense offset arrangement and/or recovery of previously waived fees, when | |
| applicable. Past performance is no guarantee of future results. Total return would have been lower if the Adviser had not | ||
| waived certain expenses. Conversely, total return would have been higher if the Adviser had not recovered previously | ||
| waived expenses. Total return is calculated assuming an initial investment made at the net asset value at the beginning of | ||
| the period, reinvestment of all dividends and distributions at net asset value during the period and redemption on the last | ||
| day of the period and is not annualized. | ||
3 | As a result of an expense limitation, the ratio of expenses (exclusive of taxes, interest, brokerage commissions, acquired | |
| fund fees and expenses, and extraordinary items) to average net assets will not exceed 1.15%. | ||
@ | Calculated based on the average number of shares outstanding during the period. | |
† | Investment income per share reflects special dividends received during the period which amounted to $0.11 per share. | |
| Excluding the special dividends, the ratio of net investment income to average net assets would have been 0.09%. | ||
# | The Adviser waived a portion of its fees. |
The accompanying notes are an integral part of the financial statements.
52
Third Avenue Trust
Financial Highlights (continued)
Selected data (for a share outstanding throughout each period) and ratios are as follows:
| Third Avenue Small-Cap Value Fund | |||||||||||||||
| Year Ended October 31, | For the Period from March 1, 2018 (commencement of investment operations) through October 31, | ||||||||||||||
| 2020 | 2019 | 2018 | |||||||||||||
Z Class: | |||||||||||||||
Net asset value, beginning of period | $ | 19.22 | $ | 20.35 | $ | 20.56 | |||||||||
|
|
|
|
|
| ||||||||||
Income/(loss) from investment operations: | |||||||||||||||
Net investment loss@ | 0.00 | * | (0.07 | ) | (0.03 | ) | |||||||||
Net gain/(loss) on investment transactions (both realized and unrealized) | (2.46 | ) | 0.99 | 1 | (0.18 | )1 | |||||||||
|
|
|
|
|
| ||||||||||
Total from investment operations | (2.46 | ) | 0.92 | (0.21 | ) | ||||||||||
|
|
|
|
|
| ||||||||||
Less distributions to shareholders: | |||||||||||||||
Distributions from net realized gain | (1.43 | ) | (2.05 | ) | — | ||||||||||
|
|
|
|
|
| ||||||||||
Total distributions | (1.43 | ) | (2.05 | ) | — | ||||||||||
|
|
|
|
|
| ||||||||||
Net asset value, end of period | $ | 15.33 | $ | 19.22 | $ | 20.35 | |||||||||
|
|
|
|
|
| ||||||||||
Total return2 | (14.03 | %) | 6.45 | % | (1.02 | %)3 | |||||||||
Ratios/Supplemental Data: | |||||||||||||||
Net assets, end of period (in thousands) | $ | 331 | $ | 431 | $ | 450 | |||||||||
Ratio of expenses to average net assets Before fee waivers/expense offset arrangement | 1.20 | % | 1.24 | % | 1.20 | %4 | |||||||||
After fee waivers/expense offset arrangement5, # | 1.05 | % | 1.05 | % | 1.05 | %4 | |||||||||
Ratio of net investment loss to average net assets | (0.02 | %) | (0.38 | %) | (0.21 | %)4 | |||||||||
Portfolio turnover rate | 37 | % | 21 | % | 44 | %3,6 | |||||||||
1 | Includes redemption fees of less than $0.01 per share. | |
2 | Performance figures reflect fee waivers, expense offset arrangement and/or recovery of previously waived fees, when applicable. Past performance is no guarantee of future results. Total return would have been lower if the Adviser had not waived certain expenses. Conversely, total return would have been higher if the Adviser had not recovered previously waived expenses. Total return is calculated assuming an initial investment made at the net asset value at the beginning of the period, reinvestment of all dividends and distributions at net asset value during the period and redemption on the last day of the period and is not annualized. | |
3 | Not annualized. | |
4 | Annualized. | |
5 | As a result of an expense limitation, the ratio of expenses (exclusive of taxes, interest, brokerage commissions, acquired fund fees and expenses, and extraordinary items) to average net assets will not exceed 1.05%. | |
6 | Reflects portfolio turnover of the Fund for the year ended October 31, 2018 | |
@ | Calculated based on the average number of shares outstanding during the period. | |
* | Amount less than $(0.01). | |
# | The Adviser waived a portion of its fees. |
The accompanying notes are an integral part of the financial statements.
53
Third Avenue Trust
Financial Highlights (continued)
Selected data (for a share outstanding throughout each period) and ratios are as follows:
| Third Avenue Real Estate Value Fund | ||||||||||||||||||||
| Years Ended October 31, | ||||||||||||||||||||
| 2020 | 2019 | 2018 | 2017 | 2016 | ||||||||||||||||
Investor Class: | ||||||||||||||||||||
Net asset value, beginning of period | $ | 28.79 | $ | 28.66 | $ | 34.35 | $ | 29.51 | $ | 31.14 | ||||||||||
|
|
|
|
|
|
|
|
|
| |||||||||||
Income/(loss) from investment operations: | ||||||||||||||||||||
Net investment income@ | 0.08 | 0.11 | 0.14 | 0.18 | * | 0.08 | ‡ | |||||||||||||
Net gain/(loss) on investment transactions (both realized and unrealized) | (4.77) | 2.66 | 1 | (3.78) | 1 | 5.10 | 1 | (0.18) | 1 | |||||||||||
|
|
|
|
|
|
|
|
|
| |||||||||||
Total from investment operations | (4.69) | 2.77 | (3.64) | 5.28 | (0.10) | |||||||||||||||
|
|
|
|
|
|
|
|
|
| |||||||||||
Less dividends and distributions to shareholders: | ||||||||||||||||||||
Dividends from net investment income | (0.22) | (0.36) | (0.27) | (0.16) | (0.13) | |||||||||||||||
Distributions from net realized gain | (4.28) | (2.28) | (1.78) | (0.28) | (1.40) | |||||||||||||||
|
|
|
|
|
|
|
|
|
| |||||||||||
Total dividends and distributions | (4.50) | (2.64) | (2.05) | (0.44) | (1.53) | |||||||||||||||
|
|
|
|
|
|
|
|
|
| |||||||||||
Net asset value, end of period | $ | 19.60 | $ | 28.79 | $ | 28.66 | $ | 34.35 | $ | 29.51 | ||||||||||
|
|
|
|
|
|
|
|
|
| |||||||||||
Total return2 | (19.37%) | 10.94% | (11.50%) | 18.13% | (0.21%) | |||||||||||||||
Ratios/Supplemental Data: | ||||||||||||||||||||
Net assets, end of period (in thousands) | $ | 45,401 | $ | 110,912 | $ | 193,069 | $ | 255,383 | $ | 243,502 | ||||||||||
Ratio of expenses to average net assets Before fee waivers, expense reimbursements/expense offset arrangement | 1.47% | 1.45% | 1.41% | 1.36% | 1.38% | |||||||||||||||
After fee waivers, expense reimbursements/expense offset arrangement3 | 1.40% | # | 1.40% | # | 1.40% | 1.36% | 1.38% | |||||||||||||
Ratio of net investment income to average net assets | 0.35% | 0.39% | 0.41% | 0.56% | * | 0.28% | ‡ | |||||||||||||
Portfolio turnover rate | 34% | 22% | 27% | 7% | 20% | |||||||||||||||
1 | Includes redemption fees of less than $0.01 per share. | |
2 | Performance figures reflect fee waivers, expense reimbursements, expense offset arrangement and/or recovery of previously waived fees, when applicable. Past performance is no guarantee of future results. Total return would have been lower in certain periods if the Adviser had not waived certain fees or reimbursed certain expenses. Conversely, total return would have been higher in certain periods if the Adviser had not recovered previously waived fees or reimbursed expenses. Total return is calculated assuming an initial investment made at the net asset value at the beginning of the period, reinvestment of all dividends and distributions at net asset value during the period and redemption on the last day of the period and is not annualized. | |
3 | As a result of an expense limitation, the ratio of expenses (exclusive of taxes, interest, brokerage commissions, acquired fund fees and expenses, and extraordinary items) to average net assets will not exceed 1.40%. | |
@ | Calculated based on the average number of shares outstanding during the period. | |
* | Investment income per share reflects a special dividend received during the period which amounted to $0.10 per share. Excluding the special dividend, the ratio of net investment income to average net assets would have been 0.25%. | |
‡ | Investment income per share reflects a special dividend received during the period which amounted to $0.09 per share. Excluding the special dividend, the ratio of net investment income/(loss) to average net assets would have been (0.04%). | |
# | The Adviser waived a portion of its fees. |
The accompanying notes are an integral part of the financial statements.
54
Third Avenue Trust
Financial Highlights (continued)
Selected data (for a share outstanding throughout each period) and ratios are as follows:
| Third Avenue Real Estate Value Fund | ||||||||||||||||||||
| Years Ended October 31, | |||||||||||||||||||
| 2020 | 2019 | 2018 | 2017 | 2016 | ||||||||||||||||
Institutional Class: | ||||||||||||||||||||
Net asset value, beginning of period | $ | 28.98 | $ | 28.88 | $ | 34.59 | 29.73 | $ | 31.36 | |||||||||||
|
|
|
|
|
|
|
|
|
| |||||||||||
Income/(loss) from investment operations: | ||||||||||||||||||||
Net investment income@ | 0.17 | 0.18 | 0.23 | 0.26 | * | 0.16 | ‡ | |||||||||||||
Net gain/(loss) on investment transactions (both realized and unrealized) | (4.82) | 2.67 | 1 | (3.80) | 1 | 5.13 | 1 | (0.18) | 1 | |||||||||||
|
|
|
|
|
|
|
|
|
| |||||||||||
Total from investment operations | (4.65) | 2.85 | (3.57) | 5.39 | (0.02) | |||||||||||||||
|
|
|
|
|
|
|
|
|
| |||||||||||
Less dividends and distributions to shareholders: | ||||||||||||||||||||
Dividends from net investment income | (0.33) | (0.47) | (0.36) | (0.25) | (0.21) | |||||||||||||||
Distributions from net realized gain | (4.28) | (2.28) | (1.78) | (0.28) | (1.40) | |||||||||||||||
|
|
|
|
|
|
|
|
|
| |||||||||||
Total dividends and distributions | (4.61) | (2.75) | (2.14) | (0.53) | (1.61) | |||||||||||||||
|
|
|
|
|
|
|
|
|
| |||||||||||
Net asset value, end of period | $ | 19.72 | $ | 28.98 | $ | 28.88 | 34.59 | $ | 29.73 | |||||||||||
|
|
|
|
|
|
|
|
|
| |||||||||||
Total return2 | (19.14%) | 11.21% | (11.25%) | 18.41% | 0.05% | |||||||||||||||
Ratios/Supplemental Data: | ||||||||||||||||||||
Net assets, end of period (in thousands) | $ | 391,651 | $ | 863,328 | $ | 1,245,973 | $ | 1,690,211 | $ | 1,596,887 | ||||||||||
Ratio of expenses to average net assets Before fee waivers/expense offset arrangement | 1.18% | 1.17% | 1.12% | 1.11% | 1.13% | |||||||||||||||
After fee waivers/expense offset arrangement3 | 1.15% | # | 1.15% | # | 1.11% | 1.11% | 1.13% | |||||||||||||
Ratio of net investment income to average net assets | 0.77% | 0.65% | 0.68% | 0.81% | * | 0.56% | ‡ | |||||||||||||
Portfolio turnover rate | 34% | 22% | 27% | 7% | 20% | |||||||||||||||
1 | Includes redemption fees of less than $0.01 per share. | |
2 | Performance figures reflect fee waivers, expense offset arrangement and/or recovery of previously waived fees, when applicable. Past performance is no guarantee of future results. Total return would have been lower if the Adviser had not waived certain expenses. Conversely, total return would have been higher if the Adviser had not recovered previously waived expenses. Total return is calculated assuming an initial investment made at the net asset value at the beginning of the period, reinvestment of all dividends and distributions at net asset value during the period and redemption on the last day of the period and is not annualized. | |
3 | As a result of an expense limitation, the ratio of expenses (exclusive of taxes, interest, brokerage commissions, acquired fund fees and expenses, and extraordinary items) to average net assets will not exceed 1.15%. | |
@ | Calculated based on the average number of shares outstanding during the period. | |
* | Investment income per share reflects a special dividend received during the period which amounted to $0.10 per share. Excluding the special dividend, the ratio of net investment income to average net assets would have been 0.50%. | |
‡ | Investment income per share reflects a special dividend received during the period which amounted to $0.09 per share. Excluding the special dividend, the ratio of net investment income to average net assets would have been 0.24%. | |
# | The Adviser waived a portion of its fees. |
The accompanying notes are an integral part of the financial statements.
55
Third Avenue Trust
Financial Highlights (continued)
Selected data (for a share outstanding throughout each period) and ratios are as follows:
| Third Avenue Real Estate Value Fund | |||||||||||||||
| Year Ended October 31, | For the Period from March 1, 2018 (commencement of investment operations) through October 31, | ||||||||||||||
| 2020 | 2019 | 2018 | |||||||||||||
Z Class: | |||||||||||||||
Net asset value, beginning of period | $ | 28.98 | $ | 28.90 | $ | 33.13 | |||||||||
|
|
|
|
|
| ||||||||||
Income/(loss) from investment operations: | |||||||||||||||
Net investment income@ | 0.22 | 0.20 | 0.20 | ||||||||||||
Net gain/(loss) on investment transactions (both realized and unrealized) | (4.85 | ) | 2.67 | 1 | (4.43 | )1 | |||||||||
|
|
|
|
|
| ||||||||||
Total from investment operations | (4.63 | ) | 2.87 | (4.23 | ) | ||||||||||
|
|
|
|
|
| ||||||||||
Less dividends and distributions to shareholders: | |||||||||||||||
Dividends from net investment income | (0.37 | ) | (0.51 | ) | — | ||||||||||
Distributions from net realized gain | (4.28 | ) | (2.28 | ) | — | ||||||||||
|
|
|
|
|
| ||||||||||
Total dividends and distributions | (4.65 | ) | (2.79 | ) | — | ||||||||||
|
|
|
|
|
| ||||||||||
Net asset value, end of period | $ | 19.70 | $ | 28.98 | $ | 28.90 | |||||||||
|
|
|
|
|
| ||||||||||
Total return2 | (19.09 | %) | 11.30 | % | (12.77 | %)3 | |||||||||
Ratios/Supplemental Data: | |||||||||||||||
Net assets, end of period (in thousands) | $ | 29,855 | $ | 55,147 | $ | 69,096 | |||||||||
Ratio of expenses to average net assets Before fee waivers/expense offset arrangement | 1.08 | % | 1.05 | % | 1.03 | %4 | |||||||||
After fee waivers/expense offset arrangement5 | 1.05 | %# | 1.05 | % | 1.03 | %4 | |||||||||
Ratio of net investment income to average net assets | 0.97 | % | 0.73 | % | 0.94 | %4 | |||||||||
Portfolio turnover rate | 34 | % | 22 | % | 27 | %3,6 | |||||||||
1 | Includes redemption fees of less than $0.01 per share. | |
2 | Performance figures reflect fee waivers, expense offset arrangement and/or recovery of previously waived fees, when applicable. Past performance is no guarantee of future results. Total return would have been lower if the Adviser had not waived certain expenses. Conversely, total return would have been higher if the Adviser had not recovered previously waived expenses. Total return is calculated assuming an initial investment made at the net asset value at the beginning of the period, reinvestment of all dividends and distributions at net asset value during the period and redemption on the last day of the period and is not annualized. | |
3 | Not annualized. | |
4 | Annualized. | |
5 | As a result of an expense limitation, the ratio of expenses (exclusive of taxes, interest, brokerage commissions, acquired fund fees and expenses, and extraordinary items) to average net assets will not exceed 1.05%. | |
6 | Reflects portfolio turnover of the Fund for the year ended October 31, 2018 | |
@ | Calculated based on the average number of shares outstanding during the period. | |
# | The Adviser waived a portion of its fees. |
The accompanying notes are an integral part of the financial statements.
56
Third Avenue Trust
October 31, 2020
1. SUMMARY OF ORGANIZATION AND SIGNIFICANT ACCOUNTING POLICIES
Organization:
Third Avenue Trust (the “Trust”) is an open-end, management investment company organized as a Delaware business trust pursuant to a Trust Instrument dated October 31, 1996. The Trust currently consists of the following diversified (within the meaning of Section 5(b)(1) of the Investment Company Act of 1940), separate investment series: Third Avenue Value Fund, Third Avenue Small-Cap Value Fund and Third Avenue Real Estate Value Fund (each a “Fund” and, collectively, the “Funds”). Third Avenue Management LLC (the “Adviser”) provides investment advisory services to each of the Funds in the Trust. The Funds seek to achieve their investment objectives by adhering to a strict value discipline when selecting securities and other instruments. Each Fund has a distinct investment mandate.
Third Avenue Value Fund seeks to achieve its long-term capital appreciation objective mainly by acquiring common stocks of well-financed companies (meaning companies with high quality assets and conservative levels of liabilities) at a discount to what the Adviser believes is their intrinsic value. Adhering to this strict value discipline, the Fund generally seeks to construct a focused portfolio of high conviction opportunities. The Fund may invest in companies of any market capitalization and across all industries. The Fund may also acquire senior securities, such as convertible securities, preferred stocks and debt instruments (including high-yield and distressed securities that may be in default and may have any or no credit rating), that the Adviser believes are undervalued. The Fund invests in both domestic and foreign securities.
Third Avenue Small-Cap Value Fund seeks to achieve its long-term capital appreciation objective mainly by acquiring equity securities, including common stocks and convertible securities, of well-financed (meaning companies with high quality assets and conservative levels of liabilities) small companies at a discount to what the Adviser believes is their intrinsic value. Adhering to this strict value discipline, the Fund generally seeks to construct a focused portfolio of high conviction opportunities. Under normal circumstances, the Fund expects to invest at least 80% of its net assets (plus the amount of any borrowing for investment purposes) in securities of companies that are considered small. The Fund considers a “small company” to be one whose market capitalization is between $50 million and the top range of capitalizations of companies in the Russell 2000 Index or the S&P Small Cap 600 Index at the time a new position is established (based on prior quarter-end data of the indexes). The Fund may also acquire senior securities of small companies, such as preferred stocks and debt instruments (including high-yield and distressed securities that may be in default and may have any or no credit rating), that the Adviser believes are undervalued. The Fund invests in both domestic and foreign securities.
57
Third Avenue Trust
Notes to Financial Statements (continued)
October 31, 2020
Third Avenue Real Estate Value Fund seeks to achieve its long-term capital appreciation objective primarily by investing in equity securities, including common stocks and convertible securities, of well-financed (meaning companies with high quality assets and conservative levels of liabilities) real estate and real estate-related companies, or in companies which own significant real estate assets or derive a significant portion of gross revenues or net profits from real estate-related companies at the time of investment (“real estate companies”). Adhering to this strict value discipline, the Fund generally seeks to construct a focused portfolio of high conviction opportunities. The Fund seeks to acquire these securities at a discount to what the Adviser believes is their intrinsic value. Under normal circumstances, at least 80% of the Fund’s net assets (plus the amount of any borrowing for investment purposes) will be invested in securities of real estate and real estate-related companies. The Fund may invest in companies of any market capitalization. The Fund may also acquire senior securities, such as preferred stocks and debt instruments (including high-yield, distressed and mortgage-backed securities that may be in default and may have any or no credit rating) of real estate companies or loans secured by real estate or real estate-related companies that the Adviser believes have above-average yield potential. The Fund invests in both domestic and foreign securities.
Because of the Funds’ disciplined and deliberate investing approach, there may be times when a Fund will have a significant cash position. A substantial cash position can adversely impact Fund performance in certain market conditions, and may make it more difficult for a Fund to achieve its investment objective.
Accounting policies:
The policies described below are followed consistently by the Funds in the preparation of their financial statements and are in conformity with accounting principles generally accepted in the United States of America (“U.S. GAAP”). The Trust is an investment company and, accordingly, follows the investment company accounting and reporting guidance of the Financial Accounting Standards Board Accounting Standards Codification (“FASB ASC”) Topic 946-Investment Companies, which is part of U.S. GAAP.
The preparation of financial statements in accordance with U.S. GAAP requires management to make estimates and assumptions that affect the reported amounts and disclosures. Actual results could differ from those estimates.
Security valuation:
Each Fund’s equity securities and closed-end funds listed on an exchange market system will generally be valued at the last sale price. Equity securities traded in the over-the-counter market are valued at their closing sale or official closing price. If there were no transactions on that day, securities traded principally on an exchange will be valued at the mean of the last bid
58
Third Avenue Trust
Notes to Financial Statements (continued)
October 31, 2020
and ask prices prior to the market close. Prices for equity securities normally are supplied by an independent pricing service approved by the Trust’s Board of Trustees (“Board of Trustees”). Fixed income securities are valued based on market quotations, which are furnished by an independent pricing service. Fixed income securities having remaining maturities of 60 days or less are valued at amortized cost, which approximates market value. Any assets held by a Fund that are denominated in foreign currencies are valued daily in U.S. dollars at the foreign currency exchange rates that are prevailing at the time that such Fund determines the daily NAV per share. Foreign securities may trade on weekends or other days when a Fund does not calculate NAV. As a result, the market value of these investments may change on days when you cannot buy or sell shares of such Fund.
Securities that do not have a readily available current market value or that have been subject to a significant event occurring between the time of the last sales price and the close of the New York Stock Exchange (the “Exchange”) are valued in good faith under the direction of the Board of Trustees. The Board of Trustees has adopted methods for valuing securities and other assets in circumstances where market quotes are not readily available and has delegated to the Adviser the responsibility for applying the valuation methods. At October 31, 2020, such securities for Third Avenue Value Fund and Third Avenue Real Estate Value Fund were valued at $0.There were no fair value securities for Third Avenue Small-Cap Value Fund. In the event that market quotes are not readily available, and the security or asset cannot be valued pursuant to one of the valuation methods, the value of the security or asset will be determined in good faith by the Adviser. On a quarterly basis, the Adviser’s fair valuation determinations will be reviewed by the Trust’s Valuation Committee. The Trust’s policy is intended to result in a calculation of each Fund’s NAV that fairly reflects security values as of the time of pricing. However, fair values determined pursuant to a Fund’s procedures may not accurately reflect the price that the Fund could obtain for a security if it were to dispose of that security as of the time of pricing.
Market quotes are considered not readily available in circumstances where there is an absence of current or reliable market-based data (e.g., trade information, bid/asked information, broker quotes), including where events occur after the close of the relevant market, but prior to the close of the Exchange, that materially affect the values of a Fund’s securities or assets. In addition, market quotes are considered not readily available when, due to extraordinary circumstances, an exchange or market on which a security trades does not open for trading for the entire day and no other market prices are available.
Securities listed on certain non-U.S. exchanges that close at a substantially earlier time than the Exchange (such as most European or Asian exchanges) are fair valued daily by an independent fair value pricing service approved by the Board of Trustees. The fair valuations for these
59
Third Avenue Trust
Notes to Financial Statements (continued)
October 31, 2020
securities may not be the same as quoted or published prices of the securities on their primary markets. Securities for which daily fair value prices from the independent fair value pricing service are not available are generally valued at the last quoted sale price at the close of an exchange and are categorized as Level 2, as defined below on which the security is traded. Values of foreign securities, currencies, and other assets and liabilities denominated in foreign currencies are translated into U.S. dollars at the exchange rate of said currencies against the U.S. dollar, as of the close of regular trading on the Exchange, as provided by an independent pricing service approved by the Board of Trustees.
Each Fund may fair value foreign securities if significant events that appear likely to affect the value of those securities occur between the time a foreign exchange closes and the time that a Fund prices its shares. Significant events may include: (i) a substantial gap between the closing time of a non-U.S. exchange and the close of the Exchange, (ii) events impacting a single issuer, (iii) governmental actions that affect securities in one sector or country, (iv) natural disasters or armed conflict, or (v) significant domestic or foreign market fluctuations. The Board of Trustees has delegated to the Adviser the responsibility for monitoring significant events that may materially affect the values of the Fund’s securities or assets and for determining whether the value of the applicable securities or assets should be re-evaluated in light of such significant events.
Fair value measurements:
In accordance with FASB ASC 820-10, Fair Value Measurements and Disclosures, the Funds disclose the fair value of their investments in a hierarchy that prioritizes the inputs to valuation techniques used to measure the fair value. Fair value is defined as the price that a Fund would receive upon selling an investment in an orderly transaction to an independent buyer in the principal or most advantageous market for the investment under current market conditions. The hierarchy gives the highest priority to valuations based upon unadjusted quoted prices in active markets for identical assets or liabilities (Level 1 measurement) and the lowest priority to valuations based upon unobservable inputs that are significant to the valuation (Level 3 measurements). The three levels of the fair value hierarchy are as follows:
• Level 1 – Inputs that reflect unadjusted quoted prices in active markets for identical assets or liabilities that the Funds have the ability to access at the measurement date;
• Level 2 – Inputs other than quoted prices that are observable for the asset or liability either directly or indirectly, including inputs in markets that are not considered to be active; and
• Level 3 – Significant unobservable inputs (including the Funds’ own assumptions in determining the fair value of investments)
60
Third Avenue Trust
Notes to Financial Statements (continued)
October 31, 2020
A financial instrument’s level within the fair value hierarchy is based on the lowest level of any input both individually and in aggregate that is significant to the fair value measurement. However, the determination of what constitutes “observable” requires significant judgment by the Funds. The Funds consider observable data to be market data which is readily available, regularly distributed or updated, reliable and verifiable, not proprietary, and provided by independent sources that are actively involved in the relevant market. The inputs or methodology used for valuing investments are not necessarily an indication of the risk associated with investing in those investments.
The Funds use valuation techniques to measure fair value that are consistent with the market approach and/or income approach, depending on the type of security and the particular circumstance. The market approach uses prices and other relevant information generated by market transactions involving identical or comparable securities. The income approach uses valuation techniques to discount estimated future cash flows to present value.
The following are certain inputs and techniques that the Funds generally use to evaluate how to classify each major category of assets and liabilities for Level 2 and Level 3, in accordance with U.S. GAAP.
Equity securities (Common Stocks, Preferred Stocks and Warrants)—Equity securities traded in inactive markets and certain foreign equity securities are valued using inputs which include broker-dealer quotes, recently executed transactions adjusted for changes in the benchmark index, or evaluated prices received from independent pricing services or brokers that take into account the integrity of the market sector and issuer, the individual characteristics of the security, and information received from broker-dealers and other market sources pertaining to the issuer or security. To the extent that these inputs are observable, the values of equity securities are categorized as Level 2.To the extent that these inputs are unobservable, the values are categorized as Level 3.
U.S. Government Obligations—U.S. Government obligations are valued by independent pricing services based on pricing models that evaluate the mean between the closing bid and askprice.Themodelsalsotakeintoconsiderationdatareceivedfromactivemarketmakersand broker-dealers, yield curves, and the spread over comparable U.S. Government issues. The spreads change daily in response to market conditions and are generally obtained from the new issue market and broker-dealer sources. To the extent that these inputs are observable, the values of U.S. Government obligations are categorized as Level 2. To the extent that these inputs are unobservable, the values are categorized as Level 3.
61
Third Avenue Trust
Notes to Financial Statements (continued)
October 31, 2020
Corporate Bonds—Corporate bonds are generally comprised of two main categories: investment grade bonds and high yield bonds. Investment grade bonds are valued by independent pricing services or brokers using various inputs and techniques, which include broker-dealer quotations, live trading levels, recently executed transactions in securities of the issuer or comparable issuers, and option adjusted spread models that include base curve and spread curve inputs. Adjustments to individual bonds can be applied to recognize trading differences compared to other bonds issued by the same issuer. High yield bonds are valued by independent pricing services or brokers based primarily on broker-dealer quotations from relevant market makers and recently executed transactions in securities of the issuer or comparable issuers. The broker-dealer quotations received are supported by credit analysis of the issuer that takes into consideration credit quality assessments, daily trading activity, and the activity of the underlying equities, listed bonds and sector specific trends. To the extent that these inputs are observable, the values of corporate bonds and notes are categorized as Level 2. To the extent that these inputs are unobservable, the values are categorized as Level 3.
Term Loans—Term loans are valued by independent pricing services based on the average of evaluated quoted prices received from multiple dealers or valued relative to other benchmark securities when broker-dealer quotes are unavailable. Inputs may include quoted prices for similar investments in active markets, interest rates, coupon rates, yield curves, option adjusted spreads, default rates, credit spreads and other unique security features in order to estimate the relevant cash flows which are then discounted to calculate fair values. To the extent that these inputs are observable, the values of term loans are categorized as Level 2. To the extent that these inputs are unobservable, the values are categorized as Level 3.
Options (Purchased and Written)—Options are valued by independent pricing services or by brokers based on pricing models that take into account, among other factors, foreign exchange rate, time until expiration, and volatility of the underlying foreign currency security. To the extent that these inputs are observable, the values of options are categorized as Level 2. To the extent that these inputs are unobservable, the values are categorized as Level 3.
62
Third Avenue Trust
Notes to Financial Statements (continued)
October 31, 2020
The following is a Summary by Level of Inputs used to value the Funds’ investments as of October 31, 2020:
Third Avenue Value Fund
Assets | Total Value at 10/31/20 | Level 1 Quoted Price | Level 2 Other Significant Observable Inputs^ | Level 3 Significant Unobservable Inputs | ||||||||||||
Common Stocks: | ||||||||||||||||
Aerospace & Defense | $ | 10,090,880 | $ | — | $ | 10,090,880 | $ | — | ||||||||
Automotive | 30,667,536 | — | 30,667,536 | — | ||||||||||||
Banks | 57,715,629 | 13,265,801 | 44,449,828 | — | ||||||||||||
Building Products | 46,418,977 | 29,395,765 | 17,023,212 | — | ||||||||||||
Business Services | 9,805,289 | 9,805,289 | — | — | ||||||||||||
Diversified Holding Companies | 21,731,932 | 4,372,790 | 17,359,142 | — | ||||||||||||
Engineering & Construction | 12,247,522 | — | 12,247,522 | — | ||||||||||||
Forest Products & Paper | 37,402,027 | 37,402,027 | — | — | ||||||||||||
Insurance | 15,667,970 | 15,667,970 | — | — | ||||||||||||
Metals & Mining | 68,085,048 | 68,085,048 | — | — | ||||||||||||
Non-U.S. Real Estate Operating Companies | 9,698,252 | — | 9,698,252 | — | ||||||||||||
Oil & Gas Production & Services | 25,222,204 | 10,296,548 | 14,925,656 | — | ||||||||||||
Retail | 3,960,427 | — | 3,960,427 | — | ||||||||||||
Transportation Infrastructure | 22,744,155 | 16,353,474 | 6,390,681 | — | ||||||||||||
U.S. Homebuilder | 7,232,198 | 7,232,198 | — | — | ||||||||||||
U.S. Real Estate Investment Trusts | 10,409,482 | 10,409,482 | — | — | ||||||||||||
U.S. Real Estate Operating Companies | 9,995,442 | 9,995,442 | — | — | ||||||||||||
|
|
|
|
|
|
|
| |||||||||
Total Common Stocks | 399,094,970 | 232,281,834 | 166,813,136 | — | ||||||||||||
Corporate Bonds: | ||||||||||||||||
Oil & Gas Production & Services | 2,301,312 | — | 2,301,312 | — | ||||||||||||
|
|
|
|
|
|
|
| |||||||||
Total Corporate Bonds | 2,301,312 | — | 2,301,312 | — | ||||||||||||
Preferred Stocks: | ||||||||||||||||
Consumer Products | — | — | — | — | * | |||||||||||
|
|
|
|
|
|
|
| |||||||||
Total Preferred Stocks | — | — | — | — | ||||||||||||
Purchased Options: | 4,259,482 | — | 4,259,482 | — | ||||||||||||
|
|
|
|
|
|
|
| |||||||||
Total Purchased Options | 4,259,482 | — | 4,259,482 | — | ||||||||||||
Total Value of Investments | $ | 405,655,764 | $ | 232,281,834 | $ | 173,373,930 | $ | — | ||||||||
|
|
|
|
|
|
|
| |||||||||
63
Third Avenue Trust
Notes to Financial Statements (continued)
October 31, 2020
Third Avenue Small-Cap Value Fund
Assets | Total Value at 10/31/20 | Level 1 Quoted Price | Level 2 Other Significant Observable Inputs^ | Level 3 Significant Unobservable Inputs | ||||||||||||
Common Stocks: | ||||||||||||||||
Auto Parts & Services | $ | 15,767,500 | $ | 15,767,500 | $ | — | $ | — | ||||||||
Bank & Thrifts | 30,009,775 | 30,009,775 | — | — | ||||||||||||
Conglomerates | 6,865,885 | 6,865,885 | — | — | ||||||||||||
Consulting & Information Technology Services | 5,452,938 | 5,452,938 | — | — | ||||||||||||
Consumer Discretionary | 4,550,014 | 4,550,014 | — | — | ||||||||||||
Consumer Staples | 5,713,383 | 5,713,383 | — | — | ||||||||||||
Financials | 2,751,723 | 2,751,723 | — | — | ||||||||||||
Home Building | 3,815,900 | 3,815,900 | — | — | ||||||||||||
Industrial Equipment | 5,620,133 | 5,620,133 | — | — | ||||||||||||
Industrial Services | 19,437,180 | 19,437,180 | — | — | ||||||||||||
Insurance & Reinsurance | 4,308,519 | 4,308,519 | — | — | ||||||||||||
Metals Manufacturing | 4,343,617 | 4,343,617 | — | — | ||||||||||||
Oil & Gas Production & Services | 3,155,299 | 3,155,299 | — | — | ||||||||||||
Real Estate | 3,902,165 | 3,902,165 | — | — | ||||||||||||
Telecommunications | 2,973,086 | 2,973,086 | — | — | ||||||||||||
U.S. Real Estate Operating Companies | 4,466,378 | 4,466,378 | — | — | ||||||||||||
|
|
|
|
|
|
|
| |||||||||
Total Common Stocks | 123,133,495 | 123,133,495 | — | — | ||||||||||||
Corporate Bonds: | ||||||||||||||||
Oil & Gas Production & Services | 1,587,827 | — | 1,587,827 | — | ||||||||||||
|
|
|
|
|
|
|
| |||||||||
Total Corporate Bonds | 1,587,827 | — | 1,587,827 | — | ||||||||||||
Closed-End Fund: | ||||||||||||||||
Financials | 3,134,454 | 3,134,454 | — | — | ||||||||||||
|
|
|
|
|
|
|
| |||||||||
Total Closed-End Fund | 3,134,454 | 3,134,454 | — | — | ||||||||||||
Total Value of Investments | $ | 127,855,776 | $ | 126,267,949 | $ | 1,587,827 | $ | — | ||||||||
|
|
|
|
|
|
|
| |||||||||
64
Third Avenue Trust
Notes to Financial Statements (continued)
October 31, 2020
Third Avenue Real Estate Value Fund
Assets | Total Value at 10/31/20 | Level 1 Quoted Price | Level 2 Other Significant Observable Inputs^ | Level 3 Significant Unobservable Inputs | ||||||||||||
Common Stocks: | ||||||||||||||||
Consulting/Management | $ | 15,838,196 | $ | 15,838,196 | $ | — | $ | — | ||||||||
Forest Products & Paper | 43,240,801 | 43,240,801 | — | — | ||||||||||||
Industrial Services | 15,589,220 | 15,589,220 | — | — | ||||||||||||
Mortgage Finance | 4,734,348 | 4,734,348 | — | — | ||||||||||||
Non-U.S. Homebuilder | 22,452,233 | — | 22,452,233 | — | ||||||||||||
Non-U.S. Real Estate Consulting/Management | 7,749,018 | — | 7,749,018 | — | ||||||||||||
Non-U.S. Real Estate Investment Trusts | 48,443,224 | — | 48,443,224 | — | ||||||||||||
Non-U.S. Real Estate Operating Companies | 122,213,753 | 30,437,095 | 91,776,658 | — | ||||||||||||
Retail-Building Products | 19,955,540 | 19,955,540 | — | — | ||||||||||||
U.S. Homebuilder | 38,392,254 | 38,392,254 | — | — | ||||||||||||
U.S. Real Estate Investment Trusts | 82,772,376 | 82,772,376 | — | — | ||||||||||||
U.S. Real Estate Operating Companies | 27,015,679 | 27,015,679 | — | — | * | |||||||||||
|
|
|
|
|
|
|
| |||||||||
Total Common Stocks | 448,396,642 | 277,975,509 | 170,421,133 | — | ||||||||||||
Preferrred Stocks: | ||||||||||||||||
Mortgage Finance | 5,986,000 | 5,986,000 | — | — | ||||||||||||
|
|
|
|
|
|
|
| |||||||||
Total Preferred Stocks | 5,986,000 | 5,986,000 | — | — | ||||||||||||
Term Loans: | ||||||||||||||||
Non-U.S. Real Estate Operating Companies | — | — | — | — | * | |||||||||||
|
|
|
|
|
|
|
| |||||||||
Total Term Loans | — | — | — | — | ||||||||||||
Purchased Options: | 540,686 | — | 540,686 | — | ||||||||||||
|
|
|
|
|
|
|
| |||||||||
Total Purchased Options | 540,686 | — | 540,686 | — | ||||||||||||
Written Options: | (661,753 | ) | — | (661,753 | ) | — | ||||||||||
|
|
|
|
|
|
|
| |||||||||
Total Written Options | (661,753 | ) | — | (661,753 | ) | — | ||||||||||
Total Value of Investments | $ | 454,261,575 | $ | 283,961,509 | $ | 170,300,066 | $ | — | ||||||||
|
|
|
|
|
|
|
| |||||||||
^ Securities categorized as Level 2 include securities listed on certain non-U.S. exchanges that close at a substantially earlier time than the Exchange (such as most European or Asian exchanges) that are fair valued daily by an independent fair value pricing service approved by the Board of Trustees.
* Investments fair valued at $0.
65
Third Avenue Trust
Notes to Financial Statements (continued)
October 31, 2020
For fair valuations using significant unobservable inputs, U.S. GAAP require each Fund to present a reconciliation of the beginning to ending balances for reported market values that present changes attributable to total realized and unrealized gains or losses, purchase and sales, and transfers in and out of Level 3 during the period. A reconciliation of Level 3 investments is presented only when each Fund had an amount of Level 3 investments at the end of the reporting period that was meaningful in relation to its net assets. The amounts and reasons for alltransfersinandoutofLevel3aredisclosedwheneachFundhadanamountoftotaltransfers in or out of Level 3 during the reporting period that was meaningful in relation to its net assets as of the end of the reporting period.
For the year ended October 31, 2020, there were no transfers in or out of Level 3.
| Information about Level 3 Fair Value Measurements | ||||
| Fair Value at | ||||
Third Avenue Value Fund | 10/31/20 | |||
Other (a) | $ -* | |||
| Fair Value at | ||||
Third Avenue Real Estate Value Fund | 10/31/20 | |||
Other (a) | $ -* | |||
| (a) | Includes investments less than 0.50% of net assets of the Fund. |
| * | Investments fair valued at $0. |
There are significant unobservable inputs used in the fair value measurement of the Funds’ Level 3 investments. Generally, a change in the assumptions used in any input in isolation may be accompanied by a change in another input. Significant changes in any of the unobservable inputs may significantly impact the fair value measurement. The impact is based on the relationship between each unobservable input and the fair value measurement.
Security transactions and investment income:
Security transactions for financial statement purposes are accounted for on a trade date basis. Dividend income is recorded on the ex-dividend date or, for certain foreign dividends, as soon as the Funds become aware of the dividends. Interest income is determined on the basis of coupon interest accrued using the effective interest method which adjusts for amortization of premiums and accretion of discounts. Dividend income on the Statement of Operations is shown net of any foreign taxes withheld on income from foreign securities. Payments received from certain investments held by the Funds may be comprised of dividends, capital gains and return of capital. The Funds originally estimate the expected classification of such payments. These amounts may subsequently be reclassified upon receipt of information from the issuer. Realized gains and losses from securities transactions are recorded on an identified cost basis.
66
Third Avenue Trust
Notes to Financial Statements (continued)
October 31, 2020
Foreign currency translation and foreign investments:
The books and records of the Funds are maintained in U.S. dollars. Foreign currency amounts are translated into U.S. dollars as follows:
• Investments and assets and liabilities denominated in foreign currencies: At the prevailing rates of exchange on the valuation date.
• Investment transactions and investment income: At the prevailing rates of exchange on the date of such transactions.
The net assets of the Funds are presented at market values using the foreign exchange rates at the close of the period. The Funds do not generally isolate that portion of the results of operations arising as a result of changes in the foreign exchange rates from the fluctuations arising from changes in the market prices of the investments held.
Similarly, the Funds do not isolate the effect of changes in foreign exchange rates from the fluctuations arising from changes in the market prices of investments sold during the period. Accordingly, realized and unrealized foreign currency gains/ (losses) are included in the reported net realized gain/(loss) and unrealized appreciation/ (depreciation) on investments transactions and balances.
Net realized gains/(losses) on foreign currency transactions represent net foreign exchange gains/(losses) from disposition of foreign currencies, currency gains or losses realized between the trade and settlement dates on securities transactions, and the difference between the amount of investment income and foreign with holding taxes recorded on the Funds’ books and the U.S. dollar equivalent amounts actually received or paid. Net unrealized currency gains/ (losses) from valuing foreign currency denominated assets and liabilities at period end exchange rates are reflected as a component of net unrealized appreciation/(depreciation) on the Statement of Assets and Liabilities. The change in net unrealized currency gains/(losses) for the period is reflected on the Statement of Operations.
Pursuant to U.S. federal income tax regulations, gains and losses from certain foreign currency transactions and the foreign currency portion of gains and losses realized on sales and maturities of foreign denominated debt securities are generally treated as ordinary income.
Payment-in-kind securities (“PIKs”):
The Funds may invest in PIKs. PIKs may make a payment at each payment date in either cash or additional securities. Those additional securities usually have the same terms, including maturity dates and interest rates, and associated risks as the original securities. The daily market quotations of the original securities may include the accrued income (referred to as a “dirty”
67
Third Avenue Trust
Notes to Financial Statements (continued)
October 31, 2020
price) and require a pro-rata adjustment from the unrealized appreciation or depreciation on investments to dividends and interest receivable on the Statement of Assets and Liabilities.
For the year ended October 31, 2020, Third Avenue Real Estate Value Fund received additional debt securities with a principal amount of EUR 773 and cost of $0 with respect to PIK securities. Third Avenue Value Fund and Third Avenue Small-Cap Value Fund did not receive any in-kind payments with respect to PIK securities for the year ended October 31, 2020.
Term loans:
The Funds typically invest in loans which are structured and administered by a third party entity (the “Agent”) that acts on behalf of a group of lenders that make or hold interests in the loan. These securities generally pay interest at rates which are periodically pre-determined by referencetoabaselendingrateplusapremium.Thesebaselendingratesaregenerallyeitherthe lending rate offered by one or more major European banks, such as the London Interbank Offered Rate (“LIBOR”), the Secured Overnight Financing Rate (“SOFR”) (which is slated to replace LIBOR by the end of December 2021), or the prime rate offered by one or more major United States banks, or the certificate of deposit rate.
These securities are ordinarily contractually obligated to receive approval from the Agent bank and/or borrower prior to disposition. Remaining maturities of term loans may be less than the stated maturities shown as a result of contractual or optional payments by the borrower. Such prepayments cannot be predicted with certainty. The interest rate disclosed reflects the rate in effect on October 31, 2020.
Forward foreign currency contracts:
The Funds may be exposed to foreign currency risks associated with portfolio investments and therefore may use forward foreign currency contracts to hedge or manage these exposures. The Funds also may buy forward foreign currency contracts to gain exposure to currencies. Forward foreign currency contracts are valued at the forward rate and are marked-to-market daily. The change in market value is included in unrealized appreciation/(depreciation) on forward foreign currency contracts. When the contract is closed, the Funds record a realized gain or loss equal to the difference between the value of the contract at the time it was opened and the value at the time it was closed.
The use of forward foreign currency contracts does not eliminate fluctuations in the underlying prices of the Funds’ portfolio securities, but it does establish a rate of exchange that can be achieved in the future. Although forward foreign currency contracts limit the risk of loss due to a decline in the value of the hedged currency, they also limit any potential gain that might result
68
Third Avenue Trust
Notes to Financial Statements (continued)
October 31, 2020
should the value of the currency increase. In addition, the Funds could be exposed to risks if the counterparties to the contracts are unable to meet the terms of their contracts.
As of October 31, 2020, the Funds did not hold any forward foreign currency contracts.
Option contracts:
The Funds may purchase and sell (“write”) put and call options on various instruments including investments, indices, and foreign currencies to manage and hedge exchange rate risks within their portfolios and also to gain long or short exposure to the underlying instruments.
An option contract gives the buyer the right, but not the obligation, to buy (call) or sell (put) an underlying item at a fixed exercise price on a certain date or during a specified period. The cost of the underlying instruments acquired through the exercise of a call option is increased by the premiums paid. The proceeds from the underlying instruments sold through the exercise of a purchased put option are decreased by the premiums paid. Investments in over-the-counter option contracts require the Funds to fair value or mark-to market the options on a daily basis, which reflects the change in the market value of the contracts at the close of each day’s trading. The cost of purchased options that expire unexercised are treated by the Funds, on expiration date, as realized losses on purchased options.
When the Funds write an option, an amount equal to the premium received by the Funds is recorded as a liability and is subsequently adjusted to the current fair value of the option written. Premiums received from writing options that expire unexercised are treated by the Funds, on the expiration date, as realized gains on written options. The difference between the premium and the amount paid on effecting an offsetting transaction, including brokerage commissions, is also treated as a realized gain, or, if the premium is less than the amount paid for an off setting transaction, as a realized loss. If a call option is exercised, the premium is added to the proceeds from the sale of the underlying security or currency in determining whether the Funds have a realized gain or loss. If a put option is exercised, the premium reduces the cost basis of the security or currency purchased by the Funds. In purchasing and writing options, the Funds bear the market risk of an unfavorable change in the price of the underlying security or the risk that the Funds may not be able to enter into a closing transaction due to an illiquid market. Exercise of a written option could result in the Funds purchasing a security or currency at a price different from the current market value. The Funds may execute transactions in both listed and over-the-counter options. Listed options involve minimal counterparty risk since listed options are guaranteed against default by the exchange on which they trade. When purchasing over-the-counter options, the Funds bear the risk of economic loss from counterparty default, equal to the market value of the option.
69
Third Avenue Trust
Notes to Financial Statements (continued)
October 31, 2020
During the year ended October 31, 2020, Third Avenue Value Fund and Third Avenue Real Estate Value Fund used purchased put and call options and written put and call options for hedging purposes.
Summary of derivatives information:
The following tables present the value of derivatives held as of October 31, 2020, by their primary underlying risk exposure and respective location on the Statement of Assets and Liabilities:
Third Avenue Value Fund
| Statement of Assets and | ||||||
Derivative Contract | Liabilities Location | Options | ||||
| Assets: | ||||||
Equity contracts | Purchased options at value | $ | 4,259,482 | |||
|
| |||||
Total | $ | 4,259,482 | ||||
|
| |||||
| Third Avenue Real Estate Value Fund | ||||||
| Statement of Assets and | ||||||
Derivative Contract | Liabilities Location | Options | ||||
Assets: | ||||||
Equity contracts | Purchased options at value | $ | 288,532 | |||
Foreign currency contracts | Purchased options at value | 252,154 | ||||
|
| |||||
Total | $ | 540,686 | ||||
|
| |||||
Liabilities: | ||||||
Equity contracts | Written options at value | $ | (175,035 | ) | ||
Foreign currency contracts | Written options at value | (486,718 | ) | |||
|
| |||||
Total | $ | (661,753 | ) | |||
|
| |||||
70
Third Avenue Trust
Notes to Financial Statements (continued)
October 31, 2020
The following tables present the effect of derivatives on the Statement of Operations during the year ended October 31, 2020, by primary risk exposure:
Third Avenue Value Fund
| Amount of Change in Unrealized Appreciation/(Depreciation) on Derivatives Recognized in Income | ||||||||||||
Derivative Contract | Purchased Options | |||||||||||
Equity contracts | $ | 392,316 | ||||||||||
Foreign currency contracts | 470,297 | |||||||||||
|
| |||||||||||
Total | $ | 862,613 | (a) | |||||||||
|
| |||||||||||
| Amount of Realized Gain/(Loss) on Derivatives Recognized in Income | ||||||||||||
Derivative Contract | Purchased Options | |||||||||||
Equity contracts | $ | 8,646,824 | ||||||||||
Foreign currency contracts | (575,500 | ) | ||||||||||
|
| |||||||||||
Total | $ | 8,071,324 | (c) | |||||||||
|
| |||||||||||
| Third Avenue Real Estate Value Fund | ||||||||||||
| Amount of Change in Unrealized Appreciation/(Depreciation) on Derivatives Recognized in Income | ||||||||||||
Derivative Contract | Purchased Options | Written Options | Total | |||||||||
Equity contracts | $ | (175,121 | ) | $ | 716,254 | $ | 541,133 | |||||
Foreign currency contracts | 742,923 | 760,176 | 1,503,099 | |||||||||
|
|
|
|
|
| |||||||
Total | $ | 567,802 | (a) | $ | 1,476,430 | (b) | $ | 2,044,232 | ||||
|
|
|
|
|
| |||||||
71
Third Avenue Trust
Notes to Financial Statements (continued)
October 31, 2020
| Amount of Realized Gain/(Loss) on Derivatives Recognized in Income | ||||||||||||
Derivative Contract | Purchased Options | Written Options | Total | |||||||||
Equity contracts | $ | (810,000 | ) | $ | 1,181,880 | $ | 371,880 | |||||
Foreign currency contracts | (1,347,460 | ) | (502,850 | ) | (1,850,310 | ) | ||||||
|
|
|
|
|
| |||||||
Total | $ | (2,157,460 | )(c) | $ | 679,030 | (d) | $ | (1,478,430 | ) | |||
|
|
|
|
|
| |||||||
| (a) | Included in “Net change in unrealized appreciation on purchased options”. |
| (b) | Included in “Net change in unrealized appreciation on written options”. |
| (c) | Included in “Net realized gain/(loss) on purchased options”. |
| (d) | Included in “Net realized gain on written options”. |
Derivatives volume:
The table below discloses the volume of the Funds’ options activities during the year ended October 31, 2020 (amounts denominated in U.S. Dollars unless otherwise noted, except number of contracts). Please refer to the tables in the Summary of derivatives information for derivative-related gains and losses associated with volume activity (measured at each month-end).
| Third Avenue Value Fund | Third Avenue Real Estate Value Fund | |||||||
OTC Equity Options: | ||||||||
Average Number of Contracts - Purchased Options | 3,162 | 1,892 | ||||||
Average Notional - Purchased Options | $ | 102,033,854 | $ | 13,184,123 | ||||
Average Number of Contracts - Written Options | — | 2,747 | ||||||
Average Notional - Written Options | $ | — | $ | 19,604,724 | ||||
Foreign Currency Options: | ||||||||
Average Notional - Purchased Options | $ | 21,538,462 | $ | 187,676,923 | ||||
Ending Notional Balance - Purchased Options | $ | — | $ | 149,000,000 | ||||
Average Notional - Written Options | $ | — | $ | 116,907,692 | ||||
Ending Notional Balance - Written Options | $ | — | $ | 93,000,000 | ||||
72
Third Avenue Trust
Notes to Financial Statements (continued)
October 31, 2020
Floating rate obligations:
The Funds may invest in debt securities with interest payments or maturity values that are not fixed, but float in conjunction with an underlying index or price. These securities may be backed by corporate issuers. The indices and prices upon which such securities can be based include interest rates and currency rates. Floating rate securities pay interest according to a coupon which is reset periodically.
Dividends and distributions to shareholders:
The amount of dividends and distributions paid to shareholders from net investment income and net realized capital gains on disposition of securities, respectively, is determined in accordance with U.S. federal income tax law and regulations which may differ from U.S. GAAP. Such dividends and distributions are recorded on the ex-dividend date. The majority of dividends and capital gains distributions from a Fund may be automatically reinvested into additional shares of that Fund, based upon the discretion of the Fund’s shareholders.
Income tax information:
The Funds have complied and intend to continue to comply with the requirements of the Internal Revenue Code of 1986 applicable to regulated investment companies, and each Fund intends to distribute all of its taxable net investment income and net realized capital gains, if any,toitsshareholders.Therefore,noprovisionforU.S.federalincometaxesisincludedonthe accompanying financial statements.
Income, including capital gains, from investments in foreign securities received by the Funds may be subject to income, withholding or other taxes imposed by foreign countries.
Management has analyzed the tax positions taken on the Funds’ U.S. federal income tax returns for all open tax years (generally the current and prior three tax years), and has concluded that no provision for U.S. federal income tax is required in the Funds’ financial statements. This conclusion may be subject to future review and adjustment at a later date based upon factors including, but not limited to, on-going analyses of and changes to tax laws, regulations and interpretations thereof. The Funds are subject to possible examination by the relevant taxing authorities for tax years for which the applicable statutes of limitations have not expired.
Expense allocation:
Expenses attributable to a specific Fund are charged to that Fund. Expenses attributable to the Trust are generally allocated using the ratio of each series’ average net assets relative to the total average net assets of the Trust. Certain expenses are shared with the Third Avenue Variable
73
Third Avenue Trust
Notes to Financial Statements (continued)
October 31, 2020
Series Trust, an affiliated fund. Such costs are allocated using the ratio of the series’ average net assets relative to the total average net assets of each series of the Trust and Third Avenue Variable Series Trust.
Share class accounting:
Investment income, common expenses and realized/unrealized gains/(losses) are allocated to the three classes of shares of each Fund on the basis of daily net assets of each class. Fees relating to a specific class are charged directly to that share class.
Trustees’ and officers’ fees:
The Trust is governed by its Board of Trustees. The Trustees receive compensation in the form of an annual retainer and per meeting fees for their services to the Trust. An employee of BNY Mellon serves as the Secretary of the Trust and is not compensated by the Funds or the Trust.
JW Fund Management LLC (“JWFM”) provides a Principal Executive Officer and Principal Financial Officer to the Trust. Duff & Phelps, LLC (“D&P”) provided the Trust with a Chief Compliance Officer and an Anti-Money Laundering Officer until September 30, 2020. Effective October 1, 2020, Alaric Compliance Services LLC (“Alaric”) provides the Trust with a Chief Compliance Officer and an Anti-Money Laundering Officer. JWFM, D&P and Alaric are compensated for their services provided to the Trust.
2. INVESTMENTS
Purchases and sales/conversions:
The aggregate cost of purchases and aggregate proceeds from sales and conversions of investments, excluding short-term investments, from unaffiliated and affiliated issuers (an affiliated person as defined in the Investment Company Act of 1940, includes, among other things, ownership of 5% or more of the outstanding voting securities of such person) for the year ended October 31, 2020 were as follows:
Purchases | Sales | |||||||
Third Avenue Value Fund | ||||||||
Affiliated | $ | — | $ | 17,257,995 | ||||
Unaffiliated | 98,117,267 | 188,317,402 | ||||||
Third Avenue Small-Cap Value Fund | ||||||||
Unaffiliated | 54,764,095 | 90,192,017 | ||||||
Third Avenue Real Estate Value Fund | ||||||||
Affiliated | — | 11,812,909 | ||||||
Unaffiliated | 229,648,657 | 589,114,819 | ||||||
74
Third Avenue Trust
Notes to Financial Statements (continued)
October 31, 2020
3. INVESTMENT ADVISORY SERVICES, ADMINISTRATION AND SERVICE FEE AGREEMENTS AND EXPENSE OFFSET ARRANGEMENT
Each Fund has an Investment Advisory Agreement with the Adviser for investment advice and certain management functions. The terms of the Investment Advisory Agreements provide the annual advisory fees based on the total average daily net assets for the Funds which are indicated as below. These fees are calculated daily and paid monthly.
Fund | Annual | |
Third Avenue Value Fund | 0.90% | |
Third Avenue Small-Cap Value Fund | 0.90% | |
Third Avenue Real Estate Value Fund | 0.90% |
Additionally, the Adviser pays certain expenses on behalf of the Funds, which are partially reimbursed by the Funds, including service fees due to third parties, and certain miscellaneous expenses.
The following were amounts payable to the Adviser at October 31, 2020:
Fund | Advisory | |||
Third Avenue Value Fund | $446,581 | |||
Third Avenue Small-Cap Value Fund | 72,534 | |||
Third Avenue Real Estate Value Fund | 647,684 | |||
Until March 1, 2021 (subject to renewal), whenever each Fund’s normal operating expenses, including the investment advisory fee and most other operating expenses, but excluding taxes, interest, brokerage commissions, acquired fund fees and expenses, and extraordinary items, exceeds the expense limitation based on each Fund’s average daily net assets, the Adviser has agreed to waive a portion of its advisory fees and/or reimburse each Fund in an amount equal to that excess. The expense limitations for each Fund are disclosed in its corresponding Financial Highlights. The waived fees and reimbursed expenses may be paid to the Adviser during the following thirty-six month period after the applicable month in which a fee is waived or expense reimbursed by the Adviser, to the extent that the payment of such fees and expenses would not cause a Fund to exceed the expense limitations. The Adviser has agreed to waive all accrued entitlements related to the fiscal periods ending October 31, 2017 and October 31, 2018, which would have been subject to repayment until October 31, 2020 and October 31, 2021, respectively.
75
Third Avenue Trust
Notes to Financial Statements (continued)
October 31, 2020
The corresponding contingent liabilities to the Adviser for the fiscal period ending October31, 2019 were $609,689, $391,500 and $230,937 for the Third Avenue Value Fund, Third Avenue Small-Cap Value Fund and Third Avenue Real Estate Value Fund, respectively and are subject to repayment during the period from November 1, 2021 through October 31, 2022.
The corresponding contingent liabilities to the Adviser for the fiscal period ending October31, 2020 are $564,761, $212,531 and $252,422 for the Third Avenue Value Fund, Third Avenue Small-Cap Value Fund and Third Avenue Real Estate Value Fund, respectively and are subject to repayment during the period from November 1, 2021 through October 31, 2023.
The Bank of New York Mellon (“BNY Mellon”) serves as administrator and provides certain custodial services for the Trust. For providing administrative and accounting services, BNY Mellon is entitled to receive a monthly fee equal to an annual percentage rate of the Funds’ average daily net assets and is subject to certain minimum monthly fees. For providing certain custodial services, BNY Mellon is entitled to receive a monthly fee, subject to certain minimum, and out of pocket expenses.
Both the Trust and the Adviser have entered into agreements with financial intermediaries to provide recordkeeping, processing, shareholder communications and other services to customers of the intermediaries investing in the Funds and have agreed to compensate the intermediaries for providing those services. Certain of those services would be provided by the Funds if the shares of each customer were registered directly with the Funds’ transfer agent. Accordingly, the Funds have agreed to reimburse a portion of the intermediary fees paid by the Adviser pursuant to provisions adopted by the Board. Each Fund pays a portion of the intermediary fees attributable to shares of the Fund not exceeding the estimated expense the Fund would have paid its transfer agent had each customer’s shares been registered directly with the transfer agent instead of held through the intermediary accounts. The Adviser pays the remainder of the fees. The fees incurred by the Funds are reflected as shareholder servicing fees in the Statement of Operations. For the year ended October 31, 2020, such fees amounted to $509,625 for Third Avenue Value Fund, $132,948 for Third Avenue Small-Cap Value Fund and $689,958 for Third Avenue Real Estate Value Fund.
Prior to January 1, 2020, the Funds had an expense offset arrangement in connection with their custodian contract. Credits realized as a result of uninvested cash balances were used to reduce a portion of the Funds’ custodian expenses. The following amounts were the reduction of expenses due to this arrangement for the year ended October 31, 2020. These amounts are reflected as “Expenses reduced by custodian fee expense offset arrangement” in the Statement of Operations.
76
Third Avenue Trust
Notes to Financial Statements (continued)
October 31, 2020
Fund | Custody Credit | |||
Third Avenue Value Fund | $ | 3,275 | ||
Third Avenue Small-Cap Value Fund | 680 | |||
Third Avenue Real Estate Value Fund | 4,351 | |||
4. RELATED PARTY TRANSACTIONS
Investment in affiliates:
A summary of the Funds’ transactions in securities of affiliated issuers for the year ended October 31, 2020 is set forth below:
77
| Third Avenue Value Fund | ||||||||||||||||||||||||||||
Name of Issuer: | Value at Oct. 31, 2019 | Purchases at Cost | Proceeds from Sales | Net Realized Gain/(Loss) | Net Change in Unrealized Appreciation (Depreciation) | Value at Oct. 31, 2020 | Investment Income | |||||||||||||||||||||
Home Products International, Inc., Series A, Convertible Preferred Stock, 8.000% | $ | 1 | $ | — | $ | — | $ | — | $ | (1 | ) | $ | — | * | $ | — | ||||||||||||
Interfor Corp. ** | 45,183,422 | — | 17,257,995 | (6,321,576 | ) | 3,960,456 | 25,564,307 | — | ||||||||||||||||||||
|
|
|
|
|
|
|
|
|
|
|
|
|
| |||||||||||||||
Total Affiliates | $ | 45,183,423 | $ | — | $ | 17,257,995 | $ | (6,321,576 | ) | $ | 3,960,455 | $ | 25,564,307 | $ | — | |||||||||||||
|
|
|
|
|
|
|
|
|
|
|
|
|
| |||||||||||||||
* Investment fair valued at $ 0. | ||||||||||||||||||||||||||||
** As of October 31, 2020, no longer an affiliate. | ||||||||||||||||||||||||||||
78
| Third Avenue Real Estate Value Fund |
| |||||||||||||||||||||||||||
Name of Issuer: | Value at Oct. 31, 2019 | Purchases at Cost | Proceeds from Sales | Net Realized Gain/(Loss) | Net Change in Unrealized Appreciation (Depreciation) | Value at Oct. 31, 2020 | Investment Income | |||||||||||||||||||||
Five Point Holdings, LLC, Class A | $ | 47,595,292 | $ | — | $ | 11,812,909 | $ | (29,372,852 | ) | $ | 13,522,312 | $ | 19,931,843 | $ | — | |||||||||||||
Trinity Place Holdings, Inc. | 20,283,214 | — | — | — | (13,199,378 | ) | 7,083,836 | — | ||||||||||||||||||||
Trinity Place Holdings, Inc. Special Stock | — | — | — | — | — | — | * | — | ||||||||||||||||||||
|
|
|
|
|
|
|
|
|
|
|
|
|
| |||||||||||||||
Total Affiliates | $ | 67,878,506 | $ | — | $ | 11,812,909 | $ | (29,372,852 | ) | $ | 322,934 | $ | 27,015,679 | $ | — | |||||||||||||
|
|
|
|
|
|
|
|
|
|
|
|
|
| |||||||||||||||
* Investment fair valued at $0. | ||||||||||||||||||||||||||||
79
Third Avenue Trust
Notes to Financial Statements (continued)
October 31, 2020
5. DISTRIBUTION EXPENSES
The Board has adopted a distribution plan (the “Plan”) pursuant to Rule 12b-1 under the Investment Company Act of 1940. The Plan provides that, as compensation for distribution and related services provided to Third Avenue Value Fund Investor Class, Third Avenue Small-Cap Value Fund Investor Class and Third Avenue Real Estate Value Fund Investor Class, each Fund’s Investor Class accrues a fee calculated at the annual rate of 0.25% of average daily net assets of the class. Such fees may be paid to institutions that provide distribution services. The amount of fees paid during any period may be more or less than the cost of distribution and other services provided. Financial Industry Regulatory Authority rules impose a ceiling on the cumulative distribution fees paid. The Plan complies with those rules.
For the year ended October 31, 2020, fees paid pursuant to the Plan were as follows:
Fund | Fees | |||
Third Avenue Value Fund | $ | 14,284 | ||
Third Avenue Small-Cap Value Fund | 6,148 | |||
Third Avenue Real Estate Value Fund | 192,200 | |||
80
Third Avenue Trust
Notes to Financial Statements (continued)
October 31, 2020
6. CAPITAL SHARE TRANSACTIONS
Each Fund is authorized to issue an unlimited number of shares of each class of beneficial interest with $0.001 par value.
Transactions in capital stock of each class were as follows:
| �� | ||||||||||||||||
| Third Avenue Value Fund | ||||||||||||||||
| For the Year Ended October 31, 2020 | For the Year Ended October 31, 2019 | |||||||||||||||
| Investor Class | Investor Class | |||||||||||||||
| Shares | Amount | Shares | Amount | |||||||||||||
Shares sold | 54,553 | $ | 1,969,763 | 35,659 | $ | 1,473,599 | ||||||||||
Shares issued upon reinvestment of dividends and distributions | 9,233 | 362,230 | 9,498 | 362,538 | ||||||||||||
Shares redeemed | (77,277 | ) | (2,602,386 | ) | (133,227 | ) | (5,336,750 | )* | ||||||||
|
|
|
|
|
|
|
| |||||||||
Net decrease | (13,491 | ) | $ | (270,393 | ) | (88,070 | ) | $ | (3,500,613 | ) | ||||||
|
|
|
|
|
|
|
| |||||||||
| For the Year Ended October 31, 2020 | For the Year Ended October 31, 2019 | |||||||||||||||
| Institutional Class | Institutional Class | |||||||||||||||
| Shares | Amount | Shares | Amount | |||||||||||||
Shares sold | 194,651 | $ | 6,432,744 | 168,468 | $ | 6,811,421 | ||||||||||
Shares issued upon reinvestment of dividends and distributions | 897,234 | 35,090,964 | 833,790 | 31,767,498 | ||||||||||||
Shares redeemed | (4,243,053 | ) | (138,878,968 | ) | (5,930,359 | ) | (240,103,551 | )* | ||||||||
|
|
|
|
|
|
|
| |||||||||
Net decrease | (3,151,168 | ) | $ | (97,355,260 | ) | (4,928,101 | ) | $ | (201,524,632 | ) | ||||||
|
|
|
|
|
|
|
| |||||||||
81
Third Avenue Trust
Notes to Financial Statements (continued)
October 31, 2020
| For the Year Ended October 31, 2020 | For the Year Ended October 31, 2019 | |||||||||||||||
| Z Class | Z Class | |||||||||||||||
| Shares | Amount | Shares | Amount | |||||||||||||
Shares sold | 3,815 | $ | 109,324 | 1,862 | $ | 79,574 | ||||||||||
Shares issued upon reinvestment of dividends and distributions | 4,120 | 160,993 | 3,238 | 123,354 | ||||||||||||
Shares redeemed | (35,815 | ) | (832,953 | ) | (11,264 | ) | (459,604 | )* | ||||||||
|
|
|
|
|
|
|
| |||||||||
Net decrease | (27,880 | ) | $ | (562,636 | ) | (6,164 | ) | $ | (256,676 | ) | ||||||
|
|
|
|
|
|
|
| |||||||||
| Third Avenue Small-Cap Value Fund | ||||||||||||||||
| For the Year Ended October 31, 2020 | For the Year Ended October 31, 2019 | |||||||||||||||
| Investor Class | Investor Class | |||||||||||||||
| Shares | Amount | Shares | Amount | |||||||||||||
Shares sold | 27,811 | $ | 405,707 | 28,403 | $ | 509,109 | ||||||||||
Shares issued upon reinvestment of dividends and distributions | 12,762 | 228,561 | 22,645 | 358,700 | ||||||||||||
Shares redeemed | (62,327 | ) | (961,989 | ) | (66,230 | ) | (1,189,531 | )* | ||||||||
|
|
|
|
|
|
|
| |||||||||
Net decrease | (21,754 | ) | $ | (327,721 | ) | (15,182 | ) | $ | (321,722 | ) | ||||||
|
|
|
|
|
|
|
| |||||||||
| For the Year Ended October 31, 2020 | For the Year Ended October 31, 2019 | |||||||||||||||
| Institutional Class | Institutional Class | |||||||||||||||
| Shares | Amount | Shares | Amount | |||||||||||||
Shares sold | 417,803 | $ | 6,223,304 | 166,222 | $ | 3,035,679 | ||||||||||
Shares issued upon reinvestment of dividends and distributions | 729,815 | 13,348,308 | 1,393,200 | 22,444,458 | ||||||||||||
Shares redeemed | (2,460,644 | ) | (38,199,135 | ) | (3,206,530 | ) | (57,579,108 | )* | ||||||||
|
|
|
|
|
|
|
| |||||||||
Net decrease | (1,313,026 | ) | $ | (18,627,523 | ) | (1,647,108 | ) | $ | (32,098,971 | ) | ||||||
|
|
|
|
|
|
|
| |||||||||
82
Third Avenue Trust
Notes to Financial Statements (continued)
October 31, 2020
| For the Year Ended October 31, 2020 | For the Year Ended October 31, 2019 | |||||||||||||||
| Z Class | Z Class | |||||||||||||||
| Shares | Amount | Shares | Amount | |||||||||||||
Shares sold | 2,219 | $ | 37,856 | 3,177 | $ | 57,700 | ||||||||||
Shares issued upon reinvestment of dividends and distributions | 1,748 | 32,040 | 2,821 | 45,478 | ||||||||||||
Shares redeemed | (4,804 | ) | (67,965 | ) | (5,722 | ) | (97,355 | )* | ||||||||
|
|
|
|
|
|
|
| |||||||||
Net increase/(decrease) | (837 | ) | $ | 1,931 | 276 | $ | 5,823 | |||||||||
|
|
|
|
|
|
|
| |||||||||
| Third Avenue Real Estate Value Fund | ||||||||||||||||
| For the Year Ended October 31, 2020 | For the Year Ended October 31, 2019 | |||||||||||||||
| Investor Class | Investor Class | |||||||||||||||
| Shares | Amount | Shares | Amount | |||||||||||||
Shares sold | 609,641 | $ | 12,837,738 | 915,895 | $ | 25,229,671 | ||||||||||
Shares issued upon reinvestment of dividends and distributions | 670,590 | 16,348,994 | 646,550 | 16,331,849 | ||||||||||||
Shares redeemed | (2,816,586 | ) | (60,890,374 | ) | (4,446,144 | ) | (122,333,417 | )* | ||||||||
|
|
|
|
|
|
|
| |||||||||
Net decrease | (1,536,355 | ) | $ | (31,703,642 | ) | (2,883,699 | ) | $ | (80,771,897 | ) | ||||||
|
|
|
|
|
|
|
| |||||||||
| For the Year Ended October 31, 2020 | For the Year Ended October 31, 2019 | |||||||||||||||
| Institutional Class | Institutional Class | |||||||||||||||
| Shares | Amount | Shares | Amount | |||||||||||||
Shares sold | 2,319,772 | $ | 51,355,524 | 4,894,542 | $ | 134,751,478 | ||||||||||
Shares issued upon reinvestment of dividends and distributions | 4,823,494 | 118,030,886 | 4,087,882 | 103,709,558 | ||||||||||||
Shares redeemed | (17,068,843 | ) | (388,519,554 | ) | (22,335,290 | ) | (615,098,185 | )* | ||||||||
|
|
|
|
|
|
|
| |||||||||
Net decrease | (9,925,577 | ) | $ | (219,133,144 | ) | (13,352,866 | ) | $ | (376,637,149 | ) | ||||||
|
|
|
|
|
|
|
| |||||||||
83
Third Avenue Trust
Notes to Financial Statements (continued)
October 31, 2020
| For the Year Ended October 31, 2020 | For the Year Ended October 31, 2019 | |||||||||||||||
| Z Class | Z Class | |||||||||||||||
| Shares | Amount | Shares | Amount | |||||||||||||
Shares sold | 149,030 | $ | 3,161,021 | 707,352 | $ | 19,048,837 | ||||||||||
Shares issued upon reinvestment of dividends and distributions | 294,763 | 7,201,061 | 126,483 | 3,206,355 | ||||||||||||
Shares redeemed | (830,829 | ) | (17,533,576 | ) | (1,322,188 | ) | (38,544,209 | )* | ||||||||
|
|
|
|
|
|
|
| |||||||||
Net decrease | (387,036 | ) | $ | (7,171,494 | ) | (488,353 | ) | $ | (16,289,017 | ) | ||||||
|
|
|
|
|
|
|
| |||||||||
| * | Redemption fees are netted with redemption amounts. |
Third Avenue Value Fund, Third Avenue Small-Cap Value Fund and Third Avenue Real Estate Value Fund each charged a redemption fee of 1% for shares redeemed or exchanged for shares of another series of the Trust within 60 days of the purchase date through April 30, 2019. Beginning May 1, 2019, the redemption/exchange fee has been eliminated for each share class.
7. COMMITMENTS AND CONTINGENCIES
In the normal course of business, the Funds enter into contracts that contain a variety of representations and warranties and which provide general indemnifications. The Funds’ maximum exposure under these arrangements is unknown, as this would involve future claims that may be made against the Funds that have not yet occurred.
8. RISKS RELATING TO CERTAIN INVESTMENTS
Market disruptions associated with the COVID-19 pandemic have had a global impact, and uncertainty exists as to its long-term implications. The COVID-19 pandemic could adversely affect the value and liquidity of the Funds’ investments, impair the Funds’ ability to satisfy redemption requests, and negatively impact the Funds’ performance. In addition, the outbreak of COVID-19, and measures taken to mitigate its effects, could result in disruptions to the services provided to the Funds by their service providers. Fund management is continuing to monitor this development and evaluate its impact on the Funds.
Foreign securities and emerging markets risk:
Foreign securities from a particular country or region may be subject to currency fluctuations and controls, or adverse political, social, economic or other developments that are unique to that particular country or region. Therefore, the prices of foreign securities in particular countries or regions may, at times, move in a different direction from those of U.S. securities.
84
Third Avenue Trust
Notes to Financial Statements (continued)
October 31, 2020
From time to time, foreign capital markets may exhibit more volatility than those in the U.S., and the securities markets of emerging market countries can be extremely volatile. Emerging market countries can generally have economic structures that are less diverse and mature, and political systems that are less stable, than those of developed countries, and, as a result, the securities markets of emerging market countries can be more volatile than more developed markets may be.
High-yield and distressed risk:
The Funds’ investments in high-yield debt securities (commonly known as “junk bonds”) and distressed securities may expose the Funds to greater risks than if the Funds only owned higher-grade securities. The value of high-yield, lower quality securities is affected by the creditworthiness of the issuers of the securities and by general economic and specific industry conditions. The prices of high yield securities can fall in response to negative news about the issuer or its industry, or the economy in general to a greater extent than those of higher rated securities. Issuers of high-yield securities are not as strong financially as those with higher credit ratings, so the securities are usually considered speculative investments. These issuers are more vulnerable to financial setbacks and recession than are more creditworthy issuers, which may impair their ability to make interest and principal payments. The Funds may also invest in distressed securities, which the Adviser considers to be issued by companies that are, or might be, involved in reorganizations or financial restructurings, either out of court or in bankruptcy. The Funds’ investments in distressed securities typically may involve the purchase of high-yield bonds, bank debt or other indebtedness of such companies.
Debt securities risk:
The market value of a debt security may decline due to general market conditions that are not specifically related to a particular company, such as real or perceived adverse economic conditions, changes in the outlook for corporate earnings, changes in interest or currency rates or adverse investor sentiment generally. The debt securities market can be susceptible to increases in volatility and decreases in liquidity. Increases in volatility and decreases in liquidity may be caused by a rise in interest rates (or the expectation of a rise in interest rates), which are at or near historic lows in the United States and in other countries. During periods of reduced market liquidity, a Fund may not be able to readily sell debt securities at prices at or near their perceived value. If a Fund needed to sell large blocks of debt securities to meet shareholder redemption requests or to raise cash, those sales could further reduce the prices of such securities.
Prices of bonds and other debt securities tend to move inversely with changes in interest rates. Typically, arise in rates will adversely affect debt securities and, accordingly, will cause the value of a Fund’s investments in these securities to decline. When interest rates fall, the values of
85
Third Avenue Trust
Notes to Financial Statements (continued)
October 31, 2020
already-issued securities generally rise, although investments in new securities may be at lower yields. The prices of high-yield debt securities, unlike investment grade securities, may fluctuate unpredictably and not necessarily inversely with changes in interest rates.
The rates on floating debt instruments adjust periodically with changes in market interest rates. Although these instruments are generally less sensitive to interest rate changes than fixed rate instruments, the value of floating rate loans and other floating rate securities may decline if their interest rates do not rise as quickly, or as much, as general interest rates. Economic and other developments can adversely affect debt securities markets.
Market risk:
Prices of securities have historically fluctuated. The market value of a security may decline due to general market conditions that are not related to the particular company, such as real or perceived adverse economic conditions, changes in the outlook for corporate earnings, changes in interest or currency rates or adverse investor sentiment generally. Markets may additionally be impacted by negative external and/or direct and indirect economic factors such as pandemics, natural disasters, global trade policies and political unrest or uncertainties. A security’s market value also may decline because of factors that affect the particular company, such as management performance, financial leverage, and reduced demand for the company’s products or services, or factors that affect the company’s industry, such as labor shortages or increased production costs and competitive conditions within an industry. The value of the Funds will similarly fluctuate and you could lose money.
Liquidity risk:
Liquidity risk exists when particular investments are difficult to sell. The Funds may not be able to sell these investments at the best prices or at the value the Funds place on them. In such a market, the value of such investments and a Fund’s share price may fall dramatically, even during periods of declining interest rates. Investments that are illiquid or that trade in lower volumes may be more difficult to value. The market for high-yield debt securities may be less liquid and therefore these securities may be harder to value or sell at an acceptable price, especially during times of market volatility or decline. Investments in foreign securities tend to have greater exposure to liquidity risk than U.S. securities. Liquidity can decline unpredictably in response to overall economic conditions or credit tightening. Investments in private debt instruments, restricted securities, and securities having substantial market and/or credit risk may involve greater liquidity risk. An unexpected increase in Fund redemption requests, including requests from shareholders who may own a significant percentage of a Fund’s shares, could cause the Fund to sell its holdings at a loss or at undesirable prices and adversely affect the Fund’s share price and increase the Fund’s liquidity risk, Fund expenses and/or taxable distributions.
86
Third Avenue Trust
Notes to Finanacial Statements (continued)
October 31, 2020
Counterparty risk:
The Funds are exposed to counterparty risk, or the risk that an institution or other entity with which the Funds have unsettled or open transactions will default. The potential loss to the Funds could exceed the value of the financial assets recorded in the Funds’ financial statements. Financial assets, which potentially expose the Funds to counterparty risk, consist principally of cash due from counterparties and investments. The Adviser seeks to minimize the Funds’ counterparty risk by performing reviews of each counterparty and by minimizing concentration of counterparty risk by undertaking transactions with multiple customers and counterparties on recognized and reputable exchanges. Delivery of securities sold is only made once the Funds have received payment. Payment is made on a purchase once the securities have been delivered by the counterparty. The trade will fail if either party fails to meet its obligation.
At October 31, 2020, the Funds had counterparty concentration of credit risk primarily with Goldman Sachs International and JPMorgan Chase Bank, N.A.
The Funds are party to International Swaps and Derivatives Association, Inc. Master Agreements (“ISDA Master Agreements”) with select counterparties that govern transactions, over-the-counter derivatives and foreign exchange contracts entered into by the Funds and those counter parties. The ISDA Master Agreements contain provisions for general obligations, representations, agreements, collateral and events of default or termination. Events of termination include conditions that may entitle counterparties to elect to terminate early and cause settlement of all outstanding transactions under the applicable ISDA Master Agreement. Any election to terminate early could be material to the financial statements of the Funds.
The considerations and factors surrounding the settlement of certain purchases and sales made on a delayed-delivery basis are governed by Master Securities Forward Transaction Agreements (“Master Forward Agreements”) between the Funds and select counterparties. The Master Forward Agreements maintain provisions for, among other things, initiation and confirmation, payment and transfer, events of default, termination, and maintenance of collateral.
The counterparty risk associated with certain contracts may be reduced by master netting arrangements to the extent that if an event of default occurs, all amounts with the counterparty are terminated and settled on a net basis. The Funds’ overall exposure to counterparty risk with respect to transactions subject to master netting arrangements can change substantially within a short period, as it is affected by each transaction subject to the arrangement.
Collateral requirements:
For derivatives traded under an ISDA Master Agreement and/or Master Forward Agreement, the collateral requirements are typically calculated by netting the mark-to-market amount for
87
Third Avenue Trust
Notes to Financial Statements (continued)
October 31, 2020
each transaction under such agreement and comparing that amount to the value of any collateral currently pledged by the Fund and the counterparty.
Cash collateral that has been pledged to cover obligations of a Fund and cash collateral received from the counter party, if any, is reported separately on the Statement of Assets and Liabilities as cash pledged as collateral and cash received as collateral, respectively. Non-cash collateral pledged by a Fund, if any, is noted in the Portfolio of Investments. Generally, the amount of collateral due from or to a party has to exceed a minimum transfer amount threshold (e.g. $500,000) before a transfer is required, which is determined at the close of business of a Fund and any additional required collateral is delivered to/pledged by a Fund on the next business day. Typically, a Fund and its counterparties are not permitted to sell, re-pledge or use the collateral they receive. To the extent amounts due to a Fund from its counter parties are not fully collateralized, contractually or otherwise, a Fund bears the risk of loss from counterparty non-performance. The Funds attempt to mitigate counterparty risk by entering into agreements only with counterparties that it believes have the financial resources to honor their obligations and by monitoring the financial stability of those counterparties.
For financial reporting purposes, the Funds do not offset derivative assets and derivative liabilities that are subject to netting arrangements in the Statement of Assets and Liabilities.
Third Avenue Value Fund
At October 31, 2020, the Fund’s derivative assets and liabilities (by type) on a gross basis are as follows:
| Assets | Liabilities | |||||||
Derivative Financial Instruments: | ||||||||
Options | $ | 4,259,482 | $ | — | ||||
|
|
|
| |||||
Total derivative assets and liabilities in the Statement of Assets and Liabilities | 4,259,482 | — | ||||||
|
|
|
| |||||
Derivatives not subject to a master netting agreement or similar agreement (“MNA”) | — | — | ||||||
|
|
|
| |||||
Total derivative assets and liabilities subject to a MNA | $ | 4,259,482 | $ | — | ||||
|
|
|
| |||||
The following table presents the Fund’s derivative assets by counterparty net of amounts available for offset under a MNA and net of the related collateral received by the Fund as of October 31, 2020:
88
Third Avenue Trust
Notes to Financial Statements (continued)
October 31, 2020
| Counterparty | Amount of Assets Subject to a MNA by Counterparty | Derivatives Available for Offset(1) | Non-cash Collateral Received(2) | Cash Collateral Received(2) | Net Amount of Derivative Assets(3) | |||||||||||||||
Goldman Sachs International | $ | 4,259,482 | $ | — | $ | — | $ | (3,720,000 | ) | $ | 539,482 | |||||||||
Third Avenue Real Estate Value Fund
At October 31, 2020, the Fund’s derivative assets and liabilities (by type) on a gross basis are as follows:
| Assets | Liabilities | |||||||||||
Derivative Financial Instruments: | ||||||||||||
Options | $ | 540,686 | $ | (661,753 | ) | |||||||
|
|
|
| |||||||||
Total derivative assets and liabilities in the Statement of Assets and Liabilities | 540,686 | (661,753 | ) | |||||||||
|
|
|
| |||||||||
Derivatives not subject to a master netting agreement or similar agreement (“MNA”) | — | — | ||||||||||
|
|
|
| |||||||||
Total derivative assets and liabilities subject to a MNA | $ | 540,686 | $ | (661,753 | ) | |||||||
|
|
|
| |||||||||
The following table presents the Fund’s derivative assets by counterparty net of amounts available for offset under a MNA and net of the related collateral received by the Fund as of October 31, 2020:
| Counterparty | Amount of Assets Subject to a MNA by Counterparty | Derivatives Available for Offset(1) | Non-cash Collateral Received(2) | Cash Collateral Received(2) | Net Amount of Derivative Assets(3) | |||||||||||||||
Goldman Sachs International | $ | 288,532 | $ | (175,035 | ) | $ | — | $ | — | $ | 113,497 | |||||||||
JPMorgan Chase Bank, N.A | 252,154 | (252,154 | ) | — | — | — | ||||||||||||||
|
|
|
|
|
|
|
|
|
| |||||||||||
| $ | 540,686 | $ | (427,189 | ) | $ | — | $ | — | $ | 113,497 | ||||||||||
|
|
|
|
|
|
|
|
|
| |||||||||||
The following table presents the Fund’s derivative liabilities by counterparty net of amounts available for offset under a MNA and net of the related collateral pledged by the Fund as of October 31, 2020:
89
Third Avenue Trust
Notes to Financial Statements (continued)
October 31, 2020
Counterparty | Amount of Liabilities Subject to a MNA by Counterparty | Derivatives Available for Offset(1) | Non-cash Collateral Pledged(2) | Cash Collateral Pledged(2) | Net Amount of Derivative Liabilities(3) | |||||||||||||||
Goldman Sachs International | $ | 175,035 | $ | (175,035 | ) | $ | — | $ | — | $ | — | |||||||||
JPMorgan Chase Bank, N.A | 486,718 | (252,154 | ) | — | (234,564 | ) | — | |||||||||||||
|
|
|
|
|
|
|
|
|
| |||||||||||
| $ | 661,753 | $ | (427,189 | ) | $ | — | $ | (234,564 | ) | $ | — | |||||||||
|
|
|
|
|
|
|
|
|
| |||||||||||
| 1 | The amount of derivatives for offset is limited to the amount of assets and/or liabilities that are subject to a MNA. |
| 2 | Excess of collateral received from or pledged to the individual counterparty may not be shown for financial reporting purposes. |
| 3 | Net amount represents the net amount receivable from or payable to the counterparty in the event of default. |
Loans and other direct debt instruments:
The Funds may invest in loans and other direct debt instruments issued by corporate borrowers. These loans represent amounts owed to lenders or lending syndicates (loans and loan participations) or to other parties. Direct debt instruments may involve a risk of loss in case of default or insolvency of the borrower and may offer less legal protection to the Fund in the event of fraud or misrepresentation. In addition, loan participations involve a risk of insolvency of the lending bank or other financial intermediary. The markets in loans are not regulated by federal securities laws or the SEC.
Cash concentration risk:
The Funds’ cash balances are held at major regional U.S. banks, JPMorgan Chase Bank, N.A. and The Bank of New York Mellon. The Funds’ cash balances, which typically exceed Federal Deposit Insurance Corporation insurance coverage, subject the Funds to a concentration of credit risk. The Funds regularly monitor the credit ratings of these financial institutions in order to mitigate the credit risk that exists with the balances in excess of insured amounts.
Off-balance sheet risk:
The Funds enter into derivatives which may represent off-balance sheet risk. Off-balance sheet risk exists when the maximum potential loss on a particular investment is greater than the value of such investment as reflected in the Statement of Assets and Liabilities.
Focused investing risk:
Although each Fund is a diversified investment company under the Investment Company Act of 1940, each Fund’s investments will normally be more focused than its peers and may emphasize investments in some issuers, industries, sectors or geographic regions more than others. To the extent that a Fund increases the relative emphasis of its investments in a particular issuer, industry, sector or geographic region, its share values may fluctuate in response to events
90
Third Avenue Trust
Notes to Financial Statements (continued)
October 31, 2020
affecting such issuer, industry, sector or geographic region. A Fund does not lose its status as a diversified investment company because of any subsequent discrepancy between the value of its various investments and the diversification requirements of the Investment Company Act of 1940, so long as any such discrepancy existing immediately after the Fund’s acquisition of any security or other property is neither wholly nor partly the result of such acquisition. Therefore, a Fund from time to time may have an investment portfolio that is considered “non-diversified” by the Investment Company Act of 1940 despite its classification as a diversified investment company.
9. FEDERAL INCOME TAXES
The amount of dividends and distributions paid by the Funds from net investment income and net realized capital gains are determined in accordance with U.S. federal income tax laws and regulations which may differ from U.S. GAAP. Such dividends and distributions are recorded by the Funds on the ex-dividend date. Capital accounts within the financial statements are adjusted for permanent book-tax differences. These adjustments have no impact on the net assets of the Funds. Capital accounts are not adjusted for temporary differences. Permanent differences are primarily due to the utilization of equalization debits, net investment losses, reclassification of certain transactions involving foreign securities and currencies, investments in passive foreign investment companies, real estate investment trusts (“REITs”), the difference in the treatment of amortization of discount on certain debt instruments, distribution reclassifications and other book to tax adjustments. For the year ended October 31, 2020, these adjustments were to increase paid-in capital by $3,853,876 and decrease total distributable earnings by $3,853,876 for the Third Avenue Small-Cap Value Fund and increase paid-in capital by $50,634,788 and decrease total distributable earnings by $50,634,788 for the Third Avenue Real Estate Value Fund. The Third Avenue Value Fund did not have any adjustments between paid-in capital and total distributable earnings.
The tax character of dividends and distributions paid during the year ended October 31, 2020 was as follows:
| Ordinary Income | Net Capital Gains | Total | |||||||||||||
Third Avenue Value Fund | $ | 15,540,555 | $ | 21,440,225 | $ | 36,980,780 | |||||||||
Third Avenue Small-Cap Value Fund(a) | — | 14,190,278 | 14,190,278 | ||||||||||||
Third Avenue Real Estate Value Fund(a) | 8,656,107 | 142,791,119 | 151,447,226 | ||||||||||||
91
Third Avenue Trust
Notes to Financial Statements (continued)
October 31, 2020
The tax character of dividends and distributions paid during the year ended October 31, 2019 was as follows:
|
| ||||||||||||||
| Ordinary Income | Net Capital Gains | Total | |||||||||||||
Third Avenue Value Fund | $ | 3,362,306 | $ | 30,086,651 | $ | 33,448,957 | |||||||||
Third Avenue Small-Cap Value Fund(a) | 806,531 | 22,792,914 | 23,599,445 | ||||||||||||
Third Avenue Real Estate Value Fund | 17,945,396 | 111,732,992 | 129,678,388 | ||||||||||||
At October 31, 2020, the accumulated undistributed earnings on a tax basis were:
|
| ||||||||||||||
| Undistributed Ordinary Income | Net Capital Gains | Net Capital Losses | |||||||||||||
Third Avenue Value Fund | $ | 2,072,081 | $ | — | $ | (23,360,514 | ) | ||||||||
Third Avenue Small-Cap Value Fund(a) | 389,155 | 1,543,247 | — | ||||||||||||
Third Avenue Real Estate Value Fund(a) | — | 4,928,304 | — | ||||||||||||
This differs from the amount shown on the Statement of Assets and Liabilities primarily due to cumulative timing differences.
(a) Includes short-term capital gains, which are taxed as ordinary income.
For the year-ended October 31, 2020, Third Avenue Value Fund generated $6,542,066 in net capital losses. As of October 31, 2020, Third Avenue Value Fund has long-term capital loss carryforwards of $23,360,514. Although there is no expiration date on the use of this carryforward, Third Avenue Value Fund will be subject to certain limitations on its use.
92
Third Avenue Trust
Notes to Financial Statements (continued)
October 31, 2020
The U.S. federal income tax basis of the Funds’ investments and the total unrealized appreciation/depreciation as of October 31, 2020 were as follows:
| Tax Basis of Investments | Appreciation | (Depreciation) | Total Unrealized Appreciation/ (Depreciation) | Other Cost Basis Adjustments | Total Net Unrealized Appreciation/ (Depreciation) | |||||||||||||||||||
Third Avenue | ||||||||||||||||||||||||
Value Fund | $ | 543,173,112 | $ | 29,680,621 | $ | (167,197,969 | ) | $ | (137,517,348 | ) | $ | 52,391 | $ | (137,464,957 | ) | |||||||||
Third Avenue | ||||||||||||||||||||||||
Small-Cap | ||||||||||||||||||||||||
Value Fund | $ | 107,515,607 | $ | 30,456,248 | $ | (10,116,079 | ) | $ | 20,340,169 | $ | — | $ | 20,340,169 | |||||||||||
Third Avenue | ||||||||||||||||||||||||
Real Estate | ||||||||||||||||||||||||
Value Fund | $ | 417,988,391 | $ | 120,896,873 | $ | (84,623,689 | ) | $ | 36,273,184 | $ | 9,394 | $ | 36,282,578 | |||||||||||
The book and tax unrealized appreciation/depreciation calculation differs. The difference is primarily attributable to deferred losses on wash sales and investments in REITs, and other timing differences. Other cost basis adjustments are primarily attributable to unrealized appreciation/(depreciation) on certain derivatives and items related to other miscellaneous investments.
93
Report of Independent Registered Public Accounting Firm
To the Board of Trustees of Third Avenue Trust and Shareholders of Third Avenue Value Fund, Third Avenue Small-Cap Value Fund and Third Avenue Real Estate Value Fund
Opinions on the Financial Statements
We have audited the accompanying statements of assets and liabilities, including the portfolios of investments, of Third Avenue Value Fund, Third Avenue Small-Cap Value Fund and Third Avenue Real Estate Value Fund (constituting Third Avenue Trust, hereafter collectively referred to as the “Funds”) as of October 31, 2020, the related statements of operations for the year ended October 31, 2020, the statements of changes in net assets for each of the two years in the period ended October 31, 2020, including the related notes, and the financial highlights for each of the periods indicated therein (collectively referred to as the “financial statements”). In our opinion, the financial statements present fairly, in all material respects, the financial position of each of the Funds as of October 31, 2020, the results of each of their operations for the year then ended, the changes in each of their net assets for each of the two years in the period ended October 31, 2020 and each of the financial highlights for each of the periods indicated therein in conformity with accounting principles generally accepted in the United States of America.
Basis for Opinions
These financial statements are the responsibility of the Funds’ management. Our responsibility is to express an opinion on the Funds’ financial statements based on our audits. We are a public accounting firm registered with the Public Company Accounting Oversight Board (United States) (PCAOB) and are required to be independent with respect to the Funds in accordance with the U.S. federal securities laws and the applicable rules and regulations of the Securities and Exchange Commission and the PCAOB.
We conducted our audits of these financial statements in accordance with the standards of the PCAOB. Those standards require that we plan and perform the audit to obtain reasonable assurance about whether the financial statements are free of material misstatement, whether due to error or fraud.
Our audits included performing procedures to assess the risks of material misstatement of the financial statements, whether due to error or fraud, and performing procedures that respond to those risks. Such procedures included examining, on a test basis, evidence regarding the amounts and disclosures in the financial statements. Our audits also included evaluating the accounting principles used and significant estimates made by management, as well as evaluating the overall presentation of the financial statements. Our procedures included confirmation of securities owned as of October 31, 2020 by correspondence with the custodians, issuer and brokers. We believe that our audits provide a reasonable basis for our opinions.
/s/PricewaterhouseCoopers LLP
Philadelphia, PA
December 29, 2020
We have served as the auditor of one or more investment companies in Third Avenue Funds since 1990.
94
Management of the Trust
(Unaudited)
Information pertaining to the Trustees and officers of the Trust is set forth below. The fund complex includes three portfolios in the Third Avenue Trust and one portfolio in the Third Avenue Variable Series Trust. The Statement of Additional Information (SAI) includes additional information about the Trustees and is available upon request, without charge, by calling (800) 443-1021.
Independent Trustees | ||||||||
Correspondence intended for any Independent Trustee may be sent to: 301 Bellevue Parkway, 2nd Floor, Wilmington, DE 19809. | ||||||||
Name & Date of Birth | Term of Office and Length of Time Served* | Position(s) Held with Registrant | Principal Occupation(s) | Other Directorships | ||||
Robert J. Christian DOB: February 1949 | Trustee since 10/19 | Trustee | Retired since February 2006; Executive Vice President of Wilmington Trust Company from February 1996 to February 2006; President of Rodney Square Management Corporation (‘‘RSMC’’) (investment advisory firm) from 1996 to 2005; Vice President of RSMC from 2005 to 2006. | Trustee of FundVantage Trust (registered investment company with 35 portfolios); Trustee of Optimum Fund Trust (registered investment company with 6 portfolios); Trustee of Third Avenue Variable Series Trust (registered investment company with 1 portfolio). | ||||
Iqbal Mansur DOB: June 1955 | Trustee since 10/19 | Trustee | Retired since September 2020; Professor of Finance, Widener University from 1998 to August 2020. | Trustee of FundVantage Trust (registered investment company with 35 portfolios); Trustee of Third Avenue Variable Series Trust (registered investment company with 1 portfolio). | ||||
95
Third Avenue Trust
Management of the Trust (continued)
(Unaudited)
Independent Trustees | ||||||||
Name & Date of Birth | Term of Office and Length of Time Served* | Position(s) Held With Registrant | Principal Occupation(s) | Other Directorships Held | ||||
Nicholas M. Marsini Jr. DOB: August 1955 | Trustee and Chairman since 10/19 | Trustee and Chairman of the Board | Retired since March 2016; President of PNC Bank Delaware from June 2011 to March 2016; Executive Vice President of Finance of BNY Mellon from July 2010 to January 2011; Executive Vice President and Chief Financial Officer of PNC Global Investment Servicing from September 1997 to July 2010. | Trustee and Chairman of the Board of FundVantage Trust (registered investment company with 35 portfolios); Trustee of Brinker Capital Destinations Trust (registered investment company with 10 portfolios); Trustee and Chairman of the Board of Third Avenue Variable Series Trust (registered investment company with 1 portfolio). | ||||
Nancy B. Wolcott DOB: November 1954 | Trustee since 10/19 | Trustee | Retired since May 2014; EVP, Head of GFI Client Service Delivery, BNY Mellon from January 2012 to May 2014; EVP, Head of US Funds Services, BNY Mellon from July 2010 to January 2012; President of PNC Global Investment Servicing from 2008 to July 2010; Chief Operating Officer of PNC Global Investment Servicing from 2007 to 2008; Executive Vice President of PFPC Worldwide Inc. from 2006 to 2007. | Trustee of FundVantage Trust (registered investment company with 35 portfolios); Trustee of Lincoln Variable Insurance Products Trust (registered investment company with 97 portfolios); Trustee of Third Avenue Variable Series Trust (registered investment company with 1 portfolio). | ||||
96
Third Avenue Trust
Management of the Trust (continued)
(Unaudited)
Independent Trustees | ||||||||
Name & Date of Birth | Term of Office and Length of Time Served* | Position(s) Held with Registrant | Principal Occupation(s) | Other Directorships Held | ||||
Stephen M. Wynne DOB: January 1955 | Trustee since 10/19 | Trustee | Retired since December 2010; Chief Executive Officer of US Funds Services, BNY Mellon Asset Servicing from July 2010 to December 2010; Chief Executive Officer of PNC Global Investment Servicing from March 2008 to July 2010; President, PNC Global Investment Servicing from 2003 to 2008. | Trustee of FundVantage Trust (registered investment company with 35 portfolios); Trustee of Copeland Trust (registered investment company with 3 portfolios); Trustee of Third Avenue Variable Series Trust (registered investment company with 1 portfolio). | ||||
| * | Each Trustee serves until his or her successor is duly elected and qualified. |
97
Third Avenue Trust
Management of the Trust (continued)
(Unaudited)
Principal Trust Officers | ||||||
Name & Date of Birth | Position(s) Held with Registrant | Principal Occupation(s) During Past 5 Years | Other Directorships | |||
Joel L. Weiss DOB: January 1963 | President, Chief Executive Officer | President of JW Fund Management LLC since June 2016; Vice President and Managing Director of BNY Mellon Investment Servicing (US) Inc. and predecessor firms from 1993 to June 2016. | N/A | |||
T. Richard Keyes DOB: January 1957 | Treasurer, Chief Financial Officer | President of TRK Fund Consulting LLC since July 2016; Head of Tax—U.S. Fund Services of BNY Mellon Investment Servicing (US) Inc. and predecessor firms February 2006 to July 2016. | N/A | |||
Gabriella Mercincavage DOB: June 1968 | Assistant Treasurer | Fund Administration Consultant since January 2019; Fund Accounting and Tax Compliance Accountant to financial services companies from November 2003 to July 2018. | N/A | |||
Vincenzo A. Scarduzio DOB: April 1972 | Secretary | Director and Vice President Regulatory Administration of The Bank of New York Mellon and predecessor firms since 2001. | N/A | |||
Guy F. Talarico DOB: August 1955 | Chief Compliance Officer and Anti-Money Laundering Officer | Chief Executive Officer of Alaric Compliance Services LLC since June 2004. | N/A | |||
98
Third Avenue Trust
Schedule of Shareholder Expenses
(Unaudited)
As a shareholder of a Fund, you incur two types of costs: (1) transaction costs, and (2) ongoing costs, including management fees, shareholder servicing fees, distribution fees (if applicable) and other Fund expenses. This example is intended to help you understand your ongoing costs (in dollars) of investing in the Funds and to compare these costs with the ongoing costs of investing in other mutual funds.
The example is based on an investment of $1,000 invested at the beginning of the period, May 1, 2020 and held for the six month period ended October 31, 2020.
Actual Expenses
For each Class of each Fund in the table below, the first line provides information about actual account values and actual expenses. You may use the information in this line, together with the amount you invested, to estimate the expenses that you paid over the period. Simply divide your account value by $1,000 (for example, an $8,600 account value divided by $1,000 = 8.6), then multiply the result by the number in the first line under the heading entitled “Expenses Paid During the Period” to estimate the expenses you paid on your account during this period.
Hypothetical Example for Comparison Purposes
The second line of each Class in the table below provides information about hypothetical account values and hypothetical expenses based on the Class’ actual expense ratio and an assumed rate of return of 5% per year before expenses, which is not the Class’ actual return. The hypothetical account values and expenses may not be used to estimate the actual ending account balance or expenses you paid for the period. You may use this information to compare the ongoing costs of investing in the Class of the Fund and other funds. To do so, compare this 5% hypothetical example with the 5% hypothetical examples that appear in the shareholder reports of the other funds.
Please note that the expenses shown in the table are meant to highlight your ongoing costs only and do not reflect any transactional costs. Therefore, the second line of each Class in the table is useful in comparing ongoing costs only, and will not help you determine the relative total costs of owning different funds. In addition, if these transactional costs were included, your costs would have been higher. The example also assumes all dividends and distributions have been reinvested.
99
Third Avenue Trust
Schedule of Shareholder Expenses (continued)
(Unaudited)
| Beginning Account Value May 1, 2020 | Ending Account Value October 31, 2020 | Expenses Paid During the Period May 1, 2020 to October 31, 2020* | Annualized Expense Ratio | |||||
Third Avenue Value Fund | ||||||||
Investor Class | ||||||||
Actual | $1,000 | $1,213.70 | $7.79 | 1.40% | ||||
Hypothetical | $1,000 | $1,018.10 | $7.10 | 1.40% | ||||
Institutional Class | ||||||||
Actual | $1,000 | $1,215.80 | $6.41 | 1.15% | ||||
Hypothetical | $1,000 | $1,019.36 | $5.84 | 1.15% | ||||
Z Class | ||||||||
Actual | $1,000 | $1,216.20 | $5.85 | 1.05% | ||||
Hypothetical | $1,000 | $1,019.86 | $5.33 | 1.05% | ||||
| Third Avenue Small-Cap Value Fund | ||||||||
Investor Class | ||||||||
Actual | $1,000 | $1,098.50 | $7.38 | 1.40% | ||||
Hypothetical | $1,000 | $1,018.10 | $7.10 | 1.40% | ||||
Institutional Class | ||||||||
Actual | $1,000 | $1,100.00 | $6.07 | 1.15% | ||||
Hypothetical | $1,000 | $1,019.36 | $5.84 | 1.15% | ||||
Z Class | ||||||||
Actual | $1,000 | $1,100.50 | $5.54 | 1.05% | ||||
Hypothetical | $1,000 | $1,019.86 | $5.33 | 1.05% | ||||
| Third Avenue Real Estate Value Fund | ||||||||
Investor Class | ||||||||
Actual | $1,000 | $ 989.90 | $7.00 | 1.40% | ||||
Hypothetical | $1,000 | $1,018.10 | $7.10 | 1.40% | ||||
Institutional Class | ||||||||
Actual | $1,000 | $ 991.50 | $5.76 | 1.15% | ||||
Hypothetical | $1,000 | $1,019.36 | $5.84 | 1.15% | ||||
Z Class | ||||||||
Actual | $1,000 | $ 991.90 | $5.26 | 1.05% | ||||
Hypothetical | $1,000 | $1,019.86 | $5.33 | 1.05% |
| * | Expenses (net of fee waivers, expense reimbursements and expense offset arrangement) are equal to the Class’ annualized expense ratio, multiplied by the average account value over the period, multiplied by the number of days in the most recent fiscal half-year (184) divided by 366. |
100
Third Avenue Trust
Federal Tax Status of Dividends and Distributions
(Unaudited)
The following information represents the tax status of dividends and distributions paid by the Funds during the fiscal year ended October 31, 2020. This information is presented to meet regulatory requirements and no current action on your part is required. The information reported below will differ from the actual amounts taxable to shareholders for the calendar year ending December 31, 2020.
Information necessary to complete your income tax returns for the calendar year ending December 31, 2020 will be issued by the Funds in the early part of 2020.
The Funds are required to make certain designations including to designate the portion of any distributions made to shareholders during their fiscal year beginning on November 1, 2019 and ending on October 31, 2020 that were from capital gains. Depending upon your instructions, distributions from the Funds were either paid to you in cash or reinvested into your account.
The following is the breakdown of the aggregate amount of dividends and distributions and deemed paid by each Fund during fiscal year ended October 31, 2020:
| Third Avenue Value Fund | Third Avenue Small-Cap Value Fund | Third Avenue Real Estate Value Fund | ||||||||||
Ordinary Income | $ | 15,540,555 | $ | 18,299 | $ | 8,656,107 | ||||||
Short-Term Capital Gains | – | – | – | |||||||||
Long-Term Capital | 21,440,225 | 14,432,035 | 144,400,656 | |||||||||
|
|
|
|
|
| |||||||
Total Dividends | $ | 36,980,780 | $ | 14,450,334 | 153,056,763 | |||||||
|
|
|
|
|
| |||||||
With respect to ordinary dividends paid by the Funds during their fiscal year ended October 31, 2020, the Funds designate the maximum allowable amounts under section 854 of the Internal Revenue Code of 1986. Such designated amounts shall not be less than the following with respect to ordinary dividends:
| Qualified Dividend Income for Individuals | Dividends Received Deduction for Corporations | |||||||||
Third Avenue Value Fund | $15,917,249 | 96.96% | ||||||||
Third Avenue Small-Cap Value Fund | 0 | 0.00% | ||||||||
Third Avenue Real Estate Value Fund | 7,488,394 | 24.66% | ||||||||
101
Third Avenue Trust
Federal Tax Status of Dividends and Distributions (continued)
(Unaudited)
The following Fund intends to elect to pass through to shareholders the income taxes paid to foreign countries which may be eligible for the foreign tax credit in accordance with Section 853 of the Internal Revenue Code of 1986.
Gross foreign source income and foreign tax expense for the year ended October 31, 2020 are as follows:
| Gross Foreign Source Income | Foreign Tax Pass Through | |||||||
Third Avenue Value Fund | $4,365,677 | $376,694 |
102
BOARD OF TRUSTEES
Robert J. Christian
Iqbal Mansur
Nicholas M. Marsini, Jr. — Chairman
Nancy B. Wolcott
Stephen M. Wynne
OFFICERS
Joel L. Weiss — President, Chief Executive Officer
T. Richard Keyes — Treasurer, Chief Financial Officer
Gabriella Mercincavage — Assistant Treasurer
Vincenzo A. Scarduzio — Secretary
Guy F. Talarico, Chief Compliance Officer, Anti-Money Laundering Officer
TRANSFER AGENT
BNY Mellon Investment Servicing (U.S.) Inc.
P.O. Box 9802
Providence, RI 02940-8002
800-443-1021 (toll-free)
INVESTMENT ADVISER
Third Avenue Management LLC
622 Third Avenue
New York, NY 10017
INDEPENDENT REGISTERED PUBLIC ACCOUNTING FIRM
PricewaterhouseCoopers LLP
2001 Market Street,
Philadelphia, PA 19103
CUSTODIANS
JPMorgan Chase Bank, N.A.
383 Madison Avenue
New York, NY 10179
The Bank of New York Mellon
240 Greenwich Street
New York, NY 10286
| Third Avenue offers multiple investment solutions with unique exposures and return profiles. Our core strategies are currently available through ’40Act mutual funds and customized accounts. If you would like further information, please contact a Relationship Manager at:
|


Item 2. Code of Ethics.
| (a) | The registrant, as of the end of the period covered by this report, has adopted a code of ethics that applies to the Registrant’s principal executive officer, principal financial officer, principal accounting officer or controller, or persons performing similar functions, regardless of whether these individuals are employed by the registrant or a third party. |
| (c) | There have been no amendments, during the period covered by this report, to a provision of the code of ethics that applies to the Registrant’s principal executive officer, principal financial officer, principal accounting officer or controller, or persons performing similar functions, regardless of whether these individuals are employed by the Registrant or a third party, and that relates to any element of the code of ethics description. |
| (d) | The registrant has not granted any waivers, including an implicit waiver, from a provision of the code of ethics that applies to the registrant’s principal executive officer, principal financial officer, principal accounting officer or controller, or persons performing similar functions, regardless of whether these individuals are employed by the registrant or a third party, that relates to one or more of the items set forth in paragraph (b) of this item’s instructions. |
Item 3. Audit Committee Financial Expert.
The Audit Committee of the Board of Trustees currently is comprised of Robert J. Christian, Iqbal Mansur and Stephen M. Wynne, each of whom is considered “independent” within the meaning set forth under Item 3 of Form N-CSR. The Board of Trustees has determined that Mr. Wynne is an “audit committee financial expert” as such term is defined by Item 3 of Form N-CSR.
The Registrant’s Board of Trustees has determined that Mr. Wynne acquired the attributes necessary to be considered an audit committee financial expert through his experience as a chief executive officer (and other senior-level accounting and/or financial positions) of several large financial institutions and because he has co-authored a text book on mutual fund accounting.
Item 4. Principal Accountant Fees and Services.
Audit Fees
| (a) | The aggregate fees billed for each of the last two fiscal years for professional services rendered by the principal accountant for the audit of the registrant’s annual financial statements or services that are normally provided by the accountant in connection with statutory and regulatory filings or engagements for those fiscal years were $100,385, without any out of pocket expenses, for the |
fiscal year ending October 31, 2020, and $102,812, without any out of pocket expenses, for the fiscal year ending October 31, 2019. |
Audit-Related Fees
| (b) | There were no fees billed in each of the last two fiscal years for assurance and related services by the Trust’s principal accountant that are reasonably related to the performance of the audit of the Trust’s financial statements and are not reported above in Item 4(a). There were no audit-related services provided to the Trust’s investment adviser or any entity controlling, controlled by, or under common control with the Trust’s investment adviser that provides ongoing services to the Trust (“Service Affiliates”) during each of the last two years that were required to be pre-approved by the Trust’s Audit Committee. |
Tax Fees
| (c) | The aggregate fees billed in each of the last two fiscal years for professional services rendered by the principal accountant for tax compliance, tax advice, and tax planning were $84,000 for the fiscal year ending October 31, 2020, and $219,760 for the fiscal year ending October 31, 2019. |
All Other Fees
| (d) | There were no fees billed to the Trust in each of the last two fiscal years for products and services provided by the Trust’s principal accountant, other than the services reported above in Items 4(a) through (c). |
(e)(1) Disclose the audit committee’s pre-approval policies and procedures described in paragraph (c)(7) of Rule 2-01
of Regulation S-X.
The Registrant’s Audit Committee Charter requires the Audit Committee to (i) (a) approve prior to appointment the engagement of independent registered public accounting firm to annually audit and provide their opinion on the Registrant’s financial statements, (b) recommend to the Independent Trustees the selection, retention or termination of the Registrant’s independent registered public accounting firm and, (c) in connection therewith, to review and evaluate matters potentially affecting the independence and capabilities of the independent registered public accounting firm; and (ii) to approve prior to appointment the engagement of the independent registered public accounting firm to provide other audit services to the Registrant, or to provide non-audit services to the Registrant, its series, an investment adviser to its series or any entity controlling, controlled by, or under common control with an investment adviser to its series (“adviser-affiliate”) that provides ongoing services to the Registrant if the engagement relates directly to the operations and financial reporting of the Registrant. The Audit Committee will not approve non-audit services that the Audit Committee believes may impair the independence of the Registrant’s independent registered public accountant. The Audit Committee may delegate, to the extent permitted by law, pre-approved responsibilities to one or more members of the Audit Committee who shall report to the full Audit Committee.
(e)(2) The percentage of services described in each of paragraphs (b) through (d) of this Item that were approved
by the audit committee pursuant to paragraph (c)(7)(i)(C) of Rule 2-01 of Regulation S-X are as follows:
| (b) | Not applicable. |
| (c) | 100.00% |
| (d) | Not applicable. |
The percentage of hours expended on the principal accountant’s engagement to audit the registrant’s financial statements for the most recent fiscal year that were attributed to work performed by persons other than the principal accountant’s full-time, permanent employees was 100.00%.
| (g) | The aggregate non-audit fees billed by the registrant’s accountant for services rendered to the registrant, and rendered to the registrant’s investment adviser (not including any sub-adviser whose role is primarily portfolio management and is subcontracted with or overseen by another investment adviser), and any entity controlling, controlled by, or under common control with the adviser that provides ongoing services to the registrant for each of the last two fiscal years of the registrant were $84,000 for the fiscal year ending October 31, 2020, and $219,760 for the fiscal year ending October 31, 2019. |
| (h) | The registrant’s audit committee of the board of trustees has considered whether the provision of non-audit services that were rendered to the registrant’s investment adviser (not including any sub-adviser whose role is primarily portfolio management and is subcontracted with or overseen by another investment adviser), and any entity controlling, controlled by, or under common control with the investment adviser that provides ongoing services to the registrant that were not pre-approved pursuant to paragraph (c)(7)(ii) of Rule 2-01 of Regulation S-X is compatible with maintaining the principal accountant’s independence. |
Item 5. Audit Committee of Listed Registrants.
Not applicable.
Item 6. Investments.
(a) Schedule of Investments in securities of unaffiliated issuers as of the close of the reporting period
Item 7. Disclosure of Proxy Voting Policies and Procedures for Closed-End Management Investment Companies.
Not applicable.
Item 8. Portfolio Managers of Closed-End Management Investment Companies.
Not applicable.
Item 9. Purchases of Equity Securities by Closed-End Management Investment Company and Affiliated Purchasers.
Not applicable.
Item 10. Submission of Matters to a Vote of Security Holders.
There have been no material changes to the procedures by which the shareholders may recommend nominees to the registrant’s board of trustees, where those changes were implemented after the registrant last provided disclosure in response to the requirements of Item 407(c)(2)(iv) of Regulation S-K (17 CFR 229.407) (as required by Item 22(b)(15) of Schedule 14A (17 CFR 240.14a-101)), or this Item.
Item 11. Controls and Procedures.
| (a) | The registrant’s principal executive and principal financial officers, or persons performing similar functions, have concluded that the registrant’s disclosure controls and procedures (as defined in Rule 30a-3(c) under the Investment Company Act of 1940, as amended (the “1940 Act”) (17 CFR 270.30a-3(c))) are effective, as of a date within 90 days of the filing date of the report that includes the disclosure required by this paragraph, based on their evaluation of these controls and procedures required by Rule 30a-3(b) under the 1940 Act (17 CFR 270.30a-3(b)) and Rules 13a-15(b) or 15d-15(b) under the Securities Exchange Act of 1934, as amended (17 CFR 240.13a-15(b) or 240.15d-15(b)). |
| (b) | There were no changes in the registrant’s internal control over financial reporting (as defined in Rule 30a-3(d) under the 1940 Act (17 CFR 270.30a-3(d)) that occurred during the registrant’s last fiscal quarter that has materially affected, or is reasonably likely to materially affect, the registrant’s internal control over financial reporting. |
Item 12. Disclosure of Securities Lending Activities for Closed-End Management Investment Companies.
Not applicable.
Item 13. Exhibits.
| (a)(1) | ||
| (a)(2) | ||
| (a)(3) | Not applicable. | |
| (a)(4) | Not applicable. | |
| (b) | ||
SIGNATURES
Pursuant to the requirements of the Securities Exchange Act of 1934 and the Investment Company Act of 1940, the registrant has duly caused this report to be signed on its behalf by the undersigned, thereunto duly authorized.
| (Registrant) | Third Avenue Trust |
| By (Signature and Title)* | /s/ Joel L. Weiss | |||
Joel L. Weiss, President and Chief Executive Officer (principal executive officer) |
| Date | January 6, 2020 |
Pursuant to the requirements of the Securities Exchange Act of 1934 and the Investment Company Act of 1940, this report has been signed below by the following persons on behalf of the registrant and in the capacities and on the dates indicated.
| By (Signature and Title)* | /s/ Joel L. Weiss | |||
Joel L. Weiss, President and Chief Executive Officer (principal executive officer) |
| Date | January 6, 2020 |
| By (Signature and Title)* | /s/ T. Richard Keyes | |||
T. Richard Keyes, Treasurer and Chief Financial Officer (principal financial officer) |
| Date | January 6, 2020 |
* Print the name and title of each signing officer under his or her signature.