UNITED STATES
SECURITIES AND EXCHANGE COMMISSION
Washington, D.C. 20549
FORM N-CSR
CERTIFIED SHAREHOLDER REPORT OF REGISTERED MANAGEMENT INVESTMENT COMPANIES
Investment Company Act file number: 811-08039
| Third Avenue Trust |
| (Exact name of registrant as specified in charter) |
| 622 Third Avenue, 32nd Floor, New York, NY 10017 | 10017 | |
| (Address of principal executive offices) | (Zip code) |
| W. James Hall III, General Counsel, 622 Third Avenue, New York, NY 10017 |
| (Name and address of agent for service) |
Registrant’s telephone number, including area code: 800-443-1021
Date of fiscal year end: October 31, 2017
Date of reporting period: April 30, 2017
Form N-CSR is to be used by management investment companies to file reports with the Commission not later than 10 days after the transmission to stockholders of any report that is required to be transmitted to stockholders under Rule 30e-1 under the Investment Company Act of 1940 (17 CFR 270.30e-1). The Commission may use the information provided on Form N-CSR in its regulatory, disclosure review, inspection, and policy making roles.
A registrant is required to disclose the information specified by Form N-CSR, and the Commission will make this information public. A registrant is not required to respond to the collection of information contained in Form N-CSR unless the Form displays a currently valid Office of Management and Budget (“OMB”) control number. Please direct comments concerning the accuracy of the information collection burden estimate and any suggestions for reducing the burden to Secretary, Securities and Exchange Commission, 100 F Street, NE, Washington, DC 20549-0609. The OMB has reviewed this collection of information under the clearance requirements of 44 U.S.C. § 3507.
EXPLANATORY NOTE
The registrant inadvertently filed its semi-annual report on June 29, 2017 on Form N-CSR (the “Original Filing”) instead of Form N-CSRS. Except as otherwise noted above, the Original Filing was accurate, timely distributed to shareholders and contained all other information required to be included in such reports by the registrant's registration statement form under the Investment Company Act of 1940 pursuant to Rule 30e-1(a) thereunder.
Item 1. Reports to Stockholders.
The Trust’s semi-annual report transmitted to shareholders pursuant to Rule 30e-l under the Investment Company Act of 1940, as amended (the “1940 Act”), is as follows:

Third Avenue Value Fund
Third Avenue Small-Cap
Value Fund
Third Avenue Real Estate
Value Fund
Third Avenue International
Value Fund
SEMI-ANNUAL REPORT
APRIL 30, 2017
To read the latest calendar quarter Portfolio Manager Commentary, please visit
www.thirdave.com
THIRD AVENUE FUNDS
Privacy Policy
Third Avenue Funds (the “Funds”) respect your right to privacy. We also know that you expect us to conduct and process your business in an accurate and efficient manner. To do so, we must collect and maintain certain personal information about you. This is the information we collect from you on applications or other forms and from the transactions you make with us, our affiliates, or third parties. We do not disclose any information about you or any of our former customers to anyone, except to our affiliates (which may include the Funds’ affiliated money management entities) and service providers, or as otherwise permitted by law. To protect your personal information, we permit access only by authorized employees. Be assured that we maintain physical, electronic and procedural safeguards that comply with federal standards to guard your personal information.
Proxy Voting Policies and Procedures
The Funds have delegated the voting of proxies relating to their voting securities to the Funds’ investment adviser pursuant to the adviser’s proxy voting guidelines. A description of these proxy voting guidelines and procedures, as well as information relating to how a Fund voted proxies relating to portfolio securities during the most recent 12-month period ended June 30, is available by August 31 each year (i) without charge, upon request, by calling (800) 443- 1021, (ii) at the website of the Securities and Exchange Commission (the “SEC”) at http://www.sec.gov, and (iii) on the Funds’ website www.thirdave.com.
Schedule of Portfolio Holdings—Form N-Q
The Funds file their complete schedule of portfolio holdings with the SEC for the first and third quarters of each fiscal year on Form N-Q. The Funds’ Form N-Q is available on the SEC’s website at http://www.sec.gov, and may be reviewed and copied at the SEC’s Public Reference Room in Washington, DC. Information on the operation of the Public Reference Room may be obtained by calling 1-800-SEC-0330.
Third Avenue Trust
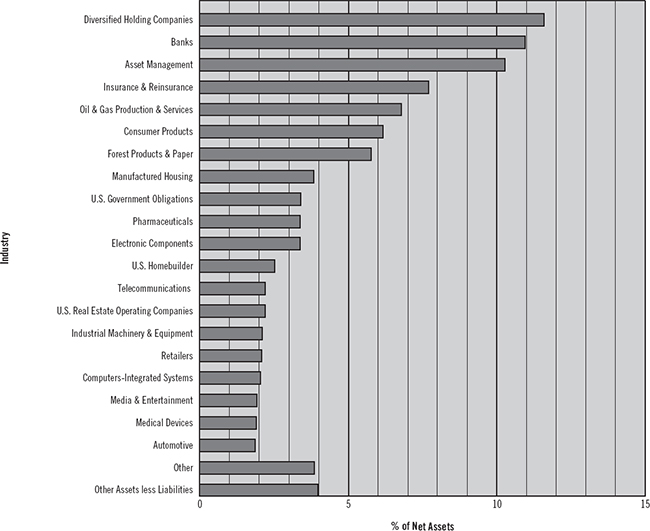
Third Avenue Value Fund
Industry Diversification
(Unaudited)
The summary of the Fund’s investments as of April 30, 2017 is as follow:
1
Third Avenue Trust
Third Avenue Value Fund
Portfolio of Investments
at April 30, 2017 (Unaudited)
| Principal Amount($) | Security† | Value (Note 1) | |||||
| Corporate Bonds & Notes - 1.32% | |||||||
| Consumer Products - 1.32% | |||||||
| 24,930,277 | Home Products International, Inc., 2nd Lien, Convertible, 6.000% Payment-in-kind Interest, due 12/20/17 (a)(b)(c)(d) | $ | 15,531,563 | ||||
| Total Corporate Bonds & Notes (Cost $24,930,277) | 15,531,563 | ||||||
| Shares | |||||||
| Common Stocks - 91.30% | |||||||
| Asset Management - 10.27% | |||||||
| 1,523,413 | Bank of New York Mellon Corp. (The) | 71,691,816 | |||||
| 1,329,056 | Brookfield Asset Management, Inc., Class A (Canada) | 49,108,619 | |||||
| 120,800,435 | |||||||
| Automotive - 1.87% | |||||||
| 441,593 | Toyota Industries Corp. (Japan) | 21,997,676 | |||||
| Banks - 10.96% | |||||||
| 834,449 | Comerica, Inc. | 58,995,544 | |||||
| 744,098 | KeyCorp. | 13,572,347 | |||||
| 470,300 | PNC Financial Services Group, Inc. (The) | 56,318,425 | |||||
| 128,886,316 | |||||||
| Computers-Integrated Systems - 2.05% | |||||||
| 372,839 | Cerner Corp. (e) | 24,141,325 | |||||
| Consumer Products - 4.85% | |||||||
| 526,368 | Home Products International, Inc. (a)(b)(d)(e) | — | |||||
| 6,398,304 | Kingfisher PLC (United Kingdom) | 28,305,791 | |||||
| 774,930 | Masco Corp. | 28,687,909 | |||||
| 56,993,700 | |||||||
| Diversified Holding Companies - 11.59% | |||||||
| 3,711,500 | CK Hutchison Holdings, Ltd. (Cayman Islands) | 46,346,567 | |||||
| 938,961 | Investor AB, Class B (Sweden) | 42,902,397 | |||||
| 311,688 | Pargesa Holding S.A. (Switzerland) | 23,304,439 | |||||
| 3,052,000 | Wheelock & Co., Ltd. (Hong Kong) | 23,773,290 | |||||
| 136,326,693 | |||||||
| Electronic Components - 3.38% | |||||||
| 265,007 | Anixter International, Inc. (e) | 21,611,321 | |||||
| 467,694 | Avnet, Inc. | 18,095,081 | |||||
| 39,706,402 | |||||||
The accompanying notes are an integral part of the financial statements.
2
Third Avenue Trust
Third Avenue Value Fund
Portfolio of Investments (continued)
at April 30, 2017 (Unaudited)
| Shares | Security† | Value (Note 1) | |||||
| Common Stocks (continued) | |||||||
| Forest Products & Paper - 5.77% | |||||||
| 2,004,410 | Weyerhaeuser Co., REIT | $ | 67,889,367 | ||||
| Industrial Machinery & Equipment - 2.11% | |||||||
| 596,029 | Johnson Controls International PLC (Ireland) | 24,776,925 | |||||
| Insurance & Reinsurance - 7.70% | |||||||
| 72,073 | Alleghany Corp. (e) | 44,014,981 | |||||
| 54,227 | White Mountains Insurance Group, Ltd. (Bermuda) | 46,577,739 | |||||
| 90,592,720 | |||||||
| Manufactured Housing - 3.84% | |||||||
| 380,173 | Cavco Industries, Inc. (e) | 45,145,544 | |||||
| Materials - 1.68% | |||||||
| 1,315,500 | Canfor Corp. (Canada) (e) | 19,755,870 | |||||
| Media & Entertainment - 1.93% | |||||||
| 341,700 | CBS Corp., Class B, Non-Voting Shares | 22,743,552 | |||||
| Medical Devices - 1.91% | |||||||
| 426,400 | LivaNova PLC (United Kingdom) (e) | 22,471,280 | |||||
| Oil & Gas Production & Services - 6.79% | |||||||
| 555,006 | Devon Energy Corp. | 21,917,187 | |||||
| 124,873 | EOG Resources, Inc. | 11,550,752 | |||||
| 903,950 | Total S.A. (France) | 46,402,717 | |||||
| 79,870,656 | |||||||
| Pharmaceuticals - 3.38% | |||||||
| 176,500 | Amgen, Inc. | 28,825,980 | |||||
| 61,638 | Shire PLC, ADR (Jersey) | 10,907,460 | |||||
| 39,733,440 | |||||||
| Retailers - 2.09% | |||||||
| 305,065 | Ralph Lauren Corp. | 24,624,847 | |||||
| Senior Housing - 1.62% | |||||||
| 1,466,533 | Brookdale Senior Living, Inc. (e) | 19,050,264 | |||||
| Telecommunications - 2.22% | |||||||
| 10,123,456 | Vodafone Group PLC (United Kingdom) | 26,074,455 | |||||
| U.S. Homebuilder - 2.53% | |||||||
| 589,518 | Lennar Corp., Class A | 29,770,659 | |||||
| U.S. Real Estate Operating Companies - 2.20% | |||||||
| 1,132,601 | Tejon Ranch Co. (a)(e) | 25,936,563 | |||||
The accompanying notes are an integral part of the financial statements.
3
Third Avenue Trust
Third Avenue Value Fund
Portfolio of Investments (continued)
at April 30, 2017 (Unaudited)
| Shares | Security† | Value (Note 1) | |||||
| Common Stocks (continued) | |||||||
| Utilities - 0.56% | |||||||
| 456,807 | Covanta Holding Corp. | $ | 6,646,542 | ||||
| Total Common Stocks (Cost $881,956,416) | 1,073,935,231 | ||||||
| Principal Amount($) | |||||||
| Short-Term Investments - 3.40% | |||||||
| U.S. Government Obligations - 3.40% | |||||||
| 40,000,000 | U.S. Treasury Bill, 0.680%, due 5/18/17 (f) | 39,987,156 | |||||
| Total Short-Term Investments (Cost $39,987,156) | 39,987,156 | ||||||
| Total Investment Portfolio - 96.02% (Cost $946,873,849) | 1,129,453,950 | ||||||
| Other Assets less Liabilities - 3.98% | 46,865,691 | ||||||
| NET ASSETS - 100.00% | $ | 1,176,319,641 | |||||
The accompanying notes are an integral part of the financial statements.
4
Third Avenue Trust
Third Avenue Value Fund
Portfolio of Investments (continued)
at April 30, 2017 (Unaudited)
Notes:
| (a) | Affiliated issuers - as defined in the Investment Company Act of 1940 (ownership by the Fund of 5% or more of the outstanding voting securities of these issuers). |
| (b) | Fair-valued security. |
| (c) | Payment-in-kind (“PIK”) security. Income may be paid as additional securities. |
| (d) | Security subject to restrictions on resale. |
| Shares/ Principal Amount($) | Issuer | Acquisiton Date | Cost | Market Value Per Unit | ||||||||
| 526,368 | Home Products International, Inc. | 5/30/07 | $ | 54,667,471 | $ | 0.00 | ||||||
| $ | 24,930,277 | Home Products International, Inc., 2nd Lien, Convertible, 6.000% Payment-in-kind Interest, due 12/20/17 | 3/16/07 - 4/3/17 | 24,930,277 | 62.30 | |||||||
At April 30, 2017, these restricted securities had a total market value of $15,531,563 or 1.32% of net assets.
| (e) | Non-income producing security. |
| (f) | Annualized yield at date of purchase. |
| † | U.S. issuer unless otherwise noted. |
ADR: American Depositary Receipt.
REIT: Real Estate Investment Trust.
| Country Concentration | ||||
| % of Net Assets | ||||
| United States* | 59.23 | % | ||
| United Kingdom | 6.53 | |||
| Canada | 5.85 | |||
| Bermuda | 3.96 | |||
| France | 3.95 | |||
| Cayman Islands | 3.94 | |||
| Sweden | 3.65 | |||
| Ireland | 2.11 | |||
| Hong Kong | 2.02 | |||
| Switzerland | 1.98 | |||
| Japan | 1.87 | |||
| Jersey | 0.93 | |||
| Total | 96.02 | % | ||
* Includes cash equivalents, classified as Short-Term Investments on the Portfolio of Investments.
The accompanying notes are an integral part of the financial statements.
5
Third Avenue Trust
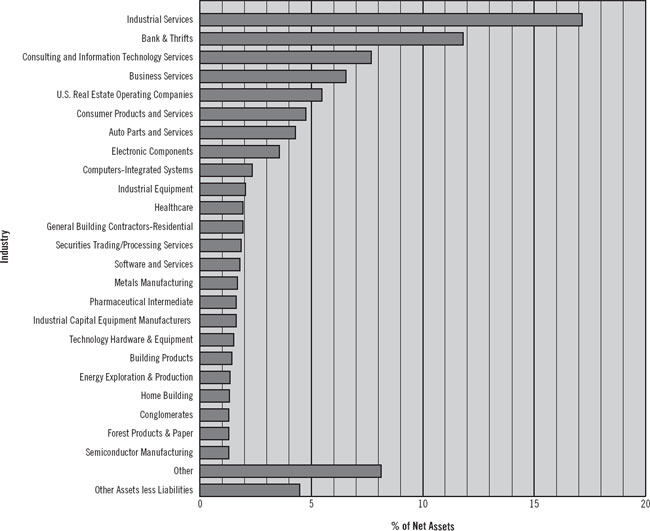
Third Avenue Small-Cap Value Fund
Industry Diversification
(Unaudited)
The summary of the Fund’s investments as of April 30, 2017 is as follow:
6
Third Avenue Trust
Third Avenue Small-Cap Value Fund
Portfolio of Investments
at April 30, 2017 (Unaudited)
| Shares | Security† | Value (Note 1) | |||||
| Common Stocks - 95.52% | |||||||
| Asset Management - 1.26% | |||||||
| 104,132 | Legg Mason, Inc. | $ | 3,892,454 | ||||
| Auto Parts and Services - 4.28% | |||||||
| 51,400 | Dorman Products, Inc. (a) | 4,273,910 | |||||
| 66,613 | Horizon Global Corp. (a) | 938,577 | |||||
| 63,347 | Standard Motor Products, Inc. | 3,219,928 | |||||
| 46,664 | Visteon Corp. (a) | 4,804,059 | |||||
| 13,236,474 | |||||||
| Bank & Thrifts - 11.81% | |||||||
| 139,306 | Commerce Bancshares, Inc. | 7,654,865 | |||||
| 60,800 | Cullen/Frost Bankers, Inc. | 5,738,912 | |||||
| 93,046 | Prosperity Bancshares, Inc. | 6,252,691 | |||||
| 221,678 | Southside Bancshares, Inc. | 7,696,660 | |||||
| 81,391 | UMB Financial Corp. | 5,900,034 | |||||
| 282,975 | Valley National Bancorp | 3,327,786 | |||||
| 36,570,948 | |||||||
| Building Products - 1.41% | |||||||
| 214,200 | Quanex Building Products Corp. | 4,369,680 | |||||
| Business Services - 6.54% | |||||||
| 125,500 | Korn/Ferry International | 4,066,200 | |||||
| 169,423 | SP Plus Corp. (a) | 5,836,622 | |||||
| 185,400 | TriNet Group, Inc. (a) | 5,450,760 | |||||
| 108,235 | Viad Corp. | 4,892,222 | |||||
| 20,245,804 | |||||||
| Computers-Integrated Systems - 2.34% | |||||||
| 192,244 | NetScout Systems, Inc. (a) | 7,237,987 | |||||
| Conglomerates - 1.28% | |||||||
| 937 | Seaboard Corp. | 3,967,267 | |||||
| Consulting and Information Technology Services - 7.66% | |||||||
| 136,292 | FTI Consulting, Inc. (a) | 4,714,340 | |||||
| 254,366 | Genpact, Ltd. (Bermuda) | 6,211,618 | |||||
| 144,822 | ICF International, Inc. (a) | 6,393,891 | |||||
| 363,406 | Syntel, Inc. | 6,399,580 | |||||
| 23,719,429 | |||||||
| Consumer Products and Services - 4.74% | |||||||
| 251,664 | 1-800-Flowers.com, Inc., Class A (a) | 2,705,388 | |||||
The accompanying notes are an integral part of the financial statements.
7
Third Avenue Trust
Third Avenue Small-Cap Value Fund
Portfolio of Investments (continued)
at April 30, 2017 (Unaudited)
| Shares | Security† | Value (Note 1) | |||||
| Common Stocks (continued) | |||||||
| Consumer Products and Services (continued) | |||||||
| 194,701 | G-III Apparel Group, Ltd. (a) | $ | 4,614,414 | ||||
| 80,458 | VCA, Inc. (a) | 7,367,539 | |||||
| 14,687,341 | |||||||
| Electronic Components - 3.55% | |||||||
| 58,456 | Anixter International, Inc. (a) | 4,767,087 | |||||
| 147,700 | Insight Enterprises, Inc. (a) | 6,218,170 | |||||
| 10,985,257 | |||||||
| Energy Exploration & Production - 1.33% | |||||||
| 163,353 | Carrizo Oil & Gas, Inc. (a) | 4,108,328 | |||||
| Food Distributors - 1.12% | |||||||
| 98,962 | Core-Mark Holding Co, Inc. | 3,465,649 | |||||
| Forest Products & Paper - 1.27% | |||||||
| 267,005 | Interfor Corp. (Canada) (a) | 3,943,314 | |||||
| General Building Contractors-Residential - 1.91% | |||||||
| 253,800 | BMC Stock Holdings, Inc. (a) | 5,913,540 | |||||
| Healthcare - 1.93% | |||||||
| 81,500 | Patterson Cos., Inc. | 3,625,935 | |||||
| 11,407 | Teleflex, Inc. | 2,359,994 | |||||
| 5,985,929 | |||||||
| Home Building - 1.32% | |||||||
| 328,600 | TRI Pointe Group, Inc. (a) | 4,091,070 | |||||
| Industrial Capital Equipment Manufacturers - 1.62% | |||||||
| 91,200 | Barnes Group, Inc. | 5,013,264 | |||||
| Industrial Equipment - 2.03% | |||||||
| 60,606 | Alamo Group, Inc. | 4,791,510 | |||||
| 22,467 | CIRCOR International, Inc. | 1,498,774 | |||||
| 6,290,284 | |||||||
| Industrial Services - 17.15% | |||||||
| 89,857 | ABM Industries, Inc. | 3,880,924 | |||||
| 161,375 | Comfort Systems USA, Inc. | 5,922,462 | |||||
| 133,804 | Cubic Corp. | 6,944,427 | |||||
| 82,107 | EMCOR Group, Inc. | 5,397,714 | |||||
| 241,920 | Interface, Inc. | 4,814,208 | |||||
| 85,246 | Multi-Color Corp. | 6,546,893 | |||||
The accompanying notes are an integral part of the financial statements.
8
Third Avenue Trust
Third Avenue Small-Cap Value Fund
Portfolio of Investments (continued)
at April 30, 2017 (Unaudited)
| Shares | Security† | Value (Note 1) | |||||
| Common Stocks (continued) | |||||||
| Industrial Services (continued) | |||||||
| 64,300 | MYR Group, Inc. (a) | $ | 2,717,318 | ||||
| 149,244 | Tetra Tech, Inc. | 6,559,274 | |||||
| 29,910 | UniFirst Corp. | 4,163,472 | |||||
| 166,319 | World Fuel Services Corp. | 6,125,529 | |||||
| 53,072,221 | |||||||
| Metals Manufacturing - 1.68% | |||||||
| 61,478 | Kaiser Aluminum Corp. | 5,189,358 | |||||
| Optical Components - 1.13% | |||||||
| 153,500 | Finisar Corp. (a) | 3,505,940 | |||||
| Pharmaceutical Intermediate - 1.64% | |||||||
| 85,485 | Cambrex Corp. (a) | 5,073,535 | |||||
| Professional Services - 0.52% | |||||||
| 80,554 | Hackett Group, Inc. (The) | 1,597,386 | |||||
| Restaurants - 0.81% | |||||||
| 102,678 | Fiesta Restaurant Group, Inc. (a) | 2,500,209 | |||||
| Retailers - 1.10% | |||||||
| 164,900 | DSW, Inc., Class A | 3,400,238 | |||||
| Securities Trading/Processing Services - 1.85% | |||||||
| 46,500 | DST Systems, Inc. | 5,724,615 | |||||
| Semiconductor Manufacturing - 1.27% | |||||||
| 340,600 | Photronics, Inc. (a) | 3,916,900 | |||||
| Software and Services - 1.80% | |||||||
| 67,198 | CSG Systems International, Inc. | 2,520,597 | |||||
| 102,555 | Progress Software Corp. | 3,047,935 | |||||
| 5,568,532 | |||||||
| Specialty Pharmaceuticals - 0.87% | |||||||
| 49,933 | ANI Pharmaceuticals, Inc. (a) | 2,702,374 | |||||
| Steel Producers - 0.95% | |||||||
| 69,287 | Haynes International, Inc. | 2,930,147 | |||||
| Technology Hardware & Equipment - 1.52% | |||||||
| 85,907 | Synaptics, Inc. (a) | 4,705,126 | |||||
| U.S. Real Estate Investment Trusts - 0.37% | |||||||
| 37,119 | Tanger Factory Outlet Centers, Inc. | 1,157,742 | |||||
The accompanying notes are an integral part of the financial statements.
9
Third Avenue Trust
Third Avenue Small-Cap Value Fund
Portfolio of Investments (continued)
at April 30, 2017 (Unaudited)
| Shares | Security† | Value (Note 1) | |||||
| Common Stocks (continued) | |||||||
| U.S. Real Estate Operating Companies - 5.46% | |||||||
| 129,227 | Alico, Inc. | $ | 3,870,349 | ||||
| 414,367 | Brookdale Senior Living, Inc. (a) | 5,382,627 | |||||
| 189,053 | Kennedy-Wilson Holdings, Inc. | 3,856,681 | |||||
| 19,139 | Vail Resorts, Inc. | 3,783,015 | |||||
| 16,892,672 | |||||||
| Total Common Stocks (Cost $220,686,261) | 295,661,014 | ||||||
| Total Investment Portfolio - 95.52% (Cost $220,686,261) | 295,661,014 | ||||||
| Other Assets less Liabilities - 4.48% | 13,880,207 | ||||||
| NET ASSETS - 100.00% | $ | 309,541,221 | |||||
Notes:
| (a) | Non-income producing security. |
| † | U.S. issuer unless otherwise noted. |
Country Concentration
| % of Net Assets | ||||
| United States | 92.24 | % | ||
| Bermuda | 2.01 | |||
| Canada | 1.27 | |||
| Total | 95.52 | % | ||
The accompanying notes are an integral part of the financial statements.
10
Third Avenue Trust
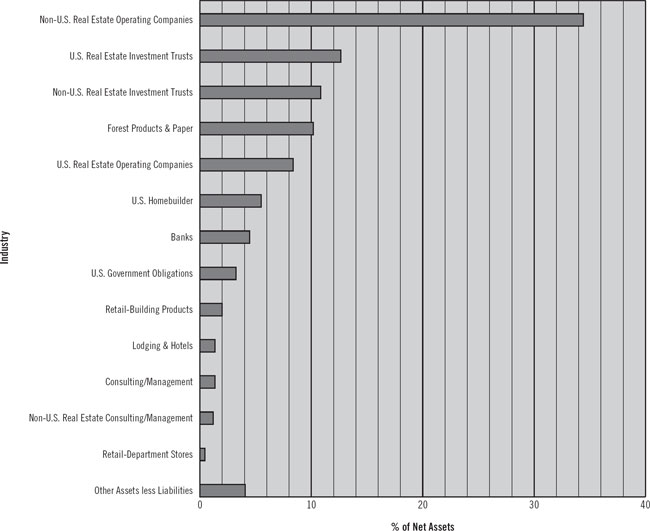
Third Avenue Real Estate Value Fund
Industry Diversification
(Unaudited)
The summary of the Fund’s investments as of April 30, 2017 is as follow:
11
Third Avenue Trust
Third Avenue Real Estate Value Fund
Portfolio of Investments
at April 30, 2017 (Unaudited)
| Principal Amount‡ | Security† | Value (Note 1) | |||||
| Term Loans - 0.43% | |||||||
| Non-U.S. Real Estate Operating Companies - 0.00%** | |||||||
| 35,913 | EUR | Concrete Investment II, Term Loans, Tranche A2, 2.000% Cash or Payment-in-kind Interest, due 10/31/17 (Luxembourg)(a)(b)(c) | $ | 39,120 | |||
| Retail-Department Stores - 0.43% | |||||||
| 10,000,000 | Neiman Marcus Group LLC, 1st Lien Term Loan, 4.250%, due 10/25/20 (c) | 8,003,750 | |||||
| Total Term Loans (Cost $8,164,875) | 8,042,870 | ||||||
| Shares | |||||||
| Common Stocks & Warrants - 87.88% | |||||||
| Banks - 4.46% | |||||||
| 1,186,849 | PNC Financial Services Group, Inc., Warrants, expire 12/31/18 (d) | 62,606,285 | |||||
| 520,400 | Zions Bancorporation | 20,831,612 | |||||
| 83,437,897 | |||||||
| Consulting/Management - 1.35% | |||||||
| 618,100 | FNF Group | 25,311,195 | |||||
| Forest Products & Paper - 10.16% | |||||||
| 3,131,100 | Rayonier, Inc., REIT | 88,359,642 | |||||
| 3,003,910 | Weyerhaeuser Co., REIT | 101,742,432 | |||||
| 190,102,074 | |||||||
| Lodging & Hotels - 1.37% | |||||||
| 4,384,514 | Millennium & Copthorne Hotels PLC (United Kingdom) | 25,581,085 | |||||
| Non-U.S. Real Estate Consulting/Management - 1.18% | |||||||
| 1,840,432 | Savills PLC (United Kingdom) | 22,144,873 | |||||
| Non-U.S. Real Estate Investment Trusts - 10.86% | |||||||
| 4,889,153 | Hammerson PLC (United Kingdom) | 37,198,616 | |||||
| 7,178,761 | Land Securities Group PLC (United Kingdom) | 102,812,116 | |||||
| 10,055,195 | Segro PLC (United Kingdom) | 63,246,731 | |||||
| 203,257,463 | |||||||
| Non-U.S. Real Estate Operating Companies - 34.40% | |||||||
| 2,077,489 | Brookfield Asset Management, Inc., Class A (Canada) | 76,763,218 | |||||
| 13,433,000 | Cheung Kong Property Holdings, Ltd. (Cayman Islands) | 96,169,701 | |||||
| 5,804,950 | City Developments, Ltd. (Singapore) | 44,795,343 | |||||
| 47,713,300 | Global Logistic Properties, Ltd. (Singapore) | 98,298,277 | |||||
| 12,366,434 | Henderson Land Development Co., Ltd. (Hong Kong) | 78,285,216 | |||||
The accompanying notes are an integral part of the financial statements.
12
Third Avenue Trust
Third Avenue Real Estate Value Fund
Portfolio of Investments (continued)
at April 30, 2017 (Unaudited)
| Shares | Security† | Value (Note 1) | |||||
| Common Stocks & Warrants (continued) | |||||||
| Non-U.S. Real Estate Operating Companies (continued) | |||||||
| 7,244,472 | Inmobiliaria Colonial SA (Spain) | $ | 56,174,764 | ||||
| 2,418,000 | Sun Hung Kai Properties, Ltd. (Hong Kong) | 36,233,747 | |||||
| 11,387,275 | Westfield Corp., REIT (Australia) | 77,438,893 | |||||
| 10,203,500 | Wheelock & Co., Ltd. (Hong Kong) | 79,479,283 | |||||
| 643,638,442 | |||||||
| Retail-Building Products - 2.01% | |||||||
| 442,930 | Lowe’s Cos., Inc. | 37,595,898 | |||||
| 825,930 | Tenon, Ltd. (New Zealand) | 95,384 | |||||
| 37,691,282 | |||||||
| U.S. Homebuilder - 5.51% | |||||||
| 2,041,461 | Lennar Corp., Class A | 103,093,780 | |||||
| U.S. Real Estate Investment Trusts - 12.62% | |||||||
| 1,667,531 | First Industrial Realty Trust, Inc. | 46,924,322 | |||||
| 4,132,617 | Forest City Realty Trust, Inc., Class A | 93,397,144 | |||||
| 360,562 | Macerich Co. (The) | 22,509,886 | |||||
| 979,769 | Parkway, Inc. | 19,742,345 | |||||
| 555,494 | Vornado Realty Trust | 53,460,743 | |||||
| 236,034,440 | |||||||
| U.S. Real Estate Operating Companies - 3.96% | |||||||
| 982,100 | Kennedy-Wilson Holdings, Inc. | 20,034,840 | |||||
| 941,627 | Tejon Ranch Co. (d) | 21,563,258 | |||||
| 4,556,286 | Trinity Place Holdings, Inc. (d)(e)(f) | 32,486,312 | |||||
| 74,084,410 | |||||||
| Total Common Stocks & Warrants (Cost $1,076,109,110) | 1,644,376,941 | ||||||
| Private Equities - 4.43% | |||||||
| U.S. Real Estate Operating Companies - 4.43% | |||||||
| 4,557,222 | Five Point Holdings, LLC, Class A (d)(f). | 82,935,744 | |||||
| Total Private Equities (Cost $75,516,188) | 82,935,744 | ||||||
The accompanying notes are an integral part of the financial statements.
13
Third Avenue Trust
Third Avenue Real Estate Value Fund
Portfolio of Investments (continued)
at April 30, 2017 (Unaudited)
| Notional Amount($) | Security† | Value (Note 1) | |||||
| Purchased Options - 0.00%** | |||||||
| Foreign Currency Call Options - 0.00%** | |||||||
| 280,000,000 | U.S. Currency, strike 8.1400 HKD, expire 8/1/17 (d) | $ | 28 | ||||
| Total Purchased Options (Cost $945,000) | 28 | ||||||
| Principal Amount($) | |||||||
| Short-Term Investments - 3.21% | |||||||
| U.S. Government Obligations - 3.21% | |||||||
| 60,000,000 | U.S. Treasury Bill, 0.680%, due 5/18/17 (g) | 59,980,733 | |||||
| Total Short-Term Investments (Cost $59,980,733) | 59,980,733 | ||||||
| Total Investment Portfolio - 95.95% (Cost $1,220,715,906) | 1,795,336,316 | ||||||
| Other Assets less Liabilities - 4.05% (h) | 75,749,819 | ||||||
| NET ASSETS - 100.00% | $ | 1,871,086,135 | |||||
Notes:
| (a) | Fair-valued security. |
| (b) | Payment-in-kind (“PIK”) security. Income may be paid as additional securities or cash at the discretion of the issuer. |
| (c) | Variable rate security. The rate disclosed is in effect as of April 30, 2017. |
| (d) | Non-income producing security. |
| (e) | Affiliated issuers - as defined in the Investment Company Act of 1940 (ownership by the Fund of 5% or more of the outstanding voting securities of these issuers). |
| (f) | Security subject to restrictions on resale. |
| Shares | Issuer | Acquisiton Date | Cost | Market Value Per Unit | |||||||||
| 4,557,222 | Five Point Holdings, LLC, Class A | 5/9/08 - 4/3/13 | $ | 75,516,188 | $ | 18.20 | |||||||
| 4,556,286 | Trinity Place Holdings, Inc. | 10/2/13 - 3/31/17 | 21,123,824 | 7.13 | |||||||||
At April 30, 2017, the restricted security had a total market value of $115,422,056 or 6.17% of net assets.
| (g) | Annualized yield at date of purchase. |
| (h) | Includes restricted cash pledged to and received from counterparties as collateral management for forward foreign currency contracts and options. |
| ‡ | Denominated in U.S. Dollars unless otherwise noted. |
| † | U.S. issuer unless otherwise noted. |
| ** | Amount represents less than 0.01% of net assets. |
EUR: Euro.
HKD: Hong Kong Dollar.
REIT: Real Estate Investment Trust.
The accompanying notes are an integral part of the financial statements.
14
Third Avenue Trust
Third Avenue Real Estate Value Fund
Portfolio of Investments (continued)
at April 30, 2017 (Unaudited)
Country Concentration
| % of Net Assets | ||||
| United States* | 48.13 | % | ||
| United Kingdom | 13.41 | |||
| Hong Kong | 10.37 | |||
| Singapore | 7.65 | |||
| Cayman Islands | 5.14 | |||
| Australia | 4.14 | |||
| Canada | 4.10 | |||
| Spain | 3.00 | |||
| New Zealand | 0.01 | |||
| Luxembourg** | 0.00 | |||
| Total | 95.95 | % | ||
* Includes cash equivalents, classified as Short-Term Investments on the Portfolio of Investments.
** Amount represents less than 0.01% of net assets.
Schedule of Forward Foreign Currency Contracts
| Contracts to Buy | Counterparty | Settlement Date | Settlement Value | Value at 4/30/17 | Unrealized Appreciation | ||||||||||||
| 5,713,719 | EUR | Goldman Sachs & Co. | 5/30/17 | $ | 6,225,961 | $ | 6,234,424 | $ | 8,463 | ||||||||
| Contracts to Sell | Counterparty | Settlement Date | Settlement Value | Value at 4/30/17 | Unrealized Appreciation | ||||||||||||
| 28,710,800 | EUR | Goldman Sachs & Co. | 5/30/17 | $ | 31,331,487 | $ | 31,327,285 | $ | 4,202 | ||||||||
| 28,710,800 | EUR | Morgan Stanley & Co. LLC | 5/30/17 | 31,329,635 | 31,327,285 | 2,350 | |||||||||||
| $ | 6,552 | ||||||||||||||||
The accompanying notes are an integral part of the financial statements.
15
Third Avenue Trust
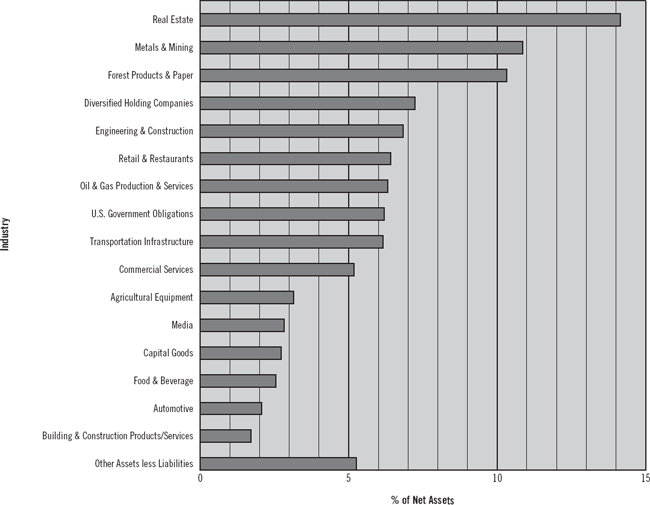
Third Avenue International Value Fund
Industry Diversification
(Unaudited)
The summary of the Fund’s investments as of April 30, 2017 is as follow:
16
Third Avenue Trust
Third Avenue International Value Fund
Portfolio of Investments
at April 30, 2017 (Unaudited)
| Principal Amount($) | Security† | Value (Note 1) | |||||
| Corporate Bonds & Notes - 1.66% | |||||||
| Oil & Gas Production & Services - 1.66% | |||||||
| 2,900,000 | Petroleum Geo-Services ASA, 7.375%, due 12/15/20 (Norway) (a) | $ | 2,668,000 | ||||
| Total Corporate Bonds & Notes | |||||||
| (Cost $2,761,026) | 2,668,000 | ||||||
| Shares | |||||||
| Common Stocks - 86.87% | |||||||
| Agricultural Equipment - 3.15% | |||||||
| 456,800 | CNH Industrial N.V. (Netherlands) | 5,070,480 | |||||
| Automotive - 2.08% | |||||||
| 45,027 | Daimler AG (Germany) | 3,355,161 | |||||
| Building & Construction Products/Services - 1.71% | |||||||
| 528,691 | Grupo Cementos de Chihuahua S.A.B de C.V. (Mexico) | 2,513,250 | |||||
| 2,138,825 | Tenon Ltd. (New Zealand) (c) | 247,005 | |||||
| 2,760,255 | |||||||
| Capital Goods - 2.73% | |||||||
| 79,081 | Nexans S.A. (France) (b) | 4,396,267 | |||||
| Commercial Services - 5.19% | |||||||
| 1,085,430 | IWG PLC (Jersey) | 4,565,456 | |||||
| 581,994 | Prosegur Cia de Seguridad S.A. (Spain) | 3,799,358 | |||||
| 8,364,814 | |||||||
| Diversified Holding Companies - 7.24% | |||||||
| 313,184 | CK Hutchison Holdings, Ltd. (Cayman Islands) | 3,910,819 | |||||
| 511,000 | Cosan Ltd., Class A (Bermuda) | 3,929,590 | |||||
| 150,733 | Leucadia National Corp | 3,827,111 | |||||
| 11,667,520 | |||||||
| Engineering & Construction - 6.84% | |||||||
| 843,184 | Amec Foster Wheeler PLC (United Kingdom) | 5,919,773 | |||||
| 35,065 | Cie d’Entreprises CFE (Belgium) | 5,110,421 | |||||
| 11,030,194 | |||||||
| Food & Beverage - 2.54% | |||||||
| 991,239 | C&C Group PLC (Ireland) | 4,089,042 | |||||
| Forest Products & Paper - 10.31% | |||||||
| 418,300 | Interfor Corp. (Canada) (b) | 6,177,743 | |||||
| 45,542,558 | Rubicon, Ltd. (New Zealand) (b)(c) | 7,035,652 | |||||
The accompanying notes are an integral part of the financial statements.
17
Third Avenue Trust
Third Avenue International Value Fund
Portfolio of Investments (continued)
at April 30, 2017 (Unaudited)
| Shares | Security† | Value (Note 1) | |||||
| Common Stocks (continued) | |||||||
| Forest Products & Paper (continued) | |||||||
| 100,543 | Weyerhaeuser Co., REIT | $ | 3,405,391 | ||||
| 16,618,786 | |||||||
| Media - 2.82% | |||||||
| 228,913 | Vivendi S.A. (France) | 4,540,545 | |||||
| Metals & Mining - 10.86% | |||||||
| 350,890 | Antofagasta PLC (United Kingdom) | 3,807,078 | |||||
| 9,670,712 | Capstone Mining Corp. (Canada) (b) | 7,509,582 | |||||
| 1,162,200 | Lundin Mining Corp. (Canada) | 6,198,173 | |||||
| 17,514,833 | |||||||
| Oil & Gas Production & Services - 4.66% | |||||||
| 2,168,928 | Petroleum Geo-Services ASA (Norway) (b) | 5,081,517 | |||||
| 13,899,800 | Vard Holdings, Ltd. (Singapore) (b) | 2,437,427 | |||||
| 7,518,944 | |||||||
| Real Estate - 14.16% | |||||||
| 1,094,650 | Atrium European Real Estate, Ltd. (Jersey) | 4,614,600 | |||||
| 592,184 | Cheung Kong Property Holdings, Ltd. (Cayman Islands) | 4,239,571 | |||||
| 3,184,000 | Global Logistic Properties, Ltd. (Singapore) | 6,559,632 | |||||
| 472,600 | Henderson Land Development Co., Ltd. (Hong Kong) | 2,991,775 | |||||
| 2,333,767 | Hibernia REIT, PLC (Ireland) | 3,241,273 | |||||
| 202,428 | Millennium & Copthorne Hotels PLC (United Kingdom) | 1,181,049 | |||||
| 22,827,900 | |||||||
| Retail & Restaurants - 6.42% | |||||||
| 1,262,600 | Arcos Dorados Holdings, Inc., Class A (British Virgin Islands) (b) | 10,353,320 | |||||
| Transportation Infrastructure - 6.16% | |||||||
| 437,092 | easyJet PLC (United Kingdom) | 6,611,615 | |||||
| 4,598,845 | Santos Brasil Participacoes S.A. (Brazil) (b) | 3,317,955 | |||||
| 9,929,570 | |||||||
| Total Common Stocks | |||||||
| (Cost $156,254,735) | 140,037,631 | ||||||
The accompanying notes are an integral part of the financial statements.
18
Third Avenue Trust
Third Avenue International Value Fund
Portfolio of Investments (continued)
at April 30, 2017 (Unaudited)
| Number of Contracts | Security† | Value (Note 1) | |||||
| Purchased Options - 0.03% | |||||||
| Exchange-Traded Fund Put Options - 0.03% | |||||||
| 5,000 | iShares MSCI EAFE ETF, strike $56.0000, expire 6/16/17 (b) | $ | 44,016 | ||||
| Total Purchased Options | |||||||
| (Cost $493,750) | 44,016 | ||||||
| Principal Amount($) | |||||||
| Short-Term Investments - 6.20% | |||||||
| U.S. Government Obligations - 6.20% | |||||||
| 10,000,000 | U.S. Treasury Bill, 0.680%, due 5/18/17 (d) | 9,996,789 | |||||
| Total Short-Term Investments | |||||||
| (Cost $9,996,789) | 9,996,789 | ||||||
| Total Investment Portfolio - 94.76% | |||||||
| (Cost $169,506,300) | 152,746,436 | ||||||
| Other Assets less Liabilities - 5.24% | 8,451,443 | ||||||
| NET ASSETS - 100.00% | $ | 161,197,879 | |||||
Notes:
| (a) | Security is exempt from registration pursuant to Rule 144A under the Securities Act of 1933. This security may be resold in transactions that are exempt from registration, normally to qualified institutional buyers. |
| (b) | Non-income producing security. |
| (c) | Affiliated issuers - as defined in the Investment Company Act of 1940 (ownership by the Fund of 5% or more of the outstanding voting securities of these issuers). |
| (d) | Annualized yield at date of purchase. |
| † | U.S. issuer unless otherwise noted. |
REIT: Real Estate Investment Trust.
The accompanying notes are an integral part of the financial statements.
19
Third Avenue Trust
Third Avenue International Value Fund
Portfolio of Investments (continued)
at April 30, 2017 (Unaudited)
| Country Concentration | |||
| % of Net Assets | |||
| Canada | 12.33 | % | |
| United Kingdom | 10.87 | ||
| United States* | 10.71 | ||
| British Virgin Islands | 6.42 | ||
| Jersey | 5.69 | ||
| Singapore | 5.58 | ||
| France | 5.54 | ||
| Cayman Islands | 5.06 | ||
| Norway | 4.81 | ||
| Ireland | 4.55 | ||
| New Zealand | 4.52 | ||
| Belgium | 3.17 | ||
| Netherlands | 3.15 | ||
| Bermuda | 2.44 | ||
| Spain | 2.36 | ||
| Germany | 2.08 | ||
| Brazil | 2.06 | ||
| Hong Kong | 1.86 | ||
| Mexico | 1.56 | ||
| Total | 94.76 | % | |
| * Includes cash equivalents, classified as Short-Term Investments on the Portfolio of Investments. |
The accompanying notes are an integral part of the financial statements.
20
Third Avenue Trust
Statement of Assets and Liabilities
at April 30, 2017 (Unaudited)
| Value Fund | Small-Cap Value Fund | Real Estate Value Fund | International Value Fund | |||||||||||||
| Assets: | ||||||||||||||||
| Investments at value (Notes 1 and 4): | ||||||||||||||||
| Unaffiliated issuers† | $ | 1,087,985,824 | $ | 295,661,014 | $ | 1,762,849,976 | $ | 145,463,779 | ||||||||
| Affiliated issuers‡ | 41,468,126 | — | 32,486,312 | 7,282,657 | ||||||||||||
| Total investments# | 1,129,453,950 | 295,661,014 | 1,795,336,288 | 152,746,436 | ||||||||||||
| Cash | 47,972,074 | 12,677,458 | 50,706,739 | 5,604,863 | ||||||||||||
| Dividends and interest receivable | 1,377,861 | 374,676 | 4,306,962 | 5,036,140 | ||||||||||||
| Receivable for securities sold | 3,540,571 | 4,316,326 | 30,079,853 | 390,529 | ||||||||||||
| Restricted cash pledged to counterparties for collateral management | — | — | 830,000 | — | ||||||||||||
| Receivables for fund shares sold | 35,065 | 13,320 | 1,044,515 | 96,829 | ||||||||||||
| Foreign currency at value^ | — | — | 946 | 4,160 | ||||||||||||
| Purchased foreign currency options* | — | — | 28 | — | ||||||||||||
| Unrealized appreciation on forward foreign currency contracts | — | — | 15,015 | — | ||||||||||||
| Other assets | 53,215 | 31,048 | 66,615 | 22,080 | ||||||||||||
| Total assets | 1,182,432,736 | 313,073,842 | 1,882,386,961 | 163,901,037 | ||||||||||||
| Liabilities: | ||||||||||||||||
| Payable for securities purchased | 2,879,078 | 2,711,626 | 8,077,273 | 1,934,898 | ||||||||||||
| Payable for fund shares redeemed | 1,391,889 | 418,697 | 979,239 | 462,485 | ||||||||||||
| Restricted cash received from counterparty for collateral management | — | — | 32,000 | — | ||||||||||||
| Payable to Adviser (Note 3) | 984,980 | 254,673 | 1,589,946 | 148,693 | ||||||||||||
| Distribution fees payable (Note 5) | 2,872 | 1,063 | 50,824 | 6,391 | ||||||||||||
| Payable to trustees | 7,938 | 329 | 33,275 | 467 | ||||||||||||
| Accrued expenses | 403,398 | 146,233 | 538,269 | 142,974 | ||||||||||||
| Taxes payable | 442,940 | — | — | 7,250 | ||||||||||||
| Total liabilities | 6,113,095 | 3,532,621 | 11,300,826 | 2,703,158 | ||||||||||||
| Net assets | $ | 1,176,319,641 | $ | 309,541,221 | $ | 1,871,086,135 | $ | 161,197,879 | ||||||||
The accompanying notes are an integral part of the financial statements.
21
Third Avenue Trust
Statement of Assets and Liabilities
at April 30, 2017 (Unaudited)
| Value Fund | Small-Cap Value Fund | Real Estate Value Fund | International Value Fund | |||||||||||||
| Summary of net assets: | ||||||||||||||||
| Capital stock, $0.001 par value, | $ | 918,200,043 | $ | 207,169,059 | $ | 1,253,086,752 | $ | 195,111,177 | ||||||||
| Accumulated undistributed net investment income/(distributions in excess of net investment income) | 11,422,749 | (3,021,469 | ) | (660,015 | ) | (3,171,872 | ) | |||||||||
| Accumulated net realized gain/(loss) on investments and foreign currency transactions | 64,133,759 | 30,475,538 | 44,033,305 | (13,605,727 | ) | |||||||||||
| Net unrealized appreciation/(depreciation) on investments and translation of foreign currency denominated assets and liabilities | 182,563,090 | 74,918,093 | 574,626,093 | (17,135,699 | ) | |||||||||||
| Net assets applicable to capital shares outstanding | $ | 1,176,319,641 | $ | 309,541,221 | $ | 1,871,086,135 | $ | 161,197,879 | ||||||||
| Investor Class | ||||||||||||||||
| Net assets | $ | 14,013,113 | $ | 5,266,152 | $ | 247,574,827 | $ | 31,403,238 | ||||||||
| Outstanding shares of beneficial interest, unlimited number of shares authorized | 262,098 | 238,450 | 7,559,118 | 1,841,681 | ||||||||||||
| Net asset value, offering and redemption price per share± | $ | 53.47 | $ | 22.08 | $ | 32.75 | $ | 17.05 | ||||||||
| Institutional Class | ||||||||||||||||
| Net assets | $ | 1,162,306,528 | $ | 304,275,069 | $ | 1,623,511,308 | $ | 129,794,641 | ||||||||
| Outstanding shares of beneficial interest, unlimited number of shares authorized | 21,725,526 | 13,648,460 | 49,289,519 | 7,616,902 | ||||||||||||
| Net asset value, offering and redemption price per share± | $ | 53.50 | $ | 22.29 | $ | 32.94 | $ | 17.04 | ||||||||
| † Cost of unaffiliated issuers | $ | 852,319,289 | $ | 220,686,261 | $ | 1,198,647,082 | $ | 151,057,641 | ||||||||
| ‡ Cost of affiliated issuers | $ | 94,554,560 | $ | — | $ | 21,123,824 | $ | 18,448,659 | ||||||||
| # Total cost | $ | 946,873,849 | $ | 220,686,261 | $ | 1,219,770,906 | $ | 169,506,300 | ||||||||
| ^ Cost of foreign currency | $ | — | $ | — | $ | 940 | $ | 4,089 | ||||||||
| * Cost of purchased foreign currency options | $ | — | $ | — | $ | 945,000 | $ | — | ||||||||
| ± Redemption price is gross of redemption fees (Note 6) | ||||||||||||||||
The accompanying notes are an integral part of the financial statements.
22
Third Avenue Trust
Statement of Operations
For the Six Months Ended April 30, 2017 (Unaudited)
| Value Fund | Small-Cap Value Fund | Real Estate Value Fund | International Value Fund | |||||||||||||
| Investment Income: | ||||||||||||||||
| Dividends - unaffiliated issuers* | $ | 4,920,739 | $ | 603,074 | $ | 15,627,665 | $ | 931,550 | ||||||||
| Dividends - affiliated issuers (Note 4) | — | — | — | 4,586,230 | ||||||||||||
| Interest - unaffiliated issuers | 46,821 | — | 179,284 | 191,395 | ||||||||||||
| Interest - payment-in-kind unaffiliated issuers (Note 1) | — | — | 107,924 | — | ||||||||||||
| Interest - payment-in-kind affiliated issuers (Notes 1 and 4) | 726,125 | — | — | — | ||||||||||||
| Other income | 13,140 | — | 36,600 | — | ||||||||||||
| Total investment income | 5,706,825 | 603,074 | 15,951,473 | 5,709,175 | ||||||||||||
| Expenses: | ||||||||||||||||
| Investment advisory fees (Note 3) | 5,311,809 | 1,395,717 | 8,038,018 | 895,808 | ||||||||||||
| Shareholder servicing fees (Note 3) | 545,480 | 138,849 | 918,512 | 76,169 | ||||||||||||
| Auditing and tax fees | 68,617 | 40,220 | 48,817 | 40,479 | ||||||||||||
| Transfer agent fees | 257,963 | 110,873 | 168,524 | 89,588 | ||||||||||||
| Reports to shareholders | 74,384 | 20,332 | 123,972 | 10,413 | ||||||||||||
| Accounting fees | 62,840 | 26,023 | 95,228 | 36,004 | ||||||||||||
| Administration fees (Note 3) | 32,461 | 8,529 | 49,121 | 3,941 | ||||||||||||
| Custodian fees | 26,669 | 3,997 | 102,856 | 17,033 | ||||||||||||
| Trustees’ and officers’ fees and expenses | 159,063 | 41,753 | 251,638 | 17,104 | ||||||||||||
| Insurance | 38,989 | 10,270 | 62,789 | 3,107 | ||||||||||||
| Legal fees | 85,624 | 20,290 | 142,751 | 12,130 | ||||||||||||
| Distribution fees (Note 5) | 17,837 | 6,456 | 295,898 | 24,252 | ||||||||||||
| Registration and filing fees | 21,952 | 17,783 | 44,475 | 18,580 | ||||||||||||
| Miscellaneous | 32,471 | 7,468 | 62,400 | 7,694 | ||||||||||||
| Total expenses | 6,736,159 | 1,848,560 | 10,404,999 | 1,252,302 | ||||||||||||
| Less: Expenses waived (Note 3) | — | (56,117 | ) | — | (222,649 | ) | ||||||||||
| Expenses reduced by custodian fee expense offset arrangement (Note 3) | (10,126 | ) | (2,570 | ) | (15,895 | ) | (2,097 | ) | ||||||||
| Net expenses | 6,726,033 | 1,789,873 | 10,389,104 | 1,027,556 | ||||||||||||
| Net investment income/(loss) | (1,019,208 | ) | (1,186,799 | ) | 5,562,369 | 4,681,619 | ||||||||||
| Realized and unrealized gain/(loss) on investments, written options, and foreign currency transactions: | ||||||||||||||||
| Net realized gain/(loss) on investments - unaffiliated issuers | 67,101,342 | 30,900,541 | 47,596,047 | (5,052,502 | ) | |||||||||||
| Net realized gain/(loss) on investments - affiliated issuers | 767,150 | — | — | (854,940 | ) | |||||||||||
| Net realized gain on written equity options | 59,100 | — | — | — | ||||||||||||
| Net realized gain/(loss) on foreign currency transactions | (47,133 | ) | 3,307 | 1,899,365 | (121,520 | ) | ||||||||||
| Net change in unrealized appreciation/(depreciation) on investments | 78,048,157 | 16,502,062 | 158,846,461 | 20,641,692 | ||||||||||||
| Net change in unrealized appreciation/(depreciation) on translation of other assets and liabilities denominated in foreign currency | 38,613 | 462 | 858,179 | (74,389 | ) | |||||||||||
| Net gain on investments and foreign currency transactions | 145,967,229 | 47,406,372 | 209,200,052 | 14,538,341 | ||||||||||||
| Net increase in net assets resulting from operations | $ | 144,948,021 | $ | 46,219,573 | $ | 214,762,421 | $ | 19,219,960 | ||||||||
| * Net of foreign withholding taxes of | $ | 254,811 | $ | — | $ | 453,122 | $ | 46,452 | ||||||||
The accompanying notes are an integral part of the financial statements.
23
Third Avenue Trust
Statement of Changes in Net Assets
| Value Fund | Small-Cap Value Fund | |||||||||||||||
| For the Six Months Ended April 30, 2017 (Unaudited) | For the Year Ended October 31, 2016 | For the Six Months Ended April 30, 2017 (Unaudited) | For the Year Ended October 31, 2016 | |||||||||||||
| Operations: | ||||||||||||||||
| Net investment income/(loss) | $ | (1,019,208 | ) | $ | 14,841,542 | $ | (1,186,799 | ) | $ | 2,026,567 | ||||||
| Net realized gain | 67,880,459 | 48,409,222 | 30,903,848 | 27,350,988 | ||||||||||||
| Net change in unrealized appreciation/(depreciation) | 78,086,770 | (64,061,867 | ) | 16,502,524 | (13,777,526 | ) | ||||||||||
| Net increase/(decrease) in net assets resulting from operations | 144,948,021 | (811,103 | ) | 46,219,573 | 15,600,029 | |||||||||||
| Dividends and Distributions to Shareholders from: | ||||||||||||||||
| Net investment income: | ||||||||||||||||
| Investor Class | (80,506 | ) | (309,798 | ) | (14,608 | ) | — | |||||||||
| Institutional Class | (9,821,084 | ) | (22,539,852 | ) | (1,692,493 | ) | — | |||||||||
| Net realized gains: | ||||||||||||||||
| Investor Class | (992,772 | ) | (1,659,569 | ) | (418,302 | ) | (1,115,615 | ) | ||||||||
| Institutional Class | (81,010,260 | ) | (96,040,894 | ) | (24,923,360 | ) | (46,384,578 | ) | ||||||||
| Decrease in net assets from dividends and distributions | (91,904,622 | ) | (120,550,113 | ) | (27,048,763 | ) | (47,500,193 | ) | ||||||||
| Capital Share Transactions: | ||||||||||||||||
| Proceeds from sale of shares | 16,063,475 | 17,208,028 | 4,654,370 | 6,657,754 | ||||||||||||
| Net asset value of shares issued in reinvestment of dividends and distributions | 88,658,512 | 116,333,170 | 26,461,606 | 46,419,821 | ||||||||||||
| Redemption fees | 2,637 | 8,925 | 1,190 | 1,725 | ||||||||||||
| Cost of shares redeemed | (138,111,983 | ) | (541,257,635 | ) | (38,057,776 | ) | (121,688,598 | ) | ||||||||
| Net decrease in net assets resulting from capital share transactions | (33,387,359 | ) | (407,707,512 | ) | (6,940,610 | ) | (68,609,298 | ) | ||||||||
| Net increase/(decrease) in net assets | 19,656,040 | (529,068,728 | ) | 12,230,200 | (100,509,462 | ) | ||||||||||
| Net assets at beginning of period | 1,156,663,601 | 1,685,732,329 | 297,311,021 | 397,820,483 | ||||||||||||
| Net assets at end of period* | $ | 1,176,319,641 | $ | 1,156,663,601 | $ | 309,541,221 | $ | 297,311,021 | ||||||||
| * Including accumulated undistributed net investment income/ (distributions in excess of net investment income) of | $ | 11,422,749 | $ | 22,343,547 | $ | (3,021,469 | ) | $ | (127,569 | ) | ||||||
The accompanying notes are an integral part of the financial statements.
24
Third Avenue Trust
Statement of Changes in Net Assets
| Real Estate Value Fund | International Value Fund | |||||||||||||||
| For the Six Months Ended April 30, 2017 (Unaudited) | For the Year Ended October 31, 2016 | For the Six Months Ended April 30, 2017 (Unaudited) | For the Year Ended October 31, 2016 | |||||||||||||
| Operations: | ||||||||||||||||
| Net investment income | $ | 5,562,369 | $ | 12, 003,062 | $ | 4,681,619 | $ | 1,555,021 | ||||||||
| Net realized gain/(loss) | 49,495,412 | 39,372,450 | (6,028,962 | ) | (6,318,910 | ) | ||||||||||
| Net change in unrealized appreciation/(depreciation) | 159,704,640 | (138,256,671 | ) | 20,567,303 | 4,112,816 | |||||||||||
| Net increase/(decrease) in net assets resulting from operations | 214,762,421 | (86,881,159 | ) | 19,219,960 | (651,073 | ) | ||||||||||
| Dividends and Distributions to Shareholders from: | ||||||||||||||||
| Net investment income: | ||||||||||||||||
| Investor Class | (1,265,619 | ) | (1,877,632 | ) | (247,203 | ) | — | |||||||||
| Institutional Class | (12,800,132 | ) | (19,925,485 | ) | (5,486,413 | ) | (331,431 | ) | ||||||||
| Net realized gains: | ||||||||||||||||
| Investor Class | (2,200,063 | ) | (19,638,175 | ) | — | (76,680 | ) | |||||||||
| Institutional Class | (14,239,140 | ) | (132,429,662 | ) | — | (2,282,943 | ) | |||||||||
| Decrease in net assets from dividends and distributions | (30,504,954 | ) | (173,870,954 | ) | (5,733,616 | ) | (2,691,054 | ) | ||||||||
| Capital Share Transactions: | ||||||||||||||||
| Proceeds from sale of shares | 135,284,772 | 304,661,847 | 32,844,251 | 4,242,388 | ||||||||||||
| Net asset value of shares issued in reinvestment of dividends and distributions | 28,821,858 | 164,892,407 | 5,571,375 | 2,618,813 | ||||||||||||
| Redemption fees | 16,938 | 105,529 | 6,403 | 4,198 | ||||||||||||
| Cost of shares redeemed | (317,683,876 | ) | (1,833,310,328 | ) | (19,336,553 | ) | (76,397,119 | ) | ||||||||
| Net increase/(decrease) in net assets resulting from capital share transactions | (153,560,308 | ) | (1,363,650,545 | ) | 19,085,476 | (69,531,720 | ) | |||||||||
| Net increase/(decrease) in net assets | 30,697,159 | (1,624,402,658 | ) | 32,571,820 | (72,873,847 | ) | ||||||||||
| Net assets at beginning of period | 1,840,388,976 | 3,464,791,634 | 128,626,059 | 201,499,906 | ||||||||||||
| Net assets at end of period* | $ | 1,871,086,135 | $ | 1,840,388,976 | $ | 161,197,879 | $ | 128,626,059 | ||||||||
| * Including accumulated undistributed net investment income/ (distributions in excess of net investment income) of | $ | (660,015 | ) | $ | 7,843,367 | $ | (3,171,872 | ) | $ | (2,119,875 | ) | |||||
The accompanying notes are an integral part of the financial statements.
25
| Third Avenue Trust |
| Financial Highlights |
| Selected data (for a share outstanding throughout each period) and ratios are as follows: |
| Third Avenue Value Fund | ||||||||||||||||||||||||
| For The Six | ||||||||||||||||||||||||
| Months Ended | ||||||||||||||||||||||||
| April 30, | Years Ended October 31, | |||||||||||||||||||||||
| 2017 | 2016 | 2015 | 2014 | 2013 | 2012 | |||||||||||||||||||
| (Unaudited) | ||||||||||||||||||||||||
| Investor Class: | ||||||||||||||||||||||||
| Net asset value, beginning of period | $ | 51.12 | $ | 54.22 | $ | 59.54 | $ | 57.73 | $ | 48.47 | $ | 44.00 | ||||||||||||
| Income/(loss) from investment operations: | ||||||||||||||||||||||||
| Net investment income/(loss)@ | (0.11 | ) | 0.41 | ‡ | 0.29 | 1.39 | ± | 0.61 | ** | 0.27 | ||||||||||||||
| Net gain/(loss) on investment transactions (both realized and unrealized) | 6.46 | 0.38 | 1 | (2.46 | )1 | 2.22 | 1 | 9.89 | 1 | 4.99 | 2 | |||||||||||||
| Total from investment operations | 6.35 | 0.79 | (2.17 | ) | 3.61 | 10.50 | 5.26 | |||||||||||||||||
| Less dividends and distributions to shareholders: | ||||||||||||||||||||||||
| Dividends from net investment income | (0.30 | ) | (0.61 | ) | (2.09 | ) | (1.80 | ) | (1.24 | ) | (0.79 | ) | ||||||||||||
| Distributions from net realized gain | (3.70 | ) | (3.28 | ) | (1.06 | ) | — | — | — | |||||||||||||||
| Total dividends and distributions | (4.00 | ) | (3.89 | ) | (3.15 | ) | (1.80 | ) | (1.24 | ) | (0.79 | ) | ||||||||||||
| Net asset value, end of period | $ | 53.47 | $ | 51.12 | $ | 54.22 | $ | 59.54 | $ | 57.73 | $ | 48.47 | ||||||||||||
| Total return3 | 12.82 | %4 | 1.74 | % | (3.90 | %) | 6.45 | % | 22.07 | % | 12.36 | % | ||||||||||||
| Ratios/Supplemental Data: | ||||||||||||||||||||||||
| Net assets, end of period (in thousands) | $ | 14,013 | $ | 14,415 | $ | 28,963 | $ | 33,936 | $ | 36,811 | $ | 25,796 | ||||||||||||
| Ratio of expenses to average net assets | ||||||||||||||||||||||||
| Before fee waivers/expense offset arrangement/recovery | 1.39 | %5 | 1.40 | % | 1.34 | % | 1.33 | % | 1.35 | % | 1.36 | % | ||||||||||||
| After fee waivers/expense offset arrangement/recovery6 | 1.39 | %5 | 1.39 | % | 1.34 | % | 1.32 | % | 1.35 | %† | 1.40 | %† | ||||||||||||
| Ratio of net investment income/(loss) to average net assets | (0.42 | %)5 | 0.83 | %‡ | 0.52 | % | 2.36 | %± | 1.15 | %** | 0.61 | % | ||||||||||||
| Portfolio turnover rate | 6 | %4 | 17 | % | 24 | % | 31 | % | 21 | % | 16 | % | ||||||||||||
| 1 | Includes redemption fees of less than $0.01 per share. |
| 2 | Includes redemption fees of $0.01 per share. |
| 3 | Performance figures may reflect fee waivers, expense offset arrangement and/or recovery of previously waived fees. Past performance is no guarantee of future results. Total return would have been lower if the Adviser had not waived certain expenses. Conversely, total return would have been higher if the Adviser had not recovered previously waived expenses. Total return is calculated assuming an initial investment made at the net asset value at the beginning of the period, reinvestment of all dividends and distributions at net asset value during the period and redemption on the last day of the period and is not annualized. |
| 4 | Not annualized. |
| 5 | Annualized. |
| 6 | As a result of an expense limitation, the ratio of expenses (exclusive of taxes, interest, brokerage commissions, acquired fund fees and expenses, and extraordinary items) to average net assets will not exceed 1.40%. |
| @ | Calculated based on the average number of shares outstanding during the period. |
| ‡ | Investment income per share reflects a special dividend received during the period which amounted to $0.19 per share. Excluding the special dividend, the ratio of net investment income to average net assets would have been 0.43%. |
| ± | Investment income per share reflects special dividends received during the period which amounted to $0.41 per share. Excluding the special dividends, the ratio of net investment income to average net assets would have been 1.67%. |
| ** | Investment income per share reflects a special dividend received during the period which amounted to $0.44 per share. Excluding the special dividend, the ratio of net investment income to average net assets would have been 0.33%. |
| † | The Adviser recovered a portion of its previously waived fees. |
The accompanying notes are an integral part of the financial statements.
26
| Third Avenue Trust |
| Financial Highlights |
| Selected data (for a share outstanding throughout each period) and ratios are as follows: |
| Third Avenue Value Fund | ||||||||||||||||||||||||
| For The Six | ||||||||||||||||||||||||
| Months Ended | ||||||||||||||||||||||||
| April 30, | Years Ended October 31, | |||||||||||||||||||||||
| 2017 | 2016 | 2015 | 2014 | 2013 | 2012 | |||||||||||||||||||
| (Unaudited) | ||||||||||||||||||||||||
| Institutional Class: | ||||||||||||||||||||||||
| Net asset value, beginning of period | $ | 51.22 | $ | 54.35 | $ | 59.69 | $ | 57.86 | $ | 48.53 | $ | 44.08 | ||||||||||||
| Income/(loss) from investment operations: | ||||||||||||||||||||||||
| Net investment income@ | (0.04 | ) | 0.57 | ‡ | 0.43 | 1.53 | ± | 0.77 | ** | 0.37 | ||||||||||||||
| Net gain/(loss) on investment transactions (both realized and unrealized)1 | 6.47 | 0.35 | (2.46 | ) | 2.23 | 9.87 | 4.98 | |||||||||||||||||
| Total from investment operations | 6.43 | 0.92 | (2.03 | ) | 3.76 | 10.64 | 5.35 | |||||||||||||||||
| Less dividends and distributions to shareholders: | ||||||||||||||||||||||||
| Dividends from net investment income | (0.45 | ) | (0.77 | ) | (2.25 | ) | (1.93 | ) | (1.31 | ) | (0.90 | ) | ||||||||||||
| Distributions from net realized gain | (3.70 | ) | (3.28 | ) | (1.06 | ) | — | — | — | |||||||||||||||
| Total dividends and distributions | (4.15 | ) | (4.05 | ) | (3.31 | ) | (1.93 | ) | (1.31 | ) | (0.90 | ) | ||||||||||||
| Net asset value, end of period | $ | 53.50 | $ | 51.22 | $ | 54.35 | $ | 59.69 | $ | 57.86 | $ | 48.53 | ||||||||||||
| Total return2 | 12.99 | %3 | 2.00 | % | (3.64 | %) | 6.70 | % | 22.40 | % | 12.61 | % | ||||||||||||
| Ratios/Supplemental Data: | ||||||||||||||||||||||||
| Net assets, end of period (in thousands) | $ | 1,162,307 | $ | 1,142,249 | $ | 1,656,769 | $ | 2,131,554 | $ | 2,594,637 | $ | 2,601,961 | ||||||||||||
| Ratio of expenses to average net assets | ||||||||||||||||||||||||
| Before fee waivers/expense offset arrangement/recovery | 1.14 | %4 | 1.15 | % | 1.09 | % | 1.08 | % | 1.10 | % | 1.11 | % | ||||||||||||
| After fee waivers/expense offset arrangement/recovery5 | 1.14 | %4 | 1.14 | % | 1.09 | % | 1.07 | % | 1.10 | %† | 1.15 | %† | ||||||||||||
| Ratio of net investment income/(loss) to average net assets | (0.17 | %)4 | 1.16 | %‡ | 0.76 | % | 2.61 | %± | 1.45 | %** | 0.83 | % | ||||||||||||
| Portfolio turnover rate | 6 | %3 | 17 | % | 24 | % | 31 | % | 21 | % | 16 | % | ||||||||||||
| 1 | Includes redemption fees of less than $0.01 per share. |
| 2 | Performance figures may reflect fee waivers, expense offset arrangement and/or recovery of previously waived fees. Past performance is no guarantee of future results. Total return would have been lower if the Adviser had not waived certain expenses. Conversely, total return would have been higher if the Adviser had not recovered previously waived expenses. Total return is calculated assuming an initial investment made at the net asset value at the beginning of the period, reinvestment of all dividends and distributions at net asset value during the period and redemption on the last day of the period and is not annualized. |
| 3 | Not annualized. |
| 4 | Annualized. |
| 5 | As a result of an expense limitation, the ratio of expenses (exclusive of taxes, interest, brokerage commissions, acquired fund fees and expenses, and extraordinary items) to average net assets will not exceed 1.15%. |
| @ | Calculated based on the average number of shares outstanding during the period. |
| ‡ | Investment income per share reflects a special dividend received during the period which amounted to $0.19 per share. Excluding the special dividend, the ratio of net investment income to average net assets would have been 0.76%. |
| ± | Investment income per share reflects special dividends received during the period which amounted to $0.41 per share. Excluding the special dividends, the ratio of net investment income to average net assets would have been 1.92%. |
| † | The Adviser recovered a portion of its previously waived fees. |
| ** | Investment income per share reflects a special dividend received during the period which amounted to $0.44 per share. Excluding the special dividend, the ratio of net investment income to average net assets would have been 0.63%. |
The accompanying notes are an integral part of the financial statements.
27
| Third Avenue Trust |
| Financial Highlights |
| Selected data (for a share outstanding throughout each period) and ratios are as follows: |
| Third Avenue Small-Cap Value Fund | ||||||||||||||||||||||||
| For The Six | ||||||||||||||||||||||||
| Months Ended | ||||||||||||||||||||||||
| April 30, | Years Ended October 31, | |||||||||||||||||||||||
| 2017 | 2016 | 2015 | 2014 | 2013 | 2012 | |||||||||||||||||||
| (Unaudited) | ||||||||||||||||||||||||
| Investor Class: | ||||||||||||||||||||||||
| Net asset value, beginning of period | $ | 20.77 | $ | 22.28 | $ | 28.18 | $ | 28.10 | $ | 22.13 | $ | 20.25 | ||||||||||||
| Income/(loss) from investment operations: | ||||||||||||||||||||||||
| Net investment income/(loss)@ | (0.11 | ) | 0.08 | ‡ | (0.10 | ) | (0.11 | ) | 0.06 | ** | (0.04 | ) | ||||||||||||
| Net gain/(loss) on investment transactions (both realized and unrealized)1 | 3.34 | 1.17 | (0.19 | ) | 1.96 | 6.57 | 2.01 | |||||||||||||||||
| Total from investment operations | 3.23 | 1.25 | (0.29 | ) | 1.85 | 6.63 | 1.97 | |||||||||||||||||
| Less dividends and distributions to shareholders: | ||||||||||||||||||||||||
| Dividends from net investment income | (0.06 | ) | — | — | — | (0.16 | ) | (0.02 | ) | |||||||||||||||
| Distributions from net realized gain | (1.86 | ) | (2.76 | ) | (5.61 | ) | (1.77 | ) | (0.50 | ) | (0.07 | ) | ||||||||||||
| Total dividends and distributions | (1.92 | ) | (2.76 | ) | (5.61 | ) | (1.77 | ) | (0.66 | ) | (0.09 | ) | ||||||||||||
| Net asset value, end of period | $ | 22.08 | $ | 20.77 | $ | 22.28 | $ | 28.18 | $ | 28.10 | $ | 22.13 | ||||||||||||
| Total return2 | 15.82 | %3 | 6.71 | % | (1.49 | %) | 6.85 | % | 30.74 | % | 9.77 | % | ||||||||||||
| Ratios/Supplemental Data: | ||||||||||||||||||||||||
| Net assets, end of period (in thousands) | $ | 5,266 | $ | 5,145 | $ | 9,379 | $ | 9,898 | $ | 11,995 | $ | 8,216 | ||||||||||||
| Ratio of expenses to average net assets | ||||||||||||||||||||||||
| Before fee waivers/expense offset arrangement/recovery | 1.44 | %4 | 1.45 | % | 1.39 | % | 1.35 | % | 1.37 | % | 1.38 | % | ||||||||||||
| After fee waivers/expense offset arrangement/recovery5 | 1.40 | %4,# | 1.40 | %# | 1.39 | % | 1.35 | % | 1.37 | % | 1.38 | %† | ||||||||||||
| Ratio of net investment income/(loss) to average net assets | (1.02 | %)4 | 0.39 | %‡ | (0.42 | %) | (0.41 | %) | 0.25 | %** | (0.18 | %) | ||||||||||||
| Portfolio turnover rate | 17 | %3 | 20 | % | 29 | % | 40 | % | 39 | % | 33 | % | ||||||||||||
| 1 | Includes redemption fees of less than $0.01 per share. |
| 2 | Performance figures may reflect fee waivers, expense offset arrangement and/or recovery of previously waived fees. Past performance is no guarantee of future results. Total return would have been lower if the Adviser had not waived certain expenses. Conversely, total return would have been higher if the Adviser had not recovered previously waived expenses. Total return is calculated assuming an initial investment made at the net asset value at the beginning of the period, reinvestment of all dividends and distributions at net asset value during the period and redemption on the last day of the period and is not annualized. |
| 3 | Not annualized. |
| 4 | Annualized. |
| 5 | As a result of an expense limitation, the ratio of expenses (exclusive of taxes, interest, brokerage commissions, acquired fund fees and expenses, and extraordinary items) to average net assets will not exceed 1.40%. |
| @ | Calculated based on the average number of shares outstanding during the period. |
| ‡ | Investment income per share reflects special dividends received during the period which amounted to $0.11 per share. Excluding the special dividends, the ratio of net investment income/(loss) to average net assets would have been (0.17%). |
| ** | Investment income per share reflects special dividends received during the period which amounted to $0.11 per share. Excluding the special dividends, the ratio of net investment income/(loss) to average net assets would have been (0.18%). |
| # | The Adviser waived a portion of its fees. |
| † | The Adviser recovered a portion of its previously waived fees. |
The accompanying notes are an integral part of the financial statements.
28
| Third Avenue Trust |
| Financial Highlights |
| Selected data (for a share outstanding throughout each period) and ratios are as follows: |
| Third Avenue Small-Cap Value Fund | ||||||||||||||||||||||||
| For The Six | ||||||||||||||||||||||||
| Months Ended | ||||||||||||||||||||||||
| April 30, | Years Ended October 31, | |||||||||||||||||||||||
| 2017 | 2016 | 2015 | 2014 | 2013 | 2012 | |||||||||||||||||||
| (Unaudited) | ||||||||||||||||||||||||
| Institutional Class: | ||||||||||||||||||||||||
| Net asset value, beginning of period | $ | 20.97 | $ | 22.42 | $ | 28.27 | $ | 28.16 | $ | 22.18 | $ | 20.30 | ||||||||||||
| Income/(loss) from investment operations: | ||||||||||||||||||||||||
| Net investment income/(loss)@ | (0.08 | ) | 0.13 | ‡ | (0.04 | ) | (0.05 | ) | 0.15 | ** | 0.01 | |||||||||||||
| Net gain/(loss) on investment transactions (both realized and unrealized)1 | 3.39 | 1.18 | (0.20 | ) | 1.97 | 6.54 | 2.01 | |||||||||||||||||
| Total from investment operations | 3.31 | 1.31 | (0.24 | ) | 1.92 | 6.69 | 2.02 | |||||||||||||||||
| Less dividends and distributions to shareholders: | ||||||||||||||||||||||||
| Dividends from net investment income | (0.13 | ) | — | — | (0.04 | ) | (0.21 | ) | (0.07 | ) | ||||||||||||||
| Distributions from net realized gain | (1.86 | ) | (2.76 | ) | (5.61 | ) | (1.77 | ) | (0.50 | ) | (0.07 | ) | ||||||||||||
| Total dividends and distributions | (1.99 | ) | (2.76 | ) | (5.61 | ) | (1.81 | ) | (0.71 | ) | (0.14 | ) | ||||||||||||
| Net asset value, end of period | $ | 22.29 | $ | 20.97 | $ | 22.42 | $ | 28.27 | $ | 28.16 | $ | 22.18 | ||||||||||||
| Total return2 | 16.03 | %3 | 6.95 | % | (1.27 | %) | 7.09 | % | 31.05 | % | 9.99 | % | ||||||||||||
| Ratios/Supplemental Data: | ||||||||||||||||||||||||
| Net assets, end of period (in thousands) | $ | 304,275 | $ | 292,166 | $ | 388,441 | $ | 510,053 | $ | 667,712 | $ | 641,684 | ||||||||||||
| Ratio of expenses to average net assets | ||||||||||||||||||||||||
| Before fee waivers/expense offset arrangement/recovery | 1.19 | %4 | 1.21 | % | 1.14 | % | 1.10 | % | 1.12 | % | 1.13 | % | ||||||||||||
| After fee waivers/expense offset arrangement/recovery5 | 1.15 | %4,# | 1.15 | %# | 1.14 | % | 1.10 | % | 1.12 | % | 1.13 | %† | ||||||||||||
| Ratio of net investment income/(loss) to average net assets | (0.76 | %)4 | 0.65 | %‡ | (0.16 | %) | (0.17 | %) | 0.62 | %** | 0.07 | % | ||||||||||||
| Portfolio turnover rate | 17 | %3 | 20 | % | 29 | % | 40 | % | 39 | % | 33 | % | ||||||||||||
| 1 | Includes redemption fees of less than $0.01 per share. |
| 2 | Performance figures may reflect fee waivers, expense offset arrangement and/or recovery of previously waived fees. Past performance is no guarantee of future results. Total return would have been lower if the Adviser had not waived certain expenses. Conversely, total return would have been higher if the Adviser had not recovered previously waived expenses. Total return is calculated assuming an initial investment made at the net asset value at the beginning of the period, reinvestment of all dividends and distributions at net asset value during the period and redemption on the last day of the period and is not annualized. |
| 3 | Not annualized. |
| 4 | Annualized. |
| 5 | As a result of an expense limitation, the ratio of expenses (exclusive of taxes, interest, brokerage commissions, acquired fund fees and expenses, and extraordinary items) to average net assets will not exceed 1.15%. |
| @ | Calculated based on the average number of shares outstanding during the period. |
| ‡ | Investment income per share reflects special dividends received during the period which amounted to $0.11 per share. Excluding the special dividends, the ratio of net investment income to average net assets would have been 0.09%. |
| ** | Investment income per share reflects special dividends received during the period which amounted to $0.11 per share. Excluding the special dividends, the ratio of net investment income to average net assets would have been 0.19%. |
| # | The Adviser waived a portion of its fees. |
| † | The Adviser recovered a portion of its previously waived fees. |
The accompanying notes are an integral part of the financial statements.
29
Third Avenue Trust
Financial Highlights
Selected data (for a share outstanding throughout each period) and ratios are as follows:
| Third Avenue Real Estate Value Fund | ||||||||||||||||||||||||
| For The Six Months Ended April 30, | Years Ended October 31, | |||||||||||||||||||||||
| 2017 | 2016 | 2015 | 2014 | 2013 | 2012 | |||||||||||||||||||
| (Unaudited) | ||||||||||||||||||||||||
| Investor Class: | ||||||||||||||||||||||||
| Net asset value, beginning of period | $ | 29.51 | $ | 31.14 | $ | 31.84 | $ | 29.40 | $ | 26.53 | $ | 21.40 | ||||||||||||
| Income/(loss) from investment operations: | ||||||||||||||||||||||||
| Net investment income/(loss)@ | 0.06 | 0.08 | ‡ | (0.04 | ) | 0.50 | ± | 0.10 | 0.16 | |||||||||||||||
| Net gain/(loss) on investment transactions (both realized and unrealized)1 | 3.62 | (0.18 | ) | 0.41 | 2.60 | 4.99 | 4.97 | |||||||||||||||||
| Total from investment operations | 3.68 | (0.10 | ) | 0.37 | 3.10 | 5.09 | 5.13 | |||||||||||||||||
| Less dividends and distributions to shareholders: | ||||||||||||||||||||||||
| Dividends from net investment income | (0.16 | ) | (0.13 | ) | (0.44 | ) | (0.26 | ) | (0.84 | ) | — | |||||||||||||
| Distributions from net realized gain | (0.28 | ) | (1.40 | ) | (0.63 | ) | (0.40 | ) | (1.38 | ) | — | |||||||||||||
| Total dividends and distributions | (0.44 | ) | (1.53 | ) | (1.07 | ) | (0.66 | ) | (2.22 | ) | — | |||||||||||||
| Net asset value, end of period | $ | 32.75 | $ | 29.51 | $ | 31.14 | $ | 31.84 | $ | 29.40 | $ | 26.53 | ||||||||||||
| Total return2 | 12.62 | %3 | (0.21 | %) | 1.12 | % | 10.84 | % | 20.61 | % | 23.97 | % | ||||||||||||
| Ratios/Supplemental Data: | ||||||||||||||||||||||||
| Net assets, end of period (in thousands) | $ | 247,575 | $ | 243,502 | $ | 438,506 | $ | 367,834 | $ | 145,169 | $ | 60,684 | ||||||||||||
| Ratio of expenses to average net assets | ||||||||||||||||||||||||
| Before fee waivers/expense offset arrangement/recovery | 1.38 | %4 | 1.38 | % | 1.35 | % | 1.34 | % | 1.34 | % | 1.34 | % | ||||||||||||
| After fee waivers/expense offset arrangement/recovery5 | 1.38 | %4 | 1.38 | % | 1.35 | % | 1.33 | % | 1.33 | % | 1.34 | % | ||||||||||||
| Ratio of net investment income/(loss) to average net assets | 0.41 | %4 | 0.28 | %‡ | (0.11 | %) | 1.63 | %± | 0.36 | % | 0.68 | % | ||||||||||||
| Portfolio turnover rate | 2 | %3 | 20 | % | 17 | % | 14 | % | 13 | % | 4 | % | ||||||||||||
| 1 | Includes redemption fees of less than $0.01 per share. |
| 2 | Performance figures may reflect fee waivers, expense offset arrangement and/or recovery of previously waived fees. Past performance is no guarantee of future results. Total return would have been lower if the Adviser had not waived certain expenses. Conversely, total return would have been higher if the Adviser had not recovered previously waived expenses. Total return is calculated assuming an initial investment made at the net asset value at the beginning of the period, reinvestment of all dividends and distributions at net asset value during the period and redemption on the last day of the period and is not annualized. |
| 3 | Not annualized. |
| 4 | Annualized. |
| 5 | As a result of an expense limitation, the ratio of expenses (exclusive of taxes, interest, brokerage commissions, acquired fund fees and expenses, and extraordinary items) to average net assets will not exceed 1.40%. |
| @ | Calculated based on the average number of shares outstanding during the period. |
| ‡ | Investment income per share reflects a special dividend received during the period which amounted to $0.09 per share. Excluding the special dividend, the ratio of net investment income/(loss) to average net assets would have been (0.04%). |
| ± | Investment income per share reflects a special dividend received during the period which amounted to $0.06 per share. Excluding the special dividend, the ratio of net investment income to average net assets would have been 1.43%. |
The accompanying notes are an integral part of the financial statements.
30
Third Avenue Trust
Financial Highlights
Selected data (for a share outstanding throughout each period) and ratios are as follows:
| Third Avenue Real Estate Value Fund | ||||||||||||||||||||||||
| For The Six Months Ended April 30, | Years Ended October 31, | |||||||||||||||||||||||
| 2017 | 2016 | 2015 | 2014 | 2013 | 2012 | |||||||||||||||||||
| (Unaudited) | ||||||||||||||||||||||||
| Institutional Class: | ||||||||||||||||||||||||
| Net asset value, beginning of period | $ | 29.73 | $ | 31.36 | $ | 32.05 | $ | 29.56 | $ | 26.66 | $ | 21.45 | ||||||||||||
| Income/(loss) from investment operations: | ||||||||||||||||||||||||
| Net investment income@ | 0.10 | 0.16 | ‡ | 0.04 | 0.56 | ± | 0.18 | 0.22 | ||||||||||||||||
| Net gain/(loss) on investment transactions (both realized and unrealized)1 | 3.64 | (0.18 | ) | 0.41 | 2.63 | 4.99 | 4.99 | |||||||||||||||||
| Total from investment operations | 3.74 | (0.02 | ) | 0.45 | 3.19 | 5.17 | 5.21 | |||||||||||||||||
| Less dividends and distributions to shareholders: | ||||||||||||||||||||||||
| Dividends from net investment income | (0.25 | ) | (0.21 | ) | (0.51 | ) | (0.30 | ) | (0.89 | ) | — | |||||||||||||
| Distributions from net realized gain | (0.28 | ) | (1.40 | ) | (0.63 | ) | (0.40 | ) | (1.38 | ) | — | |||||||||||||
| Total dividends and distributions | (0.53 | ) | (1.61 | ) | (1.14 | ) | (0.70 | ) | (2.27 | ) | — | |||||||||||||
| Net asset value, end of period | $ | 32.94 | $ | 29.73 | $ | 31.36 | $ | 32.05 | $ | 29.56 | $ | 26.66 | ||||||||||||
| Total return2 | 12.76 | %3 | 0.05 | % | 1.37 | % | 11.11 | % | 20.87 | % | 24.29 | % | ||||||||||||
| Ratios/Supplemental Data: | ||||||||||||||||||||||||
| Net assets, end of period (in thousands) | $ | 1,623,511 | $ | 1,596,887 | $ | 3,026,286 | $ | 2,866,849 | $ | 2,010,557 | $ | 1,689,612 | ||||||||||||
| Ratio of expenses to average net assets | ||||||||||||||||||||||||
| Before fee waivers/expense offset arrangement/recovery | 1.13 | %4 | 1.13 | % | 1.10 | % | 1.09 | % | 1.09 | % | 1.09 | % | ||||||||||||
| After fee waivers/expense offset arrangement/recovery5 | 1.13 | %4 | 1.13 | % | 1.10 | % | 1.08 | % | 1.08 | % | 1.09 | % | ||||||||||||
| Ratio of net investment income to average net assets | 0.66 | %4 | 0.56 | %‡ | 0.13 | % | 1.82 | %± | 0.65 | % | 0.96 | % | ||||||||||||
| Portfolio turnover rate | 2 | %3 | 20 | % | 17 | % | 14 | % | 13 | % | 4 | % | ||||||||||||
| 1 | Includes redemption fees of less than $0.01 per share. |
| 2 | Performance figures may reflect fee waivers, expense offset arrangement and/or recovery of previously waived fees. Past performance is no guarantee of future results. Total return would have been lower if the Adviser had not waived certain expenses. Conversely, total return would have been higher if the Adviser had not recovered previously waived expenses. Total return is calculated assuming an initial investment made at the net asset value at the beginning of the period, reinvestment of all dividends and distributions at net asset value during the period and redemption on the last day of the period and is not annualized. |
| 3 | Not annualized. |
| 4 | Annualized. |
| 5 | As a result of an expense limitation, the ratio of expenses (exclusive of taxes, interest, brokerage commissions, acquired fund fees and expenses, and extraordinary items) to average net assets will not exceed 1.15%. |
| @ | Calculated based on the average number of shares outstanding during the period. |
| ‡ | Investment income per share reflects a special dividend received during the period which amounted to $0.09 per share. |
Excluding the special dividend, the ratio of net investment income to average net assets would have been 0.24%.
| ± | Investment income per share reflects a special dividend received during the period which amounted to $0.06 per share. |
Excluding the special dividend, the ratio of net investment income to average net assets would have been 1.62%.
The accompanying notes are an integral part of the financial statements.
31
Third Avenue Trust
Financial Highlights
Selected data (for a share outstanding throughout each period) and ratios are as follows:
| Third Avenue International Value Fund | ||||||||||||||||||||||||
| For The Six Months Ended April 30, | Years Ended October 31, | |||||||||||||||||||||||
| 2017 | 2016 | 2015 | 2014 | 2013 | 2012 | |||||||||||||||||||
| (Unaudited) | ||||||||||||||||||||||||
| Investor Class: | ||||||||||||||||||||||||
| Net asset value, beginning of period | $ | 15.59 | $ | 15.29 | $ | 17.58 | $ | 19.96 | $ | 16.14 | $ | 15.29 | ||||||||||||
| Income/(loss) from investment operations: | ||||||||||||||||||||||||
| Net investment income@ | 0.21 | 0.13 | 0.08 | 0.39 | ± | 0.25 | ** | 0.08 | ||||||||||||||||
| Net gain/(loss) on investment transactions (both realized and unrealized)1 | 1.96 | 0.37 | (1.26 | ) | (2.55 | ) | 3.68 | 0.99 | ||||||||||||||||
| Total from investment operations | 2.17 | 0.50 | (1.18 | ) | (2.16 | ) | 3.93 | 1.07 | ||||||||||||||||
| Less dividends and distributions to shareholders: | ||||||||||||||||||||||||
| Dividends from net investment income | (0.71 | ) | — | (1.11 | ) | (0.22 | ) | (0.11 | ) | (0.22 | ) | |||||||||||||
| Distributions from net realized gain | — | (0.20 | ) | — | — | — | — | |||||||||||||||||
| Total dividends and distributions | (0.71 | ) | (0.20 | ) | (1.11 | ) | (0.22 | ) | (0.11 | ) | (0.22 | ) | ||||||||||||
| Net asset value, end of period | $ | 17.05 | $ | 15.59 | $ | 15.29 | $ | 17.58 | $ | 19.96 | $ | 16.14 | ||||||||||||
| Total return2 | 14.28 | %3 | 3.44 | % | (7.24 | %) | (10.96 | %) | 24.49 | % | 7.20 | % | ||||||||||||
| Ratios/Supplemental Data: | ||||||||||||||||||||||||
| Net assets, end of period (in thousands) | $ | 31,403 | $ | 4,465 | $ | 5,977 | $ | 12,266 | $ | 35,013 | $ | 18,533 | ||||||||||||
| Ratio of expenses to average net assets | ||||||||||||||||||||||||
| Before fee waivers and expense offset arrangement | 1.95 | %4 | 2.04 | % | 1.86 | % | 1.71 | % | 1.69 | % | 1.69 | % | ||||||||||||
| After fee waivers and expense offset arrangement5, # | 1.65 | %4 | 1.65 | % | 1.65 | % | 1.65 | % | 1.65 | % | 1.65 | % | ||||||||||||
| Ratio of net investment income to average net assets | 2.50 | %4 | 0.90 | % | 0.50 | % | 1.99 | %± | 1.37 | %** | 0.53 | % | ||||||||||||
| Portfolio turnover rate | 15 | %3 | 15 | % | 25 | % | 22 | % | 11 | % | 20 | % | ||||||||||||
| 1 | Includes redemption fees of less than $0.01 per share. |
| 2 | Performance figures may reflect fee waivers and/or expense offset arrangement. Past performance is no guarantee of future results. In the absence of fee waivers and/or expense offset arrangement, the total return would have been lower. Total return is calculated assuming an initial investment made at the net asset value at the beginning of the period, reinvestment of all dividends and distributions at net asset value during the period and redemption on the last day of the period and is not annualized. |
| 3 | Not annualized. |
| 4 | Annualized. |
| 5 | As a result of an expense limitation, the ratio of expenses (exclusive of taxes, interest, brokerage commissions, acquired fund fees and expenses, and extraordinary items) to average net assets will not exceed 1.65%. |
| @ | Calculated based on the average number of shares outstanding during the period. |
| ± | Investment income per share reflects special dividends received during the period which amounted to $0.12 per share. |
Excluding the special dividends, the ratio of net investment income to average net assets would have been 1.39%.
| ** | Investment income per share reflects a special dividend received during the period which amounted to $0.15 per share. |
Excluding the special dividend, the ratio of net investment income to average net assets would have been 0.53%.
| # | The Adviser waived a portion of its fees. |
The accompanying notes are an integral part of the financial statements.
32
Third Avenue Trust
Financial Highlights
Selected data (for a share outstanding throughout each period) and ratios are as follows:
| Third Avenue International Value Fund | ||||||||||||||||||||||||
| For The Six Months Ended April 30, | Years Ended October 31, | |||||||||||||||||||||||
| 2017 | 2016 | 2015 | 2014 | 2013 | 2012 | |||||||||||||||||||
| (Unaudited) | ||||||||||||||||||||||||
| Institutional Class: | ||||||||||||||||||||||||
| Net asset value, beginning of period | $ | 15.59 | $ | 15.29 | $ | 17.63 | $ | 20.00 | $ | 16.16 | $ | 15.33 | ||||||||||||
| Income/(loss) from investment operations: | ||||||||||||||||||||||||
| Net investment income@ | 0.58 | 0.16 | 0.13 | 0.43 | ± | 0.25 | ** | 0.12 | ||||||||||||||||
| Net gain/(loss) on investment transactions (both realized and unrealized)1 | 1.61 | 0.37 | (1.27 | ) | (2.54 | ) | 3.74 | 0.97 | ||||||||||||||||
| Total from investment operations | 2.19 | 0.53 | (1.14 | ) | (2.11 | ) | 3.99 | 1.09 | ||||||||||||||||
| Less dividends and distributions to shareholders: | ||||||||||||||||||||||||
| Dividends from net investment income | (0.74 | ) | (0.03 | ) | (1.20 | ) | (0.26 | ) | (0.15 | ) | (0.26 | ) | ||||||||||||
| Distributions from net realized gain | — | (0.20 | ) | — | — | — | — | |||||||||||||||||
| Total dividends and distributions | (0.74 | ) | (0.23 | ) | (1.20 | ) | (0.26 | ) | (0.15 | ) | (0.26 | ) | ||||||||||||
| Net asset value, end of period | $ | 17.04 | $ | 15.59 | $ | 15.29 | $ | 17.63 | $ | 20.00 | $ | 16.16 | ||||||||||||
| Total return2 | 14.45 | %3 | 3.66 | % | (6.97 | %) | (10.79 | %) | 24.89 | % | 7.39 | % | ||||||||||||
| Ratios/Supplemental Data: | ||||||||||||||||||||||||
| Net assets, end of period (in thousands) | $ | 129,795 | $ | 124,161 | $ | 195,523 | $ | 339,498 | $ | 1,223,107 | $ | 1,176,256 | ||||||||||||
| Ratio of expenses to average net assets | ||||||||||||||||||||||||
| Before fee waivers and expense offset arrangement | 1.72 | %4 | 1.79 | % | 1.61 | % | 1.46 | % | 1.44 | % | 1.44 | % | ||||||||||||
| After fee waivers and expense offset arrangement5, # | 1.40 | %4 | 1.40 | % | 1.40 | % | 1.40 | % | 1.40 | % | 1.40 | % | ||||||||||||
| Ratio of net investment income to average net assets | 7.16 | %4 | 1.14 | % | 0.82 | % | 2.19 | %± | 1.40 | %** | 0.80 | % | ||||||||||||
| Portfolio turnover rate | 15 | %3 | 15 | % | 25 | % | 22 | % | 11 | % | 20 | % | ||||||||||||
| 1 | Includes redemption fees of less than $0.01 per share. |
| 2 | Performance figures may reflect fee waivers and/or expense offset arrangement. Past performance is no guarantee of future results. In the absence of fee waivers and/or expense offset arrangement, the total return would have been lower. Total return is calculated assuming an initial investment made at the net asset value at the beginning of the period, reinvestment of all dividends and distributions at net asset value during the period and redemption on the last day of the period and is not annualized. |
| 3 | Not annualized. |
| 4 | Annualized. |
| 5 | As a result of an expense limitation, the ratio of expenses (exclusive of taxes, interest, brokerage commissions, acquired fund fees and expenses, and extraordinary items) to average net assets will not exceed 1.40%. |
| @ | Calculated based on the average number of shares outstanding during the period. |
| ± | Investment income per share reflects special dividends received during the period which amounted to $0.12 per share. |
Excluding the special dividends, the ratio of net investment income to average net assets would have been 1.59%.
| ** | Investment income per share reflects a special dividend received during the period which amounted to $0.15 per share. |
Excluding the special dividend, the ratio of net investment income to average net assets would have been 0.56%.
| # | The Adviser waived a portion of its fees. |
The accompanying notes are an integral part of the financial statements.
33
Third Avenue Trust
Notes to Financial Statements
April 30, 2017 (Unaudited)
1. SUMMARY OF ORGANIZATION AND SIGNIFICANT ACCOUNTING POLICIES
Organization:
Third Avenue Trust (the “Trust”) is an open-end, management investment company organized as a Delaware business trust pursuant to a Trust Instrument dated October 31, 1996. The Trust currently consists of the following non-diversified (within the meaning of Section 5(b)(2) of the Investment Company Act), separate investment series: Third Avenue Value Fund, Third Avenue Small-Cap Value Fund, Third Avenue Real Estate Value Fund, and Third Avenue International Value Fund (each a “Fund” and, collectively, the “Funds”). The Trust also contains the Third Avenue Focused Credit Fund, a separate non-diversified investment series of the Trust, whose financial statements are presented separately. Third Avenue Management LLC (the “Adviser”) provides investment advisory services to each of the Funds in the Trust. The Funds seek to achieve their investment objectives by adhering to a strict value discipline when selecting securities and other instruments. Each Fund has a distinct investment approach.
Third Avenue Value Fund seeks to achieve its long-term capital appreciation objective mainly by acquiring common stocks of well-financed companies (meaning companies with high quality assets and conservative levels of liabilities) at a discount to what the Adviser believes is their intrinsic value. The Fund may invest in companies of any market capitalization. The Fund may also acquire senior securities, such as convertible securities, preferred stocks and debt instruments (including high-yield and distressed securities that may be in default and may have any or no credit rating), that the Adviser believes are undervalued. The Fund invests in both domestic and foreign securities.
Third Avenue Small-Cap Value Fund seeks to achieve its long-term capital appreciation objective mainly by acquiring equity securities, including common stocks and convertible securities, of well-financed (meaning companies with high quality assets and conservative levels of liabilities) small companies at a discount to what the Adviser believes is their intrinsic value. Under normal circumstances, the Fund expects to invest at least 80% of its net assets (plus the amount of any borrowing for investment purposes) in securities of companies that are considered small. The Fund considers a “small company” to be one whose market capitalization is within the range of capitalizations during the most recent 12-month period (as measured each calendar quarter end) of companies in the Russell 2000 Index, the S&P Small Cap 600 Index or the Dow Jones Wilshire U.S. Small-Cap Index at the time of investment (based on month-end data). The Fund may also acquire senior securities, such as preferred stocks and debt instruments (including high-yield and distressed securities that may be in default and may have any or no credit rating), that the Adviser believes are undervalued. The Fund invests in both domestic and foreign securities.
34
Third Avenue Trust
Notes to Financial Statements (continued)
April 30, 2017 (Unaudited)
Third Avenue Real Estate Value Fund seeks to achieve its long-term capital appreciation objective primarily by investing in equity securities, including common stocks and convertible securities, of well-financed (meaning companies with high quality assets and conservative levels of liabilities) real estate and real estate-related companies, or in companies which own significant real estate assets or derive a significant portion of gross revenues or net profits from real estate-related companies at the time of investment (“real estate companies”). The Fund seeks to acquire these securities at a discount to what the Adviser believes is their intrinsic value. Under normal circumstances, at least 80% of the Fund’s net assets (plus the amount of any borrowing for investment purposes) will be invested in securities of real estate and real estate-related companies. The Fund may invest in companies of any market capitalization. The Fund may also acquire senior securities, such as preferred stocks and debt instruments (including high-yield, distressed and mortgage-backed securities that may be in default and may have any or no credit rating) of real estate companies or loans secured by real estate or real estate-related companies that the Adviser believes have above-average yield potential. The Fund invests in both domestic and foreign securities.
Third Avenue International Value Fund seeks to achieve its long-term capital appreciation objective primarily by acquiring equity securities, including common stocks and convertible securities, of well-financed companies (meaning companies with high quality assets and conservative levels of liabilities) located outside of the United States. While the Fund may invest in companies located anywhere in the world, it currently expects that most of its assets will be invested in the more developed countries and, under normal circumstances, at least 80% of its net assets (plus the amount of any borrowing for investment purposes) will be invested in securities of issuers located outside of the United States at the time of investment. The Fund may also acquire senior securities, such as preferred stocks and debt instruments (including high-yield and distressed securities that may be in default and may have any or no credit rating), that the Adviser believes are undervalued.
Because of the Funds’ disciplined and deliberate investing approach, there may be times when a Fund will have a significant cash position. A substantial cash position can adversely impact Fund performance in certain market conditions, and may make it more difficult for a Fund to achieve its investment objective.
Accounting policies:
The policies described below are followed consistently by the Funds in the preparation of their financial statements in conformity with accounting principles generally accepted in the United States of America (“U.S. GAAP”). The Trust is an investment company and, accordingly, follows the investment company accounting and reporting guidance of the Financial Accounting Standards Board Accounting
35
Third Avenue Trust
Notes to Financial Statements (continued)
April 30, 2017 (Unaudited)
Standards Codification (“FASB ASC”) Topic 946-Investment Companies, which is part of U.S. GAAP.
The preparation of financial statements in accordance with U.S. GAAP requires management to make estimates and assumptions that affect the reported amounts and disclosures. Actual results could differ from those estimates.
Security valuation:
Generally, the Funds’ investments are valued at market value. Securities traded on a principal stock exchange, including The NASDAQ Stock Market, Inc. (“NASDAQ”), are valued at the last quoted sales price, the NASDAQ official closing price, or, in the absence of closing sales prices on that day, securities are valued at the mean between the closing bid and asked price. In accordance with procedures approved by the Trust’s Board of Trustees (the “Board”), the Funds have retained a third party provider that applies a statistical model to provide fair value pricing for foreign equity securities with principal markets that are no longer open when a Fund calculates its net asset value (“NAV”). Debt instruments with maturities greater than 60 days, including floating rate loan securities, are valued on the basis of prices obtained from a pricing service approved by the Board or otherwise pursuant to policies and procedures approved by the Board. Investments in derivative instruments are valued independently by service providers or by broker quotes based on pricing models. Short-term cash investments are valued at cost, plus accrued interest, which approximates market value. Short-term debt securities with 60 days or less to maturity may be valued at amortized cost.
The Adviser has established a Valuation Committee (the “Committee”) which is responsible for overseeing the pricing and valuation of all securities held in the Funds. The Committee operates under pricing and valuation policies and procedures established by the Adviser and approved by the Board, including pricing policies which set forth the mechanisms and processes to be employed on a daily basis to implement these policies and procedures. In particular, the pricing policies describe how to determine market quotations for securities and other instruments. The Committee’s responsibilities include: 1) fair value determinations (and oversight of third parties used in the valuation process determinations), and 2) regular monitoring of the Adviser’s pricing and valuation policies and procedures and modification or enhancement of these policies and procedures (or recommendation of the modification of these policies and procedures) as the Committee believes appropriate.
Securities for which market quotations are not readily available are valued at “fair value”, as determined in good faith by the Committee as authorized by the Board, under procedures established by the Board. At April 30, 2017, such securities had a total fair value of $15,531,563, or 1.32% of net assets of Third Avenue Value Fund, and $39,120, or less than 0.01% of net assets of Third Avenue Real Estate Value Fund. There were no fair valued
36
Third Avenue Trust
Notes to Financial Statements (continued)
April 30, 2017 (Unaudited)
securities for Third Avenue Small-Cap Value Fund and Third Avenue International Value Fund at April 30, 2017. Among the factors that may be considered by the Committee in determining fair value are: prior trades in the security in question, trades in similar securities of the same or other issuers, the type of security, trading in marketable securities of the same issuer, the financial condition of the issuer, comparable multiples of similar issuers, the operating results of the issuer and liquidation value of the issuer. See Fair Value Measurements below for additional detail on fair value measurements for financial reporting purposes. The fair values determined in accordance with these procedures may differ significantly from the amounts which would be realized upon disposition of the securities.
Fair value measurements:
In accordance with FASB ASC 820-10, Fair Value Measurements and Disclosures, the Funds disclose the fair value of their investments in a hierarchy that prioritizes the inputs to valuation techniques used to measure the fair value. Fair value is defined as the price that a Fund would receive upon selling an investment in an orderly transaction to an independent buyer in the principal or most advantageous market for the investment under current market conditions. The hierarchy gives the highest priority to valuations based upon unadjusted quoted prices in active markets for identical assets or liabilities (Level 1 measurement) and the lowest priority to valuations based upon unobservable inputs that are significant to the valuation (Level 3 measurements). The three levels of the fair value hierarchy are as follows:
● Level 1 – Inputs that reflect unadjusted quoted prices in active markets for identical assets or liabilities that the Funds have the ability to access at the measurement date;
● Level 2 – Inputs other than quoted prices that are observable for the asset or liability either directly or indirectly, including inputs in markets that are not considered to be active;
● Level 3 – Significant unobservable inputs (including the Funds’ own assumptions in determining the fair value of investments)
A financial instrument’s level within the fair value hierarchy is based on the lowest level of any input both individually and in aggregate that is significant to the fair value measurement. However, the determination of what constitutes “observable” requires significant judgment by the Funds. The Funds consider observable data to be market data which is readily available, regularly distributed or updated, reliable and verifiable, not proprietary, and provided by independent sources that are actively involved in the relevant market. The inputs or methodology used for valuing investments are not necessarily an indication of the risk associated with investing in those investments.
37
Third Avenue Trust
Notes to Financial Statements (continued)
April 30, 2017 (Unaudited)
The Funds use valuation techniques to measure fair value that are consistent with the market approach and/or income approach, depending on the type of security and the particular circumstance. The market approach uses prices and other relevant information generated by market transactions involving identical or comparable securities. The income approach uses valuation techniques to discount estimated future cash flows to present value.
The following are certain inputs and techniques that the Funds generally use to evaluate how to classify each major category of assets and liabilities for Level 2 and Level 3, in accordance with U.S. GAAP.
Equity Securities (Common Stocks and Warrants)—Equity securities traded in inactive markets and certain foreign equity securities are valued using inputs which include broker-dealer quotes, recently executed transactions adjusted for changes in the benchmark index, or evaluated price quotes received from independent pricing services or brokers that take into account the integrity of the market sector and issuer, the individual characteristics of the security, and information received from broker-dealers and other market sources pertaining to the issuer or security. To the extent that these inputs are observable, the values of equity securities are categorized as Level 2. To the extent that these inputs are unobservable, the values are categorized as Level 3.
U.S. Government Obligations—U.S. Government obligations are valued by independent pricing services based on pricing models that evaluate the mean between the most recently quoted bid and ask price. The models also take into consideration data received from active market makers and broker-dealers, yield curves, and the spread over comparable U.S. Government issues. The spreads change daily in response to market conditions and are generally obtained from the new issue market and broker-dealer sources. To the extent that these inputs are observable, the values of U.S. Government obligations are categorized as Level 2. To the extent that these inputs are unobservable, the values are categorized as Level 3.
Corporate Bonds & Notes—Corporate bonds and notes are generally comprised of two main categories: investment grade bonds and high yield bonds. Investment grade bonds are valued by independent pricing services or brokers using various inputs and techniques, which include broker-dealer quotations, live trading levels, recently executed transactions in securities of the issuer or comparable issuers, and option adjusted spread models that include base curve and spread curve inputs. Adjustments to individual bonds can be applied to recognize trading differences compared to other bonds issued by the same issuer. High yield bonds are valued by independent pricing services or brokers based primarily on broker-dealer quotations from relevant market makers and recently executed transactions in securities of the issuer or comparable issuers. The broker-dealer quotations received are supported by credit analysis of the issuer that takes into consideration credit quality assessments, daily trading activity, and the
38
Third Avenue Trust
Notes to Financial Statements (continued)
April 30, 2017 (Unaudited)
activity of the underlying equities, listed bonds and sector specific trends. To the extent that these inputs are observable, the values of corporate bonds and notes are categorized as Level 2. To the extent that these inputs are unobservable, the values are categorized as Level 3.
Forward Foreign Currency Contracts—Forward foreign currency contracts are valued by independent pricing services using various inputs and techniques, which include broker-dealer quotations, actual trading information and foreign currency exchange rates gathered from leading market makers and foreign currency exchange trading centers throughout the world. To the extent that these inputs are observable, the values of forward foreign currency contracts are categorized as Level 2. To the extent that these inputs are unobservable, the values are categorized as Level 3.
Term Loans—Term loans are valued by independent pricing services based on the average of evaluated quoted prices received from multiple dealers or valued relative to other benchmark securities when broker-dealer quotes are unavailable. Inputs may include quoted prices for similar investments in active markets, interest rates, coupon rates, yield curves, option adjusted spreads, default rates, credit spreads and other unique security features in order to estimate the relevant cash flows which is then discounted to calculate fair values. To the extent that these inputs are observable, the values of term loans are categorized as Level 2. To the extent that these inputs are unobservable, the values are categorized as Level 3.
Options (Written and Purchased)—Options are valued by independent pricing services or by brokers based on pricing models that take into account, among other factors, foreign exchange rate, time until expiration, and volatility of the underlying foreign currency security. To the extent that these inputs are observable, the values of options are categorized as Level 2. To the extent that these inputs are unobservable, the values are categorized as Level 3.
39
| Third Avenue Trust |
| Notes to Financial Statements (continued) |
| April 30, 2017 (Unaudited) |
The following is a Summary by Level of Inputs used to value the Funds’ investments as of April 30, 2017:
| Third Avenue Value Fund | Third Avenue Small-Cap Value Fund | Third Avenue Real Estate Value Fund | Third Avenue International Value Fund | |||||||||||||
| Level 1: Quoted Prices† | ||||||||||||||||
| Investments in Securities: | ||||||||||||||||
| Common Stocks & Warrants: | ||||||||||||||||
| Building & Construction Products/Services | $ | — | $ | — | $ | — | $ | 2,513,250 | ||||||||
| Consumer Products | 28,687,909 | — | — | — | ||||||||||||
| Diversified Holding Companies | — | — | — | 7,756,701 | ||||||||||||
| Metals & Mining | — | — | — | 13,707,755 | ||||||||||||
| Non-U.S. Real Estate Operating Companies | — | — | 76,763,218 | — | ||||||||||||
| Oil & Gas Production & Services | 33,467,939 | — | — | 2,437,427 | ||||||||||||
| Real Estate | — | — | — | 7,855,873 | ||||||||||||
| Retail-Building Products | — | — | 37,595,898 | — | ||||||||||||
| Transportation Infrastructure | — | — | — | 3,317,955 | ||||||||||||
| Other** | 752,672,051 | 295,661,014 | 734,208,669 | 36,131,628 | ||||||||||||
| Total for Level 1 Securities | 814,827,899 | 295,661,014 | 848,567,785 | 73,720,589 | ||||||||||||
| Level 2: Other Significant Observable Inputs† Investments in Securities: | ||||||||||||||||
| Common Stocks: | ||||||||||||||||
| Automotive | 21,997,676 | — | — | 3,355,161 | ||||||||||||
| Building & Construction Products/Services | — | — | — | 247,005 | ||||||||||||
| Capital Goods | — | — | — | 4,396,267 | ||||||||||||
| Commercial Services | — | — | — | 8,364,814 | ||||||||||||
| Consumer Products | 28,305,791 | — | — | — | ||||||||||||
| Diversified Holding Companies | 136,326,693 | — | — | 3,910,819 | ||||||||||||
| Engineering & Construction | — | — | — | 11,030,194 | ||||||||||||
| Lodging & Hotels | — | — | 25,581,085 | — | ||||||||||||
| Media | — | — | — | 4,540,545 | ||||||||||||
| Metals & Mining | — | — | — | 3,807,078 | ||||||||||||
| Non-U.S. Real Estate Investment Trusts | — | — | 203,257,463 | — | ||||||||||||
| Non-U.S. Real Estate Operating Companies | — | — | 566,875,224 | — | ||||||||||||
| Oil & Gas Production & Services | 46,402,717 | — | — | 5,081,517 | ||||||||||||
| Real Estate | — | — | — | 14,972,027 | ||||||||||||
| Retail-Building Products | — | — | 95,384 | — | ||||||||||||
| Telecommunications | 26,074,455 | — | — | — | ||||||||||||
| Transportation Infrastructure | — | — | — | 6,611,615 | ||||||||||||
| Corporate Bonds & Notes | — | — | — | 2,668,000 | ||||||||||||
| Term Loans | — | — | 8,003,750 | — | ||||||||||||
| Purchased Options: | ||||||||||||||||
| Exchanged-Traded Fund Put Options | — | — | — | 44,016 | ||||||||||||
| Foreign Currency Call Options | — | — | 28 | — | ||||||||||||
40
| Third Avenue Trust |
| Notes to Financial Statements (continued) |
| April 30, 2017 (Unaudited) |
Summary by level of inputs (continued)
| Third Avenue Value Fund | Third Avenue Small-Cap Value Fund | Third Avenue Real Estate Value Fund | Third Avenue International Value Fund | |||||||||||||
| Short-Term Investments: | ||||||||||||||||
| U.S. Government Obligations | $ | 39,987,156 | $ | — | $ | 59,980,733 | $ | 9,996,789 | ||||||||
| Total for Level 2 Securities | 299,094,488 | — | 863,793,667 | 79,025,847 | ||||||||||||
| Level 3: Significant Unobservable Inputs | ||||||||||||||||
| Investments in Securities: | ||||||||||||||||
| Common Stocks: | ||||||||||||||||
| Consumer Products | — | * | — | — | — | |||||||||||
| Corporate Bonds & Notes | 15,531,563 | — | — | — | ||||||||||||
| Term Loans | — | — | 39,120 | — | ||||||||||||
| Private Equities: | ||||||||||||||||
| U.S. Real Estate Operating Companies | — | — | 82,935,744 | — | ||||||||||||
| Total for Level 3 Securities | 15,531,563 | — | 82,974,864 | — | ||||||||||||
| Total Value of Investments | $ | 1,129,453,950 | $ | 295,661,014 | $ | 1,795,336,316 | $ | 152,746,436 | ||||||||
| Investments in Other Financial Instruments: | ||||||||||||||||
| Level 2: Other Significant Observable Inputs | ||||||||||||||||
| Forward Foreign Currency Contracts - Assets | $ | — | $ | — | $ | 15,015 | $ | — | ||||||||
| Total Value or Appreciation/(Depreciation) of Other Financial Instruments | $ | — | $ | — | $ | 15,015 | $ | — | ||||||||
| † | The value of securities that were transferred from Level 1 to Level 2 for Third Avenue Value Fund, Third Avenue Real Estate Value Fund and Third Avenue International Value Fund was $238,888,990, $751,695,418 and $ 47,458,681, respectively. The transfer was due to certain securities trading primarily outside the U.S. whose values were adjusted following the close of the local trading. |
| * | Investments fair valued at zero. |
| ** | Please refer to the Portfolios of Investments for industry specifics of the portfolio holdings. |
Transfers from Level 1 to Level 2, or from Level 2 to Level 1, are recorded utilizing values as of the beginning of the period.
41
| Third Avenue Trust |
| Notes to Financial Statements (continued) |
| April 30, 2017 (Unaudited) |
The following is a reconciliation of Level 3 investments for which significant unobservable inputs were used to determine fair value:
Third Avenue Value Fund
| Common Stocks | Corporate Bonds & Notes | Limited Partnerships | Total | |||||||||||||
| Balance as of 10/31/16 (fair value) | ||||||||||||||||
| Consumer Products | $ | — | * | $ | 17,402,785 | $ | — | $ | 17,402,785 | |||||||
| Insurance & Reinsurance | — | — | 12,217 | 12,217 | ||||||||||||
| Payment-in-kind | ||||||||||||||||
| Consumer Products | — | 726,125 | — | 726,125 | ||||||||||||
| Sales | ||||||||||||||||
| Insurance & Reinsurance | — | (12,111 | ) | (12,111 | ) | |||||||||||
| Net change in unrealized gain/(loss) | ||||||||||||||||
| Consumer Products | — | (2,597,347 | ) | — | (2,597,347 | ) | ||||||||||
| Insurance & Reinsurance | — | — | (12,217 | ) | (12,217 | ) | ||||||||||
| Net realized gain/(loss) | ||||||||||||||||
| Insurance & Reinsurance | — | 12,111 | 12,111 | |||||||||||||
| Balance as of 4/30/17 (fair value) | ||||||||||||||||
| Consumer Products | — | * | 15,531,563 | — | 15,531,563 | |||||||||||
| Insurance & Reinsurance | — | — | — | — | ||||||||||||
| Total | $ | — | $ | 15,531,563 | $ | — | $ | 15,531,563 | ||||||||
| Net change in unrealized gain/(loss) related to securities still held as of April 30, 2017: | $ | — | $ | (2,597,347 | ) | $ | — | $ | (2,597,347 | ) | ||||||
| * | Investments fair valued at zero. |
42
| Third Avenue Trust |
| Notes to Financial Statements (continued) |
| April 30, 2017 (Unaudited) |
Third Avenue Real Estate Value Fund
| Preferred Stocks | Private Stocks | Term Loans | Total | |||||||||||||
| Balance as of 10/31/16 (fair value) | ||||||||||||||||
| Non-U.S. Real Estate Operating Companies | $ | 36,079,757 | $ | — | $ | 3,497,959 | $ | 39,577,716 | ||||||||
| U.S. Real Estate Operating Companies | — | 93,753,455 | — | 93,753,455 | ||||||||||||
| Payment-in-kind | ||||||||||||||||
| Non-U.S. Real Estate Operating Companies | — | — | 107,924 | 107,924 | ||||||||||||
| Sales | ||||||||||||||||
| Non-U.S. Real Estate Operating Companies | (31,802,983 | ) | — | (3,446,063 | ) | (35,249,046 | ) | |||||||||
| Net change in unrealized gain/(loss) | ||||||||||||||||
| Non-U.S. Real Estate Operating Companies | 5,863,814 | — | 699,869 | 6,563,683 | ||||||||||||
| U.S. Real Estate Operating Companies | — | (10,817,711 | ) | — | (10,817,711 | ) | ||||||||||
| Net realized gain/(loss) | ||||||||||||||||
| Non-U.S. Real Estate Operating Companies | (10,140,588 | ) | — | (820,569 | ) | (10,961,157 | ) | |||||||||
| Balance as of 4/30/17 (fair value) | ||||||||||||||||
| Non-U.S. Real Estate Operating Companies | — | — | 39,120 | 39,120 | ||||||||||||
| U.S. Real Estate Operating Companies | — | 82,935,744 | — | 82,935,744 | ||||||||||||
| Total | $ | — | $ | 82,935,744 | $ | 39,120 | $ | 82,974,864 | ||||||||
| Net change in unrealized gain/(loss) related to securities still held as of April 30, 2017: | $ | — | $ | (10,817,711 | ) | $ | (293 | ) | $ | (10,818,004 | ) | |||||
43
Third Avenue Trust
Notes to Financial Statements (continued)
April 30, 2017 (Unaudited)
Quantitative Information about Level 3 Fair Value Measurements
(amounts in thousands)
| Third Avenue Value Fund | Fair Value at 4/30/17 | Valuation Technique(s) | Unobservable Input(s) | Range (Weighted Average) | ||||||||||
| Restructuring | ||||||||||||||
| Corporate Bonds | $ | 15,532 | Book Value | value | $62.30 | |||||||||
| Other (a) | — | * | ||||||||||||
| $ | 15,532 | |||||||||||||
| Third Avenue Real Estate Value Fund | Fair Value at 4/30/17 | Valuation Technique(s) | Unobservable Input(s) | Range (Weighted Average) | ||||||||||
| Private Equities | $ | 82,936 | Broker Quote | # | $18.20 | |||||||||
| Restructuring | ||||||||||||||
| Term Loans | 39 | Book Value | value | $108.93 | ||||||||||
| $ | 82,975 | |||||||||||||
| # | Valuation techniques and significant unobservable inputs used by third-party pricing vendors or brokers, such as those described in Note 1, were not provided to the Adviser. The appropriateness of fair values for these securities is based on results of back testing, vendor and broker due diligence, unchanged price review and consideration of macro or security specific events. |
| (a) | Includes securities less than 0.50% of net assets within each respective Fund. |
| * | Investments fair valued at zero. |
The significant unobservable inputs used in the fair value measurement of the Funds’ investments are listed above. Generally, a change in the assumptions used in any input in isolation may be accompanied by a change in another input. Significant changes in any of the unobservable inputs may significantly impact the fair value measurement. The impact is based on the relationship between each unobservable input and the fair value measurement. Significant increases (decreases) in enterprise multiples may increase (decrease) the fair value measurement. Significant increases (decreases) in the discount for marketability may decrease (increase) the fair value measurement.
Security transactions and investment income:
Security transactions for financial statement purposes are accounted for on a trade date basis. Dividend income is recorded on the ex-dividend date or, for certain foreign dividends, as soon as the Funds become aware of the dividends. Interest income is determined on the basis of coupon interest accrued using the effective interest method which adjusts for amortization of premiums and accretion of discounts. Dividend income on the Statement of Operations are shown net of any foreign taxes withheld on income from foreign securities. Payments received from certain investments held by the Funds may be comprised of dividends, capital gains and return of capital. The Funds originally estimate the expected classification of such payments. These amounts may subsequently be reclassified upon receipt of information from the issuer. Realized gains and losses from securities transactions are recorded on an identified cost basis.
44
Third Avenue Trust
Notes to Financial Statements (continued)
April 30, 2017 (Unaudited)
Foreign currency translation and foreign investments:
The books and records of the Funds are maintained in U.S. dollars. Foreign currency amounts are translated into U.S. dollars as follows:
● Investments and assets and liabilities denominated in foreign currencies: At the prevailing rates of exchange on the valuation date.
● Investment transactions and investment income: At the prevailing rates of exchange on the date of such transactions.
The net assets of the Funds are presented at market values using the foreign exchange rates at the close of the period. The Funds do not generally isolate that portion of the results of operations arising as a result of changes in the foreign exchange rates from the fluctuations arising from changes in the market prices of the investments held.
Similarly, the Funds do not isolate the effect of changes in foreign exchange rates from the fluctuations arising from changes in the market prices of investments sold during the period. Accordingly, realized and unrealized foreign currency gains/(losses) are included in the reported net realized gain/(loss) and unrealized appreciation/(depreciation) on investments transactions and balances.
Net realized gains/(losses) on foreign currency transactions represent net foreign exchange gains/(losses) from foreign currency exchange contracts, disposition of foreign currencies, currency gains or losses realized between the trade and settlement dates on securities transactions, and the difference between the amount of investment income and foreign withholding taxes recorded on the Funds’ books and the U.S. dollar equivalent amounts actually received or paid. Net unrealized currency gains/(losses) from valuing foreign currency denominated assets and liabilities at period end exchange rates are reflected as a component of net unrealized appreciation/(depreciation) on the Statement of Assets and Liabilities. The change in net unrealized currency gains/(losses) for the period is reflected on the Statement of Operations.
Pursuant to U.S. federal income tax regulations, gains and losses from certain foreign currency transactions and the foreign currency portion of gains and losses realized on sales and maturities of foreign denominated debt securities are generally treated as ordinary income.
45
Third Avenue Trust
Notes to Financial Statements (continued)
April 30, 2017 (Unaudited)
Payment-in-kind securities:
The Funds may invest in PIKs. PIKs give the issuer the option at each interest payment date of making interest payments in either cash or additional debt securities. Those additional debt securities usually have the same terms, including maturity dates and interest rates, and associated risks as the original bonds. The daily market quotations of the original bonds may include the accrued interest (referred to as a “dirty” price) and require a pro-rata adjustment from the unrealized appreciation or depreciation on investments to interest receivable on the Statement of Assets and Liabilities.
For the six months ended April 30, 2017, the total in-kind payments with respect to PIK securities that were received by the Third Avenue Value Fund in the amounts of $726,125 or 12.72% of total investment income are shown as a separate line item on the Statement of Operations.
Term loans:
The Funds typically invest in loans which are structured and administered by a third party entity (the “Agent”) that acts on behalf of a group of lenders that make or hold interests in the loan. These securities generally pay interest at rates which are periodically pre-determined by reference to a base lending rate plus a premium. These base lending rates are generally either the lending rate offered by one or more major European banks, such as the London Interbank Offered Rate (“LIBOR”) or the prime rate offered by one or more major United States banks, or the certificate of deposit rate.
These securities are ordinarily contractually obligated to receive approval from the Agent bank and/or borrower prior to disposition. Remaining maturities of term loans may be less than the stated maturities shown as a result of contractual or optional payments by the borrower. Such prepayments cannot be predicted with certainty. The interest rate disclosed reflects the rate in effect on April 30, 2017.
Forward foreign currency contracts:
The Funds may be exposed to foreign currency risks associated with portfolio investments and therefore may use forward foreign currency contracts to hedge or manage these exposures. The Funds also may buy forward foreign currency contracts to gain exposure to currencies. Forward foreign currency contracts are valued at the forward rate and are marked-to-market daily. The change in market value is included in unrealized appreciation/(depreciation) on investments and foreign currency translations. When the contract is closed, the Funds record a realized gain or loss equal to the difference between the value of the contract at the time it was opened and the value at the time it was closed.
46
Third Avenue Trust
Notes to Financial Statements (continued)
April 30, 2017 (Unaudited)
The use of forward foreign currency contracts does not eliminate fluctuations in the underlying prices of the Funds’ portfolio securities, but it does establish a rate of exchange that can be achieved in the future. Although forward foreign currency contracts limit the risk of loss due to a decline in the value of the hedged currency, they also limit any potential gain that might result should the value of the currency increase. In addition, the Funds could be exposed to risks if the counterparties to the contracts are unable to meet the terms of their contracts.
During the six months ended April 30, 2017, Third Avenue Real Estate Value Fund used forward foreign currency contracts for hedging foreign currency risks.
Option contracts:
The Funds may purchase and sell (“write”) put and call options on various instruments including investments, indices, and foreign currency to manage and hedge exchange rate risks within their portfolios and also to gain long or short exposure to the underlying instruments.
An option contract gives the buyer the right, but not the obligation, to buy (call) or sell (put) an underlying item at a fixed exercise price on a certain date or during a specified period. The cost of the underlying instruments acquired through the exercise of a call option is increased by the premiums paid. The proceeds from the underlying instruments sold through the exercise of a purchased put option are decreased by the premiums paid. Investments in over-the-counter option contracts require the Funds to fair value or mark-to market the options on a daily basis, which reflects the change in the market value of the contracts at the close of each day’s trading. The cost of purchased options that expire unexercised are treated by the Funds, on expiration date, as realized losses on investments or foreign currency transactions.
When the Funds write an option, an amount equal to the premium received by the Funds is recorded as a liability and is subsequently adjusted to the current fair value of the option written. Premiums received from writing options that expire unexercised are treated by the Funds, on the expiration date, as realized gains on written options or foreign currency. The difference between the premium and the amount paid on effecting a closing purchase transaction, including brokerage commissions, is also treated as a realized gain, or, if the premium is less than the amount paid for the closing purchase transaction, as a realized loss. If a call option is exercised, the premium is added to the proceeds from the sale of the underlying security or currency in determining whether the Funds have a realized gain or loss. If a put option is exercised, the premium reduces the cost basis of the security or currency purchased by the Funds. In purchasing and writing options, the Funds bear the market risk of an unfavorable change in the price of the underlying security or the risk that the Funds may not be able to enter into a closing transaction due to an illiquid market. Exercise of a written option could result in the Funds purchasing a security or currency at a price different from the current market value. The Funds may execute transactions in both listed and over-the-counter options. Listed
47
Third Avenue Trust
Notes to Financial Statements (continued)
April 30, 2017 (Unaudited)
options involve minimal counterparty risk since listed options are guaranteed against default by the exchange on which they trade. When purchasing over-the-counter options, the Funds bear the risk of economic loss from counterparty default, equal to the market value of the option.
During the six months ended April 30, 2017, Third Avenue Real Estate Value Fund used purchased options on foreign currency for hedging purposes and/or to protect against losses in foreign currencies. Third Avenue International Value Fund used purchased options on exchange - traded funds to gain long exposure to the underlying instruments.
During the six months ended April 30, 2017, Third Avenue Value Fund used written put options on equities to enhance the yield of the Fund. As of April 30, 2017, the Third Avenue Value Fund no longer held any written options on equities.
Summary of derivatives information:
The following tables present the value of derivatives held as of April 30, 2017, by their primary underlying risk exposure and respective location on the Statements of Assets and Liabilities:
Third Avenue Real Estate Value Fund
| Derivative Contract | Statement of Assets and Liabilities Location | Options | Forward Foreign Currency Contracts | |||||||||
| Assets: | ||||||||||||
| Foreign currency contracts | Purchased foreign currency options | $ | 28 | $ | — | |||||||
| Foreign currency contracts | Unrealized appreciation on forward foreign currency contracts | $ | — | $ | 15,015 | |||||||
Third Avenue International Value Fund
| Derivative Contract | Statement of Assets and Liabilities Location | Options | |||||
| Assets: | |||||||
| Equity contracts | Investments at value | $ | 44,016 | ||||
Summary of derivative information:
The following tables present the effect of derivatives on the Statement of Operations during the six months ended April 30, 2017, by primary risk exposure:
48
Third Avenue Trust
Notes to Financial Statements (continued)
April 30, 2017 (Unaudited)
Third Avenue Value Fund
| Amount of Realized Gain/(Loss) on Derivatives Recognized in Income | |
| Derivative Contract | Written Options |
| Equity contracts | $59,100(a) |
Third Avenue Real Estate Value Fund
| Amount of Realized Gain/(Loss) on Derivatives Recognized in Income | |||
| Purchased | Forward Foreign | ||
| Derivative Contract | Options | Currency Contracts | Total |
| Foreign currency contracts | $(217,500)(c) | $1,990,621(c) | $1,773,121 |
| Amount of Change in Unrealized Appreciation/(Depreciation) on Derivatives Recognized in Income | |||
| Purchased | Forward Foreign | ||
| Derivative Contract | Options | Currency Contracts | Total |
| Foreign currency contracts | $127,996(d) | $626,035(d) | $754,031 |
Third Avenue International Value Fund
| Amount of Change in Unrealized Appreciation/(Depreciation) on Derivatives Recognized in Income | |
| Purchased | |
| Derivative Contract | Options |
| Equity contracts | $(449,734)(b) |
| (a) | Included in “Net realized gain on written equity options”. |
| (b) | Included in “Net change in unrealized appreciation/(depreciation) on investments”. |
| (c) | Included in “Net realized gain/(loss) on foreign currency transactions”. |
| (d) | Included in “Net change in unrealized appreciation/(depreciation) on translation of other assets and liabilities denominated in foreign currency”. |
49
Third Avenue Trust
Notes to Financial Statements (continued)
April 30, 2017 (Unaudited)
Derivatives volume:
The tables below disclose the volume of the Funds’ forward foreign currency contracts and options activities during the six months ended April 30, 2017 (amounts denominated in U.S. Dollars unless otherwise noted, except number of contracts). Please refer to the tables in the Summary of derivatives information for derivative-related gains and losses associated with volume activity (measured at each month-end).
| Third Avenue Real Estate Value Fund | Third Avenue International Value Fund | |||||||
| OTC Equity Options: | ||||||||
| Average Ending Value | $ | — | $ | 91,870 | ||||
| Foreign Currency Options: | ||||||||
| Average Notional Balance Purchased | 294,285,714 | — | ||||||
| Forward Foreign Currency Contracts: | ||||||||
| Average Settlement Value Purchased | 889,423 | — | ||||||
| Average Settlement Value Sold | 85,317,479 | — | ||||||
Floating rate obligations:
The Funds may invest in debt securities with interest payments or maturity values that are not fixed, but float in conjunction with an underlying index or price. These securities may be backed by corporate issuers. The indices and prices upon which such securities can be based include interest rates and currency rates. Floating rate securities pay interest according to a coupon which is reset periodically.
Dividends and distributions to shareholders:
The amount of dividends and distributions paid to shareholders from net investment income and net realized capital gains on disposition of securities, respectively is determined in accordance with U.S. federal income tax law and regulations which may differ from U.S. GAAP. Such dividends and distributions are recorded on the ex-dividend date. The majority of dividends and capital gains distributions from a Fund may be automatically reinvested into additional shares of that Fund, based upon the discretion of the Fund’s shareholders.
Income tax information:
The Funds have complied and intend to continue to comply with the requirements of the Internal Revenue Code applicable to regulated investment companies, and each Fund intends to distribute all of its taxable net investment income and net realized capital gains, if any, to its shareholders. Therefore, no provision for U.S. federal income taxes is included on the accompanying financial statements.
50
Third Avenue Trust
Notes to Financial Statements (continued)
April 30, 2017 (Unaudited)
Income, including capital gains, from investments in foreign securities received by the Funds may be subject to income, withholding or other taxes imposed by foreign countries.
Management has analyzed the tax positions taken on the Funds’ U.S. federal income tax returns for all open tax years (generally the current and prior three tax years), and has concluded that no provision for U.S. federal income tax is required in the Funds’ financial statements. This conclusion may be subject to future review and adjustment at a later date based upon factors including, but not limited to, on-going analyses of and changes to tax laws, regulations and interpretations thereof. The Funds are subject to possible examination by the relevant taxing authorities for tax years for which the applicable statutes of limitations have not expired.
Expense allocation:
Expenses attributable to a specific Fund are charged to that Fund. Expenses attributable to the Trust are generally allocated using the ratio of each series’ average net assets relative to the total average net assets of the Trust. Certain expenses are shared with Third Avenue Variable Series Trust, an affiliated fund group. Such costs are allocated using the ratio of the series’ average net assets relative to the total average net assets of each series of the Trust and Third Avenue Variable Series Trust.
Share class accounting:
Investment income, common expenses and realized/unrealized gains/(losses) on investments are allocated to the two classes of shares of each Fund on the basis of daily net assets of each class. Fees relating to a specific class are charged directly to that share class.
Trustees’ and officers’ fees:
The Trust does not pay any fees to its officers for their services as such, except for the Chief Compliance Officer and the Associate Director of Compliance, to whom the Trust paid $257,627, including $30,694 from Third Avenue Focused Credit Fund, for the six months ended April 30, 2017. The Trust does pay, together with Third Avenue Variable Series Trust, Trustees who are not “interested persons” (as defined in the Investment Company Act of 1940) of the Trust (“independent Trustee”) a fee of $5,000 for each meeting of the Board that each independent Trustee attends, in addition to reimbursing all independent Trustees for travel and incidental expenses incurred by them in connection with their attendance at meetings. If a special meeting is required, Trustees will each receive $2,500. Prior to January 1, 2017, the Trust, together with Third Avenue Variable Series Trust, also paid each independent Trustee an annual retainer of $65,000 (the lead independent Trustee received an additional retainer of $12,000). Effective January 1, 2017, the annual retainer was reduced to $55,000 and the additional retainer for the Chairman was set at $20,000. The Trustees on the Audit Committee each receive $2,000 for each audit committee meeting and the audit committee chairman receives an annual retainer of $6,000. Effective March 2016, one of the Trustees began acting
51
Third Avenue Trust
Notes to Financial Statements (continued)
April 30, 2017 (Unaudited)
in an Advisory Trustee capacity. Prior to January 1, 2017, the Advisory Trustee received an annual retainer of $32,500 and a fee at $2,500 for each Board meeting the Trustee attends. Effective January 1, 2017, the annual retainer was reduced to $27,500.
2. INVESTMENTS
Purchases and sales/conversions:
The aggregate cost of purchases and aggregate proceeds from sales and conversions of investments, excluding short-term investments, from unaffiliated and affiliated issuers (as defined in the Investment Company Act of 1940 as ownership by a Fund of 5% or more of the outstanding voting securities of these issuers) for the six months ended April 30, 2017 were as follows:
| Purchases | Sales | |||||||
| Third Avenue Value Fund | ||||||||
| Affiliated | $ | 726,125 | $ | 2,332,715 | ||||
| Unaffiliated | 67,660,288 | 224,207,734 | ||||||
| Third Avenue Small-Cap Value Fund | ||||||||
| Unaffiliated | 50,882,979 | 86,483,397 | ||||||
| Third Avenue Real Estate Value Fund | ||||||||
| Affiliated | 2,625,000 | — | ||||||
| Unaffiliated | 30,547,482 | 263,196,646 | ||||||
| Third Avenue International Value Fund | ||||||||
| Affiliated | — | 252,597 | ||||||
| Unaffiliated | 30,160,122 | 19,052,523 | ||||||
Unrealized appreciation/(depreciation):
The following information is based upon the book basis of investment securities as of April 30, 2017:
Third Avenue Value Fund | Third Avenue Small-Cap Value Fund | Third Avenue Real Estate Value Fund | Third Avenue International Value Fund | |||||||||||||
| Gross Unrealized Appreciation | $ | 300,820,979 | $ | 84,486,627 | $ | 599,744,245 | $ | 22,345,903 | ||||||||
| Gross Unrealized Depreciation | (118,240,878 | ) | (9,511,874 | ) | (25,123,835 | ) | (39,105,767 | ) | ||||||||
| Net Unrealized Appreciation (Depreciation) | $ | 182,580,101 | $ | 74,974,753 | $ | 574,620,410 | $ | (16,759,864 | ) | |||||||
| Book Cost | $ | 946,873,849 | $ | 220,686,261 | $ | 1,220,715,906 | $ | 169,506,300 | ||||||||
52
Third Avenue Trust
Notes to Financial Statements (continued)
April 30, 2017 (Unaudited)
Written options transactions during the period are summarized as follows:
Third Avenue Value Fund
| Equity Options Written | |||||||||
| Number of Contracts | Premiums Received | ||||||||
| Options outstanding at October 31, 2016 | — | $ | — | ||||||
| Options written | 300 | 59,100 | |||||||
| Options expired | (300 | ) | (59,100 | ) | |||||
| Options outstanding at April 30, 2017 | — | $ | — | ||||||
3. INVESTMENT ADVISORY SERVICES, ADMINISTRATION AND SERVICE FEE AGREEMENTS AND EXPENSE OFFSET ARRANGEMENT
Each Fund has an Investment Advisory Agreement with the Adviser for investment advice and certain management functions. The terms of the Investment Advisory Agreements provide the annual advisory fees based on the total average daily net assets for the Funds which are indicated as below. These fees are calculated daily and paid monthly.
| Fund | Annual Management Fee | |||
| Third Avenue Value Fund | 0.90 | % | ||
| Third Avenue Small-Cap Value Fund | 0.90 | % | ||
| Third Avenue Real Estate Value Fund | 0.90 | % | ||
| Third Avenue International Value Fund | 1.25 | % | ||
Additionally, the Adviser pays certain expenses on behalf of the Funds which are partially reimbursed by the Funds, including service fees due to third parties, the compensation expense for the Funds’ Chief Compliance Officer and Associate Director of Compliance and other miscellaneous expenses.
53
Third Avenue Trust
Notes to Financial Statements (continued)
April 30, 2017 (Unaudited)
The following were amounts payable to the Adviser at April 30, 2017:
| Value Fund | Small-Cap Value Fund | Real Estate Value Fund | International Value Fund | |||||||||||||
| Advisory fees | $ | 867,509 | $ | 216,009 | $ | 1,377,225 | $ | 130,483 | ||||||||
| Administration fees | 5,287 | 1,373 | 8,393 | 722 | ||||||||||||
| Reimbursement for officers’ fees | 4,224 | 1,097 | 6,706 | 576 | ||||||||||||
| Reimbursement for shareholder servicing fees | 107,960 | 36,194 | 197,622 | 16,912 | ||||||||||||
| Total | $ | 984,980 | $ | 254,673 | $ | 1,589,946 | $ | 148,693 | ||||||||
Until March 1, 2018 (subject to renewal), whenever each Fund’s normal operating expenses, including the investment advisory fee and most other operating expenses, but excluding taxes, interest, brokerage commissions, acquired fund fees and expenses, and extraordinary items, exceeds the expense limitation based on each Fund’s average daily net assets, the Adviser has agreed to waive a portion of its advisory fees and/or reimburse each Fund in an amount equal to that excess. The expense limitations for each Fund are disclosed in its corresponding Financial Highlights. Below are the corresponding contingent liabilities to the Adviser in effect as of April 30, 2017:
| Expenses Waived through Fiscal Periods ending | |||||||||||||||||||
| October 31, 2014 | October 31, 2015 | October 31, 2016 | October 31, 2017 | ||||||||||||||||
| Subject to Repayment until October 31, | |||||||||||||||||||
| Fund | Expiration Date | 2017 | 2018 | 2019 | 2020 | ||||||||||||||
| Third Avenue | |||||||||||||||||||
| Small-Cap Value Fund | 2/28/2018 | $ | — | $ | — | $ | 171,158 | $ | 56,117 | ||||||||||
| Third Avenue | |||||||||||||||||||
| International Value Fund | 2/28/2018 | 517,819 | 547,840 | 538,118 | 222,649 | ||||||||||||||
The waived fees and reimbursed expenses may be paid to the Adviser during the following three-year period after the end of the fiscal year in which an expense is waived or reimbursed by the Adviser, to the extent that the payment of such fees and expenses would not cause a Fund to exceed the expense limitations.
The Trust has entered into an Administration Agreement with the Adviser pursuant to which the Adviser, as administrator, is responsible for providing various administrative services to the Trust. The Adviser has in turn entered into a Sub-Administration Agreement with BNY Mellon Investment Servicing (U.S.) Inc. (“BNY Mellon”) pursuant to which BNY Mellon provides certain of these administrative services on behalf of the Adviser. Each Fund pays the Adviser a fee calculated at an annual rate of 0.0055% of the average daily net assets of each respective
54
Third Avenue Trust
Notes to Financial Statements (continued)
April 30, 2017 (Unaudited)
Fund for such services. The Adviser pays BNY Mellon an annual sub-administration fee for sub-administration services provided to the Trust equal to $204,165 including $20,940 related to Third Avenue Focused Credit Fund.
Both the Trust and the Adviser have entered into agreements with financial intermediaries to provide recordkeeping, processing, shareholder communications and other services to customers of the intermediaries investing in the Funds and have agreed to compensate the intermediaries for providing those services. Certain of those services would be provided by the Funds if the shares of each customer were registered directly with the Funds’ transfer agent. Accordingly, the Funds have agreed to reimburse a portion of the intermediary fees paid by the Adviser pursuant to provisions adopted by the Board. Each Fund pays a portion of the intermediary fees attributable to shares of the Fund not exceeding the estimated expense the Fund would have paid its transfer agent had each customer’s shares been registered directly with the transfer agent instead of held through the intermediary accounts. The Adviser pays the remainder of the fees. The fees incurred by the Funds are reflected as shareholder servicing fees in the Statements of Operations. For the six months ended April 30, 2017, such fees amounted to $545,480 for Third Avenue Value Fund, $138,849 for Third Avenue Small-Cap Value Fund, $918,512 for Third Avenue Real Estate Value Fund, and $76,169 for Third Avenue International Value Fund.
The Funds have an expense offset arrangement in connection with their custodian contract. Credits realized as a result of uninvested cash balances are used to reduce a portion of the Funds’ custodian expenses. The following amounts are the reduction of expenses due to this arrangement for the six months ended April 30, 2017. These amounts are reflected as “Expenses reduced by custodian fee expense offset arrangement” in the Statements of Operations.
| Fund | Custody Credit | |||||
| Third Avenue Value Fund | $ | 10,126 | ||||
| Third Avenue Small-Cap Value Fund | 2,570 | |||||
| Third Avenue Real Estate Value Fund | 15,895 | |||||
| Third Avenue International Value Fund | 2,097 | |||||
4. RELATED PARTY TRANSACTIONS
Investment in affiliates:
A summary of the Funds’ transactions in securities of affiliated issuers for the six months ended April 30, 2017 is set forth below:
55
Third Avenue Trust
Notes to Financial Statements (continued)
April 30, 2017 (Unaudited)
Third Avenue Value Fund
| Name of Issuer: | Shares/ Principal Amount Held at Oct 31, 2016 | Gross Purchases and Additions | Gross Sales and Reductions | Shares/ Principal Amount Held at Apr. 30, 2017 | Value at Apr 30, 2017 | Investment Income Nov. 1, 2016- Apr 30, 2017 | |||||||||||||||||||
| Home Products International, Inc. | 526,368 | — | — | 526,368 | $ | — | $ | — | |||||||||||||||||
| Home Products International, Inc., | |||||||||||||||||||||||||
| 2nd Lien, Convertible, 6.000% Payment-in-kind Interest, due 12/20/17 | 24,204,152 | 726,125 | 1 | — | 24,930,277 | 15,531,563 | 726,125 | 1 | |||||||||||||||||
| Tejon Ranch Co. | 1,217,794 | — | 85,193 | 1,132,601 | 25,936,563 | — | |||||||||||||||||||
| Total Affiliates | $ | 41,468,126 | $ | 726,125 | |||||||||||||||||||||
| 1 | PIK interest. |
Third Avenue Real Estate Value Fund
| Name of Issuer: | Shares Held at Oct. 31, 2016 | Gross Purchases and Additions | Gross Sales and Reductions | Shares Held at Apr. 30, 2017 | Value at Apr. 30, 2017 | Investment Income Nov. 1, 2016- Apr. 30, 2017 | |||||||||||||||||||
| Five Point Holdings, LLC, | |||||||||||||||||||||||||
| Class A * | 28,847,217 | — | 24,289,995 | 2 | 4,557,222 | $ | 82,935,744 | $ | — | ||||||||||||||||
| Tenon, Ltd.* | 3,653,991 | — | 2,828,061 | 2 | 825,930 | 95,384 | — | ||||||||||||||||||
| Trinity Place Holdings, Inc. | 4,206,286 | 350,000 | 1 | — | 4,556,286 | 32,486,312 | — | ||||||||||||||||||
| Total Affiliates | $ | 115,517,440 | $ | — | |||||||||||||||||||||
| * | As of April 30, 2017, no longer an affiliate. |
| 1 | Share increase due to corporate action. |
| 2 | Share decrease includes corporate action. |
Third Avenue International Value Fund
| Name of Issuer: | Shares Held at Oct 31, 2016 | Gross Purchases and Additions | Gross Sales and Reductions | Shares Held at Apr. 30, 2017 | Value at Apr 30, 2017 | Investment Income Nov. 1, 2016- Apr 30, 2017 | |||||||||||||||
| Rubicon, Ltd. | 47,077,150 | — | 1,534,592 | 45,542,558 | $ | 7,035,652 | $ | — | |||||||||||||
| Tenon, Ltd. | 4,277,651 | — | 2,138,826 | 1 | 2,138,825 | 247,005 | 4,586,230 | ||||||||||||||
| Total Affiliates | $ | 7,282,657 | $ | 4,586,230 | |||||||||||||||||
| 1 | Share decrease due to corporate action. |
56
Third Avenue Trust
Notes to Financial Statements (continued)
April 30, 2017 (Unaudited)
Certain employees of the Adviser serve as members of the board of directors of companies in which the Funds have investments. As a result of such service, for the six months ended April 30, 2017, the Funds received the following board member fees from these companies that board members employed by the Adviser agreed to have paid directly to the benefit of the Funds. These fees are included in “Other Income” on the accompanying Statements of Operations.
| Fund | Fees | |||||
| Third Avenue Value Fund | $ | 13,140 | ||||
| Third Avenue Real Estate Value Fund | 36,600 | |||||
5. DISTRIBUTION EXPENSES
The Board has adopted a distribution plan (the “Plan”) pursuant to Rule 12b-1 under the Investment Company Act. The Plan provides that, as compensation for distribution and related services provided to Third Avenue Value Fund Investor Class (“TVFVX”), Third Avenue Small-Cap Value Fund Investor Class (“TVSVX”), Third Avenue Real Estate Value Fund Investor Class (“TVRVX”), and Third Avenue International Value Fund Investor Class (“TVIVX”), each Fund’s Investor Class accrues a fee calculated at the annual rate of 0.25% of average daily net assets of the class. Such fees may be paid to institutions that provide distribution services. The amount of fees paid during any period may be more or less than the cost of distribution and other services provided. Financial Industry Regulatory Authority rules impose a ceiling on the cumulative distribution fees paid. The Plan complies with those rules.
For the six months ended April 30, 2017, distribution expenses were as follows:
| Fund | Distribution Fees | |||||
| Third Avenue Value Fund | $ | 17,837 | ||||
| Third Avenue Small-Cap Value Fund | 6,456 | |||||
| Third Avenue Real Estate Value Fund | 295,898 | |||||
| Third Avenue International Value Fund | 24,252 | |||||
6. CAPITAL SHARE TRANSACTIONS
Each Fund is authorized to issue an unlimited number of shares of each class of beneficial interest with $0.001 par value.
Transactions in capital stock of each class were as follows:
57
| Third Avenue Trust |
| Notes to Financial Statements (continued) |
| April 30, 2017 (Unaudited) |
| Third Avenue Value Fund | ||||||||||||||||
| For the Period Ended | For the Year Ended | |||||||||||||||
| April 30, 2017 | October 31, 2016 | |||||||||||||||
| Investor Class | Investor Class | |||||||||||||||
| Shares | Amount | Shares | Amount | |||||||||||||
| Shares sold | 15,596 | $ | 816,037 | 33,327 | $ | 1,650,130 | ||||||||||
| Shares Issued upon reinvestment of dividends and distributions | 20,788 | 1,055,644 | 39,489 | 1,943,257 | ||||||||||||
| Shares redeemed* | (56,287 | ) | (2,945,638 | ) | (324,983 | ) | (15,414,722 | ) | ||||||||
| Net decrease | (19,903 | ) | $ | (1,073,957 | ) | (252,167 | ) | $ | (11,821,335 | ) | ||||||
| For the Period Ended | For the Year Ended | |||||||||||||||
| April 30, 2017 | October 31, 2016 | |||||||||||||||
| Institutional Class | Institutional Class | |||||||||||||||
| Shares | Amount | Shares | Amount | |||||||||||||
| Shares sold | 287,588 | $ | 15,247,438 | 320,705 | $ | 15,557,898 | ||||||||||
| Shares Issued upon reinvestment of dividends and distributions | 1,725,485 | 87,602,868 | 2,324,998 | 114,389,913 | ||||||||||||
| Shares redeemed* | (2,586,745 | ) | (135,163,708 | ) | (10,829,026 | ) | (525,833,988 | ) | ||||||||
| Net decrease | (573,672 | ) | $ | (32,313,402 | ) | (8,183,323 | ) | $ | (395,886,177 | ) | ||||||
| Third Avenue Small-Cap Value Fund | ||||||||||||||||
| For the Period Ended | For the Year Ended | |||||||||||||||
| April 30, 2017 | October 31, 2016 | |||||||||||||||
| Investor Class | Investor Class | |||||||||||||||
| Shares | Amount | Shares | Amount | |||||||||||||
| Shares sold | 20,450 | $ | 447,737 | 26,055 | $ | 521,081 | ||||||||||
| Shares Issued upon reinvestment of dividends and distributions | 20,023 | 430,280 | 58,070 | 1,106,819 | ||||||||||||
| Shares redeemed* | (49,808 | ) | (1,101,787 | ) | (257,343 | ) | (4,821,200 | ) | ||||||||
| Net decrease | (9,335 | ) | $ | (223,770 | ) | (173,218 | ) | $ | (3,193,300 | ) | ||||||
58
| Third Avenue Trust |
| Notes to Financial Statements (continued) |
| April 30, 2017 (Unaudited) |
| For the Period Ended | For the Year Ended | |||||||||||||||
| April 30, 2017 | October 31, 2016 | |||||||||||||||
| Institutional Class | Institutional Class | |||||||||||||||
| Shares | Amount | Shares | Amount | |||||||||||||
| Shares sold | 190,491 | $ | 4,206,633 | 315,774 | $ | 6,136,673 | ||||||||||
| Shares Issued upon reinvestment of dividends and distributions | 1,200,707 | 26,031,326 | 2,358,829 | 45,313,002 | ||||||||||||
| Shares redeemed* | (1,672,049 | ) | (36,954,799 | ) | (6,067,099 | ) | (116,865,673 | ) | ||||||||
| Net decrease | (280,851 | ) | $ | (6,716,840 | ) | (3,392,496 | ) | $ | (65,415,998 | ) | ||||||
| Third Avenue Real Estate Value Fund | ||||||||||||||||
| For the Period Ended | For the Year Ended | |||||||||||||||
| April 30, 2017 | October 31, 2016 | |||||||||||||||
| Investor Class | Investor Class | |||||||||||||||
| Shares | Amount | Shares | Amount | |||||||||||||
| Shares sold | 770,261 | $ | 24,117,483 | 2,334,996 | $ | 66,856,635 | ||||||||||
| Shares Issued upon reinvestment of dividends and distributions | 114,545 | 3,447,813 | 738,578 | 21,352,283 | ||||||||||||
| Shares redeemed* | (1,577,572 | ) | (48,150,240 | ) | (8,903,248 | ) | (251,954,820 | ) | ||||||||
| Net decrease | (692,766 | ) | $ | (20,584,944 | ) | (5,829,674 | ) | $ | (163,745,902 | ) | ||||||
| For the Period Ended | For the Year Ended | |||||||||||||||
| April 30, 2017 | October 31, 2016 | |||||||||||||||
| Institutional Class | Institutional Class | |||||||||||||||
| Shares | Amount | Shares | Amount | |||||||||||||
| Shares sold | 3,543,260 | $ | 111,167,289 | 8,221,550 | $ | 237,805,212 | ||||||||||
| Shares Issued upon reinvestment of dividends and distributions | 839,089 | 25,374,045 | 4,941,140 | 143,540,124 | ||||||||||||
| Shares redeemed* | (8,813,266 | ) | (269,516,698 | ) | (55,937,866 | ) | (1,581,249,979 | ) | ||||||||
| Net decrease | (4,430,917 | ) | $ | (132,975,364 | ) | (42,775,176 | ) | $ | (1,199,904,643 | ) | ||||||
59
| Third Avenue Trust |
| Notes to Financial Statements (continued) |
| April 30, 2017 (Unaudited) |
| Third Avenue International Value Fund | ||||||||||||||||
| For the Period Ended | For the Year Ended | |||||||||||||||
| April 30, 2017 | October 31, 2016 | |||||||||||||||
| Investor Class | Investor Class | |||||||||||||||
| Shares | Amount | Shares | Amount | |||||||||||||
| Shares sold | 1,636,796 | $ | 26,274,048 | 29,295 | $ | 412,928 | ||||||||||
| Shares Issued upon reinvestment of dividends and distributions | 15,204 | 238,545 | 5,394 | 75,354 | ||||||||||||
| Shares redeemed* | (96,713 | ) | (1,615,179 | ) | (139,142 | ) | (1,918,945 | ) | ||||||||
| Net increase/(decrease) | 1,555,287 | $ | 24,897,414 | (104,453 | ) | $ | (1,430,663 | ) | ||||||||
| For the Period Ended | For the Year Ended | |||||||||||||||
| April 30, 2017 | October 31, 2016 | |||||||||||||||
| Institutional Class | Institutional Class | |||||||||||||||
| Shares | Amount | Shares | Amount | |||||||||||||
| Shares sold | 397,132 | $ | 6,570,203 | 291,318 | $ | 3,829,460 | ||||||||||
| Shares Issued upon reinvestment of dividends and distributions | 340,539 | 5,332,830 | 182,457 | 2,543,459 | ||||||||||||
| Shares redeemed* | (1,083,254 | ) | (17,714,971 | ) | (5,300,685 | ) | (74,473,976 | ) | ||||||||
| Net decrease | (345,583 | ) | $ | (5,811,938 | ) | (4,826,910 | ) | $ | (68,101,057 | ) | ||||||
| * | Redemption fees are netted with redemption amounts. |
Third Avenue Value Fund, Third Avenue Small-Cap Value Fund, Third Avenue Real Estate Value Fund, and Third Avenue International Value Fund charge a redemption fee of 1%, 1%, 1%, and 2%, respectively, for shares redeemed or exchanged for shares of another series of the Trust within 60 days or less of the purchase date.
60
Third Avenue Trust
Notes to Financial Statements (continued)
April 30, 2017 (Unaudited)
7. COMMITMENTS AND CONTINGENCIES
In the normal course of business, the Funds enter into contracts that contain a variety of representations and warranties and which provide general indemnifications. The Funds’ maximum exposure under these arrangements is unknown, as this would involve future claims that may be made against the Funds that have not yet occurred.
In 2016, the Third Avenue Focused Credit Fund became party to various derivative, securities class action and books and records lawsuits.
In 2016, the Adviser became party to various derivative and securities class action lawsuits.
In settlement of these lawsuits, the Adviser, the Third Avenue Focused Credit Fund and certain claimants have entered into agreements that would require the Adviser to pay the Third Avenue Focused Credit Fund $25 million (using its own capital and insurance proceeds) and the Third Avenue Focused Credit Fund would then pay certain former and present shareholders a total of $14.25 million in full settlement of all claims raised in the litigations. The Adviser believes that final approvals of these settlements are likely. The Third Avenue Focused Credit Fund will recognize a gain as a result of these settlements. The amount to be paid by the Adviser will not affect the Adviser’s ability to fully perform its investment advisory and other services to the Third Avenue Focused Credit Fund or the Trust.
8. RISKS RELATING TO CERTAIN INVESTMENTS
Foreign securities and emerging markets risk:
Foreign securities from a particular country or region may be subject to currency fluctuations and controls, or adverse political, social, economic or other developments that are unique to that particular country or region. Therefore, the prices of foreign securities in particular countries or regions may, at times, move in a different direction from those of U.S. securities. From time to time, foreign capital markets may exhibit more volatility than those in the U.S., and the securities markets of emerging market countries can be extremely volatile. Emerging market countries can generally have economic structures that are less diverse and mature, and political systems that are less stable, than those of developed countries, and, as a result, the securities markets of emerging market countries can be more volatile than more developed markets may be.
High yield and distressed risk:
The Funds’ investments in high-yield debt securities (commonly known as “junk bonds”) and distressed securities may expose the Funds to greater risks than if the Funds only owned higher-grade securities. The value of high-yield, lower quality securities is affected by the creditworthiness of the issuers of the securities and by general economic and specific industry conditions. The prices of high yield securities can fall in response to negative news about the issuer or its industry, or the economy in general to a greater extent than those of higher rated securities. Issuers of high-yield securities are not as strong financially as those with higher credit ratings, so the securities are usually considered speculative investments. These issuers are more vulnerable to financial setbacks and recession than are more creditworthy issuers, which may impair their ability to make interest and principal payments. The Funds may also invest in distressed securities, which the Adviser considers to be issued by companies that are, or might be, involved in reorganizations or financial restructurings, either out of court or in bankruptcy. The Funds’ investments in distressed securities typically may involve the purchase of high-yield bonds, bank debt or other indebtedness of such companies.
61
Third Avenue Trust
Notes to Financial Statements (continued)
April 30, 2017 (Unaudited)
Debt securities risk:
The market value of a debt security may decline due to general market conditions that are not specifically related to a particular company, such as real or perceived adverse economic conditions, changes in the outlook for corporate earnings, changes in interest or currency rates or adverse investor sentiment generally. The debt securities market can be susceptible to increases in volatility and decreases in liquidity. Increases in volatility and decreases in liquidity may be caused by a rise in interest rates (or the expectation of a rise in interest rates), which are at or near historic lows in the United States and in other countries. During periods of reduced market liquidity, a Fund may not be able to readily sell debt securities at prices at or near their perceived value. If a Fund needed to sell large blocks of debt securities to meet shareholder redemption requests or to raise cash, those sales could further reduce the prices of such securities.
Prices of bonds and other debt securities tend to move inversely with changes in interest rates. Typically, a rise in rates will adversely affect debt securities and, accordingly, will cause the value of a Fund’s investments in these securities to decline. When interest rates fall, the values of already-issued securities generally rise, although investments in new securities may be at lower yields. The prices of high-yield debt securities (“junk bonds”), unlike investment grade securities, may fluctuate unpredictably and not necessarily inversely with changes in interest rates.
The rates on floating debt instruments adjust periodically with changes in market interest rates. Although these instruments are generally less sensitive to interest rate changes than fixed rate instruments, the value of floating rate loans and other floating rate securities may decline if their interest rates do not rise as quickly, or as much, as general interest rates. An unexpected increase in Fund redemption requests, including requests from shareholders who may own a significant percentage of a Fund’s shares, which may be triggered by market turmoil or an increase in interest rates, could cause the Fund to sell its holdings at a loss or at undesirable prices and adversely affect the Fund’s share price and increase the Fund’s liquidity risk, Fund expenses and/or taxable distributions. Economic and other developments can adversely affect debt securities markets.
Market risk:
Prices of securities have historically fluctuated. The market value of a security may decline due to general market conditions that are not related to the particular company, such as real or perceived adverse economic conditions, changes in the outlook for corporate earnings, changes in interest or currency rates or adverse investor sentiment generally. A security’s market value also may decline because of factors that affect the particular company, such as management performance, financial leverage, and reduced demand for the company’s products or services, or
62
Third Avenue Trust
Notes to Financial Statements (continued)
April 30, 2017 (Unaudited)
factors that affect the company’s industry, such as labor shortages or increased production costs and competitive conditions within an industry. The value of the Funds will similarly fluctuate and you could lose money.
Liquidity risk:
Liquidity risk exists when particular investments are difficult to sell. The Funds may not be able to sell these investments at the best prices or at the value the Funds place on them. In such a market, the value of such investments and a Fund’s share price may fall dramatically, even during periods of declining interest rates. Investments that are illiquid or that trade in lower volumes may be more difficult to value. The market for high-yield debt securities (“junk bonds”) may be less liquid and therefore these securities may be harder to value or sell at an acceptable price, especially during times of market volatility or decline. Investments in foreign securities tend to have greater exposure to liquidity risk than U.S. securities. Liquidity can decline unpredictably in response to overall economic conditions or credit tightening. Investments in private debt instruments, restricted securities, and securities having substantial market and/or credit risk may involve greater liquidity risk.
Counterparty risk:
The Funds are exposed to counterparty risk, or the risk that an institution or other entity with which the Funds have unsettled or open transactions will default. The potential loss to the Funds could exceed the value of the financial assets recorded in the Funds’ financial statements. Financial assets, which potentially expose the Funds to counterparty risk, consist principally of cash due from counterparties and investments. The Adviser seeks to minimize the Funds’ counterparty risk by performing reviews of each counterparty and by minimizing concentration of counterparty risk by undertaking transactions with multiple customers and counterparties on recognized and reputable exchanges. Delivery of securities sold is only made once the Funds have received payment. Payment is made on a purchase once the securities have been delivered by the counterparty. The trade will fail if either party fails to meet its obligation.
At April 30, 2017, the Funds had counterparty concentration of credit risk primarily with Goldman, Sachs International, Morgan Stanley Capital Services LLC and UBS AG.
The Funds are party to International Swaps and Derivatives Association, Inc. Master Agreements (“ISDA Master Agreements”) with select counterparties that govern transactions, over-the-counter derivatives and foreign exchange contracts entered into by the Funds and those counterparties. The ISDA Master Agreements contain provisions for general obligations, representations, agreements, collateral and events of default or termination. Events of termination include conditions that may entitle counterparties to elect to terminate early and cause settlement of all outstanding transactions under the applicable ISDA Master Agreement. Any election to terminate early could be material to the financial statements of the Funds.
63
Third Avenue Trust
Notes to Financial Statements (continued)
April 30, 2017 (Unaudited)
The considerations and factors surrounding the settlement of certain purchases and sales made on a delayed-delivery basis are governed by Master Securities Forward Transaction Agreements (“Master Forward Agreements”) between the Funds and select counterparties. The Master Forward Agreements maintain provisions for, among other things, initiation and confirmation, payment and transfer, events of default, termination, and maintenance of collateral.
The counterparty risk associated with certain contracts may be reduced by master netting arrangements to the extent that if an event of default occurs, all amounts with the counterparty are terminated and settled on a net basis. The Funds’ overall exposure to counterparty risk with respect to transactions subject to master netting arrangements can change substantially within a short period, as it is affected by each transaction subject to the arrangement.
Collateral requirements:
For derivatives traded under an ISDA Master Agreement and/or Master Forward Agreement, the collateral requirements are typically calculated by netting the mark-to-market amount for each transaction under such agreement and comparing that amount to the value of any collateral currently pledged by the Fund and the counterparty.
Cash collateral that has been pledged to cover obligations of a Fund and cash collateral received from the counterparty, if any, is reported separately on the Statement of Assets and Liabilities as cash pledged as collateral and cash received as collateral, respectively. Non-cash collateral pledged by the Fund, if any, is noted in the Schedule of Investments. Generally, the amount of collateral due from or to a party has to exceed a minimum transfer amount threshold (e.g. $500,000) before a transfer is required, which is determined at the close of business of a Fund and any additional required collateral is delivered to/pledged by a Fund on the next business day. Typically, a Fund and its counterparties are not permitted to sell, re-pledge or use the collateral they receive. To the extent amounts due to a Fund from its counterparties are not fully collateralized, contractually or otherwise, a Fund bears the risk of loss from counterparty non-performance. The Funds attempt to mitigate counterparty risk by entering into agreements only with counterparties that it believes have the financial resources to honor their obligations and by monitoring the financial stability of those counterparties.
For financial reporting purposes, the Funds do not offset derivative assets and derivative liabilities that are subject to netting arrangements in the Statement of Assets and Liabilities.
Third Avenue Real Estate Value Fund
At April 30, 2017, the Fund’s derivative assets and liabilities (by type) on a gross basis are as follows:
64
Third Avenue Trust
Notes to Financial Statements (continued)
April 30, 2017 (Unaudited)
| Assets | Liabilities | |||||||
| Derivative Financial Instruments: | ||||||||
| Options | $ | 28 | $ | — | ||||
| Forward Foreign Currency Contracts | 15,015 | — | ||||||
| Total derivative assets and liabilties in the Statement of Assets and Liabilities | 15,043 | — | ||||||
| Derivatives not subject to a master netting agreement or similiar agreement (“MNA”) | — | — | ||||||
| Total derivative assets and liabilities subject to a MNA | $ | 15,043 | $ | — | ||||
The following tables present the Fund’s derivative assets by counterparty net of amounts available for offset under a MNA and net of the related collateral received by the Fund as of April 30, 2017:
| Counterparty | Amount of Assets Subject to a MNA by Counterparty | Derivatives Available for Offset1 | Non-cash Collateral Received2 | Cash Collateral Received2 | Net Amount of Derivative Assets3 | ||||||||||||||||
| Goldman Sachs International | $ | 12,665 | $ | — | $ | — | $ | (12,665 | ) | $ | — | ||||||||||
| Morgan Stanley Capital Services LLC | 2,350 | — | — | (2,350 | ) | — | |||||||||||||||
| UBS AG | 28 | — | — | (28 | ) | — | |||||||||||||||
| $ | 15,043 | $ | — | $ | — | $ | (15,043 | ) | $ | — | |||||||||||
| 1 | The amount of derviatives for offset is limited to the amount of assets and/or liabilites that are subject to a MNA. |
| 2 | Excess of collateral received from the individual counterparty may not be shown for financial reporting purposes. |
| 3 | Net amount represents the net amount receivable from the counterparty in the event of default. |
Third Avenue International Value Fund
At April 30, 2017, the Fund’s derivative assets and liabilities (by type) on a gross basis are as follows:
| Assets | Liabilities | |||||||
| Derivative Financial Instruments: | ||||||||
| Options | $ | 44,016 | $ | — | ||||
| Total derivative assets and liabilties in the Statement of Assets and Liabilities | 44,016 | — | ||||||
| Derivatives not subject to a master netting agreement or similiar agreement (“MNA”) | — | — | ||||||
| Total derivative assets and liabilities subject to a MNA | $ | 44,016 | $ | — | ||||
65
Third Avenue Trust
Notes to Financial Statements (continued)
April 30, 2017 (Unaudited)
The following tables present the Fund’s derivative assets by counterparty net of amounts available for offset under a MNA and net of the related collateral received by the Fund as of April 30, 2017:
| Counterparty | Amount of Assets Subject to a MNA by Counterparty | Derivatives Available for Offset1 | Non-cash Collateral Received2 | Cash Collateral Received2 | Net Amount of Derivative Assets3 | ||||||||||||||||
| Morgan Stanley Capital Services LLC | $ | 44,016 | $ | — | $ | — | $ | (44,016 | ) | $ | — | ||||||||||
| 1 | The amount of derviatives for offset is limited to the amount of assets and/or liabilites that are subject to a MNA. |
| 2 | Excess of collateral received from the individual counterparty may not be shown for financial reporting purposes. |
| 3 | Net amount represents the net amount receivable from the counterparty in the event of default. |
Loans and other direct debt instruments:
The Funds may invest in loans and other direct debt instruments issued by corporate borrowers. These loans represent amounts owed to lenders or lending syndicates (loans and loan participations) or to other parties. Direct debt instruments may involve a risk of loss in case of default or insolvency of the borrower and may offer less legal protection to the Fund in the event of fraud or misrepresentation. In addition, loan participations involve a risk of insolvency of the lending bank or other financial intermediary. The markets in loans are not regulated by federal securities laws or the SEC.
Cash concentration:
The Funds’ cash balances are held at a major regional U.S. bank. The Funds’ cash balances, which typically exceed Federal Deposit Insurance Corporation insurance coverage, subject the Funds to a concentration of credit risk. The Funds regularly monitor the credit ratings of this financial institution in order to mitigate the credit risk that exists with the balances in excess of insured amounts.
Off-balance sheet risk:
The Fund enters into derivatives which may represent off-balance sheet risk. Off-balance sheet risk exists when the maximum potential loss on a particular investment is greater than the value of such investment as reflected in the Statement of Assets and Liabilities.
Focused investing:
The Funds hold relatively concentrated portfolios that may contain fewer securities or industries than the portfolios of other mutual funds. Holding a relatively concentrated portfolio may increase the risk that the value of a Fund could decrease because of the poor performance of one or a few investments. Concentrated positions may be difficult to liquidate.
66
Third Avenue Trust
Notes to Financial Statements (continued)
April 30, 2017 (Unaudited)
9. FEDERAL INCOME TAXES
The difference between book and tax basis total unrealized appreciation/(depreciation) is primarily attributable to deferred losses on wash sales, mark-to-market treatment of investments in certain passive foreign investment companies, investments in REITs and partnerships, differences in the treatment of amortization of discount on certain debt instruments, and other timing differences. Other cost basis adjustments are primarily attributable to unrealized appreciation/(depreciation) on certain derivatives and items related to other miscellaneous investments.
10. SUBSEQUENT EVENTS
Management has evaluated the impact of all subsequent events on the Funds through the date the financial statements were issued, and has determined that there were no events requiring recognition or disclosure in the Funds’ financial statements.
67
Third Avenue Trust
Schedule of Shareholder Expenses
(Unaudited)
As a shareholder of a Fund, you incur two types of costs: (1) transaction costs, such as redemption fees; and (2) ongoing costs, including management fees, shareholder servicing fees, distribution fees (if applicable) and other Fund expenses. This example is intended to help you understand your ongoing costs (in dollars) of investing in the Funds and to compare these costs with the ongoing costs of investing in other mutual funds.
The example is based on an investment of $1,000 invested at the beginning of the period, November 1, 2016 and held for the six month period ended April 30, 2017.
Actual Expenses
For each Class of each Fund in the table below, the first line provides information about actual account values and actual expenses. You may use the information in this line, together with the amount you invested, to estimate the expenses that you paid over the period. Simply divide your account value by $1,000 (for example, an $8,600 account value divided by $1,000 = 8.6), then multiply the result by the number in the first line under the heading entitled “Expenses Paid During the Period” to estimate the expenses you paid on your account during this period.
Hypothetical Example for Comparison Purposes
The second line of each Class in the table below provides information about hypothetical account values and hypothetical expenses based on the Class’ actual expense ratio and an assumed rate of return of 5% per year before expenses, which is not the Class’ actual return. The hypothetical account values and expenses may not be used to estimate the actual ending account balance or expenses you paid for the period. You may use this information to compare the ongoing costs of investing in the Class of the Fund and other funds. To do so, compare this 5% hypothetical example with the 5% hypothetical examples that appear in the shareholder reports of the other funds.
Please note that the expenses shown in the table are meant to highlight your ongoing costs only and do not reflect any transactional costs, such as redemption fees. Therefore, the second line of each Class in the table is useful in comparing ongoing costs only, and will not help you determine the relative total costs of owning different funds. In addition, if these transactional costs were included, your costs would have been higher. The example also assumes all dividends and distributions have been reinvested.
68
Third Avenue Trust
Schedule of Shareholder Expenses (continued)
(Unaudited)
| Beginning Account Value November 1, 2016 | Ending Account Value April 30, 2017 | Expenses Paid During the Period November 1, 2016 to April 30, 2017* | Annualized Expense Ratio | ||||||
| Third Avenue Value Fund | |||||||||
| Investor Class | |||||||||
| Actual | $1,000 | $1,128.20 | $7.33 | 1.39% | |||||
| Hypothetical | $1,000 | $1,017.90 | $6.95 | 1.39% | |||||
| Institutional Class | |||||||||
| Actual | $1,000 | $1,129.90 | $6.02 | 1.14% | |||||
| Hypothetical | $1,000 | $1,019.14 | $5.71 | 1.14% | |||||
| Third Avenue Small-Cap Value Fund | |||||||||
| Investor Class | |||||||||
| Actual | $1,000 | $1,158.20 | $7.49 | 1.40% | |||||
| Hypothetical | $1,000 | $1,017.85 | $7.00 | 1.40% | |||||
| Institutional Class | |||||||||
| Actual | $1,000 | $1,160.30 | $6.16 | 1.15% | |||||
| Hypothetical | $1,000 | $1,019.09 | $5.76 | 1.15% | |||||
| Third Avenue Real Estate Value Fund | |||||||||
| Investor Class | |||||||||
| Actual | $1,000 | $1,126.20 | $7.28 | 1.38% | |||||
| Hypothetical | $1,000 | $1,017.95 | $6.90 | 1.38% | |||||
| Institutional Class | |||||||||
| Actual | $1,000 | $1,127.60 | $5.96 | 1.13% | |||||
| Hypothetical | $1,000 | $1,019.19 | $5.66 | 1.13% | |||||
| Third Avenue International Value Fund | |||||||||
| Investor Class | |||||||||
| Actual | $1,000 | $1,142.80 | $8.77 | 1.65% | |||||
| Hypothetical | $1,000 | $1,016.61 | $8.25 | 1.65% | |||||
| Institutional Class | |||||||||
| Actual | $1,000 | $1,144.50 | $7.44 | 1.40% | |||||
| Hypothetical | $1,000 | $1,017.85 | $7.00 | 1.40% |
| * | Expenses (net of fee waivers and expense offset arrangement) are equal to the Class’ annualized expense ratio, multiplied by the average account value over the period, multiplied by the number of days in the most recent fiscal half-year (181) divided by 365. |
69
BOARD OF TRUSTEES
William E. Chapman, II
Lucinda Franks
Edward J. Kaier
Eric Rakowski
Patrick Reinkemeyer
Charles C. Walden — Chairman
Martin Shubik — Advisory Trustee
Martin J. Whitman — Chairman Emeritus
OFFICERS
Vincent J. Dugan — Chief Financial Officer, Treasurer
Michael A. Buono — Controller, Assistant Treasurer
W. James Hall III — President, General Counsel, Secretary
Joseph J. Reardon — Chief Compliance Officer
TRANSFER AGENT
BNY Mellon Investment Servicing (U.S.) Inc.
P.O. Box 9802
Providence, RI 02940-8002
610-239-4600
800-443-1021 (toll-free)
INVESTMENT ADVISER
Third Avenue Management LLC
622 Third Avenue
New York, NY 10017
INDEPENDENT REGISTERED PUBLIC ACCOUNTING FIRM
PricewaterhouseCoopers LLP
300 Madison Avenue
New York, NY 10017
CUSTODIAN
JPMorgan Chase Bank, N.A.
383 Madison Avenue, 4th Floor
New York, NY 10179
 | Third Avenue offers multiple investment solutions with unique exposures and return profiles. Our core strategies are currently available through ‘40Act mutual funds and customized accounts. If you would like further information, please contact a Relationship Manager at: | |
www.thirdave.com | 622 Third Avenue |
|
|
New York, NY 10017 |
|
 212.906.1160
 /third-ave-management
 clientservice@thirdave.com


Third Avenue Focused
Credit Fund
SEMI-ANNUAL REPORT
APRIL 30, 2017
THIRD AVENUE FUNDS
Privacy Policy
Third Avenue Focused Credit Fund (the “Fund”) respects your right to privacy. We also know that you expect us to conduct and process your business in an accurate and efficient manner. To do so, we must collect and maintain certain personal information about you. This is the information we collect from you on applications or other forms and from the transactions you make with us, our affiliates, or third parties. We do not disclose any information about you or any of our former customers to anyone, except to our affiliates (which may include the Fund’s affiliated money management entities) and service providers, or as otherwise permitted by law. To protect your personal information, we permit access only by authorized employees. Be assured that we maintain physical, electronic and procedural safeguards that comply with federal standards to guard your personal information.
Proxy Voting Policies and Procedures
The Fund has delegated the voting of proxies relating to its voting securities to the Fund’s investment adviser pursuant to the adviser’s proxy voting guidelines. A description of these proxy voting guidelines and procedures, as well as information relating to how the Fund voted proxies relating to portfolio securities during the most recent 12-month period ended June 30, is available by August 31 each year (i) without charge, upon request, by calling (800) 443- 1021, (ii) at the website of the Securities and Exchange Commission (the “SEC”) at http://www.sec.gov, and (iii) on the Fund’s website www.focusedcreditfund.com.
Schedule of Portfolio Holdings—Form N-Q
The Fund files its complete schedule of portfolio holdings with the SEC for the first and third quarters of each fiscal year on Form N-Q. The Fund’s Form N-Q is available on the SEC’s website at http://www.sec.gov, and may be reviewed and copied at the SEC’s Public Reference Room in Washington, DC. Information on the operation of the Public Reference Room may be obtained by calling 1-800-SEC-0330.
Third Avenue Trust
Third Avenue Focused Credit Fund
Industry Diversification
(Unaudited)
The summary of the Fund’s investments as of April 30, 2017 is as follow:
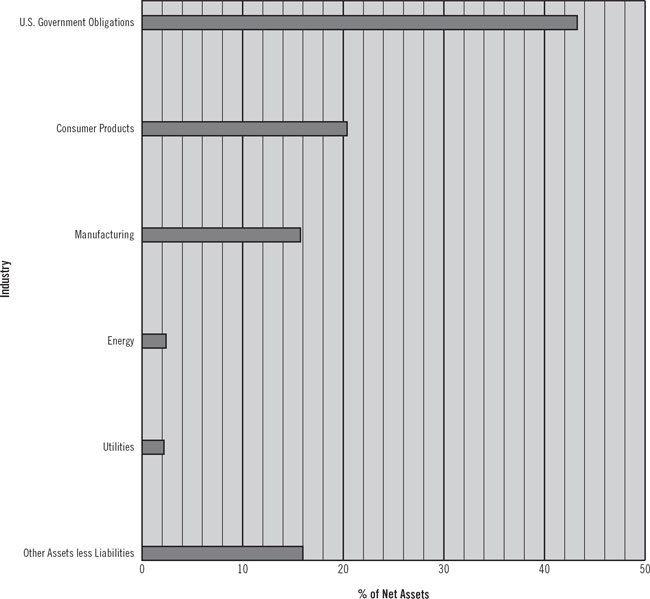
1
Third Avenue Trust
Third Avenue Focused Credit Fund
Portfolio of Investments
at April 30, 2017 (Unaudited)
| Principal Amount‡ | Security† | Value (Note 1) | |||||
| Corporate Bonds & Notes - 29.96% | |||||||
| Consumer Products - 18.36% | |||||||
| Ideal Standard International S.A. (Luxembourg): | |||||||
| 35,030,971 | EUR | Series B, 11.750% Cash or 15.750% Payment-in-kind Interest, due 5/1/18 (a)(b)(c)(d) | $ | 38,159,268 | |||
| 42,821,940 | EUR | Series C, 11.750% Cash or 17.750% Payment-in-kind Interest, due 5/1/18 (a)(b)(c)(d)(e) | 46,645,977 | ||||
| 84,805,245 | |||||||
| Manufacturing - 11.03% | |||||||
| 57,489,666 | Liberty Tire Recycling LLC, 2nd Lien, 11.000% Payment-in-kind Interest, due 3/31/21 (a)(b)(c)(d) | 50,964,589 | |||||
| Media/Cable - 0.00% | |||||||
| 25,043,351 | iHeartCommunications, Inc., Escrow, due 2/1/21 (c) | — | |||||
| Utilities - 0.57% | |||||||
| 2,873,738 | Longview Intermediate Holdings C, LLC, 12.000%, due 10/12/21 (b)(c) | 2,605,043 | |||||
| Total Corporate Bonds & Notes (Cost $151,607,755) | 138,374,877 | ||||||
| Term Loans - 5.07% | |||||||
| Energy - 0.18% | |||||||
| 923,839 | Geokinetics Holdings USA, Inc., Term Loan, 2nd Lien, 5.000% Cash and 8.000% Payment-in-kind Interest, due 8/10/18 (b)(c)(d) | 822,217 | |||||
| Financials - 0.00%* | |||||||
| 22,961 | EUR | Concrete Investment II, Term Loans, Tranche A2, 2.000% Cash or Payment-in-kind Interest, due 10/31/17 (Luxembourg)(c)(d)(f) | 25,011 | ||||
| Manufacturing - 4.73% | |||||||
| 21,860,625 | Liberty Tire Recycling Holdco, LLC, Term Loan B, 9.000%, due 7/7/20 (b)(f) | 21,833,299 | |||||
| Utilities - 0.16% | |||||||
| 900,000 | Longview Power, LLC, Revolver, 7.000%, due 4/13/20 (b)(c)(f) | 744,750 | |||||
| Total Term Loans (Cost $22,895,875) | 23,425,277 | ||||||
| Shares | |||||||
| Common Stocks & Warrants - 3.67% | |||||||
| Energy - 2.19% | |||||||
| 124,461 | Geokinetics, Inc. (b)(c)(e)(g) | 4,717,072 | |||||
The accompanying notes are an integral part of the financial statements.
2
Third Avenue Trust
Third Avenue Focused Credit Fund
Portfolio of Investments (continued)
at April 30, 2017 (Unaudited)
| Shares | Security† | Value (Note 1) | |||||
| Common Stocks & Warrants (continued) | |||||||
| Energy (continued) | |||||||
| 45,252 | Geokinetics, Inc., Warrants, expire 9/1/26 (b)(c)(g) | $ | 1,714,598 | ||||
| 50,000 | Platinum Energy Holdings, Inc. (b)(c)(e)(g) | 181,500 | |||||
| 10,874 | Platinum Energy Holdings, Inc., Warrants, expire 10/4/18 (b)(c)(e)(g) | — | |||||
| 53 | Thunderbird Resources Equity, Inc. (c)(g) | 3,498,357 | |||||
| 10,111,527 | |||||||
| Manufacturing - 0.00% | |||||||
| 3,430,293 | LTR Holdings, Inc. (b)(c)(g) | — | |||||
| Utilities - 1.48% | |||||||
| 4,550,000 | Longview Intermediate Holdings C, LLC (b)(g) | 6,256,250 | |||||
| 415,194 | Longview Intermediate Holdings C, LLC, Warrants, expire 12/19/21 (b)(c)(g) | 566,740 | |||||
| 6,822,990 | |||||||
| Total Common Stocks & Warrants (Cost $64,575,827) | 16,934,517 | ||||||
| Private Equities - 2.02% | |||||||
| Consumer Products - 2.02% | |||||||
| 1,451,633,736,282 | Ideal Standard International Equity S.A. Alpecs (Luxembourg) (b)(c)(e)(g) | 9,329,469 | |||||
| Total Private Equities (Cost $9,915,530) | 9,329,469 | ||||||
The accompanying notes are an integral part of the financial statements.
3
Third Avenue Trust
Third Avenue Focused Credit Fund
Portfolio of Investments (continued)
at April 30, 2017 (Unaudited)
| Principal Amount($) | Security† | Value (Note 1) | |||||
| Short-Term Investments - 43.29% | |||||||
| U.S. Government Obligations - 43.29% | |||||||
| 200,000,000 | U.S. Treasury Bill, 0.710%, due 5/11/17 (h) | $ | 199,960,556 | ||||
| Total Short-Term Investments (Cost $199,960,556) | 199,960,556 | ||||||
| Total Investment Portfolio - 84.01% (Cost $448,955,543) | 388,024,696 | ||||||
| Other Assets less Liabilities - 15.99% (i) | 73,869,074 | ||||||
| NET ASSETS - 100.00% | $ | 461,893,770 | |||||
Notes:
| (a) | Security is exempt from registration pursuant to Rule 144A under the Securities Act of 1933. This security may be resold in transactions that are exempt from registration, normally to qualified institutional buyers. |
| (b) | Affiliated issuers - as defined in the Investment Company Act of 1940 (ownership by the Fund of 5% or more of the outstanding voting securities of these issuers). |
| (c) | Fair-valued security. |
| (d) | Payment-in-kind (“PIK”) security. Income may be paid as additional securities or cash at the discretion of the issuer. |
| (e) | Security subject to restrictions on resale. |
| Shares/ Principal Amount1 | Issuer | Acquisiton Date | Cost | Market Value Per Unit | ||||||||
| 124,461 | Geokinetics, Inc. | 5/22/13 - 5/14/14 | $ | 13,030,780 | $ | 37.90 | ||||||
| 1,451,633,736,282 | Ideal Standard International Equity S.A. Alpecs | 10/31/14 | 9,915,530 | 0.00 | 2 | |||||||
| 42,821,940 | EUR | Ideal Standard International S.A., Series C, 11.750% Cash or 17.750% Payment-in-kind Interest, due 5/1/18 | 10/31/14 - 11/9/16 | 51,393,209 | 108.93 | |||||||
| 50,000 | Platinum Energy Holdings, Inc. | 10/4/13 | 695,746 | 3.63 | ||||||||
| 10,874 | Platinum Energy Holdings, Inc., Warrants, expire 10/4/18 | 10/4/13 | 9,743 | 0.00 | ||||||||
EUR: Euro.
| 1) | Denominated in U.S. Dollars unless otherwise noted. |
| 2) | Amount less than $0.01. |
At April 30, 2017, these restricted securities had a total market value of $60,874,018 or 13.18% of net assets.
| (f) | Variable rate security. The rate disclosed is in effect as of April 30, 2017. |
| (g) | Non-income producing security. |
| (h) | Annualized yield at date of purchase. |
| (i) | A portion is segregated for future fund commitments. |
| ‡ | Denominated in U.S. Dollars unless otherwise noted. |
| † | U.S. issuer unless otherwise noted. |
| * | Amount represents less than 0.01% of net assets. |
EUR: Euro.
The accompanying notes are an integral part of the financial statements.
4
Third Avenue Trust
Third Avenue Focused Credit Fund
Portfolio of Investments (continued)
at April 30, 2017 (Unaudited)
| Country Concentration | ||||
| % of Net Assets | ||||
| United States* | 63.62 | % | ||
| Luxembourg | 20.39 | |||
| Total | 84.01 | % | ||
* Includes cash equivalents, classified as Short-Term Investments on the Portfolio of Investments.
Schedule of Forward Foreign Currency Contracts
| Contracts to Sell |
Counterparty | Settlement Date | Settlement Value | Value at 4/30/17 | Unrealized Appreciation | |||||||
| 86,440,511 | EUR | JPMorgan Chase Bank, N.A. | 5/30/17 | $94,662,179 | $94,318,045 | $344,134 | ||||||
The accompanying notes are an integral part of the financial statements.
5
Third Avenue Trust
Third Avenue Focused Credit Fund
Statement of Assets and Liabilities
at April 30, 2017 (Unaudited)
| Assets: | ||||
| Investments at value (Notes 1 and 4): | ||||
| Unaffiliated issuers† | $ | 203,483,924 | ||
| Affiliated issuers‡ | 184,540,772 | |||
| Total investments# | 388,024,696 | |||
| Cash | 54,046,504 | |||
| Dividends and interest receivable | 5,676,224 | |||
| Receivable for securities sold | 684,422 | |||
| Restricted cash | 14,250,000 | |||
| Restricted cash for unfunded commitments (Note 6) | 350,000 | |||
| Unrealized appreciation on forward foreign currency contracts | 344,134 | |||
| Other assets | 241,857 | |||
| Total assets | 463,617,837 | |||
| Liabilities: | ||||
| Commissions payable for securities sold | 1,090,837 | |||
| Payable to Adviser (Note 3) | 5,041 | |||
| Payable to trustees | 141 | |||
| Accrued expenses | 628,048 | |||
| Total liabilities | 1,724,067 | |||
| Net assets | $ | 461,893,770 | ||
| Summary of net assets: | ||||
| Capital stock, $0.001 par value, | $ | 1,507,578,739 | ||
| Accumulated undistributed net investment income | 25,102,773 | |||
| Accumulated net realized loss on investments and foreign currency transactions | (1,010,232,441 | ) | ||
| Net unrealized appreciation/(depreciation) on investments and translation of foreign currency denominated assets and liabilities | (60,555,301 | ) | ||
| Net assets applicable to capital shares outstanding | $ | 461,893,770 | ||
| Institutional Class | ||||
| Net assets | $ | 461,893,770 | ||
| Outstanding shares of beneficial interest, unlimited number of shares authorized | 117,815,945 | |||
| Net asset value, offering and redemption price per share± | $ | 3.92 | ||
| † Cost of unaffiliated issuers | $ | 207,698,083 | ||
| ‡ Cost of affiliated issuers | $ | 241,257,460 | ||
| # Total cost | $ | 448,955,543 | ||
| ± Redemption price is gross of redemption fees (Note 5) | ||||
The accompanying notes are an integral part of the financial statements.
6
Third Avenue Trust
Third Avenue Focused Credit Fund
Statement of Operations
For the Six Months Ended April 30, 2017 (Unaudited)
| Investment Income: | ||||
| Interest - unaffiliated issuers | $ | 444,738 | ||
| Interest - affiliated issuers (Note 4) | 2,361,730 | |||
| Interest - payment-in-kind unaffiliated issuers (Note 1) | 2,762,563 | |||
| Interest - payment-in-kind affiliated issuers (Notes 1 and 4) | 9,268,158 | |||
| Other income | 244,744 | |||
| Total investment income | 15,081,933 | |||
| Expenses: | ||||
| Investment advisory fees (Note 3) | 1,825,945 | |||
| Shareholder servicing fees (Note 3) | 378,580 | |||
| Auditing and tax fees | 138,252 | |||
| Transfer agent fees | 56,647 | |||
| Reports to shareholders | 34,712 | |||
| Accounting fees | 47,903 | |||
| Administration fees (Note 3) | 13,390 | |||
| Custodian fees | 12,938 | |||
| Trustees’ and officers’ fees and expenses | 132,255 | |||
| Insurance | 168,538 | |||
| Legal fees | 926,312 | |||
| Registration and filing fees | 1,675 | |||
| Miscellaneous | 24,727 | |||
| Total expenses | 3,761,874 | |||
| Less: Expenses waived (Note 3) | (2,217,915 | ) | ||
| Expenses reduced by custodian fee expense offset arrangement (Note 3) | (7,870 | ) | ||
| Net expenses | 1,536,089 | |||
| Net investment income | 13,545,844 | |||
| Realized and unrealized gain/(loss) on investments and foreign currency transactions: | ||||
| Net realized loss on investments - unaffiliated issuers | (246,919,856 | ) | ||
| Net realized gain on investments - affiliated issuers | 4,102 | |||
| Net realized gain on foreign currency transactions | 152,792 | |||
| Net change in unrealized appreciation/(depreciation) on investments | 273,284,299 | |||
| Net change in unrealized appreciation/(depreciation) on translation of other assets and liabilities denominated in foreign currency | 970,641 | |||
| Net gain on investments and foreign currency transactions | 27,491,978 | |||
| Net increase in net assets resulting from operations | $ | 41,037,822 | ||
The accompanying notes are an integral part of the financial statements.
7
Third Avenue Trust
Third Avenue Focused Credit Fund
Statement of Changes in Net Assets
| For the Six Months Ended April 30, 2017 (Unaudited) | For the Year Ended October 31, 2016 | |||||||
| Operations: | ||||||||
| Net investment income | $ | 13,545,844 | $ | 60,049,431 | ||||
| Net realized loss | (246,762,962 | ) | (483,642,679 | ) | ||||
| Net change in unrealized appreciation/(depreciation) | 274,254,940 | 219,122,365 | ||||||
| Net increase/(decrease) in net assets resulting from operations | 41,037,822 | (204,470,883 | ) | |||||
| Dividends and Distributions to Shareholders from: | ||||||||
| Net investment income: | ||||||||
| Investor Class | — | (17,851,803 | ) | |||||
| Institutional Class | — | (36,870,495 | ) | |||||
| Return of capital: | ||||||||
| Investor Class | — | (33,532,654 | ) | |||||
| Institutional Class | (169,998,983 | ) | (69,246,221 | ) | ||||
| Decrease in net assets from dividends and distributions | (169,998,983 | ) | (157,501,173 | ) | ||||
| Capital Share Transactions:** | ||||||||
| Proceeds from sale of shares | — | 27,993,990 | ||||||
| Net asset value of shares issued in reinvestment of dividends and distributions | — | 22,804,577 | ||||||
| Redemption fees | — | 49,894 | ||||||
| Cost of shares redeemed | — | (467,236,947 | ) | |||||
| Net decrease in net assets resulting from capital share transactions | — | (416,388,486 | ) | |||||
| Net decrease in net assets | (128,961,161 | ) | (778,360,542 | ) | ||||
| Net assets at beginning of period | 590,854,931 | 1,369,215,473 | ||||||
| Net assets at end of period* | $ | 461,893,770 | $ | 590,854,931 | ||||
| * Including accumulated undistributed net investment income of | $ | 25,102,773 | $ | 11,556,929 | ||||
| ** On August 26, 2016, the Fund combined share classes so that all shares of the Investor share class were converted into shares of the Institutional share class (see Note 5). | ||||||||
The accompanying notes are an integral part of the financial statements.
8
Third Avenue Trust
Third Avenue Focused Credit Fund
Statement of Cash Flows
For the Six Months Ended April 30, 2017 (Unaudited)
| Cash Flows from Operating Activities: | ||||
| Net increase in net assets resulting from operations | $ | 41,037,822 | ||
| Adjustments to reconcile net increase in net assets resulting from operations to net cash provided by operating activities: | ||||
| Purchases of long-term securities | (3,237,625 | ) | ||
| Proceeds from sales and paydowns of long-term securities | 255,208,703 | |||
| Purchases of short-term securities | (569,832,894 | ) | ||
| Proceeds of sales of short-term securities | 369,999,079 | |||
| Net change in unrealized (appreciation)/depreciation on investments | (273,284,299 | ) | ||
| Net realized losses from investment transactions | 246,915,754 | |||
| Payment-in-kind interest income and other non-cash receipt of income | (12,030,721 | ) | ||
| Amortization of premium and discount - net | (1,344,613 | ) | ||
| Increase in restricted cash | (13,204,354 | ) | ||
| Decrease in interest and dividends receivable | 6,532,938 | |||
| Decrease in prepaid expenses, other assets and other receivables | 83,857 | |||
| Net change in unrealized (appreciation)/depreciation on forward foreign currency contracts | (813,122 | ) | ||
| Increase in accrued expenses and other liabilities | 1,267,364 | |||
| Net Cash Provided by Operating Activities | 47,297,889 | |||
| Cash Flows from Financing Activities: | ||||
| Distributions paid to shareholders | (169,998,983 | ) | ||
| Net Cash Used by Financing Activities | (169,998,983 | ) | ||
| Cash: | ||||
| Net change in cash | (122,701,094 | ) | ||
| Cash at beginning of period | 176,747,598 | |||
| Cash at end of period | $ | 54,046,504 | ||
| Noncash Operating and Financing Activities: | ||||
| Noncash investment transactions - Payment-in-kind interest income | $ | 12,030,721 | ||
The accompanying notes are an integral part of the financial statements.
9
Third Avenue Trust
Third Avenue Focused Credit Fund
Financial Highlights
Selected data (for a share outstanding throughout each period) and ratios are as follows:
| For The Six Months Ended April 30, 2017 | ||||||||||||||||||||||||
| Years Ended October 31, | ||||||||||||||||||||||||
| 2016 | 2015 | 2014 | 2013 | 2012 | ||||||||||||||||||||
| (Unaudited) | ||||||||||||||||||||||||
| Institutional Class: | ||||||||||||||||||||||||
| Net asset value, beginning of period | $ | 5.02 | $ | 7.82 | $ | 10.60 | $ | 11.07 | $ | 10.24 | $ | 10.50 | ||||||||||||
| Income/(loss) from investment operations: | ||||||||||||||||||||||||
| Net investment income@ | 0.11 | 0.68 | 0.83 | 1.12 | 0.92 | 0.79 | ||||||||||||||||||
| Net gain/(loss) on investment transactions (both realized and unrealized) | 0.23 | (2.14 | )1 | (2.74 | )1 | (0.77 | )1 | 0.77 | 1 | 0.13 | 1 | |||||||||||||
| Total from investment operations | 0.34 | (1.46 | ) | (1.91 | ) | 0.35 | 1.69 | 0.92 | ||||||||||||||||
| Less dividends and distributions to shareholders: | ||||||||||||||||||||||||
| Dividends from net investment income | — | (0.47 | ) | (0.81 | ) | (0.82 | ) | (0.86 | ) | (0.72 | ) | |||||||||||||
| Distributions from net realized gain | — | — | (0.06 | ) | — | — | (0.46 | ) | ||||||||||||||||
| Distributions from return of capital | (1.44 | ) | (0.87 | ) | — | — | — | — | ||||||||||||||||
| Total dividends and distributions | (1.44 | ) | (1.34 | ) | (0.87 | ) | (0.82 | ) | (0.86 | ) | (1.18 | ) | ||||||||||||
| Net asset value, end of period | $ | 3.92 | $ | 5.02 | $ | 7.82 | $ | 10.60 | $ | 11.07 | $ | 10.24 | ||||||||||||
| Total return2 | 9.33 | %3 | (19.11 | %) | (19.20 | %) | 2.93 | % | 16.91 | % | 9.89 | % | ||||||||||||
| Ratios/Supplemental Data: | ||||||||||||||||||||||||
| Net assets, end of period (in thousands) | $ | 461,894 | $ | 590,855 | $ | 956,546 | $ | 2,049,107 | $ | 1,016,021 | $ | 649,492 | ||||||||||||
| Ratio of expenses to average net assets | ||||||||||||||||||||||||
| Before fee waivers and expense offset arrangement | 1.55 | %4 | 1.73 | % | 0.93 | % | 0.92 | % | 0.91 | % | 0.89 | % | ||||||||||||
| After fee waivers and expense offset arrangement5 | 0.63 | %4,# | 0.60 | %# | 0.93 | % | 0.92 | % | 0.91 | % | 0.89 | % | ||||||||||||
| Ratio of net investment income to average net assets | 5.56 | %4 | 12.36 | % | 8.95 | % | 9.62 | % | 8.48 | % | 7.94 | % | ||||||||||||
| Portfolio turnover rate | 5 | %3 | 31 | % | 48 | % | 53 | % | 58 | % | 72 | % | ||||||||||||
| 1 | Includes redemption fees of less than $0.01 per share. |
| 2 | Performance figures may reflect fee waivers and/or expense offset arrangement. Past performance is no guarantee of future results. In the absence of fee waivers and/or expense offset arrangement, the total return would have been lower. Total return is calculated assuming an initial investment made at the net asset value at the beginning of the period, reinvestment of all dividends and distributions at net asset value during the period and redemption on the last day of the period and is not annualized. |
| 3 | Not annualized. |
| 4 | Annualized. |
| 5 | As a result of an expense limitation, the ratio of expenses (exclusive of taxes, interest, brokerage commissions, acquired fund fees and expenses, and extraordinary items) to average net assets will not exceed 0.95%. |
| @ | Calculated based on the average number of shares outstanding during the period. |
| # | The Adviser waived all or a portion of its fees. |
The accompanying notes are an integral part of the financial statements.
10
Third Avenue Trust
Third Avenue Focused Credit Fund
Notes to Financial Statements
April 30, 2017 (Unaudited)
| 1. | SUMMARY OF ORGANIZATION AND SIGNIFICANT ACCOUNTING POLICIES |
Organization:
Third Avenue Focused Credit Fund (the “Fund”) is a separate non-diversified (within the meaning of Section 5(b)(2) of the Investment Company Act of 1940) investment series of Third Avenue Trust (the “Trust”). The Trust, a Delaware business trust, is registered under the Investment Company Act of 1940 as an open-end management investment company. Third Avenue Management LLC (the “Adviser”) provides investment advisory services to the Fund.
On December 9, 2015, the Trust’s Board of Trustees (the “Board”) adopted a plan of liquidation (the “Plan of Liquidation”) for the Fund. Pursuant to the Plan of Liquidation, a cash distribution of $69 million (the “First Liquidating Distribution”) was paid to shareholders and the remaining assets of the Fund were contributed to a liquidating trust, FCF Liquidation Trust (the “Liquidating Trust”). Sales of Fund shares were terminated. Interests in the Liquidating Trust would then be distributed in-kind to Fund shareholders. Subsequent to the Board’s adoption of the Plan of Liquidation, the Plan of Liquidation was modified (the “Modified Plan of Liquidation”). Pursuant to the Modified Plan of Liquidation, the First Liquidating Distribution was paid to Fund shareholders; however, the remaining assets which had been contributed to the Liquidating Trust were returned to the Fund which was to serve as the vehicle to liquidate the Fund’s remaining assets. Pursuant to an exemptive order issued by the SEC on December 16, 2015, all redemptions in the Fund are suspended and subscriptions to the Fund are not accepted, retroactive to December 10, 2015. Effective December 10, 2015, the Adviser has waived its investment advisory and administration fees from the Fund. The Fund is currently in liquidation.
Below is a summary of all liquidating distributions, made after the adoption of the Modified Plan of Liquidation.
| Record | Pay | Institutional Class | Investor Class | Approximate | |||||
| Date | Date | Distribution Rate Per Share | Distribution Rate Per Share | Cash Amount | |||||
| 12/9/15 | 12/16/15 | $0.58613 | $0.58613 | $ 69 million | |||||
| 6/14/16 | 6/15/16 | 0.54632 | 0.54632 | 64 million | |||||
| 11/7/16 | 11/8/16 | 0.25463 | N/A | * | 30 million | ||||
| 11/28/16 | 11/29/16 | 1.18829 | N/A | * | 140 million | ||||
| * | On August 26, 2016, the Fund combined share classes so that all shares of the Investor share class were converted into shares of the Institutional share class. |
Accounting policies:
The policies described below are followed consistently by the Fund in the preparation of its financial statements in conformity with accounting principles generally accepted in the United States of America (“U.S. GAAP”). The Fund is an investment company and,
11
Third Avenue Trust
Third Avenue Focused Credit Fund
Notes to Financial Statements (continued)
April 30, 2017 (Unaudited)
accordingly, follows the investment company accounting and reporting guidance of the Financial Accounting Standards Board Accounting Standards Codification (“FASB ASC”) Topic 946-Investment Companies, which is part of U.S. GAAP.
The preparation of financial statements in accordance with U.S. GAAP requires management to make estimates and assumptions that affect the reported amounts and disclosures. Actual results could differ from those estimates.
Security valuation:
Generally, the Fund’s investments are valued at market value. Securities traded on a principal stock exchange, including The NASDAQ Stock Market, Inc. (“NASDAQ”), are valued at the last quoted sales price, the NASDAQ official closing price, or, in the absence of closing sales prices on that day, securities are valued at the mean between the closing bid and asked price. In accordance with procedures approved by the Board, debt instruments with maturities greater than 60 days, including floating rate loan securities, are valued on the basis of prices obtained from a pricing service approved by the Board or otherwise pursuant to policies and procedures approved by the Board. Forward foreign currency contracts valued independently by service providers based on pricing models are valued at the forward rate and are marked-to-market daily. Short-term cash investments are valued at cost, plus accrued interest, which approximates market value. Short-term debt securities with 60 days or less to maturity may be valued at amortized cost.
The Adviser has established a Valuation Committee (the “Committee”) which is responsible for overseeing the pricing and valuation of all securities held in the Fund. The Committee operates under pricing and valuation policies and procedures established by the Adviser and approved by the Board, including pricing policies which set forth the mechanisms and processes to be employed on a daily basis to implement these policies and procedures. In particular, the pricing policies describe how to determine market quotations for securities and other instruments. The Committee’s responsibilities include: 1) fair value determinations (and oversight of third parties used in the valuation process determinations), and 2) regular monitoring of the Adviser’s pricing and valuation policies and procedures and modification or enhancement of these policies and procedures (or recommendation of the modification of these policies and procedures) as the Committee believes appropriate.
Securities for which market quotations are not readily available are valued at “fair value,” as determined in good faith by the Committee as authorized by the Board, under procedures established by the Board. At April 30, 2017, such securities had a total fair value of $159,974,591, or 34.63% of the Fund’s net assets. Among the factors that may be considered by the Committee in determining fair value are: prior trades in the security in question, trades in similar securities of the same or other issuers, the type of security, trading in marketable
12
Third Avenue Trust
Third Avenue Focused Credit Fund
Notes to Financial Statements (continued)
April 30, 2017 (Unaudited)
securities of the same issuer, the financial condition of the issuer, comparable multiples of similar issuers, the operating results of the issuer and liquidation value of the issuer. See Fair Value Measurements below for additional detail on fair value measurements for financial reporting purposes. The fair values determined in accordance with these procedures may differ significantly from the amounts which would be realized upon disposition of the securities. Instability in the high yield and distressed credit market, which varies over time, makes it more difficult to obtain market quotations on certain securities owned by the Fund.
Fair value measurements:
In accordance with FASB ASC 820-10, Fair Value Measurements and Disclosures, the Fund discloses the fair value of its investments in a hierarchy that prioritizes the inputs to valuation techniques used to measure the fair value. Fair value is defined as the price that the Fund would receive upon selling an investment in an orderly transaction to an independent buyer in the principal or most advantageous market for the investment under current market conditions. The hierarchy gives the highest priority to valuations based upon unadjusted quoted prices in active markets for identical assets or liabilities (Level 1 measurement) and the lowest priority to valuations based upon unobservable inputs that are significant to the valuation (Level 3 measurements). The three levels of the fair value hierarchy are as follows:
● Level 1 — Inputs that reflect unadjusted quoted prices in active markets for identical assets or liabilities that the Fund has the ability to access at the measurement date;
● Level 2 — Inputs other than quoted prices that are observable for the asset or liability either directly or indirectly, including inputs in markets that are not considered to be active;
● Level 3 — Significant unobservable inputs (including the Fund’s own assumptions in determining the fair value of investments)
A financial instrument’s level within the fair value hierarchy is based on the lowest level of any input both individually and in aggregate that is significant to the fair value measurement. However, the determination of what constitutes “observable” requires significant judgment by the Fund. The Fund considers observable data to be market data which is readily available, regularly distributed or updated, reliable and verifiable, not proprietary, and provided by independent sources that are actively involved in the relevant market. The inputs or methodology used for valuing investments are not necessarily an indication of the risk associated with investing in those investments.
The Fund uses valuation techniques to measure fair value that are consistent with the market approach and/or income approach, depending on the type of security and the particular
13
Third Avenue Trust
Third Avenue Focused Credit Fund
Notes to Financial Statements (continued)
April 30, 2017 (Unaudited)
circumstance. The market approach uses prices and other relevant information generated by market transactions involving identical or comparable securities. The income approach uses valuation techniques to discount estimated future cash flows to present value.
The following are certain inputs and techniques that the Fund generally uses to evaluate how to classify each major category of assets and liabilities for Level 2 and Level 3, in accordance with U.S. GAAP.
Equity Securities (Common Stocks and Warrants)—Equity securities traded in inactive markets and certain foreign equity securities are valued using inputs which include broker-dealer quotes, recently executed transactions adjusted for changes in the benchmark index, or evaluated price quotes received from independent pricing services or brokers that take into account the integrity of the market sector and issuer, the individual characteristics of the security, and information received from broker-dealers and other market sources pertaining to the issuer or security. To the extent that these inputs are observable, the values of equity securities are categorized as Level 2. To the extent that these inputs are unobservable, the values are categorized as Level 3.
U.S. Government Obligations—U.S. Government obligations are valued by independent pricing services based on pricing models that evaluate the mean between the most recently quoted bid and ask price. The models also take into consideration data received from active market makers and broker-dealers, yield curves, and the spread over comparable U.S. Government issues. The spreads change daily in response to market conditions and are generally obtained from the new issue market and broker-dealer sources. To the extent that these inputs are observable, the values of U.S. Government obligations are categorized as Level 2. To the extent that these inputs are unobservable, the values are categorized as Level 3.
Corporate Bonds & Notes—Corporate bonds and notes are generally comprised of two main categories: investment grade bonds and high yield bonds. Investment grade bonds are valued by independent pricing services or brokers using various inputs and techniques, which include broker-dealer quotations, live trading levels, recently executed transactions in securities of the issuer or comparable issuers, and option adjusted spread models that include base curve and spread curve inputs. Adjustments to individual bonds can be applied to recognize trading differences compared to other bonds issued by the same issuer. High yield bonds are valued by independent pricing services or brokers based primarily on broker-dealer quotations from relevant market makers and recently executed transactions in securities of the issuer or comparable issuers. The broker-dealer quotations received are supported by credit analysis of the issuer that takes into consideration credit quality assessments, daily trading activity, and the activity of the underlying equities, listed bonds and sector specific trends. To the extent that these inputs are observable, the values of corporate bonds and notes are categorized as Level 2.
14
Third Avenue Trust
Third Avenue Focused Credit Fund
Notes to Financial Statements (continued)
April 30, 2017 (Unaudited)
To the extent that these inputs are unobservable, the values are categorized as Level 3.
Forward Foreign Currency Contracts—Forward foreign currency contracts are valued by independent pricing services using various inputs and techniques, which include broker-dealer quotations, actual trading information and foreign currency exchange rates gathered from leading market makers and foreign currency exchange trading centers throughout the world. To the extent that these inputs are observable, the values of forward foreign currency contracts are categorized as Level 2. To the extent that these inputs are unobservable, the values are categorized as Level 3.
Term Loans—Term loans are valued by independent pricing services based on the average of evaluated quoted prices received from multiple dealers or valued relative to other benchmark securities when broker-dealer quotes are unavailable. Inputs may include quoted prices for similar investments in active markets, interest rates, coupon rates, yield curves, option adjusted spreads, default rates, credit spreads and other unique security features in order to estimate the relevant cash flows which is then discounted to calculate fair values. To the extent that these inputs are observable, the values of term loans are categorized as Level 2. To the extent that these inputs are unobservable, the values are categorized as Level 3.
The following is a Summary by Level of Inputs used to value the Fund’s investments as of April 30, 2017:
| Level 2: Other Significant Observable Inputs† | |||
| Investments in Securities: | |||
| Short-Term Investments: | |||
| U.S. Government Obligations | $199,960,556 | ||
| Total for Level 2 Securities | 199,960,556 | ||
| Level 3: Significant Unobservable Inputs | |||
| Investments in Securities: | |||
| Common Stocks & Warrants: | |||
| Energy | 10,111,527 | * | |
| Manufacturing | — | * | |
| Utilities | 6,822,990 | ||
| Corporate Bonds & Notes | 138,374,877 | * | |
| Term Loans | 23,425,277 | ||
| Private Equities: | |||
| Consumer Products | 9,329,469 | ||
| Total for Level 3 Securities | 188,064,140 | ||
| Total Value of Investments | $388,024,696 |
15
| Third Avenue Trust |
| Third Avenue Focused Credit Fund |
| Notes to Financial Statements (continued) |
| April 30, 2017 (Unaudited) |
| Summary by Level of Inputs (continued) | |
| Investments in Other Financial Instruments: | |
| Level 2: Other Significant Observable Inputs | |
| Forward Foreign Currency Contracts - Assets | $344,134 |
| Total Value or Appreciation/(Depreciation) of Other Financial Instruments | $344,134 |
| † | There were no securities that were transferred from Level 1 to Level 2. |
| * | Includes investments fair valued at zero. |
Transfers from Level 1 to Level 2, or from Level 2 to Level 1, are recorded utilizing values as of the beginning of the period.
The following is a reconciliation of Level 3 investments for which significant unobservable inputs were used to determine fair value:
| Convertible | ||||||||||||||||||||
| Preferred | ||||||||||||||||||||
| Corporate | Common Stocks | Stocks and | ||||||||||||||||||
| Bonds & Notes | Term Loans | & Warrants | Private Equities | Total | ||||||||||||||||
| Balance as of 10/31/16 | ||||||||||||||||||||
| (fair value) | ||||||||||||||||||||
| Chemicals | $ | — | * | $ | 9,452,973 | $ | — | $ | 5,158,228 | (a) | $ | 14,611,201 | ||||||||
| Consumer Products | 78,824,258 | — | — | 2,358,437 | (a) | 81,182,695 | ||||||||||||||
| Energy | — | 13,222,458 | 10,022,527 | * | — | 23,244,985 | ||||||||||||||
| Financials | — | 61,938 | — | — | 61,938 | |||||||||||||||
| Gaming & Entertainment | — | 14,168,006 | — | — | 14,168,006 | |||||||||||||||
| Manufacturing | 46,078,921 | 21,312,719 | — | * | — | 67,391,640 | ||||||||||||||
| Metals & Mining | 1,882,345 | — | — | — | 1,882,345 | |||||||||||||||
| Services | 37,561,158 | — | 80,268,345 | * | 33,136 | (b) | 117,862,639 | |||||||||||||
| Transportation Services | — | — | 1,454,185 | 5,282,296 | (b) | 6,736,481 | ||||||||||||||
| Utilities | — | 437,500 | 13,081,250 | — | 13,518,750 | |||||||||||||||
| Purchases | ||||||||||||||||||||
| Energy | — | 145,646 | — | — | 145,646 | |||||||||||||||
| Media/Cable | — | † | — | — | — | — | ||||||||||||||
| Utilities | 2,691,979 | 400,000 | — | † | — | 3,091,979 | ||||||||||||||
| Sales | ||||||||||||||||||||
| Chemicals | — | ‡ | (9,512,796 | ) | — | (5,610,451 | )(a) | (15,123,247 | ) | |||||||||||
| Energy | — | (13,337,365 | ) | — | — | (13,337,365 | ) | |||||||||||||
| Financials | — | (36,110 | ) | — | — | (36,110 | ) | |||||||||||||
| Gaming & Entertainment | — | (14,088,717 | ) | — | — | (14,088,717 | ) | |||||||||||||
| Manufacturing | — | (111,250 | ) | — | — | (111,250 | ) | |||||||||||||
| Metals & Mining | (1,904,264 | ) | — | — | — | (1,904,264 | ) | |||||||||||||
| Services | (39,842,649 | ) | — | (84,461,790 | )‡ | — | (b),‡ | (124,304,439 | ) | |||||||||||
| Transportation Services | — | — | (836,441 | ) | (4,968,340 | )(b) | (5,804,781 | ) | ||||||||||||
| Bond discount/(premium) | ||||||||||||||||||||
| Chemicals | — | (242,443 | ) | — | — | (242,443 | ) | |||||||||||||
| Consumer Products | 1,041,545 | — | — | — | 1,041,545 | |||||||||||||||
| Energy | — | 28,898 | — | — | 28,898 | |||||||||||||||
| Gaming & Entertainment | — | (783 | ) | — | — | (783 | ) | |||||||||||||
16
| Third Avenue Trust |
| Third Avenue Focused Credit Fund |
| Notes to Financial Statements (continued) |
| April 30, 2017 (Unaudited) |
Reconciliation of Level 3 investments (continued)
| Convertible | ||||||||||||||||||||
| Preferred | ||||||||||||||||||||
| Corporate | Common Stocks | Stocks and | ||||||||||||||||||
| Bonds & Notes | Term Loans | & Warrants | Private Equities | Total | ||||||||||||||||
| Manufacturing | $ | 30,737 | $ | 98,045 | $ | — | $ | — | $ | 128,782 | ||||||||||
| Metals & Mining | 151,374 | — | — | — | 151,374 | |||||||||||||||
| Payment-in-kind | ||||||||||||||||||||
| Chemicals | — | 120,441 | — | — | 120,441 | |||||||||||||||
| Consumer Products | 6,662,135 | — | — | — | 6,662,135 | |||||||||||||||
| Energy | — | 34,480 | — | — | 34,480 | |||||||||||||||
| Financials | — | 504 | — | — | 504 | |||||||||||||||
| Manufacturing | 2,997,091 | — | — | — | 2,997,091 | |||||||||||||||
| Metals & Mining | 3,727,341 | — | — | — | 3,727,341 | |||||||||||||||
| Services | 2,535,378 | — | — | — | 2,535,378 | |||||||||||||||
| Utilities | 98,502 | — | — | — | 98,502 | |||||||||||||||
| Net change in unrealized | ||||||||||||||||||||
| gain/(loss) | ||||||||||||||||||||
| Chemicals | 12,377,733 | (107,139 | ) | — | (1,537,894 | )(a) | 10,732,700 | |||||||||||||
| Consumer Products | (1,722,693 | ) | — | — | 6,971,032 | (a) | 5,248,339 | |||||||||||||
| Energy | — | (1,893,264 | ) | 89,000 | — | (1,804,264 | ) | |||||||||||||
| Financials | — | 8,533 | — | — | 8,533 | |||||||||||||||
| Gaming & Entertainment | — | (204,004 | ) | — | — | (204,004 | ) | |||||||||||||
| Manufacturing | 1,857,840 | 529,683 | — | — | 2,387,523 | |||||||||||||||
| Metals & Mining | 57,060,258 | — | — | — | 57,060,258 | |||||||||||||||
| Services | — | — | 82,519,952 | 8,233,960 | (b) | 90,753,912 | ||||||||||||||
| Transportation Services | — | — | 3,901,458 | 12,451,361 | (b) | 16,352,819 | ||||||||||||||
| Utilities | (185,438 | ) | (92,750 | ) | (6,258,260 | ) | — | (6,536,448 | ) | |||||||||||
| Net realized gain/(loss) | ||||||||||||||||||||
| Chemicals | (12,377,733 | ) | 288,964 | — | 1,990,117 | (a) | (10,098,652 | ) | ||||||||||||
| Energy | — | 2,621,364 | — | — | 2,621,364 | |||||||||||||||
| Financials | — | (9,854 | ) | — | — | (9,854 | ) | |||||||||||||
| Gaming & Entertainment | — | 125,498 | — | — | 125,498 | |||||||||||||||
| Manufacturing | — | 4,102 | — | — | 4,102 | |||||||||||||||
| Metals & Mining | (60,917,054 | ) | — | — | — | (60,917,054 | ) | |||||||||||||
| Services | (253,887 | ) | — | (78,326,507 | ) | (8,267,096 | )(b) | (86,847,490 | ) | |||||||||||
| Transportation Services | — | — | (4,519,202 | ) | (12,765,317 | )(b) | (17,284,519 | ) | ||||||||||||
| Balance as of 4/30/17 (fair value) | ||||||||||||||||||||
| Chemicals | — | — | — | — | — | |||||||||||||||
| Consumer Products | 84,805,245 | — | — | 9,329,469 | (a) | 94,134,714 | ||||||||||||||
| Energy | — | 822,217 | 10,111,527 | * | — | 10,933,744 | ||||||||||||||
| Financials | — | 25,011 | — | — | 25,011 | |||||||||||||||
| Gaming & Entertainment | — | — | — | — | — | |||||||||||||||
| Manufacturing | 50,964,589 | 21,833,299 | — | * | — | 72,797,888 | ||||||||||||||
| Media/Cable | — | * | — | — | — | — | ||||||||||||||
| Metals & Mining | — | — | — | — | — | |||||||||||||||
| Services | — | — | — | — | — | |||||||||||||||
| Transportation Services | — | — | — | — | — | |||||||||||||||
| Utilities | 2,605,043 | 744,750 | 6,822,990 | — | 10,172,783 | |||||||||||||||
| Total | $ | 138,374,877 | $ | 23,425,277 | $ | 16,934,517 | $ | 9,329,469 | $ | 188,064,140 | ||||||||||
17
| Third Avenue Trust |
| Third Avenue Focused Credit Fund |
| Notes to Financial Statements (continued) |
| April 30, 2017 (Unaudited) |
Reconciliation of Level 3 investments (continued)
| Convertible | ||||||||||||||||||
| Preferred | ||||||||||||||||||
| Corporate | Common Stocks | Stocks and | ||||||||||||||||
| Bonds & Notes | Term Loans | & Warrants | Private Equities | Total | ||||||||||||||
| Net change in unrealized gain/(loss) related to securities still held as of April 30, 2017: | $ | (50,291 | ) | $ | 397,707 | $ | (6,169,260 | ) | $ | 6,971,032 | $ | 1,149,188 | ||||||
* Includes investments fair valued at zero.
† Investments acquired through corporate actions with zero cost.
‡ Includes disposal of investments with $0 proceeds.
(a) Private Equities
(b) Convertible Preferred Stocks
Quantitative Information about Level 3 Fair Value Measurements
(amounts in thousands)
| Fair Value at | Range (Weighted | ||||||||
| 4/30/17 | Valuation Technique(s) | Unobservable Input(s) | Average) | ||||||
| Corporate Bonds | $ | 138,375 | Book Value | Restructuring value | $88.65-$108.93 | ||||
| Term Loans | 21,833 | Broker Quote | # | $99.87 | |||||
| Private Equities | 9,329 | Book Value | Restructuring value | $0.00* | |||||
| Common Stocks | 6,256 | Broker Quote | # | $1.38 | |||||
| Market Comparable | |||||||||
| Common Stocks | 4,717 | Companies | Revenue multiple | 0.71x | |||||
| Common Stocks | 3,680 | Book Value | Restructuring value | $3.63-$66,006.74 | |||||
| Market Comparable | |||||||||
| Warrants | 1,715 | Companies | Revenue multiple | 0.71x | |||||
| Market Comparable | |||||||||
| Term Loans | 822 | Companies | Revenue multiple | 0.71x | |||||
| Other (a) | 1,337 | ||||||||
| $ | 188,064 |
| # | Valuation techniques and significant unobservable inputs used by third-party pricing vendors or brokers, such as those described in Note 1, were not provided to the Adviser. The appropriateness of fair values for these securities is based on results of back testing, vendor and broker due diligence, unchanged price review and consideration of macro or security specific events. |
| (a) | Includes securities less than 0.50% of net assets of the Fund. |
| * | Amount less than $0.01. |
The significant unobservable inputs used in the fair value measurement of the Fund’s investments are listed above. Generally, a change in the assumptions used in any input in isolation may be accompanied by a change in another input. Significant changes in any of the unobservable inputs may significantly impact the fair value measurement. The impact is based on the relationship between each unobservable input and the fair value measurement.
18
| Third Avenue Trust |
| Third Avenue Focused Credit Fund |
| Notes to Financial Statements (continued) |
| April 30, 2017 (Unaudited) |
Significant increases (decreases) in enterprise multiples may increase (decrease) the fair value measurement. Significant increases (decreases) in the discount for marketability may decrease (increase) the fair value measurement.
Security transactions and investment income:
Security transactions for financial statement purposes are accounted for on a trade date basis. Dividend income is recorded on the ex-dividend date or, for certain foreign dividends, as soon as the Fund becomes aware of the dividends. Interest income is determined on the basis of coupon interest accrued using the effective interest method which adjusts for amortization of premiums and accretion of discounts. Dividend income on the Statement of Operations are shown net of any foreign taxes withheld on income from foreign securities. Payments received from certain investments held by the Fund may be comprised of dividends, capital gains and return of capital. The Fund originally estimates the expected classification of such payments. These amounts may subsequently be reclassified upon receipt of information from the issuer. Realized gains and losses from securities transactions are recorded on an identified cost basis.
Foreign currency translation and foreign investments:
The books and records of the Fund are maintained in U.S. dollars. Foreign currency amounts are translated into U.S. dollars as follows:
• Investments and assets and liabilities denominated in foreign currencies: At the prevailing rates of exchange on the valuation date.
• Investment transactions and investment income: At the prevailing rates of exchange on the date of such transactions.
The net assets of the Fund are presented at market values using the foreign exchange rates at the close of the period. The Fund does not generally isolate that portion of the results of operations arising as a result of changes in the foreign exchange rates from the fluctuations arising from changes in the market prices of the investments held.
Similarly, the Fund does not isolate the effect of changes in foreign exchange rates from the fluctuations arising from changes in the market prices of investments sold during the period. Accordingly, realized and unrealized foreign currency gains/(losses) are included in the reported net realized gain/(loss) and unrealized appreciation/(depreciation) on investments transactions and balances.
Net realized gains/(losses) on foreign currency transactions represent net foreign exchange gains/(losses) from foreign currency exchange contracts, disposition of foreign currencies, currency gains or losses realized between the trade and settlement dates on securities transactions, and the difference between the amount of investment income and foreign
19
| Third Avenue Trust |
| Third Avenue Focused Credit Fund |
| Notes to Financial Statements (continued) |
| April 30, 2017 (Unaudited) |
withholding taxes recorded on the Fund’s books and the U.S. dollar equivalent amounts actually received or paid. Net unrealized currency gains/(losses) from valuing foreign currency denominated assets and liabilities at period end exchange rates are reflected as a component of net unrealized appreciation/(depreciation) on the Statement of Assets and Liabilities. The change in net unrealized currency gains/(losses) for the period is reflected on the Statement of Operations.
Pursuant to U.S. federal income tax regulations, gains and losses from certain foreign currency transactions and the foreign currency portion of gains and losses realized on sales and maturities of foreign denominated debt securities are generally treated as ordinary income.
Payment-in-kind securities:
PIKs may make a payment at each interest payment date in additional debt securities. Those additional debt securities usually have the same terms, including maturity dates and interest rates, and associated risks as the original bonds. The daily market quotations of the original bonds may include the accrued interest (referred to as a “dirty” price) and require a pro-rata adjustment from the unrealized appreciation or depreciation on investments to interest receivable on the Statement of Assets and Liabilities.
For the period ended April 30, 2017, the total in-kind payments with respect to PIK securities that were received by the Fund in the amounts of $12,030,721 or 79.77% of total investment income are shown as a separate line item on the Statement of Operations.
Term loans:
The Fund’s investments in loans typically are structured and administered by a third party entity (the “Agent”) that acts on behalf of a group of lenders that make or hold interests in the loan. These securities generally pay interest at rates which are periodically pre-determined by reference to a base lending rate plus a premium. These base lending rates are generally either the lending rate offered by one or more major European banks, such as the London Interbank Offered Rate (“LIBOR”) or the prime rate offered by one or more major United States banks, or the certificate of deposit rate.
These securities are ordinarily contractually obligated to receive approval from the Agent bank and/or borrower prior to disposition. Remaining maturities of term loans may be less than the stated maturities shown as a result of contractual or optional payments by the borrower. Such prepayments cannot be predicted with certainty. The interest rate disclosed reflects the rate in effect on April 30, 2017.
Forward foreign currency contracts:
The Fund may be exposed to foreign currency risks associated with portfolio investments and therefore may use forward foreign currency contracts to hedge or manage these exposures. The
20
| Third Avenue Trust |
| Third Avenue Focused Credit Fund |
| Notes to Financial Statements (continued) |
| April 30, 2017 (Unaudited) |
change in market value is included in unrealized appreciation/(depreciation) on investments and foreign currency translations. When the contract is closed, the Fund records a realized gain or loss equal to the difference between the value of the contract at the time it was opened and the value at the time it was closed.
The use of forward foreign currency contracts does not eliminate fluctuations in the underlying prices of the Fund’s portfolio securities, but it does establish a rate of exchange that can be achieved in the future. Although forward foreign currency contracts limit the risk of loss due to a decline in the value of the hedged currency, they also limit any potential gain that might result should the value of the currency increase. In addition, the Fund could be exposed to risks if the counterparties to the contracts are unable to meet the terms of their contracts.
During the period ended April 30, 2017, the Fund used forward foreign currency contracts for hedging foreign currency risks.
The following table presents the value of derivatives held as of April 30,2017, by their primary underlying risk exposure and respective location on the Statements of Assets and Liabilities:
| Statement of Assets and | Forward Foreign | |||||
| Derivative Contract | Liabilities Location | Currency Contracts | ||||
| Assets: | ||||||
| Foreign currency contracts | Unrealized appreciation on forward foreign | |||||
| currency contracts | $344,134 | |||||
Summary of derivative information:
The following tables present the effect of derivatives on the Statement of Operations during the six months ended April 30, 2017, by primary risk exposure:
| Amount of Realized Gain/(Loss) on Derivatives Recognized in Income | ||||
| Forward Foreign | ||||
| Derivative Contract | Currency Contracts | |||
| Foreign currency contracts | $359,455(a) | |||
| Amount of Change in Unrealized Appreciation/(Depreciation) | ||||
| on Derivatives Recognized in Income | ||||
| Forward Foreign | ||||
| Derivative Contract | Currency Contracts | |||
| Foreign currency contracts | $813,122(b) | |||
| (a) | Included in “Net realized gain on foreign currency transactions”. |
| (b) | Included in “Net change in unrealized appreciation/(depreciation) on translation of other assets and liabilities denominated in foreign currency”. |
21
| Third Avenue Trust |
| Third Avenue Focused Credit Fund |
| Notes to Financial Statements (continued) |
| April 30, 2017 (Unaudited) |
Derivatives volume:
The tables below disclose the volume of the Fund’s forward foreign currency contracts and options activities during the six months ended April 30, 2017 (amounts denominated in U.S. Dollars). Please refer to the tables in the Summary of derivatives information for derivative-related gains and losses associated with volume activity (measured at each month-end).
| Forward Foreign Currency Contracts: | ||||
| Average Settlement Value Purchased | $ | 273,038 | ||
| Average Settlement Value Sold | 90,346,887 | |||
Floating rate obligations:
The Fund may invest in debt securities with interest payments or maturity values that are not fixed, but float in conjunction with an underlying index or price. These securities may be backed by corporate issuers. The indices and prices upon which such securities can be based include interest rates and currency rates. Floating rate securities pay interest according to a coupon which is reset periodically.
Dividends and distributions to shareholders:
The amount of dividends and distributions paid to shareholders from net investment income and net realized capital gains on disposition of securities, respectively is determined in accordance with U.S. federal income tax law and regulations which may differ from U.S. GAAP.
Commencing with the First Liquidating Distribution, which was made on December 16, 2015, all distributions are intended to be part of a series of liquidating distributions which will result in the complete liquidation of the Fund. Reinvestment of liquidating distributions is not permitted.
Income tax information:
The Fund has complied with the requirements of the Internal Revenue Code applicable to regulated investment companies and intends to distribute all of its taxable net investment income and net realized capital gains, if any, to its shareholders. Therefore, no provision for U.S. federal income taxes is included on the accompanying financial statements. The Fund may, in the future, become a taxpayer if it determines it is in the best interests of the shareholders.
Income, including capital gains, from investments in foreign securities received by the Fund may be subject to income, withholding or other taxes imposed by foreign countries.
22
| Third Avenue Trust |
| Third Avenue Focused Credit Fund |
| Notes to Financial Statements (continued) |
| April 30, 2017 (Unaudited) |
Management has analyzed the tax positions taken on the Fund’s U.S. federal income tax returns for all open tax years (generally the current and prior three tax years), and has concluded that no provision for U.S. federal income tax is required in the Fund’s financial statements. This conclusion may be subject to future review and adjustment at a later date based upon factors including, but not limited to, on-going analyses of and changes to tax laws, regulations and interpretations thereof. The Fund is subject to possible examination by the relevant taxing authorities for tax years for which the applicable statutes of limitations have not expired.
Expense allocation:
Expenses attributable to the Fund are charged to it. Expenses attributable to the Trust are generally allocated using the ratio of each series’ average net assets relative to the total average net assets of the Trust. Certain expenses are shared with Third Avenue Variable Series Trust, an affiliated fund group. Such costs are allocated using the ratio of the series’ average net assets relative to the total average net assets of each series of the Trust and Third Avenue Variable Series Trust.
Trustees’ and officers’ fees:
The Trust does not pay any fees to its officers for their services as such, except for the Chief Compliance Officer and the Associate Director of Compliance, to whom the Trust paid $257,627, including $30,694 from the Fund, for the six months ended April 30, 2017. The Trust does pay, together with Third Avenue Variable Series Trust, Trustees who are not “interested persons” (as defined in the Investment Company Act of 1940) of the Trust (“independent Trustee”) a fee of $5,000 for each meeting of the Board that each independent Trustee attends, in addition to reimbursing all independent Trustees for travel and incidental expenses incurred by them in connection with their attendance at meetings. If a special meeting is required, Trustees will each receive $2,500. Prior to January 1, 2017, the Trust, together with Third Avenue Variable Series Trust, also paid each independent Trustee an annual retainer of $65,000 (the lead independent Trustee received an additional retainer of $12,000). Effective January 1, 2017, the annual retainer was reduced to $55,000 and the additional retainer for the Chairman was set at $20,000. The Trustees on the Audit Committee each receive $2,000 for each audit committee meeting and the audit committee chairman receives an annual retainer of $6,000. Effective March 2016, one of the Trustees began acting in an Advisory Trustee capacity. Prior to January 1, 2017, the Advisory Trustee received an annual retainer of $32,500 and a fee of $2,500 for each Board meeting the Trustee attends. Effective January 1, 2017, the annual retainer was reduced to $27,500.
During the year ended October 31, 2016, the Third Avenue Focused Credit Fund Demand Review Committee and Third Avenue Focused Credit Fund Oversight Committee were established. Each Trustee who serves on both of these Committees is paid $30,000 annually by
23
| Third Avenue Trust |
| Third Avenue Focused Credit Fund |
| Notes to Financial Statements (continued) |
| April 30, 2017 (Unaudited) |
the Fund, and each Trustee who serves only as a member of the Fund’s Demand Review Committee is paid $20,000 annually by the Fund.
2. INVESTMENTS
Purchases and sales/conversions:
The aggregate cost of purchases and aggregate proceeds from sales and conversions of investments, excluding short-term investments, from unaffiliated and affiliated issuers (as defined in the Investment Company Act of 1940 as ownership by the Fund of 5% or more of the outstanding voting securities of these issuers) for the six months ended April 30, 2017 were as follows:
| Purchases | Sales | ||||||||
| Affiliated | $ | 12,505,782 | $ | 111,250 | |||||
| Unaffiliated | 2,762,564 | 263,605,054 | |||||||
Unrealized appreciation/(depreciation):
The following information is based upon the book basis of investment securities as of April 30, 2017:
| Gross Unrealized Appreciation | $ | 3,017,789 | ||
| Gross Unrealized Depreciation | (63,948,636 | ) | ||
| Net Unrealized Appreciation/(Depreciation) | $ | (60,930,847 | ) | |
| Book Cost | $ | 448,955,543 |
3. INVESTMENT ADVISORY SERVICES, ADMINISTRATION AND SERVICE FEE AGREEMENTS AND EXPENSE OFFSET ARRANGEMENT
The Fund has an Investment Advisory Agreement with the Adviser for investment advice and certain management functions. The terms of the Investment Advisory Agreements provide that the Fund pay the Adviser an advisory fees at an annual rate of 0.75% based on the Fund’s total average daily net assets. These fees are calculated daily and paid monthly. The Adviser has waived its advisory fees since December 10, 2015.
Additionally, the Adviser pays certain expenses on behalf of the Fund which are partially reimbursed by the Fund, including service fees due to third parties, the compensation expense for the Fund’s Chief Compliance Officer and Associate Director of Compliance and other miscellaneous expenses. Effective December 10, 2015, the Fund no longer reimburses the Adviser for its share of the service fee expense. At April 30, 2017, the Fund had amounts payable to the Adviser of $5,041 which included $1,667 officers’ fees and $3,374 legal fees for
24
| Third Avenue Trust |
| Third Avenue Focused Credit Fund |
| Notes to Financial Statements (continued) |
| April 30, 2017 (Unaudited) |
reimbursement of expenses paid by the Adviser.
Until March 1, 2018, whenever the Fund’s normal operating expenses, including the investment advisory fee and most other operating expenses, but excluding taxes, interest, brokerage commissions, acquired fund fees and expenses, and extraordinary items, exceeded the expense limitation based on the Fund’s average daily net assets, the Adviser has agreed to waive a portion of its advisory fees and/or reimburse the Fund in an amount equal to that excess. The expense limitations for the Fund are disclosed in the Financial Highlights. Effective December 10, 2015, the Adviser will not seek any recoupment from the Fund for previously waived and/or reimbursed expenses.
The Fund has entered into an Administration Agreement with the Adviser pursuant to which the Adviser, as administrator, is responsible for providing various administrative services to the Trust. The Adviser has in turn entered into a Sub-Administration Agreement with BNY Mellon Investment Servicing (U.S.) Inc. (“BNY Mellon”) pursuant to which BNY Mellon provides certain of these administrative services on behalf of the Adviser. The Fund pays the Adviser a fee calculated at an annual rate of 0.0055% of the average daily net assets of the Fund for such services. The Adviser pays BNY Mellon an annual sub-administration fee for sub-administration services provided to the Trust equal to $204,165, including $20,940 related to the Fund. The Adviser has waived its administration fees since December 10, 2015.
Both the Fund and the Adviser have entered into agreements with financial intermediaries to provide record keeping, processing, shareholder communications and other services to customers of the intermediaries investing in the Fund and have agreed to compensate the intermediaries for providing those services. Certain of those services would be provided by the Fund if the shares of each customer were registered directly with the Fund’s transfer agent. Accordingly, prior to December 10, 2015, the Fund had agreed to reimburse a portion of the intermediary fees paid by the Adviser pursuant to provisions adopted by the Board. The Fund paid a portion of the intermediary fees attributable to shares of the Fund not exceeding the estimated expense the Fund would have paid its transfer agent had each customer’s shares been registered directly with the transfer agent instead of held through the intermediary accounts. The Adviser pays the remainder of the fees. The fees incurred by the Fund are reflected as shareholder servicing fees in the Statements of Operations. The Adviser has waived the Fund’s commitment to share in such expenses since December 10, 2015.
The Fund has an expense offset arrangement in connection with its custodian contract. Credits realized as a result of uninvested cash balances are used to reduce a portion of the Fund’s custodian expenses. The expense reduction amount due to this arrangement for the six months ended April 30, 2017 was $7,870, and the amount is reflected as “Expenses reduced by custodian fee expense offset arrangement” in the Statement of Operations.
25
| Third Avenue Trust |
| Third Avenue Focused Credit Fund |
| Notes to Financial Statements (continued) |
| April 30, 2017 (Unaudited) |
4. RELATED PARTY TRANSACTIONS
Investment in affiliates:
A summary of the Fund’s transactions in securities of affiliated issuers for the six months ended April 30, 2017 is set forth below:
| Shares/ | Shares/ | Investment | ||||||||||||||||||||||
| Principal | Principal | Income | ||||||||||||||||||||||
| Amount† | Gross | Amount† | Nov. 1, | |||||||||||||||||||||
| Held at | Purchases | Gross | Held at | Value at | 2016- | |||||||||||||||||||
| Oct. 31, | and | Sales and | Apr. 30, | Apr. 30, | Apr. 30, | |||||||||||||||||||
| Name of Issuer: | 2016 | Additions | Reductions | 2017 | 2017 | 2017 | ||||||||||||||||||
| Affinion Group Holdings, Inc., Class A* | 1,751,734 | — | 1,751,734 | — | $ | — | $ | — | ||||||||||||||||
| Affinion Group Holdings, Inc. Warrants, expire 11/9/20* | 462,266 | — | 462,266 | — | — | — | ||||||||||||||||||
| Affinion Group Holdings, Inc. Class C* | 522 | — | 522 | — | — | — | ||||||||||||||||||
| Affinion Group Holdings, Inc. Class D* | 549 | — | 549 | — | — | — | ||||||||||||||||||
| Corporate Risk Holdings Corp.* | 31,594 | — | 31,594 | — | — | — | ||||||||||||||||||
| Corporate Risk Holdings I, Inc.* | 6,248,652 | — | 6,248,652 | — | — | — | ||||||||||||||||||
| Corporate Risk Holdings LLC,11.500% Cash or 13.500% Payment-in-kind Interest, due 1/2/20* | 37,561,158 | 2,535,378 | 2 | 40,096,536 | — | — | — | |||||||||||||||||
| Geokinetics, Inc. | 124,461 | — | — | 124,461 | 4,717,072 | — | ||||||||||||||||||
| Geokinetics, Inc., Warrants, expire 9/1/26 | 45,252 | — | — | 45,252 | 1,714,598 | — | ||||||||||||||||||
| Geokinetics Holdings USA, Inc., Term Loan, 2nd Lien, 5.000% Cash and 8.000% Payment-in-kind Interest, due 8/10/18 | 743,713 | 180,126 | 2 | — | 923,839 | 822,217 | 75,255 | 3 | ||||||||||||||||
| Ideal Standard International S.A., Series B, 11.750% Cash or 15.750% Payment-in-kind Interest, due 5/1/18 | 32,473,670 | EUR | 2,557,301 | 2, EUR | — | 35,030,971 | EUR | 38,159,268 | 3,734,711 | 3 | ||||||||||||||
| Ideal Standard International S.A., Series C, 11.750% Cash or 17.750% Payment-in-kind Interest, due 5/1/18 | 39,331,288 | EUR | 3,490,652 | 2,EUR | — | 42,821,940 | EUR | 46,645,977 | 4,188,235 | 3 | ||||||||||||||
| Ideal Standard International | ||||||||||||||||||||||||
| Equity S.A. Alpecs | 1,451,633,736,282 | — | — | 4 | 9,329,469 | — | ||||||||||||||||||
26
| Third Avenue Trust |
| Third Avenue Focused Credit Fund |
| Notes to Financial Statements (continued) |
| April 30, 2017 (Unaudited) |
| Investment in affiliates (continued) | ||||||||||||||||||||||||
| Shares/ | Shares/ | Investment | ||||||||||||||||||||||
| Principal | Principal | Income | ||||||||||||||||||||||
| Amount† | Gross | Amount† | Nov. 1, | |||||||||||||||||||||
| Held at | Purchases | Gross | Held at Apr. | Value at | 2016- | |||||||||||||||||||
| Oct. 31, | and | Sales and | 30, | Apr. 30, | Apr. 30, | |||||||||||||||||||
| Name of Issuer: | 2016 | Additions | Reductions | 2017 | 2017 | 2017 | ||||||||||||||||||
| Liberty Tire Recycling Holdco, LLC, Term Loan B, 9.000%, due 7/7/20 | 21,971,875 | — | 111,250 | 21,860,625 | $ | 21,833,299 | $ | 970,290 | ||||||||||||||||
| Liberty Tire Recycling LLC, 2nd Lien, 11.000% Payment-in-kind Interest, due 3/31/21 | 54,492,575 | 2,997,091 | 2 | — | 57,489,666 | 50,964,589 | 2,543,464 | 3 | ||||||||||||||||
| Longview Intermediate Holdings C, LLC | 4,550,000 | — | — | 4,550,000 | 6,256,250 | — | ||||||||||||||||||
| Longview Intermediate Holdings C, LLC, Warrants, expire 12/19/21** | — | 415,194 | 1 | — | 415,194 | 566,740 | — | |||||||||||||||||
| Longview Intermediate Holdings C, LLC, 12.000%, due 10/12/21** | — | 2,873,738 | 2 | — | 2,873,738 | 2,605,043 | 98,502 | |||||||||||||||||
| Longview Power LLC, Revolver, 7.000%, due 4/13/20 | 500,000 | 400,000 | — | 900,000 | 744,750 | 19,431 | ||||||||||||||||||
| LTR Holdings, Inc. | 3,430,293 | — | — | 3,430,293 | — | — | ||||||||||||||||||
| Platinum Energy Holdings, Inc. | 50,000 | — | — | 50,000 | 181,500 | — | ||||||||||||||||||
| Platinum Energy Holdings, Inc., Warrants, expires 10/4/18 | 10,874 | — | — | 10,874 | — | — | ||||||||||||||||||
| Radio One, Inc., Class D* | 2,127,789 | — | 2,127,789 | — | — | — | ||||||||||||||||||
| Spanish Broadcasting System, Inc., Class A* | 639,603 | — | 639,603 | — | — | — | ||||||||||||||||||
| Total Affiliates | $ | 184,540,772 | $ | 11,629,888 |
| 1 | Share increase due to corporate action. |
| 2 | Includes PIK interest. |
| 3 | Include interest and Payment-in-kind interest. |
| 4 | Share amount held at April 30,2017 is 1,451,633,736,282. |
| † | Denominated in U.S. dollars unless otherwise noted. |
| * | As of April 30, 2017, no longer an affiliate. |
| ** | As of October 31,2016, not an affiliate. |
| EUR | Euro |
Certain employees of the Adviser serve as members of the board of directors of companies in which the Fund has investments. As a result of such service, for the six months ended April 30, 2017, the Fund received $57,500 in board member fees from these companies that board
27
| Third Avenue Trust |
| Third Avenue Focused Credit Fund |
| Notes to Financial Statements (continued) |
| April 30, 2017 (Unaudited) |
members employed by the Adviser agreed to have paid directly to the benefit of the Fund. These fees are included in “Other Income” on the accompanying Statement of Operations.
5. CAPITAL SHARE TRANSACTIONS
The Fund is authorized to issue an unlimited number of shares of each class of beneficial interest with $0.001 par value. The Fund is not issuing new shares, and redemptions in the Fund are currently suspended pursuant to an order from the SEC.
On August 26, 2016, the Fund combined share classes so that all shares of the Investor share class were converted into shares of the Institutional share class.
Transactions in capital stock were as follows:
| For the Period Ended April 30, 2017 | For the Year Ended October 31, 2016 | |||||||||||||||
| Institutional Class | Institutional Class | |||||||||||||||
| Shares | Amount | Shares | Amount | |||||||||||||
| Shares sold | — | $ | — | 2,857,103 | $ | 21,058,499 | ||||||||||
| Shares Issued upon reinvestment of dividends and distributions | — | — | 2,240,677 | 14,900,504 | ||||||||||||
| Shares redeemed* | — | — | (48,024,503 | ) | (348,307,495 | ) | ||||||||||
| Shares converted from Investor Class | — | — | 38,497,997 | 528,269,076 | ||||||||||||
| Net increase/(decrease) | — | $ | — | (4,428,726 | ) | $ | 215,920,584 | |||||||||
| * | Redemption fees are netted with redemption amounts. |
Prior to December 9, 2015, the Fund charged a redemption fee of 2%, for shares redeemed or exchanged for shares of another series of the Trust within 60 days or less of the purchase date.
6. COMMITMENTS AND CONTINGENCIES
At April 30, 2017, the Fund had the following commitments and contingencies:
| Value of | ||||||||||||||||
| Amount of | Funded | Segregated | ||||||||||||||
| Issuer | Type | Commitment | Commitment | Cash | ||||||||||||
| Longview Power, LLC | Revolver | $ | 1,250,000 | $ | 900,000 | $ | 350,000 | |||||||||
In the normal course of business, the Fund enters into contracts that contain a variety of representations and warranties and which provide general indemnifications. The Fund’s maximum exposure under these arrangements is unknown, as this would involve future claims that may be made against the Fund that have not yet occurred.
28
| Third Avenue Trust |
| Third Avenue Focused Credit Fund |
| Notes to Financial Statements (continued) |
| April 30, 2017 (Unaudited) |
In 2016, the Fund became party to various derivative, securities class action and books and records lawsuits.
In 2016, the Adviser became party to various derivative and securities class action lawsuits.
In settlement of these lawsuits, the Adviser, the Fund and certain claimants have entered into agreements that would require the Adviser to pay the Fund $25 million (using its own capital and insurance proceeds) and the Fund would then pay certain former and present shareholders a total of $14.25 million in full settlement of all claims raised in the litigations. The Adviser believes that final approvals of these settlements are likely. The Fund will recognize a gain as a result of these settlements. The amount to be paid by the Adviser will not affect the Adviser’s ability to fully perform its investment advisory and other services to the Fund or the Trust.
7. RISKS RELATING TO CERTAIN INVESTMENTS
Foreign securities and emerging markets risk:
Foreign securities from a particular country or region may be subject to currency fluctuations and controls, or adverse political, social, economic or other developments that are unique to that particular country or region. Therefore, the prices of foreign securities in particular countries or regions may, at times, move in a different direction from those of U.S. securities. From time to time, foreign capital markets may exhibit more volatility than those in the U.S., and the securities markets of emerging market countries can be extremely volatile. Emerging market countries can generally have economic structures that are less diverse and mature, and political systems that are less stable, than those of developed countries, and, as a result, the securities markets of emerging market countries can be more volatile than more developed markets may be.
High yield and distressed risk:
The Fund’s investments in high-yield debt securities (commonly known as “junk bonds”) and distressed securities may expose the Fund to greater risks than if the Fund only owned higher-grade securities. The value of high-yield, lower quality securities is affected by the creditworthiness of the issuers of the securities and by general economic and specific industry conditions. The prices of high yield securities can fall in response to negative news about the issuer or its industry, or the economy in general to a greater extent than those of higher rated securities. Issuers of high-yield securities are not as strong financially as those with higher credit ratings, so the securities are usually considered speculative investments. These issuers are more vulnerable to financial setbacks and recession than are more creditworthy issuers, which may impair their ability to make interest and principal payments. The Fund may also invest in distressed securities, which the Adviser considers to be issued by companies that are, or might be, involved in reorganizations or financial restructurings, either out of court or in bankruptcy. The Fund’s investments in distressed securities typically may involve the purchase of high-yield bonds, bank debt or other indebtedness of such companies.
Debt securities risk:
The market value of a debt security may decline due to general market conditions that are not specifically related to a particular company, such as real or perceived adverse economic conditions, changes in the outlook for corporate earnings, changes in interest or currency rates or adverse investor sentiment generally. The debt securities market can be susceptible to
29
| Third Avenue Trust |
| Third Avenue Focused Credit Fund |
| Notes to Financial Statements (continued) |
| April 30, 2017 (Unaudited) |
increases in volatility and decreases in liquidity. Increases in volatility and decreases in liquidity may be caused by a rise in interest rates (or the expectation of a rise in interest rates), which are at or near historic lows in the United States and in other countries. During periods of reduced market liquidity, the Fund may not be able to readily sell debt securities at prices at or near their perceived value. If the Fund needed to sell large blocks of debt securities to meet shareholder redemption requests or to raise cash, those sales could further reduce the prices of such securities.
Prices of bonds and other debt securities tend to move inversely with changes in interest rates. Typically, a rise in rates will adversely affect debt securities and, accordingly, will cause the value of the Fund’s investments in these securities to decline. When interest rates fall, the values of already-issued securities generally rise, although investments in new securities may be at lower yields. The prices of high-yield debt securities (“junk bonds”), unlike investment grade securities, may fluctuate unpredictably and not necessarily inversely with changes in interest rates.
The rates on floating debt instruments adjust periodically with changes in market interest rates. Although these instruments are generally less sensitive to interest rate changes than fixed rate instruments, the value of floating rate loans and other floating rate securities may decline if their interest rates do not rise as quickly, or as much, as general interest rates. An unexpected increase in Fund redemption requests, including requests from shareholders who may own a significant percentage of the Fund’s shares, which may be triggered by market turmoil or an increase in interest rates, could cause the Fund to sell its holdings at a loss or at undesirable prices and adversely affect the Fund’s share price and increase the Fund’s liquidity risk, Fund expenses and/or taxable distributions. Economic and other developments can adversely affect debt securities markets.
Market risk:
Prices of securities have historically fluctuated. The market value of a security may decline due to general market conditions that are not related to the particular company, such as real or perceived adverse economic conditions, changes in the outlook for corporate earnings, changes in interest or currency rates or adverse investor sentiment generally. A security’s market value also may decline because of factors that affect the particular company, such as management performance, financial leverage, and reduced demand for the company’s products or services, or factors that affect the company’s industry, such as labor shortages or increased production costs and competitive conditions within an industry. The value of the Fund will similarly fluctuate and you could lose money.
30
| Third Avenue Trust |
| Third Avenue Focused Credit Fund |
| Notes to Financial Statements (continued) |
| April 30, 2017 (Unaudited) |
Liquidity risk:
Liquidity risk exists when particular investments are difficult to sell. The Fund may not be able to sell these investments at the best prices or at the value the Fund place on them. In such a market, the value of such investments and a Fund’s share price may fall dramatically, even during periods of declining interest rates. Investments that are illiquid or that trade in lower volumes may be more difficult to value. The market for high-yield debt securities (“junk bonds”) may be less liquid and therefore these securities may be harder to value or sell at an acceptable price, especially during times of market volatility or decline. Investments in foreign securities tend to have greater exposure to liquidity risk than U.S. securities. Liquidity can decline unpredictably in response to overall economic conditions or credit tightening. Investments in private debt instruments, restricted securities, and securities having substantial market and/or credit risk may involve greater liquidity risk.
Counterparty risk:
The Fund is exposed to counterparty risk, or the risk that an institution or other entity with which the Fund has unsettled or open transactions will default. The potential loss to the Fund could exceed the value of the financial assets recorded in the Fund’s financial statements. Financial assets, which potentially expose the Fund to counterparty risk, consist principally of cash due from counterparties and investments. The Adviser seeks to minimize the Fund’s counterparty risk by performing reviews of each counterparty and by minimizing concentration of counterparty risk by undertaking transactions with multiple customers and counterparties on recognized and reputable exchanges. Delivery of securities sold is only made once the Fund has received payment. Payment is made on a purchase once the securities have been delivered by the counterparty. The trade will fail if either party fails to meet its obligation.
At April 30, 2017, the Fund had counterparty concentration of credit risk primarily with JPMorgan Chase Bank, N.A.
The Fund is a party to International Swaps and Derivatives Association, Inc. Master Agreements (“ISDA Master Agreements”) with select counterparties that govern transactions, over-the-counter derivatives and foreign exchange contracts entered into by the Fund and those counterparties. The ISDA Master Agreements contain provisions for general obligations, representations, agreements, collateral and events of default or termination. Events of termination include conditions that may entitle counterparties to elect to terminate early and cause settlement of all outstanding transactions under the applicable ISDA Master Agreement. Any election to terminate early could be material to the financial statements of the Fund.
The considerations and factors surrounding the settlement of certain purchases and sales made on a delayed-delivery basis are governed by Master Securities Forward Transaction Agreements
31
| Third Avenue Trust |
| Third Avenue Focused Credit Fund |
| Notes to Financial Statements (continued) |
| April 30, 2017 (Unaudited) |
(“Master Forward Agreements”) between the Fund and select counterparties. The Master Forward Agreements maintain provisions for, among other things, initiation and confirmation, payment and transfer, events of default, termination, and maintenance of collateral.
The counterparty risk associated with certain contracts may be reduced by master netting arrangements to the extent that if an event of default occurs, all amounts with the counterparty are terminated and settled on a net basis. The Fund’s overall exposure to counterparty risk with respect to transactions subject to master netting arrangements can change substantially within a short period, as it is affected by each transaction subject to the arrangement.
Collateral requirements:
For derivatives traded under an ISDA Master Agreement and/or Master Forward Agreement, the collateral requirements are typically calculated by netting the mark-to-market amount for each transaction under such agreement and comparing that amount to the value of any collateral currently pledged by the Fund and the counterparty.
Cash collateral that has been pledged to cover obligations of the Fund and cash collateral received from the counterparty, if any, is reported separately on the Statement of Assets and Liabilities as cash pledged as collateral and cash received as collateral, respectively. Non-cash collateral pledged by the Fund, if any, is noted in the Schedule of Investments. Generally, the amount of collateral due from or to a party has to exceed a minimum transfer amount threshold (e.g. $500,000) before a transfer is required, which is determined at the close of business of the Fund and any additional required collateral is delivered to/pledged by the Fund on the next business day. Typically, a Fund and its counterparties are not permitted to sell, re-pledge or use the collateral they receive. To the extent amounts due to the Fund from its counterparties are not fully collateralized, contractually or otherwise, the Fund bears the risk of loss from counterparty non-performance. The Fund attempts to mitigate counterparty risk by entering into agreements only with counterparties that it believes have the financial resources to honor their obligations and by monitoring the financial stability of those counterparties.
For financial reporting purposes, the Fund does not offset derivative assets and derivative liabilities that are subject to netting arrangements in the Statement of Assets and Liabilities.
32
| Third Avenue Trust |
| Third Avenue Focused Credit Fund |
| Notes to Financial Statements (continued) |
| April 30, 2017 (Unaudited) |
At April 30,2017, the Fund’s derivative assets and liabilities (by type) on a gross basis are as follows:
| Assets | Liabilities | |||||||
| Derivative Financial Instruments: | ||||||||
| Forward Foreign Currency Contrats | $ | 344,134 | $ | — | ||||
| Total derivative assets and liabilities in the Statement of Assets and Liabilities | 344,134 | — | ||||||
| Derivatives not subject to a master netting agreement or similiar agreement (“MNA”) | — | — | ||||||
| Total derivative assets and liabilities subject to a MNA | $ | 344,134 | $ | — | ||||
The following tables present the Fund’s derivative assets by counterparty net of amounts available for offset under a MNA and net of the related collateral pledged by the Fund as of April 30, 2017:
| Counterparty | Amount of Assets Subject to a MNA by Counterparty | Derivatives Available for Offset1 | Non-cash Collateral Received2 | Cash Collateral Received2 | Net Amount of Derivative Assets3 | |||||||||||||||
| JPMorgan Chase Bank N.A. | $ | 344,134 | $ | — | $ | — | $ | (344,134 | ) | $ | — | |||||||||
| 1 | The amount of derviatives for offset is limited to the amount of assets and/or liabilites that are subject to a MNA. |
| 2 | Excess of collateral received from the individual counterparty may not be shown for financial reporting purposes. |
| 3 | Net amount represents the net amount receivable from the counterparty in the event of default. |
Loans and other direct debt instruments:
The Fund invests in loans and other direct debt instruments issued by corporate borrowers. These loans represent amounts owed to lenders or lending syndicates (loans and loan participations) or to other parties. Direct debt instruments may involve a risk of loss in case of default or insolvency of the borrower and may offer less legal protection to the Fund in the event of fraud or misrepresentation. In addition, loan participations involve a risk of insolvency of the lending bank or other financial intermediary. The markets in loans are not regulated by federal securities laws or the SEC.
Cash concentration:
The Fund’s cash balance is held at a major regional U.S. bank. The Fund’s cash balance, which typically exceeds Federal Deposit Insurance Corporation insurance coverage, subjects the Fund to a concentration of credit risk. The Fund regularly monitors the credit ratings of this financial institution in order to mitigate the credit risk that exists with the balances in excess of insured amounts.
33
| Third Avenue Trust |
| Third Avenue Focused Credit Fund |
| Notes to Financial Statements (continued) |
| April 30, 2017 (Unaudited) |
Off-balance sheet risk:
The Fund invests in derivatives which may represent off-balance sheet risk. Off-balance sheet risk exists when the maximum potential loss on a particular investment is greater than the value of such investment as reflected in the Statement of Assets and Liabilities.
Focused investing:
The Fund holds a relatively concentrated portfolio that contains fewer securities and invests in fewer industries than the portfolios of other mutual funds. Holding a relatively concentrated portfolio may increase the risk that the value of the Fund could decrease because of the poor performance of one or a few investments. Concentrated positions may be difficult to liquidate.
8. FEDERAL INCOME TAXES
Prior to the December 9, 2015 adoption of the Plan of Liquidation, the amount of dividends and distributions paid by the Fund was based upon the Fund’s net investment income and net realized capital gains. These amounts are determined in accordance with U.S. federal income tax law and regulations which may differ from U.S. GAAP. Distributions paid by the Fund after the adoption of the Plan of Liquidation will generally be treated as part of a series of liquidating distributions for U.S. federal income tax purposes.
Dividends and distributions, including liquidating distributions, are recorded by the Funds on the ex-dividend date. In order to present accumulated undistributed net investment income (loss), accumulated net realized gain (loss) on investments and foreign currency transactions and capital stock on the Statement of Assets and Liabilities that more closely represent their tax character, certain adjustments have been made. “Book/tax” differences are either temporary or permanent in nature. To the extent these differences are permanent in nature, such amounts are reclassified within the capital accounts based on their tax-basis treatment. Temporary differences do not require reclassification. Permanent differences are primarily due to reclassification of certain transactions involving foreign securities and currencies, and partnerships, the difference in the treatment of amortization of discount on certain debt instruments, certain derivative instruments and other book to tax adjustments. Net investment income (loss), net realized capital gain (loss) on investments and foreign currency transactions and net assets were not affected by these changes.
As of October 31, 2016, Third Avenue Focused Credit Fund has a capital loss carryforward as follows:
34
| Third Avenue Trust |
| Third Avenue Focused Credit Fund |
| Notes to Financial Statements (continued) |
| April 30, 2017 (Unaudited) |
| Capital Losses incurred | ||||||||||||
| in a post-enactment year | Short-Term | Long-Term | Total | |||||||||
| Year-ended Oct. 31, 2015 | $ | 89,657,034 | $ | 217,650,552 | $ | 307,307,586 | ||||||
| Year-ended Oct. 31, 2016 | $ | 75,379,494 | $ | 378,176,547 | $ | 453,556,041 | ||||||
| Total | $ | 165,036,528 | $ | 595,827,099 | $ | 760,863,627 | ||||||
The Regulated Investment Company Modernization Act of 2010 generally allows capital losses incurred in a taxable year beginning after December 22, 2010 (“post-enactment year”) to be carried forward for an unlimited period to the extent not utilized. Post-enactment capital loss carryforwards will retain their character as either short-term or long-term capital losses.
9. SUBSEQUENT EVENTS
Pursuant to the Modified Plan of Liquidation, a cash distribution of approximately $118 million was paid to the Fund’s shareholders on May 16, 2017 (the “Fifth Liquidating Distribution”). The Fifth Liquidating Distribution of $1.00 per share was paid to shareholders of record of the Fund as of May 15, 2017. Internal Revenue Service Form 8937 - Report of Organizational Actions Affecting Basis of Securities, providing further detail with respect to the tax treatment of this distribution to the Fund’s shareholders, has been posted to the Fund’s website at www.focusedcreditfund.com.
35
| Third Avenue Trust |
| Third Avenue Focused Credit Fund |
| Schedule of Shareholder Expenses |
| (Unaudited) |
As a shareholder of the Fund, you incur two types of costs: (1) transaction costs, such as redemption fees; and (2) ongoing costs, including management fees, shareholder servicing fees, distribution fees (if applicable) and other Fund expenses. This example is intended to help you understand your ongoing costs (in dollars) of investing in the Fund and to compare these costs with the ongoing costs of investing in other mutual funds. Although the Fund is no longer charging redemption fees or paying management fees, shareholder servicing fees, or distribution fees, this example is required to be included pursuant to SEC rules.
The example is based on an investment of $1,000 invested at the beginning of the period, November 1, 2016 and held for the six month period ended April 30, 2017.
Actual Expenses
The first line of the table below provides information about actual account values and actual expenses. You may use the information in this line, together with the amount you invested, to estimate the expenses that you paid over the period. Simply divide your account value by $1,000 (for example, an $8,600 account value divided by $1,000 = 8.6), then multiply the result by the number in the first line under the heading entitled “Expenses Paid During the Period” to estimate the expenses you paid on your account during this period.
Hypothetical Example for Comparison Purposes
The second line of the table below provides information about hypothetical account values and hypothetical expenses based on the Class’ actual expense ratio and an assumed rate of return of 5% per year before expenses, which is not the Fund’s actual return. The hypothetical account values and expenses may not be used to estimate the actual ending account balance or expenses you paid for the period. You may use this information to compare the ongoing costs of investing in the Fund and other funds. To do so, compare this 5% hypothetical example with the 5% hypothetical examples that appear in the shareholder reports of the other funds.
Please note that the expenses shown in the table are meant to highlight your ongoing costs only and do not reflect any transactional costs, such as redemption fees. Therefore, the second line of the table is useful in comparing ongoing costs only, and will not help you determine the relative total costs of owning different funds. In addition, if these transactional costs were included, your costs would have been higher. The example also assumes all dividends and distributions have been reinvested.
36
| Third Avenue Trust |
| Third Avenue Focused Credit Fund |
| Schedule of Shareholder Expenses (continued) |
| (Unaudited) |
| Beginning Account Value November 1, 2016 | Ending Account Value April 30, 2017 | Expenses Paid During the Period November 1, 2016 to April 30, 2017* | Annualized Expense Ratio | |||||||||||||
| Institutional Class | ||||||||||||||||
| Actual | $1,000 | $1,093.30 | $3.27 | 0.63% | ||||||||||||
| Hypothetical | $1,000 | $1,021.67 | $3.16 | 0.63% | ||||||||||||
| * | Expenses (net of fee waivers and expense offset arrangement) are equal to the Fund’s annualized expense ratio, multiplied by the average account value over the period, multiplied by the number of days in the most recent fiscal half-year (181) divided by 365. |
37
BOARD OF TRUSTEES
William E. Chapman, II
Lucinda Franks
Edward J. Kaier
Eric Rakowski
Patrick Reinkemeyer
Charles C. Walden — Chairman
Martin Shubik — Advisory Trustee
Martin J. Whitman — Chairman Emeritus
OFFICERS
Vincent J. Dugan — Chief Financial Officer, Treasurer
Michael A. Buono — Controller, Assistant Treasurer
W. James Hall III — President, General Counsel, Secretary
Joseph J. Reardon — Chief Compliance Officer
TRANSFER AGENT
BNY Mellon Investment Servicing (U.S.) Inc.
P.O. Box 9802
Providence, RI 02940-8002
610-239-4600
800-443-1021 (toll-free)
INVESTMENT ADVISER
Third Avenue Management LLC
622 Third Avenue
New York, NY 10017
INDEPENDENT REGISTERED PUBLIC ACCOUNTING FIRM
PricewaterhouseCoopers LLP
300 Madison Avenue
New York, NY 10017
CUSTODIAN
JPMorgan Chase Bank, N.A.
383 Madison Avenue, 4th Floor
New York, NY 10179
 | The information in this booklet is intended for shareholders of the Third Avenue Focused Credit Fund which has been operating pursuant to a plan of liquidation since December 16, 2015. For more information, please visit our website or contact your Relationship Manager at: |
| www.focusedcreditfund.com | 622 Third Avenue |  | 212.906.1160 | |
| New York, NY 10017 |  | creditupdates@thirdave.com |
Item 2. Code of Ethics.
Not applicable for semi-annual reports.
Item 3. Audit Committee Financial Expert.
Not applicable for semi-annual reports.
Item 4. Principal Accountant Fees and Services.
Not applicable for semi-annual reports.
Item 5. Audit Committee of Listed Registrants.
Not applicable.
Item 6. Schedule of Investments.
Not applicable.
Item 7. Disclosure of Proxy Voting Policies and Procedures for Closed-End Management Investment Companies.
Not applicable.
Item 8. Portfolio Managers of Closed-End Management Investment Companies.
Not applicable.
Item 9. Purchase of Equity Securities by Closed-End Management Investment Company and Affiliated Purchasers.
Not applicable.
Item 10. Submission of Matters to a Vote of Security Holders.
Not applicable.
Item 11. Controls and Procedures.
(a) The Trust’s principal executive officer and principal financial officer have evaluated the Trust’s disclosure controls and procedures within 90 days of this filing and have concluded that the Trust’s disclosure controls and procedures are reasonably designed to ensure that information required to be disclosed by the Trust in this Form N-CSR is recorded, processed, summarized, and reported within the required time periods and that information required to be disclosed by the Trust in the report that it files or submits on
Form N-CSR is accumulated and communicated to the Trust’s management, including its principal executive and principal financial officers, as appropriate to allow timely decisions regarding required disclosure.
(b) The Trust’s principal executive officer and principal financial officer are aware of no changes in the Trust’s internal control over financial reporting that occurred during the second fiscal quarter of the period covered by this report that have materially affected, or are reasonably likely to materially affect, the Trust’s internal control over financial reporting.
Item 12. Exhibits.
| (a)(1) | Not applicable for semi-annual reports. |
| (a)(2) | Certifications pursuant to Rule 30a-2(a) under the 1940 Act. |
| (a)(3) | Not applicable. |
| (b) | Certifications pursuant to Rule 30a-2(b) under the 1940 Act. |
SIGNATURES
Pursuant to the requirements of the Securities Exchange Act of 1934 and the 1940 Act, the registrant has duly caused this report to be signed on its behalf by the undersigned, thereunto duly authorized.
(Registrant) Third Avenue Trust
| By: | /s/ W. James Hall | |
| Name: | W. James Hall | |
| Title: | Principal Executive Officer | |
| Date: | July 25, 2017 |
Pursuant to the requirements of the Securities Exchange Act of 1934 and the 1940 Act, this report has been signed by the following persons on behalf of the registrant and in the capacities and on the dates indicated.
| By: | /s/ W. James Hall | |
| Name: | W. James Hall | |
| Title: | Principal Executive Officer | |
| Date: | July 25, 2017 |
| By: | /s/ Vincent J. Dugan | |
| Name: | Vincent J. Dugan | |
| Title: | Principal Financial Officer | |
| Date: | July 25, 2017 |