Exhibit 99.1
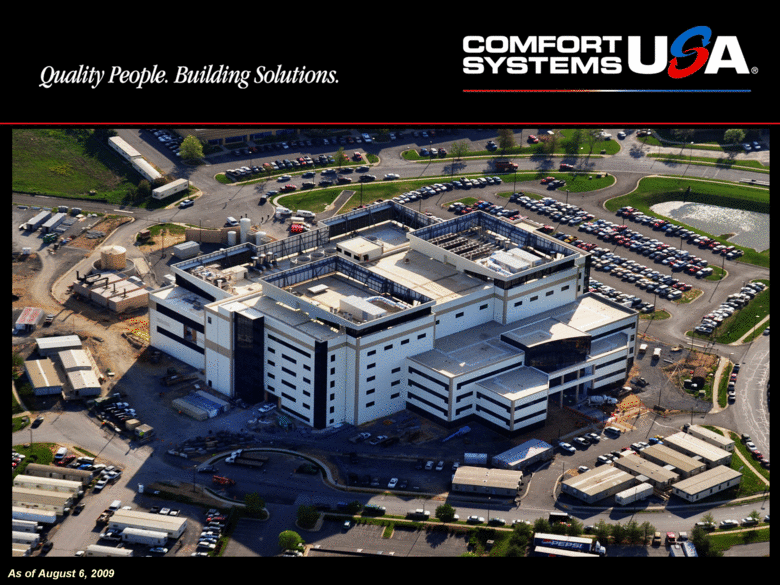
| As of August 6, 2009 |
| 2 This presentation contains “forward-looking statements” within the meaning of the Private Securities Litigation Reform Act of 1995. These statements are based on the current plans and expectations of future events Comfort Systems USA, Inc. and involve risks and uncertainties that could cause actual future activities and results of operations to be materially different from those set forth in the forward-looking statements. Important factors that could cause actual results to differ include, among others, the use of incorrect estimates for bidding a fixed-price contract, undertaking contractual commitments that exceed our labor resources, failing to perform contractual obligations efficiently enough to maintain profitability; national or regional weakness in construction activity and economic conditions, financial difficulties affecting projects, vendors, customers, or subcontractors, difficulty in obtaining or increased costs associated with bonding and insurance, shortages of labor and specialty building materials, retention of key management, our backlog failing to translate into actual revenue or profits, errors in our percentage-of-completion method of accounting, the result of competition in our markets, seasonal fluctuation in the demand for HVAC systems, the imposition of past and future liability from environmental, safety, and health regulations including the inherent risk associated with self-insurance, adverse litigation results and other risks detailed in our reports filed with the Securities and Exchange Commission. A further list and description of these risks, uncertainties and other factors are discussed under “Item 1A. Company Risks Factors” in the Company’s Annual Report on Form 10-K for the year ended December 31, 2008. These forward-looking statements speak only as of the date of this filing. Comfort Systems USA, Inc. expressly disclaims any obligation or undertaking to release publicly any updates or revisions to any forward-looking statement contained herein to reflect any change in our expectations with regard thereto or any change in events, developments, conditions or circumstances on which an such statement is based. Safe Harbor Statement |
| 3 To be the nation’s premier HVAC and mechanical systems installation and services provider. Vision |
| 4 Mission To provide the best value HVAC and mechanical systems installation and service, principally in the mid-market commercial, industrial, and institutional sectors, while caring for our customers, employees and the environment and realizing superior returns for our stockholders. |
| 5 Act with honesty and integrity. Show respect for all stakeholders. Exceed customer expectations. Seek “win-win” solutions. Demonstrate spirit, drive, and teamwork. Pursue innovation. Achieve premier safety performance. Commit to energy efficiency. Communicate openly…..and often. Impact our communities positively. Values |
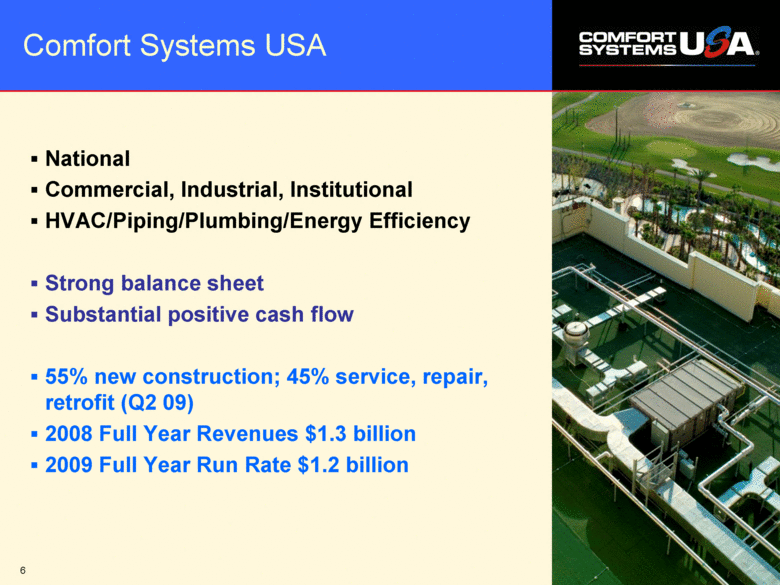
| 6 Comfort Systems USA National Commercial, Industrial, Institutional HVAC/Piping/Plumbing/Energy Efficiency Strong balance sheet Substantial positive cash flow 55% new construction; 45% service, repair, retrofit (Q2 09) 2008 Full Year Revenues $1.3 billion 2009 Full Year Run Rate $1.2 billion |
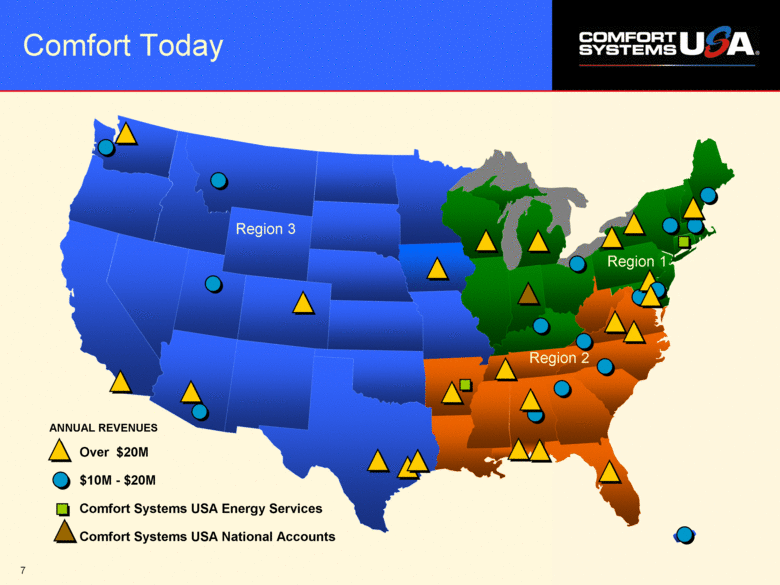
| 7 Comfort Today Over $20M $10M - $20M Comfort Systems USA Energy Services Comfort Systems USA National Accounts ANNUAL REVENUES Region 3 Region 1 Region 2 |
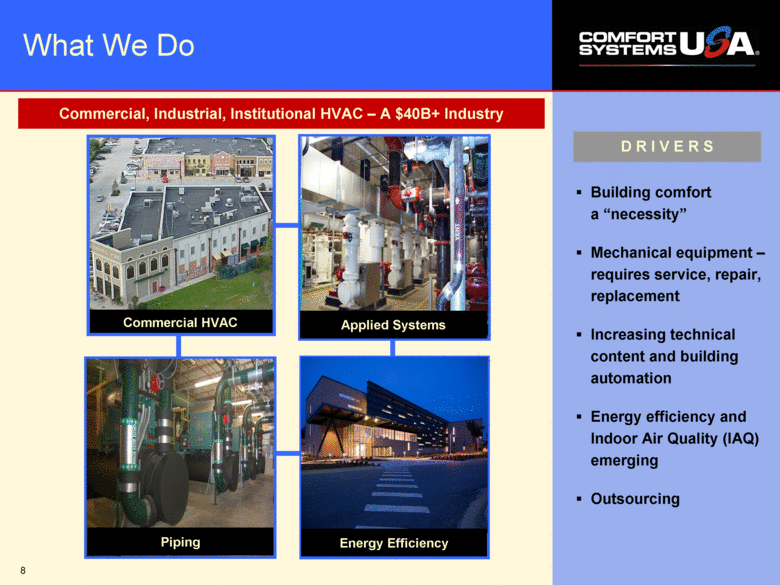
| 8 What We Do Commercial HVAC Building comfort a “necessity” Mechanical equipment – requires service, repair, replacement Increasing technical content and building automation Energy efficiency and Indoor Air Quality (IAQ) emerging Outsourcing D R I V E R S Commercial, Industrial, Institutional HVAC – A $40B+ Industry Applied Systems Piping Energy Efficiency |
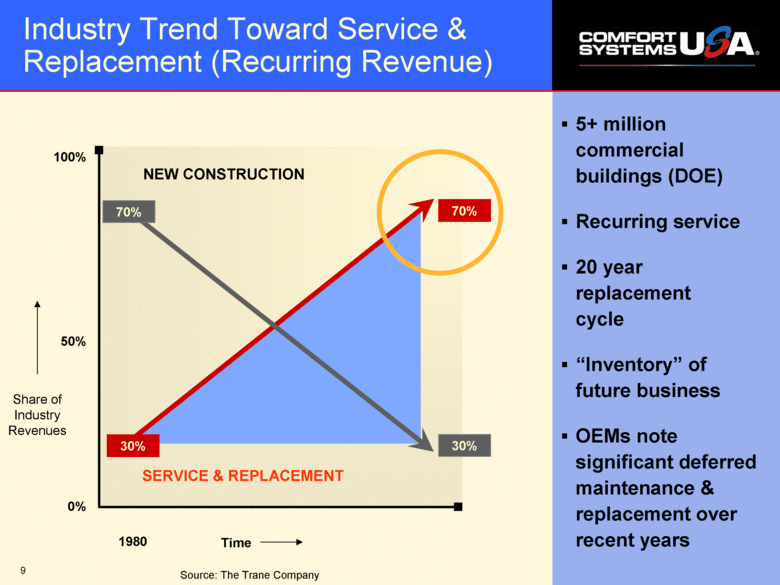
| 9 Industry Trend Toward Service & Replacement (Recurring Revenue) 5+ million commercial buildings (DOE) Recurring service 20 year replacement cycle “Inventory” of future business OEMs note significant deferred maintenance & replacement over recent years Source: The Trane Company NEW CONSTRUCTION 70% 30% 0% 50% 100% 1980 Share of Industry Revenues Time 70% 30% SERVICE & REPLACEMENT |
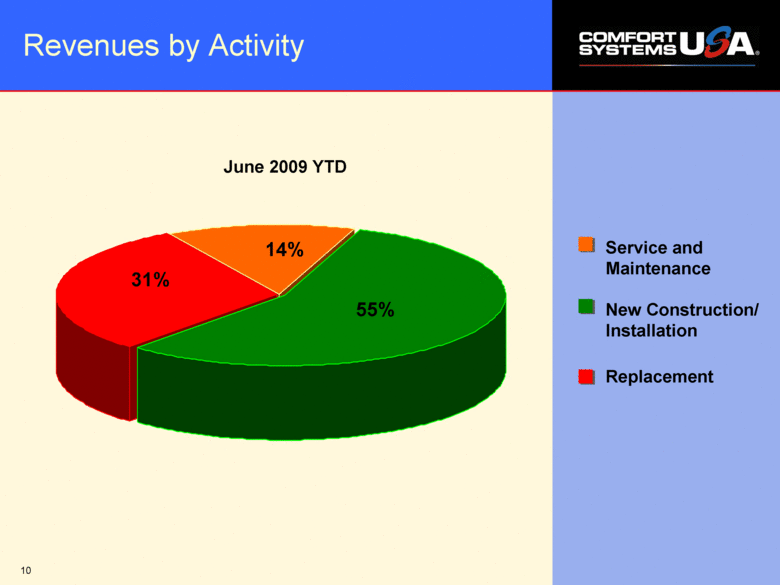
| 10 14% 31% 55% Revenues by Activity New Construction/Installation Replacement Service and Maintenance June 2009 YTD |
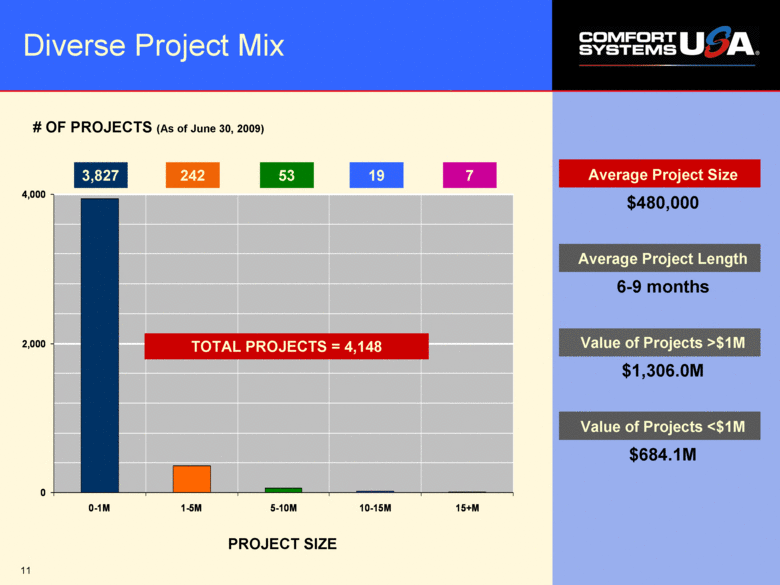
| 11 0 2,000 4,000 0-1M 1-5M 5-10M 10-15M 15+M PROJECT SIZE # OF PROJECTS (As of June 30, 2009) Diverse Project Mix Average Project Size $480,000 Average Project Length 6-9 months Value of Projects >$1M $1,306.0M Value of Projects <$1M $684.1M 3,827 242 53 19 7 TOTAL PROJECTS = 4,148 |
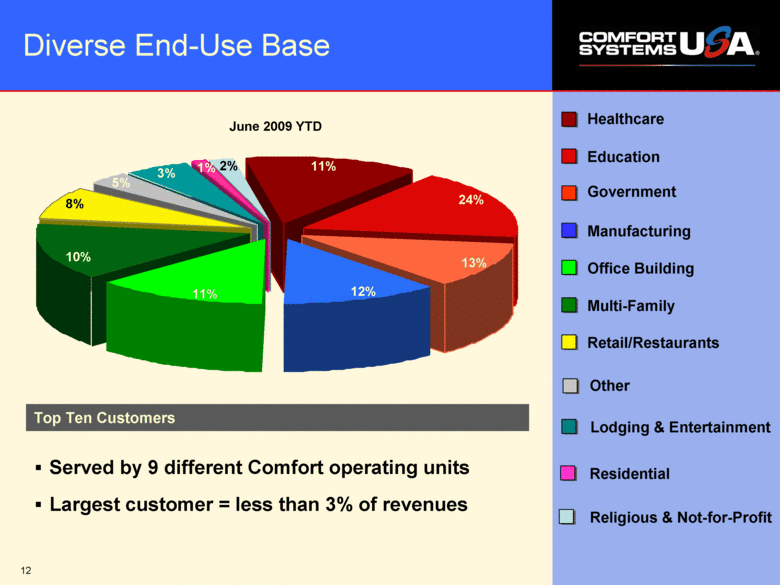
| 12 Healthcare Education Government Manufacturing Office Building Multi-Family Retail/Restaurants Other Residential 24% 13% 11% 11% 10% 8% 12% 1% 2% Top Ten Customers Diverse End-Use Base Served by 9 different Comfort operating units Largest customer = less than 3% of revenues Lodging & Entertainment June 2009 YTD 5% 3% Religious & Not-for-Profit |
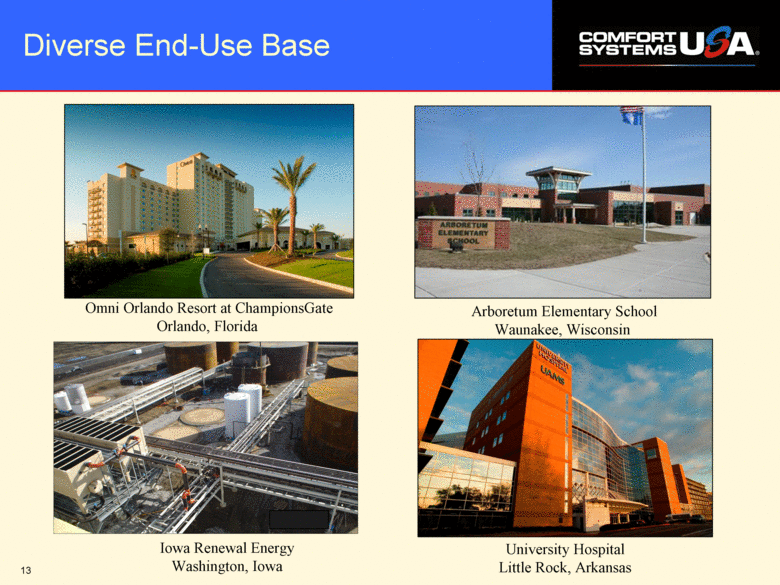
| 13 Diverse End-Use Base Omni Orlando Resort at ChampionsGate Orlando, Florida University Hospital Little Rock, Arkansas Arboretum Elementary School Waunakee, Wisconsin Iowa Renewal Energy Washington, Iowa |
| 14 Competitive Advantages High quality operations Ability to leverage and proliferate technical expertise Ability to collaborate on large jobs and share labor Energy efficiency services National multi-location service capability Purchasing economics Balance sheet strength Bonding and insurance Strong safety record |
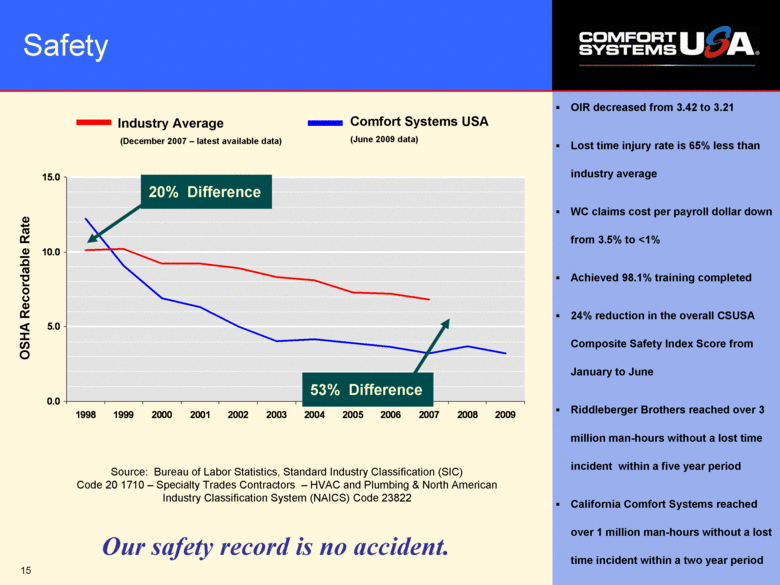
| 15 0.0 5.0 10.0 15.0 1998 1999 2000 2001 2002 2003 2004 2005 2006 2007 2008 2009 OIR decreased from 3.42 to 3.21 Lost time injury rate is 65% less than industry average WC claims cost per payroll dollar down from 3.5% to <1% Achieved 98.1% training completed 24% reduction in the overall CSUSA Composite Safety Index Score from January to June Riddleberger Brothers reached over 3 million man-hours without a lost time incident within a five year period California Comfort Systems reached over 1 million man-hours without a lost time incident within a two year period OSHA Recordable Rate Source: Bureau of Labor Statistics, Standard Industry Classification (SIC) Code 20 1710 – Specialty Trades Contractors – HVAC and Plumbing & North American Industry Classification System (NAICS) Code 23822 Safety 53% Difference 20% Difference Industry Average (December 2007 – latest available data) Comfort Systems USA (June 2009 data) Our safety record is no accident. |
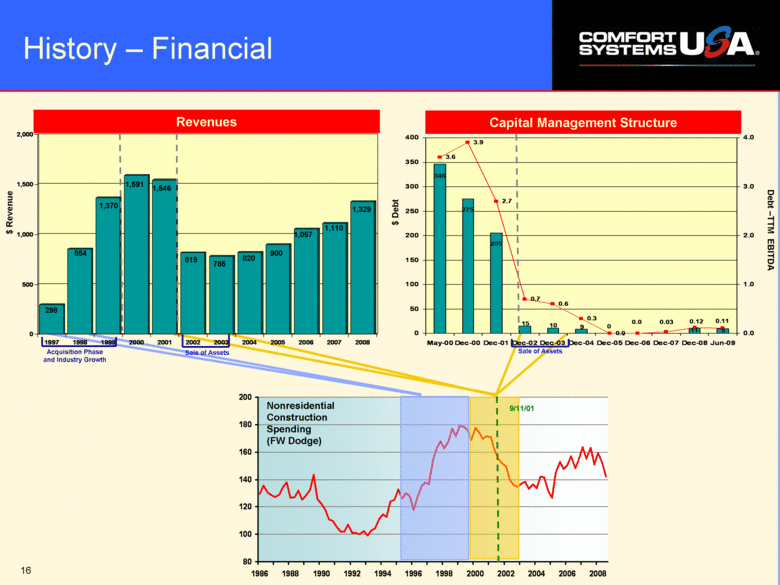
| 16 854 1,370 1,591 1,546 820 1057 900 346 275 205 80 100 120 140 160 180 200 1986 1988 1990 1992 1994 1996 1998 2000 2002 2004 2006 2008 History – Financial Nonresidential Construction Spending (FW Dodge) 9/11/01 1110 0 500 1,000 1,500 2,000 1997 1998 1999 2000 2001 2002 2003 2004 2005 2006 2007 2008 298 854 1,370 1,591 1,546 819 785 820 900 1,057 1,110 1,329 Revenues Sale of Assets Acquisition Phase and Industry Growth $ Revenue Capital Management Structure $ Debt Debt –TTM EBITDA 9 10 9 0 11 346 275 205 15 3.6 3.9 2.7 0.7 0.6 0.3 0.0 0.03 0.0 0.11 0.12 0 50 10 0 15 0 20 0 25 0 30 0 35 0 40 0 May-00 Dec-00 Dec-01 Dec-02 Dec-03 Dec-04 Dec-05 Dec-06 Dec-07 Dec-08 Jun-09 0.0 1.0 2.0 3.0 4.0 Sale of Assets |
| 17 Financial Overview |
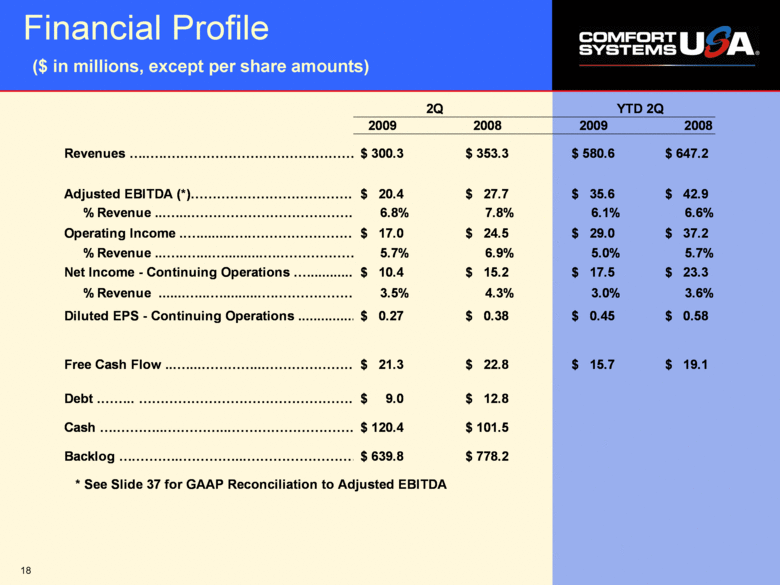
| 18 Financial Profile ($ in millions, except per share amounts) 2Q YTD 2Q 2009 2008 2009 2008 300.3 $ 353.3 $ 580.6 $ 647.2 $ 20.4 $ 27.7 $ 35.6 $ 42.9 $ % Revenue 6.8% 7.8% 6.1% 6.6% Operating Income 17.0 $ 24.5 $ 29.0 $ 37.2 $ % Revenue 5.7% 6.9% 5.0% 5.7% Net Income - Continuing Operations 10.4 $ 15.2 $ 17.5 $ 23.3 $ % Revenue 3.5% 4.3% 3.0% 3.6% Diluted EPS - Continuing Operations 0.27 $ 0.38 $ 0.45 $ 0.58 $ Free Cash Flow 21.3 $ 22.8 $ 15.7 $ 19.1 $ Debt 9.0 $ 12.8 $ Cash 120.4 $ 101.5 $ Backlog 639.8 $ 778.2 $ * See Slide 37 for GAAP Reconciliation to Adjusted EBITDA Revenues Adjusted EBITDA (*) |
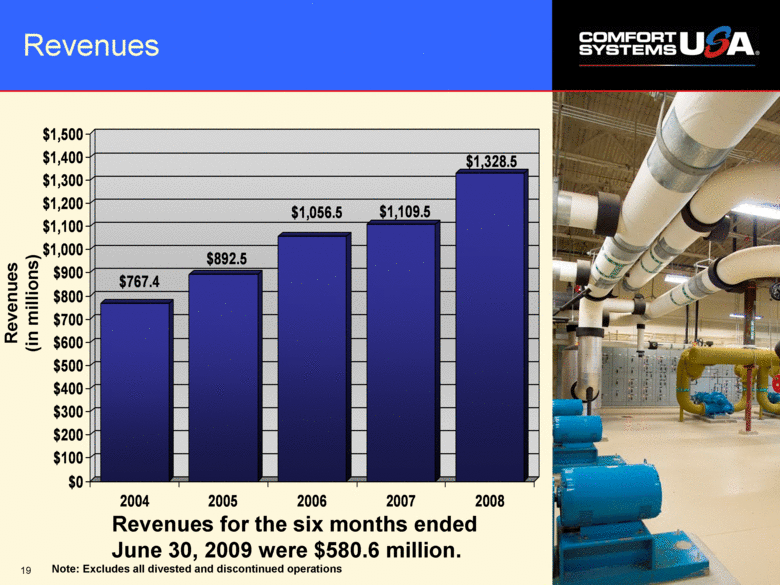
| 19 Revenues Revenues for the six months ended June 30, 2009 were $580.6 million. Revenues (in millions) $767.4 $892.5 $1,056.5 $1,109.5 $1,328.5 $0 $100 $200 $300 $400 $500 $600 $700 $800 $900 $1,000 $1,100 $1,200 $1,300 $1,400 $1,500 2004 2005 2006 2007 2008 Note: Excludes all divested and discontinued operations |
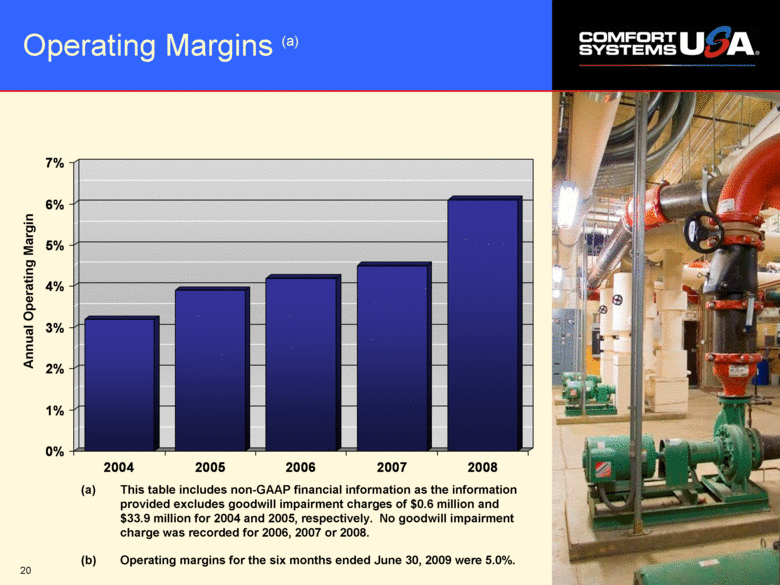
| 20 Operating Margins (a) Annual Operating Margin 0% 1% 2% 3% 4% 5% 6% 7% 2004 2005 2006 2007 2008 (a) This table includes non-GAAP financial information as the information provided excludes goodwill impairment charges of $0.6 million and $33.9 million for 2004 and 2005, respectively. No goodwill impairment charge was recorded for 2006, 2007 or 2008. (b) Operating margins for the six months ended June 30, 2009 were 5.0%. |
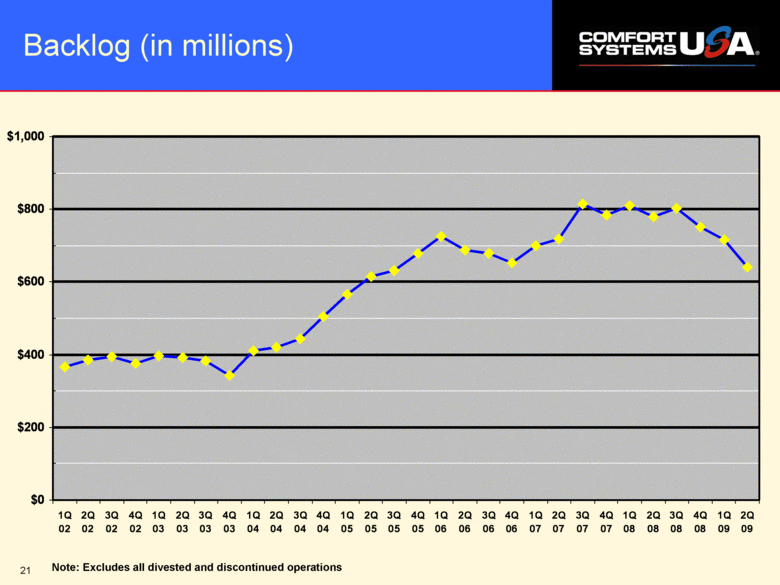
| 21 Backlog (in millions) Note: Excludes all divested and discontinued operations $0 $200 $400 $600 $800 $1,000 1Q 02 2Q 02 3Q 02 4Q 02 1Q 03 2Q 03 3Q 03 4Q 03 1Q 04 2Q 04 3Q 04 4Q 04 1Q 05 2Q 05 3Q 05 4Q 05 1Q 06 2Q 06 3Q 06 4Q 06 1Q 07 2Q 07 3Q 07 4Q 07 1Q 08 2Q 08 3Q 08 4Q 08 1Q 09 2Q 09 |
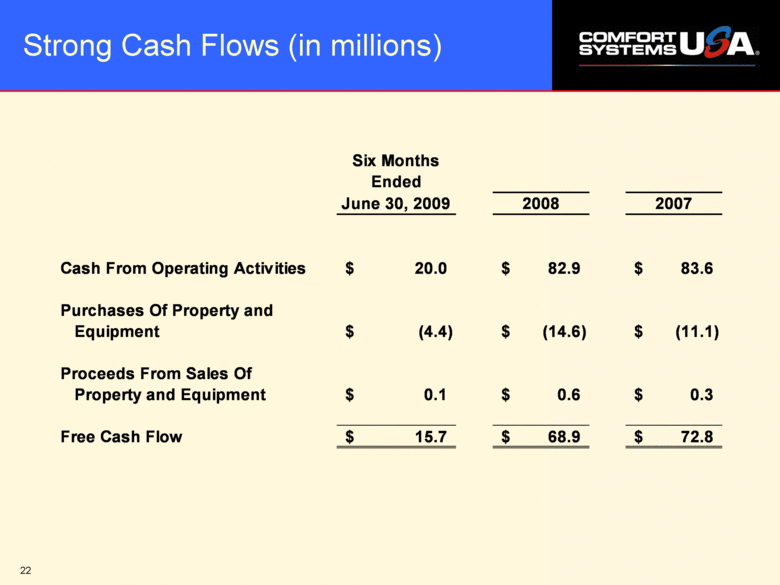
| 22 Strong Cash Flows (in millions) Six Months Ended June 30, 2009 2008 2007 Cash From Operating Activities 20.0 $ 82.9 $ 83.6 $ Purchases Of Property and Equipment (4.4) $ (14.6) $ (11.1) $ Proceeds From Sales Of Property and Equipment 0.1 $ 0.6 $ 0.3 $ Free Cash Flow 15.7 $ 68.9 $ 72.8 $ |
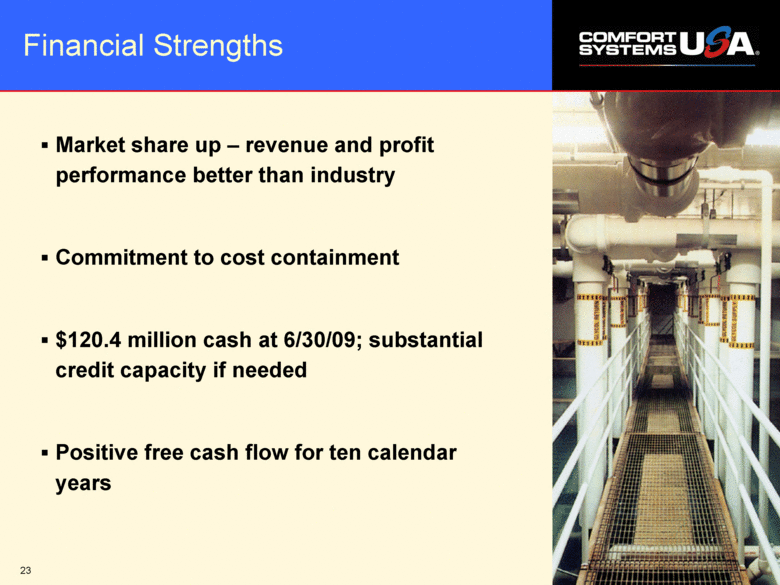
| 23 Financial Strengths Market share up – revenue and profit performance better than industry Commitment to cost containment $120.4 million cash at 6/30/09; substantial credit capacity if needed Positive free cash flow for ten calendar years |
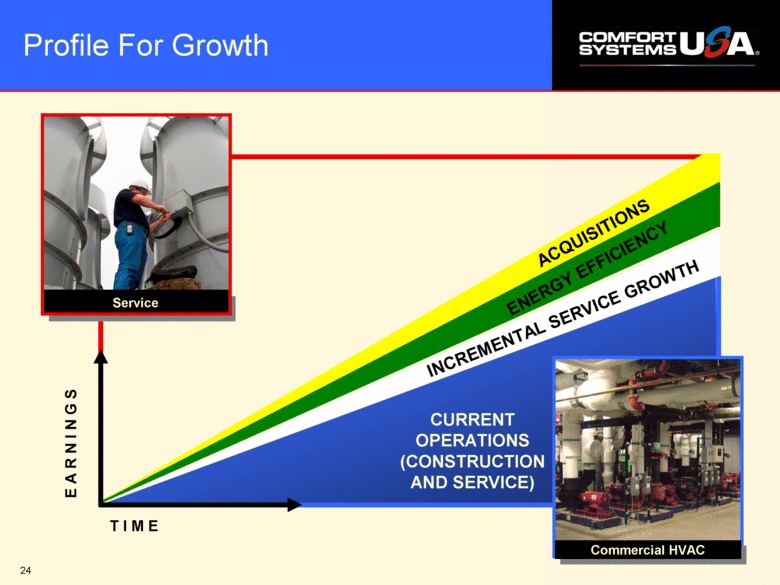
| 24 Profile For Growth T I M E E A R N I N G S Service INCREMENTAL SERVICE GROWTH CURRENT OPERATIONS (CONSTRUCTION AND SERVICE) ENERGY EFFICIENCY Commercial HVAC ACQUISITIONS |
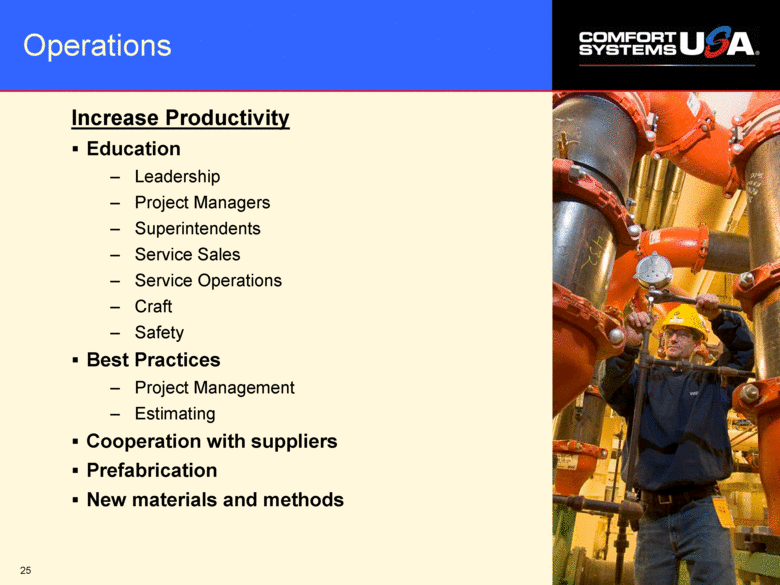
| 25 Operations Increase Productivity Education – Leadership – Project Managers – Superintendents – Service Sales – Service Operations – Craft – Safety Best Practices – Project Management – Estimating Cooperation with suppliers Prefabrication New materials and methods |
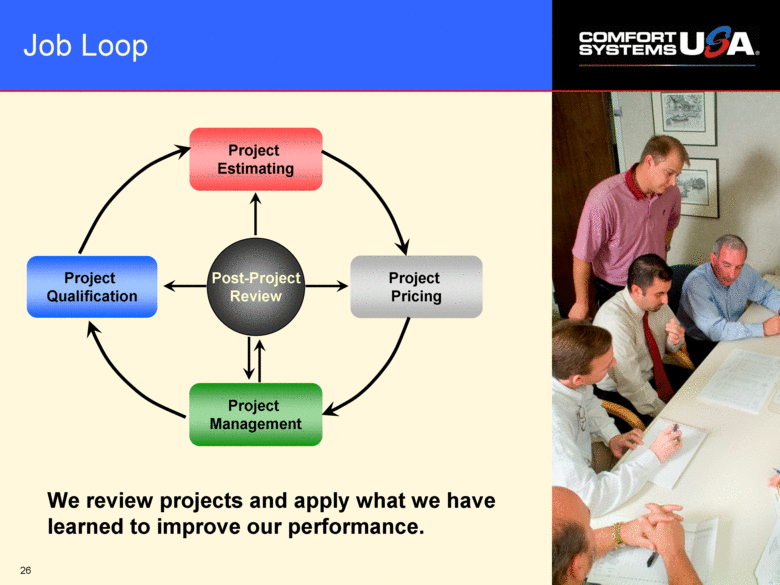
| 26 Job Loop Project Estimating Post-Project Review We review projects and apply what we have learned to improve our performance. Project Pricing Project Qualification Project Management |
| 27 The only things that evolve by themselves in an organization are disorder, friction and malperformance. -Peter Drucker |
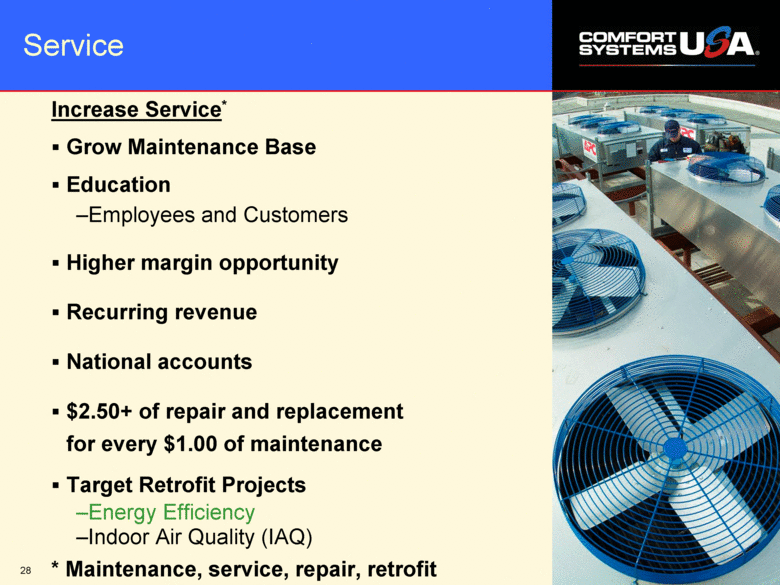
| 28 Service Increase Service* Grow Maintenance Base Education –Employees and Customers Higher margin opportunity Recurring revenue National accounts $2.50+ of repair and replacement for every $1.00 of maintenance Target Retrofit Projects –Energy Efficiency –Indoor Air Quality (IAQ) * Maintenance, service, repair, retrofit |
| 29 National Account Customers *Trademarks and logos are the property of their respective owners. |
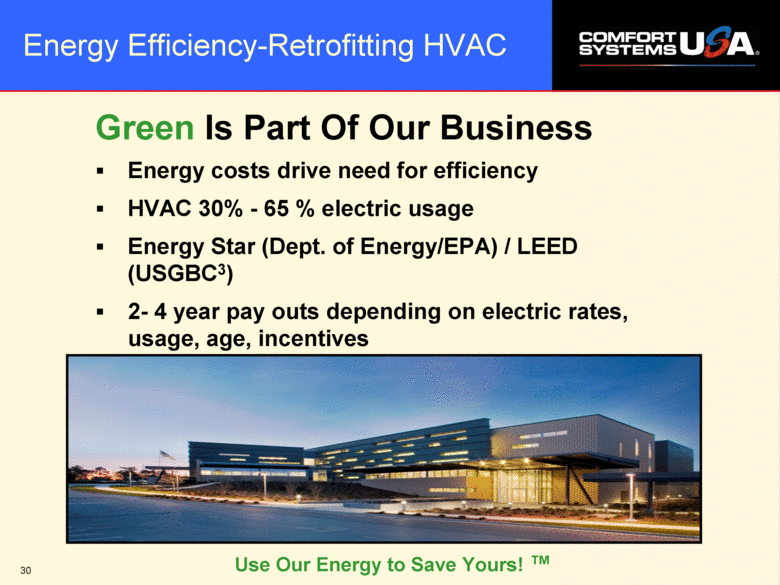
| 30 Energy Efficiency-Retrofitting HVAC Green Is Part Of Our Business Energy costs drive need for efficiency HVAC 30% - 65 % electric usage Energy Star (Dept. of Energy/EPA) / LEED (USGBC3) 2- 4 year pay outs depending on electric rates, usage, age, incentives Use Our Energy to Save Yours! ™ |
| 31 Growth Internal – More of what we do best – Service – Energy efficiency Step Out Growth – New locations for existing companies – Techs “on their own” Targeted acquisitions – Best HVAC oriented mechanical in new area |
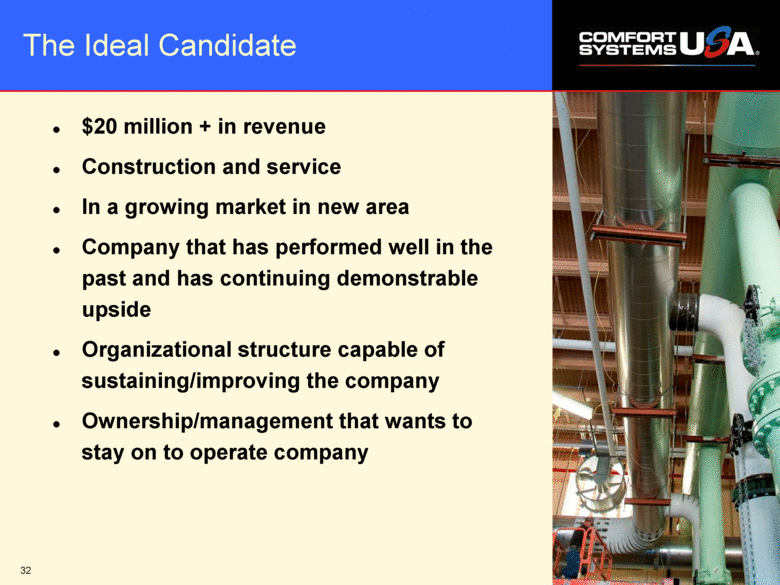
| 32 $20 million + in revenue Construction and service In a growing market in new area Company that has performed well in the past and has continuing demonstrable upside Organizational structure capable of sustaining/improving the company Ownership/management that wants to stay on to operate company The Ideal Candidate |
| 33 Boise, ID Charleston, SC Columbia/Florence, SC Dallas/Fort Worth, TX El Paso, TX Ft. Lauderdale, FL Los Angeles, CA Nashville, TN Norfolk, VA Target Markets (Listed Alphabetically) Omaha, NE Portland, OR Raleigh, NC Richmond, VA San Antonio, TX Savannah, GA Spartanburg/Greenville, SC Tampa, FL Tulsa, OK |
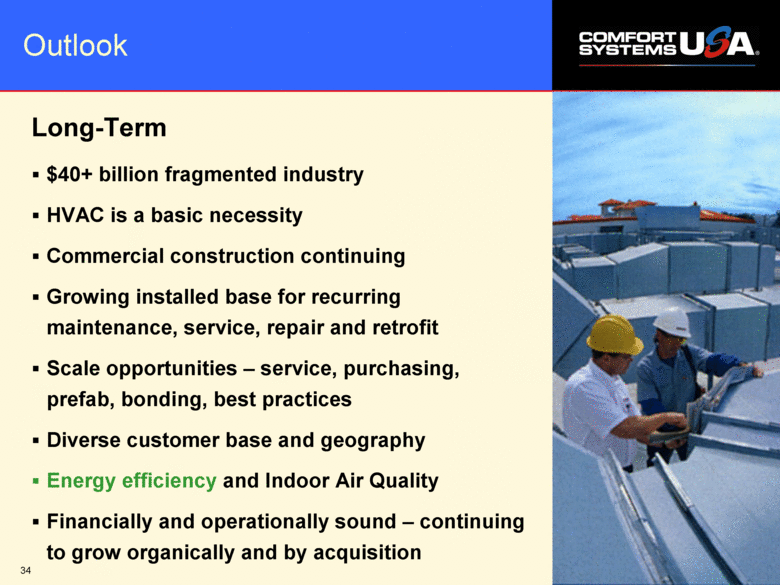
| 34 Outlook Long-Term $40+ billion fragmented industry HVAC is a basic necessity Commercial construction continuing Growing installed base for recurring maintenance, service, repair and retrofit Scale opportunities – service, purchasing, prefab, bonding, best practices Diverse customer base and geography Energy efficiency and Indoor Air Quality Financially and operationally sound – continuing to grow organically and by acquisition |
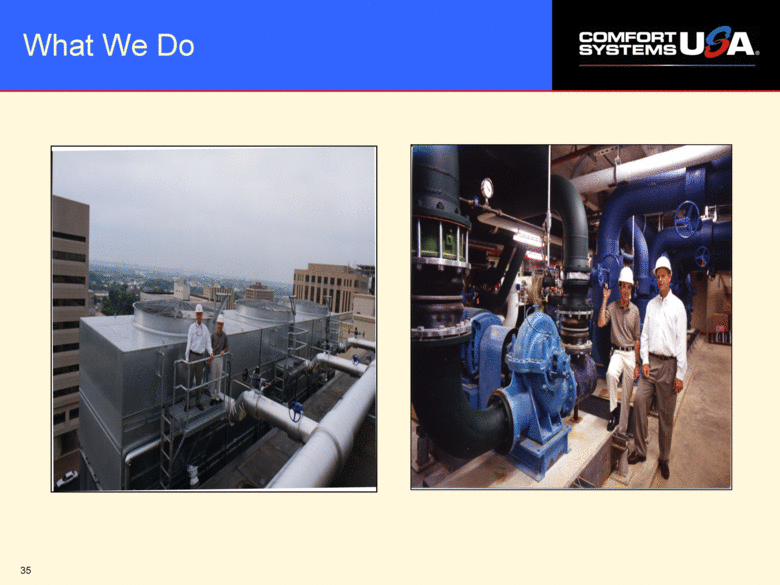
| 35 What We Do |
| 36 |
| 37 Appendix |
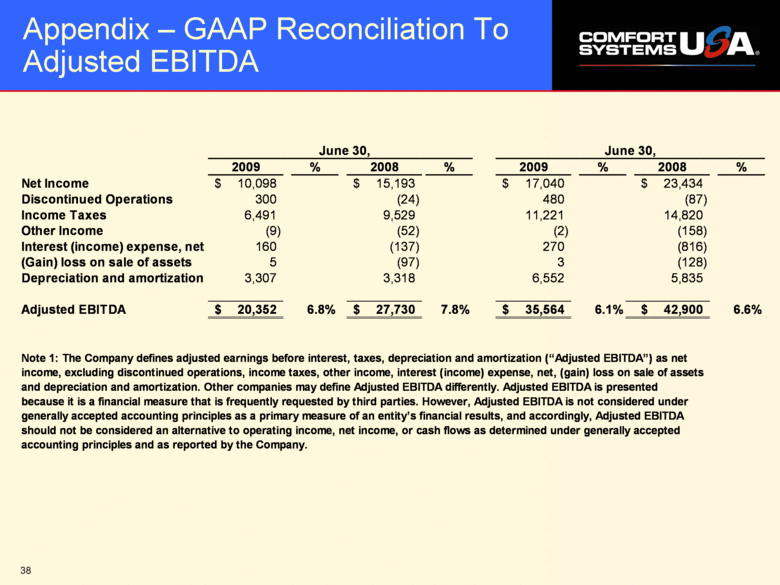
| 38 Appendix – GAAP Reconciliation To Adjusted EBITDA June 30, June 30, 2009 % 2008 % 2009 % 2008 % Net Income 10,098 $ 15,193 $ 17,040 $ 23,434 $ Discontinued Operations 300 (24) 480 (87) Income Taxes 6,491 9,529 11,221 14,820 Other Income (9) (52) (2) (158) Interest (income) expense, net 160 (137) 270 (816) (Gain) loss on sale of assets 5 (97) 3 (128) Depreciation and amortization 3,307 3,318 6,552 5,835 Adjusted EBITDA 20,352 $ 6.8% 27,730 $ 7.8% 35,564 $ 6.1% 42,900 $ 6.6% Note 1: The Company defines adjusted earnings before interest, taxes, depreciation and amortization (“Adjusted EBITDA”) as net income, excluding discontinued operations, income taxes, other income, interest (income) expense, net, (gain) loss on sale of assets and depreciation and amortization. Other companies may define Adjusted EBITDA differently. Adjusted EBITDA is presented because it is a financial measure that is frequently requested by third parties. However, Adjusted EBITDA is not considered under generally accepted accounting principles as a primary measure of an entity’s financial results, and accordingly, Adjusted EBITDA should not be considered an alternative to operating income, net income, or cash flows as determined under generally accepted accounting principles and as reported by the Company. |
| 39 C O N T A C T: Bill George Executive Vice President and CFO 1-800-723-8431 bgeorge@comfortsystemsusa.com www.comfortsystemsusa.com |