FORM 6-K
SECURITIES AND EXCHANGE COMMISSION
Washington, D.C. 20549
Report of Foreign Private Issuer
Pursuant to Rule 13a-16 or 15d-16 of
the Securities Exchange Act of 1934
For the month of August, 2024
Brazilian Distribution Company
(Translation of Registrant’s Name Into English)
Av. Brigadeiro Luiz Antonio,
3142 São Paulo, SP 01402-901
Brazil
(Address of Principal Executive Offices)
(Indicate by check mark whether the registrant files or will file annual reports under cover of Form 20-F or Form 40-F)
Form 20-F X Form 40-F
(Indicate by check mark if the registrant is submitting the Form 6-K in paper as permitted by Regulation S-T Rule
101 (b) (1)):
Yes ___ No X
(Indicate by check mark if the registrant is submitting the Form 6-K in paper as permitted by Regulation S-T Rule
101 (b) (7)):
Yes ___ No X
(Indicate by check mark whether the registrant by furnishing the information contained in this Form is also thereby furnishing the information to the Commission pursuant to Rule 12g3-2(b) under the Securities Exchange Act of 1934.)
Yes ___ No X


Earnings release 2Q24
São Paulo, August 6, 2024. GPA [B3: PCAR3] announces the results for the 2nd quarter of 2024.
As a result of the process of discontinuing the activities of the Extra hypermarkets, in 2021, and Almacenes Éxito S.A. (“Éxito”), in 2022, as disclosed in the material facts and notices to the market, these activities are accounted for as discontinued (IFRS 5 / CPC 31). Accordingly the income statement were retroactively adjusted, as defined by CVM Deliberation 598/09 – Non-current assets held for sale and discontinued operations.
From 1Q24, gas stations activities (“Gas Stations”) passed to be accounted as discontinued activities (IFRS 5 / CPC 31). Accordingly the Income statement and the notes of financial statement were retroactively adjusted, as defined by CVM Deliberation 598/09 – Non-current assets held for sale and discontinued operations.
The following comments refer to the results of continued operations, including the effects of IFRS 16/CPC 06 (R2), and comparison relative to the same period in 2023, unless otherwise indicated.
Solid operational progress with a record Gross Margin of 28.2%. Adjusted EBITDA Margin increases by 2.1 p.p., and financial leverage shows sequential reduction.
| · | Record Gross Margin reaches 28.2%, an improvement of 1.9 p.p. vs. 2Q23, with accelerated commercial captures; |
| · | Adjusted EBITDA Margin(1)(2) of 8.8%, an increase of 2.1 p.p. vs. 2Q23, and adjusted EBITDA growth(1)(2) of 34.8% vs. 2Q23; |
| · | Sequential reduction in pre-IFRS 16(3) financial leverage reaching 2.8x, with a decrease of R$ 1.2 billion in net debt vs. 2Q23; |
| · | R$ 272 million in Operational Free Cash Flow(4) in the last 12 months, a solid improvement of R$ 498 million vs. last 12 months ended in 2Q23 driven by increased profitability; |
| · | Gross revenue growth of 2.1% vs. 2Q23; |
| o | Increase of 22.5% in the Proximity format(5) with the opening and quick maturation of new stores; |
| o | Robust growth of 15.6% in e-commerce operations; |
| o | Market share(6): Increase of 0.7 p.p. in the state of São Paulo and stability at national level; |
| o | Acceleration of growth in May and June, following a strong seasonal impact in April; |
| · | Increase of 3.4% in Same-store sales ex. calendar effect vs. 2Q23; |
| o | The Proximity format grows by 6.9% with acceleration compared to previous quarters. |
INCOME STATMENT (R$ million, except when indicated) | GPA Consolidated | |||||||
| 2Q24 | 2Q23 | Δ | 6M24 | 6M23 | Δ | |||
| Gross Revenue | 4,787 | 4,688 | 2.1% | 9,654 | 9,184 | 5.1% | ||
| Net Revenue | 4,489 | 4,381 | 2.5% | 9,075 | 8,538 | 6.3% | ||
| Gross Profit | 1,265 | 1,151 | 9.9% | 2,510 | 2,219 | 13.1% | ||
| Gross Margin | 28.2% | 26.3% | 1.9 p.p. | 27.7% | 26.0% | 1.7 p.p. | ||
| Selling, General and Administrative Expenses | (915) | (902) | 1.5% | (1,835) | (1,744) | 5.2% | ||
| % of Net Revenue | 20.4% | 20.6% | -0.2 p.p. | 20.2% | 20.4% | -0.2 p.p. | ||
| National Equity Income | 16 | 15 | 4.2% | 32 | 24 | 37.4% | ||
| Adjusted EBITDA GPA Brazil (1)(2) | 396 | 294 | 34.8% | 767 | 556 | 37.9% | ||
| Adjusted EBITDA Margin - GPA Brazil (1)(2) | 8.8% | 6.7% | 2.1 p.p. | 8.5% | 6.5% | 2.0 p.p. | ||
| International Equity Income (7) | 0 | (42) | -100.0% | 0 | (87) | -100.0% | ||
| Adjusted EBITDA GPA Consolidated (2) | 396 | 252 | 57.2% | 767 | 469 | 63.6% | ||
| Adjusted EBITDA Margin - GPA Consolidated (2) | 8.8% | 5.7% | 3.1 p.p. | 8.5% | 5.5% | 3.0 p.p. | ||
| Other Operating Revenue (Expenses) | (55) | (25) | 119.8% | (259) | (76) | 241.1% | ||
| Net Income Controlling Shareholders - Continued Operations | (272) | (324) | -15.9% | (679) | (643) | 5.6% | ||
| Net Margin Controlling Shareholders - Continued Operations | -6.1% | -7.4% | 1.3 p.p. | -7.5% | -7.5% | 0.0 p.p. | ||
| Net Income Controlling Shareholders - Discontinued Operations (8) | (60) | (101) | -40.8% | (313) | (31) | 927.4% | ||
| Net Income Controlling Shareholders Consolidated (9) | (332) | (425) | -21.9% | (992) | (673) | 47.4% | ||
(1) GPA Brazil excludes impacts from the international perimeter (Cnova); (2) Operating income before interest, taxes, depreciation and amortization adjusted by other Operating Income and Expenses; (3) Net Debt divided by GPA Brasil Adjusted EBITDA pre-IFRS 16 LTM; (4) Adjusted EBITDA pre-IFRS 16, excluding equity income, minus variation in working capital, minus Capex; (5) Excluding “Aliados” revenue; (6) Source Nielsen and considers the total self-service market sales; (7) As of 4Q23, due to the sale of the total participation held in Cnova, the equity income from international operations is null; (8) It includes the results from the discontinued operation of hypermarkets, gas stations and Éxito Group; (9) It considers results from continued and discontinued operations.
| 2 |  |
Relevant events occurred in 2Q24
| · | On April 2, 2024, after the public offering for the primary distribution of shares, the Casino Group announced the reduction of its stake in the Company to 22.5% (link), resulting in the end of its control of GPA; |
| · | On April 18, 2024, the new Board of Directors, now comprising nine members, took office, including: six independent members (vs. three previously), two members of the Casino Group (vs. six previously) and one member of management (CEO). With the majority of independent members (six out of nine members), new expertise added, greater diversity (two new female members) and with the new chairman position now being held by an independent member, we had another important advance in the Company's governance (link); |
| · | On April 30, 2024, we announced adherence to the ICMS debt settlement program of the Government of the State of São Paulo, which allowed a reduction, according to the discounts resulting from this agreement, of approximately 80% for the settlement of contingencies that amounted to R$ 3.6 billion. Access the material fact in more detail at the link; |
| · | On May 2, 2024, we announced the sale of our administrative headquarters building as part of initiatives to sell non-core assets to reduce the Company's financial leverage. The transaction value totaled R$ 218 million. Access the material fact in more detail at the link; |
| · | On June 26, 2024, we announced the sale of our gas stations’ operation, for the total amount of R$ 200 million. This transaction marks the completion of our non-core asset sales plan, which began in 2023, aimed at reducing the Company's financial leverage. The total value of the sales reached R$ 1.9 billion and, when combined with the primary public offering of shares carried out in March 2024, totaling R$ 2.6 billion. The result of this initiative, along with operational improvements, led to a significant reduction in financial leverage pre-IFRS 16, which decreased from 10.6x to 2.8x when comparing 2Q23 and 2Q24, respectively. |
| 3 | |
Message from the CEO
| We closed the first half of the year with significant progress supported by the assertive strategy of our six pillars, which have led to progressive and consistent results quarter by quarter. We recorded solid operational progress in the last quarter, with a record gross margin of 28.2%, an improvement of 2.1 p.p. in the adjusted EBITDA margin, reaching 8.8%, and a growth of 34.8% compared to 2Q23, as well as a sequential reduction in financial leverage, recording a decrease to 7.9x leverage (pre-IFRS 16) compared to 2Q23. |  |
The business performance continues to improve, with increased sales, volume, and maintenance of market share gains (vs. 2Q23), especially in the São Paulo market, which confirms the efficiency of our strategy for store renovation and expansion in this area. It is important to highlight the performance of the Proximity format, which had a strong recovery in growth rates, in response to the work focused on category management and assortment review, as well as the double-digit growth performance of stores opened since 2022.
During this period, we also completed the final stage of our plan of non-core asset sales with the announcement of the sale of the Company's headquarters and the sale of the gas stations’ operation. This plan aimed an improvement of our capital structure and reduction on the Company’s financial leverage level.
The second half of the year presents many opportunities for us to continue accelerating results. It is time to close the first cycle of the turnaround project and look to the future, consolidating our market position and the value proposition of our business.
Marcelo Pimentel
GPA CEO
| 4 | |
Sales Performance
Total sales growth
| GROSS REVENUE (R$ million) | 2Q24 | Variation 2Q24/2Q23 | ||
| Total sales | Share of Sales (%) | Total sales | Same-Store Sales ex. calendar effect(5) | |
| Pão de Açúcar | 2,384 | 49.8% | 1.1% | 2.7% |
| Extra Mercado(1) | 1,554 | 32.5% | -0.5% | 3.4% |
| Proximity | 554 | 11.6% | 22.5% | 6.9% |
| Other Businesses(2) | 68 | 1.4% | 96.0% | n.d |
| GPA ex. Aliados | 4,560 | 95.3% | 3.5% | 3.4% |
| Aliados(3) | 227 | 4.7% | -19.0% | n.d. |
| GPA(4) | 4,787 | 100.0% | 2.1% | 3.4% |
(1) Remaining Compre bem stores were converted into Extra Mercado between July and August 2023; (2) Revenues mainly from commercial centers rentals agreements and Stix Fidelidade; (3) Direct sales model for small businesses; (4) Excludes Gas Stations revenue, which was classified as discontinued activities since 1Q24; (5) Adjustment of 1.5 p.p., mainly due to Easter (03/31 in 2024 vs. 04/09 in 2023).
Total sales reached R$ 4.8 billion in 2Q24, an increase of 2.1%. A highlight was the Proximity format, with an increase of 22.5%, supported by the opening of 51 stores in the last 12 months (10 of which were opened in 2Q24). The new stores continue to show accelerated maturation (approximately seven months on average).
The quarter showed a strong impact from seasonality with the anticipation of the Easter holiday to 1Q24, causing a significant cooling of demand in food retail in April. On the other hand, May and June showed a good recovery, with increased volume and traffic in stores. Additionally, during the quarter, especially in April, we noticed a strong promotional movement in some markets. Despite this scenario, we maintained our discipline in executing the plan for the continuous improvement of our customers' experience and the profitability of operations.
Same-store sales growth by banner and format
| YoY Growth Same-Store Sales(1) | 2Q22 | 3Q22 | 4Q22 | 1Q23 | 2Q23 | 3Q23 | 4Q23 | 1Q24 | 2Q24 |
| Pão de Açúcar | 4.2% | 5.5% | 6.7% | 7.5% | 8.6% | 7.2% | 4.2% | 6.7% | 2.7% |
| Extra Mercado | 4.8% | 2.0% | 4.1% | 2.2% | 3.5% | 2.5% | 2.0% | 4.5% | 3.4% |
| Proximity(2) | 8.6% | 13.1% | 13.5% | 8.8% | 5.4% | 0.4% | 0.2% | 2.3% | 6.9% |
(1) Excludes calendar effect of 1.5 p.p.; (2) Excludes “Aliados” revenue
Same-store sales increased by 3.4% ex. calendar effect
In Pão de Açúcar, same-store sales grew by 2.7%, reflecting a significant improvement in the growth rate in May and June, following a weaker April. This growth was driven by both sales volume and increased average prices and customer traffic in the stores. The categories highligths was: (i) Packaged Breads and Dairy products, which showed significant volume growth; (ii) Fruits and Vegetables, impacted by inflation in major items in the category; and (iii) Cleaning products, which also showed relevant volume growth. The Meat and Poultry and In-House Bakery categories also exhibited substantial growth with increased volumes. The Premium & Valuable customer base continued to evolve compared to the previous year, with a 1.7% increase.
In Extra Mercado, same-store sales had an increase of 3.4%, following the same trend as Pão de Açúcar. There was a strong recovery in growth rates in May and June. Positive highlights included Packaged Breads and Dairy products, as well as Fruits and Vegetables, in addition to Fish and Complementary Grocery categories. In the second quarter of 2024, we continued to enhance the customer experience, resulting in an improvement in our NPS. For the upcoming quarters, we will begin the category management, assortment and pricing review project, which has the potential to further boost sales for the brand.
In the Proximity format, in the same-store comparison, we presented an increase of 6.9%, with growth accelerating after five quarters. Stores opened since 2022 continue to contribute to growth, showing double-digit same-store increases, highlighting the quality of recent expansion projects. In 2Q24, as in previous quarters, we continued to advance market share (+2.8 p.p.) compared to small supermarkets, maintaining our profitability discipline in a margin-promoting format for the Company.
The “Aliados” format, model of direct sales to small businesses, generated R$ 227 million in sales this quarter. Starting in early 2024, we began a process to rebalance this format with a focus on profitability, which explains the reduction in sales volume compared to 2Q23.
| 5 | |
Gain of 0.7 p.p. in market share year-over-year in the sate of São Paulo, with a 2.4 p.p. gain over the last two years vs. 2Q22
We maintained the consistency market share gains in line with the strategic plan to increase profitability
| Since April 2022, with the kick off of GPA’s turnaround plan, we have maintained discipline and consistency in delivering the objectives of the six strategic pillars, resulting in growing recognition from our clients, which may be observed by the relevant gains in market share. In 2Q24, we increased our market share by 0.7 p.p. in the state of São Paulo and remained stable at the national level, compared to 2Q23 in both cases. Over the last two years, we have seen significant advances in market share, with a growth of 2.4 p.p. in the state of São Paulo and 0.8 p.p. nationally. This progress, especially in the state of São Paulo where we have the highest concentration of our operations, further reinforces the assertiveness of our direction and the sustainability of the gains we are achieving. The proximity format, with the Minuto Pão de Açúcar and Mini Extra banners, continued to show significant market share growth, gaining 2.8 p.p. compared to small supermarkets in the Greater São Paulo area, confirming the success of the value proposition delivered to customers in this format. |  |
Expansion: Success in maturing proximity stores. Opening of 51 stores in the last 12 months, including 10 stores in 2Q24
R$ 657 million of incremental sales in the quarter generated by opened stores since 2022
| The focus of our stores expansion project is the proximity format, with the Minuto Pão de Açúcar banner. This banner has a scalable and mature format, with strong capillarity potential, foreseeing the densification and verticalization of the city of São Paulo and its metropolitan region. The stores, focused on the high income public, are in premium locations and present a quickly maturation, seven months in average, with high performance, and the newest stores, opened in 2022, 2023 e 2024, overcome, in terms of profitability, the stores opened previously, and with an average profitability higher than the Company’s consolidated profitability. | 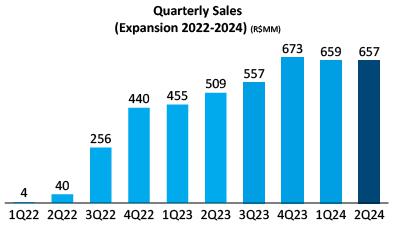 |
In 2Q24, we opened 10 stores being 6 Minuto Pão de Açúcar, 3 Mini Extra and 1 Pão de Açúcar. In the last 12 months, we accumulate 51 new stores, being: (i) 47 in proximity format, 39 Minuto Pão de Açúcar and 8 Mini Extra; and (ii) 4 Pão de Açúcar.
| 6 | |
Leader in food E-commerce channels 1P and 3P
Another quarter of strong growth and increased contribution margin
| In 2Q24, we presented an increase of 15.6% in e-commerce revenue, maintaining the strong growth of previous quarters. E-commerce sales penetration in total food sales reached 12.6%, representing a 1.5 p.p. increase from the previous year. It’s worth noting that we are the leader in sales through the e-commerce channel in Brazil, considering B2C sales through our own channels (1P) and partner platforms (3P). One of the pillars of our e-commerce differentiation is the focus on perishables, due to product quality and picking process, driven by customer trust in our products. In 2Q24, we achieved a 34% penetration of perishables’ sales in the 1P channel, advancing 8 p.p. compared to the previous year. | 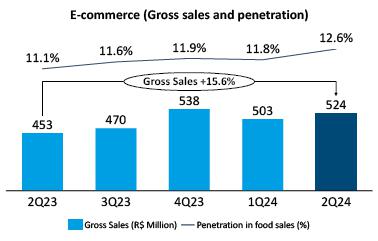 |
Following the efficiency gains process started in 4Q22 and more recently with the migration of e-commerce operations from the Distribution Center to 100% ship-from-store, the contribution margin of this channel has significantly improved, positively contributing to the plan to improve the consolidated margin.
Customers & NPS: Excellence in Service with 83 points in NPS
Greater customer satisfaction translates into increased share of wallet of premium costumers
In 2Q24, we achieved a record level of 83 points in NPS, marking the culmination of the customer reconnection journey started in 2022, an increase of 15 points compared to the same period in 2023. All our banners showed improvement compared to the previous year and quarter, demonstrating consistency and sustainability in this result. This advance is the consequence of several initiatives, highlighting continuous employee training, revitalization of Pão de Açúcar stores, and improvements in price perceptions, waiting time in checkout lines, and product availability, highlighting this last one, which reached an excellent level of 94.1% of on-shelf in the quarter, 1 p.p. better than the previous year. In this quarter, we were recognized once again by the Ebit survey (Nielsen), which assesses consumer experience in e-commerce, placing us in the diamond category, the highest position in this ranking
Another encouraging result of our strategy is the increased customer loyalty with the growth of the share of wallet of premium customers, showing a 3 percentage points increase over the last 12 months, combined with the constant growth of the Premium & Valuable customer base supported by the loyalty program (Programa Mais).
On customer loyalty, we also have a strong position in Private Labels and significant potential for developing this platform, connected to the high trust our customers have in our banners. In 2Q24, we achieved a 22.4% penetration of private label sales across our banners, with 23.0% at Pão de Açúcar, 26.3% at Extra Mercado and 20,4% at proximity format. By the end of 2Q24, we had relaunched 347 products under the new Qualitá concept, with new packaging that increased the attractiveness of these products. In the first half of the year, we also launched 102 new products out of a total of 250 expected for 2024.
The value proposition of Private Labels aims to deliver high-quality products comparable to category leaders at extremely competitive prices. The high customer loyalty to our private label products is evidenced by their presence in 8 out of 10 baskets, with customers buying Private Label products visiting stores 2.4 times more frequently than those who do not.
Another key aspect of customer loyalty is through Stix, the ecosystem of loyalty programs for major brands, where GPA is the majority partner, bringing together leading retail partners: Pão de Açúcar, Extra Mercado, Raia, Drogasil, Sodimac, C&A, and Shell, with Livelo as the financial partner for acquiring new customers for the ecosystem. Stix aims to increase average spending and frequency for its partners through its coalition loyalty programs, with a simple and practical model for earning and redeeming points. In 2Q24, the platform reached 8.8 million customers, a 48% increase from the end of 2023, with over 4 million customers engaged with two or more ecosystem partners. In the first half of 2024, R$ 198 million in points were redeemed in the Stix ecosystem, a 200% increase from the previous year. At GPA, Stix plays an important role in increasing the frequency and average spending of our recurring customers.
| 7 | |
Financial Performance
Highest Gross Margin since 2020 with accelerated commercial gains
Solid expansion of 1.9 p.p. when compared to 2Q23 and 1.0 p.p. vs. 1Q24

Gross Profit totaled R$ 1.3 billion in 2Q24, with a margin of 28.2%, showing an improvement of 1.9 p.p. and 1.0 p.p. compared to 2Q23 and 1Q24, respectively. The continuous improvement in Gross Profit compared to the previous year is mainly due to: (i) continuous progress in commercial negotiations; (ii) the start of capturing gains from the promotional efficiency project, which began implementation in April and had positive impacts in May and June; (iii) growth in retail media revenues; and (iv) reduction in logistics costs, partly due to the zero base budget project.
The promotional efficiency project has enabled more effective targeting of offers to each customer, taking into account their purchase profile. As a result, the Company focuses promotions on items that truly matter in each customer's basket, optimizing margin investment without compromising the shopping experience. This project uses machine learning tools for optimization.
The retail media project comprehends both the sale of media space in our stores and the provision of commercial intelligence to our suppliers, allowing them to optimize their marketing investment towards the audience they truly want to reach. We have 90 suppliers with 200 campaigns conducted or ongoing in the first half of 2024.
The promotional efficiency and retail media projects are in the early stage of implementation and present significant growth potential. Both projects leverage the extensive data GPA has on customer behavior, obtained through our high level of identification from our loyalty programs (Pão de Açúcar Mais and Clube Extra).
Selling, General and Administrative Expenses totaled R$ 915 million in the quarter, representing 20.4% of net revenue The efficiency gain of 0.2 p.p. compared to 2Q23 was mainly due to savings in marketing and utilities expenses, partly as a result of the zero base budget project.
Equity Income, formed by GPA's participation in FIC's results, totaled R$ 16 million, an increase of R$ 1 million compared to 2Q23. Highlights from FIC for the quarter included effective control of delinquency and a 48% increase in the use of proprietary cards in our sales channels, especially in e-commerce channels, demonstrating customer recognition of the value proposition.
| 8 | |
Continuos sequential improvement in Adusjted EBITDA margin
Expansion of 2.1 p.p. when compared to 2Q23 and 0.7 p.p. vs. 1Q24

As a result of the effects mentioned above, GPA's Adjusted EBITDA was R$ 396 million, representing a growth of 34.8% vs. 2Q23, and adjusted EBITDA margin of 8.8%, showing an improvement of 2.1 p.p. vs. 2Q23. These results demonstrate the consistency of the Company's turnaround process, with the sequential expansion in the Adjusted EBITDA margin.
For the upcoming quarters, we will continue to make progress: (i) in negotiating with our suppliers on commercial aspects; (ii) in the completion of projects that will impact the rebalancing of categories in light of the new value proposition of Pão de Açúcar and Extra Mercado banners; (iii) maturation of the promotional efficiency and retail media projects; (iv) improving shrinkage management; (v) capturing expense reductions through the implementation of new phases of the zero base budget project.
OTHER CONSOLIDATED OPERATING INCOME AND EXPENSES
In the quarter, Other Revenues and Expenses amounted to R$ (55) million. This result is primarily due to expenses related to the closure of five Extra Mercado stores.
CONSOLIDATED NET FINANCIAL RESULT
| FINANCIAL RESULT (R$ million) | GPA | |||||
| 2Q24 | 2Q23 | Δ % | 6M24 | 6M23 | Δ % | |
| Financial Revenue | 48 | 80 | -40.6% | 126 | 172 | -26.7% |
| Financial Expenses | (246) | (306) | -19.8% | (500) | (619) | -19.2% |
| Cost of Debt | (139) | (224) | -37.9% | (303) | (447) | -32.2% |
| Cost of Receivables Discount | (16) | (20) | -20.0% | (33) | (39) | -15.4% |
| Other financial expenses | (91) | (62) | 46.0% | (164) | (133) | 23.3% |
| Net Financial Revenue (Expenses) | (198) | (226) | -12.4% | (374) | (447) | -16.3% |
| % of Net Revenue | 4.4% | 5.2% | -0.8 p.p. | 4.1% | 5.2% | -1.1 p.p. |
| Interest on lease liabilities | (121) | (112) | 8.5% | (243) | (222) | 9.5% |
| Net Financial Revenue (Expenses) - Post IFRS 16 | (319) | (338) | -5.5% | (617) | (669) | -7.8% |
| % of Net Revenue - Post IFRS 16 | 7.1% | 7.7% | -0.6 p.p. | 6.8% | 7.8% | -1.0 p.p. |
The Company’s net financial result totaled R$ (199) million in 2Q24, representing 4.4% of net revenue. This result represents an improvement of 11.9% compared to the same period last year, mainly due to the reduction of R$ 1.2 billion in net debt and the reduction in the basic interest rate. The gain related to these two factors was partially offset by the start of recognizing the interest on the installments related to the ICMS debt settlement with the state of São Paulo.
Adding interest on lease liabilities, the amount reached R$ (319) million, equivalent to 7.1% of net revenue.
| 9 | |
CONSOLIDATED NET INCOME OF CONTINUED AND DESCONTINUED OPERATIONS
| ON-OFF EFFECTS CONTINUED NET INCOME (R$ million, except when indicated) | GPA | |||||
| 2Q24 | 2Q23 | Δ R$ | 6M24 | 6M23 | Δ R$ | |
| Controlling Net Income - Continued Activities | (272) | (324) | 52 | (679) | (643) | (36) |
| (+) Adjustment in Other Operating Income and Expenses | 0 | 0 | 0 | 111 | 0 | 111 |
| Provision of São Paulo ICMS' Settlement | 0 | 0 | 0 | 86 | 0 | 86 |
| GPA's headquartes' Impairment | 0 | 0 | 0 | 25 | 0 | 25 |
| (+) Non recognition of credits of Income Tax/CSLL | 100 | 57 | 43 | 199 | 72 | 127 |
| Controlling Sharholders Adjusted Net Income - Continued Operations | (173) | (267) | 95 | (369) | (571) | 202 |
In 2Q24, the Continuing Net Loss reached R$ (272) million, an improvement of R$ 52 million compared to the same period last year. Adjusting for the effect of tax credits on fiscal losses between quarters, we would present an Adjusted Continuing Net Loss of R$ (173) million, reflecting an improvement of R$ 95 million compared to 2Q23.
The Discontinued Net Loss reached R$ (60) million, mainly due to the impact of labor contingencies from Extra Hiper.
CASH GENERATION AND NET DEBT
| NET DEBT VARIATION – MANAGERIAL VIEW (R$ milhões) | GPA | |||||
| 2Q24 | 2Q23 | Δ R$ | LTM(5) 2Q24 | LTM(5) 2Q23 | Δ R$ | |
| Adjusted EBITDA GPA Brazil pre IFRS16(1) | 180 | 90 | 91 | 620 | 275 | 345 |
| (-) Share Profit of Associates Brazil | (16) | (15) | (1) | (59) | (50) | (10) |
| Income tax paid | (1) | (0) | (0) | (1) | (1) | (0) |
| Working Capital of Goods Variation | 36 | 214 | (177) | 34 | 176 | (142) |
| Inventory Variation | (114) | 114 | (227) | (31) | 44 | (75) |
| Suppliers Variation | 108 | 70 | 38 | 136 | 93 | 43 |
| Receivable Variation | 42 | 30 | 12 | (71) | 38 | (109) |
| Other Operational Asset and Liabilities Variation | 21 | 70 | (49) | 432 | 329 | 102 |
| Operational Cash Flow | 221 | 358 | (137) | 1,025 | 730 | 295 |
| Capex adjusted by BTS(2) | (158) | (138) | (20) | (753) | (956) | 203 |
| Operational Free Cash Flow | 63 | 220 | (157) | 272 | (227) | 498 |
| Other Operation Income and Expenses | (238) | (163) | (74) | (888) | (1,011) | 123 |
| Dividends | 0 | 20 | (20) | 94 | 266 | (172) |
| Adjusted Operational Free Cash Flow | (175) | 77 | (251) | (522) | (972) | 449 |
| Sale of Assets(3) | 220 | 204 | 16 | 2,288 | 3,356 | (1,068) |
| Cash Flow after Sale of Assets | 46 | 281 | (235) | 1,765 | 2,384 | (619) |
| Net Financial Cost(4) | (109) | (180) | 71 | (606) | (814) | 208 |
| Net Debt Variation | (64) | 100 | (164) | 1,160 | 1,570 | (411) |
(1) it considers EBITDA adjusted by Other Operating Income and Expenses, with the result of Equity Income from National Operations and with rental costs and expenses; (2) net from the financing of built to suit (BTS) format to the new stores of Pão de Açúcar; (3) it Includes revenues of asset sales and strategic projects, such as Follow-on, sale of Extra Hiper stores and the sale of participation in Éxito; (4) It includes interest of gross debt, cash profitability, cost with banks guarantees and cost with discount of receivables; (5) Last twelve months
For the 12 months ending in 2Q24, net debt was reduced by R$ 1.2 billion, excluding non-discounted receivables, impacted by non-core asset sales and the primary public offering of shares, totaling R$ 2.3 billion, and by operational free cash flow, which amounted to R$ 272 million, with a significant improvement of R$ 498 million compared to the same period ending in 2Q23. The improvement in free cash flow is, mainly, due to the increase in EBITDA pre-IFRS 16 and the reduction in Capex.
In other cash flow lines, it worth mention that: (i) a R$ 123 million improvement in Other Revenues and Operating Expenses, mainly due to the reduction in labor contingencies; and (ii) a R$ 208 million improvement in net financial costs, impacted by the reduction in financial leverage.
Below is a table detailing working capital of goods, demonstrating stability in terms compared to 2Q23.
| 10 | |
| WORKING CAPITAL OF GOODS (R$ million) | GPA | ||||||
| 2Q23 | 3Q23 | 4Q23 | 1Q24 | 2Q24 | 2Q24 vs 2Q23 | 2Q24 vs 1Q24 | |
| (+) Suppliers | 2,197 | 2,219 | 3,020 | 2,225 | 2,333 | 136 | 108 |
| (-) Inventory | (1,965) | (1,992) | (1,950) | (1,882) | (1,996) | (31) | (114) |
| (-) Receivables | (292) | (352) | (468) | (405) | (363) | (71) | 42 |
| (=) Cash Flow After Receivables | (59) | (126) | 603 | (62) | (26) | 34 | 36 |
| In Days of COGS | |||||||
| (+) Suppliers | 55 | 54 | 73 | 53 | 56 | 1 | 2 |
| (-) Inventory | (49) | (49) | (47) | (45) | (48) | 1 | (3) |
| (-) Receivables | (7) | (9) | (11) | (10) | (9) | (1) | 1 |
| (=) Cash Flow After Receivables | (1) | (3) | 15 | (1) | (1) | 1 | 1 |
NET DEBT CONSOLIDATED
Pre-IFRS 16 leverage improves sequentially, reaching 2.8x with a reduction of R$ 1.2 billion in net debt.
| INDEBTEDNESS (R$ milhões) | GPA | ||
| 06.30.2024 | 06.30.2023 | Δ R$ | |
| Short-Term Debt | 1,127 | 1,576 | (450) |
| Loans and Financing | 624 | 1,539 | (916) |
| Debentures | 503 | 37 | 466 |
| Long-Term Debt | 3,100 | 4,585 | (1,485) |
| Loans and Financing | 169 | 1,342 | (1,173) |
| Debentures | 2,931 | 3,243 | (312) |
| Total Gross Debt | 4,226 | 6,161 | (1,934) |
| Cash and Financial investments | (2,443) | (3,217) | 774 |
| Net Debt | 1,783 | 2,944 | (1,160) |
| On balance Credit Card Receivables not discounted | (76) | (29) | (47) |
| Net Debt incl. Credit Card Receivables not discounted | 1,708 | 2,915 | (1,207) |
| EBITDA Ajustado GPA Brasil(últimos 12 meses) | 1,490 | 1,086 | 404 |
| Net Debt including Credit Card Receivables not discounted / | 1.1x | 2.7x | -1.5x |
| Adjusted EBITDA GPA Brasil (LTM) | |||
| Adjusted EBITDA GPA Brasil pre-IFRS16 (LTM) | 620 | 275 | 345 |
| Net Debt including Credit Card Receivables not discounted / | 2.8x | 10.6x | -7.9x |
| Adjusted EBITDA GPA Brasil pre-IFRS16 (LTM) | |||
Net debt, including the balance of non-advanced receivables, reached R$ 1.7 billion, a reduction of R$ 1.2 billion compared to the same period last year. Financial leverage pre-IFRS 16, measured by net debt divided by GPA Brazil’s Adjusted EBITDA pre-IFRS 16, which includes rental expenses, decreased to 2.8x from 7.9x compared to 2Q23.
| 11 | |
INVESTMENTS
| ADJUSTED CAPEX(1) (R$ million) | GPA | |||||
| 2Q24 | 2Q23 | Δ R$ | LTM24(2) | LTM23(2) | Δ R$ | |
| New Stores and Land Acquisition | 29 | (9) | 38 | 225 | 163 | 62 |
| Store Renovations, Conversions and Maintenance | 63 | 65 | (2) | 214 | 429 | (214) |
| IT, Digital and Logistics | 65 | 81 | (16) | 314 | 365 | (51) |
| Total | 158 | 138 | 20 | 753 | 956 | (203) |
(1) Net from the financing of built to-suit format to the new stores of Pão de Açúcar; (2) Last twelve months
In 2Q24, the adjusted Capex for built-to-suit operations (“Adjusted Capex”) reached R$ 158 million, an increase of R$ 20 million compared to 2Q23, mainly in New Stores and Land Acquisitions. Over the 12 months, Adjusted Capex reached R$ 753 million, a reduction of R$ 203 million compared to the 12 months ending in 2Q23, mainly in Renovations, Conversions, and Maintenance, which in 2022 saw a higher concentration of investments in renovations for converting Extra hypermarket stores to supermarket formats.
| 12 | |
ESG AT GPA
Agenda with and for society and the environment
Commitment to Trasparecy: In 2Q24, we published our 2023 Sustainability Annual Report as part of our commitment to integrating business strategy with sustainability. The document is available on our website (link) and showcases our progress and achievements in socio-environmental issues, as well as a macro view of the business, including governance and transparency.
In July, our initiatives to provide a healthy, safe, diverse and welcoming environment were recognized by Great Place to Work (GPTW) and we are among the best companies to work for. Among the highlights is the recognition of GPA, for the 4th consecutive year, as a diverse and inclusive environment that offers opportunities for growth and professional development.
Promotion of diversity and inclusion: Reinforcing our commitments and supporting the training of our employees and partners, we held the Diversity and Sustainability Fortnight with a schedule of ESG-related content. Over 5,000 attendees participated in lectures, events, volunteer actions, a social fair with small entrepreneurs, and supplier product activations with ESG attributes. During this agenda, GPA, reaffirming its commitments, joined the Transparency 100% and Race is Priority Movements of the UN Global Compact. In June, in celebration of International LGBTQIA+ Pride Day, strengthening our commitment to respecting and promoting LGBTQIA+ rights, we conducted internal engagement actions impacting over 1,240 employees directly. Finally, during the two weeks, more than 1.5 tons of food were collected in an internal event for employees, which were donated to a partner organization, SP Invisível, helping to supplement up to 3 million meals.
Combating climate change: We continue with our public commitment to reduce scope 1 and 2 emissions by 50% by 2025 (2015 baseline), progressing with projects to replace refrigerant gases in stores. Our renewable energy consumption also remains aligned with our commitment to migrate 100% of our medium-voltage stores to the Free Energy Market by 2024, achieving a 95.8% rate in 2Q24. In 2Q24, we achieved a 7% reduction in scope 1 and 2 emissions compared to the same period in 2023, primarily due to store renovations and increased renewable energy consumption.
Animal Welfare: In 2Q24, we promoted initiatives to encourage conscious consumption of pork in partnership with the Brazilian Association of Pig Farmers (ABCS). These actions included the dissemination of a biosecurity and animal welfare guide for pig producers, aimed at advancing the supply chain. Additionally, through the Quality from the Source (QDO) Program, we held a meeting with over 600 suppliers of fruits, vegetables, and meat (beef and pork), discussing how the program integrates with GPA’s ESG strategic pillar and recognizing suppliers that demonstrated the best practices in social, environmental, and quality aspects in 2023.
Social Impact: Through Instituto GPA, GPA donated 10 tons of food to the population affected by floods in Rio Grande do Sul, which was added to 64.2 tons donated by our customers, partners, and employees in a campaign promoted by Pão de Açúcar and Extra stores. The donation was made in partnership with the NGO Amigos do Bem and nine other social organizations, and was delivered directly to those affected in the region. This volume contributes to over 449.4 tons of food donated in 2024 through fundraising campaigns for more than 100 social organizations.
| 13 | |
BREAKDOWN OF STORE CHANGES BY BANNERS
In 2Q24, we opened 10 new stores, including 9 in the proximity format and 1 under the Pão de Açúcar banner. During the same period, we closed 8 stores (5 under the Extra Mercado banner and 3 in the proximity format).
The closures made during the quarter are consistent with the process of adjusting our store network based on store performance evaluations, competitive market conditions, and movements within the rest of the network.
| Stores by Banner | 1Q24 | 2Q24 | |||||
| No. of Stores | Openings | Openings by conversion | Closing | Closing to conversion | No. of Stores | Sales area ('000 sq. m.) | |
| GPA | 698 | 10 | 0 | -7 | 0 | 701 | 558 |
| Pão de Açúcar | 193 | 1 | 0 | 0 | 0 | 194 | 266 |
| Extra Mercado | 178 | 0 | 0 | -5 | 0 | 173 | 207 |
| Mini Extra | 144 | 3 | 0 | 0 | 0 | 147 | 36 |
| Minuto Pão de Açúcar | 182 | 6 | 0 | -2 | 0 | 186 | 46 |
| Stores under Conversion / Analysis | 1 | 0 | 0 | 0 | 0 | 1 | 2 |
| 14 | |
CONSOLIDATED FINANCIAL STATEMENTS
Balance Sheet
| BALANCE SHEET | |||
| (R$ million) | ASSETS | ||
| Consolidated | |||
| 06.30.2024 | 06.30.2023 | ||
| Current Assets | 6,019 | 28,951 | |
| Cash and Marketable Securities | 2,443 | 3,217 | |
| Financial Applications | 14 | 0 | |
| Accounts Receivable | 364 | 292 | |
| Credit Card | 76 | 29 | |
| Sales Vouchers and Trade Account Receivable | 269 | 229 | |
| Allowance for Doubtful Accounts | (2) | (1) | |
| Resulting from Commercial Agreements | 21 | 35 | |
| Inventories | 1,996 | 1,965 | |
| Recoverable Taxes | 688 | 949 | |
| Credits with Controlling Shareholders | 0 | 0 | |
| Noncurrent Assets for Sale | 202 | 21,870 | |
| Claims with Related Parties | 0 | 0 | |
| Prepaid Expenses and Other Accounts Receivables | 312 | 658 | |
| Noncurrent Assets | 14,022 | 15,447 | |
| Long-Term Assets | 5,095 | 5,873 | |
| Accounts Receivable | 0 | 0 | |
| Credit Cards | 0 | 0 | |
| Recoverable Taxes | 2,556 | 2,850 | |
| Deferred Income Tax and Social Contribution | 1,143 | 1,289 | |
| Amounts Receivable from Related Parties | 17 | 46 | |
| Judicial Deposits | 428 | 686 | |
| Prepaid Expenses and Others | 951 | 1,002 | |
| Investments | 802 | 837 | |
| Investment Properties | 0 | 0 | |
| Property and Equipment | 6,217 | 6,742 | |
| Intangible Assets | 1,908 | 1,995 | |
| TOTAL ASSETS | 20,041 | 44,398 | |
| 15 | |
CONSOLIDATED FINANCIAL STATEMENTS
Balance Sheet
| BALANCE SHEET | |||
| (R$ million) | LIABILITIES | ||
| Consolidated | |||
| 06.30.2024 | 06.30.2023 | ||
| Current Liabilities | 5,834 | 18,141 | |
| Suppliers | 2,448 | 2,289 | |
| Trade payable, agreement | 165 | 217 | |
| Loans and Financing | 624 | 1,539 | |
| Debentures | 503 | 37 | |
| Lease Liability | 460 | 516 | |
| Payroll and Related Charges | 394 | 318 | |
| Taxes and Social Contribution Payable | 401 | 262 | |
| Financing for Purchase of Fixed Assets | 156 | 192 | |
| Debt with Related Parties | 6 | 86 | |
| Advertisement | 16 | 15 | |
| Provision for Restructuring | 7 | 12 | |
| Unearned Revenue | 167 | 167 | |
| Liabilities on Noncurrent Assets for Sale | 132 | 11,981 | |
| Others | 355 | 510 | |
| Long-Term Liabilities | 9,869 | 12,539 | |
| Loans and Financing | 169 | 1,342 | |
| Debentures | 2,931 | 3,243 | |
| Lease Liability | 3,854 | 3,664 | |
| Financing by purchasing assets | 276 | 0 | |
| Income tax payable | 0 | 0 | |
| Related Parties | 0 | 0 | |
| Deferred Income Tax and Social Contribution | 0 | 4 | |
| Tax Installments | 678 | 80 | |
| Provision for Contingencies | 1,460 | 2,840 | |
| Unearned Revenue | 65 | 85 | |
| Provision for loss on investment in Associates | 0 | 892 | |
| Others | 436 | 389 | |
| Shareholders' Equity | 4,339 | 13,719 | |
| Attributed to controlling shareholders | 4,332 | 11,220 | |
| Capital | 2,511 | 8,466 | |
| Capital Reserves | (73) | 20 | |
| Profit Reserves | 1,894 | 4,421 | |
| Other Comprehensive Results | (1) | (1,686) | |
| Minority Interest | 7 | 2,499 | |
| TOTAL LIABILITIES AND SHAREHOLDER'S EQUITY | 20,041 | 44,398 | |
| 16 | |
INCOME STATEMENT – 2st QUARTER OF 2024
| (R$ Million) | Consolidated | ||
| 2Q24 | 2Q23 | Δ | |
| Gross Revenue | 4,787 | 4,688 | 2.1% |
| Net Revenue | 4,489 | 4,381 | 2.5% |
| Cost of Goods Sold | (3,194) | (3,201) | -0.2% |
| Depreciation (Logistics) | (30) | (29) | 5.0% |
| Gross Profit | 1,265 | 1,151 | 9.9% |
| Selling Expenses | (741) | (769) | -3.5% |
| General and Administrative Expenses | (174) | (133) | 30.6% |
| Selling, General and Adm. Expenses | (915) | (902) | 1.5% |
| Equity Income | 16 | (26) | n.a. |
| Other Operating Revenue (Expenses) | (55) | (25) | 119.8% |
| Depreciation and Amortization | (260) | (252) | 3.1% |
| Earnings before interest and Taxes - EBIT | 51 | (54) | n.a. |
| Financial Revenue | 48 | 80 | -40.6% |
| Financial Expenses | (367) | (418) | -12.1% |
| Net Financial Result | (319) | (337) | -5.4% |
| Income (Loss) Before Income Tax | (268) | (391) | -31.4% |
| Income Tax | (3) | 67 | n.a. |
| Net Income (Loss) Company - continuing operations | (271) | (324) | -16.3% |
| Net Result from discontinued operations | (60) | (29) | 109.9% |
| Net Income (Loss) - Consolidated Company | (331) | (353) | -6.0% |
| Net Income (Loss) - Controlling Shareholders - continuing operations | (272) | (324) | -15.9% |
| Net Income (Loss) - Controlling Shareholders - discontinued operations | (60) | (101) | -40.8% |
| Net Income (Loss) - Consolidated Controlling Shareholders | (332) | (425) | -21.9% |
| Minority Interest - Non-controlling - continuing operations | 1 | 0 | 982.6% |
| Minority Interest - Non-controlling - discontinued operations | 0 | 73 | -100.0% |
| Minority Interest - Non-controlling - Consolidated | 1 | 73 | -98.4% |
| Earnings before Interest, Taxes, Depreciation, Amortization - EBITDA | 341 | 227 | 50.3% |
| Adjusted EBITDA(1) | 396 | 252 | 57.2% |
| % of Net Revenue | Consolidated | ||
| 2Q24 | 2Q23 | Δ | |
| Gross Profit | 28,2% | 26,3% | 1,9 p.p. |
| Selling Expenses | -16,5% | -17,5% | 1,0 p.p. |
| General and Administrative Expenses | -3,9% | -3,0% | -0,8 p.p. |
| Selling, General and Adm. Expenses | -20,4% | -20,6% | 0,2 p.p. |
| Equity Income | 0,4% | -0,6% | 1,0 p.p. |
| Other Operating Revenue (Expenses) | -1,2% | -0,6% | -0,6 p.p. |
| Depreciation and Amortization | -5,8% | -5,8% | 0,0 p.p. |
| Earnings before interest and Taxes - EBIT | 1,1% | -1,2% | 2,4 p.p. |
| Net Financial Result | -7,1% | -7,7% | 0,6 p.p. |
| Income (Loss) Before Income Tax | -6,0% | -8,9% | 3,0 p.p. |
| Income Tax | -0,1% | 1,5% | -1,6 p.p. |
| Net Income (Loss) Company - continuing operations | -6,0% | -7,4% | 1,4 p.p. |
| Net Income (Loss) - Consolidated Company | -7,4% | -8,0% | 0,7 p.p. |
| Net Income (Loss) - Controlling Shareholders - continuing operations | -6,1% | -7,4% | 1,3 p.p. |
| Net Income (Loss) - Consolidated Controlling Shareholders | -7,4% | -9,7% | 2,3 p.p. |
| Minority Interest - Non-controlling - continuing operations | 0,0% | 0,0% | 0,0 p.p. |
| Minority Interest - Non-controlling - Consolidated | 0,0% | 1,7% | -1,6 p.p. |
| Earnings before Interest, Taxes, Depreciation, Amortization - EBITDA | 7,6% | 5,2% | 2,4 p.p. |
| Adjusted EBITDA(1) | 8,8% | 5,7% | 3,1 p.p. |
(1) Adjusted EBITDA excludes Other Operating Income and Expenses
| 17 | |
SIGNATURES
Pursuant to the requirement of the Securities Exchange Act of 1934, the registrant has duly caused this report to be signed on its behalf by the undersigned, thereunto duly authorized.
| COMPANHIA BRASILEIRA DE DISTRIBUIÇÃO | |||
| Date: August 6, 2024 | By: /s/ Marcelo Pimentel | ||
| Name: | Marcelo Pimentel | ||
| Title: | Chief Executive Officer | ||
| By: /s/ Rafael Sirotsky Russowsky | |||
| Name: | Rafael Sirotsky Russowsky | ||
| Title: | Investor Relations Officer | ||
FORWARD-LOOKING STATEMENTS
This press release may contain forward-looking statements. These statements are statements that are not historical facts, and are based on management's current view and estimates offuture economic circumstances, industry conditions, company performance and financial results. The words "anticipates", "believes", "estimates", "expects", "plans" and similar expressions, as they relate to the company, are intended to identify forward-looking statements. Statements regarding the declaration or payment of dividends, the implementation of principal operating and financing strategies and capital expenditure plans, the direction of future operations and the factors or trends affecting financial condition, liquidity or results of operations are examples of forward-looking statements. Such statements reflect the current views of management and are subject to a number of risks and uncertainties. There is no guarantee that the expected events, trends or results will actually occur. The statements are based on many assumptions and factors, including general economic and market conditions, industry conditions, and operating factors. Any changes in such assumptions or factors could cause actual results to differ materially from current expectations.