Table of Contents
Filed Pursuant to Rule 424(b)(1)
under the Securities Act of 1933
Registration Number 333-130542
1,725,000 Shares
AMERICASBANK CORP.
Common Stock
We are a single-bank holding company that owns all of the capital stock of AmericasBank, a Maryland-chartered commercial bank that commenced operations on December 1, 1997. AmericasBank is headquartered in Towson, Maryland, which is the county seat for Baltimore County, Maryland. AmericasBank also has a branch office in the Highlandtown area of the city of Baltimore, and a mortgage origination office in Towson, Maryland.
We are offering 1,725,000 shares of our common stock.
Our common stock is quoted on the Over the Counter Bulletin Board (“OTCBB”) under the symbol “AMAB.” We have applied to have our common stock qualified for listing on the NASDAQ Capital Market under the symbol “AMAB” and to have that listing effective immediately after the closing of the offering or as soon as possible thereafter. However, NASDAQ may not approve the listing, and an active trading market for our common stock may not develop or be sustained after the offering. The last trade of our common stock reported on the OTCBB was $7.00 per share on March 1, 2006.
These shares are offered by our underwriter, as our selling agent, on a best efforts basis and subject to certain other conditions, including the right to reject any order in whole or in part. Because the offering is being conducted on a best efforts basis, the underwriter is not required to sell any minimum number or dollar amount of the shares and is not obligated to purchase the shares if they are not sold to the public. Funds received by the underwriter from investors in the offering will be deposited at, and held by, an independent escrow agent in a non-interest bearing account pending closing. Other than approval by the underwriter, there are no conditions to the release of the funds from escrow. We anticipate that delivery of the shares will be made on or about March 10, 2006.
Investing in our common stock involves risks. You should read the “Risk Factors” section beginning on page 8 of this prospectus before buying shares of common stock.
Neither the Securities and Exchange Commission nor any state securities commission or other regulatory body has approved or disapproved of the common stock or determined if this prospectus is truthful or complete. Any representation to the contrary is a criminal offense.
The shares of common stock offered are not deposit accounts and are not insured or guaranteed by the Federal Deposit Insurance Corporation or any other government agency.
| Offering Price | Underwriting Commissions(1) | Proceeds to Us(2) | ||||
Per Share | $7.00 | $0.42 | $6.58 | |||
Total(3) | $12,075,000 | $724,500 | $11,350,500 | |||
| (1) | Payable to McKinnon & Company, Inc., our underwriter. We have agreed to indemnify the underwriter against certain liabilities, including certain liabilities under the Securities Act of 1933, as amended. See “Plan of Distribution.” |
| (2) | Before deducting expenses of the offering payable by us estimated at approximately $250,000. See “Use of Proceeds.” |
| (3) | Totals assure the sale of the entire 1,725,000 shares being offered. |
McKinnon & Company, Inc.
The date of this prospectus is March 6, 2006.
Table of Contents
AMERICASBANK CORP.
AMERICASBANK
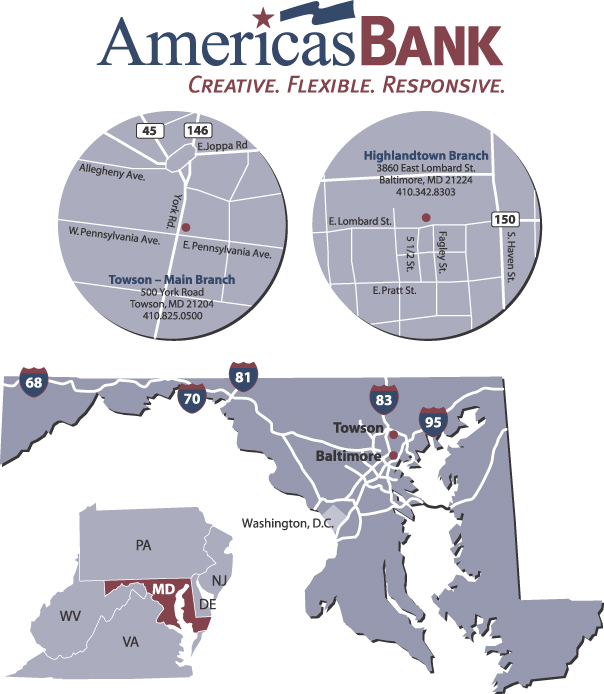
Table of Contents
This summary highlights information about AmericasBank Corp. and the offering. You should read the entire prospectus carefully, including the financial statements and notes to the financial statements. You should also consider carefully the information set forth under the heading “Risk Factors” before making any investment decision on our common stock.
On August 3, 2005, our board of directors approved a reverse stock split of our common stock whereby every four shares of common stock were converted into one share with fractional shares resulting from the split converted to cash. The split was effective at 12:01 a.m. on August 23, 2005. All share amounts and dollar amounts per share in this prospectus with regard to the common stock have been adjusted to reflect the reverse split, unless otherwise noted.
Who We Are
We are AmericasBank Corp., a bank holding company that owns AmericasBank, a Maryland-chartered commercial bank that began operations in December 1997 with $3.0 million in capital and one office located in the Highlandtown area of the city of Baltimore, Maryland. In 1999, we opened a Towson office that became our headquarters.
We incurred losses in every year since our inception and in August 2001 we agreed to enter into and operate under a Written Agreement with the Federal Reserve Bank of Richmond and the Maryland Division of Financial Regulation.
In July and August 2003, we hired a new management team consisting of: Mark H. Anders, our president and chief executive officer, A. Gary Rever, our chief financial officer, and John D. Muncks, our senior lending officer.
Mr. Anders, our president and chief executive officer, has been integrally involved in the turnaround of three community banks located in our market area during the last 14 years. Prior to joining us, Mr. Anders was the president and chief executive officer of BankAnnapolis, a $200 million commercial bank formerly known as Annapolis National Bank, from October 1999 to August 2002. Mr. Anders hired a new management group, worked closely with regulators to terminate its supervisory agreement and implemented a marketing campaign that made BankAnnapolis one of the most recognized and fastest growing banks in the Annapolis market. From October 1995 to January 1999, Mr. Anders was the president and chief executive officer of Sterling Bancorp and its subsidiary bank, Sterling Bank & Trust Co., a commercial bank in Baltimore, Maryland. Mr. Anders was hired following a failed merger and the resignation of the bank’s president. Mr. Anders engineered the sale of Sterling to Mason-Dixon Bancshares, Inc. in January 1999. From September 1991 to September 1995, Mr. Anders was a senior executive at Towson, Maryland based Bank of Maryland, a commercial bank with asset quality and capital issues operating under a regulatory agreement at the time of his hire. Mr. Anders was hired as the bank’s senior credit officer and ultimately became responsible for all line functions within the bank. Bank of Maryland was sold to Mason-Dixon Bancshares, Inc. in May 1995.
Mr. Rever, our chief financial officer, formerly worked with Mr. Anders as chief financial officer at Bank of Maryland where he was responsible for all staff functions including operations, human resources, facilities and branch administration. Mr. Rever retained his responsibilities at Bank of Maryland following its sale to Mason-Dixon Bancshares, Inc. in May 1995 and in 1998 consolidated the operating functions of Mason-Dixon’s subsidiary banks into a service corporation to eliminate redundancies and reduce costs. Mr. Rever became president of the service corporation and served in that position through Mason-Dixon’s acquisition by BB&T Corporation in July 1999. From July 1999 until June 2000, Mr. Rever worked to facilitate Mason-Dixon’s operations into BB&T Corporation. Prior to joining us, Mr. Rever was the chief financial officer of Avatech Solutions, Inc., a provider of design automation and data management solutions, from August 2000 to August 2003.
Mr. Muncks, our senior lending officer, is a career commercial banker and most recently was a member of the regional executive management group of then Baltimore, Maryland based Signet Bank - Maryland, where he served in both senior lending and credit capacities. Mr. Muncks retired from banking following Signet’s acquisition by First Union in 1998. From 2000 to 2003, Mr. Muncks was a principal in an electric sign business, which he has since sold.
|
1
Table of Contents
In March 2004, we raised $5.0 million in capital by selling shares of our common stock to our shareholders and the public, which substantially increased our legal lending limit and allowed us to grow and obtain “well capitalized” status as defined by our regulators. With this new capital infusion, we hired additional staff and launched strategies to accelerate the growth of our earning assets, improve our net interest margin, and increase our noninterest revenue while controlling our noninterest expense. Our turnaround plan is beginning to show positive results as evidenced by the sequential improvement in the net loss reported for each quarter in 2005, and we expect to achieve quarterly profitability in the first quarter of 2006.
Effective October 12, 2005, the Federal Reserve Bank of Richmond and the Maryland Division of Financial Regulation determined that AmericasBank Corp. and AmericasBank had returned to a satisfactory condition and terminated the Written Agreement. See “Supervision and Regulations – Current Regulatory Matters” on page 86 for more information about the Written Agreement and its termination.
Performance Highlights
Aided by the capital infusion in March 2004, we have seen steady improvement in our operating results beginning in the fourth quarter of 2004. Our operating results for all periods include expenses for stock-based compensation under Statement of Financial Accounting Standards No. 123,Accounting for Stock-Based Compensation, because we have performance-based options. Most of our peer institutions will not begin to accrue expenses for stock-based compensation until the first quarter of 2006 because we have performance-based options. See Note 2 in the Notes to Consolidated Financial Statements.
Some of our highlights include:
• We reduced the net loss for the nine months ended September 30, 2005 to $315,078, a reduction of $875,366 from the $1,190,444 loss for the nine months ended September 30, 2004. Our loss per basic and diluted common share for the nine month period ended September 30, 2005 was $(0.33) per share compared to $(1.62) per share for the nine months ended September 30, 2004.
• We reduced our net loss for the three months ended September 30, 2005 to $11,101 or $(0.01) per share, a decrease of $411,699 compared to our net loss of $422,800 or $(0.46) per share for the three months ended September 30, 2004.
• Our net interest income increased 135.0% to $512,703 for the three months ended September 30, 2005 from $218,132 for the three months ended September 30, 2004, and increased 130.0% to $1,271,233 for the nine months ended September 30, 2005 from $552,713 for the nine months ended September 30, 2004.
• We increased our total assets to $71,307,715 at September 30, 2005, a $31,175,616 or 77.7% increase from $40,132,099 at December 31, 2004. From September 30, 2004 to September 30, 2005, total assets increased by $35,307,139 or 98.1%, from $36,000,576.
• We increased loans and leases, net of allowance to $45,897,697 at September 30, 2005, a $14,652,535 or 46.9% increase from $31,245,162 at December 31, 2004. From September 30, 2004 to September 30, 2005, total loans and leases, net of allowance, increased by $22,599,627 or 97.0%, from $23,298,070.
• We increased our total deposits to $65,938,331 at September 30, 2005, a $31,368,038 or 90.7% increase from $34,570,293 at December 31, 2004. From September 30, 2004 to September 30, 2005, total deposits increased $35,612,933 or 117.4%, from $30,325,398. Noninterest bearing deposits increased to $11,309,272 at September 30, 2005, a 408.0% increase from $2,226,222 at December 31, 2004. From September 30, 2004 to September 30, 2005, noninterest bearing deposits increased by $9,508,666 or 528.1%, from $1,800,606.
|
2
Table of Contents
• We improved our net interest margin to 3.36% for the nine months ended September 30, 2005, compared to 2.61% for the nine months ended September 30, 2004. Our net interest margin was 2.82% for the year ended December 31, 2004, compared to 2.39% for the year ended December 31, 2003.
• We increased our noninterest revenue principally due to an increase in mortgage banking gains and fees. Noninterest revenue increased to $387,153 for the nine months ended September 30, 2005, a $270,246 or 231.2% increase from $116,907 for the nine months ended September 30, 2004.
Strategy
Our investment strategy is to be a high-performing community bank that provides above average investment returns to its shareholders while maintaining a low to moderate risk profile. Our planning horizon is ten years, starting in March 2004, when we raised $5.0 million in capital. Currently, we expect to reach quarterly profitability in the first quarter of 2006, to achieve peak efficiency within two to three years after that and to generate the core deposit base and expand the sources of fee income required for high performance within another five years. The essence of our strategy will be to stay within the traditional community bank model of serving the communities where we operate by promoting business entrepreneurship and home ownership while concentrating on products and services where we can effectively differentiate ourselves from our competitors and from the larger financial service companies operating in our market area.
Our goal for the next one to five years is to accelerate the growth of our earning assets, principally our loan portfolio, to generate higher levels of net interest income while expanding our sources of noninterest revenue and maintaining control over our noninterest expenses and credit quality. We plan to do this by continuing to hire experienced, commissioned residential mortgage lenders to generate mortgage loans and other loans secured by one-to-four family properties. We expect that the majority of mortgage loans originated by this group will be brokered or sold in the secondary market for a fee or at a profit. However, this group should also generate loans for our loan portfolio. These loans may be to owner occupants or to investors and include: adjustable rate mortgages; acquisition, development and construction loans; bridge loans; and home equity loans and lines of credit secured by secondary liens.
We have chosen to concentrate our loan activities in these loan classes for the following reasons: (i) the loans are generally well secured; (ii) the market is large and diverse and less susceptible to valuation cycles compared to other loan classes; (iii) the risk adjusted loan yields and the opportunities to generate fee income are attractive; and (iv) the loans in these classes are cost effective to originate, underwrite and manage when compared to other types of commercial and consumer loans.
We plan to expand our loan activities to include a diversified portfolio of commercial and commercial mortgage loans; however, our commercial banking activities will, at least over the next several years, target primarily high volume depository clients that can help build our core deposit base. Expanding our core deposit base, which we define as interest and noninterest bearing checking accounts, savings accounts and money market accounts, is expected to allow us to improve our net interest margin.
Location and Market Area
We consider our primary market area to be Northern Baltimore County, Maryland and the Highlandtown area of the city of Baltimore. Our secondary market area includes the Baltimore Metropolitan Area, consisting of Baltimore City and the surrounding counties of Anne Arundel, Baltimore, Carroll, Harford, Howard, and Frederick County, Maryland and south-central Pennsylvania.
Baltimore County enjoys corporate strength and diversity. Home to over 20,000 businesses, including headquarters for companies such as Black & Decker, AAI Corporation and McCormick & Company, the County offers a thriving economy and an attractive standard of living. Baltimore County’s business community is balanced across industry sectors with major operations for GM Powertrain, T. Rowe Price, Lockheed Martin, Procter & Gamble and MBNA.
|
3
Table of Contents
Our market enjoys the benefits of its close proximity to the Washington D.C. market. Baltimore is well positioned along the I-95 corridor and is seeing solid increases in business growth (particularly in the service and tech sectors). Our headquarters are within 15 miles of the BWI Thurgood Marshall Airport and 45 miles of Ronald Reagan Washington National Airport. Maryland has the third highest median household income in the country, largely driven by its proximity to the federal government in Washington, D.C.
The regional economy is perennially strong and diverse, boasts consistently high job growth and low unemployment and is increasingly small business oriented. Baltimore County is home to two of the federal government’s largest headquarters, the U.S. Social Security Administration and Centers for Medicare & Medicaid Services. The region also has a vibrant biotechnology and medical industry, including six major hospitals operating in our primary market. The medical industry, information technology, and tourism are all major growth industries for the region. The Port of Baltimore is one of the largest ports in the country. The region has over 25 colleges and universities including some of the highest ranked in the country.
Our main banking office and principal executive offices are located at 500 York Road, Towson, Maryland 21204, and we have a branch office in the Highlandtown area of the city of Baltimore. We also have a mortgage origination office in Towson. Our telephone number is (410)-823-0500 and our website address is www.americasbank.com. Information on the website is not incorporated by reference into this prospectus and is not a part of this prospectus.
|
4
Table of Contents
| THE OFFERING | ||
| Common Stock Offered | 1,725,000 shares of common stock. | |
| Best Efforts Offering | This is a best efforts offering, in which the underwriter will use its best efforts to sell the shares of common stock we are offering. The underwriter is not required to sell any minimum number or dollar amount of shares of common stock. | |
| Common Stock Outstanding | As of the date of this prospectus, we had 941,702 shares of common stock outstanding. Assuming the sale of all 1,725,000 shares in the offering, we would have 2,666,702 shares of common stock issued and outstanding. This number excludes outstanding warrants and options, which specifically consist of: | |
• Currently exercisable and unexercisable options to purchase 301,875 shares of common stock at $8.00 per share (issued to senior management and other employees); | ||
• Currently exercisable options to purchase 3,995 shares of common stock at an average exercise price of $40.42 and with exercise prices ranging from $28.00 to $48.00 per share (issued to current directors); and | ||
• Currently exercisable warrants to purchase 292,765 shares of common stock at an average exercise price of $29.25 and with exercise prices ranging from $12.80 per share to $52.00 per share. | ||
| Use of Proceeds | We intend to invest substantially all of the net offering proceeds in AmericasBank to support its loan growth and business expansion activities. Our management will have broad discretion in determining the specific timing and use of the offering proceeds. See “Use of Proceeds.” | |
| Current Ownership by Our Management | Our directors and executive officers currently beneficially own approximately 239,904 shares of our common stock or 23.38% of our outstanding common stock. See “Security Ownership of Certain Beneficial Owners and Management.” Some of our directors and executive officers have indicated to us informally that they intend to purchase additional shares of common stock in the offering. | |
| Market for Our Common Stock | Our common stock is currently quoted for trading on the Over the Counter Bulletin Board (“OTCBB”) under the symbol “AMAB”. We have applied to have our common stock qualified for listing on the NASDAQ Capital Market under the symbol “AMAB” and to have that listing effective immediately after the closing of the offering or as soon as possible thereafter. However, NASDAQ may not approve the listing, and an active trading market for our common stock may not develop or be sustained after the offering. | |
| Risk Factors | You should carefully read the “Risk Factors” section in this prospectus before making any investment decision or purchasing any shares of common stock.
| |
5
Table of Contents
The following table sets forth summary consolidated financial information for AmericasBank Corp. We derived the information for the three years ended December 31, 2004 from our audited consolidated financial statements. We derived the financial information for the nine-month period ended September 30, 2005 and 2004 from our unaudited consolidated financial statements. In our opinion, we have included all adjustments, consisting solely of normal recurring adjustments, necessary for a fair presentation of results for the selected financial information and other financial data presented herein. This information should be read together with “Management’s Discussion And Analysis Of Financial Condition And Results Of Operations” and our financial statements and the related notes included elsewhere in this prospectus. Results for past periods are not necessarily indicative of results that may be expected for any future period, and results for the nine-month period ended September 30, 2005 are not necessarily indicative of results that may be expected for the full year ending December 31, 2005. The financial data for all periods has been restated for retroactive adoption of the fair value recognition provisions of SFAS 123, Accounting for Stock-Based Compensation as further described in note 2 of our audited consolidated financial statements.
|
6
Table of Contents
| Nine Months Ended September 30, | Year Ended December 31, | |||||||||||||||||||
| 2005 | 2004 | 2004 | 2003 | 2002 | ||||||||||||||||
Income Statement Data: | ||||||||||||||||||||
Net interest income | $ | 1,271,233 | $ | 552,713 | $ | 855,230 | $ | 612,638 | $ | 494,670 | ||||||||||
Provision for loan and lease losses | 35,000 | 20,000 | 20,000 | 75,000 | 78,000 | |||||||||||||||
Noninterest revenue | 387,153 | 116,907 | 210,517 | 304,625 | 246,526 | |||||||||||||||
Noninterest expenses | 1,938,464 | 1,840,064 | 2,579,082 | 1,961,024 | 1,663,417 | |||||||||||||||
Income taxes | — | — | — | — | — | |||||||||||||||
Net loss | $ | (315,078 | ) | $ | (1,190,444 | ) | $ | (1,533,335 | ) | $ | (1,118,761 | ) | $ | (1,000,221 | ) | |||||
Per Share and Shares Outstanding Data: | ||||||||||||||||||||
Basic net loss per common share | $ | (0.33 | ) | $ | (1.62 | ) | $ | (1.95 | ) | $ | (7.37 | ) | $ | (7.25 | ) | |||||
Diluted net loss per common share | $ | (0.33 | ) | $ | (1.62 | ) | $ | (1.95 | ) | $ | (7.37 | ) | $ | (7.25 | ) | |||||
Cash dividends declared | — | — | — | — | — | |||||||||||||||
Book value per common share at period end | $ | 5.51 | $ | 6.03 | $ | 5.73 | $ | 7.75 | $ | 13.92 | ||||||||||
Tangible book value per common share at period end (1) | $ | 5.20 | $ | 6.00 | $ | 5.42 | $ | 7.60 | $ | 13.72 | ||||||||||
Common shares outstanding, period end | 941,702 | 916,515 | 941,702 | 197,765 | 147,750 | |||||||||||||||
Average common shares outstanding, basic | 941,702 | 732,893 | 785,082 | 151,860 | 137,925 | |||||||||||||||
Average common shares outstanding, diluted | 941,702 | 732,893 | 785,082 | 151,860 | 137,925 | |||||||||||||||
Balance Sheet Data: | ||||||||||||||||||||
Total assets | $ | 71,307,715 | $ | 36,000,576 | $ | 40,132,099 | $ | 27,065,027 | $ | 22,404,444 | ||||||||||
Total loans, net | 45,897,697 | 23,298,070 | 31,245,162 | 15,424,848 | 13,159,755 | |||||||||||||||
Total deposits | 65,938,331 | 30,325,398 | 34,570,293 | 25,408,838 | 20,279,668 | |||||||||||||||
Stockholders’ equity | $ | 5,184,807 | $ | 5,528,895 | $ | 5,395,804 | $ | 1,532,637 | $ | 2,058,341 | ||||||||||
Performance Ratios: | ||||||||||||||||||||
Return on average assets | (0.80 | )% | (5.30 | )% | (4.79 | )% | (4.07 | )% | (4.57 | )% | ||||||||||
Return on average equity | (8.07 | )% | (33.17 | )% | (32.64 | )% | (55.12 | )% | (41.96 | )% | ||||||||||
Net interest margin | 3.36 | % | 2.61 | % | 2.82 | % | 2.39 | % | 2.41 | % | ||||||||||
Asset Quality Ratios: | ||||||||||||||||||||
Allowance to period-end loans | 0.76 | % | 1.32 | % | 0.99 | % | 1.75 | % | 1.88 | % | ||||||||||
Non-performing loans to allowance for loan and lease losses | 177.94 | % | 11.22 | % | 55.77 | % | 12.72 | % | 17.62 | % | ||||||||||
Non-performing assets to total assets | 0.87 | % | 0.16 | % | 0.44 | % | 0.29 | % | 0.20 | % | ||||||||||
Net chargeoffs (recoveries) to average loans | 0.00 | % | (0.10 | )% | (0.10 | )% | 0.34 | % | 0.65 | % | ||||||||||
Capital Ratios: | ||||||||||||||||||||
Total risk-based capital ratio | 12.84 | % | 24.51 | % | 19.94 | % | 9.61 | % | 13.73 | % | ||||||||||
Tier I risk-based capital ratio | 11.98 | % | 23.25 | % | 18.77 | % | 8.36 | % | 12.47 | % | ||||||||||
Tier I leverage capital ratio | 7.97 | % | 17.51 | % | 13.19 | % | 5.40 | % | 8.81 | % | ||||||||||
Total equity to total assets | 7.27 | % | 15.36 | % | 13.45 | % | 5.66 | % | 9.19 | % | ||||||||||
(1) Excludes unamortized premium paid for the loans and deposits purchased from Rushmore Trust & Savings, FSB in 1997, and goodwill from the purchase of certain assets of uvm Mortgage Marketing, Inc. in October, 2004.
|
| |||||||||||||||||||
7
Table of Contents
An investment in our common stock involves risk, and you should not invest in our common stock unless you can afford to lose some or all of your investment. You should carefully read the risks described below, together with all of the other information included in this prospectus, before you decide to buy any of our common stock. Our business, prospects, financial condition and results of operations could be harmed by any of the following risks.
Risks Relating to Our Business
Our liquidity and our ability to increase our loan portfolio may be negatively affected by our lack of a credit facility.On July 12, 2002, the Federal Home Loan Bank of Atlanta rescinded AmericasBank’s line of credit because of its financial condition. Also, because of its financial position, AmericasBank has not been able to obtain an alternative line of credit. AmericasBank will seek to establish new credit relationships with the Federal Home Loan Bank of Atlanta and other commercial banks as our financial position and operating performance improves but it may not be successful. If AmericasBank is unable to obtain credit, it will have to maintain a higher level of liquid funds, which adversely affects its ability to maximize net interest income. The lack of credit may also adversely affect AmericasBank’s asset/liability management policy because AmericasBank is not able to lock in favorable rates on borrowed funds. See “Management’s Discussion and Analysis of Financial Condition and Results of Operations” and “Supervision and Regulation.”
We may continue to incur losses. We are a single bank holding company and our business is owning all of the outstanding stock of AmericasBank. As a result, our operating results and financial position depend on the operating results and financial position of AmericasBank. For the nine-month period ending September 30, 2005, and for the years ended December 31, 2004, 2003 and 2002, AmericasBank Corp. incurred net losses of approximately $315,078, $1,533,335, $1,118,761 and $1,000,221, respectively. AmericasBank Corp. may not achieve quarterly profitability within the time frame anticipated by management – which is the first quarter of 2006 - or ever. Many factors could adversely affect our short and long term operating performance, including the failure to implement fully our business strategy, unfavorable economic conditions, increased competition, loss of key personnel and government regulation. See “Management’s Discussion and Analysis of Financial Condition and Results of Operations” and “Business of AmericasBank Corp. and AmericasBank – Investment and Business Strategy.”
We depend on the services of key personnel, including Mark H. Anders, A. Gary Rever and John D. Muncks. We cannot be certain that we will be able to retain such personnel or hire replacements, and the loss of Mr. Anders, Mr. Rever, Mr. Muncks or other key personnel could disrupt our operations and result in reduced earnings or additional losses. Our goal is to become a customer-focused and relationship-driven organization. We expect our ability to operate profitably will depend in a large part on the relationships maintained with our customers by our executives. We have entered into employment agreements with Mr. Anders, our president and chief executive officer, Mr. Rever, an executive vice president and our chief financial officer and Mr. Muncks, an executive vice president and our chief lending officer, but the existence of such agreements does not assure that we will be able to retain their services. The unexpected loss of the services of Mr. Anders, Mr. Rever, Mr. Muncks or other key personnel could have a material adverse effect on our operations and could result in our inability to achieve profitability. We have sought to mitigate this risk by including non-compete provisions in Mr. Anders, Mr. Rever and Mr. Muncks’ employment agreements. See “ Management – Employment Agreements.”
Also, our anticipated growth and success, in large part, will be due to the services provided by our mortgage banking officers and the employees of our residential mortgage division. The loss of services of one or more of these persons could have a material adverse effect on our operations and our business could suffer. With the exception of Jon A. Zemarel, senior vice president and the manager of our Towson mortgage office, who was the principal of uvm Mortgage Marketing, a mortgage brokerage business from which we purchased certain assets and assumed certain liabilities in October, 2004, our mortgage loan originators are not a party to any employment agreement with us and they could terminate their employment with us at any time and for any reason. Mr. Zemarel is under a five-year employment contract expiring in October 2009, which includes a non-compete provision. See “Business of AmericasBank Corp. and AmericasBank – Investment and Business Strategy.”
We may not be successful in implementing our strategic initiatives.Our ability to implement our strategic initiatives depends on, among other things, our ability to implement fully the expansion of our residential mortgage lending division and the success of that division as well as our ability to grow core deposits. Among other factors, the success of the residential mortgage lending division is dependent in large part on market interest rates and the economy in our market area, both of which are beyond our control. Our ability to grow our core deposit base depends on, among other things, our ability to market our products to new retail and commercial customers. We may not be successful in implementing our strategic initiatives and, even if implemented, the initiatives may not be successful. See “Business of AmericasBank Corp. and AmericasBank – Investment and Business Strategy.”
Because our mortgage banking revenue is sensitive to changes in economic conditions, decreased economic activity, a slowdown in the housing market or high interest rates may reduce our profits.Our ability to reduce our losses has resulted in large part from the growth of our mortgage banking operations. For the
8
Table of Contents
nine months ended September 30, 2005, mortgage banking gains and fees increased $252,617 to $329,807, or 327.3%, from $77,190 for the nine months ended September 30, 2004. Maintaining a high level of fees and gains from this operation depends primarily on our ability to continue to originate mortgage loans. Production levels are sensitive to changes in economic conditions and can suffer from decreased economic activity, a slowdown in the housing market or higher interest rates. Generally, any sustained period of decreased economic activity or higher interest rates could adversely affect our mortgage originations and, consequently, reduce our income from mortgage banking activities. As a result, these conditions may adversely affect our net income.
If we experience greater loan and lease losses than anticipated, it will have an adverse affect on our ability to operate profitably.We believe that our current allowance for loan and lease losses is adequate and that the methodology we use to assess the adequacy of our allowance for loan and lease losses is sound. However, our monitoring, procedures and policies may not reduce certain lending risks and the estimates we use to assess the adequacy of our allowance for loan and lease losses may not cover actual losses. The reduction in our allowance for loan and leases losses as a percentage of total loans, which has declined from 1.75% at December 31, 2003, to 0.76% at September 30, 2005, is a result of the change in the composition of our loan portfolio and our strategy to concentrate our lending in loan classes with inherently lower collection risks because of the type of collateral securing the loan.
Because the risk inherent in our loan and lease portfolio may change from time to time, including our actual loan losses and the volume of adversely rated credits in our portfolio, the amount of our allowance for loan and lease losses as a percentage of gross loans may fluctuate. Greater than expected loan and lease losses or a change in the volume of adversely rated credits in our portfolio could result in an extraordinary provision expense to return the allowance to required levels, which, in turn, would reduce our earnings. In addition, systemic and pervasive loan and lease losses can cause insolvency and failure of a financial institution and, in such an event, our shareholders could lose their entire investment. See “Management’s Discussion and Analysis of Financial Condition and Results of Operations – Results of Operations – Provision for Loan and Lease Losses and Analysis of Loan and Lease Losses.”
Our profitability depends on our ability to manage our balance sheet to minimize the effects of interest rate fluctuation on our net interest margin. Our results of operations depend on the stability of our net interest margin, which is the difference in the yield we earn on our earning assets and our cost of funds, both of which are influenced by interest rate fluctuations. Interest rates, because they are influenced by, among other things, expectations about future events, including the level of economic activity, federal monetary and fiscal policy and geo-political stability, are not predictable or controllable. In addition, the interest rates we can earn on our loan and investment portfolios and the interest rates we pay on our deposits are heavily influenced by competitive factors. Community banks are often at a competitive disadvantage in managing their cost of funds compared to the large regional, super-regional or national banks that have access to the national and international capital markets. These factors influence our ability to maintain a stable net interest margin. For the nine months ended September 30, 2005, and for the year ended December 31, 2004, our net interest margin was 3.36% and 2.82%, respectively, which is below that of most banks.
We seek to maintain a neutral position in terms of the volume of assets and liabilities that mature or re-price during any period so that we may reasonably predict our net interest margin; however, interest rate fluctuations, loan prepayments, loan production and deposit flows are constantly changing and influence our ability to maintain this neutral position. Generally speaking, our earnings will be more sensitive to fluctuations in interest rates the greater the variance in the volume of assets and liabilities that mature or re-price in any period. The extent and duration of the sensitivity will depend on the cumulative variance over time, the velocity and direction of interest rates, and whether Americas Bank is more asset sensitive or liability sensitive. Accordingly, we may not be successful in maintaining this neutral position and, as a result, our net interest margin may suffer, which will negatively impact our earnings. See “Management’s Discussion and Analysis of Financial Condition and Results of Operations - Analysis of Financial Condition.”
Our large percentage of residential real estate loans for investment properties (one-to-four family and multi family) may increase the risk of credit losses, which would negatively affect our financial results.At September 30, 2005, $13,623,489 of our gross loans, or 29.4%, were loans to small builders, home improvement contractors, or investors to acquire and develop, through new construction or rehabilitation, residential properties for
9
Table of Contents
resale or to hold as investment properties. This type of lending is more speculative and involves a higher degree of credit risk than the same type of lending for owner occupied properties. We intend for our residential real estate loans for investment properties to increase both in the aggregate and as a percentage of gross loans. Such lending may involve a concentration of credit to a single borrower, a group of related borrowers, or on properties located in close proximity to each other that could be similarly affected by market conditions in that locale. The quality of this portfolio tends to be more volatile depending on the supply and demand for residential real estate in general and expectations about future market appreciation in particular. A downturn in the local real estate market could adversely affect our customers’ ability to pay on time and could affect the underlying liquidation value of our collateral, which in turn could adversely affect us. In addition, the experience level of the investors we finance varies and some may not react as quickly or effectively to a market downturn, exacerbating the severity of any problems and increasing our risk. See “Management’s Discussion and Analysis of Financial Condition and Results of Operations – Results of Operations” and “Business AmericasBank Corp. and AmericasBank – Residential Mortgage Lending.”
We have increased and plan further growth in deposits in a specific market niche, which creates an industry concentration and a customer concentration.We have made a special effort to obtain noninterest bearing deposits from title agencies. These deposits are held for short periods of time by title agencies pending the disbursement of funds in mortgage loan or mortgage loan refinancing transactions. Deposits from title agencies represented 76.6% of our total noninterest bearing deposits at September 30, 2005, which creates a real estate industry concentration. In addition, there is a customer concentration since five title agencies account for approximately 13.1% of our total deposits at September 30, 2005. These deposits can fluctuate greatly during any given month and from month to month depending on transaction scheduling and overall market conditions, and like all deposits, are subject to seasonal and cyclical market fluctuations and are particularly sensitive to slow real estate markets. In order to meet the withdrawal needs of these customers, we monitor our liquidity on a daily basis. While we have benefited from this market niche, we are exposed to liquidity and concentration risks attendant to changes in real estate markets, which could adversely impact our overall performance and financial position. See “Management’s Discussion and Analysis of Financial Condition and Results of Operations – Analysis of Financial Condition – Deposits.”
Our legal lending limit may limit our growth. We are limited in the amount we can lend to a single borrower by the amount of our capital. Generally, under current law, we may lend up to 15% of our unimpaired capital and surplus to any one borrower. As of September 30, 2005, we were able to lend approximately $767,000 to any one borrower. This amount is significantly less than that of many of our competitors and may discourage potential borrowers who have credit needs in excess of our legal lending limit from doing business with us. Our legal lending limit also impacts the efficiency of our lending operation because it tends to lower our average loan size, which means we have to generate a higher number of transactions to achieve the same portfolio volume. We can accommodate larger loans by selling participations in those loans to other financial institutions, but this strategy is not efficient or always available. We may not be able to attract or maintain customers seeking larger loans or may not be able to sell participations in such loans on terms we consider favorable. See “Supervision and Regulation.”
Our residential mortgage lending activities exposes us to repurchase liability and other risks to our business.Our objective is to systemically grow a high quality, diversified loan portfolio that affords us the opportunity to generate attractive yields on a risk adjusted basis and to earn higher levels of noninterest revenue through fees and service charges. In the short term, to generate noninterest revenue, we intend to focus our efforts on conforming and nonconforming fixed-rate conventional and government insured residential mortgage loans that can be sold in the secondary market on a servicing released basis. Secondary market activity is conducted either as a broker, where the loan is funded at settlement by an investor and the bank earns a fee, or as correspondent lender where the bank has been delegated underwriting authority from an investor, funds the loan at settlement and thereafter sells the loan to that investor and recognizes a gain on the sale.
Among other things, as a correspondent lender, we are exposed to repurchase liability for documentation defects and, for a limited time, payment performance. We also are required to refund the income that we earn on the sale of a loan if that loan is paid-off within 120 days from the time it is purchased. This contingent liability, also known as a prompt prepayment refund, is most likely to occur during periods when long-term mortgage rates contract quickly, motivating people to refinance their mortgage multiple times to lower their mortgage payments. In addition, the investors to whom we sell or broker loans evaluate our financial performance, the underlying
10
Table of Contents
performance of the loans we broker and sell to them, and the quality of our administrative functions in determining whether we qualify for their lending programs. Either party on short notice may cancel the correspondent lending and broker agreements.
We intend to focus our loan origination activities on “prime” or “A” rated borrowers, and to act as a correspondent lender when feasible because the fees and income that can be generated as a correspondent lender are typically greater than when we act as a broker. However, there are greater compliance requirements and risks associated with acting as a correspondent lender. We do not intend to be an active player in the sub-prime lending markets, although we will originate loans to borrowers who only qualify for sub-prime loans. Generally, sub-prime loans will be brokered to the secondary market to reduce repurchase liability in the event of early payment defaults.
Because of our lending activities in this area, any obligations that we have to repurchase a large number of loans or make prompt repayment refunds could have a material adverse effect on our operations and could result in our inability to achieve profitability. Also, our business could be adversely affected if any of the investors to whom we sell or broker loans terminate their relationships with us and we are not able to enter into new relationships with other investors. See “Business of AmericasBank Corp. and AmericasBank.”
We face substantial competition which could adversely affect our growth and operating results. We operate in a competitive market for financial services and face intense competition from other financial institutions both in making loans and in attracting deposits. Many of these financial institutions have been in business for many years, are significantly larger, have established customer bases, have greater financial resources and legal lending limits than we do, and are able to offer certain services that we are not able to offer. See “Business of AmericasBank Corp. and AmericasBank – Competition.”
Our operations depend upon third party vendors that perform services for us. We outsource many of our operating and banking functions, including our data processing function, our item processing and the interchange and transmission services for our ATM network. As such, our success and our ability to expand our operations depend on the services provided by these third parties. Disputes with these third parties can adversely affect our operations. We may not be able to engage appropriate vendors to adequately service our needs and the vendors that we engage may not be able to perform successfully. See “Business of AmericasBank Corp. and AmericasBank.”
Our ability to operate profitably may be dependent on our ability to implement various technologies into our operations. The market for financial services, including banking services and consumer finance services, is increasingly affected by advances in technology, including developments in telecommunications, data processing, computers, automation, Internet-based banking and telebanking. Our ability to compete successfully in our markets may depend on the extent to which we are able to exploit such technological changes. If we are not able to afford such technologies, properly or timely anticipate or implement such technologies, or properly train our staff to use such technologies, our business, financial condition or operating results could be adversely affected. See “Business of AmericasBank Corp. and AmericasBank – Other Banking Products.”
We may lose some of our net operating loss carryforwards as a result of the offering.At December 31, 2004, we had net operating loss carryforwards of approximately $5,232,241 available to offset future taxable income. Under the Internal Revenue Code, the right to this benefit becomes limited if, at any time within a three-year period, holders of more than 5% of our capital stock, in the aggregate, increase their ownership of our common
11
Table of Contents
stock by more than 50% of our outstanding capital stock in the aggregate. Essentially, the pool of shareholders who own more than 5% of our capital stock cannot own more than 50% of our outstanding capital stock in the aggregate without limiting our ability to utilize our loss carryforwards. As of the date of this prospectus, holders of more than 5% of our capital stock owned approximately 34% of our outstanding capital stock in the aggregate. If our ability to utilize our net operating losses is limited, our operations may be adversely affected as we would be required to utilize liquid assets to pay income taxes on earnings, if any, and not to fund our operations.
If the leasing companies to which we have extended credit in connection with our lease portfolio were to declare bankruptcy, we could be adversely affected.In the ordinary course of business, we have made non-recourse loans to two leasing companies totaling, as of September 30, 2005 and December 31, 2004, approximately $2,219,776 and $3,751,607, or 4.79% and 11.84%, respectively, of our loan portfolio. Each loan is secured by an assignment of the leasing company’s interest in a full pay-out lease, an assignment of the lease payments under that lease, delivery of the original lease documents and a security interest in the underlying equipment. The leasing companies service these leases, and the lessee makes payment directly to the leasing companies, which forwards the lease payments to us. Because of their structure, throughout this report we have described these loans as commercial finance leases. See “Business of AmericasBank Corp. and AmericasBank – Lending Activities - Commercial Finance Leasing.”
In addition to the normal collection risk related to this type of financing, if either leasing company were to file for bankruptcy, the bankruptcy trustee or a secured lender of the leasing company could take actions to delay AmericasBank’s receipt of payments arising from the full pay-out leases or could raise arguments that AmericasBank is not properly perfected or does not have priority with respect to its rights in the full pay-out leases, the payments arising out of them and/or the underlying equipment. Ultimately, AmericasBank believes it would be successful in any such litigation, because of, among other reasons, our possession (and thereby perfection) of the original lease documents. However, because of the size of the portfolio to our total loan and lease portfolio, any delay or denial in our receipt of funds from the lessees or ability to exercise all rights and remedies against the lessees could have a material adverse effect on our financial condition and operations.
Because AmericasBank serves a limited market area in Maryland, we could be more adversely affected by economic downturns in our market area than our larger competitors which are more geographically diverse.Our current primary market area consists of Northern Baltimore County, Maryland and the Highlandtown area of the city of Baltimore. Our secondary market area includes the Baltimore Metropolitan area, consisting of Baltimore City and the surrounding counties of Anne Arundel, Baltimore, Carroll, Harford, Howard and Frederick County, Maryland and south-central Pennsylvania. However, broad geographic diversification is not currently part of our community bank focus. As a result, if our primary or secondary market areas suffer economic downturns, our business and financial condition may be more severely affected by such circumstances. Our larger bank and financial service competitors serve more geographically diverse market areas, parts of which may not be affected by the same economic conditions that may exist in our market areas. See “Business of AmericasBank Corp. and AmericasBank – Location and Market Area.”
We may require additional capital. Management may decide to obtain additional capital in the future to support the continued growth of AmericasBank Corp. or AmericasBank. Any additional capital, if available at all, may be on terms which are not favorable to us and may result in dilution to shareholders. If adequate capital is not available, we may be required to curtail or limit our strategies for growth. See “Use of Proceeds” and “Dilution.”
12
Table of Contents
Regulatory Risks
Our need to comply with extensive and complex government regulation could have an adverse effect on our business.The banking industry is subject to extensive regulation by state and federal banking authorities. Many of the banking regulations we are governed by are intended to protect depositors, the public or the insurance funds maintained by the Federal Deposit Insurance Corporation, not shareholders. Banking regulations affect our lending practices, capital structure, investment practices, dividend policy and many other aspects of our business. These requirements may constrain our rate of growth and changes in regulations could adversely affect us. The burden imposed by these federal and state regulations may place banks in general, and AmericasBank specifically, at a competitive disadvantage compared to less regulated competitors. In addition, the cost of compliance with regulatory requirements could adversely affect our ability to reduce losses or operate profitably. See “Supervision and Regulation” for more information about applicable banking laws and regulations.
In addition, because federal regulation of financial institutions changes regularly and is the subject of constant legislative debate, we cannot forecast how federal regulation of financial institutions may change in the future nor the impact those changes may have on our operations. Although Congress in recent years has sought to reduce the regulatory burden on financial institutions with respect to the approval of specific transactions, we fully expect that the financial institution industry will remain heavily regulated in the near future and that additional laws or regulations may be adopted further regulating specific banking practices.
The costs of being a public company are proportionately higher for small companies like us due to the requirement of the Sarbanes-Oxley Act.The Sarbanes-Oxley Act of 2002 and the related rules and regulations promulgated by the Securities and Exchange Commission have increased the scope, complexity, and cost of corporate governance, reporting, and disclosure practices. These regulations are applicable to our company. We expect to experience increasing compliance costs, including costs related to internal controls and the requirement that our auditors attest to and report on management’s assessment of our internal controls, as a result of the Sarbanes-Oxley Act. The regulations are expected to be applicable to us sometime in 2007. These necessary costs are proportionately higher for a company of our size and will affect our profitability more than that of some of our larger competitors.
AmericasBank may be subject to action by the U.S. Department of Housing and Urban Development as a result of violations of the Real Estate Settlement Procedures Act.As part of an examination in 2001, the Federal Reserve Bank of Richmond identified violations by AmericasBank of the Real Estate Settlement Procedures Act. The Federal Reserve Bank of Richmond referred the Real Estate Settlement Procedures Act violations to the U.S. Department of Housing and Urban Development as is required under applicable law. To date, the U.S. Department of Housing and Urban Development has taken no action against AmericasBank. If the Department of Housing and Urban Development were to take an action against AmericasBank as a result of the violations identified by the Federal Reserve Bank of Richmond, it could have a material adverse effect on our operations.
Risks Relating to the Offering
Because our stock is not guaranteed or insured by any governmental agency, you could lose your entire investment.The shares of common stock offered in the offering are not savings accounts or deposits, are not insured or guaranteed by the Federal Deposit Insurance Corporation or any other governmental agency, and involve investment risk, including the possible loss of your entire investment. See “Supervision and Regulation.”
We will have broad discretion over the use of the net proceeds of this offering and may not allocate the proceeds in the most profitable manner. Our management will have broad discretion in determining the specific timing and use of 100% of the offering proceeds. Until utilized, we anticipate that we will invest the net offering proceeds in liquid assets. We have not otherwise made a specific allocation for the use of the net proceeds. Therefore, our management will have broad discretion as to the timing and specific application of the net proceeds, and investors will not have the opportunity to evaluate the economic, financial and other relevant information that we will use in applying the net proceeds. Although we intend to use the net proceeds to serve our best interests, our application may not ultimately reflect the most profitable application of the net proceeds. See “Use of Proceeds.”
13
Table of Contents
There is a limited trading market for our common stock; it may be difficult to sell your shares after you have purchased them.Our common stock is quoted on the OTC Bulletin Board under the symbol AMAB. We have applied to have our common stock qualified for listing on the NASDAQ Capital Market under the symbol “AMAB” and to have that listing effective immediately after the closing of the offering or as soon as possible thereafter. However, NASDAQ may not approve the listing either because we do not meet the public float requirement or for other reasons which are not apparent to us as of the date of this prospectus. Currently, we have a public float of approximately 782,062 shares and the NASDAQ rules require that we have a public float of at least 1,000,000 shares. While we are offering 1,725,000 shares in this offering, we may not sell enough to meet the public float requirements after the offering. Also, in general, as part of the listing approval process, NASDAQ has significant discretion in determining whether to list an issuer’s shares on the NASDAQ Capital Market.
Being quoted on the OTC Bulletin Board or listed on the NASDAQ Capital Market has and we believe will facilitate transactions between buyers and sellers; however, it cannot guarantee an active trading market or liquidity in our common stock. Sellers of large positions of common stock may not be able to execute transactions timely or at a desired price level. For the 12 months ended November 30, 2005, our average daily trading volume was approximately 998 shares or 0.1% of the total shares outstanding and this trading volume may not increase as a result of this offering. Even if a more active market develops after the offering, such a market may not continue, and you may not be able to sell your shares at or above the offering price. You should carefully consider the potential lack of liquidity of your investment in our common stock when making your investment decision. See “Market for Common Stock.”
This is a best efforts offering and you may be one of only a small number of investors in the offering. As a result, we may use a substantial percentage of the offering proceeds to pay for offering expenses and not to implement our business plans.This is a best efforts offering with no minimum number of shares that must be sold. The underwriter will use its best efforts to sell the common stock that we are offering and there is no firm commitment by the underwriter to sell any minimum dollar amount or number of shares. To the extent that the underwriter sells significantly less than the total number of shares that we are offering through this prospectus, you may be one of only a small number of investors in this offering, and we may use a substantial percentage of the offering proceeds to pay for the offering expenses, and not for the purposes identified under the caption “Use of Proceeds.” Any funds received from investors in the offering will be available to us regardless of the number of shares sold in this offering and will not be refunded to the investor. For example, if we sell only 10% of the shares that we are offering, or 172,500 shares, at the public offering price of $7.00, we would have gross offering proceeds of $1,207,500. Under that scenario, we estimate that we would use approximately 26.70% of that amount to pay the underwriter’s commission and estimated expenses of the offering. See “Use of Proceeds” and “Plan of Distribution.”
We do not intend to pay cash dividends in the foreseeable future.We are a separate and distinct legal entity from AmericasBank. Because our business currently is limited to owning all of the outstanding shares of capital stock of AmericasBank, our payment of dividends on the common stock generally will be funded only from dividends received from AmericasBank, which dividends are dependent on, among other things, AmericasBank’s profitability. In addition, the payment of dividends may be made only if we and AmericasBank are in compliance with certain applicable regulatory requirements governing the payment of dividends by each of them. In general, under Maryland law, AmericasBank will not be able to pay dividends so long as it has an accumulated deficit. As of November 30, 2005, AmericasBank has an accumulated deficit of approximately $5.9 million. We expect that earnings, if any, will be used initially for operating capital and we do not foresee payment of any dividends in the near future or ever.THE SHARES SHOULD NOT BE PURCHASED BY PERSONS WHO NEED OR DESIRE DIVIDEND INCOME FROM THIS INVESTMENT.See “Dividend Policy.”Our management owns, will own or has the opportunity to own a substantial portion of our common stock, and their interests may conflict with yours. Our directors and executive officers currently own 109,671 shares (representing approximately 11.65% of the outstanding shares) and beneficially own 239,904 shares of our common stock (representing 23.38% of the outstanding shares, on a fully diluted basis). The exercise price on the convertible securities that they own (options and warrants) is greater than the offering price in the offering and 180,563 of the 200,625 options granted to Messrs. Anders, Rever and Munks have not vested. If these directors and executive officers do not purchase any shares in the offering, they will own approximately 5.24% of the shares (11.02% beneficially) if all of the shares are sold. They would own a proportionately greater percentage if less than all of the shares are sold. See “Stock Ownership of Management and Principal Holders.” We expect that at least some of our directors and executive
14
Table of Contents
officers will purchase shares in the offering. Because of the percentage of stock held by our directors and executive officers, these persons could influence the outcome of any matter submitted to a vote of our shareholders. The interests of our directors and executive officers may not align precisely with your interest as a holder of our common stock. See “Description of Capital Stock” for more information about shareholder voting and other charter provisions.
Our stock value may suffer from anti-takeover provisions that may impede potential takeovers.Provisions in our corporate documents and in Maryland corporate law may make it difficult and expensive to pursue a tender offer, change in control or takeover attempt of us. As a result, you may not have an opportunity to participate in such a transaction, and the trading price of our stock may not rise to the level of other institutions that are more vulnerable to hostile takeovers. Anti-takeover provisions include, but are not limited to:
| • | The election of members of our board of directors to staggered three-year terms; |
| • | The absence of cumulative voting by shareholders in the election of directors; |
| • | Provisions governing nominations of directors by shareholders and provisions governing the submission of shareholder proposals; |
| • | Our ability to issue preferred stock and additional shares of common stock without shareholder approval; and |
| • | Directors may only be removed for cause. |
These provisions also will make it more difficult for an outsider to remove our current board of directors or management. See “Description of Capital Stock” for a description of anti-takeover provisions in our corporate documents and under Maryland law.
You will experience immediate dilution in net tangible book value per share from the offering price.The offering price of the common stock in this offering is higher than the book value per share of the common stock. Consequently, investors in this offering will incur immediate dilution. See “Dilution” for more information about the dilution to investors in the offering.
If we issue additional stock in the future, your percentage of ownership will be reduced. As a shareholder of AmericasBank Corp., you will not have preemptive rights with respect to the issuance of additional shares of common stock or the issuance of any other class of stock. This means that if we decide to issue additional shares of stock, you will not automatically be entitled to purchase additional shares to maintain your percentage of ownership. In addition, if we sell additional shares in the future, it is possible that those shares may be issued on terms more favorable than the terms of the offering, which terms could, among other things, have voting or conversion rights that would adversely affect the voting power of the common stock. Also, we have issued warrants and options and will issue additional options to purchase shares of our common stock. The exercise of these warrants or options would further dilute your ownership interest in us. See “Description of Capital Stock” for more information about shareholder voting and other charter provisions.
15
Table of Contents
SPECIAL NOTE REGARDING FORWARD-LOOKING STATEMENTS
Some of the matters discussed under the captions “Prospectus Summary,” “Risk Factors,” “Recent Developments,” “Management’s Discussion and Analysis of Financial Condition and Results of Operations,” “Business of AmericasBank Corp. and AmericasBank” and elsewhere in this prospectus include forward-looking statements. These forward-looking statements include statements regarding profitability, liquidity, allowance for loan and lease losses, interest rate sensitivity, market risk and financial and other goals. Forward-looking statements often use words such as “believe,” “expect,” “plan,” “may,” “will,” “should,” “project,” “contemplate,” “ anticipate,” “forecast,” “intend” or other words of similar meaning. You can also identify them by the fact that they do not relate strictly to historical or current facts. The forward-looking statements we use in this prospectus are subject to significant risks, assumptions and uncertainties, including among other things, the following important factors that could affect the actual outcome of future events:
| • | Loss of key personnel; |
| • | Fluctuations in market rates of interest and loan and deposit pricing, which could negatively affect our net interest margin, asset valuation and income and expense projections; |
| • | Lack of adequate liquidity to fund loan growth; |
| • | Additional charge-offs in our loan portfolio; |
| • | Adverse changes in the overall national economy as well as adverse economic conditions in our market areas; |
| • | Competitive factors within the financial services industry; |
| • | Changes in regulatory requirements and/or restrictive banking legislation; and |
| • | Other factors described in the “Risk Factors” section of this prospectus. |
Because of these and other uncertainties, our actual results and performance may be materially different from results indicated by these forward-looking statements. You should not put undue reliance on any forward-looking statements.
All forward-looking statements attributable to us or persons acting on our behalf are expressly qualified in their entirety by the cautionary statements set forth in this prospectus. Forward-looking statements speak only as of the date they are made, and we undertake no obligation to update publicly any of these statements in light of new information or future events.
16
Table of Contents
RECENT DEVELOPMENTS
The following information sets forth selected consolidated financial information and other data of AmericasBank Corp. as of the dates indicated. In our opinion, all adjustments, consisting solely of normal recurring adjustments, necessary for a fair presentation of results as of and for the year ended December 31, 2005 have been included. The selected consolidated financial information and other data insofar as it relates to the year ended December 31, 2004 is derived from our audited consolidated financial statements. You should also read “Management’s Discussion and Analysis of Financial Condition and Results of Operations” and our consolidated financial statements and the related notes included elsewhere in this prospectus. Results for past periods are not necessarily indicative of results that may be expected for any future period.
AmericasBank Corp. and Subsidiary
Consolidated Balance Sheets
December 31, | 2005 | 2004(1) | ||||||
| (Unaudited) | ||||||||
| Assets | ||||||||
Cash and due from banks | $ | 1,957,870 | $ | 866,960 | ||||
Federal funds sold and Federal Home Loan Bank deposit | 18,440,881 | 4,356,587 | ||||||
Securities available for sale | 30,000 | 348,182 | ||||||
Federal Home Loan Bank and Federal Reserve Bank stock at cost | 238,500 | 132,550 | ||||||
Loans held for sale | 1,223,616 | 1,617,048 | ||||||
Loans and leases, less allowance of $366,910 and $315,127 | 48,989,605 | 31,245,162 | ||||||
Premises and equipment | 1,005,561 | 963,560 | ||||||
Accrued interest receivable | 263,039 | 140,898 | ||||||
Goodwill | 266,985 | 266,985 | ||||||
Intangible assets | 24,222 | 28,222 | ||||||
Other assets | 305,785 | 165,945 | ||||||
| $ | 72,746,064 | $ | 40,132,099 | |||||
| Liabilities and Stockholders’ Equity | ||||||||
Deposits | ||||||||
Noninterest-bearing | $ | 7,998,387 | $ | 2,226,222 | ||||
Interest-bearing | 59,177,095 | 32,344,071 | ||||||
Total deposits | 67,175,482 | 34,570,293 | ||||||
Other liabilities | 314,531 | 166,002 | ||||||
| 67,490,013 | 34,736,295 | |||||||
Stockholders’ equity | ||||||||
Common stock, par value $.01 per share; 30,000,000 shares authorized, issued and | 9,417 | 9,417 | ||||||
Preferred stock, par value $.01 per share; 5,000,000 shares authorized, issued and | — | — | ||||||
Additional paid-in capital | 11,634,984 | 11,449,191 | ||||||
Accumulated deficit | (6,388,350 | ) | (6,080,564 | ) | ||||
Accumulated other comprehensive income | — | 17,760 | ||||||
| 5,256,051 | 5,395,804 | |||||||
| $ | 72,746,064 | $ | 40,132,099 | |||||
| (1) | The December 31, 2004 consolidated balance sheet has been restated for retroactive adoption of the fair value recognition provisions of SFAS 123,Accounting for Stock-Based Compensation, as amended, as discussed in Note 2 to the consolidated financial statements. |
17
Table of Contents
AmericasBank Corp. and Subsidiary
Consolidated Statements of Operations
Years ended December 31, | 2005 | 2004(1) | ||||||
| (Unaudited) | ||||||||
Interest revenue | ||||||||
Loans and leases, including fees | $ | 3,037,462 | $ | 1,449,372 | ||||
Federal funds sold and Federal Home Loan Bank deposit | 446,113 | 119,093 | ||||||
Preferred trust securities | 7,417 | 30,000 | ||||||
Mortgage-backed securities | — | 155 | ||||||
Other | 12,665 | 8,384 | ||||||
Total interest revenue | 3,503,657 | 1,607,004 | ||||||
Interest expense | ||||||||
Deposits | 1,685,153 | 779,527 | ||||||
Net interest income | 1,818,504 | 827,477 | ||||||
Provision for loan and lease losses | 52,000 | 20,000 | ||||||
Net interest income after provision for loan and lease losses | 1,766,504 | 807,477 | ||||||
Noninterest revenue | ||||||||
Service charges on deposit accounts and other fees | 84,467 | 58,707 | ||||||
Mortgage banking gains and fees | 484,898 | 179,563 | ||||||
Total noninterest revenue | 569,365 | 238,270 | ||||||
Noninterest expenses | ||||||||
Salaries | 1,176,913 | 1,308,652 | ||||||
Employee benefits | 309,735 | 251,049 | ||||||
Occupancy | 176,231 | 143,344 | ||||||
Furniture and equipment | 116,787 | 101,704 | ||||||
Other | 863,989 | 774,333 | ||||||
Total noninterest expenses | 2,643,655 | 2,579,082 | ||||||
Loss before income taxes | (307,786 | ) | (1,533,335 | ) | ||||
Income taxes | — | — | ||||||
Net loss | $ | (307,786 | ) | $ | (1,533,335 | ) | ||
Loss per common share - basic and diluted | $ | (0.33 | ) | $ | (1.95 | ) | ||
| (1) | Certain reclassifications have been made to the 2004 audited consolidated financial statements to conform to the presentation of the 2005 unaudited consolidated financial statements. Also, results for the year ended December 31, 2004, have been restated for retroactive adoption of the fair value recognition provisions of SFAS 123,Accounting for Stock-Based Compensation, as amended, as discussed in Note 2 to the consolidated financial statements. |
18
Table of Contents
Selected Ratios:
| 2005 | 2004 | |||||
| (Unaudited) | ||||||
Performance Ratios: | ||||||
Return on average assets | (0.53 | )% | (4.79 | )% | ||
Return on average equity | (5.89 | )% | (32.64 | )% | ||
Net interest margin | 3.29 | % | 2.73 | % | ||
Asset Quality Ratios: | ||||||
Allowance to period-end loans | 0.74 | % | 0.99 | % | ||
Non-performing loans to allowance for loan and lease losses | 169.73 | % | 55.77 | % | ||
Non-performing assets to total assets | 0.86 | % | 0.44 | % | ||
Net chargeoffs (recoveries) to average loans | 0.00 | % | (0.10 | )% | ||
Capital Ratios: | ||||||
Total risk-based capital ratio | 11.32 | % | 19.94 | % | ||
Tier I risk-based capital ratio | 10.54 | % | 18.77 | % | ||
Tier I leverage capital ratio | 6.95 | % | 13.19 | % | ||
Total equity to total assets | 7.23 | % | 13.45 | % |
Financial Condition
Total assets increased $32,613,965 (81.3%) to $72,746,064 at December 31, 2005 from $40,132,099 at December 31, 2004. Loans and leases, net of allowance, at December 31, 2005 were 48,989,605, an increase of $17,744,443 or 56.8% above the $31,245,162 reported at December 31, 2004. The investment securities portfolio was $30,000 at December 31, 2005, a decrease of $318,182 from $348,182 at December 31, 2004. Federal funds sold and Federal Home Loan Bank deposits increased to $18,440,881 at December 31, 2005, from the $4,356,587 balance at December 31, 2004, primarily as a result of increases in deposits, as described below.
Total deposits increased by $32,605,189 or 94.3% to $67,175,482 at December 31, 2005 from $34,570,293 at December 31, 2004. Interest-bearing deposits increased $26,833,024 or 83.0% to $59,177,095 at December 31, 2005, from $32,344,071 at December 31, 2004. Noninterest bearing deposits increased $5,772,165 or 259.3% from $2,226,222 at December 31, 2004, to $7,998,387 at December 31, 2005. Interest bearing deposits increased primarily as a result of the offering of premium rate certificates of deposit through an Internet-based service and through print advertising in local newspapers. The increase in noninterest bearing deposits was primarily from new accounts opened for title agencies.
The allowance for loan and lease losses was $366,910 or 0.74% of total loans and leases at December 31, 2005, compared to $315,127 or 0.99% of total loans and leases at December 31, 2004. The decline in the allowance as a percentage of total loans is due to the growth of our loan portfolio and the change in the composition of our loans. A primary focus of our lending activities are loans secured by a first lien on a one-to-four family property and home equity loans. These types of loans accounted for 60.93% and 56.52% of total loans at December 31, 2005 and December 31, 2004, respectively. Management believes that such loans traditionally have an inherently lower risk of loss than other types of loans. The concentration of loans to investors secured by residential properties increases the risk of loss. Management allocates a higher reserve percentage for loans to investors as compared to residential loans that are owner occupied in assessing the allowance for loan and lease losses; however, to date, there is no historical precedent for the reserve percentages. At December 31, 2005, we had no exposure to foreign countries or foreign borrowers. Management believes that the allowance for loan and lease losses is adequate.
Our non-performing loans were $622,671 or 1.26% of gross loans and leases at December 31, 2005, compared to $175,742 or 0.55% of gross loans and leases at December 31, 2004. The substantial increase in
19
Table of Contents
nonaccrual loans and leases was related to one loan in which we held an approximately 10% participation. Our loan balance to this borrower was $587,761 at December 31, 2005.
Total stockholders equity was $5,256,051 at December 31, 2005, a decrease of $139,753 from the $5,395,804 reported at December 31, 2004.
At December 31, 2005, we met the regulatory requirements to be considered “well capitalized.” For a discussion of our capital requirements, see “Supervision and Regulation – Capital Adequacy Guidelines” and “Prompt Corrective Action.” The following table shows the regulatory capital ratios of AmericasBank Corp. and the minimum capital ratios currently required by our banking regulator to be “well capitalized” and “adequately capitalized.”
| Risk Based Capital Analysis | ||||||||||||||
| December 31, 2005 | December 31, 2004 | |||||||||||||
| (Unaudited) | ||||||||||||||
(dollars in thousands) | ||||||||||||||
Tier 1 Capital: | ||||||||||||||
Common stock | $ | 9 | $ | 9 | ||||||||||
Additional paid-in capital | 11,635 | 11,450 | ||||||||||||
Accumulated deficit | (6,388 | ) | (6,081 | ) | ||||||||||
Less: disallowed assets | (291 | ) | (295 | ) | ||||||||||
Total Tier 1 Capital | 4,965 | 5,083 | ||||||||||||
Tier 2 Capital: | ||||||||||||||
Allowance for loan and lease losses | 367 | 315 | ||||||||||||
Total Risk Based Capital | $ | 5,332 | $ | 5,398 | ||||||||||
Risk weighted assets | $ | 47,122 | $ | 27,075 | ||||||||||
| Regulatory Minimum to be | ||||||||||||||
| Well Capitalized | Adequately Capitalized | |||||||||||||
Capital Ratios: | ||||||||||||||
Total risk based capital ratio | 11.32 | % | 19.94 | % | 10.00 | % | 8.00 | % | ||||||
Tier 1 risk based capital ratio | 10.54 | % | 18.77 | % | 6.00 | % | 4.00 | % | ||||||
Tier I leverage ratio | 6.95 | % | 13.19 | % | 5.00 | % | 4.00 | % | ||||||
Results of Operations
Net Loss
Our net loss for the year ended December 31, 2005 was $307,786 or $(0.33) per basic and diluted common share, a decrease of $1,225,549 compared to our net loss of $1,533,335 or $(1.95) per basic and diluted common share for the year ended December 31, 2004.
The reduction in our net loss was primarily from the growth of our interest earning assets. This growth resulted in an increase in net interest income of $991,027 or 119.8%, from $827,477 for the year ended December 31, 2004 to $1,818,504 for the year ended December 31, 2005. Also serving to reduce our net loss was an increase in the amount of direct loan origination costs deferred during the year ended December 31, 2005
20
Table of Contents
compared to the same period in 2004, a result of the higher volume of loan originations between the periods. This was further augmented with our reevaluation of our estimate of the costs to originate or acquire loans and leases and loans held for sale as described in the following paragraph.
In January 2005, we reevaluated our estimate of the costs to originate or acquire loans and leases and loans held for sale. This analysis resulted in a higher amount of costs deferred per loan than in prior periods. The deferral of loan origination costs results in a reduction of salaries and other noninterest expense. Deferred loan origination costs were $408,764 and $72,466 at December 31, 2005 and December 31, 2004 respectively, an increase of $336,298. The primary reason for this increase was due to greater loan originations. These deferred loan origination costs are offset by deferred revenue, principally loan fees and points, on a loan-by-loan basis and the difference is amortized to interest revenue over the life of the loan. Also, mortgage banking gains and fees from the sale of loans held for sale are reduced by the recognition of the deferred costs relating to the origination of those loans upon the sale of the loans. Deferred origination costs includes the unamortized balance of the origination costs described above, and other direct costs such as closing costs paid by us in connection with the origination of certain loans, primarily home equity loans. Management evaluates its estimate of loan origination costs quarterly.
Net Interest Income
Net interest income for the year ended December 31, 2005 increased 119.8%, to $1,818,504 from $827,477 for the year ended December 31, 2004.
Total interest revenue increased by $1,896,653 for the year ended December 31, 2005, from $1,607,004 for the year ended December 31, 2004, to $3,503,657 for the year ended December 31, 2005. The increase is primarily attributable to an increase in interest revenue from loans and leases and from federal funds sold. Interest revenue from loans and leases increased for the year ended December 31, 2005 by $1,588,090 or 109.6%. Interest revenue from federal funds sold and Federal Home Loan Bank deposits increased for the year ended December 31, 2005 by $327,020 or 274.6%.
Increases in average balances of our earning assets and market interest rates were the primary factors contributing to the significant increases in interest revenue between the comparable periods. Average loans increased by $19,593,000 or 99.1% for the year ended December 31, 2005 to $39,370,712 from $19,777,712 for the year ended December 31, 2004. The yield on loans increased from 7.09% for the year ended December 31, 2004, to 7.42% for the year ended December 31, 2005.
Average federal funds sold and Federal Home Loan Bank deposits increased by $4,423,452 or 50.0% for the year ended December 31, 2005, to $13,275,687 from $8,852,235 for the year ended December 31, 2004. The yield on these funds increased from 1.35% for the year ended December 31, 2004, to 3.36% for the year ended December 31, 2005.
The increase in yields on earning assets was due to an increase in market interest rates in response to actions by the Federal Reserve to increase the target for the federal funds rate from 1.00% as of March 31, 2004, to the target rate of 4.25% as of December 31, 2005.
Interest expense increased by $905,626 or 116.2% for the year ended December 31, 2005, to $1,685,153 from $779,527 for the year ended December 31, 2004. The increase in interest expense was due to our growth in average interest-bearing deposits and an increase in the rates paid on deposits as a result of the rise in market interest rates and our offering of premium rate certificates of deposit. Average interest bearing deposits increased by $20,904,918 or 83.2% for the year ended December 31, 2005, compared to the same period in 2004. The average rate paid on interest-bearing deposits increased from 3.10% for the year ended December 31, 2004, to 3.66% for the year ended December 31, 2005.
21
Table of Contents
Provision for Loan and Lease Losses
The provision for loan and lease losses was $52,000 during the year ended December 31, 2005 compared to $20,000 for the year ended December 31, 2004. The provision for each period reflects our risk assessment of the portfolio and the growth in loan and lease balances outstanding.
Noninterest Revenue
Noninterest revenue consisted primarily of mortgage banking gains and fees from the sale of mortgage loans, and service charges on deposit accounts, which includes debit card fees and ATM fees. Noninterest revenues increased $331,095 for the year ended December 31, 2005, to $569,365, from $238,270 for the year ended December 31, 2004. The increase for the year ended December 31, 2005, was primarily from a $305,335 increase in mortgage banking gains and fees from $179,563 for the year ended December 31, 2004 to $484,898 for the year ended December 31, 2005.
Noninterest Expense
The following table compares our noninterest expenses for the year ended December 31, 2005 and the year ended December 31, 2004.
| Years Ended December 31, | ||||||||
| (Unaudited) | ||||||||
| 2005 | 2004 | |||||||
Salaries and commissions | $ | 2,154,747 | $ | 1,327,740 | ||||
Stock-based compensation | 186,120 | 238,357 | ||||||
Deferred salaries and commissions | (1,163,954 | ) | (257,445 | ) | ||||
Salaries | 1,176,913 | 1,308,652 | ||||||
Employee benefits | 309,735 | 251,049 | ||||||
Occupancy | 176,231 | 143,344 | ||||||
Furniture and equipment | 116,787 | 101,704 | ||||||
Other | 863,989 | 774,333 | ||||||
Total noninterest expenses | $ | 2,643,655 | $ | 2,579,082 | ||||
As indicated above, in January 2005, we reevaluated our estimate of the costs to originate or acquire loans and leases and loans held for sale. This analysis resulted in a higher amount of costs deferred per loan than in prior periods. Among other things, the deferral of loan origination costs results in a reduction of salary expense as evidenced by the table above. Approximately $865,672 (or 74.4%) of the $1,163,954 deferred amount for the year ended December 31, 2005 was commission expense paid to mortgage loan originators. The remaining $298,282 (or 25.6%) of the deferred amount constituted incremental direct costs associated with originating loans during the year ended December 31, 2005. These costs represent employee compensation and related fringe benefits directly related to time spent originating loans for our portfolio. For the year ended December 31, 2004, we deferred commission expense paid to loan originators but did not defer the fixed costs associated with originating loans as management deemed these costs immaterial.
In summary, as our mortgage division generates more business, a greater proportion of our total compensation expense gets deferred. This, in turn, makes comparing our compensation expense between 2004 (when we had modest mortgage banking activity) and 2005 difficult. Also, it is important to note that a significant portion of the deferred expense for the year ended December 31, 2005 was recognized during that same period as a reduction to mortgage gains and fees or as a yield adjustment to interest revenue.
22
Table of Contents
The following table reflects the anticipated allocation of the net proceeds of the offering at the public offering price of $7.00 per share, after deducting estimated expenses. Because this is a best efforts offering and there is no minimum number of shares that must be sold, any funds received from an investor will be available to us regardless of the number of shares sold, and not be refunded to the investor. We are presenting this information assuming that we sell 10%, 50% and 100% of the shares of common stock that we are offering. Our management will have broad discretion in determining the specific timing and use of the proceeds.
| 10% | 50% | 100% | ||||||||||||||||
| Amount | Percent of Gross | Amount | Percent of Gross | Amount | Percent of Gross | |||||||||||||
Gross offering proceeds | $ | 1,207,500 | 100.00 | % | $ | 6,037,500 | 100.00 | % | $ | 12,075,000 | 100.00 | % | ||||||
Less: Estimated underwriter’s commission(1) | 72,450 | 6.00 | % | 362,250 | 6.00 | % | 724,500 | 6.00 | % | |||||||||
Estimated offering expenses excluding underwriter’s commission(2) | 250,000 | 20.70 | % | 250,000 | 4.14 | % | 250,000 | 2.07 | % | |||||||||
Net offering proceeds | $ | 885,050 | 73.30 | % | $ | 5,425,250 | 89.86 | % | $ | 11,100,500 | 91.93 | % | ||||||
Use of net proceeds: | ||||||||||||||||||
Investment in AmericasBank | $ | 885,050 | 100.00 | % | $ | 5,425,250 | 100.00 | % | $ | 11,100,500 | 100.00 | % | ||||||
| (1) | 6% of the gross offering proceeds. See “Plan of Distribution” for additional details. |
| (2) | This amount includes filing fees, printer fees and fees incurred by us for legal and accounting services. |
We intend to invest substantially all of the net offering proceeds in AmericasBank. The net proceeds will provide AmericasBank with additional capital to support its loan growth and business expansion activities.
We have not made a specific allocation for the use of the net proceeds. Until utilized, we anticipate that we will invest the net offering proceeds in liquid assets. See “Risk Factors—We will have broad discretion over the use of the net proceeds of this offering and may not allocate the proceeds in the most profitable manner.”
23
Table of Contents
On or about March 12, 2004, AmericasBank Corp.’s common stock began to be quoted for trading on the Over the Counter Bulletin Board (“OTCBB”) under the symbol “AMBB.” In connection with our reverse stock split, our symbol was changed from “AMBB” to “AMAB.” Prior to March 2004, AmericasBank Corp.’s common stock traded in privately negotiated transactions and sales, typically involving a small number of trades, which were reported from time to time on the Pink Sheets under the symbol “AMBB.”
The following table reflects the high and low sales information as reported on the OTCBB (on and after March 12, 2004) or the Pink Sheets (prior to March 12, 2004). The information reflects inter-dealer prices, which may or may not reflect retail mark-ups, mark-downs, or commissions and may not represent actual transactions. Also, these transactions may not be representative of all transactions during the indicated periods or the actual fair market value of our common stock at the time of such transactions due to the infrequency of trades and the limited market for our common stock. All information has been adjusted to reflect our one-for-four reverse stock split which was effective on August 23, 2005.
| Sale Price Range | ||||||
| High | Low | |||||
2003 | ||||||
First Quarter | $ | 8.20 | $ | 8.20 | ||
Second Quarter | 8.88 | 8.20 | ||||
Third Quarter | 12.00 | 12.00 | ||||
Fourth Quarter | 10.00 | 9.20 | ||||
| High | Low | |||||
2004 | ||||||
First Quarter | $ | 9.40 | $ | 8.00 | ||
Second Quarter | 8.80 | 7.60 | ||||
Third Quarter | 7.80 | 7.00 | ||||
Fourth Quarter | 7.80 | 7.00 | ||||
| High | Low | |||||
2005 | ||||||
First Quarter | $ | 8.00 | $ | 7.00 | ||
Second Quarter | 7.60 | 6.80 | ||||
Third Quarter | 7.80 | 6.28 | ||||
Fourth Quarter | 7.60 | 7.00 | ||||
| High | Low | |||||
2006 | ||||||
First Quarter (through March 6, 2006) | $ | 7.75 | $ | 7.00 | ||
24
Table of Contents
We have applied to have our common stock qualified for listing on the NASDAQ Capital Market under the symbol “AMAB” and to have that listing effective immediately after the closing of the offering or as soon as possible thereafter.
Pursuant to NASDAQ’s rules, in order to qualify for listing we must, among other things, have a public float of at least 1,000,000 shares. In general, public float means shares not held directly or indirectly by any officer or director of the issuer or by any person who is the beneficial owner of 10% or more of the issuer’s total outstanding shares. Currently, we have a public float of approximately 782,062 shares. Therefore, we must sell approximately 217,939 shares in the offering to persons other than our officers, directors and beneficial holders of more than 10% of our common stock in order to meet the public float requirement. However, even if we satisfy the public float requirements, NASDAQ may not accept our application. Also, in general, as part of the listing approval process, NASDAQ has significant discretion in determining whether to list an issuer’s share on the NASDAQ Capital Market and may deny our application for reasons which are not apparent to us as of the date of this prospectus.
McKinnon & Company has informed us that it intends to make a market in our common stock following the offering. However, McKinnon & Company has no obligation to be a market maker for the common stock for any particular length of time, or at all. An active trading market may not develop for our common stock or, if one develops, it may not be maintained.
As of the date of this prospectus, AmericasBank Corp. had outstanding 941,702 shares of common stock held by approximately 231 shareholders of record, options to purchase 305,870 shares of common stock and warrants to purchase 292,765 shares of common stock.
The warrants and options consist of:
| • | Currently exercisable and unexercisable options to purchase 301,875 shares of common stock at $8.00 per share (issued to senior management and other employees); |
| • | Currently exercisable options to purchase 3,995 shares of common stock at an average exercise price of $40.42 and with exercise prices ranging from $28.00 to $48.00 per share (issued to current directors); and |
| • | Currently exercisable warrants to purchase 292,765 shares of common stock at an average exercise price of $29.25 and with exercise prices ranging from $12.80 per share to $52.00 per share. |
For additional information about our common stock, warrants and the options, see “Management – Executive Compensation” and “Description of Capital Stock.”
25
Table of Contents
We have not paid cash dividends in the past and do not anticipate paying any cash dividends in the foreseeable future. We expect that we will retain all earnings, if any, in order to provide more funds to operate our business. Any payment of dividends is subject to the discretion of our board of directors, which will consider a number of factors, including our prospects for future earnings, financial condition, cash needs and general business conditions.
We are organized under the Maryland General Corporation Law, which prohibits the payment of a dividend if, after giving it effect, the corporation would not be able to pay its debts as they become due in the usual course of business or the corporation’s total assets would be less than the sum of its total liabilities plus, unless the charter permits otherwise, the amount that would be needed, if the corporation were to be dissolved, to satisfy the preferential rights upon dissolution of shareholders whose preferential rights on dissolution are superior to those receiving the distribution. In addition, because we are a bank holding company, the Federal Reserve Board may impose requirements on the payment of dividends by us. Among other things, the Federal Reserve Board has issued guidance that states, in general, that an entity experiencing financial difficulties - such as AmericasBank Corp. - should not pay or continue to pay dividends unless (i) the entity’s net income over the prior year is sufficient to fund all dividends and (ii) the earnings retained by the entity is consistent with the entity’s capital needs, asset quality and overall financial condition.
Our ability to pay any cash dividends in the future will depend primarily on AmericasBank’s ability to pay cash dividends to us. AmericasBank may only pay dividends if it is in compliance with certain regulatory requirements governing the payment of dividends by it. In general, under Maryland law, AmericasBank will not be able to pay dividends so long as it has an accumulated deficit. As of November 30, 2005, AmericasBank has an accumulated deficit of approximately $5.9 million. See “Supervision and Regulation – Regulation of AmericasBank – Dividends.”
26
Table of Contents
The following table sets forth our consolidated capitalization at September 30, 2005.
You should read this information together with our consolidated financial statements and related notes, which are included elsewhere in this prospectus.
| At September 30, 2005 | ||||
Stockholders’ Equity: | ||||
Common stock, $0.01 par value, 30,000,000 shares authorized, 941,702 shares issued and outstanding(1) | $ | 9,417 | ||
Preferred Stock, par value $0.01 per shares; 5,000,000 authorized, no shares issued and outstanding | 0 | |||
Additional paid-in capital | 11,571,032 | |||
Accumulated deficit | (6,395,642 | ) | ||
Accumulated other comprehensive income | 0 | |||
Total stockholders’ equity | $ | 5,184,807 | ||
CAPITAL RATIOS: | ||||
Tier 1 leverage ratio(2) | 7.97 | % | ||
Tier 1 risk-based capital ratio | 11.98 | % | ||
Total risk-based capital ratio | 12.84 | % | ||
Ratio of equity to total assets | 7.27 | % | ||
| (1) | Does not include 305,870 shares of common stock reserved for issuance as of September 30, 2005 upon the exercise of outstanding options or 292,765 shares of common stock reserved for issuance as of September 30, 2005 upon the exercise of outstanding warrants. The options had exercise prices ranging from $8.00 to $48.00 per share and 29,183 were exercisable at September 30, 2005. The warrants had exercise prices ranging from $12.80 to $52.00 per share and all are exercisable at September 30, 2005. |
| (2) | The leverage ratio is Tier 1 capital divided by average assets. |
27
Table of Contents
Net tangible book value per share represents the amount of stockholders’ equity, less goodwill and other intangible assets, divided by the number of shares of common stock that are outstanding. On September 30, 2005, our net tangible book value was $4,892,600 or $5.20 per share of common stock. Dilution per share to new investors in this offering represents the difference between the amount per share that these investors pay and the pro forma net tangible book value per share of common stock immediately after completion of the offering.
Assuming the sale of all 1,725,000 shares of common stock in the offering at the offering price of $7.00 per share, and after giving effect to the estimated offering expenses, at September 30, 2005, our adjusted net tangible book value would be $15,993,100 or $6.00 per share. The dilution to the new investors would be $1.00 per share or approximately 14.32% less than the price per share paid in the offering.
The following table illustrates the dilution to new investors assuming that we sell 10%, 50% and 100% of the common stock being offered. This is a best efforts offering and there is no minimum number of shares that we must sell.
Sale of 10% of Offering (172,500 shares)
Net tangible book value per share at September 30, 2005 | $ | 5.20 | ||
Increase (Decrease) attributable to investors in the offering | (0.01 | ) | ||
Pro-forma net tangible book value per share after offering | $ | 5.19 | ||
Offering price per share | $ | 7.00 | ||
Dilution per share to new investors | (1.81 | ) | ||
Dilution as a percentage of offering price | 25.92 | % | ||
| Sale of 50% of Offering (862,500 shares) | ||||
Net tangible book value per share at September 30, 2005 | $ | 5.20 | ||
Increase attributable to investors in the offering | 0.52 | |||
Pro-forma net tangible book value per share after offering | $ | 5.72 | ||
Offering price per share | $ | 7.00 | ||
Dilution per share to new investors | (1.28 | ) | ||
Dilution as a percentage of offering price | 18.30 | % | ||
| Sale of 100% of Offering (1,725,000 shares) | ||||
Net tangible book value per share at September 30, 2005 | $ | 5.20 | ||
Increase attributable to investors in the offering | 0.80 | |||
Pro-forma net tangible book value per share after offering | $ | 6.00 | ||
Offering price per share | $ | 7.00 | ||
Dilution per share to new investors | (1.00 | ) | ||
Dilution as a percentage of offering price | 14.32 | % | ||
28
Table of Contents
The following table sets forth our selected consolidated financial information. We derived the information for the three years ended December 31, 2004 from our audited consolidated financial statements. We derived the financial information for the nine-month period ended September 30, 2005 and 2004 from our unaudited consolidated financial statements. In our opinion, we have included all adjustments, consisting solely of normal recurring adjustments, necessary for a fair presentation of results for the selected financial information and other financial data presented herein. This information should be read together with “Management’s Discussion And Analysis Of Financial Condition And Results Of Operations” and our financial statements and the related notes included elsewhere in this prospectus. Results for past periods are not necessarily indicative of results that may be expected for any future period, and results for the nine-month period ended September 30, 2005 are not necessarily indicative of results that may be expected for the full year ending December 31, 2005. The financial data for all periods has been restated for retroactive adoption of the fair value recognition provisions of SFAS 123, Accounting for Stock-Based Compensation as further described in note 2 of our audited consolidated financial statements.
| Nine Months Ended September 30, | Year Ended December 31, | |||||||||||||||||||
| 2005 | 2004 | 2004 | 2003 | 2002 | ||||||||||||||||
Income Statement Data: | ||||||||||||||||||||
Net interest income | $ | 1,271,233 | $ | 552,713 | $ | 855,230 | $ | 612,638 | $ | 494,670 | ||||||||||
Provision for loan and lease losses | 35,000 | 20,000 | 20,000 | 75,000 | 78,000 | |||||||||||||||
Noninterest revenue | 387,153 | 116,907 | 210,517 | 304,625 | 246,526 | |||||||||||||||
Noninterest expenses | 1,938,464 | 1,840,064 | 2,579,082 | 1,961,024 | 1,663,417 | |||||||||||||||
Income taxes | — | — | — | — | — | |||||||||||||||
Net loss | $ | (315,078 | ) | $ | (1,190,444 | ) | $ | (1,533,335 | ) | $ | (1,118,761 | ) | $ | (1,000,221 | ) | |||||
Per Share and Shares Outstanding Data: | ||||||||||||||||||||
Basic net loss per common share | $ | (0.33 | ) | $ | (1.62 | ) | $ | (1.95 | ) | $ | (7.37 | ) | $ | (7.25 | ) | |||||
Diluted net loss per common share | $ | (0.33 | ) | $ | (1.62 | ) | $ | (1.95 | ) | $ | (7.37 | ) | $ | (7.25 | ) | |||||
Cash dividends declared | — | — | — | — | — | |||||||||||||||
Book value per common share at period end | $ | 5.51 | $ | 6.03 | $ | 5.73 | $ | 7.75 | $ | 13.92 | ||||||||||
Tangible book value per common share at period end (1) | $ | 5.20 | $ | 6.00 | $ | 5.42 | $ | 7.60 | $ | 13.72 | ||||||||||
Common shares outstanding, period end | 941,702 | 916,515 | 941,702 | 197,765 | 147,750 | |||||||||||||||
Average common shares outstanding, basic | 941,702 | 732,893 | 785,082 | 151,860 | 137,925 | |||||||||||||||
Average common shares outstanding, diluted | 941,702 | 732,893 | 785,082 | 151,860 | 137,925 | |||||||||||||||
Balance Sheet Data: | ||||||||||||||||||||
Total assets | $ | 71,307,715 | $ | 36,000,576 | $ | 40,132,099 | $ | 27,065,027 | $ | 22,404,444 | ||||||||||
Total loans, net | 45,897,697 | 23,298,070 | 31,245,162 | 15,424,848 | 13,159,755 | |||||||||||||||
Total deposits | 65,938,331 | 30,325,398 | 34,570,293 | 25,408,838 | 20,279,668 | |||||||||||||||
Stockholders’ equity | $ | 5,184,807 | $ | 5,528,895 | $ | 5,395,804 | $ | 1,532,637 | $ | 2,058,341 | ||||||||||
Performance Ratios: | ||||||||||||||||||||
Return on average assets | (0.80 | )% | (5.30 | )% | (4.79 | )% | (4.07 | )% | (4.57 | )% | ||||||||||
Return on average equity | (8.07 | )% | (33.17 | )% | (32.64 | )% | (55.12 | )% | (41.96 | )% | ||||||||||
Net interest margin | 3.36 | % | 2.61 | % | 2.82 | % | 2.39 | % | 2.41 | % | ||||||||||
Asset Quality Ratios: | ||||||||||||||||||||
Allowance to period-end loans | 0.76 | % | 1.32 | % | 0.99 | % | 1.75 | % | 1.88 | % | ||||||||||
Non-performing loans to allowance for loan and lease losses | 177.94 | % | 11.22 | % | 55.77 | % | 12.72 | % | 17.62 | % | ||||||||||
Non-performing assets to total assets | 0.87 | % | 0.16 | % | 0.44 | % | 0.29 | % | 0.20 | % | ||||||||||
Net chargeoffs (recoveries) to average loans | 0.00 | % | (0.10 | )% | 0.10 | % | 0.34 | % | 0.65 | % | ||||||||||
Capital Ratios: | ||||||||||||||||||||
Total risk-based capital ratio | 12.84 | % | 24.51 | % | 19.94 | % | 9.61 | % | 13.73 | % | ||||||||||
Tier I risk-based capital ratio | 11.98 | % | 23.25 | % | 18.77 | % | 8.36 | % | 12.47 | % | ||||||||||
Tier I leverage capital ratio | 7.97 | % | 17.51 | % | 13.19 | % | 5.40 | % | 8.81 | % | ||||||||||
Total equity to total assets | 7.27 | % | 15.36 | % | 13.45 | % | 5.66 | % | 9.19 | % | ||||||||||
| (1) | Excludes unamortized premium paid for the loans and deposits purchased from Rushmore Trust & Savings, FSB in 1997, and goodwill from the purchase of certain assets of uvm Mortgage Marketing, Inc. in October, 2004. |
29
Table of Contents
MANAGEMENT’S DISCUSSION AND ANALYSIS OF FINANCIAL CONDITION
AND RESULTS OF OPERATIONS
The following discussion is intended to assist readers in understanding and evaluating our financial condition and results of operations. You should read this review in conjunction with our financial statements and accompanying notes included elsewhere in this prospectus. Because AmericasBank Corp. has no material operations and conducts no business on its own other than owning its subsidiary, AmericasBank, the discussion primarily concerns the business of AmericasBank. However, for ease of reading and because our financial statements are presented on a consolidated basis, references to “we,” “us, “ or “our” refers to both AmericasBank Corp. and AmericasBank.
On August 3, 2005, our board of directors approved a reverse stock split of our common stock whereby every four shares of common stock would be converted into one share with fractional shares resulting from the split converted to cash. The split became effective at 12:01 a.m. on August 23, 2005. Except as otherwise described in this prospectus, all share amounts and dollar amounts per share in this prospectus with regard to the common stock have been adjusted to reflect the reverse split.
General
AmericasBank Corp. was incorporated as a Maryland corporation on June 4, 1996, to become a one-bank holding company by acquiring all of the capital stock of AmericasBank, a federal stock savings bank, upon its formation. AmericasBank commenced operations on December 1, 1997. On March 20, 1999, AmericasBank converted from a federal stock savings bank to a Maryland chartered trust company exercising the powers of a commercial bank.
AmericasBank has incurred losses in every year since its inception. AmericasBank Corp. and AmericasBank had operated under a Written Agreement with the Federal Reserve Bank of Richmond and the Maryland Division of Financial Regulation since August 2001. The Written Agreement was terminated effective October 12, 2005. Our primary challenge is to execute our business plan, produce balance sheet growth and continue to improve our operating margins to achieve profitability.
Recent Developments
On October 18, 2005, the Boards of Directors of AmericasBank Corp. and AmericasBank elected Richard C. Faint, Jr. and Allen S. Lloyd, Jr. as new directors. Mr. Faint will serve on the Compensation, Nominating and Strategic Planning Committees of AmericasBank Corp. and AmericasBank, and Mr. Lloyd will serve on the Executive and Strategic Planning Committees of AmericasBank Corp. and AmericasBank and the Loan Committee of AmericasBank.
Effective October 12, 2005, the Federal Reserve Bank of Richmond and the Maryland Division of Financial Regulation determined that we had returned to a satisfactory condition and terminated the Written Agreement.
The Written Agreement imposed operational and reporting requirements upon us and prohibited us from amending or rescinding approved plans and procedures without the prior written approval of the Federal Reserve Bank of Richmond and the Maryland Division of Financial Regulation. Among other things, the Written Agreement limited our ability to appoint directors or hire senior executive officers without the prior approval of the Federal Reserve Bank of Richmond and the Maryland Division of Financial Regulation, and required us to make various quarterly and annual reports to the Federal Reserve Bank of Richmond and the Maryland Division of Financial Regulation.
On August 25, 2005, the board of directors of AmericasBank approved an increase in the base salary payable to each of its management team pursuant to the terms of their respective employment agreements. The increases were as follows: Mr. Anders from $125,000 to $145,000, Mr. Rever from $105,000 to $125,000, and Mr. Muncks from $105,000 to $125,000.
30
Table of Contents
Effective August 23, 2005, AmericasBank Corp. implemented a one-for-four reverse stock split of its outstanding common stock where every four shares of outstanding common stock were converted into one share. Fractional shares resulting from the split were converted to cash. After the split, the number of shares of common stock outstanding declined from 3,766,810 to 941,702. The reverse stock split did not generally affect any stockholder’s percentage ownership except to the extent that it resulted in ownership of fractional shares. Outstanding options and warrants were adjusted as a result of the split. Pursuant to the rules of the OTC Bulletin Board, AmericasBank Corp.’s common stock began trading under the new stock symbol “AMAB” after the reverse stock split.
On July 29, 2005, we registered our common stock under the Securities Act of 1934, as amended (the “Exchange Act”). By registering our common stock under the Exchange Act, under Maryland law we were able to effect the reverse stock split without shareholder approval. This action saved us the costs we would have incurred in connection with a shareholders meeting to approve the reverse stock split. We are now required to comply with all the requirements of the Exchange Act, including, but not limited to, the proxy rules of the Exchange Act, and our officers, directors and beneficial owners of more than 10% of any class of our equity security are now subject to the insider reporting and trading requirements of Section 16 of the Exchange Act. We believe that this additional disclosure and information will be valuable to our shareholders.
Summary of Recent Performance
Our net loss for the nine months ended September 30, 2005 was $315,078 or $(0.33) per basic and diluted common share, a decrease of $875,366 compared to our net loss of $1,190,444 or $(1.62) per basic and diluted common share for the nine months ended September 30, 2004. The net loss included a charge to salary expense for stock-based compensation as we voluntarily adopted SFAS No. 123,Accounting for Stock-Based Compensation, as amended. See Note 2 to the Notes to Financial Statements.
The reduction in our net loss was primarily from the growth of our interest earning assets. This growth resulted in an increase in net interest income of $718,520 or 130.0%, from $552,713 for the nine months ending September 30, 2004, to $1,271,233 for the nine months ending September 30, 2005. Also serving to reduce our net loss was an increase in the amount of direct loan origination costs deferred during the first nine months of 2005 compared to the same period in 2004, a result of the higher volume of loan originations between the periods. This was further augmented with our reevaluation of our estimate of the costs to originate or acquire loans and leases and loans held for sale as described in the following paragraph.
In January 2005, we reevaluated our estimate of the costs to originate or acquire loans and leases and loans held for sale. This analysis resulted in a higher amount of costs deferred per loan than in prior periods. The deferral of loan origination costs results in a reduction of salaries and other noninterest expense. Deferred loan origination costs were $415,401 and $72,466 at September 30, 2005 and December 31, 2004 respectively, an increase of $342,935. The primary reason for this increase was due to greater loan originations. These deferred loan origination costs are offset by deferred revenue, principally loan fees and points, on a loan-by-loan basis and the difference is amortized to interest revenue over the life of the loan. Also, mortgage banking gains and fees from the sale of loans held for sale are reduced by the recognition of the deferred costs relating to the origination of those loans upon the sale of the loans. Deferred origination costs includes the unamortized balance of the origination costs described above, and other direct costs such as closing costs paid by us in connection with the origination of certain loans, primarily home equity loans. Management evaluates its estimate of loan origination costs quarterly.
Total assets increased by $31,175,616 or 77.7%, to $71,307,715 at September 30, 2005, compared to $40,132,099 at December 31, 2004. Average interest earning assets for the nine months ended September 30, 2005, were $50,616,347, an increase of $22,379,400, or 79.3% from the $28,236,947 in average interest earning assets for the first nine months of 2004. Our balance sheet growth and the rising interest rate environment have positively influenced our net interest margin increasing it for the nine months ending September 30, 2005 to 3.36% from 2.61% for the nine months ending September 30, 2004.
Loans and leases, net of allowance, at September 30, 2005 were $45,897,697, an increase of $14,652,535 or 46.9% above the $31,245,162 reported at December 31, 2004. The majority of this growth was in loans secured by one-to-four family properties and was partially offset by a decline in commercial finance leases from scheduled
31
Table of Contents
payment amortization and payoffs. Throughout 2005 we have focused our lending activities on loans secured by one-to-four family properties and substantially reduced new loan advances for commercial finance leases. We believe that this strategy improves our asset quality and is consistent with our risk management.
The production from our mortgage loan origination group continues to improve. The combined efforts of our six loan originators resulted in mortgage banking fees and gains in the first nine months of 2005 of $329,807, compared to $77,190 for the nine months ended September 30, 2004, an increase of $252,617. We originate and sell loans as a correspondent lender and as a broker. This group also provided numerous loan opportunities for us to consider that resulted in our extending credit to borrowers for portfolio loans. We are continuously recruiting experienced individuals in the mortgage business and plan to add one additional loan officer by the end of 2005.
The allowance for loan and lease losses was $349,984 or 0.76% of loans at September 30, 2005, compared to $315,127 or 0.99% of loans at December 31, 2004. The decline in the allowance for loan and lease losses as a percent of loans and leases was primarily attributable to the growth in loans secured by one to four family properties which generally carry a lower risk assessment. Our non-performing loans were $622,761 or 1.34% of gross loans at September 30, 2005, compared to $175,742 or 0.55% of loans at December 31, 2004. The substantial increase in nonaccrual loans was related to one loan in which we held an approximately 10% participation. Our loan balance to this borrower was $587,761 at September 30, 2005.
This non-performing loan is a participation in a loan to a land developer for the purchase and development of raw land that was under contract for sale as developed lots to a national homebuilder. The project ran into delays during the permitting process related primarily to storm water management issues. As a result of the delays, the interest reserve was exhausted, causing the loan to go into interest payment default. The original homebuilder has agreed to release the borrower from its purchase agreement. The participating banks have agreed to a 95 day forbearance period during which the borrower will negotiate with another homebuilder to be a replacement purchaser. We continue to believe that we will collect all of our outstanding principal balance, accrued interest and expenses, however it is possible that this will not be the case.
Total deposits at September 30, 2005 were $65,938,331, up 90.7% from $34,570,293 at December 31, 2004. The growth in deposits is the result of offering premium rate certificates of deposit through an Internet-based service and through print advertising in local newspapers. Noninterest bearing deposits were $11,309,272 at September 30, 2005, a more than four-fold increase over the $2,226,222 at December 31, 2004, reflecting our efforts to reduce our reliance on certificates of deposit as a funding source.
Our net interest margin was 3.36% for the nine months ended September 30, 2005, compared to 2.61% for the nine months ended September 30, 2004. This increase in our net interest margin is due primarily to the 112.1% increase in average loans in the first nine months of 2005 compared to the same period in 2004. Market interest rates increased between the comparable nine month periods ended September 30, 2005 and September 30, 2004, resulting in an increase in the average yield on our interest earning assets from 5.10% for the first nine months of 2004 to 6.31% for the first nine months of 2005. Correspondingly, our rate on interest bearing deposits increased to 3.55% in the nine months ended September 30, 2005, from 3.05% for the nine months ended September 30, 2004. Contributing to the higher costs of interest bearing deposits was our successful marketing of certificates of deposit and money market products to retail customers, augmented by our use of an Internet-based service to sell higher cost certificates of deposit.
Results of Operations
Net Interest Income
Net interest income is the difference between interest revenue on assets and the cost of funds supporting those assets. Earning assets are comprised primarily of loans, investments and federal funds sold; interest-bearing deposits make up the cost of funds. Noninterest bearing deposits and capital are also funding sources. Changes in the volume and mix of earning assets and funding sources along with changes in associated interest rates determine changes in net interest income.
32
Table of Contents
Nine months ended September 30, 2005 compared to nine months ended September 30, 2004
Net interest income for the nine months ended September 30, 2005 increased 130.0%, to $1,271,233 from $552,713 for the nine months ended September 30, 2004.
Total interest revenue increased by $1,309,598 for the nine months ended September 30, 2005, from $1,080,714 for the nine months ended September 30, 2004, to $2,390,312 for the nine months ended September 30, 2005. The increase is primarily attributable to an increase in interest revenue from loans and leases and from federal funds sold. Interest revenue from loans and leases increased for the nine months ended September 30, 2005 by $1,140,704 or 117.7%. Interest revenue from federal funds sold and Federal Home Loan Bank deposits increased for the nine months ended September 30, 2005 by $180,986 or 219.8%.
Increases in average balances of our earning assets and market interest rates were the primary factors contributing to the significant increases in interest revenue between the comparable periods. Average loans increased by $19,442,950 or 112.1% for the nine months ended September 30, 2005 to $36,790,003 from $17,347,053 for the nine months ended September 30, 2004. The yield on loans increased from 7.06% for the nine months ended September 30, 2004, to 7.29% for the nine months ended September 30, 2005.
Average federal funds sold and Federal Home Loan Bank deposit increased by $1,793,743 or 18.8% for the nine months ended September 30, 2005, to $11,348,302 from $9,554,559 for the nine months ended September 30, 2004. The yield on these funds increased from 1.15% for the nine months ended September 30, 2004, to 3.10% for the nine months ended September 30, 2005.
The increase in yields on earning assets was due to an increase in market interest rates in response to actions by the Federal Reserve to increase the target for the federal funds rate from 1.00% as of March 31, 2004, to the target rate of 3.75% as of September 30, 2005.
Interest expense increased by $591,078 or 112.0% for the nine months ended September 30, 2005, to $1,119,079 from $528,001 for the nine months ended September 30, 2004. The increase in interest expense was due to our growth in average interest-bearing deposits and an increase in the rates paid on deposits as a result of the rise in market interest rates and premium rate certificates of deposit.
Average interest bearing deposits increased by $19,046,805 or 82.5% for the nine months ended September 30, 2005, compared to the same period in 2004. The average rate paid on interest-bearing deposits increased from 3.05% for the nine months ended September 30, 2004, to 3.55% for the nine months ended September 30, 2005. The majority of the increase in average interest-bearing deposits was attributable to our growth in certificates of deposit and money market accounts resulting from our marketing efforts and the use of an Internet-based service to offer certificates of deposit.
Average noninterest-bearing deposits increased by $3,376,012 or 168.6% for the nine months ended September 30, 2005 to $5,378,427 from $2,002,415 for the nine months ended September 30, 2004. The increase in noninterest bearing deposits was primarily due to an increase in deposits by our title agency customers. The increase in average noninterest-bearing deposits contributed to the increase in the net margin on earning assets from 2.61% for the nine months ended September 30, 2004 to 3.36% for the nine months ended September 30, 2005.
Year ended December 31, 2004 compared to year ended December 31, 2003
Net interest income for the year ended December 31, 2004 increased 39.6% to $855,230 from $612,638 for the year ended December 31, 2003. The increase is primarily attributable to an 18.2% increase in average interest earning assets to $30,313,020 for the year ended December 31, 2004 from $25,640,811 for the year ended December 31, 2003.
Interest revenue increased by $271,584 or 19.9% from $1,363,173 for the year ended December 31, 2003 to $1,634,757 for the year ended December 31, 2004. The majority of the increase in interest revenue came from an 18.2% increase in average interest earning assets. Total average loans increased by $4,323,738 or 28.0%, mainly in commercial real estate loans, construction loans, commercial finance leases and home equity loans. Interest revenue from loans and leases, excluding loans held for sale, increased by $285,569 or 25.6% in 2004 compared to 2003.
33
Table of Contents
Interest expense amounted to $779,527 for the year ended December 31, 2004, which was $28,992 or 3.9% higher than the $750,535 for the year ended December 31, 2003. Our average interest bearing deposits increased by $1,980,370 or 8.6% for the year ended December 31, 2004 compared to the year ended December 31, 2003, primarily from an increase in average certificates of deposit and interest bearing checking, partially offset by a decline in average savings account balances.
The following tables illustrate average balances of total interest earning assets and total interest bearing liabilities for the periods indicated, showing the average distribution of assets, liabilities, stockholders’ equity and related revenue, expense and corresponding weighted average yields and rates. The average balances used in this table and other statistical data were calculated using average daily balances.
34
Table of Contents
Average Balances, Interest, and Yields/Rates
| Nine Months Ended September 30, | ||||||||||||||||||||
| 2005 | 2004 | |||||||||||||||||||
| Average balance | Interest | Yield/ Rate | Average balance | Interest | Yield/ Rate | |||||||||||||||
Assets: | ||||||||||||||||||||
Federal Funds Sold and FHLB deposit | $ | 11,348,302 | $ | 263,330 | 3.10 | % | $ | 9,554,559 | $ | 82,344 | 1.15 | % | ||||||||
FHLB and FRB stock | 221,216 | 9,142 | 5.53 | % | 145,862 | 5,313 | 4.85 | % | ||||||||||||
Investment Securities | ||||||||||||||||||||
Mortgage backed | 46 | — | 0.00 | % | 7,441 | 140 | 2.51 | % | ||||||||||||
Preferred trust | 97,802 | 7,417 | 10.14 | % | 300,000 | 22,500 | 9.99 | % | ||||||||||||
Equity security | 30,000 | 562 | 2.50 | % | 30,000 | 1,260 | 5.59 | % | ||||||||||||
Total investment securities | 127,848 | 7,979 | 8.34 | % | 337,441 | 23,900 | 9.44 | % | ||||||||||||
Loans held for sale | 2,128,978 | 104,144 | 6.54 | % | 852,032 | 49,658 | 7.76 | % | ||||||||||||
Loans: | ||||||||||||||||||||
Residential real estate | 16,462,002 | 915,739 | 7.44 | % | 4,083,821 | 240,405 | 7.84 | % | ||||||||||||
Construction and land development | 4,791,893 | 229,327 | 6.40 | % | 1,111,919 | 43,128 | 5.17 | % | ||||||||||||
Commercial, including real estate | 8,192,899 | 488,518 | 7.97 | % | 6,483,930 | 351,785 | 7.23 | % | ||||||||||||
Commercial finance leases | 3,009,410 | 159,021 | 7.06 | % | 4,449,914 | 239,002 | 7.15 | % | ||||||||||||
Home equity | 3,881,431 | 188,872 | 6.51 | % | 976,804 | 32,096 | 4.38 | % | ||||||||||||
Installment | 452,368 | 24,240 | 7.16 | % | 240,665 | 13,083 | 7.24 | % | ||||||||||||
Total loans | 36,790,003 | 2,005,717 | 7.29 | % | 17,347,053 | 919,499 | 7.06 | % | ||||||||||||
Total interest earning assets | 50,616,347 | 2,390,312 | 6.31 | % | 28,236,947 | 1,080,714 | 5.10 | % | ||||||||||||
Allowance for loan and lease losses | (321,940 | ) | (299,921 | ) | ||||||||||||||||
Noninterest-bearing cash | 1,173,779 | 894,155 | ||||||||||||||||||
Premises and equipment | 943,132 | 855,927 | ||||||||||||||||||
Other assets | 469,879 | 361,983 | ||||||||||||||||||
Total assets | 52,881,197 | 30,049,091 | ||||||||||||||||||
Liabilities and Stockholders’ Equity | ||||||||||||||||||||
Interest-bearing Deposits | ||||||||||||||||||||
Savings | 5,448,242 | 81,792 | 2.01 | % | 5,441,018 | 40,074 | 0.98 | % | ||||||||||||
NOW, money market and escrow | 4,385,916 | 110,222 | 3.36 | % | 1,214,043 | 9,598 | 1.05 | % | ||||||||||||
Certificates of deposit | 32,289,765 | 927,065 | 3.84 | % | 16,422,057 | 478,329 | 3.88 | % | ||||||||||||
Total interest-bearing deposits | 42,123,923 | 1,119,079 | 3.55 | % | 23,077,118 | 528,001 | 3.05 | % | ||||||||||||
Noninterest-bearing deposits | 5,378,427 | — | 2,002,415 | — | ||||||||||||||||
| 47,502,350 | 1,119,079 | 3.15 | % | 25,079,533 | 528,001 | 2.80 | % | |||||||||||||
Other liabilities | 159,624 | 170,480 | ||||||||||||||||||
Stockholders’ equity | 5,219,223 | 4,799,078 | ||||||||||||||||||
Total Liabilities and Stockholders’ Equity | $ | 52,881,197 | $ | 30,049,091 | ||||||||||||||||
Net interest spread | 3.16 | % | 2.30 | % | ||||||||||||||||
Net interest income | $ | 1,271,233 | $ | 552,713 | ||||||||||||||||
Net margin on earning assets | 3.36 | % | 2.61 | % | ||||||||||||||||
35
Table of Contents
Average Balances, Interest, and Yields/Rates
| Years Ended December 31, | ||||||||||||||||||||
| 2004 | 2003 | |||||||||||||||||||
| Average balance | Interest | Yield/ Rate | Average balance | Interest | Yield/ Rate | |||||||||||||||
Assets: | ||||||||||||||||||||
Federal Funds Sold and FHLB deposit | $ | 8,852,235 | $ | 119,093 | 1.35 | % | $ | 7,366,884 | $ | 80,363 | 1.09 | % | ||||||||
FHLB and FRB stock | 144,232 | 7,004 | 4.86 | % | 175,874 | 8,195 | 4.66 | % | ||||||||||||
Investment Securities | ||||||||||||||||||||
Mortgage backed | 5,690 | 155 | 2.72 | % | 97,479 | 3,479 | 3.57 | % | ||||||||||||
Preferred trust | 300,000 | 30,000 | 10.00 | % | 300,000 | 30,000 | 10.00 | % | ||||||||||||
Equity security | 30,000 | 1,380 | 4.60 | % | 30,000 | 884 | 2.95 | % | ||||||||||||
Total investment securities | 335,690 | 31,535 | 9.39 | % | 427,479 | 34,363 | 8.04 | % | ||||||||||||
Loans held for sale | 1,203,151 | 74,775 | 6.21 | % | 2,216,600 | 123,471 | 5.57 | % | ||||||||||||
Loans: | ||||||||||||||||||||
Residential real estate | 4,167,850 | 336,535 | 8.07 | % | 5,417,137 | 418,714 | 7.73 | % | ||||||||||||
Construction and land development | 2,567,577 | 153,195 | 5.97 | % | 851,024 | 39,983 | 4.70 | % | ||||||||||||
Commercial, including real estate | 7,297,376 | 526,957 | 7.22 | % | 5,369,730 | 366,942 | 6.83 | % | ||||||||||||
Commercial finance leases | 4,331,791 | 312,156 | 7.21 | % | 2,717,558 | 228,970 | 8.43 | % | ||||||||||||
Home equity | 1,117,609 | 52,209 | 4.67 | % | 706,162 | 34,622 | 4.90 | % | ||||||||||||
Installment | 295,509 | 21,298 | 7.21 | % | 392,363 | 27,550 | 7.02 | % | ||||||||||||
Total loans | 19,777,712 | 1,402,350 | 7.09 | % | 15,453,974 | 1,116,781 | 7.23 | % | ||||||||||||
Total interest earning assets | 30,313,020 | 1,634,757 | 5.39 | % | 25,640,811 | 1,363,173 | 5.32 | % | ||||||||||||
Allowance for loan and lease losses | (303,900 | ) | (278,525 | ) | ||||||||||||||||
Noninterest-bearing cash | 877,046 | 1,109,656 | ||||||||||||||||||
Premises and equipment | 895,415 | 858,267 | ||||||||||||||||||
Other assets | 247,553 | 128,283 | ||||||||||||||||||
Total assets | 32,029,134 | 27,458,492 | ||||||||||||||||||
Liabilities and Stockholders’ Equity | ||||||||||||||||||||
Interest-bearing Deposits | ||||||||||||||||||||
Savings | 5,483,001 | 61,217 | 1.12 | % | 6,428,669 | 60,083 | 0.93 | % | ||||||||||||
NOW, money market and escrow | 1,329,040 | 15,064 | 1.13 | % | 762,932 | 9,108 | 1.19 | % | ||||||||||||
Certificates of deposit | 18,307,400 | 703,246 | 3.84 | % | 15,947,470 | 681,344 | 4.27 | % | ||||||||||||
Total interest-bearing deposits | 25,119,441 | 779,527 | 3.10 | % | 23,139,071 | 750,535 | 3.24 | % | ||||||||||||
Noninterest-bearing deposits | 2,032,980 | — | 2,115,811 | — | ||||||||||||||||
| 27,152,421 | 779,527 | 2.87 | % | 25,254,882 | 750,535 | 2.97 | % | |||||||||||||
Other liabilities | 179,707 | 173,945 | ||||||||||||||||||
Stockholders’ equity | 4,697,006 | 2,029,665 | ||||||||||||||||||
Total Liabilities and Stockholders’ Equity | $ | 32,029,134 | $ | 27,458,492 | ||||||||||||||||
Net interest spread | 2.52 | % | 2.35 | % | ||||||||||||||||
Net interest income | $ | 855,230 | $ | 612,638 | ||||||||||||||||
Net margin on earning assets | 2.82 | % | 2.39 | % | ||||||||||||||||
36
Table of Contents
The following table describes the impact on our interest revenue and expense resulting from changes in average balances and average rates for the periods indicated. The change in interest revenue or expense due to both volume and rate divided proportionately between the rate and volume variances.
Nine Months Ended September 30, 2005 compared to 2004 Variance due to : | Year Ended December 31, 2004 compared to 2003 Variance due to : | |||||||||||||||||||||||
| Total | Rate | Volume | Total | Rate | Volume | |||||||||||||||||||
Interest Earning Assets: | ||||||||||||||||||||||||
Federal Funds Sold and FHLB Deposit | $ | 180,986 | $ | 163,009 | $ | 17,977 | $ | 38,730 | $ | 20,775 | $ | 17,955 | ||||||||||||
FHLB and FRB stock | 3,829 | 811 | 3,018 | (1,191 | ) | 334 | (1,525 | ) | ||||||||||||||||
Investment Securities | ||||||||||||||||||||||||
Mortgage backed | (140 | ) | (70 | ) | (70 | ) | (3,324 | ) | (668 | ) | (2,656 | ) | ||||||||||||
Preferred trust | (15,083 | ) | 546 | (15,629 | ) | — | — | — | ||||||||||||||||
Equity security | (698 | ) | (698 | ) | — | 496 | 496 | — | ||||||||||||||||
Loans held for sale | 54,486 | (13,682 | ) | 68,168 | (48,696 | ) | 12,969 | (61,665 | ) | |||||||||||||||
Loans: | ||||||||||||||||||||||||
Residential real estate | 675,334 | (21,185 | ) | 696,519 | (82,179 | ) | 17,996 | (100,175 | ) | |||||||||||||||
Construction and land development | 186,199 | 12,510 | 173,689 | 113,212 | 13,364 | 99,848 | ||||||||||||||||||
Commercial, including real estate | 136,733 | 38,431 | 98,302 | 160,015 | 21,836 | 138,179 | ||||||||||||||||||
Commercial finance leases | (79,981 | ) | (2,988 | ) | (76,993 | ) | 83,186 | (36,994 | ) | 120,180 | ||||||||||||||
Home equity | 156,776 | 22,037 | 134,739 | 17,587 | (1,705 | ) | 19,292 | |||||||||||||||||
Installment | 11,157 | (234 | ) | 11,391 | (6,252 | ) | 711 | (6,963 | ) | |||||||||||||||
Total interest revenue | 1,309,598 | 198,487 | 1,111,111 | 271,584 | 49,114 | 222,470 | ||||||||||||||||||
Interest-bearing Liabilities | ||||||||||||||||||||||||
Savings | 41,718 | 41,665 | 53 | 1,134 | 10,712 | (9,578 | ) | |||||||||||||||||
NOW, money market and escrow | 100,624 | 45,890 | 54,734 | 5,956 | (483 | ) | 6,439 | |||||||||||||||||
Certificates of deposit | 448,736 | (8,561 | ) | 457,297 | 21,902 | (72,875 | ) | 94,777 | ||||||||||||||||
Total interest-bearing deposits | 591,078 | 78,994 | 512,084 | 28,992 | (62,646 | ) | 91,638 | |||||||||||||||||
Net interest income | $ | 718,520 | $ | 119,493 | $ | 599,027 | $ | 242,592 | $ | 111,760 | $ | 130,832 | ||||||||||||
37
Table of Contents
Provision for Loan and Lease Losses and Analysis of Allowance for Loan and Lease Losses
Lending involves a risk that our loans and leases may not be repaid in full and a credit loss will result. Credit losses occur in varying amounts due to, among other factors, the type of loans being made, the credit-worthiness of the borrowers over the term of the loans, the quality of the collateral for the loan, if any, as well as general economic conditions. We maintain a reserve account for credit losses called the allowance for loan and lease losses, and charge all probable credit losses against this account in accordance with regulatory guidance, industry standards, and generally accepted accounting principles. We charge a provision for loan and lease losses to earnings to maintain our allowance for loan and lease losses at a level that we consider to represent our best estimate of the losses known and inherent in the portfolio that are both probable and reasonable to estimate, based on, among other factors, prior loss experience, volume and type of lending conducted, industry standards, economic conditions (particularly as such conditions relate to AmericasBank’s market area), regulatory guidance, the financial condition of the borrower, historical payment performance and the collateral securing the loans and leases. Recoveries on loans previously charged off are added back to the allowance.
The provision for loan and lease losses was $35,000 for the nine months ended September 30, 2005, compared to $20,000 for the nine months ended September 30, 2004. The provision for each period reflects our risk assessment of the portfolio and the growth in loan and leases balances outstanding. During the first nine months of 2005, we had nominal chargeoffs and no recoveries compared to nominal chargeoffs and $16,907 in recoveries for the first nine months of 2004.
The provision for loan and lease losses was $20,000 for the year ended December 31, 2004, compared to $75,000 for the year ended December 31, 2003, a decrease of $55,000. The decrease was primarily the result of a change in our risk assessment of the portfolio and a reduction in the amount of credit losses charged against the allowance in the respective periods. We had net recoveries of $20,050 in 2004 compared to net charge offs of $52,692 in 2003.
We have developed a methodology for evaluating the adequacy of the allowance for loan and lease losses that distinguishes between credits evaluated as a group by either loan or risk rating category and those evaluated individually. We have predetermined allowance percentages based on credit types and for each risk rating category. All loans and leases are assigned a risk rating when they are made. This risk rating is reassessed by management periodically using the various evaluation factors mentioned above. Loans and leases that exhibit an acceptable level of risk per our internal risk grading system are grouped by category and assigned a standard reserve percentage when assessing the adequacy of the allowance for loan and lease losses. Loans and leases that are adversely risk-rated, or exhibit characteristics that suggest we have a heightened risk of default, are evaluated separately from non-adversely risk rated credits. Each adversely risk rated credit is assigned a standard reserve based on its risk rating or a special reserve based on management’s assessment of the particular risk factors related to it, which may be greater or less than the standard reserve for that risk rating.
The predetermined percentages that we use are based on management’s judgment as to appropriate reserve percentages for various categories of loans, and adjusting those values based on the following: historical losses in each category, historical and current delinquency in each category, underwriting standards in each category, comparison of our losses and delinquencies to peer group performance and an assessment of the likely impact of economic and other external conditions on the performance of each category.
A test of the adequacy of the allowance for loan and lease losses is performed and reported to the Board of Directors on a quarterly basis by our senior lending officer. Our senior lending officer will recommend an increase or decrease in the provision and the board will approve or disapprove the recommendation based on a discussion of the risk factors. We believe that we use the most reliable information available to us to make a determination with respect to the allowance for loan and lease losses, recognizing that the determination is inherently subjective and that future adjustments may be necessary depending upon, among other factors, a change in economic conditions of specific borrowers or generally in the economy, and new information that becomes available to us. However, the allowance for loan and lease losses may not be sufficient to absorb losses on nonperforming assets, and may not be sufficient to cover losses on nonperforming assets in the future.
38
Table of Contents
The allowance for loan and lease losses represented 0.76%, 0.99% and 1.75% of total loans at September 30, 2005, December 31, 2004 and December 31, 2003, respectively. The decline in the allowance as a percentage of total loans is due to the growth of our loan portfolio and the change in the composition of our loans. A primary focus of our lending activities are loans secured by a first lien on a one-to-four family property and loans secured by home equity loans. These types of loans accounted for 57.55%, 56.52% and 26.31% of total loans at September 30, 2005, December 31, 2004, and December 31, 2003. Management believes that such loans traditionally have an inherently lower risk of loss than other types of loans. The concentration of loans to investors secured by residential properties increases the risk of loss. Management allocates a higher reserve percentage for loans to investors as compared to residential loans that are owner occupied in assessing the allowance for loan and lease losses; however, to date, there is no historical precedent for the reserve percentages. AmericasBank has no exposure to foreign countries or foreign borrowers. Management believes that the current allowance for loan and lease losses is adequate.
39
Table of Contents
The following table represents an analysis of the allowance for loan and lease losses for the periods indicated:
Allowance for Loan and Lease Losses
| Nine Months Ended September 30, | Year Ended December 31, | |||||||||||||||
| 2005 | 2004 | 2004 | 2003 | |||||||||||||
Balance, beginning of period | $ | 315,127 | $ | 275,077 | $ | 275,077 | $ | 252,769 | ||||||||
Provision for loan and lease losses | 35,000 | 20,000 | 20,000 | 75,000 | ||||||||||||
Chargeoffs: | ||||||||||||||||
Residential real estate | — | — | — | — | ||||||||||||
Construction and land development | — | — | — | — | ||||||||||||
Commercial, including real estate | — | — | — | 54,040 | ||||||||||||
Commercial finance leases | — | — | — | — | ||||||||||||
Home equity | — | — | — | — | ||||||||||||
Installment | 143 | 145 | 357 | — | ||||||||||||
Total chargeoffs | 143 | 145 | 357 | 54,040 | ||||||||||||
Recoveries: | ||||||||||||||||
Residential real estate | — | — | — | — | ||||||||||||
Construction and land development | — | — | — | — | ||||||||||||
Commercial, including real estate | — | 16,907 | 20,407 | 1,348 | ||||||||||||
Commercial finance leases | — | — | — | — | ||||||||||||
Home equity | — | — | — | — | ||||||||||||
Installment | — | — | — | — | ||||||||||||
Total recoveries | — | 16,907 | 20,407 | 1,348 | ||||||||||||
Net chargeoffs | 143 | (16,762 | ) | (20,050 | ) | 52,692 | ||||||||||
Balance, end of period | $ | 349,984 | $ | 311,839 | $ | 315,127 | $ | 275,077 | ||||||||
Allowance for loan losses to total loans | 0.76 | % | 1.32 | % | 0.99 | % | 1.75 | % | ||||||||
Ratio of net-chargeoffs (recoveries) during the period to average loans outstanding during period | 0.00 | % | (0.1 | )0% | (0.1 | )0% | 0.34 | % | ||||||||
40
Table of Contents
The following table provides a breakdown of the allowance for loan and lease losses as of September 30, 2005 and 2004, and as of December 31, 2004 and 2003.
Allocation of Allowance for Loan and Lease Losses
| September 30, | December 31, | |||||||||||||||||||||||
| 2005 | 2004 | 2004 | 2003 | |||||||||||||||||||||
| Amount | % of Loans in Each Category | Amount | % of Loans in Each Category | Amount | % of Loans in Each Category | Amount | % of Loans in Each Category | |||||||||||||||||
Residential real estate (1) | $ | 71,873 | 45.73 | % | $ | 68,451 | 32.83 | % | $ | 79,492 | 49.67 | % | $ | 42,379 | 20.44 | % | ||||||||
Construction and land development (1) | 92,448 | 14.42 | % | 35,180 | 5.98 | % | 45,640 | 12.54 | % | 3,676 | 4.68 | % | ||||||||||||
Commercial, including real estate (1) | 113,845 | 22.86 | % | 88,270 | 36.85 | % | 73,476 | 17.94 | % | 51,204 | 36.07 | % | ||||||||||||
Commercial finance leases | 27,750 | 4.79 | % | 98,555 | 17.93 | % | 92,345 | 11.84 | % | 136,702 | 31.14 | % | ||||||||||||
Home equity | 34,180 | 11.82 | % | 19,615 | 4.95 | % | 22,923 | 6.85 | % | 23,809 | 5.87 | % | ||||||||||||
Installment | 433 | 0.38 | % | 865 | 1.46 | % | 920 | 1.16 | % | 6,697 | 1.80 | % | ||||||||||||
Unallocated | 9,455 | 0.00 | % | 903 | 0.00 | % | 331 | 0.00 | % | 10,610 | 0.00 | % | ||||||||||||
Total | $ | 349,984 | 100.00 | % | $ | 311,839 | 100.00 | % | $ | 315,127 | 100.00 | % | $ | 275,077 | 100.00 | % | ||||||||
| (1) | Our residential real estate loans, construction and land development loans and commercial loans, including real estate, include owner occupied residential mortgages and one-to-four family and multi-family mortgages held by investors. |
Noninterest Revenue
Nine months ended September 30, 2005 compared to nine months ended September 30, 2004
Noninterest revenue consisted primarily of mortgage banking gains and fees from the sale of mortgage loans, and service charges on deposit accounts, which includes debit card fees and ATM fees. Noninterest revenues increased $270,246 for the nine months ended September 30, 2005, to $387,153, from $116,907 for the nine months ended September 30, 2004.
The increase for the nine months ended September 30, 2005, was primarily from a $252,617 increase in mortgage banking gains and fees from $77,190 for the nine months ended September 30, 2004 to $329,807 for the nine months ended September 30, 2005. We have expanded our mortgage business to originate and sell loans as either a correspondent or broker and had six mortgage loan originators at September 30, 2005, compared to one during the first nine months of 2004.
Service charges on deposit accounts and other fees increased to $57,346 for the nine months ended September 30, 2005, from $39,717 for the nine months ended September 30, 2004, respectively. The increase was primarily from fees on business accounts and ATM service charges. We have an ATM at each of our two branch locations.
Year ended December 31, 2004 compared to year ended December 31, 2003
Noninterest revenue consisted primarily of mortgage banking gains and fees from the sale of mortgage loans and service charges on deposit accounts, which includes debit card fees and ATM fees. Noninterest revenues amounted to $210,517 for the year ended December 31, 2004, a decrease of $94,108 or 30.9% from the 2003 level of $304,625. In general, the decrease resulted from a decline in mortgage banking gains and fees of $109,755 during 2004. During much of 2004 we operated with only one mortgage loan origination officer compared to five through May 2003. During the last quarter of 2002, we established and staffed a mortgage division to originate and sell loans to pre-established investors. The momentum from our mortgage business and associated earnings were substantially reduced after May 2003 when the division manager and several of his loan originators and staff severed employment from us in favor of another opportunity.
41
Table of Contents
Noninterest Expenses
Nine months ended September 30, 2005 compared to nine months ended September 30, 2004
The following table compares our noninterest expenses for the nine months ended September 30, 2005 and 2004, and for the years ended December 31, 2004 and 2003.
| Nine Months Ended September 30, | Years Ended December 31, | ||||||||||||||
| 2005 | 2004 | 2004 | 2003 | ||||||||||||
Salaries and commissions | $ | 1,532,488 | $ | 957,242 | $ | 1,327,740 | $ | 846,096 | |||||||
Stock-based compensation | 122,168 | 159,555 | 238,357 | — | |||||||||||
Deferred salaries and commissions | (830,599 | ) | (173,297 | ) | (257,445 | ) | — | ||||||||
Salaries | 824,057 | 943,500 | 1,308,652 | 846,096 | |||||||||||
Employee benefits | 247,594 | 181,105 | 251,049 | 155,540 | |||||||||||
Occupancy | 131,139 | 97,730 | 143,344 | 130,756 | |||||||||||
Furniture and equipment | 88,289 | 72,841 | 101,704 | 79,928 | |||||||||||
Other | 647,385 | 544,888 | 774,333 | 748,704 | |||||||||||
Total noninterest expenses | $ | 1,938,464 | $ | 1,840,064 | $ | 2,579,082 | $ | 1,961,024 | |||||||
Noninterest expenses for the nine months ended September 30, 2005, were $1,938,464, compared to $1,840,064 for the same period in 2004. The increase for the nine months ended September 30, 2005 was $98,400 or 5.4%. Salaries decreased $119,443 to $824,057 for the nine months ended September 30, 2005 compared to $943,500 for the nine months ended September 30, 2004, as more salary expense was deferred than in prior periods, as further described below. Also, in the first half of 2004 we expensed approximately $60,000 to provide severance benefits associated with our restructuring of certain staff positions. Employee benefits increased $66,489 to $247,594 for the nine months ended September 30, 2005 compared to $181,105 for the nine months ended September 30, 2004. The increase was mainly in payroll taxes, our IRA match, and health care benefits. Occupancy increased $33,409 to $131,139 for the nine months ended September 30, 2005 compared to $97,730 for the nine months ended September 30, 2004. This increase is primarily from additional rent associated with our Towson mortgage office and additional depreciation expense arising from the renovations to the banking floor of our 500 York Road location. Furniture and equipment increased $15,448 to $88,289 for the nine months ended September 30, 2005 compared to $72,841 for the nine months ended September 30, 2004. This expense category includes certain expenses associated with the renovation of 500 York Road that were expensed in the first quarter of 2005. Other expense increased $102,497 to $647,385 for the nine months ended September 30, 2005 compared to $544,888 for the nine months ended September 30, 2004. Increases in this expense category were associated with software depreciation, data processing fees, loan expenses, and professional services. The increases in these categories were partially offset by a decline in advertising and marketing.
As indicated above, in January 2005, we reevaluated our estimate of the costs to originate or acquire loans and leases and loans held for sale. This analysis resulted in a higher amount of costs deferred per loan than in prior periods. Among other things, the deferral of loan origination costs results in a reduction of salary expense as evidenced by the table above. Approximately $605,189 (or 72.9%) of the $830,599 deferred amount for the nine months ended September 30, 2005 was commission expense paid to mortgage loan originators. The remaining $225,410 (or 27.1%) of the deferred amount constituted direct costs associated with originating loans during the first nine months of 2005. These costs represent employee compensation and related fringe benefits directly related to time spent originating loans for our portfolio. For the nine months ended September 30, 2004 and year ended December 31, 2004, we deferred commission expense paid to loan originators but did not defer the fixed costs associated with originating loans as management deemed these costs immaterial.
42
Table of Contents
In summary, as our mortgage division generates more business, a greater proportion of our total compensation expense gets deferred. This, in turn, makes comparing our compensation expense between 2004 (when we had modest mortgage banking activity) and 2005 difficult. Also, it is important to note that a significant portion of the deferred expense for the nine months ended September 30, 2005 was recognized during that same period as a reduction to mortgage gains and fees or as a yield adjustment to interest revenue.
Year ended December 31, 2004 compared to year ended December 31, 2003
Noninterest expenses in the year ended December 31, 2004 amounted to $2,579,082 compared to the 2003 level of $1,961,024, an increase of $618,058 or 31.5%. Salaries were $1,308,652 for 2004, an increase of $462,556 or 54.7% over the $846,096 level in 2003. In July and August of 2003, we replaced our president and chief executive officer, our senior loan officer, and added a chief financial officer, thereby increasing salary expense in the second half of 2003 which carried into 2004. The aggregate annual salary of our three new executives was $325,000 compared to the aggregate annual salary of $165,000 of those replaced. Additionally, following the completion of our offering in March of 2004, we hired experienced operating managers for our bank and mortgage operations, and expanded our mortgage operations staff to support our growth strategy in the mortgage business.
Other operating expenses for 2004 were $774,333, or $25,629 (3.4%) higher than the 2003 level of $748,704. The increase was the result of higher expenses for data processing, marketing, regulatory compliance, loan expenses and ATM and credit card processing as we positioned the company to expand our product offerings and operated as a public company in 2004. These increases were partially offset by a decline in professional services and correspondent bank charges. Other operating expenses in 2004 also included approximately $29,000 in expense to record repurchased mortgage loans.
Income Taxes
We have not incurred any income tax liability since our inception. At December 31, 2004 and December 31, 2003, we had net tax operating loss carryforwards of approximately $5,232,241 and $3,933,331, respectively, available to offset future taxable income. The carryforwards at December 31, 2004 will expire beginning in 2017. However, as a result of the offering, due to the application of the federal tax laws, we could lose some or all of our net operating loss carryforwards.
Net Loss
Nine months ended September 30, 2005 compared to nine months ended September 30, 2004
Our net loss for the nine months ended September 30, 2005 was $315,078 or $(0.33) per basic and diluted common share, a decrease of $875,366 compared to our net loss of $1,190,444 or $(1.62) per basic and diluted common share for the nine months ended September 30, 2004.
Year ended December 31, 2004 compared to year ended December 31, 2003
Our net loss was $1,533,335 or $(1.95) per basic and diluted common share for 2004, an increase of $414,574 or 37.1% compared to our net loss of $1,118,761 or $(7.37) per basic and diluted common share during 2003.
Analysis of Financial Condition
Investment Securities
We have chosen to invest our available funds primarily in federal funds sold and Federal Home Loan Bank deposits. Management has made the decision to maintain its available funds in highly liquid assets because it wishes to ensure that funds are readily available to fund the growth of the loan portfolio. Management believes that this strategy will allow us to maximize interest margins while maintaining appropriate levels of liquidity to fund loan
43
Table of Contents
growth. This strategy has a negative effect on net interest income as investment securities would generally yield a higher interest rate than that being paid on our liquid assets. Also, the volatility of our deposits require that we retain funds in liquid assets.
The investment portfolio at September 30, 2005, amounted to $30,000, a decrease of $318,182, from $348,182 at December 31, 2004. All securities at September 30, 2005, and December 31, 2004, were classified as available for sale. The majority of the decrease was related to the redeemable preferred trust investment security issued by Provident Trust II, a subsidiary of Provident Bankshares Corporation. On March 31, 2005, the security was redeemed at par. We invested the proceeds from this security in federal funds pending their use to fund loan growth.
The investment portfolio at December 31, 2004 amounted to $348,182, a decrease of $18,384 or 5.0%, from $366,566 at December 31, 2003. Like the securities held at December 31, 2004, all securities at December 31, 2003 were classified as available for sale. The decrease in the investment portfolio occurred primarily due to accelerated pay backs of our mortgage backed securities due to the low interest rate environment and the refinancing of mortgages in these mortgage pools. In general, the funds received from the pay backs of the mortgaged backed securities were invested in federal funds and not reinvested into investment securities due to management’s decision to retain liquid assets pending their use to fund loan growth. The carrying value of available for sale securities included a net unrealized gain of $17,760 at December 31, 2004 compared to a net unrealized gain of $17,706 as of December 31, 2003.
The following table sets forth a summary of the investment securities portfolio as of the periods indicated. Available for sale securities are reported at estimated fair value. There were no held to maturity securities in our portfolio during any period presented.
Investment Secuirties
| September 30, | December 31, | |||||||||||
| 2005 | 2004 | 2004 | 2003 | |||||||||
Available For Sale Securities | ||||||||||||
Preferred Trust | $ | — | $ | 317,762 | $ | 317,760 | $ | 317,760 | ||||
Mortgage backed | — | 565 | 422 | 18,806 | ||||||||
Equity | 30,000 | 30,000 | 30,000 | 30,000 | ||||||||
Total Available for Sale Securities | $ | 30,000 | $ | 348,327 | $ | 348,182 | $ | 366,566 | ||||
The following table shows the amortized cost, fair value and weighted average yield of our securities portfolio at September 30, 2005. The security, which is an equity investment in Atlantic Central Bankers Bank, has no stated term. In addition to our equity investment, we regularly sell overnight federal funds at the prevailing market rate to Atlantic Central Bankers Bank, and we have also purchased participations in loans from them. Currently, Atlantic Central Bankers Bank reports that it has 250 shareholder banks. This low number of shareholders limits the marketability and trading environment for the stock. Recent sales of Atlantic Central Bankers Bank stock by Atlantic Central Bankers Bank indicates that there has been no loss in the fair value of our investment.
September 30, 2005 Available for Sale | |||||||||
| Amortized Cost | Fair Value | Average Weighted | |||||||
Equity security | 30,000 | 30,000 | 2.50 | % | |||||
| $ | 30,000 | $ | 30,000 | 2.50 | % | ||||
44
Table of Contents
Loan Portfolio
Loans and leases, net of allowance, unearned fees and origination costs increased $14,652,535 or 46.9% to $45,897,697 at September 30, 2005, from $31,245,162 at December 31, 2004.
Residential real estate loans increased by $5,442,794 (34.6%), construction and land development loans increased by $2,705,590 (68.1%), commercial loans including commercial real estate loans increased by $4,904,072 (86.2%) and home equity loans increased by $3,304,896 (152.2%) from their respective balances at December 31, 2004. Installment loans decreased by $194,389 (52.7%) and commercial finance leases decreased by $1,531,831 (40.8%) from their respective balances at December 31, 2004, from payoffs and principal amortization. We have reduced our efforts to grow the lease portfolio. Going forward, we expect to continue to see wide changes in our loan categories as we experience scheduled payoffs and as we grow our loan portfolio, particularly residential real estate loans.
The loan portfolio, net of allowance, unearned fees and origination costs increased $15,820,314 or 102.6% to $31,245,162 at December 31, 2004 from $15,424,848 at December 31, 2003. Residential real estate loans increased by $12,530,646 (390.0%), construction and land development loans increased by $3,240,569 (440.8%), commercial loans including commercial real estate loans increased by $19,093 (0.3%), commercial finance leases decreased by $1,142,000, (23.3%), home equity loans increased by $1,249,475 (135.5%) and installment loans increased by $86,004 (30.4%) from their respective balances at December 31, 2003.
Loans secured by real estate comprise the majority of the loan portfolio. AmericasBank’s loan customers are generally located in the greater Baltimore metropolitan area.
The following table summarizes the composition of the loan portfolio by dollar amount and percentages:
| Loan Portfolio | |||||||||||||||||||||
| September 30, | December 31, | ||||||||||||||||||||
| 2005 | % | 2004 | % | 2003 | % | ||||||||||||||||
Residential real estate (1) | $ | 21,186,792 | 45.73 | % | $ | 15,743,998 | 49.67 | % | $ | 3,213,352 | 20.44 | % | |||||||||
Construction and land development (1) | 6,681,405 | 14.42 | % | 3,975,815 | 12.54 | % | 735,246 | 4.68 | % | ||||||||||||
Commercial, including real estate (1) | 10,592,389 | 22.86 | % | 5,688,317 | 17.94 | % | 5,669,224 | 36.07 | % | ||||||||||||
Commercial finance leases | 2,219,776 | 4.79 | % | 3,751,607 | 11.84 | % | 4,893,607 | 31.14 | % | ||||||||||||
Home equity | 5,476,557 | 11.82 | % | 2,171,661 | 6.85 | % | 922,186 | 5.87 | % | ||||||||||||
Installment | 174,762 | 0.38 | % | 369,151 | 1.16 | % | 283,147 | 1.80 | % | ||||||||||||
| 46,331,681 | 100.00 | % | 31,700,549 | 100.00 | % | 15,716,762 | 100.00 | % | |||||||||||||
Deferred loan origination fees, net of cost | (84,000 | ) | (140,260 | ) | (16,837 | ) | |||||||||||||||
Allowance for loan and lease losses | (349,984 | ) | (315,127 | ) | (275,077 | ) | |||||||||||||||
| $ | 45,897,697 | $ | 31,245,162 | $ | 15,424,848 | ||||||||||||||||
| (1) | Our loan portfolio includes owner occupied residential mortgages and one-to-four family and multi-family mortgages held by investors. At September 30, 2005, $9,920,688 of residential real estate loans, $1,643,428 of the construction and land development loans and $2,059,372 of commercial loans, including real estate loans, were to investors. |
45
Table of Contents
The following table presents the maturities or repricing periods of our loan portfolio at September 30, 2005.
| Loan Maturity Distribution at September 30, 2005 | ||||||||||||
| 1 year or less | 1-5 years | After 5 years | Total | |||||||||
Residential real estate | $ | 3,503,921 | $ | 1,279,913 | $ | 16,402,958 | $ | 21,186,792 | ||||
Construction and land development | 2,293,059 | 2,966,229 | 1,422,117 | 6,681,405 | ||||||||
Commercial, including real estate | 2,454,550 | 1,274,984 | 6,862,855 | 10,592,389 | ||||||||
Commercial finance leases | 267,735 | 1,952,041 | — | 2,219,776 | ||||||||
Home equity | 413,656 | 13,800 | 5,049,101 | 5,476,557 | ||||||||
Installment | 3,487 | 98,785 | 72,490 | 174,762 | ||||||||
Total loans | $ | 8,936,408 | $ | 7,585,752 | $ | 29,809,521 | $ | 46,331,681 | ||||
Fixed rate | $ | 2,991,844 | $ | 5,135,174 | $ | 3,277,114 | $ | 11,404,132 | ||||
Variable rate | 5,944,564 | 2,450,578 | 26,532,407 | 34,927,549 | ||||||||
Total loans | $ | 8,936,408 | $ | 7,585,752 | $ | 29,809,521 | $ | 46,331,681 | ||||
Asset Quality
We perform monthly reviews of all delinquent loans and leases and loan officers are charged with working with customers to resolve potential credit issues and payment delinquency in a timely manner. We generally classify loans and leases as nonaccrual when collection of full principal and interest under the original terms of the credit is not expected or payment of principal or interest has become 90 days past due. Classifying a credit as nonaccrual results in us no longer accruing interest on such loan or lease and reversing any interest previously accrued but not collected. We will generally restore a nonaccrual loan or lease to accrual status when delinquent principal and interest payments are brought current and we expect to collect future monthly principal and interest payments in a timely manner and in accordance with the original repayment schedule. Generally, we credit all interest payments received on nonaccruing credits to the principal balance of the loan or lease to reduce our credit exposure. If we have collateral that mitigates our credit exposure, we may recognize interest as income when received.
Information about non-performing loans is as follows:
| September 30, | December 31, | |||||||||||
| 2005 | 2004 | 2004 | 2003 | |||||||||
Nonaccrual loans | $ | 622,761 | $ | 35,000 | $ | 54,126 | $ | 35,000 | ||||
Unrecorded interest on nonaccrual loans | 39,553 | 4,052 | 6,521 | 1,925 | ||||||||
Loans past due 90 days or more and still accruing interest | — | — | 121,616 | — | ||||||||
The substantial increase in nonaccrual loans was related to one loan in which we held an approximately 10% participation. Our loan balance to this borrower was $587,761 at September 30, 2005.
The non-performing loan is to a land developer for the purchase and development of raw land that was under contract for sale as developed lots to a national homebuilder. The project ran into delays during the permitting process related primarily to storm water management issues. As a result of the delays, the interest reserve was exhausted, causing the loan to go into interest payment default. The original homebuilder has agreed to release the borrower from its purchase agreement. The participating banks have agreed to a 95 day forbearance period during which the borrower will negotiate with another homebuilder to be a replacement purchaser. We continue to believe that we will collect all of our outstanding principal balance, accrued interest and expenses, however it is possible that this will not be the case.
46
Table of Contents
We apply the provisions of Statement of Financial Accounting Standards No. 114 (“SFAS No. 114”),Accounting by Creditors for Impairment of a Loan, as amended by Statement of Financial Accounting Standards No. 118 (“SFAS No. 118”),Accounting by Creditors for Impairment of a Loan-Income Recognition and Disclosure. SFAS No. 114 and SFAS No. 118 require that impaired loans, which consist of all modified loans and other loans for which collection of all contractual principal and interest is not probable, be measured based on the present value of expected future cash flows discounted at the loan’s effective interest rate, or at the loan’s observable market price or the fair value of the collateral if the loan is collateral dependent. If the measure of the impaired loan is less than the recorded investment in the loan, an impairment is recognized through a valuation allowance and corresponding provision for loan and lease losses. We write off impaired loans when collection of the loan is doubtful. We generally classify nonaccrual loans and leases as impaired. As of September 30, 2005, December 31, 2004 and December 31, 2003, no credit had been identified as impaired other than the nonaccrual loans and leases described above.
We classify any property acquired as a result of foreclosure on a mortgage loan as foreclosed real estate and record it at the lower of the unpaid principal balance or fair value at the date of acquisition and subsequently carry the property at the lower of cost or net realizable value. We charge any required write-down of the loan to its net realizable value against the allowance for loan and lease losses at the time of foreclosure. We charge to expense any subsequent adjustments to net realizable value. Upon foreclosure, we generally require an appraisal of the property and, thereafter, appraisals of the property on at least an annual basis and external inspections on at least a quarterly basis. As of September 30, 2005, and December 31, 2004, we had no foreclosed real estate. As of December 31, 2003, we had $42,166 recorded as foreclosed real estate.
Deposits
We seek deposits within our market area by paying competitive interest rates and offering high quality customer service. In conjunction with our growth strategy, we offer premium rate certificates of deposit to support loan growth.
In the third quarter of 2004, we began using an Internet-based service to offer our certificates of deposit. The interest rate offered on these certificates of deposit is higher than what we would typically pay within our market. We have employed this service as an interim strategy to support our loan growth plans and view it as a cost effective and efficient process to raise deposits for specific terms. The use of higher cost certificates of deposit in the short to medium term (one to five years) is integral to the business plan to bring AmericasBank to profitability. The longer term funding strategy (over five years) is to replace these higher cost deposits with lower cost and less volatile core deposits from small businesses and professional firms. The successful implementation of this stage of the strategy is highly dependent on our ability to establish confidence and deliver superior services to this group of targeted customers.
At September 30, 2005, our total deposits have increased by $31,368,038 or 90.7% to $65,938,331 from $34,570,293 at December 31, 2004. Interest-bearing deposits increased $22,284,988 or 68.9% to $54,629,059 at September 30, 2005, from $32,344,071 at December 31, 2004. In addition, our noninterest-bearing deposits increased $9,083,050 or 408.0% from $2,226,222 at December 31, 2004, to $11,309,272 at September 30, 2005.
A majority of the increase in our interest bearing deposits was in certificates of deposit and money market accounts. The growth in these accounts was due to our utilization of the Internet-based service and the use of print advertising in local newspapers to offer certificates of deposit and other interest bearing core deposit products. During the first nine months of 2005, we issued $12,572,178 in certificates of deposit through the Internet-based service at an average cost of approximately 4.46%. Deposits currently outstanding from this source, including those generated during 2004, represented 36.5% of our interest bearing deposits as of September 30, 2005. We increased our money market account by $5,783,095 or 448.6% from $1,289,164 at December 31, 2004 to $7,072,259 at September 30, 2005, reflecting our strategy to reduce the bank’s reliance on higher cost certificates of deposit as a funding source.
47
Table of Contents
The increase in noninterest bearing deposits was primarily from new accounts opened for title agencies. We have focused our marketing efforts toward these businesses and feel that our mortgage loan business will further provide us with opportunities to sell our deposit services to more of these businesses. These are monies held for short periods of time pending the disbursement of funds in mortgage loan or mortgage loan refinancing transactions. The balances on deposit with us from these depositors can fluctuate greatly during any given month, depending on transaction scheduling and overall market conditions. These balances represent a substantial portion (approximately 76.6%) of our noninterest bearing deposits, which creates a real estate industry concentration. In order to meet the withdrawal needs of these customers, we monitor our liquidity on a daily basis.
At December 31, 2004, our total deposits were $34,570,293, amounting to a $9,161,455 or 36.1% increase over the December 31, 2003 level of $25,408,838. During 2004, we issued $8,316,044 in certificates of deposit through the Internet-based service at an average cost of approximately 3.49%. Deposits from this source represented 25.7% of our interest bearing deposits as of December 31, 2004.
The following table sets forth the composition of our deposits as of September 30, 2005, December 31, 2004 and December 31, 2003:
| Deposits | ||||||||||||||||||
| September 30, | December 31, | |||||||||||||||||
| 2005 | % | 2004 | % | 2003 | % | |||||||||||||
Noninterest-bearing | $ | 11,309,272 | 17.15 | % | $ | 2,226,222 | 6.44 | % | $ | 1,739,859 | 6.85 | % | ||||||
Interest-bearing: | ||||||||||||||||||
NOW accounts | 670,894 | 1.02 | % | 273,931 | 0.79 | % | 178,889 | 0.70 | % | |||||||||
Advances from borrowers for insurance and taxes | 88,364 | 0.13 | % | 53,110 | 0.15 | % | 25,675 | 0.10 | % | |||||||||
Money market | 7,072,259 | 10.73 | % | 1,289,164 | 3.73 | % | 708,438 | 2.79 | % | |||||||||
Savings | 4,784,520 | 7.26 | % | 5,716,711 | 16.54 | % | 6,011,613 | 23.66 | % | |||||||||
Certificates of deposit, $100,000 or more | 8,085,996 | 12.26 | % | 5,017,339 | 14.51 | % | 2,744,247 | 10.80 | % | |||||||||
Other certificates of deposit | 33,927,026 | 51.45 | % | 19,993,816 | 57.84 | % | 14,000,117 | 55.10 | % | |||||||||
| 54,629,059 | 82.85 | % | 32,344,071 | 93.56 | % | 23,668,979 | 93.15 | % | ||||||||||
Total deposits | $ | 65,938,331 | 100.00 | % | $ | 34,570,293 | 100.00 | % | $ | 25,408,838 | 100.00 | % | ||||||
The following is a summary of the maturity distribution of certificates of deposit as of September 30, 2005.
Certificates of Deposit Maturity Distribution September 30, 2005 | |||||||||||||||
Three or Less | Over Three Months to Six Months | Over Six Months to Twelve Months | Over Twelve | Total | |||||||||||
Certificates of deposit: | |||||||||||||||
Less than $100,000 | $ | 1,822,188 | $ | 4,802,125 | $ | 3,487,468 | $ | 23,815,245 | $ | 33,927,026 | |||||
Greater than or equal to $ 100,000 | 538,560 | 940,832 | 1,097,000 | 5,509,604 | 8,085,996 | ||||||||||
Total | $ | 2,360,748 | $ | 5,742,957 | $ | 4,584,468 | $ | 29,324,849 | $ | 42,013,022 | |||||
Interest Rate Sensitivity Analysis and Interest Rate Risk Management
A principal objective of our asset/liability management policy is to minimize the sensitivity of our earnings and the economic value of our equity to changes in interest rates by an ongoing review of the maturity and re-pricing of interest-earning assets and interest-bearing liabilities, anticipated loan production and pre-payments, deposit flows and trends and other aspects of our operations that are affected by market interest rates. Our management has primary responsibility for asset and liability management and our board of directors oversees this process.
48
Table of Contents
Asset/liability management policies and procedures are established by the board of directors to assess and monitor interest rate sensitivity in order to reduce vulnerability to interest rate fluctuations while maintaining adequate capital levels and acceptable levels of liquidity. Periodic financial reports supply us with information to evaluate and manage rate sensitivity and adherence to policy. Our goal is to manage assets and liabilities in a manner that stabilizes net interest income and net economic value within a broad range of interest rate environments. Adjustments to the mix of assets and liabilities are made periodically in an effort to achieve dependable, steady growth in net interest income regardless of the behavior of interest rates in general.
During 2004, we purchased new software to aid us in asset-liability management. The new system provides expanded reporting and has the capacity to facilitate our budgeting and forecasting. We also revised our policies and controls for managing interest rate risk and liquidity.
As part of the interest rate risk sensitivity analysis, we examine the extent to which our assets and liabilities are interest rate sensitive and monitor the interest rate sensitivity gap. An interest rate sensitive asset or liability is one that, within a defined time period, either matures or experiences an interest rate change in line with general market rates. The interest rate sensitivity gap is the difference between interest-earning assets and interest-bearing liabilities scheduled to mature or re-price within a defined time period. A positive gap is when the amount of interest rate sensitive assets exceeds the amount of interest rate sensitive liabilities. A negative gap is when the amount of interest rate sensitive liabilities exceeds the interest rate sensitive assets. During a period of rising interest rates, a negative gap would tend to adversely affect net interest income, while a positive gap would tend to result in an increase in net interest income. During a period of declining interest rates, a negative gap would tend to result in an increase in net interest income, while a positive gap would tend to adversely affect net interest income. When a neutral gap position is maintained and the re-pricing of assets and liabilities are equally flexible and move concurrently, the impact of any increase or decrease in interest rates on net interest income would be minimal.
We currently have a positive gap over the short term, which suggests that the net yield on interest earning assets may increase during periods of rising interest rates. However, a simple interest rate “gap” analysis by itself may not be an accurate indicator of how net interest income will be affected by changes in interest rates. Income associated with interest-earning assets and costs associated with interest-bearing liabilities may not be affected uniformly by changes in interest rates. In addition, the magnitude and duration of changes in interest rates may have a significant impact on net interest income. Although certain assets and liabilities may have similar maturities or periods of re-pricing, they may react in different degrees to changes in market interest rates. Interest rates on certain types of assets and liabilities fluctuate in advance of changes in general market interest rates, while interest rates on other types may lag behind changes in general market rates. In the event of a change in interest rate, prepayment and early withdrawal levels also could deviate significantly from those assumed in calculating the interest-rate gap. The ability of many borrowers to service their debts also may decrease in the event of an interest rate increase.
The table below presents our interest rate sensitivity at September 30, 2005. Because certain categories of securities and loans reprice before their maturity date even without regard to interest rate fluctuations, we use its respective repricing date in the table below.
49
Table of Contents
Interest Sensitivity Analysis September 30, 2005 | |||||||||||||||||||
| Maturing or Repricing | |||||||||||||||||||
Within 3 Months | 4 - 12 Months | 1 - 5 Years | Over 5 Years | Total | |||||||||||||||
Interest Earning Assets: | |||||||||||||||||||
Investment securities | $ | 30,000 | $ | — | $ | — | $ | — | $ | 30,000 | |||||||||
Loans | 14,784,477 | 8,997,051 | 19,190,371 | 3,359,782 | 46,331,681 | ||||||||||||||
Loans held for sale | 5,399,798 | — | — | — | 5,399,798 | ||||||||||||||
Federal Home Loan Bank and Federal Reserve Bank stock | 238,500 | — | — | — | 238,500 | ||||||||||||||
Federal funds sold and Federal Home Loan Bank deposit | 17,067,422 | — | — | — | 17,067,422 | ||||||||||||||
Total interest earning assets | 37,520,197 | 8,997,051 | 19,190,371 | 3,359,782 | 69,067,401 | ||||||||||||||
Interest Bearing Liabilities: | |||||||||||||||||||
Interest-bearing transaction deposits | 7,831,517 | — | — | — | 7,831,517 | ||||||||||||||
Savings accounts | 4,784,520 | — | — | — | 4,784,520 | ||||||||||||||
Time deposits | 2,360,748 | 10,327,425 | 29,324,849 | — | 42,013,022 | ||||||||||||||
Total interest-bearing deposits | 14,976,785 | 10,327,425 | 29,324,849 | — | 54,629,059 | ||||||||||||||
Period Gap | $ | 22,543,412 | $ | (1,330,374 | ) | $ | (10,134,478 | ) | $ | 3,359,782 | $ | 14,438,342 | |||||||
Cumulative Gap | $ | 22,543,412 | $ | 21,213,038 | $ | 11,078,560 | $ | 14,438,342 | |||||||||||
Cumulative Gap / Total Assets | 31.61 | % | 29.75 | % | 15.54 | % | 20.25 | % | |||||||||||
Liquidity
Our overall asset/liability strategy takes into account our need to maintain adequate liquidity to fund asset growth and deposit runoff. We monitor our federal funds sold position on a daily basis in that this is our primary source of liquidity. From time to time we may sell or participate out loans to create additional liquidity as required. Additional liquidity is also available from our loans held for sale, which amounted to $5,399,798 at September 30, 2005. We have no other sources of liquidity, such as lines of credit or correspondent relationships with other financial institutions. When we achieve breakeven profitability, we hope to be successful in reinstating our line of credit with the Federal Home Loan Bank, but we may not be successful in our efforts.
Our immediate sources of liquidity are cash and due from banks and short term investments. As of September 30, 2005, we had $1,130,918 in cash and due from banks, and $17,067,422 in federal funds sold and Federal Home Loan Bank deposits. Management has made a decision to maintain liquidity instead of investing in investment securities in order to ensure that funds are readily available to fund the growth of the loan portfolio.
Our deposits from title agencies and our certificates of deposit from the Internet-based service are subject to significant volatility, thereby increasing our need to have funds available. The balances on deposit with us from the title company depositors can fluctuate greatly during any given month, depending on transaction scheduling and overall market conditions. We believe that our ability to manage the volatility of these deposits will improve as we add more of this type of account to our customer base. The depositors from the Internet-based service are generally from outside our market area who “shop” for certificate of deposit rates. If we do not continue to offer premium rates, these depositors will not retain their accounts with us. Over the long term, adding more core deposits will reduce our reliance on premium certificates of deposit as a funding source and will reduce deposit volatility.
As of December 31, 2004 and 2003, we had $866,960 and $552,269 in cash and due from banks, and $4,356,587 and $8,186,477 in federal funds sold and deposits at the Federal Home Loan Bank.
Loans held for sale were $5,399,798 at September 30, 2005, $1,617,048 at December 31, 2004 and $1,229,041 at December 31, 2003.
50
Table of Contents
We have sufficient liquidity to meet our loan commitments as well as fluctuations in deposits. We usually retain maturing certificates of deposit as we offer competitive rates on certificates of deposit. We are not aware of any demands, trends, commitments, or events that would result in our inability to meet anticipated or unexpected liquidity needs. Although we do not have a line of credit, because of our large relative amount of federal funds sold, we believe that we can adequately satisfy all of our commitments.
Capital
Our stockholders’ equity amounted to $5,184,807 at September 30, 2005, a decrease of $210,997 from the $5,395,804 reported at December 31, 2004. Our stockholders’ equity was $1,532,637 at December 31, 2003.
The following table shows the regulatory capital ratios of AmericasBank Corp. and the minimum capital ratios currently required by our banking regulator to be “well capitalized” and “adequately capitalized.” We are considered “well capitalized.” For a discussion of these capital requirements, see “Supervision and Regulation - Capital Adequacy Guidelines” and “- Prompt Corrective Action.”
| Risk Based Capital Analysis | ||||||||||||||
| September 30, 2005 | December 31, 2004 | |||||||||||||
(dollars in thousands) | ||||||||||||||
Tier 1 Capital: | ||||||||||||||
Common stock | $ | 9 | $ | 9 | ||||||||||
Additional paid-in capital | 11,571 | 11,450 | ||||||||||||
Accumulated deficit | (6,395 | ) | (6,081 | ) | ||||||||||
Less: disallowed assets | (292 | ) | (295 | ) | ||||||||||
Total Tier 1 Capital | 4,893 | 5,083 | ||||||||||||
Tier 2 Capital: | ||||||||||||||
Allowance for loan and lease losses | 350 | 315 | ||||||||||||
Total Risk Based Capital | $ | 5,243 | $ | 5,398 | ||||||||||
Risk weighted assets | $ | 40,839 | $ | 27,075 | ||||||||||
| Regulatory Minimum to be | ||||||||||||||
| Well Capitalized | Adequately Capitalized | |||||||||||||
Capital Ratios: | ||||||||||||||
Total risk based capital ratio | 12.84 | % | 19.94 | % | 10.00 | % | 8.00 | % | ||||||
Tier 1 risk based capital ratio | 11.98 | % | 18.77 | % | 6.00 | % | 4.00 | % | ||||||
Tier I leverage ratio | 7.97 | % | 13.19 | % | 5.00 | % | 4.00 | % | ||||||
51
Table of Contents
Return on Average Assets and Average Equity
The ratio of net income to average equity and average assets and certain other ratios are as follows:
| Return on Average Assets and Average Equity | ||||||||||||||||
| September 30, | December 31, | |||||||||||||||
| 2005 | 2004 | 2004 | 2003 | |||||||||||||
Average total assets | $ | 52,881,197 | $ | 30,049,091 | $ | 32,029,134 | $ | 27,458,492 | ||||||||
Average equity | $ | 5,219,223 | $ | 4,799,078 | $ | 4,697,006 | $ | 2,029,665 | ||||||||
Net loss | $ | (315,078 | ) | $ | (1,190,444 | ) | $ | (1,533,335 | ) | $ | (1,118,761 | ) | ||||
Cash dividends declared | $ | — | $ | — | $ | — | $ | — | ||||||||
Return on average assets | (0.80 | )% | (5.30 | )% | (4.79 | )% | (4.07 | )% | ||||||||
Return on average equity | (8.07 | )% | (33.17 | )% | (32.64 | )% | (55.12 | )% | ||||||||
Average stockholders’ equity to average total assets | 9.87 | % | 15.97 | % | 14.66 | % | 7.39 | % | ||||||||
Application of Critical Accounting Policies
General
Our financial statements are prepared in accordance with accounting principles generally accepted in the United States of America and follow general practices within the industry in which we operate. Application of these principles requires management to make estimates, assumptions, and judgments that affect the amounts reported in the financial statements and accompanying notes. These estimates, assumptions, and judgments are based on information available as of the date of the financial statements; accordingly, as this information changes, the financial statements could reflect different estimates, assumptions, and judgments. Certain policies inherently have a greater reliance on the use of estimates, assumptions, and judgments and as such have a greater possibility of producing results that could be materially different than originally reported. Estimates, assumptions, and judgments are necessary when assets and liabilities are required to be recorded at fair value, when a decline in the value of an asset not carried on the financial statements at fair value warrants an impairment write-down or valuation reserve to be established, or when an asset or liability needs to be recorded contingent upon a future event. Carrying assets and liabilities at fair value inherently results in more financial statement volatility. The fair values and the information used to record valuation adjustments for certain assets and liabilities are based either on quoted market prices or are provided by other third-party sources, when available.
The most significant accounting policies followed by AmericasBank are presented in Note 1 to the consolidated financial statements. These policies, along with the disclosures presented in the other financial statement notes and in this financial review, provide information on how significant assets and liabilities are valued in the financial statements and how those values are determined. Based on the valuation techniques used and the sensitivity of financial statement amounts to the methods, assumptions, and estimates underlying those amounts, management has identified the determination of the allowance for loan and lease losses as the accounting area that requires the most subjective or complex judgments, and as such could be most subject to revision as new information becomes available.
52
Table of Contents
Allowance for Loan and Lease Losses
The allowance for loan and lease losses represents management’s best estimate of losses known and inherent in the loan and lease portfolio that are both probable and reasonable to estimate, based on, among other factors, prior loss experience, volume and type of lending conducted, industry standards, economic conditions (particularly as such conditions relate to AmericasBank’s market area), regulatory guidance, the financial condition of the borrower, historical payment performance and the collateral securing the loans and leases. Determining the amount of the allowance for loan and lease losses is considered a critical accounting estimate because it requires significant estimates, assumptions and judgment. The loan and lease portfolio also represents the largest asset type on the balance sheets.
We have developed a methodology for evaluating the adequacy of the allowance for loan and lease losses that distinguishes between credits evaluated as a group by either loan or risk rating category and those evaluated individually. We have predetermined allowance percentages based on credit types and for each risk rating category. All loans and leases are assigned a risk rating when they are made. This risk rating is reassessed by management periodically using the various evaluation factors mentioned above. Loans and leases that exhibit an acceptable level of risk per our internal risk grading system are grouped by category and assigned a standard reserve percentage when assessing the adequacy of the allowance for loan and lease losses. Loans and leases that are adversely risk-rated, or exhibit characteristics that suggest we have a heightened risk of collection, are evaluated separately from non-adversely risk rated credits. Each adversely risk rated credit is assigned a standard reserve based on its risk rating or a special reserve based on an assessment of the specific risk factors related to that credit, which may be greater or lesser than the standard reserve for that risk rating.
Management has significant discretion in making the judgments inherent in the determination of the provision and allowance for loan and lease losses, including in connection with the valuation of collateral and the financial condition of the borrower, and in establishing allowance percentages and risk ratings. The establishment of allowance factors is a continuing exercise and allowance factors may change over time, resulting in an increase or decrease in the amount of the provision or allowance based upon the same volume and classification of loans.
Changes in allowance factors or in management’s interpretation of those factors will have a direct impact on the amount of the provision, and a corresponding effect on income and assets. Also, errors in management’s perception and assessment of the allowance factors could result in the allowance not being adequate to cover losses in the portfolio, and may result in additional provisions or charge-offs, which would adversely affect income and capital. For additional information regarding the allowance for loan and lease losses, see the “Provision for Loan and Lease Losses and Analysis of Allowance for Loan and Lease Losses” section of this financial review.
Fair Value Accounting for Stock Options
The Financial Accounting Standards Board encourages use of a fair value based method of accounting for stock options. In prior periods AmericasBank Corp. had elected to use the intrinsic value method to account for stock-based employee compensation plans in accordance with Accounting Principles Board Opinion No. 25,Accounting for Stock Issued to Employees for 2004. Under this method, compensation cost is recognized for awards of shares of common stock to employees only if the quoted market price of the stock at any measurement date is greater than the amount the employee must pay to acquire the stock. As permitted, AmericasBank Corp. elected to adopt the disclosure-only provisions of SFAS No. 123,Accounting for Stock-Based Compensation.
Effective January 1, 2005, AmericasBank Corp. began recognizing expense for stock-based compensation using the fair value based method of accounting described in Statement of Financial Accounting Standards (“SFAS”) No. 123,Accounting for Stock-Based Compensation, as amended. We have chosen the retroactive restatement method described in SFAS No. 148,Accounting for Stock-Based Compensation — Transition and Disclosure, which amended SFAS No. 123. As a result, financial information for all prior periods presented have been restated to reflect the salaries expense that would have been recognized had the recognition provisions of SFAS No. 123 been applied to all awards granted to employees. The use of the retroactive restatement method resulted in the restatement of previously reported balances of additional paid-in capital and accumulated deficit. As of December 31, 2004, previously reported additional paid-in capital was increased by $286,910 and accumulated deficit was increased by the same amount. As of December 31, 2003, previously reported additional paid-in capital was increased by $48,553, and accumulated deficit was increased by the same amount.
53
Table of Contents
The value of the options was estimated using the Black-Scholes option pricing model with the option life estimated at 10 years. There were no modifications made to outstanding share options prior to the adoption of the fair value method. The compensation expense not yet recognized as of September 30, 2005, was approximately $394,150.
Net Deferred Tax Asset
AmericasBank Corp. has recorded a 100% valuation allowance against the net deferred tax asset since it is more likely than not that it will not be realized. At December 31, 2004 and 2003, AmericasBank Corp. has net operating loss carryforwards of approximately $5,232,241 and $3,933,331 available to offset future taxable income. The current carryforwards will expire beginning in 2017.
Goodwill
Goodwill represents the cost in excess of the fair value of net assets acquired (including identifiable intangibles) in transactions accounted for as purchases. SFAS No. 142,Goodwill and Other Intangible Assets, requires that goodwill no longer be amortized over an estimated useful life, but rather be tested at least annually for impairment. Impairment is the condition that exists when the carrying amount of goodwill exceeds its implied fair value. The implied fair value of goodwill is the amount determined by deducting the estimated fair value of all tangible and identifiable intangible net assets of the reporting unit to which goodwill has been allocated from the estimated fair value of the reporting unit. If the recorded value of goodwill exceeds its implied value, an impairment charge is recorded for the excess. Goodwill of $266,985 was recorded when we acquired certain assets and assumed certain liabilities of uvm Mortgage Marketing in October 2004. The goodwill will be tested at least annually for impairment.
Estimate of Costs to Originate Loans
Effective January 2005, we reevaluated our estimate of the costs to originate or acquire loans and leases and loans held for sale. This analysis resulted in a higher amount of costs deferred per loan than in prior periods. The deferral of loan origination costs results in a reduction of salaries and other noninterest expense. The reduction to salaries and other noninterest expense was partially offset by a reduction in interest revenues on loans and leases due to the amortization of these costs. Also, mortgage banking gains and fees from the sale of loans held for sale were reduced by the recognition of the costs upon the sale of the loan. Deferred loan origination costs were $415,401 and $72,466 at September 30, 2005 and December 31, 2004 respectively, an increase of $342,935. This increase is a result of greater loan originations and our reevaluation of cost estimates. Deferred origination costs includes the unamortized balance of the origination costs described above, plus other direct costs such as closing costs paid by us in connection with the origination of certain loans, primarily home equity loans. Management evaluates its estimate of loan origination costs quarterly.
Off-Balance Sheet Arrangements
AmericasBank is a party to financial instruments with off-balance sheet risk in the normal course of business. These financial instruments primarily include loan commitments, lines of credit, including home-equity lines and commercial lines, and letters of credit. AmericasBank uses these financial instruments to meet the financing needs of its customers. These financial instruments involve, to varying degrees, elements of credit, interest rate, and liquidity risk. These do not represent unusual risks and management does not anticipate any accounting losses which would have a material effect on AmericasBank.
Outstanding loan commitments and lines and letters of credit at September 30, 2005 and December 31, 2004 are as follows:
September 30, 2005 | December 31, 2004 | |||||
Loan commitments | $ | 10,686,569 | $ | 1,326,321 | ||
Unused lines of credit | $ | 2,455,675 | $ | 1,700,049 | ||
Letters of credit | $ | 60,713 | $ | 89,768 | ||
54
Table of Contents
Loan commitments, which include held for sale loan commitments, are agreements to lend to a customer as long as there is no violation of any condition established in the contract. AmericasBank generally requires collateral to support financial instruments with credit risk on the same basis as it does for on-balance sheet instruments. The collateral is based on management’s credit evaluation of the counter party. Loan commitments generally have interest rates at current market amounts, fixed expiration dates or other termination clauses and may require payment of a fee. Loans held for sale are usually sold to the investor within 30 days. Unused lines of credit represent the amount of credit available to the customer so long as there is no violation of any contractual condition. These lines generally have variable interest rates. Since many of the commitments are expected to expire without being drawn upon, and since it is unlikely that customers will draw upon their lines of credit in full at any time, the total commitment amount or line of credit amount does not necessarily represent future cash requirements. We are not aware of any loss we would incur by funding our commitments or lines of credit.
Letters of credit are conditional commitments issued to guarantee the performance of a customer to a third party. AmericasBank’s exposure to credit loss in the event of nonperformance by the customer is the contract amount of the commitment. The credit risk involved in issuing letters of credit is essentially the same as that involved in extending loan facilities to customers.
In general, loan commitments, credit lines and letters of credit are made on the same terms, including with respect to collateral, as outstanding loans. Each customer’s credit-worthiness and the collateral required is evaluated on a case-by-case basis.
Recent Accounting Pronouncements
Accounting pronouncements that have been approved by the Financial Accounting Standards Board that have not become effective as of September 30, 2005 follow. These pronouncements are not expected to have any impact on the financial statements of AmericasBank Corp. other than the revised FSAB Statement 123.
FASB Statement No. 154,Accounting Changes and Error Corrections replaces APB Opinion No. 20Accounting Changes and FASB Statement No. 3Reporting Accounting Changes in Interim Financial Statements-An Amendment of APB Opinion No. 28. FASB Statement No. 154 changes the requirements for the accounting for and reporting of a change in accounting principle. It applies to all voluntary changes in accounting principle. It establishes retrospective application as the required method for reporting a change in accounting principle and the reporting of a correction of an error. The Statement is effective for accounting changes and corrections of errors made in fiscal years beginning after December 15, 2005.
FASB Statement No. 153,Exchanges of Nonmonetary Assets an Amendment of APB Opinion No. 29, eliminates the exception to fair value for exchanges of similar productive assets that was provided in APB Opinion No. 29.
FASB Statement No. 152,Accounting for Real Estate Time-Sharing Transactions, amends FASB Statement No. 66Accounting for Sales of Real Estate to reference the financial accounting and reporting guidance for real estate time-sharing transactions that is provided in AICPA Statement of Position 04-2,Accounting for Real Estate Time Sharing Transactions. This Statement also amends FASB Statement No. 67,Accounting for Costs and Initial Rental Operations of Real Estate Projects, to state that the guidance for (a) incidental operations and (b) costs incurred to sell real estate projects does not apply to real estate time-sharing transactions.
FASB Statement No. 123R,Share Based Payment, revises FASB Statement No. 123,Accounting for Stock-Based Compensationand supersedes Accounting Principles Board (APB) Opinion No. 25,Accounting for
55
Table of Contents
Stock Issued to Employees, and its related implementation guidance. Statement 123R establishes standards for the accounting for transactions in which an entity exchanges its equity instruments for goods or services. Statement 123R requires entities to recognize the cost of employee services received in exchange for awards of equity instruments based on the grant-date fair value of those awards. As such, it eliminated the alternative provided by Statement 123 that such costs could be measured either by using fair value or by using Opinion 25’s intrinsic value method of accounting which generally did not result in the recognition of compensation costs as a result of the grant of stock options to employees. In addition, Statement 123R amends FASB Statement No. 95,Statement of Cash Flows,to require that excess tax benefits be reported as a financing cash inflow rather than as a reduction of taxes paid. Statement 123R became effective as of the first interim or annual reporting period that begins after December 15, 2005 and was adopted by AmericasBank Corp. effective January 1, 2006. Effective January 1, 2005, we began recognizing expense for stock-based compensation using the fair value method of accounting, as opposed to the intrinsic value method, described in Statement 123. Using the retroactive restatement method described in FASB Statement 148,Accounting for Stock-Based Compensation – Transition and Disclosure – an amendment of FASB Statement No. 123, financial information for prior periods was restated to reflect the impact of recognizing expense for stock-based compensation under the fair value method of Statement No. 123. We do not expect the adoption of Statement 123R to have a material impact on our financial results since we have already adopted the fair value provisions of Statement 123.
AICPA Statement of Position No. 03-3,Accounting for Certain Loans or Debt Securities Acquired in a Transfer,prohibits the carrying over of valuation allowances in loans and securities acquired in a transfer. At transfer, the assets are to be recorded at the total cash flows expected to be collected. The SOP is effective for loans acquired in fiscal years beginning after December 15, 2004.
The accounting policies adopted by management are consistent with accounting principles generally accepted in the United States of America and are consistent with those followed by peer banks.
Impact of Inflation and Changing Prices and Seasonality
The financial statements and related data presented herein have been prepared in accordance with generally accepted accounting principles which require the measurement of financial position and operating results in terms of historical dollars, without considering changes in the relative purchasing power of money over time due to inflation.
Unlike industrial companies, virtually all the assets and liabilities of a financial institution are monetary in nature. As a result, interest rates have a more significant impact on a financial institution’s performance than the effects of general levels of inflation. Interest rates do not necessarily move in the same direction or in the same magnitude as the price of goods and services, and may frequently reflect government policy initiatives or economic factors not measured by price index. As discussed above, AmericasBank strives to manage its interest sensitive assets and liabilities in order to offset the effects of rate changes and inflation.
56
Table of Contents
BUSINESS OF AMERICASBANK CORP. AND AMERICASBANK
History
We were incorporated in June 1996 as a Maryland corporation to become a single-bank holding company by acquiring all of the capital stock of AmericasBank, a federal stock savings bank, upon its formation. AmericasBank commenced operations on December 1997 with $3.0 million in capital and one office located in the Highlandtown area of the city of Baltimore, Maryland. Also in December 1997, AmericasBank acquired certain loans and other assets and assumed certain deposits and other liabilities primarily related to the Baltimore, Maryland branch office of Rushmore Trust & Savings, FSB. AmericasBank commenced operations from Rushmore’s former Baltimore, Maryland branch office.
We funded the initial capitalization of AmericasBank and the transaction with Rushmore Trust & Savings, FSB by selling 75,000 shares of common stock at $40.00 per share in an initial public offering that concluded in November 1997.
On September 2, 1998, we issued to the holders of record of our common stock on September 1, 1998, a dividend of one common stock purchase warrant for each share of common stock then held by the shareholder. Warrants to purchase a total of 75,000 shares of common stock were issued and each warrant entitles the holder to purchase one share of common stock at an exercise price of $40.00 per share, subject to adjustment for certain events. These warrants are currently exercisable and expire on September 1, 2008.
In September 1999, AmericasBank (i) converted from a federal stock savings bank to a Maryland-chartered trust company exercising the powers of a commercial bank; (ii) became a member bank of the Federal Reserve System; and (iii) opened a Towson office, with that office becoming its main office location and the Baltimore office becoming a branch office. AmericasBank converted to a Maryland commercial bank so that it could expand its lending activities to include commercial loans and consumer loans without being subject to the limitations imposed under a federal thrift charter. At that time AmericasBank also planned to pursue a strategy of long-term growth by opening additional branches.
To obtain the regulatory capital necessary to convert to a Maryland chartered trust company and open the Towson, Maryland office, we sold 49,000 units at $48.00 per unit in a public offering that concluded in March 1999. Each unit consisted of one share of common stock and a warrant to purchase one share of common stock at $52.00 per share, subject to adjustment for certain events. These warrants are currently exercisable and expire on September 1, 2008.
AmericasBank was not successful in implementing its business plans in connection with the conversion. It continued to incur losses during 2000 and 2001 (after incurring losses in 1997, 1998 and 1999). Moreover, AmericasBank failed to implement proper internal and operational controls. As a result, AmericasBank Corp. and AmericasBank became subject to agreements with its regulators.
In order to restore and maintain the financial soundness of AmericasBank Corp. and AmericasBank, in August 2001, we agreed to enter into and operate under a Written Agreement with the Federal Reserve Bank of Richmond and the Maryland Division of Financial Regulation.
Also in October 2001, because of concerns related to AmericasBank’s violations of certain consumer lending laws, we agreed to operate under a Memorandum of Understanding with the Federal Reserve Bank of Richmond. As further described under the heading “Supervision and Regulation” on page86, these agreements have been terminated.
We continued to incur losses in 2002 and 2003. In May 2002, we sold 23,750 units at $20.00 per unit to eight of our directors in a private placement. Each unit consisted of one share of common stock and a warrant to purchase five shares of common stock at an exercise price of $20.00 per share, subject to adjustment for certain events. These warrants are currently exercisable and expire on September 1, 2008. The purpose of the private placement was to provide AmericasBank with additional regulatory capital.
From February to June 2003, we sold 50,015 units at $12.80 per unit to five of our directors, the profit sharing plan for one of our director’s medical practice and the spouse of a director in a private placement. Each unit consisted of one share of our Series A Preferred Stock and a warrant to purchase one share of common stock at an exercise price of $12.80 per share, subject to adjustment for certain events. These warrants are currently exercisable and expire on September 1, 2008. Among other rights, upon our sale or dissolution, the Series A Preferred Stock had a liquidation preference of $12.80 per share. The purpose of the private placement was to provide AmericasBank with additional regulatory capital.
In July and August 2003, we hired a new management team consisting of Mark H. Anders, A. Gary Rever and John D. Muncks. Mr. Anders, Mr. Rever and Mr. Muncks each have significant banking experience. In particular, Mr. Anders has been integrally involved in the turnaround of three community banks.
On December 2, 2003, the holders of our Series A Preferred Stock exchanged their 50,015 outstanding shares for 50,015 outstanding shares of common stock. The shares were exchanged to facilitate our 2004 rights and public offering (described in the next paragraph), including eliminating any liquidation preference on our outstanding capital stock. As of the date of this prospectus, we have no Series A Preferred Stock outstanding.
On March 11, 2004, we closed our rights offering of up to 100,000 shares of common stock to our shareholders of record on December 22, 2003 at $8.00 per share and our public offering of 618,750 shares plus any shares that were not sold in the rights offering at $8.00 per share. We sold an aggregate of 718,750 shares in the offerings and received net offering proceeds of $5,027,091.
With the addition of the capital from the rights and public offerings, we became a “well capitalized” bank as defined by our regulators and substantially increased our legal lending limit. Also, we hired additional staff and launched strategies to accelerate the growth of our earning assets, improve our net interest margin, and increase our noninterest revenue while controlling our fixed overhead.
On October 5, 2004, we completed the acquisition of certain assets and assumption of certain liabilities of uvm Mortgage Marketing, Inc, of Towson, Maryland. The purchase price of $274,500 consisted of cash of $145,000 and 25,000 restricted shares of Common Stock (valued at $5.18 per share) that vest over two years.
On November 18, 2004, three of our directors – Savas J. Karas, Graylin E. Smith, and John C. Weiss III – each purchased 62.5 shares of Common Stock at $8.00 per share, to satisfy the director’s stock ownership requirement under Maryland State Banking Laws.
On August 3, 2005, our board of directors approved a reverse stock split of our common stock whereby every four shares of common stock would be converted into one share with fractional shares resulting from the split converted to cash. The split became effective at 12:01 a.m. on August 23, 2005. The number of shares and warrants and the sale or exercise price for the stock and warrants referred to in this section were adjusted as if the split occurred prior to the issuance of such stock and warrants.
Our turnaround plan has begun to show positive results as evidenced by the sequential improvement in the net loss reported for each quarter in 2005. Also, as indicated above, the Memorandum of Understanding and the Written Agreement have been terminated.
Currently, AmericasBank has two branch offices and is headquartered in Towson, Maryland. AmericasBank also has one mortgage origination office in Towson, Maryland. AmericasBank is regulated by the Federal Reserve Bank of Richmond and the Maryland Division of Financial Regulation. AmericasBank is a member of the Federal Reserve System and its deposits are insured by the Federal Deposit Insurance Corporation.
57
Table of Contents
For additional information regarding the warrants described above, see “ Description of Capital Stock - Warrants.”
Investment and Business Strategy
Since the Written Agreement was terminated effective October 12, 2005, our primary challenge is to execute our business plan, produce balance sheet growth and continue to improve our operating margins to achieve profitability. Our investment strategy is to be a high-performing community bank that provides above average investment returns to its shareholders while maintaining a low to moderate risk profile. Our initial planning horizon is ten years from our March 2004 public stock offering. Currently, we expect to reach quarterly profitability in the first quarter of 2006, to achieve peak efficiency within two to three years after that and another five years to generate the core deposit base and expand the sources of fee income required for high performance. The essence of our strategy will be to stay within the traditional community bank model of serving the communities where we operate by promoting business entrepreneurship and home ownership while concentrating on products and services where we can effectively differentiate ourselves from our competitors and the larger financial services companies operating in our market area.
Our goal for the next one to five years is to accelerate the growth of our earning assets, principally our loan portfolio, to generate higher levels of net interest income while expanding our sources of noninterest income and maintaining control over our fixed expenses and credit quality. We plan to do this by continuing to hire experienced, commissioned residential mortgage lenders to generate mortgage loans and other loans secured by one-to-four family properties. We expect that the majority of mortgage loans originated by this group will be brokered or sold in the secondary market for a fee or at a profit. However, this group should also generate loans for our loan portfolio. These loans may be to owner occupants or to investors and include: adjustable rate mortgages; acquisition, development and construction loans; bridge loans; and home equity loans and lines of credit secured by secondary liens. We have chosen to concentrate our loan activities in these loan classes for the following reasons: (i) the loans are generally well secured; (ii) the market is large and diverse and less susceptible to valuation cycles compared to other loan classes; (iii) the risk adjusted loan yields and the opportunities to generate fee income are attractive; and (iv) the loans in these classes are cost effective to originate, underwrite and manage when compared to other types of commercial and consumer loans.
We plan to expand our loan activities to include a diversified portfolio of commercial and commercial mortgage loans; however, our commercial banking activities will, at least over the next several years, target primarily high volume depository clients that can help build our core deposit base. Expanding our core deposit base, which we define as interest and noninterest bearing checking accounts, savings accounts and money market accounts, is expected to improve our net interest margin. However, this will be a secondary focus during the short to medium term as we concentrate our energies on building earning assets and fee income.
58
Table of Contents
Location and Market Area
We consider our primary market area to be Northern Baltimore County, Maryland and the Highlandtown area of the city of Baltimore. Our secondary market area includes the Baltimore Metropolitan Area, consisting of Baltimore City and the surrounding counties of Anne Arundel, Baltimore, Carroll, Harford, Howard, and Frederick County, Maryland and south-central Pennsylvania. The economy of our market area is diversified, with a mix of services, manufacturing, wholesale/retail trade and federal and local government. Manufacturing in the market area is dominated by high technology, particularly within the defense industry. Similar to national trends, most of the job growth in our market area has been realized in service related industries, and service jobs account for the largest portion of the workforce.
Our market enjoys the benefits of its close proximity to the Washington D.C. market Baltimore is well positioned along the I-95 corridor and is seeing solid increases in business growth (particularly in the service and tech sectors). Our headquarters are within 15 miles of the BWI Thurgood Marshall Airport and 45 miles of Ronald Reagan Washington National Airport. Maryland has the second highest median household income in the country, largely driven by its proximity to the federal government in Washington, D.C.
The regional economy is perennially strong and diverse, boasts consistently high job growth and low unemployment and is increasingly small business oriented. Baltimore County is home to two of the federal government’s largest headquarters, the U.S. Social Security Administration and Centers for Medicare & Medicaid Services. The region also has a vibrant biotechnology and medical industry, including six major hospitals operating in our primary market. The medical industry, information technology, and tourism are all major growth industries for the region. The Port of Baltimore is one of the largest ports in the country. The region has over 25 colleges and universities including some of the highest ranked in the country.
59
Table of Contents
Based upon the most recently available data reported by the FDIC, our market, measured in terms of metropolitan statistical areas, totaled $43.9 billion in bank and thrift deposits. As of June 30, 2005, our deposit market share totaled $56.9 million, or 0.13% of this market. Accordingly, we believe that our relatively low market share provides us with significant opportunities to capture additional deposit market share and capitalize on lending opportunities brought upon by consolidation of financial institutions within our market.
AmericasBank has branch offices located in Towson, Maryland and in the Highlandtown area of the city of Baltimore. AmericasBank also has a mortgage loan origination office in Towson, Maryland. Towson, Maryland is in Baltimore County, and is the county seat. According to the Maryland Department of Economic Development, more than 10,000 people work in Towson and it is the largest unincorporated county seat in the United States. Highlandtown is in the eastern quadrant of the city of Baltimore and has historically been a stable blue-collar community of low to moderate income families.
Lending Activities
General. AmericasBank’s primary source of income is generated from the interest earned on its loan portfolio and fees generated from its lending activities. In the short term, we will focus our lending activities on residential mortgage lending, where the majority of loans are secured by one-to-four family residential properties, including both owner occupied and investment properties, because we believe that on a risk adjusted basis this loan class provides us with the best opportunity to safely and cost effectively generate accelerated balance sheet and fee income growth. We also intend to emphasize commercial mortgage loans and commercial loans extended for general business purposes to small and medium-size businesses in our primary market area and home equity loans.
Residential mortgage lending includes long-term conventional and non-conforming mortgages originated for our portfolio or for sale into the secondary market, adjustable rate mortgages, loans to homeowners or small builders and developers for the acquisition, construction or rehab of single-family homes and lot loans. Commercial mortgage loans include loans for the acquisition/development, construction or rehabilitation of commercial, multi-family or residential real property. We intend to aggressively pursue commercial lending opportunities where the loan relationships provide us with opportunities to develop high volume depository relationships. We expect the principals of the businesses we finance to personally guaranty their commercial loans. We believe that consumer installment loans and home equity loans will serve to provide further diversification and will support our retail banking platform.
Residential Mortgage Lending.
Long-Term Fixed-Rate Mortgages Originated for Sale. To generate fee income, we intend to focus our efforts on fixed-rate conventional and government insured residential mortgage loans that can be sold in the secondary market on a servicing released basis. Secondary market activity is conducted either as a broker, where the loan is funded at settlement by an investor and the bank earns a fee, or as correspondent, where the bank funds the loan at settlement and thereafter sells the loan to an investor, on a servicing released basis, and recognizes a gain on the sale. We have entered into agreements with several large financial institutions where they either close loans that we broker or they purchase loans where we act as a correspondent lender. In either case, the loan must meet the underwriting standards of the closing or purchasing financial institution. In cases where we act as a correspondent lender, the purchase price is locked-in with the purchasing investor at the time the borrower locks in his or her interest rate. Typically, loans originated for sale will be delivered to the investor within two to three weeks of closing with the borrower, with settlement with the investor occurring within one to three weeks after delivery. During this three to six week period, we recognize these loans as mortgages held for sale and we service the loans. We have not contracted with and do not intend to contract with any entity to service the loans that we hold for sale.
With respect to our secondary market activity, we intend to focus on acting as a correspondent lender whenever possible because the fees and income that can be generated as a correspondent lender are typically greater than can be generated as a loan broker. However, there are greater compliance requirements and risks associated with acting as a correspondent lender. As a result, the volume of loans originated for sale need to increase to a sufficient volume to enable us to manage the additional compliance requirements and risks in a cost effective manner.
60
Table of Contents
Maintaining a high level of broker fee income and gains from the sale of mortgages depends primarily on continuing to originate mortgage loans at similar volume levels. This may prove difficult because production levels are sensitive to changes in economic conditions and can suffer from decreased economic activity, a slowdown in the housing market or higher interest rates. Generally, any sustained period of decreased economic activity or higher interest rates could adversely affect our mortgage originations and, consequently, reduce our income from mortgage banking activities. As a result, these conditions may adversely affect our net income. We attempt to mitigate our risks by offering adjustable rate mortgage products which typically have lower interest rates, pursuing purchase money mortgage transactions and expanding our loan origination staff.
In addition, mortgage banking activities generally involve risks of loss if secondary mortgage market interest rates increase substantially while a loan is in the “pipeline” (the period beginning with the application to make or the commitment to purchase a loan and ending with the sale of the loan). Our policy is to reduce this interest rate risk by selling each mortgage loan when the borrower locks in the interest rate on the loan.
Adjustable Rate and Non-Conforming Fixed Rate Mortgages. Our residential mortgage lending also will include originating adjustable rate mortgages (ARMs) and non-conforming fixed-rate mortgages for our own portfolio and, if appropriate, for sale in the secondary market. Generally, the ARMs and non-conforming mortgages retained in our portfolio will be to homeowners who do not intend to hold the property long-term or who are seeking interim financing with an objective to seek longer-term financing at a more suitable time. These types of loans are also used to accommodate homeowners who may not meet the underwriting criteria of strict secondary market standards (but still meet credit standards). Many of the residential construction and rehabilitation loans that we will offer will be marketed with an option to convert to an ARM at the end of the construction period. We believe that many of the loans that convert will be re-financed by long term fixed-rate mortgages, which will be sold in the secondary market, providing us with the opportunity to generate additional fee income from these borrowers.
The interest rate on ARMs is based on the weekly average rate of comparable term U.S. Treasury securities adjusted to a constant maturity plus a spread with specified minimum and maximum interest rate adjustments. The interest rates on a majority of these mortgages are adjusted between one year and five years with limitations on upward adjustments of 2% per adjustment period and 6% over the life of the loan. We will generally charge a higher interest rate if the property is not owner-occupied.
ARMs are generally underwritten according to Fannie Mae or Freddie Mac guidelines using one of several automated underwriting tools now widely accepted in the industry. However, depending on the circumstances, we may also originate ARMs that do not conform to secondary market guidelines. The volume of ARMs that we originate will depend in large part on interest rates. During periods of generally low interest rates, there is a heightened demand for long-term fixed-rate mortgages and a reduced demand for ARMs. In contrast, during periods of rising or higher long term rates, there is generally an increased demand for ARMs and a reduced demand for long-term fixed-rate mortgages.
The non-conforming fixed rate mortgage loans that we will make will generally be amortized over fifteen to thirty years, but because our funding is of shorter duration, the fixed rate term generally will be from one to five years, depending on individual loan circumstances. These loans customarily include a “due on sale” clause giving AmericasBank the right to declare a loan immediately due and payable in the event, among other matters, that the borrower sells or otherwise disposes of the real property subject to the mortgage.
In general, our ARMs and non-conforming fixed-rate mortgages will have a loan to value ratio of less than or equal to 80%. However, we may lend up to 95% of the value of the property collateralizing the loan if the borrower procures private mortgage insurance. We procure (at the expense of the borrower) lenders’ title insurance on mortgage loans and require the borrower to provide fire and extended casualty insurance and, where required by applicable regulations, flood insurance. In the event that a borrower fails to pay premiums on fire and other hazard insurance policies, AmericasBank may cause insurance to be placed on the property.
Non-amortizing or Interest Only Loans. Consumer interest in non-amortizing or interest only residential mortgage loans has increased in recent years in response to escalating home prices and expanding consumer debt obligations. We view this trend as an evolution and many institutional investor and government agencies now offer interest only loan programs. We originate interest only loans for sale and for our portfolio based on the underwriting criteria of our secondary market investors or under our own loan policies. Generally, non-amortizing
61
Table of Contents
or interest only loans originated for our portfolio will have lower loan to value ratios (less than 80% of the purchase price or appraised value) or will have other credit enhancements, such as higher credit scores, balloon payments or the pledge of additional collateral. We plan to establish portfolio limits for non-amortizing or interest only loans equal to 100% of our regulatory capital. This limit does not apply to loans with a balloon maturity of 3 years or less or to loans with less than a 75% loan to value ratio.
Residential Construction, Rehab Loans and Lot Loans. We intend that our residential mortgage division will directly and indirectly originate loans to individuals to finance the acquisition of a building lot and/or the construction of a single-family dwelling, or the acquisition of an existing home that needs substantial physical renovation or reconstruction. Most of the residential construction loans will be made to individuals who intend to build a single family home on an appropriately zoned building lot that will be owner occupied upon completion of construction. However, in mature housing markets, we believe there is a growing opportunity to provide acquisition and construction financing for the purpose of substantially rehabilitating existing residential property (“rehab loans”). AmericasBank has targeted these two loan types as areas of potential growth. Construction and rehab loans will range in size from $100,000 to $1,000,000 or more depending on the property.
Construction and rehab loans will be underwritten and managed based on written construction loan policies and procedures. Generally, we will make loans in amounts up to 80% of appraised value, not to exceed 100% of cost with terms from four months to 15 months depending on the property. In the case of new construction, loan proceeds will be disbursed in increments based on approved draw schedules and advanced based on completed work as certified by site inspections. In the case of rehab loans, loan proceeds may be disbursed at completion or under approved draw schedules as certified by site improvements depending on the scope of renovations required.
Construction and rehab loans generally involve a higher degree of risk than conventional mortgage loans. Our risk of loss on a construction or rehab loan is dependent largely upon the accuracy of the initial estimate of the property’s value at the completion of construction and the estimated cost (including interest) of construction. If the estimate of construction cost proves to be inaccurate, we could be required to advance funds beyond the amount originally committed in order to facilitate completion of the project. If the estimate of anticipated value proves to be inaccurate, the value of our collateral may be insufficient to assure full repayment. We mitigate this risk somewhat by requiring physical inspection of the property by an approved inspector prior to advancing each draw request to ensure sufficient value has been created to support the advance.
In addition to construction loans and rehab loans to individuals, we may also extend construction and rehab loans to builders to erect single-family dwellings or to builders or investors to rehabilitate single-family dwellings for resale or to be held as investment properties. These loans are classified as residential real estate loans in our financial statements.
Commercial Mortgage Loans.AmericasBank has a portfolio of commercial mortgage loans, and views this kind of lending as a necessary and desirable activity going forward. Loans are made to purchase or refinance both investment properties and owner-occupied real estate. The Bank requires an independent appraisal of each property and limits its loan to 80% or less of appraised value. Title insurance is required on each property. Loans are generally structured as fixed rate loans with fifteen to thirty year amortizations, with a thirty-six to sixty month rate call or maturity, with pricing based on a spread over constant yield of treasury securities of similar duration. Repayment on these loans depends to a large degree on the results of operations and management of the properties, and repayment of such loans may be subject to adverse conditions in the real estate market or the economy.
Underwriting of these loans is based on the borrower’s capacity to service the loan after all expenses related to the real estate. If the property is an investment property, we look at the quality of the tenants and the length and terms of the leases as the borrower’s primary source of repayment. These loans will typically be guaranteed by the individual(s) who are the owners or partners in the entity that owns the property. If the property is the place of business of a company affiliated with the borrower, the loan will typically be guaranteed by the owner(s) of the property and the affiliated company that occupies the building.
We also will originate lines of credit to builders or developers for the acquisition and development of raw land (or for the acquisition of approved building lots) and the construction of 1-4 single family homes. The financing provided for these purposes is speculative and will typically include provisions that restrict the number of lots and speculative units that can be financed under the facility. These types of loans generally will have terms of eighteen to thirty-six months.
62
Table of Contents
Commercial Lending.AmericasBank offers a variety of commercial loan products. A broad range of short-to-medium term commercial loans, both collateralized and uncollateralized are made available to businesses for working capital (including inventory and receivables), business expansion and the purchase of equipment and machinery. The purpose of a particular loan generally determines its structure.
Commercial loans are almost always generated from within our primary market area. Our loans are underwritten on the basis of the borrower’s ability to service the debt from income. As a general practice, AmericasBank takes as collateral a security interest in available real estate, equipment or other chattel, although such loans may be made on an uncollateralized basis. Collateralized working capital loans are primarily secured by current assets whereas term loans are primarily collateralized by fixed assets.
Unlike residential mortgage loans, which generally are made on the basis of the borrower’s credit history and ability to make payments from his or her employment and other income, and which are collateralized by real property whose value tends to be easily ascertainable, commercial loans typically are made on the basis of the borrower’s ability to make payments from the cash flow of the business which is more variable and difficult to project. Commercial loans generally are collateralized by business assets, such as accounts receivable, equipment, and inventory. As a result, the availability of funds for the repayment of commercial loans may be substantially dependent on the success of the business itself. Further, the collateral underlying commercial loans may depreciate over time, generally cannot be appraised with as much precision as residential real estate, and may fluctuate in value based on the success of the business.
Commercial Finance Leasing.AmericasBank has invested in a portfolio of indirect, full pay-out lease transactions that are structured as multiple non-recourse fixed-rate loans to two leasing companies. Each loan is secured by an assignment of the leasing company’s interest in a full pay-out lease, an assignment of the lease payments under that lease, delivery of the original lease documents and a security interest in the underlying equipment. A default under an individual lease will not trigger a default under any other lease and the loans are not cross-collateralized. Because of their structure, throughout this report, we have described these loans as commercial finance leases.
We initiated this type of lending as a material part of our operations during the second quarter of 2003 by “purchasing” seasoned leases that had been repurchased by the originating leasing company from the original owners pursuant to repurchase rights held by the originating leasing company. Because interest rates had declined since these leases were initiated, the leasing company could book gains by reselling the remaining streams of payments to a new institution requiring lower yields. We benefited by investing excess liquidity at acceptable returns in the current rate environment into assets that had a track record of performance. Since the initial bulk “purchase,” we have continued to finance leases originated by these leasing companies on a very selective basis. This selectivity has resulted in a reduction of our commercial finance lease portfolio. The commercial finance lease portfolio as a percentage of total loans and leases has decreased to 4.79% on September 30, 2005, from 28.8% on December 31, 2003.
These opportunities were the result of a longstanding relationship of our former senior lending officer, who had many years of experience underwriting and originating lease transactions, with the principals of the two leasing companies. Due diligence on the leasing companies, in addition to the senior lending officer’s history with the companies, consisted of a thorough review of underwriting standards, documentation procedures, collection policies and financial condition.
We independently evaluate the creditworthiness of each lessee before extending credit in these transactions through, among other things, credit applications, financial statements and credit reports of the lessees and any guarantor of the lessee’s obligations, as well as copies of the invoices for the assets being leased. In general, the risks of this type of lending are substantially similar to that of commercial lending. Our collateral in these transactions generally includes construction, manufacturing and industrial equipment; office furniture, fixtures and equipment; data processing assets, including computer equipment; and medical and engineering equipment. Unlike commercial lending, our loans in these transactions may, depending upon the quality and pricing of the credit, exceed the purchase price of the equipment by up to 15% for soft costs, taxes and similar expenses that are related to
63
Table of Contents
the assets being leased. The terms of these loans are generally not greater than the useful life of the assets being leased, and often are for a shorter term. Our self-imposed credit limit for these transactions is $300,000 and our interest rate, which is fixed over the term of the loan, is based on the underlying credit of the lessee and the term of the lease.
Pursuant to an agency agreement with each leasing company, the leasing company collects all lease payments and services the leases. We monitor payment by contacting the leasing company whenever a payment is more than 15 days past due. The agency agreement may be terminated by either party upon five days notice. Upon a termination, we would assume servicing obligations under the leases. Also, pursuant to the agency agreement, we have agreed to reimburse the leasing company for all collection costs and expenses.
Consumer Loans.Our consumer loan portfolio consists and will continue to consist of installment loans to individuals for various consumer purposes, including or to include installment loans to individuals to purchase automobiles, recreation vehicles and boats; second mortgage loans, home improvement loans; home equity loans, personal loans for investment purposes and loans secured by deposit accounts. The installment period for these loans will depend on the purpose and the asset securing the loan, but are generally for terms of less than ten years.
Installment loans are attractive to us because they provide a stable source of income and they serve to build loyalty between the bank and its retail customer base. Installment loans have higher delinquency and default rates when compared to residential mortgage loans. There is a high reliance on employment stability and personal debt management in consumer installment lending since the collateral may be of reduced value at the time of collection. Accordingly, the initial determination of the borrower’s ability to repay, as indicated by past credit management, stability of employment and debt ratios, is of primary importance in the underwriting of consumer loans.
We expect that the biggest area of growth in the consumer loan portfolio will be in home equity lines of credit and amortizing fixed rate second mortgage loans. These are desirable loans types because they are secured by 1-4 family properties and can be originated by our mortgage lending division. The interest rate on home equity loans is variable and indexed to the prime lending rate. The interest rate on second mortgage loans is fixed generally for the life of the loan.
Credit Policies and Administration. Our president and our senior lending officer are primarily responsible for originating and maintaining a high quality, diversified loan portfolio. We have adopted comprehensive loan policies and underwriting standards for the types of lending we engage in or plan to engage in. These policies establish guidelines that govern our lending activities. Generally, they address such things as our desired target markets, underwriting and collateral requirements, account management procedures, loan approval procedures, handling of delinquent accounts and compliance with regulatory requirements.
Loan Solicitation and Processing.Loan originations are derived from a number of sources. Residential loan originations can be attributed to direct solicitation by AmericasBank’s loan officers based on referrals from present depositors and borrowers, AmericasBank’s directors, builders, real estate agents, attorneys, accountants and walk-in customers; and indirectly through other lenders, including other community banks, credit unions, and mortgage brokers. Loan applications, whether originated through AmericasBank or through mortgage brokers or other third party intermediaries, are underwritten and closed based on the same standards. Consumer and commercial real estate loan originations emanate from many of the same sources. Commercial loan opportunities can be referred to the bank but are just as likely to result from highly targeted direct calling efforts by bank officers. Within the next several years, we intend to continue to open loan processing offices throughout our primary market area to support our residential mortgage lending services.
The loan underwriting policies and procedures followed by AmericasBank are designed to comply with (i) federal and state banking laws, regulations and guidelines; (ii) widely accepted automated underwriting programs, and (iii) the bank’s independent assessment of the borrower’s character, ability to service the debt and the value of any assets or property serving as collateral for the loan. As part of the process, a bank loan officer meets with each applicant to obtain the appropriate employment and financial information as well as any other required loan information. Upon receipt of the borrower’s completed loan application, AmericasBank then obtains reports with respect to the borrower’s credit record, and orders and reviews an appraisal of any real estate collateral for the loan (prepared for AmericasBank through an independent appraiser). Once a loan application has been completed and all information has been obtained and verified, the loan request is submitted to a final review process. As part of the
64
Table of Contents
loan approval process, certain loans require approval of AmericasBank’s loan committee which is comprised of our president, senior lending officer and independent members of our board of directors. The loan committee meets as is deemed necessary to promptly service loan demand. All loans made to officers, directors and their affiliates require the approval of the entire board of directors (other than the interested party).
Deposit Activities
AmericasBank offers a wide range of interest bearing and noninterest bearing deposit accounts, including commercial and retail checking accounts, money market accounts, tax deferred accounts, interest bearing statement savings accounts and certificates of deposit with fixed and variable rates and a range of maturity date options.
Deposit terms vary according to the minimum balance required, the length of time the funds must remain on deposit and the interest rate. We establish maturities, terms, service fees and withdrawal penalties for deposit accounts on a periodic basis. In determining the characteristics of our deposit accounts, we consider the rates offered by competing institutions, lending and liquidity requirements, growth goals and federal regulations. We believe that we pay competitive rates on our deposit accounts.
Other Banking Products
Currently, our customers have access to telephone banking, Internet banking, ATM/debit cards, safe deposit boxes (from the Towson location), travelers’ checks, money orders, wire transfers, ACH, and direct deposit of payroll. We provide our customers with check imaging, which eliminates our cost of returning checks to customers and the clutter that cancelled checks cause to our customers. We have ATM machines at both of our branch offices.
We offer our commercial customers expanded cash management services such as sweep accounts, repurchase agreements and account reconciliation services.
We intend to continue to use the Internet and technology to augment our business plans. Moreover, we will continue to evaluate cost effective ways that technology can enhance our management, products and services. We believe that our data processing capability, provided through a third party vendor, will be adequate to support the introduction of new products and services.
Competition
The banking business is highly competitive. We compete with other commercial banks, savings associations, credit unions, mortgage banking firms, consumer finance companies, securities brokerage firms, insurance companies, money market mutual funds and other financial institutions operating in our market area and elsewhere.
We believe that, over time, we will be able to effectively leverage our talents, contacts and location to achieve accelerated loan growth, an increase in noninterest revenue and an improved net interest margin. However, our market area is highly competitive and heavily branched. Price competition in our market area for residential mortgage loans and the other loan products that we offer or intend to offer is intense. Most of our competitors have substantially greater resources and legal lending limits than we do and offer extensive and established branch networks and other services that we do not offer. Moreover, larger institutions operating in our market area have access to borrowed funds at a lower rate than is available to us. Deposit competition also is strong among institutions in our market area. As a result and in order to implement our business plans, we may need to pay above market rates for deposits and/or focus on certificates of deposit as a funding source.
Employees
As of the date of this prospectus, AmericasBank had 29 full time employees. None of our employees are covered by a collective bargaining agreement. We believe that relations with our employees are good. AmericasBank Corp. has no employees.
65
Table of Contents
On December 16, 2005, we entered into a client service agreement with Administaff Companies II, L.P. (“Administaff”), a professional employer organization that will serve as our off-site, full service human resource department. Administaff personnel management services are delivered by entering into a co-employment relationship with our employees.
Property
Towson
We acquired our headquarters, which is a full service banking branch and office facility located at 500 York Road in Towson, Maryland on December 31, 1997 for $650,000 through a former wholly owned subsidiary, AmericasBank Holdings Corporation. The building is two stories and approximately 7,000 square feet situated on .2026 acres of land. The first floor contains approximately 2,700 square feet of retail banking space, the second floor contains approximately 1,800 square feet of office space and the basement contains approximately 2,500 square feet of retail office space. In the past, we had leased the basement level office space and part of the second floor office space. Currently, we utilize all of this space for our operations. Our branch at this location opened in September 1999.
We also lease approximately 1,179 square feet of property at 504 Baltimore Avenue, Towson, Maryland for our Baltimore area mortgage origination office. The initial lease commenced on September 1, 2001 and was renewed for three additional years commencing on September 1, 2004. The renewed lease has a base rent of $1,640 per month for the first year and $1,670 and $1,700, respectively, for years two and three. We acquired this lease as part of our acquisition of certain assets and assumption of certain liabilities of uvm Mortgage Marketing Inc. in October 2004.
Highlandtown
AmericasBank leases a 1,430 square foot building located in the Highlandtown Village Shopping Center at 3860 East Lombard Street, Baltimore, Maryland from an unaffiliated party for use as a bank branch. The initial term of the lease commenced on October 18, 2000 and expired on October 30, 2005.
On August 18, 2005, AmericasBank sent notice to the landlord that it intended to exercise the first of two five year renewal options on the leased space, and on September 28, 2005, AmericasBank and the Landlord entered into a First Lease Option Confirmation Agreement to evidence the renewal. As a result of the renewal, the new lease term is from November 1, 2005 to October 31, 2010. Base rent for the first year of the renewal term is $1,489.58 per month, and base rent is $1,519.38, $1,549.17, $1,578.96, and $1,608.75 per month for years two, three, four and five, respectively. The lease contains an additional five-year renewal option with increased monthly base rent. We opened this location after operating from other space in the Highlandtown area of the city of Baltimore since our organization in December 1997.
We believe that our properties are maintained in good operating condition and are suitable and adequate for our current operational needs.
66
Table of Contents
Legal Proceedings
There are no pending legal proceedings to which AmericasBank Corp. or AmericasBank is a party or to which any of their properties are subject, nor are there proceedings known to AmericasBank Corp. to be contemplated by any governmental authority. There are no material proceedings known to AmericasBank Corp., pending or contemplated, in which any director, officer or affiliate or any principal security holder of AmericasBank Corp. is a party adverse to AmericasBank Corp. or AmericasBank or has a material interest adverse to AmericasBank Corp. or AmericasBank.
67
Table of Contents
Directors and Executive Officers
AmericasBank Corp.’s directors and executive officers and AmericasBank’s directors and executive officers are as follows:
Name | Age(1) | Position | Director Since | |||
| Lee W. Warner | 50 | Chairman and Director of AmericasBank; Chairman and Director of AmericasBank Corp. | 1998 | |||
| Mark H. Anders | 51 | President, Chief Executive Officer and Director of AmericasBank and AmericasBank Corp. | 2003 | |||
| Nicholas J. Belitsos, M.D. | 55 | Director of AmericasBank and AmericasBank Corp. | 1998 | |||
| Richard C. Faint, Jr. | 54 | Director of AmericasBank and AmericasBank Corp. | 2005 | |||
| Savas J. Karas | 38 | Director of AmericasBank and AmericasBank Corp. | 2004 | |||
| Allen S. Lloyd, Jr. | 65 | Director of AmericasBank and AmericasBank Corp. | 2005 | |||
| John D. Muncks | 57 | Executive Vice President of AmericasBank and AmericasBank Corp. and Chief Lending Officer of AmericasBank | n/a | |||
| Mark D. Noar, M.D. | 52 | Director of AmericasBank and AmericasBank Corp. | 1998 | |||
| Kenneth D. Pezzulla | 76 | Director of AmericasBank and AmericasBank Corp. | 1996 | |||
| A. Gary Rever | 53 | Chief Financial Officer, Executive Vice President and Director of AmericasBank and Director of AmericasBank Corp. | 2003 | |||
| Ramon F. Roig, Jr., M.D. | 72 | Director of AmericasBank and AmericasBank Corp. | 1998 | |||
| Graylin E. Smith | 46 | Director of AmericasBank and AmericasBank Corp. | 2004 | |||
| John C. Weiss, III | 57 | Director of AmericasBank and AmericasBank Corp. | 2004 |
| (1) | As of December 1, 2005. |
Messrs. Belitsos, Faint, Lloyd, Roig and Warner’s terms as directors of AmericasBank Corp. expire at the 2006 annual meeting of shareholders of AmericasBank Corp.
Messrs. Karas, Pezzulla, Smith and Weiss’s terms as directors of AmericasBank Corp. expire at the 2007 annual meeting of shareholders of AmericasBank Corp.
Messrs. Anders, Noar and Rever’s terms as directors of AmericasBank Corp. expire at the 2008 annual meeting of shareholders of AmericasBank Corp.
Lee W. Warneris the chairman and chief executive officer of The Warner Companies, Inc., an investment advisory firm providing estate planning and executive benefit consulting, and he has served in that capacity since December 1992. Mr. Warner is a Chartered Financial Consultant, a Certified Financial Planner, an Accredited Estate Planner, and a Chartered Life Underwriter. Mr. Warner has served as an Insurance Advisor with the State of Maryland and a Registered Representative with the National Association of Securities Dealers. He has served as a Board Member of the Practitioners Council for the International Association of Financial Planners. Mr. Warner has also served on the boards of the Children’s Cancer Foundation, Inc. and the Carson Scholars Fund, and as Vice Chairman for the American Heart Association. Mr. Warner has served as our Chairman since January 2003.
68
Table of Contents
Mark H. Anders is the president and chief executive officer of AmericasBank Corp. and AmericasBank. He has served in that capacity for AmericasBank since July 18, 2003 and for AmericasBank Corp. since November 13, 2003. From May 31, 2003 to his employment as President, Mr. Anders served as a consultant to AmericasBank. Prior to joining AmericasBank, from October 1999 to August 2002, Mr. Anders was the president and chief executive officer of BankAnnapolis, a Maryland state chartered commercial bank and president of its holding company, Annapolis Bancorp, Inc. From October 1995 until January 1999, Mr. Anders served as the president and chief executive officer of Sterling Bancorp and its subsidiary bank, Sterling Bank & Trust Co., a commercial bank located in Baltimore, Maryland. From September 1991 to September 1995, Mr. Anders was a senior executive at Towson, Maryland based Bank of Maryland.
Nicholas J. Belitson, M.D. currently practices internal medicine and gastroenterology in Baltimore, Maryland and is president of Nicholas J. Belitsos, M.D., P.A. He has served in that capacity for the past 15 years.
Richard C. Faint, Jr., currently is the President and Chief Executive Officer of ARRRK Properties, a diversified real estate company that acquires, renovates and sells real estate, provides property management services, and engages in construction services. He has served in this capacity since July 2004. Mr. Faint is also President & CEO of The Cornerstone Professional Group, an information technology consulting firm that specializes in application development and network infrastructure support for small to medium sized organizations, a position he has held since May 2004. Mr. Faint founded both companies in 2004. Mr. Faint has extensive public company career experience, having served as chief executive officer or in senior leadership roles at Citrix Systems, Sequoia Software, TheraTx, and PersonaCare, all NASDAQ-listed companies or divisions thereof. He holds a B.S. in accounting and finance from Towson University and a J.D. and MBA from the University of Baltimore.
Savas J. Karas is the founder and principal of Enterprise Solutions Group, Inc., a Hunt Valley, Maryland business solutions company. Mr. Karas founded the company in January 1994. Previously, he served as a manager with the firm of Booz-Allen and Hamilton from 1990 to 1993, and as a consultant with PricewaterhouseCoopers from 1989 to 1990. Mr. Karas is a Certified Public Accountant, a Certified Management Consultant, a Six Sigma blackbelt, and holds a Masters in Business Administration with a concentration in Accounting from Loyola College. Mr. Karas has also served as a member of the Board of Directors for the Weinberg YMCA of Central Maryland since 2003.
Allen S. Lloyd, Jr. is the President of Elastics Enterprises, Inc., an operator of amusement rides. He has served in this capacity since October 2005. He is a career financial services executive, serving from 1993 through April 2005 as an executive vice president of MBNA America, the Wilmington-based credit card company. Most recently, he was an internal consultant and project manager responsible for various process re-engineering assignments at MBNA. He has also directed MBNA’s Affinity Group Relationships in the mid-Atlantic region. He was manager of Sales and Operations for an employee leasing company for six years before joining MBNA in late 1993. Prior to that, he was an executive with Maryland National Bank and American Security Bank from 1965 to 1987, responsible for commercial lending functions at both institutions. Mr. Lloyd is a graduate of the University of Maryland.
Mark D. Noar, M.D.currently is a gastroenterologist in Baltimore, Maryland and is a principal of Endoscopic Microsurgery Associates, P.A., which is a medical practice in Baltimore, Maryland. He has served in that capacity for over 12 years. Dr. Noar also is the medical director and the chief executive officer of The Endoscopy Center, Inc., which operates an ambulatory surgery center. He has served in that capacity for over ten years.
Kenneth D. Pezzulla,became chairman of AmericasBank Corp. and AmericasBank on January 1, 2000 and served in that capacity until May 2001. From June 1996 to February 2000, Mr. Pezzulla was the secretary of AmericasBank Corp., and from December 1997 to February 2000, Mr. Pezzulla was the secretary of AmericasBank. Mr. Pezzulla currently is a member of Pezzulla and Pezzulla, LLC, a Towson law firm, and has served in that capacity since 1995. Mr. Pezzulla had a solo legal practice from 1957 to 1995. Mr. Pezzulla was a director of Rushmore Trust & Savings, FSB, from 1989 to October 1997, and was a director of its predecessor, LaCarona Building and Loan Association, from 1963 to 1989. Mr. Pezzulla was president of LaCarona Building and Loan Association from 1985 to 1988.
69
Table of Contents
A. Gary Reveris an executive vice president and the chief financial officer of AmericasBank and AmericasBank Corp. and has served in that capacity for AmericasBank since August 4, 2003 and for AmericasBank Corp. since November 13, 2003. Prior to joining AmericasBank, from August 2000 to August 2003, Mr. Rever was the chief financial officer of Avatech Solutions, Inc., a public company that provides design automation and data management solutions for the manufacturing, building design, engineering and infrastructure and facilities management markets. From 1991 to May 1995, Mr. Rever was the chief financial officer of Towson, Maryland based Bank of Maryland. In that position, Mr. Rever was responsible for all staff functions including operations, human resources, facilities and branch administration. Mr. Rever retained his responsibilities at Bank of Maryland following its sale to Mason-Dixon Bancshares, Inc. in May 1995 and in 1998 consolidated the operating functions of Mason-Dixon’s subsidiary banks into Mason-Dixon Business Services, LLC, a service corporation formed to eliminate redundancies and reduce costs. Mr. Rever became president of the service corporation and served in that position through Mason-Dixon’s acquisition by BB&T Corporation in July 1999 and until June 2000. From July 1999 until June 2000, Mr. Rever worked to facilitate Mason-Dixon’s operations into BB&T Corporation. Mr. Rever is a certified Public Accountant.
Ramon F. Roig, Jr., M.D. currently practices internal medicine and gastroenterology in Baltimore, Maryland and is President of Ramon F. Roig, M.D., P.A. He has served in that capacity since 1974.
Graylin E. Smithis a Certified Public Accountant and currently a partner with SB & Company, LLC. Mr. Smith is a founder of the firm and has served as a partner since February 2005. From July 2003 to January 2005, Mr. Smith was a partner with Abrams, Foster, Nole & Williams, P.A. in Baltimore, Maryland. From May 2002 to June 2003, Mr. Smith was a partner with the firm of Ernst & Young, LLP. From June 1981 to May 2002, he was with the firm of Arthur Andersen, LLP. He was appointed partner in September 1996. Mr. Smith is a past Chair of the Maryland Association of Certified Public Accountants and is the present Treasurer of the Associated Black Charities.
John C. Weiss, III currently serves as Chairman and CEO of Claragen, Inc., a development-stage biopharmaceutical company. He has served in that capacity since April, 2004. He also serves as Assistant Professor of Finance at University of Baltimore. He was formerly the Executive Director of the Entrepreneurship Program at the Robert G. Merrick School of Business, University of Baltimore from 1999 to 2004. He also formerly served as Executive in Residence for the Office of Research and Development at the University of Maryland, Baltimore from July 2002 thru June 2004. Since 1990, Mr. Weiss has served on the board of trustees of the St. Agnes Healthcare Foundation in Baltimore, Maryland. Since 1995 he has served on the board of visitors of the University of Maryland, Baltimore, and also served on the board of visitors of Towson University from 1995 to 2004. Mr. Weiss has formerly served in the capacity as either director or partner of several venture capital firms, namely, the Maryland Venture Capital Trust from 1990 to 2002, Anthem Capital, L.P. from 1992 to 1996, and Arete Ventures, Inc. from 1984 to 1990. From 2000 to 2002, Mr. Weiss served as interim Executive Director of the Baltimore City Parking Authority, Inc. Mr. Weiss formerly served on the board of directors of Chesapeake Biological Laboratories, Inc., (NASDAQ: CBLI) Baltimore, Maryland, from 1986 to 1998 and was its president from 1996 to 1998. Mr. Weiss is also an active member of several other community and civic boards in the Baltimore area. Mr. Weiss has a Master of Business Administration degree from Loyola College, Baltimore, Maryland.
The directors of AmericasBank Corp. are divided into three classes, with each class containing one-third of the total number of directors, as near as is possible. Each director serves for a term ending on the date of the third annual meeting of shareholders following the annual meeting at which such director was elected. Pursuant to the charter of AmericasBank Corp., the term of office of one of the three classes of directors expires each year. The officers of AmericasBank Corp. are elected annually by the board of directors following the annual meeting of shareholders and serve for terms of one year or until their successors are duly elected and qualified except where a longer term is expressly provided in an employment contract duly authorized and approved by the board of directors of AmericasBank Corp.
Directors of AmericasBank are elected annually by AmericasBank Corp., its sole shareholder.
70
Table of Contents
Executive Officers Who are Not Directors
John D. Muncks is an executive vice president and chief lending officer of AmericasBank. He has over 20 years of banking experience in the Baltimore and Washington, D.C. metropolitan areas specializing in commercial transactions. Prior to joining AmericasBank on July 28, 2003, Mr. Muncks was a principal of Sign Effects, Inc., an electronic sign business, from November 2000 until its sale in February 2003. From 1991 until 1998, Mr. Muncks served as an Executive Vice President for Signet Bank – Maryland working in both senior lending and credit capacities. Mr. Muncks was retired from 1998 until November 2000.
The officers of AmericasBank Corp. and AmericasBank are elected annually by the respective Boards of Directors following the annual meeting of shareholders and serve for terms of one year or until their successors are duly elected and qualified, except where a longer term is expressly provided in an employment contract duly authorized and approved by the Board of Directors. See “-Employment Agreements.”
Director Compensation
Our board of directors has adopted a policy pursuant to which each non-employee director (“Eligible Director”) is eligible to receive an annual retainer of $5,000, payable at the beginning of each calendar year. The policy became effective on December 30, 2005. The Eligible Directors are also eligible to receive an additional payment of $250 per meeting of the board and of a board committee. The chair of each committee and the chairman of the board of directors are each eligible to receive an additional $100 per attended committee meeting. In addition, the Eligible Directors are eligible to receive non-qualified stock options to purchase 500 shares of the our common stock at the end of each calendar year and additional stock options to purchase 1,000 shares of our common stock for each completed three year term of service on the board. The options described herein shall be granted under and shall be subject to the terms and provisions of the AmericasBank Corp. 2004 Stock Incentive Plan, as amended from time to time. We also reimburse the Eligible Directors for all reasonable expenses incurred on our behalf.
Prior to the adoption of this policy, we have not paid our directors any fees for their services.
71
Table of Contents
Executive Compensation
The following table sets forth the compensation paid by AmericasBank to its chief executive officer and to any other executive who received compensation in excess of $100,000 during 2005.
Summary Compensation Table
Name and Principal Position | Year | Annual Compensation | Long-term Compensation | |||||||||||
| Salary($) | Bonus($) | Securities Underlying Options (#) | All Other Compensation | |||||||||||
Mark H. Anders, President & CEO(1) | 2005 2004 2003 | $ $ $ | 131,667 125,000 57,291 | $ | — — — | — 80,000 — | $ $ $ | 17,328 17,132 7,255 | (4) (4) (4) | |||||
A. Gary Rever, EVP & CFO(2) | 2005 2004 2003 | $ $ $ | 111,667 105,000 43,750 | $ | — — — | — 66,875 — | $ $ $ | 14,328 14,522 5,004 | (5) (5) (5) | |||||
John D. Muncks, EVP(3) | 2005 2004 2003 | $ $ $ | 107,500 95,000 41,045 | $ | — — — | — 53,750 — | $ $ $ | 14,328 14,522 5,630 | (6) (6) (6) | |||||
| (1) | Mr. Anders has served as our president and chief executive officer since July 18, 2003. Mr. Anders also received $15,000 of consulting fees from us in 2003. |
| (2) | Mr. Rever has served as our executive vice president and chief financial officer since August 4, 2003. |
| (3) | Mr. Muncks has served as our executive vice president and chief lending officer since July 28, 2003. |
| (4) | Other compensation for Mr. Anders included a car allowance and paid health insurance of $9,000 and $8,328 respectively for 2005, $9,000 and $8,132, respectively for 2004, and $4,125 and $3,130, respectively, for 2003. |
| (5) | Other compensation for Mr. Rever included a car allowance and paid health insurance of $6,000 and $8,328 respectively for 2005, $6,000 and $8,522, respectively for 2004, and $2,500 and $2,504, respectively, for 2003. |
| (6) | Other compensation for Mr. Muncks included a car allowance and paid health insurance of $6,000 and $8,328 respectively for 2005, $6,000 and $8,522, respectively for 2004, and $2,500 and $3,130, respectively, for 2003. |
In the event any of our outstanding warrants are exercised, other than in connection with a cashless exercise, we will grant Messrs. Anders, Reyer and Muncks, either pursuant to a shareholder approved stock option plan or otherwise, options to purchase additional shares of common stock at an exercise price equal to, as of the date of exercise of the warrant, the lesser of the fair market value of our common stock or the warrant exercise price. The number of options we will grant in such event will equal an amount such that our management would own, assuming the exercise of all options held by management, the same percentage of us both before and after the exercise of the warrants.
72
Table of Contents
The following table sets forth information on the aggregate number of shares of common stock underlying unexercised options held as of December 31, 2004 by Messrs. Anders, Rever and Muncks.
Aggregate Options Table
Name | Number of Securities December 31, 2004 | Value of Unexercised Options at December 31, 2004 | ||||||||
| Exercisable | Unexercisable | Exercisable | Unexercisable | |||||||
Mark H. Anders | 8,000 | 72,000 | $ | 0 | $ | 0 | ||||
A. Gary Rever | 6,688 | 60,187 | $ | 0 | $ | 0 | ||||
John D. Muncks | 5,375 | 48,375 | $ | 0 | $ | 0 | ||||
The exercise price of these options is $8.00 per share which was equal to the fair market value on the date of grant. The market value of the common stock was $7.30 per share, which is the sales price at which shares of common stock were last sold in over the counter trading on December 31, 2005. The unexercised options are subject to the following vesting requirements:
General Vesting Rules. Subject to the limitations described under “Vesting Adjustments��� below, the stock options granted to Messrs. Anders, Rever, Muncks will vest and become exercisable in accordance with the following provisions:
(i) 10% of the options will vest on the date of grant.
(ii) If (a) AmericasBank’s return on average assets (ROAA) for each period shown in the chart below is greater than or equal to 95% of the “ROAA Hurdle” for that period, and (b) the amount of the AmericasBank’s average assets for each period shown in the chart below is greater than or equal to 95% of the “Average Assets Hurdle” for that period, then the percentage of the options set forth under “Percentage of Options Vesting” for that period, plus any options that were eligible to vest in a prior period but which did not vest under the terms of paragraphs (ii) through (vi) of “General Vesting Rules” (but specifically excluding any options that failed to vest under the terms of paragraph A, paragraph B, and/or paragraph C of “Vesting Adjustments” below), will vest one year after the last day of that period:
Period | Percentage of Options Vesting | ROAA Hurdle | Average Assets Hurdle | ||||||
January 1, 2004 – December 31, 2004 | 11.67 | % | -1.25 | % | $ | 40,542,000 | |||
January 1, 2005 – December 31, 2005 | 11.67 | % | 0.25 | % | $ | 59,672,000 | |||
January 1, 2006 – December 31, 2006 | 11.67 | % | 0.5 | % | $ | 71,471,000 | |||
January 1, 2007 – December 31, 2007 | 17.50 | % | 0.75 | % | $ | 84,024,000 | |||
January 1, 2008 – December 31, 2008 | 17.50 | % | 1.00 | % | $ | 95,583,000 | |||
January 1, 2009 – December 31, 2009 | 6.67 | % | 1.25 | % | $ | 105,708,000 | |||
January 1, 2010 – December 31, 2010 | 6.66 | % | 1.40 | % | $ | 116,137,000 | |||
January 1, 2011 – December 31, 2011** | 6.66 | % | 1.50 | % | $ | 127,814,000 | |||
January 1, 2012 – December 31, 2012** | * | * | 1.50 | % | $ | 127,814,000 | |||
January 1, 2013 – December 31, 2013** | * | * | 1.50 | % | $ | 127,814,000 | |||
| ** | See paragraph (vi) below. |
(iii) If AmericasBank’s ROAA for any period is less than 95% of the ROAA Hurdle for that period, then the number of options that are eligible to vest one year after the last day of that period as shown in the chart above will be reduced (but not below zero) by the same percentage as the percentage by which the ROAA Hurdle for that period exceeds AmericasBank’s ROAA for that period. The adjustments set forth in this paragraph (iii) is in addition to the adjustments set forth in paragraph (iv) below. The computations required under this paragraph (iii) will be made before giving effect to any adjustment required under paragraph (iv) below.
(iv) If AmericasBank’s average assets for any period is less than 95% of the Average Assets Hurdle for that period, then the number of options that are eligible to vest one year after the last day of that period as shown in the chart above will be reduced (but not below zero) by the same percentage as the percentage by which the Average Assets Hurdle for that period exceeds AmericasBank’s average assets for that period. The adjustments set forth in this paragraph (iv) are in addition to the adjustments set forth in paragraph (iii) above. The computations required under this paragraph (iv) will be made before giving effect to any adjustment required under paragraph (iii) above.
73
Table of Contents
(v) Notwithstanding the provisions of paragraph (ii), paragraph (iii), and paragraph (iv) above, but subject to the provisions of paragraph A, paragraph B, and paragraph C under “Vesting Adjustments” below, if, for any period, any options fail to vest as a result of the application of paragraph (ii), paragraph (iii), and/or paragraph (iv) above, but AmericasBank’s ROAA for the applicable period exceeds the ROAA Hurdle for that periodor AmericasBank’s average assets for the applicable period exceeds the Average Assets Hurdle for that period, then the number of options that are eligible to vest one year after the last day of that period as shown in the chart above will be reduced (but not below zero) in accordance with the following formula:
P = (B-A)
Where:
P = the percentage reduction in the number of options that are eligible to vest one year after the last day of that period;
A = (i) if AmericasBank’s ROAA for the applicable period exceeds the ROAA Hurdle for that period, the amount of such excess (expressed as a percentage); or (ii) if AmericasBank’s average assets for the applicable period exceeds the Average Assets Hurdle for that period, the amount of such excess (expressed as a percentage); and
B = (i) if the ROAA Hurdle for the applicable period exceeds AmericasBank’s ROAA for that period, the amount of such excess (expressed as a percentage); or (ii) if the Average Assets Hurdle for the applicable period exceeds AmericasBank’s average assets for that period, the amount of such excess (expressed as a percentage);
provided, however, that if, for any period, P is less than or equal to zero, then no reduction in the number of options that are eligible to vest one year after the end of that period shall be made under paragraph (iii) or paragraph (iv) above or this paragraph (v).
(vi) If the vesting criteria under paragraph (ii) under “General Vesting Rules” above for the period commencing on January 1, 2011 and ending on December 31, 2011 are satisfied, then no additional vesting will occur for the period commencing on January 1, 2012 and ending on December 31, 2012 or the period commencing on January 1, 2013 and ending on December 31, 2013. If the vesting criteria under paragraph (ii) under “General Vesting Rules” above for the period commencing on January 1, 2011 and ending on December 31, 2011 are not satisfied, but the vesting criteria for the period commencing on January 1, 2012 and ending on December 31, 2012 are satisfied, then no additional vesting will occur for the period commencing on January 1, 2013 and ending on December 31, 2013.
In addition, all options generally will immediately vest upon a “change of control” (as defined in the new management employee’s employment agreement) or if the employee is terminated without cause or terminates his employment for good reason, as described in the employment agreement. Also, any options that remain unvested as of December 31, 2014 will terminate.
Vesting Adjustments. The vesting provisions set forth under “General Vesting Rules” above will be subject to adjustment as follows:
A.Charge-Off Amount Adjustment. If, for any period shown in the chart above, the Charge-Off Amount (defined below) is greater than the Charge-Off Threshold, then the number of options that are eligible to vest one year after the last day of that period under “General Vesting Rules” above will be reduced by 5% (but not below zero) for each 0.1% by which the Charge-Off Amount exceeds 0.3%.
“Charge-Off Amount” means, for any fiscal period, the aggregate amount of loan and lease charge-offs made by AmericasBank, as determined in accordance with generally accepted accounting principles and bank regulatory requirements.
74
Table of Contents
“Charge-Off Threshold” means, for any fiscal period, 0.3% of AmericasBank’s aggregate gross loans and leases extended during such period, as determined in accordance with generally accepted accounting principles and bank regulatory requirements.
The adjustments set forth in this paragraph A are in addition to the adjustments set forth in paragraph B and paragraph C below. The computations required under this paragraph A will be made before giving effect to any adjustment required under paragraph B and paragraph C(ii) below.
B.Non-Performing Amount Adjustment. If, as of the last day of any period shown in the chart above, the Non-Performing Amount (defined below) is greater than the Non-Performing Threshold (defined below), then the number of options that are eligible to vest one year after the last day of that period under “General Vesting Rules” above will be reduced by 5% (but not below zero) for each 0.1% by which the Non-Performing Amount exceeds 1.0%.
“Non-Performing Amount” means, as of any determination date, the amount of AmericasBank’s total loans and leases outstanding that have been classified as “non-performing” (or similar status) by AmericasBank. “Non-Performing Threshold” means, as of any determination date, 1.0% of AmericasBank’s total loans and leases outstanding, as determined in accordance with generally accepted accounting principles and bank regulatory requirements.
The adjustments set forth in this paragraph B are in addition to the adjustments set forth in paragraph A above and paragraph C below. The computations required under this paragraph B will be made before giving effect to any adjustment required under paragraph A above and paragraph C(ii) below.
C.Regulatory Rating Adjustments.
(i) If, as of the last day of any period as shown in the chart above commencing on or after the earlier of
(a) December 31, 2005, or
(b) the first date on which AmericasBank’s overall composite rating is better than or equal to 2,
AmericasBank’s overall composite rating is 3 or lower, then none of the options that are eligible to vest one year after the last day of that period under “General Vesting Rules” above will vest.
(ii) If, as of the last day of any period as shown in the chart above commencing on or after the earlier of
(a) December 31, 2005, or
(b) the first date on which AmericasBank’s overall composite rating is better than or equal to 2,
the rating for AmericasBank’s management and/or asset quality is 3 or lower, then the number of options that are eligible to vest one year after the last day of that period under “General Vesting Rules” above will be reduced by 50%. The adjustments set forth in this paragraph C(ii) are in addition to the adjustments set forth in paragraph A and paragraph B above. The computations required under this paragraph C(ii) will be made before giving effect to any adjustment required under paragraph A and paragraph B above.
75
Table of Contents
(iii) If, as of the last day of any period as shown in the chart above commencing on or after the earlier of
(a) December 31, 2005, or
(b) the first date on which the rating for AmericasBank’s overall composite rating is better than or equal to 2,
the rating for AmericasBank’s management and/or asset quality has been 3 or lower for two consecutive periods, then none of the options that are eligible to vest one year after the last day of that period under “General Vesting Rules” above will vest.
The following table sets forth certain information as of December 31, 2005, with respect to compensation plans under which equity securities of AmericasBank Corp. are authorized for issuance.
| Equity Compensation Plan Information | |||||||
Plan category | Number of securities (a) | Weighted-average (b) | Number of securities (c) | ||||
1998 equity compensation plan approved by security holders(1) | 3,995 | $ | 40.42 | 14,505 | |||
2004 equity compensation plan approved by security holders(2) | 292,851 | $ | 8.00 | 27,929 | |||
| (1) | Refers to the AmericasBank Corp. 1998 Stock Option Plan. |
| (2) | Refers to the AmericasBank Corp. 2004 Stock Incentive Plan. |
76
Table of Contents
Employment Agreements
AmericasBank has entered into employment agreements with each of Mark H. Anders, A. Gary Rever and John D. Muncks.
Mark H. Anders
Effective July 18, 2003, AmericasBank entered into an employment agreement with Mr. Anders. Pursuant to the agreement, Mr. Anders will serve as the President and Chief Executive Officer of AmericasBank. The agreement has an initial term of five years. After the first anniversary date and continuing on each anniversary date thereafter, the agreement will be extended for an additional year such that the remaining term shall be five years unless written notice of non-renewal is provided to Mr. Anders at least ten and not more than 30 days following the anniversary date.
The agreement initially provided for a salary of $125,000. The compensation committee of the board of directors, will review Mr. Anders’ base salary annually and Mr. Anders will be entitled to a five percent increase if he receives a satisfactory performance evaluation from the compensation committee. On August 25, 2005, Mr. Anders’ base salary was increased to $145,000 annually. The agreement does not provide standards that Mr. Anders must meet to achieve a satisfactory performance evaluation; rather such standards will be determined by the compensation committee in its discretion. In addition, the base salary will be renegotiated upwards when and if AmericasBank achieves a one percent return on average assets, as defined under general accounting principals of the banking industry, for any fiscal year. Mr. Anders is also entitled to participate in the 2004 Stock Incentive Plan in addition to any other bonus, incentive or other executive compensation programs made available to senior management of AmericasBank.
The agreement terminates upon Mr. Anders’ death, permanent disability or by mutual written agreement. In addition, Mr. Anders may terminate the agreement within six months following a “change in control,” as described below, for good reason as described in the agreement or without good reason by providing sixty days prior written notice. AmericasBank may terminate the agreement for certain events constituting cause as described in the agreement, subject to a notice and cure period described in the agreement and determination of cause by two-thirds of the non-employee members of the board of directors. AmericasBank may also terminate the agreement without cause provided that it provides sixty days prior written notice to Mr. Anders.
If Mr. Anders terminates the agreement for good reason, or if AmericasBank terminates Mr. Anders’ employment without cause and a change in control has not occurred within the immediately preceding six months and AmericasBank has less than a .75% return on average assets for the immediately proceeding twelve months, than Mr. Anders is entitled to severance pay and liquidated damages in amount equal to his monthly base salary, to be paid in monthly installments, for a period of one year. If AmericasBank has a return on average assets greater than .75% but less than 1%, Mr. Anders is entitled to an amount equal to his monthly base salary, to be paid in monthly installments, for a period of eighteen months. If AmericasBank has a return on average assets greater than 1%, Mr. Anders is entitled to an amount equal to his monthly base salary, to be paid in monthly installments, for a period of two years.
Pursuant to the employment agreement, a “change in control” will occur upon:
| • | The acquisition, by any person or persons acting in concert of the then outstanding voting securities of either AmericasBank or AmericasBank Corp., if, after the transaction, the acquiring person (or persons) owns, controls or holds with power to vote fifty percent (50%) or more of any class of voting securities of AmericasBank or AmericasBank Corp., as the case may be; |
| • | The approval, by the shareholders of either AmericasBank or AmericasBank Corp. of a reorganization, merger or consolidation, with respect to which persons who were the shareholders of either AmericasBank or AmericasBank Corp., as the case may be, |
77
Table of Contents
immediately prior to such reorganization, merger or consolidation do not, immediately thereafter, own more than fifty percent (50%) of the combined voting power entitled to vote in the election of directors of the reorganized, merged or consolidated company’s then outstanding voting securities;
| • | The sale, transfer or assignment of all or substantially all of the assets of the AmericasBank or AmericasBank Corp. to any third party; or’ |
| • | Within any twelve-month period (beginning one year after the effective date of the employment agreement) the persons who were directors of AmericasBank immediately before the beginning of such twelve-month period (the “Incumbent Directors”) cease to constitute at least a majority of such board of directors; provided that any director who was not a director as of the effective date of the employment agreement will be deemed to be an Incumbent Director if that director was elected to such board of directors by, or on the recommendation of or with the approval of, a majority of the directors who then qualified as Incumbent Directors. |
| • | In the event a change in control has occurred as described in the first three provisions above and the employment agreement is terminated, Mr. Anders is entitled to the following: |
If the price paid by the entity or entities acquiring voting securities, voting control or assets is less than the then current book value of AmericasBank or AmericasBank Corp., Mr. Anders will receive a lump sum payment equal to his current annual base salary;
| • | If the price paid is equal or greater than book value but less than two times book value, Mr. Anders will receive a lump sum payment using the calculations involving return on average assets as provided in the event Mr. Anders terminates the agreement for good reason as described above; and |
| • | If the price paid is equal or greater than two times book value, Mr. Anders will receive a lump sum payment equal to 2.99 times his average annual salary over the prior five years and will be paid such lump sum within 30 days of the effective date of termination of the employment agreement. |
In the event a change in control has occurred as described in the fourth provision above and the employment agreement is terminated, Mr. Anders is entitled to a lump sum payment using the calculations involving return on average assets as provided in the event Mr. Anders terminates the agreement for good reason as described above.
In the event a change in control occurred, Mr. Anders would receive:
| • | $145,000 if the price paid by the entity or entities acquiring voting securities, voting control or assets was less than current book value; |
| • | If the price paid was equal or greater than book value but less than two times book value or if the change in control occurs pursuant to the fourth change in control provision described above: |
| • | $145,000 if the return on average assets is less than .75%; |
| • | $217,500 if the return on average assets if greater than .75% but less than 1%; and |
| • | $290,000 if the return on average assets is greater than 1 |
| • | $433,550 if the price paid was equal to or greater than two times book value. |
78
Table of Contents
Mr. Anders’ agreement also contains a provision whereby AmericasBank agrees to maintain in an escrow account an amount equal to Mr. Anders’ annual base salary. These escrowed funds are to be used as a source or partial source of any of the termination payments described above. Currently, Mr. Anders is waiving this requirement.
A. Gary Rever and John D. Muncks
On July 28, 2003 and August 4, 2003, AmericasBank entered into employment agreements with Mr. Muncks and Mr. Rever, respectively. Mr. Rever serves as an Executive Vice President and the Chief Financial Officer while Mr. Muncks serves as an Executive Vice President and the Chief Lending Officer. Mr. Rever’s agreement has an initial term of five years. After the third anniversary date and continuing on each anniversary date thereafter, the agreement will be extended for an additional year such that the remaining term shall be three years unless written notice of non-renewal is provided to Mr. Rever at least ten and not more than 30 days following the anniversary date. Mr. Muncks’ agreement has an initial term of three years. After the second anniversary date and continuing on each anniversary date thereafter, the agreement will be extended for an additional year such that the remaining term shall be two years unless written notice of non-renewal is provided to Mr. Muncks at least ten and not more than 30 days following the anniversary date.
Mr. Rever’s agreement provides for an initial salary of $105,000 and Mr. Muncks’ agreement provides for an initial salary of $95,000. Mr. Rever and Mr. Muncks base salaries will be reviewed annually by the compensation committee of the board of directors and each will be entitled to receive a five percent increase if he receives a satisfactory performance evaluation from the compensation committee. On August 25, 2005, Mr. Rever’s based salary was increased to $125,000 and Mr. Mr. Munck’s base salary was increased to $125,000. Mr. Rever’s and Mr. Muncks’ agreements do not provide standards that they must meet to achieve a satisfactory performance evaluation; rather such standards will be determined by the compensation committee in its discretion. In addition, their base salaries will be renegotiated upwards when and if AmericasBank achieves a one percent return on average assets for any fiscal year. Mr. Rever and Mr. Muncks also are entitled to participate in the 2004 Stock Incentive Plan in addition to any other bonus, incentive or other executive compensation programs made available to senior management of AmericasBank. See “- Incentive Compensation - 2004 Stock Incentive Plan.”
The agreements have the same termination provisions as those found in Mr. Anders’ employment agreement. If Mr. Rever or Mr. Muncks terminates their agreement for good reason, or if AmericasBank terminates their employment without cause and a change in control has not occurred within the immediately preceding six months and AmericasBank has less than a .75 % return on average assets for the immediately proceeding twelve months, than Mr. Rever and Mr. Muncks are entitled to severance pay and liquidated damages in amount equal to their monthly base salary, to be paid in monthly installments, for a period of nine months. If AmericasBank has a return on average of assets greater than 1%, Mr. Rever and Mr. Muncks are entitled to an amount equal to their monthly base salary, to be paid in monthly installments, for a period of one year.
In the event a change in control has occurred as described in the first three “change in control” provisions described for Mr. Anders and the employment agreements are terminated, Mr. Rever and Mr. Muncks are entitled to the following:
| • | If the price paid by the entity or entities acquiring voting securities, voting control or assets is less than the then current book value of AmericasBank or AmericasBank Corp., Mr. Rever and Mr. Muncks will receive a lump sum payment equal to 75% of their current annual base salary; and |
| • | If the price paid is equal or greater than book value but less than two times book value, Mr. Rever and Mr. Muncks will receive a lump sum payment equal to 1.00 times their average annual salary over the prior five years and will be paid such lump sum within 30 days of the effective date of termination of the employment agreement. |
The fourth “change in control” provision described above in Mr. Anders’ employment agreement does not constitute a change in control under Mr. Rever’ s and Mr. Muncks’ employment agreements.
79
Table of Contents
In the event a change in control occurred as of December 31, 2004, Mr. Rever would receive $78,750 if the price paid was less than book value and $105,000 if the price paid was equal or greater than book value but less than two times book value. Mr. Muncks would receive $71,250 if the price paid was than book value and $95,000 if the price paid was equal to or greater than book value but less than two times book value.
Mr. Rever’s and Mr. Muncks’ agreements also contain a provision whereby AmericasBank agrees to maintain in an escrow account an amount equal to 75% of their annual base salary. These escrowed funds are to be used as a source or partial source of any of the termination payments described above. Currently, Messer’s Rever and Muncks are waiving this requirement.
All three employment agreements contain a non-competition clause. Pursuant to this clause, Mr. Anders, Mr. Rever and Mr. Muncks agree that upon termination of their employment for any reason, thereafter for a period equal to the greater of six months or the period during which they are receiving termination payments, they will not, within a 20 mile radius of AmericasBank’s main office, either directly or indirectly, on their behalf or in the service or on behalf of others, work in any capacity which involves duties and responsibilities similar to those they perform for us or engage in any business which is the same or essentially the same as ours.
In addition to the non-competition clause, all three agreements contain a non-solicitation clause. Pursuant to this clause, Mr. Anders, Mr. Rever and Mr. Muncks agree that upon termination of their employment for any reason, thereafter for a period equal to the greater of 12 months or the period during which they are receiving termination payments, they will not, within a 20 mile radius of AmericasBank’s main office, solicit or divert or attempt to solicit or divert our customers, including actively sought potential customers, with whom Mr. Anders, Mr. Rever or Mr. Muncks had material contact during the last two years of their respective employment, for products or services that are competitive with ours. In addition, Mr. Anders, Mr. Rever and Mr. Muncks agree not to solicit, recruit or hire away, either directly or indirectly, an employee of AmericasBank or any affiliate.
The non-competition and non-solicitation of customer clauses may be waived with our prior written consent.
Incentive Compensation
1998 Stock Option Plan, as amended
On May 28, 1998, our shareholders approved the AmericasBank Corp. Stock Option Plan. As initially approved, the Stock Option Plan authorized the issuance of options to purchase 45,000 shares of our common stock pursuant to the plan. On May 27, 1999, our shareholders approved an amendment to the Stock Option Plan to authorize the issuance of options to purchase 74,400 shares of our common stock pursuant to the plan. Pursuant to the plan, we granted options to former management and to our directors. In general, prior to 2001, each director was issued options to purchase 20 shares of our common stock for each AmericasBank Corp. or AmericasBank board or committee meeting attended. We also issued options to certain directors for providing services to us.
As of the date of this prospectus, there were options to purchase 3,995 shares of our common stock outstanding pursuant to the plan. These options are exercisable at exercise prices ranging from $28.00 to $48.00. All of these options are held by current directors of AmericasBank Corp.
The Stock Option Plan became effective as of June 1, 1998, and has a 10 year term. All options granted pursuant to the plan expire on the 10th anniversary of the date of grant. The outstanding options terminate on the first anniversary of a director’s termination of service on the board of directors.
We do not anticipate granting any additional options pursuant to this Stock Option Plan.
2004 Stock Incentive Plan
General.On March 11, 2004, the Board of Director adopted the AmericasBank Corp. 2004 Stock Incentive Plan (the “2004 Plan”) and on June 3, 2004, the shareholders approved the plan. The purpose of the 2004 Plan is to promote the long-term growth and profitability of AmericasBank Corp. and any subsidiaries, including
80
Table of Contents
AmericasBank, by (i) providing key people with incentives to improve shareholder value and to contribute to the growth and financial success of AmericasBank Corp. and its subsidiaries through their future services, and (ii) enabling AmericasBank Corp. and its subsidiaries to attract, retain and reward the best-available persons.
Shares Subject to the Plan.Subject to the next sentence, 320,780 shares are eligible to be issued pursuant to the 2004 Plan. The number of shares reserved for the grant of incentive awards and the number of shares which are subject to outstanding incentive awards under the 2004 Plan will be subject to adjustment in the event of stock splits and stock dividends. If an incentive award expires or is terminated or if any shares subject to an award are repurchased or surrendered to AmericasBank Corp., such shares will again be available for future incentive awards granted under the 2004 Plan (except that, to the extent required by applicable law, no such shares will be available for purchase pursuant to incentive stock options granted under the 2004 Plan).
Administration.The 2004 Plan provides that it will be administered by our board of directors or a committee appointed by the board of directors and composed of two or more independent directors (in either case, the administrator). The Board of Directors has delegated the duty to administer the 2004 Plan to the Compensation Committee of the Board of Directors. The administrator will be authorized to determine and designate from time to time those individuals to whom incentive awards are to be granted and the type of incentive awards.
Eligibility.All officers, directors, employees and certain other persons providing services to AmericasBank Corp. or any affiliate, including AmericasBank, will be eligible to be grantees under the plan, if so designated by the administrator. In addition, employees, officers, consultants and directors who hold equity-based awards issued by a company acquired by AmericasBank Corp. may be granted a substitute award under the 2004 Plan.
Types of Awards to be Granted.
General. The types of incentive awards that may be awarded under the plan are incentive stock options, non-qualified stock options, stock appreciation rights, restricted stock, phantom stock, payouts of performance shares and other stock-based awards. Each award granted pursuant to the plan will be evidenced by a grant agreement setting forth the terms and conditions of the incentive award to be granted, which may include terms regarding the manner of payment for awards granted to a grantee, such as by payment by the tender of shares or pursuant to a cashless exercise. The terms and conditions of the grant agreement shall be determined by the administrator. All incentive awards may be granted individually or in tandem with other types of awards.
Non-Qualified Stock Options. A non-qualified stock option is an award in the form of a stock option to purchase shares of the common stock. The stock option does not qualify for the special tax treatment accorded to incentive stock options under Section 422 of the Internal Revenue Code. The exercise price of each non-qualified stock option shall not be less than the fair market value of the common stock for the date on which the stock option is granted.
Incentive Stock Options. An incentive stock option is an award in the form of a stock option to purchase shares of common stock that is intended to comply with the requirements of Section 422 of the Internal Revenue Code. The exercise price of each incentive stock option shall not be less than the fair market value of the common stock for the date on which the stock option is granted.
Stock Appreciation Rights. A stock appreciation right is an award in the form of a right to receive cash, common stock or a combination of cash and common stock in an amount equal to the appreciation in the value of the common stock over a base price established in the award. The minimum base price of a stock appreciation right shall not be less than the fair market value of the underlying stock for the date on which the stock appreciation right is granted.
Restricted Stock and Phantom Stock. Restricted stock is an award of shares of common stock that are issued subject to specified conditions and restrictions on transfer, forfeiture and/or other incidents of ownership. Phantom stock units are stock-equivalent units that may subject the grantee to the same conditions and restrictions as would be imposed on restricted stock. All phantom stock units shall have a value equal to the fair market value of one share of common stock and may be paid in cash, common stock or a combination of cash and common stock.
81
Table of Contents
Performance Awards. A performance award is an award payable in cash, common stock or a combination of cash and common stock based upon the achievement of one or more performance goals.
Other Stock-Based Awards. The administrator may grant, and establish the terms and conditions of, other stock-based awards.
Certain Adjustments.In the event of a change affecting the common stock or AmericasBank Corp.’s capitalization other than a stock split or stock dividend, or a change of control transaction (as described below), the administrator may make (i) appropriate adjustments to the maximum number and kind of shares reserved for issuance or with respect to which awards may be granted; and (ii) any adjustments in outstanding awards, including but not limited to modifying the number, kind and price of securities subject to awards.
Change in Control.In the event of any transaction resulting in a change of control (as defined in the 2004 Plan) (i) outstanding stock options and other awards that are payable in or convertible into common stock will terminate upon the effective time of the change in control unless provision is made in connection with the transaction for the continuation or assumption of such awards by, or for the substitution of the equivalent awards of, the surviving or successor entity or a parent thereof; (ii) all outstanding stock options and other awards shall vest and become exercisable to the extent provided for in the applicable grant agreement, and (iii) the holders of stock options and other awards under the 2004 Plan will be permitted, immediately before the change in control, to exercise or convert all portions of such stock options or other awards that are then exercisable or convertible or which become exercisable or convertible upon or prior to the effective time of the change in control.
Transferability.Except as otherwise determined by the administrator (i) awards granted under the 2004 Plan are not transferable other than by will or the laws of descent and distribution and (ii) awards may be exercised during a grantee’s lifetime only by the grantee or by the grantee’s guardian or legal representative.
Amendment and Termination. The Board of Directors may terminate, amend or modify the 2004 Plan at any time, but no amendment or modification shall be made which would impair the rights of any grantee of an award without the grantee’s consent. Notwithstanding anything to the contrary contained in the Plan, the Board may not amend or modify 2004 Plan without shareholder approval where such approval is required by applicable law or by the rules of any securities exchange or quotation system on which the Common Stock is listed or traded.
The administrator also has the power to amend or modify outstanding awards. However, the administrator will not make any modification that would impair any outstanding award without the consent of the grantee (except as otherwise provided in the grant agreement or in connection with a recapitalization, reorganization, change of control or similar event as described in the 2004 Plan).
Grants Outstanding under the 2004 Plan.As of the date of this prospectus, there were options to purchase 301,875 shares of our common stock outstanding pursuant to the 2004 Plan. These options are all exercisable at a price of $8.00 per share, as adjusted for the reverse stock split. We have not issued any restricted shares or restricted units under the 2004 Plan.
82
Table of Contents
SECURITY OWNERSHIP OF CERTAIN BENEFICIAL OWNERS AND MANAGEMENT
The following table sets forth the beneficial ownership of AmericasBank Corp.’s capital stock as of the date of this prospectus by (i) persons believed by AmericasBank Corp. to beneficially own more than five percent (5%) of the common stock; (ii) AmericasBank Corp.’s directors and executive officers; and (iii) all directors and executive officers of AmericasBank Corp. as a group. Unless otherwise noted below, we believe that each person named in the table has or will have the sole voting and sole investment power with respect to each of the securities reported as owned by such person.
Name and Address of Beneficial Owner(1) | Shares of Common | Warrants to Purchase Common Stock | Options to Purchase Common | Total Number of Shares of Stock Beneficially | Percent of Common Ownership | ||||||
Lee W. Warner(2) | 33,750 | 31,250 | 70 | 65,070 | 6.69 | % | |||||
Mark H. Anders(3) | 6,250 | — | 8,000 | 14,250 | 1.50 | % | |||||
Nicholas J. Belitsos, M.D(4) | 26,508 | 24,009 | 390 | 50,907 | 5.27 | % | |||||
Richard C. Faint, Jr. | — | — | — | — | — | ||||||
Savas J. Karas | 62 | — | — | 62 | 0.01 | % | |||||
Allen S. Lloyd, Jr. | — | — | — | — | — | ||||||
John D. Muncks(5) | 6,250 | — | 5,375 | 11,625 | 1.23 | % | |||||
Mark D. Noar, M.D.(6) | 13,127 | 23,128 | 215 | 36,470 | 3.78 | % | |||||
Kenneth D. Pezzulla(7) | 1,575 | 3,263 | 2,890 | 7,728 | 0.82 | % | |||||
A Gary Rever(8) | 6,250 | — | 6,688 | 12,938 | 1.36 | % | |||||
Ramon F. Roig, M.D.(9) | 15,775 | 24,525 | 430 | 40,730 | 4.21 | % | |||||
Graylin E. Smith | 62 | — | — | 62 | 0.01 | % | |||||
John C. Weiss, III | 62 | — | — | 62 | 0.01 | % | |||||
Directors and Officers as a Group, thirteen (13) people | 109,671 | 106,175 | 24,058 | 239,904 | 23.38 | % | |||||
J Clarence Jameson, III(10) | 49,969 | 73,841 | — | 123,810 | 12.19 | % | |||||
Jeffrey A. Miller, Eric D. Jacobs, Miller & Jacobs Capital, L.L.C., and Acadia Master Fund I, Ltd.(11) | 70,043 | — | — | 70,043 | 7.44 | % | |||||
John Sheldon Clark(12) | 67,500 | — | — | 67,500 | 7.17 | % | |||||
Hot Creek Ventures 2, L.P.(13) | 72,918 | — | — | 72,918 | 7.74 | % | |||||
Wellington Management Company, LLP(14) | 62,500 | — | — | 62,500 | 6.64 | % | |||||
| (1) | Unless otherwise indicated, the address of each person listed in the foregoing table is c/o AmericasBank Corp., 500 York Road, Towson, Maryland 21204. For purposes of this table, beneficial ownership has been determined in accordance with the provision of Rule 13d-3 of the Securities Exchange Act of 1934, as amended, under which, in general, a person is deemed to be the beneficial owner of a security if he |
83
Table of Contents
| or she has the power to vote or direct the voting of the security or the power to dispose of or direct the disposition of the security, or if he or she has the right to acquire beneficial ownership within sixty days. Beneficial ownership also includes any shares held in the name of an individual’s spouse, minor children or other relatives living in the individual’s home. Accordingly, the total number of shares beneficially owned includes shares of capital stock owned by the named persons as of the date of the prospectus and shares of common stock subject warrants and/or options held by the named persons that are exercisable as of, or within 60 days of, the date of the prospectus. The shares of common stock subject to warrants or options are deemed outstanding for the purpose of computing the percentage ownership of the person holding the warrants or options, but are not deemed outstanding for the purpose of computing the percentage ownership of any other person. |
| (2) | The shares of common stock and the warrants are held jointly with Mr. Warner’s wife, as to which Mr. Warner shares voting and investment power. |
| (3) | 6,250 of the shares of common stock are held for the benefit of Mr. Anders’ IRA, as to which Mr. Anders has sole voting and investment power. |
| (4) | 1,250 of the shares of common stock and 1,250 of the warrants are held for the benefit of the Nicholas J. Belitsos, M.D. Profit Sharing Trust, as to which Dr. Belitsos is the sole trustee; 12,750 shares of the common stock and 250 of the warrants are held jointly with Dr. Belitsos’ wife, as to which Dr. Belitsos shares voting and investment power; 175 shares of the common stock and 175 warrants are held by dependent children; and 250 of the shares of common stock and 250 of the warrants are held by Dr. Belitsos’ wife. Dr. Belitsos disclaims beneficial ownership as to the shares of common stock and warrants held by his wife. |
| (5) | 6,250 of the shares of common stock are held for the benefit of Mr. Muncks’ IRA, as to which Mr. Muncks has sole voting and investment power. |
| (6) | 8,566 of the shares of common stock and 12,566 of the warrants are held jointly with Dr. Noar’s wife, as to which Dr. Noar shares voting and investment power; 3,455 of the shares of common stock and 9,455 of the warrants are held by dependent children; 546 of the shares of the common stock and 546 of the warrants are held for the benefit of Dr. Noar’s IRA, as to which Dr. Noar has sole voting and investment power; and 546 of the shares of the common stock and 546 of the warrants are held by Dr. Noar’s wife’s IRA. |
| (7) | 750 of the shares of common stock and 750 of the warrants are held for the benefit of Mr. Pezzulla’s IRA, as to which Mr. Pezzulla has sole voting and investment power and 812 shares of common stock and 2,500 warrants are held jointly with Mr. Pezzulla’s wife. |
| (8) | 6,250 of the shares of common stock are held for the benefit of Mr. Rever’s IRA, as to which Mr. Rever has sole voting and investment power. |
| (9) | 750 of the shares of the common stock and 750 of the warrants are held for the benefit of Dr. Roig’s IRA, as to which Dr. Roig has sole voting and investment power; 750 shares are held jointly with Dr. Roig’s wife; 10,525 of the shares of common stock and 10,525 of the warrants are held for the benefit of Raymond F. Roig, Jr., M.D. P.A. Profit Sharing Plan & Trust, as to which Dr. Roig is the sole trustee; and 500 of the shares of common stock and 500 of the warrants are held for the benefit of Dr. Roig’s wife’s IRA, as to which Mrs. Roig has sole voting and investment power. Dr Roig disclaims beneficial ownership as to the shares of common stock and warrants held for the benefit of his wife’s IRA. |
| (10) | Mr. Jameson was a director of AmericasBank Corp and AmericasBank until June 16, 2005. 41,144 of the shares of common stock and 68,516 of the warrants are held jointly with Mr. Jameson’s wife, as to which Mr. Jameson shares voting and investment power; 6,425 of the shares of common stock and 4,675 of the warrants are held for the benefit of Mr. Jameson’s IRA, as to which Mr. Jameson has sole voting and investment power; and 2,400 of the shares of the common stock and 650 of the warrants are held by Mr. Jameson’s wife’s IRA. Mr. Jameson disclaims beneficial ownership as to the shares of common stock and warrants held by his wife’s IRA. Mr. Jameson’s address is 515 E. Joppa Road, Baltimore, Maryland 21286. |
| (11) | The information set forth in this footnote is based solely on a review of the Schedule 13G filed with the SEC on July 29, 2005 by Jeffrey A. Miller, Eric D. Jacobs, Miller & Jacobs Capital, L.L.C. and Acadia Master Fund I, Ltd. Messrs. Miller and Jacobs do not directly own any shares of the common stock, but they indirectly own 280,173 (or 70,043 shares after the reverse stock split) of common stock due to their capacity as sole managers and members of Miller & Jacobs Capital, L.L.C, which in turn (a) serves as the investment manager for Acadia Master Fund I, Ltd., (b) serves as a sub-advisor with discretionary investment authority for Acadia Life International, Ltd and (c) serves as a sub-advisor with discretionary investment authority for Avant Garde Investment, Ltd. The address for Messrs. Miller and Jacobs and Miller & Jacobs Capital, L.L.C. is P.O. Box 26039, Gallows Bay Station, Christiansted, St.Croix, USVI 00824. In the same filing, Acadia Master Fund I, Ltd. indicates that it beneficially owns 273,932 (or 68,483 shares after the reverse stock split) shares of common stock and that its address is c/o Butterfield Fund Services (Bermuda) Limited, Rosebank Center, 11 Bermudiana Road, Hamilton HM 08, Bermuda. |
| (12) | The information set forth in this footnote is based solely on a review of the Schedule 13D filed with the SEC on April 7, 2004 by John Sheldon Clark. Mr. Clark has indicated that he has beneficial ownership of 270,000 (or 67,500 shares after the reverse stock split) shares of common stock and that his address is 1633 Broadway, 30th Floor, New York, New York 10019. |
| (13) | The information set forth in this footnote is based solely on a review of the Schedule 13G filed with the SEC on August 10, 2005 by Hot Creek Capital, L. L. C., Hot Creek Investors, L.P., and David M. W. Harvey which indicates ownership of 291,675 (or 72,918 shares after the reverse stock split). Hot Creek Capital, L.L.C. is the general partner of Hot Creek Ventures 2, L.P. (“Ventures”) and David M. W. Harvey is the principal member in each of these two entities. As a result, Hot Creek Capital, L.L.C. and Mr. Harvey may be considered the beneficial owners of any shares deemed to be beneficially owned by Ventures. Each of Mr. Harvey and Hot Creek Capital, L.L.C. disclaims any beneficial ownership of the shares owned by Ventures. Their address is 6900 South McCarran Boulevard, Suite 3040, Reno, Nevada. |
| (14) | The information set forth in this footnote is based solely upon the review of the Schedule 13G filed with the SEC by Wellington Management Company, LLP (“Wellington”), an investment advisor. Wellington may be considered to beneficially own 250,000 (or 62,500 shares after the reverse stock split) which are held of record by its clients. Wellington’s address is 75 State Street, Boston, Massachusetts 02109. |
84
Table of Contents
CERTAIN RELATIONSHIPS AND RELATED TRANSACTIONS
AmericasBank has had in the past, and expects to have in the future, banking transactions with directors and executive officers and the business and professional organizations in which they are associated in the ordinary course of business. Any loans and loan commitments are made in accordance with all applicable laws. In the opinion of management, these transactions do not and will not involve more than the normal risk of collectibility or present other unfavorable features. Directors or officers with any personal interest in any loan application are excluded from considering any such loan application.
The aggregate amount of loans outstanding at December 31, 2005, 2004 and 2003 to AmericasBank’s directors, officers and their affiliates was approximately $737,882, $394,959 and $1,127,242.
Mr. Karas has provided and may continue to provide consulting services to AmericasBank Corp. and AmericasBank. For the years ended December 31, 2005, 2004 and 2003, we paid Mr. Karas an aggregate of $0, $20,000 and $0, respectively, for these services.
Mr. Warner has provided and may continue to provide insurance consulting services to AmericasBank Corp. and AmericasBank. For the year ended December 31, 2005, we purchased key man life insurance for two of our executives and paid $7,710 in insurance premiums to an insurance company. Mr. Warner acts as a broker for that particular insurance company. No amounts were paid to the insurance company or Mr. Warner for the years ended December 31, 2004 and 2003.
We expect that any business transactions with our or AmericasBank’s directors, executive officers or holders of five percent or more of our capital stock, will be made on terms that are no less favorable to us and AmericasBank than those that could be obtained from unaffiliated third parties.
85
Table of Contents
AmericasBank Corp. and AmericasBank are subject to extensive regulation under state and federal banking laws and regulations. These laws impose specific requirements and restrictions on virtually all aspects of operations and generally are intended to protect depositors, not shareholders. The following discussion is only a summary and readers should refer to particular statutory and regulatory provisions for more detailed information. In addition, management cannot predict the nature or the extent of the effect on business and earnings that new federal or state legislation may have in the future.
Current Regulatory Matters
Written Agreement
On August 3, 2001, AmericasBank Corp. and AmericasBank entered into a Written Agreement with the Federal Reserve Bank of Richmond and the Maryland Division of Financial Regulation. The Written Agreement required that AmericasBank Corp. and AmericasBank take various actions within 30, 60 and 90 days of Written Agreement. The Written Agreement also required, among other things, that AmericasBank Corp. and AmericasBank to undertake the following actions:
| • | Within 30 days after the end of each calendar quarter, submit to the Federal Reserve Bank of Richmond and the Maryland Commissioner of Financial Regulation a quarterly written report regarding the status of all loans acquired from third parties; |
| • | Within 30 days of the Written Agreement, achieve, and thereafter, maintain, through charges to current operating income, an adequate valuation reserve for loan and lease losses; |
| • | Not declare or pay any dividends without the prior written approval of the Federal Reserve Bank of Richmond and the Maryland Commissioner of Financial Regulation; |
| • | Not directly or indirectly incur any debt without prior written approval of the Federal Reserve Bank of Richmond and the Maryland Commissioner of Financial Regulation; |
| • | Within 30 days of the Written Agreement, submit to the Federal Reserve Bank of Richmond and the Maryland Commissioner of Financial Regulation a written business plan and budget for the remainder of 2001 and 2002 and, at least one month prior to the beginning of each subsequent calendar year, a business plan and budget for such calendar year; |
| • | Seek prior approval from the Federal Reserve Bank of Richmond before appointing any new director or hiring or promoting any senior executive officers; |
| • | Within 30 days after the end of each calendar quarter following the date of the Written Agreement, submit to the Federal Reserve Bank of Richmond and the Maryland Commissioner of Financial Regulation a written progress report (prepared by the board of directors) detailing the actions taken to comply with each provision of the Written Agreement and the results of those actions. |
The Written Agreement also prohibited us from amending or rescinding approved plans and procedures without the prior written approval of the Federal Reserve Bank of Richmond and the Maryland Division of Financial Regulation.
Violation of the Written Agreement would have resulted in judicial enforcement of the Written Agreement by the Federal Reserve Bank of Richmond and the Maryland Division of Financial Regulation. Violation of the Written Agreement could also have resulted in the assessment of civil money penalties against AmericasBank Corp., AmericasBank and their respective boards of directors and management, and/or other regulatory enforcement actions including, but not limited to, the removal of directors and management. If any of such actions were taken, they would have a serious adverse effect on AmericasBank Corp. and AmericasBank and could threaten their continued operations as a bank holding company and a bank.
86
Table of Contents
Effective October 12, 2005, the Federal Reserve Bank of Richmond and the Maryland Division of Financial Regulation determined that AmericasBank Corp. and AmericasBank had returned to a satisfactory condition and terminated the Written Agreement.
Memorandum of Understanding
In June 2001, AmericasBank received the consumer affairs examination report that the Federal Reserve Bank of Richmond conducted on its operations. In this report, the Federal Reserve Bank of Richmond identified violations of laws and regulations including Regulation B (Equal Credit Opportunity), Regulation E (Electronic Funds Transfer), Regulation Z (Truth in Lending), Regulation CC (Availability of Funds and Collection of Checks) and the Real Estate Settlement Procedures Act. The Federal Reserve Bank referred the Real Estate Settlement Procedures Act violations to the U.S. Department of Housing and Urban Development as is required under applicable law. As of the date of this prospectus, the U.S. Department of Housing and Urban Development has taken no action against AmericasBank.
In view of these violations, AmericasBank and the Federal Reserve Bank of Richmond entered into a Memorandum of Understanding on October 25, 2001 whereby AmericasBank and/or its board of directors agreed to take certain actions to improve its compliance procedures. We made improvements to our compliance systems in accordance with the Memorandum of Understanding and the Memorandum of Understanding was terminated during 2004.
Regulation of AmericasBank Corp.
AmericasBank Corp. is a bank holding company under the Bank Holding Company Act of 1956, as amended. As such, AmericasBank Corp. is subject to regulation and examination by the Federal Reserve Board, and is required to file periodic reports and any additional information that the Federal Reserve Board may require. The Bank Holding Company Act generally prohibits a bank holding company from engaging in activities other than banking, managing or controlling banks or other permissible subsidiaries and acquiring or retaining direct or indirect control of any company engaged in any activities closely related to banking or managing or controlling banks.
Historically, the Federal Reserve Board was required to approve, among other things, the acquisition by a proposed bank holding company of control of more than five percent (5%) of the voting shares, or substantially all the assets, of any bank, or the merger or consolidation by a bank holding company with another bank holding company. The Riegle-Neal Interstate Banking and Branching Efficiency Act of 1994 (the “Riegle-Neal Act”) repealed many of the restrictions on interstate acquisitions of banks by bank holding companies in September, 1995. As a result of the Riegle-Neal Act, subject to certain time and deposit base requirements, we can acquire a bank located in Maryland or any other state, and a bank holding company located outside of Maryland can acquire any Maryland-based bank holding company or bank.
Subsidiary banks of a bank holding company are subject to certain restrictions imposed by statute on any extensions of credit to the bank holding company or any of its subsidiaries, or investments in their stock or other securities, and on taking such stock or securities as collateral for loans to any borrower. Further, a bank holding company and any of its subsidiary banks are prohibited from engaging in certain tie-in arrangements in connection with the extension of credit. In 1997, the Federal Reserve Board adopted amendments to its Regulation Y, creating exceptions to the Bank Holding Company Act’s anti-tying prohibitions that give bank subsidiaries of holding companies greater flexibility in packaging products and services with their affiliates.
In accordance with Federal Reserve Board policy, AmericasBank Corp. is expected to act as a source of financial strength to AmericasBank and to commit resources to support AmericasBank in circumstances in which AmericasBank Corp. might not otherwise do so. The Federal Reserve Board may require a bank holding company to terminate any activity or relinquish control of a non-bank subsidiary (other than a non-bank subsidiary of a bank) upon the Federal Reserve’s determination that such activity or control constitutes a serious risk to the financial soundness or stability of any subsidiary depository institution of the bank holding company. Further, federal bank
87
Table of Contents
regulatory authorities have additional discretion to require a bank holding company to divest itself of any bank or non-bank subsidiary if the agency determines that divestiture may aid the depository institution’s financial condition.
The Federal Reserve Board imposes risk-based capital measures on bank holding companies in order to insure their capital adequacy. Because AmericasBank Corp. is a bank holding company with less than $150,000,000 in assets, AmericasBank Corp. is currently exempt from most of these risk-based capital measures. However, the Federal Reserve Board still requires that AmericasBank Corp. remain adequately capitalized and have the ability to retire any debt within 25 years from the date it is incurred.
AmericasBank Corp., as a bank holding company, is subject to dividend regulations of the Federal Reserve System. In general, a small bank holding company that has a debt to equity ratio greater than 1:1 is not expected to pay corporate dividends until such time as its debt to equity ratio declines to 1:1 or less and its bank subsidiary is otherwise well managed, well capitalized and not under any supervisory order. AmericasBank Corp. is a small bank holding company. In addition, the Federal Reserve Board has issued guidance that states, in general, that an entity experiencing financial difficulties - such as AmericasBank Corp. - should not pay or continue to pay dividends unless (i) the entity’s net income over the prior year is sufficient to fund all dividends and (ii) the earnings retained by the entity is consistent with the entity’s capital needs, asset quality and overall financial condition. Currently, AmericasBank Corp. is subject to a Written Agreement with the Federal Reserve Bank of Richmond and the Maryland Division of Financial Regulation that, among other things, prohibits the payment of dividends without prior written approval of the Federal Reserve and the Maryland Commissioner of Financial Regulation. See “Dividend Policy.”
On November 12, 1999, President Clinton signed into law the Gramm-Leach-Bliley Act (“GLBA”). Effective March 11, 2000, pursuant to authority granted under the GLBA, a bank holding company may elect to become a financial holding company and thereby engage in a broader range of financial and other activities than are permissible for traditional bank holding companies. In order to qualify for the election, all of the depository institution subsidiaries of the bank holding company must be well capitalized and well managed, as defined by regulation, and all of its depository institution subsidiaries must have achieved a rating of satisfactory or better with respect to meeting community credit needs.
Pursuant to the GLBA, financial holding companies are permitted to engage in activities that are “financial in nature” or incidental or complementary thereto and not a substantial risk to the safety and soundness of the depository institution or the financial system in general, as determined by the Federal Reserve Board. The GLBA identifies several activities as “financial in nature,” including, among others, insurance underwriting and agency, investment advisory services, merchant banking and underwriting, and dealing or making a market in securities. Being designated a financial holding company will allow insurance companies, securities brokers and other types of financial companies to affiliate with and/or acquire depository institutions. AmericasBank Corp. does not currently intend to become a financial holding company.
Under Maryland law, an existing bank holding company that desires to acquire a Maryland state-chartered bank or trust company, a federally-chartered bank with its main office in Maryland, or a bank holding company that has its principal place of business in Maryland, must file an application with the Maryland Commissioner of Financial Regulation. In approving the application, the Maryland Commissioner of Financial Regulation must consider whether the acquisition may be detrimental to the safety and soundness of the entity being acquired or whether the acquisition may result in an undue concentration of resources or a substantial reduction in competition in Maryland. The Maryland Commissioner of Financial Regulation may not approve an acquisition if, on consummation of the transaction, the acquiring company, together with all its insured depository institution affiliates, would control 30% or more of the total amount of deposits of insured depository institutions in Maryland. The Maryland Commissioner of Financial Regulation has authority to adopt by regulation a procedure to waive this requirement for good cause. In a transaction for which approval of the Maryland Commissioner of Financial Regulation is not required due to an exemption under Maryland law, or for which federal law authorizes the transaction without application to the Maryland Commissioner of Financial Regulation, the parties to the acquisition must provide written notice to the Maryland Commissioner of Financial Regulation at least 15 days before the effective date of the transaction.
88
Table of Contents
The status of AmericasBank Corp. as a registered bank holding company under the Bank Holding Company Act and a Maryland-chartered bank holding company does not exempt it from certain federal and state laws and regulations applicable to corporations generally, including, without limitation, certain provisions of the federal securities laws.
Regulation of AmericasBank
AmericasBank is a Maryland chartered trust company (with all powers of a commercial bank), is a member of the Federal Reserve System (a “state member bank”) and its deposit accounts are insured by the Bank Insurance Fund of the Federal Deposit Insurance Corporation (the “FDIC”) up to the maximum legal limits of the FDIC. It is subject to regulation, supervision and regular examination by the Maryland Commissioner of Financial Regulation and the Federal Reserve Board. The regulations of these various agencies govern most aspects of AmericasBank’s business, including required reserves against deposits, loans, investments, mergers and acquisitions, borrowing, dividends and location and number of branch offices. The laws and regulations governing AmericasBank generally have been promulgated to protect depositors and the deposit insurance funds, and not for the purpose of protecting shareholders.
Branching and Interstate Banking
The federal banking agencies are authorized to approve interstate bank merger transactions without regard to whether such transactions are prohibited by the law of any state, unless the home state of one of the banks has opted out of the interstate bank merger provisions of the Riegle-Neal Act by adopting a law after the date of enactment of the Riegle-Neal Act and prior to June 1, 1997 which applies equally to all out-of-state banks and expressly prohibits merger transactions involving out-of-state banks. Interstate acquisitions of branches are permitted only if the law of the state in which the branch is located permits such acquisitions. Such interstate bank mergers and branch acquisitions are also subject to the nationwide and statewide insured deposit concentration limitations described in the Riegle-Neal Act.
The Riegle-Neal Act authorizes the federal banking agencies to approve interstate branching de novo by national and state banks in states that specifically allow for such branching. The District of Columbia, Maryland and Virginia have all enacted laws that permit interstate acquisitions of banks and bank branches and permit out-of-state banks to establish de novo branches.
Gramm-Leach-Bliley Act
The GLBA altered substantially the statutory framework for providing banking and other financial services in the United States of America. The GLBA, among other things, eliminated many of the restrictions on affiliations among banks and securities firms, insurance firms, and other financial service providers.
The GLBA also provides protections against the transfer and use by financial institutions of consumers’ nonpublic personal information. A financial institution must provide to its customers, at the beginning of the customer relationship and annually thereafter, the institution’s policies and procedures regarding the handling of customers’ nonpublic personal financial information. The privacy provisions generally prohibit a financial institution from providing a customer’s personal financial information to unaffiliated third parties unless the institution discloses to the customer that the information may be so provided and the customer is given the opportunity to opt out of such disclosure.
Capital Adequacy Guidelines
The Federal Reserve Board and the FDIC have adopted risk based capital adequacy guidelines pursuant to which they assess the adequacy of capital in examining and supervising banks and in analyzing bank regulatory applications. Risk-based capital requirements determine the adequacy of capital based on the risk inherent in various classes of assets and off-balance sheet items.
State member banks are expected to meet a minimum ratio of total qualifying capital (the sum of core capital (Tier 1) and supplementary capital (Tier 2)) to risk weighted assets of 8%. At least half of this amount (4%)
89
Table of Contents
should be in the form of core capital. In general, this requirement is similar to the capital that a bank must have in order to be considered “adequately capitalized” under the prompt corrective action regulations. See “- “Prompt Corrective Action.” AmericasBank currently complies with this minimum requirement.
Tier 1 Capital generally consists of the sum of common stockholders’ equity and perpetual preferred stock (subject in the case of the latter to limitations on the kind and amount of such stock which may be included as Tier 1 Capital), less goodwill, without adjustment for changes in the market value of securities classified as “available for sale” in accordance with FAS 115. Tier 2 Capital consists of the following: hybrid capital instruments; perpetual preferred stock which is not otherwise eligible to be included as Tier 1 Capital; term subordinated debt and intermediate-term preferred stock; and, subject to limitations, general allowances for loan losses. Assets are adjusted under the risk-based guidelines to take into account different risk characteristics, with the categories ranging from 0% (requiring no risk-based capital) for assets such as cash, to 100% for the bulk of assets which are typically held by a commercial bank, including certain multi-family residential and commercial real estate loans, commercial business loans and consumer loans. Residential first mortgage loans on one-to-four family residential real estate and certain seasoned multi-family residential real estate loans, which are not 90 days or more past-due or non-performing and which have been made in accordance with prudent underwriting standards are assigned a 50% level in the risk-weighing system, as are certain privately-issued mortgage-backed securities representing indirect ownership of such loans. Off-balance sheet items also are adjusted to take into account certain risk characteristics.
In addition to the risk-based capital requirements, the Federal Reserve Board has established a minimum 3.0% Leverage Capital Ratio (Tier 1 Capital to total adjusted assets) requirement for the most highly-rated banks, with an additional cushion of at least 100 to 200 basis points for all other banks, which effectively increases the minimum Leverage Capital Ratio for such other banks to 4.0% - 5.0% or more. The highest-rated banks are those that are not anticipating or experiencing significant growth and have well diversified risk, including no undue interest rate risk exposure, excellent asset quality, high liquidity, good earnings and, in general, those which are considered a strong banking organization. A bank having less than the minimum Leverage Capital Ratio requirement shall, within 60 days of the date as of which it fails to comply with such requirement, submit a reasonable plan describing the means and timing by which the bank shall achieve its minimum Leverage Capital Ratio requirement. A bank which fails to file such plan is deemed to be operating in an unsafe and unsound manner, and could be subject to a cease-and-desist order. Any insured depository institution with a Leverage Capital Ratio that is less than 2.0% is deemed to be operating in an unsafe or unsound condition pursuant to Section 8(a) of the Federal Deposit Insurance Act (the “FDIA”) and is subject to potential termination of deposit insurance. However, such an institution will not be subject to an enforcement proceeding solely on account of its capital ratios if it has entered into and is in compliance with a written agreement to increase its Leverage Capital Ratio and to take such other action as may be necessary for the institution to be operated in a safe and sound manner. The capital regulations also provide, among other things, for the issuance of a capital directive, which is a final order issued to a bank that fails to maintain minimum capital or to restore its capital to the minimum capital requirement within a specified time period.
Prompt Corrective Action
Under Section 38 of the FDIA, each federal banking agency is required to implement a system of prompt corrective action for institutions that it regulates. The federal banking agencies have promulgated substantially similar regulations to implement the system of prompt corrective action established by Section 38 of the FDIA. Under the regulations, a bank will be deemed to be: (i) “well capitalized” if it has a Total Risk Based Capital Ratio of 10.0% or more, a Tier 1 Risk Based Capital Ratio of 6.0% or more, a Leverage Capital Ratio of 5.0% or more and is not subject to any written capital order or directive; (ii) “adequately capitalized” if it has a Total Risk Based Capital Ratio of 8.0% or more, a Tier 1 Risk Based Capital Ratio of 4.0% or more and a Tier 1 Leverage Capital Ratio of 4.0% or more (3.0% under certain circumstances) and does not meet the definition of “well capitalized;” (iii) “undercapitalized” if it has a Total Risk Based Capital Ratio that is less than 8.0%, a Tier 1 Risk based Capital Ratio that is less than 4.0% or a Leverage Capital Ratio that is less than 4.0% (3.0% under certain circumstances); (iv) “significantly undercapitalized” if it has a Total Risk Based Capital Ratio that is less than 6.0%, a Tier 1 Risk Based Capital Ratio that is less than 3.0% or a Leverage Capital Ratio that is less than 3.0%; and (v) “critically undercapitalized” if it has a ratio of tangible equity to total assets that is equal to or less than 2.0%.
90
Table of Contents
An institution generally must file a written capital restoration plan which meets specified requirements with an appropriate federal banking agency within 45 days of the date the institution receives notice or is deemed to have notice that it is undercapitalized, significantly undercapitalized or critically undercapitalized. A federal banking agency must provide the institution with written notice of approval or disapproval within 60 days after receiving a capital restoration plan, subject to extensions by the applicable agency.
An institution that is required to submit a capital restoration plan must concurrently submit a performance guaranty by each company that controls the institution. Such guaranty will be limited to the lesser of (i) an amount equal to 5.0% of the institution’s total assets at the time the institution was notified or deemed to have notice that it was undercapitalized or (ii) the amount necessary at such time to restore the relevant capital measures of the institution to the levels required for the institution to be classified as adequately capitalized. Such a guaranty shall expire after the federal banking agency notifies the institution that it has remained adequately capitalized for each of four consecutive calendar quarters. An institution which fails to submit a written capital restoration plan within the requisite period, including any required performance guaranty, or fails in any material respect to implement a capital restoration plan, will be subject to the restrictions in Section 38 of the FDIA which are applicable to significantly undercapitalized institutions.
A “critically undercapitalized institution” is to be placed in conservatorship or receivership within 90 days unless the FDIC formally determines that forbearance from such action would better protect the deposit insurance fund. Unless the FDIC or other appropriate federal banking regulatory agency makes specific further findings and certifies that the institution is viable and is not expected to fail, an institution that remains critically undercapitalized on average during the fourth calendar quarter after the date it becomes critically undercapitalized must be placed in receivership. The general rule is that the FDIC will be appointed as receiver within 90 days after a bank becomes critically undercapitalized unless extremely good cause is shown and the federal regulators agree to an extension. In general, good cause is defined as capital that has been raised and is immediately available for infusion into the bank except for certain technical requirements that may delay the infusion for a period of time beyond the 90 day time period.
Immediately upon becoming undercapitalized, an institution will become subject to the provisions of Section 38 of the FDIA, which (i) restrict payment of capital distributions and management fees; (ii) require that the appropriate federal banking agency monitor the condition of the institution and its efforts to restore its capital; (iii) require submission of a capital restoration plan; (iv) restrict the growth of the institution’s assets; and (v) require prior approval of certain expansion proposals. The appropriate federal banking agency for an undercapitalized institution also may take any number of discretionary supervisory actions if the agency determines that any of these actions is necessary to resolve the problems of the institution at the least possible long-term cost to the deposit insurance fund, subject in certain cases to specified procedures. These discretionary supervisory actions include: requiring the institution to raise additional capital, restricting transactions with affiliates, requiring divestiture of the institution or the sale of the institution to a willing purchaser, and any other supervisory action that the agency deems appropriate. These and additional mandatory and permissive supervisory actions may be taken with respect to significantly undercapitalized and critically undercapitalized institutions.
Additionally, under Section 11(c)(5) of the FDIA, a conservator or receiver may be appointed for an institution where: (i) an institution’s obligations exceed its assets; (ii) there is substantial dissipation of the institution’s assets or earnings as a result of any violation of law or any unsafe or unsound practice; (iii) the institution is in an unsafe or unsound condition; (iv) there is a willful violation of a cease-and-desist order; (v) the institution is unable to pay its obligations in the ordinary course of business; (vi) losses or threatened losses deplete all or substantially all of an institution’s capital, and there is no reasonable prospect of becoming “adequately capitalized” without assistance; (vii) there is any violation of law or unsafe or unsound practice or condition that is likely to cause insolvency or substantial dissipation of assets or earnings, weaken the institution’s condition, or otherwise seriously prejudice the interests of depositors or the insurance fund; (viii) an institution ceases to be insured; (ix) the institution is undercapitalized and has no reasonable prospect that it will become adequately capitalized, fails to become adequately capitalized when required to do so, or fails to submit or materially implement a capital restoration plan; or (x) the institution is critically undercapitalized or otherwise has substantially insufficient capital.
91
Table of Contents
Currently, AmericasBank is well capitalized under the prompt corrective actions regulations described above.
Regulatory Enforcement Authority
Federal banking law grants substantial enforcement powers to federal banking regulators. This enforcement authority includes, among other things, the ability to assess civil money penalties, to issue cease-and-desist or removal orders and to initiate injunctive actions against banking organizations and institution-affiliated parties. In general, these enforcement actions may be initiated for violations of laws and regulations and unsafe or unsound practices. Other actions or inactions may provide the basis for enforcement action, including misleading or untimely reports filed with regulatory authorities. Currently, we are operating under a Written Agreement with the Federal Reserve Bank of Richmond and the Maryland Division of Financial Regulation.
Transactions with Affiliates and Insiders
Maryland law imposes restrictions on certain transactions with affiliates of Maryland commercial banks. Generally, under Maryland law, a director, officer or employee of a commercial bank may not borrow, directly or indirectly, any money from the bank, unless the loan has been approved by a resolution adopted by and recorded in the minutes of the board of directors of the bank, or the executive committee of the bank, if that committee is authorized to make loans. If the executive committee approves such a loan, the loan approval must be reported to the board of directors at its next meeting. Certain commercial loans made to directors of a bank and certain consumer loans made to non-officer employees of the bank are exempt from the law’s coverage.
In addition, AmericasBank is subject to the provisions of Section 23A of the Federal Reserve Act, which limits the amount of loans or extensions of credit to, investments in, or certain other transactions with, affiliates, and limits the amount of advances to third parties collateralized by the securities or obligations of affiliates. Section 23A limits the aggregate amount of transactions with any individual affiliate to ten percent (10%) of the capital and surplus of AmericasBank and also limits the aggregate amount of transactions with all affiliates to twenty percent (20%) of capital and surplus. Loans and certain other extensions of credit to affiliates are required to be secured by collateral in an amount and of a type described in Section 23A, and the purchase of low quality assets from affiliates is generally prohibited.
AmericasBank also is subject to the provisions of Section 23B of the Federal Reserve Act which, among other things, prohibits an institution from engaging in certain transactions with certain affiliates unless the transactions are on terms substantially the same, or at least as favorable to such institution and or its subsidiaries, as those prevailing at the time for comparable transactions with non-affiliated entities. In the absence of comparable transactions, such transactions may only occur under terms and circumstances, including credit standards that in good faith would be offered to or would apply to non-affiliated companies.
We have entered into banking transactions with our directors and executive officers and the business and professional organizations in which they are associated in the ordinary course of business. Any loans and loan commitments are made in accordance with all applicable laws. See “Certain Relationships and Related Transactions.”
Loans to One Borrower
AmericasBank is subject to the statutory and regulatory limits on the extension of credit to one borrower. Generally, the maximum amount of total outstanding loans that a Maryland chartered trust company may have to any one borrower at any one time is 15% of AmericasBank’s unimpaired capital and surplus. As of September 30, 2005, we were able to lend $767,000 to any one borrower. This amount is significantly less than that of many of our competitors.
Liquidity
AmericasBank is subject to the reserve requirements imposed by the State of Maryland. A Maryland commercial bank is required to have at all times a reserve equal to at least 15% of its demand deposits.
92
Table of Contents
AmericasBank is also subject to the reserve requirements of Federal Reserve Board Regulation D, which applies to all depository institutions. Specifically, as of September 30, 2005, amounts in transaction accounts above $7,000,000 and up to $47,600,000 must have reserves held against them in the ratio of three percent of the amount. Amounts above $47,600,000 require reserves of $1,218,999 plus 10 percent of the amount in excess of $47,600,000. The Maryland reserve requirements may be used to satisfy the requirements of Federal Reserve Regulation D. We are in compliance with our reserve requirements.
Dividends
Under Maryland law, AmericasBank may declare a cash dividend, after providing for due or accrued expenses, losses, interest, and taxes, from its undivided profits or, with the prior approval of the Maryland Commissioner of Financial Regulation, from its surplus in excess of 100% of its required capital stock. Also, if AmericasBank’s surplus is less than 100% of its required capital stock, cash dividends may not be paid in excess of 90% of net earnings. AmericasBank will not be able to pay dividends so long as it has an accumulated deficit. AmericasBank currently has an accumulated deficit of approximately $5.9 million. In addition to these specific restrictions, the bank regulatory agencies have the ability to prohibit or limit proposed dividends if such regulatory agencies determine the payment of such dividends would result in AmericasBank being in an unsafe and unsound condition.
Community Reinvestment Act
AmericasBank is required to comply with the Community Reinvestment Act (“CRA”) regardless of its capital condition. The CRA requires that, in connection with its examinations of AmericasBank, the Federal Reserve evaluates the record of AmericasBank in meeting the credit needs of its local community, including low and moderate income neighborhoods, consistent with the safe and sound operation of the institution. The CRA does not establish specific lending requirements or programs for financial institutions nor does it limit an institution’s discretion to develop the types of products and services that it believes are best suited to its particular community, consistent with the CRA. These factors are considered in evaluating mergers, acquisitions and applications to open a branch or facility. The CRA also requires all institutions to make public disclosure of their CRA ratings. AmericasBank received a “Satisfactory” rating in its latest CRA examination in April 2003.
USA PATRIOT Act
On October 26, 2001, President Bush signed into law comprehensive anti-terrorism legislation known as the USA PATRIOT Act of 2001 (the “USA Patriot Act”). Title III of the USA Patriot Act substantially broadened the scope of U.S. anti-money laundering laws and regulations by imposing significant new compliance and due diligence obligations, creating new crimes and penalties and expanding the extra-territorial jurisdiction of the United States. The U.S. Treasury Department (“Treasury”) has issued a number of implementing regulations that apply various requirements of the USA Patriot Act to financial institutions such as AmericasBank. Those regulations impose new obligations on financial institutions to maintain appropriate policies, procedures and controls to detect, prevent and report money laundering and terrorist financing. Treasury is expected to issue a number of additional regulations that will further clarify the USA Patriot Act’s requirements.
Failure of a financial institution to comply with the USA Patriot Act’s requirements could have serious legal and reputational consequences for the institution. AmericasBank has adopted appropriate policies, procedures and controls to address compliance with the requirements of the USA Patriot Act under the existing regulations and will continue to revise and update its policies, procedures and controls to reflect changes required by the USA Patriot Act and Treasury’s regulations.
93
Table of Contents
Our authorized capital stock consists of 30,000,000 shares of common stock, $0.01 par value, and 5,000,000 shares of preferred stock, $0.01 par value. As of the date of this prospectus, 941,702 shares of common stock are issued and outstanding and held by approximately 231 shareholders of record. In addition, warrants to purchase 292,765 shares of common stock and options to purchase 305,870 shares of common stock are outstanding as of the date of this prospectus.
On August 3, 2005, our board of directors approved a reverse stock split of our common stock whereby every four shares of common stock would be converted into one share with fractional shares resulting from the split converted to cash. The split became effective at 12:01 a.m. on August 23, 2005.
The following summary of certain terms of our common stock and preferred stock is necessarily general and reference should be made in each case to our charter and bylaws that are filed as exhibits to the Registration Statement of which this prospectus is a part, copies of which may be obtained from the Securities and Exchange Commission.
In general, shareholders or subscribers for our stock have no personal liability for the debts and obligations of AmericasBank Corp. because of their status as shareholders or subscribers, except to the extent that the subscription price or other agreed consideration for the stock has not been paid.
Common Stock
We are authorized to issue 30,000,000 shares of common stock, par value $0.01 per share. Upon completion of the offering, including the shares of common stock currently issued and outstanding, a maximum of 2,091,702 shares of common stock will be issued and outstanding.
The outstanding shares of common stock currently are, and the shares of common stock to be issued in the offering will be, upon payment as described in this prospectus, fully paid and non-assessable. Subject to all rights of holders of any other class or series of stock, holders of common stock are entitled to receive dividends if and when the board of directors of AmericasBank Corp. declares dividends from funds legally available. In addition, holders of common stock share ratably in the net assets upon the voluntary or involuntary liquidation, dissolution or winding up of AmericasBank Corp., after distributions are made to anyone with more senior rights, as described below.
In general, each outstanding share of common stock entitles the holder to vote for the election of directors and on all other matters requiring shareholder action, and each share is entitled to one vote. Holders of common stock have no conversion, sinking fund, redemption rights or preemptive rights to subscribe to any securities of AmericasBank Corp.
Our charter grants to the board of directors the right to classify or reclassify any unissued shares of common stock from time to time by setting or changing the preferences, conversion and other rights, voting powers, restrictions, limitations as to dividends, qualifications and terms or conditions of redemption. Accordingly, the board of directors could authorize the issuance of additional shares of common stock with terms and conditions which could have the effect of discouraging a takeover or other transaction which some of our shareholders might believe to be in their best interests or in which they might receive a premium for their shares of common stock over the market price of such shares. As of the date hereof, we have no plans to classify or reclassify any unissued shares of our common stock.
Preferred Stock
We are authorized to issue 5,000,000 shares of preferred stock, par value $0.01 per share. Shares of preferred stock may be issued from time to time by the board of directors in one or more series. Prior to issuance of shares of each series of preferred stock, the board of directors is required by the Maryland General Corporation Law (“MGCL”) to fix for each series the designation, preferences, conversion and other rights, voting powers, restrictions, limitations as to dividends, qualifications and terms or conditions of redemption. The board of directors
94
Table of Contents
will not offer shares of preferred stock to “promoters” (as that term is defined under relevant state securities laws) except on the same terms as such shares are offered to all existing or new stockholders and such issuance is approved by a majority of the independent directors. The board of directors could authorize the issuance of shares of preferred stock with terms and conditions which could have the effect of discouraging a takeover or other transaction which some of our shareholders might believe to be in their best interests or in which they might receive a premium for their shares of common stock over the market price of such shares. Such shares of preferred stock also could, among other things, have voting or conversion rights that would adversely affect the voting power of the common stock.
On March 28, 2003, AmericasBank Corp. filed Articles Supplementary with the Maryland State Department of Assessments and Taxation that reclassified 156,250 shares of the authorized but unissued preferred stock, par value $0.01 per share, of AmericasBank Corp. into a series designated as Series A Preferred Stock. We issued 50,015 of these shares as part of our 2003 private placement. On December 2, 2003, the 50,015 outstanding shares of our Series A Preferred Stock were exchanged for 50,015 shares of our common stock. See “Business of AmericasBank Corp. and AmericasBank – Stock Offerings and Related Transactions.”
Warrants
General. On September 2, 1998, as a dividend to our shareholders of record on September 1, 1998, we issued warrants to purchase 75,000 shares of our common stock at an exercise price of $40.00 per share, subject to adjustment for certain events. These warrants were first exercisable beginning any time after April 1, 2000, and had an original expiration date of 5:00 p.m. on October 8, 2001. We subsequently extended the expiration date of these warrants to 5:00 p.m. on September 1, 2008.
As part of the units issued in our public offering that concluded in March 1999, we issued warrants to purchase 49,000 shares of our common stock at an exercise price of $52.00 per share, subject to adjustment in certain events. These warrants were first exercisable beginning any time after April 8, 2000, and expire at 5:00 p.m. on September 1, 2008.
As part of our 2002 private placement, we issued warrants to purchase 118,750 shares of our common stock at an exercise price of $20.00 per share, subject to adjustment for certain events. These warrants were first exercisable beginning any time after December 31, 2003, and expire at 5:00 p.m. on September 1, 2008.
As part of our 2003 private placement, we issued warrants to purchase 50,015 shares of our common stock at an exercise price of $12.80 per share, subject to adjustment for certain events. These warrants were first exercisable beginning any time after June 30, 2004 and expire at 5:00 p.m. on September 1, 2008.
For more information about the transactions pursuant to which our warrants were issued, see “Business of AmericasBank Corp. and AmericasBank – Stock Offerings and Related Transactions.”
Shares of common stock, when issued upon the exercise of our warrants in accordance with their terms, will be duly and validly issued, fully paid and non-assessable.
Except for certain restrictions on transfer and the right to a cashless exercise, which provisions are contained in the warrants issued in our 2002 and 2003 private placements but which are not contained in the warrants issued as a dividend or the warrants issued as part of our 1999 public offering, the terms of all of our warrants are the same in all material respects.
The following summary of certain terms of our warrants is necessarily general and reference should be made in each case to the form of warrants which are filed as exhibits to the Registration Statement of which this prospectus is a part, copies of which may be obtained from the Securities and Exchange Commission. See “Where You Can Find More Information.”
No Rights as Shareholders. Warrantholders are not entitled to vote, receive dividends or exercise any of the rights of holders of shares of our common stock for any purpose until the warrants held by such warrantholders have been duly exercised and payment of the exercise price has been made.
95
Table of Contents
Fractional Interests. We are not required to issue any fraction of a share of common stock upon the exercise of a warrant. In lieu of issuing a fraction of a share remaining after exercise of a warrant, we will make a cash payment for any fraction of a share equal to the same fraction of the exercise price of the warrant.
Restrictions on Transfer.Warrantholders of the warrants issued in our 2002 and 2003 private placements, in addition to any other restriction on transfer that may be applicable under the securities laws, may only transfer warrants (i) subject to a right of first refusal to us; (ii) with our prior written consent; or (iii) to a “Family Member” (as such term is defined in the warrant).
Exercise of Warrants. Subject to compliance with applicable securities laws, upon presentation and surrender of a warrant, with a duly completed and executed purchase form, at our principal offices or at such other place as we may designate, indicating the warrantholders election to exercise all or a portion (consisting of whole warrants) of the warrantholder’s warrant, together with a check payable to the order of us in the amount of the exercise price times the number of shares of common stock being purchased, we will deliver to the warrantholder, as promptly as practicable, certificates representing the shares of common stock being purchased and, if the warrantholder is purchasing less than all of the shares of common stock covered by the warrant, a new warrant.
In addition to paying by check, warrants issued in our 2002 and 2003 private placements may be exercised in whole or in part by being exchanged for a number of shares having an aggregate market price, as defined in the warrant, on the date of such exercise equal to the difference between (i) the aggregate market price of the number of shares of common stock subject to the warrant and (ii) the aggregate exercise price otherwise payable by the warrantholder for such designated shares. Upon any such exercise, the number of shares purchasable upon exercise of the warrant shall be reduced by such designated number of shares and, if a balance of shares remains after such exercise, we shall execute and deliver a new warrant for such balance.
Adjustment to Exercise Price and Number of Shares Purchasable. The exercise price and the number of shares of common stock purchasable upon exercise of the warrants is subject to adjustment to protect warrantholders against dilution in certain events, including, if we: (i) pay a dividend in shares of our common stock; (ii) subdivide outstanding shares of our common stock into a greater smaller number of shares; (iii) combine outstanding shares of our common stock into a smaller number of shares; (iv) reorganize or reclassify any of our common stock; (v) consolidate or merge with another entity (other than a merger with a subsidiary in which merger we are the continuing corporation and which does not result in any reclassification or change of the shares issuable upon exercise of the warrants); (v) participate in a share exchange in which our common stock is to be acquired; or (vi) sell or lease all or substantially all of our assets.
Anti-Takeover Provisions in our Charter and Bylaws
General.A number of provisions of our charter and bylaws deal with matters of corporate governance and certain rights of shareholders. The following discussion is a general summary of certain provisions of our charter and bylaws that might be deemed to have a potential “anti-takeover” effect. The following description of certain of the provisions of our charter and bylaws is necessarily general and reference should be made in each case to the charter and bylaws.
Classification of the Board of Directors. Our bylaws require us to have 13 directors and provide that the number of directors may be increased or decreased by the board of directors. Currently, we have 12 directors and one vacancy on our board of directors. Our directors are divided into three classes - Class A, Class B and Class C - each class consisting of an equal number of directors, or as nearly equal as possible and each director serves for a term ending on the date of the third annual meeting following the annual meeting at which such director was elected. A classified board of directors promotes continuity and stability of management but makes it more difficult for shareholders to change a majority of the directors because it generally takes at least two annual elections of directors for this to occur. We believe that classification of the board of directors will help to assure the continuity and stability of AmericasBank Corp.’s business strategies and policies as determined by the board of directors.
Absence Of Cumulative Voting. There is no cumulative voting in the election of our directors. Cumulative voting means that holders of stock of a corporation are entitled, in the election of directors, to cast a number of votes
96
Table of Contents
equal to the number of shares that they own multiplied by the number of directors to be elected. Because a shareholder entitled to cumulative voting may cast all of his votes for one nominee or disperse his votes among nominees as he chooses, cumulative voting is generally considered to increase the ability of minority shareholders to elect nominees to a corporation’s board of directors. The absence of cumulative voting means that the holders of a majority of our shares can elect all of the directors then standing for election and the holders of the remaining shares will not be able to elect any directors.
Removal of Directors. The MGCL provides that if a corporation’s directors are divided into classes, a director may only be removed for cause. Our bylaws also provide that our directors may only be removed for cause.
Amendment of Bylaws. Our bylaws may only be amended by our board of directors. Shareholders have no authority to amend our bylaws.
Authorized Shares. As indicated above, our charter authorizes the issuance of 30,000,000 shares of common stock and 5,000,000 shares of preferred stock. The authorization of a large number of common and preferred stock provides our board of directors with as much flexibility as possible to effect, among other transactions, financings, acquisitions, stock dividends, stock splits and stock options or other stock based compensation. However, the unissued authorized shares may also be used by the board of directors consistent with its fiduciary duty to deter future attempts to gain control of AmericasBank Corp. Also, as indicated above, the board of directors’ right to reclassify any unissued shares of common stock and to set the terms of one or more series of preferred stock has anti-takeover effects.
Procedures For Shareholder Nominations And Proposals. Our bylaws provide that any shareholder desiring to make a nomination for the election of directors or a proposal for new business at a meeting of shareholders must submit written notice to our secretary not less than 90 days nor more than 120 days before the first anniversary of the mailing date of the prior year’s annual meeting. Nominations and proposals that fail to follow the prescribed procedures will not be considered. We believe that it is in our and our shareholders best interests to provide sufficient time to enable management to disclose to shareholders information about a dissident slate of nominations for directors or proposals for new business. This advance notice requirement also may give management time to solicit its own proxies in an attempt to defeat any dissident slate of nominations should management determine that doing so is in the best interest of shareholders generally. Similarly, adequate advance notice of shareholder proposals will give management time to study such proposals and to determine whether to recommend to the shareholders that such proposals be adopted. For shareholder proposals to be included in our proxy materials, the shareholder must comply with all timing and information requirements of the Securities Exchange Act of 1934.
Limitations On Liabilities. Our charter provides that the personal liability of our directors and officers for monetary damages is eliminated to the fullest extent permitted by Maryland law. Maryland law currently provides that directors and officers of corporations that have adopted such a provision will generally not be so liable, except:
| • | To the extent that it is proved that the person actually received an improper benefit or profit in money, property, or services for the amount of the benefit or profit in money, property, or services actually received; and |
| • | To the extent that a judgment or other final adjudication adverse to the person is entered in a proceeding based on a finding in the proceeding that the person’s action, or failure to act, was the result of active and deliberate dishonesty and was material to the cause of action adjudicated in the proceeding. |
Our charter also provides that we will indemnify our officers and directors against liabilities and will advance expenses to such persons prior to a final disposition of an action to the fullest extent permitted by Maryland law. The rights of indemnification provided in our charter are not exclusive of any other rights which may be available under any insurance or other agreement, by resolution of shareholders or directors (regardless of whether directors authorizing such indemnification are beneficiaries thereof) or otherwise. In addition, our bylaws authorize us to maintain insurance on behalf of any person who is or was a director, officer, employee or agent of AmericasBank Corp., whether or not we would have the power to provide indemnification to such person.
97
Table of Contents
These provisions are designed to reduce, in appropriate cases, the risks incident to serving as a director, officer, employee or agent and to enable us to attract and retain the best personnel available.
Insofar as indemnification for liabilities arising under the Securities Act of 1933, as amended, may be permitted to directors, officers or persons controlling us under provisions of our charter, we have been advised that in the opinion of the Securities and Exchange Commission such indemnification is against public policy as expressed in the Securities Act of 1933, as amended, and is therefore unenforceable.
Anti-Takeover Provisions in the MGCL
In addition to the provisions contained in our charter and bylaws, the MGCL includes certain provisions applicable to Maryland corporations that may have an anti-takeover effect, including, but not limited to, the provisions discussed below.
Business Combinations. Under the MGCL, certain “business combinations” between a Maryland corporation and an “Interested Stockholder” (as described in the MGCL) are prohibited for five years after the most recent date on which the Interested Stockholder became an Interested Stockholder, unless an exemption is available. Thereafter a business combination must be recommended by the board of directors of the corporation and approved by the affirmative vote of at least: (i) 80% of the votes entitled to be cast by holders of outstanding voting shares of the corporation and (ii) two-thirds of the votes entitled to be cast by holders of outstanding voting shares of the corporation other than shares held by the Interested Stockholder with whom the business combination is to be effected, unless the corporation’s shareholders receive a minimum price (as described in the MGCL) for their shares and the consideration is received in cash or in the same form as previously paid by the Interested Stockholder for its shares. These provisions of Maryland law do not apply, however, to business combinations that are approved or exempted by the board of directors prior to the time that the Interested Stockholder becomes an Interested Stockholder. They also do not apply if the company has fewer than 100 beneficial owners of stock.
Control Share Acquisitions. The MGCL provides that “control shares” of a Maryland corporation acquired in a “control share acquisition” have no voting rights except to the extent approved by a vote of two-thirds of the shares entitled to be voted on the matter, excluding shares of stock owned by the acquirer or by officers or directors who are employees of the corporation. “Control shares” are voting shares of stock which, if aggregated with all other such shares of stock previously acquired by the acquirer, or in respect of which the acquirer is able to exercise or direct the exercise of voting power except solely by virtue of a revocable proxy, would entitle the acquirer to exercise voting power in electing directors within one of the following ranges of voting power: (i) one-tenth or more but less than one-third; (ii) one-third or more but less than a majority or (iii) a majority of all voting power. Control shares do not include shares the acquiring person is then entitled to vote as a result of having previously obtained shareholder approval. A “control share acquisition” means the acquisition of control shares, subject to certain exceptions.
A person who has made or proposes to make a control share acquisition, upon satisfaction of certain conditions (including an undertaking to pay expenses and delivery of an “acquiring person statement”), may compel the corporation’s board of directors to call a special meeting of shareholders to be held within 50 days of demand to consider the voting rights of the shares. If no request for a meeting is made, the corporation may itself present the question at any shareholders’ meeting.
Unless the charter or bylaws provide otherwise, if voting rights are not approved at the meeting or if the acquiring person does not deliver an acquiring person statement within 10 days following a control share acquisition then, subject to certain conditions and limitations, the corporation may redeem any or all of the control shares (except those for which voting rights have previously been approved) for fair value determined, without regard to the absence of voting rights for the control shares, as of the date of the last control share acquisition or of any meeting of shareholders at which the voting rights of such shares are considered and not approved. Moreover, unless the charter or bylaws provides otherwise, if voting rights for control shares are approved at a shareholders’ meeting and the acquirer becomes entitled to exercise or direct the exercise of a majority or more of all voting power, other shareholders may exercise appraisal rights. The fair value of the shares as determined for purposes of such appraisal rights may not be less than the highest price per share paid by the acquirer in the control share acquisition.
98
Table of Contents
Summary of Anti-Takeover Provisions
The foregoing provisions of our charter and bylaws and Maryland law could have the effect of discouraging an acquisition of AmericasBank Corp. or stock purchases in furtherance of an acquisition, and could accordingly, under certain circumstances, discourage transactions that might otherwise have a favorable effect on the price of our common stock. In addition, such provisions may make AmericasBank Corp. less attractive to a potential acquiror and/or might result in shareholders receiving a lesser amount of consideration for their shares of common stock than otherwise could have been available.
Our board of directors believes that the provisions described above are prudent and will reduce vulnerability to takeover attempts and certain other transactions that are not negotiated with and approved by our board of directors. Our board of directors believes that these provisions are in AmericasBank Corp.’s best interests and the best interests of its shareholders. In the board of directors’ judgment, the board of directors is in the best position to determine our true value and to negotiate more effectively for what may be in the best interests of the shareholders. Accordingly, the board of directors believes that it is in AmericasBank Corp.’s best interests and in the best interests of its shareholders to encourage potential acquirors to negotiate directly with the board of directors and that these provisions will encourage such negotiations and discourage hostile takeover attempts. It is also the board of directors’ view that these provisions should not discourage persons from proposing a merger or other transaction at prices reflective of AmericasBank Corp.’s true value and where the transaction is in the best interests of all shareholders.
Despite the board of directors’ belief as to the benefits to AmericasBank Corp. of the foregoing provisions, these provisions also may have the effect of discouraging a future takeover attempt in which shareholders might receive a substantial premium for their shares over then current market prices and may tend to perpetuate existing management. As a result, shareholders who might desire to participate in such a transaction may not have an opportunity to do so. The board of directors, however, has concluded that the potential benefits of these provisions outweigh their possible disadvantages.
Transfer Agent
American Stock Transfer & Trust Company serves as the transfer agent for our common stock.
99
Table of Contents
McKinnon & Company, Inc., 999 Waterside Drive, Suite 1200, Norfolk, Virginia, has agreed, subject to the terms and conditions contained in an underwriting agreement with us, to sell, as selling agent for us on a best efforts basis, 1,725,000 shares of common stock. Because the offering is on a best efforts basis and there is no minimum number of shares to be sold, McKinnon & Company, Inc. is not obligated to purchase any shares if they are not sold to the public, and McKinnon & Company, Inc. is not required to sell any specific number or dollar amount of shares. McKinnon & Company, Inc. is a member of the National Association of Securities Dealers, Inc. and an SEC-registered broker-dealer.
McKinnon & Company, Inc. has informed us that it proposes to sell the common stock as selling agent for us – subject to prior sale, when, as and if issued by us - in part to the public at the public offering prices set forth on the cover page of this prospectus, and in part through certain selected dealers that are members of the National Association of Securities Dealers, Inc. to customers of such selected dealers at the public offering price. Each selected dealer will receive a commission of $0.25 for each share that it sells. Purchasers are required to have an account either with McKinnon & Company, Inc. or a selected dealer to purchase shares of common stock in the offering. However, McKinnon & Company, Inc. has no obligation to open an account for any prospective investor. McKinnon & Company, Inc. reserves the right to reject any order for the purchase of shares through it in whole or in part.
At closing, McKinnon & Company, Inc. will notify all prospective investors, directly or through a selected dealer, of the number of shares to be purchased. The investors, through their dealers, will transmit their purchase funds to the escrow agent by wire transmission. The independent escrow agent is SunTrust Bank, a Georgia banking corporation,. The purpose of the escrow is to allow McKinnon & Company, Inc. to comply at closing with its obligations under the Securities Exchange Act of 1934, as amended, for the transmission of funds to an issuer in a best efforts offering. The release of funds from escrow is not dependent upon our raising any specific amounts in this offering or any other event. McKinnon & Company, Inc. will not purchase or otherwise take ownership of any shares. Closing is expected to occur on or aboutMarch 10, 2006.
We will pay McKinnon & Company, Inc. a commission equal to 6.0 percent of the aggregate sales price of the shares sold in the offering.
We determined the offering price through negotiations with McKinnon & Company, Inc. In determining the offering price, we considered the following factors, among others: the per share book value of the common stock as of December 31, 2005, September 30, 2005 and as of December 31, 2004, the trading history of the common stock, including the frequency and volume of trades and actual trading prices, but not necessarily the current quoted or last sale price; the history and our prospects and those of Americas Bank; our past and present earnings, trend of such earnings and the prospects for future earnings; the current performance and prospects of the banking industry in which we compete; the general condition of the securities market at the time of the offering and the prices of equity securities of other community banks.
McKinnon & Company, Inc. has advised us that it will use its best efforts to make a market in our common stock for a period of at least two years after the closing of the offering as long as we remain listed on the NASDAQ Capital Market or other exchange and remain current in our periodic reports that we file with the Securities and Exchange Commission.
We have agreed to indemnify and hold harmless McKinnon & Company, Inc. and the persons who control it against certain liabilities, including liability under the Securities Act of 1933, as amended. Under certain conditions, we have agreed to contribute to any payment that McKinnon & Company, Inc. may be required to make for such indemnified liabilities. In addition, we have agreed to reimburse McKinnon & Company, Inc. for its expenses, including any legal fees, that it incurs in connection with the offering.
100
Table of Contents
The validity of the shares of common stock offered by this prospectus will be passed upon for AmericasBank Corp. by Ober, Kaler, Grimes & Shriver, a Professional Corporation, 120 East Baltimore Street, Baltimore, Maryland. Certain legal matters will be passed upon for the underwriter by Williams Mullen, Richmond, Virginia.
The audited financial statements of Americas Bank Corp. included in this prospectus and in the registration statement have been audited by Rowles & Company, LLP, Independent Registered Public Accounting Firm, as set forth in their report thereon appearing elsewhere herein and in the registration statement and are included in reliance upon such report given upon the authority of such firm as experts in accounting and auditing.
WHERE YOU CAN FIND MORE INFORMATION
We are subject to the information requirements of the Securities Exchange Act of 1934, as amended, and we file annual, quarterly and current reports, proxy statements and other information with the Securities and Exchange Commission. You may read and copy any document that we file at the SEC’s public reference room facility located at 100 F Street, N.E., Room 1580, Washington, D.C. 20549. Please call the SEC at 1-800-SEC-0330 for further information on the public reference room. The SEC also maintains an Internet site at http://www.sec.gov that contains reports, proxy and information statements and other information regarding issuers, including us, that file documents with the SEC electronically through the SEC’s electronic data gathering, analysis and retrieval system known as EDGAR. On EDGAR, our reports are listed under “AmericasBank Corp.”
This prospectus is part of a registration statement we have filed with the SEC. Because the rules and regulations of the SEC allow us to omit certain portions of the registration statement from this prospectus, this prospectus does not contain all the information set forth in the registration statement. You may review the registration statement and the exhibits filed with the registration statement for further information regarding us and the shares of our common stock being offered by this prospectus. The registration statement and its exhibits may be inspected at the public reference facility of the SEC at the locations described above.
101
Table of Contents
AmericasBank Corp. and Subsidiary
Consolidated Financial Statements
December 31, 2004
Table of Contents
AmericasBank Corp. and Subsidiary
Index to Financial Statements
| Page | ||
| F-2 | ||
Consolidated financial statements | ||
| F-3 | ||
| F-4 | ||
| F-5 | ||
| F-6-7 | ||
| F-8-26 | ||
F-1
Table of Contents
Report of Independent Registered Public Accounting Firm
The Board of Directors and Stockholders
AmericasBank Corp.
Towson, Maryland
We have audited the accompanying consolidated balance sheets of AmericasBank Corp. and Subsidiary as of December 31, 2004 and 2003, and the related statements of operations, changes in stockholders’ equity, and cash flows for each of the years then ended. These financial statements are the responsibility of the Company’s management. Our responsibility is to express an opinion on these financial statements based on our audits.
We conducted our audits in accordance with standards of the Public Company Accounting Oversight Board in the United States of America. Those standards require that we plan and perform the audit to obtain reasonable assurance about whether the financial statements are free of material misstatement. We were not engaged to perform an audit of the Company’s internal control over financial reporting. Our audits included consideration of internal control over financial reporting as a basis for designing audit procedures that are appropriate in the circumstances, but not for the purpose of expressing an opinion on the effectiveness of the Company’s internal control over financial reporting. Accordingly we express no such opinion. An audit also includes examining, on a test basis, evidence supporting the amounts and disclosures in the financial statements, assessing the accounting principles used and significant estimates made by management, and evaluating the overall financial statement presentation. We believe that our audits provide a reasonable basis for our opinion.
In our opinion, the financial statements referred to above present fairly, in all material respects, the financial position of AmericasBank Corp. and Subsidiary as of December 31, 2004 and 2003, and the results of their operations and their cash flows for each of the years then ended in conformity with accounting principles generally accepted in the United States of America.
/s/ Rowles & Company LLP
Baltimore, Maryland
February 9, 2005, except for the effect of the
adoption of SFAS No. 123 as described in
Note 2, as to which the date is November 3, 2005.
F-2
Table of Contents
AmericasBank Corp. and Subsidiary
Consolidated Balance Sheets
| (Unaudited) | ||||||||||||||||
| September 30, | December 31, | |||||||||||||||
| 2005 | 2004 (1) | 2004 (1) | 2003 (1) | |||||||||||||
| Assets | ||||||||||||||||
Cash and due from banks | $ | 1,130,918 | $ | 568,873 | $ | 866,960 | $ | 552,269 | ||||||||
Federal funds sold and Federal Home Loan Bank deposit | 17,067,422 | 9,100,617 | 4,356,587 | 8,186,477 | ||||||||||||
Securities available for sale | 30,000 | 348,327 | 348,182 | 366,566 | ||||||||||||
Federal Home Loan Bank and Federal Reserve Bank stock at cost | 238,500 | 139,450 | 132,550 | 158,850 | ||||||||||||
Loans held for sale | 5,399,798 | 1,447,531 | 1,617,048 | 1,229,041 | ||||||||||||
Loans and leases, less allowance of $349,984, $311,839, $315,127 and $275,077 | 45,897,697 | 23,298,070 | 31,245,162 | 15,424,848 | ||||||||||||
Foreclosed real estate | — | 22,218 | — | 42,166 | ||||||||||||
Premises and equipment | 903,954 | 818,242 | 963,560 | 868,722 | ||||||||||||
Accrued interest receivable | 239,895 | 95,594 | 140,898 | 70,745 | ||||||||||||
Goodwill | 266,985 | — | 266,985 | — | ||||||||||||
Intangible assets | 25,222 | 27,222 | 28,222 | 29,722 | ||||||||||||
Other assets | 107,324 | 134,432 | 165,945 | 135,621 | ||||||||||||
| $ | 71,307,715 | $ | 36,000,576 | $ | 40,132,099 | $ | 27,065,027 | |||||||||
| Liabilities and Stockholders’ Equity | ||||||||||||||||
Deposits | ||||||||||||||||
Noninterest-bearing | $ | 11,309,272 | $ | 1,800,606 | $ | 2,226,222 | $ | 1,739,859 | ||||||||
Interest-bearing | 54,629,059 | 28,524,792 | 32,344,071 | 23,668,979 | ||||||||||||
Total deposits | 65,938,331 | 30,325,398 | 34,570,293 | 25,408,838 | ||||||||||||
Other liabilities | 184,577 | 146,283 | 166,002 | 123,552 | ||||||||||||
| 66,122,908 | 30,471,681 | 34,736,295 | 25,532,390 | |||||||||||||
Stockholders’ equity | ||||||||||||||||
Common stock, par value $.01 per share; 30,000,000 shares authorized, issued and outstanding 941,702, 916,515, 941,702 and 197,765 shares | 9,417 | 9,165 | 9,417 | 1,978 | ||||||||||||
Preferred stock, par value $.01 per share; 5,000,000 shares authorized, issued and outstanding 0 shares | — | — | — | — | ||||||||||||
Additional paid-in capital | 11,571,032 | 11,239,641 | 11,449,191 | 6,060,182 | ||||||||||||
Accumulated deficit | (6,395,642 | ) | (5,737,673 | ) | (6,080,564 | ) | (4,547,229 | ) | ||||||||
Accumulated other comprehensive income | — | 17,762 | 17,760 | 17,706 | ||||||||||||
| 5,184,807 | 5,528,895 | 5,395,804 | 1,532,637 | |||||||||||||
| $ | 71,307,715 | $ | 36,000,576 | $ | 40,132,099 | $ | 27,065,027 | |||||||||
| (1) | The September 30, 2004, December 31, 2004 and 2003 consolidated balance sheets have been restated for retroactive adoption of the fair value recognition provisions of SFAS 123,Accounting for Stock-Based Compensation, as amended, as discussed in Note 2. |
The accompanying notes are an integral part of these financial statements.
F-3
Table of Contents
AmericasBank Corp. and Subsidiary
Consolidated Statements of Operations
| (Unaudited) | Years Ended December 31, | |||||||||||||||
| Nine Months Ended | ||||||||||||||||
September 30, 2005 | September 30, 2004 (1) | 2004 (1) | 2003 | |||||||||||||
Interest revenue | ||||||||||||||||
Loans and leases, including fees | $ | 2,109,861 | $ | 969,157 | $ | 1,477,125 | $ | 1,240,252 | ||||||||
Federal funds sold and Federal Home Loan Bank deposit | 263,330 | 82,344 | 119,093 | 80,363 | ||||||||||||
Preferred trust securities | 7,417 | 22,500 | 30,000 | 30,000 | ||||||||||||
Mortgage-backed securities | — | 140 | 155 | 3,479 | ||||||||||||
Other | 9,704 | 6,573 | 8,384 | 9,079 | ||||||||||||
Total interest revenue | 2,390,312 | 1,080,714 | 1,634,757 | 1,363,173 | ||||||||||||
Interest expense | ||||||||||||||||
Deposits | 1,119,079 | 528,001 | 779,527 | 750,535 | ||||||||||||
Net interest income | 1,271,233 | 552,713 | 855,230 | 612,638 | ||||||||||||
Provision for loan and lease losses | 35,000 | 20,000 | 20,000 | 75,000 | ||||||||||||
Net interest income after provision for loan and lease losses | 1,236,233 | 532,713 | 835,230 | 537,638 | ||||||||||||
Noninterest revenue | ||||||||||||||||
Service charges on deposit accounts and other fees | 57,346 | 39,717 | 58,707 | 43,060 | ||||||||||||
Mortgage banking gains and fees | 329,807 | 77,190 | 151,810 | 261,565 | ||||||||||||
Total noninterest revenue | 387,153 | 116,907 | 210,517 | 304,625 | ||||||||||||
Noninterest expenses | ||||||||||||||||
Salaries | 824,057 | 943,500 | 1,308,652 | 846,096 | ||||||||||||
Employee benefits | 247,594 | 181,105 | 251,049 | 155,540 | ||||||||||||
Occupancy | 131,139 | 97,730 | 143,344 | 130,756 | ||||||||||||
Furniture and equipment | 88,289 | 72,841 | 101,704 | 79,928 | ||||||||||||
Other | 647,385 | 544,888 | 774,333 | 748,704 | ||||||||||||
Total noninterest expenses | 1,938,464 | 1,840,064 | 2,579,082 | 1,961,024 | ||||||||||||
Loss before income taxes | (315,078 | ) | (1,190,444 | ) | (1,533,335 | ) | (1,118,761 | ) | ||||||||
Income taxes | — | — | — | — | ||||||||||||
Net loss | $ | (315,078 | ) | $ | (1,190,444 | ) | $ | (1,533,335 | ) | $ | (1,118,761 | ) | ||||
Loss per common share - basic and diluted | $ | (0.33 | ) | $ | (1.62 | ) | $ | (1.95 | ) | $ | (7.37 | ) | ||||
| (1) | Results for the nine months ended September 30, 2004, and year ended December 31, 2004, have been restated for retroactive adoption of the fair value recognition provisions of SFAS 123,Accounting for Stock-Based Compensation, as amended, as discussed in Note 2 |
The accompanying notes are an integral part of these financial statements.
F-4
Table of Contents
AmericasBank Corp. and Subsidiary
Consolidated Statements of Changes in Stockholders’ Equity
| Common stock | Additional paid-in capital | Accumulated deficit | Accumulated other comprehensive income | Comprehensive income | |||||||||||||||||
| Shares | Par value | ||||||||||||||||||||
Balance, December 31, 2002 | 147,750 | $ | 1,478 | $ | 5,415,980 | $ | (3,379,915 | ) | $ | 20,798 | |||||||||||
Retroactive restatement for stock-based compensation (see note 2 ) | — | — | 48,553 | (48,553 | ) | — | |||||||||||||||
Balance, December 31, 2002, as restated | 147,750 | 1,478 | 5,464,533 | (3,428,468 | ) | 20,798 | |||||||||||||||
Net loss | — | — | — | (1,118,761 | ) | — | $ | (1,118,761 | ) | ||||||||||||
Unrealized loss on investment securities available for sale, net | — | — | — | — | (3,092 | ) | (3,092 | ) | |||||||||||||
Comprehensive income | $ | (1,121,853 | ) | ||||||||||||||||||
Common stock issued, net | 50,015 | 500 | 595,649 | — | — | ||||||||||||||||
Balance, December 31, 2003 | 197,765 | 1,978 | 6,060,182 | (4,547,229 | ) | 17,706 | |||||||||||||||
Net loss (1) | — | — | — | (1,533,335 | ) | — | $ | (1,533,335 | ) | ||||||||||||
Unrealized gain on investment securities available for sale, net | — | — | — | — | 54 | 54 | |||||||||||||||
Comprehensive income | $ | (1,533,281 | ) | ||||||||||||||||||
Stock-based compensation expense | — | — | 238,357 | — | — | ||||||||||||||||
Restricted common stock issued, net | 25,000 | 250 | 129,250 | — | — | ||||||||||||||||
Common stock issued, net | 718,937 | 7,189 | 5,021,402 | — | — | ||||||||||||||||
Balance, December 31, 2004 | 941,702 | 9,417 | 11,449,191 | (6,080,564 | ) | 17,760 | |||||||||||||||
Net loss (unaudited) | — | — | — | (315,078 | ) | — | $ | (315,078 | ) | ||||||||||||
Unrealized loss on investment securities available for sale, net (unaudited) | — | — | — | — | (17,760 | ) | (17,760 | ) | |||||||||||||
Comprehensive income (unaudited) | $ | (332,838 | ) | ||||||||||||||||||
Stock-based compensation expense (unaudited) | — | — | 122,168 | — | — | ||||||||||||||||
Cash paid for fractional shares resulting from reverse stock split (unaudited) | — | — | (327 | ) | — | — | |||||||||||||||
Balance, September 30, 2005 (unaudited) | 941,702 | $ | 9,417 | $ | 11,571,032 | $ | (6,395,642 | ) | $ | — | |||||||||||
| (1) | Net loss for the year ended December 31, 2004, has been restated for retroactive adoption of the fair value recognition provisions of SFAS 123,Accounting for Stock-Based Compensation, as amended, as discussed in Note 2 |
The accompanying notes are an integral part of these financial statements.
F-5
Table of Contents
AmericasBank Corp. and Subsidiary
Consolidated Statements of Cash Flows
| (Unaudited) | Years Ended December 31, | |||||||||||||||
| Nine Months Ended | ||||||||||||||||
September 30, 2005 | September 30, 2004 (1) | 2004 (1) | 2003 | |||||||||||||
Cash flows from operating activities | ||||||||||||||||
Interest received | $ | 2,235,055 | $ | 1,115,747 | $ | 1,691,667 | $ | 1,361,648 | ||||||||
Fees and commissions received | 57,346 | 35,713 | 54,703 | 61,416 | ||||||||||||
Interest paid | (1,085,081 | ) | (521,629 | ) | (767,999 | ) | (747,113 | ) | ||||||||
Proceeds from sales of loans held for sale | 28,294,689 | 9,684,638 | 27,487,511 | 29,469,637 | ||||||||||||
Originations of loans held for sale | (31,747,632 | ) | (9,825,938 | ) | (27,723,708 | ) | (26,682,126 | ) | ||||||||
Cash paid to suppliers and employees | (1,664,555 | ) | (1,532,044 | ) | (2,156,546 | ) | (1,848,297 | ) | ||||||||
| (3,910,178 | ) | (1,043,513 | ) | (1,414,372 | ) | 1,615,165 | ||||||||||
Cash flows from investing activities | ||||||||||||||||
Proceeds from maturity and call of investment securities Available for sale | 300,422 | 18,155 | 18,298 | 220,528 | ||||||||||||
Redemption of Federal Home Loan Bank stock | (105,950 | ) | — | 26,300 | — | |||||||||||
Redemption of Federal Reserve Bank stock | — | 19,400 | — | 30,400 | ||||||||||||
Acquisition of mortgage company | — | — | (145,000 | ) | — | |||||||||||
Loans and leases made, net of principal collected | (14,631,275 | ) | (7,952,964 | ) | (15,944,520 | ) | (2,379,279 | ) | ||||||||
Proceeds from sale of foreclosed real estate | — | 23,952 | 23,453 | — | ||||||||||||
Purchase of premises and equipment | (45,937 | ) | (77,937 | ) | (269,404 | ) | (331,879 | ) | ||||||||
| (14,482,740 | ) | (7,969,394 | ) | (16,290,873 | ) | (2,460,230 | ) | |||||||||
Cash flows from financing activities | ||||||||||||||||
Net increase in time deposits | 17,001,867 | 4,761,124 | 8,266,791 | 6,170,087 | ||||||||||||
Net increase (decrease) in other deposits | 14,366,171 | 155,436 | 894,664 | (1,040,917 | ) | |||||||||||
Cash payment for fractional shares | (327 | ) | — | — | — | |||||||||||
Proceeds from issuance of common stock | — | 5,027,091 | 5,028,591 | 596,149 | ||||||||||||
| 31,367,711 | 9,943,651 | 14,190,046 | 5,725,319 | |||||||||||||
Net increase (decrease) in cash and cash equivalents | 12,974,793 | 930,744 | (3,515,199 | ) | 4,880,254 | |||||||||||
Cash and cash equivalents at beginning of year | 5,223,547 | 8,738,746 | 8,738,746 | 3,858,492 | ||||||||||||
Cash and cash equivalents at end of year | $ | 18,198,340 | $ | 9,669,490 | $ | 5,223,547 | $ | 8,738,746 | ||||||||
| (1) | The Consolidated Statement of Cash Flows for the nine months ended September 30, 2004 and the year ended December 31, 2004, have been restated for retroactive adoption of the fair value recognition provisions of SFAS 123,Accounting for Stock-Based Compensation, as amended, as discussed in Note 2. |
The accompanying notes are an integral part of these financial statements.
F-6
Table of Contents
AmericasBank Corp. and Subsidiary
Consolidated Statements of Cash Flows
(Continued)
| (Unaudited) | Years Ended December 31, | |||||||||||||||
| Nine Months Ended | ||||||||||||||||
September 30, 2005 | September 30, 2004 (1) | 2004 (1) | 2003 | |||||||||||||
Reconciliation of net loss to net cash provided by operating activities | ||||||||||||||||
Net loss | $ | (315,078 | ) | $ | (1,190,444 | ) | $ | (1,533,335 | ) | $ | (1,118,761 | ) | ||||
Adjustments to reconcile net loss to net cash provided by operating activities | ||||||||||||||||
Depreciation and amortization | 129,709 | 103,775 | 146,987 | 114,709 | ||||||||||||
Loss on disposal of premises and equipment | — | — | — | 18,356 | ||||||||||||
Provision for loan and lease losses | 35,000 | 20,000 | 20,000 | 75,000 | ||||||||||||
Amortization of security premiums | — | 140 | 140 | 2,027 | ||||||||||||
Stock-based compensation | 122,168 | 159,555 | 238,357 | — | ||||||||||||
Gain on sale of foreclosed real estate | — | (4,004 | ) | (4,004 | ) | — | ||||||||||
Amortization of loan premium and other intangible assets | 3,000 | 2,500 | 3,499 | 3,334 | ||||||||||||
Increase (decrease) in | ||||||||||||||||
Deferred loan fees and costs, net | (56,260 | ) | 57,242 | 123,423 | (6,314 | ) | ||||||||||
Accrued interest payable | 33,998 | 6,372 | 11,528 | 3,422 | ||||||||||||
Other liabilities | (15,423 | ) | 16,359 | 30,922 | 53,695 | |||||||||||
Decrease (increase) in | ||||||||||||||||
Loans held for sale | (3,782,750 | ) | (218,490 | ) | (388,007 | ) | 2,525,946 | |||||||||
Accrued interest receivable | (98,997 | ) | (24,849 | ) | (70,153 | ) | (572 | ) | ||||||||
Other assets | 34,455 | 28,331 | 6,271 | (55,677 | ) | |||||||||||
| $ | (3,910,178 | ) | $ | (1,043,513 | ) | $ | (1,414,372 | ) | $ | 1,615,165 | ||||||
Noncash investing activity | ||||||||||||||||
Transfer of loans to foreclosed real estate | $ | — | $ | — | $ | — | $ | 42,166 | ||||||||
| (1) | The Consolidated Statement of Cash Flows for the nine months ended September 30, 2004 and the year ended December 31, 2004, have been restated for retroactive adoption of the fair value recognition provisions of SFAS 123,Accounting for Stock-Based Compensation, as amended, as discussed in Note 2. |
The accompanying notes are an integral part of these financial statements.
F-7
Table of Contents
AmericasBank Corp. and Subsidiary
Notes to Consolidated Financial Statements
| 1. | Summary of Significant Accounting Policies |
The accounting and reporting policies reflected in the financial statements conform to generally accepted accounting principles and to general practices within the banking industry. Management makes estimates and assumptions that affect the reported amounts of assets and liabilities and disclosures of commitments and contingent liabilities at the date of the financial statements and revenues and expenses during the year. Actual results could differ from those estimates.
Principles of consolidation
The consolidated financial statements include the accounts of AmericasBank Corp. (the Company) and its subsidiary AmericasBank (the Bank). Intercompany balances and transactions have been eliminated.
Business
The Bank provides credit and deposit services to individuals and businesses located in Baltimore County, Baltimore City and surrounding areas of central Maryland.
Reclassifications
Certain reclassifications have been made to the 2003 financial statements to conform with the current year presentation.
Cash and cash equivalents
For purposes of reporting cash flows, cash and cash equivalents include cash on hand, amounts due from banks, and federal funds sold. Generally, federal funds are purchased and sold for one-day periods.
Investment securities
As securities are purchased, management determines if the securities should be classified as held to maturity or available for sale. Securities which management has the intent and ability to hold to maturity are recorded at amortized cost which is cost adjusted for amortization of premiums and accretion of discounts to maturity. Securities held to meet liquidity needs or which may be sold before maturity are classified as available for sale and carried at fair value with unrealized gains and losses included in stockholders’ equity on an after-tax basis. Premiums are amortized and discounts are accreted using the interest method.
Gains and losses on disposal are determined using the specific-identification method.
Federal Reserve Bank and Federal Home Loan Bank stock
Federal Reserve Bank and Federal Home Loan Bank stock are carried at cost, which approximates fair value.
Loans held for sale
Loans held for sale are carried at the lower of aggregate cost or market value. Market value is determined based on outstanding investor commitments or, in the absence of such commitments, based on current investor yield requirements. Gains and losses on loan sales are determined using the specific-identification method.
F-8
Table of Contents
AmericasBank Corp. and Subsidiary
Notes to Consolidated Financial Statements
(Continued)
| 1. | Summary of Significant Accounting Policies(Continued) |
Loans and leases
Loans and leases are stated at face value, plus deferred origination costs, less deferred origination fees and the allowance for loan and lease losses.
Interest on loans is accrued based on the principal amounts outstanding. Origination fees and costs are amortized to income over the terms of the loans using an approximate interest method. The accrual of interest is discontinued when any portion of the principal or interest is ninety days past due and collateral is insufficient to discharge the debt in full.
Loans are considered impaired when, based on current information, management considers it unlikely that the collection of principal and interest payments will be made according to contractual terms. Generally,loans are not reviewed for impairment until the accrual of interest has been discontinued. If collection of principal is evaluated as doubtful, all payments are applied to principal.
The allowance for loan and lease losses represents an amount which, in management’s judgment, will be adequate to absorb probable losses on existing loans and other extensions of credit that may become uncollectible. Management’s judgment in determining the adequacy of the allowance is based on evaluations of the collectibility of loans. Management performs an ongoing review of its portfolio, maintaining a watch list of problem loans. These problem loans are graded and assigned risk-based factors for potential loan losses. The remaining loans are assigned risk-based factors, based on loan type, without a detailed review of the individual credits. Actual loan performance may differ from management’s estimates.
Foreclosed real estate
Real estate acquired through foreclosure is recorded at the lower of cost or fair market value on the date acquired. In general, cost equals the Bank’s investment in the property at the time of foreclosure. Losses incurred at the time of acquisition of the property are charged to the allowance for loan and lease losses. Subsequent reductions in the estimated value of the property are included in other operating expenses.
Premises and equipment
Premises and equipment are recorded at cost less accumulated depreciation. Depreciation is computed using the straight-line method.
Goodwill and Other Intangible Assets
Goodwill represents the cost in excess of the fair value of net assets acquired (including identifiable intangibles) in transactions accounted for as purchases. SFAS No. 142,Goodwill and Other Intangible Assets, requires that goodwill no longer be amortized over an estimated useful life, but rather be tested at least annually for impairment. Impairment is the condition that exists when the carrying amount of goodwill exceeds its implied fair value. The implied fair value of goodwill is the amount determined by deducting the estimated fair value of all tangible and identifiable intangible net assets of the reporting unit to which goodwill has been allocated from the estimated fair value of the reporting unit. If the recorded value of goodwill exceeds its implied value, an impairment charge is recorded for the excess. Intangible assets other than goodwill, which are determined to have finite lives, continue to be amortized on straight-line or accelerated bases over periods ranging from one to fifteen years.
Computer software is recorded at cost and amortized over three to five years using the straight-line method.
Loan premiums are amortized over fifteen years.
F-9
Table of Contents
AmericasBank Corp. and Subsidiary
Notes to Consolidated Financial Statements
(Continued)
| 1. | Summary of Significant Accounting Policies(Continued) |
Advertising costs
The Bank expenses advertising costs as they are incurred.
Reverse stock split
On August 3, 2005, the Company’s board of directors authorized a one-for-four reverse stock split where every four shares of common stock converted into one share. The record date of the reverse stock split was August 22, 2005, and the split was effective on August 23, 2005. Fractional shares resulting from the split were converted to cash. All share and per share data included in the consolidated financial statements have been restated to reflect the stock split.
Stock-based compensation - adoption of SFAS No. 148
Effective January 1, 2005, AmericasBank Corp. began recognizing expense for stock-based compensation using the fair value based method of accounting described in Statement of Financial Accounting Standards (“SFAS”) No. 123,Accounting for Stock-Based Compensation, as amended. Under SFAS No. 123, stock-based compensation expense is recognized over the vesting period of the stock-based grant based on the estimated grant date fair value of the stock-based compensation that is expected to vest. Information on the determination of the estimated value of stock options used to calculate stock-based compensation expense under the provisions of SFAS No. 123 is included in note 2. In implementing the fair value method of accounting described in SFAS No. 123, the Company chose the retroactive restatement method described in SFAS No. 148,Accounting for Stock-Based Compensation — Transition and Disclosure, which amended SFAS No. 123. As a result, financial information for all periods presented has been restated to reflect the salaries expense that would have been recognized had the recognition provisions of SFAS No. 123 been applied to all awards granted to employees. Also, the use of the retroactive restatement method resulted in the restatement of previously reported balances of additional paid-in capital and accumulated deficit.
The Company had previously used the intrinsic value method to account for stock-based employee compensation plans in accordance with Accounting Principles Board Opinion No. 25,Accounting for Stock Issued to Employees. Under this method, compensation cost is recognized for awards of shares of common stock to employees only if the quoted market price of the stock at any measurement date is greater than the amount the employee must pay to acquire the stock. Accordingly, no compensation expense was recognized for stock option awards to employees under the Company’s stock option plans since the exercise price of stock options granted was equal to the market price of the underlying stock at date of grant.
| 2004 | ||||
Net loss as reported | $ | (1,294,978 | ) | |
Total stock-based employee compensation expense determined under fair value-based method | (238,357 | ) | ||
Net loss, as restated | $ | (1,533,335 | ) | |
Net loss per share - basic and diluted | ||||
As reported | $ | (1.64 | ) | |
As restated | $ | (1.95 | ) | |
F-10
Table of Contents
Americas Bank Corp. and Subsidiary
Notes to Consolidated Financial Statements
(Continued)
The weighted average fair value of options granted in 2004 was $2.60 per share. The value was estimated using the Black-Scholes option pricing model and the following weighted average assumptions:
Expected volatility | 27.44 | % | |
Risk-free interest rate | 4.00 | % | |
Dividend yield | 0.00 | % | |
Expected lives | 10 years |
Income taxes
The provision for income taxes includes taxes payable for the current year and deferred income taxes. Deferred tax assets and liabilities are determined based on the difference between the financial statement and tax bases of assets and liabilities, using enacted tax rates in effect for the year in which the differences are expected to reverse.
| 1. | Summary of Significant Accounting Policies(Continued) |
Comprehensive income
Comprehensive income includes net income and the unrealized gain or loss net of related income taxes on investment securities available for sale.
Loss per share
Loss per common share is determined by dividing net loss by the weighted average number of common shares outstanding during the period. There were 785,082 and 151,860 weighted average common shares outstanding during 2004 and 2003.
Diluted earnings per share is determined by adjusting average shares of common stock outstanding by the potentially dilutive effects of stock options and warrants outstanding. The dilutive effects of stock options are computed using the treasury stock method. In loss periods, the potentially dilutive effect of stock options and warrants are excluded since the effect would be anti-dilutive.
| 2. | Retroactive Restatement - Stock-based Compensation |
Effective January 1, 2005, AmericasBank Corp. began recognizing expense for stock-based compensation using the fair value based method of accounting described in Statement of Financial Accounting Standards (“SFAS”) No. 123,Accounting for Stock-Based Compensation, as amended. As a result, salaries expense for the year ended December 31, 2004 included $238,357 of stock-based compensation. We have chosen the retroactive restatement method described in SFAS No. 148,Accounting for Stock-Based Compensation — Transition and Disclosure, which amended SFAS No. 123. As a result, financial information for all prior periods presented have been restated to reflect the salaries and employee benefits expense that would have been recognized had the recognition provisions of SFAS No. 123 been applied to all awards granted to employees. The use of the retroactive restatement method resulted in the restatement of previously reported balances of additional paid-in capital and accumulated deficit. As of December 31, 2002, previously reported additional paid-in capital was increased by $48,553 and accumulated deficit was increased by the same amount. There was no effect on the results of operations for the year ended December 31, 2003.
| 3. | Acquisition |
On October 5, 2004, AmericasBank completed the acquisition of certain assets and assumed certain liabilities of uvm Mortgage Marketing, Inc. of Towson, Maryland. The principal and sole shareholder of uvm Mortgage Marketing Inc. agreed to a five-year employment agreement and became the manager of the Towson mortgage production office.
The purchase price of $274,500 consisted of cash and 25,000 restricted shares of AmericasBank Corp. common stock that vest over two years. In determining the purchase price, a discount was applied to the value of the restricted shares after taking into account operating losses of the Company, the volume of stock sales in the market, the trading market of the stock, and any resale agreement provisions included in the terms of the acquisition. Furniture, equipment, trade name, and customer lists acquired as part of the purchase were recorded at fair value and are being amortized over their useful lives ranging from three to five years. Goodwill in the amount of $266,985 was recorded and will be tested at least annually for impairment. The Goodwill will be amortized over 15 years for income tax purposes.
The Bank assumed the remaining term of a three year lease for 1,179 square feet of office space located in Towson, Maryland. The lease payments were determined to be at market and rent will be expensed monthly for the 34 months remaining on the lease.
F-11
Table of Contents
AmericasBank Corp. and Subsidiary
Notes to Consolidated Financial Statements
(Continued)
The consolidated financial statements include the results of operations of uvm Mortgage Marketing, Inc. since the date of purchase.
The following schedule summarizes investing activities related to the acquisition included in the consolidated statements of cash flows for the year ended December 31, 2004:
| 2004 | ||||
Fair value of tangible and intangible assets acquired | $ | 7,515 | ||
Goodwill acquired | 266,985 | |||
Estimated fair value of restricted stock issued as part of acquisition | (129,500 | ) | ||
Cash paid for acquisition | $ | 145,000 | ||
Operating results of uvm Mortgage Marketing, Inc., prior to the purchase date, are not readily determinable.
F-12
Table of Contents
AmericasBank Corp. and Subsidiary
Notes to Consolidated Financial Statements
(Continued)
| 4. | Cash and Equivalents |
The Bank normally carries balances with other banks that exceed the federally insured limit. The average balances carried in excess of the limit were $344,866 for 2004 and $718,900 for 2003. The Bank also sells federal funds on an unsecured basis to the same banks. Average balances sold were $8,218,600 for 2004 and $6,773,988 for 2003. Banks are required to carry noninterest-bearing cash reserves at specified percentages of deposit balances. The Bank’s normal amount of cash on hand and on deposit with other banks is sufficient to satisfy the reserve requirements.
| 5. | Investment Securities |
Investment securities are summarized as follows:
December 31, 2004 | Amortized cost | Unrealized gains | Unrealized losses | Fair value | ||||||||
Available for sale | ||||||||||||
Preferred trust | $ | 300,000 | $ | 17,760 | $ | — | $ | 317,760 | ||||
Mortgage-backed | 422 | — | — | 422 | ||||||||
Equity | 30,000 | — | — | 30,000 | ||||||||
| $ | 330,422 | $ | 17,760 | $ | — | $ | 348,182 | |||||
December 31, 2003 | ||||||||||||
Available for sale | ||||||||||||
Preferred trust | $ | 300,000 | $ | 17,760 | $ | — | $ | 317,760 | ||||
Mortgage-backed | 18,860 | — | 54 | 18,806 | ||||||||
Equity | 30,000 | — | — | 30,000 | ||||||||
| $ | 348,860 | $ | 17,760 | $ | 54 | $ | 366,566 | |||||
Fair values of marketable investment securities are provided by an independent third party.
F-13
Table of Contents
AmericasBank Corp. and Subsidiary
Notes to Consolidated Financial Statements
(Continued)
| 5. | Investment Securities(Continued) |
Contractual maturities at December 31, 2004 and 2003 are shown below. Actual maturities will differ from contractual maturities because borrowers may have the right to call or prepay obligations with or without call or prepayment penalties. All investment securities held by the Company at December 31, 2004 and 2003 were classified as available for sale.
| Available for sale | ||||||
December 31, 2004 | Amortized cost | Fair value | ||||
Maturing | ||||||
Over one to five years | $ | 300,000 | $ | 317,760 | ||
Mortgage-backed, due in monthly installments | 422 | 422 | ||||
Equity security | 30,000 | 30,000 | ||||
| $ | 330,422 | $ | 348,182 | |||
December 31, 2003 | ||||||
Maturing | ||||||
Over one to five years | $ | 300,000 | $ | 317,760 | ||
Mortgage-backed, due in monthly installments | 18,860 | 18,806 | ||||
Equity security | 30,000 | 30,000 | ||||
| $ | 348,860 | $ | 366,566 | |||
No investment securities were sold prior to maturity in 2004 or 2003.
There were no pledged investment securities at December 31, 2004 or 2003.
F-14
Table of Contents
AmericasBank Corp. and Subsidiary
Notes to Consolidated Financial Statements
(Continued)
| 6. | Loans |
Major classifications of loans are as follows:
| 2004 | 2003 | |||||||
Residential real estate | $ | 15,743,998 | $ | 3,213,352 | ||||
Construction and land development | 3,975,815 | 735,246 | ||||||
Commercial, including real estate | 5,688,317 | 5,669,224 | ||||||
Commercial finance leases | 3,751,607 | 4,893,607 | ||||||
Home equity | 2,171,661 | 922,186 | ||||||
Installment | 369,151 | 283,147 | ||||||
| 31,700,549 | 15,716,762 | |||||||
Deferred loan origination fees, net of cost | (140,260 | ) | (16,837 | ) | ||||
Allowance for loan and lease losses | (315,127 | ) | (275,077 | ) | ||||
| $ | 31,245,162 | $ | 15,424,848 | |||||
The following table presents the maturities or repricing periods of our loan portfolio at December 31, 2004:
| Loan Maturity Distribution at December 31, 2004 | ||||||||||||
| 1 year or less | 1-5 years | After 5 years | Total | |||||||||
Residential real estate | $ | 2,058,525 | $ | 1,729,393 | $ | 11,956,080 | $ | 15,743,998 | ||||
Construction and land development | 1,713,482 | 1,307,761 | 954,572 | 3,975,815 | ||||||||
Commercial, including real estate | 803,517 | 1,030,777 | 3,854,023 | 5,688,317 | ||||||||
Commercial finance leases | 293,054 | 3,458,553 | — | 3,751,607 | ||||||||
Home equity | — | 207,146 | 1,964,515 | 2,171,661 | ||||||||
Installment | 161,041 | 131,902 | 76,208 | 369,151 | ||||||||
Total loans | $ | 5,029,619 | $ | 7,865,532 | $ | 18,805,398 | $ | 31,700,549 | ||||
Fixed rate | $ | 3,030,620 | $ | 6,761,799 | $ | 3,103,919 | $ | 12,896,338 | ||||
Variable rate | 1,998,999 | 1,103,733 | 15,701,479 | 18,804,211 | ||||||||
Total loans | $ | 5,029,619 | $ | 7,865,532 | $ | 18,805,398 | $ | 31,700,549 | ||||
F-15
Table of Contents
AmericasBank Corp. and Subsidiary
Notes to Consolidated Financial Statements
(Continued)
| 6. | Loans(Continued) |
Transactions in the allowance for loan and lease losses were as follows:
| 2004 | 2003 | |||||
Balance, beginning of year | $ | 275,077 | $ | 252,769 | ||
Provision charged to operations | 20,000 | 75,000 | ||||
Recoveries | 20,407 | 1,348 | ||||
| 315,484 | 329,117 | |||||
Loans charged off | 357 | 54,040 | ||||
Balance, end of year | $ | 315,127 | $ | 275,077 | ||
Loans past due 90 days or more and still accruing interest | $ | 121,616 | $ | — | ||
Information regarding our nonaccrual loans is as follows:
| 2004 | 2003 | |||||
Nonaccrual loans | $ | 54,126 | $ | 35,000 | ||
Unrecorded interest on nonaccrual loans | 6,521 | 1,925 | ||||
Specific reserve for nonaccrual loans included in the allowance for loan and lease losses | 15,000 | — | ||||
As of December 31, 2004 and 2003, management had not classified any loans as impaired other than the nonaccrual loans.
The Bank makes loans and leases to customers located primarily in Baltimore County, Baltimore City, and surrounding areas of central Maryland. Although the loan portfolio is diversified, its performance will be influenced by the regional economy.
F-16
Table of Contents
AmericasBank Corp. and Subsidiary
Notes to Consolidated Financial Statements
(Continued)
| 7. | Credit Commitments |
Outstanding loan commitments, unused lines of credit, and letters of credit were as follows:
| 2004 | 2003 | |||||
Unused lines of credit | ||||||
Commercial mortgage | $ | 712,145 | $ | — | ||
Residential mortgage | 144,297 | — | ||||
Commercial | 398,503 | 536,407 | ||||
Home-equity lines | 445,104 | 253,410 | ||||
| $ | 1,700,049 | $ | 789,817 | |||
Construction and land development loan commitments | $ | 1,326,321 | $ | 836,926 | ||
Letters of Credit | $ | 89,768 | $ | 148,955 | ||
Loan commitments and lines of credit are agreements to lend to a customer as long as there is no violation of any condition to the contract. Loan commitments generally have variable interest rates, fixed expiration dates, and may require payment of a fee. Lines of credit generally have variable interest rates. Such lines do not represent future cash requirements because it is unlikely that all customers will draw upon their lines in full at any time. Letters of credit are commitments issued to guarantee the performance of a customer to a third party.
The Bank’s maximum exposure to credit loss in the event of nonperformance by the customer is the contractual amount of the credit commitment. Loan commitments, lines of credit, and letters of credit are made on the same terms, including collateral, as outstanding loans. Management is not aware of any accounting loss to be incurred by funding these loan commitments.
F-17
Table of Contents
AmericasBank Corp. and Subsidiary
Notes to Consolidated Financial Statements
(Continued)
| 8. | Insider Loans and Deposits |
The officers and directors of the Bank enter into loan transactions with the Bank in the ordinary course of business. These loans are made on the same terms, including interest rates and collateral, as those prevailing at the time for comparable loans with unrelated borrowers. At December 31, 2004 and 2003, the total amounts of loans outstanding to officers and directors, including loans to their related interests, were $394,959 and $1,127,242, respectively. Activity in the loans during 2004 and 2003 was as follows:
| 2004 | 2003 | |||||||
Balance, beginning of year | $ | 1,127,242 | $ | 1,069,073 | ||||
New loans | 205,000 | 200,000 | ||||||
Payments | (100,557 | ) | (141,831 | ) | ||||
Changes in officers and directors | (836,726 | ) | — | |||||
Balance, end of year | $ | 394,959 | $ | 1,127,242 | ||||
At December 31, 2004 and 2003, the total amounts of deposits outstanding from officers and directors, including their related interests, were $1,457,511 and $988,987, respectively.
| 9. | Premises and Equipment |
A summary of premises and equipment and the related depreciation follows:
| Useful lives | 2004 | 2003 | ||||||
Land | $ | 143,000 | $ | 143,000 | ||||
Building and improvements | 40 years | 783,497 | 625,503 | |||||
Furniture and equipment | 3 - 7 years | 462,712 | 410,257 | |||||
Leasehold improvements | 10 years | 42,521 | 42,521 | |||||
| 1,431,730 | 1,221,281 | |||||||
Accumulated depreciation | 468,170 | 352,559 | ||||||
Net premises and equipment | $ | 963,560 | $ | 868,722 | ||||
Depreciation expense | $ | 115,611 | $ | 97,814 | ||||
Included in other assets at December 31, 2004 and 2003, is computer software carried at an amortized cost of $82,134 and $54,555, respectively. Software amortization expense was $31,376 and $16,895 in 2004 and 2003, respectively.
F-18
Table of Contents
AmericasBank Corp. and Subsidiary
Notes to Consolidated Financial Statements
(Continued)
| 10. | Deposits |
Major classifications of interest-bearing deposits are as follows:
| 2004 | 2003 | |||||
NOW accounts | $ | 273,931 | $ | 178,889 | ||
Advances from borrowers for insurance and taxes | 53,110 | 25,675 | ||||
Money market | 1,289,164 | 708,438 | ||||
Savings | 5,716,711 | 6,011,613 | ||||
Certificates of deposit, $100,000 or more | 5,017,339 | 2,744,247 | ||||
Other certificates of deposit | 19,993,816 | 14,000,117 | ||||
| $ | 32,344,071 | $ | 23,668,979 | |||
At December 31, 2004, certificates of deposit mature as follows:
Maturing in one year or less | $ | 6,951,605 | |||
Maturing over one through two years | 8,212,267 | ||||
Maturing over two through three years | 3,897,395 | ||||
Maturing over three through four years | 5,300,928 | ||||
Maturing over four through five years | 648,960 | ||||
| $ | 25,011,155 | ||||
| 11. | Lease |
The Bank occupies its Highlandtown location under the terms of a lease dated June 6, 2000. The lease commenced on December 17, 2000. The lease has an original term of five years with two options to renew for five years each.
The Bank assumed the liability for a lease in Towson, Maryland as part of the acquisition of the assets of uvm Mortgage Marketing. The lease commenced on June 16, 2001 and had a term of three years. On April 21, 2004, a supplemental lease agreement was executed extending the lease for a period of three additional years.
The leases call for the following minimum payments:
Year | Amount | ||
2005 | $ | 37,317 | |
2006 | 20,160 | ||
2007 | 13,600 | ||
| $ | 71,077 | ||
Rent expense was $40,054 and $30,570 for 2004 and 2003, respectively.
F-19
Table of Contents
AmericasBank Corp. and Subsidiary
Notes to Consolidated Financial Statements
(Continued)
| 12. | Other Noninterest Expenses |
A summary of other noninterest expenses follows:
| 2004 | 2003 | |||||
Professional services | $ | 182,632 | $ | 243,291 | ||
Data processing services | 122,290 | 101,790 | ||||
Advertising and promotion | 73,979 | 51,789 | ||||
ATM and credit card processing | 71,862 | 37,098 | ||||
FDIC and regulatory assessment | 65,765 | 43,322 | ||||
Amortization of intangible assets | 34,875 | 27,847 | ||||
Liability insurance | 43,208 | 32,659 | ||||
Telephone | 40,343 | 49,717 | ||||
Postage and courier | 39,924 | 39,540 | ||||
Stationery, printing, and supplies | 19,765 | 27,273 | ||||
Correspondent bank charges | 16,399 | 42,898 | ||||
Loan expenses | 15,603 | 5,016 | ||||
Other | 47,688 | 46,464 | ||||
| $ | 774,333 | $ | 748,704 | |||
F-20
Table of Contents
AmericasBank Corp. and Subsidiary
Notes to Consolidated Financial Statements
(Continued)
| 13. | Income Taxes |
The Company has not incurred any income tax liability since its inception.
The statutory federal income tax rate was 34% for 2004 and 2003. The Company’s effective tax rate for 2004 and 2003, was zero due to the net operating losses. The provision (benefit) for income taxes is reconciled as follows:
| 2004 | 2003 | |||||||
Loss before income taxes | $ | (1,533,335 | ) | $ | (1,118,761 | ) | ||
Tax provision at statutory rate | $ | (521,334 | ) | $ | (380,379 | ) | ||
Increase (decrease) resulting from | ||||||||
State income taxes, less federal benefit | (70,840 | ) | (51,684 | ) | ||||
Net operating loss carryover | 592,174 | 432,063 | ||||||
Provision for income taxes | $ | — | $ | — | ||||
The components of the net deferred taxes at December 31, 2004 and 2003 are as follows:
Deferred tax assets | ||||||
Allowance for loan losses | $ | 84,574 | $ | 76,850 | ||
Intangible assets | 27,922 | 35,428 | ||||
Net operating loss and charitable contribution carryforward | 2,021,726 | 1,519,891 | ||||
Accumulated depreciation | 16,566 | 17,809 | ||||
Net deferred tax before valuation allowance | 2,150,788 | 1,649,978 | ||||
Valuation allowance | 2,150,788 | 1,649,978 | ||||
Net deferred tax asset | $ | — | $ | — | ||
A 100% valuation allowance has been recorded against the net deferred tax asset since it is more likely than not that it will not be realized.
At December 31, 2004 and 2003, the Company has net operating loss carryforwards of approximately $5,232,241 and $3,933,331 available to offset future taxable income. The current carryforwards will expire beginning in 2017.
F-21
Table of Contents
AmericasBank Corp. and Subsidiary
Notes to Consolidated Financial Statements
(Continued)
| 14. | Stockholders’ Equity |
Stock options
In prior years, the Company granted stock options in accordance with the 1998 Stock Option Plan. When the stock options are vested, they may be exercised. The option price is equal to the estimated fair market value of the common stock at the date of grant. The options expire ten years after the date of grant if not exercised.
On March 11, 2004, the Company adopted the 2004 Stock Incentive Plan that was subsequently approved by the shareholders in June 2004. The option price is equal to the estimated fair market value of the common stock at the date of grant. The options expire ten years after the date of grant if not exercised. Vesting of certain options may be subject to achievement of specific financial and non-financial performance objectives as set forth in the grants. The variable vesting feature of the plan will require the Company to record compensation expense in periods where the fair market value of the Company’s common stock exceeds the exercise price of the options. A total of 320,780 shares are eligible to be issued under the plan.
Information with respect to stock options is as follows for the years ended December 31:
| 2004 | 2003 | |||||||||
| Shares | Weighted average exercise price | Shares | Weighted average exercise price | |||||||
Outstanding at beginning of year | 6,045 | $ | 40.48 | 6,045 | $ | 40.48 | ||||
Exercised | — | — | — | — | ||||||
Granted | 286,125 | 8.00 | — | — | ||||||
Forfeited | — | — | — | — | ||||||
Outstanding at end of year | 292,170 | $ | 8.68 | 6,045 | $ | 40.48 | ||||
A summary of information about stock options outstanding is as follows at December 31, 2004:
Options Outstanding | ||||||
Weighted | Shares | Weighted | Shares | |||
$8.00 | 286,125 | 9.34 | 25,113 | |||
28.00 | 555 | 5.50 | 555 | |||
40.00 | 4,292 | 3.72 | 4,292 | |||
48.00 | 1,198 | 3.99 | 1,198 | |||
8.68 | 292,170 | 9.23 | 31,158 | |||
F-22
Table of Contents
AmericasBank Corp. and Subsidiary
Notes to Consolidated Financial Statements
(Continued)
| 14. | Stockholders’ Equity(Continued) |
Stock warrants
On September 2, 1998, the Company issued to the holders of record of its common stock on September 1, 1998, a dividend of one common stock purchase warrant for each share of common stock then held by the stockholders (the A Warrants). Each A Warrant entitles the holder to purchase one share of common stock at an exercise price of $40 per share, subject to adjustment for certain events, beginning any time after April 1, 2000, until the A Warrants expire on September 1, 2008. As of December 31, 2004 there were 75,000 A Warrants outstanding.
In connection with a unit offering on October 9, 1998, the Company issued warrants (B Warrants) to purchase an aggregate of 49,000 shares of the Company’s common stock. Each B Warrant entitles the holder to purchase one share of common stock at an exercise price of $52 per share, subject to adjustment for certain events, beginning any time after April 8, 2000, until the B Warrants expire on September 1, 2008. As of December 31, 2004, there were 49,000 B Warrants outstanding.
In connection with a private placement offering on May 31, 2002, the Company issued 23,750 warrants (the C Warrants) to purchase an aggregate of 118,750 shares of the Company’s stock. Each C Warrant entitles the holder to purchase five shares of common stock at an exercise price of $20 per share, subject to adjustment for certain events, beginning any time after March 1, 2003, until the C Warrants expire on September 1, 2008. As of December 31, 2004, there were 118,750 C Warrants outstanding.
In connection with a private placement offering on March 28, 2003, the Company issued 50,015 shares of Series A Preferred Stock and stock warrants (the E Warrants) to purchase an aggregate of 50,015 shares of the Company’s stock. Each E Warrant entitles the holder to purchase one share of common stock at an exercise price of $12.80 per share, subject to adjustment for certain events, beginning any time after March 1, 2003, until the E Warrants expire on September 1, 2008. On December 2, 2003, the Series A Preferred Stock was exchanged for 50,015 shares of the Company’s common stock on a one-for-one basis. As of December 31, 2004 there were 50,015 E Warrants outstanding.
F-23
Table of Contents
AmericasBank Corp. and Subsidiary
Notes to Consolidated Financial Statements
(Continued)
| 15. | Parent Company Financial Information |
The balance sheets as of December 31, 2004 and 2003, and statements of operations for the years then ended, for AmericasBank Corp. (Parent only) are presented below:
Balance Sheets
December 31, | 2004 | 2003 | ||||||
Assets | ||||||||
Cash | $ | 129,937 | $ | 1,325 | ||||
Investment in subsidiary | 5,265,867 | 1,531,312 | ||||||
Other assets | — | 36,264 | ||||||
| $ | 5,395,804 | $ | 1,568,901 | |||||
Liabilities and Stock holders’ Equity | ||||||||
Due to subsidiary | $ | — | $ | 36,264 | ||||
Stockholders’ equity | ||||||||
Common stock | 9,417 | 1,978 | ||||||
Additional paid-in capital | 11,449,191 | 6,060,182 | ||||||
Accumulated deficit | (6,080,564 | ) | (4,547,229 | ) | ||||
Accumulated other comprehensive income | 17,760 | 17,706 | ||||||
| 5,395,804 | 1,532,637 | |||||||
| $ | 5,395,804 | $ | 1,568,901 | |||||
Statements of Operations
Years Ended December 31, | 2004 | 2003 | ||||||
Revenue | $ | 21 | $ | — | ||||
Expenses | — | (3,838 | ) | |||||
Income (loss) before undistributed net loss of subsidiary | 21 | (3,838 | ) | |||||
Equity in undistributed net loss of subsidiary | (1,533,356 | ) | (1,114,923 | ) | ||||
Net loss | $ | (1,533,335 | ) | $ | (1,118,761 | ) | ||
F-24
Table of Contents
AmericasBank Corp. and Subsidiary
Notes to Consolidated Financial Statements
(Continued)
| 16. | Capital Standards |
The Federal Reserve Board and The Federal Deposit Insurance Corporation have adopted risk-based capital standards for banking organizations. These standards require ratios of capital to assets for minimum capital adequacy and to be classified as well capitalized under prompt corrective action provisions. The capital ratios and minimum capital requirements for the Company and the Bank are as follows:
AmericasBank Corp. (in thousands) | Actual | Minimum capital adequacy | To be well capitalized | |||||||||||||||
| Amount | Ratio | Amount | Ratio | Amount | Ratio | |||||||||||||
December 31, 2004 | ||||||||||||||||||
Total capital (to risk-weighted assets) | $ | 5,398 | 19.94 | % | $ | 2,166 | 8.00 | % | $ | 2,708 | 10.00 | % | ||||||
Tier 1 capital (to risk-weighted assets) | 5,083 | 18.77 | % | 1,083 | 4.00 | % | 1,625 | 6.00 | % | |||||||||
Tier 1 capital (to average assets) | 5,083 | 13.19 | % | 1,554 | 4.00 | % | 1,942 | 5.00 | % | |||||||||
December 31, 2003 | ||||||||||||||||||
Total capital (to risk-weighted assets) | $ | 1,708 | 9.61 | % | $ | 1,422 | 8.00 | % | $ | 1,777 | 10.00 | % | ||||||
Tier 1 capital (to risk-weighted assets) | 1,485 | 8.36 | % | 711 | 4.00 | % | 1,066 | 6.00 | % | |||||||||
Tier 1 capital (to average assets) | 1,485 | 5.40 | % | 1,100 | 4.00 | % | 1,375 | 5.00 | % | |||||||||
AmericasBank (in thousands) | ||||||||||||||||||
December 31, 2004 | ||||||||||||||||||
Total capital (to risk-weighted assets) | $ | 5,269 | 19.46 | % | $ | 2,166 | 8.00 | % | $ | 2,708 | 10.00 | % | ||||||
Tier 1 capital (to risk-weighted assets) | 4,954 | 18.30 | % | 1,083 | 4.00 | % | 1,625 | 6.00 | % | |||||||||
Tier 1 capital (to average assets) | 4,954 | 12.85 | % | 1,554 | 4.00 | % | 1,942 | 5.00 | % | |||||||||
December 31, 2003 | ||||||||||||||||||
Total capital (to risk-weighted assets) | $ | 1,707 | 9.60 | % | $ | 1,422 | 8.00 | % | $ | 1,777 | 10.00 | % | ||||||
Tier 1 capital (to risk-weighted assets) | 1,484 | 8.35 | % | 711 | 4.00 | % | 1,066 | 6.00 | % | |||||||||
Tier 1 capital (to average assets) | 1,484 | 5.40 | % | 1,100 | 4.00 | % | 1,375 | 5.00 | % | |||||||||
Tier 1 capital consists of common stock, surplus, and retained earnings. Total capital includes a limited amount of the allowance for loan losses. In calculating risk-weighted assets, specified risk percentages are applied to each category of asset and off-balance-sheet items.
F-25
Table of Contents
AmericasBank Corp. and Subsidiary
Notes to Consolidated Financial Statements
(Continued)
| 16. | Capital Standards(Continued) |
Failure to meet the capital requirements could affect the Bank’s ability to pay dividends and accept deposits and may significantly affect the operations of the Bank.
On August 3, 2001, the Company and Bank entered into a Written Agreement with the Federal Reserve Board and the Maryland Division of Financial Regulation. The Agreement requires improvements to the operations of the Company including, but not limited to, maintaining adequate capital, improving management oversight, monitoring loans acquired from third parties, improving internal controls, monitoring sensitivity to market risk, and improving analysis of the adequacy of the allowance for loan losses. The Company is prohibited from paying cash dividends or incurring additional debt without prior approval from the regulators. The Company is required to submit regular written reports stating the progress in complying with the Agreement. The Company is limited in the amount of brokered deposits it may accept.
As of December 31, 2004, the Company and the Bank met the regulatory requirements to be considered well capitalized.
| 17. | Fair Value of Financial Instruments |
Fair value estimates, methods, and assumptions are summarized below for the Company’s financial instruments as of December 31, 2004 and 2003.
The carrying value and estimated fair value of financial instruments is summarized as follows:
| 2004 | 2003 | |||||||||||
| Carrying value | Estimated fair value | Carrying value | Estimated fair value | |||||||||
Assets | ||||||||||||
Cash and cash equivalents | $ | 5,223,547 | $ | 5,223,547 | $ | 8,738,746 | $ | 8,738,746 | ||||
Investment securities | 348,182 | 348,182 | 366,566 | 366,566 | ||||||||
Loans held for sale | 1,617,048 | 1,617,048 | 1,229,041 | 1,249,120 | ||||||||
Loans | 31,245,162 | 31,192,213 | 15,424,848 | 15,482,743 | ||||||||
Liabilities | ||||||||||||
Deposits | $ | 34,570,293 | $ | 34,668,816 | $ | 25,408,838 | $ | 25,875,302 | ||||
Cash and cash equivalents
The carrying amount for cash and cash equivalents approximates fair value due to the short maturity of these instruments.
Investment securities
The fair value of investment securities is based on bid prices received from an external pricing service.
Loans held for sale
The fair value of loans held for sale is based on commitments to sell loans classified as held for sale to a correspondent lender.
F-26
Table of Contents
AmericasBank Corp. and Subsidiary
Notes to Consolidated Financial Statements
(Continued)
| 17. | Fair Value of Financial Instruments (Continued) |
Loans
The fair value of loans was calculated by discounting the anticipated cash flows based on contractual maturity, weighted-average coupon, and discount rate.
Deposits
The fair value of deposits with no stated maturity, such as noninterest-bearing deposits, interest-bearing now accounts, money market, and passbook and statement savings, is deemed to be equal to the carrying amounts. The fair value of certificates of deposit is based on the discounted value on contractual cash flows. The discount rate for certificates of deposit was estimated using the rate currently offered for deposits of similar remaining maturities.
| 18. | Selected Quarterly Financial Data |
A summary of selected quarterly financial data is as follows for the years ended December 31:
| First quarter | Second quarter | Third quarter | Fourth quarter | |||||||||||||
| (Unaudited) | ||||||||||||||||
2004: | ||||||||||||||||
Interest revenue | $ | 329,712 | $ | 346,893 | $ | 404,109 | $ | 554,043 | ||||||||
Net interest income | 157,394 | 177,188 | 218,132 | 302,516 | ||||||||||||
Provision for loan and lease losses | 5,000 | 7,500 | 7,500 | — | ||||||||||||
Loss before income taxes | (404,843 | ) | (362,801 | ) | (422,800 | ) | (342,891 | ) | ||||||||
Net loss | (404,843 | ) | (362,801 | ) | (422,800 | ) | (342,891 | ) | ||||||||
Loss per common share: | ||||||||||||||||
Basic and diluted | $ | (1.11 | ) | $ | (0.40 | ) | $ | (0.46 | ) | $ | (0.36 | ) | ||||
2003: | ||||||||||||||||
Interest revenue | 328,279 | 345,409 | 336,845 | 352,640 | ||||||||||||
Net interest income | 154,776 | 142,694 | 146,062 | 169,106 | ||||||||||||
Provision for loan and lease losses | 30,000 | 15,000 | 15,000 | 15,000 | ||||||||||||
Loss before income taxes | (127,310 | ) | (317,561 | ) | (354,959 | ) | (318,931 | ) | ||||||||
Net loss | (127,310 | ) | (317,561 | ) | (354,959 | ) | (318,931 | ) | ||||||||
Loss per common share: | ||||||||||||||||
Basic and diluted | $ | (0.86 | ) | $ | (2.15 | ) | $ | (2.40 | ) | $ | (1.94 | ) | ||||
F-27
Table of Contents
No one has been authorized to give any information or to make any representations in connection with the public offering, other than those contained in this prospectus. You may not assume that we have authorized any other information or representations. The delivery of this prospectus and the sale of our common stock do not mean that there has been no change in our affairs since the date of this prospectus. This prospectus is not an offer to sell or a solicitation of an offer to buy securities in any state where the offer or sale is not permitted.
| Page | ||
| 1 | ||
| 6 | ||
| 8 | ||
| 16 | ||
| 17 | ||
| 23 | ||
| 24 | ||
| 26 | ||
| 27 | ||
| 28 | ||
| 29 | ||
Management’s Discussion and Analysis of Financial Condition and Results of Operations | 30 | |
| 57 | ||
| 68 | ||
Security Ownership of Certain Beneficial Owners and Management | 83 | |
| 85 | ||
| 86 | ||
| 94 | ||
| 100 | ||
| 101 | ||
| 101 | ||
| 101 | ||
| F-2 |

1,725,000 shares
PROSPECTUS
March 6, 2006
McKinnon & Company, Inc.