
1 Stoneridge, Inc . Fourth Quarter 2013 Earnings Release Presentation March 6, 2014 Exhibit 99.2
Statements in this presentation that are not historical facts (including, but not limited to, 2014 net sales guidance) are forward - looking statements, which involve risks and uncertainties that could cause actual events or results to differ materially from those expressed or implied by the statements. Important factors that may cause actual results to differ materially from those in the forward - looking statements include, among other factors, the loss or bankruptcy of a major customer; the costs and timing of facility closures, business realignment or similar actions; a significant change in medium - and heavy - duty truck, automotive or agricultural and off - highway vehicle production; our ability to achieve cost reductions that offset or exceed customer - mandated selling price reductions; a significant change in general economic conditions in any of the various countries in which Stoneridge operates; labor disruptions at Stoneridge’s facilities or at any of Stoneridge’s significant customers or suppliers; the ability of suppliers to supply Stoneridge with parts and components at competitive prices on a timely basis; the amount of Stoneridge’s indebtedness and the restrictive covenants contained in the agreements governing its indebtedness, including its asset - based credit facility and senior secured notes; customer acceptance of new products; capital availability or costs, including changes in interest rates or market perceptions; the failure to achieve successful integration of any acquired company or business and the items described in “Risk Factors” and other uncertainties or risks discussed in Stoneridge’s periodic and current reports filed with the Securities and Exchange Commission. Important factors that could cause the performance of the commercial vehicle and automotive industry to differ materially from those in the forward - looking statements include factors such as (1) continued economic instability or poor economic conditions in the United States and global markets, (2) changes in economic conditions, housing prices, foreign currency exchange rates, commodity prices, including shortages of and increases or volatility in the price of oil, (3) changes in laws and regulations, (4) the state of the credit markets, (5) political stability, (6) international conflicts and (7) the occurrence of force majeure events . Forward Looking Statements
Forward Looking Statements (cont’d) Also, see Rounding Differences Disclosure below These factors should not be construed as exhaustive and should be considered with the other cautionary statements in Stoneridge’s filings with the Securities and Exchange Commission. Forward - looking statements are not guarantees of future performance; Stoneridge’s actual results of operations, financial condition and liquidity, and the development of the industry in which Stoneridge operates may differ materially from those described in or suggested by the forward - looking statements contained in this presentation. In addition, even if Stoneridge’s results of operations, financial condition and liquidity, and the development of the industry in which Stoneridge operates are consistent with the forward - looking statements contained in this presentation, those results or developments may not be indicative of results or developments in subsequent periods. This presentation contains time - sensitive information that reflects management’s best analysis only as of the date of this presentation. Any forward - looking statements in this presentation speak only as of the date of this presentation, and Stoneridge undertakes no obligation to update such statements. Comparisons of results for current and any prior periods are not intended to express any future trends or indications of future performance, unless expressed as such, and should only be viewed as historical data. Stoneridge does not undertake any obligation to publicly update or revise any forward - looking statement as a result of new information, future events or otherwise, except as otherwise required by law . Rounding Differences : There may be slight immaterial differences between figures represented in our public filings compared to what is shown in this presentation. The differences are the a result of rounding due to the representation of values in millions rather than thousands in our public filings.

2013 Targeted Goals & Objectives Top line growth – annual 6% to 8% goal Sustainable cost position with focus on continuous improvement Focused technology evolution to create new products and keep existing products competitive Strong Balance Sheet provides Stoneridge opportunities to make investments Stoneridge positioned well for value creation 2013 2012 % Change $947.8 $938.5 1.0%
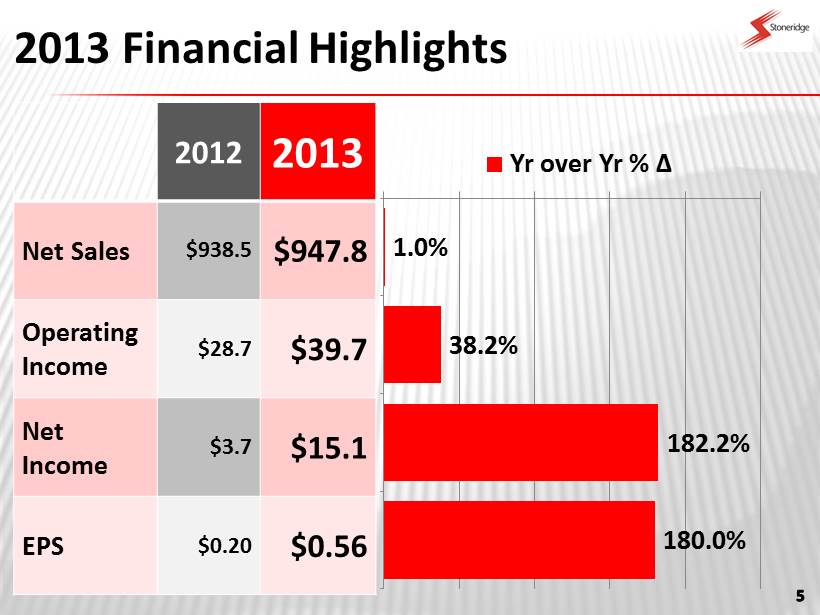
2013 Financial Highlights 1.0% 38.2% 182.2% 180.0% Net Sales Op Income Net Income EPS Yr over Yr % Δ 2012 2013 Net Sales $938.5 $947.8 Operating Income $28.7 $39.7 Net Income $3.7 $15.1 EPS $0.20 $0.56
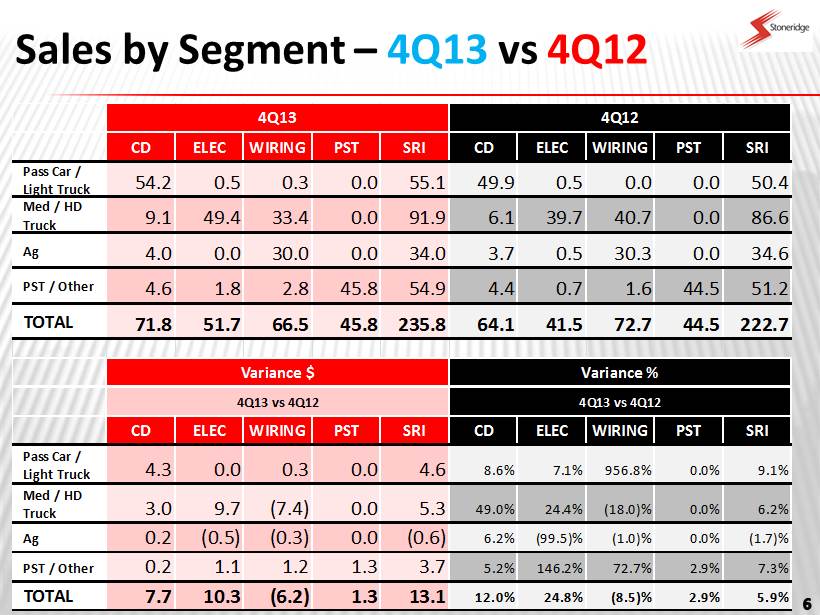
Sales by Segment – 4Q13 vs 4Q12 CD ELEC WIRING PST SRI CD ELEC WIRING PST SRI Pass Car / Light Truck 54.2 0.5 0.3 0.0 55.1 49.9 0.5 0.0 0.0 50.4 Med / HD Truck 9.1 49.4 33.4 0.0 91.9 6.1 39.7 40.7 0.0 86.6 Ag 4.0 0.0 30.0 0.0 34.0 3.7 0.5 30.3 0.0 34.6 PST / Other 4.6 1.8 2.8 45.8 54.9 4.4 0.7 1.6 44.5 51.2 TOTAL 71.8 51.7 66.5 45.8 235.8 64.1 41.5 72.7 44.5 222.7 CD ELEC WIRING PST SRI CD ELEC WIRING PST SRI Pass Car / Light Truck 4.3 0.0 0.3 0.0 4.6 8.6% 7.1% 956.8% 0.0% 9.1% Med / HD Truck 3.0 9.7 (7.4) 0.0 5.3 49.0% 24.4% (18.0)% 0.0% 6.2% Ag 0.2 (0.5) (0.3) 0.0 (0.6) 6.2% (99.5)% (1.0)% 0.0% (1.7)% PST / Other 0.2 1.1 1.2 1.3 3.7 5.2% 146.2% 72.7% 2.9% 7.3% TOTAL 7.7 10.3 (6.2) 1.3 13.1 12.0% 24.8% (8.5)% 2.9% 5.9% 4Q13 4Q12 Variance $ Variance % 4Q13 vs 4Q12 4Q13 vs 4Q12
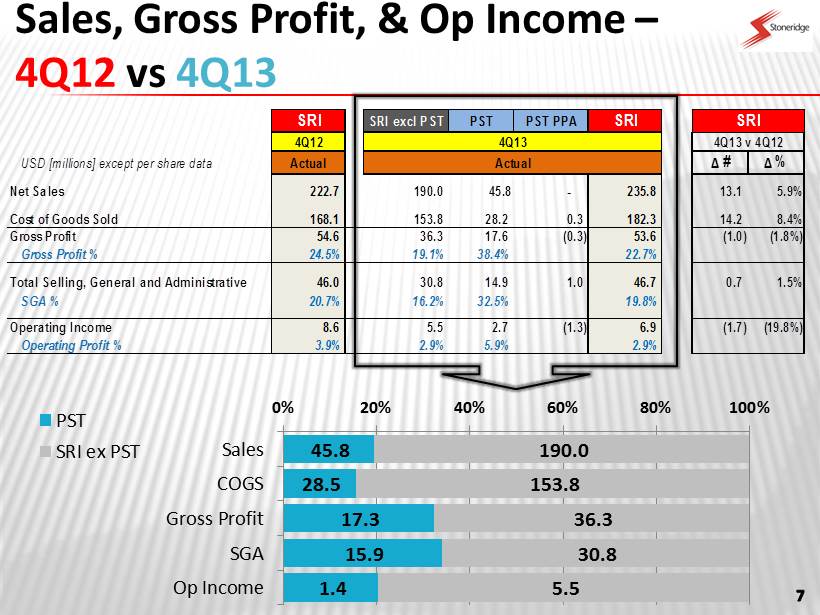
SRI SRI excl PST PST PST PPA SRI SRI 4Q12 4Q13 USD [millions] except per share data Actual Actual ∆ # ∆ % Net Sales 222.7 190.0 45.8 - 235.8 13.1 5.9% Cost of Goods Sold 168.1 153.8 28.2 0.3 182.3 14.2 8.4% Gross Profit 54.6 36.3 17.6 (0.3) 53.6 (1.0) (1.8%) Gross Profit % 24.5% 19.1% 38.4% 22.7% Total Selling, General and Administrative 46.0 30.8 14.9 1.0 46.7 0.7 1.5% SGA % 20.7% 16.2% 32.5% 19.8% Operating Income 8.6 5.5 2.7 (1.3) 6.9 (1.7) (19.8%) Operating Profit % 3.9% 2.9% 5.9% 2.9% 4Q13 v 4Q12 Sales, Gross Profit, & Op Income – 4Q12 vs 4Q13 45.8 28.5 17.3 15.9 1.4 190.0 153.8 36.3 30.8 5.5 0% 20% 40% 60% 80% 100% Sales COGS Gross Profit SGA Op Income PST SRI ex PST

4Q13 Sales Control Devices $71.7 Electronics $51.7 Wiring $66.6 PST $45.8 PST (Brazil ): Est 2012: $185 - $197 million Revenue by Business Unit Consolidated Sales : $235.8 million 2012 Guidance Core Sales (excl PST) $755 – $765 million 30.4% 19.4% 21.9% 28.3% Automotive Aftermarket Commercial Vehicle / Ag Commercial Vehicle
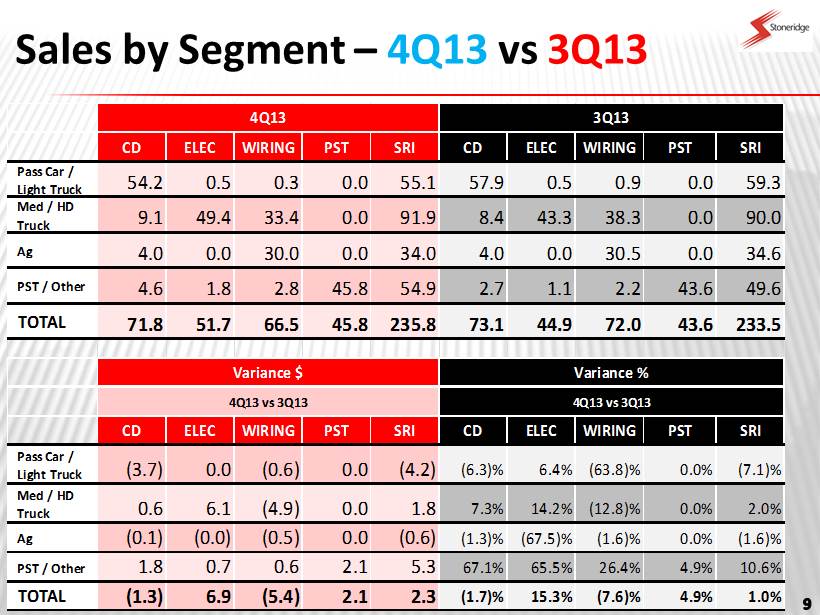
Sales by Segment – 4Q13 vs 3Q13 CD ELEC WIRING PST SRI CD ELEC WIRING PST SRI Pass Car / Light Truck 54.2 0.5 0.3 0.0 55.1 57.9 0.5 0.9 0.0 59.3 Med / HD Truck 9.1 49.4 33.4 0.0 91.9 8.4 43.3 38.3 0.0 90.0 Ag 4.0 0.0 30.0 0.0 34.0 4.0 0.0 30.5 0.0 34.6 PST / Other 4.6 1.8 2.8 45.8 54.9 2.7 1.1 2.2 43.6 49.6 TOTAL 71.8 51.7 66.5 45.8 235.8 73.1 44.9 72.0 43.6 233.5 CD ELEC WIRING PST SRI CD ELEC WIRING PST SRI Pass Car / Light Truck (3.7) 0.0 (0.6) 0.0 (4.2) (6.3)% 6.4% (63.8)% 0.0% (7.1)% Med / HD Truck 0.6 6.1 (4.9) 0.0 1.8 7.3% 14.2% (12.8)% 0.0% 2.0% Ag (0.1) (0.0) (0.5) 0.0 (0.6) (1.3)% (67.5)% (1.6)% 0.0% (1.6)% PST / Other 1.8 0.7 0.6 2.1 5.3 67.1% 65.5% 26.4% 4.9% 10.6% TOTAL (1.3) 6.9 (5.4) 2.1 2.3 (1.7)% 15.3% (7.6)% 4.9% 1.0% 4Q13 3Q13 Variance $ Variance % 4Q13 vs 3Q13 4Q13 vs 3Q13
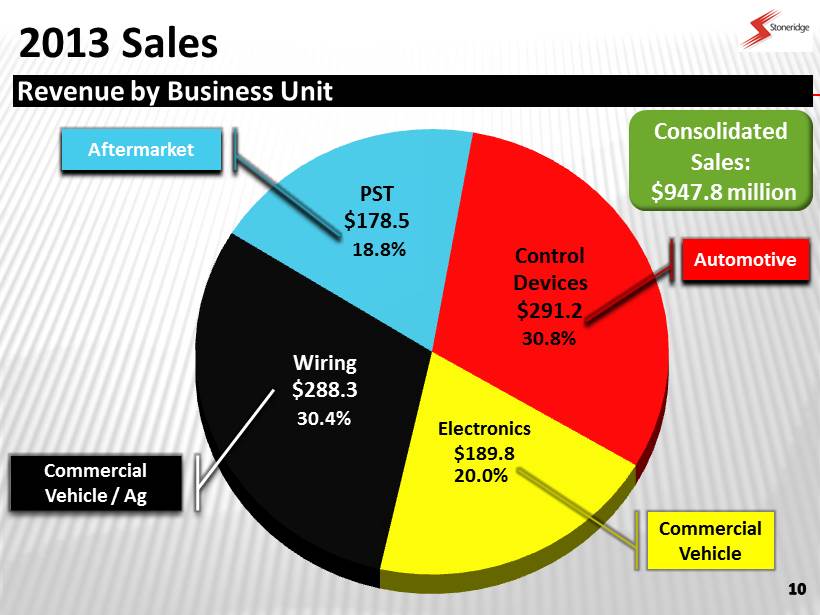
2013 Sales Control Devices $291.2 Electronics $189.8 Wiring $288.3 PST $178.5 PST (Brazil ): Est 2012: $185 - $197 million Revenue by Business Unit Consolidated Sales : $947.8 million 2012 Guidance Core Sales (excl PST) $755 – $765 million 30.8% 18.8% 20.0% 30.4% Automotive Aftermarket Commercial Vehicle / Ag Commercial Vehicle

Sales by Segment – 2013 vs 2012 CD ELEC WIRING PST SRI CD ELEC WIRING PST SRI Pass Car / Light Truck 225.3 2.8 2.0 0.0 230.1 203.4 3.6 0.6 0.0 207.6 Med / HD Truck 34.2 181.7 154.7 0.0 370.6 29.7 155.4 193.4 0.0 378.5 Ag 14.9 0.0 123.3 0.0 138.2 15.9 1.7 125.6 0.0 143.2 PST / Other 16.9 5.2 8.3 178.5 208.9 18.9 3.5 6.4 180.4 209.2 TOTAL 291.2 189.8 288.3 178.5 947.8 267.9 164.2 326.0 180.4 938.5 CD ELEC WIRING PST SRI CD ELEC WIRING PST SRI Pass Car / Light Truck 21.9 (0.8) 1.4 0.0 22.5 10.7% (21.1)% 232.7% 0.0% 10.8% Med / HD Truck 4.5 26.3 (38.7) 0.0 (7.9) 15.1% 16.9% (20.0)% 0.0% (2.1)% Ag (1.0) (1.7) (2.3) 0.0 (5.0) (6.4)% (97.6)% (1.8)% 0.0% (3.5)% PST / Other (2.0) 1.7 1.9 (1.9) (0.3) (10.7)% 48.3% 29.4% (1.0)% (0.1)% TOTAL 23.3 25.6 (37.7) (1.9) 9.3 8.7% 15.6% (11.6)% (1.0)% 1.0% 2013 2012 Variance $ Variance % 2013 vs 2012 2013 vs 2012
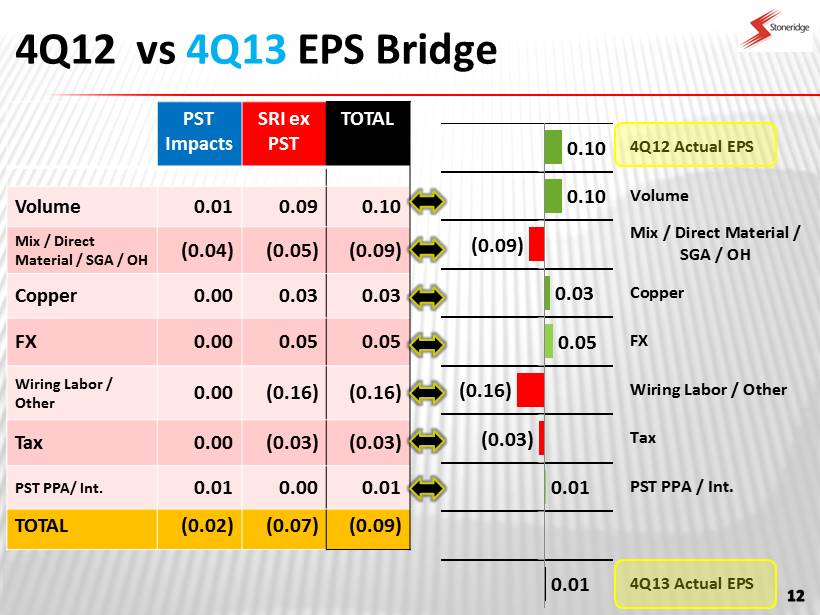
4Q12 vs 4Q13 EPS Bridge PST Impacts SRI ex PST TOTAL Volume 0.01 0.09 0.10 Mix / Direct Material / SGA / OH (0.04) (0.05) (0.09) Copper 0.00 0.03 0.03 FX 0.00 0.05 0.05 Wiring Labor / Other 0.00 (0.16) (0.16) Tax 0.00 (0.03) (0.03) PST PPA / Int. 0.01 0.00 0.01 TOTAL (0.02) (0.07) (0.09) 0.01 0.01 (0.03) (0.16) 0.05 0.03 (0.09) 0.10 0.10 4Q13 Actual EPS PST PPA / Int. Tax Wiring Labor / Other FX Copper Mix / Direct Material / SGA / OH Volume 4Q12 Actual EPS

PST Purchase Price Accounting Expense [Non Cash] (millions) Q1 Q2 Q3 Q4 Full Year 2012 1Q 2Q 3Q 4Q Full Year 2013 COGS / DM Inventory Write Up $1.8 $1.4 $0.0 $0.0 $3.2 $0.0 $0.0 $0.0 $0.0 $0.0 COGS / Depreciation – Fixed Asset Write Up $0.4 $0.3 $0.3 $0.3 $1.3 $0.3 $0.3 $0.3 $0.3 $1.2 SGA / Amortized Intangibles $1.0 $1.1 $1.3 $1.3 $4.7 $1.6 $1.5 $1.0 $1.0 $5.1 TOTAL $3.2 $2.8 $1.6 $1.6 $9.2 $1.9 $1.8 $1.3 $1.3 $6.3 Q1 Q2 Q3 Q4 2012 1Q 2Q 3Q 4Q 2013 Impact on Op Margin 1.22% 1.20% 0.73% 0.72% 0.98% 0.81% 0.74% 0.56% 0.55% 0.66% Impact on Diluted EPS $(0.06) $(0.05) $(0.03) $(0.03) $(0.17) $(0.04) $(0.04) $(0.02) $(0.03) $(0.13)

Improving Direct Material Costs in 2H12 1Q12 2Q12 1 st Half 3Q12 4Q12 2 nd Half FY 2012 1Q13 2Q13 3Q13 4Q13 FY 2013 SRI excl PST Direct Material 56.2% 56.7% 56.4% 56.0% 54.9% 55.4% 56.0% 53.9% 53.7% 54.5% 53.9% 54.0% PST Direct Material * 38.0% 37.8% 37.9% 37.0% 32.1% 34.5% 36.2% 34.9% 35.6% 40.5% 41.0% 38.0% * Excludes Purchase Accounting Expense SRI excluding PST • Commodity based material price decreases • Sales price increases (mostly Control Devices) offsetting raw material increases • Redesign of products to lower material content (Control Devices) PST • Direct material content is a function of product sales (car alarms vs. audio), pricing and BRL / USD exchange rate
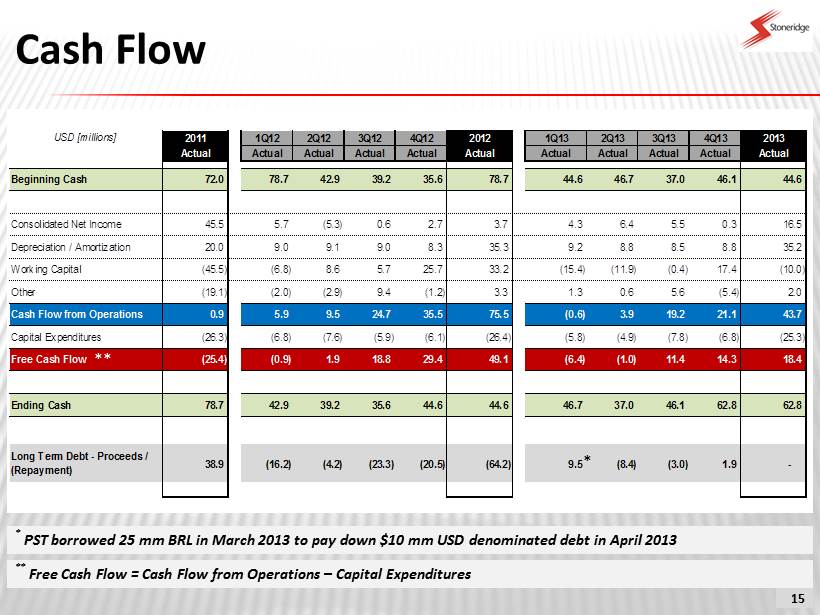
USD [millions] 2011 1Q12 2Q12 3Q12 4Q12 2012 1Q13 2Q13 3Q13 4Q13 2013 Actual Actual Actual Actual Actual Actual Actual Actual Actual Actual Actual Beginning Cash 72.0 78.7 42.9 39.2 35.6 78.7 44.6 46.7 37.0 46.1 44.6 Consolidated Net Income 45.5 5.7 (5.3) 0.6 2.7 3.7 4.3 6.4 5.5 0.3 16.5 Depreciation / Amortization 20.0 9.0 9.1 9.0 8.3 35.3 9.2 8.8 8.5 8.8 35.2 Working Capital (45.5) (6.8) 8.6 5.7 25.7 33.2 (15.4) (11.9) (0.4) 17.4 (10.0) Other (19.1) (2.0) (2.9) 9.4 (1.2) 3.3 1.3 0.6 5.6 (5.4) 2.0 Cash Flow from Operations 0.9 5.9 9.5 24.7 35.5 75.5 (0.6) 3.9 19.2 21.1 43.7 Capital Expenditures (26.3) (6.8) (7.6) (5.9) (6.1) (26.4) (5.8) (4.9) (7.8) (6.8) (25.3) Free Cash Flow (25.4) (0.9) 1.9 18.8 29.4 49.1 (6.4) (1.0) 11.4 14.3 18.4 Ending Cash 78.7 42.9 39.2 35.6 44.6 44.6 46.7 37.0 46.1 62.8 62.8 Long Term Debt - Proceeds / (Repayment) 38.9 (16.2) (4.2) (23.3) (20.5) (64.2) 9.5 (8.4) (3.0) 1.9 - Cash Flow 15 * PST borrowed 25 mm BRL in March 2013 to pay down $10 mm USD denominated debt in April 2013 * ** ** Free Cash Flow = Cash Flow from Operations – Capital Expenditures
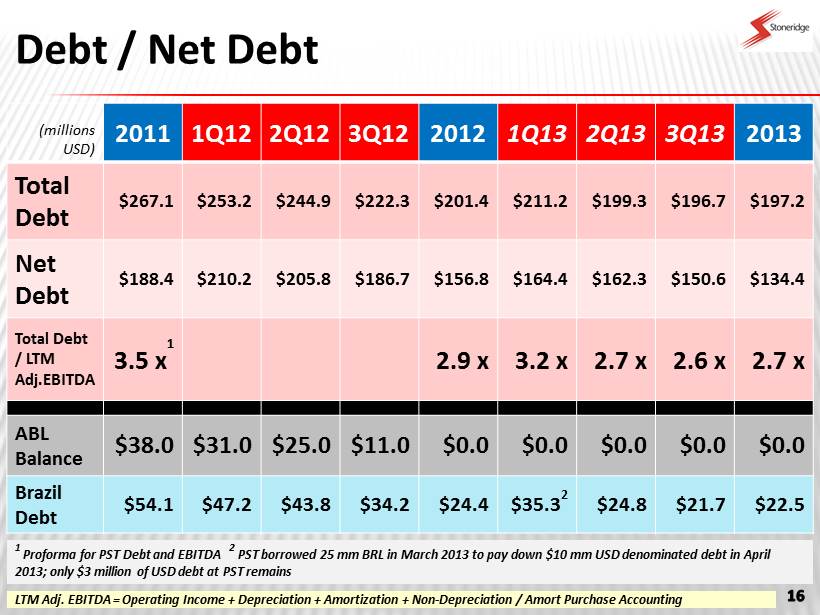
Debt / Net Debt (millions USD) 2011 1Q12 2Q12 3Q12 2012 1Q13 2Q13 3Q13 2013 Total Debt $267.1 $253.2 $244.9 $222.3 $201.4 $211.2 $199.3 $196.7 $197.2 Net Debt $188.4 $210.2 $205.8 $186.7 $156.8 $164.4 $162.3 $150.6 $134.4 Total Debt / LTM Adj.EBITDA 3.5 x 1 2.9 x 3.2 x 2.7 x 2.6 x 2.7 x ABL Balance $38.0 $31.0 $25.0 $11.0 $0.0 $0.0 $0.0 $0.0 $0.0 Brazil Debt $54.1 $47.2 $43.8 $34.2 $24.4 $35.3 2 $24.8 $21.7 $22.5 LTM Adj. EBITDA = Operating Income + Depreciation + Amortization + Non - Depreciation / Amort Purchase Accounting 1 Proforma for PST Debt and EBITDA 2 PST borrowed 25 mm BRL in March 2013 to pay down $10 mm USD denominated debt in April 2013; only $3 million of USD debt at PST remains

2014 Guidance 17 Sales: $994 - $1,083 Gross Margin: 25.5% - 27.0% Op Margin*: 5.3% - 6.3% EPS: $0.80 - $1.00 EBITDA Margin: 8.9% - 9.8% Reconciliation of Operating Margin to EBITDA Margin Operating Margin 5.3% - 6.3% Depreciation 3.1% - 3.0% Amortization 0.5% - 0.5% EBITDA Margin 8.9% - 9.8% EBITDA = Operating Margin plus depreciation & amortization * Includes PST $3.3 million of Non - Cash expense related to the purchase of PST
