UNITED STATES
SECURITI1 AND EXCHANGE COMMISSION
WASHINGTON, D.C. 20549
FORM N-CSR
CERTIFIED SHAREHOLDER REPORT OF REGISTERED MANAGEMENT
INVESTMENT COMPANIES
| Investment Company Act file number | 811-8411 |
James Advantage Funds
(Exact name of registrant as specified in charter)
1349 Fairground Road, Beavercreek, Ohio 45385
(Address of principal executive offices) (Zip code)
Barry R. James, P.O. Box 8, Alpha, Ohio 45301
(Name and address of agent for service)
| Registrant's telephone number, including area code: | (937) 426-7640 |
Date of fiscal year end: 6/30
Date of reporting period: 12/31/08
Form N-CSR is to be used by management investment companies to file reports with the Commission not later than 10 days after the transmission to stockholders of any report that is required to be transmitted to stockholders under Rule 30e-1 under the Investment Company Act of 1940 (17 CFR 270.30e-1). The Commission may use the information provided on Form N-CSR in its regulatory, disclosure review, inspection and policymaking roles.
A registrant is required to disclose the information specified by Form N-CSR, and the Commission will make this information public. A registrant is not required to respond to the collection of information contained in Form N-CSR unless the Form displays a currently valid Office of Management and Budget ("OMB") control number. Please direct comments concerning the accuracy of the information collection burden estimate and any suggestions for reducing the burden to Secretary, Securities and Exchange Commission, 450 Fifth Street, NW, Washington, DC 20549-0609. The OMB has reviewed this collection of information under the clearance requirements of 44 U.S.C. § 3507.
| Item 1. | Reports to Stockholders. |
James Advantage Funds Semi-Annual Report
Semi-Annual
Report
| December 31, 2008 | |
| (Unaudited) |
James Balanced: Golden Rainbow Fund
James Small Cap Fund
James Market Neutral Fund
James Equity Fund
James Mid Cap Fund
937 - 426 -7640
www.jamesfunds.com
LETTER TO SHAREHOLDERS
OF THE JAMES ADVANTAGE FUNDS
It was difficult to find any positive financial news in 2008 as the U.S. economy led the global economy into the most severe recession since the 1930s. The U.S. sub-prime crisis became a global crisis as financial institutions around the world suffered losses from their U.S. mortgage-backed investments. As economies in the West slowed, import demand from Asia, Africa and Latin America fell off sharply, sending economies with no exposure to the U.S. sub-prime market into serious slowdowns. There were no safe stock markets this year. About the only investment vehicle that worked really well was the U.S. Treasury market, the only really safe harbor, and one used very extensively in the James Balanced: Golden Rainbow Fund.
The Markets Over the Past Six Months
Almost all the major indices suffered badly over the last six months of 2008: the S&P 500, the Russell 2000 and the S&P Mid Cap Value Indexes declined 28.48 percent, 26.95 percent and 30.23 percent respectively. Losses many thought impossible in today’s sophisticated investment arenas mounted all year as risk models failed and exposure to untested derivatives became a liability. The public learned new terms such as Credit Default Swap and Collateralized Debt Obligation. Stock market losses, of course, reflect and precede the decline in general economic conditions and the rising unemployment rate.
Investment Goals and Objectives
Preservation of capital in declining markets is one of the major objectives of The James Balanced: Golden Rainbow Fund. That was very hard to do in a world where stocks were collapsing around the world, corporate bonds and preferred stocks were falling in value and mortgage-backed bonds were equally spurned by investors. However the Fund did aggressively purchase long term U.S. Treasury securities, which the adviser had correctly identified as the only really good investment opportunity in the year. The Fund maintained very low equity levels, but to be consistent with the parameters stated in its Prospectus it cannot be out of the equity market. Consistent with its income objective, the Fund added some high quality municipal bonds, which were yielding more than U.S. Government bonds.
The James Equity Fund, The James Small Cap Fund and the James Mid Cap Fund do not have the ability to hold bonds or to significantly reduce equity levels for more than a short time period. These Funds are charged with being fully invested in stocks that follow the adviser’s basic value strategy, stocks that the adviser’s research determines are undervalued relative to the broader stock market.
The James Market Neutral Fund seeks to provide positive returns regardless of the returns on the stock market. To achieve its objective, the Fund uses a combination of holding stocks that the adviser believes to be undervalued and selling short stocks that are considered overvalued. It may hold stocks held by the other four Funds.
Investment Philosophy
Since 1972, James Investment Research, Inc., adviser to the James Advantage Funds, has embraced conservative principles of investing. Experience has taught us that stocks with strong earnings growth, low valuations and other strong value traits are more likely to outperform the broad stock market over time, and we have found that preserving capital in down markets is very important in achieving long term growth. Our independent research is generally free of Wall Street hype and allows us to take a different path. We have found this to be very helpful where preservation of capital is a major objective, and also in avoiding economic sectors and industries at the center of a financial crisis.
1
Strategy for Meeting Fund Objectives
Every fall your Fund’s adviser, James Investment Research, Inc., updates and formalizes its Economic Outlook. That outlook helps to identify Sectors and Industries that the adviser believes to be better situated to prosper in the coming year. Our Outlook for 2008 was very bleak and we warned of a recession. Under such a dire outlook, the Funds held higher levels of cash when possible, and avoided most businesses related to housing and brokerage. Bond durations were extended in the Balanced: Golden Rainbow, and that Fund increased sharply its holding of U.S. Treasury securities. The Fund held no positions in Fannie Mae or Freddie Mac, nor did it have exposure to preferred shares issued by the major banks or brokerage houses.
The Adviser’s research team had identified certain stocks, called Bear Defenders, that tend to hold up better in down markets. These are Value stocks that have more stable earnings and often resist sharp declines better than the broader market. The Equity Fund, the Small Cap Fund and the Mid Cap Fund cannot significantly reduce equity holdings for extended periods of time. While the defenders did not perform as expected in the fourth quarter, the adviser believes they will over the long run.
Fund Performance
The James Balanced: Golden Rainbow Fund declined by 5.53 percent for the twelve months ending December 31, 2008. While a negative return is never satisfying to the Fund’s portfolio managers, the 5.53 percent loss was very good compared with the Fund’s balanced blend benchmark (the S&P 500, the Russell 2000 and the Lehman Intermediate Gov/Credit Bond Index) loss of 16.73 percent. The Fund was able to achieve these results with the use of heavy positions in Long term U.S. Treasury securities, lower equity levels overall and solid equity research. The Fund paid an ordinary dividend every quarter in 2008 and a very small ($0.0009/share) long term capital gains dividend in December.
The James Equity Fund suffered along with the broader market in 2008, dropping 39.04 percent. Its benchmark, the S&P 500, declined by 37.00 percent and most major indexes also posted similar declines. Investors should be aware that the U.S. stock market’s declines, while extremely painful, were not as severe as the declines in most foreign markets. For example, China’s markets fell over 60 percent, as did many stock markets in Asia and Latin America. The Equity Fund had reduced its exposure to international holdings very significantly and avoided those additional problems. The Fund’s efforts to reduce equity levels earlier in the year resulted in a long term capital gains distribution of $0.87 cents/share in December.
The James Small Cap Fund also performed pretty much in line with its benchmark, the Russell 2000. The Fund declined by 35.70 percent compared with a decline of 33.80 percent on the benchmark. Unlike the sharp declines in stocks in 2000-2002, small caps did not buck the trend set by the large caps this time and the pain was felt across all market capitalizations. Higher cash levels helped generate income for ordinary income distributions in March and June and the Fund paid no long term capital gains distribution in 2008.
The James Mid Cap Fund declined by 34.88 percent in 2008, compared with a decline of 34.77 percent by its benchmark, the S&P Mid Cap Value. The Fund paid an ordinary income distribution in December of $0.005/share and paid no capital gains distribution in 2008.
The James Market Neutral Fund lost 5.03 percent in 2008 versus a return of 2.06 percent on its benchmark, the 90 day U.S. Treasury Bill. The Market Neutral strives to have a positive return regardless of the direction of the stock market, but the stocks sold short in the fourth quarter did not perform as the porfolio mangers had expected. The Fund paid an ordinary dividend of $0.0048/share in December.
2
Expectations for the Future
As 2008 came to a close the Adviser’s array of risk indicators was mixed. The recent sharp declines in the markets, the growing attractiveness of stocks, seasonal factors and the preponderance of stock market bears underlie a very strong tilt to the bullish side in the Adviser’s intermediate risk indicators, signaling a strong rally in the first part of 2008. In addition, the new Obama administration is signaling additional fiscal stimulus, which may be helpful in some sectors. However the long term risk indicators remain in the bearish camp as the problems stemming from the bursting of the housing bubble will take years to fix and the additional problems created by efforts to fix the current ones, fiscal and monetary, will come back to haunt us at some point in the future. Both the bulls and the bears may stampede in 2009; investors are advised to maintain caution and seek the counsel of management styles that have proven successful in difficult times.
/s/ Thomas L. Mangan
Thomas L. Mangan
Chief Financial Officer
| Average Annual Total Returns | ||||||||||||||||||||
| As of December 31, 2008 | ||||||||||||||||||||
Six Months** | One Year | Five Years | Ten Years | Since Inception | ||||||||||||||||
| James Balanced: Golden Rainbow Fund | -4.79 | % | -5.53 | % | 6.27 | % | 5.84 | % | 8.18 | % | ||||||||||
| Standard & Poor’s 500 Index | -28.48 | % | -37.00 | % | -2.19 | % | -1.38 | % | 7.34 | % | ||||||||||
| Blended Index* | -12.76 | % | -16.73 | % | 1.66 | % | 3.60 | % | 7.48 | % | ||||||||||
(Inception 7/1/91) | ||||||||||||||||||||
| James Small Cap Fund | -30.04 | % | -35.70 | % | -1.63 | % | 3.19 | % | 4.37 | % | ||||||||||
| Russell 2000 Index | -26.95 | % | -33.80 | % | -0.93 | % | 3.02 | % | 4.86 | % | ||||||||||
(Inception 10/2/98) | ||||||||||||||||||||
| James Market Neutral Fund | -4.80 | % | -5.03 | % | 3.40 | % | 2.71 | % | 2.84 | % | ||||||||||
| 90-Day U.S. Treasury Bill Index | 0.85 | % | 2.06 | % | 3.25 | % | 3.45 | % | 3.47 | % | ||||||||||
(Inception 10/2/98) | ||||||||||||||||||||
| James Equity Fund | -33.51 | % | -39.04 | % | 0.61 | % | NA | -3.39 | % | |||||||||||
| Standard & Poor’s 500 Index | -28.48 | % | -37.00 | % | -2.19 | % | NA | -2.72 | % | |||||||||||
(Inception 11/1/99) | ||||||||||||||||||||
| James Mid Cap Fund | -34.76 | % | -34.88 | % | NA | NA | -13.27 | % | ||||||||||||
| Standard & Poor’s 400 Value Index | -30.23 | % | -34.77 | % | NA | NA | -12.30 | % | ||||||||||||
(Inception 6/30/06) | ||||||||||||||||||||
Past performance is not predictive of future results. The performance of the above Funds does not reflect the deduction of taxes that a shareholder would pay on Fund distributions or the redemption of Fund shares.
Current performance may be lower or higher than the performance data quoted. Please call 1-800-995-2637 for most recent month-end performance information.
| * | The Blended Index is comprised of a 25% weighting in the Standard & Poor’s 500 Index, a 25% weighting in the Russell 2000 Index and a 50% weighting in the Lehman Brothers Intemediate Government/Credit Index. |
| ** | Returns not annualized. |
3
JAMES ADVANTAGE FUNDS
REPRESENTATION OF PORTFOLIOS OF INVESTMENTS
December 31, 2008 (Unaudited)
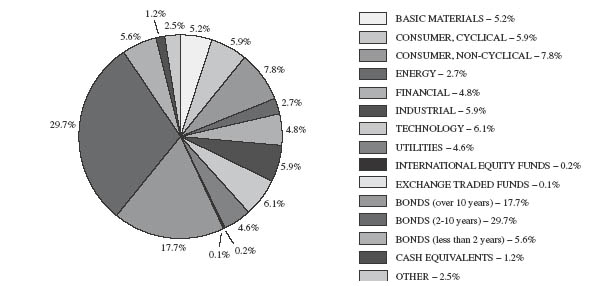
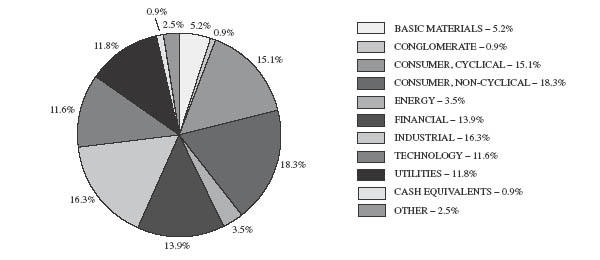
The illustrations below provide the industry sectors for the James Balanced: Golden Rainbow Fund, James Small Cap Fund, James Market Neutral Fund, James Equity Fund and James Mid Cap Fund.
James Balanced: Golden Rainbow Fund
Industry Sector Allocation (% of Net Assets)
James Small Cap Fund
Industry Sector Allocation (% of Net Assets)
4
JAMES ADVANTAGE FUNDS
REPRESENTATION OF PORTFOLIOS OF INVESTMENTS
(Continued)
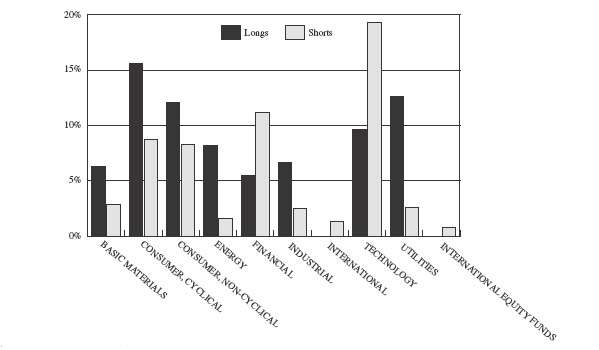
James Market Neutral Fund
Industry Sector Allocation (% of Net Assets)
(Cash, Cash Equivalents and Other Assets in Excess of Liabilities not included)
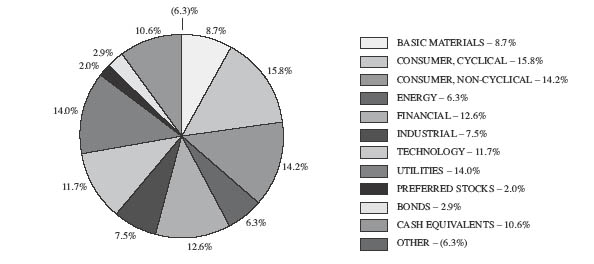
James Equity Fund
Industry Sector Allocation (% of Net Assets)
5
JAMES ADVANTAGE FUNDS
REPRESENTATION OF PORTFOLIOS OF INVESTMENTS
(Continued)
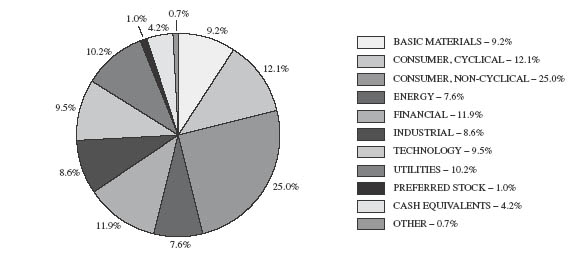
James Mid Cap Fund
Industry Sector Allocation (% of Net Assets)
6
JAMES ADVANTAGE FUNDS
STATEMENTS OF ASSETS AND LIABILITIES
December 31, 2008 (Unaudited)
James Balanced: Golden Rainbow Fund | James Small Cap Fund | James Market Neutral Fund | James Equity Fund | James Mid Cap Fund | ||||||||||||||||
| ASSETS | ||||||||||||||||||||
| Investment securities: | ||||||||||||||||||||
| At cost | $ | 617,198,872 | $ | 130,354,426 | $ | 53,396,717 | $ | 13,080,403 | $ | 6,003,521 | ||||||||||
| At value | $ | 636,577,772 | $ | 103,928,609 | $ | 47,859,672 | $ | 11,063,647 | $ | 4,388,179 | ||||||||||
| Segregated cash with brokers | — | — | 29,504,571 | — | — | |||||||||||||||
| Cash | 10,640,972 | 893,190 | 1,297,434 | 31,941 | 138,113 | |||||||||||||||
| Dividends and interest receivable | 4,589,530 | 135,933 | 24,673 | 11,236 | 6,154 | |||||||||||||||
| Receivable for securities sold | — | 1,989,981 | — | — | — | |||||||||||||||
| Receivable for capital shares sold | 5,527,259 | 119,405 | 443,092 | 16,640 | 8 | |||||||||||||||
| Other assets | 38,309 | 52,484 | — | 3,885 | 1,305 | |||||||||||||||
| TOTAL ASSETS | 657,373,842 | 107,119,602 | 79,129,442 | 11,127,349 | 4,533,759 | |||||||||||||||
| LIABILITIES | ||||||||||||||||||||
| Dividends payable | 86,309 | — | 2,491 | — | — | |||||||||||||||
| Payable for securities sold short | ||||||||||||||||||||
| (proceeds $37,612,225) | — | — | 29,265,399 | — | — | |||||||||||||||
| Payable for dividends on | ||||||||||||||||||||
| securities sold short | — | — | 9,174 | — | — | |||||||||||||||
| Payable for capital shares redeemed | 1,422,176 | 376,213 | 144,600 | 48,381 | 2 | |||||||||||||||
| Payable for securities purchased | 2,685,871 | — | 193,657 | 660,104 | 115,272 | |||||||||||||||
| Accrued expenses: | ||||||||||||||||||||
| Management fees | 380,991 | 105,953 | 73,366 | 7,195 | 1,084 | |||||||||||||||
| 12b-1 distribution and service fees | — | — | 16,364 | — | — | |||||||||||||||
| Trustees’ fees | 11,251 | — | — | — | — | |||||||||||||||
| Other affiliates | 70,601 | — | — | — | — | |||||||||||||||
| Other | 49,673 | — | — | — | — | |||||||||||||||
| TOTAL LIABILITIES | 4,706,872 | 482,166 | 29,705,051 | 715,680 | 116,358 | |||||||||||||||
| NET ASSETS | $ | 652,666,970 | $ | 106,637,436 | $ | 49,424,391 | $ | 10,411,669 | $ | 4,417,401 | ||||||||||
| NET ASSETS CONSIST OF: | ||||||||||||||||||||
| Paid-in capital | $ | 634,848,864 | $ | 176,257,281 | $ | 50,739,548 | $ | 13,021,569 | $ | 6,347,826 | ||||||||||
| Accumulated net investment | ||||||||||||||||||||
| income (loss) | (17,402 | ) | 260,308 | (495,779 | ) | 26,662 | — | |||||||||||||
| Accumulated net realized losses | ||||||||||||||||||||
| from security transactions | (1,543,392 | ) | (43,454,336 | ) | (3,629,159 | ) | (619,806 | ) | (315,083 | ) | ||||||||||
| Net unrealized appreciation (depreciation) | ||||||||||||||||||||
| on investments and securities sold short | 19,378,900 | (26,425,817 | ) | 2,809,781 | (2,016,756 | ) | (1,615,342 | ) | ||||||||||||
| NET ASSETS | $ | 652,666,970 | $ | 106,637,436 | $ | 49,424,391 | $ | 10,411,669 | $ | 4,417,401 | ||||||||||
| Shares of beneficial interest outstanding | ||||||||||||||||||||
| (unlimited number of shares | ||||||||||||||||||||
| authorized, no par) | 38,244,064 | 7,607,062 | 4,223,536 | 1,686,786 | 635,955 | |||||||||||||||
| Net asset value, offering price and | ||||||||||||||||||||
| redemption price per share | $ | 17.07 | $ | 14.02 | $ | 11.70 | $ | 6.17 | $ | 6.95 | ||||||||||
See accompanying notes to financial statements.
7
JAMES ADVANTAGE FUNDS
STATEMENTS OF OPERATIONS
For the Six Months Ended December 31, 2008 (Unaudited)
James Balanced: Golden Rainbow Fund | James Small Cap Fund | James Market Neutral Fund | James Equity Fund | James Mid Cap Fund | ||||||||||||||||
| INVESTMENT INCOME | ||||||||||||||||||||
| Dividends (Net of withholding | ||||||||||||||||||||
| taxes of $3,681, $3,032, $1,879, | ||||||||||||||||||||
| $122 and $326, respectively) | $ | 2,306,649 | $ | 1,247,998 | $ | 302,289 | $ | 129,449 | $ | 41,300 | ||||||||||
| Interest | 5,788,008 | 98,864 | 129,131 | 4,353 | 1,177 | |||||||||||||||
| TOTAL INVESTMENT INCOME | 8,094,657 | 1,346,862 | 431,420 | 133,802 | 42,477 | |||||||||||||||
| EXPENSES | ||||||||||||||||||||
| Management fees | 1,961,196 | 877,548 | 409,861 | 73,284 | 24,048 | |||||||||||||||
| 12b-1 distribution and service fees | 662,565 | 176,654 | 61,115 | 15,801 | 5,954 | |||||||||||||||
| Dividend expense on | ||||||||||||||||||||
| securities sold short | — | — | 108,115 | — | — | |||||||||||||||
| Servicing fees | 255,540 | — | — | — | — | |||||||||||||||
| Professional fees | 37,052 | — | — | — | — | |||||||||||||||
| Trustees’ fees | 7,798 | 5,720 | 5,720 | 5,720 | 5,720 | |||||||||||||||
| Registration fees | 31,542 | — | — | — | — | |||||||||||||||
| Custodian fees and expenses | 19,597 | — | — | — | — | |||||||||||||||
| Shareholder report | ||||||||||||||||||||
| printing and mailing | 17,602 | — | — | — | — | |||||||||||||||
| Postage and supplies | 2,652 | — | — | — | — | |||||||||||||||
| Compliance fees and expenses | 4,133 | — | — | — | — | |||||||||||||||
| Other expenses | 3,018 | — | — | — | — | |||||||||||||||
| TOTAL EXPENSES | 3,002,695 | 1,059,922 | 584,811 | 94,805 | 35,722 | |||||||||||||||
| NET INVESTMENT | ||||||||||||||||||||
| INCOME (LOSS) | 5,091,962 | 286,940 | (153,391 | ) | 38,997 | 6,755 | ||||||||||||||
| REALIZED AND UNREALIZED | ||||||||||||||||||||
| GAINS (LOSSES) | ||||||||||||||||||||
| ON INVESTMENTS | ||||||||||||||||||||
| Net realized gains (losses) | ||||||||||||||||||||
| from security transactions | 379,003 | (10,441,841 | ) | (4,365,881 | ) | (632,141 | ) | (31,013 | ) | |||||||||||
| Net realized gains on | ||||||||||||||||||||
| closed short positions | — | — | 8,883,217 | — | — | |||||||||||||||
| Net change in unrealized | ||||||||||||||||||||
| appreciation/depreciation on | ||||||||||||||||||||
| investments and securities sold short | (22,717,846 | ) | (40,484,084 | ) | (6,957,988 | ) | (4,682,545 | ) | (1,991,961 | ) | ||||||||||
| NET REALIZED AND | ||||||||||||||||||||
| UNREALIZED LOSSES | ||||||||||||||||||||
| ON INVESTMENTS | (22,338,843 | ) | (50,925,925 | ) | (2,440,652 | ) | (5,314,686 | ) | (2,022,974 | ) | ||||||||||
| NET DECREASE IN NET | ||||||||||||||||||||
| ASSETS RESULTING | ||||||||||||||||||||
| FROM OPERATIONS | $ | (17,246,881 | ) | $ | (50,638,985 | ) | $ | (2,594,043 | ) | $ | (5,275,689 | ) | $ | (2,016,219 | ) | |||||
See accompanying notes to financial statements.
8
JAMES BALANCED: GOLDEN RAINBOW FUND
STATEMENTS OF CHANGES IN NET ASSETS
Six Months Ended December 31, 2008 (Unaudited) | Year Ended June 30, 2008 | |||||||
| FROM OPERATIONS | ||||||||
| Net investment income | $ | 5,091,962 | $ | 8,495,832 | ||||
| Net realized gains (losses) from security transactions | 379,003 | (767,702 | ) | |||||
| Net change in unrealized appreciation/depreciation on investments | (22,717,846 | ) | 1,696,416 | |||||
| Net increase (decrease) in net assets from operations | (17,246,881 | ) | 9,424,546 | |||||
| FROM DISTRIBUTIONS TO SHAREHOLDERS | ||||||||
| Dividends from net investment income | (5,009,242 | ) | (8,538,436 | ) | ||||
| Distributions from net realized gains | (30,798 | ) | (6,758,977 | ) | ||||
| Decrease in net assets from distributions to shareholders | (5,040,040 | ) | (15,297,413 | ) | ||||
| FROM CAPITAL SHARE TRANSACTIONS | ||||||||
| Proceeds from shares sold | 311,387,464 | 225,189,882 | ||||||
| Net asset value of shares issued in reinvestment of distributions to shareholders | 4,851,129 | 14,632,263 | ||||||
| Payments for shares redeemed | (119,978,510 | ) | (96,919,708 | ) | ||||
| Net increase in net assets from capital share transactions | 196,260,083 | 142,902,437 | ||||||
| TOTAL INCREASE IN NET ASSETS | 173,973,162 | 137,029,570 | ||||||
| NET ASSETS | ||||||||
| Beginning of period | 478,693,808 | 341,664,238 | ||||||
| End of period | $ | 652,666,970 | $ | 478,693,808 | ||||
| ACCUMULATED NET INVESTMENT LOSS | $ | (17,402 | ) | $ | (79,529 | ) | ||
| SUMMARY OF CAPITAL SHARE ACTIVITY | ||||||||
| Shares sold | 18,749,536 | 12,309,745 | ||||||
| Shares issued in reinvestment of distributions to shareholders | 284,540 | 797,396 | ||||||
| Shares redeemed | (7,245,868 | ) | (5,289,755 | ) | ||||
| Net increase in shares outstanding | 11,788,208 | 7,817,386 | ||||||
| Shares outstanding, beginning of period | 26,455,856 | 18,638,470 | ||||||
| Shares outstanding, end of period | 38,244,064 | 26,455,856 | ||||||
See accompanying notes to financial statements.
9
JAMES SMALL CAP FUND
STATEMENTS OF CHANGES IN NET ASSETS
Six Months Ended December 31, 2008 (Unaudited) | Year Ended June 30, 2008 | |||||||
| FROM OPERATIONS | ||||||||
| Net investment income | $ | 286,940 | $ | 1,029,102 | ||||
| Net realized losses from security transactions | (10,441,841 | ) | (26,756,214 | ) | ||||
| Net change in unrealized appreciation/depreciation on investments | (40,484,084 | ) | (28,143,795 | ) | ||||
| Net decrease in net assets from operations | (50,638,985 | ) | (53,870,907 | ) | ||||
| FROM DISTRIBUTIONS TO SHAREHOLDERS | ||||||||
| Dividends from net investment income | — | (1,055,734 | ) | |||||
| FROM CAPITAL SHARE TRANSACTIONS | ||||||||
| Proceeds from shares sold | 14,384,622 | 72,308,744 | ||||||
| Net asset value of shares issued in reinvestment of distributions to shareholders | — | 1,010,437 | ||||||
| Payments for shares redeemed | (35,023,057 | ) | (167,944,495 | ) | ||||
| Net decrease in net assets from capital share transactions | (20,638,435 | ) | (94,625,314 | ) | ||||
| TOTAL DECREASE IN NET ASSETS | (71,277,420 | ) | (149,551,955 | ) | ||||
| NET ASSETS | ||||||||
| Beginning of period | 177,914,856 | 327,466,811 | ||||||
| End of period | $ | 106,637,436 | $ | 177,914,856 | ||||
| ACCUMULATED NET INVESTMENT INCOME (LOSS) | $ | 260,308 | $ | (5,685 | ) | |||
| SUMMARY OF CAPITAL SHARE ACTIVITY | ||||||||
| Shares sold | 893,936 | 3,242,422 | ||||||
| Shares issued in reinvestment of distributions to shareholders | — | 47,255 | ||||||
| Shares redeemed | (2,166,105 | ) | (7,743,880 | ) | ||||
| Net decrease in shares outstanding | (1,272,169 | ) | (4,454,203 | ) | ||||
| Shares outstanding, beginning of period | 8,879,231 | 13,333,434 | ||||||
| Shares outstanding, end of period | 7,607,062 | 8,879,231 | ||||||
See accompanying notes to financial statements.
10
JAMES MARKET NEUTRAL FUND
STATEMENTS OF CHANGES IN NET ASSETS
Six Months Ended December 31, 2008 (Unaudited) | Year Ended June 30, 2008 | |||||||
| FROM OPERATIONS | ||||||||
| Net investment income (loss) | $ | (153,391 | ) | $ | 338,664 | |||
| Net realized gains (losses) from: | ||||||||
| Security transactions | (4,365,881 | ) | (1,371,210 | ) | ||||
| Closed short positions | 8,883,217 | 2,200,212 | ||||||
| Net change in unrealized appreciation/depreciation on investments | (6,957,988 | ) | (207,385 | ) | ||||
| Net increase (decrease) in net assets from operations | (2,594,043 | ) | 960,281 | |||||
| FROM DISTRIBUTIONS TO SHAREHOLDERS | ||||||||
| Dividends from net investment income | (39,280 | ) | (629,826 | ) | ||||
| FROM CAPITAL SHARE TRANSACTIONS | ||||||||
| Proceeds from shares sold | 28,136,708 | 19,847,279 | ||||||
| Net asset value of shares issued in reinvestment of distributions to shareholders | 36,789 | 592,984 | ||||||
| Payments for shares redeemed | (26,404,988 | ) | (22,008,205 | ) | ||||
| Net increase (decrease) in net assets from capital share transactions | 1,768,509 | (1,567,942 | ) | |||||
| TOTAL DECREASE IN NET ASSETS | (864,814 | ) | (1,237,487 | ) | ||||
| NET ASSETS | ||||||||
| Beginning of period | 50,289,205 | 51,526,692 | ||||||
| End of period | $ | 49,424,391 | $ | 50,289,205 | ||||
| ACCUMULATED NET INVESTMENT INCOME (LOSS) | $ | (495,779 | ) | $ | 1,963 | |||
| SUMMARY OF CAPITAL SHARE ACTIVITY | ||||||||
| Shares sold | 2,342,929 | 1,618,095 | ||||||
| Shares issued in reinvestment of distributions to shareholders | 3,144 | 48,663 | ||||||
| Shares redeemed | (2,212,227 | ) | (1,809,295 | ) | ||||
| Net increase (decrease) in shares outstanding | 133,846 | (142,537 | ) | |||||
| Shares outstanding, beginning of period | 4,089,690 | 4,232,227 | ||||||
| Shares outstanding, end of period | 4,223,536 | 4,089,690 | ||||||
See accompanying notes to financial statements.
11
JAMES EQUITY FUND
STATEMENTS OF CHANGES IN NET ASSETS
Six Months Ended December 31, 2008 (Unaudited) | Year Ended June 30, 2008 | |||||||
| FROM OPERATIONS | ||||||||
| Net investment income | $ | 38,997 | $ | 47,746 | ||||
| Net realized gains (losses) from security transactions | (632,141 | ) | 2,276,455 | |||||
| Net change in unrealized appreciation/depreciation on investments | (4,682,545 | ) | (5,165,551 | ) | ||||
| Net decrease in net assets from operations | (5,275,689 | ) | (2,841,350 | ) | ||||
| FROM DISTRIBUTIONS TO SHAREHOLDERS | ||||||||
| Dividends from net investment income | — | (60,087 | ) | |||||
| Distributions from net realized gains | (1,230,653 | ) | — | |||||
| Decrease in net assets from distributions to shareholders | (1,230,653 | ) | (60,087 | ) | ||||
| FROM CAPITAL SHARE TRANSACTIONS | ||||||||
| Proceeds from shares sold | 1,585,501 | 3,690,993 | ||||||
| Net asset value of shares issued in reinvestment of distributions to shareholders | 1,224,762 | 59,595 | ||||||
| Payments for shares redeemed | (2,105,860 | ) | (10,508,250 | ) | ||||
| Net increase (decrease) in net assets from capital share transactions | 704,403 | (6,757,662 | ) | |||||
| TOTAL DECREASE IN NET ASSETS | (5,801,939 | ) | (9,659,099 | ) | ||||
| NET ASSETS | ||||||||
| Beginning of period | 16,213,608 | 25,872,707 | ||||||
| End of period | $ | 10,411,669 | $ | 16,213,608 | ||||
| ACCUMULATED NET INVESTMENT INCOME | $ | 26,662 | $ | — | ||||
| SUMMARY OF CAPITAL SHARE ACTIVITY | ||||||||
| Shares sold | 216,076 | 317,675 | ||||||
| Shares issued in reinvestment of distributions to shareholders | 223,905 | 5,227 | ||||||
| Shares redeemed | (261,017 | ) | (922,746 | ) | ||||
| Net increase (decrease) in shares outstanding | 178,964 | (599,844 | ) | |||||
| Shares outstanding, beginning of period | 1,507,822 | 2,107,666 | ||||||
| Shares outstanding, end of period | 1,686,786 | 1,507,822 | ||||||
See accompanying notes to financial statements.
12
JAMES MID CAP FUND
STATEMENTS OF CHANGES IN NET ASSETS
Six Months Ended December 31, 2008 (Unaudited) | Year Ended June 30, 2008 | |||||||
| FROM OPERATIONS | ||||||||
| Net investment income | $ | 6,755 | $ | 525 | ||||
| Net realized losses from security transactions | (31,013 | ) | (288,284 | ) | ||||
| Net change in unrealized appreciation/depreciation on investments | (1,991,961 | ) | (318,254 | ) | ||||
| Net decrease in net assets from operations | (2,016,219 | ) | (606,013 | ) | ||||
| FROM DISTRIBUTIONS TO SHAREHOLDERS | ||||||||
| Dividends from net investment income | (3,066 | ) | (4,782 | ) | ||||
| Distributions from net realized gains | — | (14,003 | ) | |||||
| Decrease in net assets from distributions to shareholders | (3,066 | ) | (18,785 | ) | ||||
| FROM CAPITAL SHARE TRANSACTIONS | ||||||||
| Proceeds from shares sold | 935,273 | 1,940,359 | ||||||
| Net asset value of shares issued in reinvestment of distributions to shareholders | 3,066 | 18,776 | ||||||
| Payments for shares redeemed | (503,530 | ) | (1,773,538 | ) | ||||
| Net increase in net assets from capital share transactions | 434,809 | 185,597 | ||||||
| TOTAL DECREASE IN NET ASSETS | (1,584,476 | ) | (439,201 | ) | ||||
| NET ASSETS | ||||||||
| Beginning of period | 6,001,877 | 6,441,078 | ||||||
| End of period | $ | 4,417,401 | $ | 6,001,877 | ||||
| ACCUMULATED NET INVESTMENT INCOME | $ | — | $ | 525 | ||||
| SUMMARY OF CAPITAL SHARE ACTIVITY | ||||||||
| Shares sold | 131,384 | 175,142 | ||||||
| Shares issued in reinvestment of distributions to shareholders | 441 | 1,700 | ||||||
| Shares redeemed | (58,765 | ) | (164,564 | ) | ||||
| Net increase in shares outstanding | 73,060 | 12,278 | ||||||
| Shares outstanding, beginning of period | 562,895 | 550,617 | ||||||
| Shares outstanding, end of period | 635,955 | 562,895 | ||||||
See accompanying notes to financial statements.
13
JAMES BALANCED: GOLDEN RAINBOW FUND
FINANCIAL HIGHLIGHTS
Per Share Data for a Share Outstanding Throughout Each Period
Six Months Ended December 31, 2008 | Year Ended June 30, | |||||||||||||||||||||||
| (Unaudited) | 2008 | 2007 | 2006 | 2005 | 2004 | |||||||||||||||||||
| Net asset value at beginning of period | $ | 18.09 | $ | 18.33 | $ | 17.32 | $ | 17.18 | $ | 15.28 | $ | 13.72 | ||||||||||||
| Income (loss) from investment operations: | ||||||||||||||||||||||||
| Net investment income | 0.16 | 0.40 | 0.39 | 0.34 | 0.26 | 0.26 | ||||||||||||||||||
| Net realized and unrealized | ||||||||||||||||||||||||
| gains (losses) on investments | (1.03 | ) | 0.11 | 1.34 | 0.75 | 1.95 | 1.56 | |||||||||||||||||
| Total from investment operations | (0.87 | ) | 0.51 | 1.73 | 1.09 | 2.21 | 1.82 | |||||||||||||||||
| Less distributions: | ||||||||||||||||||||||||
| From net investment income | (0.15 | ) | (0.40 | ) | (0.40 | ) | (0.34 | ) | (0.26 | ) | (0.26 | ) | ||||||||||||
| From net realized gains on investments | 0.00 | (A) | (0.35 | ) | (0.32 | ) | (0.61 | ) | (0.05 | ) | (0.00 | )(A) | ||||||||||||
| Total distributions | (0.15 | ) | (0.75 | ) | (0.72 | ) | (0.95 | ) | (0.31 | ) | (0.26 | ) | ||||||||||||
| Net asset value at end of period | $ | 17.07 | $ | 18.09 | $ | 18.33 | $ | 17.32 | $ | 17.18 | $ | 15.28 | ||||||||||||
| Total return | (4.79% | )(B) | 2.76% | 10.13% | 6.48% | 14.56% | 13.32% | |||||||||||||||||
| Net assets at end of period (000’s) | $ | 652,667 | $ | 478,694 | $ | 341,664 | $ | 268,766 | $ | 147,605 | $ | 83,893 | ||||||||||||
| Ratios/Supplemental Data: | ||||||||||||||||||||||||
| Ratio of net expenses to average net assets | 1.13% | (C) | 1.18% | 1.18% | 1.21% | 1.26% | 1.28% | |||||||||||||||||
| Ratio of net investment income | ||||||||||||||||||||||||
| to average net assets | 1.91% | (C) | 2.20% | 2.24% | 2.11% | 1.70% | 1.77% | |||||||||||||||||
| Portfolio turnover rate | 22% | (C) | 53% | 92% | 68% | 36% | 29% | |||||||||||||||||
(A) Amount rounds to less than $0.005.
(B) Not annualized.
(C) Annualized.
See accompanying notes to financial statements.
14
JAMES SMALL CAP FUND
FINANCIAL HIGHLIGHTS
Per Share Data for a Share Outstanding Throughout Each Period
Six Months Ended December 31, 2008 | Year Ended June 30, | |||||||||||||||||||||||
| (Unaudited) | 2008 | 2007 | 2006 | 2005 | 2004 | |||||||||||||||||||
| Net asset value at beginning of period | $ | 20.04 | $ | 24.56 | $ | 23.28 | $ | 20.46 | $ | 18.66 | $ | 13.43 | ||||||||||||
| Income (loss) from investment operations: | ||||||||||||||||||||||||
| Net investment income (loss) | 0.04 | 0.10 | 0.11 | (0.04 | ) | 0.05 | 0.01 | |||||||||||||||||
| Net realized and unrealized gains | ||||||||||||||||||||||||
| (losses) on investments | (6.06 | ) | (4.52 | ) | 1.50 | 3.19 | 2.65 | 5.26 | ||||||||||||||||
| Total from investment operations | (6.02 | ) | (4.42 | ) | 1.61 | 3.15 | 2.70 | 5.27 | ||||||||||||||||
| Less distributions: | ||||||||||||||||||||||||
| From net investment income | — | (0.10 | ) | (0.11 | ) | (0.04 | ) | — | (0.01 | ) | ||||||||||||||
| From net realized gains on investments | — | — | (0.22 | ) | (0.30 | ) | (1.00 | ) | (0.05 | ) | ||||||||||||||
| Total distributions | — | (0.10 | ) | (0.33 | ) | (0.34 | ) | (1.00 | ) | (0.06 | ) | |||||||||||||
Paid-in capital from redemption fees (A) | — | — | 0.00 | (B) | 0.01 | 0.10 | 0.02 | |||||||||||||||||
| Net asset value at end of period | $ | 14.02 | $ | 20.04 | $ | 24.56 | $ | 23.28 | $ | 20.46 | $ | 18.66 | ||||||||||||
| Total return | (30.04% | )(C) | (18.03% | ) | 6.97% | 15.59% | 15.39% | 39.47% | ||||||||||||||||
| Net assets at end of period (000’s) | $ | 106,637 | $ | 177,915 | $ | 327,467 | $ | 170,490 | $ | 54,489 | $ | 13,186 | ||||||||||||
| Ratios/Supplemental Data: | ||||||||||||||||||||||||
| Ratio of net expenses to average net assets | 1.50% | (D) | 1.50% | 1.50% | 1.50% | 1.50% | 1.50% | |||||||||||||||||
| Ratio of net investment income (loss) | ||||||||||||||||||||||||
| to average net assets | 0.41% | (D) | 0.42% | 0.54% | (0.25% | ) | 0.45% | 0.05% | ||||||||||||||||
| Portfolio turnover rate | 45% | (D) | 54% | 104% | 59% | 94% | 45% | |||||||||||||||||
| (A) | Amount calculated based on average shares outstanding throughout the period. Effective February 21, 2007, the redemption fee was eliminated. |
| (B) | Amount rounds to less than $0.005. |
| (C) | Not annualized. |
| (D) | Annualized. |
See accompanying notes to financial statements.
15
JAMES MARKET NEUTRAL FUND
FINANCIAL HIGHLIGHTS
Per Share Data for a Share Outstanding Throughout Each Period
Six Months Ended December 31, 2008 | Year Ended June 30, | |||||||||||||||||||||||
| (Unaudited) | 2008 | 2007 | 2006 | 2005 | 2004 | |||||||||||||||||||
| Net asset value at beginning of period | $ | 12.30 | $ | 12.17 | $ | 12.69 | $ | 12.27 | $ | 11.02 | $ | 9.97 | ||||||||||||
| Income (loss) from investment operations: | ||||||||||||||||||||||||
| Net investment income (loss) | (0.03 | ) | 0.11 | 0.40 | 0.17 | 0.01 | (0.13 | ) | ||||||||||||||||
| Net realized and unrealized gains | ||||||||||||||||||||||||
| (losses) on investments | (0.56 | ) | 0.20 | (0.51 | ) | 0.42 | 1.23 | 1.18 | ||||||||||||||||
| Total from investment operations | (0.59 | ) | 0.31 | (0.11 | ) | 0.59 | 1.24 | 1.05 | ||||||||||||||||
| Less distributions: | ||||||||||||||||||||||||
| From net investment income | (0.01 | ) | (0.18 | ) | (0.41 | ) | (0.18 | ) | — | — | ||||||||||||||
Paid-in capital from redemption fees(A) | — | — | 0.00 | (B) | 0.01 | 0.01 | 0.00 | (B) | ||||||||||||||||
| Net asset value at end of period | $ | 11.70 | $ | 12.30 | $ | 12.17 | $ | 12.69 | $ | 12.27 | $ | 11.02 | ||||||||||||
| Total return | (4.80% | )(D) | 2.60% | (0.84% | ) | 4.94% | 11.34% | 10.53% | ||||||||||||||||
| Net assets at end of period (000’s) | $ | 49,424 | $ | 50,289 | $ | 51,527 | $ | 75,218 | $ | 47,303 | $ | 12,528 | ||||||||||||
| Ratios/Supplemental Data: | ||||||||||||||||||||||||
| Ratio of net expenses to average | ||||||||||||||||||||||||
| net assets, excluding dividends | ||||||||||||||||||||||||
| on securities sold short | 1.95% | (E) | 1.91% | 1.94% | 1.95% | 1.95% | 1.95% | |||||||||||||||||
| Ratio of dividend expense | ||||||||||||||||||||||||
| on securities sold short | 0.44% | (E) | 0.90% | 0.32% | 0.62% | 0.42% | 0.64% | |||||||||||||||||
| Ratio of net expenses to average net assets | 2.39% | (E) | 2.81% | 2.26% | 2.57% | 2.37% | 2.59% | |||||||||||||||||
| Ratio of net investment income (loss) | ||||||||||||||||||||||||
| to average net assets | (0.63% | )(E) | 0.74% | 3.21% | 1.52% | 0.11% | (1.43% | ) | ||||||||||||||||
Portfolio turnover rate(C) | 39% | (E) | 79% | 57% | 27% | 35% | 13% | |||||||||||||||||
| (A) | Amount calculated based on average shares outstanding throughout the period. Effective February 21, 2007, the redemption fee was eliminated. |
| (B) | Amount rounds to less than $0.005. |
| (C) | Calculation does not include short positions or short transactions. Portfolio turnover rate would be higher if included. |
| (D) | Not annualized. |
| (E) | Annualized. |
See accompanying notes to financial statements.
16
JAMES EQUITY FUND
FINANCIAL HIGHLIGHTS
Per Share Data for a Share Outstanding Throughout Each Period
Six Months Ended December 31, 2008 | Year Ended June 30, | |||||||||||||||||||||||
| (Unaudited) | 2008 | 2007 | 2006 | 2005 | 2004 | |||||||||||||||||||
| Net asset value at beginning of period | $ | 10.75 | $ | 12.28 | $ | 11.04 | $ | 8.89 | $ | 7.36 | $ | 6.18 | ||||||||||||
| Income (loss) from investment operations: | ||||||||||||||||||||||||
| Net investment income | 0.03 | 0.03 | 0.04 | 0.01 | 0.01 | 0.02 | ||||||||||||||||||
| Net realized and unrealized gains | ||||||||||||||||||||||||
| (losses) on investments | (3.74 | ) | (1.53 | ) | 1.24 | 2.16 | 1.53 | 1.18 | ||||||||||||||||
| Total from investment operations | (3.71 | ) | (1.50 | ) | 1.28 | 2.17 | 1.54 | 1.20 | ||||||||||||||||
| Less distributions: | ||||||||||||||||||||||||
| From net investment income | — | (0.03 | ) | (0.04 | ) | (0.01 | ) | (0.01 | ) | (0.02 | ) | |||||||||||||
| From net realized gains on investments | (0.87 | ) | — | — | — | — | — | |||||||||||||||||
| From distributions in excess | ||||||||||||||||||||||||
| of net investment income | — | — | — | (0.01 | ) | — | — | |||||||||||||||||
| Total distributions | (0.87 | ) | (0.03 | ) | (0.04 | ) | (0.02 | ) | (0.01 | ) | (0.02 | ) | ||||||||||||
Paid-in capital from redemption fees(A) | — | — | 0.00 | (B) | 0.00 | (B) | 0.00 | (B) | 0.00 | (B) | ||||||||||||||
| Net asset value at end of period | $ | 6.17 | $ | 10.75 | $ | 12.28 | $ | 11.04 | $ | 8.89 | $ | 7.36 | ||||||||||||
| Total return | (33.51% | )(C) | (12.20% | ) | 11.59% | 24.45% | 20.96% | 19.38% | ||||||||||||||||
| Net assets at end of period (000’s) | $ | 10,412 | $ | 16,214 | $ | 25,873 | $ | 33,792 | $ | 16,833 | $ | 7,249 | ||||||||||||
| Ratios/Supplemental Data: | ||||||||||||||||||||||||
| Ratio of net expenses to average net assets | 1.50% | (D) | 1.50% | 1.50% | 1.50% | 1.50% | 1.50% | |||||||||||||||||
| Ratio of net investment income | ||||||||||||||||||||||||
| to average net assets | 0.62% | (D) | 0.23% | 0.30% | 0.06% | 0.22% | 0.25% | |||||||||||||||||
| Portfolio turnover rate | 55% | (D) | 50% | 58% | 43% | 33% | 70% | |||||||||||||||||
| (A) | Amount calculated based on average shares outstanding throughout the period. Effective February 21, 2007, the redemption fee was eliminated. |
| (B) | Amount rounds to less than $0.005. |
| (C) | Not annualized. |
| (D) | Annualized. |
See accompanying notes to financial statements.
17
JAMES MID CAP FUND
FINANCIAL HIGHLIGHTS
Per Share Data for a Share Outstanding Throughout Each Period
Six Months Ended December 31, 2008 | Year ended June 30, | |||||||||||
| (Unaudited) | 2008 | 2007 | ||||||||||
| Net asset value at beginning of period | $ | 10.66 | $ | 11.70 | $ | 10.00 | ||||||
| Income (loss) from investment operations: | ||||||||||||
| Net investment income | 0.01 | 0.00 | (A) | 0.04 | ||||||||
| Net realized and unrealized gains (losses) on investments | (3.72 | ) | (1.01 | ) | 1.70 | |||||||
| Total from investment operations | (3.71 | ) | (1.01 | ) | 1.74 | |||||||
| Less distributions: | ||||||||||||
| From net investment income | 0.00 | (A) | (0.01 | ) | — | |||||||
| From net realized gains on investments | — | (0.02 | ) | (0.04 | ) | |||||||
| Total distributions | — | (A) | (0.03 | ) | (0.04 | ) | ||||||
Paid-in capital from redemption fees(B) | — | — | 0.00 | (A) | ||||||||
| Net asset value at end of period | $ | 6.95 | $ | 10.66 | $ | 11.70 | ||||||
| Total return | (34.76% | )(C) | (8.61% | ) | 17.41% | |||||||
| Net assets at end of period (000’s) | $ | 4,417 | $ | 6,002 | $ | 6,441 | ||||||
| Ratios/Supplemental Data: | ||||||||||||
| Ratio of net expenses to average net assets | 1.50% | (D) | 1.48% | 1.49% | ||||||||
| Ratio of net investment income to average net assets | 0.28% | (D) | 0.01% | 0.40% | ||||||||
| Portfolio turnover rate | 18% | (D) | 55% | 53% | ||||||||
| (A) | Amount rounds to less than $0.005. |
| (B) | Amount calculated based on average shares outstanding throughout the period. Effective February 21, 2007, the redemption fee was eliminated. |
| (C) | Not annualized. |
| (D) | Annualized. |
See accompanying notes to financial statements.
18
JAMES BALANCED: GOLDEN RAINBOW FUND
SCHEDULE OF INVESTMENTS
December 31, 2008 (Unaudited)
| Shares | COMMON STOCKS — 43.0% | Value | ||
| BASIC MATERIALS — 5.2% | ||||
| 15,000 | Alliance Resource Partners, L.P. | $ | 403,200 | |
| 5,000 | Barrick Gold Corporation | 183,850 | ||
| 155,000 | Celanese Corporation | 1,926,650 | ||
| 127,500 | Dow Chemical Company | 1,923,975 | ||
| 116,800 | FMC Corporation | 5,224,464 | ||
| 38,000 | Foster (L.B.) Company - Class A* | 1,188,640 | ||
| 15,000 | Kinross Gold Corporation | 276,300 | ||
| 151,000 | Methanex Corporation | 1,697,240 | ||
| 46,000 | Newmont Mining Corporation | 1,872,200 | ||
| 133,000 | Nucor Corporation | 6,144,600 | ||
| 13,500 | Potash Corporation of Saskatchewan | 988,470 | ||
| 70,000 | PPG Industries, Inc. | 2,970,100 | ||
| 117,000 | RPM International, Inc. | 1,554,930 | ||
| 130,700 | Schnitzer Steel Industries, Inc. - Class A | 4,920,855 | ||
| 30,000 | Terra Nitrogen Company, L.P. | 2,842,800 | ||
| 34,118,274 | ||||
| CONSUMER, CYCLICAL — 5.9% | ||||
| 70,000 | Best Buy Company, Inc. | 1,967,700 | ||
| 105,000 | BJ’s Wholesale Club, Inc.* | 3,597,300 | ||
| 95,000 | Bob Evans Farms, Inc. | 1,940,850 | ||
| 160,000 | Dollar Tree, Inc.* | 6,688,000 | ||
| 75,000 | JAKKS Pacific, Inc.* | 1,547,250 | ||
| 104,000 | McDonald’s Corporation | 6,467,760 | ||
| 105,000 | Netflix, Inc.* | 3,138,450 | ||
| 30,000 | NIKE, Inc. - Class B | 1,530,000 | ||
| 90,000 | The Buckle, Inc. | 1,963,800 | ||
| 115,000 | The Gymboree Corporation* | 3,000,350 | ||
| 30,000 | The Home Depot, Inc. | 690,600 | ||
| 74,000 | Wal-Mart Stores, Inc. | 4,148,440 | ||
| 84,000 | Walt Disney Company | 1,905,960 | ||
| 38,586,460 | ||||
| CONSUMER, NON-CYCLICAL — 7.8% | ||||
| 120,000 | Archer-Daniels-Midland Company | 3,459,600 | ||
| 18,000 | Baxter International, Inc. | 964,620 | ||
| 103,200 | Brink’s Home Security Holdings, Inc.* | 2,262,144 | ||
| 17,000 | Bunge Ltd. | 880,090 | ||
| 95,000 | Cal-Maine Foods, Inc. | 2,726,500 | ||
| 50,000 | Caraco Pharmaceutical Laboratories, Ltd.* | 296,000 | ||
| 36,000 | Corn Products International, Inc. | 1,038,600 | ||
| 300,000 | Darling International, Inc.* | 1,647,000 | ||
| 10,000 | Del Monte Foods Company | 71,400 | ||
| 105,000 | EZCORP, Inc. - Class A* | 1,597,050 | ||
| 73,000 | Fresh Del Monte Produce, Inc.* | 1,636,660 | ||
19
JAMES BALANCED: GOLDEN RAINBOW FUND
SCHEDULE OF INVESTMENTS (Continued)
| Shares | COMMON STOCKS — 43.0% (Continued) | Value | ||
| CONSUMER, NON-CYCLICAL — 7.8% (Continued) | ||||
| 11,000 | Hewitt Associates, Inc. - Class A* | $ | 312,180 | |
| 117,700 | Ingles Markets, Inc. - Class A | 2,070,343 | ||
| 244,700 | Kroger Company | 6,462,526 | ||
| 9,000 | Manpower, Inc. | 305,910 | ||
| 154,000 | Merck & Company, Inc. | 4,681,600 | ||
| 200,000 | Omega Protein Corporation* | 802,000 | ||
| 100,000 | PepsiAmericas, Inc. | 2,036,000 | ||
| 280,000 | Pfizer, Inc. | 4,958,800 | ||
| 30,000 | Sara Lee Corporation | 293,700 | ||
| 15,000 | The Boston Beer Company, Inc. - Class A* | 426,000 | ||
| 123,200 | The Brink’s Company | 3,311,616 | ||
| 25,000 | The Toro Company | 825,000 | ||
| 125,000 | Tupperware Brands Corporation | 2,837,500 | ||
| 97,700 | Watson Wyatt Worldwide, Inc. | 4,672,014 | ||
| 50,574,853 | ||||
| ENERGY — 2.7% | ||||
| 20,000 | Apache Corporation | 1,490,600 | ||
| 110,000 | Bolt Technology Corporation* | 765,600 | ||
| 49,140 | Chevron Corporation | 3,634,886 | ||
| 44,000 | Devon Energy Corporation | 2,891,240 | ||
| 49,300 | Exxon Mobil Corporation | 3,935,619 | ||
| 63,700 | Hess Corporation | 3,416,868 | ||
| 80,000 | Mariner Energy, Inc.* | 816,000 | ||
| 50,000 | Stone Energy Corporation* | 551,000 | ||
| 10,000 | Valero Energy Corporation | 216,400 | ||
| 17,718,213 | ||||
| FINANCIAL — 4.8% | ||||
| 230,000 | American Financial Group, Inc. | 5,262,400 | ||
| 105,000 | American Physicians Capital, Inc. | 5,050,500 | ||
| 160,000 | Amerisafe, Inc.* | 3,284,800 | ||
| 102,346 | AmTrust Financial Services, Inc. | 1,187,214 | ||
| 80,000 | Assurant, Inc. | 2,400,000 | ||
| 90,000 | iShares Dow Jones U.S. Financial Sector Index Fund | 4,089,600 | ||
| 77,000 | Knight Capital Group, Inc. - Class A* | 1,243,550 | ||
| 75,000 | RenaissanceRe Holdings, Ltd. | 3,867,000 | ||
| 179,900 | Rent-A-Center, Inc.* | 3,175,235 | ||
| 22,000 | Unum Group | 409,200 | ||
| 40,750 | W.R. Berkley Corporation | 1,263,250 | ||
| 31,232,749 | ||||
| INDUSTRIAL — 5.9% | ||||
| 70,000 | AGCO Corporation* | 1,651,300 | ||
| 110,000 | Ampco-Pittsburgh Corporation | 2,387,000 | ||
| 115,000 | CSX Corporation | 3,734,050 | ||
| 101,700 | Cummins, Inc. | 2,718,441 | ||
| 35,000 | Deere & Company | 1,341,200 | ||
20
JAMES BALANCED: GOLDEN RAINBOW FUND
SCHEDULE OF INVESTMENTS (Continued)
| Shares | COMMON STOCKS — 43.0% (Continued) | Value | ||
| INDUSTRIAL — 5.9% (Continued) | ||||
| 60,000 | Eaton Corporation | $ | 2,982,600 | |
| 25,000 | Fluor Corporation | 1,121,750 | ||
| 91,000 | Gardner Denver, Inc.* | 2,123,940 | ||
| 248,000 | GrafTech International Ltd.* | 2,063,360 | ||
| 40,000 | Greif, Inc. - Class A | 1,337,200 | ||
| 50,000 | GulfMark Offshore, Inc.* | 1,189,500 | ||
| 15,000 | Johnson Controls, Inc. | 272,400 | ||
| 110,000 | Norfolk Southern Corporation | 5,175,500 | ||
| 151,700 | Owens-Illinois, Inc.* | 4,145,961 | ||
| 66,900 | Parker Hannifin Corporation | 2,845,926 | ||
| 170,000 | TBS International Ltd. - Class A* | 1,705,100 | ||
| 102,000 | The Timken Company | 2,002,260 | ||
| 38,797,488 | ||||
| TECHNOLOGY — 6.1% | ||||
| 150,000 | Arrow Electronics, Inc.* | 2,826,000 | ||
| 75,000 | Avnet, Inc.* | 1,365,750 | ||
| 17,500 | Ceradyne, Inc.* | 355,425 | ||
| 75,000 | CIBER, Inc.* | 360,750 | ||
| 180,000 | Hewlett-Packard Company | 6,532,200 | ||
| 75,000 | Hurco Companies, Inc.* | 900,000 | ||
| 125,000 | Integral Systems, Inc.* | 1,506,250 | ||
| 82,000 | International Business Machines Corporation (IBM) | 6,901,120 | ||
| 68,000 | Lockheed Martin Corporation | 5,717,440 | ||
| 72,500 | Northrop Grumman Corporation | 3,265,400 | ||
| 10,000 | Orbital Sciences Corporation* | 195,300 | ||
| 200,214 | Seagate Technology | 886,948 | ||
| 30,000 | Sierra Wireless, Inc.* | 174,900 | ||
| 125,000 | Triumph Group, Inc. | 5,307,500 | ||
| 254,500 | Western Digital Corporation* | 2,914,025 | ||
| 39,209,008 | ||||
| UTILITIES — 4.6% | ||||
| 75,000 | Alliant Energy Corporation | 2,188,500 | ||
| 115,000 | American Electric Power Company, Inc. | 3,827,200 | ||
| 200,000 | AT&T, Inc. | 5,700,000 | ||
| 145,000 | CenturyTel, Inc. | 3,962,850 | ||
| 20,000 | DTE Energy Company | 713,400 | ||
| 47,000 | Edison International | 1,509,640 | ||
| 95,800 | Energen Corporation | 2,809,814 | ||
| 31,700 | FirstEnergy Corporation | 1,539,986 | ||
| 95,000 | MDU Resources Group, Inc. | 2,050,100 | ||
| 60,000 | Sempra Energy | 2,557,800 | ||
| 72,200 | The Laclede Group, Inc. | 3,381,848 | ||
| 30,241,138 | ||||
| TOTAL COMMON STOCKS | $ | 280,478,183 | ||
21
JAMES BALANCED: GOLDEN RAINBOW FUND
SCHEDULE OF INVESTMENTS (Continued)
| Shares | INTERNATIONAL EQUITY FUNDS — 0.2% | Value | ||
| 15,000 | iShares MSCI EMU Index Fund | $ | 459,150 | |
| 87,000 | iShares MSCI Japan Index Fund | 835,200 | ||
| 20,000 | iShares MSCI Taiwan Index Fund | 151,800 | ||
| TOTAL INTERNATIONAL EQUITY FUNDS | $ | 1,446,150 | ||
| Shares | EXCHANGE TRADED FUNDS — 0.1% | Value | ||
| 10,000 | SPDR Lehman International Treasury Bond ETF | $ | 544,000 | |
| Par Value | U.S. GOVERNMENT & AGENCY BONDS — 50.6 | Value | ||
| $ 2,000,000 | Federal Farm Credit Bank, 5.950%, 3/16/09 | $ | 2,023,150 | |
| 977,951 | Government National Mortgage Association, 5.500%, 6/15/23 | 1,025,617 | ||
| 997,544 | Government National Mortgage Association, 5.000%, 10/15/38 | 1,025,233 | ||
| 500,000 | Tennessee Valley Authority, 5.625%, 1/18/11 | 534,032 | ||
| 13,000,000 | U.S. Treasury Bills, 6/4/09 | 12,994,254 | ||
| 35,000,000 | U.S. Treasury Bonds, 5.250%, 11/15/28 | 46,210,920 | ||
| 25,000,000 | U.S. Treasury Bonds, 4.500%, 2/15/36 | 33,214,850 | ||
| 2,250,000 | U.S. Treasury Inflation Indexed Note, 2.500%, 7/15/16 | 2,394,641 | ||
| 20,000,000 | U.S. Treasury Notes, 4.500%, 2/15/09 | 20,108,408 | ||
| 15,000,000 | U.S. Treasury Notes, 5.000%, 2/15/11 | 16,398,045 | ||
| 12,500,000 | U.S. Treasury Notes, 4.875%, 2/15/12 | 13,987,300 | ||
| 13,000,000 | U.S. Treasury Notes, 3.875%, 2/15/13 | 14,482,806 | ||
| 58,000,000 | U.S. Treasury Notes, 4.625%, 2/15/17 | 68,594,049 | ||
| 60,000,000 | U.S. Treasury Notes, 3.500%, 2/15/18 | 66,412,500 | ||
| 23,500,000 | U.S. Treasury Notes, 4.375%, 2/15/38 | 31,475,313 | ||
| TOTAL U.S. GOVERNMENT & AGENCY BONDS | $ | 330,881,118 | ||
| CORPORATE BONDS — 0.8% | ||||
| $ 500,000 | Anheuser-Busch Companies, Inc., 6.000%, 4/15/11 | $ | 499,616 | |
| 2,500,000 | Citigroup, Inc., 2.875%, 12/9/11 | 2,577,930 | ||
| 2,000,000 | Walmart Stores, 5.250%, 9/1/35 | 1,991,324 | ||
| TOTAL CORPORATE BONDS | $ | 5,068,870 | ||
22
JAMES BALANCED: GOLDEN RAINBOW FUND
SCHEDULE OF INVESTMENTS (Continued)
| Par Value | MUNICIPAL BONDS — 1.6% | Value | ||
| $ 1,000,000 | Adams Co CO SD No 014 Ser 2006 UTGO, 5.000%, 12/1/26 | $ | 967,770 | |
| 1,000,000 | Citrus CA Community College Ser 2007B UTGO, 4.750%, 6/1/31 | 895,700 | ||
| 1,000,000 | Friendswood TX ISD Ser 2008 UTGO (Schoolhouse), 5.000%, 2/15/37 | 967,690 | ||
| 1,000,000 | Judson TX ISD Ser 2008 UTGO, 5.000%, 2/1/37 | 923,490 | ||
| 500,000 | Kane & DeKalb Cntys IL Community Unit SD Bldg No 302 | |||
| Ser 2008 UTGO, 5.500%, 2/1/28 | 500,845 | |||
| 500,000 | Lamar TX Consolidated ISD Ser 2008 UTGO (Schoolhouse), | |||
| 5.000%, 2/15/38 | 485,050 | |||
| 1,000,000 | MA St Consolidated Loan Ser 2007C UTGO, 5.250%, 8/1/22 | 1,055,720 | ||
| 1,000,000 | Marysville MI Pub SD Ser 2007 UTGO, 5.000%, 5/1/32 | 947,220 | ||
| 125,000 | Mesa AZ IDA Rev Ser A (Discovery Health Systems), 5.625%, 1/1/29 | 131,704 | ||
| 500,000 | Mt Healthy OH CSD Sch Impt Ser 2008 UTGO, 5.000%, 12/1/26 | 481,085 | ||
| 550,000 | OH St Higher Ed Cap Fac Ser 2000A UTGO, 5.250%, 2/1/13 | 569,030 | ||
| 1,000,000 | Ohio St Ser A, 5.375%, 9/1/28 | 1,030,940 | ||
| 500,000 | Springboro OH Community CSD Ser 2007 UTGO, 5.250%, 12/1/23 | 520,065 | ||
| 1,000,000 | Will and DuPage Cntys IL Ser 2007 UTGO (Bolingbrook), 5.000%, 1/1/37 | 892,420 | ||
| TOTAL MUNICIPAL BONDS | $ | 10,368,729 | ||
| Shares | SHORT TERM INVESTMENTS — 1.2% | Value | ||
| 7,790,722 | First American Treasury Money Market Fund | $ | 7,790,722 | |
| TOTAL INVESTMENT SECURITIES — 97.5% | ||||
| (Cost $617,198,872) | $ | 636,577,772 | ||
| OTHER ASSETS IN EXCESS OF LIABILITIES — 2.5% | 16,089,198 | |||
| NET ASSETS — 100.0% | $ | 652,666,970 | ||
* Non-income producing security.
CSD – City School District
IDA – Industrial Development Authority
ISD – Independent School District
PLC – Public Liability Company
SD – School District
UTGO – Unlimited Tax General Obligation
See accompanying notes to financial statements.
23
JAMES SMALL CAP FUND
SCHEDULE OF INVESTMENTS
December 31, 2008 (Unaudited)
| Shares | COMMON STOCKS — 96.6% | Value | ||
| BASIC MATERIALS — 5.2% | ||||
| 40,600 | NOVA Chemicals Corporation | $ | 193,662 | |
| 146,800 | Olin Corporation | 2,654,144 | ||
| 20,000 | OM Group, Inc.* | 422,200 | ||
| 51,554 | Schnitzer Steel Industries, Inc. - Class A | 1,941,008 | ||
| 48,800 | W.R. Grace & Company* | 291,336 | ||
| 5,502,350 | ||||
| CONGLOMERATE — 0.9% | ||||
| 115,200 | LSB Industries, Inc.* | 958,464 | ||
| CONSUMER, CYCLICAL — 15.1% | ||||
| 220,003 | Barry (R.G.) Corporation* | 1,144,016 | ||
| 59,820 | BJ’s Wholesale Club, Inc.* | 2,049,433 | ||
| 50,048 | Dollar Tree, Inc.* | 2,092,006 | ||
| 58,435 | DreamWorks Animation SKG, Inc. - Class A* | 1,476,068 | ||
| 65,800 | JAKKS Pacific, Inc.* | 1,357,454 | ||
| 64,240 | Netflix, Inc.* | 1,920,134 | ||
| 28,560 | Polaris Industries, Inc. | 818,244 | ||
| 109,528 | The Buckle, Inc. | 2,389,901 | ||
| 54,920 | The Gymboree Corporation* | 1,432,863 | ||
| 28,100 | The Warnaco Group, Inc.* | 551,603 | ||
| 68,880 | True Religion Apparel, Inc.* | 856,867 | ||
| 16,088,589 | ||||
| CONSUMER, NON-CYCLICAL — 18.3% | ||||
| 44,340 | Brink’s Home Security Holdings, Inc.* | 971,933 | ||
| 103,000 | Cal-Maine Foods, Inc. | 2,956,100 | ||
| 149,100 | Darling International, Inc.* | 818,559 | ||
| 221,320 | Del Monte Foods Company | 1,580,225 | ||
| 118,846 | Fresh Del Monte Produce, Inc.* | 2,664,527 | ||
| 85,874 | Lincare Holdings, Inc.* | 2,312,587 | ||
| 104,760 | Omega Protein Corporation* | 420,088 | ||
| 109,300 | Ruddick Corporation | 3,022,145 | ||
| 44,340 | The Brink’s Company | 1,191,859 | ||
| 152,940 | Tupperware Brands Corporation | 3,471,737 | ||
| 19,409,760 | ||||
| ENERGY — 3.5% | ||||
| 55,777 | Basic Energy Services, Inc.* | 727,332 | ||
| 40,820 | Frontier Oil Corporation | 515,557 | ||
| 34,400 | Lufkin Industries, Inc. | 1,186,800 | ||
| 28,800 | Magellan Midstream Partners, L.P. | 870,048 | ||
| 84,975 | Parker Drilling Company* | 246,428 | ||
| 13,672 | Stone Energy Corporation* | 150,665 | ||
| 3,696,830 | ||||
24
JAMES SMALL CAP FUND
SCHEDULE OF INVESTMENTS (Continued)
| Shares | COMMON STOCKS — 96.6% (Continued) | Value | ||
| FINANCIAL — 13.9% | ||||
| 71,880 | American Financial Group, Inc. | $ | 1,644,614 | |
| 95,600 | American Physicians Capital, Inc. | 4,598,360 | ||
| 123,970 | FPIC Insurance Group, Inc.* | 5,427,407 | ||
| 80,880 | Knight Capital Group, Inc. - Class A* | 1,306,212 | ||
| 125,180 | Oriental Financial Group, Inc. | 757,339 | ||
| 64,020 | Rent-A-Center, Inc.* | 1,129,953 | ||
| 14,863,885 | ||||
| INDUSTRIAL — 16.3% | ||||
| 48,770 | Ampco-Pittsburgh Corporation | 1,058,309 | ||
| 97,200 | Applied Industrial Technologies, Inc. | 1,839,024 | ||
| 38,504 | Cascade Corporation | 1,149,729 | ||
| 133,000 | Chase Corporation | 1,501,570 | ||
| 51,430 | Gardner Denver, Inc.* | 1,200,376 | ||
| 127,310 | GrafTech International Ltd.* | 1,059,219 | ||
| 32,300 | Greif, Inc. - Class A | 1,079,789 | ||
| 29,550 | GulfMark Offshore, Inc.* | 702,995 | ||
| 635,881 | North American Galvanizing & Coatings, Inc.* | 2,435,424 | ||
| 85,800 | Tsakos Energy Navigation Ltd. | 1,571,856 | ||
| 97,420 | VSE Corporation | 3,821,787 | ||
| 17,420,078 | ||||
| TECHNOLOGY — 11.6% | ||||
| 331,054 | Amkor Technology, Inc.* | 721,698 | ||
| 241,898 | CGI Group, Inc. - Class A* | 1,886,804 | ||
| 144,440 | CIBER, Inc.* | 694,756 | ||
| 25,700 | Comtech Telecommunications Corporation* | 1,177,574 | ||
| 53,419 | Corel Corporation* | 145,834 | ||
| 28,278 | Hurco Companies, Inc.* | 339,336 | ||
| 53,960 | Integral Systems, Inc.* | 650,218 | ||
| 24,900 | Preformed Line Products Company | 1,146,396 | ||
| 37,200 | Shanda Interactive Entertainment Ltd.* | 1,203,792 | ||
| 69,927 | Sybase, Inc.* | 1,732,092 | ||
| 33,780 | Triumph Group, Inc. | 1,434,299 | ||
| 64,236 | WESCO International, Inc.* | 1,235,258 | ||
| 12,368,057 | ||||
| UTILITIES — 11.8% | ||||
| 96,871 | Atlantic Tele-Network, Inc. | 2,571,926 | ||
| 78,780 | CenturyTel, Inc. | 2,153,057 | ||
| 86,860 | El Paso Electric Company* | 1,571,297 | ||
| 109,379 | Hawaiian Electric Industries, Inc. | 2,421,651 | ||
| 41,420 | New Jersey Resources Corporation | 1,629,877 | ||
| 69,539 | WGL Holdings, Inc. | 2,273,230 | ||
| 12,621,038 | ||||
| TOTAL COMMON STOCKS | $ | 102,929,051 | ||
25
JAMES SMALL CAP FUND
SCHEDULE OF INVESTMENTS (Continued)
| Shares | SHORT TERM INVESTMENTS — 0.9% | Value | ||
| 1,000,000 | U.S. Treasury Bills, 6/4/09 | $ | 999,558 | |
| TOTAL INVESTMENT SECURITIES — 97.5% | ||||
| (Cost $130,354,426) | $ | 103,928,609 | ||
| OTHER ASSETS IN EXCESS OF LIABILITIES — 2.5% | 2,708,827 | |||
| NET ASSETS — 100.0% | $ | 106,637,436 | ||
* Non-income producing security.
See accompanying notes to financial statements.
26
JAMES MARKET NEUTRAL FUND
SCHEDULE OF INVESTMENTS
December 31, 2008 (Unaudited)
| Shares | COMMON STOCKS — 76.6% | Value | ||
| BASIC MATERIALS — 6.3% | ||||
| 24,400 | Dow Chemical Company† | $ | 368,196 | |
| 10,100 | FMC Corporation † | 451,773 | ||
| 32,800 | Methanex Corporation† | 368,672 | ||
| 11,600 | Nucor Corporation† | 535,920 | ||
| 33,300 | RPM International, Inc. † | 442,557 | ||
| 7,800 | Schnitzer Steel Industries, Inc. - Class A† | 293,670 | ||
| 6,980 | Terra Nitrogen Company, L.P. † | 661,425 | ||
| 3,122,213 | ||||
| CONSUMER, CYCLICAL — 15.6% | ||||
| 61,140 | Bob Evans Farms, Inc. † | 1,249,090 | ||
| 33,975 | Dollar Tree, Inc.* † | 1,420,154 | ||
| 24,550 | McDonald’s Corporation† | 1,526,764 | ||
| 24,800 | NIKE, Inc. - Class B† | 1,264,800 | ||
| 51,385 | The Buckle, Inc. † | 1,121,221 | ||
| 26,400 | The Gymboree Corporation*† | 688,776 | ||
| 20,000 | The Home Depot, Inc. | 460,400 | ||
| 7,731,205 | ||||
| CONSUMER, NON-CYCLICAL — 12.1% | ||||
| 50,400 | Darling International, Inc.* † | 276,696 | ||
| 19,400 | Health Care Select Sector SPDR Fund† | 515,070 | ||
| 22,500 | Kroger Company† | 594,225 | ||
| 25,070 | Merck & Company, Inc. † | 762,128 | ||
| 30,200 | The Brink's Company† | 811,776 | ||
| 40,360 | Tupperware Brands Corporation† | 916,172 | ||
| 28,300 | Watson Wyatt Worldwide, Inc. † | 1,353,306 | ||
| 20,200 | Wyeth† | 757,702 | ||
| 5,987,075 | ||||
| ENERGY — 8.2% | ||||
| 8,500 | Apache Corporation† | 633,505 | ||
| 25,900 | Bolt Technology Corporation*† | 180,264 | ||
| 18,330 | Devon Energy Corporation† | 1,204,464 | ||
| 14,250 | Exxon Mobil Corporation† | 1,137,578 | ||
| 9,300 | Hess Corporation† | 498,852 | ||
| 34,900 | Stone Energy Corporation*† | 384,598 | ||
| 4,039,261 | ||||
| FINANCIAL — 5.5% | ||||
| 69,400 | AmTrust Financial Services, Inc.† | 805,040 | ||
| 19,570 | Assurant, Inc. † | 587,100 | ||
| 78,700 | Financial Select Sector SPDR Fund† | 993,194 | ||
| 8,800 | Hospitality Properties Trust† | 130,856 | ||
| 34,100 | Oriental Financial Group, Inc. † | 206,305 | ||
| 2,722,495 | ||||
27
JAMES MARKET NEUTRAL FUND
SCHEDULE OF INVESTMENTS (Continued)
| Shares | COMMON STOCKS — 76.6% (Continued) | Value | |||
| INDUSTRIAL — 6.7% | |||||
| 20,500 | CSX Corporation† | $ | 665,635 | ||
| 23,700 | Cummins, Inc. † | 633,501 | |||
| 18,600 | Greif, Inc. - Class A† | 621,798 | |||
| 15,400 | GulfMark Offshore, Inc.* † | 366,366 | |||
| 5,300 | Norfolk Southern Corporation | 249,365 | |||
| 27,950 | Owens-Illinois, Inc.* † | 763,874 | |||
| 3,300,539 | |||||
| TECHNOLOGY — 9.6% | |||||
| 35,100 | Arrow Electronics, Inc.* † | 661,284 | |||
| 22,500 | Avnet, Inc.* † | 409,725 | |||
| 21,730 | Hewlett-Packard Company† | 788,582 | |||
| 27,250 | Hurco Companies, Inc.* † | 327,000 | |||
| 11,090 | International Business Machines Corporation (IBM) † | 933,334 | |||
| 14,190 | Northrop Grumman Corporation† | 639,118 | |||
| 18,600 | Symantec Corporation* | 251,472 | |||
| 17,100 | Triumph Group, Inc. † | 726,066 | |||
| 4,736,581 | |||||
| UTILITIES — 12.6% | |||||
| 39,500 | American Electric Power Company, Inc. † | 1,314,560 | |||
| 47,300 | AT&T, Inc. † | 1,348,050 | |||
| 35,930 | MDU Resources Group, Inc. † | 775,369 | |||
| 30,430 | Sempra Energy† | 1,297,231 | |||
| 31,800 | The Laclede Group, Inc. † | 1,489,512 | |||
| 6,224,722 | |||||
| TOTAL COMMON STOCKS | $ | 37,864,091 | |||
| Shares | SHORT TERM INVESTMENTS — 20.2% | Value | |||
| 10,000,000 | U.S. Treasury Bills, 6/4/09 | $ | 9,995,580 | ||
| TOTAL INVESTMENT SECURITIES — 96.8% | |||||
| (Cost $53,277,545) | $ | 47,859,671 | |||
| SEGREGATED CASH WITH BROKERS — 59.7% | 29,504,571 | ||||
SECURITIES SOLD SHORT — (59.2)% (Proceeds $37,612,225) | (29,265,399 | ) | |||
| OTHER ASSETS IN EXCESS OF LIABILITIES — 2.7% | 1,325,548 | ||||
| NET ASSETS — 100.0% | $ | 49,424,391 | |||
| * | Non-income producing security. |
| † | Security position is either entirely or partially held in a segregated account as collateral for securities sold short aggregating a total market value of $36,192,357. |
See accompanying notes to financial statements.
28
JAMES MARKET NEUTRAL FUND
SCHEDULE OF SECURITIES SOLD SHORT
December 31, 2008 (Unaudited)
| Shares | COMMON STOCKS — 58.4% | Value | ||
| BASIC MATERIALS — 2.9% | ||||
| 38,200 | Cooper Tire & Rubber Company | $ | 235,312 | |
| 32,900 | Foundation Coal Holdings, Inc. | 461,258 | ||
| 14,575 | James River Coal Company | 223,435 | ||
| 71,150 | Louisiana-Pacific Corporation | 110,994 | ||
| 42,376 | MAG Silver Corporation | 190,692 | ||
| 21,800 | Zoltek Companies, Inc. | 195,982 | ||
| 1,417,673 | ||||
| CONSUMER, CYCLICAL — 8.7% | ||||
| 13,075 | Cavco Industries, Inc. | 351,587 | ||
| 25,050 | Centex Corporation | 266,532 | ||
| 100,175 | Champion Enterprises, Inc. | 56,097 | ||
| 40,975 | D.R. Horton, Inc. | 289,693 | ||
| 26,925 | Gaylord Entertainment Company | 291,867 | ||
| 36,300 | GSI Commerce, Inc. | 381,876 | ||
| 23,005 | KB HOME | 313,328 | ||
| 17,400 | Lamar Advertising Company | 218,544 | ||
| 18,375 | Las Vegas Sands Corporation | 108,964 | ||
| 14,630 | Lennar Corporation | 126,842 | ||
| 21,375 | MercadoLibre, Inc. | 350,764 | ||
| 68,650 | Morgans Hotel Group | 319,909 | ||
| 46,150 | Pinnacle Entertainment, Inc. | 354,432 | ||
| 39,090 | Pulte Homes, Inc. | 427,254 | ||
| 24,900 | The Ryland Group, Inc. | 439,983 | ||
| 4,297,672 | ||||
| CONSUMER, NON-CYCLICAL — 8.3% | ||||
| 57,550 | Accuray, Inc. | 296,958 | ||
| 13,600 | AMAG Pharmaceuticals, Inc. | 487,560 | ||
| 12,175 | Cepheid, Inc. | 126,376 | ||
| 7,150 | Clinical Data, Inc. | 63,636 | ||
| 21,200 | comScore, Inc. | 270,300 | ||
| 37,500 | Elan Corporation plc ADR | 225,000 | ||
| 28,225 | Eurand NV | 243,017 | ||
| 63,440 | ev3, Inc. | 386,984 | ||
| 26,025 | Hansen Medical, Inc. | 187,900 | ||
| 22,258 | Insulet Corporation | 171,832 | ||
| 36,230 | MDS, Inc. | 222,090 | ||
| 124,400 | Nektar Therapeutics | 691,664 | ||
| 28,900 | Rigel Pharmaceuticals, Inc. | 231,200 | ||
| 54,690 | Senomyx, Inc. | 152,585 | ||
| 34,650 | Smart Balance, Inc. | 235,620 | ||
| 15,600 | The Great Atlantic & Pacific Tea Company, Inc. | 97,812 | ||
| 4,090,534 | ||||
29
JAMES MARKET NEUTRAL FUND
SCHEDULE OF SECURITIES SOLD SHORT (Continued)
| Shares | COMMON STOCKS — 58.4% (Continued) | Value | ||
| ENERGY — 1.6% | ||||
| 24,550 | Alon USA Energy, Inc. | $ | 224,632 | |
| 25,178 | BPZ Resources, Inc. | 161,140 | ||
| 38,950 | Clean Energy Fuels Corporation | 235,258 | ||
| 37,000 | Delta Petroleum Corporation | 176,120 | ||
| 797,150 | ||||
| FINANCIAL — 11.2% | ||||
| 34,125 | Boston Private Financial Holdings, Inc. | 233,415 | ||
| 24,725 | East West Bancorp, Inc. | 394,858 | ||
| 65,674 | First Horizon National Corporation | 694,174 | ||
| 8,070 | Forest City Enterprises, Inc. - Class A | 54,070 | ||
| 13,250 | KBW, Inc. | 304,750 | ||
| 42,050 | Kingsway Financial Services, Inc. | 229,172 | ||
| 22,025 | Legg Mason, Inc. | 482,568 | ||
| 40,975 | MBIA, Inc. | 166,768 | ||
| 8,300 | Northern Trust Corporation | 432,762 | ||
| 10,800 | Piper Jaffray Companies, Inc. | 429,408 | ||
| 17,500 | PrivateBancorp, Inc. | 568,050 | ||
| 19,775 | Stewart Information Services Corporation | 464,515 | ||
| 39,460 | TFS Financial Corporation | 509,034 | ||
| 14,475 | The St. Joe Company | 352,032 | ||
| 16,675 | UBS AG ADR | 238,452 | ||
| 5,554,028 | ||||
| INDUSTRIAL — 2.5% | ||||
| 24,000 | American Superconductor Corporation | 391,440 | ||
| 42,325 | Golar LNG Ltd. | 286,117 | ||
| 8,350 | Metabolix, Inc. | 106,212 | ||
| 39,800 | Modine Manufacturing Company | 193,826 | ||
| 50,925 | Taser International, Inc. | 268,884 | ||
| 1,246,479 | ||||
| INTERNATIONAL — 1.3% | ||||
| 20,875 | AngloGold Ashanti Ltd. ADR | 578,446 | ||
| 8,600 | Chicago Bridge & Iron Company N.V. ADR | 86,430 | ||
| 664,876 | ||||
| TECHNOLOGY — 19.3% | ||||
| 47,335 | 3D Systems Corporation | 375,840 | ||
| 37,625 | 3PAR, Inc. | 287,079 | ||
| 34,100 | ACI Worldwide, Inc. | 542,190 | ||
| 18,600 | Acorda Therapeutics, Inc. | 381,486 | ||
| 15,625 | Advent Software, Inc. | 312,031 | ||
| 14,185 | Affymax, Inc. | 141,709 | ||
| 72,550 | Affymetrix, Inc. | 216,924 | ||
| 28,625 | Amylin Pharmaceuticals, Inc. | 310,581 | ||
| 109,750 | Arena Pharmaceuticals, Inc. | 457,657 | ||
30
JAMES MARKET NEUTRAL FUND
SCHEDULE OF SECURITIES SOLD SHORT (Continued)
| Shares | COMMON STOCKS — 58.4% (Continued) | Value | ||
| TECHNOLOGY — 19.3% (Continued) | ||||
| 112,650 | Aruba Networks, Inc. | $ | 287,257 | |
| 21,075 | BioMarin Pharmaceutical, Inc. | 375,135 | ||
| 27,600 | Cavium Networks, Inc. | 290,076 | ||
| 46,600 | Clearwire Corporation - Class A | 229,738 | ||
| 17,325 | Cougar Biotechnology, Inc. | 450,450 | ||
| 44,025 | Cypress Bioscience, Inc. | 301,131 | ||
| 16,500 | Electronic Arts, Inc. | 264,660 | ||
| 78,890 | Micron Technology, Inc. | 208,271 | ||
| 86,475 | Palm, Inc. | 265,478 | ||
| 23,200 | Progenics Pharmaceuticals, Inc. | 239,192 | ||
| 43,620 | Rambus, Inc. | 694,430 | ||
| 33,925 | SanDisk Corporation | 325,680 | ||
| 26,900 | SBA Communications Corporation | 439,008 | ||
| 22,525 | Sequenom, Inc. | 446,896 | ||
| 18,675 | Tessera Technologies, Inc. | 221,859 | ||
| 17,800 | The Ultimate Software Group, Inc. | 259,880 | ||
| 38,130 | Theravance, Inc. | 472,431 | ||
| 23,125 | VeriFone Holdings, Inc. | 113,313 | ||
| 20,150 | Vocus, Inc. | 366,931 | ||
| 9,550 | XenoPort, Inc. | 239,514 | ||
| 9,516,827 | ||||
| UTILITIES — 2.6% | ||||
| 29,975 | Cbeyond, Inc. | 479,000 | ||
| 40,725 | EnerNOC, Inc. | 302,994 | ||
| 52,925 | Southwest Water Company | 170,419 | ||
| 12,075 | Southwestern Energy Company | 349,813 | ||
| 1,302,226 | ||||
| TOTAL COMMON STOCKS SOLD SHORT | $ | 28,887,465 | ||
| Shares | INTERNATIONAL EQUITY FUNDS — 0.8% | Value | ||
| 10,800 | iShares FTSE/Xinhua China 25 Index Fund | $ | 315,144 | |
| 4,200 | Powershares Golden Dragon Halter USX China Portfolio | 62,790 | ||
| TOTAL INTERNATIONAL EQUITY FUNDS SOLD SHORT | $ | 377,934 | ||
TOTAL INVESTMENTS SOLD SHORT — 59.2% (Proceeds $37,612,225) | $ | 29,265,399 | ||
ADR – American Depository Receipts.
PLC – Public Liability Company.
See accompanying notes to financial statements.
31
JAMES EQUITY FUND
SCHEDULE OF INVESTMENTS
December 31, 2008 (Unaudited)
| Shares | COMMON STOCKS — 90.8% | Value | ||
| BASIC MATERIALS — 8.7% | ||||
| 10,630 | Celanese Corporation | $ | 132,131 | |
| 7,400 | FMC Corporation | 331,002 | ||
| 3,780 | Nucor Corporation | 174,636 | ||
| 1,400 | Potash Corporation of Saskatchewan | 102,508 | ||
| 4,456 | Schnitzer Steel Industries, Inc. - Class A | 167,768 | ||
| 908,045 | ||||
| CONSUMER, CYCLICAL — 15.8% | ||||
| 3,500 | BJ’s Wholesale Club, Inc.* | 119,910 | ||
| 5,088 | Consumer Discretionary SPDR Fund | 109,748 | ||
| 5,840 | Dollar Tree, Inc.* | 244,112 | ||
| 7,180 | JAKKS Pacific, Inc.* | 148,123 | ||
| 5,260 | McDonald’s Corporation | 327,119 | ||
| 4,900 | Netflix, Inc.* | 146,461 | ||
| 13,674 | The Buckle, Inc. | 298,367 | ||
| 5,660 | The Gymboree Corporation* | 147,669 | ||
| 4,440 | Walt Disney Company | 100,744 | ||
| 1,642,253 | ||||
| CONSUMER, NON-CYCLICAL — 14.2% | ||||
| 4,340 | Brink’s Home Security Holdings, Inc.* | 95,133 | ||
| 950 | Bunge Ltd. | 49,182 | ||
| 6,580 | Hewitt Associates, Inc. - Class A* | 186,740 | ||
| 3,916 | Kroger Company | 103,422 | ||
| 31,780 | Omega Protein Corporation* | 127,438 | ||
| 6,140 | Pfizer, Inc. | 108,739 | ||
| 10,500 | Sara Lee Corporation | 102,795 | ||
| 4,340 | The Brink’s Company | 116,659 | ||
| 4,740 | Tupperware Brands Corporation | 107,598 | ||
| 10,000 | Watson Wyatt Worldwide, Inc. - Class A | 478,200 | ||
| 1,475,906 | ||||
| ENERGY — 6.3% | ||||
| 1,410 | Apache Corporation | 105,087 | ||
| 1,580 | Devon Energy Corporation | 103,822 | ||
| 2,900 | Exxon Mobil Corporation | 231,507 | ||
| 10,800 | Mariner Energy, Inc.* | 110,160 | ||
| 4,800 | Valero Energy Corporation | 103,872 | ||
| 654,448 | ||||
| FINANCIAL — 12.6% | ||||
| 10,665 | American Financial Group, Inc. | 244,015 | ||
| 9,180 | American Physicians Capital, Inc. | 441,558 | ||
| 6,700 | Amerisafe, Inc.* | 137,551 | ||
| 4,360 | Assurant, Inc. | 130,800 | ||
| 13,120 | Financial Select Sector SPDR Fund | 165,574 | ||
| 5,660 | Knight Capital Group, Inc. - Class A* | 91,409 | ||
32
JAMES EQUITY FUND
SCHEDULE OF INVESTMENTS (Continued)
| Shares | COMMON STOCKS — 90.8% (Continued) | Value | ||
| FINANCIAL — 12.6% (Continued) | ||||
| 6,240 | Mercer Insurance Group, Inc. | $ | 78,874 | |
| 4,360 | Oriental Financial Group, Inc. | 26,378 | ||
| 1,316,159 | ||||
| INDUSTRIAL — 7.5% | ||||
| 4,620 | Ampco-Pittsburgh Corporation | 100,254 | ||
| 3,100 | CSX Corporation | 100,657 | ||
| 4,880 | Cummins, Inc. | 130,442 | ||
| 6,960 | Gardner Denver, Inc.* | 162,447 | ||
| 7,500 | GrafTech International Ltd.* | 62,400 | ||
| 3,760 | Greif, Inc. - Class A | 125,697 | ||
| 2,240 | GulfMark Offshore, Inc.* | 53,290 | ||
| 1,149 | Parker Hannifin Corporation | 48,878 | ||
| 784,065 | ||||
| TECHNOLOGY — 11.7% | ||||
| 10,440 | CIBER, Inc. | 50,216 | ||
| 6,680 | Hewlett-Packard Company | 242,417 | ||
| 13,980 | Integral Systems, Inc.* | 168,459 | ||
| 2,990 | International Business Machines Corporation (IBM) | 251,639 | ||
| 4,340 | Northrop Grumman Corporation | 195,474 | ||
| 7,900 | Symantec Corporation* | 106,808 | ||
| 13,200 | Technology Select Sector SPDR Fund | 203,412 | ||
| 1,218,425 | ||||
| UTILITIES — 14.0% | ||||
| 8,820 | Alliant Energy Corporation | 257,368 | ||
| 5,040 | American Electric Power Company, Inc. | 167,731 | ||
| 17,200 | AT&T, Inc. | 490,199 | ||
| 3,700 | CenturyTel, Inc. | 101,121 | ||
| 1,900 | DTE Energy Company | 67,773 | ||
| 1,580 | Edison International | 50,750 | ||
| 10,890 | Energen Corporation | 319,404 | ||
| 1,454,346 | ||||
| TOTAL COMMON STOCKS | $ | 9,453,647 | ||
| PREFERRED STOCKS — 2.0% | ||||
| FINANCIAL — 0.8% | ||||
| 4,000 | General Electric Capital Corporation, 6.00%, 4/24/12 | $ | 84,000 | |
| UTILITIES — 1.2% | ||||
| 5,000 | AT&T, Inc., 6.375%, 2/15/12 | 124,700 | ||
| TOTAL PREFERRED STOCKS | $ | 208,700 | ||
33
JAMES EQUITY FUND
SCHEDULE OF INVESTMENTS (Continued)
| Par Value | U.S. GOVERNMENT & AGENCY BONDS — 2.9% | Value | |||
| $ 275,000 | U.S. Treasury Bonds, 3.125%, 4/30/13 | $ | 297,666 | ||
| Shares | SHORT TERM INVESTMENTS — 10.6% | Value | |||
| 1,103,634 | First American Treasury Money Market Fund | $ | 1,103,634 | ||
| TOTAL INVESTMENT SECURITIES — 106.3% | |||||
| (Cost $13,080,403) | $ | 11,063,647 | |||
| LIABILITIES IN EXCESS OF OTHER ASSETS — (6.3%) | (651,978 | ) | |||
| NET ASSETS — 100.0% | $ | 10,411,669 | |||
* Non-income producing security.
See accompanying notes to financial statements.
34
JAMES MID CAP FUND
SCHEDULE OF INVESTMENTS
December 31, 2008 (Unaudited)
| Shares | COMMON STOCKS — 94.1% | Value | ||
| BASIC MATERIALS — 9.2% | ||||
| 5,000 | Albermarle Corporation | $ | 111,500 | |
| 2,500 | FMC Corp. | 111,825 | ||
| 7,000 | Methanex Corporation | 78,680 | ||
| 8,000 | RPM International, Inc. | 106,320 | ||
| 408,325 | ||||
| CONSUMER, CYCLICAL — 12.1% | ||||
| 4,000 | BJ’s Wholesale Club, Inc.* | 137,040 | ||
| 2,000 | Bristow Group, Inc.* | 53,580 | ||
| 4,000 | Darden Restaurants, Inc. | 112,720 | ||
| 5,500 | Dollar Tree, Inc.* | 229,900 | ||
| 533,240 | ||||
| CONSUMER, NON-CYCLICAL — 25.0% | ||||
| 3,000 | Brink’s Home Security Holdings, Inc.* | 65,760 | ||
| 3,000 | Cal-Maine Foods, Inc. | 86,100 | ||
| 8,500 | Darling International, Inc.* | 46,665 | ||
| 2,000 | Molson Coors Brewing Company - Class B | 97,840 | ||
| 4,000 | Ruddick Corporation | 110,600 | ||
| 12,500 | Sara Lee Corporation | 122,375 | ||
| 5,000 | The Brink’s Company | 134,400 | ||
| 3,200 | The Toro Company | 105,600 | ||
| 6,500 | Tupperware Brands Corporation | 147,550 | ||
| 4,000 | Watson Wyatt Worldwide, Inc. - Class A | 191,280 | ||
| 1,108,170 | ||||
| ENERGY — 7.6% | ||||
| 10,000 | Frontier Oil Corporation | 126,300 | ||
| 1,600 | Questar Corporation | 52,304 | ||
| 1,950 | Stone Energy Corporation* | 21,489 | ||
| 3,000 | Sunoco Logistics Partners L.P. | 135,420 | ||
| 335,513 | ||||
| FINANCIAL — 11.9% | ||||
| 5,000 | American Financial Group, Inc. | 114,400 | ||
| 3,000 | Assurant, Inc. | 90,000 | ||
| 4,000 | International Bancshares Corporation | 87,320 | ||
| 10,000 | Knight Capital Group, Inc. - Class A* | 161,500 | ||
| 4,000 | Rent-A-Center, Inc. | 70,600 | ||
| 523,820 | ||||
35
JAMES MID CAP FUND
SCHEDULE OF INVESTMENTS
| Shares | COMMON STOCKS — 94.1% (Continued) | Value | ||
| INDUSTRIAL — 8.6% | ||||
| 2,500 | AGCO Corporation* | $ | 58,975 | |
| 3,500 | Gardner Denver, Inc.* | 81,690 | ||
| 7,500 | GrafTech International Ltd.* | 62,400 | ||
| 3,000 | Greif, Inc. - Class A | 100,290 | ||
| 4,000 | The Timken Company | 78,520 | ||
| 381,875 | ||||
| TECHNOLOGY — 9.5% | ||||
| 3,000 | Comtech Telecommunications Corporation* | 137,460 | ||
| 8,000 | Integral Systems, Inc.* | 96,400 | ||
| 3,000 | Teledyne Technologies, Inc.* | 133,650 | ||
| 4,500 | Western Digital Corporation* | 51,525 | ||
| 419,035 | ||||
| UTILITIES — 10.2% | ||||
| 4,000 | CenturyTel, Inc. | 109,320 | ||
| 3,000 | DTE Energy Company | 107,010 | ||
| 3,500 | Energen Corporation | 102,655 | ||
| 6,000 | MDU Resources Group, Inc. | 129,480 | ||
| 448,465 | ||||
| TOTAL COMMON STOCKS | $ | 4,158,443 | ||
| Shares | PREFERRED STOCK — 1.0% | Value | ||
| FINANCIAL — 1.0% | ||||
| 2,500 | Celanese Corporation, Series P, 4.25% | $ | 42,125 | |
| Shares | SHORT TERM INVESTMENTS — 4.2% | Value | ||
| 187,611 | First American Treasury Money Market Fund | $ | 187,611 | |
| TOTAL INVESTMENT SECURITIES — 99.3% | ||||
| (Cost $6,003,521) | $ | 4,388,179 | ||
| OTHER ASSETS IN EXCESS OF LIABILITIES — 0.7% | 29,222 | |||
| NET ASSETS — 100.0% | $ | 4,417,401 | ||
* Non-income producing security.
ADR – American Depository Receipts.
See accompanying notes to financial statements.
36
JAMES ADVANTAGE FUNDS
NOTES TO FINANCIAL STATEMENTS
December 31, 2008 (Unaudited)
1. General Information and Significant Accounting Policies
James Balanced: Golden Rainbow Fund, James Small Cap Fund, James Market Neutral Fund and James Mid Cap Fund are each a diversified series of James Advantage Funds (the “Trust”), and James Equity Fund is a non-diversified series of the Trust (individually the “Fund,” collectively the “Funds”). The Trust is an open-end management investment company that was organized as an Ohio business trust on August 29, 1997. The Trust is registered under the Investment Company Act of 1940 (the “1940 Act”). James Balanced: Golden Rainbow Fund was originally organized as a series of the Flagship Admiral Funds Inc., a Maryland corporation. On June 26, 1998, pursuant to an Agreement and Plan of Reorganization, James Balanced: Golden Rainbow Fund was restructured through a tax-free reorganization as a series of the Trust. The James Small Cap Fund and James Market Neutral Fund each commenced its public offering of shares on October 2, 1998. The James Equity Fund commenced its public offering of shares on November 1, 1999. The James Mid Cap Fund commenced its public offering of shares on June 30, 2006.
James Balanced: Golden Rainbow Fund seeks to provide total return through a combination of growth and income and preservation of capital in declining markets. The Fund seeks to achieve its objective by investing primarily in common stocks and/or debt securities that the Fund’s adviser, James Investment Research, Inc. (“James”), believes are undervalued.
James Small Cap Fund seeks to provide long-term capital appreciation. The Fund seeks to achieve its objective by investing primarily in common stocks of small capitalization companies.
James Market Neutral Fund seeks to provide positive returns regardless of the direction of the stock markets. The Fund seeks to achieve its objective by investing in common stocks that James believes are undervalued and more likely to appreciate, and selling short common stocks that James believes are overvalued and more likely to depreciate.
James Equity Fund seeks to provide long-term capital appreciation and outperform the Standard & Poor’s 500 Index (the “S&P 500 Index”). The Fund seeks to achieve its objective by investing primarily in equity securities without regard to the market capitalization of the stock. The Fund often buys stocks in the S&P 500 Index.
James Mid Cap Fund seeks to provide long-term capital appreciation. The Fund seeks to achieve its objective by investing primarily in common stocks of mid capitalization companies.
The following is a summary of significant accounting policies followed by the Funds in preparation of their financial statements, in accordance with accounting principles generally accepted in the United States of America (“GAAP”).
Share Valuation
The net asset value per share of each Fund is calculated daily by dividing the total value of the Fund’s assets, less liabilities, by the number of shares outstanding. The net asset value is determined as of the close of the NYSE (generally, 4:00 p.m., Eastern time) on each day that the NYSE is open for business, and on any other day on which there is sufficient trading in a Fund’s securities to materially affect the net asset value.
Redemption Fees
Effective February 21, 2007, the Board of Trustees of the James Advantage Funds voted to abolish the redemption fees for the James Small Cap Fund, the James Market Neutral Fund, the James Equity Fund, and the James Mid Cap Fund. Prior to February 21, 2007, the Funds charged a redemption fee of 1.00% of the amount redeemed if the shares sold were held for fewer than 90 days. The redemption fees were paid directly to the Funds.
37
JAMES ADVANTAGE FUNDS
NOTES TO FINANCIAL STATEMENTS (Continued)
Securities Valuation
Securities that are traded on any exchange are valued at the last quoted sale price. Lacking a last sale price, a security is valued at its last bid price except when, in James’s opinion, the last bid price does not accurately reflect the current value of the security. Securities that are traded on the NASDAQ over-the-counter market are valued at their NASDAQ Official Closing Price (“NOCP”) for all NASDAQ National Market (“NNM”) and NASDAQ Capital Market® securities. When market quotations are not readily available, if an event occurs after the close of the trading market (but before the time as of which the Fund calculates its net asset value) that materially affects a security’s value, when James determines that the market quotation does not accurately reflect the current value or when a restricted security is being valued, that security will be valued at its fair value as determined in good faith in conformity with guidelines adopted by and subject to review of the Board of Trustees. The Funds may use pricing services to determine market value for securities. Short-term investments in fixed-income securities with maturities of less than 60 days when acquired, or which subsequently are within 60 days of maturity, are valued by using the amortized cost method of valuation, which the Board has determined will represent fair value.
In accordance with the Trust’s good faith pricing guidelines, James is required to consider all appropriate factors relevant to the value of securities for which it has determined other pricing sources are not available or reliable as described above. No single standard for determining fair value controls, since fair value depends upon the circumstances of each individual case. As a general principle, the current fair value of an issue of securities being valued by the adviser would appear to be the amount which the owner might reasonably expect to receive for them upon their current sale. Methods which are in accord with this principle may, for example, be based on (i) a multiple of earnings; (ii) a discount from market of a similar freely traded security (including a derivative security or a basket of securities traded on other markets, exchanges or among dealers); or (iii) yield to maturity with respect to debt issues, or a combination of these and other methods.
In September 2006, the Financial Accounting Standards Board (“FASB”) issued Statement on Financial Accounting Standards (“SFAS”) No. 157, “Fair Value Measurements.” This standard establishes a single authoritative definition of fair value, sets out a framework for measuring fair value and requires additional disclosures about fair value measurements. SFAS No. 157 applies to fair value measurements already required or permitted by existing standards. SFAS No. 157 is effective for financial statements issued for fiscal years beginning after November 15, 2007 and interim periods within those fiscal years. The changes to current generally accepted accounting principles from the application of this Statement relate to the definition of fair value, the methods used to measure fair value, and the expanded disclosures about fair value measurements.
Various inputs are used in determining the value of the Funds’ investments. These inputs are summarized in the three broad levels listed below:
• Level 1 – quoted prices in active markets for identical securities
• Level 2 – other significant observable inputs (including quoted prices for similar securities, interest rates, prepayment speeds, credit risk, etc.)
• Level 3 – significant unobservable inputs (including the Fund’s own assumptions in determining the fair value of investments)
The inputs or methodology used for valuing securities are not necessarily an indication of the risk associated with investing in those securities. For example, securities maturing within 60 days of the filing are valued using amortized cost, in accordance with rules under the Investment Company Act of 1940. Generally, amortized cost approximates the current fair value of a security, but since the value is not obtained from a quoted price in an active market, such securities are reflected as Level 2.
38
JAMES ADVANTAGE FUNDS
NOTES TO FINANCIAL STATEMENTS (Continued)
The following is a summary of the inputs used to value the Funds’ net assets as of December 31, 2008:
Level 1 – Quoted Prices | Level 2 – Other Significant Observable Inputs* | Level 3 – Significant Unobservable Inputs | ||||||||||
| Investments in Securities: (Assets) | ||||||||||||
| James Balanced: Golden Rainbow Fund | $ | 290,259,056 | $ | 346,318,716 | $ | — | ||||||
| James Small Cap Fund | 102,929,051 | 999,558 | — | |||||||||
| James Market Neutral Fund | 67,368,663 | 9,995,580 | — | |||||||||
| James Equity Fund | 10,765,981 | 297,666 | — | |||||||||
| James Mid Cap Fund | 4,388,179 | — | — | |||||||||
| Investments in Securities Sold Short: (Liabilities) | ||||||||||||
| James Market Neutral Fund | $ | 29,265,399 | $ | — | $ | — | ||||||
| * | Included in Level 2 – Other Significant Observable Inputs are U.S. Treasury securities totaling $326,273,085, $999,558, $9,995,580, and $297,666 for the James Balanced: Golden Rainbow Fund, James Small Cap Fund, James Market Neutral, and James Equity Fund, respectively. |
Securities Transactions
Securities transactions are recorded on a trade date basis. Realized gains and losses from security transactions are determined using the specific identification method. Securities purchased or sold on a when-issued or delayed delivery basis may have extended settlement periods. Any securities so purchased are subject to market fluctuation during this period. The James Balanced: Golden Rainbow Fund will instruct its custodian to segregate assets in a separate account with a current value at least equal to the amount of its when-issued and delayed delivery purchase commitments. As of December 31, 2008, the James Balanced: Golden Rainbow Fund had no such outstanding purchase commitments.
Withholding taxes on foreign dividends have been provided for in accordance with the Trust’s understanding of the applicable country’s tax rules and rates.
Short Sales and Segregated Cash
The James Market Neutral Fund (the “Fund”) actively sells short common stocks. Short sales are transactions in which the Fund sells a security it does not own in anticipation of a decline in the market value of that security. To complete such a transaction, the Fund must borrow the security to deliver to the buyer upon the short sale; the Fund is then obligated to replace the security borrowed by purchasing it in the open market at some later date.
The Fund will incur a loss if the market price of the security increases between the date of the short sale and the date on which the Fund replaces the borrowed security. The Fund will realize a gain if the security declines in value between those dates. If a security sold short pays a dividend while the Fund is short that security, the Fund will pay the dividend and record that amount as an expense.
All short sales are collateralized, as required by the Fund’s prime broker. The Fund maintains the collateral in segregated accounts consisting of cash and/or high-grade liquid assets sufficient to collateralize the market value of its short positions.
Investment Income
Dividend income is recorded on the ex-dividend date. Interest income is determined on the basis of interest accrued, adjusted for amortization of premiums and accretion of discounts on all debt securities. Amortization and accretion is calculated using the effective yield method.
39
JAMES ADVANTAGE FUNDS
NOTES TO FINANCIAL STATEMENTS (Continued)
Dividends and Distributions to Shareholders
Net investment income, if any, is generally declared and distributed to shareholders of each Fund quarterly. Net realized capital gains from security transactions, if any, are distributed to shareholders not less frequently than annually. Furthermore, capital gains are distributed only to the extent they exceed available capital loss carryforwards. Distributions to shareholders of net investment income and net realized capital gains are recorded on the ex-dividend date. The amount and timing of distributions are determined in accordance with federal income tax regulations, which may differ from GAAP. Accordingly, temporary overdistributions as a result of these differences may occur and will be classified as either distributions in excess of net investment income and/or distributions in excess of net realized gains from security transactions, where applicable.
Use of Estimates
The preparation of financial statements in conformity with GAAP requires management to make estimates and assumptions that affect the reported amounts of assets and liabilities and disclosure of contingent assets and liabilities at the date of the financial statements and the reported amounts of increases and decreases in net assets from operations during the reporting period.
Federal Income Taxes
The Funds generally intend to distribute all taxable income and capital gains to shareholders and to otherwise comply with the requirements of Subchapter M of the Internal Revenue Code applicable to regulated investment companies. Therefore, no federal tax provision is required.
The tax character of distributions paid for the years ended June 30, 2008 and 2007 was as follows:
James Balanced: Golden Rainbow Fund | James Small Cap Fund | |||||||||||||||
| 2008 | 2007 | 2008 | 2007 | |||||||||||||
| From ordinary income | $ | 8,530,879 | $ | 6,967,365 | $ | 1,055,734 | $ | 3,153,359 | ||||||||
| From long-term capital gains | 6,766,534 | 5,273,855 | — | 649,545 | ||||||||||||
| From return of capital | — | — | — | 144,227 | ||||||||||||
| $ | 15,297,413 | $ | 12,241,220 | $ | 1,055,734 | $ | 3,947,131 | |||||||||
James Market Neutral Fund | James Equity Fund | James Mid Cap Fund | ||||||||||||||||||||||
| 2008 | 2007 | 2008 | 2007 | 2008 | 2007 | |||||||||||||||||||
| From ordinary income | $ | 629,826 | $ | 2,166,597 | $ | 47,752 | $ | 97,518 | $ | 18,785 | $ | 14,614 | ||||||||||||
| From long-term capital gains | — | — | 12,335 | — | — | — | ||||||||||||||||||
| $ | 629,826 | $ | 2,166,597 | $ | 60,087 | $ | 97,518 | $ | 18,785 | $ | 14,614 | |||||||||||||
40
JAMES ADVANTAGE FUNDS
NOTES TO FINANCIAL STATEMENTS (Continued)
The following information is computed on a tax basis for each item as of June 30, 2008:
James Balanced: Golden Rainbow Fund | James Small Cap Fund | James Market Neutral Fund | James Equity Fund | James Mid Cap Fund | ||||||||||||||||
| Cost of portfolio investments | $ | 433,416,829 | $ | 164,960,498 | $ | 52,505,418 | $ | 15,829,196 | $ | 5,622,336 | ||||||||||
| Gross unrealized appreciation | $ | 47,831,489 | $ | 24,850,734 | $ | 4,912,329 | $ | 3,218,823 | $ | 740,112 | ||||||||||
| Gross unrealized depreciation | (6,392,082 | ) | (10,792,467 | ) | (1,788,087 | ) | (553,034 | ) | (363,493 | ) | ||||||||||
| Net unrealized appreciation | 41,439,407 | 14,058,267 | 3,124,242 | 2,665,789 | 376,619 | |||||||||||||||
| Net unrealized appreciation | ||||||||||||||||||||
| on securities sold short | — | — | 6,645,490 | — | — | |||||||||||||||
| Capital loss carryforward | — | (17,239,544 | ) | (7,293,231 | ) | — | (47,388 | ) | ||||||||||||
| Post-October losses | (1,285,637 | ) | (15,772,951 | ) | (866,178 | ) | — | (240,896 | ) | |||||||||||
| Undistributed net investment income | — | — | — | — | 525 | |||||||||||||||
| Undistributed long-term gains | 30,786 | — | — | 1,230,653 | — | |||||||||||||||
| Other temporary differences | (79,529 | ) | (5,685 | ) | — | — | — | |||||||||||||
| Accumulated earnings | $ | 40,105,027 | $ | (18,959,913 | ) | $ | 1,610,323 | $ | 3,896,442 | $ | 88,860 | |||||||||
The difference between the cost of portfolio investments and financial statement cost for the Funds is due to certain timing differences differences in the recognition of capital losses under income tax regulations and GAAP.
During the year ended June 30, 2008, the James Market Neutral and the James Equity Fund utilized $1,649,049 and $1,033,467 of capital loss carryforwards, respectively. The capital loss carryforwards remaining as of June 30, 2008 in the table below expire as follows:
| Amount | Expiration Date | ||||
| James Small Cap Fund | $ | 17,239,544 | June 30, 2016 | ||
| James Market Neutral Fund | $ | 194,196 | June 30, 2013 | ||
| $ | 642,007 | June 30, 2014 | |||
| $ | 6,457,028 | June 30, 2015 | |||
| James Mid Cap Fund | $ | 47,388 | June 30, 2016 | ||
The capital loss carryforwards may be utilized in future years to offset net realized capital gains, if any, prior to distributing such gains to shareholders.
On July 13, 2006, the Financial Accounting Standards Board (“FASB”) released FASB Interpretation No. 48 “Accounting for Uncertainty in Income Taxes” (“FIN 48”). FIN 48 provides guidance for how uncertain tax positions should be recognized, measured, presented and disclosed in the financial statements. FIN 48 requires the evaluation of tax positions taken or expected to be taken in the course of preparing the Funds’ tax returns to determine whether the tax positions are “more-likely-than-not” of being sustained by the applicable tax authority. Tax positions not deemed to meet the more-likely-than-not threshold would be recorded as a tax benefit or expense in the current year. The Funds have analyzed their tax positions on Federal income tax returns for all open years (tax years ended June 30, 2005 through 2008) for purposes of implementing FIN 48 and have concluded that no provision for income tax is required in the financial statements.
41
JAMES ADVANTAGE FUNDS
NOTES TO FINANCIAL STATEMENTS (Continued)
Reclassification of Capital Accounts
Reclassifications result primarily from the difference in the tax treatment of net investment losses and distributions in excess of net invesment income. The following reclassifications have been made on the Statement of Assets and Liabilities and have no impact on the net assets or net asset value of the Funds:
Paid-In Capital | Undistributed Net Investment Income | Accumulated Net Realized Gains (Losses) | ||||||||||
| James Balanced: Golden Rainbow Fund | $ | — | $ | 20,593 | $ | (20,593 | ) | |||||
| James Small Cap Fund | $ | (20,947 | ) | $ | 20,947 | $ | — | |||||
| James Market Neutral Fund | $ | (292,157 | ) | $ | 305,071 | $ | (12,914 | ) | ||||
| James Equity Fund | $ | — | $ | 12,335 | $ | (12,335 | ) | |||||
| James Mid Cap Fund | $ | — | $ | 4,214 | $ | (4,214 | ) | |||||
As of December 31, 2008, the James Advantage Funds had the following federal tax cost resulting in net unrealized appreciation/depreciation as follows:
Federal Tax Cost | Gross Unrealized Appreciation | Gross Unrealized Depreciation | Net Unrealized Appreciation/ Depreciation | |||||||||||||
| James Balanced: Golden Rainbow Fund | $ | 617,856,211 | $ | 71,032,467 | $ | (52,310,906 | ) | $ | 18,721,561 | |||||||
| James Small Cap Fund | $ | 130,354,426 | $ | 6,304,253 | $ | (32,730,070 | ) | $ | (26,425,817 | ) | ||||||
| James Market Neutral Fund | $ | 53,396,717 | $ | 14,572,142 | $ | (11,762,361 | ) | $ | 2,809,781 | |||||||
| James Equity Fund | $ | 13,080,403 | $ | 721,769 | $ | (2,738,525 | ) | $ | (2,016,756 | ) | ||||||
| James Mid Cap Fund | $ | 6,003,521 | $ | 124,664 | $ | (1,740,006 | ) | $ | (1,615,342 | ) | ||||||
2. Securities Transactions
Purchases and sales (including maturities) of investments in long-term U.S. Government obligations for James Balanced: Golden Rainbow Fund for the six months ended December 31, 2008 was as follows:
| Purchases | Sales | |||||||
| James Balanced: Golden Rainbow Fund | $ | 95,563,346 | $ | 37,098,906 | ||||
Purchases and sales (including maturities) of investments in other securities for the six months ended December 31, 2008 were as follows:
| Purchases | Sales | |||||||
| James Balanced: Golden Rainbow Fund | $ | 194,458,281 | $ | 13,466,988 | ||||
| James Small Cap Fund | 39,004,059 | 29,869,970 | ||||||
| James Market Neutral Fund | 24,902,067 | 6,543,896 | ||||||
| James Equity Fund | 5,046,398 | 3,258,080 | ||||||
| James Mid Cap Fund | 1,193,873 | 423,000 | ||||||
For the six months ended December 31, 2008, the cost of securities purchased to cover short sales and the proceeds from securities sold short were $21,665,264 and $21,859,978, respectively, for the James Market Neutral Fund.
42
JAMES ADVANTAGE FUNDS
NOTES TO FINANCIAL STATEMENTS (Continued)
3. Management Fee and Other Transactions with Affiliates
A trustee and certain officers of the Trust were also officers of James or JPMorgan Chase Bank, N.A. (“JPMorgan”), the administrative services agent, shareholder services and transfer agent and accounting services agent for the Trust during the six months ended December 31, 2008.
Investment Management Agreement
The Funds retain James to manage the Funds’ investments. The investment decisions for the Funds are made by a committee of James’ personnel, which is primarily responsible for the day-to-day management of each Fund’s portfolio. James Balanced: Golden Rainbow Fund is authorized to pay James a fee equal to an annual rate of 0.74% of its average daily net assets. James Balanced: Golden Rainbow Fund is responsible for the payment of all operating expenses of the Fund.
James is authorized to receive a fee equal to (a) an annual rate of 1.25% of the average daily net assets of the James Small Cap Fund, James Equity Fund and James Mid Cap Fund, and 1.70% of James Market Neutral Fund; minus (b) the fees and expenses of the non-interested person trustees incurred by the applicable Fund.
James is responsible for the payment of all operating expenses of the James Small Cap Fund, James Market Neutral Fund, James Equity Fund, and James Mid Cap Fund, except for brokerage fees and commissions, taxes, interest (including dividend expense on securities sold short) and 12b-1 expenses.
Administrative Services Agreement
Under the terms of an Administrative Services Agreement with the Trust, JPMorgan supplies executive and regulatory services, supervises the preparation of tax returns, and coordinates the preparation of reports to shareholders and reports to and filings with the Securities and Exchange Commission and state securities authorities. For these services, JPMorgan receives a monthly fee paid by James Balanced: Golden Rainbow Fund, and paid by James for the James Small Cap Fund, James Market Neutral Fund, James Equity Fund and James Mid Cap Fund, based on the Funds’ aggregate average daily net assets, subject to a minimum monthly fee.
Transfer Agent and Shareholder Service Agreement
Under the terms of the Transfer, Dividend Disbursing, Shareholder Service and Plan Agency Agreement with the Trust, JPMorgan maintains the records of each shareholder’s account, answers shareholder inquiries concerning their accounts, processes purchases and redemptions of each Funds’ shares, acts as dividend and distribution disbursing agent and performs other shareholder service functions. For these services, JPMorgan receives a monthly fee paid by James Balanced: Golden Rainbow Fund, and paid by James for the James Small Cap Fund, James Market Neutral Fund, James Equity Fund and James Mid Cap Fund, subject to a minimum monthly fee. In addition, James Balanced: Golden Rainbow Fund and James pay JPMorgan out-of-pocket expenses including, but not limited to, postage and supplies.
Accounting Services Agreement
Under the terms of the Accounting Services Agreement with the Trust, JPMorgan calculates the daily net asset value per share and maintains the financial books and records of each Fund. For these services, JPMorgan receives a monthly fee from James Balanced: Golden Rainbow Fund and from James with respect to each of the James Small Cap Fund, James Market Neutral Fund, James Equity Fund and James Mid Cap Fund. In addition, JPMorgan is reimbursed by James Balanced: Golden Rainbow Fund and James for certain out-of-pocket expenses incurred by JPMorgan in obtaining valuations of the Funds’ portfolio securities.
43
JAMES ADVANTAGE FUNDS
NOTES TO FINANCIAL STATEMENTS (Continued)
Plan of Distribution
Each Fund has a Plan of Distribution pursuant to Rule 12b-1 under the 1940 Act (the “Plan”) under which the Fund may incur or reimburse James for expenses related to the distribution and promotion of its shares. The annual limitation for payment of such expenses under the Plans of James Balanced: Golden Rainbow Fund, James Small Cap Fund, James Market Neutral Fund, James Equity Fund and James Mid Cap Fund is 0.25% of the average daily net assets of each respective Fund.
Compliance Services Agreement
Under the terms of the Compliance Services Agreement between the Trust and JPMorgan, JPMorgan provides certain compliance services to the Trust, including developing and assisting in implementing a compliance program for JPMorgan on behalf of the funds and providing administrative support services to the Funds’ Compliance Program and Chief Compliance Officer.
Beneficial Ownership
The beneficial ownership, either directly or indirectly, of more than 25% of the voting securities of a fund creates a presumption of control of the fund under section 2(a)(9) of the Investment Company Act of 1940. As of December 31, 2008, Charles Schwab & Co., Inc. owned, for the benefit of its customers, 50.79% of the James Balanced: Golden Rainbow Fund. James, Dr. Frank James, and other affiliates of James owned 59.61% of the James Mid Cap Fund.
4. Commitments and Contingencies
The Funds indemnify the Trust’s officers and trustees for certain liabilities that might arise from their performance of their duties to the Funds. Additionally, in the normal course of business, the Funds enter into contracts that contain a variety of representations and warranties and that provide general indemnifications. The Funds’ maximum exposure under these arrangements is unknown, as this would involve future claims that may be made against the Funds that have not yet occurred. However, based on experience, the Funds expect the risk of loss to be remote.
44
JAMES ADVANTAGE FUNDS
OTHER ITEMS (Unaudited)
Proxy Voting Guidelines
James is responsible for exercising the voting rights associated with the securities purchased and held by the Funds. A description of the policies and procedures that James uses in fulfilling this responsibility and information regarding how those proxies were voted during the most recent twelve month period ended June 30 are available without charge upon request by calling toll free 1-800-995-2637. These items are also available on the Securities and Exchange Commission’s website at http://www.sec.gov. and on the James’ website at www.jamesfunds.com.
Quarterly Portfolio Disclosure
James files a complete listing of portfolio holdings for each Fund as of the end of the first and third quarters of each fiscal year on Form N-Q. The complete listing (i) is available on the Commission’s website; (ii) may be reviewed and copied at the Commission’s Public Reference Room in Washington, DC; and (iii) will be made available to shareholders upon request by calling 1-800-995-2637. Information on the operation of the Public Reference Room may be obtained by calling 1-800-SEC-0330.
Shareholder Expense Example
As a shareholder of the Funds, you incur two types of costs: (1) transaction costs, including reinvested dividends or other distributions; and redemption fees; and (2) ongoing costs, including management fees; distribution (12b-1) fees; and other Fund expenses. This example is intended to help you understand your ongoing costs (in dollars) of investing in the Funds and to compare these costs with the ongoing costs of investing in other mutual funds.
The example is based on an investment of $1,000 invested at the beginning of the period and held for the entire period (July 1, 2008 through December 31, 2008).
Actual Expenses
The first line of the table below provides information about actual account values and actual expenses. You may use the information in this line, together with the amount you invested, to estimate the expenses that you paid over the period. Simply divide your account value by $1,000 (for example, an $8,600 account value divided by $1,000 = 8.6), then multiply the result by the number in the first line under the heading entitled “Expenses Paid During the Six Months Ended December 31, 2008” to estimate the expenses you paid on your account during this period, if you held your shares for the entire period.
45
JAMES ADVANTAGE FUNDS
OTHER ITEMS (Unaudited) (Continued)
Hypothetical Example for Comparison Purposes
The second line of the table below provides information about hypothetical account values and hypothetical expenses based on the Funds’ actual expense ratio and an assumed rate of return of 5% per year before expenses, which is not the Funds’ actual return. The hypothetical account values and expenses may not be used to estimate the actual ending account balance or expenses you paid for the period. You may use this information to compare the ongoing costs of investing in the Funds and other funds. To do so, compare this 5% hypothetical example with the 5% hypothetical examples that appear in the shareholder reports of the other funds.
Note that expenses shown in the table are meant to highlight and help you compare ongoing cost only. The calculations assume no shares were bought or sold during the period. Your actual costs may have been higher or lower, depending on the amount of your investment and the timing of any purchases or redemptions.
Net Expense Ratio Annualized December 31, 2008 | Beginning Account Value July 1, 2008 | Ending Account Value December 31, 2008 | Expenses Paid During the Six Months Ended December 31, 2008* | |||||||||||||
| James Balanced: Golden Rainbow Fund | ||||||||||||||||
| Actual | 1.13 | % | $ | 1,000.00 | $ | 952.10 | $ | 5.55 | ||||||||
| Hypothetical | 1.13 | % | $ | 1,000.00 | $ | 1,019.52 | $ | 5.74 | ||||||||
| James Small Cap Fund | ||||||||||||||||
| Actual | 1.50 | % | $ | 1,000.00 | $ | 699.60 | $ | 6.43 | ||||||||
| Hypothetical | 1.50 | % | $ | 1,000.00 | $ | 1,017.64 | $ | 7.63 | ||||||||
| James Market Neutral Fund | ||||||||||||||||
| Actual | 2.39 | % | $ | 1,000.00 | $ | 952.00 | $ | 11.74 | ||||||||
| Hypothetical | 2.39 | % | $ | 1,000.00 | $ | 1,013.18 | $ | 12.11 | ||||||||
| James Equity Fund | ||||||||||||||||
| Actual | 1.50 | % | $ | 1,000.00 | $ | 1,000.00 | $ | 7.56 | ||||||||
| Hypothetical | 1.50 | % | $ | 1,000.00 | $ | 1,017.65 | $ | 7.63 | ||||||||
| James Mid Cap Fund | ||||||||||||||||
| Actual | 1.50 | % | $ | 1,000.00 | $ | 1,000.00 | $ | 7.55 | ||||||||
| Hypothetical | 1.50 | % | $ | 1,000.00 | $ | 1,017.65 | $ | 7.62 | ||||||||
| * | Expenses are equal to the Fund’s annualized expense ratio, multiplied by the average account value over the period, multiplied by 184/365 (to reflect the one-half year period). |
46
JAMES ADVANTAGE FUNDS
OTHER ITEMS (Unaudited) (Continued)
In the annual report for the fiscal year ended June 30, 2008, the James Market Neutral Fund’s Actual and Hypothetical expense example was incorrect because the calculation erroneously excluded the dividend expense on securities sold short. The corrected Actual and Hypothetical expense example for the six months ended June 30, 2008, which includes the dividend expense on securities sold short, is as follows:
Net Expense Ratio Annualized June 30, 2008 | Beginning Account Value January 1, 2008 | Ending Account Value June 30, 2008 | Expenses Paid During the Six Months Ended June 30, 2008 | |||||||||||||
| Actual | 3.33 | % | $ | 1,000.00 | $ | 997.60 | $ | 16.54 | ||||||||
| Hypothetical | 3.33 | % | $ | 1,000.00 | $ | 1,008.30 | $ | 16.63 | ||||||||
47
INVESTMENT ADVISER
James Investment Research, Inc.
P.O. Box 8
Alpha, Ohio 45301
info@jamesfunds.com
•
CUSTODIAN
U.S. Bank
425 Walnut Street
Cincinnati, Ohio 45202
•
TRANSFER AGENT
JPMorgan Chase Bank, N.A.
P.O. Box 5354
Cincinnati, Ohio 45201-5354
•
INDEPENDENT REGISTERED
PUBLIC ACCOUNTING FIRM
Deloitte & Touche LLP
250 East Fifth Street
Suite 1900
Cincinnati, Ohio 45202
•
DISTRIBUTOR
IFS Fund Distributors, Inc.
303 Broadway
Cincinnati, Ohio 45202
•
LEGAL COUNSEL
Thompson Hine LLP
312 Walnut Street
14th Floor
Cincinnati, Ohio 45202
www.jamesfunds.com
For information about the Funds, or to
make inquiries about the Funds, please call
1-800-99JAMES (1-800-995-2637).
FORM IFS-163-0201
| Item 2. | Code of Ethics. |
Not Applicable
| Item 3. | Audit Committee Financial Expert. |
Not Applicable
| Item 4. | Principal Accountant Fees and Services. |
Not Applicable
| Item 5. | Audit Committee of Listed Companies. |
Not applicable.
| Item 6. | Schedule of Investments. |
The schedule is included as part of the report to shareholders filed under Item 1 of this Form.
| Item 7. | Disclosure of Proxy Voting Policies and Procedures for Closed End Management Investment Companies. |
Not Applicable.
| Item 8. | Portfolio Managers of Closed-End Funds. |
Not applicable.
| Item 9. | Purchases of Equity Securities by Closed-End Funds. |
Not applicable.
| Item 10. | Submission of Matters to a Vote of Security Holders. |
Not applicable
| Item 11. | Controls and Procedures. |
(a) Based on an evaluation of the registrant's disclosure controls and procedures (as defined in Rule 30a-3(c) under the 1940 Act) the registrant's principal executive officer and principal financial officer have concluded that the registrant's disclosure controls and procedures are effective as of a date within 90 days of the filing date of this report.
(b) There were no significant changes in the registrant’s internal control over financial reporting that occurred during the registrant’s last fiscal half-year that have materially affected, or are reasonably likely to materially affect, the registrant’s internal control over financial reporting.
| Item 12. | Exhibits. |
| (a)(1) | Not applicable. |
| (a)(2) | Certifications required by Item 12(a)(2) of Form N-CSR are filed herewith. |
SIGNATURES
Pursuant to the requirements of the Securities Exchange Act of 1934 and the Investment Company Act of 1940, the registrant has duly caused this report to be signed on its behalf by the undersigned, thereunto duly authorized.
(Registrant) The James Advantage Funds
By (Signature and Title)
/s/ Barry R. James
Barry R. James
President
Date: March 3, 2009
Pursuant to the requirements of the Securities Exchange Act of 1934 and the Investment Company Act of 1940, this report has been signed below by the following persons on behalf of the registrant and in the capacities and on the dates indicated.
By (Signature and Title)
/s/ Barry R. James
Barry R. James
President
Date: March 3, 2009
By (Signature and Title)
/s/ Thomas L. Mangan
Thomas L. Mangan
Treasurer, Chief Financial Officer
Date: March 3, 2009