UNITED STATES
SECURITI1 AND EXCHANGE COMMISSION
WASHINGTON, D.C. 20549
FORM N-CSR
CERTIFIED SHAREHOLDER REPORT OF REGISTERED MANAGEMENT
INVESTMENT COMPANIES
Investment Company Act file number 811-8411
James Advantage Funds
(Exact name of registrant as specified in charter)
1349 Fairground Road, Beavercreek, Ohio 45385
(Address of principal executive offices) (Zip code)
Barry R. James, P.O. Box 8, Alpha, Ohio 45301
(Name and address of agent for service)
Registrant's telephone number, including area code: (937) 426-7640
Date of fiscal year end: 6/30
Date of reporting period: 12/31/09
Form N-CSR is to be used by management investment companies to file reports with the Commission not later than 10 days after the transmission to stockholders of any report that is required to be transmitted to stockholders under Rule 30e-1 under the Investment Company Act of 1940 (17 CFR 270.30e-1). The Commission may use the information provided on Form N-CSR in its regulatory, disclosure review, inspection and policymaking roles.
A registrant is required to disclose the information specified by Form N-CSR, and the Commission will make this information public. A registrant is not required to respond to the collection of information contained in Form N-CSR unless the Form displays a currently valid Office of Management and Budget ("OMB") control number. Please direct comments concerning the accuracy of the information collection burden estimate and any suggestions for reducing the burden to Secretary, Securities and Exchange Commission, 450 Fifth Street, NW, Washington, DC 20549-0609. The OMB has reviewed this collection of information under the clearance requirements of 44 U.S.C. § 3507.
Item 1. Reports to Stockholders.
James Advantage Funds Semi-Annual Report
Semi-Annual Report
| December 31, 2009 |
| (Unaudited) |
James Balanced:
Golden Rainbow Fund
James Small Cap Fund
James Market Neutral Fund
James Equity Fund
James Mid Cap Fund
937 - 426 - -7640
www.jamesfunds.com
LETTER TO SHAREHOLDERS
OF THE JAMES ADVANTAGE FUNDS
The James Advantage Funds returned to profitability in 2009, except for the Market Neutral Fund, which suffered as lower quality stocks rebounded more sharply than stocks that were not as severely punished in the bear market. While it is good to see the market doing better, investors need to realize that the market is still far from its 2007 peak. Concerns about the ability of the U.S. economy to resume sustained, non-inflationary growth and to bring down the unemployment rate are very real and will have a significant impact on the market’s performance in 2010.
The Markets Over the Past Six Months
A powerful rally off the market lows set in March continued through the second half of 2009, but at a somewhat slower pace. Stock markets around the world rallied as emerging and newly developed economies returned to growth. These economies were not as seriously burdened by the financial crisis in the U.S. and Western Europe and they benefitted from their own stimulus plans as well as sharply lower interest rates. Strengthening domestic demand coupled with an increase in demand from the West contributed to growth in India, China and most other emerging economies.
Investment Goals and Objectives
The James Balanced: Golden Rainbow Fund seeks to preserve capital in declining markets and to provide income and growth over the long term. The Treasury securities that helped keep the Fund’s losses low in 2008 lost value as interest rates rose in the second half of 2009. However, moving out of many of the long term Treasury bonds and into sovereign bonds was a plus for the Fund. Holdings in municipal bonds and GNMAs also helped the Fund meet its objectives of capital preservation and income. The Fund maintained equity levels between forty percent and fifty percent of total assets.
The James Equity Fund, The James Small Cap Fund and The James Mid Cap Fund moved higher over the last six months as the broad stock market advanced. All three Funds seek to outperform their benchmarks, the S&P 500, the Russell 2000 and the Mid Cap Value but they lagged due to the allocation to cash. The Adviser’s research points to a significant correction in stock prices. After the huge advance in stocks, a correction would be normal and lowering equity levels is a good way to prepare for that correction.
The James Market Neutral Fund did not have a good year. The Fund’s methodology is based on the Adviser’s research, which is value based. Growth stocks (those that are dependent on growing future earnings) led this rally while value stocks (those with stronger current earnings) lagged. Since the Market Neutral was short these more speculative stocks with high PEs and other characteristics, the Fund lost money in 2009.
Investment Philosophy
We believe that preservation of capital in down markets is the key to long term success. For example, while the S&P 500 rose almost 70 percent from its March, 2009 lows to its December 2009 highs, at the end of the year it was still about 30 percent below the highs set in October 2007. Avoiding even a part of those losses in 2008 went a long way to keeping shareholders whole. For example, the Balanced: Golden Rainbow Fund approached its all time high in 2009, missing by just a few pennies. This Fund’s performance is a good example of the importance of conservative investing.
Strategy for Meeting Fund Objectives
The Funds will be managed under a conservative strategy in 2010. Preservation of capital will remain the focus as the nation sorts out the implications and fallout of the various initiatives of the current administration. The Congressional elections in November add another element of risk and the eventual decisions of the Supreme Court will also likely have a major impact on the markets’ longer term course. We remain very concerned about the future, and we believe significantly higher rates of inflation, a weaker US dollar and increased regulation should be part of our strategy.
1
Your Funds will continue to hold positions in mining companies and other basic material producers that benefit from rising inflation. The municipal bonds in the Golden Rainbow will add value if tax rates rise, and we believe they will. The Funds have increased their exposure to foreign stocks, which will benefit if the U.S. dollar weakens again in 2010. The Golden Rainbow has taken positions in the highest quality sovereign bonds issued by governments in Europe, Australia, Canada and New Zealand. In addition to the income they pay, they will also add value if the U.S. dollar continues to weaken.
The Equity Fund, Small Cap Fund and Mid Cap Fund are holding cash in reserve, in anticipation of a significant correction in stock prices. While the timing of that correction can never be known in advance, our research concludes the correction is probable and a conservative allocation to stocks is warranted.
Fund Performance
The James Balanced: Golden Rainbow Fund
Over the final six months of 2009 James Balanced: Golden Rainbow Fund earned an 8.72 percent total return. The Fund’s benchmark blend (25% S&P 500, 25% Russell 2000 and 50% Barclay’s intermediate Bond Index) returned 13.40 percent. We note that growth stocks and Junk Bonds did very well in 2009, and that these are not part of the strategy your Fund employs. Still, your Fund approached an all-time NAV high, regaining all ground lost in 2008, plus more. That compared favorably with the S&P 500, which lost 37 percent in 2008 and remained about 23 percent below its December 31, 2007 level at the end of 2009. Your Fund returned 7.12 percent for the year after a dividend payment of 7.2 cents per share on December 31 compared with a return of 16.44 percent on its benchmark blend and of 26.46 percent on the S&P500.
The James Equity Fund
Over the last six months of 2009, the James Equity Fund returned 15.79 percent, compared with a return of 22.58 percent on its benchmark, the S&P 500. For the year, the Fund returned 20.96 percent compared to a 26.46 percent return on the S&P 500. As we noted, the current stock rally continues to favor Growth stocks. Examining over 8,500 stocks in our database, we note that Growth stocks outperformed Value stocks by more than 8 percent during the quarter alone and large stocks outperformed smaller issues by over 3 percent. Periods of time when junk runs are usually confined, and over longer periods, a better investment strategy is to seek bargain stocks. These stocks include companies which enjoy better relative value, profitability, and strength. During this current volatile investing environment, we continue to seek companies which are generally unloved by Wall Street, but favored by insiders. We also continue to invest in securities of all market capitalizations. Additionally, we currently enjoy somewhat higher levels of cash, as we seek future opportunities.
The James Small Cap Fund
During the last six months of 2009, the James Small Cap Fund gained 18.12 percent and its benchmark index, the Russell 2000 gained 23.90 percent. For the year, the Fund returned 20.04 percent and the benchmark rose 27.19 percent. Clearly, this past year has been a difficult environment for bargain investing. Our investing techniques don’t always work over the short term. However, over the last decade, your James Small Cap Fund almost doubled the return of the Russell 2000. The James Small Cap returned a cumulative 83.18 percent, while the Russell 2000 returned 41.85 percent. Sticking to our discipline of bargain investing has paid off during the long-term. Throughout the quarter, the best performing sectors in your James Small Cap Fund were Consumer Non-Cyclicals (returning 12.79 percent) and Utilities (gaining 7.92 percent). We continue to look for bargain securities with good relative value, profitability, and strength. Flexibility, not indexing, will likely be key during 2010.
The James Mid Cap Fund
For the last 6 months of 2009, your James Mid Cap Fund showed a return of 25.18 percent, while the Mid Cap Value Index advanced 28.18 percent. The Fund did not pay a dividend for the quarter. Performance was aided due to strong returns in Mining stocks, as well as in the Technology and Utility Sectors. DTE Energy (2.8% of portfolio) was up very strongly in spite of economic problems in Michigan. In addition, LifePoint Hospitals (2.7% of portfolio) and miner Silver Wheaton (4.4% of portfolio) had good quarters.
2
Finance stocks did poorly, but we held a relatively light position in Finance. Still, it was encouraging to see this market revert to more normal performance. That is, relatively cheap stocks, with good earnings and solid price strength, are once more starting to outperform lower quality stocks. This is a positive development that could continue for a while. However, stocks may face some retrenchment after the big run we have seen since March. Your Fund advanced about 67 percent from the market low on March 6, 2009. Mid Cap stocks continue to provide excellent diversification from either Large or Small Cap stocks.
The James Market Neutral Fund
It was a particularly difficult year for the James Market Neutral Fund. The Fund was down 17.78 percent, while at that same time, equity markets advanced. The Fund’s benchmark, the 90 day U.S. Treasury Bill rose 0.21 percent. Those stocks that rallied the most after the March lows were often the ones that declined the most in the previous nine months. Unfortunately, those stocks were also the ones that held many overvalued qualities. In many instances, the stocks that had advanced rapidly in 2009 were the ones that were losing the most money. While the rally was led by those stocks of lesser quality, we believe that a move back to a more traditional investing style will make sense for the future. This is why we continue to invest the Market Neutral Fund with longs that have strong earnings, good fundamentals and often pay a solid dividend. We will also continue to sell short those stocks which we believe to have risen too quickly, or which have many overvalued characteristics. Should we see a retrenchment in this current rally, the James Market Neutral Fund may provide a unique opportunity.
Expectations for the Future
We do not believe that the bear market has run its course or that the U.S. economy is out of the woods yet. There are too many uncertainties, especially on the political front, to justify a belief that the recession is over and stocks will continue to rally. Rather, it is more likely that 2010 will again show weakness in the economy and a decline in stock prices. We see continued problems in real estate, both residential and commercial, and a consumer that is still rebuilding the family balance sheet. Unemployment is likely to rise significantly in 2010, although temporary government hiring for the census may mask the underlying employment crisis. The markets will see through that mask, and the effects of additional government regulation and interference will eventually push stock prices lower. While a declining U.S. dollar will create opportunities in foreign stocks and bonds, it will also usher in greater inflation and raise inflation expectations. Our strategy in all our funds is to invest in value stocks that are more likely to resist the decline and to have some cash available to reinvest in stocks at much more favorable prices.

Thomas L. Mangan
CFO
3
Average Annual Total Returns As of December31, 2009 | ||||||||||||||||||||
Six Months** | One Year | Five Years | Ten Years | Since Inception | ||||||||||||||||
| James Balanced: Golden Rainbow Fund | 8.72 | % | 7.12 | % | 5.15 | % | 6.21 | % | 8.13 | % | ||||||||||
| Standard & Poor's 500 Index | 22.58 | % | 26.46 | % | 0.42 | % | -0 .95 | % | 8.29 | % | ||||||||||
| Blended Index* | 13.40 | % | 16.44 | % | 3.04 | % | 4.13 | % | 7.94 | % | ||||||||||
| (Inception 7/1/91) | ||||||||||||||||||||
| James Small Cap Fund | 18.12 | % | 20.04 | % | -2 .61 | % | 6.26 | % | 5.67 | % | ||||||||||
| Russell 2000 Index | 23.90 | % | 27.19 | % | 0.51 | % | 3.51 | % | 6.67 | % | ||||||||||
| (Inception 10/2/98) | ||||||||||||||||||||
| James Market Neutral Fund | -3 .90 | % | -1 7.78 | % | -2 .20 | % | 1.89 | % | 0.82 | % | ||||||||||
| 90-Day U.S. Treasury Bill Index | 0.11 | % | 0.21 | % | 3.02 | % | 2.99 | % | 3.19 | % | ||||||||||
| (Inception 10/2/98) | ||||||||||||||||||||
| James Equity Fund | 15.79 | % | 20.96 | % | 0.42 | % | -3 .24 | % | -1 .23 | % | ||||||||||
| Standard & Poor's 500 Index | 22.58 | % | 26.46 | % | 0.42 | % | -0 .95 | % | -0 .18 | % | ||||||||||
| (Inception 11/1/99) | ||||||||||||||||||||
| James Mid Cap Fund | 25.18 | % | 27.57 | % | NA | NA | -3 .18 | % | ||||||||||||
| Standard & Poor's 400 Value Index | 28.18 | % | 33.77 | % | NA | NA | -1 .09 | % | ||||||||||||
| (Inception 6/30/06) | ||||||||||||||||||||
Past performance is not predictive of future results. The performance of the above Funds does not reflect the deduction of taxes that a shareholder would pay on Fund distributions or the redemption of Fund shares.
Current performance may be lower or higher than the performance data quoted. Please call 1-800-995-2637 for most recent month-end performance information.
| * | The Blended Index is comprised of a 25% weighting in the Standard & Poor's 500 Index, a 25% weighting in the Russell 2000 Index and a 50% weighting in the Barclays Capital Intermediate Government/Credit Index. |
| ** | Returns not annualized. |
4
JAMES ADVANTAGE FUNDS
REPRESENTATION OF PORTFOLIOS OF INVESTMENTS
December 31, 2009 (Unaudited)
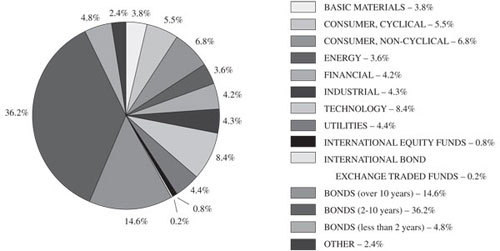
The illustrations below provide the industry sectors for the James Balanced: Golden Rainbow Fund, James Small Cap Fund, James Market Neutral Fund, James Equity Fund and James Mid Cap Fund.
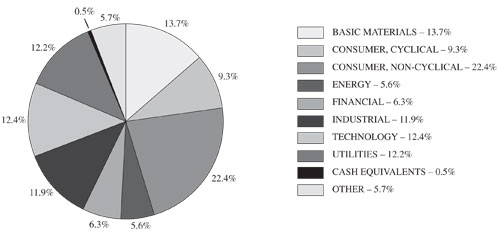
James Balanced: Golden Rainbow Fund
Industry Sector Allocation (% of Net Assets)
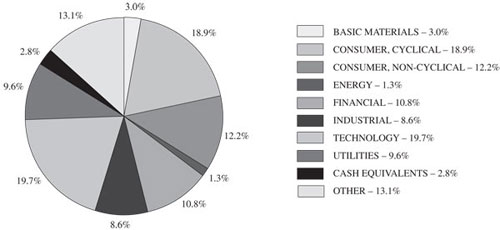
James Small Cap Fund
Industry Sector Allocation (% of Net Assets)
5
JAMES ADVANTAGE FUNDS
REPRESENTATION OF PORTFOLIOS OF INVESTMENTS
(Continued)
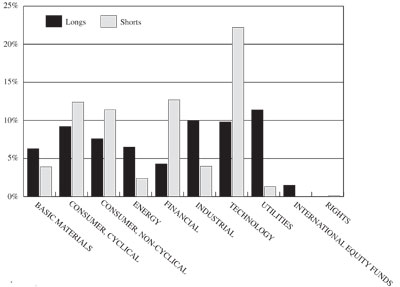
James Market Neutral Fund
Industry Sector Allocation (% of Net Assets)
(Cash, Cash Equivalents and Other Assets in Excess of Liabilities not included)
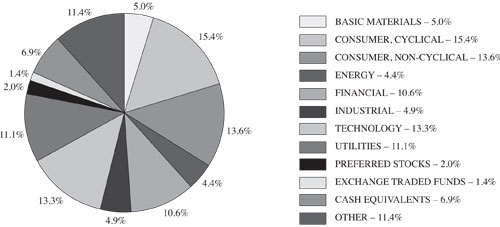
James Equity Fund
Industry Sector Allocation (% of Net Assets)
6
JAMES ADVANTAGE FUNDS
REPRESENTATION OF PORTFOLIOS OF INVESTMENTS
(Continued)
James Mid Cap Fund
Industry Sector Allocation (% of Net Assets)
7
JAMES ADVANTAGE FUNDS
STATEMENTS OF ASSETS AND LIABILITIES
December 31, 2009 (Unaudited)
James Balanced: Golden Rainbow Fund | James Small Cap Fund | James Market Neutral Fund | James Equity Fund | James Mid Cap Fund | ||||||||||||||||
| ASSETS | ||||||||||||||||||||
| Investment securities: | ||||||||||||||||||||
| At cost | $ | 497,481,417 | $ | 50,333,557 | $ | 20,153,775 | $ | 8,852,159 | $ | 3,815,450 | ||||||||||
| At value | $ | 547,887,709 | $ | 62,307,736 | $ | 23,695,186 | $ | 10,153,831 | $ | 4,479,803 | ||||||||||
| Segregated cash with brokers | — | — | 20,325,019 | — | — | |||||||||||||||
| Cash | 9,194,420 | 9,477,397 | 16,455,365 | 1,094,400 | 264,857 | |||||||||||||||
| Dividends and interest receivable | 4,243,271 | 51,789 | 42,849 | 20,946 | 8,133 | |||||||||||||||
| Receivable for securities sold | 1,091,722 | — | — | — | — | |||||||||||||||
| Receivable for capital shares sold | 1,155,882 | 102,538 | 168,456 | 207,912 | — | |||||||||||||||
| Other assets | 60,163 | — | — | — | — | |||||||||||||||
| TOTAL ASSETS | 563,633,167 | 71,939,460 | 60,686,875 | 11,477,089 | 4,752,793 | |||||||||||||||
| LIABILITIES | ||||||||||||||||||||
| Dividends payable | 193,857 | — | — | — | — | |||||||||||||||
| Payable for securities sold short (proceeds $24,537,363) | — | — | 25,033,787 | — | — | |||||||||||||||
| Payable for dividends on securities sold short | — | — | 322 | — | — | |||||||||||||||
| Payable for capital shares re deemed | 989,741 | 171,795 | 24,503 | 10,777 | — | |||||||||||||||
| Payable for securities purchased | 287,527 | — | — | — | — | |||||||||||||||
| Accrued expenses: | �� | |||||||||||||||||||
| Management fees | 353,104 | 80,704 | 49,317 | 9,016 | 1,991 | |||||||||||||||
| 12b-1 distribution and service fees | 118,756 | 16,634 | 7,653 | 2,410 | 1,017 | |||||||||||||||
| Trustees' fees | 1,983 | — | — | — | — | |||||||||||||||
| Compliance expenses and servicing fees | 93,495 | — | — | — | — | |||||||||||||||
| Other | 52,757 | — | — | — | — | |||||||||||||||
| TOTAL LIABILITIES | 2,091,220 | 269,133 | 25,115,582 | 22,203 | 3,008 | |||||||||||||||
| NET ASSETS | $ | 561,541,947 | $ | 71,670,327 | $ | 35,571,293 | $ | 11,454,886 | $ | 4,749,785 | ||||||||||
| NET ASSETS CONSIST OF: | ||||||||||||||||||||
| Paid-in capital | $ | 519,611,604 | $ | 123,830,581 | $ | 44,049,793 | $ | 11,996,576 | $ | 5,552,726 | ||||||||||
| Accumulated net investment income (loss) | 69,954 | 93,386 | (122,825 | ) | 23,704 | 3,592 | ||||||||||||||
| Accumulated net realized losses from security and foreign currency transactions | ( 8,545,903 | ) | (64,227,819 | ) | (11,400,661 | ) | (1,867,066 | ) | (1,470,886 | ) | ||||||||||
| Net unrealized appreciation on investments, foreign currency translations, and securities sold short | 50,406,292 | 11,974,179 | 3,044,986 | 1,301,672 | 664,353 | |||||||||||||||
| NET ASSETS | $ | 561,541,947 | $ | 71,670,327 | $ | 35,571,293 | $ | 11,454,886 | $ | 4,749,785 | ||||||||||
8
JAMES ADVANTAGE FUNDS
STATEMENTS OF ASSETS AND LIABILITIES (Continued)
James Balanced: Golden Rainbow Fund | James Small Cap Fund | James Market Neutral Fund | James Equity Fund | James Mid Cap Fund | ||||||||||||||||
| PRICING OF RETAIL | ||||||||||||||||||||
CLASS SHARES (A) | ||||||||||||||||||||
| Net assets attributable to | ||||||||||||||||||||
| Retail Class shares | $ | 561,189,889 | $ | 71,670,327 | $ | 35,571,293 | $ | 11,454,886 | $ | 4,749,785 | ||||||||||
| Shares of beneficial interest outstanding (unlimited number of shares authorized, no par) | 31,177,890 | 4,278,833 | 3,697,217 | 1,547,314 | 538,803 | |||||||||||||||
| Net asset value, offering price and redemption price per share | $ | 18.00 | $ | 16.75 | $ | 9.62 | $ | 7.40 | $ | 8.82 | ||||||||||
| PRICING OF INSTITUTIONAL | ||||||||||||||||||||
| CLASS SHARES | ||||||||||||||||||||
| Net assets attributable to Institutional Class shares | $ | 352,058 | N/A | N/A | N/A | N/A | ||||||||||||||
| Shares of beneficial interest outstanding (unlimited number of shares authorized, no par) | 19,555 | N/A | N/A | N/A | N/A | |||||||||||||||
| Net asset value, offering price and redemption price per share | $ | 18.00 | N/A | N/A | N/A | N/A | ||||||||||||||
| (A) | The James Small Cap Fund, James Market Neutral Fund, James Equity Fund, and James Mid Cap Fund will be presented as Retail Class shares throughout this report for financial reporting presentation purposes only. |
See accompanying Notes to Financial Statements.
9
JAMES ADVANTAGE FUNDS
STATEMENTS OF OPERATIONS
For the Six Months Ended December 31, 2009 (Unaudited)
James Balanced: Golden Rainbow Fund | James Small Cap Fund | James Market Neutral Fund | James Equity Fund | James Mid Cap Fund | ||||||||||||||||
| INVESTMENT INCOME | ||||||||||||||||||||
Dividends (Net of withholding taxes of $3,030, $251, $0, $100 and $22, respectively) | $ | 2,480,500 | $ | 846,624 | $ | 228,327 | $ | 124,355 | $ | 41,390 | ||||||||||
Interest (Net of foreign taxes of $29,825 for James Balanced: Golden Rainbow Fund) | 5,412,063 | 10,360 | — | 1,498 | — | |||||||||||||||
| TOTAL INVESTMENT INCOME | 7,892,563 | 856,984 | 228,327 | 125,853 | 41,390 | |||||||||||||||
| EXPENSES | ||||||||||||||||||||
| Management fees | 2,047,976 | 627,418 | 285,909 | 64,921 | 22,553 | |||||||||||||||
| 12b-1 distribution and service fees -Retail Class | 691,722 | 126,828 | 43,034 | 14,328 | 5,854 | |||||||||||||||
Dividend expense on securities sold short | — | — | 18,579 | — | — | |||||||||||||||
| Servicing fees | 298,228 | — | — | — | — | |||||||||||||||
| Professional fees | 94,080 | — | — | — | — | |||||||||||||||
| Trustees' fees | 3,423 | 6,720 | 6,720 | 6,720 | 6,720 | |||||||||||||||
| Registration fees | 32,720 | — | — | — | — | |||||||||||||||
| Custodian fees and expenses | 36,360 | — | — | — | — | |||||||||||||||
| Shareholder report printing and mailing | 28,041 | — | — | — | — | |||||||||||||||
| Postage and supplies | 15,474 | — | — | — | — | |||||||||||||||
| Compliance fees and expenses | 6,522 | — | — | — | — | |||||||||||||||
| Other expenses | 14,322 | — | — | — | — | |||||||||||||||
| TOTAL EXPENSES | 3,268,868 | 760,966 | 354,242 | 85,969 | 35,127 | |||||||||||||||
| NET INVESTMENT INCOME (LOSS) | 4,623,695 | 96,018 | ( 125,915 | ) | 39,884 | 6,263 | ||||||||||||||
| REALIZED AND UNREALIZED GAINS (LOSSES) ON INVESTMENTS | ||||||||||||||||||||
| Net realized gains (losses) from security transactions | 1,852,451 | 626,854 | ( 639,028 | ) | 130,863 | ( 165,725 | ) | |||||||||||||
| Net realized losses on closed short positions | — | — | ( 887,715 | ) | — | — | ||||||||||||||
| Net change in unrealized appreciation/depreciation on investments and securities sold short | 38,091,259 | 16,217,792 | 293,509 | 1,481,832 | 1,203,284 | |||||||||||||||
| Net change in unrealized appreciation/depreciation on foreign currency translation | 858,182 | — | — | — | — | |||||||||||||||
| NET REALIZED AND UNREALIZED GAINS (LOSSES) ON INVESTMENTS | 40,801,892 | 16,844,646 | ( 1,233,234 | ) | 1,612,695 | 1,037,559 | ||||||||||||||
| NET INCREASE (DECREASE) IN NET ASSETS RESULTING FROM OPERATIONS | $ | 45,425,587 | $ | 16,940,664 | $ | ( 1,359,149 | ) | $ | 1,652,579 | $ | 1,043,822 | |||||||||
See accompanying Notes to Financial Statements.
10
JAMES BALANCED: GOLDEN RAINBOW FUND
STATEMENTS OF CHANGES IN NET ASSETS
Six Months Ended December 31, 2009 (Unaudited) | Year Ended June 30, 2009(A) | |||||||
| FROM OPERATIONS | ||||||||
| Net investment income | $ | 4,623,695 | $ | 9,124,700 | ||||
| Net realized gains (losses) from security and foreign currency transactions | 1,852,451 | (8,458,231 | ) | |||||
| Net change in unrealized appreciation/depreciation on investments and foreign currency translation | 38,949,441 | (30,639,895 | ) | |||||
| Net increase (decrease) in net assets from operations | 45,425,587 | (29,973,426 | ) | |||||
| FROM DISTRIBUTIONS TO SHAREHOLDERS | ||||||||
| Retail Class: | ||||||||
| Dividends from net investment income | (4,470,845 | ) | (9,122,040 | ) | ||||
| Distributions from net realized gains | — | (30,798 | ) | |||||
| Institutional Class: | ||||||||
| Dividends from net investment income | (2,210 | ) | (952 | ) | ||||
| Decrease in net assets from distributions to shareholders | (4,473,055 | ) | (9,153,790 | ) | ||||
| FROM CAPITAL SHARE TRANSACTIONS | ||||||||
| Retail Class Shares: | ||||||||
| Proceeds from shares sold | 88,805,906 | 454,813,230 | ||||||
| Net asset value of shares issued in reinvestment of distributions to shareholders | 4,108,227 | 8,714,151 | ||||||
| Payments for shares redeemed | (110,028,001 | ) | (365,723,002 | ) | ||||
| Net increase (decrease) in net assets from Retail Class capital share transactions | (17,113,868 | ) | 97,804,379 | |||||
| Institutional Class Shares: | ||||||||
| Proceeds from shares sold | 228,000 | 101,150 | ||||||
| Net asset value of shares issued in reinvestment of distributions to shareholders | 2,210 | 952 | ||||||
| Net increase in net assets from Institutional Class capital share transactions | 230,210 | 102,102 | ||||||
| TOTAL INCREASE IN NET ASSETS | 24,068,874 | 58,779,265 | ||||||
| NET ASSETS | ||||||||
| Beginning of period | 537,473,073 | 478,693,808 | ||||||
| End of period | $ | 561,541,947 | $ | 537,473,073 | ||||
| ACCUMULATED NET INVESTMENT INCOME (LOSS) | $ | 69,954 | $ | (80,686 | ) | |||
11
JAMES BALANCED: GOLDEN RAINBOW FUND
STATEMENTS OF CHANGES IN NET ASSETS (Continued)
Six Months Ended December 31, 2009 (Unaudited) | Year Ended June 30, 2009(A) | |||||||
| SUMMARY OF CAPITAL SHARE ACTIVITY | ||||||||
| Retail Class: | ||||||||
| Shares sold | 5,022,233 | 27,570,424 | ||||||
| Shares issued in reinvestment of distributions to shareholders | 229,124 | 523,588 | ||||||
| Shares redeemed | (6,264,100 | ) | (22,359,235 | ) | ||||
| Net increase (decrease) in shares outstanding | (1,012,743 | ) | 5,734,777 | |||||
| Shares outstanding, beginning of period | 32,190,633 | 26,455,856 | ||||||
| Shares outstanding, end of period | 31,177,890 | 32,190,633 | ||||||
| Institutional Class: | ||||||||
| Shares sold | 12,546 | 6,827 | ||||||
| Shares issued in reinvestment of distributions to shareholders | 123 | 59 | ||||||
| Net increase in shares outstanding | 12,669 | 6,886 | ||||||
| Shares outstanding, beginning of period | 6,886 | — | ||||||
| Shares outstanding, end of period | 19,555 | 6,886 | ||||||
| (A) | Institutional Class represents the period from commencement of operations (March 2, 2009) through June 30, 2009. |
See accompanying Notes to Financial Statements.
12
JAMES SMALL CAP FUND
STATEMENTS OF CHANGES IN NET ASSETS
Six Months Ended December 31, 2009 (Unaudited) | Year Ended June 30, 2009 | |||||||
| FROM OPERATIONS | ||||||||
| Net investment income | $ | 96,018 | $ | 438,753 | ||||
| Net realized gains (losses) from security transactions | 626,854 | (31,842,178 | ) | |||||
| Net change in unrealized appreciation/depreciation on investments | 16,217,792 | (18,301,880 | ) | |||||
| Net increase (decrease) in net assets from operations | 16,940,664 | (49,705,305 | ) | |||||
| FROM DISTRIBUTIONS TO SHAREHOLDERS | ||||||||
| Dividends from net investment income | — | (438,651 | ) | |||||
| FROM CAPITAL SHARE TRANSACTIONS | ||||||||
| Proceeds from shares sold | 8,077,509 | 26,334,717 | ||||||
| Net asset value of shares issued in reinvestment of distributions to shareholders | — | 428,552 | ||||||
| Payments for shares redeemed | (53,148,889 | ) | (54,733,126 | ) | ||||
| Net decrease in net assets from capital share transactions | (45,071,380 | ) | (27,969,857 | ) | ||||
| TOTAL DECREASE IN NET ASSETS | (28,130,716 | ) | (78,113,813 | ) | ||||
| NET ASSETS | ||||||||
| Beginning of period | 99,801,043 | 177,914,856 | ||||||
| End of period | $ | 71,670,327 | $ | 99,801,043 | ||||
| ACCUMULATED NET INVESTMENT INCOME (LOSS) | $ | 93,386 | $ | (2,632 | ) | |||
| SUMMARY OF CAPITAL SHARE ACTIVITY | ||||||||
| Shares sold | 515,200 | 1,814,020 | ||||||
| Shares issued in reinvestment of distributions to shareholders | — | 33,618 | ||||||
| Shares redeemed | (3,276,951 | ) | (3,686,285 | ) | ||||
| Net decrease in shares outstanding | (2,761,751 | ) | (1,838,647 | ) | ||||
| Shares outstanding, beginning of period | 7,040,584 | 8,879,231 | ||||||
| Shares outstanding, end of period | 4,278,833 | 7,040,584 | ||||||
See accompanying Notes to Financial Statements.
13
JAMES MARKET NEUTRAL FUND
STATEMENTS OF CHANGES IN NET ASSETS
Six Months Ended December 31, 2009 (Unaudited) | Year Ended June 30, 2009 | |||||||
| FROM OPERATIONS | ||||||||
| Net investment loss | $ | (125,915 | ) | $ | (343,366 | ) | ||
| Net realized gains (losses) from: | ||||||||
| Security transactions | (639,028 | ) | (8,083,799 | ) | ||||
| Closed short positions | (887,715 | ) | 6,371,021 | |||||
| Net change in unrealized appreciation/depreciation on investments | 293,509 | (7,016,292 | ) | |||||
| Net decrease in net assets from operations | (1,359,149 | ) | (9,072,436 | ) | ||||
| FROM DISTRIBUTIONS TO SHAREHOLDERS | ||||||||
| Dividends from net investment income | — | (39,280 | ) | |||||
| FROM CAPITAL SHARE TRANSACTIONS | ||||||||
| Proceeds from shares sold | 13,311,317 | 35,152,127 | ||||||
| Net asset value of shares issued in reinvestment of distributions to shareholders | — | 36,060 | ||||||
| Payments for shares redeemed | (9,725,704 | ) | (43,020,847 | ) | ||||
| Net increase (decrease) in net assets from capital share transactions | 3,585,613 | (7,832,660 | ) | |||||
| TOTAL INCREASE (DECREASE) IN NET ASSETS | 2,226,464 | (16,944,376 | ) | |||||
| NET ASSETS | ||||||||
| Beginning of period | 33,344,829 | 50,289,205 | ||||||
| End of period | $ | 35,571,293 | $ | 33,344,829 | ||||
| ACCUMULATED NET INVESTMENT INCOME (LOSS) | $ | (122,825 | ) | $ | (3,090 | ) | ||
| SUMMARY OF CAPITAL SHARE ACTIVITY | ||||||||
| Shares sold | 1,365,861 | 2,985,961 | ||||||
| Shares issued in reinvestment of distributions to shareholders | — | 3,082 | ||||||
| Shares redeemed | (998,773 | ) | (3,748,604 | ) | ||||
| Net increase (decrease) in shares outstanding | 367,088 | (759,561 | ) | |||||
| Shares outstanding, beginning of period | 3,330,129 | 4,089,690 | ||||||
| Shares outstanding, end of period | 3,697,217 | 3,330,129 | ||||||
See accompanying Notes to Financial Statements.
14
JAMES EQUITY FUND
STATEMENTS OF CHANGES IN NET ASSETS
Six Months Ended December 31, 2009 (Unaudited) | Year Ended June 30, 2009 | |||||||
| FROM OPERATIONS | ||||||||
| Net investment income | $ | 39,884 | $ | 72,912 | ||||
| Net realized gains (losses) from security transactions | 130,863 | (1,997,929 | ) | |||||
| Net change in unrealized appreciation/depreciation on investments | 1,481,832 | (2,845,949 | ) | |||||
| Net increase (decrease) in net assets from operations | 1,652,579 | (4,770,966 | ) | |||||
| FROM DISTRIBUTIONS TO SHAREHOLDERS | ||||||||
| Dividends from net investment income | (15,975 | ) | (73,673 | ) | ||||
| Distributions from net realized gains | — | (1,230,653 | ) | |||||
| Decrease in net assets from distributions to shareholders | (15,975 | ) | (1,304,326 | ) | ||||
| FROM CAPITAL SHARE TRANSACTIONS | ||||||||
| Proceeds from shares sold | 770,169 | 3,055,227 | ||||||
| Net asset value of shares issued in reinvestment of distributions to shareholders | 15,536 | 1,296,378 | ||||||
| Payments for shares redeemed | (1,877,072 | ) | (3,580,272 | ) | ||||
| Net increase (decrease) in net assets from capital share transactions | (1,091,367 | ) | 771,333 | |||||
| TOTAL INCREASE (DECREASE) IN NET ASSETS | 545,237 | (5,303,959 | ) | |||||
| NET ASSETS | ||||||||
| Beginning of period | 10,909,649 | 16,213,608 | ||||||
| End of period | $ | 11,454,886 | $ | 10,909,649 | ||||
| ACCUMULATED NET INVESTMENT INCOME (LOSS) | $ | 23,704 | $ | (205 | ) | |||
| SUMMARY OF CAPITAL SHARE ACTIVITY | ||||||||
| Shares sold | 107,735 | 461,696 | ||||||
| Shares issued in reinvestment of distributions to shareholders | 2,182 | 236,210 | ||||||
| Shares redeemed | (266,266 | ) | (502,065 | ) | ||||
| Net increase (decrease) in shares outstanding | (156,349 | ) | 195,841 | |||||
| Shares outstanding, beginning of period | 1,703,663 | 1,507,822 | ||||||
| Shares outstanding, end of period | 1,547,314 | 1,703,663 | ||||||
See accompanying Notes to Financial Statements.
15
JAMES MID CAP FUND
STATEMENTS OF CHANGES IN NET ASSETS
Six Months Ended December 31, 2009 (Unaudited) | Year Ended June 30, 2009 | |||||||
| FROM OPERATIONS | ||||||||
| Net investment income | $ | 6,263 | $ | 21,474 | ||||
| Net realized losses from security transactions | (165,725 | ) | (1,017,693 | ) | ||||
| Net change in unrealized appreciation/depreciation on investments | 1,203,284 | (915,550 | ) | |||||
| Net increase (decrease) in net assets from operations | 1,043,822 | (1,911,769 | ) | |||||
| FROM DISTRIBUTIONS TO SHAREHOLDERS | ||||||||
| Dividends from net investment income | (2,651 | ) | (21,999 | ) | ||||
| FROM CAPITAL SHARE TRANSACTIONS | ||||||||
| Proceeds from shares sold | 139,821 | 1,257,054 | ||||||
| Net asset value of shares issued in reinvestment of distributions to shareholders | 2,646 | 21,942 | ||||||
| Payments for shares redeemed | (872,147 | ) | (908,811 | ) | ||||
| Net increase (decrease) in net assets from capital share transactions | (729,680 | ) | 370,185 | |||||
| TOTAL INCREASE (DECREASE) IN NET ASSETS | 311,491 | (1,563,583 | ) | |||||
| NET ASSETS | ||||||||
| Beginning of period | 4,438,294 | 6,001,877 | ||||||
| End of period | $ | 4,749,785 | $ | 4,438,294 | ||||
| ACCUMULATED NET INVESTMENT INCOME (LOSS) | $ | 3,592 | $ | (20 | ) | |||
| SUMMARY OF CAPITAL SHARE ACTIVITY | ||||||||
| Shares sold | 16,669 | 182,444 | ||||||
| Shares issued in reinvestment of distributions to shareholders | 320 | 3,373 | ||||||
| Shares redeemed | (107,939 | ) | (118,959 | ) | ||||
| Net increase (decrease) in shares outstanding | (90,950 | ) | 66,858 | |||||
| Shares outstanding, beginning of period | 629,753 | 562,895 | ||||||
| Shares outstanding, end of period | 538,803 | 629,753 | ||||||
See accompanying Notes to Financial Statements.
16
JAMES BALANCED: GOLDEN RAINBOW FUND - RETAIL CLASS
FINANCIAL HIGHLIGHTS
| Per Share Data for a Share Outstanding Throughout Each Period | ||||||||||||||||||||||||
Six Months Ended December 31, 2009 | Year Ended June 30, | |||||||||||||||||||||||
| (Unaudited) | 2009 | 2008 | 2007 | 2006 | 2005 | |||||||||||||||||||
| Net asset value at beginning of period | $ | 16.69 | $ | 18.09 | $ | 18.33 | $ | 17.32 | $ | 17.18 | $ | 15.28 | ||||||||||||
| Income (loss) from investment operations: | ||||||||||||||||||||||||
| Net investment income | 0.15 | 0.28 | 0.40 | 0. 39 | 0.34 | 0.26 | ||||||||||||||||||
| Net realized and unrealized gains (losses) on investments | 1.31 | (1.40 | ) | 0.11 | 1. 34 | 0.75 | 1.95 | |||||||||||||||||
| Total from investment operations | 1.46 | (1.12 | ) | 0.51 | 1. 73 | 1.09 | 2.21 | |||||||||||||||||
| Less distributions: | ||||||||||||||||||||||||
| From net investment income | (0.15 | ) | (0.28 | ) | (0.40 | ) | (0.40 | ) | (0.34 | ) | (0.26 | ) | ||||||||||||
| From net realized gains on investments | — | (0.00 | )(A) | (0.35 | ) | (0.32 | ) | (0.61 | ) | (0.05 | ) | |||||||||||||
| Total distributions | (0.15 | ) | (0.28 | ) | (0.75 | ) | (0.72 | ) | (0.95 | ) | (0.31 | ) | ||||||||||||
| Net asset value at end of period | $ | 18.00 | $ | 16.69 | $ | 18.09 | $ | 18.33 | $ | 17.32 | $ | 17.18 | ||||||||||||
| Total return | 8.72 | %(B) | (6.19 | % ) | 2.76 | % | 10.13 | % | 6.48 | % | 14.56 | % | ||||||||||||
| Net assets at end of period (000’s) | $ | 561,190 | $ | 537,358 | $ | 478,694 | $ | 341,664 | $ | 268,766 | $ | 147,605 | ||||||||||||
| Ratios/Supplemental Data: | ||||||||||||||||||||||||
| Ratio of net expenses to average net assets | 1.18 | %(C) | 1.16 | % | 1.18 | % | 1.18 | % | 1.21 | % | 1.26 | % | ||||||||||||
| Ratio of net investment income to average net assets | 1.67 | %(C) | 1.68 | % | 2.20 | % | 2.24 | % | 2.11 | % | 1.70 | % | ||||||||||||
| Portfolio turnover rate | 33 | %(C) | 72 | % | 53 | % | 92 | % | 68 | % | 36 | % | ||||||||||||
(A) Amount rounds to less than $0.005.
(B) Not annualized.
(C) Annualized.
See accompanying Notes to Financial Statements.
17
JAMES BALANCED: GOLDEN RAINBOW FUND -
INSTITUTIONAL CLASS
FINANCIAL HIGHLIGHTS
| Per Share Data for a Share Outstanding Throughout the Period | ||||||||
Six Months Ended December 31, 2009 (Unaudited) | Period Ended June 30, 2009(A ) | |||||||
| Net asset value at beginning of period | $ | 16.69 | $ | 14.80 | ||||
| Income from investment operations: | ||||||||
| Net investment income | 0.15 | 0.09 | ||||||
| Net realized and unrealized gains on investments | 1.33 | 1.94 | ||||||
| Total from investment operations | 1.48 | 2.03 | ||||||
| Less distributions: | ||||||||
| From net investment income | (0.17 | ) | (0.14 | ) | ||||
| Net asset value at end of period | $ | 18.00 | $ | 16.69 | ||||
Total return (B) | 8.86 | % | 13.75 | % | ||||
| Net assets at end of period (000’s) | $ | 352 | $ | 115 | ||||
| Ratios/Supplemental Data: | ||||||||
Ratio of net expenses to average net assets(C) | 0.93 | % | 0.95 | % | ||||
Ratio of net investment income to average net assets (C) | 1.94 | % | 1.63 | % | ||||
| Portfolio turnover rate | 33 | % | 72 | % | ||||
(A) Represents the period from commencement of operations (March 2, 2009) through June 30, 2009.
(B) Not annualized.
(C) Annualized.
See accompanying Notes to Financial Statements.
18
JAMES SMALL CAP FUND
FINANCIAL HIGHLIGHTS
Per Share Data for a Share Outstanding Throughout Each Period | ||||||||||||||||||||||||
Six Months Ended December 31, 2009 | Year Ended June 30, | |||||||||||||||||||||||
| (Unaudited) | 2009 | 2008 | 2007 | 2006 | 2005 | |||||||||||||||||||
| Net asset value at beginning of period | $ | 14.18 | $ | 20.04 | $ | 24.56 | $ | 23.28 | $ | 20.46 | $ | 18.66 | ||||||||||||
| Income (loss) from investment operations: | ||||||||||||||||||||||||
| Net investment income (loss) | 0.02 | 0.06 | 0.10 | 0.11 | (0.04 | ) | 0.05 | |||||||||||||||||
| Net realized and unrealized gains (losses) on investments | 2.55 | (5.86 | ) | (4.52 | ) | 1.50 | 3.19 | 2.65 | ||||||||||||||||
| Total from investment operations | 2.57 | (5.80 | ) | (4.42 | ) | 1.61 | 3.15 | 2.70 | ||||||||||||||||
| Less distributions: | ||||||||||||||||||||||||
| From net investment income | — | (0.06 | ) | (0.10 | ) | (0.11 | ) | (0.04 | ) | — | ||||||||||||||
| From net realized gains on investments | — | — | — | (0.22 | ) | (0.30 | ) | (1.00 | ) | |||||||||||||||
| Total distributions | — | (0.06 | ) | (0.10 | ) | (0.33 | ) | (0.34 | ) | (1.00 | ) | |||||||||||||
Paid-in capital from redemption fees (A) | — | — | — | 0.00 | (B) | 0.01 | 0.10 | |||||||||||||||||
| Net asset value at end of period | $ | 16.75 | $ | 14.18 | $ | 20.0 4 | $ | 24.56 | $ | 23.28 | $ | 20.46 | ||||||||||||
| Total return | 18.12 | %(c) | (28.91 | %) | (18.03 | %) | 6.97 | % | 15.59 | % | 15.39 | % | ||||||||||||
| Net assets at end of period (000’s) | $ | 71,670 | $ | 99,801 | $ | 177,915 | $ | 327,467 | $ | 170,490 | $ | 54,489 | ||||||||||||
| Ratios/Supplemental Data: | ||||||||||||||||||||||||
| Ratio of net expenses to average net assets | 1.50 | %(D) | 1.50 | % | 1.50 | % | 1.50 | % | 1.50 | % | 1.50 | % | ||||||||||||
Ratio of net investment income (loss) to average net assets | 0.19 | %(D) | 0.37 | % | 0.42 | % | 0.54 | % | (0.25 | %) | 0.45 | % | ||||||||||||
| Portfolio turnover rate | 9 | %(D) | 46 | % | 54 | % | 104 | % | 59 | % | 94 | % | ||||||||||||
(A) Amount calculated based on average shares outstanding throughout the period. Effective February 21, 2007, the redemption fee was eliminated.
(B) Amount rounds to less than $0.005.
(C) Not annualized.
(D) Annualized.
See accompanying Notes to Financial Statements.
19
JAMES MARKET NEUTRAL FUND
FINANCIAL HIGHLIGHTS
| Per Share Data for a Share Outstanding Throughout Each Period | ||||||||||||||||||||||||
| Six Months Ended December 31, 2009 | Year Ended June 30, | |||||||||||||||||||||||
| (Unaudited) | 2009 | 2008 | 2007 | 2006 | 2005 | |||||||||||||||||||
| Net asset value at beginning of period | $ | 10.01 | $ | 12.30 | $ | 12.17 | $ | 12.69 | $ | 12.27 | $ | 11.02 | ||||||||||||
| Income (loss) from investment operations: | ||||||||||||||||||||||||
| Net investment income (loss) | (0.03 | ) | (0.11 | ) | 0.11 | 0.40 | 0.17 | 0.01 | ||||||||||||||||
| Net realized and unrealized gains (losses) on investments | (0.36 | ) | (2.17 | ) | 0.20 | (0.51 | ) | 0.42 | 1.23 | |||||||||||||||
| Total from investment operations | (0.39 | ) | (2.28 | ) | 0.31 | (0.11 | ) | 0.59 | 1.24 | |||||||||||||||
| Less distributions: | ||||||||||||||||||||||||
| From net investment income | — | (0.01 | ) | (0.18 | ) | (0.41 | ) | (0.18 | ) | — | ||||||||||||||
Paid-in capital from redemption fees(A) | — | — | — | 0.00 | (B) | 0.01 | 0.01 | |||||||||||||||||
| Net asset value at end of period | $ | 9.62 | $ | 10.01 | $ | 12.30 | $ | 12.17 | $ | 12.69 | $ | 12.27 | ||||||||||||
| Total return | (3.90 | %)(D) | (18.55 | %) | 2.60 | % | (0.84 | %) | 4.94 | % | 11.34 | % | ||||||||||||
| Net assets at end of period (000’s) | $ | 35,571 | $ | 33,345 | $ | 50,289 | $ | 51,527 | $ | 75,218 | $ | 47,303 | ||||||||||||
| Ratios/Supplemental Data: | ||||||||||||||||||||||||
| Ratio of net expenses to average net assets, excluding dividends on securities sold short | 1.95 | %(E) | 1.95 | % | 1.91 | % | 1.94 | % | 1.95 | % | 1.95 | % | ||||||||||||
| Ratio of dividend expense on securities sold short | 0.11 | %(E) | 0.32 | % | 0.90 | % | 0.32 | % | 0.62 | % | 0.42 | % | ||||||||||||
| Ratio of net expenses to average net assets | 2.06 | %(E) | 2.27 | % | 2.81 | % | 2.26 | % | 2.57 | % | 2.37 | % | ||||||||||||
| Ratio of net investment income (loss) to average net assets | (0.73 | %)(E) | (0.76 | %) | 0.74 | % | 3.21 | % | 1.52 | % | 0.11 | % | ||||||||||||
Portfolio turnover rate(C) | 29 | %(E) | 65 | % | 79 | % | 57 | % | 27 | % | 35 | % | ||||||||||||
| (A) | Amount calculated based on average shares outstanding throughout the period. Effective February 21, 2007, the redemption fee was eliminated. |
| (B) | Amount rounds to less than $0.005. |
| (C) | Calculation does not include short positions or short transactions. Portfolio turnover rate would be higher if included. |
| (D) | Not annualized. |
| (E) | Annualized. |
See accompanying Notes to Financial Statements.
20
JAMES EQUITY FUND
FINANCIAL HIGHLIGHTS
| Per Share Data for a Share Outstanding Throughout Each Period | ||||||||||||||||||||||||
| Six Months Ended December 31, 2009 | Year Ended June 30, | |||||||||||||||||||||||
(Unaudited) | 2009 | 2008 | 2007 | 2006 | 2005 | |||||||||||||||||||
| Net asset value at beginning of period | $ | 6.40 | $ | 10.75 | $ | 12.28 | $ | 11.04 | $ | 8.89 | $ | 7.36 | ||||||||||||
| Income (loss) from investment operations: | ||||||||||||||||||||||||
| Net investment income | 0.03 | 0.04 | 0.03 | 0.04 | 0.01 | 0.01 | ||||||||||||||||||
| Net realized and unrealized gains (losses) on investments | 0.98 | (3.48 | ) | (1.53 | ) | 1.24 | 2.16 | 1.53 | ||||||||||||||||
| Total from investment operations | 1.01 | (3.44 | ) | (1.50 | ) | 1.28 | 2.17 | 1.54 | ||||||||||||||||
| Less distributions: | ||||||||||||||||||||||||
| From net investment income | (0.01 | ) | (0.04 | ) | (0.03 | ) | (0.04 | ) | (0.01 | ) | (0.01 | ) | ||||||||||||
| From net realized gains on investments | — | (0.87 | ) | — | — | — | — | |||||||||||||||||
| From distributions in excess of net investment income | — | — | — | — | (0.01 | ) | — | |||||||||||||||||
| Total distributions | (0.01 | ) | (0.91 | ) | (0.03 | ) | (0.04 | ) | (0.02 | ) | (0.01 | ) | ||||||||||||
Paid-in capital from redemption fees(A) | — | — | — | 0.00 | (B) | 0.00 | (B) | 0.00 | (B) | |||||||||||||||
| Net asset value at end of period | $ | 7.40 | $ | 6.40 | $ | 10.75 | $ | 12.28 | $ | 11.04 | $ | 8.89 | ||||||||||||
| Total return | 15.79 | %(C) | (30.54 | %) | (12.20 | %) | 11.59 | % | 24.45 | % | 20.96 | % | ||||||||||||
| Net assets at end of period (000’s) | $ | 11,455 | $ | 10,910 | $ | 16,214 | $ | 25,873 | $ | 33,792 | $ | 16,833 | ||||||||||||
| Ratios/Supplemental Data: | ||||||||||||||||||||||||
| Ratio of net expenses to average net assets | 1.50 | %(D) | 1.50 | % | 1.50 | % | 1.50 | % | 1.50 | % | 1.50 | % | ||||||||||||
| Ratio of net investment income to average net assets | 0.70 | %(D) | 0.63 | % | 0.23 | % | 0.30 | % | 0.06 | % | 0.22 | % | ||||||||||||
| Portfolio turnover rate | 14 | %(D) | 81 | % | 50 | % | 58 | % | 43 | % | 33 | % | ||||||||||||
(A) Amount calculated based on average shares outstanding throughout the period. Effective February 21, 2007, the redemption fee was eliminated.
(B) Amount rounds to less than $0.005.
(C) Not annualized.
(D) Annualized.
See accompanying Notes to Financial Statements.
21
| JAMES MID CAP FUND |
| FINANCIAL HIGHLIGHTS |
| Per Share Data for a Share Outstanding Throughout Each Period |
Six Months Ended December 31, 2009 | Year Ended June 30, | |||||||||||||||
| (Unaudited) | 2009 | 2008 | 2007 | |||||||||||||
| Net asset value at beginning of period | $ | 7.05 | $ | 10.66 | $ | 11.70 | $ | 10.00 | ||||||||
| Income (loss) from investment operations: | ||||||||||||||||
| Net investment income | 0.01 | 0.03 | 0.00 | (A) | 0.04 | |||||||||||
| Net realized and unrealized gains (losses) on investments | 1.76 | (3.61 | ) | (1.01 | ) | 1.70 | ||||||||||
| Total from investment operations | 1.77 | (3.58 | ) | (1.01 | ) | 1.74 | ||||||||||
| Less distributions: | ||||||||||||||||
| From net investment income | (0.00 | )(A) | (0.03 | ) | (0.01 | ) | — | |||||||||
| From net realized gains on investments | — | — | (0.02 | ) | (0.04 | ) | ||||||||||
| Total distributions | (0.00 | )(A) | (0.03 | ) | (0.03 | ) | (0.04 | ) | ||||||||
Paid-in capital from redemption fees(B) | — | — | — | 0.00 | (A) | |||||||||||
| Net asset value at end of period | $ | 8.82 | $ | 7.05 | $ | 10.66 | $ | 11.70 | ||||||||
| Total return | 25.18 | % (C) | (33.51 | %) | (8.61 | %) | 17.41 | % | ||||||||
| Net assets at end of period (000’s) | $ | 4,750 | $ | 4,438 | $ | 6,002 | $ | 6,441 | ||||||||
| Ratios/Supplemental Data: | ||||||||||||||||
| Ratio of net expenses to average net assets | 1.50 | % (D) | 1.50 | % | 1.48 | % | 1.49 | % | ||||||||
| Ratio of net investment income to average net assets | 0.27 | % (D) | 0.48 | % | 0.01 | % | 0.40 | % | ||||||||
| Portfolio turnover rate | 14 | % (D) | 38 | % | 55 | % | 53 | % | ||||||||
| (A) | Amount rounds to less than $0.005. |
| (B) | Amount calculated based on average shares outstanding throughout the period. Effective February 21, 2007, the redemption fee was eliminated. |
| (C) | Not annualized. |
| (D) | Annualized. |
See accompanying Notes to Financial Statements.
22
JAMES BALANCED: GOLDEN RAINBOW FUND
SCHEDULE OF INVESTMENTS
December 31, 2009 (Unaudited)
| Shares | COMMON STOCKS — 41.0% | Value | |||
| BASIC MATERIALS — 3.8% | |||||
| 85,000 | Barrick Gold Corporation | $ | 3,347,300 | ||
| 116,800 | FMC Corporation | 6,512,768 | |||
| 6,000 | Gold Trust SPDR* | 643,860 | |||
| 20,000 | iShares Silver Trust* | 331,400 | |||
| 37,000 | Kinross Gold Corporation | 680,800 | |||
| 97,000 | Newmont Mining Corporation | 4,589,070 | |||
| 30,000 | Olin Corporation | 525,600 | |||
| 30,000 | PPG Industries, Inc. | 1,756,200 | |||
| 30,000 | Terra Nitrogen Company, L.P. | 3,122,400 | |||
| 21,509,398 | |||||
| CONSUMER, CYCLICAL — 5.5% | |||||
| 70,000 | Best Buy Company, Inc. | 2,762,200 | |||
| 100,000 | BJ's Wholesale Club, Inc.* | 3,271,000 | |||
| 100,000 | Bob Evans Farms, Inc. | 2,895,000 | |||
| 98,000 | Central Garden & Pet Company* | 1,048,600 | |||
| 135,000 | Dollar Tree, Inc.* | 6,520,500 | |||
| 15,000 | Family Dollar Stores, Inc. | 417,450 | |||
| 40,000 | McDonald’s Corporation | 2,497,600 | |||
| 58,000 | Netflix, Inc.* | 3,198,120 | |||
| 10,000 | NIKE, Inc. - Class B | 660,700 | |||
| 40,000 | The Buckle, Inc. | 1,171,200 | |||
| 105,000 | The Gymboree Corporation* | 4,566,450 | |||
| 30,000 | Wal-Mart Stores, Inc. | 1,603,500 | |||
| 30,612,320 | |||||
| CONSUMER, NON-CYCLICAL — 6.8% | |||||
| 100,000 | Archer-Daniels-Midland Company | 3,131,000 | |||
| 90,900 | Darling International, Inc.* | 761,742 | |||
| 110,000 | Del Monte Foods Company | 1,247,400 | |||
| 115,000 | EZCORP, Inc. - Class A* | 1,979,150 | |||
| 73,000 | Fresh Del Monte Produce, Inc.* | 1,613,300 | |||
| 42,700 | Ingles Markets, Inc. - Class A | 646,051 | |||
| 160,000 | Kroger Company | 3,284,800 | |||
| 154,000 | Merck & Company, Inc. | 5,627,160 | |||
| 13,000 | Mylan, Inc.* | 239,590 | |||
| 80,000 | PepsiAmericas, Inc. | 2,340,800 | |||
| 280,000 | Pfizer, Inc. | 5,093,200 | |||
| 120,000 | Sara Lee Corporation | 1,461,600 | |||
| 125,000 | Tupperware Brands Corporation | 5,821,250 | |||
| 92,700 | Watson Wyatt Worldwide, Inc. - Class A | 4,405,104 | |||
| 37,652,147 |
23
JAMES BALANCED: GOLDEN RAINBOW FUND
SCHEDULE OF INVESTMENTS (Continued)
| Shares | COMMON STOCKS — 41.0% (Continued) | Value | |||
| ENERGY — 3.6% | |||||
| 27,500 | Apache Corporation | $ | 2,837,175 | ||
| 10,000 | Bolt Technology Corporation* | 110,200 | |||
| 69,140 | Chevron Corporation | 5,323,089 | |||
| 64,000 | Devon Energy Corporation | 4,704,000 | |||
| 64,300 | Exxon Mobil Corporation | 4,384,617 | |||
| 50,000 | Imperial Oil, Ltd. | 1,933,000 | |||
| 8,000 | Noble Energy, Inc. | 569,760 | |||
| 12,000 | Suburban Propane Partners, L.P. | 564,960 | |||
| 20,426,801 | |||||
| FINANCIAL — 4.2% | |||||
| 245,000 | American Financial Group, Inc. | 6,112,750 | |||
| 140,000 | American Physicians Capital, Inc. | 4,244,800 | |||
| 155,000 | Amerisafe, Inc.* | 2,785,350 | |||
| 109,346 | AmTrust Financial Services, Inc. | 1,292,470 | |||
| 100,000 | Annaly Capital Management, Inc. | 1,735,000 | |||
| 2,000 | Euro Currency Trust | 285,820 | |||
| 16,000 | iShares Dow Jones U.S. Financial Sector Index Fund | 828,480 | |||
| 57,000 | Knight Capital Group, Inc. - Class A* | 877,800 | |||
| 250,900 | Rent-A-Center, Inc.* | 4,445,948 | |||
| 37,000 | Unum Group | 722,240 | |||
| 23,330,658 | |||||
| INDUSTRIAL — 4.3% | |||||
| 102,000 | AGCO Corporation* | 3,298,680 | |||
| 115,000 | Ampco-Pittsburgh Corporation | 3,625,950 | |||
| 70,000 | CSX Corporation | 3,394,300 | |||
| 35,000 | Cummins, Inc. | 1,605,100 | |||
| 7,000 | Fluor Corporation | 315,280 | |||
| 243,000 | GrafTech International Ltd.* | 3,778,650 | |||
| 10,000 | Granite Construction, Inc. | 336,600 | |||
| 40,000 | Greif, Inc. - Class A | 2,159,200 | |||
| 5,000 | Norfolk Southern Corporation | 262,100 | |||
| 171,700 | Owens-Illinois, Inc.* | 5,643,779 | |||
| 24,419,639 | |||||
| TECHNOLOGY — 8.4% | |||||
| 30,000 | Arrow Electronics, Inc.* | 888,300 | |||
| 10,000 | Avnet, Inc.* | 301,600 | |||
| 14,000 | Computer Sciences Corporation* | 805,420 | |||
| 40,000 | Deluxe Corporation | 591,600 | |||
| 30,000 | Goodrich Corporation | 1,927,500 | |||
| 170,000 | Hewlett-Packard Company | 8,756,700 | |||
| 82,000 | International Business Machines Corporation (IBM) | 10,733,799 | |||
| 33,000 | Lockheed Martin Corporation | 2,486,550 | |||
| 57,500 | Northrop Grumman Corporation | 3,211,375 | |||
| 8,000 | SYNNEX Corporation* | 245,280 |
24
JAMES BALANCED: GOLDEN RAINBOW FUND
SCHEDULE OF INVESTMENTS (Continued)
| Shares | COMMON STOCKS — 41.0% (Continued) | Value | |||
| TECHNOLOGY — 8.4% (Continued) | |||||
| 130,000 | Triumph Group, Inc. | $ | 6,272,500 | ||
| 239,500 | Western Digital Corporation* | 10,573,925 | |||
| 46,794,549 | |||||
| UTILITIES — 4.4% | |||||
| 115,000 | American Electric Power Company, Inc. | 4,000,850 | |||
| 185,000 | AT&T, Inc. | 5,185,550 | |||
| 180,000 | CenturyTel, Inc. | 6,517,800 | |||
| 20,000 | DTE Energy Company | 871,800 | |||
| 41,000 | Edison International | 1,425,980 | |||
| 16,700 | FirstEnergy Corporation | 775,715 | |||
| 87,000 | MDU Resources Group, Inc. | 2,053,200 | |||
| 14,000 | ONEOK, Inc. | 623,980 | |||
| 60,000 | Sempra Energy | 3,358,800 | |||
| 5,000 | The Laclede Group, Inc. | 168,850 | |||
| 24,982,525 | |||||
| TOTAL COMMON STOCKS | $ | 229,728,037 | |||
| Shares | INTERNATIONAL EQUITY EXCHANGE TRADED FUNDS — 0.8% | Value | |||
| 12,000 | iShares FTSE/Xinhua China 25 Index Fund | $ | 507,240 | ||
| 20,000 | iShares MSCI All Peru Capped Index Fund | 654,000 | |||
| 39,000 | iShares MSCI Canada Index Fund | 1,026,870 | |||
| 20,000 | iShares MSCI Chile Investable Market Index Fund | 1,095,800 | |||
| 72,000 | iShares MSCI Japan Index Fund | 701,280 | |||
| 14,000 | iShares MSCI South Korea Index Fund | 666,960 | |||
| TOTAL INTERNATIONAL EQUITY EXCHANGE TRADED FUNDS | $ | 4,652,150 | |||
| Shares | INTERNATIONAL BOND EXCHANGE TRADED FUNDS — 0.2% | Value | |||
| 20,000 | SPDR Barclays Capital International Treasury Bond ETF | $ | 1,136,600 |
25
JAMES BALANCED: GOLDEN RAINBOW FUND
SCHEDULE OF INVESTMENTS (Continued)
| Par Value | U.S. GOVERNMENT & AGENCY BONDS — 38.8% | Value | |||
| $ | 674,796 | Government National Mortgage Association, 5.500%, 6/15/23 | $ | 716,844 | |
| 868,579 | Government National Mortgage Association, 5.000%, 10/15/38 | 894,877 | |||
| 1,921,239 | Government National Mortgage Association, 4.500%, 2/15/39 | 1,925,926 | |||
| 3,496,195 | Government National Mortgage Association, 4.000%, 3/20/39 | 3,374,084 | |||
| 4,962,447 | Government National Mortgage Association, 4.500%, 6/15/39 | 4,974,555 | |||
| 2,980,769 | Government National Mortgage Association, 4.500%, 7/15/39 | 2,988,041 | |||
| 9,907,235 | Government National Mortgage Association, 4.000%, 9/15/39 | 9,589,045 | |||
| 500,000 | Tennessee Valley Authority, 5.625%, 1/18/11 | 525,955 | |||
| 5,000,000 | U.S. Treasury Bonds, 4.375%, 2/15/38 | 4,800,000 | |||
| 22,500,000 | U.S. Treasury Bonds, 3.500%, 2/15/39 | 18,428,895 | |||
| 5,000,000 | U.S. Treasury Inflation Indexed Note, 1.250%, 4/15/14 | 5,278,373 | |||
| 8,750,000 | U.S. Treasury Inflation Indexed Note, 2.500%, 7/15/16 | 10,199,519 | |||
| 11,500,000 | U.S. Treasury Inflation Indexed Note, 1.625%, 1/15/18 | 12,147,291 | |||
| 23,000,000 | U.S. Treasury Notes, 1.250%, 11/30/10 | 23,161,713 | |||
| 10,000,000 | U.S. Treasury Notes, 4.875%, 2/15/12 | 10,760,160 | |||
| 19,300,000 | U.S. Treasury Notes, 3.875%, 2/15/13 | 20,554,500 | |||
| 48,000,000 | U.S. Treasury Notes, 4.625%, 2/15/17 | 51,828,767 | |||
| 17,400,000 | U.S. Treasury Notes, 3.500%, 2/15/18 | 17,257,268 | |||
| 20,000,000 | U.S. Treasury Notes, 2.750%, 2/15/19 | 18,412,500 | |||
| TOTAL U.S. GOVERNMENT & AGENCY BONDS | $ | 217,818,313 | |||
| Par Value | CORPORATE BONDS — 3.7% | Value | |||
| $ | 500,000 | Anheuser-Busch Companies, Inc., 6.000%, 4/15/11 | $ | 527,243 | |
| 1,000,000 | Caterpillar, Inc., 7.900%, 12/15/18 | 1,219,932 | |||
| 1,000,000 | Caterpillar, Inc., 8.250%, 12/15/38 | 1,334,614 | |||
| 2,500,000 | Citigroup, Inc., 2.875%, 12/9/11 | 2,574,998 | |||
| 1,500,000 | E.I. Du Pont De Nemours, 5.750%, 3/15/19 | 1,608,245 | |||
| 2,000,000 | General Electric Capital Corporation, 6.875%, 1/10/39 | 2,065,370 | |||
| 785,000 | McDonald's Corporation, 5.700%, 2/1/39 | 800,716 | |||
| 3,700,000 | Microsoft Corporation, 5.200%, 6/1/39 | 3,623,399 | |||
| 5,000,000 | U.S. Bancorp, 2.250%, 3/13/12 | 5,083,204 | |||
| 2,000,000 | Walmart Stores, 5.250%, 9/1/35 | 1,966,638 | |||
| TOTAL CORPORATE BONDS | $ | 20,804,359 | |||
| Par Value | MUNICIPAL BONDS** — 4.5% | Value | |||
| $ | 1,000,000 | Adams Co CO SD No 014 Ser 2006 UTGO, 5.000%, 12/1/26 | $ | 1,053,690 | |
| 1,000,000 | Citrus CA Community College Ser 2007B UTGO, 4.750%, 6/1/31 | 980,200 | |||
| 4,620,000 | Columbus OH CSD UTGO, 6.150%, 12/1/33 | 4,626,514 | |||
| 1,000,000 | East Baton Rouge LA Swr Community Rev, 5.125%, 2/1/29 | 1,056,770 | |||
| 1,000,000 | FL St Brd Ed Cap Outlay 2007 Ser D UTGO, 5.000%, 6/1/38 | 1,030,210 | |||
| 1,000,000 | Friendswood TX ISD Ser 2008 UTGO (Schoolhouse), 5.000%, 2/15/37 | 1,046,120 |
26
JAMES BALANCED: GOLDEN RAINBOW FUND
SCHEDULE OF INVESTMENTS (Continued)
| Par Value | MUNICIPAL BONDS** — 4.5% (Continued) | Value | |||
| $ | 3,000,000 | GA St Ser B UTGO, 4.500%, 1/1/29 | $ | 3,154,140 | |
| 1,000,000 | Illinois St Ser A, 4.750%, 9/1/26 | 1,030,030 | |||
| 1,000,000 | Judson TX ISD Ser 2008 UTGO, 5.000%, 2/1/37 | 1,016,650 | |||
| 500,000 | Kane & DeKalb Cntys IL Community Unit SD Bldg No 302 | ||||
| Ser 2008 UTGO, 5.500%, 2/1/28 | 534,835 | ||||
| 500,000 | Lamar TX Consolidated ISD Ser 2008 UTGO (Schoolhouse), 5.000%, 2/15/38 | 521,875 | |||
| 1,000,000 | MA St Consolidated Loan Ser 2007C UTGO, 5.250%, 8/1/22 | 1,119,530 | |||
| 1,000,000 | Marysville MI Pub SD Ser 2007 UTGO, 5.000%, 5/1/32 | 1,015,880 | |||
| 125,000 | Mesa AZ IDA Rev Ser A (Discovery Health Systems), 5.625%, 1/1/29 | 126,250 | |||
| 1,100,000 | Miamisburg OH CSD UTGO, 5.000%, 12/1/33 | 1,165,692 | |||
| 500,000 | Mt Healthy OH CSD Sch Impt Ser 2008 UTGO, 5.000%, 12/1/26 | 531,740 | |||
| 550,000 | OH St Higher Ed Cap Fac Ser 2000A UTGO, 5.250%, 2/1/13 | 552,250 | |||
| 1,000,000 | OH St Ser A, 5.375%, 9/1/28 | 1,106,680 | |||
| 1,000,000 | OH St Univ Gen Rcpts Ser A, 5.000%, 12/1/28 | 1,066,620 | |||
| 500,000 | Springboro OH Community CSD Ser 2007 UTGO, 5.250%, 12/1/23 | 569,175 | |||
| 1,000,000 | Tyler TX ISD UTGO, 5.000%, 2/15/34 | 1,028,850 | |||
| 1,000,000 | Will and DuPage Cntys IL Ser 2007 UTGO (Bolingbrook), 5.000%, 1/1/37 | 962,740 | |||
| TOTAL MUNICIPAL BONDS | $ | 25,296,441 | |||
| Par Value | FOREIGN BONDS — 8.6% | Value | |||
| $ | 10,000,000 | Australian Government, 5.250%, 3/15/19 | $ | 8,723,647 | |
| 6,000,000 | Bundesrepublik Deutschland, 3.750%, 1/4/19 | 8,880,292 | |||
| 10,000,000 | Canada Government, 3.750%, 6/1/19 | 9,617,580 | |||
| 25,000,000 | Denmark DGB, 4.000%, 11/15/19 | 4,927,847 | |||
| 6,000,000 | Netherlands Government, 4.000%, 7/15/19 | 8,912,592 | |||
| 5,000,000 | New Zealand Government, 6.000%, 12/15/17 | 3,666,727 | |||
| 21,000,000 | Norwegian Government, 4.500%, 5/22/19 | 3,723,124 | |||
| TOTAL FOREIGN BONDS | $ | 48,451,809 | |||
| TOTAL INVESTMENTS SECURITIES — 97.6% | |||||
| (Amortized Cost $497,481,417) | $ | 547,887,709 | |||
| OTHER ASSETS IN EXCESS OF LIABILITIES — 2.4% | 13,654,238 | ||||
| NET ASSETS — 100.0% | $ | 561,541,947 |
* Non-income producing security.
** All municipal securities are rated A or higher (Unaudited).
† Represents original purchase par.
CSD – City School District
IDA – Industrial Development Authority
ISD – Independent School District
SD – School District
UTGO – Unlimited Tax General Obligation
| Foreign Bonds Securities Allocation | ||||
| % of total | ||||
| net assets | ||||
| Asia - Pacific | 2.2 | % | ||
| Europe- Euro | 3.2 | % | ||
| Europe | 1.5 | % | ||
| North America | 1.7 | % | ||
| 8.6 | % | |||
See accompanying Notes to Financial Statements.
27
JAMES SMALL CAP FUND
SCHEDULE OF INVESTMENTS
December 31, 2009 (Unaudited)
| Shares | COMMON STOCKS — 84.1% | Value | |||
| BASIC MATERIALS — 3.0% | |||||
| 107,820 | Aurizon Mines Ltd.* | $ | 485,190 | ||
| 1,400 | Hawkins, Inc. | 30,562 | |||
| 1,900 | Innophos Holdings, Inc. | 43,681 | |||
| 191,600 | Northgate Minerals Corporation* | 590,127 | |||
| 2,800 | Oil-Dri Corporation of America | 43,400 | |||
| 6,550 | ShengdaTech, Inc.* | 40,152 | |||
| 24,580 | Silver Standard Resources, Inc.* | 537,565 | |||
| 12,420 | Terra Industries, Inc. | 399,800 | |||
| 2,170,477 | |||||
| CONSUMER, CYCLICAL — 18.9% | |||||
| 1,575 | America's Car-Mart, Inc.* | 41,470 | |||
| 18,860 | Big Lots, Inc.* | 546,563 | |||
| 28,120 | BJ's Wholesale Club, Inc.* | 919,805 | |||
| 16,560 | Bob Evans Farms, Inc. | 479,412 | |||
| 124,160 | Central Garden & Pet Company* | 1,328,512 | |||
| 31,188 | Dollar Tree, Inc.* | 1,506,380 | |||
| 4,000 | Dorman Products, Inc.* | 62,640 | |||
| 20,875 | DreamWorks Animation SKG, Inc. - Class A* | 833,956 | |||
| 1,075 | Frisch's Restaurants, Inc. | 25,639 | |||
| 42,060 | Netflix, Inc.* | 2,319,188 | |||
| 28,560 | Polaris Industries, Inc. | 1,246,073 | |||
| 25,220 | RadioShack Corporation | 491,790 | |||
| 1,150 | Red Robin Gourmet Burgers, Inc.* | 20,585 | |||
| 70,228 | The Buckle, Inc. | 2,056,276 | |||
| 36,940 | The Gymboree Corporation* | 1,606,521 | |||
| 1,675 | True Religion Apparel, Inc.* | 30,971 | |||
| 13,515,781 | |||||
| CONSUMER, NON-CYCLICAL — 12.2% | |||||
| 26,200 | Allied Healthcare International, Inc.* | 76,242 | |||
| 4,725 | Allion Healthcare, Inc.* | 30,996 | |||
| 2,000 | ATC Technology Corporation* | 47,700 | |||
| 18,560 | Biovail Corporation | 259,098 | |||
| 10,300 | Compania Cervecerias Unidas S.A. ADR | 401,906 | |||
| 184,000 | Del Monte Foods Company | 2,086,560 | |||
| 102,746 | Fresh Del Monte Produce, Inc.* | 2,270,687 | |||
| 7,300 | Hanger Orthopedic Group, Inc.* | 100,959 | |||
| 22,680 | LifePoint Hospitals, Inc.* | 737,327 | |||
| 9,625 | NovaMed, Inc.* | 37,345 | |||
| 4,100 | Nutraceutical International Corporation* | 50,717 | |||
| 9,200 | Shamir Optical Industry Ltd.* | 73,600 | |||
| 52,000 | Tupperware Brands Corporation | 2,421,639 | |||
| 3,400 | Village Super Market, Inc. - Class A | 92,888 | |||
| 2,025 | Young Innovations, Inc. | 50,180 | |||
| 8,737,844 |
28
JAMES SMALL CAP FUND
SCHEDULE OF INVESTMENTS (Continued)
| Shares | COMMON STOCKS — 84.1% (Continued) | Value | |||
| ENERGY — 1.3% | |||||
| 1,850 | RGC Resources, Inc. | $ | 54,668 | ||
| 13,100 | Sunoco Logistics Partners L.P. | 876,259 | |||
| 930,927 | |||||
| FINANCIAL — 10.8% | |||||
| 71,880 | American Financial Group, Inc. | 1,793,406 | |||
| 72,153 | American Physicians Capital, Inc. | 2,187,678 | |||
| 4,750 | ePlus, Inc.* | 78,423 | |||
| 58,590 | FPIC Insurance Group, Inc.* | 2,262,745 | |||
| 2,375 | Mercer Insurance Group, Inc. | 43,154 | |||
| 4,725 | QC Holdings, Inc. | 22,727 | |||
| 75,880 | Rent-A-Center, Inc.* | 1,344,594 | |||
| 1,150 | World Acceptance Corporation* | 41,205 | |||
| 7,773,932 | |||||
| INDUSTRIAL — 8.6% | |||||
| 34,180 | Beacon Roofing Supply, Inc.* | 546,880 | |||
| 2,800 | International Shipholding Corporation | 86,996 | |||
| 1,250 | Jinpan International Ltd. | 59,588 | |||
| 450 | K-Tron International, Inc.* | 48,933 | |||
| 3,475 | LSB Industries, Inc.* | 48,998 | |||
| 406,146 | North American Galvanizing & Coatings, Inc.* | 1,969,807 | |||
| 4,550 | Portec Rail Products, Inc. | 48,731 | |||
| 1,625 | Standex International Corporation | 32,646 | |||
| 47,380 | Tsakos Energy Navigation Ltd. | 694,591 | |||
| 58,360 | VSE Corporation | 2,630,868 | |||
| 6,168,038 | |||||
| TECHNOLOGY — 19.7% | |||||
| 205,418 | CGI Group, Inc. - Class A* | 2,785,468 | |||
| 9,025 | Computer Task Group, Inc.* | 72,290 | |||
| 34,440 | CSG Systems International, Inc.* | 657,460 | |||
| 3,675 | Ebix, Inc.* | 179,450 | |||
| 38,640 | EnerSys* | 845,057 | |||
| 3,950 | Formula Systems (1985) Ltd. ADR | 43,806 | |||
| 10,300 | GSI Technology, Inc.* | 46,144 | |||
| 24,900 | Preformed Line Products Company | 1,090,620 | |||
| 37,200 | Shanda Interactive Entertainment Ltd. ADR* | 1,957,092 | |||
| 69,927 | Sybase, Inc.* | 3,034,831 | |||
| 33,780 | Triumph Group, Inc. | 1,629,885 | |||
| 2,325 | USA Mobility, Inc.* | 25,598 | |||
| 2,000 | Versant Corporation* | 30,520 | |||
| 64,236 | WESCO International, Inc.* | 1,735,014 | |||
| 14,133,235 |
29
JAMES SMALL CAP FUND
SCHEDULE OF INVESTMENTS (Continued)
| Shares | COMMON STOCKS — 84.1% (Continued) | Value | |||
| UTILITIES — 9.6% | |||||
| 48,051 | Atlantic Tele-Network, Inc. | $ | 2,643,286 | ||
| 1,400 | Chesapeake Utilities Corporation | 44,870 | |||
| 925 | Delta Natural Gas Company, Inc. | 26,464 | |||
| 86,860 | El Paso Electric Company* | 1,761,521 | |||
| 5,375 | HickoryTech Corporation | 47,461 | |||
| 69,539 | WGL Holdings, Inc. | 2,332,338 | |||
| 6,855,940 | |||||
| TOTAL COMMON STOCKS | $ | 60,286,174 | |||
| Par | SHORT TERM INVESTMENTS — 2.8% | Value | |||
| $ | 2,000,000 | U.S. Treasury Notes, 4.000%, 4/15/10 | $ | 2,021,562 | |
| TOTAL INVESTMENT SECURITIES — 86.9% | |||||
| (Cost $50,333,557) | $ | 62,307,736 | |||
| OTHER ASSETS IN EXCESS OF LIABILITIES — 13.1% | 9,362,591 | ||||
| NET ASSETS — 100.0% | $ | 71,670,327 |
* Non-income producing security.
ADR–American Depository Receipts.
See accompanying Notes to Financial Statements.
30
JAMES MARKET NEUTRAL FUND
SCHEDULE OF INVESTMENTS
December 31, 2009 (Unaudited)
| Shares | COMMON STOCKS — 66.6% | Value | ||||
| BASIC MATERIALS — 6.3% | ||||||
| 10,100 | FMC Corporation † | $ | 563,176 | |||
| 39,900 | iShares Silver Trust † | 661,143 | ||||
| 6,250 | SPDR Gold Trust † | 670,688 | ||||
| 3,430 | Terra Nitrogen Company, L.P. † | 356,994 | ||||
| 2,252,001 | ||||||
| CONSUMER, CYCLICAL — 9.2% | ||||||
| 22,440 | Bob Evans Farms, Inc. † | 649,638 | ||||
| 14,650 | Dollar Tree, Inc.* † | 707,595 | ||||
| 4,275 | McDonald’s Corporation † | 266,931 | ||||
| 5,525 | NIKE, Inc. - Class B † | 365,037 | ||||
| 24,710 | The Buckle, Inc. † | 723,508 | ||||
| 12,575 | The Gymboree Corporation* † | 546,887 | ||||
| 3,259,596 | ||||||
| CONSUMER, NON-CYCLICAL — 7.6% | ||||||
| 8,725 | Kroger Company † | 179,124 | ||||
| 25,070 | Merck & Company, Inc. † | 916,058 | ||||
| 19,897 | Pfizer, Inc. † | 361,926 | ||||
| 20,835 | Tupperware Brands Corporation † | 970,286 | ||||
| 5,700 | Watson Wyatt Worldwide, Inc. † | 270,864 | ||||
| 2,698,258 | ||||||
| ENERGY — 6.5% | ||||||
| 8,500 | Apache Corporation † | 876,944 | ||||
| 25,900 | Bolt Technology Corporation* † | 285,418 | ||||
| 5,605 | Devon Energy Corporation † | 411,968 | ||||
| 5,225 | Exxon Mobil Corporation † | 356,293 | ||||
| 8,425 | Suburban Propane Partners, L.P. † | 396,649 | ||||
| 2,327,272 | ||||||
| FINANCIAL — 4.3% | ||||||
| 69,400 | AmTrust Financial Services, Inc. † | 820,308 | ||||
| 20,200 | Annally Capital Management, Inc. † | 350,470 | ||||
| 21,125 | Rent-A-Center, Inc.* † | 374,335 | ||||
| 1,545,113 | ||||||
| INDUSTRIAL — 10.0% | ||||||
| 25,900 | CSX Corporation † | 1,255,891 | ||||
| 18,600 | Greif, Inc. - Class A † | 1,004,028 | ||||
| 39,625 | Owens-Illinois, Inc.* † | 1,302,474 | ||||
| 3,562,393 |
31
JAMES MARKET NEUTRAL FUND
SCHEDULE OF INVESTMENTS (Continued)
| Shares | COMMON STOCKS — 66.6% (Continued) | Value | ||||
| TECHNOLOGY — 9.8% | ||||||
| 9,000 | Hewlett-Packard Company † | $ | 463,590 | |||
| 6,500 | International Business Machines Corporation (IBM) † | 850,850 | ||||
| 14,190 | Northrop Grumman Corporation † | 792,512 | ||||
| 31,025 | Symantec Corporation* † | 555,037 | ||||
| 17,100 | Triumph Group, Inc. † | 825,075 | ||||
| 3,487,064 | ||||||
| UTILITIES — 11.4% | ||||||
| 28,275 | American Electric Power Company, Inc. † | 983,687 | ||||
| 29,925 | AT&T, Inc. † | 838,798 | ||||
| 35,930 | MDU Resources Group, Inc. † | 847,948 | ||||
| 9,175 | ONEOK, Inc.* † | 408,930 | ||||
| 16,605 | Sempra Energy † | 929,548 | ||||
| 4,008,911 | ||||||
| INTERNATIONAL EQUITY EXCHANGE TRADED FUNDS — 1.5% | ||||||
| 10,775 | Chile Fund, Inc. † | 192,872 | ||||
| 4,150 | iShares FTSE/Xinhua China 25 Index Fund † | 175,421 | ||||
| 7,075 | iShares MSCI Canada Index Fund † | 186,285 | ||||
| 554,578 | ||||||
| TOTAL COMMON STOCKS | $ | 23,695,186 | ||||
| TOTAL INVESTMENT SECURITIES — 66.6% | ||||||
| (Cost $20,153,775) | $ | 23,695,186 | ||||
SEGREGATED CASH WITH BROKERS — 57.1% | 20,325,019 | |||||
SECURITIES SOLD SHORT—(70.3)% (Proceeds $24,537,363) | (25,033,787 | ) | ||||
| OTHER ASSETS IN EXCESS OF LIABILITIES — 46.6% | 16,584,875 | |||||
| NET ASSETS — 100.0% | $ | 35,571,293 |
| * | Non-income producing security. |
| † | Security position is either entirely or partially held in a segregated account as collateral for securities sold short aggregating a total market value of $23,472,027. |
See accompanying Notes to Financial Statements.
32
JAMES MARKET NEUTRAL FUND
SCHEDULE OF SECURITIES SOLD SHORT
December 31, 2009 (Unaudited)
| Shares | COMMON STOCKS — 70.3% | Value | |||
| BASIC MATERIALS —3.9% | |||||
| 4,725 | Agnico-Eagle Mines Limited | $ | 255,150 | ||
| 29,196 | Fibria Celulose S.A. ADR | 666,837 | |||
| 42,376 | MAG Silver Corporation | 254,256 | |||
| 21,800 | Zoltek Companies, Inc. | 207,100 | |||
| 1,383,343 | |||||
| CONSUMER, CYCLICAL — 12.4% | |||||
| 50,000 | AMR Corporation | 386,500 | |||
| 13,075 | Cavco Industries, Inc. | 469,654 | |||
| 17,910 | Crocs, Inc. | 102,983 | |||
| 26,925 | Gaylord Entertainment Company | 531,769 | |||
| 18,025 | KB HOME | 246,582 | |||
| 12,310 | K-Swiss, Inc. - Class A | 122,361 | |||
| 36,125 | Live Nation, Inc. | 307,424 | |||
| 9,075 | M.D.C. Holdings, Inc. | 281,688 | |||
| 68,650 | Morgans Hotel Group | 310,984 | |||
| 64,761 | Pulte Homes, Inc. | 647,610 | |||
| 24,900 | The Ryland Group, Inc. | 490,530 | |||
| 24,300 | TiVo, Inc. | 247,374 | |||
| 14,750 | Toll Brothers, Inc. | 277,447 | |||
| 4,422,906 | |||||
| CONSUMER, NON-CYCLICAL — 11.4% | |||||
| 6,680 | AMAG Pharmaceuticals, Inc. | 254,040 | |||
| 4,295 | Auxilium Pharmaceuticals, Inc. | 128,764 | |||
| 12,175 | Cepheid, Inc. | 151,944 | |||
| 7,150 | Clinical Data, Inc. | 130,559 | |||
| 37,500 | Elan Corporation PLC ADR | 244,500 | |||
| 28,225 | Eurand NV | 364,102 | |||
| 26,025 | Hansen Medical, Inc. | 78,857 | |||
| 22,258 | Insulet Corporation | 317,844 | |||
| 36,228 | MDS, Inc. | 277,144 | |||
| 28,900 | Rigel Pharmaceuticals, Inc. | 274,839 | |||
| 13,000 | Salix Pharmaceuticals Ltd. | 330,200 | |||
| 54,690 | Senomyx, Inc. | 206,181 | |||
| 19,020 | Smithfield Foods, Inc. | 288,914 | |||
| 16,175 | Sotheby's | 363,614 | |||
| 15,600 | The Great Atlantic & Pacific Tea Company, Inc. | 183,924 | |||
| 6,100 | United Therapeutics Corporation | 321,165 | |||
| 8,560 | Volcano Corporation | 148,773 | |||
| 4,065,364 |
33
JAMES MARKET NEUTRAL FUND
SCHEDULE OF SECURITY SOLD SHORT (Continued)
| Shares | COMMON STOCKS — 70.3% (Continued) | Value | |||
| ENERGY — 2.4% | |||||
| 25,178 | BPZ Resources, Inc. | $ | 239,191 | ||
| 38,950 | Clean Energy Fuels Corporation | 600,219 | |||
| 839,410 | |||||
| FINANCIAL — 12.7% | |||||
| 17,600 | Bank of America Corporation | 265,056 | |||
| 6,890 | City National Corporation | 314,184 | |||
| 24,725 | East West Bancorp, Inc. | 390,655 | |||
| 33,789 | First Horizon National Corporation | 452,777 | |||
| 30,000 | KeyCorp | 166,500 | |||
| 42,050 | Kingsway Financial Services, Inc. | 73,588 | |||
| 40,975 | MBIA, Inc. | 163,080 | |||
| 22,880 | National Penn Bancshares, Inc. | 132,476 | |||
| 24,025 | Old Republic International Corporation | 241,211 | |||
| 21,540 | Pinnacle Financial Partners, Inc. | 306,299 | |||
| 19,775 | Stewart Information Services Corporation | 223,062 | |||
| 12,950 | SunTrust Banks, Inc. | 262,755 | |||
| 23,960 | TFS Financial Corporation | 290,874 | |||
| 11,365 | The St. Joe Company | 328,335 | |||
| 16,675 | UBS AG ADR | 258,629 | |||
| 8,950 | ViewPoint Financial Group | 128,970 | |||
| 32,210 | Whitney Holding Corporation | 293,433 | |||
| 20,000 | Zions Bancorporation | 256,600 | |||
| 4,548,484 | |||||
| INDUSTRIAL — 4.0% | |||||
| 42,325 | Golar LNG Ltd. | 542,606 | |||
| 35,000 | L-1 Identity Solutions, Inc. | 262,150 | |||
| 8,350 | Metabolix, Inc. | 92,435 | |||
| 50,925 | Taser International, Inc. | 223,052 | |||
| 5,475 | Vulcan Materials Company | 288,368 | |||
| 1,408,611 | |||||
| TECHNOLOGY — 22.2% | |||||
| 29,042 | 3D Systems Corporation | 328,175 | |||
| 6,874 | Abraxis BioScience, Inc. | 278,741 | |||
| 11,725 | Acorda Therapeutics, Inc. | 295,704 | |||
| 14,185 | Affymax, Inc. | 350,937 | |||
| 43,775 | Airvana, Inc. | 332,690 | |||
| 28,625 | Amylin Pharmaceuticals, Inc. | 406,189 | |||
| 62,765 | Arena Pharmaceuticals, Inc. | 222,816 | |||
| 43,025 | bebe stores, inc. | 269,767 | |||
| 27,600 | Cavium Networks, Inc. | 657,708 | |||
| 46,600 | Clearwire Corporation - Class A | 315,016 | |||
| 12,000 | Crown Castle International Corporation | 468,480 | |||
| 44,025 | Cypress Bioscience, Inc. | 253,584 | |||
| 14,500 | Dendreon Corporation | 381,060 |
34
JAMES MARKET NEUTRAL FUND
SCHEDULE OF SECURITY SOLD SHORT (Continued)
| Shares | COMMON STOCKS — 70.3% (Continued) | Value | |||
| TECHNOLOGY — 22.2% (Continued) | |||||
| 16,500 | Electronic Arts, Inc. | $ | 292,875 | ||
| 43,300 | Ener1, Inc. | 274,522 | |||
| 17,525 | Infinera Corporation | 155,447 | |||
| 14,150 | International Rectifier Corporation | 312,998 | |||
| 20,800 | Isis Pharmaceuticals, Inc. | 230,880 | |||
| 19,275 | Leap Wireless International, Inc. | 338,276 | |||
| 20,350 | Palm, Inc. | 204,314 | |||
| 19,320 | Rambus, Inc. | 471,408 | |||
| 12,270 | SBA Communications Corporation | 419,143 | |||
| 22,525 | Sequenom, Inc. | 93,253 | |||
| 20,150 | Vocus, Inc. | 362,700 | |||
| 9,550 | XenoPort, Inc. | 177,248 | |||
| 7,893,931 | |||||
| UTILITIES — 1.3% | |||||
| 21,205 | Cbeyond, Inc. | 333,979 | |||
| 20,825 | RRI Energy, Inc. | 119,119 | |||
| 453,098 | |||||
| TOTAL COMMON STOCKS SOLD SHORT | $ | 25,015,147 | |||
| Shares | RIGHTS — 0.1% | Value | |||
| 46,600 | Clearwire Corporation Rights | $ | 18,640 | ||
TOTAL SECURITIES SOLD SHORT — 70.4% (Proceeds $24,537,363) | $ | 25,033,787 |
ADR – American Depository Receipts.
PLC – Public Liability Company.
See accompanying Notes to Financial Statements.
35
JAMES EQUITY FUND
SCHEDULE OF INVESTMENTS
December 31, 2009 (Unaudited)
| Shares | COMMON STOCKS — 78.3% | Value | |||
| BASIC MATERIALS — 5.0% | |||||
| 2,440 | Barrick Gold Corporation | $ | 96,087 | ||
| 5,840 | FMC Corporation | 325,638 | |||
| 150 | Hawkins, Inc. | 3,275 | |||
| 5,320 | IAMGOLD Corporation | 83,205 | |||
| 200 | Innophos Holdings, Inc. | 4,598 | |||
| 300 | Oil-Dri Corporation of America | 4,650 | |||
| 725 | ShengdaTech, Inc.* | 4,444 | |||
| 3,300 | Silver Wheaton Corporation* | 49,566 | |||
| 571,463 | |||||
| CONSUMER, CYCLICAL — 15.4% | |||||
| 175 | America's Car-Mart, Inc.* | 4,608 | |||
| 3,769 | Big Lots, Inc.* | 109,226 | |||
| 3,500 | BJ's Wholesale Club, Inc.* | 114,485 | |||
| 7,440 | Bob Evans Farms, Inc. | 215,388 | |||
| 20,820 | Central Garden & Pet Company* | 222,774 | |||
| 5,840 | Dollar Tree, Inc.* | 282,071 | |||
| 450 | Dorman Products, Inc.* | 7,047 | |||
| 6,760 | Family Dollar Stores, Inc. | 188,131 | |||
| 125 | Frisch's Restaurants, Inc. | 2,981 | |||
| 2,420 | Netflix, Inc.* | 133,439 | |||
| 125 | Red Robin Gourmet Burgers, Inc.* | 2,238 | |||
| 3,954 | The Buckle, Inc. | 115,773 | |||
| 8,160 | The Gymboree Corporation* | 354,877 | |||
| 175 | True Religion Apparel, Inc.* | 3,236 | |||
| 1,756,274 | |||||
| CONSUMER, NON-CYCLICAL — 13.6% | |||||
| 2,900 | Allied Healthcare International, Inc.* | 8,439 | |||
| 525 | Allion Healthcare, Inc.* | 3,444 | |||
| 1,700 | Archer-Daniels-Midland Company | 53,227 | |||
| 225 | ATC Technology Corporation* | 5,366 | |||
| 3,280 | Biovail Corporation | 45,789 | |||
| 9,500 | ConAgra Foods, Inc. | 218,975 | |||
| 16,920 | Del Monte Foods Company | 191,873 | |||
| 1,840 | EZCORP, Inc. - Class A* | 31,666 | |||
| 800 | Hanger Orthopedic Group, Inc.* | 11,064 | |||
| 3,140 | LifePoint Hospitals, Inc.* | 102,081 | |||
| 5,220 | Merck & Company, Inc. | 190,739 | |||
| 1,050 | NovaMed, Inc.* | 4,074 | |||
| 450 | Nutraceutical International Corporation* | 5,567 | |||
| 9,560 | Pfizer, Inc. | 173,896 | |||
| 19,820 | Sara Lee Corporation | 241,407 | |||
| 1,025 | Shamir Optical Industry Ltd. | 8,200 |
36
JAMES EQUITY FUND
SCHEDULE OF INVESTMENTS (Continued)
| Shares | COMMON STOCKS — 78.3% (Continued) | Value | |||
| CONSUMER, NON-CYCLICAL — 13.6% (Continued) | |||||
| 2,380 | Tupperware Brands Corporation | $ | 110,837 | ||
| 375 | Village Super Market, Inc. - Class A | 10,245 | |||
| 2,680 | Watson Wyatt Worldwide, Inc. - Class A | 127,354 | |||
| 225 | Young Innovations, Inc. | 5,576 | |||
| 1,549,819 | |||||
| ENERGY — 4.4% | |||||
| 1,410 | Apache Corporation | 145,470 | |||
| 2,280 | Chevron Corporation | 175,537 | |||
| 1,580 | Devon Energy Corporation | 116,130 | |||
| 200 | RGC Resources, Inc. | 5,910 | |||
| 940 | Sunoco Logistics Partners L.P. | 62,877 | |||
| 505,924 | |||||
| FINANCIAL — 10.6% | |||||
| 10,665 | American Financial Group, Inc. | 266,092 | |||
| 8,053 | American Physicians Capital, Inc. | 244,167 | |||
| 6,700 | Amerisafe, Inc.* | 120,399 | |||
| 525 | ePlus, Inc.* | 8,668 | |||
| 250 | FPIC Insurance Group, Inc.* | 9,655 | |||
| 6,490 | Mercer Insurance Group, Inc. | 117,923 | |||
| 525 | QC Holdings, Inc. | 2,525 | |||
| 11,160 | Rent-A-Center, Inc.* | 197,755 | |||
| 12,620 | Unum Group | 246,342 | |||
| 125 | World Acceptance Corporation* | 4,479 | |||
| 1,218,005 | |||||
| INDUSTRIAL — 4.9% | |||||
| 1,460 | Cooper Industries PLC - Class A | 62,254 | |||
| 3,100 | CSX Corporation | 150,318 | |||
| 1,960 | Greif, Inc. - Class A | 105,801 | |||
| 300 | International Shipholding Corporation | 9,321 | |||
| 150 | Jinpan International Ltd. | 7,151 | |||
| 50 | K-Tron International, Inc.* | 5,437 | |||
| 375 | LSB Industries, Inc.* | 5,288 | |||
| 925 | North American Galvanizing & Coatings, Inc.* | 4,486 | |||
| 1,820 | Owens-Illinois, Inc.* | 59,823 | |||
| 500 | Portec Rail Products, Inc. | 5,355 | |||
| 175 | Standex International Corporation | 3,516 | |||
| 1,320 | The Black & Decker Corporation | 85,576 | |||
| 1,220 | Tidewater, Inc. | 58,499 | |||
| 562,825 |
37
JAMES EQUITY FUND
SCHEDULE OF INVESTMENTS (Continued)
| Shares | COMMON STOCKS — 78.3% (Continued) | Value | |||
| TECHNOLOGY — 13.3% | |||||
| 1,020 | Affiliated Computer Services, Inc. - Class A* | $ | 60,884 | ||
| 4,400 | Computer Sciences Corporation* | 253,132 | |||
| 1,000 | Computer Task Group, Inc.* | 8,010 | |||
| 400 | Ebix, Inc.* | 19,532 | |||
| 425 | Formula Systems (1985) Ltd. ADR | 4,713 | |||
| 800 | General Dynamics Corporation | 54,536 | |||
| 2,800 | Goodrich Corporation | 179,900 | |||
| 1,125 | GSI Technology, Inc.* | 5,040 | |||
| 2,260 | Hewlett-Packard Company | 116,413 | |||
| 1,750 | International Business Machines Corporation (IBM) | 229,075 | |||
| 4,340 | Northrop Grumman Corporation | 242,389 | |||
| 14,360 | Symantec Corporation* | 256,899 | |||
| 1,400 | SYNNEX Corporation* | 42,924 | |||
| 920 | Triumph Group, Inc. | 44,390 | |||
| 250 | USA Mobility, Inc.* | 2,753 | |||
| 225 | Versant Corporation* | 3,434 | |||
| 1,524,024 | |||||
| UTILITIES — 11.1% | |||||
| 5,040 | American Electric Power Company, Inc. | 175,342 | |||
| 9,700 | AT&T, Inc. | 271,891 | |||
| 11,042 | CenturyTel, Inc. | 399,830 | |||
| 150 | Chesapeake Utilities Corporation | 4,808 | |||
| 100 | Delta Natural Gas Company, Inc. | 2,861 | |||
| 5,940 | DTE Energy Company | 258,925 | |||
| 1,580 | Edison International | 54,952 | |||
| 600 | HickoryTech Corporation | 5,298 | |||
| 1,800 | Sempra Energy | 100,764 | |||
| 1,274,671 | |||||
| TOTAL COMMON STOCKS | $ | 8,963,005 | |||
| Shares/Par | SHORT TERM INVESTMENTS — 6.9% | Value | |||
| 87,336 | First American Treasury Money Market Fund | $ | 87,336 | ||
| $ | 700,000 | U.S. Treasury Notes, 4.000%, 4/15/10 | 707,547 | ||
| TOTAL SHORT TERM INVESTMENTS | $ | 794,883 |
38
JAMES EQUITY FUND
SCHEDULE OF INVESTMENTS (Continued)
| Shares | PREFERRED STOCKS — 2.0% | Value | |||
| FINANCIAL — 0.8% | |||||
| 4,000 | General Electric Capital Corporation, 6.00%, 4/24/47(4/24/12)** | $ | 96,720 | ||
| UTILITIES — 1.2% | |||||
| 5,000 | AT&T, Inc., 6.375%, 2/15/56 (2/15/12)** | 133,450 | |||
| TOTAL PREFERRED STOCKS | $ | 230,170 | |||
| Shares | INTERNATIONAL EQUITY EXCHANGE TRADED FUNDS — 1.4% | Value | |||
| 3,280 | Chile Fund, Inc. | $ | 58,712 | ||
| 1,780 | India Fund, Inc.* | 54,646 | |||
| 1,240 | iShares FTSE/Xinhua China 25 Index Fund | 52,415 | |||
| $ | 165,773 | ||||
| TOTAL INVESTMENT SECURITIES — 88.6% | |||||
| (Cost $8,852,159) | $ | 10,153,831 | |||
| OTHER ASSETS IN EXCESS OF LIABILITIES — 11.4% | 1,301,055 | ||||
| NET ASSETS — 100.0% | $ | 11,454,886 |
*Non-income producing security.
**Date in parenthesis represents call date.
ADR – American Depository Receipts.
PLC – Public Liability Company.
See accompanying Notes to Financial Statements.
39
JAMES MID CAP FUND
SCHEDULE OF INVESTMENTS
December 31, 2009 (Unaudited)
| Shares | COMMON STOCKS — 93.8% | Value | |||
| BASIC MATERIALS — 13.7% | |||||
| 2,500 | FMC Corporation | $ | 139,400 | ||
| 12,500 | IAMGOLD Corporation | 195,500 | |||
| 6,000 | Olin Corporation | 105,120 | |||
| 14,000 | Silver Wheaton Corporation* | 210,280 | |||
| 650,300 | |||||
| CONSUMER, CYCLICAL — 9.3% | |||||
| 4,000 | BJ's Wholesale Club, Inc.* | 130,840 | |||
| 4,000 | Darden Restaurants, Inc. | 140,280 | |||
| 3,500 | Dollar Tree, Inc.* | 169,050 | |||
| 440,170 | |||||
| CONSUMER, NON-CYCLICAL — 22.4% | |||||
| 5,000 | ConAgra Foods, Inc. | 115,250 | |||
| 10,000 | Del Monte Foods Company | 113,400 | |||
| 3,000 | Life Technologies Corporation* | 156,690 | |||
| 4,000 | LifePoint Hospitals, Inc.* | 130,040 | |||
| Sara Lee Corporation | 152,250 | ||||
| 4,500 | Tupperware Brands Corporation | 209,565 | |||
| 4,000 | Watson Wyatt Worldwide, Inc. - Class A | 190,080 | |||
| 1,067,275 | |||||
| ENERGY — 5.6% | |||||
| 1,600 | Questar Corporation | 66,512 | |||
| 3,000 | Sunoco Logistics Partners L.P. | 200,670 | |||
| 267,182 | |||||
| FINANCIAL — 6.3% | |||||
| 5,000 | American Financial Group, Inc. | 124,750 | |||
| 7,500 | OneBeacon Insurance Group Ltd. | 103,350 | |||
| 4,000 | Rent-A-Center, Inc.* | 70,880 | |||
| 298,980 | |||||
| INDUSTRIAL — 11.9% | |||||
| 2,500 | AGCO Corporation* | 80,850 | |||
| 7,500 | GrafTech International Ltd.* | 116,625 | |||
| 2,500 | Granite Construction, Inc. | 84,150 | |||
| 3,000 | Greif, Inc. - Class A | 161,940 | |||
| 2,500 | Tidewater, Inc. | 119,875 | |||
| 563,440 |
40
JAMES MID CAP FUND
SCHEDULE OF INVESTMENTS (Continued)
| Shares | COMMON STOCKS — 93.8% (Continued) | Value | |||
| TECHNOLOGY — 12.4% | |||||
| 2,000 | Affiliated Computer Services, Inc. - Class A* | $ | 119,380 | ||
| 2,500 | Computer Sciences Corporation* | 143,825 | |||
| 1,000 | Goodrich Corporation | 64,250 | |||
| 15,000 | Qwest Communications International, Inc. | 63,150 | |||
| 4,500 | Western Digital Corporation* | 198,675 | |||
| 589,280 | |||||
| UTILITIES — 12.2% | |||||
| 4,000 | CenturyTel, Inc. | 144,840 | |||
| 3,000 | DTE Energy Company | 130,770 | |||
| 3,500 | Energen Corporation | 163,800 | |||
| 6,000 | MDU Resources Group, Inc. | 141,600 | |||
| 581,010 | |||||
| TOTAL COMMON STOCKS | $ | 4,457,637 | |||
| Shares | SHORT TERM INVESTMENTS — 0.5% | Value | |||
| 22,166 | First American Treasury Money Market Fund | $ | 22,166 | ||
| TOTAL INVESTMENT SECURITIES — 94.3% | |||||
| (Cost $3,815,450) | $ | 4,479,803 | |||
| OTHER ASSETS IN EXCESS OF LIABILITIES — 5.7% | 269,982 | ||||
| NET ASSETS — 100.0% | $ | 4,749,785 |
*Non-income producing security.
See accompanying Notes to Financial Statements.
41
JAMES ADVANTAGE FUNDS NOTES TO FINANCIAL STATEMENTS December 31, 2009 (Unaudited) |
1. General Information and Significant Accounting Policies
James Balanced: Golden Rainbow Fund, James Small Cap Fund, James Market Neutral Fund and James Mid Cap Fund are each a diversified series of James Advantage Funds (the “Trust”), and James Equity Fund is a non-diversified series of the Trust (individually a “Fund,” collectively the “Funds”). The Trust is an open-end management investment company that was organized as an Ohio business trust on August 29, 1997. The Trust is registered under the Investment Company Act of 1940 (the “1940 Act”). James Balanced: Golden Rainbow Fund was originally organized as a series of the Flagship Admiral Funds Inc., a Maryland corporation. On June 26, 1998, pursuant to an Agreement and Plan of Reorganization, James Balanced: Golden Rainbow Fund was restructured through a tax-free reorganization as a series of the Trust. The James Small Cap Fund and James Market Neutral Fund each commenced its public offering of shares on October 2, 1998. The James Equity Fund commenced its public offering of shares on November 1, 1999. The James Mid Cap Fund commenced its public offering of shares on June 30, 2006. Each class represents an interest in the same portfolio of investments and has the same rights, but differs primarily in distribution fees and shareholder features. The Retail Class shares are subject to distribution (12b-1) fees but have a lower minimum investment requirement and offer certain shareholder services not available to Institutional Class shareholders. Institutional Class shares are not subject to 12b-1 fees and are available only through investment advisers and bank trust departments that have made arrangements for shares of all of their clients investing in the Fund to be held in an omnibus account (as well as other entities that are approved by management of the Trust).
James Balanced: Golden Rainbow Fund seeks to provide total return through a combination of growth and income and preservation of capital in declining markets. The Fund seeks to achieve its objective by investing primarily in common stocks and/or debt securities that the Fund’s adviser, James Investment Research, Inc. (“James”), believes are undervalued.
James Small Cap Fund seeks to provide long-term capital appreciation. The Fund seeks to achieve its objective by investing primarily in common stocks of small capitalization companies.
James Market Neutral Fund seeks to provide positive returns regardless of the direction of the stock markets. The Fund seeks to achieve its objective by investing in common stocks that James believes are undervalued and more likely to appreciate, and selling short common stocks that James believes are overvalued and more likely to depreciate.
James Equity Fund seeks to provide long-term capital appreciation and outperform the Standard & Poor’s 500 Index (the “S&P 500 Index”). The Fund seeks to achieve its objective by investing primarily in equity securities without regard to the market capitalization of the stock. The Fund often buys stocks in the S&P 500 Index.
James Mid Cap Fund seeks to provide long-term capital appreciation. The Fund seeks to achieve its objective by investing primarily in common stocks of mid capitalization companies.
The following is a summary of significant accounting policies followed by the Funds in preparation of their financial statements, in accordance with accounting principles generally accepted in the United States of America (“GAAP”).
42
JAMES ADVANTAGE FUNDS NOTES TO FINANCIAL STATEMENTS (Continued) |
Share Valuation
The net asset value per share of each Fund, other than the James Balanced: Golden Rainbow Fund, is calculated daily by dividing the total value of the Fund’s assets, less liabilities, by the number of shares outstanding. The net asset value per share of each class of shares of the James Balanced: Golden Rainbow Fund is calculated daily by dividing the total value of the Fund’s assets attributable to that class, less liabilities attributable to that class, by the number of outstanding shares of that class.
Securities Valuation
The Funds' portfolio securities are valued as of the close of the New York Stock Exchange (“NYSE”) (generally, 4:00 p.m., Eastern time) on each day that the NYSE is open for business, and on any other day on which there is sufficient trading in a Fund’s securities to materially affect the net asset value. Securities that are traded on any exchange are valued at the last quoted sale price. Lacking a last sale price, a security is valued at its last bid price except when, in James’s opinion, the last bid price does not accurately reflect the current value of the security. Securities that are traded on the NASDAQ over-the-counter market are valued at their NASDAQ Official Closing Price (“NOCP”) for all NASDAQ National Market (“NNM”) and NASDAQ Capital Market® securities. When market quotations are not readily available, if an event occurs after the close of the trading market (but before the time as of which a Fund calculates its net asset value) that materially affects a security’s value, when James determines that the market quotation does not accurately reflect the current value or when a restricted security is being valued, that security will be valued at its fair value as determined in good faith in conformity with guidelines adopted by and subject to review of the Board of Trustees. The Funds may use pricing services to determine market value for securities. Debt securities are valued on the basis of valuations provided by dealers or by an independent pricing service that determines valuations based upon market transactions for normal, institutional-size trading units of similar securities. Short-term investments in fixed-income securities with maturities of less than 60 days when acquired, or which subsequently are within 60 days of maturity, are valued by using the amortized cost method of valuation, which the Board has determined will approximate fair value.
For valuation purposes, quotations of foreign securities in a foreign currency are converted to U.S. dollar equivalents at the time of pricing the Funds. In computing the net asset value of the Funds, the values of foreign portfolio securities are generally based upon market quotations which, depending upon the exchange or market, may be last sale price, last bid price, or the average of the last bid and asked prices as of, in each case, the close of the appropriate exchange or another designated time.
The calculation of the share price of the Funds holding foreign securities in its portfolio does not take place contemporaneously with the determination of the values of many of the foreign portfolio securities used in such calculation. Events affecting the values of foreign portfolio securities that occur between the time their prices are determined and the calculation of the Fund’s share price will not be reflected in the calculation unless the Adviser determines, subject to review by the Board of Trustees, that the particular event would materially affect net asset value, in which case an adjustment will be made.
43
JAMES ADVANTAGE FUNDS NOTES TO FINANCIAL STATEMENTS (Continued) |
In accordance with the Trust’s good faith pricing guidelines, James is required to consider all appropriate factors relevant to the value of securities for which it has determined other pricing sources are not available or reliable as described above. There is no single standard for determining fair value, since fair value depends upon the circumstances of each individual case. As a general principle, the current fair value of an issue of securities being valued by the adviser would appear to be the amount which the owner might reasonably expect to receive for them upon their current sale. Methods which are in accordance with this principle may, for example, be based on (i) a multiple of earnings; (ii) a discount from market of a similar freely traded security (including a derivative security or a basket of securities traded on other markets, exchanges or among dealers); or (iii) yield to maturity with respect to debt issues, or a combination of these and other methods.
The Funds have adopted Fair Value Measurements. Fair Value Measurements establishes a single authoritative definition of fair value, sets out a framework for measuring fair value and requires additional disclosures about fair value measurements.
Various inputs are used in determining the value of the Funds’ investments. These inputs are summarized in the three broad levels listed below:
| • | Level 1 – quoted prices in active markets for identical securities |
| • | Level 2 –other significant observable inputs (including quoted prices for similar securities, interest rates, prepayment speeds, credit risk, etc.) |
| • | Level 3 –significant unobservable inputs (including a Fund’s own assumptions in determining the fair value of investments) |
The inputs or methodology used for valuing securities are not necessarily an indication of the risk associated with investing in those securities. For example, securities maturing within 60 days of the filing are valued using amortized cost, in accordance with rules under the Investment Company Act of 1940. Generally, amortized cost approximates the current fair value of a security, but since the value is not obtained from a quoted price in an active market, such securities are reflected as Level 2.
44
| JAMES ADVANTAGE FUNDS |
| NOTES TO FINANCIAL STATEMENTS (Continued) |
The following is a summary of the inputs used to value the Funds’ net assets as of December 31, 2009:
| Level 2 – | ||||||||||||
| Other | Level 3 – | |||||||||||
| Level 1 – | Significant | Significant | ||||||||||
| Quoted | Observable | Unobservable | ||||||||||
| Prices | Inputs | Inputs | ||||||||||
| Investments in Securities | ||||||||||||
| (Assets) | ||||||||||||
| James Balanced: Golden Rainbow Fund | ||||||||||||
| Common Stock * | $ | 229,728,037 | $ | — | $ | — | ||||||
| Corporate Bonds | — | 20,804,359 | — | |||||||||
| Foreign Government Bonds | — | 48,451,809 | — | |||||||||
| Municipal Bonds | — | 25,296,441 | — | |||||||||
| Exchange Traded Funds | 5,788,750 | — | — | |||||||||
| U.S. Government Agencies | — | 24,989,327 | — | |||||||||
| U.S. Treasuries | 192,828,986 | — | — | |||||||||
| James Small Cap Fund | ||||||||||||
| Common Stock * | 60,286,174 | — | — | |||||||||
| U.S. Treasuries | 2,021,562 | — | — | |||||||||
| James Market Neutral Fund | ||||||||||||
| Common Stock * | 23,140,608 | — | — | |||||||||
| Exchange Traded Funds | 554,578 | — | — | |||||||||
| James Equity Fund | ||||||||||||
| Common Stock * | 8,963,005 | — | — | |||||||||
| Mutual Funds | 87,336 | — | — | |||||||||
| Preferred Stock | 230,170 | — | — | |||||||||
| U.S. Treasuries | 707,547 | — | — | |||||||||
| Exchange Traded Funds | 165,773 | — | — | |||||||||
| James Mid Cap Fund | ||||||||||||
| Common Stock * | 4,457,637 | — | — | |||||||||
| Mutual Funds | 22,166 | — | — | |||||||||
| Investments in Securities Sold Short: | ||||||||||||
| (Liabilities) | ||||||||||||
| James Market Neutral Fund | ||||||||||||
| Common Stock * | $ | 25,015,147 | $ | — | $ | — | ||||||
| Rights | 18,640 | — | — | |||||||||
| * | All equity securities are classified as Level 1. See Schedule of Investments for industry classification. |
Securities Transactions
Securities transactions are recorded on a trade date basis. Realized gains and losses from security transactions are determined using the specific identification method. Securities purchased or sold on a when-issued or delayed delivery basis may have extended settlement periods. Any securities so purchased are subject to market fluctuation during this period. The James Balanced: Golden Rainbow Fund will instruct its custodian to segregate assets in a separate account with a current value at least equal to the amount of its when-issued and delayed delivery purchase commitments.
Withholding taxes on foreign dividends have been provided for in accordance with the Trust’s understanding of the applicable country’s tax rules and rates.
45
JAMES ADVANTAGE FUNDS
NOTES TO FINANCIAL STATEMENTS (Continued)
Foreign Currency Translation
The market value of investment securities, other assets and liabilities of the James Balanced: Golden Rainbow Fund denominated in foreign currencies are translated into U.S. dollars at the current exchange rate at the close of each business day. Purchases and sales of securities, income receipts and expense payments are translated into U.S. dollars based at the exchange rate on the date of the transaction.
Reported net realized foreign exchange gains or losses arise from sales and maturities of short-term securities, sales of foreign currencies, currency gains or losses realized between the trade and settlement dates on securities transactions, the difference between the amounts of dividends, interest, and foreign withholding taxes recorded on the Funds’ books, and the U.S. dollar equivalent of the amounts actually received or paid. Net unrealized foreign exchange gains and losses arise from the changes in the value of assets and liabilities including investments in securities at the reporting period, resulting from changes in the exchange rate.
Short Sales and Segregated Cash
The James Market Neutral Fund actively sells short common stocks. Short sales are transactions in which the Fund sells a security it does not own in anticipation of a decline in the market value of that security. To complete such a transaction, the Fund must borrow the security to deliver to the buyer upon the short sale; the Fund is then obligated to replace the security borrowed by purchasing it in the open market at some later date.
The Fund will incur a loss if the market price of the security increases between the date of the short sale and the date on which the Fund replaces the borrowed security. The Fund will realize a gain if the security declines in value between those dates. If a security sold short pays a dividend while the Fund is short that security, the Fund will pay the dividend and record that amount as an expense.
All short sales are collateralized, as required by the Fund’s prime broker. The Fund maintains the collateral in segregated accounts consisting of cash and/or high-grade liquid assets sufficient to collateralize the market value of its short positions.
Investment Income
Dividend income is recorded on the ex-dividend date. Interest income is determined on the basis of interest accrued, adjusted for amortization of premiums and accretion of discounts on all debt securities. Amortization and accretion is calculated using the effective yield method.
Dividends and Distributions to Shareholders
Net investment income, if any, is generally declared and distributed to shareholders of each Fund quarterly. Net realized capital gains from security transactions, if any, are distributed to shareholders not less frequently than annually. Furthermore, capital gains are distributed only to the extent they exceed available capital loss carryforwards. Distributions to shareholders of net investment income and net realized capital gains are recorded on the ex-dividend date. The amount and timing of distributions are determined in accordance with federal income tax regulations, which may differ from GAAP. Accordingly, temporary over distributions as a result of these differences may occur and will be classified as either distributions in excess of net investment income and/or distributions in excess of net realized gains from security transactions, where applicable.
Allocations
Investment income earned, realized capital gains and losses, and unrealized appreciation and depreciation for the James Balanced: Golden Rainbow Fund is allocated daily to each class of shares based upon its proportionate share of total net assets of the Fund. Class specific expenses are charged directly to the class incurring the expense. Common expenses, which are not attributable to a specific class, are allocated daily to each class of shares based upon its proportionate share of total net assets of the Fund. Expenses not directly billed to a particular Fund are allocated proportionally among all Funds daily in relation to net assets of each Fund or another reasonable measure.
46
JAMES ADVANTAGE FUNDS
NOTES TO FINANCIAL STATEMENTS (Continued)
Use of Estimates
The preparation of financial statements in conformity with GAAP requires management to make estimates and assumptions that affect the reported amounts of assets and liabilities and disclosure of contingent assets and liabilities at the date of the financial statements and the reported amounts of increases and decreases in net assets from operations during the reporting period. Actual results could differ from those estimates.
Federal Income Taxes
The Funds generally intend to distribute all taxable income and capital gains to shareholders, if any, and to otherwise continue to comply with the requirements of Subchapter M of the Internal Revenue Code applicable to regulated investment companies. Therefore, no federal tax provision is required.
The tax character of distributions paid for the years ended June 30, 2009 and 2008 was as follows:
James Balanced: Golden Rainbow Fund | James Small Cap Fund | |||||||||||||||
| 2009 | 2008 | 2009 | 2008 | |||||||||||||
| From ordinary income | $ | 9,123,004 | $ | 8,530,879 | $ | 438,651 | $ | 1,055,734 | ||||||||
| From long-term capital gains | 30,786 | 6,766,534 | — | — | ||||||||||||
| $ | 9,153,790 | $ | 15,297,413 | $ | 438,651 | $ | 1,055,734 | |||||||||
| James Market Neutral Fund | James Equity Fund | James Mid Cap Fund | ||||||||||||||||||||||
| 2009 | 2008 | 2009 | 2008 | 2009 | 2008 | |||||||||||||||||||
| From ordinary income | $ | 39,280 | $ | 629,826 | $ | 73,673 | $ | 47,752 | $ | 21,999 | $ | 18,785 | ||||||||||||
| From long-term capital gains | — | — | 1,230,653 | 12,335 | — | — | ||||||||||||||||||
| $ | 39,280 | $ | 629,826 | $ | 1,304,326 | $ | 60,087 | $ | 21,999 | $ | 18,785 | |||||||||||||
The following information is computed on a tax basis for each item as of June 30, 2009:
| James | ||||||||||||||||||||
| Balanced: | James | James | James | |||||||||||||||||
| Golden Rainbow | Small Cap | Market Neutral | James Equity | Mid Cap | ||||||||||||||||
| Fund | Fund | Fund | Fund | Fund | ||||||||||||||||
| Tax cost of portfolio investments | $ | 505,955,774 | $ | 99,633,392 | $ | 26,263,802 | $ | 10,873,554 | $ | 4,698,008 | ||||||||||
| Gross unrealized appreciation | $ | 33,569,708 | $ | 9,029,355 | $ | 2,244,132 | $ | 927,958 | $ | 303,860 | ||||||||||
| Gross unrealized depreciation | (22,165,416 | ) | (13,272,968 | ) | (3,559,729 | ) | (1,108,118 | ) | (842,791 | ) | ||||||||||
| Net unrealized appreciation | ||||||||||||||||||||
| (depreciation) | 11,404,292 | (4,243,613 | ) | (1,315,597 | ) | (180,160 | ) | (538,931 | ) | |||||||||||
| Net unrealized appreciation | ||||||||||||||||||||
| on securities sold short | — | — | 4,070,164 | — | — | |||||||||||||||
| Capital loss carryforward | (1,259,804 | ) | (37,540,261 | ) | (7,749,272 | ) | (527,658 | ) | (319,297 | ) | ||||||||||
| Post-October losses | (9,087,338 | ) | (27,314,412 | ) | (2,124,646 | ) | (1,470,271 | ) | (985,864 | ) | ||||||||||
| Undistributed net investment income | 32,285 | — | — | — | — | |||||||||||||||
| Other temporary differences | (111,624 | ) | (2,632 | ) | — | (205 | ) | (20 | ) | |||||||||||
| Accumulated earnings (deficit) | $ | 977,811 | $ | (69,100,918 | ) | $ | (7,119,351 | ) | $ | (2,178,294 | ) | $ | (1,844,112 | ) | ||||||
47
JAMES ADVANTAGE FUNDS
NOTES TO FINANCIAL STATEMENTS (Continued)
The difference between the cost of portfolio investments on a tax basis and financial statement cost for the Funds is due to certain timing differences in the recognition of capital losses under income tax regulations and GAAP.
The capital loss carryforwards remaining as of June 30, 2009 in the table below expire as follows:
| Amount | Expiration Date | ||||
| James Golden Rainbow Fund | $ | 1,259,804 | June 30, 2017 | ||
| James Small Cap Fund | $ | 17,239,544 | June 30, 2016 | ||
| $ | 20,300,717 | June 30, 2017 | |||
| James Market Neutral Fund | $ | 194,196 | June 30, 2013 | ||
| $ | 642,007 | June 30, 2014 | |||
| $ | 6,457,028 | June 30, 2015 | |||
| $ | 456,041 | June 30, 2017 | |||
| James Equity Fund | $ | 527,658 | June 30, 2017 | ||
| James Mid Cap Fund | $ | 47,388 | June 30, 2016 | ||
| $ | 271,909 | June 30, 2017 | |||
The capital loss carryforwards may be utilized in future years to offset net realized capital gains, if any, prior to distributing such gains to shareholders.
The Funds have analyzed their tax positions taken on Federal income tax returns for all open tax years (tax years ended June 30, 2006 through 2009) and have concluded that no provision for income tax is required in their financial statements.
Reclassification of Capital Accounts
Reclassifications result primarily from the difference in the tax treatment of net investment losses and distributions in excess of net investment income. The following reclassifications have been made on the Statements of Assets and Liabilities and have no impact on the net assets or net asset value of the Funds:
Paid-In Capital | Undistributed Net | Accumulated NetRealized Gains (Losses) | ||||||||||
| James Balanced: Golden Rainbow Fund | $ | — | $ | (2,865 | ) | $ | 2,865 | |||||
| James Small Cap Fund | $ | (2,951 | ) | $ | 2,951 | $ | — | |||||
| James Market Neutral Fund | $ | (382,042 | ) | $ | 383,773 | $ | (1,731 | ) | ||||
| James Equity Fund | $ | (556 | ) | $ | 556 | $ | — | |||||
| James Mid Cap Fund | $ | (796 | ) | $ | (20 | ) | $ | 816 | ||||
As of December 31, 2009, the James Advantage Funds had the following federal tax cost resulting in net unrealized appreciation/depreciation as follows:
| Gross | Gross | Net Unrealized | ||||||||||||||
| Federal Tax | Unrealized | Unrealized | Appreciation/ | |||||||||||||
| Cost | Appreciation | Depreciation | Depreciation | |||||||||||||
| James Balanced: Golden Rainbow Fund | $ | 497,533,976 | $ | 57,613,119 | $ | (7,259,386 | ) | $ | 50,353,733 | |||||||
| James Small Cap Fund | $ | 50,333,557 | $ | 14,588,024 | $ | (2,613,845 | ) | $ | 11,974,179 | |||||||
| James Market Neutral Fund | $ | 20,153,775 | $ | 8,484,243 | $ | (5,439,257 | ) | $ | 3,044,986 | |||||||
| James Equity Fund | $ | 8,852,159 | $ | 1,703,242 | $ | (401,570 | ) | $ | 1,301,672 | |||||||
| James Mid Cap Fund | $ | 3,815,450 | $ | 919,508 | $ | (255,155 | ) | $ | 664,353 | |||||||
48
JAMES ADVANTAGE FUNDS
NOTES TO FINANCIAL STATEMENTS (Continued)
2. Securities Transactions
Purchases and sales (including maturities) of investments in long-term U.S. Government obligations for the six months ended December 31, 2009 was as follows:
| Purchases | Sales | |||||||
| James Balanced: Golden Rainbow Fund | $ | 33,758,198 | $ | 51,430,141 | ||||
Purchases and sales (including maturities) of investments in other securities for the six months ended December 31, 2009 were as follows:
| Purchases | Sales | |||||||
| James Balanced: Golden Rainbow Fund | $ | 54,432,266 | $ | 39,981,081 | ||||
| James Small Cap Fund | 3,759,333 | 41,431,742 | ||||||
| James Market Neutral Fund | 3,729,998 | 9,204,058 | ||||||
| James Equity Fund | 687,379 | 2,014,162 | ||||||
| James Mid Cap Fund | 310,919 | 1,027,752 | ||||||
For the six months ended December 31, 2009, the cost of securities purchased to cover short sales and the proceeds from securities sold short were $11,189,446 and $8,273,414 respectively, for the James Market Neutral Fund.
3. Management Fee and Other Transactions with Affiliates
A trustee and certain officers of the Trust were also officers of James or JPMorgan Chase Bank, N.A. (“JPMorgan”), the administrative services agent, shareholder services and transfer agent and accounting services agent for the Trust during the six months ended December 31, 2009.
Investment Management Agreement
The Funds retain James to manage the Funds’ investments. The investment decisions for the Funds are made by a committee of James’ personnel, which is primarily responsible for the day-to-day management of each Fund’s portfolio. James Balanced: Golden Rainbow Fund is authorized to pay James a fee equal to an annual rate of 0.74% of its average daily net assets. James Balanced: Golden Rainbow Fund is responsible for the payment of all of its operating expenses.
James is authorized to receive a fee equal to (a) an annual rate of 1.25% of the average daily net assets of the James Small Cap Fund, James Equity Fund and James Mid Cap Fund, and 1.70% of James Market Neutral Fund; minus (b) the fees and expenses of the non-interested person trustees incurred by the applicable Fund.
James is responsible for the payment of all operating expenses of the James Small Cap Fund, James Market Neutral Fund, James Equity Fund, and James Mid Cap Fund, except for brokerage fees and commissions, taxes, interest (including dividend expense on securities sold short) and 12b-1 expenses.
Administrative Services Agreement
Under the terms of an Administrative Services Agreement with the Trust, JPMorgan supplies executive and regulatory services, supervises the preparation of tax returns, and coordinates the preparation of reports to shareholders and reports to and filings with the Securities and Exchange Commission and state securities authorities. For these services, JPMorgan receives a monthly fee paid by James Balanced: Golden Rainbow Fund, and paid by James for the James Small Cap Fund, James Market Neutral Fund, James Equity Fund and James Mid Cap Fund, based on the Funds’ aggregate average daily net assets, subject to a minimum monthly fee.
49
JAMES ADVANTAGE FUNDS
NOTES TO FINANCIAL STATEMENTS (Continued)
Transfer Agent and Shareholder Service Agreement
Under the terms of the Transfer, Dividend Disbursing, Shareholder Service and Plan Agency Agreement with the Trust, JPMorgan maintains the records of each shareholder’s account, answers shareholder inquiries concerning their accounts, processes purchases and redemptions of each Funds’ shares, acts as dividend and distribution disbursing agent and performs other shareholder service functions. For these services, JPMorgan receives a monthly fee paid by James Balanced: Golden Rainbow Fund, and paid by James for the James Small Cap Fund, James Market Neutral Fund, James Equity Fund and James Mid Cap Fund, subject to a minimum monthly fee. In addition, James Balanced: Golden Rainbow Fund and James pay JPMorgan out-of-pocket expenses including, but not limited to, postage and supplies.
Accounting Services Agreement
Under the terms of the Accounting Services Agreement with the Trust, JPMorgan calculates the daily net asset value per share and maintains the financial books and records of each Fund. For these services, JPMorgan receives a monthly fee from James Balanced: Golden Rainbow Fund and from James with respect to each of the James Small Cap Fund, James Market Neutral Fund, James Equity Fund and James Mid Cap Fund. In addition, JPMorgan is reimbursed by James Balanced: Golden Rainbow Fund and James for certain out-of-pocket expenses incurred by JPMorgan in obtaining valuations of the Funds’ portfolio securities.
Plan of Distribution
Each Fund (only the Retail Class of the James Balanced: Golden Rainbow Fund) has adopted a plan pursuant to Rule 12b-1 under the 1940 Act (collectively, the “Plans”) under which each Fund may incur expenses related to distribution of its shares and for services provided to shareholders. Payments under a Plan are made to the Adviser, which uses them to pay distribution and shareholder service expenses on behalf of and as agent of the Fund. The amount payable by each Fund (the Retail Class of the James Balanced: Golden Rainbow Fund) under its Plan is 0.25% of its average daily net assets for the year. The Plans are compensation plans, which mean that payments are made to the Adviser regardless of 12b-1 expenses actually incurred. Therefore, payments under a Plan may exceed distribution and shareholder service expenses incurred pursuant to the Plan, and the Adviser is permitted to retain the excess. It is also possible that 12b-1 expenses paid by the Adviser for a period will exceed the payments received by the Adviser, in which case the Adviser may pay such excess expenses out of its own resources. Payments received by the Adviser under the Plans are in addition to the fees paid to the Adviser pursuant to the Management Agreements. The Plans require that the Adviser act in the Funds’ best interests in expending the payments it receives from the Funds and use payments solely for the purpose of paying Distribution Expenses on behalf of the Funds. The Funds’ Distributor verifies all payment amounts to be made to brokers that have properly executed dealer agreements with the Funds before the Adviser will make such payments.
Compliance Services Agreement
Under the terms of the Compliance Services Agreement between the Trust and JPMorgan, JPMorgan provides certain compliance services to the Trust, including developing and assisting in implementing a compliance program for JPMorgan on behalf of the funds and providing administrative support services to the Funds’ Compliance Program and Chief Compliance Officer. The Adviser pays all fees under this agreement for the James Small Cap Fund, James Market Neutral Fund, James Equity Fund, and James Mid Cap Fund.
50
JAMES ADVANTAGE FUNDS
NOTES TO FINANCIAL STATEMENTS (Continued)
Beneficial Ownership
The beneficial ownership, either directly or indirectly, of more than 25% of the voting securities of a fund creates a presumption of control of the fund under section 2(a)(9) of the Investment Company Act of 1940. As of December 31, 2009, Charles Schwab & Co., Inc. owned, for the benefit of its customers, 32.80% of the James Balanced: Golden Rainbow Fund, Retail Class shares. James, Dr. Frank James, and other affiliates of James owned 91.70%, 32.26%, and 62.56% of the James Balanced: Golden Rainbow Fund, Institutional Class shares, James Equity Fund, and James Mid Cap Fund, respectively.
4. Commitments and Contingencies
The Funds indemnify the Trust’s officers and trustees for certain liabilities that might arise from their performance of their duties to the Funds. Additionally, in the normal course of business, the Funds enter into contracts that contain a variety of representations and warranties and that provide general indemnifications. The Funds’ maximum exposure under these arrangements is unknown, as this would involve future claims that may be made against the Funds that have not yet occurred. However, based on experience, the Funds expect the risk of loss to be remote.
5. Subsequent Events
The Funds evaluated subsequent events from December 31, 2009, the date of these Schedules of Investments, through February 22, 2010, the date this report was issued and available. There were no subsequent events to report that would have a material impact on the Funds’ Financial Statements.
The Board of Trustees has selected ALPS, Inc, Denver Colorado, as the Funds’ Transfer Agent, Fund Accountant and Fund Administrator. This change is expected to occur in the first quarter of 2010.
51
JAMES ADVANTAGE FUNDS
OTHER ITEMS (Unaudited)
Proxy Voting Guidelines
James is responsible for exercising the voting rights associated with the securities purchased and held by the Funds. A description of the policies and procedures that James uses in fulfilling this responsibility and information regarding how those proxies were voted during the most recent twelve month period ended June 30 are available without charge upon request by calling toll free 1-800-995-2637. These items are also available on the Securities and Exchange Commission’s website at http://www.sec.gov.
Quarterly Portfolio Disclosure
James files a complete listing of portfolio holdings for each Fund as of the end of the first and third quarters of each fiscal year on Form N-Q. The complete listing (i) is available on the Commission’s website; (ii) may be reviewed and copied at the Commission’s Public Reference Room in Washington, DC; and (iii) will be made available to shareholders upon request by calling 1-800-995-2637. Information on the operation of the Public Reference Room may be obtained by calling 1-800-SEC-0330.
Shareholder Expense Example
As a shareholder of the Funds, you incur two types of costs: (1) transaction costs, including reinvested dividends or other distributions; and redemption fees; and (2) ongoing costs, including management fees; distribution (12b-1) fees; and other Fund expenses. This example is intended to help you understand your ongoing costs (in dollars) of investing in the Funds and to compare these costs with the ongoing costs of investing in other mutual funds.
The example is based on an investment of $1,000 invested at the beginning of the period and held for the entire period July 1, 2009 through December 31, 2009).
Actual Expenses
The first line of the table below provides information about actual account values and actual expenses. You may use the information in this line, together with the amount you invested, to estimate the expenses that you paid over the period. Simply divide your account value by $1,000 (for example, an $8,600 account value divided by $1,000 = 8.6), then multiply the result by the number in the first line under the heading entitled "Expenses Paid During the Six Months Ended December 31, 2009" to estimate the expenses you paid on your account during this period, if you held your shares for the entire period.
52
JAMES ADVANTAGE FUNDS
OTHER ITEMS (Unaudited) (Continued)
Hypothetical Example for Comparison Purposes
The second line of the table below provides information about hypothetical account values and hypothetical expenses based on the Funds' actual expense ratio and an assumed rate of return of 5% per year before expenses, which is not the Funds' actual return. The hypothetical account values and expenses may not be used to estimate the actual ending account balance or expenses you paid for the period. You may use this information to compare the ongoing costs of investing in the Funds and other funds. To do so, compare this 5% hypothetical example with the 5% hypothetical examples that appear in the shareholder reports of the other funds.
Note that expenses shown in the table are meant to highlight and help you compare ongoing cost only. The calculations assume no shares were bought or sold during the period. Your actual costs may have been higher or lower, depending on the amount of your investment and the timing of any purchases or redemptions.
Net Expense Ratio Annualized December 31, 2009 | Beginning Account Value July 1, 2009 | Ending Account Value December 31, 2009 | Expenses Paid During the Six Months Ended December 31, 2009* | |||||||||||||
| James Balanced: Golden Rainbow Fund | ||||||||||||||||
| Retail Class Actual | 1.18% | $ | 1,000.00 | $ | 1,087.20 | $ | 6.21 | |||||||||
| Retail Class Hypothetical | 1.18% | $ | 1,000.00 | $ | 1,019.25 | $ | 6.01 | |||||||||
| Institutional Class Actual | 0.93% | $ | 1,000.00 | $ | 1,088.60 | $ | 4.90 | |||||||||
| Institutional Class Hypothetical | 0.93% | $ | 1,000.00 | $ | 1,020.51 | $ | 4.74 | |||||||||
| James Small Cap Fund | ||||||||||||||||
| Actual | 1.50% | $ | 1,000.00 | $ | 1,181.20 | $ | 8.26 | |||||||||
| Hypothetical | 1.50% | $ | 1,000.00 | $ | 1,017.63 | $ | 7.64 | |||||||||
| James Market Neutral Fund | ||||||||||||||||
| Actual | 2.06% | $ | 1,000.00 | $ | 961.00 | $ | 10.17 | |||||||||
| Hypothetical | 2.06% | $ | 1,000.00 | $ | 1,014.83 | $ | 10.45 | |||||||||
| James Equity Fund | ||||||||||||||||
| Actual | 1.50% | $ | 1,000.00 | $ | 1,157.90 | $ | 8.16 | |||||||||
| Hypothetical | 1.50% | $ | 1,000.00 | $ | 1,017.65 | $ | 7.63 | |||||||||
| James Mid Cap Fund | ||||||||||||||||
| Actual | 1.50% | $ | 1,000.00 | $ | 1,251.80 | $ | 8.51 | |||||||||
| Hypothetical | 1.50% | $ | 1,000.00 | $ | 1,017.65 | $ | 7.63 | |||||||||
| * | Expenses are equal to the Fund's annualized expense ratio, multiplied by the average account value over the period, multiplied by 184/365 (to reflect the one-half year period). |
53
THIS PAGE INTENTIONALLY LEFT BLANK
THIS PAGE INTENTIONALLY LEFT BLANK
INVESTMENT ADVISER
James Investment Research, Inc.
P.O. Box 8
Alpha, Ohio 45301
info@jamesfunds.com
•
CUSTODIAN
U.S. Bank
425 Walnut Street
Cincinnati, Ohio 45202
•
TRANSFER AGENT
JPMorgan Chase Bank, N.A.
P.O. Box 5354
Cincinnati, Ohio 45201-5354
•
INDEPENDENT REGISTERED
PUBLIC ACCOUNTING FIRM
Deloitte & Touche LLP
250 East Fifth Street
Suite 1900
Cincinnati, Ohio 45202
•
DISTRIBUTOR
Unified Financial Services, Inc.
2960 N. Meridian Street
Indianapolis, Indiana 46208
•
LEGAL COUNSEL
Thompson Hine LLP
312 Walnut Street
14th Floor
Cincinnati, Ohio 45202
www.jamesfunds.com
For information about the Funds, or to
make inquiries about the Funds, please call
1-800-99JAMES (1-800-995-2637).
FORM IFS-163-0201
Item 2. Code of Ethics.
Not Applicable
Item 3. Audit Committee Financial Expert.
Not Applicable
Item 4. Principal Accountant Fees and Services.
Not Applicable
Item 5. Audit Committee of Listed Companies.
Not applicable.
Item 6. Schedule of Investments.
The schedule is included as part of the report to shareholders filed under Item 1 of this Form.
Item 7. Disclosure of Proxy Voting Policies and Procedures for Closed End Management Investment Companies.
Not Applicable.
Item 8. Portfolio Managers of Closed-End Funds.
Not applicable.
Item 9. Purchases of Equity Securities by Closed-End Funds.
Not applicable.
Item 10. Submission of Matters to a Vote of Security Holders.
Not applicable
Item 11. Controls and Procedures.
(a) Based on an evaluation of the registrant's disclosure controls and procedures (as defined in Rule 30a-3(c) under the 1940 Act) the registrant's principal executive officer and principal financial officer have concluded that the registrant's disclosure controls and procedures are effective as of a date within 90 days of the filing date of this report.
(b) There were no significant changes in the registrant’s internal control over financial reporting that occurred during the registrant’s last fiscal half-year that have materially affected, or are reasonably likely to materially affect, the registrant’s internal control over financial reporting.
Item 12. Exhibits.
| (a)(1) | Not applicable. |
| (a)(2) | Certifications required by Item 12(a)(2) of Form N-CSR are filed herewith. |
SIGNATURES
Pursuant to the requirements of the Securities Exchange Act of 1934 and the Investment Company Act of 1940, the registrant has duly caused this report to be signed on its behalf by the undersigned, thereunto duly authorized.
(Registrant) The James Advantage Funds
By (Signature and Title)
/s/ Barry R. James
Barry R. James
President
Date: March 2, 2010
Pursuant to the requirements of the Securities Exchange Act of 1934 and the Investment Company Act of 1940, this report has been signed below by the following persons on behalf of the registrant and in the capacities and on the dates indicated.
By (Signature and Title)
/s/ Barry R. James
Barry R. James
President
Date: March 2, 2010
By (Signature and Title)
/s/ Thomas L. Mangan
Thomas L. Mangan
Treasurer, Chief Financial Officer
Date: March 2, 2010