UNITED STATES
SECURITIES AND EXCHANGE COMMISSION
WASHINGTON, D.C. 20549
FORM N-CSR
CERTIFIED SHAREHOLDER REPORT OF REGISTERED
MANAGEMENT INVESTMENT COMPANIES
811-08411
(Investment Company Act file number)
The James Advantage Funds
(Exact name of registrant as specified in charter)
1349 Fairground Road
Xenia, Ohio 45385
(Address of principal executive offices) (Zip code)
Barry R. James
P.O. Box 8
Alpha, Ohio 45301
(Name and address of agent for service)
Registrant’s telephone number, including area code: (937) 426-7640
Date of fiscal year end: June 30
Date of reporting period: July 1, 2017 – June 30, 2018
Item 1. Reports to Stockholders.

TABLE OF CONTENTS
| Shareholder Letter | 1 |
| Growth of $10,000 or $50,000 Charts | 5 |
| Representation of Schedules of Investments | 9 |
| Disclosure of Fund Expenses | 10 |
| Schedule of Investments | |
| James Balanced: Golden Rainbow Fund | 11 |
| James Small Cap Fund | 24 |
| James Mid Cap Fund | 27 |
| James Micro Cap Fund | 30 |
| James Aggressive Allocation Fund | 32 |
| James Long-Short Fund | 35 |
| Statements of Assets and Liabilities | 38 |
| Statements of Operations | 40 |
| Statements of Changes in Net Assets | 41 |
| Financial Highlights | |
| James Balanced: Golden Rainbow Fund - Retail Class | 48 |
| James Balanced: Golden Rainbow Fund - Institutional Class | 49 |
| James Small Cap Fund | 50 |
| James Mid Cap Fund | 51 |
| James Micro Cap Fund | 52 |
| James Aggressive Allocation Fund | 53 |
| James Long-Short Fund | 54 |
| Notes to Financial Statements | 55 |
| Report of Independent Registered Public Accounting Firm | 63 |
| Additional Information | 64 |
| Disclosure Regarding Approval of Fund Advisory Agreements | 65 |
| Trustees & Officers | 68 |
| Privacy Policy | 70 |
| James Advantage Funds | Shareholder Letter |
June 30, 2018 (Unaudited)
LETTER TO THE SHAREHOLDERS OF THE JAMES ADVANTAGE FUNDS
We always remember the money you have invested in our funds is directly tied to your future. It might be vacations or dream trips, college and career aspirations, retirement, charitable giving or providing for your family. As always, we have tried to build a no-load fund family which adequately addresses both risk and reward. We are honored and thankful for your trust. We are pleased to report all of our Funds made money during the last year.
While the stock market advanced last year, the advance was somewhat concentrated. For example, the top ten stocks in the S&P 500® Index were so dominant, if you excluded them the index would have returned 6.1% less than with them. It was a year of vastly varying sector returns. Our research shows Utility and Non-Cyclical stocks did little while Technology and Cyclical stocks did very well. We have had good diversification in your funds, which both helped and hurt at times.
Our flagship Fund, the James Balanced: Golden Rainbow Fund seeks to provide total return through a combination of growth and income and preservation of capital in declining markets. This worked very well in 2008, when the Fund was down 5.53% while the S&P 500® Index was down 37.00%. While we seek to continually improve results, we nonetheless remain committed to our time tested risk management philosophy.
Over the last year the markets were adapting to a change in direction by the Federal Reserve and also changes in government policy. Cuts in taxes and regulations were often seen as a boon to business and earnings. This gave a boost to the stock market while bonds generally produced income and little more. The Bloomberg Barclays U.S. Intermediate Term Government Bond Index actually saw losses in total return.
Here is some information about the past fiscal year.
The Market Over the Past Year
The S&P 500® Index, a commonly used barometer of the stock market, rose 14.37% over the twelve months ended June 30, 2018. The stock market started the fiscal year strong. However, in January it seemed like the market had gotten ahead of itself and needed a breather. It then experienced a correction of almost 9%. Then, the market made little progress the rest of the year as it remained in a trading range. Over these twelve months the Dow Jones Industrial Average rose 16.31%, while smaller capitalization stocks, represented by the Russell 2000® Index, rose 17.57%. At the other end of the return spectrum, the Bloomberg Barclays U.S. Intermediate Government/Credit Bond Index, a measure of the fixed income markets, fell 0.58% on a total return basis.
Investment Goals and Objectives
Our research team uses our proprietary approach to try and identify securities we believe are undervalued. In our experience, these stocks typically hold up better in difficult markets and have the potential to trade higher as the market rallies. We do not drift from our style simply because the markets are embracing a current, but temporary, fad. We believe value investing will outperform over the long run, a fact supported by much academic research. Investors should realize value investing does not always outperform growth and there are no assurances that value’s past outperformance will be repeated. The Long-Short Fund invests in long positions we view as undervalued and sells short securities that are overvalued. The James Aggressive Allocation Fund and James Balanced: Golden Rainbow Fund invest in equities, but also in high quality fixed income securities.
The investment objectives of each Fund are stated in its Prospectus, and each Fund has a primary benchmark that may help investors understand broad trends and portfolio performance. Some Funds also have a secondary benchmark. Of course, benchmarks do not take into account black-swan types of risks, unusual trends, or particularized investment goals.
Investment Philosophy
The Fund’s adviser does its own research using quantitative databases and statistical expertise and other elements to help measure risk levels and the potential impact on future stock and bond price movements. The adviser employs a proprietary investment approach to select equity securities it believes are undervalued and more likely to appreciate. The adviser focuses on characteristics such as being overlooked by Wall Street, management commitment and value. The adviser also assesses a number of fundamental factors such as earnings, earnings trends, price earnings multiples, return on assets, other financial statement data as well as its own proprietary calculations. The adviser evaluates over 8,000 companies of all capitalization ranges. For the James Micro Cap, the James Small Cap and the James Mid Cap Fund, the adviser refines its approach by using a capitalization screen and evaluates thousands of companies within the appropriate capitalization range. For all Funds, the adviser normally will sell a security when the investment no longer meets the adviser’s investment criteria. The adviser’s Investment Committee has a great deal of investment experience, exceeding over 200 years in total with James. We believe our combination of quantitative modeling and hands-on management makes us unique and supports the James Advantage Funds.
| Annual Report | June 30, 2018 | 1 |
| Shareholder Letter | James Advantage Funds |
June 30, 2018 (Unaudited)
Fund Performance
Three key issues have been driving the markets in the last fiscal year.
| ● | The stock and bond markets have had to adapt to a rising Federal Funds rate and Quantitative Tightening. Much of the stock advance in the last 10 years has come because of the support of the Federal Reserve. |
| ● | The market seemed to anticipate the tax cuts and did well until a short time after their passage. The old investing proverb is “Buy on the rumor, sell on the news.” |
| ● | Our economy continues to move ahead and this can be attractive to other investors. Of course, trade arguments and conflicts can eventually damage the global economic landscape. |
The James Balanced: Golden Rainbow Fund Retail Class shares rose 1.87% over the twelve months ended June 30, 2018. Its blended secondary benchmark, a composite index comprised of the Russell 2000® Index, the S&P 500® Index and the Bloomberg Barclays Capital U.S. Intermediate Government/Credit Bond Index, rose by 7.53%. The Fund trailed this benchmark as our type of investing lagged growth stocks over the year. As mentioned previously, a narrow band of growth stocks added to the return of some of the indexes. In addition, bond prices fell during the period.
The largest contributors to the James Balanced: Golden Rainbow Fund’s performance were United Rentals, Inc. and Best Buy. United Rentals is an equipment rental company that serves the construction industry. The company returned 30.6% during the year as sales accelerated and the belief that they would increase further as infrastructure building was given serious discussion in Washington. Best Buy, a retail consumer electronics store, increased by 32.5% over the fiscal year. Much of the run-up can be attributed to higher consumer spending around the holiday season at the same time federal income tax cuts were being finalized.
The largest detractors to the Fund’s performance were the Unum Group and U.S. Treasury 2.75% due November 15, 2047. Unum Group provides group disability and special risk insurance to employees at their worksites. This long term holding declined 19.4% over the year after the company reported lower profits than estimated in their May 2, 2018 earnings announcement. Long term U.S. treasury bonds have been an important component of the James: Balanced Golden Rainbow Fund as they provide income and diversification to the stock portion of the Fund. During the fiscal year, the Federal Reserve was in the process of raising the Fed Funds rate in an effort to stem future inflation. Being a longer dated issue, these bonds have a higher sensitivity to interest rate changes.
The James Small Cap Fund rose 11.41% over the fiscal year versus a rise of 17.57% for the Russell 2000® Index, its benchmark. The Fund was helped by good returns in the Finance sector but hurt by losses in the Utility sector.
The top contributors to the Small Cap Fund’s performance were Weight Watchers International and Deckers Outdoor Corp. Weight Watchers International as its name suggests, provides weight control programs and support to its members. Sales and earnings continued to do well as Americans strived to be more healthy and fit. While being one of the smaller positions in the Fund, the 55.4% return for the fiscal year helped to boost the Net Asset Value (NAV). Deckers Outdoor Corp. designs and markets footwear for men, women and children. Some of their more well-known name brands include UGG Boots, Teva Sandals and Hoka running shoes. Deckers provided a nice return of 70.7% from the November purchase date. These strong returns can be attributed to five straight quarters of beating management targets and improved margins.
Detractors to the performance of the James Small Cap Fund were Applied Optoelectronics and AK Steel Holding Corporation. Applied Optoelectronics manufactures and supplies fiber-optic networking products. Pricing wars and competition hurt Applied Optoelectronics considerably in the latter half of the 2017 calendar year. Even though the stock was held for a very brief time, there was a 43% decline over the holding period. The stock was sold to avoid further losses in late October. AK Steel Holding Corp. produces carbon, stainless and electrical flat rolled steel for automotive, infrastructure and manufacturing markets. The stock declined 35.5% over the holding period, before it was sold by the Fund in November of 2017. Back to back quarters of negative earnings harmed the stock, shortly before the Trump Administration began to discuss tariffs on steel imports from outside the United States.
The James Mid Cap Fund rose 7.27% over the year while its benchmark, the S&P 400® MidCap Value Index, rose 11.17%. The Fund’s positions in Energy and Consumer Cyclical stocks boosted performance while the Industrial sector slipped.
The largest contributors to the James Mid Cap Fund’s performance were American Eagle Outfitters and First Solar, Inc. American Eagle Outfitters sells casual apparel, footwear and accessories to men, women and children. This long term holding returned 81.8% for the fiscal year as same store sales growth had been in the high single digits. First Solar, Inc. designs and manufactures solar panels and modules. The stock was up 71.9% in part to a new mandate that had been put in place by the California requiring new homes to be powered by solar panels.
Office Depot, Inc. and Pilgrim’s Pride Corporation were the top detractors to the James Mid Cap Fund’s performance. Office Depot, Inc. is a chain store that sells office products from warehouse stores and more recently online. The stock fell 45% and was removed from the Fund in November of 2017. Both sales and earnings began to lag due to increased online presence and competition from companies like Amazon and other discounters. Pilgrim’s Pride Corporation produces prepared and fresh chicken in the United States and Mexico. Recent acquisitions and mergers did not pay off as quickly as the company had planned, potentially adding more debt to the company as interest rates rose.
| 2 | www.jamesfunds.com |
| James Advantage Funds | Shareholder Letter |
June 30, 2018 (Unaudited)
The James Micro Cap Fund rose 11.62% while its benchmark, the Russell Microcap® Index, rose 20.21% over the fiscal year. This Fund focuses on companies with market capitalizations at the time of purchase no larger than the stocks in the Russell Microcap® Index, including exchange traded funds that invest primarily in such securities. The Fund’s position in Finance stocks helped performance while the Consumer Cyclical stocks lost ground.
LGI Homes and Enova International were top contributors to the James Micro Cap Fund’s performance. LGI Homes is a residential home builder that operates in Texas, Arizona, Florida and Georgia. After a strong run up the last quarter of 2017, the stock was sold in early 2018, but only after earning 42.8%. LGI did show strong increases in home closings on a year-over-year basis along with many other home builders as buyers rushed in to close on homes prior to higher interest rates. Enova International offers online financial services to individuals who have limited access to traditional banking services. Much of their income is derived from short-term or installment loans. The stock made 146% and was held over the entire fiscal year.
The largest detractors to the James Micro Cap Fund’s performance were Natural Health Trends Corp. and Flexsteel Industries, Inc. Natural Health Trends Corp. markets a line of natural health and beauty care products. This thinly traded micro cap stock pulled back in the fourth quarter of calendar year 2017 and was subsequently sold to avoid any further declines. Flexsteel Industries Inc. manufactures and sells furniture. Most of their product is sold to furniture dealers and or department stores who in turn sell to the end customer. Retail sales remained positive for the U.S. economy, however big ticket items trailed those of its smaller price tag brethren.
The James Long-Short Fund rose 1.35%, the S&P 500® Index, rose 14.37%. The Long-Short Fund can be leveraged up to 130%, but does not have to be leveraged, nor is it required to have any short positions at all. This Fund attempts to take advantage of volatile markets where it can capitalize on market swings, both up and down. The Fund’s prospectus advises shareholders and potential shareholders not to expect a tight correlation to the S&P 500® Index. The Fund lagged its benchmark because many of the stocks sold short were growth stocks, which outperformed the mostly value stocks held in long positions. The Fund did not use any bond investments during the year.
The largest contributors to performance of the James Long-Short Fund were Best Buy and Northrop Grumman. Best Buy, a retail consumer electronics store, increased by 32.5% during the fiscal year. Much of the run-up can be attributed to higher consumer spending around the holiday season at the same time federal income tax cuts were being finalized. Northrop Grumman is an aerospace and defense technology company. The stock was held for the entire fiscal year and made 21.5%. As tensions between countries escalate throughout the world, demand for Northrop Grumman’s aircraft and weaponry continue to have strong demand. Most of the company’s customers are governments across the globe.
Detractors to the James Long-Short Fund’s performance were holdings in Goodyear Tire and Rubber and Manpower Group. Goodyear Tire and Rubber manufactures and distributes tires for cars, trucks, heavy equipment and even airplanes. The stock peaked in January along with the rest of the market; however, it has not recovered and fell 25.6% over the fiscal year. Concerns in the automotive industry were exacerbated as talks of tariffs crept up. Sales moved ahead over the past year, however costs moved up at an ever higher rate, perhaps due to increased prices in petroleum, one of the components used in tire production. Manpower Group provides employment services including temporary staffing and permanent workers. Earnings over the past year have met expectations but the stock price suffered due to concerns over a potential economic slowdown in Europe.
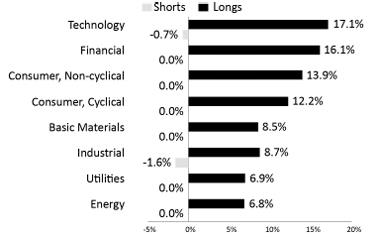
Finally, the James Aggressive Allocation Fund rose 7.36% while its blended secondary benchmark, 65% Russell 3000® and 35% Bloomberg Barclays U.S. Aggregate Government/Credit Bond Index, rose 9.24%. The Fund seeks to provide total return through a combination of growth and income. Preservation of capital in declining markets is a secondary objective. It is expected the Fund will usually run higher equity levels than the James Balanced: Golden Rainbow Fund and in this period it outperformed the James Balanced: Golden Rainbow Fund as a result. The Fund’s position in the Consumer Non-Cyclical sector added to performance while holdings in the Technology and Industrial sectors underperformed.
HollyFrontier Corporation and Weight Watchers International were the top contributors to the James Aggressive Fund’s performance. HollyFrontier Corporation refines, stores, transports and sells refined petroleum products. Even though HollyFrontier was not owned for the entire fiscal year, it did manage to return 91.3% over the holding period. Even as oil prices increased, the crack spread increased at an even quicker pace which allowed this refiner to increase margins. Weight Watchers International as its name suggests, provides weight control programs and support to its members. Sales and earnings continued to do well as Americans strived to be more healthy and fit. The Fund held Weight Watchers for a longer period of time and allowed for more capital appreciation than one of our other Funds. During its time in the Fund it returned 125% over the fiscal year.
The primary detractors to the performance of the James Aggressive Allocation Fund were McDermott International and Chesapeake Energy. McDermott International is a worldwide energy services company based out of Houston, Texas. The stock fluctuated in price per share from $16.14 up to $27.21, but never found a consistent up trend. Due to the timing of some of the purchases and sales by the Fund, the stock had a negative return of 26.3%. Chesapeake Energy produces oil and natural gas, but its main focus is on discovering natural gas reserves. For a very long time the stock decreased in price, bottoming out late February. Even though the stock maintained a very low Price/Earnings ratio, the stock was sold in October and replaced to not incur additional losses.
| Annual Report | June 30, 2018 | 3 |
| Shareholder Letter | James Advantage Funds |
June 30, 2018 (Unaudited)
Please see the following charts for longer term comparisons for all our Funds.
Expectations for the Future
While no one knows the future, we try to study history and recent trends to get a feel for the risks in the different markets.
As we said last year “The Federal Reserve is raising rates and Washington remains disjointed.” The economy appears to be advancing and inflation has not accelerated much. Interest rates remain fairly low and corporate earnings have gotten a solid boost from growth and tax cuts. A possible trade war could sap much of the economy’s strength and history shows no one wins.
The stock market faces a number of hurdles. Valuations remain elevated and it seems a narrow group of large Technology stocks have been providing much of the returns in this market. Sentiment has shifted from over confidence to slightly scared. We have also observed some other unusual trends – where low quality stocks have been vastly outperforming higher quality stocks. This has never been sustainable in the past and a return to normal is growing more likely. We believe small stocks and bargain stocks, defined as those which enjoy good relative value, profitability and price strength, will eventually reap the benefits of the fact they have underperformed for a period of time.
Bonds lagged last year but have started to improve recently. We believe bonds will provide a good offset to the risks in stocks, but they are not going to produce a lot of income. In the Funds that hold bonds, we expect to start the year with modest durations in high quality bonds. Because we invest in only high quality bonds, sovereigns and U.S. government obligations, we do not expect problems to arise from a credit standpoint.
As we start the new fiscal year, our risk indicators suggest taking a somewhat neutral approach to equity levels. We still think the market is in a broad topping region, but these tops can take considerable time. We do think we will see better days for our style in the future.
Barry R. James, CFA, CIC
President
The views of the author and information discussed in this commentary are as of the date of publication, are subject to change, and may not reflect the writer’s current views. The views expressed represent an assessment of market conditions at a specific point in time, are opinions only, and should not be relied upon as investment advice regarding a particular investment or markets in general. Such information does not constitute a recommendation to buy or sell specific securities or investment vehicles. It should not be assumed that any investment will be profitable or will equal the performance of the Funds or any securities or any sectors mentioned in this letter. The subject matter contained in this letter has been derived from several sources believed to be reliable and accurate at the time of compilation. Neither James Investment Research, Inc. nor the Funds accept any liability for losses either direct or consequential caused by the use of this information. Diversification cannot guarantee gain or prevent loss.
You should carefully consider the investment objectives, potential risks, management fees, and charges and expenses of a Fund before investing. The Funds’ prospectuses contain this and other information. You may obtain a current copy of a Fund’s prospectus by calling 1-800-995-2637.
Past performance is no guarantee of future results. The investment return and principal value of an investment in any Fund will fluctuate so that an investor’s shares, when redeemed, may be worth more or less than their original cost. Investors may obtain performance information current to the last month-end at www.jamesfunds.com.
Holdings shown represent an average weight in the Fund for the time period June 30, 2017 to June 30, 2018.
Barry R. James is a registered representative of ALPS Distributors, Inc.
CFA® is a trademark owned by the CFA Institute.
The Dow Jones Industrial Average is a price-weighted average of 30 actively traded Blue-Chip stocks.
Price/Earnings ratio is a valuation of a company’s current share price compared to its per-share earnings.
Price earnings multiple is a measure of how expensive a stock is.
“Black swan” risks relate to an event or occurrence that deviates beyond what is normally expected of a situation and is extremely difficult to predict.
Return on assets is an indicator of how profitable a company is relative to its total assets.
Quantitative Tightening is a course of action undertaken by the Federal Reserve to constrict spending in an economy that is seen to be growing too quickly or to curb inflation when it is rising too fast.
Indices are not actively managed and do not reflect any deduction for fees, expenses or taxes. An investor may not invest directly in an index.
Diversification does not eliminate the risk of experiencing investment loss.
| 4 | www.jamesfunds.com |
| James Advantage Funds | Growth of $10,000 or $50,000 Charts |
June 30, 2018 (Unaudited)
Comparison of the Change in Value of a $10,000 Investment in the James Balanced: Golden Rainbow Fund – Retail Class
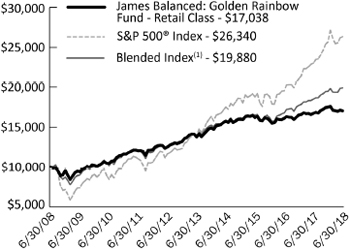
James Balanced: Golden Rainbow Fund – Retail Class Average Annual Total Returns
| 1 Year | 5 Years | 10 Years | Since Inception(2) | |
| James Balanced: Golden Rainbow – Retail Class | 1.87% | 4.35% | 5.47% | 7.52% |
| S&P 500® Index | 14.37% | 13.42% | 10.17% | 9.81% |
| Blended Index(1) | 7.53% | 7.36% | 7.11% | 8.01% |
| Russell 2000® Index | 17.57% | 12.46% | 10.60% | 10.32% |
| Barclays Capital U.S. Intermediate Government/Credit Bond Index | -0.58% | 1.60% | 3.08% | 5.18% |
| (1) | The Blended Index is comprised of a 25% weighting in the S&P 500® Index, a 25% weighting in the Russell 2000® Index and a 50% weighting in the Barclays Capital U.S. Intermediate Government/Credit Bond Index. |
| (2) | Inception was July 1, 1991. |
The total annual operating expense ratio as stated in the fee table of the most recent prospectus, dated November 1, 2017, was 0.97%.
Comparison of the Change in Value of a $50,000 Investment in the James Balanced: Golden Rainbow Fund – Institutional Class
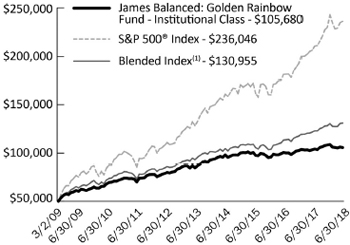
James Balanced: Golden Rainbow Fund – Institutional Class Average Annual Total Returns
| 1 Year | 5 Years | Since Inception(2) | |
| James Balanced: Golden Rainbow – Institutional Class | 2.11%(3) | 4.62% | 8.35% |
| S&P 500® Index | 14.37% | 13.42% | 18.10% |
| Blended Index(1) | 7.53% | 7.36% | 10.87% |
| Russell 2000® Index | 17.57% | 12.46% | 19.03% |
| Barclays Capital U.S. Intermediate Government/ Credit Bond Index | -0.58% | 1.60% | 2.97% |
| (1) | The Blended Index is comprised of a 25% weighting in the S&P 500® Index, a 25% weighting in the Russell 2000® Index and a 50% weighting in the Barclays Capital U.S. Intermediate Government/Credit Bond Index. |
| (2) | Inception was March 2, 2009. |
| (3) | Excludes adjustments in accordance with accounting principles generally accepted in the United States of America and as such, the net asset value and total return for shareholder transactions reported to the market may differ from the net asset value for financial reporting purposes. |
The total annual operating expense ratio as stated in the fee table of the most recent prospectus, dated November 1, 2017, was 0.72%.
Past performance does not guarantee future results. The performance data quoted represents past performance and current returns may be lower or higher. The investment return and principal value will fluctuate so that an investor’s shares, when redeemed, may be worth more or less than the original cost. These performance figures do not reflect the deduction of taxes that a shareholder would pay on Fund distributions or the redemption of Fund shares. Please call 1-800-995-2637 for most recent month-end performance information.
The S&P 500® Index is an unmanaged index of 500 common stocks chosen for market size, liquidity and industry group representation.
The Russell 2000® Index is a widely recognized, unmanaged index comprised of the 2,000 smallest U.S. domiciled publicly-traded common stocks of the Russell 3000® Index, which represents approximately 8% of the total market capitalization of the Russell 3000® Index, an unmanaged index of the 3,000 largest U.S. domiciled publicly-traded common stocks by market capitalization.
The Barclays Capital U.S. Intermediate Government/Credit Bond Index measures the performance of U.S. Dollar denominated U.S. Treasuries, government-related and investment grade U.S. corporate securities that have a remaining maturity of greater than one year and less than ten years.
The S&P 500® Index, Russell 2000® Index, Barclays Capital U.S. Intermediate Government/Credit Bond Index and Blended Index are widely recognized unmanaged indices of security prices and are representative of a broader market and range of securities than is found in the Fund’s portfolio. The Index returns do not reflect the deduction of expenses, which have been deducted from a Fund’s returns. The Index returns assume reinvestment of all distributions and do not reflect the deduction of taxes and fees. Individuals cannot invest directly in any Index; however, an individual can invest in exchange traded funds or other investment vehicles that attempt to track the performance of a benchmark index.
| Annual Report | June 30, 2018 | 5 |
| Growth of $10,000 or $50,000 Charts | James Advantage Funds |
June 30, 2018 (Unaudited)
Comparison of the Change in Value of a $10,000 Investment in the James Small Cap Fund
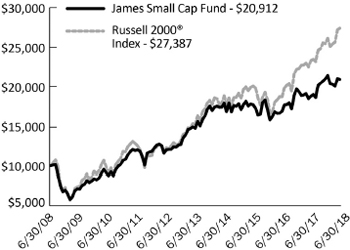
James Small Cap Fund
Average Annual Total Returns
| 1 Year | 5 Years | 10 Years | Since Inception(1) | |
| James Small Cap Fund | 11.41% | 7.26% | 7.66% | 8.07% |
| Russell 2000® Index | 17.57% | 12.46% | 10.60% | 9.59% |
| (1) | Fund inception was October 2, 1998. |
The total annual operating expense ratio as stated in the fee table of the most recent prospectus, dated November 1, 2017, was 1.52%.
Comparison of the Change in Value of a $10,000 Investment in the James Mid Cap Fund
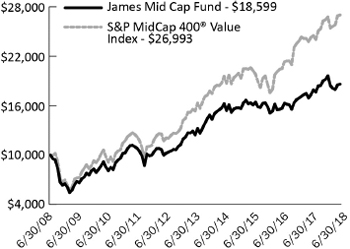
James Mid Cap Fund
Average Annual Total Returns
| 1 Year | 5 Years | 10 Years | Since Inception(1) | |
| James Mid Cap Fund | 7.27% | 8.36% | 6.40% | 5.93% |
| S&P MidCap 400® Value Index | 11.17% | 11.96% | 10.44% | 8.89% |
| (1) | Fund inception was June 30, 2006. |
The total annual operating expense ratio as stated in the fee table of the most recent prospectus, dated November 1, 2017, was 1.52%.
Past performance does not guarantee future results. The performance data quoted represents past performance and current returns may be lower or higher. The investment return and principal value will fluctuate so that an investor’s shares, when redeemed, may be worth more or less than the original cost. These performance figures do not reflect the deduction of taxes that a shareholder would pay on Fund distributions or the redemption of Fund shares. Please call 1-800-995-2637 for most recent month-end performance information.
Mid, Small and Micro Cap investing involve greater risk not associated with investing in more established companies, such as greater price volatility, business risk, less liquidity and increased competitive threat.
The Mid Cap Fund invests in stocks of mid-cap companies which tend to be more volatile and can be less liquid than stocks of large-cap companies. Diversification does not guarantee a profit or protect against loss. Current and future portfolio holdings are subject to risk.
The Russell 2000® Index is a widely recognized, unmanaged index comprised of the 2,000 smallest U.S. domiciled publicly-traded common stocks of the Russell 3000® Index, which represents approximately 8% of the total market capitalization of the Russell 3000® Index, an unmanaged index of the 3,000 largest U.S. domiciled publicly-traded common stocks by market capitalization.
The S&P MidCap 400® Value Index is a recognized, unmanaged index of mid cap stocks considered to be value stocks using Standard and Poor’s methodology.
The Russell 2000® Index and S&P MidCap Value 400® Index are widely recognized unmanaged indices of security prices and are representative of a broader market and range of securities than is found in the Fund’s portfolio. The Index returns do not reflect the deduction of expenses, which have been deducted from a Fund’s returns. The Index returns assume reinvestment of all distributions and do not reflect the deduction of taxes and fees. Individuals cannot invest directly in any Index; however, an individual can invest in exchange traded funds or other investment vehicles that attempt to track the performance of a benchmark index.
| 6 | www.jamesfunds.com |
| James Advantage Funds | Growth of $10,000 or $50,000 Charts |
June 30, 2018 (Unaudited)
Comparison of the Change in Value of a $10,000 Investment in the James Micro Cap Fund
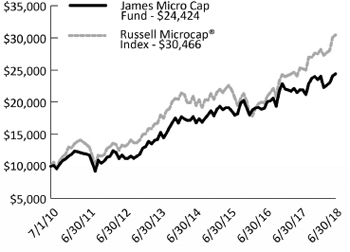
James Micro Cap Fund
Average Annual Total Returns
| 1 Year | 5 Year | Since Inception(1) | |
| James Micro Cap Fund | 11.62% | 11.45% | 11.81% |
| Russell Microcap® Index | 20.21% | 12.78% | 14.95% |
| (1) | Fund inception was July 1, 2010. |
The total annual operating expense ratio as stated in the fee table of the most recent prospectus, dated November 1, 2017, was 1.52%.
Comparison of the Change in Value of a $10,000 Investment in the James Aggressive Allocation Fund
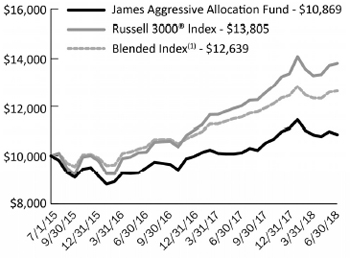
James Aggressive Allocation Fund
Average Annual Total Returns
| 1 Year | Since Inception(2) | |
| James Aggressive Allocation Fund | 7.36% | 2.82% |
| Russell 3000® Index | 14.78% | 11.35% |
| Blended Index(1) | 9.24% | 8.12% |
| (1) | The Blended Index is comprised of a 35% weighting in the Barclays U.S. Aggregate Government/Credit Bond Index and a 65% weighting in the Russell 3000® Index. |
| (2) | Fund inception was July 1, 2015. |
The total annual operating expense ratio as stated in the fee table of the most recent prospectus, dated November 1, 2017, was 1.01%.
Past performance does not guarantee future results. The performance data quoted represents past performance and current returns may be lower or higher. The investment return and principal value will fluctuate so that an investor’s shares, when redeemed, may be worth more or less than the original cost. These performance figures do not reflect the deduction of taxes that a shareholder would pay on Fund distributions or the redemption of Fund shares. Please call 1-800-995-2637 for most recent month-end performance information.
Mid, Small and Micro Cap investing involve greater risk not associated with investing in more established companies, such as greater price volatility, business risk, less liquidity and increased competitive threat.
The Russell Microcap® Index measures the performance of the microcap segment of the U.S. equity market. It makes up less than 3% of the U.S. equity market. It includes 1,000 of the smallest securities in the small cap Russell 2000® Index, plus the next smallest eligible securities by market cap.
The Russell 3000® Index is a stock market index of U.S. stocks. The index measures the performance of 3,000 publicly held U.S. companies based on total market capitalization, which represents approximately 98% of the investable U.S. equity market.
The Barclays U.S. Aggregate Government/Credit Bond Index (an unmanaged index generally representative of dollar denominated U.S. Treasuries, government related and investment grade U.S. corporate securities that have a remaining maturity greater than one year).
The Russell Microcap® Index and the Blended Index are widely recognized unmanaged indices of security prices and are representative of a broader market and range of securities than is found in the Fund’s portfolio. The Index returns do not reflect the deduction of expenses, which have been deducted from a Fund’s returns. The Index returns assume reinvestment of all distributions and do not reflect the deduction of taxes and fees. Individuals cannot invest directly in any Index; however, an individual can invest in exchange traded funds or other investment vehicles that attempt to track the performance of a benchmark index.
| Annual Report | June 30, 2018 | 7 |
| Growth of $10,000 or $50,000 Charts | James Advantage Funds |
June 30, 2018 (Unaudited)
Comparison of the Change in Value of a $10,000 Investment in the James Long-Short Fund
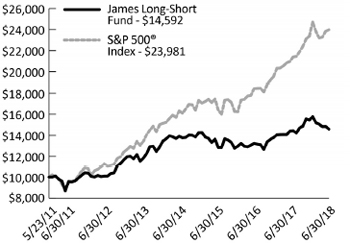
James Long-Short Fund
Average Annual Total Returns
| 1 Year | 5 Years | Since Inception(1) | |
| James Long-Short Fund | 1.35% | 4.39% | 5.46% |
| S&P 500® Index | 14.37% | 13.42% | 13.10% |
| (1) | Fund inception was May 23, 2011. |
The total annual operating expense ratio as stated in the fee table of the most recent prospectus, dated November 1, 2017, was 1.58%.
Past performance does not guarantee future results. The performance data quoted represents past performance and current returns may be lower or higher. The investment return and principal value will fluctuate so that an investor’s shares, when redeemed, may be worth more or less than the original cost. These performance figures do not reflect the deduction of taxes that a shareholder would pay on Fund distributions or the redemption of Fund shares. Please call 1-800-995-2637 for most recent month-end performance information.
Short selling incurs significant additional risk; theoretically, stocks sold short have unlimited upside risk potential. In addition, this strategy depends on the Adviser’s ability to correctly identify undervalued and overvalued stocks, and that the stock markets are reasonable and efficient. Periods of extreme volatility may harm the performance of this product. The Long-Short Fund may have a high portfolio turnover rate. A high portfolio turnover rate can result in increased brokerage commission costs and may expose taxable shareholders to potentially larger current tax liability.
The S&P 500® Index is an unmanaged index of 500 common stocks chosen for market size, liquidity and industry group representation.
The S&P 500® Index is a widely recognized unmanaged index of security prices and are representative of a broader market and range of securities than is found in the Fund’s portfolio. The Index return does not reflect the deduction of expenses, which have been deducted from a Fund’s returns. The Index return assumes reinvestment of all distributions and does not reflect the deduction of taxes and fees. Individuals cannot invest directly in any Index; however, an individual can invest in exchange traded funds or other investment vehicles that attempt to track the performance of a benchmark index.
| 8 | www.jamesfunds.com |
| James Advantage Funds | Representation of Schedules of Investments |
June 30, 2018 (Unaudited)
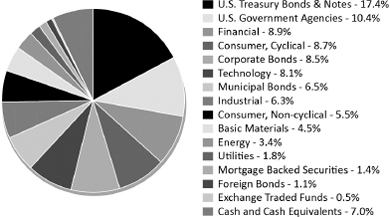
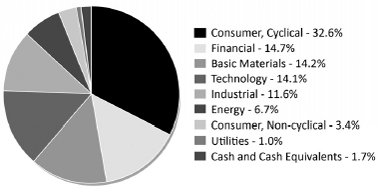
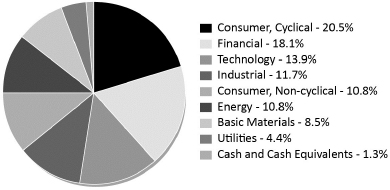
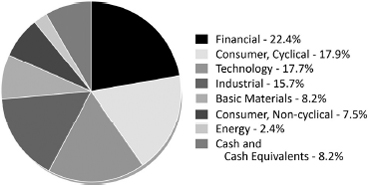
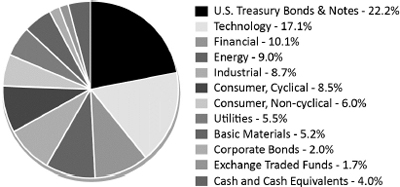
The illustrations below provide the industry sectors for the James Balanced: Golden Rainbow Fund, James Small Cap Fund, James Mid Cap Fund, James Micro Cap Fund, James Aggressive Allocation Fund and James Long-Short Fund.
James Balanced: Golden Rainbow Fund - Industry Sector Allocation (% of Net Assets)*
James Small Cap Fund -Industry Sector Allocation (% of Net Assets)*
James Mid Cap Fund - Industry Sector Allocation (% of Net Assets)*
James Micro Cap Fund - Industry Sector Allocation (% of Net Assets)*
James Aggressive Allocation Fund - Industry Sector Allocation (% of Net Assets)*
James Long-Short Fund - Industry Sector Allocation (% of Net Assets)*
(Cash and Cash Equivalents and Other Assets in Excess of Liabilities not included)
| * | Holdings are subject to change, and may not reflect the current or future position of the portfolio. |
| Annual Report | June 30, 2018 | 9 |
| Disclosure of Fund Expenses | James Advantage Funds |
June 30, 2018 (Unaudited)
Example. As a shareholder of a Fund, you incur two types of costs: (1) transaction costs, including reinvested dividends or other distributions, and redemption fees; and (2) ongoing costs, including management fees, distribution (12b-1) fees and other Fund expenses. This example is intended to help you understand your ongoing costs (in dollars) of investing in the Funds and to compare these costs with the ongoing costs of investing in other mutual funds.
The example is based on an investment of $1,000 invested at the beginning of the period and held for the entire period January 1, 2018 through June 30, 2018.
Actual Expenses. The first line of the table below provides information about actual account values and actual expenses. You may use the information in this line, together with the amount you invested, to estimate the expenses that you paid over the period. Simply divide your account value by $1,000 (for example, an $8,600 account value divided by $1,000 = 8.6), then multiply the result by the number in the first line under the heading “Expense Paid During Period” to estimate the expenses you paid on your account during this period.
Hypothetical Example for Comparison Purposes. The second line of the table below provides information about hypothetical account values and hypothetical expenses based on a Fund’s actual expense ratio and an assumed rate of return of 5% per year before expenses, which is not the Fund’s actual returns. The hypothetical account values and expenses may not be used to estimate the actual ending account balance or expenses you paid for the period. You may use this information to compare the ongoing costs of investing in a Fund and other mutual funds. To do so, compare this 5% hypothetical example with the 5% hypothetical examples that appear in the shareholder reports of the other funds.
Please note that expenses shown in the table are meant to highlight and help you compare ongoing costs only. The calculations assume no shares were bought or sold during the period. Your actual costs may have been higher or lower, depending on the amount of your investment and the timing of any purchases or redemptions.
| Net Expense Ratio Annualized June 30, 2018(a) | Beginning Account Value January 1, 2018 | Ending Account Value June 30, 2018 | Expense Paid During Period(b) | |
| James Balanced: Golden Rainbow Fund | ||||
| Retail Class Actual | 1.00% | $1,000.00 | $973.70 | $4.89 |
| Retail Class Hypothetical (5% return before expenses) | 1.00% | $1,000.00 | $1,019.84 | $5.01 |
| Institutional Class Actual | 0.74% | $1,000.00 | $975.20 | $3.62 |
| Institutional Class Hypothetical (5% return before expenses) | 0.74% | $1,000.00 | $1,021.12 | $3.71 |
| James Small Cap Fund | ||||
| Actual | 1.50% | $1,000.00 | $996.70 | $7.43 |
| Hypothetical (5% return before expenses) | 1.50% | $1,000.00 | $1,017.36 | $7.50 |
| James Mid Cap Fund | ||||
| Actual | 1.50% | $1,000.00 | $970.10 | $7.33 |
| Hypothetical (5% return before expenses) | 1.50% | $1,000.00 | $1,017.36 | $7.50 |
| James Micro Cap Fund | ||||
| Actual | 1.50% | $1,000.00 | $1,037.70 | $7.58 |
| Hypothetical (5% return before expenses) | 1.50% | $1,000.00 | $1,017.36 | $7.50 |
| James Aggressive Allocation Fund | ||||
| Actual | 0.98% | $1,000.00 | $978.00 | $4.81 |
| Hypothetical (5% return before expenses) | 0.98% | $1,000.00 | $1,019.93 | $4.91 |
| James Long-Short Fund | ||||
| Actual | 1.59%(c) | $1,000.00 | $944.50 | $7.67 |
| Hypothetical (5% return before expenses) | 1.59%(c) | $1,000.00 | $1,016.91 | $7.95 |
| (a) | Annualized, based on the Fund's most recent fiscal half year expenses. |
| (b) | Expenses are equal to the Fund's annualized expense ratio multiplied by the average account value over the period, multiplied by the number of days in the most recent fiscal half year (181), divided by 365. |
| (c) | Dividend and interest expense on securities sold short and interest expense totaled 0.09% (annualized) of average net assets for the six months ended June 30, 2018. Total annual operating expense of 1.59% includes the 0.09% of dividend and interest expense. |
| 10 | www.jamesfunds.com |
| James Balanced: Golden Rainbow Fund | Schedule of Investments |
June 30, 2018
| Shares or Principal Amount | Value | |||||||
| COMMON STOCKS-47.22% | ||||||||
| Basic Materials-4.50% | ||||||||
| 57,065 | AdvanSix, Inc.* | $ | 2,090,291 | |||||
| 35,910 | Alcoa Corp.* | 1,683,461 | ||||||
| 68,725 | Allegheny Technologies, Inc.* | 1,726,372 | ||||||
| 24,145 | Arch Coal, Inc., Class A | 1,893,692 | ||||||
| 222,205 | Avery Dennison Corp. | 22,687,130 | ||||||
| 45,860 | Boise Cascade Co. | 2,049,942 | ||||||
| 251,470 | Celanese Corp., Series A | 27,928,258 | ||||||
| 38,800 | Chemours Co. | 1,721,168 | ||||||
| 253,315 | Cleveland-Cliffs, Inc.* | 2,135,445 | ||||||
| 67,405 | Covia Holdings Corp.* | 1,251,037 | ||||||
| 18,660 | Eastman Chemical Co. | 1,865,254 | ||||||
| 173,050 | Fortuna Silver Mines, Inc.* | 982,924 | ||||||
| 930,620 | Golden Star Resources, Ltd.* | 628,169 | ||||||
| 128,605 | Harsco Corp.* | 2,842,171 | ||||||
| 281,690 | Hudbay Minerals, Inc. | 1,577,464 | ||||||
| 66,650 | Huntsman Corp. | 1,946,180 | ||||||
| 37,740 | International Paper Co. | 1,965,499 | ||||||
| 198,100 | Intrepid Potash, Inc.* | 812,210 | ||||||
| 18,870 | KMG Chemicals, Inc. | 1,392,229 | ||||||
| 30,130 | Koppers Holdings, Inc.* | 1,155,486 | ||||||
| 41,515 | Kraton Corp.* | 1,915,502 | ||||||
| 81,530 | Kronos Worldwide, Inc. | 1,836,871 | ||||||
| 69,635 | Louisiana-Pacific Corp. | 1,895,465 | ||||||
| 18,760 | LyondellBasell Industries NV, Class A | 2,060,786 | ||||||
| 36,635 | Materion Corp. | 1,983,785 | ||||||
| 52,740 | Mercer International, Inc. | 922,950 | ||||||
| 56,210 | NL Industries, Inc.* | 489,027 | ||||||
| 49,610 | Norbord, Inc. | 2,039,963 | ||||||
| 96,480 | Rayonier Advanced Materials, Inc. | 1,648,843 | ||||||
| 21,580 | Schnitzer Steel Industries, Inc., Class A | 727,246 | ||||||
| 42,185 | Steel Dynamics, Inc. | 1,938,401 | ||||||
| 26,675 | Trinseo SA | 1,892,591 | ||||||
| 56,745 | United States Steel Corp. | 1,971,889 | ||||||
| 59,025 | Universal Forest Products, Inc. | 2,161,496 | ||||||
| 23,295 | Westlake Chemical Corp. | 2,507,241 | ||||||
| 106,326,438 | ||||||||
| Consumer, Cyclical-8.69% | ||||||||
| 71,305 | Abercrombie & Fitch Co., Class A | 1,745,546 | ||||||
| 85,270 | Acushnet Holdings Corp. | 2,085,704 | ||||||
| 36,695 | AMC Networks, Inc., Class A* | 2,282,429 | ||||||
| 99,255 | American Eagle Outfitters, Inc. | 2,307,679 | ||||||
| 225,040 | Arcos Dorados Holdings, Inc., Class A | 1,564,028 | ||||||
| 28,380 | Asbury Automotive Group, Inc.* | 1,945,449 | ||||||
| 42,000 | Athene Holding, Ltd., Class A* | 1,841,280 | ||||||
| 28,895 | Atlas Air Worldwide Holdings, Inc.* | 2,071,771 | ||||||
| 183,060 | Avianca Holdings SA, Sponsored ADR | 1,182,568 | ||||||
| 341,845 | Best Buy Co., Inc. | 25,494,800 | ||||||
| 81,725 | Bloomin' Brands, Inc. | 1,642,672 | ||||||
| 42,960 | Brinker International, Inc. | 2,044,896 | ||||||
| 32,610 | Brunswick Corp. | 2,102,693 | ||||||
| 88,020 | Buckle, Inc. | 2,367,738 | ||||||
| 60,055 | Caleres, Inc. | 2,065,291 | ||||||
See Notes to Financial Statements.
| Annual Report | June 30, 2018 | 11 |
| Schedule of Investments | James Balanced: Golden Rainbow Fund |
June 30, 2018
| Shares or Principal Amount | Value | |||||||
| Consumer, Cyclical (continued) | ||||||||
| 111,545 | Callaway Golf Co. | $ | 2,116,009 | |||||
| 92,740 | Cannae Holdings, Inc* | 1,720,327 | ||||||
| 31,115 | Carnival Corp. | 1,783,201 | ||||||
| 73,030 | Century Communities, Inc.* | 2,304,096 | ||||||
| 202,685 | Chico's FAS, Inc. | 1,649,856 | ||||||
| 60,060 | China Yuchai International, Ltd. | 1,303,302 | ||||||
| 23,835 | Columbia Sportswear Co. | 2,180,187 | ||||||
| 31,670 | CVS Health Corp. | 2,037,964 | ||||||
| 20,705 | Deckers Outdoor Corp.* | 2,337,387 | ||||||
| 27,220 | Dillard's, Inc., Class A | 2,572,290 | ||||||
| 83,665 | Discovery Communications, Inc., Class A* | 2,300,787 | ||||||
| 43,515 | DR Horton, Inc. | 1,784,115 | ||||||
| 83,405 | DSW, Inc., Class A | 2,153,517 | ||||||
| 85,695 | Fiat Chrysler Automobiles NV | 1,618,779 | ||||||
| 178,650 | Ford Motor Co. | 1,977,655 | ||||||
| 69,015 | Gap, Inc. | 2,235,396 | ||||||
| 53,845 | General Motors Co. | 2,121,493 | ||||||
| 28,975 | Group 1 Automotive, Inc. | 1,825,425 | ||||||
| 85,955 | Guess?, Inc. | 1,839,437 | ||||||
| 48,010 | Harley-Davidson, Inc. | 2,020,261 | ||||||
| 217,590 | Hawaiian Holdings, Inc. | 7,822,361 | ||||||
| 34,675 | Herbalife Nutrition, Ltd.* | 1,862,741 | ||||||
| 45,400 | Insight Enterprises, Inc.* | 2,221,422 | ||||||
| 9,960 | Johnson Outdoors, Inc., Class A | 841,919 | ||||||
| 71,045 | KB Home | 1,935,266 | ||||||
| 32,415 | Kohl's Corp. | 2,363,054 | ||||||
| 25,480 | Las Vegas Sands Corp. | 1,945,653 | ||||||
| 61,880 | M/I Homes, Inc.* | 1,638,582 | ||||||
| 65,195 | Macy's, Inc. | 2,440,249 | ||||||
| 61,563 | MDC Holdings, Inc. | 1,894,294 | ||||||
| 165,030 | Meritage Homes Corp.* | 7,253,069 | ||||||
| 31,785 | Michael Kors Holdings, Ltd.* | 2,116,881 | ||||||
| 53,350 | Navistar International Corp.* | 2,172,412 | ||||||
| 117,895 | News Corp., Class B | 1,868,636 | ||||||
| 620 | NVR, Inc.* | 1,841,617 | ||||||
| 26,415 | Omnicom Group, Inc. | 2,014,672 | ||||||
| 30,360 | PACCAR, Inc. | 1,881,106 | ||||||
| 33,230 | Patrick Industries, Inc.* | 1,889,126 | ||||||
| 63,460 | Penn National Gaming, Inc.* | 2,131,621 | ||||||
| 41,690 | Penske Automotive Group, Inc. | 1,953,177 | ||||||
| 60,605 | Pinnacle Entertainment, Inc.* | 2,044,207 | ||||||
| 17,855 | Polaris Industries, Inc. | 2,181,524 | ||||||
| 63,090 | PulteGroup, Inc. | 1,813,838 | ||||||
| 81,415 | Qurate Retail, Inc.* | 1,727,626 | ||||||
| 19,815 | RH* | 2,768,156 | ||||||
| 46,940 | Rush Enterprises, Inc., Class A* | 2,036,257 | ||||||
| 131,775 | Sally Beauty Holdings, Inc.* | 2,112,353 | ||||||
| 69,345 | Sinclair Broadcast Group, Inc., Class A | 2,229,442 | ||||||
| 35,325 | SkyWest, Inc. | 1,833,368 | ||||||
| 21,565 | SodaStream International, Ltd.* | 1,839,495 | ||||||
| 8,155 | Stamps.com, Inc.* | 2,063,623 | ||||||
| 64,188 | Systemax, Inc. | 2,203,574 | ||||||
| 63,515 | Tailored Brands, Inc. | 1,620,903 | ||||||
| 115,150 | Tilly's, Inc., Class A | 1,744,523 | ||||||
See Notes to Financial Statements.
| 12 | www.jamesfunds.com |
| James Balanced: Golden Rainbow Fund | Schedule of Investments |
June 30, 2018
| Shares or Principal Amount | Value | |||||||
| Consumer, Cyclical (continued) | ||||||||
| 44,950 | Toll Brothers, Inc. | $ | 1,662,701 | |||||
| 111,150 | TRI Pointe Group, Inc.* | 1,818,414 | ||||||
| 28,990 | United Continental Holdings, Inc.* | 2,021,473 | ||||||
| 50,900 | Urban Outfitters, Inc.* | 2,267,595 | ||||||
| 63,770 | Viacom, Inc., Class B | 1,923,303 | ||||||
| 55,505 | Viacom, Inc., Class A | 1,967,652 | ||||||
| 149,005 | Wal-Mart Stores, Inc. | 12,762,278 | ||||||
| 70,995 | William Lyon Homes, Class A* | 1,647,084 | ||||||
| 50,955 | Winnebago Industries, Inc. | 2,068,773 | ||||||
| 46,540 | World Wrestling Entertainment, Inc., Class A | 3,389,043 | ||||||
| 10,220 | Wynn Resorts, Ltd. | 1,710,215 | ||||||
| 204,171,306 | ||||||||
| Consumer, Non-cyclical-5.53% | ||||||||
| 19,605 | AbbVie, Inc. | 1,816,403 | ||||||
| 36,325 | Amn Healthcare Services, Inc.* | 2,128,645 | ||||||
| 71,935 | Anthem, Inc. | 17,122,688 | ||||||
| 44,785 | Archer-Daniels-Midland Co. | 2,052,497 | ||||||
| 23,945 | ASGN, Inc.* | 1,872,260 | ||||||
| 44,060 | Avis Budget Group, Inc.* | 1,431,950 | ||||||
| 41,480 | Cal-Maine Foods, Inc.* | 1,901,858 | ||||||
| 103,290 | CBIZ, Inc.* | 2,375,670 | ||||||
| 17,030 | Dun & Bradstreet Corp. | 2,088,729 | ||||||
| 28,140 | Express Scripts Holding Co.* | 2,172,689 | ||||||
| 102,020 | First Data Corp., Class A* | 2,135,279 | ||||||
| 48,540 | FTI Consulting, Inc.* | 2,935,699 | ||||||
| 179,745 | Gannett Co., Inc. | 1,923,271 | ||||||
| 47,150 | Grand Canyon Education, Inc.* | 5,262,412 | ||||||
| 20,015 | HCA Healthcare, Inc. | 2,053,539 | ||||||
| 30,030 | Heidrick & Struggles International, Inc. | 1,051,050 | ||||||
| 21,665 | Helen of Troy, Ltd.* | 2,132,919 | ||||||
| 30,340 | ICF International, Inc. | 2,155,657 | ||||||
| 17,340 | JM Smucker Co. | 1,863,703 | ||||||
| 45,010 | K12, Inc.* | 736,814 | ||||||
| 111,945 | Kelly Services, Inc., Class A | 2,513,165 | ||||||
| 36,430 | Korn/Ferry International | 2,256,110 | ||||||
| 11,415 | Laboratory Corp. of America Holdings* | 2,049,335 | ||||||
| 66,070 | Lantheus Holdings, Inc.* | 961,319 | ||||||
| 36,430 | LifePoint Health, Inc.* | 1,777,784 | ||||||
| 153,225 | Mallinckrodt PLC* | 2,859,179 | ||||||
| 90,358 | ManpowerGroup, Inc. | 7,776,209 | ||||||
| 16,825 | Medifast, Inc. | 2,694,692 | ||||||
| 650,000 | Pfizer, Inc. | 23,582,000 | ||||||
| 93,010 | Pilgrim's Pride Corp.* | 1,872,291 | ||||||
| 31,575 | Robert Half International, Inc. | 2,055,533 | ||||||
| 45,000 | Schweitzer-Mauduit International, Inc. | 1,967,400 | ||||||
| 34,465 | Sotheby's* | 1,872,828 | ||||||
| 61,395 | Tenet Healthcare Corp.* | 2,061,030 | ||||||
| 37,365 | TriNet Group, Inc.* | 2,090,198 | ||||||
| 82,135 | TrueBlue, Inc.* | 2,213,538 | ||||||
| 29,105 | Tyson Foods, Inc., Class A | 2,003,879 | ||||||
| 42,920 | United Natural Foods, Inc.* | 1,830,967 | ||||||
| 19,095 | United Therapeutics Corp.* | 2,160,599 | ||||||
| 236,478 | Valhi, Inc. | 1,125,635 | ||||||
See Notes to Financial Statements.
| Annual Report | June 30, 2018 | 13 |
| Schedule of Investments | James Balanced: Golden Rainbow Fund |
June 30, 2018
| Shares or Principal Amount | Value | |||||||
| Consumer, Non-cyclical (continued) | ||||||||
| 27,965 | Weight Watchers International, Inc.* | $ | 2,827,262 | |||||
| 9,085 | WellCare Health Plans, Inc.* | 2,237,090 | ||||||
| 130,001,775 | ||||||||
| Energy-3.38% | ||||||||
| 625,415 | Chesapeake Energy Corp.* | 3,277,175 | ||||||
| 15,700 | Chevron Corp. | 1,984,951 | ||||||
| 44,360 | ConocoPhillips | 3,088,343 | ||||||
| 30,235 | Continental Resources, Inc.* | 1,958,019 | ||||||
| 50,870 | CVR Energy, Inc. | 1,881,681 | ||||||
| 40,660 | Delek US Holdings, Inc. | 2,039,912 | ||||||
| 572,445 | Denbury Resources, Inc.* | 2,753,460 | ||||||
| 295,000 | Equinor ASA, Sponsored ADR | 7,790,950 | ||||||
| 216,580 | Gulfport Energy Corp.* | 2,722,411 | ||||||
| 29,805 | HollyFrontier Corp. | 2,039,556 | ||||||
| 210,075 | Laredo Petroleum, Inc.* | 2,020,922 | ||||||
| 59,850 | Mammoth Energy Services, Inc.* | 2,032,506 | ||||||
| 99,060 | Marathon Oil Corp. | 2,066,392 | ||||||
| 98,133 | McDermott International, Inc.* | 1,928,313 | ||||||
| 66,700 | Murphy Oil Corp. | 2,252,459 | ||||||
| 59,540 | Noble Energy, Inc. | 2,100,571 | ||||||
| 172,625 | Oasis Petroleum, Inc.* | 2,238,946 | ||||||
| 51,490 | Peabody Energy Corp. | 2,341,765 | ||||||
| 93,665 | Phillips 66 | 10,519,516 | ||||||
| 163,025 | QEP Resources, Inc.* | 1,998,687 | ||||||
| 34,365 | SolarEdge Technologies, Inc.* | 1,644,365 | ||||||
| 167,205 | SRC Energy, Inc.* | 1,842,599 | ||||||
| 90,125 | Valero Energy Corp. | 9,988,554 | ||||||
| 63,565 | Viper Energy Partners LP | 2,028,359 | ||||||
| 73,575 | Warrior Met Coal, Inc. | 2,028,463 | ||||||
| 43,440 | Whiting Petroleum Corp.* | 2,290,157 | ||||||
| 78,859,032 | ||||||||
| Financial-8.94% | ||||||||
| 36,190 | AerCap Holdings NV* | 1,959,689 | ||||||
| 43,900 | Aflac, Inc. | 1,888,578 | ||||||
| 45,260 | Air Lease Corp. | 1,899,562 | ||||||
| 91,440 | Aircastle, Ltd. | 1,874,520 | ||||||
| 20,565 | Allstate Corp. | 1,876,968 | ||||||
| 73,760 | Ally Financial, Inc. | 1,937,675 | ||||||
| 66,215 | American Equity Investment Life Holding Co. | 2,383,740 | ||||||
| 19,815 | American Express Co. | 1,941,870 | ||||||
| 46,293 | American Financial Group, Inc. | 4,968,628 | ||||||
| 180,920 | Ashford Hospitality Trust, Inc., REIT | 1,465,452 | ||||||
| 73,775 | Associated Banc-Corp | 2,014,057 | ||||||
| 72,140 | B. Riley Financial, Inc. | 1,626,757 | ||||||
| 66,065 | Bank of America Corp. | 1,862,372 | ||||||
| 35,270 | Bank of New York Mellon Corp. | 1,902,111 | ||||||
| 160,585 | BGC Partners, Inc., Class A | 1,817,822 | ||||||
| 21,975 | Capital One Financial Corp. | 2,019,502 | ||||||
| 88,950 | Carlyle Group LP | 1,894,635 | ||||||
| 95,995 | CBRE Group, Inc, Class A* | 4,582,801 | ||||||
| 64,390 | Chesapeake Lodging Trust, REIT | 2,037,300 | ||||||
| 11,355 | Cigna Corp. | 1,929,782 | ||||||
See Notes to Financial Statements.
| 14 | www.jamesfunds.com |
| James Balanced: Golden Rainbow Fund | Schedule of Investments |
June 30, 2018
| Shares or Principal Amount | Value | |||||||
| Financial (continued) | ||||||||
| 39,970 | CNA Financial Corp. | $ | 1,825,830 | |||||
| 95,910 | CNO Financial Group, Inc. | 1,826,126 | ||||||
| 39,230 | CorEnergy Infrastructure Trust, Inc., REIT | 1,475,048 | ||||||
| 170,045 | DiamondRock Hospitality Co., REIT | 2,088,153 | ||||||
| 48,810 | Employers Holdings, Inc. | 1,962,162 | ||||||
| 43,840 | Encore Capital Group, Inc.* | 1,604,544 | ||||||
| 143,165 | Enova International, Inc.* | 5,232,681 | ||||||
| 18,750 | Evercore, Inc., Class A | 1,977,187 | ||||||
| 123,300 | EZCORP, Inc., Class A* | 1,485,765 | ||||||
| 59,645 | Fifth Third Bancorp | 1,711,811 | ||||||
| 264,250 | First BanCorp* | 2,021,512 | ||||||
| 4,545 | First Citizens BancShares, Inc., Class A | 1,832,998 | ||||||
| 96,700 | Forestar Group, Inc.* | 2,006,525 | ||||||
| 8,230 | Goldman Sachs Group, Inc. | 1,815,291 | ||||||
| 97,300 | Host Hotels & Resorts, Inc., REIT | 2,050,111 | ||||||
| 20,365 | Infinity Property & Casualty Corp. | 2,898,958 | ||||||
| 119,175 | Invesco Mortgage Capital, Inc., REIT | 1,894,883 | ||||||
| 11,480 | Jones Lang LaSalle, Inc. | 1,905,565 | ||||||
| 277,360 | JPMorgan Chase & Co. | 28,900,912 | ||||||
| 136,720 | Ladder Capital Corp., REIT | 2,135,566 | ||||||
| 51,230 | Legg Mason, Inc. | 1,779,218 | ||||||
| 44,845 | LGI Homes, Inc.* | 2,588,902 | ||||||
| 29,945 | LPL Financial Holdings, Inc. | 1,962,595 | ||||||
| 31,270 | McGrath RentCorp | 1,978,453 | ||||||
| 41,720 | MetLife, Inc. | 1,818,992 | ||||||
| 186,945 | MGIC Investment Corp.* | 2,004,050 | ||||||
| 37,360 | Morgan Stanley | 1,770,864 | ||||||
| 15,310 | MutualFirst Financial, Inc. | 577,953 | ||||||
| 232,630 | Nelnet, Inc., Class A | 13,587,918 | ||||||
| 59,955 | OneMain Holdings, Inc.* | 1,995,902 | ||||||
| 44,685 | Piper Jaffray Cos. | 3,434,042 | ||||||
| 32,240 | Progressive Corp. | 1,906,996 | ||||||
| 104,290 | Santander Consumer U.S.A. Holdings, Inc. | 1,990,896 | ||||||
| 19,905 | State Street Corp. | 1,852,956 | ||||||
| 33,025 | Stifel Financial Corp. | 1,725,556 | ||||||
| 29,285 | SunTrust Banks, Inc. | 1,933,396 | ||||||
| 59,820 | Synchrony Financial | 1,996,792 | ||||||
| 36,945 | Synovus Financial Corp. | 1,951,804 | ||||||
| 77,905 | TCF Financial Corp. | 1,918,021 | ||||||
| 146,625 | Third Point Reinsurance, Ltd.* | 1,832,813 | ||||||
| 183,270 | Torchmark Corp. | 14,920,011 | ||||||
| 56,550 | Triton International, Ltd. | 1,733,823 | ||||||
| 83,480 | Umpqua Holdings Corp. | 1,885,813 | ||||||
| 58,920 | Universal Insurance Holdings, Inc. | 2,068,092 | ||||||
| 425,000 | Unum Group | 15,720,750 | ||||||
| 57,375 | Virtu Financial, Inc., Class A | 1,523,306 | ||||||
| 105,165 | Waddell & Reed Financial, Inc., Class A | 1,889,815 | ||||||
| 35,810 | Walker & Dunlop, Inc. | 1,992,827 | ||||||
| 99,030 | Western Union Co. | 2,013,280 | ||||||
| 86,370 | Xenia Hotels & Resources, Inc., REIT | 2,103,973 | ||||||
| 35,260 | Zions Bancorporation | 1,857,849 | ||||||
| 210,853,107 | ||||||||
See Notes to Financial Statements.
| Annual Report | June 30, 2018 | 15 |
| Schedule of Investments | James Balanced: Golden Rainbow Fund |
June 30, 2018
| Shares or Principal Amount | Value | |||||||
| Industrial-6.28% | ||||||||
| 31,785 | AGCO Corp. | $ | 1,929,985 | |||||
| 46,800 | Allison Transmission Holdings, Inc. | 1,894,932 | ||||||
| 471,615 | American Axle & Manufacturing Holdings, Inc.* | 7,338,329 | ||||||
| 19,160 | ArcBest Corp. | 875,612 | ||||||
| 107,725 | Atkore International Group, Inc.* | 2,237,448 | ||||||
| 51,180 | Ball Corp. | 1,819,449 | ||||||
| 39,790 | BorgWarner, Inc. | 1,717,336 | ||||||
| 53,560 | CAI International, Inc.* | 1,244,734 | ||||||
| 148,115 | Casella Waste Systems, Inc., Class A* | 3,793,225 | ||||||
| 13,035 | Caterpillar, Inc. | 1,768,458 | ||||||
| 45,610 | Comfort Systems USA, Inc. | 2,088,938 | ||||||
| 16,100 | Cooper-Standard Holding, Inc.* | 2,103,787 | ||||||
| 43,130 | Crown Holdings, Inc.* | 1,930,499 | ||||||
| 13,520 | Cummins, Inc. | 1,798,160 | ||||||
| 81,925 | Dana, Inc. | 1,654,066 | ||||||
| 12,500 | Deere & Co. | 1,747,500 | ||||||
| 1 | Delphi Automotive PLC | 45 | ||||||
| 15,130 | Encore Wire Corp. | 717,918 | ||||||
| 28,070 | GATX Corp. | 2,083,636 | ||||||
| 41,590 | Generac Holdings, Inc.* | 2,151,451 | ||||||
| 67,000 | Global Brass & Copper Holdings, Inc. | 2,100,450 | ||||||
| 104,690 | H&E Equipment Services, Inc. | 3,937,391 | ||||||
| 89,980 | Hollysys Automation Technologies, Ltd. | 1,992,157 | ||||||
| 20,745 | Kadant, Inc. | 1,994,632 | ||||||
| 119,485 | KBR, Inc. | 2,141,171 | ||||||
| 34,950 | Kimball Electronics, Inc.* | 639,585 | ||||||
| 10,200 | Lear Corp. | 1,895,262 | ||||||
| 520,890 | Magna International, Inc. | 30,279,336 | ||||||
| 61,065 | Matson, Inc. | 2,343,675 | ||||||
| 93,765 | Meritor, Inc.* | 1,928,746 | ||||||
| 102,700 | Milacron Holdings Corp.* | 1,944,111 | ||||||
| 22,495 | MSA Safety, Inc. | 2,167,168 | ||||||
| 15,030 | NACCO Industries, Inc., Class A | 507,263 | ||||||
| 107,825 | NCI Building Systems, Inc.* | 2,264,325 | ||||||
| 26,690 | Oshkosh Corp. | 1,876,841 | ||||||
| 102,505 | Owens-Illinois, Inc.* | 1,723,109 | ||||||
| 17,125 | Packaging Corp. of America | 1,914,404 | ||||||
| 21,395 | Reliance Steel & Aluminum Co. | 1,872,918 | ||||||
| 71,615 | Silgan Holdings, Inc. | 1,921,430 | ||||||
| 37,460 | Sonoco Products Co. | 1,966,650 | ||||||
| 64,970 | Stoneridge, Inc.* | 2,283,046 | ||||||
| 42,825 | Tenneco, Inc. | 1,882,587 | ||||||
| 48,290 | Terex Corp. | 2,037,355 | ||||||
| 41,590 | Timken Co. | 1,811,245 | ||||||
| 56,550 | Tower International, Inc. | 1,798,290 | ||||||
| 71,475 | TriMas Corp.* | 2,101,365 | ||||||
| 146,415 | United Rentals, Inc.* | 21,613,782 | ||||||
| 54,900 | Vectrus, Inc.* | 1,692,018 | ||||||
| 6,815 | WW Grainger, Inc. | 2,101,746 | ||||||
| 14,250 | Zebra Technologies Corp., Class A* | 2,041,313 | ||||||
| 147,668,879 | ||||||||
| Technology-8.13% | ||||||||
| 720,542 | ACCO Brands Corp. | 9,979,507 | ||||||
See Notes to Financial Statements.
| 16 | www.jamesfunds.com |
| James Balanced: Golden Rainbow Fund | Schedule of Investments |
June 30, 2018
| Shares or Principal Amount | Value | |||||||
| Technology (continued) | ||||||||
| 11,665 | Amgen, Inc. | $ | 2,153,242 | |||||
| 36,120 | Appfolio, Inc., Class A* | 2,208,738 | ||||||
| 37,250 | Applied Materials, Inc. | 1,720,577 | ||||||
| 73,365 | ARRIS International PLC* | 1,793,407 | ||||||
| 167,225 | Arrow Electronics, Inc.* | 12,588,698 | ||||||
| 49,890 | Avnet, Inc. | 2,139,782 | ||||||
| 32,520 | Blucora, Inc.* | 1,203,240 | ||||||
| 50,000 | Cabot Microelectronics Corp. | 5,378,000 | ||||||
| 12,430 | CACI International, Inc., Class A* | 2,095,076 | ||||||
| 25,595 | CDW Corp. | 2,067,820 | ||||||
| 18,375 | Citrix Systems, Inc.* | 1,926,435 | ||||||
| 442,810 | Corning, Inc. | 12,181,703 | ||||||
| 63,770 | CTS Corp. | 2,295,720 | ||||||
| 125,370 | Cypress Semiconductor Corp. | 1,953,265 | ||||||
| 186,500 | Deluxe Corp. | 12,348,165 | ||||||
| 65,425 | Diodes, Inc.* | 2,255,200 | ||||||
| 39,840 | DXC Technology Co. | 3,211,502 | ||||||
| 18,885 | Enanta Pharmaceuticals, Inc.* | 2,188,771 | ||||||
| 68,310 | Engility Holdings, Inc.* | 2,093,018 | ||||||
| 57,580 | Entegris, Inc. | 1,951,962 | ||||||
| 93,180 | EVERTEC, Inc. | 2,035,983 | ||||||
| 59,335 | Fabrinet* | 2,188,868 | ||||||
| 33,025 | Garmin, Ltd. | 2,014,525 | ||||||
| 113,195 | Hewlett Packard Enterprise Co. | 1,653,779 | ||||||
| 89,885 | HP, Inc. | 2,039,491 | ||||||
| 135,170 | Innoviva, Inc.* | 1,865,346 | ||||||
| 363,510 | Intel Corp. | 18,070,082 | ||||||
| 25,385 | InterDigital, Inc. | 2,053,647 | ||||||
| 150,565 | KEMET Corp.* | 3,636,145 | ||||||
| 85,020 | Kulicke & Soffa Industries, Inc. | 2,025,176 | ||||||
| 10,125 | Lam Research Corp. | 1,750,106 | ||||||
| 6,135 | Lockheed Martin Corp. | 1,812,463 | ||||||
| 89,720 | Micron Technology, Inc.* | 4,704,917 | ||||||
| 17,955 | MKS Instruments, Inc. | 1,718,294 | ||||||
| 18,285 | Motorola Solutions, Inc. | 2,127,825 | ||||||
| 69,035 | NCR Corp.* | 2,069,669 | ||||||
| 17,500 | Northrop Grumman Corp. | 5,384,750 | ||||||
| 27,210 | Nova Measuring Instruments, Ltd.* | 741,473 | ||||||
| 85,645 | ON Semiconductor Corp.* | 1,904,317 | ||||||
| 224,340 | Orbotech, Ltd.* | 13,864,212 | ||||||
| 54,430 | PC Connection, Inc. | 1,807,076 | ||||||
| 9,930 | Perspecta, Inc. | 204,062 | ||||||
| 24,565 | Qorvo, Inc.* | 1,969,376 | ||||||
| 84,570 | Sabre Corp. | 2,083,805 | ||||||
| 22,605 | Science Applications International Corp. | 1,829,423 | ||||||
| 35,005 | Seagate Technology PLC | 1,976,732 | ||||||
| 20,825 | Shutterfly, Inc.* | 1,874,875 | ||||||
| 113,400 | SYNNEX Corp. | 10,944,234 | ||||||
| 66,905 | Syntel, Inc.* | 2,146,981 | ||||||
| 33,160 | Ultra Clean Holdings, Inc.* | 550,456 | ||||||
| 52,730 | United States Cellular Corp.* | 1,953,119 | ||||||
| 105,300 | Vishay Intertechnology, Inc. | 2,442,960 | ||||||
See Notes to Financial Statements.
| Annual Report | June 30, 2018 | 17 |
| Schedule of Investments | James Balanced: Golden Rainbow Fund |
June 30, 2018
| Shares or Principal Amount | Value | |||||||
| Technology (continued) | ||||||||
| 24,900 | Western Digital Corp. | $ | 1,927,509 | |||||
| 191,105,504 | ||||||||
| Utilities-1.77% | ||||||||
| 158,285 | AES Corp. | 2,122,602 | ||||||
| 88,658 | AT&T, Inc. | 2,846,808 | ||||||
| 191,850 | CenterPoint Energy, Inc. | 5,316,163 | ||||||
| 30,755 | Energen Corp.* | 2,239,579 | ||||||
| 53,107 | Entergy Corp. | 4,290,515 | ||||||
| 47,360 | Exelon Corp. | 2,017,536 | ||||||
| 57,375 | FirstEnergy Corp. | 2,060,336 | ||||||
| 45,710 | New Jersey Resources Corp. | 2,045,523 | ||||||
| 82,270 | NRG Energy, Inc. | 2,525,689 | ||||||
| 69,210 | Pinnacle West Capital Corp. | 5,575,558 | ||||||
| 83,220 | PNM Resources, Inc. | 3,237,258 | ||||||
| 479,790 | Southwestern Energy Co.* | 2,542,887 | ||||||
| 74,295 | Telephone & Data Systems, Inc. | 2,037,169 | ||||||
| 41,040 | Verizon Communications, Inc. | 2,064,722 | ||||||
| 40,922,345 | ||||||||
| TOTAL COMMON STOCKS (Cost $880,557,984) | 1,109,908,386 | |||||||
| Shares or Principal Amount | Value | |||||||
| EXCHANGE TRADED FUNDS-0.49% | ||||||||
| 114,500 | iShares® Gold Trust ETF* | 1,376,290 | ||||||
| 92,910 | iShares® MSCI All Peru Capped ETF | 3,646,717 | ||||||
| 429,760 | iShares® Silver Trust ETF* | 6,510,864 | ||||||
| TOTAL EXCHANGE TRADED FUNDS (Cost $9,460,245) | 11,533,871 | |||||||
| Shares or Principal Amount | Value | |||||||
| CORPORATE BONDS-8.52% | ||||||||
| Basic Materials-0.07% | ||||||||
| $ | 1,500,000 | E.I. du Pont de Nemours & Co., 5.750%, 3/15/19 | 1,529,669 | |||||
| Consumer, Cyclical-0.55% | ||||||||
| 5,000,000 | eBay, Inc., 2.600%, 7/15/22 | 4,772,997 | ||||||
| 5,000,000 | Home Depot, Inc., 2.700%, 4/1/23 | 4,879,644 | ||||||
| 785,000 | McDonald's Corp., 5.700%, 2/1/39 | 897,018 | ||||||
| 2,000,000 | Wal-Mart Stores, Inc., 5.250%, 9/1/35 | 2,322,558 | ||||||
| 12,872,217 | ||||||||
| Consumer, Non-cyclical-0.63% | ||||||||
| 10,000,000 | Coca-Cola Co., 3.200%, 11/1/23 | 9,968,943 | ||||||
| 1,950,000 | Dr Pepper Snapple Group, Inc., 2.530%, 11/15/21 | 1,883,665 | ||||||
| 3,000,000 | Hershey Co., 4.125%, 12/1/20 | 3,080,190 | ||||||
| 14,932,798 | ||||||||
| Energy-1.44% | ||||||||
| 5,000,000 | Apache Corp., 3.250%, 4/15/22 | 4,874,121 | ||||||
| 5,000,000 | BP Capital Markets PLC, 3.245%, 5/6/22 | 4,982,876 | ||||||
| 5,050,000 | Shell International Finance BV, 2.375%, 8/21/22 | 4,884,759 | ||||||
| 5,000,000 | Shell International Finance BV, 6.375%, 12/15/38 | 6,481,002 | ||||||
| See Notes to Financial Statements. |
| 18 | www.jamesfunds.com |
| James Balanced: Golden Rainbow Fund | Schedule of Investments |
June 30, 2018
| Shares or Principal Amount | Value | |||||||
| Energy (continued) | ||||||||
| $ | 2,625,000 | Shell International Finance BV, 4.375%, 5/11/45 | $ | 2,688,529 | ||||
| 10,000,000 | Statoil ASA, 2.250%, 11/8/19 | 9,928,036 | ||||||
| 33,839,323 | ||||||||
| Financial-2.84% | ||||||||
| 3,000,000 | American Express Credit Corp., 2.125%, 7/27/18 | 2,999,302 | ||||||
| 5,250,000 | American Express Credit Corp., 2.600%, 9/14/20 | 5,189,919 | ||||||
| 5,000,000 | Australia & New Zealand Banking Group, Ltd., 2.625%, 5/19/22 | 4,831,947 | ||||||
| 8,100,000 | Berkshire Hathaway, Inc., 3.750%, 8/15/21 | 8,322,584 | ||||||
| 10,000,000 | GE Capital International Funding Co. Unlimited Co., 2.342%, 11/15/20 | 9,769,653 | ||||||
| 10,000,000 | HSBC Holdings PLC, 4.000%, 3/30/22 | 10,143,299 | ||||||
| 5,000,000 | National Australia Bank, Ltd., 2.500%, 5/22/22 | 4,789,622 | ||||||
| 5,000,000 | National Rural Utilities Cooperative Finance Corp., 2.450%, 6/15/22 | 4,768,763 | ||||||
| 6,000,000 | PNC Bank NA, 2.950%, 2/23/25 | 5,742,453 | ||||||
| 5,305,000 | US Bank NA Cincinnati, 3M US L + 0.32%, 1/24/20(a) | 5,316,314 | ||||||
| 5,000,000 | Wells Fargo & Co., 2.500%, 3/4/21 | 4,890,523 | ||||||
| 66,764,379 | ||||||||
| Industrial-0.64% | ||||||||
| 1,000,000 | Caterpillar, Inc., 8.250%, 12/15/38 | 1,512,412 | ||||||
| 10,000,000 | General Electric Co., 3M US L + 0.80%, 4/15/20(a) | 10,065,619 | ||||||
| 1,000,000 | General Electric Co., 2.700%, 10/9/22 | 967,379 | ||||||
| 2,000,000 | General Electric Co., 6.875%, 1/10/39 | 2,531,115 | ||||||
| 15,076,525 | ||||||||
| Technology-2.35% | ||||||||
| 8,000,000 | Alphabet, Inc., 3.625%, 5/19/21 | 8,168,960 | ||||||
| 3,419,000 | Apple, Inc., 1.550%, 2/7/20 | 3,358,286 | ||||||
| 10,000,000 | Apple, Inc., 3M US L + 0.20%, 2/7/20(a) | 10,027,503 | ||||||
| 4,840,000 | Gilead Sciences, Inc., 4.600%, 9/1/35 | 4,978,297 | ||||||
| 5,000,000 | Intel Corp., 3.300%, 10/1/21 | 5,047,903 | ||||||
| 5,000,000 | Intel Corp., 2.875%, 5/11/24 | 4,840,416 | ||||||
| 9,000,000 | Microsoft Corp., 1.850%, 2/6/20 | 8,884,710 | ||||||
| 3,700,000 | Microsoft Corp., 5.200%, 6/1/39 | 4,326,174 | ||||||
| 6,000,000 | Oracle Corp., 2.400%, 9/15/23 | 5,657,734 | ||||||
| 55,289,983 | ||||||||
| TOTAL CORPORATE BONDS (Cost $201,688,611) | 200,304,894 | |||||||
| Shares or Principal Amount | Value | |||||||
| MUNICIPAL BONDS-6.52% | ||||||||
| Florida-0.57% | ||||||||
| 10,775,000 | Florida State Board of Education Capital Outlay General Obligation Bonds, Series C, 5.000%, 6/1/23 | 12,268,846 | ||||||
| 1,000,000 | Florida State Board of Education Capital Outlay General Obligation Bonds, Series D, 5.000%, 6/1/38 | 1,012,510 | ||||||
| 13,281,356 | ||||||||
| Georgia-0.37% | ||||||||
| 3,000,000 | State of Georgia General Obligation Unlimited Bonds, Series B, Partially Prefunded, 4.500%, 1/1/29(b) | 3,040,590 | ||||||
| 5,000,000 | State of Georgia General Obligation Unlimited Bonds, Series D, 5.000%, 2/1/25 | 5,627,300 | ||||||
| 8,667,890 | ||||||||
| Hawaii-0.43% | ||||||||
| 9,000,000 | City and County of Honolulu General Obligation Unlimited Bonds, Series B, 5.000%, 11/1/25 | 10,062,270 | ||||||
| Maryland-0.21% | ||||||||
| 5,000,000 | County of Montgomery General Obligation Unlimited Bonds, Series A, 3.000%, 11/1/29 | 5,005,450 | ||||||
| See Notes to Financial Statements. |
| Annual Report | June 30, 2018 | 19 |
| Schedule of Investments | James Balanced: Golden Rainbow Fund |
June 30, 2018
| Shares or Principal Amount | Value | |||||||
| Ohio-1.83% | ||||||||
| $ | 7,450,000 | Beavercreek City School District General Obligation Unlimited Bonds, 3.250%, 12/1/36 | $ | 7,368,348 | ||||
| 5,450,000 | City of Columbus General Obligation Various Purpose Limited Tax Bonds, Series B, 3.250%, 8/15/24 | 5,693,124 | ||||||
| 5,000,000 | County of Cuyahoga General Obligation Limited (Capital Improvement), Series A, 4.000%, 12/1/37 | 5,121,200 | ||||||
| Greenville City School District General Obligation Unlimited Bonds (School Improvement): | ||||||||
| 5,000,000 | 5.000%, 1/1/46 | 5,421,000 | ||||||
| 11,000,000 | 5.500%, 1/1/51 | 11,932,470 | ||||||
| 1,100,000 | Miamisburg City School District General Obligation Unlimited Bonds (School Facilities Construction & Improvement), Prerefunded 12/1/18 @ 100, 5.000%, 12/1/33(b) | 1,116,071 | ||||||
| 1,000,000 | Ohio State University General Recipients Revenue Bonds, Series C, 4.910%, 6/1/40 | 1,146,060 | ||||||
| 500,000 | Springboro Community City School District General Obligation Unlimited Bonds, 5.250%, 12/1/23 | 569,150 | ||||||
| 3,475,000 | State of Ohio General Obligation Unlimited Bonds, Series C, 5.000%, 9/1/19 | 3,612,367 | ||||||
| 1,000,000 | The Ohio State University Revenue Bonds, Series A, Prerefunded 12/1/18 @ 100, 5.000%, 12/1/28(b) | 1,014,422 | ||||||
| 42,994,212 | ||||||||
| Pennsylvania-1.29% | ||||||||
| 7,050,000 | Commonwealth of Pennsylvania General Obligation Unlimited Bonds, First Series, 5.000%, 9/15/26 | 8,145,570 | ||||||
| 20,000,000 | Commonwealth of Pennsylvania General Obligation Unlimited Bonds, First Series, Prefunded 6/1/22 @ 100, 5.000%, 6/1/24(b) | 22,294,000 | ||||||
| 30,439,570 | ||||||||
| Tennessee-0.23% | ||||||||
| 5,000,000 | Metropolitan Government of Nashville & Davidson County TN General Obligation Unlimited Bonds, Series C, 4.000%, 7/1/24 | 5,467,550 | ||||||
| Texas-0.88% | ||||||||
| 5,000,000 | Houston Texas Independent School District General Obligation Limited Bonds, Series A, 5.000%, 2/15/28 | 5,816,700 | ||||||
| 5,335,000 | Port of Houston Authority General Obligation Unlimited Bonds, Series D-1, 5.000%, 10/1/35 | 5,690,471 | ||||||
| 7,620,000 | Transportation Community Mobility General Obligation Unlimited Bonds, Series A, 5.000%, 10/1/25 | 8,941,003 | ||||||
| 235,000 | Tyler Independent School District General Obligation Unlimited Bonds, Unrefunded 2016, 5.000%, 2/15/34 | 235,632 | ||||||
| 20,683,806 | ||||||||
| Washington-0.48% | ||||||||
| 5,000,000 | State of Washington General Obligation Unlimited Bonds, Series D, 4.000%, 2/1/37 | 5,158,050 | ||||||
| 5,845,000 | State of Washington General Obligation Various Purpose Unlimited Bonds, Series D, 5.000%, 2/1/20 | 6,148,648 | ||||||
| 11,306,698 | ||||||||
| Wisconsin-0.23% | ||||||||
| 5,000,000 | State of Wisconsin General Obligation Unlimited Bonds, Series C, Prefunded 5/1/21 @ 100, 5.000%, 5/1/25(b) | 5,421,750 | ||||||
| TOTAL MUNICIPAL BONDS (Cost $152,415,063) | 153,330,552 | |||||||
| Shares or Principal Amount | Value | |||||||
| U.S. GOVERNMENT AGENCIES-10.40% | ||||||||
| Federal Agricultural Mortgage Corporation-0.69% | ||||||||
| $ | 10,000,000 | 3M US L + 0.08%, 1/3/22(a) | 10,050,939 | |||||
| 6,177,000 | 3.150%, 11/9/27 | 6,082,560 | ||||||
| 16,133,499 | ||||||||
| Federal Farm Credit Banks-2.50% | ||||||||
| 10,000,000 | 1.170%, 5/16/19 | 9,899,660 | ||||||
| 10,000,000 | 2.350%, 5/2/24 | 9,529,670 | ||||||
| 5,725,000 | 2.750%, 11/6/26 | 5,545,401 | ||||||
| 10,000,000 | 3.300%, 3/22/27 | 10,000,110 | ||||||
| See Notes to Financial Statements. |
| 20 | www.jamesfunds.com |
| James Balanced: Golden Rainbow Fund | Schedule of Investments |
June 30, 2018
| Shares or Principal Amount | Value | |||||||
| Federal Farm Credit Banks (continued) | ||||||||
| $ | 10,000,000 | 2.800%, 6/2/28 | $ | 9,372,300 | ||||
| 5,000,000 | 3.390%, 5/20/30 | 4,840,765 | ||||||
| 5,000,000 | 3.420%, 5/27/31 | 4,899,860 | ||||||
| 5,000,000 | 3.110%, 11/1/33 | 4,765,170 | ||||||
| 58,852,936 | ||||||||
| Federal Home Loan Banks-5.83% | ||||||||
| 50,000,000 | 1.000%, 8/28/18 | 49,921,250 | ||||||
| 11,250,000 | 1.200%, 5/23/19 | 11,134,204 | ||||||
| 5,000,000 | 1.600%, 10/22/20 | 4,876,305 | ||||||
| 10,000,000 | 2.050%, 6/9/23 | 9,561,480 | ||||||
| 10,000,000 | 2.875%, 6/13/25 | 9,879,020 | ||||||
| 10,000,000 | 2.620%, 4/28/26 | 9,496,740 | ||||||
| 10,000,000 | 3.000%, 7/12/27 | 9,576,880 | ||||||
| 5,981,481 | 3.000%, 4/18/31 | 5,618,400 | ||||||
| 19,000,000 | 2.000%, 6/30/31(c) | 17,752,270 | ||||||
| 5,000,000 | 4.080%, 5/25/33 | 5,035,655 | ||||||
| 4,200,000 | 4.200%, 7/11/33 | 4,181,730 | ||||||
| 137,033,934 | ||||||||
| Federal Home Loan Mortgage Corporation-0.63% | ||||||||
| 5,000,000 | 1.500%, 8/26/19(c) | 4,970,925 | ||||||
| 10,000,000 | 1.800%, 4/13/20 | 9,855,650 | ||||||
| 14,826,575 | ||||||||
| Tennessee Valley Authority-0.54% | ||||||||
| 10,000,000 | 5.250%, 9/15/39 | 12,625,340 | ||||||
| United States Department of Housing and Urban Development-0.21% | ||||||||
| 5,000,000 | 2.050%, 8/1/19 | 4,972,300 | ||||||
| TOTAL U.S. GOVERNMENT AGENCIES (Cost $250,827,271) | 244,444,584 | |||||||
| Shares or Principal Amount | Value | |||||||
| MORTGAGE BACKED SECURITIES-1.37% | ||||||||
| Fannie Mae REMICS-0.21% | ||||||||
| 4,885,177 | 3.500%, 5/25/47 | 4,901,635 | ||||||
| Federal National Mortgage Association-1.16% | ||||||||
| 9,437,860 | 3.500%, 9/1/33 | 9,576,428 | ||||||
| 19,127,734 | 2.500%, 1/1/57 | 17,782,325 | ||||||
| 27,358,753 | ||||||||
| TOTAL MORTGAGE BACKED SECURITIES (Cost $32,971,233) | 32,260,388 | |||||||
| Shares or Principal Amount | Value | |||||||
| U.S. TREASURY BONDS & NOTES-17.39% | ||||||||
| International Bank for Reconstruction & Development-0.09% | ||||||||
| $ | 2,245,000 | 2.000%, 10/30/20 | 2,201,979 | |||||
| U.S. Treasury Bonds-3.63% | ||||||||
| 85,000,000 | 3.000%, 2/15/48 | 85,199,219 | ||||||
| See Notes to Financial Statements. |
| Annual Report | June 30, 2018 | 21 |
| Schedule of Investments | James Balanced: Golden Rainbow Fund |
June 30, 2018
| Shares or Principal Amount | Value | |||||||
| U.S. Treasury Notes-10.76% | ||||||||
| $ | 80,000,000 | 2.750%, 2/15/19 | $ | 80,246,875 | ||||
| 25,000,000 | 1.125%, 2/28/19 | 24,816,406 | ||||||
| 25,000,000 | 1.250%, 6/30/19 | 24,725,586 | ||||||
| 25,000,000 | 0.750%, 7/15/19 | 24,585,938 | ||||||
| 50,000,000 | 1.000%, 11/30/19 | 48,984,375 | ||||||
| 50,000,000 | 2.375%, 4/15/21 | 49,675,781 | ||||||
| 253,034,961 | ||||||||
| United States Treasury Inflation Indexed Bonds-2.91% | ||||||||
| 38,738,700 | 0.125%, 1/15/22 | 38,079,218 | ||||||
| 30,256,200 | 0.625%, 4/15/23 | 30,203,398 | ||||||
| 68,282,616 | ||||||||
| TOTAL U.S. TREASURY BONDS & NOTES (Cost $407,278,559) | 408,718,775 | |||||||
| Shares or Principal Amount | Value | |||||||
| FOREIGN BONDS-1.08% | ||||||||
| Australia Government Bond-0.32% | ||||||||
| AUD 10,000,000 | 5.250%, 3/15/19 | 7,570,751 | ||||||
| New Zealand Government Bond-0.44% | ||||||||
| NZD 15,000,000 | 5.000%, 3/15/19 | 10,389,282 | ||||||
| Singapore Government-0.32% | ||||||||
| SGD 10,000,000 | 2.250%, 6/1/21 | 7,373,292 | ||||||
| TOTAL FOREIGN BONDS (Cost $27,326,630) | 25,333,325 | |||||||
| Shares or Principal Amount | Value | |||||||
| SHORT TERM INVESTMENTS-6.77% | ||||||||
| Mutual Fund-2.59% | ||||||||
| 61,030,139 | First American Treasury Obligations Fund, Class Z, 7-Day Yield 1.723% | 61,030,139 | ||||||
| U.S. Treasury Bill-4.18% | ||||||||
| 100,000,000 | U.S. Treasury Bill, 2.175%, 4/25/2019(d) | 98,177,781 | ||||||
| TOTAL SHORT TERM INVESTMENTS (Cost $159,229,722) | 159,207,920 | |||||||
| TOTAL INVESTMENT SECURITIES-99.76% (Cost $2,121,755,318) | 2,345,042,695 | |||||||
| OTHER ASSETS IN EXCESS OF LIABILITIES-0.24% | 5,642,656 | |||||||
| NET ASSETS-100.00% | $ | 2,350,685,351 | ||||||
For Fund compliance purposes, the Fund's industry classifications refer to any one or more of the industry sub-classifications used by one or more widely recognized market indexes or ratings group indexes, and/or as defined by Fund management. Those definitions may not apply for purposes of this report, which may combine industry sub-classifications for reporting ease. Industries are shown as a percentage of net assets.
| * | Non-income producing security. |
| (a) | Floating or variable rate security. The reference rate is described below. The rate in effect as of June 30, 2018 is based on the reference rate plus the displayed spread as of the security’s last reset date. |
| See Notes to Financial Statements. |
| 22 | www.jamesfunds.com |
| James Balanced: Golden Rainbow Fund | Schedule of Investments |
June 30, 2018
| (b) | Prefunded Issues are bonds which are prerefunded and collateralized by U.S. Treasury securities held in escrow and used to pay principal and interest on tax exempt issues and to retire the bonds in full at the earliest refunding date. |
| (c) | Step coupon. Coupon increases periodically based upon a predetermined schedule. Interest rate disclosed is that which is in effect as of June 30, 2018. |
| (d) | Rate shown represents the bond equivalent yield to maturity at date of purchase. |
Investment Abbreviations:
LIBOR - London Interbank Offered Rate
Libor Rates:
3M US L - 3 Month LIBOR as of June 30, 2018 was 2.34%
AUD - Australian Dollar
NZD - New Zealand Dollar
SGD - Singapore Dollar
| See Notes to Financial Statements. |
| Annual Report | June 30, 2018 | 23 |
| Schedule of Investments | James Small Cap Fund |
June 30, 2018
| Shares | Value | |||||||
| COMMON STOCKS-98.31% | ||||||||
| Basic Materials-14.21% | ||||||||
| 24,065 | Boise Cascade Co. | $ | 1,075,705 | |||||
| 18,010 | Carpenter Technology Corp. | 946,786 | ||||||
| 142,325 | Cleveland-Cliffs, Inc.* | 1,199,800 | ||||||
| 36,560 | Ferro Corp.* | 762,276 | ||||||
| 110,635 | Hudbay Minerals, Inc. | 619,556 | ||||||
| 18,815 | Koppers Holdings, Inc.* | 721,555 | ||||||
| 17,900 | Kraton Corp.* | 825,906 | ||||||
| 61,510 | Mercer International, Inc. | 1,076,425 | ||||||
| 31,190 | Schnitzer Steel Industries, Inc., Class A | 1,051,103 | ||||||
| 8,279,112 | ||||||||
| Consumer, Cyclical-32.62% | ||||||||
| 15,690 | Atlas Air Worldwide Holdings, Inc.* | 1,124,973 | ||||||
| 116 | Biglari Holdings, Inc., Class A* | 110,200 | ||||||
| 1,160 | Biglari Holdings, Inc., Class B* | 212,848 | �� | |||||
| 13,400 | Brinker International, Inc. | 637,840 | ||||||
| 50,435 | Builders FirstSource, Inc.* | 922,456 | ||||||
| 7,950 | Children's Place, Inc. | 960,360 | ||||||
| 39,075 | China Yuchai International, Ltd. | 847,928 | ||||||
| 13,620 | Deckers Outdoor Corp.* | 1,537,562 | ||||||
| 11,110 | Group 1 Automotive, Inc. | 699,930 | ||||||
| 12,290 | Hawaiian Holdings, Inc. | 441,825 | ||||||
| 38,580 | Interface, Inc. | 885,411 | ||||||
| 15,150 | KB Home | 412,686 | ||||||
| 29,327 | MDC Holdings, Inc. | 902,392 | ||||||
| 13,690 | Patrick Industries, Inc.* | 778,276 | ||||||
| 17,455 | Rush Enterprises, Inc., Class A* | 757,198 | ||||||
| 18,915 | SkyWest, Inc. | 981,689 | ||||||
| 13,875 | SodaStream International, Ltd.* | 1,183,538 | ||||||
| 28,450 | SPX Corp.* | 997,173 | ||||||
| 23,180 | Systemax, Inc. | 795,769 | ||||||
| 59,795 | Tailored Brands, Inc. | 1,525,968 | ||||||
| 50,260 | TRI Pointe Group, Inc.* | 822,254 | ||||||
| 31,150 | William Lyon Homes, Class A* | 722,680 | ||||||
| 18,575 | Winnebago Industries, Inc. | 754,145 | ||||||
| 19,015,101 | ||||||||
| Consumer, Non-cyclical-3.44% | ||||||||
| 10,595 | Magellan Health, Inc.* | 1,016,590 | ||||||
| 27,235 | Tivity Health, Inc.* | 958,672 | ||||||
| 5,652 | Valhi, Inc. | 26,904 | ||||||
| 2,002,166 | ||||||||
| Energy-6.67% | ||||||||
| 201,925 | Chesapeake Energy Corp.* | 1,058,087 | ||||||
| 27,635 | Diamond Offshore Drilling, Inc.* | 576,466 | ||||||
| 68,905 | Gulfport Energy Corp.* | 866,136 | ||||||
| 73,260 | Laredo Petroleum, Inc.* | 704,761 | ||||||
| 34,301 | McDermott International, Inc.* | 674,015 | ||||||
| 3,879,465 | ||||||||
See Notes to Financial Statements.
| 24 | www.jamesfunds.com |
| James Small Cap Fund | Schedule of Investments |
June 30, 2018
| Shares | Value | |||||||
| Financial-14.71% | ||||||||
| 29,830 | American Equity Investment Life Holding Co. | $ | 1,073,880 | |||||
| 18,320 | Encore Capital Group, Inc.* | 670,512 | ||||||
| 93,370 | First BanCorp* | 714,280 | ||||||
| 226,420 | Genworth Financial, Inc., Class A* | 1,018,890 | ||||||
| 21,505 | Houlihan Lokey, Inc. | 1,101,486 | ||||||
| 13,515 | LGI Homes, Inc.* | 780,221 | ||||||
| 21,015 | Moelis & Co., Class A | 1,232,530 | ||||||
| 12,595 | Piper Jaffray Cos. | 967,926 | ||||||
| 41,430 | Xenia Hotels & Resources, Inc., REIT | 1,009,235 | ||||||
| 8,568,960 | ||||||||
| Industrial-11.60% | ||||||||
| 49,110 | American Axle & Manufacturing Holdings, Inc.* | 764,152 | ||||||
| 19,855 | Encore Wire Corp. | 942,120 | ||||||
| 17,490 | Greenbrier Cos., Inc. | 922,597 | ||||||
| 25,900 | H&E Equipment Services, Inc. | 974,099 | ||||||
| 33,455 | Meritor, Inc.* | 688,169 | ||||||
| 50,175 | Milacron Holdings Corp.* | 949,813 | ||||||
| 38,750 | Modine Manufacturing Co.* | 707,187 | ||||||
| 39,250 | Quad Graphics, Inc. | 817,577 | ||||||
| 6,765,714 | ||||||||
| Technology-14.06% | ||||||||
| 68,450 | ACCO Brands Corp. | 948,032 | ||||||
| 42,595 | Blucora, Inc.* | 1,576,015 | ||||||
| 11,143 | Deluxe Corp. | 737,778 | ||||||
| 49,420 | Innoviva, Inc.* | 681,996 | ||||||
| 79,960 | Iridium Communications, Inc.* | 1,287,356 | ||||||
| 31,415 | Nova Measuring Instruments, Ltd.* | 856,059 | ||||||
| 14,480 | Orbotech, Ltd.* | 894,864 | ||||||
| 37,620 | Syntel, Inc.* | 1,207,226 | ||||||
| 8,189,326 | ||||||||
| Utilities-1.00% | ||||||||
| 15,010 | PNM Resources, Inc. | 583,889 | ||||||
| 583,889 | ||||||||
| TOTAL COMMON STOCKS (Cost $47,719,647) | 57,283,733 | |||||||
| Shares | Value | ||||||
| SHORT TERM INVESTMENTS-1.68% | |||||||
| Mutual Fund-1.68% | |||||||
| 976,627 | First American Treasury Obligations Fund, Class Z, 7-Day Yield 1.723% | 976,627 | |||||
| TOTAL SHORT TERM INVESTMENTS (Cost $976,627) | 976,627 | ||||||
| TOTAL INVESTMENT SECURITIES-99.99% (Cost $48,696,274) | 58,260,360 | ||||||
| OTHER ASSETS IN EXCESS OF LIABILITIES-0.01% | 6,721 | ||||||
| NET ASSETS-100.00% | $ | 58,267,081 | |||||
See Notes to Financial Statements.
| Annual Report | June 30, 2018 | 25 |
| Schedule of Investments | James Small Cap Fund |
June 30, 2018
For Fund compliance purposes, the Fund's industry classifications refer to any one or more of the industry sub-classifications used by one or more widely recognized market indexes or ratings group indexes, and/or as defined by Fund management. Those definitions may not apply for purposes of this report, which may combine industry sub-classifications for reporting ease. Industries are shown as a percentage of net assets.
| * | Non-income producing security. |
See Notes to Financial Statements.
| 26 | www.jamesfunds.com |
| James Mid Cap Fund | Schedule of Investments |
June 30, 2018
| Shares | Value | |||||||
| COMMON STOCKS-98.68% | ||||||||
| Basic Materials-8.48% | ||||||||
| 5,245 | Allegheny Technologies, Inc.* | $ | 131,754 | |||||
| 2,970 | Chemours Co. | 131,749 | ||||||
| 19,380 | Cleveland-Cliffs, Inc.* | 163,373 | ||||||
| 5,105 | Huntsman Corp. | 149,066 | ||||||
| 6,230 | Kronos Worldwide, Inc. | 140,362 | ||||||
| 5,330 | Louisiana-Pacific Corp. | 145,083 | ||||||
| 3,780 | Norbord, Inc. | 155,434 | ||||||
| 2,035 | Trinseo SA | 144,383 | ||||||
| 4,345 | United States Steel Corp. | 150,989 | ||||||
| 1,312,193 | ||||||||
| Consumer, Cyclical-20.48% | ||||||||
| 2,790 | AMC Networks, Inc., Class A* | 173,538 | ||||||
| 7,590 | American Eagle Outfitters, Inc. | 176,467 | ||||||
| 6,260 | Bloomin' Brands, Inc. | 125,826 | ||||||
| 3,290 | Brinker International, Inc. | 156,604 | ||||||
| 1,565 | Deckers Outdoor Corp.* | 176,673 | ||||||
| 2,150 | Dillard's, Inc., Class A | 203,175 | ||||||
| 6,410 | Discovery Communications, Inc., Class A* | 176,275 | ||||||
| 3,670 | Harley-Davidson, Inc. | 154,434 | ||||||
| 5,440 | KB Home | 148,186 | ||||||
| 4,985 | Macy's, Inc. | 186,589 | ||||||
| 2,440 | Michael Kors Holdings, Ltd.* | 162,504 | ||||||
| 4,850 | Penn National Gaming, Inc.* | 162,911 | ||||||
| 3,190 | Penske Automotive Group, Inc. | 149,451 | ||||||
| 4,830 | PulteGroup, Inc. | 138,862 | ||||||
| 1,510 | RH* | 210,947 | ||||||
| 2,700 | SkyWest, Inc. | 140,130 | ||||||
| 3,450 | Toll Brothers, Inc. | 127,616 | ||||||
| 8,510 | TRI Pointe Group, Inc.* | 139,224 | ||||||
| 3,560 | World Wrestling Entertainment, Inc., Class A | 259,239 | ||||||
| 3,168,651 | ||||||||
| Consumer, Non-cyclical-10.85% | ||||||||
| 3,370 | Avis Budget Group, Inc.* | 109,525 | ||||||
| 2,550 | FTI Consulting, Inc.* | 154,224 | ||||||
| 2,770 | Korn/Ferry International | 171,546 | ||||||
| 7,110 | Pilgrim's Pride Corp.* | 143,124 | ||||||
| 4,690 | Tenet Healthcare Corp.* | 157,443 | ||||||
| 2,860 | TriNet Group, Inc.* | 159,988 | ||||||
| 3,290 | United Natural Foods, Inc.* | 140,351 | ||||||
| 1,470 | United Therapeutics Corp.* | 166,331 | ||||||
| 18,090 | Valhi, Inc. | 86,108 | ||||||
| 2,150 | Weight Watchers International, Inc.* | 217,365 | ||||||
| 690 | WellCare Health Plans, Inc.* | 169,906 | ||||||
| 1,675,911 | ||||||||
| Energy-10.75% | ||||||||
| 47,850 | Chesapeake Energy Corp.* | 250,734 | ||||||
| 3,120 | Delek US Holdings, Inc. | 156,530 | ||||||
| 16,070 | Laredo Petroleum, Inc.* | 154,593 | ||||||
| 5,110 | Murphy Oil Corp. | 172,565 | ||||||
See Notes to Financial Statements.
| Annual Report | June 30, 2018 | 27 |
| Schedule of Investments | James Mid Cap Fund |
June 30, 2018
| Shares | Value | |||||||
| Energy (continued) | ||||||||
| 3,940 | Peabody Energy Corp. | $ | 179,191 | |||||
| 12,480 | QEP Resources, Inc.* | 153,005 | ||||||
| 2,630 | SolarEdge Technologies, Inc.* | 125,845 | ||||||
| 12,780 | SRC Energy, Inc.* | 140,836 | ||||||
| 4,860 | Viper Energy Partners LP | 155,083 | ||||||
| 3,330 | Whiting Petroleum Corp.* | 175,558 | ||||||
| 1,663,940 | ||||||||
| Financial-18.12% | ||||||||
| 2,750 | AerCap Holdings NV* | 148,913 | ||||||
| 5,080 | American Equity Investment Life Holding Co. | 182,880 | ||||||
| 5,640 | Associated Banc-Corp | 153,972 | ||||||
| 12,285 | BGC Partners, Inc., Class A | 139,066 | ||||||
| 6,810 | Carlyle Group LP | 145,053 | ||||||
| 12,750 | DiamondRock Hospitality Co., REIT | 156,570 | ||||||
| 1,445 | Evercore, Inc., Class A | 152,375 | ||||||
| 880 | Jones Lang LaSalle, Inc. | 146,071 | ||||||
| 2,020 | Kemper Corp. | 152,813 | ||||||
| 3,920 | Legg Mason, Inc. | 136,142 | ||||||
| 2,299 | LPL Financial Holdings, Inc. | 150,676 | ||||||
| 14,320 | MGIC Investment Corp.* | 153,510 | ||||||
| 4,590 | OneMain Holdings, Inc.* | 152,801 | ||||||
| 7,985 | Santander Consumer U.S.A. Holdings, Inc. | 152,434 | ||||||
| 2,525 | Stifel Financial Corp. | 131,931 | ||||||
| 5,960 | TCF Financial Corp. | 146,735 | ||||||
| 4,270 | Triton International, Ltd. | 130,918 | ||||||
| 4,390 | Virtu Financial, Inc., Class A | 116,555 | ||||||
| 7,580 | Western Union Co. | 154,101 | ||||||
| 2,803,516 | ||||||||
| Industrial-11.66% | ||||||||
| 2,430 | AGCO Corp. | 147,550 | ||||||
| 3,570 | Allison Transmission Holdings, Inc. | 144,549 | ||||||
| 1,230 | Cooper-Standard Holding, Inc.* | 160,724 | ||||||
| 3,310 | Crown Holdings, Inc.* | 148,156 | ||||||
| 6,275 | Dana, Inc. | 126,692 | ||||||
| 3,190 | Generac Holdings, Inc.* | 165,019 | ||||||
| 9,130 | KBR, Inc. | 163,610 | ||||||
| 1,720 | MSA Safety, Inc. | 165,705 | ||||||
| 2,040 | Oshkosh Corp. | 143,453 | ||||||
| 1,633 | Reliance Steel & Aluminum Co. | 142,953 | ||||||
| 3,190 | Timken Co. | 138,924 | ||||||
| 1,090 | Zebra Technologies Corp., Class A* | 156,143 | ||||||
| 1,803,478 | ||||||||
| Technology-13.90% | ||||||||
| 5,610 | ARRIS International PLC* | 137,136 | ||||||
| 2,010 | Arrow Electronics, Inc.* | 151,313 | ||||||
| 3,840 | Avnet, Inc. | 164,698 | ||||||
| 950 | CACI International, Inc., Class A* | 160,122 | ||||||
| 9,590 | Cypress Semiconductor Corp. | 149,412 | ||||||
| 4,410 | Entegris, Inc. | 149,499 | ||||||
| 1,390 | MKS Instruments, Inc. | 133,023 | ||||||
| 5,290 | NCR Corp.* | 158,594 | ||||||
See Notes to Financial Statements.
| 28 | www.jamesfunds.com |
| James Mid Cap Fund | Schedule of Investments |
June 30, 2018
| Shares | Value | |||||||
| Technology (continued) | ||||||||
| 6,560 | ON Semiconductor Corp.* | $ | 145,862 | |||||
| 6,475 | Sabre Corp. | 159,544 | ||||||
| 1,720 | Science Applications International Corp. | 139,200 | ||||||
| 5,130 | Syntel, Inc.* | 164,622 | ||||||
| 4,050 | United States Cellular Corp.* | 150,012 | ||||||
| 8,055 | Vishay Intertechnology, Inc. | 186,876 | ||||||
| 2,149,913 | ||||||||
| Utilities-4.44% | ||||||||
| 12,100 | AES Corp. | 162,261 | ||||||
| 2,370 | Energen Corp.* | 172,583 | ||||||
| 3,500 | New Jersey Resources Corp. | 156,625 | ||||||
| 36,700 | Southwestern Energy Co.* | 194,510 | ||||||
| 685,979 | ||||||||
| TOTAL COMMON STOCKS (Cost $14,665,053) | 15,263,581 | |||||||
| Shares | Value | |||||||
| SHORT TERM INVESTMENTS-1.39% | ||||||||
| Mutual Fund-1.39% | ||||||||
| 214,993 | First American Treasury Obligations Fund, Class Z, 7-Day Yield 1.723% | 214,993 | ||||||
| TOTAL SHORT TERM INVESTMENTS (Cost $214,993) | 214,993 | |||||||
| TOTAL INVESTMENT SECURITIES-100.07% (Cost $14,880,046) | 15,478,574 | |||||||
| OTHER LIABILITIES IN EXCESS OF OTHER ASSETS-(0.07)% | (10,305 | ) | ||||||
| NET ASSETS-100.00% | $ | 15,468,269 | ||||||
For Fund compliance purposes, the Fund's industry classifications refer to any one or more of the industry sub-classifications used by one or more widely recognized market indexes or ratings group indexes, and/or as defined by Fund management. Those definitions may not apply for purposes of this report, which may combine industry sub-classifications for reporting ease. Industries are shown as a percentage of net assets.
| * | Non-income producing security. |
See Notes to Financial Statements.
| Annual Report | June 30, 2018 | 29 |
| Schedule of Investments | James Micro Cap Fund |
June 30, 2018
| Shares | Value | |||||||
| COMMON STOCKS-91.77% | ||||||||
| Basic Materials-8.15% | ||||||||
| 73,270 | Fortuna Silver Mines, Inc.* | $ | 416,174 | |||||
| 394,000 | Golden Star Resources, Ltd.* | 265,950 | ||||||
| 5,670 | KMG Chemicals, Inc. | 418,333 | ||||||
| 8,920 | Koppers Holdings, Inc.* | 342,082 | ||||||
| 22,330 | Mercer International, Inc. | 390,775 | ||||||
| 23,800 | NL Industries, Inc.* | 207,060 | ||||||
| 9,140 | Schnitzer Steel Industries, Inc., Class A | 308,018 | ||||||
| 2,348,392 | ||||||||
| Consumer, Cyclical-17.86% | ||||||||
| 56,090 | Avianca Holdings SA, Sponsored ADR | 362,341 | ||||||
| 18,470 | Century Communities, Inc.* | 582,728 | ||||||
| 17,780 | China Yuchai International, Ltd. | 385,826 | ||||||
| 12,931 | Flexsteel Industries, Inc. | 515,947 | ||||||
| 8,880 | Hamilton Beach Brands Holding Co., Class A | 257,964 | ||||||
| 13,300 | Haverty Furniture Cos., Inc. | 287,280 | ||||||
| 4,220 | Johnson Outdoors, Inc., Class A | 356,717 | ||||||
| 18,860 | Kimball International, Inc., Class B | 304,778 | ||||||
| 15,740 | M/I Homes, Inc.* | 416,795 | ||||||
| 13,386 | Patrick Industries, Inc.* | 760,994 | ||||||
| 35,110 | Tilly's, Inc., Class A | 531,917 | ||||||
| 20,400 | Wabash National Corp. | 380,664 | ||||||
| 5,143,951 | ||||||||
| Consumer, Non-cyclical-7.51% | ||||||||
| 12,720 | Heidrick & Struggles International, Inc. | 445,200 | ||||||
| 10,912 | John B Sanfilippo & Son, Inc. | 812,398 | ||||||
| 19,060 | K12, Inc.* | 312,012 | ||||||
| 13,730 | Kelly Services, Inc., Class A | 308,238 | ||||||
| 19,550 | Lantheus Holdings, Inc.* | 284,452 | ||||||
| 2,162,300 | ||||||||
| Energy-2.43% | ||||||||
| 97,890 | W&T Offshore, Inc.* | 699,914 | ||||||
| 699,914 | ||||||||
| Financial-22.37% | ||||||||
| 28,470 | Ares Commercial Real Estate Corp., REIT | 393,171 | ||||||
| 63,330 | Drive Shack, Inc.* | 488,908 | ||||||
| 24,160 | Enova International, Inc.* | 883,048 | ||||||
| 36,510 | EZCORP, Inc., Class A* | 439,945 | ||||||
| 4,620 | Federal Agricultural Mortgage Corp., Class C | 413,398 | ||||||
| 29,390 | Forestar Group, Inc.* | 609,842 | ||||||
| 32,430 | iStar, Inc., REIT* | 349,920 | ||||||
| 7,700 | LGI Homes, Inc.* | 444,521 | ||||||
| 4,040 | Meta Financial Group, Inc. | 393,496 | ||||||
| 27,360 | MoneyGram International, Inc.* | 183,038 | ||||||
| 40,690 | OFG Bancorp | 571,694 | ||||||
| 5,370 | Piper Jaffray Cos. | 412,685 | ||||||
| 9,620 | SP Plus Corp.* | 357,864 | ||||||
See Notes to Financial Statements.
| 30 | www.jamesfunds.com |
| James Micro Cap Fund | Schedule of Investments |
June 30, 2018
| Shares | Value | |||||||
| Financial (continued) | ||||||||
| 14,450 | Universal Insurance Holdings, Inc. | $ | 507,195 | |||||
| 6,448,725 | ||||||||
| Industrial-15.75% | ||||||||
| 8,110 | ArcBest Corp. | 370,627 | ||||||
| 16,110 | CAI International, Inc.* | 374,396 | ||||||
| 21,350 | Casella Waste Systems, Inc., Class A* | 546,773 | ||||||
| 71,170 | DHT Holdings, Inc. | 333,787 | ||||||
| 6,410 | Encore Wire Corp. | 304,154 | ||||||
| 22,415 | Global Brass & Copper Holdings, Inc. | 702,710 | ||||||
| 4,440 | NACCO Industries, Inc., Class A | 149,850 | ||||||
| 19,540 | Stoneridge, Inc.* | 686,636 | ||||||
| 17,330 | Tower International, Inc. | 551,094 | ||||||
| 16,740 | Vectrus, Inc.* | 515,927 | ||||||
| 4,535,954 | ||||||||
| Technology-17.70% | ||||||||
| 13,770 | Blucora, Inc.* | 509,490 | ||||||
| 7,240 | Engility Holdings, Inc.* | 221,834 | ||||||
| 59,560 | Extreme Networks, Inc.* | 474,098 | ||||||
| 41,800 | Iridium Communications, Inc.* | 672,980 | ||||||
| 21,350 | KEMET Corp.* | 515,602 | ||||||
| 11,520 | Nova Measuring Instruments, Ltd.* | 313,920 | ||||||
| 16,136 | Orbotech, Ltd.* | 997,205 | ||||||
| 34,858 | PC Connection, Inc. | 1,157,286 | ||||||
| 14,040 | Ultra Clean Holdings, Inc.* | 233,064 | ||||||
| 5,095,479 | ||||||||
| TOTAL COMMON STOCKS (Cost $19,371,926) | 26,434,715 | |||||||
| Shares | Value | |||||||
| SHORT TERM INVESTMENTS-8.14% | ||||||||
| Mutual Fund-8.14% | ||||||||
| 2,343,108 | First American Treasury Obligations Fund, Class Z, 7-Day Yield 1.723% | 2,343,108 | ||||||
| TOTAL SHORT TERM INVESTMENTS (Cost $2,343,108) | 2,343,108 | |||||||
| TOTAL INVESTMENT SECURITIES-99.91% (Cost $21,715,034) | 28,777,823 | |||||||
| OTHER ASSETS IN EXCESS OF LIABILITIES-0.09% | 26,874 | |||||||
| NET ASSETS-100.00% | $ | 28,804,697 | ||||||
For Fund compliance purposes, the Fund's industry classifications refer to any one or more of the industry sub-classifications used by one or more widely recognized market indexes or ratings group indexes, and/or as defined by Fund management. Those definitions may not apply for purposes of this report, which may combine industry sub-classifications for reporting ease. Industries are shown as a percentage of net assets.
| * | Non-income producing security. |
See Notes to Financial Statements.
| Annual Report | June 30, 2018 | 31 |
| Schedule of Investments | James Aggressive Allocation Fund |
June 30, 2018
| Shares or Principal Amount | Value | |||||||
| COMMON STOCKS-70.21% | ||||||||
| Basic Materials-5.20% | ||||||||
| 1,000 | Celanese Corp., Series A | $ | 111,060 | |||||
| 4,000 | Louisiana-Pacific Corp. | 108,880 | ||||||
| 4,000 | Orion Engineered Carbons SA | 123,400 | ||||||
| 1,700 | Trinseo SA | 120,615 | ||||||
| 1,000 | Westlake Chemical Corp. | 107,630 | ||||||
| 571,585 | ||||||||
| Consumer, Cyclical-8.47% | ||||||||
| 1,750 | Asbury Automotive Group, Inc.* | 119,962 | ||||||
| 1,500 | Best Buy Co., Inc. | 111,870 | ||||||
| 1,000 | Deckers Outdoor Corp.* | 112,890 | ||||||
| 4,000 | Gap, Inc. | 129,560 | ||||||
| 1,700 | Kohl's Corp. | 123,930 | ||||||
| 1,300 | Macy's, Inc. | 48,659 | ||||||
| 900 | Michael Kors Holdings, Ltd.* | 59,940 | ||||||
| 2,000 | SkyWest, Inc. | 103,800 | ||||||
| 1,400 | Wal-Mart Stores, Inc. | 119,910 | ||||||
| 930,521 | ||||||||
| Consumer, Non-cyclical-6.02% | ||||||||
| 325 | Aetna, Inc. | 59,637 | ||||||
| 1,400 | Helen of Troy, Ltd.* | 137,830 | ||||||
| 500 | Humana, Inc. | 148,815 | ||||||
| 6,000 | Kroger Co. | 170,700 | ||||||
| 1,450 | Weight Watchers International, Inc.* | 146,595 | ||||||
| 663,577 | ||||||||
| Energy-9.02% | ||||||||
| 1,600 | Anadarko Petroleum Corp. | 117,200 | ||||||
| 2,700 | ConocoPhillips | 187,974 | ||||||
| 2,500 | Ecopetrol SA, Sponsored ADR | 51,375 | ||||||
| 2,000 | HollyFrontier Corp. | 136,860 | ||||||
| 1,200 | Marathon Petroleum Corp. | 84,192 | ||||||
| 1,200 | Phillips 66 | 134,772 | ||||||
| 2,500 | Valero Energy Corp. | 277,075 | ||||||
| 989,448 | ||||||||
| Financial-10.13% | ||||||||
| 1,400 | Allstate Corp. | 127,778 | ||||||
| 1,150 | American Financial Group, Inc. | 123,429 | ||||||
| 575 | Goldman Sachs Group, Inc. | 126,828 | ||||||
| 3,000 | Houlihan Lokey, Inc. | 153,660 | ||||||
| 1,500 | JPMorgan Chase & Co. | 156,300 | ||||||
| 1,250 | KB Financial Group, Inc., ADR | 58,100 | ||||||
| 8,500 | Regions Financial Corp. | 151,130 | ||||||
| 1,500 | Stifel Financial Corp. | 78,375 | ||||||
| 1,700 | Torchmark Corp. | 138,397 | ||||||
| 1,113,997 | ||||||||
| Industrial-8.73% | ||||||||
| 2,000 | BorgWarner, Inc. | 86,320 | ||||||
| 1,200 | Deere & Co. | 167,760 | ||||||
See Notes to Financial Statements.
| 32 | www.jamesfunds.com |
| James Aggressive Allocation Fund | Schedule of Investments |
June 30, 2018
| Shares or Principal Amount | Value | |||||||
| Industrial (continued) | ||||||||
| 500 | FedEx Corp. | $ | 113,530 | |||||
| 1,750 | Greenbrier Cos., Inc. | 92,313 | ||||||
| 3,750 | H&E Equipment Services, Inc. | 141,038 | ||||||
| 500 | Lear Corp. | 92,905 | ||||||
| 4,000 | TriMas Corp.* | 117,600 | ||||||
| 1,000 | United Rentals, Inc.* | 147,620 | ||||||
| 959,086 | ||||||||
| Technology-17.10% | ||||||||
| 600 | Amgen, Inc. | 110,754 | ||||||
| 600 | Apple, Inc. | 111,066 | ||||||
| 1,000 | Arrow Electronics, Inc.* | 75,280 | ||||||
| 1,100 | Cabot Microelectronics Corp. | 118,316 | ||||||
| 2,700 | Cisco Systems, Inc. | 116,181 | ||||||
| 1,000 | First Solar, Inc.* | 52,660 | ||||||
| 3,300 | Intel Corp. | 164,043 | ||||||
| 5,000 | KEMET Corp.* | 120,750 | ||||||
| 400 | Lockheed Martin Corp. | 118,172 | ||||||
| 3,000 | Micron Technology, Inc.* | 157,320 | ||||||
| 1,250 | Motorola Solutions, Inc. | 145,463 | ||||||
| 250 | Northrop Grumman Corp. | 76,925 | ||||||
| 6,000 | ON Semiconductor Corp.* | 133,410 | ||||||
| 4,500 | Sykes Enterprises, Inc.* | 129,510 | ||||||
| 5,000 | Vishay Intertechnology, Inc. | 116,000 | ||||||
| 1,700 | Western Digital Corp. | 131,597 | ||||||
| 1,877,447 | ||||||||
| Utilities-5.54% | ||||||||
| 10,000 | AES Corp. | 134,100 | ||||||
| 1,500 | Entergy Corp. | 121,185 | ||||||
| 3,000 | Exelon Corp. | 127,800 | ||||||
| 3,000 | New Jersey Resources Corp. | 134,250 | ||||||
| 3,000 | NRG Energy, Inc. | 92,100 | ||||||
| 609,435 | ||||||||
| TOTAL COMMON STOCKS (Cost $6,712,659) | 7,715,096 | |||||||
| Shares or Principal Amount | Value | |||||||
| EXCHANGE TRADED FUNDS-1.71% | ||||||||
| 5,000 | Global X MSCI Colombia ETF | 52,450 | ||||||
| 1,500 | iShares® MSCI France ETF | 45,780 | ||||||
| 750 | SPDR® Gold Shares ETF* | 88,988 | ||||||
| TOTAL EXCHANGE TRADED FUNDS (Cost $192,080) | 187,218 | |||||||
| Shares or Principal Amount | Value | |||||||
| CORPORATE BONDS-1.94% | ||||||||
| Consumer, Cyclical-0.60% | ||||||||
| $ | 67,000 | Walt Disney Co., 0.875%, 7/12/19 | 65,729 | |||||
See Notes to Financial Statements.
| Annual Report | June 30, 2018 | 33 |
| Schedule of Investments | James Aggressive Allocation Fund |
June 30, 2018
| Shares or Principal Amount | Value | |||||||
| Financial-0.45% | ||||||||
| $ | 50,000 | PNC Bank NA, 1.950%, 3/4/19 | $ | 49,726 | ||||
| Industrial-0.44% | ||||||||
| 50,000 | General Electric Co., 2.700%, 10/9/22 | 48,369 | ||||||
| Technology-0.45% | ||||||||
| 50,000 | Microsoft Corp., 1.850%, 2/6/20 | 49,359 | ||||||
| TOTAL CORPORATE BONDS (Cost $216,948) | 213,183 | |||||||
| Shares or Principal Amount | Value | |||||||
| U.S. TREASURY BONDS & NOTES-22.16% | ||||||||
| U.S. Treasury Bonds-6.91% | ||||||||
| $ | 500,000 | 2.750%, 11/15/47 | 476,582 | |||||
| 275,000 | 3.125%, 5/15/48 | 282,380 | ||||||
| 758,962 | ||||||||
| U.S. Treasury Notes-11.98% | ||||||||
| 475,000 | 0.750%, 10/31/18 | 473,051 | ||||||
| 850,000 | 1.125%, 2/28/19 | 843,758 | ||||||
| 1,316,809 | ||||||||
| United States Treasury Inflation Indexed Bonds-3.27% | ||||||||
| 250,085 | 0.625%, 7/15/21 | 251,037 | ||||||
| 110,682 | 0.125%, 1/15/22 | 108,798 | ||||||
| 359,835 | ||||||||
| TOTAL U.S. TREASURY BONDS & NOTES (Cost $2,429,519) | 2,435,606 | |||||||
| Shares or Principal Amount | Value | |||||||
| SHORT TERM INVESTMENTS-3.92% | ||||||||
| Mutual Fund-3.92% | ||||||||
| 431,035 | First American Government Obligations Fund , Class Z, 7-Day Yield 1.744% | 431,035 | ||||||
| TOTAL SHORT TERM INVESTMENTS (Cost $431,035) | 431,035 | |||||||
| TOTAL INVESTMENT SECURITIES-99.94% (Cost $9,982,241) | 10,982,138 | |||||||
| OTHER ASSETS IN EXCESS OF LIABILITIES-0.06% | 7,134 | |||||||
| NET ASSETS-100.00% | $ | 10,989,272 | ||||||
For Fund compliance purposes, the Fund's industry classifications refer to any one or more of the industry sub-classifications used by one or more widely recognized market indexes or ratings group indexes, and/or as defined by Fund management. Those definitions may not apply for purposes of this report, which may combine industry sub-classifications for reporting ease. Industries are shown as a percentage of net assets.
| * | Non-income producing security. |
See Notes to Financial Statements.
| 34 | www.jamesfunds.com |
| James Long-Short Fund | Schedule of Investments |
June 30, 2018
| Shares | Value | |||||||
| COMMON STOCKS-90.24% | ||||||||
| Basic Materials-8.51% | ||||||||
| 6,330 | Avery Dennison Corp. | $ | 646,293 | |||||
| 7,800 | Celanese Corp., Series A(a) | 866,268 | ||||||
| 1,750 | Westlake Chemical Corp. | 188,352 | ||||||
| 1,700,913 | ||||||||
| Consumer, Cyclical-12.20% | ||||||||
| 10,540 | Best Buy Co., Inc. | 786,073 | ||||||
| 8,700 | Big Lots, Inc. | 363,486 | ||||||
| 4,970 | General Motors Co. | 195,818 | ||||||
| 10,290 | Meritage Homes Corp.*(a) | 452,245 | ||||||
| 6,930 | Southwest Airlines Co.(a) | 352,598 | ||||||
| 3,380 | Wal-Mart Stores, Inc. | 289,497 | ||||||
| 2,439,717 | ||||||||
| Consumer, Non-cyclical-13.94% | ||||||||
| 2,130 | Aetna, Inc.(a) | 390,855 | ||||||
| 3,890 | Grand Canyon Education, Inc.* | 434,163 | ||||||
| 5,040 | ManpowerGroup, Inc. | 433,742 | ||||||
| 13,545 | Pfizer, Inc.(a) | 491,413 | ||||||
| 3,060 | Sanderson Farms, Inc. | 321,759 | ||||||
| 1,720 | UnitedHealth Group, Inc.(a) | 421,985 | ||||||
| 2,885 | Weight Watchers International, Inc.* | 291,674 | ||||||
| 2,785,591 | ||||||||
| Energy-6.74% | ||||||||
| 60,825 | Chesapeake Energy Corp.* | 318,723 | ||||||
| 4,970 | HollyFrontier Corp. | 340,097 | ||||||
| 3,050 | Phillips 66 | 342,546 | ||||||
| 5,000 | Royal Dutch Shell PLC, Class A, Sponsored ADR | 346,150 | ||||||
| 1,347,516 | ||||||||
| Financial-16.14% | ||||||||
| 8,240 | Aaron's, Inc. | 358,028 | ||||||
| 6,900 | Aflac, Inc. | 296,838 | ||||||
| 14,790 | Chimera Investment Corp., REIT | 270,361 | ||||||
| 9,750 | Fifth Third Bancorp | 279,825 | ||||||
| 8,140 | JPMorgan Chase & Co.(a) | 848,188 | ||||||
| 15,690 | Regions Financial Corp. | 278,968 | ||||||
| 5,750 | Travelers Cos., Inc.(a) | 703,455 | ||||||
| 5,120 | Unum Group | 189,389 | ||||||
| 3,225,052 | ||||||||
| Industrial-8.70% | ||||||||
| 4,130 | BorgWarner, Inc. | 178,251 | ||||||
| 7,030 | Dana, Inc. | 141,936 | ||||||
| 4,500 | Deere & Co. | 629,100 | ||||||
| 9,560 | Owens-Illinois, Inc.* | 160,704 | ||||||
| 4,260 | United Rentals, Inc.* | 628,861 | ||||||
| 1,738,852 | ||||||||
| Technology-17.09% | ||||||||
| 9,870 | Cisco Systems, Inc. | 424,706 | ||||||
See Notes to Financial Statements.
| Annual Report | June 30, 2018 | 35 |
| Schedule of Investments | James Long-Short Fund |
June 30, 2018
| Shares | Value | |||||||
| Technology (continued) | ||||||||
| 6,625 | Deluxe Corp.(a) | $ | 438,641 | |||||
| 5,650 | Intel Corp. | 280,861 | ||||||
| 1,680 | International Business Machines Corp. | 234,696 | ||||||
| 9,830 | Kulicke & Soffa Industries, Inc. | 234,151 | ||||||
| 5,900 | Micron Technology, Inc.* | 309,396 | ||||||
| 2,360 | Motorola Solutions, Inc. | 274,633 | ||||||
| 2,130 | Northrop Grumman Corp.(a) | 655,401 | ||||||
| 6,260 | Tower Semiconductor, Ltd.* | 137,783 | ||||||
| 5,480 | Western Digital Corp. | 424,207 | ||||||
| 3,414,475 | ||||||||
| Utilities-6.92% | ||||||||
| 2,590 | American Electric Power Co., Inc.(a) | 179,357 | ||||||
| 7,040 | Edison International(a) | 445,421 | ||||||
| 5,985 | NRG Energy, Inc. | 183,739 | ||||||
| 14,745 | PNM Resources, Inc.(a) | 573,581 | ||||||
| 1,382,098 | ||||||||
| TOTAL COMMON STOCKS (Cost $13,024,172) | 18,034,214 | |||||||
| Shares | Value | |||||||
| SHORT TERM INVESTMENTS-10.81% | ||||||||
| Mutual Fund-10.81% | ||||||||
| 2,161,013 | First American Treasury Obligations Fund, Class Z, 7-Day Yield 1.723% | 2,161,013 | ||||||
| TOTAL SHORT TERM INVESTMENTS (Cost $2,161,013) | 2,161,013 | |||||||
| TOTAL INVESTMENT SECURITIES-101.05% (Cost $15,185,185) | 20,195,227 | |||||||
| SECURITIES SOLD SHORT-(2.31)% (Proceeds $551,957) | (460,856 | ) | ||||||
| OTHER ASSETS IN EXCESS OF LIABILITIES-1.26% | 251,215 | (b) | ||||||
| NET ASSETS-100.00% | $ | 19,985,586 | ||||||
| Shares | Value | |||||||
| SCHEDULE OF SECURITIES SOLD SHORT | ||||||||
| COMMON STOCKS-(2.31)% | ||||||||
| Industrial-(1.57)% | ||||||||
| (914 | ) | Tesla, Inc. | $ | (313,456 | ) | |||
| Technology-(0.74)% | ||||||||
| (2,200 | ) | Incyte Corp., Ltd. | (147,400 | ) | ||||
| (460,856 | ) | |||||||
| TOTAL COMMON STOCKS SOLD SHORT (Proceeds $551,957) | ||||||||
| TOTAL SECURITIES SOLD SHORT-(2.31)% (Proceeds $551,957) | $ | (460,856 | ) | |||||
See Notes to Financial Statements.
| 36 | www.jamesfunds.com |
| James Long-Short Fund | Schedule of Investments |
June 30, 2018
For Fund compliance purposes, the Fund's industry classifications refer to any one or more of the industry sub-classifications used by one or more widely recognized market indexes or ratings group indexes, and/or as defined by Fund management. Those definitions may not apply for purposes of this report, which may combine industry sub-classifications for reporting ease. Industries are shown as a percentage of net assets.
| * | Non-income producing security. |
| (a) | Security position is either entirely or partially held in a segregated account as collateral for securities sold short, aggregating a total security position market value of $4,643,287. |
| (b) | Includes cash which is being held as collateral for securities sold short in the amount of $256,062. |
See Notes to Financial Statements.
| Annual Report | June 30, 2018 | 37 |
| Statements of Assets and Liabilities | James Advantage Funds |
June 30, 2018
| James Balanced: Golden Rainbow Fund | James Small Cap Fund | James Mid Cap Fund | James Micro Cap Fund | James Aggressive Allocation Fund | James Long-Short Fund | |||||||||||||||||||
| ASSETS: | ||||||||||||||||||||||||
| Investment securities: | ||||||||||||||||||||||||
| At cost | $ | 2,121,755,318 | $ | 48,696,274 | $ | 14,880,046 | $ | 21,715,034 | $ | 9,982,241 | $ | 15,185,185 | ||||||||||||
| At value | $ | 2,345,042,695 | $ | 58,260,360 | $ | 15,478,574 | $ | 28,777,823 | $ | 10,982,138 | $ | 20,195,227 | ||||||||||||
| Cash | 16,976 | – | – | – | – | – | ||||||||||||||||||
| Deposits with brokers for securities sold short | – | – | – | – | – | 257,161 | ||||||||||||||||||
| Dividends and interest receivable | 8,295,999 | 134,264 | 9,067 | 62,555 | 16,023 | 31,108 | ||||||||||||||||||
| Receivable for securities sold | 12,673,804 | – | – | – | – | – | ||||||||||||||||||
| Receivable for capital shares sold | 432,916 | 104 | – | – | – | 153 | ||||||||||||||||||
| Other assets | 47,366 | – | – | – | – | – | ||||||||||||||||||
| Total Assets | 2,366,509,756 | 58,394,728 | 15,487,641 | 28,840,378 | 10,998,161 | 20,483,649 | ||||||||||||||||||
| LIABILITIES: | ||||||||||||||||||||||||
| Due to broker for securities sold short | – | – | – | – | – | 1,099 | ||||||||||||||||||
| Payable for securities sold short (proceeds $-, $-, $-, $-, $- and $551,957, respectively) | – | – | – | – | – | 460,856 | ||||||||||||||||||
| Payable for capital shares redeemed | 9,600,019 | 54,095 | – | – | – | 11,066 | ||||||||||||||||||
| Payable for securities purchased | 4,195,800 | – | – | – | – | – | ||||||||||||||||||
| Accrued expenses: | ||||||||||||||||||||||||
| Management fees | 1,340,856 | 61,226 | 16,125 | 35,681 | 8,889 | 20,843 | ||||||||||||||||||
| 12b-1 distribution and service fees | 320,463 | 12,326 | 3,247 | – | – | 4,199 | ||||||||||||||||||
| Other payables | 367,267 | – | – | – | – | – | ||||||||||||||||||
| Total Liabilities | 15,824,405 | 127,647 | 19,372 | 35,681 | 8,889 | 498,063 | ||||||||||||||||||
| Net Assets | $ | 2,350,685,351 | $ | 58,267,081 | $ | 15,468,269 | $ | 28,804,697 | $ | 10,989,272 | $ | 19,985,586 | ||||||||||||
| NET ASSETS CONSIST OF: | ||||||||||||||||||||||||
| Paid-in capital | $ | 2,011,827,798 | $ | 43,551,888 | $ | 13,641,120 | $ | 20,611,888 | $ | 10,025,770 | $ | 15,219,684 | ||||||||||||
| Accumulated net investment income/(loss) | 472,531 | – | – | (35,512 | ) | 40,605 | – | |||||||||||||||||
| Accumulated net gain/(loss) | 115,107,253 | 5,151,107 | 1,228,621 | 1,165,532 | (77,000 | ) | (335,241 | ) | ||||||||||||||||
| Net unrealized appreciation | 223,277,769 | 9,564,086 | 598,528 | 7,062,789 | 999,897 | 5,101,143 | ||||||||||||||||||
| Net Assets | $ | 2,350,685,351 | $ | 58,267,081 | $ | 15,468,269 | $ | 28,804,697 | $ | 10,989,272 | $ | 19,985,586 | ||||||||||||
See Notes to Financial Statements.
| 38 | www.jamesfunds.com |
| James Advantage Funds | Statements of Assets and Liabilities |
June 30, 2018
| James Balanced: Golden Rainbow Fund | James Small Cap Fund | James Mid Cap Fund | James Micro Cap Fund | James Aggressive Allocation Fund | James Long-Short Fund | |||||||||||||||||||
| PRICING OF RETAIL CLASS SHARES: | ||||||||||||||||||||||||
| Net assets | $ | 1,514,451,497 | N/A | N/A | N/A | N/A | N/A | |||||||||||||||||
| Shares of beneficial interest outstanding (unlimited number of shares authorized, no par) | 64,945,054 | N/A | N/A | N/A | N/A | N/A | ||||||||||||||||||
| Net assets value, offering price and redemption price per share | $ | 23.32 | N/A | N/A | N/A | N/A | N/A | |||||||||||||||||
| PRICING OF INSTITUTIONAL CLASS SHARES: | ||||||||||||||||||||||||
| Net assets | $ | 836,233,854 | N/A | N/A | N/A | N/A | N/A | |||||||||||||||||
| Shares of beneficial interest outstanding (unlimited number of shares authorized, no par) | 36,267,743 | N/A | N/A | N/A | N/A | N/A | ||||||||||||||||||
| Net assets value, offering price and redemption price per share | $ | 23.06 | N/A | N/A | N/A | N/A | N/A | |||||||||||||||||
| PRICING OF SHARES | ||||||||||||||||||||||||
| Net assets | N/A | $ | 58,267,081 | $ | 15,468,269 | $ | 28,804,697 | $ | 10,989,272 | $ | 19,985,586 | |||||||||||||
| Shares of beneficial interest outstanding (unlimited number of shares authorized, no par) | N/A | 1,933,662 | 1,400,897 | 1,611,374 | 1,030,650 | 1,381,102 | ||||||||||||||||||
| Net assets value, offering price and redemption price per share | N/A | $ | 30.13 | $ | 11.04 | $ | 17.88 | $ | 10.66 | $ | 14.47 | |||||||||||||
See Notes to Financial Statements.
| Annual Report | June 30, 2018 | 39 |
| Statements of Operations | James Advantage Funds |
For the Year Ended June 30, 2018
| James Balanced: Golden Rainbow Fund | James Small Cap Fund | James Mid Cap Fund | James Micro Cap Fund | James Aggressive Allocation Fund | James Long-Short Fund | |||||||||||||||||||
| INVESTMENT INCOME: | ||||||||||||||||||||||||
| Dividends (Net of withholding taxes of $204,902, $129, $1,972, $1,864, $1,139 and $953, respectively) | $ | 23,396,476 | $ | 752,380 | $ | 207,404 | $ | 375,244 | $ | 143,828 | $ | 386,625 | ||||||||||||
| Interest | 35,573,562 | – | – | – | 52,018 | – | ||||||||||||||||||
| Total Investment Income | 58,970,038 | 752,380 | 207,404 | 375,244 | 195,846 | 386,625 | ||||||||||||||||||
| EXPENSES: | ||||||||||||||||||||||||
| Management fees | 19,071,073 | 791,455 | 193,682 | 435,998 | 101,459 | 263,529 | ||||||||||||||||||
| 12b-1 distribution and service fees - Retail Class | 4,599,464 | – | – | – | – | – | ||||||||||||||||||
| 12b-1 distribution and service fees | – | 159,156 | 38,942 | – | – | 52,990 | ||||||||||||||||||
| Dividend expense on securities sold short | – | – | – | – | – | 13,986 | ||||||||||||||||||
| Broker fees and charges on securities sold short | – | – | – | – | – | 5,083 | ||||||||||||||||||
| Administration fee | 1,034,979 | – | – | – | – | – | ||||||||||||||||||
| Transfer agent fee | 295,358 | – | – | – | – | – | ||||||||||||||||||
| Interest expense | – | 80 | 1 | 201 | – | – | ||||||||||||||||||
| Custodian fees | 232,456 | – | – | – | – | – | ||||||||||||||||||
| Professional fees | 207,256 | – | – | – | – | – | ||||||||||||||||||
| Trustee fees | 203,717 | 4,323 | 1,028 | 1,807 | 684 | 1,421 | ||||||||||||||||||
| Registration fees | 76,188 | – | – | – | – | – | ||||||||||||||||||
| Shareholder report printing and mailing | 175,808 | – | – | – | – | – | ||||||||||||||||||
| Other expenses | 99,638 | – | – | – | – | – | ||||||||||||||||||
| Total Expenses | 25,995,937 | 955,014 | 233,653 | 438,006 | 102,143 | 337,009 | ||||||||||||||||||
| Net Investment Income/(Loss) | 32,974,101 | (202,634 | ) | (26,249 | ) | (62,762 | ) | 93,703 | 49,616 | |||||||||||||||
| REALIZED AND UNREALIZED GAIN/(LOSS) ON INVESTMENTS: | ||||||||||||||||||||||||
| Net realized gain/(loss) from: | ||||||||||||||||||||||||
| Investments | 218,597,660 | 10,754,697 | 1,384,203 | 1,040,424 | 394,817 | 850,747 | ||||||||||||||||||
| Securities sold short | – | – | – | – | – | (288,068 | ) | |||||||||||||||||
| Foreign currency transactions | 17,909 | (119 | ) | (2 | ) | – | 6 | – | ||||||||||||||||
| Total realized gain/(loss) | 218,615,569 | 10,754,578 | 1,384,201 | 1,040,424 | 394,823 | 562,679 | ||||||||||||||||||
| Net change in unrealized appreciation/(depreciation) on investments | (178,845,341 | ) | (3,552,275 | ) | (327,869 | ) | 1,984,895 | 217,184 | (363,690 | ) | ||||||||||||||
| Net change in unrealized appreciation on securities sold short | – | – | – | – | – | 36,057 | ||||||||||||||||||
| Net change in unrealized depreciation on foreign currency translation | (18,279 | ) | (65 | ) | – | – | – | – | ||||||||||||||||
| Total change in unrealized appreciation/(depreciation) | (178,863,620 | ) | (3,552,340 | ) | (327,869 | ) | 1,984,895 | 217,184 | (327,633 | ) | ||||||||||||||
| Net Realized and Unrealized Gain on Investments | 39,751,949 | 7,202,238 | 1,056,332 | 3,025,319 | 612,007 | 235,046 | ||||||||||||||||||
| Net Increase in Net Assets Resulting from Operations | $ | 72,726,050 | $ | 6,999,604 | $ | 1,030,083 | $ | 2,962,557 | $ | 705,710 | $ | 284,662 | ||||||||||||
See Notes to Financial Statements.
| 40 | www.jamesfunds.com |
| James Balanced: Golden Rainbow Fund | Statements of Changes in Net Assets |
| For the Year Ended June 30, 2018 | For the Year Ended June 30, 2017 | |||||||
| FROM OPERATIONS: | ||||||||
| Net investment income | $ | 32,974,101 | $ | 44,307,182 | ||||
| Net realized gain | 218,615,569 | 180,042,507 | ||||||
| Net change in unrealized depreciation | (178,863,620 | ) | (67,166,407 | ) | ||||
| Net Increase in net assets resulting from operations | 72,726,050 | 157,183,282 | ||||||
| DISTRIBUTIONS TO SHAREHOLDERS: | ||||||||
| Retail Class Shares: | ||||||||
| From net investment income | (19,616,842 | ) | (29,725,195 | ) | ||||
| From net realized gain on investments | (119,580,644 | ) | (10,139,227 | ) | ||||
| Institutional Class Shares: | ||||||||
| From net investment income | (13,990,021 | ) | (20,087,654 | ) | ||||
| From net realized gain on investments | (70,483,977 | ) | (5,583,143 | ) | ||||
| Decrease in net assets from distributions to shareholders | (223,671,484 | ) | (65,535,219 | ) | ||||
| CAPITAL SHARE TRANSACTIONS: | ||||||||
| Retail Class Shares: | ||||||||
| Proceeds from shares sold | 130,840,615 | 307,631,275 | ||||||
| Net asset value of shares issued in reinvestment of distributions to shareholders | 135,381,667 | 38,471,828 | ||||||
| Payments for shares redeemed, net of redemption fees | (820,705,338 | ) | (1,134,659,577 | ) | ||||
| Net Decrease in net assets from Retail Class capital share transactions | (554,483,056 | ) | (788,556,474 | ) | ||||
| Institutional Class Shares: | ||||||||
| Proceeds from shares sold | 149,242,321 | 274,252,442 | ||||||
| Net asset value of shares issued in reinvestment of distributions to shareholders | 66,623,349 | 19,458,265 | ||||||
| Payments for shares redeemed | (543,632,020 | ) | (618,481,705 | ) | ||||
| Net Decrease in net assets from Institutional Class capital share transactions | (327,766,350 | ) | (324,770,998 | ) | ||||
| Total Decrease in Net Assets | (1,033,194,840 | ) | (1,021,679,409 | ) | ||||
| NET ASSETS: | ||||||||
| Beginning of year | 3,383,880,191 | 4,405,559,600 | ||||||
| End of year | $ | 2,350,685,351 | $ | 3,383,880,191 | ||||
| Accumulated Net Investment Income | $ | 472,531 | $ | 1,147,937 | ||||
See Notes to Financial Statements.
| Annual Report | June 30, 2018 | 41 |
| Statements of Changes in Net Assets | James Balanced: Golden Rainbow Fund |
| For the Year Ended June 30, 2018 | For the Year Ended June 30, 2017 | |||||||
| SUMMARY OF CAPITAL SHARE ACTIVITY: | ||||||||
| Retail Class Shares: | ||||||||
| Shares sold | 5,371,862 | 12,579,499 | ||||||
| Shares issued in reinvestment of distributions to shareholders | 5,645,079 | 1,576,194 | ||||||
| Shares redeemed | (33,682,073 | ) | (46,397,523 | ) | ||||
| Net Decrease in shares outstanding | (22,665,132 | ) | (32,241,830 | ) | ||||
| Shares outstanding, beginning of period | 87,610,186 | 119,852,016 | ||||||
| Shares outstanding, end of period | 64,945,054 | 87,610,186 | ||||||
| Institutional Class Shares: | ||||||||
| Shares sold | 6,192,447 | 11,324,733 | ||||||
| Shares issued in reinvestment of distributions to shareholders | 2,808,316 | 804,853 | ||||||
| Shares redeemed | (22,647,178 | ) | (25,523,675 | ) | ||||
| Net Decrease in shares outstanding | (13,646,415 | ) | (13,394,089 | ) | ||||
| Shares outstanding, beginning of period | 49,914,158 | 63,308,247 | ||||||
| Shares outstanding, end of period | 36,267,743 | 49,914,158 | ||||||
See Notes to Financial Statements.
| 42 | www.jamesfunds.com |
| James Small Cap Fund | Statements of Changes in Net Assets |
| For the Year Ended June 30, 2018 | For the Year Ended June 30, 2017 | |||||||
| FROM OPERATIONS: | ||||||||
| Net investment income/(loss) | $ | (202,634 | ) | $ | 490,070 | |||
| Net realized gain | 10,754,578 | 16,038,130 | ||||||
| Net change in unrealized depreciation | (3,552,340 | ) | (7,509,937 | ) | ||||
| Net Increase in net assets resulting from operations | 6,999,604 | 9,018,263 | ||||||
| DISTRIBUTIONS TO SHAREHOLDERS: | ||||||||
| From net investment income | (407,489 | ) | (400,002 | ) | ||||
| From net realized gain on investments | (13,184,672 | ) | – | |||||
| Decrease in net assets from distributions to shareholders | (13,592,161 | ) | (400,002 | ) | ||||
| CAPITAL SHARE TRANSACTIONS: | ||||||||
| Proceeds from shares sold | 3,339,992 | 4,446,345 | ||||||
| Net asset value of shares issued in reinvestment of distributions to shareholders | 12,971,014 | 366,727 | ||||||
| Payments for shares redeemed | (19,054,254 | ) | (30,054,112 | ) | ||||
| Net Decrease in net assets from capital share transactions | (2,743,248 | ) | (25,241,040 | ) | ||||
| Total Decrease in Net Assets | (9,335,805 | ) | (16,622,779 | ) | ||||
| NET ASSETS: | ||||||||
| Beginning of year | 67,602,886 | 84,225,665 | ||||||
| End of year | $ | 58,267,081 | $ | 67,602,886 | ||||
| Accumulated Net Investment Income | $ | – | $ | 407,486 | ||||
| SUMMARY OF CAPITAL SHARE ACTIVITY: | ||||||||
| Shares sold | 102,092 | 131,508 | ||||||
| Shares issued in reinvestment of distributions to shareholders | 436,403 | 10,227 | ||||||
| Shares redeemed | (595,417 | ) | (900,250 | ) | ||||
| Net Decrease in shares outstanding | (56,922 | ) | (758,515 | ) | ||||
| Shares outstanding, beginning of period | 1,990,584 | 2,749,099 | ||||||
| Shares outstanding, end of period | 1,933,662 | 1,990,584 | ||||||
See Notes to Financial Statements.
| Annual Report | June 30, 2018 | 43 |
| Statements of Changes in Net Assets | James Mid Cap Fund |
| For the Year Ended June 30, 2018 | For the Year Ended June 30, 2017 | |||||||
| FROM OPERATIONS: | ||||||||
| Net investment income/(loss) | $ | (26,249 | ) | $ | 50,998 | |||
| Net realized gain | 1,384,201 | 4,757,419 | ||||||
| Net change in unrealized depreciation | (327,869 | ) | (3,363,332 | ) | ||||
| Net Increase in net assets resulting from operations | 1,030,083 | 1,445,085 | ||||||
| DISTRIBUTIONS TO SHAREHOLDERS: | ||||||||
| From net investment income | (55,290 | ) | (19,996 | ) | ||||
| From net realized gain on investments | (3,523,636 | ) | (1,674,446 | ) | ||||
| Decrease in net assets from distributions to shareholders | (3,578,926 | ) | (1,694,442 | ) | ||||
| CAPITAL SHARE TRANSACTIONS: | ||||||||
| Proceeds from shares sold | 2,066,829 | 1,418,143 | ||||||
| Net asset value of shares issued in reinvestment of distributions to shareholders | 3,550,103 | 1,664,429 | ||||||
| Payments for shares redeemed | (2,459,168 | ) | (2,299,515 | ) | ||||
| Net Increase in net assets from capital share transactions | 3,157,764 | 783,057 | ||||||
| Total Increase in Net Assets | 608,921 | 533,700 | ||||||
| NET ASSETS: | ||||||||
| Beginning of year | 14,859,348 | 14,325,648 | ||||||
| End of year | $ | 15,468,269 | $ | 14,859,348 | ||||
| Accumulated Net Investment Income | $ | – | $ | 37,273 | ||||
| SUMMARY OF CAPITAL SHARE ACTIVITY: | ||||||||
| Shares sold | 163,932 | 108,509 | ||||||
| Shares issued in reinvestment of distributions to shareholders | 315,748 | 132,072 | ||||||
| Shares redeemed | (204,577 | ) | (170,964 | ) | ||||
| Net Increase in shares outstanding | 275,103 | 69,617 | ||||||
| Shares outstanding, beginning of period | 1,125,794 | 1,056,177 | ||||||
| Shares outstanding, end of period | 1,400,897 | 1,125,794 | ||||||
See Notes to Financial Statements.
| 44 | www.jamesfunds.com |
| James Micro Cap Fund | Statements of Changes in Net Assets |
| For the Year Ended June 30, 2018 | For the Year Ended June 30, 2017 | |||||||
| FROM OPERATIONS: | ||||||||
| Net investment income/(loss) | $ | (62,762 | ) | $ | 74,351 | |||
| Net realized gain | 1,040,424 | 4,773,673 | ||||||
| Net change in unrealized appreciation/(depreciation) | 1,984,895 | (895,775 | ) | |||||
| Net Increase in net assets resulting from operations | 2,962,557 | 3,952,249 | ||||||
| DISTRIBUTIONS TO SHAREHOLDERS: | ||||||||
| From net investment income | (97,620 | ) | – | |||||
| From net realized gain on investments | (2,102,730 | ) | – | |||||
| Decrease in net assets from distributions to shareholders | (2,200,350 | ) | – | |||||
| CAPITAL SHARE TRANSACTIONS: | ||||||||
| Proceeds from shares sold | 2,389,041 | 7,818,009 | ||||||
| Net asset value of shares issued in reinvestment of distributions to shareholders | 2,177,624 | – | ||||||
| Payments for shares redeemed, net of redemption fees | (8,332,906 | ) | (6,476,089 | ) | ||||
| Net Increase/(Decrease) in net assets from capital share transactions | (3,766,241 | ) | 1,341,920 | |||||
| Total Increase/(Decrease) in Net Assets | (3,004,034 | ) | 5,294,169 | |||||
| NET ASSETS: | ||||||||
| Beginning of year | 31,808,731 | 26,514,562 | ||||||
| End of year | $ | 28,804,697 | $ | 31,808,731 | ||||
| Accumulated Net Investment Income/(Loss) | $ | (35,512 | ) | $ | 97,622 | |||
| SUMMARY OF CAPITAL SHARE ACTIVITY: | ||||||||
| Shares sold | 136,672 | 464,020 | ||||||
| Shares issued in reinvestment of distributions to shareholders | 126,190 | – | ||||||
| Shares redeemed | (493,438 | ) | (386,257 | ) | ||||
| Net Increase/(Decrease) in shares outstanding | (230,576 | ) | 77,763 | |||||
| Shares outstanding, beginning of period | 1,841,949 | 1,764,186 | ||||||
| Shares outstanding, end of period | 1,611,373 | 1,841,949 | ||||||
See Notes to Financial Statements.
| Annual Report | June 30, 2018 | 45 |
| Statements of Changes in Net Assets | James Aggressive Allocation Fund |
| For the Year Ended June 30, 2018 | For the Year Ended June 30, 2017 | |||||||
| FROM OPERATIONS: | ||||||||
| Net investment income | $ | 93,703 | $ | 85,250 | ||||
| Net realized gain | 394,823 | 62,289 | ||||||
| Net change in unrealized appreciation | 217,184 | 415,138 | ||||||
| Net Increase in net assets resulting from operations | 705,710 | 562,677 | ||||||
| DISTRIBUTIONS TO SHAREHOLDERS: | ||||||||
| From net investment income | (75,908 | ) | (84,996 | ) | ||||
| Decrease in net assets from distributions to shareholders | (75,908 | ) | (84,996 | ) | ||||
| CAPITAL SHARE TRANSACTIONS: | ||||||||
| Proceeds from shares sold | 1,739,939 | 2,828,998 | ||||||
| Net asset value of shares issued in reinvestment of distributions to shareholders | 75,908 | 84,996 | ||||||
| Payments for shares redeemed | (1,410,496 | ) | (609,188 | ) | ||||
| Net Increase in net assets from capital share transactions | 405,351 | 2,304,806 | ||||||
| Total Increase in Net Assets | 1,035,153 | 2,782,487 | ||||||
| NET ASSETS: | ||||||||
| Beginning of year | 9,954,119 | 7,171,632 | ||||||
| End of year | $ | 10,989,272 | $ | 9,954,119 | ||||
| Accumulated Net Investment Income | $ | 40,605 | $ | 22,955 | ||||
| SUMMARY OF CAPITAL SHARE ACTIVITY: | ||||||||
| Shares sold | 160,956 | 291,401 | ||||||
| Shares issued in reinvestment of distributions to shareholders | 6,932 | 8,577 | ||||||
| Shares redeemed | (133,033 | ) | (61,509 | ) | ||||
| Net Increase in shares outstanding | 34,855 | 238,469 | ||||||
| Shares outstanding, beginning of period | 995,795 | 757,326 | ||||||
| Shares outstanding, end of period | 1,030,650 | 995,795 | ||||||
See Notes to Financial Statements.
| 46 | www.jamesfunds.com |
| James Long-Short Fund | Statements of Changes in Net Assets |
| For the Year Ended June 30, 2018 | For the Year Ended June 30, 2017 | |||||||
| FROM OPERATIONS: | ||||||||
| Net investment income | $ | 49,616 | $ | 89,674 | ||||
| Net realized gain | 562,679 | 1,332,216 | ||||||
| Net change in unrealized appreciation/(depreciation) | (327,633 | ) | 751,160 | |||||
| Net Increase in net assets resulting from operations | 284,662 | 2,173,050 | ||||||
| DISTRIBUTIONS TO SHAREHOLDERS: | ||||||||
| From net investment income | (64,997 | ) | – | |||||
| Decrease in net assets from distributions to shareholders | (64,997 | ) | – | |||||
| CAPITAL SHARE TRANSACTIONS: | ||||||||
| Proceeds from shares sold | 1,566,816 | 503,629 | ||||||
| Net asset value of shares issued in reinvestment of distributions to shareholders | 64,533 | – | ||||||
| Payments for shares redeemed | (3,324,551 | ) | (5,922,071 | ) | ||||
| Net Decrease in net assets from capital share transactions | (1,693,202 | ) | (5,418,442 | ) | ||||
| Total Decrease in Net Assets | (1,473,537 | ) | (3,245,392 | ) | ||||
| NET ASSETS: | ||||||||
| Beginning of year | 21,459,123 | 24,704,515 | ||||||
| End of year | $ | 19,985,586 | $ | 21,459,123 | ||||
| Accumulated Net Investment Income | $ | – | $ | – | ||||
| SUMMARY OF CAPITAL SHARE ACTIVITY: | ||||||||
| Shares sold | 105,469 | 37,695 | ||||||
| Shares issued in reinvestment of distributions to shareholders | 4,190 | – | ||||||
| Shares redeemed | (226,680 | ) | (442,700 | ) | ||||
| Net Decrease in shares outstanding | (117,021 | ) | (405,005 | ) | ||||
| Shares outstanding, beginning of period | 1,498,122 | 1,903,127 | ||||||
| Shares outstanding, end of period | 1,381,101 | 1,498,122 | ||||||
See Notes to Financial Statements.
| Annual Report | June 30, 2018 | 47 |
| Financial Highlights | James Balanced: Golden Rainbow Fund – Retail Class |
For a share outstanding throughout the years indicated.
| For the Year Ended June 30, 2018 | For the Year Ended June 30, 2017 | For the Year Ended June 30, 2016 | For the Year Ended June 30, 2015 | For the Year Ended June 30, 2014 | ||||||||||||||||
| Net asset value - beginning of year | $ | 24.70 | $ | 24.14 | $ | 24.96 | $ | 25.28 | $ | 22.55 | ||||||||||
| Income/(Loss) from investment operations: | ||||||||||||||||||||
| Net investment income(a) | 0.26 | 0.25 | 0.25 | 0.22 | 0.24 | |||||||||||||||
| Net realized and unrealized gain/(loss) | 0.24 | 0.68 | (0.41 | ) | 0.49 | 2.96 | ||||||||||||||
| Total from investment operations | 0.50 | 0.93 | (0.16 | ) | 0.71 | 3.20 | ||||||||||||||
| Less distributions: | ||||||||||||||||||||
| From net investment income | (0.27 | ) | (0.28 | ) | (0.23 | ) | (0.18 | ) | (0.24 | ) | ||||||||||
| From net realized gain on investments | (1.61 | ) | (0.09 | ) | (0.43 | ) | (0.85 | ) | (0.23 | ) | ||||||||||
| Total distributions | (1.88 | ) | (0.37 | ) | (0.66 | ) | (1.03 | ) | (0.47 | ) | ||||||||||
| Paid-in capital from redemption fees | – | 0.00 | (b) | – | – | – | ||||||||||||||
| Net asset value at end of year | $ | 23.32 | $ | 24.70 | $ | 24.14 | $ | 24.96 | $ | 25.28 | ||||||||||
| Total return | 1.87 | % | 3.92 | % | (0.64 | )% | 2.90 | % | 14.32 | % | ||||||||||
| Net assets, end of year (in thousands) | $ | 1,514,451 | $ | 2,163,786 | $ | 2,892,809 | $ | 2,973,350 | $ | 2,493,030 | ||||||||||
| Ratios/Supplemental Data: | ||||||||||||||||||||
| Ratio of expenses to average net assets | 0.99 | % | 0.96 | % | 0.96 | % | 0.97 | % | 1.00 | % | ||||||||||
| Ratio of net investment income to average net assets | 1.05 | % | 1.02 | % | 1.03 | % | 0.87 | % | 0.99 | % | ||||||||||
| Portfolio turnover rate | 75 | % | 46 | % | 46 | % | 43 | % | 32 | % | ||||||||||
| (a) | Calculated using the average shares method. |
| (b) | Amount rounds to less than $0.005 per share. |
See Notes to Financial Statements.
| 48 | www.jamesfunds.com |
| James Balanced: Golden Rainbow Fund – Institutional Class | Financial Highlights |
For a share outstanding throughout the years indicated.
| For the Year Ended June 30, 2018 | For the Year Ended June 30, 2017 | For the Year Ended June 30, 2016 | For the Year Ended June 30, 2015 | For the Year Ended June 30, 2014 | ||||||||||||||||
| Net asset value - beginning of year | $ | 24.44 | $ | 23.89 | $ | 24.72 | $ | 25.05 | $ | 22.35 | ||||||||||
| Income/(Loss) from investment operations: | ||||||||||||||||||||
| Net investment income(a) | 0.31 | 0.31 | 0.31 | 0.28 | 0.29 | |||||||||||||||
| Net realized and unrealized gain/(loss) | 0.25 | 0.68 | (0.42 | ) | 0.50 | 2.94 | ||||||||||||||
| Total from investment operations | 0.56 | 0.99 | (0.11 | ) | 0.78 | 3.23 | ||||||||||||||
| Less distributions: | ||||||||||||||||||||
| From net investment income | (0.33 | ) | (0.35 | ) | (0.29 | ) | (0.26 | ) | (0.30 | ) | ||||||||||
| From net realized gain on investments | (1.61 | ) | (0.09 | ) | (0.43 | ) | (0.85 | ) | (0.23 | ) | ||||||||||
| Total distributions | (1.94 | ) | (0.44 | ) | (0.72 | ) | (1.11 | ) | (0.53 | ) | ||||||||||
| Paid-in capital from redemption fees | – | 0.00 | (b) | – | – | – | ||||||||||||||
| Net asset value at end of year | $ | 23.06 | $ | 24.44 | $ | 23.89 | $ | 24.72 | $ | 25.05 | ||||||||||
| Total return | 2.16 | % | 4.19 | % | (0.43 | )% | 3.20 | % | 14.59 | % | ||||||||||
| Net assets, end of year (in thousands) | $ | 836,234 | $ | 1,220,095 | $ | 1,512,751 | $ | 1,277,641 | $ | 805,973 | ||||||||||
| Ratios/Supplemental Data: | ||||||||||||||||||||
| Ratio of expenses to average net assets | 0.74 | % | 0.71 | % | 0.71 | % | 0.73 | % | 0.75 | % | ||||||||||
| Ratio of net investment income to average net assets | 1.30 | % | 1.27 | % | 1.28 | % | 1.11 | % | 1.24 | % | ||||||||||
| Portfolio turnover rate | 75 | % | 46 | % | 46 | % | 43 | % | 32 | % | ||||||||||
| (a) | Calculated using the average shares method. |
| (b) | Amount rounds to less than $0.005 per share. |
See Notes to Financial Statements.
| Annual Report | June 30, 2018 | 49 |
| Financial Highlights | James Small Cap Fund |
For a share outstanding throughout the years indicated.
| For the Year Ended June 30, 2018 | For the Year Ended June 30, 2017 | For the Year Ended June 30, 2016 | For the Year Ended June 30, 2015 | For the Year Ended June 30, 2014 | ||||||||||||||||
| Net asset value - beginning of year | $ | 33.96 | $ | 30.64 | $ | 33.47 | $ | 33.88 | $ | 28.66 | ||||||||||
| Income/(Loss) from investment operations: | ||||||||||||||||||||
| Net investment income/(loss)(a) | (0.10 | ) | 0.21 | 0.17 | 0.01 | (0.00 | )(b) | |||||||||||||
| Net realized and unrealized gain/(loss) | 3.82 | 3.28 | (1.64 | ) | (0.42 | ) | 6.12 | |||||||||||||
| Total from investment operations | 3.72 | 3.49 | (1.47 | ) | (0.41 | ) | 6.12 | |||||||||||||
| Less distributions: | ||||||||||||||||||||
| From net investment income | (0.19 | ) | (0.17 | ) | (0.12 | ) | – | (0.90 | ) | |||||||||||
| From net realized gain on investments | (7.36 | ) | – | (1.24 | ) | – | – | |||||||||||||
| Total distributions | (7.55 | ) | (0.17 | ) | (1.36 | ) | – | (0.90 | ) | |||||||||||
| Net asset value at end of year | $ | 30.13 | $ | 33.96 | $ | 30.64 | $ | 33.47 | $ | 33.88 | ||||||||||
| Total return | 11.41 | % | 11.36 | % | (4.62 | )% | (1.21 | )% | 21.46 | % | ||||||||||
| Net assets, end of year (in thousands) | $ | 58,267 | $ | 67,603 | $ | 84,226 | $ | 125,145 | $ | 163,537 | ||||||||||
| Ratios/Supplemental Data: | ||||||||||||||||||||
| Ratio of expenses to average net assets | 1.50 | % | 1.50 | % | 1.50 | % | 1.50 | % | 1.50 | % | ||||||||||
| Ratio of net investment income/(loss) to average net assets | (0.32 | )% | 0.62 | % | 0.55 | % | 0.04 | % | (0.00 | )%(c) | ||||||||||
| Portfolio turnover rate | 124 | % | 129 | % | 57 | % | 76 | % | 62 | % | ||||||||||
| (a) | Calculated using the average shares method. |
| (b) | Amount rounds to less than ($0.005) per share. |
| (c) | Amount rounds to less than (0.005%). |
See Notes to Financial Statements.
| 50 | www.jamesfunds.com |
| James Mid Cap Fund | Financial Highlights |
For a share outstanding throughout the years indicated.
| For the Year Ended June 30, 2018 | For the Year Ended June 30, 2017 | For the Year Ended June 30, 2016 | For the Year Ended June 30, 2015 | For the Year Ended June 30, 2014 | ||||||||||||||||
| Net asset value - beginning of year | $ | 13.20 | $ | 13.56 | $ | 14.86 | $ | 16.42 | $ | 12.97 | ||||||||||
| Income/(Loss) from investment operations: | ||||||||||||||||||||
| Net investment income/(loss)(a) | (0.02 | ) | 0.05 | 0.08 | (0.02 | ) | 0.01 | |||||||||||||
| Net realized and unrealized gain/(loss) | 1.03 | 1.29 | (0.42 | ) | (0.15 | ) | 3.87 | |||||||||||||
| Total from investment operations | 1.01 | 1.34 | (0.34 | ) | (0.17 | ) | 3.88 | |||||||||||||
| Less distributions: | ||||||||||||||||||||
| From net investment income | (0.04 | ) | (0.02 | ) | (0.05 | ) | (0.01 | ) | (0.04 | ) | ||||||||||
| From net realized gain on investments | (3.13 | ) | (1.68 | ) | (0.91 | ) | (1.38 | ) | (0.39 | ) | ||||||||||
| Total distributions | (3.17 | ) | (1.70 | ) | (0.96 | ) | (1.39 | ) | (0.43 | ) | ||||||||||
| Net asset value at end of year | $ | 11.04 | $ | 13.20 | $ | 13.56 | $ | 14.86 | $ | 16.42 | ||||||||||
| Total return | 7.27 | % | 10.50 | % | (2.46 | )% | (0.86 | )% | 30.34 | % | ||||||||||
| Net assets, end of year (in thousands) | $ | 15,468 | $ | 14,859 | $ | 14,326 | $ | 21,190 | $ | 18,631 | ||||||||||
| Ratios/Supplemental Data: | ||||||||||||||||||||
| Ratio of expenses to average net assets | 1.50 | % | 1.50 | % | 1.50 | % | 1.50 | % | 1.50 | % | ||||||||||
| Ratio of net investment income/(loss) to average net assets | (0.17 | )% | 0.35 | % | 0.54 | % | (0.13 | )% | 0.05 | % | ||||||||||
| Portfolio turnover rate | 191 | % | 150 | % | 47 | % | 50 | % | 31 | % | ||||||||||
| (a) | Calculated using the average shares method. |
See Notes to Financial Statements.
| Annual Report | June 30, 2018 | 51 |
| Financial Highlights | James Micro Cap Fund |
For a share outstanding throughout the years indicated.
| For the Year Ended June 30, 2018 | For the Year Ended June 30, 2017 | For the Year Ended June 30, 2016 | For the Year Ended June 30, 2015 | For the Year Ended June 30, 2014 | ||||||||||||||||
| Net asset value - beginning of year | $ | 17.27 | $ | 15.03 | $ | 15.11 | $ | 17.40 | $ | 13.96 | ||||||||||
| Income/(Loss) from investment operations: | ||||||||||||||||||||
| Net investment income/(loss)(a) | (0.04 | ) | 0.04 | (0.04 | ) | 0.06 | (0.05 | ) | ||||||||||||
| Net realized and unrealized gain/(loss) | 1.99 | 2.20 | (0.06 | ) | 1.12 | 3.50 | ||||||||||||||
| Total from investment operations | 1.95 | 2.24 | (0.10 | ) | 1.18 | 3.45 | ||||||||||||||
| Less distributions: | ||||||||||||||||||||
| From net investment income | (0.06 | ) | – | (0.01 | ) | (0.02 | ) | (0.01 | ) | |||||||||||
| From net realized gain on investments | (1.29 | ) | – | – | (3.45 | ) | – | |||||||||||||
| Total distributions | (1.35 | ) | – | (0.01 | ) | (3.47 | ) | (0.01 | ) | |||||||||||
| Paid-in capital from redemption fees | 0.01 | 0.00 | (b) | 0.03 | 0.00 | (b) | 0.00 | (b) | ||||||||||||
| Net asset value at end of year | $ | 17.88 | $ | 17.27 | $ | 15.03 | $ | 15.11 | $ | 17.40 | ||||||||||
| Total return | 11.62 | % | 14.90 | % | (0.44 | )% | 7.95 | % | 24.75 | % | ||||||||||
| Net assets, end of year (in thousands) | $ | 28,805 | $ | 31,809 | $ | 26,515 | $ | 24,026 | $ | 16,256 | ||||||||||
| Ratios/Supplemental Data: | ||||||||||||||||||||
| Ratio of expenses to average net assets | 1.50 | % | 1.50 | % | 1.50 | % | 1.50 | % | 1.50 | % | ||||||||||
| Ratio of net investment income/(loss) to average net assets | (0.22 | )% | 0.23 | % | (0.24 | )% | 0.38 | % | (0.31 | )% | ||||||||||
| Portfolio turnover rate | 37 | % | 97 | % | 44 | % | 52 | % | 96 | % | ||||||||||
| (a) | Calculated using the average shares method. |
| (b) | Amount rounds to less than $0.005 per share. |
See Notes to Financial Statements.
| 52 | www.jamesfunds.com |
| James Aggressive Allocation Fund | Financial Highlights |
For a share outstanding throughout the years indicated.
| For the Year Ended June 30, 2018 | For the Year Ended June 30, 2017 | For the Year Ended June 30, 2016(a) | ||||||||||
| Net asset value - beginning of year | $ | 10.00 | $ | 9.47 | $ | 10.00 | ||||||
| Income/(Loss) from investment operations: | ||||||||||||
| Net investment income(b) | 0.10 | 0.09 | 0.07 | |||||||||
| Net realized and unrealized gain/(loss) | 0.64 | 0.53 | (0.57 | ) | ||||||||
| Total from investment operations | 0.74 | 0.62 | (0.50 | ) | ||||||||
| Less distributions: | ||||||||||||
| From net investment income | (0.08 | ) | (0.09 | ) | (0.03 | ) | ||||||
| Total distributions | (0.08 | ) | (0.09 | ) | (0.03 | ) | ||||||
| Net asset value at end of year | $ | 10.66 | $ | 10.00 | $ | 9.47 | ||||||
| Total return | 7.36 | % | 6.54 | % | (4.98 | )% | ||||||
| Net assets, end of year (in thousands) | $ | 10,989 | $ | 9,954 | $ | 7,172 | ||||||
| Ratios/Supplemental Data: | ||||||||||||
| Ratio of expenses to average net assets | 0.98 | % | 0.98 | % | 0.98 | % | ||||||
| Ratio of net investment income to average net assets | 0.90 | % | 0.95 | % | 0.81 | % | ||||||
| Portfolio turnover rate | 219 | % | 198 | % | 218 | % | ||||||
| (a) | Fund commenced operations on July 1, 2015. |
| (b) | Calculated using the average shares method. |
See Notes to Financial Statements.
| Annual Report | June 30, 2018 | 53 |
| Financial Highlights | James Long-Short Fund |
For a share outstanding throughout the years indicated.
| For the Year Ended June 30, 2018 | For the Year Ended June 30, 2017 | For the Year Ended June 30, 2016 | For the Year Ended June 30, 2015 | For the Year Ended June 30, 2014 | ||||||||||||||||
| Net asset value - beginning of year | $ | 14.32 | $ | 12.98 | $ | 13.24 | $ | 13.80 | $ | 11.70 | ||||||||||
| Income/(Loss) from investment operations: | ||||||||||||||||||||
| Net investment income/(loss)(a) | 0.03 | 0.05 | (0.09 | ) | (0.13 | ) | (0.06 | ) | ||||||||||||
| Net realized and unrealized gain/(loss) | 0.17 | 1.29 | (0.17 | ) | (0.43 | ) | 2.16 | |||||||||||||
| Total from investment operations | 0.20 | 1.34 | (0.26 | ) | (0.56 | ) | 2.10 | |||||||||||||
| Less distributions: | ||||||||||||||||||||
| From net investment income | (0.05 | ) | – | – | – | – | ||||||||||||||
| Total distributions | (0.05 | ) | – | – | – | – | ||||||||||||||
| Net asset value at end of year | $ | 14.47 | $ | 14.32 | $ | 12.98 | $ | 13.24 | $ | 13.80 | ||||||||||
| Total return | 1.35 | % | 10.32 | % | (1.96 | )% | (4.06 | )% | 17.95 | % | ||||||||||
| Net assets, end of year (in thousands) | $ | 19,986 | $ | 21,459 | $ | 24,705 | $ | 33,890 | $ | 23,446 | ||||||||||
| Ratios/Supplemental Data: | ||||||||||||||||||||
| Ratio of expenses to average net assets(b) | 1.59 | % | 1.56 | % | 2.50 | % | 2.70 | % | 2.57 | % | ||||||||||
| Ratio of net investment income/(loss) to average net assets | 0.23 | % | 0.40 | % | (0.70 | )% | (0.92 | )% | (0.44 | )% | ||||||||||
| Portfolio turnover rate | 21 | % | 38 | % | 49 | % | 117 | % | 171 | % | ||||||||||
| (a) | Calculated using the average shares method. |
| (b) | Dividend and interest expense on securities sold short totaled 0.09%, 0.06%, 1.00%, 1.20% and 1.07% of average net assets for the years ended June 30, 2018, June 30, 2017, June 30, 2016, June 30, 2015 and June 30, 2014, respectively. |
See Notes to Financial Statements.
| 54 | www.jamesfunds.com |
| James Advantage Funds | Notes to Financial Statements |
June 30, 2018
1. ORGANIZATION
James Advantage Funds (the “Trust”) is an open-end management investment company that was organized as an Ohio business trust on August 29, 1997. The Trust is registered under the Investment Company Act of 1940, as amended (the “1940 Act”). James Balanced: Golden Rainbow Fund, James Small Cap Fund, James Mid Cap Fund, James Micro Cap Fund, James Aggressive Allocation Fund, and James Long-Short Fund are each a diversified series of the Trust (individually a “Fund,” collectively the “Funds”). Each class of James Balanced: Golden Rainbow Fund represents an interest in the same portfolio of investments and has the same rights, but differs primarily in distribution fees and shareholder features. The Retail Class shares are subject to distribution (12b-1) fees but have a lower minimum investment requirement and offer certain shareholder services not available to Institutional Class shareholders. The Institutional Class shares are not subject to distribution (12b-1) fees and are available only through investment advisers and bank trust departments that have made arrangements for shares of all of their clients investing in the Fund to be held in an omnibus account (as well as other investors that are approved by management of the Trust). The James Balanced: Golden Rainbow Fund registered T Class Shares with the Securities and Exchange Commission on April 3, 2017. As of June 30, 2018, the James Balanced: Golden Rainbow Fund has not offered T Class Shares to shareholders and as such, no financial data is included within this annual report.
James Balanced: Golden Rainbow Fund seeks to provide total return through a combination of growth and income and preservation of capital in declining markets. The James Balanced: Golden Rainbow Fund seeks to achieve its objective by investing primarily in common stocks and/or debt securities that the Fund’s adviser, James Investment Research, Inc. (“James” or the “Adviser”), believes are undervalued.
James Small Cap Fund seeks to provide long-term capital appreciation. The James Small Cap Fund seeks to achieve its objective by investing primarily in common stocks of small capitalization companies. The Adviser defines small capitalization as those companies with market capitalizations at the time of purchase no larger than the stocks in the James Small Cap Fund’s benchmark, the Russell 2000® Index. As of June 30, 2018, the stock with the maximum capitalization in the Russell 2000® Index had a capitalization of $6.69 billion.
James Mid Cap Fund seeks to provide long-term capital appreciation. The James Mid Cap Fund seeks to achieve its objective by investing primarily in common stocks of mid capitalization companies. The Adviser defines mid capitalization companies as those with market capitalizations at the time of purchase that fall within the range of the S&P MidCap 400® Value Index. As of June 30, 2018, the stock with the maximum capitalization in the S&P MidCap 400® Value Index had a capitalization of $26.52 billion.
James Micro Cap Fund seeks to provide long-term capital appreciation. The James Micro Cap Fund seeks to achieve its objective by investing primarily in common stocks of micro capitalization companies. Micro capitalization companies are defined as those companies with market capitalizations at the time of purchase no larger than the stocks in the Russell Microcap® Index, including exchange traded funds (“ETFs”) that invest primarily in such securities. As of June 30, 2018, the stock with the maximum capitalization in the Russell Microcap® Index had a capitalization of $1.97 billion.
James Aggressive Allocation Fund seeks to provide total return through a combination of growth and income. Preservation of capital in declining markets is a secondary objective. The James Aggressive Allocation Fund will generally run equity allocations of 60% or higher and, therefore, could be more volatile than a more conservative fund that holds a smaller percentage of its assets in stocks. Due to its aggressive nature, the James Aggressive Allocation Fund will generally have a turnover ratio much higher than the James Balanced: Golden Rainbow Fund.
James Long-Short Fund seeks to provide long-term capital appreciation. The James Long-Short Fund seeks to achieve its objective by investing primarily in foreign and domestic equity securities that the Adviser believes are undervalued and more likely to appreciate, and by selling short equity securities that the Adviser believes are overvalued and more likely to depreciate. The James Long-Short Fund also may take long positions in domestic and foreign fixed income securities that the Adviser believes are more likely to appreciate in the interest rate and spread environment anticipated by the Adviser, and short positions in fixed income securities that the Adviser believes are more likely to depreciate in the interest rate and spread environment anticipated by the Adviser. The James Long-Short Fund seeks to achieve positive returns on both the long positions and short positions that it takes in various securities.
2. SIGNIFICANT ACCOUNTING POLICIES
The following is a summary of significant accounting policies followed by the Funds in preparation of their financial statements, in accordance with accounting principles generally accepted in the United States of America (“GAAP”). The Funds are considered an investment company for financial reporting purposes under GAAP.
Share Valuation
The net asset value per share of each Fund, other than the James Balanced: Golden Rainbow Fund, is calculated daily by dividing the total value of the Fund’s assets, less liabilities, by the number of shares outstanding. The net asset value per share of each class of shares of the James Balanced: Golden Rainbow Fund is calculated daily by dividing the total value of the Fund’s assets attributable to that class, less liabilities attributable to that class, by the number of outstanding shares of that class. The offering price and redemption price per share is equal to the net asset value per share, except that shares of the James Micro Cap Fund are subject to a redemption fee of 2% if redeemed within 180 days of purchase. Redemption fees received by the James Micro Cap Fund were $19,044 and $5,848 for the years ended June 30, 2018 and June 30, 2017, respectively. The redemption fee is reflected in the “Payment for shares redeemed, net of redemption fees” in the Statements of Changes in Net Assets.
| Annual Report | June 30, 2018 | 55 |
| Notes to Financial Statements | James Advantage Funds |
June 30, 2018
Securities Valuation
Securities are valued at fair value. The Funds' portfolio securities, including short positions, are valued as of the close of the New York Stock Exchange (“NYSE”) (generally, 4:00 p.m., Eastern time) on each day that the NYSE is open for business. Equity securities that are traded on any exchange, including closed-end funds and exchange-traded funds, are valued at the last quoted sale price on the exchange or market in which such securities are principally traded. Lacking a last sale price, a security is valued at its last bid price except when, in James’ opinion, the last bid price does not accurately reflect the current value of the security. Securities that are traded on the NASDAQ® over-the-counter market are valued at their NASDAQ® Official Closing Price (“NOCP”) for all NASDAQ® National Market (“NNM”) and NASDAQ® Capital Market® securities. When market quotations are not readily available, if an event occurs after the close of the trading market (but before the time as of which a Fund calculates its net asset value) that materially affects a security’s value, when James determines that the market quotation does not accurately reflect the current value or when a non-144A restricted security is being valued, that security will be valued at its fair value as determined in good faith in conformity with guidelines adopted by and subject to review of the Board of Trustees (the “Board”). Corporate bonds, U.S. government agencies, U.S. Treasury bonds & notes, foreign, and municipal bonds are generally valued at the mean between the closing bid and asked prices provided by an independent pricing service. The pricing services generally use market models that consider trade data, yields, spreads, quotations from dealers and active market makers, credit worthiness, market information of comparable securities, and other relevant security specific information. Asset backed/commercial mortgage backed securities are generally valued at the mean between the closing bid and asked prices provided by an independent pricing service. The pricing service generally uses models that consider trade data, prepayment, and default projections, benchmark yield and spread data and estimated cash flows of each tranche of the issuer. If the Adviser decides that a price provided by the pricing service does not accurately reflect the fair market value of the securities or when prices are not readily available from a pricing service, those securities will be priced at fair value as determined in good faith by the Adviser. Shares of open-end investment companies are valued at net asset value.
For valuation purposes, quotations of foreign securities in a foreign currency are converted to U.S. dollar equivalents at the time of pricing the Funds. The values of foreign portfolio securities are generally based upon market quotations which, depending upon the exchange or market, may be last sale price, last bid price or the average of the last bid and asked prices as of, in each case, the close of the appropriate exchange or another designated time.
In accordance with the Trust’s good faith pricing guidelines, James is required to consider all appropriate factors relevant to the value of securities for which it has determined other pricing sources are not available or reliable as described above. There is no single standard for determining fair value, since fair value depends upon the circumstances of each individual case. As a general principle, the current fair value of an issue of securities being valued by the Adviser would appear to be the amount that the owner might reasonably expect to receive for them upon their current sale. Methods which are in accordance with this principle may, for example, be based on (i) a multiple of earnings, (ii) a discount from market of a similar freely traded security (including a derivative security or a basket of securities traded on other markets, exchanges or among dealers), or (iii) yield to maturity with respect to debt issues, or a combination of these and other methods.
Various inputs are used in determining the value of the Funds’ investments. These inputs are summarized in the three broad levels listed below:
| Level 1 - | Unadjusted quoted prices in active markets for identical, unrestricted assets or liabilities that a Fund has the ability to access at the measurement date; |
| Level 2 - | Quoted prices which are not active, quoted prices for similar assets or liabilities in active markets or inputs other than quoted prices that are observable (either directly or indirectly) for substantially the full term of the asset or liability; or |
| Level 3 - | Significant unobservable prices or inputs (including a Fund’s own assumptions in determining the fair value of investments) where there is little or no market activity for the asset or liability at the measurement date. |
The inputs or methodologies used for valuing securities are not necessarily an indication of the risk associated with investing in those securities.
| 56 | www.jamesfunds.com |
| James Advantage Funds | Notes to Financial Statements |
June 30, 2018
The following is a summary of the inputs used to value the Funds’ investments as of June 30, 2018:
James Balanced: Golden Rainbow Fund
| Valuation Inputs | ||||||||||||||||
| Investments in Securities at Value* | Level 1 | Level 2 | Level 3 | Total | ||||||||||||
| Common Stocks | $ | 1,109,908,386 | $ | – | $ | - | $ | 1,109,908,386 | ||||||||
| Exchange Traded Funds | 11,533,871 | – | – | 11,533,871 | ||||||||||||
| Corporate Bonds | – | 200,304,894 | – | 200,304,894 | ||||||||||||
| Municipal Bonds | – | 153,330,552 | – | 153,330,552 | ||||||||||||
| U.S. Government Agencies | – | 244,444,584 | – | 244,444,584 | ||||||||||||
| Mortgage Backed Securities | – | 32,260,388 | – | 32,260,388 | ||||||||||||
| U.S. Treasury Bonds & Notes | 406,516,796 | 2,201,979 | – | 408,718,775 | ||||||||||||
| Foreign Bonds | – | 25,333,325 | – | 25,333,325 | ||||||||||||
| Short Term Investments | 159,207,920 | – | – | 159,207,920 | ||||||||||||
| Total | $ | 1,687,166,973 | $ | 657,875,722 | $ | – | $ | 2,345,042,695 | ||||||||
James Small Cap Fund
| Valuation Inputs | ||||||||||||||||
| Investments in Securities at Value* | Level 1 | Level 2 | Level 3 | Total | ||||||||||||
| Common Stocks | $ | 57,283,733 | $ | – | $ | – | $ | 57,283,733 | ||||||||
| Short Term Investments | 976,627 | – | – | 976,627 | ||||||||||||
| Total | $ | 58,260,360 | $ | – | $ | – | $ | 58,260,360 | ||||||||
James Mid Cap Fund
| Valuation Inputs | ||||||||||||||||
| Investments in Securities at Value* | Level 1 | Level 2 | Level 3 | Total | ||||||||||||
| Common Stocks | $ | 15,263,581 | $ | – | $ | – | $ | 15,263,581 | ||||||||
| Short Term Investments | 214,993 | – | – | 214,993 | ||||||||||||
| Total | $ | 15,478,574 | $ | – | $ | – | $ | 15,478,574 | ||||||||
James Micro Cap Fund
| Valuation Inputs | ||||||||||||||||
| Investments in Securities at Value* | Level 1 | Level 2 | Level 3 | Total | ||||||||||||
| Common Stocks | $ | 26,434,715 | $ | – | $ | – | $ | 26,434,715 | ||||||||
| Short Term Investments | 2,343,108 | – | – | 2,343,108 | ||||||||||||
| Total | $ | 28,777,823 | $ | – | $ | – | $ | 28,777,823 | ||||||||
James Aggressive Allocation Fund
| Valuation Inputs | ||||||||||||||||
| Investments in Securities at Value* | Level 1 | Level 2 | Level 3 | Total | ||||||||||||
| Common Stocks | $ | 7,715,096 | $ | – | $ | – | $ | 7,715,096 | ||||||||
| Exchange Traded Funds | 187,218 | – | – | 187,218 | ||||||||||||
| Corporate Bonds | – | 213,183 | – | 213,183 | ||||||||||||
| U.S. Treasury Bonds & Notes | 2,435,606 | – | – | 2,435,606 | ||||||||||||
| Short Term Investments | 431,035 | – | – | 431,035 | ||||||||||||
| Total | $ | 10,768,955 | $ | 213,183 | $ | – | $ | 10,982,138 | ||||||||
| Annual Report | June 30, 2018 | 57 |
| Notes to Financial Statements | James Advantage Funds |
June 30, 2018
James Long-Short Fund
| Valuation Inputs | ||||||||||||||||
| Investments in Securities at Value* | Level 1 | Level 2 | Level 3 | Total | ||||||||||||
| Common Stocks | $ | 18,034,214 | $ | – | $ | – | $ | 18,034,214 | ||||||||
| Short Term Investments | 2,161,013 | – | – | 2,161,013 | ||||||||||||
| Total | $ | 20,195,227 | $ | – | $ | – | $ | 20,195,227 | ||||||||
| Valuation Inputs | ||||||||||||||||
| Other Financial Instruments* | Level 1 | Level 2 | Level 3 | Total | ||||||||||||
| Liabilities | ||||||||||||||||
| Securities Sold Short | ||||||||||||||||
| Common Stocks | $ | (460,856 | ) | $ | – | $ | – | $ | (460,856 | ) | ||||||
| TOTAL | $ | (460,856 | ) | $ | – | $ | – | $ | (460,856 | ) | ||||||
| * | For detailed descriptions of sector and industry, see the accompanying Schedule of Investments. |
The Funds recognize transfers between levels at the end of period. For the year ended June 30, 2018, the Funds did not have any transfers between Level 1 and Level 2 securities.
Investment Transactions
Investment transactions are recorded on a trade date basis. Gains and losses are determined using the specific identification method, which liquidates all losses first, before any gains. Securities purchased or sold on a when-issued or delayed delivery basis may have extended settlement periods. Any securities so purchased are subject to market fluctuation during this period. The Funds will instruct its custodian to segregate assets in a separate account with a current value at least equal to the amount of its when-issued and delayed delivery purchase commitments. As of June 30, 2018, the Funds did not hold when-issued securities or delayed delivery purchase commitments.
Withholding taxes on foreign dividends have been provided for in accordance with the Trust’s understanding of the applicable country’s tax rules and rates.
Foreign Currency Translation
The market value of investment securities and other assets and liabilities denominated in foreign currencies are translated into U.S. dollars at the current exchange rate, provided by WM Reuters, at the close of each business day. Purchases and sales of securities, income receipts and expense payments are translated into U.S. dollars based at the exchange rate on the date of the transaction.
Reported net realized foreign exchange gains or losses arise from sales and maturities of short-term securities, sales of foreign currencies, currency gains or losses realized and between the trade and settlement dates on securities transactions, and the difference between the amounts of dividends, interest, and foreign withholding taxes recorded on the Funds’ books and the U.S. dollar equivalent of the amounts actually received or paid. Net unrealized foreign exchange gains and losses arise from the changes in the value of assets and liabilities including investments in securities at the reporting period, resulting from changes in the exchange rate. The portion of realized and unrealized gains or losses on investments due fluctuations in foreign currency exchange rates is not separately disclosed and is included in realized and unrealized gains or losses on investments, when applicable.
Short Sales and Segregated Cash
The James Long-Short Fund may actively sell short equity and fixed income securities. Short sales are transactions in which the Fund sells a security it does not own in anticipation of a decline in the market value of that security. To complete such a transaction, the Fund must borrow the security to deliver to the buyer upon the short sale; the Fund is then obligated to replace the security borrowed by purchasing it in the open market at some later date.
The Fund will incur a loss if the market price of the security increases between the date of the short sale and the date on which the Fund replaces the borrowed security. The Fund will realize a gain if the security declines in value between those dates. The Fund is required to pay any dividend or interest due on securities sold short. Such dividends and interest are recorded as an expense. The Fund may pay fees or charges on the assets borrowed for securities sold short.
All short sales are collateralized, as required by the Fund’s prime broker. The Fund maintains the collateral in segregated accounts consisting of cash and/or equity securities sufficient to collateralize the market value of the Fund’s short positions.
Investment Income
Dividend income and dividend expense on long securities and securities sold short are recorded on the ex-dividend date. Interest income is determined on the basis of interest accrued, adjusted for amortization of premiums and accretion of discounts on all debt securities. Amortization and accretion is calculated using the effective yield method.
Dividend income includes dividends earned on Real Estate Investment Trusts (“REITs”), which may include a return of capital. As such, important taxation issues may arise, which the Funds account for when information is provided by the issuing REIT.
| 58 | www.jamesfunds.com |
| James Advantage Funds | Notes to Financial Statements |
June 30, 2018
Due to the actual character of dividends paid by REITs not being available until the end of the calendar year, the net investment income and long-term capital gains of the Funds can be different on the tax return compared to this annual report. Substantial unanticipated levels of return of capital may affect the Funds’ earnings and profits from which distributions are made.
Distributions received from Limited Partnership investments of a Fund are usually recorded as a return of capital and are excluded from available income in the calculation of distributions paid by the Funds. Return of capital is recorded as a reduction to the cost of investments in the Statements of Assets and Liabilities and in the Schedule of Investments.
Dividends and Distributions to Shareholders
Net investment income, if any, is generally declared and distributed to shareholders of each Fund on at least an annual basis. Net realized capital gains from security transactions, if any, are distributed to shareholders not less frequently than annually. Furthermore, capital gains are distributed only to the extent they exceed available capital loss carryforwards. Distributions to shareholders of net investment income and net realized capital gains are recorded on the ex-dividend date. The amount and timing of distributions are determined in accordance with federal income tax regulations, which may differ from GAAP.
Allocation of Income and Expense
Investment income earned, realized capital gains and losses, and unrealized appreciation and depreciation for the James Balanced: Golden Rainbow Fund is allocated daily to each class of shares based upon its proportionate share of total net assets of the Fund. Classspecific expenses are charged directly to the class incurring the expense. Common expenses, which are not attributable to a specific class, are allocated daily to each class of shares based upon its proportionate share of total net assets of the Fund. The Advisor pays the expenses of each Fund, except for the James Balanced: Golden Rainbow fund. These expenses exclude the management fees, detailed in Note 4, brokerage fees and commissions, taxes, interest (including dividend expense on securities sold short), fees and expenses of the non-interested person trustees, 12b-1 fees and extraordinary expenses. Expenses not directly billed to a particular Fund are allocated proportionally among all Funds daily in relation to net assets of each Fund or another reasonable measure.
Use of Estimates
The preparation of financial statements in conformity with GAAP requires management to make estimates and assumptions that affect the reported amounts of assets and liabilities and disclosure of contingent assets and liabilities at the date of the financial statements and the reported amounts of increases and decreases in net assets from operations during the reporting period. Actual results could differ from those estimates.
Federal Income Taxes
The Funds generally intend to distribute all taxable income and capital gains to shareholders, if any, and to otherwise continue to comply with the requirements of Subchapter M of the Internal Revenue Code of 1986, as amended, applicable to regulated investment companies. Therefore, no federal tax provision is required.
As of and during the year ended June 30, 2018, the Funds did not have a liability for any unrecognized tax benefits. The Funds file U.S. federal, state, and local tax returns as required. The Funds’ tax returns are subject to examination by the relevant tax authorities until expiration of the applicable statute of limitations, which is generally three years after the filing of the tax return for federal purposes and four years for most state returns. Tax returns for open years have incorporated no uncertain tax positions that require a provision for income taxes.
Reclassifications, which are determined in accordance with federal income tax regulations, result primarily from the differences in the GAAP (book) and tax treatment of certain investments such as partnerships, grantor trusts, foreign currency and PFICs.
| James Balanced: Golden Rainbow Fund | James Small Cap Fund | James Mid Cap Fund | James Micro Cap Fund | James Aggressive Allocation Fund | James Long- Short Fund | |||||||||||||||||||
| Paid-in capital | $ | (313 | ) | $ | (47 | ) | $ | – | $ | (162,486 | ) | $ | – | $ | (15,381 | ) | ||||||||
| Accumulated net investment income/(loss) | (42,644 | ) | 202,637 | 44,266 | 27,248 | (145 | ) | 15,381 | ||||||||||||||||
| Accumulated net realized gain/(loss) | 42,957 | (202,590 | ) | (44,266 | ) | 135,238 | 145 | – | ||||||||||||||||
| Included in the amounts reclassified above were net operating losses offset to Paid-in capital, were as follows | $ | – | $ | – | $ | – | $ | 162,428 | $ | – | $ | – | ||||||||||||
| Annual Report | June 30, 2018 | 59 |
| Notes to Financial Statements | James Advantage Funds |
June 30, 2018
As of June 30, 2018, the components of distributable earnings on a tax basis were as follows:
| James Balanced: Golden Rainbow Fund | James Small Cap Fund | James Mid Cap Fund | James Micro Cap Fund | James Aggressive Allocation Fund | James Long-Short Fund | |||||||||||||||||||
| Tax cost of portfolio investments | $ | 2,122,043,776 | $ | 48,696,274 | $ | 14,889,660 | $ | 21,715,034 | $ | 9,991,982 | $ | 15,216,581 | ||||||||||||
| Gross unrealized appreciation | $ | 261,711,005 | $ | 11,062,636 | $ | 1,242,376 | $ | 7,774,401 | $ | 1,165,894 | $ | 5,613,918 | ||||||||||||
| Gross unrealized depreciation | (38,712,086 | ) | (1,498,550 | ) | (653,462 | ) | (711,612 | ) | (175,738 | ) | (544,171 | ) | ||||||||||||
| Net depreciation of foreign currency | (9,608 | ) | – | – | – | – | – | |||||||||||||||||
| Net unrealized appreciation | 222,989,311 | 9,564,086 | 588,914 | 7,062,789 | 990,156 | 5,069,747 | ||||||||||||||||||
| Accumulated capital gains/(losses) | 115,391,353 | 4,401,606 | 410,522 | 1,165,532 | (67,259 | ) | (303,845 | ) | ||||||||||||||||
| Undistributed ordinary income | 476,889 | 749,501 | 827,713 | – | 40,605 | – | ||||||||||||||||||
| Other cumulative effect of timing differences | – | – | – | (35,512 | ) | – | – | |||||||||||||||||
| Total | $ | 338,857,553 | $ | 14,715,193 | $ | 1,827,149 | $ | 8,192,809 | $ | 963,502 | $ | 4,765,902 | ||||||||||||
The difference between the cost of portfolio investments on a tax basis and financial statement cost for the Funds is due primarily to the deferral of wash sale losses and to the differing treatment of certain investments under income tax regulations and GAAP.
The tax character of distributions paid for the year ended June 30, 2018 was as follows:
| James Balanced: Golden Rainbow Fund | James Small Cap Fund | James Mid Cap Fund | James Micro Cap Fund | James Aggressive Allocation Fund | James Long-Short Fund | |||||||||||||||||||
| Ordinary Income | $ | 33,606,863 | $ | 1,959,939 | $ | 523,039 | $ | 97,622 | $ | 75,908 | $ | 64,997 | ||||||||||||
| Long-Term Capital Gains | 190,064,621 | 11,632,222 | 3,055,887 | 2,102,728 | – | – | ||||||||||||||||||
| Total | $ | 223,671,484 | $ | 13,592,161 | $ | 3,578,926 | $ | 2,200,350 | $ | 75,908 | $ | 64,997 | ||||||||||||
The tax character of distributions paid for the year ended June 30, 2017 was as follows:
James Golden Rainbow Fund | James Small Cap Fund | James Mid Cap Fund | James Micro Cap Fund | James Aggressive Allocation Fund | James Long-Short Fund | |||||||||||||||||||
| Ordinary Income | $ | 49,812,849 | $ | 400,002 | $ | 131,210 | $ | – | $ | 84,996 | $ | – | ||||||||||||
| Long-Term Capital Gains | 15,722,370 | – | 1,563,232 | – | – | – | ||||||||||||||||||
| Total | $ | 65,535,219 | $ | 400,002 | $ | 1,694,442 | $ | – | $ | 84,996 | $ | – | ||||||||||||
Capital Losses
Under the tax code, Capital Losses are carried over to future tax years and will retain their character as either short-term or long-term capital losses. These losses do not include any late year capital losses (losses arising in the period from November 1st through June 30th) that the funds have elected to defer for the current fiscal year. The Funds’ ability to utilize capital loss carryforwards in the future may be limited under the Internal Revenue Code and related regulations based on the results of future transactions.
Capital loss carryovers used during the period ended June 30, 2018, were:
| Amount | ||||
| James Aggressive Allocation Fund | $ | 346,134 | ||
| James Long-Short Fund | 184,934 | |||
Capital losses carried forward to the next tax year were as follows:
| Short Term | Long Term | ||||||||
| James Long-Short Fund | $ | 303,845 | $ | – | |||||
The Funds elect to defer to the year ending June 30, 2019 capital losses recognized during the period November 1, 2017 through June 30, 2018 in the amount of:
| Amount | |||||
| James Aggressive Allocation Fund | $ | 67,259 | |||
| 60 | www.jamesfunds.com |
| James Advantage Funds | Notes to Financial Statements |
June 30, 2018
3. INVESTMENT TRANSACTIONS
Purchases and sales (including maturities) of investments in long-term U.S. Government obligations for the year ended June 30, 2018 were as follows:
| Purchases | Sales | |||||||
| James Balanced: Golden Rainbow Fund | $ | 740,035,622 | $ | 1,204,268,348 | ||||
| James Aggressive Allocation Fund | 7,355,376 | 7,040,504 | ||||||
Purchases and sales (including maturities) of investments in other long-term securities for the year ended June 30, 2018 were as follows:
| Purchases | Sales | |||||||
| James Balanced: Golden Rainbow Fund | $ | 1,321,436,671 | $ | 1,980,758,700 | ||||
| James Small Cap Fund | 77,329,363 | 92,229,809 | ||||||
| James Mid Cap Fund | 28,631,214 | 28,482,379 | ||||||
| James Micro Cap Fund | 10,139,767 | 17,989,834 | ||||||
| James Aggressive Allocation Fund | 14,922,790 | 15,094,455 | ||||||
| James Long-Short Fund | 3,794,668 | 4,740,152 | ||||||
For the year ended June 30, 2018, the cost of securities purchased to cover short sales and the proceeds from securities sold short were $1,852,095 and $4,433,622, respectively, for the James Long-Short Fund. As of June 30, 2018, the James Long-Short Fund held securities sold short with a value of $460,856. Unrealized appreciation from short sales as of June 30, 2018 were $91,101.
4. MANAGEMENT FEE AND OTHER TRANSACTIONS WITH AFFILIATES
Investment Management Agreement
The Funds retain James to manage the Funds’ investments. The investment decisions for the Funds are made by a committee of James’ personnel, which is primarily responsible for the day-to-day management of each Fund’s portfolio. The Funds pay James on a monthly basis at the annual rate set forth below of the Funds’ average daily net assets.
James Balanced: Golden Rainbow Fund
| Average Total Net Assets | Contractual Fee |
| Up to and including $500 million | 0.74% |
| Over $500 million and including $1 billion | 0.70% |
| Over $1 billion and including $2 billion | 0.65% |
| Over $2 billion | 0.60% |
James Small Cap Fund
| Average Total Net Assets | Contractual Fee |
| Up to and including $500 million | 1.25% |
| Over $500 million and including $1 billion | 1.20% |
| Over $1 billion and including $2 billion | 1.15% |
| Over $2 billion | 1.10% |
James Mid Cap Fund
| Average Total Net Assets | Contractual Fee |
| Up to and including $500 million | 1.25% |
| Over $500 million and including $1 billion | 1.20% |
| Over $1 billion and including $2 billion | 1.15% |
| Over $2 billion | 1.10% |
James Micro Cap Fund
| Average Total Net Assets | Contractual Fee |
| Up to and including $500 million | 1.50% |
| Over $500 million | 1.45% |
James Aggressive Allocation Fund
| Average Total Net Assets | Contractual Fee |
| Up to and including $500 million | 0.98% |
| Over $500 million and including $1 billion | 0.95% |
| Over $1 billion and including $2 billion | 0.90% |
| Over $2 billion | 0.85% |
James Long-Short Fund
| Average Total Net Assets | Contractual Fee |
| Up to and including $500 million | 1.25% |
| Over $500 million and including $1 billion | 1.20% |
| Over $1 billion and including $2 billion | 1.15% |
| Over $2 billion | 1.10% |
Advisory fees for the James Small Cap Fund, James Mid Cap Fund, James Micro Cap Fund, James Aggressive Allocation Fund and James Long-Short Fund are reduced by the fees and expenses of the non-interested trustees incurred by the applicable Fund. Under the investment management agreement, James is responsible for the payment of all operating expenses of the James Small Cap Fund, James Mid Cap Fund, James Micro Cap Fund, James Aggressive Allocation Fund and James Long-Short Fund, except for brokerage fees and commissions, taxes, interest (including dividend expense on securities sold short), fees and expenses of non-interested person trustees, 12b-1 expenses and extraordinary expenses.
| Annual Report | June 30, 2018 | 61 |
| Notes to Financial Statements | James Advantage Funds |
June 30, 2018
Administrative Services Agreement
ALPS Fund Services, Inc. (“ALPS” or the “Administrator”) serves as administrator to the Funds. ALPS receives a monthly fee paid by James Balanced: Golden Rainbow Fund, for itself, and paid by James for the remaining Funds, subject to a minimum monthly fee. Pursuant to an administrative agreement, ALPS will provide operational services to the Funds including, but not limited to fund accounting and fund administration and generally assist in each Fund’s operations. Administration fees paid by the Funds for the year ended June 30, 2018 are disclosed in the Statements of Operations.
Transfer Agency and Services Agreement
ALPS, pursuant to a Transfer Agency and Services Agreement with the Trust, serves as transfer agent for the Funds. Under the Transfer Agency and Services Agreement, ALPS receives an annual minimum fee, a fee based upon the number of shareholder accounts and is also reimbursed for out-of-pocket expenses. These fees and reimbursements for out-of-pocket expenses are paid by James Balanced: Golden Rainbow Fund, for itself, and by James for the remaining Funds. Transfer agent fees paid by the Funds for the year ended June 30, 2018 are disclosed in the Statements of Operations.
Plans of Distribution
The James Balanced: Golden Rainbow Fund (Retail Class), James Small Cap Fund, James Mid Cap Fund and James Long-Short Fund have adopted a plan pursuant to Rule 12b-1 under the 1940 Act (collectively, the “Plans”) under which each Fund may incur expenses related to distribution of its shares and for services provided to shareholders. These expenses are reflected as 12b-1 distribution and service fees on the Statements of Operations. Payments under a Plan are made to James, which uses them to pay distribution and shareholder service expenses on behalf of and as agent of the Fund. The amount payable by each Fund (the Retail Class of the James Balanced: Golden Rainbow Fund), with a Plan, under its Plan is 0.25% of its average daily net assets for the year. The Plans are compensation plans, which means that payments are made to James regardless of 12b-1 expenses actually incurred. Therefore, payments under a Plan may exceed distribution and shareholder service expenses incurred pursuant to the Plan, and James is permitted to retain the excess. It is also possible that 12b-1 expenses paid by James for a period will exceed the payments received by James, in which case James may pay such excess expenses out of its own resources. Payments received by James under the Plans are in addition to the fees paid to James pursuant to the Management Agreements. The Plans require that James act in the Funds’ best interests in expending the payments it receives from the Funds and use payments solely for the purpose of paying distribution and shareholder services expenses on behalf of the Funds. The Funds’ distributor, ALPS Distributors, Inc., validates all payment amounts to be made to brokers that have properly executed dealer agreements with the Funds before James will make such payments.
Trustee Fees
Each Trustee who is not an officer or employee of the Adviser, or any of their affiliates (“Independent Trustees”) receives (1) a quarterly retainer of $7,900, (2) a per meeting fee regularly scheduled meetings of $2,100, (3) an audit committee fee of $1,000 paid to the audit committee chair and $500 to the other Independent Trustees, (4) $210 for any special meeting held outside of a regularly scheduled board meeting, and (5) reimbursement for all reasonable out-of-pocket expenses relating to attendance at meetings. Such fees are presented on the Statements of Operations as Trustee Fees.
5. COMMITMENTS AND CONTINGENCIES
The Funds indemnify the Trust’s officers and trustees for certain liabilities that might arise from their performance of their duties to the Funds. Additionally, in the normal course of business, the Funds enter into contracts that contain a variety of representations and warranties and that provide general indemnifications. The Funds’ maximum exposure under these arrangements is unknown, as this would involve future claims that may be made against the Funds that have not yet occurred. However, based on experience, the Funds expect the risk of loss to be remote.
6. LINE OF CREDIT
Each Fund has a revolving line of credit agreement with U.S. Bank, N.A. (the “Bank”). Borrowings under these arrangements are secured by investments held in the Funds’ portfolios as notated on the Schedules of Investments and bear interest at the Bank’s prime rate. For the year ended June 30, 2018, the James Small Cap Fund, James Mid Cap Fund, and James Micro Cap Fund utilized their line of credit. The average amount of borrowings was $103,167 over 6 days with a weighted-average interest rate of 4.63% for the James Small Cap Fund. The average amount of borrowings was $4,000 over 1 day with a weighted-average interest rate of 4.50% for the James Mid Cap Fund. The average amount of borrowings was $240,714 over 7 days with a weighted-average interest rate of 4.32% for the James Micro Cap Fund. During the year ended June 30, 2018, the James Balanced: Golden Rainbow Fund, James Aggressive Allocation Fund, and James Long-Short Fund did not utilize line of credit. Interest on funded and unfunded loans was $80 for the James Small Cap Fund, $1 for the James Mid Cap Fund, and $201 for the James Micro Cap Fund for the year ended June 30, 2018. Each Fund’s line of credit agreement expired on July 10, 2018 and was renewed for one year. The terms of the agreements can be characterized as follows:
| Fund | Maximum Balance Available | Interest Rate | Expiration Date | |||||
| James Balanced: Golden Rainbow Fund | $ | 50,000,000 | Prime Rate* | July 9, 2019 | ||||
| James Small Cap Fund | $ | 3,500,000 | Prime Rate* | July 9, 2019 | ||||
| James Mid Cap Fund | $ | 750,000 | Prime Rate* | July 9, 2019 | ||||
| James Micro Cap Fund | $ | 1,500,000 | Prime Rate* | July 9, 2019 | ||||
| James Aggressive Allocation Fund | $ | 500,000 | Prime Rate* | July 9, 2019 | ||||
| James Long-Short Fund | $ | 3,000,000 | Prime Rate* | July 9, 2019 | ||||
| * | The rate at which the Bank announces as its prime lending rate. |
| 62 | www.jamesfunds.com |
James Advantage Funds Report of Independent Registered Public Accounting Firm
To the shareholders and the Board of Trustees of James Advantage Funds
Opinion on the Financial Statements and Financial Highlights
We have audited the accompanying statements of assets and liabilities of James Advantage Funds comprising the James Balanced: Golden Rainbow Fund, James Small Cap Fund, James Mid Cap Fund, James Micro Cap Fund, James Aggressive Allocation Fund, and James Long-Short Fund (the "Funds"), including the schedules of investments, as of June 30, 2018; the related statements of operations for the year then ended, the statements of changes in net assets for each of the two years in the period then ended, and the financial highlights for each of the five years in the period then ended for the Funds, except James Aggressive Allocation Fund; the related statement of operations for the year then ended, changes in net assets for each of the two years in the period then ended, and financial highlights for each of the three years in the period then ended, for James Aggressive Allocation Fund; and the related notes.
In our opinion, the financial statements and financial highlights present fairly, in all material respects, the financial position of the Funds, except James Aggressive Allocation Fund as of June 30, 2018, and the results of their operations for the year then ended, the changes in their net assets for each of the two years in the period then ended, and the financial highlights for each of the five years in the period then ended in conformity with accounting principles generally accepted in the United States of America. Also, in our opinion, the financial statements and financial highlights present fairly, in all material respects, the financial position of James Aggressive Allocation Fund as of June 30, 2018; the results of operations for the year then ended, the changes in net assets for each of the two years in the period then ended, and financial highlights for each of the three years in the period then ended, in conformity with accounting principles generally accepted in the United States of America.
Basis for Opinion
These financial statements and financial highlights are the responsibility of the Funds’ management. Our responsibility is to express an opinion on the Funds’ financial statements and financial highlights based on our audits. We are a public accounting firm registered with the Public Company Accounting Oversight Board (United States) (PCAOB) and are required to be independent with respect to the Funds in accordance with the U.S. federal securities laws and the applicable rules and regulations of the Securities and Exchange Commission and the PCAOB. We conducted our audits in accordance with the standards of the PCAOB. Those standards require that we plan and perform the audit to obtain reasonable assurance about whether the financial statements and financial highlights are free of material misstatement, whether due to error or fraud. The Funds are not required to have, nor were we engaged to perform, an audit of their internal control over financial reporting. As part of our audits we are required to obtain an understanding of internal control over financial reporting but not for the purpose of expressing an opinion on the effectiveness of the Funds’ internal control over financial reporting. Accordingly, we express no such opinion.
Our audits included performing procedures to assess the risks of material misstatement of the financial statements and financial highlights, whether due to error or fraud, and performing procedures that respond to those risks. Such procedures included examining, on a test basis, evidence regarding the amounts and disclosures in the financial statements and financial highlights. Our audits also included evaluating the accounting principles used and significant estimates made by management, as well as evaluating the overall presentation of the financial statements and financial highlights. Our procedures included confirmation of securities owned as of June 30, 2018, by correspondence with the custodian and brokers; when replies were not received from brokers, we performed other auditing procedures. We believe that our audits provide a reasonable basis for our opinion.
DELOITTE & TOUCHE LLP
Denver, Colorado
August 24, 2018
We have served as the auditor of one or more James Advantage Funds investment companies since 1998.
| Annual Report | June 30, 2018 | 63 |
| Additional Information | James Advantage Funds |
June 30, 2018 (Unaudited)
PROXY VOTING GUIDELINES
James is responsible for exercising the voting rights associated with the securities purchased and held by the Funds. A description of the policies and procedures that James uses in fulfilling this responsibility and information regarding how those proxies were voted during the most recent 12-month period ended June 30 are available without charge upon request by calling toll free 1-800-995-2637. These items are also available on the Securities and Exchange Commission’s (the “Commission”) website at http://www.sec.gov.
QUARTERLY PORTFOLIO DISCLOSURE
James files a complete listing of portfolio holdings for each Fund as of the end of the first and third quarters of each fiscal year on Form N-Q. The complete listing (i) is available on the Commission’s website; (ii) may be reviewed and copied at the Commission’s Public Reference Room in Washington, DC; and (iii) will be made available to shareholders upon request by calling 1-800-995-2637. Information on the operation of the Public Reference Room may be obtained by calling 1-800-SEC-0330.
TAX DESIGNATIONS
Qualified Dividend Income
The percentage of ordinary income dividends distributed during the calendar year ended December 31, 2017 are designated as qualified dividend income (QDI) as defined in Section 1(h)(11) of the Internal Revenue Code in the following percentages:
| Amount | |
| James Balanced: Golden Rainbow Fund | 70.82% |
| James Small Cap Fund | 18.53% |
| James Mid Cap Fund | 20.20% |
| James Micro Cap Fund | 100.00% |
| James Aggressive Allocation Fund | 100.00% |
| James Long-Short Fund | 100.00% |
Dividends Received Deduction
For corporate shareholders, the following ordinary dividends paid during the calendar year ended December 31, 2017 qualify for the corporate dividends received deduction:
| Amount | |
| James Balanced: Golden Rainbow Fund | 68.53% |
| James Small Cap Fund | 20.63% |
| James Mid Cap Fund | 21.99% |
| James Micro Cap Fund | 100.00% |
| James Aggressive Allocation Fund | 100.00% |
| James Long-Short Fund | 100.00% |
Pursuant to Section 852(b)(3) of the Internal Revenue Code, James Balanced: Golden Rainbow Fund designated $190,064,622, James Advantage Small Cap Fund designated $ 11,632,222, James Mid Cap Fund designated $ 3,055,887, and James Micro Cap Fund designated $2,102,728 as long-term capital gains dividend.
| 64 | www.jamesfunds.com |
| James Advantage Funds | Disclosure Regarding Approval of Fund Advisory Agreements |
June 30, 2018 (Unaudited)
The Board of Trustees (the “Board”), including a majority of the Trustees who are not “interested persons” of the Trust (the “Independent Trustees”), approved the Management Agreement with James Investment Research (the “Adviser”) for the James Balanced: Golden Rainbow Fund, the James Small Cap Fund, the James Long-Short Fund, James Aggressive Allocation Fund, the James Mid Cap Fund and the James Micro Cap Fund (the “Funds”) at a meeting on February 19, 2018.
In renewing and approving the Management Agreements, the Board, including the Independent Trustees, considered the following factors:
Nature, Extent and Quality of Services
The Board received and considered information regarding the nature, extent and quality of services to be provided to the Funds under the Management Agreements. The Board reviewed certain background materials supplied by the Adviser, including its organizational structure and Form ADV.
The Board reviewed and considered information regarding the Adviser’s investment advisory personnel, its history as an asset manager and its performance, and the amount of assets currently under management by Adviser and its affiliated investment adviser. The Board also took into account the research and decision-making processes used by the Adviser, including the methods adopted to seek to achieve compliance with the investment objectives, policies and restrictions of each Fund. The Board noted that the Adviser continues to primarily rely on in-house research when making its investment decisions for each Fund.
The Board considered the background and experience of the Adviser’s management in connection with the Funds, including reviewing the qualifications, backgrounds and responsibilities of the management team primarily responsible for the day-to-day portfolio management of the Funds.
The Board also reviewed, among other things, the Adviser’s compliance policies generally, including its insider trading policies and procedures and its Code of Ethics.
The Board discussed each Fund’s strategy for investing in other investment companies, such as closed-end mutual funds and exchange-traded funds, to gain exposure to particular investment products, indexes, or foreign market sectors or indices.
Based on the information provided, the Board determined that the nature, extent and quality of services rendered by the Adviser to each Fund under the applicable Management Agreement was adequate and appropriate in light of the needs of such Fund. Based on the information provided, the Board also determined that the fees to be paid to the Adviser are based on services provided that are in addition to, rather than duplicative of, the services provided under the advisory agreements of other investment companies owned by the Funds.
Cost of Services Provided
The Board also reviewed the current management fees and net annual operating expense ratios of each Fund, comparing them with the management fees of a peer group of funds with the same, or very similar, investment objectives and strategies. According to the Adviser, each peer group had been selected based on the investment style and strategies employed by the Funds, as well as by asset size, and was in large part, consistent with the peer group that had been used in prior periods and in other similar reports provided to the Trustees from time to time.
The Board noted that all of the Funds, except The James Balanced: Golden Rainbow Fund, have a universal fee structure. Under the universal fee structure, the Adviser generally pays the expenses of the Fund. The Board noted that for the universal fee Funds, it would not be unreasonable for the Adviser to be compensated with a higher management fee relative to the peer group members that do not employ this universal fee structure, and that comparing the universal fee against the net annual operating expense ratios of comparable funds was of analytical value. The Board also reviewed calculations prepared by the Adviser to derive a “net adjusted management fee” for each of the universal fee Funds equal to the universal fee after deduction of all direct non-distribution expenses of the Fund paid by the Adviser. The Board reviewed the comparison of the net adjusted management fee for each Fund relative to the average management fee for its peer group. The Board also reviewed the net annual operating expense ratio for each Fund relative to its peer group.
The Board further noted that some of the funds in the peer groups were one class of a fund that had many classes or were one fund of a much larger fund complex and, thus, could benefit from economies of scale provided by the other classes of such fund or complex. The Board also noted the additional difficulty of comparing the net expense ratios of long-short funds because of their widely differing expense levels for interest expenses, securities sold short, and other similar line items unique to that class of funds.
Based on the information provided, the Board determined that the actual management fee for the James Balanced: Golden Rainbow Fund: Retail Class and the James Balanced: Golden Rainbow Fund: Institutional Class was slightly above the peer group average; and the net adjusted management fee for the James Small Cap Fund and James Micro Cap Fund was above the peer group average, while the same fee for the James Mid Cap Fund, James Long-Short Fund was below the peer group average, and for the James Aggressive Allocation Fund was significantly below the peer group average.
| Annual Report | June 30, 2018 | 65 |
| Disclosure Regarding Approval of Fund Advisory Agreements | James Advantage Funds |
June 30, 2018 (Unaudited)
Based on the information provided, the Board also determined that the net expense ratios for the James Balanced: Golden Rainbow Fund: Institutional Class, James Long-Short Fund, and the James Aggressive Allocation Fund were slightly lower than its respective peer group median expense ratios. In contrast, the Board determined that the net expense ratios for the James Balanced: Golden Rainbow Fund: Retail Class, James Small Cap Fund, James Mid Cap Fund, and James Micro Cap Fund were generally higher than their respective peer group median expense ratios. The Board concluded that these differences were reasonable in light of the long-term performance of each Fund, the services provided by the Adviser, and the net adjusted management fees paid by each Fund.
Performance
The Board reviewed the performance data for each Fund provided by the Adviser, including (to the extent available), one-year, three-year, five-year and ten-year (or since inception, as applicable) average annual total returns as of December 31, 2017. The Board also reviewed comparisons of each Fund’s performance against peer group performance, Morningstar group performance, and respective benchmarks.
With respect to The James Balanced: Golden Rainbow Fund, they noted that the Fund’s Retail Class had outperformed its peer group average and Morningstar group average for the five- and ten-year periods, but underperformed during the one-year and three-year period, and that the Institutional Class had similarly outperformed those groups during the five-year, and underperformed during the one-year and three-year period. With respect to the James Small Cap Fund, the Board noted that the Fund had underperformed its peer group average and Morningstar group average for the one-, three-, five-year, and ten-year periods. The Board then noted that the James Mid Cap Fund had underperformed its peer group average and Morningstar group average for the three-, five-year, and ten-year periods, but had outperformed its peer group average and Morningstar group average during the one-year period. For the James Micro Cap Fund, the Board noted that the Fund had outperformed its peer group average and Morningstar group average during the five-year period, outperformed its peer group average and underperformed its Morningstar group average during the three-year period, and underperformed its peer group and the Morningstar group average during the one-year period. For the James Long-Short Fund, the Board noted that the Fund had outperformed its peer group average and Morningstar group average during the one-year and five-year period, but underperformed during the three-year period. For the James Aggressive Allocation Fund, the Board noted that the Fund had a short performance record, and outperformed its peer group average during the one-year period, but underperformed its Morningstar group average during the same period.
Based on the information provided, the Board determined that, with the exception of the James Small Cap Fund, the performance of each Fund was favorable over some or many of the periods considered for each Fund.
Comparable Accounts
The Board reviewed comparisons of the fees charged by the Adviser to each Fund against fees charged to certain private account and other registered investment company clients of the Adviser using similar strategies, if any.
Based on the information provided, the Board determined that, bearing in mind the limitations of comparing different types of clients and the different levels of service typically associated with such client accounts, the fee structures applicable to the Adviser’s other clients were not indicative of any unreasonableness with respect to the advisory fees payable by each Fund.
Adviser Profitability
The Board reviewed a profitability analysis provided by the Adviser with respect to each Fund for the twelve months ended September 30, 2017, reflecting revenues net of certain fees and expenses under each Management Agreement, and incorporating the Adviser’s assumptions and estimates of, among other items, direct expenses applied to each Fund. The Board also considered certain industry-related materials regarding the analysis of fund profitability and took note of other long term industry and cyclical trends regarding profitability generally. The Board noted that profitability analysis had changed for prior years due to certain changes in the tax treatment of the Adviser.
The Board discussed the assumptions and estimates included in the fund profitability analysis, and received additional information from the Adviser about these assumptions and estimates.
Based on the information provided, the Board determined that the overall profitability of each Fund to the Adviser, before taking into account distribution expenses incurred by the Adviser, was not unreasonable.
| 66 | www.jamesfunds.com |
| James Advantage Funds | Disclosure Regarding Approval of Fund Advisory Agreements |
June 30, 2018 (Unaudited)
Economies of Scale
The Board considered whether economies of scale in the provision of services to the Funds would be shared with, and passed along to, the Fund shareholders under the Management Agreements. The Board noted that each Management Agreement included breakpoints in the management fee for each Fund, and that several of the breakpoints for the James Balanced: Golden Rainbow Fund were currently in effect.
Based on the information provided, the Board determined there were mechanisms in place for each Fund to cause the benefits of economies of scale to be shared with, and passed along to, the Fund shareholders.
Other Benefits to the Adviser
The Board reviewed and considered material other incidental benefits derived or to be derived by the Adviser from its relationship with the Funds. The Board noted that the Adviser does not have any soft dollar arrangements. The Board also noted that the Adviser benefits from its association with the Funds, and that the Adviser benefits from favorable press, name recognition, and other intangible effects generated by the Funds.
Based on the information provided, the Board determined there were no material other benefits accruing to the Adviser in connection with its relationship with the Funds.
The Board indicated that the information presented and the discussion of the information were adequate for making a determination regarding the renewal of the Management Agreements. During the review process, the Board noted certain instances where clarification or follow-up was appropriate and others where the Board determined that further clarification or follow-up was not necessary. In those instances where clarification or follow-up was requested, the Board determined that in each case either information responsive to its requests had been provided, or where any request was outstanding in whole or in part, given the totality of the information provided with respect to the Management Agreements, the Board had received sufficient information to renew and approve the applicable Agreement.
After further discussion, and based upon all of the above-mentioned factors and their related conclusions, with no single factor or conclusion being determinative and with each Trustee not necessarily attributing the same weight to each factor, the Board unanimously determined that the continuation of each Management Agreement for an additional year was in the best interests of the applicable Fund and its shareholders.
| Annual Report | June 30, 2018 | 67 |
| Trustees & Officers | James Advantage Funds |
June 30, 2018 (Unaudited)
The Board of Trustees has overall responsibility for management of the Trust under the laws of Ohio governing the responsibilities of trustees of business trusts. Following are the Trustees and executive officers of the Trust, their present occupation with the Trust or Funds, age and principal occupation during the past 5 years for the fiscal year ended June 30, 2018.
Additional information regarding the Fund’s Trustees is included in the Statement of Additional Information, which can be obtained without charge by calling 1-800-995-2637.
INTERESTED TRUSTEES
| Name/Address*/Age | Position(s) With Fund/Time Served/ During Past 5 years1 | Principal Occupation by Trustee | Number of Portfolios in Fund Complex Overseen | Other Directorships Held by Trustee Outside During the Past Five Years |
| Barry R. James2, CFA James Investment Research, Inc. 1349 Fairground Road Xenia, OH 45385 Year of Birth: 1956 | President & Trustee since 1997 | President and CEO, James Investment Research (2005 - present); CEO and Director, James Capital Alliance (1992 - present) | 6 | Director, Heart to Honduras (2006 - present); Director, FAIR Foundation (2010 - present) |
| INDEPENDENT TRUSTEES | ||||
| Name/Address*/Age | Position(s) With Funds/Time Served/ During Past 5 years1 | Principal Occupation(s) by Trustee | Number of Portfolios in Fund Complex Overseen | Other Directorships Held by Trustee Outside During the Past Five Years |
| Anthony P. D’Angelo Year of Birth: 1930 | Trustee since 1997 | Retired, Professor Emeritus, Graduate School of Logistics and Acquisitions Management, Air Force Institute of Technology, Wright-Patterson AFB, Ohio (Retired since 1999) | 6 | None |
| Leslie L. Brandon Year of Birth: 1942 | Trustee since 2003 | Retired Partner, Ernst & Young LLP, Columbus, Ohio (1966 - 2000) | 6 | None |
| Ronald D. Brown Year of Birth: 1953 | Trustee Since 2014 | Interim Chief Executive Officer, LSI Industries Inc. (2018-Present); Vice Chairman, The Armor Group (2017-2018); Chief Operating Officer, The Armor Group (2013-2017); Chief Financial Officer, Makino Inc. (2010 - 2013); Managing Director, Taft Business Consulting LLC. (2009 - 2013) | 6 | Director, of AO Smith Corporation (2001 - present); Board Trustee of University of Cincinnati (2013 - present); Director, Zep, Inc. (2010 - 2015) Director of Makino Inc. (2010 - 2013)
|
| Robert F. Chelle Year of Birth: 1948 | Trustee since 2014 | Retired Founding Director of the L. William Crotty Center for Entrepreneurial Leadership at the University of Dayton (1999 - 2015); President/CEO, High Voltage Maintenance Corp, Dayton, OH (1974-1999) | 6 | Director of DRT Mfg. Co.(2007 - present), School Outfitters (2010 - present), Harlamert-HRG Food Brokerage, Prime Controls (2008 - present), The Siebenthaler Company (1986 - present). |
| Richard C. Russell Year of Birth: 1946 | Trustee since 2003 | Consultant, Danis Companies (construction and real estate development firm), (2002 - present); Retired CEO & CFO, Danis Companies (1983-2002) | 6 | Director, Excellence in Motivation (1996 - present); Director, DRT Manufacturing, Co. (1999 - present); Director, Catholic Community Foundation for the Archdiocese of Cincinnati, Inc. (2015 - present); Director, Catholic Education Foundation for the Archdiocese of Cincinnati, Inc. (2015 - present); |
| * | All Trustees may be contacted at c/o The James Advantage Funds, Attn: Secretary, 1349 Fairground Road, Xenia, OH 45385 |
| 1 | Each Trustee is elected to serve in accordance with the Declaration of Trust and Bylaws of the Trust until his or her successor is duly elected and qualified. |
| 2 | Mr. James is an “interested person” of the Trust as defined in the 1940 Act because of his relationship to James Investment Research, Inc., which serves as the investment adviser to the Trust. |
| 68 | www.jamesfunds.com |
| James Advantage Funds | Trustees & Officers |
June 30, 2018 (Unaudited)
| OFFICERS | ||
| Name/Address/Age | Positions Held With Fund/Date Service Began | Principal Occupation by Officer |
| Thomas L. Mangan James Investment Research, Inc. 1349 Fairground Road Xenia, OH 45385 Year of Birth: 1949 | Vice President, Secretary and Chief Financial Officer since 1997 | Senior Vice President, James Investment Research, Inc., Chief Compliance Officer, James Investment Research, Inc. (1997-2011) |
| Lesley Ott James Investment Research, Inc. 1349 Fairground Road Xenia, OH 45385 Year of Birth: 1983 | Chief Compliance Officer since 2012 | Chief Compliance Officer, James Investment Research, Inc. and James Capital Alliance, Inc. (since 2012), Deputy Operating Officer, James Investment Research, Inc. (since 2017), Deputy Chief Compliance Officer, James Investment Research, Inc. and James Capital Alliance, Inc. (2010-2011) |
| Richard Brian Culpepper James Investment Research, Inc. 1349 Fairground Road Xenia, OH 45385 Year of Birth: 1972 | Assistant Secretary since 2011 | Senior Vice President, James Investment Research, Inc. (since 2018), Vice President, James Investment Research, Inc. (2014-2018), First Vice President of James Investment Research, Inc. (2009-2014) |
| Andrea E. Kuchli, c/o ALPS Fund Services, Inc. 1290 Broadway, Ste. 1100 Denver, CO 80203 Year of Birth: 1985 | Assistant Secretary since 2015 | Vice President and Senior Counsel of ALPS Fund Services, Inc. (2015 - present); Secretary of the Principal Real Estate Income Fund (2015 - present), Secretary of the Elevation ETF Trust (2015-present), ALPS Variable Investment Trust (2016-present) and ALPS ETF Trust (2015-present), Associate Attorney, Davis Graham & Stubbs LLP (2014 - 2015); Associate Attorney, Dechert LLP (2011 - 2014) |
| Amy Broerman James Investment Research, Inc. 1349 Fairground Road Xenia, OH 45385 Year of Birth: 1972 | Deputy Chief Financial Officer since 2018 Treasurer since 2012 | Assistant Vice President of Operations, James Investment Research, Inc. (since 2008), Assistant Treasurer of James Advantage Funds (2002-2012) |
| Jennell Panella c/o ALPS Fund Services, Inc. 1290 Broadway, Ste. 1100 Denver, CO 80203 Year of Birth: 1974 | Assistant Treasurer since 2013 | Fund Controller of ALPS Fund Services, Inc. (since June 2012), Financial Reporting Manager, Parker Global Strategies, LLC (2009-2012) |
| Brian P. Shepardson James Investment Research, Inc. 1349 Fairground Road Xenia, OH 45385 Year of Birth: 1973 | Assistant Secretary since 2018 Assistant Treasurer since 2015 | First Vice President, James Investment Research, Inc. (since 2014), Assistant Vice President of James Investment Research, Inc. (2009-2014). |
| Annual Report | June 30, 2018 | 69 |
| Privacy Policy | James Advantage Funds |
June 30, 2018 (Unaudited)
Facts
What does James Advantage Funds do with your personal information?
Why?
Financial companies choose how they share your personal information. Federal law gives consumers the right to limit some, but not all sharing. Federal law also requires us to tell you how we collect, share, and protect your personal information. Please read this notice carefully to understand what we do.
What?
The types of personal information we collect and share depends on the product or service that you have with us. This information can include:
| ● | Social Security number and wire transfer instructions |
| ● | account transactions and transaction history |
| ● | investment experience and purchase history |
When you are no longer our customer, we continue to share your information as described in this notice.
How?
All financial companies need to share customers’ personal information to run their everyday business. In the section below, we list the reasons financial companies can share their customers’ personal information; the reasons James Advantage Funds chooses to share; and whether you can limit this sharing.
| Reasons we can share your personal information: | Does James Advantage Funds share information? | Can you limit this sharing? |
| For our everyday business purposes - such as to process your transactions, maintain your account(s), respond to court orders and legal investigations, or report to credit bureaus. | YES | NO |
| For our marketing purposes - to offer our products and services to you. | YES | NO |
| For joint marketing with other financial companies. | NO | We don’t share |
| For our affiliates’ everyday business purposes - information about your transactions and records. | NO | We don’t share |
| For our affiliates’ everyday business purposes - information about your credit worthiness. | NO | We don’t share |
| For our affiliates to market to you | NO | We don’t share |
| For non-affiliates to market to you | NO | We don’t share |
Questions? Call 1-800-99 James
| What we do: | |
How does James Advantage Funds protect my personal information? | To protect your personal information from unauthorized access and use, we use security measures that comply with federal law. These measures include computer safeguards and secured files and buildings.
Our service providers are held accountable for adhering to strict policies and procedures to prevent any misuse of your nonpublic personal information. |
How does James Advantage Funds collect my personal information? | We collect your personal information, for example, when you ● open an account or deposit money ● direct us to buy securities or direct us to sell your securities ● seek advice about your investments We also collect your personal information from others, such as credit bureaus, affiliates, or other companies. |
| Why can’t I limit all sharing? | Federal law gives you the right to limit only: ● sharing for affiliates’ everyday business purposes - information about your creditworthiness. ● affiliates from using your information to market to you. ● sharing for nonaffiliates to market to you. State laws and individual companies may give you additional rights to limit sharing. |
| Definitions | |
| Affiliates | Companies related by common ownership or control. They can be financial and non-financial companies. ● Our affiliates include financial companies, such as James Investment Research, Inc. and James Capital Alliance. |
| Non-affiliates | Companies not related by common ownership or control. They can be financial and non-financial companies. ● James Advantage Funds does not share with nonaffiliates so they can market to you. |
| Joint marketing | A formal agreement between nonaffiliated financial companies that together market financial products or services to you. ● James Advantage Funds does not jointly market. |
| 70 | www.jamesfunds.com |
Intentionally Left Blank

Item 2. Code of Ethics.
| (a) | As of the end of the period covered by this report, the registrant has adopted a code of ethics that applies to the registrant’s principal executive officer, principal financial officer, principal accounting officer or controller, or persons performing similar functions, regardless of whether these individuals are employed by the registrant or a third party. |
| (b) | For purposes of this item, “code of ethics” means written standards that are reasonably designed to deter wrongdoing and to promote: |
| (1) | Honest and ethical conduct, including the ethical handling of actual or apparent conflicts of interest between personal and professional relationships; |
| (2) | Full, fair, accurate, timely, and understandable disclosure in reports and documents that a registrant files with, or submits to, the Commission and in other public communications made by the registrant; |
| (3) | Compliance with applicable governmental laws, rules, and regulations; |
| (4) | The prompt internal reporting of violations of the code to an appropriate person or persons identified in the code; and |
| (5) | Accountability for adherence to the code. |
| (c) | Amendments: During the period covered by this report, there were no amendments to the provisions of the code of ethics. |
| (d) | Waivers: During the period covered by this report, the registrant has not granted any express or implicit waivers from the provisions of the code of ethics. |
| (e) | Not applicable to this report. |
| (f) | The Registrant’s Code of Ethics for Senior Financial Officers, which is the subject of the disclosure required by Item 2(a) of Form N-CSR, was filed as Exhibit 12(a)(1) to the Registrant’s Certified Shareholder Report on Form N-CSR, File No. 811-08411, on September 7, 2016. |
Item 3. Audit Committee Financial Expert.
| (a) | The registrant’s board of trustees has determined that Leslie L. Brandon is an audit committee financial expert. Mr. Brandon is independent for purposes of this Item 3. |
| (b) | For purposes of this Item, an “audit committee financial expert” means a person who has the following attributes: |
| (1) | An understanding of generally accepted accounting principles and financial statements; |
| (2) | The ability to assess the general application of such principles in connection with the accounting for estimates, accruals, and reserves; |
| (3) | Experience preparing, auditing, analyzing, or evaluating financial statements that present a breadth and level of complexity of accounting issues that are generally comparable to the breadth and complexity of issues that can reasonably be expected to be raised by the registrant’s financial statements, or experience actively supervising one or more persons engaged in such activities; |
| (4) | An understanding of internal control over financial reporting; and |
| (5) | An understanding of audit committee functions. |
| (c) | A person shall have acquired such attributes through: |
| (1) | Education and experience as a principal financial officer, principal accounting officer, controller, public accountant, or auditor or experience in one or more positions that involve the performance of similar functions; |
| (2) | Experience actively supervising a principal financial officer, principal accounting officer, controller, public accountant, auditor, or person performing similar functions; |
| (3) | Experience overseeing or assessing the performance of companies or public accountants with respect to the preparation, auditing, or evaluation of financial statements; or |
| (4) | Other relevant experience. |
(d)
| (1) | A person who is determined to be an audit committee financial expert will not be deemed an “expert” for any purpose, including without limitation for purposes of Section 11 of the Securities Act of 1933 (15 U.S.C. 77k), as a result of being designated or identified as an audit committee financial expert pursuant to this Item. |
| (2) | The designation or identification of a person as an audit committee financial expert pursuant to this Item does not impose on such person any duties, obligations, or liability that are greater than the duties, obligations, and liability imposed on such person as a member of the audit committee and board of directors in the absence of such designation or identification. |
| (3) | The designation or identification of a person as an audit committee financial expert pursuant to this Item does not affect the duties, obligations, or liability of any other member of the audit committee or board of directors. |
Item 4. Principal Accountant Fees and Services.
| (a) | Audit Fees. |
| June 30, 2018 | June 30, 2017 |
| $110,000 | $110,000 |
Such audit fees represent the aggregate fees billed for the fiscal years ended June 30, 2018 and June 30, 2017 for professional services rendered by Deloitte & Touche LLP for the audit of the registrant’s annual financial statements.
| (b) | Audit-Related Fees. |
| Registrant | Adviser | |
| June 30, 2018 | $0 | $0 |
| June 30, 2017 | $0 | $0 |
Neither the registrant nor the adviser was billed any fees by Deloitte & Touche LLP for the fiscal years ended June 30, 2018 and June 30, 2017 for assurance and related services that were reasonably related to the performance of the audit of the registrant’s financial statement and not otherwise included under “Audit Fees” above.
| (c) | Tax Fees. |
| Registrant | Adviser | |
| June 30, 2018 | $15,760 | $0 |
| June 30, 2017 | $15,760 | $0 |
“Tax fees” shown in the table above were for services provided by Deloitte & Touche LLP in relation to the preparation of excise filings and income tax returns for the registrant.
| (d) | All Other Fees. |
| Registrant | Adviser | |
| June 30, 2018 | $0 | $0 |
| June 30, 2017 | $7,500 | $0 |
The registrant was not billed any fees by Deloitte & Touche LLP for products and services provided by Deloitte & Touche LLP, other than the services reported above in items (a) - (c), for the fiscal years ended June 30, 2018 and June 30, 2017.
| (e) | Pre-Approval Policies and Procedures. |
| (1) | Pursuant to the registrant’s Audit Committee Charter (the “Charter”), the Audit Committee is directly responsible for the appointment, termination, compensation, and oversight of the work of any registered public accounting firm employed by the registrant. In addition, the Charter provides that the Audit Committee is responsible for reviewing and approving in advance any and all proposals under which the independent auditor would provide “permissible non-audit services” (as defined in the Charter) to the registrant or to the investment adviser to the registrant (not including any sub-adviser whose role is primarily portfolio management and that is sub-contracted or overseen by the investment adviser to the registrant) or any entity controlling, controlled by, or under common control with the investment adviser that provides ongoing services to the registrant if those permissible non-audit services relate directly to the operations and financial reporting of the registrant. In determining whether to pre-approve non-audit services, the Audit Committee considers whether such services are consistent with the independent auditor’s independence. |
(2)
| Registrant | Adviser | |
| Audit Related | n/a | n/a |
| Tax Fees | 100% | n/a |
| Other Fees | 100% | n/a |
| (f) | Not applicable to the registrant. |
| (g) | Aggregate non-audit fees billed by the registrant’s accountant: |
| Registrant | Adviser | |
| June 30, 2018 | $10,748 | $0 |
| June 30, 2017 | $12,071 | $0 |
| (h) | The registrant’s audit committee of the board of trustees has considered that the provision of non-audit services that were rendered to an entity controlling, controlled by, or under common control with the registrant’s investment adviser that provides ongoing services to the registrant for the fiscal years ended June 30, 2018 and June 30, 2017, as identified above, that were not pre-approved pursuant to paragraph (c)(7)(ii) of Rule 2-01 of Regulation S-X, are compatible with maintaining Deloitte & Touche LLP’s independence. |
Item 5. Audit Committee of Listed Registrants.
Not applicable to the registrant.
Item 6. Investments.
| (a) | The Schedule of Investments is included as part of the report to shareholders filed under Item 1 of this Form. |
| (b) | Not applicable to the registrant. |
Item 7. Disclosure of Proxy Voting Policies and Procedures for Closed-End Management Investment Companies.
Not applicable to the registrant.
Item 8. Portfolio Managers of Closed-End Management Investment Companies.
Not applicable to the registrant.
Item 9. Purchases of Equity Securities by Closed-End Management Investment Company and Affiliates Purchasers.
Not applicable to the registrant.
Item 10. Submission of Matters to a Vote of Security Holders.
The registrant has not adopted procedures by which shareholders may recommend nominees to the registrant’s board of trustees.
Item 11. Controls and Procedures.
| (a) | Based on an evaluation of the registrant’s disclosure controls and procedures (as defined in Rule 30a-3(c) under the Investment Company Act of 1940, as amended), the registrant’s principal executive officer and principal financial officer have concluded that the registrant’s disclosure controls and procedures are effective as of a date within 90 days of the filing date of this report. |
| (b) | There were no changes in the registrant’s internal control over financial reporting (as defined in Rule 30a-3(d) under the Investment Company Act of 1940, as amended) that occurred during the period covered by this Report that have materially affected, or are reasonably likely to materially affect, the registrant’s internal control over financial reporting. |
Item 12. Disclosure of Securities Lending Activities for Closed-End Management Investment Companies.
Not applicable.
Item 13. Exhibits.
| (a)(1) | Registrant’s Code of Ethics for Principal Executive and Senior Financial Officers, which is the subject of the disclosure required by Item 2 of Form N-CSR, was filed as Exhibit 12(a)(1) to the Registrant’s Certified Shareholder Report on Form N-CSR, File No. 811-08411, on September 7, 2016. |
| (a)(2) | Certifications required by Item 13(a)(2) of Form N-CSR are filed herewith as Exhibit 99.CERT. |
| (a)(3) | Not applicable. |
| (a)(4) | Not applicable. |
| (b) | Certifications required by Item 13(b) of Form N-CSR are filed herewith as Exhibit 99.906CERT. |
SIGNATURES
Pursuant to the requirements of the Securities Exchange Act of 1934 and the Investment Company Act of 1940, the Registrant has duly caused this Report to be signed on its behalf by the undersigned, thereunto duly authorized.
(Registrant) The James Advantage Funds
By (Signature and Title)
| /s/ Barry R. James |
Barry R. James
President
Date: September 6, 2018
Pursuant to the requirements of the Securities Exchange Act of 1934 and the Investment Company Act of 1940, this report has been signed below by the following persons on behalf of the registrant and in the capacities and on the dates indicated.
By (Signature and Title)
| /s/ Barry R. James |
Barry R. James
President
Date: September 6, 2018
By (Signature and Title)
| /s/ Thomas L. Mangan |
Thomas L. Mangan
Chief Financial Officer
Date: September 6, 2018