Table of Contents
UNITED STATES
SECURITIES AND EXCHANGE COMMISSION
Washington, D.C. 20549
FORM N-CSR
CERTIFIED SHAREHOLDER REPORT OF REGISTERED
MANAGEMENT INVESTMENT COMPANIES
Investment Company Act file number: 811-08437
Undiscovered Managers Funds
(Exact name of registrant as specified in charter)
277 Park Avenue
New York, NY 10172
(Address of principal executive offices) (Zip code)
Gregory S. Samuels
277 Park Avenue
New York, NY 10172
(Name and Address of Agent for Service)
Registrant’s telephone number, including area code: (800) 480-4111
Date of fiscal year end: June 30
Date of reporting period: July 1, 2020 through December 31, 2020
Form N-CSR is to be used by management investment companies to file reports with the Commission not later than 10 days after the transmission to stockholders of any report that is required to be transmitted to stockholders under Rule 30e-1 under the Investment Company Act of 1940 (17 CFR 270.30e-1). The Commission may use the information provided on Form N-CSR in its regulatory, disclosure review, inspection, and policymaking roles.
A registrant is required to disclose the information specified by Form N-CSR, and the Commission will make this information public. A registrant is not required to respond to the collection of information contained in Form N-CSR unless the Form displays a currently valid Office of Management and Budget (“OMB”) control number. Please direct comments concerning the accuracy of the information collection burden estimate and any suggestions for reducing the burden to Secretary, Securities and Exchange Commission, 450 Fifth Street, NW, Washington, DC 20549-0609. The OMB has reviewed this collection of information under the clearance requirements of 44 U.S.C. Section 3507.
Table of Contents
ITEM 1. REPORTS TO STOCKHOLDERS.
a.) The following is a copy of the report transmitted to shareholders pursuant to Rule 30e-1 under the Investment Company Act of 1940 (17 CFR 270.30e-1).
b.) A copy of the notice transmitted to shareholders in reliance on Rule 30e-3 under the 1940 Act that contains disclosures specified by paragraph (c)(3) of that rule is included in the Annual Report. Not Applicable. Notices do not incorporate disclosures from the shareholder report.
Table of Contents
Semi-Annual Report
Undiscovered Managers Funds
December 31, 2020 (Unaudited)
Undiscovered Managers Behavioral Value Fund

Table of Contents
Investments in the Fund are not deposits or obligations of, or guaranteed or endorsed by, any bank and are not insured or guaranteed by the FDIC, the Federal Reserve Board or any other government agency. You could lose money if you sell when the Fund’s share price is lower than when you invested.
Past performance is no guarantee of future performance. The general market views expressed in this report are opinions based on market and other conditions through the end of the reporting period and are subject to change without notice. These views are not intended to predict the future performance of the Fund or the securities markets. References to specific securities and their issuers are for illustrative purposes only and are not intended to be, and should not be interpreted as, recommendations to purchase or sell such securities. Such views are not meant as investment advice and may not be relied on as an indication of trading intent on behalf of the Fund.
Prospective investors should refer to the Fund’s prospectuses for a discussion of the Fund’s investment objective, strategies and risks. Call J.P. Morgan Funds Service Center at 1-800-480-4111 for a prospectus containing more complete information about the Fund, including management fees and other expenses. Please read it carefully before investing.
Table of Contents
February 4, 2021 (Unaudited)
Dear Shareholders,
The year ahead holds the potential for a strong recovery in the global economy thanks to the massive efforts of central banks and governments and the development of multiple vaccines against Covid-19. While significant economic and health care challenges remain ahead, the uncertainty and turbulence of 2020 has abated.
 |
“Investors who remained fully invested over the second half of 2020, in the face of uncertainty over the pandemic, the economy and a contested U.S. presidential election, were likely rewarded for their perseverance.” — Andrea L. Lisher |
The second half of 2020 was notable for an accelerating rebound in equity markets from the steep sell-off in the first quarter of the year when the pandemic was first declared by the World Health Organization. Positive news about clinical trials of new vaccines, followed by the first approvals of those vaccines in November 2020, bolstered investor expectations that the pandemic would be halted and that economic and social activity could begin to resume in the year ahead. As overall demand for equities increased in the final half of 2020, investors began to turn their focus from companies that could endure the pandemic to those that could benefit from a potential recovery in local, national and international economies. For the six months ended December 31, 2020, the S&P 500 Index generated a total return of 22.16%.
Investors who remained fully invested over the second half of 2020, in the face of uncertainty over the pandemic, the economy and a contested U.S. presidential election, were likely rewarded for their perseverance.
The implementation of mass vaccinations on the national and global scales is not without challenges and the rebuilding of economies at all levels is likely to depend on how successfully the pandemic is fought. However, the advances in the fight against Covid-19 provide policymakers and investors with the opportunity to plan for the future and meet those challenges. J.P. Morgan Asset Management has thrived amid the many challenges presented by the pandemic. Moreover, our deep experience in risk management enabled us to successfully navigate increased volatility in global financial markets. Throughout 2020, we continued to seek to operate under the same fundamental practices and principles that have driven our success for more than a century with an unwavering focus on putting our clients at the center of everything we do.
On behalf of J.P. Morgan Asset Management, thank you for entrusting us to manage your investment. Should you have any questions, please visit www.jpmorganfunds.com or contact the J.P. Morgan Funds Service Center at 1-800-480-4111.
Sincerely yours,

Andrea L. Lisher
Head of Americas, Client
J.P. Morgan Asset Management
| DECEMBER 31, 2020 | UNDISCOVERED MANAGERS FUNDS | 1 | ||||||||
Table of Contents
Undiscovered Managers Behavioral Value Fund
SIX MONTHS ENDED DECEMBER 31, 2020 (Unaudited)
| REPORTING PERIOD RETURN: | ||||
| Fund (Class L Shares)* | 44.49% | |||
| Russell 2000 Value Index | 36.77% | |||
| Net Assets as of 12/31/2020 (In Thousands) | $4,856,344 | |||
INVESTMENT OBJECTIVE**
The Undiscovered Managers Behavioral Value Fund (the “Fund”) seeks to provide capital appreciation.
HOW DID THE MARKET PERFORM?
Overall, the second half of 2020 was marked by U.S. equity market gains in the final months of the year amid the rollout of multiple vaccines against Covid-19, followed by the eventual approval of $900 billion in federal pandemic relief that was signed into law December 27, 2020.
Globally, U.S. equity led a broad rebound in both developed markets and emerging markets equity at the start of the period. Leading U.S. equity indexes rose in July and August 2020, punctuated by five consecutive record high closings for S&P 500 Index in late August – a stretch not seen since 2017. Notably, Apple Inc. issued a 4-for-1 stock split in August and became the first publicly listed company with a valuation surpassing $2 trillion.
The U.S. Federal Reserve (the “Fed”) signaled its continued support for asset purchases and low benchmark interest rates. While the spread of Covid-19 accelerated in the U.S., multiple candidate vaccines were being developed around the world and the number of hospitalizations at the end of the summer was relatively small compared with what was to come at the end of the year.
Equity prices across the globe largely declined over September and October 2020. Re-closings across Asia and Europe in response to Covid-19 had dented investor optimism. The inability of the U.S. Congress to adopt further spending for pandemic relief put acute pressure on the S&P 500 Index in the final week of October.
U.S. equity prices began to rebound in November and by mid-month the S&P 500 Index reached a closing high and crossed 3,600 points for the first time amid the U.S. Food and Drug Administration’s approval of the first Covid-19 vaccines. While the results of the U.S. presidential election were contested, President-elect Joe Biden’s early cabinet choices – including former Fed Chairwoman Janet Yellen – removed some investor uncertainty. The Fed kept interest rates and policies unchanged and Congressional negotiations over proposed relief and stimulus spending continued through the month.
Globally, equity markets maintained upward momentum through the end of December, largely driven by investor
expectations that mass vaccinations and the reopening of economies would unleash pent up demand from consumers, businesses and governments. Notably, emerging markets equity outperformed developed markets equity, including U.S. equity, in the second half of 2020 as China, Taiwan and South Korea appeared to have greater success in containing the pandemic.
In the U.S., growth stocks continued to outperform value stocks but the difference narrowed somewhat during the period as share price valuations rose. Additionally, shares of select companies that had seen their stock prices plummet in the first half of 2020 benefitted from increased investor appetite for bargains in the second half of the year. At year’s end, the largest 10 companies in the S&P 500 Index made up 27.4% of the index’s value, compared with 22.7% at the end of 2019 and 21.0% at the end of 2018.
For the six months ended December 31, 2020, the Russell 2000 Index returned 37.9%, the Russell Mid Cap Index returned 28.9% and the Russell 1000 Index returned 24.5%. The S&P 500 Index posted a total return of 22.16%.
WHAT WERE THE MAIN DRIVERS OF THE FUND’S PERFORMANCE?
For the six months ended December 31, 2020, the Fund’s Class L Shares outperformed the Russell 2000 Value Index (the “Benchmark”). The Fund’s overweight position and security selection in the industrials sector and its overweight position in the financials sector were leading contributors to performance relative to the Benchmark, while the Fund’s underweight position and security selection in the consumer discretionary sector and its underweight position in the consumer staples sector were leading detractors from relative performance.
Leading individual contributors to relative performance included the Fund’s overweight positions in National General Holdings Corp., Matson Inc. and its out-of-Benchmark position in Olin Corp. Shares of National General Holdings, an insurance provider, rose after Allstate Corp. announced it would acquire the company for about $4 billion. Shares of Matson, a shipping and logistics provider, rose amid increased demand for its express shipping from China to the port of Long Beach, Calif., due to the pandemic. Shares of Olin, a chemicals manufacturer, rose after the company’s new chief executive shifted corporate strategy and prices for chemicals used in construction began to rebound.
| 2 | UNDISCOVERED MANAGERS FUNDS | DECEMBER 31, 2020 | ||||||||
Table of Contents
Leading individual detractors from relative performance included the Fund’s out-of-Benchmark positions in Graphic Packaging Holding Co. and Energizer Holding Inc., and its overweight position in Investors Bancorp Inc. Shares of Graphic Packaging Holding, a packing manufacturer, underperformed as investors expected the business would not significantly benefit from a potential vaccine-driven reopening of the economy. Shares of Energizer Holdings, a batteries and lighting manufacturer, fell after the company reported lower-than-expected earnings and cash flow for its fiscal fourth quarter. Shares of Investors Bancorp, a bank holding company, underperformed its peers among small cap regional/thrift banks as investors sought higher returns elsewhere.
HOW WAS THE FUND POSITIONED?
The Fund’s sub-adviser, Fuller & Thaler Asset Management Inc., looked for stocks that it believed were mispriced based on behavioral biases. The sub-adviser generally utilizes a three-pronged approach that includes i) positive signals such as significant share purchases by company insiders or stock repurchase activity by the company; ii) evidence of market overreaction due to behavioral factors like loss aversion or stereotyping that has resulted in an absolute or relative decline in the valuation of certain securities; and iii) analysis of the company’s fundamentals with regard to business model, valuation and credit risk.
During the reporting period, the Fund’s largest overweight positions versus the Benchmark were in the financials and materials sectors, while its largest underweight positions versus the Benchmark were in the consumer discretionary and health care sectors.
| * | The return shown is based on net asset values calculated for shareholder transactions and may differ from the return shown in the financial highlights, which reflects adjustments made to the net asset values in accordance with accounting principles generally accepted in the United States of America. |
| ** | The adviser seeks to achieve the Fund’s objective. There can be no guarantee that it will be achieved. |
| TOP TEN EQUITY HOLDINGS OF THE PORTFOLIO*** | ||||||||
| 1. | Investors Bancorp, Inc. | 4.0 | % | |||||
| 2. | First Horizon National Corp. | 3.5 | ||||||
| 3. | Graphic Packaging Holding Co. | 3.3 | ||||||
| 4. | TCF Financial Corp. | 3.2 | ||||||
| 5. | FNB Corp. | 2.7 | ||||||
| 6. | KeyCorp | 2.4 | ||||||
| 7. | Brink’s Co. (The) | 2.3 | ||||||
| 8. | CNO Financial Group, Inc. | 2.3 | ||||||
| 9. | Terex Corp. | 2.1 | ||||||
| 10. | First Midwest Bancorp, Inc. | 2.1 | ||||||
PORTFOLIO COMPOSITION BY SECTOR*** | ||||
| Financials | 32.2 | % | ||
| Industrials | 18.9 | |||
| Materials | 14.6 | |||
| Real Estate | 8.8 | |||
| Information Technology | 6.6 | |||
| Consumer Discretionary | 5.0 | |||
| Energy | 3.3 | |||
| Health Care | 2.2 | |||
| Consumer Staples | 2.0 | |||
| Utilities | 1.7 | |||
| Short-Term Investments | 4.7 | |||
| *** | Percentages indicated are based on total investments as of December 31, 2020. The Fund’s portfolio composition is subject to change. |
| DECEMBER 31, 2020 | UNDISCOVERED MANAGERS FUNDS | 3 | ||||||||
Table of Contents
Undiscovered Managers Behavioral Value Fund
FUND COMMENTARY
SIX MONTHS ENDED DECEMBER 31, 2020 (Unaudited) (continued)
AVERAGE ANNUAL TOTAL RETURNS AS OF DECEMBER 31, 2020 | ||||||||||||||||||
| INCEPTION DATE OF CLASS | 6 MONTH* | 1 YEAR | 5 YEAR | 10 YEAR | ||||||||||||||
CLASS A SHARES | June 4, 2004 | |||||||||||||||||
With Sales Charge** | 36.61 | % | (2.32 | )% | 6.58 | % | 9.50 | % | ||||||||||
Without Sales Charge | 44.18 | 3.10 | 7.74 | 10.09 | ||||||||||||||
CLASS C SHARES | June 4, 2004 | |||||||||||||||||
With CDSC*** | 42.82 | 1.59 | 7.20 | 9.65 | ||||||||||||||
Without CDSC | 43.82 | 2.59 | 7.20 | 9.65 | ||||||||||||||
CLASS I SHARES | April 30, 2013 | 44.40 | 3.37 | 8.01 | 10.36 | |||||||||||||
CLASS L SHARES | December 28, 1998 | 44.49 | 3.53 | 8.17 | 10.49 | |||||||||||||
CLASS R2 SHARES | April 30, 2013 | 43.99 | 2.85 | 7.47 | 9.88 | |||||||||||||
CLASS R3 SHARES | March 1, 2017 | 44.18 | 3.09 | 7.74 | 10.09 | |||||||||||||
CLASS R4 SHARES | March 1, 2017 | 44.35 | 3.35 | 8.01 | 10.36 | |||||||||||||
CLASS R5 SHARES | March 1, 2017 | 44.48 | 3.52 | 8.18 | 10.49 | |||||||||||||
CLASS R6 SHARES | April 30, 2013 | 44.57 | 3.62 | 8.28 | 10.57 | |||||||||||||
| * | Not annualized. |
| ** | Sales Charge for Class A Shares is 5.25%. |
| *** | Assumes a 1% CDSC (contingent deferred sales charge) for the 6 month and one year periods and 0% CDSC thereafter. |
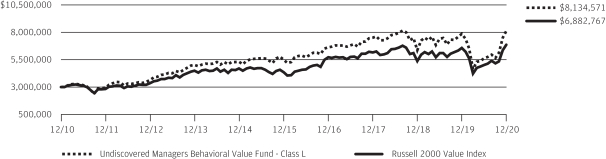
TEN YEAR PERFORMANCE (12/31/10 TO 12/31/20)
The performance quoted is past performance and is not a guarantee of future results. Mutual funds are subject to certain market risks. Investment returns and principal value of an investment will fluctuate so that an investor’s shares, when redeemed, may be worth more or less than their original cost. Current performance may be higher or lower than the performance data shown. For up-to-date month-end performance information please call 1-800-480-4111.
Returns for Class R6 and Class I Shares prior to their inception date are based on the performance of Class L Shares. The actual returns of Class I Shares would have been lower than those shown because Class I Shares have higher expenses than Class L Shares. The actual returns of Class R6 Shares would have been different than those shown because Class R6 Shares have different expenses than Class L Shares.
Returns for Class R2 Shares prior to their inception date are based on the performance of Class A Shares. The actual returns of Class R2 Shares would have been lower than those shown because Class R2 Shares have higher expenses than Class A Shares.
Returns for Class R3, Class R4 and Class R5 Shares prior to their inception dates are based on the performance of the Class A, Class I and Class L Shares, respectively. The actual returns for Class R3, Class R4 and Class R5 Shares would have been similar to those shown because Class R3, Class R4 and Class R5 Shares have similar expenses to Class A, Class I and Class L Shares, respectively.
The graph illustrates comparative performance for $3,000,000 invested in Class L Shares of the Undiscovered Managers Behavioral Value Fund and the
Russell 2000 Value Index from December 31, 2010 to December 31, 2020. The performance of the Fund assumes reinvestment of all dividends and capital gain distributions, if any, and does not include a sales charge. The performance of the Russell 2000 Value Index does not reflect the deduction of expenses or a sales charge associated with a mutual fund and has been adjusted to reflect reinvestment of all dividends and capital gain distributions of securities included in the benchmark, if applicable. The Russell 2000 Value Index is an unmanaged index, which measures the performance of those Russell 2000 companies with lower price-to-book ratios and lower forecasted growth values. Investors cannot invest directly in an index.
Class L Shares have a $3,000,000 minimum initial investment.
Fund performance may reflect the waiver of the Fund’s fees and reimbursement of expenses for certain periods. Without these waivers and reimbursements, performance would have been lower. Also, performance shown in this section does not reflect the deduction of taxes that a shareholder would pay on Fund distributions or on gains resulting from redemptions of Fund shares.
Because Class C Shares automatically convert to Class A Shares after 8 years, the 10 year average annual total return shown above for Class C reflects Class A performance for the period after conversion.
The returns shown are based on net asset values calculated for shareholder transactions and may differ from the returns shown in the financial highlights, which reflect adjustments made to the net asset values in accordance with accounting principles generally accepted in the United States of America.
| 4 | UNDISCOVERED MANAGERS FUNDS | DECEMBER 31, 2020 | ||||||||
Table of Contents
Undiscovered Managers Behavioral Value Fund
SCHEDULE OF PORTFOLIO INVESTMENTS
AS OF DECEMBER 31, 2020 (Unaudited)
| INVESTMENTS | SHARES (000) | VALUE ($000) | ||||||
Common Stocks — 97.7% |
| |||||||
Auto Components — 2.7% |
| |||||||
American Axle & Manufacturing Holdings, Inc. * | 1,589 | 13,255 | ||||||
Cooper-Standard Holdings, Inc. * | 853 | 29,584 | ||||||
Gentherm, Inc.* | 1,119 | 72,969 | ||||||
Tenneco, Inc., Class A * | 1,511 | 16,017 | ||||||
|
| |||||||
| 131,825 | ||||||||
|
| |||||||
Banks — 28.1% |
| |||||||
Bancorp, Inc. (The) * | 1,663 | 22,695 | ||||||
Brookline Bancorp, Inc. | 2,974 | 35,810 | ||||||
CIT Group, Inc. | 2,575 | 92,449 | ||||||
First Hawaiian, Inc. | 4,050 | 95,508 | ||||||
First Horizon National Corp. | 13,804 | 176,136 | ||||||
First Midwest Bancorp, Inc. (a) | 6,506 | 103,571 | ||||||
FNB Corp. (a) | 14,019 | 133,176 | ||||||
Hope Bancorp, Inc. | 6,839 | 74,617 | ||||||
Investors Bancorp, Inc. | 18,727 | 197,753 | ||||||
KeyCorp | 7,286 | 119,563 | ||||||
Simmons First National Corp., Class A | 1,251 | 27,001 | ||||||
TCF Financial Corp. | 4,352 | 161,125 | ||||||
Texas Capital Bancshares, Inc. * | 1,369 | 81,451 | ||||||
United Bankshares, Inc. (a) | 1,357 | 43,957 | ||||||
|
| |||||||
| 1,364,812 | ||||||||
|
| |||||||
Beverages — 1.1% |
| |||||||
Primo Water Corp. | 3,449 | 54,080 | ||||||
|
| |||||||
Building Products — 4.0% |
| |||||||
Builders FirstSource, Inc. * | 546 | 22,263 | ||||||
JELD-WEN Holding, Inc. * | 3,960 | 100,434 | ||||||
Resideo Technologies, Inc. * | 3,369 | 71,634 | ||||||
|
| |||||||
| 194,331 | ||||||||
|
| |||||||
Capital Markets — 0.6% |
| |||||||
Janus Henderson Group plc (United Kingdom) (a) | 955 | 31,055 | ||||||
|
| |||||||
Chemicals — 5.7% |
| |||||||
Cabot Corp. | 2,129 | 95,538 | ||||||
Celanese Corp. | 121 | 15,701 | ||||||
Koppers Holdings, Inc. * | 1,382 | 43,056 | ||||||
Olin Corp. | 3,445 | 84,609 | ||||||
Trinseo SA | 736 | 37,697 | ||||||
|
| |||||||
| 276,601 | ||||||||
|
| |||||||
Commercial Services & Supplies — 5.3% |
| |||||||
Brink’s Co. (The) (a) | 1,567 | 112,791 | ||||||
Covanta Holding Corp. | 5,022 | 65,943 | ||||||
Harsco Corp. * | 940 | 16,901 | ||||||
| INVESTMENTS | SHARES (000) | VALUE ($000) | ||||||
Commercial Services & Supplies — continued |
| |||||||
Herman Miller, Inc. | 1,763 | 59,586 | ||||||
|
| |||||||
| 255,221 | ||||||||
|
| |||||||
Communications Equipment — 1.2% |
| |||||||
ADTRAN, Inc. | 1,527 | 22,552 | ||||||
CommScope Holding Co., Inc. * | 2,600 | 34,845 | ||||||
|
| |||||||
| 57,397 | ||||||||
|
| |||||||
Construction & Engineering — 1.3% |
| |||||||
Granite Construction, Inc. (a) | 2,277 | 60,813 | ||||||
|
| |||||||
Construction Materials — 0.8% |
| |||||||
Eagle Materials, Inc. | 365 | 36,952 | ||||||
|
| |||||||
Containers & Packaging — 7.7% |
| |||||||
Berry Global Group, Inc. * | 1,341 | 75,366 | ||||||
Crown Holdings, Inc. * | 950 | 95,161 | ||||||
Graphic Packaging Holding Co. | 9,664 | 163,709 | ||||||
Greif, Inc., Class A (a) | 852 | 39,964 | ||||||
|
| |||||||
| 374,200 | ||||||||
|
| |||||||
Electric Utilities — 1.5% |
| |||||||
Portland General Electric Co. | 1,752 | 74,913 | ||||||
|
| |||||||
Electronic Equipment, Instruments & Components — 2.2% |
| |||||||
Avnet, Inc. | 694 | 24,374 | ||||||
Dolby Laboratories, Inc., Class A | 249 | 24,187 | ||||||
Flex Ltd. * | 1,030 | 18,516 | ||||||
MTS Systems Corp. | 711 | 41,340 | ||||||
|
| |||||||
| 108,417 | ||||||||
|
| |||||||
Energy Equipment & Services — 0.8% |
| |||||||
KLX Energy Services Holdings, Inc. * (a) | 280 | 1,812 | ||||||
Patterson-UTI Energy, Inc. | 6,053 | 31,840 | ||||||
TETRA Technologies, Inc.* | 5,460 | 4,704 | ||||||
|
| |||||||
| 38,356 | ||||||||
|
| |||||||
Equity Real Estate Investment Trusts (REITs) — 9.1% |
| |||||||
Alexander & Baldwin, Inc. | 912 | 15,675 | ||||||
Brixmor Property Group, Inc. | 5,522 | 91,382 | ||||||
Chatham Lodging Trust | 2,381 | 25,711 | ||||||
Colony Capital, Inc. (a) | 3,193 | 15,359 | ||||||
Franklin Street Properties Corp. | 5,181 | 22,641 | ||||||
Kite Realty Group Trust | 3,527 | 52,759 | ||||||
Pebblebrook Hotel Trust (a) | 2,911 | 54,728 | ||||||
Rayonier, Inc. | 1,889 | 55,503 | ||||||
Retail Properties of America, Inc., Class A | 2,191 | 18,758 | ||||||
Ryman Hospitality Properties, Inc. | 1,295 | 87,739 | ||||||
|
| |||||||
| 440,255 | ||||||||
|
| |||||||
SEE NOTES TO FINANCIAL STATEMENTS.
| DECEMBER 31, 2020 | UNDISCOVERED MANAGERS FUNDS | 5 | ||||||||
Table of Contents
Undiscovered Managers Behavioral Value Fund
SCHEDULE OF PORTFOLIO INVESTMENTS
AS OF DECEMBER 31, 2020 (Unaudited) (continued)
| INVESTMENTS | SHARES (000) | VALUE ($000) | ||||||
Common Stocks — continued |
| |||||||
Gas Utilities — 0.2% |
| |||||||
Southwest Gas Holdings, Inc. | 132 | 7,996 | ||||||
|
| |||||||
Health Care Providers & Services — 1.0% |
| |||||||
Ensign Group, Inc. (The) | 692 | 50,434 | ||||||
|
| |||||||
Health Care Technology — 1.2% |
| |||||||
Allscripts Healthcare Solutions, Inc. * (a) | 4,000 | 57,764 | ||||||
|
| |||||||
Household Durables — 1.0% |
| |||||||
TRI Pointe Group, Inc. * | 2,928 | 50,513 | ||||||
|
| |||||||
Household Products — 0.9% |
| |||||||
Energizer Holdings, Inc. (a) | 1,085 | 45,776 | ||||||
|
| |||||||
Insurance — 4.3% |
| |||||||
Assured Guaranty Ltd. | 898 | 28,292 | ||||||
CNO Financial Group, Inc. | 5,055 | 112,375 | ||||||
Enstar Group Ltd. * | 111 | 22,808 | ||||||
White Mountains Insurance Group Ltd. (a) | 44 | 43,584 | ||||||
|
| |||||||
| 207,059 | ||||||||
|
| |||||||
IT Services — 1.1% |
| |||||||
Sykes Enterprises, Inc. * | 1,384 | 52,138 | ||||||
|
| |||||||
Machinery — 4.0% |
| |||||||
Enerpac Tool Group Corp. (a) | 846 | 19,130 | ||||||
Hyster-Yale Materials Handling, Inc. | 434 | 25,831 | ||||||
Kennametal, Inc. (a) | 1,208 | 43,771 | ||||||
Terex Corp. | 3,067 | 106,992 | ||||||
|
| |||||||
| 195,724 | ||||||||
|
| |||||||
Marine — 2.1% |
| |||||||
Matson, Inc. | 1,763 | 100,465 | ||||||
|
| |||||||
Metals & Mining — 0.3% |
| |||||||
Commercial Metals Co. | 734 | 15,075 | ||||||
|
| |||||||
Oil, Gas & Consumable Fuels — 2.6% |
| |||||||
PBF Energy, Inc., Class A (a) | 727 | 5,160 | ||||||
Range Resources Corp. * (a) | 2,835 | 18,994 | ||||||
WPX Energy, Inc. * | 12,425 | 101,261 | ||||||
|
| |||||||
| 125,415 | ||||||||
|
| |||||||
Paper & Forest Products — 0.5% |
| |||||||
Glatfelter Corp. | 1,475 | 24,165 | ||||||
|
| |||||||
Software — 0.8% |
| |||||||
Verint Systems, Inc. * | 572 | 38,397 | ||||||
|
| |||||||
Specialty Retail — 0.2% |
| |||||||
Designer Brands, Inc., Class A (a) | 1,496 | 11,446 | ||||||
|
| |||||||
| INVESTMENTS | SHARES (000) | VALUE ($000) | ||||||
Technology Hardware, Storage & Peripherals — 1.5% |
| |||||||
NCR Corp. * | 1,927 | 72,415 | ||||||
|
| |||||||
Textiles, Apparel & Luxury Goods — 1.1% |
| |||||||
Columbia Sportswear Co. (a) | 626 | 54,689 | ||||||
|
| |||||||
Trading Companies & Distributors — 2.8% |
| |||||||
Applied Industrial Technologies, Inc. | 773 | 60,320 | ||||||
Beacon Roofing Supply, Inc. * | 1,414 | 56,832 | ||||||
MRC Global, Inc. * | 3,130 | 20,754 | ||||||
|
| |||||||
| 137,906 | ||||||||
|
| |||||||
Total Common Stocks |
| 4,746,605 | ||||||
|
| |||||||
Short-Term Investments — 4.9% | ||||||||
Investment Companies — 2.6% |
| |||||||
JPMorgan Prime Money Market Fund Class IM Shares, 0.12% (b) (c) | 124,349 | 124,412 | ||||||
|
| |||||||
Investment of Cash Collateral from Securities Loaned — 2.3% |
| |||||||
JPMorgan Securities Lending Money Market Fund Agency SL Class Shares, 0.15% (b) (c) | 96,966 | 96,976 | ||||||
JPMorgan U.S. Government Money Market Fund Class IM Shares, 0.03% (b) (c) | 16,679 | 16,679 | ||||||
|
| |||||||
Total Investment of Cash Collateral from Securities Loaned | 113,655 | |||||||
|
| |||||||
Total Short-Term Investments | 238,067 | |||||||
|
| |||||||
Total Investments — 102.6% | 4,984,672 | |||||||
Liabilities in Excess of | (128,328 | ) | ||||||
|
| |||||||
NET ASSETS — 100.0% | 4,856,344 | |||||||
|
| |||||||
Percentages indicated are based on net assets.
| (a) | The security or a portion of this security is on loan at December 31, 2020. The total value of securities on loan at December 31, 2020 is approximately $110,652,000. | |
| (b) | Investment in an affiliated fund, which is registered under the Investment Company Act of 1940, as amended, and is advised by J.P. Morgan Investment Management Inc. | |
| (c) | The rate shown is the current yield as of December 31, 2020. | |
| * | Non-income producing security. |
SEE NOTES TO FINANCIAL STATEMENTS.
| 6 | UNDISCOVERED MANAGERS FUNDS | DECEMBER 31, 2020 | ||||||||
Table of Contents
THIS PAGE IS INTENTIONALLY LEFT BLANK
| DECEMBER 31, 2020 | UNDISCOVERED MANAGERS FUNDS | 7 | ||||||||
Table of Contents
STATEMENT OF ASSETS AND LIABILITIES
AS OF DECEMBER 31, 2020 (Unaudited)
(Amounts in thousands, except per share amounts)
| Undiscovered Managers Behavioral Value Fund | ||||
ASSETS: |
| |||
Investments in non-affiliates, at value | $ | 4,746,605 | ||
Investments in affiliates, at value | 124,412 | |||
Investment of cash collateral received from securities loaned, at value (See Note 2.B.) | 113,655 | |||
Cash | 11 | |||
Receivables: | ||||
Investment securities sold | 669 | |||
Fund shares sold | 7,579 | |||
Dividends from non-affiliates | 6,989 | |||
Dividends from affiliates | — | (a) | ||
Tax reclaims | 21 | |||
Securities lending income (See Note 2.B.) | 14 | |||
|
| |||
Total Assets | 4,999,955 | |||
|
| |||
LIABILITIES: |
| |||
Payables: | ||||
Collateral received on securities loaned (See Note 2.B.) | 113,655 | |||
Fund shares redeemed | 25,935 | |||
Accrued liabilities: | ||||
Investment advisory fees | 2,850 | |||
Administration fees | 285 | |||
Distribution fees | 143 | |||
Service fees | 430 | |||
Custodian and accounting fees | 50 | |||
Trustees’ and Chief Compliance Officer’s fees | 2 | |||
Other | 261 | |||
|
| |||
Total Liabilities | 143,611 | |||
|
| |||
Net Assets | $ | 4,856,344 | ||
|
| |||
| (a) | Amount rounds to less than one thousand. |
SEE NOTES TO FINANCIAL STATEMENTS.
| 8 | UNDISCOVERED MANAGERS FUNDS | DECEMBER 31, 2020 | ||||||||
Table of Contents
| Undiscovered Managers Behavioral Value Fund | ||||
NET ASSETS: |
| |||
Paid-in-Capital | $ | 4,338,979 | ||
Total distributable earnings (loss) | 517,365 | |||
|
| |||
Total Net Assets | $ | 4,856,344 | ||
|
| |||
Net Assets: |
| |||
Class A | $ | 377,989 | ||
Class C | 80,534 | |||
Class I | 875,034 | |||
Class L | 2,004,808 | |||
Class R2 | 18,113 | |||
Class R3 | 6,058 | |||
Class R4 | 2,052 | |||
Class R5 | 12,863 | |||
Class R6 | 1,478,893 | |||
|
| |||
Total | $ | 4,856,344 | ||
|
| |||
Outstanding units of beneficial interest (shares) |
| |||
($0.0001 par value; unlimited number of shares authorized): | ||||
Class A | 6,039 | |||
Class C | 1,377 | |||
Class I | 13,665 | |||
Class L | 31,198 | |||
Class R2 | 293 | |||
Class R3 | 98 | |||
Class R4 | 32 | |||
Class R5 | 200 | |||
Class R6 | 22,979 | |||
Net Asset Value (a): | ||||
Class A — Redemption price per share | $ | 62.60 | ||
Class C — Offering price per share (b) | 58.49 | |||
Class I — Offering and redemption price per share | 64.03 | |||
Class L — Offering and redemption price per share | 64.26 | |||
Class R2 — Offering and redemption price per share | 61.86 | |||
Class R3 — Offering and redemption price per share | 61.93 | |||
Class R4 — Offering and redemption price per share | 63.88 | |||
Class R5 — Offering and redemption price per share | 64.21 | |||
Class R6 — Offering and redemption price per share | 64.36 | |||
Class A maximum sales charge | 5.25 | % | ||
Class A maximum public offering price per share | $ | 66.07 | ||
|
| |||
Cost of investments in non-affiliates | $ | 3,900,839 | ||
Cost of investments in affiliates | 124,424 | |||
Investment securities on loan, at value (See Note 2.B.) | 110,652 | |||
Cost of investment of cash collateral (See Note 2.B.) | 113,655 | |||
| (a) | Per share amounts may not recalculate due to rounding of net assets and/or shares outstanding. |
| (b) | Redemption price for Class C Shares varies based upon length of time the shares are held. |
SEE NOTES TO FINANCIAL STATEMENTS.
| DECEMBER 31, 2020 | UNDISCOVERED MANAGERS FUNDS | 9 | ||||||||
Table of Contents
STATEMENT OF OPERATIONS
FOR THE SIX MONTHS ENDED DECEMBER 31, 2020 (Unaudited)
(Amounts in thousands)
| Undiscovered Managers Behavioral Value Fund | ||||
INVESTMENT INCOME: |
| |||
Dividend income from non-affiliates | $ | 45,249 | ||
Dividend income from affiliates | 34 | |||
Income from securities lending (net) (See Note 2.B.) | 25 | |||
|
| |||
Total investment income | 45,308 | |||
|
| |||
EXPENSES: |
| |||
Investment advisory fees | 14,954 | |||
Administration fees | 1,495 | |||
Distribution fees: | ||||
Class A | 409 | |||
Class C | 279 | |||
Class R2 | 38 | |||
Class R3 | 6 | |||
Service fees: | ||||
Class A | 409 | |||
Class C | 93 | |||
Class I | 773 | |||
Class L | 874 | |||
Class R2 | 19 | |||
Class R3 | 6 | |||
Class R4 | 2 | |||
Class R5 | 5 | |||
Custodian and accounting fees | 74 | |||
Interest expense to affiliates | 2 | |||
Professional fees | 51 | |||
Trustees’ and Chief Compliance Officer’s fees | 19 | |||
Printing and mailing costs | 124 | |||
Registration and filing fees | 146 | |||
Transfer agency fees (See Note 2.E.) | 121 | |||
Other | 51 | |||
|
| |||
Total expenses | 19,950 | |||
|
| |||
Less fees waived | (1,087 | ) | ||
Less expense reimbursements | (17 | ) | ||
|
| |||
Net expenses | 18,846 | |||
|
| |||
Net investment income (loss) | 26,462 | |||
|
| |||
REALIZED/UNREALIZED GAINS (LOSSES): | ||||
Net realized gain (loss) on transactions from: |
| |||
Investments in non-affiliates | (29,234 | ) | ||
Investments in affiliates | (8 | ) | ||
|
| |||
Net realized gain (loss) | (29,242 | ) | ||
|
| |||
Change in net unrealized appreciation/depreciation on: |
| |||
Investments in non-affiliates | 1,508,927 | |||
Investments in affiliates | (11 | ) | ||
|
| |||
Change in net unrealized appreciation/depreciation | 1,508,916 | |||
|
| |||
Net realized/unrealized gains (losses) | 1,479,674 | |||
|
| |||
Change in net assets resulting from operations | $ | 1,506,136 | ||
|
| |||
SEE NOTES TO FINANCIAL STATEMENTS.
| 10 | UNDISCOVERED MANAGERS FUNDS | DECEMBER 31, 2020 | ||||||||
Table of Contents
STATEMENTS OF CHANGES IN NET ASSETS
FOR THE PERIODS INDICATED
(Amounts in thousands)
| Undiscovered Managers Behavioral Value Fund | ||||||||
| Six Months Ended December 31, 2020 (Unaudited) | Year Ended June 30, 2020 | |||||||
CHANGE IN NET ASSETS RESULTING FROM OPERATIONS: |
| |||||||
Net investment income (loss) | $ | 26,462 | $ | 58,169 | ||||
Net realized gain (loss) | (29,242 | ) | (172,522 | ) | ||||
Change in net unrealized appreciation/depreciation | 1,508,916 | (1,135,166 | ) | |||||
|
|
|
| |||||
Change in net assets resulting from operations | 1,506,136 | (1,249,519 | ) | |||||
|
|
|
| |||||
DISTRIBUTIONS TO SHAREHOLDERS: | ||||||||
Class A | (2,133 | ) | (25,306 | ) | ||||
Class C | (15 | ) | (6,670 | ) | ||||
Class I | (7,011 | ) | (44,385 | ) | ||||
Class L | (18,134 | ) | (130,833 | ) | ||||
Class R2 | (78 | ) | (826 | ) | ||||
Class R3 | (38 | ) | (252 | ) | ||||
Class R4 | (15 | ) | (189 | ) | ||||
Class R5 | (119 | ) | (422 | ) | ||||
Class R6 | (14,680 | ) | (54,411 | ) | ||||
|
|
|
| |||||
Total distributions to shareholders | (42,223 | ) | (263,294 | ) | ||||
|
|
|
| |||||
CAPITAL TRANSACTIONS: |
| |||||||
Change in net assets resulting from capital transactions | (257,050 | ) | (214,160 | ) | ||||
|
|
|
| |||||
NET ASSETS: |
| |||||||
Change in net assets | 1,206,863 | (1,726,973 | ) | |||||
Beginning of period | 3,649,481 | 5,376,454 | ||||||
|
|
|
| |||||
End of period | $ | 4,856,344 | $ | 3,649,481 | ||||
|
|
|
| |||||
CAPITAL TRANSACTIONS: | ||||||||
Class A | ||||||||
Proceeds from shares issued | $ | 42,085 | $ | 74,371 | ||||
Distributions reinvested | 1,867 | 23,062 | ||||||
Cost of shares redeemed | (93,633 | ) | (236,917 | ) | ||||
|
|
|
| |||||
Change in net assets resulting from Class A capital transactions | (49,681 | ) | (139,484 | ) | ||||
|
|
|
| |||||
Class C | ||||||||
Proceeds from shares issued | 2,785 | 3,148 | ||||||
Distributions reinvested | 14 | 5,965 | ||||||
Cost of shares redeemed | (28,857 | ) | (50,499 | ) | ||||
|
|
|
| |||||
Change in net assets resulting from Class C capital transactions | (26,058 | ) | (41,386 | ) | ||||
|
|
|
| |||||
Class I | ||||||||
Proceeds from shares issued | 262,797 | 266,901 | ||||||
Distributions reinvested | 5,327 | 34,256 | ||||||
Cost of shares redeemed | (171,443 | ) | (448,062 | ) | ||||
|
|
|
| |||||
Change in net assets resulting from Class I capital transactions | 96,681 | (146,905 | ) | |||||
|
|
|
| |||||
Class L | ||||||||
Proceeds from shares issued | 228,798 | 903,320 | ||||||
Distributions reinvested | 15,784 | 94,882 | ||||||
Cost of shares redeemed | (677,797 | ) | (1,072,603 | ) | ||||
|
|
|
| |||||
Change in net assets resulting from Class L capital transactions | (433,215 | ) | (74,401 | ) | ||||
|
|
|
| |||||
SEE NOTES TO FINANCIAL STATEMENTS.
| DECEMBER 31, 2020 | UNDISCOVERED MANAGERS FUNDS | 11 | ||||||||
Table of Contents
STATEMENTS OF CHANGES IN NET ASSETS
FOR THE PERIODS INDICATED (continued)
(Amounts in thousands)
| Undiscovered Managers Behavioral Value Fund | ||||||||
| Six Months Ended December 31, 2020 (Unaudited) | Year Ended June 30, 2020 | |||||||
CAPITAL TRANSACTIONS: (continued) | ||||||||
Class R2 | ||||||||
Proceeds from shares issued | 1,516 | 3,978 | ||||||
Distributions reinvested | 78 | 826 | ||||||
Cost of shares redeemed | (2,820 | ) | (4,181 | ) | ||||
|
|
|
| |||||
Change in net assets resulting from Class R2 capital transactions | (1,226 | ) | 623 | |||||
|
|
|
| |||||
Class R3 | ||||||||
Proceeds from shares issued | 2,190 | 4,573 | ||||||
Distributions reinvested | 38 | 252 | ||||||
Cost of shares redeemed | (2,233 | ) | (3,215 | ) | ||||
|
|
|
| |||||
Change in net assets resulting from Class R3 capital transactions | (5 | ) | 1,610 | |||||
|
|
|
| |||||
Class R4 | ||||||||
Proceeds from shares issued | 211 | 1,567 | ||||||
Distributions reinvested | 15 | 189 | ||||||
Cost of shares redeemed | (374 | ) | (1,852 | ) | ||||
|
|
|
| |||||
Change in net assets resulting from Class R4 capital transactions | (148 | ) | (96 | ) | ||||
|
|
|
| |||||
Class R5 | ||||||||
Proceeds from shares issued | 1,734 | 6,750 | ||||||
Distributions reinvested | 76 | 246 | ||||||
Cost of shares redeemed | (2,057 | ) | (10,405 | ) | ||||
|
|
|
| |||||
Change in net assets resulting from Class R5 capital transactions | (247 | ) | (3,409 | ) | ||||
|
|
|
| |||||
Class R6 | ||||||||
Proceeds from shares issued | 447,734 | 410,856 | ||||||
Distributions reinvested | 9,920 | 45,569 | ||||||
Cost of shares redeemed | (300,805 | ) | (267,137 | ) | ||||
|
|
|
| |||||
Change in net assets resulting from Class R6 capital transactions | 156,849 | 189,288 | ||||||
|
|
|
| |||||
Total change in net assets resulting from capital transactions | $ | (257,050 | ) | $ | (214,160 | ) | ||
|
|
|
| |||||
SHARE TRANSACTIONS: |
| |||||||
Class A |
| |||||||
Issued | 827 | 1,533 | ||||||
Reinvested | 30 | 382 | ||||||
Redeemed | (1,889 | ) | (4,676 | ) | ||||
|
|
|
| |||||
Change in Class A Shares | (1,032 | ) | (2,761 | ) | ||||
|
|
|
| |||||
Class C |
| |||||||
Issued | 56 | 67 | ||||||
Reinvested | — | (a) | 107 | |||||
Redeemed | (642 | ) | (1,080 | ) | ||||
|
|
|
| |||||
Change in Class C Shares | (586 | ) | (906 | ) | ||||
|
|
|
| |||||
Class I |
| |||||||
Issued | 4,547 | 5,689 | ||||||
Reinvested | 85 | 554 | ||||||
Redeemed | (3,387 | ) | (9,348 | ) | ||||
|
|
|
| |||||
Change in Class I Shares | 1,245 | (3,105 | ) | |||||
|
|
|
| |||||
SEE NOTES TO FINANCIAL STATEMENTS.
| 12 | UNDISCOVERED MANAGERS FUNDS | DECEMBER 31, 2020 | ||||||||
Table of Contents
| Undiscovered Managers Behavioral Value Fund | ||||||||
| Six Months Ended December 31, 2020 (Unaudited) | Year Ended June 30, 2020 | |||||||
SHARE TRANSACTIONS: (continued) |
| |||||||
Class L |
| |||||||
Issued | 4,429 | 18,328 | ||||||
Reinvested | 250 | 1,529 | ||||||
Redeemed | (13,570 | ) | (21,874 | ) | ||||
|
|
|
| |||||
Change in Class L Shares | (8,891 | ) | (2,017 | ) | ||||
|
|
|
| |||||
Class R2 |
| |||||||
Issued | 30 | 82 | ||||||
Reinvested | 1 | 14 | ||||||
Redeemed | (54 | ) | (81 | ) | ||||
|
|
|
| |||||
Change in Class R2 Shares | (23 | ) | 15 | |||||
|
|
|
| |||||
Class R3 |
| |||||||
Issued | 44 | 90 | ||||||
Reinvested | 1 | 4 | ||||||
Redeemed | (45 | ) | (61 | ) | ||||
|
|
|
| |||||
Change in Class R3 Shares | — | (a) | 33 | |||||
|
|
|
| |||||
Class R4 |
| |||||||
Issued | 3 | 29 | ||||||
Reinvested | — | (a) | 3 | |||||
Redeemed | (7 | ) | (42 | ) | ||||
|
|
|
| |||||
Change in Class R4 Shares | (4 | ) | (10 | ) | ||||
|
|
|
| |||||
Class R5 |
| |||||||
Issued | 33 | 145 | ||||||
Reinvested | 1 | 4 | ||||||
Redeemed | (39 | ) | (179 | ) | ||||
|
|
|
| |||||
Change in Class R5 Shares | (5 | ) | (30 | ) | ||||
|
|
|
| |||||
Class R6 |
| |||||||
Issued | 9,078 | 7,982 | ||||||
Reinvested | 157 | 733 | ||||||
Redeemed | (5,777 | ) | (5,129 | ) | ||||
|
|
|
| |||||
Change in Class R6 Shares | 3,458 | 3,586 | ||||||
|
|
|
| |||||
| (a) | Amount rounds to less than one thousand. |
SEE NOTES TO FINANCIAL STATEMENTS.
| DECEMBER 31, 2020 | UNDISCOVERED MANAGERS FUNDS | 13 | ||||||||
Table of Contents
FOR THE PERIODS INDICATED
| Per share operating performance | |||||||||||||||||||||||||||
| Investment operations | Distributions | |||||||||||||||||||||||||||
| Net asset value, beginning of period | Net investment income (loss) (b) | Net realized and unrealized gains (losses) on investments | Total from investment operations | Net investment income | Net realized gain | Total distributions | ||||||||||||||||||||||
Undiscovered Managers Behavioral Value Fund | ||||||||||||||||||||||||||||
Class A | ||||||||||||||||||||||||||||
Six Months Ended December 31, 2020 (Unaudited) | $ | 43.66 | $ | 0.24 | $ | 19.05 | $ | 19.29 | $ | (0.35 | ) | $ | — | $ | (0.35 | ) | ||||||||||||
Year Ended June 30, 2020 | 60.63 | 0.50 | (14.56 | ) | (14.06 | ) | (0.23 | ) | (2.68 | ) | (2.91 | ) | ||||||||||||||||
September 1, 2018 through June 30, 2019 (f) | 73.97 | 0.51 | (7.92 | ) | (7.41 | ) | (0.54 | ) | (5.39 | ) | (5.93 | ) | ||||||||||||||||
Year Ended August 31, 2018 | 63.57 | 0.59 | 12.77 | 13.36 | (0.46 | ) | (2.50 | ) | (2.96 | ) | ||||||||||||||||||
Year Ended August 31, 2017 | 60.15 | 0.32 | 4.95 | 5.27 | (0.40 | ) | (1.45 | ) | (1.85 | ) | ||||||||||||||||||
Year Ended August 31, 2016 | 55.30 | 0.49 | 6.29 | 6.78 | (0.31 | ) | (1.62 | ) | (1.93 | ) | ||||||||||||||||||
Year Ended August 31, 2015 | 55.38 | 0.37 | 0.81 | 1.18 | (0.43 | ) | (0.83 | ) | (1.26 | ) | ||||||||||||||||||
Class C | ||||||||||||||||||||||||||||
Six Months Ended December 31, 2020 (Unaudited) | 40.67 | 0.10 | 17.73 | 17.83 | (0.01 | ) | — | (0.01 | ) | |||||||||||||||||||
Year Ended June 30, 2020 | 56.73 | 0.21 | (13.59 | ) | (13.38 | ) | — | (2.68 | ) | (2.68 | ) | |||||||||||||||||
September 1, 2018 through June 30, 2019 (f) | 69.55 | 0.24 | (7.43 | ) | (7.19 | ) | (0.24 | ) | (5.39 | ) | (5.63 | ) | ||||||||||||||||
Year Ended August 31, 2018 | 59.93 | 0.24 | 12.01 | 12.25 | (0.13 | ) | (2.50 | ) | (2.63 | ) | ||||||||||||||||||
Year Ended August 31, 2017 | 56.84 | 0.01 | 4.67 | 4.68 | (0.14 | ) | (1.45 | ) | (1.59 | ) | ||||||||||||||||||
Year Ended August 31, 2016 | 52.43 | 0.20 | 5.95 | 6.15 | (0.12 | ) | (1.62 | ) | (1.74 | ) | ||||||||||||||||||
Year Ended August 31, 2015 | 52.64 | 0.09 | 0.77 | 0.86 | (0.24 | ) | (0.83 | ) | (1.07 | ) | ||||||||||||||||||
Class I | ||||||||||||||||||||||||||||
Six Months Ended December 31, 2020 (Unaudited) | 44.72 | 0.32 | 19.51 | 19.83 | (0.52 | ) | — | (0.52 | ) | |||||||||||||||||||
Year Ended June 30, 2020 | 62.04 | 0.65 | (14.88 | ) | (14.23 | ) | (0.41 | ) | (2.68 | ) | (3.09 | ) | ||||||||||||||||
September 1, 2018 through June 30, 2019 (f) | 75.61 | 0.65 | (8.11 | ) | (7.46 | ) | (0.72 | ) | (5.39 | ) | (6.11 | ) | ||||||||||||||||
Year Ended August 31, 2018 | 64.95 | 0.78 | 13.04 | 13.82 | (0.66 | ) | (2.50 | ) | (3.16 | ) | ||||||||||||||||||
Year Ended August 31, 2017 | 61.41 | 0.50 | 5.04 | 5.54 | (0.55 | ) | (1.45 | ) | (2.00 | ) | ||||||||||||||||||
Year Ended August 31, 2016 | 56.37 | 0.64 | 6.43 | 7.07 | (0.41 | ) | (1.62 | ) | (2.03 | ) | ||||||||||||||||||
Year Ended August 31, 2015 | 56.41 | 0.52 | 0.82 | 1.34 | (0.55 | ) | (0.83 | ) | (1.38 | ) | ||||||||||||||||||
Class L | ||||||||||||||||||||||||||||
Six Months Ended December 31, 2020 (Unaudited) | 44.88 | 0.35 | 19.61 | 19.96 | (0.58 | ) | — | (0.58 | ) | |||||||||||||||||||
Year Ended June 30, 2020 | 62.25 | 0.74 | (14.93 | ) | (14.19 | ) | (0.50 | ) | (2.68 | ) | (3.18 | ) | ||||||||||||||||
September 1, 2018 through June 30, 2019 (f) | 75.89 | 0.74 | (8.16 | ) | (7.42 | ) | (0.83 | ) | (5.39 | ) | (6.22 | ) | ||||||||||||||||
Year Ended August 31, 2018 | 65.17 | 0.88 | 13.10 | 13.98 | (0.76 | ) | (2.50 | ) | (3.26 | ) | ||||||||||||||||||
Year Ended August 31, 2017 | 61.60 | 0.59 | 5.07 | 5.66 | (0.64 | ) | (1.45 | ) | (2.09 | ) | ||||||||||||||||||
Year Ended August 31, 2016 | 56.52 | 0.73 | 6.44 | 7.17 | (0.47 | ) | (1.62 | ) | (2.09 | ) | ||||||||||||||||||
Year Ended August 31, 2015 | 56.52 | 0.60 | 0.83 | 1.43 | (0.60 | ) | (0.83 | ) | (1.43 | ) | ||||||||||||||||||
| (a) | Annualized for periods less than one year, unless otherwise noted. |
| (b) | Calculated based upon average shares outstanding. |
| (c) | Not annualized for periods less than one year. |
| (d) | Includes adjustments in accordance with accounting principles generally accepted in the United States of America and as such, the net asset values for financial reporting purposes and the returns based upon those net asset values may differ from the net asset values and returns for shareholder transactions. |
| (e) | Includes earnings credits and interest expense, if applicable, each of which is less than 0.005% unless otherwise noted. |
| (f) | The Fund changed its fiscal year end from August 31st to June 30th. |
| (g) | Commencement of offering of class of shares. |
SEE NOTES TO FINANCIAL STATEMENTS.
| 14 | UNDISCOVERED MANAGERS FUNDS | DECEMBER 31, 2020 | ||||||||
Table of Contents
| Ratios/Supplemental data | |||||||||||||||||||||||||
| Ratios to average net assets (a) | ||||||||||||||||||||||||||
| Net asset value, end of period | Total return (excludes sales charge) (c)(d) | Net assets, end of period (000’s) | Net expenses (e) | Net investment income (loss) | Expenses without waivers, reimbursements and earnings credits | Portfolio turnover rate (c) | ||||||||||||||||||||
| $ | 62.60 | 44.20 | % | $ | 377,989 | 1.29 | % | 0.96 | % | 1.35 | % | 11 | % | |||||||||||||
| 43.66 | (24.49 | ) | 308,675 | 1.30 | 0.92 | 1.35 | 44 | |||||||||||||||||||
| 60.63 | (9.41 | ) | 596,068 | 1.30 | 0.99 | 1.35 | 35 | |||||||||||||||||||
| 73.97 | 21.46 | 888,695 | 1.29 | 0.86 | 1.35 | 29 | ||||||||||||||||||||
| 63.57 | 8.76 | 907,053 | 1.28 | 0.51 | 1.76 | 24 | ||||||||||||||||||||
| 60.15 | 12.70 | 1,146,043 | 1.29 | 0.88 | 1.83 | 44 | ||||||||||||||||||||
| 55.30 | 2.23 | 696,222 | 1.29 | 0.66 | 1.86 | 36 | ||||||||||||||||||||
| 58.49 | 43.84 | 80,534 | 1.79 | 0.45 | 1.85 | 11 | ||||||||||||||||||||
| 40.67 | (24.87 | ) | 79,818 | 1.80 | 0.42 | 1.85 | 44 | |||||||||||||||||||
| 56.73 | (9.78 | ) | 162,769 | 1.80 | 0.48 | 1.85 | 35 | |||||||||||||||||||
| 69.55 | 20.85 | 233,455 | 1.79 | 0.37 | 1.85 | 29 | ||||||||||||||||||||
| 59.93 | 8.22 | 247,259 | 1.78 | 0.02 | 2.23 | 24 | ||||||||||||||||||||
| 56.84 | 12.13 | 300,255 | 1.79 | 0.38 | 2.28 | 44 | ||||||||||||||||||||
| 52.43 | 1.73 | 185,342 | 1.79 | 0.17 | 2.31 | 36 | ||||||||||||||||||||
| 64.03 | 44.36 | 875,034 | 1.04 | 1.22 | 1.10 | 11 | ||||||||||||||||||||
| 44.72 | (24.29 | ) | 555,350 | 1.05 | 1.18 | 1.10 | 44 | |||||||||||||||||||
| 62.04 | (9.22 | ) | 963,136 | 1.05 | 1.24 | 1.10 | 35 | |||||||||||||||||||
| 75.61 | 21.75 | 1,220,927 | 1.04 | 1.11 | 1.10 | 29 | ||||||||||||||||||||
| 64.95 | 9.03 | 1,145,714 | 1.03 | 0.77 | 1.44 | 24 | ||||||||||||||||||||
| 61.41 | 12.99 | 1,095,710 | 1.04 | 1.13 | 1.49 | 44 | ||||||||||||||||||||
| 56.37 | 2.49 | 579,340 | 1.04 | 0.91 | 1.54 | 36 | ||||||||||||||||||||
| 64.26 | 44.49 | 2,004,808 | 0.89 | 1.35 | 0.95 | 11 | ||||||||||||||||||||
| 44.88 | (24.18 | ) | 1,799,190 | 0.90 | 1.34 | 0.95 | 44 | |||||||||||||||||||
| 62.25 | (9.11 | ) | 2,621,266 | 0.90 | 1.39 | 0.95 | 35 | |||||||||||||||||||
| 75.89 | 21.95 | 3,589,067 | 0.90 | 1.24 | 0.95 | 29 | ||||||||||||||||||||
| 65.17 | 9.19 | 2,873,203 | 0.88 | 0.91 | 1.28 | 24 | ||||||||||||||||||||
| 61.60 | 13.16 | 2,230,948 | 0.89 | 1.28 | 1.31 | 44 | ||||||||||||||||||||
| 56.52 | 2.65 | 1,154,307 | 0.89 | 1.06 | 1.33 | 36 | ||||||||||||||||||||
SEE NOTES TO FINANCIAL STATEMENTS.
| DECEMBER 31, 2020 | UNDISCOVERED MANAGERS FUNDS | 15 | ||||||||
Table of Contents
FINANCIAL HIGHLIGHTS
FOR THE PERIODS INDICATED (continued)
| Per share operating performance | |||||||||||||||||||||||||||
| Investment operations | Distributions | |||||||||||||||||||||||||||
| Net asset value, beginning of period | Net investment income (loss) (b) | Net realized and unrealized gains (losses) on investments | Total from investment operations | Net investment income | Net realized gain | Total distributions | ||||||||||||||||||||||
Undiscovered Managers Behavioral Value Fund (continued) |
| |||||||||||||||||||||||||||
Class R2 | ||||||||||||||||||||||||||||
Six Months Ended December 31, 2020 (Unaudited) | $ | 43.14 | $ | 0.18 | $ | 18.80 | $ | 18.98 | $ | (0.26 | ) | $ | — | $ | (0.26 | ) | ||||||||||||
Year Ended June 30, 2020 | 59.98 | 0.37 | (14.41 | ) | (14.04 | ) | (0.12 | ) | (2.68 | ) | (2.80 | ) | ||||||||||||||||
September 1, 2018 through June 30, 2019 (f) | 73.28 | 0.37 | (7.83 | ) | (7.46 | ) | (0.45 | ) | (5.39 | ) | (5.84 | ) | ||||||||||||||||
Year Ended August 31, 2018 | 63.05 | 0.42 | 12.65 | 13.07 | (0.34 | ) | (2.50 | ) | (2.84 | ) | ||||||||||||||||||
Year Ended August 31, 2017 | 59.78 | 0.17 | 4.90 | 5.07 | (0.35 | ) | (1.45 | ) | (1.80 | ) | ||||||||||||||||||
Year Ended August 31, 2016 | 55.09 | 0.34 | 6.28 | 6.62 | (0.31 | ) | (1.62 | ) | (1.93 | ) | ||||||||||||||||||
Year Ended August 31, 2015 | 55.18 | 0.20 | 0.84 | 1.04 | (0.30 | ) | (0.83 | ) | (1.13 | ) | ||||||||||||||||||
Class R3 | ||||||||||||||||||||||||||||
Six Months Ended December 31, 2020 (Unaudited) | 43.23 | 0.24 | 18.86 | 19.10 | (0.40 | ) | — | (0.40 | ) | |||||||||||||||||||
Year Ended June 30, 2020 | 60.14 | 0.51 | (14.42 | ) | (13.91 | ) | (0.32 | ) | (2.68 | ) | (3.00 | ) | ||||||||||||||||
September 1, 2018 through June 30, 2019 (f) | 73.69 | 0.44 | (7.86 | ) | (7.42 | ) | (0.74 | ) | (5.39 | ) | (6.13 | ) | ||||||||||||||||
Year Ended August 31, 2018 | 63.57 | 0.47 | 12.86 | 13.33 | (0.71 | ) | (2.50 | ) | (3.21 | ) | ||||||||||||||||||
March 1, 2017 (g) through August 31, 2017 | 64.80 | 0.13 | (1.36 | ) | (1.23 | ) | — | — | — | |||||||||||||||||||
Class R4 | ||||||||||||||||||||||||||||
Six Months Ended December 31, 2020 (Unaudited) | 44.58 | 0.31 | 19.46 | 19.77 | (0.47 | ) | — | (0.47 | ) | |||||||||||||||||||
Year Ended June 30, 2020 | 61.89 | 0.67 | (14.86 | ) | (14.19 | ) | (0.44 | ) | (2.68 | ) | (3.12 | ) | ||||||||||||||||
September 1, 2018 through June 30, 2019 (f) | 75.50 | 0.63 | (8.09 | ) | (7.46 | ) | (0.76 | ) | (5.39 | ) | (6.15 | ) | ||||||||||||||||
Year Ended August 31, 2018 | 64.94 | 0.76 | 13.06 | 13.82 | (0.76 | ) | (2.50 | ) | (3.26 | ) | ||||||||||||||||||
March 1, 2017 (g) through August 31, 2017 | 66.12 | 0.15 | (1.33 | ) | (1.18 | ) | — | — | — | |||||||||||||||||||
Class R5 | ||||||||||||||||||||||||||||
Six Months Ended December 31, 2020 (Unaudited) | 44.86 | 0.36 | 19.58 | 19.94 | (0.59 | ) | — | (0.59 | ) | |||||||||||||||||||
Year Ended June 30, 2020 | 62.20 | 0.77 | (14.95 | ) | (14.18 | ) | (0.48 | ) | (2.68 | ) | (3.16 | ) | ||||||||||||||||
September 1, 2018 through June 30, 2019 (f) | 75.88 | 0.61 | (8.04 | ) | (7.43 | ) | (0.86 | ) | (5.39 | ) | (6.25 | ) | ||||||||||||||||
Year Ended August 31, 2018 | 65.17 | 0.72 | 13.26 | 13.98 | (0.77 | ) | (2.50 | ) | (3.27 | ) | ||||||||||||||||||
March 1, 2017 (g) through August 31, 2017 | 66.30 | 0.29 | (1.42 | ) | (1.13 | ) | — | — | — | |||||||||||||||||||
Class R6 | ||||||||||||||||||||||||||||
Six Months Ended December 31, 2020 (Unaudited) | 44.97 | 0.39 | 19.64 | 20.03 | (0.64 | ) | — | (0.64 | ) | |||||||||||||||||||
Year Ended June 30, 2020 | 62.36 | 0.80 | (14.95 | ) | (14.15 | ) | (0.56 | ) | (2.68 | ) | (3.24 | ) | ||||||||||||||||
September 1, 2018 through June 30, 2019 (f) | 76.05 | 0.74 | (8.14 | ) | (7.40 | ) | (0.90 | ) | (5.39 | ) | (6.29 | ) | ||||||||||||||||
Year Ended August 31, 2018 | 65.29 | 0.94 | 13.15 | 14.09 | (0.83 | ) | (2.50 | ) | (3.33 | ) | ||||||||||||||||||
Year Ended August 31, 2017 | 61.70 | 0.66 | 5.07 | 5.73 | (0.69 | ) | (1.45 | ) | (2.14 | ) | ||||||||||||||||||
Year Ended August 31, 2016 | 56.59 | 0.72 | 6.52 | 7.24 | (0.51 | ) | (1.62 | ) | (2.13 | ) | ||||||||||||||||||
Year Ended August 31, 2015 | 56.58 | 0.63 | 0.85 | 1.48 | (0.64 | ) | (0.83 | ) | (1.47 | ) | ||||||||||||||||||
| (a) | Annualized for periods less than one year, unless otherwise noted. |
| (b) | Calculated based upon average shares outstanding. |
| (c) | Not annualized for periods less than one year. |
| (d) | Includes adjustments in accordance with accounting principles generally accepted in the United States of America and as such, the net asset values for financial reporting purposes and the returns based upon those net asset values may differ from the net asset values and returns for shareholder transactions. |
| (e) | Includes earnings credits and interest expense, if applicable, each of which is less than 0.005% unless otherwise noted. |
| (f) | The Fund changed its fiscal year end from August 31st to June 30th. |
| (g) | Commencement of offering of class of shares. |
SEE NOTES TO FINANCIAL STATEMENTS.
| 16 | UNDISCOVERED MANAGERS FUNDS | DECEMBER 31, 2020 | ||||||||
Table of Contents
| Ratios/Supplemental data | |||||||||||||||||||||||||
| Ratios to average net assets (a) | ||||||||||||||||||||||||||
| Net asset value, end of period | Total return (excludes sales charge) (c)(d) | Net assets, end of period (000’s) | Net expenses (e) | Net investment income (loss) | Expenses without waivers, reimbursements and earnings credits | Portfolio turnover rate (c) | ||||||||||||||||||||
| $ | 61.86 | 44.02 | % | $ | 18,113 | 1.54 | % | 0.72 | % | 1.62 | % | 11 | % | |||||||||||||
| 43.14 | (24.68 | ) | 13,640 | 1.55 | 0.71 | 1.62 | 44 | |||||||||||||||||||
| 59.98 | (9.59 | ) | 18,078 | 1.55 | 0.72 | 1.63 | 35 | |||||||||||||||||||
| 73.28 | 21.16 | 20,684 | 1.54 | 0.61 | 1.63 | 29 | ||||||||||||||||||||
| 63.05 | 8.47 | 17,759 | 1.53 | 0.27 | 2.05 | 24 | ||||||||||||||||||||
| 59.78 | 12.43 | 12,822 | 1.54 | 0.61 | 2.10 | 44 | ||||||||||||||||||||
| 55.09 | 1.98 | 4,845 | 1.54 | 0.36 | 2.10 | 36 | ||||||||||||||||||||
| 61.93 | 44.20 | 6,058 | 1.29 | 0.96 | 1.35 | 11 | ||||||||||||||||||||
| 43.23 | (24.48 | ) | 4,254 | 1.30 | 0.99 | 1.36 | 44 | |||||||||||||||||||
| 60.14 | (9.41 | ) | 3,935 | 1.29 | 0.88 | 1.36 | 35 | |||||||||||||||||||
| 73.69 | 21.45 | 1,784 | 1.30 | 0.67 | 1.38 | 29 | ||||||||||||||||||||
| 63.57 | (1.90 | ) | 133 | 1.29 | 0.40 | 1.66 | 24 | |||||||||||||||||||
| 63.88 | 44.37 | 2,052 | 1.04 | 1.21 | 1.11 | 11 | ||||||||||||||||||||
| 44.58 | (24.29 | ) | 1,584 | 1.05 | 1.20 | 1.11 | 44 | |||||||||||||||||||
| 61.89 | (9.22 | ) | 2,827 | 1.05 | 1.20 | 1.11 | 35 | |||||||||||||||||||
| 75.50 | 21.76 | 2,461 | 1.05 | 1.08 | 1.10 | 29 | ||||||||||||||||||||
| 64.94 | (1.78 | ) | 1,586 | 1.04 | 0.47 | 1.42 | 24 | |||||||||||||||||||
| 64.21 | 44.48 | 12,863 | 0.89 | 1.37 | 0.95 | 11 | ||||||||||||||||||||
| 44.86 | (24.18 | ) | 9,215 | 0.90 | 1.40 | 0.96 | 44 | |||||||||||||||||||
| 62.20 | (9.11 | ) | 14,636 | 0.89 | 1.18 | 0.95 | 35 | |||||||||||||||||||
| 75.88 | 21.95 | 4,521 | 0.90 | 1.00 | 1.02 | 29 | ||||||||||||||||||||
| 65.17 | (1.70 | ) | 821 | 0.89 | 0.88 | 1.26 | 24 | |||||||||||||||||||
| 64.36 | 44.56 | 1,478,893 | 0.80 | 1.49 | 0.85 | 11 | ||||||||||||||||||||
| 44.97 | (24.10 | ) | 877,755 | 0.80 | 1.47 | 0.85 | 44 | |||||||||||||||||||
| 62.36 | (9.04 | ) | 993,739 | 0.80 | 1.41 | 0.85 | 35 | |||||||||||||||||||
| 76.05 | 22.08 | 727,352 | 0.80 | 1.33 | 0.85 | 29 | ||||||||||||||||||||
| 65.29 | 9.29 | 464,750 | 0.78 | 1.01 | 1.16 | 24 | ||||||||||||||||||||
| 61.70 | 13.28 | 309,958 | 0.78 | 1.24 | 1.17 | 44 | ||||||||||||||||||||
| 56.59 | 2.73 | 54,931 | 0.79 | 1.10 | 1.19 | 36 | ||||||||||||||||||||
SEE NOTES TO FINANCIAL STATEMENTS.
| DECEMBER 31, 2020 | UNDISCOVERED MANAGERS FUNDS | 17 | ||||||||
Table of Contents
AS OF DECEMBER 31, 2020 (Unaudited)
1. Organization
Undiscovered Managers Funds (the “Trust”) was organized on September 29, 1997, as a Massachusetts business trust and is registered under the Investment Company Act of 1940, as amended (the “1940 Act”), as an open-end management investment company.
The following is a separate fund of the Trust (the “Fund”) covered by this report:
| Classes Offered | Diversification Classification | |||
| Undiscovered Managers Behavioral Value Fund | Class A, Class C, Class I, Class L, Class R2, Class R3, Class R4, Class R5 and Class R6 | Diversified |
The investment objective of the Fund is capital appreciation.
Class L Shares of the Fund are publicly offered on a limited basis. Investors are not eligible to purchase shares of the Fund unless they meet certain requirements as described in the Fund’s prospectus. Prior to April 15, 2020, Class A, Class C, Class I, Class R2, Class R3, Class R4, Class R5 and Class R6 Shares were publicly offered on a limited basis. Investors were not eligible to purchase shares of the Fund unless they met certain requirements as described in the Fund’s prospectus.
Class A Shares generally provide for a front-end sales charge while Class C Shares provide for a contingent deferred sales charge (“CDSC”). No sales charges are assessed with respect to Class I, Class L, Class R2, Class R3, Class R4, Class R5 and Class R6 Shares. Certain Class A Shares, for which front-end sales charges have been waived, may be subject to a CDSC as described in the Fund’s prospectus. Effective October 1, 2020, Class C Shares automatically convert to Class A Shares after eight years. Prior to October 1, 2020, Class C Shares automatically converted to Class A Shares after ten years. All classes of shares have equal rights as to earnings, assets and voting privileges, except that each class may bear different transfer agency, distribution and service fees and each class has exclusive voting rights with respect to its distribution plan and shareholder servicing agreements.
J.P. Morgan Investment Management Inc. (“JPMIM”), an indirect, wholly-owned subsidiary of JPMorgan Chase & Co. (“JPMorgan”), acts as Adviser (the “Adviser”) and Administrator (the “Administrator”) to the Fund.
2. Significant Accounting Policies
The following is a summary of significant accounting policies followed by the Fund in the preparation of its financial statements. The Fund is an investment company and, accordingly, follows the investment company accounting and reporting guidance of the Financial Accounting Standards Board (“FASB”) Accounting Standards Codification Topic 946 — Investment Companies, which is part of U.S. generally accepted accounting principles (“GAAP”). The preparation of financial statements in conformity with GAAP requires management to make estimates and assumptions that affect (i) the reported amounts of assets and liabilities, (ii) disclosure of contingent assets and liabilities at the date of the financial statements, and (iii) the reported amounts of increases and decreases in net assets from operations during the reporting period. Actual results could differ from those estimates.
A. Valuation of Investments — Investments are valued in accordance with GAAP and the Fund’s valuation policies set forth by, and under the supervision and responsibility of, the Board of Trustees of the Trust (the “Board”), which established the following approach to valuation, as described more fully below: (i) investments for which market quotations are readily available shall be valued at their market value and (ii) all other investments for which market quotations are not readily available shall be valued at their fair value as determined in good faith by the Board.
The Administrator has established the J.P. Morgan Asset Management Americas Valuation Committee (“AVC”) to assist the Board with the oversight and monitoring of the valuation of the Fund’s investments. The Administrator implements the valuation policies of the Fund’s investments, as directed by the Board. The AVC oversees and carries out the policies for the valuation of investments held in the Fund. This includes monitoring the appropriateness of fair values based on results of ongoing valuation oversight including, but not limited to, consideration of macro or security specific events, market events, and pricing vendor and broker due diligence. The Administrator is responsible for discussing and assessing the potential impacts to the fair values on an ongoing basis, and, at least on a quarterly basis, with the AVC and the Board.
Equities and other exchange-traded instruments are valued at the last sale price or official market closing price on the primary exchange on which the instrument is traded before the net asset values (“NAV”) of the Fund are calculated on a valuation date.
Investments in open-end investment companies (“Underlying Funds”) are valued at each Underlying Fund’s NAV per share as of the report date.
Valuations reflected in this report are as of the report date. As a result, changes in valuation due to market events and/or issuer-related events after the report date and prior to issuance of the report are not reflected herein.
The various inputs that are used in determining the valuation of the Fund’s investments are summarized into the three broad levels listed below.
| • | Level 1 — Unadjusted inputs using quoted prices in active markets for identical investments. |
| • | Level 2 — Other significant observable inputs including, but not limited to, quoted prices for similar investments, inputs other than quoted prices that are observable for investments (such as interest rates, prepayment speeds, credit risk, etc.) or other market corroborated inputs. |
| • | Level 3 — Significant inputs based on the best information available in the circumstances, to the extent observable inputs are not available (including the Fund’s assumptions in determining the fair value of investments). |
| 18 | UNDISCOVERED MANAGERS FUNDS | DECEMBER 31, 2020 | ||||||||
Table of Contents
A financial instrument’s level within the fair value hierarchy is based on the lowest level of any input, both individually and in the aggregate, that is significant to the fair value measurement. The inputs or methodology used for valuing instruments are not necessarily an indication of the risk associated with investing in those instruments.
The following table represents each valuation input as presented on the Schedule of Portfolio Investments (“SOI”) (amounts in thousands):
| Level 1 Quoted prices | Level 2 Other significant observable inputs | Level 3 Significant | Total | |||||||||||||
Total Investments in Securities (a) | $ | 4,984,672 | $ | — | $ | — | $ | 4,984,672 | ||||||||
|
|
|
|
|
|
|
| |||||||||
| (a) | Please refer to the SOI for specifics of portfolio holdings. |
B. Securities Lending — The Fund is authorized to engage in securities lending in order to generate additional income. The Fund is able to lend to approved borrowers. Citibank N.A. (“Citibank”) serves as lending agent for the Fund, pursuant to a Securities Lending Agency Agreement (the “Securities Lending Agency Agreement”). Securities loaned are collateralized by cash equal to at least 100% of the market value plus accrued interest on the securities lent, which is invested in the Class IM Shares of the JPMorgan U.S. Government Money Market Fund and the Agency SL Class Shares of the JPMorgan Securities Lending Money Market Fund. The Fund retains loan fees and the interest on cash collateral investments but is required to pay the borrower a rebate for the use of cash collateral. In cases where the lent security is of high value to borrowers, there may be a negative rebate (i.e., a net payment from the borrower to the Fund). Upon termination of a loan, the Fund is required to return to the borrower an amount equal to the cash collateral, plus any rebate owed to the borrowers. The remaining maturities of the securities lending transactions are considered overnight and continuous. Loans are subject to termination by the Fund or the borrower at any time.
The net income earned on the securities lending (after payment of rebates and Citibank’s fee) is included on the Statement of Operations as Income from securities lending (net). The Fund also receives payments from the borrower during the period of the loan, equivalent to dividends and interest earned on the securities loaned, which are recorded as Dividend or Interest income, respectively, on the Statement of Operations.
Under the Securities Lending Agency Agreement, Citibank marks to market the loaned securities on a daily basis. In the event the cash received from the borrower is less than 102% of the value of the loaned securities (105% for loans of non-U.S. securities), Citibank requests additional cash from the borrower so as to maintain a collateralization level of at least 102% of the value of the loaned securities plus accrued interest (105% for loans of non-U.S. securities), subject to certain de minimis amounts.
The value of securities out on loan is recorded as an asset on the Statement of Assets and Liabilities. The value of the cash collateral received is recorded as a liability on the Statement of Assets and Liabilities and details of collateral investments are disclosed on the SOI.
The Fund bears the risk of loss associated with the collateral investments and is not entitled to additional collateral from the borrower to cover any such losses. To the extent that the value of the collateral investments declines below the amount owed to a borrower, the Fund may incur losses that exceed the amount it earned on lending the security. Upon termination of a loan, the Fund may use leverage (borrow money) to repay the borrower for cash collateral posted if the Adviser does not believe that it is prudent to sell the collateral investments to fund the payment of this liability. Securities lending activity is subject to master netting arrangements.
The following table presents the Fund’s value of the securities on loan with Citibank, net of amounts available for offset under the master netting arrangements and any related collateral received or posted by the Fund as of December 31, 2020 (amounts in thousands).
| Investment Securities on Loan, at value, Presented on the Statement of Assets and Liabilities | Cash Collateral Posted by Borrower* | Net Amount Due to Counterparty (not less than zero) | ||||||||||
| $ | 110,652 | $ | (110,652 | ) | $ | — | ||||||
| * | Collateral posted reflects the value of securities on loan and does not include any additional amounts received from the borrower. |
Securities lending also involves counterparty risks, including the risk that the loaned securities may not be returned in a timely manner or at all. Subject to certain conditions, Citibank has agreed to indemnify the Fund from losses resulting from a borrower’s failure to return a loaned security.
JPMIM voluntarily waived investment advisory fees charged to the Fund to reduce the impact of the cash collateral investment in the JPMorgan U.S. Government Money Market Fund from 0.15% to 0.06%. For the six months ended December 31, 2020, JPMIM waived fees associated with the Fund’s investment in the JPMorgan U.S. Government Money Market Fund as follows (amounts in thousands):
| $ | 3 |
The above waiver is included in the determination of earnings on cash collateral investment and in the calculation of Citibank’s compensation and is included on the Statement of Operations as Income from securities lending (net).
| DECEMBER 31, 2020 | UNDISCOVERED MANAGERS FUNDS | 19 | ||||||||
Table of Contents
NOTES TO FINANCIAL STATEMENTS
AS OF DECEMBER 31, 2020 (Unaudited) (continued)
C. Investment Transactions with Affiliates — The Fund invested in Underlying Funds which are advised by the Adviser. An issuer which is under common control with the Fund may be considered an affiliate. For the purposes of the financial statements, the Fund assumes the issuers listed in the table below to be affiliated issuers. Underlying Funds’ distributions may be reinvested into the Underlying Funds. Reinvestment amounts are included in the purchase cost amounts in the table below. Amounts in the table below are in thousands.
| For the six months ended December 31, 2020 | ||||||||||||||||||||||||||||||||||||
| Security Description | Value at June 30, 2020 | Purchases at Cost | Proceeds from Sales | Net Realized Gain (Loss) | Change in Unrealized Appreciation/ (Depreciation) | Value at December 31, 2020 | Shares at December 31, 2020 | Dividend Income | Capital Gain Distributions | |||||||||||||||||||||||||||
JPMorgan Prime Money Market Fund Class IM Shares, 0.12% (a)(b) | $ | 65,770 | $ | 567,466 | $ | 508,808 | $ | (8 | ) | $ | (8 | ) | $ | 124,412 | 124,349 | $ | 34 | $ | — | |||||||||||||||||
JPMorgan Securities Lending Money Market Fund Agency SL Class Shares, 0.15% (a)(b) | 86,997 | 149,000 | 139,001 | (17 | )* | (3 | ) | 96,976 | 96,966 | 104 | * | — | ||||||||||||||||||||||||
JPMorgan U.S. Government Money Market Fund Class IM Shares, 0.03% (a)(b) | 12,828 | 126,375 | 122,524 | — | — | 16,679 | 16,679 | 3 | * | — | ||||||||||||||||||||||||||
|
|
|
|
|
|
|
|
|
|
|
|
|
|
|
| |||||||||||||||||||||
Total | $ | 165,595 | $ | 842,841 | $ | 770,333 | $ | (25 | ) | $ | (11 | ) | $ | 238,067 | $ | 141 | $ | — | ||||||||||||||||||
|
|
|
|
|
|
|
|
|
|
|
|
|
|
|
| |||||||||||||||||||||
| (a) | Investment in an affiliated fund, which is registered under the Investment Company Act of 1940, as amended, and is advised by J.P. Morgan Investment Management Inc. |
| (b) | The rate shown is the current yield as of December 31, 2020. |
| * | Amount is included on the Statement of Operations as Income from securities lending (net) (after payments of rebates and Citibank’s fee). |
D. Security Transactions and Investment Income — Investment transactions are accounted for on the trade date (the date the order to buy or sell is executed). Securities gains and losses are calculated on a specifically identified cost basis. Dividend income is recorded on the ex-dividend date or when the Fund first learns of the dividend.
To the extent such information is publicly available, the Fund records distributions received in excess of income earned from underlying investments as a reduction of cost of investments and/or realized gain. Such amounts are based on estimates if actual amounts are not available and actual amounts of income, realized gain and return of capital may differ from the estimated amounts. The Fund adjusts the estimated amounts of the components of distributions (and consequently its net investment income) as necessary, once the issuers provide information about the actual composition of the distributions.
E. Allocation of Income and Expenses — Expenses directly attributable to the Fund are charged directly to the Fund, while the expenses attributable to more than one fund of the Trust are allocated among the applicable funds. Investment income, realized and unrealized gains and losses and expenses, other than class-specific expenses, are allocated daily to each class of shares based upon the proportion of net assets of each class at the beginning of each day.
Transfer agency fees are class-specific expenses. The amount of the transfer agency fees charged to each share class of the Fund for the six months ended December 31, 2020 are as follows (amounts in thousands):
| Class A | Class C | Class I | Class L | Class R2 | Class R3 | Class R4 | Class R5 | Class R6 | Total | |||||||||||||||||||||||||||||||
Transfer agency fees | $ | 12 | $ | 3 | $ | 6 | $ | 68 | $ | 2 | $ | — | (a) | $ | — | (a) | $ | 1 | $ | 29 | $ | 121 | ||||||||||||||||||
| (a) | Amount rounds to less than one thousand. |
F. Federal Income Taxes — The Fund is treated as a separate taxable entity for Federal income tax purposes. The Fund’s policy is to comply with the provisions of the Internal Revenue Code (the “Code”) applicable to regulated investment companies and to distribute to shareholders all of its distributable net investment income and net realized capital gains on investments. Accordingly, no provision for Federal income tax is necessary. Management has reviewed the Fund’s tax positions for all open tax years and has determined that as of December 31, 2020, no liability for Federal income tax is required in the Fund’s financial statements for net unrecognized tax benefits. However, management’s conclusions may be subject to future review based on changes in, or the interpretation of, the accounting standards or tax laws and regulations. The Fund’s Federal tax returns for the prior three fiscal years remain subject to examination by the Internal Revenue Service.
G. Distributions to Shareholders — Distributions from net investment income, if any, are generally declared and paid at least annually and are declared separately for each class. No class has preferential dividend rights; differences in per share rates are due to differences in separate class expenses. Net realized capital gains, if any, are distributed at least annually. The amount of distributions from net investment income and net realized capital gains is determined in accordance with Federal income tax regulations, which may differ from GAAP. To the extent these “book/tax” differences are permanent in nature (i.e., that they result from other than timing of recognition — “temporary differences”), such amounts are reclassified within the capital accounts based on their Federal tax basis treatment.
| 20 | UNDISCOVERED MANAGERS FUNDS | DECEMBER 31, 2020 | ||||||||
Table of Contents
H. Recent Accounting Pronouncement — In March 2020, the FASB issued Accounting Standards Update No. 2020-04 (“ASU 2020-04”), Reference Rate Reform (Topic 848) – Facilitation of the Effects of Reference Rate Reform on Financial Reporting. ASU 2020-04 provides optional temporary financial reporting relief from the effect of certain types of contract modifications due to the planned discontinuation of the London Interbank Offered Rate (“LIBOR”) and other interbank-offered based reference rates as of the end of 2021. ASU 2020-04 became effective upon the issuance and its optional relief can be applied through December 31, 2022. Management is currently evaluating the impact, if any, to the Fund’s financial statements of applying ASU 2020-04.
3. Fees and Other Transactions with Affiliates
A. Investment Advisory Fee — Pursuant to an Investment Advisory Agreement, the Adviser manages the investments of the Fund and for such services is paid a fee. The investment advisory fee is accrued daily and paid monthly at an annual rate of 0.75% of the Fund’s average daily net assets.
A Sub-advisory Agreement exists between JPMIM and Fuller & Thaler Asset Management, Inc. for the Fund. Under the terms of the Sub-Advisory Agreement, JPMIM pays the sub-adviser a portion of fees received by JPMIM.
The Adviser waived investment advisory fees and/or reimbursed expenses as outlined in Note 3.F.
B. Administration Fee — Pursuant to an Administration Agreement, the Administrator provides certain administration services to the Fund. In consideration of these services, the Administrator receives a fee accrued daily and paid monthly at an annual rate of 0.075% of the first $10 billion of the Fund’s average daily net assets, plus 0.050% of the Fund’s average daily net assets between $10 billion and $20 billion, plus 0.025% of the Fund’s average daily net assets between $20 billion and $25 billion, plus 0.01% of the Fund’s average daily net assets in excess of $25 billion. For the six months ended December 31, 2020, the effective annualized rate was 0.07% of the Fund’s average daily net assets, notwithstanding any fee waivers and/or expense reimbursements.
The Administrator waived administration fees as outlined in Note 3.F.
JPMorgan Chase Bank, N.A. (“JPMCB”), a wholly-owned subsidiary of JPMorgan, serves as the Fund’s sub-administrator (the “Sub-administrator”). For its services as Sub-administrator, JPMCB receives a portion of the fees payable to the Administrator.
C. Distribution Fees — Pursuant to a Distribution Agreement, JPMorgan Distribution Services, Inc. (“JPMDS”), an indirect, wholly-owned subsidiary of JPMorgan, serves as the Fund’s principal underwriter and promotes and arranges for the sale of the Fund’s shares.
The Board has adopted a Distribution Plan (the “Distribution Plan”) for Class A, Class C, Class R2 and Class R3 Shares of the Fund pursuant to Rule 12b-1 under the 1940 Act. Class I, Class L, Class R4, Class R5 and Class R6 Shares of the Fund do not charge a distribution fee. The Distribution Plan provides that the Fund shall pay, with respect to the applicable share classes, distribution fees, including payments to JPMDS, at annual rates of the average daily net assets as shown in the table below:
| Class A | Class C | Class R2 | Class R3 | |||||||||||
| 0.25% | 0.75 | % | 0.50 | % | 0.25 | % | ||||||||
In addition, JPMDS is entitled to receive the front-end sales charges from purchases of Class A Shares and the CDSC from redemptions of Class C Shares and certain Class A Shares for which front-end sales charges have been waived. For the six months ended December 31, 2020, JPMDS retained the following (amounts in thousands):
| Front-End Sales Charge | CDSC | |||||
| $14 | $ | — | (a) | |||
| (a) | Amount rounds to less than one thousand. |
D. Service Fees — The Trust, on behalf of the Fund, has entered into a Shareholder Servicing Agreement with JPMDS under which JPMDS provides certain support services to fund shareholders. For performing these services, JPMDS receives a fee with respect to all share classes, except Class R6 Shares which do not charge a service fee, that is accrued daily and paid monthly equal to a percentage of the average daily net assets as shown in the table below:
| Class A | Class C | Class I | Class L | Class R2 | Class R3 | Class R4 | Class R5 | |||||||||||||||||||||||
| 0.25% | 0.25 | % | 0.25 | % | 0.10 | % | 0.25 | % | 0.25 | % | 0.25 | % | 0.10 | % | ||||||||||||||||
JPMDS has entered into shareholder services contracts with affiliated and unaffiliated financial intermediaries who provide shareholder services and other related services to their clients or customers who invest in the Fund. Pursuant to such contracts, JPMDS will pay all or a portion of such fees earned to financial intermediaries for performing such services.
JPMDS waived service fees as outlined in Note 3.F.
E. Custodian and Accounting Fees — JPMCB provides portfolio custody and accounting services to the Fund. For performing these services, the Fund pays JPMCB transaction and asset-based fees that vary according to the number of transactions and positions, plus out-of-pocket expenses. The amounts paid directly to JPMCB by the Fund for custody and accounting services are included in Custodian and accounting fees on the Statement of Operations.
| DECEMBER 31, 2020 | UNDISCOVERED MANAGERS FUNDS | 21 | ||||||||
Table of Contents
NOTES TO FINANCIAL STATEMENTS
AS OF DECEMBER 31, 2020 (Unaudited) (continued)
Interest income earned on cash balances at the custodian, if any, is included in Interest income from affiliates on the Statement of Operations.
Interest expense paid to the custodian related to cash overdrafts, if any, is included in Interest expense to affiliates on the Statement of Operations.
F. Waivers and Reimbursements — The Adviser, Administrator and/or JPMDS have contractually agreed to waive fees and/or reimburse the Fund to the extent that total annual operating expenses (excluding acquired fund fees and expenses other than certain money market fund fees as described below, dividend and interest expenses related to short sales, interest, taxes, expenses related to litigation and potential litigation, expenses related to trustee elections and extraordinary expenses) exceed the percentages of the Fund’s respective average daily net assets as shown in the table below:
| Class A | Class C | Class I | Class L | Class R2 | Class R3 | Class R4 | Class R5 | Class R6 | ||||||||||||||||||||||||||
| 1.30% | 1.80 | % | 1.05 | % | 0.90 | % | 1.55 | % | 1.30 | % | 1.05 | % | 0.90 | % | 0.80 | % | ||||||||||||||||||
The expense limitation agreement was in effect for the six months ended December 31, 2020 and the contractual expense limitation percentages in the table above are in place until at least October 31, 2021.
For the six months ended December 31, 2020, the Fund’s service providers waived fees and/or reimbursed expenses for the Fund as follows (amounts in thousands). None of these parties expect the Fund to repay any such waived fees and/or reimbursed expenses in future years.
| Contractual Waivers | ||||||||||||||||||||
| Investment Advisory Fees | Administration Fees | Service Fees | Total | Contractual Reimbursements | ||||||||||||||||
| $ | 914 | $ | 91 | $ | 63 | $ | 1,068 | $ | 17 | |||||||||||
Additionally, the Fund may invest in one or more money market funds advised by the Adviser (affiliated money market funds). The Adviser, Administrator and/or JPMDS, as shareholder servicing agent, have contractually agreed to waive fees and/or reimburse expenses in an amount sufficient to offset the respective net fees each collects from the affiliated money market fund on the Fund’s investment in such affiliated money market fund, except for investments of securities lending cash collateral. None of these parties expect the Fund to repay any such waived fees and/or reimbursed expenses in future years.
The amount of these waivers resulting from investments in these money market funds for the six months ended December 31, 2020 was approximately $19,000.
G. Other — Certain officers of the Trust are affiliated with the Adviser, the Administrator and JPMDS. Such officers, with the exception of the Chief Compliance Officer, receive no compensation from the Fund for serving in their respective roles.
The Board designated and appointed a Chief Compliance Officer to the Fund pursuant to Rule 38a-1 under the 1940 Act. The Fund, along with affiliated funds, makes reimbursement payments, on a pro-rata basis, to the Administrator for a portion of the fees associated with the office of the Chief Compliance Officer. Such fees are included in Trustees’ and Chief Compliance Officer’s fees on the Statement of Operations.
The Trust adopted a Trustee Deferred Compensation Plan (the “Plan”) which allows the independent Trustees to defer the receipt of all or a portion of compensation related to performance of their duties as Trustees. The deferred fees are invested in various J.P. Morgan Funds until distribution in accordance with the Plan.
The Securities and Exchange Commission (“SEC”) has granted an exemptive order permitting the Fund to engage in principal transactions with J.P. Morgan Securities LLC, an affiliated broker, involving taxable money market instruments, subject to certain conditions.
4. Investment Transactions
During the six months ended December 31, 2020, purchases and sales of investments (excluding short-term investments) were as follows (amounts in thousands):
| Purchases (excluding U.S. Government) | Sales (excluding U.S. Government) | |||||||
| $ | 426,866 | $ | 743,487 | |||||
During the six months ended December 31, 2020, there were no purchases or sales of U.S. Government securities.
5. Federal Income Tax Matters
For Federal income tax purposes, the estimated cost and unrealized appreciation (depreciation) in value of investments held at December 31, 2020 were as follows (amounts in thousands):
| Aggregate Cost | Gross Unrealized Appreciation | Gross Unrealized Depreciation | Net Unrealized Appreciation (Depreciation) | |||||||||||
| $4,138,918 | $ | 1,121,005 | $ | 275,251 | $ | 845,754 | ||||||||
| 22 | UNDISCOVERED MANAGERS FUNDS | DECEMBER 31, 2020 | ||||||||
Table of Contents
As of June 30, 2020, the Fund had net capital loss carryforwards as follows (amounts in thousands):
| Capital Loss Carryforward Character | ||||||||
| Short-Term | Long-Term | |||||||
| $ | — | $ | 10,434 | |||||
Late year ordinary losses incurred after December 31 as well as net capital losses incurred after October 31 and within the taxable year are deemed to arise on the first business day of the Fund’s next taxable year. For the year ended June 30, 2020, the Fund deferred to July 1, 2020 late year ordinary losses and post-October capital losses of (amounts in thousands):
| Net Capital Losses | ||||||||
| Short-Term | Long-Term | |||||||
| $ | 43,633 | $ | 47,656 | |||||
6. Borrowings
The Fund relies upon an exemptive order granted by the SEC (the “Order”) permitting the establishment and operation of an Interfund Lending Facility (the “Facility”). The Facility allows the Fund to directly lend and borrow money to or from any other fund relying upon the Order at rates beneficial to both the borrowing and lending funds. Advances under the Facility are taken primarily for temporary or emergency purposes, including the meeting of redemption requests that otherwise might require the untimely disposition of securities, and are subject to the Fund’s borrowing restrictions. The Interfund loan rate is determined, as specified in the Order, by averaging the current repurchase agreement rate and the current bank loan rate. The Order was granted to JPMorgan Trust II and may be relied upon by the Fund because the Fund and the series of JPMorgan Trust II are all investment companies in the same “group of investment companies” (as defined in Section 12(d)(1)(G) of the 1940 Act).
The Fund had no borrowings outstanding from another fund at December 31, 2020. Average borrowings from the Facility during the six months ended December 31, 2020, were as follows (amounts in thousands, except number of days outstanding):
| Average Borrowings | Average Interest Rate Paid | Number of Days Outstanding | Interest Paid | |||||||||||||
| $ | 8,647 | 0.82 | % | 12 | $ | 2 | ||||||||||
The Trust and JPMCB have entered into a financing arrangement. Under this arrangement, JPMCB provides an unsecured, uncommitted credit facility in the aggregate amount of $100 million to certain of the J.P. Morgan Funds, including the Fund. Advances under the arrangement are taken primarily for temporary or emergency purposes, including the meeting of redemption requests that otherwise might require the untimely disposition of securities, and are subject to the Fund’s borrowing restrictions. Interest on borrowings is payable at a rate determined by JPMCB at the time of borrowing. This agreement has been extended until November 1, 2021.
The Fund had no borrowings outstanding from the unsecured, uncommitted credit facility during the six months ended December 31, 2020.
The Trust, along with certain other trusts for J.P. Morgan Funds (“Borrowers”), has entered into a joint syndicated senior unsecured revolving credit facility totaling $1.5 billion (“Credit Facility”) with various lenders and The Bank of New York Mellon, as administrative agent for the lenders. This Credit Facility provides a source of funds to the Borrowers for temporary and emergency purposes, including the meeting of redemption requests that otherwise might require the untimely disposition of securities. Under the terms of the Credit Facility, a borrowing fund must have a minimum of $25,000,000 in adjusted net asset value and not exceed certain adjusted net asset coverage ratios prior to and during the time in which any borrowings are outstanding. If a fund does not comply with the aforementioned requirements, the fund must remediate within three business days with respect to the $25,000,000 minimum adjusted net asset value or within one business day with respect to certain asset coverage ratios or the administrative agent at the request of, or with the consent of, the lenders may terminate the Credit Facility and declare any outstanding borrowings to be due and payable immediately.
Interest associated with any borrowing under the Credit Facility is charged to the borrowing fund at a rate of interest equal to 1.00%, which has increased to 1.25% pursuant to the amendment referenced below, plus the greater of the federal funds effective rate or one month LIBOR. The annual commitment fee to maintain the Credit Facility is 0.15% and is incurred on the unused portion of the Credit Facility and is allocated to all participating funds pro rata based on their respective net assets. Effective August 11, 2020, this agreement has been amended and restated for a term of 364 days, unless extended, and to include the change to the interest rate charged for borrowing from the Credit Facility to 1.25%, as noted above, and an upfront fee of 0.075% of the Credit Facility to be charged and paid by all participating funds of the Credit Facility.
The Fund did not utilize the Credit Facility during the six months ended December 31, 2020.
7. Risks, Concentrations and Indemnifications
In the normal course of business, the Fund enters into contracts that contain a variety of representations which provide general indemnifications. The Fund’s maximum exposure under these arrangements is unknown. The amount of exposure would depend on future claims that may be brought against the Fund. However, based on experience, the Fund expects the risk of loss to be remote.
| DECEMBER 31, 2020 | UNDISCOVERED MANAGERS FUNDS | 23 | ||||||||
Table of Contents
AS OF DECEMBER 31, 2020 (Unaudited) (continued)
As of December 31, 2020, the Fund had two individual shareholder and/or non-affiliated omnibus accounts, which owned 29.1% of the Fund’s outstanding shares.
Significant shareholder transactions by these shareholders may impact the Fund’s performance and liquidity.
The Fund invests in companies with relatively small market capitalizations. Investments in companies with relatively small market capitalizations may involve greater risk than is usually associated with stocks of larger companies. These securities may have limited marketability and may be subject to more abrupt or erratic movements in price than securities of companies with larger capitalizations.
LIBOR is intended to represent the rate at which contributing banks may obtain short-term borrowings from each other in the London interbank market. The regulatory authority that oversees financial services firms and financial markets in the U.K. has announced that, after the end of 2021, it would no longer persuade or compel contributing banks to make rate submissions for purposes of determining the LIBOR rate. As a result, it is possible that commencing in 2022, LIBOR may no longer be available or no longer deemed an appropriate reference rate upon which to determine the interest rate on or impacting certain loans, notes, derivatives and other instruments or investments comprising some or all of the Fund’s portfolio. In light of this eventuality, public and private sector industry initiatives are currently underway to identify new or alternative reference rates to be used in place of LIBOR. There is no assurance that the composition or characteristics of any such alternative reference rate will be similar to or produce the same value or economic equivalence as LIBOR or that it will have the same volume or liquidity as did LIBOR prior to its discontinuance or unavailability, which may affect the value or liquidity or return on certain investments of the Fund and result in costs incurred in connection with closing out positions and entering into new trades. These risks may also apply with respect to changes in connection with other interbank offering rates (e.g., Euribor) and a wide range of other index levels, rates and values that are treated as “benchmarks” and are the subject of recent regulatory reform.
The Fund is subject to infectious disease epidemics/pandemics risk. The worldwide outbreak of COVID-19, a novel coronavirus disease, has negatively affected economies, markets and individual companies throughout the world. The effects of this COVID-19 pandemic to public health, and business and market conditions, including exchange trading suspensions and closures may continue to have a significant negative impact on the performance of the Fund’s investments, increase the Fund’s volatility, exacerbate other pre-existing political, social and economic risks to the Fund and negatively impact broad segments of businesses and populations. The Fund’s operations may be interrupted as a result, which may have a significant negative impact on investment performance. In addition, governments, their regulatory agencies, or self-regulatory organizations may take actions in response to the pandemic that affect the instruments in which the Fund invests, or the issuers of such instruments, in ways that could also have a significant negative impact on the Fund’s investment performance. The full impact of this COVID-19 pandemic, or other future epidemics/pandemics, is currently unknown.
| 24 | UNDISCOVERED MANAGERS FUNDS | DECEMBER 31, 2020 | ||||||||
Table of Contents
SCHEDULE OF SHAREHOLDER EXPENSES
(Unaudited)
Hypothetical $1,000 Investment
As a shareholder of the Fund, you incur two types of costs: (1) transaction costs, including sales charges (loads) on purchase payments and (2) ongoing costs, including investment advisory fees, administration fees, distribution fees and other Fund expenses. The examples below are intended to help you understand your ongoing costs (in dollars) of investing in the Fund and to compare these ongoing costs with the ongoing costs of investing in other mutual funds. The examples assume that you had a $1,000 investment in each Class at the beginning of the reporting period, July 1, 2020, and continued to hold your shares at the end of the reporting period, December 31, 2020.
Actual Expenses
For each Class of the Fund in the table below, the first line provides information about actual account values and actual expenses. You may use the information in this line, together with the amount you invested, to estimate the expenses that you paid over the period. Simply divide your account value by $1,000 (for example, an $8,600 account value divided by $1,000 = 8.6), then multiply the result by the number in the first line of each Class under the heading titled “Expenses Paid During the Period” to estimate the expenses you paid on your account during this period.
Hypothetical Example for Comparison Purposes
The second line of each Class in the table below provides information about hypothetical account values and hypothetical expenses based on the Class’ actual expense ratio and an assumed rate of return of 5% per year before expenses, which is not the Class’ actual return. The hypothetical account values and expenses may not be used to estimate the actual ending account balance or expenses you paid for the period. You may use this information to compare the ongoing costs of investing in the Class of the Fund and other funds. To do so, compare this 5% hypothetical example with the 5% hypothetical examples that appear in the shareholder reports of the other funds. Please note that the expenses shown in the table are meant to highlight your ongoing costs only and do not reflect any transaction costs, such as sales charges (loads) or redemption fees. Therefore, the second line for each Class in the table is useful in comparing ongoing costs only, and will not help you determine the relative total costs of owning different funds. In addition, if these transaction costs were included, your costs would have been higher. The examples also assume all dividends and distributions have been reinvested.
| Beginning Account Value July 1, 2020 | Ending Account Value December 31, 2020 | Expenses Paid During the Period* | Annualized Expense Ratio | |||||||||||||
Undiscovered Managers Behavioral Value Fund | ||||||||||||||||
Class A | ||||||||||||||||
Actual | $ | 1,000.00 | $ | 1,442.00 | $ | 7.94 | 1.29 | % | ||||||||
Hypothetical | 1,000.00 | 1,018.70 | 6.56 | 1.29 | ||||||||||||
Class C | ||||||||||||||||
Actual | 1,000.00 | 1,438.40 | 11.00 | 1.79 | ||||||||||||
Hypothetical | 1,000.00 | 1,016.18 | 9.10 | 1.79 | ||||||||||||
Class I | ||||||||||||||||
Actual | 1,000.00 | 1,443.60 | 6.41 | 1.04 | ||||||||||||
Hypothetical | 1,000.00 | 1,019.96 | 5.30 | 1.04 | ||||||||||||
Class L | ||||||||||||||||
Actual | 1,000.00 | 1,444.90 | 5.48 | 0.89 | ||||||||||||
Hypothetical | 1,000.00 | 1,020.72 | 4.53 | 0.89 | ||||||||||||
Class R2 | ||||||||||||||||
Actual | 1,000.00 | 1,440.20 | 9.47 | 1.54 | ||||||||||||
Hypothetical | 1,000.00 | 1,017.44 | 7.83 | 1.54 | ||||||||||||
Class R3 | ||||||||||||||||
Actual | 1,000.00 | 1,442.00 | 7.94 | 1.29 | ||||||||||||
Hypothetical | 1,000.00 | 1,018.70 | 6.56 | 1.29 | ||||||||||||
Class R4 | ||||||||||||||||
Actual | 1,000.00 | 1,443.70 | 6.41 | 1.04 | ||||||||||||
Hypothetical | 1,000.00 | 1,019.96 | 5.30 | 1.04 | ||||||||||||
Class R5 | ||||||||||||||||
Actual | 1,000.00 | 1,444.80 | 5.48 | 0.89 | ||||||||||||
Hypothetical | 1,000.00 | 1,020.72 | 4.53 | 0.89 | ||||||||||||
Class R6 | ||||||||||||||||
Actual | 1,000.00 | 1,445.60 | 4.93 | 0.80 | ||||||||||||
Hypothetical | 1,000.00 | 1,021.17 | 4.08 | 0.80 | ||||||||||||
| * | Expenses are equal to each Class’ respective annualized expense ratio, multiplied by the average account value over the period, multiplied by 184/365 (to reflect the one-half year period). |
| DECEMBER 31, 2020 | UNDISCOVERED MANAGERS FUNDS | 25 | ||||||||
Table of Contents
BOARD APPROVAL OF INVESTMENT ADVISORY AGREEMENT
(Unaudited)
The Board of Trustees has established various standing committees composed of Trustees with diverse backgrounds, to which the Board of Trustees has assigned specific subject matter responsibilities to further enhance the effectiveness of the Board’s oversight and decision making. The Board of Trustees and its investment committees (money market and alternative products, equity, and fixed income) meet regularly throughout the year and consider factors that are relevant to their annual consideration of investment advisory agreements at each meeting. They also meet for the specific purpose of considering investment advisory agreement annual renewals. The Board of Trustees held meetings in June and August 2020, at which the Trustees considered the continuation of the investment advisory agreement for the Fund whose semi-annual report is contained herein and of the sub-advisory agreement for the Fund (each an “Advisory Agreement” and collectively, the “Advisory Agreements”). In accordance with SEC guidance, due to the COVID-19 pandemic, the meetings were conducted through video conference. At the June meeting, the Board’s investment committees met to review and consider performance, expense and related information for the J.P. Morgan Funds. Each investment committee reported to the full Board, which then considered the investment committee’s preliminary findings. At the August meeting, the Trustees continued their review and consideration. The Trustees, including a majority of the Trustees who are not parties to the Advisory Agreement or “interested persons” (as defined in the 1940 Act) of any party to the Advisory Agreements or any of their affiliates, approved the continuation of each Advisory Agreements on August 11, 2020.
As part of their review of the Advisory Agreements, the Trustees considered and reviewed performance and other information about the Fund received from the Adviser. This information includes the Fund’s performance as compared to the performance of their peers and benchmarks and analyses by the Adviser of the Fund’s performance. In addition, at each of their regular meetings throughout the year, the Trustees considered reports on the performance of certain J.P. Morgan Funds provided by an independent management consulting firm (“independent consultant”). In addition, in preparation for the June and August meetings, the Trustees requested, received, and evaluated extensive materials from the Adviser and/or Fuller & Thaler Asset Management, Inc., the sub-adviser for the Fund (the “Sub-Adviser”), including performance and expense information compiled by Broadridge, using data from Lipper Inc. and/or Morningstar Inc., independent providers of investment company data (together, “Broadridge”). The Trustees’ independent consultant also provided additional analyses of the performance of the Fund as compared to the Fund’s objective and peers. Before voting on the Advisory Agreements, the Trustees reviewed the Advisory Agreements with representatives of the Adviser, counsel to the Trust and independent legal counsel and received a memorandum from independent
legal counsel to the Trustees discussing the legal standards for their consideration of the Advisory Agreements. The Trustees also discussed the Advisory Agreements in executive sessions with independent legal counsel at which no representatives of the Adviser or Sub-Adviser were present.
A summary of the material factors evaluated by the Trustees in determining whether to approve the Advisory Agreements is provided below. Each Trustee attributed different weights to the various factors and no factor alone was considered determinative. The Trustees considered information provided with respect to the Fund throughout the year, including additional reporting and information provided in connection with the market volatility caused by the COVID-19 pandemic, as well as materials furnished specifically in connection with the annual review process. From year to year, the Trustees consider and place emphasis on relevant information in light of changing circumstances in market and economic conditions. After considering and weighing the factors and information they had received, the Trustees found that the compensation to be received by the Adviser from the Fund under the Advisory Agreement and by the Sub-Adviser from the Adviser, as applicable, was fair and reasonable under the circumstances and determined that the continuance of each Advisory Agreement was in the best interests of the Fund and its shareholders.
Nature, Extent and Quality of Services Provided by the Adviser and Sub-Adviser
The Trustees received and considered information regarding the nature, extent and quality of services provided to the Fund under the applicable Advisory Agreement. The Trustees took into account information furnished throughout the year at Trustee meetings, as well as the materials furnished specifically in connection with this annual review process. The Trustees considered the background and experience of the Adviser’s and Sub-Adviser’s senior management, personnel changes, if any, and the expertise of, and the amount of attention given to the Fund by, investment personnel of the Adviser and Sub-Adviser, as applicable. In addition, the Trustees reviewed the qualifications, backgrounds and responsibilities of the portfolio management team primarily responsible for the day-to-day management of the Fund and the infrastructure supporting the team, including personnel changes, if any. In addition, the Board considered its discussions with the Adviser regarding the Adviser’s business continuity plan and steps the Adviser was taking to provide ongoing services to the Fund during the COVID-19 pandemic, and the Adviser’s success in continuing to provide services to the Fund and their shareholders throughout this period. The Trustees also considered information provided by the Adviser and JPMorgan Distribution Services, Inc. (“JPMDS”) about the structure and distribution strategy of the Fund. The Trustees reviewed information relating to the Adviser’s and Sub-Adviser’s risk governance model, as applicable, and reports showing the Adviser’s and Sub-Adviser’s
| 26 | UNDISCOVERED MANAGERS FUNDS | DECEMBER 31, 2020 | ||||||||
Table of Contents
compliance structure and ongoing compliance processes, as applicable. The Trustees also considered the quality of the administration services provided by the Adviser in its role as administrator.
The Trustees also considered their knowledge of the nature and quality of services provided by the Adviser and its affiliates, and Sub-Adviser, as applicable, to the Fund gained from their experience as Trustees of the J.P. Morgan Fund. In addition, they considered the overall reputation and capabilities of the Adviser and its affiliates, and Sub-Adviser, as applicable, the commitment of the Adviser and Sub-Adviser, as applicable, to provide high quality service to the Fund(s), their overall confidence in the Adviser’s and Sub-Adviser’s, as applicable, integrity and the Adviser’s and Sub-Adviser’s, as applicable, responsiveness to questions or concerns raised by them, including the Adviser’s and Sub-Adviser’s, as applicable, willingness to consider and implement organizational and operational changes designed to improve investment results and the services provided to the Fund. In addition, the Trustees considered the different roles and responsibilities performed by the Adviser and Sub-Adviser under the Advisory Agreements, including the Adviser’s monitoring and evaluating of the Sub-Adviser to help assure that the Sub-Adviser is managing the Fund consistently with its investment objectives and restrictions.
Based upon these considerations and other factors, the Trustees concluded that they were satisfied with the nature, extent and quality of the investment advisory services provided to the Fund by the Adviser and, as applicable, the Sub-Adviser.
Costs of Services Provided and Profitability to the Adviser and its Affiliates
The Trustees received and considered information regarding the profitability to the Adviser and its affiliates in providing services to the Fund. The Trustees reviewed and discussed this information. The Trustees recognized that this information is not audited and represents the Adviser’s determination of its and its affiliates revenues from the contractual services provided to the Fund, less expenses of providing such services. Expenses include direct and indirect costs and are calculated using an allocation methodology developed by the Adviser. The Trustees also recognized that it is difficult to make comparisons of profitability from fund investment advisory contracts because comparative information is not generally publicly available and is affected by numerous factors, including the structure of the particular adviser, the types of funds it manages, its business mix, numerous assumptions regarding allocations and the fact that publicly-traded fund managers’ operating profits and net income are net of distribution and marketing expenses. Based upon their review, and taking into consideration the factors noted above, the Trustees concluded that the profitability to the Adviser under the Advisory
Agreement was not unreasonable in light of the services and benefits provided to the Fund.
The Trustees also considered that JPMDS, an affiliate of the Adviser, and the Adviser earn fees from the Fund for providing shareholder and administration services, respectively. These fees were shown separately in the profitability analysis presented to the Trustees. The Trustees also considered the payments of Rule 12b-1 fees to JPMDS, which also acts as the Fund’s distributor, and that these fees are in turn generally paid to financial intermediaries that sell the Fund, including financial intermediaries that are affiliates of the Adviser (although they are retained by JPMDS in certain instances). The Trustees also considered the fees paid to JPMorgan Chase Bank, N.A. (“JPMCB”) for custody and fund accounting, and other related services.
Fall-Out Benefits
The Trustees reviewed information regarding potential “fall-out” or ancillary benefits received by the Adviser and its affiliates as a result of their relationship with the Fund. The Trustees considered that the J.P. Morgan Funds’ operating accounts are held at JPMCB, which, as a result, will receive float benefits for certain J.P. Morgan Funds, as applicable. The Trustees also noted that the Adviser supports a diverse set of products and services, which benefits the Adviser by allowing it to leverage its infrastructure to serve additional clients, including the benefit that may be received by the Adviser and its affiliates in connection with the Fund’s potential investments in other funds advised by the Adviser. The Trustees also reviewed the Adviser’s allocation of fund brokerage for the J.P. Morgan Funds complex, including allocations to brokers who provide research to the Adviser.
Economies of Scale
The Trustees considered the extent to which the Fund may benefit from economies of scale. The Trustees considered that there may not be a direct relationship between economies of scale realized by the Fund and those realized by the Adviser as assets increase. The Trustees considered the extent to which the Fund was priced to scale and whether it would be appropriate to add advisory breakpoints, but noted that the Fund has implemented fee waivers and contractual expense limitations (“Fee Caps”) which allow the Fund’s shareholders to share potential economies of scale from its inception, prior to reaching scale, and that the fees remain satisfactory relative to peer funds. The Trustees considered the benefits to the Fund of the use of an affiliated distributor and custodian, including the ability to rely on existing infrastructure supporting distribution, custodial and transfer agent services and the ability to negotiate competitive fees for the Fund. The Trustees further considered the Adviser’s and JPMDS’s ongoing investments in their business in support of the Fund, including the Adviser’s and/or JPMDS’s investments in trading systems, technology
| DECEMBER 31, 2020 | UNDISCOVERED MANAGERS FUNDS | 27 | ||||||||
Table of Contents
BOARD APPROVAL OF INVESTMENT ADVISORY AGREEMENT
(Unaudited) (continued)
(including improvements to the J.P. Morgan Funds’ website, and cybersecurity improvements), retention of key talent, and regulatory support enhancements. The Trustees concluded that the current fee structure for the Fund, including any Fee Caps that the Adviser has in place that serve to limit the overall net expense ratios of the Fund at competitive levels, was reasonable. The Trustees concluded that the Fund’s shareholders received the benefits of potential economies of scale through the Fee Caps and the Adviser’s reinvestment in its operations to serve the Fund and their shareholders. The Trustees noted that the Adviser’s reinvestment ensures sufficient resources in terms of personnel and infrastructure to support the Fund.
Independent Written Evaluation of the Fund’s Chief Compliance Officer
The Trustees noted that, upon their direction, the Chief Compliance Officer for the Fund had prepared an independent written evaluation in order to assist the Trustees in determining the reasonableness of the proposed management fees. The Trustees considered the written evaluation in determining whether to continue the Advisory Agreements.
Fees Relative to Adviser’s Other Clients
The Trustees received and considered information about the nature and extent of investment advisory services and fee rates offered to other clients of the Adviser, including institutional separate accounts, collective investment trusts, ETFs and/or funds sub-advised by the Adviser, for investment management styles substantially similar to that of the Fund. The Trustees considered the complexity of investment management for registered mutual funds relative to the Adviser’s other clients and noted differences, as applicable, in the regulatory, legal and other risks and responsibilities of providing services to the different clients. The Trustees considered that serving as an adviser to a registered mutual fund involves greater responsibilities and risks than acting as a sub-adviser and observed that sub-advisory fees may be lower than those charged by the Adviser to the Fund. The Trustees also noted that the adviser, not the mutual fund, pays the sub-advisory fee and that many responsibilities related to the advisory function are retained by the primary adviser. The Trustees concluded that the fee rates charged to the Fund in comparison to those charged to the Adviser’s other clients were reasonable.
Investment Performance
The Trustees received and considered absolute and/or relative performance information for the Fund in a report prepared by Broadridge. The Trustees considered the total return performance information, which included the ranking of the Fund within a performance universe made up of funds with the same Broadridge investment classification and objective (the “Universe”), as well as a subset of funds within the Universe (the “Peer Group”), by total return for the applicable one-,
three- and five-year periods. The Trustees reviewed a description of Broadridge’s methodology for selecting mutual funds in the Fund’s Universe and Peer Group and noted that Universe and Peer Group rankings were not calculated if the number of funds in the Universe and/or Peer Group did not meet a predetermined minimum. The Broadridge materials provided to the Trustees highlighted information with respect to certain representative classes to assist the Trustees in their review. As part of this review, the Trustees also reviewed the Fund’s performance against its benchmark and considered the performance information provided for the Fund at regular Board meetings by the Adviser and the Trustees’ independent consultant and also considered the special analysis prepared by the Trustees’ independent consultant. The Trustees also engaged with the Adviser to consider what steps might be taken to improve performance, as applicable. The Broadridge performance data noted by the Trustees as part of their review and the determinations made by the Trustees with respect to the Fund’s performance for certain representative classes are summarized below:
The Trustees noted that the Fund’s performance for Class A shares was in the fifth, third and third quintiles based upon the Peer Group, and in the second, second and first quintiles based upon the Universe, for the one-, three- and five-year periods ended December 31, 2019, respectively. The Trustees noted that the performance for Class L shares was in the fourth, third and second quintiles based upon the Peer Group, and in the second, second and first quintiles based upon the Universe, for the one-, three- and five-year periods ended December 31, 2019, respectively. The Trustees noted that the performance for Class R6 shares was in the fourth, fourth and second quintiles based upon the Peer Group, and in the second, first and first quintiles based upon the Universe, for the one-, three- and five-year periods ended December 31, 2019, respectively. The Trustees discussed the performance and the investment strategy of the Fund with the Adviser and reviewed the performance analysis and evaluation prepared by the independent consultant. Based upon these discussions and various other factors, the Trustees concluded that the Fund’s performance was satisfactory under the circumstances. The Trustees requested, however, that the Fund’s Adviser provide additional Fund performance information to be reviewed with the members of the Board’s equity committee at each of its regularly scheduled meetings over the course of the next year.
Advisory Fees and Expense Ratios
The Trustees considered the contractual advisory fee rate and the administration fee rate paid by the Fund to the Adviser and compared the combined rate to the information prepared by Broadridge concerning management fee rates paid by other funds in the same Broadridge category as the Fund. The Trustees recognized that Broadridge reported the Fund’s management fee rate as the combined contractual advisory fee and
| 28 | UNDISCOVERED MANAGERS FUNDS | DECEMBER 31, 2020 | ||||||||
Table of Contents
administration fee rates. The Trustees also reviewed information about other expenses and the expense ratios for the Fund and noted that Universe and Peer Group rankings were not calculated if the number of funds in the Universe and/or Peer Groups did not meet a predetermined minimum. The Trustees considered the Fee Caps currently in place for the Fund, the net advisory fee rate and net expense ratio for each share class, as applicable, taking into account any waivers and/or reimbursements, and, where deemed appropriate by the Trustees, additional waivers and/or reimbursements. The Trustees also considered the fees paid by the Adviser to the Sub-Adviser out of the advisory fee. The Trustees recognized that it is difficult to make comparisons of advisory fees because there are variations in the services that are included in the fees paid by other funds. The Trustees’ determinations as a result of the review of the Fund’s advisory fees and expense ratios for certain representative classes are summarized below:
The Trustees noted that, the Fund’s net advisory fee for Class A shares was in the fourth and third quintiles based upon the Peer Group and Universe, respectively, and that the actual total expenses for Class A shares were in the fifth and fourth quintiles based upon the Peer Group and Universe, respectively. The Trustees noted that the net advisory fee for Class L shares was in the third quintile based upon both the Peer Group and Universe, and that the actual total expenses for Class L shares were in the first and second quintiles, based upon the Peer Group and Universe, respectively. The Trustees noted that the net advisory fee for Class R6 shares was in the fourth and third quintiles based upon the Peer Group and Universe, respectively, and that the actual total expenses for Class R6 shares were in the fourth and first quintiles based upon the Peer Group and Universe, respectively. After considering the factors identified above, in light of this information, the Trustees concluded that the advisory fee paid by the Fund to the Adviser and by the Adviser to the Sub-Adviser was satisfactory in light of the services provided to the Fund.
| DECEMBER 31, 2020 | UNDISCOVERED MANAGERS FUNDS | 29 | ||||||||
Table of Contents
J.P. Morgan Funds are distributed by JPMorgan Distribution Services, Inc., which is an affiliate of JPMorgan Chase & Co. Affiliates of JPMorgan Chase & Co. receive fees for providing various services to the funds.
Contact JPMorgan Distribution Services, Inc. at 1-800-480-4111 for a fund prospectus. You can also visit us at www.jpmorganfunds.com. Investors should carefully consider the investment objectives and risk as well as charges and expenses of the mutual fund before investing. The prospectus contains this and other information about the mutual fund. Read the prospectus carefully before investing.
Investors may obtain information about the Securities Investor Protection Corporation (SIPC), including the SIPC brochure, by visiting www.sipc.org or by calling SIPC at 202-371-8300.
The Fund files a complete schedule of its fund holdings for the first and third quarters of its fiscal year with the SEC as an exhibit to its report on Form N-PORT. The Fund’s Form N-PORT reports are available on the SEC’s website at http://www.sec.gov. The Fund’s quarterly holdings can be found by visiting the J.P. Morgan Funds’ website at www.jpmorganfunds.com.
A description of the Fund’s policies and procedures with respect to the disclosure of the Fund’s holdings is available in the prospectuses and Statement of Additional Information.
A copy of proxy policies and procedures is available without charge upon request by calling 1-800-480-4111 and on the Fund’s website at www.jpmorganfunds.com. A description of such policies and procedures is on the SEC’s website at www.sec.gov. The Trustees have delegated the authority to vote proxies for securities owned by the Fund to the Adviser. A copy of the Fund’s voting record for the most recent 12-month period ended June 30 is available on the SEC’s website at www.sec.gov or at the Fund’s website at www.jpmorganfunds.com no later than August 31 of each year. The Fund’s proxy voting record will include, among other things, a brief description of the matter voted on for each fund security, and will state how each vote was cast, for example, for or against the proposal.

Table of Contents

J.P. Morgan Asset Management is the brand name for the asset management business of JPMorgan Chase & Co. and its affiliates worldwide.
| © JPMorgan Chase & Co., 2020. All rights reserved. December 2020. | SAN-UM-1220 |
Table of Contents
ITEM 2. CODE OF ETHICS.
Disclose whether, as of the end of the period covered by the report, the registrant has adopted a code of ethics that applies to the registrant’s principal executive officer, principal financial officer, principal accounting officer or controller, or persons performing similar functions, regardless of whether these individuals are employed by the registrant or a third party. If the registrant has not adopted such a code of ethics, explain why it has not done so.
The registrant must briefly describe the nature of any amendment, during the period covered by the report, to a provision of its code of ethics that applies to the registrant’s principal executive officer, principal financial officer, principal accounting officer or controller, or persons performing similar functions, regardless of whether these individuals are employed by the registrant or a third party, and that relates to any element of the code of ethics definition enumerated in paragraph (b) of this Item. The registrant must file a copy of any such amendment as an exhibit pursuant to Item 13(a)(1), unless the registrant has elected to satisfy paragraph (f) of this Item by positing its code of ethics on its website pursuant to paragraph (f)(2) of this Item, or by undertaking to provide its code of ethics to any person without charge, upon request, pursuant to paragraph (f)(3) of this Item.
If the registrant has, during the period covered by the report, granted a waiver, including an implicit waiver, from a provision of the code of ethics that applies to the registrant’s principal executive officer, principal financial officer, principal accounting officer or controller, or persons performing similar functions, regardless of whether these individuals are employed by the registrant or third party, that relates to one or more items set forth in paragraph (b) of this Item, the registrant must briefly describe the nature of the waiver, the name of the person to whom the waiver was granted, and the date of the waiver.
Not applicable to a semi-annual report.
ITEM 3. AUDIT COMMITTEE FINANCIAL EXPERT.
(a) (1) Disclose that the registrant’s board of directors has determined that the registrant either:
(i) Has at least one audit committee financial expert serving on its audit committee; or
(ii) Does not have an audit committee financial expert serving on its audit committee.
(2) If the registrant provides the disclosure required by paragraph (a)(1)(i) of this Item, it must disclose the name of the audit committee financial expert and whether that person is “independent.” In order to be considered “independent” for purposes of this Item, a member of an audit committee may not, other than in his or her capacity as a member of the audit committee, the board of directors, or any other board committee:
(i) Accept directly or indirectly any consulting, advisory, or other compensatory fee from the issuer; or
(ii) Be an “interested person” of the investment company as defined in Section 2(a)(19) of the Act (15 U.S.C. 80a-2(a)(19)).
(3) If the registrant provides the disclosure required by paragraph (a)(1)(ii) of this Item, it must explain why it does not have an audit committee financial expert.
Not applicable to a semi-annual report.
Table of Contents
ITEM 4. PRINCIPAL ACCOUNTANT FEES AND SERVICES.
(a) Disclose, under the caption Audit Fees, the aggregate fees billed for each of the last two fiscal years for professional services rendered by the principal accountant for the audit of the registrant’s annual financial statements or services that are normally provided by the accountant in connection with statutory and regulatory filings or engagements for those fiscal years.
(b) Disclose, under the caption Audit-Related Fees, the aggregate fees billed in each of the last two fiscal years for assurance and related services by the principal accountant that are reasonably related to the performance of the audit of the registrant’s financial statements and are not reported under paragraph (a) of this Item. Registrants shall describe the nature of the services comprising the fees disclosed under this category.
(c) Disclose, under the caption Tax Fees, the aggregate fees billed in each of the last two fiscal years for professional services rendered by the principal accountant for tax compliance, tax advice, and tax planning. Registrants shall describe the nature of the services comprising the fees disclosed under this category.
(d) Disclose, under the caption All Other Fees, the aggregate fees billed in each of the last two fiscal years for products and services provided by the principal accountant, other than the services reported in paragraphs (a) through (c) of this Item. Registrants shall describe the nature of the services comprising the fees disclosed under this category.
(e) (1) Disclose the audit committee’s pre-approval policies and procedures described in paragraph (c)(7) of Rule 2-01 of Regulation S-X.
(2) Disclose the percentage of services described in each of paragraphs (b) through (d) of this Item that were approved by the audit committee pursuant to paragraph (c)(7)(i)(C) of Rule 2-01 of Regulation S-X.
(f) If greater than 50 percent, disclose the percentage of hours expended on the principal accountant’s engagement to audit the registrant’s financial statements for the most recent fiscal year that were attributed to work performed by persons other than the principal accountant’s full-time, permanent employees.
(g) Disclose the aggregate non-audit fees billed by the registrant’s accountant for services rendered to the registrant, and rendered to the registrant’s investment adviser (not including any sub-adviser whose role is primarily portfolio management and is subcontracted with or overseen by another investment adviser), and any entity controlling, controlled by, or under common control with the adviser that provides ongoing services to the registrant for each of the last two fiscal years of the registrant.
(h) Disclose whether the registrant’s audit committee of the board of directors has considered whether the provision of non-audit services that were rendered to the registrant’s investment adviser (not including any subadviser whose role is primarily portfolio management and is subcontracted with or overseen by another investment adviser), and any entity controlling, controlled by, or under common control with the investment adviser that provides ongoing services to the registrant that were not pre-approved pursuant to paragraph (c)(7)(ii) of Rule 2-01 of Regulation S-X is compatible with maintaining the principal accountant’s independence.
Not applicable to a semi-annual report.
ITEM 5. AUDIT COMMITTEE OF LISTED REGISTRANTS.
(a) If the registrant is a listed issuer as defined in Rule 10A-3 under the Exchange Act (17CFR 240.10A-3), state whether or not the registrant has a separately-designated standing audit committee established in accordance with Section 3(a)(58)(A) of the Exchange Act (15 U.S.C. 78c(a)(58)(A)). If the registrant has such a committee, however designated, identify each committee member. If the entire board of directors is acting as the registrant’s audit committee as specified in Section 3(a)(58)(B) of the Exchange Act (15 U.S.C. 78c(a)(58)(B)), so state.
(b) If applicable, provide the disclosure required by Rule 10A-3(d) under the Exchange Act (17CFR 240.10A-3(d)) regarding an exemption from the listing standards for all audit committees.
Not applicable to a semi-annual report.
Table of Contents
ITEM 6. INVESTMENTS.
File Schedule I – Investments in securities of unaffiliated issuers as of the close of the reporting period as set forth in Section 210.12-12 of Regulation S-X, unless the schedule is included as part of the report to shareholders filed under Item 1 of this Form.
Included in Item 1.
ITEM 7. DISCLOSURE OF PROXY VOTING POLICIES AND PROCEDURES FOR CLOSED-END MANAGEMENT INVESTMENT COMPANIES.
Not applicable.
ITEM 8. PORTFOLIO MANAGERS OF CLOSED-END MANAGEMENT INVESTMENT COMPANIES.
Not applicable.
ITEM 9. PURCHASE OF EQUITY SECURITIES BY CLOSED-END MANAGEMENT INVESTMENT COMPANY AND AFFILIATED PURCHASERS.
Not applicable.
ITEM 10. SUBMISSION OF MATTERS TO A VOTE OF SECURITY HOLDERS.
Describe any material changes to the procedures by which shareholders may recommend nominees to the registrant’s board of directors, where those changes were implemented after the registrant last provided disclosure in response to the requirements of Item 7(d)(2)(ii)(G) of Schedule 14A (17 CFR 240.14a-101), or this Item.
No material changes to report.
ITEM 11. CONTROLS AND PROCEDURES.
(a) Disclose the conclusions of the registrant’s principal executive and principal financial officers, or persons performing similar functions, regarding the effectiveness of the registrant’s disclosure controls and procedures (as defined in Rule 30a-3(c) under the Act (17 CFR 270.30a-3(c))) as of a date within 90 days of the filing date of the report that includes the disclosure required by this paragraph, based on the evaluation of these controls and procedures required by Rule 30a-3(b) under the Act (17 CFR 270.30a-3(b)) and Rules 13a-15(b) or 15d-15(b) under the Exchange Act (17 CFR 240.13a-15(b) or 240.15d-15(b)).
The Registrant’s principal executive and principal financial officers have concluded, based on their evaluation of the Registrant’s disclosure controls and procedures as of a date within 90 days of the filing date of this report, that the Registrant’s disclosure controls and procedures are reasonably designed to ensure that information required to be disclosed by the Registrant on Form N-CSR is recorded, processed, summarized and reported within the required time periods and that information required to be disclosed by the Registrant in the reports that it files or submits on Form N-CSR is accumulated and communicated to the Registrant’s management, including its principal executive and principal financial officers, as appropriate to allow timely decisions regarding required disclosure.
(b) Disclose any change in the registrant’s internal control over financial reporting (as defined in Rule 30a-3(d) under the Act (17 CFR 270.30a-3(d)) that occurred during the registrant’s second fiscal quarter of the period covered by this report that has materially affected, or is reasonably likely to materially affect, the registrant’s internal control over financial reporting.
There were no changes in the Registrant’s internal control over financial reporting that occurred during the last fiscal quarter covered by this report that have materially affected, or are reasonably likely to materially affect, the Registrant’s internal control over financial reporting.
Table of Contents
ITEM 12. DISCLOSURE OF SECURITIES LENDING ACTIVITIES FOR CLOSED-END MANAGEMENT INVESTMENT COMPANIES.
Not applicable.
ITEM 13. EXHIBITS.
| (a) | File the exhibits listed below as part of this Form. Letter or number the exhibits in the sequence indicated. |
(1) Any code of ethics, or amendment thereto, that is the subject of the disclosure required by Item 2, to the extent that the registrant intends to satisfy the Item 2 requirements through filing of an exhibit.
Not applicable.
(2) A separate certification for each principal executive officer and principal financial officer of the registrant as required by Rule 30a-2(a) under the Act (17 CFR 270.30a-2).
(3) Any written solicitation to purchase securities under Rule 23c-1 under the Act (17 CFR 270.23c-1) sent or given during the period covered by the report by or on behalf of the registrant to 10 or more persons.
Not applicable.
| (b) | A separate or combined certification for each principal executive officer and principal officer of the registrant as required by Rule 30a-2(b) under the Act of 1940. |
Table of Contents
SIGNATURES
Pursuant to the requirements of the Securities Exchange Act of 1934 and the Investment Company Act of 1940, the registrant has duly caused this report to be signed on its behalf by the undersigned, thereunto duly authorized.
Undiscovered Managers Funds
| By: | /s/ Brian S. Shlissel | |
| Brian S. Shlissel | ||
| President and Principal Executive Officer | ||
| March 5, 2021 |
Pursuant to the requirements of the Securities Exchange Act of 1934 and the Investment Company Act of 1940, this report has been signed below by the following persons on behalf of the registrant and in the capacities and on the dates indicated.
| By: | /s/ Brian S. Shlissel | |
| Brian S. Shlissel | ||
| President and Principal Executive Officer | ||
| March 5, 2021 | ||
| By: | /s/ Timothy J. Clemens | |
| Timothy J. Clemens | ||
| Treasurer and Principal Financial Officer | ||
| March 5, 2021 | ||