UNITED STATES
SECURITIES AND EXCHANGE COMMISSION
Washington, D.C. 20549
FORM N-CSR
CERTIFIED SHAREHOLDER REPORT OF REGISTERED
MANAGEMENT INVESTMENT COMPANIES
Investment Company Act file number: 811-08437
Undiscovered Managers Funds
(Exact name of registrant as specified in charter)
277 Park Avenue
New York, NY 10172
(Address of principal executive offices) (Zip code)
Gregory S. Samuels
277 Park Avenue
New York, NY 10172
(Name and Address of Agent for Service)
Registrant’s telephone number, including area code: (800) 480-4111
Date of fiscal year end: June 30
Date of reporting period: July 1, 2022 through December 31, 2022
Form N-CSR is to be used by management investment companies to file reports with the Commission not later than 10 days after the transmission to stockholders of any report that is required to be transmitted to stockholders under Rule 30e-1 under the Investment Company Act of 1940 (17 CFR 270.30e-1). The Commission may use the information provided on Form N-CSR in its regulatory, disclosure review, inspection, and policymaking roles.
A registrant is required to disclose the information specified by Form N-CSR, and the Commission will make this information public. A registrant is not required to respond to the collection of information contained in Form N-CSR unless the Form displays a currently valid Office of Management and Budget (“OMB”) control number. Please direct comments concerning the accuracy of the information collection burden estimate and any suggestions for reducing the burden to Secretary, Securities and Exchange Commission, 450 Fifth Street, NW, Washington, DC 20549-0609. The OMB has reviewed this collection of information under the clearance requirements of 44 U.S.C. Section 3507.
ITEM 1. REPORTS TO STOCKHOLDERS.
a.) The following is a copy of the report transmitted to shareholders pursuant to Rule 30e-1 under the Investment Company Act of 1940 (17 CFR 270.30e-1).
b.) A copy of the notice transmitted to shareholders in reliance on Rule 30e-3 under the 1940 Act that contains disclosures specified by paragraph (c)(3) of that rule is included in the Annual Report. Not Applicable. Notices do not incorporate disclosures from the shareholder reports.
Undiscovered Managers Behavioral Value Fund |

1 | |
2 | |
6 | |
9 | |
18 | |
22 | |
29 | |
31 |
Past performance is no guarantee of future performance. The general market views expressed in this report are opinions based on market and other conditions through the end of the reporting period and are subject to change without notice. These views are not intended to predict the future performance of the Fund or the securities markets.
Prospective investors should refer to the Fund's prospectuses for a discussion of the Fund's investment objectives, strategies and risks. Call J.P. Morgan Funds Service Center at 1-800-480-4111 for a prospectus containing more complete information about the Fund, including management fees and other expenses. Please read it carefully before investing.
February 13, 2023 (Unaudited)
 | “Investors may face continued economic and geopolitical challenges in the year ahead. However, some of the acute risks encountered in 2022 appear to have receded and last year’s reset in asset prices may provide attractive investment opportunities.” — Brian S. Shlissel |

President - J.P. Morgan Funds
J.P. Morgan Asset Management
1-800-480-4111 or www.jpmorganfunds.com for more information
December 31, 2022 | Undiscovered Managers Funds | 1 |
SIX MONTHS ENDED December 31, 2022 (Unaudited)
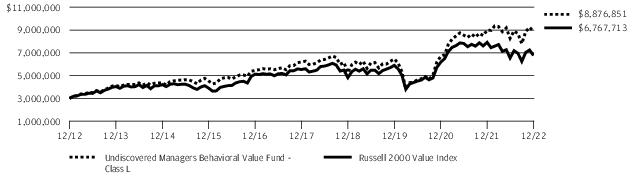
REPORTING PERIOD RETURN: | |
Fund (Class L Shares) * | 7.34% |
Russell 2000 Value Index | 3.42% |
Net Assets as of 12/31/2022 (In Thousands) | $7,317,925 |
2 | Undiscovered Managers Funds | December 31, 2022 |
TOP TEN HOLDINGS OF THE PORTFOLIO AS OF December 31, 2022 | PERCENT OF TOTAL INVESTMENTS | |
1. | Old National Bancorp | 3.9% |
2. | FNB Corp. | 3.6 |
3. | Graphic Packaging Holding Co. | 3.5 |
4. | Berry Global Group, Inc. | 2.9 |
5. | Ensign Group, Inc. (The) | 2.7 |
6. | White Mountains Insurance Group Ltd. | 2.4 |
7. | Maximus, Inc. | 2.4 |
8. | Devon Energy Corp. | 2.3 |
9. | Portland General Electric Co. | 2.2 |
10. | Brink's Co. (The) | 2.1 |
PORTFOLIO COMPOSITION BY SECTOR AS OF December 31, 2022 | PERCENT OF TOTAL INVESTMENTS |
Financials | 30.1% |
Materials | 15.0 |
Industrials | 14.1 |
Utilities | 7.3 |
Real Estate | 6.5 |
Consumer Discretionary | 5.7 |
Information Technology | 5.5 |
Health Care | 5.1 |
Consumer Staples | 4.3 |
Energy | 4.3 |
Communication Services | 0.6 |
Short-Term Investments | 1.5 |
December 31, 2022 | Undiscovered Managers Funds | 3 |
SIX MONTHS ENDED December 31, 2022 (Unaudited) (continued)
INCEPTION DATE OF CLASS | 6 MONTH* | 1 YEAR | 5 YEAR | 10 YEAR | |
CLASS A SHARES | June 4, 2004 | ||||
With Sales Charge ** | 1.51% | (6.70)% | 5.92% | 10.43% | |
Without Sales Charge | 7.14 | (1.53) | 7.06 | 11.02 | |
CLASS C SHARES | June 4, 2004 | ||||
With CDSC *** | 5.88 | (3.02) | 6.53 | 10.58 | |
Without CDSC | 6.88 | (2.02) | 6.53 | 10.58 | |
Class I SHARES | April 30, 2013 | 7.29 | (1.28) | 7.34 | 11.30 |
Class L SHARES | December 28, 1998 | 7.34 | (1.18) | 7.48 | 11.46 |
Class R2 SHARES | April 30, 2013 | 6.98 | (1.83) | 6.79 | 10.75 |
Class R3 SHARES | March 1, 2017 | 7.13 | (1.58) | 7.05 | 11.02 |
Class R4 SHARES | March 1, 2017 | 7.25 | (1.33) | 7.32 | 11.30 |
Class R5 SHARES | March 1, 2017 | 7.33 | (1.19) | 7.48 | 11.46 |
Class R6 SHARES | April 30, 2013 | 7.39 | (1.10) | 7.59 | 11.57 |
* | Not annualized. |
** | Sales Charge for Class A Shares is 5.25%. |
*** | Assumes a 1% CDSC (contingent deferred sales charge) for the 6 month and one year periods and 0% CDSC thereafter. |
4 | Undiscovered Managers Funds | December 31, 2022 |
December 31, 2022 | Undiscovered Managers Funds | 5 |
AS OF December 31, 2022 (Unaudited)
INVESTMENTS | SHARES (000) | VALUE ($000) |
Common Stocks — 99.2% | ||
Auto Components — 1.0% | ||
American Axle & Manufacturing Holdings, Inc. * | 2,794 | 21,848 |
Gentherm, Inc. * | 782 | 51,073 |
72,921 | ||
Banks — 18.9% | ||
Bancorp, Inc. (The) * | 1,204 | 34,175 |
Brookline Bancorp, Inc. | 3,281 | 46,429 |
Citizens Financial Group, Inc. | 3,721 | 146,498 |
First Citizens BancShares, Inc., Class A | 110 | 83,709 |
First Hawaiian, Inc. (a) | 2,854 | 74,321 |
First Horizon Corp. | 724 | 17,737 |
FNB Corp. | 20,036 | 261,472 |
Hope Bancorp, Inc. | 6,733 | 86,243 |
Huntington Bancshares, Inc. | 3,608 | 50,879 |
KeyCorp | 8,358 | 145,589 |
Old National Bancorp | 16,014 | 287,937 |
Simmons First National Corp., Class A | 1,849 | 39,894 |
United Bankshares, Inc. | 1,537 | 62,215 |
Valley National Bancorp | 3,857 | 43,626 |
1,380,724 | ||
Beverages — 1.3% | ||
Primo Water Corp. | 6,256 | 97,216 |
Building Products — 2.5% | ||
Armstrong World Industries, Inc. | 423 | 29,045 |
JELD-WEN Holding, Inc. * | 8,412 | 81,173 |
Resideo Technologies, Inc. * | 4,484 | 73,759 |
183,977 | ||
Capital Markets — 0.5% | ||
Janus Henderson Group plc | 1,490 | 35,054 |
Chemicals — 5.0% | ||
Cabot Corp. | 1,720 | 114,982 |
Celanese Corp. | 340 | 34,789 |
Koppers Holdings, Inc. | 1,808 | 50,969 |
Olin Corp. | 2,575 | 136,312 |
Trinseo plc | 1,301 | 29,554 |
366,606 | ||
Commercial Services & Supplies — 3.3% | ||
Brink's Co. (The) | 2,915 | 156,561 |
MillerKnoll, Inc. | 4,073 | 85,570 |
242,131 | ||
INVESTMENTS | SHARES (000) | VALUE ($000) |
Communications Equipment — 0.8% | ||
ADTRAN Holdings, Inc. | 1,742 | ��32,736 |
CommScope Holding Co., Inc. * | 3,316 | 24,374 |
57,110 | ||
Construction & Engineering — 1.1% | ||
Granite Construction, Inc. | 2,379 | 83,448 |
Construction Materials — 0.7% | ||
Eagle Materials, Inc. | 395 | 52,437 |
Containers & Packaging — 9.3% | ||
Berry Global Group, Inc. | 3,542 | 214,023 |
Crown Holdings, Inc. | 1,185 | 97,417 |
Graphic Packaging Holding Co. | 11,663 | 259,494 |
Greif, Inc., Class A | 975 | 65,364 |
Silgan Holdings, Inc. | 878 | 45,546 |
681,844 | ||
Diversified Consumer Services — 0.3% | ||
Frontdoor, Inc. * | 994 | 20,679 |
Electric Utilities — 2.2% | ||
Portland General Electric Co. | 3,338 | 163,548 |
Electronic Equipment, Instruments & Components — 0.4% | ||
Avnet, Inc. | 742 | 30,861 |
Energy Equipment & Services — 1.1% | ||
Patterson-UTI Energy, Inc. | 3,352 | 56,441 |
TETRA Technologies, Inc. * | 6,249 | 21,622 |
78,063 | ||
Equity Real Estate Investment Trusts (REITs) — 5.9% | ||
Alexander & Baldwin, Inc. | 1,054 | 19,746 |
Chatham Lodging Trust | 2,706 | 33,201 |
Franklin Street Properties Corp. | 5,920 | 16,162 |
Healthcare Realty Trust, Inc. | 4,689 | 90,362 |
Kite Realty Group Trust | 4,683 | 98,578 |
Pebblebrook Hotel Trust (a) | 3,876 | 51,891 |
Physicians Realty Trust | 4,615 | 66,783 |
Rayonier, Inc. | 1,589 | 52,351 |
429,074 | ||
Food Products — 1.1% | ||
Nomad Foods Ltd. (United Kingdom) * | 4,748 | 81,858 |
Gas Utilities — 2.9% | ||
Southwest Gas Holdings, Inc. | 1,927 | 119,246 |
Spire, Inc. | 1,319 | 90,856 |
210,102 | ||
6 | Undiscovered Managers Funds | December 31, 2022 |
INVESTMENTS | SHARES (000) | VALUE ($000) |
Common Stocks — continued | ||
Health Care Equipment & Supplies — 1.0% | ||
ICU Medical, Inc. * | 472 | 74,314 |
Health Care Providers & Services — 3.7% | ||
Ensign Group, Inc. (The) | 2,112 | 199,799 |
ModivCare, Inc. * | 753 | 67,601 |
267,400 | ||
Health Care Technology — 0.5% | ||
Veradigm, Inc. * | 2,106 | 37,142 |
Household Durables — 1.3% | ||
Tri Pointe Homes, Inc. * | 5,104 | 94,892 |
Household Products — 1.9% | ||
Energizer Holdings, Inc. | 2,804 | 94,080 |
Reynolds Consumer Products, Inc. (a) | 1,554 | 46,580 |
140,660 | ||
Insurance — 10.1% | ||
Assured Guaranty Ltd. | 916 | 57,045 |
Axis Capital Holdings Ltd. (a) | 875 | 47,376 |
CNO Financial Group, Inc. | 5,911 | 135,074 |
Enstar Group Ltd. * | 427 | 98,591 |
Horace Mann Educators Corp. | 1,198 | 44,782 |
James River Group Holdings Ltd. | 1,356 | 28,352 |
Kemper Corp. | 3,017 | 148,424 |
White Mountains Insurance Group Ltd. | 125 | 176,518 |
736,162 | ||
IT Services — 2.4% | ||
Maximus, Inc. | 2,357 | 172,860 |
Machinery — 2.0% | ||
Donaldson Co., Inc. | 484 | 28,477 |
Hyster-Yale Materials Handling, Inc. | 185 | 4,686 |
Kennametal, Inc. | 1,464 | 35,214 |
Terex Corp. | 1,847 | 78,928 |
147,305 | ||
Marine — 1.0% | ||
Matson, Inc. | 1,117 | 69,793 |
Media — 0.6% | ||
TEGNA, Inc. | 2,126 | 45,041 |
Metals & Mining — 0.0% ^ | ||
Commercial Metals Co. | 60 | 2,907 |
INVESTMENTS | SHARES (000) | VALUE ($000) |
Multi-Utilities — 2.2% | ||
Black Hills Corp. | 1,154 | 81,144 |
NorthWestern Corp. | 1,385 | 82,221 |
163,365 | ||
Oil, Gas & Consumable Fuels — 3.2% | ||
Devon Energy Corp. | 2,786 | 171,381 |
Range Resources Corp. | 2,528 | 63,245 |
234,626 | ||
Professional Services — 1.5% | ||
Science Applications International Corp. | 1,006 | 111,650 |
Real Estate Management & Development — 0.7% | ||
Cushman & Wakefield plc * (a) | 3,247 | 40,452 |
DigitalBridge Group, Inc. | 733 | 8,023 |
48,475 | ||
Software — 2.1% | ||
Dolby Laboratories, Inc., Class A | 493 | 34,769 |
NCR Corp. * | 4,030 | 94,326 |
Verint Systems, Inc. * | 595 | 21,598 |
150,693 | ||
Textiles, Apparel & Luxury Goods — 3.1% | ||
Carter's, Inc. (a) | 840 | 62,630 |
Columbia Sportswear Co. | 1,123 | 98,349 |
Hanesbrands, Inc. (a) | 10,827 | 68,862 |
229,841 | ||
Thrifts & Mortgage Finance — 0.9% | ||
Radian Group, Inc. | 3,343 | 63,756 |
Trading Companies & Distributors — 2.7% | ||
Applied Industrial Technologies, Inc. | 692 | 87,255 |
Beacon Roofing Supply, Inc. * | 1,387 | 73,207 |
MRC Global, Inc. * | 3,427 | 39,679 |
200,141 | ||
Total Common Stocks (Cost $5,997,992) | 7,258,676 | |
Short-Term Investments — 1.5% | ||
Investment Companies — 0.5% | ||
JPMorgan Prime Money Market Fund Class IM Shares, 4.49% (b) (c) (Cost $39,693) | 39,693 | 39,713 |
Investment of Cash Collateral from Securities Loaned — 1.0% | ||
JPMorgan Securities Lending Money Market Fund Agency SL Class Shares, 4.56% (b) (c) | 58,998 | 59,016 |
December 31, 2022 | Undiscovered Managers Funds | 7 |
AS OF December 31, 2022 (Unaudited) (continued)
INVESTMENTS | SHARES (000) | VALUE ($000) |
Short-Term Investments — continued | ||
Investment of Cash Collateral from Securities Loaned — continued | ||
JPMorgan U.S. Government Money Market Fund Class IM Shares, 4.12% (b) (c) | 10,050 | 10,050 |
Total Investment of Cash Collateral from Securities Loaned (Cost $69,061) | 69,066 | |
Total Short-Term Investments (Cost $108,754) | 108,779 | |
Total Investments — 100.7% (Cost $6,106,746) | 7,367,455 | |
Liabilities in Excess of Other Assets — (0.7)% | (49,530) | |
NET ASSETS — 100.0% | 7,317,925 | |
Percentages indicated are based on net assets. |
^ | Amount rounds to less than 0.1% of net assets. | |
* | Non-income producing security. | |
(a) | The security or a portion of this security is on loan at December 31, 2022. The total value of securities on loan at December 31, 2022 is $67,788. | |
(b) | Investment in an affiliated fund, which is registered under the Investment Company Act of 1940, as amended, and is advised by J.P. Morgan Investment Management Inc. | |
(c) | The rate shown is the current yield as of December 31, 2022. | |
8 | Undiscovered Managers Funds | December 31, 2022 |
AS OF December 31, 2022 (Unaudited)
(Amounts in thousands, except per share amounts)
Undiscovered Managers Behavioral Value Fund | |
ASSETS: | |
Investments in non-affiliates, at value | $7,258,676 |
Investments in affiliates, at value | 39,713 |
Investments of cash collateral received from securities loaned, at value (See Note 2.B.) | 69,066 |
Cash | 752 |
Receivables: | |
Fund shares sold | 29,087 |
Dividends from non-affiliates | 8,056 |
Dividends from affiliates | 5 |
Securities lending income (See Note 2.B.) | 7 |
Total Assets | 7,405,362 |
LIABILITIES: | |
Payables: | |
Investment securities purchased | 858 |
Collateral received on securities loaned (See Note 2.B.) | 69,066 |
Fund shares redeemed | 11,682 |
Accrued liabilities: | |
Investment advisory fees | 4,474 |
Administration fees | 449 |
Distribution fees | 168 |
Service fees | 595 |
Custodian and accounting fees | 45 |
Other | 100 |
Total Liabilities | 87,437 |
Net Assets | $7,317,925 |
December 31, 2022 | Undiscovered Managers Funds | 9 |
AS OF December 31, 2022 (Unaudited) (continued)
(Amounts in thousands, except per share amounts)
Undiscovered Managers Behavioral Value Fund | |
NET ASSETS: | |
Paid-in-Capital | $6,066,643 |
Total distributable earnings (loss) | 1,251,282 |
Total Net Assets | $7,317,925 |
Net Assets: | |
Class A | $574,307 |
Class C | 59,345 |
Class I | 1,703,248 |
Class L | 2,474,049 |
Class R2 | 14,001 |
Class R3 | 6,393 |
Class R4 | 6,638 |
Class R5 | 20,163 |
Class R6 | 2,459,781 |
Total | $7,317,925 |
Outstanding units of beneficial interest (shares) ($0.0001 par value; unlimited number of shares authorized): | |
Class A | 7,825 |
Class C | 871 |
Class I | 22,610 |
Class L | 32,703 |
Class R2 | 193 |
Class R3 | 88 |
Class R4 | 89 |
Class R5 | 267 |
Class R6 | 32,457 |
Net Asset Value (a): | |
Class A — Redemption price per share | $73.39 |
Class C — Offering price per share (b) | 68.13 |
Class I — Offering and redemption price per share | 75.33 |
Class L — Offering and redemption price per share | 75.65 |
Class R2 — Offering and redemption price per share | 72.46 |
Class R3 — Offering and redemption price per share | 72.51 |
Class R4 — Offering and redemption price per share | 75.08 |
Class R5 — Offering and redemption price per share | 75.58 |
Class R6 — Offering and redemption price per share | 75.78 |
Class A maximum sales charge | 5.25% |
Class A maximum public offering price per share [net asset value per share/(100% – maximum sales charge)] | $77.46 |
Cost of investments in non-affiliates | $5,997,992 |
Cost of investments in affiliates | 39,693 |
Investment securities on loan, at value (See Note 2.B.) | 67,788 |
Cost of investment of cash collateral (See Note 2.B.) | 69,061 |
10 | Undiscovered Managers Funds | December 31, 2022 |
FOR THE SIX MONTHS ENDED December 31, 2022 (Unaudited)
(Amounts in thousands)
Undiscovered Managers Behavioral Value Fund | |
INVESTMENT INCOME: | |
Interest income from affiliates | $2 |
Dividend income from non-affiliates | 77,570 |
Dividend income from affiliates | 4,363 |
Income from securities lending (net) (See Note 2.B.) | 19 |
Total investment income | 81,954 |
EXPENSES: | |
Investment advisory fees | 27,272 |
Administration fees | 2,727 |
Distribution fees: | |
Class A | 701 |
Class C | 234 |
Class R2 | 34 |
Class R3 | 8 |
Service fees: | |
Class A | 701 |
Class C | 78 |
Class I | 2,130 |
Class L | 1,234 |
Class R2 | 17 |
Class R3 | 8 |
Class R4 | 8 |
Class R5 | 9 |
Custodian and accounting fees | 125 |
Professional fees | 63 |
Trustees’ and Chief Compliance Officer’s fees | 25 |
Printing and mailing costs | 210 |
Registration and filing fees | 149 |
Transfer agency fees (See Note 2.E.) | 209 |
Other | 119 |
Total expenses | 36,061 |
Less fees waived | (2,682) |
Less expense reimbursements | (5) |
Net expenses | 33,374 |
Net investment income (loss) | 48,580 |
December 31, 2022 | Undiscovered Managers Funds | 11 |
FOR THE SIX MONTHS ENDED December 31, 2022 (Unaudited) (continued)
(Amounts in thousands)
Undiscovered Managers Behavioral Value Fund | |
REALIZED/UNREALIZED GAINS (LOSSES): | |
Net realized gain (loss) on transactions from: | |
Investments in non-affiliates | $208,229 |
Investments in affiliates | 163 |
Net realized gain (loss) | 208,392 |
Change in net unrealized appreciation/depreciation on: | |
Investments in non-affiliates | 242,287 |
Investments in affiliates | 21 |
Change in net unrealized appreciation/depreciation | 242,308 |
Net realized/unrealized gains (losses) | 450,700 |
Change in net assets resulting from operations | $499,280 |
12 | Undiscovered Managers Funds | December 31, 2022 |
FOR THE PERIODS INDICATED
(Amounts in thousands)
Undiscovered Managers Behavioral Value Fund | ||
Six Months Ended December 31, 2022 (Unaudited) | Year Ended June 30, 2022 | |
CHANGE IN NET ASSETS RESULTING FROM OPERATIONS: | ||
Net investment income (loss) | $48,580 | $75,718 |
Net realized gain (loss) | 208,392 | 739,263 |
Change in net unrealized appreciation/depreciation | 242,308 | (1,059,245) |
Change in net assets resulting from operations | 499,280 | (244,264) |
DISTRIBUTIONS TO SHAREHOLDERS: | ||
Class A | (47,351) | (15,952) |
Class C | (4,991) | (2,215) |
Class I | (144,835) | (68,227) |
Class L | (209,068) | (90,833) |
Class R2 | (1,128) | (395) |
Class R3 | (542) | (203) |
Class R4 | (550) | (98) |
Class R5 | (1,654) | (662) |
Class R6 | (209,284) | (81,631) |
Total distributions to shareholders | (619,403) | (260,216) |
CAPITAL TRANSACTIONS: | ||
Change in net assets resulting from capital transactions | 574,940 | 147,944 |
NET ASSETS: | ||
Change in net assets | 454,817 | (356,536) |
Beginning of period | 6,863,108 | 7,219,644 |
End of period | $7,317,925 | $6,863,108 |
December 31, 2022 | Undiscovered Managers Funds | 13 |
FOR THE PERIODS INDICATED (continued)
(Amounts in thousands)
Undiscovered Managers Behavioral Value Fund | ||
Six Months Ended December 31, 2022 (Unaudited) | Year Ended June 30, 2022 | |
CAPITAL TRANSACTIONS: | ||
Class A | ||
Proceeds from shares issued | $85,183 | $174,060 |
Distributions reinvested | 41,941 | 14,108 |
Cost of shares redeemed | (61,384) | (124,494) |
Change in net assets resulting from Class A capital transactions | 65,740 | 63,674 |
Class C | ||
Proceeds from shares issued | 5,463 | 8,349 |
Distributions reinvested | 4,821 | 2,171 |
Cost of shares redeemed | (12,279) | (33,002) |
Change in net assets resulting from Class C capital transactions | (1,995) | (22,482) |
Class I | ||
Proceeds from shares issued | 493,166 | 1,145,651 |
Distributions reinvested | 101,012 | 37,126 |
Cost of shares redeemed | (530,615) | (1,212,570) |
Change in net assets resulting from Class I capital transactions | 63,563 | (29,793) |
Class L | ||
Proceeds from shares issued | 287,795 | 678,463 |
Distributions reinvested | 189,496 | 81,975 |
Cost of shares redeemed | (285,486) | (893,844) |
Change in net assets resulting from Class L capital transactions | 191,805 | (133,406) |
Class R2 | ||
Proceeds from shares issued | 1,366 | 4,073 |
Distributions reinvested | 1,128 | 395 |
Cost of shares redeemed | (1,190) | (3,767) |
Change in net assets resulting from Class R2 capital transactions | 1,304 | 701 |
Class R3 | ||
Proceeds from shares issued | 1,242 | 3,820 |
Distributions reinvested | 542 | 203 |
Cost of shares redeemed | (1,247) | (3,792) |
Change in net assets resulting from Class R3 capital transactions | 537 | 231 |
Class R4 | ||
Proceeds from shares issued | 1,040 | 5,113 |
Distributions reinvested | 550 | 98 |
Cost of shares redeemed | (1,067) | (1,125) |
Change in net assets resulting from Class R4 capital transactions | 523 | 4,086 |
14 | Undiscovered Managers Funds | December 31, 2022 |
Undiscovered Managers Behavioral Value Fund | ||
Six Months Ended December 31, 2022 (Unaudited) | Year Ended June 30, 2022 | |
CAPITAL TRANSACTIONS: (continued) | ||
Class R5 | ||
Proceeds from shares issued | $3,148 | $5,771 |
Distributions reinvested | 1,083 | 505 |
Cost of shares redeemed | (1,578) | (6,459) |
Change in net assets resulting from Class R5 capital transactions | 2,653 | (183) |
Class R6 | ||
Proceeds from shares issued | 375,088 | 889,600 |
Distributions reinvested | 144,508 | 49,400 |
Cost of shares redeemed | (268,786) | (673,884) |
Change in net assets resulting from Class R6 capital transactions | 250,810 | 265,116 |
Total change in net assets resulting from capital transactions | $574,940 | $147,944 |
SHARE TRANSACTIONS: | ||
Class A | ||
Issued | 1,106 | 2,155 |
Reinvested | 559 | 181 |
Redeemed | (799) | (1,548) |
Change in Class A Shares | 866 | 788 |
Class C | ||
Issued | 75 | 112 |
Reinvested | 70 | 30 |
Redeemed | (170) | (441) |
Change in Class C Shares | (25) | (299) |
Class I | ||
Issued | 6,224 | 13,735 |
Reinvested | 1,312 | 464 |
Redeemed | (6,789) | (14,933) |
Change in Class I Shares | 747 | (734) |
Class L | ||
Issued | 3,615 | 8,177 |
Reinvested | 2,448 | 1,021 |
Redeemed | (3,623) | (10,694) |
Change in Class L Shares | 2,440 | (1,496) |
Class R2 | ||
Issued | 18 | 51 |
Reinvested | 15 | 5 |
Redeemed | (15) | (48) |
Change in Class R2 Shares | 18 | 8 |
December 31, 2022 | Undiscovered Managers Funds | 15 |
FOR THE PERIODS INDICATED (continued)
(Amounts in thousands)
Undiscovered Managers Behavioral Value Fund | ||
Six Months Ended December 31, 2022 (Unaudited) | Year Ended June 30, 2022 | |
SHARE TRANSACTIONS: (continued) | ||
Class R3 | ||
Issued | 16 | 48 |
Reinvested | 7 | 3 |
Redeemed | (16) | (48) |
Change in Class R3 Shares | 7 | 3 |
Class R4 | ||
Issued | 14 | 61 |
Reinvested | 7 | 1 |
Redeemed | (14) | (13) |
Change in Class R4 Shares | 7 | 49 |
Class R5 | ||
Issued | 40 | 70 |
Reinvested | 14 | 6 |
Redeemed | (20) | (78) |
Change in Class R5 Shares | 34 | (2) |
Class R6 | ||
Issued | 4,723 | 10,678 |
Reinvested | 1,864 | 615 |
Redeemed | (3,376) | (8,086) |
Change in Class R6 Shares | 3,211 | 3,207 |
16 | Undiscovered Managers Funds | December 31, 2022 |
FOR THE PERIODS INDICATED
Per share operating performance | |||||||
Investment operations | Distributions | ||||||
Net asset value, beginning of period | Net investment income (loss)(b) | Net realized and unrealized gains (losses) on investments | Total from investment operations | Net investment income | Net realized gain | Total distributions | |
Undiscovered Managers Behavioral Value Fund | |||||||
Class A | |||||||
Six Months Ended December 31, 2022(Unaudited) | $74.51 | $0.40 | $5.03 | $5.43 | $(0.62) | $(5.93) | $(6.55) |
Year Ended June 30, 2022 | 79.82 | 0.55 | (3.28) | (2.73) | (0.54) | (2.04) | (2.58) |
Year Ended June 30, 2021 | 43.66 | 0.49 | 36.02 | 36.51 | (0.35) | — | (0.35) |
Year Ended June 30, 2020 | 60.63 | 0.50 | (14.56) | (14.06) | (0.23) | (2.68) | (2.91) |
September 1, 2018 June 30, 2019 through (g) | 73.97 | 0.51 | (7.92) | (7.41) | (0.54) | (5.39) | (5.93) |
Year Ended August 31, 2018 | 63.57 | 0.59 | 12.77 | 13.36 | (0.46) | (2.50) | (2.96) |
Year Ended August 31, 2017 | 60.15 | 0.32 | 4.95 | 5.27 | (0.40) | (1.45) | (1.85) |
Class C | |||||||
Six Months Ended December 31, 2022(Unaudited) | 69.37 | 0.18 | 4.71 | 4.89 | (0.20) | (5.93) | (6.13) |
Year Ended June 30, 2022 | 74.40 | 0.12 | (3.02) | (2.90) | (0.09) | (2.04) | (2.13) |
Year Ended June 30, 2021 | 40.67 | 0.16 | 33.58 | 33.74 | (0.01) | — | (0.01) |
Year Ended June 30, 2020 | 56.73 | 0.21 | (13.59) | (13.38) | — | (2.68) | (2.68) |
September 1, 2018 June 30, 2019 through (g) | 69.55 | 0.24 | (7.43) | (7.19) | (0.24) | (5.39) | (5.63) |
Year Ended August 31, 2018 | 59.93 | 0.24 | 12.01 | 12.25 | (0.13) | (2.50) | (2.63) |
Year Ended August 31, 2017 | 56.84 | 0.01 | 4.67 | 4.68 | (0.14) | (1.45) | (1.59) |
Class I | |||||||
Six Months Ended December 31, 2022(Unaudited) | 76.37 | 0.51 | 5.15 | 5.66 | (0.77) | (5.93) | (6.70) |
Year Ended June 30, 2022 | 81.75 | 0.76 | (3.37) | (2.61) | (0.73) | (2.04) | (2.77) |
Year Ended June 30, 2021 | 44.72 | 0.70 | 36.85 | 37.55 | (0.52) | — | (0.52) |
Year Ended June 30, 2020 | 62.04 | 0.65 | (14.88) | (14.23) | (0.41) | (2.68) | (3.09) |
September 1, 2018 June 30, 2019 through (g) | 75.61 | 0.65 | (8.11) | (7.46) | (0.72) | (5.39) | (6.11) |
Year Ended August 31, 2018 | 64.95 | 0.78 | 13.04 | 13.82 | (0.66) | (2.50) | (3.16) |
Year Ended August 31, 2017 | 61.41 | 0.50 | 5.04 | 5.54 | (0.55) | (1.45) | (2.00) |
Class L | |||||||
Six Months Ended December 31, 2022(Unaudited) | 76.71 | 0.55 | 5.17 | 5.72 | (0.85) | (5.93) | (6.78) |
Year Ended June 30, 2022 | 82.10 | 0.86 | (3.38) | (2.52) | (0.83) | (2.04) | (2.87) |
Year Ended June 30, 2021 | 44.88 | 0.75 | 37.05 | 37.80 | (0.58) | — | (0.58) |
Year Ended June 30, 2020 | 62.25 | 0.74 | (14.93) | (14.19) | (0.50) | (2.68) | (3.18) |
September 1, 2018 June 30, 2019 through (g) | 75.89 | 0.74 | (8.16) | (7.42) | (0.83) | (5.39) | (6.22) |
Year Ended August 31, 2018 | 65.17 | 0.88 | 13.10 | 13.98 | (0.76) | (2.50) | (3.26) |
Year Ended August 31, 2017 | 61.60 | 0.59 | 5.07 | 5.66 | (0.64) | (1.45) | (2.09) |
Class R2 | |||||||
Six Months Ended December 31, 2022(Unaudited) | 73.53 | 0.27 | 4.97 | 5.24 | (0.38) | (5.93) | (6.31) |
Year Ended June 30, 2022 | 78.78 | 0.32 | (3.23) | (2.91) | (0.30) | (2.04) | (2.34) |
Year Ended June 30, 2021 | 43.14 | 0.29 | 35.61 | 35.90 | (0.26) | — | (0.26) |
Year Ended June 30, 2020 | 59.98 | 0.37 | (14.41) | (14.04) | (0.12) | (2.68) | (2.80) |
September 1, 2018 June 30, 2019 through (g) | 73.28 | 0.37 | (7.83) | (7.46) | (0.45) | (5.39) | (5.84) |
Year Ended August 31, 2018 | 63.05 | 0.42 | 12.65 | 13.07 | (0.34) | (2.50) | (2.84) |
Year Ended August 31, 2017 | 59.78 | 0.17 | 4.90 | 5.07 | (0.35) | (1.45) | (1.80) |
Class R3 | |||||||
Six Months Ended December 31, 2022(Unaudited) | 73.66 | 0.37 | 4.98 | 5.35 | (0.57) | (5.93) | (6.50) |
Year Ended June 30, 2022 | 78.96 | 0.50 | (3.22) | (2.72) | (0.54) | (2.04) | (2.58) |
Year Ended June 30, 2021 | 43.23 | 0.48 | 35.65 | 36.13 | (0.40) | — | (0.40) |
Year Ended June 30, 2020 | 60.14 | 0.51 | (14.42) | (13.91) | (0.32) | (2.68) | (3.00) |
September 1, 2018 June 30, 2019 through (g) | 73.69 | 0.44 | (7.86) | (7.42) | (0.74) | (5.39) | (6.13) |
Year Ended August 31, 2018 | 63.57 | 0.47 | 12.86 | 13.33 | (0.71) | (2.50) | (3.21) |
March 1, 2017 (h) through August 31, 2017 | 64.80 | 0.13 | (1.36) | (1.23) | — | — | — |
18 | Undiscovered Managers Funds | December 31, 2022 |
Ratios/Supplemental data | ||||||
Ratios to average net assets (a) | ||||||
Net asset value, end of period | Total return (excluding sales charge)(c)(d) | Net assets, end of period (000's) | Net expenses(e) | Net investment income (loss) | Expenses without waivers and reimbursements | Portfolio turnover rate(c) |
$73.39 | 7.15% | $574,307 | 1.23% (f) | 1.02% (f) | 1.35% (f) | 19% |
74.51 | (3.56) | 518,471 | 1.27 | 0.68 | 1.35 | 37 |
79.82 | 83.87 | 492,556 | 1.29 | 0.78 | 1.34 | 30 |
43.66 | (24.49) | 308,675 | 1.30 | 0.92 | 1.35 | 44 |
60.63 | (9.41) | 596,068 | 1.30 | 0.99 | 1.35 | 35 |
73.97 | 21.46 | 888,695 | 1.29 | 0.86 | 1.35 | 29 |
63.57 | 8.76 | 907,053 | 1.28 | 0.51 | 1.76 | 24 |
68.13 | 6.89 | 59,345 | 1.73(f) | 0.51(f) | 1.85(f) | 19 |
69.37 | (4.04) | 62,159 | 1.77 | 0.15 | 1.85 | 37 |
74.40 | 82.97 | 88,919 | 1.79 | 0.27 | 1.84 | 30 |
40.67 | (24.87) | 79,818 | 1.80 | 0.42 | 1.85 | 44 |
56.73 | (9.78) | 162,769 | 1.80 | 0.48 | 1.85 | 35 |
69.55 | 20.85 | 233,455 | 1.79 | 0.37 | 1.85 | 29 |
59.93 | 8.22 | 247,259 | 1.78 | 0.02 | 2.23 | 24 |
75.33 | 7.29 | 1,703,248 | 0.98(f) | 1.27(f) | 1.11(f) | 19 |
76.37 | (3.32) | 1,669,775 | 1.02 | 0.91 | 1.10 | 37 |
81.75 | 84.32 | 1,847,319 | 1.05 | 1.02 | 1.10 | 30 |
44.72 | (24.29) | 555,350 | 1.05 | 1.18 | 1.10 | 44 |
62.04 | (9.22) | 963,136 | 1.05 | 1.24 | 1.10 | 35 |
75.61 | 21.75 | 1,220,927 | 1.04 | 1.11 | 1.10 | 29 |
64.95 | 9.03 | 1,145,714 | 1.03 | 0.77 | 1.44 | 24 |
75.65 | 7.34 | 2,474,049 | 0.89(f) | 1.36(f) | 0.95(f) | 19 |
76.71 | (3.20) | 2,321,525 | 0.90 | 1.04 | 0.95 | 37 |
82.10 | 84.61 | 2,607,467 | 0.90 | 1.18 | 0.95 | 30 |
44.88 | (24.18) | 1,799,190 | 0.90 | 1.34 | 0.95 | 44 |
62.25 | (9.11) | 2,621,266 | 0.90 | 1.39 | 0.95 | 35 |
75.89 | 21.95 | 3,589,067 | 0.90 | 1.24 | 0.95 | 29 |
65.17 | 9.19 | 2,873,203 | 0.88 | 0.91 | 1.28 | 24 |
72.46 | 6.99 | 14,001 | 1.54(f) | 0.71(f) | 1.61(f) | 19 |
73.53 | (3.83) | 12,917 | 1.55 | 0.40 | 1.62 | 37 |
78.78 | 83.41 | 13,172 | 1.54 | 0.49 | 1.61 | 30 |
43.14 | (24.68) | 13,640 | 1.55 | 0.71 | 1.62 | 44 |
59.98 | (9.59) | 18,078 | 1.55 | 0.72 | 1.63 | 35 |
73.28 | 21.16 | 20,684 | 1.54 | 0.61 | 1.63 | 29 |
63.05 | 8.47 | 17,759 | 1.53 | 0.27 | 2.05 | 24 |
72.51 | 7.13 | 6,393 | 1.29(f) | 0.96(f) | 1.35(f) | 19 |
73.66 | (3.59) | 5,977 | 1.30 | 0.63 | 1.35 | 37 |
78.96 | 83.86 | 6,122 | 1.29 | 0.78 | 1.35 | 30 |
43.23 | (24.48) | 4,254 | 1.30 | 0.99 | 1.36 | 44 |
60.14 | (9.41) | 3,935 | 1.29 | 0.88 | 1.36 | 35 |
73.69 | 21.45 | 1,784 | 1.30 | 0.67 | 1.38 | 29 |
63.57 | (1.90) | 133 | 1.29 | 0.40 | 1.66 | 24 |
December 31, 2022 | Undiscovered Managers Funds | 19 |
FOR THE PERIODS INDICATED (continued)
Per share operating performance | |||||||
Investment operations | Distributions | ||||||
Net asset value, beginning of period | Net investment income (loss)(b) | Net realized and unrealized gains (losses) on investments | Total from investment operations | Net investment income | Net realized gain | Total distributions | |
Undiscovered Managers Behavioral Value Fund (continued) | |||||||
Class R4 | |||||||
Six Months Ended December 31, 2022(Unaudited) | $76.18 | $0.48 | $5.14 | $5.62 | $(0.79) | $(5.93) | $(6.72) |
Year Ended June 30, 2022 | 81.55 | 0.81 | (3.42) | (2.61) | (0.72) | (2.04) | (2.76) |
Year Ended June 30, 2021 | 44.58 | 0.67 | 36.77 | 37.44 | (0.47) | — | (0.47) |
Year Ended June 30, 2020 | 61.89 | 0.67 | (14.86) | (14.19) | (0.44) | (2.68) | (3.12) |
September 1, 2018 June 30, 2019 through (g) | 75.50 | 0.63 | (8.09) | (7.46) | (0.76) | (5.39) | (6.15) |
Year Ended August 31, 2018 | 64.94 | 0.76 | 13.06 | 13.82 | (0.76) | (2.50) | (3.26) |
March 1, 2017 (h) through August 31, 2017 | 66.12 | 0.15 | (1.33) | (1.18) | — | — | — |
Class R5 | |||||||
Six Months Ended December 31, 2022(Unaudited) | 76.65 | 0.55 | 5.17 | 5.72 | (0.86) | (5.93) | (6.79) |
Year Ended June 30, 2022 | 82.04 | 0.87 | (3.39) | (2.52) | (0.83) | (2.04) | (2.87) |
Year Ended June 30, 2021 | 44.86 | 0.78 | 36.99 | 37.77 | (0.59) | — | (0.59) |
Year Ended June 30, 2020 | 62.20 | 0.77 | (14.95) | (14.18) | (0.48) | (2.68) | (3.16) |
September 1, 2018 June 30, 2019 through (g) | 75.88 | 0.61 | (8.04) | (7.43) | (0.86) | (5.39) | (6.25) |
Year Ended August 31, 2018 | 65.17 | 0.72 | 13.26 | 13.98 | (0.77) | (2.50) | (3.27) |
March 1, 2017 (h) through August 31, 2017 | 66.30 | 0.29 | (1.42) | (1.13) | — | — | — |
Class R6 | |||||||
Six Months Ended December 31, 2022(Unaudited) | 76.87 | 0.59 | 5.18 | 5.77 | (0.93) | (5.93) | (6.86) |
Year Ended June 30, 2022 | 82.27 | 0.95 | (3.40) | (2.45) | (0.91) | (2.04) | (2.95) |
Year Ended June 30, 2021 | 44.97 | 0.84 | 37.10 | 37.94 | (0.64) | — | (0.64) |
Year Ended June 30, 2020 | 62.36 | 0.80 | (14.95) | (14.15) | (0.56) | (2.68) | (3.24) |
September 1, 2018 June 30, 2019 through (g) | 76.05 | 0.74 | (8.14) | (7.40) | (0.90) | (5.39) | (6.29) |
Year Ended August 31, 2018 | 65.29 | 0.94 | 13.15 | 14.09 | (0.83) | (2.50) | (3.33) |
Year Ended August 31, 2017 | 61.70 | 0.66 | 5.07 | 5.73 | (0.69) | (1.45) | (2.14) |
(a) | Annualized for periods less than one year, unless otherwise noted. |
(b) | Calculated based upon average shares outstanding. |
(c) | Not annualized for periods less than one year. |
(d) | Includes adjustments in accordance with accounting principles generally accepted in the United States of America and as such, the net asset values for financial reporting purposes and the returns based upon those net asset values may differ from the net asset values and returns for shareholder transactions. |
(e) | Includes earnings credits and interest expense, if applicable, each of which is less than 0.005% unless otherwise noted. |
(f) | Certain non-recurring expenses incurred by the Fund were not annualized for the period indicated. |
(g) | The Fund changed its fiscal year end from August 31st to June 30th. |
(h) | Commencement of offering of class of shares. |
20 | Undiscovered Managers Funds | December 31, 2022 |
Ratios/Supplemental data | ||||||
Ratios to average net assets (a) | ||||||
Net asset value, end of period | Total return (excluding sales charge)(c)(d) | Net assets, end of period (000's) | Net expenses(e) | Net investment income (loss) | Expenses without waivers and reimbursements | Portfolio turnover rate(c) |
$75.08 | 7.25% | $6,638 | 1.04% (f) | 1.20% (f) | 1.10% (f) | 19% |
76.18 | (3.34) | 6,205 | 1.05 | 0.99 | 1.12 | 37 |
81.55 | 84.31 | 2,690 | 1.05 | 1.02 | 1.11 | 30 |
44.58 | (24.29) | 1,584 | 1.05 | 1.20 | 1.11 | 44 |
61.89 | (9.22) | 2,827 | 1.05 | 1.20 | 1.11 | 35 |
75.50 | 21.76 | 2,461 | 1.05 | 1.08 | 1.10 | 29 |
64.94 | (1.78) | 1,586 | 1.04 | 0.47 | 1.42 | 24 |
75.58 | 7.34 | 20,163 | 0.89(f) | 1.37(f) | 0.95(f) | 19 |
76.65 | (3.20) | 17,819 | 0.90 | 1.05 | 0.95 | 37 |
82.04 | 84.60 | 19,235 | 0.90 | 1.20 | 0.95 | 30 |
44.86 | (24.18) | 9,215 | 0.90 | 1.40 | 0.96 | 44 |
62.20 | (9.11) | 14,636 | 0.89 | 1.18 | 0.95 | 35 |
75.88 | 21.95 | 4,521 | 0.90 | 1.00 | 1.02 | 29 |
65.17 | (1.70) | 821 | 0.89 | 0.88 | 1.26 | 24 |
75.78 | 7.39 | 2,459,781 | 0.79(f) | 1.46(f) | 0.85(f) | 19 |
76.87 | (3.11) | 2,248,260 | 0.80 | 1.14 | 0.85 | 37 |
82.27 | 84.79 | 2,142,164 | 0.80 | 1.29 | 0.84 | 30 |
44.97 | (24.10) | 877,755 | 0.80 | 1.47 | 0.85 | 44 |
62.36 | (9.04) | 993,739 | 0.80 | 1.41 | 0.85 | 35 |
76.05 | 22.08 | 727,352 | 0.80 | 1.33 | 0.85 | 29 |
65.29 | 9.29 | 464,750 | 0.78 | 1.01 | 1.16 | 24 |
December 31, 2022 | Undiscovered Managers Funds | 21 |
AS OF December 31, 2022 (Unaudited)
(Dollar values in thousands)
Classes Offered | Diversification Classification | |
Undiscovered Managers Behavioral Value Fund | Class A, Class C, Class I, Class L, Class R2, Class R3, Class R4, Class R5 and Class R6 | Diversfied |
22 | Undiscovered Managers Funds | December 31, 2022 |
Level 1 Quoted prices | Level 2 Other significant observable inputs | Level 3 Significant unobservable inputs | Total | |
Total Investments in Securities (a) | $7,367,455 | $— | $— | $7,367,455 |
(a) | Please refer to the SOI for specifics of portfolio holdings. |
Investment Securities on Loan, at value, Presented on the Statement of Assets and Liabilities | Cash Collateral Posted by Borrower* | Net Amount Due to Counterparty (not less than zero) | |
$67,788 | $(67,788) | $— |
* | Collateral posted reflects the value of securities on loan and does not include any additional amounts received from the borrower. |
December 31, 2022 | Undiscovered Managers Funds | 23 |
AS OF December 31, 2022 (Unaudited) (continued)
(Dollar values in thousands)
$1 |
For the six months ended December 31, 2022 | |||||||||
Security Description | Value at June 30, 2022 | Purchases at Cost | Proceeds from Sales | Net Realized Gain (Loss) | Change in Unrealized Appreciation/ (Depreciation) | Value at December 31, 2022 | Shares at December 31, 2022 | Dividend Income | Capital Gain Distributions |
JPMorgan Prime Money Market Fund Class IM Shares, 4.49% (a) (b) | $370,457 | $1,354,837 | $1,685,760 | $163 | $16 | $39,713 | 39,693 | $4,363 | $— |
JPMorgan Securities Lending Money Market Fund Agency SL Class Shares, 4.56% (a) (b) | 8,936 | 229,199 | 179,136 | 12* | 5 | 59,016 | 58,998 | 361* | — |
JPMorgan U.S. Government Money Market Fund Class IM Shares, 4.12% (a) (b) | 2,397 | 144,433 | 136,780 | — | — | 10,050 | 10,050 | 65* | — |
Total | $381,790 | $1,728,469 | $2,001,676 | $175 | $21 | $108,779 | $4,789 | $— | |
(a) | Investment in an affiliated fund, which is registered under the Investment Company Act of 1940, as amended, and is advised by J.P. Morgan Investment Management Inc. |
(b) | The rate shown is the current yield as of December 31, 2022. |
* | Amount is included on the Statement of Operations as Income from securities lending (net) (after payments of rebates and Citibank’s fee). |
24 | Undiscovered Managers Funds | December 31, 2022 |
Class A | Class C | Class I | Class L | Class R2 | Class R3 | Class R4 | Class R5 | Class R6 | Total | |
Transfer agency fees | $9 | $2 | $100 | $70 | $1 | $—(a) | $—(a) | $1 | $26 | $209 |
(a) | Amount rounds to less than one thousand. |
Class A | Class C | Class R2 | Class R3 | |
0.25% | 0.75% | 0.50% | 0.25% |
December 31, 2022 | Undiscovered Managers Funds | 25 |
AS OF December 31, 2022 (Unaudited) (continued)
(Dollar values in thousands)
Front-End Sales Charge | CDSC | |
$31 | $2 |
Class A | Class C | Class I | Class L | Class R2 | Class R3 | Class R4 | Class R5 | |
0.25% | 0.25% | 0.25% | 0.10% | 0.25% | 0.25% | 0.25% | 0.10% |
Class A | Class C | Class I | Class L | Class R2 | Class R3 | Class R4 | Class R5 | Class R6 | |
1.24% | 1.74% | 0.99% | 0.90% | 1.55% | 1.30% | 1.05% | 0.90% | 0.80% |
Contractual Waivers | |||||
Investment Advisory Fees | Administration Fees | Service Fees | Total | Contractual Reimbursements | |
$1,475 | $148 | $837 | $2,460 | $4 | |
26 | Undiscovered Managers Funds | December 31, 2022 |
Purchases (excluding U.S. Government) | Sales (excluding U.S. Government) | |
$1,648,963 | $1,312,405 |
Aggregate Cost | Gross Unrealized Appreciation | Gross Unrealized Depreciation | Net Unrealized Appreciation (Depreciation) | |
$6,106,746 | $1,579,174 | $318,465 | $1,260,709 |
December 31, 2022 | Undiscovered Managers Funds | 27 |
AS OF December 31, 2022 (Unaudited) (continued)
(Dollar values in thousands)
28 | Undiscovered Managers Funds | December 31, 2022 |
(Unaudited)
Hypothetical $1,000 Investment
Beginning Account Value July 1, 2022 | Ending Account Value December 31, 2022 | Expenses Paid During the Period* | Annualized Expense Ratio | |
Undiscovered Managers Behavioral Value Fund | ||||
Class A | ||||
Actual | $1,000.00 | $1,071.50 | $6.42 | 1.23% |
Hypothetical | 1,000.00 | 1,019.00 | 6.26 | 1.23 |
Class C | ||||
Actual | 1,000.00 | 1,068.90 | 9.02 | 1.73 |
Hypothetical | 1,000.00 | 1,016.48 | 8.79 | 1.73 |
Class I | ||||
Actual | 1,000.00 | 1,072.90 | 5.12 | 0.98 |
Hypothetical | 1,000.00 | 1,020.26 | 4.99 | 0.98 |
Class L | ||||
Actual | 1,000.00 | 1,073.40 | 4.65 | 0.89 |
Hypothetical | 1,000.00 | 1,020.72 | 4.53 | 0.89 |
Class R2 | ||||
Actual | 1,000.00 | 1,069.90 | 8.03 | 1.54 |
Hypothetical | 1,000.00 | 1,017.44 | 7.83 | 1.54 |
Class R3 | ||||
Actual | 1,000.00 | 1,071.30 | 6.73 | 1.29 |
Hypothetical | 1,000.00 | 1,018.70 | 6.56 | 1.29 |
Class R4 | ||||
Actual | 1,000.00 | 1,072.50 | 5.43 | 1.04 |
Hypothetical | 1,000.00 | 1,019.96 | 5.30 | 1.04 |
Class R5 | ||||
Actual | 1,000.00 | 1,073.40 | 4.65 | 0.89 |
Hypothetical | 1,000.00 | 1,020.72 | 4.53 | 0.89 |
December 31, 2022 | Undiscovered Managers Funds | 29 |
(Unaudited) (continued)
Hypothetical $1,000 Investment
Beginning Account Value July 1, 2022 | Ending Account Value December 31, 2022 | Expenses Paid During the Period* | Annualized Expense Ratio | |
Undiscovered Managers Behavioral Value Fund (continued) | ||||
Class R6 | ||||
Actual | $1,000.00 | $1,073.90 | $4.13 | 0.79% |
Hypothetical | 1,000.00 | 1,021.22 | 4.02 | 0.79 |
* | Expenses are equal to each Class’ respective annualized expense ratio, multiplied by the average account value over the period, multiplied by 184/365 (to reflect the one-half year period). |
30 | Undiscovered Managers Funds | December 31, 2022 |
(Unaudited)
December 31, 2022 | Undiscovered Managers Funds | 31 |
(Unaudited) (continued)
32 | Undiscovered Managers Funds | December 31, 2022 |
December 31, 2022 | Undiscovered Managers Funds | 33 |
(Unaudited) (continued)
34 | Undiscovered Managers Funds | December 31, 2022 |


ITEM 2. CODE OF ETHICS.
Not applicable to a semi-annual report.
ITEM 3. AUDIT COMMITTEE FINANCIAL EXPERT.
Not applicable to a semi-annual report.
ITEM 4. PRINCIPAL ACCOUNTANT FEES AND SERVICES.
Not applicable to a semi-annual report.
ITEM 5. AUDIT COMMITTEE OF LISTED REGISTRANTS.
Not applicable to a semi-annual report.
ITEM 6. INVESTMENTS.
File Schedule I – Investments in securities of unaffiliated issuers as of the close of the reporting period as set forth in Section 210.12-12 of Regulation S-X, unless the schedule is included as part of the report to shareholders filed under Item 1 of this Form.
Included in Item 1.
ITEM 7. DISCLOSURE OF PROXY VOTING POLICIES AND PROCEDURES FOR CLOSED-END MANAGEMENT INVESTMENT COMPANIES.
Not applicable.
ITEM 8. PORTFOLIO MANAGERS OF CLOSED-END MANAGEMENT INVESTMENT COMPANIES.
Not applicable.
ITEM 9. PURCHASE OF EQUITY SECURITIES BY CLOSED-END MANAGEMENT INVESTMENT COMPANY AND AFFILIATED PURCHASERS.
Not applicable.
ITEM 10. SUBMISSION OF MATTERS TO A VOTE OF SECURITY HOLDERS.
Describe any material changes to the procedures by which shareholders may recommend nominees to the registrant’s board of directors, where those changes were implemented after the registrant last provided disclosure in response to the requirements of Item 7(d)(2)(ii)(G) of Schedule 14A (17 CFR 240.14a-101), or this Item.
No material changes to report.
ITEM 11. CONTROLS AND PROCEDURES.
(a) Disclose the conclusions of the registrant’s principal executive and principal financial officers, or persons performing similar functions, regarding the effectiveness of the registrant’s disclosure controls and procedures (as defined in Rule 30a-3(c) under the Act (17 CFR 270.30a-3(c))) as of a date within 90 days of the filing date of the report that includes the disclosure required by this paragraph, based on the evaluation of these controls and procedures required by Rule 30a-3(b) under the Act (17 CFR 270.30a-3(b)) and Rules 13a-15(b) or 15d-15(b) under the Exchange Act (17 CFR 240.13a-15(b) or 240.15d-15(b)).
The Registrant’s principal executive and principal financial officers have concluded, based on their evaluation of the Registrant’s disclosure controls and procedures as of a date within 90 days of the filing date of this report, that the Registrant’s disclosure controls and procedures are reasonably designed to ensure that information required to be disclosed by the Registrant on Form N-CSR is recorded, processed, summarized and reported within the required time periods and that information required to be disclosed by the Registrant in the reports that it files or submits on Form N-CSR is accumulated and communicated to the Registrant’s management, including its principal executive and principal financial officers, as appropriate to allow timely decisions regarding required disclosure.
(b) Disclose any change in the registrant’s internal control over financial reporting (as defined in Rule 30a-3(d) under the Act (17 CFR 270.30a-3(d)) that occurred during period covered by this report that has materially affected, or is reasonably likely to materially affect, the registrant’s internal control over financial reporting.
There were no changes in the Registrant’s internal control over financial reporting that occurred during the period covered by this report that have materially affected, or are reasonably likely to materially affect, the Registrant’s internal control over financial reporting.
ITEM 12. DISCLOSURE OF SECURITIES LENDING ACTIVITIES FOR CLOSED-END MANAGEMENT INVESTMENT COMPANIES.
Not applicable.
ITEM 13. EXHIBITS.
| (a) | File the exhibits listed below as part of this Form. Letter or number the exhibits in the sequence indicated. |
(1) Any code of ethics, or amendment thereto, that is the subject of the disclosure required by Item 2, to the extent that the registrant intends to satisfy the Item 2 requirements through filing of an exhibit.
Not applicable.
(2) A separate certification for each principal executive officer and principal financial officer of the registrant as required by Rule 30a-2(a) under the Act (17 CFR 270.30a-2), exactly as set forth below:
(1) Any written solicitation to purchase securities under Rule 23c-1 under the Act (17 CFR 270.23c-1) sent or given during the period covered by the report by or on behalf of the registrant to 10 or more persons.
Not applicable.
(2) Change in the registrant’s independent public accountant. Provide the information called for by Item 4 of Form 8-K under the Exchange Act (17 CFR 249.308). Unless otherwise specified by Item 4, or related to and necessary for a complete understanding of information not previously disclosed, the information should relate to events occurring during the reporting period.
Not applicable.
| (b) | A separate or combined certification for each principal executive officer and principal officer of the registrant as required by Rule 30a-2(b) under the Act of 1940. |
SIGNATURES
Pursuant to the requirements of the Securities Exchange Act of 1934 and the Investment Company Act of 1940, the registrant has duly caused this report to be signed on its behalf by the undersigned, thereunto duly authorized.
Undiscovered Managers Funds
| By: | /s/ Brian S. Shlissel | |
| Brian S. Shlissel | ||
| President and Principal Executive Officer | ||
| March 2, 2023 |
Pursuant to the requirements of the Securities Exchange Act of 1934 and the Investment Company Act of 1940, this report has been signed below by the following persons on behalf of the registrant and in the capacities and on the dates indicated.
| By: | /s/ Brian S. Shlissel | |
| Brian S. Shlissel | ||
| President and Principal Executive Officer | ||
| March 2, 2023 | ||
| By: | /s/ Timothy J. Clemens | |
| Timothy J. Clemens | ||
| Treasurer and Principal Financial Officer | ||
| March 2, 2023 | ||