
| Fund (Class) | Costs of a $10,000 investment | Costs paid as a percentage of a $10,000 investment |
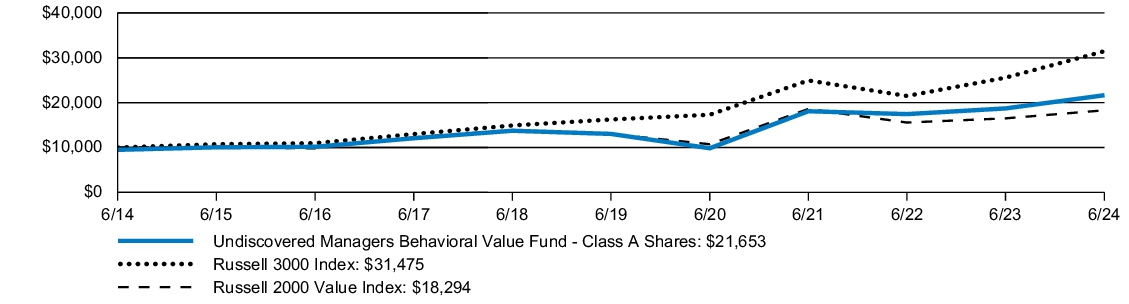
| Undiscovered Managers Behavioral Value Fund (Class A Shares) | $134 | 1.24% |
- During the reporting period, the U.S. regional banking industry posted a significant recovery as conditions broadly stabilized following the bank failures that occurred in the first half of 2023, and the SPDR S&P Regional Banking ETF returned 24.32%. The Fund’s overweight allocation to banks, which had been driven by elevated insider buying activity and attractive valuations, contributed to performance relative to the Index.
- The Fund’s security selection and average overweight position in the financials sector and its security selection in the industrials sector contributed to performance relative to the Index.
- The Fund’s security selection in the energy and materials sectors detracted from performance relative to the Index.
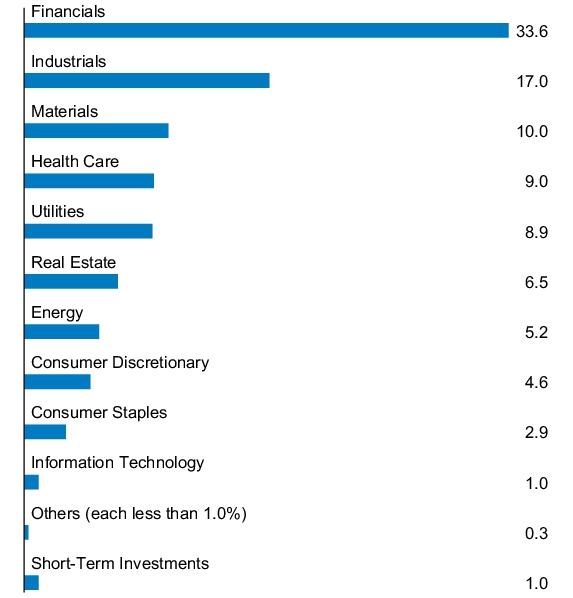
- During the reporting period, the Fund’s largest sector overweight allocations compared to the Index were in the financials and materials sectors, while its largest sector underweight allocations compared to the Index were in the consumer discretionary and energy sectors.
| AVERAGE ANNUAL TOTAL RETURNS | INCEPTION DATE | 1 YEAR | 5 YEAR | 10 YEAR | |||
| Undiscovered Managers Behavioral Value Fund (Class A Shares) | June 4, 2004 | 9.64 | % | 9.51 | % | 8.03 | % |
| Undiscovered Managers Behavioral Value Fund (Class A Shares) - excluding sales charge | 15.71 | 10.70 | 8.62 | ||||
| Russell 3000 Index | 23.13 | 14.14 | 12.15 | ||||
| Russell 2000 Value Index | 10.90 | 7.07 | 6.23 |
KEY FUND STATISTICS
| Fund net assets (000's) | $9,063,302 | |
| Total number of portfolio holdings | $105 | |
| Portfolio turnover rate | $27 | % |
| Total advisory fees paid (000's) | $57,438 |
(% of Total Investments)


- Prospectus
- Financial information
- Fund holdings
- Proxy voting information
| Fund (Class) | Costs of a $10,000 investment | Costs paid as a percentage of a $10,000 investment |
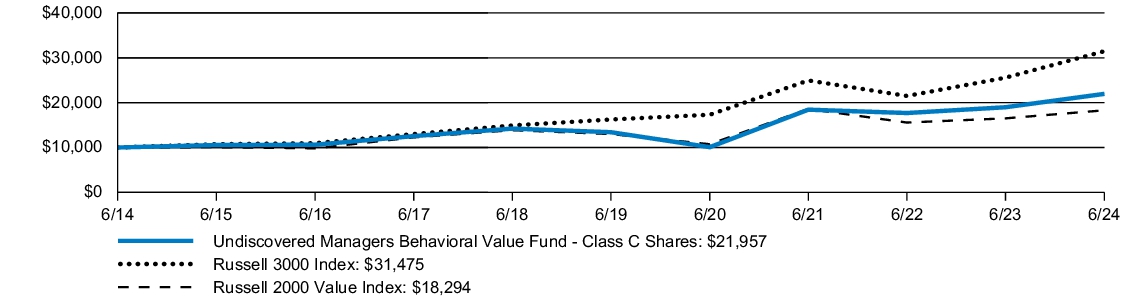
| Undiscovered Managers Behavioral Value Fund (Class C Shares) | $187 | 1.74% |
- During the reporting period, the U.S. regional banking industry posted a significant recovery as conditions broadly stabilized following the bank failures that occurred in the first half of 2023, and the SPDR S&P Regional Banking ETF returned 24.32%. The Fund’s overweight allocation to banks, which had been driven by elevated insider buying activity and attractive valuations, contributed to performance relative to the Index.
- The Fund’s security selection and average overweight position in the financials sector and its security selection in the industrials sector contributed to performance relative to the Index.
- The Fund’s security selection in the energy and materials sectors detracted from performance relative to the Index.
- During the reporting period, the Fund’s largest sector overweight allocations compared to the Index were in the financials and materials sectors, while its largest sector underweight allocations compared to the Index were in the consumer discretionary and energy sectors.
| AVERAGE ANNUAL TOTAL RETURNS | INCEPTION DATE | 1 YEAR | 5 YEAR | 10 YEAR | |||
| Undiscovered Managers Behavioral Value Fund (Class C Shares) | June 4, 2004 | 14.14 | % | 10.15 | % | 8.18 | % |
| Undiscovered Managers Behavioral Value Fund (Class C Shares) - excluding sales charge | 15.14 | 10.15 | 8.18 | ||||
| Russell 3000 Index | 23.13 | 14.14 | 12.15 | ||||
| Russell 2000 Value Index | 10.90 | 7.07 | 6.23 |
KEY FUND STATISTICS
| Fund net assets (000's) | $9,063,302 | |
| Total number of portfolio holdings | $105 | |
| Portfolio turnover rate | $27 | % |
| Total advisory fees paid (000's) | $57,438 |
(% of Total Investments)

- Prospectus
- Financial information
- Fund holdings
- Proxy voting information
| Fund (Class) | Costs of a $10,000 investment | Costs paid as a percentage of a $10,000 investment |
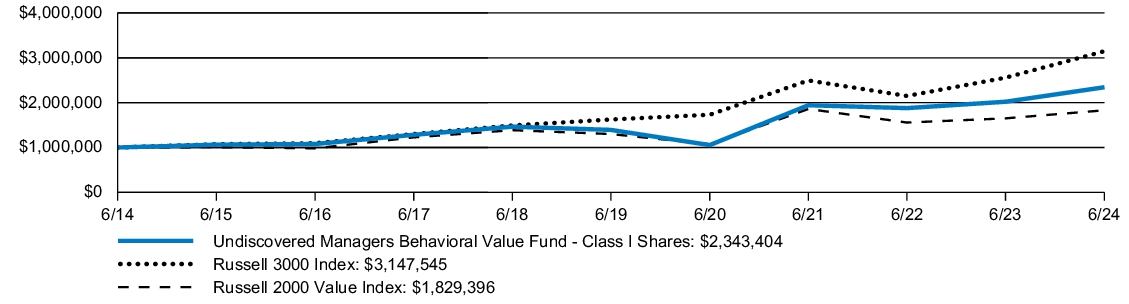
| Undiscovered Managers Behavioral Value Fund (Class I Shares) | $107 | 0.99% |
- During the reporting period, the U.S. regional banking industry posted a significant recovery as conditions broadly stabilized following the bank failures that occurred in the first half of 2023, and the SPDR S&P Regional Banking ETF returned 24.32%. The Fund’s overweight allocation to banks, which had been driven by elevated insider buying activity and attractive valuations, contributed to performance relative to the Index.
- The Fund’s security selection and average overweight position in the financials sector and its security selection in the industrials sector contributed to performance relative to the Index.
- The Fund’s security selection in the energy and materials sectors detracted from performance relative to the Index.
- During the reporting period, the Fund’s largest sector overweight allocations compared to the Index were in the financials and materials sectors, while its largest sector underweight allocations compared to the Index were in the consumer discretionary and energy sectors.
| AVERAGE ANNUAL TOTAL RETURNS | INCEPTION DATE | 1 YEAR | 5 YEAR | 10 YEAR | |||
| Undiscovered Managers Behavioral Value Fund (Class I Shares) | April 30, 2013 | 16.00 | % | 10.98 | % | 8.89 | % |
| Russell 3000 Index | 23.13 | 14.14 | 12.15 | ||||
| Russell 2000 Value Index | 10.90 | 7.07 | 6.23 |
KEY FUND STATISTICS
| Fund net assets (000's) | $9,063,302 | |
| Total number of portfolio holdings | $105 | |
| Portfolio turnover rate | $27 | % |
| Total advisory fees paid (000's) | $57,438 |
(% of Total Investments)

- Prospectus
- Financial information
- Fund holdings
- Proxy voting information
| Fund (Class) | Costs of a $10,000 investment | Costs paid as a percentage of a $10,000 investment |
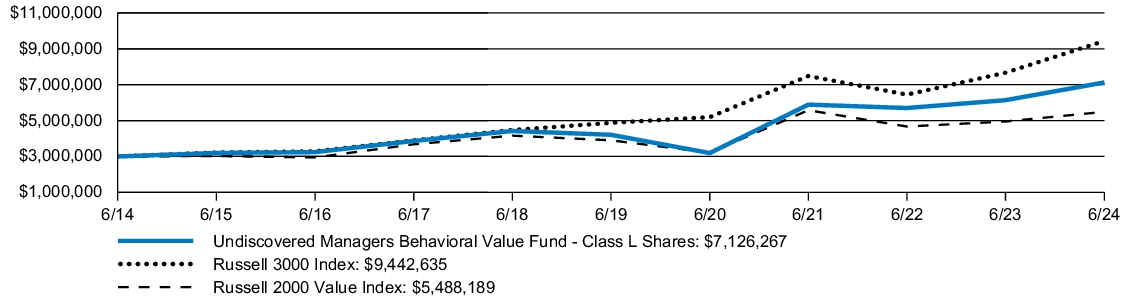
| Undiscovered Managers Behavioral Value Fund (Class L Shares) | $97 | 0.90% |
- During the reporting period, the U.S. regional banking industry posted a significant recovery as conditions broadly stabilized following the bank failures that occurred in the first half of 2023, and the SPDR S&P Regional Banking ETF returned 24.32%. The Fund’s overweight allocation to banks, which had been driven by elevated insider buying activity and attractive valuations, contributed to performance relative to the Index.
- The Fund’s security selection and average overweight position in the financials sector and its security selection in the industrials sector contributed to performance relative to the Index.
- The Fund’s security selection in the energy and materials sectors detracted from performance relative to the Index.
- During the reporting period, the Fund’s largest sector overweight allocations compared to the Index were in the financials and materials sectors, while its largest sector underweight allocations compared to the Index were in the consumer discretionary and energy sectors.
| AVERAGE ANNUAL TOTAL RETURNS | INCEPTION DATE | 1 YEAR | 5 YEAR | 10 YEAR | |||
| Undiscovered Managers Behavioral Value Fund (Class L Shares) | December 28, 1998 | 16.10 | % | 11.11 | % | 9.04 | % |
| Russell 3000 Index | 23.13 | 14.14 | 12.15 | ||||
| Russell 2000 Value Index | 10.90 | 7.07 | 6.23 |
KEY FUND STATISTICS
| Fund net assets (000's) | $9,063,302 | |
| Total number of portfolio holdings | $105 | |
| Portfolio turnover rate | $27 | % |
| Total advisory fees paid (000's) | $57,438 |
(% of Total Investments)

- Prospectus
- Financial information
- Fund holdings
- Proxy voting information
| Fund (Class) | Costs of a $10,000 investment | Costs paid as a percentage of a $10,000 investment |
| Undiscovered Managers Behavioral Value Fund (Class R2 Shares) | $167 | 1.55% |
- During the reporting period, the U.S. regional banking industry posted a significant recovery as conditions broadly stabilized following the bank failures that occurred in the first half of 2023, and the SPDR S&P Regional Banking ETF returned 24.32%. The Fund’s overweight allocation to banks, which had been driven by elevated insider buying activity and attractive valuations, contributed to performance relative to the Index.
- The Fund’s security selection and average overweight position in the financials sector and its security selection in the industrials sector contributed to performance relative to the Index.
- The Fund’s security selection in the energy and materials sectors detracted from performance relative to the Index.
- During the reporting period, the Fund’s largest sector overweight allocations compared to the Index were in the financials and materials sectors, while its largest sector underweight allocations compared to the Index were in the consumer discretionary and energy sectors.
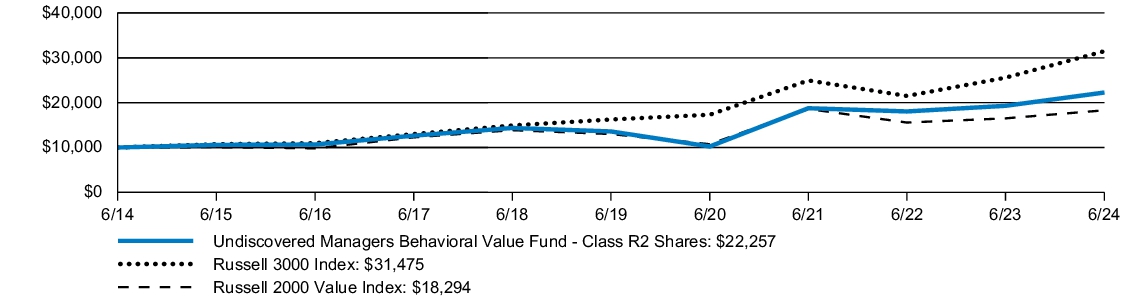
| AVERAGE ANNUAL TOTAL RETURNS | INCEPTION DATE | 1 YEAR | 5 YEAR | 10 YEAR | |||
| Undiscovered Managers Behavioral Value Fund (Class R2 Shares) | April 30, 2013 | 15.35 | % | 10.39 | % | 8.33 | % |
| Russell 3000 Index | 23.13 | 14.14 | 12.15 | ||||
| Russell 2000 Value Index | 10.90 | 7.07 | 6.23 |
KEY FUND STATISTICS
| Fund net assets (000's) | $9,063,302 | |
| Total number of portfolio holdings | $105 | |
| Portfolio turnover rate | $27 | % |
| Total advisory fees paid (000's) | $57,438 |
(% of Total Investments)

- Prospectus
- Financial information
- Fund holdings
- Proxy voting information
| Fund (Class) | Costs of a $10,000 investment | Costs paid as a percentage of a $10,000 investment |
| Undiscovered Managers Behavioral Value Fund (Class R3 Shares) | $140 | 1.30% |
- During the reporting period, the U.S. regional banking industry posted a significant recovery as conditions broadly stabilized following the bank failures that occurred in the first half of 2023, and the SPDR S&P Regional Banking ETF returned 24.32%. The Fund’s overweight allocation to banks, which had been driven by elevated insider buying activity and attractive valuations, contributed to performance relative to the Index.
- The Fund’s security selection and average overweight position in the financials sector and its security selection in the industrials sector contributed to performance relative to the Index.
- The Fund’s security selection in the energy and materials sectors detracted from performance relative to the Index.
- During the reporting period, the Fund’s largest sector overweight allocations compared to the Index were in the financials and materials sectors, while its largest sector underweight allocations compared to the Index were in the consumer discretionary and energy sectors.

| AVERAGE ANNUAL TOTAL RETURNS | INCEPTION DATE | 1 YEAR | 5 YEAR | 10 YEAR | |||
| Undiscovered Managers Behavioral Value Fund (Class R3 Shares) | March 1, 2017 | 15.64 | % | 10.67 | % | 8.60 | % |
| Russell 3000 Index | 23.13 | 14.14 | 12.15 | ||||
| Russell 2000 Value Index | 10.90 | 7.07 | 6.23 |
KEY FUND STATISTICS
| Fund net assets (000's) | $9,063,302 | |
| Total number of portfolio holdings | $105 | |
| Portfolio turnover rate | $27 | % |
| Total advisory fees paid (000's) | $57,438 |
(% of Total Investments)

- Prospectus
- Financial information
- Fund holdings
- Proxy voting information
| Fund (Class) | Costs of a $10,000 investment | Costs paid as a percentage of a $10,000 investment |
| Undiscovered Managers Behavioral Value Fund (Class R4 Shares) | $113 | 1.05% |
- During the reporting period, the U.S. regional banking industry posted a significant recovery as conditions broadly stabilized following the bank failures that occurred in the first half of 2023, and the SPDR S&P Regional Banking ETF returned 24.32%. The Fund’s overweight allocation to banks, which had been driven by elevated insider buying activity and attractive valuations, contributed to performance relative to the Index.
- The Fund’s security selection and average overweight position in the financials sector and its security selection in the industrials sector contributed to performance relative to the Index.
- The Fund’s security selection in the energy and materials sectors detracted from performance relative to the Index.
- During the reporting period, the Fund’s largest sector overweight allocations compared to the Index were in the financials and materials sectors, while its largest sector underweight allocations compared to the Index were in the consumer discretionary and energy sectors.
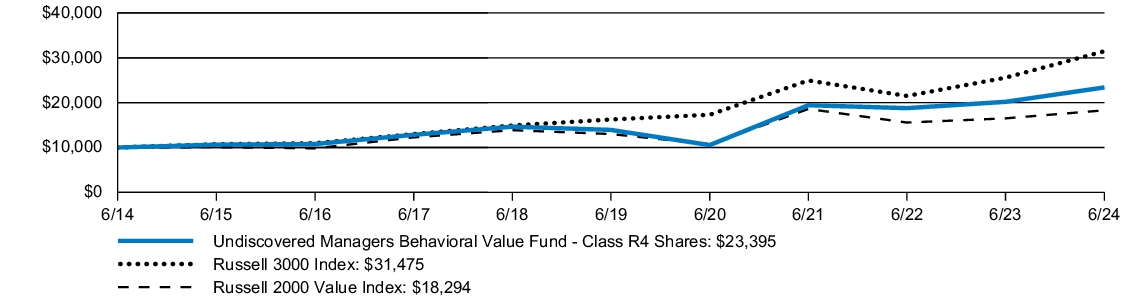
| AVERAGE ANNUAL TOTAL RETURNS | INCEPTION DATE | 1 YEAR | 5 YEAR | 10 YEAR | |||
| Undiscovered Managers Behavioral Value Fund (Class R4 Shares) | March 1, 2017 | 15.92 | % | 10.94 | % | 8.87 | % |
| Russell 3000 Index | 23.13 | 14.14 | 12.15 | ||||
| Russell 2000 Value Index | 10.90 | 7.07 | 6.23 |
KEY FUND STATISTICS
| Fund net assets (000's) | $9,063,302 | |
| Total number of portfolio holdings | $105 | |
| Portfolio turnover rate | $27 | % |
| Total advisory fees paid (000's) | $57,438 |
(% of Total Investments)
- Prospectus
- Financial information
- Fund holdings
- Proxy voting information
| Fund (Class) | Costs of a $10,000 investment | Costs paid as a percentage of a $10,000 investment |
| Undiscovered Managers Behavioral Value Fund (Class R5 Shares) | $97 | 0.90% |
- During the reporting period, the U.S. regional banking industry posted a significant recovery as conditions broadly stabilized following the bank failures that occurred in the first half of 2023, and the SPDR S&P Regional Banking ETF returned 24.32%. The Fund’s overweight allocation to banks, which had been driven by elevated insider buying activity and attractive valuations, contributed to performance relative to the Index.
- The Fund’s security selection and average overweight position in the financials sector and its security selection in the industrials sector contributed to performance relative to the Index.
- The Fund’s security selection in the energy and materials sectors detracted from performance relative to the Index.
- During the reporting period, the Fund’s largest sector overweight allocations compared to the Index were in the financials and materials sectors, while its largest sector underweight allocations compared to the Index were in the consumer discretionary and energy sectors.
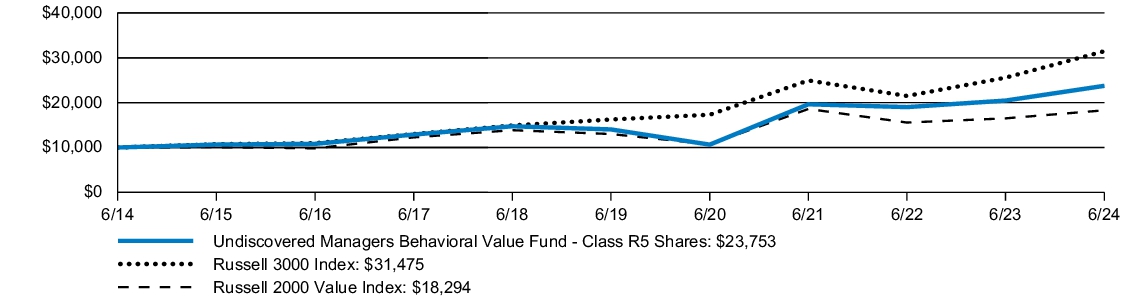
| AVERAGE ANNUAL TOTAL RETURNS | INCEPTION DATE | 1 YEAR | 5 YEAR | 10 YEAR | |||
| Undiscovered Managers Behavioral Value Fund (Class R5 Shares) | March 1, 2017 | 16.10 | % | 11.11 | % | 9.04 | % |
| Russell 3000 Index | 23.13 | 14.14 | 12.15 | ||||
| Russell 2000 Value Index | 10.90 | 7.07 | 6.23 |
KEY FUND STATISTICS
| Fund net assets (000's) | $9,063,302 | |
| Total number of portfolio holdings | $105 | |
| Portfolio turnover rate | $27 | % |
| Total advisory fees paid (000's) | $57,438 |
(% of Total Investments)

- Prospectus
- Financial information
- Fund holdings
- Proxy voting information
| Fund (Class) | Costs of a $10,000 investment | Costs paid as a percentage of a $10,000 investment |
| Undiscovered Managers Behavioral Value Fund (Class R6 Shares) | $86 | 0.80% |
- During the reporting period, the U.S. regional banking industry posted a significant recovery as conditions broadly stabilized following the bank failures that occurred in the first half of 2023, and the SPDR S&P Regional Banking ETF returned 24.32%. The Fund’s overweight allocation to banks, which had been driven by elevated insider buying activity and attractive valuations, contributed to performance relative to the Index.
- The Fund’s security selection and average overweight position in the financials sector and its security selection in the industrials sector contributed to performance relative to the Index.
- The Fund’s security selection in the energy and materials sectors detracted from performance relative to the Index.
- During the reporting period, the Fund’s largest sector overweight allocations compared to the Index were in the financials and materials sectors, while its largest sector underweight allocations compared to the Index were in the consumer discretionary and energy sectors.
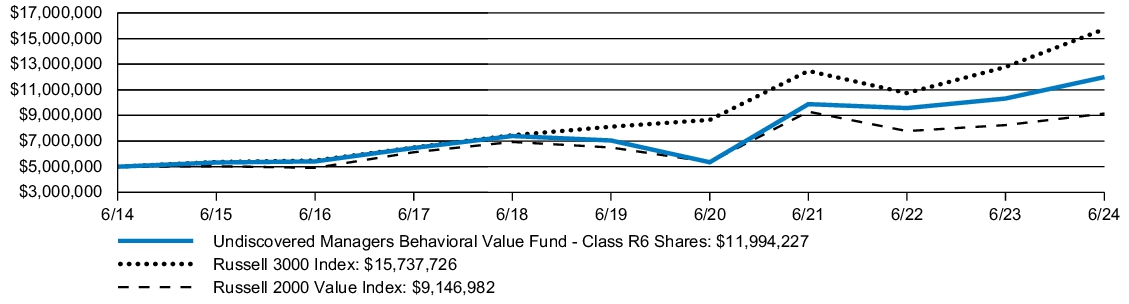
| AVERAGE ANNUAL TOTAL RETURNS | INCEPTION DATE | 1 YEAR | 5 YEAR | 10 YEAR | |||
| Undiscovered Managers Behavioral Value Fund (Class R6 Shares) | April 30, 2013 | 16.21 | % | 11.22 | % | 9.14 | % |
| Russell 3000 Index | 23.13 | 14.14 | 12.15 | ||||
| Russell 2000 Value Index | 10.90 | 7.07 | 6.23 |
KEY FUND STATISTICS
| Fund net assets (000's) | $9,063,302 | |
| Total number of portfolio holdings | $105 | |
| Portfolio turnover rate | $27 | % |
| Total advisory fees paid (000's) | $57,438 |
(% of Total Investments)

- Prospectus
- Financial information
- Fund holdings
- Proxy voting information
ITEM 2. CODE OF ETHICS.
Disclose whether, as of the end of the period covered by the report, the registrant has adopted a code of ethics that applies to the registrant’s principal executive officer, principal financial officer, principal accounting officer or controller, or persons performing similar functions, regardless of whether these individuals are employed by the registrant or a third party. If the registrant has not adopted such a code of ethics, explain why it has not done so.
The registrant must briefly describe the nature of any amendment, during the period covered by the report, to a provision of its code of ethics that applies to the registrant’s principal executive officer, principal financial officer, principal accounting officer or controller, or persons performing similar functions, regardless of whether these individuals are employed by the registrant or a third party, and that relates to any element of the code of ethics definition enumerated in paragraph (b) of this Item. The registrant must file a copy of any such amendment as an exhibit pursuant to Item 13(a)(1), unless the registrant has elected to satisfy paragraph (f) of this Item by positing its code of ethics on its website pursuant to paragraph (f)(2) of this Item, or by undertaking to provide its code of ethics to any person without charge, upon request, pursuant to paragraph (f)(3) of this Item.
If the registrant has, during the period covered by the report, granted a waiver, including an implicit waiver, from a provision of the code of ethics that applies to the registrant’s principal executive officer, principal financial officer, principal accounting officer or controller, or persons performing similar functions, regardless of whether these individuals are employed by the registrant or third party, that relates to one or more items set forth in paragraph (b) of this Item, the registrant must briefly describe the nature of the waiver, the name of the person to whom the waiver was granted, and the date of the waiver.
The Registrant has adopted a code of ethics that applies to the Registrant’s principal executive officer and principal financial officer. There were no amendments to the code of ethics or waivers granted with respect to the code of ethics in the period covered by the report.
ITEM 3. AUDIT COMMITTEE FINANCIAL EXPERT.
(a) (1) Disclose that the registrant’s board of directors has determined that the registrant either:
(i) Has at least one audit committee financial expert serving on its audit committee; or
(ii) Does not have an audit committee financial expert serving on its audit committee.
The Registrant’s Board of Trustees has determined that the Registrant has at least one audit committee financial expert serving on its audit committee. The Securities and Exchange Commission has stated that the designation or identification of a person as an audit committee financial expert pursuant to this Item 3 of Form N-CSR does not impose on such person any duties, obligations or liabilities that are greater than the duties, obligations and liabilities imposed on such person as a member of the Audit Committee and the Board of Trustees in the absence of such designation or identification.
(2) If the registrant provides the disclosure required by paragraph (a)(1)(i) of this Item, it must disclose the name of the audit committee financial expert and whether that person is “independent.” In order to be considered “independent” for purposes of this Item, a member of an audit committee may not, other than in his or her capacity as a member of the audit committee, the board of directors, or any other board committee:
(i) Accept directly or indirectly any consulting, advisory, or other compensatory fee from the issuer; or
(ii) Be an “interested person” of the investment company as defined in Section 2(a)(19) of the Act (15 U.S.C. 80a-2(a)(19)).
The Audit committee financial experts are Gary L. French, Kathleen M. Gallagher, Raymond Kanner and Lawrence R. Maffia, each of whom is not an “interested person” of the Registrant and is also “independent” as defined by the U.S. Securities and Exchange Commission for the purposes of the audit committee financial expert determination.
(3) If the registrant provides the disclosure required by paragraph (a)(1)(ii) of this Item, it must explain why it does not have an audit committee financial expert.
Not applicable.
ITEM 4. PRINCIPAL ACCOUNTANT FEES AND SERVICES.
(a) Disclose, under the caption Audit Fees, the aggregate fees billed for each of the last two fiscal years for professional services rendered by the principal accountant for the audit of the registrant’s annual financial statements or services that are normally provided by the accountant in connection with statutory and regulatory filings or engagements for those fiscal years.
AUDIT FEES
2024 – $36,513
2023 – $33,420
(b) Disclose, under the caption Audit-Related Fees, the aggregate fees billed in each of the last two fiscal years for assurance and related services by the principal accountant that are reasonably related to the performance of the audit of the registrant’s financial statements and are not reported under paragraph (a) of this Item. Registrants shall describe the nature of the services comprising the fees disclosed under this category.
AUDIT-RELATED FEES
2024 – $5,824
2023 – $5,495
Audit-related fees consists of security count procedures performed as required under Rule 17f-2 of the Investment Company Act of 1940 during the Registrant’s fiscal year.
(c) Disclose, under the caption Tax Fees, the aggregate fees billed in each of the last two fiscal years for professional services rendered by the principal accountant for tax compliance, tax advice, and tax planning. Registrants shall describe the nature of the services comprising the fees disclosed under this category.
TAX FEES
2024 – $10,998
2023 – $10,357
The tax fees consist of fees billed in connection with preparing the federal regulated investment company income tax returns for the Registrant for the tax years ended June 30, 2024 and 2023, respectively.
For the last fiscal year, no tax fees were required to be approved pursuant to paragraph (c)(7)(ii) of Rule 2-01 of Regulation S-X.
(d) Disclose, under the caption All Other Fees, the aggregate fees billed in each of the last two fiscal years for products and services provided by the principal accountant, other than the services reported in paragraphs (a) through (c) of this Item. Registrants shall describe the nature of the services comprising the fees disclosed under this category.
ALL OTHER FEES
2024 – Not applicable
2023 – Not applicable
(e) (1) Disclose the audit committee’s pre-approval policies and procedures described in paragraph (c)(7) of Rule 2-01 of Regulation S-X.
Pursuant to the Registrant’s Audit Committee Charter and written policies and procedures for the pre-approval of audit and non-audit services (the “Pre-approval Policy”), the Audit Committee pre-approves all audit and non-audit services performed by the Registrant’s independent public registered accounting firm for the Registrant. In addition, the Audit Committee pre-approves the auditor’s engagement for non-audit services with the Registrant’s investment adviser (not including a sub-adviser whose role is primarily portfolio management and is sub-contracted or overseen by another investment adviser) and any Service Affiliate in accordance with paragraph (c)(7)(ii) of Rule 2-01 of Regulation S-X, if the engagement relates directly to the operations and financial reporting of the Registrant. Proposed services may be pre-approved either 1) without consideration of specific case-by-case services or 2) require the specific pre-approval of the Audit Committee. Therefore, initially the Pre-approval Policy listed a number of audit and non-audit services that have been approved by the Audit Committee, or which were not subject to pre-approval under the transition provisions of Sarbanes-Oxley Act of 2002 (the
“Pre-approval List”). The Audit Committee annually reviews and pre-approves the services included on the Pre-approval List that may be provided by the independent public registered accounting firm without obtaining additional specific pre-approval of individual services from the Audit Committee. The Audit Committee adds to, or subtracts from, the list of general pre-approved services from time to time, based on subsequent determinations. All other audit and non-audit services not on the Pre-approval List must be specifically pre-approved by the Audit Committee.
One or more members of the Audit Committee may be appointed as the Committee’s delegate for the purposes of considering whether to approve such services. Any pre-approvals granted by the delegate will be reported, for informational purposes only, to the Audit Committee at its next scheduled meeting. The Audit Committee’s responsibilities to pre-approve services performed by the independent public registered accounting firm are not delegated to management.
(2) Disclose the percentage of services described in each of paragraphs (b) through (d) of this Item that were approved by the audit committee pursuant to paragraph (c)(7)(i)(C) of Rule 2-01 of Regulation S-X.
2024 – 0.0%
2023 – 0.0%
(f) If greater than 50 percent, disclose the percentage of hours expended on the principal accountant’s engagement to audit the registrant’s financial statements for the most recent fiscal year that were attributed to work performed by persons other than the principal accountant’s full-time, permanent employees.
Not applicable – Less than 50%.
(g) Disclose the aggregate non-audit fees billed by the registrant’s accountant for services rendered to the registrant, and rendered to the registrant’s investment adviser (not including any sub-adviser whose role is primarily portfolio management and is subcontracted with or overseen by another investment adviser), and any entity controlling, controlled by, or under common control with the adviser that provides ongoing services to the registrant for each of the last two fiscal years of the registrant.
The aggregate non-audit fees billed by the independent registered public accounting firm for services rendered to the Registrant, and rendered to Service Affiliates, for the last two calendar year ends were:
2023 – $34.9 million
2022 – $31.6 million
(h) Disclose whether the registrant’s audit committee of the board of directors has considered whether the provision of non-audit services that were rendered to the registrant’s investment adviser (not including any subadviser whose role is primarily portfolio management and is subcontracted with or overseen by another investment adviser), and any entity controlling, controlled by, or under common control with the investment adviser that provides ongoing services to the registrant that were not pre-approved pursuant to paragraph (c)(7)(ii) of Rule 2-01 of Regulation S-X is compatible with maintaining the principal accountant’s independence.
The Registrant’s Audit Committee has considered whether the provision of the non-audit services that were rendered to Service Affiliates that were not pre-approved (not requiring pre-approval) is compatible with maintaining the independent public registered accounting firm’s independence. All services provided by the independent public registered accounting firm to the Registrant or to Service Affiliates that were required to be pre-approved were pre-approved as required.
(i) A registrant identified by the Commission pursuant to Section 104(i)(2)(A) of the Sarbanes-Oxley Act of 2002 (15 U.S.C. 7214(i)(2)(A)), as having retained, for the preparation of the audit report on its financial statements included in the Form NCSR, a registered public accounting firm that has a branch or office that is located in a foreign jurisdiction and that the Public Company Accounting Oversight Board has determined it is unable to inspect or investigate completely because of a position taken by an authority in the foreign jurisdiction must electronically submit to the Commission on a supplemental basis documentation that establishes that the registrant is not owned or controlled by a governmental entity in the foreign jurisdiction. The registrant must submit this documentation on or before the due date for this form. A registrant that is owned or controlled by a foreign governmental entity is not required to submit such documentation.
Not applicable.
(j) A registrant that is a foreign issuer, as defined in 17 CFR 240.3b-4, identified by the Commission pursuant to Section 104(i)(2)(A) of the Sarbanes-Oxley Act of 2002 (15 U.S.C. 7214(i)(2)(A)), as having retained, for the preparation of the audit report on its financial statements included in the Form N-CSR, a registered public accounting firm that has a branch or office that is located in a foreign jurisdiction and that the Public Company Accounting Oversight Board has determined it is unable to inspect or investigate completely because of a position taken by an authority in the foreign jurisdiction, for each year in which the registrant is so identified, must
provide the below disclosures. Also, any such identified foreign issuer that uses a variable-interest entity or any similar structure that results in additional foreign entities being consolidated in the financial statements of the registrant is required to provide the below disclosures for itself and its consolidated foreign operating entity or entities. A registrant must disclose:
| (1) | That, for the immediately preceding annual financial statement period, a registered public accounting firm that the PCAOB was unable to inspect or investigate completely, because of a position taken by an authority in the foreign jurisdiction, issued an audit report for the registrant; |
| (2) | The percentage of shares of the registrant owned by governmental entities in the foreign jurisdiction in which the registrant is incorporated or otherwise organized; |
| (3) | Whether governmental entities in the applicable foreign jurisdiction with respect to that registered public accounting firm have a controlling financial interest with respect to the registrant; |
| (4) | The name of each official of the Chinese Communist Party who is a member of the board of directors of the registrant or the operating entity with respect to the registrant; and |
| (5) | Whether the articles of incorporation of the registrant (or equivalent organizing document) contains any charter of the Chinese Communist Party, including the text of any such charter. |
Not applicable.
ITEM 5. AUDIT COMMITTEE OF LISTED REGISTRANTS.
(a) If the registrant is a listed issuer as defined in Rule 10A-3 under the Exchange Act (17CFR 240.10A-3), state whether or not the registrant has a separately-designated standing audit committee established in accordance with Section 3(a)(58)(A) of the Exchange Act (15 U.S.C. 78c(a)(58)(A)). If the registrant has such a committee, however designated, identify each committee member. If the entire board of directors is acting as the registrant’s audit committee as specified in Section 3(a)(58)(B) of the Exchange Act (15 U.S.C. 78c(a)(58)(B)), so state.
(b) If applicable, provide the disclosure required by Rule 10A-3(d) under the Exchange Act (17CFR 240.10A-3(d)) regarding an exemption from the listing standards for all audit committees.
Not applicable.
ITEM 6. INVESTMENTS.
File Schedule I – Investments in securities of unaffiliated issuers as of the close of the reporting period as set forth in Section 210.12-12 of Regulation S-X, unless the schedule is included as part of the report to shareholders filed under Item 1 of this Form.
Included in Item 1.
ITEM 7. FINANCIAL STATEMENTS AND FINANCIAL HIGHLIGHTS FOR OPEN-END MANAGEMENT INVESTMENT COMPANIES
1 | |
4 | |
12 | |
16 | |
24 | |
25 |
INVESTMENTS | SHARES (000) | VALUE ($000) |
Common Stocks — 99.2% | ||
Aerospace & Defense — 0.3% | ||
Mercury Systems, Inc. * | 1,028 | 27,745 |
Automobile Components — 0.6% | ||
American Axle & Manufacturing Holdings, Inc. * | 2,801 | 19,581 |
Gentherm, Inc. * | 785 | 38,685 |
58,266 | ||
Banks — 22.2% | ||
Brookline Bancorp, Inc. | 3,982 | 33,249 |
Citizens Financial Group, Inc. | 9,787 | 352,612 |
Cullen/Frost Bankers, Inc. | 130 | 13,170 |
CVB Financial Corp. | 1,444 | 24,897 |
East West Bancorp, Inc. | 697 | 51,060 |
First Citizens BancShares, Inc., Class A | 92 | 155,688 |
First Hawaiian, Inc. | 5,008 | 103,956 |
First Horizon Corp. | 1,221 | 19,259 |
FNB Corp. | 19,828 | 271,249 |
Hope Bancorp, Inc. | 6,277 | 67,413 |
Huntington Bancshares, Inc. | 2,164 | 28,518 |
KeyCorp | 22,221 | 315,756 |
Old National Bancorp | 17,008 | 292,374 |
Simmons First National Corp., Class A | 1,301 | 22,875 |
United Bankshares, Inc. | 1,296 | 42,043 |
Valley National Bancorp | 13,580 | 94,786 |
WaFd, Inc. | 3,142 | 89,809 |
Western Alliance Bancorp | 562 | 35,335 |
2,014,049 | ||
Beverages — 1.6% | ||
Primo Water Corp. | 6,526 | 142,659 |
Building Products — 3.2% | ||
Armstrong World Industries, Inc. | 688 | 77,943 |
JELD-WEN Holding, Inc. * | 6,534 | 88,006 |
Resideo Technologies, Inc. * | 6,338 | 123,980 |
289,929 | ||
Capital Markets — 0.2% | ||
Janus Henderson Group plc | 531 | 17,912 |
Chemicals — 3.2% | ||
Cabot Corp. | 1,103 | 101,407 |
Koppers Holdings, Inc. | 1,733 | 64,095 |
Olin Corp. | 2,710 | 127,767 |
293,269 | ||
Commercial Services & Supplies — 3.0% | ||
ABM Industries, Inc. | 1,048 | 53,014 |
INVESTMENTS | SHARES (000) | VALUE ($000) |
Commercial Services & Supplies — continued | ||
Brink's Co. (The) | 1,634 | 167,268 |
MillerKnoll, Inc. | 1,853 | 49,077 |
269,359 | ||
Construction & Engineering — 1.6% | ||
Granite Construction, Inc. (a) | 2,377 | 147,292 |
Containers & Packaging — 6.8% | ||
Berry Global Group, Inc. | 3,809 | 224,181 |
Crown Holdings, Inc. | 793 | 58,984 |
Graphic Packaging Holding Co. (a) | 8,655 | 226,840 |
Greif, Inc., Class A | 1,035 | 59,478 |
Silgan Holdings, Inc. | 1,063 | 44,995 |
614,478 | ||
Diversified Consumer Services — 0.3% | ||
Frontdoor, Inc. * | 720 | 24,329 |
Diversified REITs — 0.5% | ||
Alexander & Baldwin, Inc. | 1,057 | 17,930 |
Broadstone Net Lease, Inc. | 1,703 | 27,030 |
44,960 | ||
Electric Utilities — 3.0% | ||
PNM Resources, Inc. | 3,958 | 146,296 |
Portland General Electric Co. | 2,851 | 123,281 |
269,577 | ||
Energy Equipment & Services — 1.1% | ||
Patterson-UTI Energy, Inc. | 7,699 | 79,767 |
TETRA Technologies, Inc. * | 6,267 | 21,682 |
101,449 | ||
Financial Services — 1.4% | ||
NCR Atleos Corp. * | 2,020 | 54,578 |
Radian Group, Inc. | 2,227 | 69,255 |
123,833 | ||
Food Products — 0.8% | ||
Nomad Foods Ltd. (United Kingdom) | 4,328 | 71,317 |
Gas Utilities — 4.6% | ||
Southwest Gas Holdings, Inc. | 1,302 | 91,638 |
Spire, Inc. | 3,641 | 221,109 |
UGI Corp. | 4,515 | 103,401 |
416,148 | ||
Health Care Equipment & Supplies — 5.1% | ||
Dentsply Sirona, Inc. | 8,231 | 205,032 |
June 30, 2024 | Undiscovered Managers Funds | 1 |
INVESTMENTS | SHARES (000) | VALUE ($000) |
Common Stocks — continued | ||
Health Care Equipment & Supplies — continued | ||
Envista Holdings Corp. * | 3,425 | 56,959 |
ICU Medical, Inc. * | 1,286 | 152,648 |
Integra LifeSciences Holdings Corp. * | 1,566 | 45,643 |
460,282 | ||
Health Care Providers & Services — 3.7% | ||
AMN Healthcare Services, Inc. * | 1,479 | 75,757 |
Ensign Group, Inc. (The) | 1,944 | 240,520 |
ModivCare, Inc. * | 756 | 19,826 |
336,103 | ||
Health Care REITs — 2.8% | ||
Healthpeak Properties, Inc. | 12,894 | 252,727 |
Health Care Technology — 0.2% | ||
Veradigm, Inc. * (a) | 2,111 | 20,057 |
Hotel & Resort REITs — 1.5% | ||
Chatham Lodging Trust | 2,713 | 23,116 |
Pebblebrook Hotel Trust | 8,475 | 116,524 |
139,640 | ||
Hotels, Restaurants & Leisure — 0.6% | ||
Marriott Vacations Worldwide Corp. | 593 | 51,791 |
Household Durables — 0.5% | ||
Tri Pointe Homes, Inc. * | 1,171 | 43,636 |
Household Products — 0.6% | ||
Energizer Holdings, Inc. | 1,411 | 41,667 |
Reynolds Consumer Products, Inc. | 329 | 9,215 |
50,882 | ||
Insurance — 9.9% | ||
Assured Guaranty Ltd. | 965 | 74,431 |
Axis Capital Holdings Ltd. | 1,040 | 73,459 |
CNO Financial Group, Inc. | 3,564 | 98,784 |
Enstar Group Ltd. * | 345 | 105,624 |
Horace Mann Educators Corp. | 3,254 | 106,142 |
James River Group Holdings Ltd. | 2,482 | 19,188 |
Kemper Corp. | 3,769 | 223,635 |
White Mountains Insurance Group Ltd. | 109 | 198,444 |
899,707 | ||
Machinery — 3.7% | ||
AGCO Corp. | 1,078 | 105,529 |
Hillenbrand, Inc. | 2,296 | 91,898 |
Hyster-Yale, Inc. | 186 | 12,949 |
John Bean Technologies Corp. | 454 | 43,090 |
INVESTMENTS | SHARES (000) | VALUE ($000) |
Machinery — continued | ||
Kennametal, Inc. | 1,269 | 29,875 |
Terex Corp. | 948 | 51,968 |
335,309 | ||
Marine Transportation — 1.3% | ||
Matson, Inc. | 888 | 116,329 |
Media — 0.3% | ||
TEGNA, Inc. | 2,132 | 29,713 |
Multi-Utilities — 1.4% | ||
Black Hills Corp. | 1,332 | 72,440 |
Northwestern Energy Group, Inc. | 1,030 | 51,557 |
123,997 | ||
Oil, Gas & Consumable Fuels — 4.1% | ||
Devon Energy Corp. | 6,027 | 285,677 |
Range Resources Corp. | 2,535 | 84,984 |
370,661 | ||
Professional Services — 2.7% | ||
Dun & Bradstreet Holdings, Inc. | 6,942 | 64,281 |
Genpact Ltd. | 1,328 | 42,749 |
Maximus, Inc. | 935 | 80,156 |
Science Applications International Corp. | 480 | 56,448 |
243,634 | ||
Real Estate Management & Development — 0.2% | ||
Cushman & Wakefield plc * | 2,223 | 23,119 |
Retail REITs — 1.1% | ||
Kite Realty Group Trust | 4,654 | 104,165 |
Software — 0.9% | ||
NCR Voyix Corp. * | 4,902 | 60,535 |
Verint Systems, Inc. * | 747 | 24,072 |
84,607 | ||
Specialized REITs — 0.3% | ||
Rayonier, Inc. | 867 | 25,208 |
Specialty Retail — 0.8% | ||
Advance Auto Parts, Inc. | 1,216 | 77,034 |
Textiles, Apparel & Luxury Goods — 1.8% | ||
Carter's, Inc. | 1,212 | 75,101 |
Columbia Sportswear Co. (a) | 421 | 33,299 |
Hanesbrands, Inc. * (a) | 10,856 | 53,521 |
161,921 | ||
2 | Undiscovered Managers Funds | June 30, 2024 |
INVESTMENTS | SHARES (000) | VALUE ($000) |
Common Stocks — continued | ||
Trading Companies & Distributors — 1.3% | ||
Beacon Roofing Supply, Inc. * | 357 | 32,303 |
MRC Global, Inc. * | 3,436 | 44,352 |
MSC Industrial Direct Co., Inc., Class A | 482 | 38,262 |
114,917 | ||
Total Common Stocks (Cost $7,325,758) | 8,992,010 | |
Short-Term Investments — 1.1% | ||
Investment Companies — 0.8% | ||
JPMorgan Prime Money Market Fund Class IM Shares, 5.39% (b) (c) (Cost $67,128) | 67,115 | 67,128 |
Investment of Cash Collateral from Securities Loaned — 0.3% | ||
JPMorgan Securities Lending Money Market Fund Agency SL Class Shares, 5.39% (b) (c) | 23,985 | 23,985 |
JPMorgan U.S. Government Money Market Fund Class IM Shares, 5.25% (b) (c) | 3,072 | 3,072 |
Total Investment of Cash Collateral from Securities Loaned (Cost $27,057) | 27,057 | |
Total Short-Term Investments (Cost $94,185) | 94,185 | |
Total Investments — 100.3% (Cost $7,419,943) | 9,086,195 | |
Liabilities in Excess of Other Assets — (0.3)% | (22,893 ) | |
NET ASSETS — 100.0% | 9,063,302 | |
Percentages indicated are based on net assets. |
Abbreviations | |
REIT | Real Estate Investment Trust |
* | Non-income producing security. |
(a) | The security or a portion of this security is on loan at June 30, 2024. The total value of securities on loan at June 30, 2024 is $26,685. |
(b) | Investment in an affiliated fund, which is registered under the Investment Company Act of 1940, as amended, and is advised by J.P. Morgan Investment Management Inc. |
(c) | The rate shown is the current yield as of June 30, 2024. |
June 30, 2024 | Undiscovered Managers Funds | 3 |
Undiscovered Managers Behavioral Value Fund | |
ASSETS: | |
Investments in non-affiliates, at value | $8,992,010 |
Investments in affiliates, at value | 67,128 |
Investments of cash collateral received from securities loaned, at value (See Note 2.C.) | 27,057 |
Cash | 578 |
Receivables: | |
Investment securities sold | 15,256 |
Fund shares sold | 11,534 |
Dividends from non-affiliates | 13,839 |
Dividends from affiliates | 10 |
Securities lending income (See Note 2.C.) | 2 |
Total Assets | 9,127,414 |
LIABILITIES: | |
Payables: | |
Investment securities purchased | 22,285 |
Collateral received on securities loaned (See Note 2.C.) | 27,057 |
Fund shares redeemed | 7,730 |
Accrued liabilities: | |
Investment advisory fees | 5,238 |
Administration fees | 529 |
Distribution fees | 169 |
Service fees | 707 |
Custodian and accounting fees | 67 |
Trustees’ and Chief Compliance Officer’s fees | — (a) |
Other | 330 |
Total Liabilities | 64,112 |
Net Assets | $9,063,302 |
4 | Undiscovered Managers Funds | June 30, 2024 |
Undiscovered Managers Behavioral Value Fund | |
NET ASSETS: | |
Paid-in-Capital | $7,335,792 |
Total distributable earnings (loss) | 1,727,510 |
Total Net Assets | $9,063,302 |
Net Assets: | |
Class A | $685,654 |
Class C | 33,128 |
Class I | 2,641,019 |
Class L | 2,617,030 |
Class R2 | 15,945 |
Class R3 | 6,596 |
Class R4 | 8,592 |
Class R5 | 21,759 |
Class R6 | 3,033,579 |
Total | $9,063,302 |
Outstanding units of beneficial interest (shares) ($0.0001 par value; unlimited number of shares authorized): | |
Class A | 8,754 |
Class C | 458 |
Class I | 32,711 |
Class L | 32,247 |
Class R2 | 207 |
Class R3 | 86 |
Class R4 | 107 |
Class R5 | 268 |
Class R6 | 37,286 |
Net Asset Value (a): | |
Class A — Redemption price per share | $78.33 |
Class C — Offering price per share (b) | 72.22 |
Class I — Offering and redemption price per share | 80.74 |
Class L — Offering and redemption price per share | 81.15 |
Class R2 — Offering and redemption price per share | 77.12 |
Class R3 — Offering and redemption price per share | 77.30 |
Class R4 — Offering and redemption price per share | 80.40 |
Class R5 — Offering and redemption price per share | 81.06 |
Class R6 — Offering and redemption price per share | 81.36 |
Class A maximum sales charge | 5.25 % |
Class A maximum public offering price per share [net asset value per share/(100% – maximum sales charge)] | $82.67 |
Cost of investments in non-affiliates | $7,325,758 |
Cost of investments in affiliates | 67,128 |
Investment securities on loan, at value (See Note 2.C.) | 26,685 |
Cost of investment of cash collateral (See Note 2.C.) | 27,057 |
June 30, 2024 | Undiscovered Managers Funds | 5 |
Undiscovered Managers Behavioral Value Fund | |
INVESTMENT INCOME: | |
Interest income from affiliates | $— (a) |
Dividend income from non-affiliates | 202,937 |
Dividend income from affiliates | 8,575 |
Income from securities lending (net) (See Note 2.C.) | 205 |
Total investment income | 211,717 |
EXPENSES: | |
Investment advisory fees | 60,927 |
Administration fees | 6,085 |
Distribution fees: | |
Class A | 1,611 |
Class C | 291 |
Class R2 | 73 |
Class R3 | 16 |
Service fees: | |
Class A | 1,611 |
Class C | 97 |
Class I | 5,221 |
Class L | 2,499 |
Class R2 | 36 |
Class R3 | 16 |
Class R4 | 20 |
Class R5 | 24 |
Custodian and accounting fees | 250 |
Interest expense to affiliates | 7 |
Professional fees | 74 |
Trustees’ and Chief Compliance Officer’s fees | 53 |
Printing and mailing costs | 521 |
Registration and filing fees | 424 |
Transfer agency fees (See Note 2.F.) | 370 |
Other | 80 |
Total expenses | 80,306 |
Less fees waived | (5,633 ) |
Less expense reimbursements | (7 ) |
Net expenses | 74,666 |
Net investment income (loss) | 137,051 |
6 | Undiscovered Managers Funds | June 30, 2024 |
Undiscovered Managers Behavioral Value Fund | |
REALIZED/UNREALIZED GAINS (LOSSES): | |
Net realized gain (loss) on transactions from: | |
Investments in non-affiliates | $356,332 |
Investments in affiliates | (85 ) |
Net realized gain (loss) | 356,247 |
Change in net unrealized appreciation/depreciation on: | |
Investments in non-affiliates | 673,804 |
Investments in affiliates | — (a) |
Change in net unrealized appreciation/depreciation | 673,804 |
Net realized/unrealized gains (losses) | 1,030,051 |
Change in net assets resulting from operations | $1,167,102 |
June 30, 2024 | Undiscovered Managers Funds | 7 |
Undiscovered Managers Behavioral Value Fund | ||
Year Ended June 30, 2024 | Year Ended June 30, 2023 | |
CHANGE IN NET ASSETS RESULTING FROM OPERATIONS: | ||
Net investment income (loss) | $137,051 | $106,629 |
Net realized gain (loss) | 356,247 | 426,313 |
Change in net unrealized appreciation/depreciation | 673,804 | (25,953 ) |
Change in net assets resulting from operations | 1,167,102 | 506,989 |
DISTRIBUTIONS TO SHAREHOLDERS: | ||
Class A | (52,892 ) | (47,351 ) |
Class C | (3,156 ) | (4,991 ) |
Class I | (150,126 ) | (144,835 ) |
Class L | (200,662 ) | (209,068 ) |
Class R2 | (1,142 ) | (1,128 ) |
Class R3 | (496 ) | (542 ) |
Class R4 | (636 ) | (550 ) |
Class R5 | (1,977 ) | (1,654 ) |
Class R6 | (229,842 ) | (209,284 ) |
Total distributions to shareholders | (640,929 ) | (619,403 ) |
CAPITAL TRANSACTIONS: | ||
Change in net assets resulting from capital transactions | 1,062,527 | 723,908 |
NET ASSETS: | ||
Change in net assets | 1,588,700 | 611,494 |
Beginning of period | 7,474,602 | 6,863,108 |
End of period | $9,063,302 | $7,474,602 |
8 | Undiscovered Managers Funds | June 30, 2024 |
Undiscovered Managers Behavioral Value Fund | ||
Year Ended June 30, 2024 | Year Ended June 30, 2023 | |
CAPITAL TRANSACTIONS: | ||
Class A | ||
Proceeds from shares issued | $145,201 | $168,951 |
Distributions reinvested | 46,163 | 41,941 |
Cost of shares redeemed | (129,522 ) | (135,806 ) |
Change in net assets resulting from Class A capital transactions | 61,842 | 75,086 |
Class C | ||
Proceeds from shares issued | 7,203 | 9,140 |
Distributions reinvested | 2,969 | 4,821 |
Cost of shares redeemed | (24,686 ) | (30,021 ) |
Change in net assets resulting from Class C capital transactions | (14,514 ) | (16,060 ) |
Class I | ||
Proceeds from shares issued | 1,294,246 | 950,210 |
Distributions reinvested | 95,038 | 101,012 |
Cost of shares redeemed | (681,894 ) | (883,430 ) |
Change in net assets resulting from Class I capital transactions | 707,390 | 167,792 |
Class L | ||
Proceeds from shares issued | 484,135 | 587,789 |
Distributions reinvested | 183,580 | 189,496 |
Cost of shares redeemed | (675,899 ) | (607,345 ) |
Change in net assets resulting from Class L capital transactions | (8,184 ) | 169,940 |
Class R2 | ||
Proceeds from shares issued | 2,879 | 3,245 |
Distributions reinvested | 1,142 | 1,128 |
Cost of shares redeemed | (2,681 ) | (3,309 ) |
Change in net assets resulting from Class R2 capital transactions | 1,340 | 1,064 |
Class R3 | ||
Proceeds from shares issued | 2,175 | 2,261 |
Distributions reinvested | 496 | 542 |
Cost of shares redeemed | (2,219 ) | (2,920 ) |
Change in net assets resulting from Class R3 capital transactions | 452 | (117 ) |
Class R4 | ||
Proceeds from shares issued | 2,762 | 2,405 |
Distributions reinvested | 635 | 550 |
Cost of shares redeemed | (2,559 ) | (1,831 ) |
Change in net assets resulting from Class R4 capital transactions | 838 | 1,124 |
Class R5 | ||
Proceeds from shares issued | 11,578 | 10,106 |
Distributions reinvested | 1,112 | 1,083 |
Cost of shares redeemed | (14,437 ) | (6,605 ) |
Change in net assets resulting from Class R5 capital transactions | (1,747 ) | 4,584 |
June 30, 2024 | Undiscovered Managers Funds | 9 |
Undiscovered Managers Behavioral Value Fund | ||
Year Ended June 30, 2024 | Year Ended June 30, 2023 | |
CAPITAL TRANSACTIONS: (continued) | ||
Class R6 | ||
Proceeds from shares issued | $832,643 | $759,898 |
Distributions reinvested | 166,522 | 144,508 |
Cost of shares redeemed | (684,055 ) | (583,911 ) |
Change in net assets resulting from Class R6 capital transactions | 315,110 | 320,495 |
Total change in net assets resulting from capital transactions | $1,062,527 | $723,908 |
SHARE TRANSACTIONS: | ||
Class A | ||
Issued | 1,896 | 2,238 |
Reinvested | 606 | 559 |
Redeemed | (1,692 ) | (1,812 ) |
Change in Class A Shares | 810 | 985 |
Class C | ||
Issued | 102 | 128 |
Reinvested | 42 | 70 |
Redeemed | (350 ) | (430 ) |
Change in Class C Shares | (206 ) | (232 ) |
Class I | ||
Issued | 16,302 | 12,214 |
Reinvested | 1,210 | 1,312 |
Redeemed | (8,695 ) | (11,495 ) |
Change in Class I Shares | 8,817 | 2,031 |
Class L | ||
Issued | 6,106 | 7,540 |
Reinvested | 2,324 | 2,448 |
Redeemed | (8,564 ) | (7,870 ) |
Change in Class L Shares | (134 ) | 2,118 |
Class R2 | ||
Issued | 38 | 43 |
Reinvested | 15 | 15 |
Redeemed | (35 ) | (44 ) |
Change in Class R2 Shares | 18 | 14 |
Class R3 | ||
Issued | 29 | 31 |
Reinvested | 7 | 7 |
Redeemed | (29 ) | (40 ) |
Change in Class R3 Shares | 7 | (2 ) |
10 | Undiscovered Managers Funds | June 30, 2024 |
Undiscovered Managers Behavioral Value Fund | ||
Year Ended June 30, 2024 | Year Ended June 30, 2023 | |
SHARE TRANSACTIONS: (continued) | ||
Class R4 | ||
Issued | 36 | 31 |
Reinvested | 8 | 7 |
Redeemed | (33 ) | (24 ) |
Change in Class R4 Shares | 11 | 14 |
Class R5 | ||
Issued | 144 | 128 |
Reinvested | 14 | 14 |
Redeemed | (178 ) | (87 ) |
Change in Class R5 Shares | (20 ) | 55 |
Class R6 | ||
Issued | 10,457 | 9,750 |
Reinvested | 2,103 | 1,864 |
Redeemed | (8,610 ) | (7,524 ) |
Change in Class R6 Shares | 3,950 | 4,090 |
June 30, 2024 | Undiscovered Managers Funds | 11 |
Per share operating performance | |||||||
Investment operations | Distributions | ||||||
Net asset value, beginning of period | Net investment income (loss)(a) | Net realized and unrealized gains (losses) on investments | Total from investment operations | Net investment income | Net realized gain | Total distributions | |
Undiscovered Managers Behavioral Value Fund | |||||||
Class A | |||||||
Year Ended June 30, 2024 | $73.49 | $1.05 | $10.23 | $11.28 | $(1.15 ) | $(5.29 ) | $(6.44 ) |
Year Ended June 30, 2023 | 74.51 | 0.85 | 4.68 | 5.53 | (0.62 ) | (5.93 ) | (6.55 ) |
Year Ended June 30, 2022 | 79.82 | 0.55 | (3.28 ) | (2.73 ) | (0.54 ) | (2.04 ) | (2.58 ) |
Year Ended June 30, 2021 | 43.66 | 0.49 | 36.02 | 36.51 | (0.35 ) | — | (0.35 ) |
Year Ended June 30, 2020 | 60.63 | 0.50 | (14.56 ) | (14.06 ) | (0.23 ) | (2.68 ) | (2.91 ) |
Class C | |||||||
Year Ended June 30, 2024 | 68.05 | 0.59 | 9.48 | 10.07 | (0.61 ) | (5.29 ) | (5.90 ) |
Year Ended June 30, 2023 | 69.37 | 0.42 | 4.39 | 4.81 | (0.20 ) | (5.93 ) | (6.13 ) |
Year Ended June 30, 2022 | 74.40 | 0.12 | (3.02 ) | (2.90 ) | (0.09 ) | (2.04 ) | (2.13 ) |
Year Ended June 30, 2021 | 40.67 | 0.16 | 33.58 | 33.74 | (0.01 ) | — | (0.01 ) |
Year Ended June 30, 2020 | 56.73 | 0.21 | (13.59 ) | (13.38 ) | — | (2.68 ) | (2.68 ) |
Class I | |||||||
Year Ended June 30, 2024 | 75.53 | 1.30 | 10.50 | 11.80 | (1.30 ) | (5.29 ) | (6.59 ) |
Year Ended June 30, 2023 | 76.37 | 1.07 | 4.79 | 5.86 | (0.77 ) | (5.93 ) | (6.70 ) |
Year Ended June 30, 2022 | 81.75 | 0.76 | (3.37 ) | (2.61 ) | (0.73 ) | (2.04 ) | (2.77 ) |
Year Ended June 30, 2021 | 44.72 | 0.70 | 36.85 | 37.55 | (0.52 ) | — | (0.52 ) |
Year Ended June 30, 2020 | 62.04 | 0.65 | (14.88 ) | (14.23 ) | (0.41 ) | (2.68 ) | (3.09 ) |
Class L | |||||||
Year Ended June 30, 2024 | 75.88 | 1.34 | 10.59 | 11.93 | (1.37 ) | (5.29 ) | (6.66 ) |
Year Ended June 30, 2023 | 76.71 | 1.14 | 4.81 | 5.95 | (0.85 ) | (5.93 ) | (6.78 ) |
Year Ended June 30, 2022 | 82.10 | 0.86 | (3.38 ) | (2.52 ) | (0.83 ) | (2.04 ) | (2.87 ) |
Year Ended June 30, 2021 | 44.88 | 0.75 | 37.05 | 37.80 | (0.58 ) | — | (0.58 ) |
Year Ended June 30, 2020 | 62.25 | 0.74 | (14.93 ) | (14.19 ) | (0.50 ) | (2.68 ) | (3.18 ) |
Class R2 | |||||||
Year Ended June 30, 2024 | 72.44 | 0.79 | 10.09 | 10.88 | (0.91 ) | (5.29 ) | (6.20 ) |
Year Ended June 30, 2023 | 73.53 | 0.61 | 4.61 | 5.22 | (0.38 ) | (5.93 ) | (6.31 ) |
Year Ended June 30, 2022 | 78.78 | 0.32 | (3.23 ) | (2.91 ) | (0.30 ) | (2.04 ) | (2.34 ) |
Year Ended June 30, 2021 | 43.14 | 0.29 | 35.61 | 35.90 | (0.26 ) | — | (0.26 ) |
Year Ended June 30, 2020 | 59.98 | 0.37 | (14.41 ) | (14.04 ) | (0.12 ) | (2.68 ) | (2.80 ) |
Class R3 | |||||||
Year Ended June 30, 2024 | 72.59 | 0.98 | 10.11 | 11.09 | (1.09 ) | (5.29 ) | (6.38 ) |
Year Ended June 30, 2023 | 73.66 | 0.79 | 4.64 | 5.43 | (0.57 ) | (5.93 ) | (6.50 ) |
Year Ended June 30, 2022 | 78.96 | 0.50 | (3.22 ) | (2.72 ) | (0.54 ) | (2.04 ) | (2.58 ) |
Year Ended June 30, 2021 | 43.23 | 0.48 | 35.65 | 36.13 | (0.40 ) | — | (0.40 ) |
Year Ended June 30, 2020 | 60.14 | 0.51 | (14.42 ) | (13.91 ) | (0.32 ) | (2.68 ) | (3.00 ) |
Class R4 | |||||||
Year Ended June 30, 2024 | 75.25 | 1.22 | 10.49 | 11.71 | (1.27 ) | (5.29 ) | (6.56 ) |
Year Ended June 30, 2023 | 76.18 | 1.03 | 4.76 | 5.79 | (0.79 ) | (5.93 ) | (6.72 ) |
Year Ended June 30, 2022 | 81.55 | 0.81 | (3.42 ) | (2.61 ) | (0.72 ) | (2.04 ) | (2.76 ) |
Year Ended June 30, 2021 | 44.58 | 0.67 | 36.77 | 37.44 | (0.47 ) | — | (0.47 ) |
Year Ended June 30, 2020 | 61.89 | 0.67 | (14.86 ) | (14.19 ) | (0.44 ) | (2.68 ) | (3.12 ) |
Class R5 | |||||||
Year Ended June 30, 2024 | 75.81 | 1.33 | 10.59 | 11.92 | (1.38 ) | (5.29 ) | (6.67 ) |
Year Ended June 30, 2023 | 76.65 | 1.15 | 4.80 | 5.95 | (0.86 ) | (5.93 ) | (6.79 ) |
Year Ended June 30, 2022 | 82.04 | 0.87 | (3.39 ) | (2.52 ) | (0.83 ) | (2.04 ) | (2.87 ) |
Year Ended June 30, 2021 | 44.86 | 0.78 | 36.99 | 37.77 | (0.59 ) | — | (0.59 ) |
Year Ended June 30, 2020 | 62.20 | 0.77 | (14.95 ) | (14.18 ) | (0.48 ) | (2.68 ) | (3.16 ) |
12 | Undiscovered Managers Funds | June 30, 2024 |
Ratios/Supplemental data | ||||||
Ratios to average net assets | ||||||
Net asset value, end of period | Total return (excludes sales charge)(b) | Net assets, end of period (000's) | Net expenses(c) | Net investment income (loss) | Expenses without waivers and reimbursements | Portfolio turnover rate |
$78.33 | 15.70 % | $685,654 | 1.24 % | 1.36 % | 1.35 % | 27 % |
73.49 | 7.30 | 583,756 | 1.24 | 1.13 | 1.35 | 39 |
74.51 | (3.56 ) | 518,471 | 1.27 | 0.68 | 1.35 | 37 |
79.82 | 83.87 | 492,556 | 1.29 | 0.78 | 1.34 | 30 |
43.66 | (24.49 ) | 308,675 | 1.30 | 0.92 | 1.35 | 44 |
72.22 | 15.12 | 33,128 | 1.74 | 0.84 | 1.86 | 27 |
68.05 | 6.77 | 45,189 | 1.74 | 0.60 | 1.85 | 39 |
69.37 | (4.04 ) | 62,159 | 1.77 | 0.15 | 1.85 | 37 |
74.40 | 82.97 | 88,919 | 1.79 | 0.27 | 1.84 | 30 |
40.67 | (24.87 ) | 79,818 | 1.80 | 0.42 | 1.85 | 44 |
80.74 | 15.99 | 2,641,019 | 0.99 | 1.64 | 1.10 | 27 |
75.53 | 7.58 | 1,804,655 | 0.99 | 1.38 | 1.11 | 39 |
76.37 | (3.32 ) | 1,669,775 | 1.02 | 0.91 | 1.10 | 37 |
81.75 | 84.32 | 1,847,319 | 1.05 | 1.02 | 1.10 | 30 |
44.72 | (24.29 ) | 555,350 | 1.05 | 1.18 | 1.10 | 44 |
81.15 | 16.09 | 2,617,030 | 0.90 | 1.70 | 0.95 | 27 |
75.88 | 7.67 | 2,457,156 | 0.90 | 1.46 | 0.95 | 39 |
76.71 | (3.20 ) | 2,321,525 | 0.90 | 1.04 | 0.95 | 37 |
82.10 | 84.61 | 2,607,467 | 0.90 | 1.18 | 0.95 | 30 |
44.88 | (24.18 ) | 1,799,190 | 0.90 | 1.34 | 0.95 | 44 |
77.12 | 15.35 | 15,945 | 1.55 | 1.05 | 1.62 | 27 |
72.44 | 6.96 | 13,716 | 1.55 | 0.82 | 1.62 | 39 |
73.53 | (3.83 ) | 12,917 | 1.55 | 0.40 | 1.62 | 37 |
78.78 | 83.41 | 13,172 | 1.54 | 0.49 | 1.61 | 30 |
43.14 | (24.68 ) | 13,640 | 1.55 | 0.71 | 1.62 | 44 |
77.30 | 15.62 | 6,596 | 1.30 | 1.30 | 1.36 | 27 |
72.59 | 7.25 | 5,744 | 1.30 | 1.06 | 1.35 | 39 |
73.66 | (3.59 ) | 5,977 | 1.30 | 0.63 | 1.35 | 37 |
78.96 | 83.86 | 6,122 | 1.29 | 0.78 | 1.35 | 30 |
43.23 | (24.48 ) | 4,254 | 1.30 | 0.99 | 1.36 | 44 |
80.40 | 15.92 | 8,592 | 1.05 | 1.55 | 1.11 | 27 |
75.25 | 7.50 | 7,249 | 1.05 | 1.33 | 1.10 | 39 |
76.18 | (3.34 ) | 6,205 | 1.05 | 0.99 | 1.12 | 37 |
81.55 | 84.31 | 2,690 | 1.05 | 1.02 | 1.11 | 30 |
44.58 | (24.29 ) | 1,584 | 1.05 | 1.20 | 1.11 | 44 |
81.06 | 16.08 | 21,759 | 0.90 | 1.68 | 0.95 | 27 |
75.81 | 7.67 | 21,861 | 0.90 | 1.48 | 0.95 | 39 |
76.65 | (3.20 ) | 17,819 | 0.90 | 1.05 | 0.95 | 37 |
82.04 | 84.60 | 19,235 | 0.90 | 1.20 | 0.95 | 30 |
44.86 | (24.18 ) | 9,215 | 0.90 | 1.40 | 0.96 | 44 |
June 30, 2024 | Undiscovered Managers Funds | 13 |
Per share operating performance | |||||||
Investment operations | Distributions | ||||||
Net asset value, beginning of period | Net investment income (loss)(a) | Net realized and unrealized gains (losses) on investments | Total from investment operations | Net investment income | Net realized gain | Total distributions | |
Undiscovered Managers Behavioral Value Fund (continued) | |||||||
Class R6 | |||||||
Year Ended June 30, 2024 | $76.05 | $1.44 | $10.61 | $12.05 | $(1.45 ) | $(5.29 ) | $(6.74 ) |
Year Ended June 30, 2023 | 76.87 | 1.23 | 4.81 | 6.04 | (0.93 ) | (5.93 ) | (6.86 ) |
Year Ended June 30, 2022 | 82.27 | 0.95 | (3.40 ) | (2.45 ) | (0.91 ) | (2.04 ) | (2.95 ) |
Year Ended June 30, 2021 | 44.97 | 0.84 | 37.10 | 37.94 | (0.64 ) | — | (0.64 ) |
Year Ended June 30, 2020 | 62.36 | 0.80 | (14.95 ) | (14.15 ) | (0.56 ) | (2.68 ) | (3.24 ) |
(a) | Calculated based upon average shares outstanding. |
(b) | Includes adjustments in accordance with accounting principles generally accepted in the United States of America and as such, the net asset values for financial reporting purposes and the returns based upon those net asset values may differ from the net asset values and returns for shareholder transactions. |
(c) | Includes interest expense, if applicable, which is less than 0.005% unless otherwise noted. |
14 | Undiscovered Managers Funds | June 30, 2024 |
Ratios/Supplemental data | ||||||
Ratios to average net assets | ||||||
Net asset value, end of period | Total return (excludes sales charge)(b) | Net assets, end of period (000's) | Net expenses(c) | Net investment income (loss) | Expenses without waivers and reimbursements | Portfolio turnover rate |
$81.36 | 16.21 % | $3,033,579 | 0.80 % | 1.81 % | 0.85 % | 27 % |
76.05 | 7.78 | 2,535,276 | 0.80 | 1.57 | 0.85 | 39 |
76.87 | (3.11 ) | 2,248,260 | 0.80 | 1.14 | 0.85 | 37 |
82.27 | 84.79 | 2,142,164 | 0.80 | 1.29 | 0.84 | 30 |
44.97 | (24.10 ) | 877,755 | 0.80 | 1.47 | 0.85 | 44 |
June 30, 2024 | Undiscovered Managers Funds | 15 |
Classes Offered | Diversification Classification | |
Undiscovered Managers Behavioral Value Fund | Class A, Class C, Class I, Class L, Class R2, Class R3, Class R4, Class R5 and Class R6 | Diversified |
16 | Undiscovered Managers Funds | June 30, 2024 |
Level 1 Quoted prices | Level 2 Other significant observable inputs | Level 3 Significant unobservable inputs | Total | |
Total Investments in Securities (a) | $9,086,195 | $— | $— | $9,086,195 |
(a) | Please refer to the SOI for specifics of portfolio holdings. |
June 30, 2024 | Undiscovered Managers Funds | 17 |
Investment Securities on Loan, at value, Presented on the Statement of Assets and Liabilities | Cash Collateral Posted by Borrower* | Net Amount Due to Counterparty (not less than zero) | |
$26,685 | $(26,685 ) | $— |
* | Collateral posted reflects the value of securities on loan and does not include any additional amounts received from the borrower. |
For the year ended June 30, 2024 | |||||||||
Security Description | Value at June 30, 2023 | Purchases at Cost | Proceeds from Sales | Net Realized Gain (Loss) | Change in Unrealized Appreciation/ (Depreciation) | Value at June 30, 2024 | Shares at June 30, 2024 | Dividend Income | Capital Gain Distributions |
JPMorgan Prime Money Market Fund Class IM Shares, 5.39% (a) (b) | $13,761 | $2,429,872 | $2,376,420 | $(85 ) | $— | $67,128 | 67,115 | $8,575 | $— |
JPMorgan Securities Lending Money Market Fund Agency SL Class Shares, 5.39% (a) (b) | 155,968 | 524,999 | 657,000 | 18 * | — (c) | 23,985 | 23,985 | 5,620 * | — |
JPMorgan U.S. Government Money Market Fund Class IM Shares, 5.25% (a) (b) | 19,372 | 246,511 | 262,811 | — | — | 3,072 | 3,072 | 697 * | — |
Total | $189,101 | $3,201,382 | $3,296,231 | $(67 ) | $— (c) | $94,185 | $14,892 | $— | |
(a) | Investment in an affiliated fund, which is registered under the Investment Company Act of 1940, as amended, and is advised by J.P. Morgan Investment Management Inc. |
(b) | The rate shown is the current yield as of June 30, 2024. |
(c) | Amount rounds to less than one thousand. |
* | Amount is included on the Statement of Operations as Income from securities lending (net) (after payments of rebates and Citibank’s fee). |
18 | Undiscovered Managers Funds | June 30, 2024 |
Class A | Class C | Class I | Class L | Class R2 | Class R3 | Class R4 | Class R5 | Class R6 | Total | |
Transfer agency fees | $26 | $4 | $56 | $196 | $4 | $1 | $1 | $2 | $80 | $370 |
Paid-in-Capital | Accumulated undistributed (distributions in excess of) net investment income | Accumulated net realized gains (losses) | |
$22,795 | $4,917 | $(27,712 ) |
June 30, 2024 | Undiscovered Managers Funds | 19 |
Class A | Class C | Class R2 | Class R3 | |
0.25 % | 0.75 % | 0.50 % | 0.25 % |
Front-End Sales Charge | CDSC | |
$53 | $2 |
Class A | Class C | Class I | Class L | Class R2 | Class R3 | Class R4 | Class R5 | |
0.25 % | 0.25 % | 0.25 % | 0.10 % | 0.25 % | 0.25 % | 0.25 % | 0.10 % |
Class A | Class C | Class I | Class L | Class R2 | Class R3 | Class R4 | Class R5 | Class R6 | |
1.24 % | 1.74 % | 0.99 % | 0.90 % | 1.55 % | 1.30 % | 1.05 % | 0.90 % | 0.80 % |
Contractual Waivers | |||||
Investment Advisory Fees | Administration Fees | Service Fees | Total | Contractual Reimbursements | |
$3,307 | $331 | $1,813 | $5,451 | $6 | |
20 | Undiscovered Managers Funds | June 30, 2024 |
Purchases (excluding U.S. Government) | Sales (excluding U.S. Government) | |
$2,705,131 | $2,191,046 |
Aggregate Cost | Gross Unrealized Appreciation | Gross Unrealized Depreciation | Net Unrealized Appreciation (Depreciation) | |
$7,609,646 | $1,905,171 | $428,622 | $1,476,549 |
Ordinary Income* | Net Long-Term Capital Gains | Total Distributions Paid | |
$308,539 | $332,390 | $640,929 |
* | Short-term gain distributions are treated as ordinary income for income tax purposes. |
June 30, 2024 | Undiscovered Managers Funds | 21 |
Ordinary Income* | Net Long-Term Capital Gains | Total Distributions Paid | |
$124,428 | $494,975 | $619,403 |
* | Short-term gain distributions are treated as ordinary income for income tax purposes. |
Current Distributable Ordinary Income | Current Distributable Long-Term Capital Gain (Tax Basis Capital Loss Carryover) | Unrealized Appreciation (Depreciation) | |
$153,933 | $97,105 | $1,476,549 |
Average Borrowings | Average Interest Rate Paid | Number of Days Outstanding | Interest Paid | |
$7,357 | 6.06 % | 3 | $4 |
22 | Undiscovered Managers Funds | June 30, 2024 |
June 30, 2024 | Undiscovered Managers Funds | 23 |
24 | Undiscovered Managers Funds | June 30, 2024 |
June 30, 2024 | Undiscovered Managers Funds | 25 |


ITEM 8. CHANGES IN AND DISAGREEMENTS WITH ACCOUNTANTS FOR OPEN-END MANAGEMENT INVESTMENT COMPANIES
Refer to Item 7.
ITEM 9. PROXY DISCLOSURES FOR OPEN-END MANAGEMENT INVESTMENT COMPANIES.
Refer to Item 7.
ITEM 10. REMUNERATION PAID TO DIRECTORS, OFFICERS, AND OTHERS OF OPEN-END MANAGEMENT INVESTMENT COMPANIES.
Refer to Item 7.
ITEM 11. STATEMENT REGARDING BASIS FOR APPROVAL OF INVESTMENT ADVISORY CONTRACT.
Refer to Item 7.
ITEM 12. DISCLOSURE OF PROXY VOTING POLICIES AND PROCEDURES FOR CLOSED-END MANAGEMENT INVESTMENT COMPANIES.
Not applicable.
ITEM 13. PORTFOLIO MANAGERS OF CLOSED-END MANAGEMENT INVESTMENT COMPANIES.
Not applicable.
ITEM 14. PURCHASES OF EQUITY SECURITIES BY CLOSED-END MANAGEMENT INVESTMENT COMPANY AND AFFILIATED PURCHASERS.
Not applicable.
ITEM 15. SUBMISSION OF MATTERS TO A VOTE OF SECURITY HOLDERS.
Describe any material changes to the procedures by which shareholders may recommend nominees to the registrant’s board of directors, where those changes were implemented after the registrant last provided disclosure in response to the requirements of Item 7(d)(2)(ii)(G) of Schedule 14A (17 CFR 240.14a-101), or this Item.
No material changes to report.
ITEM 16. CONTROLS AND PROCEDURES.
(a) Disclose the conclusions of the registrant’s principal executive and principal financial officers, or persons performing similar functions, regarding the effectiveness of the registrant’s disclosure controls and procedures (as defined in Rule 30a-3(c) under the Act (17 CFR 270.30a-3(c))) as of a date within 90 days of the filing date of the report that includes the disclosure required by this paragraph, based on the evaluation of these controls and procedures required by Rule 30a-3(b) under the Act (17 CFR 270.30a-3(b)) and Rules 13a-15(b) or 15d-15(b) under the Exchange Act (17 CFR 240.13a-15(b) or 240.15d-15(b)).
The Registrant’s principal executive and principal financial officers have concluded, based on their evaluation of the Registrant’s disclosure controls and procedures as of a date within 90 days of the filing date of this report, that the Registrant’s disclosure controls and procedures are reasonably designed to ensure that information required to be disclosed by the Registrant on Form N-CSR is recorded, processed, summarized and reported within the required time periods and that information required to be disclosed by the Registrant in the reports that it files or submits on Form N-CSR is accumulated and communicated to the Registrant’s management, including its principal executive and principal financial officers, as appropriate to allow timely decisions regarding required disclosure.
(b) Disclose any change in the registrant’s internal control over financial reporting (as defined in Rule 30a-3(d) under the Act (17 CFR 270.30a-3(d)) that occurred during the period covered by this report that has materially affected, or is reasonably likely to materially affect, the registrant’s internal control over financial reporting.
There were no changes in the Registrant’s internal control over financial reporting that occurred during the period covered by this report that have materially affected, or are reasonably likely to materially affect, the Registrant’s internal control over financial reporting.
ITEM 17. DISCLOSURE OF SECURITIES LENDING ACTIVITIES FOR CLOSED-END MANAGEMENT INVESTMENT COMPANIES.
Not applicable.
ITEM 18. RECOVERY OF ERRONEOUSLY AWARDED COMPENSATION.
Not applicable.
ITEM 19. EXHIBITS.
| (a) | File the exhibits listed below as part of this Form. Letter or number the exhibits in the sequence indicated. |
Code of Ethics applicable to its Principal Executive and Principal Financial Officers pursuant to Section 406 of the Sarbanes-Oxley Act of 2002 attached hereto.
Certifications pursuant to Rule 30a-2(a) under the Investment Company Act of 1940 are attached hereto.
(1) Any written solicitation to purchase securities under Rule 23c-1 under the Act (17 CFR 270.23c-1) sent or given during the period covered by the report by or on behalf of the registrant to 10 or more persons.
Not applicable.
(2) Change in the registrant’s independent public accountant. Provide the information called for by Item 4 of Form 8-K under the Exchange Act (17 CFR 249.308). Unless otherwise specified by Item 4, or related to and necessary for a complete understanding of information not previously disclosed, the information should relate to events occurring during the reporting period.
Not applicable.
| (b) |
Certifications pursuant to Rule 30a-2(b) under the Investment Company Act of 1940 are attached hereto.
SIGNATURES
Pursuant to the requirements of the Securities Exchange Act of 1934 and the Investment Company Act of 1940, the registrant has duly caused this report to be signed on its behalf by the undersigned, thereunto duly authorized.
Undiscovered Managers Funds | ||
| By: | /s/ Brian S. Shlissel | |
| Brian S. Shlissel | ||
| President and Principal Executive Officer | ||
| September 6, 2024 | ||
Pursuant to the requirements of the Securities Exchange Act of 1934 and the Investment Company Act of 1940, this report has been signed below by the following persons on behalf of the registrant and in the capacities and on the dates indicated.
| By: | /s/ Brian S. Shlissel | |
| Brian S. Shlissel | ||
| President and Principal Executive Officer | ||
| September 6, 2024 | ||
| By: | /s/ Timothy J. Clemens | |
| Timothy J. Clemens | ||
| Treasurer and Principal Financial Officer | ||
| September 6, 2024 | ||