       © 2012 Mercury Computer Systems, Inc. Lazard Capital Markets Kansas City, MO/Dallas, TX Road Show May 8, 2012 Mark Aslett President & CEO Kevin Bisson SVP & CFO Exhibit 99.1 |
 © 2012 Mercury Computer Systems, Inc. 2 Forward-Looking Safe Harbor Statement This presentation contains certain forward-looking statements, as that term is defined in the Private Securities Litigation Reform Act of 1995, including those relating to fiscal 2012 business performance and beyond and the Company’s plans for growth and improvement in profitability and cash flow. You can identify these statements by the use of the words “may,” “will,” “could,” “should,” “plans,” “expects,” “anticipates,” “continue,” “estimate,” “project,” “intend,” “likely,” “probable,” and similar expressions. These forward-looking statements involve risks and uncertainties that could cause actual results to differ materially from those projected or anticipated. Such risks and uncertainties include, but are not limited to, general economic and business conditions, including unforeseen weakness in the Company’s markets, effects of continued geopolitical unrest and regional conflicts, competition, changes in technology and methods of marketing, delays in completing engineering and manufacturing programs, changes in customer order patterns, changes in product mix, continued success in technological advances and delivering technological innovations, continued funding of defense programs, the timing of such funding, changes in the U.S. Government’s interpretation of federal procurement rules and regulations, market acceptance of the Company's products, shortages in components, production delays due to performance quality issues with outsourced components, inability to fully realize the expected benefits from acquisitions and divestitures or delays in realizing such benefits, challenges in integrating acquired businesses and achieving anticipated synergies, changes to export regulations, increases in tax rates, changes to generally accepted accounting principles, difficulties in retaining key employees and customers, unanticipated costs under fixed-price service and system integration engagements, and various other factors beyond our control. These risks and uncertainties also include such additional risk factors as are discussed in the Company's filings with the U.S. Securities and Exchange Commission, including its Annual Report on Form 10-K for the fiscal year ended June 30, 2011. The Company cautions readers not to place undue reliance upon any such forward-looking statements, which speak only as of the date made. The Company undertakes no obligation to update any forward-looking statement to reflect events or circumstances after the date on which such statement is made. Use of Non-GAAP (Generally Accepted Accounting Principles) Financial Measures In addition to reporting financial results in accordance with generally accepted accounting principles, or GAAP, the Company provides adjusted EBITDA and free cash flow, which are non-GAAP financial measures. Adjusted EBITDA excludes certain non-cash and other specified charges. Free cash flow is defined as cash flow from operating activities less capital expenditures. In addition the use of a last twelve months (“LTM”) period is not in accordance with GAAP. The LTM period presented is the mathematical addition of the results of the fourth quarter of fiscal 2011 and the first, second and third quarters of fiscal 2012. The Company believes these non-GAAP financial measures are useful to help investors better understand its past financial performance and prospects for the future. However, the presentation of adjusted EBITDA and free cash flow is not meant to be considered in isolation or as a substitute for financial information provided in accordance with GAAP. Management believes the adjusted EBITDA and free cash flow financial measures assist in providing a more complete understanding of the Company’s underlying operational results and trends, and management uses these measures along with the corresponding GAAP financial measures to manage the Company’s business, to evaluate its performance compared to prior periods and the marketplace, and to establish operational goals. A reconciliation of GAAP to non-GAAP financial results discussed in this presentation is contained in the Appendix hereto. |
       © 2012 Mercury Computer Systems, Inc. Introducing Mercury Computer Systems • MRCY on NASDAQ • Real-time digital image, signal and sensor processing • Commercial-item company unique business model • Focused on DoD priorities • Deployed on ~300 programs with 25+ Primes • $229M FY11 revenues; 18% Adj. EBITDA margin; 750+ employees • Defense revenue 61% growth (13% CAGR) FY07– FY11 Best-of-breed provider of open, commercially developed application ready and multi-INT subsystems for the ISR market 3 |
             © 2012 Mercury Computer Systems, Inc. 4 • FY12 Defense budget approved - $530B base spending • FY13 Defense budget request announced - $525B base spending • Budget Control Act reduced FYDP spend growth vs 2012 request • Budget Control Act Jan 2013 sequester • 2012 election year © 2012 Mercury Computer Systems, Inc. Slower growth in defense spending anticipated over next 5 years 4 Defense industry turning the page on a decade of war Source: DOD Comptroller 2012 Budget Request |
             © 2012 Mercury Computer Systems, Inc. 5 • New DoD roles and missions announced • Smaller force structure to protect readiness • Increased investment in key areas e.g. ISR, EW • Build capacity and capability of international partners • Defense procurement reform also underway © 2012 Mercury Computer Systems, Inc. … where there will be clear winners and losers 5 In the near term we believe the industry is entering an 18 month transition period … |
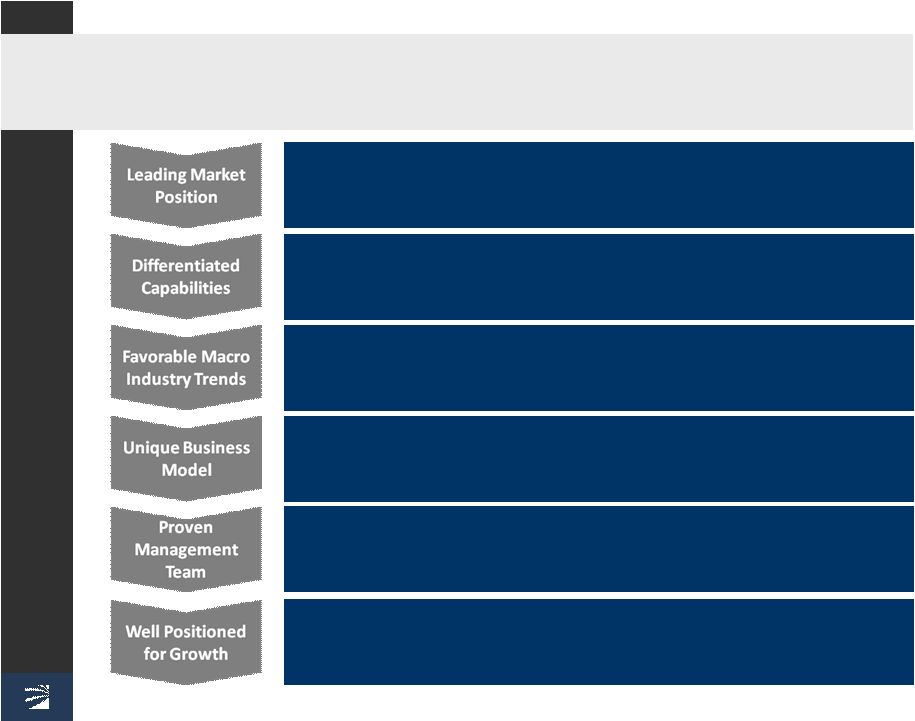 © 2012 Mercury Computer Systems, Inc. 6 Mercury investment highlights Pure-play C4ISR, EW and defense electronics company entrenched on a diverse mix of programs aligned with DoD priorities Best-of-breed provider of specialized sensor processing subsystems to large defense Primes targeting platform upgrades Increased ISR usage, shift to onboard processing and exploitation and evolving EW threats driving greater demand for Mercury solutions Well positioned to benefit from DoD procurement reform, which is driving increased outsourcing by the large defense Primes Well-defined strategy with a demonstrated track record of double-digit defense revenue growth and improved profitability Successful transformation has positioned the business for strong organic growth augmented through strategic acquisitions |
       Mercury has strategically positioned its business to grow Growth strategy summary 1. Expand our capabilities and offerings along sensor chain 2. Expand market presence within defense electronics 3. Continue to grow our customer and program base 4. Capitalize on Prime outsourcing / supply chain consolidation 5. Acquire complementary companies 7 © 2012 Mercury Computer Systems, Inc. |
 © 2012 Mercury Computer Systems, Inc. 8 Historically, Mercury focused on one element of sensor chain We are the leader in high-performance embedded computing RACE++ Boards From |
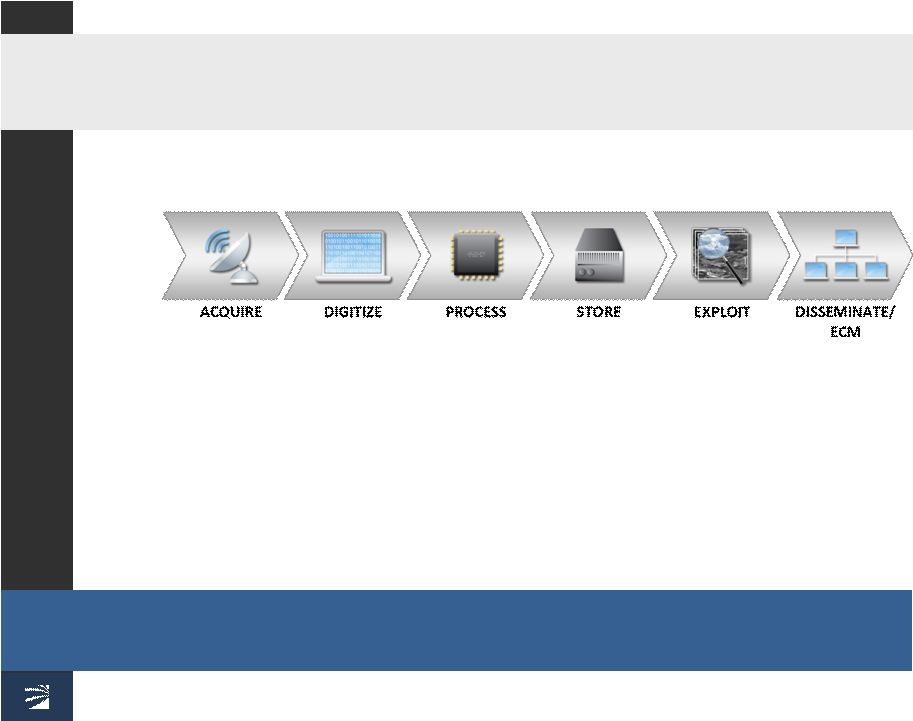
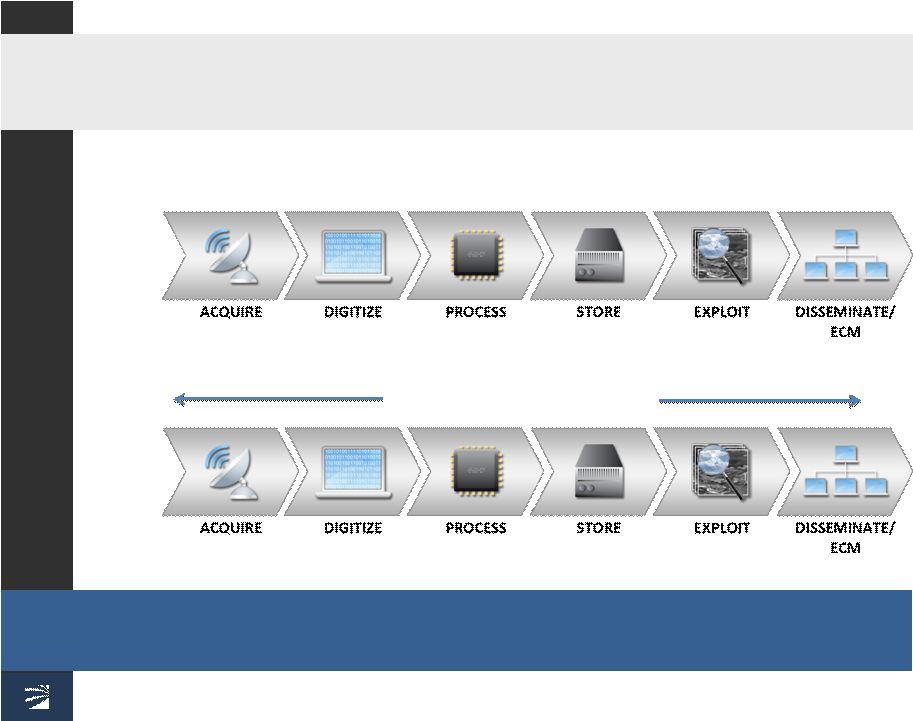   © 2012 Mercury Computer Systems, Inc. 9 We now view our market opportunity as providing end-to-end open sensor processing subsystems – a much larger opportunity We are systematically growing our capabilities, services and offerings along the sensor chain organically and by acquisition Services and Systems Integration To RACE++ Boards From Open Sensor Processing Subsystems |
    © 2012 Mercury Computer Systems, Inc. 10 Mercury’s traditional market was narrowly defined as airborne radar processing … ... limiting our growth potential within the C4ISR market C4ISR IMINT C4I RADAR EW EO/IR $9,695M 25% |
    © 2012 Mercury Computer Systems, Inc. 11 Since then, we have systematically broadened our addressable market within C4ISR … … by investing in new products and capabilities C4ISR C4I S e n s o r, P r o g r a m a n d P l a t f o r m A g n o s t i c RADAR EO/IR $9,695M 25% $6,755M 17% $7,801M 20% $10,737M 28% EW |
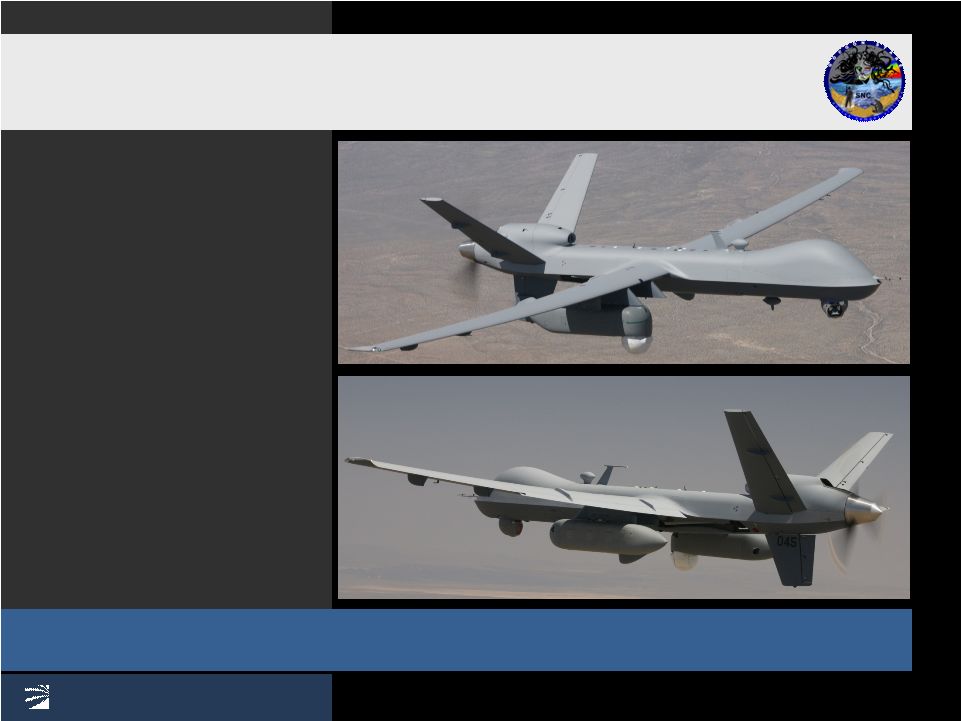
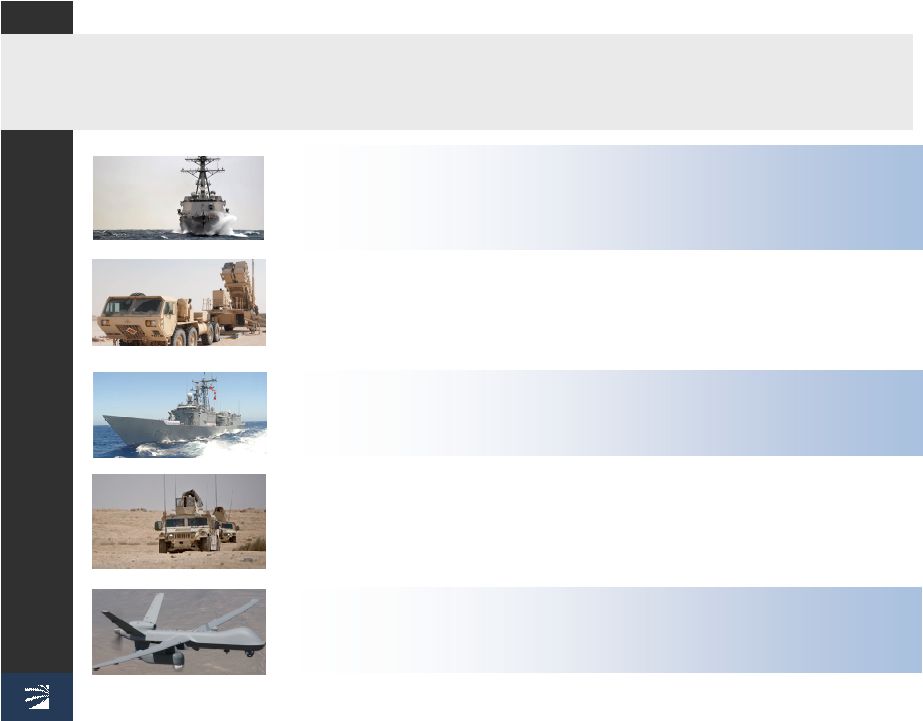
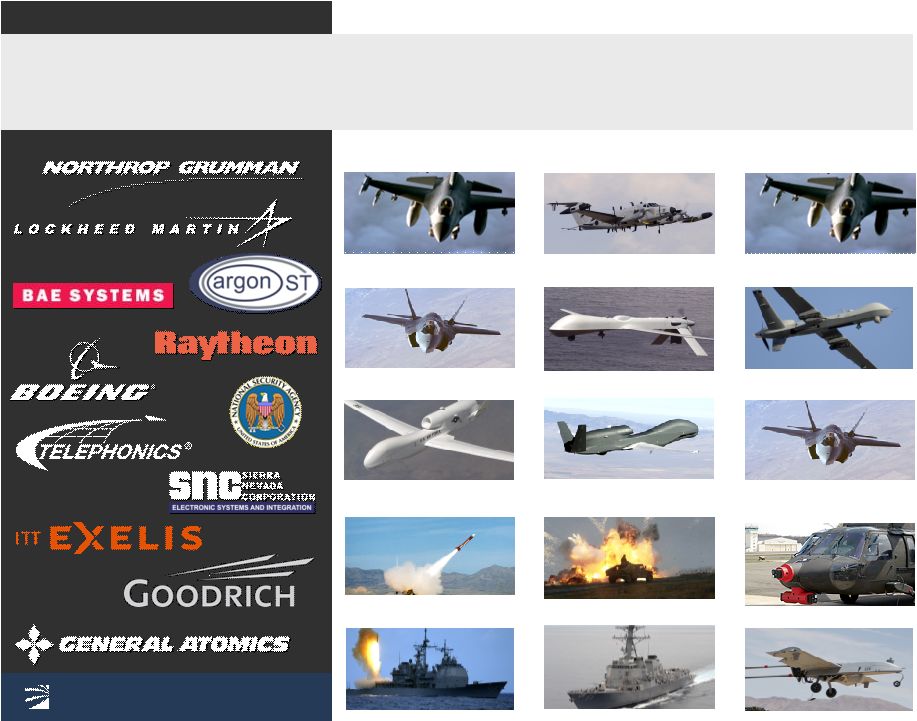 © 2012 Mercury Computer Systems, Inc. 12 We are deployed on 300+ programs with 25+ Primes RADAR EW EO/IR – C4I BAMS Global Hawk BAMS Global Hawk SEWIP SEWIP AEGIS AEGIS Ashore AEGIS AEGIS Ashore Guardrail Guardrail Patriot Patriot Predator Predator Reaper Gorgon Stare Reaper Gorgon Stare F-16 F-16 JCREW 3.3 JCREW 3.3 ADAS ADAS Shadow Shadow Global Hawk Global Hawk F-35 F-35 F-35 F-35 F-16 F-16 |
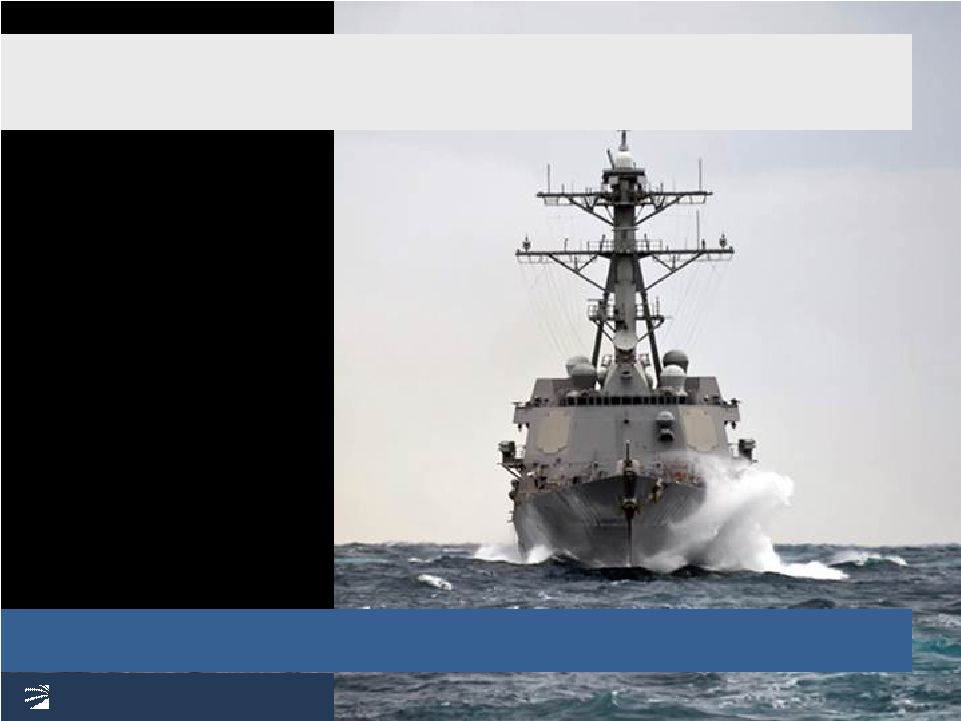    © 2012 Mercury Computer Systems, Inc. Aegis ballistic missile defense: SPY-1 BMD Radar • Countering rogue nations’ ballistic missile threats • Highest performance radar processor Application Ready Subsystem • 19 ship sets booked FY08-11 • $24M booked in FY11, $75M+ booked to date • Additional 35 ship sets scheduled through GFY16 • AMDR pushout likely • Additional upside Mercury’s largest single program in production to date © 2012 Mercury Computer Systems, Inc. 13 |
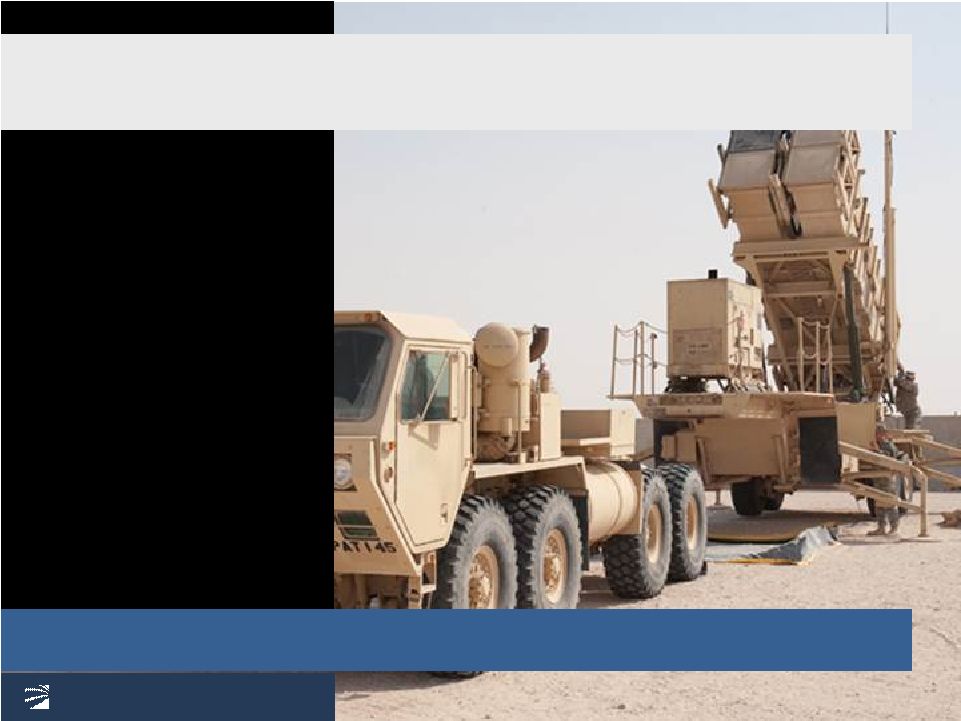    © 2012 Mercury Computer Systems, Inc. Program in production; FMS and US Army upgrade driving growth Patriot missile defense: Next generation ground radar • Services-led design win – Prime outsourcing example • Sophisticated radar processor Application Ready Subsystem • Production awards received to date: $36M – UAE, Taiwan, Saudi Arabia • Potential future FMS awards – Up to 16 countries • MEADS funding termination • Major growth potential beginning in GFY13 with US Army Patriot upgrade © 2012 Mercury Computer Systems, Inc. 14 |
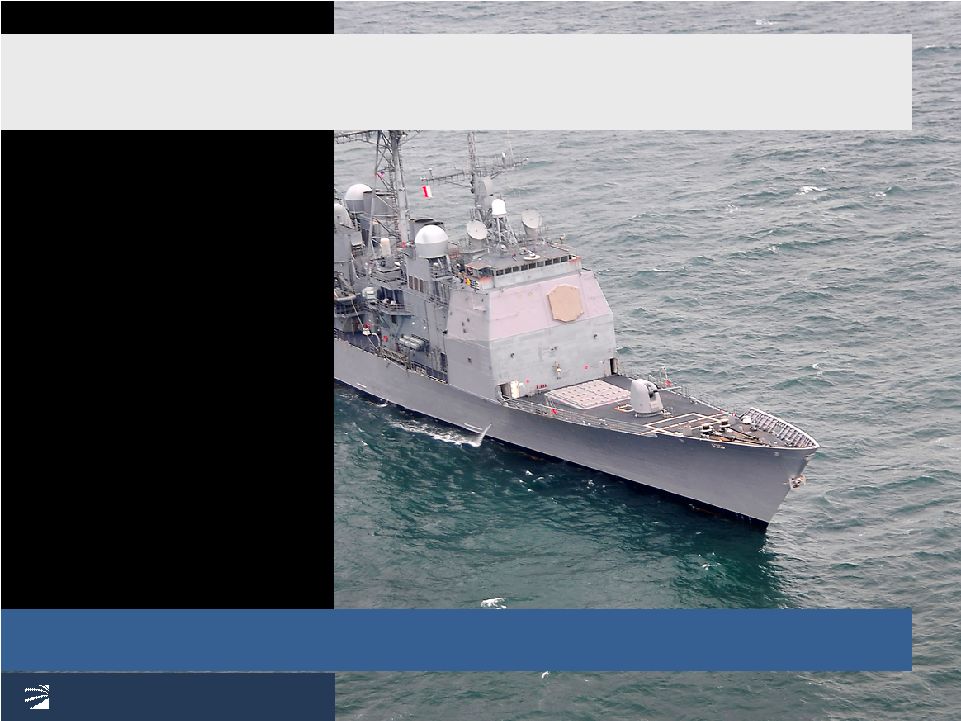          © 2012 Mercury Computer Systems, Inc. SEWIP Block 2: Countering new emerging peer threats • Naval surface fleet EW upgrade: 100+ ships • Delivered best-of-breed EW Application Ready Subsystem • Moving from EMD phase to LRIP in next 12 months • Production begins GFY15 • Upside opportunities with Block 1 upgrade and Block 3 • Lockheed and Raytheon partnering on SEWIP Block 3 Strong partnership with Prime driving Mercury content expansion © 2012 Mercury Computer Systems, Inc. 15 |
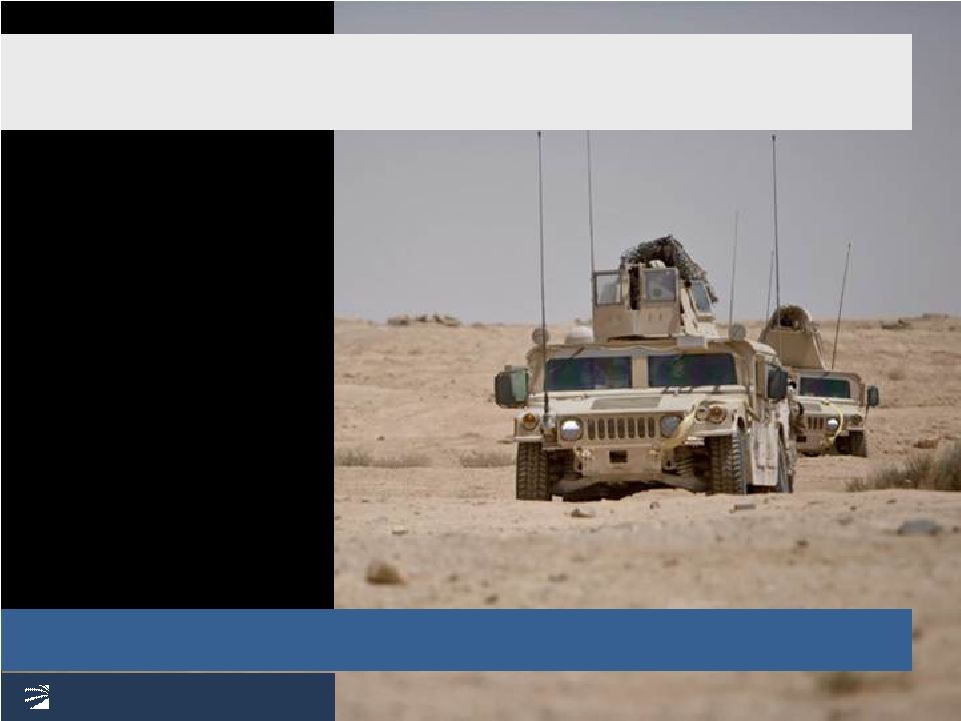       © 2012 Mercury Computer Systems, Inc. JCREW I1B1 (3.3): Joint services CIED program of record Software defined jammer to defeat roadside bombs • Program currently in EMD (engineering) phase • Milestone C next official gate. Signifies transition to Low Rate Initial Production (LRIP) • LRIP and 1st year production funded in GFY12 budget and GFY13 budget request • JCREW I1B1 program of record in FY13 budget • US Marine Corps req’ts: – Total : 3100 mounted, 790 man portable, 13 fixed sites – GFY13 : 1020 mounted, 790 man portable Expect move from EMD phase into Low Rate Initial Production Note: Mercury was not involved in prior generations © 2012 Mercury Computer Systems, Inc. 16 |
             © 2012 Mercury Computer Systems, Inc. 17 Gorgon Stare Increment 2 New program win • Increment 2 – Total contract potential $31-37M – $22M booked Q3 YTD FY12 – Quick reaction capability; delivery in 18 months – New onboard processor and storage for advanced wide area sensors – Potential upside: flight systems and spares • Future Increments to GFY18 – Processor upgrades – Onboard multi-INT fusion – PED improvements Several opportunities for growth over the next 3-6 years Several opportunities for growth over the next 3-6 years 17 |
 © 2012 Mercury Computer Systems, Inc. 18 Program growth driver update JCREW 3.3 (I1B1): Counter-IED Program expected to transition from EMD phase to LRIP Patriot: Missile Defense Potential U.S. Army upgrades beginning in GFY13 Aegis: Ballistic Missile Defense Well-defined upgrade provides foundational revenue SEWIP: Naval Electronic Warfare LRIP expected to begin GFY13 Gorgon Stare: Wide-area airborne surveillance Received $22M for Increment 2 development |
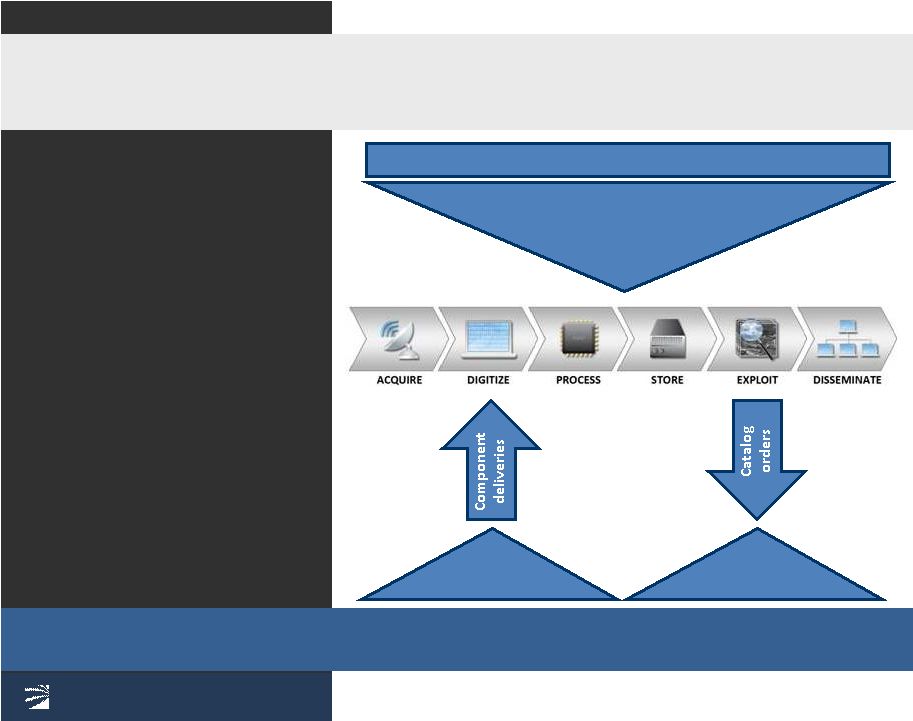 © 2012 Mercury Computer Systems, Inc. 19 Embedded computing consolidation Primes reducing in-house engineering while consolidating supply chain for subsystem design & integration Primes retaining platform system design & integration RF component / assembly consolidation • Reduce risk given firm-fixed price contracts • Address high-fixed cost operating model • Increase success rate on new programs and production recompetes • Develop differentiated, more affordable solutions with fewer internal R&D dollars • Compress upgrade development and deployment cycles • Consolidate supply base at subsystem level Outsourcing could substantially increase our market opportunity even with defense spending cuts Mercury has strategically positioned its business to help |
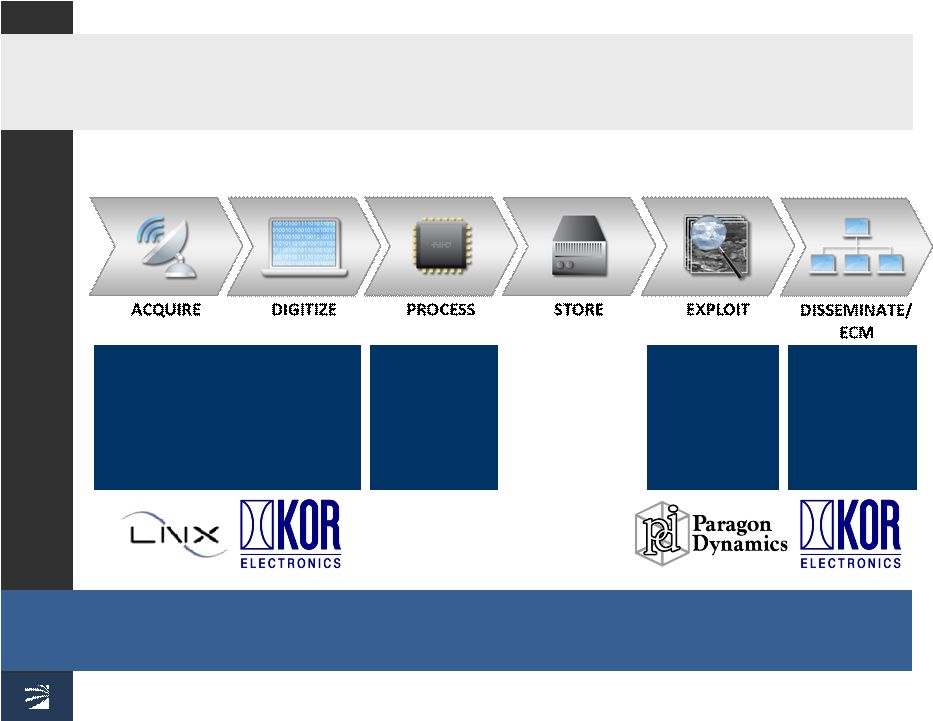 © 2012 Mercury Computer Systems, Inc. 20 Exploitation and Fusion Tailored feeds directly to field forces or ECM RF acquisition targets: RF transmitters / receivers Power amplifiers Synthesizers DRFM Mission Computing and Embedded Security We are developing capabilities organically and are looking to supplement that through acquisitions ACS and MFS Acquisition Target Areas We view our market opportunity as providing end-to-end, open sensor processing subsystems to the Primes |
 Positioned for growth in a changing industry • Focused on the right defense market segments • Well positioned on key programs and platforms • Capabilities help address today’s and tomorrow’s threats • Business model aligned with defense procurement reform • Outsourcing partner to the Primes for sensor subsystems • Strong defense revenue growth and improved profitability • Pursuing complementary acquisitions to accelerate growth 21 © 2012 Mercury Computer Systems, Inc. |
 © 2012 Mercury Computer Systems, Inc. Financial Overview |
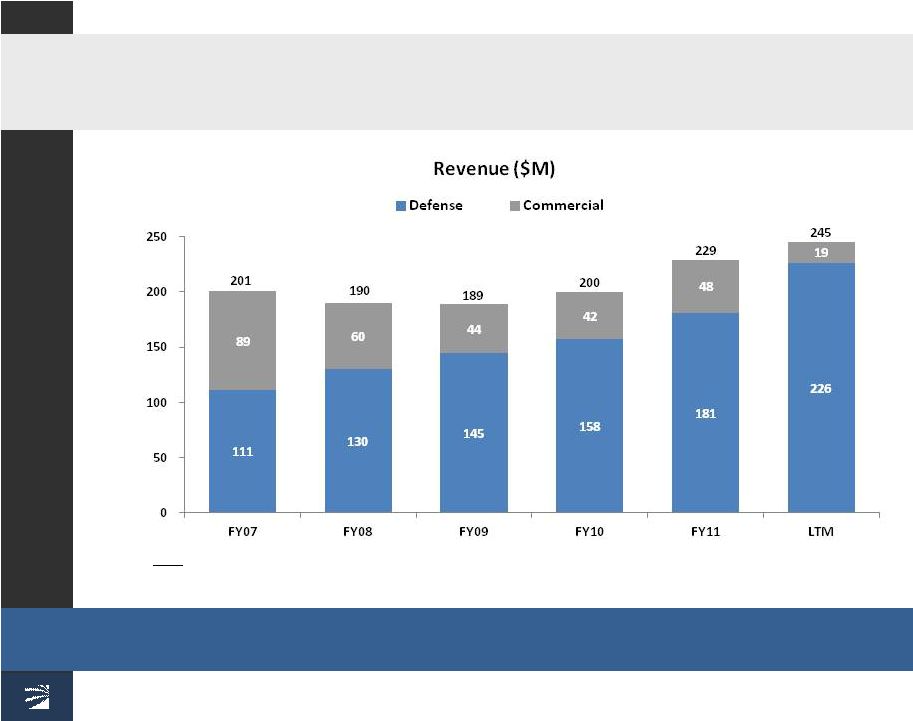 © 2012 Mercury Computer Systems, Inc. 23 Defense revenue growth accelerating Defense: 13% CAGR FY07-11 Notes: • FY07-10 figures adjusted for discontinued operations. |
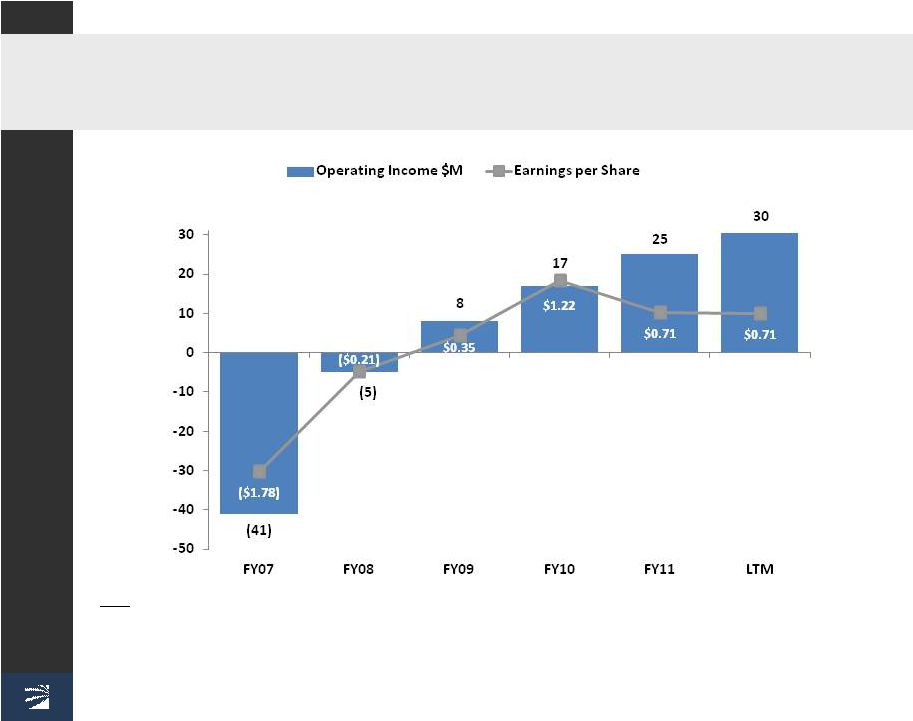 © 2012 Mercury Computer Systems, Inc. 24 Profitability restored and improving Notes: • FY07 figures are as reported in the Company’s fiscal 2007 Form 10K and have not been restated for discontinued operations. • FY08 – FY11 figures are as reported in the Company’s fiscal 2011 Form 10K. • FY10 Earnings per Share of $1.22 were positively influenced by $0.68 from the partial reversal of the valuation allowance against deferred tax assets and an effective FY10 tax rate benefit of approximately 5%. • FY11 and LTM EPS includes the impact of 5.6M additional shares from our follow-on public stock offering on February 16, 2011. |
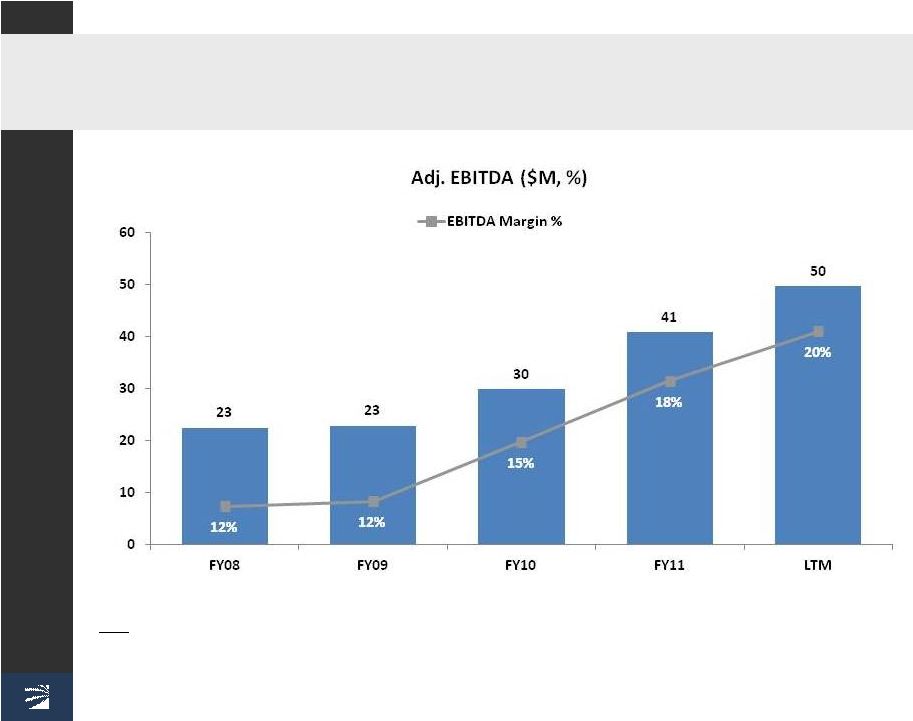 © 2012 Mercury Computer Systems, Inc. 25 Adjusted EBITDA above pro forma target Notes: • FY08 figures are as reported in the Company’s fiscal 2010 Form 10K. FY09-11 figures are as reported in the Company’s fiscal 2011 Form 10K. • Adjusted EBITDA excludes interest income and expense, income taxes, depreciation, amortization of acquired intangible assets, restructuring expense, impairment of long-lived assets, acquisition and other related expenses, and stock-based compensation costs. |
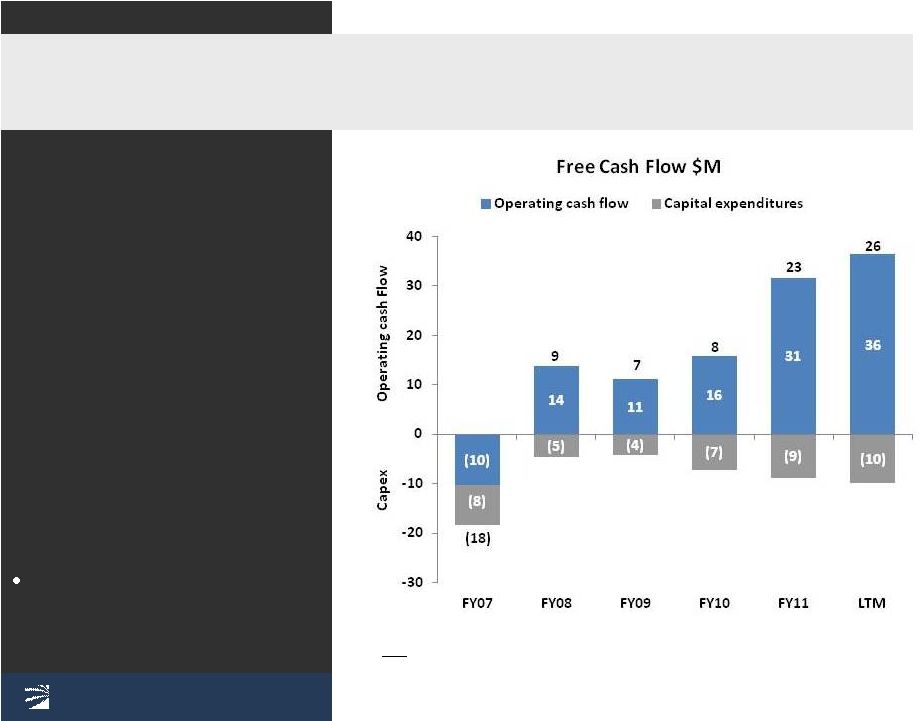 © 2012 Mercury Computer Systems, Inc. 26 Generating healthy free cash flow from operations • Engineering and supply chain transformation – Engineering methods – Investments in DFM – Operational efficiencies – Reduced lead times – Improved cost of quality – Outsourced manufacturing Note: • Free cash flow is defined as cash provided by operating activities less capital expenditures. Efficient working capital platform supports growth |
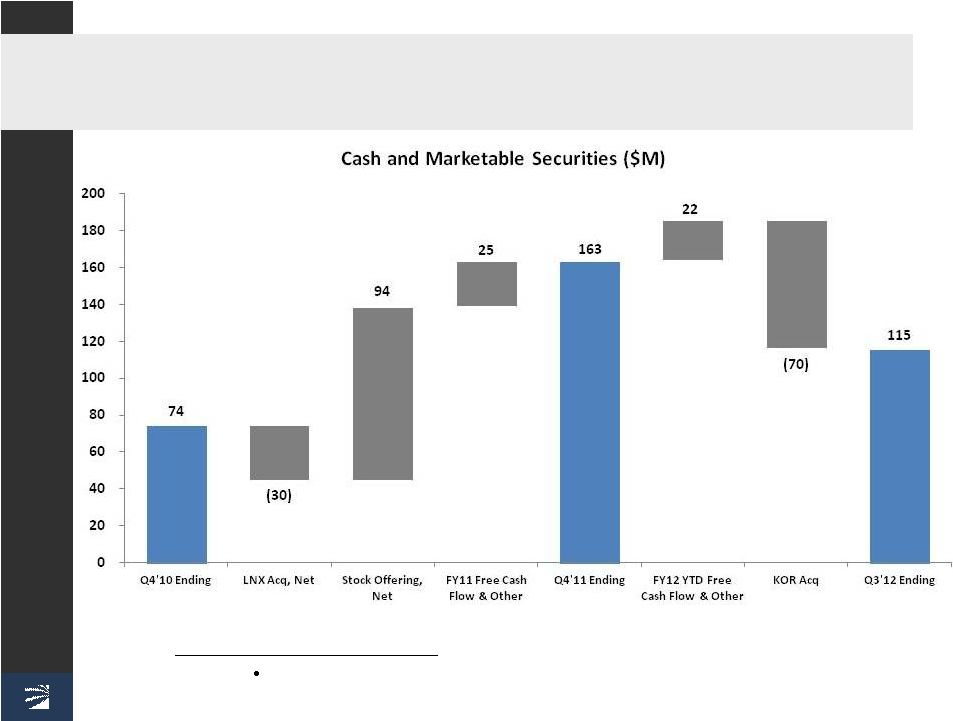 © 2012 Mercury Computer Systems, Inc. 27 Balance sheet poised for investment No short and long term debt Other financing sources available: $500M Shelf Registration • $35M Operating line of credit (no drawdowns) |
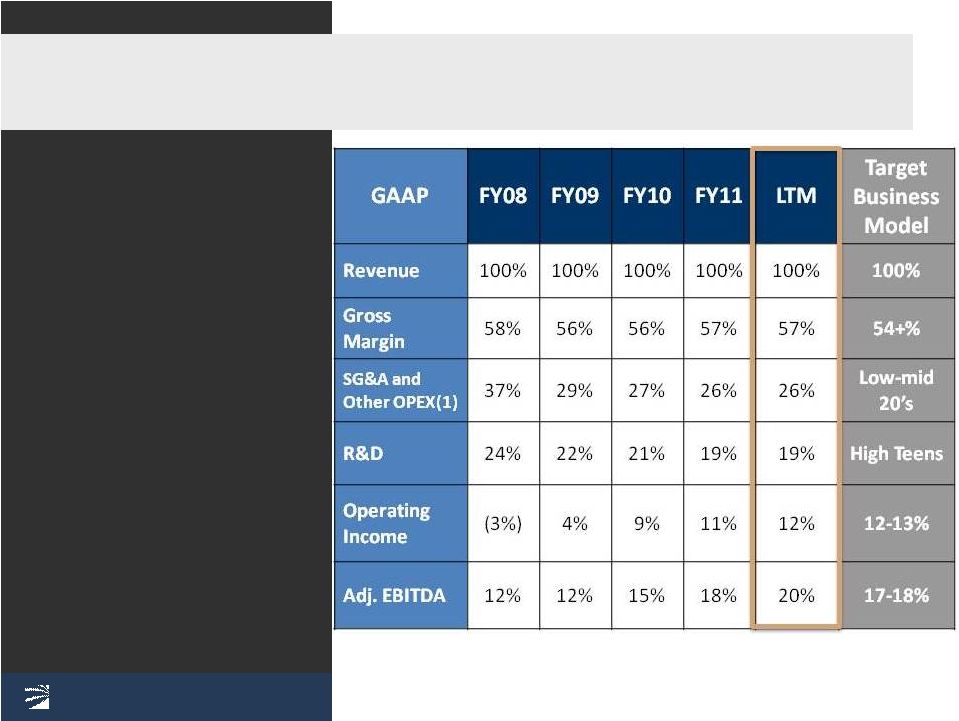 © 2012 Mercury Computer Systems, Inc. 28 Performing at target business model • ACS : MFS LTM revenue split 92% : 8% respectively • High mix, low volume • R&D delivering significant added value and returns • Increased lower margin engineering services and systems integration • Services-led design wins lead to long-term production subsystem annuity revenues (1) Other OPEX includes Amortization of Acquired Intangible Assets, Impairment of Goodwill and Long Lived Assets, Restructuring, Gain on Sale of Long Lived Assets, and Acquisition Costs and Other Related Expenses. |
 © 2012 Mercury Computer Systems, Inc. 29 Q3 YTD FY12 year over year comparison (GAAP) GAAP Q3 YTD FY12 Q3 YTD FY11 Delta Total Revenue ($M) 184 167 10% Defense Revenue ($M) 173 127 36% Gross Margin % Revenue 57.5% 56.8% 70 bps Operating Expenses ($M) 82 76 6 Operating Income ($M) % Revenue 24 13.1% 19 11.2% 5 1.9 pts Adj EBITDA 40 31 9 EPS (Continuing Operations) $0.56 $0.57 ($0.01) Op Cash Flow ($M) 28 23 5 Bookings Total Backlog ($M) 12-mo Backlog($M) 170 105 95 140 86 70 22% 23% 35% Notes: Q3 YTD FY12 tax rate 33%, Q3 YTD FY11 tax rate 29% |
 © 2012 Mercury Computer Systems, Inc. 30 Q4 FY12 guidance Q4 FY11 Actual Quarter Ending June 30, 2012 Low High Revenue $61 $60 $66 GAAP EPS (Continuing) $0.14 $0.04 $0.10 Adj EBITDA $10.1 $7.0 $9.5 Note - Adj EBITDA Adjustments: Net income (Continuing) 4.3 1.3 3.0 Interest (income) expense, net 0.0 0.0 0.0 Income tax (benefit) expense 2.3 0.7 1.6 Depreciation 1.7 2.3 2.3 Amortization of acquired intangible assets 0.7 1.1 1.1 Impairment of long-lived assets 0.2 0.0 0.0 Fair value adjustments from purchase accounting (0.4) (0.1) (0.1) Stock-based compensation cost 1.4 1.6 1.6 Adj EBITDA $10.1 $7.0 $9.5 Notes: Fiscal 2011 and 2012 EPS includes the impact of 5.6M additional shares from our follow-on public stock offering on February 16, 2011. |
 © 2012 Mercury Computer Systems, Inc. 31 FY12 full year financial guidance • Total revenue growth of 7% - 9% ($244 - $250 million) • Defense revenue growth of approximately 30% ($230 - $235 million) • Gross margin of approximately 55% • GAAP EPS of $0.60 to $0.66 per share • Adjusted EBITDA above 18% target business model |
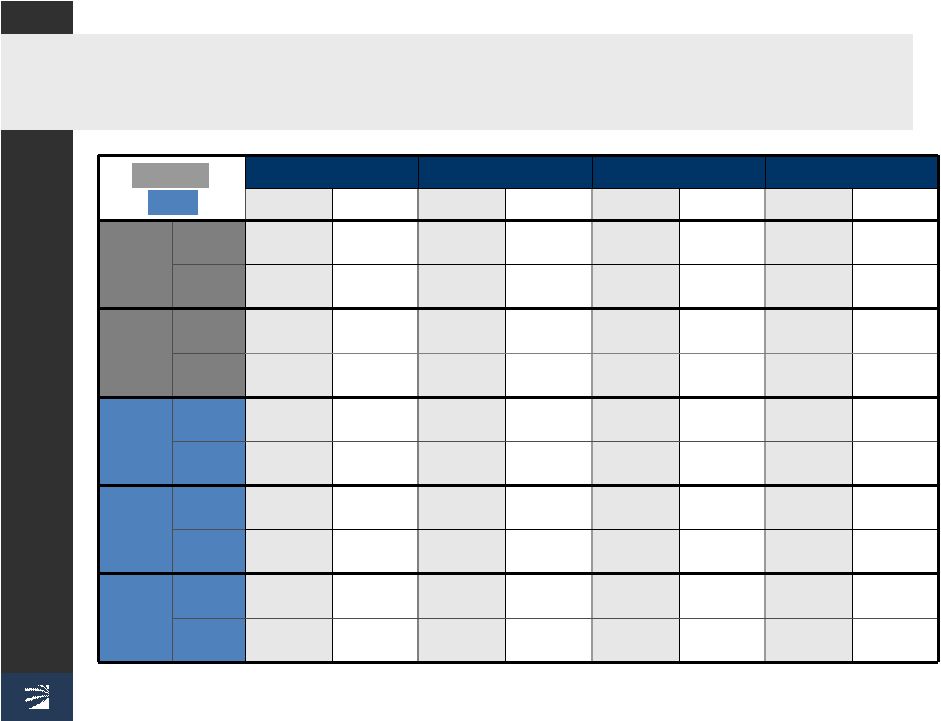 © 2012 Mercury Computer Systems, Inc. 32 Guidance: Strong performance track record Q1 Q2 Q3 Q4 Reported Guidance Reported Guidance Reported Guidance Reported Guidance 2008 Revenue ($M) 49.2 48.0 52.6 51.0 56.5 53.0-55.0 55.2 53.0-56.0 EPS ($) 0.09 (0.08) 0.04 (0.05) 0.04 (0.04)-0.00 0.01 (0.05)-0.01 2009 Revenue ($M) 49.1 47.0-49.0 50.7 47.0-49.0 50.6 48.0-50.0 48.4 46.0-48.0 EPS ($) 0.07 (0.07)-(0.03) 0.03 (0.05)-0.00 0.20 0.05-0.09 0.13 0.05-0.08 2010 Revenue ($M) 47.4 43.0-45.0 45.2 40.0-42.0 43.6 41.0-43.0 63.6 58.0-60.0 EPS ($) 0.19 0.03-0.08 0.08 (0.08)-(0.04) 0.16 (0.15)-(0.11) 0.77 0.25-0.28 2011 Revenue ($M) 52.1 48.0-50.0 55.5 54.0-55.0 59.9 58.0-60.0 61.2 57.0-59.0 EPS ($) 0.16 0.03-0.06 0.22 0.10-0.12 0.20 0.16-0.18 0.14 0.11-0.13 2012 Revenue ($M) 49.1 54.0-56.0 68.0 67.0-69.0 67.0 65.0-68.0 60.0-66.0 EPS ($) 0.09 0.10-0.12 0.30 0.24-0.27 0.17 0.09-0.11 0.04-0.10 Non-GAAP GAAP |
 • Strong bookings growth and rebuilding backlog • Defense revenue growth accelerating • Profitability restored and improving • Generating healthy free cash flows from operations • Scalable working capital platform • Strong balance sheet with no debt • Performing at target business model Financial summary 33 © 2012 Mercury Computer Systems, Inc. |
 © 2012 Mercury Computer Systems, Inc. Appendix |
 © 2012 Mercury Computer Systems, Inc. 35 Adjusted EBITDA reconciliation Years Ended June 30, (000'S) 2008 2009 2010 2011 LTM Income (loss) from continuing operations $ (4,437) $ 7,909 $ 28,069 $ 18,507 $ 21,207 Interest expense (income), net (3,129) 492 (151) 45 10 Income tax expense (benefit) 3,710 109 (9,377) 8,060 10,802 Depreciation 7,372 5,640 5,147 6,364 7,454 Amortization of acquired intangible assets 5,146 2,414 1,710 1,984 3,336 Restructuring 4,454 1,712 231 — — Impairment of long-lived assets 561 — 211 150 150 Acquisition costs and other related expenses — — — 412 768 Fair value adjustments from purchase accounting — — — (219) (612) Stock-based compensation costs 8,848 4,582 4,016 5,580 6,552 Adjusted EBITDA $ 22,525 $ 22,858 $ 29,856 $ 40,883 $ 49,667 |
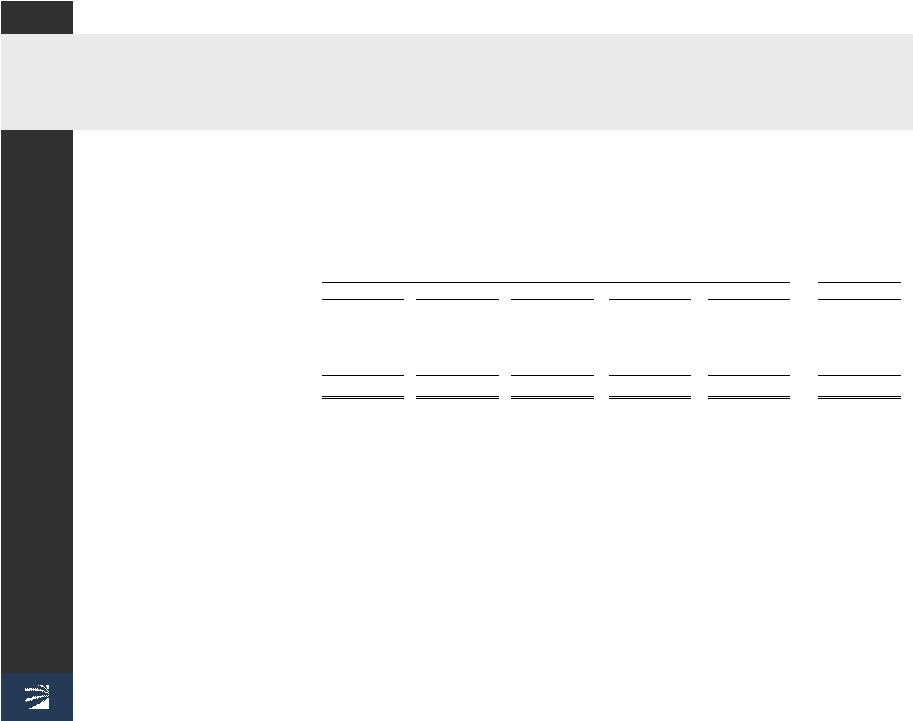 © 2012 Mercury Computer Systems, Inc. 36 Free cash flow reconciliation Years Ended June 30 2007 2008 2009 2010 2011 LTM Cash flows from operating activities $ (10,313) $ 13,726 $ 11,199 $ 15,708 $ 31,474 $ 36,316 Capital expenditures (8,109) (4,625) (4,126) (7,334) (8,825) (9,927) Free cash flow $ (18,422) $ 9,101 $ 7,073 $ 8,374 $ 22,649 $ 26,389 |