Table of Contents
UNITED STATES
SECURITIES AND EXCHANGE COMMISSION
Washington, D.C. 20549
FORM N-CSR
CERTIFIED SHAREHOLDER REPORT OF REGISTERED
MANAGEMENT INVESTMENT COMPANIES
Investment Company Act file number: 811-08549
Oak Associates Funds
(Exact name of registrant as specified in charter)
101 Federal Street, Boston, Massachusetts 02110
(Address of principal executive offices) (Zip code)
Leslie Manna
Oak Associates, ltd.
3875 Embassy Parkway, Suite 250
Akron, Ohio 44333-8334
(Name and address of agent for service)
Registrant’s telephone number, including area code: 1-888-462-5386
Date of fiscal year end: October 31
Date of reporting period: November 1, 2011 – October 31, 2012
Table of Contents
Item 1. Reports to Stockholders.
Table of Contents
Table of Contents

Oak Associates, ltd., advisor to the Oak Associates Funds, has been managing growth-oriented portfolios for over 25 years.
We appreciate the many long-term shareholders who invest alongside us in the Oak Associates Funds. Employees and their families are among the largest shareholders in the funds. Here are our core investment philosophies.
| ||||
| Long-term focus | |
To us, the appeal of an investment is driven by the long-term fundamentals of the company and its opportunity set, rather than short-term trading factors. We believe that this long-term mindset is increasingly valuable in today’s short-term oriented market. | ||
| Concentrated portfolios | |
We construct our portfolios with our best ideas, which means that our favorite stock ideas aren’t diluted by investments in less-favored positions. A recent study showed that managers gave up performance because they failed to concentrate in their best ideas. Concentration takes discipline, conviction and experience. We continue to adhere to a strategy of concentrated portfolios. | ||
| Low turnover | |
Hospital wings are rarely endowed by day traders. When we invest in a company, we do so with the intention of holding that stock for several years, not a few quarters. Low turnover can have the effect of minimizing trading costs as well as tempering the natural human instinct to act upon every data point. | ||
| Contrarian | |
Being a good investor often requires not doing what the rest of the market is doing. While it’s difficult to go against the crowd - because as humans we are psychologically wired to herd - we believe that long-term outperformance requires it. One benefit of being located in Akron, Ohio (aside from being a great place to live), is that we are removed from the financial centers in other areas of the country, minimizing our chances of being swept up by the herd mentality. We value independent thinking and believe it is beneficial to our investment perspective. | ||
The value of a Fund’s investments will vary from day to day in response to the activities of individual companies and general market and economic conditions. Due to the limited number of underlying investments, concentrated funds are more susceptible to the price movements of any one holding and thus are generally more volatile than a more broadly diversified portfolio. | ||

Table of Contents
| Shareholder Letter | ||
November 30, 2012 |
Dear Fellow Shareholder:
The past year witnessed alternating reemergence and retreat of many of the same issues that have hung over the market for the past few years: the European debt crisis, the US federal deficit and debt level, an economic growth scare, and stubbornly high unemployment. To these were added decelerating global economic growth, uncertainty over the presidential election, the “Fiscal Cliff,” and the Supreme Court’s ruling on the Affordable Care Act. In spite of all this, it was another positive year for most indices, and for six of our seven mutual funds.
It is interesting, too, to look back at the returns of the last ten years. Some might be quite surprised to learn that it has been a fruitful decade for stocks, and for our funds, some of which have posted annualized returns in excess of 10%. Granted, this is using a low starting point (late 2002), but it also includes the dreadful market correction of 2008/2009.
Recently our two original funds, White Oak and Pin Oak, turned 20-years old. The thinking behind the launch of these funds in 1992 was that the little guy should have the same opportunity to have Oak manage his or her money as the institutions and high-net-worth clients did. Our management style has evolved over the years, but we have adhered to a core set of principles that guide us to this day – a long-term time horizon, concentrated portfolios, and low turnover. In an investing world that has become only more short-term oriented over the years, these principles, we believe, are even more sensible. Those who invested at the inception of White Oak and held onto their shares have earned a cumulative return of over 347%. This means that a $1,000 investment would be worth over $4,400 today. (Past performance is not indicative of future results.)
These figures not only illustrate the power of compounding but also demonstrate the resilience of stocks in the face of bad news. Consider the multitude of problems the market has faced in the last two decades. A partial list includes the Asian financial crisis, the Russian default, the fall of Long Term Capital Management, the bursting of the tech bubble, 9/11, the arrest of various corporate executives, the mutual fund late trading scandal, lost trust in Wall Street research, the implosion of the gargantuan Bernie Madoff pyramid scheme, the bursting of the housing bubble, the 2008 financial crisis and severe recession, the failure of iconic financial institutions, municipalities and states struggling to make ends meet, the European financial crisis, the “Flash Crash,” subpar economic growth, a ballooning federal debt, and political polarization at extreme levels. It’s a daunting list. But it’s also a testament to Corporate America. Looking at that list, would one have expected to earn 347% on a 20-year investment?
The lesson may be that, as the saying goes, the market does indeed climb a wall of worry. Put another way, our problems are always intimidating, and the current set certainly qualifies in that regard, but capitalism has always endured and corporate earnings power, the foundation of stock prices, has steadily risen in the face of these issues. We suspect this will continue for the next 20 years, even though the majority of the challenges we will face are unknown to us at the present time. One risk that is identifiable is that our nation is unable to bring the growth in federal debt down to a manageable level and that our creditors decide that, rather than lending to us at 2%, they need an interest rate of 5%, or 7%, or 13% in order to compensate them for the risk of either not being paid back, or, more likely, being paid back in dollars that are worth far less than when the creditor bought the bond. This rise in rates of course would make it even harder to control the growth of our debt, which would perpetuate the problem; this is similar to what Europe is dealing with currently. So, what to do? Our instinct is that disaster will be averted, largely because it is in everyone’s interest to do so, but also because history is on our side. But even if one wanted to protect himself from such a calamitous event, where would he hide? Cash? A depreciating currency erodes the value of cash. Bonds? A rise in bond yields to the upper single-digits would result in a capital loss of about half a bond investor’s principal. Granted, stocks would likely not fair well, but neither would the traditional alternatives.
Over the past year investors continued the stampede into bonds and bond funds, eschewing stocks and stock funds. This is being driven by investor caution in the wake of the financial crisis, a desire for reliable income, and the impressive past returns and lower volatility of bonds. But, given the 30-year bull market in bonds, we suspect there is a lack of understanding or appreciation for the potential for
Table of Contents
| Shareholder Letter | ||
loss. Bonds can decline in value, and if rates rise, by definition they WILL decline in value. Investors haven’t had to worry about this because bonds have been essentially a one-way trade for over thirty years as rates have steadily fallen. But with long-term rates at less than 2%, the upside (from a decline in rates) is limited while the downside (from a rise in rates) is huge. From current levels a move in interest rates on 10-year Treasurys to 0.5% would result in a capital gain on the bond of about 11%, whereas a move in rates to 9% would result in a capital loss of about 50%. A rise in rates to just 5% would reduce an investor’s principal by roughly 25%.
There was an interesting situation with some of our funds this past year. First some background. When a mutual fund sells a security in its portfolio and realizes a gain, unless there is an offsetting loss, the fund is required to make a capital gain distribution to shareholders, typically near the end of the calendar year. If the shareholder holds the shares in a taxable account, this distribution is taxable. If a fund has unused losses from previous years, it may carry these over to future years so that they may be used to offset gains. Some of our funds had losses that were due to expire at the end of this past fiscal year, so we systematically sold certain securities at a gain so that the losses could be used before expiring. Upon selling the various securities, in the vast majority of cases we immediately bought them back, so that the construction of the portfolios did not change. We negotiated a discounted commission rate on the transactions so that the direct trading costs were nominal, and our institutional broker did a fine job executing trades in a manner that we believe minimized risks and indirect costs to the portfolios.
By selling many of our holdings and then buying them back, we raised the cost basis of those stocks, and as a result, we dramatically reduced the future tax liability of some of the funds, which, for those of you holding shares in taxable accounts, reduces your future tax liability. In our judgment the benefit of this exercise to our shareholders was well worth the cost. We are proud of the tax efficiency of our funds, and this should significantly bolster that efficiency for years to come. Please note that this was all perfectly legal. One of the reasons for communicating this information to you is that all this trading activity caused the turnover rate in some of the funds to be inflated. Please don’t be shocked; it does not represent any deviation from our low turnover strategy.
Thank you for placing your trust in us.
Best regards,

Mark Oelschlager, CFA
Portfolio Manager
This manager commentary represents an assessment of the market environment at a specific point in time and is not intended to be a forecast of future events, or a guarantee of future results. This information should not be relied upon by the reader as research or investment advice.
Investments are subject to market fluctuations and a fund’s share price can fall because of weakness in the broad market, a particular industry, or a specific holding.
CFA is a registered trademark of the CFA Institute.
The following has been provided to you for informational purposes only, and should not be considered tax advise. Please consult your tax advisor for further assistance.
Table of Contents
| HIGHLIGHTS from the 2012 FISCAL YEAR | ||
| October 31, 2011 to October 31, 2012 (Unaudited) |
November 2011 | The Wall Street Journal recognized Live Oak Health Sciences Fund and Red Oak Technology Select Fund among “top-performing funds in each category.” November 7, 2011 | |
| Dow Jones Newswires interviewed Mark Oelschlager for its fund profile titled “Red Oak Fund Targets Strong Tech Platforms.” November 9, 2011 | ||
December 2011 | The Wall Street Journal recognized Red Oak Technology Select Fund among “top-performing funds in each category.” December 6, 2011 | |
January 2012 | The Wall Street Journal recognized Red Oak Technology Select Fund among “top-performing funds in each category.” January 6, 2012 | |
| The Associated Press interviewed Mark Oelschlager for a profile on Live Oak Health Sciences Fund. January 8, 2012. | ||
| Forbes interviewed Mark Oelschlager for its article titled “If You Could Love Only One Stock in 2012.” January 27, 2012 | ||
February 2012 | SmartMoney magazine named Pin Oak Equity Fund in its list of “Top 100 Mutual Funds.” February 2012 | |
| The Wall Street Journal recognized Rock Oak Core Growth Fund and Black Oak Emerging Technology Fund among “top-performing funds in each category.” February 6, 2012 | ||
| TheStreet.com named Red Oak Technology Select Fund in its article titled “Technology Mutual Funds That Look Enticing.” February 8, 2012 | ||
| TheStreet.com recognized Live Oak Health Sciences Fund and Red Oak Technology Fund in its “Top-Rated Mutual Funds” lists. February 2012 | ||
| CNN/Money quoted Mark Oelschlager in ‘The Buzz’ column about technology companies. February 17, 2012. | ||
| USA Today quoted Mark Oelschlager in a story about the health care sector. February 17, 2012. | ||
March 2012 | Advisor Perspectives featured Mark Oelschlager’s Economic Update. March 12, 2012 | |
| Dow Jones Newswires interviewed Robert Stimpson for its fund profile titled “Black Oak Emerging Tech Fund Follows Long, Deep Path.” March 28, 2012 | ||
Table of Contents
| HIGHLIGHTS from the 2012 FISCAL YEAR | ||
| October 31, 2011 to October 31, 2012 (Unaudited) |
April 2012 | Advisor Perspectives featured Robert Stimpson’s first quarter market commentary titled “Time Heals All Wounds.” April 4, 2012 | |
| The Wall Street Journal recognized Red Oak Technology Select Fund among “top-performing funds in each category.” April 4, 2012 | ||
| Bloomberg News interviewed Robert Stimpson on Qualcomm. April 17, 2012 | ||
| The Wall Street Journal quoted Robert Stimpson on comments regarding Facebook. April 27, 2007 | ||
May 2012 | Fidelity.com included Red Oak Technology Select Fund in an article about sector funds titled “9 Funds to Fine-Tune Your Portfolio.” May 9, 2012 | |
| Barron’s interviewed Mark Oelschlager and Jim Oelschlager for an article featuring Red Oak Technology Select Fund, titled “Like Father, Like Son.” May 14, 2012 | ||
June 2012 | Bloomberg News quoted Robert Stimpson on comments regarding Facebook. June 6, 2012 | |
July 2012 | Advisor Perspectives named Mark Oelschlager among “Venerated Voices” for his May 22, 2012 commentary, “The Harsh Realities of Bond Math,” which was among most-read commentaries in the second quarter. July 31, 2012 | |
September 2012 | Zacks Investment Research named Black Oak Emerging Technology Fund among “Top 5 Zacks #1 Ranked Technology Mutual Funds.” September 25, 2012 | |
October 2012 | Advisor Perspectives featured Robert Stimpson’s third quarter market commentary titled “An Alternate Reality.” October 22, 2012 | |
| Ben Shepard’s Wall Street interviewed Mark Oelschlager for a profile on Pin Oak Equity Fund. October 2012 | ||
READ MORE AT WWW.OAKFUNDS.COM
Table of Contents
| 1 | ||
| 4 | ||
| 6 | ||
| 8 | ||
| 10 | ||
| 12 | ||
| 14 | ||
| 16 | ||
| 18 | ||
| 20 | ||
| 38 | ||
| 40 | ||
| 42 | ||
| 46 | ||
| 60 | ||
| 69 | ||
| 70 | ||
Table of Contents
| White Oak Select Growth Fund | ||
James D. Oelschlager Chief Investment Officer & Portfolio Manager
Mark W. Oelschlager, CFA Portfolio Manager
Robert D. Stimpson, CFA Portfolio Manager | White Oak Select Growth Fund (“The Fund”) gained 8.72% for the fiscal year ended October 31, 2012, while the comparative index, the S&P 500 Index, rose 15.21%, and the Lipper Large-Cap Growth peer group average increased 10.10%. Over the past five years, the Fund has returned 1.48% annually, compared to the S&P 500’s 0.36% gain and peer group’s 0.12% decline.
The fiscal year 2012 saw stocks appreciate based on a recovery in the beleaguered housing market and in spite of persistent Eurozone concerns and an economic slowdown in China. The underlying fundamentals within the portfolio’s companies remain strong, with profit margins high and balance sheets healthy. The economic problems abroad and the Presidential election cycle provided intermittent volatility, but equity markets ultimately climbed higher.
The recovery in the housing sector helped entice investors back into the equity markets. For the past few years, investors have favored the perceived certainty of fixed-income funds in light of Europe’s sovereign debt crisis and a faltering economic recovery domestically. The ratio of money flowing into bonds versus equities has been staggering. Yet with bond yields depressed and indications from the Federal Reserve that yields may remain low for an extended period, the quest for yield has driven some investors to delve into large-cap equities.
The recovery in the housing sector bodes well for the broader stock market since it benefits both financial firms and consumer sentiment. Financial stocks gain from the shoring up of real estate-based balance sheets and an improved ability to increase lending. Consumer sentiment is positively correlated with housing prices and leads to both higher consumer spending and a drop in deleveraging.
The renewed interest in equity investments, however, has yet to filter down throughout the entire stock market. The drive for yield has favored blue chip and high dividend-yielding stocks, which garnered a disproportionate share of flows. During the year, the Fund’s largest overweight sector was technology; and while some tech companies have begun to issue dividends, the nascent practice remains firmly with mature bellwether companies. This explains some of the Fund’s under-performance versus the benchmark.
Standout performers in the Fund included biotechnology leader Amgen, which benefited from optimism over its osteoporosis drug and an aggressive share repurchase program. | |
Financial firms JP Morgan Chase and US Bancorp also contributed strongly to the Fund’s return. The financial institutions have rallied with the recovery in the housing markets and improved sentiment towards financial stocks in general.
Laggards included offshore drilling company Transocean, which has seen rental rates for its rigs decline due to concerns over the global economy and the rise of alternative hydrocarbon supplies, such as shale. Other disappointments included mining company Goldcorp and semiconductor company Broadcom.
The macroeconomic environment has been supportive for stocks despite negative political rhetoric, lackluster employment growth and concerns over the fiscal cliff. These issues created a wall of worry that stocks climbed throughout 2012. Going forward, the outlook remains positive. Strict capital discipline over the last few years has helped companies keep profitability high, and a pattern of | ||


Annual Report | October 31, 2012 | 1 |
Table of Contents
| White Oak Select Growth Fund | ||
returning capital to shareholders has been welcomed by equity investors. Meanwhile, pessimism towards global fiscal issues has kept sentiment poor. The result is an environment where corporate earnings remain healthy and valuations are attractive. While it is impossible to predict what will happen in 2013, the characteristics that tend to mark turning points for equities, such as excess optimism and extreme valuations, remain distant.
Long-term shareholders of the Fund may notice that the fiscal year 2012 portfolio turnover is over 80%, significantly higher that the Fund’s historical average. As discussed in the Shareholder Letter, this turnover is atypical and does not represent a change in management style or philosophy regarding the Fund’s low turnover, buy-and-hold approach. During 2012, the Fund sold (and subsequently repurchased) numerous positions with large unrealized gains in order to use tax losses that were expiring on October 31, 2012. Ultimately, this trading allowed the Fund to offset a large amount of capital gains, as well as establish a higher cost basis for those positions, thereby lowering the level of future tax liability.
Thank you for your investment with Oak Associates Funds.
Mutual fund investing involves risk, including the possible loss of principal. The value of the Fund’s investments will vary from day to day in response to the activities of individual companies and general market and economic conditions. Due to the limited number of underlying investments, the Fund is more susceptible to the price movements of any one holding and thus may be more volatile than a more broadly diversified portfolio.
2 | 1-888-462-5386 | www.oakfunds.com |
Table of Contents
| Manager Discussion & Analysis | ||
| All data below as of October 31, 2012 (Unaudited) |
| Fund Data | ||
Ticker Symbol | WOGSX | |
Share Price | $42.50 | |
Total Net Assets | $228.6M | |
Portfolio Turnover | 86% | |
Industry Weightings^ | ||
Information Technology | 39.1% | |
Financials | 29.5% | |
Health Care | 21.2% | |
Consumer Discretionary | 5.4% | |
Energy | 3.9% | |
Materials | 0.6% | |
Cash & Other Assets | 0.3% | |
| Top 10 Holdings^ | ||||
1. | ACE, Ltd. | 6.1% | ||
2. | KLA-Tencor Corp. | 5.5% | ||
3. | UnitedHealth Group, Inc. | 5.5% | ||
4. | Amazon.com, Inc. | 5.4% | ||
5. | JPMorgan Chase & Co. | 5.4% | ||
6. | Amgen, Inc. | 5.3% | ||
7. | Google, Inc. - Class A | 5.3% | ||
8. | The Charles Schwab Corp. | 5.0% | ||
9. | International Business Machines Corp. | 4.8% | ||
10. | Cisco Systems, Inc. | 4.7% | ||
^ Percentages are based on net assets. Holdings are subject to change.
Growth of $10,000 Chart
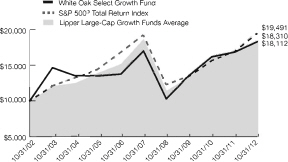
The chart above represents historical performance of a hypothetical investment of $10,000 in the Fund over the past 10 years (or for the life of the Fund if shorter). Past performance does not guarantee future results. This chart does not reflect the deduction of taxes that a shareholder would pay on Fund distributions or the redemption of Fund shares.
| Average Annual Total Return | ||||||||||
| 1 Year Return | 3 Year Return | 5 year Return | 10 year Return | Inception to Date | ||||||
White Oak Select Growth Fund | 8.72% | 10.57% | 1.48% | 6.24% | 7.54%* | |||||
S&P 500® Total Return Index1 | 15.21% | 13.21% | 0.36% | 6.91% | 8.24%* | |||||
Lipper Large-Cap Growth Funds Average2 | 10.10% | 11.36% | -0.12% | 6.12% | 7.18%** | |||||
*Since 08/03/1992 **Since 07/31/1992 | Gross Expense Ratio (Per the current prospectus): 1.14% |
The performance data quoted represents past performance. Past performance does not guarantee future results. The investment return and principal value of an investment will fluctuate so that an investor’s shares, when redeemed, may be worth more or less than their original cost and current performance may be lower or higher than the performance quoted. For performance data current to the most recent month end, please visit www.oakfunds.com or call 1-888-462-5386.
1 Standard & Poor’s is the source and owner of the S&P Index data. 2Lipper Inc. is the source and owner of the Lipper Classification data. See Pages 17 and 18 for additional disclosure.
Annual Report | October 31, 2012 | 3 |
Table of Contents
| Pin Oak Equity Fund | ||
Mark W. Oelschlager, CFA Portfolio Manager | Pin Oak Equity Fund (the “Fund”) rose 15.22% for the year ended October 31, 2012, while the comparative index, the S&P 500 Index, gained 15.21% and the Lipper Multi-Cap Core peer group returned 11.11%. Over the past five years, The Fund returned 3.73% annually, while the index gained .36% and the peer group declined .69%.
The economy continued to disappoint, as Gross Domestic Product growth remained depressed and the unemployment rate made slow progress downward. Many companies (and investors, for that matter) seem paralyzed by uncertainty over the economy, the sovereign debt crisis in Europe, regulatory issues, and tax rates. While this has hampered economic growth, one side benefit of the reduced investment is that it keeps capacity growth restrained, which helps keep profit margins high. Another (larger) factor in keeping margins elevated is free trade, which suppresses labor and material costs. A major thesis of the bears during this upward move in the market has been that profit margins must come down. But as long as capital spending remains responsible and free trade intact, they can stay high. | |
In last year’s report we talked about how we thought the financial stocks held appeal for long-term investors. Our investment in Financials paid off over the past twelve months, as interest in the sector returned and the stocks rallied. Portfolio holdings Wells Fargo, Capital One, SunTrust, and Great Southern Bancorp all rose more than 30%. One reason for this move is the improvement in the housing market. Turnover and prices are up, and foreclosures and homes for sale are down. This recovery was inevitable given the paucity of new supply in recent years, and should have legs given the relative value of buying versus renting in today’s market and the improvement in consumers’ income statements. We still hold a large position in the sector, as valuations remain compelling and the continued improvement in the housing sector should provide a tailwind.
The Fund’s energy holdings hurt performance, likely due to concerns about decelerating economic growth in emerging markets. As prospects for these economies improve, and as the US recovery progresses, we would expect interest in this sector to increase.
Investor cautiousness has driven heavy flows into bond funds and out of stock funds. To the extent that people do have interest in stocks or stock funds, it is currently focused on the higher-yielding areas of the market, which are generally regarded as safer areas. In essence, the craving for yield has spilled over from the bond market and into the stock market, pushing up valuations of companies that pay a high dividend. This phenomenon has skewed the traditional relationship between cyclical and non-cyclical stocks, making the former unusually attractive, especially in light of a likely hike in dividend tax rates. So we are focusing our investments in what we believe are the more attractive areas currently: the less defensive areas of the market.
As we noted in the Shareholder Letter, in order to maximize the tax efficiency of the Fund by taking advantage of expiring losses, we did an unusually large amount of trading before the end of the fiscal year. This resulted in a spike in Pin Oak’s turnover ratio. Be assured that this spike does not represent any change in our investment philosophy.
Thank you for your investment with Oak Associates Funds.
Mutual fund investing involves risk, including the possible loss of principal. The value of the Fund’s investments will vary from day to day in response to the activities of individual companies and general market and economic conditions. | ||

4 | 1-888-462-5386 | www.oakfunds.com |
Table of Contents
| Manager Discussion & Analysis | ||
| All data below as of October 31, 2012 (Unaudited) |
| Fund Data | ||
Ticker Symbol | POGSX | |
Share Price | $32.86 | |
Total Net Assets | $69.1M | |
Portfolio Turnover | 98% | |
| Industry Weightings^ | ||
Financials | 33.4% | |
Information Technology | 27.6% | |
Consumer Discretionary | 19.3% | |
Industrials | 9.5% | |
Energy | 7.8% | |
Materials | 0.9% | |
Cash & Other Assets | 1.5% | |
| Top 10 Holdings^ | ||||
1. | Wells Fargo & Co. | 4.7% | ||
2. | Amdocs, Ltd. | 4.4% | ||
3. | Capital One Financial Corp. | 4.1% | ||
4. | The Charles Schwab Corp. | 4.0% | ||
5. | Nabors Industries, Ltd. | 4.0% | ||
6. | Microsoft Corp. | 3.9% | ||
7. | CIT Group, Inc. | 3.9% | ||
8. | News Corp. - Class A | 3.8% | ||
9. | lAC/lnterActive Corp. | 3.7% | ||
10. | Garmin, Ltd. | 3.6% | ||
^ Percentages are based on net assets. Holdings are subject to change.
Growth of $10,000 Chart
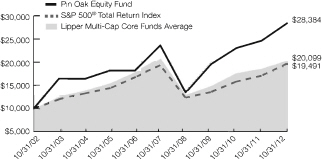
The chart above represents historical performance of a hypothetical investment of $10,000 in the Fund over the past 10 years (or for the life of the Fund if shorter). Past performance does not guarantee future results. This chart does not reflect the deduction of taxes that a shareholder would pay on Fund distributions or the redemption of Fund shares.
| Average Annual Total Return | ||||||||||
1 Year Return | 3 Year Return | 5 year Return | 10 year Return | Inception to Date | ||||||
Pin Oak Equity Fund | 15.22% | 13.20% | 3.73% | 10.99% | 6.26%* | |||||
S&P 500® Total Return Index1 | 15.21% | 13.21% | 0.36% | 6.91% | 8.24%* | |||||
Lipper Multi-Cap Core Funds Average2 | 11.11% | 11.19% | -0.69% | 7.23% | 8.18%** | |||||
| *Since 08/03/1992 **Since 07/31/1992 | Gross Expense Ratio (Per the current prospectus): 1.20% | |||||||||
The performance data quoted represents past performance. Past performance does not guarantee future results. The investment return and principal value of an investment will fluctuate so that an investor’s shares, when redeemed, may be worth more or less than their original cost and current performance may be lower or higher than the performance quoted. For performance data current to the most recent month end, please visit www.oakfunds.com or call 1-888-462-5386.
1 Standard & Poor’s is the source and owner of the S&P Index data. 2 Lipper Inc. is the source and owner of the Lipper Classification data. See Pages 17 and 18 for additional disclosure.
Annual Report | October 31, 2012 | 5 |
Table of Contents
| Rock Oak Core Growth Fund | ||
Robert D. Stimpson, CFA Portfolio Manager | The Rock Oak Core Growth Fund (“The Fund”) rose 1.20% for the fiscal year ending October 31, 2012. The Fund underperformed the benchmark S&P 500 Index’s gain of 15.21%. The S&P 500 Index had a strong year as investors’ interest in large-cap equities emerged following a multi-year preference for fixed-income funds. The renewed appetite, however, developed for large-cap blue chips and dividend-yielding stocks. These characteristics position the S&P 500 as a prime beneficiary of money returning to stocks. As a result, the blue chip index will likely outperform most actively managed funds this calendar year. The Lipper Multi-Cap Growth Category peer group gained 9.33% for the fiscal year.
Historically, the Fund has sought to outperform the market by focusing on companies’ fundamentals, investing in stocks without regard to the S&P 500’s holdings. In fact, it has often preferred companies not held by popular indexes, as they tend to be overlooked by Wall Street and institutional investors. This concept is referred to as “active share investing,” which asserts that the less a portfolio mimics its benchmark, the higher the probability it will outperform the index. The Fund has recognized this propensity historically and yet, for 2012, the more a portfolio looked like the S&P 500, the higher the probability it outperformed. This is unusual. However, as the economic recovery progresses and investors’ appetite for risk grows, the companies with growth characteristics typical of the Fund’s holdings are likely to benefit. As asset flows return to equities, it is common for risk tolerance to shift from perceived safer blue chips into higher beta asset classes. |

The most dramatic change in the economic backdrop of 2012 was the recovery in home prices. This is a resounding positive for all equity investors going forward. The housing market had been a drag on the economy and consumer sentiment for over five years. High levels of foreclosures, poor sales, weak new home starts and falling prices have finally reversed. Time has cured many wounds and a stable, if not healthy, housing market has benefits beyond just homebuilding stocks. Since the value of one’s home is typically his largest asset, an improvement in home prices boosts both consumer sentiment and spending. Home loans and mortgage securities are also some of the largest sources of collateral for banks. Therefore, stable-to-rising home prices help financial institutions extend credit and accelerate lending activity. As a result of the housing recovery, financial stocks have also been strong performers in 2012.
The Fund’s overweight to the Technology sector limited its performance during the fiscal year. The sector’s positive attributes during the year included its valuation, high profit margins and exposure to global markets. Despite the combination of these offensive and defensive characteristics, the sector failed to perform as anticipated. Its mediocre performance could be explained by the slowdown in China and lack of dividend distributions. While many leading technology companies have now embraced dividends, their yields remain well behind the rest of the market. Income-focused investors have preferred absolute yield rather than the dividend growth opportunity that most technology stocks offer.
The Fund’s best performing stock for the fiscal year was Gilead Sciences, which rose 61%. As a whole, the biotechnology sector did well last year and Gilead continues to dominate the HIV/AIDS therapeutics segment. The Fund’s worst performing stock was C-Trip International, down 44%. The Chinese-based online travel company has fallen due to slow economic growth in Asia. Since the Chinese government’s stimulus initiatives are focused on domestic consumption, the Fund remains optimistic the stock will recover.
Going forward, the Rock Oak Fund remains focused on attractively valued companies with strong growth prospects, which have demonstrated a commitment to shareholder value creation. The outlook for US stocks remains attractive due to the improvements in the housing market and potential for employment growth. Pessimism over political deadlock and the fiscal situation domestically have kept valuations attractive and sentiment contained.
Thank you for your investment with Oak Associates Funds.
Mutual fund investing involves risk, including the possible loss of principal. The value of the Fund’s investments will vary from day to day in response to the activities of individual companies and general market and economic conditions.
6 | 1-888-462-5386 | www.oakfunds.com |
Table of Contents
| Manager Discussion & Analysis | ||
| All data below as of October 31, 2012 (Unaudited) |
| Fund Data | ||||
Ticker Symbol | RCKSX | |||
Share Price | $11.78 | |||
Total Net Assets | $6.5M | |||
Portfolio Turnover | 56% | |||
| Industry Weightings^ | ||||
Information Technology | 35.3% | |||
Financials | 16.9% | |||
Consumer Discretionary | 12.7% | |||
Health Care | 11.0% | |||
Energy | 6.3% | |||
Industrials | 6.2% | |||
Materials | 6.1% | |||
Consumer Staples | 3.2% | |||
Cash & Other Assets | 2.3% | |||
| Top 10 Holdings^ | ||||||
1. | Apple, Inc. | 4.6 | % | |||
2. | CF Industries Holdings, Inc. | 4.1 | % | |||
3. | VMware, Inc. - Class A | 3.9 | % | |||
4. | AmerisourceBergen Corp. | 3.9 | % | |||
5. | Capital One Financial Corp. | 3.7 | % | |||
6. | Symantec Corp. | 3.7 | % | |||
7. | Las Vegas Sands Corp. | 3.6 | % | |||
8. | Mastercard, Inc. - Class A | 3.5 | % | |||
9. | American Express Co. | 3.5 | % | |||
10. | Wells Fargo & Co. | 3.5 | % | |||
^ Percentages are based on net assets. Holdings are subject to change.
Growth of $10,000 Chart
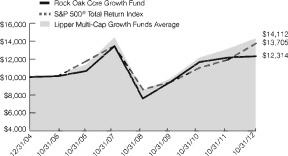
The chart above represents historical performance of a hypothetical investment of $10,000 in the Fund over the past 10 years (or for the life of the Fund if shorter). Past performance does not guarantee future results. This chart does not reflect the deduction of taxes that a shareholder would pay on Fund distributions or the redemption of Fund shares. Fee waivers are in effect; if they had not been in effect, performance would have been lower.
| Average Annual Total Return | ||||||||||||||||||||
| 1 Year Return | 3 Year Return | 5 year Return | 10 year Return | Inception to Date* | ||||||||||||||||
Rock Oak Core Growth Fund | 1.20% | 9.03% | -1.75% | – | 2.69% | |||||||||||||||
S&P 500® Total Return Index1 | 15.21% | 13.21% | 0.36% | – | 4.11% | |||||||||||||||
Lipper Multi-Cap Growth Funds Average2 | 9.33% | 12.33% | -0.58% | – | 4.33% | |||||||||||||||
| *Since 12/31/2004 | Gross Expense Ratio (Per the current prospectus): 1.65% |
The performance data quoted represents past performance. Past performance does not guarantee future results. The investment return and principal value of an investment will fluctuate so that an investor’s shares, when redeemed, may be worth more or less than their original cost and current performance may be lower or higher than the performance quoted. For performance data current to the most recent month end, please visit www.oakfunds.com or call 1-888-462-5386.
1 Standard & Poor’s is the source and owner of the S&P Index data. 2Lipper Inc. is the source and owner of the Lipper Classification data. See Pages 17 and 18 for additional disclosure.
Annual Report | October 31, 2012 | 7 |
Table of Contents
| River Oak Discovery Fund | ||
Robert D. Stimpson, CFA Portfolio Manager | The River Oak Discovery Fund (“The Fund”) rose 5.49% for the fiscal year ending October 31, 2012, while the Russell 2000 Growth Index benchmark gained 9.70%. Since inception on June 30, 2005, the River Oak Fund has returned 4.76% annually versus the Lipper Small-Cap Growth peer group’s 5.01% gain. Over the same time period, the Russell 2000 Growth Index has risen 5.69% per year. The Fund’s underperformance emanated from its more defensive positioning and greater International exposure over the last 18 months.
Dramatic improvements in the housing market helped drive US stocks higher in 2012. Following a multi-year preference for fixed-income funds, investors returned to the equity markets. Their arrival however, favored large-cap, blue chip companies such as those in the S&P 500. Persistently low yields in the bond market and indications from the Federal Reserve that yields may remain depressed for an extended period made dividends and the earnings yields on stocks increasingly attractive. The initial appetite for stocks favored blue chips, but investors’ interests are likely to spread to smaller-cap and higher-beta segments as confidence grows. |

Investors’ preference for blue chip companies was evident throughout the year as the S&P 500 Index outperformed most other market-cap and style indexes. Given the higher risk nature of small-cap stocks and an uncertain political outlook for much of the fiscal year, the segment underperformed. In light of the additional risks, the Fund held more cash than usual and invested in companies with strong visibility. These steps ultimately hindered performance as broader market averages climbed a wall of worry for much of the year.
While large-cap stocks outperformed their smaller compatriots in 2012, the improvements in the economy, job market, and financial sector bode well for all segments of the market. A healthy housing industry has tertiary benefits for investors. Not only do rising/stable home prices support better consumer sentiment, but home loans are among the largest sources of collateral for banks. With stronger balance sheets, financial institutions can accelerate lending or ease strict credit requirements. This adds fuel to the economic recovery.
The Fund’s best performing stock this fiscal year was Sourcefire Inc., a cyber security company, which gained 93%. The sector remains a popular theme for the Fund as information security is a perpetual problem with consistent growth. The Fund has since reduced its exposure to Sourcefire due to its rapid rate of appreciation and reallocated to securities with a better return profile. Molycorp was the Fund’s worst performing holding in fiscal year 2012, dropping 73%. The metals and mining company has suffered from the Chinese government’s control over rare earth elements supply. As the world’s largest supplier of rare earth elements, China’s export quota decisions create volatility for Molycorp. Rare earth elements are crucial building blocks for numerous electronic components and magnets. The Fund continues to hold Molycorp as the need for a supplier outside of China remains a high priority for the US government and technology companies. The investment, however, has been a disappointment.
Looking into 2013, the recent fiscal year performance of US stocks is a strong signal that investors may be willing to once again embrace higher-risk asset classes. With the recovery in the housing market, the end of political uncertainty in the White House, and improving consumer sentiment, investor confidence should spread to other market segments. We believe small-cap stocks offer attractive return potential. The Fund will continue to seek out niche companies with a strong commitment to shareholder value creation. Corporate balance sheets and profitability remain healthy and the opportunities in stocks appear significantly better than bonds.
Thank you for your investment with Oak Associates Funds.
Mutual fund investing involves risk, including the possible loss of principal. Funds that emphasize investments in smaller companies generally will experience greater price volatility.
8 | 1-888-462-5386 | www.oakfunds.com |
Table of Contents
| Manager Discussion & Analysis | ||
| All data below as of October 31, 2012 (Unaudited) |
| Fund Data | ||||
Ticker Symbol | RIVSX | |||
Share Price | $13.46 | |||
Total Net Assets | $10.8M | |||
Portfolio Turnover | 72% | |||
| Industry Weightings^ | ||||
Information Technology | 25.5% | |||
Financials | 19.5% | |||
Consumer Discretionary | 15.9% | |||
Energy | 10.1% | |||
Consumer Staples | 7.5% | |||
Health Care | 7.0% | |||
Telecommunication Services | 3.1% | |||
Materials | 2.9% | |||
Cash & Other Assets | 8.5% | |||
| Top 10 Holdings^ | ||||||
1. | MercadoLibre, Inc. | 4.8% | ||||
2. | B&G Foods, Inc. | 4.4% | ||||
3. | PrivateBancorp, Inc. | 4.3% | ||||
4. | ViewPoint Financial Group, Inc. | 4.0% | ||||
5. | Oceaneering International, Inc. | 3.9% | ||||
6. | Illumina, Inc. | 3.9% | ||||
7. | Veeco Instruments, Inc. | 3.8% | ||||
8. | Hollysys Automation Technologies, Ltd. | 3.6% | ||||
9. | Dril-Quip, Inc. | 3.3% | ||||
10. | Assurant, Inc. | 3.3% | ||||
^ Percentages are based on net assets. Holdings are subject to change.
Growth of $10,000 Chart
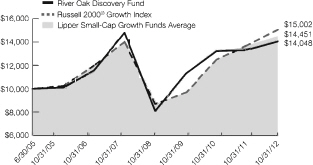
The chart above represents historical performance of a hypothetical investment of $10,000 in the Fund over the past 10 years (or for the life of the Fund if shorter). Past performance does not guarantee future results. This chart does not reflect the deduction of taxes that a shareholder would pay on Fund distributions or the redemption of Fund shares. Fee waivers are in effect; if they had not been in effect, performance would have been lower.
| Average Annual Total Return | ||||||||||||||||||||
| 1 Year Return | 3 Year Return | 5 year Return | 10 year Return | Inception to Date* | ||||||||||||||||
River Oak Discovery Fund | 5.49% | 7.58% | -1.03% | – | 4.76% | |||||||||||||||
Russell 2000® Growth Index1 | 9.70% | 15.74% | 1.41% | – | 5.69% | |||||||||||||||
Lipper Small-Cap Growth Funds Average2 | 9.05% | 15.40% | 0.48% | – | 5.01% | |||||||||||||||
| * Since 06/30/2005 | Gross Expense Ratio (Per the Current prospectus): 1.53% | |||||||||
The performance data quoted represents past performance. Past performance does not guarantee future results. The investment return and principal value of an investment will fluctuate so that an investor’s shares, when redeemed, may be worth more or less than their original cost and current performance may be lower or higher than the performance quoted. For performance data current to the most recent month end, please visit www.oakfunds.com or call 1-888-462-5386.
1 Russell Investments is the source and owner of the Russell Index data. 2Lipper Inc. is the source and owner of the Lipper Classification data. See Pages 17 and 18 for additional disclosure.
Annual Report | October 31, 2012 | 9 |
Table of Contents
| Red Oak Technology Select Fund | ||
Mark W. Oelschlager, CFA Portfolio Manager | Red Oak Technology Fund (“The Fund”) rose 1.98% for the year ended October 31, 2012, while the comparative index, the NASDAQ 100 Index, which includes holdings within sectors beyond just technology, gained 13.51%, and the Lipper Science and Technology peer group rose 2.06%. Over the past five years, the Fund returned 2.27% annually, while the index gained 4.24% and the peer group declined .35%.
Technology was one of the poorer performing sectors for the year, mainly due to a weakening global economy; tech is very much a global business. In spite of subdued revenue growth, operating margins, as in many other sectors, have remained high. This, along with restrained capital spending, has produced prodigious cash flow, presenting a dilemma for company managements. Much of the cash is generated by overseas operations, and if it is brought back to the United States, it is taxed at corporate tax rates even though it has already been taxed in the local country. Therefore managements have decided to keep much of their cash overseas, which prevents them from returning it to shareholders through dividends and share buybacks. This is one reason that cash is close to 1/5 the sector’s market capitalization, higher than for any other sector. But there is still a lot of cash at home, and there are plenty of examples of companies increasing dividends. Within the portfolio, several companies have boosted their dividends – and by staggering amounts: Cisco Systems increased its dividend by 75% this past summer; Accenture by 80% over the past year and a half; and CA by 400% in early 2012. |

In fact, in the third quarter, tech dividends were 61% higher than they were the year before, helped to a large extent by the initiation of a dividend by Apple, a fund holding. With so many investors these days looking for yield, it’s a wonder more are not interested in the growing payouts of technology companies.
Some of the Fund’s winners for the year included analytics and processing provider Alliance Data Systems, hard drive maker Western Digital, and consumer electronics purveyor Apple. The Fund’s two aerospace and defense holdings, Northrop Grumman and Huntington Ingalls, also rose sharply, as fears about cuts in defense spending eased. We had added to our positions about a year ago when the group was out of favor.
A major mistake we made was our commitment to some holdings that depend on the personal computer and printing business. Hewlett Packard, Dell, and Lexmark were negatively impacted as tablet computers encroached on their businesses. We knew this would be an issue, but we underestimated the impact.
As we noted in the Shareholder Letter, in order to maximize the tax efficiency of the Fund by taking advantage of expiring losses, we did an unusually large amount of trading before the end of the fiscal year. This resulted in a spike in Red Oak’s turnover ratio. Be assured that this spike does not represent any change in our investment philosophy.
Thank you for your investment with Oak Associates Funds.
Mutual fund investing involves risk, including the possible loss of principal. Funds that emphasize investments in technology generally will experience greater price volatility. There are additional risks associated with investing in a single-sector fund, including greater sensitivity to economic, political, or regulatory developments impacting the sector.
10 | 1-888-462-5386 | www.oakfunds.com |
Table of Contents
| Manager Discussion & Analysis | ||
| All data below as of October 31, 2012 (Unaudited) |
| Fund Data | ||||
Ticker Symbol | ROGSX | |||
Share price | $9.79 | |||
Total Net Assets | $64.9M | |||
Portfolio Turnover | 83% | |||
| Industry Weightings^ | ||||
Information Technology | 89.6% | |||
Industrials | 7.2% | |||
Consumer Discretionary | 2.3% | |||
Telecommunication Services | 0.5% | |||
Cash & Other Assets | 0.4% | |||
| Top 10 Holdings^ | ||||||
1. | Accenture PLC - Class A | 6.0% | ||||
2. | Alliance Data Systems Corp. | 5.1% | ||||
3. | lAC/lnterActive Corp. | 5.0% | ||||
4. | Symantec Corp. | 4.9% | ||||
5. | Northrop Grumman Corp. | 4.8% | ||||
6. | KLA-Tencor Corp. | 4.7% | ||||
7. | Total System Services, Inc. | 4.3% | ||||
8. | CA, Inc. | 4.1% | ||||
9. | International Business Machines Corp. | 4.1% | ||||
10. | Google, Inc. - Class A | 4.0% | ||||
^ Percentages are based on net assets. Holdings are subject to change.
Growth of $10,000 Chart
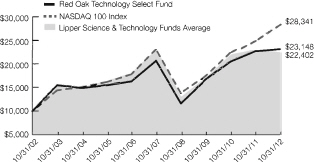
The chart above represents historical performance of a hypothetical investment of $10,000 in the Fund over the past 10 years (or for the life of the Fund if shorter). Past performance does not guarantee future results. This chart does not reflect the deduction of taxes that a shareholder would pay on Fund distributions or the redemption of Fund shares.
| Average Annual Total Return | ||||||||||||||||||||
| 1 Year Return | 3 Year Return | 5 year Return | 10 year Return | Inception to Date* | ||||||||||||||||
Red Oak Technology Select Fund | 1.98% | 11.62% | 2.27% | 8.75% | -0.15% | |||||||||||||||
NASDAQ 100 Index1 | 13.51% | 17.74% | 4.24% | 10.98% | 3.12% | |||||||||||||||
Lipper Science & Technology Funds Average2 | 2.06% | 10.17% | -0.35% | 8.40% | 2.48% | |||||||||||||||
| *Since 12/31/1998 | Gross Expense Ratio (Per the current prospectus): 1.32% |
The performance data quoted represents past performance. Past performance does not guarantee future results. The investment return and principal value of an investment will fluctuate so that an investor’s shares, when redeemed, may be worth more or less than their original cost and current performance may be lower or higher than the performance quoted. For performance data current to the most recent month end, please visit www.oakfunds.com or call 1-888-462-5386.
1 NASDAQ is the source and owner of the NASDAQ Index data. 2Lipper Inc. is the source and owner of the Lipper Classification data. See Pages 17 and 18 for additional disclosure.
Annual Report | October 31, 2012 | 11 |
Table of Contents
| Black Oak Technology Fund | ||
Robert D. Stimpson, CFA Portfolio Manager | The Black Oak Emerging Technology Fund (“The Fund”) fell 3.96% during the fiscal year ending October 31, 2012. During the same period, the NASDAQ Composite Index rose 12.32%. The Fund underperformed the benchmark index, which is more diversified and not exclusively invested in the technology sector. The Lipper Science & Technology peer group gained 2.06% for the fiscal year. Over the last five years, the Fund has lost 1.91% per year compared to a 0.35% decline in the peer group.
The fiscal year 2012 proved to be a volatile period for global equities due to uncertainty surrounding the upcoming Presidential elections, continued turmoil in certain Eurozone economies, and an economic slowdown in China. While employment data remained muted throughout the year, a recovery in the housing sector helped propel broader US equity markets higher. The Fund’s focus on small technology stocks limited its participation in this rebound. Throughout the year, investors’ preferences for large-cap, blue chip stocks were pervasive. Indeed, the S&P 500 Index was one of the top performing indexes with large-cap and lower-beta companies outperforming. |

The performance of blue chips reflects investors’ gradual shift back into equities following a multi-year distaste for stocks and preference for fixed-income investments. With yields on bonds depressed – a result of high demand and governmental policies – investors have transitioned to dividend-paying equities. Technology stocks had been slow to embrace the practice of returning cash to shareholders as dividends, but this behavior is changing. And while dividend payouts are increasing in the technology sector, investors sought a more familiar area of the equity market to obtain yield and dividends: A far larger proportion of equity flows this year went to S&P 500 companies, which offer a longer history of yield and dividend payments. As a result, most mutual fund managers will likely underperform the S&P 500 in 2012.
Compared to the NASDAQ Composite, the Fund suffered from its focus on emerging-technology companies and high-beta characteristics. In a market that favored large, dividend-paying stocks, the Fund lacked exposure to what was in vogue. During the year, Apple rose 47% and was a top contributor to returns for both the Fund and benchmark index. Held by the Fund for many years, Apple, however, boasts a market capitalization significantly larger than the average portfolio holding.
To counter the negative headwinds of a risk-averse market, the Fund held more cash than normal, and sought out companies with stable earnings and low valuations. The portfolio’s weakest stock was Molycorp, which lost 73%. The mining company focuses on rare earth elements, the essential materials used in electronic and magnetic components. However, China maintains a near monopoly on rare earth elements supply, and its export quota decisions created volatility for Molycorp. The Fund continues to hold Molycorp, since the need for a rare earth elements supplier outside of China remains a high priority for the US government and technology companies. The investment however, has been a disappointment.
Going forward, the Black Oak Fund will continue to seek niche technology companies with solid earnings prospects that are trading at favorable valuations. The Fund’s exposure to companies with attractive cash flow characteristics will increase. At emerging technology companies, excess cash flow has traditionally been reinvested in the business. Yet with a renewed interest in shareholder-friendly capital allocation practices, firms which demonstrate a commitment to shareholder value – and have the strong cash flow to support it – may attract the first wave of investors looking for high growth stocks.
Thank you for your investment with Oak Associates Funds.
Mutual fund investing involves risk, including the possible loss of principal. Funds that emphasize investments in technology generally will experience greater price volatility. There are additional risks associated with investing in a single-sector fund with a limited number of holdings versus a more broadly diversified portfolio, including greater sensitivity to economic, political, or regulatory developments impacting the sector. Funds that emphasize investments in smaller or mid-sized companies may experience greater price volatility.
12 | 1-888-462-5386 | www.oakfunds.com |
Table of Contents
| Manager Discussion & Analysis | ||
| All data below as of October 31, 2012 (Unaudited) |
| Fund Data | ||||
Ticker Symbol | BOGSX | |||
Share Price | $2.67 | |||
Total Net Assets | $25.1M | |||
Portfolio Turnover | 33% | |||
| Industry Weightings^ | ||||
Information Technology | 86.9% | |||
Health Care | 3.3% | |||
Materials | 2.2% | |||
Telecommunication Services | 0.6% | |||
Cash & Other Assets | 7.0% | |||
| Top 10 Holdings^ | ||||||
1. | Cognizant Technology Solutions Corp. - Class A | 5.9% | ||||
2. | Qualcomm, Inc. | 5.7% | ||||
3. | Apple, Inc. | 5.5% | ||||
4. | MercadoLibre, Inc. | 5.4% | ||||
5. | Salesforce.com, Inc. | 5.4% | ||||
6. | VMware, Inc. - Class A | 5.1% | ||||
7. | Red Hat, Inc. | 5.1% | ||||
8. | ANSYS, Inc. | 4.7% | ||||
9. | Itron, Inc. | 4.1% | ||||
10. | NetApp, Inc. | 3.6% | ||||
^ Percentages are based on net assets. Holdings are subject to change.
Growth of $10,000 Chart
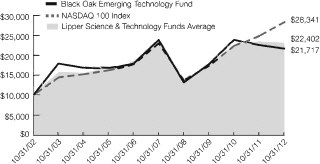
The chart above represents historical performance of a hypothetical investment of $10,000 in the Fund over the past 10 years (or for the life of the Fund if shorter). Past performance does not guarantee future results. This chart does not reflect the deduction of taxes that a shareholder would pay on Fund distributions or the redemption of Fund shares. Fee waivers are in effect; if they had not been in effect, performance would have been lower.
| Average Annual Total Return | ||||||||||||||||||||
| 1 Year Return | 3 Year Return | 5 year Return | 10 year Return | Inception to Date | ||||||||||||||||
Black Oak Emerging Technology Fund | -3.96% | 6.83% | -1.91% | 8.06% | | -10.55%* | | |||||||||||||
NASDAQ 100 Index1 | 13.51% | 17.74% | 4.24% | 10.98% | 1.54%* | |||||||||||||||
Upper Science & Technology Funds Average2 | 2.06% | 10.17% | -0.35% | 8.40% | -0.63%** | |||||||||||||||
| * Since 12/29/2000 **Since 12/31/2000 | Gross Expense Ratio (Per the current prospectus): 1.35% |
The performance data quoted represents past performance. Past performance does not guarantee future results. The investment return and principal value of an investment will fluctuate so that an investor’s shares, when redeemed, may be worth more or less than their original cost and current performance may be lower or higher than the performance quoted. For performance data current to the most recent month end, please visit www.oakfunds.com or call 1-888-462-5386.
1 NASDAQ is the source and owner of the NASDAQ Index data. 2Lipper Inc. is the source and owner of the Lipper Classification data. See Pages 17 and 18 for additional disclosure.
Annual Report | October 31, 2012 | 13 |
Table of Contents
| Live Oak Health Sciences Fund | ||
Mark W. Oelschlager, CFA Portfolio Manager | Live Oak Health Sciences Fund (“The Fund”) returned 9.02% for the year ended October 31, 2012, while the comparative index, the S&P 500 Health Care Index, gained 22.12%, and the Lipper Health & Biotechnology peer group returned 21.22%. Over the past five years, the Fund returned 5.94% annually, while the index gained 4.30% and the peer group gained 6.24%.
In June the Supreme Court surprisingly upheld all the main elements of the Affordable Care Act, paving the way for the new regulations to take effect. This surprising ruling illustrates why it is so difficult – and, we believe, unwise–to trade or invest based on expected political outcomes.
Our portfolio produced nice gains for the year but did not keep up with many of its more biotech-focused peers. Driven by the tremendous liquidity in the market, biotechs are having their day in the sun right now after a long period of poor returns. Our limited exposure to this area helped the Fund outperform its peers for several years in a row, but we are going through a period now where it is hurting relative performance. That said, we are not making any dramatic changes to our strategy, believing that the better opportunities reside elsewhere, in industries such as medical devices, Pharmaceuticals, and pharmaceutical distribution. The biotech companies that are profitable are currently trading at about double the earnings multiple of these less-sexy groups, which indicates that expectations are high (and difficult to meet). And of course, a large percentage of the biotech industry is unprofitable, a fact that hasn’t kept the stocks from rallying. Over time biotechs have confounded the efficient market theorists by producing below-average returns with above-average risk, so we are sticking with our method of slow, steady and opportunistic, rather than trying to play the momentum in the biotechs. |

Standout performers for the year included the pharmaceutical companies, some of which returned more than 30%. Companies such as Pfizer and Eli Lilly have made it through the patent expiration issues that hung over their stocks, and have been returning capital to shareholders and developing the next generation of therapeutic compounds.
Laggards included institutional pharmacy company Pharmerica, whose planned sale to a rival was blocked by regulators, and managed care organization Wellpoint, who experienced higher medical costs and lower enrollment.
We spend a lot of time hunting for new ideas, but continue to be judicious about pulling the trigger. We are encouraged by the fact that all three of the new stocks (Merck, Patterson, and Zimmer) we added to the portfolio over the past year have posted double-digit returns since purchased.
Thank you for your investment with Oak Associates Funds.
Mutual fund investing involves risk, including the possible loss of principal Funds that emphasize investments in health care generally will experience greater price volatility. There are additional risks associated with investing in a single-sector fund versus a more broadly diversified portfolio, including greater sensitivity to economic, political, or regulatory developments impacting the sector.
14 | 1-888-462-5386 | www.oakfunds.com |
Table of Contents
| Manager Discussion & Analysis | ||
| All data below as of October 31,2012 (Unaudited) |
| Fund Data | ||||
Ticker Symbol | LOGSX | |||
Share Price | $14.67 | |||
Total Net Assets | $33.0M | |||
Portfolio Turnover | 16% | |||
| Industry Weightings^ | ||||
Health Care | 98.7% | |||
Cash & Other Assets | 1.3% | |||
| Top 10 Holdings^ | ||||||
1. | McKesson Corp. | 5.6% | ||||
2. | AmerisourceBergen Corp. | 5.3% | ||||
3. | Cardinal Health, Inc. | 4.6% | ||||
4. | Pfizer, Inc. | 4.4% | ||||
5. | Amgen, Inc. | 4.4% | ||||
6. | Zimmer Holdings, Inc. | 4.1% | ||||
7. | AstraZeneca PLC ADR | 4.0% | ||||
8. | Becton Dickinson and Co. | 3.9% | ||||
9. | CR Bard, Inc. | 3.8% | ||||
10. | Merck & Co., Inc. | 3.7% | ||||
^ Percentages are based on net assets.
Holdings are subject to change.
Growth of $10,000 Chart
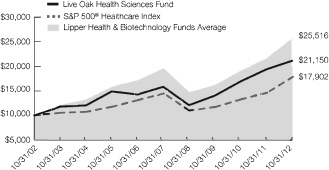
The chart above represents historical performance of a hypothetical investment of $10,000 in the Fund over the past 10 years (or for the life of the Fund if shorter). Past performance does not guarantee future results. This chart does not reflect the deduction of taxes that a shareholder would pay on Fund distributions or the redemption of Fund shares.
| Average Annual Total Return | ||||||||||||||||||||
| 1 Year Return | 3 Year Return | 5 year Return | 10 year Return | Inception to Date | ||||||||||||||||
Live Oak Health Sciences Fund | 9.02% | 14.61% | 5.94% | 7.78% | 4.55%* | |||||||||||||||
S&P 500® Healthcare Index1 | 22.12% | 14.98% | 4.30% | 5.99% | 3.81%* | |||||||||||||||
Lipper Health & Biotechnology Funds Average2 | 21.22% | 17.24% | 6.24% | 9.82% | 5.56%** | |||||||||||||||
| * Since 06/29/2001 ** Since 06/30/2001 | Gross Expense Ratio (Per the current prospectus): 1.26% |
The performance data quoted represents past performance. Past performance does not guarantee future results. The investment return and principal value of an investment will fluctuate so that an investor’s shares, when redeemed, may be worth more or less than their original cost and current performance may be lower or higher than the performance quoted. For performance data current to the most recent month end, please visit www.oakfunds.com or call 1-888-462-5386.
1 Standard & Poor’s is the source and owner of the S&P Index data. 2Lipper Inc. is the source and owner of the Lipper Classification data. See Pages 17 and 18 for additional disclosure.
Annual Report | October 31, 2012 | 15 |
Table of Contents
| Important Disclosures | ||
| As of October 31, 2012 (Unaudited) |
Index Definitions and Disclosures
All indices are unmanaged and index performance figures include reinvestment of dividends but do not reflect any fees, expenses or taxes. Investors cannot invest directly in an index.
NASDAQ 100 Index – The NASDAQ 100 Index includes 100 of the largest domestic and international non-financial securities listed on The Nasdaq Stock Market based on market capitalization.
Russell 2000 Growth Index – The Russell 2000 Growth Index measures the performance of the small-cap growth segment of the U.S. equity universe. It includes those Russell 2000 companies with higher price-to-book ratios and higher forecasted growth values.
S&P 500 Healthcare Index – The S&P 500 Healthcare Index is a capitalization-weighted index that encompasses two main industry groups. The first includes companies who manufacture health care equipment and supplies or provide health care related services, including distributors of health care products, providers of basic health-care services, and owners and operators of health care facilities and organizations. The second group consists of companies primarily involved in the research, development, production and marketing of Pharmaceuticals and biotechnology products.
S&P 500 Index – The S&P 500 Index is a commonly recognized, market capitalization weighted index of 500 widely held equity securities, designed to measure broad U.S. equity performance.
Lipper Multi-Cap Core Funds – Multi-Cap Core Funds Funds that, by portfolio practice, invest in a variety of market-capitalization ranges without concentrating 75% of their equity assets in any one market-capitalization range over an extended period of time. Multi-cap core funds typically have average characteristics compared to the S&P SuperComposite 1500 Index.
Lipper Health/Biotechnology Funds – Funds that invest primarily in the equity securities of domestic companies engaged in healthcare, medicine, and biotechnology.
Lipper Large-Cap Growth Funds – Funds that, by portfolio practice, invest at least 75% of their equity assets in companies with market capitalizations (on a three-year weighted basis) above Lipper’s USDE large-cap floor. Large-cap growth funds typically have an above-average price-to-earnings ratio, price to-book ratio, and three-year sales-per-share growth value, compared to the S&P 500 Index.
Lipper Multi-Cap Growth Funds – Funds that, by portfolio practice, invest in a variety of market capitalization ranges without concentrating 75% of their equity assets in any one market capitalization range over an extended period of time. Multi-cap growth funds typically have an above-average price-to-earnings ratio, price-to-book ratio, and three-year sales per-share growth value, compared to the S&P SuperComposite 1500 Index.
Lipper Science & Technology Funds – Funds that invest primarily in the equity securities of domestic companies engaged in science and technology.
Lipper Small-Cap Growth Funds – Funds that, by portfolio practice, invest at least 75% of their equity assets in companies with market capitalizations (on a three-year weighted basis) below Lipper’s USDE small-cap ceiling. Small-cap growth funds typically have an above-average price-to-earnings ratio, price-to-book ratio, and three-year sales-per-share growth value, compared to the S&P Small-Cap 600 Index.
16 | 1-888-462-5386 | www.oakfunds.com |
Table of Contents
| Important Disclosures | ||
| As of October 31, 2012 (Unaudited) |
Lipper – A Thomson Reuters Company is the source and owner of the Lipper Classification data contained in this material and all trademarks and copyrights related thereto. Any further dissemination or redistribution is strictly prohibited. Lipper Inc. is not responsible for the formatting or configuration of this material or for any inaccuracy in Oak Associates Funds presentation thereof.
NASDAQ is the source and owner of the NASDAQ Index data contained in this material and all trademarks and copyrights related thereto. Any further dissemination or redistribution is strictly prohibited. NASDAQ is not responsible for the formatting or configuration of this material or for any inaccuracy in Oak Associates Funds presentation thereof.
Russell Investments is the source and owner of the Russell Index data contained in this material and all trademarks and copyrights related thereto. Any further dissemination or redistribution is strictly prohibited. Russell Investments is not responsible for the formatting or configuration of this material or for any inaccuracy in Oak Associates Funds presentation thereof.
Standard & Poor’s is the source and owner of the S&P Index data contained in this material and all trademarks and copyrights related thereto. Any further dissemination or redistribution is strictly prohibited. Standard & Poor’s is not responsible for the formatting or configuration of this material or for any inaccuracy in Oak Associates Funds presentation thereof.
Beta a measure of the volitility, or systematic risk, of a security or a portfolio in comparison to the market as a whole.
Annual Report | October 31, 2012 | 17 |
Table of Contents
| Disclosure of Fund Expenses | ||
| As of October 31, 2012 (Unaudited) |
All mutual funds have operating expenses. As a shareholder of a fund, your Investment is affected by these ongoing costs, which include (among others) costs for portfolio management, administrative services, and shareholder reports like this one. It is important for you to understand the impact of these costs on your investment returns.
Operating expenses such as these are deducted from the fund’s gross income and directly reduce your final investment return. These expenses are expressed as a percentage of the fund’s average net assets; this percentage is known as the fund’s expense ratio.
The following examples use the expense ratio and are intended to help you understand the ongoing costs (in dollars) of investing in your Fund and to compare these costs with those of other mutual funds. The examples are based on an investment of $1,000 made at the beginning of the period shown and held for the entire period.
The table on the next page illustrates your Fund’s costs in two ways:
Actual Fund Return. This section helps you to estimate the actual expenses after fee waivers that your Fund incurred over the period. The “Expenses Paid During Period” column shows the actual dollar expense cost incurred by a $1,000 investment in the Fund, and the “Ending Account Value” number is derived from deducting that expense cost from the Fund’s gross investment return.
You can use this information, together with the actual amount you invested in the Fund, to estimate the expenses you paid over that period. Simply divide your actual account value by $1,000 to arrive at a ratio (for example, an $8,600 account value divided by $1,000 = $8.6), then multiply that ratio by the number shown for your Fund under “Expenses Paid During Period”.
Hypothetical 5% Return. This section helps you compare your Fund’s costs with those of other mutual funds. It assumes that the Fund had an annual 5% return before expenses during the year, but that the expense ratio (Column 3) for the period is unchanged. This example is useful in making comparisons because the Securities and Exchange Commission requires all mutual funds to make this 5% calculation. You can assess your Fund’s comparative cost by comparing the hypothetical result for your Fund in the “Expense Paid During Period” column with those that appear in the same charts in the shareholder reports for other funds.
Note: Because the return is set at 5% for comparison purposes — NOT your Fund’s actual return— the account values shown may not apply to your specific investment.
18 | 1-888-462-5386 | www.oakfunds.com |
Table of Contents
| Disclosure of Fund Expenses | ||
| As of October 31, 2012 (Unaudited) |
| Beginning Account Value 05/01/2012 | Ending Account Value 10/31/2012 | Annualized Expense Ratio | Expenses Paid During the Period(a) | |||||
White Oak Select Growth Fund | ||||||||
Actual Return | $1,000.00 | $988.80 | 1.15% | $5.75 | ||||
Hypothetical 5% Return | $1,000.00 | $1,019.36 | 1.15% | $5.84 | ||||
Pin Oak Equity Fund | ||||||||
Actual Return | $1,000.00 | $997.60 | 1.22% | $6.13 | ||||
Hypothetical 5% Return | $1,000.00 | $1,019.00 | 1.22% | $6.19 | ||||
Rock Oak Core Growth Fund | ||||||||
Actual Return | $1,000.00 | $929.80 | 1.25% | $6.06 | ||||
Hypothetical 5% Return | $1,000.00 | $1,018.85 | 1.25% | $6.34 | ||||
River Oak Discovery Fund | ||||||||
Actual Return | $1,000.00 | $940.60 | 1.35% | $6.59 | ||||
Hypothetical 5% Return | $1,000.00 | $1,018.35 | 1.35% | $6.85 | ||||
Red Oak Technology Select Fund | ||||||||
Actual Return | $1,000.00 | $915.00 | 1.33% | $6.40 | ||||
Hypothetical 5% Return | $1,000.00 | $1,018.45 | 1.33% | $6.75 | ||||
Black Oak Emerging Technology Fund | ||||||||
Actual Return | $1,000.00 | $858.50 | 1.35% | $6.31 | ||||
Hypothetical 5% Return | $1,000.00 | $1,018.35 | 1.35% | $6.85 | ||||
Live Oak Health Sciences Fund | ||||||||
Actual Return | $1,000.00 | $1,026.60 | 1.27% | $6.47 | ||||
Hypothetical 5% Return | $1,000.00 | $1,018.75 | 1.27% | $6.44 |
| (a) | Expenses are equal to the Fund’s annualized expense ratio multiplied by the average account value over the period, multiplied by 184/366 (to reflect the one-half year period). |
Annual Report | October 31, 2012 | 19 |
Table of Contents
| Schedules of Investments | White Oak Select Growth Fund | |
| As of October 31, 2012 |
| Security Description | Shares | Value | ||||||
COMMON STOCKS (99.7%) | ||||||||
CONSUMER DISCRETIONARY (5.4%) | ||||||||
Internet & Catalog Retail (5.4%) | 53,300 | $ | 12,409,306 | |||||
|
| |||||||
Amazon.com, lnc.(a) | ||||||||
ENERGY (3.9%) | ||||||||
Energy Equipment & Services (3.9%) Transocean, Ltd. | 195,000 | 8,909,550 | ||||||
|
| |||||||
FINANCIALS (29.5%) | ||||||||
Capital Markets (9.1%) The Charles Schwab Corp. | 838,200 | 11,382,756 | ||||||
US Bancorp | 280,000 | 9,298,800 | ||||||
|
| |||||||
| 20,681,556 | ||||||||
|
| |||||||
Commercial Banks (8.9%) | ||||||||
CIT Group, lnc.(a) | 280,400 | 10,436,488 | ||||||
M&T Bank Corp. | 60,000 | 6,246,000 | ||||||
TCF Financial Corp. | 325,000 | 3,718,000 | ||||||
|
| |||||||
| 20,400,488 | ||||||||
|
| |||||||
Diversified Financial Services (5.4%) | ||||||||
JPMorgan Chase & Co. | 295,400 | 12,312,272 | ||||||
|
| |||||||
Insurance (6.1%) | ||||||||
ACE, Ltd. | 177,500 | 13,960,375 | ||||||
|
| |||||||
HEALTH CARE (21.2%) | ||||||||
Biotechnology (5.3%) | ||||||||
Amgen, Inc. | 141,100 | 12,211,499 | ||||||
|
| |||||||
Health Care Equipment & Supplies (3.4%) | ||||||||
Stryker Corp. | 149,000 | 7,837,400 | ||||||
|
| |||||||
Health Care Providers & Services (9.0%) | ||||||||
Express Scripts Holding Co.(a) | 130,000 | 8,000,200 | ||||||
UnitedHealth Group, Inc. | 222,500 | 12,460,000 | ||||||
|
| |||||||
| 20,460,200 | ||||||||
|
| |||||||
Pharmaceuticals (3.5%) | ||||||||
Teva Pharmaceutical Industries, Ltd. ADR | 197,000 | 7,962,740 | ||||||
|
| |||||||
INFORMATION TECHNOLOGY (39.1%) | ||||||||
Communications Equipment (9.3%) Cisco Systems, Inc. | 630,000 | 10,798,200 | ||||||
Qualcomm, Inc. | 178,100 | 10,432,208 | ||||||
|
| |||||||
| 21,230,408 | ||||||||
|
| |||||||
20 | 1-888-462-5386 | www.oakfunds.com |
Table of Contents
| White Oak Select Growth Fund | Schedules of Investments | |
| As of October 31, 2012 |
| Security Description | Shares | Value | ||||||
Computers & Peripherals (4.9%) | ||||||||
International Business Machines Corp. | 56,900 | $11,068,757 | ||||||
|
| |||||||
Internet Software & Services (5.3%) | ||||||||
Google, Inc.- Class A(a) | 17,900 | 12;167,883 | ||||||
|
| |||||||
IT Services (4.4%) | ||||||||
Cognizant Technology Solutions Corp. - Class A(a) | 150,000 | 9,997,500 | ||||||
|
| |||||||
Semiconductors & Semiconductor Equipment (9.4%) | ||||||||
Broadcom Corp. - Class A | 282,000 | 8,892,870 | ||||||
KLA-Tencor Corp. | 271,300 | 12,620,876 | ||||||
|
| |||||||
| 21,513,746 | ||||||||
|
| |||||||
Software (5.8%) | ||||||||
Salesforce.com, lnc.(a) | 60,000 | 8,758,800 | ||||||
Symantec Corp.(a) | 250,000 | 4,547,500 | ||||||
|
| |||||||
| 13,306,300 | ||||||||
|
| |||||||
MATERIALS (0.6%) | ||||||||
Metals & Mining (0.6%) | ||||||||
Goldcorp, Inc. | 30,000 | 1,356,900 | ||||||
|
| |||||||
TOTAL COMMON STOCKS | ||||||||
(Cost $232,051,980) | 227,786,880 | |||||||
|
| |||||||
SHORT TERM INVESTMENTS (0.6%) | ||||||||
Fidelity Institutional Money Market Government | ||||||||
Portfolio - Class 1 (7 day yield 0.010%) | 1,439,312 | 1,439,312 | ||||||
|
| |||||||
TOTAL SHORT TERM INVESTMENTS | ||||||||
(Cost $1,439,312) | 1,439,312 | |||||||
|
| |||||||
TOTAL INVESTMENTS - (100.3%) | ||||||||
(Cost $233,491,292) | $229,226,192 | |||||||
Liabilities in Excess of Other Assets - (-0.3%) | (630,678) | |||||||
|
| |||||||
NET ASSETS -(100.0%) | $228,595,514 | |||||||
|
| |||||||
| (a) | Non-income producing security. |
Common Abbreviations:
ADR - American Depositary Receipt.
Ltd - Limited.
The accompanying notes are an integral part of the financial statements.
Annual Report | October 31, 2012 | 21 |
Table of Contents
| Schedules of Investments | Pin Oak Equity Fund | |
| As of October 31, 2012 |
| Security Description | Shares | Value | ||||||
COMMON STOCKS (98.5%) | ||||||||
CONSUMER DISCRETIONARY (19.3%) | ||||||||
Auto Components (1.4%) | ||||||||
Visteon Corp.(a) | 22,300 | $983,430 | ||||||
|
| |||||||
Hotels, Restaurants & Leisure (2.7%) | ||||||||
Interval Leisure Group, Inc. | 97,084 | 1,850,421 | ||||||
|
| |||||||
Household Durables (3.6%) | ||||||||
Garmin, Ltd. | 65,100 | 2,473,149 | ||||||
|
| |||||||
Internet & Catalog Retail (2.1%) | ||||||||
Amazon.com, lnc.(a) | 6,350 | 1,478,407 | ||||||
|
| |||||||
Media (9.5%) | ||||||||
DISH Network Corp. - Class A | 68,300 | 2,433,529 | ||||||
The Interpublic Group of Cos., Inc. | 152,000 | 1,535,200 | ||||||
News Corp. - Class A | 109,000 | 2,607,280 | ||||||
|
| |||||||
| 6,576,009 | ||||||||
|
| |||||||
ENERGY (7.8%) | ||||||||
Energy Equipment & Services (7.8%) | ||||||||
Diamond Offshore Drilling, Inc. | 32,700 | 2,264,148 | ||||||
Nabors Industries, Ltd.(a) | 203,600 | 2,746,564 | ||||||
Pioneer Energy Services Corp.(a) | 56,200 | 370,920 | ||||||
|
| |||||||
| 5,381,632 | ||||||||
|
| |||||||
FINANCIALS (33.4%) | ||||||||
Capital Markets (8.3%) | ||||||||
The Bank of New York Mellon Corp. | 77,000 | 1,902,670 | ||||||
The Charles Schwab Corp. | 204,000 | 2,770,320 | ||||||
Morgan Stanley | 60,500 | 1,051,490 | ||||||
|
| |||||||
| 5,724,480 | ||||||||
|
| |||||||
Commercial Banks (16.5%) | ||||||||
CIT Group, lnc.(a) | 73,000 | 2,717,060 | ||||||
First Bancorp | 57,735 | 603,331 | ||||||
Great Southern Bancorp, Inc. | 55,845 | 1,584,323 | ||||||
International Bancshares Corp. | 99,500 | 1,805,925 | ||||||
SunTrust Banks, Inc. | 51,200 | 1,392,640 | ||||||
Wells Fargo & Co. | 97,000 | 3,267,930 | ||||||
|
| |||||||
| 11,371,209 | ||||||||
|
| |||||||
Consumer Finance (4.1%) | ||||||||
Capital One Financial Corp. | 47,400 | 2,852,058 | ||||||
|
| |||||||
Insurance (4.5%) | ||||||||
Everest Re Group, Ltd. | 8,400 | 932,820 | ||||||
22 | 1-888-462-5386 | www.oakfunds.com |
Table of Contents
| Pin Oak Equity Fund | Schedules of Investments | |
| As of October 31, 2012 |
| Security Description | Shares | Value | ||||||
Insurance (continued) | ||||||||
The Travelers Cos., Inc. | 31,000 | $2,199,140 | ||||||
|
| |||||||
| 3,131,960 | ||||||||
|
| |||||||
INDUSTRIALS (9.5%) | ||||||||
Aerospace & Defense (6.5%) | ||||||||
Lockheed Martin Corp. | 22,700 | 2,126,309 | ||||||
Raytheon Co. | 42,000 | 2,375,520 | ||||||
|
| |||||||
| 4,501,829 | ||||||||
|
| |||||||
Machinery (3.0%) | ||||||||
Parker Hannifin Corp. | 26,500 | 2,084,490 | ||||||
|
| |||||||
INFORMATION TECHNOLOGY (27.6%) | ||||||||
Internet Software & Services (7.1%) | ||||||||
Google, Inc. -Class A(a) | 3,500 | 2,379,195 | ||||||
lAC/lnterActive Corp. | 52,856 | 2,555,588 | ||||||
|
| |||||||
| 4,934,783 | ||||||||
|
| |||||||
IT Services (9.4%) | ||||||||
Amdocs, Ltd. | 92,672 | 3,064,663 | ||||||
Paychex, Inc. | 47,049 | 1,525,799 | ||||||
The Western Union Co. | 152,000 | 1,930,400 | ||||||
|
| |||||||
| 6,520,862 | ||||||||
|
| |||||||
Semiconductors & Semiconductor Equipment (1.4%) | ||||||||
KLA-Tencor Corp. | 20,500 | 953,660 | ||||||
|
| |||||||
Software (9.7%) | ||||||||
BMC Software, lnc.(a) | 50,000 | 2,035,000 | ||||||
Fair Isaac Corp. | 41,750 | 1,945,550 | ||||||
Microsoft Corp. | 95,300 | 2,719,385 | ||||||
|
| |||||||
| 6,699,935 | ||||||||
|
| |||||||
MATERIALS (0.9%) | ||||||||
Metals & Mining (0.9%) | ||||||||
Teck Resources, Ltd. - Class B | 19,000 | 605,720 | ||||||
|
| |||||||
TOTAL COMMON STOCKS | ||||||||
(Cost $70,532,967) | 68,124,034 | |||||||
|
| |||||||
Annual Report | October 31, 2012 | 23 |
Table of Contents
| Schedules of Investments | Pin Oak Equity Fund | |
| As of October 31, 2012 |
| Security Description | Shares | Value | ||||||
SHORT TERM INVESTMENTS (1.5%) | ||||||||
Fidelity Institutional Money Market Government | ||||||||
Portfolio - Class 1 (7 day yield 0.010%) | 1,007,466 | $1,007,466 | ||||||
|
| |||||||
TOTAL SHORT TERM INVESTMENTS | ||||||||
(Cost $1,007,466) | 1,007,466 | |||||||
|
| |||||||
TOTAL INVESTMENTS - (100.0%) | ||||||||
(Cost $71,540,433) | $69,131,500 | |||||||
Liabilities in Excess of Other Assets - (0.0%)(b) | (24,097) | |||||||
|
| |||||||
NET ASSETS - (100.0%) | $69,107,403 | |||||||
|
| |||||||
| (a) | Non-income producing security. |
| (b) | Less than 0.05%. |
Common Abbreviations:
Ltd. - Limited.
The accompanying notes are an integral part of the financial statements.
24 | 1-888-462-5386 | www.oakfunds.com |
Table of Contents
| Rock Oak Core Growth Fund | Schedules of Investments | |
| As of October 31, 2012 |
| Security Description | Shares | Value | ||||||
COMMON STOCKS (97.7%) | ||||||||
CONSUMER DISCRETIONARY (12.7%) | ||||||||
Hotels, Restaurants & Leisure (6.9%) | ||||||||
Las Vegas Sands Corp. | 5,000 | $ | 232,200 | |||||
Wynn Resorts, Ltd. | 1,800 | 217,908 | ||||||
|
| |||||||
| 450,108 | ||||||||
|
| |||||||
Media (2.3%) | ||||||||
DISH Network Corp. - Class A | 4,200 | 149,646 | ||||||
|
| |||||||
Specialty Retail (3.5%) | ||||||||
Staples, Inc. | 19,700 | 226,845 | ||||||
|
| |||||||
CONSUMER STAPLES (3.2%) | ||||||||
Food & Staples Retailing (2.4%) | ||||||||
Whole Foods Market, Inc. | 1,700 | 161,041 | ||||||
|
| |||||||
Personal Products (0.8%) | ||||||||
Herbalife, Ltd. | 1,000 | 51,350 | ||||||
|
| |||||||
ENERGY (6.3%) | ||||||||
Energy Equipment & Services (6.3%) | ||||||||
National Oilwell Varco, Inc. | 2,700 | 198,990 | ||||||
Transocean, Ltd. | 3,600 | 164,484 | ||||||
Weatherford International, Ltd.(a) | 4,200 | 47,460 | ||||||
|
| |||||||
| 410,934 | ||||||||
|
| |||||||
FINANCIALS (16.9%) | ||||||||
Capital Markets (3.4%) | ||||||||
The Bank of New York Mellon Corp. | 9,000 | 222,390 | ||||||
|
| |||||||
Commercial Banks (6.3%) | ||||||||
Comerica, Inc. | 6,000 | 178,860 | ||||||
Wells Fargo & Co. | 6,800 | 229,092 | ||||||
|
| |||||||
| 407,952 | ||||||||
|
| |||||||
Consumer Finance (7.2%) | ||||||||
American Express Co. | 4,100 | 229,477 | ||||||
Capital One Financial Corp. | 4,000 | 240,680 | ||||||
|
| |||||||
| 470,157 | ||||||||
|
| |||||||
HEALTH CARE (11.0%) | ||||||||
Biotechnology (3.0%) | ||||||||
Gilead Sciences, lnc.(a) | 2,900 | 194,764 | ||||||
|
| |||||||
Health Care Equipment & Supplies (0.8%) | ||||||||
Intuitive Surgical, lnc.(a) | 100 | 54,222 | ||||||
|
| |||||||
Annual Report | October 31, 2012 | 25 |
Table of Contents
| Schedules of Investments | Rock Oak Core Growth Fund | |
| As of October 31, 2012 |
| Security Description | Shares | Value | ||||||
Health Care Providers & Services (3.9%) | ||||||||
AmerisourceBergen Corp. | 6,400 | $252,416 | ||||||
|
| |||||||
Life Sciences Tools & Services (3.3%) | ||||||||
Illumina, lnc.(a) | 4,500 | 213,795 | ||||||
|
| |||||||
INDUSTRIALS (6.2%) | ||||||||
Aerospace & Defense (6.2%) | ||||||||
General Dynamics Corp. | 1,000 | 68,080 | ||||||
Honeywell International, Inc. | 3,300 | 202,092 | ||||||
Lockheed Martin Corp. | 1,400 | 131,138 | ||||||
|
| |||||||
| 401,310 | ||||||||
|
| |||||||
INFORMATION TECHNOLOGY (35.3%) | ||||||||
Communications Equipment (4.7%) | ||||||||
F5 Networks, lnc.(a) | 1,400 | 115,472 | ||||||
Qualcomm, Inc. | 3,300 | 193,298 | ||||||
|
| |||||||
| 308,770 | ||||||||
|
| |||||||
Computers & Peripherals (9.7%) | ||||||||
Apple, Inc. | 500 | 297,550 | ||||||
EMC Corp.(a) | 6,900 | 168,498 | ||||||
Western Digital Corp. | 4,800 | 164,304 | ||||||
|
| |||||||
| 630,352 | ||||||||
|
| |||||||
Internet Software & Services (1.8%) | ||||||||
Baidu, Inc. ADR(a) | 1,100 | 117,282 | ||||||
|
| |||||||
IT Services (6.8%) | ||||||||
Cognizant Technology Solutions Corp. - Class A(a) | 3,200 | 213,280 | ||||||
Mastercard, Inc. - Class A | 500 | 230,465 | ||||||
|
| |||||||
| 443,745 | ||||||||
|
| |||||||
Semiconductors & Semiconductor Equipment (1.9%) | ||||||||
Broadcom Corp. - Class A | 3,900 | 122,986 | ||||||
|
| |||||||
Software (10.4%) | ||||||||
Salesforce.com, lnc.(a) | 1,250 | 182,475 | ||||||
Symantec Corp.(a) | 13,200 | 240,108 | ||||||
VMware, Inc. - Class A(a) | 3,000 | 254,310 | ||||||
|
| |||||||
| 676,893 | ||||||||
|
| |||||||
MATERIALS (6.1%) | ||||||||
Chemicals (6.1%) | ||||||||
CF Industries Holdings, Inc. | 1,300 | 266,747 | ||||||
Sociedad Quimica y Minera de Chile SA ADR | 2,275 | 131,609 | ||||||
|
| |||||||
| 398,356 | ||||||||
|
| |||||||
TOTAL COMMON STOCKS (Cost $4,863,962) | 6,365,314 | |||||||
|
| |||||||
26 | 1-888-462-5386 | www.oakfunds.com |
Table of Contents
| Rock Oak Core Growth Fund | Schedules of Investments | |
| As of October 31, 2012 |
| Security Description | Shares | Value | ||||||
SHORT TERM INVESTMENTS (8.7%) | ||||||||
Fidelity Institutional Money Market Government | ||||||||
Portfolio - Class I (7 day yield 0.010%) | 564,348 | $564,348 | ||||||
|
| |||||||
TOTAL SHORT TERM INVESTMENTS | ||||||||
(Cost $564,348) | 564,348 | |||||||
|
| |||||||
TOTAL INVESTMENTS - (106.4%) (Cost $5,428,310) | $6,929,662 | |||||||
Liabilities in Excess of Other Assets - (-6.4%) | (417,373) | |||||||
|
| |||||||
NET ASSETS - (100.0%) | $6,512,289 | |||||||
|
| |||||||
| (a) | Non-income producing security. |
Common Abbreviations:
ADR - American Depositary Receipt.
Ltd. - Limited.
SA - Generally designates corporations in various countries, mostly those employing the civil law.
The accompanying notes are an integral part of the financial statements.
Annual Report | October 31, 2012 | 27 |
Table of Contents
| Schedules of Investments | River Oak Discovery Fund | |
| As of October 31, 2012 |
| Security Description | Shares | Value | ||||||
COMMON STOCKS (91.5%) | ||||||||
CONSUMER DISCRETIONARY (15.9%) | ||||||||
Diversified Consumer Services (6.2%) | ||||||||
Capella Education Co.(a) | 100 | $3,122 | ||||||
Coinstar, lnc.(a) | 6,300 | 295,722 | ||||||
DeVry, Inc. | 6,300 | 165,438 | ||||||
K12, lnc.(a) | 10,000 | 204,700 | ||||||
| 668,982 | ||||||||
Hotels, Restaurants & Leisure (1.6%) | ||||||||
Ctrip.com International, Ltd. ADR(a) | 8,200 | 164,082 | ||||||
Leisure Equipment & Products (2.0%) | ||||||||
LeapFrog Enterprises, lnc.(a) | 24,500 | 216,580 | ||||||
Media (6.1%) | ||||||||
Morningstar, Inc. | 5,300 | 333,794 | ||||||
Valassis Communications, lnc.(a) | 12,500 | 325,250 | ||||||
| 659,044 | ||||||||
CONSUMER STAPLES (7.5%) | ||||||||
Beverages (3.1%) | ||||||||
The Boston Beer Co., Inc. - Class A(a) | 3,100 | 333,498 | ||||||
Food Products (4.4%) | ||||||||
B&G Foods, Inc. | 15,725 | 475,996 | ||||||
ENERGY (10.1%) | ||||||||
Energy Equipment & Services (10.1%) | ||||||||
Atwood Oceanics, lnc.(a) | 6,600 | 315,480 | ||||||
Dril-Quip, lnc.(a) | 5,100 | 353,226 | ||||||
Oceaneering International, Inc. | 8,100 | 423,873 | ||||||
| 1,092,579 | ||||||||
FINANCIALS (19.5%) | ||||||||
Capital Markets (5.5%) | ||||||||
Janus Capital Group, Inc. | 29,400 | 249,900 | ||||||
Stifel Financial Corp.(a) | 10,700 | 339,190 | ||||||
| 589,090 | ||||||||
Commercial Banks (6.8%) | ||||||||
PrivateBancorp, Inc. | 28,700 | 463,792 | ||||||
Zions Bancorporation | 12,600 | 270,522 | ||||||
| 734,314 | ||||||||
Insurance (3.2%) | ||||||||
Assurant, Inc. | 9,300 | 351,633 | ||||||
28 | 1-888-462-5386 | www.oakfunds.com |
Table of Contents
| River Oak Discovery Fund | Schedules of Investments | |
| As of October 31, 2012 |
| Security Description | Shares | Value | ||||||
Thrifts & Mortgage Finance (4.0%) | ||||||||
ViewPoint Financial Group, Inc. | 20,600 | $428,480 | ||||||
HEALTH CARE (7.0%) | ||||||||
Biotechnology (3.1%) | ||||||||
Cubist Pharmaceuticals, lnc.(a) | 7,750 | 332,475 | ||||||
Life Sciences Tools & Services (3.9%) | ||||||||
Illumina, lnc.(a) | 8,900 | 422,839 | ||||||
INFORMATION TECHNOLOGY (25.5%) | ||||||||
Computers & Peripherals (2.0%) | ||||||||
QLogic Corp.(a) | 23,300 | 218,554 | ||||||
STEC, lnc.(a) | 100 | 587 | ||||||
| 219,141 | ||||||||
Electronic Equipment & Instruments (7.5%) | ||||||||
Dolby Laboratories, Inc. - Class A(a) | 9,500 | 300,105 | ||||||
Hollysys Automation Technologies, Ltd.(a) | 37,200 | 386,136 | ||||||
Itron, lnc.(a) | 100 | 4,106 | ||||||
Newport Corp.(a) | 10,258 | 110,991 | ||||||
| 801,338 | ||||||||
Internet Software & Services (6.8%) | ||||||||
MercadoLibre, Inc. | 6,200 | 520,614 | ||||||
Sohu.com, lnc.(a) | 5,600 | 212,688 | ||||||
| 733,302 | ||||||||
Semiconductors & Semiconductor Equipment (3.9%) | ||||||||
GT Advanced Technologies, lnc.(a) | 1,000 | 4,340 | ||||||
TriQuint Semiconductor, lnc.(a) | 100 | 470 | ||||||
Veeco Instruments, lnc.(a) | 13,500 | 414,450 | ||||||
| 419,260 | ||||||||
Software (5.3%) | ||||||||
FactSet Research Systems, Inc. | 1,500 | 135,825 | ||||||
Fortinet, lnc.(a) | 5,800 | 112,346 | ||||||
SolarWinds, lnc.(a) | 6,400 | 323,776 | ||||||
| 571,947 | ||||||||
MATERIALS (2.9%) | ||||||||
Metals & Mining (2.9%) | ||||||||
Lynas Corp., Ltd. ADR(a) | 50,000 | 37,500 | ||||||
Walter Energy, Inc. | 7,700 | 269,192 | ||||||
| 306,692 | ||||||||
TELECOMMUNICATION SERVICES (3.1%) | ||||||||
Wireless Telecommunication Services (3.1%) | ||||||||
Boingo Wireless, lnc.(a) | 45,100 | 330,132 | ||||||
TOTAL COMMON STOCKS (Cost $7,677,569) | 9,851,404 | |||||||
Annual Report | October 31, 2012 | 29 |
Table of Contents
| Schedules of Investments | River Oak Discovery Fund | |
| As of October 31, 2012 |
| Security Description | Shares | Value | ||||||
SHORT TERM INVESTMENTS (11.9%) | ||||||||
Fidelity Institutional Money Market Government Portfolio - Class 1 (7 day yield 0.010%) | 1,285,123 | $1,285,123 | ||||||
|
| |||||||
TOTAL SHORT TERM INVESTMENTS (Cost $1,285,123) | 1,285,123 | |||||||
|
| |||||||
TOTAL INVESTMENTS - (103.4%) (Cost $8,962,692) | $11,136,527 | |||||||
Liabilities in Excess of Other Assets - (-3.4%) | (370,066) | |||||||
|
| |||||||
NET ASSETS - (100.0%) | $10,766,461 | |||||||
|
| |||||||
| (a) | Non-income producing security. |
Common Abbreviations:
ADR - American Depositary Receipt.
Ltd. - Limited.
The accompanying notes are an integral part of the financial statements.
30 | 1-888-462-5386 | www.oakfunds.com |
Table of Contents
| Red Oak Technology Select Fund | Schedules of Investments | |
| As of October 31, 2012 |
| Security Description | Shares | Value | ||||||
COMMON STOCKS (99.6%) | ||||||||
CONSUMER DISCRETIONARY (2.3%) | ||||||||
Internet & Catalog Retail (2.3%) | ||||||||
Amazon.com, lnc.(a) | 6,450 | $1,501,689 | ||||||
|
| |||||||
INDUSTRIALS (7.2%) | ||||||||
Aerospace & Defense (7.2%) | ||||||||
Huntington Ingalls Industries, Inc. | 37,566 | 1,592,047 | ||||||
Northrop Grumman Corp. | 45,000 | 3,091,050 | ||||||
|
| |||||||
| 4,683,097 | ||||||||
|
| |||||||
INFORMATION TECHNOLOGY (89.6%) | ||||||||
Communications Equipment (4.4%) | ||||||||
Cisco Systems, Inc. | 142,000 | 2,433,880 | ||||||
Research In Motion, Ltd.(a) | 51,100 | 405,223 | ||||||
|
| |||||||
| 2,839,103 | ||||||||
|
| |||||||
Computers & Peripherals (17.9%) | ||||||||
Apple, Inc. | 3,960 | 2,356,596 | ||||||
Dell, Inc. | 115,300 | 1,064,219 | ||||||
EMC Corp.(a) | 26,000 | 634,920 | ||||||
Hewlett-Packard Co. | 99,500 | 1,378,075 | ||||||
International Business Machines Corp. | 13,600 | 2,645,608 | ||||||
Lexmark International, Inc. - Class A | 77,000 | 1,637,020 | ||||||
Western Digital Corp. | 55,900 | 1,913,457 | ||||||
|
| |||||||
| 11,629,895 | ||||||||
|
| |||||||
Electronic Equipment & Instruments (7.8%) | ||||||||
Arrow Electronics, lnc.(a) | 54,100 | 1,905,943 | ||||||
Corning, Inc. | 179,000 | 2,103,250 | ||||||
Ingram Micro, Inc. - Class A(a) | 66,600 | 1,012,320 | ||||||
|
| |||||||
| 5,021,513 | ||||||||
|
| |||||||
Internet Software & Services (9.7%) | ||||||||
Google, Inc. - Class A(a) | 3,850 | 2,617,115 | ||||||
lAC/lnterActive Corp. | 67,000 | 3,239,450 | ||||||
Yahoo!, lnc.(a) | 25,100 | 421,931 | ||||||
|
| |||||||
| 6,278,496 | ||||||||
|
| |||||||
IT Services (17.4%) | ||||||||
Accenture PLC - Class A | 57,600 | 3,882,816 | ||||||
Alliance Data Systems Corp.(a) | 23,000 | 3,290,150 | ||||||
Computer Sciences Corp. | 44,000 | 1,339,800 | ||||||
Total System Services, Inc. | 124,000 | 2,788,760 | ||||||
|
| |||||||
| 11,301,526 | ||||||||
|
| |||||||
Semiconductors & Semiconductor Equipment (16.8%) | ||||||||
Applied Materials, Inc. | 211,000 | 2,236,600 | ||||||
Avago Technologies, Ltd. | 13,300 | 439,299 | ||||||
Integrated Device Technology, lnc.(a) | 126,700 | 689,248 | ||||||
Intel Corp. | 36,500 | 789,312 | ||||||
Annual Report | October 31, 2012 | 31 |
Table of Contents
| Schedules of Investments | Red Oak Technology Select Fund | |
| As of October 31, 2012 |
| Security Description | Shares | Value | ||||||
Semiconductors & Semiconductor Equipment (continued) | ||||||||
KLA-Tencor Corp. | 65,100 | $3,028,452 | ||||||
Marvell Technology Group, Ltd. | 124,400 | 981,516 | ||||||
Spansion, Inc. - Class A(a) | 94,662 | 1,049,802 | ||||||
Xilinx, Inc. | 52,000 | 1,703,520 | ||||||
|
| |||||||
| 10,917,749 | ||||||||
|
| |||||||
Software (15.6%) | ||||||||
CA, Inc. | 119,000 | 2,679,880 | ||||||
Check Point Software Technologies, Ltd.(a) | 48,100 | 2,141,893 | ||||||
Symantec Corp.(a) | 174,000 | 3,165,060 | ||||||
Synopsys, lnc.(a) | 66,800 | 2,150,960 | ||||||
|
| |||||||
| 10,137,793 | ||||||||
|
| |||||||
TELECOMMUNICATION SERVICES (0.5%) | ||||||||
Wireless Telecommunication Services (0.5%) | ||||||||
Sprint Nextel Corp.(a) | 56,800 | 314,672 | ||||||
|
| |||||||
TOTAL COMMON STOCKS (Cost $74,726,569) | 64,625,533 | |||||||
|
| |||||||
SHORT TERM INVESTMENTS (0.6%) | ||||||||
Fidelity Institutional Money Market Government | ||||||||
Portfolio - Class I (7 day yield 0.010%) | 362,985 | 362,985 | ||||||
|
| |||||||
TOTAL SHORT TERM INVESTMENTS (Cost $362,985) | 362,985 | |||||||
|
| |||||||
TOTAL INVESTMENTS - (100.2%) (Cost $75,089,554) | $64,988,518 | |||||||
Liabilities in Excess of Other Assets - (-0.2%) | (106,784 | ) | ||||||
|
| |||||||
NET ASSETS - (100.0%) | $64,881,734 | |||||||
|
| |||||||
| (a) | Non-income producing security. |
Common Abbreviations:
Ltd. - Limited.
PLC - Public Limited Company.
The accompanying notes are an integral part of the financial statements.
32 | 1-888-462-5386 | www.oakfunds.com |
Table of Contents
| Black Oak Emerging Technology Fund | Schedules of Investments | |
| As of October 31, 2012 |
| Security Description | Shares | Value | ||||||
COMMON STOCKS (93.0%) | ||||||||
HEALTH CARE (3.3%) | ||||||||
Health Care Technology (1.2%) | ||||||||
Cerner Corp.(a) | 3,800 | $289,522 | ||||||
|
| |||||||
Life Sciences Tools & Services (2.1%) | ||||||||
Illumina, lnc.(a) | 11,300 | 536,863 | ||||||
|
| |||||||
INFORMATION TECHNOLOGY (86.9%) | ||||||||
Communications Equipment (5.7%) | ||||||||
Qualcomm, Inc. | 24,250 | 1,420,444 | ||||||
|
| |||||||
Computers & Peripherals (12.4%) | ||||||||
Apple, Inc. | 2,300 | 1,368,730 | ||||||
NetApp, lnc.(a) | 33,400 | 898,460 | ||||||
Western Digital Corp. | 24,800 | 848,904 | ||||||
|
| |||||||
| 3,116,094 | ||||||||
|
| |||||||
Electronic Equipment & Instruments (8.1%) | ||||||||
Dolby Laboratories, Inc. - Class A(a) | 23,800 | 751,842 | ||||||
Itron, lnc.(a) | 24,800 | 1,018,288 | ||||||
Newport Corp.(a) | 24,142 | 261,216 | ||||||
|
| |||||||
| 2,031,346 | ||||||||
|
| |||||||
Internet Software & Services (9.3%) | ||||||||
MercadoLibre, Inc. | 16,000 | 1,343,520 | ||||||
NetEase.com, Inc. ADR(a) | 11,200 | 604,800 | ||||||
Sohu.com, lnc.(a) | 9,700 | 368,406 | ||||||
|
| |||||||
| 2,316,726 | ||||||||
|
| |||||||
IT Services (5.9%) | ||||||||
Cognizant Technology Solutions Corp. - Class A(a) | 22,150 | 1,476,297 | ||||||
|
| |||||||
Semiconductors & Semiconductor Equipment (14.5%) | ||||||||
GT Advanced Technologies, lnc.(a) | 40,000 | 173,600 | ||||||
Lam Research Corp.(a) | 23,800 | 842,520 | ||||||
Marvell Technology Group, Ltd. | 92,700 | 731,403 | ||||||
Micrel, Inc. | 28,200 | 273,258 | ||||||
NVIDIA Corp. | 66,650 | 797,801 | ||||||
TriQuint Semiconductor, lnc.(a) | 174,600 | 820,620 | ||||||
|
| |||||||
| 3,639,202 | ||||||||
|
| |||||||
Software (31.0%) | ||||||||
ANSYS, lnc.(a) | 16,600 | 1,176,608 | ||||||
Asialnfo-Linkage, lnc.(a) | 23,500 | 235,000 | �� | |||||
CA, Inc. | 37,300 | 839,996 | ||||||
Citrix Systems, lnc.(a) | 8,300 | 513,023 | ||||||
Fortinet, lnc.(a) | 22,700 | 439,699 | ||||||
Red Hat, lnc.(a) | 25,800 | 1,268,586 | ||||||
Annual Report | October 31, 2012 | 33 |
Table of Contents
| Schedules of Investments | Black Oak Emerging Technology Fund | |
| As of October 31, 2012 |
| Security Description | Shares | Value | ||||||
Software (continued) | ||||||||
Salesforce.com, lnc.(a) | 9,200 | $1,343,016 | ||||||
SolarWinds, lnc.(a) | 13,100 | 662,729 | ||||||
VMware, Inc. - Class A(a) | 15,200 | 1,288,504 | ||||||
|
| |||||||
| 7,767,161 | ||||||||
|
| |||||||
MATERIALS (2.2%) | ||||||||
Metals & Mining (2.2%) | ||||||||
Lynas Corp., Ltd. ADR(a) | 350,000 | 262,500 | ||||||
Molycorp, lnc.(a) | 28,600 | 297,440 | ||||||
|
| |||||||
| 559,940 | ||||||||
|
| |||||||
TELECOMMUNICATION SERVICES (0.6%) | ||||||||
Wireless Telecommunication Services (0.6%) | ||||||||
Boingo Wireless, Inc. | 20,000 | 146,400 | ||||||
|
| |||||||
TOTAL COMMON STOCKS (Cost $24,058,476) | 23,299,995 | |||||||
|
| |||||||
SHORT TERM INVESTMENTS (7.2%) | ||||||||
Fidelity Institutional Money Market Government | ||||||||
Portfolio - Class I (7 day yield 0.010%) | 1,800,397 | 1,800,397 | ||||||
|
| |||||||
TOTAL SHORT TERM INVESTMENTS (Cost $1,800,397) | 1,800,397 | |||||||
|
| |||||||
TOTAL INVESTMENTS - (100.2%) (Cost $25,858,873) | $25,100,392 | |||||||
Liabilities in Excess of Other Assets - (-0.2%) | (50,379) | |||||||
|
| |||||||
NET ASSETS - (100.0%) | $25,050,013 | |||||||
|
| |||||||
| (a) | Non-income producing security. |
Common Abbreviations:
ADR - American Depositary Receipt.
Ltd. - Limited.
The accompanying notes are an integral part of the financial statements.
34 | 1-888-462-5386 | www.oakfunds.com |
Table of Contents
| Live Oak Health Sciences Fund | Schedules of Investments | |
| As of October 31, 2012 |
| Security Description | Shares | Value | ||||||
COMMON STOCKS (98.7%) | ||||||||
HEALTH CARE (98.7%) | ||||||||
Biotechnology (4.6%) | ||||||||
Amgen, Inc. | 16,800 | $ | 1,453,956 | |||||
Targacept, lnc.(a) | 17,881 | 72,955 | ||||||
|
| |||||||
| 1,526,911 | ||||||||
|
| |||||||
Health Care Equipment & Supplies (26.2%) | ||||||||
Baxter International, Inc. | 14,000 | 876,820 | ||||||
Becton Dickinson and Co. | 16,900 | 1,278,992 | ||||||
Boston Scientific Corp.(a) | 147,500 | 758,150 | ||||||
CareFusion Corp.(a) | 14,900 | 395,744 | ||||||
Covidien PLC | 15,100 | 829,745 | ||||||
CR Bard, Inc. | 13,100 | 1,260,089 | ||||||
Greatbatch, lnc.(a) | 38,584 | 848,076 | ||||||
Medtronic, Inc. | 19,500 | 810,810 | ||||||
Stryker Corp. | 3,800 | 199,880 | ||||||
Zimmer Holdings, Inc. | 21,300 | 1,367,673 | ||||||
|
| |||||||
| 8,625,979 | ||||||||
|
| |||||||
Health Care Providers & Services (29.3%) | ||||||||
AmerisourceBergen Corp. | 44,200 | 1,743,248 | ||||||
Cardinal Health, Inc. | 36,800 | 1,513,584 | ||||||
McKesson Corp. | 19,850 | 1,852,204 | ||||||
Molina Healthcare, lnc.(a) | 22,275 | 558,434 | ||||||
Patterson Cos., Inc. | 29,200 | 975,280 | ||||||
PharMerica Corp.(a) | 73,392 | 896,850 | ||||||
UnitedHealth Group, Inc. | 20,700 | 1,159,200 | ||||||
WellPoint, Inc. | 15,700 | 962,096 | ||||||
|
| |||||||
| 9,660,896 | ||||||||
|
| |||||||
Life Sciences Tools & Services (8.5%) | ||||||||
Affymetrix, lnc.(a) | 23,000 | 72,910 | ||||||
Agilent Technologies, Inc. | 27,500 | 989,725 | ||||||
Techne Corp. | 8,900 | 599,504 | ||||||
Waters Corp.(a) | 14,000 | 1,145,340 | ||||||
|
| |||||||
| 2,807,479 | ||||||||
|
| |||||||
Pharmaceuticals (30.1%) | ||||||||
AstraZeneca PLC ADR | 28,100 | 1,303,840 | ||||||
Eli Lilly & Co. | 18,000 | 875,340 | ||||||
GlaxoSmithKline PLC ADR | 26,300 | 1,180,870 | ||||||
Johnson & Johnson | 16,100 | 1,140,202 | ||||||
Merck & Co., Inc. | 27,000 | 1,232,010 | ||||||
Novartis AG ADR | 16,700 | 1,009,682 | ||||||
Pfizer, Inc. | 58,800 | 1,462,356 | ||||||
Sanofi ADR | 23,692 | 1,038,894 | ||||||
Annual Report | October 31, 2012 | 35 |
Table of Contents
| Schedules of Investments | Live Oak Health Sciences Fund | |
| As of October 31, 2012 |
| Security Description | Shares | Value | ||||||
Pharmaceuticals (continued) | ||||||||
Teva Pharmaceutical Industries, Ltd. ADR | 16,700 | $675,014 | ||||||
|
| |||||||
| 9,918,208 | ||||||||
|
| |||||||
TOTAL COMMON STOCKS (Cost $26,399,334) | 32,539,473 | |||||||
|
| |||||||
SHORT TERM INVESTMENTS (1.4%) | ||||||||
Fidelity Institutional Money Market Government | ||||||||
Portfolio - Class 1 (7 day yield 0.010%) | 472,151 | 472,151 | ||||||
|
| |||||||
TOTAL SHORT TERM INVESTMENTS (Cost $472,151) | 472,151 | |||||||
|
| |||||||
TOTAL INVESTMENTS - (100.1%) (Cost $26,871,485) | $33,011,624 | |||||||
Liabilities in Excess of Other Assets - (-0.1%) | (44,916) | |||||||
|
| |||||||
NET ASSETS - (100.0%) | $32,966,708 | |||||||
|
| |||||||
| (a) | Non-income producing security. |
Common Abbreviations:
ADR - American Depositary Receipt.
AG - Aktiengesellschaft is a German term that refers to a corporation that is limited by shares, i.e., owned
by shareholders.
Ltd. - Limited.
PLC - Public Limited Company.
The accompanying notes are an integral part of the financial statements.
36 | 1-888-462-5386 | www.oakfunds.com |
Table of Contents
OAK ASSOCIATES FUNDS
This Page Intentionally Left Blank
Table of Contents
| Statements of Assests and Liabilities | ||
| As of October 31, 2012 |
White Oak Select Growth Fund |
Pin Oak Equity Fund | |||||||
Investments at cost | $ | 233,491,292 | $ | 71,540,433 | ||||
ASSETS: | ||||||||
Investments at fair value | $ | 229,226,192 | $ | 69,131,500 | ||||
Cash | – | – | ||||||
Receivable for capital shares sold | 39,469 | 32,059 | ||||||
Receivable for investment securities sold | – | – | ||||||
Dividends and interest receivable | 10 | 78,178 | ||||||
Prepaid expenses | 37,353 | 12,522 | ||||||
Total Assets | 229,303,024 | 69,254,259 | ||||||
LIABILITIES: | ||||||||
Payable for fund shares redeemed | 408,702 | 46,178 | ||||||
Investment advisory fees payable | 147,032 | 44,781 | ||||||
Administration fees payable | 18,016 | 5,803 | ||||||
Trustees’ fees payable | 27,428 | 8,429 | ||||||
Payable for investment securities purchased | – | – | ||||||
Principal financial officer fees payable | 428 | 121 | ||||||
Printing fees payable | 19,274 | 5,527 | ||||||
Transfer agent fees payable | 58,270 | 17,297 | ||||||
Legal fees payable | 9,816 | 3,016 | ||||||
Audit fees payable | 13,500 | 13,500 | ||||||
Other accrued expenses | 5,044 | 2,204 | ||||||
Total Liabilities | 707,510 | 146,856 | ||||||
Total Net Assets | $ | 228,595,514 | $ | 69,107,403 | ||||
NET ASSETS: | ||||||||
Paid-in capital (unlimited authorization - no par value) | $ | 585,720,600 | $ | 88,813,469 | ||||
Accumulated undistributed net investment income (loss) | 646,401 | 458,993 | ||||||
Accumulated net realized gain (loss) on investments | (353,506,387) | (17,756,126) | ||||||
Net unrealized appreciation (depreciation) on investments | (4,265,100) | (2,408,933) | ||||||
Total Net Assets | $ | 228,595,514 | $ | 69,107,403 | ||||
PORTFOLIO SHARES: | ||||||||
Net Assets | $ | 228,595,514 | $ | 69,107,403 | ||||
Total shares outstanding at end of period | 5,378,677 | 2,103,163 | ||||||
Net assets value, offering and redemption price per | ||||||||
share (net assets ÷ shares outstanding) | $ | 42.50 | $ | 32.86 | ||||
38 | 1-888-462-5386 | www.oakfunds.com |
Table of Contents
Rock Oak Core Growth Fund | River Oak Discovery Fund | Red Oak Technology Select Fund | Black Oak Emerging Technology Fund | Live Oak Health Sciences Fund | ||||||||||||||
| $ | 5,428,310 | $ | 8,962,692 | $ | 75,089,554 | $ | 25,858,873 | $ | 26,871,485 | |||||||||
| $ | 6,929,662 | $ | 11,136,527 | $ | 64,988,518 | $ | 25,100,392 | $ | 33,011,624 | |||||||||
| – | – | 466 | – | – | ||||||||||||||
| 600 | 750 | 967 | 13,285 | 2,259 | ||||||||||||||
| – | 616,908 | – | – | – | ||||||||||||||
| 2,142 | 4 | 46,658 | 8 | 6,552 | ||||||||||||||
| – | 5,236 | 11,653 | 3,250 | 8,261 | ||||||||||||||
| 6,932,404 | 11,759,425 | 65,048,262 | 25,116,935 | 33,028,696 | ||||||||||||||
| 200,000 | 757 | 59,572 | 16,993 | 8,573 | ||||||||||||||
| 2,131 | 6,555 | 42,056 | 14,901 | 21,102 | ||||||||||||||
| 914 | 1,251 | 5,481 | 2,307 | 2,976 | ||||||||||||||
| 808 | 1,314 | 8,136 | 3,234 | 3,899 | ||||||||||||||
| 199,875 | 966,017 | – | – | – | ||||||||||||||
| 13 | 20 | 136 | 54 | 61 | ||||||||||||||
| 468 | 720 | 6,778 | 2,347 | 2,605 | ||||||||||||||
| 1,842 | 1,971 | 26,412 | 11,670 | 6,883 | ||||||||||||||
| 289 | 470 | 2,912 | 1,158 | 1,395 | ||||||||||||||
| 13,500 | 13,500 | 13,500 | 13,500 | 13,500 | ||||||||||||||
| 275 | 389 | 1,545 | 758 | 994 | ||||||||||||||
| 420,115 | 992,964 | 166,528 | 66,922 | 61,988 | ||||||||||||||
| $ | 6,512,289 | $ | 10,766,461 | $ | 64,881,734 | $ | 25,050,013 | $ | 32,966,708 | |||||||||
| $ | 4,935,288 | $ | 8,632,295 | $ | 80,454,415 | $ | 29,880,738 | $ | 24,972,896 | |||||||||
| 9,778 | – | 116,802 | (272,116) | 213,527 | ||||||||||||||
| 65,871 | (39,669) | (5,588,447) | (3,800,128) | 1,640,146 | ||||||||||||||
| 1,501,352 | 2,173,835 | (10,101,036) | (758,481) | 6,140,139 | ||||||||||||||
| $ | 6,512,289 | $ | 10,766,461 | $ | 64,881,734 | $ | 25,050,013 | $ | 32,966,708 | |||||||||
| $ | 6,512,289 | $ | 10,766,461 | $ | 64,881,734 | $ | 25,050,013 | $ | 32,966,708 | |||||||||
| 552,642 | 799,597 | 6,625,865 | 9,368,561 | 2,247,411 | ||||||||||||||
| $ | 11.78 | $ | 13.46 | $ | 9.79 | $ | 2.67 | $ | 14.67 | |||||||||
Annual Report | October 31, 2012 | 39 |
Table of Contents
| Statements of Operations | ||
| For the Year Ended October 31, 2012 |
White Oak Select Growth Fund | Pin Oak Equity Fund | |||||||
INVESTMENT INCOME: | ||||||||
Dividends | $ | 3,405,442 | $ | 1,282,535 | ||||
Interest | 96 | 170 | ||||||
Less: Foreign withholding tax | (56,708) | – | ||||||
Total Investment Income | 3,348,830 | 1,282,705 | ||||||
EXPENSES: | ||||||||
Investment advisory fees | 1,726,652 | 502,681 | ||||||
Administration fees | 207,306 | 62,206 | ||||||
Trustees’ fees | 109,082 | 31,639 | ||||||
Legal and audit fees | 94,149 | 36,723 | ||||||
Transfer agent fees | 412,140 | 125,656 | ||||||
Registration fees | 24,519 | 24,685 | ||||||
Printing fees | 55,546 | 17,360 | ||||||
Custodian fees | 9,299 | 4,473 | ||||||
Principal financial officer fees | 5,129 | 1,445 | ||||||
Insurance and other fees | 58,607 | 16,844 | ||||||
Total Expenses | 2,702,429 | 823,712 | ||||||
Less: Investment advisory fees waived | – | – | ||||||
Net Expenses | 2,702,429 | 823,712 | ||||||
Net Investment Income (Loss) | 646,401 | 458,993 | ||||||
Net realized gain on securities sold | 84,727,509 | 21,550,899 | ||||||
Net change in unrealized appreciation (depreciation) of investment securities | (65,863,131) | (12,458,152) | ||||||
Net Realized and Unrealized Gain (Loss) on Investments |
|
18,864,378 |
|
|
9,092,747 |
| ||
Net Increase (Decrease) in Net Assets Resulting From Operations | $ | 19,510,779 | $ | 9,551,740 | ||||
40 | 1-888-462-5386 | www.oakfunds.com |
Table of Contents
|
Rock Oak Core Growth Fund | River Oak Discovery Fund | Red Oak Technology Select Fund | Black Oak Emerging Technology Fund | Live Oak Health Sciences Fund | ||||||||||||||
| $ | 94,502 | $ | 91,066 | $ | 1,072,493 | $ | 79,235 | $ | 675,117 | |||||||||
| 23 | 63 | 311 | 338 | 107 | ||||||||||||||
| (227) | – | – | – | (26,440) | ||||||||||||||
| 94,298 | 91,129 | 1,072,804 | 79,573 | 648,784 | ||||||||||||||
| 50,277 | 101,524 | 543,899 | 211,906 | 243,062 | ||||||||||||||
| 8,259 | 12,269 | 67,097 | 26,996 | 31,416 | ||||||||||||||
| 3,144 | 5,259 | 34,443 | 13,159 | 15,386 | ||||||||||||||
| 15,424 | 17,056 | 39,973 | 22,953 | 25,133 | ||||||||||||||
| 17,243 | 17,729 | 199,432 | 96,824 | 49,892 | ||||||||||||||
| 21,151 | 21,113 | 23,678 | 21,782 | 22,096 | ||||||||||||||
| 2,608 | 3,356 | 21,358 | 7,757 | 9,323 | ||||||||||||||
| 341 | 596 | 6,251 | 1,292 | 2,664 | ||||||||||||||
| 149 | 248 | 1,634 | 632 | 721 | ||||||||||||||
| 3,102 | 4,103 | 18,237 | 7,981 | 9,021 | ||||||||||||||
| 121,698 | 183,253 | 956,002 | 411,282 | 408,714 | ||||||||||||||
| (36,771) | (30,968) | – | (24,696) | – | ||||||||||||||
| 84,927 | 152,285 | 956,002 | 386,586 | 408,714 | ||||||||||||||
| 9,371 | (61,156) | 116,802 | (307,013) | 240,070 | ||||||||||||||
| 91,729 | 12,915 | 25,186,386 | 728,567 | 1,642,727 | ||||||||||||||
|
| (44,864) |
| 620,664 | (23,784,503) | (1,311,101) | 953,613 | ||||||||||||
|
46,865 |
|
|
633,579 |
|
|
1,401,883 |
|
|
(582,534) |
|
|
2,596,340 |
| ||||
| $ | 56,236 | $ | 572,423 | $ | 1,518,685 | $ | (889,547) | $ | 2,836,410 | |||||||||
Annual Report | October 31, 2012 | 41 |
Table of Contents
| Statements of Changes in Net Assets | ||
White Oak Select Growth Fund | Pin Oak Equity Fund | |||||||||||||||
| For The Year Ended 2012 | For The Year Ended 2011 | For The Year 2012 | For The Year 2011 | ||||||||||||
INVESTMENT ACTIVITIES: | ||||||||||||||||
Net investment income (loss) | $ | 646,401 | $ | (201,041) | $ | 458,993 | $ | (106,161) | ||||||||
Net realized gain on securities sold | 84,727,509 | 23,554,204 | 21,550,899 | 10,668,033 | ||||||||||||
Net change in unrealized appreciation (depreciation) of investment securities | (65,863,131) | (12,133,501) | (12,458,152) | (5,775,317) | ||||||||||||
Net Increase (Decrease) in Net Assets Resulting from Operations | 19,510,779 | 11,219,662 | 9,551,740 | 4,786,555 | ||||||||||||
DISTRIBUTIONS TO SHAREHOLDERS: |
| |||||||||||||||
Net income | – | – | – | (219,936) | ||||||||||||
Realized capital gains | – | – | – | – | ||||||||||||
Total Distributions | – | – | – | (219,936) | ||||||||||||
CAPITAL SHARE TRANSACTIONS (IN DOLLARS): |
| |||||||||||||||
Shares issued | 10,909,801 | 8,834,933 | 8,843,805 | 15,384,694 | ||||||||||||
Shares issued in lieu of cash distributions | – | – | – | 208,139 | ||||||||||||
Shares redeemed | (43,381,886) | (37,682,261) | (13,502,592) | (25,789,978) | ||||||||||||
Net Increase (Decrease) in Net Assets from Capital Share Transactions | (32,472,085) | (28,847,328) | (4,658,787) | (10,197,145) | ||||||||||||
Total Increase (Decrease) in Net Assets | (12,961,306) | (17,627,666) | 4,892,953 | (5,630,526) | ||||||||||||
NET ASSETS: | ||||||||||||||||
Beginning of period | 241,556,820 | 259,184,486 | 64,214,450 | 69,844,976 | ||||||||||||
End of period | $ | 228,595,514 | $ | 241,556,820 | $ | 69,107,403 | $ | 64,214,450 | ||||||||
Including accumulated undistributed net investment income | $ | 646,401 | $ | – | $ | 458,993 | $ | – | ||||||||
SHARES ISSUED AND REDEEMED: | ||||||||||||||||
Issued | 274,929 | 218,861 | 279,612 | 521,981 | ||||||||||||
Issued in lieu of cash distributions | – | – | – | 7,402 | ||||||||||||
Redeemed | (1,075,438) | (940,386) | (427,802) | (888,042) | ||||||||||||
Net Increase (Decrease) in Share Transactions | (800,509) | (721,525) | (148,190) | (358,659) | ||||||||||||
The accompanying notes are an integral part of the financial statements. | ||
42 | 1-888-462-5386 | www.oakfunds.com | |
Table of Contents
|
Rock Oak Core Growth Fund | River Oak Discovery Fund | Red Oak Technology Select Fund | ||||||||||||||||||||
For The Year Ended October 31, 2012 | For The Year Ended | For The Year Ended 2012 | For The Year Ended 2011 | For The Year Ended | For The Year Ended 2011 | |||||||||||||||||
| $ | 9,371 | $ | (25,017) | $ | (61,156) | $ | (65,346) | $ | 116,802 | $ | (289,208) | |||||||||||
| 91,729 | 219,334 | 12,915 | 4,252 | 25,186,386 | 8,323,742 | |||||||||||||||||
|
| (44,864) |
| 88,246 | 620,664 | (66,227) | (23,784,503) | (1,034,760) | |||||||||||||||
|
| 56,236 |
| 282,563 | 572,423 | (127,321) | 1,518,685 | 6,999,774 | |||||||||||||||
| – | – | – | – | – | – | |||||||||||||||||
| – | – | – | (130,972) | – | – | |||||||||||||||||
| – | – | – | (130,972) | – | – | |||||||||||||||||
| 402,058 | 812,464 | 682,356 | 2,467,112 | 7,217,018 | 11,958,223 | |||||||||||||||||
| – | – | – | 128,699 | – | – | |||||||||||||||||
| (836,408) | (948,447) | (803,232) | (1,147,156) | (15,964,756) | (12,262,647) | |||||||||||||||||
|
| (434,350) |
| (135,983) | (120,876) | 1,448,655 | (8,747,738) | (304,424) | |||||||||||||||
| (378,114) | 146,580 | 451,547 | 1,190,362 | (7,229,053) | 6,695,350 | |||||||||||||||||
| 6,890,403 | 6,743,823 | 10,314,914 | 9,124,552 | 72,110,787 | 65,415,437 | |||||||||||||||||
| $6,512,289 | $ | 6,890,403 | $ | 10,766,461 | $ | 10,314,914 | $ | 64,881,734 | $ | 72,110,787 | ||||||||||||
|
| $9,778 |
| $ | – | $ | – | $ | – | $ | 116,802 | $ | – | ||||||||||
| 33,009 | 65,828 | 50,387 | 171,104 | 713,832 | 1,274,983 | |||||||||||||||||
| – | – | – | 9,662 | – | – | |||||||||||||||||
| (72,577) | (77,904) | (58,931) | (83,338) | (1,600,288) | (1,307,236) | |||||||||||||||||
|
| (39,568) |
| (12,076) | (8,544) | 97,428 | (886,456) | (32,253) | |||||||||||||||
Annual Report | October 31, 2012 | 43 |
Table of Contents
| Statements of Changes in Net Assets | ||
| Black Oak Emerging Technology Fund | Live Oak Health Sciences Fund | |||||||||||||||
| For The Year Ended October 31, 2012 | For The Year Ended | For The Year Ended October 31, 2012 | For The Year Ended October 31, 2011 | |||||||||||||
INVESTMENT ACTIVITIES: | ||||||||||||||||
Net investment income (loss) | $ | (307,013) | $ | (434,406) | $ | 240,070 | $ | 113,601 | ||||||||
Net realized gain on securities sold | 728,567 | 1,005,786 | 1,642,727 | 965,557 | ||||||||||||
Net change in unrealized appreciation (depreciation) of investment securities | (1,311,101) | (1,296,949) | 953,613 | 1,443,672 | ||||||||||||
Net Increase (Decrease) in Net Assets Resulting from Operations | (889,547) | (725,569) | 2,836,410 | 2,522,830 | ||||||||||||
DISTRIBUTIONS TO SHAREHOLDERS: | ||||||||||||||||
Net income | – | – | (140,312) | (32,926) | ||||||||||||
Realized capital gains | – | – | (967,970) | (912,476) | ||||||||||||
Total Distributions | – | – | (1,108,282) | (945,402) | ||||||||||||
CAPITAL SHARE TRANSACTIONS (IN DOLLARS): |
| |||||||||||||||
Shares issued | 2,155,557 | 6,829,946 | 8,901,438 | 12,417,643 | ||||||||||||
Shares issued in lieu of cash distributions | – | – | 1,059,913 | 923,428 | ||||||||||||
Shares redeemed | (5,209,368) | (20,825,249) | (7,793,950) | (5,442,774) | ||||||||||||
Net Increase (Decrease) in Net Assets from Capital Share Transactions | (3,053,811) | (13,995,303) | 2,167,401 | 7,898,297 | ||||||||||||
Total Increase (Decrease) in Net Assets | (3,943,358) | (14,720,872) | 3,895,529 | 9,475,725 | ||||||||||||
NET ASSETS: | ||||||||||||||||
Beginning of period | 28,993,371 | 43,714,243 | 29,071,179 | 19,595,454 | ||||||||||||
End of period | $ | 25,050,013 | $ | 28,993,371 | $ | 32,966,708 | $ | 29,071,179 | ||||||||
Including accumulated undistributed net investment income (loss) | $ | (272,116) | $ | – | $ | 213,527 | $ | 113,600 | ||||||||
SHARES ISSUED AND REDEEMED: | ||||||||||||||||
Issued | 720,690 | 2,206,626 | 641,642 | 886,012 | ||||||||||||
Issued in lieu of cash distributions | – | – | 82,871 | 73,933 | ||||||||||||
Redeemed | (1,766,648) | (6,682,886) | (554,347) | (409,127) | ||||||||||||
Net Increase (Decrease) in Share Transactions | (1,045,958) | (4,476,260) | 170,166 | 550,818 | ||||||||||||
The accompanying notes are an integral part of the financial statements. | ||
44 | 1-888-462-5386 | www.oakfunds.com | |
Table of Contents
OAK ASSOCIATES FUNDS
This Page Intentionally Left Blank
Table of Contents
| Financial Highlights | ||
| For a share outstanding throughout the years ended |
| Year Ended October 31, 2012 | ||||
WHITE OAK SELECT GROWTH FUND | ||||
Net Asset Value Beginning of Period | $ | 39.09 | ||
Income (Loss) From Operations | ||||
Net Investment Income (Loss)(a) | 0.11 | |||
Realized and Unrealized Gain or (Losses) in Securities(a) | 3.30 | |||
Total From Operations | 3.41 | |||
Less Distributions: | ||||
Dividends from Net Investment Income | – | |||
Distributions from Capital Gains | – | |||
Total Dividends and Distributions | – | |||
Net Asset Value End of Period | $ | 42.50 | ||
Total Return(b) | 8.72% | |||
Net Assets End of Period (000) | $ | 228,596 | ||
Ratio of Net Expenses to Average Net Assets | 1.16% | |||
Ratio of Net Investment Income (Loss) to Average Net Assets | 0.28% | |||
Ratio of Net Expenses to Average Net Assets (Excluding Fees Paid Indirectly) | N/A | |||
Ratio of Expenses to Average Net Assets (Excluding Waivers and/or Fees Paid Indirectly) | 1.16% | |||
Portfolio Turnover Rate | 86% | |||
| (a) | Per Share calculations were performed using average shares for the period. |
| (b) | Figures do not reflect the deduction of taxes the shareholder will pay on fund distributions or redemption of fund shares. |
The accompanying notes are an integral part of the financial statements.
46 | 1-888-462-5386 | www.oakfunds.com |
Table of Contents
|
| Year Ended October 31, 2011 | Year Ended October 31, 2010 | Year Ended October 31, 2009 | Year Ended October 31, 2008 | |||||||||||||
| $ | 37.56 | $ | 31.44 | $ | 23.89 | $ | 39.49 | |||||||||
| (0.03) | (0.20) | (0.18) | (0.23) | |||||||||||||
| 1.56 | 6.32 | 7.73 | (15.37) | |||||||||||||
| 1.53 | 6.12 | 7.55 | (15.60) | |||||||||||||
| – | – | – | – | |||||||||||||
| – | – | – | – | |||||||||||||
| – | – | – | – | |||||||||||||
| $ | 39.09 | $ | 37.56 | $ | 31.44 | $ | 23.89 | |||||||||
| 4.07% | 19.47% | 31.60% | (39.50)% | |||||||||||||
| $ | 241,557 | $ | 259,184 | $ | 319,359 | $ | 215,862 | |||||||||
| 1.14% | 1.25% | 1.25% | 1.25% | |||||||||||||
| (0.08)% | (0.58)% | (0.70)% | (0.70)% | |||||||||||||
| N/A | N/A | 1.25% | 1.25% | |||||||||||||
| 1.14% | 1.34% | 1.51% | 1.41% | |||||||||||||
| 12% | 14% | 31% | 25% | |||||||||||||
Annual Report | October 31, 2012 | 47 |
Table of Contents
| Financial Highlights | ||
| For a share outstanding throughout the years ended |
| Year Ended October 31, 2012 | ||||
PIN OAK EQUITY FUND | ||||
Net Asset Value Beginning of Period | $ | 28.52 | ||
Income (Loss) From Operations | ||||
Net Investment Income (Loss)(a) | 0.21 | |||
Realized and Unrealized Gain or (Losses) in Securities(a) | 4.13 | |||
Total From Operations | 4.34 | |||
Less Distributions: | ||||
Dividends from Net Investment Income | – | |||
Distributions from Capital Gains | – | |||
Total Dividends and Distributions | – | |||
Net Asset Value End of Period | $ | 32.86 | ||
Total Return(b) | 15.22% | |||
Net Assets End of Period (000) | $ | 69,107 | ||
Ratio of Net Expenses to Average Net Assets | 1.21% | |||
Ratio of Net Investment Income (Loss) to Average Net Assets | 0.68% | |||
Ratio of Net Expenses to Average Net Assets (Excluding Fees Paid Indirectly) | N/A | |||
Ratio of Expenses to Average Net Assets (Excluding Waivers and/or Fees Paid Indirectly) | 1.21% | |||
Portfolio Turnover Rate | 98% | |||
| (a) | Per share calculations were performed using average shares for the period. |
| (b) | Figures do not reflect the deduction of taxes the shareholder will pay on fund distributions or redemption of fund shares. |
The accompanying notes are an integral part of the financial statements.
48 | 1-888-462-5386 | www.oakfunds.com |
Table of Contents
|
Year Ended October 31, 2011 | Year Ended October 31, 2010 | Year Ended October 31, 2009 | Year Ended October 31, 2008 | |||||||||||
| $ 26.76 | $ | 22.74 | $ | 15.58 | $ | 27.46 | ||||||||
| (0.05) | 0.07 | (0.11) | (0.08) | |||||||||||
| 1.90 | 3.96 | 7.27 | (11.80) | |||||||||||
| 1.85 | 4.03 | 7.16 | (11.88) | |||||||||||
| (0.09) | (0.01) | – | – | |||||||||||
| – | – | – | – | |||||||||||
| (0.09) | (0.01) | – | – | |||||||||||
| $ 28.52 | $ | 26.76 | $ | 22.74 | $ | 15.58 | ||||||||
| 6.92% | 17.74% | 45.96% | (43.26)% | |||||||||||
| $ 64,214 | $ | 69,845 | $ | 118,532 | $ | 36,198 | ||||||||
| 1.20% | 1.25% | 1.25% | 1.25% | |||||||||||
| (0.16)% | 0.27% | (0.58)% | (0.34)% | |||||||||||
| N/A | N/A | 1.25% | 1.25% | |||||||||||
| 1.20% | 1.33% | 1.60% | 1.51% | |||||||||||
| 27% | 35% | 16% | 38% | |||||||||||
Annual Report | October 31, 2012 | 49 |
Table of Contents
| Financial Highlights | ||
| For a share outstanding throughout the years ended |
| Year Ended October 31, 2012 | ||||
ROCK OAK CORE GROWTH FUND | ||||
Net Asset Value Beginning of Period | $ | 11.64 | ||
Income (Loss) From Operations | ||||
Net Investment Income (Loss)(a) | 0.02 | |||
Realized and Unrealized Gain or (Losses) in Securities(a) | 0.12 | |||
Total From Operations | 0.14 | |||
Less Distributions: | ||||
Dividends from Net Investment Income | – | |||
Distributions from Capital Gains | – | |||
Total Dividends and Distributions | – | |||
Net Asset Value End of Period | $ | 11.78 | ||
Total Return(b) | 1.20% | |||
Net Assets End of Period (000) | $ | 6,512 | ||
Ratio of Net Expenses to Average Net Assets | 1.25% | |||
Ratio of Net Investment Income (Loss) to Average Net Assets | 0.14% | |||
Ratio of Net Expenses to Average Net Assets (Excluding Fees Paid Indirectly) | N/A | |||
Ratio of Expenses to Average Net Assets (Excluding Waivers and/or Fees Paid Indirectly | 1.79% | |||
Portfolio Turnover Rate | 56% | |||
| (a) | per share calculations were performed using average shares for the period. |
| (b) | Figures do not reflect the deduction of taxes the shareholder will pay on fund distributions or redemption of fund shares. |
The accompanying notes are an integral part of the financial statements.
50 | 1-888-462-5386 | www.oakfunds.com |
Table of Contents
| Year Ended October 31, 2011 | Year Ended October 31, 2010 | Year Ended October 31, 2009 | Year Ended October 31, 2008 | |||||||||||||
| $ | 11.16 | $ | 9.09 | $ | 7.28 | $ | 13.45 | |||||||||
| (0.04) | (0.06) | (0.04) | (0.06) | |||||||||||||
| 0.52 | 2.13 | 1.85 | (5.54) | |||||||||||||
| 0.48 | 2.07 | 1.81 | (5.60) | |||||||||||||
| – | – | – | – | |||||||||||||
| – | – | – | (0.57) | |||||||||||||
| – | – | – | (0.57) | |||||||||||||
| $ | 11.64 | $ | 11.16 | $ | 9.09 | $ | 7.28 | |||||||||
| 4.30% | 22.77% | 24.86% | (43.43)% | |||||||||||||
| $ | 6,890 | $ | 6,744 | $ | 5,798 | $ | 4,571 | |||||||||
| 1.25% | 1.25% | 1.25% | 1.25% | |||||||||||||
| (0.35)% | (0.59)% | (0.56)% | (0.53)% | |||||||||||||
| N/A | N/A | 1.25% | 1.25% | |||||||||||||
| 1.65% | 1.54% | 1.82% | 1.56% | |||||||||||||
| 40% | 62% | 45% | 92% | |||||||||||||
Annual Report | October 31, 2012 | 51 |
Table of Contents
| Financial Highlights | ||
| For a share outstanding throughout the years ended |
| Year Ended October 31, 2012 | ||||
RIVER OAK DISCOVERY FUND | ||||
Net Asset Value Beginning of Period | $ | 12.76 | ||
Income (Loss) From Operations | (0.07) | |||
Net Investment Income (Loss)(a) | ||||
Realized and Unrealized Gain or (Losses) in Securities(a) | 0.77 | |||
Total From Operations | 0.70 | |||
Less Distributions: | ||||
Dividends from Net Investment Income | – | |||
Distributions from Capital Gains | – | |||
Total Dividends and Distributions | – | |||
Net Asset Value End of Period | $ | 13.46 | ||
Total Return(b) | 5.49% | |||
Net Assets End of Period (000) | $ | 10,766 | ||
Ratio of Net Expenses to Average Net Assets | 1.35% | |||
Ratio of Net Investment Loss to Average Net Assets | (0.54)% | |||
Ratio of Net Expenses to Average Net Assets (Excluding Fees Paid Indirectly) | N/A | |||
Ratio of Expenses to Average Net Assets (Excluding Waivers and/or Fees Paid Indirectly) | 1.62% | |||
Portfolio Turnover Rate | 72% | |||
| (a) | per share calculations were performed using average shares for the period. |
| (b) | Figures do not reflect the deduction of taxes the shareholder will pay on fund distributions or redemption of fund shares. |
The accompanying notes are an integral part of the financial statements.
52 | 1-888-462-5386 | www.oakfunds.com |
Table of Contents
|
| Year Ended October 31, 2011 | Year Ended October 31, 2010 | Year Ended October 31, 2009 | Year Ended October 31 ,2008 | |||||||||||||
| $ | 12.84 | $ | 10.96 | $ | 7.86 | $ | 14.80 | |||||||||
| (0.08) | (0.10) | (0.09) | (0.08) | |||||||||||||
| 0.18 | 1.98 | 3.19 | (6.46) | |||||||||||||
| 0.10 | 1.88 | 3.10 | (6.54) | |||||||||||||
| – | – | – | – | |||||||||||||
| (0.18) | – | – | (0.40) | |||||||||||||
| (0.18) | – | – | (0.40) | |||||||||||||
| $ | 12.76 | $ | 12.84 | $ | 10.96 | $ | 7.86 | |||||||||
| 0.74% | 17.15% | 39.44% | (45.31)% | |||||||||||||
| $ | 10,315 | $ | 9,125 | $ | 8,247 | $ | 4,168 | |||||||||
| 1.35% | 1.35% | 1.35% | 1.35% | |||||||||||||
| (0.61)% | (0.83)% | (1.03)% | (0.68)% | |||||||||||||
| N/A | N/A | 1.35% | 135% | |||||||||||||
| 1.52% | 1.57% | 1.92% | 1.76% | |||||||||||||
| 92% | 56% | 67% | 145% | |||||||||||||
Annual Report | October 31, 2012 | 53 |
Table of Contents
| Financial Highlights | ||
| For a share outstanding throughout the years ended |
Year Ended October 31, 2012 | ||||
RED OAK TECHNOLOGY SELECT FUND | ||||
Net Asset Value Beginning of Period | $ | 9.60 | ||
Income (Loss) From Operations | ||||
Net Investment Income (Loss)(a) | 0.02 | |||
Realized and Unrealized Gain or (Losses) in Securities(a) | 0.17 | |||
Total From Operations | 0.19 | |||
| ||||
Less Distributions: | ||||
Dividends from Net Investment Income | – | |||
Distributions from Capital Gains | – | |||
Total Dividends and Distributions | – | |||
Net Asset Value End of Period | $ | 9.79 | ||
| ||||
Total Return(b) | 1.98% | |||
Net Assets End of Period (000) | $ | 64,882 | ||
| ||||
Ratio of Net Expenses to Average Net Assets | 1.30% | |||
Ratio of Net Investment Income (Loss) to Average Net Assets | 0.16% | |||
| ||||
Ratio of Net Expenses to Average Net Assets (Excluding Fees Paid Indirectly) | N/A | |||
Ratio of Expenses to Average Net Assets (Excluding Waivers and/or Fees Paid Indirectly) | 130% | |||
Portfolio Turnover Rate | 83% | |||
| (a) | per share calculations were performed using average shares for the period. |
| (b) | Figures do not reflect the deduction of taxes the shareholder will pay on fund distributions or redemption of fund shares. |
The accompanying notes are an integral part of the financial statements.
54 | 1-888-462-5386 | www.oakfunds.com |
Table of Contents
Year Ended October 31, 2011 | Year Ended October 31, 2010 | Year Ended October 31, 2009 | Year Ended October 31, 2008 | |||||||||||
| $ | 8.67 | $ | 7.04 | $ | 4.92 | $ | 8.75 | |||||||
| (0.04) | (0.05) | (0.03) | (0.06) | |||||||||||
| 0.97 | 1.68 | 2.15 | (3.77) | |||||||||||
| 0.93 | 1.63 | 2.12 | (3.83) | |||||||||||
| – | – | – | – | |||||||||||
| – | – | – | – | |||||||||||
| – | – | – | – | |||||||||||
| $ | 9.60 | $ | 8.67 | $ | 7.04 | $ | 4.92 | |||||||
| 10.73% | 23.15% | 43.09% | (43.77)% | |||||||||||
| $ | 72,111 | $ | 65,415 | $ | 73,511 | $ | 44,079 | |||||||
| 1.32% | 1.35% | 1.35% | 1.35% | |||||||||||
| (0.43)% | (0.70)% | (0.56)% | (0.80)% | |||||||||||
| N/A | N/A | 135% | 1.35% | |||||||||||
| 1.32% | 1.53% | 1.82% | 1.58% | |||||||||||
| 24% | 28% | 30% | 17% | |||||||||||
Annual Report | October 31, 2012 | 55 |
Table of Contents
| Financial Highlights | ||
| For a share outstanding throughout the years ended |
| Year Ended October 31, 2012 | ||||
BLACK OAK EMERGING TECHNOLOGY FUND | ||||
Net Asset Value Beginning of Period | $ | 2.78 | ||
Income (Loss) From Operations | ||||
Net Investment Income (Loss)(a) | (0.03) | |||
Realized and Unrealized Gain or (Losses) in Securities(a) | (0.08) | |||
Total From Operations | (0.11) | |||
Less Distributions: | ||||
Dividends from Net Investment Income | – | |||
Distributions from Capital Gains | – | |||
Total Dividends and Distributions | – | |||
Net Asset Value End of Period | $ | 2.67 | ||
Total Return(b) | (3.96)% | |||
Net Assets End of Period (000) | $ | 25,050 | ||
Ratio of Net Expenses to Average Net Assets | 1.35% | |||
Ratio of Net Investment Loss to Average Net Assets | (1.07)% | |||
Ratio of Net Expenses to Average Net Assets (Excluding Fees Paid Indirectly) | N/A | |||
Ratio of Expenses to Average Net Assets (Excluding Waivers and/or Fees Paid Indirectly) | 1.44% | |||
Portfolio Turnover Rate | 33% | |||
| (a) | Per share calculations were performed using average shares for the period. |
| (b) | Figures do not reflect the deduction of taxes the shareholder will pay on fund distributions or redemption of fund shares. |
The accompanying notes are an integral part of the financial statements.
56 | 1-888-462-5386 | www.oakfunds.com |
Table of Contents
|
| Year Ended October 31, 2011 | Year Ended October 31, 2010 | Year Ended October 31, 2009 | Year Ended October 31, 2008 | |||||||||||
| $ | 2.94 | $ | 2.19 | $ | 1.63 | $ | 2.94 | |||||||
| (0.04) | (0.03) | (0.02) | (0.02) | |||||||||||
| (0.12) | 0.78 | 0.58 | (1.29) | |||||||||||
| (0.16) | 0.75 | 0.56 | (1.31) | |||||||||||
| – | – | – | – | |||||||||||
| – | – | – | – | |||||||||||
| – | – | – | – | |||||||||||
| $ | 2.78 | $ | 2.94 | $ | 2.19 | $ | 1.63 | |||||||
| (5.44)% | 34.25% | 34.36% | (44.56)% | |||||||||||
| $ | 28,993 | $ | 43,714 | $ | 37,596 | $ | 19,478 | |||||||
| 1.35% | 1.35% | 1.35% | 1.35% | |||||||||||
| (1.16)% | (1.16)% | (1.15)% | (0.94)% | |||||||||||
| N/A | N/A | 1.35% | 1.35% | |||||||||||
| 1.35% | 1.55% | 1.93% | 1.76% | |||||||||||
| 54% | 99% | 49% | 79% | |||||||||||
Annual Report | October 31, 2012 | 57 |
Table of Contents
| Financial Highlights | ||
| For a share outstanding throughout the years ended |
| Year Ended October 31, 2012 | ||||
LIVE OAK HEALTH SCIENCES FUND | ||||
Net Asset Value Beginning of Period | $ | 14.00 | ||
Income (Loss) From Operations | ||||
Net Investment Income (Loss)(a) | 0.10 | |||
Realized and Unrealized Gain or (Losses) in Securities(a) | 1.09 | |||
Total From Operations | 1.19 | |||
Less Distributions: | ||||
Dividends from Net Investment Income | (0.07) | |||
Distributions from Capital Gains | (0.45) | |||
Total Dividends and Distributions | (0.52) | |||
Net Asset Value End of Period | $ | 14.67 | ||
Total Return(b) | 9.02% | |||
Net Assets End of Period (000) | $ | 32,967 | ||
Ratio of Net Expenses to Average Net Assets | 1.24% | |||
Ratio of Net Investment Income (Loss) to Average Net Assets | 0.73% | |||
Ratio of Net Expenses to Average Net Assets (Excluding Fees Paid Indirectly) | N/A | |||
Ratio of Expenses to Average Net Assets (Excluding Waivers and/or Fees Paid Indirectly) | 1.24% | |||
Portfolio Turnover Rate | 16% | |||
| (a) | Per share calculations were performed using average shares for the period. |
| (b) | Figures do not reflect the deduction of taxes the shareholder will pay on fund distributions or redemption of fund shares. |
The accompanying notes are an integral part of the financial statements.
58 | 1-888-462-5386 | www.oakfunds.com |
Table of Contents
| Year Ended October 31, 2011 | Year Ended October 31, 2010 | Year Ended October 31, 2009 | Year Ended October 31, 2008 | |||||||||||
| $ | 12.84 | $ | 11.00 | $ | 9.48 | $ | 12.41 | |||||||
| 0.06 | 0.02 | (0.01) | (0.04) | |||||||||||
| 1.72 | 2.22 | 1.53 | (2.89) | |||||||||||
| 1.78 | 2.24 | 1.52 | (2.93) | |||||||||||
| (0.02) | – | – | – | |||||||||||
| (0.60) | (0.40) | – | – | |||||||||||
| (0.62) | (0.40) | – | – | |||||||||||
| $ | 14.00 | $ | 12.84 | $ | 11.00 | $ | 9.48 | |||||||
| 14.46% | 20.66% | 16.03% | (23.61)% | |||||||||||
| $ | 29,071 | $ | 19,595 | $ | 16,249 | $ | 14,013 | |||||||
| 1.25% | 1.35% | 1.35% | 1.35% | |||||||||||
| 0.47% | 0.17% | 0.08% | (0.36)% | |||||||||||
| N/A | N/A | 1.35% | 1.35% | |||||||||||
| 1.25% | 1.38% | 1.61% | 1.52% | |||||||||||
| 17% | 22% | 31% | 25% | |||||||||||
Annual Report | October 31, 2012 | 59 |
Table of Contents
| Notes to Financial Statements | ||
| As of October 31, 2012 |
1. ORGANIZATION:
The Oak Associates Funds (the “Trust”), a Massachusetts business trust, is registered under the Investment Company Act of 1940, as amended, as an open–end management investment company with seven funds: White Oak Select Growth Fund, Pin Oak Equity Fund, Rock Oak Core Growth Fund and River Oak Discovery Fund (“diversified funds”); Red Oak Technology Select Fund, Black Oak Emerging Technology Fund and Live Oak Health Sciences Fund (“non–diversified funds”) (collectively referred to as “Funds” and individually referred to as a “Fund”). The investment objectives of the Funds are to seek long-term capital growth. The assets of each Fund are segregated, and a shareholder’s interest is limited to the Fund in which shares are held. The Funds’ prospectus provides a description of each Fund’s investment objectives, policies and strategies.
2. SIGNIFICANT ACCOUNTING POLICIES:
The following is a summary of significant accounting policies followed by the Funds.
Use of Estimates – These policies are in conformity with U.S. generally accepted accounting principles (“GAAP”). The preparation of financial statements in accordance with GAAP requires management to make estimates and assumptions that affect the reported amounts and disclosures in the financial statements during the reporting period. Management believes the estimates and security valuations are appropriate; however, actual results may differ from those estimates, and the security valuations reflected in the financial statements may differ from the value the Funds ultimately realize upon the sale of the securities.
Security Valuation – Investments in equity securities, which are traded on a national exchange, are stated at the last quoted sales price if readily available for such equity securities on each business day. Investments in equity securities, which are reported on the NASDAQ national market system are valued at the official closing price; other equity securities traded in the over–the–counter market and listed equity securities for which no sale was reported on that date are stated at the last quoted bid price. Debt obligations exceeding sixty days to maturity for which market quotations are readily available are valued at the most recently quoted bid price. Debt obligations with sixty days or less remaining until maturity may be valued at their amortized cost, which approximates market value.
Redeemable securities issued by open–end registered investment companies are valued at the investment company’s applicable net asset value.
Securities for which market prices are not “readily available” are valued in accordance with Fair Value Procedures established by the Funds’ Board of Trustees. The Funds’ Fair Value Procedures are implemented through a Fair Value Committee (the “Committee”) designated by the Funds’ Board of Trustees. Some of the more common reasons that may necessitate that a security be valued using Fair Value Procedures include: the security’s trading has been halted or suspended; the security has been de–listed from a national exchange; the security’s primary trading market is temporarily closed at a time when under normal conditions it would be open; the security has not been traded for an extended period of time; the security’s primary pricing source is not able or willing to provide a price; a significant event with respect to a security or securities has occurred after the close of the market or exchange on which the security or securities principally trades and before the time the Fund calculates net asset value; or trading of the security is subject to local government-imposed restrictions. When a security is valued in accordance with the Fair Value
60 | 1-888-462-5386 | www.oakfunds.com |
Table of Contents
| Notes to Financial Statements | ||
| As of October 31, 2012 |
Procedures, the Committee will determine the value after taking into consideration relevant information reasonably available to the Committee.
Security Transactions and Investment Income – Security transactions are accounted for on the date the security is purchased or sold (trade date). Dividend income is recognized on the ex–dividend date. Interest income is recognized on the accrual basis. Withholding taxes on foreign dividends have been provided for in accordance with the Funds’ understanding of the applicable country’s tax rules and rates. Costs used in determining realized gains and losses on the sales of investment securities are those of the specific securities sold. If applicable, any foreign capital gains taxes are accrued, net of unrealized gains, and are payable upon the sale of such investments.
Expenses – Expenses that are directly related to one of the Funds are charged to that Fund. Other operating expenses of the Trust are prorated to the Funds on the basis of relative daily net assets.
Dividends and Distributions to Shareholders – Dividends from net investment income are declared and paid to shareholders on an annual basis, as applicable. Net realized capital gains on sales of securities, if any, are distributed to shareholders at least annually. Distributions to shareholders are determined in accordance with income tax regulations and are recorded on the ex–dividend date.
Income and capital gain distributions are determined in accordance with federal income tax regulations, which may differ from GAAP. Therefore, the source of the funds’ distributions may be shown in the accompanying financial statements as either from or in excess of net investment income or net realized gain, or from paid–in capital, depending upon the type of book/tax differences that may exist.
3. FAIR VALUE MEASUREMENTS:
A three-tier hierarchy has been established to classify fair value measurements for disclosure purposes. Inputs refer broadly to the assumptions that market participants would use in pricing the asset or liability including assumptions about risk. Inputs may be observable and unobservable. Observable inputs are inputs that reflect the assumptions market participants would use in pricing the asset or liability that are developed based on market data obtained from sources independent of the reporting entity. Unobservable inputs are inputs that reflect the reporting entity’s own assumptions about the assumptions market participants would use in pricing the asset or liability that are developed based on the best information available.
Various inputs are used in determining the value of each Fund’s investments as of the reporting period end. The designated input levels are not necessarily an indication of the risk or liquidity associated with these investments. These inputs are categorized in the following hierarchy under applicable financial accounting standards:
The three-tier hierarchy is summarized as follows:
| 1) | Level 1 - Unadjusted quoted prices in active markets for identical, unrestricted assets or liabilities that a Fund has the ability to access at the measurement date; |
Annual Report | October 31, 2012 | 61 |
Table of Contents
| Notes to Financial Statements | ||
| As of October 31, 2012 |
| 2) | Level 2 - Quoted prices which are not active, quoted prices for similar assets or liabilities in active markets or inputs other than quoted prices that are observable (either directly or indirectly) for substantially the full term of the asset or liability; and |
| 3) | Level 3 - Significant unobservable prices or inputs (including the Fund’s own assumptions in determining the fair value of investments) where there is little or no market activity for the asset and liability at the measurement date. |
The following is a summary of the inputs used to value each Funds investments as of October 31, 2012.
| Level 1 | Level 2 | Level 3 | Total | |||||||||||||
| WHITE OAK SELECT GROWTH FUND | ||||||||||||||||
Common Stocks | $ | 227,786,880 | $ | – | $ | – | $ | 227,786,880 | ||||||||
Short Term Investments | 1,439,312 | – | – | 1,439,312 | ||||||||||||
Total | $ | 229,226,192 | $ | – | $ | – | $ | 229,226,192 | ||||||||
| Level 1 | Level 2 | Level 3 | Total | |||||||||||||
| PIN OAK EQUITY FUND | ||||||||||||||||
Common Stocks | $ | 68,124,034 | $ | – | $ | – | $ | 68,124,034 | ||||||||
Short Term Investments | 1,007,466 | – | – | 1,007,466 | ||||||||||||
Total | $ | 69,131,500 | $ | – | $ | – | $ | 69,131,500 | ||||||||
| Level 1 | Level 2 | Level 3 | Total | |||||||||||||
| ROCK OAK CORE GROWTH FUND | ||||||||||||||||
Common Stocks | $ | 6,365,314 | $ | – | $ | – | $ | 6,365,314 | ||||||||
Short Term Investments | 564,348 | – | – | 564,348 | ||||||||||||
Total | $ | 6,929,662 | $ | – | $ | – | $ | 6,929,662 | ||||||||
| Level 1 | Level 2 | Level 3 | Total | |||||||||||||
| RIVER OAK DISCOVERY FUND | ||||||||||||||||
Common Stocks | $ | 9,851,404 | $ | – | $ | – | $ | 9,851,404 | ||||||||
Short Term Investments | 1,285,123 | – | – | 1,285,123 | ||||||||||||
Total | $ | 11,136,527 | $ | – | $ | – | $ | 11,136,527 | ||||||||
| Level 1 | Level 2 | Level 3 | Total | |||||||||||||
| RED OAK TECHNOLOGY SELECT FUND | ||||||||||||||||
Common Stocks | $ | 64,625,533 | $ | – | $ | – | $ | 64,625,533 | ||||||||
Short Term Investments | 362,985 | – | – | 362,985 | ||||||||||||
Total | $ | 64,988,518 | $ | – | $ | – | $ | 64,988,518 | ||||||||
| Level 1 | Level 2 | Level 3 | Total | |||||||||||||
| BLACK OAK EMERGING TECHNOLOGY FUND | ||||||||||||||||
Common Stocks | $ | 23,299,995 | $ | – | $ | – | $ | 23,299,995 | ||||||||
Short Term Investments | 1,800,397 | – | – | 1,800,397 | ||||||||||||
Total | $ | 25,100,392 | $ | – | $ | – | $ | 25,100,392 | ||||||||
62 | 1-888-462-5386 | www.oakfunds.com |
Table of Contents
| Notes to Financial Statements | ||
| As of October 31, 2012 |
| Level 1 | Level 2 | Level 3 | Total | |||||||||||||
| LIVE OAK HEALTH SCIENCES FUND | ||||||||||||||||
Common Stocks | $ | 32,539,473 | $ | – | $ | – | $ | 32,539,473 | ||||||||
Short Term Investments | 472,151 | – | – | 472,151 | ||||||||||||
Total | $ | 33,011,624 | $ | – | $ | – | $ | 33,011,624 | ||||||||
The above tables are presented by levels of disaggregation for each asset class. For detailed descriptions of the underlying industries, see the accompanying Schedules of Investments. There were no transfers into or out of Level I and 2 during the period. There were no Level 3 securities held during the period.
4. TRANSACTIONS WITH AFFILIATES:
Certain officers of the Trust are also officers of Oak Associates, Ltd., (the “Advisor”) ALPS Fund Services, Inc. (the “Administrator”) and/or ALPS Distributors, Inc. (the “Distributor”). Such officers are paid no fees by the Trust for serving as officers of the Trust.
5. ADMINISTRATION, TRANSFER AGENT AND DISTRIBUTION AGREEMENTS:
Administration: ALPS Fund Services, Inc. (the “Administrator”) serves as administrator to the Trust. The Trust and the Administrator have entered into an administration agreement (the “Administration Agreement”). Under the Administration Agreement, the Administrator provides the Trust with administrative services, including regulatory reporting, fund accounting services, including calculating the Funds’ daily net asset value, and all necessary office space, equipment, personnel and facilities. The Administration Agreement provides that the Administrator shall not be liable for any error of judgment or mistake of law or for any loss suffered by the Trust in connection with the matters to which the Administration Agreement relates, except a loss resulting from willful misfeasance, bad faith or negligence on the part of the Administrator in the performance of its duties or from reckless disregard by it of its duties and obligations there under. The Administration Agreement shall remain in effect for a period of one year after the effective date of the agreement and shall continue in effect for successive periods of one year unless terminated by either party on not less than 60 days’ prior written notice to the other party.
Transfer Agent: ALPS Fund Services, Inc. (the “Transfer Agent”) serves as transfer agent, dividend paying agent and shareholder service agent for the Trust under a transfer agency services agreement with the Trust.
Distribution: The Trust and ALPS Distributors, Inc. (the “Distributor”), an affiliate of the Administrator, are parties to a distribution agreement (the “Distribution Agreement”) whereby the Distributor acts as principal underwriter for the Trust’s shares. The Distributor agreed to use its best efforts in distributing Fund shares but is not obligated to sell any particular number of shares. The Distributor does not receive compensation under the Distribution Agreement for distribution of Fund shares.
6. INVESTMENT ADVISORY AND CUSTODIAN AGREEMENTS:
The Trust and the Adviser are parties to an Investment Advisory Agreement, under which the Adviser receives an annual fee equal to 0.74% of the average daily net assets of each Fund, except for the River Oak Discovery Fund for which the Adviser receives 0.90% of the average daily net
Annual Report | October 31, 2012 | 63 |
Table of Contents
| Notes to Financial Statements | ||
| As of October 31, 2012 |
assets of the Fund. The Adviser has agreed to contractually waive all or a portion of its fees (and to reimburse the Funds’ expenses if necessary) in order to limit operating expenses to not more than 1.25% of the average daily net assets of the White Oak Select Growth, Rock Oak Core Growth and Pin Oak Equity Funds, and 1.35% of the average daily net assets of the River Oak Discovery, Red Oak Technology Select, Black Oak Emerging Technology and Live Oak Health Sciences Funds for one year periods. The Adviser contractually agreed to continue this arrangement through February 28, 2013.
U.S. Bank N.A. acts as custodian (the “Custodian”) for the Funds. The Custodian plays no role in determining the investment policies of the Funds or which securities are to be purchased or sold by the Funds.
7. INVESTMENT TRANSACTIONS:
The cost of security purchases and the proceeds from security sales, other than short–term investments, for the year ended October 31, 2012, were as follows:
| Fund | Purchases | Sales | ||||||
White Oak Select Growth Fund | $ | 201,429,824 | $ | 233,501,814 | ||||
Pin Oak Equity Fund | 65,140,121 | 67,738,192 | ||||||
Rock Oak Core Growth Fund | 3,659,739 | 4,059,839 | ||||||
River Oak Discovery Fund | 7,698,193 | 8,495,933 | ||||||
Red Oak Technology Select Fund | 59,368,290 | 65,394,417 | ||||||
Black Oak Emerging Technology Fund | 9,051,279 | 12,978,796 | ||||||
Live Oak Health Sciences Fund | 6,907,574 | 5,241,792 | ||||||
8. FEDERAL INCOME TAXES AND TAX BASIS INFORMATION:
Each of the Funds is classified as a separate taxable entity for Federal income tax purposes. Each of the Funds intend to continue to qualify as a separate “regulated investment company” under Sub–chapter M of the Internal Revenue Code and make the requisite distributions to shareholders that will be sufficient to relieve it from Federal income tax and Federal excise tax. Therefore, no Federal tax provision is required.
To the extent that dividends from net investment income and distributions from net realized capital gains exceed amounts reported in the financial statements, such amounts are reported separately.
The amounts of dividends from net investment income and distributions from net realized capital gains are determined in accordance with Federal income tax regulations, which may differ from those amounts determined under accounting principles generally accepted in the United States of America. These book/tax differences are either temporary or permanent in nature. The character of dividends from net investment income or distributions from net realized gains made during the year, and the timing of may differ from the year that the income or realized gains (losses) were recorded by the Funds. To the extent these differences are permanent, adjustments are made to the appropriate equity accounts in the period that the differences arise. These differences are primarily due to the reclass of distributions on net operating losses and expiration of capital loss carryforwards.
64 | 1-888-462-5386 | www.oakfunds.com |
Table of Contents
| Notes to Financial Statements | ||
| As of October 31, 2012 |
Accordingly, the following permanent differences have been reclassified to/from the following accounts:
| Fund | Undistributed Net Investment Income | Accumulated Capital Gains/(losses) | Paid–in Capital | |||||||||
White Oak Select Growth Fund | $ | – | $ | 659,529,164 | $ | (659,529,164) | ||||||
Pin Oak Equity Fund | – | 68,732,508 | (68,732,508) | |||||||||
Rock Oak Core Growth Fund | 407 | – | (407) | |||||||||
River Oak Discovery Fund | 61,156 | (6,184) | (54,972) | |||||||||
Red Oak Technology Select Fund | – | 9,035,532 | (9,035,532) | |||||||||
Black Oak Emerging Technology Fund | 34,897 | – | (34,897) | |||||||||
Live Oak Health Sciences Fund | 169 | (168) | (1) | |||||||||
Included in the reclasses above were net operating losses offset to paid-in capital in the amount of $47,916 and $34,897 for the River Oak Discovery Fund and Black Oak Emerging Technology Fund, respectively.
The tax character of the distributions paid by the Funds for the fiscal year ended October 31, 2012 is as follows:
| Fund | Ordinary Income | Long–Term Capital Gain | Total | |||||||||
Live Oak Health Sciences Fund | $ | 352,999 | $ | 755,283 | $ | 1,108,282 | ||||||
The tax character of the distributions paid by the Funds for the fiscal year ended October 31, 2011 is as follows:
| Fund | Ordinary Income | Long–Term Capital Gain | Total | |||||||||
Pin Oak Equity Fund | $ | 219,936 | $ | – | $ | 219,936 | ||||||
River Oak Discovery Fund | $ | – | $ | 130,972 | $ | 130,972 | ||||||
Live Oak Health Sciences Fund | $ | 442,160 | $ | 503,242 | $ | 945,402 | ||||||
As of October 31, 2012, the components of distributable earnings on a tax basis were as follows:
Undistributed Net Investment Income | Accumulated Capital Gains/ (Losses) | Unrealized Appreciation/ (Depreciation) | Cumulative Effect of Timing Differences | Total | ||||||||||||||||
White Oak Select Growth Fund | $646,401 | $ | (353,506,387) | $(4,265,100) | – | $(357,125,086) | ||||||||||||||
Pin Oak Equity Fund | 458,993 | (17,756,126) | (2,408,933) | – | (19,706,066) | |||||||||||||||
Rock Oak Core Growth Fund | 9,778 | 65,871 | 1,501,352 | – | 1,577,001 | |||||||||||||||
River Oak Discovery Fund | – | 283 | 2,133,883 | – | 2,134,166 | |||||||||||||||
Red Oak Technology Select Fund | 116,802 | (4,597,059) | (11,092,424) | – | (15,572,681) | |||||||||||||||
Black Oak Emerging Technology Fund | | – | | (3,797,285) | (761,324) | $(272,116) | (4,830,725) | |||||||||||||
Live Oak Health Sciences Fund | 213,527 | 1,642,726 | 6,137,559 | – | 7,993,812 | |||||||||||||||
Annual Report | October 31, 2012 | 65 |
Table of Contents
| Notes to Financial Statements | ||
| As of October 31, 2012 |
For Federal income tax purposes, capital loss carryforwards may be carried forward and applied against future capital gains.
At October 31, 2012, the Funds had capital loss carryforwards available to offset future realized capital gains through the indicated expiration dates:
Expiring October 31, | White Oak Select Growth Fund | Pin Oak Equity Fund | Rock Oak Core Growth Fund | River Oak Discovery Fund | Red Oak Technology Select Fund | Black Oak Emerging Technology Fund | Live Oak Health Sciences Fund | |||||||||||||||||||||
| 2013 | $ | 321,944,019 | $ | 17,756,126 | $ | – | $ | – | $ | – | $ | – | $ | – | ||||||||||||||
| 2014 | – | – | – | – | – | – | – | |||||||||||||||||||||
| 2015 | – | – | – | – | – | – | – | |||||||||||||||||||||
| 2016 | 22,546,570 | – | – | – | – | – | – | |||||||||||||||||||||
| 2017 | 9,015,798 | – | – | – | 4,597,059 | 3,797,285 | – | |||||||||||||||||||||
| Total | $ | 353,506,387 | $ | 17,756,126 | $ | – | $ | – | $ | 4,597,059 | $ | 3,797,285 | $ | – | ||||||||||||||
For the year ended October 31, 2012, the funds did not incur any new capital loss carryforwards under the new law.
Capital loss carryovers used during the year ended October 31, 2012 were as follows:
Used October 31, 2012 | White Oak Select Growth Fund | Pin Oak Fund | Rock Oak Core Growth Fund | River Oak Discovery Fund | Red Oak Technology Select Fund | Black Oak Emerging Technology Fund | Live Oak Health Sciences Fund | |||||||
| $(84,727,509) | $(21,550,899) | $(17,180) | $(12,968) | $(25,197,327) | $(728,567) | – |
Under the Regulated Investment Company Modernization Act of 2010 (the “Act”), net capital losses recognized in tax years beginning after December 22, 2010 may be carried forward indefinitely, and the character of the losses is retained as short-term and/or long-term. Under the law in effect prior to the Act, net capital losses were carried forward for eight years and treated as short-term. As a transition rule, the Act requires that post-enactment net capital losses be used before pre-enactment net capital losses.
The following Fund elected to defer to the period ending October 31, 2013, late year ordinary losses in the amount of:
| Amount | ||
Black Oak Emerging Technology Fund | $272,116 |
66 | 1-888-462-5386 | www.oakfunds.com |
Table of Contents
| Notes to Financial Statements | ||
| As of October 31, 2012 |
At October 31, 2012, the total cost of securities for Federal income tax purposes and the aggregate gross unrealized appreciation and depreciation for securities held by the Funds is as follows:
| Federal Tax Cost | Aggregate Gross Appreciation | Aggregate Gross Depreciation | Net | |||||||||||||
White Oak Select Growth Fund | $ 233,491,292 | $ | 6,053,585 | $(10,318,685) | $(4,265,100) | |||||||||||
Pin Oak Equity Fund | 71,540,433 | 1,507,826 | (3,916,759) | (2,408,933) | ||||||||||||
Rock Oak Core Growth Fund | 5,428,310 | 1,554,315 | (52,963) | 1,501,352 | ||||||||||||
River Oak Discovery Fund | 9,002,644 | 2,232,945 | (99,062) | 2,133,883 | ||||||||||||
Red Oak Technology Select Fund | 76,080,942 | 246,326 | (11,338,750) | (11,092,424) | ||||||||||||
Black Oak Emerging Technology Fund | 25,861,716 | 3,288,682 | (4,050,006) | (761,324) | ||||||||||||
Live Oak Health Sciences Fund | 26,874,065 | 7,226,239 | (1,088,680) | 6,137,559 | ||||||||||||
Management evaluates the Funds’ tax positions to determine if the taken tax positions meet the minimum recognition threshold by measuring and recognizing tax liabilities in the Financial Statements. The threshold is established by accounting for uncertainities in income tax positions, taken or expected. Recognition of tax benefits of an uncertain tax position is required only when the position is “more likely than not” to be sustained assuming examination by taxing authorities. The Funds recognize interest and penalties, if any, related to unrecognized tax benefits as income tax expense in the Statements of Operations. During the period, the Funds did not incur any interest or penalties.
Management has analyzed the Funds’ tax position taken on federal income tax returns for all open tax years (current and prior three tax years) and has concluded that as of and for the year ended October 31, 2012, no provision for income tax would be required in the Funds’ financial statements. The Funds’ federal and state income and federal excise tax returns for tax years for which the applicable statutes of limitations have not expired are subject to examination by the Internal Revenue Service and state departments of revenue.
9. CONCENTRATION OF CREDIT RISK AND OWNERSHIP:
The Red Oak Technology Select Fund and the Black Oak Emerging Technology Fund invest a substantial portion of their assets in securities in the technology industry. The Live Oak Health Sciences Fund invests a substantial portion of its assets in securities in the health care, medicine and life sciences industries. Therefore, each of these Funds may be more affected by economic developments in those industries than a general equity fund would be.
In the normal course of business, the Funds enter into contracts that provide general indemnifications. The Funds’ maximum exposure under these arrangements is dependent on future claims that may be made against the Funds and, therefore, cannot be established; however based on experience, the risk of loss from such claims is considered remote.
From time to time, the Funds may have a concentration of several shareholders holding a significant percentage of shares outstanding. Investment activities of these shareholders could have a material impact on the Fund.
Annual Report | October 31, 2012 | 67 |
Table of Contents
| Notes to Financial Statements | ||
| As of October 31, 2012 |
As of October 31, 2012, the James D. Oelschlager Trust owned 35.20% of the River Oak Discovery Fund.
10. TRUSTEE AND OFFICERS FEES
As of October 31, 2012, there were seven Trustees, five of whom are not “interested persons” (within the meaning of the 1940 Act) of the Trust (the “Independent Trustees”). Each Independent Trustee receives a retainer of $30,000 per year. The chairperson of the Audit Committee receives an additional retainer of $500 per calendar quarter and the Lead Independent Trustee receives an additional retainer of $1,500 per calendar quarter. In addition, each Independent Trustee is also paid a fee of $2,000 for each meeting of the Board of Trustees attended or participated in, as the case may be. The Trustees are paid $1,000 per each telephonic board meeting. The Independent Trustees are not paid an additional fee from the Trust for attendance at and/or participation in meetings of the various committees of the Board. The Independent Trustees are also reimbursed for meeting-related expenses. Officers of the Trust and Trustees who are interested persons of the Trust receive no salary or fees from the Trust.
68 | 1-888-462-5386 | www.oakfunds.com |
Table of Contents
| Report of Independent Registered Accounting Firm | ||
To the Shareholders and Board of Trustees
Oak Associates Funds
We have audited the accompanying statements of assets and liabilities of Oak Associates Funds, comprising White Oak Select Growth Fund, Pin Oak Equity Fund, Rock Oak Core Growth Fund, River Oak Discovery Fund, Red Oak Technology Select Fund, Black Oak Emerging Technology Fund, and Live Oak Health Sciences Fund (the “Funds”), including the schedules of investments, as of October 31, 2012, and the related statements of operations for the year then ended, and the statements of changes in net assets for each of the two years in the period then ended, and the financial highlights for each of the three years in the period then ended. These financial statements and financial highlights are the responsibility of the Fund management. Our responsibility is to express an opinion on these financial statements and financial highlights based on our audits. The financial highlights for the years indicated prior to October 31, 2010, were audited by another independent registered public accounting firm, whose report dated December 23, 2009, expressed an unqualified opinion on those financial highlights.
We conducted our audits in accordance with the standards of the Public Company Accounting Oversight Board (United States). Those standards require that we plan and perform the audit to obtain reasonable assurance about whether the financial statements and financial highlights are free of material misstatement. An audit includes examining, on a test basis, evidence supporting the amounts and disclosures in the financial statements. Our procedures included confirmation of securities owned as of October 31, 2012, by correspondence with the custodian and brokers. An audit also includes assessing the accounting principles used and significant estimates made by management, as well as evaluating the overall financial statement presentation. We believe that our audits provide a reasonable basis for our opinion.
In our opinion, the financial statements and financial highlights referred to above present fairly, in all material respects, the financial position of each of the Funds constituting Oak Associates Funds as of October 31, 2012, the results of their operations for the year then ended, the changes in their net assets for each of the two years in the period then ended, and the financial highlights for each of the three years, in the period then ended, in conformity with accounting principles generally accepted in the United States of America.

COHEN FUND AUDIT SERVICES, LTD.
Cleveland, Ohio
December 21, 2012
Annual Report | October 31, 2012 | 69 |
Table of Contents
| Additional Information | ||
| As of October 31, 2012 (Unaudited) |
SHAREHOLDER TAX INFORMATION (UNAUDITED)
For shareholders that do not have an October 31, 2012 tax year end, this notice is for informational purposes only. For shareholders with an October 31, 2012 tax year end, please consult your tax advisor as to the pertinence of this notice. The information and distributions reported herein may differ from information and distributions taxable to the shareholders for the calendar year ended December 31, 2012.
For the fiscal year ended October 31, 2012 each fund is designating the following items with regard to distributions paid during the year.
During the year ended October 31, 2012 72.98% of the dividends paid by the Live Oak Health Science Fund respectively from ordinary income qualify for the corporate dividend received deduction.
Also during the year ended October 31, 2012 100.00% of the dividends paid by the Live Oak Health Sciences Fund respectively from ordinary income met the requirements of the tax rules regarding qualified dividend income.
During the year ended October 31, 2012 Live Oak Health Sciences Fund distributed $755,283 from Long-Term Capital Gains.
70 | 1-888-462-5386 | www.oakfunds.com |
Table of Contents
| Additional Information | ||
| As of October 31, 2012 (Unaudited) |
TRUSTEES OF THE TRUST
| Name & Age(1) | Position Held with Trust | Length of Time Served (Yrs.)(2) | Number of Portfolios in Fund Complex Overseen by Board Member(3) | Principal Occupation(s) During Past Five Years | Other Directorships Held by Board Member(4) | |||||
| J. John Canon (77) | Trustee | 11 | 7 | President and Chairman of the Board, Synergistic Partners, Inc. 1975-1999 | Trustee of Proconex | |||||
| Thomas E. Gretter, MD (77) | Trustee | 10 | 7 | Physician, Cleveland Clinic (Health Care) since 1966 | None | |||||
James D. Oelschlager(5) (70) | Trustee, Chairman | 11 | 7 | Managing Member, President CIO and Founder of Oak Associates, ltd. since 1985 | None | |||||
John G. Stimpson(5) (70) | Trustee | 11 | 7 | Director of International Equity Sales and Equity Sales Manager, Salomon Brothers (New York) from 1985-1993 | Board of Directors, Morgan Stanley Trust Company from 1988-1993 | |||||
Pauline F. Ramig (72) | Trustee | 4 | 7 | Financial Planning Practioner, Raming Financial Planning since 1991 | Trustee of Opera Cleveland | |||||
Robert P. Stephans (69) | Trustee | 4 | 7 | CPA for Stephans, Kun & Co., Certified Public Accountants since 1980 | None | |||||
Michael R. Shade (64) | Trustee | 4 | 7 | Attorney at Law; Partner, Shade & Shade since December, 1979 | None |
| 1 | Each Trustee may be contacted in writing to the Trustee c/o Oak Associates Funds, 3875 Embassy Parkway, Suite 250, Akron, OH 44333. Each Officer may be contacted in writing to the Officer c/o ALPS Fund Services, Inc., 1290 Broadway Suite 1100. Denver, CO 80203. |
| 2 | Each Trustee shall hold office during the lifetime of this Trust until the election and qualification of his successor, or until he sooner dies, resigns or is removed in accordance with the Trust’s Declaration of Trust. |
| 3 | The “Oak Associates Funds Complex” consists of all registered investment companies for which Oak Associates, ltd. serves as investment adviser. As of October 31, 2012, the Oak Associates Funds Complex consisted of 7 Funds. |
| 4 | Directorships of companies are required to report to the Securities and Exchange Commission under the Securities Exchange Act of 1934 (i.e., “public companies ”) or other investment companies registered under the Investment Company Act of 1940. |
| 5 | Messrs. Oelschlager and Stimpson are considered “interested” persons of the Trust as that term is defined in the Investment Company Act of 1940. Mr. Oelschlager is interested by virtue of his controlling ownership interest in the Adviser. Mr. Stimpson is considered interested because of his family relationship with an employee of the Adviser. |
Annual Report | October 31, 2012 | 71 |
Table of Contents
| Additional Information | ||
| As of October 31, 2012 (Unaudited) |
OFFICERS OF THE TRUST
| Name & Age(1) | Position Held with Trust | Length of Time Served (Yrs.) | Number of Portfolios in Fund Complex Overseen by Board Member | Principal Occupation(s) During Past Five Years | Other Directorships Held | |||||
Sandra Noll(2) (48) | Chief Compliance Officer | 11 | N/A | Director of Client Services at Oak Associates, ltd., since 1998 and Compliance Officer of Oak Associates, ltd., since 1994 | N/A | |||||
Leslie Manna(2) (50) | President/ Chief Executive Officer | 11 | N/A | Mutual Fund Coordinator of Oak Associates, ltd., since 1995 | N/A | |||||
Pete Greenly(3) (43) | Treasurer/ Principal Financial Officer | Since November 7, 2012 | N/A | Fund Controller, ALPS Fund, Services, Inc. since June 2011; Manager of Valuations with Great West Life and Annuity from 2011 to 2012, Supervisor of Fund Accounting at Janus Capital from February 2011 to November 2011, Project Manager at Old Mutual Capital from 2007 - 2010, Manager of Fund Accounting and Operations with Founders Asset Management, LLC from 1994-2006. | N/A | |||||
Rhonda Mills(3) (46) | Vice President/ Secretary | Since November 7, 2012 | N/A | Vice President and Associate Counsel of ALPS, ALPS Advisors, Inc., ALPS Distributors, Inc. and FTAM Distributors, Inc. since 2011. Managing Member, Mills Law, LLC from 2010 to 2011. Counsel, Old Mutual Capital, Inc. from 2006-2009. | N/A |
| 1 | Each Officer may be contacted in writing to the Officer c/o ALPS Fund Services, Inc., 1290 Broadway Suite 1100, Denver, CO 80203. |
| 2 | Mmes. Noll and Manna are considered to be “affiliates” of the Adviser by virtue of their employment by the Adviser. |
| 3 | Mr. Greenly and Ms. Mills also serve as officers to one or more mutual funds for which ALPS Fund Services, Inc. or its affiliates act as investment manager, administrator, or distributor. |
For more information regarding the Trustees, please refer to the Statement of Additional Information, which is available upon request by calling 1-888-462-5386.
72 | 1-888-462-5386 | www.oakfunds.com |
Table of Contents
| Notes | ||
Table of Contents
| Notes | ||
Table of Contents
OAK ASSOCIATES FUNDS
This Page Intentionally Left Blank
Table of Contents
OAK ASSOCIATES FUNDS
This Page Intentionally Left Blank
Table of Contents

By Mail
Oak Associates Funds
P.O. Box 8233
Denver, CO 80201-8233
By Telephone 1-888-462-5386 Monday through Friday, 8:30 a.m. to 8:00 p.m. ET
On The Web www.oakfunds.com
Click on the My Oak Account section to take advantage of these features:
| • | Trade Online |
| • | Access and Update Account Information |
| • | Go Paperless with eDelivery |
| • | View and download account history |
| • | Establish a systematic investment plan |
The Trust files its complete schedule of portfolio holdings of each Fund with the Securities and Exchange Commission for the first and third quarters of each fiscal year on Form N-Q within sixty days after the end of the period. The Trust’s Forms N-Q is available on the Commission’s website at http://www.sec.gov, and may be reviewed and copied at the Commission’s Public Reference Room in Washington DC. Information on the operation of the Public Reference Room may be obtained by calling 1-800-SEC-0330.
A description of the policies and procedures that the Funds use to determine how to vote proxies relating to portfolio securities, as well as information relating to how a Fund voted proxies relating to portfolio securities during the most recent 12-month period ended June 30, is available (i) without charge, upon request, by calling 1-888-462-5386; and (ii) on the Commission’s website at http://www.sec.gov.
This report has been prepared for Oak Associates Funds Shareholders and may be distributed to others only if preceded or accompanied by a prospectus.
Oak Associates Funds are distributed by ALPS Distributors, Inc.

Table of Contents

Table of Contents
Item 2. Code of Ethics.
| (a) | The Registrant, as of the end of the period covered by this report, has adopted a code of ethics that applies to the Registrant’s principal executive officer, principal financial officer, principal accounting officer or controller or any persons performing similar functions on behalf of the Registrant. |
| (b) | Not applicable to Registrant. |
| (c) | During the period covered by this report, no amendments were made to the provisions of the code of ethics adopted in 2(a) above. |
| (d) | During the period covered by this report, no implicit or explicit waivers to the provisions of the code of ethics adopted in 2(a) above were granted. |
| (e) | Not applicable to Registrant. |
| (f) | The Registrant’s Code of Ethics is attached as Exhibit 2(f). |
Item 3. Audit Committee Financial Expert.
The Registrant’s board of trustees has determined that the Registrant has at least one financial expert serving on the audit committee. The audit committee financial expert serving on the audit committee is Robert Stephans and is independent as defined in Form N-CSR Item 3(a)(2). Mr. Stephans has served as a Certified Public Accountant for Stephans, Kun & Co. since 1980.
Item 4. Principal Accountant Fees and Services.
The principal accountant fees for the fiscal years ended October 31, 2012 and 2011 were collected by Cohen Fund Audit Services, Ltd. The Trust aggregate fees for services rendered to the Trust for the last two fiscal years are as follows:
| (a) | Audit Fees: The aggregate fees billed for each of the last two fiscal years for professional services rendered by the applicable principal accountant for the audit of the Registrant’s annual financial statements or services that are normally provided by the accountant in connection with statutory and regulatory filings or engagements for fiscal years 2012 and 2011 were $77,000 and $77,000, respectively. |
| (b) | Audit-Related Fees: The aggregate fees billed in each of the last two fiscal years for assurance and related services by the applicable principal accountant that are reasonably related to the performance of the audit of the Registrant’s financial statements and are not reported under paragraph (a) of this Item for fiscal years 2012 and 2011 were $0 and $0, respectively. |
Table of Contents
| (c) | Tax Fees: The aggregate fees billed in each of the last two fiscal years for professional services rendered by the applicable principal accountant for tax compliance, tax advice and tax planning for fiscal years 2012 and 2011 were $14,000 and $14,000, respectively. |
| (d) | All Other Fees: The aggregate fees billed in each of the last two fiscal years for products and services provided by the applicable principal accountant, other than the services reported in paragraphs (a) through (c) of this Item, for fiscal years 2012 and 2011 were $0 and $0, respectively. |
(e)(1) | Not Applicable. | |
(e)(2) |
No services described in paragraphs (b) through (d) of this Item were approved by the Registrant’s audit committee pursuant to paragraph (c)(7)(i)(C) of Rule 2-01 of Regulation S-X. |
| (f) | Not applicable to Registrant. |
| (g) | The aggregate non-audit fees and services billed by the applicable principal account for fiscal years 2012 and 2011 were $0 and $0, respectively. |
| (h) | During the past fiscal year, the registrant’s principal accountant did not report to the registrant’s audit committee the existence of any non-audit services that were provided to either the registrant’s investment adviser or to any entity controlling, controlled by, or under common control with the registrant’s investment adviser that provided ongoing services to the registrant. |
Item 5. Audit Committee of Listed Registrants.
Not applicable to open-end management investment companies.
Item 6. Schedule of Investments.
| (a) | Schedule of Investments in securities of unaffiliated issuers as of the close of the reporting period is included as part of the Report to Stockholders filed under Item 1 of this Form N-CSR. |
| (b) | Not applicable. |
| Item 7. | Disclosure of Proxy Voting Policies and Procedures for Closed-End Management Investment Companies. |
Not applicable to open-end management investment companies.
Item 8. Portfolio Managers of Closed-End Management Investment Companies.
Table of Contents
Not applicable to open-end management investment companies.
| Item 9. | Purchases of Equity Securities by Closed-End Management Investment Companies and Affiliated Purchasers. |
Not applicable to open-end management investment companies.
Item 10. Submission of Matters to a Vote of Security Holders.
None.
Item 11. Controls and Procedures.
(a) The registrant’s principal executive and principal financial officers, or persons performing similar functions, regarding the effectiveness of the registrant’s disclosure controls and procedures (as defined in Rule 30a-3(c) under the Act (17 CFR 270.30a-3(c))) as of a date within 90 days of the filing date of the report that includes the disclosure required by this paragraph, based on the evaluation of these controls and procedures required by Rule 30a-3(b) under the Act (17 CFR 270.30a-3(b)) and Rules 13a-15(b) or 15d-15(b) under the Exchange Act (17 CFR 240.13a-15(b) or 240.15d-15(b)).
(b) There has been no change in the registrant’s internal control over financial reporting (as defined in Rule 30a-3(d) under the Act (17 CFR 270.30a-3(d)) that occurred during the second fiscal quarter of the period covered by this report that has materially affected, or is reasonably likely to materially affect, the registrant’s internal control over financial reporting.
Item 12. Exhibits.
(a)(1) Code of Ethics attached hereto as Exhibit 2(f).
(a)(2) A separate certification for the principal executive officer and the principal financial officer of the registrant as required by Rule 30a-2(a) under the Investment Company Act of 1940, as amended (17 CFR 270.30a-2(a)), are filed herewith.
(a)(3) None.
(b) Officer certifications as required by Rule 30a-2(b) under the Investment Company Act of 1940, as amended (17 CFR 270.30a-2(b)) also accompany this filing as an Exhibit.
Table of Contents
SIGNATURES
Pursuant to the requirements of the Securities Exchange Act of 1934 and the Investment Company Act of 1940, the Registrant has duly caused this report to be signed on its behalf by the undersigned, thereunto duly authorized.
OAK ASSOCIATES FUNDS
By | /s/ Leslie Manna | |||
Leslie Manna | ||||
President | ||||
Date: | January 7, 2013 | |||
Pursuant to the requirements of the Securities Exchange Act of 1934 and the Investment Company Act of 1940, this report has been signed below by the following persons on behalf of the Registrant and in the capacities and on the dates indicated.
By | /s/ Leslie Manna | |||
| Leslie Manna | ||||
| President and Principal Executive Officer | ||||
Date: | January 7, 2013 | |||
By | /s/ Pete Greenly | |||
| Pete Greenly | ||||
| Treasurer and Principal Financial Officer | ||||
Date: | January 7, 2013 | |||