UNITED STATES
SECURITIES AND EXCHANGE COMMISSION
Washington, D.C. 20549
FORM N-CSR
CERTIFIED SHAREHOLDER REPORT OF REGISTERED
MANAGEMENT INVESTMENT COMPANIES
Investment Company Act file number: 811-08549
Oak Associates Funds
(Exact name of registrant as specified in charter)
101 Federal Street, Boston, Massachusetts 02110
(Address of principal executive offices) (Zip code)
Leslie Manna
Oak Associates, ltd.
3875 Embassy Parkway, Suite 250
Akron, Ohio 44333-8334
(Name and address of agent for service)
Registrant’s telephone number, including area code: 1-888-462-5386
Date of fiscal year end: October 31
Date of reporting period: November 1, 2012 – October 31, 2013
Item 1. Reports to Stockholders.

ANNUAL REPORT
October 31, 2013

White Oak Select Growth Fund | WOGSX
Pin Oak Equity Fund | POGSX
Rock Oak Core Growth Fund | RCKSX
River Oak Discovery Fund | RIVSX
Red Oak Technology Select Fund | ROGSX
Black Oak Emerging Technology Fund | BOGSX
Live Oak Health Sciences Fund | LOGSX

Oak Associates, ltd., advisor to the Oak Associates Funds, has been managing growth-oriented portfolios for over 25 years. | ||
We appreciate the many long-term shareholders who invest alongside us in the Oak Associates Funds. Employees and their families are among the largest shareholders in the funds. Here are our core investment philosophies.
| ||
 | Long-term focus |
To us, the appeal of an investment is driven by the long-term fundamentals of the company and its opportunity set, rather than short-term trading factors. We believe that this long-term mindset is increasingly valuable in today’s short-term oriented market.
| Concentrated portfolios |
We construct our portfolios with our best ideas, which means that our favorite stock ideas aren’t diluted by investments in less-favored positions. A recent study showed that managers gave up performance because they failed to concentrate in their best ideas. Concentration takes discipline, conviction and experience. We continue to adhere to a strategy of concentrated portfolios.
| Low turnover |
Hospital wings are rarely endowed by day traders. When we invest in a company, we do so with the intention of holding that stock for several years, not a few quarters. Low turnover can have the effect of minimizing trading costs as well as tempering the natural human instinct to act upon every data point.
| Contrarian |
Being a good investor often requires not doing what the rest of the market is doing. While it’s difficult to go against the crowd - because as humans we are psychologically wired to herd - we believe that long-term outperformance requires it. One benefit of being located in Akron, Ohio (aside from being a great place to live), is that we are removed from the financial centers in other areas of the country, minimizing our chances of being swept up by the herd mentality. We value independent thinking and believe it is beneficial to our investment perspective.
The value of a Fund’s investments will vary from day to day in response to the activities of individual companies and general market and economic conditions. Due to the limited number of underlying investments, concentrated funds are more susceptible to the price movements of any one holding and thus are generally more volatile than a more broadly diversified portfolio.
Shareholder Letter | ||
| November 26, 2013 | ||
Dear Fellow Shareholder:
The fiscal year ending October 31, 2013 was an outstanding year for stocks, and all seven of our funds participated, with returns ranging from 26% to 41%. The five-year numbers are even more startling, as cumulative returns ranged from 109% to 180%. It is important to remember though that this period started in the midst of the financial crisis; it is unrealistic to believe that these returns will be duplicated over the next five years.
Over the last twelve months, US stocks maintained an upward path, in spite of an economy that continues to disappoint many. Healthy gains in the equity market were driven by accommodative monetary policy, strong profitability, and healthy corporate capital allocation. The long-awaited correction in profit margins has yet to materialize, and while we are not necessarily taking a side in the great margin debate, the lack of aggression on the part of corporate managers increases the chances that profitability stays high. Given sluggish economic growth, companies have been reticent to ramp up capital spending and have been relatively restrained on acquisitions, instead allocating capital toward dividends and stock buybacks, which is positive. When companies spend on new equipment or acquire other companies, it expands their capital base, and they must grow profits by the same amount just to maintain the same return on capital. This is not as easy as it sounds, and when many companies are employing this strategy at the same time it is even more difficult because they are battling each other for the same incremental dollar. This is a long-winded way of saying that even though economic growth has been disappointing and corporate confidence subdued, it is these very conditions that arguably have allowed this run in stocks to continue.
Even though economic growth has been mediocre, the unemployment rate is declining, though this is partially explained by the fall in the labor participation rate; many people have given up looking for work, which means they are no longer counted as unemployed. Worldwide growth is positive but slow, and monetary policy in the developed markets is loose. It is interesting that emerging markets, which were very popular with investors a couple years ago, have lost their appeal as commodity prices have corrected. The relationship between commodity prices and emerging market growth may be self-reinforcing, and a further unwind of the commodity trade may cause problems in places like Russia, China, and Brazil.
The emerging market weakness and attendant drop in commodity prices has been a boon to the US because it has helped keep inflation low. Over 70% of our economy is consumption, and when prices are lower it increases consumers’ purchasing power. Lower prices also allow the Federal Reserve to maintain loose money, the goal of which is to boost the economy. Contributing to the decline in commodity prices is the US shale boom, which is keeping natural gas prices depressed – a major positive for home heating costs – and driving increased domestic oil production. Most people would be stunned to learn that the US is currently producing more oil than it imports.
The sequester has helped keep federal spending relatively flat, and, along with increasing receipts from a growing economy, this has led to dramatic improvement in the budget deficit. It is still elevated, and the long-term entitlement issues remain, but at least in the short-term it is moving in the right direction.
In last year’s report we talked about the fact that investors were pouring money into bond funds and disregarding stock funds. As is so often the case, the public was the perfect reverse
Shareholder Letter | ||
barometer, as stocks trounced bonds over the past twelve months. Talk by the Fed of a tapering of its quantitative easing program led to a rise in bond yields, which sent many of those investors fleeing for the exits. Some of that money is flowing back into stocks, and it will be interesting to see how durable the trend is if interest rates continue to climb.
Over the past year, or three years, or five years, there have been many times when the headlines were unsettling. It is natural during these times to think about becoming more conservative by, say, attempting to time the market by holding more cash. If we had done this, returns would not have been as strong, as each time the market resumed its ascent. Two of our core principles are maintaining a long-term perspective and remaining fully invested. Both serve us well in times of turmoil and, over time, we believe adhering to these principles leads to superior returns.
Thank you for the opportunity to manage your money.
Best regards,

Mark Oelschlager, CFA
Portfolio Manager
This manager commentary represents an assessment of the market environment at a specific point in time and is not intended to be a forecast of future events, or a guarantee of future results. This information should not be relied upon by the reader as research or investment advice.
Investments are subject to market fluctuations and a fund’s share price can fall because of weakness in the broad market, a particular industry, or a specific holding.
CFA is a registered trademark of the CFA Institute.
The following has been provided to you for informational purposes only, and should not be considered tax advice. Please consult your tax advisor for further assistance.
| HIGHLIGHTS from the 2013 FISCAL YEAR | ||
| October 31, 2012 to October 31, 2013 (Unaudited) | ||
November 2012 | TheStreet.com featured Mark Oelschlager in its ‘Five Spot’ Q&A with the portfolio manager in an article titled, “Charge Into Wells Fargo, Charles Schwab.” November 2, 2012 | |||||
| Fidelity.com interviewed Mark Oelschlager for its article, “Are fallen stars like Apple a buy?” November 19, 2012 | ||||||
December 2012 | Reuters interviewed Robert Stimpson for comments on Research in Motion. Mr. Stimpson was quoted in the article, “For tech investors, it’s hard to know when to bolt.” December 27, 2012 | |||||
January 2013 | Advisor Perspectives featured Mark Oelschlager’s Economic Update, “Is the Fed Doing the Right Thing?” January 28, 2013 | |||||
February 2013 | The Wall Street Journal, in its monthly fund analysis, recognized White Oak Select Growth Fund and Black Oak Emerging Technology Fund among “Category Kings” in their respective categories, Large-Cap Growth and Science & Technology. | |||||
| Forbes included Mark Oelschlager in its annual “Love Only One” stock competition, noting that Mr. Oelschlager had the third- best performance in the magazine’s 2012 contest for his pick of JP Morgan Chase. Article title: “If You Could Love Only One Stock in 2013.” February 7, 2013 | ||||||
| Dow Jones Newswires featured Pin Oak Equity Fund in its ‘Tip Sheet Profile’ titled, “Pin Oak Doesn’t Have Time for Short-Term Trends.” February 12, 2013 | ||||||
| The Wall Street Journal, in its monthly fund analysis, recognized White Oak Select Growth Fund and Red Oak Technology Select among “Category Kings” in their respective categories, Large- Cap Growth and Science & Technology. | ||||||
March 2013 | The Associated Press cited Red Oak Technology Select Fund as having a low allocation in Apple, Inc. in an article about the stock’s popularity with mutual funds. Article title: “No Apple Here.” March 24, 2013 | |||||
April 2013 | Advisor Perspectives featured Mark Oelschlager’s First Quarter Market Commentary. April 9, 2013 | |||||
| Charles Schwab named Red Oak Technology Select Fund to its Mutual Fund OneSource Select List™ for the second quarter of 2013. | ||||||
| ||||||
| HIGHLIGHTS from the 2013 FISCAL YEAR | ||
| October 31, 2012 to October 31, 2013 (Unaudited) | ||
July 2013 | Advisor Perspectives featured Mark Oelschlager’s Second Quarter Market Commentary. July 3, 2013 | |||||
| Charles Schwab named Red Oak Technology Select Fund to its Mutual Fund OneSource Select List™ for the third quarter of 2013. | ||||||
| The Wall Street Journal, in its quarterly fund analysis, recognized White Oak Select Growth Fund among “Category Kings” in the Large-Cap Growth peer group. Pin Oak Equity Fund was recognized among “Five-Year Best Performers.” July 8, 2013 | ||||||
| Fidelity.com interviewed Mark Oelschlager on current investment opportunities for the article, “7 Stock Bargains.” July 25, 2013 | ||||||
August 2013 | Zacks Investment Research highlighted Red Oak Technology Select Fund among technology funds identified as a “Strong Buy” in its article, “Zacks #1 Ranked Technology Mutual Funds.” August 14, 2013 | |||||
September 2013 | Kiplinger’s Personal Finance ranked Pin Oak Equity Fund in its list of “best-performing midsize-company stock funds.” September 2013 issue | |||||
October 2013 | Charles Schwab named Red Oak Technology Select Fund to its Mutual Fund OneSource Select List™ for the fourth quarter of 2013. | |||||
| ||||||
READ MORE AT WWW.OAKFUNDS.COM
| TABLE of CONTENTS | ||||||||
| Performance Update | ||||||||
| 1 | ||||||||
| 4 | ||||||||
| 6 | ||||||||
| 8 | ||||||||
| 10 | ||||||||
| 12 | ||||||||
| 14 | ||||||||
| Important Disclosures | 16 | |||||||
| Disclosure of Fund Expenses | 18 | |||||||
| Financial Statements | ||||||||
| 20 | ||||||||
| 38 | ||||||||
| 40 | ||||||||
| 42 | ||||||||
| 46 | ||||||||
| 60 | ||||||||
| 70 | ||||||||
| 71 | ||||||||
James D. Oelschlager Chief Investment Officer & Portfolio Manager
Mark W. Oelschlager, CFA Portfolio Manager
Robert D. Stimpson, CFA Portfolio Manager | The White Oak Select Growth Fund (“The Fund”) gained 26.65% for the fiscal year ended October 31, 2013, while the comparative index, the S&P 500 Index, rose 27.18%, and the Lipper Large-Cap Growth peer group average increased 29.24%. Over the past five years, the Fund has returned 17.64% annually, compared to the S&P 500’s 15.17% and peer group’s 15.71% gain.
The fiscal year 2013 saw stocks appreciate due to a rise in earnings and an expansion in the valuation multiple assigned by investors. The low inflation environment and stable economic outlook supported both earnings growth and the rise in valuation. Many commodities have fallen to a 3-year low, and the slowdown in emerging markets has kept inflationary pressures at bay. Falling energy prices have benefited the market in two ways. Energy can be a major input cost for manufacturers, who then pass the price increases through to shoppers. Higher gasoline prices are also painful to consumers. Therefore, a drop in energy prices, along with $3 a gallon gasoline nationwide, has been a stimulus to consumers and energy intensive businesses. Indeed, the Consumer Discretionary sector was the top-performing segment of the S&P 500 over the last 12 months.
The Fund’s performance compared to the benchmark S&P 500 Index is tied to its underexposure to the Consumer Discretionary and Industrials sectors. Both groups benefit from the drop in energy prices. The natural gas revolution, created through the widespread proliferation of fracking and horizontal drilling, has kept manufacturers’ input costs down. Meanwhile, lower gasoline prices have boosted consumer sentiment and spending. A rise in long-term bond yields has dampened the housing market recovery, but not sufficiently to hurt consumer sentiment. Speculation over the end of the Federal Reserve’s quantitative easing has added to long-term concerns over the direction of bond yields. Weakness in the bond market aided the return of equities in 2013.
In general, the underlying fundamentals within the portfolio’s companies remain strong, with profit margins high and healthy balance sheets, despite the persistent Eurozone concerns and a slowdown in China. Indeed, stocks paid little attention to the 2013 shutdown of the US government and difficult rollout of the Affordable Care Act (Obamacare). The ability to overlook the intermittent political volatility highlights the importance of underlying fundamentals to equity investors, rather than the 24-hour news media hype. |


The Fund’s top-performing holding was Charles Schwab, which gained 69%. The financial services firm had suffered under the weight of low interest rates and was forced to waive hundreds of millions of dollars in fees each quarter to sustain the value of its money market funds. With a rise in rates and possible end to the Fed’s external involvement in the fixed-income market, the earnings power of Charles Schwab has the potential to improve dramatically. Online retailer Amazon.com was the next best-performer, rising 56%, reflecting the resilience of consumer spending.
Laggards included IBM, which failed to deliver on elevated expectations, following strong earnings in 2012. The technology giant fell 6%. Other disappointments include mining company Goldcorp, though a small position in the Fund, and generic pharmaceuticals company Teva.
Annual Report | October 31, 2013 |
1 |
White Oak Select Growth Fund |
The macroeconomic environment has been supportive for stocks despite negative political rhetoric, lackluster employment growth and concerns over the debt ceiling. Strict capital discipline over the last few years has helped companies keep profitability high, and a pattern of returning capital to shareholders has been welcomed by equity investors. The result is a low-inflation environment where corporate earnings remain healthy and valuations are attractive. While it is impossible to predict what will happen in 2014, the characteristics that tend to mark turning points for equities, such as excess optimism and extreme valuations, remain distant.
As in fiscal year 2012, the Fund took advantage of expiring tax losses by placing trades to reset the cost basis of many holdings which had significant capital gains. This trading allowed the Fund to lower the level of future tax liabilities, but drove portfolio turnover artificially higher compared to the Fund’s historical average. This trading is atypical and does not represent a change in management style or philosophy regarding the Fund’s low turnover, buy-and-hold approach.
Thank you for your investment with Oak Associates Funds.
Mutual fund investing involves risk, including the possible loss of principal. The value of the Fund’s investments will vary from day to day in response to the activities of individual companies and general market and economic conditions. Due to the limited number of underlying investments, the Fund is more susceptible to the price movements of any one holding and thus may be more volatile than a more broadly diversified portfolio.
2 |
1-888-462-5386 | www.oakfunds.com |
| Manager Discussion & Analysis | ||
| All data below as of October 31, 2013 (Unaudited) |
Fund Data
| ||||
Ticker Symbol | WOGSX | |||
Share Price | $53.66 | |||
Total Net Assets | $253.8M | |||
Portfolio Turnover | 89% | |||
Industry Weightings^
| ||||
Information Technology | 34.5% | |||
Financials | 29.3% | |||
Health Care | 19.4% | |||
Energy | 7.1% | |||
Consumer Discretionary | 5.0% | |||
Materials | 0.3% | |||
Cash & Other Assets | 4.4% | |||
Top 10 Holdings^
| ||||
1. Google, Inc. - Class A | 7.0% | |||
2. JPMorgan Chase & Co. | 6.0% | |||
3. Cisco Systems, Inc. | 5.6% | |||
4. KLA-Tencor Corp. | 5.5% | |||
5. Amazon.com, Inc. | 5.0% | |||
6. Amgen, Inc. | 4.9% | |||
7. ACE, Ltd. | 4.9% | |||
8. US Bancorp | 4.7% | |||
9. The Charles Schwab Corp. | 4.7% | |||
10. Stryker Corp. | 4.3% | |||
^ Percentages are based on net assets. Holdings are subject to change.
Growth of $10,000 Chart
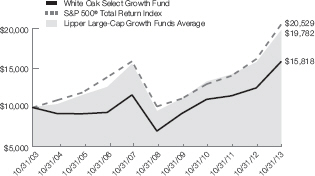
The chart above represents historical performance of a hypothetical investment of $10,000 in the Fund over the past 10 years (or for the life of the Fund if shorter). Past performance does not guarantee future results. This chart does not reflect the deduction of taxes that a shareholder would pay on Fund distributions or the redemption of Fund shares.
| Average Annual Total Return | ||||||||||
1 Year Return | 3 Year Return | 5 Year Return | 10 Year Return | Inception to Date | ||||||
White Oak Select Growth Fund | 26.65% | 12.75% | 17.64% | 4.69% | 8.38%* | |||||
S&P 500® Total Return Index1 | 27.18% | 16.56% | 15.17% | 7.46% | 9.06%* | |||||
Lipper Large-Cap Growth Funds Average2 | 29.24% | 14.89% | 15.71% | 7.06% | 8.15%** | |||||
*Since 08/03/1992 **Since 07/31/1992 | Gross Expense Ratio (Per the current prospectus): 1.16% |
The performance data quoted represents past performance. Past performance does not guarantee future results. The investment return and principal value of an investment will fluctuate so that an investor’s shares, when redeemed, may be worth more or less than their original cost and current performance may be lower or higher than the performance quoted. For performance data current to the most recent month-end, please visit www.oakfunds.com or call 1-888-462-5386.
1 Standard & Poor’s is the source and owner of the S&P Index data. 2 Lipper Inc. is the source and owner of the Lipper Classification data. See Pages 16 and 17 for additional disclosure.
Annual Report | October 31, 2013 |
3 |
Mark W. Oelschlager, CFA Portfolio Manager | Pin Oak Equity Fund rose 31.94% for the year ended October 31, 2013, while the comparative index, the S&P 500 Index, gained 27.18% and the Lipper Multi-Cap Core Average returned 29.38%. For the last five years, the Fund’s cumulative return was 179.36%, versus 102.63% for the S&P 500 and 102.80% for the Lipper.
The five-year performance is of particular interest because five years ago the nation was in the midst of a financial crisis. People were scared, and the stock market was plummeting. Rather than running for cover, which was very popular at the time, we kept our focus on the long-term and uncovered numerous opportunities in the cyclical areas of the market, such as technology and consumer discretionary sectors. This boosted returns. That said, we were not content to rest on the fruits of this win, and we have continued to try to identify exploitable anomalies in the market at the same time managing with an eye on risk-reward. |

This was the fifth consecutive fiscal year that the Fund posted a positive return for shareholders, and, outside of the 6.92% posted in fiscal 2011, the worst year of the five was 15.22%. It is highly unlikely that the next five years will be as fruitful, and in accordance with this we have pulled back on the risk profile of the portfolio.
In last year’s report we mentioned the bubble in the higher-yielding parts of the stock market and that it was creating relative opportunity in the more cyclical areas of the market. Over the past year the bubble has deflated a bit, as the cyclicals have outperformed the yield plays. The latter still appear dearly priced relative to the market, but not as egregiously as they were a year ago.
We are maintaining a large position in the financial sector, believing that investors’ focus on short-term (depressed) earnings power is creating mis-pricings, particularly among the lenders. Interestingly, even though its earnings haven’t dramatically improved, one of the Fund’s star performers of the past year was Charles Schwab, which returned nearly 70%. Schwab’s bottom line has been hurt by low interest rates, and the mere talk by the Fed of ending its quantitative easing program prompted investors to factor in the positive effect of higher rates on the company.
Our media holdings also generated robust gains, with Interpublic Group, which raised its dividend 25%, and Twenty-First Century Fox, which spun off its publishing division, both rising more than 60%.
The laggards, drilling contractor Diamond Offshore, integrated oil company Royal Dutch Shell, and miner Teck Resources, all came from the commodity area, which is being hurt by the slowdown in the emerging markets. This is a small portion of the portfolio, but energy is starting to look more attractive and we are starting to poke around a bit more there.
As was the case in fiscal 2012, in order to maximize the tax efficiency of the Fund by taking advantage of expiring losses, we did an unusually large amount of trading before the end of the fiscal year, which resulted in an elevated turnover ratio. Be assured that this does not represent any change to our investment philosophy. Also, we do not expect to repeat this exercise in fiscal 2014 or thereafter.
Mutual fund investing involves risk, including the possible loss of principal. The value of the Fund’s investments will vary from day to day in response to the activities of individual companies and general market and economic conditions.
The following has been provided to you for informational purposes only, and should not be considered tax advice. Please consult your tax advisor for further assistance.
4 |
1-888-462-5386 | www.oakfunds.com |
| Manager Discussion & Analysis | ||
| All data below as of October 31, 2013 (Unaudited) |
Fund Data | ||||
Ticker Symbol | POGSX | |||
Share Price | $43.07 | |||
Total Net Assets | $81.4M | |||
Portfolio Turnover | 117% | |||
Industry Weightings^ | ||||
Financials | 37.5% | |||
Information Technology | 26.0% | |||
Consumer Discretionary | 12.9% | |||
Energy | 7.7% | |||
Industrials | 7.6% | |||
Consumer Staples | 4.9% | |||
Materials | 1.3% | |||
Cash & Other Assets | 2.1% |
Top 10 Holdings^ | ||||
1. Wells Fargo & Co. | 6.0 | % | ||
2. The Charles Schwab Corp. | 5.0 | % | ||
3. Microsoft Corp. | 4.9 | % | ||
4. Amdocs, Ltd. | 4.8 | % | ||
5. Twenty-First Century Fox, Inc. | 4.6 | % | ||
6. Google, Inc. - Class A | 4.4 | % | ||
7. Capital One Financial Corp. | 4.4 | % | ||
8. Raytheon Co. | 4.2 | % | ||
9. CIT Group, Inc. | 3.8 | % | ||
10. The Travelers Cos., Inc. | 3.3 | % | ||
| ^ | Percentages are based on net assets. Holdings are subject to change. |
Growth of $10,000 Chart
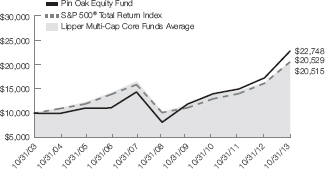
The chart above represents historical performance of a hypothetical investment of $10,000 in the Fund over the past 10 years (or for the life of the Fund if shorter). Past performance does not guarantee future results. This chart does not reflect the deduction of taxes that a shareholder would pay on Fund distributions or the redemption of Fund shares.
Average Annual Total Return
| ||||||||||
1 Year Return | 3 Year Return | 5 Year Return | 10 Year Return | Inception to Date | ||||||
Pin Oak Equity Fund | 31.94% | 17.57% | 22.81% | 8.57% | 7.35%* | |||||
S&P 500® Total Return Index1 | 27.18% | 16.56% | 15.17% | 7.46% | 9.06%* | |||||
Lipper Multi-Cap Core Funds Average2 | 29.38% | 14.56% | 15.19% | 7.45% | 9.12%** | |||||
*Since 08/03/1992 **Since 07/31/1992 | Gross Expense Ratio (Per the current prospectus): 1.21% | |||||||||
The performance data quoted represents past performance. Past performance does not guarantee future results. The investment return and principal value of an investment will fluctuate so that an investor’s shares, when redeemed, may be worth more or less than their original cost and current performance may be lower or higher than the performance quoted. For performance data current to the most recent month-end, please visit www.oakfunds.com or call 1-888-462-5386.
1 Standard & Poor’s is the source and owner of the S&P Index data. 2 Lipper Inc. is the source and owner of the Lipper Classification data. See Pages 16 and 17 for additional disclosure.
Annual Report | October 31, 2013 |
5 |
Robert D. Stimpson, CFA Portfolio Manager | The Rock Oak Core Growth Fund (“The Fund”) rose 29.51% for the fiscal year ending October 31, 2013. The Fund outperformed the benchmark S&P 500 Index’s gain of 27.18%. US stocks had a strong year as a renewed interest in equities developed following a multi-year preference for fixed-income and yield-oriented strategies. In the five-year period since October 2008, the Fund has produced an annualized return of 15.95%, compared to 15.17% for the S&P 500.
The fiscal year 2013 saw US stocks profit from solid earnings growth and an expansion in the valuation multiple assigned by investors. The strong performance of stocks has also attracted investors back into the equity markets and higher risk asset classes. As each quarter passes, the trauma of the 2008 subprime crisis becomes less memorable. Indeed, the Fund and the S&P 500 have gained over 100% since the early-2009 market bottom. |

Throughout the year, the economic recovery progressed but at a tepid rate. Job growth has been persistently slow to rebound and improvements in the housing market waned as bond yields ticked higher. However, inflationary pressures remain low, due to falling commodity prices and cheaper gasoline, a meaningful expense to consumers. The mixed economic data has kept the Federal Reserve policy of quantitative easing intact and the risks of a change in interest rates remains distant. This is a situation that stocks enjoy. They receive the benefits of growth without the prospect of a sudden change in policy to affect their valuation multiples. As long as earnings growth is healthy and investor sentiment remains positive, the environment favors equities.
The most dramatic event in the political landscape of 2013 was the short-term shutdown of the US government and related debt-ceiling debates. While disruptive and newsworthy, the events only added short-term volatility to the markets. The stock market overlooked the noise created by the media and politicians and focused on the underlying fundamentals of the economic recovery. Likewise, while problems with the Affordable Care Act and its implementation continue, they have yet to alter the direction of stocks or affect sentiment.
Compared to the S&P 500, the Fund’s overweight to the Technology sector boosted its performance during the fiscal year. The tech sector’s positive attributes included its attractive valuation, high profit margins and strong capital deployment discipline. The Fund’s best-performing stock for the year was Western Digital Corp, which rose 107%. The disc drive maker saw both earnings growth and multiple expansion drive its shares higher. Genomics tool-maker Illumina was also a standout-performer, gaining 97%. The Fund’s largest laggard was Apple Inc., dropping 16%. The stock had been a top-performer in 2012 but has struggled this year as investors speculate over what will drive future growth for the consumer electronics giant.
Going forward, the Rock Oak Fund remains focused on attractively valued companies with strong growth prospects, which have also demonstrated a commitment to shareholder value creation. Over the course of the year, the Fund has shed several of its mega-cap holdings, preferring opportunity and value available elsewhere. With pessimism over political deadlock and Obamacare keeping excess enthusiasm at bay, the resulting outlook for US stocks remains attractive due to the not-too-hot, not-too-cold economic environment. A leadership change at the Federal Reserve may prolong this condition, as incoming Chairman Janet Yellen is known for favoring a more cautious withdrawal of stimulus.
Thank you for your investment with Oak Associates Funds.
Mutual fund investing involves risk, including the possible loss of principal. The value of the Fund’s investments will vary from day to day in response to the activities of individual companies and general market and economic conditions.
6 |
1-888-462-5386 | www.oakfunds.com |
| Manager Discussion & Analysis | ||
| All data below as of October 31, 2013 (Unaudited) |
Fund Data
Ticker Symbol | RCKSX | |
Share Price | $15.04 | |
Total Net Assets | $7.5M | |
Portfolio Turnover | 65% | |
Industry Weightings^
| ||
Information Technology | 38.4% | |
Financials | 13.8% | |
Consumer Discretionary | 12.8% | |
Health Care | 9.5% | |
Industrials | 8.4% | |
Energy | 6.3% | |
Consumer Staples | 2.6% | |
Materials | 2.0% | |
Cash & Other Assets | 6.2% | |
Top 10 Holdings^
| ||
1. Illumina, Inc. | 4.6% | |
2. Wynn Resorts, Ltd. | 4.4% | |
3. Genworth Financial, Inc. | 4.3% | |
4. CA, Inc. | 4.2% | |
5. Computer Sciences Corp. | 3.7% | |
6. Salesforce.com, Inc. | 3.6% | |
7. Comerica, Inc. | 3.5% | |
8. Western Digital Corp. | 3.4% | |
9. SunTrust Banks, Inc. | 3.2% | |
10. Workday, Inc. - Class A | 3.2% | |
^ Percentages are based on net assets. Holdings are subject to change.
Growth of $10,000 Chart
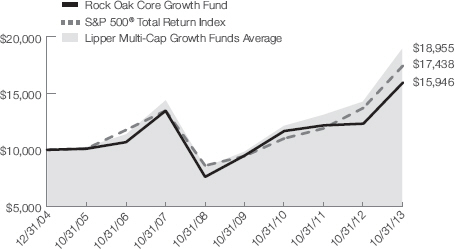 | This chart represents historical performance of a hypothetical investment of $10,000 in the Fund over the past 10 years (or for the life of the Fund if shorter). Past performance does not guarantee future results. This chart does not reflect the deduction of taxes that a shareholder would pay on Fund distributions or the redemption of Fund shares. Fee waivers are in effect; if they had not been in effect, performance would have been lower. |
Average Annual Total Return | ||||||||||
1 Year Return | 3 Year Return | 5 Year Return | 10 Year Return | Inception to Date* | ||||||
Rock Oak Core Growth Fund | 29.51% | 10.98% | 15.95% | – | 5.42% | |||||
S&P 500® Total Return Index1 | 27.18% | 16.56% | 15.17% | – | 6.50% | |||||
Lipper Multi-Cap Growth Funds Average2 | 30.79% | 15.50% | 16.95% | – | 7.31% | |||||
*Since 12/31/2004 | Gross/Net Expense Ratio (Per the current prospectus): 1.80%/1.26% | |||||||||
The Adviser has contractually agreed for a period of one year from February 28, 2013 to waive all or a portion of its fee for the Fund (and to reimburse expenses to the extent necessary) in order to limit Fund total operating expenses (excluding Acquired Fund Fees and Expenses) to an annual rate of not more than 1.25% of average daily net assets. This contractual fee waiver may only be terminated by the Board of Trustees of the Trust.
The performance data quoted represents past performance. Past performance does not guarantee future results. The investment return and principal value of an investment will fluctuate so that an investor’s shares, when redeemed, may be worth more or less than their original cost and current performance may be lower or higher than the performance quoted. For performance data current to the most recent month-end, please visit www.oakfunds.com or call 1-888-462-5386.
1 Standard & Poor’s is the source and owner of the S&P Index data. 2 Lipper Inc. is the source and owner of the Lipper Classification data. See Pages 16 and 17 for additional disclosure.
Annual Report | October 31, 2013 |
7 |
Robert D. Stimpson, CFA Portfolio Manager
| The River Oak Discovery Fund (“The Fund”) rose 31.50% for the fiscal year ending October 31, 2013, while the benchmark Russell 2000 Growth Index gained 39.84%. The Fund lagged the benchmark index due to its underexposure to healthcare and industrial stocks.
US stocks posted strong gains in fiscal year 2013. Solid earnings and an increase in the valuation multiple assigned to companies by investors drove prices higher. A rise in bond yields mid-year also accelerated the flight out of fixed-income and yield-oriented investments back into equities. This reallocation benefited large-caps initially, but spread to higher-risk segments of the market during the year. The outperformance of small-cap stocks, which offer more beta than large-caps, is a reflection of their higher risk/reward profile. |
Throughout the fiscal year, economic data continued to be lackluster. Job growth has remained stagnant and higher interest rates have slowed the housing market recovery. However, lower energy and fuel costs, combined with the overall low inflation environment, helped boost consumer sentiment and spending. Gasoline, a sensitive expense for US consumers, has retreated to around $3 nationwide. A slowdown in international markets has also kept commodity prices depressed, promoting the low inflation, slow growth scenario that stocks enjoy. The mixed macroeconomic outlook supports the Federal Reserve’s continued policy of sustained quantitative easing stimulus. A change in leadership at the Fed next year is also likely to support further accommodative policies as incoming Chairman Janet Yellen has expressed concern over withdrawing stimulus prematurely.
The short-term shutdown of the US government, debt-ceiling debate, and launch of the Affordable Care Act (colloquially known as Obamacare) dominated the media during the year. Stocks have done well to overlook the news and political frenzy and instead have focused on the economy and company fundamentals. The problems associated with the rollout of the insurance exchanges and individual mandate might affect economic growth in 2014, but it is still too early to tell whether the present attempt at universal insurance coverage will meet its end goal effectively or need massive revamping.
The improvement in consumer confidence and investor sentiment ultimately bodes well for small-cap stocks. Their domestic focus avoids the uncertainties related to emerging markets and Europe’s weak economies. The strong performance of the segment is also likely to benefit from future reallocation of capital. Historically, small-cap stocks remain one of the best-performing segments of the market over the long-run.
The Fund’s strongest performer this fiscal year was CTrip.com International. The Chinese online travel company, which had been a laggard in 2012, rose 171%. Boston Beer Company was the second best performing security, gaining 113%. The gains seen by the maker of Samuel Adams Beer reflects the dual benefits of earnings and valuation multiple expansion. The Fund’s two worst-performing stocks were both coal companies. Walter Energy and Alpha Natural Resources dropped 54% and 47%, respectively, on weak coal prices, concerns over regulations and weaker Chinese demand. Both positions were eventually sold. Compared to the Russell 2000 Growth Index, the Fund was underweight industrial and healthcare stocks. Both sectors, which had performed well in 2012, achieved strong returns again in 2013. The Fund underperformed the benchmark this year as a result of the lack of exposure to these areas of strength.
Looking into 2014, the recent fiscal year performance of US stocks is a strong signal that investors may be willing to once again embrace higher-risk asset classes. We believe small-cap stocks continue to offer attractive return potential. The Fund is committed to seeking out niche companies with a strong commitment to shareholder value creation.
Thank you for your investment with Oak Associates Funds.
Mutual fund investing involves risk, including the possible loss of principal. Funds that emphasize investments in smaller companies generally will experience greater price volatility.
8 |
1-888-462-5386 | www.oakfunds.com |
| Manager Discussion & Analysis | ||
| All data below as of October 31, 2013 (Unaudited) |
Fund Data
| ||||
Ticker Symbol | RIVSX | |||
Share Price | $17.70 | |||
Total Net Assets | $13.3M | |||
Portfolio Turnover | 63% | |||
Industry Weightings^
| ||||
Information Technology | 37.4% | |||
Consumer Discretionary | 19.5% | |||
Financials | 15.3% | |||
Consumer Staples | 8.1% | |||
Health Care | 7.5% | |||
Energy | 4.1% | |||
Industrials | 2.7% | |||
Cash & Other Assets | 5.4% | |||
Top 10 Holdings^
| ||||
1. Assurant, Inc. | 4.1% | |||
2. MercadoLibre, Inc. | 3.7% | |||
3. Hollysys Automation Technologies, Ltd. | 3.6% | |||
4. 3D Systems Corp. | 3.6% | |||
5. United Therapeutics Corp. | 3.4% | |||
6. Ctrip.com International, Ltd. ADR | 3.4% | |||
7. Capella Education Co. | 3.3% | |||
8. Cubist Pharmaceuticals, Inc. | 3.1% | |||
9. LeapFrog Enterprises, Inc. | 3.1% | |||
10. Unisys Corp. | 3.0% | |||
^ Percentages are based on net assets. Holdings are subject to change.
Growth of $10,000 Chart
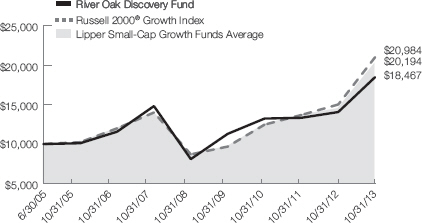 | This chart represents historical performance of a hypothetical investment of $10,000 in the Fund over the past 10 years (or for the life of the Fund if shorter). Past performance does not guarantee future results. This chart does not reflect the deduction of taxes that a shareholder would pay on Fund distributions or the redemption of Fund shares. Fee waivers are in effect; if they had not been in effect, performance would have been lower. |
Average Annual Total Return | ||||||||||
1 Year Return | 3 Year Return | 5 Year Return | 10 Year Return | Inception to Date* | ||||||
River Oak Discovery Fund | 31.50% | 11.80% | 17.95% | – | 7.64% | |||||
Russell 2000® Growth Index1 | 39.84% | 19.00% | 19.27% | – | 9.30% | |||||
Lipper Small-Cap Growth Funds Average2 | 37.41% | 18.14% | 19.22% | – | 8.62% | |||||
*Since 06/30/2005 | Gross/Net Expense Ratio (Per the current prospectus): 1.63%/1.36% | |||||||||
The Adviser has contractually agreed for a period of one year from February 28, 2013 to waive all or a portion of its fee for the Fund (and to reimburse expenses to the extent necessary) in order to limit Fund total operating expenses (excluding Acquired Fund Fees and Expenses) to an annual rate of not more than 1.35% of average daily net assets. This contractual fee waiver may only be terminated by the Board of Trustees of the Trust.
The performance data quoted represents past performance. Past performance does not guarantee future results. The investment return and principal value of an investment will fluctuate so that an investor’s shares, when redeemed, may be worth more or less than their original cost and current performance may be lower or higher than the performance quoted. For performance data current to the most recent month-end, please visit www.oakfunds.com or call 1-888-462-5386.
1 Russell Investments is the source and owner of the Russell Index data. 2 Lipper Inc. is the source and owner of the Lipper Classification data. See Pages 16 and 17 for additional disclosure.
Annual Report | October 31, 2013 |
9 |
Mark W. Oelschlager, CFA Portfolio Manager
| Red Oak Technology Fund rose 40.76% for the year ended October 31, 2013, while the comparative index, the NASDAQ 100 Index, which includes holdings within sectors beyond just technology, gained 29.49%, and the Lipper Science and Technology Average rose 31.95%. For the last five years, the Fund’s cumulative return was 180.05%, versus 165.98% for the NASDAQ 100 and 132.29% for the Lipper.
Technology was one of the market’s best-performing sectors over the past twelve months, as economic worries eased a bit and profit margins stayed elevated. Free cash flow production and conservative capital allocation remain positive characteristics of the sector. |
Perhaps the most prominent issue in tech stock investing these days is the effect of cloud computing, which entails the use of offsite servers in lieu of onsite infrastructure. Rather than having all their applications and data residing in-house, as they have traditionally done, many corporations are choosing to move them to “the cloud,” where they are accessed via the Internet. This trend is generating excitement about the purveyors of these services and concern about those who serve the traditional space, which has contributed to a bit of a dichotomy in the sector in terms of valuations. Empirical Research Partners segmented the tech stocks and discovered that the “high-flyers,” a group with high valuations and fast sales growth that also happens to include many cloud companies, are trading at an unusually high premium to the rest of the sector. At the same time, the organizations that are viewed as having obsolescence risk are trading at steep discounts, with many offering free cash flow yields of around 10%. Examples include IBM, Cisco Systems, Oracle, EMC, Hewlett-Packard, Microsoft and Intel.
Historically with tech stocks it has paid to fade excitement and embrace controversy. We think this time will be no different. While cloud computing is likely here to stay, we believe “old tech” is likely to outperform the cloud plays, given the massive gap in expectations.
The Fund’s strong performers over the past year included disk drive company Western Digital, database marketer Alliance Data Systems, printer giant Lexmark, and hardware maker Hewlett Packard. It is interesting that Lexmark and HP were noted in last year’s report as two of the worst performers.
Laggards included iPhone seller Apple and “old tech” companies EMC and IBM. We have long been torn on Apple, enticed by its strong returns on capital, attractive valuation and “lock-in” effect of its devices, but uncomfortable with the sustainability of its dominance, not to mention the unrivaled popularity of its stock with investors, analysts and portfolio managers. The stock was/is a modest position in the Fund.
Mutual fund investing involves risk, including the possible loss of principal. Funds that emphasize investments in technology generally will experience greater price volatility. There are additional risks associated with investing in a single-sector fund, including greater sensitivity to economic, political, or regulatory developments impacting the sector.
10 |
1-888-462-5386 | www.oakfunds.com |
| Manager Discussion & Analysis | ||
| All data below as of October 31, 2013 (Unaudited) |
Fund Data
| ||||
| ||||
Ticker Symbol | ROGSX | |||
Share Price | $13.74 | |||
Total Net Assets | $105.6M | |||
Portfolio Turnover | 15% | |||
Industry Weightings^
| ||||
| ||||
Information Technology | 85.9% | |||
Industrials | 7.3% | |||
Consumer Discretionary | 2.2% | |||
Cash & Other Assets | 4.6% | |||
Top 10 Holdings^
| ||||
| ||||
1. Alliance Data Systems Corp. | 5.2% | |||
2. Northrop Grumman Corp. | 4.7% | |||
3. Google, Inc. - Class A | 4.6% | |||
4. Oracle Corp. | 4.5% | |||
5. KLA-Tencor Corp. | 4.1% | |||
6. Cisco Systems, Inc. | 4.1% | |||
7. Check Point Software Technologies, Ltd. | 3.8% | |||
8. Accenture PLC - Class A | 3.8% | |||
9. Western Digital Corp. | 3.8% | |||
10. Symantec Corp. | 3.6% | |||
^ Percentages are based on net assets. Holdings are subject to change.
Growth of $10,000 Chart
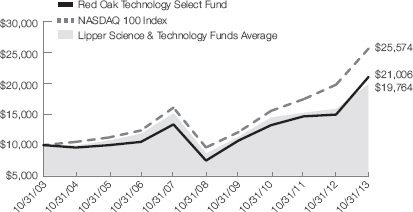
The chart above represents historical performance of a hypothetical investment of $10,000 in the Fund over the past 10 years (or for the life of the Fund if shorter). Past performance does not guarantee future results. This chart does not reflect the deduction of taxes that a shareholder would pay on Fund distributions or the redemption of Fund shares.
Average Annual Total Return | ||||||||||
| 1 Year Return | 3 Year Return | 5 Year Return | 10 Year Return | Inception to Date* | ||||||
Red Oak Technology Select Fund | 40.76% | 16.70% | 22.87% | 7.70% | 2.19% | |||||
NASDAQ 100 Index1 | 29.49% | 18.10% | 21.61% | 9.84% | 4.72% | |||||
Lipper Science & Technology Funds Average2 | 31.95% | 11.58% | 18.36% | 7.05% | 4.06% | |||||
*Since 12/31/1998 | Gross Expense Ratio (Per the current prospectus): 1.30% | |||||||||
The performance data quoted represents past performance. Past performance does not guarantee future results. The investment return and principal value of an investment will fluctuate so that an investor’s shares, when redeemed, may be worth more or less than their original cost and current performance may be lower or higher than the performance quoted. For performance data current to the most recent month-end, please visit www.oakfunds.com or call 1-888-462-5386.
1 NASDAQ is the source and owner of the NASDAQ Index data. 2 Lipper Inc. is the source and owner of the Lipper Classification data. See Pages 16 and 17 for additional disclosure.
Annual Report | October 31, 2013 |
11 |
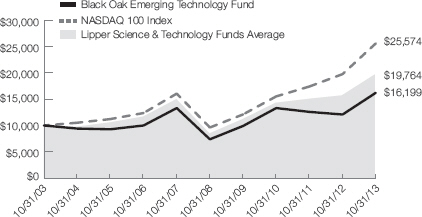
Robert D. Stimpson, CFA Portfolio Manager | The Black Oak Emerging Technology Fund (“The Fund”) rose 34.08% during the fiscal year ending October 31, 2013. During the same period, the NASDAQ Composite Index rose 29.49%. The Lipper Science & Technology peer group gained 31.95% for the fiscal year. Over the last five years, the Fund has achieved an annualized return of 17.04% per year.
The fiscal year 2013 saw strong returns for US stocks, due to continued economic improvements and a renewed appetite for risk. Stocks benefited from not only strong earnings, but also an expansion in the valuation multiple assigned by investors. For much of the last 5 years, the memory of the 2008 subprime crisis has permeated the markets, causing fixed-income and yield-based investments to garner much of the capital flows. Over the last year however, stocks have regained investors’ attention. The S&P 500 has risen over 100% from the early-2009 market bottom and the performance has swayed investors to reconsider their risk aversion. |
Throughout the year, economic data remained muted and higher bond yields slowed the housing market recovery. Nevertheless, the higher home prices and a decline in inflationary pressures promoted better consumer spending and sentiment. Many commodities have fallen to 3-year lows while gasoline, an important expense for consumers, has dropped to around $3 per gallon nationwide.
The Fund’s focus on emerging technology stocks enhanced returns for the fiscal year compared to the NASDAQ Composite. The technology sector, however, lagged other economically sensitive sectors, such as financials and consumer discretionary. Investors’ appetite for large-cap stocks remains pervasive even though higher-risk asset classes are showing signs of increasing investor interest.
The Fund’s top-performing stock for the year was Western Digital Corp, which rose 107% and was among the five largest holdings. The disc drive maker saw both earnings growth and multiple expansion drive its shares higher. 3D Systems, a maker of three-dimensional printers, gained 113%, but was a small position in the Fund due to its valuation and high levels of hype surrounding 3D printing technology. VMWare was the Fund’s largest detractor to performance. The server virtualization company fell 22% during the fiscal year 2013 as results failed to match elevated expectations.
Going forward, the Black Oak Fund will continue to seek niche technology companies with solid earnings prospects that are trading at favorable valuations. Within the technology sector, excess cash flow has traditionally been aggressively reinvested in the business. Yet with a renewed interest in shareholder-friendly capital allocation practices, firms which demonstrate a commitment to shareholder value – and have the strong cash flow to support it – may attract the first wave of investors looking for high growth stocks.
Thank you for your investment with Oak Associates Funds.
Mutual fund investing involves risk, including the possible loss of principal. Funds that emphasize investments in technology generally will experience greater price volatility. There are additional risks associated with investing in a single-sector fund with a limited number of holdings versus a more broadly diversified portfolio, including greater sensitivity to economic, political, or regulatory developments impacting the sector. Funds that emphasize investments in smaller or mid-sized companies may experience greater price volatility.
12 |
1-888-462-5386 | www.oakfunds.com |
| Manager Discussion & Analysis | ||
| All data below as of October 31, 2013 (Unaudited) |
Fund Data
| ||||
| ||||
Ticker Symbol | BOGSX | |||
Share Price | $3.58 | |||
Total Net Assets | $29.9M | |||
Portfolio Turnover | 58% | |||
Industry Weightings^
| ||||
| ||||
Information Technology | 90.2% | |||
Health Care | 5.6% | |||
Industrials | 1.8% | |||
Cash & Other Assets | 2.4% | |||
Top 10 Holdings^
| ||||
| ||||
1. Apple, Inc. | 5.2% | |||
2. Qualcomm, Inc. | 4.9% | |||
3. Salesforce.com, Inc. | 4.9% | |||
4. CA, Inc. | 4.8% | |||
5. Computer Sciences Corp. | 4.2% | |||
6. Linear Technology Corp. | 4.2% | |||
7. Cognizant Technology Solutions Corp. - Class A | 4.0% | |||
8. Lam Research Corp. | 3.9% | |||
9. Western Digital Corp. | 3.7% | |||
10. MercadoLibre, Inc. | 3.7% | |||
^ Percentages are based on net assets. Holdings are subject to change.
Growth of $10,000 Chart
| This chart represents historical performance of a hypothetical investment of $10,000 in the Fund over the past 10 years (or for the life of the Fund if shorter). Past performance does not guarantee future results. This chart does not reflect the deduction of taxes that a shareholder would pay on Fund distributions or the redemption of Fund shares. Fee waivers are in effect; if they had not been in effect, performance would have been lower. |
Average Annual Total Return | ||||||||||
| 1 Year Return | 3 Year Return | 5 Year Return | 10 Year Return | Inception to Date | ||||||
Black Oak Emerging Technology Fund | 34.08% | 6.79% | 17.04% | 4.94% | -7.69%* | |||||
NASDAQ 100 Index1 | 29.49% | 18.10% | 21.61% | 9.84% | 3.48%* | |||||
Lipper Science & Technology Funds Average2 | 31.95% | 11.58% | 18.36% | 7.05% | 1.58%** | |||||
*Since 12/29/2000 **Since 12/31/2000 | Gross/Net Expense Ratio (Per the current prospectus): 1.45%/1.36% | |||||||||
The Adviser has contractually agreed for a period of one year from February 28, 2013 to waive all or a portion of its fee for the Fund (and to reimburse expenses to the extent necessary) in order to limit Fund total operating expenses (excluding Acquired Fund Fees and Expenses) to an annual rate of not more than 1.35% of average daily net assets. This contractual fee waiver may only be terminated by the Board of Trustees of the Trust.
The performance data quoted represents past performance. Past performance does not guarantee future results. The investment return and principal value of an investment will fluctuate so that an investor’s shares, when redeemed, may be worth more or less than their original cost and current performance may be lower or higher than the performance quoted. For performance data current to the most recent month-end, please visit www.oakfunds.com or call 1-888-462-5386.
1 NASDAQ is the source and owner of the NASDAQ Index data. 2 Lipper Inc. is the source and owner of the Lipper Classification data. See Pages 16 and 17 for additional disclosure.
Annual Report | October 31, 2013 |
13 |
Mark W. Oelschlager, CFA Portfolio Manager | Live Oak Health Sciences Fund rose 36.07% for the year ended October 31, 2013, while the comparative index, the S&P 500 Health Care Index 500 Index, gained 34.50%, and the Lipper Health and Biotech Average rose 41.60%.
Healthcare stocks continued their remarkable ascent in the face of the approaching launch date of the Affordable Care Act and even the implementation issues of the new law. The recent underperformance of the Fund is a result of not owning enough biotech stocks, which have been incredibly strong performers. We made a mistake by not building a larger position in the biotech group a couple years ago when it was out of favor. That said, we believe it would be just as big a mistake to add to the group at this point. Expectations have gone from subdued to ebullient, taking valuations to extreme levels. The interest and excitement in the group was confirmed by a recent biotech survey of analysts and portfolio managers by ISI Group. Of the 241 respondents (most of which follow all market sectors), 75% believe that biotech stocks will outperform the market in 2014, while only 9% think they will lag. Participants were highly optimistic about the continuation of favorable research and development productivity, FDA cooperation, and drug pricing. When conditions in an industry cannot get any better, when the |
valuations reflect it, and when everyone is on board, it seems to us that the downside greatly exceeds the upside. We do not know what the catalyst will be (perhaps an end of the Fed’s quantitative easing?), but we expect the biotechs to underperform.
The Affordable Care Act insurance exchanges were launched on October 1, and the difficulties with the website have been well-documented. A more relevant problem for the new healthcare law though may be the inability to get enough young and healthy people to sign up. If too few of these sign up, insurers will have to raise their rates to compensate for the greater risk of those in the pool. The higher prices would lead to even fewer young and healthy individuals signing up, which would force rates even higher, and so on until the entire market crumbled. The individual mandate requires everyone to purchase insurance, but the penalty for not doing so is modest (the greater of 1% of income or $95) in the first year and then increases. Nobody is talking about raising the penalty, but that may be the only way to lure enough people onto the exchanges to keep the law intact. There is a possibility that President Obama will waive the individual mandate for a year, just as he did for employers, but this would exacerbate the insurance market problem.
The drug distributors, a major focus of the Fund, were star performers, with McKesson and AmerisourceBergen both returning over 65%. Medical devices also stood out, with Boston Scientific leading the way on a 127% rise.
Incredibly, only one stock in the portfolio had a negative return: Teva Pharmaceutical, which is dealing with increased competition in the MS space.
Mutual fund investing involves risk, including the possible loss of principal. Funds that emphasize investments in health care generally will experience greater price volatility. There are additional risks associated with investing in a single-sector fund versus a more broadly diversified portfolio, including greater sensitivity to economic, political, or regulatory developments impacting the sector.
14 |
1-888-462-5386 | www.oakfunds.com |
| Manager Discussion & Analysis | ||
| All data below as of October 31, 2013 (Unaudited) |
Fund Data
| ||||
| ||||
Ticker Symbol | LOGSX | |||
Share Price | $18.83 | |||
Total Net Assets | $42.5M | |||
Portfolio Turnover | 12% | |||
Industry Weightings^
| ||||
| ||||
Health Care | 100.2% | |||
Cash & Other Assets and Liabilities | -0.2% | |||
Top 10 Holdings^
| ||||
| ||||
1. CR Bard, Inc. | 6.0% | |||
2. AmerisourceBergen Corp. | 5.5% | |||
3. Cardinal Health, Inc. | 5.4% | |||
4. McKesson Corp. | 5.2% | |||
5. Amgen, Inc. | 4.6% | |||
6. Becton Dickinson and Co. | 4.2% | |||
7. Boston Scientific Corp. | 3.9% | |||
8. Agilent Technologies, Inc. | 3.8% | |||
9. Pfizer, Inc. | 3.7% | |||
10. AstraZeneca PLC ADR | 3.6% | |||
^ Percentages are based on net assets. Holdings are subject to change.
Growth of $10,000 Chart
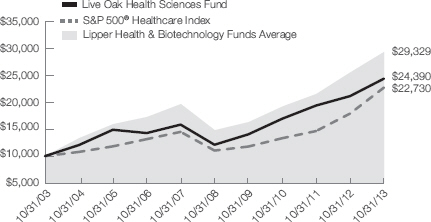
The chart above represents historical performance of a hypothetical investment of $10,000 in the Fund over the past 10 years (or for the life of the Fund if shorter). Past performance does not guarantee future results. This chart does not reflect the deduction of taxes that a shareholder would pay on Fund distributions or the redemption of Fund shares.
Average Annual Total Return | ||||||||||
1 Year Return | 3 Year Return | 5 Year Return | 10 Year Return | Inception to Date | ||||||
Live Oak Health Sciences Fund | 36.07% | 19.30% | 18.91% | 9.33% | 6.81%* | |||||
S&P 500® Healthcare Index1 | 34.50% | 21.80% | 16.90% | 8.56% | 6.01%* | |||||
Lipper Health & Biotechnology Funds Average2 | 41.60% | 24.04% | 20.33% | 11.36% | 8.27%** | |||||
*Since 06/29/2001 **Since 06/30/2001 | Gross Expense Ratio (Per the current prospectus): 1.24% | |||||||||
The performance data quoted represents past performance. Past performance does not guarantee future results. The investment return and principal value of an investment will fluctuate so that an investor’s shares, when redeemed, may be worth more or less than their original cost and current performance may be lower or higher than the performance quoted. For performance data current to the most recent month-end, please visit www.oakfunds.com or call 1-888-462-5386.
1 Standard & Poor’s is the source and owner of the S&P Index data. 2 Lipper Inc. is the source and owner of the Lipper Classification data. See Pages 16 and 17 for additional disclosure.
Annual Report | October 31, 2013 |
15 |
As of October 31, 2013 (Unaudited) |
Index Definitions and Disclosures
All indices are unmanaged and index performance figures include reinvestment of dividends but do not reflect any fees, expenses or taxes. Investors cannot invest directly in an index.
NASDAQ 100 Index – The NASDAQ 100 Index includes 100 of the largest domestic and international non-financial securities listed on The Nasdaq Stock Market based on market capitalization.
Russell 2000 Growth Index – The Russell 2000 Growth Index measures the performance of the small-cap growth segment of the U.S. equity universe. It includes those Russell 2000 companies with higher price-to-book ratios and higher forecasted growth values.
S&P 500 Health Care Index – The S&P 500 Health Care Index is a capitalization-weighted index that encompasses two main industry groups. The first includes companies who manufacture health care equipment and supplies or provide health care related services, including distributors of health care products, providers of basic health care services, and owners and operators of health care facilities and organizations. The second group consists of companies primarily involved in the research, development, production and marketing of pharmaceuticals and biotechnology products.
S&P 500 Index – The S&P 500 Index is a commonly recognized, market capitalization weighted index of 500 widely held equity securities, designed to measure broad U.S. equity performance.
Lipper Multi-Cap Core Funds – Funds that, by portfolio practice, invest in a variety of market-capitalization ranges without concentrating 75% of their equity assets in any one market-capitalization range over an extended period of time. Multi-cap core funds typically have average characteristics compared to the S&P SuperComposite 1500 Index.
Lipper Health/Biotechnology Funds – Funds that invest primarily in the equity securities of domestic companies engaged in health care, medicine, and biotechnology.
Lipper Large-Cap Growth Funds – Funds that, by portfolio practice, invest at least 75% of their equity assets in companies with market capitalizations (on a three-year weighted basis) above Lipper’s USDE large-cap floor. Large-cap growth funds typically have an above-average price-to-earnings ratio, price-to-book ratio, and three-year sales-per-share growth value, compared to the S&P 500 Index.
Lipper Multi-Cap Growth Funds – Funds that, by portfolio practice, invest in a variety of market capitalization ranges without concentrating 75% of their equity assets in any one market capitalization range over an extended period of time. Multi-cap growth funds typically have an above-average price-to-earnings ratio, price-to-book ratio, and three-year sales per-share growth value, compared to the S&P SuperComposite 1500 Index.
Lipper Science & Technology Funds – Funds that invest primarily in the equity securities of domestic companies engaged in science and technology.
Lipper Small-Cap Growth Funds – Funds that, by portfolio practice, invest at least 75% of their equity assets in companies with market capitalizations (on a three-year weighted basis) below Lipper’s USDE small-cap ceiling. Small-cap growth funds typically have an above-average
16 |
1-888-462-5386 | www.oakfunds.com |
| Important Disclosures | ||
| As of October 31, 2013 (Unaudited) |
price-to-earnings ratio, price-to-book ratio, and three-year sales-per-share growth value, compared to the S&P Small-Cap 600 Index.
Lipper, a Thomson Reuters Company, is the source and owner of the Lipper Classification data contained in this material and all trademarks and copyrights related thereto. Any further dissemination or redistribution is strictly prohibited. Lipper Inc. is not responsible for the formatting or configuration of this material or for any inaccuracy in Oak Associates Funds presentation thereof.
NASDAQ is the source and owner of the NASDAQ Index data contained in this material and all trademarks and copyrights related thereto. Any further dissemination or redistribution is strictly prohibited. NASDAQ is not responsible for the formatting or configuration of this material or for any inaccuracy in Oak Associates Funds’ presentation thereof.
Russell Investments is the source and owner of the Russell Index data contained in this material and all trademarks and copyrights related thereto. Any further dissemination or redistribution is strictly prohibited. Russell Investments is not responsible for the formatting or configuration of this material or for any inaccuracy in Oak Associates Funds’ presentation thereof.
Standard & Poor’s is the source and owner of the S&P Index data contained in this material and all trademarks and copyrights related thereto. Any further dissemination or redistribution is strictly prohibited. Standard & Poor’s is not responsible for the formatting or configuration of this material or for any inaccuracy in Oak Associates Funds’ presentation thereof.
Beta – A measure of the volatility, or systematic risk, of a security or a portfolio in comparison to the market as a whole.
Free Cash Flow – A measure of financial performance calculated as operating cash flow minus capital expenditures.
Annual Report | October 31, 2013 |
17 |
As of October 31, 2013 (Unaudited) |
All mutual funds have operating expenses. As a shareholder of a fund, your investment is affected by these ongoing costs, which include (among others) costs for portfolio management, administrative services, and shareholder reports like this one. It is important for you to understand the impact of these costs on your investment returns.
Operating expenses such as these, are deducted from the Fund’s gross income and directly reduce your final investment return. These expenses are expressed as a percentage of the Fund’s average net assets; this percentage is known as the Fund’s expense ratio.
The following examples use the expense ratio and are intended to help you understand the ongoing costs (in dollars) of investing in your Fund and to compare these costs with those of other mutual funds. The examples are based on an investment of $1,000 made at the beginning of the period shown and held for the entire period.
The table on the next page illustrates your Fund’s costs in two ways:
Actual Fund Return. This section helps you to estimate the actual expenses after fee waivers that your Fund incurred over the period. The “Expenses Paid During Period” column shows the actual dollar expense cost incurred by a $1,000 investment in the Fund, and the “Ending Account Value” number is derived from deducting that expense cost from the Fund’s gross investment return.
You can use this information, together with the actual amount you invested in the Fund, to estimate the expenses you paid over that period. Simply divide your actual account value by $1,000 to arrive at a ratio (for example, an $8,600 account value divided by $1,000 = 8.6), then multiply that ratio by the number shown for your Fund under “Expenses Paid During Period”.
Hypothetical 5% Return. This section helps you compare your Fund’s costs with those of other mutual funds. It assumes that the Fund had an annual 5% return before expenses during the year, but that the expense ratio (Column 3) for the period is unchanged. This example is useful in making comparisons because the Securities and Exchange Commission requires all mutual funds to make this 5% calculation. You can assess your Fund’s comparative cost by comparing the hypothetical result for your Fund in the “Expense Paid During Period” column with those that appear in the same charts in the shareholder reports for other funds.
Note: Because the return is set at 5% for comparison purposes — NOT your Fund’s actual return—the account values shown may not apply to your specific investment.
18 |
1-888-462-5386 | www.oakfunds.com |
| Disclosure of Fund Expenses | ||
| As of October 31, 2013 (Unaudited) |
Beginning Account Value | Ending Account Value 10/31/2013 | Annualized Expense Ratio | Expenses Paid During the Period(a) | |||||
White Oak Select Growth Fund | ||||||||
Actual Return | $1,000.00 | $1,132.00 | 1.10% | $5.91 | ||||
Hypothetical 5% Return | $1,000.00 | $1,019.66 | 1.10% | $5.60 | ||||
Pin Oak Equity Fund | ||||||||
Actual Return | $1,000.00 | $1,160.60 | 1.14% | $6.21 | ||||
Hypothetical 5% Return | $1,000.00 | $1,019.46 | 1.14% | $5.80 | ||||
Rock Oak Core Growth Fund | ||||||||
Actual Return | $1,000.00 | $1,148.10 | 1.25% | $6.77 | ||||
Hypothetical 5% Return | $1,000.00 | $1,018.90 | 1.25% | $6.36 | ||||
River Oak Discovery Fund | ||||||||
Actual Return | $1,000.00 | $1,191.10 | 1.35% | $7.46 | ||||
Hypothetical 5% Return | $1,000.00 | $1,018.40 | 1.35% | $6.87 | ||||
Red Oak Technology Select Fund | ||||||||
Actual Return | $1,000.00 | $1,150.80 | 1.19% | $6.45 | ||||
Hypothetical 5% Return | $1,000.00 | $1,019.21 | 1.19% | $6.06 | ||||
Black Oak Emerging Technology Fund | ||||||||
Actual Return | $1,000.00 | $1,181.50 | 1.35% | $7.42 | ||||
Hypothetical 5% Return | $1,000.00 | $1,018.40 | 1.35% | $6.87 | ||||
Live Oak Health Sciences Fund | ||||||||
Actual Return | $1,000.00 | $1,164.50 | 1.13% | $6.16 | ||||
Hypothetical 5% Return | $1,000.00 | $1,019.51 | 1.13% | $5.75 |
| (a) | Expenses are equal to the Fund’s annualized expense ratio for the six month period ending October 31, 2013 multiplied by the average account value over the period, multiplied by 184/365 (to reflect the one-half year period). |
Annual Report | October 31, 2013 |
19 |
| White Oak Select Growth Fund | ||
As of October 31, 2013 |
| Security Description | Shares | Value | ||||||
COMMON STOCKS (95.6%) | ||||||||
CONSUMER DISCRETIONARY (5.0%) | ||||||||
Internet & Catalog Retail (5.0%) | ||||||||
Amazon.com, Inc.(a) | 35,000 | $12,741,050 | ||||||
|
| |||||||
ENERGY (7.1%) | ||||||||
Energy Equipment & Services (3.6%) | ||||||||
Transocean, Ltd. | 195,000 | 9,178,650 | ||||||
|
| |||||||
Oil, Gas & Consumable Fuels (3.5%) | ||||||||
Exxon Mobil Corp. | 98,000 | 8,782,760 | ||||||
|
| |||||||
FINANCIALS (29.3%) | ||||||||
Capital Markets (9.4%) | ||||||||
The Charles Schwab Corp. | 522,000 | 11,823,300 | ||||||
US Bancorp | 320,000 | 11,955,200 | ||||||
|
| |||||||
| 23,778,500 | ||||||||
|
| |||||||
Commercial Banks (9.0%) | ||||||||
CIT Group, Inc.(a) | 182,400 | 8,784,384 | ||||||
M&T Bank Corp. | 60,000 | 6,751,800 | ||||||
TCF Financial Corp. | 487,000 | 7,392,660 | ||||||
|
| |||||||
| 22,928,844 | ||||||||
|
| |||||||
Diversified Financial Services (6.0%) | ||||||||
JPMorgan Chase & Co. | 295,400 | 15,224,916 | ||||||
|
| |||||||
Insurance (4.9%) | ||||||||
ACE, Ltd. | 129,000 | 12,311,760 | ||||||
|
| |||||||
HEALTH CARE (19.4%) | ||||||||
Biotechnology (4.9%) | ||||||||
Amgen, Inc. | 108,000 | 12,528,000 | ||||||
|
| |||||||
Health Care Equipment & Supplies (8.4%) | ||||||||
CR Bard, Inc. | 75,400 | 10,270,988 | ||||||
Stryker Corp. | 149,000 | 11,005,140 | ||||||
|
| |||||||
| 21,276,128 | ||||||||
|
| |||||||
Health Care Providers & Services (3.2%) | ||||||||
Express Scripts Holding Co.(a) | 130,000 | 8,127,600 | ||||||
|
| |||||||
Pharmaceuticals (2.9%) | ||||||||
Teva Pharmaceutical Industries, Ltd. ADR | 197,000 | 7,306,730 | ||||||
|
| |||||||
20 |
1-888-462-5386 | www.oakfunds.com |
White Oak Select Growth Fund | Schedules of Investments | |
| As of October 31, 2013 |
| Security Description | Shares | Value | ||||||
INFORMATION TECHNOLOGY (34.5%) | ||||||||
Communications Equipment (8.4%) | ||||||||
Cisco Systems, Inc. | 630,000 | $14,175,000 | ||||||
Qualcomm, Inc. | 103,100 | 7,162,357 | ||||||
|
| |||||||
| 21,337,357 | ||||||||
|
| |||||||
Computers & Peripherals (4.0%) | ||||||||
International Business Machines Corp. | 56,900 | 10,197,049 | ||||||
|
| |||||||
Internet Software & Services (7.0%) | ||||||||
Google, Inc. - Class A(a) | 17,200 | 17,725,976 | ||||||
|
| |||||||
IT Services (3.6%) | ||||||||
Cognizant Technology Solutions Corp. - Class A(a) | 104,500 | 9,084,185 | ||||||
|
| |||||||
Semiconductors & Semiconductor Equipment (6.3%) | ||||||||
Broadcom Corp. - Class A | 75,000 | 2,004,000 | ||||||
KLA-Tencor Corp. | 211,800 | 13,894,080 | ||||||
|
| |||||||
| 15,898,080 | ||||||||
|
| |||||||
Software (5.2%) | ||||||||
Salesforce.com, Inc.(a) | 142,400 | 7,598,464 | ||||||
Symantec Corp. | 250,000 | 5,685,000 | ||||||
|
| |||||||
| 13,283,464 | ||||||||
|
| |||||||
MATERIALS (0.3%) | ||||||||
Metals & Mining (0.3%) | ||||||||
Goldcorp, Inc. | 30,000 | 762,900 | ||||||
|
| |||||||
TOTAL COMMON STOCKS (Cost $250,392,404) | 242,473,949 | |||||||
|
| |||||||
SHORT TERM INVESTMENTS (1.2%) | ||||||||
Fidelity Institutional Money Market Government Portfolio - Class I (7 day yield 0.010%) | 3,115,749 | 3,115,749 | ||||||
|
| |||||||
TOTAL SHORT TERM INVESTMENTS (Cost $3,115,749) | 3,115,749 | |||||||
|
| |||||||
TOTAL INVESTMENTS - (96.8%) (Cost $253,508,153) | $245,589,698 | |||||||
Assets in Excess of Other Liabilities - (3.2%) | 8,213,521 | |||||||
|
| |||||||
NET ASSETS - (100.0%) | $253,803,219 | |||||||
|
| |||||||
Annual Report | October 31, 2013 |
21 |
Schedules of Investments | White Oak Select Growth Fund | |
As of October 31, 2013 |
| (a) | Non-income producing security. |
Common Abbreviations:
ADR - American Depositary Receipt.
Ltd. - Limited.
The accompanying notes are an integral part of the financial statements.
22 |
1-888-462-5386 | www.oakfunds.com |
Pin Oak Equity Fund | Schedules of Investments | |
| As of October 31, 2013 |
| Security Description | Shares | Value | ||||||
COMMON STOCKS (97.9%) | ||||||||
CONSUMER DISCRETIONARY (12.9%) | ||||||||
Auto Components (2.1%) | ||||||||
Visteon Corp.(a) | 22,300 | $1,719,107 | ||||||
|
| |||||||
Internet & Catalog Retail (2.9%) | ||||||||
Amazon.com, Inc.(a) | 6,350 | 2,311,591 | ||||||
|
| |||||||
Media (7.9%) | ||||||||
The Interpublic Group of Cos., Inc. | 135,000 | 2,268,000 | ||||||
News Corp. - Class A(a) | 27,250 | 479,600 | ||||||
Twenty-First Century Fox, Inc. - Class A | 109,000 | 3,714,720 | ||||||
|
| |||||||
| 6,462,320 | ||||||||
|
| |||||||
CONSUMER STAPLES (4.9%) | ||||||||
Beverages (2.7%) | ||||||||
PepsiCo, Inc. | 25,600 | 2,152,704 | ||||||
|
| |||||||
Household Products (2.2%) | ||||||||
Energizer Holdings, Inc. | 18,500 | 1,815,035 | ||||||
|
| |||||||
ENERGY (7.7%) | ||||||||
Energy Equipment & Services (5.9%) | ||||||||
Diamond Offshore Drilling, Inc. | 35,600 | 2,204,708 | ||||||
Nabors Industries, Ltd. | 146,600 | 2,562,568 | ||||||
|
| |||||||
| 4,767,276 | ||||||||
|
| |||||||
Oil, Gas & Consumable Fuels (1.8%) | ||||||||
Royal Dutch Shell PLC, ADR | 22,181 | 1,478,585 | ||||||
|
| |||||||
FINANCIALS (37.5%) | ||||||||
Capital Markets (9.4%) | ||||||||
The Bank of New York Mellon Corp. | 77,000 | 2,448,600 | ||||||
The Charles Schwab Corp. | 180,708 | 4,093,036 | ||||||
Morgan Stanley | 37,500 | 1,077,375 | ||||||
|
| |||||||
| 7,619,011 | ||||||||
|
| |||||||
Commercial Banks (17.7%) | ||||||||
CIT Group, Inc.(a) | 65,000 | 3,130,400 | ||||||
First Bancorp | 50,135 | 751,022 | ||||||
Great Southern Bancorp, Inc. | 55,845 | 1,568,128 | ||||||
International Bancshares Corp. | 99,500 | 2,273,575 | ||||||
SunTrust Banks, Inc. | 53,000 | 1,782,920 | ||||||
Wells Fargo & Co. | 115,000 | 4,909,350 | ||||||
|
| |||||||
| 14,415,395 | ||||||||
|
| |||||||
Consumer Finance (4.4%) | ||||||||
Capital One Financial Corp. | 52,400 | 3,598,308 | ||||||
|
| |||||||
Annual Report | October 31, 2013 |
23 |
Schedules of Investments | Pin Oak Equity Fund | |
As of October 31, 2013 |
| Security Description | Shares | Value | ||||||
Insurance (6.0%) | ||||||||
Assurant, Inc. | 12,000 | $701,760 | ||||||
Everest Re Group, Ltd. | 10,100 | 1,552,774 | ||||||
The Travelers Cos., Inc. | 31,000 | 2,675,300 | ||||||
|
| |||||||
| 4,929,834 | ||||||||
|
| |||||||
INDUSTRIALS (7.6%) | ||||||||
Aerospace & Defense (6.9%) | ||||||||
Lockheed Martin Corp. | 16,400 | 2,186,776 | ||||||
Raytheon Co. | 42,000 | 3,459,540 | ||||||
|
| |||||||
| 5,646,316 | ||||||||
|
| |||||||
Machinery (0.7%) | ||||||||
Parker Hannifin Corp. | 5,000 | 583,600 | ||||||
|
| |||||||
INFORMATION TECHNOLOGY (26.0%) | ||||||||
Electronic Equipment & Instruments (2.0%) | ||||||||
Flextronics International, Ltd.(a) | 206,000 | 1,625,340 | ||||||
|
| |||||||
Internet Software & Services (7.1%) | ||||||||
Google, Inc. - Class A(a) | 3,500 | 3,607,030 | ||||||
IAC/InterActive Corp. | 40,856 | 2,181,302 | ||||||
|
| |||||||
| 5,788,332 | ||||||||
|
| |||||||
IT Services (10.2%) | ||||||||
Amdocs, Ltd. | 101,672 | 3,909,288 | ||||||
Paychex, Inc. | 43,049 | 1,819,251 | ||||||
The Western Union Co. | 152,000 | 2,587,040 | ||||||
|
| |||||||
| 8,315,579 | ||||||||
|
| |||||||
Semiconductors & Semiconductor Equipment (1.8%) | ||||||||
KLA-Tencor Corp. | 21,800 | 1,430,080 | ||||||
|
| |||||||
Software (4.9%) | ||||||||
Microsoft Corp. | 113,300 | 4,005,155 | ||||||
|
| |||||||
MATERIALS (1.3%) | ||||||||
Metals & Mining (1.3%) | ||||||||
Teck Resources, Ltd. - Class B | 38,814 | 1,037,886 | ||||||
|
| |||||||
TOTAL COMMON STOCKS (Cost $78,823,035) | 79,701,454 | |||||||
|
| |||||||
24 |
1-888-462-5386 | www.oakfunds.com |
Pin Oak Equity Fund | Schedules of Investments | |
| As of October 31, 2013 |
| Security Description | Shares | Value | ||||||
| ||||||||
SHORT TERM INVESTMENTS (2.2%) | ||||||||
Fidelity Institutional Money Market Government Portfolio - Class I (7 day yield 0.010%) | 1,779,498 | $1,779,498 | ||||||
|
| |||||||
TOTAL SHORT TERM INVESTMENTS (Cost $1,779,498) | 1,779,498 | |||||||
|
| |||||||
TOTAL INVESTMENTS - (100.1%) (Cost $80,602,533) | $81,480,952 | |||||||
Liabilities in Excess of Other Assets - (-0.1%) | (73,055) | |||||||
|
| |||||||
NET ASSETS - (100.0%) | $81,407,897 | |||||||
|
| |||||||
| (a) | Non-income producing security. |
Common Abbreviations:
ADR - American Depositary Receipt.
Ltd. - Limited.
PLC - Public Limited Company.
The accompanying notes are an integral part of the financial statements.
Annual Report | October 31, 2013 |
25 |
Schedules of Investments | Rock Oak Core Growth Fund | |
As of October 31, 2013 |
| Security Description | Shares | Value | ||||||
| ||||||||
COMMON STOCKS (93.8%) | ||||||||
CONSUMER DISCRETIONARY (12.8%) | ||||||||
Hotels, Restaurants & Leisure (7.6%) | ||||||||
Wyndham Worldwide Corp. | 3,550 | $235,720 | ||||||
Wynn Resorts, Ltd. | 2,000 | 332,500 | ||||||
|
| |||||||
| 568,220 | ||||||||
|
| |||||||
Media (2.0%) | ||||||||
DISH Network Corp. - Class A | 3,200 | 154,240 | ||||||
|
| |||||||
Specialty Retail (3.2%) | ||||||||
Staples, Inc. | 14,850 | 239,382 | ||||||
|
| |||||||
CONSUMER STAPLES (2.6%) | ||||||||
Beverages (2.6%) | ||||||||
Molson Coors Brewing Co. - Class B | 3,550 | 191,700 | ||||||
|
| |||||||
ENERGY (6.3%) | ||||||||
Energy Equipment & Services (3.2%) | ||||||||
Transocean, Ltd. | 3,600 | 169,452 | ||||||
Weatherford International, Ltd.(a) | 4,200 | 69,048 | ||||||
|
| |||||||
| 238,500 | ||||||||
|
| |||||||
Oil, Gas & Consumable Fuels (3.1%) | ||||||||
HollyFrontier Corp. | 5,150 | 237,209 | ||||||
|
| |||||||
FINANCIALS (13.8%) | ||||||||
Commercial Banks (6.7%) | ||||||||
Comerica, Inc. | 6,000 | 259,800 | ||||||
SunTrust Banks, Inc. | 7,200 | 242,208 | ||||||
|
| |||||||
| 502,008 | ||||||||
|
| |||||||
Insurance (7.1%) | ||||||||
Genworth Financial, Inc. - Class A(a) | 22,050 | 320,387 | ||||||
Hartford Financial Services Group, Inc. | 6,400 | 215,680 | ||||||
|
| |||||||
| 536,067 | ||||||||
|
| |||||||
HEALTH CARE (9.5%) | ||||||||
Health Care Providers & Services (4.9%) | ||||||||
AmerisourceBergen Corp. | 2,300 | 150,259 | ||||||
Quest Diagnostics, Inc. | 3,550 | 212,680 | ||||||
|
| |||||||
| 362,939 | ||||||||
|
| |||||||
Life Sciences Tools & Services (4.6%) | ||||||||
Illumina, Inc.(a) | 3,700 | 345,987 | ||||||
|
| |||||||
26 |
1-888-462-5386 | www.oakfunds.com |
Rock Oak Core Growth Fund | Schedules of Investments | |
| As of October 31, 2013 |
| Security Description | Shares | Value | ||||||
| ||||||||
INDUSTRIALS (8.4%) | ||||||||
Aerospace & Defense (3.2%) | ||||||||
L-3 Communications Holdings, Inc. | 2,350 | $236,058 | ||||||
|
| |||||||
Commercial Services & Supplies (2.6%) | ||||||||
The ADT Corp. | 4,450 | 192,996 | ||||||
|
| |||||||
Professional Services (2.6%) | ||||||||
Nielsen Holdings NV | 5,000 | 197,200 | ||||||
|
| |||||||
INFORMATION TECHNOLOGY (38.4%) | ||||||||
Communications Equipment (1.5%) | ||||||||
F5 Networks, Inc.(a) | 1,400 | 114,114 | ||||||
|
| |||||||
Computers & Peripherals (5.9%) | ||||||||
NetApp, Inc. | 4,800 | 186,288 | ||||||
Western Digital Corp. | 3,650 | 254,150 | ||||||
|
| |||||||
| 440,438 | ||||||||
|
| |||||||
Electronic Equipment & Instruments (1.9%) | ||||||||
Amphenol Corp. - Class A | 1,750 | 140,507 | ||||||
|
| |||||||
IT Services (8.6%) | ||||||||
Cognizant Technology Solutions Corp. - Class A(a) | 2,100 | 182,553 | ||||||
Computer Sciences Corp. | 5,650 | 278,319 | ||||||
Vantiv, Inc. Class A(a) | 6,550 | 180,125 | ||||||
|
| |||||||
| 640,997 | ||||||||
|
| |||||||
Semiconductors & Semiconductor Equipment (4.4%) | ||||||||
Broadcom Corp. - Class A | 3,900 | 104,208 | ||||||
Linear Technology Corp. | 5,500 | 226,270 | ||||||
|
| |||||||
| 330,478 | ||||||||
|
| |||||||
Software (16.1%) | ||||||||
Autodesk, Inc.(a) | 4,200 | 167,622 | ||||||
CA, Inc. | 9,950 | 316,012 | ||||||
Salesforce.com, Inc.(a) | 5,000 | 266,800 | ||||||
Symantec Corp. | 9,700 | 220,578 | ||||||
Workday, Inc. - Class A(a) | 3,200 | 239,584 | ||||||
|
| |||||||
| 1,210,596 | ||||||||
|
| |||||||
MATERIALS (2.0%) | ||||||||
Chemicals (2.0%) | ||||||||
CF Industries Holdings, Inc. | 700 | 150,920 | ||||||
|
| |||||||
TOTAL COMMON STOCKS (Cost $5,258,688) | 7,030,556 | |||||||
|
| |||||||
Annual Report | October 31, 2013 |
27 |
Schedules of Investments | Rock Oak Core Growth Fund | |
As of October 31, 2013 |
| Security Description | Shares | Value | ||||||
| ||||||||
SHORT TERM INVESTMENTS (6.4%) | ||||||||
Fidelity Institutional Money Market Government Portfolio - Class I (7 day yield 0.010%) | 477,825 | $477,825 | ||||||
|
| |||||||
TOTAL SHORT TERM INVESTMENTS (Cost $477,825) | 477,825 | |||||||
|
| |||||||
TOTAL INVESTMENTS - (100.2%) (Cost $5,736,513) | $7,508,381 | |||||||
Liabilities in Excess of Other Assets - (-0.2%) | (13,265) | |||||||
|
| |||||||
NET ASSETS - (100.0%) | $7,495,116 | |||||||
|
| |||||||
| (a) | Non-income producing security. |
Common Abbreviations:
Ltd. - Limited.
NV - Naamloze Vennootschap is the Dutch term for a public limited liability corporation. (Netherlands)
The accompanying notes are an integral part of the financial statements.
28 |
1-888-462-5386 | www.oakfunds.com |
River Oak Discovery Fund | Schedules of Investments | |
| As of October 31, 2013 |
| Security Description | Shares | Value | ||||||
| ||||||||
COMMON STOCKS (94.6%) | ||||||||
CONSUMER DISCRETIONARY (19.5%) | ||||||||
Diversified Consumer Services (10.2%) | ||||||||
Apollo Group, Inc. - Class A(a) | 13,600 | $362,984 | ||||||
Capella Education Co.(a) | 7,100 | 432,532 | ||||||
DeVry, Inc. | 10,600 | 380,540 | ||||||
K12, Inc.(a) | 10,000 | 182,800 | ||||||
|
| |||||||
| 1,358,856 | ||||||||
|
| |||||||
Hotels, Restaurants & Leisure (3.4%) | ||||||||
Ctrip.com International, Ltd. ADR(a) | 8,350 | 452,987 | ||||||
|
| |||||||
Leisure Equipment & Products (3.1%) | ||||||||
LeapFrog Enterprises, Inc.(a) | 47,800 | 409,168 | ||||||
|
| |||||||
Media (2.8%) | ||||||||
Morningstar, Inc. | 4,650 | 373,349 | ||||||
|
| |||||||
CONSUMER STAPLES (8.1%) | ||||||||
Beverages (2.3%) | ||||||||
The Boston Beer Co., Inc. - Class A(a) | 1,350 | 309,947 | ||||||
|
| |||||||
Food & Staples Retailing (2.9%) | ||||||||
The Andersons, Inc. | 5,150 | 382,027 | ||||||
|
| |||||||
Food Products (2.9%) | ||||||||
B&G Foods, Inc. | 11,625 | 393,506 | ||||||
|
| |||||||
ENERGY (4.1%) | ||||||||
Energy Equipment & Services (4.1%) | ||||||||
Atwood Oceanics, Inc.(a) | 4,000 | 212,520 | ||||||
Dril-Quip, Inc.(a) | 2,800 | 328,776 | ||||||
|
| |||||||
| 541,296 | ||||||||
|
| |||||||
FINANCIALS (15.3%) | ||||||||
Capital Markets (2.2%) | ||||||||
Janus Capital Group, Inc. | 29,400 | 290,178 | ||||||
|
| |||||||
Commercial Banks (5.3%) | ||||||||
PrivateBancorp, Inc. | 16,300 | 397,068 | ||||||
Zions Bancorporation | 10,800 | 306,396 | ||||||
|
| |||||||
| 703,464 | ||||||||
|
| |||||||
Insurance (5.7%) | ||||||||
Assurant, Inc. | 9,300 | 543,864 | ||||||
CNO Financial Group, Inc. | 14,000 | 218,120 | ||||||
|
| |||||||
| 761,984 | ||||||||
|
| |||||||
Annual Report | October 31, 2013 |
29 |
Schedules of Investments | River Oak Discovery Fund | |
As of October 31, 2013 |
| Security Description | Shares | Value | ||||||
| ||||||||
Thrifts & Mortgage Finance (2.1%) | ||||||||
ViewPoint Financial Group, Inc. | 12,600 | $274,806 | ||||||
|
| |||||||
HEALTH CARE (7.5%) | ||||||||
Biotechnology (7.5%) | ||||||||
Cubist Pharmaceuticals, Inc.(a) | 6,750 | 418,500 | ||||||
PDL BioPharma, Inc. | 15,000 | 121,350 | ||||||
United Therapeutics Corp.(a) | 5,150 | 455,878 | ||||||
|
| |||||||
| 995,728 | ||||||||
|
| |||||||
INDUSTRIALS (2.7%) | ||||||||
Professional Services (2.7%) | ||||||||
ICF International, Inc.(a) | 10,271 | 355,582 | ||||||
|
| |||||||
INFORMATION TECHNOLOGY (37.4%) | ||||||||
Computers & Peripherals (5.4%) | ||||||||
3D Systems Corp.(a) | 7,650 | 476,136 | ||||||
Stratasys, Ltd.(a) | 2,150 | 243,444 | ||||||
|
| |||||||
| 719,580 | ||||||||
|
| |||||||
Electronic Equipment & Instruments (8.9%) | ||||||||
Dolby Laboratories, Inc. - Class A | 9,500 | 339,530 | ||||||
Hollysys Automation Technologies, Ltd.(a) | 28,700 | 481,299 | ||||||
Itron, Inc.(a) | 4,800 | 204,816 | ||||||
Newport Corp.(a) | 10,258 | 162,794 | ||||||
|
| |||||||
| 1,188,439 | ||||||||
|
| |||||||
Internet Software & Services (6.1%) | ||||||||
MercadoLibre, Inc. | 3,650 | 491,418 | ||||||
Sohu.com, Inc.(a) | 4,650 | 311,364 | ||||||
|
| |||||||
| 802,782 | ||||||||
|
| |||||||
IT Services (3.0%) | ||||||||
Unisys Corp.(a) | 15,200 | 400,520 | ||||||
|
| |||||||
Semiconductors & Semiconductor Equipment (10.3%) | ||||||||
Cirrus Logic, Inc.(a) | 13,850 | 310,655 | ||||||
Kulicke & Soffa Industries, Inc.(a) | 26,800 | 345,720 | ||||||
Magnachip Semiconductor Corp.(a) | 13,550 | 253,250 | ||||||
Marvell Technology Group, Ltd. | 21,300 | 255,600 | ||||||
Veeco Instruments, Inc.(a) | 7,000 | 204,470 | ||||||
|
| |||||||
| 1,369,695 | ||||||||
|
| |||||||
Software (3.7%) | ||||||||
Fortinet, Inc.(a) | 13,450 | 270,480 | ||||||
Qualys, Inc.(a) | 10,700 | 222,560 | ||||||
|
| |||||||
| 493,040 | ||||||||
|
| |||||||
TOTAL COMMON STOCKS (Cost $8,223,658) | 12,576,934 | |||||||
|
| |||||||
30 |
1-888-462-5386 | www.oakfunds.com |
River Oak Discovery Fund | Schedules of Investments | |
| As of October 31, 2013 |
| Security Description | Shares | Value | ||||||
| ||||||||
SHORT TERM INVESTMENTS (3.1%) | ||||||||
Fidelity Institutional Money Market Government Portfolio - Class I (7 day yield 0.010%) | 414,540 | $414,540 | ||||||
|
| |||||||
TOTAL SHORT TERM INVESTMENTS (Cost $414,540) | 414,540 | |||||||
|
| |||||||
TOTAL INVESTMENTS - (97.7%) (Cost $8,638,198) | $12,991,474 | |||||||
Assets in Excess of Other Liabilities - (2.3%) | 312,613 | |||||||
|
| |||||||
NET ASSETS - (100.0%) | $13,304,087 | |||||||
|
| |||||||
| (a) | Non-income producing security. |
Common Abbreviations:
ADR - American Depositary Receipt.
Ltd. - Limited.
The accompanying notes are an integral part of the financial statements.
Annual Report | October 31, 2013 |
31 |
Schedules of Investments | Red Oak Technology Select Fund | |
As of October 31, 2013 |
| Security Description | Shares | Value | ||||||
| ||||||||
COMMON STOCKS (95.4%) | ||||||||
CONSUMER DISCRETIONARY (2.2%) | ||||||||
Internet & Catalog Retail (2.2%) | ||||||||
Amazon.com, Inc.(a) | 6,450 | $2,347,994 | ||||||
|
| |||||||
INDUSTRIALS (7.3%) | ||||||||
Aerospace & Defense (7.3%) | ||||||||
Huntington Ingalls Industries, Inc. | 38,466 | 2,752,242 | ||||||
Northrop Grumman Corp. | 46,000 | 4,945,460 | ||||||
|
| |||||||
| 7,697,702 | ||||||||
|
| |||||||
INFORMATION TECHNOLOGY (85.9%) | ||||||||
Communications Equipment (4.4%) | ||||||||
Blackberry LTD.(a) | 43,100 | 340,921 | ||||||
Cisco Systems, Inc. | 194,000 | 4,365,000 | ||||||
|
| |||||||
| 4,705,921 | ||||||||
|
| |||||||
Computers & Peripherals (15.1%) | ||||||||
Apple, Inc. | 3,960 | 2,068,506 | ||||||
EMC Corp. | 84,000 | 2,021,880 | ||||||
Hewlett-Packard Co. | 118,500 | 2,887,845 | ||||||
International Business Machines Corp. | 17,000 | 3,046,570 | ||||||
Lexmark International, Inc. - Class A | 54,000 | 1,919,700 | ||||||
Western Digital Corp. | 57,100 | 3,975,873 | ||||||
|
| |||||||
| 15,920,374 | ||||||||
|
| |||||||
Electronic Equipment & Instruments (8.6%) | ||||||||
Arrow Electronics, Inc.(a) | 63,900 | 3,068,478 | ||||||
Corning, Inc. | 170,000 | 2,905,300 | ||||||
Flextronics International, Ltd.(a) | 20,000 | 157,800 | ||||||
Ingram Micro, Inc. - Class A(a) | 128,600 | 2,979,662 | ||||||
|
| |||||||
| 9,111,240 | ||||||||
|
| |||||||
Internet Software & Services (6.6%) | ||||||||
Google, Inc. - Class A(a) | 4,700 | 4,843,726 | ||||||
IAC/InterActive Corp. | 39,000 | 2,082,210 | ||||||
|
| |||||||
| 6,925,936 | ||||||||
|
| |||||||
IT Services (14.9%) | ||||||||
Accenture PLC - Class A | 54,200 | 3,983,700 | ||||||
Alliance Data Systems Corp.(a) | 23,000 | 5,452,380 | ||||||
Computer Sciences Corp. | 49,000 | 2,413,740 | ||||||
CSG Systems International, Inc. | 29,129 | 811,534 | ||||||
Total System Services, Inc. | 103,000 | 3,072,490 | ||||||
|
| |||||||
| 15,733,844 | ||||||||
|
| |||||||
Semiconductors & Semiconductor Equipment (15.5%) | ||||||||
Applied Materials, Inc. | 72,000 | 1,285,200 | ||||||
Intel Corp. | 117,500 | 2,870,525 | ||||||
KLA-Tencor Corp. | 66,600 | 4,368,960 | ||||||
Marvell Technology Group, Ltd. | 179,400 | 2,152,800 | ||||||
32 |
1-888-462-5386 | www.oakfunds.com |
Red Oak Technology Select Fund | Schedules of Investments | |
| As of October 31, 2013 |
Security Description |
| Shares/Principal Amount |
| Value | ||||
Semiconductors & Semiconductor Equipment (continued) | ||||||||
NVIDIA Corp. | 142,000 | $2,155,560 | ||||||
Spansion, Inc. - Class A(a) | 109,662 | 1,312,654 | ||||||
Xilinx, Inc. | 48,000 | 2,180,160 | ||||||
|
| |||||||
| 16,325,859 | ||||||||
|
| |||||||
Software (20.8%) | ||||||||
CA, Inc. | 119,000 | 3,779,440 | ||||||
Check Point Software Technologies, Ltd.(a) | 69,400 | 4,026,588 | ||||||
Microsoft Corp. | 102,000 | 3,605,700 | ||||||
Oracle Corp. | 143,000 | 4,790,500 | ||||||
Symantec Corp. | 168,000 | 3,820,320 | ||||||
Synopsys, Inc.(a) | 54,800 | 1,997,460 | ||||||
|
| |||||||
| 22,020,008 | ||||||||
|
| |||||||
TOTAL COMMON STOCKS | ||||||||
(Cost $86,214,182) | 100,788,878 | |||||||
|
| |||||||
REPURCHASE AGREEMENTS (4.9%) | ||||||||
Tri-Party Repurchase Agreement with Morgan Stanley and Bank of New York (Tri-Party), 0.04%, dated 10/31/13 and maturing 11/01/13 with a repurchase amount of $5,129,703, collateralized by U.S. Treasury Securities with rates ranging from 0.25% to 6.125% and with maturity dates ranging from 5/15/16 to 11/15/27 with a collateral value of $5,232,315. | $5,129,698 | 5,129,698 | ||||||
|
| |||||||
TOTAL REPURCHASE AGREEMENTS | ||||||||
(Cost $5,129,698) | 5,129,698 | |||||||
|
| |||||||
TOTAL INVESTMENTS - (100.3%) | ||||||||
(Cost $91,343,880) | $105,918,576 | |||||||
Liabilities in Excess of Other Assets - (-0.3%) | (326,929) | |||||||
|
| |||||||
NET ASSETS - (100.0%) | $105,591,647 | |||||||
|
| |||||||
| (a) | Non-income producing security. |
Common Abbreviations:
Ltd. - Limited.
PLC - Public Limited Company.
The accompanying notes are an integral part of the financial statements.
Annual Report | October 31, 2013 |
33 |
Schedules of Investments | Black Oak Emerging Technology Fund | |
As of October 31, 2013 |
| Security Description | Shares | Value | ||||||
| ||||||||
COMMON STOCKS (97.6%) | ||||||||
HEALTH CARE (5.6%) | ||||||||
Biotechnology (2.0%) | ||||||||
PDL BioPharma, Inc. | 74,250 | $600,682 | ||||||
|
| |||||||
Life Sciences Tools & Services (3.6%) | ||||||||
Illumina, Inc.(a) | 11,300 | 1,056,663 | ||||||
|
| |||||||
INDUSTRIALS (1.8%) | ||||||||
Professional Services (1.8%) | ||||||||
ICF International, Inc.(a) | 15,101 | 522,797 | ||||||
|
| |||||||
INFORMATION TECHNOLOGY (90.2%) | ||||||||
Communications Equipment (5.7%) | ||||||||
Palo Alto Networks, Inc.(a) | 5,900 | 248,744 | ||||||
Qualcomm, Inc. | 21,150 | 1,469,291 | ||||||
|
| |||||||
| 1,718,035 | ||||||||
|
| |||||||
Computers & Peripherals (21.1%) | ||||||||
3D Systems Corp.(a) | 17,350 | 1,079,864 | ||||||
Apple, Inc. | 2,950 | 1,540,932 | ||||||
EMC Corp. | 36,100 | 868,927 | ||||||
Fusion-io, Inc.(a) | 23,000 | 247,250 | ||||||
NetApp, Inc. | 18,800 | 729,628 | ||||||
Stratasys, Ltd.(a) | 6,300 | 713,349 | ||||||
Western Digital Corp. | 15,950 | 1,110,599 | ||||||
|
| |||||||
| 6,290,549 | ||||||||
|
| |||||||
Electronic Equipment & Instruments (6.4%) | ||||||||
Amphenol Corp. - Class A | 6,600 | 529,914 | ||||||
Arrow Electronics, Inc.(a) | 21,000 | 1,008,420 | ||||||
Newport Corp.(a) | 24,142 | 383,134 | ||||||
|
| |||||||
| 1,921,468 | ||||||||
|
| |||||||
Internet Software & Services (9.0%) | ||||||||
MercadoLibre, Inc. | 8,100 | 1,090,543 | ||||||
NetEase.com, Inc. ADR | 14,900 | 1,005,899 | ||||||
Sohu.com, Inc.(a) | 8,700 | 582,552 | ||||||
|
| |||||||
| 2,678,994 | ||||||||
|
| |||||||
IT Services (14.4%) | ||||||||
Alliance Data Systems Corp.(a) | 4,000 | 948,240 | ||||||
Cognizant Technology Solutions Corp. - Class A(a) | 13,850 | 1,203,980 | ||||||
Computer Sciences Corp. | 25,600 | 1,261,056 | ||||||
Unisys Corp.(a) | 33,300 | 877,455 | ||||||
|
| |||||||
| 4,290,731 | ||||||||
|
| |||||||
Semiconductors & Semiconductor Equipment (14.6%) | ||||||||
Cirrus Logic, Inc.(a) | 45,000 | 1,009,350 | ||||||
Lam Research Corp.(a) | 21,200 | 1,149,676 | ||||||
34 |
1-888-462-5386 | www.oakfunds.com |
Black Oak Emerging Technology Fund | Schedules of Investments | |
| As of October 31, 2013 |
Security Description | Shares | Value | ||||||
Semiconductors & Semiconductor Equipment (continued) | ||||||||
Linear Technology Corp. | 30,200 | $1,242,428 | ||||||
Marvell Technology Group, Ltd. | 79,500 | 954,000 | ||||||
|
| |||||||
| 4,355,454 | ||||||||
|
| |||||||
Software (19.0%) | ||||||||
CA, Inc. | 45,100 | 1,432,376 | ||||||
Citrix Systems, Inc.(a) | 16,200 | 919,836 | ||||||
Fortinet, Inc.(a) | 22,700 | 456,497 | ||||||
Qualys, Inc.(a) | 31,100 | 646,880 | ||||||
Salesforce.com, Inc.(a) | 27,200 | 1,451,392 | ||||||
Workday, Inc. - Class A(a) | 10,300 | 771,161 | ||||||
|
| |||||||
| 5,678,142 | ||||||||
|
| |||||||
TOTAL COMMON STOCKS | ||||||||
(Cost $22,771,778) | 29,113,515 | |||||||
|
| |||||||
SHORT TERM INVESTMENTS (2.6%) | ||||||||
Fidelity Institutional Money Market Government Portfolio - Class I (7 day yield 0.010%) | 786,154 | 786,154 | ||||||
|
| |||||||
TOTAL SHORT TERM INVESTMENTS | ||||||||
(Cost $786,154) | 786,154 | |||||||
|
| |||||||
TOTAL INVESTMENTS - (100.2%) | ||||||||
(Cost $23,557,932) | $29,899,669 | |||||||
Liabilities in Excess of Other Assets - (-0.2%) | (46,814 | ) | ||||||
|
| |||||||
NET ASSETS - (100.0%) | $29,852,855 | |||||||
|
| |||||||
| (a) | Non-income producing security. |
Common Abbreviations:
ADR - American Depositary Receipt.
Ltd. - Limited.
The accompanying notes are an integral part of the financial statements.
Annual Report | October 31, 2013 |
42 |
Schedules of Investments | Live Oak Health Sciences Fund | |
As of October 31, 2013 |
| Security Description | Shares | Value | ||||||
| ||||||||
COMMON STOCKS (100.2%) | ||||||||
HEALTH CARE (100.2%) | ||||||||
Biotechnology (4.8%) | ||||||||
Amgen, Inc. | 16,800 | $1,948,800 | ||||||
Targacept, Inc.(a) | 23,881 | 113,435 | ||||||
|
| |||||||
| 2,062,235 | ||||||||
|
| |||||||
Health Care Equipment & Supplies (27.9%) | ||||||||
Becton Dickinson and Co. | 16,900 | 1,776,697 | ||||||
Boston Scientific Corp.(a) | 142,500 | 1,665,825 | ||||||
CareFusion Corp.(a) | 14,900 | 577,673 | ||||||
Covidien PLC | 11,400 | 730,854 | ||||||
CR Bard, Inc. | 18,800 | 2,560,936 | ||||||
Greatbatch, Inc.(a) | 17,684 | 674,114 | ||||||
Medtronic, Inc. | 22,100 | 1,268,540 | ||||||
Stryker Corp. | 17,000 | 1,255,620 | ||||||
Zimmer Holdings, Inc. | 15,300 | 1,338,291 | ||||||
|
| |||||||
| 11,848,550 | ||||||||
|
| |||||||
Health Care Providers & Services (32.1%) | ||||||||
AmerisourceBergen Corp. | 35,800 | 2,338,814 | ||||||
Cardinal Health, Inc. | 38,800 | 2,276,008 | ||||||
McKesson Corp. | 14,050 | 2,196,577 | ||||||
Omnicare, Inc. | 27,000 | 1,489,050 | ||||||
Owens & Minor, Inc. | 32,000 | 1,197,440 | ||||||
Patterson Cos., Inc. | 29,200 | 1,241,292 | ||||||
PharMerica Corp.(a) | 50,516 | 745,616 | ||||||
UnitedHealth Group, Inc. | 12,000 | 819,120 | ||||||
WellPoint, Inc. | 15,700 | 1,331,360 | ||||||
|
| |||||||
| 13,635,277 | ||||||||
|
| |||||||
Life Sciences Tools & Services (9.0%) | ||||||||
Agilent Technologies, Inc. | 32,100 | 1,629,396 | ||||||
Techne Corp. | 8,900 | 777,771 | ||||||
Waters Corp.(a) | 14,000 | 1,412,880 | ||||||
|
| |||||||
| 3,820,047 | ||||||||
|
| |||||||
Pharmaceuticals (26.4%) | ||||||||
AstraZeneca PLC ADR | 28,800 | 1,522,368 | ||||||
Eli Lilly & Co. | 18,000 | 896,760 | ||||||
GlaxoSmithKline PLC ADR | 24,900 | 1,310,487 | ||||||
Johnson & Johnson | 13,700 | 1,268,757 | ||||||
Mallinckrodt PLC(a) | 1,887 | 79,273 | ||||||
Merck & Co., Inc. | 30,000 | 1,352,700 | ||||||
Novartis AG ADR | 16,700 | 1,295,085 | ||||||
Pfizer, Inc. | 51,554 | 1,581,677 | ||||||
Sanofi ADR | 22,892 | 1,224,264 | ||||||
36 |
1-888-462-5386 | www.oakfunds.com |
Live Oak Health Sciences Fund | Schedules of Investments | |
| As of October 31, 2013 |
| Security Description | Shares | Value | ||||||
| ||||||||
Pharmaceuticals (continued) | ||||||||
Teva Pharmaceutical Industries, Ltd. ADR | 18,300 | $678,747 | ||||||
|
| |||||||
| 11,210,118 | ||||||||
|
| |||||||
TOTAL COMMON STOCKS (Cost $26,518,460) | 42,576,227 | |||||||
|
| |||||||
SHORT TERM INVESTMENTS (0.0%)(b) | ||||||||
Fidelity Institutional Money Market Government Portfolio - Class I (7 day yield 0.010%) | 6,121 | 6,121 | ||||||
|
| |||||||
TOTAL SHORT TERM INVESTMENTS (Cost $6,121) | 6,121 | |||||||
|
| |||||||
TOTAL INVESTMENTS - (100.2%) (Cost $26,524,581) | $ | 42,582,348 | ||||||
Liabilities in Excess of Other Assets - (-0.2%) | (65,326) | |||||||
|
| |||||||
NET ASSETS - (100.0%) | $ | 42,517,022 | ||||||
|
| |||||||
| (a) | Non-income producing security. |
| (b) | Less than 0.05%. |
Common Abbreviations:
ADR - American Depositary Receipt.
AG - Aktiengesellschaft is a German term that refers to a corporation that is limited by shares, i.e., owned by shareholders.
Ltd. - Limited.
PLC - Public Limited Company.
The accompanying notes are an integral part of the financial statements.
Annual Report | October 31, 2013 |
37 |
As of October 31, 2013 |
| White Oak Select Growth Fund | Pin Oak Equity Fund | |||||||
| ||||||||
Investments at cost | $ | 253,508,153 | $ | 80,602,533 | ||||
| ||||||||
ASSETS: | ||||||||
Investments at fair value | $ | 245,589,698 | $ | 81,480,952 | ||||
Cash | – | – | ||||||
Receivable for capital shares sold | 7,448 | 20,414 | ||||||
Receivable for investment securities sold | 98,842,451 | 10,331,830 | ||||||
Dividends and interest receivable | 20,802 | 28,506 | ||||||
Prepaid expenses | 38,224 | 16,639 | ||||||
| ||||||||
Total Assets | 344,498,623 | 91,878,341 | ||||||
| ||||||||
LIABILITIES: | ||||||||
Payable for fund shares redeemed | 133,236 | 36,036 | ||||||
Investment advisory fees payable | 157,604 | 50,737 | ||||||
Administration fees payable | 17,285 | 5,806 | ||||||
Trustees’ fees payable | 24,795 | 7,974 | ||||||
Payable for investment securities purchased | 90,277,757 | 10,331,717 | ||||||
Principal financial officer fees payable | 401 | 129 | ||||||
Printing fees payable | 18,707 | 5,485 | ||||||
Transfer agent fees payable | 40,515 | 14,703 | ||||||
Legal fees payable | 8,274 | 2,754 | ||||||
Audit fees payable | 13,500 | 13,500 | ||||||
Other accrued expenses | 3,330 | 1,603 | ||||||
| ||||||||
Total Liabilities | 90,695,404 | 10,470,444 | ||||||
| ||||||||
Total Net Assets | $ | 253,803,219 | $ | 81,407,897 | ||||
| ||||||||
NET ASSETS: | ||||||||
Paid-in capital (unlimited authorization - no par value) | $ | 292,160,746 | $ | 80,009,143 | ||||
Accumulated undistributed net investment income (loss) | 1,123,296 | 520,335 | ||||||
Accumulated net realized gain (loss) on investments | (31,562,368) | – | ||||||
Net unrealized appreciation (depreciation) on investments | (7,918,455) | 878,419 | ||||||
| ||||||||
Total Net Assets | $ | 253,803,219 | $ | 81,407,897 | ||||
| ||||||||
PORTFOLIO SHARES: | ||||||||
Net Assets | $ | 253,803,219 | $ | 81,407,897 | ||||
Total shares outstanding at end of period | 4,730,098 | 1,890,193 | ||||||
Net assets value, offering and redemption price per share (net assets ÷ shares outstanding) | $ | 53.66 | $ | 43.07 | ||||
| ||||||||
| The accompanying notes are an integral part of the financial statements. | ||
38 |
1-888-462-5386 | www.oakfunds.com |
Rock Oak Core Growth Fund | River Oak Discovery Fund | Red Oak Technology Select Fund | Black Oak Technology Fund | Live Oak Health Sciences Fund | ||||||||||||||
|
| |||||||||||||||||
| $ | 5,736,513 | $ | 8,638,198 | $ | 91,343,880 | $ | 23,557,932 | | $ | 26,524,581 | ||||||||
|
| |||||||||||||||||
| $ | 7,508,381 | $ | 12,991,474 | $ | 105,918,576 | $ | 29,899,669 | $ | 42,582,348 | |||||||||
| – | – | 16,679 | – | – | ||||||||||||||
| – | – | 119,939 | 300 | 5,000 | ||||||||||||||
| – | 328,361 | – | – | 228,794 | ||||||||||||||
| 1,533 | 1,515 | 50,432 | 10 | 8,781 | ||||||||||||||
| 7,489 | 11,042 | 25,433 | 16,410 | 14,413 | ||||||||||||||
|
| |||||||||||||||||
| 7,517,403 | 13,332,392 | 106,131,059 | 29,916,389 | 42,839,336 | ||||||||||||||
|
| |||||||||||||||||
| 1,800 | – | 309,137 | 5,129 | 264,731 | ||||||||||||||
| 2,851 | 8,998 | 64,242 | 25,200 | 26,926 | ||||||||||||||
| 779 | 1,257 | 7,258 | 2,244 | 3,245 | ||||||||||||||
| 719 | 1,290 | 9,552 | 2,952 | 4,233 | ||||||||||||||
| – | – | 100,894 | – | – | ||||||||||||||
| 12 | 21 | 155 | 48 | 68 | ||||||||||||||
| 407 | 679 | 6,900 | 2,032 | 2,651 | ||||||||||||||
| 1,514 | 1,544 | 23,157 | 10,703 | 4,651 | ||||||||||||||
| 415 | 598 | 3,176 | 1,130 | 1,535 | ||||||||||||||
| 13,500 | 13,500 | 13,500 | 13,500 | 13,500 | ||||||||||||||
| 290 | 418 | 1,441 | 596 | 774 | ||||||||||||||
|
| |||||||||||||||||
| 22,287 | 28,305 | 539,412 | 63,534 | 322,314 | ||||||||||||||
|
| |||||||||||||||||
| $ | 7,495,116 | $ | 13,304,087 | $ | 105,591,647 | $ | 29,852,855 | $ | 42,517,022 | |||||||||
|
| |||||||||||||||||
| $ | 4,265,101 | $ | 7,879,161 | $ | 95,269,074 | $ | 26,551,506 | $ | 24,672,702 | |||||||||
| 20,429 | – | 321,786 | (138,246) | 233,036 | ||||||||||||||
| 1,437,718 | 1,071,650 | (4,573,909) | (2,902,142) | 1,553,517 | ||||||||||||||
| 1,771,868 | 4,353,276 | 14,574,696 | 6,341,737 | 16,057,767 | ||||||||||||||
|
| |||||||||||||||||
| $ | 7,495,116 | $ | 13,304,087 | $ | 105,591,647 | $ | 29,852,855 | $ | 42,517,022 | |||||||||
|
| |||||||||||||||||
| $ | 7,495,116 | $ | 13,304,087 | $ | 105,591,647 | $ | 29,852,855 | $ | 42,517,022 | |||||||||
| 498,296 | 751,814 | 7,682,707 | 8,327,656 | 2,258,319 | ||||||||||||||
| $ | 15.04 | $ | 17.70 | $ | 13.74 | $ | 3.58 | $ | 18.83 | |||||||||
|
| |||||||||||||||||
Annual Report | October 31, 2013 |
39 |
For the Year Ended October 31, 2013 |
White Oak Select | Pin Oak Equity Fund | |||||||
| ||||||||
INVESTMENT INCOME: | ||||||||
Dividends | $ | 3,967,792 | $ | 1,390,774 | ||||
Less: Foreign withholding tax | (42,274) | (3,778) | ||||||
| ||||||||
Total Investment Income | 3,925,518 | 1,386,996 | ||||||
| ||||||||
EXPENSES: | ||||||||
Investment advisory fees | 1,798,736 | 552,249 | ||||||
Administration fees | 206,249 | 64,953 | ||||||
Trustees’ fees | 108,426 | 33,065 | ||||||
Legal and audit fees | 111,138 | 42,976 | ||||||
Transfer agent fees | 353,588 | 116,450 | ||||||
Registration fees | 15,413 | 15,222 | ||||||
Printing fees | 51,526 | 15,748 | ||||||
Custodian fees | 10,579 | 4,492 | ||||||
Principal financial officer fees | 5,052 | 1,560 | ||||||
Insurance and other fees | 56,881 | 19,946 | ||||||
| ||||||||
Total Expenses | 2,717,588 | 866,661 | ||||||
| ||||||||
Less: Investment advisory fees waived | – | – | ||||||
| ||||||||
Net Expenses | 2,717,588 | 866,661 | ||||||
| ||||||||
Net Investment Income (Loss) | 1,207,930 | 520,335 | ||||||
| ||||||||
Net realized gain on securities sold | 59,454,836 | 16,781,767 | ||||||
Net change in unrealized appreciation (depreciation) of investment securities | (3,653,355) | 3,287,352 | ||||||
| ||||||||
Net Realized and Unrealized Gain on Investments | 55,801,481 | 20,069,119 | ||||||
| ||||||||
Net Increase in Net Assets Resulting From Operations | $ | 57,009,411 | $ | 20,589,454 | ||||
| ||||||||
| The accompanying notes are an integral part of the financial statements. | ||
40 |
1-888-462-5386 | www.oakfunds.com |
| Rock Oak Core Growth Fund | River Oak Discovery Fund | Red Oak Technology Select Fund | Black Oak Emerging Technology Fund | Live Oak Health Sciences Fund | ||||||||||||||
|
| |||||||||||||||||
| $ | 120,973 | $ | 97,838 | $ | 1,386,606 | $ | 314,530 | $ | 762,587 | |||||||||
| (418) | – | – | – | (21,810) | ||||||||||||||
|
| |||||||||||||||||
| 120,555 | 97,838 | 1,386,606 | 314,530 | 740,777 | ||||||||||||||
|
| |||||||||||||||||
| 50,120 | 106,684 | 592,849 | 200,506 | 284,928 | ||||||||||||||
| 7,682 | 12,290 | 69,257 | 24,452 | 34,556 | ||||||||||||||
| 2,996 | 5,240 | 35,293 | 12,049 | 16,980 | ||||||||||||||
| 15,872 | 17,914 | 44,472 | 23,954 | 28,403 | ||||||||||||||
| 15,822 | 16,174 | 183,566 | 84,660 | 43,048 | ||||||||||||||
| 13,694 | 13,530 | 14,591 | 13,899 | 14,377 | ||||||||||||||
| 2,003 | 2,692 | 18,602 | 6,079 | 7,808 | ||||||||||||||
| 616 | 1,073 | 4,863 | 1,621 | 2,084 | ||||||||||||||
| 141 | 247 | 1,642 | 563 | 796 | ||||||||||||||
| 2,925 | 4,011 | 19,397 | 7,888 | 9,756 | ||||||||||||||
|
| |||||||||||||||||
| 111,871 | 179,855 | 984,532 | 375,671 | 442,736 | ||||||||||||||
|
| |||||||||||||||||
| (27,215) | (19,829) | – | (9,884) | – | ||||||||||||||
|
| |||||||||||||||||
| 84,656 | 160,026 | 984,532 | 365,787 | 442,736 | ||||||||||||||
|
| |||||||||||||||||
| 35,899 | (62,188) | 402,074 | (51,257) | 298,041 | ||||||||||||||
|
| |||||||||||||||||
| 1,438,328 | 1,113,957 | 1,014,538 | 897,986 | 1,556,098 | ||||||||||||||
| 270,516 | 2,179,441 | 24,675,732 | 7,100,218 | 9,917,628 | ||||||||||||||
|
| |||||||||||||||||
| 1,708,844 | 3,293,398 | 25,690,270 | 7,998,204 | 11,473,726 | ||||||||||||||
|
| |||||||||||||||||
| $ | 1,744,743 | $ | 3,231,210 | $ | 26,092,344 | $ | 7,946,947 | $ | 11,771,767 | |||||||||
|
| |||||||||||||||||
Annual Report | October 31, 2013 |
41 |
White Oak Select Growth Fund | Pin Oak Equity Fund | |||||||||||||||
|
| |||||||||||||||
For The Year Ended | For The Year Ended 2012 | For The Year Ended | For The Year Ended | |||||||||||||
| ||||||||||||||||
INVESTMENT ACTIVITIES: | ||||||||||||||||
Net investment income (loss) | $ | 1,207,930 | $ | 646,401 | $ | 520,335 | $ | 458,993 | ||||||||
Net realized gain on securities sold | 59,454,836 | 84,727,509 | 16,781,767 | 21,550,899 | ||||||||||||
Net change in unrealized appreciation (depreciation) of investment securities | (3,653,355) | (65,863,131) | 3,287,352 | (12,458,152) | ||||||||||||
| ||||||||||||||||
Net Increase in Net Assets Resulting from Operations | 57,009,411 | 19,510,779 | 20,589,454 | 9,551,740 | ||||||||||||
| ||||||||||||||||
DISTRIBUTIONS TO SHAREHOLDERS: | ||||||||||||||||
Net income | (731,035) | – | (458,987) | – | ||||||||||||
Realized capital gains | – | – | – | – | ||||||||||||
| ||||||||||||||||
Total Distributions | (731,035) | – | (458,987) | – | ||||||||||||
| ||||||||||||||||
CAPITAL SHARE TRANSACTIONS (IN DOLLARS): | ||||||||||||||||
Shares issued | 7,017,798 | 10,909,801 | 12,256,979 | 8,843,805 | ||||||||||||
Shares issued in lieu of cash distributions | 685,000 | – | 433,051 | – | ||||||||||||
Shares redeemed | (38,773,469) | (43,381,886) | (20,520,003) | (13,502,592) | ||||||||||||
| ||||||||||||||||
Net Increase (Decrease) in Net Assets from Capital Share Transactions | (31,070,671) | (32,472,085) | (7,829,973) | (4,658,787) | ||||||||||||
| ||||||||||||||||
Total Increase (Decrease) in Net Assets | 25,207,705 | (12,961,306) | 12,300,494 | 4,892,953 | ||||||||||||
| ||||||||||||||||
NET ASSETS: | ||||||||||||||||
Beginning of period | 228,595,514 | 241,556,820 | 69,107,403 | 64,214,450 | ||||||||||||
| ||||||||||||||||
End of period | $ | 253,803,219 | $ | 228,595,514 | $ | 81,407,897 | $ | 69,107,403 | ||||||||
| ||||||||||||||||
Including accumulated undistributed net investment income | $ | 1,123,296 | $ | 646,401 | $ | 520,335 | $ | 458,993 | ||||||||
| ||||||||||||||||
SHARES ISSUED AND REDEEMED: | ||||||||||||||||
Issued | 146,591 | 274,929 | 328,423 | 279,612 | ||||||||||||
Issued in lieu of cash distributions | 15,477 | – | 12,644 | – | ||||||||||||
Redeemed | (810,647) | (1,075,438) | (554,037) | (427,802) | ||||||||||||
| ||||||||||||||||
Net Increase (Decrease) in Share Transactions | (648,579) | (800,509) | (212,970) | (148,190) | ||||||||||||
| ||||||||||||||||
| The accompanying notes are an integral part of the financial statements. | ||
42 |
1-888-462-5386 | www.oakfunds.com |
Rock Oak Core Growth Fund | River Oak Discovery Fund | Red Oak Technology Select Fund | ||||||||||||||||||||
|
| |||||||||||||||||||||
For The Year Ended October 31, | For The Year Ended October 31, | For The Year Ended October 31, | For The Year Ended October 31, | For The Year Ended October 31, | For The Year Ended October 31, | |||||||||||||||||
|
| |||||||||||||||||||||
| $ | 35,899 | $ | 9,371 | $ | (62,188) | $ | (61,156) | $ | 402,074 | $ | 116,802 | |||||||||||
| 1,438,328 | 91,729 | 1,113,957 | 12,915 | 1,014,538 | 25,186,386 | |||||||||||||||||
| 270,516 | (44,864) | 2,179,441 | 620,664 | �� | 24,675,732 | (23,784,503) | ||||||||||||||||
|
| |||||||||||||||||||||
| 1,744,743 | 56,236 | 3,231,210 | 572,423 | 26,092,344 | 1,518,685 | |||||||||||||||||
|
| |||||||||||||||||||||
| (25,866) | – | – | – | (197,281) | – | |||||||||||||||||
| (65,870) | – | – | – | – | – | |||||||||||||||||
|
| |||||||||||||||||||||
| (91,736) | – | – | – | (197,281) | – | |||||||||||||||||
|
| |||||||||||||||||||||
| 112,974 | 402,058 | 263,324 | 682,356 | 41,532,457 | 7,217,018 | |||||||||||||||||
| 87,408 | – | – | – | 186,117 | – | |||||||||||||||||
| (870,562) | (836,408) | (956,908) | (803,232) | (26,903,724) | (15,964,756) | |||||||||||||||||
|
| |||||||||||||||||||||
| (670,180) | (434,350) | (693,584) | (120,876) | 14,814,850 | (8,747,738) | |||||||||||||||||
|
| |||||||||||||||||||||
| 982,827 | (378,114) | 2,537,626 | 451,547 | 40,709,913 | (7,229,053) | |||||||||||||||||
|
| |||||||||||||||||||||
| 6,512,289 | 6,890,403 | 10,766,461 | 10,314,914 | 64,881,734 | 72,110,787 | |||||||||||||||||
|
| |||||||||||||||||||||
| $ | 7,495,116 | $ | 6,512,289 | $ | 13,304,087 | $ | 10,766,461 | $ | 105,591,647 | $ | 64,881,734 | |||||||||||
|
| |||||||||||||||||||||
| $ | 20,429 | $ | 9,778 | $ | – | $ | – | $ | 321,786 | $ | 116,802 | |||||||||||
|
| |||||||||||||||||||||
| 8,369 | 33,009 | 16,787 | 50,387 | 3,311,368 | 713,832 | |||||||||||||||||
| 7,182 | – | – | – | 17,709 | – | |||||||||||||||||
| (69,897) | (72,577) | (64,570) | (58,931) | (2,272,235) | �� | (1,600,288) | ||||||||||||||||
|
| |||||||||||||||||||||
| (54,346) | (39,568) | (47,783) | (8,544) | 1,056,842 | (886,456) | |||||||||||||||||
|
| |||||||||||||||||||||
Annual Report | October 31, 2013 |
43 |
Statements of Changes in Net Assets | ||
| Black Oak Emerging Technology Fund | Live Oak Health Sciences Fund | |||||||||||||||
|
| |||||||||||||||
For The Year Ended | For The Year Ended October 31, 2012 | For The Year Ended October 31, 2013 | For The Year Ended October 31, 2012 | |||||||||||||
| ||||||||||||||||
INVESTMENT ACTIVITIES: | ||||||||||||||||
Net investment income (loss) | $ | (51,257) | $ | (307,013) | $ | 298,041 | $ | 240,070 | ||||||||
Net realized gain on securities sold | 897,986 | 728,567 | 1,556,098 | 1,642,727 | ||||||||||||
Net change in unrealized appreciation (depreciation) of investment securities | 7,100,218 | (1,311,101) | 9,917,628 | 953,613 | ||||||||||||
| ||||||||||||||||
Net Increase (Decrease) in Net Assets Resulting from Operations | 7,946,947 | (889,547) | 11,771,767 | 2,836,410 | ||||||||||||
| ||||||||||||||||
DISTRIBUTIONS TO SHAREHOLDERS: | ||||||||||||||||
Net income | – | – | (278,532) | (140,312) | ||||||||||||
Realized capital gains | – | – | (1,642,727) | (967,970) | ||||||||||||
| ||||||||||||||||
Total Distributions | – | – | (1,921,259) | (1,108,282) | ||||||||||||
| ||||||||||||||||
CAPITAL SHARE TRANSACTIONS (IN DOLLARS): | ||||||||||||||||
Shares issued | 859,255 | 2,155,557 | 5,776,247 | 8,901,438 | ||||||||||||
Shares issued in lieu of cash distributions | – | – | 1,855,791 | 1,059,913 | ||||||||||||
Shares redeemed | (4,003,360) | (5,209,368) | (7,932,232) | (7,793,950) | ||||||||||||
| ||||||||||||||||
Net Increase (Decrease) in Net Assets from Capital Share Transactions | (3,144,105) | (3,053,811) | (300,194) | 2,167,401 | ||||||||||||
| ||||||||||||||||
Total Increase (Decrease) in Net Assets | 4,802,842 | (3,943,358) | 9,550,314 | 3,895,529 | ||||||||||||
| ||||||||||||||||
NET ASSETS: | ||||||||||||||||
Beginning of period | 25,050,013 | 28,993,371 | 32,966,708 | 29,071,179 | ||||||||||||
| ||||||||||||||||
End of period | $ | 29,852,855 | $ | 25,050,013 | $ | 42,517,022 | $ | 32,966,708 | ||||||||
| ||||||||||||||||
Including accumulated undistributed net investment income (loss) | $ | (138,246) | $ | (272,116) | $ | 233,036 | $ | 213,527 | ||||||||
| ||||||||||||||||
SHARES ISSUED AND REDEEMED: | ||||||||||||||||
Issued | 271,318 | 720,690 | 355,554 | 641,642 | ||||||||||||
Issued in lieu of cash distributions | – | – | 128,696 | 82,871 | ||||||||||||
Redeemed | (1,312,223) | (1,766,648) | (473,342) | (554,347) | ||||||||||||
| ||||||||||||||||
Net Increase (Decrease) in Share Transactions | (1,040,905) | (1,045,958) | 10,908 | 170,166 | ||||||||||||
| ||||||||||||||||
| The accompanying notes are an integral part of the financial statements. | ||
44 |
1-888-462-5386 | www.oakfunds.com |
OAK ASSOCIATES FUNDS
This Page Intentionally Left Blank
For a share outstanding throughout the years ended |
Year Ended October 31, 2013 | ||||
| ||||
WHITE OAK SELECT GROWTH FUND | ||||
Net Asset Value Beginning of Period | $ | 42.50 | ||
Income (Loss) From Operations | ||||
Net Investment Income (Loss)(a) | 0.24 | |||
Realized and Unrealized Gain in Securities(a) | 11.06 | |||
| ||||
Total From Operations | 11.30 | |||
| ||||
Less Distributions: | ||||
Dividends from Net Investment Income | (0.14) | |||
Distributions from Capital Gains | – | |||
| ||||
Total Dividends and Distributions | (0.14) | |||
| ||||
Net Asset Value End of Period | $ | 53.66 | ||
| ||||
Total Return(b) | 26.65% | |||
Net Assets End of Period (000) | $ | 253,803 | ||
Ratio of Net Expenses to Average Net Assets | 1.12% | |||
Ratio of Net Investment Income (Loss) to Average Net Assets | 0.50% | |||
Ratio of Net Expenses to Average Net Assets (Excluding Fees Paid Indirectly) | N/A | |||
Ratio of Expenses to Average Net Assets (Excluding Waivers and/or Fees Paid Indirectly) | 1.12% | |||
Portfolio Turnover Rate | 89% | |||
| (a) | Per share calculations were performed using average shares for the period. |
| (b) | Figures do not reflect the deduction of taxes the shareholder will pay on fund distributions or redemption of fund shares. |
The accompanying notes are an integral part of the financial statements.
46 |
1-888-462-5386 | www.oakfunds.com |
| Year Ended October 31, 2012 | Year Ended October 31, 2011 | Year Ended October 31, 2010 | Year Ended October 31, 2009 | |||||||||||
|
| |||||||||||||
| $ | 39.09 | $ | 37.56 | $ | 31.44 | $ | 23.89 | |||||||
| 0.11 | (0.03) | (0.20) | (0.18) | |||||||||||
| 3.30 | 1.56 | 6.32 | 7.73 | |||||||||||
|
| |||||||||||||
| 3.41 | 1.53 | 6.12 | 7.55 | |||||||||||
|
| |||||||||||||
| – | – | – | – | |||||||||||
| – | – | – | – | |||||||||||
|
| |||||||||||||
| – | – | – | – | |||||||||||
|
| |||||||||||||
| $ | 42.50 | $ | 39.09 | $ | 37.56 | $ | 31.44 | |||||||
|
| |||||||||||||
| 8.72% | 4.07% | 19.47% | 31.60% | |||||||||||
| $ | 228,596 | $ | 241,557 | $ | 259,184 | $ | 319,359 | |||||||
| 1.16% | 1.14% | 1.25% | 1.25% | |||||||||||
| 0.28% | (0.08)% | (0.58)% | (0.70)% | |||||||||||
| N/A | N/A | N/A | 1.25% | |||||||||||
| 1.16% | 1.14% | 1.34% | 1.51% | |||||||||||
| 86% | 12% | 14% | 31% | |||||||||||
Annual Report | October 31, 2013 |
47 |
Financial Highlights | ||
For a share outstanding throughout the years ended |
| Year Ended October 31, 2013 | ||||
| ||||
PIN OAK EQUITY FUND | ||||
Net Asset Value Beginning of Period | $ | 32.86 | ||
Income (Loss) From Operations | ||||
Net Investment Income (Loss)(a) | 0.26 | |||
Realized and Unrealized Gain in Securities(a) | 10.18 | |||
| ||||
Total From Operations | 10.44 | |||
| ||||
Less Distributions: | ||||
Dividends from Net Investment Income | (0.23) | |||
Distributions from Capital Gains | – | |||
| ||||
Total Dividends and Distributions | (0.23) | |||
| ||||
Net Asset Value End of Period | $ | 43.07 | ||
| ||||
Total Return(b) | 31.94% | |||
Net Assets End of Period (000) | $ | 81,408 | ||
Ratio of Net Expenses to Average Net Assets | 1.16% | |||
Ratio of Net Investment Income (Loss) to Average Net Assets | 0.70% | |||
Ratio of Net Expenses to Average Net Assets (Excluding Fees Paid Indirectly) | N/A | |||
Ratio of Expenses to Average Net Assets (Excluding Waivers and/or Fees Paid Indirectly) | 1.16% | |||
Portfolio Turnover Rate | 117% | |||
| (a) | Per share calculations were performed using average shares for the period. |
| (b) | Figures do not reflect the deduction of taxes the shareholder will pay on fund distributions or redemption of fund shares. |
The accompanying notes are an integral part of the financial statements.
48 |
1-888-462-5386 | www.oakfunds.com |
| Year Ended October 31, 2012 | Year Ended October 31, 2011 | Year Ended October 31, 2010 | Year Ended October 31, 2009 | |||||||||||
|
| |||||||||||||
| $ | 28.52 | $ | 26.76 | $ | 22.74 | $ | 15.58 | |||||||
| 0.21 | (0.05) | 0.07 | (0.11) | |||||||||||
| 4.13 | 1.90 | 3.96 | 7.27 | |||||||||||
|
| |||||||||||||
| 4.34 | 1.85 | 4.03 | 7.16 | |||||||||||
|
| |||||||||||||
| – | (0.09) | (0.01) | – | |||||||||||
| – | – | – | – | |||||||||||
|
| |||||||||||||
| – | (0.09) | (0.01) | – | |||||||||||
|
| |||||||||||||
| $ | 32.86 | $ | 28.52 | $ | 26.76 | $ | 22.74 | |||||||
|
| |||||||||||||
| 15.22% | 6.92% | 17.74% | 45.96% | |||||||||||
| $ | 69,107 | $ | 64,214 | $ | 69,845 | $ | 118,532 | |||||||
| 1.21% | 1.20% | 1.25% | 1.25% | |||||||||||
| 0.68% | (0.16)% | 0.27% | (0.58)% | |||||||||||
| N/A | N/A | N/A | 1.25% | |||||||||||
| 1.21% | 1.20% | 1.33% | 1.60% | |||||||||||
| 98% | 27% | 35% | 16% | |||||||||||
Annual Report | October 31, 2013 |
49 |
Financial Highlights | ||
For a share outstanding throughout the years ended |
| Year Ended October 31, 2013 | ||||
| ||||
ROCK OAK CORE GROWTH FUND | ||||
Net Asset Value Beginning of Period | $ | 11.78 | ||
Income (Loss) From Operations | ||||
Net Investment Income (Loss)(a) | 0.07 | |||
Realized and Unrealized Gain in Securities(a) | 3.37 | |||
| ||||
Total From Operations | 3.44 | |||
| ||||
Less Distributions: | ||||
Dividends from Net Investment Income | (0.05) | |||
Distributions from Capital Gains | (0.13) | |||
| ||||
Total Dividends and Distributions | (0.18) | |||
| ||||
Net Asset Value End of Period | $ | 15.04 | ||
| ||||
Total Return(b) | 29.51% | |||
Net Assets End of Period (000) | $ | 7,495 | ||
Ratio of Net Expenses to Average Net Assets | 1.25% | |||
Ratio of Net Investment Income (Loss) to Average Net Assets | 0.53% | |||
Ratio of Net Expenses to Average Net Assets (Excluding Fees Paid Indirectly) | N/A | |||
Ratio of Expenses to Average Net Assets (Excluding Waivers and/or Fees Paid Indirectly) | 1.65% | |||
Portfolio Turnover Rate | 65% | |||
| (a) | Per share calculations were performed using average shares for the period. |
| (b) | Figures do not reflect the deduction of taxes the shareholder will pay on fund distributions or redemption of fund shares. |
The accompanying notes are an integral part of the financial statements.
50 |
1-888-462-5386 | www.oakfunds.com |
| Year Ended October 31, 2012 | Year Ended October 31, 2011 | Year Ended October 31, 2010 | Year Ended October 31, 2009 | |||||||||||
|
| |||||||||||||
| $ | 11.64 | $ | 11.16 | $ | 9.09 | $ | 7.28 | |||||||
| 0.02 | (0.04) | (0.06) | (0.04) | |||||||||||
| 0.12 | 0.52 | 2.13 | 1.85 | |||||||||||
|
| |||||||||||||
| 0.14 | 0.48 | 2.07 | 1.81 | |||||||||||
|
| |||||||||||||
| – | – | – | – | |||||||||||
| – | – | – | – | |||||||||||
|
| |||||||||||||
| – | – | – | – | |||||||||||
|
| |||||||||||||
| $ | 11.78 | $ | 11.64 | $ | 11.16 | $ | 9.09 | |||||||
|
| |||||||||||||
| 1.20% | 4.30% | 22.77% | 24.86% | |||||||||||
| $ | 6,512 | $ | 6,890 | $ | 6,744 | $ | 5,798 | |||||||
| 1.25% | 1.25% | 1.25% | 1.25% | |||||||||||
| 0.14% | (0.35)% | (0.59)% | (0.56)% | |||||||||||
| N/A | N/A | N/A | 1.25% | |||||||||||
| 1.79% | 1.65% | 1.54% | 1.82% | |||||||||||
| 56% | 40% | 62% | 45% | |||||||||||
Annual Report | October 31, 2013 |
51 |
Financial Highlights | ||
For a share outstanding throughout the years ended |
| Year Ended October 31, 2013 | ||||
| ||||
RIVER OAK DISCOVERY FUND | ||||
Net Asset Value Beginning of Period | $ | 13.46 | ||
Income (Loss) From Operations | ||||
Net Investment Income (Loss)(a) | (0.08) | |||
Realized and Unrealized Gain in Securities(a) | 4.32 | |||
| ||||
Total From Operations | 4.24 | |||
| ||||
Less Distributions: | ||||
Dividends from Net Investment Income | – | |||
Distributions from Capital Gains | – | |||
| ||||
Total Dividends and Distributions | – | |||
| ||||
Net Asset Value End of Period | $ | 17.70 | ||
| ||||
Total Return(b) | 31.50% | |||
Net Assets End of Period (000) | $ | 13,304 | ||
Ratio of Net Expenses to Average Net Assets | 1.35% | |||
Ratio of Net Investment Loss to Average Net Assets | (0.52)% | |||
Ratio of Net Expenses to Average Net Assets (Excluding Fees Paid Indirectly) | N/A | |||
Ratio of Expenses to Average Net Assets (Excluding Waivers and/or Fees Paid Indirectly) | 1.52% | |||
Portfolio Turnover Rate | 63% | |||
| (a) | Per share calculations were performed using average shares for the period. |
| (b) | Figures do not reflect the deduction of taxes the shareholder will pay on fund distributions or redemption of fund shares. |
The accompanying notes are an integral part of the financial statements.
52 |
1-888-462-5386 | www.oakfunds.com |
| Year Ended October 31, 2012 | Year Ended October 31, 2011 | Year Ended October 31, 2010 | Year Ended October 31, 2009 | |||||||||||
|
| |||||||||||||
| $ | 12.76 | $ | 12.84 | $ | 10.96 | $ | 7.86 | |||||||
| (0.07) | (0.08) | (0.10) | (0.09) | |||||||||||
| 0.77 | 0.18 | 1.98 | 3.19 | |||||||||||
|
| |||||||||||||
| 0.70 | 0.10 | 1.88 | 3.10 | |||||||||||
|
| |||||||||||||
| – | – | – | – | |||||||||||
| – | (0.18) | – | – | |||||||||||
|
| |||||||||||||
| – | (0.18) | – | – | |||||||||||
|
| |||||||||||||
| $ | 13.46 | $ | 12.76 | $ | 12.84 | $ | 10.96 | |||||||
|
| |||||||||||||
| 5.49% | 0.74% | 17.15% | 39.44% | |||||||||||
| $ | 10,766 | $ | 10,315 | $ | 9,125 | $ | 8,247 | |||||||
| 1.35% | 1.35% | 1.35% | 1.35% | |||||||||||
| (0.54)% | (0.61)% | (0.83)% | (1.03)% | |||||||||||
| N/A | N/A | N/A | 1.35% | |||||||||||
| 1.62% | 1.52% | 1.57% | 1.92% | |||||||||||
| 72% | 92% | 56% | 67% | |||||||||||
Annual Report | October 31, 2013 |
53 |
Financial Highlights | ||
For a share outstanding throughout the years ended |
| Year Ended October 31, 2013 | ||||
| ||||
RED OAK TECHNOLOGY SELECT FUND | ||||
Net Asset Value Beginning of Period | $ | 9.79 | ||
Income (Loss) From Operations | ||||
Net Investment Income (Loss)(a) | 0.06 | |||
Realized and Unrealized Gain in Securities(a) | 3.92 | |||
| ||||
Total From Operations | 3.98 | |||
| ||||
Less Distributions: | ||||
Dividends from Net Investment Income | (0.03) | |||
Distributions from Capital Gains | – | |||
| ||||
Total Dividends and Distributions | (0.03) | |||
| ||||
Net Asset Value End of Period | $ | 13.74 | ||
| ||||
Total Return(b) | 40.76% | |||
Net Assets End of Period (000) | $ | 105,592 | ||
Ratio of Net Expenses to Average Net Assets | 1.23% | |||
Ratio of Net Investment Income (Loss) to Average Net Assets | 0.50% | |||
Ratio of Net Expenses to Average Net Assets (Excluding Fees Paid Indirectly) | N/A | |||
Ratio of Expenses to Average Net Assets (Excluding Waivers and/or Fees Paid Indirectly) | 1.23% | |||
Portfolio Turnover Rate | 15% | |||
| (a) | Per share calculations were performed using average shares for the period. |
| (b) | Figures do not reflect the deduction of taxes the shareholder will pay on fund distributions or redemption of fund shares. |
The accompanying notes are an integral part of the financial statements.
54 |
1-888-462-5386 | www.oakfunds.com |
| Year Ended October 31, 2012 | Year Ended October 31, 2011 | Year Ended October 31, 2010 | Year Ended October 31, 2009 | |||||||||||
|
| |||||||||||||
| $ | 9.60 | $ | 8.67 | $ | 7.04 | $ | 4.92 | |||||||
| 0.02 | (0.04) | (0.05) | (0.03) | |||||||||||
| 0.17 | 0.97 | �� | 1.68 | 2.15 | ||||||||||
|
| |||||||||||||
| 0.19 | 0.93 | 1.63 | 2.12 | |||||||||||
|
| |||||||||||||
| – | – | – | – | |||||||||||
| – | – | – | – | |||||||||||
|
| |||||||||||||
| – | – | – | – | |||||||||||
|
| |||||||||||||
| $ | 9.79 | $ | 9.60 | $ | 8.67 | $ | 7.04 | |||||||
|
| |||||||||||||
| 1.98% | 10.73% | 23.15% | 43.09% | |||||||||||
| $ | 64,882 | $ | 72,111 | $ | 65,415 | $ | 73,511 | |||||||
| 1.30% | 1.32% | 1.35% | 1.35% | |||||||||||
| 0.16% | (0.43)% | (0.70)% | (0.56)% | |||||||||||
| N/A | N/A | N/A | 1.35% | |||||||||||
| 1.30% | 1.32% | 1.53% | 1.82% | |||||||||||
| 83% | 24% | 28% | 30% | |||||||||||
Annual Report | October 31, 2013 |
55 |
Financial Highlights | ||
For a share outstanding throughout the years ended |
| Year Ended October 31, 2013 | ||||
| ||||
BLACK OAK EMERGING TECHNOLOGY FUND | ||||
Net Asset Value Beginning of Period | $ | 2.67 | ||
Income (Loss) From Operations | ||||
Net Investment Income (Loss)(a) | (0.01) | |||
Realized and Unrealized Gain or (Losses) in Securities(a) | 0.92 | |||
| ||||
Total From Operations | 0.91 | |||
| ||||
Less Distributions: | ||||
Dividends from Net Investment Income | – | |||
Distributions from Capital Gains | – | |||
| ||||
Total Dividends and Distributions | – | |||
| ||||
Net Asset Value End of Period | $ | 3.58 | ||
| ||||
Total Return(b) | 34.08% | |||
Net Assets End of Period (000) | $ | 29,853 | ||
Ratio of Net Expenses to Average Net Assets | 1.35% | |||
Ratio of Net Investment Loss to Average Net Assets | (0.19)% | |||
Ratio of Net Expenses to Average Net Assets (Excluding Fees Paid Indirectly) | N/A | |||
Ratio of Expenses to Average Net Assets (Excluding Waivers and/or Fees Paid Indirectly) | 1.39% | |||
Portfolio Turnover Rate | 58% | |||
| (a) | Per share calculations were performed using average shares for the period. |
| (b) | Figures do not reflect the deduction of taxes the shareholder will pay on fund distributions or redemption of fund shares. |
The accompanying notes are an integral part of the financial statements.
56 |
1-888-462-5386 | www.oakfunds.com |
| Year Ended October 31, 2012 | Year Ended October 31, 2011 | Year Ended October 31, 2010 | Year Ended October 31, 2009 | |||||||||||
|
| |||||||||||||
| $ | 2.78 | $ | 2.94 | $ | 2.19 | $ | 1.63 | |||||||
| (0.03) | (0.04) | (0.03) | (0.02) | |||||||||||
| (0.08) | (0.12) | 0.78 | 0.58 | |||||||||||
|
| |||||||||||||
| (0.11) | (0.16) | 0.75 | 0.56 | |||||||||||
|
| |||||||||||||
| – | – | – | – | |||||||||||
| – | – | – | – | |||||||||||
|
| |||||||||||||
| – | – | – | – | |||||||||||
|
| |||||||||||||
| $ | 2.67 | $ | 2.78 | $ | 2.94 | $ | 2.19 | |||||||
|
| |||||||||||||
| (3.96)% | (5.44)% | 34.25% | 34.36% | |||||||||||
| $ | 25,050 | $ | 28,993 | $ | 43,714 | $ | 37,596 | |||||||
| 1.35% | 1.35% | 1.35% | 1.35% | |||||||||||
| (1.07)% | (1.16)% | (1.16)% | (1.15)% | |||||||||||
| N/A | N/A | N/A | 1.35% | |||||||||||
| 1.44% | 1.35% | 1.55% | 1.93% | |||||||||||
| 33% | 54% | 99% | 49% | |||||||||||
Annual Report | October 31, 2013 |
57 |
Financial Highlights | ||
For a share outstanding throughout the years ended |
| Year Ended October 31, 2013 | ||||
| ||||
LIVE OAK HEALTH SCIENCES FUND | ||||
Net Asset Value Beginning of Period | $ | 14.67 | ||
Income (Loss) From Operations | ||||
Net Investment Income (Loss)(a) | 0.13 | |||
Realized and Unrealized Gain in Securities(a) | 4.90 | |||
| ||||
Total From Operations | 5.03 | |||
| ||||
Less Distributions: | ||||
Dividends from Net Investment Income | (0.13) | |||
Distributions from Capital Gains | (0.74) | |||
| ||||
Total Dividends and Distributions | (0.87) | |||
| ||||
Net Asset Value End of Period | $ | 18.83 | ||
| ||||
Total Return(b) | 36.07% | |||
Net Assets End of Period (000) | $ | 42,517 | ||
Ratio of Net Expenses to Average Net Assets | 1.15% | |||
Ratio of Net Investment Income to Average Net Assets | 0.77% | |||
Ratio of Net Expenses to Average Net Assets (Excluding Fees Paid Indirectly) | N/A | |||
Ratio of Expenses to Average Net Assets (Excluding Waivers and/or Fees Paid Indirectly) | 1.15% | |||
Portfolio Turnover Rate | 12% | |||
| (a) | Per share calculations were performed using average shares for the period. |
| (b) | Figures do not reflect the deduction of taxes the shareholder will pay on fund distributions or redemption of fund shares. |
The accompanying notes are an integral part of the financial statements.
58 |
1-888-462-5386 | www.oakfunds.com |
| Year Ended October 31, 2012 | Year Ended October 31, 2011 | Year Ended October 31, 2010 | Year Ended October 31, 2009 | |||||||||||
|
| |||||||||||||
| $ | 14.00 | $ | 12.84 | $ | 11.00 | $ | 9.48 | |||||||
| 0.10 | 0.06 | 0.02 | (0.01) | |||||||||||
| 1.09 | 1.72 | 2.22 | 1.53 | |||||||||||
|
| |||||||||||||
| 1.19 | 1.78 | 2.24 | 1.52 | |||||||||||
|
| |||||||||||||
| (0.07) | (0.02) | – | – | |||||||||||
| (0.45) | (0.60) | (0.40) | – | |||||||||||
|
| |||||||||||||
| (0.52) | (0.62) | (0.40) | – | |||||||||||
|
| |||||||||||||
| $ | 14.67 | $ | 14.00 | $ | 12.84 | $ | 11.00 | |||||||
|
| |||||||||||||
| 9.02% | 14.46% | 20.66% | 16.03% | |||||||||||
| $ | 32,967 | $ | 29,071 | $ | 19,595 | $ | 16,249 | |||||||
| 1.24% | 1.25% | 1.35% | 1.35% | |||||||||||
| 0.73% | 0.47% | 0.17% | 0.08% | |||||||||||
| N/A | N/A | N/A | 1.35% | |||||||||||
| 1.24% | 1.25% | 1.38% | 1.61% | |||||||||||
| 16% | 17% | 22% | 31% | |||||||||||
Annual Report | October 31, 2013 |
59 |
As of October 31, 2013 |
1. ORGANIZATION:
The Oak Associates Funds (the “Trust”), a Massachusetts business trust, is registered under the Investment Company Act of 1940, as amended, as an open-end management investment company with seven funds: White Oak Select Growth Fund, Pin Oak Equity Fund, Rock Oak Core Growth Fund and River Oak Discovery Fund (“diversified funds”); Red Oak Technology Select Fund, Black Oak Emerging Technology Fund and Live Oak Health Sciences Fund (“non-diversified funds”) (collectively referred to as “Funds” and individually referred to as a “Fund”). The investment objectives of the Funds are to seek long-term capital growth. The assets of each Fund are segregated, and a shareholder’s interest is limited to the Fund in which shares are held. The Funds’ prospectus provides a description of each Fund’s investment objectives, policies and strategies.
2. SIGNIFICANT ACCOUNTING POLICIES:
The following is a summary of significant accounting policies followed by the Funds.
Use of Estimates – These policies are in conformity with U.S. generally accepted accounting principles (“GAAP”). The preparation of financial statements in accordance with GAAP requires management to make estimates and assumptions that affect the reported amounts and disclosures in the financial statements during the reporting period. Management believes the estimates and security valuations are appropriate; however, actual results may differ from those estimates, and the security valuations reflected in the financial statements may differ from the value the Funds ultimately realize upon the sale of the securities.
Security Valuation – Investments in equity securities, which are traded on a national exchange, are stated at the last quoted sales price if readily available for such equity securities on each business day. Investments in equity securities, which are reported on the NASDAQ national market system are valued at the official closing price; other equity securities traded in the over-the-counter market and listed equity securities for which no sale was reported on that date are stated at the last quoted bid price. Debt obligations exceeding sixty days to maturity for which market quotations are readily available are valued at the most recently quoted bid price. Debt obligations with sixty days or less remaining until maturity may be valued at their amortized cost, which approximates market value.
Redeemable securities issued by open-end registered investment companies are valued at the investment company’s applicable net asset value.
Securities for which market prices are not “readily available” are valued in accordance with Fair Value Procedures established by the Funds’ Board of Trustees. The Funds’ Fair Value Procedures are implemented through a Fair Value Committee (the “Committee”) designated by the Funds’ Board of Trustees. Some of the more common reasons that may necessitate that a security be valued using Fair Value Procedures include: the security’s trading has been halted or suspended; the security has been de–listed from a national exchange; the security’s primary trading market is temporarily closed at a time when under normal conditions it would be open; the security has not been traded for an extended period of time; the security’s primary pricing source is not able or willing to provide a price; a significant event with respect to a security or securities has occurred after the close of the market or exchange on which the security or securities principally trades and before the time the Fund calculates net asset value; or trading of the security is subject to local government–imposed restrictions. When a security is valued in accordance with the Fair Value Procedures, the Committee will determine the value after taking into consideration relevant information reasonably available to the Committee.
60 |
1-888-462-5386 | www.oakfunds.com |
| Notes to Financial Statements | ||
| As of October 31, 2013 |
Security Transactions and Investment Income – Security transactions are accounted for on the date the security is purchased or sold (trade date). Dividend income is recognized on the ex-dividend date. Interest income is recognized on the accrual basis. Withholding taxes on foreign dividends have been provided for in accordance with the Funds’ understanding of the applicable country’s tax rules and rates. Costs used in determining realized gains and losses on the sales of investment securities are those of the specific securities sold. If applicable, any foreign capital gains taxes are accrued, net of unrealized gains, and are payable upon the sale of such investments.
Expenses – Expenses that are directly related to one of the Funds are charged to that Fund. Other operating expenses of the Trust are prorated to the Funds on the basis of relative daily net assets.
Repurchase Agreements – The Funds invest in tri-party repurchase agreements. Securities held as collateral for tri-party repurchase agreements are maintained by the broker’s custodian bank in a segregated account until maturity of the repurchase agreement. Provisions of the repurchase agreements and procedures adopted by the Board of Trustees require that the market value of the collateral, including accrued interest thereon, is sufficient in the event of default by the counterparty. If the counterparty defaults and the value of the collateral declines or if the counter-party enters an insolvency proceeding, realization of the collateral by the Funds may be delayed or limited.
Dividends and Distributions to Shareholders – Dividends from net investment income are declared and paid to shareholders on an annual basis, as applicable. Net realized capital gains on sales of securities, if any, are distributed to shareholders at least annually. Distributions to shareholders are determined in accordance with income tax regulations and are recorded on the ex-dividend date.
Income and capital gain distributions are determined in accordance with federal income tax regulations, which may differ from GAAP. Therefore, the source of the Funds’ distributions may be shown in the accompanying financial statements as either from or in excess of net investment income or net realized gain, or from paid-in capital, depending upon the type of book/tax differences that may exist.
3. FAIR VALUE MEASUREMENTS:
A three-tier hierarchy has been established to classify fair value measurements for disclosure purposes. Inputs refer broadly to the assumptions that market participants would use in pricing the asset or liability including assumptions about risk. Inputs may be observable and unobservable. Observable inputs are inputs that reflect the assumptions market participants would use in pricing the asset or liability that are developed based on market data obtained from sources independent of the reporting entity. Unobservable inputs are inputs that reflect the reporting entity’s own assumptions about the assumptions market participants would use in pricing the asset or liability that are developed based on the best information available.
Annual Report | October 31, 2013 |
61 |
Notes to Financial Statements | ||
As of October 31, 2013 |
Various inputs are used in determining the value of each Fund’s investments as of the reporting period end. The designated input levels are not necessarily an indication of the risk or liquidity associated with these investments. These inputs are categorized in the following hierarchy under applicable financial accounting standards:
The three-tier hierarchy is summarized as follows:
1) Level 1 - Quoted and Unadjusted prices in active markets for identical securities
2) Level 2 - Other Significant Observable Inputs (including quoted prices for similar securities, interest rates, prepayments speeds, credit risk, etc.)
3) Level 3 - Significant Unobservable Inputs (including the Fund’s own assumptions in determining the fair value of investments)
The following is a summary of the inputs used to value each Funds investments as of October 31, 2013.
| Level 1 | Level 2 | Level 3 | Total | |||||||||||||
| ||||||||||||||||
WHITE OAK SELECT GROWTH FUND | ||||||||||||||||
Common Stocks | $ | 242,473,949 | $ | – | $ | – | $ | 242,473,949 | ||||||||
Short Term Investments | 3,115,749 | – | – | 3,115,749 | ||||||||||||
| ||||||||||||||||
Total | $ | 245,589,698 | $ | – | $ | – | $ | 245,589,698 | ||||||||
| ||||||||||||||||
| Level 1 | Level 2 | Level 3 | Total | |||||||||||||
| ||||||||||||||||
PIN OAK EQUITY FUND | ||||||||||||||||
Common Stocks | $ | 79,701,454 | $ | – | $ | – | $ | 79,701,454 | ||||||||
Short Term Investments | 1,779,498 | – | – | 1,779,498 | ||||||||||||
| ||||||||||||||||
Total | $ | 81,480,952 | $ | – | $ | – | $ | 81,480,952 | ||||||||
| ||||||||||||||||
| Level 1 | Level 2 | Level 3 | Total | |||||||||||||
| ||||||||||||||||
ROCK OAK CORE GROWTH FUND | ||||||||||||||||
Common Stocks | $ | 7,030,556 | $ | – | $ | – | $ | 7,030,556 | ||||||||
Short Term Investments | 477,825 | – | – | 477,825 | ||||||||||||
| ||||||||||||||||
Total | $ | 7,508,381 | $ | – | $ | – | $ | 7,508,381 | ||||||||
| ||||||||||||||||
| Level 1 | Level 2 | Level 3 | Total | |||||||||||||
| ||||||||||||||||
RIVER OAK DISCOVERY FUND | ||||||||||||||||
Common Stocks | $ | 12,576,934 | $ | – | $ | – | $ | 12,576,934 | ||||||||
Short Term Investments | 414,540 | – | – | 414,540 | ||||||||||||
| ||||||||||||||||
Total | $ | 12,991,474 | $ | – | $ | – | $ | 12,991,474 | ||||||||
| ||||||||||||||||
| Level 1 | Level 2 | Level 3 | Total | |||||||||||||
| ||||||||||||||||
RED OAK TECHNOLOGY SELECT FUND | ||||||||||||||||
Common Stocks | $ | 100,788,878 | $ | – | $ | – | $ | 100,788,878 | ||||||||
Repurchase Agreements | – | 5,129,698 | – | 5,129,698 | ||||||||||||
| ||||||||||||||||
Total | $ | 100,788,878 | $ | 5,129,698 | $ | – | $ | 105,918,576 | ||||||||
| ||||||||||||||||
62 |
1-888-462-5386 | www.oakfunds.com |
| Notes to Financial Statements | ||
| As of October 31, 2013 |
| Level 1 | Level 2 | Level 3 | Total | |||||||||||||
| ||||||||||||||||
BLACK OAK EMERGING TECHNOLOGY FUND | ||||||||||||||||
Common Stocks | $ | 29,113,515 | $ | – | $ | – | $ | 29,113,515 | ||||||||
Short Term Investments | 786,154 | – | – | 786,154 | ||||||||||||
| ||||||||||||||||
Total | $ | 29,899,669 | $ | – | $ | – | $ | 29,899,669 | ||||||||
| ||||||||||||||||
| Level 1 | Level 2 | Level 3 | Total | |||||||||||||
| ||||||||||||||||
LIVE OAK HEALTH SCIENCES FUND | ||||||||||||||||
Common Stocks | $ | 42,576,227 | $ | – | $ | – | $ | 42,576,227 | ||||||||
Short Term Investments | 6,121 | – | – | 6,121 | ||||||||||||
| ||||||||||||||||
Total | $ | 42,582,348 | $ | – | $ | – | $ | 42,582,348 | ||||||||
| ||||||||||||||||
The above tables are presented by levels of disaggregation for each asset class. For detailed descriptions of the underlying industries, see the accompanying Schedules of Investments. There were no transfers into or out of Level I and 2 during the year. There were no Level 3 securities held during the year. It is the Fund’s policy to recognize transfers into and out of levels at the end of the reporting period.
4. TRANSACTIONS WITH AFFILIATES:
Certain officers of the Trust are also officers of Oak Associates, ltd., (the “Advisor”), ALPS Fund Services, Inc. (the “Administrator”) and/or ALPS Distributors, Inc. (the “Distributor”). Such officers are paid no fees by the Trust for serving as officers of the Trust.
5. ADMINISTRATION, TRANSFER AGENT AND DISTRIBUTION AGREEMENTS:
Administration: ALPS Fund Services, Inc. (the “Administrator”) serves as administrator to the Trust. The Trust and the Administrator have entered into an administration, bookkeeping and pricing services agreement (the “Administration Agreement”). Under the Administration Agreement, the Administrator provides the Trust with administrative services, including regulatory reporting, fund accounting services, and calculating the Funds’ daily net asset value, and provides all necessary office space, equipment, personnel and facilities for annual fee. The Administration Agreement provides that the Administrator shall not be liable for any error of judgment or mistake of law or for any loss suffered by the Trust in connection with the matters to which the Administration Agreement relates, except a loss resulting from willful misfeasance, bad faith or negligence on the part of the Administrator in the performance of its duties or from reckless disregard by it of its duties and obligations there under. The Administration Agreement shall remain in effect for a period of one year after the effective date of the agreement and shall continue in effect for successive periods of one year unless terminated by either party on not less than 60 days’ prior written notice to the other party.
Administrative Fee: ALPS Fund Services, Inc. (“ALPS”) provides the Funds with certain administrative personnel and services. The fees paid to ALPS are based on an annual rate of 0.08% of the daily average aggregate net assets of the Trust for the period, subject to a $400,000 annual minimum (on the Trust level). Fees are allocated to each Fund based on daily net assets (each Fund’s net assets as a percentage of total Trust net assets).
Transfer Agent: ALPS Fund Services, Inc. (the “Transfer Agent”) serves as transfer agent, dividend paying agent and shareholder service agent for the Trust under a transfer agency and services
Annual Report | October 31, 2013 |
63 |
Notes to Financial Statements | ||
As of October 31, 2013 |
agreement with the Trust. As of August 7, 2013, the fees changed to $9,000 annually per fund and $10 annually per open account.
Distribution: The Trust and ALPS Distributors, Inc. (the “Distributor”), an affiliate of the Administrator, are parties to a distribution agreement (the “Distribution Agreement”) whereby the Distributor acts as principal underwriter for the Trust’s shares. The Distributor has agreed to use its best efforts in distributing Fund shares but is not obligated to sell any particular number of shares. The Distributor does not receive compensation under the Distribution Agreement for distribution of Fund shares.
6. INVESTMENT ADVISORY AND CUSTODIAN AGREEMENTS:
The Trust and the Advisor are parties to an Investment Advisory Agreement, under which the Advisor receives an annual fee equal to 0.74% of the average daily net assets of each Fund, except for the River Oak Discovery Fund for which the Adviser receives 0.90% of the average daily net assets of the Fund. The Advisor has agreed to contractually waive all or a portion of its fees (and to reimburse the Funds’ expenses if necessary) in order to limit operating expenses to not more than 1.25% of the average daily net assets of the White Oak Select Growth, Rock Oak Core Growth and Pin Oak Equity Funds, and 1.35% of the average daily net assets of the River Oak Discovery, Red Oak Technology Select, Black Oak Emerging Technology and Live Oak Health Sciences Funds for one year periods. The Adviser contractually agreed to continue this arrangement through February 28, 2014.
U.S. Bank N.A. acts as custodian (the “Custodian”) for the Funds. The Custodian plays no role in determining the investment policies of the Funds or which securities are to be purchased or sold by the Funds.
7. INVESTMENT TRANSACTIONS:
The cost of security purchases and the proceeds from security sales, other than short–term investments, for the year ended October 31, 2013, were as follows:
| Fund | Purchases | Sales | ||||||
| ||||||||
White Oak Select Growth Fund | $ | 213,688,314 | $ | 254,578,865 | ||||
Pin Oak Equity Fund | 84,477,151 | 92,241,524 | ||||||
Rock Oak Core Growth Fund | 4,176,419 | 5,208,793 | ||||||
River Oak Discovery Fund | 7,126,932 | 7,677,170 | ||||||
Red Oak Technology Select Fund | 23,392,266 | 11,865,051 | ||||||
Black Oak Emerging Technology Fund | 14,794,378 | 16,972,971 | ||||||
Live Oak Health Sciences Fund | 4,349,496 | 5,777,049 | ||||||
8. FEDERAL INCOME TAXES AND TAX BASIS INFORMATION:
Each of the Funds is classified as a separate taxable entity for Federal income tax purposes. Each of the Funds intend to continue to qualify as a separate “regulated investment company” under Sub–chapter M of the Internal Revenue Code of 1986, as amended, and make the requisite distributions to shareholders that will be sufficient to relieve it from Federal income tax and Federal excise tax. Therefore, no Federal tax provision is required.
To the extent that dividends from net investment income and distributions from net realized capital gains exceed amounts reported in the financial statements, such amounts are reported separately.
64 |
1-888-462-5386 | www.oakfunds.com |
| Notes to Financial Statements | ||
| As of October 31, 2013 |
The amounts of dividends from net investment income and distributions from net realized capital gains are determined in accordance with Federal income tax regulations, which may differ from those amounts determined under accounting principles generally accepted in the United States of America. These book/tax differences are either temporary or permanent in nature. The character of dividends from net investment income or distributions from net realized gains made during the year, and the timing of may differ from the year that the income or realized gains (losses) were recorded by the Funds. To the extent these differences are permanent, adjustments are made to the appropriate equity accounts in the period that the differences arise. These differences are primarily due to the reclass of distributions on net operating losses and expiration of capital loss carryforwards.
Accordingly, the following permanent differences have been reclassified to/from the following accounts:
| Undistributed Ordinary Income | Accumulated Capital Gain/(Loss) | Paid-in Capital | ||||||||||
White Oak Select Growth Fund | $ | – | $ | 262,489,183 | $ | (262,489,183) | ||||||
Pin Oak Equity Fund | (6) | 974,359 | (974,353) | |||||||||
Rock Oak Core Growth Fund | 618 | (611) | (7) | |||||||||
River Oak Discovery Fund | 62,188 | (2,638) | (59,550) | |||||||||
Red Oak Technology Select Fund | 191 | – | (191) | |||||||||
Black Oak Emerging Technology Fund | 185,127 | – | (185,127) | |||||||||
Live Oak Health Sciences Fund | – | – | – | |||||||||
The tax character of the distributions paid by the Funds for the fiscal year ended October 31, 2013 is as follows:
| Ordinary Income | Long-Term Capital Gain | Total | ||||||||||
White Oak Select Growth Fund | $ | 731,035 | $ | – | $ 731,035 | |||||||
Pin Oak Equity Fund | 458,987 | – | 458,987 | |||||||||
Rock Oak Core Growth Fund | 24,848 | 66,888 | 91,736 | |||||||||
River Oak Discovery Fund | – | – | – | |||||||||
Red Oak Technology Select Fund | 197,281 | – | 197,281 | |||||||||
Black Oak Emerging Technology Fund | – | – | – | |||||||||
Live Oak Health Sciences Fund | 278,532 | 1,642,727 | 1,921,259 | |||||||||
The tax character of the distributions paid by the Funds for the fiscal year ended October 31, 2012 is as follows:
| Fund | Ordinary Income | Long-Term Capital Gain | Total | |||||||||
Live Oak Health Sciences Fund | $ | 352,999 | $ | 755,283 | $ | 1,108,282 | ||||||
Annual Report | October 31, 2013 |
65 |
Notes to Financial Statements | ||
As of October 31, 2013 |
As of October 31, 2013, the components of distributable earnings on a tax basis were as follows:
Undistributed Net Investment Income | Accumulated Gains/(Losses) | Unrealized Appreciation/ (Depreciation) | Cumulative Effect of Timing | Total | ||||||||||||||||
White Oak Select Growth Fund | 1,123,296 | $ | (31,562,368 | ) | $ | (7,918,455 | ) | $ | – | $ | (38,357,527 | ) | ||||||||
Pin Oak Equity Fund | 520,335 | – | 878,419 | – | 1,398,754 | |||||||||||||||
Rock Oak Core Growth Fund | 231,572 | 1,226,575 | 1,771,868 | – | 3,230,015 | |||||||||||||||
River Oak Discovery Fund | – | 1,077,933 | 4,346,993 | – | 5,424,926 | |||||||||||||||
Red Oak Technology Select Fund | 321,786 | (3,582,521 | ) | 13,583,308 | – | 10,322,573 | ||||||||||||||
Black Oak Emerging Technology Fund | – | (2,902,142 | ) | 6,341,737 | (138,246) | 3,301,349 | ||||||||||||||
Live Oak Health Sciences Fund | 274,681 | 1,514,452 | 16,055,187 | – | 17,844,320 | |||||||||||||||
At October 31, 2013, the Funds had capital loss carryforwards available to offset future realized capital gains through the indicated expiration dates:
| White Oak Select Growth Fund | Pin Oak Equity Fund | Rock Oak Core Growth Fund | River Oak Discovery Fund | Red Oak Technology Select Fund | Black Oak Emerging Technology Fund | Live Oak Health Sciences Fund | ||||||||||||||||||||||
2014 | $ | – | $ | – | $ | – | $ | – | $ | – | $ | – | $ | – | ||||||||||||||
2015 | $ | – | $ | – | $ | – | $ | – | $ | – | $ | – | $ | – | ||||||||||||||
2016 | $ | 22,546,570 | $ | – | $ | – | $ | – | $ | – | $ | – | $ | – | ||||||||||||||
2017 | $ | 9,015,798 | $ | – | $ | – | $ | – | $ | 3,582,521 | $ | 2,902,142 | $ | – | ||||||||||||||
Total | $ | 31,562,368 | $ | – | $ | – | $ | – | $ | 3,582,521 | $ | 2,902,142 | $ | – | ||||||||||||||
For Federal income tax purposes, capital loss carryforwards may be carried forward and applied against future capital gains.
66 |
1-888-462-5386 | www.oakfunds.com |
| Notes to Financial Statements | ||
| As of October 31, 2013 |
During the year ended October 31, 2013, the Funds utilized the following capital loss carryforwards:
White Oak Select Growth Fund | Pin Oak Equity Fund | Rock Oak Core Growth Fund | River Oak Discovery Fund | Red Oak Technology Select Fund | Black Oak Emerging Technology Fund | Live Oak Fund | ||||||||||||||||||||
| $ | (59,511,236 | ) | $ | (16,781,767 | ) | $ | – | $ | (1,843 | ) | $ | (1,014,538 | ) | $ | (895,143 | ) | $ | – | ||||||||
The following Fund elected to defer to the period ending October 31, 2014, late year ordinary losses in the amount of:
| Amount | ||||
Black Oak Emerging Technology Fund | $ | 138,246 | ||
At October 31, 2013, the total cost of securities for Federal income tax purposes and the aggregate gross unrealized appreciation and depreciation for securities held by the Funds is as follows:
| Federal Tax Cost | Aggregate Gross Appreciation | Aggregate Gross Depreciation | Net | |||||||||||||
White Oak Select Growth Fund | $ | 253,508,153 | $ | 1,074,824 | $ | (8,993,279 | ) | $ | (7,918,455 | ) | ||||||
Pin Oak Equity Fund | 80,602,533 | 2,326,962 | (1,448,543 | ) | 878,419 | |||||||||||
Rock Oak Core Growth Fund | 5,736,513 | 1,801,714 | (29,846 | ) | 1,771,868 | |||||||||||
River Oak Discovery Fund | 8,644,481 | 4,410,339 | (63,346 | ) | 4,346,993 | |||||||||||
Red Oak Technology Select Fund | 92,335,268 | 18,428,389 | (4,845,081 | ) | 13,583,308 | |||||||||||
Black Oak Emerging Technology Fund | 23,557,932 | 7,133,041 | (791,304 | ) | 6,341,737 | |||||||||||
Live Oak Health Sciences Fund | 26,527,161 | 16,217,541 | (162,354 | ) | 16,055,187 | |||||||||||
Management evaluates the Funds’ tax positions to determine if the taken tax positions meet the minimum recognition threshold by measuring and recognizing tax liabilities in the Financial Statements. The threshold is established by accounting for uncertainties in income tax positions, taken or expected. Recognition of tax benefits of an uncertain tax position is required only when the position is “more likely than not” to be sustained assuming examination by taxing authorities. The Funds recognize interest and penalties, if any, related to unrecognized tax benefits as income tax expense in the Statements of Operations. During the year, the Funds did not incur any interest or penalties.
Management has analyzed the Funds’ tax position taken on federal income tax returns for all open tax years (current and prior three tax years) and has concluded that as of and for the year ended October 31, 2013, no provision for income tax would be required in the Funds’ financial statements. The Funds’ federal and state income and federal excise tax returns for tax years (current and prior three tax years) for which the applicable statutes of limitations have not expired are subject to examination by the Internal Revenue Service and state departments of revenue.
Annual Report | October 31, 2013 |
67 |
Notes to Financial Statements | ||
As of October 31, 2013 |
9. CONCENTRATION OF CREDIT RISK AND OWNERSHIP:
The Red Oak Technology Select Fund and the Black Oak Emerging Technology Fund invest a substantial portion of their assets in securities in the technology industry. The Live Oak Health Sciences Fund invests a substantial portion of its assets in securities in the health care, medicine and life sciences industries. Therefore, each of these Funds may be more affected by economic developments in those industries than a general equity fund would be.
In the normal course of business, the Funds enter into contracts that provide general indemnifications. The Funds’ maximum exposure under these arrangements is dependent on future claims that may be made against the Funds and, therefore, cannot be established; however based on experience, the risk of loss from such claims is considered remote.
From time to time, the Funds may have a concentration of several shareholders holding a significant percentage of shares outstanding. Investment activities of these shareholders could have a material impact on the Fund.
As of October 31, 2013, the James D. Oelschlager Trust owned 38.63% of the River Oak Discovery Fund.
10. TRUSTEE AND OFFICERS FEES:
As of October 31, 2013, there were seven Trustees, five of whom are not “interested persons” (within the meaning of the 1940 Act) of the Trust (the “Independent Trustees”). Each Independent Trustee receives a retainer of $30,000 per year. The chairperson of the Audit Committee receives an additional retainer of $500 per calendar quarter and the Lead Independent Trustee receives an additional retainer of $1,500 per calendar quarter. In addition, each Independent Trustee is also paid a fee of $2,000 for each meeting of the Board of Trustees attended or participated in, as the case may be. The Trustees are paid $1,000 per each telephonic board meeting. The Independent Trustees are not paid an additional fee from the Trust for attendance at and/or participation in meetings of the various committees of the Board. The Independent Trustees are also reimbursed for meeting-related expenses. Officers of the Trust and Trustees who are interested persons of the Trust receive no salary or fees from the Trust.
11. INDEMNIFICATIONS:
Under the Trust’s organizational documents, its officers and Trustees are indemnified against certain liability arising out of the performance of their duties to the Trust. Additionally, in the normal course of business, the Trust enters into contracts with service providers that may contain general indemnification clauses, which may permit indemnification to the extent permissible under applicable law. The Trust’s maximum exposure under these arrangements is unknown, as this would involve future claims that may be made against the Trust that have not yet occurred.
12. RECENT ACCOUNTING PRONOUNCEMENTS:
In December 2011, the Financial Accounting Standards Board (FASB) issued Accounting Standards Update (ASU) No. 2011-11, Balance Sheet (Topic 210): Disclosures about Offsetting Assets and Liabilities. The amendments in the ASU enhance disclosures about offsetting of financial assets and liabilities to enable investors to understand the effect of these arrangements on a Fund’s financial position. In January 2013, FASB issued ASU No. 2013-01, Balance Sheet (Topic 210): Clarifying the Scope of Disclosures about Offsetting Assets and Liabilities. The amendments in ASU No. 2013-01
68 |
1-888-462-5386 | www.oakfunds.com |
| Notes to Financial Statements | ||
| As of October 31, 2013 |
clarify the intended scope of disclosures required by ASU No. 2011-11. These ASUs are effective for interim and annual reporting periods beginning on or after January 1, 2013. The Funds believes the adoption of these ASUs will not have a material impact on their financial statements.
In June 2013, the FASB issued ASU 2013-08, Amendments to the Scope, Measurement and Disclosure Requirements (“ASU 2013-08”), modifying Accounting Standards Codification (“ASC”) 946. The modifications were a result of a joint effort by the FASB and the International Accounting Standards Board to develop a consistent approach for determining whether an entity is an investment company for which fair value of investments is the most relevant measurement. ASU 2013-08 requires a reporting entity to disclose that it is an investment company and is applying the guidance as set forth in ASC 946, to disclose any changes in, and the reasons for, its status as an investment company and to disclose information related to whether it has provided or is contractually required to provide financial support to any of its investees. The effective date of ASU 2013-08 is for interim and annual periods beginning after December 15, 2013. At this time, management is evaluating the implications of this requirement and the impact it will have to the financial statement amounts and footnote disclosures, if any.
13. SUBSEQUENT EVENTS:
On December 18, 2013, The Funds declared a ordinary dividend, short-term capital gains and long-term capital gains, which were payable on December 19, 2013. Please see the below table for the distribution amounts:
| Fund | Ordinary Dividend Total | Short-Term Capital Gain Total | Long-Term Capital Gain Total | |||||||||
White Oak Select Growth Fund | $ | 1,123,336 | $ | – | $ | – | ||||||
Pin Oak Equity Fund | $ | 520,352 | $ | – | $ | – | ||||||
Rock Oak Core Growth Fund | $ | 30,551 | $ | 211,143 | $ | 1,226,573 | ||||||
River Oak Discovery Fund | $ | – | $ | – | $ | 1,077,940 | ||||||
Red Oak Technology Select Fund | $ | 461,552 | $ | – | $ | – | ||||||
Live Oak Health Sciences Fund | $ | 296,848 | $ | 41,638 | $ | 1,514,461 | ||||||
Annual Report | October 31, 2013 |
69 |
To the Shareholders and Board of Trustees
Oak Associates Funds
We have audited the accompanying statements of assets and liabilities, including the schedules of investments, of Oak Associates Funds, comprising White Oak Select Growth Fund, Pin Oak Equity Fund, Rock Oak Core Growth Fund, River Oak Discovery Fund, Red Oak Technology Select Fund, Black Oak Emerging Technology Fund, and Live Oak Health Sciences Fund (the “Funds”), as of October 31, 2013, and the related statements of operations for the year then ended, and the statements of changes in net assets for each of the two years in the period then ended, and the financial highlights for each of the four years in the period then ended. These financial statements and financial highlights are the responsibility of the Funds’ management. Our responsibility is to express an opinion on these financial statements and financial highlights based on our audits. The financial highlights for the year ended October 31, 2009 were audited by another registered public accounting firm, whose report dated December 23, 2009, expressed an unqualified opinion on those financial highlights.
We conducted our audits in accordance with the standards of the Public Company Accounting Oversight Board (United States). Those standards require that we plan and perform the audit to obtain reasonable assurance about whether the financial statements and financial highlights are free of material misstatement. An audit includes examining, on a test basis, evidence supporting the amounts and disclosures in the financial statements. Our procedures included confirmation of securities owned as of October 31, 2013, by correspondence with the custodian and brokers. An audit also includes assessing the accounting principles used and significant estimates made by management, as well as evaluating the overall financial statement presentation. We believe that our audits provide a reasonable basis for our opinion.
In our opinion, the financial statements and financial highlights referred to above present fairly, in all material respects, the financial position of each of the Funds constituting Oak Associates Funds as of October 31, 2013, the results of their operations for the year then ended, the changes in their net assets for each of the two years in the period then ended, and the financial highlights for each of the four years in the period then ended, in conformity with accounting principles generally accepted in the United States of America.
COHEN FUND AUDIT SERVICES, LTD.
Cleveland, Ohio
December 20, 2013
70 |
1-888-462-5386 | www.oakfunds.com |
| Additional Information | ||
| As of October 31, 2013 (Unaudited) |
UNAUDITED TAX INFORMATION:
The White Oak Select Growth Fund, Rock Oak Core Growth Fund, Red Oak Technology Fund and Live Oak Health Sciences Fund designate the following for federal income tax purposes for the calendar year ended December 31, 2012:
Qualified Dividend Income 100%
Corporate Dividends Received Deduction 100%
The Pin Oak Equity Fund designates the following for federal income tax purposes for the calendar year ended December 31, 2012:
Qualified Dividend Income 98.58%
Corporate Dividends Received Deduction 98.58%
In early 2013, if applicable, shareholders of record should have received this information for the distributions paid to them by the Fund during the calendar year 2012 via Form 1099. The Fund will notify shareholders in early 2014 of amounts paid to them by the Fund, if any, during the calendar year 2013.
Pursuant to Section 852(b)(3) of the Internal Revenue Code, the Rock Oak Core Growth Fund and Live Oak Health Sciences Fund designated $66,888 and $1,642,727 as long-term capital gain dividends respectively.
Annual Report | October 31, 2013 |
71 |
Additional Information | ||
As of October 31, 2013 (Unaudited) |
TRUSTEES OF THE TRUST
| Name & Age(1) | Position Held with Trust | Length of Time Served (Yrs.)(2) | Number of Portfolios in Fund Complex Overseen by Board Member(3) | Principal Occupation(s) During Past Five Years | Other Directorships Held by Board Member(4) | |||||
J. John Canon (78) | Trustee | 12 | 7 | Retired. Member of Board, Proconex (process control equipment), 1985 – 2007; President and Chairman of the Board, Synergistic Partners, Inc. (technology for information management), 1975 – 1999 | None | |||||
Thomas E. Gretter, MD (78) | Trustee | 11 | 7 | Physician, Cleveland Clinic (Health Care) since 1966 | None | |||||
James D. Oelschlager(5) (71) | Trustee, Chairman | 12 | 7 | Managing Member, President, CIO and Founder of Oak Associates, ltd. since 1985 | None | |||||
John G. Stimpson(5) (71) | Trustee | 12 | 7 | Retired since 1993. Board of Directors, Morgan Stanley Trust Company, 1988 – 1993; Director of International Equity Sales and Equity Sales Manager, Salomon Brothers (New York) from 1985 –1993 | None | |||||
Pauline F. Ramig (73) | Trustee | 5 | 7 | Financial Planning Practitioner, Ramig Financial Planning since 1991 | None | |||||
Robert P. Stephans (70) | Trustee | 5 | 7 | Retired since June 2008. CPA for Stephans, Kun & Co., Certified Public Accountants, 1987 – 2008; Partner, Case, Sabatini and Stephans PC, 1980 – 1987 | None | |||||
Michael R. Shade (65) | Trustee | 5 | 7 | Attorney at Law; Partner, Shade & Shade since December, 1979 | None |
72 |
1-888-462-5386 | www.oakfunds.com |
| Additional Information | ||
| As of October 31, 2013 (Unaudited) |
| 1 | Each Trustee may be contacted in writing to the Trustee c/o Oak Associates Funds, 3875 Embassy Parkway, Suite 250, Akron, OH 44333. Each Officer may be contacted in writing to the Officer c/o ALPS Fund Services, Inc., 1290 Broadway Suite 1100, Denver, CO 80203. |
| 2 | Each Trustee shall hold office during the lifetime of this Trust until the election and qualification of his successor, or until he sooner dies, resigns or is removed in accordance with the Trust’s Declaration of Trust. |
| 3 | The “Oak Associates Funds Complex” consists of all registered investment companies for which Oak Associates, ltd. serves as investment adviser. As of October 31, 2013, the Oak Associates Funds Complex consisted of 7 Funds. |
| 4 | Directorships of companies are required to report to the Securities and Exchange Commission under the Securities Exchange Act of 1934 (i.e., “public companies”) or other investment companies registered under the Investment Company Act of 1940. |
| 5 | Messrs. Oelschlager and Stimpson are considered “interested” persons of the Trust as that term is defined in the Investment Company Act of 1940. Mr. Oelschlager is interested by virtue of his controlling ownership interest in the Adviser. Mr. Stimpson is considered interested because of his family relationship with an employee of the Adviser. |
Annual Report | October 31, 2013 |
73 |
Additional Information | ||
As of October 31, 2013 (Unaudited) |
OFFICERS OF THE TRUST
| Name & Age(1) | Position Held with Trust | Length of Time Served (Yrs.) | Number of Portfolios in Fund Complex Overseen by Board Member | Principal Occupation(s) During Past Five Years | Other Directorships Held | |||||
Sandra Noll(2) (49) | Chief Compliance Officer | 12 | N/A | Director of Client Services at Oak Associates, ltd., since 1998 and Compliance Officer of Oak Associates, ltd., since 1994 | N/A | |||||
Leslie Manna(2) (51) | President/ Chief Executive Officer | 12 | N/A | Mutual Fund Coordinator of Oak Associates, ltd., since 1995 | N/A | |||||
Pete Greenly(3) (44) | Treasurer/ Principal Financial Officer | Since November 7, 2012 | N/A | Fund Controller, ALPS Fund Services, Inc. since June 2011; Manager of Valuations with Great West Life and Annuity from 2011 to 2012, Supervisor of Fund Accounting at Janus Capital from February 2011 to November 2011, Project Manager at Old Mutual Capital from 2007 - 2010, Manager of Fund Accounting and Operations with Founders Asset Management, LLC from 1994 – 2006 | N/A | |||||
Rhonda Mills(3) (47) | Vice President/ Secretary | Since February 28, 2012 | N/A | Vice President and Associate Counsel of ALPS, ALPS Advisors, Inc., ALPS Distributors, Inc. since 2011. Managing Member, Mills Law, LLC from 2010 to 2011. Counsel, Old Mutual Capital, Inc. from 2006 – 2009 | N/A |
| 1 | Each Officer may be contacted in writing to the Officer c/o ALPS Fund Services, Inc., 1290 Broadway Suite 1100, Denver, CO 80203. |
| 2 | Mmes. Noll and Manna are considered to be “affiliates” of the Adviser by virtue of their employment by the Adviser. |
| 3 | Mr. Greenly and Ms. Mills also serve as officers of ALPS Distributors, Inc., the Funds’ distributor. |
For more information regarding the Trustees, please refer to the Statement of Additional Information, which is available upon request by calling 1-888-462-5386.
74 |
1-888-462-5386 | www.oakfunds.com |

By Mail
Oak Associates Funds
P.O. Box 8233
Denver, CO 80201-8233
By Telephone 1-888-462-5386 Monday through Friday, 8:30 a.m. to 8:00 p.m. ET
On The Web www.oakfunds.com
Click on the My Oak Account section to take advantage of these features:
— Trade Online
— Access and Update Account Information
— Go Paperless with eDelivery
— View and download account history
— Establish a systematic investment plan
The Trust files its complete schedule of portfolio holdings of each Fund with the Securities and Exchange Commission for the first and third quarters of each fiscal year on Form N-Q within sixty days after the end of the period. The Trust’s Forms N-Q is available on the Commission’s website at http://www.sec.gov, and may be reviewed and copied at the Commission’s Public Reference Room in Washington DC. Information on the operation of the Public Reference Room may be obtained by calling 1-800-SEC-0330.
A description of the policies and procedures that the Funds use to determine how to vote proxies relating to portfolio securities, as well as information relating to how a Fund voted proxies relating to portfolio securities during the most recent 12-month period ended June 30, is available (i) without charge, upon request, by calling 1-888-462-5386; and (ii) on the Commission’s website at http://www.sec.gov.
This report has been prepared for Oak Associates Funds Shareholders and may be distributed to others only if preceded or accompanied by a prospectus.
Oak Associates Funds are distributed by ALPS Distributors, Inc.


Item 2. Code of Ethics.
As of the end of the period covered by this report, the Registrant has adopted a code of ethics that applies to the Registrant’s Principal Executive Officer and Principal Financial Officer. During the period covered by this report, there were no material changes made to provisions of the code of ethics, nor were there any waivers granted from a provision of the code of ethics. A copy of the Registrant’s code of ethics is filed with this N-CSR.
Item 3. Audit Committee Financial Expert.
The Registrant’s board of trustees has determined that the Registrant has at least one financial expert serving on the audit committee. The audit committee financial expert serving on the audit committee is Robert Stephans and is independent as defined in Form N-CSR Item 3(a)(2). Mr. Stephans has served as a Certified Public Accountant for Stephans, Kun & Co. since 1980.
Item 4. Principal Accountant Fees and Services.
The principal accountant fees for the fiscal years ended October 31, 2013 and 2012 were collected by Cohen Fund Audit Services, Ltd. The Trust aggregate fees for services rendered to the Trust for the last two fiscal years are as follows:
| (a) | Audit Fees: The aggregate fees billed for each of the last two fiscal years for professional services rendered by the applicable principal accountant for the audit of the Registrant’s annual financial statements or services that are normally provided by the accountant in connection with statutory and regulatory filings or engagements for fiscal years 2013 and 2012 were $80,500 and $77,000, respectively. |
| (b) | Audit-Related Fees: The aggregate fees billed in each of the last two fiscal years for assurance and related services by the applicable principal accountant that are reasonably related to the performance of the audit of the Registrant’s financial statements and are not reported under paragraph (a) of this Item for fiscal years 2013 and 2012 were $0 and $0, respectively. |
| (c) | Tax Fees: The aggregate fees billed in each of the last two fiscal years for professional services rendered by the applicable principal accountant for tax compliance, tax advice and tax planning for fiscal years 2013 and 2012 were $14,000 and $14,000, respectively. |
| (d) | All Other Fees: The aggregate fees billed in each of the last two fiscal years for products and services provided by the applicable principal accountant, other than the services reported in paragraphs (a) through (c) of this Item, for fiscal years 2013 and 2012 were $0 and $0, respectively. |
| (e)(1) | Not Applicable. |
| (e)(2) | No services described in paragraphs (b) through (d) of this Item were approved by the Registrant’s audit committee pursuant to paragraph (c)(7)(i)(C) of Rule 2-01 of Regulation S-X. |
| (f) | Not applicable to Registrant. |
| (g) | The aggregate non-audit fees and services billed by the applicable principal account for fiscal years 2013 and 2012 were $0 and $0, respectively. |
| (h) | During the past fiscal year, the Registrant’s principal accountant did not report to the Registrant’s audit committee the existence of any non-audit services that were provided to either the Registrant’s investment adviser or to any entity controlling, controlled by, or under common control with the Registrant’s investment adviser that provided ongoing services to the Registrant. |
| Item 5. | Audit Committee of Listed Registrants. |
Not applicable to open-end management investment companies.
| Item 6. | Schedule of Investments. |
| (a) | Schedule of Investments in securities of unaffiliated issuers as of the close of the reporting period is included as part of the Report to Stockholders filed under Item 1 of this Form N-CSR. |
| (b) | Not applicable. |
| Item 7. | Disclosure of Proxy Voting Policies and Procedures for Closed-End Management Investment Companies. |
Not applicable to open-end management investment companies.
| Item 8. | Portfolio Managers of Closed-End Management Investment Companies. |
Not applicable to open-end management investment companies.
| Item 9. | Purchases of Equity Securities by Closed-End Management Investment Companies and Affiliated Purchasers. |
Not applicable to open-end management investment companies.
| Item 10. | Submission of Matters to a Vote of Security Holders. |
None.
| Item 11. | Controls and Procedures. |
(a) The Registrant’s principal executive and principal financial officers, or persons performing similar functions, regarding the effectiveness of the Registrant’s disclosure controls and procedures (as defined in Rule 30a-3(c) under the Act (17 CFR 270.30a-3(c))) as of a date within 90 days of the filing date of the report that includes the disclosure required by this paragraph, based on the evaluation of these controls and procedures required by Rule 30a-3(b) under the Act (17 CFR 270.30a-3(b)) and Rules 13a-15(b) or 15d-15(b) under the Exchange Act (17 CFR 240.13a-15(b) or 240.15d-15(b)).
(b) There has been no change in the Registrant’s internal control over financial reporting (as defined in Rule 30a-3(d) under the Act (17 CFR 270.30a-3(d)) that occurred during the second fiscal quarter of the period covered by this report that has materially affected, or is reasonably likely to materially affect, the Registrant’s internal control over financial reporting.
| Item 12. | Exhibits. |
(a)(1) Code of Ethics is filed herewith.
(a)(2) A separate certification for the principal executive officer and the principal financial officer of the Registrant as required by Rule 30a-2(a) under the Investment Company Act of 1940, as amended (17 CFR 270.30a-2(a)), are filed herewith.
(a)(3) None.
(b) Officer certifications as required by Rule 30a-2(b) under the Investment Company Act of 1940, as amended (17 CFR 270.30a-2(b)) are filed herewith.
SIGNATURES
Pursuant to the requirements of the Securities Exchange Act of 1934 and the Investment Company Act of 1940, the Registrant has duly caused this report to be signed on its behalf by the undersigned, thereunto duly authorized.
OAK ASSOCIATES FUNDS
By | /s/ Leslie Manna | |
Leslie Manna | ||
President | ||
Date: | January 9, 2014 | |
Pursuant to the requirements of the Securities Exchange Act of 1934 and the Investment Company Act of 1940, this report has been signed below by the following persons on behalf of the Registrant and in the capacities and on the dates indicated.
By | /s/ Leslie Manna | |
Leslie Manna | ||
President and Principal Executive Officer | ||
Date: | January 9, 2014 | |
By | /s/ Pete Greenly | |
Pete Greenly | ||
Treasurer and Principal Financial Officer | ||
Date: | January 9, 2014 | |