UNITED STATES
SECURITIES AND EXCHANGE COMMISSION
Washington, D.C. 20549
FORM N-CSR
CERTIFIED SHAREHOLDER REPORT OF REGISTERED
MANAGEMENT INVESTMENT COMPANIES
Investment Company Act file number: 811-08549
Oak Associates Funds
(Exact name of registrant as specified in charter)
3875 Embassy Parkway, Suite 250, Akron, Ohio 44333
(Address of principal executive offices) (Zip code)
Charles A. Kiraly
Oak Associates, ltd.
3875 Embassy Parkway, Suite 250
Akron, Ohio 44333-8334
(Name and address of agent for service)
Registrant’s telephone number, including area code: 1-888-462-5386
Date of fiscal year end: October 31
Date of reporting period: November 1, 2015 – October 31, 2016
Item 1. Reports to Stockholders.
Oak Investment Philosophy
Oak Associates, ltd., advisor to the Oak Associates Funds, has been managing growth-oriented portfolios for 30 years.
We appreciate the many long-term shareholders who invest alongside us in the Oak Associates Funds. Employees and their families are among the largest shareholders in the funds. Here is our approach to investing.
 | Long-term focus |
To us, the appeal of an investment is driven by the long-term fundamentals of the company and its opportunity set, rather than short-term trading factors. We believe that this long-term mindset is increasingly valuable in today’s short-term oriented market.
| Concentrated portfolios |
We construct our portfolios with our best ideas, which means that our favorite stock ideas aren’t diluted by investments in less-favored positions. A recent study showed that managers gave up performance because they failed to concentrate in their best ideas. Concentration takes discipline, conviction and experience. We continue to adhere to a strategy of concentrated portfolios.
| Low turnover |
Hospital wings are rarely endowed by day traders. When we invest in a company, we do so with the intention of holding that stock for several years, not a few quarters. Low turnover can have the effect of minimizing trading costs as well as tempering the natural human instinct to act upon every data point.
| Independent thinking |
Being a good investor often requires not doing what the rest of the market is doing. While it’s difficult to go against the crowd - because as humans we are psychologically wired to herd - we believe that long-term outperformance requires it. One benefit of being located in Akron, Ohio (aside from being a great place to live), is that we are removed from the financial centers in other areas of the country, minimizing our chances of being swept up by the herd mentality. We value independent thinking and believe it is beneficial to our investment perspective.
The value of a Fund’s investments will vary from day to day in response to the activities of individual companies and general market and economic conditions. Due to the limited number of underlying investments, funds that invest a significant portion of its assets in particular industry sectors or concentrated funds that focus on a particular industry or group of industries are more susceptible to the price movements of any one holding or industry and thus are generally more volatile than a portfolio invested in a wider variety of industries or industry sectors.
Shareholder Letter
Dear Fellow Shareholder:
It is important for us as investors to understand what is happening in the market and not just with individual companies. Figuring out why something is happening from a broad perspective can help us set the direction of our portfolios. There are two trends that have distorted the market recently, and while these have been in place for a while, their impact reached a zenith in mid-2016. One trend is low interest rates. Because yield-driven investors (retirees would be one example) are not getting much return in the bond market, they have moved into the higher-dividend-yielding parts of the equity market to try to earn dependable income on their savings. The second trend is a hyper-focus on safety or preservation of principal. The financial crisis and severe market decline in 2008 and early 2009 understandably spooked people and caused them to constantly look around the corner for the next crisis; it seems that a couple times a year some sort of crisis in Europe, China or elsewhere causes the US market to dip, only to rebound. Assets flooded into “low-volatility,” “smart beta,” and other “alternative” products that supposedly offered a better mousetrap. There is a lot of overlap between those plays that potentially offer yield and safety (for example, utilities and consumer staples offer both), so the two trends have at times become indistinguishable. An emphasis on yield and safety may sound like a good thing, and in a vacuum there is nothing wrong with it, but as with any other investing idea, it can be taken to extremes.
Two compelling statistics from Empirical Research Partners:
| · | In 2007 less than 1% of the market was in stocks that were highly correlated (60% or more) with the performance of the Treasury bond market. In October 2016 that number hit 17%. |
| · | If we take the price/earnings ratio for the cohort of the stock market that is most correlated with Treasury bonds and compare it to the P/E of the cohort of the stock market that is least correlated with Treasurys, that measure hit a 33-year high in 2016. |
The first statistic tells us that the bond market is having a strong influence on the action in the stock market. The second statistic tells us how it has distorted the valuations, inflating the perceived safety/yield plays. This has led us to largely avoid the bond surrogates (perceived safety/yield) and to focus on the anti-bond surrogates, such as the financial stocks.
For the first half of 2016 financials lagged, as the bond proxies pushed higher, helped by the news that the United Kingdom had voted to exit the European Union (a decision commonly referred to as “Brexit”). This represented the peak of the yield/stability trade, as it became consensus that interest rates were likely going to stay low for a very long time and that central banks around the globe would continue to force nominal interest rates into negative territory. Bank stocks were labeled “dead money.” But as often happens, things changed. Brexit started looking less scary and global monetary authorities began rethinking their positon that lower interest rates are always good for an economy. In addition, wage growth in the US continued to accelerate, and other measures of inflation crept higher. All of this drove bank stocks higher. From early July through the end of October, the KBW Bank Index returned over 19% while the rest of the S&P 500 declined. This trend then got a turbo boost in early November when Donald Trump was elected President of the US. This latter move by bank stocks benefited our portfolios a great deal but will not be reflected in the fiscal year numbers that concluded in October.
A side effect of the intense focus on loss aversion in the market is that it reduces the time horizon of those that employ it. Hyper-sensitivity to the next decline creates an itchy trigger finger and a shoot-first, ask-questions-later mentality. A falling stock price leads to clients demanding their advisors “do something” to protect their wealth. Of course all of this short-termism exacerbates the swings in the individual stocks, which creates greater mis-pricings, which creates opportunities for investors that are focused on the long-term. Our friends at Empirical characterized it as the equity yield curve steepening, meaning that there is an increasing gap between the expected return of those that focus on the long-term and the expected return of those that focus on the short-term. This was heartening to us since, as long-term investors, we prefer to do our work at the long end of the curve.
Shareholder Letter
Another trend in this business has been to move money from active managers (ones, such as Oak, who attempt to beat a market benchmark) to passive vehicles that attempt to merely match a benchmark. For many years active managers have seen more money flowing out than coming in. The thinking is that since most managers underperform their benchmark, one is better off attaining an indexed return. We acknowledge that beating the benchmark is not an easy endeavor, but there are managers who do so. Our three largest funds are White Oak, Pin Oak, and Red Oak. Many of you have invested in them, and we thank you. Over the ten years ended October 31, White Oak generated a cumulative return of 118%, while the S&P 500 returned 91%. For the same period, Pin Oak outperformed its benchmark, the Russell 3000, 169% to 92%, and Red Oak beat the S&P 500 Equal Weight Information Technology Index 197% to 143%. All of these returns for our funds are net of expenses. Many academics would attribute these numbers to luck. Without question luck comes into play in short periods of time, given the randomness of the market, just as it does for a baseball player in a limited number of plate appearances. But for ten years, through a full market cycle, and by these margins, we would strongly argue that it is not due to randomness. There is no doubt that our funds will experience a period of underperformance at some point, as do all funds, and it may even last for years. Our goal is to continue to outperform over long periods of time. The Oak funds have bucked the passive trend of late and attracted a strong flow of new money. This is good news not only for Oak but to our long-time shareholders as well, as a growing fund can spread its fixed expenses over a larger base of assets thereby reducing its expense ratio.
Some comments on President-elect Trump. We are encouraged by Mr. Trump’s plan to lower corporate and personal income tax rates and his vow to reduce regulation. This could greatly benefit our economy. On the other hand, his anti-trade campaign rhetoric is concerning and would likely be quite harmful to the US and global economies if carried through. His cabinet appointments may give an indication about how he will govern.
As our funds continue to grind higher it is important to remind you that there will indeed be another correction, and it may even be severe. We don’t know when it will come, nor does anyone else, and when it arrives we won’t flock to cash. We will continue to focus on maximizing returns over a full market cycle by investing in companies that we believe are attractively priced.
We feel fortunate that you have entrusted us to manage your money.
| Sincerely, |
 |
| Mark Oelschlager, CFA |
| Co-Chief Investment Officer and Portfolio Manager |
The performance data quoted represents past performance. Past performance does not guarantee future results. The investment return and principal value of an investment will fluctuate so that an Investor’s shares, when redeemed, may be worth more or less than their original cost and current performance may be lower or higher than the performance quoted. Visit www.oakfunds.com/Funds/ Performance.aspx for standardized performance, including performance data current to the most recent month-end.
HIGHLIGHTS from the 2016 FISCAL YEAR
October 31, 2015 to October 31, 2016 (Unaudited)
| January, 2016 | An Investopedia article named White Oak Select Growth among funds for “investors who want exposure to the market, but want to focus on established companies”. “The Top 5 Large Cap Mutual Funds for 2016,” by John Edwards. January 14, 2016. |
| March, 2016 | Crain’s Cleveland Business quoted Robert Stimpson in a story on fee models for investment advisors entitled, “New way to pay: Financial planners accept flat fees,” by Jeremy Nobile. March 13, 2016. |
On March 21, 2016, a Barron’s “Review” item quoted Jim Oelschlager on the market outlook (“Will Stocks’ Rebound Continue? Four market pros voice their very disparate views to Barron’s”). March 21, 2016. |
| July, 2016 | Zacks Investment Research recommended Live Oak Health Sciences among healthcare funds ranked “Strong Buy” and expected “to outperform peers in the future” (“3 Top-Rated Healthcare Mutual Funds to Invest In”). July 13, 2016. |
Mark Oelschlager was quote on Cigna in Barron’s article, “Cigna Looks Healthy, Deal or No Deal: Anthem’s deal to buy managed-care rival Cigna might not pass regulatory muster. But Cigna shareholders could win, regardless, given the forecast for robust earnings growth,” by Robin Goldwyn Blumenthal. July 18, 2016. |
HIGHLIGHTS from the 2016 FISCAL YEAR
October 31, 2015 to October 31, 2016 (Unaudited)
| August, 2016 | Zacks Investment Research recommended Red Oak Technology Select among four technology mutual funds with strong three- and five-year performance, low expenses, a Zacks “Buy” ranking, and Alphabet as a top holding (“Alphabet’s Stellar Results Put 4 Mutual Funds in Play”). August 1, 2016. |
Bottom Line Personal featured stock recommendations “for the next 10 years or more” from Mark Oelschlager as manager of Pin Oak Equity Fund (“8 Best Stocks for the Next 10 Years”). August 15, 2016. |
An Investopedia entry noted White Oak Select Growth among “Top Large Cap Mutual Funds.” August 23, 2016. |
READ MORE AT WWW.OAKFUNDS.COM
TABLE of CONTENTS
| Performance Update | |
| White Oak Select Growth Fund | 2 |
| Pin Oak Equity Fund | 4 |
| Rock Oak Core Growth Fund | 6 |
| River Oak Discovery Fund | 8 |
| Red Oak Technology Select Fund | 10 |
| Black Oak Emerging Technology Fund | 12 |
| Live Oak Health Sciences Fund | 14 |
| Important Disclosures | 16 |
| Disclosure of Fund Expenses | 19 |
| Financial Statements | |
| Schedules of Investments | 21 |
| Statements of Assets and Liabilities | 38 |
| Statements of Operations | 40 |
| Statements of Changes in Net Assets | 42 |
| Financial Highlights | 46 |
| Notes to Financial Statements | 60 |
| Report of Independent Registered Public Accounting Firm | 72 |
| Additional Information | 73 |
White Oak Select Growth Fund
 James D. Oelschlager Co-Chief Investment Officer & Portfolio Manager  Mark W. Oelschlager, CFA Co-Chief Investment Officer & Portfolio Manager  Robert D. Stimpson, CFA Portfolio Manager | White Oak Equity Fund (“the Fund”) returned 4.07% for the fiscal year ended October 31, 2016, while the S&P 500 Index did 4.51% and the Lipper Large-Cap Growth Average -0.23%. For the last ten years, the Fund’s cumulative return was 117.78%, versus 91.24% for the S&P 500 and 102.45% for the Lipper. The political environment has been increasingly polarized, and the stock market is no different as many stocks line up either with Treasury bonds or against them. Given the froth that has developed in the areas that trade with Treasurys, such as utilities, consumer staples and telecom, we have positioned the portfolio in other sectors – and even added to this tilt as opportunity presented itself throughout the year. In February when concerns about China’s economy rattled the markets and caused Treasury yields to dip, we added to long-time holding Charles Schwab which was beaten down. At the same time, some of the growth stocks were being punished, and we purchased shares of Facebook. Both have since rebounded. In the summer, bonds rallied (yields plummeted), reaching a crescendo when Britain voted to exit the European Union. The yields of many sovereign bonds entered negative territory, meaning those that purchased this debt were guaranteed to get back less than they invested if they held the bonds until maturity. This insanity was a sure sign of a bond bubble, so it only made sense to allocate cash to the portion of the market that was the anti-bond play: the financials. We already had a substantial position in the financial sector as the bond bubble was inflating, but as it reached its peak and it was assumed that negative yields were here to stay, we added to the group with State Street, a large custody bank that was being hurt by low interest rates. The stock then rose about 24% over the next three months as yields began to rise. This activity in the Fund belies our general proclivity to not make many changes. Turnover remains low, and our focus is always on the long-term attractiveness of an investment. Laggards in the portfolio were overrepresented by health care, which was the worst performing sector in the market for the twelve months. Teva Pharmaceutical, Amgen, and Express Scripts all declined, as questions arose industry-wide about the future pricing power of therapies. Thank you for your investment with Oak Associates Funds. |
Mutual fund investing involves risk, including the possible loss of principal. The value of the Fund’s investments will vary from day to day in response to the activities of individual companies and general market and economic conditions. Because the Fund may invest a significant portion of its assets in particular industry sectors which it believes hold the most potential for favorable returns, poor performance or adverse economic events affecting one or more of these overweighted sectors could have a greater impact on the Fund than it would on another mutual fund with a broader range of investments.
| 2 | 1-888-462-5386 | www.oakfunds.com |
| Manager Discussion & Analysis |
All data below as of October 31, 2016 (Unaudited)
| Fund Data | |
| Ticker | WOGSX |
| Share Price | $67.44 |
| Total Net Assets | $248.4 M |
| Portfolio Turnover | 13.91% |
| Sector Allocation^ | |
| Information Technology | 41.8% |
| Financials | 34.8% |
| Health Care | 12.1% |
| Consumer Discretionary | 7.2% |
| Industrials | 3.9% |
| Energy | 0.7% |
| Cash & Other Assets | -0.5% |
| Top 10 Holdings^ | |
| 1. Alphabet, Inc. | 9.8% |
| 2. JPMorgan Chase & Co. | 7.9% |
| 3. Cisco Systems, Inc. | 7.2% |
| 4. Amazon.com, Inc. | 7.2% |
| 5. The Charles Schwab Corp. | 6.1% |
| 6. Amgen, Inc. | 6.1% |
| 7. US Bancorp | 5.5% |
| 8. KLA-Tencor Corp. | 5.4% |
| 9. Xilinx, Inc. | 4.5% |
| 10. United Parcel Sesrvice, Inc. | 3.9% |
| ^ | Percentages are based on net assets. Holdings are subject to change. |
Growth of $10,000 Chart
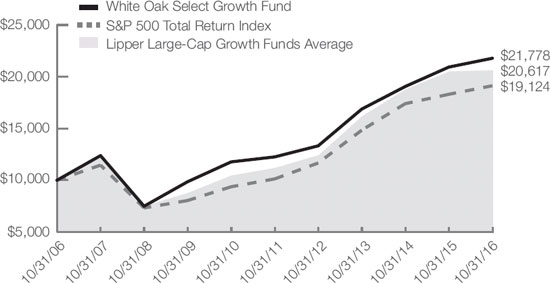
The chart above represents historical performance of a hypothetical investment of $10,000 in the Fund over the past 10 years (or for the life of the Fund if shorter). Past performance does not guarantee future results. This chart does not reflect the deduction of taxes that a shareholder would pay on Fund distributions or the redemption of Fund shares.
| Average Annual Total Return | ||||
| 1 Year Return | 3 Year Return | 5 Year Return | 10 Year Return | |
| White Oak Select Growth Fund | 4.07% | 8.89% | 12.20% | 8.09% |
S&P 500® Total Return Index1 | 4.51% | 8.84% | 13.57% | 6.70% |
Lipper Large-Cap Growth Funds Average2 | -0.23% | 7.66% | 12.26% | 7.21% |
Gross/Net Expense Ratio (per the current prospectus): 1.06%*
| * | Please refer to the Financial Highlights for more recent expense ratio information. |
The performance data quoted represents past performance. Past performance does not guarantee future results. The investment return and principal value of an investment will fluctuate so that an investor’s shares, when redeemed, may be worth more or less than their original cost and current performance may be lower or higher than the performance quoted. For performance data current to the most recent month-end, please visit www.oakfunds.com or call 1-888-462-5386.
1 | Standard & Poor’s is the source and owner of the S&P Index data. 2 Lipper Inc. is the source and owner of the Lipper Classification data. See Pages 16 and 17 for additional disclosure. |
| Annual Report | October 31, 2016 | 3 |
Pin Oak Equity Fund
 Mark W. Oelschlager, CFA Co-Chief Investment Officer & Portfolio Manager |
Pin Oak Equity Fund (“the Fund”) returned 5.54% for the fiscal year ended October 31, 2016, while the Russell 3000 Index gained 4.24% and the Lipper Multi-Cap Core Average 1.53%. For the last ten years, a period that includes one of the worst financial crises in US history, the Fund’s cumulative return was 169.12%, versus 92.30% for the Russell and 74.93% for the Lipper.
This was the eighth consecutive fiscal year of positive returns for the Fund, a streak that we know will end someday. The market had to endure a couple scares over the past 12 months. Early in 2016 there was concern about China’s economy, and then in the summer came the vote by Britain to leave the European Union. With each episode cyclical stocks (those sensitive to the economy) were hit especially hard but snapped back when the market determined that the situations were manageable.
In recent times a dichotomy has developed in the market. On one side stand the sectors that traditionally offer investors safety due to their stability or offer high dividend yields. Examples are utilities, consumer staples, telecom, health care, and real estate investment trusts. On the other side sit the economically-sensitive sectors, such as financials, technology, and industrials. Some of these groups have become unusually anti-correlated with each other, as the bond market and movement of interest rates exert a heavy influence on the market.
The general yearning for yield and stability distorted valuations in the market, and we took advantage of this by focusing the portfolio in the anti-bond plays and away from the yield/stability groups. This helped the Fund late in the fiscal year as rates rose and confidence in the economy improved.
Internet companies Amazon, Alphabet, and recent addition eBay all posted nice gains, as did industrials Parker-Hannifin, Enersys, and Raytheon, which all returned double-digits. Our avoidance of health care helped on a relative basis, as it was the poorest performing of all market sectors.
Laggards included Twenty-First Century Fox, who is suffering from slowing cable subscriber growth; Wells Fargo, which is dealing with an unauthorized-account scandal; and Great Southern Bancorp, which was hurt by lower interest rates.
The prevailing wisdom of the day is that in order to effectively manage money one has to be nimble and ready to change course quickly in order to preserve principal. We don’t agree, as the attempts to do so tend to compound a problem. It is important to constantly re-evaluate the risk-reward of one’s positions, but to react to every data point is not only counterproductive but also an increasingly crowded game (which makes a game that was already difficult even harder to win). We will continue to go against the grain when we believe it makes sense to do so and will assess companies based on their long-term outlook and prevailing price.
Thank you for your investment with Oak Associates Funds.
Mutual fund investing involves risk, including the possible loss of principal. The value of the Fund’s investments will vary from day to day in response to the activities of individual companies and general market and economic conditions. Because the Fund may invest a significant portion of its assets in particular industry sectors which it believes hold the most potential for favorable returns, poor performance or adverse economic events affecting one or more of these overweighted sectors could have a greater impact on the Fund than it would on another mutual fund with a broader range of investments.
| 4 | 1-888-462-5386 | www.oakfunds.com |
Manager Discussion & Analysis
All data below as of October 31, 2016 (Unaudited)
| Fund Data | |
| Ticker | POGSX |
| Share Price | $53.35 |
| Total Net Assets | $109.9 M |
| Portfolio Turnover | 10.32% |
| Sector Allocation^ | |
| Financials | 39.0% |
| Information Technology | 30.6% |
| Consumer Discretionary | 10.5% |
| Industrials | 6.4% |
| Consumer Staples | 5.0% |
| Energy | 4.3% |
| Materials | 0.8% |
| Cash & Other Assets | 3.4% |
| Top 10 Holdings^ | ||
| 1. | The Charles Schwab Corp. | 5.7% |
| 2. | Wells Fargo & Co. | 5.4% |
| 3. | Alphabet, Inc. | 5.1% |
| 4. | PepsiCo, Inc. | 5.0% |
| 5. | The Bank of New York Mellon Corp. | 5.0% |
| 6. | Paychex, Inc. | 4.6% |
| 7. | Capital One Financial Corp. | 4.3% |
| 8. | Amdocs, Ltd. | 3.9% |
| 9. | SunTrust Banks, Inc. | 3.7% |
| 10. | Flextronics International, Ltd. | 3.6% |
| ^ | Percentages are based on net assets. Holdings are subject to change. |
Growth of $10,000 Chart
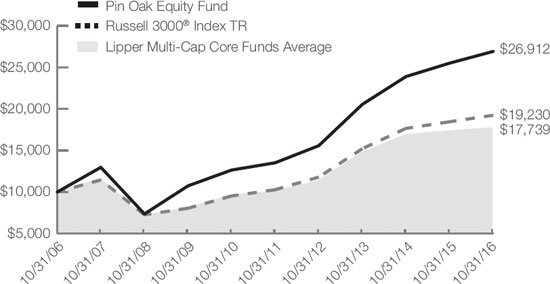
The chart above represents historical performance of a hypothetical investment of $10,000 in the Fund over the past 10 years (or for the life of the Fund if shorter). Past performance does not guarantee future results. This chart does not reflect the deduction of taxes that a shareholder would pay on Fund distributions or the redemption of Fund shares.
| Average Annual Total Return | ||||
| 1 Year Return | 3 Year Return | 5 Year Return | 10 Year Return | |
| Pin Oak Equity Fund | 5.54% | 9.41% | 14.77% | 10.41% |
Russell 3000® Index TR1 | 4.24% | 8.13% | 13.35% | 6.76% |
Lipper Multi-Cap Core Funds Average2 | 1.53% | 5.87% | 11.53% | 5.63% |
Gross/Net Expense Ratio (per the current prospectus): 1.10%*
| * | Please refer to the Financial Highlights for more recent expense ratio information. |
The performance data quoted represents past performance. Past performance does not guarantee future results. The investment return and principal value of an investment will fluctuate so that an investor’s shares, when redeemed, may be worth more or less than their original cost and current performance may be lower or higher than the performance quoted. For performance data current to the most recent month-end, please visit www.oakfunds.com or call 1-888-462-5386.
1 | Russell Investments is the source and owner of the Russell Index data. 2 Lipper Inc. is the source and owner of the Lipper Classification data. See Pages 16 and 17 for additional disclosure. |
| Annual Report | October 31, 2016 | 5 |
Rock Oak Core Growth Fund
 Robert D. Stimpson, CFA Portfolio Manager |
The Rock Oak Core Growth Fund (“the Fund”) rose 3.98% for the fiscal year ended October 31, 2016. The Fund’s performance compares to the benchmark S&P 500 Index’s gain of 4.51%. The Lipper Multi-Cap Growth Fund peer group fell 0.83% in the fiscal year. Over the last five years, the Fund has returned 8.67% per year.
The fiscal year 2016 saw US stocks weather international volatility and impending changes to the Federal Reserve’s (“the Fed”) monetary policy. Employment data continued to improve, and the national unemployment rate dropped under 5%. Hourly earnings and job openings also recovered, pressuring the Federal Reserve to fulfill its assertions to raise short-term interest rates from very low levels. The Fed has been prepping the investor community regarding its intentions to raise the Fed Funds rate for well over a year. A rate hike seems imminent, and the financial sector has responded positively to the likelihood. The sector has suffered from weak earnings power due to the low rates, but the combination of higher rates, improved book values, and better reserves bodes well for the sector.
Economic weakness in China and Japan’s decision to pursue a negative interest rate policy rattled markets in early 2016. It took the markets several months to reclaim lost territory, but US equities remained a preferred market by global investors due to its healthy economy and stability. The United Kingdom’s somewhat surprising decision to leave the European Union caused a sharp correction mid-year. Once again, this decline was quickly reclaimed and the major US averages rose to all-time highs.
The Fund’s best performing stock was Computer Sciences Corp, which rose 72%. The IT services company is being acquired by the Enterprise Services Business Unit of Hewlett Packard, which will then spin out into a separate company. Symantec Corp was the Fund’s second best performer. The security and antivirus company rose 54% as internet security and cyber protection remain a top priority area of spending for corporations.
The Fund’s largest laggard was oil services company Weatherford International. Despite a large move in the first half of 2016, oil prices and the prospects for energy sector remains problematic. The industry needs to see a sustained recovery in oil prices and growth in international markets. The uncertainty in both has weighed on Weatherford.
Going forward, the Rock Oak Fund remains focused on attractively-valued companies with strong growth prospects that have also demonstrated a commitment to creation of shareholder value. The outlook for US stocks remains attractive due to the low inflation, stable growth environment.
Thank you for your investment with Oak Associates Funds.
Mutual fund investing involves risk, including the possible loss of principal. The value of the Fund’s investments will vary from day to day in response to the activities of individual companies and general market and economic conditions. Because the Fund may invest a significant portion of its assets in particular industry sectors which it believes hold the most potential for favorable returns, poor performance or adverse economic events affecting one or more of these overweighted sectors could have a greater impact on the Fund than it would on another mutual fund with a broader range of investments.
| 6 | 1-888-462-5386 | www.oakfunds.com |
Manager Discussion & Analysis
All data below as of October 31, 2016 (Unaudited)
| Fund Data | |
| Ticker | RCKSX |
| Share Price | $12.74 |
| Total Net Assets | $7.4 M |
| Portfolio Turnover | 10.59% |
| Sector Allocation^ | |
| Information Technology | 57.3% |
| Financials | 15.0% |
| Consumer Discretionary | 9.6% |
| Industrials | 7.4% |
| Health Care | 4.3% |
| Consumer Staples | 3.4% |
| Cash & Other Assets | 3.0% |
| Top 10 Holdings^ | ||
| 1. | Vantiv, Inc. | 5.2% |
| 2. | Salesforce.com, Inc. | 5.1% |
| 3. | Linear Technology Corp. | 4.5% |
| 4. | SunTrust Banks, Inc. | 4.4% |
| 5. | Xilinx, Inc. | 4.2% |
| 6. | Computer Sciences Corp. | 4.2% |
| 7. | The Hartford Financial Services Group, Inc. | 4.1% |
| 8. | CA, Inc. | 4.1% |
| 9. | Autodesk, Inc. | 4.1% |
| 10. | F5 Networks, Inc. | 4.0% |
| ^ | Percentages are based on net assets. Holdings are subject to change. |
Growth of $10,000 Chart
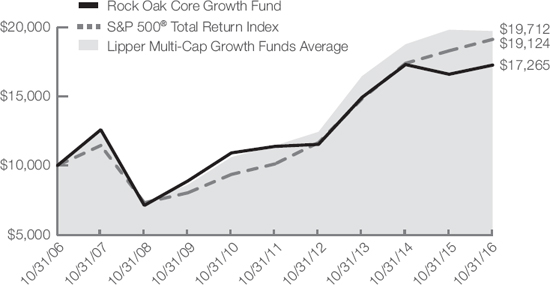
This chart represents historical performance of a hypothetical investment of $10,000 in the Fund over the past 10 years (or for the life of the Fund if shorter). Past performance does not guarantee future results. This chart does not reflect the deduction of taxes that a shareholder would pay on Fund distributions or the redemption of Fund shares. Fee waivers are in effect; if they had not been in effect, performance would have been lower.
| Average Annual Total Return | ||||
| 1 Year Return | 3 Year Return | 5 Year Return | 10 Year Return | |
| Rock Oak Core Growth Fund | 3.98% | 4.96% | 8.67% | 5.61% |
S&P 500® Total Return Index1 | 4.51% | 8.84% | 13.57% | 6.70% |
Lipper Multi-Cap Growth Funds Average2 | -0.83% | 5.85% | 11.37% | 6.85% |
Gross/Net Expense Ratio (per the current prospectus): 1.52%/1.25%*
| * | Please refer to the Financial Highlights for more recent expense ratio information. |
The Adviser has contractually agreed through February 28, 2017, to waive all or a portion of its fee for the Fund (and to reimburse expenses to the extent necessary) in order to limit Fund total operating expenses (excluding Acquired Fund Fees and Expenses) to an annual rate of not more than 1.25% of average daily net assets. This contractual fee waiver may only be terminated subject to approval by the Board of Trustees of the Trust.
The performance data quoted represents past performance. Past performance does not guarantee future results. The investment return and principal value of an investment will fluctuate so that an investor’s shares, when redeemed, may be worth more or less than their original cost and current performance may be lower or higher than the performance quoted. For performance data current to the most recent month-end, please visit www.oakfunds.com or call 1-888-462-5386.
1 | Standard & Poor’s is the source and owner of the S&P Index data. 2 Lipper Inc. is the source and owner of the Lipper Classification data. See Pages 16 and 17 for additional disclosure. |
| Annual Report | October 31, 2016 | 7 |
River Oak Discovery Fund
 Robert D. Stimpson, CFA Portfolio Manager |
The River Oak Discovery Fund (“the Fund”) rose 3.39% for the fiscal year ended October 31, 2016, outperforming the benchmark Russell 2000 Growth Index which fell 0.49%. The Lipper Small Cap Growth Peer Group dropped 0.37%. Over the last five years, the Fund has risen 9.00% annually. US stocks struggled in the first half of the fiscal year 2016 before moving to record highs in the second half of the fiscal year. Concerns over global growth as weakness in China and negative interest rates in Japan weighed on markets in January, but equities recovered headed into the spring. The United Kingdom’s somewhat surprising decision to leave the European Union rattled US stocks momentarily in the summer. Since the unwinding of the economic and political marriage will take up to two years, the impact of the Brexit is still unanswered. Importantly, a shift in tone from global central banks to a more accommodative position mid-year helped propel the S&P 500 to a new all-time high. |
A combination of low inflation and stable growth has produced an environment favorable to equity investments. The conclusion of the US Presidential election cycle also propelled the market just after the end of the fiscal year. Optimism over an end to gridlock in Washington and the potential for less regulation were applauded by investors. However, President-elect Trump’s position on trade may prove problematic and will be an issue to watch once he assumes office.
For well over a year now, the Federal Reserve has been preparing investors for higher short-term interest rates. Given the improvements in the stock market and stable job market, an interest rate increase is likely in the near future. Yet, the speed and number of rate increases remains uncertain. Financials, which had been hurt by the low interest rate environment, have rallied strongly on the prospect of higher short-term rates and better earnings power.
The Fund’s strongest performer this fiscal year was Cirrus Logic, gaining 77%. The semiconductor firm supplies audio and communications chips for Apple and other consumer electronic companies. MercadoLibre, the Latin American internet commerce company, was the Fund’s second best performing holding, gaining 71%.
The Fund’s two worst-performing stocks were CAI international and Skullcandy. Despite attractive valuations, both companies have struggled with their respective competitive environment. Both positions were sold during the year due to their underperformance.
Looking into 2017, investors’ interest in small-cap stocks has improved after several years of large-cap preference. A strong stock market and cyclical outperformance in particular has helped improve risk appetite for the segment. The Fund is committed to seeking out niche companies with a strong commitment to creation of shareholder value.
Thank you for your investment with Oak Associates Funds.
Mutual fund investing involves risk, including the possible loss of principal. Because the Fund may invest a significant portion of its assets in particular industry sectors which it believes hold the most potential for favorable returns, poor performance or adverse economic events affecting one or more of these overweighted sectors could have a greater impact on the Fund than it would on another mutual fund with a broader range of investments. Funds that emphasize investments in smaller companies generally will experience greater price volatility.
| 8 | 1-888-462-5386 | www.oakfunds.com |
Manager Discussion & Analysis
All data below as of October 31, 2016 (Unaudited)
| Fund Data | |
| Ticker | RIVSX |
| Share Price | $14.21 |
| Total Net Assets | $12.3 M |
| Portfolio Turnover | 21.16% |
| Sector Allocation^ | |
| Information Technology | 45.4% |
| Financials | 22.6% |
| Health Care | 11.9% |
| Industrials | 9.9% |
| Materials | 2.7% |
| Consumer Discretionary | 2.4% |
| Energy | 2.0% |
| Cash & Other Assets | 3.1% |
| Top 10 Holdings^ | ||
| 1. | Cirrus Logic, Inc. | 7.0% |
| 2. | Advanced Energy Industries, Inc. | 5.6% |
| 3. | PrivateBancorp, Inc. | 4.5% |
| 4. | Fabrinet | 4.4% |
| 5. | Assurant, Inc. | 4.1% |
| 6. | Fortinet, Inc. | 3.9% |
| 7. | United Therapeutics Corp. | 3.6% |
| 8. | Argan, Inc. | 3.5% |
| 9. | TASER International, Inc. | 3.4% |
| 10. | MercadoLibre, Inc. | 3.4% |
| ^ | Percentages are based on net assets. Holdings are subject to change. |
Growth of $10,000 Chart
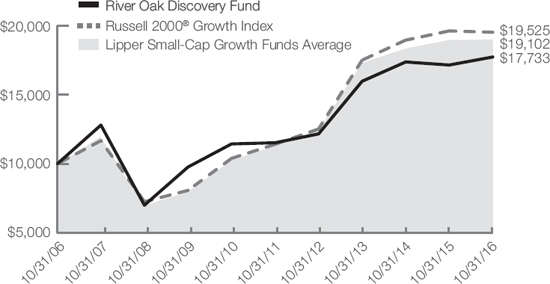
This chart represents historical performance of a hypothetical investment of $10,000 in the Fund over the past 10 years (or for the life of the Fund if shorter). Past performance does not guarantee future results. This chart does not reflect the deduction of taxes that a shareholder would pay on Fund distributions or the redemption of Fund shares. Fee waivers are in effect; if they had not been in effect, performance would have been lower.
| Average Annual Total Return | ||||
| 1 Year Return | 3 Year Return | 5 Year Return | 10 Year Return | |
| River Oak Discovery Fund | 3.39% | 3.54% | 9.00% | 5.90% |
Russell 2000® Growth Index1 | -0.49% | 3.70% | 11.34% | 6.92% |
Lipper Small-Cap Growth Funds Average2 | -0.37% | 2.31% | 10.05% | 6.43% |
Gross/Net Expense Ratio (per the current prospectus): 1.45%/1.35%*
| * | Please refer to the Financial Highlights for more recent expense ratio information. |
The Adviser has contractually agreed through February 28, 2017, to waive all or a portion of its fee for the Fund (and to reimburse expenses to the extent necessary) in order to limit Fund total operating expenses (excluding Acquired Fund Fees and Expenses) to an annual rate of not more than 1.35% of average daily net assets. This contractual fee waiver may only be terminated subject to approval by the Board of Trustees of the Trust.
The performance data quoted represents past performance. Past performance does not guarantee future results. The investment return and principal value of an investment will fluctuate so that an investor’s shares, when redeemed, may be worth more or less than their original cost and current performance may be lower or higher than the performance quoted. For performance data current to the most recent month-end, please visit www.oakfunds.com or call 1-888-462-5386.
| 1 | Russell Investments is the source and owner of the Russell Index data. 2 Lipper Inc. is the source and owner of the Lipper Classification data. See Pages 16 and 17 for additional disclosure. |
| Annual Report | October 31, 2016 | 9 |
Red Oak Technology Select Fund
 Mark W. Oelschlager, CFA Co-Chief Investment Officer & Portfolio Manager |
Red Oak Technology Select Fund (“the Fund”) posted a return of 17.14% for the fiscal year ended October 31, 2016, while the S&P 500 Equal Weight Information Technology Index returned 14.60%, and the Lipper Science and Technology Fund Average rose 8.62%. For the last ten years, the Fund’s cumulative return was 196.47%, versus 143.22% for the Index and 133.09% for the Lipper. The strong performance versus our peers and the index is a function of not just what we owned but what we didn’t own. Technology tends to be populated with plenty of hot growth stories, but most of these tend to disappoint due to either an unsustainable growth trajectory or lack of competitive advantages. Some examples are 3D printing, cloud computing, and wearable cameras. Our avoidance of such areas helped prevent the permanent loss of capital that is the enemy of good long-term returns. |
Tech was the second best performing sector for the trailing twelve months. In spite of the strong run in the stocks, there remain many tech companies that sport free cash flow yields north of 6%, which is even more appealing in an environment of low bond yields.
Technology companies have been the biggest beneficiaries of globalized supply chains that have resulted in improved efficiency and reduced costs. This has driven profit margins to high levels, and their restrained capital spending has allowed the margins to remain elevated, consistently surprising the market. In the old days, tech company managements worried less about profitability and allocated capital more recklessly, as they focused on growth. Today, with top-line growth harder to come by in a world of sluggish economic growth, the companies have been more prudent, doing things like raising dividends. President-elect Trump presented a strong anti-trade stance during his campaign, and tech companies have perhaps the most to lose if his tough talk turns into action and the generally free trade environment becomes restricted.
Winners in the portfolio for the year included semiconductor company NVIDIA, who is seeing increasing demand for its graphics chips; IT hardware giant Hewlett Packard Enterprise, which is cutting costs and spinning off its services business; and hard disk drive chip purveyor Marvell, who reached a settlement on a patent infringement suit.
Laggards included networking equipment company Juniper Networks, which lost market share to rivals; hard disk drive maker Western Digital, who saw profit margins decline; and electronic payment processing company Total System Services, whose stock took a breather after more than doubling the previous 2 ½ years.
Turnover in the Fund remains low, and areas of focus are Software and Services, Internet, IT Hardware, and Semiconductors. We continue to try to identify companies with some combination of sustainable competitive advantage and attractive valuation.
Thank you for your investment with Oak Associates Funds.
Mutual fund investing involves risk, including the possible loss of principal. Because the assets of the Fund may be concentrated in an industry or group of industries, the Fund is subject to the risk that economic, political, or other conditions that have negative effect on that industry or group of industries will negatively impact the Fund to a greater extent than if the Fund’s assets were invested in a wider variety of industries.
| 10 | 1-888-462-5386 | www.oakfunds.com |
Manager Discussion & Analysis
All data below as of October 31, 2016 (Unaudited)
| Fund Data | |
| Ticker | ROGSX |
| Share Price | $19.27 |
| Total Net Assets | $189.1 M |
| Portfolio Turnover | 6.11% |
| Sector Allocation^ | |
| Information Technology | 89.0% |
| Industrials | 4.6% |
| Consumer Discretionary | 2.5% |
| Cash & Other Assets | 3.9% |
| Top 10 Holdings^ | ||
| 1. | Alphabet, Inc. | 6.8% |
| 2. | NVIDIA Corp. | 5.0% |
| 3. | Cisco Systems, Inc. | 4.3% |
| 4. | Intel Corp. | 3.6% |
| 5. | Oracle Corp. | 3.5% |
| 6. | Microsoft Corp. | 3.5% |
| 7. | Synopsys, Inc. | 3.4% |
| 8. | Huntington Ingalls Industries, Inc. | 3.4% |
| 9. | Qualcomm, Inc. | 3.1% |
| 10. | Ingram Micro, Inc. | 3.1% |
| ^ | Percentages are based on net assets. Holdings are subject to change. |
Growth of $10,000 Chart
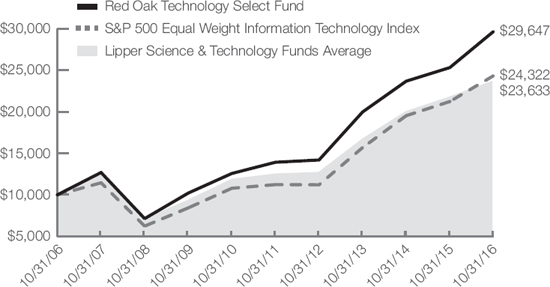
The chart above represents historical performance of a hypothetical investment of $10,000 in the Fund over the past 10 years (or for the life of the Fund if shorter). Past performance does not guarantee future results. This chart does not reflect the deduction of taxes that a shareholder would pay on Fund distributions or the redemption of Fund shares.
| Average Annual Total Return | ||||
| 1 Year Return | 3 Year Return | 5 Year Return | 10 Year Return | |
| Red Oak Technology Select Fund | 17.14% | 14.08% | 16.34% | 11.48% |
S&P 500 Equal Weight Information Technology Index1 | 14.60% | 15.75% | 16.73% | 9.29% |
Lipper Science & Technology Funds Average2 | 8.62% | 11.65% | 13.27% | 8.63% |
Gross/Net Expense Ratio (per the current prospectus): 1.11%*
| * | Please refer to the Financial Highlights for more recent expense ratio information. |
The performance data quoted represents past performance. Past performance does not guarantee future results. The investment return and principal value of an investment will fluctuate so that an investor’s shares, when redeemed, may be worth more or less than their original cost and current performance may be lower or higher than the performance quoted. For performance data current to the most recent month-end, please visit www.oakfunds.com or call 1-888-462-5386.
1 | Standard & Poor’s is the source and owner of the S&P Index data. 2 Lipper Inc. is the source and owner of the Lipper Classification data. See Pages 16 and 17 for additional disclosure. |
| Annual Report | October 31, 2016 | 11 |
Black Oak Emerging Technology Fund
 Robert D. Stimpson, CFA Portfolio Manager |
The Black Oak Emerging Technology Fund (“the Fund”) rose 9.59% during the fiscal year ended October 31, 2016. Over the same period, the Lipper Science & Technology Peer Group gained 8.62%. The S&P 500 Equal Weighted Technology Index, a benchmark that avoids the affects of market capitalization on performance, rose 14.60%. For the last five years, the Fund has achieved an annualized return of 10.92%. Technology stocks performed well in 2016, despite the economic doom and gloom perpetuated by the presidential election cycle and uncertainty over the United Kingdom leaving the European Union. Economic data continues to paint a mixed picture of global growth, but domestically, low inflation, stable growth and improving employment rates supported stock prices. The Federal Reserve has primed the investment community for a year now that short-term interest rates will rise in the near future. The path to normalized rates is still uncertain, but financials, which have suffered from the low rate environment, have rallied on the prospect of better earnings power. |
Global macro issues affected volatility early in 2016 but subsided as the year progressed after global central banks expressed a more accommodative tone toward economic growth. The UK’s unexpected decision to leave the European Union also caused mid-year turbulence, but the US market quickly recovered. The Brexit process is lengthy and will involve approximately two years of negotiations before the true impact will be known.
The domestic US economy continues to improve and optimism has been building following the election, with hopes for lower gridlock and less regulation. President-elect Trump’s position on trade remains a concern and will be something to monitor going forward.
The Fund’s top performing stock for the second year running was Cirrus Logic, which rose 77%. The semiconductor company supplies chips to Apple and others for use in mobile communications equipment. IT services and consulting company Computer Sciences was the fund’s second best performing holding, rising 72% in the fiscal year.
The Fund’s worst performing stock was Computer Programs and Systems, a healthcare IT software company. Despite the stock’s attractive valuation, the stock dropped sharply after missing earnings and slashing it’s dividend. The company was sold during the year to capture the tax loss.
Going forward, the Black Oak Fund will continue to seek niche technology companies with solid earnings prospects that are trading at favorable valuations.
Thank you for your investment with Oak Associates Funds.
Mutual fund investing involves risk, including the possible loss of principal. Because the Fund may invest a significant portion of its assets in particular industry sectors which it believes hold the most potential for favorable returns, poor performance or adverse economic events affecting one or more of these overweighted sectors could have a greater impact on the Fund than it would on another mutual fund with a broader range of investments. Funds that emphasize investments in smaller or mid-sized companies may experience greater price volatility.
| 12 | 1-888-462-5386 | www.oakfunds.com |
Manager Discussion & Analysis
All data below as of October 31, 2016 (Unaudited)
| Fund Data | |
| Ticker | BOGSX |
| Share Price | $4.53 |
| Total Net Assets | $32.9 M |
| Portfolio Turnover | 34.76% |
| Sector Allocation^ | |
| Information Technology | 90.2% |
| Health Care | 2.4% |
| Cash & Other Assets | 7.4% |
| Top 10 Holdings^ | ||
| 1. | Apple, Inc. | 6.3% |
| 2. | Cirrus Logic, Inc. | 6.3% |
| 3. | Salesforce.com, Inc. | 4.8% |
| 4. | Qualcomm, Inc. | 4.2% |
| 5. | CA, Inc. | 4.2% |
| 6. | Silicon Motion Technology Corp. - ADR | 4.1% |
| 7. | Lam Research Corp. | 3.8% |
| 8. | Fortinet, Inc. | 3.4% |
| 9. | Computer Sciences Corp. | 3.3% |
| 10. | Infoblox, Inc. | 3.2% |
| ^ | Percentages are based on net assets. Holdings are subject to change. |
Growth of $10,000 Chart
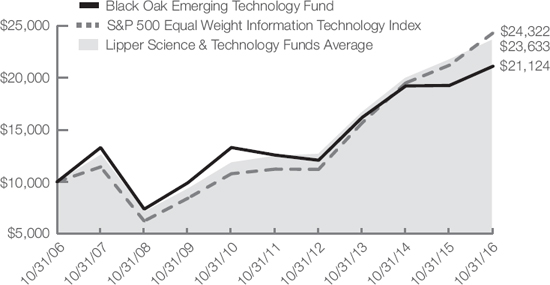
This chart represents historical performance of a hypothetical investment of $10,000 in the Fund over the past 10 years (or for the life of the Fund if shorter). Past performance does not guarantee future results. This chart does not reflect the deduction of taxes that a shareholder would pay on Fund distributions or the redemption of Fund shares. Fee waivers are in effect; if they had not been in effect, performance would have been lower.
| Average Annual Total Return | ||||
| 1 Year Return | 3 Year Return | 5 Year Return | 10 Year Return | |
| Black Oak Emerging Technology Fund | 9.59% | 9.25% | 10.92% | 7.77% |
S&P 500 Equal Weight Information Technology Index1 | 14.60% | 15.75% | 16.73% | 9.29% |
Lipper Science & Technology Funds Average2 | 8.62% | 11.65% | 13.27% | 8.63% |
Gross/Net Expense Ratio (per the current prospectus): 1.25%*
| * | Please refer to the Financial Highlights for more recent expense ratio information. |
The performance data quoted represents past performance. Past performance does not guarantee future results. The investment return and principal value of an investment will fluctuate so that an investor’s shares, when redeemed, may be worth more or less than their original cost and current performance may be lower or higher than the performance quoted. For performance data current to the most recent month-end, please visit www.oakfunds.com or call 1-888-462-5386.
1 | Standard & Poor’s is the source and owner of the S&P Index data. 2 Lipper Inc. is the source and owner of the Lipper Classification data. See Pages 16 and 17 for additional disclosure. |
| Annual Report | October 31, 2016 | 13 |
Live Oak Health Sciences Fund
 Mark W. Oelschlager, CFA Co-Chief Investment Officer & Portfolio Manager |
Live Oak Health Sciences Fund (“the Fund”) fell 1.81% for the fiscal year ended October 31, 2016, while the comparative index, the S&P 500 Health Care Index, lost 3.96%, and the Lipper Health and Biotech Fund Average declined 10.85%. For the last ten years the Fund’s cumulative return was 163.65%, versus 145.35% for the Index and 176.25% for the Lipper. For years health care was the star performer of the market, as everything fell into place: strong unit growth, increased research productivity, pricing power, favorable political environment, demographic tailwind, implementation of the Affordable Care Act, financial engineering and other merger activity, and a perception of offering downside mitigation in a falling market. Many of these changed recently, and the prices of the stocks suffered. For the past year, health care was the worst performing of the eleven market sectors. After everything had gone right for so long, this reversal of fortune was inevitable, and we managed to limit the downside to our portfolio much better than did our peers. |
The primary culprit for the weakness in the sector is a greater focus, particularly by legislators, on the pricing of therapeutics. With most health care expenditures being made with “other people’s money,” the products are ripe for regular healthy price increases, and the companies have naturally taken advantage of this. Of course, a good thing can be ruined if it is taken to excess, and in the view of many, pharmaceutical executives have indeed taken their power too far. But to add a new twist to the tale, the presumed President-to-be, Hillary Clinton, was upset in the election by Donald Trump, who, along with a GOP Congress, is likely to be friendlier to the sector. This does not mean that the pharmaceutical industry is home-free, as the legislative pressure is sure to persist in some form, but it dramatically reduces the chances of a worst-case scenario for the sector.
For the past year many of the standouts in the portfolio were the medical device companies, such as Stryker, Becton Dickinson, CR Bard, Medtronic, and Johnson & Johnson (which also has a large drug segment). All of these returned between 13% and 22%.
Poor performers included distributors Cardinal Health and McKesson, and pharmacy benefit manager Express Scripts. These fell on worries about the impact on their business models of more modest pharmaceutical price gains. We believe the correction in these stocks has been overdone.
We largely avoided the biotech and specialty pharmaceutical areas throughout their rise and during the subsequent descent but are now finding some opportunity amid the rubble. In the latter part of the fiscal year we purchased shares of biotech titan Biogen and specialty pharma companies Endo and Mylan, all of which we believe were oversold.
Thank you for your investment with Oak Associates Funds.
Mutual fund investing involves risk, including the possible loss of principal. Because the assets of the Fund may be concentrated in an industry or group of industries, the Fund is subject to the risk that economic, political, or other conditions that have negative effect on that industry or group of industries will negatively impact the Fund to a greater extent than if the Fund’s assets were invested in a wider variety of industries.
| 14 | 1-888-462-5386 | www.oakfunds.com |
Manager Discussion & Analysis
All data below as of October 31, 2016 (Unaudited)
| Fund Data | |
| Ticker | LOGSX |
| Share Price | $17.93 |
| Total Net Assets | $56.1 M |
| Portfolio Turno | 13.73% |
| Sector Allocation^ | |
| Health Care | 97.5% |
| Information Technology | 1.4% |
| Cash & Other Assets | 1.1% |
| Top 10 Holdings^ | |
| 1. Amgen, Inc. | 6.6% |
| 2. Cardinal Health, Inc. | 4.5% |
| 3. McKesson Corp. | 4.3% |
| 4. Becton Dickinson and Co. | 4.2% |
| 5. Merck & Co., Inc. | 4.2% |
| 6. Waters Corp. | 4.1% |
| 7. CR Bard, Inc. | 4.0% |
| 8. Owens & Minor, Inc. | 4.0% |
| 9. Anthem, Inc. | 3.8% |
| 10. Express Scripts Holding Co. | 3.6% |
| ^ | Percentages are based on net assets. Holdings are subject to change. |
Growth of $10,000 Chart
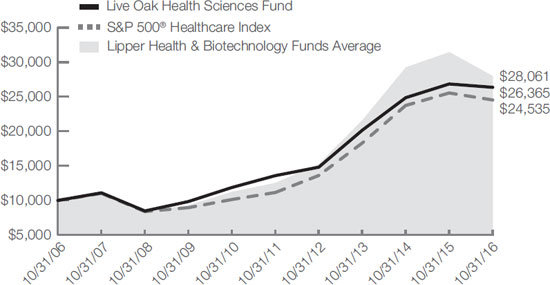
The chart above represents historical performance of a hypothetical investment of $10,000 in the Fund over the past 10 years (or for the life of the Fund if shorter). Past performance does not guarantee future results. This chart does not reflect the deduction of taxes that a shareholder would pay on Fund distributions or the redemption of Fund shares.
| Average Annual Total Return | ||||
| 1 Year Return | 3 Year Return | 5 Year Return | 10 Year Return | |
| Live Oak Health Sciences Fund | -1.81% | 9.36% | 14.18% | 10.18% |
S&P 500® Healthcare Index1 | -3.96% | 10.25% | 17.09% | 9.39% |
Lipper Health & Biotechnology Funds Average2 | -10.85% | 8.57% | 16.93% | 10.46% |
Gross/Net Expense Ratio (per the current prospectus): 1.08%*
| * | Please refer to the Financial Highlights for more recent expense ratio information. |
The performance data quoted represents past performance. Past performance does not guarantee future results. The investment return and principal value of an investment will fluctuate so that an investor’s shares, when redeemed, may be worth more or less than their original cost and current performance may be lower or higher than the performance quoted. For performance data current to the most recent month-end, please visit www.oakfunds.com or call 1-888-462-5386.
1 | Standard & Poor’s is the source and owner of the S&P Index data. 2 Lipper Inc. is the source and owner of the Lipper Classification data. See Pages 16 and 17 for additional disclosure. |
| Annual Report | October 31, 2016 | 15 |
Important Disclosures
As of October 31, 2016 (Unaudited)
Index Definitions and Disclosures
All indices are unmanaged and index performance figures include reinvestment of dividends but do not reflect any fees, expenses or taxes. Investors cannot invest directly in an index.
Lipper, a Thomson Reuters Company, is the source and owner of the Lipper Classification data contained in this material and all trademarks and copyrights related thereto. Any further dissemination or redistribution is strictly prohibited. Lipper Inc. is not responsible for the formatting or configuration of this material or for any inaccuracy in Oak Associates Funds presentation thereof.
Lipper Health/Biotechnology Funds – Funds that invest primarily in the equity securities of domestic companies engaged in health care, medicine, and biotechnology.
Lipper Large-Cap Growth Funds – Funds that, by portfolio practice, invest at least 75% of their equity assets in companies with market capitalizations (on a three-year weighted basis) above Lipper’s USDE large-cap floor. Large-cap growth funds typically have an above-average price-to-earnings ratio, price-to-book ratio, and three-year sales-per-share growth value, compared to the S&P 500 Index.
Lipper Multi-Cap Core Funds – Funds that, by portfolio practice, invest in a variety of market-capitalization ranges without concentrating 75% of their equity assets in any one market-capitalization range over an extended period of time. Multi-cap core funds typically have average characteristics compared to the S&P SuperComposite 1500 Index.
Lipper Multi-Cap Growth Funds – Funds that, by portfolio practice, invest in a variety of market capitalization ranges without concentrating 75% of their equity assets in any one market capitalization range over an extended period of time. Multi-cap growth funds typically have an above-average price-to-earnings ratio, price-to-book ratio, and three-year sales per-share growth value, compared to the S&P SuperComposite 1500 Index.
Lipper Science & Technology Funds – Funds that invest primarily in the equity securities of domestic companies engaged in science and technology.
Lipper Small-Cap Growth Funds – Funds that, by portfolio practice, invest at least 75% of their equity assets in companies with market capitalizations (on a three-year weighted basis) below Lipper’s USDE small-cap ceiling. Small-cap growth funds typically have an above-average price-to-earnings ratio, price-to-book ratio, and three-year sales-per-share growth value, compared to the S&P Small-Cap 600 Index.
NASDAQ is the source and owner of the NASDAQ Index data contained in this material and all trademarks and copyrights related thereto. Any further dissemination or redistribution is strictly prohibited. NASDAQ is not responsible for the formatting or configuration of this material or for any inaccuracy in Oak Associates Funds’ presentation thereof.
Russell Investments is the source and owner of the Russell Index data contained in this material and all trademarks and copyrights related thereto. Any further dissemination or redistribution is strictly prohibited. Russell Investments is not responsible for the formatting or configuration of this material or for any inaccuracy in Oak Associates Funds’ presentation thereof.
| 16 | 1-888-462-5386 | www.oakfunds.com |
Important Disclosures
As of October 31, 2016 (Unaudited)
Russell 2000 Growth Index – The Russell 2000 Growth Index measures the performance of the small-cap growth segment of the U.S. equity universe. It includes those Russell 2000 companies with higher price-to-book ratios and higher forecasted growth values.
Russell 3000 Index – The Russell 3000 Index measures the performance of 3,000 publicly held US companies based on total market capitalization, which represents approximately 98% of the investable US equity market.
Standard & Poor’s is the source and owner of the S&P Index data contained in this material and all trademarks and copyrights related thereto. Any further dissemination or redistribution is strictly prohibited. Standard & Poor’s is not responsible for the formatting or configuration of this material or for any inaccuracy in Oak Associates Funds’ presentation thereof.
S&P 500 Index – is a commonly-recognized, market capitalization weighted index of 500 widely held equity securities, designed to measure broad U.S. equity performance.
S&P 500 Equal Weight Information Technology Index – The S&P 500 Equal Weight Information Technology Index is an unmanaged equal weighted version of the S&P 500 Information Technology Index that consists of the common stocks of the following industries: internet equipment, computers and peripherals, electronic equipment, office electronics and instruments, semiconductor equipment and products, diversified telecommunication services, and wireless telecommunication services that comprise the Information Technology sector of the S&P 500 Index.
S&P 500 Health Care Index – The S&P 500 Health Care Index is a capitalization-weighted index that encompasses two main industry groups. The first includes companies who manufacture health care equipment and supplies or provide health care related services, including distributors of health care products, providers of basic health care services, and owners and operators of health care facilities and organizations. The second group consists of companies primarily involved in the research, development, production and marketing of pharmaceuticals and biotechnology products.
S&P 500 Total Return Index – The S&P 500 Total Return Index is a commonly recognized, market capitalization weighted index of 500 widely held equity securities, designed to measure broad U.S. equity performance.
Investment Definitions
Smart beta defines a set of investment strategies that emphasize the use of alternative index construction rules to traditional market capitalization based indices. Smart beta emphasizes capturing investment factors of market inefficiencies in a rules-based and transparent way.
Correlation is a statistic that measures the degree to which two securities move in relation to each other.
The price-earnings ratio (P/E Ratio) is the ratio for valuing a company that measures its current share price relative to its per-share earnings. The price-earnings ratio can be calculated as market value per share divided by earnings per share.
| Annual Report | October 31, 2016 | 17 |
Important Disclosures
As of October 31, 2016 (Unaudited)
The KBW Bank Index is an economic index consisting of the stocks of 24 banking companies. This index serves as a benchmark of the banking sector. This index trades on the Philadelphia Stock Exchange, where it was created.
Book value of an asset is the value at which the asset is carried on a balance sheet and calculated by taking the cost of an asset minus the accumulated depreciation. Book value is also the net asset value of a company, calculated as total assets minus intangible assets and liabilities.
Free cash flow yield is an overall return evaluation ratio of a stock, which standardizes the free cash flow per share a company is expected to earn against its market price per share. The ratio is calculated by taking the free cash flow per share divided by the share price.
18 | 1-888-462-5386 | www.oakfunds.com |
Disclosure of Fund Expenses
As of October 31, 2016 (Unaudited)
All mutual funds have operating expenses. As a shareholder of a fund, your investment is affected by these ongoing costs, which include (among others) costs for portfolio management, administrative services, and shareholder reports like this one. It is important for you to understand the impact of these costs on your investment returns.
Operating expenses such as these, are deducted from the Fund’s gross income and directly reduce your final investment return. These expenses are expressed as a percentage of the Fund’s average net assets; this percentage is known as the Fund’s expense ratio.
The following examples use the expense ratio and are intended to help you understand the ongoing costs (in dollars) of investing in your Fund and to compare these costs with those of other mutual funds. The examples are based on an investment of $1,000 made at the beginning of the period shown and held for the entire period.
The table on the next page illustrates your Fund’s costs in two ways:
Actual Fund Return. This section helps you to estimate the actual expenses after fee waivers that your Fund incurred over the period. The “Expenses Paid During Period” column shows the actual dollar expense cost incurred by a $1,000 investment in the Fund, and the “Ending Account Value” number is derived from deducting that expense cost from the Fund’s gross investment return.
You can use this information, together with the actual amount you invested in the Fund, to estimate the expenses you paid over that period. Simply divide your actual account value by $1,000 to arrive at a ratio (for example, an $8,600 account value divided by $1,000 = 8.6), then multiply that ratio by the number shown for your Fund under “Expenses Paid During Period”.
Hypothetical 5% Return. This section helps you compare your Fund’s costs with those of other mutual funds. It assumes that the Fund had an annual 5% return before expenses during the year, but that the expense ratio (Column 3) for the period is unchanged. This example is useful in making comparisons because the Securities and Exchange Commission requires all mutual funds to make this 5% calculation. You can assess your Fund’s comparative cost by comparing the hypothetical result for your Fund in the “Expense Paid During Period” column with those that appear in the same charts in the shareholder reports for other funds.
Note: Because the return is set at 5% for comparison purposes — NOT your Fund’s actual return—the account values shown may not apply to your specific investment.
| Annual Report | October 31, 2016 | 19 |
Disclosure of Fund Expenses
As of October 31, 2016 (Unaudited)
| Beginning Account Value 05/01/2016 | Ending Account Value 10/31/2016 | Annualized Expense Ratio | Expenses Paid During the Period(a) | |
| White Oak Select Growth Fund | ||||
| Actual Return | $1,000.00 | $1,071.20 | 1.04% | $5.41 |
| Hypothetical 5% Return | $1,000.00 | $1,019.91 | 1.04% | $5.28 |
| Pin Oak Equity Fund | ||||
| Actual Return | $1,000.00 | $1,078.90 | 1.08% | $5.64 |
| Hypothetical 5% Return | $1,000.00 | $1,019.71 | 1.08% | $5.48 |
| Rock Oak Core Growth Fund | ||||
| Actual Return | $1,000.00 | $1,093.60 | 1.25% | $6.58 |
| Hypothetical 5% Return | $1,000.00 | $1,018.85 | 1.25% | $6.34 |
| River Oak Discovery Fund | ||||
| Actual Return | $1,000.00 | $1,027.50 | 1.35% | $6.88 |
| Hypothetical 5% Return | $1,000.00 | $1,018.35 | 1.35% | $6.85 |
| Red Oak Technology Select Fund | ||||
| Actual Return | $1,000.00 | $1,189.50 | 1.07% | $5.89 |
| Hypothetical 5% Return | $1,000.00 | $1,019.76 | 1.07% | $5.43 |
| Black Oak Emerging Technology Fund | ||||
| Actual Return | $1,000.00 | $1,141.10 | 1.25% | $6.73 |
| Hypothetical 5% Return | $1,000.00 | $1,018.85 | 1.25% | $6.34 |
| Live Oak Health Sciences Fund | ||||
| Actual Return | $1,000.00 | $960.70 | 1.13% | $5.57 |
| Hypothetical 5% Return | $1,000.00 | $1,019.46 | 1.13% | $5.74 |
(a) | Expenses are equal to the Fund's annualized expense ratio multiplied by the average account value over the period, multiplied by 184/366 (to reflect the one-half year period). |
| 20 | 1-888-462-5386 | www.oakfunds.com |
| White Oak Select Growth Fund | Schedules of Investments |
As of October 31, 2016
| Security Description | Shares | Value | ||||||
| COMMON STOCKS (100.5%) | ||||||||
| CONSUMER DISCRETIONARY (7.2%) | ||||||||
| Internet & Catalog Retail (7.2%) | ||||||||
Amazon.com, Inc.(a) | 22,645 | $ | 17,885,474 | |||||
| ENERGY (0.7%) | ||||||||
| Energy Equipment & Services (0.7%) | ||||||||
Transocean, Ltd.(a) | 195,000 | 1,873,950 | ||||||
| FINANCIALS (34.8%) | ||||||||
| Capital Markets (8.5%) | ||||||||
| The Charles Schwab Corp. | 481,900 | 15,276,230 | ||||||
| State Street Corp. | 83,500 | 5,862,535 | ||||||
| 21,138,765 | ||||||||
| Commercial Banks (15.0%) | ||||||||
| CIT Group, Inc. | 190,400 | 6,917,232 | ||||||
| TCF Financial Corp. | 529,000 | 7,564,700 | ||||||
| US Bancorp | 308,000 | 13,786,080 | ||||||
| Wells Fargo & Co. | 193,000 | 8,879,930 | ||||||
| 37,147,942 | ||||||||
| Diversified Financial Services (7.9%) | ||||||||
| JPMorgan Chase & Co. | 284,900 | 19,732,174 | ||||||
| Insurance (3.4%) | ||||||||
| Chubb, Ltd. | 65,600 | 8,331,200 | ||||||
| HEALTH CARE (12.1%) | ||||||||
| Biotechnology (6.1%) | ||||||||
| Amgen, Inc. | 108,000 | 15,245,280 | ||||||
| Health Care Providers & Services (2.7%) | ||||||||
Express Scripts Holding Co.(a) | 100,000 | 6,740,000 | ||||||
| Pharmaceuticals (3.3%) | ||||||||
| Teva Pharmaceutical Industries, Ltd. - Sponsored ADR | 189,000 | 8,077,860 | ||||||
| INDUSTRIALS (3.9%) | ||||||||
| Air Freight & Logistics (3.9%) | ||||||||
| United Parcel Service, Inc. - Class B | 90,000 | 9,698,400 | ||||||
| INFORMATION TECHNOLOGY (41.8%) | ||||||||
| Communications Equipment (10.0%) | ||||||||
| Cisco Systems, Inc. | 584,000 | 17,917,120 | ||||||
| Annual Report | October 31, 2016 | 21 |
| Schedules of Investments | White Oak Select Growth Fund |
As of October 31, 2016
| Security Description | Shares | Value | ||||||
| Communications Equipment (continued) | ||||||||
| Qualcomm, Inc. | 102,100 | $ | 7,016,312 | |||||
| 24,933,432 | ||||||||
| Internet Software & Services (12.5%) | ||||||||
Alphabet, Inc. - Class A(a) | 14,130 | 11,443,887 | ||||||
Alphabet, Inc. - Class C(a) | 16,495 | 12,940,988 | ||||||
Facebook, Inc. - Class A(a) | 14,000 | 1,833,860 | ||||||
Salesforce.com, Inc.(a) | 64,600 | 4,855,336 | ||||||
| 31,074,071 | ||||||||
| IT Services (6.9%) | ||||||||
Cognizant Technology Solutions Corp. - Class A(a) | 146,700 | 7,533,045 | ||||||
| International Business Machines Corp. | 61,900 | 9,513,411 | ||||||
| 17,046,456 | ||||||||
| Semiconductors & Semiconductor Equipment (9.9%) | ||||||||
| KLA-Tencor Corp. | 179,800 | 13,504,778 | ||||||
| Xilinx, Inc. | 220,000 | 11,191,400 | ||||||
| 24,696,178 | ||||||||
| Software (2.5%) | ||||||||
| Symantec Corp. | 247,000 | 6,182,410 | ||||||
TOTAL COMMON STOCKS (Cost $224,724,360) | 249,803,592 | |||||||
| SHORT TERM INVESTMENTS (0.7%) | ||||||||
| Tri-Party Repurchase Agreement with South Street Securities Wachovia Tri-Party, 0.15%, dated 10/31/16 and maturing 11/01/16, collateralized by U.S. Treasury Securities with rates ranging from 0.000% to 2.000% and maturity dates ranging from 08/17/17 to 09/30/21 with a par value of $1,723,176 and a collateral value of $1,727,643. | 1,693,761 | $ | 1,693,761 | |||||
TOTAL SHORT TERM INVESTMENTS (Cost $1,693,761) | 1,693,761 | |||||||
TOTAL INVESTMENTS - (101.2%) (Cost $226,418,121) | $ | 251,497,353 | ||||||
| Liabilities in Excess of Other Assets - (-1.2%) | (3,064,242 | ) | ||||||
| NET ASSETS - (100.0%) | $ | 248,433,111 | ||||||
(a) | Non-income producing security. |
The accompanying notes are an integral part of the financial statements.
| 22 | 1-888-462-5386 | www.oakfunds.com |
| Pin Oak Equity Fund | Schedules of Investments |
As of October 31, 2016
| Security Description | Shares | Value | ||||||
| COMMON STOCKS (96.6%) | ||||||||
| CONSUMER DISCRETIONARY (10.5%) | ||||||||
| Auto Components (1.8%) | ||||||||
| Gentex Corp. | 117,000 | $ | 1,978,470 | |||||
| Internet & Catalog Retail (3.3%) | ||||||||
Amazon.com, Inc.(a) | 4,600 | 3,633,172 | ||||||
| Media (5.4%) | ||||||||
| The Interpublic Group of Cos., Inc. | 106,000 | 2,373,340 | ||||||
| Twenty-First Century Fox, Inc. - Class A | 34,000 | 893,180 | ||||||
| Twenty-First Century Fox, Inc. - Class B | 101,100 | 2,668,029 | ||||||
| 5,934,549 | ||||||||
| CONSUMER STAPLES (5.0%) | ||||||||
| Beverages (5.0%) | ||||||||
| PepsiCo, Inc. | 51,500 | 5,520,800 | ||||||
| ENERGY (4.3%) | ||||||||
| Energy Equipment & Services (2.2%) | ||||||||
| Nabors Industries, Ltd. | 189,100 | 2,250,290 | ||||||
Transocean, Ltd.(a) | 25,000 | 240,250 | ||||||
| 2,490,540 | ||||||||
| Oil, Gas & Consumable Fuels (2.1%) | ||||||||
| Valero Energy Corp. | 38,500 | 2,280,740 | ||||||
| FINANCIALS (39.0%) | ||||||||
| Capital Markets (10.8%) | ||||||||
| The Bank of New York Mellon Corp. | 127,500 | 5,516,925 | ||||||
| The Charles Schwab Corp. | 199,251 | 6,316,257 | ||||||
| 11,833,182 | ||||||||
| Commercial Banks (16.8%) | ||||||||
| CIT Group, Inc. | 65,500 | 2,379,615 | ||||||
| First Bancorp | 44,301 | 875,831 | ||||||
| Great Southern Bancorp, Inc. | 51,514 | 2,130,104 | ||||||
| International Bancshares Corp. | 99,500 | 3,069,575 | ||||||
| SunTrust Banks, Inc. | 89,300 | 4,039,039 | ||||||
| Wells Fargo & Co. | 130,200 | 5,990,502 | ||||||
| 18,484,666 | ||||||||
| Consumer Finance (4.3%) | ||||||||
| Capital One Financial Corp. | 64,400 | 4,768,176 | ||||||
| Insurance (7.1%) | ||||||||
| Assurant, Inc. | 17,500 | 1,409,100 | ||||||
| Everest Re Group, Ltd. | 14,800 | 3,012,096 | ||||||
| Annual Report | October 31, 2016 | 23 |
| Schedules of Investments | Pin Oak Equity Fund |
As of October 31, 2016
| Security Description | Shares | Value | ||||||
| Insurance (continued) | ||||||||
| The Travelers Cos., Inc. | 31,000 | $ | 3,353,580 | |||||
| 7,774,776 | ||||||||
| INDUSTRIALS (6.4%) | ||||||||
| Aerospace & Defense (0.7%) | ||||||||
| Raytheon Co. | 5,700 | 778,677 | ||||||
| Electrical Equipment (2.2%) | ||||||||
| EnerSys | 37,217 | 2,423,943 | ||||||
| Machinery (3.5%) | ||||||||
| Parker-Hannifin Corp. | 31,000 | 3,805,250 | ||||||
| INFORMATION TECHNOLOGY (30.6%) | ||||||||
| Electronic Equipment & Instruments (3.6%) | ||||||||
Flextronics International, Ltd.(a) | 277,000 | 3,930,630 | ||||||
| Internet Software & Services (10.4%) | ||||||||
Alphabet, Inc. - Class A(a) | 3,500 | 2,834,650 | ||||||
Alphabet, Inc. - Class C(a) | 3,509 | 2,752,951 | ||||||
eBay, Inc.(a) | 129,000 | 3,677,790 | ||||||
| IAC/InterActive Corp. | 34,256 | 2,207,457 | ||||||
| 11,472,848 | ||||||||
| IT Services (11.4%) | ||||||||
| Amdocs, Ltd. | 73,572 | 4,300,283 | ||||||
| Paychex, Inc. | 92,549 | 5,108,705 | ||||||
| The Western Union Co. | 154,000 | 3,090,780 | ||||||
| 12,499,768 | ||||||||
| Semiconductors & Semiconductor Equipment (5.2%) | ||||||||
| KLA-Tencor Corp. | 32,400 | 2,433,564 | ||||||
| Xilinx, Inc. | 65,500 | 3,331,985 | ||||||
| 5,765,549 | ||||||||
| MATERIALS (0.8%) | ||||||||
| Metals & Mining (0.8%) | ||||||||
| Teck Resources, Ltd. - Class B | 38,814 | 837,606 | ||||||
TOTAL COMMON STOCKS (Cost $88,025,824) | 106,213,342 | |||||||
| 24 | 1-888-462-5386 | www.oakfunds.com |
| Pin Oak Equity Fund | Schedules of Investments |
As of October 31, 2016
| Security Description | Shares | Value | ||||||
| SHORT TERM INVESTMENTS (3.4%) | ||||||||
| Tri-Party Repurchase Agreement with South Street Securities Wachovia Tri-Party, 0.15%, dated 10/31/16 and maturing 11/01/16, collateralized by U.S. Treasury Securities with rates ranging from 0.000% to 2.000% and with maturity dates ranging from 08/17/17 to 09/30/21 with a par value of $3,825,079 and a collateral value of $3,834,994. | 3,759,785 | $ | 3,759,785 | |||||
TOTAL SHORT TERM INVESTMENTS (Cost $3,759,785) | 3,759,785 | |||||||
TOTAL INVESTMENTS - (100.0%) (Cost $91,785,609) | $ | 109,973,127 | ||||||
Liabilities in Excess of Other Assets - (0.0%)(b) | (44,703 | ) | ||||||
| NET ASSETS - (100.0%) | $ | 109,928,424 | ||||||
(a) | Non-income producing security. |
(b) | Less than 0.05%. |
The accompanying notes are an integral part of the financial statements.
| Annual Report | October 31, 2016 | 25 |
| Schedules of Investments | Rock Oak Core Growth Fund |
As of October 31, 2016
| Security Description | Shares | Value | ||||||
| COMMON STOCKS (97.0%) | ||||||||
| CONSUMER DISCRETIONARY (9.6%) | ||||||||
| Hotels, Restaurants & Leisure (3.1%) | ||||||||
| Wyndham Worldwide Corp. | 3,445 | $ | 226,819 | |||||
| Media (6.5%) | ||||||||
Discovery Communications, Inc. - Class A(a) | 7,800 | 203,658 | ||||||
Liberty Media Corp. - Class A(a) | 1,725 | 48,006 | ||||||
Liberty SiriusXM Group - Class A(a) | 6,900 | 229,563 | ||||||
| 481,227 | ||||||||
| CONSUMER STAPLES (3.4%) | ||||||||
| Beverages (3.4%) | ||||||||
| Molson Coors Brewing Co. - Class B | 2,400 | 249,144 | ||||||
| FINANCIALS (15.0%) | ||||||||
| Commercial Banks (4.4%) | ||||||||
| SunTrust Banks, Inc. | 7,200 | 325,656 | ||||||
| Consumer Finance (6.5%) | ||||||||
| Capital One Financial Corp. | 3,250 | 240,630 | ||||||
| Synchrony Financial | 8,350 | 238,726 | ||||||
| 479,356 | ||||||||
| Insurance (4.1%) | ||||||||
| The Hartford Financial Services Group, Inc. | 6,950 | 306,565 | ||||||
| HEALTH CARE (4.3%) | ||||||||
| Life Sciences Tools & Services (2.6%) | ||||||||
Illumina, Inc.(a) | 1,400 | 190,596 | ||||||
| Pharmaceuticals (1.7%) | ||||||||
Jazz Pharmaceuticals PLC(a) | 1,170 | 128,080 | ||||||
| INDUSTRIALS (7.4%) | ||||||||
| Aerospace & Defense (4.0%) | ||||||||
| L-3 Communications Holdings, Inc. | 2,150 | 294,421 | ||||||
| Professional Services (3.4%) | ||||||||
| Nielsen Holdings PLC | 5,650 | 254,363 | ||||||
| INFORMATION TECHNOLOGY (57.3%) | ||||||||
| Communications Equipment (4.0%) | ||||||||
F5 Networks, Inc.(a) | 2,150 | 297,151 | ||||||
| 26 | 1-888-462-5386 | www.oakfunds.com |
| Rock Oak Core Growth Fund | Schedules of Investments |
As of October 31, 2016
| Security Description | Shares | Value | ||||||
| Computers & Peripherals (3.5%) | ||||||||
| Western Digital Corp. | 4,395 | $ | 256,844 | |||||
| Internet Software & Services (5.1%) | ||||||||
Salesforce.com, Inc.(a) | 5,000 | 375,800 | ||||||
| IT Services (13.2%) | ||||||||
Cognizant Technology Solutions Corp. - Class A(a) | 2,800 | 143,780 | ||||||
| Computer Sciences Corp. | 5,650 | 307,643 | ||||||
| CSRA, Inc. | 5,650 | 141,758 | ||||||
Vantiv, Inc. - Class A(a) | 6,550 | 382,258 | ||||||
| 975,439 | ||||||||
| Semiconductors & Semiconductor Equipment (9.0%) | ||||||||
| Broadcom, Ltd. | 130 | 22,136 | ||||||
| Linear Technology Corp. | 5,500 | 330,330 | ||||||
| Xilinx, Inc. | 6,150 | 312,851 | ||||||
| 665,317 | ||||||||
| Software (14.9%) | ||||||||
Autodesk, Inc.(a) | 4,200 | 303,576 | ||||||
| CA, Inc. | 9,950 | 305,863 | ||||||
Check Point Software Technologies, Ltd.(a) | 3,000 | 253,680 | ||||||
| Symantec Corp. | 9,700 | 242,791 | ||||||
| 1,105,910 | ||||||||
| Technology Hardware, Storage & Peripherals (7.6%) | ||||||||
| NetApp, Inc. | 8,755 | 297,145 | ||||||
| Seagate Technology PLC | 7,710 | 264,530 | ||||||
| 561,675 | ||||||||
TOTAL COMMON STOCKS (Cost $5,110,052) | 7,174,363 | |||||||
| Annual Report | October 31, 2016 | 27 |
| Schedules of Investments | Rock Oak Core Growth Fund |
As of October 31, 2016
| Security Description | Shares | Value | ||||||
| SHORT TERM INVESTMENTS (1.3%) | ||||||||
| Tri-Party Repurchase Agreement with South Street Securities Wachovia Tri-Party, 0.15%, dated 10/31/16 and maturing 11/01/16, collateralized by U.S. Treasury Securities with rates ranging from 0.000% to 2.000% and with maturity dates ranging from 08/17/17 to 09/30/21 with a par value of $95,096 and a collateral value of $95,343. | 93,473 | $ | 93,473 | |||||
TOTAL SHORT TERM INVESTMENTS (Cost $93,473) | 93,473 | |||||||
TOTAL INVESTMENTS - (98.3%) (Cost $5,203,525) | $ | 7,267,836 | ||||||
| Assets in Excess of Other Liabilities - (1.7%) | 127,402 | |||||||
| NET ASSETS - (100.0%) | $ | 7,395,238 | ||||||
(a) | Non-income producing security. |
The accompanying notes are an integral part of the financial statements.
| 28 | 1-888-462-5386 | www.oakfunds.com |
| River Oak Discovery Fund | Schedules of Investments |
As of October 31, 2016
| Security Description | Shares | Value | ||||||
| COMMON STOCKS (96.9%) | ||||||||
| CONSUMER DISCRETIONARY (2.4%) | ||||||||
| Specialty Retail (2.4%) | ||||||||
| Abercrombie & Fitch Co. - Class A | 20,450 | $ | 298,774 | |||||
| ENERGY (2.0%) | ||||||||
| Energy Equipment & Services (2.0%) | ||||||||
| Atwood Oceanics, Inc. | 31,550 | 240,727 | ||||||
| FINANCIALS (22.6%) | ||||||||
| Capital Markets (6.2%) | ||||||||
| Calamos Asset Management, Inc. - Class A | 15,700 | 101,422 | ||||||
Cowen Group, Inc. - Class A(a) | 86,900 | 282,425 | ||||||
| Janus Capital Group, Inc. | 29,400 | 376,908 | ||||||
| 760,755 | ||||||||
| Commercial Banks (10.5%) | ||||||||
| PrivateBancorp, Inc. | 12,300 | 556,452 | ||||||
| Union Bankshares Corp. | 14,050 | 392,416 | ||||||
| Zions Bancorporation | 10,800 | 347,868 | ||||||
| 1,296,736 | ||||||||
| Insurance (5.9%) | ||||||||
| Assurant, Inc. | 6,350 | 511,302 | ||||||
| CNO Financial Group, Inc. | 14,000 | 211,120 | ||||||
| 722,422 | ||||||||
| HEALTH CARE (11.9%) | ||||||||
| Biotechnology (3.5%) | ||||||||
United Therapeutics Corp.(a) | 3,650 | 438,255 | ||||||
| Health Care Providers & Services (5.3%) | ||||||||
Amsurg Corp.(a) | 5,450 | 325,637 | ||||||
Magellan Health, Inc.(a) | 6,350 | 326,708 | ||||||
| 652,345 | ||||||||
| Heath Care Technology (3.1%) | ||||||||
| Quality Systems, Inc. | 29,500 | 380,255 | ||||||
| INDUSTRIALS (9.9%) | ||||||||
| Aerospace & Defense (3.4%) | ||||||||
TASER International, Inc.(a) | 18,895 | 422,870 | ||||||
| Construction & Engineering (3.5%) | ||||||||
| Argan, Inc. | 7,650 | 434,902 | ||||||
| Annual Report | October 31, 2016 | 29 |
| Schedules of Investments | River Oak Discovery Fund |
As of October 31, 2016
| Security Description | Shares | Value | ||||||
| Machinery (3.0%) | ||||||||
| Kadant, Inc. | 7,010 | $ | 362,067 | |||||
| INFORMATION TECHNOLOGY (45.4%) | ||||||||
| Electronic Equipment & Instruments (9.7%) | ||||||||
| Dolby Laboratories, Inc. - Class A | 7,200 | 342,648 | ||||||
Fabrinet(a) | 14,320 | 543,587 | ||||||
| Hollysys Automation Technologies, Ltd. | 15,500 | 308,605 | ||||||
| 1,194,840 | ||||||||
| Electronic Equipment, Instruments (2.7%) | ||||||||
II-VI, Inc.(a) | 12,205 | 339,299 | ||||||
| Internet Software & Services (3.4%) | ||||||||
| MercadoLibre, Inc. | 2,500 | 420,025 | ||||||
| Semiconductors & Semiconductor Equipment (18.5%) | ||||||||
Advanced Energy Industries, Inc.(a) | 14,450 | 689,265 | ||||||
Ambarella, Inc.(a) | 5,430 | 333,239 | ||||||
Cirrus Logic, Inc.(a) | 15,900 | 858,282 | ||||||
Kulicke & Soffa Industries, Inc.(a) | 29,700 | 393,228 | ||||||
| 2,274,014 | ||||||||
| Software (11.1%) | ||||||||
FireEye, Inc.(a) | 23,005 | 267,318 | ||||||
Fortinet, Inc.(a) | 14,950 | 479,297 | ||||||
VASCO Data Security International, Inc.(a) | 21,035 | 289,232 | ||||||
Verint Systems, Inc.(a) | 9,170 | 330,120 | ||||||
| 1,365,967 | ||||||||
| MATERIALS (2.7%) | ||||||||
| Forest Products & Paper (2.7%) | ||||||||
| Mercer International, Inc. | 42,840 | 338,436 | ||||||
TOTAL COMMON STOCKS (Cost $8,979,720) | 11,942,689 | |||||||
| 30 | 1-888-462-5386 | www.oakfunds.com |
| River Oak Discovery Fund | Schedules of Investments |
As of October 31, 2016
| Security Description | Shares | Value | ||||||
| SHORT TERM INVESTMENTS (3.2%) | ||||||||
| Tri-Party Repurchase Agreement with South Street Securities Wachovia Tri-Party, 0.15%, dated 10/31/16 and maturing 11/01/16, collateralized by U.S. Treasury Securities with rates ranging from 0.000% to 2.000% and with maturity dates ranging from 08/17/17 to 09/30/21 with a par value of $402,678 and a collateral value of $403,722. | 395,805 | $ | 395,805 | |||||
TOTAL SHORT TERM INVESTMENTS (Cost $395,805) | 395,805 | |||||||
TOTAL INVESTMENTS - (100.1%) (Cost $9,375,525) | $ | 12,338,494 | ||||||
| Liabilities in Excess of Other Assets - (-0.1%) | (16,731 | ) | ||||||
| NET ASSETS - (100.0%) | $ | 12,321,763 | ||||||
(a) | Non-income producing security. |
The accompanying notes are an integral part of the financial statements.
| Annual Report | October 31, 2016 | 31 |
| Schedules of Investments | Red Oak Technology Select Fund |
As of October 31, 2016
| Security Description | Shares | Value | ||||||
| COMMON STOCKS (96.1%) | ||||||||
| CONSUMER DISCRETIONARY (2.5%) | ||||||||
| Internet & Catalog Retail (2.5%) | ||||||||
Amazon.com, Inc.(a) | 6,050 | $ | 4,778,411 | |||||
| INDUSTRIALS (4.6%) | ||||||||
| Aerospace & Defense (4.6%) | ||||||||
| Huntington Ingalls Industries, Inc. | 39,366 | 6,352,098 | ||||||
| Northrop Grumman Corp. | 9,850 | 2,255,650 | ||||||
| 8,607,748 | ||||||||
| INFORMATION TECHNOLOGY (89.0%) | ||||||||
| Communications Equipment (9.2%) | ||||||||
| Cisco Systems, Inc. | 263,000 | 8,068,840 | ||||||
| Juniper Networks, Inc. | 136,000 | 3,582,240 | ||||||
| Qualcomm, Inc. | 85,000 | 5,841,200 | ||||||
| 17,492,280 | ||||||||
| Computers & Peripherals (6.1%) | ||||||||
| Apple, Inc. | 50,120 | 5,690,625 | ||||||
| HP, Inc. | 219,500 | 3,180,555 | ||||||
| Western Digital Corp. | 45,000 | 2,629,800 | ||||||
| 11,500,980 | ||||||||
| Electronic Equipment & Instruments (8.6%) | ||||||||
Arrow Electronics, Inc.(a) | 59,275 | 3,622,888 | ||||||
| Corning, Inc. | 176,000 | 3,996,960 | ||||||
Flextronics International, Ltd.(a) | 75,000 | 1,064,250 | ||||||
| Ingram Micro, Inc. - Class A | 156,600 | 5,825,520 | ||||||
Keysight Technologies, Inc.(a) | 54,000 | 1,771,200 | ||||||
| 16,280,818 | ||||||||
| Internet Software & Services (12.4%) | ||||||||
Alphabet, Inc. - Class A(a) | 5,100 | 4,130,490 | ||||||
Alphabet, Inc. - Class C(a) | 11,066 | 8,681,719 | ||||||
eBay, Inc.(a) | 123,000 | 3,506,730 | ||||||
Facebook, Inc. - Class A(a) | 26,025 | 3,409,015 | ||||||
| IAC/InterActive Corp. | 58,100 | 3,743,964 | ||||||
| 23,471,918 | ||||||||
| IT Services (11.8%) | ||||||||
| Accenture PLC - Class A | 37,200 | 4,324,128 | ||||||
Alliance Data Systems Corp.(a) | 22,900 | 4,682,363 | ||||||
| Computer Sciences Corp. | 52,700 | 2,869,515 | ||||||
| CSG Systems International, Inc. | 32,619 | 1,240,501 | ||||||
| CSRA, Inc. | 59,000 | 1,480,310 | ||||||
| International Business Machines Corp. | 34,700 | 5,333,043 | ||||||
| Total System Services, Inc. | 47,500 | 2,369,300 | ||||||
| 22,299,160 | ||||||||
| 32 | 1-888-462-5386 | www.oakfunds.com |
| Red Oak Technology Select Fund | Schedules of Investments |
As of October 31, 2016
| Security Description | Shares | Value | ||||||
| Semiconductors & Semiconductor Equipment (16.2%) | ||||||||
| Intel Corp. | 195,300 | $ | 6,810,111 | |||||
| KLA-Tencor Corp. | 73,600 | 5,528,096 | ||||||
| Marvell Technology Group, Ltd. | 228,400 | 2,976,052 | ||||||
| NVIDIA Corp. | 134,000 | 9,535,440 | ||||||
| Xilinx, Inc. | 113,900 | 5,794,093 | ||||||
| 30,643,792 | ||||||||
| Software (21.0%) | ||||||||
| CA, Inc. | 117,000 | 3,596,580 | ||||||
Check Point Software Technologies, Ltd.(a) | 62,200 | 5,259,632 | ||||||
Dell Technologies, Inc. - Class V(a) | 7,657 | 375,897 | ||||||
| Microsoft Corp. | 109,700 | 6,573,224 | ||||||
| Oracle Corp. | 171,100 | 6,573,662 | ||||||
Red Hat, Inc.(a) | 41,600 | 3,221,920 | ||||||
| Symantec Corp. | 130,000 | 3,253,900 | ||||||
Synopsys, Inc.(a) | 108,100 | 6,411,411 | ||||||
VMware, Inc. - Class A(a) | 55,300 | 4,346,580 | ||||||
| 39,612,806 | ||||||||
| Technology Hardware, Storage & Peripherals (3.7%) | ||||||||
| Hewlett Packard Enterprise Co. | 155,500 | 3,494,085 | ||||||
| NetApp, Inc. | 104,500 | 3,546,730 | ||||||
| 7,040,815 | ||||||||
TOTAL COMMON STOCKS (Cost $129,102,383) | 181,728,728 | |||||||
| SHORT TERM INVESTMENTS (3.9%) | ||||||||
| Tri-Party Repurchase Agreement with South Street Securities Wachovia Tri-Party, 0.15%, dated 10/31/16 and maturing 11/01/16, collateralized by U.S. Treasury Securities with rates ranging from 0.000% to 2.000% and with maturity dates ranging from 08/17/17 to 09/30/21 with a par value of $7,481,718 and collateral value of $7,501,112. | 7,354,006 | $ | 7,354,006 | |||||
TOTAL SHORT TERM INVESTMENTS (Cost $7,354,006) | 7,354,006 | |||||||
TOTAL INVESTMENTS - (100.0%) (Cost $136,456,389) | $ | 189,082,734 | ||||||
Liabilities in Excess of Other Assets - (0.0%)(b) | (19,219 | ) | ||||||
| NET ASSETS - (100.0%) | $ | 189,063,515 | ||||||
(a) | Non-income producing security. |
(b) | Less than 0.05%. |
The accompanying notes are an integral part of the financial statements.
| Annual Report | October 31, 2016 | 33 |
| Schedules of Investments | Black Oak Emerging Technology Fund |
As of October 31, 2016
| Security Description | Shares | Value | ||||||
| COMMON STOCKS (92.6%) | ||||||||
| HEALTH CARE (2.4%) | ||||||||
| Life Sciences Tools & Services (2.4%) | ||||||||
Illumina, Inc.(a) | 5,800 | $ | 789,612 | |||||
| INFORMATION TECHNOLOGY (90.2%) | ||||||||
| Communications Equipment (10.0%) | ||||||||
F5 Networks, Inc.(a) | 7,150 | 988,201 | ||||||
Palo Alto Networks, Inc.(a) | 5,900 | 907,597 | ||||||
| Qualcomm, Inc. | 20,215 | 1,389,175 | ||||||
| 3,284,973 | ||||||||
| Computers & Peripherals (6.3%) | ||||||||
| Apple, Inc. | 18,200 | 2,066,428 | ||||||
| Electronic Equipment & Instruments (4.9%) | ||||||||
Arrow Electronics, Inc.(a) | 15,745 | 962,334 | ||||||
| SYNNEX Corp. | 6,275 | 643,439 | ||||||
| 1,605,773 | ||||||||
| Internet Software & Services (8.7%) | ||||||||
Blucora, Inc.(a) | 31,535 | 419,415 | ||||||
| MercadoLibre, Inc. | 5,200 | 873,652 | ||||||
Salesforce.com, Inc.(a) | 21,085 | 1,584,749 | ||||||
| 2,877,816 | ||||||||
| IT Services (14.3%) | ||||||||
Alliance Data Systems Corp.(a) | 4,550 | 930,338 | ||||||
Cognizant Technology Solutions Corp. - Class A(a) | 9,600 | 492,960 | ||||||
| Computer Sciences Corp. | 19,950 | 1,086,278 | ||||||
| CSG Systems International, Inc. | 15,680 | 596,310 | ||||||
| CSRA, Inc. | 19,950 | 500,546 | ||||||
Perficient, Inc.(a) | 19,165 | 356,661 | ||||||
| Science Applications International Corp. | 10,665 | 734,925 | ||||||
| 4,698,018 | ||||||||
| Semiconductors & Semiconductor Equipment (21.7%) | ||||||||
Ambarella, Inc.(a) | 15,275 | 937,427 | ||||||
Cirrus Logic, Inc.(a) | 38,200 | 2,062,036 | ||||||
| IXYS Corp. | 57,745 | 612,097 | ||||||
| Lam Research Corp. | 12,950 | 1,254,337 | ||||||
| Silicon Motion Technology Corp. - ADR | 33,000 | 1,340,130 | ||||||
| Tessera Technologies, Inc. | 25,650 | 951,615 | ||||||
| 7,157,642 | ||||||||
| Software (22.2%) | ||||||||
Barracuda Networks, Inc.(a) | 33,345 | 777,605 | ||||||
| CA, Inc. | 45,100 | 1,386,374 | ||||||
Citrix Systems, Inc.(a) | 9,800 | 831,040 | ||||||
Dell Technologies, Inc. - Class V(a) | 4,804 | 235,825 | ||||||
| 34 | 1-888-462-5386 | www.oakfunds.com |
| Black Oak Emerging Technology Fund | Schedules of Investments |
As of October 31, 2016
| Security Description | Shares | Value | ||||||
| Software (continued) | ||||||||
Fortinet, Inc.(a) | 34,760 | $ | 1,114,406 | |||||
Infoblox, Inc.(a) | 39,750 | 1,053,375 | ||||||
Qualys, Inc.(a) | 23,700 | 882,825 | ||||||
VASCO Data Security International, Inc.(a) | 74,275 | 1,021,281 | ||||||
| 7,302,731 | ||||||||
| Technology Hardware, Storage & Peripherals (2.1%) | ||||||||
| Seagate Technology PLC | 20,045 | 687,744 | ||||||
TOTAL COMMON STOCKS (Cost $20,709,507) | 30,470,737 | |||||||
| SHORT TERM INVESTMENTS (7.6%) | ||||||||
| Tri-Party Repurchase Agreement with South Street Securities Wachovia Tri-Party, 0.15%, dated 10/31/16 and maturing 11/01/16, collateralized by U.S. Treasury Securities with rates ranging from 0.000% to 2.000% and with maturity dates ranging from 08/17/17 to 09/30/21 with a par value of $2,530,443 and a collateral value of $2,537,003. | 2,487,249 | $ | 2,487,249 | |||||
TOTAL SHORT TERM INVESTMENTS (Cost $2,487,249) | 2,487,249 | |||||||
TOTAL INVESTMENTS - (100.2%) (Cost $23,196,756) | $ | 32,957,986 | ||||||
| Liabilities in Excess of Other Assets - (-0.2%) | (63,690 | ) | ||||||
| NET ASSETS - (100.0%) | $ | 32,894,296 | ||||||
(a) | Non-income producing security. |
The accompanying notes are an integral part of the financial statements.
| Annual Report | October 31, 2016 | 35 |
| Schedules of Investments | Live Oak Health Sciences Fund |
As of October 31, 2016
| Security Description | Shares | Value | ||||||
| COMMON STOCKS (98.9%) | ||||||||
| HEALTH CARE (97.5%) | ||||||||
| Biotechnology (9.6%) | ||||||||
| Amgen, Inc. | 26,200 | $ | 3,698,392 | |||||
Biogen, Inc.(a) | 5,900 | 1,653,062 | ||||||
| 5,351,454 | ||||||||
| Health Care Equipment & Supplies (17.7%) | ||||||||
| Becton Dickinson and Co. | 14,100 | 2,367,531 | ||||||
| CR Bard, Inc. | 10,350 | 2,242,638 | ||||||
Halyard Health, Inc.(a) | 8,000 | 258,800 | ||||||
| Medtronic PLC | 16,996 | 1,394,012 | ||||||
| St Jude Medical, Inc. | 22,500 | 1,751,400 | ||||||
| Stryker Corp. | 16,700 | 1,926,345 | ||||||
| 9,940,726 | ||||||||
| Health Care Providers & Services (38.8%) | ||||||||
| Aetna, Inc. | 14,700 | 1,578,045 | ||||||
| Anthem, Inc. | 17,300 | 2,108,178 | ||||||
| Cardinal Health, Inc. | 37,100 | 2,548,399 | ||||||
| Cigna Corp. | 10,700 | 1,271,481 | ||||||
DaVita HealthCare Partners, Inc.(a) | 34,200 | 2,004,804 | ||||||
Express Scripts Holding Co.(a) | 30,300 | 2,042,220 | ||||||
| McKesson Corp. | 19,150 | 2,435,305 | ||||||
| Owens & Minor, Inc. | 68,680 | 2,228,666 | ||||||
| Quest Diagnostics, Inc. | 23,300 | 1,897,552 | ||||||
| UnitedHealth Group, Inc. | 12,700 | 1,794,891 | ||||||
VCA, Inc.(a) | 29,700 | 1,825,362 | ||||||
| 21,734,903 | ||||||||
| Life Sciences Tools & Services (7.2%) | ||||||||
Charles River Laboratories International, Inc.(a) | 22,800 | 1,730,064 | ||||||
Waters Corp.(a) | 16,700 | 2,323,638 | ||||||
| 4,053,702 | ||||||||
| Pharmaceuticals (24.2%) | ||||||||
| AstraZeneca PLC - Sponsored ADR | 27,000 | 764,640 | ||||||
| Eli Lilly & Co. | 16,500 | 1,218,360 | ||||||
Endo International PLC(a) | 70,000 | 1,312,500 | ||||||
| GlaxoSmithKline PLC - Sponsored ADR | 47,900 | 1,916,479 | ||||||
| Johnson & Johnson | 14,700 | 1,705,053 | ||||||
| Merck & Co., Inc. | 40,100 | 2,354,672 | ||||||
Mylan NV(a) | 17,500 | 638,750 | ||||||
| Sanofi - ADR | 46,992 | 1,827,519 | ||||||
| Teva Pharmaceutical Industries, Ltd. - Sponsored ADR | 42,500 | 1,816,450 | ||||||
| 13,554,423 | ||||||||
| 36 | 1-888-462-5386 | www.oakfunds.com |
| Live Oak Health Sciences Fund | Schedules of Investments |
As of October 31, 2016
| Security Description | Shares | Value | ||||||
| INFORMATION TECHNOLOGY (1.4%) | ||||||||
| Electronic Equipment & Instruments (1.4%) | ||||||||
Keysight Technologies, Inc.(a) | 24,500 | $ | 803,600 | |||||
TOTAL COMMON STOCKS (Cost $41,955,898) | 55,438,808 | |||||||
| SHORT TERM INVESTMENTS (1.0%) | ||||||||
| Tri-Party Repurchase Agreement with South Street Securities Wachovia Tri-Party, 0.15%, dated 10/31/16 and maturing 11/01/16, collateralized by U.S. Treasury Securities with rates ranging from 0.000% to 2.000% and with maturity dates ranging from 08/17/17 to 09/30/21 with a par value of $552,210 and with a collateral value of $553,642. | 542,784 | $ | 542,784 | |||||
TOTAL SHORT TERM INVESTMENTS (Cost $542,784) | 542,784 | |||||||
TOTAL INVESTMENTS - (99.9%) (Cost $42,498,682) | $ | 55,981,592 | ||||||
| Assets in Excess of Other Liabilities - (0.1%) | 77,760 | |||||||
| NET ASSETS - (100.0%) | $ | 56,059,352 | ||||||
(a) | Non-income producing security. |
The accompanying notes are an integral part of the financial statements.
| Annual Report | October 31, 2016 | 37 |
Statements of Assets and Liabilities
As of October 31, 2016
| White Oak Select Growth Fund | Pin Oak Equity Fund | |||||||
| Investments at cost | $ | 226,418,121 | $ | 91,785,609 | ||||
| ASSETS: | ||||||||
| Investments at fair value | $ | 251,497,353 | $ | 109,973,127 | ||||
| Receivable for fund shares sold | 7,966 | 54,053 | ||||||
| Receivable for investment securities sold | – | – | ||||||
| Dividends and interest receivable | 7 | 70,988 | ||||||
| Prepaid expenses | 28,802 | 14,108 | ||||||
| Total Assets | 251,534,128 | 110,112,276 | ||||||
| LIABILITIES: | ||||||||
| Payable for fund shares redeemed | 2,812,140 | 52,596 | ||||||
| Investment advisory fees payable | 159,386 | 68,681 | ||||||
| Administration fees payable | 15,740 | 7,415 | ||||||
| Trustees' fees payable | 21,694 | 9,123 | ||||||
| Payable for investment securities purchased | – | – | ||||||
| Principal financial officer fees payable | 668 | 276 | ||||||
| Printing fees payable | 10,879 | 4,622 | ||||||
| Transfer agent fees payable | 47,621 | 19,150 | ||||||
| Legal and audit fees payable | 24,261 | 17,942 | ||||||
| Other accrued expenses | 8,628 | 4,047 | ||||||
| Total Liabilities | 3,101,017 | 183,852 | ||||||
| Total Net Assets | $ | 248,433,111 | $ | 109,928,424 | ||||
| NET ASSETS: | ||||||||
| Paid-in capital (unlimited authorization - no par value) | $ | 229,351,700 | $ | 89,185,191 | ||||
| Accumulated undistributed net investment income (loss) | 2,283,775 | 660,979 | ||||||
| Accumulated net realized gain (loss) on investments | (8,281,596 | ) | 1,894,736 | |||||
| Net unrealized appreciation on investments | 25,079,232 | 18,187,518 | ||||||
| Total Net Assets | $ | 248,433,111 | $ | 109,928,424 | ||||
| PORTFOLIO SHARES: | ||||||||
| Net Assets | $ | 248,433,111 | $ | 109,928,424 | ||||
| Total shares outstanding at end of period | 3,683,740 | 2,060,440 | ||||||
| Net assets value, offering and redemption price per share (net assets ÷ shares outstanding) | $ | 67.44 | $ | 53.35 | ||||
The accompanying notes are an integral part of the financial statements.
| 38 | 1-888-462-5386 | www.oakfunds.com |
| Rock Oak Core Growth Fund | River Oak Discovery Fund | Red Oak Technology Select Fund | Black Oak Emerging Technology Fund | Live Oak Health Sciences Fund | |||||||||||||||
| $ | 5,203,525 | $ | 9,375,525 | $ | 136,456,389 | $ | 23,196,756 | $ | 42,498,682 | ||||||||||
| $ | 7,267,836 | $ | 12,338,494 | $ | 189,082,734 | $ | 32,957,986 | $ | 55,981,592 | ||||||||||
| 200 | 150 | 1,080,177 | 200 | 183,058 | |||||||||||||||
| 178,248 | – | – | – | 641,592 | |||||||||||||||
| – | 4,434 | 51,362 | 10 | 2,732 | |||||||||||||||
| 2,071 | 6,952 | 18,037 | 4,898 | 12,759 | |||||||||||||||
| 7,448,355 | 12,350,030 | 190,232,310 | 32,963,094 | 56,821,733 | |||||||||||||||
| 32,181 | – | 249,538 | 12,334 | 62,514 | |||||||||||||||
| 2,304 | 8,135 | 113,372 | 21,204 | 37,153 | |||||||||||||||
| 1,217 | 1,676 | 11,448 | 2,879 | 4,402 | |||||||||||||||
| 625 | 1,084 | 14,682 | 2,849 | 5,102 | |||||||||||||||
| – | – | 708,909 | – | 624,254 | |||||||||||||||
| 19 | 33 | 424 | 87 | 159 | |||||||||||||||
| 217 | 355 | 7,429 | 1,343 | 2,155 | |||||||||||||||
| 1,992 | 2,047 | 37,043 | 11,594 | 7,878 | |||||||||||||||
| 13,812 | 14,040 | 20,516 | 14,911 | 15,997 | |||||||||||||||
| 750 | 897 | 5,434 | 1,597 | 2,767 | |||||||||||||||
| 53,117 | 28,267 | 1,168,795 | 68,798 | 762,381 | |||||||||||||||
| $ | 7,395,238 | $ | 12,321,763 | $ | 189,063,515 | $ | 32,894,296 | $ | 56,059,352 | ||||||||||
| $ | 5,373,854 | $ | 9,458,140 | $ | 133,047,700 | $ | 21,826,998 | $ | 42,201,766 | ||||||||||
| 43,898 | (50,960 | ) | 864,301 | – | 227,008 | ||||||||||||||
| (86,825 | ) | (48,386 | ) | 2,525,169 | 1,306,068 | 147,668 | |||||||||||||
| 2,064,311 | 2,962,969 | 52,626,345 | 9,761,230 | 13,482,910 | |||||||||||||||
| $ | 7,395,238 | $ | 12,321,763 | $ | 189,063,515 | $ | 32,894,296 | $ | 56,059,352 | ||||||||||
| $ | 7,395,238 | $ | 12,321,763 | $ | 189,063,515 | $ | 32,894,296 | $ | 56,059,352 | ||||||||||
| 580,557 | 867,395 | 9,810,969 | 7,253,805 | 3,126,515 | |||||||||||||||
| $ | 12.74 | $ | 14.21 | $ | 19.27 | $ | 4.53 | $ | 17.93 | ||||||||||
| Annual Report | October 31, 2016 | 39 |
Statements of Operations
For the Year Ended October 31, 2016
| White Oak Select Growth Fund | Pin Oak Equity Fund | |||||||
| INVESTMENT INCOME: | ||||||||
| Dividends | $ | 5,267,123 | $ | 1,984,540 | ||||
| Interest | 2,787 | 3,438 | ||||||
| Less: Foreign withholding tax | (39,219 | ) | (16,600 | ) | ||||
| Total Investment Income | 5,230,691 | 1,971,378 | ||||||
| EXPENSES: | ||||||||
| Investment advisory fees | 1,855,566 | 750,661 | ||||||
| Administration fees | 186,034 | 76,985 | ||||||
| Trustees' fees | 97,151 | 39,424 | ||||||
| Legal and audit fees | 76,749 | 38,870 | ||||||
| Transfer agent fees | 155,487 | 65,489 | ||||||
| Sub transfer agent fees | 140,965 | 53,905 | ||||||
| Registration fees | 21,033 | 22,140 | ||||||
| Printing fees | 36,794 | 15,944 | ||||||
| Custodian fees | 12,206 | 6,494 | ||||||
| Principal financial officer fees | 4,190 | 1,693 | ||||||
| Insurance and other fees | 60,761 | 22,869 | ||||||
| Total Expenses | 2,646,936 | 1,094,474 | ||||||
| Less: Investment advisory fees waived | – | – | ||||||
| Net Expenses | 2,646,936 | 1,094,474 | ||||||
| Net Investment Income (Loss) | 2,583,755 | 876,904 | ||||||
| Net realized gain (loss) on securities sold | 16,035,475 | 1,894,762 | ||||||
| Net change in unrealized appreciation (depreciation) of investment securities | (9,431,729 | ) | 2,891,068 | |||||
| Net Realized and Unrealized Gain (Loss) on Investments | 6,603,746 | 4,785,830 | ||||||
| Net Increase (Decrease) in Net Assets Resulting From Operations | $ | 9,187,501 | $ | 5,662,734 | ||||
The accompanying notes are an integral part of the financial statements.
| 40 | 1-888-462-5386 | www.oakfunds.com |
| Rock Oak Core Growth Fund | River Oak Discovery Fund | Red Oak Technology Select Fund | Black Oak Emerging Technology Fund | Live Oak Health Sciences Fund | |||||||||||||||
| $ | 197,783 | $ | 115,987 | $ | 3,226,423 | $ | 467,030 | $ | 979,070 | ||||||||||
| 578 | 1,223 | 4,202 | 2,436 | 1,536 | |||||||||||||||
| – | – | – | (1,020 | ) | (37,983 | ) | |||||||||||||
| 198,361 | 117,210 | 3,230,625 | 468,446 | 942,623 | |||||||||||||||
| 53,739 | 111,296 | 1,055,634 | 229,901 | 409,336 | |||||||||||||||
| 7,474 | 11,523 | 106,921 | 25,148 | 42,919 | |||||||||||||||
| 2,818 | 4,775 | 54,967 | 11,936 | 21,176 | |||||||||||||||
| 15,320 | 16,581 | 48,292 | 21,186 | 27,113 | |||||||||||||||
| 14,890 | 14,966 | 98,279 | 60,938 | 31,338 | |||||||||||||||
| 641 | 736 | 111,431 | 13,853 | 15,802 | |||||||||||||||
| 18,302 | 18,687 | 19,483 | 18,277 | 20,976 | |||||||||||||||
| 1,632 | 2,077 | 23,118 | 5,288 | 7,665 | |||||||||||||||
| 1,589 | 1,658 | 7,845 | 2,862 | 4,857 | |||||||||||||||
| 121 | 205 | 2,355 | 517 | 920 | |||||||||||||||
| 3,236 | 4,518 | 32,648 | 9,090 | 34,371 | |||||||||||||||
| 119,762 | 187,022 | 1,560,973 | 398,996 | 616,473 | |||||||||||||||
| (28,988 | ) | (20,076 | ) | – | – | – | |||||||||||||
| 90,774 | 166,946 | 1,560,973 | 398,996 | 616,473 | |||||||||||||||
| 107,587 | (49,736 | ) | 1,669,652 | 69,450 | 326,150 | ||||||||||||||
| (85,930 | ) | (40,444 | ) | 2,647,186 | 1,433,063 | 2,267,649 | |||||||||||||
| 237,246 | 485,427 | 19,253,931 | 1,358,179 | (3,960,509 | ) | ||||||||||||||
| 151,316 | 444,983 | 21,901,117 | 2,791,242 | (1,692,860 | ) | ||||||||||||||
| $ | 258,903 | $ | 395,247 | $ | 23,570,769 | $ | 2,860,692 | $ | (1,366,710 | ) | |||||||||
| Annual Report | October 31, 2016 | 41 |
Statements of Changes in Net Assets
| White Oak Select Growth Fund | Pin Oak Equity Fund | |||||||||||||||
| For The Year Ended October 31 2016 | For The Year Ended October 31 2015 | For The Year Ended October 31 2016 | For The Year Ended October 31 2015 | |||||||||||||
| INVESTMENT ACTIVITIES: | ||||||||||||||||
| Net investment income (loss) | $ | 2,583,755 | $ | 3,854,520 | $ | 876,904 | $ | 1,002,982 | ||||||||
| Net realized gain (loss) on securities sold | 16,035,475 | 6,226,107 | 1,894,762 | 2,916,283 | ||||||||||||
| Net change in unrealized appreciation (depreciation) of investment securities | (9,431,729 | ) | 13,777,664 | 2,891,068 | 2,140,163 | |||||||||||
| Net Increase (Decrease) in Net Assets Resulting from Operations | 9,187,501 | 23,858,291 | 5,662,734 | 6,059,428 | ||||||||||||
| DISTRIBUTIONS TO SHAREHOLDERS: | ||||||||||||||||
| Net income | (1,677,212 | ) | (4,050,002 | ) | (762,856 | ) | (1,020,000 | ) | ||||||||
| Realized capital gains | – | – | (2,912,364 | ) | (170,590 | ) | ||||||||||
| Total Distributions | (1,677,212 | ) | (4,050,002 | ) | (3,675,220 | ) | (1,190,590 | ) | ||||||||
| CAPITAL SHARE TRANSACTIONS (IN DOLLARS): | ||||||||||||||||
| Shares issued | 20,547,788 | 8,533,677 | 27,038,414 | 18,248,411 | ||||||||||||
| Shares issued in lieu of cash distributions | 1,580,149 | 3,800,921 | 3,326,291 | 1,097,355 | ||||||||||||
| Shares redeemed | (38,857,403 | ) | (30,711,155 | ) | (21,399,655 | ) | (19,555,154 | ) | ||||||||
| Net Increase (Decrease) in Net Assets from Capital Share Transactions | (16,729,466 | ) | (18,376,557 | ) | 8,965,050 | (209,388 | ) | |||||||||
| Total Increase (Decrease) in Net Assets | (9,219,177 | ) | 1,431,732 | 10,952,564 | 4,659,450 | |||||||||||
| NET ASSETS: | ||||||||||||||||
| Beginning of period | 257,652,288 | 256,220,556 | 98,975,860 | 94,316,410 | ||||||||||||
| End of period | $ | 248,433,111 | $ | 257,652,288 | $ | 109,928,424 | $ | 98,975,860 | ||||||||
| Including accumulated undistributed net investment income (loss) | $ | 2,283,775 | $ | 1,377,232 | $ | 660,979 | $ | 546,931 | ||||||||
| SHARES ISSUED AND REDEEMED: | ||||||||||||||||
| Issued | 318,157 | 138,165 | 545,240 | 361,192 | ||||||||||||
| Issued in lieu of cash distributions | 23,902 | 64,499 | 65,465 | 22,809 | ||||||||||||
| Redeemed | (609,288 | ) | (497,768 | ) | (437,227 | ) | (392,476 | ) | ||||||||
| Net Increase (Decrease) in Share Transactions | (267,229 | ) | (295,104 | ) | 173,478 | (8,475 | ) | |||||||||
The accompanying notes are an integral part of the financial statements.
| 42 | 1-888-462-5386 | www.oakfunds.com |
| Rock Oak Core Growth Fund | River Oak Discovery Fund | Red Oak Technology Select Fund | |||||||||||||||||||||
| For The Year Ended October 31 2016 | For The Year Ended October 31 2015 | For The Year Ended October 31 2016 | For The Year Ended October 31 2015 | For The Year Ended October 31 2016 | For The Year Ended October 31 2015 | ||||||||||||||||||
| $ | 107,587 | $ | 2,697 | $ | (49,736 | ) | $ | (38,680 | ) | $ | 1,669,652 | $ | 1,673,092 | ||||||||||
| (85,930 | ) | 175,225 | (40,444 | ) | (7,942 | ) | 2,647,186 | 7,072,248 | |||||||||||||||
| 237,246 | (509,020 | ) | 485,427 | (70,683 | ) | 19,253,931 | 435,418 | ||||||||||||||||
| 258,903 | (331,098 | ) | 395,247 | (117,305 | ) | 23,570,769 | 9,180,758 | ||||||||||||||||
| (60,295 | ) | (26,752 | ) | (14,119 | ) | – | (1,455,611 | ) | (1,415,013 | ) | |||||||||||||
| (175,227 | ) | (588,577 | ) | – | (2,955,988 | ) | (4,075,253 | ) | – | ||||||||||||||
| (235,522 | ) | (615,329 | ) | (14,119 | ) | (2,955,988 | ) | (5,530,864 | ) | (1,415,013 | ) | ||||||||||||
| 307,326 | 136,959 | 158,944 | 349,028 | 74,929,886 | 18,931,396 | ||||||||||||||||||
| 186,202 | 595,902 | 7,988 | 2,897,201 | 5,008,817 | 1,320,574 | ||||||||||||||||||
| (929,007 | ) | (470,470 | ) | (808,194 | ) | (1,506,462 | ) | (39,916,417 | ) | (39,289,543 | ) | ||||||||||||
| (435,479 | ) | 262,391 | (641,262 | ) | 1,739,767 | 40,022,286 | (19,037,573 | ) | |||||||||||||||
| (412,098 | ) | (684,036 | ) | (260,134 | ) | (1,333,526 | ) | 58,062,191 | (11,271,828 | ) | |||||||||||||
| 7,807,336 | 8,491,372 | 12,581,897 | 13,915,423 | 131,001,324 | 142,273,152 | ||||||||||||||||||
| $ | 7,395,238 | $ | 7,807,336 | $ | 12,321,763 | $ | 12,581,897 | $ | 189,063,515 | $ | 131,001,324 | ||||||||||||
| $ | 43,898 | $ | (4,286 | ) | $ | (50,960 | ) | $ | (38,684 | ) | $ | 864,301 | $ | 650,260 | |||||||||
| 24,269 | 10,383 | 11,174 | 23,634 | 4,138,045 | 1,131,253 | ||||||||||||||||||
| 15,300 | 45,454 | 573 | 207,536 | 302,282 | 81,017 | ||||||||||||||||||
| (76,822 | ) | (35,392 | ) | (58,450 | ) | (102,417 | ) | (2,257,110 | ) | (2,356,716 | ) | ||||||||||||
| (37,253 | ) | 20,445 | (46,703 | ) | 128,753 | 2,183,217 | (1,144,446 | ) | |||||||||||||||
| Annual Report | October 31, 2016 | 43 |
Statements of Changes in Net Assets
| Black Oak Emerging Technology Fund | Live Oak Health Sciences Fund | |||||||||||||||
| For The Year Ended October 31 2016 | For The Year Ended October 31 2015 | For The Year Ended October 31 2016 | For The Year Ended October 31 2015 | |||||||||||||
| INVESTMENT ACTIVITIES: | ||||||||||||||||
| Net investment income (loss) | $ | 69,450 | $ | (211,377 | ) | $ | 326,150 | $ | 334,234 | |||||||
| Net realized gain on securities sold | 1,433,063 | 1,354,785 | 2,267,649 | 6,911,069 | ||||||||||||
| Net change in unrealized appreciation (depreciation) of investment securities | 1,358,179 | (969,145 | ) | (3,960,509 | ) | (3,297,151 | ) | |||||||||
| Net Increase (Decrease) in Net Assets Resulting from Operations | 2,860,692 | 174,263 | (1,366,710 | ) | 3,948,152 | |||||||||||
| DISTRIBUTIONS TO SHAREHOLDERS: | ||||||||||||||||
| Net income | – | – | (1,883,024 | ) | (292,377 | ) | ||||||||||
| Realized capital gains | (944,209 | ) | – | (6,908,453 | ) | (4,756,063 | ) | |||||||||
| Total Distributions | (944,209 | ) | – | (8,791,477 | ) | (5,048,440 | ) | |||||||||
| CAPITAL SHARE TRANSACTIONS (IN DOLLARS): | ||||||||||||||||
| Shares issued | 1,133,653 | 1,652,031 | 13,892,851 | 6,305,893 | ||||||||||||
| Shares issued in lieu of cash distributions | 814,965 | – | 7,836,751 | 4,812,062 | ||||||||||||
| Shares redeemed | (3,268,885 | ) | (3,667,021 | ) | (8,684,293 | ) | (7,093,921 | ) | ||||||||
| Net Increase (Decrease) in Net Assets from Capital Share Transactions | (1,320,267 | ) | (2,014,990 | ) | 13,045,309 | 4,024,034 | ||||||||||
| Total Increase (Decrease) in Net Assets | 596,216 | (1,840,727 | ) | 2,887,122 | 2,923,746 | |||||||||||
| NET ASSETS: | ||||||||||||||||
| Beginning of period | 32,298,080 | 34,138,807 | 53,172,230 | 50,248,484 | ||||||||||||
| End of period | $ | 32,894,296 | $ | 32,298,080 | $ | 56,059,352 | $ | 53,172,230 | ||||||||
| Including accumulated undistributed net investment income (loss) | $ | – | $ | (196,430 | ) | $ | 227,008 | $ | 275,060 | |||||||
| SHARES ISSUED AND REDEEMED: | ||||||||||||||||
| Issued | 261,227 | 367,563 | 714,136 | 289,675 | ||||||||||||
| Issued in lieu of cash distributions | 197,807 | – | 405,890 | 236,117 | ||||||||||||
| Redeemed | (791,999 | ) | (817,061 | ) | (450,008 | ) | (327,298 | ) | ||||||||
| Net Increase (Decrease) in Share Transactions | (332,965 | ) | (449,498 | ) | 670,018 | 198,494 | ||||||||||
The accompanying notes are an integral part of the financial statements.
| 44 | 1-888-462-5386 | www.oakfunds.com |
OAK ASSOCIATES FUNDS
This Page Intentionally Left Blank
Financial Highlights
For a share outstanding throughout the years ended
| Year Ended October 31, 2016 | ||||
| WHITE OAK SELECT GROWTH FUND | ||||
| Net Asset Value Beginning of Period | $ | 65.21 | ||
| Income (Loss) From Operations | ||||
Net Investment Income(a) | 0.66 | |||
Realized and Unrealized Gain in Securities(a) | 1.99 | |||
| Total From Operations | 2.65 | |||
| Less Distributions: | ||||
| Dividends from Net Investment Income | (0.42 | ) | ||
| Distributions from Capital Gains | – | |||
| Total Dividends and Distributions | (0.42 | ) | ||
| Net Asset Value End of Period | $ | 67.44 | ||
Total Return(b) | 4.07 | % | ||
| Net Assets End of Period (000) | $ | 248,433 | ||
| Ratio of Net Expenses to Average Net Assets | 1.06 | % | ||
| Ratio of Net Investment Income to Average Net Assets | 1.03 | % | ||
| Ratio of Expenses to Average Net Assets (Excluding Waivers and/or Fees Paid Indirectly) | 1.06 | % | ||
| Portfolio Turnover Rate | 14 | % | ||
(a) | Per share calculations were performed using average shares for the period. |
(b) | Figures do not reflect the deduction of taxes the shareholder will pay on fund distributions or redemption of fund shares. |
The accompanying notes are an integral part of the financial statements.
| 46 | 1-888-462-5386 | www.oakfunds.com |
| Year Ended October 31, 2015 | Year Ended October 31, 2014 | Year Ended October 31, 2013 | Year Ended October 31, 2012 | ||||||||||||
| $ | 60.34 | $ | 53.66 | $ | 42.50 | $ | 39.09 | ||||||||
| 0.94 | 0.35 | 0.24 | 0.11 | ||||||||||||
| 4.90 | 6.57 | 11.06 | 3.30 | ||||||||||||
| 5.84 | 6.92 | 11.30 | 3.41 | ||||||||||||
| (0.97 | ) | (0.24 | ) | (0.14 | ) | – | |||||||||
| – | – | – | – | ||||||||||||
| (0.97 | ) | (0.24 | ) | (0.14 | ) | – | |||||||||
| $ | 65.21 | $ | 60.34 | $ | 53.66 | $ | 42.50 | ||||||||
| 9.84 | % | 12.94 | % | 26.65 | % | 8.72 | % | ||||||||
| $ | 257,652 | $ | 256,221 | $ | 253,803 | $ | 228,596 | ||||||||
| 1.06 | % | 1.10 | % | 1.12 | % | 1.16 | % | ||||||||
| 1.52 | % | 0.61 | % | 0.50 | % | 0.28 | % | ||||||||
| 1.06 | % | 1.10 | % | 1.12 | % | 1.16 | % | ||||||||
| 9 | % | 1 | % | 89 | % | 86 | % | ||||||||
| Annual Report | October 31, 2016 | 47 |
Financial Highlights
For a share outstanding throughout the years ended
| Year Ended October 31, 2016 | ||||
| PIN OAK EQUITY FUND | ||||
| Net Asset Value Beginning of Period | $ | 52.45 | ||
| Income (Loss) From Operations | ||||
Net Investment Income(a) | 0.43 | |||
Realized and Unrealized Gain in Securities(a) | 2.38 | |||
| Total From Operations | 2.81 | |||
| Less Distributions: | ||||
| Dividends from Net Investment Income | (0.40 | ) | ||
| Distributions from Capital Gains | (1.51 | ) | ||
| Total Dividends and Distributions | (1.91 | ) | ||
| Net Asset Value End of Period | $ | 53.35 | ||
Total Return(b) | 5.54 | % | ||
| Net Assets End of Period (000) | $ | 109,928 | ||
| Ratio of Net Expenses to Average Net Assets | 1.08 | % | ||
| Ratio of Net Investment Income to Average Net Assets | 0.86 | % | ||
| Ratio of Expenses to Average Net Assets (Excluding Waivers and/or Fees Paid Indirectly) | 1.08 | % | ||
| Portfolio Turnover Rate | 10 | % | ||
(a) | Per share calculations were performed using average shares for the period. |
(b) | Figures do not reflect the deduction of taxes the shareholder will pay on fund distributions or redemption of fund shares. |
The accompanying notes are an integral part of the financial statements.
| 48 | 1-888-462-5386 | www.oakfunds.com |
| Year Ended October 31, 2015 | Year Ended October 31, 2014 | Year Ended October 31, 2013 | Year Ended October 31, 2012 | ||||||||||||
| $ | 49.76 | $ | 43.07 | $ | 32.86 | $ | 28.52 | ||||||||
| 0.54 | 0.30 | 0.26 | 0.21 | ||||||||||||
| 2.77 | 6.67 | 10.18 | 4.13 | ||||||||||||
| 3.31 | 6.97 | 10.44 | 4.34 | ||||||||||||
| (0.53 | ) | (0.28 | ) | (0.23 | ) | – | |||||||||
| (0.09 | ) | – | – | – | |||||||||||
| (0.62 | ) | (0.28 | ) | (0.23 | ) | – | |||||||||
| $ | 52.45 | $ | 49.76 | $ | 43.07 | $ | 32.86 | ||||||||
| 6.76 | % | 16.25 | % | 31.94 | % | 15.22 | % | ||||||||
| $ | 98,976 | $ | 94,316 | $ | 81,408 | $ | 69,107 | ||||||||
| 1.10 | % | 1.13 | % | 1.16 | % | 1.21 | % | ||||||||
| 1.09 | % | 0.64 | % | 0.70 | % | 0.68 | % | ||||||||
| 1.10 | % | 1.13 | % | 1.16 | % | 1.21 | % | ||||||||
| 15 | % | 5 | % | 117 | % | 98 | % | ||||||||
| Annual Report | October 31, 2016 | 49 |
Financial Highlights
For a share outstanding throughout the years ended
| Year Ended October 31, 2016 | ||||
| ROCK OAK CORE GROWTH FUND | ||||
| Net Asset Value Beginning of Period | $ | 12.64 | ||
| Income (Loss) From Operations | ||||
Net Investment Income(a) | 0.18 | |||
Realized and Unrealized Gain or (Losses) in Securities(a) | 0.31 | |||
| Total From Operations | 0.49 | |||
| Less Distributions: | ||||
| Dividends from Net Investment Income | (0.10 | ) | ||
| Distributions from Capital Gains | (0.29 | ) | ||
| Total Dividends and Distributions | (0.39 | ) | ||
| Net Asset Value End of Period | $ | 12.74 | ||
Total Return(c) | 3.98 | % | ||
| Net Assets End of Period (000) | $ | 7,395 | ||
| Ratio of Net Expenses to Average Net Assets | 1.25 | % | ||
| Ratio of Net Investment Income to Average Net Assets | 1.48 | % | ||
| Ratio of Expenses to Average Net Assets (Excluding Waivers and/or Fees Paid Indirectly) | 1.65 | % | ||
| Portfolio Turnover Rate | 11 | % | ||
(a) | Per share calculations were performed using average shares for the period. |
(b) | Less than $0.005 per share. |
(c) | Figures do not reflect the deduction of taxes the shareholder will pay on fund distributions or redemption of fund shares. |
The accompanying notes are an integral part of the financial statements.
| 50 | 1-888-462-5386 | www.oakfunds.com |
| Year Ended October 31, 2015 | Year Ended October 31, 2014 | Year Ended October 31, 2013 | Year Ended October 31, 2012 | ||||||||||||
| $ | 14.21 | $ | 15.04 | $ | 11.78 | $ | 11.64 | ||||||||
| 0.00 | (b) | 0.05 | 0.07 | 0.02 | |||||||||||
| (0.54 | ) | 2.06 | 3.37 | 0.12 | |||||||||||
| (0.54 | ) | 2.11 | 3.44 | 0.14 | |||||||||||
| (0.04 | ) | (0.06 | ) | (0.05 | ) | – | |||||||||
| (0.99 | ) | (2.88 | ) | (0.13 | ) | – | |||||||||
| (1.03 | ) | (2.94 | ) | (0.18 | ) | – | |||||||||
| $ | 12.64 | $ | 14.21 | $ | 15.04 | $ | 11.78 | ||||||||
| (4.04 | )% | 15.89 | % | 29.51 | % | 1.20 | % | ||||||||
| $ | 7,807 | $ | 8,491 | $ | 7,495 | $ | 6,512 | ||||||||
| 1.25 | % | 1.25 | % | 1.25 | % | 1.25 | % | ||||||||
| 0.03 | % | 0.33 | % | 0.53 | % | 0.14 | % | ||||||||
| 1.52 | % | 1.58 | % | 1.65 | % | 1.79 | % | ||||||||
| 32 | % | 29 | % | 65 | % | 56 | % | ||||||||
| Annual Report | October 31, 2016 | 51 |
Financial Highlights
For a share outstanding throughout the years ended
| Year Ended October 31, 2016 | ||||
| RIVER OAK DISCOVERY FUND | ||||
| Net Asset Value Beginning of Period | $ | 13.76 | ||
| Income (Loss) From Operations | ||||
Net Investment Loss(a) | (0.06 | ) | ||
Realized and Unrealized Gain or (Losses) in Securities(a) | 0.53 | |||
| Total From Operations | 0.47 | |||
| Less Distributions: | ||||
| Dividends from Net Investment Income | (0.02 | ) | ||
| Distributions from Capital Gains | – | |||
| Total Dividends and Distributions | (0.02 | ) | ||
| Net Asset Value End of Period | $ | 14.21 | ||
Total Return(b) | 3.39 | % | ||
| Net Assets End of Period (000) | $ | 12,322 | ||
| Ratio of Net Expenses to Average Net Assets | 1.35 | % | ||
| Ratio of Net Investment Loss to Average Net Assets | (0.40 | )% | ||
| Ratio of Expenses to Average Net Assets (Excluding Waivers and/or Fees Paid Indirectly) | 1.51 | % | ||
| Portfolio Turnover Rate | 21 | % | ||
(a) | Per share calculations were performed using average shares for the period. |
(b) | Figures do not reflect the deduction of taxes the shareholder will pay on fund distributions or redemption of fund shares. |
The accompanying notes are an integral part of the financial statements.
| 52 | 1-888-462-5386 | www.oakfunds.com |
| Year Ended October 31, 2015 | Year Ended October 31, 2014 | Year Ended October 31, 2013 | Year Ended October 31, 2012 | ||||||||||||
| $ | 17.72 | $ | 17.70 | $ | 13.46 | $ | 12.76 | ||||||||
| (0.04 | ) | (0.13 | ) | (0.08 | ) | (0.07 | ) | ||||||||
| (0.13 | ) | 1.59 | 4.32 | 0.77 | |||||||||||
| (0.17 | ) | 1.46 | 4.24 | 0.70 | |||||||||||
| – | – | – | – | ||||||||||||
| (3.79 | ) | (1.44 | ) | – | – | ||||||||||
| (3.79 | ) | (1.44 | ) | – | – | ||||||||||
| $ | 13.76 | $ | 17.72 | $ | 17.70 | $ | 13.46 | ||||||||
| (1.27 | )% | 8.69 | % | 31.50 | % | 5.49 | % | ||||||||
| $ | 12,582 | $ | 13,915 | $ | 13,304 | $ | 10,766 | ||||||||
| 1.35 | % | 1.35 | % | 1.35 | % | 1.35 | % | ||||||||
| (0.28 | )% | (0.71 | )% | (0.52 | )% | (0.54 | )% | ||||||||
| 1.45 | % | 1.48 | % | 1.52 | % | 1.62 | % | ||||||||
| 17 | % | 96 | % | 63 | % | 72 | % | ||||||||
| Annual Report | October 31, 2016 | 53 |
Financial Highlights
For a share outstanding throughout the years ended
| Year Ended October 31, 2016 | ||||
| RED OAK TECHNOLOGY SELECT FUND | ||||
| Net Asset Value Beginning of Period | $ | 17.17 | ||
| Income (Loss) From Operations | ||||
Net Investment Income(a) | 0.20 | |||
Realized and Unrealized Gain in Securities(a) | 2.62 | |||
| Total From Operations | 2.82 | |||
| Less Distributions: | ||||
| Dividends from Net Investment Income | (0.19 | ) | ||
| Distributions from Capital Gains | (0.53 | ) | ||
| Total Dividends and Distributions | (0.72 | ) | ||
| Net Asset Value End of Period | $ | 19.27 | ||
Total Return(b) | 17.14 | % | ||
| Net Assets End of Period (000) | $ | 189,064 | ||
| Ratio of Net Expenses to Average Net Assets | 1.09 | % | ||
| Ratio of Net Investment Income to Average Net Assets | 1.17 | % | ||
| Ratio of Expenses to Average Net Assets (Excluding Waivers and/or Fees Paid Indirectly) | 1.09 | % | ||
| Portfolio Turnover Rate | 6 | % | ||
| (a) | Per share calculations were performed using average shares for the period. |
| (b) | Figures do not reflect the deduction of taxes the shareholder will pay on fund distributions or redemption of fund shares. |
The accompanying notes are an integral part of the financial statements.
| 54 | 1-888-462-5386 | www.oakfunds.com |
| Year Ended October 31, 2015 | Year Ended October 31, 2014 | Year Ended October 31, 2013 | Year Ended October 31, 2012 | ||||||||||||
| $ | 16.22 | $ | 13.74 | $ | 9.79 | $ | 9.60 | ||||||||
| 0.20 | 0.06 | 0.06 | 0.02 | ||||||||||||
| 0.91 | 2.48 | 3.92 | 0.17 | ||||||||||||
| 1.11 | 2.54 | 3.98 | 0.19 | ||||||||||||
| (0.16 | ) | (0.06 | ) | (0.03 | ) | – | |||||||||
| – | – | – | – | ||||||||||||
| (0.16 | ) | (0.06 | ) | (0.03 | ) | – | |||||||||
| $ | 17.17 | $ | 16.22 | $ | 13.74 | $ | 9.79 | ||||||||
| 6.91 | % | 18.54 | % | 40.76 | % | 1.98 | % | ||||||||
| $ | 131,001 | $ | 142,273 | $ | 105,592 | $ | 64,882 | ||||||||
| 1.11 | % | 1.15 | % | 1.23 | % | 1.30 | % | ||||||||
| 1.19 | % | 0.41 | % | 0.50 | % | 0.16 | % | ||||||||
| 1.11 | % | 1.15 | % | 1.23 | % | 1.30 | % | ||||||||
| 4 | % | 7 | % | 15 | % | 83 | % | ||||||||
| Annual Report | October 31, 2016 | 55 |
Financial Highlights
For a share outstanding throughout the years ended
| Year Ended October 31, 2016 | ||||
| BLACK OAK EMERGING TECHNOLOGY FUND | ||||
| Net Asset Value Beginning of Period | $ | 4.26 | ||
| Income (Loss) From Operations | ||||
Net Investment Income (Loss)(a) | 0.01 | |||
Realized and Unrealized Gain or (Losses) in Securities(a) | 0.39 | |||
| Total From Operations | 0.40 | |||
| Less Distributions: | ||||
| Dividends from Net Investment Income | – | |||
| Distributions from Capital Gains | (0.13 | ) | ||
| Total Dividends and Distributions | (0.13 | ) | ||
| Net Asset Value End of Period | $ | 4.53 | ||
Total Return(b) | 9.59 | % | ||
| Net Assets End of Period (000) | $ | 32,894 | ||
| Ratio of Net Expenses to Average Net Assets | 1.28 | % | ||
| Ratio of Net Investment Income (Loss) to Average Net Assets | 0.22 | % | ||
| Ratio of Expenses to Average Net Assets (Excluding Waivers and/or Fees Paid Indirectly) | 1.28 | % | ||
| Portfolio Turnover Rate | 35 | % | ||
| (a) | Per share calculations were performed using average shares for the period. |
| (b) | Figures do not reflect the deduction of taxes the shareholder will pay on fund distributions or redemption of fund shares. |
The accompanying notes are an integral part of the financial statements.
| 56 | 1-888-462-5386 | www.oakfunds.com |
| Year Ended October 31, 2015 | Year Ended October 31, 2014 | Year Ended October 31, 2013 | Year Ended October 31, 2012 | ||||||||||||
| $ | 4.25 | $ | 3.58 | $ | 2.67 | $ | 2.78 | ||||||||
| (0.03 | ) | (0.01 | ) | (0.01 | ) | (0.03 | ) | ||||||||
| 0.04 | 0.68 | 0.92 | (0.08 | ) | |||||||||||
| 0.01 | 0.67 | 0.91 | (0.11 | ) | |||||||||||
| – | – | – | – | ||||||||||||
| – | – | – | – | ||||||||||||
| – | – | – | – | ||||||||||||
| $ | 4.26 | $ | 4.25 | $ | 3.58 | $ | 2.67 | ||||||||
| 0.24 | % | 18.72 | % | 34.08 | % | (3.96 | )% | ||||||||
| $ | 32,298 | $ | 34,139 | $ | 29,853 | $ | 25,050 | ||||||||
| 1.25 | % | 1.31 | % | 1.35 | % | 1.35 | % | ||||||||
| (0.61 | )% | (0.32 | )% | (0.19 | )% | (1.07 | )% | ||||||||
| 1.25 | % | 1.31 | % | 1.39 | % | 1.44 | % | ||||||||
| 17 | % | 41 | % | 58 | % | 33 | % | ||||||||
| Annual Report | October 31, 2016 | 57 |
Financial Highlights
For a share outstanding throughout the years ended
| Year Ended October 31, 2016 | ||||
| LIVE OAK HEALTH SCIENCES FUND | ||||
| Net Asset Value Beginning of Period | $ | 21.65 | ||
| Income (Loss) From Operations | ||||
Net Investment Income(a) | 0.11 | |||
Realized and Unrealized Gain or (Losses) in Securities(a) | (0.33 | ) | ||
| Total From Operations | (0.22 | ) | ||
| Less Distributions: | ||||
| Dividends from Net Investment Income | (0.67 | ) | ||
| Distributions from Capital Gains | (2.83 | ) | ||
| Total Dividends and Distributions | (3.50 | ) | ||
| Net Asset Value End of Period | $ | 17.93 | ||
Total Return(b) | (1.85 | )%(c) | ||
| Net Assets End of Period (000) | $ | 56,059 | ||
| Ratio of Net Expenses to Average Net Assets | 1.11 | % | ||
| Ratio of Net Investment Income to Average Net Assets | 0.59 | % | ||
| Ratio of Expenses to Average Net Assets (Excluding Waivers and/or Fees Paid Indirectly) | 1.11 | % | ||
| Portfolio Turnover Rate | 14 | % | ||
| (a) | Per share calculations were performed using average shares for the period. |
| (b) | Figures do not reflect the deduction of taxes the shareholder will pay on fund distributions or redemption of fund shares. |
| (c) | Performance difference between Manager Discussion & Analysis and Financial Highlights is due to financial reporting adjustments. |
The accompanying notes are an integral part of the financial statements.
| 58 | 1-888-462-5386 | www.oakfunds.com |
| Year Ended October 31, 2015 | Year Ended October 31, 2014 | Year Ended October 31, 2013 | Year Ended October 31, 2012 | ||||||||||||
| $ | 22.25 | $ | 18.83 | $ | 14.67 | $ | 14.00 | ||||||||
| 0.14 | 0.13 | 0.13 | 0.10 | ||||||||||||
| 1.51 | 4.11 | 4.90 | 1.09 | ||||||||||||
| 1.65 | 4.24 | 5.03 | 1.19 | ||||||||||||
| (0.13 | ) | (0.13 | ) | (0.13 | ) | (0.07 | ) | ||||||||
| (2.12 | ) | (0.69 | ) | (0.74 | ) | (0.45 | ) | ||||||||
| (2.25 | ) | (0.82 | ) | (0.87 | ) | (0.52 | ) | ||||||||
| $ | 21.65 | $ | 22.25 | $ | 18.83 | $ | 14.67 | ||||||||
| 8.02 | % | 23.36 | % | 36.07 | % | 9.02 | % | ||||||||
| $ | 53,172 | $ | 50,248 | $ | 42,517 | $ | 32,967 | ||||||||
| 1.08 | % | 1.12 | % | 1.15 | % | 1.24 | % | ||||||||
| 0.62 | % | 0.64 | % | 0.77 | % | 0.73 | % | ||||||||
| 1.08 | % | 1.12 | % | 1.15 | % | 1.24 | % | ||||||||
| 28 | % | 15 | % | 12 | % | 16 | % | ||||||||
| Annual Report | October 31, 2016 | 59 |
Notes to Financial Statements
As of October 31, 2016
1. ORGANIZATION:
The Oak Associates Funds (the “Trust”), a Massachusetts business trust, is registered under the Investment Company Act of 1940, as amended, as an open-end management investment company with seven diversified funds: White Oak Select Growth Fund, Pin Oak Equity Fund, Rock Oak Core Growth Fund, River Oak Discovery Fund, Red Oak Technology Select Fund, Black Oak Emerging Technology Fund and Live Oak Health Sciences Fund (collectively referred to as “Funds” and individually referred to as a “Fund”). The investment objective of each Fund is to seek long-term capital growth. The assets of each Fund are segregated, and a shareholder’s interest is limited to the Fund in which shares are held. The Funds’ prospectus provides a description of each Fund’s investment objective, policies and strategies.
2. SIGNIFICANT ACCOUNTING POLICIES:
The following is a summary of significant accounting policies followed by the Funds.
Use of Estimates – These policies are in conformity with U.S. generally accepted accounting principles (“GAAP”). Each Fund is considered an investment company for financial reporting purposes under GAAP. The preparation of financial statements in accordance with GAAP requires management to make estimates and assumptions that affect the reported amounts and disclosures in the financial statements during the reporting period. Management believes the estimates and security valuations are appropriate; however, actual results may differ from those estimates, and the security valuations reflected in the financial statements may differ from the value the Funds ultimately realize upon the sale of the securities.
Security Valuation – Investments in equity securities, which are traded on a national exchange, are stated at the last quoted sales price if readily available for such equity securities on each business day. Investments in equity securities, which are reported on the NASDAQ national market system are valued at the official closing price; other equity securities traded in the over-the-counter market and listed equity securities for which no sale was reported on that date are stated at the last quoted bid price. Debt obligations exceeding sixty days to maturity for which market quotations are readily available are valued at the most recently quoted bid price. Debt obligations with sixty days or less remaining until maturity may be valued at their amortized cost, which approximates market value. Investments in repurchase agreements are generally valued at par each business day.
Redeemable securities issued by open-end registered investment companies are valued at the investment company’s applicable net asset value (“NAV”).
Securities for which market prices are not “readily available” are valued in accordance with Fair Value Procedures established by the Funds’ Board of Trustees. The Funds’ Fair Value Procedures are implemented through a Fair Value Committee (the “Committee”) designated by the Funds’ Board of Trustees. Some of the more common reasons that may necessitate that a security be valued using Fair Value Procedures include: the security’s trading has been halted or suspended; the security has been de–listed from a national exchange; the security’s primary trading market is temporarily closed at a time when under normal conditions it would be open; the security has not been traded for an extended period of time; the security’s primary pricing source is not able or willing to provide a price; a significant event with respect to a security or securities has occurred after the close of the market or exchange on which the security or securities principally trades and before the time the Fund calculates net asset value; or trading of the security is subject to local government–imposed restrictions. When a security is valued in accordance with the Fair Value Procedures, the Committee will determine the value after taking into consideration relevant information reasonably available to the Committee.
| 60 | 1-888-462-5386 | www.oakfunds.com |
Notes to Financial Statements
As of October 31, 2016
Security Transactions and Investment Income – Security transactions are accounted for on the date the security is purchased or sold (trade date). Dividend income is recognized on the ex-dividend date. Interest income is recognized on the accrual basis. Withholding taxes on foreign dividends have been provided for in accordance with the Funds’ understanding of the applicable country’s tax rules and rates. Costs used in determining realized gains and losses on the sales of investment securities are those of the specific securities sold. If applicable, any foreign capital gains taxes are accrued, net of unrealized gains, and are payable upon the sale of such investments.
Expenses – Expenses that are directly related to one of the Funds are charged to that Fund. Expenses not directly billed to a particular Fund are allocated proportionally among all Funds daily in relation to net assets of each Fund or another reasonable allocation method.
Repurchase Agreements – The Funds invest in tri-party repurchase agreements. Securities held as collateral for tri-party repurchase agreements are maintained by the broker's custodian bank in a segregated account until maturity of the repurchase agreement. Provisions of the repurchase agreements and procedures adopted by the Board of Trustees require that the market value of the collateral, including accrued interest thereon, is sufficient in the event of default by the counterparty. A custody agreement in connection with the Master Repurchase Agreement defines eligible securities for collateral in relation to each repurchase agreement. Under the Master Repurchase Agreement, if the counterparty defaults and the value of the collateral declines or if the counter-party enters an insolvency proceeding, realization of the collateral by the Funds may be delayed or limited. At fiscal year end, certain Funds had investments in repurchase agreements. The gross value and related collateral received for those investments are presented in each applicable Fund’s Schedule of Investments. The value of the related collateral received exceeded the value of the repurchase agreements as of the period end.
Master Agreements and Netting Arrangements – Certain Funds may participate in various repurchase agreements, such as, but not limited to Master Repurchase Agreements, which govern the terms of certain transactions with select counterparties (collectively “Master Agreements”). These Master Agreements generally include provisions for general obligations, agreements, representations, collateral and provisions for events of default or termination. These Master Agreements also include provisions for netting arrangements that help reduce credit and counterparty risk associated with relevant transactions. The netting arrangements are generally tied to credit related events that if triggered, would cause an event of default or termination giving a Fund or counterparty the right to terminate early and cause settlement, on a net basis, of all transactions under the applicable Master Agreement. In the event of an early termination or default event, the total market value exposure would be offset against collateral exchanged to date, which would result in a net receivable or payable that would be due from or to the counterparty. Credit related events include, but are not limited to, bankruptcy, failure to make timely payments, restructuring, obligation acceleration, obligation default, a material decline in net assets, decline in credit rating or repudiation/moratorium. An election made by a counterparty to terminate a transaction early under a Master Agreement could have an adverse impact on a Fund’s financial statements. Master Agreements can also help limit counterparty risk by requiring collateral posting arrangements at pre-arranged exposure levels. Collateral under the Master Agreements is usually in the form of cash, U.S. Treasury or U.S. Government agency securities, but may include other types of securities. There can be no assurance that the Master Agreements will be successful in limiting credit or counterparty risk.
| Annual Report | October 31, 2016 | 61 |
Notes to Financial Statements
As of October 31, 2016
Dividends and Distributions to Shareholders – Dividends from net investment income are declared and paid to shareholders on an annual basis, as applicable. Net realized capital gains on sales of securities, if any, are distributed to shareholders at least annually. Distributions to shareholders are determined in accordance with income tax regulations and are recorded on the ex-dividend date.
Income and capital gain distributions are determined in accordance with federal income tax regulations, which may differ from GAAP. Therefore, the source of the Funds’ distributions may be shown in the accompanying financial statements as either from or in excess of net investment income or net realized gain, or from paid-in capital, depending upon the type of book/tax differences that may exist.
3. FAIR VALUE MEASUREMENTS:
A three-tier hierarchy has been established to classify fair value measurements for disclosure purposes. Inputs refer broadly to the assumptions that market participants would use in pricing the asset or liability including assumptions about risk. Inputs may be observable and unobservable. Observable inputs are inputs that reflect the assumptions market participants would use in pricing the asset or liability that are developed based on market data obtained from sources independent of the reporting entity. Unobservable inputs are inputs that reflect the reporting entity’s own assumptions about the assumptions market participants would use in pricing the asset or liability that are developed based on the best information available.
Various inputs are used in determining the value of each Fund’s investments as of the reporting period end. The designated input levels are not necessarily an indication of the risk or liquidity associated with these investments. These inputs are categorized in the following hierarchy under applicable financial accounting standards:
The three-tier hierarchy is summarized as follows:
Level 1 – Unadjusted quoted prices in active markets for identical assets or liabilities that a Fund has the ability to access at the measurement date, including but not limited to:
Equity Securities – investments for which market quotations are readily available that are valued at the last reported sale price or official closing price as reported by an independent pricing service on the primary market or exchange on which they are traded.
Investment Companies – investments in open-end registered investment companies which are valued at their closing NAV.
| 62 | 1-888-462-5386 | www.oakfunds.com |
| Notes to Financial Statements |
As of October 31, 2016
Level 2 – Quoted prices which are not active, quoted prices for similar assets or liabilities in active markets or inputs other than quoted prices that are observable (either directly or indirectly) for substantially the full term of the asset or liability, including but not limited to:
Repurchase Agreements – investments in overnight tri-party repurchase agreements which are valued at par.
All Securities – quoted prices for similar securities, including matrix pricing; quoted prices based on recently executed transactions; adjusted quoted prices based on observable and formulaic inputs; or, prices using other observable correlated market inputs.
Level 3 – Significant unobservable prices or inputs (including the Fund’s own assumptions in determining the fair value of investments) where there is little or no market activity for the asset and liability at the measurement date, including but not limited to:
All Securities – modeling or manual pricing based on the Adviser’s own assumptions in determining fair value of investments; or, the significant use of other unobservable or very stale inputs within fair valuation.
The following is a summary of the inputs used to value each Fund’s investments as of October 31, 2016.
| Level 1 | Level 2 | Level 3 | Total | |||||||||||||
| WHITE OAK SELECT GROWTH FUND | ||||||||||||||||
| Common Stocks | $ | 249,803,592 | $ | – | $ | – | $ | 249,803,592 | ||||||||
| Short Term Investments | – | 1,693,761 | – | 1,693,761 | ||||||||||||
| Total | $ | 249,803,592 | $ | 1,693,761 | $ | – | $ | 251,497,353 | ||||||||
| Level 1 | Level 2 | Level 3 | Total | |||||||||||||
| PIN OAK EQUITY FUND | ||||||||||||||||
| Common Stocks | $ | 106,213,342 | $ | – | $ | – | $ | 106,213,342 | ||||||||
| Short Term Investments | – | 3,759,785 | – | 3,759,785 | ||||||||||||
| Total | $ | 106,213,342 | $ | 3,759,785 | $ | – | $ | 109,973,127 | ||||||||
| Level 1 | Level 2 | Level 3 | Total | |||||||||||||
| ROCK OAK CORE GROWTH FUND | ||||||||||||||||
| Common Stocks | $ | 7,174,363 | $ | – | $ | – | $ | 7,174,363 | ||||||||
| Short Term Investments | – | 93,473 | – | 93,473 | ||||||||||||
| Total | $ | 7,174,363 | $ | 93,473 | $ | – | $ | 7,267,836 | ||||||||
| Level 1 | Level 2 | Level 3 | Total | |||||||||||||
| RIVER OAK DISCOVERY FUND | ||||||||||||||||
| Common Stocks | $ | 11,942,689 | $ | – | $ | – | $ | 11,942,689 | ||||||||
| Short Term Investments | – | 395,805 | – | 395,805 | ||||||||||||
| Total | $ | 11,942,689 | $ | 395,805 | $ | – | $ | 12,338,494 | ||||||||
| Annual Report | October 31, 2016 | 63 |
| Notes to Financial Statements |
As of October 31, 2016
| Level 1 | Level 2 | Level 3 | Total | |||||||||||||
| RED OAK TECHNOLOGY SELECT FUND | ||||||||||||||||
| Common Stocks | $ | 181,728,728 | $ | – | $ | – | $ | 181,728,728 | ||||||||
| Short Term Investments | – | 7,354,006 | – | 7,354,006 | ||||||||||||
| Total | $ | 181,728,728 | $ | 7,354,006 | $ | – | $ | 189,082,734 | ||||||||
| Level 1 | Level 2 | Level 3 | Total | |||||||||||||
| BLACK OAK EMERGING TECHNOLOGY FUND | ||||||||||||||||
| Common Stocks | $ | 30,470,737 | $ | – | $ | – | $ | 30,470,737 | ||||||||
| Short Term Investments | – | 2,487,249 | – | 2,487,249 | ||||||||||||
| Total | $ | 30,470,737 | $ | 2,487,249 | $ | – | $ | 32,957,986 | ||||||||
| Level 1 | Level 2 | Level 3 | Total | |||||||||||||
| LIVE OAK HEALTH SCIENCES FUND | ||||||||||||||||
| Common Stocks | $ | 55,438,808 | $ | – | $ | – | $ | 55,438,808 | ||||||||
| Short Term Investments | – | 542,784 | – | 542,784 | ||||||||||||
| Total | $ | 55,438,808 | $ | 542,784 | $ | – | $ | 55,981,592 | ||||||||
The above tables are presented by levels of disaggregation for each asset class. For detailed descriptions of the underlying industries, see the accompanying Schedules of Investments. There were no transfers into or out of Level I and 2 during the period. There were no Level 3 securities held during the period. It is the Funds’ policy to recognize transfers into and out of levels at the end of the reporting period.
4. TRANSACTIONS WITH AFFILIATES:
Certain officers and trustees of the Trust are also officers of Oak Associates, ltd., investment adviser to the Funds (the “Adviser”), ALPS Fund Services, Inc. the administrator, fund accountant and transfer agent for the Funds (“ALPS”), and/or ALPS Distributors, Inc. the Funds’ distributor (the “Distributor”). Such officers are paid no fees by the Trust for serving as officers to the Trust. Pursuant to a PFO Services Agreement between ALPS and the Trust, ALPS provides a qualified person to serve as the Trust’s Principal Financial Officer (“PFO”). Principal financial officer fees payable pursuant to the terms of the PFO Services Agreement represent payments made by the Trust to ALPS and not to any individual employee of ALPS serving as PFO to the Trust.
5. ADMINISTRATION, TRANSFER AGENT AND DISTRIBUTION AGREEMENTS:
Administration: ALPS Fund Services, Inc. (the “Administrator”) serves as administrator to the Trust. The Trust and the Administrator have entered into an administration, bookkeeping and pricing services agreement (the “Administration Agreement”). Under the Administration Agreement, the Administrator provides the Trust with administrative services, including regulatory reporting, fund accounting services, and calculating the Funds’ daily net asset value, and provides all necessary office space, equipment, personnel and facilities for annual fee. The Administration Agreement provides that the Administrator shall not be liable for any error of judgment or mistake of law or for any loss suffered by the Trust in connection with the matters to which the Administration Agreement relates, except a loss resulting from willful misfeasance, bad faith or negligence on the part of the Administrator in the performance of its duties or from reckless disregard by it of its duties and obligations thereunder. The Administration Agreement shall remain in effect for a period of one year after the effective date of the agreement and shall continue in effect for successive periods of one year unless terminated by either party on not less than 60 days’ prior written notice to the other party.
| 64 | 1-888-462-5386 | www.oakfunds.com |
| Notes to Financial Statements |
As of October 31, 2016
Administrative Fee: ALPS Fund Services, Inc. (“ALPS”) provides the Funds with certain administrative personnel and services. The fees paid to ALPS are based on an annual rate of the daily average aggregate net assets of the Trust for the period. Fees are allocated to each Fund based on daily net assets (each Fund’s net assets as a percentage of total Trust net assets).
Transfer Agent: ALPS Fund Services, Inc. (the “Transfer Agent”) serves as transfer agent, dividend paying agent and shareholder service agent for the Trust under a transfer agency and services agreement with the Trust.
Distribution: The Trust and ALPS Distributors, Inc. (the “Distributor”), an affiliate of the Administrator, are parties to a distribution agreement (the “Distribution Agreement”) whereby the Distributor acts as principal underwriter for the Trust’s shares. The Distributor has agreed to use its best efforts in distributing Fund shares but is not obligated to sell any particular number of shares. The Distributor does not receive compensation under the Distribution Agreement for distribution of Fund shares.
6. INVESTMENT ADVISORY AND CUSTODIAN AGREEMENTS:
The Trust and the Adviser are parties to an Investment Advisory Agreement, under which the Adviser receives an annual fee equal to 0.74% of the average daily net assets of each Fund, except for the River Oak Discovery Fund for which the Adviser receives 0.90% of the average daily net assets of the Fund. The Adviser has agreed to contractually waive all or a portion of its fees (and to reimburse the Funds’ expenses if necessary) in order to limit operating expenses to not more than 1.25% of the average daily net assets of the White Oak Select Growth, Rock Oak Core Growth and Pin Oak Equity Funds, and 1.35% of the average daily net assets of the River Oak Discovery, Red Oak Technology Select, Black Oak Emerging Technology and Live Oak Health Sciences Funds for one year periods. The Adviser contractually agreed to continue this arrangement through February 28, 2017.*
The following table lists the contractual advisory fees and fee waivers that were in effect during the fiscal year ended October 31, 2016:
| Advisory Fees as a Percentage of Average Net Assets | |||
| Fund | Annual Rate | Fee Waiver* | Net Annual Rate |
| White Oak Select Growth Fund | 0.74% | 0.74% | |
| Pin Oak Equity Fund | 0.74% | 0.74% | |
| Rock Oak Core Growth Fund | 0.74% | (0.40%) | 0.34% |
| River Oak Discovery Fund | 0.90% | (0.16%) | 0.74% |
| Red Oak Technology Select Fund | 0.74% | 0.74% | |
| Black Oak Emerging Technology Fund | 0.74% | 0.74% | |
| Live Oak Health Sciences Fund | 0.74% | 0.74% | |
U.S. Bank N.A. acts as custodian (the “Custodian”) for the Funds.
| Annual Report | October 31, 2016 | 65 |
| Notes to Financial Statements |
As of October 31, 2016
7. INVESTMENT TRANSACTIONS:
The cost of security purchases and the proceeds from security sales, other than short–term investments, for the year ended October 31, 2016, were as follows:
| Fund | Purchases | Sales | ||||||
| White Oak Select Growth Fund | $ | 34,790,261 | $ | 47,403,033 | ||||
| Pin Oak Equity Fund | 17,449,876 | 10,273,656 | ||||||
| Rock Oak Core Growth Fund | 742,848 | 1,454,755 | ||||||
| River Oak Discovery Fund | 2,484,427 | 2,713,851 | ||||||
| Red Oak Technology Select Fund | 38,474,043 | 8,670,013 | ||||||
| Black Oak Emerging Technology Fund | 10,389,483 | 13,018,073 | ||||||
| Live Oak Health Sciences Fund | 13,248,861 | 7,448,336 | ||||||
8. FEDERAL INCOME TAXES AND TAX BASIS INFORMATION:
Each of the Funds is classified as a separate taxable entity for Federal income tax purposes. Each of the Funds intends to continue to qualify as a separate “regulated investment company” under Sub–chapter M of the Internal Revenue Code of 1986, as amended, and make the requisite distributions to shareholders that will be sufficient to relieve it from Federal income tax and Federal excise tax. Therefore, no Federal tax provision is required.
The amounts of dividends from net investment income and distributions from net realized capital gains are determined in accordance with Federal income tax regulations, which may differ from those amounts determined under accounting principles generally accepted in the United States of America. These book/tax differences are either temporary or permanent in nature. The character of dividends from net investment income or distributions from net realized gains made during the year, and the timing may differ from the year that the income or realized gains (losses) were recorded by the Funds. To the extent these differences are permanent, adjustments are made to the appropriate equity accounts in the period that the differences arise. These differences are primarily due to differences in the treatment of net operating losses and certain other investments.
Accordingly, the following permanent differences have been reclassified to/from the following accounts:
| Undistributed Ordinary Income | Accumulated Capital Gain/(Loss) | Paid-in Capital | ||||||||||
| White Oak Select Growth Fund | $ | – | $ | – | $ | – | ||||||
| Pin Oak Equity Fund | – | – | – | |||||||||
| Rock Oak Core Growth Fund | 892 | (892 | ) | – | ||||||||
| River Oak Discovery Fund | 51,579 | – | (51,579 | ) | ||||||||
| Red Oak Technology Select Fund | – | – | – | |||||||||
| Black Oak Emerging Technology Fund | 126,980 | (126,980 | ) | – | ||||||||
| Live Oak Health Sciences Fund | 1,508,822 | (2,119,982 | ) | 611,160 | ||||||||
| 66 | 1-888-462-5386 | www.oakfunds.com |
| Notes to Financial Statements |
As of October 31, 2016
Included in the amounts reclassified was a net operating loss offset to Paid-in Capital of:
| Amount | ||||
| River Oak Discovery Fund | $ | 51,622 | ||
These reclassifications have no impact on net assets or the results of operations. The Funds had permanent book/tax differences primarily attributable to net operating losses and certain other investments.
The tax character of the distributions paid by the Funds for the fiscal year ended October 31, 2016 is as follows:
| Ordinary Income | Long-Term Capital Gain | Total | ||||||||||
| White Oak Select Growth Fund | $ | 1,677,212 | $ | – | $ | 1,677,212 | ||||||
| Pin Oak Equity Fund | 762,856 | 2,912,364 | 3,675,220 | |||||||||
| Rock Oak Core Growth Fund | 59,403 | 176,119 | 235,522 | |||||||||
| River Oak Discovery Fund | 14,162 | – | 14,162 | |||||||||
| Red Oak Technology Select Fund | 1,455,611 | 4,075,253 | 5,530,864 | |||||||||
| Black Oak Emerging Technology Fund | – | 944,209 | 944,209 | |||||||||
| Live Oak Health Sciences Fund | 2,290,226 | 6,501,251 | 8,791,477 | |||||||||
The tax character of the distributions paid by the Funds for the fiscal year ended October 31, 2015 is as follows:
| Ordinary Income | Long-Term Capital Gain | Total | ||||||||||
| White Oak Select Growth Fund | $ | 4,050,002 | $ | – | $ | 4,050,002 | ||||||
| Pin Oak Equity Fund | 1,190,590 | – | 1,190,590 | |||||||||
| Rock Oak Core Growth Fund | 26,752 | 588,577 | 615,329 | |||||||||
| River Oak Discovery Fund | 647,427 | 2,308,561 | 2,955,988 | |||||||||
| Red Oak Technology Select Fund | 1,415,013 | – | 1,415,013 | |||||||||
| Black Oak Emerging Technology Fund | – | – | – | |||||||||
| Live Oak Health Sciences Fund | 329,908 | 4,718,532 | 5,048,440 | |||||||||
As of October 31, 2016, the components of distributable earnings on a tax basis were as follows:
| Undistributed Net Investment Income | Accumulated Capital Gains/(Losses) | Unrealized Appreciation/ (Depreciation) | Cumulative Effect of Timing Differences | Total | ||||||||||||||||
| White Oak Select Growth Fund | $ | 2,283,775 | $ | (8,281,596 | ) | $ | 25,079,232 | $ | – | $ | 19,081,411 | |||||||||
| Pin Oak Equity Fund | 665,646 | 1,894,922 | 18,182,665 | – | 20,743,233 | |||||||||||||||
| Rock Oak Core Growth Fund | 43,898 | (86,825 | ) | 2,064,311 | – | 2,021,384 | ||||||||||||||
| River Oak Discovery Fund | – | (48,386 | ) | 2,962,969 | (50,960 | ) | 2,863,623 | |||||||||||||
| Annual Report | October 31, 2016 | 67 |
Notes to Financial Statements
As of October 31, 2016
| Undistributed Net Investment Income | Accumulated Capital Gains/(Losses) | Unrealized Appreciation/ (Depreciation) | Cumulative Effect of Timing Differences | Total | ||||||||||||||||
| Red Oak Technology Select Fund | $ | 880,496 | $ | 2,516,067 | 52,619,252 | – | 56,015,815 | |||||||||||||
| Black Oak Emerging Technology Fund | 160,799 | 1,145,269 | 9,761,230 | – | 11,067,298 | |||||||||||||||
| Live Oak Health Sciences Fund | 227,008 | 906,749 | 12,723,829 | – | 13,857,586 | |||||||||||||||
At October 31, 2016, the Funds had capital loss carryforwards available to offset future realized capital gains through the indicated expiration dates:
| White Oak Select Growth Fund | Pin Oak Equity Fund | Rock Oak Core Growth Fund | River Oak Discovery Fund | Red Oak Technology Select Fund | Black Oak Emerging Technology Fund | Live Oak Health Sciences Fund | ||||||||||||||||||||||
| 2017 | $ | 8,281,596 | $ | – | $ | – | $ | – | $ | – | $ | – | $ | – | ||||||||||||||
| Total | $ | 8,281,596 | $ | – | $ | – | $ | – | $ | – | $ | – | $ | – | ||||||||||||||
For Federal income tax purposes, capital loss carryforwards may be carried forward indefinitely and applied against future capital gains.
| Fund | Short-Term | Long-Term | ||||||
| White Oak Select Growth Fund | $ | – | $ | – | ||||
| Pin Oak Equity Fund | – | – | ||||||
| Rock Oak Core Growth Fund | 86,825 | – | ||||||
| River Oak Discovery Fund | – | 48,386 | ||||||
| Red Oak Technology Select Fund | – | – | ||||||
| Black Oak Emerging Technology Fund | – | – | ||||||
| Live Oak Health Sciences Fund | – | – | ||||||
During the year ended October 31, 2016, the Funds utilized the following capital loss carryforwards:
| Used October 31, 2016 | White Oak Select Growth Fund | Pin Oak Equity Fund | Rock Oak Core Growth Fund | River Oak Discovery Fund | Red Oak Technology Select Fund | Black Oak Emerging Technology Fund | Live Oak Health Sciences Fund | |||||||||||||||||||||
| $ | (16,035,475 | ) | $ | – | $ | – | $ | – | $ | – | $ | – | $ | – | ||||||||||||||
| 68 | 1-888-462-5386 | www.oakfunds.com |
Notes to Financial Statements
As of October 31, 2016
The following Fund elected to defer to the year ending October 31, 2017, late year ordinary losses in the amount of:
| Amount | ||||
| River Oak Discovery Fund | $ | 50,960 | ||
At October 31, 2016, the total cost of securities for Federal income tax purposes and the aggregate gross unrealized appreciation and depreciation for securities held by the Funds is as follows:
| Federal Tax Cost | Aggregate Gross Appreciation | Aggregate Gross Depreciation | Net Appreciation | |||||||||||||
| White Oak Select Growth Fund | $ | 226,418,121 | $ | 43,456,602 | $ | (18,377,370 | ) | $ | 25,079,232 | |||||||
| Pin Oak Equity Fund | 91,790,462 | 21,360,779 | (3,178,114 | ) | 18,182,665 | |||||||||||
| Rock Oak Core Growth Fund | 5,203,525 | 2,268,875 | (204,564 | ) | 2,064,311 | |||||||||||
| River Oak Discovery Fund | 9,375,525 | 4,014,244 | (1,051,275 | ) | 2,962,969 | |||||||||||
| Red Oak Technology Select Fund | 136,463,482 | 54,375,266 | (1,756,014 | ) | 52,619,252 | |||||||||||
| Black Oak Emerging Technology Fund | 23,196,756 | 10,306,826 | (545,596 | ) | 9,761,230 | |||||||||||
| Live Oak Health Sciences Fund | 43,257,763 | 14,318,966 | (1,595,137 | ) | 12,723,829 | |||||||||||
Management evaluates the Funds’ tax positions to determine if the taken tax positions meet the minimum recognition threshold by measuring and recognizing tax liabilities in the Financial Statements. The threshold is established by accounting for uncertainties in income tax positions, taken or expected. Recognition of tax benefits of an uncertain tax position is required only when the position is “more likely than not” to be sustained assuming examination by taxing authorities. The Funds recognize interest and penalties, if any, related to unrecognized tax benefits as income tax expense in the Statements of Operations. During the year, the Funds did not incur any interest or penalties.
Management has analyzed the Funds’ tax position taken on federal income tax returns for all open tax years (current and prior three tax years) and has concluded that as of and for the year ended October 31, 2016, no provision for income tax would be required in the Funds’ financial statements. The Funds’ federal and state income and federal excise tax returns for tax years (current and prior three tax years) for which the applicable statutes of limitations have not expired are subject to examination by the Internal Revenue Service and state departments of revenue.
9. CONCENTRATION OF CREDIT RISK AND OWNERSHIP:
The Red Oak Technology Select Fund and the Black Oak Emerging Technology Fund invest a substantial portion of their assets in securities in the technology industry. The Live Oak Health Sciences Fund invests a substantial portion of its assets in securities in the health care, medicine and life sciences industries. Therefore, each of these Funds may be more affected by economic developments in those industries than a general equity fund would be.
In the normal course of business, the Funds enter into contracts that provide general indemnifications. The Funds’ maximum exposure under these arrangements is dependent on future claims that may be made against the Funds and, therefore, cannot be established; however based on experience, the risk of loss from such claims is considered remote.
| Annual Report | October 31, 2016 | 69 |
Notes to Financial Statements
As of October 31, 2016
From time to time, the Funds may have a concentration of several shareholders holding a significant percentage of shares outstanding. Investment activities of these shareholders could have a material impact on the Fund.
As of October 31, 2016, the James D. Oelschlager Trust owned 41.60% of the River Oak Discovery Fund.
10. TRUSTEE AND OFFICERS FEES:
As of October 31, 2016, there were seven Trustees, five of whom are not “interested persons” (within the meaning of the 1940 Act) of the Trust (the “Independent Trustees”). For the period from November 1, 2015 to December 31, 2015, each Independent Trustee received a retainer at an annual rate of $30,000 per year, was also paid a fee of $2,000 for each meeting of the Board of Trustees attended or participated in person, and/or was also paid $1,000 per attendance at each telephonic board meeting, as applicable. Each Independent Trustee was also entitled to be paid an additional $1,000 per telephonic or in-person meeting at which they receive and review preliminary materials provided in connection with the annual continuation of the advisory agreement in accordance with Section 15(c) of the 1940 Act, as applicable, though no such meetings took place during the period from November 1, 2015 to December 31, 2015. For the period from November 1, 2015 to December 31, 2015, the chairperson of the Audit Committee received an additional retainer at the rate of $500 per calendar quarter during which an Audit Committee Meeting was held and the Lead Independent Trustee received an additional retainer at the rate of $1,500 per calendar quarter.
Effective January 1, 2016, each Independent Trustee receives a retainer at an annual rate of $30,000 per year. Also effective January 1, 2016, each Independent Trustee is also paid a fee of $3,500 for each meeting of the Board of Trustees attended or participated in person, and/or is also paid $1,000 per attendance at each telephonic board meeting, as applicable. Each Independent Trustee is paid $4,000 per telephonic or in-person meeting at which they receive and review preliminary materials provided in connection with the annual continuation of the advisory agreement in accordance with Section 15(c) of the 1940 Act. The chairperson of the Audit Committee receives an additional retainer of $1,000 per calendar quarter during which an Audit Committee Meeting is held and the Lead Independent Trustee receives an additional retainer of $3,500 per calendar quarter. The increases in scheduled fees paid to the Independent Trustees that became effective on January 1, 2016, as described above, will be implemented over the next three calendar years at a rate of one-third of the total increase each year.
The Independent Trustees who do not serve as chairpersons of the applicable Board committee are not paid an additional fee from the Trust for attendance at and/or participation in such meetings of the various committees of the Board. The Independent Trustees are also reimbursed for meeting-related expenses. Officers of the Trust and Trustees who are interested persons of the Trust receive no salary or fees from the Trust.
11. INDEMNIFICATIONS:
Under the Trust’s organizational documents, its officers and Trustees are indemnified against certain liability arising out of the performance of their duties to the Trust. Additionally, in the normal course of business, the Trust enters into contracts with service providers that may contain general indemnification clauses, which may permit indemnification to the extent permissible under applicable law. The Trust’s maximum exposure under these arrangements is unknown, as this would involve future claims that may be made against the Trust that have not yet occurred.
| 70 | 1-888-462-5386 | www.oakfunds.com |
Notes to Financial Statements
As of October 31, 2016
12. SUBSEQUENT EVENTS:
On December 14, 2016, The Funds declared an ordinary dividend, short-term capital gains and long-term capital gains, which were payable on December 15, 2016. Please see the below table for the distribution amounts:
| Fund | Ordinary Dividend Total | Short-Term Capital Gain Total | Long-Term Capital Gain Total | |||||||||
| White Oak Select Growth Fund | $ | 2,687,021 | $ | – | $ | – | ||||||
| Pin Oak Equity Fund | $ | 827,884 | $ | 4,676 | $ | 1,894,933 | ||||||
| Rock Oak Core Growth Fund | $ | 54,642 | $ | – | $ | – | ||||||
| River Oak Discovery Fund | $ | – | $ | – | $ | – | ||||||
| Red Oak Technology Select Fund | $ | 993,217 | $ | 16,195 | $ | 2,516,143 | ||||||
| Black Oak Emerging Technology Fund | $ | 9,364 | $ | 160,840 | $ | 1,145,326 | ||||||
| Live Oak Health Sciences Fund | $ | 315,657 | $ | – | $ | 906,767 | ||||||
Management has evaluated subsequent events through the issuance of these financial statements and has noted no such events except the subsequent distribution disclosed above and the passing away of one of the Trust's Trustees, Robert P. Stephans, as mentioned in the Trustees of the Trust table on pages 74 and 75.
| Annual Report | October 31, 2016 | 71 |
Report of Independent Registered Public Accounting Firm
To the Shareholders and Board of Trustees of
Oak Associates Funds
We have audited the accompanying statements of assets and liabilities, including the schedules of investments, of Oak Associates Funds comprising White Oak Select Growth Fund, Pin Oak Equity Fund, Rock Oak Core Growth Fund, River Oak Discovery Fund, Red Oak Technology Select Fund, Black Oak Emerging Technology Fund, and Live Oak Health Sciences Fund (the “Funds”) as of October 31, 2016, and the related statements of operations for the year then ended, the statements of changes in net assets for each of the two years in the period then ended, and the financial highlights for each of the five years in the period then ended. These financial statements and financial highlights are the responsibility of the Funds’ management. Our responsibility is to express an opinion on these financial statements and financial highlights based on our audits.
We conducted our audits in accordance with the standards of the Public Company Accounting Oversight Board (United States). Those standards require that we plan and perform the audit to obtain reasonable assurance about whether the financial statements and financial highlights are free of material misstatement. An audit includes examining, on a test basis, evidence supporting the amounts and disclosures in the financial statements. Our procedures included confirmation of securities owned as of October 31, 2016, by correspondence with the custodian and brokers. An audit also includes assessing the accounting principles used and significant estimates made by management, as well as evaluating the overall financial statement presentation. We believe that our audits provide a reasonable basis for our opinion.
In our opinion, the financial statements and financial highlights referred to above present fairly, in all material respects, the financial position of each of the Funds constituting Oak Associates Funds, as of October 31, 2016, the results of their operations for the year then ended, the changes in their net assets for each of the two years in the period then ended, and the financial highlights for each of the five years in the period then ended, in conformity with accounting principles generally accepted in the United States of America.

COHEN & COMPANY, LTD.
Cleveland, Ohio
December 20, 2016
| 72 | 1-888-462-5386 | www.oakfunds.com |
Additional Information
As of October 31, 2016 (Unaudited)
UNAUDITED TAX INFORMATION:
The White Oak Select Growth Fund, Rock Oak Core Growth Fund, Pin Oak Equity Fund, River Oak Discovery Fund, Red Oak Technology Select Fund, Black Oak Emerging Technology Fund, and Live Oak Health Sciences Fund designate 100%, 100%, 100%, 0%, 100%, 0%, and 100%, respectively, of the income dividends distributed between January 1, 2015 and December 31, 2015, as qualified dividend income (QDI) as defined in Section 1(h)(11) of the Internal Revenue Code.
Pursuant to Section 854(b)(2) of the Internal Revenue Code, the White Oak Select Growth Fund, Rock Oak Core Growth Fund, Pin Oak Equity Fund, River Oak Discovery Fund, Red Oak Technology Select Fund, Black Oak Emerging Technology Fund, and Live Oak Health Sciences Fund designate 91.49%, 100%, 100%, 0%, 100%, 0%, and 80.79%, respectively, of the ordinary income dividends distributed between January 1, 2015 and December 31, 2015, as qualifying for the corporate dividends received deduction.
In early 2016, if applicable, shareholders of record should have received this information for the distributions paid to them by the Fund during the calendar year 2015 via Form 1099. The Fund will notify shareholders in early 2017 of amounts paid to them by the Fund, if any, during the calendar year 2016.
Pursuant to Section 852(b)(3) of the Internal Revenue Code, the Rock Oak Core Growth Fund, Pin Oak Equity Fund, Black Oak Emerging Technology Fund, Red Oak Technology Select Fund, and Live Oak Health Sciences Fund designated $176,119, $2,912,364, $944,209, $4,075,253, and $6,501,251 as long-term capital gain dividends respectively.
| Annual Report | October 31, 2016 | 73 |
Additional Information
As of October 31, 2016 (Unaudited)
TRUSTEES OF THE TRUST
Name & Age(1) | Position Held with Trust | Length of Time Served (Yrs.)(2) | Number of Portfolios in Fund Complex Overseen by Board Member(3) | Principal Occupation(s) During Past Five Years | Other Directorships Held by Board Member(4) |
J. John Canon (81) | Trustee | 15 | 7 | Retired. Member of Board, Proconex (process control equipment), 1985 – 2007; President and Chairman of the Board, Synergistic Partners, Inc. (technology for information management), 1975 – 1999. | None |
| Thomas E. Gretter, MD (81) | Trustee | 14 | 7 | Physician, Cleveland Clinic (Health Care) since 1966. | None |
James D. Oelschlager(5) (74) | Trustee, Chairman | 15 | 7 | Managing Member, President, CO-CIO (since October 9, 2014); CIO and Founder of Oak Associates, ltd. since 1985. | None |
John G. Stimpson(5) (74) | Trustee | 15 | 7 | Retired since 1993. Board of Directors, Morgan Stanley Trust Company, 1988 – 1993; Director of International Equity Sales and Equity Sales Manager, Salomon Brothers (New York) from 1985 – 1993. | None |
Pauline F. Ramig (76) | Trustee | 8 | 7 | Financial Planning Practitioner, Ramig Financial Planning since 1991. | None |
Robert P. Stephans  (73) | Trustee | 8 | 7 | Retired since June 2008. CPA for Stephans, Kun & Co., Certified Public Accountants, 1987 – 2008; Partner, Case, Sabatini and Stephans PC, 1980 – 1987. | None |
Michael R. Shade (68) | Trustee | 8 | 7 | Attorney at Law; Partner, Shade & Shade since December, 1979. | None |
| 74 | 1-888-462-5386 | www.oakfunds.com |
Additional Information
As of October 31, 2016 (Unaudited)
1 | Each Trustee may be contacted in writing to the Trustee c/o Oak Associates Funds, 3875 Embassy Parkway, Suite 250, Akron, OH 44333. Each Officer may be contacted in writing to the Officer c/o ALPS Fund Services, Inc., 1290 Broadway Suite 1100, Denver, CO 80203. |
2 | Each Trustee shall hold office during the lifetime of this Trust until the election and qualification of his or her successor, or until he or she sooner dies, resigns or is removed in accordance with the Trust’s Declaration of Trust. |
3 | The “Oak Associates Funds Complex” consists of all series of the Trust for which Oak Associates, ltd. serves as investment adviser. As of October 31, 2016, the Oak Associates Funds Complex consisted of 7 Funds. |
4 | Directorships of companies are required to report to the Securities and Exchange Commission under the Securities Exchange Act of 1934 (i.e., “public companies”) or other investment companies registered under the Investment Company Act of 1940. |
5 | Messrs. Oelschlager and Stimpson are considered “interested” persons of the Trust as that term is defined in the Investment Company Act of 1940. Mr. Oelschlager is interested by virtue of his controlling ownership interest in the Adviser. Mr. Stimpson is considered interested because of his family relationship with an employee of the Adviser. |
| On December 18, 2016, Robert P. Stephans, an incredible person and valued Trustee, passed away unexpectedly. He will be greatly missed and the Trust thanks him for his dedication and service to our shareholders. |
| Annual Report | October 31, 2016 | 75 |
Additional Information
As of October 31, 2016 (Unaudited)
OFFICERS OF THE TRUST
Name & Age(1) | Position Held with Trust | Length of Time Served (Yrs.) | Number of Portfolios in Fund Complex Overseen by Board Member | Principal Occupation(s) During Past Five Years | Other Directorships Held |
Charles A. Kiraly(2) (46) | President/ Chief Executive Officer | 2 | N/A | Director of Mutual Fund Operations at Oak Associates, ltd. since July 2014; Vice President and Senior Fund Administrator at PNC Capital Advisors, LLC from August 2006 to June 2014. Compliance Analyst III at Victory Capital Management Inc. from August 2005 to July 2006. Vice President for Fairport Asset Management, LLC from April 1996 to August 2005. | N/A |
Margaret L. Ballinger(2) (63) | Chief Compliance Officer | 1 | N/A | Chief Compliance Officer since December 2014 and Chief Operating Officer since 1996 for Oak Associates, ltd. Co-founder of Oak Associates, ltd. In 1985. | N/A |
Pete Greenly (47) | Treasurer/ Principal Financial Officer | 4 | N/A | Fund Controller, ALPS Fund Services, Inc. since June 2012; Manager of Valuations with Great West Life and Annuity from 2011 to 2012. | N/A |
Karen Gilomen (46) | Secretary | 5 months | N/A | Senior Counsel and Vice President, ALPS Fund Services, Inc. since August 2016, Vice President, General Counsel and Chief Compliance Officer at Monticello Associates from 2010 to 2016. | N/A |
| 76 | 1-888-462-5386 | www.oakfunds.com |
Additional Information
As of October 31, 2016 (Unaudited)
1 | Each Officer may be contacted in writing to the Officer c/o ALPS Fund Services, Inc., 1290 Broadway Suite 1100, Denver, CO 80203. |
2 | Mr. Kiraly and Ms. Ballinger are considered to be “affiliates” of the Adviser by virtue of their employment by the Adviser. |
For more information regarding the Trustees, please refer to the Statement of Additional Information, which is available upon request by calling 1-888-462-5386 or on the Funds' website at www.oakfunds.com.
| Annual Report | October 31, 2016 | 77 |
OAK ASSOCIATES FUNDS
This Page Intentionally Left Blank
CONTACT US
By Mail
Oak Associates Funds
P.O. Box 8233
Denver, CO 80201-8233
By Telephone 1-888-462-5386 Monday through Friday, 9:00 a.m. to 8:00 p.m. ET
On The Web www.oakfunds.com
Click on the My Oak Account section to take advantage of these features:
| · | Trade Online |
| · | Access and Update Account Information |
| · | Go Paperless with eDelivery |
| · | View and download account history |
| · | Establish a systematic investment plan |
The Trust files its complete schedule of portfolio holdings of each Fund with the Securities and Exchange Commission for the first and third quarters of each fiscal year on Form N-Q within sixty days after the end of the period. The Trust’s Form N-Q is available on the Commission’s website at http://www.sec.gov, and may be reviewed and copied at the Commission’s Public Reference Room in Washington DC. Information on the operation of the Public Reference Room may be obtained by calling 1-800-SEC-0330.
A description of the policies and procedures that the Funds use to determine how to vote proxies relating to portfolio securities, as well as information relating to how a Fund voted proxies relating to portfolio securities during the most recent 12-month period ended June 30, is available (i) without charge, upon request, by calling 1-888- 462-5386; and (ii) on the Commission’s website at http://www.sec.gov.
This report has been prepared for Oak Associates Funds Shareholders and may be distributed to others only if preceded or accompanied by a prospectus.
Oak Associates Funds are distributed by ALPS Distributors, Inc.

Item 2. Code of Ethics.
| (a) | The Registrant, as of the end of the period covered by this report, has adopted a code of ethics that applies to the Registrant's principal executive officer, principal financial officer, principal accounting officer or controller or any persons performing similar functions on behalf of the Registrant. |
| (b) | Not applicable to Registrant. |
| (c) | During the period covered by this report, no amendments were made to the provisions of the code of ethics adopted in 2(a) above. |
| (d) | During the period covered by this report, no implicit or explicit waivers to the provisions of the code of ethics adopted in 2(a) above were granted. |
| (e) | Not applicable to Registrant. |
| (f) | The Registrant's Code of Ethics is attached as Exhibit 2(f). |
Item 3. Audit Committee Financial Expert.
The Registrant's board of trustees has determined that Robert Stephans, a member of the Registrant's audit committee, was an audit committee financial expert during the reporting period and until his death on December 18, 2016. Mr. Stephens was “independent” as defined in Form N-CSR Item 3(a)(2). The Registrant's board of trustees has not yet determined whether another of its members is an audit committee financial expert.
Item 4. Principal Accountant Fees and Services.
The principal accountant fees for the fiscal years ended October 31, 2016 and 2015 were collected by Cohen & Company, Ltd. The Trust aggregate fees for services rendered to the Trust for the last two fiscal years are as follows:
| (a) | Audit Fees: The aggregate fees billed for each of the last two fiscal years for professional services rendered by the applicable principal accountant for the audit of the Registrant's annual financial statements or services that are normally provided by the accountant in connection with statutory and regulatory filings or engagements for fiscal years 2016 and 2015 were $80,500 and $80,500, respectively. |
| (b) | Audit-Related Fees: The aggregate fees billed in each of the last two fiscal years for assurance and related services by the applicable principal accountant that are reasonably related to the performance of the audit of the Registrant's financial statements and are not reported under paragraph (a) of this Item for fiscal years 2016 and 2015 were $0 and $0, respectively. |
| (c) | Tax Fees: The aggregate fees billed in each of the last two fiscal years for professional services rendered by the applicable principal accountant for tax compliance, tax advice and tax planning for fiscal years 2016 and 2015 were $14,000 and $14,000, respectively. |
| (d) | All Other Fees: The aggregate fees billed in each of the last two fiscal years for products and services provided by the applicable principal accountant, other than the services reported in paragraphs (a) through (c) of this Item, for fiscal years 2016 and 2015 were $0 and $0, respectively. |
| (e)(1) | Not Applicable. |
| (e)(2) | No services described in paragraphs (b) through (d) of this Item were approved by the Registrant’s audit committee pursuant to paragraph (c)(7)(i)(C) of Rule 2-01 of Regulation S-X. |
| (f) | Not applicable to Registrant. |
| (g) | The aggregate non-audit fees and services billed by the applicable principal account for fiscal years 2016 and 2015 were $0 and $0, respectively. |
| (h) | During the past fiscal year, the Registrant's principal accountant did not report to the Registrant's audit committee the existence of any non-audit services that were provided to either the Registrant's investment adviser or to any entity controlling, controlled by, or under common control with the Registrant's investment adviser that provided ongoing services to the Registrant. |
Item 5. Audit Committee of Listed Registrants.
Not applicable to open-end management investment companies.
Item 6. Schedule of Investments.
| (a) | Schedule of Investments in securities of unaffiliated issuers as of the close of the reporting period is included as part of the Report to Stockholders filed under Item 1 of this Form N-CSR. |
| (b) | Not applicable. |
Item 7. Disclosure of Proxy Voting Policies and Procedures for Closed-End Management Investment Companies.
Not applicable to open-end management investment companies.
Item 8. Portfolio Managers of Closed-End Management Investment Companies.
Not applicable to open-end management investment companies.
Item 9. Purchases of Equity Securities by Closed-End Management Investment Companies and Affiliated Purchasers.
Not applicable to open-end management investment companies.
Item 10. Submission of Matters to a Vote of Security Holders.
None.
Item 11. Controls and Procedures.
(a) The Registrant's principal executive and principal financial officers, or persons performing similar functions, regarding the effectiveness of the Registrant's disclosure controls and procedures (as defined in Rule 30a-3(c) under the Act (17 CFR 270.30a-3(c))) as of a date within 90 days of the filing date of the report that includes the disclosure required by this paragraph, based on the evaluation of these controls and procedures required by Rule 30a-3(b) under the Act (17 CFR 270.30a-3(b)) and Rules 13a-15(b) or 15d-15(b) under the Exchange Act (17 CFR 240.13a-15(b) or 240.15d-15(b)).
(b) There has been no change in the Registrant's internal control over financial reporting (as defined in Rule 30a-3(d) under the Act (17 CFR 270.30a-3(d)) that occurred during the second fiscal quarter of the period covered by this report that has materially affected, or is reasonably likely to materially affect, the Registrant's internal control over financial reporting.
Item 12. Exhibits.
(a)(1) Code of Ethics attached hereto as Exhibit 2(f).
(a)(2) A separate certification for the principal executive officer and the principal financial officer of the Registrant as required by Rule 30a-2(a) under the Investment Company Act of 1940, as amended (17 CFR 270.30a-2(a)), are filed herewith.
(a)(3) None.
(b) Officer certifications as required by Rule 30a-2(b) under the Investment Company Act of 1940, as amended (17 CFR 270.30a-2(b)) are filed herewith.
SIGNATURES
Pursuant to the requirements of the Securities Exchange Act of 1934 and the Investment Company Act of 1940, the Registrant has duly caused this report to be signed on its behalf by the undersigned, thereunto duly authorized.
OAK ASSOCIATES FUNDS
| By | /s/ Charles A. Kiraly | |
| Charles A. Kiraly | ||
| President | ||
| Date: | January _, 2017 |
Pursuant to the requirements of the Securities Exchange Act of 1934 and the Investment Company Act of 1940, this report has been signed below by the following persons on behalf of the Registrant and in the capacities and on the dates indicated.
| By | /s/ Charles A. Kiraly | |
| Charles A. Kiraly | ||
| President and Principal Executive Officer | ||
| Date: | January _, 2017 |
| By | /s/ Pete Greenly | |
| Pete Greenly | ||
| Treasurer and Principal Financial Officer | ||
| Date: | January _, 2017 |