UNITED STATES
SECURITIES AND EXCHANGE COMMISSION
Washington, D.C. 20549
FORM N-CSR
CERTIFIED SHAREHOLDER REPORT OF REGISTERED
MANAGEMENT INVESTMENT COMPANIES
Investment Company Act file number: 811-08549
Oak Associates Funds
(Exact name of registrant as specified in charter)
3875 Embassy Parkway, Suite 250
Akron, Ohio 44333
(Address of principal executive offices) (Zip code)
Charles A. Kiraly
3875 Embassy Parkway, Suite 250
Akron, Ohio 44333
(Name and address of agent for service)
Registrant’s telephone number, including area code: 1-888-462-5386
Date of fiscal year end: October 31
Date of reporting period: October 31, 2017
Form N-CSR is to be used by management investment companies to file reports with the Commission not later than 10 days after the transmission to stockholders of any report that is required to be transmitted to stockholders under Rule 30e-1 under the Investment Company Act of 1940 (17 CFR 270.30e-1). The Commission may use the information provided on Form N-CSR in its regulatory, disclosure review, inspection and policymaking roles.
A registrant is required to disclose the information specified by Form N-CSR, and the Commission will make this information public. A registrant is not required to respond to the collection of information contained in Form N-CSR unless the Form displays a currently valid Office of Management and Budget ("OMB") control number. Please direct comments concerning the accuracy of the information collection burden estimate and any suggestions for reducing the burden to Secretary, Securities and Exchange Commission, 450 Fifth Street, NW, Washington, DC 20549-0609. The OMB has reviewed this collection of information under the clearance requirements of 44 U.S.C. § 3507.
Item 1. Reports to Stockholders.
| Oak Investment Philosophy |
Oak Associates, ltd., advisor to the Oak Associates Funds, has been managing concentrated, low-turnover portfolios for over 30 years. We appreciate the many long-term shareholders who invest alongside us in the Oak Associates Funds. Oak Associates employees, as well as their friends and families, maintain significant investments in the Funds. As fellow shareholders, we have a vested interest in ensuring that the highest standards are maintained and that the portfolios are positioned for future growth. Here is our approach to investing. | |
 | Long-term focus To us, the appeal of an investment is driven by the long-term fundamentals of the company and its opportunity set, rather than short-term trading factors. We believe that this long-term mindset is increasingly valuable in today’s short-term oriented market. |
| Concentrated portfolios We construct our portfolios with our best ideas, which means that our favorite stock ideas aren’t diluted by investments in less-favored positions. Academic studies have shown that managers gave up performance because they failed to concentrate in their best ideas. Concentration takes discipline, conviction and experience. We continue to adhere to a strategy of concentrated portfolios. |
| Low turnover When we invest in a company, we do so with the intention of holding that stock for several years, not a few quarters. Low turnover can have the effect of minimizing trading costs as well as tempering the natural human instinct to act upon every data point. |
| Independent thinking Being a good investor often requires not doing what the rest of the market is doing. While it’s difficult to go against the crowd – because as humans we are physiologically wired to herd – we believe that long-term outperformance requires it. One benefit of being located in Akron, Ohio (aside from being a great place to live), is that we are removed from the financial centers in other areas of the country, minimizing our chances of being swept up by the herd mentality. We value independent thinking and believe it is beneficial to our investment perspective. |
| The value of a Fund’s investments will vary from day to day in response to the activities of individual companies and general market and economic conditions. Due to a limited number of underlying investments, funds that invest a signification portion of their assets in particular industry sectors or concentrated funds that focus on a particular industry or group of industries are more susceptible to the price movements of any one holding or industry and thus are generally more volatile than a portfolio invested in a wider variety of industries or industry sectors. |
Shareholder Letter
November 30, 2017
Dear Fellow Shareholder:
U.S. economic growth accelerated in 2017, as employment strengthened and the economies of our foreign trade partners improved. Long-awaited progress on wages also materialized, especially at the low end of the wage scale. For years we have heard about increasing income inequality and the need to do something to fix it. It remains a complex issue that has not been fully resolved, but it is interesting that, as it so often does, the free market has started to bring things back into balance on its own.
With no economic recession since 2009 and none in sight, stocks continued their ascent. This economic cycle has been slower moving than ones in the past. Some reasons for this include persistently low inflation, conservative behavior by company managements, and responsible lending practices by banks. While these factors have kept a lid on economic growth, they have also prevented a recession and the correction in stocks that usually accompanies it.
Robust corporate profitability continues to confound many, as margins stay high. This has allowed earnings to compound at a nice pace and for companies to return capital to shareholders in the form of dividends and share buybacks. While most focus on the dividend yields of stocks, we feel the growth in the dividends themselves has been an overlooked story of this bull market. Over the last seven years, S&P 500 dividends per share have grown at a compound annual rate of 11.7%. This translates to more than a doubling in nominal dividends over that period.
Stocks are likely also being helped by a more favorable regulatory environment and prospects for tax reform. As we write this, legislators are working towards an agreement that would lower the corporate tax rate, though it may not pass into law until 2018. Through a high tax rate on companies and a policy that, unlike in other countries, taxes profits earned abroad, the US corporate tax system has put American businesses at a competitive disadvantage for years. Changes to both of these issues are on the table.
The change in market leadership has been notable. For most of 2016 the stocks of lowly valued companies (“value”) outperformed, but almost perfectly in sync with the calendar turning to 2017 conditions changed abruptly, as shares of companies that are growing revenue and earnings at a fast pace (“growth”) started to lead the market. The Russell 3000 is a broad market index with companies of all sizes. Through mid-November, the growth portion of this index was up 23.5% in 2017, while the value portion was up only 5.6%; that is a massive gap. At times, it seems like the market is being dominated by a few huge companies, such as Facebook, Apple, Amazon, Netflix, and Alphabet (Google). We do own some of these stocks, but in general our portfolios don’t perform as well on a relative basis when the market is being led by growth. Over the long-term we expect our approach of investing in attractively-priced stocks to help our performance, as growth on average underperforms over the long-run – though in recent years this has not been the case.
Despite the recent outperformance of growth versus value, our long-term relative returns remain strong. Focusing primarily on our three largest Funds: over the last ten years, White Oak has returned 117% cumulatively, versus 106% for the S&P 500 and 112% for the Lipper Large-Cap Growth Funds Average. Pin Oak has returned 153%, versus 108% for the Russell 3000 and 84% for the Lipper Multi-Cap Core Funds Average. Red Oak has returned 217%, versus 149% for the Lipper Science & Technology Funds Average. Of course these include the painful correction of 2008/2009. The numbers for our Funds and the market since the correction are significantly better, and we implore our shareholders to understand that future returns are very unlikely to be as good. Market valuations are on the high end of the historic range and company profit margins are high. Both of these have created nice tailwinds for stocks in recent years, but their (we are speaking of valuations and margins) upside appears limited from here. That doesn’t mean stocks are a poor long-term
Shareholder Letter
investment – they still offer superior value to bonds and should offer positive returns over the long-term – but we believe it is important to keep expectations in check. We expect stock returns over the next ten years to be well below historical averages.
During the year we completed a successful transition to a new fund administrator, Ultimus Fund Solutions. These folks do all of the back-office work for our mutual funds so that we can focus primarily on the investing part. Our decision to change administrators was done for a variety of reasons and was part of a broader effort to provide high quality service at a reasonable cost to our shareholders. These efforts, along with strong growth in assets during the year, have helped reduce the expense ratios of our Funds, which translates into more money in your pocket.
August marked the 25-year anniversary of the Oak Associates Funds. The Funds were launched because we wanted all investors – not just institutions and high-net-worth individuals – to have the opportunity to invest with Oak. Today our seven mutual funds total more than $1 billion, and we sincerely thank you for helping us build this fund family into what it is today. We feel fortunate to be able to manage your money.
Best regards,

Mark Oelschlager, CFA
Co-Chief Investment Officer and Portfolio Manager
Co-Chief Investment Officer and Portfolio Manager
All investing involves risk. The performance data quoted represents past performance. Past performance does not guarantee future results. The investment return and principal value of an investment will fluctuate so that an Investor’s shares, when redeemed, may be worth more or less than their original cost and current performance may be lower or higher than the performance quoted. Visit www.oakfunds.com/Funds/Performance.aspx for standardized performance, including performance data current to the most recent month-end. The commentary above and later where it appears in this report, is for informational purposes only and does not represent an offer, recommendation or solicitation to buy, hold or sell any security. The specific securities identified and described do not represent all of the securities purchased or sold and you should not assume that investments in the securities identified and discussed will be profitable.
HIGHLIGHTS from the 2017 FISCAL YEAR
October 31, 2016 to October 31, 2017 (Unaudited)
| January 2017 | In “The Journal Report,” The Wall Street Journal recognized White Oak Select Growth, Red Oak Technology Select, Rock Oak Core Growth, and Live Oak Health Sciences among the top 10 best-performing in their Lipper categories based on total returns for 1-year ended 12/31/16. January 9, 2017. In the January 9 Barron’s “Lipper Mutual Fund Quarterly” section, Red Oak Technology Select was the top-performing Science & Technology fund in the fourth quarter of 2016, according to Lipper. Zacks Investment Research highlighted Live Oak Health Sciences among the best-performing healthcare funds of 2016 (“5 Best Performing Healthcare Mutual Funds of 2016”). January 23, 2017. |
| March 2017 | In the annual funds review in the March issue of Kiplinger’s Personal Finance, Pin Oak Equity appeared ranked among top 10 performing large company stock funds for the three-, five- and 10-year periods ended December 31, 2016, according to Morningstar. Pin Oak Equity Fund was highlighted by Mutual Fund Observer, an independent, online publication that analyzes mutual funds – with a special focus on innovative, independent, lesser-known funds. March 2017 edition. Mark Oelschlager commented in a USA Today story on the outlook for the healthcare sector (“Health Care Stocks Regain Footing Amid Fight Over Law: Group is second best in S&P 500 performance in 2017,” p. B1, by Adam Shell). March 21, 2017. Lipper Fund Awards 2017: Lipper recognized Red Oak Technology Select for its Consistently Strong Risk-Adjusted Performance for 10 years as of 11/30/2016 among 104 Science and Technology Funds at the Lipper Awards Ceremony on March 23, 2017. The March 27 issue of Citywire Professional Buyer, a bi-weekly magazine targeted to fund analysts and manager researchers, noted Red Oak Technology Select among top-performing technology funds for the three years through February 28, 2017. Pin Oak Equity and Red Oak Technology Select were included among Investor’s Business Daily’s 2017 “IBD Best Mutual Funds,” a supplement in the March 27 edition. IBD profiled Pin Oak Equity Fund as part of this supplement (“Contrarian Pin Oak Equity Rises to the Top” by Scott Lehtonen). March 27, 2017. Money Management Executive named Pin Oak manager Mark Oelschlager among top ten fund managers to watch. March 27, 2017. |
HIGHLIGHTS from the 2017 FISCAL YEAR
October 31, 2016 to October 31, 2017 (Unaudited)
| April 2017 | Investopedia highlighted Red Oak Technology Select among “top technology mutual fund picks for 2017” (“Top 4 Technology Mutual Funds for 2017,” by Sheila Olson). April 14, 2017. |
| June 2017 | Red Oak Technology Select was featured in MarketWatch’s article, “Google’s stock is still ‘compelling,’ says outperforming tech fund manager.” June 29, 2017 by Philip Van Doorn. |
| August 2017 | An August 22 Investopedia posting included Red Oak Technology Select among four top technology funds for 2017 (“Top 4 Technology Mutual Funds for 2017,” by Sheila Olson). |
| October 2017 | Red Oak Technology Select was named by The Wall Street Journal among best-performing stock funds for the ten-year period ended September 29. October 9, 2017. |
READ MORE AT WWW.OAKFUNDS.COM
TABLE of CONTENTS
| Performance Update | |
| White Oak Select Growth Fund | 2 |
| Pin Oak Equity Fund | 4 |
| Rock Oak Core Growth Fund | 6 |
| River Oak Discovery Fund | 8 |
| Red Oak Technology Select Fund | 10 |
| Black Oak Emerging Technology Fund | 12 |
| Live Oak Health Sciences Fund | 14 |
| Important Disclosures | 16 |
| Disclosure of Fund Expenses | 19 |
| Financial Statements | |
| Schedules of Investments | 20 |
| Statements of Assets and Liabilities | 40 |
| Statements of Operations | 42 |
| Statements of Changes in Net Asset | 44 |
| Financial Highlights | 48 |
| Notes to Financial Statements | 52 |
| Report of Independent Registered Public Accounting Firm | 63 |
| Additional Information | 64 |
White Oak Select Growth Fund
 James D. Oelschlager Co-Chief Investment Officer & Portfolio Manager  Mark W. Oelschlager, CFA Co-Chief Investment Officer & Portfolio Manager  Robert D. Stimpson, CFA Portfolio Manager | White Oak Select Growth Fund (the “Fund”) gained 23.36% for the fiscal year ended October 31, 2017, while the S&P 500® Total Return Index returned 23.63% and the Lipper Large-Cap Growth Funds Average returned 27.29%. For the last ten years, the Fund’s cumulative return was 117.10%, versus 106.38% for the S&P 500® and 111.79% for the Lipper. Near the start of the fiscal year the Federal Reserve followed through with its multi-year admonitions that short-term interest rates would rise with signs of economic stability in the U.S. With the S&P 500® charging to new all-time highs, unemployment at a 10-year low, and high levels of both profits and margins, it was no surprise that the Fed raised rates. The hikes started in December of 2016 with a 25 basis points increase, followed by several additional quarter point rate hikes until the target rate reached 1.25%. Despite the start of the normalization in rates, U.S. stocks climbed strongly over the year. One segment that enjoyed the prospects of higher short-term interest rates and the prospects of a slower economic expansion was large-cap growth stocks. Companies that can demonstrate sales or earnings growth as economic conditions tighten are often assigned higher valuations. Higher rates also hampered higher yielding equity-based investment strategies, with utilities, dividend payers and REITS among the largest underperformers in the year. As a result, financials, a large weighting for the Fund, continued to perform well as higher rates boost net interest margins and earnings power. Technology stocks, another large weighting in the Fund, are also characterized for their growth qualities. Within the Fund, the best-performing holding was KLA-Tencor. The company, which makes process control equipment for semiconductor manufacturing, rose 48% as strength within the technology sector and emerging markets boosted sales. JP Morgan was the second best-performing holding, also gaining 48%, on broad strength across its businesses, improved credit quality and on the prospects of a more favorable regulatory environment. Teva Pharmaceuticals was the worst-performing stock in the Fund. Health care, in general, struggled, due to uncertainty over the current administration’s attempts to repeal and replace Obamacare, as well as vilification of drug companies over pricing. Poor results over the year prompted Teva to cut its dividend, an event that is rarely received well. Looking into 2018, we believe the potential for tax relief and a lower regulatory burden all bode well for corporate profits going forward. President Trump’s proclivity for more protectionist trade policies remains an issue to monitor. Overall, interest rates remain low and corporations continue to demonstrate fiscal restraint that tends to benefit shareholders. Thank you for your investment with Oak Associates Funds. |
Mutual fund investing involves risk, including the possible loss of principal. The value of the Fund’s investments will vary from day to day in response to the activities of individual companies and general market and economic conditions. Because the Fund may invest a significant portion of its assets in particular industry sectors which it believes hold the most potential for favorable returns, poor performance or adverse economic events affecting one or more of these overweighted sectors could have a greater impact on the Fund than it would on another mutual fund with a broader range of investments.
| 2 | 1-888-462-5386 | www.oakfunds.com |
Manager Discussion & Analysis
All data below as of October 31, 2017 (Unaudited)
| Fund Data | |
| Ticker | WOGSX |
| Share Price | $82.36 |
| Total Net Assets | $285.7 M |
| Portfolio Turnover | 12.92% |
| Sector Allocation^ | |
| Information Technology | 41.4% |
| Financials | 32.1% |
| Health Care | 11.8% |
| Consumer Discrectionary | 8.3% |
| Industrials | 3.7% |
| Consumer Staples | 2.0% |
| Energy | 0.2% |
| Cash & Other Assets | 0.5% |
| Top 10 Holdings^ | ||
| 1. | Alphabet, Inc. | 10.7% |
| 2. | Amazon.com, Inc. | 8.3% |
| 3. | Charles Schwab Corp. | 7.4% |
| 4. | KLA-Tencor Corp. | 6.9% |
| 5. | Cisco Systems, Inc. | 6.8% |
| 6. | Amgen, Inc. | 6.6% |
| 7. | Xilinx, Inc. | 5.1% |
| 8. | U.S. Bancorp | 5.0% |
| 9. | JPMorgan Chase & Co. | 4.6% |
| 10. | United Parcel Service, Inc., Class B | 3.7% |
^ Percentages are based on net assets. Holdings are subject to change.
Growth of $10,000 Chart
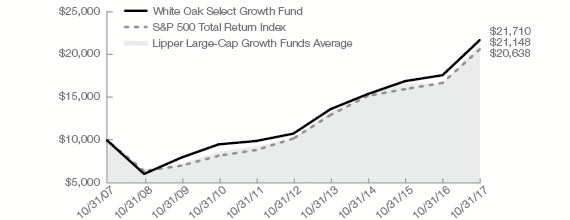
The chart above represents historical performance of a hypothetical investment of $10,000 in the Fund over the past 10 years (or for the life of the Fund if shorter). This chart and the table below do not reflect the deduction of taxes that a shareholder would pay on Fund distributions or the redemption of Fund shares.
| Average Annual Total Return | ||||
| 1 Year Return | 3 Year Return | 5 Year Return | 10 Year Return | |
| White Oak Select Growth Fund | 23.36% | 12.14% | 15.07% | 8.06% |
S&P 500® Total Return Index1 | 23.63% | 10.77% | 15.18% | 7.51% |
Lipper Large-Cap Growth Funds Average2 | 27.29% | 11.21% | 15.56% | 7.71% |
Gross/Net Expense Ratio (per the prospectus): 1.06%
Gross/Net Expense Ratio (as of fiscal year end October 31, 2017): 0.98%
The performance data quoted represents past performance. Past performance does not guarantee future results. The investment return and principal value of an investment will fluctuate so that an investor’s shares, when redeemed, may be worth more or less than their original cost and current performance may be lower or higher than the performance quoted. For performance data current to the most recent month-end, please visit www.oakfunds.com or call 1-888-462-5386.
1 | Standard & Poor’s is the source and owner of the S&P Index data. 2 Lipper Inc. is the source and owner of the Lipper Classification data. See Pages 16 and 17 for additional disclosure. |
| Annual Report | October 31, 2017 | 3 |
Pin Oak Equity Fund
Mark W. Oelschlager, CFA
Co-Chief Investment Officer
Co-Chief Investment Officer
& Portfolio Manager
Pin Oak Equity Fund (the “Fund”) gained 21.86% for the fiscal year ended October 31, 2017, while the Russell 3000® Total Return Index returned 23.98% and the Lipper Multi-Cap Core Funds Average returned 21.97%. For the last ten years, a period that includes one of the worst financial crises in U.S. history, the Fund’s cumulative return was 152.96%, versus 108.16% for the Russell and 84.06% for the Lipper. This was the ninth consecutive fiscal year of positive returns for the Fund, a streak sure to end at some point. When Donald Trump was elected President of the United States in November 2016, it accelerated the upward move in interest rates as well as the rise in financial stocks, both of which were already underway before the election. This also continued the trend in the outperformance of the “value” stocks, or those considered inexpensive on various metrics. All of this helped the Fund outperform in late 2016. But 2017 has been a different story as more growth-oriented factors drew the attention of investors, propelling shares of “growth” companies higher. Pin Oak has some exposure to some of these companies, such as Alphabet (Google) and Amazon, but in general our investing style avoids the faster growers because of their higher embedded expectations and below-average return history. The unfavorable style bias offset the Fund’s strong sector positioning for the year. Our two largest sector weightings, by far, were financials and technology, which also happened to be the two best-performing sectors in the market for the past twelve months. |
As risks in the market have grown, our positioning has become incrementally more defensive, meaning recent purchases have been in areas with more stability. We have had a large exposure to the financial sector for years, and still do, but as the bank stocks have gone from extremely attractive to just attractive, we have trimmed the exposure there. We believe this is prudent risk management.
Leaders during the year included Internet conglomerate IAC/Interactive, whose shares doubled on strong results from online dating business Match and home services operation HomeAdvisor; financial services company Charles Schwab, which benefitted from rising interest rates; and multinational industrial giant Parker Hannifin, who reported accelerating sales growth and rising profit margins.
Laggards included land drilling contractor Nabors, who saw demand for its services slow; advertising company Interpublic Group, whose customers are increasingly turning to alternative channels; and pharmaceutical behemoth GlaxoSmithKline, which faced increasing competition in its respiratory franchise.
Thank you for your investment with Oak Associates Funds.
Mutual fund investing involves risk, including the possible loss of principal. The value of the Fund’s investments will vary from day to day in response to the activities of individual companies and general market and economic conditions. Because the Fund may invest a significant portion of its assets in particular industry sectors which it believes hold the most potential for favorable returns, poor performance or adverse economic events affecting one or more of these overweighted sectors could have a greater impact on the Fund than it would on another mutual fund with a broader range of investments.
| 4 | 1-888-462-5386 | www.oakfunds.com |
Manager Discussion & Analysis
All data below as of October 31, 2017 (Unaudited)
| Fund Data | |
| Ticker | POGSX |
| Share Price | $63.72 |
| Total Net Assets | $222.1 M |
| Portfolio Turnover | 7.55% |
| Sector Allocation^ | |
| Financials | 32.5% |
| Information Technology | 32.0% |
| Consumer Discrectionary | 10.8% |
| Health Care | 8.1% |
| Consumer Staples | 4.4% |
| Energy | 4.2% |
| Industrials | 1.4% |
| Materials | 0.7% |
| Cash & Other Assets | 5.9% |
| Top 10 Holdings^ | ||
| 1. | Alphabet, Inc. | 7.1% |
| 2. | Bank of New York Mellon | 5.6% |
| 3. | Charles Schwab Corp. | 5.0% |
| 4. | Paychex, Inc. | 4.5% |
| 5. | PepsiCo, Inc. | 4.4% |
| 6. | GlaxoSmithKline PLC ADR | 3.7% |
| 7. | Valero Energy Corp. | 3.6% |
| 8. | Travelers Cos., Inc. | 3.6% |
| 9. | IAC/InterActiveCorp | 3.6% |
| 10. | Amdocs Ltd. | 3.5% |
| ^ | Percentages are based on net assets. Holdings are subject to change. |
Growth of $10,000 Chart
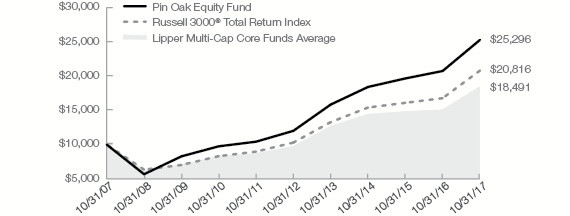
The chart above represents historical performance of a hypothetical investment of $10,000 in the Fund over the past 10 years (or for the life of the Fund if shorter). This chart and the table below do not reflect the deduction of taxes that a shareholder would pay on Fund distributions or the redemption of Fund shares.
| Average Annual Total Return | ||||
| 1 Year Return | 3 Year Return | 5 Year Return | 10 Year Return | |
| Pin Oak Equity Fund | 21.86% | 11.15% | 16.06% | 9.72% |
Russell 3000® Total Return Index1 | 23.98% | 10.53% | 15.12% | 7.61% |
Lipper Multi-Cap Core Funds Average2 | 21.97% | 8.29% | 13.51% | 6.18% |
Gross/Net Expense Ratio (per the prospectus): 1.08%
Gross/Net Expense Ratio (as of fiscal year end October 31, 2017): 0.98%
The performance data quoted represents past performance. Past performance does not guarantee future results. The investment return and principal value of an investment will fluctuate so that an investor’s shares, when redeemed, may be worth more or less than their original cost and current performance may be lower or higher than the performance quoted. For performance data current to the most recent month-end, please visit www.oakfunds.com or call 1-888-462-5386.
1 | Russell Investments is the source and owner of the Russell Index data. 2 Lipper Inc. is the source and owner of the Lipper Classification data. See Pages 16 and 17 for additional disclosure. |
| Annual Report | October 31, 2017 | 5 |
Rock Oak Core Growth Fund
Robert D. Stimpson, CFA
Portfolio Manager
Rock Oak Core Growth Fund (the “Fund”) gained 27.02% for the fiscal year ended October 31, 2017, while the S&P 500® Total Return Index returned 23.63% and the Lipper Multi-Cap Growth Funds Average returned 27.44%. Over the last five years, the Fund has gained 13.70% per year on average. The fiscal year 2017 saw U.S. stocks climb higher on optimism over less regulation, tax reform and continued economic expansion. Despite President Trump’s inability to repeal and replace Obamacare as of this writing, optimism is high that Congress can implement tax reform. While the benefits to the economy or consumers are still uncertain, lower corporate tax rates and the repatriation of overseas capital could reward equity shareholders. The Federal Reserve had been prepping the investor community regarding its intentions to raise the Fed Funds rate for a very long time. Therefore, the December 2016 liftoff surprised no one and failed to thwart U.S. stocks’ advance. However, the likelihood of a higher interest rate environment and slower economic expansion did disproportionately benefit the large-cap growth segment of the market. Companies that demonstrate the ability to grow sales or earnings in a slowing economy often obtain a premium valuation as economic prospects narrow. This cycle was no exception. |
The Fund’s best-performing stock was Wyndham Worldwide, which rose 66%. The global hotel company has benefited from strength not only in the U.S. market, but also from the international market. Western Digital was the Fund’s second best performer. The hard disk drive maker climbed 56%.
The Fund’s largest laggard was media company Discovery Communications, which fell 27%. The outlook for the media industry remains clouded by new online competitors, changing demographics, and internet-based distribution models.
Going forward, Rock Oak remains focused on companies with strong earnings prospects that have also demonstrated a commitment to creating shareholder value. The outlook for U.S. stocks remains attractive in our view due to the low inflation, a stable growth environment and prudent financial management which supports company fundamentals.
Thank you for your investment with Oak Associates Funds.
Mutual fund investing involves risk, including the possible loss of principal. The value of the Fund’s investments will vary from day to day in response to the activities of individual companies and general market and economic conditions. Because the Fund may invest a significant portion of its assets in particular industry sectors which it believes hold the most potential for favorable returns, poor performance or adverse economic events affecting one or more of these overweighted sectors could have a greater impact on the Fund than it would on another mutual fund with a broader range of investments.
| 6 | 1-888-462-5386 | www.oakfunds.com |
Manager Discussion & Analysis
All data below as of October 31, 2017 (Unaudited)
| Fund Data | |
| Ticker | RCKSX |
| Share Price | $16.07 |
| Total Net Assets | $9.2 M |
| Portfolio Turnover | 29.49% |
| Sector Allocation^ | |
| Information Technology | 45.9% |
| Health Care | 17.2% |
| Consumer Discrectionary | 16.1% |
| Financials | 12.2% |
| Industrials | 5.8% |
| Consumer Staples | 2.0% |
| Cash & Other Assets | 0.8% |
| Top 10 Holdings^ | ||
| 1. | Amazon.com, Inc. | 5.7% |
| 2. | DXC Technology Co. | 5.6% |
| 3. | AbbVie, Inc. | 4.9% |
| 4. | SunTrust Banks, Inc. | 4.7% |
| 5. | Netflix, Inc. | 4.4% |
| 6. | L3 Technologies, Inc. | 4.4% |
| 7. | Western Digital Corp. | 4.3% |
| 8. | NetApp, Inc. | 4.2% |
| 9. | Hartford Financial Services Group, Inc. | 4.2% |
| 10. | Wyndham Worldwide Corp. | 4.0% |
| ^ | Percentages are based on net assets. Holdings are subject to change. |
Growth of $10,000 Chart
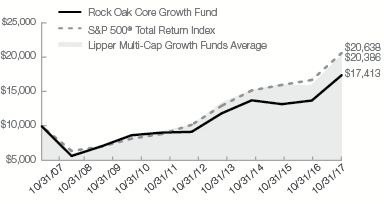 |
This chart represents historical performance of a hypothetical investment of $10,000 in the Fund over the past 10 years (or for the life of the Fund if shorter). This chart and the table below do not reflect the deduction of taxes that a shareholder would pay on Fund distributions or the redemption of Fund shares. Fee waivers are in effect; if they had not been in effect, performance would have been lower.
| Average Annual Total Return | ||||
| 1 Year Return | 3 Year Return | 5 Year Return | 10 Year Return | |
| Rock Oak Core Growth Fund | 27.02% | 8.22% | 13.70% | 5.70% |
S&P 500® Total Return Index1 | 23.63% | 10.77% | 15.18% | 7.51% |
Lipper Multi-Cap Growth Funds Average2 | 27.44% | 10.03% | 14.81% | 7.23% |
Gross/Net Expense Ratio (per the prospectus): 1.65%/1.25%
Gross/Net Expense Ratio (as of fiscal year end October 31, 2017): 1.51%/1.25%
The Adviser has contractually agreed through February 28, 2018, to waive all or a portion of its fee for the Fund (and to reimburse expenses to the extent necessary) in order to limit Fund total operating expenses (excluding interest, taxes, brokerage commissions, Acquired Fund Fees and Expenses) to an annual rate of not more than 1.25% of average daily net assets. This contractual fee waiver may only be terminated subject to approval by the Board of Trustees of the Trust.
The performance data quoted represents past performance. Past performance does not guarantee future results. The investment return and principal value of an investment will fluctuate so that an investor’s shares, when redeemed, may be worth more or less than their original cost and current performance may be lower or higher than the performance quoted. For performance data current to the most recent month-end, please visit www.oakfunds.com or call 1-888-462-5386.
1 | Standard & Poor’s is the source and owner of the S&P Index data. 2 Lipper Inc. is the source and owner of the Lipper Classification data. See Pages 16 and 17 for additional disclosure. |
| Annual Report | October 31, 2017 | 7 |
River Oak Discovery Fund
Robert D. Stimpson, CFA
Portfolio Manager
River Oak Discovery Fund (the “Fund”) gained 22.59% for the fiscal year ended October 31, 2017, while the Russell 2000® Growth Total Return Index returned 31.00% and the Lipper Small-Cap Growth Funds Average returned 29.16%. Over the last five years, the Fund has gained 12.31% per year on average. U.S. stocks rallied strongly in the first part of the fiscal year following the election of President Trump. Prospects for lower regulation and tax relief underscored the initial reaction by U.S. equities. Following the “Trump bump,” small-cap stocks traded sideways for much of 2017, then rallied in the beginning of the fourth quarter. The real beneficiaries within the U.S. market were large-cap stocks, particularly those characterized as growth companies. With the Federal Reserve finally following through on its rhetoric to raise interest rates, the likelihood of a slower economic expansion has caused companies that can demonstrate sales or earnings growth in a tighter monetary environment to receive a premium valuation from investors. |
A combination of low inflation and stable growth has also created an environment favorable to equity investments. Yet, for well over a year now, the Federal Reserve has been preparing investors for higher interest rates and finally began raising rates in December of 2016. Three additional interest rate hikes followed, but failed to thwart U.S. equities. Given the improvements in the stock market and low unemployment rate, which has fallen to a 10-year low of 4.1% as of October 2017, additional rate increases are likely as the Fed seeks to normalize rates and rearm its tool kit.
The Fund’s strongest performer this fiscal year was Kadant Inc., gaining 122%. The recycled paper and fluid management company beat earnings estimates several times during the year. Mercer International, a pulp and paper making company, was the Fund’s second best-performing holding, rising 93%. Both companies began the fiscal year at attractive valuations and may have benefited from the possibility of favorable protectionist policies under the new administration.
The Fund’s worst-performing stock was Endo International, a specialty pharmaceutical company, which lost 66%. Despite its inexpensive valuation, the company is challenged by falling sales, pricing uncertainty and high levels of debts. The position was sold due to its deteriorating financial solvency.
Looking into 2018, investors continue to show a preference for large-cap and growth stocks. We believe this is a distraction, however, which makes what we see as opportunities easier to identify among interesting small-cap stocks. A strong stock market helps boost investor sentiment and generally reduces risk aversion that typically hurts the appetite for the segment. The Fund is committed to seeking out niche companies with a strong commitment to creation of shareholder value.
Thank you for your investment with Oak Associates Funds.
Mutual fund investing involves risk, including the possible loss of principal. The value of the Fund’s investments will vary from day to day in response to the activities of individual companies and general market and economic conditions. Because the Fund may invest a significant portion of its assets in particular industry sectors which it believes hold the most potential for favorable returns, poor performance or adverse economic events affecting one or more of these overweighted sectors could have a greater impact on the Fund than it would on another mutual fund with a broader range of investments.
| 8 | 1-888-462-5386 | www.oakfunds.com |
Manager Discussion & Analysis
All data below as of October 31, 2017 (Unaudited)
| Fund Data | |
| Ticker | RIVSX |
| Share Price | $17.42 |
| Total Net Assets | $14.4 M |
| Portfolio Turnover | 43.50% |
| Sector Allocation^ | |
| Information Technology | 35.7% |
| Financials | 19.2% |
| Health Care | 12.9% |
| Consumer Discrectionary | 12.3% |
| Industrials | 11.3% |
| Materials | 4.4% |
| Consumer Staples | 3.2% |
| Cash & Other Assets | 1.0% |
| Top 10 Holdings^ | ||
| 1. | SolarEdge Technologies, Inc. | 5.9% |
| 2. | Kadant, Inc. | 5.5% |
| 3. | Advanced Energy Industries, Inc. | 5.4% |
| 4. | Assurant, Inc. | 4.4% |
| 5. | Mercer International, Inc. | 4.4% |
| 6. | Fortinet, Inc. | 4.1% |
| 7. | Cirrus Logic, Inc. | 4.1% |
| 8. | Kulicke & Soffa Industries, Inc. | 4.0% |
| 9. | Magellan Health, Inc. | 3.8% |
| 10. | Zions BanCorp | 3.5% |
^ Percentages are based on net assets. Holdings are subject to change.
Growth of $10,000 Chart
 |
The chart represents historical performance of a hypothetical investment of $10,000 in the Fund over the past 10 years (or for the life of the Fund if shorter). This chart and the table below do not reflect the deduction of taxes that a shareholder would pay on Fund distributions or the redemption of Fund shares. Fee waivers are in effect; if they had not been in effect, performance would have been lower.
| Average Annual Total Return | ||||
| 1 Year Return | 3 Year Return | 5 Year Return | 10 Year Return | |
| River Oak Discovery Fund | 22.59% | 7.76% | 12.31% | 5.44% |
Russell 2000® Growth Total Return Index1 | 31.00% | 10.51% | 15.36% | 8.16% |
Lipper Small-Cap Growth Funds Average2 | 29.16% | 9.47% | 13.72% | 7.21% |
Gross/Net Expense Ratio (per the prospectus): 1.51%/1.35%
Gross/Net Expense Ratio (as of fiscal year end October 31, 2017): 1.41% /1.35%
The Adviser has contractually agreed through February 28, 2018, to waive all or a portion of its fee for the Fund (and to reimburse expenses to the extent necessary) in order to limit Fund total operating expenses (excluding interest, taxes, brokerage commissions, Acquired Fund Fees and Expenses) to an annual rate of not more than 1.35% of average daily net assets. This contractual fee waiver may only be terminated subject to approval by the Board of Trustees of the Trust.
The performance data quoted represents past performance. Past performance does not guarantee future results. The investment return and principal value of an investment will fluctuate so that an investor’s shares, when redeemed, may be worth more or less than their original cost and current performance may be lower or higher than the performance quoted. For performance data current to the most recent month-end, please visit www.oakfunds.com or call 1-888-462-5386.
1 | Russell Investments is the source and owner of the Russell Index data. 2 Lipper Inc. is the source and owner of the Lipper Classification data. See Pages 16 and 17 for additional disclosure. |
| Annual Report | October 31, 2017 | 9 |
Red Oak Technology Select Fund
Mark W. Oelschlager, CFA
Co-Chief Investment Officer
Co-Chief Investment Officer
& Portfolio Manager
Red Oak Technology Select Fund (the “Fund”) gained 35.76% for the fiscal year ended October 31, 2017, while the S&P 500 Equal Weight Information Technology Index returned 37.82% and the Lipper Science & Technology Funds Average returned 37.47%. For the last ten years, the Fund’s cumulative return was 217.39%, versus 193.04% for the Index and 148.95% for the Lipper. The 10-year returns demonstrate a wide performance gap between the Fund and its peers. We attribute this to our focus on valuation and earnings sustainability, two factors that are sometimes overlooked in tech investing. The value of a company is the sum of its future profits. Therefore it is important to gauge how durable a company’s business is, especially in a sector like technology where things change so often. This is why we feel it is dangerous to base investment decisions on hot stories, one-year growth rates, and the like. |
Technology was the best-performing sector for the fiscal year, after being second in the previous year and second the year before that. There are 11 market sectors, so this performance by tech stocks the last three years is remarkable. Whether one is talking about the sector, the Fund, or tech fund averages, we believe these returns are unlikely to be duplicated in the coming years.
We have talked for years about how technology companies have been prime beneficiaries of the outsourcing trend, as many have moved to an “asset-light” business model by paying foreign entities to do what the companies can’t do as efficiently. This has driven profit margins and returns on capital higher. For years the market was reluctant to give them credit for this, meaning it was pricing the stocks as if the higher profitability would eventually reverse or be competed away. The reversal hasn’t come, and investors have gradually bought into the idea that the elevated profitability might be somewhat sustainable and pushed valuations higher. The stocks have also been aided recently by hopes for tax reform in the U.S.
The portfolio’s hit rate was high this past year, as more than 3/4 of all positions held for the full twelve months returned more than 25%, including mega-caps Amazon, Alphabet (Google), Facebook, Apple, and Intel. Two stocks whose returns exceeded 100% were semiconductor company NVIDIA, which rose almost 200% on accelerating revenue growth, and Internet conglomerate IAC/Interactive, which saw strength in its online dating segment and home service operation.
Laggards included Qualcomm, which is involved in legal disputes with various entities over the pricing of its CDMA licensing; Juniper Networks, due to struggles in the competitive market for networking equipment; and IT services company IBM, who is trying to manage a transition to cloud-based services.
Thank you for your investment with Oak Associates Funds.
Mutual fund investing involves risk, including the possible loss of principal. The value of the Fund’s investments will vary from day to day in response to the activities of individual companies and general market and economic conditions. Because the Fund may invest a significant portion of its assets in particular industry sectors which it believes hold the most potential for favorable returns, poor performance or adverse economic events affecting one or more of these overweighted sectors could have a greater impact on the Fund than it would on another mutual fund with a broader range of investments.
| 10 | 1-888-462-5386 | www.oakfunds.com |
Manager Discussion & Analysis
All data below as of October 31, 2017 (Unaudited)
| Fund Data | |
| Ticker | ROGSX |
| Share Price | $25.78 |
| Total Net Assets | $486.3 M |
| Portfolio Turnover | 14.63% |
| Sector Allocation^ | |
| Information Technology | 91.2% |
| Consumer Discrectionary | 3.5% |
| Industrials | 1.9% |
| Cash & Other Assets | 3.4% |
| Top 10 Holdings^ | ||
| 1. | Alphabet, Inc. | 9.0% |
| 2. | Intel Corp. | 4.9% |
| 3. | Microsoft Corp. | 4.8% |
| 4. | Facebook, Inc., Class A | 4.8% |
| 5. | Cisco Systems, Inc. | 4.1% |
| 6. | Oracle Corp. | 3.9% |
| 7. | Red Hat, Inc. | 3.8% |
| 8. | Apple, Inc. | 3.8% |
| 9. | Synopsys, Inc. | 3.6% |
| 10. | Amazon.com, Inc. | 3.5% |
| ^ | Percentages are based on net assets. Holdings are subject to change. |
Growth of $10,000 Chart
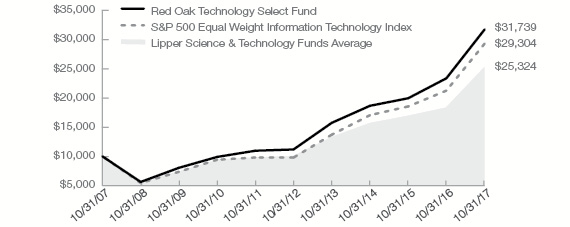
The chart represents historical performance of a hypothetical investment of $10,000 in the Fund over the past 10 years (or for the life of the Fund if shorter). This chart and the table below do not reflect the deduction of taxes that a shareholder would pay on Fund distributions or the redemption of Fund shares.
| Average Annual Total Return | ||||
| 1 Year Return | 3 Year Return | 5 Year Return | 10 Year Return | |
| Red Oak Technology Select Fund | 35.76% | 19.35% | 23.19% | 12.24% |
S&P 500 Equal Weight Information Technology Index1 | 37.82% | 19.74% | 24.50% | 11.35% |
Lipper Science & Technology Funds Average2 | 37.47% | 16.98% | 19.86% | 9.34% |
Gross/Net Expense Ratio (per the prospectus): 1.09%
Gross/Net Expense Ratio (as of fiscal year end October 31, 2017): 0.97%
The performance data quoted represents past performance. Past performance does not guarantee future results. The investment return and principal value of an investment will fluctuate so that an investor’s shares, when redeemed, may be worth more or less than their original cost and current performance may be lower or higher than the performance quoted. For performance data current to the most recent month-end, please visit www.oakfunds.com or call 1-888-462-5386.
1 | Standard & Poor’s is the source and owner of the S&P Index data. 2 Lipper Inc. is the source and owner of the Lipper Classification data. See Pages 16 and 17 for additional disclosure. |
| Annual Report | October 31, 2017 | 11 |
Black Oak Emerging Technology Fund
Robert D. Stimpson, CFA
Portfolio Manager
Black Oak Emerging Technology Fund (the “Fund”) gained 21.16% during the fiscal year ended October 31, 2017, while the S&P 500® Equal Weight Information Technology Index returned 37.82% and the Lipper Science & Technology Funds Average returned 37.47%. Over the last five years, the Fund has gained 16.20% per year on average. |
In general, stocks have enjoyed the low-inflation, slow growth environment and thrived despite the prospects of higher short-term interest rates. The path to normalized rates is still uncertain, but given the longstanding promotion from the Fed, the stock market has demonstrated a level of comfort with the plan and continues rallying higher despite the 1% increase in the Fed Funds rate to 1.25%.
The domestic U.S. economy also continues to charge forward. Nationwide the unemployment rate has recently fallen to 4.1% as of October 2017, a 10-year low. Congress is set to embark on tax reform and despite their failure to successfully repeal and replace Obamacare, prospects are high that some simplification to the tax code is likely. President Trump’s protectionist position on trade remains a concern and will be something to monitor going forward.
The Fund’s top-performing stock for the year was IXYS Corporation, which rose 133%. The company develops power semiconductor chips and was acquired by electronic component company Littelfuse in March 2017. Semiconductor processing equipment maker Lam Research was the Fund’s second best–performing holding, gaining 118% over the fiscal year.
The Fund’s worst-performing stock was Xperi, an audio technology company, which lost 35%. The company was sold during the year after net income turned negative due to higher operating expenses.
Going forward, the Fund will continue to seek opportunities within technology companies exposed to emerging niches, with solid earnings prospects, which are trading at favorable valuations.
Thank you for your investment with Oak Associates Funds.
Mutual fund investing involves risk, including the possible loss of principal. The value of the Fund’s investments will vary from day to day in response to the activities of individual companies and general market and economic conditions. Because the Fund may invest a significant portion of its assets in particular industry sectors which it believes hold the most potential for favorable returns, poor performance or adverse economic events affecting one or more of these overweighted sectors could have a greater impact on the Fund than it would on another mutual fund with a broader range of investments.
| 12 | 1-888-462-5386 | www.oakfunds.com |
Manager Discussion & Analysis
All data below as of October 31, 2017 (Unaudited)
| Fund Data | |
| Ticker | BOGSX |
| Share Price | $5.28 |
| Total Net Assets | $37.3 M |
| Portfolio Turnover | 39.38% |
| Sector Allocation^ | |
| Information Technology | 94.2% |
| Health Care | 5.2% |
| Cash & Other Assets | 0.6% |
| Top 10 Holdings^ | ||
| 1. | Apple, Inc. | 6.4% |
| 2. | Baidu, Inc. ADR | 5.3% |
| 3. | Lam Research Corp. | 5.2% |
| 4. | DXC Technology Co. | 4.9% |
| 5. | CA, Inc. | 4.6% |
| 6. | IXYS Corp. | 4.2% |
| 7. | Silicon Motion Technology Corp. ADR | 4.0% |
| 8. | Cirrus Logic, Inc. | 4.0% |
| 9. | Facebook, Inc., Class A | 3.9% |
| 10. | Tencent Holdings Ltd. ADR | 3.7% |
^ Percentages are based on net assets. Holdings are subject to change.
Growth of $10,000 Chart
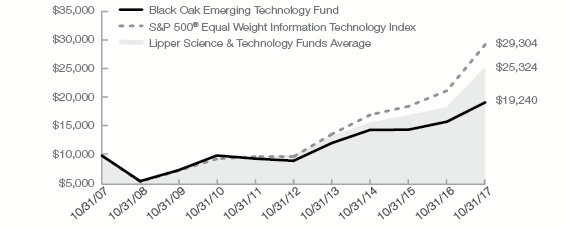
The chart represents historical performance of a hypothetical investment of $10,000 in the Fund over the past 10 years (or for the life of the Fund if shorter). This chart and the table below do not reflect the deduction of taxes that a shareholder would pay on Fund distributions or the redemption of Fund shares. Fee waivers are in effect; if they had not been in effect, performance would have been lower.
| Average Annual Total Return | ||||
| 1 Year Return | 3 Year Return | 5 Year Return | 10 Year Return | |
| Black Oak Emerging Technology Fund | 21.16% | 10.00% | 16.20% | 6.76% |
S&P 500® Equal Weight Information Technology Index1 | 37.82% | 19.74% | 24.50% | 11.35% |
Lipper Science & Technology Funds Average2 | 37.47% | 16.98% | 19.86% | 9.34% |
Gross/Net Expense Ratio (per the prospectus): 1.28%
Gross/Net Expense Ratio (as of fiscal year end October 31, 2017): 1.17%
The performance data quoted represents past performance. Past performance does not guarantee future results. The investment return and principal value of an investment will fluctuate so that an investor’s shares, when redeemed, may be worth more or less than their original cost and current performance may be lower or higher than the performance quoted. For performance data current to the most recent month-end, please visit www.oakfunds.com or call 1-888-462-5386.
1 | Standard & Poor’s is the source and owner of the S&P Index data. 2 Lipper Inc. is the source and owner of the Lipper Classification data. See Pages 16 and 17 for additional disclosure. |
| Annual Report | October 31, 2017 | 13 |
Live Oak Health Sciences Fund
Mark W. Oelschlager, CFA
Co-Chief Investment Officer
Co-Chief Investment Officer
& Portfolio Manager
Live Oak Health Sciences Fund (the “Fund”) gained 13.78% for the fiscal year ended October 31, 2017, while the S&P 500® Health Care Index returned 22.61% and the Lipper Health & Biotechnology Funds Average returned 26.42%. For the last ten years the Fund’s cumulative return was 170.24%, versus 172.80% for the Index and 212.76% for the Lipper. The Department of Justice blocked two large managed care mergers: Anthem-Cigna and Aetna-Humana. Despite this, the stocks have done very well, with Anthem, Cigna, and Aetna returning 74%, 66%, and 60% respectively during the fiscal year. All three were held in the Fund for the full year. The only large insurer that wasn’t involved in the consolidation drama was longtime holding UnitedHealth, which gained 51%. Incredibly, despite the rapid appreciation in the stock prices, these companies still offer investors above-average free cash flow yields. |
While managed care, medical device stocks and several of our other holdings had a strong year, this was a difficult period for the Fund on a relative basis, as in general the winners kept on winning and the losers kept on losing, creating a difficult environment for our style of trying to find overlooked opportunities. Pharmaceutical distributors (e.g. Cardinal Health -8%), pharmacy benefit managers (Express Scripts –9%), and generic pharmaceuticals (Teva Pharmaceutical -67%) held in the portfolio all weighed on returns. These stocks are being affected by concerns about pricing power and in some cases regulatory fears. In our opinion these worries are overblown and the market is pricing in an overly pessimistic scenario. The price-to-earnings (“P/E”) multiples on the distributors and pharmacy benefit manager stocks range from 8 to 12, while the generics are priced even lower. At a time when most companies are trading at a price-to-earnings ratio P/E in the high teens or low 20s, we believe these represent attractive entry points for long-term investors.
Thank you for your investment with Oak Associates Funds.
Mutual fund investing involves risk, including the possible loss of principal. The value of the Fund’s investments will vary from day to day in response to the activities of individual companies and general market and economic conditions. Because the Fund may invest a significant portion of its assets in particular industry sectors which it believes hold the most potential for favorable returns, poor performance or adverse economic events affecting one or more of these overweighted sectors could have a greater impact on the Fund than it would on another mutual fund with a broader range of investments.
| 14 | 1-888-462-5386 | www.oakfunds.com |
Manager Discussion & Analysis
All data below as of October 31, 2017 (Unaudited)
| Fund Data | |
| Ticker | LOGSX |
| Share Price | $19.98 |
| Total Net Assets | $64.7 M |
| Portfolio Turnover | 14.22% |
| Sector Allocation^ | |
| Health Care | 97.0% |
| Cash & Other Assets | 3.0% |
| Top 10 Holdings^ | ||
| 1. | Amgen, Inc. | 7.1% |
| 2. | Anthem, Inc. | 5.6% |
| 3. | Biogen, Inc. | 5.3% |
| 4. | Waters Corp. | 5.1% |
| 5. | C.R. Bard, Inc. | 5.0% |
| 6. | Express Scripts Holding Co. | 4.7% |
| 7. | McKesson Corp. | 4.1% |
| 8. | UnitedHealth Group, Inc. | 4.1% |
| 9. | Charles River Laboratories International, Inc. | 4.1% |
| 10. | Cardinal Health, Inc. | 3.8% |
^ Percentages are based on net assets. Holdings are subject to change.
Growth of $10,000 Chart
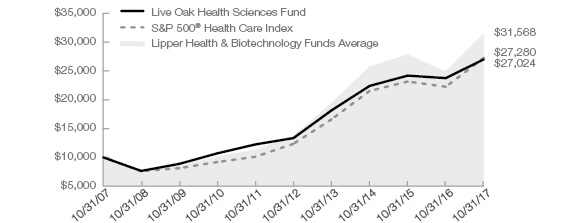
The chart above represents historical performance of a hypothetical investment of $10,000 in the Fund over the past 10 years (or for the life of the Fund if shorter). This chart and the table below do not reflect the deduction of taxes that a shareholder would pay on Fund distributions or the redemption of Fund shares.
| Average Annual Total Return | ||||
| 1 Year Return | 3 Year Return | 5 Year Return | 10 Year Return | |
| Live Oak Health Sciences Fund | 13.78% | 6.45% | 15.16% | 10.45% |
S&P 500® Health Care Index1 | 22.61% | 8.20% | 17.19% | 10.56% |
Lipper Health & Biotechnology Funds Average2 | 26.42% | 6.88% | 17.89% | 11.88% |
Gross/Net Expense Ratio (per the prospectus): 1.11%
Gross/Net Expense Ratio (as of fiscal year end October 31, 2017): 1.02%
The performance data quoted represents past performance. Past performance does not guarantee future results. The investment return and principal value of an investment will fluctuate so that an investor’s shares, when redeemed, may be worth more or less than their original cost and current performance may be lower or higher than the performance quoted. For performance data current to the most recent month-end, please visit www.oakfunds.com or call 1-888-462-5386.
1 | Standard & Poor’s is the source and owner of the S&P Index data. 2 Lipper Inc. is the source and owner of the Lipper Classification data. See Pages 16 and 17 for additional disclosure. |
| Annual Report | October 31, 2017 | 15 |
Important Disclosures
As of October 31, 2017 (Unaudited)
Index Definitions and Disclosures
All indices are unmanaged and index performance figures include reinvestment of dividends but do not reflect any fees, expenses or taxes. Investors cannot invest directly in an index.
Lipper, a Thomson Reuters Company, is the source and owner of the Lipper Classification data contained in this material and all trademarks and copyrights related thereto. Any further dissemination or redistribution is strictly prohibited. Lipper Inc. is not responsible for the formatting or configuration of this material or for any inaccuracy in Oak Associates Funds’ presentation thereof.
Lipper Health & Biotechnology Funds – Funds that invest primarily in the equity securities of domestic companies engaged in health care, medicine, and biotechnology.
Lipper Large-Cap Growth Funds – Funds that, by portfolio practice, invest at least 75% of their equity assets in companies with market capitalizations (on a three-year weighted basis) above Lipper’s USDE large-cap floor. Large-cap growth funds typically have an above-average price-to-earnings ratio, price-to-book ratio, and three-year sales-per-share growth value, compared to the S&P 500® Index.
Lipper Multi-Cap Core Funds – Funds that, by portfolio practice, invest in a variety of market-capitalization ranges without concentrating 75% of their equity assets in any one market-capitalization range over an extended period of time. Multi-cap core funds typically have average characteristics compared to the S&P SuperComposite 1500 Index.
Lipper Multi-Cap Growth Funds – Funds that, by portfolio practice, invest in a variety of market capitalization ranges without concentrating 75% of their equity assets in any one market capitalization range over an extended period of time. Multi-cap growth funds typically have an above-average price-to-earnings ratio, price-to-book ratio, and three-year sales per-share growth value, compared to the S&P SuperComposite 1500 Index.
Lipper Science & Technology Funds – Funds that invest primarily in the equity securities of domestic companies engaged in science and technology.
Lipper Small-Cap Growth Funds – Funds that, by portfolio practice, invest at least 75% of their equity assets in companies with market capitalizations (on a three-year weighted basis) below Lipper’s USDE small-cap ceiling. Small-cap growth funds typically have an above-average price-to-earnings ratio, price-to-book ratio, and three-year sales-per-share growth value, compared to the S&P Small-Cap 600 Index.
NASDAQ is the source and owner of the NASDAQ Index data contained in this material and all trademarks and copyrights related thereto. Any further dissemination or redistribution is strictly prohibited. NASDAQ is not responsible for the formatting or configuration of this material or for any inaccuracy in Oak Associates Funds’ presentation thereof.
Russell Investments is the source and owner of the Russell Index data contained in this material and all trademarks and copyrights related thereto. Any further dissemination or redistribution is strictly prohibited. Russell Investments is not responsible for the formatting or configuration of this material or for any inaccuracy in Oak Associates Funds’ presentation thereof.
Russell 2000® Growth Total Return Index – The Russell 2000® Growth Total Return Index measures the performance of the small-cap growth segment of the U.S. equity universe. It includes those Russell 2000 companies with higher price-to-book ratios and higher forecasted growth values.
| 16 | 1-888-462-5386 | www.oakfunds.com |
Important Disclosures
All data below as of October 31, 2017 (Unaudited)
Russell 3000® Total Return Index – The Russell 3000® Total Return Index measures the performance of 3,000 publicly held US companies based on total market capitalization, which represents approximately 98% of the investable US equity market.
Standard & Poor’s is the source and owner of the S&P Index data contained in this material and all trademarks and copyrights related thereto. Any further dissemination or redistribution is strictly prohibited. Standard & Poor’s is not responsible for the formatting or configuration of this material or for any inaccuracy in Oak Associates Funds’ presentation thereof.
S&P 500® Index – is a commonly-recognized, market capitalization weighted index of 500 widely held equity securities, designed to measure broad U.S. equity performance.
S&P 500® Equal Weight Information Technology Index – The S&P 500® Equal Weight Information Technology Index is an unmanaged equal weighted version of the S&P 500® Information Technology Index that consists of the common stocks of the following industries: internet equipment, computers and peripherals, electronic equipment, office electronics and instruments, semiconductor equipment and products, diversified telecommunication services, and wireless telecommunication services that comprise the Information Technology sector of the S&P 500® Index.
S&P 500® Health Care Index – The S&P 500® Health Care Index is a capitalization-weighted index that encompasses two main industry groups. The first includes companies who manufacture health care equipment and supplies or provide health care related services, including distributors of health care products, providers of basic health care services, and owners and operators of health care facilities and organizations. The second group consists of companies primarily involved in the research, development, production and marketing of pharmaceuticals and biotechnology products.
S&P 500® Total Return Index – The S&P 500® Total Return Index is a commonly recognized, market capitalization weighted index of 500 widely held equity securities, designed to measure broad U.S. equity performance.
Investment Definitions
Smart beta defines a set of investment strategies that emphasize the use of alternative index construction rules to traditional market capitalization based indices. Smart beta emphasizes capturing investment factors of market inefficiencies in a rules-based and transparent way.
Correlation is a statistic that measures the degree to which two securities move in relation to each other.
The P/E is the ratio for valuing a company that measures its current share price relative to its per-share earnings. The price-earnings ratio can be calculated as market value per share divided by earnings per share.
The KBW Bank Index is an economic index consisting of the stocks of 24 banking companies. This index serves as a benchmark of the banking sector. This index trades on the Philadelphia Stock Exchange, where it was created.
Book value of an asset is the value at which the asset is carried on a balance sheet and calculated by taking the cost of an asset minus the accumulated depreciation. Book value is also the net asset value of a company, calculated as total assets minus intangible assets and liabilities.
Free cash flow yield is an overall return evaluation ratio of a stock, which standardizes the free cash flow per share a company is expected to earn against its market price per share. The ratio is calculated by taking the free cash flow per share divided by the share price.
| Annual Report | October 31, 2017 | 17 |
Disclosure of Fund Expenses
As of October 31, 2017 (Unaudited)
All mutual funds have operating expenses. As a shareholder of a fund, your investment is affected by these ongoing costs, which include (among others) costs for portfolio management, administrative services, and shareholder reports like this one. It is important for you to understand the impact of these costs on your investment returns.
Operating expenses such as these, are deducted from the Fund’s gross income and directly reduce your final investment return. These expenses are expressed as a percentage of the Fund’s average net assets; this percentage is known as the Fund’s expense ratio.
The following examples use the expense ratio and are intended to help you understand the ongoing costs (in dollars) of investing in your Fund and to compare these costs with those of other mutual funds. The examples are based on an investment of $1,000 made at the beginning of the period shown and held for the entire period.
The table on the next page illustrates your Fund’s costs in two ways:
Actual Fund Return. This section helps you to estimate the actual expenses after fee waivers that your Fund incurred over the period. The “Expenses Paid During Period” column shows the actual dollar expense cost incurred by a $1,000 investment in the Fund, and the “Ending Account Value” number is derived from deducting that expense cost from the Fund’s gross investment return.
You can use this information, together with the actual amount you invested in the Fund, to estimate the expenses you paid over that period. Simply divide your actual account value by $1,000 to arrive at a ratio (for example, an $8,600 account value divided by $1,000 = 8.6), then multiply that ratio by the number shown for your Fund under “Expenses Paid During Period”.
Hypothetical 5% Return. This section helps you compare your Fund’s costs with those of other mutual funds. It assumes that the Fund had an annual 5% return before expenses during the year, but that the expense ratio (Column 3) for the period is unchanged. This example is useful in making comparisons because the Securities and Exchange Commission requires all mutual funds to make this 5% calculation. You can assess your Fund’s comparative cost by comparing the hypothetical result for your Fund in the “Expense Paid During Period” column with those that appear in the same charts in the shareholder reports for other funds.
Note: Because the return is set at 5% for comparison purposes — NOT your Fund’s actual return— the account values shown may not apply to your specific investment.
| 18 | 1-888-462-5386 | www.oakfunds.com |
Disclosure of Fund Expenses
As of October 31, 2017 (Unaudited)
Beginning Account Value May 1, 2017 | Ending Account Value October 31, 2017 | Annualized Expense Ratio | Expenses Paid During Period(a) | |
| White Oak Select Growth Fund | ||||
| Actual Return | $1,000.00 | $ 1,079.10 | 0.96% | $5.05 |
| Hypothetical 5% Return | $1,000.00 | $ 1,020.35 | 0.96% | $4.91 |
| Pin Oak Equity Fund | ||||
| Actual Return | $1,000.00 | $ 1,053.00 | 1.00% | $5.16 |
| Hypothetical 5% Return | $1,000.00 | $ 1,020.18 | 1.00% | $5.08 |
| Rock Oak Core Growth Fund | ||||
| Actual Return | $1,000.00 | $ 1,094.70 | 1.25% | $6.60 |
| Hypothetical 5% Return | $1,000.00 | $ 1,018.90 | 1.25% | $6.36 |
| River Oak Discovery Fund | ||||
| Actual Return | $1,000.00 | $ 1,075.30 | 1.35% | $7.06 |
| Hypothetical 5% Return | $1,000.00 | $ 1,018.40 | 1.35% | $6.87 |
| Red Oak Technology Select Fund | ||||
| Actual Return | $1,000.00 | $ 1,149.40 | 0.99% | $5.38 |
| Hypothetical 5% Return | $1,000.00 | $ 1,020.20 | 0.99% | $5.05 |
| Black Oak Emerging Technology Fund | ||||
| Actual Return | $1,000.00 | $ 1,073.20 | 1.15% | $6.03 |
| Hypothetical 5% Return | $1,000.00 | $ 1,019.39 | 1.15% | $5.88 |
| Live Oak Health Sciences Fund | ||||
| Actual Return | $1,000.00 | $ 1,008.10 | 1.01% | $5.10 |
| Hypothetical 5% Return | $1,000.00 | $ 1,020.13 | 1.01% | $5.13 |
(a) | Expenses are equal to the Fund’s annualized expense ratio multiplied by the average account value over the period, multiplied by 184/365 (to reflect the one-half year period). |
| Annual Report | October 31, 2017 | 19 |
White Oak Select Growth Fund | Schedule of Investments |
As of October 31, 2017
| Shares | Fair Value | |||||||
| Common Stocks — 99.46% | ||||||||
| Consumer Discretionary — 8.34% | ||||||||
| Internet & Direct Marketing Retail — 8.34% | ||||||||
| Amazon.com, Inc. * | 21,545 | $ | 23,813,257 | |||||
| Consumer Staples — 2.04% | ||||||||
| Beverages — 2.04% | ||||||||
| PepsiCo, Inc. | 53,000 | 5,842,190 | ||||||
| Energy — 0.16% | ||||||||
| Energy Equipment & Services — 0.16% | ||||||||
Transocean Ltd. (a) * | 43,000 | 451,500 | ||||||
| Financials — 32.09% | ||||||||
| Capital Markets — 10.11% | ||||||||
| Charles Schwab Corp. | 472,900 | 21,204,836 | ||||||
| State Street Corp. | 83,500 | 7,682,000 | ||||||
| 28,886,836 | ||||||||
| Commercial Banks — 13.97% | ||||||||
CIT Group, Inc. (a) | 177,400 | 8,270,388 | ||||||
| TCF Financial Corp. | 511,000 | 9,310,420 | ||||||
| U.S. Bancorp | 263,000 | 14,301,940 | ||||||
| Wells Fargo & Co. | 143,000 | 8,028,020 | ||||||
| 39,910,768 | ||||||||
| Diversified Financial Services — 4.60% | ||||||||
| JPMorgan Chase & Co. | 130,600 | 13,139,666 | ||||||
| Insurance — 3.41% | ||||||||
Chubb Ltd. (a) | 64,600 | 9,742,972 | ||||||
| Health Care — 11.78% | ||||||||
| Biotechnology — 6.63% | ||||||||
| Amgen, Inc. | 108,000 | 18,923,760 | ||||||
| Health Care Providers & Services — 4.24% | ||||||||
| CVS Health Corp. | 85,600 | 5,866,168 | ||||||
Express Scripts Holding Co. (a) * | 102,000 | 6,251,580 | ||||||
| 12,117,748 | ||||||||
| 20 | 1-888-462-5386 | www.oakfunds.com |
Schedule of Investments | White Oak Select Growth Fund |
As of October 31, 2017
| Shares | Fair Value | |||||||
| Pharmaceuticals — 0.91% | ||||||||
Teva Pharmaceutical Industries Ltd. ADR (a) | 189,000 | $ | 2,608,200 | |||||
| Industrials — 3.70% | ||||||||
| Air Freight & Logistics — 3.70% | ||||||||
| United Parcel Service, Inc., Class B | 90,000 | 10,577,700 | ||||||
| Information Technology — 41.35% | ||||||||
| Communications Equipment — 8.61% | ||||||||
| Cisco Systems, Inc. | 571,000 | 19,499,650 | ||||||
| QUALCOMM, Inc. | 100,100 | 5,106,101 | ||||||
| 24,605,751 | ||||||||
| Internet Software & Services — 14.06% | ||||||||
| Alphabet, Inc., Class A * | 13,310 | 13,749,762 | ||||||
| Alphabet, Inc., Class C * | 16,495 | 16,769,477 | ||||||
| Facebook, Inc., Class A * | 35,900 | 6,464,154 | ||||||
| Salesforce.com, Inc. * | 31,100 | 3,182,774 | ||||||
| 40,166,167 | ||||||||
| IT Services — 6.74% | ||||||||
| Cognizant Technology Solutions Corp., Class A | 128,200 | 9,700,894 | ||||||
| International Business Machines Corp. | 61,900 | 9,536,314 | ||||||
| 19,237,208 | ||||||||
| Semiconductors & Semiconductor Equipment — 11.94% | ||||||||
| KLA-Tencor Corp. | 179,800 | 19,578,422 | ||||||
Xilinx, Inc. (a) | 197,200 | 14,531,668 | ||||||
| 34,110,090 | ||||||||
| Total Common Stocks | ||||||||
| (Cost $213,164,351) | 284,133,813 | |||||||
| Annual Report | October 31, 2017 | 21 |
White Oak Select Growth Fund | Schedule of Investments |
As of October 31, 2017
| Shares or Principal | Fair Value | |||||||
| Short-Term Investments — 8.74% | ||||||||
| Repurchase Agreement — 0.66% | ||||||||
| Tri-Party Repurchase Agreement with South Street Securities Wachovia Tri-Party, 0.88%, dated 10/31/17 and maturing 11/01/17, collateralized by U.S. Treasury Securities with rates ranging from 1.88% to 2.25% and maturity dates ranging from 9/30/22 to 1/31/24 with a par value of $1,906,817 and a collateral value of $1,915,104. | 1,877,552 | $ | 1,877,552 | |||||
| Collateral for Securities Loaned — 8.08% | ||||||||
Mount Vernon Liquid Assets Portfolio, LLC, 1.34% (b) | 23,081,485 | 23,081,485 | ||||||
| Total Short-Term Investments | ||||||||
| (Cost $24,959,037) | 24,959,037 | |||||||
| Total Investments — 108.20% | ||||||||
| (Cost $238,123,388) | 309,092,850 | |||||||
| Liabilities in Excess of Other Assets — (8.20)% | (23,435,097 | ) | ||||||
| NET ASSETS — 100.00% | $ | 285,657,753 | ||||||
(a) | Security, or a portion of the security position, is currently on loan. The total market value of securities on loan is $22,607,547. |
(b) | Rate disclosed is the seven day effective yield as of October 31, 2017. |
| * | Non-income producing security. |
| ADR — American Depositary Receipt |
The sectors shown on the schedule of investments are based on the Global Industry Classification Standard, or GICS® (“GICS”). The GICS was developed by and/or is the exclusive property of MSCI, Inc. and Standard & Poor’s Financial Services LLC (“S&P”). GICS is a service mark of MSCI, Inc. and S&P and has been licensed for use by Ultimus Fund Solutions, LLC.
The accompanying notes are an integral part of the financial statements.
| 22 | 1-888-462-5386 | www.oakfunds.com |
| Schedule of Investments | Pin Oak Equity Fund |
As of October 31, 2017
| Shares | Fair Value | |||||||
| Common Stocks — 94.14% | ||||||||
| Consumer Discretionary — 10.80% | ||||||||
| Auto Components — 1.89% | ||||||||
Gentex Corp. (a) | 216,500 | $ | 4,202,265 | |||||
| Internet & Direct Marketing Retail — 2.55% | ||||||||
| Amazon.com, Inc. * | 5,120 | 5,659,034 | ||||||
| Media — 4.45% | ||||||||
Interpublic Group of Cos., Inc. (a) | 170,000 | 3,272,500 | ||||||
| Twenty-First Century Fox, Inc., Class B | 259,800 | 6,611,910 | ||||||
| 9,884,410 | ||||||||
| Textiles, Apparel & Luxury Goods — 1.91% | ||||||||
Hanesbrands, Inc. (a) | 188,000 | 4,230,000 | ||||||
| Consumer Staples — 4.41% | ||||||||
| Beverages — 4.41% | ||||||||
| PepsiCo, Inc. | 88,800 | 9,788,424 | ||||||
| Energy — 4.20% | ||||||||
| Energy Equipment & Services — 0.59% | ||||||||
| Nabors Industries Ltd. | 185,100 | 1,042,113 | ||||||
Transocean Ltd. (a) * | 25,000 | 262,500 | ||||||
| 1,304,613 | ||||||||
| Oil, Gas & Consumable Fuels — 3.61% | ||||||||
Valero Energy Corp. (a) | 101,800 | 8,031,002 | ||||||
| Financials — 32.52% | ||||||||
| Capital Markets — 10.61% | ||||||||
| Bank of New York Mellon Corp. | 242,300 | 12,466,335 | ||||||
| Charles Schwab Corp. | 247,251 | 11,086,735 | ||||||
| 23,553,070 | ||||||||
| Commercial Banks — 10.33% | ||||||||
CIT Group, Inc. (a) | 100,500 | 4,685,310 | ||||||
| Great Southern Bancorp, Inc. | 34,728 | 1,866,630 | ||||||
| International Bancshares Corp. | 70,535 | 2,863,721 | ||||||
| SunTrust Banks, Inc. | 105,000 | 6,322,050 | ||||||
| Wells Fargo & Co. | 128,400 | 7,208,376 | ||||||
| 22,946,087 | ||||||||
| Consumer Finance — 4.02% | ||||||||
| Capital One Financial Corp. | 83,300 | 7,678,594 | ||||||
| Annual Report | October 31, 2017 | 23 |
Pin Oak Equity Fund | Schedule of Investments |
As of October 31, 2017
| Shares | Fair Value | |||||||
| Consumer Finance (continued) | ||||||||
| Synchrony Financial | 38,000 | $ | 1,239,560 | |||||
| 8,918,154 | ||||||||
| Insurance — 7.56% | ||||||||
| Assurant, Inc. | 37,300 | 3,754,245 | ||||||
| Everest Re Group Ltd. | 21,400 | 5,081,430 | ||||||
| Travelers Cos., Inc. | 60,100 | 7,960,245 | ||||||
| 16,795,920 | ||||||||
| Health Care — 8.12% | ||||||||
| Health Care Providers & Services — 4.43% | ||||||||
| DaVita HealthCare Partners, Inc. * | 127,400 | 7,738,276 | ||||||
| McKesson Corp. | 15,300 | 2,109,564 | ||||||
| 9,847,840 | ||||||||
| Pharmaceuticals — 3.69% | ||||||||
GlaxoSmithKline PLC ADR (a) | 224,800 | 8,189,464 | ||||||
| Industrials — 1.38% | ||||||||
| Electrical Equipment — 0.15% | ||||||||
| EnerSys | 4,722 | 327,565 | ||||||
| Machinery — 1.23% | ||||||||
| Parker-Hannifin Corp. | 15,050 | 2,748,280 | ||||||
| Information Technology — 32.00% | ||||||||
| Electronic Equipment, Instruments & Components — 2.56% | ||||||||
| Flex Ltd. * | 320,000 | 5,696,000 | ||||||
| Internet Software & Services — 13.94% | ||||||||
| Alphabet, Inc., Class A * | 3,750 | 3,873,900 | ||||||
| Alphabet, Inc., Class C * | 11,759 | 11,954,670 | ||||||
| eBay, Inc. * | 191,000 | 7,189,240 | ||||||
| IAC/InterActiveCorp * | 61,456 | 7,930,897 | ||||||
| 30,948,707 | ||||||||
| IT Services — 9.55% | ||||||||
| Amdocs Ltd. | 120,572 | 7,849,237 | ||||||
Paychex, Inc. (a) | 156,349 | 9,973,503 | ||||||
Western Union Co. (a) | 171,000 | 3,396,060 | ||||||
| 21,218,800 | ||||||||
| Semiconductors & Semiconductor Equipment — 5.95% | ||||||||
| KLA-Tencor Corp. | 61,900 | 6,740,291 | ||||||
Xilinx, Inc. (a) | 87,700 | 6,462,613 | ||||||
| 13,202,904 | ||||||||
| 24 | 1-888-462-5386 | www.oakfunds.com |
Schedule of Investments | Pin Oak Equity Fund |
As of October 31, 2017
| Shares or Principal | Fair Value | |||||||
| Materials — 0.71% | ||||||||
| Metals & Mining — 0.71% | ||||||||
| Teck Resources Ltd., Class B | 76,814 | $ | 1,570,078 | |||||
| Total Common Stocks | ||||||||
| (Cost $163,785,621) | 209,062,617 | |||||||
| Short-Term Investments — 29.96% | ||||||||
| Repurchase Agreement — 6.19% | ||||||||
| Tri-Party Repurchase Agreement with South Street Securities Wachovia Tri-Party, 0.88%, dated 10/31/17 and maturing 11/01/17, collateralized by U.S. Treasury Securities with rates ranging from 1.88% to 2.25% and maturity dates ranging from 9/30/22 to 1/31/24 with a par value of $13,969,000 and a collateral value of $14,029,705. | 13,754,606 | 13,754,606 | ||||||
| Collateral for Securities Loaned — 23.77% | ||||||||
Mount Vernon Liquid Assets Portfolio, LLC, 1.34% (b) | 52,784,748 | 52,784,748 | ||||||
| Total Short-Term Investments | ||||||||
| (Cost $66,539,354) | 66,539,354 | |||||||
| Total Investments — 124.10% | ||||||||
| (Cost $230,324,975) | 275,601,971 | |||||||
| Liabilities in Excess of Other Assets — (24.10)% | (53,516,571 | ) | ||||||
| NET ASSETS — 100.00% | $ | 222,085,400 | ||||||
(a) | Security, or a portion of the security position, is currently on loan. The total market value of securities on loan is $51,539,747. |
(b) | Rate disclosed is the seven day effective yield as of October 31, 2017. |
| * | Non-income producing security. |
| ADR — American Depositary Receipt |
The sectors shown on the schedule of investments are based on the Global Industry Classification Standard, or GICS® (“GICS”). The GICS was developed by and/or is the exclusive property of MSCI, Inc. and Standard & Poor’s Financial Services LLC (“S&P”). GICS is a service mark of MSCI, Inc. and S&P and has been licensed for use by Ultimus Fund Solutions, LLC.
The accompanying notes are an integral part of the financial statements.
| Annual Report | October 31, 2017 | 25 |
Rock Oak Core Growth Fund | Schedule of Investments |
As of October 31, 2017
| Shares | Fair Value | |||||||
| Common Stocks — 99.07% | ||||||||
| Consumer Discretionary — 16.05% | ||||||||
| Hotels, Restaurants & Leisure — 4.01% | ||||||||
| Wyndham Worldwide Corp. | 3,445 | $ | 368,098 | |||||
| Internet & Direct Marketing Retail — 10.09% | ||||||||
| Amazon.com, Inc. * | 470 | 519,482 | ||||||
| Netflix, Inc. * | 2,075 | 407,592 | ||||||
| 927,074 | ||||||||
| Media — 1.95% | ||||||||
| Liberty SiriusXM Group, Class A * | 4,295 | 179,144 | ||||||
| Consumer Staples — 2.03% | ||||||||
| Beverages — 2.03% | ||||||||
| Molson Coors Brewing Co., Class B | 2,300 | 186,001 | ||||||
| Financials — 12.15% | ||||||||
| Commercial Banks — 4.72% | ||||||||
| SunTrust Banks, Inc. | 7,200 | 433,512 | ||||||
| Consumer Finance — 3.26% | ||||||||
| Capital One Financial Corp. | 3,250 | 299,585 | ||||||
| Insurance — 4.17% | ||||||||
Hartford Financial Services Group, Inc. (a) | 6,950 | 382,597 | ||||||
| Health Care — 17.15% | ||||||||
| Biotechnology — 11.49% | ||||||||
| AbbVie, Inc. | 4,940 | 445,835 | ||||||
| Biogen, Inc. * | 920 | 286,727 | ||||||
| Gilead Sciences, Inc. | 4,300 | 322,328 | ||||||
| 1,054,890 | ||||||||
| Life Sciences Tools & Services — 3.13% | ||||||||
| Illumina, Inc. * | 1,400 | 287,266 | ||||||
| Pharmaceuticals — 2.53% | ||||||||
| Jazz Pharmaceuticals PLC * | 1,645 | 232,817 | ||||||
| Industrials — 5.78% | ||||||||
| Aerospace & Defense — 4.38% | ||||||||
| L3 Technologies, Inc. | 2,150 | 402,437 | ||||||
| 26 | 1-888-462-5386 | www.oakfunds.com |
Schedule of Investments | Rock Oak Core Growth Fund |
As of October 31, 2017
| Shares | Fair Value | |||||||
| Professional Services — 1.40% | ||||||||
Nielsen Holdings PLC (a) | 3,470 | $ | 128,633 | |||||
| Information Technology — 45.91% | ||||||||
| Communications Equipment — 2.84% | ||||||||
| F5 Networks, Inc. * | 2,150 | 260,730 | ||||||
| Internet Software & Services — 12.76% | ||||||||
Alphabet, Inc., Class C (a) * | 320 | 325,325 | ||||||
| Facebook, Inc., Class A * | 1,795 | 323,208 | ||||||
| Salesforce.com, Inc. * | 3,030 | 310,090 | ||||||
Tencent Holdings Ltd. ADR (a) * | 4,730 | 213,087 | ||||||
| 1,171,710 | ||||||||
| IT Services — 13.08% | ||||||||
| Cognizant Technology Solutions Corp., Class A | 2,800 | 211,876 | ||||||
CSRA, Inc. (a) | 5,650 | 180,744 | ||||||
| DXC Technology Co. | 5,650 | 517,088 | ||||||
Vantiv, Inc., Class A (a) * | 4,160 | 291,200 | ||||||
| 1,200,908 | ||||||||
| Software — 7.35% | ||||||||
CA, Inc. (a) | 9,950 | 322,181 | ||||||
Check Point Software Technologies Ltd. (a) * | 3,000 | 353,130 | ||||||
| 675,311 | ||||||||
| Technology Hardware, Storage & Peripherals — 9.88% | ||||||||
NetApp, Inc. (a) | 8,755 | 388,897 | ||||||
Seagate Technology PLC (a) | 3,410 | 126,068 | ||||||
| Western Digital Corp. | 4,395 | 392,342 | ||||||
| 907,307 | ||||||||
| Total Common Stocks | ||||||||
| (Cost $5,694,063) | 9,098,020 | |||||||
| Annual Report | October 31, 2017 | 27 |
Rock Oak Core Growth Fund | Schedule of Investments |
As of October 31, 2017
| Shares or Principal | Fair Value | |||||||
| Short-Term Investments — 33.32% | ||||||||
| Repurchase Agreement — 2.46% | ||||||||
| Tri-Party Repurchase Agreement with South Street Securities Wachovia Tri-Party, 0.88%, dated 10/31/17 and maturing 11/01/17, collateralized by U.S. Treasury Securities with rates ranging from 1.88% to 2.25% and maturity dates ranging from 9/30/22 to 1/31/24 with a par value of $229,643 and a collateral value of $230,640. | 226,118 | $ | 226,118 | |||||
| Collateral for Securities Loaned — 30.86% | ||||||||
Mount Vernon Liquid Assets Portfolio, LLC, 1.34% (b) | 2,833,283 | 2,833,283 | ||||||
| Total Short-Term Investments | ||||||||
| (Cost $3,059,401) | 3,059,401 | |||||||
| Total Investments — 132.39% | ||||||||
| (Cost $8,753,464) | 12,157,421 | |||||||
| Liabilities in Excess of Other Assets — (32.39)% | (2,974,471 | ) | ||||||
| NET ASSETS — 100.00% | $ | 9,182,950 | ||||||
(a) | Security, or a portion of the security position, is currently on loan. The total market value of securities on loan is $2,776,622. |
(b) | Rate disclosed is the seven day effective yield as of October 31, 2017. |
| * | Non-income producing security. |
| ADR — American Depositary Receipt |
The sectors shown on the schedule of investments are based on the Global Industry Classification Standard, or GICS® (“GICS”). The GICS was developed by and/or is the exclusive property of MSCI, Inc. and Standard & Poor’s Financial Services LLC (“S&P”). GICS is a service mark of MSCI, Inc. and S&P and has been licensed for use by Ultimus Fund Solutions, LLC.
The accompanying notes are an integral part of the financial statements.
| 28 | 1-888-462-5386 | www.oakfunds.com |
Schedule of Investments | River Oak Discovery Fund |
As of October 31, 2017
| Shares | Fair Value | |||||||
| Common Stocks — 98.89% | ||||||||
| Consumer Discretionary — 12.32% | ||||||||
| Diversified Consumer Services — 6.21% | ||||||||
| Adtalem Global Education, Inc. | 11,810 | $ | 436,380 | |||||
| American Public Education, Inc. * | 5,000 | 100,000 | ||||||
| Capella Education Co. | 4,405 | 358,787 | ||||||
| 895,167 | ||||||||
| Household Durables — 3.07% | ||||||||
| M.D.C. Holdings, Inc. | 11,950 | 442,628 | ||||||
| Specialty Retail — 3.04% | ||||||||
| Aaron's, Inc. | 11,930 | 439,024 | ||||||
| Consumer Staples — 3.15% | ||||||||
| Beverages — 3.15% | ||||||||
Boston Beer Co., Inc., Class A (a) * | 2,555 | 454,918 | ||||||
| Financials — 19.19% | ||||||||
| Capital Markets — 5.60% | ||||||||
| Cowen Group, Inc., Class A * | 21,725 | 325,875 | ||||||
| Janus Henderson Group PLC | 13,873 | 482,087 | ||||||
| 807,962 | ||||||||
| Commercial Banks — 6.84% | ||||||||
Union Bankshares Corp. (a) | 14,050 | 484,866 | ||||||
| Zions BanCorp | 10,800 | 501,768 | ||||||
| 986,634 | ||||||||
| Insurance — 6.75% | ||||||||
| Assurant, Inc. | 6,350 | 639,127 | ||||||
| CNO Financial Group, Inc. | 14,000 | 335,580 | ||||||
| 974,707 | ||||||||
| Health Care — 12.90% | ||||||||
| Biotechnology — 2.98% | ||||||||
United Therapeutics Corp. (a) * | 3,625 | 429,889 | ||||||
| Health Care Providers & Services — 6.71% | ||||||||
| Envision Healthcare Corp. * | 10,020 | 426,852 | ||||||
| Magellan Health, Inc. * | 6,350 | 541,655 | ||||||
| 968,507 | ||||||||
| Health Care Technology — 0.56% | ||||||||
| Quality Systems, Inc. | 5,700 | 80,199 | ||||||
| Annual Report | October 31, 2017 | 29 |
River Oak Discovery Fund | Schedule of Investments |
As of October 31, 2017
| Shares | Fair Value | |||||||
| Pharmaceuticals — 2.65% | ||||||||
| Lannett Co., Inc. * | 19,190 | $ | 381,881 | |||||
| Industrials — 11.32% | ||||||||
| Construction & Engineering — 2.22% | ||||||||
| Argan, Inc. | 4,655 | 320,031 | ||||||
| Machinery — 5.52% | ||||||||
| Kadant, Inc. | 7,010 | 796,336 | ||||||
| Professional Services — 3.58% | ||||||||
| Barrett Business Services, Inc. | 3,151 | 191,549 | ||||||
| RPX Corp. * | 25,000 | 325,500 | ||||||
| 517,049 | ||||||||
| Information Technology — 35.65% | ||||||||
| Electronic Equipment, Instruments & Components — 5.30% | ||||||||
Dolby Laboratories, Inc., Class A (a) | 7,200 | 417,168 | ||||||
| Hollysys Automation Technologies Ltd. | 15,500 | 347,975 | ||||||
| 765,143 | ||||||||
| Semiconductors & Semiconductor Equipment — 22.48% | ||||||||
| Advanced Energy Industries, Inc. * | 9,170 | 776,882 | ||||||
Ambarella, Inc. (a) * | 8,005 | 451,802 | ||||||
| Cirrus Logic, Inc. * | 10,510 | 588,560 | ||||||
| Kulicke & Soffa Industries, Inc. * | 25,285 | 572,705 | ||||||
| SolarEdge Technologies, Inc. * | 25,955 | 852,622 | ||||||
| 3,242,571 | ||||||||
| Software — 7.87% | ||||||||
FireEye, Inc. (a) * | 23,005 | 389,245 | ||||||
| Fortinet, Inc. * | 14,950 | 589,180 | ||||||
| Verint Systems, Inc. * | 3,720 | 156,984 | ||||||
| 1,135,409 | ||||||||
| Materials — 4.36% | ||||||||
| Paper & Forest Products — 4.36% | ||||||||
| Mercer International, Inc. | 42,840 | 629,748 | ||||||
| Total Common Stocks | ||||||||
| (Cost $9,267,566) | 14,267,803 | |||||||
| 30 | 1-888-462-5386 | www.oakfunds.com |
Schedule of Investments | River Oak Discovery Fund |
As of October 31, 2017
| Shares or Principal | Fair Value | |||||||
| Short-Term Investments — 14.26% | ||||||||
| Repurchase Agreement — 1.97% | ||||||||
| Tri-Party Repurchase Agreement with South Street Securities Wachovia Tri-Party, 0.88%, dated 10/31/17 and maturing 11/01/17, collateralized by U.S. Treasury Securities with rates ranging from 1.88% to 2.25% and maturity dates ranging from 9/30/22 to 1/31/24 with a par value of $288,721 and a collateral value of $289,975. | 284,289 | $ | 284,289 | |||||
| Collateral for Securities Loaned — 12.29% | ||||||||
Mount Vernon Liquid Assets Portfolio, LLC, 1.34% (b) | 1,772,096 | 1,772,096 | ||||||
| Total Short-Term Investments | ||||||||
| (Cost $2,056,385) | 2,056,385 | |||||||
| Total Investments — 113.15% | ||||||||
| (Cost $11,323,951) | 16,324,188 | |||||||
| Liabilities in Excess of Other Assets — (13.15)% | (1,896,709 | ) | ||||||
| NET ASSETS — 100.00% | $ | 14,427,479 | ||||||
(a) | Security, or a portion of the security position, is currently on loan. The total market value of securities on loan is $1,760,871. |
(b) | Rate disclosed is the seven day effective yield as of October 31, 2017. |
| * | Non-income producing security. |
The sectors shown on the schedule of investments are based on the Global Industry Classification Standard, or GICS® (“GICS”). The GICS was developed by and/or is the exclusive property of MSCI, Inc. and Standard & Poor’s Financial Services LLC (“S&P”). GICS is a service mark of MSCI, Inc. and S&P and has been licensed for use by Ultimus Fund Solutions, LLC.
The accompanying notes are an integral part of the financial statements.
| Annual Report | October 31, 2017 | 31 |
Red Oak Technology Select Fund | Schedule of Investments |
As of October 31, 2017
| Shares | Fair Value | |||||||
| Common Stocks — 96.55% | ||||||||
| Consumer Discretionary — 3.50% | ||||||||
| Internet & Direct Marketing Retail — 3.50% | ||||||||
| Amazon.com, Inc. * | 15,400 | $ | 17,021,312 | |||||
| Industrials — 1.87% | ||||||||
| Aerospace & Defense — 1.87% | ||||||||
| Huntington Ingalls Industries, Inc. | 38,966 | 9,072,454 | ||||||
| Information Technology — 91.18% | ||||||||
| Communications Equipment — 7.48% | ||||||||
| Cisco Systems, Inc. | 586,000 | 20,011,900 | ||||||
| Juniper Networks, Inc. | 414,000 | 10,279,620 | ||||||
| QUALCOMM, Inc. | 119,500 | 6,095,695 | ||||||
| 36,387,215 | ||||||||
| Electronic Equipment & Instruments — 2.53% | ||||||||
| Arrow Electronics, Inc. * | 3,575 | 298,834 | ||||||
| Corning, Inc. | 383,000 | 11,991,730 | ||||||
| 12,290,564 | ||||||||
| Internet Software & Services — 19.30% | ||||||||
| Alphabet, Inc., Class A * | 16,830 | 17,386,063 | ||||||
| Alphabet, Inc., Class C * | 25,996 | 26,428,573 | ||||||
| eBay, Inc. * | 309,300 | 11,642,052 | ||||||
| Facebook, Inc., Class A * | 129,025 | 23,232,242 | ||||||
| IAC/InterActiveCorp * | 117,700 | 15,189,185 | ||||||
| 93,878,115 | ||||||||
| IT Services — 10.83% | ||||||||
| Accenture PLC, Class A | 76,400 | 10,876,304 | ||||||
| Alliance Data Systems Corp. | 41,500 | 9,284,795 | ||||||
CSRA, Inc. (a) | 277,947 | 8,891,525 | ||||||
| DXC Technology Co. | 40,670 | 3,722,118 | ||||||
| International Business Machines Corp. | 61,100 | 9,413,066 | ||||||
| Total System Services, Inc. | 145,600 | 10,490,480 | ||||||
| 52,678,288 | ||||||||
| Semiconductors & Semiconductor Equipment — 14.62% | ||||||||
| Intel Corp. | 522,800 | 23,782,172 | ||||||
| KLA-Tencor Corp. | 146,100 | 15,908,829 | ||||||
| Marvell Technology Group Ltd. | 224,400 | 4,144,668 | ||||||
| NVIDIA Corp. | 10,900 | 2,254,229 | ||||||
Skyworks Solutions, Inc. (a) | 101,770 | 11,587,532 | ||||||
| 32 | 1-888-462-5386 | www.oakfunds.com |
| Schedule of Investments | Red Oak Technology Select Fund |
As of October 31, 2017
| Shares or Principal | Fair Value | |||||||
| Semiconductors & Semiconductor Equipment (continued) | ||||||||
Xilinx, Inc. (a) | 181,900 | $ | 13,404,211 | |||||
| 71,081,641 | ||||||||
| Software — 24.61% | ||||||||
CA, Inc. (a) | 329,000 | 10,653,020 | ||||||
Check Point Software Technologies Ltd. (a) * | 107,200 | 12,618,512 | ||||||
| Dell Technologies, Inc., Class V * | 7,657 | 633,770 | ||||||
| Microsoft Corp. | 283,500 | 23,581,530 | ||||||
| Oracle Corp. | 376,100 | 19,143,490 | ||||||
Red Hat, Inc. (a) * | 154,500 | 18,668,235 | ||||||
| Synopsys, Inc. * | 204,600 | 17,701,992 | ||||||
VMware, Inc., Class A (a) * | 139,300 | 16,672,817 | ||||||
| 119,673,366 | ||||||||
| Technology Hardware, Storage & Peripherals — 11.81% | ||||||||
| Apple, Inc. | 109,320 | 18,479,453 | ||||||
| Hewlett Packard Enterprise Co. | 309,500 | 4,308,240 | ||||||
| HP, Inc. | 430,500 | 9,277,275 | ||||||
NetApp, Inc. (a) | 239,500 | 10,638,590 | ||||||
Seagate Technology PLC (a) | 282,400 | 10,440,328 | ||||||
| Western Digital Corp. | 48,000 | 4,284,960 | ||||||
| 57,428,846 | ||||||||
| Total Common Stocks | ||||||||
| (Cost $331,790,533) | 469,511,801 | |||||||
| Short-Term Investments — 22.05% | ||||||||
| Repurchase Agreement — 3.39% | ||||||||
| Tri-Party Repurchase Agreement with South Street Securities Wachovia Tri-Party, 0.88%, dated 10/31/17 and maturing 11/01/17, collateralized by U.S. Treasury Securities with rates ranging from 1.88% to 2.25% and maturity dates ranging from 9/30/22 to 1/31/24 with a par value of $16,724,949 and a collateral value of $16,797,631. | 16,468,257 | 16,468,257 | ||||||
| Annual Report | October 31, 2017 | 33 |
Red Oak Technology Select Fund | Schedule of Investments |
As of October 31, 2017
| Share | Fair Value | |||||||
| Collateral for Securities Loaned — 18.66% | ||||||||
Mount Vernon Liquid Assets Portfolio, LLC, 1.34% (b) | 90,769,043 | $ | 90,769,043 | |||||
| Total Short-Term Investments | ||||||||
| (Cost $107,237,300) | 107,237,300 | |||||||
| Total Investments — 118.60% | ||||||||
| (Cost $439,027,833) | 576,749,101 | |||||||
| Liabilities in Excess of Other Assets — (18.60)% | (90,453,848 | ) | ||||||
| NET ASSETS — 100.00% | $ | 486,295,253 | ||||||
(a) | Security, or a portion of the security position, is currently on loan. The total market value of securities on loan is $89,461,926. |
(b) | Rate disclosed is the seven day effective yield as of October 31, 2017. |
| * | Non-income producing security. |
The sectors shown on the schedule of investments are based on the Global Industry Classification Standard, or GICS® (“GICS”). The GICS was developed by and/or is the exclusive property of MSCI, Inc. and Standard & Poor’s Financial Services LLC (“S&P”). GICS is a service mark of MSCI, Inc. and S&P and has been licensed for use by Ultimus Fund Solutions, LLC.
The accompanying notes are an integral part of the financial statements.
| 34 | 1-888-462-5386 | www.oakfunds.com |
Schedule of Investments | Black Oak Emerging Technology Fund |
As of October 31, 2017
| Shares | Fair Value | |||||||
| Common Stocks — 99.39% | ||||||||
| Health Care — 5.19% | ||||||||
| Health Care Technology — 2.00% | ||||||||
Quality Systems, Inc. (a) | 53,000 | $ | 745,710 | |||||
| Life Sciences Tools & Services — 3.19% | ||||||||
| Illumina, Inc. * | 5,800 | 1,190,102 | ||||||
| Information Technology — 94.20% | ||||||||
| Communications Equipment — 10.10% | ||||||||
| CalAmp Corp * | 35,000 | 795,550 | ||||||
| F5 Networks, Inc. * | 8,805 | 1,067,782 | ||||||
| Palo Alto Networks, Inc. * | 5,900 | 868,480 | ||||||
| QUALCOMM, Inc. | 20,215 | 1,031,167 | ||||||
| 3,762,979 | ||||||||
| Internet Software & Services — 19.88% | ||||||||
| Baidu, Inc. ADR * | 8,150 | 1,988,111 | ||||||
| Blucora, Inc. * | 49,350 | 1,070,895 | ||||||
| Facebook, Inc., Class A * | 8,000 | 1,440,480 | ||||||
| LogMeIn, Inc. | 1,684 | 203,848 | ||||||
| Salesforce.com, Inc. * | 13,000 | 1,330,420 | ||||||
| Tencent Holdings Ltd. ADR * | 30,480 | 1,373,124 | ||||||
| 7,406,878 | ||||||||
| IT Services — 14.70% | ||||||||
Alliance Data Systems Corp. (a) | 2,760 | 617,495 | ||||||
| Cognizant Technology Solutions Corp., Class A | 9,600 | 726,432 | ||||||
| CSG Systems International, Inc. | 16,255 | 688,237 | ||||||
CSRA, Inc. (a) | 19,950 | 638,201 | ||||||
| DXC Technology Co. | 19,950 | 1,825,824 | ||||||
Perficient, Inc. (a) * | 29,165 | 567,259 | ||||||
| Science Applications International Corp. | 5,665 | 415,471 | ||||||
| 5,478,919 | ||||||||
| Semiconductors & Semiconductor Equipment — 24.42% | ||||||||
Ambarella, Inc. (a) * | 15,275 | 862,121 | ||||||
| Cirrus Logic, Inc. * | 26,800 | 1,500,800 | ||||||
| IXYS Corp. * | 62,690 | 1,548,443 | ||||||
Lam Research Corp. (a) | 9,255 | 1,930,315 | ||||||
MaxLinear, Inc., Class A (a) * | 34,600 | 846,662 | ||||||
Photronics, Inc. (a) * | 94,125 | 913,012 | ||||||
Silicon Motion Technology Corp. ADR (a) | 31,000 | 1,501,020 | ||||||
| 9,102,373 | ||||||||
| Annual Report | October 31, 2017 | 35 |
Black Oak Emerging Technology Fund | Schedule of Investments |
As of October 31, 2017
| Shares or Principal | Fair Value | |||||||
| Software — 12.89% | ||||||||
CA, Inc. (a) | 52,770 | $ | 1,708,693 | |||||
| Citrix Systems, Inc. * | 16,090 | 1,329,195 | ||||||
| Dell Technologies, Inc., Class V * | 4,803 | 397,544 | ||||||
| Fortinet, Inc. * | 34,760 | 1,369,892 | ||||||
| 4,805,324 | ||||||||
| Technology Hardware, Storage & Peripherals — 12.21% | ||||||||
| Apple, Inc. | 14,000 | 2,366,560 | ||||||
NetApp, Inc. (a) | 25,785 | 1,145,370 | ||||||
Seagate Technology PLC (a) | 28,045 | 1,036,824 | ||||||
| 4,548,754 | ||||||||
| Total Common Stocks | ||||||||
| (Cost $23,242,430) | 37,041,039 | |||||||
| Short-Term Investments — 29.27% | ||||||||
| Repurchase Agreement — 3.47% | ||||||||
| Tri-Party Repurchase Agreement with South Street Securities Wachovia Tri-Party, 0.88%, dated 10/31/17 and maturing 11/01/17, collateralized by U.S. Treasury Securities with rates ranging from 1.88% to 2.25% and maturity dates ranging from 9/30/22 to 1/31/24 with a par value of $1,312,886 and a collateral value of $1,318,592. | 1,292,736 | 1,292,736 | ||||||
| 36 | 1-888-462-5386 | www.oakfunds.com |
Schedule of Investments | Black Oak Emerging Technology Fund |
As of October 31, 2017
| Shares | Fair Value | |||||||
| Collateral for Securities Loaned — 25.80% | ||||||||
Mount Vernon Liquid Assets Portfolio, LLC, 1.34% (b) | 9,614,594 | $ | 9,614,594 | |||||
| Total Short-Term Investments | ||||||||
| (Cost $10,907,330) | 10,907,330 | |||||||
| Total Investments — 128.66% | ||||||||
| (Cost $34,149,760) | 47,948,369 | |||||||
| Liabilities in Excess of Other Assets — (28.66)% | (10,681,006 | ) | ||||||
| NET ASSETS — 100.00% | $ | 37,267,363 | ||||||
(a) | Security, or a portion of the security position, is currently on loan. The total market value of securities on loan is $9,489,567. |
b) | Rate disclosed is the seven day effective yields as of October 31, 2017. |
| * | Non-income producing security. |
| ADR — American Depositary Receipt |
The sectors shown on the schedule of investments are based on the Global Industry Classification Standard, or GICS® (“GICS”). The GICS was developed by and/or is the exclusive property of MSCI, Inc. and Standard & Poor’s Financial Services LLC (“S&P”). GICS is a service mark of MSCI, Inc. and S&P and has been licensed for use by Ultimus Fund Solutions, LLC.
The accompanying notes are an integral part of the financial statements.
| Annual Report | October 31, 2017 | 37 |
Live Oak Health Sciences Fund | Schedule of Investments |
As of October 31, 2017
| Shares | Fair Value | |||||||
| Common Stocks — 97.00% | ||||||||
| Health Care — 97.00% | ||||||||
| Biotechnology — 12.71% | ||||||||
| Amgen, Inc. | 26,200 | $ | 4,590,764 | |||||
| Biogen, Inc. * | 10,950 | 3,412,677 | ||||||
| Bioverativ, Inc. * | 4,050 | 228,825 | ||||||
| 8,232,266 | ||||||||
| Health Care Equipment & Supplies — 13.01% | ||||||||
Becton Dickinson and Co. (a) | 6,100 | 1,272,887 | ||||||
| C.R. Bard, Inc. | 9,850 | 3,221,639 | ||||||
| Halyard Health, Inc. * | 8,000 | 337,200 | ||||||
| Medtronic PLC | 15,196 | 1,223,582 | ||||||
Stryker Corp. (a) | 15,300 | 2,369,511 | ||||||
| 8,424,819 | ||||||||
| Health Care Providers & Services — 41.21% | ||||||||
| Aetna, Inc. | 14,300 | 2,431,429 | ||||||
| Anthem, Inc. | 17,300 | 3,619,333 | ||||||
| Cardinal Health, Inc. | 39,500 | 2,445,050 | ||||||
| Cigna Corp. | 10,700 | 2,110,254 | ||||||
| CVS Health Corp. | 15,100 | 1,034,803 | ||||||
| DaVita HealthCare Partners, Inc. * | 39,400 | 2,393,156 | ||||||
Express Scripts Holding Co. (a) * | 50,000 | 3,064,500 | ||||||
| McKesson Corp. | 19,450 | 2,681,766 | ||||||
Owens & Minor, Inc. (a) | 87,080 | 2,139,556 | ||||||
Quest Diagnostics, Inc. (a) | 22,300 | 2,091,294 | ||||||
| UnitedHealth Group, Inc. | 12,700 | 2,669,794 | ||||||
| 26,680,935 | ||||||||
| Life Sciences Tools & Services — 9.15% | ||||||||
| Charles River Laboratories International, Inc. * | 22,800 | 2,651,412 | ||||||
| Waters Corp. * | 16,700 | 3,274,035 | ||||||
| 5,925,447 | ||||||||
| Pharmaceuticals — 20.92% | ||||||||
| Bayer AG ADR | 37,200 | 1,210,116 | ||||||
| Eli Lilly & Co. | 16,500 | 1,352,010 | ||||||
| Endo International PLC * | 124,000 | 791,120 | ||||||
GlaxoSmithKline PLC ADR (a) | 64,300 | 2,342,449 | ||||||
| Johnson & Johnson | 14,700 | 2,049,327 | ||||||
| Merck & Co., Inc. | 34,300 | 1,889,587 | ||||||
| 38 | 1-888-462-5386 | www.oakfunds.com |
Schedule of Investments | Live Oak Health Sciences Fund |
As of October 31, 2017
| Shares or Principal | Fair Value | |||||||
| Pharmaceuticals (continued) | ||||||||
| Mylan NV * | 19,400 | $ | 692,774 | |||||
| Sanofi ADR | 49,692 | 2,349,438 | ||||||
Teva Pharmaceutical Industries Ltd. ADR (a) | 62,800 | 866,640 | ||||||
| 13,543,461 | ||||||||
| Total Common Stocks | ||||||||
| (Cost $45,344,201) | 62,806,928 | |||||||
| Short-Term Investments — 23.17% | ||||||||
| Repurchase Agreement — 3.16% | ||||||||
| Tri-Party Repurchase Agreement with South Street Securities Wachovia Tri-Party, 0.88%, dated 10/31/17 and maturing 11/01/17, collateralized by U.S. Treasury Securities with rates ranging from 1.88% to 2.25% and maturity dates ranging from 9/30/22 to 1/31/24 with a par value of $2,078,284 and a collateral value of $2,087,316. | 2,046,387 | 2,046,387 | ||||||
| Collateral for Securities Loaned — 20.01% | ||||||||
Mount Vernon Liquid Assets Portfolio, LLC, 1.34% (b) | 12,953,108 | 12,953,108 | ||||||
| Total Short-Term Investments | ||||||||
| (Cost $14,999,495) | 14,999,495 | |||||||
| Total Investments — 120.17% | ||||||||
| (Cost $60,343,696) | 77,806,423 | |||||||
| Liabilities in Excess of Other Assets — (20.17)% | (13,059,395 | ) | ||||||
| NET ASSETS — 100.00% | $ | 64,747,028 | ||||||
(a) | Security, or a portion of the security position, is currently on loan. The total market value of securities on loan is $12,667,323. |
b) | Rate disclosed is the seven day effective yields as of October 31, 2017. |
| * | Non-income producing security. |
| ADR — American Depositary Receipt |
The sectors shown on the schedule of investments are based on the Global Industry Classification Standard, or GICS® (“GICS”). The GICS was developed by and/or is the exclusive property of MSCI, Inc. and Standard & Poor’s Financial Services LLC (“S&P”). GICS is a service mark of MSCI, Inc. and S&P and has been licensed for use by Ultimus Fund Solutions, LLC.
The accompanying notes are an integral part of the financial statements.
| Annual Report | October 31, 2017 | 39 |
Statements of Assets and Liabilities
October 31, 2017
White Oak Select Growth Fund | Pin Oak Equity Fund | |||||||
| ASSETS | ||||||||
| Investments in securities at value (cost $238,123,388, $230,324,975, $8,753,464, $11,323,951, $439,027,833, $34,149,760 and $60,343,696), including $22,607,547, $51,539,747, $2,776,622, $1,760,871, $89,461,926, $9,489,567 and $12,667,323 of securities on loan | $ | 309,092,850 | $ | 275,601,971 | ||||
| Receivable for fund shares sold | 1,477 | 93,433 | ||||||
| Receivable for investments sold | — | 174,410 | ||||||
| Dividends and interest receivable | 42,846 | 136,663 | ||||||
| Tax reclaims receivable | — | — | ||||||
| Prepaid expenses | 19,709 | 21,586 | ||||||
| Total Assets | 309,156,882 | 276,028,063 | ||||||
| LIABILITIES | ||||||||
| Payable for fund shares redeemed | 150,647 | 745,048 | ||||||
| Payable for investments purchased | — | 202,186 | ||||||
| Payable for collateral upon return of securities loaned | 23,081,485 | 52,784,748 | ||||||
| Investment advisory fees payable | 177,897 | 140,807 | ||||||
| Administration fees payable | 11,440 | 8,866 | ||||||
| Transfer agent fees payable | 8,889 | 3,598 | ||||||
| Trustee fees payable | 10,519 | 8,351 | ||||||
| Other accrued expenses | 58,252 | 49,059 | ||||||
| Total Liabilities | 23,499,129 | 53,942,663 | ||||||
| NET ASSETS | $ | 285,657,753 | $ | 222,085,400 | ||||
| Net Assets consist of: | ||||||||
| Paid-in capital (unlimited authorization - no par value) | $ | 212,728,303 | $ | 172,954,447 | ||||
| Accumulated undistributed net investment income (loss) | 1,945,902 | 1,168,801 | ||||||
| Accumulated undistributed net realized gain from investments | 14,086 | 2,685,156 | ||||||
| Net unrealized appreciation on investments | 70,969,462 | 45,276,996 | ||||||
| NET ASSETS | $ | 285,657,753 | $ | 222,085,400 | ||||
| Total shares outstanding at end of year | 3,468,219 | 3,485,331 | ||||||
| Net asset value, offering and redemption price per share (net assets/shares outstanding) | $ | 82.36 | $ | 63.72 | ||||
The accompanying notes are an integral part of the financial statements.
| 40 | 1-888-462-5386 | www.oakfunds.com |
Rock Oak Core Growth Fund | River Oak Discovery Fund | Red Oak Technology Select Fund | Black Oak Emerging Technology Fund | Live Oak Health Sciences Fund | ||||||||||||||
| $ | 12,157,421 | $ | 16,324,188 | $ | 576,749,101 | $ | 47,948,369 | $ | 77,806,423 | |||||||||
| 4,000 | — | 399,165 | 950 | 8,298 | ||||||||||||||
| 434,028 | 408,659 | 858,254 | 420,279 | 41,791 | ||||||||||||||
| 3,167 | 3,153 | 102,015 | 32 | 7,600 | ||||||||||||||
| — | — | — | — | 3,128 | ||||||||||||||
| 2,900 | 8,621 | 37,612 | 4,219 | 11,200 | ||||||||||||||
| 12,601,516 | 16,744,621 | 578,146,147 | 48,373,849 | 77,878,440 | ||||||||||||||
| — | — | 643,831 | 848 | 105,367 | ||||||||||||||
| 562,116 | 514,756 | — | 1,437,134 | — | ||||||||||||||
| 2,833,283 | 1,772,096 | 90,769,043 | 9,614,594 | 12,953,108 | ||||||||||||||
| 4,708 | 10,840 | 297,203 | 23,502 | 41,682 | ||||||||||||||
| 372 | 589 | 18,599 | 1,544 | 2,584 | ||||||||||||||
| 706 | 712 | 5,601 | 3,435 | 1,811 | ||||||||||||||
| 338 | 533 | 17,414 | 1,387 | 2,458 | ||||||||||||||
| 17,043 | 17,616 | 99,203 | 24,042 | 24,402 | ||||||||||||||
| 3,418,566 | 2,317,142 | 91,850,894 | 11,106,486 | 13,131,412 | ||||||||||||||
| $ | 9,182,950 | $ | 14,427,479 | $ | 486,295,253 | $ | 37,267,363 | $ | 64,747,028 | |||||||||
| $ | 5,251,165 | $ | 8,751,144 | $ | 317,078,695 | $ | 20,773,169 | $ | 44,019,199 | |||||||||
| 5,990 | (81,754 | ) | 1,413,839 | 59,141 | 240,261 | |||||||||||||
| 521,838 | 757,852 | 30,081,451 | 2,636,444 | 3,024,841 | ||||||||||||||
| 3,403,957 | 5,000,237 | 137,721,268 | 13,798,609 | 17,462,727 | ||||||||||||||
| $ | 9,182,950 | $ | 14,427,479 | $ | 486,295,253 | $ | 37,267,363 | $ | 64,747,028 | |||||||||
| 571,487 | 828,279 | 18,861,895 | 7,062,256 | 3,240,678 | ||||||||||||||
| $ | 16.07 | $ | 17.42 | $ | 25.78 | $ | 5.28 | $ | 19.98 | |||||||||
| Annual Report | October 31, 2017 | 41 |
Statements of Operations
For the year ended October 31, 2017
White Oak Select Growth Fund | Pin Oak Equity Fund | |||||||
| INVESTMENT INCOME | ||||||||
| Dividends | $ | 5,024,244 | $ | 3,148,642 | ||||
| Securities lending income | 43,092 | 35,990 | ||||||
| Interest | 7,066 | 137,509 | ||||||
| Less: Foreign withholding tax | (31,327 | ) | (3,798 | ) | ||||
| Total Investment Income | 5,043,075 | 3,318,343 | ||||||
| EXPENSES | ||||||||
| Investment Adviser | 2,023,272 | 1,496,775 | ||||||
| Administration | 157,070 | 114,314 | ||||||
| Transfer agent | 96,843 | 50,162 | ||||||
| Sub transfer agent fees | 131,544 | 113,111 | ||||||
| Legal | 60,415 | 40,112 | ||||||
| Registration | 20,568 | 24,788 | ||||||
| Custodian | 13,102 | 14,763 | ||||||
| Audit | 13,500 | 13,500 | ||||||
| Trustee | 56,260 | 37,996 | ||||||
| Insurance | 30,372 | 12,754 | ||||||
| Pricing | 1,900 | 2,514 | ||||||
| Report printing | 27,363 | 26,437 | ||||||
| Principal financial officer | 2,480 | 1,630 | ||||||
| Miscellaneous | 59,238 | 33,700 | ||||||
| Total Expenses | 2,693,927 | 1,982,556 | ||||||
| Less: Investment advisory fees waived | — | — | ||||||
| Net Expenses | 2,693,927 | 1,982,556 | ||||||
| Net Investment Income (Loss) | 2,349,148 | 1,335,787 | ||||||
| Net Realized and Unrealized Gain (Loss) on Investments | ||||||||
| Net realized gain on investment securities transactions | 8,295,682 | 2,690,019 | ||||||
| Net realized loss on foreign currency translations | — | (71 | ) | |||||
| Net change in unrealized appreciation of investment securities | 45,890,230 | 27,089,478 | ||||||
| Net Realized and Unrealized Gain on Investments | 54,185,912 | 29,779,426 | ||||||
| Net Increase in Net Assets Resulting From Operations | $ | 56,535,060 | $ | 31,115,213 | ||||
The accompanying notes are an integral part of the financial statements.
| 42 | 1-888-462-5386 | www.oakfunds.com |
Rock Oak Core Growth Fund | River Oak Discovery Fund | Red Oak Technology Select Fund | Black Oak Emerging Technology Fund | Live Oak Health Sciences Fund | ||||||||||||||
| $ | 118,420 | $ | 89,335 | $ | 5,174,752 | $ | 320,116 | $ | 996,219 | |||||||||
| 1,957 | 4,469 | 124,763 | 12,670 | 17,332 | ||||||||||||||
| 1,594 | 5,700 | 136,676 | 10,032 | 9,646 | ||||||||||||||
| — | (186 | ) | — | (935 | ) | (26,763 | ) | |||||||||||
| 121,971 | 99,318 | 5,436,191 | 341,883 | 996,434 | ||||||||||||||
| 62,202 | 124,518 | 2,960,189 | 265,449 | 484,413 | ||||||||||||||
| 4,817 | 7,960 | 225,094 | 20,559 | 37,397 | ||||||||||||||
| 12,482 | 12,552 | 70,854 | 40,249 | 23,409 | ||||||||||||||
| 801 | 748 | 279,293 | 13,319 | 25,960 | ||||||||||||||
| 1,845 | 3,072 | 77,676 | 7,941 | 14,178 | ||||||||||||||
| 20,406 | 18,764 | 24,273 | 20,686 | 20,982 | ||||||||||||||
| 1,751 | 1,986 | 27,394 | 3,291 | 4,714 | ||||||||||||||
| 13,500 | 13,500 | 13,500 | 13,500 | 13,500 | ||||||||||||||
| 1,707 | 2,860 | 73,653 | 7,331 | 13,154 | ||||||||||||||
| 833 | 1,475 | 19,758 | 3,928 | 7,267 | ||||||||||||||
| 2,022 | 2,295 | 2,917 | 2,359 | 2,421 | ||||||||||||||
| 742 | 1,000 | 56,038 | 3,761 | 7,128 | ||||||||||||||
| 76 | 126 | 3,112 | 325 | 584 | ||||||||||||||
| 3,712 | 4,091 | 59,682 | 18,557 | 12,418 | ||||||||||||||
| 126,896 | 194,947 | 3,893,433 | 421,255 | 667,525 | ||||||||||||||
| (21,659 | ) | (7,896 | ) | — | — | — | ||||||||||||
| 105,237 | 187,051 | 3,893,433 | 421,255 | 667,525 | ||||||||||||||
| 16,734 | (87,733 | ) | 1,542,758 | (79,372 | ) | 328,909 | ||||||||||||
| 608,663 | 806,237 | 30,088,617 | 2,784,419 | 3,783,940 | ||||||||||||||
| — | — | — | — | — | ||||||||||||||
| 1,339,646 | 2,037,268 | 85,094,923 | 4,037,379 | 3,979,817 | ||||||||||||||
| 1,948,309 | 2,843,505 | 115,183,540 | 6,821,798 | 7,763,757 | ||||||||||||||
| $ | 1,965,043 | $ | 2,755,772 | $ | 116,726,298 | $ | 6,742,426 | $ | 8,092,666 | |||||||||
| Annual Report | October 31, 2017 | 43 |
Statements of Changes in Net Assets
| White Oak Select Growth Fund | Pin Oak Equity Fund | |||||||||||||||
For the Year Ended October 31, 2017 | For the Year Ended October 31, 2016 | For the Year Ended October 31, 2017 | For the Year Ended October 31, 2016 | |||||||||||||
| INVESTMENT ACTIVITIES | ||||||||||||||||
| Net investment income (loss) | $ | 2,349,148 | $ | 2,583,755 | $ | 1,335,787 | $ | 876,904 | ||||||||
| Net realized gain (loss) on investment securities transactions and foreign currency translations | 8,295,682 | 16,035,475 | 2,689,948 | 1,894,762 | ||||||||||||
| Net change in unrealized appreciation (depreciation) of investment securities | 45,890,230 | (9,431,729 | ) | 27,089,478 | 2,891,068 | |||||||||||
| Net Increase (Decrease) in Net Assets Resulting from Operations | 56,535,060 | 9,187,501 | 31,115,213 | 5,662,734 | ||||||||||||
| DISTRIBUTIONS TO SHAREHOLDERS | ||||||||||||||||
| From net investment income | (2,687,021 | ) | (1,677,212 | ) | (827,884 | ) | (762,856 | ) | ||||||||
| From net realized gains | — | — | (1,899,609 | ) | (2,912,364 | ) | ||||||||||
| Total Distributions | (2,687,021 | ) | (1,677,212 | ) | (2,727,493 | ) | (3,675,220 | ) | ||||||||
| CAPITAL TRANSACTIONS | ||||||||||||||||
| Proceeds from shares sold | 9,104,353 | 20,547,788 | 160,255,640 | 27,038,414 | ||||||||||||
| Reinvestment of distributions | 2,549,043 | 1,580,149 | 2,531,718 | 3,326,291 | ||||||||||||
| Amount paid for shares redeemed | (28,276,793 | ) | (38,857,403 | ) | (79,018,102 | ) | (21,399,655 | ) | ||||||||
| Net Increase (Decrease) in Net Assets Resulting from Capital Transactions | (16,623,397 | ) | (16,729,466 | ) | 83,769,256 | 8,965,050 | ||||||||||
| Total Increase (Decrease) in Net Assets | 37,224,642 | (9,219,177 | ) | 112,156,976 | 10,952,564 | |||||||||||
| NET ASSETS | ||||||||||||||||
| Beginning of year | 248,433,111 | 257,652,288 | 109,928,424 | 98,975,860 | ||||||||||||
| End of year | $ | 285,657,753 | $ | 248,433,111 | $ | 222,085,400 | $ | 109,928,424 | ||||||||
| Accumulated undistributed net investment income (loss) | $ | 1,945,902 | $ | 2,283,775 | $ | 1,168,801 | $ | 660,979 | ||||||||
| SHARE TRANSACTIONS | ||||||||||||||||
| Shares sold | 121,717 | 318,157 | 2,675,663 | 545,240 | ||||||||||||
| Shares issued in reinvestment of distributions | 35,222 | 23,902 | 43,411 | 65,465 | ||||||||||||
| Shares redeemed | (372,460 | ) | (609,288 | ) | (1,294,183 | ) | (437,227 | ) | ||||||||
| Net Increase (Decrease) in Shares Outstanding | (215,521 | ) | (267,229 | ) | 1,424,891 | 173,478 | ||||||||||
The accompanying notes are an integral part of the financial statements.
| 44 | 1-888-462-5386 | www.oakfunds.com |
| Rock Oak Core Growth Fund | River Oak Discovery Fund | Red Oak Technology Select Fund | ||||||||||||||||||||
| For the Year Ended October 31, 2017 | For the Year Ended October 31, 2016 | For the Year Ended October 31, 2017 | For the Year Ended October 31, 2016 | For the Year Ended October 31, 2017 | For the Year Ended October 31, 2016 | |||||||||||||||||
| $ | 16,734 | $ | 107,587 | $ | (87,733 | ) | $ | (49,736 | ) | $ | 1,542,758 | $ | 1,669,652 | |||||||||
| 608,663 | (85,930 | ) | 806,237 | (40,444 | ) | 30,088,617 | 2,647,186 | |||||||||||||||
| 1,339,646 | 237,246 | 2,037,268 | 485,427 | 85,094,923 | 19,253,931 | |||||||||||||||||
| 1,965,043 | 258,903 | 2,755,772 | 395,247 | 116,726,298 | 23,570,769 | |||||||||||||||||
| (54,642 | ) | (60,295 | ) | — | (14,119 | ) | (993,217 | ) | (1,455,611 | ) | ||||||||||||
| — | (175,227 | ) | — | — | (2,532,338 | ) | (4,075,253 | ) | ||||||||||||||
| (54,642 | ) | (235,522 | ) | — | (14,119 | ) | (3,525,555 | ) | (5,530,864 | ) | ||||||||||||
| �� | ||||||||||||||||||||||
| 278,335 | 307,326 | 189,919 | 158,944 | 343,894,387 | 74,929,886 | |||||||||||||||||
| 45,524 | 186,202 | — | 7,988 | 3,369,836 | 5,008,817 | |||||||||||||||||
| (446,548 | ) | (929,007 | ) | (839,975 | ) | (808,194 | ) | (163,233,228 | ) | (39,916,417 | ) | |||||||||||
| (122,689 | ) | (435,479 | ) | (650,056 | ) | (641,262 | ) | 184,030,995 | 40,022,286 | |||||||||||||
| 1,787,712 | (412,098 | ) | 2,105,716 | (260,134 | ) | 297,231,738 | 58,062,191 | |||||||||||||||
| 7,395,238 | 7,807,336 | 12,321,763 | 12,581,897 | 189,063,515 | 131,001,324 | |||||||||||||||||
| $ | 9,182,950 | $ | 7,395,238 | $ | 14,427,479 | $ | 12,321,763 | $ | 486,295,253 | $ | 189,063,515 | |||||||||||
| $ | 5,990 | $ | 43,898 | $ | (81,754 | ) | $ | (50,960 | ) | $ | 1,413,839 | $ | 864,301 | |||||||||
| 18,955 | 24,269 | 11,769 | 11,174 | 16,048,396 | 4,138,045 | |||||||||||||||||
| 3,347 | 15,300 | — | 573 | 166,823 | 302,282 | |||||||||||||||||
| (31,372 | ) | (76,822 | ) | (50,885 | ) | (58,450 | ) | (7,164,293 | ) | (2,257,110 | ) | |||||||||||
| (9,070 | ) | (37,253 | ) | (39,116 | ) | (46,703 | ) | 9,050,926 | 2,183,217 | |||||||||||||
| Annual Report | October 31, 2017 | 45 |
Statements of Changes in Net Assets
| Black Oak Emerging Technology Fund | Live Oak Health Sciences Fund | |||||||||||||||
| For the Year Ended October 31, 2017 | For the Year Ended October 31, 2016 | For the Year Ended October 31, 2017 | For the Year Ended October 31, 2016 | |||||||||||||
| INVESTMENT ACTIVITIES | ||||||||||||||||
| Net investment income (loss) | $ | (79,372 | ) | $ | 69,450 | $ | 328,909 | $ | 326,150 | |||||||
| Net realized gain (loss) on investment securities transactions and foreign currency translations | 2,784,419 | 1,433,063 | 3,783,940 | 2,267,649 | ||||||||||||
| Net change in unrealized appreciation (depreciation) of investment securities | 4,037,379 | 1,358,179 | 3,979,817 | (3,960,509 | ) | |||||||||||
| Net Increase (Decrease) in Net Assets Resulting from Operations | 6,742,426 | 2,860,692 | 8,092,666 | (1,366,710 | ) | |||||||||||
| DISTRIBUTIONS TO SHAREHOLDERS | ||||||||||||||||
| From net investment income | (9,364 | ) | — | (315,656 | ) | (1,883,024 | ) | |||||||||
| From net realized gains | (1,306,166 | ) | (944,209 | ) | (906,767 | ) | (6,908,453 | ) | ||||||||
| Total Distributions | (1,315,530 | ) | (944,209 | ) | (1,222,423 | ) | (8,791,477 | ) | ||||||||
| CAPITAL TRANSACTIONS | ||||||||||||||||
| Proceeds from shares sold | 1,335,137 | 1,133,653 | 15,901,469 | 13,892,851 | ||||||||||||
| Reinvestment of distributions | 1,152,138 | 814,965 | 1,107,629 | 7,836,751 | ||||||||||||
| Amount paid for shares redeemed | (3,541,104 | ) | (3,268,885 | ) | (15,191,665 | ) | (8,684,293 | ) | ||||||||
| Net Increase (Decrease) in Net Assets Resulting from Capital Transactions | (1,053,829 | ) | (1,320,267 | ) | 1,817,433 | 13,045,309 | ||||||||||
| Total Increase (Decrease) in Net Assets | 4,373,067 | 596,216 | 8,687,676 | 2,887,122 | ||||||||||||
| NET ASSETS | ||||||||||||||||
| Beginning of year | 32,894,296 | 32,298,080 | 56,059,352 | 53,172,230 | ||||||||||||
| End of year | $ | 37,267,363 | $ | 32,894,296 | $ | 64,747,028 | $ | 56,059,352 | ||||||||
| Accumulated undistributed net investment income (loss) | $ | 59,141 | $ | — | $ | 240,261 | $ | 227,008 | ||||||||
| SHARE TRANSACTIONS | ||||||||||||||||
| Shares sold | 275,090 | 261,227 | 833,815 | 714,136 | ||||||||||||
| Shares issued in reinvestment of distributions | 249,381 | 197,807 | 60,825 | 405,890 | ||||||||||||
| Shares redeemed | (716,020 | ) | (791,999 | ) | (780,477 | ) | (450,008 | ) | ||||||||
| Net Increase (Decrease) in Shares Outstanding | (191,549 | ) | (332,965 | ) | 114,163 | 670,018 | ||||||||||
The accompanying notes are an integral part of the financial statements.
| 46 | 1-888-462-5386 | www.oakfunds.com |
OAK ASSOCIATES FUNDS
This Page Intentionally Left Blank
Financial Highlights
For a share outstanding throughout the years ended
Net Asset Value Beginning of Year | Net Investment Income (Loss) (a) | Realized and Unrealized Gain (Loss) in Securities | Total From Operations | Dividends from Net Investment Income | ||||||||||||||||
| White Oak Select Growth Fund | ||||||||||||||||||||
| For the year ended October 31, 2017 | $ | 67.44 | 0.65 | 15.00 | 15.65 | (0.73 | ) | |||||||||||||
| For the year ended October 31, 2016 | $ | 65.21 | 0.66 | 1.99 | 2.65 | (0.42 | ) | |||||||||||||
| For the year ended October 31, 2015 | $ | 60.34 | 0.94 | 4.90 | 5.84 | (0.97 | ) | |||||||||||||
| For the year ended October 31, 2014 | $ | 53.66 | 0.35 | 6.57 | 6.92 | (0.24 | ) | |||||||||||||
| For the year ended October 31, 2013 | $ | 42.50 | 0.24 | 11.06 | 11.30 | (0.14 | ) | |||||||||||||
| Pin Oak Equity Fund | ||||||||||||||||||||
| For the year ended October 31, 2017 | $ | 53.35 | 0.40 | 11.15 | 11.55 | (0.36 | ) | |||||||||||||
| For the year ended October 31, 2016 | $ | 52.45 | 0.43 | 2.38 | 2.81 | (0.40 | ) | |||||||||||||
| For the year ended October 31, 2015 | $ | 49.76 | 0.54 | 2.77 | 3.31 | (0.53 | ) | |||||||||||||
| For the year ended October 31, 2014 | $ | 43.07 | 0.30 | 6.67 | 6.97 | (0.28 | ) | |||||||||||||
| For the year ended October 31, 2013 | $ | 32.86 | 0.26 | 10.18 | 10.44 | (0.23 | ) | |||||||||||||
| Rock Oak Core Growth Fund | ||||||||||||||||||||
| For the year ended October 31, 2017 | $ | 12.74 | 0.03 | 3.40 | 3.43 | (0.10 | ) | |||||||||||||
| For the year ended October 31, 2016 | $ | 12.64 | 0.18 | 0.31 | 0.49 | (0.10 | ) | |||||||||||||
| For the year ended October 31, 2015 | $ | 14.21 | — | (c) | (0.54 | ) | (0.54 | ) | (0.04 | ) | ||||||||||
| For the year ended October 31, 2014 | $ | 15.04 | 0.05 | 2.06 | 2.11 | (0.06 | ) | |||||||||||||
| For the year ended October 31, 2013 | $ | 11.78 | 0.07 | 3.37 | 3.44 | (0.05 | ) | |||||||||||||
| River Oak Discovery Fund | ||||||||||||||||||||
| For the year ended October 31, 2017 | $ | 14.21 | (0.10 | ) | 3.31 | 3.21 | — | |||||||||||||
| For the year ended October 31, 2016 | $ | 13.76 | (0.06 | ) | 0.53 | (0.47 | ) | (0.02 | ) | |||||||||||
| For the year ended October 31, 2015 | $ | 17.72 | (0.04 | ) | (0.13 | ) | (0.17 | ) | — | |||||||||||
| For the year ended October 31, 2014 | $ | 17.70 | (0.13 | ) | 1.59 | 1.46 | — | |||||||||||||
| For the year ended October 31, 2013 | $ | 13.46 | (0.08 | ) | 4.32 | 4.24 | — | |||||||||||||
(a) | Per share calculations were performed using average shares for the period. |
(b) | Figures do not reflect the deduction of taxes the shareholder will pay on fund distributions or redemption of fund shares. |
(c) | Less than $0.005 per share. |
The accompanying notes are an integral part of the financial statements.
| 48 | 1-888-462-5386 | www.oakfunds.com |
| Distributions from Capital Gains | Total Dividends and Distributions | Net Asset Value End of Year | Total Return(b) | Net Assets End of Year (000) | Ratio of Net Expenses to Average Net Assets | Ratio of Net Investment Income (Loss) to Average Net Assets | Ratio of Expenses to Average Net Assets (Excluding Waivers and/or Fees Paid Indirectly) | Portfolio Turnover Rate | ||||||||||||||||||||||||||
| — | (0.73 | ) | $ | 82.36 | 23.36 | % | $ | 285,658 | 0.98 | % | 0.86 | % | 0.98 | % | 13 | % | ||||||||||||||||||
| — | (0.42 | ) | $ | 67.44 | 4.07 | % | $ | 248,433 | 1.06 | % | 1.03 | % | 1.06 | % | 14 | % | ||||||||||||||||||
| — | (0.97 | ) | $ | 65.21 | 9.84 | % | $ | 257,652 | 1.06 | % | 1.52 | % | 1.06 | % | 9 | % | ||||||||||||||||||
| — | (0.24 | ) | $ | 60.34 | 12.94 | % | $ | 256,221 | 1.10 | % | 0.61 | % | 1.10 | % | 1 | % | ||||||||||||||||||
| — | (0.14 | ) | $ | 53.66 | 26.65 | % | $ | 253,803 | 1.12 | % | 0.50 | % | 1.12 | % | 89 | % | ||||||||||||||||||
| (0.82 | ) | (1.18 | ) | $ | 63.72 | 21.86 | % | $ | 222,085 | 0.98 | % | 0.66 | % | 0.98 | % | 8 | % | |||||||||||||||||
| (1.51 | ) | (1.91 | ) | $ | 53.35 | 5.54 | % | $ | 109,928 | 1.08 | % | 0.86 | % | 1.08 | % | 10 | % | |||||||||||||||||
| (0.09 | ) | (0.62 | ) | $ | 52.45 | 6.76 | % | $ | 98,976 | 1.10 | % | 1.09 | % | 1.10 | % | 15 | % | |||||||||||||||||
| — | (0.28 | ) | $ | 49.76 | 16.25 | % | $ | 94,316 | 1.13 | % | 0.64 | % | 1.13 | % | 5 | % | ||||||||||||||||||
| — | (0.23 | ) | $ | 43.07 | 31.94 | % | $ | 81,408 | 1.16 | % | 0.70 | % | 1.16 | % | 117 | % | ||||||||||||||||||
| — | (0.10 | ) | $ | 16.07 | 27.02 | % | $ | 9,183 | 1.25 | % | 0.20 | % | 1.51 | % | 31 | % | ||||||||||||||||||
| (0.29 | ) | (0.39 | ) | $ | 12.74 | 3.98 | % | $ | 7,395 | 1.25 | % | 0.48 | % | 1.65 | % | 11 | % | |||||||||||||||||
| (0.99 | ) | (1.03 | ) | $ | 12.64 | (4.04 | %) | $ | 7,807 | 1.25 | % | 0.03 | % | 1.52 | % | 32 | % | |||||||||||||||||
| (2.88 | ) | (2.94 | ) | $ | 14.21 | 15.89 | % | $ | 8,491 | 1.25 | % | 0.33 | % | 1.58 | % | 29 | % | |||||||||||||||||
| (0.13 | ) | (0.18 | ) | $ | 15.04 | 29.51 | % | $ | 7,495 | 1.25 | % | 0.53 | % | 1.65 | % | 65 | % | |||||||||||||||||
| — | — | $ | 17.42 | 22.59 | % | $ | 14,427 | 1.35 | % | (0.63 | %) | 1.41 | % | 43 | % | |||||||||||||||||||
| — | (0.02 | ) | $ | 14.21 | 3.39 | % | $ | 12,322 | 1.35 | % | (0.40 | %) | 1.51 | % | 21 | % | ||||||||||||||||||
| (3.79 | ) | (3.79 | ) | $ | 13.76 | (1.27 | %) | $ | 12,582 | 1.35 | % | (0.28 | %) | 1.45 | % | 17 | % | |||||||||||||||||
| (1.44 | ) | (1.44 | ) | $ | 17.72 | 8.69 | % | $ | 13,915 | 1.35 | % | (0.71 | %) | 1.48 | % | 96 | % | |||||||||||||||||
| — | — | $ | 17.70 | 31.50 | % | $ | 13,304 | 1.35 | % | (0.52 | %) | 1.52 | % | 63 | % | |||||||||||||||||||
| Annual Report | October 31, 2017 | 49 |
Financial Highlights
For a share outstanding throughout the years ended
Net Asset Value Beginning of Year | Net Investment Income (Loss) (a) | Realized and Unrealized Gain (Loss) in Securities | Total From Operations | Dividends from Net Investment Income | ||||||||||||||||
| Red Oak Technology Select Fund | ||||||||||||||||||||
| For the year ended October 31, 2017 | $ | 19.27 | 0.09 | 6.71 | 6.80 | (0.08 | ) | |||||||||||||
| For the year ended October 31, 2016 | $ | 17.17 | 0.20 | 2.62 | 2.82 | (0.19 | ) | |||||||||||||
| For the year ended October 31, 2015 | $ | 16.22 | 0.20 | 0.91 | 1.11 | (0.16 | ) | |||||||||||||
| For the year ended October 31, 2014 | $ | 13.74 | 0.06 | 2.48 | 2.54 | (0.06 | ) | |||||||||||||
| For the year ended October 31, 2013 | $ | 9.79 | 0.06 | 3.92 | 3.98 | (0.03 | ) | |||||||||||||
| Black Oak Emerging Technology Fund | ||||||||||||||||||||
| For the year ended October 31, 2017 | $ | 4.53 | (0.01 | ) | 0.94 | 0.93 | — | (c) | ||||||||||||
| For the year ended October 31, 2016 | $ | 4.26 | 0.01 | 0.39 | 0.40 | — | ||||||||||||||
| For the year ended October 31, 2015 | $ | 4.25 | (0.03 | ) | 0.04 | 0.01 | — | |||||||||||||
| For the year ended October 31, 2014 | $ | 3.58 | (0.01 | ) | 0.68 | 0.67 | — | |||||||||||||
| For the year ended October 31, 2013 | $ | 2.67 | (0.01 | ) | 0.92 | 0.91 | — | |||||||||||||
| Live Oak Health Sciences Fund | ||||||||||||||||||||
| For the year ended October 31, 2017 | $ | 17.93 | 0.10 | 2.33 | 2.43 | (0.10 | ) | |||||||||||||
| For the year ended October 31, 2016 | $ | 21.65 | 0.11 | (0.33 | ) | (0.22 | ) | (0.67 | ) | |||||||||||
| For the year ended October 31, 2015 | $ | 22.25 | 0.14 | 1.51 | 1.65 | (0.13 | ) | |||||||||||||
| For the year ended October 31, 2014 | $ | 18.83 | 0.13 | 4.11 | 4.24 | (0.13 | ) | |||||||||||||
| For the year ended October 31, 2013 | $ | 14.67 | 0.13 | 4.90 | 5.03 | (0.13 | ) | |||||||||||||
(a) | Per share calculations were performed using average shares for the period. |
(b) | Figures do not reflect the deduction of taxes the shareholder will pay on fund distributions or redemption of fund shares. |
(c) | Less than $0.005 per share. |
The accompanying notes are an integral part of the financial statements.
| 50 | 1-888-462-5386 | www.oakfunds.com |
| Distributions from Capital Gains | Total Dividends and Distributions | Net Asset Value End of Year | Total Return(b) | Net Assets End of Year (000) | Ratio of Net Expenses to Average Net Assets | Ratio of Net Investment Income (Loss) to Average Net Assets | Ratio of Expenses to Average Net Assets (Excluding Waivers and/or Fees Paid Indirectly) | Portfolio Turnover Rate | ||||||||||||||||||||||||||
| (0.21 | ) | (0.29 | ) | $ | 25.78 | 35.76 | % | $ | 486,295 | 0.97 | % | 0.38 | % | 0.97 | % | 16 | % | |||||||||||||||||
| (0.53 | ) | (0.72 | ) | $ | 19.27 | 17.14 | % | $ | 189,064 | 1.09 | % | 1.17 | % | 1.09 | % | 6 | % | |||||||||||||||||
| — | (0.16 | ) | $ | 17.17 | 6.91 | % | $ | 131,001 | 1.11 | % | 1.19 | % | 1.11 | % | 4 | % | ||||||||||||||||||
| — | (0.06 | ) | $ | 16.22 | 18.54 | % | $ | 142,273 | 1.15 | % | 0.41 | % | 1.15 | % | 7 | % | ||||||||||||||||||
| — | (0.03 | ) | $ | 13.74 | 40.76 | % | $ | 105,592 | 1.23 | % | 0.50 | % | 1.23 | % | 15 | % | ||||||||||||||||||
| (0.18 | ) | (0.18 | ) | $ | 5.28 | 21.16 | % | $ | 37,267 | 1.17 | % | (0.22 | %) | 1.17 | % | 39 | % | |||||||||||||||||
| (0.13 | ) | (0.13 | ) | $ | 4.53 | 9.59 | % | $ | 32,894 | 1.28 | % | 0.22 | % | 1.28 | % | 35 | % | |||||||||||||||||
| — | — | $ | 4.26 | 0.24 | % | $ | 32,298 | 1.25 | % | (0.61 | %) | 1.25 | % | 17 | % | |||||||||||||||||||
| — | — | $ | 4.25 | 18.72 | % | $ | 34,139 | 1.31 | % | (0.32 | %) | 1.31 | % | 41 | % | |||||||||||||||||||
| — | — | $ | 3.58 | 34.08 | % | $ | 29,853 | 1.35 | % | (0.19 | %) | 1.39 | % | 58 | % | |||||||||||||||||||
| (0.28 | ) | (0.38 | ) | $ | 19.98 | 13.78 | % | $ | 64,747 | 1.02 | % | 0.50 | % | 1.02 | % | 14 | % | |||||||||||||||||
| (2.83 | ) | (3.50 | ) | $ | 17.93 | (1.85 | %) | $ | 56,059 | 1.11 | % | 0.59 | % | 1.11 | % | 14 | % | |||||||||||||||||
| (2.12 | ) | (2.25 | ) | $ | 21.65 | 8.02 | % | $ | 53,172 | 1.08 | % | 0.62 | % | 1.08 | % | 28 | % | |||||||||||||||||
| (0.69 | ) | (0.82 | ) | $ | 22.25 | 23.36 | % | $ | 50,248 | 1.12 | % | 0.64 | % | 1.12 | % | 15 | % | |||||||||||||||||
| (0.74 | ) | (0.87 | ) | $ | 18.83 | 36.07 | % | $ | 42,517 | 1.15 | % | 0.77 | % | 1.15 | % | 12 | % | |||||||||||||||||
| Annual Report | October 31, 2017 | 51 |
Notes to Financial Statements
As of October 31, 2017
1. ORGANIZATION:
The Oak Associates Funds (the “Trust”), a Massachusetts business trust, is registered under the Investment Company Act of 1940, as amended (the “1940 Act”), as an open-end management investment company with seven diversified funds: White Oak Select Growth Fund, Pin Oak Equity Fund, Rock Oak Core Growth Fund, River Oak Discovery Fund, Red Oak Technology Select Fund, Black Oak Emerging Technology Fund and Live Oak Health Sciences Fund (collectively referred to as “Funds” and each individually referred to as a “Fund”). The investment objective of each Fund is to seek long-term capital growth. The assets of each Fund are segregated, and a shareholder’s interest is limited to the Fund in which shares are held. The Funds’ prospectus provides a description of each Fund’s investment objective, policies and strategies.
2. SIGNIFICANT ACCOUNTING POLICIES:
The following is a summary of significant accounting policies followed by the Funds.
Use of Estimates – These policies are in conformity with U.S. generally accepted accounting principles (“GAAP”). Each Fund is considered an investment company for financial reporting purposes under GAAP. The preparation of financial statements in accordance with GAAP requires management to make estimates and assumptions that affect the reported amounts and disclosures in the financial statements during the reporting period. Management believes the estimates and security valuations are appropriate; however, actual results may differ from those estimates, and the security valuations reflected in the financial statements may differ from the value the Funds ultimately realize upon the sale of the securities.
Security Valuation – Investments in equity securities, which are traded on a national exchange, are stated at the last quoted sales price if readily available for such equity securities on each business day. Investments in equity securities, which are reported on the NASDAQ national market system are valued at the official closing price; other equity securities traded in the over-the-counter market and listed equity securities for which no sale was reported on that date are stated at the last quoted bid price. Debt obligations exceeding sixty days to maturity for which market quotations are readily available are valued at the most recently quoted bid price. Debt obligations with sixty days or less remaining until maturity may be valued at their amortized cost, which approximates fair value. Investments in repurchase agreements are generally valued at par each business day.
Redeemable securities issued by open-end registered investment companies and unregistered private liquidity funds operating to similar limitations as money market mutual funds are both valued at the applicable net asset value (“NAV”) as determined by those funds each business day.
Securities for which market prices are not “readily available” are valued in accordance with Fair Value Procedures established by the Funds’ Board of Trustees. The Board of Trustees has determined to delegate responsibility for pricing and fair valuation determinations for portfolio securities to Funds’ adviser, Oak Associates, Ltd. (“Oak” or the “Adviser”), subject to oversight of the Board of Trustees. Oak may, in turn and subject to its oversight, delegate pricing of securities for which market prices are readily available to the Funds’ administrator. All fair valuation determinations shall be made by Oak’s Fair Value Committee (the “Committee”), in accordance with policies and procedures established by the Board of Trustees and subject to oversight of the Board. Oak and the administrator have established and maintain policies and procedures reasonably designed to ensure that their pricing and valuation policies and procedures conform to the requirements of the Funds’ Fair Value Procedures. Some of the more common reasons that may necessitate that a security be valued using Fair Value Procedures include: the security’s trading has been halted or suspended; the security has been de–listed from a national exchange; the security’s primary
| 52 | 1-888-462-5386 | www.oakfunds.com |
Notes to Financial Statements
As of October 31, 2017
trading market is temporarily closed at a time when under normal conditions it would be open; the security has not been traded for an extended period of time; the security’s primary pricing source is not able or willing to provide a price; a significant event with respect to a security or securities has occurred after the close of the market or exchange on which the security or securities principally trades and before the time the Fund calculates net asset value; or trading of the security is subject to local government–imposed restrictions. When a security is valued in accordance with the Fair Value Procedures, the Committee will determine the value after taking into consideration relevant information reasonably available to the Committee.
Security Transactions and Investment Income – Security transactions are accounted for on the date the security is purchased or sold (trade date) for financial reporting purposes. Dividend income is recognized on the ex-dividend date. Interest income is recognized on the accrual basis. Withholding taxes on foreign dividends have been provided for in accordance with the Funds’ understanding of the applicable country’s tax rules and rates. Costs used in determining realized gains and losses on the sales of investment securities are those of the specific securities sold. If applicable, any foreign capital gains taxes are accrued, net of unrealized gains, and are payable upon the sale of such investments.
Expenses – Expenses that are directly related to one of the Funds are charged to that Fund. Expenses not directly billed to a particular Fund are allocated proportionally among all Funds daily in relation to net assets of each Fund or another reasonable allocation method.
Repurchase Agreements – The Funds invest in tri-party repurchase agreements. Securities held as collateral for tri-party repurchase agreements are maintained by the broker’s custodian bank in a segregated account until maturity of the repurchase agreement. Provisions of the repurchase agreements and procedures adopted by the Board of Trustees require that the market value of the collateral, including accrued interest thereon, is sufficient in the event of default by the counterparty. A custody agreement in connection with the Master Repurchase Agreement defines eligible securities for collateral in relation to each repurchase agreement. Under the Master Repurchase Agreement, if the counterparty defaults and the value of the collateral declines or if the counter-party enters an insolvency proceeding, realization of the collateral by the Funds may be delayed or limited. At fiscal year-end, certain Funds had investments in repurchase agreements. The gross value and related collateral received for those investments are presented in each applicable Fund’s Schedule of Investments. The value of the related collateral received exceeded the value of the repurchase agreements as of the period end.
Master Agreements and Netting Arrangements – Certain Funds may participate in various repurchase agreements, such as, but not limited to Master Repurchase Agreements, which govern the terms of certain transactions with select counterparties (collectively “Master Agreements”). These Master Agreements generally include provisions for general obligations, agreements, representations, collateral and provisions for events of default or termination. These Master Agreements also include provisions for netting arrangements that help reduce credit and counterparty risk associated with relevant transactions. The netting arrangements are generally tied to credit related events that if triggered, would cause an event of default or termination giving a Fund or counterparty the right to terminate early and cause settlement, on a net basis, of all transactions under the applicable Master Agreement. In the event of an early termination or default event, the total market value exposure would be offset against collateral exchanged to date, which would result in a net receivable or payable that would be due from or to the counterparty. Credit related events include, but are not limited to, bankruptcy, failure to make timely payments, restructuring, obligation acceleration, obligation default, a material decline in net assets, decline in credit rating or repudiation/moratorium. An election made by a counterparty to terminate a transaction early under a Master Agreement could have an adverse impact on a Fund’s financial
| Annual Report | October 31, 2017 | 53 |
Notes to Financial Statements
As of October 31, 2017
statements. Master Agreements can also help limit counterparty risk by requiring collateral posting arrangements at pre-arranged exposure levels. Collateral under the Master Agreements is usually in the form of cash, U.S. Treasury or U.S. Government agency securities, but may include other types of securities. There can be no assurance that the Master Agreements will be successful in limiting credit or counterparty risk.
Securities Lending – The Trust has entered into a Securities Lending Agreement (“SLA”) with U.S. Bank National Association (the “Agent”). Under the terms of the SLA, the Funds may lend securities to certain broker-dealers and banks in exchange for collateral in the amount of at least 102% of the value of U.S. securities loaned or at least 105% of the value of non-U.S. securities loaned, marked to market daily or up to one-third of a Fund’s total asset value. The collateral can be received in the form of cash collateral and/or non-cash collateral. Non-cash collateral can include U.S. Government Securities and letters of credit. The cash collateral is invested in the Mount Vernon Liquid Assets Portfolio, LLC, as noted in the Funds’ Schedules of Portfolio Investments. The market value of the loaned securities is determined daily at the close of business of the Funds and any additional required collateral is delivered to each Fund on the next business day. The Funds continue to benefit from interest or dividends on the securities loaned and may also earn a return from the collateral. The Funds pay various fees in connection with the investment of cash collateral. The Funds pay the Agent fees based on the investment income received from securities lending activities. Although risk is mitigated by the collateral, the Funds could experience a delay in recovering its securities and possible loss of income or value if the borrower fails to return them. The contractual maturity of repurchase agreements are on an overnight and continuous basis. Cash and cash equivalent collateral on securities lending transactions are on an overnight and continuous basis.
The following is a summary of each Funds’ securities lending agreements and related cash and non-cash collateral received as of October 31, 2017:
Market Value of Securities on Loan | Cash and Cash Equivalents/ Cash Collateral Received | |||||||
| White Oak Select Growth Fund | $ | 22,607,547 | $ | 23,081,485 | ||||
| Pin Oak Equity Fund | 51,539,747 | 52,784,748 | ||||||
| Rock Oak Core Growth Fund | 2,776,622 | 2,833,283 | ||||||
| River Oak Discovery Fund | 1,760,871 | 1,772,096 | ||||||
| Red Oak Technology Select Fund | 89,461,926 | 90,769,043 | ||||||
| Black Oak Emerging Technology Fund | 9,489,567 | 9,614,594 | ||||||
| Live Oak Health Sciences Fund | 12,667,323 | 12,953,108 | ||||||
Dividends and Distributions to Shareholders – Dividends from net investment income are declared and paid to shareholders on an annual basis, as applicable. Net realized capital gains on sales of securities, if any, are distributed to shareholders at least annually. Distributions to shareholders are determined in accordance with income tax regulations and are recorded on the ex-dividend date. Income and capital gain distributions are determined in accordance with federal income tax regulations, which may differ from GAAP. Therefore, the source of the Funds’ distributions may be shown in the accompanying financial statements as either from or in excess of net investment income or net realized gain, or from paid-in capital, depending upon the type of book/tax differences that may exist.
| 54 | 1-888-462-5386 | www.oakfunds.com |
Notes to Financial Statements
As of October 31, 2017
3. FAIR VALUE MEASUREMENTS:
A three-tier hierarchy has been established to classify fair value measurements for disclosure purposes. Inputs refer broadly to the assumptions that market participants would use in pricing the asset or liability including assumptions about risk. Inputs may be observable and unobservable. Observable inputs are inputs that reflect the assumptions market participants would use in pricing the asset or liability that are developed based on market data obtained from sources independent of the reporting entity. Unobservable inputs are inputs that reflect the reporting entity’s own assumptions about the assumptions market participants would use in pricing the asset or liability that are developed based on the best information available.
Various inputs are used in determining the value of each Fund’s investments as of the reporting period end. The designated input levels are not necessarily an indication of the risk or liquidity associated with these investments. These inputs are categorized in the following hierarchy under applicable financial accounting standards:
The three-tier hierarchy is summarized as follows:
Level 1 – Unadjusted quoted prices in active markets for identical assets or liabilities that a Fund has the ability to access at the measurement date, including but not limited to:
Equity Securities – investments for which market quotations are readily available that are valued at the last reported sale price or official closing price as reported by an independent pricing service on the primary market or exchange on which they are traded.
Investment Companies – investments in open-end registered investment companies which are valued at their closing NAV.
Level 2 – Quoted prices which are not active, quoted prices for similar assets or liabilities inactive markets or inputs other than quoted prices that are observable (either directly or indirectly) for substantially the full term of the asset or liability, including but not limited to:
Repurchase Agreements – investments in overnight tri-party repurchase agreements which are valued at par.
All Securities – quoted prices for similar securities, including matrix pricing; quoted prices based on recently executed transactions; adjusted quoted prices based on observable and formulaic inputs; or, prices using other observable correlated market inputs.
Level 3 – Significant unobservable prices or inputs (including the Fund’s own assumptions in determining the fair value of investments) where there is little or no market activity for the asset and liability at the measurement date, including but not limited to:
All Securities – modeling or manual pricing based on the Adviser’s own assumptions in determining fair value of investments; or, the significant use of other unobservable or very stale inputs within fair valuation.
| Annual Report | October 31, 2017 | 55 |
Notes to Financial Statements
As of October 31, 2017
The following is a summary of the inputs used to value each Fund’s investments as of October 31, 2017:
| Level 1 | Level 2 | Level 3 | Total | |||||||||||||
| WHITE OAK SELECT GROWTH FUND | ||||||||||||||||
| Common Stocks | $ | 284,133,813 | $ | — | $ | — | $ | 284,133,813 | ||||||||
| Short Term Investments | — | |||||||||||||||
| Repurchase Agreement | — | 1,877,552 | — | 1,877,552 | ||||||||||||
| Collateral for Securities Loaned* | — | — | — | 23,081,485 | ||||||||||||
| Total | $ | 284,133,813 | $ | 1,877,552 | $ | — | $ | 309,092,850 | ||||||||
| Level 1 | Level 2 | Level 3 | Total | |||||||||||||
| PIN OAK EQUITY FUND | ||||||||||||||||
| Common Stocks | $ | 209,062,617 | $ | — | $ | — | $ | 209,062,617 | ||||||||
| Short Term Investments | ||||||||||||||||
| Repurchase Agreement | — | 13,754,606 | — | 13,754,606 | ||||||||||||
| Collateral for Securities Loaned* | — | — | — | 52,784,748 | ||||||||||||
| Total | $ | 209,062,617 | $ | 13,754,606 | $ | — | $ | 275,601,971 | ||||||||
| Level 1 | Level 2 | Level 3 | Total | |||||||||||||
| ROCK OAK CORE GROWTH FUND | ||||||||||||||||
| Common Stocks | $ | 9,098,020 | $ | — | $ | — | $ | 9,098,020 | ||||||||
| Short Term Investments | ||||||||||||||||
| Repurchase Agreement | — | 226,118 | — | 226,118 | ||||||||||||
| Collateral for Securities Loaned* | — | — | — | 2,833,283 | ||||||||||||
| Total | $ | 9,098,020 | $ | 226,118 | $ | — | $ | 12,157,421 | ||||||||
| Level 1 | Level 2 | Level 3 | Total | |||||||||||||
| RIVER OAK DISCOVERY FUND | ||||||||||||||||
| Common Stocks | $ | 14,267,803 | $ | — | $ | — | $ | 14,267,803 | ||||||||
| Short Term Investments | ||||||||||||||||
| Repurchase Agreement | — | 284,289 | — | 284,289 | ||||||||||||
| Collateral for Securities Loaned* | — | — | — | 1,772,096 | ||||||||||||
| Total | $ | 14,267,803 | $ | 284,289 | $ | — | $ | 16,324,188 | ||||||||
| Level 1 | Level 2 | Level 3 | Total | |||||||||||||
| RED OAK TECHNOLOGY SELECT FUND | ||||||||||||||||
| Common Stocks | $ | 469,511,801 | $ | — | $ | — | $ | 469,511,801 | ||||||||
| Short Term Investments | ||||||||||||||||
| Repurchase Agreement | — | 16,468,257 | — | 16,468,257 | ||||||||||||
| Collateral for Securities Loaned* | — | — | — | 90,769,043 | ||||||||||||
| Total | $ | 469,511,801 | $ | 16,468,257 | $ | — | $ | 576,749,101 | ||||||||
| 56 | 1-888-462-5386 | www.oakfunds.com |
Notes to Financial Statements
As of October 31, 2017
| Level 1 | Level 2 | Level 3 | Total | |||||||||||||
| BLACK OAK EMERGING TECHNOLOGY FUND | ||||||||||||||||
| Common Stocks | $ | 37,041,039 | $ | — | $ | — | $ | 37,041,039 | ||||||||
| Short Term Investments | ||||||||||||||||
| Repurchase Agreement | — | 1,292,736 | — | 1,292,736 | ||||||||||||
| Collateral for Securities Loaned* | — | — | — | 9,614,594 | ||||||||||||
| Total | $ | 37,041,039 | $ | 1,292,736 | $ | — | $ | 47,948,369 | ||||||||
| Level 1 | Level 2 | Level 3 | Total | |||||||||||||
| LIVE OAK HEALTH SCIENCES FUND | ||||||||||||||||
| Common Stocks | $ | 62,806,928 | $ | — | $ | — | $ | 62,806,928 | ||||||||
| Short Term Investments | ||||||||||||||||
| Repurchase Agreement | — | 2,046,387 | — | 2,046,387 | ||||||||||||
| Collateral for Securities Loaned* | — | — | — | 12,953,108 | ||||||||||||
| Total | $ | 62,806,928 | $ | 2,046,387 | $ | — | $ | 77,806,423 | ||||||||
| * | Certain investments that are measured at fair value using the net asset value per share (or its equivalent) practical expedient have not been categorized in the fair value hierarchy. The fair value amounts presented in the table are intended to permit reconciliation of the fair value hierarchy to the amounts presented in the Statement of Assets and Liabilities. |
The above tables are presented by levels of disaggregation for each asset class. For detailed descriptions of the underlying industries, see the accompanying Schedules of Investments. There were no transfers into or out of Level 1 and 2 during the period. There were no Level 3 securities held during the period. It is the Funds’ policy to recognize transfers into and out of levels at the end of the reporting period.
4. FEES AND OTHER RELATED PARTY TRANSACTIONS:
The Trust and the Adviser are parties to an Investment Advisory Agreement, under which the Adviser receives an annual fee equal to 0.74% of the average daily net assets of each Fund, except for the River Oak Discovery Fund for which the Adviser receives 0.90% of the average daily net assets of the Fund. The Adviser has contractually agreed through February 28, 2018, to waive all or a portion of its fees (and to reimburse expenses to the extent necessary) in order to limit Fund total operating expenses to not more than 1.25% of the average daily net assets of White Oak Select Growth Fund, Pin Oak Equity Fund and Rock Oak Core Growth Fund, and 1.35% of the average daily net assets of each of River Oak Discovery Fund, Red Oak Technology Select Fund, Black Oak Emerging Technology Fund and Live Oak Health Sciences Fund.
| Annual Report | October 31, 2017 | 57 |
Notes to Financial Statements
As of October 31, 2017
The following table lists the contractual advisory fees and fee waivers that were in effect during the fiscal year ended October 31, 2017:
| Advisory Fees as a Percentage of Average Net Assets | |||
| Fund | Annual Rate | Fee Waiver | Net Annual Rate |
| White Oak Select Growth Fund | 0.74% | 0.74% | |
| Pin Oak Equity Fund | 0.74% | 0.74% | |
| Rock Oak Core Growth Fund | 0.74% | (0.26)% | 0.48% |
| River Oak Discovery Fund | 0.90% | (0.06)% | 0.84% |
| Red Oak Technology Select Fund | 0.74% | 0.74% | |
| Black Oak Emerging Technology Fund | 0.74% | 0.74% | |
| Live Oak Health Sciences Fund | 0.74% | 0.74% | |
Ultimus Fund Solutions, LLC (“Ultimus”) provides the Funds with administration, fund accounting and transfer agency services, including all regulatory reporting. The Funds pay Ultimus fees in accordance with the agreements for such services. In addition, each Fund pays out-of-pocket expenses including, but not limited to, postage, supplies and costs of pricing its portfolio securities.
Under the terms of a Distribution Agreement with the Trust, Ultimus Fund Distributors, LLC (the “Distributor”) serves as the principal underwriter to each Fund. The Distributor is a wholly-owned subsidiary of Ultimus. The Distributor is compensated by the Adviser (not the Funds) for acting as principal underwriter.
Prior to August 28, 2017, ALPS Fund Services, Inc. (“ALPS”) provided administration, fund accounting and transfer agency services to the Funds and ALPS Distributors, Inc. served as the principal underwriter to each Fund (collectively referred to as “ALPS”). The Funds paid ALPS for its services in accordance with various service agreements.
U.S. Bank N.A acts as custodian for the Funds.
Certain officers and trustees of the Trust are also officers of the Adviser, Ultimus and/or the Distributor. Such officers are paid no fees by the Trust for serving as officers and trustees to the Trust.
5. INVESTMENT TRANSACTIONS:
The cost of security purchases and the proceeds from security sales, other than short–term investments, for the fiscal year ended October 31, 2017, were as follows:
| Fund | Purchases | Sales | ||||||
| White Oak Select Growth Fund | $ | 34,452,458 | $ | 54,371,049 | ||||
| Pin Oak Equity Fund | 87,640,455 | 14,589,668 | ||||||
| Rock Oak Core Growth Fund | 2,476,387 | 2,499,079 | ||||||
| River Oak Discovery Fund | 5,626,942 | 6,143,238 | ||||||
| Red Oak Technology Select Fund | 232,960,919 | 60,397,287 | ||||||
| Black Oak Emerging Technology Fund | 13,537,245 | 13,788,635 | ||||||
| Live Oak Health Sciences Fund | 9,177,599 | 9,573,089 | ||||||
| 58 | 1-888-462-5386 | www.oakfunds.com |
Notes to Financial Statements
As of October 31, 2017
6. FEDERAL INCOME TAXES AND TAX BASIS INFORMATION:
Each of the Funds is classified as a separate taxable entity for Federal income tax purposes. Each of the Funds has qualified and intends to continue to qualify as a separate “regulated investment company” under Sub–chapter M of the Internal Revenue Code of 1986, as amended, and make the requisite distributions to shareholders that will be sufficient to relieve it from Federal income tax and Federal excise tax. Therefore, no Federal tax provision is required.
The amounts of dividends from net investment income and distributions from net realized capital gains are determined in accordance with Federal income tax regulations, which may differ from those amounts determined under accounting principles generally accepted in the United States of America. These book/tax differences are either temporary or permanent in nature. The character of dividends from net investment income or distributions from net realized gains made during the year, and the timing may differ from the year that the income or realized gains (losses) were recorded by the Funds. To the extent these differences are permanent, adjustments are made to the appropriate equity accounts in the period that the differences arise. These differences are primarily due to differences in the treatment of net operating losses and certain other investments.
Accordingly, the following permanent differences have been reclassified to/from the following accounts:
| Fund | Undistributed Ordinary Income | Accumulated Capital Gain/(Loss) | Paid-in Capital | |||||||||
| White Oak Select Growth Fund | $ | — | $ | — | $ | — | ||||||
| Pin Oak Equity Fund | (81 | ) | 81 | — | ||||||||
| Rock Oak Core Growth Fund | — | — | — | |||||||||
| River Oak Discovery Fund | 56,939 | 1 | (56,940 | ) | ||||||||
| Red Oak Technology Select Fund | (3 | ) | 3 | — | ||||||||
| Black Oak Emerging Technology Fund | 147,877 | (147,877 | ) | — | ||||||||
| Live Oak Health Sciences Fund | — | — | — | |||||||||
These reclassifications have no impact on net assets or the results of operations. The Funds had permanent book/tax differences primarily attributable to net operating losses, foreign currency, and distribution redesignations.
The tax character of the distributions paid by the Funds for the fiscal year ended October 31, 2017 is as follows:
| Fund | Ordinary Income | Long-Term Capital Gain | Total | |||||||||
| White Oak Select Growth Fund | $ | 2,687,021 | $ | — | $ | 2,687,021 | ||||||
| Pin Oak Equity Fund | 832,560 | 1,894,933 | 2,727,493 | |||||||||
| Rock Oak Core Growth Fund | 54,642 | — | 54,642 | |||||||||
| River Oak Discovery Fund | — | — | — | |||||||||
| Red Oak Technology Select Fund | 1,009,412 | 2,516,143 | 3,525,555 | |||||||||
| Black Oak Emerging Technology Fund | 170,204 | 1,145,326 | 1,315,530 | |||||||||
| Live Oak Health Sciences Fund | 315,656 | 906,767 | 1,222,423 | |||||||||
| Annual Report | October 31, 2017 | 59 |
Notes to Financial Statements
As of October 31, 2017
The tax character of the distributions paid by the Funds for the fiscal year ended October 31, 2016 is as follows:
| Fund | Ordinary Income | Long-Term Capital Gain | Total | |||||||||
| White Oak Select Growth Fund | $ | 1,677,212 | $ | — | $ | 1,677,212 | ||||||
| Pin Oak Equity Fund | 762,856 | 2,912,364 | 3,675,220 | |||||||||
| Rock Oak Core Growth Fund | 59,403 | 176,119 | 235,522 | |||||||||
| River Oak Discovery Fund | 14,162 | — | 14,162 | |||||||||
| Red Oak Technology Select Fund | 1,455,611 | 4,075,253 | 5,530,864 | |||||||||
| Black Oak Emerging Technology Fund | — | 944,209 | 944,209 | |||||||||
| Live Oak Health Sciences Fund | 2,290,226 | 6,501,251 | 8,791,477 | |||||||||
As of October 31, 2017, the components of distributable earnings on a tax basis were as follows:
| Fund | Undistributed Net Investment Income | Accumulated Capital Gain (Loss) | Unrealized Appreciation/ (Depreciation) | Cumulative Effect of Timing Differences | Total | |||||||||||||||
| White Oak Select Growth Fund | $ | 1,494,553 | $ | 14,086 | $ | 71,420,811 | $ | — | $ | 72,929,450 | ||||||||||
| Pin Oak Equity Fund | 761,712 | 2,690,009 | 45,679,232 | — | 49,130,953 | |||||||||||||||
| Rock Oak Core Growth Fund | 1,535 | 521,838 | 3,421,970 | (13,558 | ) | 3,931,785 | ||||||||||||||
| River Oak Discovery Fund | — | 757,852 | 5,031,273 | (112,790 | ) | 5,676,335 | ||||||||||||||
| Red Oak Technology Select Fund | 2,583,908 | 28,103,051 | 138,529,599 | — | 169,216,558 | |||||||||||||||
| Black Oak Emerging Technology Fund | — | 2,660,501 | 13,879,639 | (45,946 | ) | 16,494,194 | ||||||||||||||
| Live Oak Health Sciences Fund | 98,034 | 3,685,901 | 16,943,894 | — | 20,727,829 | |||||||||||||||
As of October 31, 2017, the difference between book basis and tax basis unrealized appreciation (depreciation) is primarily attributable to wash sales and corporate action and partnership basis adjustments.
During the fiscal year ended October 31, 2017, the White Oak Select Growth Fund, Rock Oak Core Growth Fund and River Oak Discovery Fund utilized $8,281,596, $86,825 and $48,386 in capital loss carryforwards, respectively.
The Rock Oak Core Growth Fund, River Oak Discovery Fund and Black Oak Emerging Technology Fund elected to defer to the year ending October 31, 2018, late year ordinary losses in the amount of $13,558, $112,790 and $45,946, respectively.
| 60 | 1-888-462-5386 | www.oakfunds.com |
Notes to Financial Statements
As of October 31, 2017
At October 31, 2017, the total cost of securities for Federal income tax purposes and the aggregate gross unrealized appreciation and depreciation for securities held by the Funds is as follows:
| Fund | Federal Tax Cost | Gross Appreciation | Gross Depreciation | Net Appreciation | ||||||||||||
| White Oak Select Growth Fund | $ | 237,672,039 | $ | 85,163,530 | $ | (13,742,719 | ) | $ | 71,420,811 | |||||||
| Pin Oak Equity Fund | 229,922,739 | 51,572,783 | (5,893,551 | ) | 45,679,232 | |||||||||||
| Rock Oak Core Growth Fund | 8,735,451 | 3,431,348 | (9,378 | ) | 3,421,970 | |||||||||||
| River Oak Discovery Fund | 11,292,915 | 5,114,632 | (83,359 | ) | 5,031,273 | |||||||||||
| Red Oak Technology Select Fund | 438,219,502 | 143,282,331 | (4,752,732 | ) | 138,529,599 | |||||||||||
| Black Oak Emerging Technology Fund | 34,068,730 | 13,901,348 | (21,709 | ) | 13,879,639 | |||||||||||
| Live Oak Health Sciences Fund | 60,862,529 | 22,312,982 | (5,369,088 | ) | 16,943,894 | |||||||||||
Management evaluates the Funds’ tax positions to determine if the taken tax positions meet the minimum recognition threshold by measuring and recognizing tax liabilities in the Financial Statements. The threshold is established by accounting for uncertainties in income tax positions, taken or expected. Recognition of tax benefits of an uncertain tax position is required only when the position is “more likely than not” to be sustained assuming examination by taxing authorities. The Funds recognize interest and penalties, if any, related to unrecognized tax benefits as income tax expense in the Statements of Operations. During the year ended October 31, 2017, the Funds did not incur any interest or penalties.
Management has analyzed the Funds’ tax position taken on federal income tax returns for all open tax years (current and prior three tax years) and has concluded that as of and for the year ended October 31, 2017, no provision for income tax would be required in the Funds’ financial statements. The Funds’ federal and state income and federal excise tax returns for tax years (current and prior three tax years) for which the applicable statutes of limitations have not expired are subject to examination by the Internal Revenue Service and state departments of revenue.
7. CONCENTRATION OF CREDIT RISK AND OWNERSHIP:
The Red Oak Technology Select Fund and the Black Oak Emerging Technology Fund invest a substantial portion of their assets in securities in the technology industry. The Live Oak Health Sciences Fund invests a substantial portion of its assets in securities in the health care, medicine and life sciences industries. Therefore, each of these Funds may be more affected by economic developments in those industries than a general equity fund would be.
In the normal course of business, the Funds enter into contracts that provide general indemnifications. The Funds’ maximum exposure under these arrangements is dependent on future claims that may be made against the Funds and, therefore, cannot be established; however based on experience, the risk of loss from such claims is considered remote.
From time to time, the Funds may have a concentration of several shareholders holding a significant percentage of shares outstanding. Investment activities of these shareholders could have a material impact on the applicable Fund.
As of October 31, 2017, the James D. Oelschlager Trust owned 42.56% of the River Oak Discovery Fund and Vanita B. Oelschlager owned 25.34% of the Rock Oak Core Growth Fund.
| Annual Report | October 31, 2017 | 61 |
Notes to Financial Statements
As of October 31, 2017
8. TRUSTEE AND OFFICERS FEES:
As of October 31, 2017, there were five Trustees, three of whom are not “interested persons” (within the meaning of the 1940 Act) of the Trust (the “Independent Trustees”). Effective January 1, 2016, each Independent Trustee receives a retainer at an annual rate of $30,000 per year. Also effective January 1, 2016, each Independent Trustee is also paid a fee of $3,500 for each meeting of the Board of Trustees attended or participated in person, and/or is also paid $1,000 per attendance at each telephonic board meeting, as applicable. Each Independent Trustee is paid $4,000 per telephonic or in-person meeting at which they receive and review preliminary materials provided in connection with the annual continuation of the advisory agreement in accordance with Section 15(c) of the 1940 Act. The chairperson of the Audit Committee receives an additional retainer of $1,000 per calendar quarter during which an Audit Committee meeting is held and the Lead Independent Trustee receives an additional retainer of $3,500 per calendar quarter. The increases in scheduled fees paid to the Independent Trustees that became effective on January 1, 2016, as described above, are being implemented over the three calendar years following January 1, 2016 at a rate of one-third of the total increase each year.
The Independent Trustees who do not serve as chairpersons of the applicable Board committee are not paid an additional fee from the Trust for attendance at and/or participation in such meetings of the various committees of the Board. The Independent Trustees are also reimbursed for meeting-related expenses. Officers of the Trust and Trustees who are interested persons of the Trust receive no salary or fees from the Trust, although they may be reimbursed for meeting-related expenses.
9. INDEMNIFICATIONS:
Under the Trust’s organizational documents, its officers and Trustees are indemnified against certain liability arising out of the performance of their duties to the Trust. Additionally, in the normal course of business, the Trust enters into contracts with service providers that may contain general indemnification clauses, which may permit indemnification to the extent permissible under applicable law. The Trust’s maximum exposure under these arrangements is unknown, as this would involve future claims that may be made against the Trust that have not yet occurred.
10. SUBSEQUENT EVENTS:
On December 12, 2017, The Funds declared an ordinary dividend, short-term capital gains and long-term capital gains, which were payable on December 13, 2017. Please see the below table for the distribution amounts:
| Fund | Ordinary Dividend | Short-Term Capital Gain | Long-Term Capital Gain | |||||||||
| White Oak Select Growth Fund | $ | 0.565536 | $ | — | $ | 0.004094 | ||||||
| Pin Oak Equity Fund | 0.372877 | — | 0.808182 | |||||||||
| Rock Oak Core Growth Fund | 0.010489 | — | 0.913782 | |||||||||
| River Oak Discovery Fund | — | — | 0.916703 | |||||||||
| Red Oak Technology Select Fund | 0.099606 | 0.105710 | 1.496233 | |||||||||
| Black Oak Emerging Technology Fund | — | 0.010556 | 0.378748 | |||||||||
| Live Oak Health Sciences Fund | 0.094019 | 0.005514 | 1.152825 | |||||||||
Management has evaluated subsequent events through the issuance of these financial statements and has noted no such events except the subsequent distribution disclosed above.
| 62 | 1-888-462-5386 | www.oakfunds.com |
Report of Independent Registered Public Accounting Firm
To the Shareholders and Board of Trustees of
Oak Associates Funds
Oak Associates Funds
We have audited the accompanying statements of assets and liabilities, including the schedules of investments, of Oak Associates Funds, comprising White Oak Select Growth Fund, Pin Oak Equity Fund, Rock Oak Core Growth Fund, River Oak Discovery Fund, Red Oak Technology Select Fund, Black Oak Emerging Technology Fund, and Live Oak Health Sciences Fund (the “Funds”) as of October 31, 2017, and the related statements of operations for the year then ended, the statements of changes in net assets for each of the two years in the period then ended, and the financial highlights for each of the five years in the period then ended. These financial statements and financial highlights are the responsibility of the Funds’ management. Our responsibility is to express an opinion on these financial statements and financial highlights based on our audits.
We conducted our audits in accordance with the standards of the Public Company Accounting Oversight Board (United States). Those standards require that we plan and perform the audit to obtain reasonable assurance about whether the financial statements and financial highlights are free of material misstatement. An audit includes examining, on a test basis, evidence supporting the amounts and disclosures in the financial statements. Our procedures included confirmation of securities owned as of October 31, 2017, by correspondence with the custodian and brokers. An audit also includes assessing the accounting principles used and significant estimates made by management, as well as evaluating the overall financial statement presentation. We believe that our audits provide a reasonable basis for our opinion.
In our opinion, the financial statements and financial highlights referred to above present fairly, in all material respects, the financial position of each of the Funds constituting Oak Associates Funds, as of October 31, 2017, the results of their operations for the year then ended, the changes in their net assets for each of the two years in the period then ended, and the financial highlights for each of the five years in the period then ended, in conformity with accounting principles generally accepted in the United States of America.

COHEN & COMPANY, LTD.
Cleveland, Ohio
December 28, 2017
Cleveland, Ohio
December 28, 2017
| Annual Report | October 31, 2017 | 63 |
Additional Information
As of October 31, 2017 (Unaudited)
1. UNAUDITED TAX INFORMATION:
The White Oak Select Growth Fund, Rock Oak Core Growth Fund, Pin Oak Equity Fund, River Oak Discovery Fund, Red Oak Technology Select Fund, Black Oak Emerging Technology Fund, and Live Oak Health Sciences Fund designate 100%, 100%, 100%, 0%, 100%, 34.16%, and 100%, respectively, of the income dividends distributed between January 1, 2016 and December 31, 2016, as qualified dividend income (QDI) as defined in Section 1(h)(11) of the Internal Revenue Code.
Pursuant to Section 854(b)(2) of the Internal Revenue Code, the White Oak Select Growth Fund, Rock Oak Core Growth Fund, Pin Oak Equity Fund, River Oak Discovery Fund, Red Oak Technology Select Fund, Black Oak Emerging Technology Fund, and Live Oak Health Sciences Fund designate 100%, 100%, 100%, 0%, 100%, 34.16%, and 41.61%, respectively, of the ordinary income dividends distributed between January 1, 2015 and December 31, 2015, as qualifying for the corporate dividends received deduction.
In early 2017, if applicable, shareholders of record should have received this information for the distributions paid to them by the Fund during the calendar year 2016 via Form 1099. The Fund will notify shareholders in early 2018 of amounts paid to them by the Fund, if any, during the calendar year 2017.
Pursuant to Section 852(b)(3) of the Internal Revenue Code, the Pin Oak Equity Fund, Black Oak Emerging Technology Fund, Red Oak Technology Select Fund and Live Oak Health Sciences Fund designated $1,894,933, $1,145,326, $2,516,143 and $906,767 as long-term capital gain dividends respectively.
2. PROXY VOTING POLICIES AND VOTING RECORD
A description of the policies and procedures that the Fund uses to determine how to vote proxies relating to portfolio securities and information regarding how the Fund voted those proxies during the most recent twelve month period ended June 30 are available without charge, upon request: (1) by calling the Fund at 1-888-462-5386; and (2) from Fund documents filed with the Securities and Exchange Commission (“SEC”) on the SEC’s website at www.sec.gov.
3. QUARTERLY PORTFOLIO HOLDINGS
The Funds file its complete schedule of portfolio holdings with the SEC for the first and third quarters of each fiscal year on Form N-Q. The Funds’ Forms N-Q are available on the SEC’s website at http://www.sec.gov. You may review and make copies at the SEC’s Public Reference Room in Washington, D.C. You may also obtain copies after paying a duplicating fee by writing the SEC’s Public Reference Section, Washington, D.C. 20549-0102 or by electronic request to publicinfo@sec.gov, or is available without charge, upon request, by calling the Fund at 1-888-462-5386. Information on the operation of the Public Reference Room may be obtained by calling the SEC at 1-800-SEC-0330, (1-800-732-0330).
| 64 | 1-888-462-5386 | www.oakfunds.com |
OAK ASSOCIATES FUNDS
This Page Intentionally Left Blank
Additional Information
As of October 31, 2017 (Unaudited)
TRUSTEES OF THE TRUST
Name & Age(1) | Position Held with Trust | Length of Time Served (Yrs.)(2) | Number of Portfolios in Fund Complex Overseen by Board Member(3) | Principal Occupation(s) During Past Five Years | Other Directorships Held by Board Member(4) |
J. John Canon (82) | Trustee | 16 | 7 | Retired. Member of Board, Proconex (process control equipment), 1985 – 2007; President and Chairman of the Board, Synergistic Partners, Inc. (technology for information management), 1975 – 1999. | None |
James D. Oelschlager(5) (75) | Trustee, Chairman | 16 | 7 | Managing Member, President, CO-CIO (since October 9, 2014); CIO and Founder of Oak Associates, ltd. since 1985. | None |
John G. Stimpson(5) (75) | Trustee | 16 | 7 | Retired since 1993. Board of Directors, Morgan Stanley Trust Company, 1988 – 1993; Director of International Equity Sales and Equity Sales Manager, Salomon Brothers (New York) from 1985 – 1993. | None |
Pauline F. Ramig (77) | Trustee | 9 | 7 | Financial Planning Practitioner, Ramig Financial Planning since 1991. | None |
Michael R. Shade (69) | Trustee | 9 | 7 | Attorney at Law; Partner, Shade & Shade since December, 1979. | None |
| 66 | 1-888-462-5386 | www.oakfunds.com |
Additional Information
As of October 31, 2017 (Unaudited)
1 | Each Trustee may be contacted in writing to the Trustee c/o Oak Associates Funds, 3875 Embassy Parkway, Suite 250, Akron, OH 44333. |
2 | Each Trustee shall hold office during the lifetime of this Trust until the election and qualification of his or her successor, or until he or she sooner dies, resigns or is removed in accordance with the Trust’s Agreement and Declaration of Trust. |
3 | The “Oak Associates Funds Complex” consists of all series of the Trust for which Oak Associates, ltd. serves as investment adviser. As of October 31, 2017, the Oak Associates Funds Complex consisted of 7 Funds. |
4 | Directorships of companies are required to report to the Securities and Exchange Commission under the Securities Exchange Act of 1934 (i.e., “public companies”) or other investment companies registered under the Investment Company Act of 1940. |
5 | Messrs. Oelschlager and Stimpson are considered “interested” persons of the Trust as that term is defined in the Investment Company Act of 1940. Mr. Oelschlager is interested by virtue of his controlling ownership interest in the Adviser. Mr. Stimpson is considered interested because of his family relationship with an employee of the Adviser. |
| Annual Report | October 31, 2017 | 67 |
Additional Information
As of October 31, 2017 (Unaudited)
OFFICERS OF THE TRUST
Name & Age(1) | Position Held with Trust | Length of Time Served (Yrs.)(2) | Number of Portfolios in Fund Complex Overseen by Board Member(3) | Principal Occupation(s) During Past Five Years | Other Directorships Held by Board Member(4) |
Charles A. Kiraly(2) (47) | President/ Chief Executive Officer | 3 | N/A | Director of Mutual Fund Operations at Oak Associates, ltd. since July 2014; Vice President and Senior Fund Administrator at PNC Capital Advisors, LLC from August 2006 to June 2014. | N/A |
Margaret L. Ballinger(2) (64) | Chief Compliance Officer | 2 | N/A | Chief Compliance Officer since December 2014 and Chief Operating Officer since 1996 for Oak Associates, ltd. Co-founder of Oak Associates, ltd. In 1985. | N/A |
Bryan Ashmus (44) | Treasurer | 2 months | N/A | Vice President and Director of Financial Administration, Ultimus Fund Solutions, LLC (December 2015 to present); Vice President and Manager of Financial Administration, Huntington Asset Services, Inc. (n/k/a Ultimus Asset Services, LLC) (September 2013 to December 2015); Vice President, Fund Administration, Citi Fund Services Ohio, Inc. (May 2005 to September 2013) | N/A |
Bo Howell (36) | Secretary | 2 months | N/A | Vice President, Director of Fund Administration, Ultimus Fund Solutions, LLC (since 2014); Counsel, Securities and Mutual Funds, Western & Southern Financial Group (2012 – 2014). |
| 68 | 1-888-462-5386 | www.oakfunds.com |
Additional Information
As of October 31, 2017 (Unaudited)
1 | Each Officer may be contacted in writing to the Officer c/o Ultimus Fund Solutions, LLC, 225 Pictoria Drive, Suite 450, Cincinnati, OH 45246. . |
2 | Mr. Kiraly and Ms. Ballinger are considered to be “affiliates” of the Adviser by virtue of their employment by the Adviser. |
For more information regarding the Trustees, please refer to the Statement of Additional Information, which is available upon request by calling 1-888-462-5386 or on the Funds’ website at www.oakfunds.com.
| Annual Report | October 31, 2017 | 69 |
OAK ASSOCIATES FUNDS
This Page Intentionally Left Blank
| CONTACT US |
By Mail
Oak Associates Funds
225 Pictoria Drive, Suite 450
Cincinnati, OH 45246
Oak Associates Funds
225 Pictoria Drive, Suite 450
Cincinnati, OH 45246
By Telephone 1-888-462-5386 Monday through Friday, 8:00 a.m. to 6:00 p.m. ET
On The Web www.oakfunds.com
Click on the My Oak Account section to take advantage of these features:
Click on the My Oak Account section to take advantage of these features:
● Trade Online
● Access and Update Account Information
● Go Paperless with eDelivery
● View and download account history
● Establish a systematic investment plan
The Trust files its complete schedule of portfolio holdings of each Fund with the Securities and Exchange Commission for the first and third quarters of each fiscal year on Form N-Q within sixty days after the end of the period. The Trust’s Form N-Q is available on the Commission’s website at http://www.sec.gov, and may be reviewed and copied at the Commission’s Public Reference Room in Washington DC. Information on the operation of the Public Reference Room may be obtained by calling 1-800-SEC-0330.
A description of the policies and procedures that the Funds use to determine how to vote proxies relating to portfolio securities, as well as information relating to how a Fund voted proxies relating to portfolio securities during the most recent 12-month period ended June 30, is available (i) without charge, upon request, by calling 1-888-462-5386; and (ii) on the Commission’s website at http://www.sec.gov.
This report has been prepared for Oak Associates Funds Shareholders and may be distributed to others only if preceded or accompanied by a prospectus.
Oak Associates Funds are distributed by Ultimus Fund Distributors, LLC

Item 2. Code of Ethics.
(a) As of the end of the period covered by the report, the registrant has adopted a code of ethics that applies to the registrant’s Principal Executive Officer and Principal Financial Officer.
(b) Not applicable.
(c) During the period covered by the report, with respect to the registrant's code of ethics that applies to its Principal Executive Officer and Principal Financial Officer: there have been no amendments to a provision that relates to any element of the code of ethics definition enumerated in paragraph (b) of this Item 2.
(d) During the period covered by the report, with respect to the registrant's code of ethics that applies to its Principal Executive Officer and Principal Financial Officer: there have been no waivers granted from a provision that relates to any element of the code of ethics definition enumerated in paragraph (b) of this Item 2.
(e) Not applicable.
(f) The registrant has included a copy of the code of ethics that applies to the registrant’s Principal Executive Officer and Principal Financial Officer. This code of ethics is included as an Exhibit on this Form N-CSR.
Item 3. Audit Committee Financial Expert.
The Registrant's board of trustees has determined that John Canon, chairman of the Registrant's audit committee, was an audit committee financial expert during the reporting period.
Item 4. Principal Accountant Fees and Services.
(a) Audit Fees billed to the registrant by its principal accountants for the two most recent fiscal years:
Fiscal year ended 2017: $84,000
Fiscal year ended 2016: $80,500
(b) Audit-Related Fees billed to the registrant by its principal accountants for the two most recent fiscal years:
Fiscal year ended 2017: $0
Fiscal year ended 2016: $0
Fees for 2017 and 2016 related to the agreed-upon review of items within the Management’s Discussion of Fund Performance sections of the Funds’ Form N-CSR filing. Amount requiring approval of the registrant's audit committee pursuant to paragraph (c)(7)(ii) of Rule 2-01 of Regulation S-X, $0 and $0 respectively.
(c) Tax Fees billed to the registrant by its principal accountants for the two most recent fiscal years:
Fiscal year ended 2017: $15,750
Fiscal year ended 2016: $14,000
Fees for 2017 and 2016 related to the review of the registrant's tax returns. Amount requiring approval of the registrant's audit committee pursuant to paragraph (c)(7)(ii) of Rule 2-01 of Regulation S-X, $0 and $0 respectively.
(d) All other fees billed to the registrant by its principal accountants for the two most recent fiscal years:
Fiscal year ended 2017: $0
Fiscal year ended 2016: $0
Amount requiring approval of the registrant's audit committee pursuant to paragraph (c)(7)(ii) of Rule 2-01 of Regulation S-X, $0 and $0 respectively.
(e)(1) Not Applicable.
(e)(2) The percentage of services described in each of paragraphs (b) through (d) of this Item that were approved by the audit committee pursuant to paragraph (c)(7)(i)(C) of Rule 2-01 of Regulation S-X are as follows:
(b) 0%
(c) 0%
(d) 0%
(f) Not applicable.
(g) The aggregate non-audit fees and services billed by the applicable principal account for the two most recent fiscal years:
Fiscal year ended 2017: $0
Fiscal year ended 2016: $0
(h) The registrant’s audit committee of the board of directors has considered whether the provision of non-audit services that were rendered to the registrant’s investment adviser (not including any sub-adviser whose role is primarily portfolio management and is subcontracted with or overseen by another investment adviser), and any entity controlling, controlled by, or under common control with the investment adviser that provides ongoing services to the registrant that were not pre-approved pursuant to paragraph (c)(7)(ii) of Rule 2-01 of Regulation S-X is compatible with maintaining the principal accountant’s independence.
Item 5. Audit Committee of Listed Registrants.
Not applicable.
Item 6. Schedule of Investments.
(a) Schedule of Investments in securities of unaffiliated issuers as of the close of the reporting period is included as part of the Report to Stockholders filed under Item 1 of this Form N-CSR.
(b) Not applicable.
Item 7. Disclosure of Proxy Voting Policies and Procedures for Closed-End Management Investment Companies.
Not applicable.
Item 8. Portfolio Managers of Closed-End Management Investment Companies.
Not applicable.
Item 9. Purchases of Equity Securities by Closed-End Management Investment Company and Affiliated Purchasers.
Not applicable.
Item 10. Submission of Matters to a Vote of Security Holders.
Not applicable.
Item 11. Controls and Procedures.
(a) The registrant’s Principal Executive Officer and Principal Financial Officer have concluded that the registrant's disclosure controls and procedures (as defined in Rule 30a-3(c) under the Act) are effective in design and operation and are sufficient to form the basis of the certifications required by Rule 30a-2 under the Act, based on their evaluation of these disclosure controls and procedures within 90 days of the filing of this report on Form N-CSR.
(b) There were no changes in the registrant’s internal control over financial reporting (as defined in Rule 30a-3(d) under the Act (17 CFR 270.30a-3(d)) that occurred during the period covered by this report that have materially affected or are reasonably likely to materially affect, the registrant’s internal control over financial reporting.
Item 12. Disclosure of Securities Lending Activities for Closed-End Investment Companies.
NOT APPLICABLE
Item 13. Exhibits.
(a)(1) The code of ethics that is the subject of the disclosure required by Item 2 is attached hereto.
(a)(2) Certifications pursuant to Rule 30a-2(a) are attached hereto.
(a)(3) Not applicable.
(b) Certifications pursuant to Rule 30a-2(b) are furnished herewith.
SIGNATURES
Pursuant to the requirements of the Securities Exchange Act of 1934 and the Investment Company Act of 1940, the registrant has duly caused this report to be signed on its behalf by the undersigned, thereunto duly authorized.
| (Registrant) | Oak Associates Funds | |
| By (Signature and Title)* | /s/ Charles A. Kiraly | |
| Charles A. Kiraly, President | ||
| Date | 1/3/18 | |
Pursuant to the requirements of the Securities Exchange Act of 1934 and the Investment Company Act of 1940, this report has been signed below by the following persons on behalf of the registrant and in the capacities and on the dates indicated.
| By (Signature and Title)* | /s/ Charles A. Kiraly | |
| Charles A. Kiraly, President and Principal Executive Officer | ||
| Date | 1/3/18 | |
| By (Signature and Title)* | /s/ Bryan Ashmus | |
| Bryan Ashmus, Treasurer and Principal Financial Officer | ||
| Date | 1/3/18 | |