UNITED STATES
SECURITIES AND EXCHANGE COMMISSION
Washington, D.C. 20549
FORM N-CSRS
CERTIFIED SHAREHOLDER REPORT OF REGISTERED
MANAGEMENT INVESTMENT COMPANIES
Investment Company Act file number : 811-08549
Oak Associates Funds
(Exact name of registrant as specified in charter)
3875 Embassy Parkway, Suite 250
Akron, Ohio 44333
(Address of principal executive offices) (Zip code)
Charles A. Kiraly
3875 Embassy Parkway, Suite 250
Akron, Ohio 44333
(Name and address of agent for service)
Registrant’s telephone number, including area code: 1-888-462-5386
Date of fiscal year end: October 31
Date of reporting period: April 30, 2018
Item 1. Reports to Stockholders.

TABLE of CONTENTS
Shareholder Letter | 1 |
Performance Update | |
White Oak Select Growth Fund | 2 |
Pin Oak Equity Fund | 3 |
Rock Oak Core Growth Fund | 4 |
River Oak Discovery Fund | 5 |
Red Oak Technology Select Fund | 6 |
Black Oak Emerging Technology Fund | 7 |
Live Oak Health Sciences Fund | 8 |
Important Disclosures | 9 |
Disclosure of Fund Expenses | 11 |
Financial Statements | |
Schedules of Investments | 13 |
Statements of Assets and Liabilities | 32 |
Statements of Operations | 34 |
Statements of Changes in Net Assets | 36 |
Financial Highlights | 40 |
Notes to Financial Statements | 44 |
Additional Information | 54 |
Shareholder Letter
Dear Fellow Shareholder,
We are pleased to send you the Oak Associates Funds Semi-Annual Report which contains information on the holdings of each of the Funds, along with the Financial Highlights and Statements of Assets and Liabilities, Operations, and Changes in Net Assets for the six-month period ended April 30, 2018. We encourage you to read the report to help you stay informed about your investments.
We recognize that this is only a six-month snapshot of your portfolio, and we urge you to visit our website at www.oakfunds.com for more detailed fund information and market commentaries.
As always, we appreciate the trust you have placed in us and thank you for your investment.
Sincerely,
Oak Associates Funds
Semi-Annual Report | April 30, 2018 (Unaudited) | 1 |
White Oak Select Growth Fund | Performance Update |
All data below as of April 30, 2018 (Unaudited) |
Fund Data | |
Ticker | WOGSX |
Share Price | $88.78 |
Total Net Assets | $302.3M |
Portfolio Turnover | 4.72% |
Sector Allocation^ | |
Information Technology | 39.5% |
Financials | 30.2% |
Health Care | 12.2% |
Consumer Discretionary | 12.0% |
Industrials | 3.3% |
Consumer Staples | 2.1% |
Cash & Other Assets | 0.7% |
Top 10 Holdings^ | ||
1. | Amazon.com, Inc. | 10.6% |
2. | Alphabet, Inc. | 9.8% |
3. | Charles Schwab Corporation (The) | 8.4% |
4. | Cisco Systems, Inc. | 7.9% |
5. | Amgen, Inc. | 6.2% |
6. | KLA-Tencor Corporation | 6.1% |
7. | JPMorgan Chase & Company | 4.5% |
8. | U.S. Bancorp | 4.4% |
9. | TCF Financial Corporation | 4.2% |
10. | Xilinx, Inc. | 4.0% |
| ^ | Percentages are based on net assets. Holdings are subject to change. |
Growth of $10,000 Chart
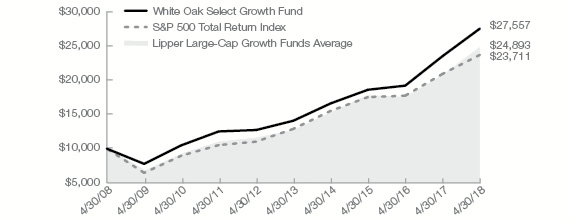
The chart above represents historical performance of a hypothetical investment of $10,000 in the Fund over the past 10 years. Past performance does not guarantee future results. This chart and the table below do not reflect the deduction of taxes that a shareholder would pay on Fund distributions or the redemption of Fund shares.
Average Annual Total Return | ||||
1 Year | 3 Year | 5 Year | 10 Year | |
White Oak Select Growth Fund | 17.10% | 13.96% | 14.36% | 10.67% |
S&P 500® Total Return Index1 | 13.27% | 10.57% | 12.96% | 9.02% |
Lipper Large-Cap Growth Funds Average2 | 19.74% | 11.68% | 14.33% | 9.47% |
Gross/Net Expense Ratio (per the prospectus dated February 28, 2018): 0.97%
Gross/Net Expense Ratio (as of the six months ended April 30, 2018): 0.92%
The performance data quoted represents past performance. Past performance does not guarantee future results. The investment return and principal value of an investment will fluctuate so that an investor’s shares, when redeemed, may be worth more or less than their original cost and current performance may be lower or higher than the performance quoted. For performance data current to the most recent month-end, please visit www.oakfunds.com or call 1-888-462-5386.
| 1 | Standard & Poor’s is the source and owner of the S&P Index data. |
| 2 | Lipper Inc. is the source and owner of the Lipper Classification data. See Pages 9 and 10 for additional disclosure. |
2 | 1-888-462-5386 | www.oakfunds.com |
Pin Oak Equity Fund | Performance Update |
All data below as of April 30, 2018 (Unaudited) |
Fund Data | |
Ticker | POGSX |
Share Price | $66.70 |
Total Net Assets | $227.8M |
Portfolio Turnover | 7.00% |
Sector Allocation^ | |
Financials | 32.3% |
Information Technology | 28.4% |
Consumer Discretionary | 13.6% |
Health Care | 9.9% |
Energy | 5.1% |
Consumer Staples | 4.2% |
Materials | 1.1% |
Cash & Other Assets | 5.4% |
Top 10 Holdings^ | ||
1. | Alphabet, Inc. | 6.9% |
2. | Charles Schwab Corporation (The) | 5.9% |
3. | Bank of New York Mellon Corporation (The) | 5.8% |
4. | Valero Energy Corporation | 5.0% |
5. | Paychex, Inc. | 4.4% |
6. | PepsiCo, Inc. | 4.2% |
7. | GlaxoSmithKline PLC - ADR | 4.0% |
8. | Amdocs Ltd. | 3.8% |
9. | Twenty-First Century Fox, Inc. - Class B | 3.7% |
10. | Amazon.com, Inc. | 3.5% |
| ^ | Percentages are based on net assets. Holdings are subject to change. |
Growth of $10,000 Chart
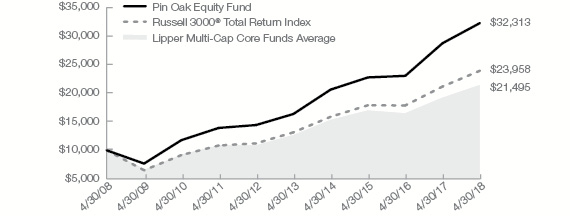
The chart above represents historical performance of a hypothetical investment of $10,000 in the Fund over the past 10 years. Past performance does not guarantee future results. This chart and the table below do not reflect the deduction of taxes that a shareholder would pay on Fund distributions or the redemption of Fund shares.
Average Annual Total Return | ||||
1 Year | 3 Year | 5 Year | 10 Year | |
Pin Oak Equity Fund | 12.23% | 12.35% | 14.57% | 12.44% |
Russell 3000® Total Return Index1 | 13.05% | 10.20% | 12.75% | 9.13% |
Lipper Multi-Cap Core Funds Average2 | 11.53% | 7.89% | 10.97% | 7.68% |
Gross/Net Expense Ratio (per the prospectus dated February 28, 2018): 0.97%
Gross/Net Expense Ratio (as of the six months ended April 30, 2018): 0.95%
The performance data quoted represents past performance. Past performance does not guarantee future results. The investment return and principal value of an investment will fluctuate so that an investor’s shares, when redeemed, may be worth more or less than their original cost and current performance may be lower or higher than the performance quoted. For performance data current to the most recent month-end, please visit www.oakfunds.com or call 1-888-462-5386.
| 1 | Russell Investments is the source and owner of the Russell Index data. |
| 2 | Lipper Inc. is the source and owner of the Lipper Classification data. See Pages 9 and 10 for additional disclosure. |
Semi-Annual Report | April 30, 2018 (Unaudited) | 3 |
Rock Oak Core Growth Fund | Performance Update |
All data below as of April 30, 2018 (Unaudited) |
Fund Data | |
Ticker | RCKSX |
Share Price | $17.03 |
Total Net Assets | $13.5M |
Portfolio Turnover | 7.74% |
Sector Allocation^ | |
Information Technology | 40.4% |
Consumer Discretionary | 15.4% |
Health Care | 13.5% |
Financials | 9.0% |
Energy | 5.3% |
Industrials | 4.2% |
Materials | 2.7% |
Consumer Staples | 1.8% |
Cash & Other Assets | 7.7% |
Top 10 Holdings^ | ||
1. | Amazon.com, Inc. | 5.4% |
2. | NetApp, Inc. | 4.3% |
3. | DXC Technology Company | 4.3% |
4. | Alphabet, Inc. | 4.0% |
5. | F5 Networks, Inc. | 3.6% |
6. | SunTrust Banks, Inc. | 3.6% |
7. | AbbVie, Inc. | 3.5% |
8. | HollyFrontier Corporation | 3.4% |
9. | L3 Technologies, Inc. | 3.4% |
10. | CA, Inc. | 3.3% |
| ^ | Percentages are based on net assets. Holdings are subject to change. |
Growth of $10,000 Chart

This chart represents historical performance of a hypothetical investment of $10,000 in the Fund over the past 10 years. Past performance does not guarantee future results. This chart and the table below do not reflect the deduction of taxes that a shareholder would pay on Fund distributions or the redemption of Fund shares. Fee waivers are in effect; if they had not been in effect, performance would have been lower.
Average Annual Total Return | ||||
1 Year | 3 Year | 5 Year | 10 Year | |
Rock Oak Core Growth Fund | 22.84% | 11.13% | 13.60% | 7.99% |
S&P 500® Total Return Index1 | 13.27% | 10.57% | 12.96% | 9.02% |
Lipper Multi-Cap Growth Funds Average2 | 18.13% | 10.11% | 13.17% | 9.25% |
Gross/Net Expense Ratio (per the prospectus dated February 28, 2018): 1.50%/1.25%
Gross/Net Expense Ratio (as of the six months ended April 30, 2018): 1.37%/1.25%
The Adviser has contractually agreed through February 28, 2019, to waive all or a portion of its fee for the Fund (and to reimburse expenses to the extent necessary) in order to limit Fund total operating expenses (excluding Acquired Fund Fees and Expenses) to an annual rate of not more than 1.25% of average daily net assets. This contractual fee waiver may only be terminated subject to approval by the Board of Trustees of the Trust.
The performance data quoted represents past performance. Past performance does not guarantee future results. The investment return and principal value of an investment will fluctuate so that an investor’s shares, when redeemed, may be worth more or less than their original cost and current performance may be lower or higher than the performance quoted. For performance data current to the most recent month-end, please visit www.oakfunds.com or call 1-888-462-5386.
| 1 | Standard & Poor’s is the source and owner of the S&P Index data. |
| 2 | Lipper Inc. is the source and owner of the Lipper Classification data. See Pages 9 and 10 for additional disclosure. |
4 | 1-888-462-5386 | www.oakfunds.com |
River Oak Discovery Fund | Performance Update |
All data below as of April 30, 2018 (Unaudited) |
Fund Data | |
Ticker | RIVSX |
Share Price | $16.61 |
Total Net Assets | $13.7 M |
Portfolio Turnover | 28.00% |
Sector Allocation^ | |
Information Technology | 30.4% |
Health Care | 19.1% |
Financials | 17.6% |
Consumer Discretionary | 12.5% |
Materials | 6.8% |
Industrials | 6.6% |
Consumer Staples | 4.2% |
Cash & Other Assets | 2.8% |
Top 10 Holdings^ | ||
1. | SolarEdge Technologies, Inc. | 5.1% |
2. | Assurant, Inc. | 4.3% |
3. | Kulicke & Soffa Industries, Inc. | 4.2% |
4. | Mercer International, Inc. | 4.2% |
5. | Boston Beer Company, Inc. (The) - Class A | 4.2% |
6. | Adtalem Global Education, Inc. | 4.1% |
7. | Magellan Health, Inc. | 3.9% |
8. | Union Bankshares Corporation | 3.9% |
9. | Aaron's, Inc. | 3.6% |
10. | AllianceBernstein Holding, L.P. | 3.6% |
| ^ | Percentages are based on net assets. Holdings are subject to change. |
Growth of $10,000 Chart
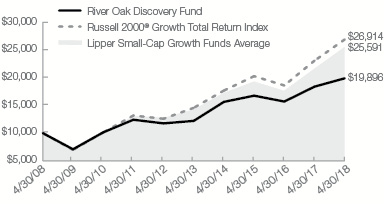
The chart represents historical performance of a hypothetical investment of $10,000 in the Fund over the past 10 years. Past performance does not guarantee future results. This chart and the table below do not reflect the deduction of taxes that a shareholder would pay on Fund distributions or the redemption of Fund shares. Fee waivers are in effect; if they had not been in effect, performance would have been lower.
Average Annual Total Return | ||||
1 Year | 3 Year | 5 Year | 10 Year | |
River Oak Discovery Fund | 8.18% | 5.88% | 10.26% | 7.12% |
Russell 2000® Growth Total Return Index1 | 16.60% | 9.89% | 13.07% | 10.41% |
Lipper Small-Cap Growth Funds Average2 | 18.18% | 9.69% | 12.26% | 9.71% |
Gross/Net Expense Ratio (per the prospectus dated February 28, 2018): 1.40%/1.35%
Gross/Net Expense Ratio (as of the six months ended April 30, 2018): 1.42%/1.35%
The Adviser has contractually agreed through February 28, 2019, to waive all or a portion of its fee for the Fund (and to reimburse expenses to the extent necessary) in order to limit Fund total operating expenses (excluding Acquired Fund Fees and Expenses) to an annual rate of not more than 1.35% of average daily net assets. This contractual tee waiver may only be terminated subject to approval by the Board of Trustees of the Trust.
The performance data quoted represents past performance. Past performance does not guarantee future results. The investment return and principal value of an investment will fluctuate so that an investor’s shares, when redeemed, may be worth more or less than their original cost and current performance may be lower or higher than the performance quoted. For performance data current to the most recent month-end, please visit www.oakfunds.com or call 1-888-462-5386.
| 1 | Russell Investments is the source and owner of the Russell Index data. |
| 2 | Lipper Inc. is the source and owner of the Lipper Classification data. See Pages 9 and 10 for additional disclosure. |
Semi-Annual Report | April 30, 2018 (Unaudited) | 5 |
Red Oak Technology Select Fund | Performance Update |
All data below as of April 30, 2018 (Unaudited) |
Fund Data | |
Ticker | ROGSX |
Share Price | $25.92 |
Total Net Assets | $503.4 M |
Portfolio Turnover | 3.78% |
Sector Allocation^ | |
Information Technology | 91.3% |
Consumer Discretionary | 4.8% |
Cash & Other Assets | 3.9% |
Top 10 Holdings^ | ||
1. | Alphabet, Inc. | 8.7% |
2. | Intel Corporation | 5.4% |
3. | Microsoft Corporation | 5.2% |
4. | Cisco Systems, Inc. | 5.1% |
5. | Red Hat, Inc. | 5.0% |
6. | Facebook, Inc. - Class A | 4.9% |
7. | Amazon.com, Inc. | 4.8% |
8. | Apple, Inc. | 3.7% |
9. | VMware, Inc. - Class A | 3.7% |
10. | Oracle Corporation | 3.6% |
| ^ | Percentages are based on net assets. Holdings are subject to change. |
Growth of $10,000 Chart

The chart represents historical performance of a hypothetical investment of $10,000 in the Fund over the past 10 years. Past performance does not guarantee future results. This chart and the table below do not reflect the deduction of taxes that a shareholder would pay on Fund distributions or the redemption of Fund shares.
Average Annual Total Return | ||||
1 Year | 3 Year | 5 Year | 10 Year | |
Red Oak Technology Select Fund | 23.55% | 19.92% | 20.04% | 14.92% |
S&P 500 Equal Weight | 24.36% | 19.58% | 21.44% | 13.86% |
Lipper Science & Technology Funds Average2 | 24.60% | 16.65% | 18.69% | 11.92% |
Gross/Net Expense Ratio (per the prospectus dated February 28, 2018): 0.96%
Gross/Net Expense Ratio (as of the six months ended April 30, 2018): 0.94%
The performance data quoted represents past performance. Past performance does not guarantee future results. The investment return and principal value of an investment will fluctuate so that an investor’s shares, when redeemed, may be worth more or less than their original cost and current performance may be lower or higher than the performance quoted. For performance data current to the most recent month-end, please visit www.oakfunds.com or call 1-888-462-5386.
| 1 | Standard & Poor’s is the source and owner of the S&P Index data. |
| 2 | Lipper Inc. is the source and owner of the Lipper Classification data. See Pages 9 and 10 for additional disclosure. |
6 | 1-888-462-5386 | www.oakfunds.com |
Black Oak Emerging Technology Fund | Performance Update |
All data below as of April 30, 2018 (Unaudited) |
Fund Data | |
Ticker | BOGSX |
Share Price | $5.24 |
Total Net Assets | $37.9 M |
Portfolio Turnover | 5.58% |
Sector Allocation^ | |
Information Technology | 90.7% |
Health Care | 5.6% |
Cash & Other Assets | 3.7% |
Top 10 Holdings^ | ||
1. | Apple, Inc. | 6.1% |
2. | DXC Technology Company | 5.4% |
3. | Baidu, Inc. - ADR | 5.4% |
4. | CA, Inc. | 4.8% |
5. | NetApp, Inc. | 4.5% |
6. | Lam Research Corporation | 4.5% |
7. | Citrix Systems, Inc. | 4.4% |
8. | Seagate Technology plc | 4.3% |
9. | salesforce.com, Inc. | 4.1% |
10. | Tencent Holdings Ltd. - ADR | 3.9% |
| ^ | Percentages are based on net assets. Holdings are subject to change. |
Growth of $10,000 Chart
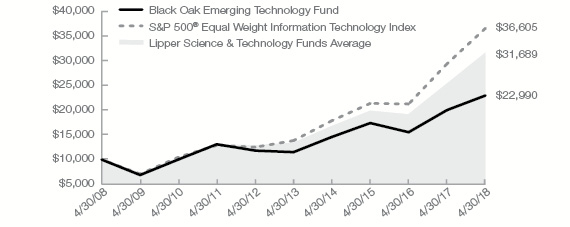
The chart represents historical performance of a hypothetical investment of $10,000 in the Fund over the past 10 years. Past performance does not guarantee future results. This chart and the table below do not reflect the deduction of taxes that a shareholder would pay on Fund distributions or the redemption of Fund shares. Fee waivers are in effect; if they had not been in effect, performance would have been lower.
Average Annual Total Return | ||||
1 Year | 3 Year | 5 Year | 10 Year | |
Black Oak Emerging Technology Fund | 14.71% | 9.70% | 14.82% | 8.68% |
S&P 500® Equal Weight | 24.36% | 19.58% | 21.44% | 13.86% |
Lipper Science & Technology Funds Average2 | 24.60% | 16.65% | 18.69% | 11.92% |
Gross/Net Expense Ratio (per the prospectus dated February 28, 2018): 1.16%
Gross/Net Expense Ratio (as of the six months ended April 30, 2018): 1.08%
The performance data quoted represents past performance. Past performance does not guarantee future results. The investment return and principal value of an investment will fluctuate so that an investor’s shares, when redeemed, may be worth more or less than their original cost and current performance may be lower or higher than the performance quoted. For performance data current to the most recent month-end, please visit www.oakfunds.com or call 1-888-462-5386.
| 1 | Standard & Poor’s is the source and owner of the S&P Index data. |
| 2 | Lipper Inc. is the source and owner of the Lipper Classification data. See Pages 9 and 10 for additional disclosure. |
Semi-Annual Report | April 30, 2018 (Unaudited) | 7 |
Live Oak Health Sciences Fund | Performance Update |
All data below as of April 30, 2018 (Unaudited) |
Fund Data | |
Ticker | LOGSX |
Share Price | $18.92 |
Total Net Assets | $60.4 M |
Portfolio Turnover | 14.54% |
Sector Allocation^ | |
Health Care | 98.3% |
Cash & Other Assets | 1.7% |
Top 10 Holdings^ | ||
1. | Amgen, Inc. | 7.6% |
2. | Anthem, Inc. | 6.8% |
3. | Express Scripts Holding Company | 6.4% |
4. | Waters Corporation | 5.2% |
5. | McKesson Corporation | 5.0% |
6. | Biogen, Inc. | 4.9% |
7. | GlaxoSmithKline plc - ADR | 4.3% |
8. | Aetna, Inc. | 4.2% |
9. | Cardinal Health, Inc. | 4.2% |
10. | DaVita, Inc. | 4.1% |
| ^ | Percentages are based on net assets. Holdings are subject to change. |
Growth of $10,000 Chart
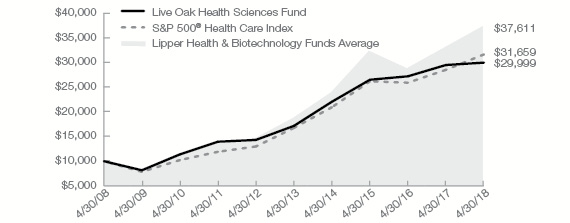
The chart above represents historical performance of a hypothetical investment of $10,000 in the Fund over the past 10 years. Past performance does not guarantee future results. This chart and the table below do not reflect the deduction of taxes that a shareholder would pay on Fund distributions or the redemption of Fund shares.
Average Annual Total Return | ||||
1 Year | 3 Year | 5 Year | 10 Year | |
Live Oak Health Sciences Fund | 1.62% | 4.19% | 11.82% | 11.61% |
S&P 500® Health Care Index1 | 10.91% | 6.50% | 13.56% | 12.21% |
Lipper Health & Biotechnology Funds Average2 | 12.87% | 4.53% | 14.41% | 13.58% |
Gross/Net Expense Ratio (per the prospectus dated February 28, 2018): 1.01%
Gross/Net Expense Ratio (as of the six months ended April 30, 2018): 1.00%
The performance data quoted represents past performance. Past performance does not guarantee future results. The investment return and principal value of an investment will fluctuate so that an investor’s shares, when redeemed, may be worth more or less than their original cost and current performance may be lower or higher than the performance quoted. For performance data current to the most recent month-end, please visit www.oakfunds.com or call 1-888-462-5386.
| 1 | Standard & Poor’s is the source and owner of the S&P Index data. |
| 2 | Lipper Inc. is the source and owner of the Lipper Classification data. See Pages 9 and 10 for additional disclosure. |
8 | 1-888-462-5386 | www.oakfunds.com |
Important Disclosures
As of April 30, 2018 (Unaudited)
Index Definitions and Disclosures
All indices are unmanaged and index performance figures include reinvestment of dividends but do not reflect any fees, expenses or taxes. Investors cannot invest directly in an index.
Lipper, a Thomson Reuters Company, is the source and owner of the Lipper Classification data contained in this material and all trademarks and copyrights related thereto. Any further dissemination or redistribution is strictly prohibited. Lipper Inc. is not responsible for the formatting or configuration of this material or for any inaccuracy in Oak Associates Funds’ presentation thereof.
Lipper Health & Biotechnology Funds – Funds that invest primarily in the equity securities of domestic companies engaged in health care, medicine, and biotechnology.
Lipper Large-Cap Growth Funds – Funds that, by portfolio practice, invest at least 75% of their equity assets in companies with market capitalizations (on a three-year weighted basis) above Lipper’s USDE large-cap floor. Large-cap growth funds typically have an above-average price-to-earnings ratio, price-to-book ratio, and three-year sales-per-share growth value, compared to the S&P 500® Index.
Lipper Multi-Cap Core Funds – Funds that, by portfolio practice, invest in a variety of market-capitalization ranges without concentrating 75% of their equity assets in any one market-capitalization range over an extended period of time. Multi-cap core funds typically have average characteristics compared to the S&P SuperComposite 1500 Index.
Lipper Multi-Cap Growth Funds – Funds that, by portfolio practice, invest in a variety of market capitalization ranges without concentrating 75% of their equity assets in any one market capitalization range over an extended period of time. Multi-cap growth funds typically have an above-average price-to-earnings ratio, price-to-book ratio, and three-year sales per-share growth value, compared to the S&P SuperComposite 1500 Index.
Lipper Science & Technology Funds – Funds that invest primarily in the equity securities of domestic companies engaged in science and technology.
Lipper Small-Cap Growth Funds – Funds that, by portfolio practice, invest at least 75% of their equity assets in companies with market capitalizations (on a three-year weighted basis) below Lipper’s USDE small-cap ceiling. Small-cap growth funds typically have an above-average price-to-earnings ratio, price-to-book ratio, and three-year sales-per-share growth value, compared to the S&P Small-Cap 600 Index.
NASDAQ is the source and owner of the NASDAQ Index data contained in this material and all trademarks and copyrights related thereto. Any further dissemination or redistribution is strictly prohibited. NASDAQ is not responsible for the formatting or configuration of this material or for any inaccuracy in Oak Associates Funds’ presentation thereof.
Russell Investments is the source and owner of the Russell Index data contained in this material and all trademarks and copyrights related thereto. Any further dissemination or redistribution is strictly prohibited. Russell Investments is not responsible for the formatting or configuration of this material or for any inaccuracy in Oak Associates Funds’ presentation thereof.
Russell 2000® Growth Total Return Index – The Russell 2000® Growth Total Return Index measures the performance of the small-cap growth segment of the U.S. equity universe. It includes those Russell 2000 companies with higher price-to-book ratios and higher forecasted growth values.
Semi-Annual Report | April 30, 2018 (Unaudited) | 9 |
Important Disclosures
All data below as of April 30, 2018 (Unaudited)
Russell 3000® Total Return Index – The Russell 3000® Total Return Index measures the performance of 3,000 publicly held US companies based on total market capitalization, which represents approximately 98% of the investable US equity market.
Standard & Poor’s is the source and owner of the S&P Index data contained in this material and all trademarks and copyrights related thereto. Any further dissemination or redistribution is strictly prohibited. Standard & Poor’s is not responsible for the formatting or configuration of this material or for any inaccuracy in Oak Associates Funds’ presentation thereof.
S&P 500® Index – is a commonly-recognized, market capitalization weighted index of 500 widely held equity securities, designed to measure broad U.S. equity performance.
S&P 500® Equal Weight Information Technology Index – The S&P 500® Equal Weight Information Technology Index is an unmanaged equal weighted version of the S&P 500® Information Technology Index that consists of the common stocks of the following industries: internet equipment, computers and peripherals, electronic equipment, office electronics and instruments, semiconductor equipment and products, diversified telecommunication services, and wireless telecommunication services that comprise the Information Technology sector of the S&P 500® Index.
S&P 500® Health Care Index – The S&P 500® Health Care Index is a capitalization-weighted index that encompasses two main industry groups. The first includes companies who manufacture health care equipment and supplies or provide health care related services, including distributors of health care products, providers of basic health care services, and owners and operators of health care facilities and organizations. The second group consists of companies primarily involved in the research, development, production and marketing of pharmaceuticals and biotechnology products.
S&P 500® Total Return Index – The S&P 500® Total Return Index is a commonly recognized, market capitalization weighted index of 500 widely held equity securities, designed to measure broad U.S. equity performance.
Investment Definitions
Smart beta defines a set of investment strategies that emphasize the use of alternative index construction rules to traditional market capitalization based indices. Smart beta emphasizes capturing investment factors of market inefficiencies in a rules-based and transparent way.
Correlation is a statistic that measures the degree to which two securities move in relation to each other.
The P/E is the ratio for valuing a company that measures its current share price relative to its per-share earnings. The price-earnings ratio can be calculated as market value per share divided by earnings per share.
Book value of an asset is the value at which the asset is carried on a balance sheet and calculated by taking the cost of an asset minus the accumulated depreciation. Book value is also the net asset value of a company, calculated as total assets minus intangible assets and liabilities.
Free cash flow yield is an overall return evaluation ratio of a stock, which standardizes the free cash flow per share a company is expected to earn against its market price per share. The ratio is calculated by taking the free cash flow per share divided by the share price.
10 | 1-888-462-5386 | www.oakfunds.com |
Disclosure of Fund Expenses
As of April 30, 2018 (Unaudited)
All mutual funds have operating expenses. As a shareholder of a fund, your investment is affected by these ongoing costs, which include (among others) costs for portfolio management, administrative services, and shareholder reports like this one. It is important for you to understand the impact of these costs on your investment returns and to compare these costs with the ongoing cost of investing in other mutual funds.
Operating expenses such as these, are deducted from the Fund’s gross income and directly reduce your final investment return. These expenses are expressed as a percentage of the Fund’s average net assets; this percentage is known as the Fund’s expense ratio.
The following examples use the expense ratio and are intended to help you understand the ongoing costs (in dollars) of investing in your Fund and to compare these costs with those of other mutual funds. The examples are based on an investment of $1,000 made at the beginning of the period shown and held for the entire period.
The table on the next page illustrates your Fund’s costs in two ways:
Actual Fund Return. This section helps you to estimate the actual expenses after fee waivers that your Fund incurred over the period. The “Expenses Paid During Period” column shows the actual dollar expense cost incurred by a $1,000 investment in the Fund, and the “Ending Account Value” number is derived from deducting that expense cost from the Fund’s gross investment return.
You can use this information, together with the actual amount you invested in the Fund, to estimate the expenses you paid over that period. Simply divide your actual account value by $1,000 to arrive at a ratio (for example, an $8,600 account value divided by $1,000 = 8.6), then multiply that ratio by the number shown for your Fund under “Expenses Paid During Period”.
Hypothetical 5% Return. This section helps you compare your Fund’s costs with those of other mutual funds. It assumes that the Fund had an annual 5% return before expenses during the year, but that the expense ratio (Column 3) for the period is unchanged. This example is useful in making comparisons because the Securities and Exchange Commission requires all mutual funds to make this 5% calculation. You can assess your Fund’s comparative cost by comparing the hypothetical result for your Fund in the “Expense Paid During Period” column with those that appear in the same charts in the shareholder reports for other funds.
Note: Because the return is set at 5% for comparison purposes — NOT your Fund’s actual return— the account values shown may not apply to your specific investment.
Semi-Annual Report | April 30, 2018 (Unaudited) | 11 |
Disclosure of Fund Expenses
As of April 30, 2018 (Unaudited)
Beginning Account Value November 1, 2017 | Ending | Annualized Expense | Expenses Period(a) | |
White Oak Select Growth Fund | ||||
Actual Return | $1,000.00 | $1,085.20 | 0.92% | $4.78 |
Hypothetical 5% Return | $1,000.00 | $1,020.21 | 0.92% | $4.63 |
Pin Oak Equity Fund | ||||
Actual Return | $1,000.00 | $1,065.80 | 0.95% | $4.87 |
Hypothetical 5% Return | $1,000.00 | $1,020.08 | 0.95% | $4.76 |
Rock Oak Core Growth Fund | ||||
Actual Return | $1,000.00 | $1,122.20 | 1.25% | $6.58 |
Hypothetical 5% Return | $1,000.00 | $1,018.60 | 1.25% | $6.26 |
River Oak Discovery Fund | ||||
Actual Return | $1,000.00 | $1,006.10 | 1.35% | $6.71 |
Hypothetical 5% Return | $1,000.00 | $1,018.10 | 1.35% | $6.75 |
Red Oak Technology Select Fund | ||||
Actual Return | $1,000.00 | $1,074.90 | 0.94% | $4.83 |
Hypothetical 5% Return | $1,000.00 | $1,020.14 | 0.94% | $4.70 |
Black Oak Emerging Technology Fund | ||||
Actual Return | $1,000.00 | $1,068.90 | 1.08% | $5.55 |
Hypothetical 5% Return | $1,000.00 | $1,019.43 | 1.08% | $5.42 |
Live Oak Health Sciences Fund | ||||
Actual Return | $1,000.00 | $1,008.10 | 1.00% | $4.97 |
Hypothetical 5% Return | $1,000.00 | $1,019.85 | 1.00% | $5.00 |
(a) | Expenses are equal to the Fund’s annualized expense ratio multiplied by the average account value over the period, multiplied by 181/365 (to reflect the one-half year period). |
12 | 1-888-462-5386 | www.oakfunds.com |
| White Oak Select Growth Fund | Schedule of Investments |
| As of April 30, 2018 (Unaudited) |
| Shares | Fair Value | |||||||
| COMMON STOCKS — 99.49% | ||||||||
| CONSUMER DISCRETIONARY — 12.01% | ||||||||
| Internet & Direct Marketing Retail — 10.55% | ||||||||
Amazon.com, Inc. (a) | 20,365 | $ | 31,894,237 | |||||
| Specialty Retail — 1.46% | ||||||||
| Lowe's Companies, Inc. | 53,500 | 4,410,005 | ||||||
| CONSUMER STAPLES — 2.14% | ||||||||
| Beverages — 2.14% | ||||||||
| PepsiCo, Inc. | 64,000 | 6,460,160 | ||||||
| FINANCIALS — 30.24% | ||||||||
| Capital Markets — 11.12% | ||||||||
Charles Schwab Corporation (The) (b) | 454,100 | 25,284,288 | ||||||
| State Street Corporation | 83,500 | 8,331,630 | ||||||
| 33,615,918 | ||||||||
| Commercial Banks — 11.67% | ||||||||
CIT Group, Inc. (b) | 177,400 | 9,393,330 | ||||||
| TCF Financial Corporation | 508,000 | 12,613,640 | ||||||
| U.S. Bancorp | 263,000 | 13,268,350 | ||||||
| 35,275,320 | ||||||||
| Diversified Financial Services — 4.55% | ||||||||
| JPMorgan Chase & Company | 126,300 | 13,738,914 | ||||||
| Insurance — 2.90% | ||||||||
| Chubb Ltd. | 64,600 | 8,764,282 | ||||||
| HEALTH CARE — 12.24% | ||||||||
| Biotechnology — 8.56% | ||||||||
Amgen, Inc. (b) | 108,000 | 18,843,840 | ||||||
Gilead Sciences, Inc. (b) | 97,500 | 7,042,425 | ||||||
| 25,886,265 | ||||||||
| Health Care Providers & Services — 2.56% | ||||||||
Express Scripts Holding Company (a) (b) | 102,000 | 7,721,400 | ||||||
| Pharmaceuticals — 1.12% | ||||||||
Teva Pharmaceutical Industries Ltd. - ADR (b) | 189,000 | 3,398,220 | ||||||
Semi-Annual Report | April 30, 2018 (Unaudited) | 13 |
| Schedule of Investments | White Oak Select Growth Fund |
| As of April 30, 2018 (Unaudited) |
| Shares | Fair Value | |||||||
| INDUSTRIALS — 3.34% | ||||||||
| Air Freight & Logistics — 3.34% | ||||||||
| United Parcel Service, Inc. - Class B | 89,000 | $ | 10,101,500 | |||||
| INFORMATION TECHNOLOGY — 39.52% | ||||||||
| Communications Equipment — 9.63% | ||||||||
Cisco Systems, Inc. (b) | 542,000 | 24,005,180 | ||||||
| QUALCOMM, Inc. | 100,100 | 5,106,101 | ||||||
| 29,111,281 | ||||||||
| Internet Software & Services — 13.38% | ||||||||
Alphabet, Inc. - Class A (a) (b) | 12,680 | 12,915,594 | ||||||
Alphabet, Inc. - Class C (a) | 16,495 | 16,780,859 | ||||||
Facebook, Inc. - Class A (a) | 40,600 | 6,983,200 | ||||||
salesforce.com, Inc. (a) (b) | 31,100 | 3,762,789 | ||||||
| 40,442,442 | ||||||||
| IT Services — 6.44% | ||||||||
| Cognizant Technology Solutions Corporation - Class A | 128,200 | 10,489,324 | ||||||
| International Business Machines Corporation | 61,900 | 8,973,024 | ||||||
| 19,462,348 | ||||||||
| Semiconductors & Semiconductor Equipment — 10.07% | ||||||||
| KLA-Tencor Corporation | 179,800 | 18,292,852 | ||||||
| Xilinx, Inc. | 188,900 | 12,134,936 | ||||||
| 30,427,788 | ||||||||
| TOTAL COMMON STOCKS | ||||||||
| (Cost $206,177,860) | 300,710,080 | |||||||
14 | 1-888-462-5386 | www.oakfunds.com |
| White Oak Select Growth Fund | Schedule of Investments |
| As of April 30, 2018 (Unaudited) |
Shares or Principal ($) | Fair Value | |||||||
| SHORT-TERM INVESTMENTS — 11.71% | ||||||||
| REPURCHASE AGREEMENTS — 0.55% | ||||||||
| Tri-Party Repurchase Agreement with South Street Securities Wachovia Tri-Party, 1.56%, dated 4/30/18 and maturing 5/1/18, collaterized by U.S Treasury Securities with rates ranging from 1.50% to 2.88% and maturity dates from 10/25/18 to 8/15/26 with a par value of $1,729,166 and a collateral value of $1,683,248. | 1,650,239 | $ | 1,650,239 | |||||
| COLLATERAL FOR SECURITIES LOANED — 11.16% | ||||||||
Mount Vernon Liquid Assets Portfolio, LLC, 2.03% (c) | 33,728,097 | 33,728,097 | ||||||
| TOTAL SHORT-TERM INVESTMENTS | ||||||||
| (Cost $35,378,336) | 35,378,336 | |||||||
| TOTAL INVESTMENTS — 111.20% | ||||||||
| (Cost $241,556,196) | 336,088,416 | |||||||
| Liabilities in Excess of Other Assets — (11.20)% | (33,833,889 | ) | ||||||
| NET ASSETS — 100.00% | $ | 302,254,527 | ||||||
(a) | Non-income producing security. |
(b) | Security, or a portion of the security position, is currently on loan. The total market value of securities on loan is $32,753,861. |
(c) | Rate disclosed is the seven day effective yield as of April 30, 2018. |
ADR — American Depositary Receipt. |
The sectors shown on the schedule of investments are based on the Global Industry Classification Standard, or GICS® (“GICS”). The GICS was developed by and/or is the exclusive property of MSCI, Inc. and Standard & Poor’s Financial Services LLC (“S&P”). GICS is a service mark of MSCI, Inc. and S&P and has been licensed for use by Ultimus Fund Solutions, LLC.
The accompanying notes are an integral part of the financial statements.
Semi-Annual Report | April 30, 2018 (Unaudited) | 15 |
| Schedule of Investments | Pin Oak Equity Fund |
| As of April 30, 2018 (Unaudited) |
| Shares | Fair Value | |||||||
| COMMON STOCKS — 94.44% | ||||||||
| CONSUMER DISCRETIONARY — 13.56% | ||||||||
| Auto Components — 2.16% | ||||||||
Gentex Corporation (a) | 216,500 | $ | 4,923,210 | |||||
| Diversified Consumer Services — 2.11% | ||||||||
H&R Block, Inc. (a) | 174,000 | 4,811,100 | ||||||
| Internet & Direct Marketing Retail — 3.52% | ||||||||
Amazon.com, Inc. (b) | 5,120 | 8,018,586 | ||||||
| Media — 3.74% | ||||||||
| Twenty-First Century Fox, Inc. - Class B | 236,100 | 8,516,127 | ||||||
| Textiles, Apparel & Luxury Goods — 2.03% | ||||||||
Hanesbrands, Inc. (a) | 250,500 | 4,626,735 | ||||||
| CONSUMER STAPLES — 4.21% | ||||||||
| Beverages — 4.21% | ||||||||
| PepsiCo, Inc. | 95,100 | 9,599,394 | ||||||
| ENERGY — 5.13% | ||||||||
| Energy Equipment & Services — 0.13% | ||||||||
Transocean Ltd. (a) (b) | 25,000 | 309,250 | ||||||
| Oil, Gas & Consumable Fuels — 5.00% | ||||||||
| Valero Energy Corporation | 102,600 | 11,381,418 | ||||||
| FINANCIALS — 32.25% | ||||||||
| Capital Markets — 11.73% | ||||||||
| Bank of New York Mellon Corporation (The) | 242,300 | 13,207,773 | ||||||
| Charles Schwab Corporation (The) | 242,651 | 13,510,807 | ||||||
| 26,718,580 | ||||||||
| Commercial Banks — 9.55% | ||||||||
| CIT Group, Inc. | 103,000 | 5,453,850 | ||||||
| Great Southern Bancorp, Inc. | 28,010 | 1,480,329 | ||||||
| International Bancshares Corporation | 58,835 | 2,341,633 | ||||||
| SunTrust Banks, Inc. | 105,000 | 7,014,000 | ||||||
| Wells Fargo & Company | 105,400 | 5,476,584 | ||||||
| 21,766,396 | ||||||||
16 | 1-888-462-5386 | www.oakfunds.com |
| Pin Oak Equity Fund | Schedule of Investments |
As of April 30, 2018 (Unaudited) |
| Shares | Fair Value | |||||||
| Consumer Finance — 4.53% | ||||||||
| Capital One Financial Corporation | 83,300 | $ | 7,548,646 | |||||
| Synchrony Financial | 83,300 | 2,763,061 | ||||||
| 10,311,707 | ||||||||
| Insurance — 6.44% | ||||||||
| Assurant, Inc. | 36,400 | 3,378,648 | ||||||
| Everest Re Group Ltd. | 16,100 | 3,745,987 | ||||||
| Travelers Companies, Inc. (The) | 57,400 | 7,553,840 | ||||||
| 14,678,475 | ||||||||
| HEALTH CARE — 9.87% | ||||||||
| Health Care Providers & Services — 4.16% | ||||||||
DaVita, Inc. (a) (b) | 110,400 | 6,932,016 | ||||||
| McKesson Corporation | 16,300 | 2,546,223 | ||||||
| 9,478,239 | ||||||||
| Pharmaceuticals — 5.71% | ||||||||
GlaxoSmithKline PLC - ADR (a) | 226,800 | 9,096,948 | ||||||
| Sanofi - ADR | 35,300 | 1,387,996 | ||||||
Teva Pharmaceutical Industries Ltd. - ADR (a) | 140,000 | 2,517,200 | ||||||
| 13,002,144 | ||||||||
| INFORMATION TECHNOLOGY — 28.37% | ||||||||
| Internet Software & Services — 13.17% | ||||||||
Alphabet, Inc. - Class A (a) (b) | 3,690 | 3,758,560 | ||||||
Alphabet, Inc. - Class C (b) | 11,679 | 11,881,397 | ||||||
eBay, Inc. (a) (b) | 191,000 | 7,235,080 | ||||||
IAC/InterActiveCorp (a) (b) | 44,056 | 7,143,240 | ||||||
| 30,018,277 | ||||||||
| IT Services — 9.70% | ||||||||
| Amdocs Ltd. | 127,672 | 8,585,942 | ||||||
| Paychex, Inc. | 167,249 | 10,130,272 | ||||||
Western Union Company (The) (a) | 171,000 | 3,377,250 | ||||||
| 22,093,464 | ||||||||
| Semiconductors & Semiconductor Equipment — 5.50% | ||||||||
| KLA-Tencor Corporation | 66,400 | 6,755,536 | ||||||
| Xilinx, Inc. | 89,900 | 5,775,176 | ||||||
| 12,530,712 | ||||||||
| MATERIALS — 1.05% | ||||||||
| Metals & Mining — 1.05% | ||||||||
| Teck Resources Limited - Class B | 94,814 | 2,382,676 | ||||||
| TOTAL COMMON STOCKS | ||||||||
| (Cost $160,682,080) | 215,166,490 | |||||||
Semi-Annual Report | April 30, 2018 (Unaudited) | 17 |
| Schedule of Investments | Pin Oak Equity Fund |
| As of April 30, 2018 (Unaudited) |
Shares or Principal ($) | Fair Value | |||||||
| SHORT-TERM INVESTMENTS — 25.18% | ||||||||
| REPURCHASE AGREEMENTS — 5.76% | ||||||||
| Tri-Party Repurchase Agreement with South Street Securities Wachovia Tri-Party, 1.56%, dated 4/30/18 and maturing 5/1/18, collaterized by U.S Treasury Securities with rates ranging from 1.50% to 2.88% and maturity dates from 10/25/18 to 8/15/26 with a par value of $13,772,211 and a collateral value of $13,406,490. | 13,143,589 | $ | 13,143,589 | |||||
| COLLATERAL FOR SECURITIES LOANED — 19.42% | ||||||||
Mount Vernon Liquid Assets Portfolio, LLC, 2.03% (c) | 44,233,371 | 44,233,371 | ||||||
| TOTAL SHORT-TERM INVESTMENTS | ||||||||
| (Cost $57,376,960) | 57,376,960 | |||||||
| TOTAL INVESTMENTS — 119.62% | ||||||||
| (Cost $218,059,040) | 272,543,450 | |||||||
| Liabilities in Excess of Other Assets — (19.62)% | (44,715,700 | ) | ||||||
| NET ASSETS — 100.00% | $ | 227,827,750 | ||||||
(a) | Security, or a portion of the security position, is currently on loan. The total market value of securities on loan is $43,119,039. |
(b) | Non-income producing security. |
(c) | Rate disclosed is the seven day effective yield as of April 30, 2018. |
ADR — American Depositary Receipt. |
The sectors shown on the schedule of investments are based on the Global Industry Classification Standard, or GICS® (“GICS”). The GICS was developed by and/or is the exclusive property of MSCI, Inc. and Standard & Poor’s Financial Services LLC (“S&P”). GICS is a service mark of MSCI, Inc. and S&P and has been licensed for use by Ultimus Fund Solutions, LLC.
The accompanying notes are an integral part of the financial statements.
18 | 1-888-462-5386 | www.oakfunds.com |
| Rock Oak Core Growth Fund | Schedule of Investments |
| As of April 30, 2018 (Unaudited) |
| Shares | Fair Value | |||||||
| COMMON STOCKS — 92.28% | ||||||||
| CONSUMER DISCRETIONARY — 15.38% | ||||||||
| Hotels, Restaurants & Leisure — 3.25% | ||||||||
| Wyndham Worldwide Corporation | 3,845 | $ | 439,137 | |||||
| Internet & Direct Marketing Retail — 8.71% | ||||||||
Amazon.com, Inc. (a) (b) | 470 | 736,081 | ||||||
Netflix, Inc. (b) | 1,420 | 443,693 | ||||||
| 1,179,774 | ||||||||
| Media — 0.69% | ||||||||
Liberty Media Corporation - Liberty SiriusXM - A - Series A (b) | 2,235 | 93,356 | ||||||
| Textiles, Apparel & Luxury Goods — 2.73% | ||||||||
| Ralph Lauren Corporation | 3,365 | 369,645 | ||||||
| CONSUMER STAPLES — 1.79% | ||||||||
| Beverages — 1.79% | ||||||||
| Molson Coors Brewing Company - Class B | 3,400 | 242,216 | ||||||
| ENERGY — 5.33% | ||||||||
| Energy Equipment & Services — 1.88% | ||||||||
| National Oilwell Varco, Inc. | 6,595 | 255,029 | ||||||
| Oil, Gas & Consumable Fuels — 3.45% | ||||||||
| HollyFrontier Corporation | 7,685 | 466,402 | ||||||
| FINANCIALS — 9.01% | ||||||||
| Commercial Banks — 3.56% | ||||||||
SunTrust Banks, Inc. (a) | 7,200 | 480,960 | ||||||
| Consumer Finance — 2.69% | ||||||||
| Capital One Financial Corporation | 4,025 | 364,746 | ||||||
| Insurance — 2.76% | ||||||||
| Hartford Financial Services Group, Inc. (The) | 6,950 | 374,188 | ||||||
| HEALTH CARE — 13.50% | ||||||||
| Biotechnology — 7.68% | ||||||||
| AbbVie, Inc. | 4,940 | 476,957 | ||||||
Biogen, Inc. (b) | 920 | 251,712 | ||||||
Gilead Sciences, Inc. (a) | 4,300 | 310,589 | ||||||
| 1,039,258 | ||||||||
Semi-Annual Report | April 30, 2018 (Unaudited) | 19 |
| Schedule of Investments | Rock Oak Core Growth Fund |
| As of April 30, 2018 (Unaudited) |
| Shares | Fair Value | |||||||
| Life Sciences Tools & Services — 2.49% | ||||||||
Illumina, Inc. (a) (b) | 1,400 | $ | 337,302 | |||||
| Pharmaceuticals — 3.33% | ||||||||
Jazz Pharmaceuticals PLC (b) | 2,965 | 450,799 | ||||||
| INDUSTRIALS — 4.17% | ||||||||
| Aerospace & Defense — 3.36% | ||||||||
| L3 Technologies, Inc. | 2,325 | 455,421 | ||||||
| Professional Services — 0.81% | ||||||||
| Nielsen Holdings PLC | 3,470 | 109,132 | ||||||
| INFORMATION TECHNOLOGY — 40.44% | ||||||||
| Communications Equipment — 3.61% | ||||||||
F5 Networks, Inc. (b) | 3,000 | 489,270 | ||||||
| Internet Software & Services — 11.80% | ||||||||
Alphabet, Inc. - Class C (b) | 530 | 539,184 | ||||||
iQIYI, Inc. - ADR (b) | 21,010 | 378,810 | ||||||
salesforce.com, Inc. (a) (b) | 3,030 | 366,600 | ||||||
Tencent Holdings Ltd. - ADR (a) | 6,355 | 312,221 | ||||||
| 1,596,815 | ||||||||
| IT Services — 11.24% | ||||||||
| Alliance Data Systems Corporation | 1,830 | 371,582 | ||||||
| Cognizant Technology Solutions Corporation - Class A | 2,800 | 229,096 | ||||||
| DXC Technology Company | 5,650 | 582,289 | ||||||
Worldpay, Inc. - Class A (b) | 4,160 | 337,875 | ||||||
| 1,520,842 | ||||||||
| Software — 5.47% | ||||||||
| CA, Inc. | 12,975 | 451,530 | ||||||
Check Point Software Technologies Ltd. (a) (b) | 3,000 | 289,530 | ||||||
| 741,060 | ||||||||
| Technology Hardware, Storage & Peripherals — 8.32% | ||||||||
NetApp, Inc. (a) | 8,755 | 582,908 | ||||||
Seagate Technology PLC (a) | 3,410 | 197,405 | ||||||
| Western Digital Corporation | 4,395 | 346,282 | ||||||
| 1,126,595 | ||||||||
| MATERIALS — 2.66% | ||||||||
| Chemicals — 2.66% | ||||||||
| Eastman Chemical Company | 3,530 | 360,342 | ||||||
| TOTAL COMMON STOCKS | ||||||||
| (Cost $8,219,441) | 12,492,289 | |||||||
20 | 1-888-462-5386 | www.oakfunds.com |
| Rock Oak Core Growth Fund | Schedule of Investments |
| As of April 30, 2018 (Unaudited) |
Shares or Principal ($) | Fair Value | |||||||
| SHORT-TERM INVESTMENTS — 34.60% | ||||||||
| MONEY MARKET FUNDS — 0.10% | ||||||||
Fidelity Investments Money Market Government Portfolio - | 14,600 | $ | 14,600 | |||||
| REPURCHASE AGREEMENTS — 7.26% | ||||||||
| Tri-Party Repurchase Agreement with South Street Securities Wachovia Tri-Party, 1.56%, dated 4/30/18 and maturing 5/1/18, collaterized by U.S Treasury Securities with rates ranging from 1.50% to 2.88% and maturity dates from 10/25/18 to 8/15/26 with a par value of $1,029,669 and a collateral value of $1,002,326. | 982,671 | 982,671 | ||||||
| COLLATERAL FOR SECURITIES LOANED — 27.24% | ||||||||
Mount Vernon Liquid Assets Portfolio, LLC, 2.03% (c) | 3,686,329 | 3,686,329 | ||||||
| TOTAL SHORT-TERM INVESTMENTS | ||||||||
| (Cost $4,683,600) | 4,683,600 | |||||||
| TOTAL INVESTMENTS — 126.88% | ||||||||
| (Cost $12,903,041) | 17,175,889 | |||||||
| Liabilities in Excess of Other Assets — (26.88)% | (3,637,851 | ) | ||||||
| NET ASSETS — 100.00% | $ | 13,538,038 | ||||||
(a) | Security, or a portion of the security position, is currently on loan. The total market value of securities on loan is $3,576,801. |
(b) | Non-income producing security. |
(c) | Rate disclosed is the seven day effective yield as of April 30, 2018. |
ADR — American Depositary Receipt. |
The sectors shown on the schedule of investments are based on the Global Industry Classification Standard, or GICS® (“GICS”). The GICS was developed by and/or is the exclusive property of MSCI, Inc. and Standard & Poor’s Financial Services LLC (“S&P”). GICS is a service mark of MSCI, Inc. and S&P and has been licensed for use by Ultimus Fund Solutions, LLC.
The accompanying notes are an integral part of the financial statements.
Semi-Annual Report | April 30, 2018 (Unaudited) | 21 |
| Schedule of Investments | River Oak Discovery Fund |
| As of April 30, 2018 (Unaudited) |
| Shares | Fair Value | |||||||
| COMMON STOCKS — 97.17% | ||||||||
| CONSUMER DISCRETIONARY — 12.50% | ||||||||
| Diversified Consumer Services — 5.58% | ||||||||
Adtalem Global Education, Inc. (a) | 11,810 | $ | 562,156 | |||||
American Public Education, Inc. (a) | 5,000 | 201,500 | ||||||
| 763,656 | ||||||||
| Leisure Products — 3.28% | ||||||||
Nautilus, Inc. (a) | 30,825 | 448,504 | ||||||
| Specialty Retail — 3.64% | ||||||||
| Aaron's, Inc. | 11,930 | 498,316 | ||||||
| CONSUMER STAPLES — 4.19% | ||||||||
| Beverages — 4.19% | ||||||||
Boston Beer Company, Inc. (The) - Class A (a) | 2,555 | 572,703 | ||||||
| FINANCIALS — 17.56% | ||||||||
| Capital Markets — 3.64% | ||||||||
| AllianceBernstein Holding, L.P. | 18,315 | 498,168 | ||||||
| Commercial Banks — 3.88% | ||||||||
| Union Bankshares Corporation | 14,050 | 531,231 | ||||||
| Insurance — 6.88% | ||||||||
| Assurant, Inc. | 6,350 | 589,406 | ||||||
| CNO Financial Group, Inc. | 16,365 | 350,866 | ||||||
| 940,272 | ||||||||
| Thrifts & Mortgage Finance — 3.16% | ||||||||
| Dime Community Bancshares, Inc. | 21,870 | 431,933 | ||||||
| HEALTH CARE — 19.12% | ||||||||
| Biotechnology — 6.38% | ||||||||
Eagle Pharmaceuticals, Inc. (a) (b) | 7,725 | 401,777 | ||||||
United Therapeutics Corporation (a) | 4,275 | 470,721 | ||||||
| 872,498 | ||||||||
| Health Care Providers & Services — 6.62% | ||||||||
Envision Healthcare Corporation (a) (b) | 10,020 | 372,443 | ||||||
Magellan Health, Inc. (a) | 6,350 | 532,447 | ||||||
| 904,890 | ||||||||
| Health Care Technology — 0.56% | ||||||||
Quality Systems, Inc. (a) | 5,700 | 76,551 | ||||||
22 | 1-888-462-5386 | www.oakfunds.com |
| River Oak Discovery Fund | Schedule of Investments |
| As of April 30, 2018 (Unaudited) |
| Shares | Fair Value | |||||||
| Pharmaceuticals — 5.56% | ||||||||
Innoviva, Inc. (a) (b) | 28,490 | $ | 413,105 | |||||
Lannett Company, Inc. (a) (b) | 22,285 | 347,646 | ||||||
| 760,751 | ||||||||
| INDUSTRIALS — 6.61% | ||||||||
| Machinery — 1.46% | ||||||||
| Kadant, Inc. | 2,160 | 199,260 | ||||||
| Professional Services — 5.15% | ||||||||
| Barrett Business Services, Inc. | 4,156 | 363,733 | ||||||
| RPX Corporation | 31,460 | 340,712 | ||||||
| 704,445 | ||||||||
| INFORMATION TECHNOLOGY — 30.41% | ||||||||
| Electronic Equipment, Instruments & Components — 5.40% | ||||||||
| Hollysys Automation Technologies Limited | 15,500 | 341,930 | ||||||
KEMET Corporation (a) | 23,135 | 398,385 | ||||||
| 740,315 | ||||||||
| IT Services — 3.13% | ||||||||
| Convergys Corporation | 18,310 | 427,722 | ||||||
| Semiconductors & Semiconductor Equipment — 17.70% | ||||||||
Advanced Energy Industries, Inc. (a) | 6,560 | 390,648 | ||||||
Ambarella, Inc. (a) (b) | 8,005 | 372,953 | ||||||
Cirrus Logic, Inc. (a) | 10,510 | 383,300 | ||||||
Kulicke & Soffa Industries, Inc. (a) | 25,285 | 578,774 | ||||||
SolarEdge Technologies, Inc. (a) | 13,225 | 696,295 | ||||||
| 2,421,970 | ||||||||
| Software — 4.18% | ||||||||
FireEye, Inc. (a) | 23,005 | 415,240 | ||||||
Verint Systems, Inc. (a) | 3,720 | 156,612 | ||||||
| 571,852 | ||||||||
| MATERIALS — 6.78% | ||||||||
| Chemicals — 2.58% | ||||||||
| Kronos Worldwide, Inc. | 15,335 | 353,318 | ||||||
| Paper & Forest Products — 4.20% | ||||||||
| Mercer International, Inc. | 42,840 | 574,056 | ||||||
| TOTAL COMMON STOCKS | ||||||||
| (Cost $10,319,811) | 13,292,411 | |||||||
Semi-Annual Report | April 30, 2018 (Unaudited) | 23 |
| Schedule of Investments | River Oak Discovery Fund |
| As of April 30, 2018 (Unaudited) |
| Shares | Fair Value | |||||||
| SHORT-TERM INVESTMENTS — 15.77% | ||||||||
| MONEY MARKET FUNDS — 2.80% | ||||||||
Fidelity Investments Money Market Government Portfolio - | 384,565 | $ | 384,565 | |||||
| COLLATERAL FOR SECURITIES LOANED — 12.97% | ||||||||
Mount Vernon Liquid Assets Portfolio, LLC, 2.03% (c) | 1,772,023 | 1,772,023 | ||||||
| TOTAL SHORT-TERM INVESTMENTS | ||||||||
| (Cost $2,156,588) | 2,156,588 | |||||||
| TOTAL INVESTMENTS — 112.94% | ||||||||
| (Cost $12,476,399) | 15,448,999 | |||||||
| Liabilities in Excess of Other Assets — (12.94)% | (1,769,913 | ) | ||||||
| NET ASSETS — 100.00% | $ | 13,679,086 | ||||||
(a) | Non-income producing security. |
(b) | Security, or a portion of the security position, is currently on loan. The total market value of securities on loan is $1,699,120. |
(c) | Rate disclosed is the seven day effective yield as of April 30, 2018. |
The sectors shown on the schedule of investments are based on the Global Industry Classification Standard, or GICS® (“GICS”). The GICS was developed by and/or is the exclusive property of MSCI, Inc. and Standard & Poor’s Financial Services LLC (“S&P”). GICS is a service mark of MSCI, Inc. and S&P and has been licensed for use by Ultimus Fund Solutions, LLC.
The accompanying notes are an integral part of the financial statements.
24 | 1-888-462-5386 | www.oakfunds.com |
| Red Oak Technology Select Fund | Schedule of Investments |
| As of April 30, 2018 (Unaudited) |
| Shares | Fair Value | |||||||
| COMMON STOCKS — 96.10% | ||||||||
| CONSUMER DISCRETIONARY — 4.79% | ||||||||
| Internet & Direct Marketing Retail — 4.79% | ||||||||
Amazon.com, Inc. (a) (b) | 15,400 | $ | 24,118,402 | |||||
| INFORMATION TECHNOLOGY — 91.31% | ||||||||
| Communications Equipment — 8.40% | ||||||||
| Cisco Systems, Inc. | 579,000 | 25,643,910 | ||||||
| Juniper Networks, Inc. | 429,000 | 10,549,110 | ||||||
| QUALCOMM, Inc. | 119,500 | 6,095,695 | ||||||
| 42,288,715 | ||||||||
| Electronic Equipment, Instruments & Components — 1.27% | ||||||||
| Corning, Inc. | 236,000 | 6,376,720 | ||||||
| Internet Software & Services — 18.65% | ||||||||
Alphabet, Inc. - Class A (b) | 16,840 | 17,152,887 | ||||||
Alphabet, Inc. - Class C (b) | 25,996 | 26,446,511 | ||||||
eBay, Inc. (a) (b) | 309,300 | 11,716,284 | ||||||
Facebook, Inc. - Class A (b) | 142,025 | 24,428,300 | ||||||
IAC/InterActiveCorp (a) (b) | 87,200 | 14,138,608 | ||||||
| 93,882,590 | ||||||||
| IT Services — 8.55% | ||||||||
| Accenture plc - Class A | 78,300 | 11,838,960 | ||||||
| Alliance Data Systems Corporation | 41,500 | 8,426,575 | ||||||
| International Business Machines Corporation | 65,300 | 9,465,888 | ||||||
| Total System Services, Inc. | 158,200 | 13,298,292 | ||||||
| 43,029,715 | ||||||||
| Semiconductors & Semiconductor Equipment — 14.01% | ||||||||
| Intel Corporation | 522,800 | 26,986,936 | ||||||
| KLA-Tencor Corporation | 170,600 | 17,356,844 | ||||||
Marvell Technology Group Ltd. (a) | 254,400 | 5,103,264 | ||||||
| Skyworks Solutions, Inc. | 101,770 | 8,829,565 | ||||||
| Xilinx, Inc. | 190,400 | 12,231,296 | ||||||
| 70,507,905 | ||||||||
| Software — 25.59% | ||||||||
CA, Inc. (a) | 332,000 | 11,553,600 | ||||||
Check Point Software Technologies Ltd. (a) (b) | 134,800 | 13,009,548 | ||||||
Dell Technologies, Inc. - Class V (b) | 7,657 | 549,543 | ||||||
| Microsoft Corporation | 280,200 | 26,204,304 | ||||||
Semi-Annual Report | April 30, 2018 (Unaudited) | 25 |
| Schedule of Investments | Red Oak Technology Select Fund |
| As of April 30, 2018 (Unaudited) |
| Shares | Fair Value | |||||||
| Software (continued) | ||||||||
| Oracle Corporation | 397,600 | $ | 18,158,392 | |||||
Red Hat, Inc. (b) | 154,500 | 25,192,770 | ||||||
Synopsys, Inc. (b) | 182,000 | 15,562,820 | ||||||
VMware, Inc. - Class A (a) (b) | 139,300 | 18,563,118 | ||||||
| 128,794,095 | ||||||||
| Technology Hardware, Storage & Peripherals — 14.84% | ||||||||
| Apple, Inc. | 113,520 | 18,760,315 | ||||||
| Hewlett Packard Enterprise Company | 323,500 | 5,515,675 | ||||||
| HP, Inc. | 438,500 | 9,423,365 | ||||||
NetApp, Inc. (a) | 252,500 | 16,811,450 | ||||||
Seagate Technology plc (a) | 282,400 | 16,348,136 | ||||||
| Western Digital Corporation | 99,800 | 7,863,242 | ||||||
| 74,722,183 | ||||||||
| TOTAL COMMON STOCKS | ||||||||
| (Cost $331,255,541) | 483,720,325 | |||||||
26 | 1-888-462-5386 | www.oakfunds.com |
| Red Oak Technology Select Fund | Schedule of Investments |
| As of April 30, 2018 (Unaudited) |
Shares or Principal ($) | Market Value | |||||||
| SHORT-TERM INVESTMENTS — 16.15% | ||||||||
| MONEY MARKET FUNDS — 0.01% | ||||||||
Fidelity Investments Money Market Government Portfolio - | 32,156 | $ | 32,156 | |||||
| REPURCHASE AGREEMENTS — 3.99% | ||||||||
| Tri-Party Repurchase Agreement with South Street Securities Wachovia Tri-Party, 1.56%, dated 4/30/18 and maturing 5/1/18, collaterized by U.S Treasury Securities with rates ranging from 1.50% to 2.88% and maturity dates from 10/25/18 to 8/15/26 with a par value of $21,032,932 and a collateral value of $20,474,402. | 20,072,900 | 20,072,900 | ||||||
| COLLATERAL FOR SECURITIES LOANED — 12.15% | ||||||||
Mount Vernon Liquid Assets Portfolio, LLC, 2.03% (c) | 61,166,417 | 61,166,417 | ||||||
| TOTAL SHORT-TERM INVESTMENTS | ||||||||
| (Cost $81,271,473) | 81,271,473 | |||||||
| TOTAL INVESTMENTS — 112.25% | ||||||||
| (Cost $412,527,014) | 564,991,798 | |||||||
| Liabilities in Excess of Other Assets — (12.25)% | (61,619,756 | ) | ||||||
| NET ASSETS — 100.00% | $ | 503,372,042 | ||||||
(a) | Security, or a portion of the security position, is currently on loan. The total market value of securities on loan is $59,865,405. |
(b) | Non-income producing security. |
(c) | Rate disclosed is the seven day effective yield as of April 30, 2018. |
The sectors shown on the schedule of investments are based on the Global Industry Classification Standard, or GICS® (“GICS”). The GICS was developed by and/or is the exclusive property of MSCI, Inc. and Standard & Poor’s Financial Services LLC (“S&P”). GICS is a service mark of MSCI, Inc. and S&P and has been licensed for use by Ultimus Fund Solutions, LLC.
The accompanying notes are an integral part of the financial statements.
Semi-Annual Report | April 30, 2018 (Unaudited) | 27 |
| Schedule of Investments | Black Oak Emerging Technology Fund |
| As of April 30, 2018 (Unaudited) |
| Shares | Fair Value | |||||||
| COMMON STOCKS — 96.27% | ||||||||
| HEALTH CARE — 5.56% | ||||||||
| Health Care Technology — 1.88% | ||||||||
Quality Systems, Inc. (a) | 53,000 | $ | 711,790 | |||||
| Life Sciences Tools & Services — 3.68% | ||||||||
Illumina, Inc. (a) (b) | 5,800 | 1,397,394 | ||||||
| INFORMATION TECHNOLOGY — 90.71% | ||||||||
| Communications Equipment — 9.50% | ||||||||
F5 Networks, Inc. (a) | 8,805 | 1,436,008 | ||||||
Palo Alto Networks, Inc. (a) | 5,900 | 1,135,809 | ||||||
| QUALCOMM, Inc. | 20,215 | 1,031,167 | ||||||
| 3,602,984 | ||||||||
| Electronic Equipment, Instruments & Components — 0.91% | ||||||||
KEMET Corporation (a) | 20,000 | 344,400 | ||||||
| Internet Software & Services — 24.89% | ||||||||
Baidu, Inc. - ADR (a) | 8,150 | 2,044,834 | ||||||
Blucora, Inc. (a) | 49,350 | 1,283,100 | ||||||
Facebook, Inc. - Class A (a) (b) | 8,000 | 1,376,000 | ||||||
iQIYI, Inc. - ADR (a) | 21,150 | 381,335 | ||||||
| LogMeIn, Inc. | 1,684 | 185,577 | ||||||
| NetEase, Inc. - ADR | 4,305 | 1,106,686 | ||||||
salesforce.com, Inc. (a) (b) | 13,000 | 1,572,870 | ||||||
Tencent Holdings Ltd. - ADR (b) | 30,480 | 1,497,482 | ||||||
| 9,447,884 | ||||||||
| IT Services — 13.98% | ||||||||
| Alliance Data Systems Corporation | 2,760 | 560,418 | ||||||
| Cognizant Technology Solutions Corporation - Class A | 9,600 | 785,472 | ||||||
| CSG Systems International, Inc. | 16,255 | 695,551 | ||||||
| DXC Technology Company | 19,950 | 2,056,048 | ||||||
Perficient, Inc. (a) (b) | 29,165 | 721,250 | ||||||
| Science Applications International Corporation | 5,665 | 486,000 | ||||||
| 5,304,739 | ||||||||
| Semiconductors & Semiconductor Equipment — 12.66% | ||||||||
Ambarella, Inc. (a) (b) | 15,275 | 711,662 | ||||||
Cirrus Logic, Inc. (a) | 26,800 | 977,396 | ||||||
Lam Research Corporation (b) | 9,255 | 1,712,731 | ||||||
Silicon Motion Technology Corporation - ADR (b) | 31,000 | 1,401,510 | ||||||
| 4,803,299 | ||||||||
28 | 1-888-462-5386 | www.oakfunds.com |
| Black Oak Emerging Technology Fund | Schedule of Investments |
| As of April 30, 2018 (Unaudited) |
| Shares | Fair Value | |||||||
| Software — 13.87% | ||||||||
| CA, Inc. | 52,770 | $ | 1,836,397 | |||||
Citrix Systems, Inc. (a) | 16,090 | 1,655,822 | ||||||
Dell Technologies, Inc. - Class V (a) | 4,803 | 344,711 | ||||||
Fortinet, Inc. (a) | 25,740 | 1,424,966 | ||||||
| 5,261,896 | ||||||||
| Technology Hardware, Storage & Peripherals — 14.90% | ||||||||
| Apple, Inc. | 14,000 | 2,313,640 | ||||||
NetApp, Inc. (b) | 25,785 | 1,716,765 | ||||||
Seagate Technology plc (b) | 28,045 | 1,623,525 | ||||||
| 5,653,930 | ||||||||
| TOTAL COMMON STOCKS | ||||||||
| (Cost $21,770,212) | 36,528,316 | |||||||
| SHORT-TERM INVESTMENTS — 35.01% | ||||||||
| MONEY MARKET FUNDS — 3.93% | ||||||||
Fidelity Investments Money Market Government Portfolio - | 1,491,602 | 1,491,602 | ||||||
| COLLATERAL FOR SECURITIES LOANED — 31.08% | ||||||||
Mount Vernon Liquid Assets Portfolio, LLC, 2.03% (c) | 11,790,776 | 11,790,776 | ||||||
| TOTAL SHORT-TERM INVESTMENTS | ||||||||
| (Cost $13,282,378) | 13,282,378 | |||||||
| �� | ||||||||
| TOTAL INVESTMENTS — 131.28% | ||||||||
| (Cost $35,052,590) | 49,810,694 | |||||||
| Liabilities in Excess of Other Assets — (31.28)% | (11,866,942 | ) | ||||||
| NET ASSETS — 100.00% | $ | 37,943,752 | ||||||
(a) | Non-income producing security. |
(b) | Security, or a portion of the security position, is currently on loan. The total market value of securities on loan is $11,447,710. |
(c) | Rate disclosed is the seven day effective yield as of April 30, 2018. |
ADR — American Depositary Receipt. |
The sectors shown on the schedule of investments are based on the Global Industry Classification Standard, or GICS® (“GICS”). The GICS was developed by and/or is the exclusive property of MSCI, Inc. and Standard & Poor’s Financial Services LLC (“S&P”). GICS is a service mark of MSCI, Inc. and S&P and has been licensed for use by Ultimus Fund Solutions, LLC.
The accompanying notes are an integral part of the financial statements.
Semi-Annual Report | April 30, 2018 (Unaudited) | 29 |
| Schedule of Investments | Live Oak Health Sciences Fund |
| As of April 30, 2018 (Unaudited) |
| Shares | Fair Value | |||||||
| COMMON STOCKS — 98.30% | ||||||||
| HEALTH CARE — 98.30% | ||||||||
| Biotechnology — 16.15% | ||||||||
| Amgen, Inc. | 26,200 | $ | 4,571,376 | |||||
Biogen, Inc. (a) | 10,850 | 2,968,560 | ||||||
Celgene Corporation (a) | 14,600 | 1,271,660 | ||||||
| Gilead Sciences, Inc. | 13,200 | 953,436 | ||||||
| 9,765,032 | ||||||||
| Health Care Equipment & Supplies — 5.55% | ||||||||
Becton, Dickinson and Company (b) | 4,400 | 1,020,228 | ||||||
Halyard Health, Inc. (a) | 7,500 | 355,275 | ||||||
| Medtronic plc | 11,896 | 953,226 | ||||||
| Stryker Corporation | 6,060 | 1,026,686 | ||||||
| 3,355,415 | ||||||||
| Health Care Providers & Services — 45.38% | ||||||||
| Aetna, Inc. | 14,300 | 2,560,415 | ||||||
Anthem, Inc. (b) | 17,300 | 4,082,627 | ||||||
| Cardinal Health, Inc. | 39,500 | 2,534,715 | ||||||
| Cigna Corporation | 10,700 | 1,838,474 | ||||||
CVS Health Corp. (b) | 15,100 | 1,054,433 | ||||||
DaVita, Inc. (a) | 39,400 | 2,473,926 | ||||||
Express Scripts Holding Company (a) | 51,000 | 3,860,700 | ||||||
| McKesson Corporation | 19,450 | 3,038,285 | ||||||
Owens & Minor, Inc. (b) | 87,080 | 1,415,050 | ||||||
Quest Diagnostics, Inc. (b) | 21,300 | 2,155,560 | ||||||
| UnitedHealth Group, Inc. | 10,200 | 2,411,280 | ||||||
| 27,425,465 | ||||||||
| Life Sciences Tools & Services — 8.53% | ||||||||
Charles River Laboratories International, Inc. (a) | 19,300 | 2,010,867 | ||||||
Waters Corporation (a) | 16,700 | 3,146,447 | ||||||
| 5,157,314 | ||||||||
| Pharmaceuticals — 22.69% | ||||||||
AstraZeneca plc - ADR (b) | 28,100 | 998,393 | ||||||
Endo International plc (a) | 127,000 | 727,710 | ||||||
GlaxoSmithKline plc - ADR (b) | 64,300 | 2,579,073 | ||||||
Johnson & Johnson (b) | 14,700 | 1,859,403 | ||||||
Mylan N.V. (a) | 26,400 | 1,023,264 | ||||||
| Novartis AG - ADR | 12,000 | 920,280 | ||||||
| Novo Nordisk A/S - ADR | 16,500 | 774,510 | ||||||
| Pfizer, Inc. | 47,800 | 1,749,958 | ||||||
30 | 1-888-462-5386 | www.oakfunds.com |
| Live Oak Health Sciences Fund | Schedule of Investments |
| As of April 30, 2018 (Unaudited) |
Shares or Principal ($) | Fair Value | |||||||
| Pharmaceuticals (continued) | ||||||||
| Sanofi - ADR | 49,692 | $ | 1,953,889 | |||||
Teva Pharmaceutical Industries Ltd. - ADR (b) | 62,800 | 1,129,144 | ||||||
| 13,715,624 | ||||||||
| TOTAL COMMON STOCKS | ||||||||
| (Cost $47,609,859) | 59,418,850 | |||||||
| SHORT-TERM INVESTMENTS — 28.03% | ||||||||
| MONEY MARKET FUNDS — 0.07% | ||||||||
Fidelity Investments Money Market Government Portfolio - | 40,795 | 40,795 | ||||||
| REPURCHASE AGREEMENTS — 1.59% | ||||||||
| Tri-Party Repurchase Agreement with South Street Securities Wachovia Tri-Party, 1.56%, dated 4/30/18 and maturing 5/1/18, collaterized by U.S. Treasury Securities with rates ranging from 1.50% to 2.88% and maturity dates from 10/25/18 to 8/15/26 with a par value of $1,009,622 and a collateral value of $982,811. | 963,538 | 963,538 | ||||||
| COLLATERAL FOR SECURITIES LOANED — 26.37% | ||||||||
Mount Vernon Liquid Assets Portfolio, LLC, 2.03% (c) | 15,939,883 | 15,939,883 | ||||||
| TOTAL SHORT-TERM INVESTMENTS | ||||||||
| (Cost $16,944,216) | 16,944,216 | |||||||
| TOTAL INVESTMENTS — 126.33% | ||||||||
| (Cost $64,554,075) | 76,363,066 | |||||||
| Liabilities in Excess of Other Assets — (26.33)% | (15,913,586 | ) | ||||||
| NET ASSETS — 100.00% | $ | 60,449,480 | ||||||
(a) | Non-income producing security. |
(b) | Security, or a portion of the security position, is currently on loan. The total market value of securities on loan is $15,464,538. |
(c) | Rate disclosed is the seven day effective yield as of April 30, 2018. |
ADR — American Depositary Receipt. |
The sectors shown on the schedule of investments are based on the Global Industry Classification Standard, or GICS® (“GICS”). The GICS was developed by and/or is the exclusive property of MSCI, Inc. and Standard & Poor’s Financial Services LLC (“S&P”). GICS is a service mark of MSCI, Inc. and S&P and has been licensed for use by Ultimus Fund Solutions, LLC.
The accompanying notes are an integral part of the financial statements.
Semi-Annual Report | April 30, 2018 (Unaudited) | 31 |
Statements of Assets and Liabilities
April 30, 2018 (Unaudited)
| White Oak Select Growth Fund | Pin Oak Equity Fund | |||||||
| ASSETS | ||||||||
| Investment securities at value (cost $241,556,196, $218,059,040, $12,903,041, $12,476,399, $412,527,014, $35,052,590 and $64,554,075), including $32,753,861, $43,119,039, $3,576,801, $1,699,120, $59,865,405, $11,447,710 and $15,464,538 of securities on loan | $ | 336,088,416 | $ | 272,543,450 | ||||
| Receivable for fund shares sold | 4,093 | 228,975 | ||||||
| Receivable for investments sold | 110,280 | — | ||||||
| Dividends and interest receivable | 22,460 | 58,745 | ||||||
| Tax reclaims receivable | — | — | ||||||
| Prepaid expenses | 23,393 | 24,672 | ||||||
| Total Assets | 336,248,642 | 272,855,842 | ||||||
| LIABILITIES | ||||||||
| Payable for fund shares redeemed | 32,032 | 101,840 | ||||||
| Payable for investments purchased | — | 510,473 | ||||||
| Payable for collateral upon return of securities loaned | 33,728,097 | 44,233,371 | ||||||
| Investment advisory fees payable | 182,527 | 137,009 | ||||||
| Administration fees payable | 8,987 | 6,538 | ||||||
| Transfer agent fees payable | 8,079 | 3,880 | ||||||
| Trustee fees payable | 8,095 | 6,300 | ||||||
| Other accrued expenses | 26,298 | 28,681 | ||||||
| Total Liabilities | 33,994,115 | 45,028,092 | ||||||
| NET ASSETS | $ | 302,254,527 | $ | 227,827,750 | ||||
| Net Assets consist of: | ||||||||
| Paid-in capital (unlimited authorization - no par value) | $ | 207,091,686 | $ | 168,704,707 | ||||
| Accumulated undistributed net investment income (loss) | 1,139,716 | 758,997 | ||||||
| Accumulated undistributed net realized gain (loss) from investments | (509,095 | ) | 3,879,636 | |||||
| Net unrealized appreciation on investments | 94,532,220 | 54,484,410 | ||||||
| Net Assets | $ | 302,254,527 | $ | 227,827,750 | ||||
| Total shares outstanding at end of period | 3,404,663 | 3,415,858 | ||||||
| Net asset value, offering and redemption price per share (net assets/shares outstanding) | $ | 88.78 | $ | 66.70 | ||||
The accompanying notes are an integral part of the financial statements.
32 | 1-888-462-5386 | www.oakfunds.com |
Rock Oak Core Growth Fund | River Oak Discovery Fund | Red Oak Technology Select Fund | Black Oak Emerging Technology Fund | Live Oak Health Sciences Fund | ||||||||||||||
| $ | 17,175,889 | $ | 15,448,999 | $ | 564,991,798 | $ | 49,810,694 | $ | 76,363,066 | |||||||||
| 44,578 | 150 | 417,987 | 4,970 | 822 | ||||||||||||||
| — | — | 1,117,143 | — | 108,432 | ||||||||||||||
| 4,913 | 985 | 180,560 | 1,732 | 7,810 | ||||||||||||||
| — | — | — | — | 11,771 | ||||||||||||||
| 13,789 | 19,694 | 30,914 | 15,388 | 20,350 | ||||||||||||||
| 17,239,169 | 15,469,828 | 566,738,402 | 49,832,784 | 76,512,251 | ||||||||||||||
| — | — | 387,318 | 60,509 | 7,400 | ||||||||||||||
| — | — | 1,406,230 | — | 62,300 | ||||||||||||||
| 3,686,329 | 1,772,023 | 61,166,417 | 11,790,776 | 15,939,883 | ||||||||||||||
| 7,214 | 9,028 | 305,895 | 23,158 | 36,664 | ||||||||||||||
| 325 | 534 | 16,747 | 1,389 | 1,844 | ||||||||||||||
| 857 | 881 | 5,321 | 3,425 | 1,930 | ||||||||||||||
| 297 | 450 | 15,107 | 1,159 | 1,753 | ||||||||||||||
| 6,109 | 7,826 | 63,325 | 8,616 | 10,997 | ||||||||||||||
| 3,701,131 | 1,790,742 | 63,366,360 | 11,889,032 | 16,062,771 | ||||||||||||||
| $ | 13,538,038 | $ | 13,679,086 | $ | 503,372,042 | $ | 37,943,752 | $ | 60,449,480 | |||||||||
| $ | 9,044,786 | $ | 8,653,446 | $ | 330,985,758 | $ | 21,604,998 | $ | 43,111,856 | |||||||||
| (2,394 | ) | (106,945 | ) | 632,069 | 41,586 | 143,505 | ||||||||||||
| 222,798 | 2,159,985 | 19,289,431 | 1,539,064 | 5,385,128 | ||||||||||||||
| 4,272,848 | 2,972,600 | 152,464,784 | 14,758,104 | 11,808,991 | ||||||||||||||
| $ | 13,538,038 | $ | 13,679,086 | $ | 503,372,042 | $ | 37,943,752 | $ | 60,449,480 | |||||||||
| 795,119 | 823,329 | 19,418,096 | 7,239,316 | 3,195,598 | ||||||||||||||
| $ | 17.03 | $ | 16.61 | $ | 25.92 | $ | 5.24 | $ | 18.92 | |||||||||
Semi-Annual Report | April 30, 2018 (Unaudited) | 33 |
Statements of Operations
For the Six Months Ended April 30, 2018 (Unaudited)
| White Oak Select Growth Fund | Pin Oak Equity Fund | |||||||
| INVESTMENT INCOME | ||||||||
| Dividends | $ | 2,511,145 | $ | 1,808,256 | ||||
| Securities lending income | 20,136 | 26,677 | ||||||
| Interest | 3,250 | 63,588 | ||||||
| Less: Foreign withholding tax | (2,410 | ) | (6,730 | ) | ||||
| Total Investment Income | 2,532,121 | 1,891,791 | ||||||
| EXPENSES | ||||||||
| Investment adviser | 1,114,645 | 825,656 | ||||||
| Administration | 66,782 | 49,400 | ||||||
| Sub transfer agent fees | 63,661 | 64,921 | ||||||
| Transfer agent | 41,045 | 24,402 | ||||||
| Legal | 23,016 | 17,043 | ||||||
| Trustee | 21,119 | 15,593 | ||||||
| Report printing | 16,861 | 17,154 | ||||||
| Registration | 10,044 | 13,912 | ||||||
| Insurance | 8,793 | 8,075 | ||||||
| Audit | 8,341 | 8,341 | ||||||
| Custodian | 6,797 | 5,748 | ||||||
| Pricing | 118 | 240 | ||||||
| Miscellaneous | 11,180 | 10,000 | ||||||
| Total Expenses | 1,392,402 | 1,060,485 | ||||||
| Less: Investment advisory fees waived | — | — | ||||||
| Net Expenses | 1,392,402 | 1,060,485 | ||||||
| Net Investment Income (Loss) | 1,139,719 | 831,306 | ||||||
| Realized and Unrealized Gain (Loss) on Investments | ||||||||
| Net realized gain (loss) on investment securities transactions | (509,101 | ) | 3,883,956 | |||||
| Net realized gain on foreign currency transactions | — | 533 | ||||||
| Net change in unrealized appreciation (depreciation) of investment securities | 23,562,758 | 9,207,414 | ||||||
| Net Realized and Unrealized Gain on Investments | 23,053,657 | 13,091,903 | ||||||
| Net Increase in Net Assets from Operations | $ | 24,193,376 | $ | 13,923,209 | ||||
The accompanying notes are an integral part of the financial statements.
34 | 1-888-462-5386 | www.oakfunds.com |
Rock Oak Core | River Oak Discovery Fund | Red Oak Technology Select Fund | Black Oak Emerging Technology Fund | Live Oak Health Sciences Fund | ||||||||||||||
| $ | 61,594 | $ | 57,471 | $ | 3,287,679 | $ | 180,354 | $ | 510,768 | |||||||||
| 1,100 | 11,394 | 57,353 | 7,358 | 7,807 | ||||||||||||||
| 851 | 120 | 86,466 | 694 | 2,526 | ||||||||||||||
| — | — | — | (340 | ) | — | |||||||||||||
| 63,545 | 68,985 | 3,431,498 | 188,066 | 521,101 | ||||||||||||||
| 38,946 | 62,831 | 1,845,692 | 140,549 | 235,377 | ||||||||||||||
| 2,248 | 3,200 | 112,735 | 8,632 | 14,245 | ||||||||||||||
| 422 | 411 | 172,700 | 6,589 | 14,951 | ||||||||||||||
| 8,101 | 8,118 | 32,409 | 18,698 | 12,150 | ||||||||||||||
| 782 | 1,080 | 38,852 | 2,971 | 4,861 | ||||||||||||||
| 724 | 1,002 | 36,359 | 2,719 | 4,373 | ||||||||||||||
| 509 | 643 | 32,990 | 2,471 | 4,124 | ||||||||||||||
| 8,734 | 9,442 | 13,392 | 8,996 | 9,869 | ||||||||||||||
| 299 | 442 | 17,412 | 1,204 | 2,241 | ||||||||||||||
| 8,340 | 8,341 | 8,341 | 8,341 | 8,341 | ||||||||||||||
| 617 | 872 | 10,819 | 1,495 | 2,409 | ||||||||||||||
| 172 | 139 | 284 | 188 | 177 | ||||||||||||||
| 2,314 | 2,473 | 20,428 | 2,768 | 4,134 | ||||||||||||||
| 72,208 | 98,994 | 2,342,413 | 205,621 | 317,252 | ||||||||||||||
| (6,269 | ) | (4,818 | ) | — | — | — | ||||||||||||
| 65,939 | 94,176 | 2,342,413 | 205,621 | 317,252 | ||||||||||||||
| (2,394 | ) | (25,191 | ) | 1,089,085 | (17,555 | ) | 203,849 | |||||||||||
| 222,798 | 2,159,985 | 19,296,553 | 1,637,279 | 6,063,818 | ||||||||||||||
| — | — | — | — | — | ||||||||||||||
| 868,891 | (2,027,637 | ) | 14,743,516 | 959,495 | (5,653,736 | ) | ||||||||||||
| 1,091,689 | 132,348 | 34,040,069 | 2,596,774 | 410,082 | ||||||||||||||
| $ | 1,089,295 | $ | 107,157 | $ | 35,129,154 | $ | 2,579,219 | $ | 613,931 | |||||||||
Semi-Annual Report | April 30, 2018 (Unaudited) | 35 |
Statements of Changes in Net Assets
| White Oak Select Growth Fund | Pin Oak Equity Fund | |||||||||||||||
| For The Six Months Ended April 30, 2018 (Unaudited) | For the Year Ended October 31, 2017 | For The Six Months Ended April 30, 2018 (Unaudited) | For the Year Ended October 31, 2017 | |||||||||||||
| INVESTMENT ACTIVITIES | ||||||||||||||||
| Net investment income (loss) | $ | 1,139,719 | $ | 2,349,148 | $ | 831,306 | $ | 1,335,787 | ||||||||
| Net realized gain (loss) on investment securities transactions and foreign currency translations | (509,101 | ) | 8,295,682 | 3,884,489 | 2,689,948 | |||||||||||
| Net change in unrealized appreciation (depreciation) of investment securities | 23,562,758 | 45,890,230 | 9,207,414 | 27,089,478 | ||||||||||||
| Net Increase in Net Assets Resulting from Operations | 24,193,376 | 56,535,060 | 13,923,209 | 31,115,213 | ||||||||||||
| DISTRIBUTIONS TO SHAREHOLDERS | ||||||||||||||||
| From net investment income | (1,945,905 | ) | (2,687,021 | ) | (1,241,110 | ) | (827,884 | ) | ||||||||
| From net realized gains | (14,080 | ) | — | (2,690,009 | ) | (1,899,609 | ) | |||||||||
| Total Distributions | (1,959,985 | ) | (2,687,021 | ) | (3,931,119 | ) | (2,727,493 | ) | ||||||||
| CAPITAL TRANSACTIONS | ||||||||||||||||
| Proceeds from shares sold | 5,203,805 | 9,104,353 | 25,154,094 | 160,255,640 | ||||||||||||
| Reinvestment of distributions | 1,853,767 | 2,549,043 | 3,718,183 | 2,531,718 | ||||||||||||
| Amount paid for shares redeemed | (12,694,189 | ) | (28,276,793 | ) | (33,122,017 | ) | (79,018,102 | ) | ||||||||
| Net Increase (Decrease) in Net Assets Resulting from Capital Transactions | (5,636,617 | ) | (16,623,397 | ) | (4,249,740 | ) | 83,769,256 | |||||||||
| Total Increase (Decrease) in Net Assets | 16,596,774 | 37,224,642 | 5,742,350 | 112,156,976 | ||||||||||||
| NET ASSETS | ||||||||||||||||
| Beginning of period | 285,657,753 | 248,433,111 | 222,085,400 | 109,928,424 | ||||||||||||
| End of period | $ | 302,254,527 | $ | 285,657,753 | $ | 227,827,750 | $ | 222,085,400 | ||||||||
| Accumulated undistributed net investment income (loss) | $ | 1,139,716 | $ | 1,945,902 | $ | 758,997 | $ | 1,168,801 | ||||||||
| SHARE TRANSACTIONS | ||||||||||||||||
| Shares sold | 58,756 | 121,717 | 374,502 | 2,675,663 | ||||||||||||
| Shares issued in reinvestment of distributions | 21,755 | 35,222 | 57,124 | 43,411 | ||||||||||||
| Shares redeemed | (144,067 | ) | (372,460 | ) | (501,099 | ) | (1,294,183 | ) | ||||||||
| Net Increase (Decrease) in Shares Outstanding | (63,556 | ) | (215,521 | ) | (69,473 | ) | 1,424,891 | |||||||||
The accompanying notes are an integral part of the financial statements.
36 | 1-888-462-5386 | www.oakfunds.com |
| Rock Oak Core Growth Fund | River Oak Discovery Fund | Red Oak Technology Select Fund | ||||||||||||||||||||
| For The Six Months Ended April 30, 2018 (Unaudited) | For the Year Ended October 31, 2017 | For The Six Months Ended April 30, 2018 (Unaudited) | For the Year Ended October 31, 2017 | For The Six Months Ended April 30, 2018 (Unaudited) | For the Year Ended October 31, 2017 | |||||||||||||||||
| $ | (2,394 | ) | $ | 16,734 | $ | (25,191 | ) | $ | (87,733 | ) | $ | 1,089,085 | $ | 1,542,758 | ||||||||
| 222,798 | 608,663 | 2,159,985 | 806,237 | 19,296,553 | 30,088,617 | |||||||||||||||||
| 868,891 | 1,339,646 | (2,027,637 | ) | 2,037,268 | 14,743,516 | 85,094,923 | ||||||||||||||||
| 1,089,295 | 1,965,043 | 107,157 | 2,755,772 | 35,129,154 | 116,726,298 | |||||||||||||||||
| (5,990 | ) | (54,642 | ) | — | — | (1,870,855 | ) | (993,217 | ) | |||||||||||||
| (521,838 | ) | — | (757,852 | ) | — | (30,088,573 | ) | (2,532,338 | ) | |||||||||||||
| (527,828 | ) | (54,642 | ) | (757,852 | ) | — | (31,959,428 | ) | (3,525,555 | ) | ||||||||||||
| 4,512,024 | 278,335 | 301,798 | 189,919 | 78,206,955 | 343,894,387 | |||||||||||||||||
| 440,165 | 45,524 | 421,980 | — | 30,741,091 | 3,369,836 | |||||||||||||||||
| (1,158,568 | ) | (446,548 | ) | (821,476 | ) | (839,975 | ) | (95,040,983 | ) | (163,233,228 | ) | |||||||||||
| 3,793,621 | (122,689 | ) | (97,698 | ) | (650,056 | ) | 13,907,063 | 184,030,995 | ||||||||||||||
| 4,355,088 | 1,787,712 | (748,393 | ) | 2,105,716 | 17,076,789 | 297,231,738 | ||||||||||||||||
| 9,182,950 | 7,395,238 | 14,427,479 | 12,321,763 | 486,295,253 | 189,063,515 | |||||||||||||||||
| $ | 13,538,038 | $ | 9,182,950 | $ | 13,679,086 | $ | 14,427,479 | $ | 503,372,042 | $ | 486,295,253 | |||||||||||
| $ | (2,394 | ) | $ | 5,990 | $ | (106,945 | ) | $ | (81,754 | ) | $ | 632,069 | $ | 1,413,839 | ||||||||
| 263,854 | 18,955 | 17,610 | 11,769 | 3,004,027 | 16,048,396 | |||||||||||||||||
| 28,054 | 3,347 | 25,375 | — | 1,248,623 | 166,823 | |||||||||||||||||
| (68,276 | ) | (31,372 | ) | (47,935 | ) | (50,885 | ) | (3,696,449 | ) | (7,164,293 | ) | |||||||||||
| 223,632 | (9,070 | ) | (4,950 | ) | (39,116 | ) | 556,201 | 9,050,926 | ||||||||||||||
Semi-Annual Report | April 30, 2018 (Unaudited) | 37 |
Statements of Changes in Net Assets
| Black Oak Emerging Technology Fund | Live Oak Health Sciences Fund | |||||||||||||||
| For The Six Months Ended April 30, 2018 (Unaudited) | For the Year Ended October 31, 2017 | For The Six Months Ended April 30, 2018 (Unaudited) | For the Year Ended October 31, 2017 | |||||||||||||
| INVESTMENT ACTIVITIES | ||||||||||||||||
| Net investment income (loss) | $ | (17,555 | ) | $ | (79,372 | ) | $ | 203,849 | $ | 328,909 | ||||||
| Net realized gain (loss) on investment securities transactions | 1,637,279 | 2,784,419 | 6,063,818 | 3,783,940 | ||||||||||||
| Net change in unrealized appreciation (depreciation) of investment securities | 959,495 | 4,037,379 | (5,653,736 | ) | 3,979,817 | |||||||||||
| Net Increase (Decrease) in Net Assets Resulting from Operations | 2,579,219 | 6,742,426 | 613,931 | 8,092,666 | ||||||||||||
| DISTRIBUTIONS TO SHAREHOLDERS | ||||||||||||||||
| From net investment income | — | (9,364 | ) | (300,605 | ) | (315,656 | ) | |||||||||
| From net realized gains | (2,734,659 | ) | (1,306,166 | ) | (3,703,531 | ) | (906,767 | ) | ||||||||
| Total Distributions | (2,734,659 | ) | (1,315,530 | ) | (4,004,136 | ) | (1,222,423 | ) | ||||||||
| CAPITAL TRANSACTIONS | ||||||||||||||||
| Proceeds from shares sold | 610,849 | 1,335,137 | 1,866,951 | 15,901,469 | ||||||||||||
| Reinvestment of distributions | 2,385,442 | 1,152,138 | 3,641,204 | 1,107,629 | ||||||||||||
| Amount paid for shares redeemed | (2,164,462 | ) | (3,541,104 | ) | (6,415,498 | ) | (15,191,665 | ) | ||||||||
| Net Increase (Decrease) in Net Assets Resulting from Capital Transactions | 831,829 | (1,053,829 | ) | (907,343 | ) | 1,817,433 | ||||||||||
| Total Increase (Decrease) in Net Assets | 676,389 | 4,373,067 | (4,297,548 | ) | 8,687,676 | |||||||||||
| NET ASSETS | ||||||||||||||||
| Beginning of period | 37,267,363 | 32,894,296 | 64,747,028 | 56,059,352 | ||||||||||||
| End of period | $ | 37,943,752 | $ | 37,267,363 | $ | 60,449,480 | $ | 64,747,028 | ||||||||
| Accumulated undistributed net investment income (loss) | $ | 41,586 | $ | 59,141 | $ | 143,505 | $ | 240,261 | ||||||||
| SHARE TRANSACTIONS | ||||||||||||||||
| Shares sold | 116,475 | 275,090 | 95,367 | 833,815 | ||||||||||||
| Shares issued in reinvestment of distributions | 472,365 | 249,381 | 187,788 | 60,825 | ||||||||||||
| Shares redeemed | (411,780 | ) | (716,020 | ) | (328,235 | ) | (780,477 | ) | ||||||||
| Net Increase (Decrease) in Shares Outstanding | 177,060 | (191,549 | ) | (45,080 | ) | 114,163 | ||||||||||
The accompanying notes are an integral part of the financial statements.
38 | 1-888-462-5386 | www.oakfunds.com |
OAK ASSOCIATES FUNDS
This Page Intentionally Left Blank
Financial Highlights
For a share outstanding throughout each of the periods ended
| Net Asset Value Beginning of Period | Net Investment Income | Realized and Unrealized Gain (Loss) in Securities | Total From Operations | Dividends from Net Investment Income | ||||||||||||||||
| White Oak Select Growth Fund | ||||||||||||||||||||
| For the six months ended April 30, 2018 (Unaudited) | $ | 82.36 | 0.33 | 6.66 | 6.99 | (0.57 | ) | |||||||||||||
| For the year ended October 31, 2017 | $ | 67.44 | 0.65 | 15.00 | 15.65 | (0.73 | ) | |||||||||||||
| For the year ended October 31, 2016 | $ | 65.21 | 0.66 | 1.99 | 2.65 | (0.42 | ) | |||||||||||||
| For the year ended October 31, 2015 | $ | 60.34 | 0.94 | 4.90 | 5.84 | (0.97 | ) | |||||||||||||
| For the year ended October 31, 2014 | $ | 53.66 | 0.35 | 6.57 | 6.92 | (0.24 | ) | |||||||||||||
| For the year ended October 31, 2013 | $ | 42.50 | 0.24 | 11.06 | 11.30 | (0.14 | ) | |||||||||||||
| Pin Oak Equity Fund | ||||||||||||||||||||
| For the six months ended April 30, 2018 (Unaudited) | $ | 63.72 | 0.25 | 3.91 | 4.16 | (0.37 | ) | |||||||||||||
| For the year ended October 31, 2017 | $ | 53.35 | 0.40 | 11.15 | 11.55 | (0.36 | ) | |||||||||||||
| For the year ended October 31, 2016 | $ | 52.45 | 0.43 | 2.38 | 2.81 | (0.40 | ) | |||||||||||||
| For the year ended October 31, 2015 | $ | 49.76 | 0.54 | 2.77 | 3.31 | (0.53 | ) | |||||||||||||
| For the year ended October 31, 2014 | $ | 43.07 | 0.30 | 6.67 | 6.97 | (0.28 | ) | |||||||||||||
| For the year ended October 31, 2013 | $ | 32.86 | 0.26 | 10.18 | 10.44 | (0.23 | ) | |||||||||||||
| Rock Oak Core Growth Fund | ||||||||||||||||||||
| For the six months ended April 30, 2018 (Unaudited) | $ | 16.07 | — | (c) | 1.88 | 1.88 | (0.01 | ) | ||||||||||||
| For the year ended October 31, 2017 | $ | 12.74 | 0.03 | 3.40 | 3.43 | (0.10 | ) | |||||||||||||
| For the year ended October 31, 2016 | $ | 12.64 | 0.18 | 0.31 | 0.49 | (0.10 | ) | |||||||||||||
| For the year ended October 31, 2015 | $ | 14.21 | — | (c) | (0.54 | ) | (0.54 | ) | (0.04 | ) | ||||||||||
| For the year ended October 31, 2014 | $ | 15.04 | 0.05 | 2.06 | 2.11 | (0.06 | ) | |||||||||||||
| For the year ended October 31, 2013 | $ | 11.78 | 0.07 | 3.37 | 3.44 | (0.05 | ) | |||||||||||||
| River Oak Discovery Fund | ||||||||||||||||||||
| For the six months ended April 30, 2018 (Unaudited) | $ | 17.42 | (0.03 | ) | 0.14 | 0.11 | — | |||||||||||||
| For the year ended October 31, 2017 | $ | 14.21 | (0.10 | ) | 3.31 | 3.21 | — | |||||||||||||
| For the year ended October 31, 2016 | $ | 13.76 | (0.06 | ) | 0.53 | (0.47 | ) | (0.02 | ) | |||||||||||
| For the year ended October 31, 2015 | $ | 17.72 | (0.04 | ) | (0.13 | ) | (0.17 | ) | — | |||||||||||
| For the year ended October 31, 2014 | $ | 17.70 | (0.13 | ) | 1.59 | 1.46 | — | |||||||||||||
| For the year ended October 31, 2013 | $ | 13.46 | (0.08 | ) | 4.32 | 4.24 | — | |||||||||||||
(a) | Per share calculations were performed using average shares for the period. |
(b) | Figures do not reflect the deduction of taxes the shareholder will pay on fund distributions or redemption of fund shares. |
(c) | Less than $0.005 per share. |
The accompanying notes are an integral part of the financial statements.
40 | 1-888-462-5386 | www.oakfunds.com |
| Distributions from Capital Gains | Total Dividends and Distributions | Net Asset Value End of Period | Total Return(b) | Net Assets End of Period (000) | Ratio of Net Expenses to Average Net Assets | Ratio of Net Investment Income (Loss) to Average Net Assets | Ratio of Expenses to Average Net Assets (Excluding Waivers and/or Fees Paid Indirectly) | Portfolio Turnover Rate | ||||||||||||||||||||||||||
| — | (c) | (0.57 | ) | $ | 88.78 | 8.52 | %(d) | $ | 302,255 | 0.92 | %(e) | 0.76 | %(e) | 0.92 | %(e) | 5 | %(d) | |||||||||||||||||
| — | (0.73 | ) | $ | 82.36 | 23.36 | % | $ | 285,658 | 0.98 | % | 0.86 | % | 0.98 | % | 13 | % | ||||||||||||||||||
| — | (0.42 | ) | $ | 67.44 | 4.07 | % | $ | 248,433 | 1.06 | % | 1.03 | % | 1.06 | % | 14 | % | ||||||||||||||||||
| — | (0.97 | ) | $ | 65.21 | 9.84 | % | $ | 257,652 | 1.06 | % | 1.52 | % | 1.06 | % | 9 | % | ||||||||||||||||||
| — | (0.24 | ) | $ | 60.34 | 12.94 | % | $ | 256,221 | 1.10 | % | 0.61 | % | 1.10 | % | 1 | % | ||||||||||||||||||
| — | (0.14 | ) | $ | 53.66 | 26.65 | % | $ | 253,803 | 1.12 | % | 0.50 | % | 1.12 | % | 89 | % | ||||||||||||||||||
| (0.81 | ) | (1.18 | ) | $ | 66.70 | 6.58 | %(d) | $ | 227,828 | 0.95 | %(e) | 0.74 | %(e) | 0.95 | %(e) | 7 | %(d) | |||||||||||||||||
| (0.82 | ) | (1.18 | ) | $ | 63.72 | 21.86 | % | $ | 222,085 | 0.98 | % | 0.66 | % | 0.98 | % | 8 | % | |||||||||||||||||
| (1.51 | ) | (1.91 | ) | $ | 53.35 | 5.54 | % | $ | 109,928 | 1.08 | % | 0.86 | % | 1.08 | % | 10 | % | |||||||||||||||||
| (0.09 | ) | (0.62 | ) | $ | 52.45 | 6.76 | % | $ | 98,976 | 1.10 | % | 1.09 | % | 1.10 | % | 15 | % | |||||||||||||||||
| — | (0.28 | ) | $ | 49.76 | 16.25 | % | $ | 94,316 | 1.13 | % | 0.64 | % | 1.13 | % | 5 | % | ||||||||||||||||||
| — | (0.23 | ) | $ | 43.07 | 31.94 | % | $ | 81,408 | 1.16 | % | 0.70 | % | 1.16 | % | 117 | % | ||||||||||||||||||
| (0.91 | ) | (0.92 | ) | $ | 17.03 | 12.22 | %(d) | $ | 13,538 | 1.25 | %(e) | (0.05 | %)(e) | 1.37 | %(e) | 8 | %(d) | |||||||||||||||||
| — | (0.10 | ) | $ | 16.07 | 27.02 | % | $ | 9,183 | 1.25 | % | 0.20 | % | 1.51 | % | 31 | % | ||||||||||||||||||
| (0.29 | ) | (0.39 | ) | $ | 12.74 | 3.98 | % | $ | 7,395 | 1.25 | % | 0.48 | % | 1.65 | % | 11 | % | |||||||||||||||||
| (0.99 | ) | (1.03 | ) | $ | 12.64 | (4.04 | %) | $ | 7,807 | 1.25 | % | 0.03 | % | 1.52 | % | 32 | % | |||||||||||||||||
| (2.88 | ) | (2.94 | ) | $ | 14.21 | 15.89 | % | $ | 8,491 | 1.25 | % | 0.33 | % | 1.58 | % | 29 | % | |||||||||||||||||
| (0.13 | ) | (0.18 | ) | $ | 15.04 | 29.51 | % | $ | 7,495 | 1.25 | % | 0.53 | % | 1.65 | % | 65 | % | |||||||||||||||||
| (0.92 | ) | (0.92 | ) | $ | 16.61 | 0.61 | %(d) | $ | 13,679 | 1.35 | %(e) | (0.36 | %)(e) | 1.42 | %(e) | 28 | %(d) | |||||||||||||||||
| — | — | $ | 17.42 | 22.59 | % | $ | 14,427 | 1.35 | % | (0.63 | %) | 1.41 | % | 43 | % | |||||||||||||||||||
| — | (0.02 | ) | $ | 14.21 | 3.39 | % | $ | 12,322 | 1.35 | % | (0.40 | %) | 1.51 | % | 21 | % | ||||||||||||||||||
| (3.79 | ) | (3.79 | ) | $ | 13.76 | (1.27 | %) | $ | 12,582 | 1.35 | % | (0.28 | %) | 1.45 | % | 17 | % | |||||||||||||||||
| (1.44 | ) | (1.44 | ) | $ | 17.72 | 8.69 | % | $ | 13,915 | 1.35 | % | (0.71 | %) | 1.48 | % | 96 | % | |||||||||||||||||
| — | — | $ | 17.70 | 31.50 | % | $ | 13,304 | 1.35 | % | (0.52 | %) | 1.52 | % | 63 | % | |||||||||||||||||||
(d) | Not Annualized. |
(e) | Annualized. |
Semi-Annual Report | April 30, 2018 (Unaudited) | 41 |
Financial Highlights
For a share outstanding throughout the periods ended
| Net Asset Value Beginning of Period | Net Investment Income | Realized and Unrealized Gain (Loss) in Securities | Total From Operations | Dividends from Net Investment Income | ||||||||||||||||
| Red Oak Technology Select Fund | ||||||||||||||||||||
| For the six months ended April 30, 2018 (Unaudited) | $ | 25.78 | 0.06 | 1.78 | 1.84 | (0.10 | ) | |||||||||||||
| For the year ended October 31, 2017 | $ | 19.27 | 0.09 | 6.71 | 6.80 | (0.08 | ) | |||||||||||||
| For the year ended October 31, 2016 | $ | 17.17 | 0.20 | 2.62 | 2.82 | (0.19 | ) | |||||||||||||
| For the year ended October 31, 2015 | $ | 16.22 | 0.20 | 0.91 | 1.11 | (0.16 | ) | |||||||||||||
| For the year ended October 31, 2014 | $ | 13.74 | 0.06 | 2.48 | 2.54 | (0.06 | ) | |||||||||||||
| For the year ended October 31, 2013 | $ | 9.79 | 0.06 | 3.92 | 3.98 | (0.03 | ) | |||||||||||||
| Black Oak Emerging Technology Fund | ||||||||||||||||||||
| For the six months ended April 30, 2018 (Unaudited) | $ | 5.28 | — | (e) | 0.35 | 0.35 | — | |||||||||||||
| For the year ended October 31, 2017 | $ | 4.53 | (0.01 | ) | 0.94 | 0.93 | — | (e) | ||||||||||||
| For the year ended October 31, 2016 | $ | 4.26 | 0.01 | 0.39 | 0.40 | — | ||||||||||||||
| For the year ended October 31, 2015 | $ | 4.25 | (0.03 | ) | 0.04 | 0.01 | — | |||||||||||||
| For the year ended October 31, 2014 | $ | 3.58 | (0.01 | ) | 0.68 | 0.67 | — | |||||||||||||
| For the year ended October 31, 2013 | $ | 2.67 | (0.01 | ) | 0.92 | 0.91 | — | |||||||||||||
| Live Oak Health Sciences Fund | ||||||||||||||||||||
| For the six months ended April 30, 2018 (Unaudited) | $ | 19.98 | 0.06 | 0.13 | 0.19 | (0.09 | ) | |||||||||||||
| For the year ended October 31, 2017 | $ | 17.93 | 0.10 | 2.33 | 2.43 | (0.10 | ) | |||||||||||||
| For the year ended October 31, 2016 | $ | 21.65 | 0.11 | (0.33 | ) | (0.22 | ) | (0.67 | ) | |||||||||||
| For the year ended October 31, 2015 | $ | 22.25 | 0.14 | 1.51 | 1.65 | (0.13 | ) | |||||||||||||
| For the year ended October 31, 2014 | $ | 18.83 | 0.13 | 4.11 | 4.24 | (0.13 | ) | |||||||||||||
| For the year ended October 31, 2013 | $ | 14.67 | 0.13 | 4.90 | 5.03 | (0.13 | ) | |||||||||||||
(a) | Per share calculations were performed using average shares for the period. |
(b) | Figures do not reflect the deduction of taxes the shareholder will pay on fund distributions or redemption of fund shares. |
(c) | Not Annualized. |
(d) | Annualized. |
(e) | Less than $0.005 per share. |
The accompanying notes are an integral part of the financial statements.
42 | 1-888-462-5386 | www.oakfunds.com |
| Distributions from Capital Gains | Total Dividends and Distributions | Net Asset Value End of Period | Total Return(b) | Net Assets End of Period (000) | Ratio of Net Expenses to Average Net Assets | Ratio of Net Investment Income (Loss) to Average Net Assets | Ratio of Expenses to Average Net Assets (Excluding Waivers and/or Fees Paid Indirectly) | Portfolio Turnover Rate | ||||||||||||||||||||||||||
| (1.60 | ) | (1.70 | ) | $ | 25.92 | 7.49 | %(c) | $ | 503,372 | 0.94 | %(d) | 0.44 | %(d) | 0.94 | %(d) | 4 | %(c) | |||||||||||||||||
| (0.21 | ) | (0.29 | ) | $ | 25.78 | 35.76 | % | $ | 486,295 | 0.97 | % | 0.38 | % | 0.97 | % | 16 | % | |||||||||||||||||
| (0.53 | ) | (0.72 | ) | $ | 19.27 | 17.14 | % | $ | 189,064 | 1.09 | % | 1.17 | % | 1.09 | % | 6 | % | |||||||||||||||||
| — | (0.16 | ) | $ | 17.17 | 6.91 | % | $ | 131,001 | 1.11 | % | 1.19 | % | 1.11 | % | 4 | % | ||||||||||||||||||
| — | (0.06 | ) | $ | 16.22 | 18.54 | % | $ | 142,273 | 1.15 | % | 0.41 | % | 1.15 | % | 7 | % | ||||||||||||||||||
| — | (0.03 | ) | $ | 13.74 | 40.76 | % | $ | 105,592 | 1.23 | % | 0.50 | % | 1.23 | % | 15 | % | ||||||||||||||||||
| (0.39 | ) | (0.39 | ) | $ | 5.24 | 6.89 | %(c) | $ | 37,944 | 1.08 | %(d) | (0.09 | %)(d) | 1.08 | %(d) | 6 | %(c) | |||||||||||||||||
| (0.18 | ) | (0.18 | ) | $ | 5.28 | 21.16 | % | $ | 37,267 | 1.17 | % | (0.22 | %) | 1.17 | % | 39 | % | |||||||||||||||||
| (0.13 | ) | (0.13 | ) | $ | 4.53 | 9.59 | % | $ | 32,894 | 1.28 | % | 0.22 | % | 1.28 | % | 35 | % | |||||||||||||||||
| — | — | $ | 4.26 | 0.24 | % | $ | 32,298 | 1.25 | % | (0.61 | %) | 1.25 | % | 17 | % | |||||||||||||||||||
| — | — | $ | 4.25 | 18.72 | % | $ | 34,139 | 1.31 | % | (0.32 | %) | 1.31 | % | 41 | % | |||||||||||||||||||
| — | — | $ | 3.58 | 34.08 | % | $ | 29,853 | 1.35 | % | (0.19 | %) | 1.39 | % | 58 | % | |||||||||||||||||||
| (1.16 | ) | (1.25 | ) | $ | 18.92 | 0.81 | %(c) | $ | 60,449 | 1.00 | %(d) | 0.64 | %(d) | 1.00 | %(d) | 15 | %(c) | |||||||||||||||||
| (0.28 | ) | (0.38 | ) | $ | 19.98 | 13.78 | % | $ | 64,747 | 1.02 | % | 0.50 | % | 1.02 | % | 14 | % | |||||||||||||||||
| (2.83 | ) | (3.50 | ) | $ | 17.93 | (1.85 | %) | $ | 56,059 | 1.11 | % | 0.59 | % | 1.11 | % | 14 | % | |||||||||||||||||
| (2.12 | ) | (2.25 | ) | $ | 21.65 | 8.02 | % | $ | 53,172 | 1.08 | % | 0.62 | % | 1.08 | % | 28 | % | |||||||||||||||||
| (0.69 | ) | (0.82 | ) | $ | 22.25 | 23.36 | % | $ | 50,248 | 1.12 | % | 0.64 | % | 1.12 | % | 15 | % | |||||||||||||||||
| (0.74 | ) | (0.87 | ) | $ | 18.83 | 36.07 | % | $ | 42,517 | 1.15 | % | 0.77 | % | 1.15 | % | 12 | % | |||||||||||||||||
Semi-Annual Report | April 30, 2018 (Unaudited) | 43 |
Notes to Financial Statements
As of April 30, 2018 (Unaudited)
1. ORGANIZATION:
The Oak Associates Funds (the “Trust”), a Massachusetts business trust, is registered under the Investment Company Act of 1940, as amended, as an open-end management investment company with seven diversified funds: White Oak Select Growth Fund, Pin Oak Equity Fund, Rock Oak Core Growth Fund, River Oak Discovery Fund, Red Oak Technology Select Fund, Black Oak Emerging Technology Fund and Live Oak Health Sciences Fund (collectively referred to as “Funds” and individually referred to as a “Fund”). The investment objective of each Fund is to seek long-term capital growth. The assets of each Fund are segregated, and a shareholder’s interest is limited to the Fund in which shares are held. The Funds’ prospectus provides a description of each Fund’s investment objective, policies and strategies.
2. SIGNIFICANT ACCOUNTING POLICIES:
The following is a summary of significant accounting policies followed by the Funds.
Use of Estimates – These policies are in conformity with U.S. generally accepted accounting principles (“GAAP”). Each Fund is considered an investment company for financial reporting purposes under GAAP. The preparation of financial statements in accordance with GAAP requires management to make estimates and assumptions that affect the reported amounts and disclosures in the financial statements during the reporting period. Management believes the estimates and security valuations are appropriate; however, actual results may differ from those estimates, and the security valuations reflected in the financial statements may differ from the value the Funds ultimately realize upon the sale of the securities.
Security Valuation – Investments in equity securities, which are traded on a national exchange, are stated at the last quoted sales price if readily available for such equity securities on each business day. Investments in equity securities, which are reported on the NASDAQ national market system are valued at the official closing price; other equity securities traded in the over-the-counter market and listed equity securities for which no sale was reported on that date are stated at the last quoted bid price. Debt obligations exceeding sixty days to maturity for which market quotations are readily available are valued at the most recently quoted bid price. Debt obligations with sixty days or less remaining until maturity may be valued at their amortized cost, which approximates market value, in the absence of a current quoted bid price. Investments in repurchase agreements are generally valued at par each business day.
Redeemable securities issued by open-end registered investment companies are valued at the investment company’s applicable net asset value (“NAV”) as determined by those funds each business day.
Securities for which market prices are not “readily available” are valued in accordance with Fair Value Procedures established by the Funds’ Board of Trustees. The Board of Trustees has determined to delegate responsibility for pricing and fair valuation determinations for portfolio securities to Funds’ adviser, Oak Associates, Ltd. (“Oak” or the “Adviser”), subject to oversight of the Board of Trustees. Oak may, in turn and subject to its oversight, delegate pricing of securities for which market prices are readily available to the Funds’ administrator. All fair valuation determinations shall be made by Oak’s Fair Value Committee (the “Committee”), in accordance with policies and procedures established by the Board of Trustees and subject to oversight of the Board. Oak and the administrator have established and maintain policies and procedures reasonably designed to ensure that their pricing and valuation policies and procedures conform to the requirements of the Funds’ Fair Value Procedures. Some of the more common reasons that may necessitate that a security be valued using Fair Value Procedures include: the security’s trading has been halted
44 | 1-888-462-5386 | www.oakfunds.com |
Notes to Financial Statements
As of April 30, 2018 (Unaudited)
or suspended; the security has been de–listed from a national exchange; the security’s primary trading market is temporarily closed at a time when under normal conditions it would be open; the security has not been traded for an extended period of time; the security’s primary pricing source is not able or willing to provide a price; a significant event with respect to a security or securities has occurred after the close of the market or exchange on which the security or securities principally trades and before the time the Fund calculates net asset value; or trading of the security is subject to local government–imposed restrictions. When a security is valued in accordance with the Fair Value Procedures, the Committee will determine the value after taking into consideration relevant information reasonably available to the Committee.
Security Transactions and Investment Income – Security transactions are accounted for on the date the security is purchased or sold (trade date) for financial reporting purposes. Dividend income is recognized on the ex-dividend date. Interest income is recognized on the accrual basis. Withholding taxes on foreign dividends have been provided for in accordance with the Funds’ understanding of the applicable country’s tax rules and rates. Costs used in determining realized gains and losses on the sales of investment securities are those of the specific securities sold. If applicable, any foreign capital gains taxes are accrued, net of unrealized gains, and are payable upon the sale of such investments.
Expenses – Expenses that are directly related to one of the Funds are charged to that Fund. Expenses not directly billed to a particular Fund are allocated proportionally among all Funds daily in relation to net assets of each Fund or another reasonable allocation method.
Repurchase Agreements – The Funds may invest in tri-party repurchase agreements. Securities held as collateral for tri-party repurchase agreements are maintained by the broker’s custodian bank in a segregated account until maturity of the repurchase agreement. Provisions of the repurchase agreements and procedures adopted by the Board of Trustees require that the market value of the collateral, including accrued interest thereon, is sufficient in the event of default by the counterparty. A custody agreement in connection with the Master Repurchase Agreement defines eligible securities for collateral in relation to each repurchase agreement. Under the Master Repurchase Agreement, if the counterparty defaults and the value of the collateral declines or if the counter-party enters an insolvency proceeding, realization of the collateral by the Funds may be delayed or limited. At fiscal year-end, certain Funds had investments in repurchase agreements. The gross value and related collateral received for those investments are presented in each applicable Fund’s Schedule of Investments. The value of the related collateral received exceeded the value of the repurchase agreements as of the period end.
Master Agreements and Netting Arrangements – Certain Funds may participate in various repurchase agreements, such as, but not limited to Master Repurchase Agreements, which govern the terms of certain transactions with select counterparties (collectively “Master Agreements”). These Master Agreements generally include provisions for general obligations, agreements, representations, collateral and provisions for events of default or termination. These Master Agreements also include provisions for netting arrangements that help reduce credit and counterparty risk associated with relevant transactions. The netting arrangements are generally tied to credit related events that if triggered, would cause an event of default or termination giving a Fund or counterparty the right to terminate early and cause settlement, on a net basis, of all transactions under the applicable Master Agreement. In the event of an early termination or default event, the total market value exposure would be offset against collateral exchanged to date, which would result in a net receivable or payable that would be due from or to the counterparty. Credit related events include, but are not limited to, bankruptcy, failure to make timely payments, restructuring, obligation acceleration, obligation default, a material decline in net assets, decline in credit rating or repudiation/moratorium. An election made by a counterparty to terminate a
Semi-Annual Report | April 30, 2018 (Unaudited) | 45 |
Notes to Financial Statements
As of April 30, 2018 (Unaudited)
transaction early under a Master Agreement could have an adverse impact on a Fund’s financial statements. Master Agreements can also help limit counterparty risk by requiring collateral posting arrangements at pre-arranged exposure levels. Collateral under the Master Agreements is usually in the form of cash, U.S. Treasury or U.S. Government agency securities, but may include other types of securities. There can be no assurance that the Master Agreements will be successful in limiting credit or counterparty risk.
Securities Lending – The Trust has entered into a Securities Lending Agreement (“SLA”) with U.S. Bank National Association (the “Agent”). Under the terms of the SLA, the Funds may lend securities to certain broker-dealers and banks in exchange for collateral in the amount of at least 102% of the value of U.S. securities loaned or at least 105% of the value of non-U.S. securities loaned, marked to market daily. The collateral can be received in the form of cash collateral and/or non-cash collateral. Non-cash collateral can include U.S. Government Securities and letters of credit. The cash collateral is invested in the Mount Vernon Liquid Assets Portfolio, LLC, as noted in the Funds’ Schedules of Portfolio Investments. The market value of the loaned securities is determined daily at the close of business of the Funds and any additional required collateral is delivered to each Fund on the next business day. The Funds continue to benefit from interest or dividends on the securities loaned and may also earn a return from the collateral. The Funds pay various fees in connection with the investment of cash collateral. The Funds pay the Agent fees based on the investment income received from securities lending activities. Although risk is mitigated by the collateral, the Funds could experience a delay in recovering its securities and possible loss of income or value if the borrower fails to return them. The contractual maturity of repurchase agreements are on an overnight and continuous basis. Cash and cash equivalent collateral on securities lending transactions are on an overnight and continuous basis.
The following is a summary of each Funds’ securities lending agreements and related cash and non-cash collateral received as of April 30, 2018:
| Market Value of Securities on Loan | Cash Collateral Received | |||||||
| White Oak Select Growth Fund | $ | 32,753,861 | $ | 33,728,097 | ||||
| Pin Oak Equity Fund | 43,119,039 | 44,233,371 | ||||||
| Rock Oak Core Growth Fund | 3,576,801 | 3,686,329 | ||||||
| River Oak Discovery Fund | 1,699,120 | 1,772,023 | ||||||
| Red Oak Technology Select Fund | 59,865,405 | 61,166,417 | ||||||
| Black Oak Emerging Technology Fund | 11,447,710 | 11,790,776 | ||||||
| Live Oak Health Sciences Fund | 15,464,538 | 15,939,883 | ||||||
Dividends and Distributions to Shareholders – Dividends from net investment income are declared and paid to shareholders on an annual basis, as applicable. Net realized capital gains on sales of securities, if any, are distributed to shareholders at least annually. Distributions to shareholders are determined in accordance with income tax regulations and are recorded on the ex-dividend date. Income and capital gain distributions are determined in accordance with federal income tax regulations, which may differ from GAAP. Therefore, the source of the Funds’ distributions may be shown in the accompanying financial statements as either from or in excess of net investment income or net realized gain, or from paid-in capital, depending upon the type of book/tax differences that may exist.
46 | 1-888-462-5386 | www.oakfunds.com |
Notes to Financial Statements
As of April 30, 2018 (Unaudited)
3. FAIR VALUE MEASUREMENTS:
A three-tier hierarchy has been established to classify fair value measurements for disclosure purposes. Inputs refer broadly to the assumptions that market participants would use in pricing the asset or liability including assumptions about risk. Inputs may be observable and unobservable. Observable inputs are inputs that reflect the assumptions market participants would use in pricing the asset or liability that are developed based on market data obtained from sources independent of the reporting entity. Unobservable inputs are inputs that reflect the reporting entity’s own assumptions about the assumptions market participants would use in pricing the asset or liability that are developed based on the best information available.
Various inputs are used in determining the value of each Fund’s investments as of the reporting period end. The designated input levels are not necessarily an indication of the risk or liquidity associated with these investments. These inputs are categorized in the following hierarchy under applicable financial accounting standards:
The three-tier hierarchy is summarized as follows:
Level 1 – Unadjusted quoted prices in active markets for identical assets or liabilities that a Fund has the ability to access at the measurement date, including but not limited to:
Equity Securities – investments for which market quotations are readily available that are valued at the last reported sale price or official closing price as reported by an independent pricing service on the primary market or exchange on which they are traded.
Investment Companies – investments in open-end registered investment companies which are valued at their closing NAV.
Level 2 – Quoted prices which are not active, quoted prices for similar assets or liabilities inactive markets or inputs other than quoted prices that are observable (either directly or indirectly) for substantially the full term of the asset or liability, including but not limited to:
Repurchase Agreements – investments in overnight tri-party repurchase agreements which are valued at par.
All Securities – quoted prices for similar securities, including matrix pricing; quoted prices based on recently executed transactions; adjusted quoted prices based on observable and formulaic inputs; or, prices using other observable correlated market inputs.
Level 3 – Significant unobservable prices or inputs (including the Fund’s own assumptions in determining the fair value of investments) where there is little or no market activity for the asset and liability at the measurement date, including but not limited to:
All Securities – modeling or manual pricing based on the Adviser’s own assumptions in determining fair value of investments; or, the significant use of other unobservable or very stale inputs within fair valuation.
Semi-Annual Report | April 30, 2018 (Unaudited) | 47 |
Notes to Financial Statements
As of April 30, 2018 (Unaudited)
The following is a summary of the inputs used to value each Fund’s investments as of April 30, 2018:
| Level 1 | Level 2 | Level 3 | Total | |||||||||||||
| WHITE OAK SELECT GROWTH FUND | ||||||||||||||||
| Common Stocks | $ | 300,710,080 | $ | — | $ | — | $ | 300,710,080 | ||||||||
| Short Term Investments | — | |||||||||||||||
| Repurchase Agreements | — | 1,650,239 | — | 1,650,239 | ||||||||||||
| Collateral for Securities Loaned* | — | — | — | 33,728,097 | ||||||||||||
| Total | $ | 300,710,080 | $ | 1,650,239 | $ | — | $ | 336,088,416 | ||||||||
| Level 1 | Level 2 | Level 3 | Total | |||||||||||||
| PIN OAK EQUITY FUND | ||||||||||||||||
| Common Stocks | $ | 215,166,490 | $ | — | $ | — | $ | 215,166,490 | ||||||||
| Short Term Investments | ||||||||||||||||
| Repurchase Agreements | — | 13,143,589 | — | 13,143,589 | ||||||||||||
| Collateral for Securities Loaned* | — | — | — | 44,233,371 | ||||||||||||
| Total | $ | 215,166,490 | $ | 13,143,589 | $ | — | $ | 272,543,450 | ||||||||
| Level 1 | Level 2 | Level 3 | Total | |||||||||||||
| ROCK OAK CORE GROWTH FUND | ||||||||||||||||
| Common Stocks | $ | 12,492,289 | $ | — | $ | — | $ | 12,492,289 | ||||||||
| Short Term Investments | ||||||||||||||||
| Money Market Funds | 14,600 | — | — | 14,600 | ||||||||||||
| Repurchase Agreements | — | 982,671 | — | 982,671 | ||||||||||||
| Collateral for Securities Loaned* | — | — | — | 3,686,329 | ||||||||||||
| Total | $ | 12,506,889 | $ | 982,671 | $ | — | $ | 17,175,889 | ||||||||
| Level 1 | Level 2 | Level 3 | Total | |||||||||||||
| RIVER OAK DISCOVERY FUND | ||||||||||||||||
| Common Stocks | $ | 13,292,411 | $ | — | $ | — | $ | 13,292,411 | ||||||||
| Short Term Investments | ||||||||||||||||
| Money Market Funds | 384,565 | — | — | 384,565 | ||||||||||||
| Collateral for Securities Loaned* | — | — | — | 1,772,023 | ||||||||||||
| Total | $ | 13,676,976 | $ | — | $ | — | $ | 15,448,999 | ||||||||
| Level 1 | Level 2 | Level 3 | Total | |||||||||||||
| RED OAK TECHNOLOGY SELECT FUND | ||||||||||||||||
| Common Stocks | $ | 483,720,325 | $ | — | $ | — | $ | 483,720,325 | ||||||||
| Short Term Investments | ||||||||||||||||
| Money Market Funds | 32,156 | — | — | 32,156 | ||||||||||||
| Repurchase Agreements | — | 20,072,900 | — | 20,072,900 | ||||||||||||
| Collateral for Securities Loaned* | — | — | — | 61,166,417 | ||||||||||||
| Total | $ | 483,752,481 | $ | 20,072,900 | $ | — | $ | 564,991,798 | ||||||||
48 | 1-888-462-5386 | www.oakfunds.com |
Notes to Financial Statements
As of April 30, 2018 (Unaudited)
| Level 1 | Level 2 | Level 3 | Total | |||||||||||||
| BLACK OAK EMERGING TECHNOLOGY FUND | ||||||||||||||||
| Common Stocks | $ | 36,528,316 | $ | — | $ | — | $ | 36,528,316 | ||||||||
| Short Term Investments | ||||||||||||||||
| Money Market Funds | 1,491,602 | — | — | 1,491,602 | ||||||||||||
| Collateral for Securities Loaned* | — | — | — | 11,790,776 | ||||||||||||
| Total | $ | 38,019,918 | $ | — | $ | — | $ | 49,810,694 | ||||||||
| Level 1 | Level 2 | Level 3 | Total | |||||||||||||
| LIVE OAK HEALTH SCIENCES FUND | ||||||||||||||||
| Common Stocks | $ | 59,418,850 | $ | — | $ | — | $ | 59,418,850 | ||||||||
| Short Term Investments | ||||||||||||||||
| Money Market Funds | 40,795 | — | — | 40,795 | ||||||||||||
| Repurchase Agreements | — | 963,538 | — | 963,538 | ||||||||||||
| Collateral for Securities Loaned* | — | — | — | 15,939,883 | ||||||||||||
| Total | $ | 59,459,645 | $ | 963,538 | $ | — | $ | 76,363,066 | ||||||||
* | Certain investments that are measured at fair value using the net asset value per share (or its equivalent) practical expedient have not been categorized in the fair value hierarchy. The fair value amounts presented in the table are intended to permit reconciliation of the fair value hierarchy to the amounts presented in the Statement of Assets and Liabilities. |
The above tables are presented by levels of disaggregation for each asset class. For detailed descriptions of the underlying industries, see the accompanying Schedules of Investments. There were no transfers into or out of Level 1 and 2 during the period. There were no Level 3 securities held during the period. It is the Funds’ policy to recognize transfers into and out of levels at the end of the reporting period.
4. FEES AND OTHER RELATED PARTY TRANSACTIONS:
The Trust and the Adviser are parties to an Investment Advisory Agreement, under which the Adviser receives an annual fee equal to 0.74% of the average daily net assets of each Fund, except for the River Oak Discovery Fund for which the Adviser receives 0.90% of the average daily net assets of the Fund. The Adviser has contractually agreed through February 28, 2019, to waive all or a portion of its fees (and to reimburse the Funds’ expenses if necessary) in order to limit Fund total operating expenses (excluding interest, taxes, brokerage commissions, other expenditures which are capitalized in accordance with generally accepted accounting principles, other extraordinary expenses not incurred in the ordinary course of such Fund’s business and amounts payable pursuant to any plan adopted in accordance with Rule 12b-1 under the 1940 Act, and expenses for which payment has been made through the use of all or a portion of brokerage commissions (or markups or markdowns) generated by the Fund) to not more than 1.25% of the average daily net assets of the White Oak Select Growth Fund, Pin Oak Equity Fund and Rock Oak Core Growth Funds, and 1.35% of the average daily net assets of the River Oak Discovery Fund, Red Oak Technology Select Fund, Black Oak Emerging Technology Fund and Live Oak Health Sciences Fund.
Semi-Annual Report | April 30, 2018 (Unaudited) | 49 |
Notes to Financial Statements
As of April 30, 2018 (Unaudited)
The following table lists the contractual advisory fees and fee waivers that were in effect during the six months ended April 30, 2018:
Advisory Fees as a Percentage of Average Net Assets | |||
Fund | Annual Rate | Fee Waiver | Net Annual Rate |
White Oak Select Growth Fund | 0.74% | 0.74% | |
Pin Oak Equity Fund | 0.74% | 0.74% | |
Rock Oak Core Growth Fund | 0.74% | (0.12)% | 0.62% |
River Oak Discovery Fund | 0.90% | (0.07)% | 0.83% |
Red Oak Technology Select Fund | 0.74% | 0.74% | |
Black Oak Emerging Technology Fund | 0.74% | 0.74% | |
Live Oak Health Sciences Fund | 0.74% | 0.74% | |
Ultimus Fund Solutions, LLC (“Ultimus”) provides the Funds with administration, fund accounting and transfer agency services, including all regulatory reporting. The Funds pay Ultimus fees in accordance with the agreements for such services. In addition, each Fund pays out-of-pocket expenses including, but not limited to, postage, supplies and costs of pricing its portfolio securities.
Under the terms of a Distribution Agreement with the Trust, Ultimus Fund Distributors, LLC (the “Distributor”) serves as the principal underwriter to each Fund. The Distributor is a wholly-owned subsidiary of Ultimus. The Distributor is compensated by the Adviser (not the Funds) for acting as principal underwriter.
Certain officers and trustees of the Trust are also officers of the Adviser, Ultimus and/or the Distributor. Such officers are paid no fees by the Trust for serving as officers or trustees to the Trust.
5. INVESTMENT TRANSACTIONS:
The cost of security purchases and the proceeds from security sales, other than short–term investments, for the six months ended April 30, 2018 were as follows:
| Fund | Purchases | Sales | ||||||
| White Oak Select Growth Fund | $ | 14,156,014 | $ | 20,633,405 | ||||
| Pin Oak Equity Fund | 14,951,142 | 21,938,639 | ||||||
| Rock Oak Core Growth Fund | 3,103,937 | 10,352,668 | ||||||
| River Oak Discovery Fund | 3,741,689 | 4,849,427 | ||||||
| Red Oak Technology Select Fund | 18,385,413 | 38,216,958 | ||||||
| Black Oak Emerging Technology Fund | 2,067,495 | 5,176,992 | ||||||
| Live Oak Health Sciences Fund | 9,000,334 | 12,798,495 | ||||||
6. FEDERAL INCOME TAXES AND TAX BASIS INFORMATION:
Each of the Funds is classified as a separate taxable entity for Federal income tax purposes. Each of the Funds has qualified and intends to continue to qualify as a separate “regulated investment company” under Sub–chapter M of the Internal Revenue Code of 1986, as amended, and make the requisite distributions to shareholders that will be sufficient to relieve it from Federal income tax and Federal excise tax. Therefore, no Federal tax provision is required.
50 | 1-888-462-5386 | www.oakfunds.com |
Notes to Financial Statements
As of April 30, 2018 (Unaudited)
The amounts of dividends from net investment income and distributions from net realized capital gains are determined in accordance with Federal income tax regulations, which may differ from those amounts determined under accounting principles generally accepted in the United States of America. These book/tax differences are either temporary or permanent in nature. The character of dividends from net investment income or distributions from net realized gains made during the year, and the timing may differ from the year that the income or realized gains (losses) were recorded by the Funds. To the extent these differences are permanent, adjustments are made to the appropriate equity accounts in the period that the differences arise. These differences are primarily due to differences in the treatment of net operating losses and certain other investments.
The tax character of the distributions paid by the Funds for the fiscal year ended October 31, 2017 was as follows:
| Fund | Ordinary Income | Long-Term Capital Gain | Total | |||||||||
| White Oak Select Growth Fund | $ | 2,687,021 | $ | — | $ | 2,687,021 | ||||||
| Pin Oak Equity Fund | 832,560 | 1,894,933 | 2,727,493 | |||||||||
| Rock Oak Core Growth Fund | 54,642 | — | 54,642 | |||||||||
| River Oak Discovery Fund | — | — | — | |||||||||
| Red Oak Technology Select Fund | 1,009,412 | 2,516,143 | 3,525,555 | |||||||||
| Black Oak Emerging Technology Fund | 170,204 | 1,145,326 | 1,315,530 | |||||||||
| Live Oak Health Sciences Fund | 315,656 | 906,767 | 1,222,423 | |||||||||
As of October 31, 2017, the components of distributable earnings on a tax basis were as follows:
| Fund | Undistributed Net Investment Income | Accumulated Capital Gain (Loss) | Unrealized Appreciation/ (Depreciation) | Cumulative Effect of Timing Differences | Total | |||||||||||||||
| White Oak Select Growth Fund | $ | 1,494,553 | $ | 14,086 | $ | 71,420,811 | $ | — | $ | 72,929,450 | ||||||||||
| Pin Oak Equity Fund | 761,712 | 2,690,009 | 45,679,232 | — | 49,130,953 | |||||||||||||||
| Rock Oak Core Growth Fund | 1,535 | 521,838 | 3,421,970 | (13,558 | ) | 3,931,785 | ||||||||||||||
| River Oak Discovery Fund | — | 757,852 | 5,031,273 | (112,790 | ) | 5,676,335 | ||||||||||||||
| Red Oak Technology Select Fund | 2,583,908 | 28,103,051 | 138,529,599 | — | 169,216,558 | |||||||||||||||
| Black Oak Emerging Technology Fund | — | 2,660,501 | 13,879,639 | (45,946 | ) | 16,494,194 | ||||||||||||||
| Live Oak Health Sciences Fund | 98,034 | 3,685,901 | 16,943,894 | — | 20,727,829 | |||||||||||||||
As of October 31, 2017, the difference between book basis and tax basis unrealized appreciation (depreciation) is primarily attributable to wash sales and corporate action and partnership basis adjustments.
Semi-Annual Report | April 30, 2018 (Unaudited) | 51 |
Notes to Financial Statements
As of April 30, 2018 (Unaudited)
During the fiscal year ended October 31, 2017, the White Oak Select Growth Fund, Rock Oak Core Growth Fund and River Oak Discovery Fund utilized $8,281,596, $86,825 and $48,386 in capital loss carryforwards, respectively.
The Rock Oak Core Growth Fund, River Oak Discovery Fund and Black Oak Emerging Technology Fund elected to defer to the year ending October 31, 2018, late year ordinary losses in the amount of $13,558, $112,790 and $45,946, respectively.
At April 30, 2018, the total cost of securities for Federal income tax purposes and the aggregate gross unrealized appreciation and depreciation for securities held by the Funds is as follows:
| Fund | Federal Tax Cost | Gross Appreciation | Gross Depreciation | Net Appreciation | ||||||||||||
| White Oak Select Growth Fund | $ | 241,104,847 | $ | 105,197,527 | $ | (10,213,958 | ) | $ | 94,983,569 | |||||||
| Pin Oak Equity Fund | 217,656,804 | 56,986,623 | (2,099,977 | ) | 54,886,646 | |||||||||||
| Rock Oak Core Growth Fund | 12,885,028 | 4,365,726 | (74,865 | ) | 4,290,861 | |||||||||||
| River Oak Discovery Fund | 12,445,363 | 3,371,059 | (367,423 | ) | 3,003,636 | |||||||||||
| Red Oak Technology Select Fund | 411,718,683 | 158,987,371 | (5,714,256 | ) | 153,273,115 | |||||||||||
| Black Oak Emerging Technology Fund | 34,971,560 | 15,193,739 | (354,605 | ) | 14,839,134 | |||||||||||
| Live Oak Health Sciences Fund | 65,072,908 | 16,813,963 | (5,523,805 | ) | 11,290,158 | |||||||||||
Management evaluates the Funds’ tax positions to determine if the taken tax positions meet the minimum recognition threshold by measuring and recognizing tax liabilities in the Financial Statements. The threshold is established by accounting for uncertainties in income tax positions, taken or expected. Recognition of tax benefits of an uncertain tax position is required only when the position is “more likely than not” to be sustained assuming examination by taxing authorities. The Funds recognize interest and penalties, if any, related to unrecognized tax benefits as income tax expense in the Statements of Operations. During the period, the Funds did not incur any interest or penalties.
Management has analyzed the Funds’ tax positions taken on federal income tax returns for all open tax years (current and prior three tax years) and has concluded that as of and for the six months ended April 30. 2018, no provision for income tax would be required in the Funds’ financial statements. The Funds’ federal and state income and federal excise tax returns for tax years (current and prior three tax years) for which the applicable statutes of limitations have not expired are subject to examination by the Internal Revenue Service and state departments of revenue.
7. CONCENTRATION OF CREDIT RISK AND OWNERSHIP:
The Red Oak Technology Select Fund and the Black Oak Emerging Technology Fund invest a substantial portion of their assets in securities in the technology sector. The Live Oak Health Sciences Fund invests a substantial portion of its assets in securities in the health care, medicine and life sciences industries. Therefore, each of these Funds may be more affected by economic developments in those sectors than a general equity fund would be.
52 | 1-888-462-5386 | www.oakfunds.com |
Notes to Financial Statements
As of April 30, 2018 (Unaudited)
In the normal course of business, the Funds enter into contracts that provide general indemnifications. The Funds’ maximum exposure under these arrangements is dependent on future claims that may be made against the Funds and, therefore, cannot be established; however based on experience, the risk of loss from such claims is considered remote.
From time to time, the Funds may have a concentration of several shareholders holding a significant percentage of shares outstanding. Investment activities of these shareholders could have a material impact on the Fund.
As of April 30, 2018, the James D. Oelschlager Trust owned 42.43% of the River Oak Discovery Fund and Vanita B. Oelschlager owned 20.75% of the Rock Oak Core Growth Fund.
8. TRUSTEE AND OFFICERS FEES:
As of April 30, 2018, there were five Trustees, three of whom are not “interested persons” (within the meaning of the 1940 Act) of the Trust (the “Independent Trustees”). Effective January 1, 2016, each Independent Trustee receives a retainer at an annual rate of $30,000 per year. Also effective January 1, 2016, each Independent Trustee is also paid a fee of $3,500 for each meeting of the Board of Trustees attended or participated in person, and/or is also paid $1,000 per attendance at each telephonic board meeting, as applicable. Each Independent Trustee is paid $4,000 per telephonic or in-person meeting at which they receive and review preliminary materials provided in connection with the annual continuation of the advisory agreement in accordance with Section 15(c) of the 1940 Act. The chairperson of the Audit Committee receives an additional retainer of $1,000 per calendar quarter during which an Audit Committee Meeting is held and the Lead Independent Trustee receives an additional retainer of $3,500 per calendar quarter. The increases in scheduled fees paid to the Independent Trustees that became effective on January 1, 2016, as described above, will be implemented over the next three calendar years at a rate of one-third of the total increase each year.
The Independent Trustees who do not serve as chairpersons of the applicable Board committee are not paid an additional fee from the Trust for attendance at and/or participation in such meetings of the various committees of the Board. The Independent Trustees are also reimbursed for meeting-related expenses. Officers of the Trust and Trustees who are interested persons of the Trust receive no salary or fees from the Trust, although they may be reimbursed for meeting-related expenses.
9. INDEMNIFICATIONS:
Under the Trust’s organizational documents, its officers and Trustees are indemnified against certain liability arising out of the performance of their duties to the Trust. Additionally, in the normal course of business, the Trust enters into contracts with service providers that may contain general indemnification clauses, which may permit indemnification to the extent permissible under applicable law. The Trust’s maximum exposure under these arrangements is unknown, as this would involve future claims that may be made against the Trust that have not yet occurred.
10. SUBSEQUENT EVENTS:
Management has evaluated events or transactions from April 30, 2018, through the date these financial statements were issued, that would merit recognition or disclosure in the financial statements. There were no subsequent events to report that would have material impact in the Funds’ financial statements.
Semi-Annual Report | April 30, 2018 (Unaudited) | 53 |
Additional Information
As of April 30, 2018 (Unaudited)
BOARD CONSIDERATIONS IN APPROVING THE RENEWAL OF THE ADVISORY AGREEMENT
The advisory agreement between the Trust and the Adviser for each Fund of the Trust (the “Advisory Agreement”) was approved for an initial two-year term, and may be continued from year to year thereafter as to a Fund so long as such continuance is approved at least annually, (i) by the vote of the Board of Trustees (the “Board” or “Trustees”) or by a vote of the shareholders of the Fund, and (ii) by the vote of a majority of the Trustees who are not parties to the Advisory Agreement or “interested persons,” as such term is defined in the Investment Company Act of 1940, as amended (“1940 Act”), of any party thereto (the “Independent Trustees”), cast in person at a meeting called for the purpose of voting on such approval.
At an in-person meeting held on February 11-12, 2018, the Trustees, including a majority of the Independent Trustees, unanimously approved the continuation of the Advisory Agreement with respect to each Fund for an additional one-year term, effective February 27, 2018.
In determining whether to approve the continuation of the Advisory Agreement, the Trustees considered a wide variety of information from the Adviser, including information provided by the Adviser in response to a request from counsel on behalf of the Trustees in accordance with Section 15(c) of the 1940 Act, to assist in their deliberations as well as information received throughout the year, both in writing and during meetings, regarding the Funds, including Fund performance, expense ratios, portfolio composition and regulatory compliance (the “Adviser Materials”). Prior to the in-person Board meeting held on February 11-12, 2018, the Independent Trustees held a special meeting on January 29, 2018 via teleconference to discuss the Adviser Materials. Following the January 29, 2018 meeting, the Independent Trustees, with the assistance of their independent legal counsel, requested the Adviser to provide additional information to the Trustees for the February 11-12, 2018 meeting. In addition, the Independent Trustees discussed and considered the Adviser Materials and the renewal of the Advisory Agreement in an executive session of the Independent Trustees held during the February 11-12, 2018 in person Board meeting, and received counsel from their independent legal counsel.
As part of the Board’s decision-making process, the Board considered the nature, extent, and quality of the services provided to each of the Funds by the Adviser. In this regard, the Board considered presentations by Trust officers and representatives of the Adviser. The Board noted that the Adviser has managed the Funds since their inception, and the Board believes that a long-term relationship with a capable, conscientious investment adviser is in the best interest of the Funds. The Board also considered that shareholders invest in a Fund specifically seeking the Adviser’s investment expertise and style. The Board also noted that when shareholders invest in a Fund, they know the advisory fee that is paid by the Fund. In this regard, the Board considered, in particular, that each Fund is managed in accordance with its investment objective and policies as disclosed to shareholders.
The Board also reviewed and considered the Adviser Materials. These presentations and the Adviser Materials contained information that assisted the Trustees in assessing the Adviser’s investment advisory services, its investment process and regulatory/compliance capabilities and record, as well as the Adviser’s investment philosophy, Fund performance records, and trade execution capabilities. The Board reviewed information regarding various services provided by the Adviser to the Funds, including the personnel performing such services. The Board also considered non-advisory services provided to the Funds, such as the services of Adviser employees as Trust officers and other personnel provided that are necessary for Fund operations. The Board particularly noted that the services of the Trust’s Chief Compliance Officer are provided to the Funds at no cost to the Funds. The Board also noted that Adviser employees serving as Trust officers oversee and manage
54 | 1-888-462-5386 | www.oakfunds.com |
Additional Information
As of April 30, 2018 (Unaudited)
the other Fund service providers. Based on their review, the Independent Trustees concluded that they were satisfied with the nature, extent and quality of the services provided to the Funds by the Adviser.
The Trustees considered the investment performance of each Fund. The Trustees reviewed presentations by the Adviser’s portfolio managers for each Fund as well as a report prepared by the Trust’s administrator that provided performance information for the three month, year-to-date, one year, two year, three year, five year, ten year and since inception periods ended December 31, 2017 (as applicable to each Fund), including information comparing each Fund’s performance to that of various benchmarks and peer funds as categorized by Lipper Inc. (“Lipper”) and Morningstar, Inc. (“Morningstar”), both independent sources of investment company data.
The Trustees also considered performance information in the Adviser Materials for each of the Funds as compared to each Fund’s benchmark, peer group averages and any applicable comparable funds or accounts managed by the Adviser for the one year, three year, five year, ten year and since inception periods (as applicable to each Fund) ending as of the Funds’ fiscal year ended October 31, 2017. The Trustees evaluated the performance of the Adviser’s separate accounts relative to the White Oak Select Growth Fund (“White Oak Fund”), River Oak Discovery Fund (“River Oak Fund”), Pin Oak Equity Fund (“Pin Oak Fund”) and Red Oak Technology Select Fund (“Red Oak Fund), and in the case of the Red Oak Fund and the Live Oak Health Sciences Fund (“Live Oak Fund”), to a similarly managed mutual fund for which the Adviser serves as sub-adviser.
The Trustees also reviewed the Adviser’s commentary regarding the performance data and the various factors contributing to each Fund’s short- and long-term performance. The Trustees took note of the various periods where each Fund outperformed, underperformed or performed in line with its respective peer group averages and benchmark. The Trustees noted that while each of the Funds’ relative performance was positive and generally favorable, all of the Funds had lagged their respective benchmarks and respective peer group averages for the year periods ended October 31, 2017 and December 31, 2017, with the exception being that Rock Oak Core Growth Fund (“Rock Oak Fund”) outperformed both its benchmark and its Morningstar peer group average over the same periods. For certain of the other longer-term periods ended October 31 and December 31, the Trustees noted that the Funds outperformed their respective benchmarks and peer group averages, and underperformed for others, except Black Oak Emerging Technology Fund lagged its respective benchmark and peer group averages for most periods. In the case of each Fund with performance that lagged a relevant peer group or benchmark for certain periods (but not necessarily all periods), the Trustees considered explanations provided by the Adviser regarding the various factors contributing to the relative underperformance of such Fund, including, among other things, differences in a Fund’s respective investment strategies and portfolio construction in comparison to the funds included in its respective Morningstar and Lipper peer groups. Further, the Board discussed with the Adviser the reasons behind such results for each applicable Fund. In addition, the Trustees considered other factors that supported the continuation of the Advisory Agreement, including the following: (i) that the Adviser’s investment decisions, such as security selection and sector allocation, contributing to such underperformance were consistent with each Fund’s respective investment objective and policies; (ii) that shorter-term or longer-term performance, as applicable, was competitive when compared to the performance of relevant peer groups or benchmarks; and (iii) that many of the Funds’ peers are larger in size than the corresponding Fund, and this factor may impact the relative performance of the Funds. Taking note of the Adviser’s discussion of (i) the various factors contributing to each Fund’s performance and (ii) its continuing commitment to each Fund’s current investment strategy, the Independent Trustees concluded that the investment performance of each Fund was sufficient.
Semi-Annual Report | April 30, 2018 (Unaudited) | 55 |
Additional Information
As of April 30, 2018 (Unaudited)
The Trustees considered the advisory fees paid to the Adviser, the total expense ratios of each Fund, and the Adviser’s commitment to continue to waive its advisory fees and/or reimburse Fund expenses in order to maintain stated caps on Fund operating expenses. The Trustees reviewed presentations by Trust officers, including information about the reported fees and expenses of each Fund’s peer funds compiled by the Trust’s administrator from data obtained from Lipper. The Trustees also received information from the Adviser regarding compensation arrangements for other accounts managed by the Adviser, and evaluated the explanations provided by the Adviser as to differences in fees charged to the Funds and such accounts. The Trustees noted that the Adviser waived a portion of its advisory fee with respect to each of the Rock Oak Fund and the River Oak Fund in order to maintain the stated cap on Fund operating expenses. The Independent Trustees further considered the Adviser’s profitability derived from its relationship with the Trust on a Fund-by-Fund basis, based on information reported by the Adviser, including information regarding the financial condition of the Adviser. The Independent Trustees concluded that each Fund’s advisory fee set forth in the Advisory Agreement was reasonable and did not result in an excessive profit to the Adviser in relation to the nature, extent and quality of services provided. The Independent Trustees also concluded that the overall expense ratio for each Fund is reasonable in comparison to the average expense ratio of funds in each Fund’s respective Lipper category, and in light of various factors, such as Fund size and quality of service.
The Trustees considered the information provided by the Adviser with respect to potential “fall out” benefits to the Adviser from its relationship with the Funds, such as benefits to the Adviser in receipt of research paid for with Fund commissions (i.e., soft dollars) and in attracting and retaining non-Fund advisory clients. The Trustees also reviewed additional information provided by the Adviser in connection with their follow-up question on the Adviser’s estimated annual soft dollar commitment. The Trustees considered the information they were provided about the Adviser’s portfolio brokerage practices on behalf of the Funds, including its policies with respect to obtaining benefits from use of the Funds’ brokerage commissions to obtain research that also could be used for the Adviser’s other clients, and the Independent Trustees concluded that the Adviser’s portfolio brokerage practices appeared to be reasonably designed to achieve best execution on Fund trades.
The Trustees considered whether there were economies of scale in managing the Funds, and in light of the relatively small size of the Funds and the Adviser’s commitment to waive its advisory fees and/or reimburse Fund expenses in order to maintain stated caps on the Funds’ operating expenses, determined that such economies of scale were not present. As such, the Trustees did not consider whether any economies of scale were adequately shared with Fund shareholders.
In voting to approve the continuation of the Advisory Agreement, the Board considered all factors it deemed relevant, including the Adviser Materials. In arriving at its decision, the Board did not identify any single factor as being of paramount importance and each member of the Board gave varying weights to each factor according to his or her own judgment. The Board determined that the renewal of the Advisory Agreement would be in the best interests of each Fund and its shareholders. As a result, the Board, including a majority of the Independent Trustees, unanimously approved the continuation of the Advisory Agreement for each Fund.
56 | 1-888-462-5386 | www.oakfunds.com |
OAK ASSOCIATES FUNDS
This Page Intentionally Left Blank
OAK ASSOCIATES FUNDS
This Page Intentionally Left Blank
OAK ASSOCIATES FUNDS
This Page Intentionally Left Blank
Oak Associates Funds
Privacy Policy
Oak Associates Funds recognizes and respects the privacy concerns of our shareholders. The Funds collect nonpublic personal information about you in the course of doing business and providing you with individualized service. “Nonpublic personal information” is personally identifiable financial information about you. We do not sell your personal information to anyone and we do not disclose it to anyone except as permitted or required by law or as described in this policy.
INFORMATION WE COLLECT
● | Information we receive from you on applications and other forms (such as your name, birth date, address and social security number); |
● | Information about the transactions in your accounts; |
● | Information about any bank account you use for transfers between your bank account and your Oak Associates accounts; and |
● | Information we receive about you as a result of your inquiries by mail, email and telephone. |
INFORMATION WE SHARE
Oak Associates Funds only discloses your nonpublic personal information as required or permitted by law. The Funds may disclose this information:
● | So that we may complete transactions you authorize or request; and |
● | So that we may provide you with information about Oak Associates Funds products and services; we may disclose information to companies that provide services to us, such as transfer agents or printers and mailers that prepare and distribute materials to you. |
INFORMATION SECURITY
Within Oak Associates Funds, access to your information is restricted to the individuals who need to know the information to service your account. Each Fund conducts its business through its trustees, officers and third party service providers, pursuant to agreements with the Fund. The Fund and its service providers maintain physical, electronic and procedural safeguards that comply with federal standards to guard your information. In the event that you hold shares of the Fund through a financial intermediary, including, but not limited to, a broker-dealer, bank or trust company, the privacy policy of your financial intermediary will govern how your nonpublic personal information will be shared with nonaffiliated third parties by that entity.
TO PROTECT YOUR PRIVACY
We recommend that you do not provide your account information or Oak Associates Funds user name or password to anyone. If you become aware of any suspicious activity relating to your account, please contact us immediately at 1-888-462-5386.
QUESTIONS
Should you have any questions regarding the Funds’ Privacy Policy, please call
1-888-462-5386
OAK ASSOCIATES FUNDS
CONTACT US
By Mail
Oak Associates Funds
225 Pictoria Drive, Suite 450
Cincinnati, OH 45246
By Telephone 1-888-462-5386 Monday through Friday, 8:00 a.m. to 6:00 p.m. ET
On The Web www.oakfunds.com
Click on the My Oak Account section to take advantage of these features:
| ● | Trade Online |
| ● | Access and Update Account Information |
| ● | Go Paperless with eDelivery |
| ● | View and download account history |
| ● | Establish a systematic investment plan |
The Trust files its complete schedule of portfolio holdings of each Fund with the Securities and Exchange Commission for the first and third quarters of each fiscal year on Form N-Q within sixty days after the end of the period. The Trust’s Form N-Q is available on the Commission’s website at http://www.sec.gov, and may be reviewed and copied at the Commission’s Public Reference Room in Washington DC. Information on the operation of the Public Reference Room may be obtained by calling 1-800-SEC-0330.
A description of the policies and procedures that the Funds use to determine how to vote proxies relating to portfolio securities, as well as information relating to how a Fund voted proxies relating to portfolio securities during the most recent 12-month period ended June 30, is available (i) without charge, upon request, by calling 1-888-462-5386; and (ii) on the Commission’s website at http://www.sec.gov.
This report has been prepared for Oak Associates Funds Shareholders and may be distributed to others only if preceded or accompanied by a prospectus.
Oak Associates Funds are distributed by Ultimus Fund Distributors, LLC

Item 2. Code of Ethics.
Not applicable to semiannual reports.
Item 3. Audit Committee Financial Expert.
Not applicable to semiannual reports.
Item 4. Principal Accountant Fees and Services.
Not applicable to semiannual reports.
Item 5. Audit Committee of Listed Registrants.
Not applicable.
Item 6. Schedule of Investments.
(a) Included as part of the report to Stockholders filed under Item 1 of this Form.
(b) Not applicable.
Item 7. Disclosure of Proxy Voting Policies and Procedures for Closed-End Management Investment Companies.
Not applicable.
Item 8. Portfolio Managers of Closed-End Management Investment Companies.
Not applicable.
Item 9. Purchases of Equity Securities by Closed-End Management Investment Company and Affiliated Purchasers.
Not applicable.
Item 10. Submission of Matters to a Vote of Security Holders.
None.
Item 11. Controls and Procedures.
(a) The registrant’s Principal Executive Officer and Principal Financial Officer have concluded that the registrant's disclosure controls and procedures (as defined in Rule 30a-3(c) under the Act) are effective in design and operation and are sufficient to form the basis of the certifications required by Rule 30a-2 under the Act, based on their evaluation of these disclosure controls and procedures within 90 days of the filing of this report on Form N-CSR.
(b) There were no changes in the registrant’s internal control over financial reporting (as defined in Rule 30a-3(d) under the Act (17 CFR 270.30a-3(d)) that occurred during the second fiscal quarter of the period covered by this report that have materially affected or are reasonably likely to materially affect, the registrant’s internal control over financial reporting.
Item 12. Disclosure of Securities Lending Activities for Closed-End Investment Companies.
Not applicable.
Item 13. Exhibits.
(a)(1) Not applicable.
(a)(2) Certifications pursuant to Rule 30a-2(a) are attached hereto.
(a)(3) Not applicable.
(b) Certifications pursuant to Rule 30a-2(b) are furnished herewith.
SIGNATURES
Pursuant to the requirements of the Securities Exchange Act of 1934 and the Investment Company Act of 1940, the registrant has duly caused this report to be signed on its behalf by the undersigned, thereunto duly authorized.
| (Registrant) | Oak Associates Funds |
| By (Signature and Title) | /s/ Charles A. Kiraly | |
| Charles A. Kiraly, President and Principal Executive Officer | ||
| Date | 6/18/2018 |
Pursuant to the requirements of the Securities Exchange Act of 1934 and the Investment Company Act of 1940, this report has been signed below by the following persons on behalf of the registrant and in the capacities and on the dates indicated.
| By (Signature and Title) | /s/ Charles A. Kiraly | |
| Charles A. Kiraly, President and Principal Executive Officer | ||
| Date | 6/18/2018 |
| By (Signature and Title) | /s/ Bryan Ashmus | |
| Bryan Ashmus, Treasurer and Principal Financial Officer | ||
| Date | 6/18/2018 |