UNITED STATES
SECURITIES AND EXCHANGE COMMISSION
Washington, D.C. 20549
FORM N-CSR
CERTIFIED SHAREHOLDER REPORT OF REGISTERED
MANAGEMENT INVESTMENT COMPANIES
Investment Company Act file number : 811-08549
Oak Associates Funds
(Exact name of registrant as specified in charter)
3875 Embassy Parkway, Suite 250
Akron, Ohio 44333
(Address of principal executive offices) (Zip code)
Charles A. Kiraly
3875 Embassy Parkway, Suite 250
Akron, Ohio 44333
(Name and address of agent for service)
Registrant’s telephone number, including area code: 1-888-462-5386
Date of fiscal year end: October 31
Date of reporting period: October 31, 2018
Form N-CSR is to be used by management investment companies to file reports with the Commission not later than 10 days after the transmission to stockholders of any report that is required to be transmitted to stockholders under Rule 30e-1 under the Investment Company Act of 1940 (17 CFR 270.30e-1). The Commission may use the information provided on Form N-CSR in its regulatory, disclosure review, inspection and policymaking roles.
A registrant is required to disclose the information specified by Form N-CSR, and the Commission will make this information public. A registrant is not required to respond to the collection of information contained in Form N-CSR unless the Form displays a currently valid Office of Management and Budget ("OMB") control number. Please direct comments concerning the accuracy of the information collection burden estimate and any suggestions for reducing the burden to Secretary, Securities and Exchange Commission, 450 Fifth Street, NW, Washington, DC 20549-0609. The OMB has reviewed this collection of information under the clearance requirements of 44 U.S.C. § 3507.
Item 1. Reports to Stockholders.

Oak Investment Philosophy |
Oak Associates, ltd., advisor to the Oak Associates Funds, has been managing concentrated, low-turnover portfolios for over 30 years.
We appreciate the many long-term shareholders who invest alongside us in the Oak Associates Funds. Oak Associates employees, as well as their friends and families, maintain significant investments in the Funds. As fellow shareholders, we have a vested interest in ensuring that the highest standards are maintained and that the portfolios are positioned for future growth. Here is our approach to investing. |
 | Long-term focus |
| To us, the appeal of an investment is driven by the long-term fundamentals of the company and its opportunity set, rather than short-term trading factors. We believe that this long-term mindset is increasingly valuable in today’s short-term oriented market. | |
 | Concentrated portfolios |
| We construct our portfolios with our best ideas, which means that our favorite stock ideas aren’t diluted by investments in less-favored positions. Academic studies have shown that managers gave up performance because they failed to concentrate in their best ideas. Concentration takes discipline, conviction and experience. We continue to adhere to a strategy of concentrated portfolios. | |
 | Low turnover |
| When we invest in a company, we do so with the intention of holding that stock for several years, not a few quarters. Low turnover can have the effect of minimizing trading costs as well as tempering the natural human instinct to act upon every data point. | |
 | Independent thinking |
| Being a good investor often requires not doing what the rest of the market is doing. While it’s difficult to go against the crowd – because as humans we are physiologically wired to herd – we believe that long-term outperformance requires it. One benefit of being located in Akron, Ohio (aside from being a great place to live), is that we are removed from the financial centers in other areas of the country, minimizing our chances of being swept up by the herd mentality. We value independent thinking and believe it is beneficial to our investment perspective. |
The value of a Fund’s investments will vary from day to day in response to the activities of individual companies and general market and economic conditions. Due to a limited number of underlying investments, funds that invest a signification portion of their assets in particular industry sectors or concentrated funds that focus on a particular industry or group of industries are more susceptible to the price movements of any one holding or industry and thus are generally more volatile than a portfolio invested in a wider variety of industries or industry sectors.
TABLE of CONTENTS |
Shareholder Letter | 1 |
Performance Update | |
White Oak Select Growth Fund | 6 |
Pin Oak Equity Fund | 9 |
Rock Oak Core Growth Fund | 11 |
River Oak Discovery Fund | 13 |
Red Oak Technology Select Fund | 15 |
Black Oak Emerging Technology Fund | 17 |
Live Oak Health Sciences Fund | 19 |
Important Disclosures | 21 |
Disclosure of Fund Expenses | 23 |
Financial Statements | |
Schedules of Investments | 25 |
Statements of Assets and Liabilities | 45 |
Statements of Operations | 47 |
Statements of Changes in Net Assets | 49 |
Financial Highlights | 53 |
Notes to Financial Statements | 57 |
Report of Independent Registered Public Accounting Firm | 68 |
Additional Information | 69 |
Shareholder Letter
November 30, 2018
Dear Fellow Shareholder:
With the passage of The Tax Cuts and Jobs Act, and the continuation of strong incremental pretax corporate profit margins, corporate profits surged in 2018. Stock prices rose more modestly than did profits, meaning price/earnings multiples contracted. This is not surprising, as the market looks ahead, and discounted the news of the fatter profits in advance. So why did stock multiples contract? There are a couple of plausible explanations. One is that the market grew increasingly concerned about United States trade policy - specifically toward China. Each side has imposed tariffs on imports from the other nation, a game of tit for tat that has shown no sign of ending. As we have written about on numerous occasions, this burgeoning trade war concerns us, as it threatens to upend the economic status quo – a status quo that has been characterized by booming corporate profits that were created to a significant degree by the ability of American companies to take advantage of global supply chains and also to move production offshore. Analysts or reporters sometimes publish simple calculations that indicate a small impact of tariffs on economic output. These are dangerously misleading, as they fail to account for all the effects of such policy.
Another possible drag on stock returns over the past year was rising interest rates. As the economy has expanded and inflation has edged higher, the Federal Reserve has raised short-term lending rates, which acts as a headwind on economic growth. In addition, the rise in longer-term rates such as those on mortgages has not only made home purchases more expensive but has acted as a disincentive for homeowners to trade up, as one would have to switch from a mortgage that was likely locked in at a much lower rate to one based on higher prevailing rates. This lack of home turnover has deprived the economy of a natural lubricant.
So given the escalating tariffs and rising interest rates, the market has begun pricing in a reasonable chance of recession. We don’t know how the trade war will play out, but the market’s response to all this seems rational.
Fortunately, before the market sold off and defense and stability came back into favor, Oak made some minor shifts in that direction in some of the funds. This consisted primarily of adding to healthcare, which looked attractive to us. This helped us better weather the autumn correction.
Another noteworthy development during the year was the continued outperformance of “growth” (companies that are growing sales or earnings at high rates) versus “value” (companies that trade at low valuations). Since the beginning of 2017 there has been a large gap in returns between the two groups, though growth gave back a chunk of this in October. In fact, growth stocks have had the upper hand for the
1 | 1-888-462-5386 | www.oakfunds.com |
Shareholder Letter
better part of ten years, an unusual state of affairs given the superior long-term record of value stocks. We do have some large positions in growth stocks, but on the whole the strength in growth probably hurt us on a relative basis over the past year.
It is interesting to look at returns for the ten years ending October 31, as the starting point is the middle of the 2008 financial crisis. For our three largest funds....
Red Oak’s ten-year cumulative return was 529.68%, versus 380.56% for the Lipper Science & Technology Funds Average. White Oak’s cumulative return was 292.79%, versus 246.68% for the S&P 500 and 276.68% for the Lipper Large-Cap Growth Funds Average. Pin Oak returned 371.46%, versus 207.67% for the Lipper Multi-Cap Core Funds Average and 250.02% for the Russell 3000® Total Return Index. Clearly those that stuck with stocks and resisted the urge to sell during the crisis were rewarded over the long run. Given the different starting point, we expect returns for the next ten years to be much lower.
In large part due to these strong returns, our funds have garnered strong interest from new investors. This goes against the recent industry trend of money flowing away from active managers like Oak and toward passive products like index funds. We are grateful for your business and appreciative of the confidence you have placed in us. You may be interested in visiting our website, www.oakfunds.com, which was re-launched in 2018. It is a good resource for Oak commentaries and recent news.
Best regards,

Mark Oelschlager, CFA
Co-Chief Investment Officer and Portfolio Manager
All investing involves risk. The performance data quoted represents past performance. Past performance does not guarantee future results. The investment return and principal value of an investment will fluctuate so that an Investor’s shares, when redeemed, may be worth more or less than their original cost and current performance may be lower or higher than the performance quoted. Visit www.oakfunds.com/Funds/Performance.aspx for standardized performance, including performance data current to the most recent month-end. The commentary above and later where it appears in this report, is for informational purposes only and does not represent an offer, recommendation or solicitation to buy, hold or sell any security. The specific securities identified and described do not represent all of the securities purchased or sold and you should not assume that investments in the securities identified and discussed will be profitable.
Annual Report | October 31, 2018 | 2 |
HIGHLIGHTS from the 2018 FISCAL YEAR
October 31, 2017 to October 31, 2018 (Unaudited)
November 2017 | Investopedia highlighted Red Oak Technology Select among “top technology mutual fund picks for 2017” (“Top 4 Technology Mutual Funds for 2017,” by Sheila Olson). November 16, 2017. |
December 2017 | Zacks Equity Research profiled Red Oak Technology Select in its article, “Is Red Oak Technology Select (ROGSX) a Strong Mutual Fund Pick Right Now?” December 27, 2017. |
February 2018 | In “The Journal Report,” the Wall Street Journal’s monthly review of mutual funds, Rock Oak Core Growth appeared in ‘Category Kings,’ ranking among top funds in its peer group for year-to-date total return through January 31, according to Lipper. February 5, 2018.
Financial Planning listed Red Oak Technology Select in its slide show of “Top-performing stock funds since 2008 financial crisis.” Red Oak was the 18th-best performer among stock funds with at least $500 million, for the 10 year period. By Lee Conrad and Andrew Shilling. February 21, 2018.
Lipper Fund Awards 2018 – For the second year in a row, Lipper recognized Red Oak Technology Select for its Consistently Strong Risk-Adjusted Performance for 10 years as of 11/30/2017 among 104 Science and Technology Funds at the Lipper Awards Ceremony on February 27, 2018.
Oak Associates was pleased to report lower expense ratios for all seven Funds, as of the October 31, 2017 Annual Report. Each fund is now operating at its lowest expense ratio in ten years (or more). Of particular note, the three largest funds (White Oak, Pin Oak and Red Oak) have expenses below 1.00%. |
HIGHLIGHTS from the 2018 FISCAL YEAR
October 31, 2017 to October 31, 2018 (Unaudited)
March 2018 | In the annual funds review in the March issue of Kiplinger’s Personal Finance, Red Oak Technology Select appeared ranked among top-10 sector funds for five years through December 31, according to Morningstar. (“Winners, Winners, Winners: U.S. stocks posted stellar results, but foreign stocks did even better,” p. 56, by Anne Kates Smith).
Robert Stimpson was quoted about Cognizant Technology Solutions in USA Today’s lead article in the Money section, “From Apple to Lockheed Martin, 9 Stocks to Splurge On This Spring” (page 1B, by Adam Shell). March 16, 2018.
CNBC.com profiled Pin Oak Equity: “Manager of this market-beating fund finds success despite not being a ‘gunslinger’ like his dad” by Fred Imbert. March 27, 2018.
On March 28, Oak Associates Funds introduced the newly designed oakfunds.com. The site was re-launched with the goal of enhancing our investors’ online experience. |
April 2018 | MarketWatch profiled Pin Oak Equity in “The Secret to Being a Better Investor.” Highlights included: “Everybody cares what other people think. But if you care less about that, you [may] have an advantage in the market.” and “Key winning personality traits you need to beat the markets: Be indifferent to what others think; be unemotional about investing; be humble.” - Mark Oelschlager, Portfolio Manager of Pin Oak Equity and Co-Chief Investment Officer of Oak Associates.
Red Oak Technology Select Fund (ROGSX) was named to Charles Schwab’s Mutual Fund OneSource Select List™ and Schwab’s Mutual Fund Select List Advisor Edition™ for the second quarter of 2018. |
May 2018 | In “The Journal Report,” the Wall Street Journal’s monthly review of mutual funds, Rock Oak Core Growth appeared in ‘Category Kings,’ ranking among top funds in its peer group for year-to-date total return through April 30, according to Lipper. May 7, 2018.
Red Oak Technology Select was among recommendations by CFRA (the Center for Financial Research & Analysis) in the ETF Trends article (“Energy and Tech are not Necessarily Oil and Water in a Fund,” by Todd Rosenbluth). May 16, 2018. |
HIGHLIGHTS from the 2018 FISCAL YEAR
October 31, 2017 to October 31, 2018 (Unaudited)
July 2018 | Barron’s profiled Mark Oelschlager and Pin Oak Equity Fund, writing, “Mark Oelschlager, the manager of Oak Associates’ Pin Oak Equity Fund, has shown he can be a good shepherd in good times and bad. The $246.4 million fund, which has earned a five-star rating from Morningstar, is ranked No.1 in its large blend category for the past 10 and 15 years, and has outperformed both its peers and the S&P 500 for the past three, five, 10, and 15 years. The no-load fund charges annual fees of 0.97%.” (“Alphabet, H&R Block, and 4 Other Stocks for Turbulent Times” by Teresa Rivas.”) July 30, 2018.
Red Oak Technology Select Fund (ROGSX) was named to Charles Schwab’s Mutual Fund OneSource Select List™ and Schwab’s Mutual Fund Select List Advisor Edition™ for the third quarter of 2018. |
August 2018 | Forbes listed Red Oak Technology Select and Pin Oak Equity in “Choose These Mutual Funds If They Are Available In Your 401(k) Plan” by Ken Kam. Excerpt: “Choose The Manager Not The Fund... Morningstar’s mutual fund database returned 17 no-load mutual funds that are still open to new investors and whose managers have been at the helm for 10 years, long enough to prove their skill. All have outperformed the S&P 500’s 10 year return of 10.61% and their category benchmark by enough of a margin to make a difference to investors.” August 2, 2018.
Financial Planning listed Red Oak Technology Select in its slide show of “Top-performing active funds since the financial crisis.” Red Oak was the 12th-best performer for 10 years among actively-managed stock funds with at least $250 million in assets and initial investment minimums of $100, 000 or lower. By Andrew Shilling and Maddy Perkins. August 8, 2018. |
October 2018 | Barron’s quoted Robert Stimpson in its article “Dow Tumbles 180 Points Because the Jobs Report Is Really an Inflation Gauge,” by Teresa Rivas. October 5, 2018.
Red Oak ranked #8 among active funds for three years with a 21.89% average annual return in Financial Planning’s list, according to Morningstar Direct (“Top-performing active mutual funds over 3 years,” Andrew Shilling). October 24, 2018. |
READ MORE AT WWW.OAKFUNDS.COM
White Oak Select Growth Fund
James D. Oelschlager & Portfolio Manager
 Mark W. Oelschlager, CFA
 Robert D. Stimpson, CFA | White Oak Select Growth Fund (the “Fund”) gained 9.46% for the fiscal year ended October 31, 2018, while the S&P 500 Index returned 7.35% and the Lipper Large-Cap Growth Funds Average returned 9.59%. For the last ten years, the Fund’s cumulative return was 292.79%, versus 246.68% for the S&P 500.
US stocks had a solid year as tax reform took the baton from loose monetary policies to drive stocks higher. Shares of companies characterized as growth stocks disproportionately outperformed during the fiscal year. As the economic expansion ages, companies which can grow earnings and revenues often receive a scarcity premium. The Federal Reserve progressed on its path to raise short-term interest rates as it seeks to normalize the tools in its financial arsenal in preparation for the next recession. For now, it appears the interest rate hikes are not due to any tangible threat of inflation, but more a removal of the quantitative easing lingering from the 2008 sub-prime crisis. The Fed’s mandate is to promote employment and prevent inflation. With unemployment at a historically low level less than 4% and few signs of inflation, the Fed’s actions appear consistent with a desire to prepare for future battles rather than curtail the current expansion.
Tax reform added a boost to equities due to the ability to repatriate foreign profits at lower rates and fewer tax brackets. The reforms increase the probability of additional return of capital to shareholders through dividends or buybacks. They also help keep profit margins up and allow for additional expansion, investment, or higher wages. Consumer sentiment has remained healthy throughout the year and GDP growth at 3.5% is considered a healthy level. One area of weakness is housing, where higher rates have affected some markets and the homebuilding stocks. But longer-term, the supply and demand for new homes and household creation should support the sector. Housing remains a key area of the economy as it represents a significant asset on the consumer’s balance sheet.
As the economic expansion has aged, the Fund has broadened its sector exposure bets with financials, technology and health care carrying similar weights. Financials tend to benefit from higher interest rates, particularly when the consumer is healthy and lending standards are improving. Yet in this cycle, the flattening of the yield curve has hampered the group. This overhang is likely to abate as rates normalize. Within the Fund, the best performing holding was Express Scripts. The pharmacy benefits management company rose 58%. The largest contributor to returns was online retailing giant Amazon.com. Amazon.com was up 44% during the year as it continues to transform commerce and successfully expand into related areas such as cloud services, digital content and home automation.
State Street Corporation was the worst performing stock in the Fund. Financials tend to benefit from a rising interest rate environment, but this cycle the sector has been hampered by the flattening of the yield curve which narrows the interest rate spread important to margins. |

Annual Report | October 31, 2018 | 6 |
White Oak Select Growth Fund
Looking to 2019, a resolution to the Chinese trade dispute would be a positive for stocks. As it stands, the uncertainty of the disagreement is affecting corporations’ decisions about supply chains and investment which have been a main driver of record high profit margins. A failure to resolve the disagreement and avoid a large trade war could hurt equity prices. Fortunately, the President knows this and needs both the economy and the stock market healthy in advance of the 2020 election cycle. The Federal Reserve has also suggested its willingness to be accommodative to the economy and pause rate increases if needed.
Overall, the interest rate environment remains low and corporations continue to demonstrate fiscal restraint that tends to benefit shareholders.
Thank you for your investment with Oak Associates Funds.
Mutual fund investing involves risk, including the possible loss of principal. The value of the Fund’s investments will vary from day to day in response to the activities of individual companies and general market and economic conditions. Because the Fund may invest a significant portion of its assets in particular industry sectors which it believes hold the most potential for favorable returns, poor performance or adverse economic events affecting one or more of these overweighted sectors could have a greater impact on the Fund than it would on another mutual fund with a broader range of investments.
7 | 1-888-462-5386 | www.oakfunds.com |
White Oak Select Growth Fund | Performance Update |
All data below as of October 31, 2018 (Unaudited) |
Fund Data |
|
Ticker | WOGSX |
Share Price | $89.55 |
Total Net Assets | $318.0M |
Portfolio Turnover | 14% |
Sector Allocation^ |
|
Information Technology | 26.9% |
Financials | 22.2% |
Health Care | 21.0% |
Consumer Discrectionary | 12.2% |
Communication Services | 11.9% |
Consumer Staples | 2.4% |
Cash & Other Assets | 3.4% |
Top 10 Holdings^ |
| |
1. | Alphabet, Inc. | 9.9% |
2. | Amazon.com, Inc. | 9.6% |
3. | Cisco Systems, Inc. | 7.8% |
4. | Charles Schwab Corporation (The) | 6.6% |
5. | Amgen, Inc. | 6.5% |
6. | KLA-Tencor Corporation | 5.2% |
7. | Pfizer, Inc. | 5.1% |
8. | Xilinx, Inc. | 5.1% |
9. | U.S. Bancorp | 4.3% |
10. | TCF Financial Corporation | 3.4% |
| ^ | Percentages are based on net assets. Holdings are subject to change. |
Growth of $10,000 Chart
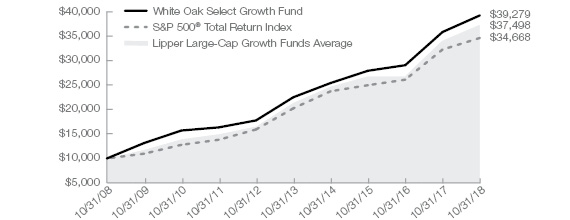
The chart represents historical performance of a hypothetical investment of $10,000 in the Fund over the past 10 years. Past performance does not guarantee future results. This chart and the table below do not reflect the deduction of taxes that a shareholder would pay on Fund distributions or the redemption of Fund shares.
Average Annual Total Return | ||||
| 1 Year | 3 Year | 5 Year | 10 Year |
White Oak Select Growth Fund | 9.46% | 12.01% | 11.76% | 14.66% |
S&P 500® Total Return Index1 | 7.35% | 11.52% | 11.34% | 13.24% |
Lipper Large-Cap Growth Funds Average2 | 9.59% | 11.70% | 11.82% | 14.07% |
Gross/Net Expense Ratio (per the prospectus dated February 28, 2018): 0.97%
Gross/Net Expense Ratio (as of fiscal year end October 31, 2018): 0.93%
The performance data quoted represents past performance. Past performance does not guarantee future results. The investment return and principal value of an investment will fluctuate so that an investor’s shares, when redeemed, may be worth more or less than their original cost and current performance may be lower or higher than the performance quoted. For performance data current to the most recent month-end, please visit www.oakfunds.com or call 1-888-462-5386.
| 1 | Standard & Poor’s is the source and owner of the S&P Index data. 2 Lipper Inc. is the source and owner of the Lipper Classification data. See Pages 18 and 19 for additional disclosure. |
Annual Report | October 31, 2018 | 8 |
Pin Oak Equity Fund

Mark W. Oelschlager, CFA
Co-Chief Investment Officer
& Portfolio Manager
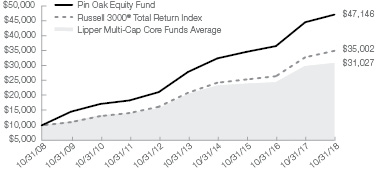
Pin Oak Equity Fund (the “Fund”) returned 5.75% for the fiscal year ended October 31, 2018, while the Russell 3000® Total Return Index returned 6.60% and the Lipper Multi-Cap Core Funds Average returned 3.43%. For the last ten years, the Fund’s cumulative return was 371.46%, versus 250.02% for the Russell and 207.67% for the Lipper. This was the tenth consecutive fiscal year of positive returns for the Fund, a streak sure to end at some point.
The strength of growth and momentum stocks that started in 2017 continued into 2018. This was a headwind for the Fund’s relative performance, as, with a few exceptions, we tend to favor stocks with lower embedded expectations. Despite this, the Fund held its own for the year. More significantly, the long-term relative performance is far above that of our peers and the benchmark. We are long-term investors - and we prefer to be judged that way.
In the last month of the fiscal year, the growth and momentum trade suddenly reversed as the market sold off. The Fund held up slightly better than the market during this correction.
During the year, as valuations and economic risks both rose, we continued to gradually reduce risk by trimming exposure to economically sensitive areas and adding to more defensive ones. One of the defensive sectors, healthcare, has been an area of emphasis for us recently, as the market has priced in what we believe are relatively bearish scenarios for many of the pharmaceutical and biotech companies. This sets up the opportunity for outperformance if things play out there better than the market expects.
As mentioned, the net effect of the changes during the year was to give the Fund more stability/defensiveness, but it also resulted in a more diversified portfolio. The changes were not dramatic, and we do maintain large exposure to the financials sector and select areas within technology, both of which are economically sensitive, but a more balanced portfolio seems prudent at a time in which there are fewer obvious market dislocations.
Leaders during the year included media company Twenty-First Century Fox, which reached an agreement to sell some of its properties to Disney; Internet conglomerate IAC/Interactive, whose online dating service continues to grow; and specialty pharmaceutical company Teva, which demonstrated progress in its turnaround effort under its new CEO.
Laggards included apparel company Hanesbrands, who lost a large contract with a major retailer; e-commerce facilitator eBay, who saw rising competition in its core business; and private-label credit card purveyor Synchrony Financial, which lost a large contract to a major retailer.
Thank you for your investment with Oak Associates Funds.
Mutual fund investing involves risk, including the possible loss of principal. The value of the Fund’s investments will vary from day to day in response to the activities of individual companies and general market and economic conditions. Because the Fund may invest a significant portion of its assets in particular industry sectors which it believes hold the most potential for favorable returns, poor performance or adverse economic events affecting one or more of these overweighted sectors could have a greater impact on the Fund than it would on another mutual fund with a broader range of investments.
9 | 1-888-462-5386 | www.oakfunds.com |
Pin Oak Equity Fund | Performance Update |
All data below as of October 31, 2018 (Unaudited) |
Fund Data |
|
Ticker | POGSX |
Share Price | $66.18 |
Total Net Assets | $260.9M |
Portfolio Turnover | 12% |
Sector Allocation^ |
|
Financials | 28.5% |
Information Technology | 15.8% |
Health Care | 14.8% |
Communication Services | 13.6% |
Consumer Discrectionary | 11.7% |
Energy | 4.6% |
Consumer Staples | 4.5% |
Materials | 1.0% |
Industrials | 0.1% |
Cash & Other Assets | 5.4% |
Top 10 Holdings^ |
| |
1. | Alphabet, Inc. | 6.6% |
2. | Bank of New York Mellon Corporation (The) | 5.0% |
3. | Charles Schwab Corporation (The) | 4.7% |
4. | PepsiCo, Inc. | 4.5% |
5. | Paychex, Inc. | 4.4% |
6. | Twenty-First Century Fox, Inc. - Class B | 4.1% |
7. | GlaxoSmithKline plc - ADR | 3.8% |
8. | Valero Energy Corporation | 3.7% |
9. | KLA-Tencor Corporation | 3.4% |
10. | Capital One Financial Corporation | 3.2% |
| ^ | Percentages are based on net assets. Holdings are subject to change. |
Growth of $10,000 Chart
| The chart represents historical performance of a hypothetical investment of $10,000 in the Fund over the past 10 years. Past performance does not guarantee future results. This chart and the table below do not reflect the deduction of taxes that a shareholder would pay on Fund distributions or the redemption of Fund shares. |
Average Annual Total Return | ||||
| 1 Year | 3 Year | 5 Year | 10 Year |
Pin Oak Equity Fund | 5.75% | 10.79% | 11.04% | 16.77% |
Russell 3000® Total Return Index1 | 6.60% | 11.27% | 10.81% | 13.35% |
Lipper Multi-Cap Core Funds Average2 | 3.43% | 8.66% | 8.36% | 11.78% |
Gross/Net Expense Ratio (per the prospectus dated February 28, 2018): 0.97%
Gross/Net Expense Ratio (as of fiscal year end October 31, 2018): 0.95%
The performance data quoted represents past performance. Past performance does not guarantee future results. The investment return and principal value of an investment will fluctuate so that an investor’s shares, when redeemed, may be worth more or less than their original cost and current performance may be lower or higher than the performance quoted. For performance data current to the most recent month-end, please visit www.oakfunds.com or call 1-888-462-5386.
| 1 | Russell Investments is the source and owner of the Russell Index data. 2 Lipper Inc. is the source and owner of the Lipper Classification data. See Pages 18 and 19 for additional disclosure. |
Annual Report | October 31, 2018 | 10 |
Rock Oak Core Growth Fund

Robert D. Stimpson, CFA
Portfolio Manager
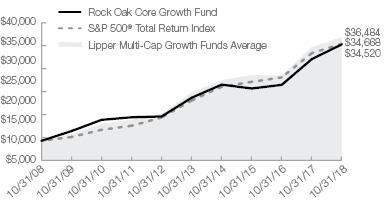
Rock Oak Core Growth Fund (the “Fund”) gained 12.15% for the fiscal year ended October 31, 2018, while the S&P 500® Index returned 7.35% and the Lipper Multi-Cap Growth Funds Average returned 7.71%. Over the last ten years, the Fund has gained 13.19% per year on average.
The fiscal year 2018 saw US stocks driven by a handful of large-cap growth stocks. As the economic expansion aged and geopolitical risks increased, investors favored companies characterized by their ability to grow earnings despite the prospects of a slowing economy. Tax reform in early 2018 also boosted stocks as lower taxes support higher profit margins, incremental investment, and additional return on capital to shareholders through dividends and buybacks. With the Federal Reserve determined to reset the Fed Funds rate to a normalized level and remove the loose monetary conditions that helped support the economy since the 2008 sub-prime crisis, stocks welcomed the additional stimulus that tax relief provides while the Fed withdraws quantitative easing.
During the fiscal year, the Federal Reserve methodically raised Fed Funds rates by 1% to 2.25%, the highest level in a decade. The Central Bank was able to raise the short-term lending rate due to continued strong economic data and the perception the stimulus provided by low interest rates could be withdrawn. National unemployment has fallen below 4%, an 18-year low, and tangible evidence the economy has been robust. Given the Fed’s dual mandate to promote full-employment and thwart inflation, the Fed walks a fine line between job growth and inflation tied to a tight labor market and rising prices. For now, there appears to be sufficient slack in the economy to raise interest rates with historically low unemployment rates. As it had in 2017, a rising interest rate environment and potential of slower economic growth disproportionally benefited the large-cap growth sector of the market. Companies that demonstrate the ability to grow sales or earnings in a slowing economy often obtain a premium as economic prospects narrow. This cycle was no exception.
The Fund’s best performing stock was NetApp Inc., which rose 79%. The storage network company benefited from the proliferation of flash-based storage devices and growth in the firm’s cloud data analytics platform. Netflix was the Fund’s second best performer. The online media company climbed 56% due to subscriber growth and successful content creation.
The Fund’s largest laggard was hard-drive maker Western Digital, which fell 50% despite its low valuation. The company’s stock suffered from ongoing weakness in memory and disc drive prices.
Going forward, the Fund remains focused on seeking companies with strong earnings prospects that have also demonstrated a commitment to creation of shareholder value. The outlook for US stocks remains attractive due to the low inflation, stable growth environment and prudent financial discipline which support company fundamentals.
Thank you for your investment with Oak Associates Funds.
Mutual fund investing involves risk, including the possible loss of principal. The value of the Fund’s investments will vary from day to day in response to the activities of individual companies and general market and economic conditions. Because the Fund may invest a significant portion of its assets in particular industry sectors which it believes hold the most potential for favorable returns, poor performance or adverse economic events affecting one or more of these overweighted sectors could have a greater impact on the Fund than it would on another mutual fund with a broader range of investments.
11 | 1-888-462-5386 | www.oakfunds.com |
Rock Oak Core Growth Fund | Performance Update |
All data below as of October 31, 2018 (Unaudited) |
Fund Data |
|
Ticker | RCKSX |
Share Price | $17.02 |
Total Net Assets | $20.4M |
Portfolio Turnover | 14% |
Sector Allocation^ |
|
Information Technology | 41.2% |
Health Care | 13.7% |
Consumer Discrectionary | 12.4% |
Communication Services | 10.6% |
Financials | 7.3% |
Energy | 4.9% |
Industrials | 3.0% |
Consumer Staples | 2.7% |
Cash & Other Assets | 4.2% |
Top 10 Holdings^ |
| |
1. | Baidu, Inc. - ADR | 4.0% |
2. | CA, Inc. | 4.0% |
3. | Amazon.com, Inc. | 3.7% |
4. | Alliance Data Systems Corporation | 3.6% |
5. | F5 Networks, Inc. | 3.5% |
6. | NetApp, Inc. | 3.4% |
7. | Cognizant Technology Solutions Corporation - Class A | 3.2% |
8. | Gilead Sciences, Inc. | 3.2% |
9. | TAL Education Group - ADR | 3.2% |
10. | Ralph Lauren Corporation | 3.1% |
| ^ | Percentages are based on net assets. Holdings are subject to change. |
Growth of $10,000 Chart
| The chart represents historical performance of a hypothetical investment of $10,000 in the Fund over the past 10 years. Past performance does not guarantee future results. This chart and the table below do not reflect the deduction of taxes that a shareholder would pay on Fund distributions or the redemption of Fund shares. Fee waivers are in effect; if they had not been in effect, performance would have been lower. |
Average Annual Total Return | ||||
| 1 Year | 3 Year | 5 Year | 10 Year |
Rock Oak Core Growth Fund | 12.15% | 13.99% | 10.50% | 13.19% |
S&P 500® Total Return Index1 | 7.35% | 11.52% | 11.34% | 13.24% |
Lipper Multi-Cap Growth Funds Average2 | 7.71% | 10.72% | 10.10% | 13.68% |
Gross/Net Expense Ratio (per the prospectus dated February 28, 2018): 1.50%/1.25%
Gross/Net Expense Ratio (as of fiscal year end October 31, 2018): 1.32%/1.25%
The Adviser has contractually agreed through February 28, 2019, to waive all or a portion of its fee for the Fund (and to reimburse expenses to the extent necessary) in order to limit Fund total operating expenses (excluding interest, taxes, brokerage commissions and “Acquired Fund” Fees and Expenses, as applicable) to an annual rate of not more than 1.25% of average daily net assets. This contractual waiver may only be terminated subject to approval by the Board of Trustees of the Trust.
The performance data quoted represents past performance. Past performance does not guarantee future results. The investment return and principal value of an investment will fluctuate so that an investor’s shares, when redeemed, may be worth more or less than their original cost and current performance may be lower or higher than the performance quoted. For performance data current to the most recent month-end, please visit www.oakfunds.com or call 1-888-462-5386.
| 1 | Standard & Poor’s is the source and owner of the S&P Index data. 2 Lipper Inc. is the source and owner of the Lipper Classification data. See Pages 18 and 19 for additional disclosure. |
Annual Report | October 31, 2018 | 12 |
River Oak Discovery Fund

Robert D. Stimpson, CFA
Portfolio Manager
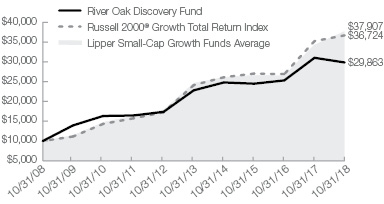
River Oak Discovery Fund (the “Fund”) lost 3.82% for the fiscal year ended October 31, 2018, while the Russell 2000 Growth Index rose 4.13%. Over the last ten years, the Fund has gained 11.56% per year on average.
For the fiscal year 2018, US stocks initially rallied on sweeping tax reform. Lower corporate tax brackets and the ability to repatriate foreign profits can boost margins, enable expansion, generate new investment, and create the potential for addition return of capital to shareholders. As the year progressed, volatility rose due to political rhetoric, concerns over trade policy, and interest rate hikes at the hands of the Federal Reserve. The prospects of rising rates and growing risks pushed investors to congregate into more growth-oriented companies, which tend to outperform as the economy slows. The ability to drive earnings and revenue growth becomes a scarce attribute as the potential for a slower economic expansion develops and investors reward those companies that grow revenue strongly, regardless of valuation.
As the large-cap growth stocks represent a high percentage of the top 10 holdings of popular benchmark indices, the overall performance of the market is masked by the strength in these stocks. As a result, the market is somewhat weaker than the headline numbers indicate. Small-cap stocks also underperformed their large-cap brethren not only due to the dominance of growth stocks within the popular indices, but due to the high risk aversion that often hampers smaller companies.
Unemployment remains low - under 4% - a level that breeds concerns over wage inflation in a tight labor market and the potential for higher rates to thwart economic overheating. GDP growth at 3.5% is a healthy rate and is above the quarterly run rate for 2017. Given the solid economic numbers, it remains likely the Fed will continue on course and raise the Fed Funds rate in several additional 25 basis point increments as it seeks to rearm its toolkit and withdraw quantitative easing. During the fiscal year, the Fed raised rates by a full 1% to 2.25%, the highest level in a decade.
The Fund’s strongest performer this fiscal year was Boston Beer Company, which rose 72%. American Public Education was the Fund’s second best performing holding, rising 59%. The for-profit education company recovered from poor perception of the sector following scandals at competitors and concern over government-backed student loan growth. As these concerns have waned, the sector has recovered strongly and its value proposition of providing alternative educations paths to working individuals and non-traditional student populations appears intact.
The Fund’s worst performing stock was Advanced Energy Industries. The company, which provides power conversion and control systems for the semiconductor industry, fell 49% on concerns over its customer diversification and the industry’s exposure to Chinese factories. President Trump’s administration is set on rewriting the trade policy with China and the rhetoric and uncertainty is weighing on specific sectors.
Looking to 2019, we feel the domestic focus of small-cap stocks is an attractive attribute when considering the weakness in international markets, the strong dollar, and trade risks. The Fund is committed to seeking out niche companies with a strong commitment to creation of shareholder value.
Thank you for your investment with Oak Associates Funds.
Mutual fund investing involves risk, including the possible loss of principal. The value of the Fund’s investments will vary from day to day in response to the activities of individual companies and general market and economic conditions. Because the Fund may invest a significant portion of its assets in particular industry sectors which it believes hold the most potential for favorable returns, poor performance or adverse economic events affecting one or more of these overweighted sectors could have a greater impact on the Fund than it would on another mutual fund with a broader range of investments.
13 | 1-888-462-5386 | www.oakfunds.com |
River Oak Discovery Fund | Performance Update |
All data below as of October 31, 2018 (Unaudited) |
Fund Data |
|
Ticker | RIVSX |
Share Price | $15.88 |
Total Net Assets | $13.0M |
Portfolio Turnover | 43% |
Sector Allocation^ |
|
Information Technology | 33.0% |
Financials | 18.5% |
Consumer Discretionary | 14.4% |
Health Care | 13.5% |
Consumer Staples | 6.0% |
Industrials | 4.6% |
Materials | 4.1% |
Communication Services | 1.1% |
Cash & Other Assets | 4.8% |
Top 10 Holdings^ |
| |
1. | Boston Beer Company, Inc. (The) - Class A | 6.1% |
2. | Adtalem Global Education, Inc. | 4.6% |
3. | Assurant, Inc. | 4.5% |
4. | Aaron's, Inc. | 4.3% |
5. | Mercer International, Inc. | 4.1% |
6. | AllianceBernstein Holding, L.P. | 4.1% |
7. | Kulicke & Soffa Industries, Inc. | 4.0% |
8. | SolarEdge Technologies, Inc. | 4.0% |
9. | Cirrus Logic, Inc. | 3.9% |
10. | KEMET Corporation | 3.9% |
| ^ | Percentages are based on net assets. Holdings are subject to change. |
Growth of $10,000 Chart
| The chart represents historical performance of a hypothetical investment of $10,000 in the Fund over the past 10 years. Past performance does not guarantee future results. This chart and the table below do not reflect the deduction of taxes that a shareholder would pay on Fund distributions or the redemption of Fund shares. Fee waivers are in effect; if they had not been in effect, performance would have been lower. |
Average Annual Total Return | ||||
| 1 Year | 3 Year | 5 Year | 10 Year |
River Oak Discovery Fund | -3.82% | 6.83% | 5.53% | 11.56% |
Russell 2000® Growth Total Return Index1 | 4.13% | 10.72% | 8.75% | 13.89% |
Lipper Small-Cap Growth Funds Average2 | 10.11% | 12.22% | 8.72% | 14.05% |
Gross/Net Expense Ratio (per the prospectus dated February 28, 2018): 1.40%/1.35%
Gross/Net Expense Ratio (as of fiscal year end October 31, 2018): 1.50%/1.35%
The Adviser has contractually agreed through February 28, 2019, to waive all or a portion of its fee for the Fund (and to reimburse expenses to the extent necessary) in order to limit Fund total operating expenses (excluding interest, taxes, brokerage commissions and “Acquired Fund” Fees and Expenses, as applicable) to an annual rate of not more than 1.35% of average daily net assets. This contractual fee waiver may only be terminated subject to approval by the Board of Trustees of the Trust.
The performance data quoted represents past performance. Past performance does not guarantee future results. The investment return and principal value of an investment will fluctuate so that an investor’s shares, when redeemed, may be worth more or less than their original cost and current performance may be lower or higher than the performance quoted. For performance data current to the most recent month-end, please visit www.oakfunds.com or call 1-888-462-5386.
| 1 | Russell Investments is the source and owner of the Russell Index data. 2 Lipper Inc. is the source and owner of the Lipper Classification data. See Pages 18 and 19 for additional disclosure. |
Annual Report | October 31, 2018 | 14 |
Red Oak Technology Select Fund

Mark W. Oelschlager, CFA
Co-Chief Investment Officer
& Portfolio Manager
Red Oak Technology Select Fund (the “Fund”) returned 11.56% for the fiscal year ended October 31, 2018, while the S&P 500® Equal Weight Information Technology Index (the “Index”) returned 8.36% and the Lipper Science & Technology Funds Average returned 5.78%. For the last ten years, the Fund’s cumulative return was 529.68%, versus 483.42% for the Index and 380.56% for the Lipper Science & Technology Funds Average.
For the better part of the last two years, the growth (and momentum) style has been in favor, while value has been out of favor. This has generallly boosted technology stocks, most of which fall into the former category. That said, the Fund’s approach leans toward value, which means we have faced a bit of a headwind recently in competing with our peers. Given this, we are pleased with our outperformance versus other tech funds for the last year. Of course, we believe the long-term results are far more meaningful.
Relative performance aside, as detailed in the first paragraph the absolute returns in technology stocks for the last ten years are staggering. Much of this is due to the starting point: the depths of the 2008 financial crisis. It’s an important reminder that when there is blood in the streets, those that buy, or stay invested, tend to be rewarded.
But the strong run in tech stocks was propelled by other factors as well. The role of technology in our lives continues to grow, which has driven sales higher for those that design the semiconductors, software, and related equipment that power these new products. In addition, there are a handful of large companies (such as Google and Facebook) that have built platforms that make it difficult for others to compete and that also are very scalable, meaning it doesn’t require a lot of additional investment to accommodate more business. Finally, the sector has been the biggest beneficiary of the globalization of supply chains. The ability of companies to pay someone else to manufacture products or to provide the necessary inputs has pushed profit margins higher – and allowed them to remain high for longer than many investors expected - which of course has been good for stock prices.
The Fund’s strongest performer for the year was storage and data management provider NetApp, which is benefiting from the build-out of the cloud. Other standout performers included Internet conglomerate IAC/Interactive, whose online dating service continues to grow, and e-commerce behemoth Amazon, who surprised investors with strong profitability.
Hard-drive company Western Digital was the worst laggard, as it struggled with the transition to solid-state drives. Other poor performers were enterprise tech company IBM, which is attempting to transition its business by acquiring open source software provider Red Hat, and semiconductor company Skyworks Solutions, as sales growth decelerated from 2017.
Thank you for your investment with Oak Associates Funds.
Mutual fund investing involves risk, including the possible loss of principal. The value of the Fund’s investments will vary from day to day in response to the activities of individual companies and general market and economic conditions. Because the Fund may invest a significant portion of its assets in particular industry sectors which it believes hold the most potential for favorable returns, poor performance or adverse economic events affecting one or more of these overweighted sectors could have a greater impact on the Fund than it would on another mutual fund with a broader range of investments.
15 | 1-888-462-5386 | www.oakfunds.com |
Red Oak Technology Select Fund | Performance Update |
All data below as of October 31, 2018 (Unaudited) |
Fund Data |
|
Ticker | ROGSX |
Share Price | $26.90 |
Total Net Assets | $544.2M |
Portfolio Turnover | 9% |
Sector Allocation^ |
|
Information Technology | 75.8% |
Communication Services | 15.8% |
Consumer Discrectionary | 6.3% |
Cash & Other Assets | 2.1% |
Top 10 Holdings^ |
| |
1. | Alphabet, Inc. | 8.6% |
2. | Microsoft Corporation | 5.5% |
3. | Apple, Inc. | 5.1% |
4. | Cisco Systems, Inc. | 5.0% |
5. | Red Hat, Inc. | 4.9% |
6. | Intel Corporation | 4.8% |
7. | Amazon.com, Inc. | 4.5% |
8. | Facebook, Inc. - Class A | 4.0% |
9. | Oracle Corporation | 3.8% |
10. | VMware, Inc. - Class A | 3.7% |
| ^ | Percentages are based on net assets. Holdings are subject to change. |
Growth of $10,000 Chart
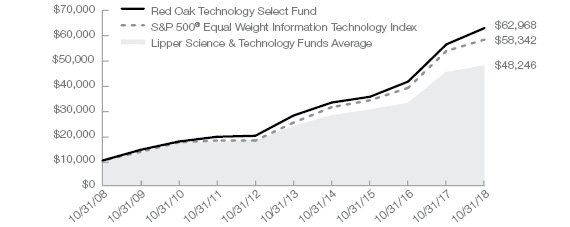
The chart represents historical performance of a hypothetical investment of $10,000 in the Fund over the past 10 years. Past performance does not guarantee future results. This chart and the table below do not reflect the deduction of taxes that a shareholder would pay on Fund distributions or the redemption of Fund shares.
Average Annual Total Return | ||||
| 1 Year | 3 Year | 5 Year | 10 Year |
Red Oak Technology Select Fund | 11.56% | 21.06% | 17.59% | 20.20% |
S&P 500® Equal Weight Information Technology Index1 | 8.36% | 19.64% | 18.30% | 19.29% |
Lipper Science & Technology Funds Average2 | 5.78% | 16.38% | 14.97% | 16.75% |
Gross/Net Expense Ratio (per the prospectus dated February 28, 2018): 0.96%
Gross/Net Expense Ratio (as of fiscal year end October 31, 2018): 0.94%
The performance data quoted represents past performance. Past performance does not guarantee future results. The investment return and principal value of an investment will fluctuate so that an investor’s shares, when redeemed, may be worth more or less than their original cost and current performance may be lower or higher than the performance quoted. For performance data current to the most recent month-end, please visit www.oakfunds.com or call 1-888-462-5386.
| 1 | Standard & Poor’s is the source and owner of the S&P Index data. 2 Lipper Inc. is the source and owner of the Lipper Classification data. See Pages 18 and 19 for additional disclosure. |
Annual Report | October 31, 2018 | 16 |
Black Oak Emerging Technology Fund

Robert D. Stimpson, CFA
Portfolio Manager
Black Oak Emerging Technology Fund (the “Fund”) gained 8.12% during the fiscal year ended October 31, 2018, while the S&P 500® Equal Weighted Technology Index and the Lipper Science & Technology Funds Average returned 5.78%. Over the last ten years, the Fund has gained 14.14% per year on average.
Technology stocks had a good 2018. Driven by strong corporate profits, optimism over the potential return of capital to shareholders, and a preference for growth sectors, US tech stocks led the market higher. The gains were most pronounced in the large-cap stocks, particularly in the growth space. As the economic expansion has aged, and with the Federal Reserve raising interest rates, companies characterized by the ability to grow revenue when the economy is slowing have found favor with investors. These large-cap, blue chip tech growth stocks also dominate most market indexes, skewing the performance of the indexes relative to the broader market and their small-cap peers.
In general, stocks have enjoyed the low-inflation, slow growth environment and thrived despite the prospects of higher short-term interest rates. The path to normalized short-term rates has begun and is beginning to show its effects on areas of the economy, such as housing. But GDP growth remains healthy at 3.5% and unemployment has fallen below 4%, an 18-year low.
President Trump’s protectionist position on trade remains a concern and will be something to monitor going forward. Having reached new trade deals with Mexico and Canada, the administration seems committed to a tougher stance with China. The uncertainty, particularly for tech companies with extensive supply chains in China such as the semiconductor and consumer electronics companies, hangs over the industry.
The Fund’s top performing stock for the year was Fortinet, a cyber security company, which rose 108%. Cyber attacks are only increasing in the digital economy and protecting networks, consumer information, and digital assets are a top spending priority. Storage networking company Netapp was the second best performing holding, at a 79% gain. Demand for its cloud based services and memory products has been strong.
The Fund’s worst performing stock was Netease Inc., a Chinese gaming and social media company. The stock has fallen on concerns over the domestic Chinese economy and changes to the approval process for new video games. The effects a trade war and the rising dollar might wreak on the mainland economy have also affected most US-listed Chinese ADRs. While understandable, the Chinese government will stimulate its economy and has already expressed support for the domestic-centric industries.
Going forward, the Fund will continue to seek opportunities within technology companies exposed to emerging niches, with solid earnings prospects, and that are trading at favorable valuations.
Thank you for your investment with Oak Associates Funds.
Mutual fund investing involves risk, including the possible loss of principal. The value of the Fund’s investments will vary from day to day in response to the activities of individual companies and general market and economic conditions. Because the Fund may invest a significant portion of its assets in particular industry sectors which it believes hold the most potential for favorable returns, poor performance or adverse economic events affecting one or more of these overweighted sectors could have a greater impact on the Fund than it would on another mutual fund with a broader range of investments.
17 | 1-888-462-5386 | www.oakfunds.com |
Black Oak Emerging Technology Fund | Performance Update |
All data below as of October 31, 2018 (Unaudited) |
Fund Data |
|
Ticker | BOGSX |
Share Price | $5.30 |
Total Net Assets | $36.8M |
Portfolio Turnover | 19% |
Sector Allocation^ |
|
Information Technology | 75.6% |
Communication Services | 10.7% |
Health Care | 5.4% |
Financials | 2.3% |
Cash & Other Assets | 6.0% |
Top 10 Holdings^ |
| |
1. | Apple, Inc. | 8.3% |
2. | NetApp, Inc. | 5.5% |
3. | Citrix Systems, Inc. | 4.5% |
4. | Baidu, Inc. - ADR | 4.2% |
5. | F5 Networks, Inc. | 4.2% |
6. | Fortinet, Inc. | 4.1% |
7. | DXC Technology Company | 4.0% |
8. | Illumina, Inc. | 3.9% |
9. | Salesforce.com, inc. | 3.7% |
10. | CA, Inc. | 3.4% |
| ^ | Percentages are based on net assets. Holdings are subject to change. |
Growth of $10,000 Chart
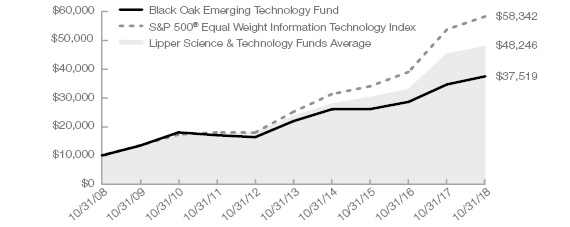
The chart represents historical performance of a hypothetical investment of $10,000 in the Fund over the past 10 years. Past performance does not guarantee future results. This chart and the table below do not reflect the deduction of taxes that a shareholder would pay on Fund distributions or the redemption of Fund shares. Fee waivers are in effect; if they had not been in effect, performance would have been lower.
Average Annual Total Return | ||||
| 1 Year | 3 Year | 5 Year | 10 Year |
Black Oak Emerging Technology Fund | 8.12% | 12.81% | 11.30% | 14.14% |
S&P 500® Equal Weight Information Technology Index1 | 8.36% | 19.64% | 18.30% | 19.29% |
Lipper Science & Technology Funds Average2 | 5.78% | 16.38% | 14.97% | 16.75% |
Gross/Net Expense Ratio (per the prospectus dated February 28, 2018): 1.16%
Gross/Net Expense Ratio (as of fiscal year end October 31, 2018): 1.11%
The performance data quoted represents past performance. Past performance does not guarantee future results. The investment return and principal value of an investment will fluctuate so that an investor’s shares, when redeemed, may be worth more or less than their original cost and current performance may be lower or higher than the performance quoted. For performance data current to the most recent month-end, please visit www.oakfunds.com or call 1-888-462-5386.
| 1 | Standard & Poor’s is the source and owner of the S&P Index data. 2 Lipper Inc. is the source and owner of the Lipper Classification data. See Pages 18 and 19 for additional disclosure. |
Annual Report | October 31, 2018 | 18 |
Live Oak Health Sciences Fund

Mark W. Oelschlager, CFA
Co-Chief Investment Officer & Portfolio Manager
Live Oak Health Sciences Fund (the “Fund”) returned 7.68% for the fiscal year ended October 31, 2018, while the S&P 500® Health Care Index (the “Index”) returned 11.28% and the Lipper Health & Biotechnology Funds Average returned 9.36%. For the last ten years, the Fund’s cumulative return was 280.95%, versus 299.21% for the Index and 348.90% for the Lipper Health & Biotechnology Funds Average.
One of the themes in healthcare over the past year has been disruption. Amazon received pharmacy licenses in some states and acquired an online pharmacy, which spooked some parts of the sector. In addition, Amazon, JP Morgan and Berkshire Hathaway have teamed up to try to lower healthcare costs for their employees. Also, with the Democrats gaining control of the House of Representatives in late 2018, there is the potential for legislation that would allow Medicare to negotiate prices on various therapies, which could hurt pricing power in the sector. President Trump has indicated he is open to this idea.
Growth stocks led the way over the past year, which runs counter to our style. That said, there were some examples of more traditional value opportunities coming to fruition. It is interesting that three of the worst performing stocks in the Fund for the 2017 fiscal year – Endo, Express Scripts, and Teva – were the three best performing stocks in the latest fiscal year, returning 165.52%, 58.22% and 45.62%, respectively.
The managed care companies, which generally have done a solid job of growing enrollment and controlling expenses, continued their strong multi-year run. Anthem returned 33.36%, UnitedHealth 26.01%, and Aetna 17.95% for the past twelve months.
Poor performers included medical device distributor Owens & Minor and specialty pharmaceutical company Mylan, who are both suffering from pricing pressure, and pharmaceutical distributor Cardinal Health, which is dealing with intensifying competition in its core business.
Biotech has never been an area of major emphasis for the Fund since the valuations tend to be high, but we have been buying there as expectations have come down to more reasonable levels. To be more specific, we have focused our buying in the large profitable biotechs, not the more speculative unprofitable players. We have also added to the pharmaceuticals, which we believe offer long-term opportunity. Some pharma companies have been in the news for agreeing to keep drug prices flat for a time. This is part of the political game they must play in order to keep the regulators at bay.
Thank you for your investment with Oak Associates Funds.
Mutual fund investing involves risk, including the possible loss of principal. The value of the Fund’s investments will vary from day to day in response to the activities of individual companies and general market and economic conditions. Because the Fund may invest a significant portion of its assets in particular industry sectors which it believes hold the most potential for favorable returns, poor performance or adverse economic events affecting one or more of these overweighted sectors could have a greater impact on the Fund than it would on another mutual fund with a broader range of investments.
19 | 1-888-462-5386 | www.oakfunds.com |
Live Oak Health Sciences Fund | Performance Update |
All data below as of October 31, 2018 (Unaudited) |
Fund Data |
|
Ticker | LOGSX |
Share Price | $20.21 |
Total Net Assets | $65.7M |
Portfolio Turnover | 23% |
Sector Allocation^ |
|
Health Care | 97.0% |
Cash & Other Assets | 3.0% |
Top 10 Holdings^ |
| |
1. | Amgen, Inc. | 7.7% |
2. | Express Scripts Holding Company | 7.5% |
3. | Biogen, Inc. | 5.0% |
4. | Waters Corporation | 4.8% |
5. | McKesson Corporation | 4.5% |
6. | Aetna, Inc. | 4.3% |
7. | Cardinal Health, Inc. | 4.3% |
8. | Anthem, Inc. | 4.2% |
9. | UnitedHealth Group, Inc. | 4.1% |
10. | DaVita, Inc. | 4.0% |
| ^ | Percentages are based on net assets. Holdings are subject to change. |
Growth of $10,000 Chart
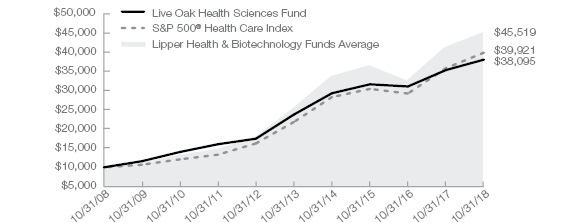
The chart represents historical performance of a hypothetical investment of $10,000 in the Fund over the past 10 years. Past performance does not guarantee future results. This chart and the table below do not reflect the deduction of taxes that a shareholder would pay on Fund distributions or the redemption of Fund shares.
Average Annual Total Return | ||||
| 1 Year | 3 Year | 5 Year | 10 Year |
Live Oak Health Sciences Fund | 7.68% | 6.36% | 9.89% | 14.31% |
S&P 500® Health Care Index1 | 11.28% | 9.43% | 12.83% | 14.85% |
Lipper Health & Biotechnology Funds Average2 | 9.36% | 7.16% | 12.18% | 16.03% |
Gross/Net Expense Ratio (per the prospectus dated February 28, 2018): 1.01%
Gross/Net Expense Ratio (as of fiscal year end October 31, 2018): 1.01%
The performance data quoted represents past performance. Past performance does not guarantee future results. The investment return and principal value of an investment will fluctuate so that an investor’s shares, when redeemed, may be worth more or less than their original cost and current performance may be lower or higher than the performance quoted. For performance data current to the most recent month-end, please visit www.oakfunds.com or call 1-888-462-5386.
| 1 | Standard & Poor’s is the source and owner of the S&P Index data. 2 Lipper Inc. is the source and owner of the Lipper Classification data. See Pages 18 and 19 for additional disclosure. |
Annual Report | October 31, 2018 | 20 |
Important Disclosures
As of October 31, 2018 (Unaudited)
Index Definitions and Disclosures
All indices are unmanaged and index performance figures include reinvestment of dividends but do not reflect any fees, expenses or taxes. Investors cannot invest directly in an index.
Lipper, a Thomson Reuters Company, is the source and owner of the Lipper Classification data contained in this material and all trademarks and copyrights related thereto. Any further dissemination or redistribution is strictly prohibited. Lipper Inc. is not responsible for the formatting or configuration of this material or for any inaccuracy in Oak Associates Funds’ presentation thereof.
Lipper Health & Biotechnology Funds – Funds that invest primarily in the equity securities of domestic companies engaged in health care, medicine, and biotechnology.
Lipper Large-Cap Growth Funds – Funds that, by portfolio practice, invest at least 75% of their equity assets in companies with market capitalizations (on a three-year weighted basis) above Lipper’s USDE large-cap floor. Large-cap growth funds typically have an above-average price-to-earnings ratio, price-to-book ratio, and three-year sales-per-share growth value, compared to the S&P 500® Index.
Lipper Multi-Cap Core Funds – Funds that, by portfolio practice, invest in a variety of market-capitalization ranges without concentrating 75% of their equity assets in any one market-capitalization range over an extended period of time. Multi-cap core funds typically have average characteristics compared to the S&P SuperComposite 1500 Index.
Lipper Multi-Cap Growth Funds – Funds that, by portfolio practice, invest in a variety of market capitalization ranges without concentrating 75% of their equity assets in any one market capitalization range over an extended period of time. Multi-cap growth funds typically have an above-average price-to-earnings ratio, price-to-book ratio, and three-year sales per-share growth value, compared to the S&P SuperComposite 1500 Index.
Lipper Science & Technology Funds – Funds that invest primarily in the equity securities of domestic companies engaged in science and technology.
Lipper Small-Cap Growth Funds – Funds that, by portfolio practice, invest at least 75% of their equity assets in companies with market capitalizations (on a three-year weighted basis) below Lipper’s USDE small-cap ceiling. Small-cap growth funds typically have an above-average price-to-earnings ratio, price-to-book ratio, and three-year sales-per-share growth value, compared to the S&P Small-Cap 600 Index.
NASDAQ is the source and owner of the NASDAQ Index data contained in this material and all trademarks and copyrights related thereto. Any further dissemination or redistribution is strictly prohibited. NASDAQ is not responsible for the formatting or configuration of this material or for any inaccuracy in Oak Associates Funds’ presentation thereof.
Russell Investments is the source and owner of the Russell Index data contained in this material and all trademarks and copyrights related thereto. Any further dissemination or redistribution is strictly prohibited. Russell Investments is not responsible for the formatting or configuration of this material or for any inaccuracy in Oak Associates Funds’ presentation thereof.
Russell 2000® Growth Total Return Index – The Russell 2000® Growth Total Return Index measures the performance of the small-cap growth segment of the U.S. equity universe. It includes those Russell 2000 companies with higher price-to-book ratios and higher forecasted growth values.
21 | 1-888-462-5386 | www.oakfunds.com |
Important Disclosures
All data below as of October 31, 2018 (Unaudited)
Russell 3000® Total Return Index – The Russell 3000® Total Return Index measures the performance of 3,000 publicly held US companies based on total market capitalization, which represents approximately 98% of the investable US equity market.
Standard & Poor’s is the source and owner of the S&P Index data contained in this material and all trademarks and copyrights related thereto. Any further dissemination or redistribution is strictly prohibited. Standard & Poor’s is not responsible for the formatting or configuration of this material or for any inaccuracy in Oak Associates Funds’ presentation thereof.
S&P 500® Index – is a commonly-recognized, market capitalization weighted index of 500 widely held equity securities, designed to measure broad U.S. equity performance.
S&P 500® Equal Weight Information Technology Index – The S&P 500® Equal Weight Information Technology Index is an unmanaged equal weighted version of the S&P 500® Information Technology Index that consists of the common stocks of the following industries: internet equipment, computers and peripherals, electronic equipment, office electronics and instruments, semiconductor equipment and products, diversified telecommunication services, and wireless telecommunication services that comprise the Information Technology sector of the S&P 500® Index.
S&P 500® Health Care Index – The S&P 500® Health Care Index is a capitalization-weighted index that encompasses two main industry groups. The first includes companies who manufacture health care equipment and supplies or provide health care related services, including distributors of health care products, providers of basic health care services, and owners and operators of health care facilities and organizations. The second group consists of companies primarily involved in the research, development, production and marketing of pharmaceuticals and biotechnology products.
S&P 500® Total Return Index – The S&P 500® Total Return Index is a commonly recognized, market capitalization weighted index of 500 widely held equity securities, designed to measure broad U.S. equity performance.
Investment Definitions
Smart beta defines a set of investment strategies that emphasize the use of alternative index construction rules to traditional market capitalization based indices. Smart beta emphasizes capturing investment factors of market inefficiencies in a rules-based and transparent way.
Correlation is a statistic that measures the degree to which two securities move in relation to each other.
The P/E is the ratio for valuing a company that measures its current share price relative to its per-share earnings. The price-earnings ratio can be calculated as market value per share divided by earnings per share.
The KBW Bank Index is an economic index consisting of the stocks of 24 banking companies. This index serves as a benchmark of the banking sector. This index trades on the Philadelphia Stock Exchange, where it was created.
Book value of an asset is the value at which the asset is carried on a balance sheet and calculated by taking the cost of an asset minus the accumulated depreciation. Book value is also the net asset value of a company, calculated as total assets minus intangible assets and liabilities.
Free cash flow yield is an overall return evaluation ratio of a stock, which standardizes the free cash flow per share a company is expected to earn against its market price per share. The ratio is calculated by taking the free cash flow per share divided by the share price.
Annual Report | October 31, 2018 | 22 |
Disclosure of Fund Expenses
As of October 31, 2018 (Unaudited)
As a shareholder of the Funds, you incur two types of costs: (1) transaction costs and (2) ongoing costs, including management fees, distribution and service (12b-1) fees, and other Fund expenses. These examples are intended to help you understand your ongoing costs (in dollars) of investing in the Funds and to compare these costs with the ongoing costs of investing in other mutual funds.
The Example is based on an investment of $1,000 invested at the beginning of the period and held for the entire period from May 1, 2018 through October 31, 2018.
Actual Expenses
The first line of the table for each Fund provides information about actual account values and actual expenses. You may use the information in these lines, together with the amount you invested, to estimate the expenses that you paid over the period. Simply divide your account value by $1,000 (for example, an $8,600 account value divided by $1,000 = 8.60), then multiply the result by the number in the first line under the heading “Expenses Paid During Period” to estimate the expenses you paid on your account during this period.
Hypothetical Example for Comparison Purposes
The second line of the table for each Fund provides information about hypothetical account values and hypothetical expenses based on the Funds’ actual expense ratios and an assumed rate of return of 5% per year before expenses, which is not the Funds’ actual return. The hypothetical account values and expenses may not be used to estimate the actual ending account balances or expenses you paid for the period. You may use this information to compare the ongoing costs of investing in the Funds and other funds. To do so, compare this 5% hypothetical example with the 5% hypothetical examples that appear in the shareholder reports of the other funds.
Expenses shown in the table are meant to highlight your ongoing costs only. Therefore, the second line of the table for each class is useful in comparing ongoing costs only and will not help you determine the relative total costs of owning different funds. In addition, if transaction costs were included, your costs would have been higher.
23 | 1-888-462-5386 | www.oakfunds.com |
Disclosure of Fund Expenses
As of October 31, 2018 (Unaudited)
| Beginning | Ending | Annualized | Expenses |
White Oak Select Growth Fund | ||||
Actual Return | $1,000.00 | $ 1,008.70 | 0.94% | $4.74 |
Hypothetical 5% Return | $1,000.00 | $ 1,020.48 | 0.94% | $4.77 |
Pin Oak Equity Fund | ||||
Actual Return | $1,000.00 | $ 992.20 | 0.95% | $4.76 |
Hypothetical 5% Return | $1,000.00 | $ 1,020.43 | 0.95% | $4.83 |
Rock Oak Core Growth Fund | ||||
Actual Return | $1,000.00 | $ 999.40 | 1.25% | $6.30 |
Hypothetical 5% Return | $1,000.00 | $ 1,018.91 | 1.25% | $6.36 |
River Oak Discovery Fund | ||||
Actual Return | $1,000.00 | $ 956.10 | 1.35% | $6.66 |
Hypothetical 5% Return | $1,000.00 | $ 1,018.40 | 1.35% | $6.87 |
Red Oak Technology Select Fund | ||||
Actual Return | $1,000.00 | $ 1,037.80 | 0.94% | $4.82 |
Hypothetical 5% Return | $1,000.00 | $ 1,020.47 | 0.94% | $4.78 |
Black Oak Emerging Technology Fund | ||||
Actual Return | $1,000.00 | $ 1,011.50 | 1.14% | $5.79 |
Hypothetical 5% Return | $1,000.00 | $ 1,019.45 | 1.14% | $5.81 |
Live Oak Health Sciences Fund | ||||
Actual Return | $1,000.00 | $ 1,068.20 | 1.02% | $5.34 |
Hypothetical 5% Return | $1,000.00 | $ 1,020.04 | 1.02% | $5.22 |
| (a) | Expenses are equal to the Fund’s annualized expense ratio multiplied by the average account value over the period, multiplied by 184/365 (to reflect the one-half year period). |
Annual Report | October 31, 2018 | 24 |
White Oak Select Growth Fund | Schedule of Investments |
As of October 31, 2018 |
| Shares | Fair | ||||||
COMMON STOCKS — 96.52% | ||||||||
COMMUNICATION SERVICES — 11.87% | ||||||||
Interactive Media & Services — 11.87% | ||||||||
Alphabet, Inc. - Class A (a) | 12,680 | $ | 13,828,554 | |||||
Alphabet, Inc. - Class C (a) | 16,495 | 17,761,322 | ||||||
Facebook, Inc. - Class A (a) | 40,600 | 6,162,674 | ||||||
| 37,752,550 | ||||||||
CONSUMER DISCRETIONARY — 12.24% | ||||||||
Internet & Direct Marketing Retail — 9.65% | ||||||||
Amazon.com, Inc. (a) | 19,205 | 30,689,782 | ||||||
Specialty Retail — 2.59% | ||||||||
Lowe's Companies, Inc. (b) | 86,500 | 8,236,530 | ||||||
CONSUMER STAPLES — 2.36% | ||||||||
Beverages — 2.36% | ||||||||
PepsiCo, Inc. | 66,900 | 7,518,222 | ||||||
FINANCIALS — 22.21% | ||||||||
Capital Markets — 8.71% | ||||||||
Charles Schwab Corporation (The) | 454,100 | 20,997,584 | ||||||
State Street Corporation | 97,700 | 6,716,875 | ||||||
| 27,714,459 | ||||||||
Commercial Banks — 10.38% | ||||||||
CIT Group, Inc. (b) | 177,400 | 8,405,212 | ||||||
TCF Financial Corporation | 519,000 | 10,836,720 | ||||||
U.S. Bancorp | 263,000 | 13,747,010 | ||||||
| 32,988,942 | ||||||||
Diversified Financial Services — 0.58% | ||||||||
JPMorgan Chase & Company | 17,000 | 1,853,340 | ||||||
Insurance — 2.54% | ||||||||
Chubb Ltd. | 64,600 | 8,069,186 | ||||||
HEALTH CARE — 20.98% | ||||||||
Biotechnology — 9.08% | ||||||||
Amgen, Inc. | 108,000 | 20,821,320 | ||||||
Gilead Sciences, Inc. | 118,500 | 8,079,330 | ||||||
| 28,900,650 | ||||||||
Health Care Providers & Services — 3.11% | ||||||||
Express Scripts Holding Company (a) | 102,000 | 9,890,940 | ||||||
25 | 1-888-462-5386 | www.oakfunds.com |
Schedule of Investments | White Oak Select Growth Fund |
As of October 31, 2018 |
| Shares | Fair | ||||||
Pharmaceuticals — 8.79% | ||||||||
Novartis AG - ADR (b) | 79,600 | $ | 6,961,816 | |||||
Pfizer, Inc. | 375,000 | 16,147,500 | ||||||
Teva Pharmaceutical Industries Ltd. - ADR (b) | 242,000 | 4,835,160 | ||||||
| 27,944,476 | ||||||||
INFORMATION TECHNOLOGY — 26.86% | ||||||||
Communications Equipment — 10.21% | ||||||||
Cisco Systems, Inc. | 542,000 | 24,796,500 | ||||||
QUALCOMM, Inc. (b) | 122,300 | 7,691,447 | ||||||
| 32,487,947 | ||||||||
Internet Software & Services — 1.34% | ||||||||
Salesforce.com, Inc. (a) | 31,100 | 4,268,164 | ||||||
IT Services — 5.06% | ||||||||
Cognizant Technology Solutions Corporation - Class A | 129,700 | 8,953,191 | ||||||
International Business Machines Corporation (IBM) | 61,900 | 7,145,117 | ||||||
| 16,098,308 | ||||||||
Semiconductors & Semiconductor Equipment — 10.25% | ||||||||
KLA-Tencor Corporation | 179,800 | 16,458,891 | ||||||
Xilinx, Inc. | 188,900 | 16,126,393 | ||||||
| 32,585,284 | ||||||||
TOTAL COMMON STOCKS (Cost $214,199,389) | 306,998,780 | |||||||
Annual Report | October 31, 2018 | 26 |
White Oak Select Growth Fund | Schedule of Investments |
As of October 31, 2018 |
| Shares or | Fair | ||||||
SHORT-TERM INVESTMENTS — 14.19% | ||||||||
REPURCHASE AGREEMENTS — 3.60% | ||||||||
Tri-Party Repurchase Agreement with South Street Securities Wachovia Tri-Party, 1.97%, dated 10/31/18 and maturing 11/1/18, collateralized by U.S. Treasury Securities with rates ranging from 1.75% to 2.75% and maturity dates ranging from 12/15/20 to 6/30/25 with a par value of $11,858,643 and a collateral value of $11,691,799. | 11,462,535 | $ | 11,462,535 | |||||
COLLATERAL FOR SECURITIES LOANED — 10.59% | ||||||||
Mount Vernon Liquid Assets Portfolio, LLC, 2.39% (c) | 33,680,316 | 33,680,316 | ||||||
TOTAL SHORT-TERM INVESTMENTS (Cost $45,142,851) | 45,142,851 | |||||||
TOTAL INVESTMENTS — 110.71% (Cost $259,342,240) | 352,141,631 | |||||||
Liabilities in Excess of Other Assets — (10.71)% | (34,104,202 | ) | ||||||
NET ASSETS — 100.00% | $ | 318,037,429 | ||||||
| (a) | Non-income producing security. |
| (b) | Security, or a portion of the security position, is currently on loan. The total market value of securities on loan is $33,390,077. |
| (c) | Rate disclosed is the seven day effective yield as of October 31, 2018. |
ADR — American Depositary Receipt.
The sectors shown on the schedule of investments are based on the Global Industry Classification Standard, or GICS® (“GICS”). The GICS was developed by and/or is the exclusive property of MSCI, Inc. and Standard & Poor’s Financial Services LLC (“S&P”). GICS is a service mark of MSCI, Inc. and S&P and has been licensed for use by Ultimus Fund Solutions, LLC.
The accompanying notes are an integral part of the financial statements.
27 | 1-888-462-5386 | www.oakfunds.com |
Schedule of Investments | Pin Oak Equity Fund |
As of October 31, 2018 |
| Shares | Fair | ||||||
COMMON STOCKS — 94.64% | ||||||||
COMMUNICATION SERVICES — 13.63% | ||||||||
Entertainment — 4.09% | ||||||||
Twenty-First Century Fox, Inc. - Class B | 236,100 | $ | 10,666,998 | |||||
Interactive Media & Services — 9.54% | ||||||||
Alphabet, Inc. - Class A (a) | 3,950 | 4,307,791 | ||||||
Alphabet, Inc. - Class C (a) | 12,019 | 12,941,699 | ||||||
IAC/InterActiveCorp (a) | 38,856 | 7,638,701 | ||||||
| 24,888,191 | ||||||||
CONSUMER DISCRETIONARY — 11.72% | ||||||||
Auto Components — 2.36% | ||||||||
Gentex Corporation (b) | 292,500 | 6,157,125 | ||||||
Diversified Consumer Services — 2.23% | ||||||||
H&R Block, Inc. | 219,000 | 5,812,260 | ||||||
Internet & Direct Marketing Retail — 5.48% | ||||||||
Amazon.com, Inc. (a) | 5,120 | 8,181,811 | ||||||
eBay, Inc. (a) | 210,500 | 6,110,815 | ||||||
| 14,292,626 | ||||||||
Textiles, Apparel & Luxury Goods — 1.65% | ||||||||
Hanesbrands, Inc. (b) | 251,500 | 4,315,740 | ||||||
CONSUMER STAPLES — 4.53% | ||||||||
Beverages — 4.53% | ||||||||
PepsiCo, Inc. | 105,200 | 11,822,376 | ||||||
ENERGY — 4.56% | ||||||||
Oil, Gas & Consumable Fuels — 4.56% | ||||||||
Royal Dutch Shell plc - Class A - ADR | 35,000 | 2,211,650 | ||||||
Valero Energy Corporation | 106,400 | 9,691,976 | ||||||
| 11,903,626 | ||||||||
FINANCIALS — 28.52% | ||||||||
Capital Markets — 9.69% | ||||||||
Bank of New York Mellon Corporation (The) | 275,500 | 13,039,415 | ||||||
Charles Schwab Corporation (The) | 264,551 | 12,232,838 | ||||||
| 25,272,253 | ||||||||
Commercial Banks — 8.90% | ||||||||
CIT Group, Inc. (b) | 126,600 | 5,998,308 | ||||||
Great Southern Bancorp, Inc. | 28,010 | 1,516,742 | ||||||
International Bancshares Corporation | 62,735 | 2,427,845 | ||||||
SunTrust Banks, Inc. | 122,300 | 7,663,317 | ||||||
Annual Report | October 31, 2018 | 28 |
Pin Oak Equity Fund | Schedule of Investments |
As of October 31, 2018 |
| Shares | Fair | ||||||
Commercial Banks (continued) | ||||||||
Wells Fargo & Company | 105,400 | $ | 5,610,442 | |||||
| 23,216,654 | ||||||||
Consumer Finance — 4.84% | ||||||||
Capital One Financial Corporation | 94,600 | 8,447,780 | ||||||
Synchrony Financial | 144,300 | 4,167,384 | ||||||
| 12,615,164 | ||||||||
Insurance — 5.09% | ||||||||
Assurant, Inc. | 38,900 | 3,781,469 | ||||||
Everest Re Group Ltd. | 10,600 | 2,309,316 | ||||||
Travelers Companies, Inc. (The) (b) | 57,400 | 7,182,462 | ||||||
| 13,273,247 | ||||||||
HEALTH CARE — 14.77% | ||||||||
Biotechnology — 2.59% | ||||||||
Amgen, Inc. | 8,000 | 1,542,320 | ||||||
Biogen, Inc. (a) | 7,100 | 2,160,317 | ||||||
Celgene Corporation (a) | 18,200 | 1,303,120 | ||||||
Gilead Sciences, Inc. | 25,800 | 1,759,044 | ||||||
| 6,764,801 | ||||||||
Health Care Providers & Services — 4.59% | ||||||||
DaVita, Inc. (a) | 114,300 | 7,696,962 | ||||||
McKesson Corporation | 34,300 | 4,279,268 | ||||||
| 11,976,230 | ||||||||
Pharmaceuticals — 7.59% | ||||||||
GlaxoSmithKline plc - ADR | 256,800 | �� | 10,030,608 | |||||
Roche Holding AG - ADR | 177,000 | 5,373,720 | ||||||
Teva Pharmaceutical Industries Ltd. - ADR (b) | 220,000 | 4,395,600 | ||||||
| 19,799,928 | ||||||||
INDUSTRIALS — 0.12% | ||||||||
Electrical Equipment — 0.12% | ||||||||
Generac Holdings, Inc. (a) | 5,920 | 300,322 | ||||||
INFORMATION TECHNOLOGY — 15.81% | ||||||||
IT Services — 9.28% | ||||||||
Amdocs Ltd. | 127,672 | 8,077,807 | ||||||
Paychex, Inc. | 173,649 | 11,372,273 | ||||||
Western Union Company (The) (b) | 263,000 | 4,744,520 | ||||||
| 24,194,600 | ||||||||
Semiconductors & Semiconductor Equipment — 6.53% | ||||||||
KLA-Tencor Corporation | 97,700 | 8,943,458 | ||||||
Xilinx, Inc. | 94,800 | 8,093,076 | ||||||
| 17,036,534 | ||||||||
29 | 1-888-462-5386 | www.oakfunds.com |
Schedule of Investments | Pin Oak Equity Fund |
As of October 31, 2018 |
| Shares or | Fair | ||||||
MATERIALS — 0.98% | ||||||||
Metals & Mining — 0.98% | ||||||||
Teck Resources Limited - Class B | 123,814 | $ | 2,559,235 | |||||
TOTAL COMMON STOCKS | 246,867,910 | |||||||
SHORT-TERM INVESTMENTS — 17.36% | ||||||||
REPURCHASE AGREEMENTS — 5.59% | ||||||||
Tri-Party Repurchase Agreement with South Street Securities Wachovia Tri-Party, 1.97%, dated 10/31/18 and maturing 11/1/18, collateralized by U.S. Treasury Securities with rates ranging from 1.75% to 2.75% and maturity dates ranging from 12/15/20 to 6/30/25 with a par value of $15,091,520 and a collateral value of $14,879,191. | 14,587,426 | 14,587,426 | ||||||
COLLATERAL FOR SECURITIES LOANED — 11.77% | ||||||||
Mount Vernon Liquid Assets Portfolio, LLC, 2.39% (c) | 30,695,452 | 30,695,452 | ||||||
TOTAL SHORT-TERM INVESTMENTS (Cost $45,282,878) | 45,282,878 | |||||||
TOTAL INVESTMENTS — 112.00% (Cost $243,536,087) | 292,150,788 | |||||||
Liabilities in Excess of Other Assets — (12.00)% | (31,291,336 | ) | ||||||
NET ASSETS — 100.00% | $ | 260,859,452 | ||||||
(a) | Non-income producing security. |
(b) | Security, or a portion of the security position, is currently on loan. The total market value of securities on loan is $30,131,026. |
(c) | Rate disclosed is the seven day effective yield as of October 31, 2018. |
ADR — American Depositary Receipt. |
The sectors shown on the schedule of investments are based on the Global Industry Classification Standard, or GICS® (“GICS”). The GICS was developed by and/or is the exclusive property of MSCI, Inc. and Standard & Poor’s Financial Services LLC (“S&P”). GICS is a service mark of MSCI, Inc. and S&P and has been licensed for use by Ultimus Fund Solutions, LLC.
The accompanying notes are an integral part of the financial statements.
Annual Report | October 31, 2018 | 30 |
Rock Oak Core Growth Fund | Schedule of Investments |
As of October 31, 2018 |
| Shares | Fair | ||||||
COMMON STOCKS — 95.67% | ||||||||
COMMUNICATION SERVICES — 10.58% | ||||||||
Entertainment — 2.98% | ||||||||
Netflix, Inc. (a) | 2,010 | $ | 606,578 | |||||
Interactive Media & Services — 3.60% | ||||||||
Alphabet, Inc. - Class C (a) | 530 | 570,688 | ||||||
Tencent Holdings Ltd. - ADR | 4,730 | 162,381 | ||||||
| 733,069 | ||||||||
Internet Software & Services — 4.00% | ||||||||
Baidu, Inc. - ADR (a) | 4,285 | 814,407 | ||||||
CONSUMER DISCRETIONARY — 12.37% | ||||||||
Diversified Consumer Services — 3.16% | ||||||||
TAL Education Group - ADR (a) | 22,170 | 642,487 | ||||||
Hotels, Restaurants & Leisure — 2.01% | ||||||||
Wyndham Destinations, Inc. | 3,845 | 137,959 | ||||||
Wyndham Hotels & Resorts, Inc. | 5,505 | 271,341 | ||||||
| 409,300 | ||||||||
Internet & Direct Marketing Retail — 3.69% | ||||||||
Amazon.com, Inc. (a) | 470 | 751,065 | ||||||
Media — 0.45% | ||||||||
Liberty Media Corporation - Liberty SiriusXM - Series A (a) | 2,235 | 92,171 | ||||||
Textiles, Apparel & Luxury Goods — 3.06% | ||||||||
Ralph Lauren Corporation | 4,810 | 623,424 | ||||||
CONSUMER STAPLES — 2.71% | ||||||||
Beverages — 2.71% | ||||||||
Molson Coors Brewing Company - Class B (b) | 8,625 | 552,000 | ||||||
ENERGY — 4.92% | ||||||||
Energy Equipment & Services — 2.37% | ||||||||
National Oilwell Varco, Inc. (b) | 13,125 | 483,000 | ||||||
Oil, Gas & Consumable Fuels — 2.55% | ||||||||
HollyFrontier Corporation | 7,685 | 518,276 | ||||||
FINANCIALS — 7.27% | ||||||||
Commercial Banks — 2.22% | ||||||||
SunTrust Banks, Inc. | 7,200 | 451,152 | ||||||
31 | 1-888-462-5386 | www.oakfunds.com |
Schedule of Investments | Rock Oak Core Growth Fund |
As of October 31, 2018 |
| Shares | Fair | ||||||
Consumer Finance — 2.92% | ||||||||
Capital One Financial Corporation | 6,650 | $ | 593,845 | |||||
Insurance — 2.13% | ||||||||
Hartford Financial Services Group, Inc. (The) | 9,565 | 434,442 | ||||||
HEALTH CARE — 13.70% | ||||||||
Biotechnology — 8.71% | ||||||||
AbbVie, Inc. | 6,450 | 502,133 | ||||||
Biogen, Inc. (a) | 2,040 | 620,711 | ||||||
Gilead Sciences, Inc. | 9,550 | 651,118 | ||||||
| 1,773,962 | ||||||||
Life Sciences Tools & Services — 2.14% | ||||||||
Illumina, Inc. (a) | 1,400 | 435,610 | ||||||
Pharmaceuticals — 2.85% | ||||||||
Jazz Pharmaceuticals plc (a) | 3,655 | 580,487 | ||||||
INDUSTRIALS — 2.96% | ||||||||
Aerospace & Defense — 2.96% | ||||||||
L3 Technologies, Inc. | 3,185 | 603,462 | ||||||
INFORMATION TECHNOLOGY — 41.16% | ||||||||
Communications Equipment — 4.69% | ||||||||
F5 Networks, Inc. (a)(b) | 4,090 | 716,895 | ||||||
Ubiquiti Networks, Inc. (b) | 2,555 | 237,845 | ||||||
| 954,740 | ||||||||
Internet Software & Services — 4.10% | ||||||||
iQIYI, Inc. - ADR (a)(b) | 13,155 | 258,364 | ||||||
Salesforce.com, inc. (a) | 4,200 | 576,408 | ||||||
| 834,772 | ||||||||
IT Services — 13.41% | ||||||||
Alliance Data Systems Corporation | 3,520 | 725,755 | ||||||
Cognizant Technology Solutions Corporation - Class A | 9,480 | 654,404 | ||||||
DXC Technology Company | 6,970 | 507,625 | ||||||
Perspecta, Inc. (b) | 18,855 | 461,759 | ||||||
Worldpay, Inc. - Class A (a) | 4,160 | 382,054 | ||||||
| 2,731,597 | ||||||||
Semiconductors & Semiconductor Equipment — 1.92% | ||||||||
Qorvo, Inc. (a)(b) | 5,325 | 391,441 | ||||||
Annual Report | October 31, 2018 | 32 |
Rock Oak Core Growth Fund | Schedule of Investments |
As of October 31, 2018 |
| Shares | Fair | ||||||
Software — 9.89% | ||||||||
CA, Inc. | 18,260 | $ | 810,013 | |||||
Check Point Software Technologies Ltd. (a)(b) | 5,365 | 595,515 | ||||||
HubSpot, Inc. (a)(b) | 1,665 | 225,857 | ||||||
RealPage, Inc. (a) | 3,625 | 192,125 | ||||||
Ultimate Software Group, Inc. (The) (a) | 720 | 191,974 | ||||||
| 2,015,484 | ||||||||
Technology Hardware, Storage & Peripherals — 7.15% | ||||||||
NetApp, Inc. (b) | 8,755 | 687,180 | ||||||
Seagate Technology plc (b) | 11,420 | 459,427 | ||||||
Western Digital Corporation | 7,220 | 310,965 | ||||||
| 1,457,572 | ||||||||
TOTAL COMMON STOCKS (Cost $15,732,321) | 19,484,343 | |||||||
33 | 1-888-462-5386 | www.oakfunds.com |
Schedule of Investments | Rock Oak Core Growth Fund |
As of October 31, 2018 |
| Shares or | Fair | ||||||
SHORT-TERM INVESTMENTS — 27.06% | ||||||||
REPURCHASE AGREEMENTS — 3.70% | ||||||||
Tri-Party Repurchase Agreement with South Street Securities Wachovia Tri-Party, 1.97%, dated 10/31/18 and maturing 11/1/18, collateralized by U.S. Treasury Securities with rates ranging from 1.75% to 2.75% and maturity dates ranging from 12/15/20 to 6/30/25 with a par value of $778,539 and a collateral value of $767,585. | 752,534 | $ | 752,534 | |||||
COLLATERAL FOR SECURITIES LOANED — 23.36% | ||||||||
Mount Vernon Liquid Assets Portfolio, LLC, 2.39% (c) | 4,757,552 | 4,757,552 | ||||||
TOTAL SHORT-TERM INVESTMENTS (Cost $5,510,086) | 5,510,086 | |||||||
TOTAL INVESTMENTS — 122.73% (Cost $21,242,407) | 24,994,429 | |||||||
Liabilities in Excess of Other Assets — (22.73)% | (4,628,964 | ) | ||||||
NET ASSETS — 100.00% | $ | 20,365,465 | ||||||
(a) | Non-income producing security. |
(b) | Security, or a portion of the security position, is currently on loan. The total market value of securities on loan is $4,758,375. |
(c) | Rate disclosed is the seven day effective yield as of October 31, 2018. |
ADR — American Depositary Receipt. |
The sectors shown on the schedule of investments are based on the Global Industry Classification Standard, or GICS® (“GICS”). The GICS was developed by and/or is the exclusive property of MSCI, Inc. and Standard & Poor’s Financial Services LLC (“S&P”). GICS is a service mark of MSCI, Inc. and S&P and has been licensed for use by Ultimus Fund Solutions, LLC.
The accompanying notes are an integral part of the financial statements.
Annual Report | October 31, 2018 | 34 |
River Oak Discovery Fund | Schedule of Investments |
As of October 31, 2018 |
| Shares | Fair | ||||||
COMMON STOCKS — 95.31% | ||||||||
COMMUNICATION SERVICES — 1.12% | ||||||||
Interactive Media & Services — 1.12% | ||||||||
QuinStreet, Inc. (a) | 9,100 | $ | 144,690 | |||||
CONSUMER DISCRETIONARY — 14.39% | ||||||||
Diversified Consumer Services — 7.14% | ||||||||
Adtalem Global Education, Inc. (a) | 11,810 | 597,940 | ||||||
American Public Education, Inc. (a) | 10,000 | 327,300 | ||||||
| 925,240 | ||||||||
Leisure Products — 2.91% | ||||||||
Nautilus, Inc. (a) | 30,825 | 376,990 | ||||||
Specialty Retail — 4.34% | ||||||||
Aaron's, Inc. | 11,930 | 562,261 | ||||||
CONSUMER STAPLES — 6.06% | ||||||||
Beverages — 6.06% | ||||||||
Boston Beer Company, Inc. (The) - Class A (a)(b) | 2,555 | 785,126 | ||||||
FINANCIALS — 18.52% | ||||||||
Capital Markets — 4.09% | ||||||||
AllianceBernstein Holding, L.P. | 18,315 | 529,487 | ||||||
Commercial Banks — 3.70% | ||||||||
Union Bankshares Corporation | 14,050 | 479,667 | ||||||
Insurance — 8.01% | ||||||||
Assurant, Inc. | 6,000 | 583,260 | ||||||
CNO Financial Group, Inc. (b) | 24,045 | 454,451 | ||||||
| 1,037,711 | ||||||||
Thrifts & Mortgage Finance — 2.72% | ||||||||
Dime Community Bancshares, Inc. | 21,870 | 352,544 | ||||||
HEALTH CARE — 13.51% | ||||||||
Biotechnology — 6.60% | ||||||||
Eagle Pharmaceuticals, Inc. (a)(b) | 7,725 | 380,379 | ||||||
United Therapeutics Corporation (a)(b) | 4,275 | 473,927 | ||||||
| 854,306 | ||||||||
Health Care Providers & Services — 3.19% | ||||||||
Magellan Health, Inc. (a) | 6,350 | 413,131 | ||||||
35 | 1-888-462-5386 | www.oakfunds.com |
Schedule of Investments | River Oak Discovery Fund |
As of October 31, 2018 |
| Shares | Fair | ||||||
Health Care Technology — 0.65% | ||||||||
NextGen Healthcare, Inc. (a) | 5,700 | $ | 84,189 | |||||
Pharmaceuticals — 3.07% | ||||||||
Innoviva, Inc. (a)(b) | 28,490 | 397,720 | ||||||
INDUSTRIALS — 4.62% | ||||||||
Machinery — 1.65% | ||||||||
Kadant, Inc. | 2,160 | 213,192 | ||||||
Professional Services — 2.97% | ||||||||
Barrett Business Services, Inc. | 6,101 | 383,875 | ||||||
INFORMATION TECHNOLOGY — 32.96% | ||||||||
Electronic Equipment, Instruments & Components — 7.58% | ||||||||
Hollysys Automation Technologies Limited | 15,500 | 297,910 | ||||||
KEMET Corporation (a) | 23,135 | 503,881 | ||||||
SYNNEX Corporation | 2,313 | 179,477 | ||||||
| 981,268 | ||||||||
Semiconductors & Semiconductor Equipment — 18.55% | ||||||||
Advanced Energy Industries, Inc. (a) | 8,570 | 368,767 | ||||||
Cirrus Logic, Inc. (a) | 13,650 | 511,056 | ||||||
Cohu, Inc. | 5,625 | 117,000 | ||||||
Kulicke & Soffa Industries, Inc. | 25,285 | 514,044 | ||||||
Silicon Motion Technology Corporation - ADR | 10,095 | 379,471 | ||||||
SolarEdge Technologies, Inc. (a)(b) | 13,225 | 512,204 | ||||||
| 2,402,542 | ||||||||
Software — 6.83% | ||||||||
FireEye, Inc. (a)(b) | 23,005 | 425,362 | ||||||
Paylocity Holding Corporation (a) | 2,040 | 134,212 | ||||||
Verint Systems, Inc. (a) | 3,720 | 169,892 | ||||||
Workiva, Inc. (a) | 4,530 | 154,428 | ||||||
| 883,894 | ||||||||
MATERIALS — 4.13% | ||||||||
Paper & Forest Products — 4.13% | ||||||||
Mercer International, Inc. | 35,145 | 534,555 | ||||||
TOTAL COMMON STOCKS (Cost $9,555,242) | 12,342,388 | |||||||
Annual Report | October 31, 2018 | 36 |
River Oak Discovery Fund | Schedule of Investments |
As of October 31, 2018 |
| Shares or | Fair | ||||||
SHORT-TERM INVESTMENTS — 29.05% | ||||||||
MONEY MARKET FUNDS — 0.01% | ||||||||
Fidelity Investments Money Market Government Portfolio - Class I, 2.06% (c) | 1,169 | $ | 1,169 | |||||
REPURCHASE AGREEMENTS — 12.74% | ||||||||
Tri-Party Repurchase Agreement with South Street Securities Wachovia Tri-Party, 1.97%, dated 10/31/18 and maturing 11/1/18, collateralized by U.S. Treasury Securities with rates ranging from 1.75% to 2.75% and maturity dates ranging from 12/15/20 to 6/30/25 with a par value of $1,706,124 and a collateral value of $1,682,120. | 1,649,135 | 1,649,135 | ||||||
COLLATERAL FOR SECURITIES LOANED — 16.30% | ||||||||
Mount Vernon Liquid Assets Portfolio, LLC, 2.39% (c) | 2,111,526 | 2,111,526 | ||||||
TOTAL SHORT-TERM INVESTMENTS (Cost $3,761,830) | 3,761,830 | |||||||
TOTAL INVESTMENTS — 124.36% (Cost $13,317,072) | 16,104,218 | |||||||
Liabilities in Excess of Other Assets — (24.36)% | (3,154,105 | ) | ||||||
NET ASSETS — 100.00% | $ | 12,950,113 | ||||||
(a) | Non-income producing security. |
(b) | Security, or a portion of the security position, is currently on loan. The total market value of securities on loan is $1,964,121. |
(c) | Rate disclosed is the seven day effective yield as of October 31, 2018. |
ADR — American Depositary Receipt. |
The sectors shown on the schedule of investments are based on the Global Industry Classification Standard, or GICS® (“GICS”). The GICS was developed by and/or is the exclusive property of MSCI, Inc. and Standard & Poor’s Financial Services LLC (“S&P”). GICS is a service mark of MSCI, Inc. and S&P and has been licensed for use by Ultimus Fund Solutions, LLC.
The accompanying notes are an integral part of the financial statements.
37 | 1-888-462-5386 | www.oakfunds.com |
Schedule of Investments | Red Oak Technology Select Fund |
As of October 31, 2018 |
| Shares | Fair | ||||||
COMMON STOCKS — 97.90% | ||||||||
COMMUNICATION SERVICES — 15.76% | ||||||||
Interactive Media & Services — 15.76% | ||||||||
Alphabet, Inc. - Class A (a) | 17,490 | $ | 19,074,244 | |||||
Alphabet, Inc. - Class C (a) | 25,996 | 27,991,713 | ||||||
Facebook, Inc. - Class A (a) | 143,225 | 21,740,123 | ||||||
IAC/InterActiveCorp (a) | 86,200 | 16,946,058 | ||||||
| 85,752,138 | ||||||||
CONSUMER DISCRETIONARY — 6.32% | ||||||||
Internet & Direct Marketing Retail — 6.32% | ||||||||
Amazon.com, Inc. (a) | 15,400 | 24,609,354 | ||||||
eBay, Inc. (a) | 336,300 | 9,762,789 | ||||||
| 34,372,143 | ||||||||
INFORMATION TECHNOLOGY — 75.82% | ||||||||
Communications Equipment — 9.21% | ||||||||
Cisco Systems, Inc. | 598,000 | 27,358,500 | ||||||
Juniper Networks, Inc. | 436,000 | 12,761,720 | ||||||
QUALCOMM, Inc. (b) | 159,000 | 9,999,510 | ||||||
| 50,119,730 | ||||||||
Electronic Equipment, Instruments & Components — 1.38% | ||||||||
Corning, Inc. (b) | 236,000 | 7,540,200 | ||||||
IT Services — 9.29% | ||||||||
Accenture plc - Class A | 78,300 | 12,341,646 | ||||||
Alliance Data Systems Corporation (b) | 41,500 | 8,556,470 | ||||||
DXC Technology Company | 82,300 | 5,993,909 | ||||||
International Business Machines Corporation (IBM) | 79,900 | 9,222,857 | ||||||
Total System Services, Inc. | 158,200 | 14,419,930 | ||||||
| 50,534,812 | ||||||||
Semiconductors & Semiconductor Equipment — 12.98% | ||||||||
Intel Corporation | 553,800 | 25,962,144 | ||||||
KLA-Tencor Corporation | 195,900 | 17,932,686 | ||||||
Skyworks Solutions, Inc. (b) | 113,970 | 9,888,037 | ||||||
Xilinx, Inc. | 197,800 | 16,886,186 | ||||||
| 70,669,053 | ||||||||
Software — 27.58% | ||||||||
CA, Inc. (b) | 361,000 | 16,013,960 | ||||||
Check Point Software Technologies Ltd. (a)(b) | 156,300 | 17,349,300 | ||||||
Citrix Systems, Inc. (a)(b) | 40,000 | 4,098,800 | ||||||
Dell Technologies, Inc. - Class V (a) | 7,657 | 692,116 | ||||||
Microsoft Corporation | 280,200 | 29,928,163 | ||||||
Oracle Corporation | 428,100 | 20,908,404 | ||||||
Red Hat, Inc. (a) | 155,200 | 26,638,528 | ||||||
Synopsys, Inc. (a) | 163,000 | 14,593,390 | ||||||
Annual Report | October 31, 2018 | 38 |
Red Oak Technology Select Fund | Schedule of Investments |
As of October 31, 2018 |
| Shares or | Fair | ||||||
Software (continued) | ||||||||
VMware, Inc. - Class A (a)(b) | 140,600 | $ | 19,879,434 | |||||
| 150,102,095 | ||||||||
Technology Hardware, Storage & Peripherals — 15.38% | ||||||||
Apple, Inc. | 127,520 | 27,909,027 | ||||||
Hewlett Packard Enterprise Company | 386,500 | 5,894,125 | ||||||
HP, Inc. | 451,500 | 10,899,210 | ||||||
NetApp, Inc. (b) | 252,500 | 19,818,725 | ||||||
Seagate Technology plc | 307,400 | 12,366,702 | ||||||
Western Digital Corporation (b) | 157,600 | 6,787,832 | ||||||
| 83,675,621 | ||||||||
TOTAL COMMON STOCKS (Cost $364,842,406) | 532,765,792 | |||||||
SHORT-TERM INVESTMENTS — 10.95% | ||||||||
REPURCHASE AGREEMENTS — 2.15% | ||||||||
Tri-Party Repurchase Agreement with South Street Securities Wachovia Tri-Party, 1.97%, dated 10/31/18 and maturing 11/1/18, collateralized by U.S. Treasury Securities with rates ranging from 1.75% to 2.75% and maturity dates ranging from 12/15/20 to 6/30/25 with a par value of $12,111,469 and a collateral value of $11,941,068. | 11,706,916 | 11,706,916 | ||||||
COLLATERAL FOR SECURITIES LOANED — 8.80% | ||||||||
Mount Vernon Liquid Assets Portfolio, LLC, 2.39% (c) | 47,868,166 | 47,868,166 | ||||||
TOTAL SHORT-TERM INVESTMENTS (Cost $59,575,082) | 59,575,082 | |||||||
TOTAL INVESTMENTS — 108.85% (Cost $424,417,488) | 592,340,874 | |||||||
Liabilities in Excess of Other Assets — (8.85)% | (48,137,551 | ) | ||||||
NET ASSETS — 100.00% | $ | 544,203,323 | ||||||
(a) | Non-income producing security. |
(b) | Security, or a portion of the security position, is currently on loan. The total market value of securities on loan is $47,969,684. |
(c) | Rate disclosed is the seven day effective yield as of October 31, 2018. |
The sectors shown on the schedule of investments are based on the Global Industry Classification Standard, or GICS® (“GICS”). The GICS was developed by and/or is the exclusive property of MSCI, Inc. and Standard & Poor’s Financial Services LLC (“S&P”). GICS is a service mark of MSCI, Inc. and S&P and has been licensed for use by Ultimus Fund Solutions, LLC.
The accompanying notes are an integral part of the financial statements.
39 | 1-888-462-5386 | www.oakfunds.com |
Schedule of Investments | Black Oak Emerging Technology Fund |
As of October 31, 2018 |
| Shares | Fair | ||||||
COMMON STOCKS — 93.99% | ||||||||
COMMUNICATION SERVICES — 10.71% | ||||||||
Interactive Media & Services — 6.50% | ||||||||
Facebook, Inc. - Class A (a) | 6,125 | $ | 929,714 | |||||
QuinStreet, Inc. (a)(b) | 25,935 | 412,367 | ||||||
Tencent Holdings Ltd. - ADR | 30,480 | 1,046,378 | ||||||
| 2,388,459 | ||||||||
Internet Software & Services — 4.21% | ||||||||
Baidu, Inc. - ADR (a) | 8,150 | 1,548,989 | ||||||
FINANCIALS — 2.28% | ||||||||
Capital Markets — 2.28% | ||||||||
Blucora, Inc. (a)(b) | 28,975 | 837,957 | ||||||
HEALTH CARE — 5.41% | ||||||||
Health Care Technology — 1.49% | ||||||||
NextGen Healthcare, Inc. (a) | 37,045 | 547,155 | ||||||
Life Sciences Tools & Services — 3.92% | ||||||||
Illumina, Inc. (a) | 4,635 | 1,442,180 | ||||||
INFORMATION TECHNOLOGY — 75.59% | ||||||||
Communications Equipment — 12.22% | ||||||||
F5 Networks, Inc. (a)(b) | 8,805 | 1,543,340 | ||||||
Palo Alto Networks, Inc. (a)(b) | 5,900 | 1,079,936 | ||||||
QUALCOMM, Inc. (b) | 18,620 | 1,171,012 | ||||||
Ubiquiti Networks, Inc. (b) | 7,480 | 696,313 | ||||||
| 4,490,601 | ||||||||
Electronic Equipment, Instruments & Components — 1.19% | ||||||||
KEMET Corporation (a) | 20,000 | 435,600 | ||||||
Internet Software & Services — 4.80% | ||||||||
iQIYI, Inc. - ADR (a)(b) | 21,150 | 415,386 | ||||||
Salesforce.com, inc. (a) | 9,825 | 1,348,383 | ||||||
| 1,763,769 | ||||||||
IT Services — 11.94% | ||||||||
Alliance Data Systems Corporation (b) | 3,500 | 721,630 | ||||||
Cognizant Technology Solutions Corporation - Class A | 9,600 | 662,688 | ||||||
CSG Systems International, Inc. | 5,255 | 184,451 | ||||||
DXC Technology Company | 19,950 | 1,452,958 | ||||||
Perficient, Inc. (a) | 29,165 | 729,708 | ||||||
Perspecta, Inc. (b) | 9,975 | 244,288 | ||||||
Annual Report | October 31, 2018 | 40 |
Black Oak Emerging Technology Fund | Schedule of Investments |
As of October 31, 2018 |
| Shares | Fair | ||||||
IT Services (continued) | ||||||||
Science Applications International Corporation (b) | 5,665 | $ | 393,774 | |||||
| 4,389,497 | ||||||||
Semiconductors & Semiconductor Equipment — 11.48% | ||||||||
Cirrus Logic, Inc. (a)(b) | 26,800 | 1,003,392 | ||||||
Cohu, Inc. | 16,025 | 333,320 | ||||||
Diodes, Inc. (a) | 16,535 | 499,192 | ||||||
Lam Research Corporation (b) | 7,205 | 1,021,164 | ||||||
Qorvo, Inc. (a)(b) | 7,800 | 573,378 | ||||||
Silicon Motion Technology Corporation - ADR | 20,940 | 787,135 | ||||||
| 4,217,581 | ||||||||
Software — 17.05% | ||||||||
CA, Inc. | 28,450 | 1,262,042 | ||||||
Citrix Systems, Inc. (a)(b) | 16,090 | 1,648,743 | ||||||
Dell Technologies, Inc. - Class V (a) | 4,803 | 434,143 | ||||||
Fortinet, Inc. (a) | 18,440 | 1,515,399 | ||||||
HubSpot, Inc. (a)(b) | 3,250 | 440,863 | ||||||
LogMeIn, Inc. | 1 | 86 | ||||||
Paylocity Holding Corporation (a) | 5,855 | 385,200 | ||||||
Ultimate Software Group, Inc. (The) (a) | 1,405 | 374,615 | ||||||
Workiva, Inc. (a) | 6,000 | 204,540 | ||||||
| 6,265,631 | ||||||||
Technology Hardware, Storage & Peripherals — 16.91% | ||||||||
Apple, Inc. | 14,000 | 3,064,040 | ||||||
NetApp, Inc. (b) | 25,785 | 2,023,865 | ||||||
Seagate Technology plc (b) | 28,045 | 1,128,250 | ||||||
| 6,216,155 | ||||||||
TOTAL COMMON STOCKS (Cost $21,029,263) | 34,543,574 | |||||||
41 | 1-888-462-5386 | www.oakfunds.com |
Schedule of Investments | Black Oak Emerging Technology Fund |
As of October 31, 2018 |
| Shares or | Fair | ||||||
SHORT-TERM INVESTMENTS — 39.22% | ||||||||
MONEY MARKET FUNDS — 0.06% | ||||||||
Fidelity Investments Money Market Government Portfolio - Class I, 2.06% (c) | 22,945 | $ | 22,945 | |||||
REPURCHASE AGREEMENTS — 5.92% | ||||||||
Tri-Party Repurchase Agreement with South Street Securities Wachovia Tri-Party, 1.97%, dated 10/31/18 and maturing 11/1/18, collateralized by U.S. Treasury Securities with rates ranging from 1.75% to 2.75% and maturity dates ranging from 12/15/20 to 6/30/25 with a par value of $2,250,820 and a collateral value of $2,219,153. | 2,175,637 | 2,175,637 | ||||||
COLLATERAL FOR SECURITIES LOANED — 33.24% | ||||||||
Mount Vernon Liquid Assets Portfolio, LLC, 2.39% (c) | 12,214,857 | 12,214,857 | ||||||
TOTAL SHORT-TERM INVESTMENTS (Cost $14,413,439) | 14,413,439 | |||||||
TOTAL INVESTMENTS — 133.21% (Cost $35,442,702) | 48,957,013 | |||||||
Liabilities in Excess of Other Assets — (33.21)% | (12,204,087 | ) | ||||||
NET ASSETS — 100.00% | $ | 36,752,926 | ||||||
(a) | Non-income producing security. |
(b) | Security, or a portion of the security position, is currently on loan. The total market value of securities on loan is $12,163,836. |
(c) | Rate disclosed is the seven day effective yield as of October 31, 2018. |
ADR — American Depositary Receipt. |
The sectors shown on the schedule of investments are based on the Global Industry Classification Standard, or GICS® (“GICS”). The GICS was developed by and/or is the exclusive property of MSCI, Inc. and Standard & Poor’s Financial Services LLC (“S&P”). GICS is a service mark of MSCI, Inc. and S&P and has been licensed for use by Ultimus Fund Solutions, LLC.
The accompanying notes are an integral part of the financial statements.
Annual Report | October 31, 2018 | 42 |
Live Oak Health Sciences Fund | Schedule of Investments |
As of October 31, 2018 |
| Shares | Fair | ||||||
COMMON STOCKS — 96.93% | ||||||||
HEALTH CARE — 96.93% | ||||||||
Biotechnology — 19.10% | ||||||||
Amgen, Inc. | 26,200 | $ | 5,051,098 | |||||
Biogen, Inc. (a) | 10,850 | 3,301,330 | ||||||
Celgene Corporation (a) | 28,500 | 2,040,600 | ||||||
Gilead Sciences, Inc. | 31,700 | 2,161,306 | ||||||
| 12,554,334 | ||||||||
Health Care Equipment & Supplies — 3.38% | ||||||||
Medtronic plc | 13,796 | 1,239,157 | ||||||
Stryker Corporation | 6,060 | 983,053 | ||||||
| 2,222,210 | ||||||||
Health Care Providers & Services — 42.19% | ||||||||
Aetna, Inc. | 14,300 | 2,837,120 | ||||||
Anthem, Inc. | 10,010 | 2,758,456 | ||||||
Cardinal Health, Inc. (b) | 55,400 | 2,803,240 | ||||||
Cigna Corporation | 10,700 | 2,287,767 | ||||||
CVS Health Corp. (b) | 16,500 | 1,194,435 | ||||||
DaVita, Inc. (a) | 39,400 | 2,653,196 | ||||||
Express Scripts Holding Company (a) | 51,000 | 4,945,470 | ||||||
McKesson Corporation | 23,550 | 2,938,098 | ||||||
Owens & Minor, Inc. (b) | 87,080 | 687,932 | ||||||
Quest Diagnostics, Inc. | 20,800 | 1,957,488 | ||||||
UnitedHealth Group, Inc. | 10,200 | 2,665,770 | ||||||
| 27,728,972 | ||||||||
Life Sciences Tools & Services — 8.27% | ||||||||
Charles River Laboratories International, Inc. (a)(b) | 18,600 | 2,265,852 | ||||||
Waters Corporation (a) | 16,700 | 3,167,823 | ||||||
| 5,433,675 | ||||||||
Pharmaceuticals — 23.99% | ||||||||
Endo International PLC (a) | 127,000 | 2,151,380 | ||||||
GlaxoSmithKline plc - ADR | 64,300 | 2,511,558 | ||||||
Johnson & Johnson | 14,700 | 2,057,853 | ||||||
Mylan N.V. (a) | 28,000 | 875,000 | ||||||
Novartis AG - ADR (b) | 14,600 | 1,276,916 | ||||||
Novo Nordisk A/S - ADR | 18,000 | 777,240 | ||||||
Pfizer, Inc. | 57,500 | 2,475,950 | ||||||
Sanofi - ADR | 49,692 | 2,222,226 | ||||||
Teva Pharmaceutical Industries Ltd. - ADR (b) | 70,800 | 1,414,584 | ||||||
| 15,762,707 | ||||||||
TOTAL COMMON STOCKS (Cost $49,862,583) | 63,701,898 | |||||||
43 | 1-888-462-5386 | www.oakfunds.com |
Schedule of Investments | Live Oak Health Sciences Fund |
As of October 31, 2018 |
| Shares or | Fair | ||||||
SHORT-TERM INVESTMENTS — 13.47% | ||||||||
REPURCHASE AGREEMENTS — 3.12% | ||||||||
Tri-Party Repurchase Agreement with South Street Securities Wachovia Tri-Party, 1.97%, dated 10/31/18 and maturing 11/1/18, collateralized by U.S. Treasury Securities with rates ranging from 1.75% to 2.75% and maturity dates ranging from 12/15/20 to 6/30/25 with a par value of $2,121,685 and a collateral value of $2,091,834. | 2,050,815 | $ | 2,050,815 | |||||
COLLATERAL FOR SECURITIES LOANED — 10.35% | ||||||||
Mount Vernon Liquid Assets Portfolio, LLC, 2.39% (c) | 6,799,658 | 6,799,658 | ||||||
TOTAL SHORT-TERM INVESTMENTS (Cost $8,850,473) | 8,850,473 | |||||||
TOTAL INVESTMENTS — 110.40% (Cost $58,713,056) | 72,552,371 | |||||||
Liabilities in Excess of Other Assets — (10.40)% | (6,834,913 | ) | ||||||
NET ASSETS — 100.00% | $ | 65,717,458 | ||||||
(a) | Non-income producing security. |
(b) | Security, or a portion of the security position, is currently on loan. The total market value of securities on loan is $6,130,003. |
(c) | Rate disclosed is the seven day effective yield as of October 31, 2018. |
ADR — American Depositary Receipt. |
The sectors shown on the schedule of investments are based on the Global Industry Classification Standard, or GICS® (“GICS”). The GICS was developed by and/or is the exclusive property of MSCI, Inc. and Standard & Poor’s Financial Services LLC (“S&P”). GICS is a service mark of MSCI, Inc. and S&P and has been licensed for use by Ultimus Fund Solutions, LLC.
The accompanying notes are an integral part of the financial statements.
Annual Report | October 31, 2018 | 44 |
Statements of Assets and Liabilities
October 31, 2018
| White Oak Select | Pin Oak | ||||||
ASSETS | ||||||||
Investment securities at value (cost $259,342,240, $243,536,087, $21,242,407, $13,317,072, $424,417,488, $35,442,702 and $58,713,056), including $33,390,077, $30,131,026, $4,758,375, $1,964,121, $47,969,684, $12,163,836 and $6,130,003 of securities on loan at value | $ | 352,141,631 | $ | 292,150,788 | ||||
Receivable for fund shares sold | 111,985 | 120,481 | ||||||
Receivable for investments sold | — | 1,946,616 | ||||||
Dividends and interest receivable | 41,100 | 175,181 | ||||||
Tax reclaims receivable | 9,432 | — | ||||||
Prepaid expenses and other assets | 27,042 | 25,279 | ||||||
Total Assets | 352,331,190 | 294,418,345 | ||||||
LIABILITIES | ||||||||
Payable for fund shares redeemed | 67,490 | 225,944 | ||||||
Payable for investments purchased | 278,094 | 2,418,162 | ||||||
Payable for collateral upon return of securities loaned | 33,680,316 | 30,695,452 | ||||||
Investment advisory fees payable | 206,220 | 167,376 | ||||||
Administration fees payable | 12,183 | 10,093 | ||||||
Transfer agent fees payable | 6,910 | 3,416 | ||||||
Trustee fees payable | 716 | 421 | ||||||
Other accrued expenses | 41,832 | 38,029 | ||||||
Total Liabilities | 34,293,761 | 33,558,893 | ||||||
NET ASSETS | $ | 318,037,429 | $ | 260,859,452 | ||||
Net Assets consist of: | ||||||||
Paid-in capital (unlimited authorization - no par value) | $ | 220,979,625 | $ | 205,896,478 | ||||
Accumulated earnings | 97,057,804 | 54,962,974 | ||||||
Net Assets | $ | 318,037,429 | $ | 260,859,452 | ||||
Total shares outstanding at end of year | 3,551,575 | 3,941,502 | ||||||
Net asset value, offering and redemption price per share (net assets/shares outstanding) | $ | 89.55 | $ | 66.18 | ||||
The accompanying notes are an integral part of the financial statements.
45 | 1-888-462-5386 | www.oakfunds.com |
Rock Oak Core | River Oak | Red Oak | Black Oak | Live Oak Health | ||||||||||||||
| $ | 24,994,429 | $ | 16,104,218 | $ | 592,340,874 | $ | 48,957,013 | $ | 72,552,371 | |||||||||
| 146,375 | — | 550,799 | 2,250 | 40 | ||||||||||||||
| — | — | — | — | 190,556 | ||||||||||||||
| 6,247 | 3,367 | 114,959 | 137 | 15,523 | ||||||||||||||
| — | — | — | — | 16,923 | ||||||||||||||
| 6,321 | 7,692 | 37,842 | 58,986 | 14,340 | ||||||||||||||
| 25,153,372 | 16,115,277 | 593,044,474 | 49,018,386 | 72,789,753 | ||||||||||||||
| — | — | 419,454 | 2,000 | 21,925 | ||||||||||||||
| — | 1,028,569 | 101,071 | — | 181,508 | ||||||||||||||
| 4,757,552 | 2,111,526 | 47,868,166 | 12,214,857 | 6,799,658 | ||||||||||||||
| 9,911 | 5,104 | 347,870 | 24,077 | 42,784 | ||||||||||||||
| 876 | 506 | 21,142 | 1,519 | 2,507 | ||||||||||||||
| 1,313 | 1,321 | 5,967 | 3,050 | 1,952 | ||||||||||||||
| — | — | 1,279 | 59 | 47 | ||||||||||||||
| 18,255 | 18,138 | 76,202 | 19,898 | 21,914 | ||||||||||||||
| 4,787,907 | 3,165,164 | 48,841,151 | 12,265,460 | 7,072,295 | ||||||||||||||
| $ | 20,365,465 | $ | 12,950,113 | $ | 544,203,323 | $ | 36,752,926 | $ | 65,717,458 | |||||||||
| $ | 16,501,544 | $ | 8,464,320 | $ | 353,793,179 | $ | 19,840,873 | $ | 44,348,005 | |||||||||
| 3,863,921 | 4,485,793 | 190,410,144 | 16,912,053 | 21,369,453 | ||||||||||||||
| $ | 20,365,465 | $ | 12,950,113 | $ | 544,203,323 | $ | 36,752,926 | $ | 65,717,458 | |||||||||
| 1,196,374 | 815,439 | 20,234,041 | 6,929,568 | 3,252,454 | ||||||||||||||
| $ | 17.02 | $ | 15.88 | $ | 26.90 | $ | 5.30 | $ | 20.21 | |||||||||
Annual Report | October 31, 2018 | 46 |
Statements of Operations
For the Year Ended October 31, 2018
| White Oak Select | Pin Oak | ||||||
INVESTMENT INCOME | ||||||||
Dividends | $ | 4,806,019 | $ | 4,092,475 | ||||
Securities lending income | 49,383 | 65,530 | ||||||
Interest | 74,796 | 224,897 | ||||||
Less: Foreign withholding tax | (2,410 | ) | (24,457 | ) | ||||
Total Investment Income | 4,927,788 | 4,358,445 | ||||||
EXPENSES | ||||||||
Investment adviser | 2,330,733 | 1,771,950 | ||||||
Administration | 140,725 | 107,299 | ||||||
Sub transfer agent | 130,398 | 131,085 | ||||||
Transfer agent | 81,219 | 48,859 | ||||||
Legal | 52,489 | 39,149 | ||||||
Trustee | 42,341 | 31,997 | ||||||
Report printing | 34,320 | 30,570 | ||||||
Registration | 23,504 | 29,110 | ||||||
Insurance | 17,246 | 16,427 | ||||||
Audit | 16,950 | 16,950 | ||||||
Custodian | 13,547 | 11,439 | ||||||
Pricing | 867 | 999 | ||||||
Miscellaneous | 47,363 | 37,643 | ||||||
Total Expenses | 2,931,702 | 2,273,477 | ||||||
Less: Investment advisory fees waived | — | — | ||||||
Net Expenses | 2,931,702 | 2,273,477 | ||||||
Net Investment Income (Loss) | 1,996,086 | 2,084,968 | ||||||
Realized and Unrealized Gain (Loss) on Investments | ||||||||
Net realized gain on investment securities transactions | 2,262,324 | 4,339,946 | ||||||
Net realized gain on foreign currency transactions | — | 521 | ||||||
Net change in unrealized appreciation (depreciation) of investment securities | 21,829,929 | 3,337,705 | ||||||
Net Realized and Unrealized Gain (Loss) on Investments | 24,092,253 | 7,678,172 | ||||||
Net Increase (Decrease) in Net Assets from Operations | $ | 26,088,339 | $ | 9,763,140 | ||||
The accompanying notes are an integral part of the financial statements.
47 | 1-888-462-5386 | www.oakfunds.com |
Rock Oak Core | River Oak | Red Oak | Black Oak | Live Oak Health | ||||||||||||||
| $ | 177,356 | $ | 107,993 | $ | 6,594,246 | $ | 305,185 | $ | 1,039,886 | |||||||||
| 6,487 | 14,839 | 114,074 | 22,307 | 17,322 | ||||||||||||||
| 11,610 | 2,564 | 289,482 | 5,527 | 19,661 | ||||||||||||||
| (506 | ) | — | — | (1,690 | ) | (10,960 | ) | |||||||||||
| 194,947 | 125,396 | 6,997,802 | 331,329 | 1,065,909 | ||||||||||||||
| 108,422 | 127,359 | 3,922,429 | 290,965 | 476,208 | ||||||||||||||
| 6,607 | 6,333 | 237,854 | 17,634 | 28,836 | ||||||||||||||
| 3,725 | 881 | 368,927 | 14,192 | 28,179 | ||||||||||||||
| 16,540 | 16,501 | 67,888 | 36,542 | 23,871 | ||||||||||||||
| 2,974 | 2,458 | 87,122 | 6,694 | 10,742 | ||||||||||||||
| 2,017 | 1,864 | 71,002 | 5,229 | 8,462 | ||||||||||||||
| 2,925 | 2,700 | 56,341 | 6,413 | 8,938 | ||||||||||||||
| 20,008 | 22,372 | 29,891 | 20,345 | 21,727 | ||||||||||||||
| 601 | 871 | 35,718 | 2,368 | 4,411 | ||||||||||||||
| 16,950 | 16,950 | 16,950 | 16,950 | 16,950 | ||||||||||||||
| 955 | 948 | 22,178 | 1,752 | 3,818 | ||||||||||||||
| 567 | 638 | 655 | 396 | 556 | ||||||||||||||
| 12,201 | 12,242 | 60,507 | 18,104 | 18,100 | ||||||||||||||
| 194,492 | 212,117 | 4,977,462 | 437,584 | 650,798 | ||||||||||||||
| (10,982 | ) | (21,180 | ) | — | — | — | ||||||||||||
| 183,510 | 190,937 | 4,977,462 | 437,584 | 650,798 | ||||||||||||||
| 11,437 | (65,541 | ) | 2,020,340 | (106,255 | ) | 415,111 | ||||||||||||
| 100,462 | 1,791,329 | 20,930,556 | 3,543,071 | 7,854,061 | ||||||||||||||
| — | — | — | — | — | ||||||||||||||
| 348,065 | (2,213,091 | ) | 30,202,118 | (284,298 | ) | (3,623,412 | ) | |||||||||||
| 448,527 | (421,762 | ) | 51,132,674 | 3,258,773 | 4,230,649 | |||||||||||||
| $ | 459,964 | $ | (487,303 | ) | $ | 53,153,014 | $ | 3,152,518 | $ | 4,645,760 | ||||||||
Annual Report | October 31, 2018 | 48 |
Statements of Changes in Net Assets
White Oak Select | Pin Oak | |||||||||||||||
| For the Year | For the Year | For the Year | For the Year | ||||||||||||
INVESTMENT ACTIVITIES | ||||||||||||||||
Net investment income (loss) | $ | 1,996,086 | $ | 2,349,148 | $ | 2,084,968 | $ | 1,335,787 | ||||||||
Net realized gain on investment securities transactions and foreign currency translations | 2,262,324 | 8,295,682 | 4,340,467 | 2,689,948 | ||||||||||||
Net change in unrealized appreciation (depreciation) of investments securities | 21,829,929 | 45,890,230 | 3,337,705 | 27,089,478 | ||||||||||||
Net Increase (Decrease) in Net Assets Resulting from Operations | 26,088,339 | 56,535,060 | 9,763,140 | 31,115,213 | ||||||||||||
DISTRIBUTIONS TO SHAREHOLDERS FROM | ||||||||||||||||
Earnings | (1,959,985 | ) | (2,687,021 | ) | (3,931,119 | ) | (2,727,493 | ) | ||||||||
Total Distributions | (1,959,985 | ) | (2,687,021 | ) | (3,931,119 | ) | (2,727,493 | ) | ||||||||
CAPITAL TRANSACTIONS | ||||||||||||||||
Proceeds from shares sold | 34,747,330 | 9,104,353 | 85,564,499 | 160,255,640 | ||||||||||||
Reinvestment of distributions | 1,853,766 | 2,549,043 | 3,718,183 | 2,531,718 | ||||||||||||
Amount paid for shares redeemed | (28,349,774 | ) | (28,276,793 | ) | (56,340,651 | ) | (79,018,102 | ) | ||||||||
Net Increase (Decrease) in Net Assets Resulting from Capital Transactions | 8,251,322 | (16,623,397 | ) | 32,942,031 | 83,769,256 | |||||||||||
Total Increase (Decrease) in Net Assets | 32,379,676 | 37,224,642 | 38,774,052 | 112,156,976 | ||||||||||||
NET ASSETS | ||||||||||||||||
Beginning of year | 285,657,753 | 248,433,111 | 222,085,400 | 109,928,424 | ||||||||||||
End of year | $ | 318,037,429 | $ | 285,657,753 | $ | 260,859,452 | $ | 222,085,400 | ||||||||
SHARE TRANSACTIONS | ||||||||||||||||
Shares sold | 371,788 | 121,717 | 1,236,349 | 2,675,663 | ||||||||||||
Shares issued in reinvestment of distributions | 21,755 | 35,222 | 57,124 | 43,411 | ||||||||||||
Shares redeemed | (310,187 | ) | (372,460 | ) | (837,302 | ) | (1,294,183 | ) | ||||||||
Net Increase (Decrease) in Shares Outstanding | 83,356 | (215,521 | ) | 456,171 | 1,424,891 | |||||||||||
The accompanying notes are an integral part of the financial statements.
49 | 1-888-462-5386 | www.oakfunds.com |
Rock Oak Core | River Oak | Red Oak Technology | ||||||||||||||||||||
For the Year | For the Year | For the Year | For the Year | For the Year | For the Year | |||||||||||||||||
| $ | 11,437 | $ | 16,734 | $ | (65,541 | ) | $ | (87,733 | ) | $ | 2,020,340 | $ | 1,542,758 | |||||||||
| 100,462 | 608,663 | 1,791,329 | 806,237 | 20,930,556 | 30,088,617 | |||||||||||||||||
| 348,065 | 1,339,646 | (2,213,091 | ) | 2,037,268 | 30,202,118 | 85,094,923 | ||||||||||||||||
| 459,964 | 1,965,043 | (487,303 | ) | 2,755,772 | 53,153,014 | 116,726,298 | ||||||||||||||||
| (527,828 | ) | (54,642 | ) | (757,851 | ) | — | (31,959,428 | ) | (3,525,555 | ) | ||||||||||||
| (527,828 | ) | (54,642 | ) | (757,851 | ) | — | (31,959,428 | ) | (3,525,555 | ) | ||||||||||||
| 14,935,944 | 278,335 | 440,737 | 189,919 | 160,609,152 | 343,894,387 | |||||||||||||||||
| 440,165 | 45,524 | 421,980 | — | 30,741,091 | 3,369,836 | |||||||||||||||||
| (4,125,730 | ) | (446,548 | ) | (1,094,929 | ) | (839,975 | ) | (154,635,759 | ) | (163,233,228 | ) | |||||||||||
| 11,250,379 | (122,689 | ) | (232,212 | ) | (650,056 | ) | 36,714,484 | 184,030,995 | ||||||||||||||
| 11,182,515 | 1,787,712 | (1,477,366 | ) | 2,105,716 | 57,908,070 | 297,231,738 | ||||||||||||||||
| 9,182,950 | 7,395,238 | 14,427,479 | 12,321,763 | 486,295,253 | 189,063,515 | |||||||||||||||||
| $ | 20,365,465 | $ | 9,182,950 | $ | 12,950,113 | $ | 14,427,479 | $ | 544,203,323 | $ | 486,295,253 | |||||||||||
| 829,344 | 18,955 | 25,461 | 11,769 | 5,980,250 | 16,048,396 | |||||||||||||||||
| 28,054 | 3,347 | 25,375 | — | 1,248,623 | 166,823 | |||||||||||||||||
| (232,511 | ) | (31,372 | ) | (63,676 | ) | (50,885 | ) | (5,856,727 | ) | (7,164,293 | ) | |||||||||||
| 624,887 | (9,070 | ) | (12,840 | ) | (39,116 | ) | 1,372,146 | 9,050,926 | ||||||||||||||
Annual Report | October 31, 2018 | 50 |
Statements of Changes in Net Assets
Black Oak Emerging | Live Oak | |||||||||||||||
| For the Year | For the Year | For the Year | For the Year | ||||||||||||
INVESTMENT ACTIVITIES | ||||||||||||||||
Net investment income (loss) | $ | (106,255 | ) | $ | (79,372 | ) | $ | 415,111 | $ | 328,909 | ||||||
Net realized gain on investment securities transactions and foreign currency translations | 3,543,071 | 2,784,419 | 7,854,061 | 3,783,940 | ||||||||||||
Net change in unrealized appreciation (depreciation) of investments securities | (284,298 | ) | 4,037,379 | (3,623,412 | ) | 3,979,817 | ||||||||||
Net Increase (Decrease) in Net Assets Resulting from Operations | 3,152,518 | 6,742,426 | 4,645,760 | 8,092,666 | ||||||||||||
DISTRIBUTIONS TO SHAREHOLDERS FROM | ||||||||||||||||
Earnings | (2,734,659 | ) | (1,315,530 | ) | (4,004,136 | ) | (1,222,423 | ) | ||||||||
Total Distributions | (2,734,659 | ) | (1,315,530 | ) | (4,004,136 | ) | (1,222,423 | ) | ||||||||
CAPITAL TRANSACTIONS | ||||||||||||||||
Proceeds from shares sold | 1,433,312 | 1,335,137 | 7,733,552 | 15,901,469 | ||||||||||||
Reinvestment of distributions | 2,385,442 | 1,152,138 | 3,641,204 | 1,107,629 | ||||||||||||
Amount paid for shares redeemed | (4,751,050 | ) | (3,541,104 | ) | (11,045,950 | ) | (15,191,665 | ) | ||||||||
Net Increase (Decrease) in Net Assets Resulting from Capital Transactions | (932,296 | ) | (1,053,829 | ) | 328,806 | 1,817,433 | ||||||||||
Total Increase (Decrease) in Net Assets | (514,437 | ) | 4,373,067 | 970,430 | 8,687,676 | |||||||||||
NET ASSETS | ||||||||||||||||
Beginning of year | 37,267,363 | 32,894,296 | 64,747,028 | 56,059,352 | ||||||||||||
End of year | $ | 36,752,926 | $ | 37,267,363 | $ | 65,717,458 | $ | 64,747,028 | ||||||||
SHARE TRANSACTIONS | ||||||||||||||||
Shares sold | 258,443 | 275,090 | 379,797 | 833,815 | ||||||||||||
Shares issued in reinvestment of distributions | 472,365 | 249,381 | 187,788 | 60,825 | ||||||||||||
Shares redeemed | (863,496 | ) | (716,020 | ) | (555,809 | ) | (780,477 | ) | ||||||||
Net Increase (Decrease) in Shares Outstanding | (132,688 | ) | (191,549 | ) | 11,776 | 114,163 | ||||||||||
The accompanying notes are an integral part of the financial statements.
51 | 1-888-462-5386 | www.oakfunds.com |
(a) | For the year ended October 31, 2017, distributions to shareholders from earnings consisted of $2,687,021 from net investment income for White Oak Select Growth Fund, $827,884 from net investment income and $1,899,609 from net realized gains for Pin Oak Equity Fund, $54,642 from net investment income for Rock Oak Core Growth Fund, $993,217 from net investment income and $2,532,338 from net realized gains for Red Oak Technology Select Fund, $9,364 from net investment income and $1,306,166 from net realized gains for Black Oak Emerging Technology Fund, and $315,656 from net investment income and $906,767 from net realized gains for Live Oak Health Sciences Fund. |
As of October 31, 2017, accumulated undistributed net investment income (loss) was $1,945,902, $1,168,801, $5,990, $(81,754), $1,413,839, $59,141 and $240,261 for White Oak Select Growth Fund, Pin Oak Equity Fund, Rock Oak Core Growth Fund, River Oak Discovery Fund, Red Oak Technology Select Fund, Black Oak Emerging Technology Fund and Live Oak Health Sciences Fund, respectively. |
Annual Report | October 31, 2018 | 52 |
Financial Highlights
For a share outstanding throughout each year
| Net Asset | Net | Realized and | Total From | Dividends from | |||||||||||||||
White Oak Select Growth Fund | ||||||||||||||||||||
For the year ended October 31, 2018 | $ | 82.36 | $ | 0.58 | $ | 7.18 | $ | 7.76 | $ | (0.57 | ) | |||||||||
For the year ended October 31, 2017 | 67.44 | 0.65 | 15.00 | 15.65 | (0.73 | ) | ||||||||||||||
For the year ended October 31, 2016 | 65.21 | 0.66 | 1.99 | 2.65 | (0.42 | ) | ||||||||||||||
For the year ended October 31, 2015 | 60.34 | 0.94 | 4.90 | 5.84 | (0.97 | ) | ||||||||||||||
For the year ended October 31, 2014 | 53.66 | 0.35 | 6.57 | 6.92 | (0.24 | ) | ||||||||||||||
Pin Oak Equity Fund | ||||||||||||||||||||
For the year ended October 31, 2018 | $ | 63.72 | $ | 0.59 | $ | 3.05 | $ | 3.64 | $ | (0.37 | ) | |||||||||
For the year ended October 31, 2017 | 53.35 | 0.40 | 11.15 | 11.55 | (0.36 | ) | ||||||||||||||
For the year ended October 31, 2016 | 52.45 | 0.43 | 2.38 | 2.81 | (0.40 | ) | ||||||||||||||
For the year ended October 31, 2015 | 49.76 | 0.54 | 2.77 | 3.31 | (0.53 | ) | ||||||||||||||
For the year ended October 31, 2014 | 43.07 | 0.30 | 6.67 | 6.97 | (0.28 | ) | ||||||||||||||
Rock Oak Core Growth Fund | ||||||||||||||||||||
For the year ended October 31, 2018 | $ | 16.07 | $ | 0.01 | $ | 1.86 | $ | 1.87 | $ | (0.01 | ) | |||||||||
For the year ended October 31, 2017 | 12.74 | 0.03 | 3.40 | 3.43 | (0.10 | ) | ||||||||||||||
For the year ended October 31, 2016 | 12.64 | 0.18 | 0.31 | 0.49 | (0.10 | ) | ||||||||||||||
For the year ended October 31, 2015 | 14.21 | — | (c) | (0.54 | ) | (0.54 | ) | (0.04 | ) | |||||||||||
For the year ended October 31, 2014 | 15.04 | 0.05 | 2.06 | 2.11 | (0.06 | ) | ||||||||||||||
River Oak Discovery Fund | ||||||||||||||||||||
For the year ended October 31, 2018 | $ | 17.42 | $ | (0.08 | ) | $ | (0.54 | ) | $ | (0.62 | ) | $ | — | |||||||
For the year ended October 31, 2017 | 14.21 | (0.10 | ) | 3.31 | 3.21 | — | ||||||||||||||
For the year ended October 31, 2016 | 13.76 | (0.06 | ) | 0.53 | (0.47 | ) | (0.02 | ) | ||||||||||||
For the year ended October 31, 2015 | 17.72 | (0.04 | ) | (0.13 | ) | (0.17 | ) | — | ||||||||||||
For the year ended October 31, 2014 | 17.70 | (0.13 | ) | 1.59 | 1.46 | — | ||||||||||||||
(a) | Per share calculations were performed using average shares for the period. |
(b) | Figures do not reflect the deduction of taxes the shareholder will pay on fund distributions or redemption of fund shares. |
(c) | Less than $0.005 per share. |
The accompanying notes are an integral part of the financial statements.
53 | 1-888-462-5386 | www.oakfunds.com |
Distributions | Total | Net Asset | Total | Net Assets | Ratio of Net | Ratio of Net | Ratio of | Portfolio | ||||||||||||||||||||||||||
| $ | — | (c) | $ | (0.57 | ) | $ | 89.55 | 9.46 | % | $ | 318,037 | 0.93 | % | 0.63 | % | 0.93 | % | 14 | % | |||||||||||||||
| — | (0.73 | ) | 82.36 | 23.36 | % | 285,658 | 0.98 | % | 0.86 | % | 0.98 | % | 13 | % | ||||||||||||||||||||
| — | (0.42 | ) | 67.44 | 4.07 | % | 248,433 | 1.06 | % | 1.03 | % | 1.06 | % | 14 | % | ||||||||||||||||||||
| — | (0.97 | ) | 65.21 | 9.84 | % | 257,652 | 1.06 | % | 1.52 | % | 1.06 | % | 9 | % | ||||||||||||||||||||
| — | (0.24 | ) | 60.34 | 12.94 | % | 256,221 | 1.10 | % | 0.61 | % | 1.10 | % | 1 | % | ||||||||||||||||||||
| ||||||||||||||||||||||||||||||||||
| $ | (0.81 | ) | $ | (1.18 | ) | $ | 66.18 | 5.75 | % | $ | 260,859 | 0.95 | % | 0.87 | % | 0.95 | % | 12 | % | |||||||||||||||
| (0.82 | ) | (1.18 | ) | 63.72 | 21.86 | % | 222,085 | 0.98 | % | 0.66 | % | 0.98 | % | 8 | % | |||||||||||||||||||
| (1.51 | ) | (1.91 | ) | 53.35 | 5.54 | % | 109,928 | 1.08 | % | 0.86 | % | 1.08 | % | 10 | % | |||||||||||||||||||
| (0.09 | ) | (0.62 | ) | 52.45 | 6.76 | % | 98,976 | 1.10 | % | 1.09 | % | 1.10 | % | 15 | % | |||||||||||||||||||
| — | (0.28 | ) | 49.76 | 16.25 | % | 94,316 | 1.13 | % | 0.64 | % | 1.13 | % | 5 | % | ||||||||||||||||||||
| ||||||||||||||||||||||||||||||||||
| $ | (0.91 | ) | $ | (0.92 | ) | $ | 17.02 | 12.15 | % | $ | 20,365 | 1.25 | % | 0.08 | % | 1.32 | % | 14 | % | |||||||||||||||
| — | (0.10 | ) | 16.07 | 27.02 | % | 9,183 | 1.25 | % | 0.20 | % | 1.51 | % | 31 | % | ||||||||||||||||||||
| (0.29 | ) | (0.39 | ) | 12.74 | 3.98 | % | 7,395 | 1.25 | % | 0.48 | % | 1.65 | % | 11 | % | |||||||||||||||||||
| (0.99 | ) | (1.03 | ) | 12.64 | (4.04 | %) | 7,807 | 1.25 | % | 0.03 | % | 1.52 | % | 32 | % | |||||||||||||||||||
| (2.88 | ) | (2.94 | ) | 14.21 | 15.89 | % | 8,491 | 1.25 | % | 0.33 | % | 1.58 | % | 29 | % | |||||||||||||||||||
| ||||||||||||||||||||||||||||||||||
| $ | (0.92 | ) | $ | (0.92 | ) | $ | 15.88 | (3.82 | %) | $ | 12,950 | 1.35 | % | (0.46 | %) | 1.50 | % | 43 | % | |||||||||||||||
| — | — | 17.42 | 22.59 | % | 14,427 | 1.35 | % | (0.63 | %) | 1.41 | % | 43 | % | |||||||||||||||||||||
| — | (0.02 | ) | 14.21 | 3.39 | % | 12,322 | 1.35 | % | (0.40 | %) | 1.51 | % | 21 | % | ||||||||||||||||||||
| (3.79 | ) | (3.79 | ) | 13.76 | (1.27 | %) | 12,582 | 1.35 | % | (0.28 | %) | 1.45 | % | 17 | % | |||||||||||||||||||
| (1.44 | ) | (1.44 | ) | 17.72 | 8.69 | % | 13,915 | 1.35 | % | (0.71 | %) | 1.48 | % | 96 | % | |||||||||||||||||||
Annual Report | October 31, 2018 | 54 |
Financial Highlights
For a share outstanding throughout each year
| Net Asset | Net | Realized and | Total From | Dividends from | |||||||||||||||
Red Oak Technology Select Fund | ||||||||||||||||||||
For the year ended October 31, 2018 | $ | 25.78 | $ | 0.10 | $ | 2.72 | $ | 2.82 | $ | (0.10 | ) | |||||||||
For the year ended October 31, 2017 | 19.27 | 0.09 | 6.71 | 6.80 | (0.08 | ) | ||||||||||||||
For the year ended October 31, 2016 | 17.17 | 0.20 | 2.62 | 2.82 | (0.19 | ) | ||||||||||||||
For the year ended October 31, 2015 | 16.22 | 0.20 | 0.91 | 1.11 | (0.16 | ) | ||||||||||||||
For the year ended October 31, 2014 | 13.74 | 0.06 | 2.48 | 2.54 | (0.06 | ) | ||||||||||||||
Black Oak Emerging Technology Fund | ||||||||||||||||||||
For the year ended October 31, 2018 | $ | 5.28 | $ | (0.01 | ) | $ | 0.42 | $ | 0.41 | $ | — | |||||||||
For the year ended October 31, 2017 | 4.53 | (0.01 | ) | 0.94 | 0.93 | — | (c) | |||||||||||||
For the year ended October 31, 2016 | 4.26 | 0.01 | 0.39 | 0.40 | — | |||||||||||||||
For the year ended October 31, 2015 | 4.25 | (0.03 | ) | 0.04 | 0.01 | — | ||||||||||||||
For the year ended October 31, 2014 | 3.58 | (0.01 | ) | 0.68 | 0.67 | — | ||||||||||||||
Live Oak Health Sciences Fund | ||||||||||||||||||||
For the year ended October 31, 2018 | $ | 19.98 | $ | 0.13 | $ | 1.35 | $ | 1.48 | $ | (0.09 | ) | |||||||||
For the year ended October 31, 2017 | 17.93 | 0.10 | 2.33 | 2.43 | (0.10 | ) | ||||||||||||||
For the year ended October 31, 2016 | 21.65 | 0.11 | (0.33 | ) | (0.22 | ) | (0.67 | ) | ||||||||||||
For the year ended October 31, 2015 | 22.25 | 0.14 | 1.51 | 1.65 | (0.13 | ) | ||||||||||||||
For the year ended October 31, 2014 | 18.83 | 0.13 | 4.11 | 4.24 | (0.13 | ) | ||||||||||||||
(a) | Per share calculations were performed using average shares for the period. |
(b) | Figures do not reflect the deduction of taxes the shareholder will pay on fund distributions or redemption of fund shares. |
(c) | Less than $0.005 per share. |
The accompanying notes are an integral part of the financial statements.
55 | 1-888-462-5386 | www.oakfunds.com |
Distributions | Total | Net Asset | Total | Net Assets | Ratio of Net | Ratio of Net | Ratio of | Portfolio | ||||||||||||||||||||||||||
| $ | (1.60 | ) | $ | (1.70 | ) | $ | 26.90 | 11.56 | % | $ | 544,203 | 0.94 | % | 0.38 | % | 0.94 | % | 9 | % | |||||||||||||||
| (0.21 | ) | (0.29 | ) | 25.78 | 35.76 | % | 486,295 | 0.97 | % | 0.38 | % | 0.97 | % | 16 | % | |||||||||||||||||||
| (0.53 | ) | (0.72 | ) | 19.27 | 17.14 | % | 189,064 | 1.09 | % | 1.17 | % | 1.09 | % | 6 | % | |||||||||||||||||||
| — | (0.16 | ) | 17.17 | 6.91 | % | 131,001 | 1.11 | % | 1.19 | % | 1.11 | % | 4 | % | ||||||||||||||||||||
| — | (0.06 | ) | 16.22 | 18.54 | % | 142,273 | 1.15 | % | 0.41 | % | 1.15 | % | 7 | % | ||||||||||||||||||||
| ||||||||||||||||||||||||||||||||||
| $ | (0.39 | ) | $ | (0.39 | ) | $ | 5.30 | 8.12 | % | $ | 36,753 | 1.11 | % | (0.27 | %) | 1.11 | % | 19 | % | |||||||||||||||
| (0.18 | ) | (0.18 | ) | 5.28 | 21.16 | % | 37,267 | 1.17 | % | (0.22 | %) | 1.17 | % | 39 | % | |||||||||||||||||||
| (0.13 | ) | (0.13 | ) | 4.53 | 9.59 | % | 32,894 | 1.28 | % | 0.22 | % | 1.28 | % | 35 | % | |||||||||||||||||||
| — | — | 4.26 | 0.24 | % | 32,298 | 1.25 | % | (0.61 | %) | 1.25 | % | 17 | % | |||||||||||||||||||||
| — | — | 4.25 | 18.72 | % | 34,139 | 1.31 | % | (0.32 | %) | 1.31 | % | 41 | % | |||||||||||||||||||||
| ||||||||||||||||||||||||||||||||||
| $ | (1.16 | ) | $ | (1.25 | ) | $ | 20.21 | 7.68 | % | $ | 65,717 | 1.01 | % | 0.65 | % | 1.01 | % | 23 | % | |||||||||||||||
| (0.28 | ) | (0.38 | ) | 19.98 | 13.78 | % | 64,747 | 1.02 | % | 0.50 | % | 1.02 | % | 14 | % | |||||||||||||||||||
| (2.83 | ) | (3.50 | ) | 17.93 | (1.85 | %) | 56,059 | 1.11 | % | 0.59 | % | 1.11 | % | 14 | % | |||||||||||||||||||
| (2.12 | ) | (2.25 | ) | 21.65 | 8.02 | % | 53,172 | 1.08 | % | 0.62 | % | 1.08 | % | 28 | % | |||||||||||||||||||
| (0.69 | ) | (0.82 | ) | 22.25 | 23.36 | % | 50,248 | 1.12 | % | 0.64 | % | 1.12 | % | 15 | % | |||||||||||||||||||
Annual Report | October 31, 2018 | 56 |
Notes to Financial Statements
As of October 31, 2018
1. ORGANIZATION:
The Oak Associates Funds (the “Trust”), a Massachusetts business trust, is registered under the Investment Company Act of 1940, as amended, as an open-end management investment company with seven diversified funds: White Oak Select Growth Fund, Pin Oak Equity Fund, Rock Oak Core Growth Fund, River Oak Discovery Fund, Red Oak Technology Select Fund, Black Oak Emerging Technology Fund and Live Oak Health Sciences Fund (collectively referred to as “Funds” and individually referred to as a “Fund”). The investment objective of each Fund is to seek long-term capital growth. The assets of each Fund are segregated, and a shareholder’s interest is limited to the Fund in which shares are held. The Funds’ prospectus provides a description of each Fund’s investment objective, policies and strategies.
2. SIGNIFICANT ACCOUNTING POLICIES:
The following is a summary of significant accounting policies followed by the Funds.
Use of Estimates – These policies are in conformity with U.S. generally accepted accounting principles (“GAAP”). Each Fund is an investment company and accordingly follows the investment company accounting and reporting guidance of the Financial Accounting Standards Board (FASB) Accounting Standard Codification Topic 946 “Financial Services - Investment Companies” including FASB Accounting Standard Update ASU 2013-08. The preparation of financial statements in accordance with GAAP requires management to make estimates and assumptions that affect the reported amounts and disclosures of contingent assets and liabilities in the financial statements and the reported amounts of income and expenses during the reporting period. Management believes the estimates and security valuations are appropriate; however, actual results may differ from those estimates, and the security valuations reflected in the financial statements may differ from the value the Funds ultimately realize upon the sale of the securities.
Security Valuation – Investments in equity securities, which are traded on a national exchange, are stated at the last quoted sales price if readily available for such equity securities on each business day. Investments in equity securities, which are reported on the NASDAQ national market system are valued at the official closing price; other equity securities traded in the over-the-counter market and listed equity securities for which no sale was reported on that date are stated at the last quoted bid price. Debt obligations exceeding sixty days to maturity for which market quotations are readily available are valued at the most recently quoted bid price. Debt obligations with sixty days or less remaining until maturity may be valued at their amortized cost, which approximates fair value, in the absence of a current quoted bid price. Investments in repurchase agreements are generally valued at par each business day.
Redeemable securities issued by open-end registered investment companies are valued at the investment company’s applicable net asset value (“NAV”) as determined by those funds each business day.
Securities for which market prices are not “readily available” are valued in accordance with Fair Value Procedures established by the Funds’ Board of Trustees (the “Board”). The Board of Trustees has determined to delegate responsibility for pricing and fair valuation determinations for portfolio securities to Funds’ adviser, Oak Associates, Ltd. (“Oak” or the “Adviser”), subject to oversight of the Board of Trustees. Oak may, in turn and subject to its oversight, delegate pricing of securities for which market prices are readily available to the Funds’ administrator. All fair valuation determinations shall be made by Oak’s Fair Value Committee (the “Committee”), in accordance with policies and procedures established by the Board of Trustees and subject to oversight of the Board. Oak and the administrator have established and maintain policies and procedures
57 | 1-888-462-5386 | www.oakfunds.com |
Notes to Financial Statements
As of October 31, 2018
reasonably designed to ensure that their pricing and valuation policies and procedures conform to the requirements of the Funds’ Fair Value Procedures. Some of the more common reasons that may necessitate that a security be valued using Fair Value Procedures include: the security’s trading has been halted or suspended; the security has been de–listed from a national exchange; the security’s primary trading market is temporarily closed at a time when under normal conditions it would be open; the security has not been traded for an extended period of time; the security’s primary pricing source is not able or willing to provide a price; a significant event with respect to a security or securities has occurred after the close of the market or exchange on which the security or securities principally trades and before the time the Fund calculates net asset value; or trading of the security is subject to local government–imposed restrictions. When a security is valued in accordance with the Fair Value Procedures, the Committee will determine the value after taking into consideration relevant information reasonably available to the Committee.
Security Transactions and Investment Income – Security transactions are accounted for on the date the security is purchased or sold (trade date) for financial reporting purposes. Dividend income is recognized on the ex-dividend date. Interest income is recognized on the accrual basis. Withholding taxes on foreign dividends have been provided for in accordance with the Funds’ understanding of the applicable country’s tax rules and rates. Costs used in determining realized gains and losses on the sales of investment securities are those of the specific securities sold. If applicable, any foreign capital gains taxes are accrued, net of unrealized gains, and are payable upon the sale of such investments.
Expenses – Expenses that are directly related to one of the Funds are charged to that Fund. Expenses not directly billed to a particular Fund are allocated proportionally among all Funds daily in relation to net assets of each Fund or another reasonable allocation method.
Repurchase Agreements – The Funds may invest in tri-party repurchase agreements. Securities held as collateral for tri-party repurchase agreements are maintained by the broker’s custodian bank in a segregated account until maturity of the repurchase agreement. Provisions of the repurchase agreements and procedures adopted by the Board of Trustees require that the market value of the collateral, including accrued interest thereon, is sufficient in the event of default by the counterparty. A custody agreement in connection with the Master Repurchase Agreement defines eligible securities for collateral in relation to each repurchase agreement. Under the Master Repurchase Agreement, if the counterparty defaults and the value of the collateral declines or if the counter-party enters an insolvency proceeding, realization of the collateral by the Funds may be delayed or limited. At fiscal year-end, certain Funds had investments in repurchase agreements. The gross value and related collateral received for those investments are presented in each applicable Fund’s Schedule of Investments. The value of the related collateral received exceeded the value of the repurchase agreements as of the period end.
Master Agreements and Netting Arrangements – Certain Funds may participate in various repurchase agreements, such as, but not limited to Master Repurchase Agreements, which govern the terms of certain transactions with select counterparties (collectively “Master Agreements”). These Master Agreements generally include provisions for general obligations, agreements, representations, collateral and provisions for events of default or termination. These Master Agreements also include provisions for netting arrangements that help reduce credit and counterparty risk associated with relevant transactions. The netting arrangements are generally tied to credit related events that if triggered, would cause an event of default or termination giving a Fund or counterparty the right to terminate early and cause settlement, on a net basis, of all transactions under the applicable Master Agreement. In the event of an early termination or default event, the total market value exposure would be offset against collateral exchanged to date, which would result in a net receivable or payable that would be due from or to the counterparty.
Annual Report | October 31, 2018 | 58 |
Notes to Financial Statements
As of October 31, 2018
Credit related events include, but are not limited to, bankruptcy, failure to make timely payments, restructuring, obligation acceleration, obligation default, a material decline in net assets, decline in credit rating or repudiation/moratorium. An election made by a counterparty to terminate a transaction early under a Master Agreement could have an adverse impact on a Fund’s financial statements. Master Agreements can also help limit counterparty risk by requiring collateral posting arrangements at pre-arranged exposure levels. Collateral under the Master Agreements is usually in the form of cash, U.S. Treasury or U.S. Government agency securities, but may include other types of securities. There can be no assurance that the Master Agreements will be successful in limiting credit or counterparty risk.
Securities Lending – The Trust has entered into a Securities Lending Agreement (“SLA”) with U.S. Bank National Association (the “Agent”). Under the terms of the SLA, the Funds may lend securities to certain broker-dealers and banks in exchange for collateral in the amount of at least 102% of the value of U.S. securities loaned or at least 105% of the value of non-U.S. securities loaned, marked to market daily. The collateral can be received in the form of cash collateral and/or non-cash collateral. Non-cash collateral can include U.S. Government Securities and letters of credit. The cash collateral is invested in the Mount Vernon Liquid Assets Portfolio, LLC (“Mount Vernon”), as noted in the Funds’ Schedules of Investments. Mount Vernon seeks to maximize current income to the extent consistent with the preservation of capital and liquidity; and to maintain a stable NAV of $1.00. The market value of the loaned securities is determined daily at the close of business of the Funds and any additional required collateral is delivered to each Fund on the next business day. The Funds continue to benefit from interest or dividends on the securities loaned and may also earn a return from the collateral. The Funds pay various fees in connection with the investment of cash collateral. The Funds pay the Agent fees based on the investment income received from securities lending activities. Although risk is mitigated by the collateral, the Funds could experience a delay in recovering its securities and possible loss of income or value if the borrower fails to return them. The contractual maturity of repurchase agreements are on an overnight and continuous basis. Cash and cash equivalent collateral on securities lending transactions are on an overnight and continuous basis.
The following is a summary of each Funds’ securities lending agreements and related cash and non-cash collateral received as of October 31, 2018:
| Market Value of | Cash Collateral | ||||||
White Oak Select Growth Fund | $ | 33,390,077 | $ | 33,680,316 | ||||
Pin Oak Equity Fund | 30,131,026 | 30,695,452 | ||||||
Rock Oak Core Growth Fund | 4,758,375 | 4,757,552 | ||||||
River Oak Discovery Fund | 1,964,121 | 2,111,526 | ||||||
Red Oak Technology Select Fund | 47,969,684 | 47,868,166 | ||||||
Black Oak Emerging Technology Fund | 12,163,836 | 12,214,857 | ||||||
Live Oak Health Sciences Fund | 6,130,003 | 6,799,658 | ||||||
Dividends and Distributions to Shareholders – Dividends from net investment income are declared and paid to shareholders on an annual basis, as applicable. Net realized capital gains on sales of securities, if any, are distributed to shareholders at least annually. Distributions to shareholders are determined in accordance with income tax regulations and are recorded on the ex-dividend date. Income and capital gain distributions are determined in accordance with federal income tax regulations, which may differ from GAAP. Therefore, the source of the Funds’ distributions may be shown in the accompanying financial statements as either accumulated earnings, or from paid-in capital, depending upon the type of book/tax differences that may exist.
59 | 1-888-462-5386 | www.oakfunds.com |
Notes to Financial Statements
As of October 31, 2018
3. FAIR VALUE MEASUREMENTS:
A three-tier hierarchy has been established to classify fair value measurements for disclosure purposes. Inputs refer broadly to the assumptions that market participants would use in pricing the asset or liability including assumptions about risk. Inputs may be observable and unobservable. Observable inputs are inputs that reflect the assumptions market participants would use in pricing the asset or liability that are developed based on market data obtained from sources independent of the reporting entity. Unobservable inputs are inputs that reflect the reporting entity’s own assumptions about the assumptions market participants would use in pricing the asset or liability that are developed based on the best information available.
Various inputs are used in determining the value of each Fund’s investments as of the reporting period end. The designated input levels are not necessarily an indication of the risk or liquidity associated with these investments. These inputs are categorized in the following hierarchy under applicable financial accounting standards:
The three-tier hierarchy is summarized as follows:
Level 1 – Unadjusted quoted prices in active markets for identical assets or liabilities that a Fund has the ability to access at the measurement date, including but not limited to:
Equity Securities – investments for which market quotations are readily available that are valued at the last reported sale price or official closing price as reported by an independent pricing service on the primary market or exchange on which they are traded.
Investment Companies – investments in open-end registered investment companies which are valued at their closing NAV.
Level 2 – Quoted prices which are not active, quoted prices for similar assets or liabilities inactive markets or inputs other than quoted prices that are observable (either directly or indirectly) for substantially the full term of the asset or liability, including but not limited to:
Repurchase Agreements – investments in overnight tri-party repurchase agreements which are valued at par.
All Securities – quoted prices for similar securities, including matrix pricing; quoted prices based on recently executed transactions; adjusted quoted prices based on observable and formulaic inputs; or, prices using other observable correlated market inputs.
Level 3 – Significant unobservable prices or inputs (including the Fund’s own assumptions in determining the fair value of investments) where there is little or no market activity for the asset and liability at the measurement date, including but not limited to:
All Securities – modeling or manual pricing based on the Adviser’s own assumptions in determining fair value of investments; or, the significant use of other unobservable or very stale inputs within fair valuation.
Annual Report | October 31, 2018 | 60 |
Notes to Financial Statements
As of October 31, 2018
The following is a summary of the inputs used to value each Fund’s investments as of October 31, 2018:
| Level 1 | Level 2 | Level 3 | Total | ||||||||||||
WHITE OAK SELECT GROWTH FUND | ||||||||||||||||
Common Stocks | $ | 306,998,780 | $ | — | $ | — | $ | 306,998,780 | ||||||||
Short Term Investments | ||||||||||||||||
Repurchase Agreements | — | 11,462,535 | — | 11,462,535 | ||||||||||||
Collateral for Securities Loaned* | — | — | — | 33,680,316 | ||||||||||||
Total | $ | 306,998,780 | $ | 11,462,535 | $ | — | $ | 352,141,631 | ||||||||
| Level 1 | Level 2 | Level 3 | Total | ||||||||||||
PIN OAK EQUITY FUND | ||||||||||||||||
Common Stocks | $ | 246,867,910 | $ | — | $ | — | $ | 246,867,910 | ||||||||
Short Term Investments | ||||||||||||||||
Repurchase Agreements | — | 14,587,426 | — | 14,587,426 | ||||||||||||
Collateral for Securities Loaned* | — | — | — | 30,695,452 | ||||||||||||
Total | $ | 246,867,910 | $ | 14,587,426 | $ | — | $ | 292,150,788 | ||||||||
| Level 1 | Level 2 | Level 3 | Total | ||||||||||||
ROCK OAK CORE GROWTH FUND | ||||||||||||||||
Common Stocks | $ | 19,484,343 | $ | — | $ | — | $ | 19,484,343 | ||||||||
Short Term Investments | ||||||||||||||||
Repurchase Agreement | — | 752,534 | — | 752,534 | ||||||||||||
Collateral for Securities Loaned* | — | — | — | 4,757,552 | ||||||||||||
Total | $ | 19,484,343 | $ | 752,534 | $ | — | $ | 24,994,429 | ||||||||
| Level 1 | Level 2 | Level 3 | Total | ||||||||||||
RIVER OAK DISCOVERY FUND | ||||||||||||||||
Common Stocks | $ | 12,342,388 | $ | — | $ | — | $ | 12,342,388 | ||||||||
Short Term Investments | ||||||||||||||||
Money Market Funds | 1,169 | — | — | 1,169 | ||||||||||||
Repurchase Agreements | — | 1,649,135 | — | 1,649,135 | ||||||||||||
Collateral for Securities Loaned* | — | — | — | 2,111,526 | ||||||||||||
Total | $ | 12,343,557 | $ | 1,649,135 | $ | — | $ | 16,104,218 | ||||||||
| Level 1 | Level 2 | Level 3 | Total | ||||||||||||
RED OAK TECHNOLOGY SELECT FUND | ||||||||||||||||
Common Stocks | $ | 532,765,792 | $ | — | $ | — | $ | 532,765,792 | ||||||||
Short Term Investments | ||||||||||||||||
Repurchase Agreements | — | 11,706,916 | — | 11,706,916 | ||||||||||||
Collateral for Securities Loaned* | — | — | — | 47,868,166 | ||||||||||||
Total | $ | 532,765,792 | $ | 11,706,916 | $ | — | $ | 592,340,874 | ||||||||
61 | 1-888-462-5386 | www.oakfunds.com |
Notes to Financial Statements
As of October 31, 2018
| Level 1 | Level 2 | Level 3 | Total | ||||||||||||
BLACK OAK EMERGING TECHNOLOGY FUND | ||||||||||||||||
Common Stocks | $ | 34,543,574 | $ | — | $ | — | $ | 34,543,574 | ||||||||
Short Term Investments | ||||||||||||||||
Money Market Funds | 22,945 | — | — | 22,945 | ||||||||||||
Repurchase Agreements | — | 2,175,637 | — | 2,175,637 | ||||||||||||
Collateral for Securities Loaned* | — | — | — | 12,214,857 | ||||||||||||
Total | $ | 34,566,519 | $ | 2,175,637 | $ | — | $ | 48,957,013 | ||||||||
| Level 1 | Level 2 | Level 3 | Total | ||||||||||||
LIVE OAK HEALTH SCIENCES FUND | ||||||||||||||||
Common Stocks | $ | 63,701,898 | $ | — | $ | — | $ | 63,701,898 | ||||||||
Short Term Investments | ||||||||||||||||
Repurchase Agreements | — | 2,050,815 | — | 2,050,815 | ||||||||||||
Collateral for Securities Loaned* | — | — | — | 6,799,658 | ||||||||||||
Total | $ | 63,701,898 | $ | 2,050,815 | $ | — | $ | 72,552,371 | ||||||||
| * | Certain investments that are measured at fair value using the net asset value per share (or its equivalent) practical expedient have not been categorized in the fair value hierarchy. The fair value amounts presented in the table are intended to permit reconciliation of the fair value hierarchy to the amounts presented in the Statement of Assets and Liabilities. |
The above tables are presented by levels of disaggregation for each asset class. For detailed descriptions of the underlying industries, see the accompanying Schedules of Investments. There were no Level 3 securities held during the period.
4. FEES AND OTHER RELATED PARTY TRANSACTIONS:
The Trust and the Adviser are parties to an Investment Advisory Agreement, under which the Adviser receives an annual fee equal to 0.74% of the average daily net assets of each Fund, except for the River Oak Discovery Fund for which the Adviser receives 0.90% of the average daily net assets of the Fund. The Adviser has contractually agreed through February 28, 2019, to waive all or a portion of its fees (and to reimburse the Funds’ expenses if necessary) in order to limit Fund total operating expenses (excluding taxes, brokerage commissions, and “Acquired Fund” Fees and expenses, as applicable) to not more than 1.25% of the average daily net assets of the White Oak Select Growth Fund, Pin Oak Equity Fund and Rock Oak Core Growth Funds, and 1.35% of the average daily net assets of the River Oak Discovery Fund, Red Oak Technology Select Fund, Black Oak Emerging Technology Fund and Live Oak Health Sciences Fund.
Annual Report | October 31, 2018 | 62 |
Notes to Financial Statements
As of October 31, 2018
The following table lists the contractual advisory fees and fee waivers that were in effect during the fiscal year ended October 31, 2018:
Advisory Fees as a Percentage of Average Net Assets | |||
Fund | Annual Rate | Fee Waiver | Net Annual Rate |
White Oak Select Growth Fund | 0.74% | 0.74% | |
Pin Oak Equity Fund | 0.74% | 0.74% | |
Rock Oak Core Growth Fund | 0.74% | (0.07)% | 0.67% |
River Oak Discovery Fund | 0.90% | (0.15)% | 0.75% |
Red Oak Technology Select Fund | 0.74% | 0.74% | |
Black Oak Emerging Technology Fund | 0.74% | 0.74% | |
Live Oak Health Sciences Fund | 0.74% | 0.74% | |
Ultimus Fund Solutions, LLC (“Ultimus”) provides the Funds with administration, fund accounting and transfer agency services, including all regulatory reporting. The Funds pay Ultimus fees in accordance with the agreements for such services. In addition, each Fund pays out-of-pocket expenses including, but not limited to, postage, supplies and costs of pricing its portfolio securities.
Under the terms of a Distribution Agreement with the Trust, Ultimus Fund Distributors, LLC (the “Distributor”) serves as the principal underwriter to each Fund. The Distributor is a wholly-owned subsidiary of Ultimus. The Distributor is compensated by the Adviser (not the Funds) for acting as principal underwriter.
Certain officers and trustees of the Trust are also officers of the Adviser, Ultimus and/or the Distributor. Such officers are paid no fees by the Trust for serving as officers or trustees to the Trust.
5. INVESTMENT TRANSACTIONS:
The cost of security purchases and the proceeds from security sales, other than short–term investments, for the fiscal year ended October 31, 2018 were as follows:
Fund | Purchases | Sales | ||||||
White Oak Select Growth Fund | $ | 43,280,144 | $ | 44,087,753 | ||||
Pin Oak Equity Fund | 56,755,231 | 26,627,471 | ||||||
Rock Oak Core Growth Fund | 11,903,144 | 1,965,230 | ||||||
River Oak Discovery Fund | 5,708,917 | 7,180,345 | ||||||
Red Oak Technology Select Fund | 57,771,165 | 45,258,798 | ||||||
Black Oak Emerging Technology Fund | 7,019,764 | 12,697,902 | ||||||
Live Oak Health Sciences Fund | 14,099,932 | 17,435,610 | ||||||
6. FEDERAL INCOME TAXES AND TAX BASIS INFORMATION:
Each of the Funds is classified as a separate taxable entity for Federal income tax purposes. Each of the Funds has qualified and intends to continue to qualify as a separate “regulated investment company” under Sub–chapter M of the Internal Revenue Code of 1986, as amended, and make the requisite distributions to shareholders that will be sufficient to relieve it from Federal income tax and Federal excise tax. Therefore, no Federal tax provision is required.
63 | 1-888-462-5386 | www.oakfunds.com |
Notes to Financial Statements
As of October 31, 2018
The amounts of dividends from net investment income and distributions from net realized capital gains are determined in accordance with Federal income tax regulations, which may differ from those amounts determined under accounting principles generally accepted in the United States of America. These book/tax differences are either temporary or permanent in nature. The character of dividends from net investment income or distributions from net realized gains made during the year, and the timing may differ from the year that the income or realized gains (losses) were recorded by the Funds. To the extent these differences are permanent, adjustments are made to the appropriate equity accounts in the period that the differences arise. These differences are primarily due to differences in the treatment of net operating losses and certain other investments.
Accordingly, the following permanent differences have been reclassified to/from the following accounts:
Fund | Accumulated | Paid-in Capital | ||||||
River Oak Discovery Fund | $ | 54,612 | $ | (54,612 | ) | |||
The tax character of the distributions paid by the Funds for the fiscal year ended October 31, 2018 was as follows:
Fund | Ordinary | Long-Term | Total | |||||||||
White Oak Select Growth Fund | $ | 1,942,559 | $ | 17,426 | $ | 1,959,985 | ||||||
Pin Oak Equity Fund | 1,241,110 | 2,690,009 | 3,931,119 | |||||||||
Rock Oak Core Growth Fund | 5,990 | 521,838 | 527,828 | |||||||||
River Oak Discovery Fund | — | 757,851 | 757,851 | |||||||||
Red Oak Technology Select Fund | 3,856,358 | 28,103,070 | 31,959,428 | |||||||||
Black Oak Emerging Technology Fund | — | 2,734,659 | 2,734,659 | |||||||||
Live Oak Health Sciences Fund | 318,235 | 3,685,902 | 4,004,137 | |||||||||
The tax character of the distributions paid by the Funds for the fiscal year ended October 31, 2017 was as follows:
Fund | Ordinary | Long-Term | Total | |||||||||
White Oak Select Growth Fund | $ | 2,687,021 | $ | — | $ | 2,687,021 | ||||||
Pin Oak Equity Fund | 832,560 | 1,894,933 | 2,727,493 | |||||||||
Rock Oak Core Growth Fund | 54,642 | — | 54,642 | |||||||||
River Oak Discovery Fund | — | — | — | |||||||||
Red Oak Technology Select Fund | 1,009,412 | 2,516,143 | 3,525,555 | |||||||||
Black Oak Emerging Technology Fund | 170,204 | 1,145,326 | 1,315,530 | |||||||||
Live Oak Health Sciences Fund | 315,656 | 906,767 | 1,222,423 | |||||||||
Annual Report | October 31, 2018 | 64 |
Notes to Financial Statements
As of October 31, 2018
As of October 31, 2018, the components of distributable earnings on a tax basis were as follows:
Fund | Undistributed | Accumulated | Unrealized | Cumulative | Total | |||||||||||||||
White Oak Select Growth Fund | $ | 1,539,027 | $ | 2,259,091 | $ | 93,259,686 | $ | — | $ | 97,057,804 | ||||||||||
Pin Oak Equity Fund | 1,429,893 | 4,340,050 | 49,193,031 | — | 54,962,974 | |||||||||||||||
Rock Oak Core Growth Fund | — | 100,469 | 3,803,466 | (40,014 | ) | 3,863,921 | ||||||||||||||
River Oak Discovery Fund | — | 1,745,947 | 2,838,853 | (99,007 | ) | 4,485,793 | ||||||||||||||
Red Oak Technology Select Fund | 910,770 | 20,580,391 | 168,918,983 | — | 190,410,144 | |||||||||||||||
Black Oak Emerging Technology Fund | — | 3,465,522 | 13,636,047 | (189,516 | ) | 16,912,053 | ||||||||||||||
Live Oak Health Sciences Fund | 587,719 | 7,287,274 | 13,494,460 | — | 21,369,453 | |||||||||||||||
As of October 31, 2018, the difference between book basis and tax basis unrealized appreciation (depreciation) is primarily attributable to wash sales and return of capital adjustments and partnership basis adjustments.
The Rock Oak Core Growth Fund, River Oak Discovery Fund and Black Oak Emerging Technology Fund elected to defer to the year ending October 31, 2019, late year ordinary losses in the amount of $40,014, $99,007 and $189,516, respectively.
At October 31, 2018, the total cost of securities for Federal income tax purposes and the aggregate gross unrealized appreciation and depreciation for securities held by the Funds is as follows:
Fund | Federal Tax Cost | Gross | Gross | Net Appreciation | ||||||||||||
White Oak Select Growth Fund | $ | 258,881,945 | $ | 105,200,488 | $ | (11,940,802 | ) | $ | 93,259,686 | |||||||
Pin Oak Equity Fund | 242,957,757 | 52,923,962 | (3,730,931 | ) | 49,193,031 | |||||||||||
Rock Oak Core Growth Fund | 21,190,963 | 4,220,805 | (417,339 | ) | 3,803,466 | |||||||||||
River Oak Discovery Fund | 13,265,365 | 3,119,872 | (281,019 | ) | 2,838,853 | |||||||||||
Red Oak Technology Select Fund | 423,421,891 | 181,002,878 | (12,083,895 | ) | 168,918,983 | |||||||||||
Black Oak Emerging Technology Fund | 35,320,966 | 14,238,715 | (602,668 | ) | 13,636,047 | |||||||||||
Live Oak Health Sciences Fund | 59,057,911 | 18,660,580 | (5,166,120 | ) | 13,494,460 | |||||||||||
Management evaluates the Funds’ tax positions to determine if the taken tax positions meet the minimum recognition threshold by measuring and recognizing tax liabilities in the Financial Statements. The threshold is established by accounting for uncertainties in income tax positions, taken or expected. Recognition of tax benefits of an uncertain tax position is required only when the position is “more likely than not” to be sustained assuming examination by taxing authorities.
65 | 1-888-462-5386 | www.oakfunds.com |
Notes to Financial Statements
As of October 31, 2018
The Funds recognize interest and penalties, if any, related to unrecognized tax benefits as income tax expense in the Statements of Operations. During the period, the Funds did not incur any interest or penalties.
Management has analyzed the Funds’ tax positions taken on federal income tax returns for all open tax years (current and prior three tax years) and has concluded that as of and for the fiscal year ended October 31, 2018, no provision for income tax would be required in the Funds’ financial statements. The Funds’ federal and state income and federal excise tax returns for tax years (current and prior three tax years) for which the applicable statutes of limitations have not expired are subject to examination by the Internal Revenue Service and state departments of revenue.
7. CONCENTRATION OF CREDIT RISK AND OWNERSHIP:
The Red Oak Technology Select Fund and the Black Oak Emerging Technology Fund invest a substantial portion of their assets in securities in the information technology sector. The Live Oak Health Sciences Fund invests a substantial portion of its assets in securities in the health care, medicine and life sciences industries. Therefore, each of these Funds may be more affected by economic developments in those sectors than a general equity fund would be.
In the normal course of business, the Funds enter into contracts that provide general indemnifications. The Funds’ maximum exposure under these arrangements is dependent on future claims that may be made against the Funds and, therefore, cannot be established; however based on experience, the risk of loss from such claims is considered remote.
From time to time, the Funds may have a concentration of several shareholders holding a significant percentage of shares outstanding. Investment activities of these shareholders could have a material impact on the Fund.
As of October 31, 2018, the James D. Oelschlager Trust owned 58.48% of the River Oak Discovery Fund.
8. TRUSTEE AND OFFICERS FEES:
As of October 31, 2018, there were five Trustees, three of whom are not “interested persons” (within the meaning of the 1940 Act) of the Trust (the “Independent Trustees”). Effective January 1, 2016, each Independent Trustee receives a retainer at an annual rate of $30,000 per year. Also effective January 1, 2016, each Independent Trustee is also paid a fee of $3,500 for each meeting of the Board of Trustees attended or participated in person, and/or is also paid $1,000 per attendance at each telephonic board meeting, as applicable. Each Independent Trustee is paid $4,000 per telephonic or in-person meeting at which they receive and review preliminary materials provided in connection with the annual continuation of the advisory agreement in accordance with Section 15(c) of the 1940 Act. The chairperson of the Audit Committee receives an additional retainer of $1,000 per calendar quarter during which an Audit Committee Meeting is held and the Lead Independent Trustee receives an additional retainer of $3,500 per calendar quarter. The increases in scheduled fees paid to the Independent Trustees that became effective on January 1, 2016, as described above, were implemented over three calendar years at a rate of one-third of the total increase each year.
Annual Report | October 31, 2018 | 66 |
Notes to Financial Statements
As of October 31, 2018
The Independent Trustees who do not serve as chairpersons of the applicable Board committee are not paid an additional fee from the Trust for attendance at and/or participation in such meetings of the various committees of the Board. The Independent Trustees are also reimbursed for meeting-related expenses. Officers of the Trust and Trustees who are interested persons of the Trust receive no salary or fees from the Trust, although they may be reimbursed for meeting-related expenses.
9. INDEMNIFICATIONS:
Under the Trust’s organizational documents, its officers and Trustees are indemnified against certain liability arising out of the performance of their duties to the Trust. Additionally, in the normal course of business, the Trust enters into contracts with service providers that may contain general indemnification clauses, which may permit indemnification to the extent permissible under applicable law. The Trust’s maximum exposure under these arrangements is unknown, as this would involve future claims that may be made against the Trust that have not yet occurred.
10. RECENT ACCOUNTING PRONOUNCEMENT
In August 2018, FASB issued Accounting Standards Update No. 2018-13 (“ASU 2018-13”), “Disclosure Framework - Changes to the Disclosure Requirements for Fair Value Measurement,” which amends the fair value measurement disclosure requirements of ASC Topic 820, “Fair Value Measurement” (“ASC 820”). ASU 2018-13 includes new, eliminated, and modified disclosure requirements for ASC 820. In addition, ASU 2018-13 clarifies that materiality is an appropriate consideration of entities when evaluating disclosure requirements. ASU 2018-13 is effective for fiscal years beginning after December 15, 2019, including interim periods therein. Early adoption is permitted and the Fund has adopted ASU 2018-13 with these financial statements.
11. SUBSEQUENT EVENTS:
On December 11, 2018, The Funds declared an ordinary dividend, short-term capital gains and long-term capital gains, which were payable on December 12, 2018. Please see the below table for the distribution amounts:
Fund | Ordinary | Short-Term | Long-Term | |||||||||
White Oak Select Growth Fund | $ | 0.542353 | $ | — | $ | 0.634848 | ||||||
Pin Oak Equity Fund | 0.620904 | — | 1.145814 | |||||||||
Rock Oak Core Growth Fund | 0.002259 | — | 0.087254 | |||||||||
River Oak Discovery Fund | — | — | 2.168335 | |||||||||
Red Oak Technology Select Fund | 0.109637 | 0.017281 | 1.015311 | |||||||||
Black Oak Emerging Technology Fund | — | — | 0.505685 | |||||||||
Live Oak Health Sciences Fund | 0.134582 | 0.118899 | 2.232051 | |||||||||
The Red Oak Technology Select Fund will pay out an ordinary income dividend to shareholders of record of the Fund as of close of business on December 27, 2018. The amount of the ordinary income dividend is to be determined and paid on December 28, 2018.
67 | 1-888-462-5386 | www.oakfunds.com |
Report of Independent Registered Public Accounting Firm
To the Shareholders and Board of Trustees of
Oak Associates Funds
Opinion on the Financial Statements
We have audited the accompanying statements of assets and liabilities, including the schedules of investments, of Oak Associates Funds, comprising White Oak Select Growth Fund, Pin Oak Equity Fund, Rock Oak Core Growth Fund, River Oak Discovery Fund, Red Oak Technology Select Fund, Black Oak Emerging Technology Fund, and Live Oak Health Sciences Fund (the “Funds”) as of October 31, 2018, and the related statements of operations for the year then ended, the statements of changes in net assets for each of the two years in the period then ended, including the related notes, and the financial highlights for each of the five years in the period then ended (collectively referred to as the “financial statements”). In our opinion, the financial statements present fairly, in all material respects, the financial position of each of the Funds as of October 31, 2018, the results of their operations for the year then ended, the changes in their net assets for each of the two years in the period then ended, and the financial highlights for each of the five years in the period then ended, in conformity with accounting principles generally accepted in the United States of America.
Basis for Opinion
These financial statements are the responsibility of the Funds’ management. Our responsibility is to express an opinion on the Funds’ financial statements based on our audits. We are a public accounting firm registered with the Public Company Accounting Oversight Board (United States) (“PCAOB”) and are required to be independent with respect to the Funds in accordance with the U.S. federal securities laws and the applicable rules and regulations of the Securities and Exchange Commission and the PCAOB.
We conducted our audits in accordance with the standards of the PCAOB. Those standards require that we plan and perform the audit to obtain reasonable assurance about whether the financial statements are free of material misstatement, whether due to error or fraud.
Our audits included performing procedures to assess the risks of material misstatement of the financial statements, whether due to error or fraud, and performing procedures that respond to those risks. Such procedures included examining, on a test basis, evidence regarding the amounts and disclosures in the financial statements. Our procedures included confirmation of securities owned as of October 31, 2018, by correspondence with the custodian and brokers. Our audits also included evaluating the accounting principles used and significant estimates made by management, as well as evaluating the overall presentation of the financial statements. We believe that our audits provide a reasonable basis for our opinion.
We have served as the Funds’ auditor since 2009.

COHEN & COMPANY, LTD.
Cleveland, Ohio
December 20, 2018
Annual Report | October 31, 2018 | 68 |
Additional Information
As of October 31, 2018 (Unaudited)
1. UNAUDITED TAX INFORMATION:
The White Oak Select Growth Fund, Pin Oak Equity Fund, Rock Oak Core Growth Fund, River Oak Discovery Fund, Red Oak Technology Select Fund, Black Oak Emerging Technology Fund, and Live Oak Health Sciences Fund designate 100%, 100%, 100%, 0%, 100%, 0% and 100%, respectively, of the income dividends distributed between January 1, 2017 and December 31, 2017, as qualified dividend income (QDI) as defined in Section 1(h)(11) of the Internal Revenue Code.
Pursuant to Section 854(b)(2) of the Internal Revenue Code, the White Oak Select Growth Fund, Pin Oak Equity Fund, Rock Oak Core Growth Fund, River Oak Discovery Fund, Red Oak Technology Select Fund, Black Oak Emerging Technology Fund, and Live Oak Health Sciences Fund designate 100%, 100%, 100%, 0%, 100%, 0% and 89%, respectively, of the ordinary income dividends distributed between January 1, 2017 and December 31, 2017, as qualifying for the corporate dividends received deduction.
In early 2018, if applicable, shareholders of record should have received this information for the distributions paid to them by the Fund during the calendar year 2017 via Form 1099. The Fund will notify shareholders in early 2019 of amounts paid to them by the Fund, if any, during the calendar year 2018.
Pursuant to Section 852(b)(3) of the Internal Revenue Code, the White Oak Select Growth Fund, Pin Oak Equity Fund, Rock Oak Core Growth Fund, River Oak Discovery Fund, Red Oak Technology Select Fund, Black Oak Emerging Technology Fund, and Live Oak Health Sciences Fund designated $17,426, $2,690,009, $521,838, $757,851, $28,103,070, $2,734,659 and $3,685,902 as long-term capital gain dividends, respectively.
2. PROXY VOTING POLICIES AND VOTING RECORD
A description of the policies and procedures that the Fund uses to determine how to vote proxies relating to portfolio securities and information regarding how the Fund voted those proxies during the most recent twelve month period ended June 30 are available without charge, upon request: (1) by calling the Fund at 1-888-462-5386; and (2) from Fund documents filed with the Securities and Exchange Commission (“SEC”) on the SEC’s website at www.sec.gov.
3. QUARTERLY PORTFOLIO HOLDINGS
The Funds file its complete schedule of portfolio holdings with the SEC for the first and third quarters of each fiscal year on Form N-Q. The Funds’ Forms N-Q are available on the SEC’s website at http://www.sec.gov. Form N-Q is being rescinded. Once Form N-Q is rescinded, disclosure of the Funds’ complete holdings will be required to be made monthly on Form N-PORT, with every third month made available to the public by the Commission 60 days after the end of the Funds’ fiscal quarter.
69 | 1-888-462-5386 | www.oakfunds.com |
OAK ASSOCIATES FUNDS
This Page Intentionally Left Blank
Additional Information
As of October 31, 2018 (Unaudited)
TRUSTEES OF THE TRUST
Name & Age(1) | Position | Length | Number of | Principal Occupation(s) | Other |
J. John Canon (83) | Trustee | 17 | 7 | Retired. Member of Board, Proconex (process control equipment), 1985 – 2007; President and Chairman of the Board, Synergistic Partners, Inc. (technology for information management), 1975 – 1999. | None |
James D. Oelschlager(5) (76) | Trustee, Chairman | 17 | 7 | Managing Member, President, CO-CIO (since October 9, 2014); CIO and Founder of Oak Associates, ltd. since 1985. | None |
John G. Stimpson(5) (76) | Trustee | 17 | 7 | Retired since 1993. Board of Directors, Morgan Stanley Trust Company, 1988 – 1993; Director of International Equity Sales and Equity Sales Manager, Salomon Brothers (New York) from 1985 – 1993. | None |
Pauline F. Ramig (78) | Trustee | 10 | 7 | Financial Planning Practitioner, Ramig Financial Planning since 1991. | None |
Michael R. Shade (70) | Trustee | 10 | 7 | Attorney at Law; Partner, Shade & Shade since December, 1979. | None |
71 | 1-888-462-5386 | www.oakfunds.com |
Additional Information
As of October 31, 2018 (Unaudited)
1 | Each Trustee may be contacted in writing to the Trustee c/o Oak Associates Funds, 3875 Embassy Parkway, Suite 250, Akron, OH 44333. Each Officer may be contacted in writing to the Officer c/o Ultimus Fund Solutions, LLC, 225 Pictoria Drive, Suite 450, Cincinnati, OH 45426. |
2 | Each Trustee shall hold office during the lifetime of this Trust until the election and qualification of his or her successor, or until he or she sooner dies, resigns or is removed in accordance with the Trust’s Declaration of Trust. |
3 | The “Oak Associates Funds Complex” consists of all series of the Trust for which Oak Associates, ltd. serves as investment adviser. As of October 31, 2018, the Oak Associates Funds Complex consisted of 7 Funds. |
4 | Directorships of companies are required to report to the Securities and Exchange Commission under the Securities Exchange Act of 1934 (i.e., “public companies”) or other investment companies registered under the Investment Company Act of 1940. |
5 | Messrs. Oelschlager and Stimpson are considered “interested” persons of the Trust as that term is defined in the Investment Company Act of 1940. Mr. Oelschlager is interested by virtue of his controlling ownership interest in the Adviser. Mr. Stimpson is considered interested because of his family relationship with an employee of the Adviser. |
Annual Report | October 31, 2018 | 72 |
Additional Information
As of October 31, 2018 (Unaudited)
OFFICERS OF THE TRUST
Name & Age(1) | Position | Length | Number of | Principal Occupation(s) | Other |
Charles A. Kiraly(2) (48) | President/ Chief Executive Officer | 4 | N/A | Director of Mutual Fund Operations at Oak Associates, ltd. since July 2014; Vice President and Senior Fund Administrator at PNC Capital Advisors, LLC from August 2006 to June 2014. | N/A |
Margaret L. Ballinger(2) (65) | Chief Compliance Officer | 3 | N/A | Chief Compliance Officer since December 2014 and Chief Operating Officer since 1996 for Oak Associates, ltd. Co-founder of Oak Associates, ltd. In 1985. | N/A |
Bryan W. Ashmus (45) | Treasurer | 1 | N/A | Vice President and Director of Financial Administration, Ultimus Fund Solutions, LLC (December 2015 to present); Vice President and Manager of Financial Administration, Huntington Asset Services, Inc. (n/k/a Ultimus Asset Services, LLC) (September 2013 to December 2015) | N/A |
Maggie Bull (52) | Secretary | 1 | N/A | Senior Attorney, Ultimus Fund Solutions, LLC (June 2017 to present); Chief Compliance Officer and Legal Counsel, Meeder Funds, Meeder Investment Management (2011 – 2016). |
1 | Each Officer may be contacted in writing to the Officer c/o Ultimus Fund Solutions, LLC, 225 Pictoria Drive, Suite 450, Cincinnati, OH 45246. |
2 | Mr. Kiraly and Ms. Ballinger are considered to be “affiliates” of the Adviser by virtue of their employment by the Adviser. |
73 | 1-888-462-5386 | www.oakfunds.com |
Additional Information
As of October 31, 2018 (Unaudited)
For more information regarding the Trustees, please refer to the Statement of Additional Information, which is available upon request by calling 1-888-462-5386 or on the Funds’ website at www.oakfunds.com.
Annual Report | October 31, 2018 | 74 |
Oak Associates Funds
Privacy Policy
Oak Associates Funds recognizes and respects the privacy concerns of our shareholders. The Funds collect nonpublic personal information about you in the course of doing business and providing you with individualized service. “Nonpublic personal information” is personally identifiable financial information about you. We do not sell your personal information to anyone and we do not disclose it to anyone except as permitted or required by law or as described in this policy.
INFORMATION WE COLLECT
● | Information we receive from you on applications and other forms (such as your name, birth date, address and social security number); |
● | Information about the transactions in your accounts; |
● | Information about any bank account you use for transfers between your bank account and your Oak Associates accounts; and |
● | Information we receive about you as a result of your inquiries by mail, email and telephone. |
INFORMATION WE SHARE
Oak Associates Funds only discloses your nonpublic personal information as required or permitted by law. The Funds may disclose this information:
● | So that we may complete transactions you authorize or request; and |
● | So that we may provide you with information about Oak Associates Funds products and services; we may disclose information to companies that provide services to us, such as transfer agents or printers and mailers that prepare and distribute materials to you. |
INFORMATION SECURITY
Within Oak Associates Funds, access to your information is restricted to the individuals who need to know the information to service your account. Each Fund conducts its business through its trustees, officers and third party service providers, pursuant to agreements with the Fund. The Fund and its service providers maintain physical, electronic and procedural safeguards that comply with federal standards to guard your information. In the event that you hold shares of the Fund through a financial intermediary, including, but not limited to, a broker-dealer, bank or trust company, the privacy policy of your financial intermediary will govern how your nonpublic personal information will be shared with nonaffiliated third parties by that entity.
TO PROTECT YOUR PRIVACY
We recommend that you do not provide your account information or Oak Associates Funds user name or password to anyone. If you become aware of any suspicious activity relating to your account, please contact us immediately at 1-888-462-5386.
QUESTIONS
Should you have any questions regarding the Funds’ Privacy Policy, please call
1-888-462-5386
OAK ASSOCIATES FUNDS
CONTACT US
By Mail
Oak Associates Funds
225 Pictoria Drive, Suite 450
Cincinnati, OH 45246
By Telephone 1-888-462-5386 Monday through Friday, 8:00 a.m. to 6:00 p.m. ET
On The Web www.oakfunds.com
Click on the My Oak Account section to take advantage of these features:
| ● | Trade Online |
| ● | Access and Update Account Information |
| ● | Go Paperless with eDelivery |
| ● | View and download account history |
| ● | Establish a systematic investment plan |
The Trust files its complete schedule of portfolio holdings of each Fund with the Securities and Exchange Commission for the first and third quarters of each fiscal year on Form N-Q within sixty days after the end of the period. The Trust’s Form N-Q is available on the Commission’s website at http://www.sec.gov.
A description of the policies and procedures that the Funds use to determine how to vote proxies relating to portfolio securities, as well as information relating to how a Fund voted proxies relating to portfolio securities during the most recent 12-month period ended June 30, is available (i) without charge, upon request, by calling 1-888-462-5386; and (ii) on the Commission’s website at http://www.sec.gov.
This report has been prepared for Oak Associates Funds Shareholders and may be distributed to others only if preceded or accompanied by a prospectus.
Oak Associates Funds are distributed by Ultimus Fund Distributors, LLC

Item 2. Code of Ethics.
(a) As of the end of the period covered by the report, the registrant has adopted a code of ethics that applies to the registrant’s Principal Executive Officer and Principal Financial Officer.
(b) Not applicable.
(c) During the period covered by the report, with respect to the registrant's code of ethics that applies to its Principal Executive Officer and Principal Financial Officer: there have been no amendments to a provision that relates to any element of the code of ethics definition enumerated in paragraph (b) of this Item 2.
(d) During the period covered by the report, with respect to the registrant's code of ethics that applies to its Principal Executive Officer and Principal Financial Officer: there have been no waivers granted from a provision that relates to any element of the code of ethics definition enumerated in paragraph (b) of this Item 2.
(e) Not applicable.
(f) The registrant has included a copy of the code of ethics that applies to the registrant’s Principal Executive Officer and Principal Financial Officer. This code of ethics is included as an Exhibit on this Form N-CSR.
Item 3. Audit Committee Financial Expert.
(a) The registrant’s board of trustees has determined that the registrant does not have an audit committee financial expert. The committee members and the full Board considered a possibility of adding a member that would qualify as an expert. The audit committee determined that, although none of its members meet the technical definition of an audit committee expert, the committee has sufficient financial expertise to adequately perform its duties under the Audit Committee Charter without the addition of a qualified expert.
Item 4. Principal Accountant Fees and Services.
(a) Audit Fees billed to the registrant by its principal accountants for the two most recent fiscal years:
Fiscal year ended 2018: $84,000
Fiscal year ended 2017: $84,000
(b) Audit-Related Fees billed to the registrant by its principal accountants for the two most recent fiscal years:
Fiscal year ended 2018: $0
Fiscal year ended 2017: $0
Fees for 2018 and 2017 related to the agreed-upon review of items within the Management’s Discussion of Fund Performance sections of the Funds’ Form N-CSR filing. Amount requiring approval of the registrant's audit committee pursuant to paragraph (c)(7)(ii) of Rule 2-01 of Regulation S-X, $0 and $0 respectively.
(c) Tax Fees billed to the registrant by its principal accountants for the two most recent fiscal years:
Fiscal year ended 2018: $21,000
Fiscal year ended 2017: $15,750
Fees for 2018 and 2017 related to the review of the registrant's tax returns. Amount requiring approval of the registrant's audit committee pursuant to paragraph (c)(7)(ii) of Rule 2-01 of Regulation S-X, $0 and $0 respectively.
(d) All other fees billed to the registrant by its principal accountants for the two most recent fiscal years:
Fiscal year ended 2018: $0
Fiscal year ended 2017: $0
Amount requiring approval of the registrant's audit committee pursuant to paragraph (c)(7)(ii) of Rule 2-01 of Regulation S-X, $0 and $0 respectively.
(e)(1) Not Applicable.
(e)(2) The percentage of services described in each of paragraphs (b) through (d) of this Item that were approved by the audit committee pursuant to paragraph (c)(7)(i)(C) of Rule 2-01 of Regulation S-X are as follows:
(b) 0%
(c) 0 %
(d) 0%
(f) Not applicable.
(g) The aggregate non-audit fees and services billed by the applicable principal account for the two most recent fiscal years:
Fiscal year ended 2018: $0
Fiscal year ended 2017: $0
(h) The registrant’s audit committee of the board of directors has considered whether the provision of non-audit services that were rendered to the registrant’s investment adviser (not including any sub-adviser whose role is primarily portfolio management and is subcontracted with or overseen by another investment adviser), and any entity controlling, controlled by, or under common control with the investment adviser that provides ongoing services to the registrant that were not pre-approved pursuant to paragraph (c)(7)(ii) of Rule 2-01 of Regulation S-X is compatible with maintaining the principal accountant’s independence.
Item 5. Audit Committee of Listed Registrants.
Not applicable.
Item 6. Schedule of Investments.
(a) Schedule of Investments in securities of unaffiliated issuers as of the close of the reporting period is included as part of the Report to Stockholders filed under Item 1 of this Form N-CSR.
(b) Not applicable.
Item 7. Disclosure of Proxy Voting Policies and Procedures for Closed-End Management Investment Companies.
Not applicable.
Item 8. Portfolio Managers of Closed-End Management Investment Companies.
Not applicable.
Item 9. Purchases of Equity Securities by Closed-End Management Investment Company and Affiliated Purchasers.
Not applicable.
Item 10. Submission of Matters to a Vote of Security Holders.
Not applicable.
Item 11. Controls and Procedures.
(a) The registrant’s Principal Executive Officer and Principal Financial Officer have concluded that the registrant's disclosure controls and procedures (as defined in Rule 30a-3(c) under the Act) are effective in design and operation and are sufficient to form the basis of the certifications required by Rule 30a-2 under the Act, based on their evaluation of these disclosure controls and procedures within 90 days of the filing of this report on Form N-CSR.
(b) There were no changes in the registrant’s internal control over financial reporting (as defined in Rule 30a-3(d) under the Act (17 CFR 270.30a-3(d)) that occurred during the period covered by this report that have materially affected or are reasonably likely to materially affect, the registrant’s internal control over financial reporting.
Item 12. Disclosure of Securities Lending Activities for Closed-End Investment Companies.
Not applicable.
Item 13. Exhibits.
(a)(1) The code of ethics that is the subject of the disclosure required by Item 2 is attached hereto.
(a)(2) Certifications pursuant to Rule 30a-2(a) are attached hereto.
(a)(3) Not applicable.
(b) Certifications pursuant to Rule 30a-2(b) are furnished herewith.
SIGNATURES
Pursuant to the requirements of the Securities Exchange Act of 1934 and the Investment Company Act of 1940, the registrant has duly caused this report to be signed on its behalf by the undersigned, thereunto duly authorized.
| (Registrant) | Oak Associates Funds | ||
| By (Signature and Title)* | /s/ Charles A. Kiraly | ||
| Charles A. Kiraly, President | |||
| Date | 1/3/2019 | ||
Pursuant to the requirements of the Securities Exchange Act of 1934 and the Investment Company Act of 1940, this report has been signed below by the following persons on behalf of the registrant and in the capacities and on the dates indicated.
| By (Signature and Title)* | /s/ Charles A. Kiraly | ||
| Charles A. Kiraly, President and Principal Executive Officer | |||
| Date | 1/3/2019 | ||
| By (Signature and Title)* | /s/ Bryan Ashmus | ||
| Bryan Ashmus, Treasurer and Principal Financial Officer | |||
| Date | 1/3/2019 | ||