Exhibit (c)(16)
|

Exhibit (c)(16)
Goldman
Sachs
J.Crew Discussion Materials
Goldman, Sachs & Co.
September 2010
[13-September-2010]
|
Goldman
Sachs
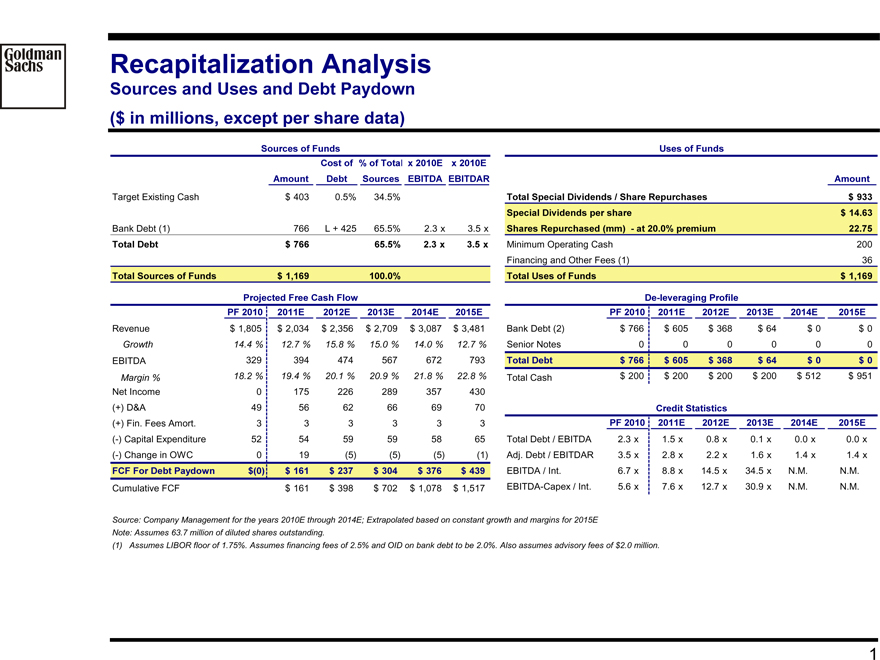
Recapitalization Analysis
Sources and Uses and Debt Paydown ($ in millions, except per share data)
Sources of Funds
Cost of % of Total x 2010E x 2010E
Amount Debt Sources EBITDA EBITDAR
Target Existing Cash $ 403 0.5% 34.5%
Bank Debt (1) 766 L + 425 65.5% 2.3 x 3.5 x
Total Debt $ 766 65.5% 2.3 x 3.5 x
Total Sources of Funds $ 1,169 100.0%
Projected Free Cash Flow
PF 2010 2011E 2012E 2013E 2014E 2015E
Revenue $ 1,805 $ 2,034 $ 2,356 $ 2,709 $ 3,087 $ 3,481
Growth 14.4 % 12.7 % 15.8 % 15.0 % 14.0 % 12.7 %
EBITDA 329 394 474 567 672 793
Margin % 18.2 % 19.4 % 20.1 % 20.9 % 21.8 % 22.8 %
Net Income 0 175 226 289 357 430
(+) D&A 49 56 62 66 69 70
(+) Fin. Fees Amort. 3 3 3 3 3 3
(-) Capital Expenditure 52 54 59 59 58 65
(-) Change in OWC 0 19(5)(5)(5)(1)
FCF For Debt Paydown $(0) $ 161 $ 237 $ 304 $ 376 $ 439
Cumulative FCF $ 161 $ 398 $ 702 $ 1,078 $ 1,517
Uses of Funds
Amount
Total Special Dividends / Share Repurchases $ 933
Special Dividends per share $ 14.63
Shares Repurchased (mm) - at 20.0% premium 22.75
Minimum Operating Cash 200
Financing and Other Fees (1) 36
Total Uses of Funds $ 1,169
De-leveraging Profile
PF 2010 2011E 2012E 2013E 2014E 2015E
Bank Debt (2) $ 766 $ 605 $ 368 $ 64 $ 0 $ 0
Senior Notes 0 0 0 0 0 0
Total Debt $ 766 $ 605 $ 368 $ 64 $ 0 $ 0
Total Cash $ 200 $ 200 $ 200 $ 200 $ 512 $ 951
Credit Statistics
PF 2010 2011E 2012E 2013E 2014E 2015E
Total Debt / EBITDA 2.3 x 1.5 x 0.8 x 0.1 x 0.0 x 0.0 x
Adj. Debt / EBITDAR 3.5 x 2.8 x 2.2 x 1.6 x 1.4 x 1.4 x
EBITDA / Int. 6.7 x 8.8 x 14.5 x 34.5 x N.M. N.M.
EBITDA-Capex / Int. 5.6 x 7.6 x 12.7 x 30.9 x N.M. N.M.
Source: Company Management for the years 2010E through 2014E; Extrapolated based on constant growth and margins for 2015E Note: Assumes 63.7 million of diluted shares outstanding.
(1) Assumes LIBOR floor of 1.75%. Assumes financing fees of 2.5% and OID on bank debt to be 2.0%. Also assumes advisory fees of $2.0 million.
1 |
|
|
Goldman
Sachs
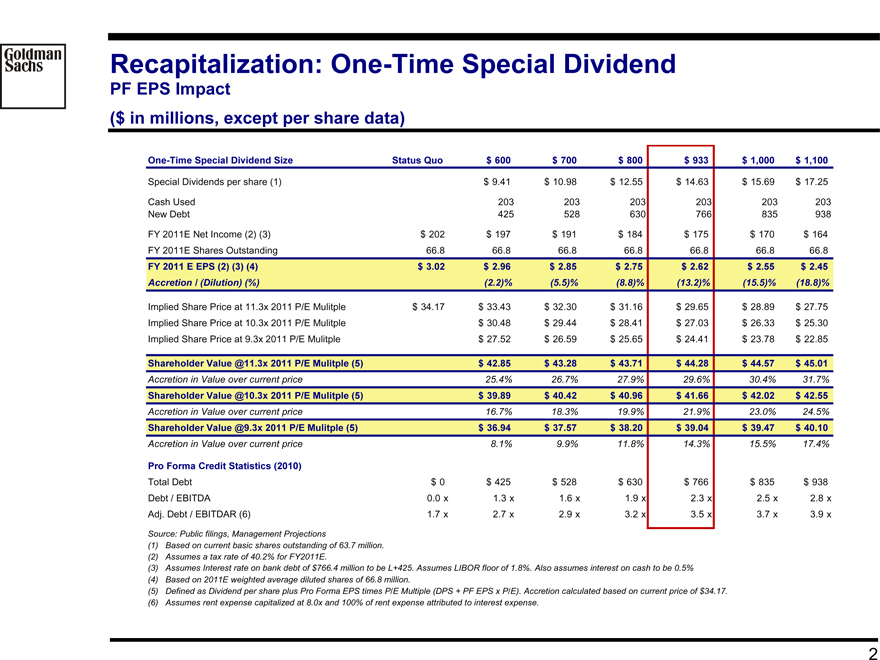
Recapitalization: One-Time Special Dividend
PF EPS Impact
($ in millions, except per share data)
One-Time Special Dividend Size Status Quo $ 600 $ 700 $ 800 $ 933 $ 1,000 $ 1,100
Special Dividends per share (1) $ 9.41 $ 10.98 $ 12.55 $ 14.63 $ 15.69 $ 17.25
Cash Used 203 203 203 203 203 203
New Debt 425 528 630 766 835 938
FY 2011E Net Income (2) (3) $ 202 $ 197 $ 191 $ 184 $ 175 $ 170 $ 164
FY 2011E Shares Outstanding 66.8 66.8 66.8 66.8 66.8 66.8 66.8
FY 2011 E EPS (2) (3) (4) $ 3.02 $ 2.96 $ 2.85 $ 2.75 $ 2.62 $ 2.55 $ 2.45
Accretion / (Dilution) (%)(2.2)%(5.5)%(8.8)%(13.2)%(15.5)%(18.8)%
Implied Share Price at 11.3x 2011 P/E Mulitple $ 34.17 $ 33.43 $ 32.30 $ 31.16 $ 29.65 $ 28.89 $ 27.75
Implied Share Price at 10.3x 2011 P/E Mulitple $ 30.48 $ 29.44 $ 28.41 $ 27.03 $ 26.33 $ 25.30
Implied Share Price at 9.3x 2011 P/E Mulitple $ 27.52 $ 26.59 $ 25.65 $ 24.41 $ 23.78 $ 22.85
Shareholder Value @11.3x 2011 P/E Mulitple (5) $ 42.85 $ 43.28 $ 43.71 $ 44.28 $ 44.57 $ 45.01
Accretion in Value over current price 25.4% 26.7% 27.9% 29.6% 30.4% 31.7%
Shareholder Value @10.3x 2011 P/E Mulitple (5) $ 39.89 $ 40.42 $ 40.96 $ 41.66 $ 42.02 $ 42.55
Accretion in Value over current price 16.7% 18.3% 19.9% 21.9% 23.0% 24.5%
Shareholder Value @9.3x 2011 P/E Mulitple (5) $ 36.94 $ 37.57 $ 38.20 $ 39.04 $ 39.47 $ 40.10
Accretion in Value over current price 8.1% 9.9% 11.8% 14.3% 15.5% 17.4%
Pro Forma Credit Statistics (2010)
Total Debt $ 0 $ 425 $ 528 $ 630 $ 766 $ 835 $ 938
Debt / EBITDA 0.0 x 1.3 x 1.6 x 1.9 x 2.3 x 2.5 x 2.8 x
Adj. Debt / EBITDAR (6) 1.7 x 2.7 x 2.9 x 3.2 x 3.5 x 3.7 x 3.9 x
Source: Public filings, Management Projections
(1) |
| Based on current basic shares outstanding of 63.7 million. (2) Assumes a tax rate of 40.2% for FY2011E. |
(3) Assumes Interest rate on bank debt of $766.4 million to be L+425. Assumes LIBOR floor of 1.8%. Also assumes interest on cash to be 0.5% (4) Based on 2011E weighted average diluted shares of 66.8 million.
(5) Defined as Dividend per share plus Pro Forma EPS times P/E Multiple (DPS + PF EPS x P/E). Accretion calculated based on current price of $34.17. (6) Assumes rent expense capitalized at 8.0x and 100% of rent expense attributed to interest expense.
2 |
|
|
Goldman
Sachs
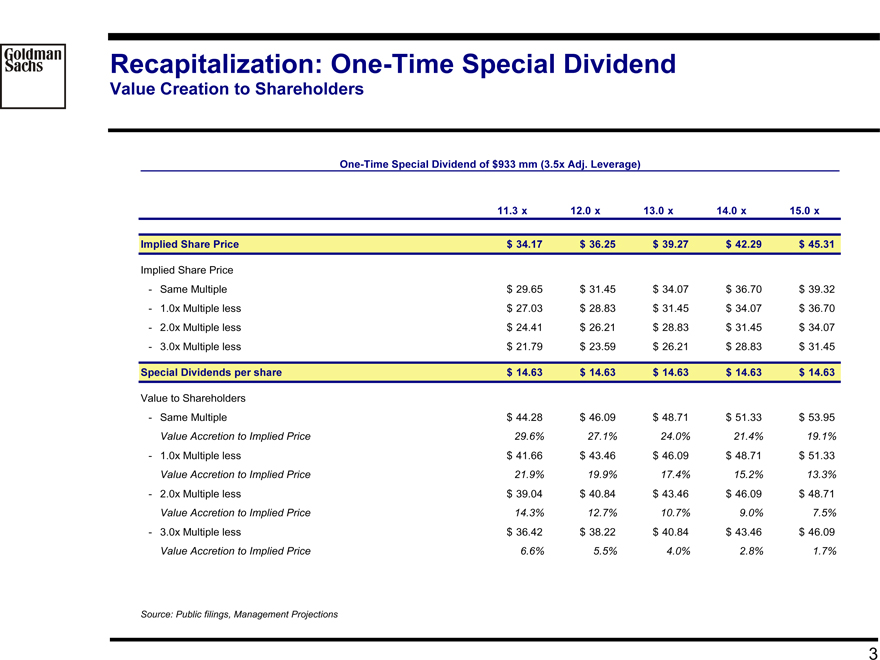
Recapitalization: One-Time Special Dividend
Value Creation to Shareholders
One-Time Special Dividend of $933 mm (3.5x Adj. Leverage)
11.3 |
| x 12.0 x 13.0 x 14.0 x 15.0 x |
Implied Share Price $ 34.17 $ 36.25 $ 39.27 $ 42.29 $ 45.31
Implied Share Price
- Same Multiple $ 29.65 $ 31.45 $ 34.07 $ 36.70 $ 39.32
- 1.0x Multiple less $ 27.03 $ 28.83 $ 31.45 $ 34.07 $ 36.70
- 2.0x Multiple less $ 24.41 $ 26.21 $ 28.83 $ 31.45 $ 34.07
- 3.0x Multiple less $ 21.79 $ 23.59 $ 26.21 $ 28.83 $ 31.45
Special Dividends per share $ 14.63 $ 14.63 $ 14.63 $ 14.63 $ 14.63
Value to Shareholders
- Same Multiple $ 44.28 $ 46.09 $ 48.71 $ 51.33 $ 53.95
Value Accretion to Implied Price 29.6% 27.1% 24.0% 21.4% 19.1%
- 1.0x Multiple less $ 41.66 $ 43.46 $ 46.09 $ 48.71 $ 51.33
Value Accretion to Implied Price 21.9% 19.9% 17.4% 15.2% 13.3%
- 2.0x Multiple less $ 39.04 $ 40.84 $ 43.46 $ 46.09 $ 48.71
Value Accretion to Implied Price 14.3% 12.7% 10.7% 9.0% 7.5%
- 3.0x Multiple less $ 36.42 $ 38.22 $ 40.84 $ 43.46 $ 46.09
Value Accretion to Implied Price 6.6% 5.5% 4.0% 2.8% 1.7%
Source: Public filings, Management Projections
3 |
|
|
Goldman
Sachs
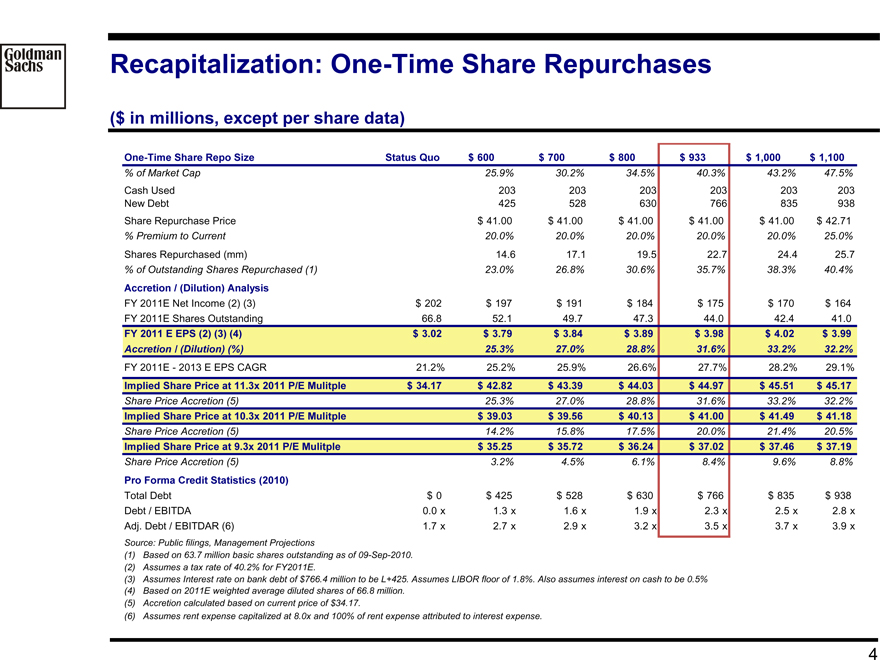
Recapitalization: One-Time Share Repurchases
($ in millions, except per share data)
One-Time Share Repo Size Status Quo $ 600 $ 700 $ 800 $ 933 $ 1,000 $ 1,100
% of Market Cap 25.9% 30.2% 34.5% 40.3% 43.2% 47.5%
Cash Used 203 203 203 203 203 203
New Debt 425 528 630 766 835 938
Share Repurchase Price $ 41.00 $ 41.00 $ 41.00 $ 41.00 $ 41.00 $ 42.71
% Premium to Current 20.0% 20.0% 20.0% 20.0% 20.0% 25.0%
Shares Repurchased (mm) 14.6 17.1 19.5 22.7 24.4 25.7
% of Outstanding Shares Repurchased (1) 23.0% 26.8% 30.6% 35.7% 38.3% 40.4%
Accretion / (Dilution) Analysis
FY 2011E Net Income (2) (3) $ 202 $ 197 $ 191 $ 184 $ 175 $ 170 $ 164
FY 2011E Shares Outstanding 66.8 52.1 49.7 47.3 44.0 42.4 41.0
FY 2011 E EPS (2) (3) (4) $ 3.02 $ 3.79 $ 3.84 $ 3.89 $ 3.98 $ 4.02 $ 3.99
Accretion / (Dilution) (%) 25.3% 27.0% 28.8% 31.6% 33.2% 32.2%
FY 2011E - 2013 E EPS CAGR 21.2% 25.2% 25.9% 26.6% 27.7% 28.2% 29.1%
Implied Share Price at 11.3x 2011 P/E Mulitple $ 34.17 $ 42.82 $ 43.39 $ 44.03 $ 44.97 $ 45.51 $ 45.17
Share Price Accretion (5) 25.3% 27.0% 28.8% 31.6% 33.2% 32.2%
Implied Share Price at 10.3x 2011 P/E Mulitple $ 39.03 $ 39.56 $ 40.13 $ 41.00 $ 41.49 $ 41.18
Share Price Accretion (5) 14.2% 15.8% 17.5% 20.0% 21.4% 20.5%
Implied Share Price at 9.3x 2011 P/E Mulitple $ 35.25 $ 35.72 $ 36.24 $ 37.02 $ 37.46 $ 37.19
Share Price Accretion (5) 3.2% 4.5% 6.1% 8.4% 9.6% 8.8%
Pro Forma Credit Statistics (2010)
Total Debt $ 0 $ 425 $ 528 $ 630 $ 766 $ 835 $ 938
Debt / EBITDA 0.0 x 1.3 x 1.6 x 1.9 x 2.3 x 2.5 x 2.8 x
Adj. Debt / EBITDAR (6) 1.7 x 2.7 x 2.9 x 3.2 x 3.5 x 3.7 x 3.9 x
Source: Public filings, Management Projections
(1) Based on 63.7 million basic shares outstanding as of 09-Sep-2010.
(2) Assumes a tax rate of 40.2% for FY2011E.
(3) Assumes Interest rate on bank debt of $766.4 million to be L+425. Assumes LIBOR floor of 1.8%. Also assumes interest on cash to be 0.5%
(4) Based on 2011E weighted average diluted shares of 66.8 million.
(5) Accretion calculated based on current price of $34.17.
(6) Assumes rent expense capitalized at 8.0x and 100% of rent expense attributed to interest expense.
4
|
Goldman
Sachs
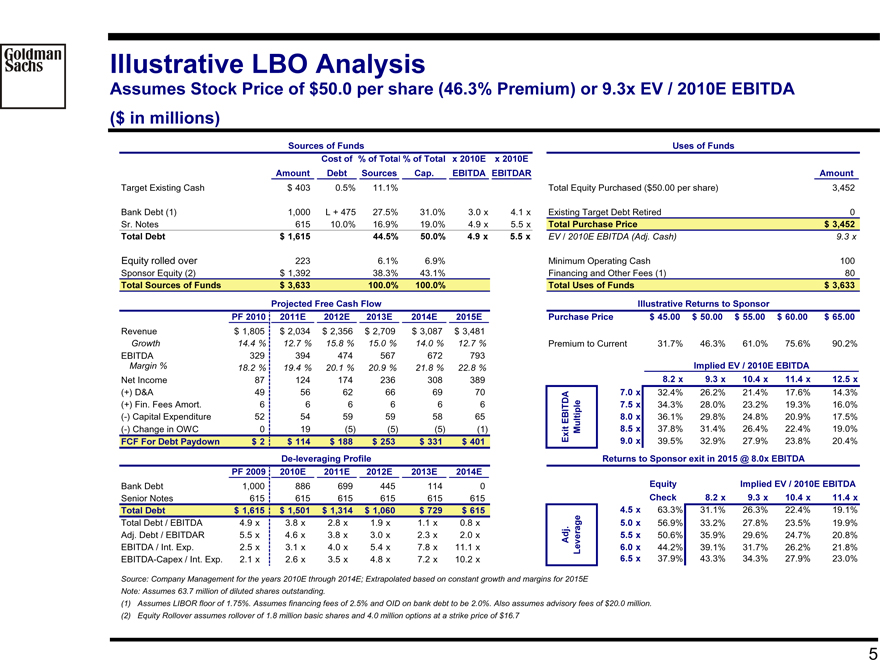
Illustrative LBO Analysis
Assumes Stock Price of $50.0 per share (46.3% Premium) or 9.3x EV / 2010E EBITDA ($ in millions)
Sources of Funds
Cost of % of Total % of Total x 2010E x 2010E
Amount Debt Sources Cap. EBITDA EBITDAR
Target Existing Cash $ 403 0.5% 11.1%
Bank Debt (1) 1,000 L + 475 27.5% 31.0% 3.0 x 4.1 x
Sr. Notes 615 10.0% 16.9% 19.0% 4.9 x 5.5 x
Total Debt $ 1,615 44.5% 50.0% 4.9 x 5.5 x
Equity rolled over 223 6.1% 6.9%
Sponsor Equity (2) $ 1,392 38.3% 43.1%
Total Sources of Funds $ 3,633 100.0% 100.0%
Projected Free Cash Flow
PF 2010 2011E 2012E 2013E 2014E 2015E
Revenue $ 1,805 $ 2,034 $ 2,356 $ 2,709 $ 3,087 $ 3,481
Growth 14.4 % 12.7 % 15.8 % 15.0 % 14.0 % 12.7 %
EBITDA 329 394 474 567 672 793
Margin % 18.2 % 19.4 % 20.1 % 20.9 % 21.8 % 22.8 %
Net Income 87 124 174 236 308 389
(+) D&A 49 56 62 66 69 70
(+) Fin. Fees Amort. 6 6 6 6 6 6
(-) Capital Expenditure 52 54 59 59 58 65
(-) Change in OWC 0 19 (5) (5) (5) (1)
FCF For Debt Paydown $ 2 $ 114 $ 188 $ 253 $ 331 $ 401
De-leveraging Profile
PF 2009 2010E 2011E 2012E 2013E 2014E
Bank Debt 1,000 886 699 445 114 0
Senior Notes 615 615 615 615 615 615
Total Debt $ 1,615 $ 1,501 $ 1,314 $ 1,060 $ 729 $ 615
Total Debt / EBITDA 4.9 x 3.8 x 2.8 x 1.9 x 1.1 x 0.8 x
Adj. Debt / EBITDAR 5.5 x 4.6 x 3.8 x 3.0 x 2.3 x 2.0 x
EBITDA / Int. Exp. 2.5 x 3.1 x 4.0 x 5.4 x 7.8 x 11.1 x
EBITDA-Capex / Int. Exp. 2.1 x 2.6 x 3.5 x 4.8 x 7.2 x 10.2 x
Uses of Funds
Amount
Total Equity Purchased ($50.00 per share) 3,452
Existing Target Debt Retired 0
Total Purchase Price $ 3,452
EV / 2010E EBITDA (Adj. Cash) 9.3 x
Minimum Operating Cash 100
Financing and Other Fees (1) 80
Total Uses of Funds $ 3,633
Illustrative Returns to Sponsor
Purchase Price $ 45.00 $ 50.00 $ 55.00 $ 60.00 $ 65.00
Premium to Current 31.7% 46.3% 61.0% 75.6% 90.2%
Implied EV / 2010E EBITDA
Exit EBITDA Multiple
8.2 |
| x 9.3 x 10.4 x 11.4 x 12.5 x |
7.0 |
| x 32.4% 26.2% 21.4% 17.6% 14.3% |
7.5 |
| x 34.3% 28.0% 23.2% 19.3% 16.0% |
8.0 |
| x 36.1% 29.8% 24.8% 20.9% 17.5% |
8.5 |
| x 37.8% 31.4% 26.4% 22.4% 19.0% |
9.0 |
| x 39.5% 32.9% 27.9% 23.8% 20.4% |
Returns to Sponsor exit in 2015 @ 8.0x EBITDA
Equity Implied EV / 2010E EBITDA
Adj Leverage
Check 8.2 x 9.3 x 10.4 x 11.4 x
4.5 |
| x 63.3% 31.1% 26.3% 22.4% 19.1% |
5.0 |
| x 56.9% 33.2% 27.8% 23.5% 19.9% |
5.5 |
| x 50.6% 35.9% 29.6% 24.7% 20.8% |
6.0 |
| x 44.2% 39.1% 31.7% 26.2% 21.8% |
6.5 |
| x 37.9% 43.3% 34.3% 27.9% 23.0% |
Source: Company Management for the years 2010E through 2014E; Extrapolated based on constant growth and margins for 2015E Note: Assumes 63.7 million of diluted shares outstanding.
(1) Assumes LIBOR floor of 1.75%. Assumes financing fees of 2.5% and OID on bank debt to be 2.0%. Also assumes advisory fees of $20.0 million. (2) Equity Rollover assumes rollover of 1.8 million basic shares and 4.0 million options at a strike price of $16.7
5 |
|
|
Goldman
Sachs
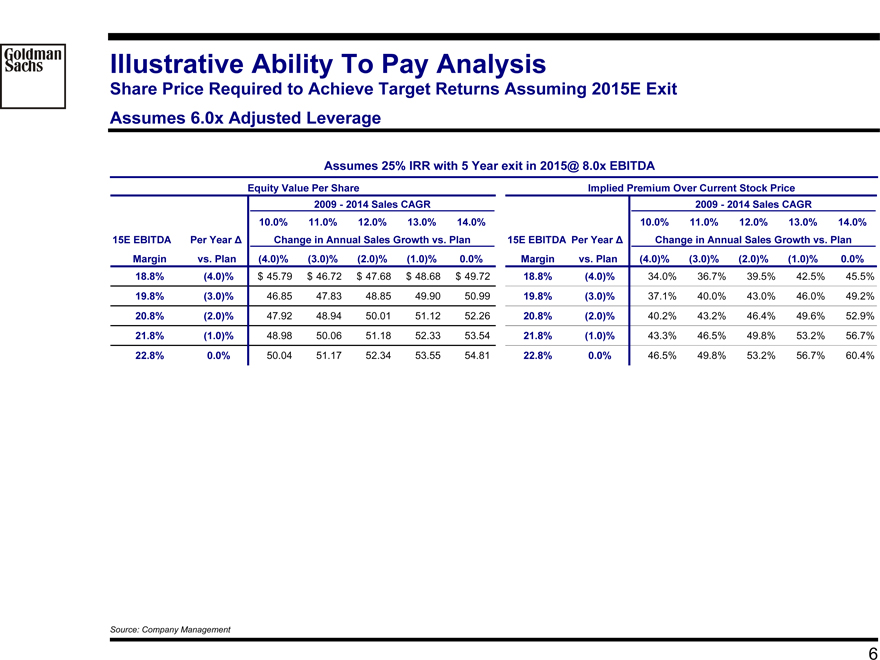
Illustrative Ability To Pay Analysis
Share Price Required to Achieve Target Returns Assuming 2015E Exit Assumes 6.0x Adjusted Leverage
Assumes 25% IRR with 5 Year exit in 2015@ 8.0x EBITDA
Equity Value Per Share Implied Premium Over Current Stock Price
2009 - 2014 Sales CAGR 2009 - 2014 Sales CAGR
10.0% 11.0% 12.0% 13.0% 14.0% 10.0% 11.0% 12.0% 13.0% 14.0%
15E EBITDA Per Year Change in Annual Sales Growth vs. Plan 15E EBITDA Per Year Change in Annual Sales Growth vs. Plan
Margin vs. Plan (4.0)% (3.0)% (2.0)% (1.0)% (0.0)%
18.8% (4.0)% $ 45.79 $ 46.72 $ 47.68 $ 48.68 $ 49.72 18.8% (4.0)% 34.0% 36.7% 39.5% 42.5% 45.5%
19.8% (3.0)% 46.85 47.83 48.85 49.90 50.99 19.8% (3.0)% 37.1% 40.0% 43.0% 46.0% 49.2%
20.8% (2.0)% 47.92 48.94 50.01 51.12 52.26 20.8% (2.0)% 40.2% 43.2% 46.4% 49.6% 52.9%
21.8% (1.0)% 48.98 50.06 51.18 52.33 53.54 21.8% (1.0)% 43.3% 46.5% 49.8% 53.2% 56.7%
22.8% 0.0% 50.04 51.17 52.34 53.55 54.81 22.8% 0.0% 46.5% 49.8% 53.2% 56.7% 60.4%
Source: Company Management
6
|
Goldman
Sachs
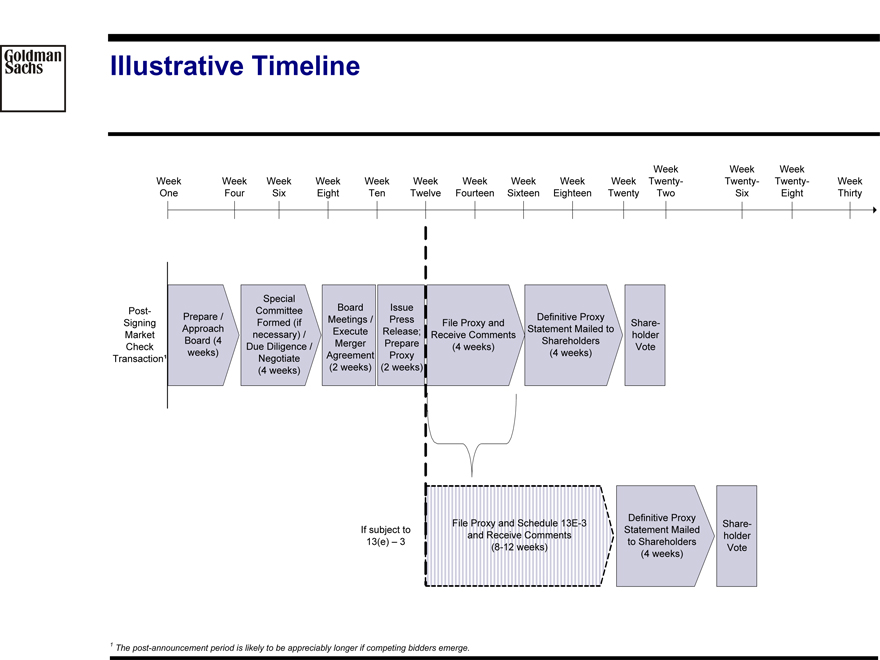
Illustrative Timeline
Week One
Week Four
Week Six
Week Eight
Week Ten
Week Twelve
Week Fourteen
Week Sixteen
Week Eighteen
Week Twenty
Week Twenty-Two
Week Twenty-Six
Week Twenty-Eight
Week Thirty
Post-Signing Market Check Transaction1
Prepare/Approach Board (4 weeks)
Special Committee Formed (if necessary Due Diligence/ Negotiate (4 weeks)
Board Meetings/Execute Merger Agreement (2 weeks)
Issue press Release; Prepare Proxy (2 weeks)
File Proxy and Receive Comments (4 weeks)
Definitive Proxy Statement Mailed to Shareholders (4 weeks)
Share-holder Vote
If subject to 13(e)-3
File Proxy and Schedule 13E-3 and Receive Comments (8-12 weeks)
Definitive Proxy Statement Mailed to Shareholders (4 weeks)
Share-holder Vote
1 The post-announcement period is likely to be appreciably longer if competing bidders emerge.
Exhibit 1
|
Goldman Sachs
J.Crew Back Up Pages
Goldman, Sachs & Co. September 2010
|
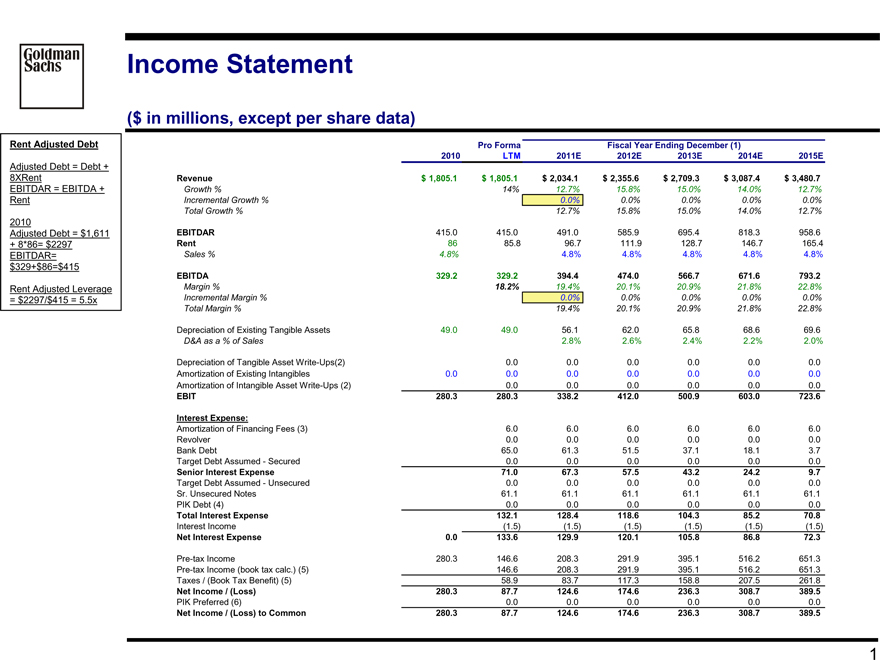
Rent Adjusted Debt
Adjusted Debt = Debt +
8XRent EBITDAR = EBITDA + Rent
2010
Adjusted Debt = $1,611 + 8*86= $2297 EBITDAR= $329+$86=$415
Rent Adjusted Leverage = $2297/$415 = 5.5x
Goldman Sachs
Income Statement
($ in millions, except per share data)
Pro Forma Fiscal Year Ending December (1)
2010 LTM 2011E 2012E 2013E 2014E 2015E
Revenue $ 1,805.1 $ 1,805.1 $ 2,034.1 $ 2,355.6 $ 2,709.3 $ 3,087.4 $ 3,480.7
Growth % 14% 12.7% 15.8% 15.0% 14.0% 12.7%
Incremental Growth % 0.0% 0.0% 0.0% 0.0% 0.0%
Total Growth % 12.7% 15.8% 15.0% 14.0% 12.7%
EBITDAR 415.0 415.0 491.0 585.9 695.4 818.3 958.6
Rent 86 85.8 96.7 111.9 128.7 146.7 165.4
Sales % 4.8% 4.8% 4.8% 4.8% 4.8% 4.8%
EBITDA 329.2 329.2 394.4 474.0 566.7 671.6 793.2
Margin % 18.2% 19.4% 20.1% 20.9% 21.8% 22.8%
Incremental Margin % 0.0% 0.0% 0.0% 0.0% 0.0%
Total Margin % 19.4% 20.1% 20.9% 21.8% 22.8%
Depreciation of Existing Tangible Assets 49.0 49.0 56.1 62.0 65.8 68.6 69.6
D&A as a % of Sales 2.8% 2.6% 2.4% 2.2% 2.0%
Depreciation of Tangible Asset Write-Ups(2) 0.0 0.0 0.0 0.0 0.0 0.0
Amortization of Existing Intangibles 0.0 0.0 0.0 0.0 0.0 0.0 0.0
Amortization of Intangible Asset Write-Ups (2) 0.0 0.0 0.0 0.0 0.0 0.0
EBIT 280.3 280.3 338.2 412.0 500.9 603.0 723.6
Interest Expense:
Amortization of Financing Fees (3) 6.0 6.0 6.0 6.0 6.0 6.0
Revolver 0.0 0.0 0.0 0.0 0.0 0.0
Bank Debt 65.0 61.3 51.5 37.1 18.1 3.7
Target Debt Assumed - Secured 0.0 0.0 0.0 0.0 0.0 0.0
Senior Interest Expense 71.0 67.3 57.5 43.2 24.2 9.7
Target Debt Assumed - Unsecured 0.0 0.0 0.0 0.0 0.0 0.0
Sr. Unsecured Notes 61.1 61.1 61.1 61.1 61.1 61.1
PIK Debt (4) 0.0 0.0 0.0 0.0 0.0 0.0
Total Interest Expense 132.1 128.4 118.6 104.3 85.2 70.8
Interest Income(1.5)(1.5)(1.5)(1.5)(1.5)(1.5)
Net Interest Expense 0.0 133.6 129.9 120.1 105.8 86.8 72.3
Pre-tax Income 280.3 146.6 208.3 291.9 395.1 516.2 651.3
Pre-tax Income (book tax calc.) (5) 146.6 208.3 291.9 395.1 516.2 651.3
Taxes / (Book Tax Benefit) (5) 58.9 83.7 117.3 158.8 207.5 261.8
Net Income / (Loss) 280.3 87.7 124.6 174.6 236.3 308.7 389.5
PIK Preferred (6) 0.0 0.0 0.0 0.0 0.0 0.0
Net Income / (Loss) to Common 280.3 87.7 124.6 174.6 236.3 308.7 389.5
1
|

Goldman Sachs
Cash Flow
($ in millions, except per share data)
Pro Forma Fiscal Year Ending December (1)
2010 LTM 2011E 2012E 2013E 2014E 2015E
Net Income / (Loss) to Common $ 280.3 $ 87.7 $ 124.9 $ 174.9 $ 236.6 $ 309.0 $ 389.8
Additions
Depreciation of Existing Tangible Assets 49.0 49.0 56.1 62.0 65.8 68.6 69.6
Depreciation of Tangible Asset Write-Ups(2) 0.0 0.0 0.0 0.0 0.0 0.0
Amortization of Existing Intangibles 0.0 0.0 0.0 0.0 0.0 0.0
Amortization of Intangible Asset Write-Ups (2) 0.0 0.0 0.0 0.0 0.0
Amortization of Financing Fees (3) 6.0 6.0 6.0 6.0 6.0 6.0
PIK Interest (4) 0.0 0.0 0.0 0.0 0.0 0.0
PIK Dividends (5) 0.0 0.0 0.0 0.0 0.0 0.0
Deferred Taxes (from transaction purchase accounting) (2) (6) 0.0 0.0 0.0 0.0 0.0
Cash Tax Benefit from Loss Carryforwards (6) 0.0 0.0 0.0 0.0 0.0
Other Deferred Taxes 0.0 0.0 0.0 0.0 0.0 0.0
Other Non-Cash Expenses 0.0 0.0 0.0 0.0 0.0 0.0
Total Additions 49.0 55.0 62.2 68.0 71.8 74.6 75.6
Subtractions
Increase / (Decrease) in Working Capital 0.4 0.4 19.3 (4.5) (4.8) (5.1) (1.1)
Reversal of Book Tax Benefit (7) 0.0 0.0 0.0 0.0 0.0 0.0 0.0
Mandatory Capital Expenditures 52.5 52.5 53.9 59.4 59.5 57.7 65.0
Capex as % of Sales 2.6% 2.5% 2.2% 1.9% 1.9%
Discretionary Capital Expenditures 0.0 0.0 0.0 0.0 0.0 0.0 0.0
Total Capital Expenditures 52.5 52.5 53.9 59.4 59.5 57.7 65.0
Total Subtractions 52.9 52.9 73.1 54.9 54.6 52.6 63.9
Free Cash Flow Available for Debt Service 276.4 89.8 113.9 188.0 253.7 331.0 401.5
Cumulative Free Cash Flow 113.9 301.9 555.6 886.7 1,288.2
0.0 0.0 0.0 0.0 0.0
Cash Taxes
Pre-tax Income (book tax calc.) $ 146.6 $ 208.3 $ 291.9 $ 395.1 $ 516.2 $ 651.3
Plus: Reversal of Asset Write-Up D&A for Tax (2) (6) 0.0 0.0 0.0 0.0 0.0 0.0
Less: Goodwill Amortization for Tax (2) (6) 0.0 0.0 0.0 0.0 0.0 0.0
Pre-tax Income before Loss Carryforward (cash tax calc.) $ 146.6 $ 208.3 $ 291.9 $ 395.1 $ 516.2 $ 651.3
Pre-tax Income after Loss Carryforward (cash tax calc.) $ 0.0 $ 208.3 $ 291.9 $ 395.1 $ 516.2 $ 651.3
Tax Loss Carryforward—End of Year $ 0.0 0.0 0.0 0.0 0.0 0.0
2
|
Goldman Sachs
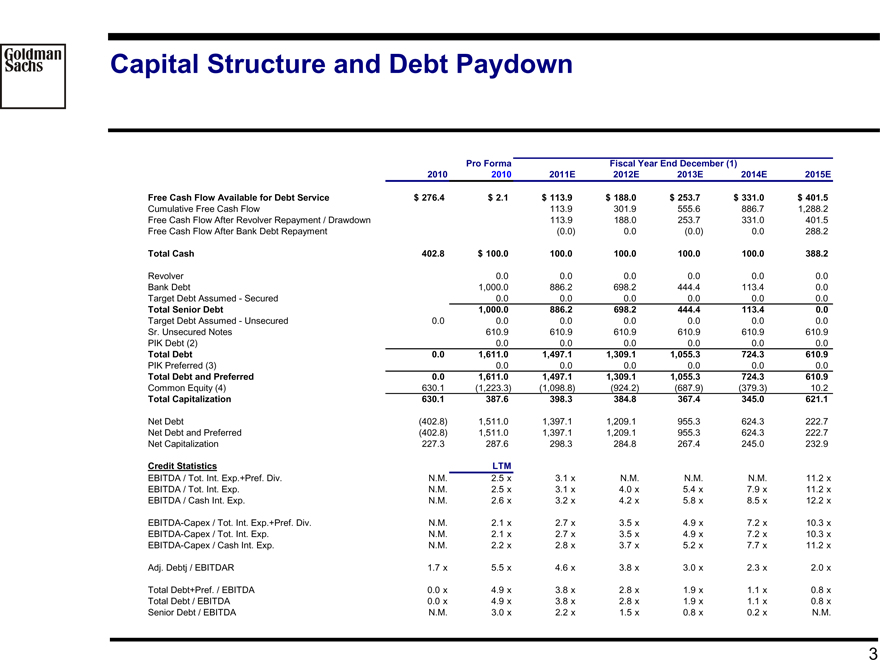
Capital Structure and Debt Paydown
Pro Forma Fiscal Year End December (1)
2010 2010 2011E 2012E 2013E 2014E 2015E
Free Cash Flow Available for Debt Service $ 276.4 $ 2.1 $ 113.9 $ 188.0 $ 253.7 $ 331.0 $ 401.5
Cumulative Free Cash Flow 113.9 301.9 555.6 886.7 1,288.2
Free Cash Flow After Revolver Repayment / Drawdown 113.9 188.0 253.7 331.0 401.5
Free Cash Flow After Bank Debt Repayment (0.0) 0.0 (0.0) 0.0 288.2
Total Cash 402.8 $ 100.0 100.0 100.0 100.0 100.0 388.2
Revolver 0.0 0.0 0.0 0.0 0.0 0.0
Bank Debt 1,000.0 886.2 698.2 444.4 113.4 0.0
Target Debt Assumed - Secured 0.0 0.0 0.0 0.0 0.0 0.0
Total Senior Debt 1,000.0 886.2 698.2 444.4 113.4 0.0
Target Debt Assumed - Unsecured 0.0 0.0 0.0 0.0 0.0 0.0 0.0
Sr. Unsecured Notes 610.9 610.9 610.9 610.9 610.9 610.9
PIK Debt (2) 0.0 0.0 0.0 0.0 0.0 0.0
Total Debt 0.0 1,611.0 1,497.1 1,309.1 1,055.3 724.3 610.9
PIK Preferred (3) 0.0 0.0 0.0 0.0 0.0 0.0
Total Debt and Preferred 0.0 1,611.0 1,497.1 1,309.1 1,055.3 724.3 610.9
Common Equity (4) 630.1(1,223.3)(1,098.8)(924.2)(687.9)(379.3) 10.2
Total Capitalization 630.1 387.6 398.3 384.8 367.4 345.0 621.1
Net Debt (402.8) 1,511.0 1,397.1 1,209.1 955.3 624.3 222.7
Net Debt and Preferred (402.8) 1,511.0 1,397.1 1,209.1 955.3 624.3 222.7
Net Capitalization 227.3 287.6 298.3 284.8 267.4 245.0 232.9
Credit Statistics LTM
EBITDA / Tot. Int. Exp.+Pref. Div. N.M. 2.5 x 3.1 x N.M. N.M. N.M. 11.2 x
EBITDA / Tot. Int. Exp. N.M. 2.5 x 3.1 x 4.0 x 5.4 x 7.9 x 11.2 x
EBITDA / Cash Int. Exp. N.M. 2.6 x 3.2 x 4.2 x 5.8 x 8.5 x 12.2 x
EBITDA-Capex / Tot. Int. Exp.+Pref. Div. N.M. 2.1 x 2.7 x 3.5 x 4.9 x 7.2 x 10.3 x
EBITDA-Capex / Tot. Int. Exp. N.M. 2.1 x 2.7 x 3.5 x 4.9 x 7.2 x 10.3 x
EBITDA-Capex / Cash Int. Exp. N.M. 2.2 x 2.8 x 3.7 x 5.2 x 7.7 x 11.2 x
Adj. Debtj / EBITDAR 1.7 x 5.5 x 4.6 x 3.8 x 3.0 x 2.3 x 2.0 x
Total Debt+Pref. / EBITDA 0.0 x 4.9 x 3.8 x 2.8 x 1.9 x 1.1 x 0.8 x
Total Debt / EBITDA 0.0 x 4.9 x 3.8 x 2.8 x 1.9 x 1.1 x 0.8 x
Senior Debt / EBITDA N.M. 3.0 x 2.2 x 1.5 x 0.8 x 0.2 x N.M.
3 |
|