Exhibit 99.1

INVESTOR PRESENTATIONSEPTEMBER 2019

TABLE OF CONTENTS * ABOUT ESSEX 3 EXECUTIVE SUMMARY 4WEST COAST FUNDAMENTALS 9OPERATING PERFORMANCE 22INVESTMENTS AND CAPITAL ALLOCATION 262019 GUIDANCE AND BALANCE SHEET 33DEFINITIONS & RECONCILIATIONS 39

THE ONLY PUBLIC MULTIFAMILY REIT DEDICATED TO THE WEST COAST ESSEX AT A GLANCE (1) Represents percent of pro rata NOI as of 6/30/19, rounded to the nearest percent.(2) Oakland includes Alameda and Contra Costa Counties.(3) As of 6/30/19. San Francisco MD 9%Oakland(2) 12%Santa Clara 20% Ventura 6%Los Angeles 18%Orange County 10%San Diego 8% SOUTHERN, CA42% of NOI(1) NORTHERN, CA42% of NOI(1) SEATTLE17% of NOI(1) *
EXECUTIVE SUMMARY – KEY HIGHLIGHTS *
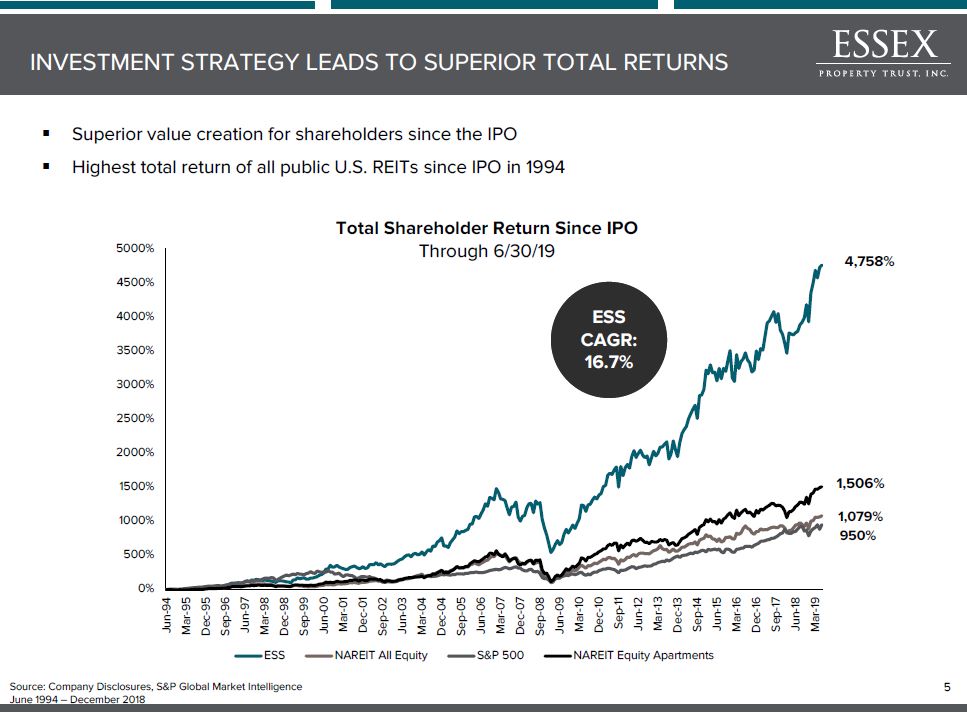
Superior value creation for shareholders since the IPOHighest total return of all public U.S. REITs since IPO in 1994 1,506% 950% 4,758% ESS CAGR: 16.7% 1,079% INVESTMENT STRATEGY LEADS TO SUPERIOR TOTAL RETURNS Source: Company Disclosures, S&P Global Market IntelligenceJune 1994 – December 2018 *
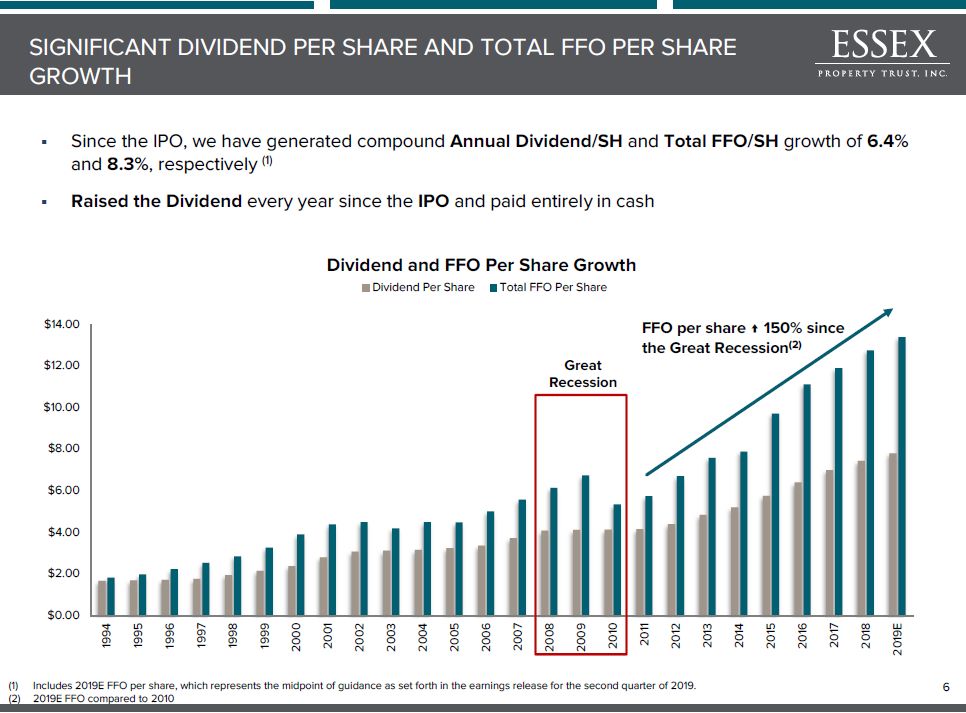
Since the IPO, we have generated compound Annual Dividend/SH and Total FFO/SH growth of 6.4% and 8.3%, respectively (1)Raised the Dividend every year since the IPO and paid entirely in cash Great Recession FFO per share ↑ 150% since the Great Recession(2) SIGNIFICANT DIVIDEND PER SHARE AND TOTAL FFO PER SHARE GROWTH Includes 2019E FFO per share, which represents the midpoint of guidance as set forth in the earnings release for the second quarter of 2019. 2019E FFO compared to 2010 *
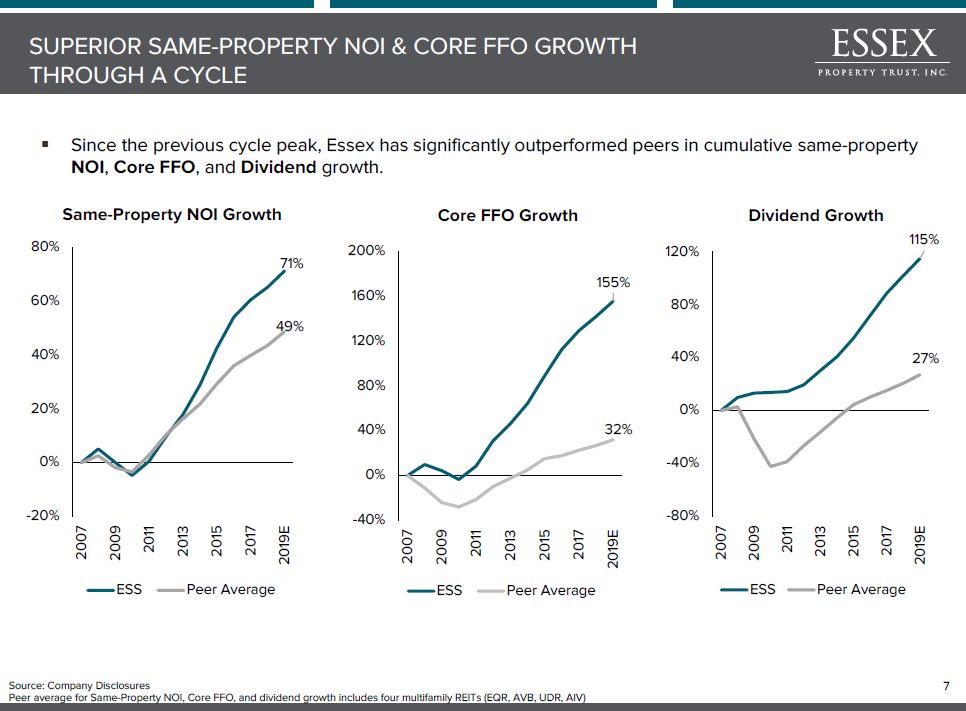
Since the previous cycle peak, Essex has significantly outperformed peers in cumulative same-property NOI, Core FFO, and Dividend growth. SUPERIOR SAME-PROPERTY NOI & CORE FFO GROWTH THROUGH A CYCLE Source: Company Disclosures Peer average for Same-Property NOI, Core FFO, and dividend growth includes four multifamily REITs (EQR, AVB, UDR, AIV) *

WEST COAST FUNDAMENTALS Brio | Walnut Creek, CA
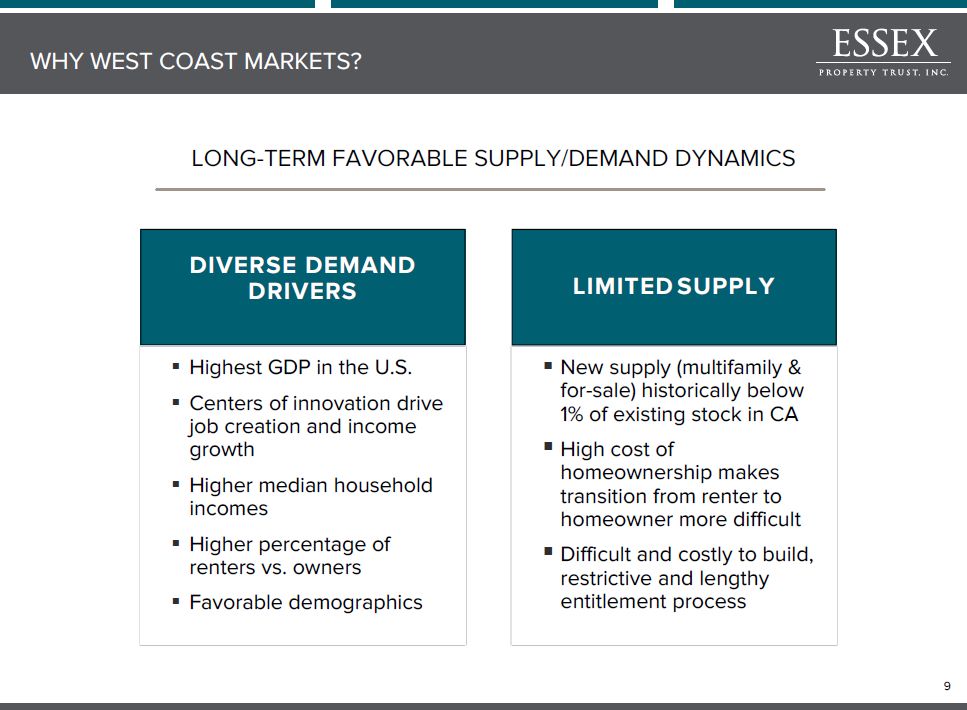
WHY WEST COAST MARKETS? * LONG-TERM FAVORABLE SUPPLY/DEMAND DYNAMICS DIVERSE DEMAND DRIVERS Highest GDP in the U.S.Centers of innovation drive job creation and income growthHigher median household incomesHigher percentage of renters vs. ownersFavorable demographics New supply (multifamily & for-sale) historically below 1% of existing stock in CAHigh cost of homeownership makes transition from renter to homeowner more difficultDifficult and costly to build, restrictive and lengthy entitlement process LIMITED SUPPLY
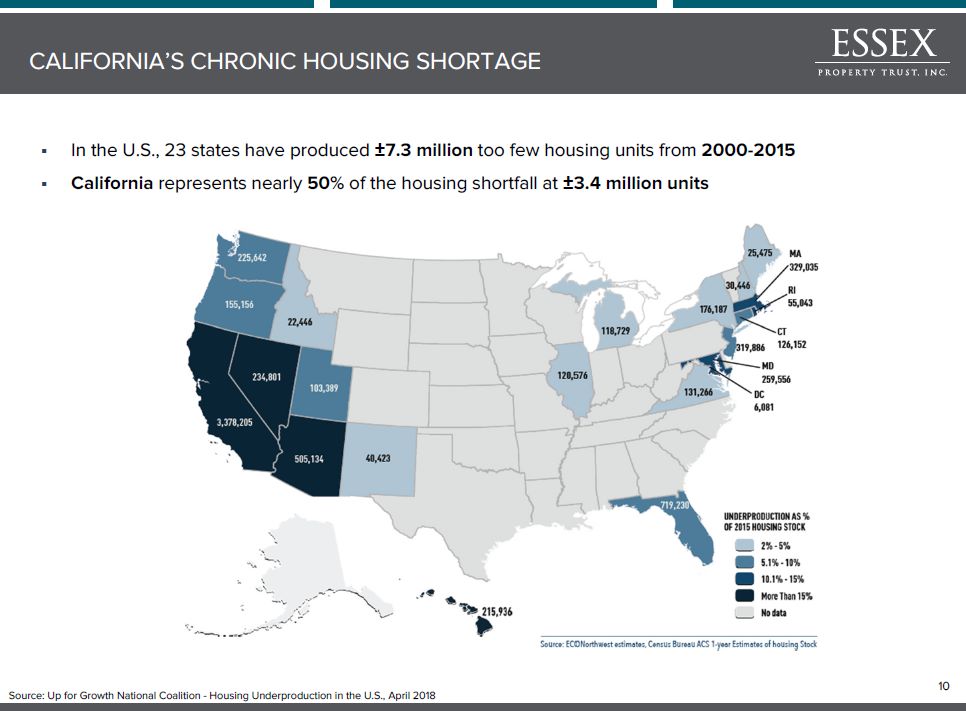
CALIFORNIA’S CHRONIC HOUSING SHORTAGE Source: Up for Growth National Coalition - Housing Underproduction in the U.S., April 2018 * In the U.S., 23 states have produced ±7.3 million too few housing units from 2000-2015California represents nearly 50% of the housing shortfall at ±3.4 million units
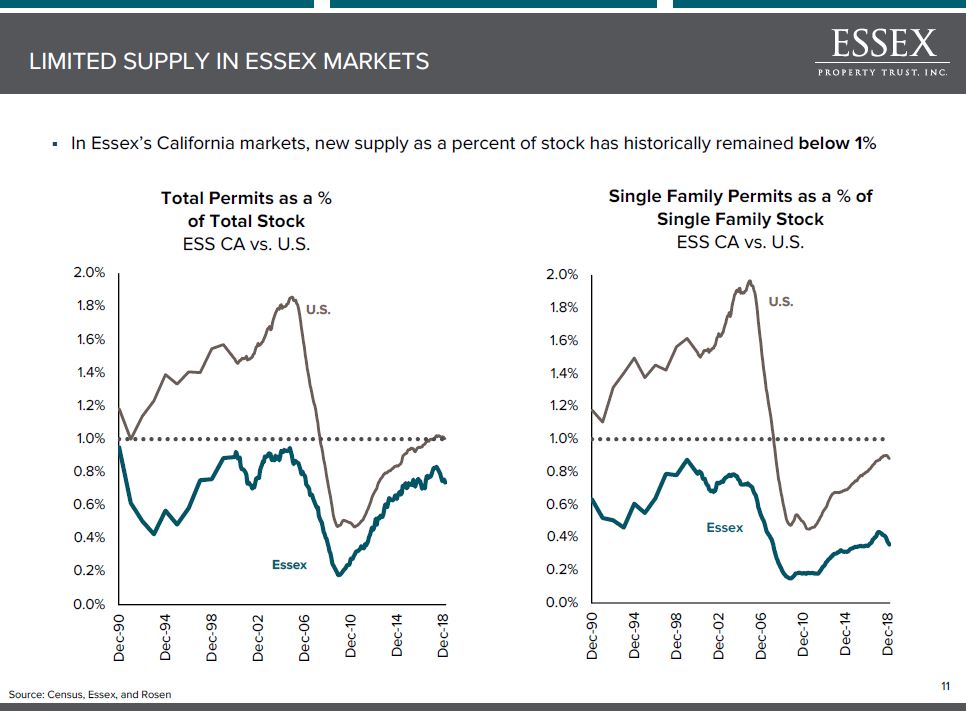
In Essex’s California markets, new supply as a percent of stock has historically remained below 1% LIMITED SUPPLY IN ESSEX MARKETS Source: Census, Essex, and Rosen * U.S. Essex
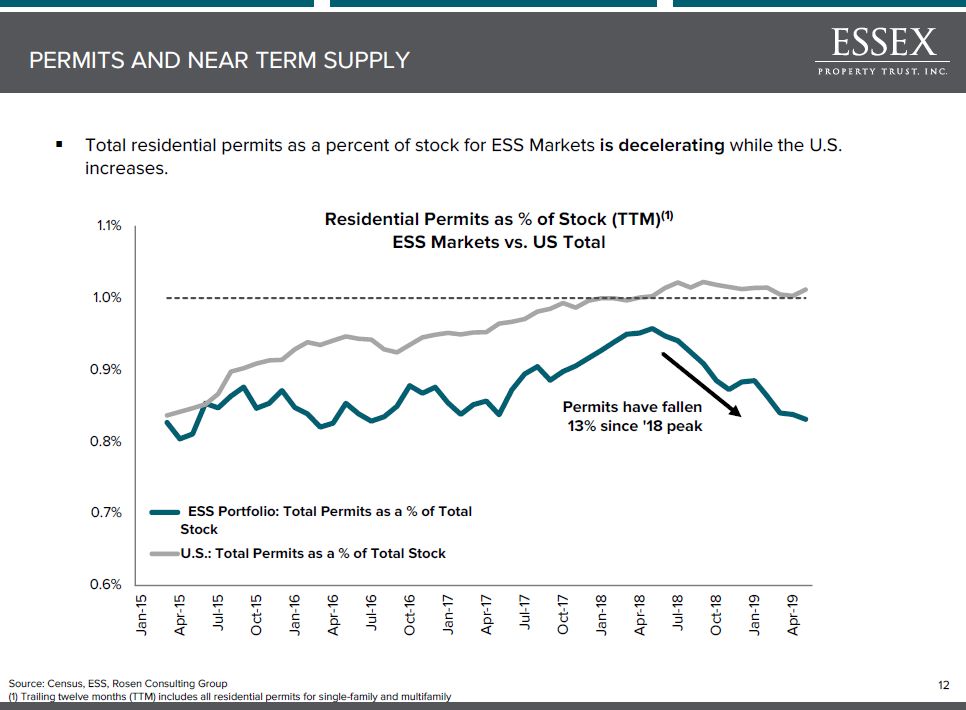
Total residential permits as a percent of stock for ESS Markets is decelerating while the U.S. increases. PERMITS AND NEAR TERM SUPPLY Source: Census, ESS, Rosen Consulting Group(1) Trailing twelve months (TTM) includes all residential permits for single-family and multifamily * Permits have fallen 13% since '18 peak
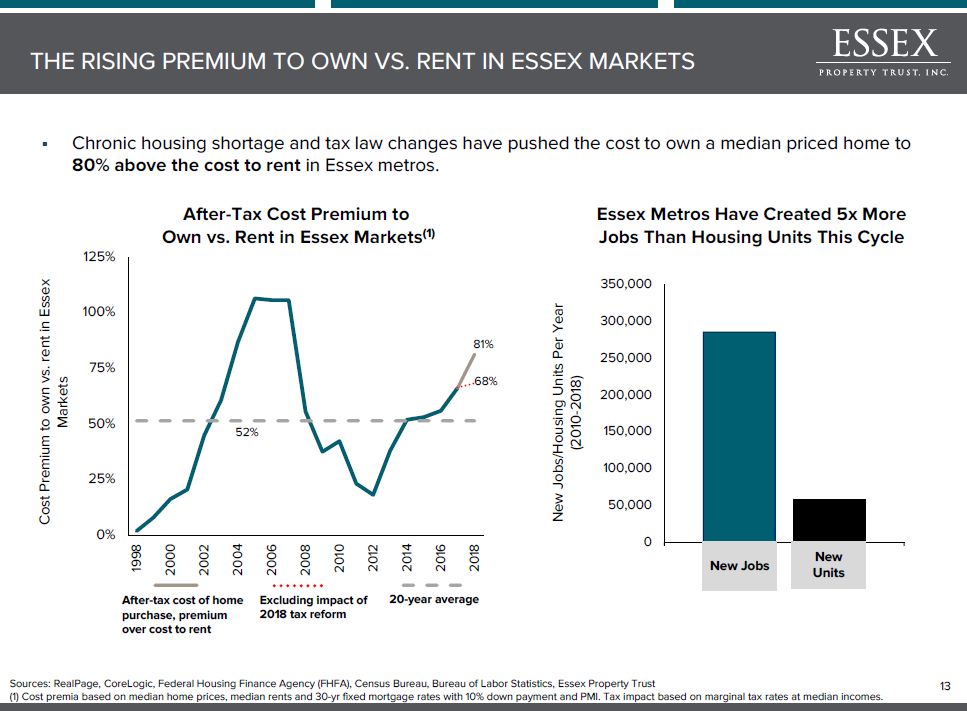
Chronic housing shortage and tax law changes have pushed the cost to own a median priced home to 80% above the cost to rent in Essex metros. Essex Metros Have Created 5x More Jobs Than Housing Units This Cycle After-Tax Cost Premium to Own vs. Rent in Essex Markets(1) After-tax cost of home purchase, premium over cost to rent Excluding impact of 2018 tax reform 20-year average NewUnits New Jobs THE RISING PREMIUM TO OWN VS. RENT IN ESSEX MARKETS Sources: RealPage, CoreLogic, Federal Housing Finance Agency (FHFA), Census Bureau, Bureau of Labor Statistics, Essex Property Trust(1) Cost premia based on median home prices, median rents and 30-yr fixed mortgage rates with 10% down payment and PMI. Tax impact based on marginal tax rates at median incomes. *
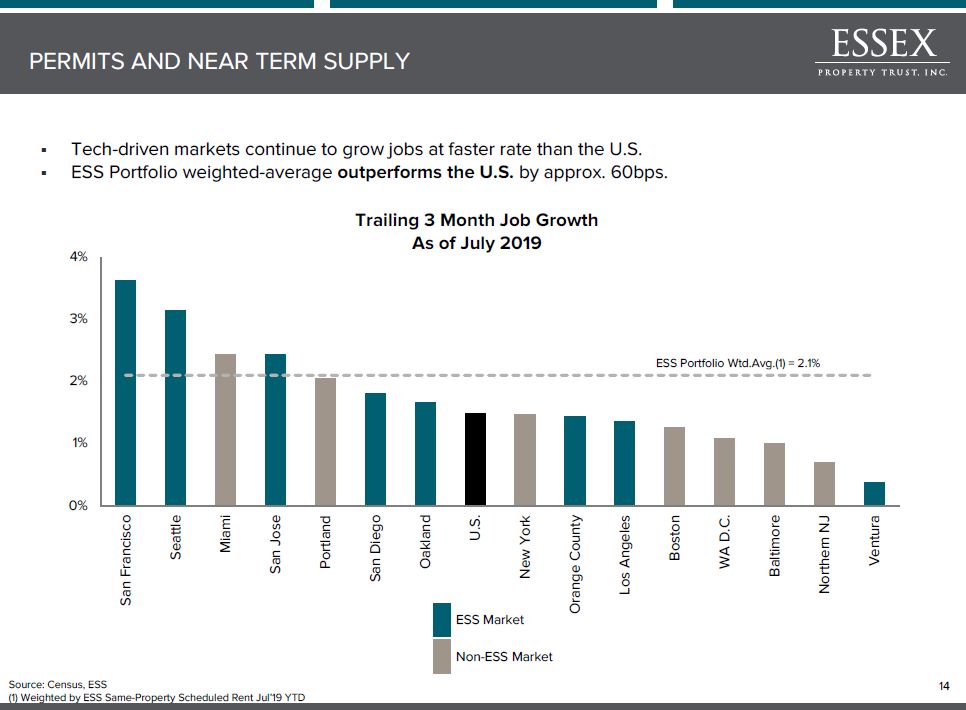
Tech-driven markets continue to grow jobs at faster rate than the U.S.ESS Portfolio weighted-average outperforms the U.S. by approx. 60bps. ESS Market Non-ESS Market PERMITS AND NEAR TERM SUPPLY Source: Census, ESS(1) Weighted by ESS Same-Property Scheduled Rent Jul’19 YTD *
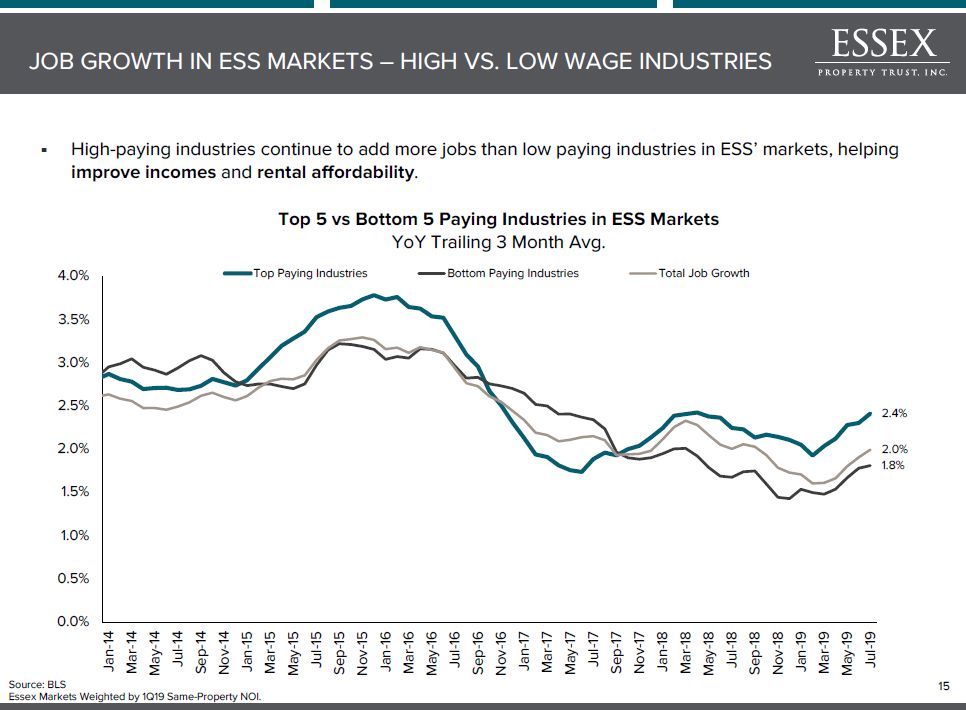
High-paying industries continue to add more jobs than low paying industries in ESS’ markets, helping improve incomes and rental affordability. JOB GROWTH IN ESS MARKETS – HIGH VS. LOW WAGE INDUSTRIES Source: BLSEssex Markets Weighted by 1Q19 Same-Property NOI. *
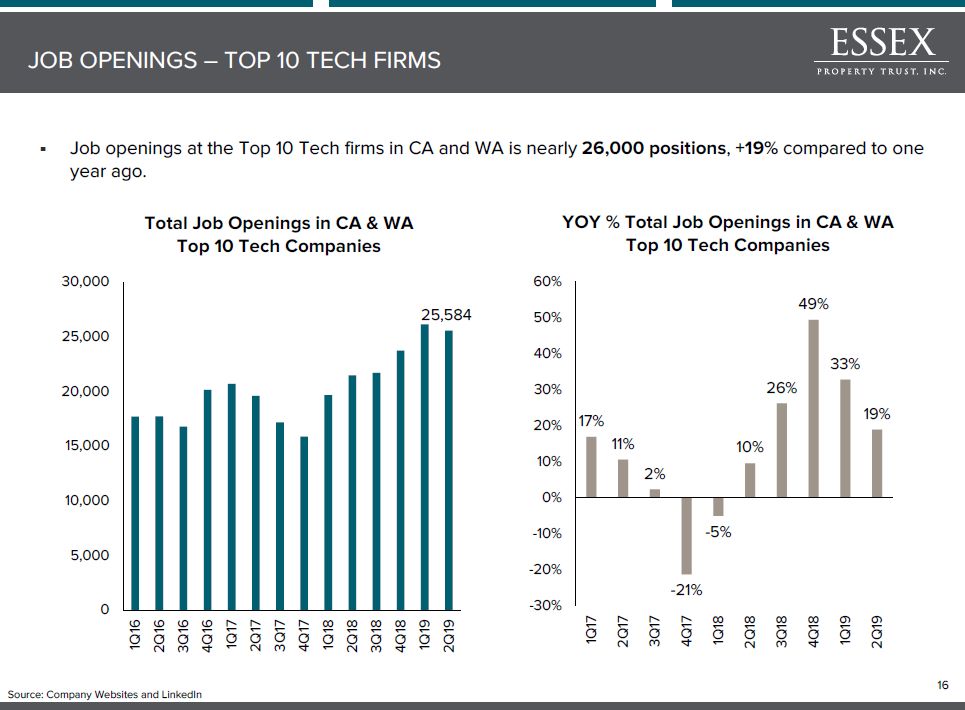
Job openings at the Top 10 Tech firms in CA and WA is nearly 26,000 positions, +19% compared to one year ago. JOB OPENINGS – TOP 10 TECH FIRMS Source: Company Websites and LinkedIn *
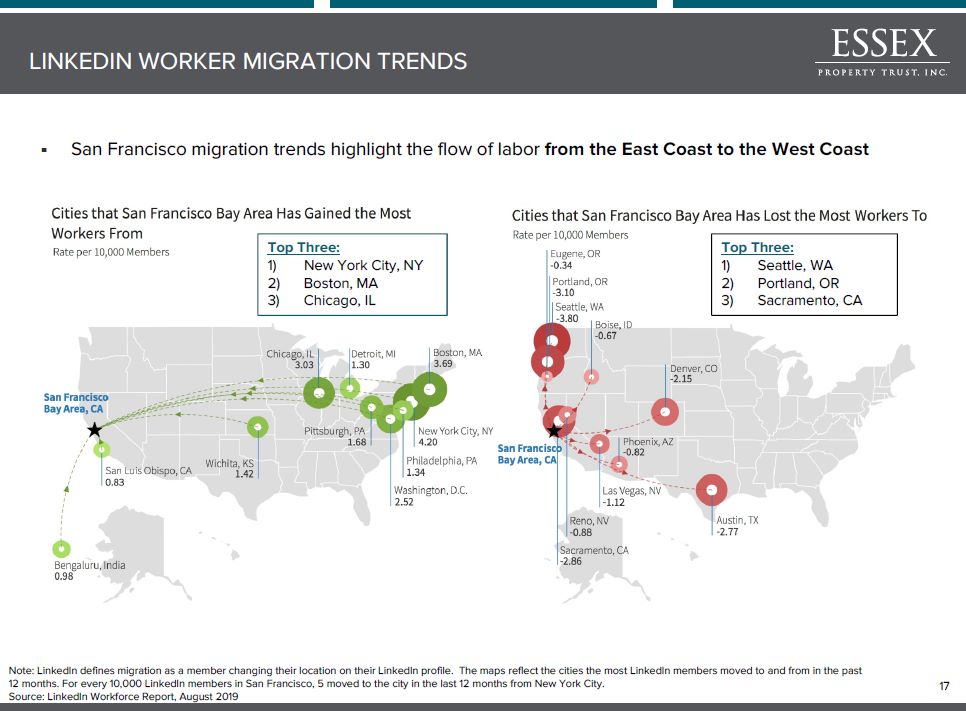
San Francisco migration trends highlight the flow of labor from the East Coast to the West Coast Top Three: Seattle, WAPortland, ORSacramento, CA Top Three: New York City, NYBoston, MAChicago, IL LINKEDIN WORKER MIGRATION TRENDS Note: LinkedIn defines migration as a member changing their location on their LinkedIn profile. The maps reflect the cities the most LinkedIn members moved to and from in the past 12 months. For every 10,000 LinkedIn members in San Francisco, 5 moved to the city in the last 12 months from New York City.Source: LinkedIn Workforce Report, August 2019 *
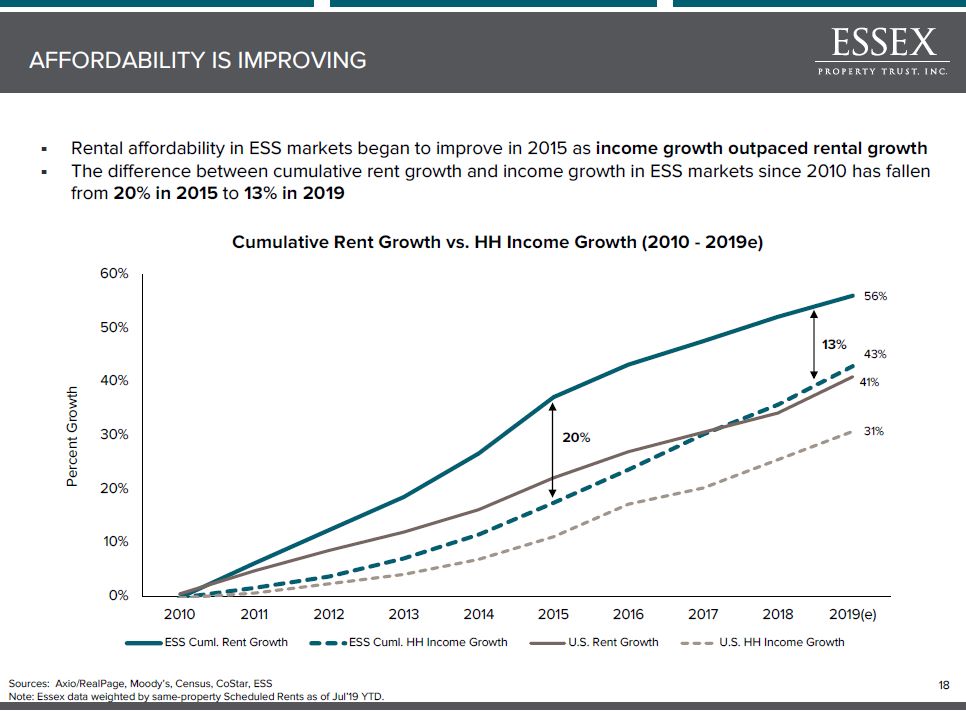
Rental affordability in ESS markets began to improve in 2015 as income growth outpaced rental growth The difference between cumulative rent growth and income growth in ESS markets since 2010 has fallen from 20% in 2015 to 13% in 2019 AFFORDABILITY IS IMPROVING Sources: Axio/RealPage, Moody’s, Census, CoStar, ESSNote: Essex data weighted by same-property Scheduled Rents as of Jul’19 YTD. * 13% 20%
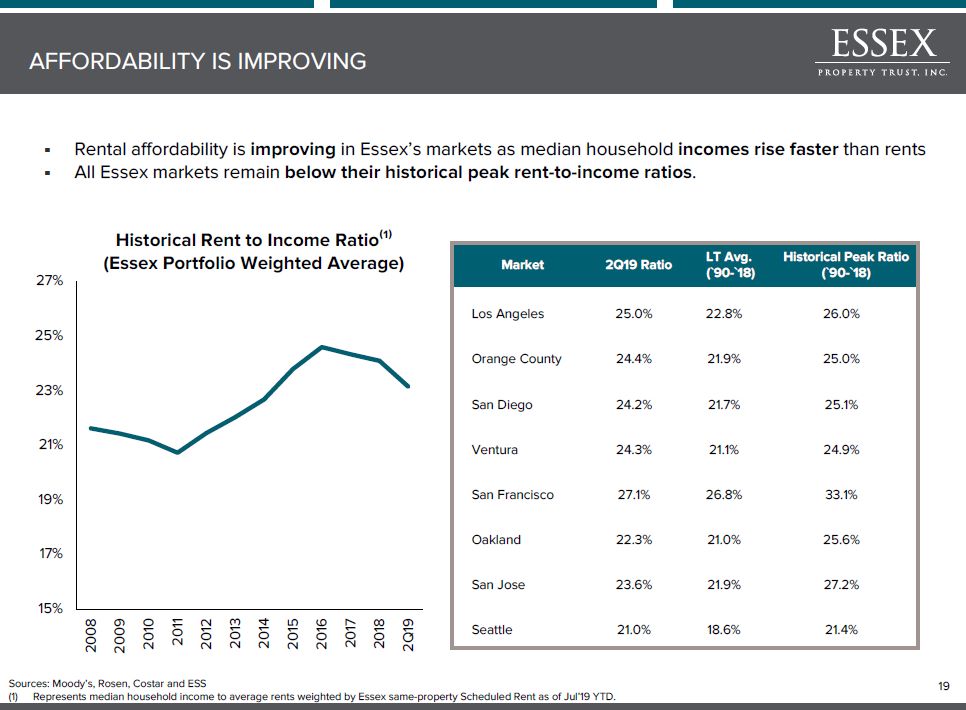
Rental affordability is improving in Essex’s markets as median household incomes rise faster than rentsAll Essex markets remain below their historical peak rent-to-income ratios. AFFORDABILITY IS IMPROVING Sources: Moody’s, Rosen, Costar and ESSRepresents median household income to average rents weighted by Essex same-property Scheduled Rent as of Jul’19 YTD. *
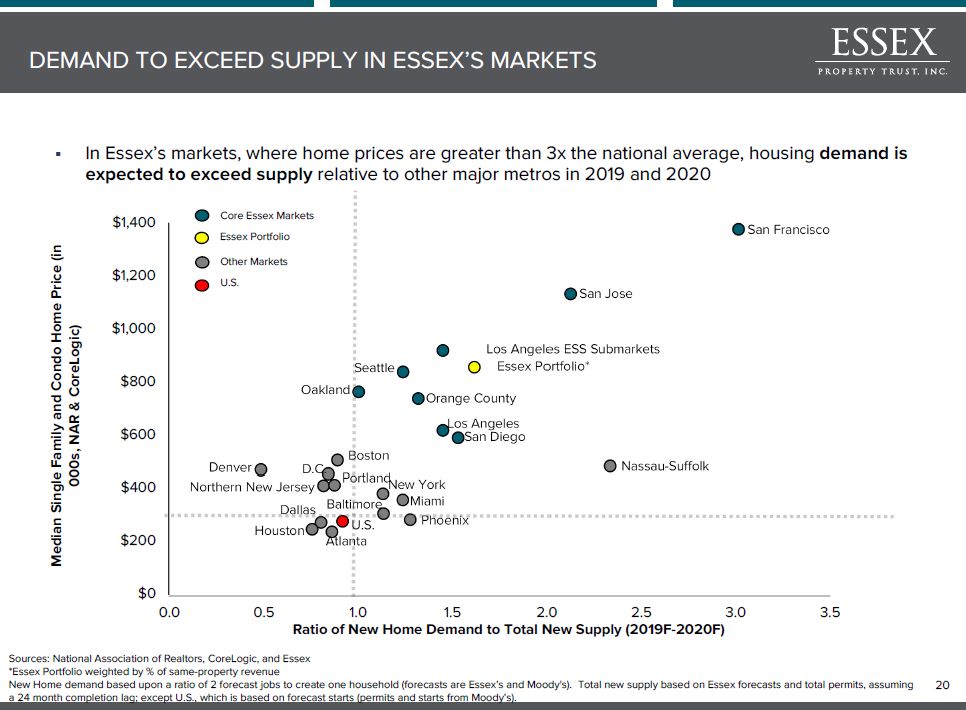
In Essex’s markets, where home prices are greater than 3x the national average, housing demand is expected to exceed supply relative to other major metros in 2019 and 2020 DEMAND TO EXCEED SUPPLY IN ESSEX’S MARKETS Sources: National Association of Realtors, CoreLogic, and Essex*Essex Portfolio weighted by % of same-property revenueNew Home demand based upon a ratio of 2 forecast jobs to create one household (forecasts are Essex’s and Moody's). Total new supply based on Essex forecasts and total permits, assuming a 24 month completion lag; except U.S., which is based on forecast starts (permits and starts from Moody’s). *
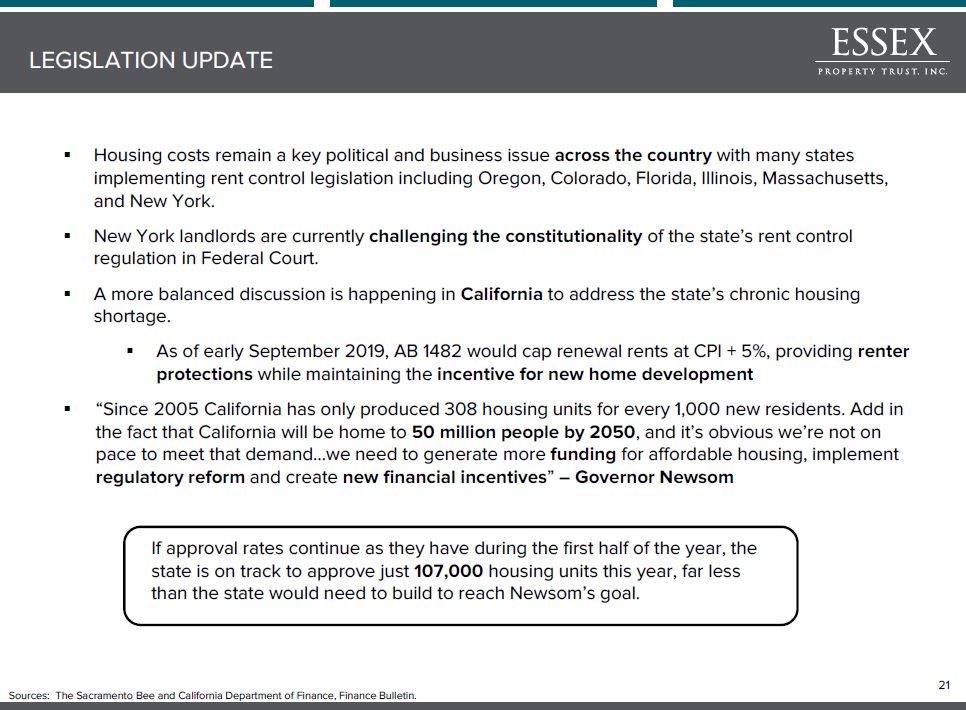
LEGISLATION UPDATE * Housing costs remain a key political and business issue across the country with many states implementing rent control legislation including Oregon, Colorado, Florida, Illinois, Massachusetts, and New York. New York landlords are currently challenging the constitutionality of the state’s rent control regulation in Federal Court.A more balanced discussion is happening in California to address the state’s chronic housing shortage. As of early September 2019, AB 1482 would cap renewal rents at CPI + 5%, providing renter protections while maintaining the incentive for new home development “Since 2005 California has only produced 308 housing units for every 1,000 new residents. Add in the fact that California will be home to 50 million people by 2050, and it’s obvious we’re not on pace to meet that demand…we need to generate more funding for affordable housing, implement regulatory reform and create new financial incentives” – Governor Newsom If approval rates continue as they have during the first half of the year, the state is on track to approve just 107,000 housing units this year, far less than the state would need to build to reach Newsom’s goal. Sources: The Sacramento Bee and California Department of Finance, Finance Bulletin.
OPERATING PERFORMANCE 5600 Wilshire | Los Angeles, CA
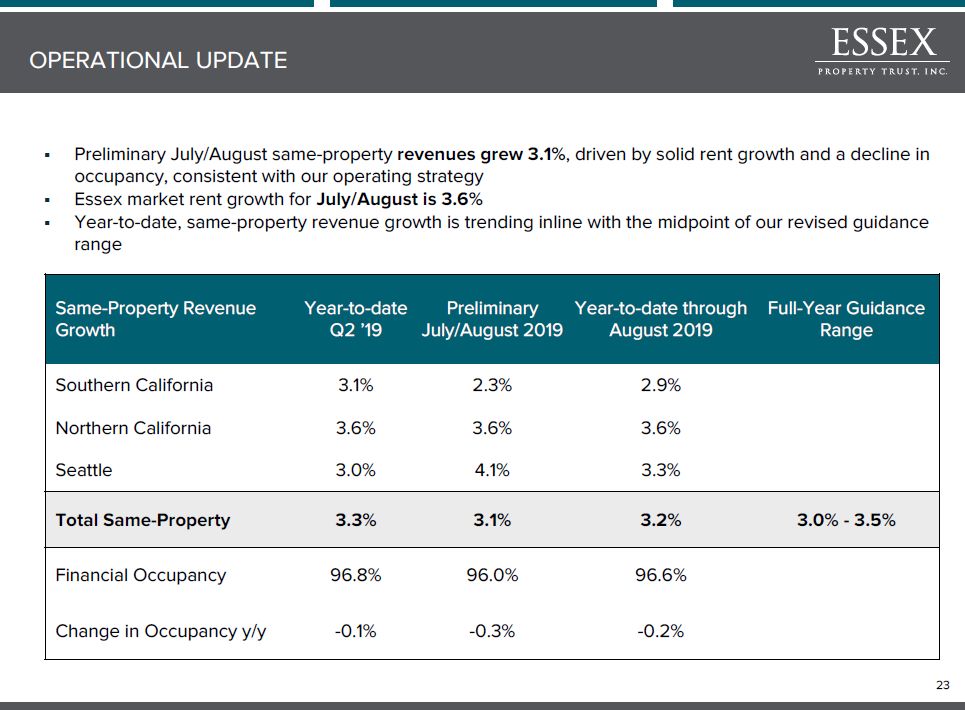
Preliminary July/August same-property revenues grew 3.1%, driven by solid rent growth and a decline in occupancy, consistent with our operating strategyEssex market rent growth for July/August is 3.6%Year-to-date, same-property revenue growth is trending inline with the midpoint of our revised guidance range Same-Property Revenue Growth Year-to-date Q2 ’19 Preliminary July/August 2019 Year-to-date through August 2019 Full-Year Guidance Range Southern California 3.1% 2.3% 2.9% Northern California 3.6% 3.6% 3.6% Seattle 3.0% 4.1% 3.3% Total Same-Property 3.3% 3.1% 3.2% 3.0% - 3.5% Financial Occupancy 96.8% 96.0% 96.6% Change in Occupancy y/y -0.1% -0.3% -0.2% OPERATIONAL UPDATE *
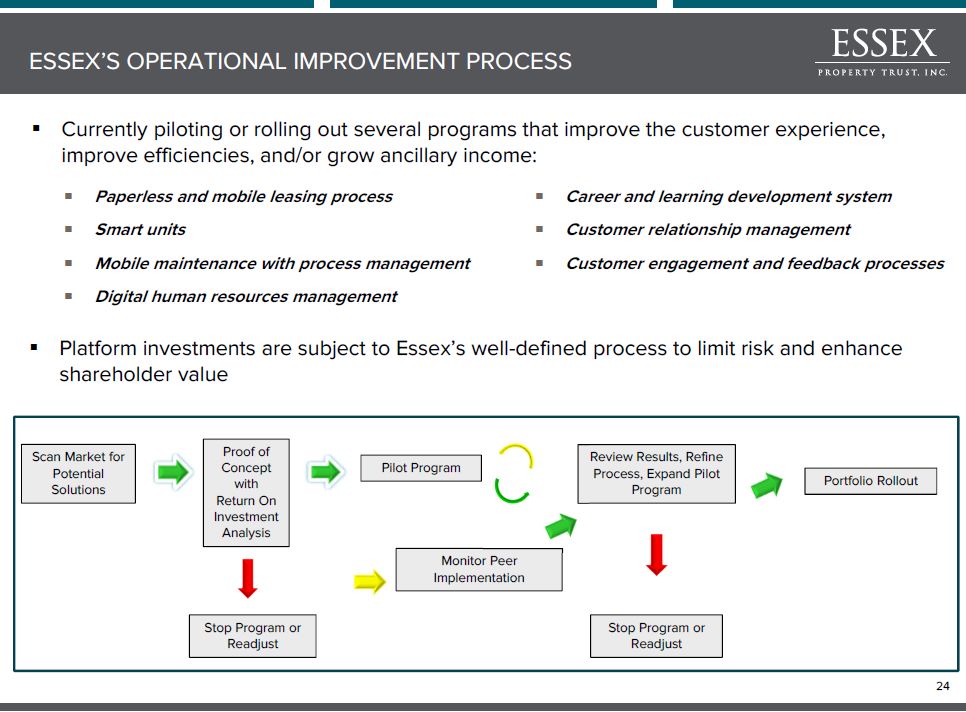
Y Currently piloting or rolling out several programs that improve the customer experience, improve efficiencies, and/or grow ancillary income: Platform investments are subject to Essex’s well-defined process to limit risk and enhance shareholder value Scan Market for Potential Solutions Proof of Concept with Return On Investment Analysis Pilot Program Monitor Peer Implementation Review Results, Refine Process, Expand Pilot Program Stop Program or Readjust Stop Program or Readjust ESSEX’S OPERATIONAL IMPROVEMENT PROCESS * Portfolio Rollout
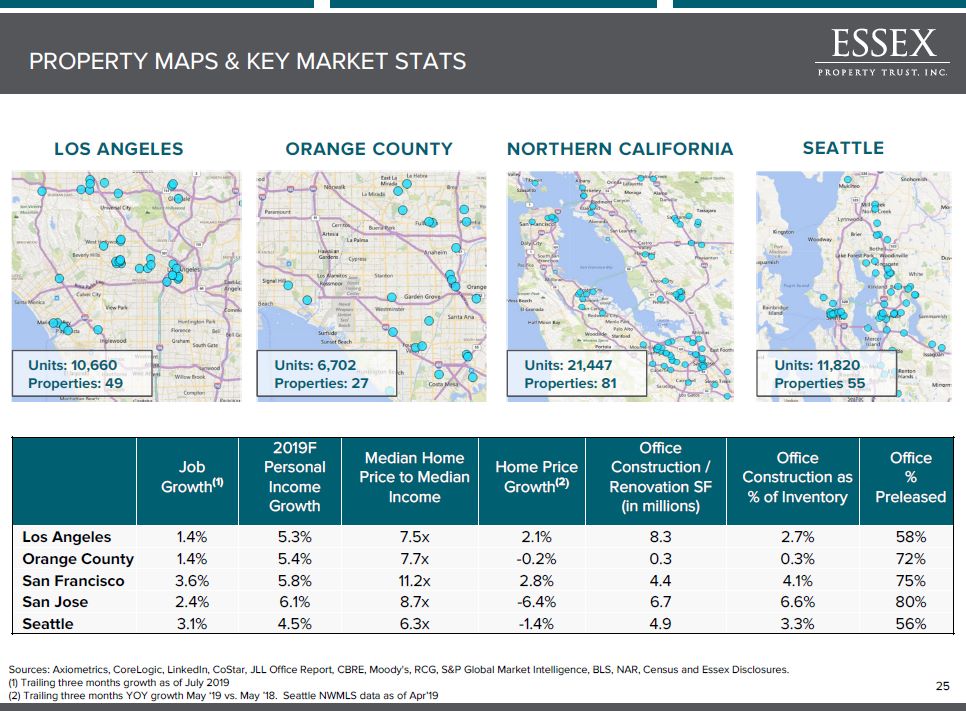
Job Growth(1) 2019F Personal Income Growth Median Home Price to Median Income Home Price Growth(2) Office Construction / Renovation SF (in millions) Office Construction as % of Inventory Office % Preleased Los Angeles 1.4% 5.3% 7.5x 2.1% 8.3 2.7% 58% Orange County 1.4% 5.4% 7.7x -0.2% 0.3 0.3% 72% San Francisco 3.6% 5.8% 11.2x 2.8% 4.4 4.1% 75% San Jose 2.4% 6.1% 8.7x -6.4% 6.7 6.6% 80% Seattle 3.1% 4.5% 6.3x -1.4% 4.9 3.3% 56% LOS ANGELES ORANGE COUNTY NORTHERN CALIFORNIA SEATTLE Units: 10,660Properties: 49 Units: 6,702 Properties: 27 Units: 21,447Properties: 81 Units: 11,820Properties 55 PROPERTY MAPS & KEY MARKET STATS Sources: Axiometrics, CoreLogic, LinkedIn, CoStar, JLL Office Report, CBRE, Moody's, RCG, S&P Global Market Intelligence, BLS, NAR, Census and Essex Disclosures.(1) Trailing three months growth as of July 2019(2) Trailing three months YOY growth May ‘19 vs. May ’18. Seattle NWMLS data as of Apr’19 *

INVESTMENTS AND CAPITAL ALLOCATION One South Market | San Jose, CA

ACQUISITIONS: Improve the NAV/share, cash flow/share and growth prospects of the company DEVELOPMENT:Develop high-quality tenant-desired apartment homes near transportation nodes REDEVELOPMENT: Focused on rent justified improvements to maximize NOI and value CONDO OPTIONALITY:Potential value creation through ~9,000 condo convertible apartment homes in the Essex Portfolio CO-INVESTMENT PLATFORM:Facilitates growth via private capital and provides attractive risk adjusted returns PREF. EQUITY/SUBORDINATED DEBT: Opportunistically invest in high-quality development and stabilized assets in our existing markets Brio | Walnut Creek, CA 500 Folsom | San Francisco, CA CentrePointe | San Diego, CA Essex Skyline | Santa Ana, CA Century Towers | San Jose, CA Meridian at Midtown | San Jose, CA CORE COMPETENCIES TO CREATE VALUE *
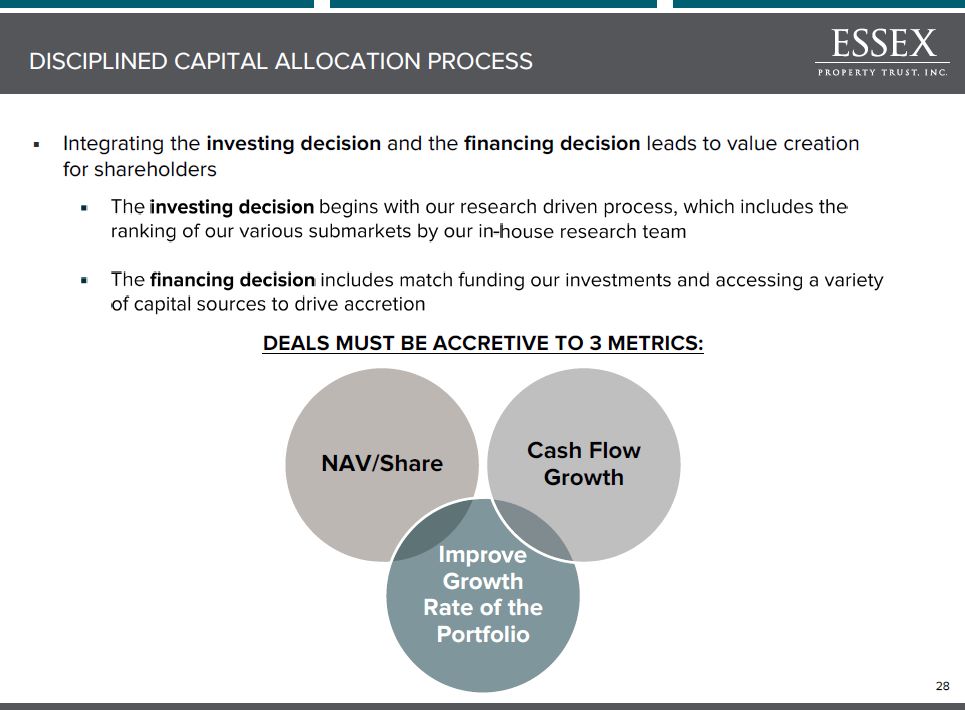
Y DEALS MUST BE ACCRETIVE TO 3 METRICS: DISCIPLINED CAPITAL ALLOCATION PROCESS *
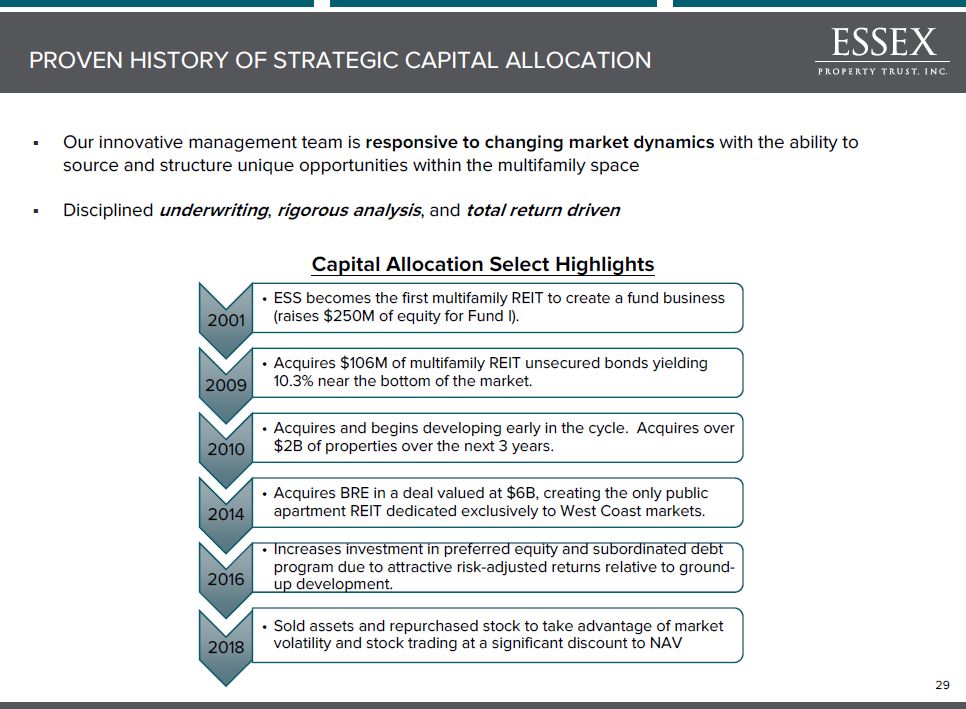
Our innovative management team is responsive to changing market dynamics with the ability to source and structure unique opportunities within the multifamily spaceDisciplined underwriting, rigorous analysis, and total return driven Y Capital Allocation Select Highlights PROVEN HISTORY OF STRATEGIC CAPITAL ALLOCATION *
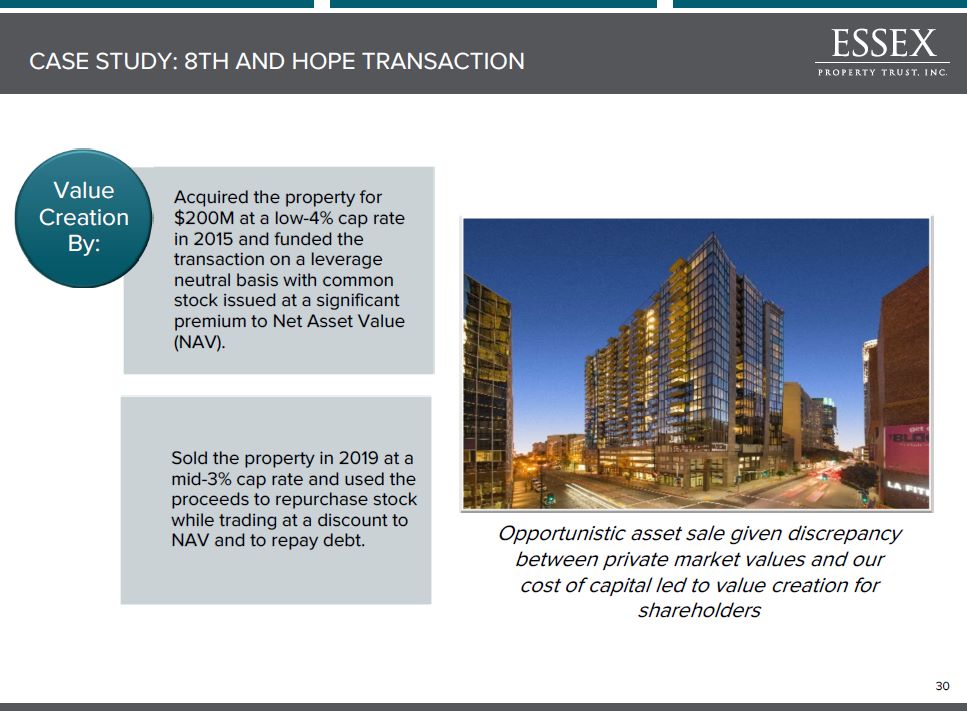
Y Opportunistic asset sale given discrepancy between private market values and our cost of capital led to value creation for shareholders CASE STUDY: 8TH AND HOPE TRANSACTION *
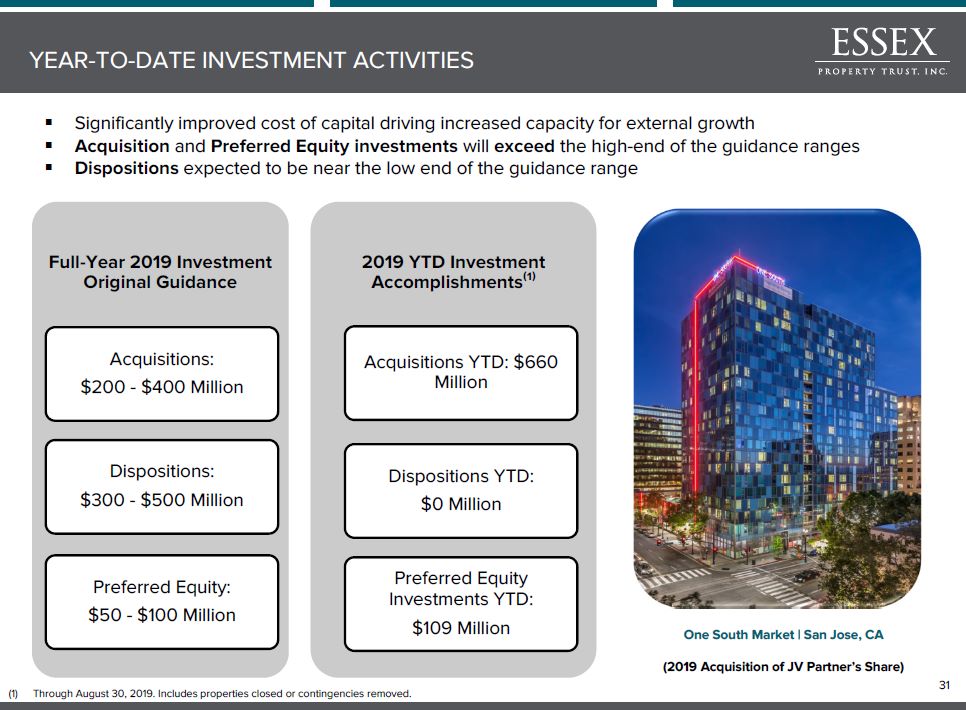
One South Market | San Jose, CA (2019 Acquisition of JV Partner’s Share) YEAR-TO-DATE INVESTMENT ACTIVITIES * Through August 30, 2019. Includes properties closed or contingencies removed. Significantly improved cost of capital driving increased capacity for external growthAcquisition and Preferred Equity investments will exceed the high-end of the guidance rangesDispositions expected to be near the low end of the guidance range
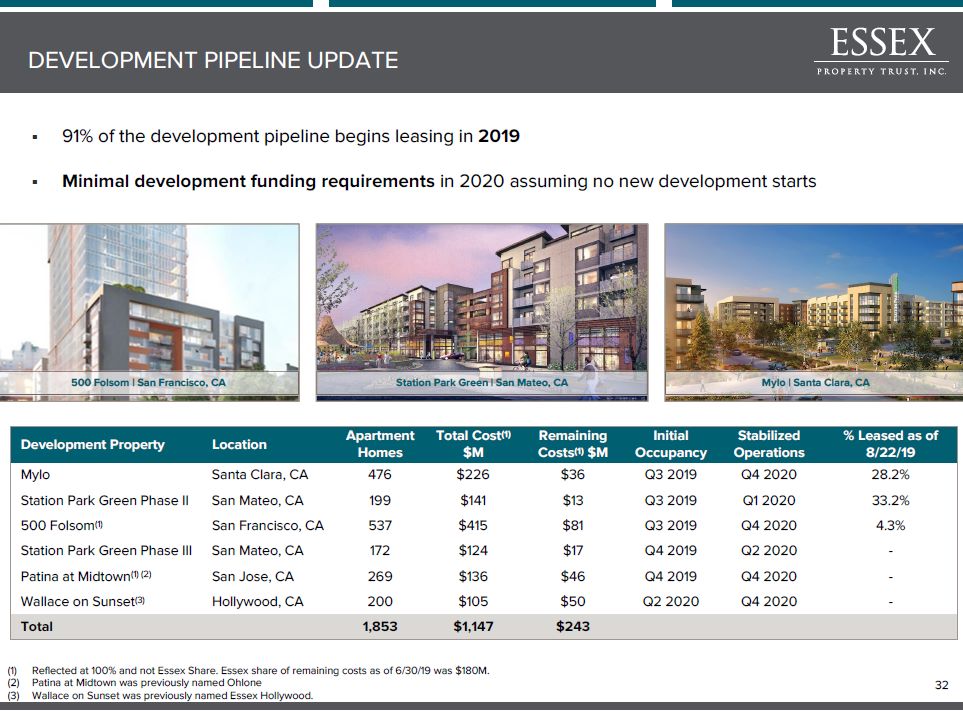
Development Property Location Apartment Homes Total Cost(1) $M Remaining Costs(1) $M Initial Occupancy Stabilized Operations % Leased as of 8/22/19 Mylo Santa Clara, CA 476 $226 $36 Q3 2019 Q4 2020 28.2% Station Park Green Phase II San Mateo, CA 199 $141 $13 Q3 2019 Q1 2020 33.2% 500 Folsom(1) San Francisco, CA 537 $415 $81 Q3 2019 Q4 2020 4.3% Station Park Green Phase III San Mateo, CA 172 $124 $17 Q4 2019 Q2 2020 - Patina at Midtown(1) (2) San Jose, CA 269 $136 $46 Q4 2019 Q4 2020 - Wallace on Sunset(3) Hollywood, CA 200 $105 $50 Q2 2020 Q4 2020 - Total 1,853 $1,147 $243 91% of the development pipeline begins leasing in 2019Minimal development funding requirements in 2020 assuming no new development starts 500 Folsom | San Francisco, CA Station Park Green | San Mateo, CA Mylo | Santa Clara, CA DEVELOPMENT PIPELINE UPDATE Reflected at 100% and not Essex Share. Essex share of remaining costs as of 6/30/19 was $180M.Patina at Midtown was previously named Ohlone Wallace on Sunset was previously named Essex Hollywood. *

2019 GUIDANCE & BALANCE SHEET Station Park Green | Mateo, CA
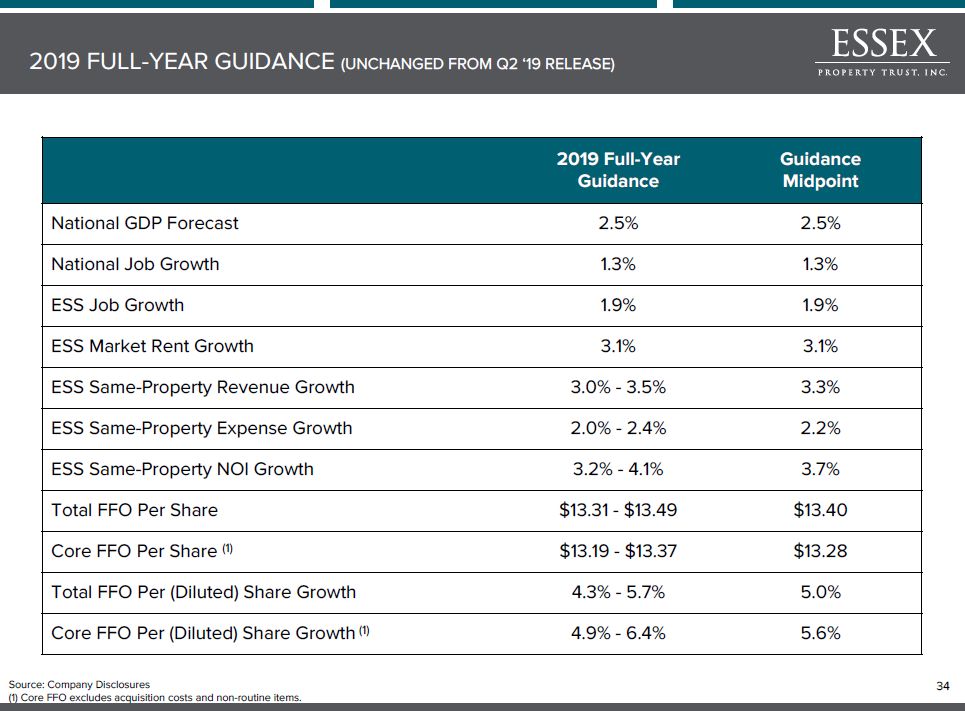
2019 Full-Year Guidance GuidanceMidpoint National GDP Forecast 2.5% 2.5% National Job Growth 1.3% 1.3% ESS Job Growth 1.9% 1.9% ESS Market Rent Growth 3.1% 3.1% ESS Same-Property Revenue Growth 3.0% - 3.5% 3.3% ESS Same-Property Expense Growth 2.0% - 2.4% 2.2% ESS Same-Property NOI Growth 3.2% - 4.1% 3.7% Total FFO Per Share $13.31 - $13.49 $13.40 Core FFO Per Share (1) $13.19 - $13.37 $13.28 Total FFO Per (Diluted) Share Growth 4.3% - 5.7% 5.0% Core FFO Per (Diluted) Share Growth (1) 4.9% - 6.4% 5.6% 2019 FULL-YEAR GUIDANCE (UNCHANGED FROM Q2 ‘19 RELEASE) Source: Company Disclosures(1) Core FFO excludes acquisition costs and non-routine items. *
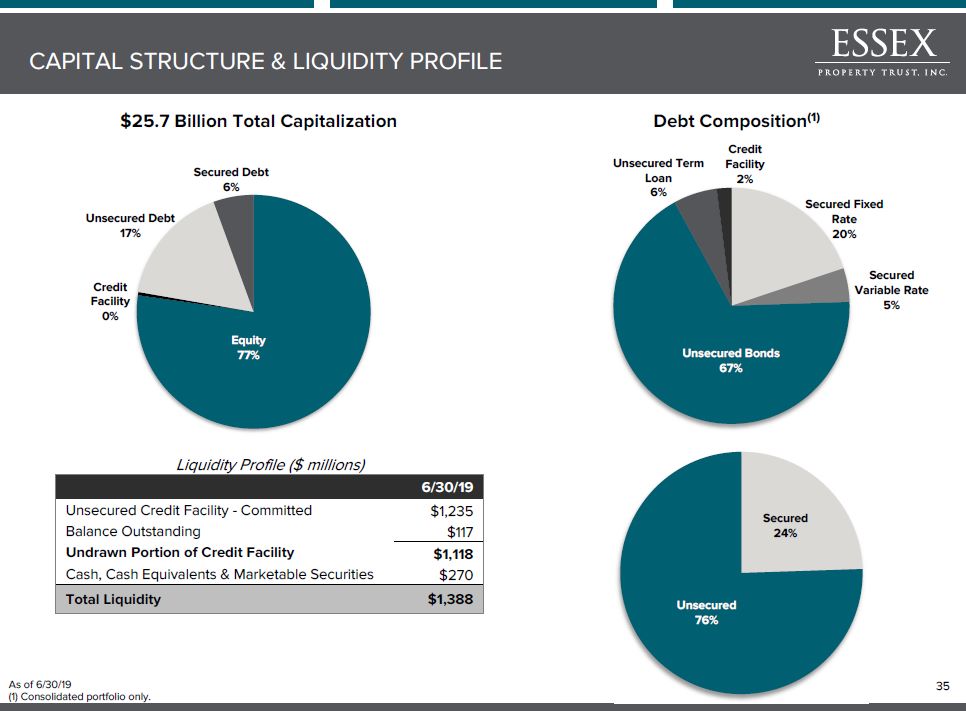
CAPITAL STRUCTURE & LIQUIDITY PROFILE As of 6/30/19(1) Consolidated portfolio only. * $25.7 Billion Total Capitalization Debt Composition(1)
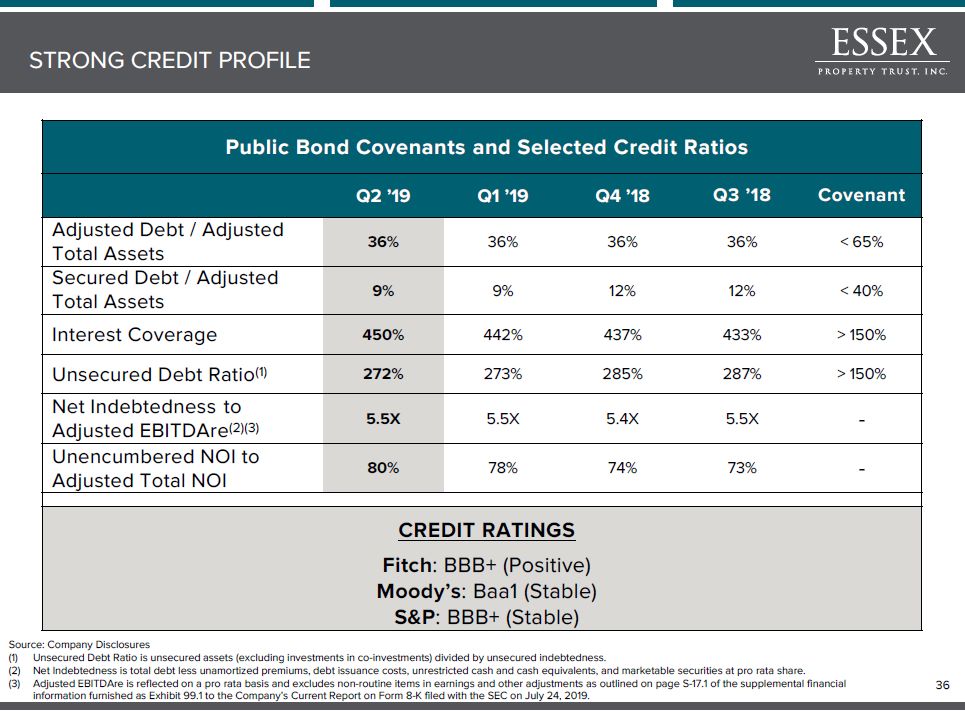
Public Bond Covenants and Selected Credit Ratios Q2 ’19 Q1 ’19 Q4 ’18 Q3 ’18 Covenant Adjusted Debt / Adjusted Total Assets 36% 36% 36% 36% < 65% Secured Debt / Adjusted Total Assets 9% 9% 12% 12% < 40% Interest Coverage 450% 442% 437% 433% > 150% Unsecured Debt Ratio(1) 272% 273% 285% 287% > 150% Net Indebtedness to Adjusted EBITDAre(2)(3) 5.5X 5.5X 5.4X 5.5X - Unencumbered NOI to Adjusted Total NOI 80% 78% 74% 73% - CREDIT RATINGSFitch: BBB+ (Positive)Moody’s: Baa1 (Stable) S&P: BBB+ (Stable) STRONG CREDIT PROFILE Source: Company DisclosuresUnsecured Debt Ratio is unsecured assets (excluding investments in co-investments) divided by unsecured indebtedness.Net Indebtedness is total debt less unamortized premiums, debt issuance costs, unrestricted cash and cash equivalents, and marketable securities at pro rata share.Adjusted EBITDAre is reflected on a pro rata basis and excludes non-routine items in earnings and other adjustments as outlined on page S-17.1 of the supplemental financial information furnished as Exhibit 99.1 to the Company’s Current Report on Form 8-K filed with the SEC on July 24, 2019. *
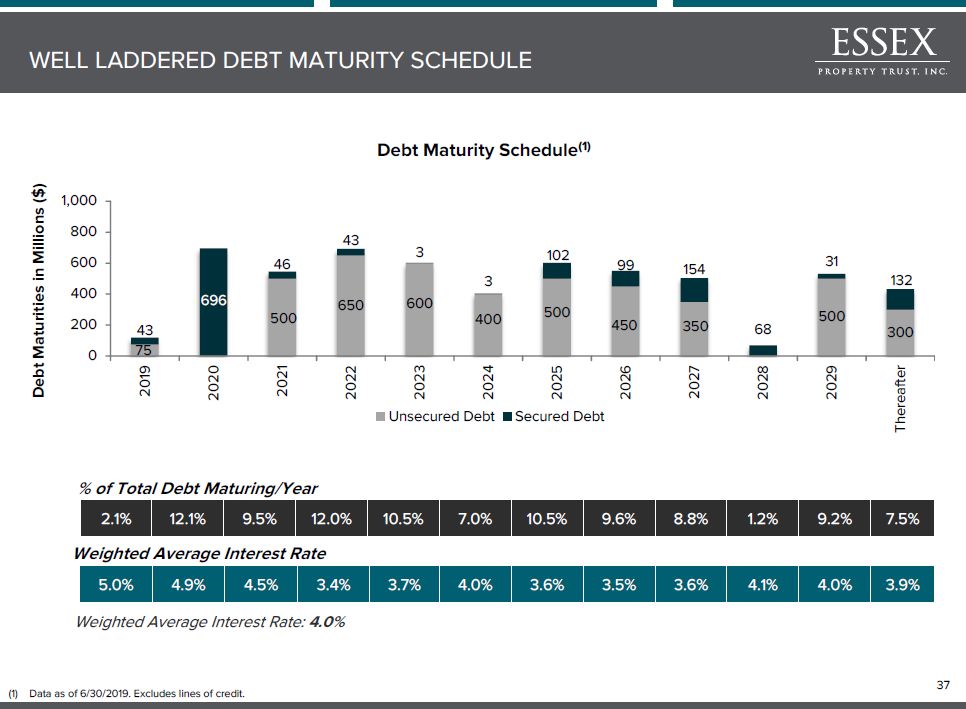
% of Total Debt Maturing/Year 2.1% 12.1% 9.5% 12.0% 10.5% 7.0% 10.5% 9.6% 8.8% 1.2% 9.2% 7.5% Debt Maturity Schedule(1) Weighted Average Interest Rate 5.0% 4.9% 4.5% 3.4% 3.7% 4.0% 3.6% 3.5% 3.6% 4.1% 4.0% 3.9% Weighted Average Interest Rate: 4.0% WELL LADDERED DEBT MATURITY SCHEDULE (1) Data as of 6/30/2019. Excludes lines of credit. *
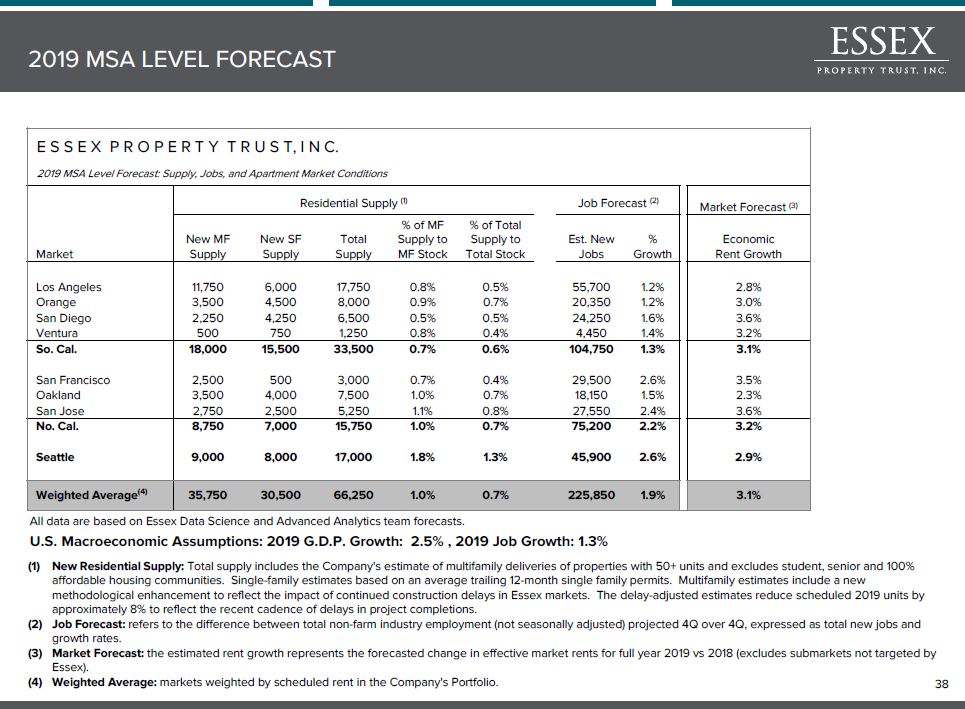
All data are based on Essex Data Science and Advanced Analytics team forecasts.U.S. Macroeconomic Assumptions: 2019 G.D.P. Growth: 2.5% , 2019 Job Growth: 1.3% E S S E X P R O P E R T Y T R U S T, I N C. 2019 MSA Level Forecast: Supply, Jobs, and Apartment Market Conditions Residential Supply (1) Job Forecast (2) Market Forecast (3) Market New MF Supply New SF Supply Total Supply % of MF Supply to MF Stock % of Total Supply to Total Stock Est. New Jobs % Growth Economic Rent Growth Los Angeles 11,750 6,000 17,750 0.8% 0.5% 55,700 1.2% 2.8% Orange 3,500 4,500 8,000 0.9% 0.7% 20,350 1.2% 3.0% San Diego 2,250 4,250 6,500 0.5% 0.5% 24,250 1.6% 3.6% Ventura 500 750 1,250 0.8% 0.4% 4,450 1.4% 3.2% So. Cal. 18,000 15,500 33,500 0.7% 0.6% 104,750 1.3% 3.1% San Francisco 2,500 500 3,000 0.7% 0.4% 29,500 2.6% 3.5% Oakland 3,500 4,000 7,500 1.0% 0.7% 18,150 1.5% 2.3% San Jose 2,750 2,500 5,250 1.1% 0.8% 27,550 2.4% 3.6% No. Cal. 8,750 7,000 15,750 1.0% 0.7% 75,200 2.2% 3.2% Seattle 9,000 8,000 17,000 1.8% 1.3% 45,900 2.6% 2.9% Weighted Average(4) 35,750 30,500 66,250 1.0% 0.7% 225,850 1.9% 3.1% 2019 MSA LEVEL FORECAST * New Residential Supply: Total supply includes the Company's estimate of multifamily deliveries of properties with 50+ units and excludes student, senior and 100% affordable housing communities. Single-family estimates based on an average trailing 12-month single family permits. Multifamily estimates include a new methodological enhancement to reflect the impact of continued construction delays in Essex markets. The delay-adjusted estimates reduce scheduled 2019 units by approximately 8% to reflect the recent cadence of delays in project completions. Job Forecast: refers to the difference between total non-farm industry employment (not seasonally adjusted) projected 4Q over 4Q, expressed as total new jobs and growth rates.Market Forecast: the estimated rent growth represents the forecasted change in effective market rents for full year 2019 vs 2018 (excludes submarkets not targeted by Essex).Weighted Average: markets weighted by scheduled rent in the Company's Portfolio.

DEFINITIONS & RECONCILIATIONS
SAFE HARBOR STATEMENT UNDER THE PRIVATE LITIGATION REFORM ACT OF 1995This presentation includes “forward-looking statements” within the meaning of Section 27A of the Securities Act of 1933, as amended, and Section 21E of the Securities Exchange Act of 1934, as amended. Forward looking statements are statements which are not historical facts, including statements regarding the Company's expectations, estimates, assumptions, hopes, intentions, beliefs and strategies regarding the future. Words such as “expects,” “assumes,” “anticipates,” “may,” “will,” “intends,” “plans,” “projects,” “believes,” “seeks,” “future,” “estimates,” and variations of such words and similar expressions are intended to identify such forward-looking statements. Such forward-looking statements include, among other things, statements regarding the Company’s financial guidance for the full-year 2019, its intent, beliefs or expectations with respect to the timing of completion of current development and redevelopment projects and the stabilization of such projects, the timing of lease-up and occupancy of its apartment communities, the anticipated operating performance of its apartment communities, the total projected costs of development and redevelopment projects, co-investment activities, qualification as a REIT under the Internal Revenue Code of 1986, as amended, the real estate markets in the geographies in which the Company’s properties are located and in the United States in general, the adequacy of future cash flows to meet anticipated cash needs, its financing activities and the use of proceeds from such activities, the availability of debt and equity financing, general economic conditions including the potential impacts from the economic conditions, trends affecting the Company’s financial condition or results of operations, changes to U.S. tax laws and regulations in general or specifically related to REITs or real estate, changes to laws and regulations in jurisdictions in which communities the Company owns are located, and other information that is not historical information.While the Company’s management believes the assumptions underlying its forward-looking statements are reasonable, such forward-looking statements involve known and unknown risks, uncertainties and other factors, many of which are beyond the Company’s control, which could cause the actual results, performance of the Company to be materially different from any future results, performance or achievements expressed or implied by such forward-looking statements. The Company cannot assure the future results or outcome of the matters described in these statements; rather, these statements merely reflect the Company’s current expectations of the approximate outcomes of the matters discussed. Factors that might cause the Company’s actual results, performance or achievements to differ materially from those expressed or implied by these forward-looking statements include, but are not limited to, the following: the Company may fail to achieve its business objectives; the actual completion of development and redevelopment projects may be subject to delays; the stabilization dates of such projects may be delayed; the Company may abandon or defer development or redevelopment projects for a number of reasons, including changes in local market conditions which make development less desirable, increases in costs of development, increases in the cost of capital or lack of capital availability, resulting in losses; the total projected costs of current development and redevelopment projects may exceed expectations; such development and redevelopment projects may not be completed; development and redevelopment projects and acquisitions may fail to meet expectations; estimates of future income from an acquired property may prove to be inaccurate; occupancy rates and rental demand may be adversely affected by competition and local economic and market conditions; there may be increased interest rates and operating costs; the Company may be unsuccessful in the management of its relationships with its co-investment partners; future cash flows may be inadequate to meet operating requirements and/or may be insufficient to provide for dividend payments in accordance with REIT requirements; there may be a downturn in general economic conditions, the real estate industry, and the markets in which the Company’s communities are located; changes in laws or regulations; the terms of any refinancing may not be as favorable as the terms of existing indebtedness; unexpected difficulties in leasing of development projects; volatility in financial and securities markets; the Company’s failure to successfully operate acquired properties; unforeseen consequences from cyber-intrusion; the Company’s inability to maintain our investment grade credit rating with the rating agencies; government approvals, actions and initiatives, including the need for compliance with environmental requirements; and those further risks, special considerations, and other factors referred to in the Company’s annual report on Form 10-K, quarterly reports on Form 10-Q, and other reports that the Company files with the Securities and Exchange Commission from time to time. All forward looking statements are made as of the date hereof, the Company assumes no obligation to update or supplement this information for any reason, and therefore, they may not represent the Company’s estimates and assumptions after the date of this presentation.REGULATION G DISCLAIMERThis presentation contains certain non-GAAP financial measures within the meaning of Regulation G of the Securities Exchange Act of 1934. The Company’s definitions and calculations of such measures may differ from those used by other companies and, therefore, may not be comparable. The Company’s definitions of these terms and, if applicable, the reasons for their use and reconciliations to the most directly comparable GAAP measures are included in the Appendix. DISCLAIMERS *
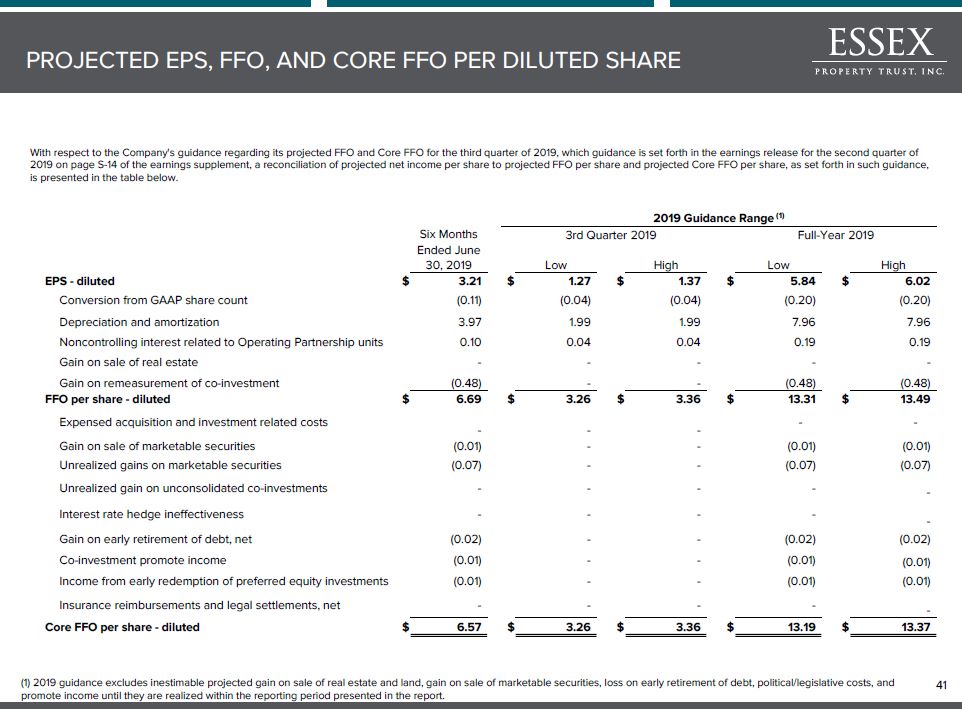
With respect to the Company's guidance regarding its projected FFO and Core FFO for the third quarter of 2019, which guidance is set forth in the earnings release for the second quarter of 2019 on page S-14 of the earnings supplement, a reconciliation of projected net income per share to projected FFO per share and projected Core FFO per share, as set forth in such guidance, is presented in the table below. PROJECTED EPS, FFO, AND CORE FFO PER DILUTED SHARE (1) 2019 guidance excludes inestimable projected gain on sale of real estate and land, gain on sale of marketable securities, loss on early retirement of debt, political/legislative costs, and promote income until they are realized within the reporting period presented in the report. * 2019 Guidance Range (1) Six Months Ended June 30, 2019 3rd Quarter 2019 Full-Year 2019 Low High Low High EPS - diluted $ 3.21 $ 1.27 $ 1.37 $ 5.84 $ 6.02 Conversion from GAAP share count (0.11) (0.04) (0.04) (0.20) (0.20) Depreciation and amortization 3.97 1.99 1.99 7.96 7.96 Noncontrolling interest related to Operating Partnership units 0.10 0.04 0.04 0.19 0.19 Gain on sale of real estate - - - - - Gain on remeasurement of co-investment (0.48) - - (0.48) (0.48) FFO per share - diluted $ 6.69 $ 3.26 $ 3.36 $ 13.31 $ 13.49 Expensed acquisition and investment related costs - - - - - Gain on sale of marketable securities (0.01) - - (0.01) (0.01) Unrealized gains on marketable securities (0.07) - - (0.07) (0.07) Unrealized gain on unconsolidated co-investments - - - - - Interest rate hedge ineffectiveness - - - - - Gain on early retirement of debt, net (0.02) - - (0.02) (0.02) Co-investment promote income (0.01) - - (0.01) (0.01) Income from early redemption of preferred equity investments (0.01) - - (0.01) (0.01) Insurance reimbursements and legal settlements, net - - - - - Core FFO per share - diluted $ 6.57 $ 3.26 $ 3.36 $ 13.19 $ 13.37
ADJUSTED EBITDAre RECONCILIATION The National Association of Real Estate Investment Trusts ("NAREIT”) defines earnings before interest, taxes, depreciation and amortization for real estate ("EBITDAre") (September 2017 White Paper) as net income (computed in accordance with U.S. generally accepted accounting principles ("U.S. GAAP")” before interest expense, income taxes, depreciation and amortization expense, and further adjusted for gains and losses from sales of depreciated operating properties, impairment write-downs of depreciated operating properties, impairment write-downs of investments in unconsolidated entities caused by a decrease in value of depreciated operating properties within the joint venture and adjustments to reflect the Company’s share of EBITDAre of investments in unconsolidated entities. The Company believes that EBITDAre is useful to investors, creditors and rating agencies as a supplemental measure of the Company’s ability to incur and service debt because it is a recognized measure of performance by the real estate industry, and by excluding gains or losses related to sales or impairment of depreciated operating properties, EBITDAre can help compare the Company’s credit strength between periods or as compared to different companies.Adjusted EBITDAre represents EBITDAre further adjusted for non-comparable items and is a component of the credit ratio, "Net Indebtedness Divided by Adjusted EBITDAre, normalized and annualized," presented on page S-6 of the earnings supplement for the second quarter of 2019, in the section titled "Selected Credit Ratios," and it is not intended to be a measure of free cash flow for management’s discretionary use, as it does not consider certain cash requirements such as income tax payments, debt service requirements, capital expenditures and other fixed charges. Adjusted EBITDAre is an important metric in evaluating the credit strength of the Company and its ability to service its debt obligations. The Company believes that Adjusted EBITDAre is useful to investors, creditors and rating agencies because it allows investors to compare the Company’s credit strength to prior reporting periods and to other companies without the effect of items that by their nature are not comparable from period to period and tend to obscure the Company’s actual credit quality.EBITDAre and Adjusted EBITDAre are not recognized measurements under U.S. GAAP. Because not all companies use identical calculations, the Company's presentation of EBITDAre and Adjusted EBITDAre may not be comparable to similarly titled measures of other companies. RECONCILIATIONS OF NON-GAAP FINANCIAL MEASURES AND OTHER TERMS *
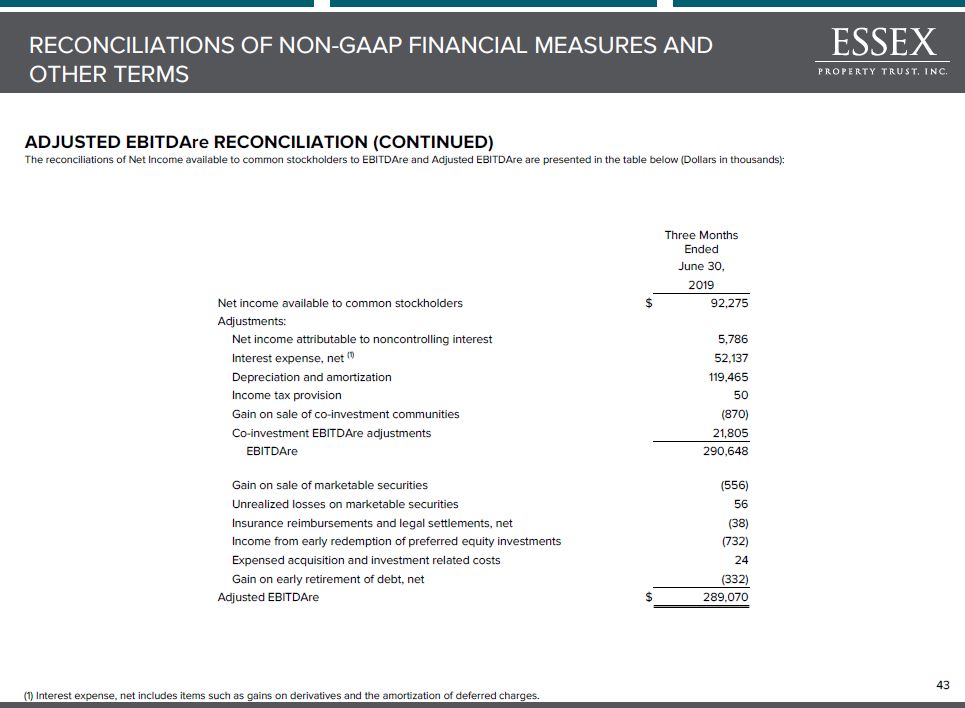
ADJUSTED EBITDAre RECONCILIATION (CONTINUED)The reconciliations of Net Income available to common stockholders to EBITDAre and Adjusted EBITDAre are presented in the table below (Dollars in thousands): RECONCILIATIONS OF NON-GAAP FINANCIAL MEASURES AND OTHER TERMS (1) Interest expense, net includes items such as gains on derivatives and the amortization of deferred charges. * Three Months Ended June 30, 2019 Net income available to common stockholders $ 92,275 Adjustments: Net income attributable to noncontrolling interest 5,786 Interest expense, net (1) 52,137 Depreciation and amortization 119,465 Income tax provision 50 Gain on sale of co-investment communities (870) Co-investment EBITDAre adjustments 21,805 EBITDAre 290,648 Gain on sale of marketable securities (556) Unrealized losses on marketable securities 56 Insurance reimbursements and legal settlements, net (38) Income from early redemption of preferred equity investments (732) Expensed acquisition and investment related costs 24 Gain on early retirement of debt, net (332) Adjusted EBITDAre $ 289,070
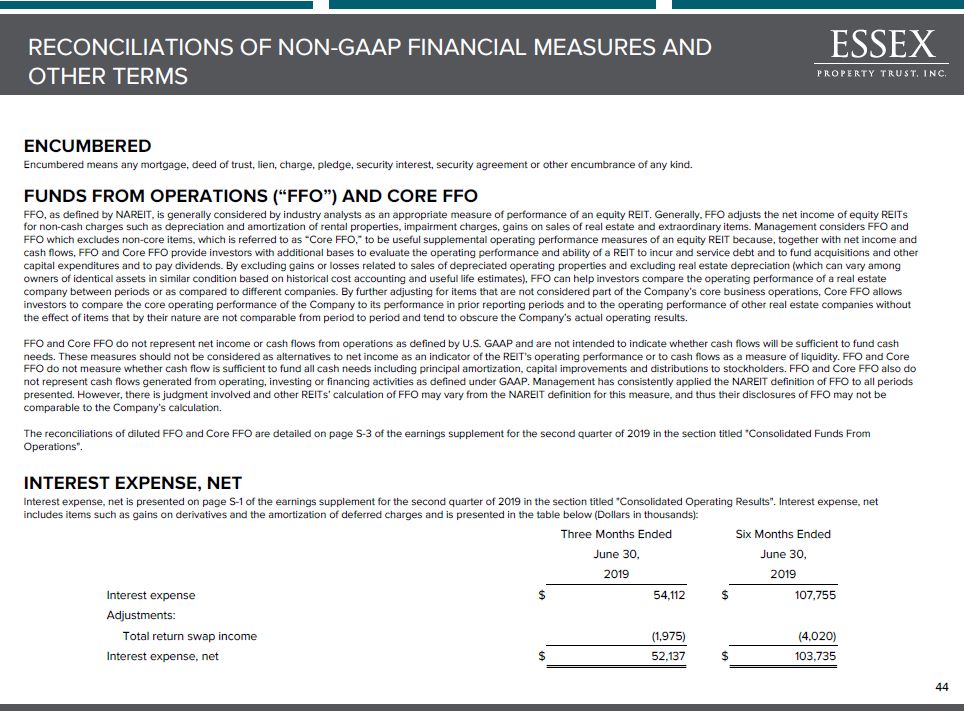
ENCUMBEREDEncumbered means any mortgage, deed of trust, lien, charge, pledge, security interest, security agreement or other encumbrance of any kind.FUNDS FROM OPERATIONS (“FFO”) AND CORE FFOFFO, as defined by NAREIT, is generally considered by industry analysts as an appropriate measure of performance of an equity REIT. Generally, FFO adjusts the net income of equity REITs for non-cash charges such as depreciation and amortization of rental properties, impairment charges, gains on sales of real estate and extraordinary items. Management considers FFO and FFO which excludes non-core items, which is referred to as “Core FFO,” to be useful supplemental operating performance measures of an equity REIT because, together with net income and cash flows, FFO and Core FFO provide investors with additional bases to evaluate the operating performance and ability of a REIT to incur and service debt and to fund acquisitions and other capital expenditures and to pay dividends. By excluding gains or losses related to sales of depreciated operating properties and excluding real estate depreciation (which can vary among owners of identical assets in similar condition based on historical cost accounting and useful life estimates), FFO can help investors compare the operating performance of a real estate company between periods or as compared to different companies. By further adjusting for items that are not considered part of the Company’s core business operations, Core FFO allows investors to compare the core operating performance of the Company to its performance in prior reporting periods and to the operating performance of other real estate companies without the effect of items that by their nature are not comparable from period to period and tend to obscure the Company’s actual operating results.FFO and Core FFO do not represent net income or cash flows from operations as defined by U.S. GAAP and are not intended to indicate whether cash flows will be sufficient to fund cash needs. These measures should not be considered as alternatives to net income as an indicator of the REIT's operating performance or to cash flows as a measure of liquidity. FFO and Core FFO do not measure whether cash flow is sufficient to fund all cash needs including principal amortization, capital improvements and distributions to stockholders. FFO and Core FFO also do not represent cash flows generated from operating, investing or financing activities as defined under GAAP. Management has consistently applied the NAREIT definition of FFO to all periods presented. However, there is judgment involved and other REITs’ calculation of FFO may vary from the NAREIT definition for this measure, and thus their disclosures of FFO may not be comparable to the Company’s calculation.The reconciliations of diluted FFO and Core FFO are detailed on page S-3 of the earnings supplement for the second quarter of 2019 in the section titled "Consolidated Funds From Operations".INTEREST EXPENSE, NETInterest expense, net is presented on page S-1 of the earnings supplement for the second quarter of 2019 in the section titled "Consolidated Operating Results". Interest expense, net includes items such as gains on derivatives and the amortization of deferred charges and is presented in the table below (Dollars in thousands): * RECONCILIATIONS OF NON-GAAP FINANCIAL MEASURES AND OTHER TERMS Three Months Ended Six Months Ended June 30, June 30, 2019 2019 Interest expense $ 54,112 $ 107,755 Adjustments: Total return swap income (1,975) (4,020) Interest expense, net $ 52,137 $ 103,735
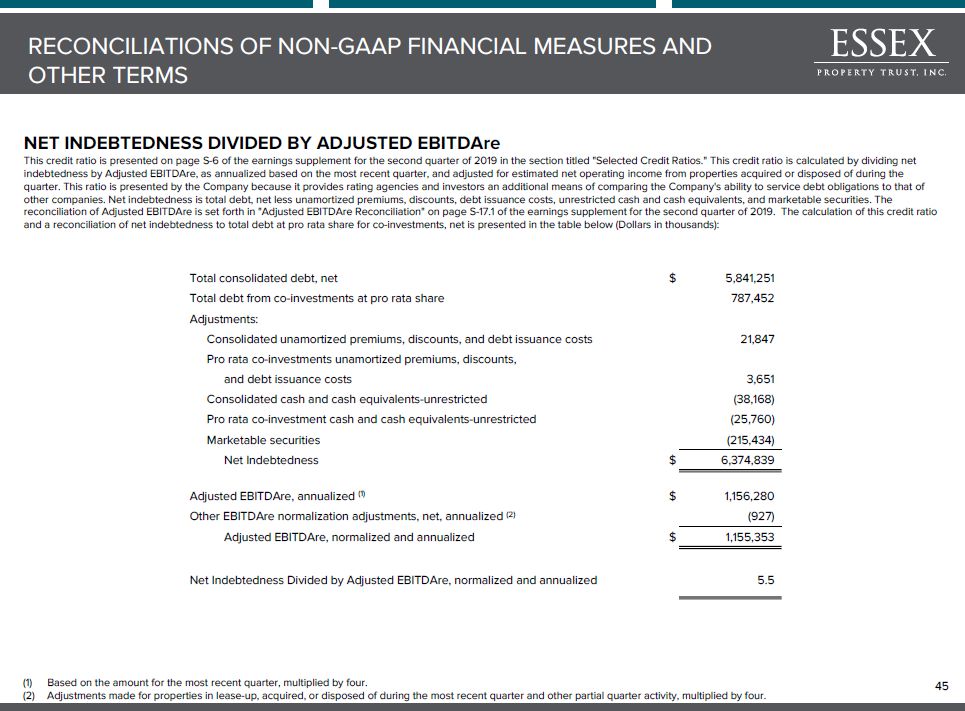
NET INDEBTEDNESS DIVIDED BY ADJUSTED EBITDAreThis credit ratio is presented on page S-6 of the earnings supplement for the second quarter of 2019 in the section titled "Selected Credit Ratios." This credit ratio is calculated by dividing net indebtedness by Adjusted EBITDAre, as annualized based on the most recent quarter, and adjusted for estimated net operating income from properties acquired or disposed of during the quarter. This ratio is presented by the Company because it provides rating agencies and investors an additional means of comparing the Company's ability to service debt obligations to that of other companies. Net indebtedness is total debt, net less unamortized premiums, discounts, debt issuance costs, unrestricted cash and cash equivalents, and marketable securities. The reconciliation of Adjusted EBITDAre is set forth in "Adjusted EBITDAre Reconciliation" on page S-17.1 of the earnings supplement for the second quarter of 2019. The calculation of this credit ratio and a reconciliation of net indebtedness to total debt at pro rata share for co-investments, net is presented in the table below (Dollars in thousands): Based on the amount for the most recent quarter, multiplied by four.Adjustments made for properties in lease-up, acquired, or disposed of during the most recent quarter and other partial quarter activity, multiplied by four. * RECONCILIATIONS OF NON-GAAP FINANCIAL MEASURES AND OTHER TERMS Total consolidated debt, net $ 5,841,251 Total debt from co-investments at pro rata share 787,452 Adjustments: Consolidated unamortized premiums, discounts, and debt issuance costs 21,847 Pro rata co-investments unamortized premiums, discounts, and debt issuance costs 3,651 Consolidated cash and cash equivalents-unrestricted (38,168) Pro rata co-investment cash and cash equivalents-unrestricted (25,760) Marketable securities (215,434) Net Indebtedness $ 6,374,839 Adjusted EBITDAre, annualized (1) $ 1,156,280 Other EBITDAre normalization adjustments, net, annualized (2) (927) Adjusted EBITDAre, normalized and annualized $ 1,155,353 Net Indebtedness Divided by Adjusted EBITDAre, normalized and annualized 5.5
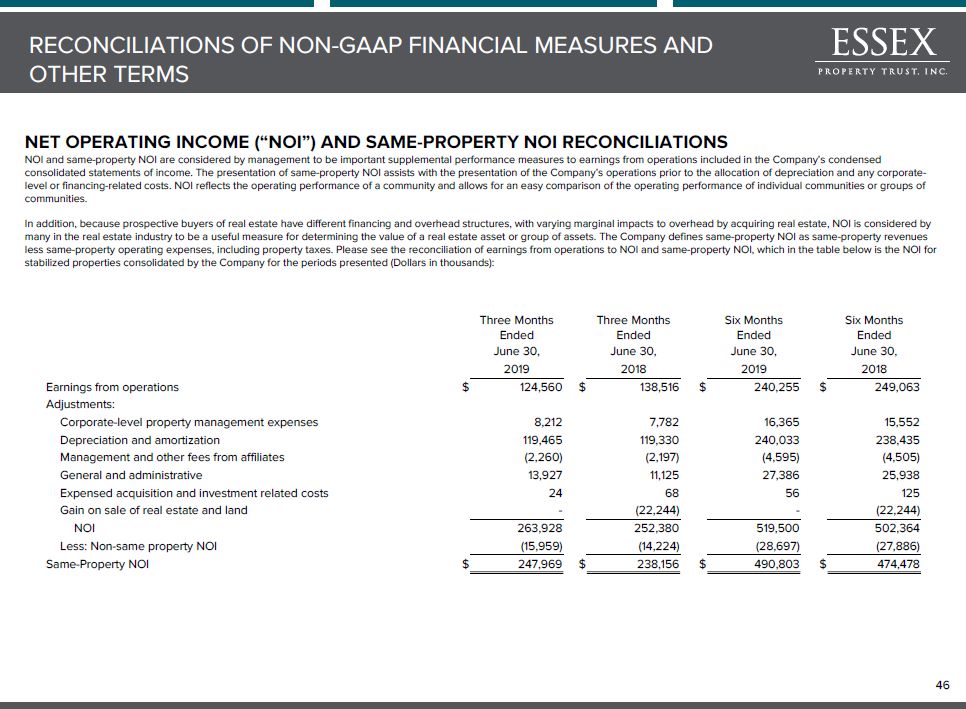
NET OPERATING INCOME (“NOI”) AND SAME-PROPERTY NOI RECONCILIATIONSNOI and same-property NOI are considered by management to be important supplemental performance measures to earnings from operations included in the Company’s condensed consolidated statements of income. The presentation of same-property NOI assists with the presentation of the Company’s operations prior to the allocation of depreciation and any corporate-level or financing-related costs. NOI reflects the operating performance of a community and allows for an easy comparison of the operating performance of individual communities or groups of communities. In addition, because prospective buyers of real estate have different financing and overhead structures, with varying marginal impacts to overhead by acquiring real estate, NOI is considered by many in the real estate industry to be a useful measure for determining the value of a real estate asset or group of assets. The Company defines same-property NOI as same-property revenues less same-property operating expenses, including property taxes. Please see the reconciliation of earnings from operations to NOI and same-property NOI, which in the table below is the NOI for stabilized properties consolidated by the Company for the periods presented (Dollars in thousands): * RECONCILIATIONS OF NON-GAAP FINANCIAL MEASURES AND OTHER TERMS Three Months Ended Three Months Ended Six Months Ended Six Months Ended June 30, June 30, June 30, June 30, 2019 2018 2019 2018 Earnings from operations $ 124,560 $ 138,516 $ 240,255 $ 249,063 Adjustments: Corporate-level property management expenses 8,212 7,782 16,365 15,552 Depreciation and amortization 119,465 119,330 240,033 238,435 Management and other fees from affiliates (2,260) (2,197) (4,595) (4,505) General and administrative 13,927 11,125 27,386 25,938 Expensed acquisition and investment related costs 24 68 56 125 Gain on sale of real estate and land - (22,244) - (22,244) NOI 263,928 252,380 519,500 502,364 Less: Non-same property NOI (15,959) (14,224) (28,697) (27,886) Same-Property NOI $ 247,969 $ 238,156 $ 490,803 $ 474,478
PUBLIC BOND COVENANTSPublic Bond Covenants refer to certain covenants set forth in instruments governing the Company's unsecured indebtedness. These instruments require the Company to meet specified financial covenants, including covenants relating to net worth, fixed charge coverage, debt service coverage, the amounts of total indebtedness and secured indebtedness, leverage and certain investment limitations. These covenants may restrict the Company's ability to expand or fully pursue its business strategies. The Company's ability to comply with these covenants may be affected by changes in the Company's operating and financial performance, changes in general business and economic conditions, adverse regulatory developments or other events adversely impacting it. The breach of any of these covenants could result in a default under the Company's indebtedness, which could cause those and other obligations to become due and payable. If any of the Company's indebtedness is accelerated, the Company may not be able to repay it. For risks related to failure to comply with these covenants, see "Item 1A: Risk Factors - Risks Related to Our Indebtedness and Financings" in the Company's annual report on Form 10-K and other reports filed by the Company with the Securities and Exchange Commission ("SEC").The ratios set forth on page S-6 of the earnings supplement for the second quarter of 2019 in the section titled "Public Bond Covenants" are provided only to show the Company's compliance with certain specified covenants that are contained in indentures related to the Company's issuance of Senior Notes, which indentures are filed by the Company with the SEC. See, for example, the Indenture dated August 7, 2019, filed by the Company as Exhibit 4.1 to the Company's Form 8-K, filed on August 7, 2019. These ratios should not be used for any other purpose, including without limitation to evaluate the Company's financial condition or results of operations, nor do they indicate the Company's covenant compliance as of any other date or for any other period. The capitalized terms in the disclosure are defined in the indentures filed by the Company with the SEC and may differ materially from similar terms used by other companies that present information about their covenant compliance.SECURED DEBTSecured Debt means debt of the Company or any of its subsidiaries which is secured by an encumbrance on any property or assets of the Company or any of its subsidiaries. The Company's total amount of Secured Debt is set forth on page S-5 of the earnings supplement for the second quarter of 2019. * RECONCILIATIONS OF NON-GAAP FINANCIAL MEASURES AND OTHER TERMS
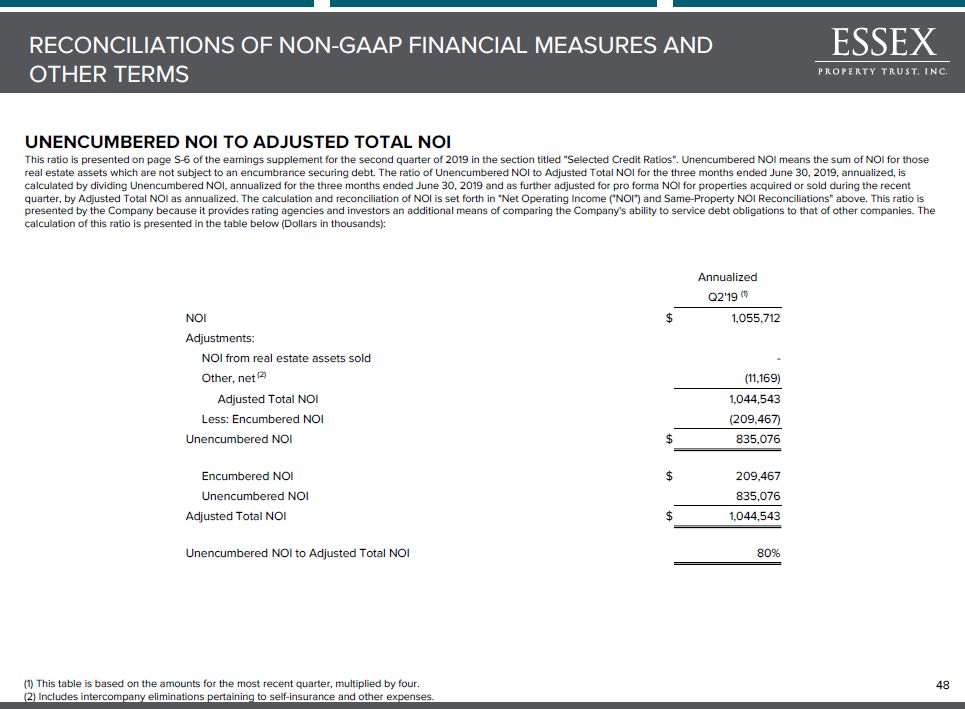
UNENCUMBERED NOI TO ADJUSTED TOTAL NOIThis ratio is presented on page S-6 of the earnings supplement for the second quarter of 2019 in the section titled "Selected Credit Ratios". Unencumbered NOI means the sum of NOI for those real estate assets which are not subject to an encumbrance securing debt. The ratio of Unencumbered NOI to Adjusted Total NOI for the three months ended June 30, 2019, annualized, is calculated by dividing Unencumbered NOI, annualized for the three months ended June 30, 2019 and as further adjusted for pro forma NOI for properties acquired or sold during the recent quarter, by Adjusted Total NOI as annualized. The calculation and reconciliation of NOI is set forth in "Net Operating Income ("NOI") and Same-Property NOI Reconciliations" above. This ratio is presented by the Company because it provides rating agencies and investors an additional means of comparing the Company's ability to service debt obligations to that of other companies. The calculation of this ratio is presented in the table below (Dollars in thousands): (1) This table is based on the amounts for the most recent quarter, multiplied by four.(2) Includes intercompany eliminations pertaining to self-insurance and other expenses. * RECONCILIATIONS OF NON-GAAP FINANCIAL MEASURES AND OTHER TERMS Annualized Q2'19 (1) NOI $ 1,055,712 Adjustments: NOI from real estate assets sold - Other, net (2) (11,169) Adjusted Total NOI 1,044,543 Less: Encumbered NOI (209,467) Unencumbered NOI $ 835,076 Encumbered NOI $ 209,467 Unencumbered NOI 835,076 Adjusted Total NOI $ 1,044,543 Unencumbered NOI to Adjusted Total NOI 80%

NOTES *

NOTES *

NOTES *