Exhibit 99.1

OCTOBER 2015 INVESTOR PRESENTATIONJUNE 2016

SAFE HARBOR DISCLOSURE Certain statements in this presentation, which are not historical facts, may be considered forward-looking statements within the meaning of the federal securities laws. The forward looking statements, some of which can be identified by terms and phrases such as “forecast”, “estimate”, “expect”, “anticipate”, “should”, “could”, “may”, and similar expressions, reflect the current views of Essex Property Trust, Inc. (“Essex” or the “Company”) and its affiliates with respect to future events and are subject to risks and uncertainties. Such forward-looking statements involve the risk that actual results could be materially different from those described in such forward-looking statements. Factors that could cause actual results to be materially different are discussed under the caption “Risk Factors” in Item 1A of the Company’s Report on Form 10-K for the year ended December 31, 2015. All forward-looking statements and reasons why results may differ included in this presentation are made of the date hereof, and we assume no obligation to update any such forward-looking statements or reasons why actual results may differ. ABOUT ESSEXWEST COAST INVESTMENT STRATEGYINVESTMENT OVERVIEWFINANCIAL PERFORMANCE, CAPITAL MANAGEMENT& 2016 GUIDANCEAPPENDIX TRACK RECORD WEST COAST OVERVIEW TECH INDUSTRY: THEN & NOW ESSEX PORTFOLIO SUSTAINABILITY PAGE(S)2 – 3 4 – 9 10 – 1415 – 2324 25 – 2930 – 33 34 – 3940 – 4344 – 46 TABLE OF CONTENTS Pacific Electric Lots, Los Angeles, CA 1

Represents percent of pro rata NOI as of 3/31/16.East Bay includes Alameda and Contra Costa Counties.Multifamily REITs represent the total return of 7 peers through 12/31/15. ESSEX IS THE ONLY PUBLIC MULTIFAMILY REIT DEDICATED EXCLUSIVELY TO THE WEST COAST Northern CA,39% of NOI(1) Seattle,17% of NOI(1) 2 Southern CA,44% of NOI(1) San Francisco MD 9%East Bay(2) 13%Santa Clara 18% Ventura 5%Los Angeles 20%Orange County 11%San Diego 8% Dedicated to the urban and suburban coastal markets of California and Washington with high barriers to housing construction Long track record of success with highest shareholder returns of multifamily REITs(3) over 5, 10, and 20 year periods2nd highest total return of all public REITs since IPO in 199422 year history of increasing cash dividendTop executives share an average tenure of roughly 19 yearsS&P 500 Company

KEY STRATEGIC OBJECTIVES Add value through strategic redevelopmentAcquire and develop West Coast properties near transportation nodes in submarkets with highest expected rent growth Drive rent growth on high occupancyInternal value creation through transformational synergiesMaintain strong balance sheet and financial flexibility The DylanLos Angeles, CA 3

STRONG WEST COAST FUNDAMENTALS

Trailing 3 Month Job GrowthAs of April 2016 U.S. Avg. = 1.9% Essex Portfolio Wtd. Avg. = 3.0%(1) ESS Markets Non ESS Markets ROBUST WEST COAST JOB GROWTH WEST COAST JOB GROWTH OUTPACES THE U.S. AND OTHER MAJOR MSA’S Source: BLS (not seasonally adjusted)For those markets included in this graph which represents 99% of Essex’s NOI at the Company’s pro rata share as of 3/31/16. 5

FAVORABLE DEMOGRAPHIC TRENDS INDICATE CONTINUED RENTAL DEMAND Source: Census FAVORABLE DEMOGRAPHICS U.S. Population by Age Group(in Millions) 6

U.S. Avg. = 5.5% Essex Portfolio Wtd. Avg. = 6.4%(1) STRONG PERSONAL INCOME GROWTH SUPPORTS RENT GROWTH IN ESS MARKETS STRONG PERSONAL INCOME GROWTH Source: BEA, Rosen Consulting Group, Economy.comFor those markets included in this graph which represents 99% of Essex’s NOI at the Company’s pro rata share as of 3/31/16. 7

Source: Census, ESS, Rosen Consulting Group LIMITED SUPPLY IN ESS MARKETS ESS CA SUPPLY AS A PERCENT OF STOCK HAS HISTORICALLY BEEN BELOW 1% AND REMAINS MUTEDRELATIVE TO THE NATION, ESS’ CA MARKETS HAVE LESS HOUSING SUPPLY WITH BETTER JOB GROWTH 8

15% RENT GROWTH IN ESS MARKETS IS EXPECTED TO EXCEED THE U.S. AND TOP 20 MSA’S(1) THROUGH 2020 WEST COAST EXPECTED TO CONTINUE TO OUTPERFORM Source: Axiometrics Derived Rents (Actual 3Q 2008-4Q 2015; Forecast 1Q 2016-4Q 2020)(1) Top 20 MSA’s excludes Essex markets, but includes the other major metros in the U.S. 9 Cumulative Rent Growth: ESS vs. Major Metros and U.S. 10%

INVESTMENT OVERVIEW

ACQUISITIONSImprove the NAV/sh, cash flow/sh and growth prospects of the CompanyDEVELOPMENTDevelop high-quality tenant desired apartment homes near transportation nodesREDEVELOPMENTFocused on rent justified improvements to maximize NOI and valueCO-INVESTMENT PLATFORMFacilitates growth via private capital and provides attractive risk adjusted returns CORE COMPETENCIES TO CREATE VALUE One South Market Avant Park 20 Bunker Hill(Rendering) 11

STRATEGIC CAPITAL ALLOCATION INVESTMENT ACTIVITY SINCE THE BEGINNING OF 2015 12 82% of acquisition investments have been in Southern California 67% of disposition activity has been in Northern CaliforniaImproved portfolio by selling older properties situated in non-core locations Acquisitions Property Name Location Year Acquired Apartment Homes Age ContractPrice Price/ Home 8th & Hope Southern CA 2015 290 2 $ 200,000 $ 690 The Huxley(1) Southern CA 2015 187 2 $ 48,784 $ 522 The Dylan(1) Southern CA 2015 184 2 $ 51,266 $ 557 Reveal(1) Southern CA 2015 438 6 $ 73,013 $ 337 Avant Southern CA 2015 440 2 $ 172,000 $ 391 Enso Northern CA 2015 183 2 $ 93,000 $ 508 Mio Northern CA 2016 103 1 $ 51,300 $ 498 Form 15 Southern CA 2016 242 2 $ 97,400 $ 402 Total/Wtd. Average 2,067 3 $ 786,763 $ 465 Dispositions Property Name Location Year Sold Apartment Homes Age ContractPrice Price/ Home Pinnacle S. Mountain Phoenix 2015 552 20 $ 63,750 $ 115 Sharon Green Northern CA 2015 296 46 $ 245,000 $ 828 The Heights(1) Southern CA 2016 332 12 $ 46,900 $ 283 Harvest Park Northern CA 2016 104 12 $ 30,500 $ 293 Canyon Creek(1) Southern CA 2016 200 30 $ 26,750 $ 268 Total/Wtd. Average 1,484 24 $ 412,900 $ 328 Mio Canyon Creek Contract price represents the Company’s pro rata share.

YEAR-TO-DATE DEVELOPMENT STARTS GATEWAY VILLAGE Location Santa Clara, CA Apartment Homes 476 Total Cost $226M Construction Start Q2 2016 Initial Occupancy Q2 2018 13

Total cost in billions and not ESS share. Includes only those projects under construction as of 3/31/16.Based on initial occupancy.As of 3/31/16. EXPECT TO COMPLETE CONSTRUCTION AND BEGIN LEASING 3 PROJECTS IN 2016 FOR A TOTAL COST OF $270.0M3 ANTICIPATED DEVELOPMENT STARTS FOR 2016 (1 SHOWN IN THE TABLE BELOW) Cost in millions DEVELOPMENT PIPELINE UPDATE Delivery of Development Timeline(2) # of Properties Units Total Cost(1) 2016 3 555 $0.3 2017 2 975 $0.5 2018 2 1,021 $0.6 Total 7 2,551 $1.4 ESS Share(3) Total Cost $1.0 Unfunded Cost $0.7 Total cost as a % of total market cap. 4.6% Unfunded cost as a % of total market cap. 3.2% 14

FINANCIAL PERFORMANCE, CAPITAL MANAGEMENT & 2016 GUIDANCE

Source: Company Disclosures 2016 is the midpoint of company guidance as of First Quarter 2016 Earnings Releases. Peer average represents 7 multifamily REITs. CONTINUED OUTPERFORMANCE VS. PEERS ESS SAME-PROPERTY NOI GROWTH HAS EXCEEDED THE PEER AVERAGE BY 3.5% ANNUALLY FOR THE LAST 4 YEARSNOI GROWTH IN 2016 IS PROJECTED TO OUTPERFORM THE PEER GROUP YET AGAIN AND BE THE HIGHEST AMONG THE PEERS (1) (2) 16

2016 SAME-PROPERTY REVENUE GROWTH Same-Property Revenue Growth Q1 2016Actuals April/May 2016Actuals YTD throughMay Full-Year 2016 Guidance Range Southern California 6.1% 6.0% 6.0% 5.25% – 6.25% Northern California 9.1% 7.7% 8.5% 8.50% – 9.50% Seattle 7.0% 7.5% 7.2% 6.00% – 7.00% Total 7.3% 6.9% 7.1% 6.50% – 7.50% Financial Occupancy 96.0% 95.9% 96.0% Q1 2016 SAME-PROPERTY REVENUE GROWTH EXCEEDED THE MIDPOINT OF OUR FULL-YEAR GUIDANCE RANGE IN ALL REGIONSFOR APRIL/MAY, SAME-PROPERTY REVENUE GROWTH IS TRACKING SLIGHTLY BELOW THE MIDPOINT OF OUR FULL-YEAR GUIDANCE RANGE The Highlands at WynhavenIssaquah, WA EmmeEmeryville, CA The HuntingtonHuntington Beach, CA 17

Assumes the stock buyback program is balance sheet neutral.Assumes consensus NAV estimate and not the Company’s internal NAV. Discount to NAV(2) 5.0% 10.0% 15.0% 20.0% 25.0% 30.0% Disposition Cap Rate 5.25% ($1.9) ($1.2) ($0.4) $0.5 $1.5 $2.6 5.00% ($1.0) ($0.3) $0.5 $1.4 $2.4 $3.5 4.75% ($0.1) $0.6 $1.4 $2.2 $3.2 $4.4 4.50% $0.8 $1.5 $2.3 $3.1 $4.1 $5.3 4.25% $1.7 $2.4 $3.1 $4.0 $5.0 $6.2 4.00% $2.5 $3.3 $4.0 $4.9 $5.9 $7.1 Portfolio Management Opportunistic Strategy HYPOTHETICAL CAPITAL ALLOCATION STRATEGY: RUNNING THE MACHINE IN REVERSE COMPANY HAS A $250M STOCK BUYBACK PROGRAM APPROVED BY THE BOARD OF DIRECTORSESTIMATED $ ACCRETION TO CORE FFO FROM EXECUTION OF THE BUYBACK PROGRAM(1)VALUE CREATION (SHOWN IN TABLE BELOW) IS DEPENDENT ON DISPOSITION OPPORTUNITIES AS WELL AS DISCOUNT TO NAV $ Value Creation/(Dilution) in Millions 18
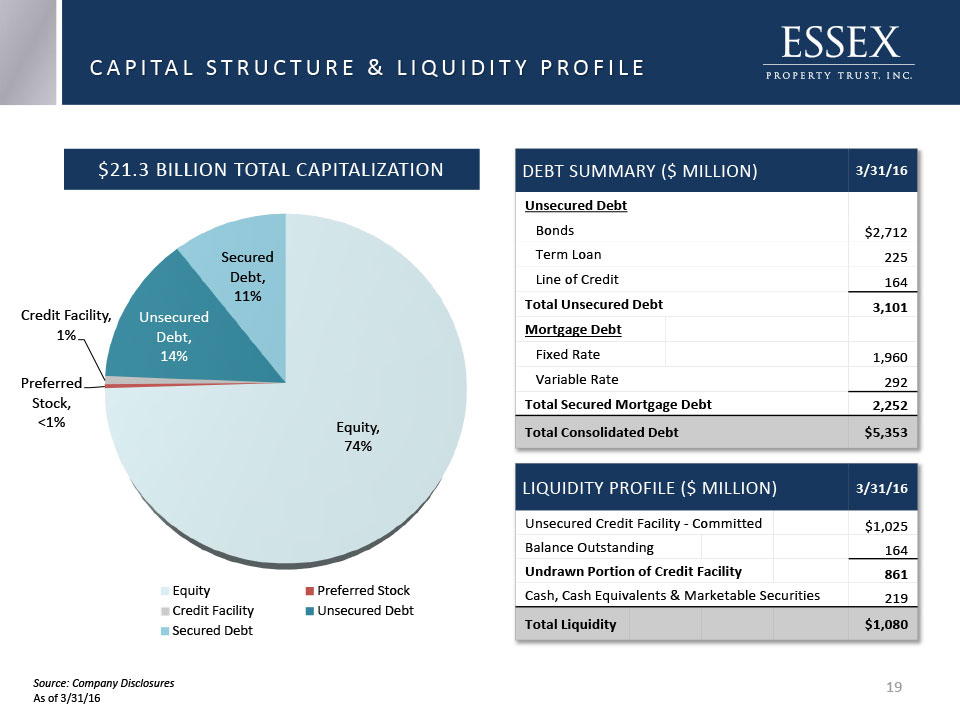
$21.3 BILLION TOTAL CAPITALIZATION DEBT SUMMARY ($ MILLION) 3/31/16 Unsecured Debt Bonds $2,712 Term Loan 225 Line of Credit 164 Total Unsecured Debt 3,101 Mortgage Debt Fixed Rate 1,960 Variable Rate 292 Total Secured Mortgage Debt 2,252 Total Consolidated Debt $5,353 Source: Company DisclosuresAs of 3/31/16 CAPITAL STRUCTURE & LIQUIDITY PROFILE LIQUIDITY PROFILE ($ MILLION) 3/31/16 Unsecured Credit Facility - Committed $1,025 Balance Outstanding 164 Undrawn Portion of Credit Facility 861 Cash, Cash Equivalents & Marketable Securities 219 Total Liquidity $1,080 19

Source: Company DisclosuresUnsecured debt ratio is unsecured assets (excluding investments in joint ventures) divided by unsecured indebtedness.Net Indebtedness is total debt less unamortized premiums, unrestricted cash, and marketable securities.Adjusted EBITDA annualizes the pro forma NOI for current quarter acquisitions and excludes non-routine items in earnings. SELECT BALANCE SHEET RATIOS 3/31/16 12/31/15 COVENANT TARGETS Secured Debt / Undepreciated Book 16% 16% < 40% < 16% Total Debt / Undepreciated Book 38% 38% < 65% < 42% Interest Coverage 372% 357% > 150% > 300% Unsecured Debt Ratio(1) 293% 292% > 150% > 250% Net Indebtedness to Recurring EBITDA(2)(3) 5.7X 5.8X 6.0X – 7.0X Unencumbered NOI to Total NOI 67% 66% > 65% CREDIT RATINGSFITCH: BBB+ (STABLE)MOODY’S: Baa2 (POSITIVE) S&P: BBB (POSITIVE) STRONG CREDIT PROFILE 20

Debt Maturities in Millions ($) 4.7% 11.2% 6.6% 12.9% 13.4% 10.6% 6.5% 11.5% 7.7% 9.9% 0.0% 5.0% % of Total Debt Maturing/Year WELL LADDERED DEBT MATURITY SCHEDULE Debt Maturity Schedule(1) (1) As of 3/31/2016. Excludes lines of credit. 2.6% 3.2% 5.3% 3.4% 4.9% 4.3% 3.7% 3.6% 4.0% 3.5% 1.0% 0.9% Weighted Average Interest Rate 21

2016 Revised Midpoint Change to Midpoint of Initial Guidance National GDP Forecast 2.3% (0.5%) National Job Growth 2.0% No Change ESS Job Growth 2.6% 0.1% ESS Market Rent Growth 6.0% No Change ESS Same-Property Revenue Growth 7.0% No Change ESS Same-Property Expense Growth(1) 3.8% No Change ESS Same-Property NOI Growth 8.5% No Change Total FFO Per Share $10.86 $0.01 Core FFO Per Share (2) $10.92 No Change Total FFO Per (Diluted) Share Growth 11.7% 0.1% Core FFO Per (Diluted) Share Growth (2) 11.3% No Change Source: Company DisclosuresReflects the Company’s change to property management fee allocation.Core FFO excludes merger related costs, acquisition costs and non-routine items. 2016 GUIDANCE 22

All data are based on Essex Property Trust, Inc. forecasts.U.S. Economic Assumptions: 2016 G.D.P. Growth: 2.3% , 2016 Job Growth: 2.0%New Residential Supply: MF reflects Company's internal estimate of actual multifamily deliveries; SF is based on 12 month single family trailing permits reported by the US Census Bureau.Job Forecast: refers to the difference between total non-farm industry employment (not seasonally adjusted) projected 4Q over 4Q, expressed as total new jobs and growth rates.Market Forecast: the estimated rent growth represents the forecasted change in effective market rents for full year 2016 vs 2015 (excludes submarkets not targeted by Essex).Weighted Average: markets weighted by scheduled rent in the Company's Portfolio. E S S E X P R O P E R T Y T R U S T, I N C. 2016 MSA Level Forecast: Supply, Jobs, and Apartment Market Conditions Residential Supply (1) Job Forecast (2) Market Forecast (3) Market New MF Supply New SF Supply Total Supply % of MF Supply to MF Stock % of Total Supply to Total Stock Est. New Jobs Dec-Dec % Growth Economic Rent Growth Los Angeles 11,000 5,700 16,700 0.7% 0.5% 94,600 2.2% 5.5% Orange 3,800 3,800 7,600 0.9% 0.7% 39,500 2.5% 5.6% San Diego 3,300 3,500 6,800 0.7% 0.6% 36,700 2.6% 5.3% Ventura 150 700 850 0.2% 0.3% 5,350 1.8% 5.4% So. Cal. 18,250 13,700 31,950 0.7% 0.5% 176,150 2.3% 5.5% San Francisco 5,400 650 6,050 1.3% 0.8% 34,700 3.0% 6.3% Oakland 1,600 4,300 5,900 0.5% 0.6% 27,900 2.5% 6.7% San Jose 5,850 2,100 7,950 2.3% 1.2% 31,300 3.0% 6.3% No. Cal. 12,850 7,050 19,900 1.5% 0.9% 93,900 2.8% 6.5% Seattle 8,450 7,100 15,550 1.7% 1.3% 48,600 3.0% 6.1% Weighted Average(4) 39,550 27,850 67,400 1.2% 0.8% 318,650 2.6% 6.0% 2016 MSA FORECAST 23

APPENDIX

ESTABLISHED TRACK RECORD OF SUCCESS
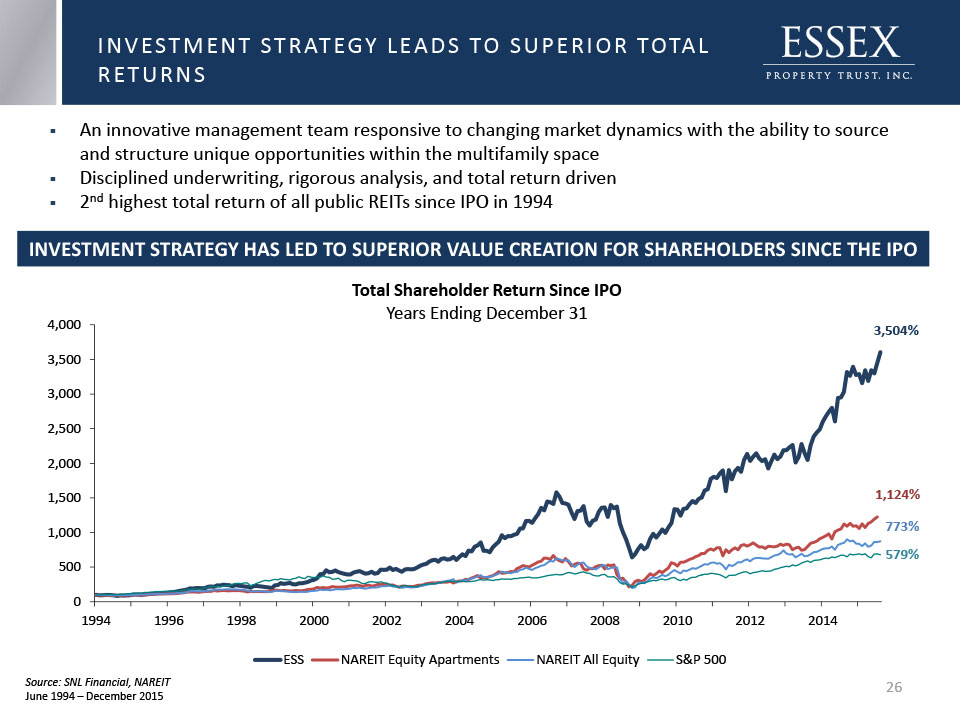
INVESTMENT STRATEGY LEADS TO SUPERIOR TOTAL RETURNS Total Shareholder Return Since IPOYears Ending December 31 An innovative management team responsive to changing market dynamics with the ability to source and structure unique opportunities within the multifamily spaceDisciplined underwriting, rigorous analysis, and total return driven2nd highest total return of all public REITs since IPO in 1994 3,504% 773% 579% 1,124% Source: SNL Financial, NAREITJune 1994 – December 2015 INVESTMENT STRATEGY HAS LED TO SUPERIOR VALUE CREATION FOR SHAREHOLDERS SINCE THE IPO 26

HISTORY OF GROWTH IN DIVIDEND PER SHARE Essex has maintained its commitment to dividend safety and has increased its dividend every year for the past 22 years, representing 283% in dividend growth since the IPO 27

SIGNIFICANT TOTAL FFO PER SHARE GROWTH (1) Through 2015 actuals. Excludes 2016 estimated growth.(2) 1994 Total FFO represents Proforma FFO due to the Company's IPO in June 1994. Since the IPO, Total FFO has increased 434%, or 8% annually(1)Over the past 5 years Core FFO per Share has increased 96%(1) 28

2009 2016(1) Cumulative Change CAGR # of Units(2) 27,248 59,441 118.1% 13.3% # of Properties 133 244 83.5% 10.2% Share Price $83.65 $233.86 179.6% 17.9% Equity Market Cap $2.7B $16.0B 492.6% 32.9% Total Market Cap $4.6B $21.3B 363.0% 27.8% Annualized Dividend/Share $4.12 $ 6.40 55.3% 7.3% Core FFO/Share $5.43 $10.92(3) 101.1% 11.8% Consensus NAV/Share $70.68 $228.55 223.4% 20.7% Total Return to Shareholders(1) 239.4% 21.6% Source: Green Street Advisors, SNL Financial, Company DisclosuresAs of 3/31/16. Total Return 12/31/09 - 3/31/16.All units, not pro rata share.Through 2016 midpoint of guidance range as of 3/31/16. 29 SUBSTANTIAL GROWTH SINCE THE GREAT RECESSION
WHY WEST COAST?

WEST COAST SIGNIFICANCE Rank State Q3 2015 GDP(1) ($M) % of Total 1 California 2,448,467 14% 2 Texas 1,639,375 9% 3 New York 1,455,568 8% 4 Florida 893,189 5% 5 Illinois 771,896 4% Source: BEA, IMF(1) Q3 2015 GDP is seasonally adjusted at annual rates. The combined GDP of California and Washington would be the 5th largest economy in the world 31 Rank Nation 2015 GDP ($M) % of Total 1 United States 17,947,000 24% 2 China 10,982,829 14% 3 Japan 4,123,258 5% 4 Germany 3,357,614 4% 5 California & Washington 2,897,871 4% 6 United Kingdom 2,849,345 4% 7 France 2,421,560 3% 8 India 2,090,796 3% 9 Italy 1,815,757 2% 10 Brazil 1,772,589 2% CA is the largest state in the U.S. totaling 14% of U.S. GDP National GDP Rankings United States GDP Rankings

WHY WEST COAST MARKETS? FAVORABLE DEMOGRAPHICSHigher incomes coupled with a higher cost of home ownershipHigher percentage of educated 25-34 year olds DIVERSE DEMAND DRIVERSHighest GDP in the U.S.Job growth consistently outpaces the U.S.Centers of innovation and drivers of job creation LOW SUPPLYLong-term at below 1% of total supplyHigh cost of home ownership 32

WHY WEST COAST MARKETS? Source: DQ News, NWMLS, NAR, Moody’s. Data as of March 2016.Represents the average annual new supply as a % of stock since 1990. ESS Markets U.S. 33

TECH INDUSTRY: THEN & NOW

Source: PWC MoneyTree, Renaissance Capital, US Department of Commerce, Internet World Stats, UF Warrington TECH TODAY VS. DOT-COM THEN (2000) NOW (2015) % OF THE WORLD WITH ACCESS TO INTERNET 7% 46% GLOBAL INTERNET POPULATION 0.4B 3.4B NUMBER OF DEVICES PER PERSON 1 4.3 (by 2020) PRICE-TO-SALES RATIO 48.9 6.5 NUMBER OF INTERNET/SOCIAL MEDIA IPOS 90 24 MEDIAN AGE OF COMPANIES GOING PUBLIC 5 11 VENTURE CAPITAL FUNDING $79B $35B US ECOMMERCE REVENUE $12B $342B 35

WEALTH CREATION IS ACCELERATING ON THE WEST COAST SEATTLE SAN FRANCISCO LOS ANGELES BOSTON NEW YORK WASHINGTON D.C. SAN JOSE TECH HUBS ON THE WEST COAST HAVE HELPED FUEL A SHIFT IN ECONOMIC POWER FROM THE EAST COAST TO THE WEST COAST SAN JOSE HAS THE HIGHEST GDP PER CAPITA OF ALL MAJOR U.S. CITIES BOSTON Real GDP/Capita: $74,746 Growth: 16% NEW YORK Real GDP/Capita: $70,830 Growth: 16% WASHINGTON D.C. Real GDP/Capita: $72,191 Growth: 8% SEATTLE Real GDP/Capita: $75,874 Growth: 18% SAN FRANCISCO Real GDP/Capita: $80,643 Growth: 16% SAN JOSE Real GDP/Capita: $105,482 Growth: 46% LOS ANGELES Real GDP/Capita: $60,148 Growth: 17% Source: Bureau of Economic AnalysisReal GDP represents 2014 Per Capita Real GDP by MSA and growth represents Cumulative Growth 2001-2014. 36

UNICORNS Rank Company Total Employees Est. Bay Area/Seattle Employees Est. Market Value ($B)(1) 1 Uber 4,400 2,310 $62.5 2 Airbnb 1,600 850 $27.0 3 Palantir 1,800 1,100 $20.1 4 Pinterest 700 600 $11.2 5 Dropbox 1,200 765 $10.4 6 Theranos 700 530 $9.0 7 Lyft 1,000 630 $5.5 8 Zenefits 1,300 620 $4.5 9 Cloudera 1,250 440 $4.1 10 SoFi 525 470 $4.0 11 Docusign 1,500 960 $3.0 12 Houzz 650 500 $2.3 13 Nutanix 1,000 780 $2.1 14 AppDynamics 850 575 $2.1 15 SurveyMonkey 650 410 $2.0 16 Medallia 800 550 $1.3 17 Okta 500 300 $1.2 18 Apttus 900 300 $1.1 19 Tintri 500 490 $1.0 20 Kabam 825 480 $1.0 Total 22,650 13,660 $175.3 Source: Silicon Valley Business Journal, Puget Sound Business Journal, San Francisco Business Times, Wiki, Essex estimatesValuations are based on the last round of funding. eBay data includes both eBay, Inc. and PayPal Holdings, Inc. “UNICORNS” VS. PUBLIC TECH COMPANIES PUBLIC TECH COMPANIES Rank Company Total Employees Est. Bay Area/Seattle Employees Est. Market Value ($B) 1 Apple 110,000 25,150 $528.2 2 Alphabet 64,115 34,700 $483.5 3 Microsoft 112,689 45,600 $393.3 4 Facebook 12,691 6,500 $331.7 5 Amazon 230,800 27,960 $328.8 6 Oracle 135,070 7,465 $162.6 7 Intel 107,300 6,790 $142.8 8 Cisco Systems 71,833 14,638 $140.6 9 eBay (2) 28,400 6,280 $73.1 10 Salesforce 19,000 5,100 $55.5 Total 891,898 180,183 $2,640.1 TOP 10 PUBLIC TECH COMPANIES EMPLOY GREATER THAN 13X MORE PEOPLE THAN THE TOP 20 UNICORNS IN THE BAY AREA AND SEATTLEBOTTOM LINE: MOVEMENTS MADE BY LARGE PUBLIC TECH COMPANIES SUCH AS APPLE AND ALPHABET HAVE A MORE RELEVANT IMPACT ON THE ECONOMY THAN UNICORNS 37

COMPARISON OF 10 LARGEST PUBLIC TECH VS. NON-TECH FIRMS TECH FIRMS HAVE CREATED ~$2.0 TRILLION IN EQUITY MARKET VALUE OVER THE PAST 10 YEARS, GROWING 3.0X FASTER THAN NON-TECH FIRMS TECH FIRMS HAVE 2.2X MORE CASH ON HAND THAN NON-TECH FIRMSALL TOP 10 TECH FIRMS AND 3 OF THE TOP NON-TECH FIRMS ARE HEADQUARTERED IN ESS MARKETSTOP TECH FIRMS HAVE 17,700 JOB OPENINGS IN CALIFORNIA AND WASHINGTON, DEMONSTRATING THEIR COMMITMENT TO GROW Source: Company DisclosuresIncludes only 9 tech and 9 non-tech companies as Facebook and Visa were not public in 2005.Includes cash, cash equivalents, and marketable securities.Excludes banks. Top 10 Largest Public Companies Headquarters Equity Market Capitalization (May 31, 2016) Equity Market Capitalization (Dec. 31, 2005)(1) Change Cash Available as of 2015(2) Tech Northern CA/Seattle $2,723.3 $755.0 $1,968.3 $556.3 Non-Tech(3) Various $2,321.3 $1,655.9 $665.4 $256.5 Difference $402.0 ($900.9) $1,302.9 $299.8 Ratio of Tech to Non-Tech 1.2X 0.5X 3.0X 2.2X All data in billions except ratio 38

LARGE TECH FIRMS CONTINUE TO HIRE Source: Company Disclosures(1) Includes Top 10 Largest Public Tech Firms today that have been public since 2005. TOP 10 LARGE TECH FIRMS GLOBAL EMPLOYMENT GROWTH OVER THE PAST DECADE HAS CONTINUED TO RISEOVER THE TEN YEAR PERIOD, THE COMPOUND ANNUAL GROWTH RATE OF EMPLOYMENT HIRING HAS BEEN 10.1% 39

Both San Francisco and San Jose have seen strong trailing three month job growth as of April of 4.1% and 3.9%, respectively. Approximately 39% of the month-over-month job gains in San Francisco came from the Professional and Business Services sector. Office absorption in the first quarter in Silicon Valley was 825,000 sf, or 1.2% of stock, with an additional 3.5M sf under construction (nearly 50% of which is pre-leased).First quarter office absorption in the San Francisco MD was 153,000 sf, or 0.2% of stock, with 4.7M sf under construction (37% of which is pre-leased). Source: Axiometrics, Moody's, RCG, SNL, BLS, Census and ESS Disclosures as of March 31, 2016. Trailing 3 months beginning April 2016.Home Prices as of March 2016. U.S. uses NAR 4Q15. NORTHERN CALIFORNIA HIGHLIGHTS Northern CA Totals Units 19,295 Properties 73 Pro rata % of NOI 39.3% SS Occupancy 96.1% Market Data U.S. San Francisco San Jose Trailing 3 Month Job Growth 1.9% 4.1% 3.9% Personal Income Growth 2016F 5.5% 7.3% 7.1% Median Home Price(1) $223,000 $1,082,000 $775,000 NORTHERN CALIFORNIA PORTFOLIO NORTHERN CALIFORNIA AREA MAP 40
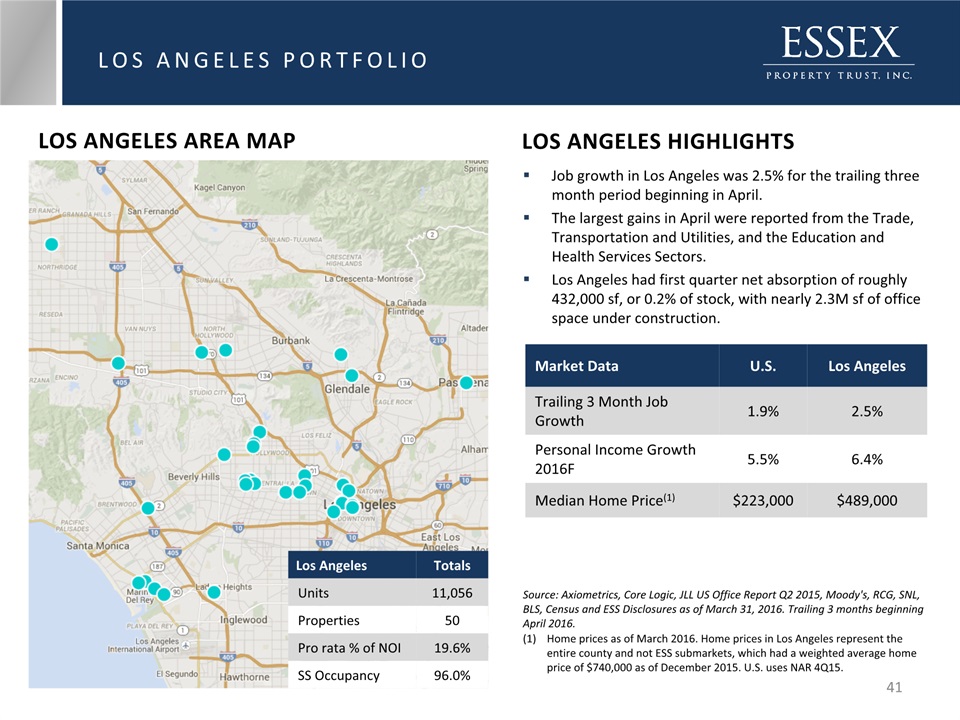
Source: Axiometrics, Core Logic, JLL US Office Report Q2 2015, Moody's, RCG, SNL, BLS, Census and ESS Disclosures as of March 31, 2016. Trailing 3 months beginning April 2016.Home prices as of March 2016. Home prices in Los Angeles represent the entire county and not ESS submarkets, which had a weighted average home price of $740,000 as of December 2015. U.S. uses NAR 4Q15. LOS ANGELES PORTFOLIO LOS ANGELES HIGHLIGHTS Los Angeles Totals Units 11,056 Properties 50 Pro rata % of NOI 19.6% SS Occupancy 96.0% Job growth in Los Angeles was 2.5% for the trailing three month period beginning in April. The largest gains in April were reported from the Trade, Transportation and Utilities, and the Education and Health Services Sectors.Los Angeles had first quarter net absorption of roughly 432,000 sf, or 0.2% of stock, with nearly 2.3M sf of office space under construction. Market Data U.S. Los Angeles Trailing 3 Month Job Growth 1.9% 2.5% Personal Income Growth 2016F 5.5% 6.4% Median Home Price(1) $223,000 $489,000 LOS ANGELES AREA MAP 41

Source: Axiometrics, Moody's, RCG, SNL, BLS, Census and ESS Disclosures as of March 31, 2016. Trailing 3 months beginning April 2016.Home Prices as of March 2016. U.S. uses NAR 4Q15. ORANGE COUNTY PORTFOLIO ORANGE COUNTY HIGHLIGHTS Orange County had job growth of 3.0% for the trailing three month period beginning April 2016.Professional and Business Services and Trade, Transportation and Utilities were the industries leading the job growth in April.Orange County absorbed 230,000 sf of office space in the first quarter, representing 0.2% of stock, with nearly 1.1M sf currently under construction. Market Data U.S. Orange County Trailing 3 Month Job Growth 1.9% 3.0% Personal Income Growth 2016F 5.5% 6.0% Median Home Price(1) $223,000 $610,000 Orange County Totals Units 6,932 Properties 28 Pro rata % of NOI 10.9% SS Occupancy 96.1% ORANGE COUNTY AREA MAP 42
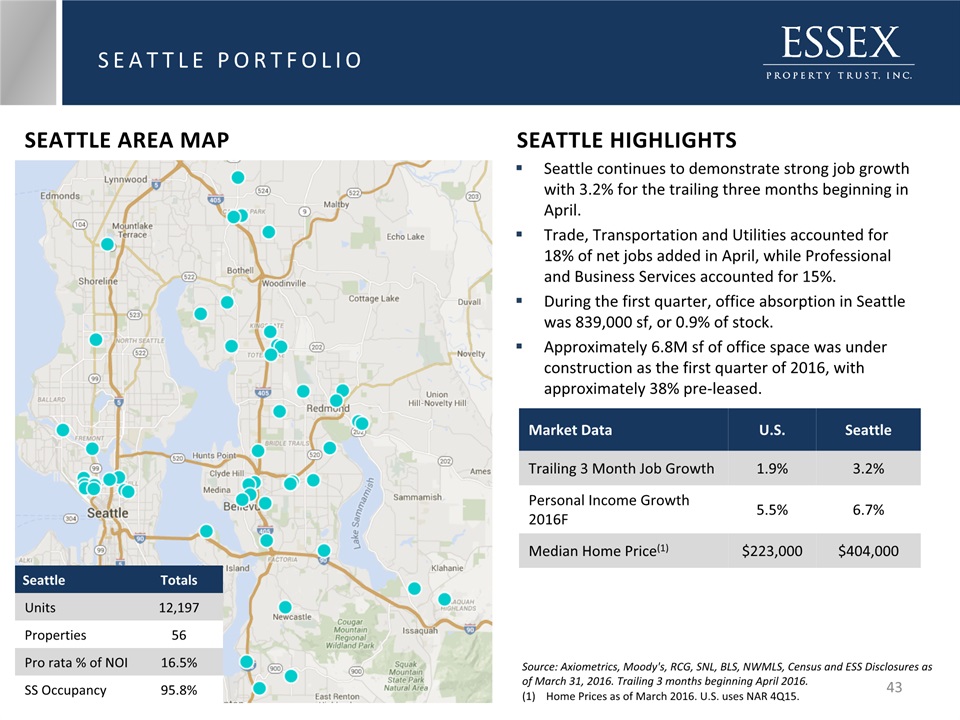
Source: Axiometrics, Moody's, RCG, SNL, BLS, NWMLS, Census and ESS Disclosures as of March 31, 2016. Trailing 3 months beginning April 2016.Home Prices as of March 2016. U.S. uses NAR 4Q15. SEATTLE HIGHLIGHTS SEATTLE PORTFOLIO Market Data U.S. Seattle Trailing 3 Month Job Growth 1.9% 3.2% Personal Income Growth 2016F 5.5% 6.7% Median Home Price(1) $223,000 $404,000 Seattle Totals Units 12,197 Properties 56 Pro rata % of NOI 16.5% SS Occupancy 95.8% Seattle continues to demonstrate strong job growth with 3.2% for the trailing three months beginning in April. Trade, Transportation and Utilities accounted for 18% of net jobs added in April, while Professional and Business Services accounted for 15%. During the first quarter, office absorption in Seattle was 839,000 sf, or 0.9% of stock. Approximately 6.8M sf of office space was under construction as the first quarter of 2016, with approximately 38% pre-leased. SEATTLE AREA MAP 43

COMMITMENT TO SUSTAINABILITY

2016 2015 2014 2009 2008 2006 45 SUSTAINABLE COMMITTMENTFor the past 10 years, Essex has been incorporating green initiatives within its apartment communities SUSTAINABILITY INITIATIVES

46 DEDICATION TO SUSTAINABLE LIVING SUSTAINABLE INITIATIVES THROUGHOUT THE ORGANIZATION *LEED is a nationally recognized program established by the U.S. Green Building Council to encourage the design of environmentally responsible buildings. GreenPoint Rated is California-specific program through Build It Green, which encourages healthy, energy- and resource-efficient building practices in the state. DEVELOPMENT MAINTENANCE & REDEVELOPMENT LIVING ENVIRONMENTS Since 2009, the Company has achieved:LEED* certified status at 6 communitiesGreenPoint Ratings* at 6 propertiesPursuing LEED certification on 2 recently completed developmentsPursuing GreenPoint Ratings on 3 development communities We are focused on improving the efficiency of our properties through our redevelopment program and ongoing property maintenance activitiesKey Areas of Focus:Energy ConservationInstalling high efficiency boilers and CO systemsInstalling energy efficient lightingWater ConservationDrought tolerant landscapingInstalling rain sensors and drip irrigationWaste ManagementReducing waste through the implementation of a recycling program in 2014 Caring for the environment by providing communities that:Have good in-door air qualitySmoke-free, use of low or no VC paint, mandate green cleaning productsPromote recyclingUtilize paperless transactions through online portalsAre conveniently located near public transit

NOTES 47