UNITED STATES
SECURITIES AND EXCHANGE COMMISSION
Washington, D.C. 20549
FORM N-CSR
CERTIFIED SHAREHOLDER REPORT OF REGISTERED MANAGEMENT INVESTMENT COMPANIES
Investment Company Act file number: 811-08629
HARTFORD SERIES FUND, INC.
(Exact name of registrant as specified in charter)
690 Lee Road, Wayne, Pennsylvania 19087
(Address of Principal Executive Offices) (Zip Code)
Thomas R. Phillips, Esquire
Hartford Funds Management Company, LLC
690 Lee Road
Wayne, Pennsylvania 19087
(Name and Address of Agent for Service)
Copy to:
John V. O’Hanlon, Esquire
Dechert LLP
One International Place, 40th Floor
100 Oliver Street
Boston, Massachusetts 02110-2605
Registrant’s telephone number, including area code: (610) 386-4068
Date of fiscal year end: December 31
Date of reporting period: December 31, 2021
Form N-CSR is to be used by management investment companies to file reports with the Commission not later than 10 days after the transmission to stockholders of any report that is required to be transmitted to stockholders under Rule 30e-1 under the Investment Company Act of 1940 (17 CFR 270.30e-1). The Commission may use the information provided on Form N-CSR in its regulatory, disclosure review, inspection, and policymaking roles.
A registrant is required to disclose the information specified by Form N-CSR, and the Commission will make this information public. A registrant is not required to respond to the collection of information contained in Form N-CSR unless the Form displays a currently valid Office of Management and Budget (“OMB”) control number. Please direct comments concerning the accuracy of the information collection burden estimate and any suggestions for reducing the burden to Secretary, Securities and Exchange Commission, 100 F Street, NE, Washington, DC 20549. The OMB has reviewed this collection of information under the clearance requirements of 44 U.S.C. § 3507.
Item 1. Reports to Stockholders.
(a)


| ■ Hartford Balanced HLS Fund |
| ■ Hartford Capital Appreciation HLS Fund |
| ■ Hartford Disciplined Equity HLS Fund |
| ■ Hartford Dividend and Growth HLS Fund |
| ■ Hartford Healthcare HLS Fund |
| ■ Hartford International Opportunities HLS Fund |
| ■ Hartford MidCap HLS Fund |
| ■ Hartford Small Cap Growth HLS Fund |
| ■ Hartford Small Company HLS Fund |
| ■ Hartford Stock HLS Fund |
| ■ Hartford Total Return Bond HLS Fund |
| ■ Hartford Ultrashort Bond HLS Fund |
 |

President
Hartford HLS Funds
| 1 | S&P 500 Index is a market capitalization-weighted price index composed of 500 widely held common stocks. The index is unmanaged and not available for direct investment. Past performance does not guarantee future results. |
| 2 | The Personal Consumption Expenditures Price Index, which excludes food and energy prices, rose 5.7% in November 2021. Source: U.S. Bureau of Economic Analysis and the St. Louis Fed, as of November 2021. |
December 31, 2021 (Unaudited)
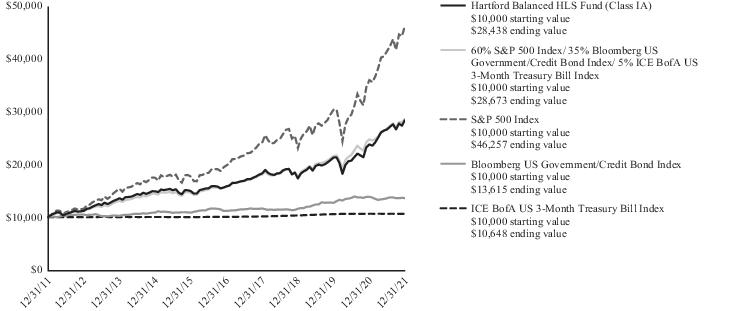
| Inception 03/31/1983 Sub-advised by Wellington Management Company LLP | Investment objective – The Fund seeks long-term total return. |
| Average Annual Total Returns | |||
| for the Periods Ended 12/31/2021 | |||
| 1 Year | 5 Years | 10 Years | |
| Class IA | 19.64% | 12.43% | 11.02% |
| Class IB | 19.37% | 12.14% | 10.74% |
| 60% S&P 500 Index/ 35% Bloomberg US Government/Credit Bond Index/5% ICE BofA US 3-Month Treasury Bill Index1 | 15.87% | 12.64% | 11.11% |
| S&P 500 Index | 28.71% | 18.47% | 16.55% |
| Bloomberg US Government/Credit Bond Index | -1.75% | 3.99% | 3.13% |
| ICE BofA US 3-Month Treasury Bill Index | 0.05% | 1.14% | 0.63% |
| 1 | Calculated by Hartford Funds Management Company, LLC |
| 2 |
December 31, 2021 (Unaudited)
Manager Discussion
| 3 |
December 31, 2021 (Unaudited)
| 4 |
December 31, 2021 (Unaudited)
| Composition by Security Type(1) | |
| as of 12/31/2021 | |
| Category | Percentage of Net Assets |
| Equity Securities | |
| Common Stocks | 68.7% |
| Fixed Income Securities | |
| Asset & Commercial Mortgage-Backed Securities | 2.8% |
| Corporate Bonds | 12.3 |
| Foreign Government Obligations | 0.3 |
| Municipal Bonds | 0.7 |
| U.S. Government Agencies(2) | 0.3 |
| U.S. Government Securities | 14.0 |
| Total | 30.4% |
| Short-Term Investments | 0.7 |
| Other Assets & Liabilities | 0.2 |
| Total | 100.0% |
| (1) | For Fund compliance purposes, the Fund may not use the same classification system. These classifications are used for financial reporting purposes. |
| (2) | All, or a portion of the securities categorized as U.S. Government Agencies, were agency mortgage-backed securities as of December 31, 2021. |
| 5 |
December 31, 2021 (Unaudited)
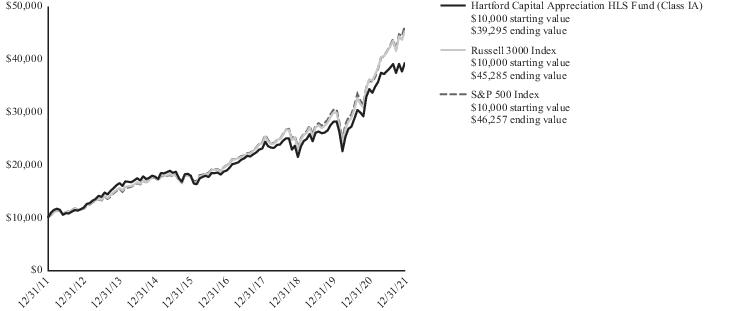
| Inception 04/02/1984 Sub-advised by Wellington Management Company LLP | Investment objective – The Fund seeks growth of capital. |
| Average Annual Total Returns | |||
| for the Periods Ended 12/31/2021 | |||
| 1 Year | 5 Years | 10 Years | |
| Class IA | 14.76% | 15.86% | 14.67% |
| Class IB | 14.45% | 15.56% | 14.38% |
| Class IC | 14.18% | 15.28% | 14.10% |
| Russell 3000 Index | 25.66% | 17.97% | 16.30% |
| S&P 500 Index | 28.71% | 18.47% | 16.55% |
| 6 |
December 31, 2021 (Unaudited)
Manager Discussion
| 7 |
December 31, 2021 (Unaudited)
| 8 |
December 31, 2021 (Unaudited)
| Composition by Sector(1) | |
| as of 12/31/2021 | |
| Sector | Percentage of Net Assets |
| Equity Securities | |
| Communication Services | 8.5% |
| Consumer Discretionary | 14.9 |
| Consumer Staples | 7.2 |
| Energy | 1.4 |
| Financials | 11.9 |
| Health Care | 14.2 |
| Industrials | 9.8 |
| Information Technology | 22.7 |
| Materials | 3.3 |
| Real Estate | 2.5 |
| Utilities | 2.0 |
| Total | 98.4% |
| Short-Term Investments | 1.8 |
| Other Assets & Liabilities | (0.2) |
| Total | 100.0% |
| (1) | A sector may be comprised of several industries. For Fund compliance purposes, the Fund may not use the same classification system. These sector classifications are used for financial reporting purposes. |
| 9 |
December 31, 2021 (Unaudited)
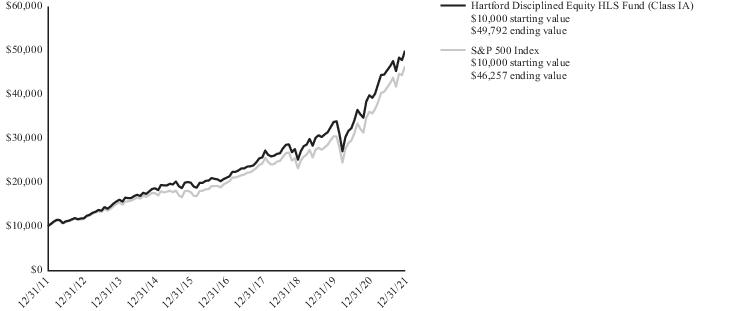
| Inception 05/29/1998 Sub-advised by Wellington Management Company LLP | Investment objective – The Fund seeks growth of capital. |
| Average Annual Total Returns | |||
| for the Periods Ended 12/31/2021 | |||
| 1 Year | 5 Years | 10 Years | |
| Class IA | 25.52% | 18.88% | 17.41% |
| Class IB | 25.21% | 18.59% | 17.12% |
| Class IC | 24.92% | 18.30% | 16.83% |
| S&P 500 Index | 28.71% | 18.47% | 16.55% |
| 10 |
December 31, 2021 (Unaudited)
Manager Discussion
| 11 |
December 31, 2021 (Unaudited)
| Composition by Sector(1) | |
| as of 12/31/2021 | |
| Sector | Percentage of Net Assets |
| Equity Securities | |
| Communication Services | 11.8% |
| Consumer Discretionary | 11.8 |
| Consumer Staples | 6.3 |
| Energy | 1.3 |
| Financials | 11.8 |
| Health Care | 14.4 |
| Industrials | 9.1 |
| Information Technology | 28.1 |
| Materials | 1.1 |
| Real Estate | 1.7 |
| Utilities | 2.0 |
| Total | 99.4% |
| Short-Term Investments | 0.6 |
| Other Assets & Liabilities | 0.0 * |
| Total | 100.0% |
| * | Percentage rounds to zero. |
| (1) | A sector may be comprised of several industries. For Fund compliance purposes, the Fund may not use the same classification system. These sector classifications are used for financial reporting purposes. |
| 12 |
December 31, 2021 (Unaudited)
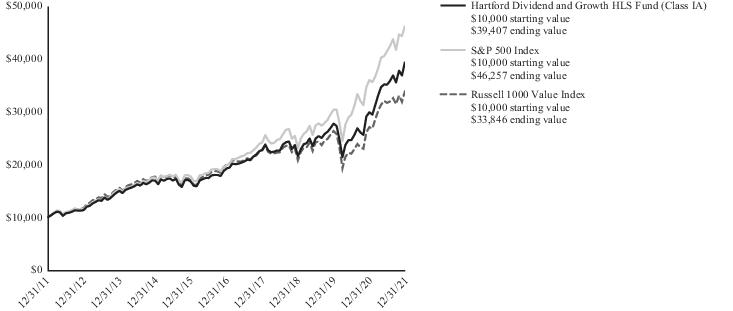
| Inception 03/09/1994 Sub-advised by Wellington Management Company LLP | Investment objective – The Fund seeks a high level of current income consistent with growth of capital. |
| Average Annual Total Returns | |||
| for the Periods Ended 12/31/2021 | |||
| 1 Year | 5 Years | 10 Years | |
| Class IA | 32.00% | 15.44% | 14.70% |
| Class IB | 31.68% | 15.15% | 14.41% |
| S&P 500 Index | 28.71% | 18.47% | 16.55% |
| Russell 1000 Value Index | 25.16% | 11.16% | 12.97% |
| 13 |
December 31, 2021 (Unaudited)
Manager Discussion
| 14 |
December 31, 2021 (Unaudited)
| Composition by Sector(1) | |
| as of 12/31/2021 | |
| Sector | Percentage of Net Assets |
| Equity Securities | |
| Communication Services | 7.5% |
| Consumer Discretionary | 6.2 |
| Consumer Staples | 6.0 |
| Energy | 3.9 |
| Financials | 18.3 |
| Health Care | 15.5 |
| Industrials | 8.9 |
| Information Technology | 20.2 |
| Materials | 3.6 |
| Real Estate | 3.2 |
| Utilities | 4.4 |
| Total | 97.7% |
| Short-Term Investments | 1.8 |
| Other Assets & Liabilities | 0.5 |
| Total | 100.0% |
| (1) | A sector may be comprised of several industries. For Fund compliance purposes, the Fund may not use the same classification system. These sector classifications are used for financial reporting purposes. |
| 15 |
December 31, 2021 (Unaudited)
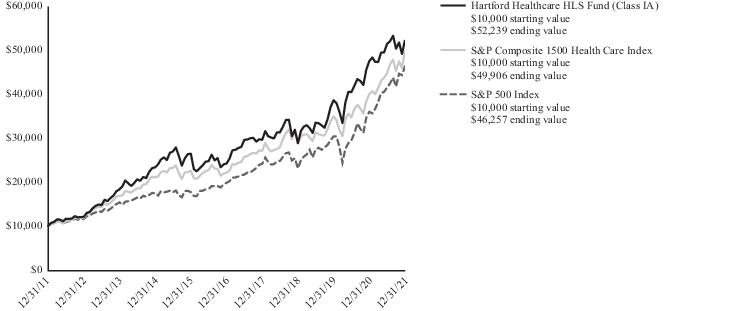
| Inception 05/01/2000 Sub-advised by Wellington Management Company LLP | Investment objective – The Fund seeks long-term capital appreciation. |
| Average Annual Total Returns | |||
| for the Periods Ended 12/31/2021 | |||
| 1 Year | 5 Years | 10 Years | |
| Class IA | 10.01% | 16.64% | 17.98% |
| Class IB | 9.76% | 16.35% | 17.68% |
| S&P Composite 1500 Health Care Index | 24.85% | 17.70% | 17.44% |
| S&P 500 Index | 28.71% | 18.47% | 16.55% |
| 16 |
December 31, 2021 (Unaudited)
| * | Robert L. Deresiewicz announced his plan to retire and withdraw from the partnership of Wellington Management Company LLP’s parent company, and effective June 30, 2022, he will no longer serve as a portfolio manager for the Fund. Robert Deresiewicz’s portfolio management responsibilities will transition to Wen Shi in the months leading up to his departure. |
Manager Discussion
| 17 |
December 31, 2021 (Unaudited)
| 18 |
December 31, 2021 (Unaudited)
| Composition by Subsector(1) | |
| as of 12/31/2021 | |
| Subsector | Percentage of Net Assets |
| Equity Securities | |
| Biotechnology | 15.1% |
| Consumer Finance | 0.1 |
| Diversified Financial Services | 0.3 |
| Diversified Telecommunication Services | 0.2 |
| Health Care Equipment & Supplies | 21.7 |
| Health Care Providers & Services | 21.6 |
| Insurance | 0.1 |
| Life Sciences Tools & Services | 11.9 |
| Pharmaceuticals | 27.5 |
| Total | 98.5% |
| Short-Term Investments | 2.2 |
| Other Assets & Liabilities | (0.7) |
| Total | 100.0% |
| (1) | For Fund compliance purposes, the Fund may not use the same classification system. These subsector classifications are used for financial reporting purposes. |
| 19 |
December 31, 2021 (Unaudited)
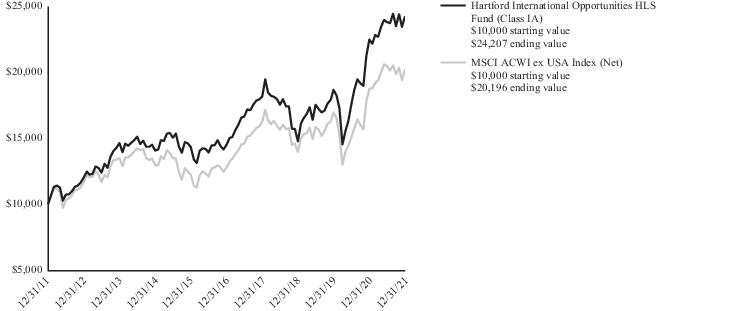
| Inception 07/02/1990 Sub-advised by Wellington Management Company LLP | Investment objective – The Fund seeks long-term growth of capital. |
| Average Annual Total Returns | |||
| for the Periods Ended 12/31/2021 | |||
| 1 Year | 5 Years | 10 Years | |
| Class IA | 7.82% | 10.81% | 9.24% |
| Class IB | 7.57% | 10.54% | 8.97% |
| MSCI ACWI ex USA Index (Net) | 7.82% | 9.61% | 7.28% |
| 20 |
December 31, 2021 (Unaudited)
Manager Discussion
| 21 |
December 31, 2021 (Unaudited)
| 22 |
December 31, 2021 (Unaudited)
| Composition by Sector(1) | |
| as of 12/31/2021 | |
| Sector | Percentage of Net Assets |
| Equity Securities | |
| Communication Services | 4.4% |
| Consumer Discretionary | 13.3 |
| Consumer Staples | 6.2 |
| Energy | 5.3 |
| Financials | 17.9 |
| Health Care | 9.4 |
| Industrials | 12.1 |
| Information Technology | 15.0 |
| Materials | 7.8 |
| Real Estate | 3.0 |
| Utilities | 2.8 |
| Total | 97.2% |
| Short-Term Investments | 1.7 |
| Other Assets & Liabilities | 1.1 |
| Total | 100.0% |
| (1) | A sector may be comprised of several industries. For Fund compliance purposes, the Fund may not use the same classification system. These sector classifications are used for financial reporting purposes. |
| 23 |
December 31, 2021 (Unaudited)
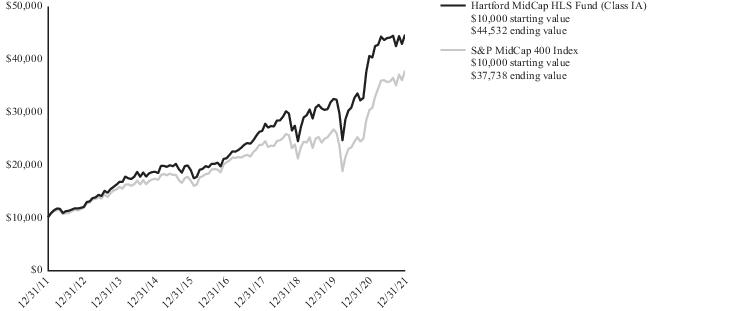
| Inception 07/14/1997 Sub-advised by Wellington Management Company LLP | Investment objective – The Fund seeks long-term growth of capital. |
| Average Annual Total Returns | |||
| for the Periods Ended 12/31/2021 | |||
| 1 Year | 5 Years | 10 Years | |
| Class IA | 9.91% | 16.05% | 16.11% |
| Class IB | 9.62% | 15.76% | 15.82% |
| S&P MidCap 400 Index | 24.76% | 13.09% | 14.20% |
| 24 |
December 31, 2021 (Unaudited)
Manager Discussion
| 25 |
December 31, 2021 (Unaudited)
| Composition by Sector(1) | |
| as of 12/31/2021 | |
| Sector | Percentage of Net Assets |
| Equity Securities | |
| Communication Services | 3.0% |
| Consumer Discretionary | 12.2 |
| Consumer Staples | 1.0 |
| Energy | 0.1 |
| Financials | 12.4 |
| Health Care | 17.6 |
| Industrials | 16.8 |
| Information Technology | 26.5 |
| Materials | 3.1 |
| Real Estate | 4.7 |
| Utilities | 2.6 |
| Total | 100.0% |
| Short-Term Investments | 0.6 |
| Other Assets & Liabilities | (0.6) |
| Total | 100.0% |
| (1) | A sector may be comprised of several industries. For Fund compliance purposes, the Fund may not use the same classification system. These sector classifications are used for financial reporting purposes. |
| 26 |
December 31, 2021 (Unaudited)
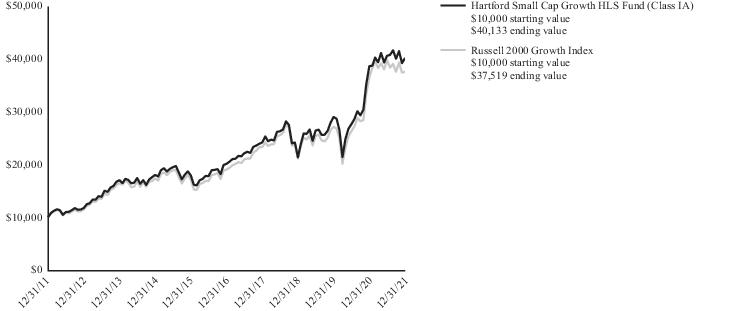
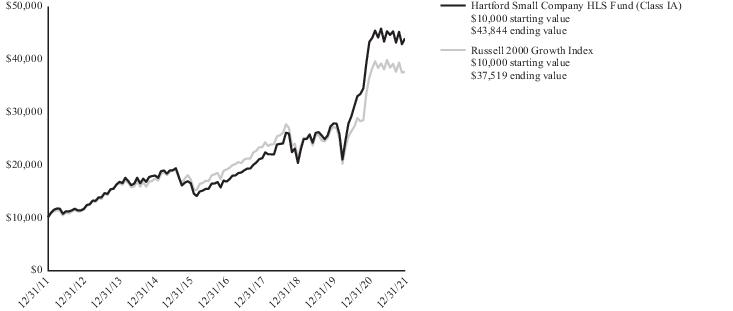
| Inception 05/02/1994 Sub-advised by Wellington Management Company LLP | Investment objective – The Fund seeks long-term capital appreciation. |
| Average Annual Total Returns | |||
| for the Periods Ended 12/31/2021 | |||
| 1 Year | 5 Years | 10 Years | |
| Class IA | 4.02% | 14.81% | 14.91% |
| Class IB | 3.76% | 14.53% | 14.62% |
| Russell 2000 Growth Index | 2.83% | 14.53% | 14.14% |
| 27 |
December 31, 2021 (Unaudited)
Manager Discussion
| 28 |
December 31, 2021 (Unaudited)
| Composition by Sector(1) | |
| as of 12/31/2021 | |
| Sector | Percentage of Net Assets |
| Equity Securities | |
| Communication Services | 2.4% |
| Consumer Discretionary | 14.5 |
| Consumer Staples | 4.2 |
| Energy | 0.5 |
| Financials | 4.9 |
| Health Care | 23.9 |
| Industrials | 17.2 |
| Information Technology | 24.3 |
| Materials | 2.4 |
| Real Estate | 4.9 |
| Total | 99.2% |
| Short-Term Investments | 1.0 |
| Other Assets & Liabilities | (0.2) |
| Total | 100.0% |
| (1) | A sector may be comprised of several industries. For Fund compliance purposes, the Fund may not use the same classification system. These sector classifications are used for financial reporting purposes. |
| 29 |
December 31, 2021 (Unaudited)
| Inception 08/09/1996 Sub-advised by Wellington Management Company LLP | Investment objective – The Fund seeks growth of capital. |
| Average Annual Total Returns | |||
| for the Periods Ended 12/31/2021 | |||
| 1 Year | 5 Years | 10 Years | |
| Class IA | 1.56% | 21.23% | 15.93% |
| Class IB | 1.30% | 20.92% | 15.64% |
| Russell 2000 Growth Index | 2.83% | 14.53% | 14.14% |
| 30 |
December 31, 2021 (Unaudited)
| * | The Fund supplemented its prospectus on 1/12/2022, which reflected that effective February 28, 2023, Steven C. Angeli, CFA will no longer serve as a portfolio manager to the Fund as he will be assuming a new role at Wellington Management Company LLP. Mr. Angeli’s portfolio management responsibilities will transition to Ranjit Ramachandran. |
Manager Discussion
| 31 |
December 31, 2021 (Unaudited)
| Composition by Sector(1) | |
| as of 12/31/2021 | |
| Sector | Percentage of Net Assets |
| Equity Securities | |
| Communication Services | 4.1% |
| Consumer Discretionary | 15.1 |
| Energy | 2.2 |
| Financials | 4.0 |
| Health Care | 23.9 |
| Industrials | 17.0 |
| Information Technology | 27.5 |
| Materials | 1.0 |
| Real Estate | 3.5 |
| Total | 98.3% |
| Short-Term Investments | 1.9 |
| Other Assets & Liabilities | (0.2) |
| Total | 100.0% |
| (1) | A sector may be comprised of several industries. For Fund compliance purposes, the Fund may not use the same classification system. These sector classifications are used for financial reporting purposes. |
| 32 |
December 31, 2021 (Unaudited)
| Inception 08/31/1977 Sub-advised by Wellington Management Company LLP | Investment objective – The Fund seeks long-term growth of capital. |
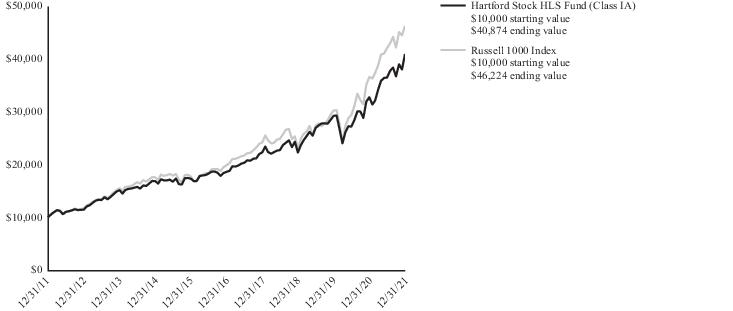
| Average Annual Total Returns | |||
| for the Periods Ended 12/31/2021 | |||
| 1 Year | 5 Years | 10 Years | |
| Class IA | 24.98% | 17.08% | 15.12% |
| Class IB | 24.67% | 16.78% | 14.83% |
| Russell 1000 Index | 26.46% | 18.43% | 16.54% |
| 33 |
December 31, 2021 (Unaudited)
Manager Discussion
| 34 |
December 31, 2021 (Unaudited)
| Composition by Sector(1) | |
| as of 12/31/2021 | |
| Sector | Percentage of Net Assets |
| Equity Securities | |
| Communication Services | 1.9% |
| Consumer Discretionary | 11.7 |
| Consumer Staples | 17.0 |
| Financials | 8.7 |
| Health Care | 20.0 |
| Industrials | 19.8 |
| Information Technology | 12.1 |
| Materials | 5.4 |
| Real Estate | 3.0 |
| Total | 99.6% |
| Short-Term Investments | 0.8 |
| Other Assets & Liabilities | (0.4) |
| Total | 100.0% |
| (1) | A sector may be comprised of several industries. For Fund compliance purposes, the Fund may not use the same classification system. These sector classifications are used for financial reporting purposes. |
| 35 |
December 31, 2021 (Unaudited)
| Inception 08/31/1977 Sub-advised by Wellington Management Company LLP | Investment objective – The Fund seeks a competitive total return, with income as a secondary objective. |
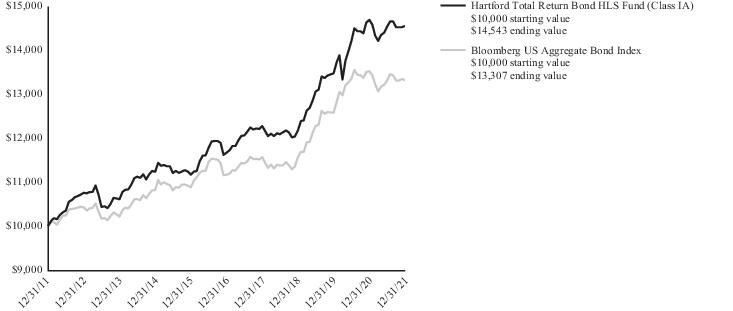
| Average Annual Total Returns | |||
| for the Periods Ended 12/31/2021 | |||
| 1 Year | 5 Years | 10 Years | |
| Class IA | -0.95% | 4.51% | 3.82% |
| Class IB | -1.18% | 4.24% | 3.56% |
| Bloomberg US Aggregate Bond Index | -1.54% | 3.57% | 2.90% |
| 36 |
December 31, 2021 (Unaudited)
Manager Discussion
| 37 |
December 31, 2021 (Unaudited)
| Composition by Security Type(1) | |
| as of 12/31/2021 | |
| Category | Percentage of Net Assets |
| Equity Securities | |
| Common Stocks | 0.0% * |
| Preferred Stocks | 0.1 |
| Warrants | 0.0 * |
| Total | 0.1% |
| Fixed Income Securities | |
| Asset & Commercial Mortgage-Backed Securities | 22.2% |
| Corporate Bonds | 29.2 |
| Foreign Government Obligations | 6.8 |
| Municipal Bonds | 1.4 |
| Senior Floating Rate Interests | 4.4 |
| U.S. Government Agencies(2) | 39.2 |
| U.S. Government Securities | 22.8 |
| Total | 126.0% |
| Short-Term Investments | 0.7 |
| Purchased Options | 0.0 * |
| Other Assets & Liabilities | (26.8) |
| Total | 100.0% |
| * | Percentage rounds to zero. |
| (1) | For Fund compliance purposes, the Fund may not use the same classification system. These classifications are used for financial reporting purposes. |
| (2) | All, or a portion of the securities categorized as U.S. Government Agencies, were agency mortgage-backed securities as of December 31, 2021. |
| 38 |
December 31, 2021 (Unaudited)
| Inception 06/30/1980 Sub-advised by Wellington Management Company LLP | Investment objective – The Fund seeks total return and income consistent with preserving capital and maintaining liquidity. |
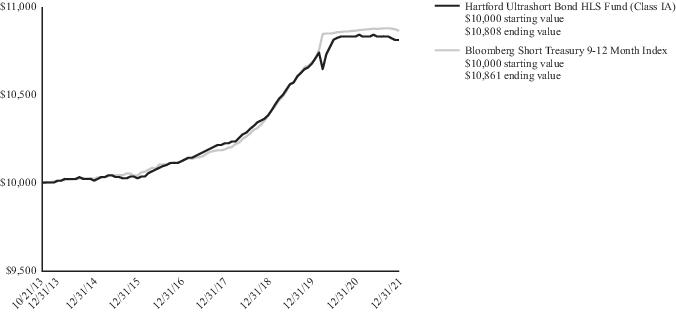
| Average Annual Total Returns | |||
| for the Periods Ended 12/31/2021 | |||
| 1 Year | 5 Years | Since Inception1 | |
| Class IA | -0.19% | 1.32% | 0.95% |
| Class IB | -0.46% | 1.08% | 0.70% |
| Bloomberg Short Treasury 9-12 Month Index | 0.00% | 1.43% | 1.01% |
| 1 | On 10/21/2013, the Fund converted from a money market fund to an ultrashort bond fund. Since Inception returns are from conversion date (10/21/2013) to 12/31/2021. |
| 39 |
December 31, 2021 (Unaudited)
Manager Discussion
| 40 |
December 31, 2021 (Unaudited)
| Composition by Security Type(1) | |
| as of 12/31/2021 | |
| Category | Percentage of Net Assets |
| Fixed Income Securities | |
| Asset & Commercial Mortgage-Backed Securities | 33.1% |
| Corporate Bonds | 31.9 |
| Municipal Bonds | 0.3 |
| U.S. Government Agencies(2) | 0.9 |
| U.S. Government Securities | 6.8 |
| Total | 73.0% |
| Short-Term Investments | 27.0 |
| Other Assets & Liabilities | 0.0 * |
| Total | 100.0% |
| * | Percentage rounds to zero. |
| (1) | For Fund compliance purposes, the Fund may not use the same classification system. These classifications are used for financial reporting purposes. |
| (2) | All, or a portion of the securities categorized as U.S. Government Agencies, were agency mortgage-backed securities as of December 31, 2021. |
| 41 |
| Bloomberg US Government/Credit Bond Index (reflects no deduction for fees, expenses or taxes) is designed to measure the non-securitized component of the U.S. Aggregate Index. It includes investment grade, U.S. dollar-denominated, fixed-rate Treasuries, government-related and corporate securities. |
| Bloomberg Short Treasury 9-12 Month Index (reflects no deduction for fees, expenses or taxes) includes aged U.S. Treasury bills, notes and bonds with a remaining maturity from 1 up to (but not including) 12 months. It excludes zero coupon strips. |
| Bloomberg US Aggregate Bond Index (reflects no deduction for fees, expenses or taxes) is composed of securities that cover the US investment grade fixed rate bond market, with index components for government and corporate securities, mortgage pass-through securities, and asset-backed securities. |
| ICE BofA US 3-Month Treasury Bill Index (reflects no deduction for fees, expenses or taxes) is comprised of a single issue purchased at the beginning of the month and held for a full month. At the end of the month that issue is sold and rolled into a newly selected issue. The issue selected at each month-end rebalancing is the outstanding Treasury Bill that matures closest to, but not beyond, three months from the rebalancing date. To qualify for selection, an issue must have settled on or before the month-end rebalancing date. |
| MSCI ACWI (All Country World) ex USA Index (Net) (reflects reinvested dividends net of withholding taxes but reflects no deduction for fees, expenses or other taxes) is designed to capture large and mid cap representation across developed markets (excluding the United States) and emerging market countries. |
| Russell 1000 Index (reflects no deduction for fees, expenses or taxes) is designed to measure the performance of the 1,000 largest companies in the Russell 3000 Index which is designed to measure the performance of the 3,000 largest U.S. companies based on total market capitalizations. |
| Russell 3000 Index (reflects no deduction for fees, expenses or taxes) is designed to measure the performance of the 3,000 largest U.S. companies based on total market capitalization. |
| Russell 2000 Growth Index (reflects no deduction for fees, expenses or taxes) is designed to measure the performance of those Russell 2000 Index companies with higher price-to-book ratios and higher forecasted growth values. The Russell 2000 Index is an index comprised of 2,000 of the smallest U.S.-domiciled company common stocks based on a combination of their market capitalization and current index membership. |
| Russell 1000 Value Index (reflects no deduction for fees, expenses or taxes) is designed to measure the performance of those Russell 1000 Index companies with lower price-to-book ratios and lower forecasted growth values. The Russell 1000 Index is designed to measure the performance of the 1,000 largest companies in the Russell 3000 Index based on their market capitalization and current index membership. |
| S& P Composite 1500 Health Care Index (reflects no deduction for fees, expenses or taxes) is a float-adjusted market capitalization-weighted index comprised of those companies included in the S&P Composite 1500 that are classified as members of the Global Industry Classification Standard (GICS®) health care sector. |
| S&P MidCap 400 Index (reflects no deduction for fees, expenses or taxes) is a float-adjusted market capitalization-weighted index designed to measure the performance of the mid-cap segment of the market. The index is composed of 400 constituent companies. |
| S&P 500 Index (reflects no deduction for fees, expenses or taxes) is a float-adjusted market capitalization-weighted price index composed of 500 widely held common stocks. |
| “Bloomberg®” and the above referenced Bloomberg index(es) are service marks of Bloomberg Finance L.P. and its affiliates, including Bloomberg Index Services Limited (“BISL”), the administrator of the index (collectively, “Bloomberg”), and have been licensed for use for certain purposes by Hartford Funds Management Company, LLC ("HFMC"). The Funds are not sponsored, endorsed, sold or promoted by Bloomberg. Bloomberg does not make any representation or warranty, express or implied, to the owners of or counterparties to the Funds or any member of the public regarding the advisability of investing in securities generally or in the Funds particularly. The only relationship of Bloomberg to HFMC is the licensing of certain trademarks, trade names and service marks and of the above referenced Bloomberg index(es), which is determined, composed and calculated by BISL without regard to HFMC or the Funds. Bloomberg has no obligation to take the needs of HFMC or the owners of the Funds into consideration in determining, composing or calculating the above referenced Bloomberg index(es). Bloomberg is not responsible for and has not participated in the determination of the timing of, prices at, or quantities of the Funds to be issued. Bloomberg shall not have any obligation or liability, including, without limitation, to the Funds' customers, in connection with the administration, marketing or trading of the Funds. |
| BLOOMBERG DOES NOT GUARANTEE THE ACCURACY AND/OR THE COMPLETENESS OF THE ABOVE REFERENCED BLOOMBERG INDEX(ES) OR ANY DATA RELATED THERETO AND SHALL HAVE NO LIABILITY FOR ANY ERRORS, OMISSIONS OR INTERRUPTIONS THEREIN. BLOOMBERG DOES NOT MAKE ANY WARRANTY, EXPRESS OR IMPLIED, AS TO RESULTS TO BE OBTAINED BY HFMC, OWNERS OF THE FUNDS OR ANY OTHER PERSON OR ENTITY FROM THE USE OF THE ABOVE REFERENCED BLOOMBERG INDEX(ES) OR ANY DATA RELATED THERETO. BLOOMBERG DOES NOT MAKE ANY EXPRESS OR IMPLIED WARRANTIES AND EXPRESSLY DISCLAIMS ALL WARRANTIES OF MERCHANTABILITY OR FITNESS FOR A PARTICULAR PURPOSE OR USE WITH RESPECT TO THE ABOVE REFERENCED BLOOMBERG INDEX(ES) OR ANY DATA RELATED THERETO. WITHOUT LIMITING ANY OF THE FOREGOING, TO THE MAXIMUM EXTENT ALLOWED BY LAW, BLOOMBERG, ITS LICENSORS, AND ITS AND THEIR RESPECTIVE EMPLOYEES, CONTRACTORS, AGENTS, SUPPLIERS, AND VENDORS SHALL HAVE NO LIABILITY OR RESPONSIBILITY WHATSOEVER FOR ANY INJURY OR |
| 42 |
| DAMAGES --WHETHER DIRECT, INDIRECT, CONSEQUENTIAL, INCIDENTAL, PUNITIVE OR OTHERWISE --ARISING IN CONNECTION WITH THE ABOVE REFERENCED BLOOMBERG INDEX(ES) OR ANY DATA OR VALUES RELATING THERETO --WHETHER ARISING FROM THEIR NEGLIGENCE OR OTHERWISE, EVEN IF NOTIFIED OF THE POSSIBILITY THEREOF. |
| Neither MSCI nor any other party involved in or related to compiling, computing or creating the MSCI data makes any express or implied warranties or representations with respect to such data (or the results to be obtained by the use thereof), and all such parties hereby expressly disclaim all warranties of originality, accuracy, completeness, merchantability or fitness for a particular purpose with respect to any of such data. Without limiting any of the foregoing, in no event shall MSCI, any of its affiliates or any third party involved in or related to compiling, computing or creating the data have any liability for any direct, indirect, special, punitive, consequential or any other damages (including lost profits) even if notified of the possibility of such damages. No further distribution or dissemination of the MSCI data is permitted without MSCI’s express written consent. |
| 43 |
| Actual Return | Hypothetical (5% return before expenses) | ||||||||||||
| Beginning Account Value July 1, 2021 | Ending Account Value December 31, 2021 | Expenses paid during the period July 1, 2021 through December 31, 2021 | Beginning Account Value July 1, 2021 | Ending Account Value December 31, 2021 | Expenses paid during the period July 1, 2021 through December 31, 2021 | Annualized expense ratio | |||||||
| Hartford Balanced HLS Fund | |||||||||||||
| Class IA | $ 1,000.00 | $ 1,069.10 | $ 3.29 | $ 1,000.00 | $ 1,022.03 | $ 3.21 | 0.63% | ||||||
| Class IB | $ 1,000.00 | $ 1,067.80 | $ 4.59 | $ 1,000.00 | $ 1,020.77 | $ 4.48 | 0.88% | ||||||
| Hartford Capital Appreciation HLS Fund | |||||||||||||
| Class IA | $ 1,000.00 | $ 1,042.60 | $ 3.45 | $ 1,000.00 | $ 1,021.83 | $ 3.41 | 0.67% | ||||||
| Class IB | $ 1,000.00 | $ 1,041.30 | $ 4.73 | $ 1,000.00 | $ 1,020.57 | $ 4.69 | 0.92% | ||||||
| Class IC | $ 1,000.00 | $ 1,040.00 | $ 6.02 | $ 1,000.00 | $ 1,019.31 | $ 5.96 | 1.17% | ||||||
| Hartford Disciplined Equity HLS Fund | |||||||||||||
| Class IA | $ 1,000.00 | $ 1,098.60 | $ 3.17 | $ 1,000.00 | $ 1,022.18 | $ 3.06 | 0.60% | ||||||
| Class IB | $ 1,000.00 | $ 1,097.60 | $ 4.49 | $ 1,000.00 | $ 1,020.92 | $ 4.33 | 0.85% | ||||||
| Class IC | $ 1,000.00 | $ 1,096.20 | $ 5.81 | $ 1,000.00 | $ 1,019.66 | $ 5.60 | 1.10% | ||||||
| Hartford Dividend and Growth HLS Fund | |||||||||||||
| Class IA | $ 1,000.00 | $ 1,123.10 | $ 3.53 | $ 1,000.00 | $ 1,021.88 | $ 3.36 | 0.66% | ||||||
| Class IB | $ 1,000.00 | $ 1,121.40 | $ 4.87 | $ 1,000.00 | $ 1,020.62 | $ 4.63 | 0.91% | ||||||
| Hartford Healthcare HLS Fund | |||||||||||||
| Class IA | $ 1,000.00 | $ 1,017.50 | $ 4.73 | $ 1,000.00 | $ 1,020.52 | $ 4.74 | 0.93% | ||||||
| Class IB | $ 1,000.00 | $ 1,016.20 | $ 6.00 | $ 1,000.00 | $ 1,019.26 | $ 6.01 | 1.18% | ||||||
| Hartford International Opportunities HLS Fund | |||||||||||||
| Class IA | $ 1,000.00 | $ 1,018.40 | $ 3.71 | $ 1,000.00 | $ 1,021.53 | $ 3.72 | 0.73% | ||||||
| Class IB | $ 1,000.00 | $ 1,016.80 | $ 4.98 | $ 1,000.00 | $ 1,020.27 | $ 4.99 | 0.98% | ||||||
| Hartford MidCap HLS Fund | |||||||||||||
| Class IA | $ 1,000.00 | $ 1,014.50 | $ 3.55 | $ 1,000.00 | $ 1,021.68 | $ 3.57 | 0.70% | ||||||
| Class IB | $ 1,000.00 | $ 1,013.00 | $ 4.82 | $ 1,000.00 | $ 1,020.42 | $ 4.84 | 0.95% | ||||||
| 44 |
| Actual Return | Hypothetical (5% return before expenses) | ||||||||||||
| Beginning Account Value July 1, 2021 | Ending Account Value December 31, 2021 | Expenses paid during the period July 1, 2021 through December 31, 2021 | Beginning Account Value July 1, 2021 | Ending Account Value December 31, 2021 | Expenses paid during the period July 1, 2021 through December 31, 2021 | Annualized expense ratio | |||||||
| Hartford Small Cap Growth HLS Fund | |||||||||||||
| Class IA | $ 1,000.00 | $ 989.60 | $ 3.21 | $ 1,000.00 | $ 1,021.98 | $ 3.26 | 0.64% | ||||||
| Class IB | $ 1,000.00 | $ 988.50 | $ 4.46 | $ 1,000.00 | $ 1,020.72 | $ 4.53 | 0.89% | ||||||
| Hartford Small Company HLS Fund | |||||||||||||
| Class IA | $ 1,000.00 | $ 970.00 | $ 3.82 | $ 1,000.00 | $ 1,021.32 | $ 3.92 | 0.77% | ||||||
| Class IB | $ 1,000.00 | $ 968.70 | $ 5.06 | $ 1,000.00 | $ 1,020.06 | $ 5.19 | 1.02% | ||||||
| Hartford Stock HLS Fund | |||||||||||||
| Class IA | $ 1,000.00 | $ 1,122.20 | $ 2.73 | $ 1,000.00 | $ 1,022.63 | $ 2.60 | 0.51% | ||||||
| Class IB | $ 1,000.00 | $ 1,120.70 | $ 4.06 | $ 1,000.00 | $ 1,021.37 | $ 3.87 | 0.76% | ||||||
| Hartford Total Return Bond HLS Fund | |||||||||||||
| Class IA | $ 1,000.00 | $ 1,001.40 | $ 2.52 | $ 1,000.00 | $ 1,022.68 | $ 2.55 | 0.50% | ||||||
| Class IB | $ 1,000.00 | $ 999.90 | $ 3.78 | $ 1,000.00 | $ 1,021.42 | $ 3.82 | 0.75% | ||||||
| Hartford Ultrashort Bond HLS Fund | |||||||||||||
| Class IA | $ 1,000.00 | $ 998.10 | $ 2.22 | $ 1,000.00 | $ 1,022.99 | $ 2.24 | 0.44% | ||||||
| Class IB | $ 1,000.00 | $ 996.40 | $ 3.47 | $ 1,000.00 | $ 1,021.73 | $ 3.52 | 0.69% | ||||||
| 45 |
December 31, 2021
| Shares or Principal Amount | Market Value† | ||
| ASSET & COMMERCIAL MORTGAGE-BACKED SECURITIES - 2.8% | |||
| Asset-Backed - Automobile - 0.3% | |||
| $ 3,008,172 | CFMT 2021-AL1 LLC 1.39%, 09/22/2031(1) | $ 3,000,855 | |
| 1,810,000 | Credit Acceptance Auto Loan Trust 1.24%, 10/15/2029(1) | 1,810,125 | |
| 545,000 | Ford Credit Auto Lease Trust 0.78%, 09/15/2025 | 540,677 | |
| Ford Credit Auto Owner Trust | |||
| 275,000 | 1.61%, 10/17/2033(1) | 271,414 | |
| 260,000 | 1.91%, 10/17/2033(1) | 258,548 | |
| 5,881,619 | |||
| Asset-Backed - Credit Card - 0.0% | |||
| 575,000 | Mercury Financial Credit Card Master Trust 1.54%, 03/20/2026(1) | 574,477 | |
| Asset-Backed - Finance & Insurance - 0.7% | |||
| 530,000 | Bain Capital Credit CLO Ltd. 1.35%, 07/24/2034(1)(2)(3) | 529,698 | |
| 310,000 | Battalion CLO Ltd. 1.89%, 07/15/2034(1)(2)(3) | 309,778 | |
| Bayview Koitere Fund Trust | |||
| 489,091 | 3.50%, 07/28/2057(1)(3)(4) | 496,906 | |
| 249,784 | 4.00%, 11/28/2053(1)(3)(4) | 253,090 | |
| 2,620,995 | Madison Park Funding Ltd. 0.87%, 04/15/2029, 3 mo. USD LIBOR + 0.750%(1)(2) | 2,621,058 | |
| Magnetite Ltd. | |||
| 2,637,710 | 0.92%, 01/15/2028, 3 mo. USD LIBOR + 0.800%(1)(2) | 2,641,045 | |
| 750,000 | 1.52%, 01/15/2034, 3 mo. USD LIBOR + 1.400%(1)(2) | 749,998 | |
| 1,615,000 | 1.66%, 11/15/2028, 3 mo. USD LIBOR + 1.500%(1)(2) | 1,615,599 | |
| 375,000 | Shackleton CLO Ltd. 1.33%, 10/20/2034(1)(2) | 375,000 | |
| 450,000 | Sound Point CLO Ltd. 1.78%, 10/25/2034(1)(2) | 450,094 | |
| Taco Bell Funding LLC | |||
| 650,000 | 1.95%, 08/25/2051(1) | 637,170 | |
| 595,000 | 2.29%, 08/25/2051(1) | 588,169 | |
| 1,541,060 | Treman Park CLO Ltd. 1.20%, 10/20/2028, 3 mo. USD LIBOR + 1.070%(1)(2) | 1,540,379 | |
| 500,000 | Venture 34 CLO Ltd. 1.35%, 10/15/2031, 3 mo. USD LIBOR + 1.230%(1)(2) | 499,713 | |
| 1,500,000 | Wellfleet CLO Ltd. 1.88%, 07/20/2032, 3 mo. USD LIBOR + 1.750%(1)(2) | 1,499,095 | |
| 14,806,792 | |||
| Commercial Mortgage-Backed Securities - 0.5% | |||
| 1,100,000 | Arbor Multifamily Mortgage Securities Trust 2.57%, 10/15/2054(1) | 1,132,149 | |
| 255,000 | BFLD Trust 2.16%, 11/15/2028, 1 mo. USD LIBOR + 2.050%(1)(2) | 255,199 | |
| BX Trust | |||
| 3,315,000 | 0.62%, 10/15/2023(1)(2) | 3,281,977 | |
| 1,460,000 | 1.41%, 10/15/2036(1)(2)(3) | 1,456,338 | |
| BXHPP Trust | |||
| 780,000 | 0.76%, 08/15/2036(1)(2)(3) | 775,901 | |
| 690,000 | 1.01%, 08/15/2036(1)(2)(3) | 682,233 | |
| FREMF Mortgage Trust | |||
| 160,000 | 3.51%, 11/25/2045(1)(3)(4) | 162,850 | |
| 285,000 | 3.67%, 01/25/2048(1)(3)(4) | 299,466 | |
| 160,000 | 3.69%, 04/25/2048(1)(3)(4) | 168,506 | |
| 200,000 | 3.78%, 10/25/2048(1)(3)(4) | 211,988 | |
| 160,000 | 3.88%, 02/25/2050(1)(3)(4) | 167,273 | |
| 1,015,000 | 4.08%, 09/25/2025(1)(3)(4) | 1,090,795 | |
| Shares or Principal Amount | Market Value† | ||
| ASSET & COMMERCIAL MORTGAGE-BACKED SECURITIES - 2.8% - (continued) | |||
| Commercial Mortgage-Backed Securities - 0.5% - (continued) | |||
| $ 260,000 | 4.16%, 04/25/2049(1)(3)(4) | $ 281,328 | |
| 295,000 | Life Mortgage Trust 0.81%, 03/15/2038(1)(2) | 292,971 | |
| 375,000 | SFAVE Commercial Mortgage Securities Trust 4.14%, 01/05/2043(1)(3)(4) | 406,662 | |
| 1,735,000 | SREIT Trust 2021-MFP 1.18%, 11/15/2038, 1 mo. USD LIBOR + 1.080%(1)(2) | 1,726,705 | |
| 12,392,341 | |||
| Other Asset-Backed Securities - 0.9% | |||
| 230,811 | Aaset Trust 3.84%, 05/15/2039(1) | 206,808 | |
| Affirm Asset Securitization Trust | |||
| 615,000 | 0.88%, 08/15/2025(1) | 615,141 | |
| 870,000 | 1.03%, 08/17/2026(1) | 864,059 | |
| 591,709 | 1.07%, 08/15/2025(1) | 590,518 | |
| 1,425,000 | Aligned Data Centers Issuer LLC 1.94%, 08/15/2046(1) | 1,403,594 | |
| Bayview Opportunity Master Fund Trust | |||
| 246,792 | 3.50%, 01/28/2055(1)(3)(4) | 249,677 | |
| 259,285 | 3.50%, 06/28/2057(1)(3)(4) | 262,977 | |
| Castlelake Aircraft Structured Trust | |||
| 228,519 | 3.47%, 01/15/2046(1) | 231,132 | |
| 436,655 | 3.97%, 04/15/2039(1) | 430,453 | |
| CF Hippolyta LLC | |||
| 332,754 | 1.53%, 03/15/2061(1) | 327,086 | |
| 163,966 | 1.98%, 03/15/2061(1) | 162,062 | |
| 1,705,000 | CIFC Funding Ltd. 1.17%, 04/24/2030, 3 mo. USD LIBOR + 1.050%(1)(2) | 1,705,213 | |
| 855,700 | Domino's Pizza Master Issuer LLC 3.15%, 04/25/2051(1) | 874,607 | |
| 1,718,464 | FirstKey Homes Trust 1.54%, 08/17/2038(1) | 1,675,588 | |
| 1,374,193 | Home Partners of America 2021-2 Trust 2.30%, 12/17/2026(1) | 1,355,173 | |
| Horizon Aircraft Finance Ltd. | |||
| 281,277 | 3.43%, 11/15/2039(1) | 275,431 | |
| 219,019 | 3.72%, 07/15/2039(1) | 214,601 | |
| 194,517 | Mach I 3.47%, 10/15/2039(1) | 190,343 | |
| 188,480 | MAPS Ltd. 4.46%, 03/15/2044(1) | 185,236 | |
| Mill City Mortgage Loan Trust | |||
| 9,936 | 2.50%, 04/25/2057(1)(3)(4) | 9,937 | |
| 273,405 | 2.75%, 01/25/2061(1)(3)(4) | 276,790 | |
| 1,580,000 | Neuberger Berman Loan Advisers CLO Ltd. 1.47%, 10/18/2029, 3 mo. USD LIBOR + 1.350%(1)(2) | 1,575,845 | |
| 480,000 | New Economy Assets Phase 1 Sponsor LLC 2.41%, 10/20/2061(1) | 481,192 | |
| 500,000 | Octagon Investment Partners Ltd. 1.52%, 01/25/2031, 3 mo. USD LIBOR + 1.400%(1)(2) | 498,624 | |
| 2,025,000 | SCF Equipment Leasing 0.83%, 08/21/2028(1) | 2,017,938 | |
| 457,787 | SoFi Consumer Loan Program Trust 0.49%, 09/25/2030(1) | 455,968 | |
| 738,150 | Sonic Capital LLC 2.19%, 08/20/2051(1) | 718,644 | |
| 179,684 | START Ireland 4.09%, 03/15/2044(1) | 178,607 | |
| Towd Point Mortgage Trust | |||
| 34,072 | 2.25%, 04/25/2056(1)(3)(4) | 34,080 | |
| 68,924 | 2.75%, 04/25/2057(1)(3)(4) | 69,462 | |
| 321,993 | 2.75%, 06/25/2057(1)(3)(4) | 327,225 | |
| 149,937 | 3.00%, 01/25/2058(1)(3)(4) | 151,831 | |
| 46 |
December 31, 2021
| Shares or Principal Amount | Market Value† | ||
| ASSET & COMMERCIAL MORTGAGE-BACKED SECURITIES - 2.8% - (continued) | |||
| Other Asset-Backed Securities - 0.9% - (continued) | |||
| Vantage Data Centers Issuer LLC | |||
| $ 1,150,000 | 1.65%, 09/15/2045(1) | $ 1,124,210 | |
| 332,067 | 3.19%, 07/15/2044(1) | 339,213 | |
| 20,079,265 | |||
| Whole Loan Collateral CMO - 0.4% | |||
| Angel Oak Mortgage Trust | |||
| 1,234,650 | 1.46%, 09/25/2066(1)(3)(4) | 1,223,330 | |
| 150,466 | 2.62%, 11/25/2059(1)(3)(4) | 150,284 | |
| 42,673 | 3.63%, 03/25/2049(1)(3)(4) | 42,825 | |
| 1,319,720 | COLT 2021-5 Mortgage Loan Trust 1.73%, 11/26/2066(1)(3)(4) | 1,314,875 | |
| 280,000 | Connecticut Avenue Securities Trust 1.60%, 10/25/2041(1)(2) | 280,471 | |
| 675,000 | CSMC Trust 1.84%, 10/25/2066(1)(3)(4) | 673,229 | |
| Fannie Mae Connecticut Avenue Securities | |||
| 553,289 | 2.30%, 01/25/2030, 1 mo. USD LIBOR + 2.200%(2) | 562,741 | |
| 229,629 | 5.00%, 11/25/2024, 1 mo. USD LIBOR + 4.900%(2) | 239,095 | |
| 307,984 | 6.00%, 10/25/2028, 1 mo. USD LIBOR + 5.900%(2) | 321,481 | |
| Flagstar Mortgage Trust | |||
| 755,479 | 2.00%, 09/25/2041(1)(3)(4) | 761,829 | |
| 427,699 | 4.00%, 05/25/2048(1)(3)(4) | 434,301 | |
| 311,878 | MetLife Securitization Trust 3.00%, 04/25/2055(1)(3)(4) | 317,656 | |
| 610,370 | Seasoned Credit Risk Transfer Trust 3.50%, 10/25/2058 | 634,287 | |
| 1,030,798 | Starwood Mortgage Residential Trust 1.92%, 11/25/2066(1)(3)(4) | 1,033,658 | |
| 7,990,062 | |||
| Total Asset & Commercial Mortgage-Backed Securities (cost $60,288,827) | $ 61,724,556 | ||
| CORPORATE BONDS - 12.3% | |||
| Aerospace/Defense - 0.5% | |||
| 850,000 | BAE Systems Holdings, Inc. 3.85%, 12/15/2025(1) | $ 911,454 | |
| Boeing Co. | |||
| 1,155,000 | 1.43%, 02/04/2024(5) | 1,153,427 | |
| 2,040,000 | 2.20%, 02/04/2026 | 2,040,076 | |
| 911,000 | 3.25%, 03/01/2028 | 943,516 | |
| 375,000 | 3.45%, 11/01/2028 | 392,449 | |
| 590,000 | 3.95%, 08/01/2059 | 615,324 | |
| 410,000 | Boeing Co. (The) 3.63%, 02/01/2031 | 437,674 | |
| 560,000 | Lockheed Martin Corp. 4.85%, 09/15/2041 | 713,422 | |
| 1,500,000 | Raytheon Technologies Corp. 4.13%, 11/16/2028 | 1,679,165 | |
| Teledyne Technologies, Inc. | |||
| 1,255,000 | 2.25%, 04/01/2028 | 1,255,486 | |
| 1,005,000 | 2.75%, 04/01/2031 | 1,020,269 | |
| 685,000 | United Technologies Corp. 3.95%, 08/16/2025 | 742,984 | |
| 11,905,246 | |||
| Agriculture - 0.3% | |||
| 310,000 | Altria Group, Inc. 4.50%, 05/02/2043 | 322,165 | |
| 3,985,000 | BAT Capital Corp. 3.56%, 08/15/2027 | 4,182,159 | |
| 1,065,000 | Imperial Brands Finance plc 3.75%, 07/21/2022(1) | 1,076,760 | |
| 5,581,084 | |||
| Shares or Principal Amount | Market Value† | ||
| CORPORATE BONDS - 12.3% - (continued) | |||
| Airlines - 0.1% | |||
| $ 621,851 | Continental Airlines, Inc. 5.98%, 10/19/2023 | $ 628,954 | |
| 509,038 | Southwest Airlines Co. 6.15%, 02/01/2024 | 517,425 | |
| 123,781 | United Airlines Class B Pass-Through Trust 4.60%, 09/01/2027 | 125,572 | |
| 1,271,951 | |||
| Auto Manufacturers - 0.3% | |||
| General Motors Financial Co., Inc. | |||
| 3,185,000 | 3.70%, 05/09/2023 | 3,280,190 | |
| 1,245,000 | 3.95%, 04/13/2024 | 1,310,243 | |
| 1,625,000 | Hyundai Capital America 0.80%, 04/03/2023(1) | 1,617,712 | |
| 920,000 | Volkswagen Group of America Finance LLC 3.35%, 05/13/2025(1) | 968,337 | |
| 7,176,482 | |||
| Beverages - 0.0% | |||
| 580,000 | Anheuser-Busch InBev Worldwide, Inc. 4.60%, 06/01/2060 | 720,780 | |
| 275,000 | Constellation Brands, Inc. 2.88%, 05/01/2030 | 282,498 | |
| 1,003,278 | |||
| Biotechnology - 0.1% | |||
| 1,480,000 | Gilead Sciences, Inc. 2.80%, 10/01/2050 | 1,441,248 | |
| 885,000 | Royalty Pharma plc 3.55%, 09/02/2050 | 880,669 | |
| 2,321,917 | |||
| Commercial Banks - 4.1% | |||
| Banco Santander S.A. | |||
| 1,200,000 | 3.13%, 02/23/2023 | 1,227,496 | |
| 600,000 | 3.85%, 04/12/2023 | 620,681 | |
| Bank of America Corp. | |||
| 1,570,000 | 1.73%, 07/22/2027, (1.73% fixed rate until 07/22/2026; 3 mo. USD SOFR + 0.960% thereafter)(4) | 1,559,460 | |
| 2,210,000 | 2.30%, 07/21/2032, (2.30% fixed rate until 07/21/2031; 3 mo. USD SOFR + 1.220% thereafter)(4) | 2,175,436 | |
| 1,380,000 | 2.48%, 09/21/2036, (2.48% fixed rate until 09/21/2031; 5 year USD CMT + 1.200% thereafter)(4) | 1,338,339 | |
| 1,799,000 | 3.42%, 12/20/2028, (3.42% fixed rate until 12/20/2027; 3 mo. USD LIBOR + 1.040% thereafter)(4) | 1,922,097 | |
| 1,610,000 | 3.59%, 07/21/2028, (3.59% fixed rate until 07/21/2027; 3 mo. USD LIBOR + 1.370% thereafter)(4) | 1,733,962 | |
| 4,225,000 | 4.20%, 08/26/2024 | 4,529,693 | |
| Barclays plc | |||
| 1,510,000 | 2.89%, 11/24/2032, (2.89% fixed rate until 11/24/2031; 12 mo. USD CMT + 1.300% thereafter)(4) | 1,522,490 | |
| 1,060,000 | 3.33%, 11/24/2042, (3.33% fixed rate until 11/24/2041; 12 mo. USD CMT + 1.300% thereafter)(3)(4) | 1,081,784 | |
| 1,000,000 | 3.93%, 05/07/2025, (3.93% fixed rate until 05/07/2024; 3 mo. USD LIBOR + 1.610% thereafter)(4) | 1,051,845 | |
| BNP Paribas S.A. | |||
| 830,000 | 2.82%, 11/19/2025, (2.82% fixed rate until 11/19/2024; 3 mo. USD LIBOR + 1.111% thereafter)(1)(4) | 854,379 | |
| 1,000,000 | 3.38%, 01/09/2025(1) | 1,050,395 | |
| BPCE S.A. | |||
| 2,225,000 | 5.15%, 07/21/2024(1) | 2,410,217 | |
| 3,625,000 | 5.70%, 10/22/2023(1) | 3,897,099 | |
| 47 |
December 31, 2021
| Shares or Principal Amount | Market Value† | ||
| CORPORATE BONDS - 12.3% - (continued) | |||
| Commercial Banks - 4.1% - (continued) | |||
| $ 1,350,000 | Cooperatieve Rabobank UA 1.11%, 02/24/2027, (1.11% fixed rate until 02/24/2026; 3 mo. USD SOFR + 0.55% thereafter)(1)(4) | $ 1,310,488 | |
| Credit Agricole S.A. | |||
| 1,025,000 | 3.25%, 10/04/2024(1) | 1,072,492 | |
| 535,000 | 3.75%, 04/24/2023(1) | 554,338 | |
| 790,000 | 4.38%, 03/17/2025(1) | 848,318 | |
| Credit Suisse AG | |||
| 530,000 | 3.57%, 01/09/2023(1) | 530,150 | |
| 250,000 | 3.63%, 09/09/2024 | 265,159 | |
| Credit Suisse Group AG | |||
| 4,225,000 | 3.09%, 05/14/2032, (3.09% fixed rate until 05/14/2031; 3 mo. USD SOFR + 1.730% thereafter)(1)(4) | 4,303,952 | |
| 1,425,000 | 3.75%, 03/26/2025 | 1,512,681 | |
| Danske Bank A/S | |||
| 1,865,000 | 1.62%, 09/11/2026, (1.62% fixed rate until 09/11/2025; 12 mo. USD CMT + 1.350% thereafter)(1)(4) | 1,838,242 | |
| 775,000 | 3.88%, 09/12/2023(1) | 806,142 | |
| 440,000 | 5.00%, 01/12/2022(1) | 440,390 | |
| 575,000 | 5.38%, 01/12/2024(1) | 619,060 | |
| Goldman Sachs Group, Inc. | |||
| 1,300,000 | 1.43%, 03/09/2027, (1.43% fixed rate until 03/09/2026; 3 mo. USD SOFR + 0.798% thereafter)(4) | 1,274,188 | |
| 630,000 | 2.62%, 04/22/2032, (2.62% fixed rate until 04/22/2031; 3 mo. USD SOFR + 1.281% thereafter)(4) | 635,243 | |
| 560,000 | 2.65%, 10/21/2032, (2.65% fixed rate until 10/21/2031; 3 mo. USD SOFR + 1.264% thereafter)(4) | 564,171 | |
| 510,000 | 3.80%, 03/15/2030 | 561,951 | |
| 1,150,000 | 6.25%, 02/01/2041 | 1,675,978 | |
| HSBC Holdings plc | |||
| 2,085,000 | 1.59%, 05/24/2027, (1.59% fixed rate until 05/24/2026; 3 mo. USD SOFR + 1.290% thereafter)(4) | 2,040,124 | |
| 1,975,000 | 2.21%, 08/17/2029, (2.21% fixed rate until 08/17/2028; 3 mo. USD SOFR + 1.285% thereafter)(4) | 1,937,686 | |
| 655,000 | 2.80%, 05/24/2032, (2.80% fixed rate until 05/24/2031; 3 mo. USD SOFR + 1.187% thereafter)(4) | 657,774 | |
| 2,745,000 | 2.87%, 11/22/2032, (2.87% fixed rate until 11/22/2031; 3 mo. USD SOFR + 1.410% thereafter)(4) | 2,771,043 | |
| 2,625,000 | 3.60%, 05/25/2023 | 2,722,354 | |
| JP Morgan Chase & Co. | |||
| 620,000 | 2.52%, 04/22/2031, (2.52% fixed rate until 04/22/2030; 3 mo. USD LIBOR 2.040% thereafter)(4) | 627,298 | |
| 545,000 | 2.58%, 04/22/2032, (2.58% fixed rate until 04/22/2031; 3 mo. USD SOFR + 1.250% thereafter)(4) | 552,629 | |
| 390,000 | 3.11%, 04/22/2041, (3.11% fixed rate until 04/22/2040; 3 mo. USD SOFR + 2.460% thereafter)(4) | 405,023 | |
| Shares or Principal Amount | Market Value† | ||
| CORPORATE BONDS - 12.3% - (continued) | |||
| Commercial Banks - 4.1% - (continued) | |||
| $ 705,000 | 3.70%, 05/06/2030, (3.70% fixed rate until 05/06/2029; 3 mo. USD LIBOR + 1.160% thereafter)(4) | $ 771,153 | |
| 805,000 | 4.45%, 12/05/2029, (4.45% fixed rate until 12/05/2028; 3 mo. USD LIBOR + 1.330% thereafter)(4) | 914,348 | |
| Morgan Stanley | |||
| 1,755,000 | 1.93%, 04/28/2032, (1.93% fixed rate until 04/28/2031; 3 mo. USD SOFR + 1.020% thereafter)(4) | 1,678,883 | |
| 2,120,000 | 2.48%, 09/16/2036, (2.48% fixed rate until 09/16/2031; 3 mo. USD SOFR + 1.360% thereafter)(4) | 2,041,247 | |
| 515,000 | 2.51%, 10/20/2032, (2.51% fixed rate until 10/20/2031; 3 mo. USD SOFR + 1.200% thereafter)(4) | 515,107 | |
| 1,450,000 | 3.13%, 07/27/2026 | 1,536,880 | |
| 1,000,000 | 3.70%, 10/23/2024 | 1,065,180 | |
| 1,865,000 | National Australia Bank Ltd. 2.33%, 08/21/2030(1) | 1,788,541 | |
| 4,905,000 | NBK SPC Ltd. 2.75%, 05/30/2022(1) | 4,941,297 | |
| 1,755,000 | Santander Holdings USA, Inc. 3.40%, 01/18/2023 | 1,793,769 | |
| Standard Chartered plc | |||
| 1,130,000 | 0.99%, 01/12/2025, (0.99% fixed rate until 01/12/2024; 3 mo. USD LIBOR + 0.78% thereafter)(1)(4) | 1,117,240 | |
| 3,215,000 | 1.21%, 03/23/2025, (1.21% fixed rate until 03/23/2024; 12 mo. USD CMT + 0.880% thereafter)(1)(4) | 3,186,387 | |
| 1,695,000 | UBS Group AG 1.49%, 08/10/2027, (1.49% fixed rate until 08/10/2026; 12 mo. USD CMT + 0.850% thereafter)(1)(4) | 1,654,484 | |
| 1,485,000 | UniCredit S.p.A. 1.98%, 06/03/2027, (1.98% fixed rate until 06/03/2026; 12 mo. USD CMT + 1.200% thereafter)(1)(4) | 1,447,596 | |
| 3,980,000 | US Bancorp 2.49%, 11/03/2036, (2.49% fixed rate until 11/03/2031; 5 year USD CMT + 0.9500% thereafter)(4) | 3,969,394 | |
| 4,344,000 | Wells Fargo & Co. 4.48%, 01/16/2024 | 4,614,198 | |
| 90,537,951 | |||
| Commercial Services - 0.0% | |||
| 830,000 | Global Payments, Inc. 2.15%, 01/15/2027 | 833,815 | |
| Construction Materials - 0.1% | |||
| 972,000 | Carrier Global Corp. 2.72%, 02/15/2030 | 993,611 | |
| 996,000 | Johnson Controls International plc 4.95%, 07/02/2064(6) | 1,291,892 | |
| 2,285,503 | |||
| Diversified Financial Services - 0.5% | |||
| 1,189,000 | AerCap Ireland Capital DAC / AerCap Global Aviation Trust 3.88%, 01/23/2028(5) | 1,261,823 | |
| Avolon Holdings Funding Ltd. | |||
| 1,169,000 | 2.13%, 02/21/2026(1) | 1,147,940 | |
| 430,000 | 2.53%, 11/18/2027(1) | 418,004 | |
| 1,900,000 | 2.75%, 02/21/2028(1) | 1,865,791 | |
| 751,000 | 4.38%, 05/01/2026(1) | 804,770 | |
| 1,875,000 | Capital One Financial Corp. 3.75%, 04/24/2024 | 1,976,508 | |
| 48 |
December 31, 2021
| Shares or Principal Amount | Market Value† | ||
| CORPORATE BONDS - 12.3% - (continued) | |||
| Diversified Financial Services - 0.5% - (continued) | |||
| $ 2,125,000 | Intercontinental Exchange, Inc. 1.85%, 09/15/2032 | $ 2,036,698 | |
| 1,004,349 | Postal Square L.P. 8.95%, 06/15/2022 | 1,037,992 | |
| 10,549,526 | |||
| Electric - 0.9% | |||
| 1,200,000 | American Transmission Systems Inc 2.65%, 01/15/2032(1) | 1,212,569 | |
| Cleco Corporate Holdings LLC | |||
| 650,000 | 3.38%, 09/15/2029 | 661,669 | |
| 1,030,000 | 3.74%, 05/01/2026 | 1,098,852 | |
| 1,960,000 | Cleveland Electric Illuminating Co. 3.50%, 04/01/2028(1) | 2,088,292 | |
| 855,000 | Consolidated Edison Co of New York Inc 3.20%, 12/01/2051 | 857,837 | |
| 360,000 | Dominion Energy South Carolina, Inc. 6.63%, 02/01/2032 | 489,704 | |
| 1,200,000 | Duke Energy Carolinas LLC 6.10%, 06/01/2037 | 1,630,179 | |
| 245,000 | Georgia Power Co. 4.75%, 09/01/2040 | 289,727 | |
| 1,275,000 | Indianapolis Power and Light Co. 6.60%, 06/01/2037(1) | 1,792,604 | |
| 691,000 | Mid-Atlantic Interstate Transmission LLC 4.10%, 05/15/2028(1) | 759,533 | |
| 1,290,000 | NextEra Energy Capital Holdings, Inc. 1.90%, 06/15/2028 | 1,277,500 | |
| Niagara Mohawk Power Corp. | |||
| 370,000 | 3.03%, 06/27/2050(1) | 352,386 | |
| 645,000 | 4.28%, 12/15/2028(1) | 710,167 | |
| 165,000 | PacifiCorp 4.13%, 01/15/2049 | 190,746 | |
| 241,000 | Pennsylvania Electric Co. 3.60%, 06/01/2029(1) | 256,654 | |
| San Diego Gas & Electric Co. | |||
| 2,715,000 | 1.70%, 10/01/2030 | 2,600,829 | |
| 90,000 | 3.75%, 06/01/2047 | 100,513 | |
| 25,000 | 4.15%, 05/15/2048 | 29,888 | |
| SCE Recovery Funding LLC | |||
| 500,340 | 0.86%, 11/15/2031 | 477,126 | |
| 220,000 | 1.94%, 05/15/2038 | 209,934 | |
| 125,000 | 2.51%, 11/15/2043 | 120,118 | |
| 1,070,000 | Sempra Energy 4.13%, 04/01/2052, (4.13% fixed rate until 01/01/2027; 5 year USD CMT + 2.868% thereafter)(4) | 1,084,571 | |
| Southern Co. | |||
| 1,050,000 | 2.95%, 07/01/2023 | 1,075,387 | |
| 255,000 | 4.00%, 01/15/2051, (4.00% fixed rate until 10/15/2025; 5 year USD CMT + 3.733% thereafter)(4) | 260,737 | |
| 350,000 | Tucson Electric Power Co. 4.00%, 06/15/2050 | 404,416 | |
| 20,031,938 | |||
| Environmental Control - 0.1% | |||
| 1,480,000 | Republic Services, Inc. 2.30%, 03/01/2030 | 1,485,033 | |
| Food - 0.1% | |||
| Conagra Brands, Inc. | |||
| 900,000 | 1.38%, 11/01/2027 | 860,148 | |
| 455,000 | 4.60%, 11/01/2025 | 500,485 | |
| Shares or Principal Amount | Market Value† | ||
| CORPORATE BONDS - 12.3% - (continued) | |||
| Food - 0.1% - (continued) | |||
| $ 285,000 | McCormick & Co., Inc. 2.50%, 04/15/2030 | $ 288,374 | |
| 480,000 | Sigma Alimentos S.A. de C.V. 4.13%, 05/02/2026(1) | 508,889 | |
| 2,157,896 | |||
| Gas - 0.1% | |||
| 330,000 | Boston Gas Co. 3.15%, 08/01/2027(1) | 342,588 | |
| 1,870,000 | KeySpan Gas East Corp. 2.74%, 08/15/2026(1) | 1,909,590 | |
| 2,252,178 | |||
| Healthcare - Products - 0.2% | |||
| 2,725,000 | Alcon Finance Corp. 3.00%, 09/23/2029(1) | 2,847,203 | |
| Boston Scientific Corp. | |||
| 1,530,000 | 2.65%, 06/01/2030 | 1,561,269 | |
| 135,000 | 4.00%, 03/01/2029 | 150,040 | |
| 4,558,512 | |||
| Healthcare - Services - 0.6% | |||
| Anthem, Inc. | |||
| 1,510,000 | 2.25%, 05/15/2030 | 1,506,217 | |
| 1,710,000 | 4.10%, 03/01/2028 | 1,897,361 | |
| 475,000 | Children's Hospital 2.93%, 07/15/2050 | 469,430 | |
| CommonSpirit Health | |||
| 45,000 | 3.91%, 10/01/2050 | 50,246 | |
| 308,000 | 4.19%, 10/01/2049 | 359,621 | |
| 590,000 | 4.20%, 08/01/2023 | 617,026 | |
| 245,000 | 4.35%, 11/01/2042 | 281,892 | |
| Dignity Health | |||
| 714,000 | 3.81%, 11/01/2024 | 755,880 | |
| 1,353,000 | 4.50%, 11/01/2042(5) | 1,616,775 | |
| 425,000 | HCA, Inc. 5.25%, 06/15/2049 | 547,619 | |
| Mercy Health | |||
| 1,400,000 | 3.56%, 08/01/2027 | 1,501,210 | |
| 455,000 | 4.30%, 07/01/2028(5) | 512,153 | |
| 1,050,000 | Ochsner LSU Health System of North Louisiana 2.51%, 05/15/2031 | 1,028,197 | |
| 335,000 | Sutter Health 2.29%, 08/15/2030 | 334,872 | |
| Toledo Hospital | |||
| 900,000 | 5.33%, 11/15/2028 | 1,009,348 | |
| 320,000 | 5.75%, 11/15/2038(5) | 373,683 | |
| UnitedHealth Group, Inc. | |||
| 355,000 | 2.00%, 05/15/2030 | 352,807 | |
| 125,000 | 2.90%, 05/15/2050 | 127,832 | |
| 13,342,169 | |||
| Insurance - 0.6% | |||
| American International Group, Inc. | |||
| 750,000 | 3.40%, 06/30/2030 | 811,829 | |
| 2,150,000 | 4.25%, 03/15/2029 | 2,458,762 | |
| 375,000 | 4.38%, 06/30/2050 | 469,116 | |
| 2,815,000 | Athene Global Funding 2.50%, 03/24/2028(1) | 2,833,241 | |
| 1,200,000 | Equitable Financial Life Global Funding 1.40%, 08/27/2027(1) | 1,163,768 | |
| 200,000 | Five Corners Funding Trust 4.42%, 11/15/2023(1) | 212,006 | |
| Liberty Mutual Group, Inc. | |||
| 122,000 | 4.25%, 06/15/2023(1) | 127,437 | |
| 428,000 | 4.57%, 02/01/2029(1) | 492,231 | |
| 705,000 | Marsh & McLennan Cos., Inc. 4.38%, 03/15/2029 | 804,299 | |
| 49 |
December 31, 2021
| Shares or Principal Amount | Market Value† | ||
| CORPORATE BONDS - 12.3% - (continued) | |||
| Insurance - 0.6% - (continued) | |||
| $ 3,320,000 | Nippon Life Insurance Co. 2.90%, 09/16/2051, (2.90% fixed rate until 09/16/2031; 5 year USD CMT + 2.600% thereafter)(1)(4) | $ 3,286,900 | |
| 132,000 | Northwestern Mutual Life Insurance Co. 3.63%, 09/30/2059(1) | 145,991 | |
| 12,805,580 | |||
| Investment Company Security - 0.1% | |||
| 1,120,000 | JAB Holdings B.V. 3.75%, 05/28/2051(1) | 1,219,228 | |
| IT Services - 0.1% | |||
| 3,190,000 | Kyndryl Holdings, Inc. 3.15%, 10/15/2031(1) | 3,097,890 | |
| Lodging - 0.1% | |||
| 2,003,000 | Genting New York LLC 3.30%, 02/15/2026(1) | 1,983,823 | |
| Media - 0.4% | |||
| Charter Communications Operating LLC / Charter Communications Operating Capital | |||
| 2,525,000 | 2.30%, 02/01/2032 | 2,399,747 | |
| 85,000 | 3.70%, 04/01/2051 | 82,474 | |
| 243,000 | 4.80%, 03/01/2050 | 272,963 | |
| 187,000 | 5.13%, 07/01/2049 | 217,604 | |
| Comcast Corp. | |||
| 1,367,000 | 2.89%, 11/01/2051(1) | 1,327,316 | |
| 1,500,000 | 4.40%, 08/15/2035 | 1,800,656 | |
| Discovery Communications LLC | |||
| 935,000 | 3.95%, 03/20/2028 | 1,016,898 | |
| 583,000 | 4.00%, 09/15/2055 | 613,275 | |
| 752,000 | 4.65%, 05/15/2050 | 885,176 | |
| Time Warner Cable LLC | |||
| 395,000 | 6.55%, 05/01/2037 | 517,836 | |
| 250,000 | 7.30%, 07/01/2038 | 354,582 | |
| 130,000 | Time Warner Entertainment Co., L.P. 8.38%, 03/15/2023 | 140,975 | |
| 9,629,502 | |||
| Oil & Gas - 0.4% | |||
| Equinor ASA | |||
| 85,000 | 2.88%, 04/06/2025 | 88,743 | |
| 2,470,000 | 3.00%, 04/06/2027 | 2,607,122 | |
| Hess Corp. | |||
| 705,000 | 5.60%, 02/15/2041 | 872,523 | |
| 1,775,000 | 7.30%, 08/15/2031 | 2,365,712 | |
| Qatar Petroleum | |||
| 935,000 | 2.25%, 07/12/2031(1) | 926,181 | |
| 780,000 | 3.13%, 07/12/2041(1) | 788,281 | |
| 615,000 | Saudi Arabian Oil Co. 3.50%, 04/16/2029(1) | 657,281 | |
| 8,305,843 | |||
| Pharmaceuticals - 0.2% | |||
| AbbVie, Inc. | |||
| 645,000 | 3.45%, 03/15/2022 | 645,590 | |
| 975,000 | 3.80%, 03/15/2025 | 1,038,248 | |
| 955,000 | Bayer U.S. Finance LLC 3.38%, 10/08/2024(1) | 998,369 | |
| 955,000 | Cigna Corp. 4.38%, 10/15/2028 | 1,086,218 | |
| CVS Health Corp. | |||
| 113,000 | 4.30%, 03/25/2028 | 126,900 | |
| 685,000 | 4.88%, 07/20/2035 | 838,672 | |
| 650,000 | Takeda Pharmaceutical Co., Ltd. 3.18%, 07/09/2050 | 657,694 | |
| 5,391,691 | |||
| Pipelines - 0.5% | |||
| Energy Transfer Operating L.P. | |||
| 180,000 | 4.95%, 06/15/2028 | 202,632 | |
| Shares or Principal Amount | Market Value† | ||
| CORPORATE BONDS - 12.3% - (continued) | |||
| Pipelines - 0.5% - (continued) | |||
| $ 750,000 | 5.00%, 05/15/2050 | $ 865,838 | |
| 945,000 | 5.35%, 05/15/2045 | 1,088,299 | |
| 872,000 | 7.60%, 02/01/2024 | 958,462 | |
| Enterprise Products Operating LLC | |||
| 100,000 | 3.70%, 01/31/2051 | 105,298 | |
| 145,000 | 3.95%, 01/31/2060 | 157,193 | |
| 3,085,000 | Galaxy Pipeline Assets Bidco Ltd. 2.16%, 03/31/2034(1) | 3,023,671 | |
| Gray Oak Pipeline LLC | |||
| 606,000 | 2.60%, 10/15/2025(1) | 607,454 | |
| 100,000 | 3.45%, 10/15/2027(1) | 104,456 | |
| 425,000 | TransCanada PipeLines Ltd. 4.10%, 04/15/2030 | 474,531 | |
| 2,470,000 | Western Midstream Operating L.P. 4.00%, 07/01/2022 | 2,476,175 | |
| 10,064,009 | |||
| Real Estate Investment Trusts - 0.4% | |||
| American Tower Corp. | |||
| 375,000 | 4.40%, 02/15/2026 | 409,421 | |
| 400,000 | 5.00%, 02/15/2024 | 430,499 | |
| 1,110,000 | CubeSmart L.P. 2.25%, 12/15/2028 | 1,111,148 | |
| EPR Properties | |||
| 2,255,000 | 3.60%, 11/15/2031 | 2,233,498 | |
| 1,538,000 | 3.75%, 08/15/2029 | 1,553,609 | |
| 245,000 | 4.75%, 12/15/2026 | 261,968 | |
| 240,000 | 4.95%, 04/15/2028 | 259,155 | |
| 985,000 | Equinix, Inc. 3.00%, 07/15/2050 | 943,781 | |
| SBA Tower Trust | |||
| 545,000 | 1.63%, 05/15/2051(1) | 536,377 | |
| 300,000 | 1.88%, 07/15/2050(1) | 299,605 | |
| 470,000 | 2.84%, 01/15/2050(1) | 482,291 | |
| 225,000 | 3.45%, 03/15/2048(1) | 226,089 | |
| 8,747,441 | |||
| Retail - 0.1% | |||
| 1,000,000 | AutoZone, Inc. 3.25%, 04/15/2025 | 1,050,443 | |
| Semiconductors - 0.3% | |||
| 375,000 | Broadcom Corp. / Broadcom Cayman Finance Ltd. 3.88%, 01/15/2027 | 406,844 | |
| Broadcom, Inc. | |||
| 800,000 | 2.60%, 02/15/2033(1) | 780,850 | |
| 1,595,000 | 3.42%, 04/15/2033(1) | 1,673,999 | |
| 510,000 | 3.50%, 02/15/2041(1) | 522,604 | |
| 160,000 | 4.15%, 11/15/2030 | 177,628 | |
| 2,275,000 | Microchip Technology, Inc. 0.97%, 02/15/2024 | 2,250,708 | |
| 5,812,633 | |||
| Software - 0.1% | |||
| Oracle Corp. | |||
| 670,000 | 3.60%, 04/01/2050 | 658,385 | |
| 730,000 | 3.65%, 03/25/2041 | 740,080 | |
| 315,000 | 3.85%, 04/01/2060 | 312,315 | |
| 1,405,000 | 3.95%, 03/25/2051 | 1,463,958 | |
| 3,174,738 | |||
| Telecommunications - 0.7% | |||
| AT&T, Inc. | |||
| 1,930,000 | 3.10%, 02/01/2043 | 1,881,920 | |
| 1,110,000 | 3.30%, 02/01/2052 | 1,091,223 | |
| 835,000 | 3.50%, 09/15/2053 | 845,711 | |
| 84,000 | 3.65%, 06/01/2051 | 87,316 | |
| 146,000 | 3.85%, 06/01/2060 | 153,142 | |
| 200,000 | 4.30%, 12/15/2042 | 226,738 | |
| 50 |
December 31, 2021
| Shares or Principal Amount | Market Value† | ||
| CORPORATE BONDS - 12.3% - (continued) | |||
| Telecommunications - 0.7% - (continued) | |||
| $ 2,185,000 | 4.45%, 04/01/2024 | $ 2,332,581 | |
| 450,000 | Deutsche Telekom International Finance B.V. 3.60%, 01/19/2027(1) | 482,367 | |
| 576,000 | Orange S.A. 9.00%, 03/01/2031 | 883,437 | |
| 1,820,000 | Sprint Spectrum Co. LLC / Sprint Spectrum Co. II LLC / Sprint Spectrum Co. III LLC 4.74%, 03/20/2025(1) | 1,904,084 | |
| 3,660,000 | T-Mobile USA, Inc. 2.70%, 03/15/2032(1) | 3,687,529 | |
| Verizon Communications, Inc. | |||
| 648,000 | 2.36%, 03/15/2032(1) | 639,278 | |
| 715,000 | 4.75%, 11/01/2041 | 886,177 | |
| 283,000 | 4.81%, 03/15/2039 | 355,688 | |
| 15,457,191 | |||
| Transportation - 0.1% | |||
| 1,160,000 | Canadian Pacific Railway Co. 2.45%, 12/02/2031 | 1,182,240 | |
| Trucking & Leasing - 0.2% | |||
| 2,185,000 | DAE Funding LLC 1.55%, 08/01/2024(1) | 2,168,613 | |
| Penske Truck Leasing Co. L.P. / PTL Finance Corp. | |||
| 155,000 | 2.70%, 11/01/2024(1) | 159,752 | |
| 2,850,000 | 3.95%, 03/10/2025(1) | 3,037,668 | |
| 5,366,033 | |||
| Total Corporate Bonds (cost $264,219,761) | $ 270,582,764 | ||
| FOREIGN GOVERNMENT OBLIGATIONS - 0.3% | |||
| Chile - 0.2% | |||
| 3,425,000 | Chile Government International Bond 2.55%, 07/27/2033 | $ 3,330,812 | |
| Mexico - 0.0% | |||
| 960,000 | Mexico Government International Bond 4.28%, 08/14/2041 | 994,800 | |
| Qatar - 0.1% | |||
| 1,680,000 | Qatar Government International Bond 3.88%, 04/23/2023(1) | 1,746,612 | |
| Saudi Arabia - 0.0% | |||
| 800,000 | Saudi Government International Bond 2.88%, 03/04/2023(1) | 818,837 | |
| Total Foreign Government Obligations (cost $6,840,339) | $ 6,891,061 | ||
| MUNICIPAL BONDS - 0.7% | |||
| General - 0.2% | |||
| 365,000 | City of Sacramento, CA, (AGM Insured) 6.42%, 08/01/2023 | $ 395,920 | |
| 540,000 | Kansas, ST, Development Finance Authority 2.77%, 05/01/2051 | 536,046 | |
| 1,250,000 | Philadelphia, PA, Auth Industrial Dev, (NATL Insured) 6.55%, 10/15/2028 | 1,570,794 | |
| 750,000 | Sales Tax Securitization Corp., IL Rev 4.79%, 01/01/2048 | 955,482 | |
| 3,458,242 | |||
| General Obligation - 0.2% | |||
| 3,710,000 | State of Illinois, GO 5.10%, 06/01/2033 | 4,288,331 | |
| Shares or Principal Amount | Market Value† | ||
| MUNICIPAL BONDS - 0.7% - (continued) | |||
| Power - 0.0% | |||
| $ 291,000 | New York Utility Debt Securitization Auth 3.44%, 12/15/2025 | $ 298,582 | |
| Tobacco - 0.0% | |||
| Golden State, CA, Tobacco Securitization Corp. | |||
| 35,000 | 2.75%, 06/01/2034 | 35,208 | |
| 185,000 | 3.00%, 06/01/2046 | 189,506 | |
| 75,000 | 3.29%, 06/01/2042 | 76,302 | |
| 301,016 | |||
| Transportation - 0.2% | |||
| 650,000 | Chicago, IL, Transit Auth 6.90, 12/01/2040, | 915,471 | |
| Foothill-Eastern Transportation Corridor Agency, CA,, (AGM Insured) | |||
| 705,000 | 3.92%, 01/15/2053 | 753,640 | |
| 95,000 | 4.09%, 01/15/2049 | 102,112 | |
| 875,000 | Illinois State Toll Highway Auth, Taxable Rev 6.18%, 01/01/2034 | 1,193,167 | |
| Metropolitan Transportation Auth, NY, Rev | |||
| 35,000 | 6.20%, 11/15/2026 | 39,569 | |
| 375,000 | 6.67%, 11/15/2039 | 532,637 | |
| 785,000 | 6.81%, 11/15/2040 | 1,117,001 | |
| 710,000 | New York and New Jersey Port Auth, Taxable Rev 3.18%, 07/15/2060 | 704,232 | |
| 5,357,829 | |||
| Utility - Electric - 0.1% | |||
| 785,000 | Illinois Municipal Electric Agency 6.83%, 02/01/2035 | 1,013,910 | |
| 732,000 | Municipal Electric Auth, GA 6.64%, 04/01/2057 | 1,114,431 | |
| 2,128,341 | |||
| Total Municipal Bonds (cost $14,412,283) | $ 15,832,341 | ||
| U.S. GOVERNMENT AGENCIES - 0.3% | |||
| Mortgage-Backed Agencies - 0.3% | |||
| FHLMC - 0.1% | |||
| 168,945 | 0.70%, 01/25/2051, 1 mo. USD SOFR + 0.650%(1)(2) | $ 168,895 | |
| 466,478 | 0.85%, 08/25/2033, 1 mo. USD SOFR + 0.800%(1)(2) | 466,197 | |
| 6,204 | 2.34%, 04/01/2029, 12 mo. USD CMT + 2.245%(2) | 6,242 | |
| 1,271,823 | 2.60%, 03/25/2030, 1 mo. USD LIBOR + 2.500%(2) | 1,296,300 | |
| 768,685 | 2.85%, 10/25/2050, SOFR + 2.800%(1)(2) | 774,736 | |
| 12,953 | 4.00%, 03/01/2041 | 14,119 | |
| 370,589 | 5.10%, 12/25/2028, 1 mo. USD LIBOR + 5.000%(2) | 386,042 | |
| 3,112,531 | |||
| FNMA - 0.1% | |||
| 105,349 | 0.49%, 10/25/2024, 1 mo. USD LIBOR + 0.400%(2) | 105,371 | |
| 325,000 | 3.07%, 02/01/2025 | 340,682 | |
| 11,296 | 4.50%, 11/01/2023 | 12,081 | |
| 68,784 | 4.50%, 03/01/2038 | 75,550 | |
| 28,361 | 4.50%, 11/01/2039 | 31,353 | |
| 17,075 | 4.50%, 04/01/2040 | 18,732 | |
| 43,692 | 4.50%, 08/01/2040 | 48,149 | |
| 15,442 | 4.50%, 02/01/2041 | 17,009 | |
| 51 |
December 31, 2021
| Shares or Principal Amount | Market Value† | ||
| U.S. GOVERNMENT AGENCIES - 0.3% - (continued) | |||
| Mortgage-Backed Agencies - 0.3% - (continued) | |||
| FNMA - 0.1% - (continued) | |||
| $ 275,411 | 4.50%, 04/01/2041 | 303,973 | |
| 175,572 | 4.50%, 06/01/2041 | $ 194,048 | |
| 225,174 | 4.50%, 07/01/2041 | 249,014 | |
| 62,685 | 4.50%, 09/01/2041 | 69,305 | |
| 56,298 | 4.50%, 07/01/2044 | 60,530 | |
| 1,525,797 | |||
| GNMA - 0.1% | |||
| 41,895 | 5.00%, 07/15/2037 | 48,113 | |
| 2,731 | 6.00%, 06/15/2024 | 2,998 | |
| 2,807 | 6.00%, 07/15/2026 | 3,082 | |
| 924 | 6.00%, 03/15/2028 | 1,018 | |
| 22,456 | 6.00%, 04/15/2028 | 24,740 | |
| 31,779 | 6.00%, 05/15/2028 | 34,935 | |
| 13,921 | 6.00%, 06/15/2028 | 15,309 | |
| 15,623 | 6.00%, 07/15/2028 | 17,168 | |
| 5,125 | 6.00%, 08/15/2028 | 5,636 | |
| 32,062 | 6.00%, 09/15/2028 | 35,251 | |
| 62,674 | 6.00%, 10/15/2028 | 68,917 | |
| 45,102 | 6.00%, 11/15/2028 | 49,592 | |
| 58,567 | 6.00%, 12/15/2028 | 64,410 | |
| 1,052 | 6.00%, 12/15/2031 | 1,180 | |
| 13,543 | 6.00%, 09/15/2032 | 15,652 | |
| 4,603 | 6.00%, 11/15/2032 | 5,168 | |
| 1,687 | 6.00%, 04/15/2033 | 1,856 | |
| 59,345 | 6.00%, 06/15/2033 | 66,625 | |
| 18,931 | 6.00%, 10/15/2033 | 21,995 | |
| 2,012 | 6.00%, 11/15/2033 | 2,335 | |
| 21,851 | 6.00%, 10/15/2034 | 24,044 | |
| 50,985 | 6.00%, 01/15/2035 | 56,245 | |
| 6,162 | 6.00%, 05/15/2035 | 6,783 | |
| 6,844 | 6.00%, 06/15/2035 | 7,541 | |
| 153 | 6.50%, 03/15/2026 | 168 | |
| 2,168 | 6.50%, 01/15/2028 | 2,386 | |
| 23,686 | 6.50%, 03/15/2028 | 25,987 | |
| 53,150 | 6.50%, 04/15/2028 | 58,370 | |
| 16,210 | 6.50%, 05/15/2028 | 17,785 | |
| 76,987 | 6.50%, 06/15/2028 | 84,474 | |
| 5,101 | 6.50%, 10/15/2028 | 5,597 | |
| 1,438 | 6.50%, 02/15/2035 | 1,628 | |
| 5,919 | 7.00%, 11/15/2031 | 6,487 | |
| 3,120 | 7.00%, 03/15/2032 | 3,423 | |
| 626,903 | 7.00%, 11/15/2032 | 730,286 | |
| 74,723 | 7.00%, 01/15/2033 | 85,238 | |
| 86,345 | 7.00%, 05/15/2033 | 98,150 | |
| 13,168 | 7.00%, 07/15/2033 | 14,839 | |
| 97,466 | 7.00%, 11/15/2033 | 111,175 | |
| 38,145 | 7.50%, 09/16/2035 | 42,704 | |
| 76 | 8.00%, 09/15/2026 | 81 | |
| 23 | 8.00%, 11/15/2026 | 24 | |
| 3,942 | 8.00%, 12/15/2026 | 4,331 | |
| 72 | 8.00%, 09/15/2027 | 73 | |
| 2,652 | 8.00%, 07/15/2029 | 2,978 | |
| 7,154 | 8.00%, 12/15/2029 | 7,368 | |
| 3,315 | 8.00%, 01/15/2030 | 3,407 | |
| 2,009 | 8.00%, 02/15/2030 | 2,020 | |
| 680 | 8.00%, 03/15/2030 | 683 | |
| 7,444 | 8.00%, 04/15/2030 | 7,473 | |
| 3,648 | 8.00%, 05/15/2030 | 3,791 | |
| 27,888 | 8.00%, 06/15/2030 | 28,998 | |
| 1,096 | 8.00%, 07/15/2030 | 1,126 | |
| 26,332 | 8.00%, 08/15/2030 | 27,500 | |
| Shares or Principal Amount | Market Value† | ||
| U.S. GOVERNMENT AGENCIES - 0.3% - (continued) | |||
| Mortgage-Backed Agencies - 0.3% - (continued) | |||
| GNMA - 0.1% - (continued) | |||
| $ 12,698 | 8.00%, 09/15/2030 | $ 13,043 | |
| 5,070 | 8.00%, 11/15/2030 | 5,090 | |
| 61,485 | 8.00%, 12/15/2030 | 64,259 | |
| 2,041,535 | |||
| Total U.S. Government Agencies (cost $6,440,918) | $ 6,679,863 | ||
| U.S. GOVERNMENT SECURITIES - 14.0% | |||
| U.S. Treasury Securities - 14.0% | |||
| U.S. Treasury Bonds - 5.6% | |||
| 1,395,000 | 1.63%, 11/15/2050 | $ 1,305,796 | |
| 15,090,000 | 1.75%, 08/15/2041 | 14,677,383 | |
| 35,000 | 1.88%, 02/15/2051 | 34,787 | |
| 21,485,000 | 1.88%, 11/15/2051 | 21,414,502 | |
| 7,100,000 | 2.00%, 11/15/2041 | 7,204,281 | |
| 10,980,000 | 2.00%, 08/15/2051 | 11,244,206 | |
| 18,370,000 | 2.50%, 02/15/2045(7) | 20,276,605 | |
| 2,624,000 | 2.75%, 11/15/2047 | 3,067,108 | |
| 8,040,800 | 2.88%, 05/15/2043 | 9,375,070 | |
| 7,895,000 | 3.13%, 08/15/2044 | 9,620,798 | |
| 4,630,000 | 3.38%, 05/15/2044 | 5,848,811 | |
| 14,935,000 | 4.38%, 02/15/2038 | 20,626,052 | |
| 124,695,399 | |||
| U.S. Treasury Notes - 8.4% | |||
| 1,175,000 | 0.13%, 05/15/2023 | 1,168,299 | |
| 4,000,000 | 0.13%, 05/31/2023 | 3,975,312 | |
| 7,700,000 | 0.13%, 06/30/2023 | 7,648,266 | |
| 15,470,000 | 0.25%, 09/30/2023 | 15,362,435 | |
| 4,540,000 | 0.25%, 05/31/2025 | 4,417,633 | |
| 16,075,000 | 0.25%, 07/31/2025 | 15,598,401 | |
| 8,770,000 | 0.25%, 08/31/2025 | 8,499,021 | |
| 14,815,000 | 0.25%, 09/30/2025 | 14,352,031 | |
| 4,050,000 | 0.38%, 10/31/2023 | 4,026,586 | |
| 8,325,000 | 0.38%, 11/30/2025 | 8,077,201 | |
| 6,815,000 | 0.38%, 12/31/2025 | 6,608,687 | |
| 7,435,000 | 0.38%, 01/31/2026 | 7,196,267 | |
| 4,300,000 | 0.50%, 02/28/2026 | 4,179,902 | |
| 1,560,000 | 0.63%, 07/31/2026 | 1,517,770 | |
| 3,620,000 | 0.75%, 03/31/2026 | 3,553,115 | |
| 5,655,000 | 0.75%, 04/30/2026 | 5,545,876 | |
| 3,455,000 | 0.75%, 05/31/2026 | 3,385,900 | |
| 2,305,000 | 0.75%, 08/31/2026 | 2,254,758 | |
| 10,155,000 | 0.88%, 06/30/2026 | 9,999,502 | |
| 9,165,000 | 0.88%, 09/30/2026 | 9,007,119 | |
| 3,745,000 | 1.13%, 10/31/2026 | 3,722,471 | |
| 11,355,000 | 1.25%, 11/30/2026 | 11,355,000 | |
| 6,050,000 | 1.25%, 12/31/2026 | 6,047,637 | |
| 960,000 | 1.25%, 03/31/2028 | 952,238 | |
| 150,000 | 1.25%, 05/31/2028 | 148,641 | |
| 1,480,000 | 1.25%, 09/30/2028 | 1,463,870 | |
| 510,000 | 1.25%, 08/15/2031 | 499,242 | |
| 1,020,000 | 1.38%, 10/31/2028 | 1,016,812 | |
| 11,690,000 | 1.38%, 11/15/2031 | 11,556,661 | |
| 530,000 | 1.50%, 11/30/2028 | 532,567 | |
| 52 |
December 31, 2021
| Shares or Principal Amount | Market Value† | ||
| U.S. GOVERNMENT SECURITIES - 14.0% - (continued) | |||
| U.S. Treasury Securities - 14.0% - (continued) | |||
| U.S. Treasury Notes - 8.4% - (continued) | |||
| $ 2,905,000 | 1.63%, 10/31/2026 | $ 2,955,951 | |
| 7,680,000 | 2.00%, 11/15/2026 | 7,949,400 | |
| 184,574,571 | |||
| Total U.S. Government Securities (cost $297,781,186) | $ 309,269,970 | ||
| COMMON STOCKS - 68.7% | |||
| Automobiles & Components - 0.9% | |||
| 533,406 | Gentex Corp. | $ 18,589,199 | |
| Banks - 3.7% | |||
| 250,128 | JP Morgan Chase & Co. | 39,607,769 | |
| 131,170 | M&T Bank Corp. | 20,145,089 | |
| 109,687 | PNC Financial Services Group, Inc. | 21,994,437 | |
| 81,747,295 | |||
| Capital Goods - 6.4% | |||
| 171,925 | Fortune Brands Home & Security, Inc. | 18,378,783 | |
| 84,112 | General Dynamics Corp. | 17,534,829 | |
| 76,171 | Hubbell, Inc. | 15,864,134 | |
| 226,657 | Johnson Controls International plc | 18,429,481 | |
| 80,218 | L3Harris Technologies, Inc. | 17,105,686 | |
| 88,067 | Middleby Corp.* | 17,328,063 | |
| 44,474 | Northrop Grumman Corp. | 17,214,551 | |
| 228,835 | Raytheon Technologies Corp. | 19,693,540 | |
| 141,549,067 | |||
| Commercial & Professional Services - 1.2% | |||
| 190,929 | IHS Markit Ltd. | 25,378,283 | |
| Consumer Durables & Apparel - 0.8% | |||
| 153,468 | Lennar Corp. Class A | 17,826,843 | |
| Diversified Financials - 1.9% | |||
| 228,162 | Ares Management Corp. Class A | 18,542,726 | |
| 239,821 | Morgan Stanley | 23,540,829 | |
| 42,083,555 | |||
| Energy - 0.9% | |||
| 112,739 | Pioneer Natural Resources Co. | 20,504,969 | |
| Food & Staples Retailing - 0.8% | |||
| 215,458 | Sysco Corp. | 16,924,226 | |
| Food, Beverage & Tobacco - 1.8% | |||
| 535,643 | Keurig Dr Pepper, Inc. | 19,743,801 | |
| 295,297 | Mondelez International, Inc. Class A | 19,581,144 | |
| 39,324,945 | |||
| Health Care Equipment & Services - 7.0% | |||
| 73,371 | Anthem, Inc. | 34,010,393 | |
| 68,915 | Becton Dickinson and Co. | 17,330,744 | |
| 414,126 | Boston Scientific Corp.* | 17,592,073 | |
| 274,574 | Centene Corp.* | 22,624,898 | |
| 174,018 | Medtronic plc | 18,002,162 | |
| 91,116 | UnitedHealth Group, Inc. | 45,752,988 | |
| 155,313,258 | |||
| Insurance - 3.7% | |||
| 105,668 | Assurant, Inc. | 16,469,415 | |
| 123,772 | Chubb Ltd. | 23,926,365 | |
| Shares or Principal Amount | Market Value† | ||
| COMMON STOCKS - 68.7% - (continued) | |||
| Insurance - 3.7% - (continued) | |||
| 384,407 | MetLife, Inc. | $ 24,021,593 | |
| 173,294 | Progressive Corp. | 17,788,629 | |
| 82,206,002 | |||
| Materials - 2.4% | |||
| 496,513 | Axalta Coating Systems Ltd.* | 16,444,510 | |
| 124,465 | Celanese Corp. | 20,917,588 | |
| 230,963 | Sealed Air Corp. | 15,583,074 | |
| 52,945,172 | |||
| Media & Entertainment - 8.7% | |||
| 28,358 | Alphabet, Inc. Class C* | 82,056,425 | |
| 538,129 | Comcast Corp. Class A | 27,084,033 | |
| 154,914 | Electronic Arts, Inc. | 20,433,157 | |
| 137,426 | Meta Platforms, Inc. Class A* | 46,223,235 | |
| 211,571 | Omnicom Group, Inc. | 15,501,807 | |
| 191,298,657 | |||
| Pharmaceuticals, Biotechnology & Life Sciences - 5.9% | |||
| 311,626 | AstraZeneca plc ADR | 18,152,214 | |
| 123,954 | Eli Lilly & Co. | 34,238,574 | |
| 705,592 | Pfizer, Inc. | 41,665,208 | |
| 47,477 | Roche Holding AG | 19,696,362 | |
| 77,453 | Vertex Pharmaceuticals, Inc.* | 17,008,679 | |
| 130,761,037 | |||
| Real Estate - 0.8% | |||
| 377,671 | Gaming and Leisure Properties, Inc. REIT | 18,377,471 | |
| Retailing - 3.2% | |||
| 11,702,200 | Allstar Co.(8)(9)(10)(11) | — | |
| 75,268 | Home Depot, Inc. | 31,236,973 | |
| 304,245 | TJX Cos., Inc. | 23,098,280 | |
| 296,434 | Victoria's Secret & Co.* | 16,463,944 | |
| 70,799,197 | |||
| Semiconductors & Semiconductor Equipment - 3.4% | |||
| 122,157 | Analog Devices, Inc. | 21,471,536 | |
| 39,049 | KLA Corp. | 16,795,365 | |
| 214,580 | Micron Technology, Inc. | 19,988,127 | |
| 113,569 | Qorvo, Inc.* | 17,761,056 | |
| 76,016,084 | |||
| Software & Services - 10.0% | |||
| 67,542 | Accenture plc Class A | 27,999,536 | |
| 180,546 | Amdocs Ltd. | 13,512,063 | |
| 161,606 | Fidelity National Information Services, Inc. | 17,639,295 | |
| 128,864 | Global Payments, Inc. | 17,419,835 | |
| 323,422 | Microsoft Corp. | 108,773,287 | |
| 96,449 | salesforce.com, Inc.* | 24,510,584 | |
| 92,151 | VMware, Inc. Class A | 10,678,458 | |
| 220,533,058 | |||
| Technology Hardware & Equipment - 3.6% | |||
| 612,423 | Cisco Systems, Inc. | 38,809,245 | |
| 523,373 | Corning, Inc. | 19,485,177 | |
| 87,715 | F5 Networks, Inc.* | 21,464,738 | |
| 79,759,160 | |||
| Transportation - 0.7% | |||
| 263,730 | Knight-Swift Transportation Holdings, Inc. | 16,071,706 | |
| 53 |
December 31, 2021
| Shares or Principal Amount | Market Value† | ||
| COMMON STOCKS - 68.7% - (continued) | |||
| Utilities - 0.9% | |||
| 330,323 | Exelon Corp. | $ 19,079,456 | |
| Total Common Stocks (cost $879,953,349) | $ 1,517,088,640 | ||
| Total Long-Term Investments (Cost $1,529,936,663) | $ 2,188,069,195 | ||
| SHORT-TERM INVESTMENTS - 0.7% | |||
| Repurchase Agreements - 0.7% | |||
| $ 15,592,417 | Fixed Income Clearing Corp. Repurchase Agreement dated 12/31/2021 at 0.020%, due on 01/03/2022 with a maturity value of $15,592,443; collateralized by U.S. Treasury Government Bond at 3.000%, maturing 08/15/2048, with a market value of $15,904,294 | $ 15,592,417 | |
| Securities Lending Collateral - 0.0% | |||
| 10,605 | Fidelity Investments Money Market Funds, Government Portfolio, Institutional Class, 0.01%(12) | 10,605 | |
| 277,691 | Goldman Sachs Financial Square Funds, Government Fund, Institutional Class, 0.03%(12) | 277,691 | |
| 16,179 | Invesco Government & Agency Portfolio, Institutional Class, 0.03%(12) | 16,179 | |
| 304,475 | |||
| Total Short-Term Investments (cost $15,896,892) | $ 15,896,892 | ||
| Total Investments (cost $1,545,833,555) | 99.8% | $ 2,203,966,087 | |
| Other Assets and Liabilities | 0.2% | 4,836,963 | |
| Total Net Assets | 100.0% | $ 2,208,803,050 | |
| Note: | Percentage of investments as shown is the ratio of the total market value to total net assets. |
| Prices of foreign equities that are principally traded on certain foreign markets will generally be adjusted daily pursuant to a fair value pricing service approved by the Board of Directors in order to reflect an adjustment for factors occurring after the close of certain foreign markets but before the close of the New York Stock Exchange. | |
| The Fund may refer to any one or more of the industry classifications used by one or more widely recognized market indices, ratings group and/or as defined by Fund management. Industry classifications may not be identical across all security types. | |
| Equity industry classifications used in this report are the Global Industry Classification Standard, which was developed by and is the exclusive property and service mark of MSCI, Inc. and Standard & Poor’s. |
| * | Non-income producing. |
| (1) | Security was purchased pursuant to Rule 144A under the Securities Act of 1933 and may be sold in transactions that are exempt from registration (typically only to qualified institutional buyers) or in a public offering registered under the Securities Act of 1933. At December 31, 2021, the aggregate value of these securities was $159,260,632, representing 7.2% of net assets. |
| (2) | Variable rate securities; the rate reported is the coupon rate in effect at December 31, 2021. Base lending rates may be subject to a floor or cap. |
| (3) | Variable or floating rate security, which interest rate adjusts periodically based on changes in current interest rates and prepayments on the underlying pool of assets. Rate shown is the rate in effect as of period end. |
| (4) | Fixed to variable rate investment. The rate shown reflects the fixed rate in effect at December 31, 2021. Rate will reset at a future date. Base lending rates may be subject to a floor or cap. |
| (5) | Represents entire or partial securities on loan. See Note 8 in the accompanying Notes to Financial Statements for securities lending information. |
| (6) | Security is a “step-up” bond where coupon increases or steps up at a predetermined date. Rate shown is current coupon rate. |
| (7) | All, or a portion of the security, was pledged as collateral in connection with futures contracts. As of December 31, 2021, the market value of securities pledged was $496,705. |
| (8) | Affiliated company – The Fund owns greater than 5% of the outstanding voting securities of this issuer. |
| (9) | This security is valued in good faith at fair value as determined under policies and procedures established by and under the supervision of the Board of Directors. At December 31, 2021, the aggregate fair value of this security was $0, which represented 0.0% of total net assets. This amount excludes securities that are principally traded in certain foreign markets and whose prices are adjusted pursuant to a third party pricing service methodology approved by the Board of Directors. |
| (10) | Investment in securities not registered under the Securities Act of 1933 (excluding securities acquired pursuant to Rule 144A and Regulation S). At the end of the period, the value of such restricted securities amounted to $0 or 0.0% of net assets. |
| Period Acquired | Security Name | Shares/ Par Value | Total Cost | Market Value | ||||
| 08/2011 | Allstar Co. | 11,702,200 | $ — | $ — |
| (11) | Investment valued using significant unobservable inputs. |
| (12) | Current yield as of period end. |
| Futures Contracts Outstanding at December 31, 2021 | ||||||||
| Description | Number of Contracts | Expiration Date | Current Notional Amount | Value and Unrealized Appreciation/ (Depreciation) | ||||
| Long position contracts: | ||||||||
| U.S. Treasury 2-Year Note Future | 132 | 03/31/2022 | $ 28,798,688 | $ (14,679) | ||||
| U.S. Treasury 5-Year Note Future | 168 | 03/31/2022 | 20,324,062 | 46,474 | ||||
| 54 |
December 31, 2021
| Futures Contracts Outstanding at December 31, 2021 – (continued) | ||||||||
| Description | Number of Contracts | Expiration Date | Current Notional Amount | Value and Unrealized Appreciation/ (Depreciation) | ||||
| Long position contracts – (continued): | ||||||||
| U.S. Treasury 10-Year Note Future | 13 | 03/22/2022 | $ 1,696,094 | $ (4,774) | ||||
| Total | $ 27,021 | |||||||
| Short position contracts: | ||||||||
| U.S. Treasury 10-Year Ultra Bond Future | 102 | 03/22/2022 | $ (14,936,625) | $ (151,710) | ||||
| Total futures contracts | $ (124,689) | |||||||
| Description | Total | Level 1 | Level 2 | Level 3(1) | ||||
| Assets | ||||||||
| Asset & Commercial Mortgage-Backed Securities | $ 61,724,556 | $ — | $ 61,724,556 | $ — | ||||
| Corporate Bonds | 270,582,764 | — | 270,582,764 | — | ||||
| Foreign Government Obligations | 6,891,061 | — | 6,891,061 | — | ||||
| Municipal Bonds | 15,832,341 | — | 15,832,341 | — | ||||
| U.S. Government Agencies | 6,679,863 | — | 6,679,863 | — | ||||
| U.S. Government Securities | 309,269,970 | — | 309,269,970 | — | ||||
| Common Stocks | ||||||||
| Automobiles & Components | 18,589,199 | 18,589,199 | — | — | ||||
| Banks | 81,747,295 | 81,747,295 | — | — | ||||
| Capital Goods | 141,549,067 | 141,549,067 | — | — | ||||
| Commercial & Professional Services | 25,378,283 | 25,378,283 | — | — | ||||
| Consumer Durables & Apparel | 17,826,843 | 17,826,843 | — | — | ||||
| Diversified Financials | 42,083,555 | 42,083,555 | — | — | ||||
| Energy | 20,504,969 | 20,504,969 | — | — | ||||
| Food & Staples Retailing | 16,924,226 | 16,924,226 | — | — | ||||
| Food, Beverage & Tobacco | 39,324,945 | 39,324,945 | — | — | ||||
| Health Care Equipment & Services | 155,313,258 | 155,313,258 | — | — | ||||
| Insurance | 82,206,002 | 82,206,002 | — | — | ||||
| Materials | 52,945,172 | 52,945,172 | — | — | ||||
| Media & Entertainment | 191,298,657 | 191,298,657 | — | — | ||||
| Pharmaceuticals, Biotechnology & Life Sciences | 130,761,037 | 111,064,675 | 19,696,362 | — | ||||
| Real Estate | 18,377,471 | 18,377,471 | — | — | ||||
| Retailing | 70,799,197 | 70,799,197 | — | — | ||||
| Semiconductors & Semiconductor Equipment | 76,016,084 | 76,016,084 | — | — | ||||
| Software & Services | 220,533,058 | 220,533,058 | — | — | ||||
| Technology Hardware & Equipment | 79,759,160 | 79,759,160 | — | — | ||||
| Transportation | 16,071,706 | 16,071,706 | — | — | ||||
| Utilities | 19,079,456 | 19,079,456 | — | — | ||||
| Short-Term Investments | 15,896,892 | 304,475 | 15,592,417 | — | ||||
| Futures Contracts(2) | 46,474 | 46,474 | — | — | ||||
| Total | $ 2,204,012,561 | $ 1,497,743,227 | $ 706,269,334 | $ — | ||||
| Liabilities | ||||||||
| Futures Contracts(2) | $ (171,163) | $ (171,163) | $ — | $ — | ||||
| Total | $ (171,163) | $ (171,163) | $ — | $ — |
| (1) | For the year ended December 31, 2021, investments valued at $13,925,618 were transferred into Level 3 due to the unavailability of active market pricing. There were no transfers out of Level 3. |
| (2) | Derivative instruments (excluding purchased and written options, if applicable) are valued at the unrealized appreciation/(depreciation) on the investments. |
| 55 |
December 31, 2021
| Shares or Principal Amount | Market Value† | ||
| COMMON STOCKS - 97.5% | |||
| Automobiles & Components - 1.6% | |||
| 673,911 | Arrival S.A.* | $ 5,000,420 | |
| 18,090 | Ferrari N.V. | 4,656,473 | |
| 177,565 | General Motors Co.* | 10,410,636 | |
| 38,657 | Tesla, Inc.* | 40,851,944 | |
| 106,751 | Thor Industries, Inc. | 11,077,551 | |
| 71,997,024 | |||
| Banks - 2.5% | |||
| 712,822 | Bank of America Corp. | 31,713,451 | |
| 615,273 | Commerzbank AG* | 4,654,893 | |
| 93,526 | JP Morgan Chase & Co. | 14,809,842 | |
| 35,967 | KBC Group N.V. | 3,090,329 | |
| 150,929 | M&T Bank Corp. | 23,179,676 | |
| 513,300 | Mitsubishi UFJ Financial Group, Inc. | 2,793,519 | |
| 142,857 | Royal Bank of Canada | 15,161,510 | |
| 238,570 | Zions Bancorp NA | 15,068,081 | |
| 110,471,301 | |||
| Capital Goods - 6.2% | |||
| 8,640 | 3M Co. | 1,534,723 | |
| 60,751 | AerCap Holdings N.V.* | 3,974,330 | |
| 74,103 | Airbus SE* | 9,481,021 | |
| 38,275 | Carlisle Cos., Inc. | 9,496,793 | |
| 17,302 | Dover Corp. | 3,142,043 | |
| 220,020 | Emerson Electric Co. | 20,455,259 | |
| 141,290 | General Dynamics Corp. | 29,454,726 | |
| 350,600 | HF Global, Inc.(1)(2)(3) | 7,373,118 | |
| 40,016 | Honeywell International, Inc. | 8,343,736 | |
| 402,869 | Johnson Controls International plc | 32,757,278 | |
| 83,534 | Lockheed Martin Corp. | 29,688,819 | |
| 59,493 | Middleby Corp.* | 11,705,843 | |
| 104,321 | Northrop Grumman Corp. | 40,379,530 | |
| 296,166 | Raytheon Technologies Corp. | 25,488,046 | |
| 8,428 | Roper Technologies, Inc. | 4,145,396 | |
| 29,470 | Siemens AG | 5,104,286 | |
| 412,478 | Westinghouse Air Brake Technologies Corp. | 37,993,349 | |
| 280,518,296 | |||
| Commercial & Professional Services - 1.4% | |||
| 42,737 | Booz Allen Hamilton Holding Corp. | 3,623,670 | |
| 223,348 | Copart, Inc.* | 33,864,024 | |
| 59,865 | CoStar Group, Inc.* | 4,731,131 | |
| 177,957 | Leidos Holdings, Inc. | 15,820,378 | |
| 46,910 | Recruit Holdings Co., Ltd. | 2,854,740 | |
| 60,893,943 | |||
| Consumer Durables & Apparel - 2.5% | |||
| 24,893 | Cie Financiere Richemont S.A. | 3,719,881 | |
| 97,475 | Garmin Ltd. | 13,273,171 | |
| 141,446 | Lennar Corp. Class A | 16,430,367 | |
| 29,261 | Lululemon Athletica, Inc.* | 11,454,218 | |
| 235,886 | NIKE, Inc. Class B | 39,315,120 | |
| 2,832 | NVR, Inc.* | 16,733,920 | |
| 37,300 | Sony Corp. | 4,710,176 | |
| 108,820 | Steven Madden Ltd. | 5,056,865 | |
| 110,693,718 | |||
| Consumer Services - 4.5% | |||
| 323,100 | Airbnb, Inc. Class A* | 53,792,919 | |
| 7,350 | Booking Holdings, Inc.* | 17,634,340 | |
| 30,198 | Chegg, Inc.* | 927,079 | |
| 2,142 | Chipotle Mexican Grill, Inc.*(4) | 3,744,751 | |
| 750,245 | Compass Group plc* | 16,890,779 | |
| 374,789 | DraftKings, Inc. Class A* | 10,295,454 | |
| 424,268 | Las Vegas Sands Corp.* | 15,969,448 | |
| Shares or Principal Amount | Market Value† | ||
| COMMON STOCKS - 97.5% - (continued) | |||
| Consumer Services - 4.5% - (continued) | |||
| 166,247 | McDonald's Corp. | $ 44,565,833 | |
| 265,245 | Penn National Gaming, Inc.* | 13,752,953 | |
| 207,607 | Six Flags Entertainment Corp.* | 8,839,906 | |
| 106,052 | Yum! Brands, Inc. | 14,726,381 | |
| 201,139,843 | |||
| Diversified Financials - 4.0% | |||
| 126,508 | Allfunds Group plc* | 2,491,131 | |
| 203,137 | American Express Co. | 33,233,213 | |
| 397,573 | Bank of New York Mellon Corp. | 23,091,040 | |
| 23,929 | BlackRock, Inc. | 21,908,435 | |
| 369,419 | Charles Schwab Corp. | 31,068,138 | |
| 5,060 | Coinbase Global, Inc. Class A* | 1,276,992 | |
| 312,151 | Equitable Holdings, Inc. | 10,235,431 | |
| 163,458 | Intermediate Capital Group plc | 4,867,897 | |
| 195,842 | Raymond James Financial, Inc. | 19,662,537 | |
| 30,360 | S&P Global, Inc. | 14,327,795 | |
| 231,706 | Voya Financial, Inc. | 15,364,425 | |
| 81,880 | XP, Inc. Class A* | 2,353,231 | |
| 179,880,265 | |||
| Energy - 1.4% | |||
| 335,178 | Baker Hughes Co. | 8,064,383 | |
| 531,570 | Canadian Natural Resources Ltd. | 22,458,832 | |
| 94,492 | ConocoPhillips | 6,820,433 | |
| 65,281 | Diamondback Energy, Inc. | 7,040,556 | |
| 260,619 | Halliburton Co. | 5,960,356 | |
| 44,790 | Occidental Petroleum Corp. | 1,298,462 | |
| 360,385 | Schlumberger Ltd. | 10,793,531 | |
| 62,436,553 | |||
| Food & Staples Retailing - 0.1% | |||
| 70,870 | Sysco Corp. | 5,566,839 | |
| Food, Beverage & Tobacco - 5.0% | |||
| 607,996 | Altria Group, Inc. | 28,812,931 | |
| 577,134 | Coca-Cola Co. | 34,172,104 | |
| 50,931 | Constellation Brands, Inc. Class A | 12,782,153 | |
| 432,268 | Diageo plc | 23,634,702 | |
| 145,785 | General Mills, Inc. | 9,822,993 | |
| 638,945 | Keurig Dr Pepper, Inc. | 23,551,513 | |
| 111,887 | Mondelez International, Inc. Class A | 7,419,227 | |
| 265,053 | PepsiCo., Inc. | 46,042,357 | |
| 286,217 | Philip Morris International, Inc. | 27,190,615 | |
| 155,584 | Tyson Foods, Inc. Class A | 13,560,701 | |
| 226,989,296 | |||
| Health Care Equipment & Services - 7.8% | |||
| 66,576 | ABIOMED, Inc.* | 23,912,102 | |
| 290,553 | Baxter International, Inc. | 24,941,069 | |
| 74,167 | Becton Dickinson and Co. | 18,651,517 | |
| 321,764 | Boston Scientific Corp.* | 13,668,535 | |
| 23,248 | Cardinal Health, Inc. | 1,197,040 | |
| 251,570 | Centene Corp.* | 20,729,368 | |
| 206,812 | CVS Health Corp. | 21,334,726 | |
| 212,316 | Dentsply Sirona, Inc. | 11,845,110 | |
| 26,523 | DexCom, Inc.* | 14,241,525 | |
| 178,627 | Encompass Health Corp. | 11,657,198 | |
| 213,676 | GoodRx Holdings, Inc. Class A*(4) | 6,982,932 | |
| 35,155 | Humana, Inc. | 16,306,998 | |
| 39,762 | Insulet Corp.* | 10,579,475 | |
| 60,433 | McKesson Corp. | 15,021,831 | |
| 331,065 | Medtronic plc | 34,248,674 | |
| 180,188 | Oak Street Health, Inc.* | 5,971,430 | |
| 57,776 | Quest Diagnostics, Inc. | 9,995,826 | |
| 56 |
December 31, 2021
| Shares or Principal Amount | Market Value† | ||
| COMMON STOCKS - 97.5% - (continued) | |||
| Health Care Equipment & Services - 7.8% - (continued) | |||
| 975,389 | Sharecare, Inc.* | $ 4,379,497 | |
| 47,856 | Stryker Corp. | 12,797,651 | |
| 34,115 | Teleflex, Inc. | 11,206,095 | |
| 105,293 | UnitedHealth Group, Inc. | 52,871,827 | |
| 36,957 | Veeva Systems, Inc. Class A* | 9,441,774 | |
| 351,982,200 | |||
| Household & Personal Products - 2.1% | |||
| 579,017 | Colgate-Palmolive Co. | 49,413,311 | |
| 45,075 | Kimberly-Clark Corp. | 6,442,119 | |
| 242,800 | Procter & Gamble Co. | 39,717,224 | |
| 95,572,654 | |||
| Insurance - 4.5% | |||
| 696,019 | Aflac, Inc. | 40,640,550 | |
| 163,295 | Athene Holding Ltd. Class A* | 13,607,372 | |
| 372,446 | Chubb Ltd. | 71,997,536 | |
| 248,932 | Marsh & McLennan Cos., Inc. | 43,269,360 | |
| 390,510 | MetLife, Inc. | 24,402,970 | |
| 71,708 | Travelers Cos., Inc. | 11,217,283 | |
| 205,135,071 | |||
| Materials - 3.3% | |||
| 38,394 | Albemarle Corp. | 8,975,365 | |
| 72,267 | Celanese Corp. | 12,145,192 | |
| 137,931 | CRH plc | 7,308,395 | |
| 160,703 | Ecolab, Inc. | 37,699,317 | |
| 254,751 | FMC Corp. | 27,994,587 | |
| 91,209 | Linde plc | 31,597,534 | |
| 123,631 | Reliance Steel & Aluminum Co. | 20,055,421 | |
| 79,699 | Rio Tinto plc | 5,255,849 | |
| 151,031,660 | |||
| Media & Entertainment - 8.0% | |||
| 245,552 | Activision Blizzard, Inc. | 16,336,575 | |
| 29,794 | Alphabet, Inc. Class A* | 86,314,410 | |
| 10,899 | Cable One, Inc. | 19,219,842 | |
| 17,191 | Charter Communications, Inc. Class A* | 11,208,016 | |
| 261,725 | Electronic Arts, Inc. | 34,521,527 | |
| 34,628 | Live Nation Entertainment, Inc.* | 4,144,625 | |
| 191,950 | Match Group, Inc.* | 25,385,388 | |
| 104,868 | Meta Platforms, Inc. Class A* | 35,272,352 | |
| 5,494 | Netflix, Inc.* | 3,309,805 | |
| 347,251 | Omnicom Group, Inc. | 25,443,081 | |
| 189,386 | Pinterest, Inc. Class A* | 6,884,181 | |
| 96,965 | Roku, Inc.* | 22,127,413 | |
| 6,906 | Sea Ltd. ADR* | 1,544,941 | |
| 224,181 | Snap, Inc. Class A* | 10,543,232 | |
| 104,376 | Spotify Technology S.A.* | 24,427,115 | |
| 62,600 | Tencent Holdings Ltd. | 3,652,779 | |
| 182,999 | Twitter, Inc.* | 7,909,217 | |
| 89,826 | Walt Disney Co.* | 13,913,149 | |
| 162,053 | ZoomInfo Technologies, Inc.* | 10,403,803 | |
| 362,561,451 | |||
| Pharmaceuticals, Biotechnology & Life Sciences - 6.4% | |||
| 43,182 | Alnylam Pharmaceuticals, Inc.* | 7,322,804 | |
| 146,073 | Apellis Pharmaceuticals, Inc.* | 6,906,331 | |
| 235,804 | AstraZeneca plc ADR | 13,735,583 | |
| 51,166 | Biogen, Inc.* | 12,275,747 | |
| 89,277 | Danaher Corp. | 29,373,026 | |
| 98,489 | Elanco Animal Health, Inc.* | 2,795,118 | |
| 34,056 | Eli Lilly & Co. | 9,406,948 | |
| 258,375 | Exact Sciences Corp.* | 20,109,326 | |
| 47,499 | Illumina, Inc.* | 18,070,520 | |
| Shares or Principal Amount | Market Value† | ||
| COMMON STOCKS - 97.5% - (continued) | |||
| Pharmaceuticals, Biotechnology & Life Sciences - 6.4% - (continued) | |||
| 266,612 | Johnson & Johnson | $ 45,609,315 | |
| 72,007 | Kodiak Sciences, Inc.* | 6,104,753 | |
| 4,749 | Lonza Group AG | 3,953,960 | |
| 215,515 | Organon & Co. | 6,562,432 | |
| 462,520 | Pfizer, Inc. | 27,311,806 | |
| 181,322 | PTC Therapeutics, Inc.* | 7,222,055 | |
| 29,399 | Regeneron Pharmaceuticals, Inc.* | 18,566,056 | |
| 100,908 | Sanofi | 10,125,508 | |
| 191,461 | Seagen, Inc.* | 29,599,871 | |
| 81,706 | Ultragenyx Pharmaceutical, Inc.* | 6,870,657 | |
| 34,015 | Vertex Pharmaceuticals, Inc.* | 7,469,694 | |
| 289,391,510 | |||
| Real Estate - 2.5% | |||
| 106,333 | American Tower Corp. REIT | 31,102,403 | |
| 423,597 | Americold Realty Trust REIT | 13,889,746 | |
| 49,195 | Crown Castle International Corp. REIT | 10,268,964 | |
| 12,520 | Equinix, Inc. REIT | 10,589,917 | |
| 30,501 | Prologis, Inc. REIT | 5,135,148 | |
| 192,432 | Redfin Corp.* | 7,387,464 | |
| 745,361 | VICI Properties, Inc. REIT(4) | 22,442,820 | |
| 149,870 | Welltower, Inc. REIT | 12,854,350 | |
| 113,670,812 | |||
| Retailing - 6.3% | |||
| 52,258 | Alibaba Group Holding Ltd. ADR* | 6,207,728 | |
| 8,451,700 | Allstar Co.(1)(2)(3)(5) | — | |
| 14,326 | Amazon.com, Inc.* | 47,767,755 | |
| 7,294 | AutoZone, Inc.* | 15,291,069 | |
| 53,917 | CarMax, Inc.* | 7,021,611 | |
| 190,510 | Chewy, Inc. Class A*(4) | 11,234,375 | |
| 45,605 | Dollar General Corp. | 10,755,027 | |
| 177,940 | Dollar Tree, Inc.* | 25,004,129 | |
| 65,374 | Etsy, Inc.* | 14,312,984 | |
| 83,745 | Five Below, Inc.* | 17,326,003 | |
| 88,269 | LKQ Corp. | 5,298,788 | |
| 8,321 | MercadoLibre, Inc.* | 11,220,036 | |
| 175,310 | Ross Stores, Inc. | 20,034,427 | |
| 37,562 | Target Corp. | 8,693,349 | |
| 691,095 | TJX Cos., Inc. | 52,467,932 | |
| 115,140 | Tory Burch LLC(1)(2)(3) | 5,258,428 | |
| 53,942 | Ulta Beauty, Inc.* | 22,242,444 | |
| 27,471 | Zalando SE*(6) | 2,212,967 | |
| 282,349,052 | |||
| Semiconductors & Semiconductor Equipment - 4.6% | |||
| 280,146 | Advanced Micro Devices, Inc.* | 40,313,010 | |
| 2,177 | ASML Holding N.V. | 1,743,820 | |
| 26,513 | Broadcom, Inc. | 17,642,015 | |
| 152,895 | First Solar, Inc.* | 13,326,328 | |
| 91,270 | Infineon Technologies AG | 4,201,930 | |
| 18,612 | KLA Corp. | 8,005,207 | |
| 95,455 | Marvell Technology, Inc. | 8,351,358 | |
| 174,100 | Micron Technology, Inc. | 16,217,415 | |
| 62,168 | MKS Instruments, Inc. | 10,827,801 | |
| 107,253 | NVIDIA Corp. | 31,544,180 | |
| 39,515 | NXP Semiconductors N.V. | 9,000,727 | |
| 47,396 | Qorvo, Inc.* | 7,412,261 | |
| 41,058 | SolarEdge Technologies, Inc.* | 11,519,643 | |
| 54,885 | Synaptics, Inc.* | 15,889,756 | |
| 57 |
December 31, 2021
| Shares or Principal Amount | Market Value† | ||
| COMMON STOCKS - 97.5% - (continued) | |||
| Semiconductors & Semiconductor Equipment - 4.6% - (continued) | |||
| 120,000 | Taiwan Semiconductor Manufacturing Co., Ltd. | $ 2,654,519 | |
| 44,732 | Universal Display Corp. | 7,382,122 | |
| 206,032,092 | |||
| Software & Services - 14.4% | |||
| 51,902 | Accenture plc Class A | 21,515,974 | |
| 138,721 | ANSYS, Inc.* | 55,643,767 | |
| 14,428 | Autodesk, Inc.* | 4,057,009 | |
| 20,184 | Avalara, Inc.* | 2,605,956 | |
| 101,715 | Block, Inc. Class A* | 16,427,990 | |
| 235,301 | Cognizant Technology Solutions Corp. Class A | 20,875,905 | |
| 176,453 | Dynatrace, Inc.* | 10,648,938 | |
| 38,304 | Fair Isaac Corp.* | 16,611,296 | |
| 203,406 | Fidelity National Information Services, Inc. | 22,201,765 | |
| 62,677 | Five9, Inc.* | 8,606,806 | |
| 64,869 | FleetCor Technologies, Inc.* | 14,520,277 | |
| 524,123 | Genpact Ltd. | 27,820,449 | |
| 11,872 | Global Payments, Inc. | 1,604,857 | |
| 192,544 | GoDaddy, Inc. Class A* | 16,339,284 | |
| 180,704 | Guidewire Software, Inc.* | 20,515,325 | |
| 342,899 | International Business Machines Corp. | 45,831,880 | |
| 3,756 | Intuit, Inc. | 2,415,934 | |
| 91,881 | Mastercard, Inc. Class A | 33,014,681 | |
| 91,031 | Microsoft Corp. | 30,615,546 | |
| 22,120 | MongoDB, Inc.* | 11,709,222 | |
| 495,275 | Oracle Corp. | 43,192,933 | |
| 20,871 | Palo Alto Networks, Inc.* | 11,620,138 | |
| 48,278 | Paycom Software, Inc.* | 20,044,543 | |
| 94,992 | RingCentral, Inc. Class A* | 17,796,751 | |
| 69,754 | salesforce.com, Inc.* | 17,726,584 | |
| 5,611 | Sharecare, Inc. Earnout(1)(2)(3) | 5,039 | |
| 1,994 | Shopify, Inc. Class A* | 2,746,516 | |
| 327,501 | UiPath, Inc.*(4) | 14,125,118 | |
| 53,878 | Varonis Systems, Inc.* | 2,628,169 | |
| 245,962 | Visa, Inc. Class A | 53,302,425 | |
| 173,860 | VMware, Inc. Class A | 20,146,897 | |
| 1,048,047 | Western Union Co. | 18,697,158 | |
| 98,205 | WEX, Inc.* | 13,787,000 | |
| 116,508 | Workday, Inc. Class A* | 31,827,655 | |
| 651,229,787 | |||
| Technology Hardware & Equipment - 3.7% | |||
| 26,106 | Apple, Inc. | 4,635,642 | |
| 225,544 | Arista Networks, Inc.* | 32,421,950 | |
| 77,455 | CDW Corp. | 15,861,235 | |
| 390,678 | Cisco Systems, Inc. | 24,757,265 | |
| 86,295 | F5 Networks, Inc.* | 21,117,250 | |
| 943,830 | Flex Ltd.* | 17,300,404 | |
| 242,921 | II-VI, Inc.* | 16,598,792 | |
| 5,470 | Keyence Corp. | 3,439,307 | |
| 140,077 | Lumentum Holdings, Inc.* | 14,815,944 | |
| 12,489 | Motorola Solutions, Inc. | 3,393,261 | |
| 140,709 | Samsung Electronics Co., Ltd. | 9,241,051 | |
| 11,901 | TE Connectivity Ltd. | 1,920,107 | |
| 165,502,208 | |||
| Telecommunication Services - 0.5% | |||
| 206,349 | T-Mobile U.S., Inc.* | 23,932,357 | |
| Shares or Principal Amount | Market Value† | ||
| COMMON STOCKS - 97.5% - (continued) | |||
| Transportation - 2.2% | |||
| 77,534 | J.B. Hunt Transport Services, Inc. | $ 15,847,950 | |
| 255,600 | Localiza Rent a Car S.A. | 2,432,100 | |
| 360,527 | Uber Technologies, Inc.* | 15,116,897 | |
| 135,689 | Union Pacific Corp. | 34,184,130 | |
| 145,512 | United Parcel Service, Inc. Class B | 31,189,042 | |
| 98,770,119 | |||
| Utilities - 2.0% | |||
| 137,548 | Avangrid, Inc.(4) | 6,860,894 | |
| 433,780 | CenterPoint Energy, Inc. | 12,106,800 | |
| 79,924 | Consolidated Edison, Inc. | 6,819,116 | |
| 145,372 | Duke Energy Corp. | 15,249,523 | |
| 379,684 | Exelon Corp. | 21,930,548 | |
| 1,201,510 | Iberdrola S.A. | 14,225,849 | |
| 154,594 | Pinnacle West Capital Corp. | 10,912,790 | |
| 88,105,520 | |||
| Total Common Stocks (cost $3,273,764,933) | $ 4,395,853,571 | ||
| CONVERTIBLE PREFERRED STOCKS - 0.0% | |||
| Software & Services - 0.0% | |||
| 58 | Magic Leap, Inc. Series C*(1)(2)(3) | $ 445 | |
| 50,200 | Nanigans, Inc. Series D*(1)(2)(3) | — | |
| Total Convertible Preferred Stocks (cost $1,227,675) | $ 445 | ||
| EXCHANGE-TRADED FUNDS - 0.9% | |||
| Other Investment Pools & Funds - 0.9% | |||
| 9,560 | iShares MSCI ACWI ETF (4) | $ 1,011,257 | |
| 130,529 | iShares Russell 1000 Growth ETF | 39,888,357 | |
| 40,899,614 | |||
| Total Exchange-Traded Funds (cost $38,224,323) | $ 40,899,614 | ||
| WARRANTS - 0.0% | |||
| Software & Services - 0.0% | |||
| 118,391 | Nanigans, Inc. Expires 6/18/28*(1)(2)(3) | $ — | |
| Total Warrants (cost $—) | $ — | ||
| Total Long-Term Investments (Cost $3,313,216,931) | $ 4,436,753,630 | ||
| SHORT-TERM INVESTMENTS - 1.8% | |||
| Repurchase Agreements - 1.3% | |||
| $ 58,420,800 | Fixed Income Clearing Corp. Repurchase Agreement dated 12/31/2021 at 0.020%, due on 1/3/2021 with a maturity value of $58,420,897; collateralized by U.S. Treasury Bond at 2.25%, maturing 05/15/2041, with a market value of $59,589,293. | $ 58,420,800 | |
| Securities Lending Collateral - 0.5% | |||
| 826,330 | Fidelity Investments Money Market Funds, Government Portfolio, Institutional Class, 0.01%(7) | 826,330 | |
| 58 |
December 31, 2021
| Shares or Principal Amount | Market Value† | ||
| SHORT-TERM INVESTMENTS - 1.8% - (continued) | |||
| Securities Lending Collateral - 0.5% - (continued) | |||
| 21,636,988 | Goldman Sachs Financial Square Funds, Government Fund, Institutional Class, 0.03%(7) | $ 21,636,988 | |
| 1,260,597 | Invesco Government & Agency Portfolio, Institutional Class, 0.03%(7) | 1,260,597 | |
| 23,723,915 | |||
| Total Short-Term Investments (cost $82,144,715) | $ 82,144,715 | ||
| Total Investments (cost $3,395,361,646) | 100.2% | $ 4,518,898,345 | |
| Other Assets and Liabilities | (0.2)% | (8,496,219) | |
| Total Net Assets | 100.0% | $ 4,510,402,126 | |
| Note: | Percentage of investments as shown is the ratio of the total market value to total net assets. |
| Prices of foreign equities that are principally traded on certain foreign markets will generally be adjusted daily pursuant to a fair value pricing service approved by the Board of Directors in order to reflect an adjustment for factors occurring after the close of certain foreign markets but before the close of the New York Stock Exchange. | |
| Equity industry classifications used in this report are the Global Industry Classification Standard, which was developed by and is the exclusive property and service mark of MSCI, Inc. and Standard & Poor’s. | |
| For Fund compliance purposes, the Fund may not use the same classification system. These classifications are used for financial reporting purposes. | |
| See “Glossary” for abbreviation descriptions. |
| * | Non-income producing. |
| (1) | These securities are valued in good faith at fair value as determined under policies and procedures established by and under the supervision of the Board of Directors. At December 31, 2021, the aggregate fair value of these securities are $12,637,030, which represented 0.3% of total net assets. This amount excludes securities that are principally traded in certain foreign markets and whose prices are adjusted pursuant to a third party pricing service methodology approved by the Board of Directors. |
| (2) | Investment in securities not registered under the Securities Act of 1933 (excluding securities acquired pursuant to Rule 144A and Regulation S). At the end of the period, the value of such restricted securities amounted to $12,637,030 or 0.3% of net assets. |
| Period Acquired | Security Name | Shares/ Par Value | Total Cost | Market Value | ||||
| 08/2011 | Allstar Co. | 8,451,700 | $ — | $ — | ||||
| 06/2015 | HF Global, Inc. | 350,600 | 4,713,607 | 7,373,118 | ||||
| 12/2015 | Magic Leap, Inc. Series C Convertible Preferred | 58 | 679,566 | 445 | ||||
| 03/2015 | Nanigans, Inc. Series D Convertible Preferred | 50,200 | 548,109 | — | ||||
| 12/2021 | Nanigans, Inc. Expires 6/18/28 Warrants | 118,391 | — | — | ||||
| 07/2021 | Sharecare, Inc. Earnout | 5,611 | — | 5,039 | ||||
| 11/2013 | Tory Burch LLC | 115,140 | 9,024,247 | 5,258,428 | ||||
| $ 14,965,529 | $ 12,637,030 |
| (3) | Investment valued using significant unobservable inputs. |
| (4) | Represents entire or partial securities on loan. See Note 8 in the accompanying Notes to Financial Statements for securities lending information. |
| (5) | Affiliated company – The Fund owns greater than 5% of the outstanding voting securities of this issuer. |
| (6) | Security was purchased pursuant to Rule 144A under the Securities Act of 1933 and may be sold in transactions that are exempt from registration (typically only to qualified institutional buyers) or in a public offering registered under the Securities Act of 1933. At December 31, 2021, the aggregate value of this security was $2,212,967, representing 0.0% of net assets. |
| (7) | Current yield as of period end. |
| Futures Contracts Outstanding at December 31, 2021 | ||||||||
| Description | Number of Contracts | Expiration Date | Current Notional Amount | Value and Unrealized Appreciation/ (Depreciation) | ||||
| Long position contracts: | ||||||||
| NASDAQ 100 E-MINI Future | 175 | 03/18/2022 | $ 57,122,625 | $ (257,154) | ||||
| Total futures contracts | $ (257,154) | |||||||
| 59 |
December 31, 2021
| Description | Total | Level 1 | Level 2 | Level 3(1) | ||||
| Assets | ||||||||
| Common Stocks | ||||||||
| Automobiles & Components | $ 71,997,024 | $ 67,340,551 | $ 4,656,473 | $ — | ||||
| Banks | 110,471,301 | 99,932,560 | 10,538,741 | — | ||||
| Capital Goods | 280,518,296 | 258,559,871 | 14,585,307 | 7,373,118 | ||||
| Commercial & Professional Services | 60,893,943 | 58,039,203 | 2,854,740 | — | ||||
| Consumer Durables & Apparel | 110,693,718 | 102,263,661 | 8,430,057 | — | ||||
| Consumer Services | 201,139,843 | 184,249,064 | 16,890,779 | — | ||||
| Diversified Financials | 179,880,265 | 175,012,368 | 4,867,897 | — | ||||
| Energy | 62,436,553 | 62,436,553 | — | — | ||||
| Food & Staples Retailing | 5,566,839 | 5,566,839 | — | — | ||||
| Food, Beverage & Tobacco | 226,989,296 | 203,354,594 | 23,634,702 | — | ||||
| Health Care Equipment & Services | 351,982,200 | 351,982,200 | — | — | ||||
| Household & Personal Products | 95,572,654 | 95,572,654 | — | — | ||||
| Insurance | 205,135,071 | 205,135,071 | — | — | ||||
| Materials | 151,031,660 | 138,467,416 | 12,564,244 | — | ||||
| Media & Entertainment | 362,561,451 | 358,908,672 | 3,652,779 | — | ||||
| Pharmaceuticals, Biotechnology & Life Sciences | 289,391,510 | 275,312,042 | 14,079,468 | — | ||||
| Real Estate | 113,670,812 | 113,670,812 | — | — | ||||
| Retailing | 282,349,052 | 274,877,657 | 2,212,967 | 5,258,428 | ||||
| Semiconductors & Semiconductor Equipment | 206,032,092 | 197,431,823 | 8,600,269 | — | ||||
| Software & Services | 651,229,787 | 651,224,748 | — | 5,039 | ||||
| Technology Hardware & Equipment | 165,502,208 | 152,821,850 | 12,680,358 | — | ||||
| Telecommunication Services | 23,932,357 | 23,932,357 | — | — | ||||
| Transportation | 98,770,119 | 98,770,119 | — | — | ||||
| Utilities | 88,105,520 | 73,879,671 | 14,225,849 | — | ||||
| Convertible Preferred Stocks | 445 | — | — | 445 | ||||
| Exchange-Traded Funds | 40,899,614 | 40,899,614 | — | — | ||||
| Warrants | — | — | — | — | ||||
| Short-Term Investments | 82,144,715 | 23,723,915 | 58,420,800 | — | ||||
| Total | $ 4,518,898,345 | $ 4,293,365,885 | $ 212,895,430 | $ 12,637,030 | ||||
| Liabilities | ||||||||
| Futures Contracts(2) | $ (257,154) | $ (257,154) | $ — | $ — | ||||
| Total | $ (257,154) | $ (257,154) | $ — | $ — |
| (1) | For the year ended December 31, 2021, investments valued at $10,057,523 were transferred into Level 3 due to the unavailability of active market pricing, and investments valued at $5,261,607 were transferred out of Level 3 due to the availability of significant observable inputs. |
| (2) | Derivative instruments (excluding purchased and written options, if applicable) are valued at the unrealized appreciation/(depreciation) on the investments. |
| 60 |
December 31, 2021
| Shares or Principal Amount | Market Value† | ||
| COMMON STOCKS - 99.2% | |||
| Automobiles & Components - 1.7% | |||
| 1,159,859 | Ford Motor Co. | $ 24,090,271 | |
| 34,757 | Tesla, Inc.* | 36,730,503 | |
| 60,820,774 | |||
| Banks - 5.2% | |||
| 1,731,778 | Bank of America Corp. | 77,046,803 | |
| 495,346 | JP Morgan Chase & Co. | 78,438,039 | |
| 117,071 | PNC Financial Services Group, Inc. | 23,475,077 | |
| 178,959,919 | |||
| Capital Goods - 5.8% | |||
| 245,855 | AMETEK, Inc. | 36,150,519 | |
| 90,196 | Deere & Co. | 30,927,307 | |
| 339,734 | Fortune Brands Home & Security, Inc. | 36,317,565 | |
| 130,092 | IDEX Corp. | 30,743,341 | |
| 123,743 | Illinois Tool Works, Inc. | 30,539,772 | |
| 431,286 | Raytheon Technologies Corp. | 37,116,473 | |
| 201,794,977 | |||
| Commercial & Professional Services - 2.2% | |||
| 119,930 | Equifax, Inc. | 35,114,305 | |
| 247,794 | Leidos Holdings, Inc. | 22,028,886 | |
| 138,888 | Republic Services, Inc. | 19,367,932 | |
| 76,511,123 | |||
| Consumer Durables & Apparel - 2.2% | |||
| 265,850 | NIKE, Inc. Class B | 44,309,220 | |
| 458,193 | VF Corp. | 33,548,891 | |
| 77,858,111 | |||
| Consumer Services - 2.6% | |||
| 116,721 | Airbnb, Inc. Class A* | 19,432,879 | |
| 10,257 | Booking Holdings, Inc.* | 24,608,902 | |
| 171,310 | McDonald's Corp. | 45,923,072 | |
| 89,964,853 | |||
| Diversified Financials - 5.0% | |||
| 277,668 | American Express Co. | 45,426,485 | |
| 41,752 | BlackRock, Inc. | 38,226,461 | |
| 413,318 | Charles Schwab Corp. | 34,760,044 | |
| 559,274 | Morgan Stanley | 54,898,336 | |
| 173,311,326 | |||
| Energy - 1.3% | |||
| 489,954 | EOG Resources, Inc. | 43,522,614 | |
| Food & Staples Retailing - 1.1% | |||
| 262,685 | Walmart, Inc. | 38,007,893 | |
| Food, Beverage & Tobacco - 2.2% | |||
| 177,718 | Constellation Brands, Inc. Class A | 44,601,886 | |
| 317,922 | Monster Beverage Corp.* | 30,533,229 | |
| 75,135,115 | |||
| Health Care Equipment & Services - 7.2% | |||
| 242,426 | Abbott Laboratories | 34,119,035 | |
| 389,318 | Baxter International, Inc. | 33,419,057 | |
| 129,208 | Becton Dickinson and Co. | 32,493,228 | |
| 393,251 | Hologic, Inc.* | 30,107,297 | |
| 98,878 | Laboratory Corp. of America Holdings* | 31,068,456 | |
| 179,569 | UnitedHealth Group, Inc. | 90,168,778 | |
| 251,375,851 | |||
| Shares or Principal Amount | Market Value† | ||
| COMMON STOCKS - 99.2% - (continued) | |||
| Household & Personal Products - 3.0% | |||
| 377,669 | Colgate-Palmolive Co. | $ 32,230,272 | |
| 444,774 | Procter & Gamble Co. | 72,756,131 | |
| 104,986,403 | |||
| Insurance - 1.6% | |||
| 168,131 | Chubb Ltd. | 32,501,404 | |
| 233,268 | Progressive Corp. | 23,944,960 | |
| 56,446,364 | |||
| Materials - 1.1% | |||
| 219,717 | PPG Industries, Inc. | 37,888,000 | |
| Media & Entertainment - 10.9% | |||
| 66,828 | Alphabet, Inc. Class A* | 193,603,389 | |
| 240,762 | Meta Platforms, Inc. Class A* | 80,980,299 | |
| 78,403 | Netflix, Inc.* | 47,233,103 | |
| 355,668 | Walt Disney Co.* | 55,089,417 | |
| 376,906,208 | |||
| Pharmaceuticals, Biotechnology & Life Sciences - 7.2% | |||
| 140,633 | Danaher Corp. | 46,269,664 | |
| 202,528 | Eli Lilly & Co. | 55,942,284 | |
| 654,484 | Merck & Co., Inc. | 50,159,654 | |
| 60,289 | Regeneron Pharmaceuticals, Inc.* | 38,073,709 | |
| 88,550 | Thermo Fisher Scientific, Inc. | 59,084,102 | |
| 249,529,413 | |||
| Real Estate - 1.7% | |||
| 124,006 | American Tower Corp. REIT | 36,271,755 | |
| 454,943 | Gaming and Leisure Properties, Inc. REIT | 22,137,526 | |
| 58,409,281 | |||
| Retailing - 5.3% | |||
| 38,051 | Amazon.com, Inc.* | 126,874,971 | |
| 723,183 | TJX Cos., Inc. | 54,904,053 | |
| 38,805 | Tory Burch LLC*(1)(2)(3) | 1,772,226 | |
| 183,551,250 | |||
| Semiconductors & Semiconductor Equipment - 6.0% | |||
| 276,159 | Advanced Micro Devices, Inc.* | 39,739,280 | |
| 81,968 | KLA Corp. | 35,255,256 | |
| 66,496 | NVIDIA Corp. | 19,557,139 | |
| 218,040 | QUALCOMM, Inc. | 39,872,975 | |
| 150,818 | Teradyne, Inc. | 24,663,267 | |
| 262,844 | Texas Instruments, Inc. | 49,538,209 | |
| 208,626,126 | |||
| Software & Services - 11.9% | |||
| 234,212 | Fidelity National Information Services, Inc. | 25,564,240 | |
| 153,099 | Global Payments, Inc. | 20,695,923 | |
| 251,009 | GoDaddy, Inc. Class A* | 21,300,624 | |
| 140,030 | Mastercard, Inc. Class A | 50,315,579 | |
| 575,195 | Microsoft Corp. | 193,449,582 | |
| 44,476 | Palo Alto Networks, Inc.* | 24,762,458 | |
| 191,472 | salesforce.com, Inc.* | 48,658,779 | |
| 105,204 | Workday, Inc. Class A* | 28,739,629 | |
| 413,486,814 | |||
| Technology Hardware & Equipment - 10.0% | |||
| 935,482 | Apple, Inc. | 166,113,538 | |
| 173,173 | CDW Corp. | 35,462,367 | |
| 912,194 | Corning, Inc. | 33,960,983 | |
| 134,369 | F5 Networks, Inc.* | 32,881,438 | |
| 61 |
December 31, 2021
| Shares or Principal Amount | Market Value† | ||
| COMMON STOCKS - 99.2% - (continued) | |||
| Technology Hardware & Equipment - 10.0% - (continued) | |||
| 177,579 | Motorola Solutions, Inc. | $ 48,248,214 | |
| 338,689 | NetApp, Inc. | 31,156,001 | |
| 347,822,541 | |||
| Telecommunication Services - 0.9% | |||
| 636,038 | Verizon Communications, Inc. | 33,048,535 | |
| Transportation - 1.1% | |||
| 145,446 | FedEx Corp. | 37,618,153 | |
| Utilities - 2.0% | |||
| 409,974 | American Electric Power Co., Inc. | 36,475,387 | |
| 304,654 | Duke Energy Corp. | 31,958,204 | |
| 68,433,591 | |||
| Total Common Stocks (cost $2,137,824,544) | $ 3,444,015,235 | ||
| CONVERTIBLE PREFERRED STOCKS - 0.2% | |||
| Software & Services - 0.2% | |||
| 1,871,878 | Essence Group Holdings Corp. Series 3*(1)(2)(3) | $ 4,061,975 | |
| 287,204 | Lookout, Inc. Series F*(1)(2)(3) | 2,550,372 | |
| Total Convertible Preferred Stocks (cost $6,240,761) | $ 6,612,347 | ||
| Total Long-Term Investments (Cost $2,144,065,305) | $ 3,450,627,582 | ||
| SHORT-TERM INVESTMENTS - 0.6% | |||
| Repurchase Agreements - 0.6% | |||
| $ 19,661,557 | Fixed Income Clearing Corp. Repurchase Agreement dated 12/31/2021 at 0.020%, due on 01/03/2022 with a maturity value of $19,661,590; collateralized by U.S. Treasury Bond at 2.000%, maturing 11/15/2041, with a market value of $20,054,842 | $ 19,661,557 | |
| Total Short-Term Investments (cost $19,661,557) | $ 19,661,557 | ||
| Total Investments (cost $2,163,726,862) | 100.0% | $ 3,470,289,139 | |
| Other Assets and Liabilities | 0.0% | 1,006,151 | |
| Total Net Assets | 100.0% | $ 3,471,295,290 | |
| Note: | Percentage of investments as shown is the ratio of the total market value to total net assets. |
| Equity industry classifications used in this report are the Global Industry Classification Standard, which was developed by and is the exclusive property and service mark of MSCI, Inc. and Standard & Poor’s. | |
| For Fund compliance purposes, the Fund may not use the same classification system. These classifications are used for financial reporting purposes. | |
| See “Glossary” for abbreviation descriptions. |
| * | Non-income producing. |
| (1) | These securities are valued in good faith at fair value as determined under policies and procedures established by and under the supervision of the Board of Directors. At December 31, 2021, the aggregate fair value of these securities are $8,384,573, which represented 0.2% of total net assets. This amount excludes securities that are principally traded in certain foreign markets and whose prices are adjusted pursuant to a third party pricing service methodology approved by the Board of Directors. |
| (2) | Investment in securities not registered under the Securities Act of 1933 (excluding securities acquired pursuant to Rule 144A and Regulation S). At the end of the period, the value of such restricted securities amounted to $8,384,573 or 0.2% of net assets. |
| Period Acquired | Security Name | Shares/ Par Value | Total Cost | Market Value | ||||
| 05/2014 | Essence Group Holdings Corp. Series 3 Convertible Preferred | 1,871,878 | $ 2,960,001 | $ 4,061,975 | ||||
| 07/2014 | Lookout, Inc. Series F Convertible Preferred | 287,204 | 3,280,760 | 2,550,372 | ||||
| 11/2013 | Tory Burch LLC | 38,805 | 3,041,403 | 1,772,226 | ||||
| $ 9,282,164 | $ 8,384,573 |
| (3) | Investment valued using significant unobservable inputs. |
| † | See Significant Accounting Policies of accompanying Notes to Financial Statements regarding valuation of investments. |
| 62 |
December 31, 2021
| Description | Total | Level 1 | Level 2 | Level 3(1) | ||||
| Assets | ||||||||
| Common Stocks | ||||||||
| Automobiles & Components | $ 60,820,774 | $ 60,820,774 | $ — | $ — | ||||
| Banks | 178,959,919 | 178,959,919 | — | — | ||||
| Capital Goods | 201,794,977 | 201,794,977 | — | — | ||||
| Commercial & Professional Services | 76,511,123 | 76,511,123 | — | — | ||||
| Consumer Durables & Apparel | 77,858,111 | 77,858,111 | — | — | ||||
| Consumer Services | 89,964,853 | 89,964,853 | — | — | ||||
| Diversified Financials | 173,311,326 | 173,311,326 | — | — | ||||
| Energy | 43,522,614 | 43,522,614 | — | — | ||||
| Food & Staples Retailing | 38,007,893 | 38,007,893 | — | — | ||||
| Food, Beverage & Tobacco | 75,135,115 | 75,135,115 | — | — | ||||
| Health Care Equipment & Services | 251,375,851 | 251,375,851 | — | — | ||||
| Household & Personal Products | 104,986,403 | 104,986,403 | — | — | ||||
| Insurance | 56,446,364 | 56,446,364 | — | — | ||||
| Materials | 37,888,000 | 37,888,000 | — | — | ||||
| Media & Entertainment | 376,906,208 | 376,906,208 | — | — | ||||
| Pharmaceuticals, Biotechnology & Life Sciences | 249,529,413 | 249,529,413 | — | — | ||||
| Real Estate | 58,409,281 | 58,409,281 | — | — | ||||
| Retailing | 183,551,250 | 181,779,024 | — | 1,772,226 | ||||
| Semiconductors & Semiconductor Equipment | 208,626,126 | 208,626,126 | — | — | ||||
| Software & Services | 413,486,814 | 413,486,814 | — | — | ||||
| Technology Hardware & Equipment | 347,822,541 | 347,822,541 | — | — | ||||
| Telecommunication Services | 33,048,535 | 33,048,535 | — | — | ||||
| Transportation | 37,618,153 | 37,618,153 | — | — | ||||
| Utilities | 68,433,591 | 68,433,591 | — | — | ||||
| Convertible Preferred Stocks | 6,612,347 | — | — | 6,612,347 | ||||
| Short-Term Investments | 19,661,557 | — | 19,661,557 | — | ||||
| Total | $ 3,470,289,139 | $ 3,442,243,009 | $ 19,661,557 | $ 8,384,573 |
| (1) | For the year ended December 31, 2021, there were no transfers in and out of Level 3. |
| Common Stocks | Convertible Preferred Stocks | Escrows | Total | |||||||
| Beginning balance | $ 3,119,637 | $ 31,015,085 | $ 5,167 | $ 34,139,889 | ||||||
| Purchases | — | 549,247 | — | 549,247 | ||||||
| Sales | (1,217,677) | (51,498,823) | (17,809) | (52,734,309) | ||||||
| Accrued discounts/(premiums) | — | — | — | — | ||||||
| Total realized gain/(loss) | 562,690 | 37,790,877 | 17,809 | 38,371,376 | ||||||
| Net change in unrealized appreciation/(depreciation) | (692,424) | (11,244,039) | (5,167) | (11,941,630) | ||||||
| Transfers into Level 3 | — | — | — | — | ||||||
| Transfers out of Level 3 | — | — | — | — | ||||||
| Ending balance | $ 1,772,226 | $ 6,612,347 | $ — | $ 8,384,573 | ||||||
| The change in net unrealized appreciation/(depreciation) relating to the Level 3 investments held at December 31, 2021 was $(745,739). | ||||||||||
| 63 |
December 31, 2021
| Shares or Principal Amount | Market Value† | ||
| COMMON STOCKS - 97.7% | |||
| Banks - 6.4% | |||
| 2,090,424 | Bank of America Corp. | $ 93,002,964 | |
| 726,030 | JP Morgan Chase & Co. | 114,966,850 | |
| 288,258 | PNC Financial Services Group, Inc. | 57,801,494 | |
| 265,771,308 | |||
| Capital Goods - 6.6% | |||
| 190,722 | General Dynamics Corp. | 39,759,815 | |
| 624,608 | Ingersoll Rand, Inc. | 38,644,497 | |
| 439,953 | Johnson Controls International plc | 35,772,579 | |
| 158,039 | Lockheed Martin Corp. | 56,168,641 | |
| 570,120 | Otis Worldwide Corp. | 49,640,348 | |
| 612,232 | Raytheon Technologies Corp. | 52,688,686 | |
| 272,674,566 | |||
| Commercial & Professional Services - 1.1% | |||
| 272,235 | Waste Management, Inc. | 45,436,022 | |
| Consumer Services - 2.5% | |||
| 359,309 | Hilton Worldwide Holdings, Inc.* | 56,048,611 | |
| 172,403 | McDonald's Corp. | 46,216,072 | |
| 102,264,683 | |||
| Diversified Financials - 5.8% | |||
| 347,132 | American Express Co. | 56,790,795 | |
| 47,548 | BlackRock, Inc. | 43,533,047 | |
| 674,454 | Charles Schwab Corp. | 56,721,581 | |
| 223,333 | Northern Trust Corp. | 26,712,860 | |
| 118,921 | S&P Global, Inc. | 56,122,388 | |
| 239,880,671 | |||
| Energy - 3.9% | |||
| 439,487 | Chevron Corp. | 51,573,800 | |
| 682,874 | ConocoPhillips | 49,289,845 | |
| 311,765 | Marathon Petroleum Corp. | 19,949,842 | |
| 852,594 | Total SE ADR | 42,169,299 | |
| 162,982,786 | |||
| Food & Staples Retailing - 2.5% | |||
| 587,923 | Sysco Corp. | 46,181,351 | |
| 397,765 | Walmart, Inc. | 57,552,618 | |
| 103,733,969 | |||
| Food, Beverage & Tobacco - 2.6% | |||
| 935,394 | Coca-Cola Co. | 55,384,679 | |
| 800,297 | Mondelez International, Inc. Class A | 53,067,694 | |
| 108,452,373 | |||
| Health Care Equipment & Services - 7.4% | |||
| 120,320 | Anthem, Inc. | 55,773,133 | |
| 198,303 | Becton Dickinson and Co. | 49,869,238 | |
| 153,802 | HCA Healthcare, Inc. | 39,514,810 | |
| 517,402 | Medtronic plc | 53,525,237 | |
| 214,127 | UnitedHealth Group, Inc. | 107,521,732 | |
| 306,204,150 | |||
| Household & Personal Products - 0.9% | |||
| 412,240 | Colgate-Palmolive Co. | 35,180,562 | |
| Insurance - 6.1% | |||
| 913,434 | American International Group, Inc. | 51,937,857 | |
| 447,735 | Chubb Ltd. | 86,551,653 | |
| 557,536 | MetLife, Inc. | 34,840,425 | |
| Shares or Principal Amount | Market Value† | ||
| COMMON STOCKS - 97.7% - (continued) | |||
| Insurance - 6.1% - (continued) | |||
| 295,847 | Principal Financial Group, Inc. | $ 21,398,613 | |
| 517,798 | Prudential Financial, Inc. | 56,046,456 | |
| 250,775,004 | |||
| Materials - 3.6% | |||
| 349,525 | Celanese Corp. | 58,741,172 | |
| 497,916 | FMC Corp. | 54,715,989 | |
| 193,427 | PPG Industries, Inc. | 33,354,552 | |
| 146,811,713 | |||
| Media & Entertainment - 5.6% | |||
| 54,403 | Alphabet, Inc. Class A* | 157,607,667 | |
| 1,449,489 | Comcast Corp. Class A | 72,952,781 | |
| 230,560,448 | |||
| Pharmaceuticals, Biotechnology & Life Sciences - 8.1% | |||
| 188,294 | Agilent Technologies, Inc. | 30,061,137 | |
| 695,879 | AstraZeneca plc ADR | 40,534,952 | |
| 996,183 | Bristol-Myers Squibb Co. | 62,112,010 | |
| 586,608 | Merck & Co., Inc. | 44,957,637 | |
| 514,398 | Novartis AG ADR | 44,994,393 | |
| 1,870,236 | Pfizer, Inc. | 110,437,436 | |
| 333,097,565 | |||
| Real Estate - 3.2% | |||
| 156,102 | American Tower Corp. REIT | 45,659,835 | |
| 1,924,587 | Host Hotels & Resorts, Inc. REIT* | 33,468,568 | |
| 144,610 | Public Storage REIT | 54,165,122 | |
| 133,293,525 | |||
| Retailing - 3.7% | |||
| 127,596 | Home Depot, Inc. | 52,953,616 | |
| 196,317 | Lowe's Cos., Inc. | 50,744,018 | |
| 641,081 | TJX Cos., Inc. | 48,670,870 | |
| 152,368,504 | |||
| Semiconductors & Semiconductor Equipment - 3.4% | |||
| 96,927 | Broadcom, Inc. | 64,496,195 | |
| 370,888 | Micron Technology, Inc. | 34,548,217 | |
| 229,609 | Texas Instruments, Inc. | 43,274,408 | |
| 142,318,820 | |||
| Software & Services - 8.9% | |||
| 118,447 | Accenture plc Class A | 49,102,204 | |
| 793,284 | Cognizant Technology Solutions Corp. Class A | 70,380,156 | |
| 428,484 | Fidelity National Information Services, Inc. | 46,769,029 | |
| 600,324 | Microsoft Corp. | 201,900,968 | |
| 368,152,357 | |||
| Technology Hardware & Equipment - 7.9% | |||
| 672,990 | Apple, Inc. | 119,502,834 | |
| 1,240,126 | Cisco Systems, Inc. | 78,586,785 | |
| 1,071,940 | Corning, Inc. | 39,908,326 | |
| 1,585,585 | HP, Inc. | 59,728,987 | |
| 98,573 | Motorola Solutions, Inc. | 26,782,284 | |
| 324,509,216 | |||
| Telecommunication Services - 1.9% | |||
| 1,541,415 | Verizon Communications, Inc. | 80,091,923 | |
| Transportation - 1.2% | |||
| 207,257 | Ryanair Holdings plc ADR* | 21,208,609 | |
| 104,500 | Union Pacific Corp. | 26,326,685 | |
| 47,535,294 | |||
| 64 |
December 31, 2021
| Shares or Principal Amount | Market Value† | ||
| COMMON STOCKS - 97.7% - (continued) | |||
| Utilities - 4.4% | |||
| 539,565 | Dominion Energy, Inc. | $ 42,388,226 | |
| 430,052 | Duke Energy Corp. | 45,112,455 | |
| 943,674 | Exelon Corp. | 54,506,610 | |
| 290,160 | Sempra Energy | 38,382,365 | |
| 180,389,656 | |||
| Total Common Stocks (cost $2,194,373,901) | $ 4,032,485,115 | ||
| SHORT-TERM INVESTMENTS - 1.8% | |||
| Repurchase Agreements - 1.8% | |||
| $ 72,902,802 | Fixed Income Clearing Corp. Repurchase Agreement dated 12/31/2021 at 0.020%, due on 01/03/2022 with a maturity value of $72,902,924; collateralized by U.S. Treasury Bond at 1.750%, maturing 08/15/2041, with a market value of $74,360,953 | $ 72,902,802 | |
| Total Short-Term Investments (cost $72,902,802) | $ 72,902,802 | ||
| Total Investments (cost $2,267,276,703) | 99.5% | $ 4,105,387,917 | |
| Other Assets and Liabilities | 0.5% | 19,702,133 | |
| Total Net Assets | 100.0% | $ 4,125,090,050 | |
| Note: | Percentage of investments as shown is the ratio of the total market value to total net assets. |
| Equity industry classifications used in this report are the Global Industry Classification Standard, which was developed by and is the exclusive property and service mark of MSCI, Inc. and Standard & Poor’s. | |
| For Fund compliance purposes, the Fund may not use the same classification system. These classifications are used for financial reporting purposes. | |
| See “Glossary” for abbreviation descriptions. |
| * | Non-income producing. |
| † | See Significant Accounting Policies of accompanying Notes to Financial Statements regarding valuation of investments. |
| Description | Total | Level 1 | Level 2 | Level 3(1) | ||||
| Assets | ||||||||
| Common Stocks | ||||||||
| Banks | $ 265,771,308 | $ 265,771,308 | $ — | $ — | ||||
| Capital Goods | 272,674,566 | 272,674,566 | — | — | ||||
| Commercial & Professional Services | 45,436,022 | 45,436,022 | — | — | ||||
| Consumer Services | 102,264,683 | 102,264,683 | — | — | ||||
| Diversified Financials | 239,880,671 | 239,880,671 | — | — | ||||
| Energy | 162,982,786 | 162,982,786 | — | — | ||||
| Food & Staples Retailing | 103,733,969 | 103,733,969 | — | — | ||||
| Food, Beverage & Tobacco | 108,452,373 | 108,452,373 | — | — | ||||
| Health Care Equipment & Services | 306,204,150 | 306,204,150 | — | — | ||||
| Household & Personal Products | 35,180,562 | 35,180,562 | — | — | ||||
| Insurance | 250,775,004 | 250,775,004 | — | — | ||||
| Materials | 146,811,713 | 146,811,713 | — | — | ||||
| Media & Entertainment | 230,560,448 | 230,560,448 | — | — | ||||
| Pharmaceuticals, Biotechnology & Life Sciences | 333,097,565 | 333,097,565 | — | — | ||||
| Real Estate | 133,293,525 | 133,293,525 | — | — | ||||
| Retailing | 152,368,504 | 152,368,504 | — | — | ||||
| Semiconductors & Semiconductor Equipment | 142,318,820 | 142,318,820 | — | — | ||||
| Software & Services | 368,152,357 | 368,152,357 | — | — | ||||
| Technology Hardware & Equipment | 324,509,216 | 324,509,216 | — | — | ||||
| Telecommunication Services | 80,091,923 | 80,091,923 | — | — | ||||
| Transportation | 47,535,294 | 47,535,294 | — | — | ||||
| Utilities | 180,389,656 | 180,389,656 | — | — | ||||
| Short-Term Investments | 72,902,802 | — | 72,902,802 | — | ||||
| Total | $ 4,105,387,917 | $ 4,032,485,115 | $ 72,902,802 | $ — |
| (1) | For the year ended December 31, 2021, there were no transfers in and out of Level 3. |
| 65 |
December 31, 2021
| Shares or Principal Amount | Market Value† | ||
| COMMON STOCKS - 98.5% | |||
| Biotechnology - 15.1% | |||
| 73,787 | 89bio, Inc.* | $ 964,396 | |
| 57,713 | Abcam plc* | 1,353,775 | |
| 6,510 | Alnylam Pharmaceuticals, Inc.* | 1,103,966 | |
| 103,687 | Amicus Therapeutics, Inc.* | 1,197,585 | |
| 16,400 | Arena Pharmaceuticals, Inc.* | 1,524,216 | |
| 3,276 | Argenx SE ADR* | 1,147,223 | |
| 8,134 | Ascendis Pharma A/S ADR* | 1,094,267 | |
| 21,548 | BioAtla, Inc.* | 422,987 | |
| 3,278 | BioNTech SE* | 845,068 | |
| 18,171 | Blueprint Medicines Corp.* | 1,946,296 | |
| 24,970 | Celldex Therapeutics, Inc.* | 964,841 | |
| 48,735 | Entrada Therapeutics, Inc.*(1) | 834,343 | |
| 141,000 | Everest Medicines Ltd.*(2) | 630,249 | |
| 22,590 | Exact Sciences Corp.* | 1,758,180 | |
| 12,323 | Genus plc | 826,464 | |
| 46,579 | Gracell Biotechnologies, Inc. ADR*(1) | 281,337 | |
| 134,527 | ImmunoGen, Inc.* | 998,190 | |
| 119,000 | InnoCare Pharma Ltd.*(2) | 233,660 | |
| 38,688 | Invitae Corp.* | 590,766 | |
| 79,993 | Ironwood Pharmaceuticals, Inc.* | 932,718 | |
| 1,985 | Karuna Therapeutics, Inc.* | 260,035 | |
| 10,710 | Kodiak Sciences, Inc.* | 907,994 | |
| 17,348 | Kymera Therapeutics, Inc.* | 1,101,425 | |
| 15,518 | Madrigal Pharmaceuticals, Inc.* | 1,314,995 | |
| 3,469 | Moderna, Inc.* | 881,057 | |
| 23,053 | Myovant Sciences Ltd.* | 358,935 | |
| 33,962 | Nurix Therapeutics, Inc.* | 983,200 | |
| 13,026 | Sage Therapeutics, Inc.* | 554,126 | |
| 12,034 | Seagen, Inc.* | 1,860,457 | |
| 27,250 | Veracyte, Inc.* | 1,122,700 | |
| 14,413 | Verve Therapeutics, Inc.*(1) | 531,407 | |
| 20,510 | Zai Lab Ltd. ADR* | 1,290,827 | |
| 6,998 | Zealand Pharma A/S ADR*(1) | 149,337 | |
| 30,967,022 | |||
| Consumer Finance - 0.1% | |||
| 14,030 | Orion Acquisition Corp.* | 139,248 | |
| Health Care Distributors - 1.4% | |||
| 23,626 | AdaptHealth Corp.* | 577,892 | |
| 55,922 | Covetrus, Inc.* | 1,116,762 | |
| 26,224 | Owens & Minor, Inc. | 1,140,744 | |
| 2,835,398 | |||
| Health Care Equipment - 19.5% | |||
| 32,181 | Baxter International, Inc. | 2,762,417 | |
| 17,480 | Becton Dickinson and Co. | 4,395,870 | |
| 135,213 | Boston Scientific Corp.* | 5,743,848 | |
| 7,681 | DiaSorin S.p.A. | 1,461,279 | |
| 46,921 | Edwards Lifesciences Corp.* | 6,078,616 | |
| 19,752 | Glaukos Corp.* | 877,779 | |
| 23,505 | Hologic, Inc.* | 1,799,543 | |
| 13,559 | Inari Medical, Inc.* | 1,237,530 | |
| 9,044 | Insulet Corp.* | 2,406,337 | |
| 13,277 | Integra LifeSciences Holdings Corp.* | 889,426 | |
| 7,708 | iRhythm Technologies, Inc.* | 907,155 | |
| 39,224 | Koninklijke Philips N.V. | 1,451,743 | |
| 2,053 | Masimo Corp.* | 601,077 | |
| 71,205 | Smith & Nephew plc | 1,242,696 | |
| 20,356 | Stryker Corp. | 5,443,602 | |
| 6,858 | Teleflex, Inc. | 2,252,716 | |
| 134,000 | Venus MedTech Hangzhou, Inc. Class H*(1)(2) | 510,859 | |
| 40,062,493 | |||
| Shares or Principal Amount | Market Value† | ||
| COMMON STOCKS - 98.5% - (continued) | |||
| Health Care Facilities - 2.7% | |||
| 55,068 | Cano Health, Inc.*(1) | $ 490,656 | |
| 23,501 | Encompass Health Corp. | 1,533,675 | |
| 13,743 | HCA Healthcare, Inc. | 3,530,852 | |
| 5,555,183 | |||
| Health Care Services - 2.3% | |||
| 40,703 | agilon health, Inc.* | 1,098,981 | |
| 6,361 | Amedisys, Inc.* | 1,029,719 | |
| 48,992 | Aveanna Healthcare Holdings, Inc.* | 362,541 | |
| 7,150 | Laboratory Corp. of America Holdings* | 2,246,601 | |
| 4,737,842 | |||
| Health Care Supplies - 2.2% | |||
| 4,147 | Align Technology, Inc.* | 2,725,325 | |
| 8,697 | Haemonetics Corp.* | 461,289 | |
| 6,313 | Quidel Corp.* | 852,192 | |
| 364,000 | Shandong Weigao Group Medical Polymer Co., Ltd. Class H | 453,797 | |
| 4,492,603 | |||
| Integrated Telecommunication Services - 0.2% | |||
| 45,130 | MedTech Acquisition Corp.* | 452,654 | |
| Life & Health Insurance - 0.1% | |||
| 28,437 | Oscar Health, Inc. Class A*(1) | 223,231 | |
| Life Sciences Tools & Services - 11.9% | |||
| 25,453 | Agilent Technologies, Inc. | 4,063,571 | |
| 2,359 | Bio-Techne Corp. | 1,220,405 | |
| 25,816 | Danaher Corp. | 8,493,722 | |
| 7,177 | Illumina, Inc.* | 2,730,418 | |
| 25,053 | NanoString Technologies, Inc.* | 1,057,988 | |
| 27,596 | NeoGenomics, Inc.* | 941,576 | |
| 5,415 | Oxford Industries, Inc.* | 51,160 | |
| 36,842 | Syneos Health, Inc.* | 3,782,937 | |
| 1,852 | Tecan Group AG | 1,124,842 | |
| 55,554 | WuXi AppTec Co., Ltd. Class H(2) | 959,878 | |
| 24,426,497 | |||
| Managed Health Care - 15.2% | |||
| 38,213 | Centene Corp.* | 3,148,751 | |
| 10,202 | Humana, Inc. | 4,732,300 | |
| 6,389 | Molina Healthcare, Inc.* | 2,032,213 | |
| 55,900 | Notre Dame Intermedica Participacoes S.A. | 605,667 | |
| 41,214 | UnitedHealth Group, Inc. | 20,695,198 | |
| 31,214,129 | |||
| Other Diversified Financial Services - 0.3% | |||
| 72,104 | DA32 Life Science Tech Acquisition Corp. Class A* | 707,340 | |
| Pharmaceuticals - 27.5% | |||
| 136,100 | Astellas Pharma, Inc. | 2,215,099 | |
| 63,371 | AstraZeneca plc ADR | 3,691,361 | |
| 119,309 | Bristol-Myers Squibb Co. | 7,438,916 | |
| 30,400 | Chugai Pharmaceutical Co., Ltd. | 990,918 | |
| 294,000 | CSPC Pharmaceutical Group Ltd. | 320,133 | |
| 75,435 | Daiichi Sankyo Co., Ltd. | 1,919,928 | |
| 24,309 | Eisai Co., Ltd. | 1,379,969 | |
| 21,542 | Elanco Animal Health, Inc.* | 611,362 | |
| 42,435 | Eli Lilly & Co. | 11,721,396 | |
| 23,082 | Hikma Pharmaceuticals plc | 693,176 | |
| 35,945 | Hutchmed China Ltd.*(1) | 261,248 | |
| 8,979 | Hutchmed China Ltd. ADR* | 314,983 | |
| 170,200 | Hypera S.A. | 863,834 | |
| 40,400 | Kyowa Kirin Co., Ltd. | 1,101,534 | |
| 11,196 | Novartis AG | 983,815 | |
| 66 |
December 31, 2021
| Shares or Principal Amount | Market Value† | ||
| COMMON STOCKS - 98.5% - (continued) | |||
| Pharmaceuticals - 27.5% - (continued) | |||
| 54,176 | Ono Pharmaceutical Co., Ltd. | $ 1,346,566 | |
| 239,566 | Pfizer, Inc. | 14,146,372 | |
| 7,972 | UCB S.A. | 909,812 | |
| 22,607 | Zoetis, Inc. | 5,516,786 | |
| 56,427,208 | |||
| Total Common Stocks (cost $144,555,121) | $ 202,240,848 | ||
| SHORT-TERM INVESTMENTS - 2.2% | |||
| Repurchase Agreements - 1.3% | |||
| $ 2,707,778 | Fixed Income Clearing Corp. Repurchase Agreement dated 12/31/2021 at 0.020%, due on 01/03/2022 with a maturity value of $2,707,783; collateralized by U.S. Treasury Bond at 1.750%, maturing 08/15/2041, with a market value of $2,762,013 | $ 2,707,778 | |
| Securities Lending Collateral - 0.9% | |||
| 65,757 | Fidelity Investments Money Market Funds, Government Portfolio, Institutional Class, 0.01%(3) | 65,757 | |
| 1,721,823 | Goldman Sachs Financial Square Funds, Government Fund, Institutional Class, 0.03%(3) | 1,721,823 | |
| 100,316 | Invesco Government & Agency Portfolio, Institutional Class, 0.03%(3) | 100,316 | |
| 1,887,896 | |||
| Total Short-Term Investments (cost $4,595,674) | $ 4,595,674 | ||
| Total Investments (cost $149,150,795) | 100.7% | $ 206,836,522 | |
| Other Assets and Liabilities | (0.7)% | (1,445,739) | |
| Total Net Assets | 100.0% | $ 205,390,783 | |
| Note: | Percentage of investments as shown is the ratio of the total market value to total net assets. |
| Prices of foreign equities that are principally traded on certain foreign markets will generally be adjusted daily pursuant to a fair value pricing service approved by the Board of Directors in order to reflect an adjustment for factors occurring after the close of certain foreign markets but before the close of the New York Stock Exchange. | |
| Equity industry classifications used in this report are the Global Industry Classification Standard, which was developed by and is the exclusive property and service mark of MSCI, Inc. and Standard & Poor’s. | |
| For Fund compliance purposes, the Fund may not use the same classification system. These classifications are used for financial reporting purposes. | |
| See “Glossary” for abbreviation descriptions. |
| * | Non-income producing. |
| (1) | Represents entire or partial securities on loan. See Note 8 in the accompanying Notes to Financial Statements for securities lending information. |
| (2) | Security was purchased pursuant to Rule 144A under the Securities Act of 1933 and may be sold in transactions that are exempt from registration (typically only to qualified institutional buyers) or in a public offering registered under the Securities Act of 1933. At December 31, 2021, the aggregate value of these securities was $2,334,646, representing 1.1% of net assets. |
| (3) | Current yield as of period end. |
| † | See Significant Accounting Policies of accompanying Notes to Financial Statements regarding valuation of investments. |
| Description | Total | Level 1 | Level 2 | Level 3(1) | ||||
| Assets | ||||||||
| Common Stocks | ||||||||
| Biotechnology | $ 30,967,022 | $ 29,152,318 | $ 1,814,704 | $ — | ||||
| Consumer Finance | 139,248 | 139,248 | — | — | ||||
| Health Care Distributors | 2,835,398 | 2,835,398 | — | — | ||||
| Health Care Equipment | 40,062,493 | 35,395,916 | 4,666,577 | — | ||||
| Health Care Facilities | 5,555,183 | 5,555,183 | — | — | ||||
| Health Care Services | 4,737,842 | 4,737,842 | — | — | ||||
| Health Care Supplies | 4,492,603 | 4,038,806 | 453,797 | — | ||||
| Integrated Telecommunication Services | 452,654 | 452,654 | — | — | ||||
| Life & Health Insurance | 223,231 | 223,231 | — | — | ||||
| Life Sciences Tools & Services | 24,426,497 | 22,341,777 | 2,084,720 | — | ||||
| Managed Health Care | 31,214,129 | 31,214,129 | — | — | ||||
| Other Diversified Financial Services | 707,340 | 707,340 | — | — | ||||
| Pharmaceuticals | 56,427,208 | 44,305,010 | 12,122,198 | — | ||||
| Short-Term Investments | 4,595,674 | 1,887,896 | 2,707,778 | — | ||||
| Total | $ 206,836,522 | $ 182,986,748 | $ 23,849,774 | $ — |
| (1) | For the year ended December 31, 2021, there were no transfers in and out of Level 3. |
| 67 |
December 31, 2021
| Shares or Principal Amount | Market Value† | ||
| COMMON STOCKS - 97.1% | |||
| Australia - 2.1% | |||
| 1,283,090 | Goodman Group REIT | $ 24,733,890 | |
| Belgium - 1.8% | |||
| 244,418 | KBC Group N.V. | 21,000,696 | |
| Brazil - 1.4% | |||
| 795,012 | Localiza Rent a Car S.A. | 7,564,746 | |
| 294,620 | XP, Inc. Class A* | 8,467,379 | |
| 16,032,125 | |||
| Canada - 6.0% | |||
| 278,678 | Brookfield Asset Management, Inc. Class A | 16,829,292 | |
| 956,770 | Cenovus Energy, Inc. | 11,731,296 | |
| 13,629 | Constellation Software, Inc. | 25,286,727 | |
| 104,166 | Ritchie Bros Auctioneers, Inc. | 6,374,552 | |
| 7,650 | Shopify, Inc. Class A* | 10,537,033 | |
| 70,758,900 | |||
| China - 9.2% | |||
| 3,849,000 | China Longyuan Power Group Corp. Ltd. Class H | 8,990,560 | |
| 1,213,500 | China Merchants Bank Co., Ltd. Class H | 9,440,519 | |
| 142,397 | China Tourism Group Duty Free Corp. Ltd. Class A | 4,908,923 | |
| 404,526 | ENN Energy Holdings Ltd. | 7,626,007 | |
| 1,341 | Hangzhou Tigermed Consulting Co., Ltd. Class H(1) | 17,015 | |
| 1,145,000 | Li Ning Co., Ltd. | 12,560,689 | |
| 403,600 | Meituan Class B*(1) | 11,671,091 | |
| 409,400 | Proya Cosmetics Co., Ltd. Class A | 13,388,931 | |
| 768,200 | Shandong Sinocera Functional Material Co., Ltd. Class A | 5,130,978 | |
| 509,591 | Tencent Holdings Ltd. | 29,735,197 | |
| 304,900 | WuXi AppTec Co., Ltd. Class H(1) | 5,268,153 | |
| 108,738,063 | |||
| Denmark - 1.3% | |||
| 41,635 | Ascendis Pharma A/S ADR* | 5,601,157 | |
| 18,020 | DSV Panalpina A/S | 4,199,169 | |
| 13,831 | Genmab A/S* | 5,520,685 | |
| 15,321,011 | |||
| France - 8.3% | |||
| 503,325 | AXA S.A. | 14,980,591 | |
| 305,700 | BNP Paribas S.A. | 21,136,412 | |
| 458,924 | Bureau Veritas S.A. | 15,235,785 | |
| 53,234 | Cie de Saint-Gobain | 3,744,829 | |
| 5,195 | Hermes International | 9,077,604 | |
| 4,859 | Kering S.A. | 3,898,626 | |
| 25,738 | L'Oreal S.A. | 12,272,204 | |
| 7,050 | LVMH Moet Hennessy Louis Vuitton SE | 5,826,357 | |
| 59,079 | Schneider Electric SE | 11,614,659 | |
| 97,787,067 | |||
| Germany - 6.0% | |||
| 1,693,611 | Commerzbank AG* | 12,813,137 | |
| 446,234 | Infineon Technologies AG | 20,543,924 | |
| 162,892 | Siemens AG | 28,213,347 | |
| 107,033 | Zalando SE*(1) | 8,622,201 | |
| 70,192,609 | |||
| Hong Kong - 1.7% | |||
| 106,000 | Hong Kong Exchanges & Clearing Ltd. | 6,199,300 | |
| 689,645 | Techtronic Industries Co., Ltd. | 13,748,002 | |
| 19,947,302 | |||
| Shares or Principal Amount | Market Value† | ||
| COMMON STOCKS - 97.1% - (continued) | |||
| India - 3.5% | |||
| 337,102 | HDFC Bank Ltd. | $ 6,673,682 | |
| 1,577,249 | ICICI Bank Ltd. | 15,679,359 | |
| 585,110 | Reliance Industries Ltd. | 18,586,940 | |
| 40,939,981 | |||
| Ireland - 1.3% | |||
| 238,165 | CRH plc | 12,619,382 | |
| 49,460 | Smurfit Kappa Group plc | 2,726,056 | |
| 15,345,438 | |||
| Israel - 1.1% | |||
| 75,100 | CyberArk Software Ltd.* | 13,013,328 | |
| Italy - 1.8% | |||
| 82,305 | Ferrari N.V. | 21,185,794 | |
| Japan - 14.0% | |||
| 119,300 | Bandai Namco Holdings, Inc. | 9,327,873 | |
| 281,300 | Dai-ichi Life Holdings, Inc. | 5,673,812 | |
| 93,525 | Daikin Industries Ltd. | 21,185,206 | |
| 53,972 | Eisai Co., Ltd. | 3,063,872 | |
| 66,800 | Hoya Corp. | 9,912,567 | |
| 246,200 | Kao Corp. | 12,894,553 | |
| 30,022 | Keyence Corp. | 18,876,575 | |
| 3,108,500 | Mitsubishi UFJ Financial Group, Inc. | 16,917,310 | |
| 55,500 | Oriental Land Co., Ltd. | 9,358,803 | |
| 244,915 | Recruit Holdings Co., Ltd. | 14,904,470 | |
| 184,500 | Sony Corp. | 23,298,323 | |
| 209,500 | Subaru Corp. | 3,743,306 | |
| 38,987 | Sysmex Corp. | 5,262,524 | |
| 543,300 | T&D Holdings, Inc. | 6,941,073 | |
| 7,000 | Tokyo Electron Ltd. | 4,029,006 | |
| 165,389,273 | |||
| Luxembourg - 1.4% | |||
| 513,135 | ArcelorMittal S.A. | 16,460,672 | |
| Netherlands - 7.0% | |||
| 229,382 | AerCap Holdings N.V.* | 15,006,170 | |
| 7,193 | Argenx SE ADR* | 2,518,917 | |
| 13,640 | ASML Holding N.V. | 10,925,911 | |
| 64,039 | Koninklijke DSM N.V. | 14,421,986 | |
| 85,804 | Koninklijke Philips N.V. | 3,175,744 | |
| 1,103,824 | Royal Dutch Shell plc Class A | 24,145,943 | |
| 679,588 | Stellantis N.V. | 12,829,654 | |
| 83,024,325 | |||
| Norway - 0.7% | |||
| 291,461 | Equinor ASA | 7,717,679 | |
| Singapore - 0.5% | |||
| 27,207 | Sea Ltd. ADR* | 6,086,478 | |
| South Korea - 2.2% | |||
| 179,038 | Coupang, Inc.* | 5,260,137 | |
| 253,675 | Samsung Electronics Co., Ltd. | 16,660,083 | |
| 6,975 | Samsung SDI Co., Ltd.* | 3,836,054 | |
| 25,756,274 | |||
| Spain - 2.1% | |||
| 148,606 | Cellnex Telecom S.A.(1) | 8,608,389 | |
| 1,316,219 | Iberdrola S.A. | 15,584,001 | |
| 24,192,390 | |||
| 68 |
December 31, 2021
| Shares or Principal Amount | Market Value† | ||
| COMMON STOCKS - 97.1% - (continued) | |||
| Sweden - 0.6% | |||
| 30,997 | Spotify Technology S.A.* | $ 7,254,228 | |
| Switzerland - 7.2% | |||
| 92,782 | Cie Financiere Richemont S.A. | 13,864,861 | |
| 25,255 | Lonza Group AG | 21,027,009 | |
| 109,741 | Nestle S.A. | 15,321,741 | |
| 638 | Partners Group Holding AG | 1,053,216 | |
| 66,470 | Roche Holding AG | 27,575,819 | |
| 38,768 | TE Connectivity Ltd. | 6,254,829 | |
| 85,097,475 | |||
| Taiwan - 4.0% | |||
| 118,623 | MediaTek, Inc. | 5,090,055 | |
| 1,888,806 | Taiwan Semiconductor Manufacturing Co., Ltd. | 41,782,267 | |
| 46,872,322 | |||
| Thailand - 1.1% | |||
| 2,981,373 | Kasikornbank PCL | 12,673,401 | |
| United Kingdom - 10.8% | |||
| 280,624 | Allfunds Group plc* | 5,525,905 | |
| 625,519 | Anglo American plc | 25,728,984 | |
| 189,024 | AstraZeneca plc | 22,072,207 | |
| 362,894 | Diageo plc | 19,841,606 | |
| 592,166 | Intermediate Capital Group plc | 17,635,130 | |
| 32,946 | London Stock Exchange Group plc | 3,099,234 | |
| 396,683 | Prudential plc | 6,859,777 | |
| 229,493 | Rio Tinto plc | 15,134,199 | |
| 568,138 | Segro plc REIT | 11,056,948 | |
| 126,953,990 | |||
| Total Common Stocks (cost $899,031,628) | $ 1,142,474,711 | ||
| EXCHANGE-TRADED FUNDS - 0.1% | |||
| Other Investment Pools & Funds - 0.1% | |||
| 29,344 | iShares MSCI ACWI ex U.S. ETF | $ 1,631,526 | |
| Total Exchange-Traded Funds (cost $1,599,571) | $ 1,631,526 | ||
| Total Long-Term Investments (cost $900,631,199) | $ 1,144,106,237 | ||
| SHORT-TERM INVESTMENTS - 1.7% | |||
| Repurchase Agreements - 1.7% | |||
| 20,328,588 | Fixed Income Clearing Corp. Repurchase Agreement dated 12/31/2021 at 0.020%, due on 01/03/2022 with a maturity value of $20,328,622; collateralized by U.S. Treasury Bond at 1.750%, maturing 08/15/2041, with a market value of $20,735,210 | $ 20,328,588 | |
| Total Short-Term Investments (cost $20,328,588) | $ 20,328,588 | ||
| Total Investments (cost $920,959,787) | 98.9% | $ 1,164,434,825 | |
| Other Assets and Liabilities | 1.1% | 12,562,266 | |
| Total Net Assets | 100.0% | $ 1,176,997,091 | |
| Note: | Percentage of investments as shown is the ratio of the total market value to total net assets. |
| Prices of foreign equities that are principally traded on certain foreign markets will generally be adjusted daily pursuant to a fair value pricing service approved by the Board of Directors in order to reflect an adjustment for factors occurring after the close of certain foreign markets but before the close of the New York Stock Exchange. | |
| Equity industry classifications used in this report are the Global Industry Classification Standard, which was developed by and is the exclusive property and service mark of MSCI, Inc. and Standard & Poor’s. | |
| For Fund compliance purposes, the Fund may not use the same classification system. These classifications are used for financial reporting purposes. | |
| See “Glossary” for abbreviation descriptions. |
| * | Non-income producing. |
| (1) | Security was purchased pursuant to Rule 144A under the Securities Act of 1933 and may be sold in transactions that are exempt from registration (typically only to qualified institutional buyers) or in a public offering registered under the Securities Act of 1933. At December 31, 2021, the aggregate value of these securities was $34,186,849, representing 2.9% of net assets. |
| † | See Significant Accounting Policies of accompanying Notes to Financial Statements regarding valuation of investments. |
| 69 |
December 31, 2021
| Description | Total | Level 1 | Level 2 | Level 3(1) | ||||
| Assets | ||||||||
| Common Stocks | ||||||||
| Australia | $ 24,733,890 | $ — | $ 24,733,890 | $ — | ||||
| Belgium | 21,000,696 | — | 21,000,696 | — | ||||
| Brazil | 16,032,125 | 16,032,125 | — | — | ||||
| Canada | 70,758,900 | 70,758,900 | — | — | ||||
| China | 108,738,063 | — | 108,738,063 | — | ||||
| Denmark | 15,321,011 | 5,601,157 | 9,719,854 | — | ||||
| France | 97,787,067 | — | 97,787,067 | — | ||||
| Germany | 70,192,609 | — | 70,192,609 | — | ||||
| Hong Kong | 19,947,302 | — | 19,947,302 | — | ||||
| India | 40,939,981 | — | 40,939,981 | — | ||||
| Ireland | 15,345,438 | — | 15,345,438 | — | ||||
| Israel | 13,013,328 | 13,013,328 | — | — | ||||
| Italy | 21,185,794 | — | 21,185,794 | — | ||||
| Japan | 165,389,273 | — | 165,389,273 | — | ||||
| Luxembourg | 16,460,672 | — | 16,460,672 | — | ||||
| Netherlands | 83,024,325 | 17,525,087 | 65,499,238 | — | ||||
| Norway | 7,717,679 | — | 7,717,679 | — | ||||
| Singapore | 6,086,478 | 6,086,478 | — | — | ||||
| South Korea | 25,756,274 | 5,260,137 | 20,496,137 | — | ||||
| Spain | 24,192,390 | — | 24,192,390 | — | ||||
| Sweden | 7,254,228 | 7,254,228 | — | — | ||||
| Switzerland | 85,097,475 | 6,254,829 | 78,842,646 | — | ||||
| Taiwan | 46,872,322 | — | 46,872,322 | — | ||||
| Thailand | 12,673,401 | 12,673,401 | — | — | ||||
| United Kingdom | 126,953,990 | 5,525,905 | 121,428,085 | — | ||||
| Exchange-Traded Funds | 1,631,526 | 1,631,526 | — | — | ||||
| Short-Term Investments | 20,328,588 | — | 20,328,588 | — | ||||
| Total | $ 1,164,434,825 | $ 167,617,101 | $ 996,817,724 | $ — |
| (1) | For the year ended December 31, 2021, there were no transfers in and out of Level 3. |
| 70 |
December 31, 2021
| Shares or Principal Amount | Market Value† | ||
| COMMON STOCKS - 100.0% | |||
| Automobiles & Components - 0.2% | |||
| 561,583 | Arrival S.A.*(1) | $ 4,166,946 | |
| Banks - 5.3% | |||
| 155,657 | Cullen/Frost Bankers, Inc. | 19,623,678 | |
| 31,328 | First Citizens BancShares, Inc. Class A | 25,997,228 | |
| 123,929 | First Republic Bank | 25,592,578 | |
| 146,392 | M&T Bank Corp. | 22,482,883 | |
| 235,640 | Prosperity Bancshares, Inc. | 17,036,772 | |
| 110,733,139 | |||
| Capital Goods - 10.9% | |||
| 138,013 | Axon Enterprise, Inc.* | 21,668,041 | |
| 207,289 | Builders FirstSource, Inc.* | 17,766,740 | |
| 149,354 | Graco, Inc. | 12,040,920 | |
| 148,188 | IDEX Corp. | 35,019,788 | |
| 754,001 | Ingersoll Rand, Inc. | 46,650,042 | |
| 92,033 | Lennox International, Inc. | 29,851,824 | |
| 164,143 | Lincoln Electric Holdings, Inc. | 22,893,024 | |
| 70,536 | Middleby Corp.* | 13,878,663 | |
| 52,240 | Watsco, Inc. | 16,344,851 | |
| 141,828 | Westinghouse Air Brake Technologies Corp. | 13,063,777 | |
| 229,177,670 | |||
| Commercial & Professional Services - 2.6% | |||
| 1,051,610 | Dun & Bradstreet Holdings, Inc.* | 21,547,489 | |
| 629,430 | GFL Environmental, Inc. | 23,823,925 | |
| 163,368 | IAA, Inc.* | 8,269,688 | |
| 53,641,102 | |||
| Consumer Durables & Apparel - 6.8% | |||
| 212,391 | Carter's, Inc. | 21,498,217 | |
| 7,094 | NVR, Inc.* | 41,917,524 | |
| 210,555 | PVH Corp. | 22,455,691 | |
| 1,011,475 | Under Armour, Inc. Class C* | 18,247,009 | |
| 447,261 | Vizio Holding Corp.* | 8,690,281 | |
| 364,728 | YETI Holdings, Inc.* | 30,210,420 | |
| 143,019,142 | |||
| Consumer Services - 2.3% | |||
| 236,579 | Choice Hotels International, Inc. | 36,903,958 | |
| 122,321 | Hyatt Hotels Corp. Class A* | 11,730,584 | |
| 48,634,542 | |||
| Diversified Financials - 2.7% | |||
| 65,733 | Credit Acceptance Corp.*(1) | 45,203,270 | |
| 107,165 | Hamilton Lane, Inc. Class A | 11,104,437 | |
| 56,307,707 | |||
| Energy - 0.1% | |||
| 118,306 | Coterra Energy, Inc. | 2,247,814 | |
| Food & Staples Retailing - 0.0% | |||
| 21,621 | Performance Food Group Co.* | 992,188 | |
| Food, Beverage & Tobacco - 1.0% | |||
| 343,297 | Lamb Weston Holdings, Inc. | 21,758,164 | |
| Health Care Equipment & Services - 5.1% | |||
| 128,616 | Encompass Health Corp. | 8,393,480 | |
| 103,383 | Inari Medical, Inc.* | 9,435,766 | |
| 8,410 | Insulet Corp.* | 2,237,649 | |
| 450,840 | Integra LifeSciences Holdings Corp.* | 30,201,772 | |
| 10,383 | Masimo Corp.* | 3,039,935 | |
| 78,293 | Molina Healthcare, Inc.* | 24,903,437 | |
| Shares or Principal Amount | Market Value† | ||
| COMMON STOCKS - 100.0% - (continued) | |||
| Health Care Equipment & Services - 5.1% - (continued) | |||
| 72,957 | Nevro Corp.* | $ 5,914,624 | |
| 69,144 | Teleflex, Inc. | 22,712,421 | |
| 106,839,084 | |||
| Insurance - 4.4% | |||
| 42,912 | Erie Indemnity Co. Class A(1) | 8,267,426 | |
| 326,830 | Fidelity National Financial, Inc. | 17,053,989 | |
| 153,683 | Globe Life, Inc. | 14,403,171 | |
| 21,702 | Markel Corp.* | 26,780,268 | |
| 13,034 | White Mountains Insurance Group Ltd. | 13,215,172 | |
| 148,130 | WR Berkley Corp. | 12,204,431 | |
| 91,924,457 | |||
| Materials - 3.1% | |||
| 1,125,144 | Element Solutions, Inc. | 27,318,496 | |
| 400,015 | Silgan Holdings, Inc. | 17,136,643 | |
| 338,217 | Steel Dynamics, Inc. | 20,993,129 | |
| 65,448,268 | |||
| Media & Entertainment - 3.0% | |||
| 17,818 | Cable One, Inc. | 31,421,152 | |
| 486,693 | Cargurus, Inc.* | 16,372,352 | |
| 2,219,407 | Zynga, Inc. Class A* | 14,204,205 | |
| 61,997,709 | |||
| Pharmaceuticals, Biotechnology & Life Sciences - 12.5% | |||
| 26,740 | Alnylam Pharmaceuticals, Inc.* | 4,534,569 | |
| 483,748 | Apellis Pharmaceuticals, Inc.* | 22,871,605 | |
| 147,943 | Arena Pharmaceuticals, Inc.* | 13,749,822 | |
| 6,159 | Bio-Techne Corp. | 3,186,297 | |
| 189,198 | Exact Sciences Corp.* | 14,725,280 | |
| 98,571 | ICON plc* | 30,527,439 | |
| 852,361 | Iovance Biotherapeutics, Inc.* | 16,271,571 | |
| 219,208 | Jazz Pharmaceuticals plc* | 27,927,099 | |
| 181,277 | Kodiak Sciences, Inc.* | 15,368,664 | |
| 77,769 | Mirati Therapeutics, Inc.* | 11,407,935 | |
| 192,651 | NeoGenomics, Inc.* | 6,573,252 | |
| 449,149 | PTC Therapeutics, Inc.* | 17,889,605 | |
| 215,697 | Reata Pharmaceuticals, Inc. Class A* | 5,687,930 | |
| 430,803 | Sage Therapeutics, Inc.* | 18,326,360 | |
| 208,867 | Syneos Health, Inc.* | 21,446,464 | |
| 215,503 | Ultragenyx Pharmaceutical, Inc.* | 18,121,647 | |
| 69,409 | United Therapeutics Corp.* | 14,997,897 | |
| 263,613,436 | |||
| Real Estate - 4.7% | |||
| 209,130 | Life Storage, Inc. REIT | 32,034,533 | |
| 50,757 | PS Business Parks, Inc. REIT | 9,347,917 | |
| 281,805 | Redfin Corp.*(1) | 10,818,494 | |
| 321,272 | Rexford Industrial Realty, Inc. REIT | 26,058,372 | |
| 598,913 | STORE Capital Corp. REIT | 20,602,607 | |
| 98,861,923 | |||
| Retailing - 2.9% | |||
| 142,923 | CarMax, Inc.* | 18,612,863 | |
| 155,291 | Chewy, Inc. Class A*(1) | 9,157,510 | |
| 154,915 | Etsy, Inc.* | 33,917,090 | |
| 61,687,463 | |||
| Semiconductors & Semiconductor Equipment - 5.8% | |||
| 408,535 | First Solar, Inc.* | 35,607,911 | |
| 204,715 | MKS Instruments, Inc. | 35,655,212 | |
| 104,444 | Silicon Laboratories, Inc.* | 21,559,330 | |
| 100,822 | Synaptics, Inc.* | 29,188,977 | |
| 122,011,430 | |||
| 71 |
December 31, 2021
| Shares or Principal Amount | Market Value† | ||
| COMMON STOCKS - 100.0% - (continued) | |||
| Software & Services - 11.3% | |||
| 129,631 | Black Knight, Inc.* | $ 10,745,113 | |
| 314,016 | Digital Turbine, Inc.* | 19,151,836 | |
| 916,637 | Genpact Ltd. | 48,655,092 | |
| 184,779 | Guidewire Software, Inc.* | 20,977,960 | |
| 374,632 | Informatica, Inc.* | 13,853,891 | |
| 277,783 | LiveRamp Holdings, Inc.* | 13,319,695 | |
| 371,643 | Olo, Inc.* | 7,733,891 | |
| 201,035 | Q2 Holdings, Inc.* | 15,970,220 | |
| 138,386 | Science Applications International Corp. | 11,567,686 | |
| 271,933 | Shift4 Payments, Inc. Class A* | 15,753,079 | |
| 551,740 | Teradata Corp.* | 23,432,398 | |
| 256,230 | WEX, Inc.* | 35,972,130 | |
| 237,132,991 | |||
| Technology Hardware & Equipment - 10.0% | |||
| 102,765 | CDW Corp. | 21,044,217 | |
| 1,668,583 | CommScope Holding Co., Inc.* | 18,421,156 | |
| 195,894 | F5 Networks, Inc.* | 47,937,221 | |
| 1,796,650 | Flex Ltd.* | 32,932,594 | |
| 648,944 | II-VI, Inc.* | 44,342,344 | |
| 369,667 | Lumentum Holdings, Inc.* | 39,099,679 | |
| 171,047 | National Instruments Corp. | 7,469,622 | |
| 211,246,833 | |||
| Transportation - 2.7% | |||
| 35,149 | AMERCO | 25,526,258 | |
| 25,630 | J.B. Hunt Transport Services, Inc. | 5,238,772 | |
| 418,826 | Knight-Swift Transportation Holdings, Inc. | 25,523,257 | |
| 56,288,287 | |||
| Utilities - 2.6% | |||
| 194,687 | Black Hills Corp. | 13,739,062 | |
| 313,102 | NiSource, Inc. | 8,644,746 | |
| 717,452 | UGI Corp. | 32,938,221 | |
| 55,322,029 | |||
| Total Common Stocks (cost $1,379,303,096) | $ 2,103,052,324 | ||
| SHORT-TERM INVESTMENTS - 0.6% | |||
| Repurchase Agreements - 0.1% | |||
| $ 1,507,681 | Fixed Income Clearing Corp. Repurchase Agreement dated 12/31/2021 at 0.020%, due on 01/03/2022 with a maturity value of $1,507,684; collateralized by U.S. Treasury Bond at 2.000%, maturing 11/15/2041, with a market value of $1,537,919 | $ 1,507,681 | |
| Shares or Principal Amount | Market Value† | ||
| SHORT-TERM INVESTMENTS - 0.6% - (continued) | |||
| Securities Lending Collateral - 0.5% | |||
| 375,058 | Fidelity Investments Money Market Funds, Government Portfolio, Institutional Class, 0.01%(2) | $ 375,058 | |
| 9,820,690 | Goldman Sachs Financial Square Funds, Government Fund, Institutional Class, 0.03%(2) | 9,820,690 | |
| 572,165 | Invesco Government & Agency Portfolio, Institutional Class, 0.03%(2) | 572,165 | |
| 10,767,913 | |||
| Total Short-Term Investments (cost $12,275,594) | $ 12,275,594 | ||
| Total Investments (cost $1,391,578,690) | 100.6% | $ 2,115,327,918 | |
| Other Assets and Liabilities | (0.6)% | (12,015,709) | |
| Total Net Assets | 100.0% | $ 2,103,312,209 | |
| Note: | Percentage of investments as shown is the ratio of the total market value to total net assets. |
| Prices of foreign equities that are principally traded on certain foreign markets will generally be adjusted daily pursuant to a fair value pricing service approved by the Board of Directors in order to reflect an adjustment for factors occurring after the close of certain foreign markets but before the close of the New York Stock Exchange. | |
| Equity industry classifications used in this report are the Global Industry Classification Standard, which was developed by and is the exclusive property and service mark of MSCI, Inc. and Standard & Poor’s. | |
| For Fund compliance purposes, the Fund may not use the same classification system. These classifications are used for financial reporting purposes. | |
| See “Glossary” for abbreviation descriptions. |
| * | Non-income producing. |
| (1) | Represents entire or partial securities on loan. See Note 8 in the accompanying Notes to Financial Statements for securities lending information. |
| (2) | Current yield as of period end. |
| † | See Significant Accounting Policies of accompanying Notes to Financial Statements regarding valuation of investments. |
| 72 |
December 31, 2021
| Description | Total | Level 1 | Level 2 | Level 3(1) | ||||
| Assets | ||||||||
| Common Stocks | ||||||||
| Automobiles & Components | $ 4,166,946 | $ 4,166,946 | $ — | $ — | ||||
| Banks | 110,733,139 | 110,733,139 | — | — | ||||
| Capital Goods | 229,177,670 | 229,177,670 | — | — | ||||
| Commercial & Professional Services | 53,641,102 | 53,641,102 | — | — | ||||
| Consumer Durables & Apparel | 143,019,142 | 143,019,142 | — | — | ||||
| Consumer Services | 48,634,542 | 48,634,542 | — | — | ||||
| Diversified Financials | 56,307,707 | 56,307,707 | — | — | ||||
| Energy | 2,247,814 | 2,247,814 | — | — | ||||
| Food & Staples Retailing | 992,188 | 992,188 | — | — | ||||
| Food, Beverage & Tobacco | 21,758,164 | 21,758,164 | — | — | ||||
| Health Care Equipment & Services | 106,839,084 | 106,839,084 | — | — | ||||
| Insurance | 91,924,457 | 91,924,457 | — | — | ||||
| Materials | 65,448,268 | 65,448,268 | — | — | ||||
| Media & Entertainment | 61,997,709 | 61,997,709 | — | — | ||||
| Pharmaceuticals, Biotechnology & Life Sciences | 263,613,436 | 263,613,436 | — | — | ||||
| Real Estate | 98,861,923 | 98,861,923 | — | — | ||||
| Retailing | 61,687,463 | 61,687,463 | — | — | ||||
| Semiconductors & Semiconductor Equipment | 122,011,430 | 122,011,430 | — | — | ||||
| Software & Services | 237,132,991 | 237,132,991 | — | — | ||||
| Technology Hardware & Equipment | 211,246,833 | 211,246,833 | — | — | ||||
| Transportation | 56,288,287 | 56,288,287 | — | — | ||||
| Utilities | 55,322,029 | 55,322,029 | — | — | ||||
| Short-Term Investments | 12,275,594 | 10,767,913 | 1,507,681 | — | ||||
| Total | $ 2,115,327,918 | $ 2,113,820,237 | $ 1,507,681 | $ — |
| (1) | For the year ended December 31, 2021, there were no transfers in and out of Level 3. |
| 73 |
December 31, 2021
| Shares or Principal Amount | Market Value† | ||
| COMMON STOCKS - 99.2% | |||
| Automobiles & Components - 3.0% | |||
| 10,446,098 | Fox Factory Holding Corp.* | $ 18,835,513 | |
| 137,123 | Patrick Industries, Inc. | 11,064,455 | |
| 103,275 | Thor Industries, Inc. | 10,716,847 | |
| 40,616,815 | |||
| Banks - 2.8% | |||
| 633,193 | MGIC Investment Corp. | 9,130,643 | |
| 184,862 | Synovus Financial Corp. | 8,849,344 | |
| 111,041 | Triumph Bancorp, Inc.* | 13,222,762 | |
| 74,249 | Western Alliance Bancorp | 7,992,905 | |
| 39,195,654 | |||
| Capital Goods - 10.0% | |||
| 121,480 | Altra Industrial Motion Corp. | 6,264,724 | |
| 111,237 | Applied Industrial Technologies, Inc. | 11,424,040 | |
| 81,789 | Armstrong World Industries, Inc. | 9,497,339 | |
| 88,901 | Boise Cascade Co. | 6,329,751 | |
| 68,290 | Builders FirstSource, Inc.* | 5,853,136 | |
| 77,010 | Chart Industries, Inc.* | 12,282,325 | |
| 63,955 | Curtiss-Wright Corp. | 8,868,640 | |
| 261,485 | Hydrofarm Holdings Group, Inc.* | 7,397,411 | |
| 109,666 | ITT, Inc. | 11,206,768 | |
| 105,471 | John Bean Technologies Corp. | 16,196,127 | |
| 165,170 | SPX Corp.* | 9,857,345 | |
| 95,229 | SPX FLOW, Inc. | 8,235,404 | |
| 600,578 | WillScot Mobile Mini Holdings Corp.* | 24,527,605 | |
| 137,940,615 | |||
| Commercial & Professional Services - 6.2% | |||
| 156,513 | ASGN, Inc.* | 19,313,704 | |
| 48,287 | CACI International, Inc. Class A* | 12,999,343 | |
| 56,129 | Clean Harbors, Inc.* | 5,599,990 | |
| 91,087 | Exponent, Inc. | 10,632,586 | |
| 118,567 | Insperity, Inc. | 14,003,948 | |
| 93,631 | Tetra Tech, Inc. | 15,898,544 | |
| 149,512 | Viad Corp.* | 6,397,619 | |
| 84,845,734 | |||
| Consumer Durables & Apparel - 3.5% | |||
| 26,544 | Deckers Outdoor Corp.* | 9,723,333 | |
| 95,557 | PVH Corp. | 10,191,154 | |
| 49,572 | TopBuild Corp.* | 13,677,411 | |
| 298,025 | Traeger, Inc.*(1) | 3,623,984 | |
| 288,655 | Under Armour, Inc. Class C* | 5,207,336 | |
| 73,321 | YETI Holdings, Inc.* | 6,073,178 | |
| 48,496,396 | |||
| Consumer Services - 6.8% | |||
| 251,901 | BJ's Restaurants, Inc.* | 8,703,179 | |
| 53,262 | Churchill Downs, Inc. | 12,830,816 | |
| 515,277 | GAN Ltd.* | 4,735,396 | |
| 539,552 | Mister Car Wash, Inc.* | 9,825,242 | |
| 163,391 | Penn National Gaming, Inc.* | 8,471,823 | |
| 183,546 | Texas Roadhouse, Inc. | 16,386,987 | |
| 110,165 | Wingstop, Inc. | 19,036,512 | |
| 378,624 | Zurn Water Solutios Corp. | 13,781,914 | |
| 93,771,869 | |||
| Diversified Financials - 1.4% | |||
| 200,371 | OneMain Holdings, Inc. | 10,026,565 | |
| 138,313 | Stifel Financial Corp. | 9,740,001 | |
| 19,766,566 | |||
| Energy - 0.5% | |||
| 368,551 | Magnolia Oil & Gas Corp. Class A | 6,954,557 | |
| Shares or Principal Amount | Market Value† | ||
| COMMON STOCKS - 99.2% - (continued) | |||
| Food & Staples Retailing - 1.1% | |||
| 319,549 | Performance Food Group Co.* | $ 14,664,104 | |
| Food, Beverage & Tobacco - 2.5% | |||
| 94,993 | Freshpet, Inc.* | 9,049,983 | |
| 58,256 | Lancaster Colony Corp. | 9,647,194 | |
| 192,543 | Simply Good Foods Co.* | 8,004,012 | |
| 467,974 | Sovos Brands, Inc.* | 7,043,009 | |
| 33,744,198 | |||
| Health Care Equipment & Services - 10.7% | |||
| 28,077 | Amedisys, Inc.* | 4,545,105 | |
| 104,664 | AtriCure, Inc.* | 7,277,288 | |
| 275,045 | Covetrus, Inc.* | 5,492,649 | |
| 121,265 | Glaukos Corp.* | 5,389,017 | |
| 147,347 | Globus Medical, Inc. Class A* | 10,638,453 | |
| 192,465 | Health Catalyst, Inc.* | 7,625,463 | |
| 118,613 | Integer Holdings Corp.* | 10,152,087 | |
| 172,963 | Integra LifeSciences Holdings Corp.* | 11,586,791 | |
| 72,430 | LHC Group, Inc.* | 9,939,569 | |
| 44,712 | ModivCare, Inc.* | 6,630,342 | |
| 68,496 | Nevro Corp.* | 5,552,971 | |
| 118,707 | Omnicell, Inc.* | 21,419,491 | |
| 248,642 | Owens & Minor, Inc. | 10,815,927 | |
| 767,026 | R1 RCM, Inc.* | 19,551,493 | |
| 76,391 | Tandem Diabetes Care, Inc.* | 11,498,373 | |
| 148,115,019 | |||
| Household & Personal Products - 0.6% | |||
| 324,945 | Beauty Health Co.* | 7,850,671 | |
| Insurance - 0.7% | |||
| 161,827 | James River Group Holdings Ltd. | 4,662,236 | |
| 85,692 | Kemper Corp. | 5,037,833 | |
| 9,700,069 | |||
| Materials - 2.4% | |||
| 382,436 | Axalta Coating Systems Ltd.* | 12,666,280 | |
| 82,382 | Ingevity Corp.* | 5,906,790 | |
| 124,665 | Louisiana-Pacific Corp. | 9,767,503 | |
| 111,502 | Ranpak Holdings Corp.* | 4,190,245 | |
| 32,530,818 | |||
| Media & Entertainment - 2.2% | |||
| 165,793 | Bumble, Inc. Class A* | 5,613,751 | |
| 166,599 | Cardlytics, Inc.* | 11,010,528 | |
| 128,470 | Ziff Davis, Inc.* | 14,242,184 | |
| 30,866,463 | |||
| Pharmaceuticals, Biotechnology & Life Sciences - 13.2% | |||
| 325,745 | Aclaris Therapeutics, Inc.* | 4,736,332 | |
| 147,464 | Akero Therapeutics, Inc.* | 3,118,864 | |
| 103,404 | ALX Oncology Holdings, Inc.*(1) | 2,222,152 | |
| 140,793 | Apellis Pharmaceuticals, Inc.* | 6,656,693 | |
| 79,818 | Arena Pharmaceuticals, Inc.* | 7,418,285 | |
| 43,269 | Arrowhead Pharmaceuticals, Inc.* | 2,868,735 | |
| 81,407 | Arvinas, Inc.* | 6,686,771 | |
| 132,677 | Avidity Biosciences, Inc.* | 3,153,732 | |
| 86,081 | BioAtla, Inc.* | 1,689,770 | |
| 27,461 | Biohaven Pharmaceutical Holding Co., Ltd.* | 3,784,400 | |
| 101,399 | Blueprint Medicines Corp.* | 10,860,847 | |
| 157,593 | Celldex Therapeutics, Inc.* | 6,089,393 | |
| 175,862 | Cytokinetics, Inc.* | 8,015,790 | |
| 152,094 | Dyne Therapeutics, Inc.*(1) | 1,808,398 | |
| 47,738 | Fate Therapeutics, Inc.* | 2,793,150 | |
| 385,915 | Heron Therapeutics, Inc.*(1) | 3,523,404 | |
| 652,313 | ImmunoGen, Inc.* | 4,840,162 | |
| 60,183 | Intellia Therapeutics, Inc.* | 7,116,038 | |
| 74 |
December 31, 2021
| Shares or Principal Amount | Market Value† | ||
| COMMON STOCKS - 99.2% - (continued) | |||
| Pharmaceuticals, Biotechnology & Life Sciences - 13.2% - (continued) | |||
| 167,513 | KalVista Pharmaceuticals, Inc.* | $ 2,216,197 | |
| 51,380 | Karuna Therapeutics, Inc.* | 6,730,780 | |
| 68,715 | Kodiak Sciences, Inc.* | 5,825,658 | |
| 119,671 | Kymera Therapeutics, Inc.* | 7,597,912 | |
| 56,641 | Madrigal Pharmaceuticals, Inc.* | 4,799,758 | |
| 398,526 | Mersana Therapeutics, Inc.* | 2,478,832 | |
| 32,730 | Mirati Therapeutics, Inc.* | 4,801,164 | |
| 172,155 | NanoString Technologies, Inc.* | 7,270,106 | |
| 226,039 | NeoGenomics, Inc.* | 7,712,451 | |
| 172,867 | PTC Therapeutics, Inc.* | 6,885,293 | |
| 164,002 | RAPT Therapeutics, Inc.* | 6,023,793 | |
| 218,814 | Revance Therapeutics, Inc.* | 3,571,044 | |
| 137,065 | Revolution Medicines, Inc.* | 3,449,926 | |
| 122,737 | Scholar Rock Holding Corp.* | 3,048,787 | |
| 254,365 | Syndax Pharmaceuticals, Inc.* | 5,568,050 | |
| 221,828 | TCR2 Therapeutics, Inc.* | 1,033,718 | |
| 203,026 | TG Therapeutics, Inc.* | 3,857,494 | |
| 79,780 | Turning Point Therapeutics, Inc.* | 3,805,506 | |
| 114,215 | Veracyte, Inc.* | 4,705,658 | |
| 169,127 | Y-mAbs Therapeutics, Inc.* | 2,741,549 | |
| 181,506,592 | |||
| Real Estate - 4.9% | |||
| 373,172 | Essential Properties Realty Trust, Inc. REIT | 10,758,549 | |
| 509,788 | Independence Realty Trust, Inc. REIT | 13,167,824 | |
| 71,574 | PS Business Parks, Inc. REIT | 13,181,783 | |
| 103,409 | Redfin Corp.*(1) | 3,969,871 | |
| 177,015 | Rexford Industrial Realty, Inc. REIT | 14,357,687 | |
| 125,633 | Ryman Hospitality Properties, Inc. REIT* | 11,553,211 | |
| 66,988,925 | |||
| Retailing - 2.2% | |||
| 206,649 | Foot Locker, Inc. | 9,016,096 | |
| 185,012 | Ollie's Bargain Outlet Holdings, Inc.* | 9,470,764 | |
| 108,747 | Shutterstock, Inc. | 12,057,867 | |
| 30,544,727 | |||
| Semiconductors & Semiconductor Equipment - 5.9% | |||
| 177,422 | Axcelis Technologies, Inc.* | 13,228,585 | |
| 111,860 | Cirrus Logic, Inc.* | 10,293,357 | |
| 244,303 | Lattice Semiconductor Corp.* | 18,825,989 | |
| 159,028 | Power Integrations, Inc. | 14,772,111 | |
| 84,316 | Synaptics, Inc.* | 24,410,325 | |
| 81,530,367 | |||
| Software & Services - 15.7% | |||
| 127,278 | Alarm.com Holdings, Inc.* | 10,794,447 | |
| 117,910 | Blackbaud, Inc.* | 9,312,532 | |
| 96,283 | Concentrix Corp. | 17,198,069 | |
| 41,600 | Consensus Cloud Solutions, Inc.* | 2,407,392 | |
| 208,952 | Digital Turbine, Inc.* | 12,743,983 | |
| 42,031 | DigitalOcean Holdings, Inc.* | 3,376,350 | |
| 31,231 | Everbridge, Inc.* | 2,102,783 | |
| 132,881 | ExlService Holdings, Inc.* | 19,237,182 | |
| 137,934 | LiveRamp Holdings, Inc.* | 6,613,935 | |
| 57,750 | Manhattan Associates, Inc.* | 8,979,548 | |
| 129,581 | Mimecast Ltd.* | 10,310,760 | |
| 208,561 | Olo, Inc.* | 4,340,154 | |
| 140,040 | Perficient, Inc.* | 18,105,772 | |
| 96,581 | Q2 Holdings, Inc.* | 7,672,395 | |
| 142,011 | Rapid7, Inc.* | 16,713,275 | |
| 500,601 | Repay Holdings Corp.* | 9,145,980 | |
| 90,900 | Shift4 Payments, Inc. Class A* | 5,265,837 | |
| 108,528 | Sprinklr, Inc.*(1) | 1,722,339 | |
| Shares or Principal Amount | Market Value† | ||
| COMMON STOCKS - 99.2% - (continued) | |||
| Software & Services - 15.7% - (continued) | |||
| 108,252 | Sprout Social, Inc. Class A* | $ ��9,817,374 | |
| 261,503 | Telos Corp.* | 4,032,376 | |
| 234,202 | Varonis Systems, Inc.* | 11,424,374 | |
| 227,434 | Veritone, Inc.*(1) | 5,112,716 | |
| 821,665 | Verra Mobility Corp.* | 12,678,291 | |
| 60,440 | Workiva, Inc.* | 7,886,816 | |
| 216,994,680 | |||
| Technology Hardware & Equipment - 2.7% | |||
| 206,294 | II-VI, Inc.* | 14,096,069 | |
| 108,150 | Insight Enterprises, Inc.* | 11,528,790 | |
| 107,037 | Lumentum Holdings, Inc.* | 11,321,303 | |
| 36,946,162 | |||
| Telecommunication Services - 0.2% | |||
| 46,997 | Bandwidth, Inc. Class A* | 3,372,505 | |
| Total Common Stocks (cost $978,402,281) | $ 1,366,943,506 | ||
| SHORT-TERM INVESTMENTS - 1.0% | |||
| Repurchase Agreements - 0.4% | |||
| $ 5,265,851 | Fixed Income Clearing Corp. Repurchase Agreement dated 12/31/2021 at 0.020%, due on 01/03/2022 with a maturity value of $5,265,860; collateralized by U.S. Treasury Bond at 1.750%, maturing 08/15/2041, with a market value of $5,371,174 | $ 5,265,851 | |
| Securities Lending Collateral - 0.6% | |||
| 315,854 | Fidelity Investments Money Market Funds, Government Portfolio, Institutional Class, 0.01%(2) | 315,854 | |
| 8,270,462 | Goldman Sachs Financial Square Funds, Government Fund, Institutional Class, 0.03%(2) | 8,270,462 | |
| 481,847 | Invesco Government & Agency Portfolio, Institutional Class, 0.03%(2) | 481,847 | |
| 9,068,163 | |||
| Total Short-Term Investments (cost $14,334,014) | $ 14,334,014 | ||
| Total Investments (cost $992,736,295) | 100.2% | $ 1,381,277,520 | |
| Other Assets and Liabilities | (0.2)% | (2,534,311) | |
| Total Net Assets | 100.0% | $ 1,378,743,209 | |
| Note: | Percentage of investments as shown is the ratio of the total market value to total net assets. |
| Equity industry classifications used in this report are the Global Industry Classification Standard, which was developed by and is the exclusive property and service mark of MSCI, Inc. and Standard & Poor’s. | |
| For Fund compliance purposes, the Fund may not use the same classification system. These classifications are used for financial reporting purposes. | |
| See “Glossary” for abbreviation descriptions. |
| * | Non-income producing. |
| (1) | Represents entire or partial securities on loan. See Note 8 in the accompanying Notes to Financial Statements for securities lending information. |
| 75 |
December 31, 2021
| (2) | Current yield as of period end. |
| † | See Significant Accounting Policies of accompanying Notes to Financial Statements regarding valuation of investments. |
| Description | Total | Level 1 | Level 2 | Level 3(1) | ||||
| Assets | ||||||||
| Common Stocks | ||||||||
| Automobiles & Components | $ 40,616,815 | $ 40,616,815 | $ — | $ — | ||||
| Banks | 39,195,654 | 39,195,654 | — | — | ||||
| Capital Goods | 137,940,615 | 137,940,615 | — | — | ||||
| Commercial & Professional Services | 84,845,734 | 84,845,734 | — | — | ||||
| Consumer Durables & Apparel | 48,496,396 | 48,496,396 | — | — | ||||
| Consumer Services | 93,771,869 | 93,771,869 | — | — | ||||
| Diversified Financials | 19,766,566 | 19,766,566 | — | — | ||||
| Energy | 6,954,557 | 6,954,557 | — | — | ||||
| Food & Staples Retailing | 14,664,104 | 14,664,104 | — | — | ||||
| Food, Beverage & Tobacco | 33,744,198 | 33,744,198 | — | — | ||||
| Health Care Equipment & Services | 148,115,019 | 148,115,019 | — | — | ||||
| Household & Personal Products | 7,850,671 | 7,850,671 | — | — | ||||
| Insurance | 9,700,069 | 9,700,069 | — | — | ||||
| Materials | 32,530,818 | 32,530,818 | — | — | ||||
| Media & Entertainment | 30,866,463 | 30,866,463 | — | — | ||||
| Pharmaceuticals, Biotechnology & Life Sciences | 181,506,592 | 181,506,592 | — | — | ||||
| Real Estate | 66,988,925 | 66,988,925 | — | — | ||||
| Retailing | 30,544,727 | 30,544,727 | — | — | ||||
| Semiconductors & Semiconductor Equipment | 81,530,367 | 81,530,367 | — | — | ||||
| Software & Services | 216,994,680 | 216,994,680 | — | — | ||||
| Technology Hardware & Equipment | 36,946,162 | 36,946,162 | — | — | ||||
| Telecommunication Services | 3,372,505 | 3,372,505 | — | — | ||||
| Short-Term Investments | 14,334,014 | 9,068,163 | 5,265,851 | — | ||||
| Total | $ 1,381,277,520 | $ 1,376,011,669 | $ 5,265,851 | $ — |
| (1) | For the year ended December 31, 2021, there were no transfers in and out of Level 3. |
| 76 |
December 31, 2021
| Shares or Principal Amount | Market Value† | ||
| COMMON STOCKS - 98.3% | |||
| Banks - 3.4% | |||
| 154,611 | Ameris Bancorp | $ 7,681,074 | |
| 124,578 | Synovus Financial Corp. | 5,963,549 | |
| 80,890 | Western Alliance Bancorp | 8,707,809 | |
| 22,352,432 | |||
| Capital Goods - 16.3% | |||
| 38,299 | Acuity Brands, Inc. | 8,108,664 | |
| 215,690 | Altra Industrial Motion Corp. | 11,123,133 | |
| 139,707 | Applied Industrial Technologies, Inc. | 14,347,909 | |
| 131,785 | Builders FirstSource, Inc.* | 11,295,292 | |
| 207,260 | Colfax Corp.* | 9,527,742 | |
| 55,538 | Curtiss-Wright Corp. | 7,701,454 | |
| 384,640 | Fluor Corp.* | 9,527,533 | |
| 69,470 | Gibraltar Industries, Inc.* | 4,632,260 | |
| 45,148 | Helios Technologies, Inc. | 4,748,215 | |
| 75,659 | Hydrofarm Holdings Group, Inc.* | 2,140,393 | |
| 44,843 | Kornit Digital Ltd.* | 6,827,347 | |
| 54,234 | Middleby Corp.* | 10,671,082 | |
| 42,464 | WESCO International, Inc.* | 5,587,838 | |
| 106,238,862 | |||
| Consumer Durables & Apparel - 3.9% | |||
| 14,026 | Cavco Industries, Inc.* | 4,455,359 | |
| 69,858 | Crocs, Inc.* | 8,957,193 | |
| 155,599 | Skyline Champion Corp.* | 12,289,209 | |
| 25,701,761 | |||
| Consumer Services - 3.5% | |||
| 89,409 | Boyd Gaming Corp.* | 5,862,548 | |
| 327,105 | Mister Car Wash, Inc.* | 5,956,582 | |
| 47,604 | Planet Fitness, Inc. Class A* | 4,311,970 | |
| 38,918 | Wingstop, Inc. | 6,725,031 | |
| 22,856,131 | |||
| Diversified Financials - 0.6% | |||
| 72,510 | Hannon Armstrong Sustainable Infrastructure Capital, Inc. REIT | 3,851,731 | |
| Energy - 2.2% | |||
| 159,372 | Chesapeake Energy Corp. | 10,282,681 | |
| 217,370 | Magnolia Oil & Gas Corp. Class A | 4,101,772 | |
| 14,384,453 | |||
| Health Care Equipment & Services - 11.3% | |||
| 154,318 | Accolade, Inc.* | 4,067,823 | |
| 388,270 | Cross Country Healthcare, Inc.* | 10,778,375 | |
| 80,966 | Globus Medical, Inc. Class A* | 5,845,745 | |
| 122,680 | Health Catalyst, Inc.* | 4,860,582 | |
| 37,712 | Inspire Medical Systems, Inc.* | 8,676,023 | |
| 130,159 | Integra LifeSciences Holdings Corp.* | 8,719,351 | |
| 62,952 | LHC Group, Inc.* | 8,638,903 | |
| 37,736 | Omnicell, Inc.* | 6,809,084 | |
| 338,396 | R1 RCM, Inc.* | 8,625,714 | |
| 43,360 | Tandem Diabetes Care, Inc.* | 6,526,547 | |
| 73,548,147 | |||
| Materials - 1.0% | |||
| 113,500 | Cabot Corp. | 6,378,700 | |
| Media & Entertainment - 3.6% | |||
| 36,679 | Cardlytics, Inc.* | 2,424,115 | |
| 146,197 | Cargurus, Inc.* | 4,918,067 | |
| 222,933 | Criteo S.A. ADR* | 8,665,406 | |
| 65,709 | Ziff Davis, Inc.* | 7,284,500 | |
| 23,292,088 | |||
| Shares or Principal Amount | Market Value† | ||
| COMMON STOCKS - 98.3% - (continued) | |||
| Pharmaceuticals, Biotechnology & Life Sciences - 12.6% | |||
| 158,470 | Aclaris Therapeutics, Inc.* | $ 2,304,154 | |
| 25,151 | ALX Oncology Holdings, Inc.* | 540,495 | |
| 244,875 | Amicus Therapeutics, Inc.* | 2,828,306 | |
| 49,610 | Apellis Pharmaceuticals, Inc.* | 2,345,561 | |
| 23,919 | Arena Pharmaceuticals, Inc.* | 2,223,032 | |
| 29,171 | Ascendis Pharma A/S ADR* | 3,924,375 | |
| 41,721 | BioAtla, Inc.* | 818,983 | |
| 49,824 | Blueprint Medicines Corp.* | 5,336,649 | |
| 38,887 | Celldex Therapeutics, Inc.* | 1,502,594 | |
| 48,602 | Crinetics Pharmaceuticals, Inc.* | 1,380,783 | |
| 49,002 | Fate Therapeutics, Inc.* | 2,867,107 | |
| 457,382 | ImmunoGen, Inc.* | 3,393,774 | |
| 30,723 | Intellia Therapeutics, Inc.* | 3,632,687 | |
| 114,507 | KalVista Pharmaceuticals, Inc.* | 1,514,928 | |
| 19,489 | Karuna Therapeutics, Inc.* | 2,553,059 | |
| 21,638 | Kodiak Sciences, Inc.* | 1,834,470 | |
| 59,424 | Kymera Therapeutics, Inc.* | 3,772,830 | |
| 23,580 | Madrigal Pharmaceuticals, Inc.* | 1,998,169 | |
| 50,046 | Medpace Holdings, Inc.* | 10,892,011 | |
| 164,186 | Mersana Therapeutics, Inc.* | 1,021,237 | |
| 131,468 | Myovant Sciences Ltd.* | 2,046,957 | |
| 63,520 | NanoString Technologies, Inc.* | 2,682,449 | |
| 169,065 | NeoGenomics, Inc.* | 5,768,498 | |
| 77,920 | RAPT Therapeutics, Inc.* | 2,862,001 | |
| 75,968 | Revolution Medicines, Inc.* | 1,912,114 | |
| 67,154 | Rocket Pharmaceuticals, Inc.* | 1,465,972 | |
| 80,952 | Scholar Rock Holding Corp.* | 2,010,848 | |
| 47,756 | Turning Point Therapeutics, Inc.* | 2,277,961 | |
| 80,483 | Veracyte, Inc.* | 3,315,899 | |
| 60,027 | Y-mAbs Therapeutics, Inc.* | 973,038 | |
| 82,000,941 | |||
| Real Estate - 3.5% | |||
| 203,379 | Essential Properties Realty Trust, Inc. REIT | 5,863,417 | |
| 265,293 | Independence Realty Trust, Inc. REIT | 6,852,518 | |
| 151,600 | Pebblebrook Hotel Trust REIT | 3,391,292 | |
| 71,992 | Ryman Hospitality Properties, Inc. REIT* | 6,620,384 | |
| 22,727,611 | |||
| Retailing - 7.7% | |||
| 5,016,400 | Allstar Co.(1)(2)(3)(4) | — | |
| 71,316 | Five Below, Inc.* | 14,754,567 | |
| 48,605 | Floor & Decor Holdings, Inc. Class A* | 6,319,136 | |
| 154,417 | National Vision Holdings, Inc.* | 7,410,472 | |
| 262,526 | Porch Group, Inc.*(5) | 4,092,780 | |
| 109,096 | Revolve Group, Inc.* | 6,113,740 | |
| 83,001 | Shutterstock, Inc. | 9,203,151 | |
| 43,094 | Tory Burch LLC(2)(3)(4) | 1,968,104 | |
| 49,861,950 | |||
| Semiconductors & Semiconductor Equipment - 7.3% | |||
| 129,684 | Maxeon Solar Technologies Ltd.*(5) | 1,802,608 | |
| 49,956 | MKS Instruments, Inc. | 8,700,836 | |
| 67,365 | Synaptics, Inc.* | 19,502,841 | |
| 434,497 | Tower Semiconductor Ltd.* | 17,240,841 | |
| 47,247,126 | |||
| Software & Services - 15.7% | |||
| 49,608 | Concentrix Corp. | 8,860,981 | |
| 140,312 | Digital Turbine, Inc.* | 8,557,629 | |
| 292,600 | Jamf Holding Corp.* | 11,121,726 | |
| 117,926 | LiveRamp Holdings, Inc.* | 5,654,552 | |
| 34,587 | Manhattan Associates, Inc.* | 5,377,932 | |
| 146,209 | Mimecast Ltd.* | 11,633,850 | |
| 70,927 | New Relic, Inc.* | 7,799,133 | |
| 77 |
December 31, 2021
| Shares or Principal Amount | Market Value† | ||
| COMMON STOCKS - 98.3% - (continued) | |||
| Software & Services - 15.7% - (continued) | |||
| 390,266 | Payoneer Global, Inc.* | $ 2,868,455 | |
| 64,780 | Perficient, Inc.* | 8,375,406 | |
| 79,652 | Rapid7, Inc.* | 9,374,244 | |
| 251,659 | Repay Holdings Corp.* | 4,597,810 | |
| 184,792 | Varonis Systems, Inc.* | 9,014,154 | |
| 560,211 | Verra Mobility Corp.* | 8,644,056 | |
| 101,879,928 | |||
| Technology Hardware & Equipment - 4.5% | |||
| 178,912 | Calix, Inc.* | 14,307,593 | |
| 124,812 | II-VI, Inc.* | 8,528,404 | |
| 36,191 | Novanta, Inc.* | 6,381,559 | |
| 29,217,556 | |||
| Telecommunication Services - 0.5% | |||
| 44,576 | Bandwidth, Inc. Class A* | 3,198,774 | |
| Transportation - 0.7% | |||
| 13,623 | Saia, Inc.* | 4,591,360 | |
| Total Common Stocks (cost $533,191,436) | $ 639,329,551 | ||
| SHORT-TERM INVESTMENTS - 1.9% | |||
| Repurchase Agreements - 1.5% | |||
| $ 9,988,699 | Fixed Income Clearing Corp. Repurchase Agreement dated 12/31/2021 at 0.020%, due on 01/03/2022 with a maturity value of $9,988,716; collateralized by U.S. Treasury Bond at 1.750%, maturing 08/15/2041, with a market value of $10,188,566 | $ 9,988,699 | |
| Securities Lending Collateral - 0.4% | |||
| 88,619 | Fidelity Investments Money Market Funds, Government Portfolio, Institutional Class, 0.01%(6) | 88,619 | |
| 2,320,434 | Goldman Sachs Financial Square Funds, Government Fund, Institutional Class, 0.03%(6) | 2,320,434 | |
| 135,191 | Invesco Government & Agency Portfolio, Institutional Class, 0.03%(6) | 135,191 | |
| 2,544,244 | |||
| Total Short-Term Investments (cost $12,532,943) | $ 12,532,943 | ||
| Total Investments (cost $545,724,379) | 100.2% | $ 651,862,494 | |
| Other Assets and Liabilities | (0.2)% | (1,240,254) | |
| Total Net Assets | 100.0% | $ 650,622,240 | |
| Note: | Percentage of investments as shown is the ratio of the total market value to total net assets. |
| Equity industry classifications used in this report are the Global Industry Classification Standard, which was developed by and is the exclusive property and service mark of MSCI, Inc. and Standard & Poor’s. | |
| For Fund compliance purposes, the Fund may not use the same classification system. These classifications are used for financial reporting purposes. | |
| See “Glossary” for abbreviation descriptions. |
| * | Non-income producing. |
| (1) | Affiliated company – The Fund owns greater than 5% of the outstanding voting securities of this issuer. |
| (2) | These securities are valued in good faith at fair value as determined under policies and procedures established by and under the supervision of the Board of Directors. At December 31, 2021, the aggregate fair value of these securities are $1,968,104, which represented 0.3% of total net assets. This amount excludes securities that are principally traded in certain foreign markets and whose prices are adjusted pursuant to a third party pricing service methodology approved by the Board of Directors. |
| (3) | Investment in securities not registered under the Securities Act of 1933 (excluding securities acquired pursuant to Rule 144A and Regulation S). At the end of the period, the value of such restricted securities amounted to $1,968,104 or 0.3% of net assets. |
| Period Acquired | Security Name | Shares/ Par Value | Total Cost | Market Value | ||||
| 08/2011 | Allstar Co. | 5,016,400 | $ — | $ — | ||||
| 11/2013 | Tory Burch LLC | 43,094 | 3,377,559 | 1,968,104 | ||||
| $ 3,377,559 | $ 1,968,104 |
| (4) | Investment valued using significant unobservable inputs. |
| (5) | Represents entire or partial securities on loan. See Note 8 in the accompanying Notes to Financial Statements for securities lending information. |
| (6) | Current yield as of period end. |
| † | See Significant Accounting Policies of accompanying Notes to Financial Statements regarding valuation of investments. |
| 78 |
December 31, 2021
| Description | Total | Level 1 | Level 2 | Level 3(1) | ||||
| Assets | ||||||||
| Common Stocks | ||||||||
| Banks | $ 22,352,432 | $ 22,352,432 | $ — | $ — | ||||
| Capital Goods | 106,238,862 | 106,238,862 | — | — | ||||
| Consumer Durables & Apparel | 25,701,761 | 25,701,761 | — | — | ||||
| Consumer Services | 22,856,131 | 22,856,131 | — | — | ||||
| Diversified Financials | 3,851,731 | 3,851,731 | — | — | ||||
| Energy | 14,384,453 | 14,384,453 | — | — | ||||
| Health Care Equipment & Services | 73,548,147 | 73,548,147 | — | — | ||||
| Materials | 6,378,700 | 6,378,700 | — | — | ||||
| Media & Entertainment | 23,292,088 | 23,292,088 | — | — | ||||
| Pharmaceuticals, Biotechnology & Life Sciences | 82,000,941 | 82,000,941 | — | — | ||||
| Real Estate | 22,727,611 | 22,727,611 | — | — | ||||
| Retailing | 49,861,950 | 47,893,846 | — | 1,968,104 | ||||
| Semiconductors & Semiconductor Equipment | 47,247,126 | 47,247,126 | — | — | ||||
| Software & Services | 101,879,928 | 101,879,928 | — | — | ||||
| Technology Hardware & Equipment | 29,217,556 | 29,217,556 | — | — | ||||
| Telecommunication Services | 3,198,774 | 3,198,774 | — | — | ||||
| Transportation | 4,591,360 | 4,591,360 | — | — | ||||
| Short-Term Investments | 12,532,943 | 2,544,244 | 9,988,699 | — | ||||
| Total | $ 651,862,494 | $ 639,905,691 | $ 9,988,699 | $ 1,968,104 |
| (1) | For the year ended December 31, 2021, investments valued at $5,969,516 were transferred into Level 3 due to the unavailability of active market pricing. There were no transfers out of Level 3. |
| 79 |
December 31, 2021
| Shares or Principal Amount | Market Value† | ||
| COMMON STOCKS - 99.6% | |||
| Banks - 1.4% | |||
| 111,264 | PNC Financial Services Group, Inc. | $ 22,310,657 | |
| Capital Goods - 12.9% | |||
| 45,192 | Deere & Co. | 15,495,885 | |
| 175,498 | General Dynamics Corp. | 36,586,068 | |
| 217,000 | Honeywell International, Inc. | 45,246,670 | |
| 83,455 | Lockheed Martin Corp. | 29,660,742 | |
| 132,193 | Northrop Grumman Corp. | 51,167,944 | |
| 398,670 | Raytheon Technologies Corp. | 34,309,540 | |
| 212,466,849 | |||
| Consumer Durables & Apparel - 2.9% | |||
| 288,278 | NIKE, Inc. Class B | 48,047,294 | |
| Consumer Services - 2.9% | |||
| 179,439 | McDonald's Corp. | 48,102,213 | |
| Diversified Financials - 2.2% | |||
| 226,267 | American Express Co. | 37,017,281 | |
| Food & Staples Retailing - 2.1% | |||
| 62,287 | Costco Wholesale Corp. | 35,360,330 | |
| Food, Beverage & Tobacco - 7.9% | |||
| 916,505 | Coca-Cola Co. | 54,266,261 | |
| 607,715 | Diageo plc | 33,227,449 | |
| 244,452 | PepsiCo., Inc. | 42,463,757 | |
| 129,957,467 | |||
| Health Care Equipment & Services - 10.2% | |||
| 402,069 | Baxter International, Inc. | 34,513,603 | |
| 358,367 | Medtronic plc | 37,073,066 | |
| 132,460 | Stryker Corp. | 35,422,453 | |
| 121,447 | UnitedHealth Group, Inc. | 60,983,397 | |
| 167,992,519 | |||
| Household & Personal Products - 7.0% | |||
| 719,454 | Colgate-Palmolive Co. | 61,398,205 | |
| 332,283 | Procter & Gamble Co. | 54,354,853 | |
| 115,753,058 | |||
| Insurance - 5.1% | |||
| 201,481 | Chubb Ltd. | 38,948,292 | |
| 259,535 | Marsh & McLennan Cos., Inc. | 45,112,374 | |
| 84,060,666 | |||
| Materials - 5.4% | |||
| 178,771 | Ecolab, Inc. | 41,937,889 | |
| 136,681 | Linde plc* | 47,350,399 | |
| 89,288,288 | |||
| Media & Entertainment - 1.9% | |||
| 608,992 | Comcast Corp. Class A | 30,650,567 | |
| Pharmaceuticals, Biotechnology & Life Sciences - 9.8% | |||
| 90,803 | Danaher Corp. | 29,875,095 | |
| 339,647 | Johnson & Johnson | 58,103,412 | |
| 456,479 | Merck & Co., Inc. | 34,984,551 | |
| 640,477 | Pfizer, Inc. | 37,820,167 | |
| 160,783,225 | |||
| Real Estate - 3.0% | |||
| 82,750 | American Tower Corp. REIT | 24,204,375 | |
| 68,140 | Public Storage REIT | 25,522,518 | |
| 49,726,893 | |||
| Shares or Principal Amount | Market Value† | ||
| COMMON STOCKS - 99.6% - (continued) | |||
| Retailing - 5.9% | |||
| 9,440,100 | Allstar Co.(1)(2)(3)(4) | $ — | |
| 77,361 | Home Depot, Inc. | 32,105,588 | |
| 848,339 | TJX Cos., Inc. | 64,405,897 | |
| 96,511,485 | |||
| Semiconductors & Semiconductor Equipment - 1.2% | |||
| 108,109 | Texas Instruments, Inc. | 20,375,303 | |
| Software & Services - 10.9% | |||
| 99,790 | Accenture plc Class A | 41,367,945 | |
| 124,050 | Automatic Data Processing, Inc. | 30,588,249 | |
| 71,204 | Mastercard, Inc. Class A | 25,585,021 | |
| 121,809 | Microsoft Corp. | 40,966,803 | |
| 193,875 | Visa, Inc. Class A | 42,014,651 | |
| 180,522,669 | |||
| Transportation - 6.9% | |||
| 266,714 | Canadian National Railway Co. | 32,761,786 | |
| 179,362 | Union Pacific Corp. | 45,186,669 | |
| 166,235 | United Parcel Service, Inc. Class B | 35,630,810 | |
| 113,579,265 | |||
| Total Common Stocks (cost $881,464,115) | $ 1,642,506,029 | ||
| SHORT-TERM INVESTMENTS - 0.8% | |||
| Repurchase Agreements - 0.8% | |||
| $ 13,339,853 | Fixed Income Clearing Corp. Repurchase Agreement dated 12/31/2021 at 0.020%, due on 01/03/2022 with a maturity value of $13,339,875; collateralized by U.S. Treasury Bond at 3.000%, maturing 08/15/2048, with a market value of $13,606,678 | $ 13,339,853 | |
| Total Short-Term Investments (cost $13,339,853) | $ 13,339,853 | ||
| Total Investments (cost $894,803,968) | 100.4% | $ 1,655,845,882 | |
| Other Assets and Liabilities | (0.4)% | (6,940,148) | |
| Total Net Assets | 100.0% | $ 1,648,905,734 | |
| Note: | Percentage of investments as shown is the ratio of the total market value to total net assets. |
| Prices of foreign equities that are principally traded on certain foreign markets will generally be adjusted daily pursuant to a fair value pricing service approved by the Board of Directors in order to reflect an adjustment for factors occurring after the close of certain foreign markets but before the close of the New York Stock Exchange. | |
| Equity industry classifications used in this report are the Global Industry Classification Standard, which was developed by and is the exclusive property and service mark of MSCI, Inc. and Standard & Poor’s. | |
| For Fund compliance purposes, the Fund may not use the same classification system. These classifications are used for financial reporting purposes. | |
| See “Glossary” for abbreviation descriptions. |
| 80 |
December 31, 2021
| * | Non-income producing. |
| (1) | Affiliated company – The Fund owns greater than 5% of the outstanding voting securities of this issuer. |
| (2) | This security is valued in good faith at fair value as determined under policies and procedures established by and under the supervision of the Board of Directors. At December 31, 2021, the aggregate fair value of this security was $0, which represented 0.0% of total net assets. This amount excludes securities that are principally traded in certain foreign markets and whose prices are adjusted pursuant to a third party pricing service methodology approved by the Board of Directors. |
| (3) | Investment in securities not registered under the Securities Act of 1933 (excluding securities acquired pursuant to Rule 144A and Regulation S). At the end of the period, the value of such restricted securities amounted to $0 or 0.0% of net assets. |
| Period Acquired | Security Name | Shares/ Par Value | Total Cost | Market Value | ||||
| 08/2011 | Allstar Co. | 9,440,100 | $ — | $ — |
| (4) | Investment valued using significant unobservable inputs. |
| † | See Significant Accounting Policies of accompanying Notes to Financial Statements regarding valuation of investments. |
| Description | Total | Level 1 | Level 2 | Level 3(1) | ||||
| Assets | ||||||||
| Common Stocks | ||||||||
| Banks | $ 22,310,657 | $ 22,310,657 | $ — | $ — | ||||
| Capital Goods | 212,466,849 | 212,466,849 | — | — | ||||
| Consumer Durables & Apparel | 48,047,294 | 48,047,294 | — | — | ||||
| Consumer Services | 48,102,213 | 48,102,213 | — | — | ||||
| Diversified Financials | 37,017,281 | 37,017,281 | — | — | ||||
| Food & Staples Retailing | 35,360,330 | 35,360,330 | — | — | ||||
| Food, Beverage & Tobacco | 129,957,467 | 96,730,018 | 33,227,449 | — | ||||
| Health Care Equipment & Services | 167,992,519 | 167,992,519 | — | — | ||||
| Household & Personal Products | 115,753,058 | 115,753,058 | — | — | ||||
| Insurance | 84,060,666 | 84,060,666 | — | — | ||||
| Materials | 89,288,288 | 89,288,288 | — | — | ||||
| Media & Entertainment | 30,650,567 | 30,650,567 | — | — | ||||
| Pharmaceuticals, Biotechnology & Life Sciences | 160,783,225 | 160,783,225 | — | — | ||||
| Real Estate | 49,726,893 | 49,726,893 | — | — | ||||
| Retailing | 96,511,485 | 96,511,485 | — | — | ||||
| Semiconductors & Semiconductor Equipment | 20,375,303 | 20,375,303 | — | — | ||||
| Software & Services | 180,522,669 | 180,522,669 | — | — | ||||
| Transportation | 113,579,265 | 113,579,265 | — | — | ||||
| Short-Term Investments | 13,339,853 | — | 13,339,853 | — | ||||
| Total | $ 1,655,845,882 | $ 1,609,278,580 | $ 46,567,302 | $ — |
| (1) | For the year ended December 31, 2021, investments valued at $11,233,719 were transferred into Level 3 due to the unavailability of active market pricing. There were no transfers out of Level 3. |
| 81 |
December 31, 2021
| Shares or Principal Amount | Market Value† | ||
| ASSET & COMMERCIAL MORTGAGE-BACKED SECURITIES - 22.2% | |||
| Asset-Backed - Automobile - 0.9% | |||
| $ 2,375,000 | AmeriCredit Automobile Receivables Trust 2.58%, 09/18/2025 | $ 2,414,271 | |
| 1,590,000 | Credit Acceptance Auto Loan Trust 1.00%, 05/15/2030(1) | 1,576,965 | |
| 2,045,000 | Drive Auto Receivables Trust 2.70%, 02/16/2027 | 2,079,169 | |
| Exeter Automobile Receivables Trust | |||
| 4,595,000 | 2.58%, 09/15/2025(1) | 4,669,570 | |
| 1,390,000 | 2.73%, 12/15/2025(1) | 1,418,436 | |
| 1,975,000 | Prestige Auto Receivables Trust 1.62%, 11/16/2026(1) | 1,966,172 | |
| 665,000 | Santander Drive Auto Receivables Trust 1.48%, 01/15/2027 | 666,933 | |
| Westlake Automobile Receivables Trust | |||
| 1,930,000 | 1.65%, 02/17/2026(1) | 1,934,612 | |
| 3,365,000 | 2.72%, 11/15/2024(1) | 3,422,263 | |
| 20,148,391 | |||
| Asset-Backed - Credit Card - 0.1% | |||
| 2,210,000 | Mercury Financial Credit Card Master Trust 1.54%, 03/20/2026(1) | 2,207,991 | |
| Asset-Backed - Finance & Insurance - 3.5% | |||
| 774,964 | Aaset Trust 3.35%, 01/16/2040(1) | 727,297 | |
| Bayview Koitere Fund Trust | |||
| 2,754,131 | 3.50%, 07/28/2057(1)(2) | 2,798,140 | |
| 1,078,885 | 4.00%, 11/28/2053(1)(2) | 1,093,165 | |
| BlueMountain CLO Ltd. | |||
| 3,660,000 | 1.23%, 04/20/2034, 3 mo. USD LIBOR + 1.100%(1)(3) | 3,646,030 | |
| 6,995,000 | 1.27%, 04/19/2034, 3 mo. USD LIBOR + 1.150%(1)(3) | 6,987,438 | |
| 1,910,000 | Carlyle U.S. CLO Ltd. 1.18%, 04/15/2034, 3 mo. USD LIBOR + 1.060%(1)(3) | 1,901,720 | |
| 1,061,759 | CF Hippolyta LLC 1.99%, 07/15/2060(1) | 1,043,055 | |
| 4,175,000 | Cirrus Funding Ltd. 4.80%, 01/25/2037(1) | 4,318,549 | |
| 4,485,000 | Columbia Cent CLO 27 Ltd. 1.35%, 01/25/2035(1)(3) | 4,481,744 | |
| 940,879 | Fieldstone Mortgage Investment Trust 0.64%, 05/25/2036, 1 mo. USD LIBOR + 0.540%(3) | 782,427 | |
| 3,267,261 | First Franklin Mortgage Loan Trust 0.58%, 04/25/2036, 1 mo. USD LIBOR + 0.480%(3) | 3,134,261 | |
| 2,718,793 | GSAMP Trust 0.19%, 01/25/2037, 1 mo. USD LIBOR + 0.090%(3) | 1,968,078 | |
| 645,370 | NRZ Excess Spread-Collateralized Notes 3.84%, 12/25/2025(1) | 648,147 | |
| Pretium Mortgage Credit Partners LLC | |||
| 2,084,344 | 1.87%, 07/25/2051(1)(4) | 2,063,288 | |
| 2,610,000 | 2.49%, 07/25/2051(1) | 2,605,777 | |
| 5,375,000 | Redding Ridge Asset Management LLC 1.23%, 07/15/2036, 3 mo. USD LIBOR + 1.110%(1)(3) | 5,366,008 | |
| 5,155,000 | Regatta Funding Ltd. 1.29%, 04/20/2034, 3 mo. USD LIBOR + 1.160%(1)(3) | 5,152,160 | |
| 377,545 | Securitized Asset-Backed Receivables LLC Trust 0.28%, 07/25/2036, 1 mo. USD LIBOR + 0.180%(3) | 175,269 | |
| 5,775,000 | Sound Point CLO Ltd. 1.19%, 04/25/2034, 3 mo. USD LIBOR + 1.070%(1)(3) | 5,773,545 | |
| Shares or Principal Amount | Market Value† | ||
| ASSET & COMMERCIAL MORTGAGE-BACKED SECURITIES - 22.2% - (continued) | |||
| Asset-Backed - Finance & Insurance - 3.5% - (continued) | |||
| Symphony CLO Ltd. | |||
| $ 2,937,660 | 1.08%, 07/14/2026, 3 mo. USD LIBOR + 0.950%(1)(3) | $ 2,938,515 | |
| 6,615,000 | 1.10%, 04/19/2034, 3 mo. USD LIBOR + 0.980%(1)(3) | 6,586,198 | |
| 5,815,000 | Thompson Park CLO Ltd. 1.12%, 04/15/2034, 3 mo. USD LIBOR + 1.000%(1)(3) | 5,810,424 | |
| 2,255,000 | Venture CLO Ltd. 1.36%, 04/15/2034, 3 mo. USD LIBOR + 1.240%(1)(3) | 2,257,329 | |
| 6,473,720 | Voya CLO Ltd. 1.02%, 01/18/2029, 3 mo. USD LIBOR + 0.900%(1)(3) | 6,471,137 | |
| 1,996,800 | Wendy's Funding LLC 3.88%, 03/15/2048(1) | 2,073,062 | |
| 80,802,763 | |||
| Asset-Backed - Home Equity - 0.5% | |||
| 2,780,000 | CPT Mortgage Trust 2.87%, 11/13/2039(1) | 2,895,301 | |
| GSAA Home Equity Trust | |||
| 4,694,302 | 0.26%, 02/25/2037, 1 mo. USD LIBOR + 0.160%(3) | 1,798,077 | |
| 2,080,300 | 0.46%, 11/25/2036, 1 mo. USD LIBOR + 0.360%(3) | 735,095 | |
| 520,738 | 5.98%, 06/25/2036(2) | 192,949 | |
| 2,701,223 | Legacy Mortgage Asset Trust 3.00%, 06/25/2059(1)(4) | 2,705,442 | |
| 64,539 | Morgan Stanley Asset-Backed Securities Capital, Inc. Trust 0.40%, 06/25/2036, 1 mo. USD LIBOR + 0.300%(3) | 59,376 | |
| 1,256,873 | Morgan Stanley Mortgage Loan Trust 0.44%, 11/25/2036, 1 mo. USD LIBOR + 0.340%(3) | 475,022 | |
| Soundview Home Loan Trust | |||
| 1,992,899 | 0.28%, 07/25/2037, 1 mo. USD LIBOR + 0.180%(3) | 1,911,134 | |
| 425,924 | 0.60%, 11/25/2036, 1 mo. USD LIBOR + 0.500%(3) | 418,329 | |
| 11,190,725 | |||
| Commercial Mortgage-Backed Securities - 4.7% | |||
| BBCMS Mortgage Trust | |||
| 8,553,000 | 0.96%, 08/15/2036, 1 mo. USD LIBOR + 0.850%(1)(3) | 8,545,130 | |
| 27,168,517 | 1.44%, 02/15/2050(2)(5) | 1,604,885 | |
| Benchmark Mortgage Trust | |||
| 11,736,780 | 0.50%, 01/15/2051(2)(5) | 288,458 | |
| 19,467,554 | 0.51%, 07/15/2051(2)(5) | 468,796 | |
| 8,926,589 | 1.06%, 08/15/2052(2)(5) | 513,827 | |
| 25,842,413 | 1.23%, 03/15/2062(2)(5) | 1,780,111 | |
| 10,405,677 | 1.52%, 01/15/2054(2)(5) | 1,191,923 | |
| 2,759,980 | 1.79%, 07/15/2053(2)(5) | 290,900 | |
| 4,425,630 | BX Commercial Mortgage Trust 1.03%, 10/15/2036, 1 mo. USD LIBOR + 0.920%(1)(3) | 4,426,851 | |
| 2,920,000 | CAMB Commercial Mortgage Trust 2.66%, 12/15/2037, 1 mo. USD LIBOR + 2.550%(1)(3) | 2,913,554 | |
| 3,855,000 | CD Mortgage Trust 2.46%, 08/10/2049 | 3,909,674 | |
| Citigroup Commercial Mortgage Trust | |||
| 17,395,697 | 0.91%, 07/10/2047(2)(5) | 358,885 | |
| 20,671,192 | 1.02%, 04/10/2048(2)(5) | 586,541 | |
| 2,357,000 | 4.12%, 11/15/2049(2) | 2,396,298 | |
| 1,439,980 | Citigroup Mortgage Loan Trust 3.23%, 11/25/2070(1)(4) | 1,440,836 | |
| 82 |
December 31, 2021
| Shares or Principal Amount | Market Value† | ||
| ASSET & COMMERCIAL MORTGAGE-BACKED SECURITIES - 22.2% - (continued) | |||
| Commercial Mortgage-Backed Securities - 4.7% - (continued) | |||
| Commercial Mortgage Trust | |||
| $ 6,827,439 | 0.55%, 02/10/2047(2)(5) | $ 67,704 | |
| 3,168,842 | 0.71%, 08/10/2046(2)(5) | 30,783 | |
| 948,544 | 2.82%, 10/15/2045 | 953,610 | |
| 1,659,863 | 2.85%, 10/15/2045 | 1,677,692 | |
| 1,145,000 | 3.10%, 03/10/2046 | 1,156,499 | |
| 568,061 | 3.21%, 03/10/2046 | 577,990 | |
| 6,780,000 | 3.42%, 03/10/2031(1) | 6,949,975 | |
| 1,260,000 | 3.61%, 06/10/2046(2) | 1,296,765 | |
| 206,366 | 4.02%, 07/10/2045 | 210,463 | |
| 630,000 | 4.07%, 02/10/2047(2) | 659,228 | |
| 1,045,000 | 4.21%, 08/10/2046(2) | 1,085,822 | |
| 535,000 | 4.24%, 02/10/2047(2) | 562,041 | |
| 615,085 | 4.25%, 07/10/2045(2) | 638,241 | |
| 1,920,000 | 4.75%, 10/15/2045(1)(2) | 679,987 | |
| 27,672 | Credit Suisse First Boston Mortgage Securities Corp. 4.88%, 04/15/2037 | 27,863 | |
| CSAIL Commercial Mortgage Trust | |||
| 57,171,872 | 0.74%, 06/15/2057(2)(5) | 1,153,225 | |
| 2,547,048 | 0.93%, 11/15/2048(2)(5) | 75,302 | |
| 7,267,238 | 1.87%, 01/15/2049(2)(5) | 487,425 | |
| 4,277,490 | DBJPM Mortgage Trust 1.71%, 09/15/2053(2)(5) | 400,000 | |
| 4,340,000 | GS Mortgage Securities Corp. 2.95%, 11/05/2034(1) | 4,381,671 | |
| GS Mortgage Securities Trust | |||
| 1,135,087 | 0.00%, 08/10/2044(1)(2)(5)(6) | 11 | |
| 41,415,123 | 0.06%, 07/10/2046(2)(5) | 36,710 | |
| 1,580,166 | 3.67%, 04/10/2047(1) | 63,207 | |
| 785,121 | 4.07%, 01/10/2047 | 819,969 | |
| 2,215,000 | 4.96%, 04/10/2047(1)(2) | 1,245,125 | |
| JP Morgan Chase Commercial Mortgage Securities Trust | |||
| 2,185,000 | 2.73%, 10/15/2045(1)(2) | 1,742,057 | |
| 1,400,000 | 2.81%, 01/16/2037(1) | 1,425,314 | |
| 476,919 | 2.84%, 12/15/2047 | 481,696 | |
| 1,290,924 | 4.36%, 12/15/2047(1)(2) | 1,062,300 | |
| JPMBB Commercial Mortgage Securities Trust | |||
| 17,424,605 | 0.60%, 09/15/2047(2)(5) | 239,268 | |
| 4,436,435 | 0.62%, 05/15/2048(2)(5) | 75,378 | |
| 855,054 | 3.36%, 07/15/2045 | 869,905 | |
| Morgan Stanley Bank of America Merrill Lynch Trust | |||
| 10,022,156 | 0.97%, 12/15/2047(2)(5) | 227,620 | |
| 1,340,932 | 0.98%, 10/15/2048(2)(5) | 36,601 | |
| 1,530,000 | 3.13%, 12/15/2048 | 1,553,241 | |
| 1,232,400 | 3.18%, 08/15/2045 | 1,236,537 | |
| 795,172 | 4.26%, 10/15/2046(2) | 828,522 | |
| Morgan Stanley Capital Trust | |||
| 7,446,023 | 1.34%, 06/15/2050(2)(5) | 387,160 | |
| 1,460,000 | 5.09%, 07/15/2049(1)(2) | 806,724 | |
| 82,680 | 5.66%, 10/12/2052(1)(2) | 25,747 | |
| 2,475,000 | MTRO Commercial Mortgage Trust 1.91%, 12/15/2033, 1 mo. USD LIBOR + 1.800%(1)(3) | 2,407,997 | |
| 1,370,000 | Natixis Commercial Mortgage Securities Trust 2.91%, 10/15/2036(1) | 1,367,255 | |
| 791,099 | Oaktown Re Ltd. 1.65%, 07/25/2028, 1 mo. USD LIBOR + 1.550%(1)(3) | 791,099 | |
| 790,000 | SFAVE Commercial Mortgage Securities Trust 3.87%, 01/05/2043(1)(2) | 830,689 | |
| Shares or Principal Amount | Market Value† | ||
| ASSET & COMMERCIAL MORTGAGE-BACKED SECURITIES - 22.2% - (continued) | |||
| Commercial Mortgage-Backed Securities - 4.7% - (continued) | |||
| $ 5,410,000 | SG Commercial Mortgage Securities Trust 2.63%, 03/15/2037(1) | $ 5,507,394 | |
| 4,257,103 | UBS Commercial Mortgage Trust 1.05%, 08/15/2050(2)(5) | 188,555 | |
| UBS-Barclays Commercial Mortgage Trust | |||
| 790,000 | 2.85%, 12/10/2045 | 795,781 | |
| 1,826,539 | 3.09%, 08/10/2049 | 1,839,866 | |
| 2,065,000 | 3.18%, 03/10/2046 | 2,093,592 | |
| 775,000 | 3.24%, 04/10/2046 | 789,280 | |
| Wells Fargo Commercial Mortgage Trust | |||
| 15,862,970 | 1.09%, 05/15/2048(2)(5) | 444,688 | |
| 1,036,612 | 2.92%, 10/15/2045 | 1,044,452 | |
| 3,085,000 | 2.94%, 10/15/2049 | 3,234,771 | |
| 430,000 | 4.15%, 05/15/2048(2) | 432,288 | |
| Wells Fargo N.A. | |||
| 20,012,172 | 0.60%, 11/15/2062(2)(5) | 833,297 | |
| 9,760,048 | 0.65%, 11/15/2062(2)(5) | 448,957 | |
| 39,353,709 | 0.73%, 11/15/2050(2)(5) | 1,438,689 | |
| 4,509,122 | 0.79%, 11/15/2054(2)(5) | 171,223 | |
| 19,681,897 | 0.83%, 09/15/2062(2)(5) | 1,084,217 | |
| 35,411,434 | 0.88%, 01/15/2063(2)(5) | 2,151,801 | |
| 12,725,734 | 0.90%, 05/15/2062(2)(5) | 716,561 | |
| 21,100,477 | 1.78%, 03/15/2063(2)(5) | 2,719,292 | |
| 2,545,000 | 2.04%, 02/15/2054 | 2,515,960 | |
| WF-RBS Commercial Mortgage Trust | |||
| 255,115 | 2.88%, 12/15/2045 | 257,998 | |
| 1,061,630 | 3.00%, 08/15/2045 | 1,066,602 | |
| 1,137,886 | 3.07%, 03/15/2045 | 1,153,505 | |
| 450,000 | 3.35%, 05/15/2045 | 459,615 | |
| 486,343 | 3.72%, 05/15/2047 | 496,950 | |
| 230,000 | 4.05%, 03/15/2047 | 240,937 | |
| 1,095,000 | 4.15%, 08/15/2046(2) | 1,131,716 | |
| 710,000 | 4.89%, 06/15/2044(1)(2) | 440,760 | |
| 790,000 | 5.77%, 04/15/2045(1)(2) | 791,185 | |
| 106,839,019 | |||
| Other Asset-Backed Securities - 3.4% | |||
| Affirm Asset Securitization Trust | |||
| 1,529,989 | 1.90%, 01/15/2025(1) | 1,537,282 | |
| 597,633 | 3.46%, 10/15/2024(1) | 609,043 | |
| 885,000 | Arbor Realty Commercial Real Estate Notes Ltd. 1.21%, 05/15/2036, 1 mo. USD LIBOR + 1.100%(1)(3) | 883,339 | |
| 1,945,000 | Avant Loans Funding Trust 1.21%, 07/15/2030(1) | 1,928,947 | |
| 5,645,000 | Bain Capital Credit CLO Ltd. 1.30%, 07/25/2034, 3 mo. USD LIBOR + 1.180%(1)(3) | 5,648,511 | |
| 1,770,415 | Bayview Mortgage Fund Trust 3.50%, 01/28/2058(1)(2) | 1,776,334 | |
| Bayview Opportunity Master Fund Trust | |||
| 1,178,000 | 3.50%, 01/28/2055(1)(2) | 1,191,772 | |
| 1,383,345 | 3.50%, 06/28/2057(1)(2) | 1,403,044 | |
| 2,328,045 | 4.00%, 10/28/2064(1)(2) | 2,356,195 | |
| Domino's Pizza Master Issuer LLC | |||
| 2,308,400 | 2.66%, 04/25/2051(1) | 2,318,116 | |
| 1,424,625 | 3.67%, 10/25/2049(1) | 1,499,425 | |
| 3,176,750 | 4.12%, 07/25/2048(1) | 3,246,975 | |
| 6,190,000 | Madison Park Funding Ltd. 1.25%, 07/17/2034, 3 mo. USD LIBOR + 1.120%(1)(3) | 6,182,981 | |
| 1,015,000 | Marlette Funding Trust 1.06%, 09/15/2031(1) | 1,007,069 | |
| 83 |
December 31, 2021
| Shares or Principal Amount | Market Value† | ||
| ASSET & COMMERCIAL MORTGAGE-BACKED SECURITIES - 22.2% - (continued) | |||
| Other Asset-Backed Securities - 3.4% - (continued) | |||
| $ 4,808,807 | Preston Ridge Partners Mortgage Trust LLC 2.95%, 10/25/2025(1)(4) | $ 4,796,747 | |
| 5,870,000 | RR LLC 1.27%, 07/15/2035, 3 mo. USD LIBOR + 1.150%(1)(3) | 5,870,892 | |
| 484,950 | Sapphire Aviation Finance Ltd. 3.23%, 03/15/2040(1) | 470,911 | |
| 4,087,193 | Seasoned Credit Risk Transfer Trust 3.50%, 03/25/2058 | 4,324,594 | |
| 1,435,000 | Summit Issuer LLC 2.29%, 12/20/2050(1) | 1,422,159 | |
| Towd Point Mortgage Trust | |||
| 1,893,624 | 0.69%, 02/25/2057, 1 mo. USD LIBOR + 0.600%(1)(3) | 1,892,642 | |
| 164,738 | 2.25%, 04/25/2056(1)(2) | 164,780 | |
| 321,117 | 2.75%, 08/25/2055(1)(2) | 321,874 | |
| 2,095,806 | 2.75%, 10/25/2056(1)(2) | 2,113,874 | |
| 529,427 | 2.75%, 04/25/2057(1)(2) | 533,555 | |
| 2,295,221 | 2.75%, 06/25/2057(1)(2) | 2,332,516 | |
| 1,200,436 | 2.75%, 07/25/2057(1)(2) | 1,213,029 | |
| 1,308,157 | Upstart Securitization Trust 0.83%, 07/20/2031(1) | 1,303,457 | |
| 2,728,316 | VCAT LLC 1.74%, 05/25/2051(1)(4) | 2,692,768 | |
| 5,775,000 | Venture CLO Ltd. 1.25%, 04/15/2034, 3 mo. USD LIBOR + 1.130%(1)(3) | 5,762,526 | |
| 4,560,000 | Wellfleet CLO Ltd. 1.30%, 07/20/2032, 3 mo. USD LIBOR + 1.170%(1)(3) | 4,560,734 | |
| 5,019,775 | Wendy's Funding LLC 2.37%, 06/15/2051(1) | 4,903,848 | |
| 771,125 | Wingstop Funding LLC 2.84%, 12/05/2050(1) | 769,933 | |
| 77,039,872 | |||
| Whole Loan Collateral CMO - 9.1% | |||
| 4,645,047 | 510 Asset Backed Trust 2.12%, 06/25/2061(1)(4) | 4,581,972 | |
| Alternative Loan Trust | |||
| 144,584 | 0.64%, 01/25/2036, 1 mo. USD LIBOR + 0.540%(3) | 144,212 | |
| 752,784 | 0.68%, 11/25/2035, 1 mo. USD LIBOR + 0.640%(3) | 670,497 | |
| 642,253 | 5.75%, 05/25/2036 | 378,806 | |
| Angel Oak Mortgage Trust | |||
| 2,372,266 | 0.91%, 01/25/2066(1)(2) | 2,373,362 | |
| 2,201,655 | 0.99%, 04/25/2053(1)(2) | 2,195,576 | |
| 1,894,739 | 0.99%, 04/25/2066(1)(2) | 1,879,121 | |
| 2,730,000 | 1.82%, 11/25/2066(1)(2) | 2,729,667 | |
| 232,085 | 3.63%, 03/25/2049(1)(2) | 232,910 | |
| 2,606,831 | Arroyo Mortgage Trust 3.35%, 04/25/2049(1)(2) | 2,624,743 | |
| Banc of America Funding Trust | |||
| 725,283 | 0.70%, 05/20/2047, 1 mo. USD LIBOR + 0.600%(3) | 735,928 | |
| 2,509,740 | 5.77%, 05/25/2037(2) | 2,590,910 | |
| 97,249 | 6.35%, 01/25/2037(4) | 97,916 | |
| 565,305 | BCAP LLC Trust 0.28%, 03/25/2037, 1 mo. USD LIBOR + 0.180%(3) | 556,355 | |
| 142,733 | Bear Stearns Adjustable Rate Mortgage Trust 2.38%, 10/25/2035, 12 mo. USD CMT + 2.300%(3) | 145,945 | |
| 626,261 | Bear Stearns Alt-A Trust 0.60%, 01/25/2036, 1 mo. USD LIBOR + 0.500%(3) | 750,252 | |
| Shares or Principal Amount | Market Value† | ||
| ASSET & COMMERCIAL MORTGAGE-BACKED SECURITIES - 22.2% - (continued) | |||
| Whole Loan Collateral CMO - 9.1% - (continued) | |||
| $ 215,962 | Bear Stearns Mortgage Funding Trust 0.28%, 10/25/2036, 1 mo. USD LIBOR + 0.180%(3) | $ 206,835 | |
| 326,757 | Bellemeade Re Ltd. 1.50%, 10/25/2029, 1 mo. USD LIBOR + 1.400%(1)(3) | 326,757 | |
| BRAVO Residential Funding Trust | |||
| 1,339,012 | 0.94%, 02/25/2049(1)(2) | 1,328,497 | |
| 1,782,071 | 0.97%, 03/25/2060(1)(2) | 1,762,944 | |
| CHL Mortgage Pass-Through Trust | |||
| 309,666 | 2.72%, 11/20/2035(2) | 286,470 | |
| 1,155,482 | 2.91%, 09/25/2047(2) | 1,106,958 | |
| 1,378,814 | CIM Trust 3.00%, 04/25/2057(1)(2) | 1,391,634 | |
| COLT Mortgage Loan Trust | |||
| 2,757,271 | 0.91%, 06/25/2066(1)(2) | 2,724,587 | |
| 5,961,387 | 1.11%, 10/25/2066(1)(2) | 5,879,935 | |
| Connecticut Avenue Securities Trust | |||
| 185,897 | 2.10%, 07/25/2039, 1 mo. USD LIBOR + 2.000%(1)(3) | 186,074 | |
| 222,231 | 2.20%, 06/25/2039, 1 mo. USD LIBOR + 2.100%(1)(3) | 222,372 | |
| 353,465 | 2.25%, 09/25/2031, 1 mo. USD LIBOR + 2.150%(1)(3) | 354,817 | |
| 1,051,498 | 2.25%, 11/25/2039, 1 mo. USD LIBOR + 2.150%(1)(3) | 1,051,497 | |
| 374,116 | 2.40%, 08/25/2031, 1 mo. USD LIBOR + 2.300%(1)(3) | 375,661 | |
| 1,226,040 | Credit Suisse First Boston Mortgage Securities Corp. 5.50%, 06/25/2035 | 1,108,942 | |
| 2,442,539 | Credit Suisse Mortgage Capital Certificates 0.94%, 05/25/2066(1)(2) | 2,402,037 | |
| CSMC Trust | |||
| 1,505,335 | 1.80%, 12/27/2060(1)(2) | 1,495,120 | |
| 2,695,000 | 1.84%, 10/25/2066(1)(2) | 2,687,931 | |
| 1,637,775 | 3.25%, 04/25/2047(1)(2) | 1,687,916 | |
| 1,280,721 | Deephaven Residential Mortgage Trust 0.90%, 04/25/2066(1)(2) | 1,259,181 | |
| 1,015,179 | Eagle RE Ltd. 1.80%, 11/25/2028, 1 mo. USD LIBOR + 1.700%(1)(3) | 1,015,180 | |
| 1,057,549 | Ellington Financial Mortgage Trust 0.93%, 06/25/2066(1)(2) | 1,037,331 | |
| Fannie Mae Connecticut Avenue Securities | |||
| 1,357,066 | 3.65%, 07/25/2029, 1 mo. USD LIBOR + 3.550%(3) | 1,389,629 | |
| 2,174,747 | 4.45%, 05/25/2029, 1 mo. USD LIBOR + 4.350%(3) | 2,257,708 | |
| 479,948 | 5.00%, 11/25/2024, 1 mo. USD LIBOR + 4.900%(3) | 499,733 | |
| 405,052 | 5.80%, 04/25/2028, 1 mo. USD LIBOR + 5.700%(3) | 426,658 | |
| 233,925 | 6.10%, 09/25/2028, 1 mo. USD LIBOR + 6.000%(3) | 241,703 | |
| GCAT Trust | |||
| 2,413,729 | 1.04%, 05/25/2066(1)(2) | 2,402,822 | |
| 2,420,000 | 1.92%, 08/25/2066(1)(2) | 2,420,531 | |
| 18,322 | GMACM Mortgage Loan Trust 2.93%, 04/19/2036(2) | 15,907 | |
| GSR Mortgage Loan Trust | |||
| 854,040 | 0.40%, 01/25/2037, 1 mo. USD LIBOR + 0.300%(3) | 202,569 | |
| 997,875 | 2.87%, 01/25/2036(2) | 1,020,612 | |
| 84 |
December 31, 2021
| Shares or Principal Amount | Market Value† | ||
| ASSET & COMMERCIAL MORTGAGE-BACKED SECURITIES - 22.2% - (continued) | |||
| Whole Loan Collateral CMO - 9.1% - (continued) | |||
| HarborView Mortgage Loan Trust | |||
| $ 691,253 | 0.29%, 01/19/2038, 1 mo. USD LIBOR + 0.190%(3) | $ 672,962 | |
| 2,412,667 | 0.34%, 12/19/2036, 1 mo. USD LIBOR + 0.240%(3) | 2,417,746 | |
| 905,561 | Home Re Ltd. 1.70%, 10/25/2028, 1 mo. USD LIBOR + 1.600%(1)(3) | 905,562 | |
| 797,352 | IndyMac Index Mortgage Loan Trust 2.90%, 03/25/2036(2) | 694,247 | |
| 135,126 | JP Morgan Mortgage Trust 2.98%, 04/25/2037(2) | 123,781 | |
| 1,412,551 | LCM L.P. 1.17%, 10/20/2027, 3 mo. USD LIBOR + 1.040%(1)(3) | 1,412,720 | |
| Legacy Mortgage Asset Trust | |||
| 1,515,379 | 1.75%, 04/25/2061(1)(4) | 1,511,944 | |
| 1,898,918 | 1.75%, 07/25/2061(1)(4) | 1,874,389 | |
| 3,664,770 | 3.25%, 11/25/2059(1)(4) | 3,675,208 | |
| 708,644 | Lehman XS Trust 0.52%, 07/25/2046, 1 mo. USD LIBOR + 0.420%(3) | 735,260 | |
| LSTAR Securities Investment Ltd. | |||
| 4,067,561 | 1.80%, 03/02/2026, 1 mo. USD LIBOR + 1.700%(1)(3) | 4,068,326 | |
| 2,525,382 | 1.90%, 02/01/2026, 1 mo. USD LIBOR + 1.800%(1)(3) | 2,523,754 | |
| 1,249,153 | 2.60%, 04/01/2024, 1 mo. USD LIBOR + 2.500%(1)(3) | 1,248,416 | |
| 2,670,088 | 2.60%, 05/01/2024, 1 mo. USD LIBOR + 1.250%(1)(3) | 2,658,825 | |
| 229,740 | MASTR Adjustable Rate Mortgages Trust 2.73%, 11/21/2034(2) | 232,316 | |
| 4,441,406 | MFA LLC 2.36%, 03/25/2060(1)(4) | 4,439,265 | |
| MFRA Trust | |||
| 477,021 | 1.01%, 01/26/2065(1)(2) | 474,477 | |
| 2,024,191 | 1.03%, 11/25/2064(1)(2) | 2,005,019 | |
| 2,032,807 | 1.15%, 04/25/2065(1)(2) | 2,029,611 | |
| New Residential Mortgage Loan Trust | |||
| 2,537,763 | 0.85%, 01/25/2048, 1 mo. USD LIBOR + 0.750%(1)(3) | 2,538,722 | |
| 1,475,551 | 0.94%, 10/25/2058(1)(2) | 1,462,118 | |
| 1,948,390 | 1.60%, 06/25/2057, 1 mo. USD LIBOR + 1.500%(1)(3) | 1,971,719 | |
| 604,781 | 2.49%, 09/25/2059(1)(2) | 606,667 | |
| 1,884,939 | 3.50%, 08/25/2059(1)(2) | 1,933,724 | |
| 2,112,763 | 3.75%, 11/26/2035(1)(2) | 2,205,861 | |
| 2,049,576 | 3.75%, 11/25/2056(1)(2) | 2,161,862 | |
| 3,654,928 | 4.00%, 02/25/2057(1)(2) | 3,851,745 | |
| 3,667,490 | 4.00%, 03/25/2057(1)(2) | 3,859,405 | |
| 2,856,939 | 4.00%, 04/25/2057(1)(2) | 2,994,362 | |
| 2,015,271 | 4.00%, 05/25/2057(1)(2) | 2,113,087 | |
| 3,250,255 | 4.00%, 08/27/2057(1)(2) | 3,403,520 | |
| 1,420,065 | 4.00%, 12/25/2057(1)(2) | 1,494,657 | |
| 4,461,202 | NMLT Trust 1.19%, 05/25/2056(1)(2) | 4,423,715 | |
| 267,669 | Oaktown Re Ltd. 1.50%, 07/25/2029, 1 mo. USD LIBOR + 1.400%(1)(3) | 267,766 | |
| 1,410,338 | OZLM Ltd. 1.18%, 04/30/2027, 3 mo. USD LIBOR + 1.050%(1)(3) | 1,410,444 | |
| 1,062,419 | PMT Credit Risk Transfer Trust 2.10%, 03/27/2024, 1 mo. USD LIBOR + 2.000%(1)(3) | 1,062,395 | |
| Preston Ridge Partners Mortgage Trust LLC | |||
| 2,693,450 | 1.79%, 06/25/2026(1)(4) | 2,654,176 | |
| Shares or Principal Amount | Market Value† | ||
| ASSET & COMMERCIAL MORTGAGE-BACKED SECURITIES - 22.2% - (continued) | |||
| Whole Loan Collateral CMO - 9.1% - (continued) | |||
| $ 2,815,425 | 1.79%, 07/25/2026(1)(4) | $ 2,807,083 | |
| 5,151,059 | 1.87%, 04/25/2026(1)(4) | 5,136,926 | |
| 907,885 | 2.36%, 11/25/2025(1)(4) | 905,266 | |
| 2,267,989 | 2.49%, 10/25/2026(1)(4) | 2,255,431 | |
| 5,234,061 | Pretium Mortgage Credit Partners LLC 1.99%, 02/25/2061(1)(4) | 5,159,617 | |
| 692,817 | RBSGC Mortgage Loan Trust 6.25%, 01/25/2037 | 696,923 | |
| 2,105,683 | RCO VII Mortgage LLC 1.87%, 05/26/2026(1)(4) | 2,075,950 | |
| 518,542 | Residential Accredit Loans, Inc. 6.00%, 12/25/2035 | 520,856 | |
| Seasoned Credit Risk Transfer Trust | |||
| 2,465,776 | 2.50%, 08/25/2059 | 2,537,246 | |
| 1,949,819 | 3.50%, 11/25/2057 | 2,100,799 | |
| 5,196,272 | 3.50%, 07/25/2058 | 5,618,887 | |
| 1,031,046 | 3.50%, 08/25/2058 | 1,117,845 | |
| 4,385,366 | 3.50%, 10/25/2058 | 4,661,933 | |
| Starwood Mortgage Residential Trust | |||
| 1,210,262 | 0.94%, 05/25/2065(1)(2) | 1,200,936 | |
| 3,910,442 | 1.92%, 11/25/2066(1)(2) | 3,921,288 | |
| 648,719 | Structured Agency Credit Risk Trust 1.75%, 04/25/2043, 1 mo. USD LIBOR + 1.650%(1)(3) | 648,914 | |
| 2,840,000 | Toorak Mortgage Corp. Ltd. 2.24%, 06/25/2024(1)(4) | 2,829,619 | |
| 5,567,460 | Towd Point Mortgage Trust 2.92%, 11/30/2060(1)(2) | 5,554,627 | |
| 898,238 | VCAT LLC 2.12%, 03/27/2051(1)(4) | 896,238 | |
| Verus Securitization Trust | |||
| 1,890,627 | 0.92%, 02/25/2064(1)(2) | 1,884,954 | |
| 1,963,090 | 0.94%, 07/25/2066(1)(2) | 1,945,155 | |
| 1,686,183 | 1.03%, 02/25/2066(1)(2) | 1,668,567 | |
| 2,850,000 | 1.82%, 11/25/2066(1)(2) | 2,848,293 | |
| 5,663,942 | 1.83%, 10/25/2066(1)(2) | 5,661,526 | |
| 2,780,450 | VOLT XCIV LLC 2.24%, 02/27/2051(1)(4) | 2,765,581 | |
| WaMu Mortgage Pass-Through Certificates Trust | |||
| 1,826,331 | 0.90%, 12/25/2046, 12 mo. USD MTA + 0.820%(3) | 1,694,178 | |
| 363,260 | 0.94%, 06/25/2044, 1 mo. USD LIBOR + 0.840%(3) | 359,303 | |
| 738,078 | 2.81%, 06/25/2037(2) | 720,907 | |
| 26,851,914 | Wells Fargo Commercial Mortgage Trust 0.90%, 09/15/2057(2)(5) | 767,618 | |
| 208,546,959 | |||
| Total Asset & Commercial Mortgage-Backed Securities (cost $511,422,095) | $ 506,775,720 | ||
| CORPORATE BONDS - 29.2% | |||
| Advertising - 0.0% | |||
| 500,000 | Lamar Media Corp. 3.75%, 02/15/2028 | $ 501,250 | |
| Aerospace/Defense - 0.6% | |||
| Boeing Co. | |||
| 1,900,000 | 5.04%, 05/01/2027 | 2,140,684 | |
| 1,390,000 | 5.15%, 05/01/2030 | 1,620,993 | |
| 2,127,000 | L3Harris Technologies, Inc. 3.85%, 06/15/2023 | 2,209,433 | |
| 85 |
December 31, 2021
| Shares or Principal Amount | Market Value† | ||
| CORPORATE BONDS - 29.2% - (continued) | |||
| Aerospace/Defense - 0.6% - (continued) | |||
| $ 960,000 | Northrop Grumman Corp. 5.15%, 05/01/2040 | $ 1,248,556 | |
| Raytheon Technologies Corp. | |||
| 3,455,000 | 2.38%, 03/15/2032 | 3,455,533 | |
| 395,000 | 3.03%, 03/15/2052 | 398,492 | |
| 32,000 | 3.65%, 08/16/2023 | 33,272 | |
| United Technologies Corp. | |||
| 1,565,000 | 3.95%, 08/16/2025 | 1,697,475 | |
| 760,000 | 4.45%, 11/16/2038 | 918,146 | |
| 13,722,584 | |||
| Agriculture - 0.4% | |||
| 1,110,000 | Altria Group, Inc. 3.70%, 02/04/2051 | 1,038,327 | |
| BAT Capital Corp. | |||
| 585,000 | 2.26%, 03/25/2028 | 570,513 | |
| 1,755,000 | 2.79%, 09/06/2024 | 1,808,445 | |
| 3,265,000 | BAT International Finance plc 1.67%, 03/25/2026 | 3,206,797 | |
| 1,760,000 | Kernel Holding S.A. 6.50%, 10/17/2024(7) | 1,770,433 | |
| 8,394,515 | |||
| Airlines - 0.0% | |||
| 85,000 | United Airlines, Inc. 4.63%, 04/15/2029(1) | 87,656 | |
| Apparel - 0.2% | |||
| 550,000 | Hanesbrands, Inc. 4.88%, 05/15/2026(1) | 587,813 | |
| 3,550,000 | William Carter Co. 5.63%, 03/15/2027(1) | 3,669,812 | |
| 4,257,625 | |||
| Auto Manufacturers - 0.2% | |||
| 505,000 | Ford Motor Co. 3.25%, 02/12/2032 | 517,120 | |
| General Motors Co. | |||
| 915,000 | 5.20%, 04/01/2045 | 1,135,459 | |
| 145,000 | 6.80%, 10/01/2027 | 178,089 | |
| General Motors Financial Co., Inc. | |||
| 265,000 | 1.25%, 01/08/2026 | 259,407 | |
| 2,660,000 | 1.50%, 06/10/2026 | 2,618,531 | |
| 4,708,606 | |||
| Beverages - 0.3% | |||
| Anheuser-Busch InBev Worldwide, Inc. | |||
| 1,507,000 | 3.75%, 07/15/2042 | 1,647,386 | |
| 645,000 | 4.75%, 04/15/2058 | 800,568 | |
| 2,059,000 | 5.45%, 01/23/2039 | 2,700,974 | |
| Constellation Brands, Inc. | |||
| 150,000 | 2.25%, 08/01/2031 | 146,778 | |
| 612,000 | 3.15%, 08/01/2029 | 646,064 | |
| 5,941,770 | |||
| Biotechnology - 0.3% | |||
| 95,000 | Baxalta, Inc. 3.60%, 06/23/2022 | 95,798 | |
| 3,210,000 | Gilead Sciences, Inc. 1.65%, 10/01/2030 | 3,079,990 | |
| Royalty Pharma plc | |||
| 2,090,000 | 2.15%, 09/02/2031 | 1,976,683 | |
| 545,000 | 2.20%, 09/02/2030 | 528,095 | |
| 475,000 | 3.30%, 09/02/2040 | 480,060 | |
| 6,160,626 | |||
| Chemicals - 0.2% | |||
| 290,000 | Chemours Co. 5.38%, 05/15/2027(8) | 310,300 | |
| 2,760,000 | DuPont de Nemours, Inc. 4.21%, 11/15/2023 | 2,918,933 | |
| Shares or Principal Amount | Market Value† | ||
| CORPORATE BONDS - 29.2% - (continued) | |||
| Chemicals - 0.2% - (continued) | |||
| $ 731,000 | LYB International Finance LLC 1.25%, 10/01/2025 | $ 718,970 | |
| 290,000 | Olin Corp. 5.13%, 09/15/2027 | 297,613 | |
| 4,245,816 | |||
| Commercial Banks - 5.2% | |||
| 3,775,000 | Bangkok Bank PCL 3.47%, 09/23/2036, (3.47% fixed rate until 09/23/2031; 5 year USD CMT + 2.150% thereafter)(1)(9) | 3,780,647 | |
| Bank of America Corp. | |||
| 1,370,000 | 2.46%, 10/22/2025, (2.46% fixed rate until 10/22/2024; 3 mo. USD LIBOR + 0.870% thereafter)(9) | 1,407,384 | |
| 965,000 | 2.57%, 10/20/2032, (2.57% fixed rate until 10/20/2031; 3 mo. USD SOFR + 1.210% thereafter)(9) | 970,787 | |
| 1,565,000 | 3.19%, 07/23/2030, (3.19% fixed rate until 07/23/2029; 3 mo. USD LIBOR + 1.180% thereafter)(9) | 1,651,958 | |
| 2,465,000 | 3.31%, 04/22/2042, (3.31% fixed rate until 04/22/2041; 3 mo. USD SOFR + 1.580% thereafter)(9) | 2,598,133 | |
| 3,650,000 | 3.37%, 01/23/2026, (3.37% fixed rate until 01/23/2025; 3 mo. USD LIBOR + 0.810% thereafter)(9) | 3,841,254 | |
| 1,860,000 | 3.71%, 04/24/2028, (3.70% fixed rate until 04/24/2027; 3 mo. USD LIBOR + 1.512% thereafter)(9) | 2,019,819 | |
| 4,225,000 | 4.08%, 03/20/2051, (4.08% fixed rate until 03/20/2050; 3 mo. USD LIBOR + 3.150% thereafter)(9) | 5,093,904 | |
| 185,000 | 7.75%, 05/14/2038 | 290,473 | |
| BNP Paribas S.A. | |||
| 1,090,000 | 1.32%, 01/13/2027, (1.32% fixed rate until 01/13/2026; 3 mo. USD SOFR + 1.004% thereafter)(1)(9) | 1,061,180 | |
| 410,000 | 2.16%, 09/15/2029, (2.16% fixed rate until 09/15/2028; 3 mo. USD SOFR + 1.218% thereafter)(1)(9) | 401,788 | |
| 1,940,000 | 2.22%, 06/09/2026, (2.22% fixed rate until 06/09/2025; 3 mo. USD SOFR + 2.074% thereafter)(1)(9) | 1,958,895 | |
| Citigroup, Inc. | |||
| 1,780,000 | 2.52%, 11/03/2032, (2.52% fixed rate until 11/03/2031; 3 mo. USD SOFR + 1.177% thereafter)(9) | 1,780,013 | |
| 555,000 | 2.56%, 05/01/2032, (2.56% fixed rate until 05/01/2031; 3 mo. USD SOFR + 1.167% thereafter)(9) | 558,513 | |
| 3,275,000 | 3.35%, 04/24/2025, (3.35% fixed rate until 04/24/2024; 3 mo. USD LIBOR + 0.897% thereafter)(9) | 3,420,201 | |
| 2,745,000 | 3.70%, 01/12/2026 | 2,969,568 | |
| 1,795,000 | 3.98%, 03/20/2030, (3.98% fixed rate until 03/20/2029; 3 mo. USD LIBOR + 1.338% thereafter)(9) | 1,983,212 | |
| 631,000 | 4.41%, 03/31/2031, (4.41% fixed rate until 03/31/2030; 3 mo. USD SOFR + 3.914% thereafter)(9) | 721,336 | |
| 1,660,000 | 4.45%, 09/29/2027 | 1,852,044 | |
| 86 |
December 31, 2021
| Shares or Principal Amount | Market Value† | ||
| CORPORATE BONDS - 29.2% - (continued) | |||
| Commercial Banks - 5.2% - (continued) | |||
| $ 865,000 | Credit Suisse Group AG 3.09%, 05/14/2032, (3.09% fixed rate until 05/14/2031; 3 mo. USD SOFR + 1.730% thereafter)(1)(9) | $ 881,164 | |
| Danske Bank A/S | |||
| 1,890,000 | 5.00%, 01/12/2022(1) | 1,891,675 | |
| 1,970,000 | 5.38%, 01/12/2024(1) | 2,120,954 | |
| 1,545,000 | Deutsche Bank AG 2.31%, 11/16/2027 (2.31% fixed rate until 11/16/2026; thereafter)(9) | 1,544,789 | |
| Goldman Sachs Group, Inc. | |||
| 1,530,000 | 0.93%, 10/21/2024, (0.93% fixed rate until 10/21/2023; 3 mo. USD SOFR + 0.486% thereafter)(9) | 1,523,586 | |
| 2,810,000 | 2.38%, 07/21/2032, (2.38% fixed rate until 07/21/2031; 3 mo. USD SOFR + 1.248% thereafter)(9) | 2,769,947 | |
| 3,500,000 | 2.62%, 04/22/2032, (2.62% fixed rate until 04/22/2031; 3 mo. USD SOFR + 1.281% thereafter)(9) | 3,529,127 | |
| 320,000 | 2.65%, 10/21/2032, (2.65% fixed rate until 10/21/2031; 3 mo. USD SOFR + 1.264% thereafter)(9) | 322,383 | |
| 965,000 | 2.91%, 07/24/2023, (2.91% fixed rate until 07/24/2022; 3 mo. USD LIBOR + 0.990% thereafter)(9) | 975,893 | |
| 2,680,000 | 3.81%, 04/23/2029, (3.81% fixed rate until 04/23/2028; 3 mo. USD LIBOR + 1.158% thereafter)(9) | 2,917,439 | |
| 3,035,000 | 4.22%, 05/01/2029, (4.22% fixed rate until 05/01/2028; 3 mo. USD LIBOR + 1.301% thereafter)(9) | 3,373,959 | |
| 65,000 | 6.25%, 02/01/2041 | 94,729 | |
| 546,000 | 6.75%, 10/01/2037 | 775,740 | |
| HSBC Holdings plc | |||
| 2,440,000 | 0.98%, 05/24/2025, (0.98% fixed rate until 05/24/2024; 3 mo. USD SOFR + 0.708% thereafter)(9) | 2,410,956 | |
| 1,425,000 | 1.59%, 05/24/2027, (1.59% fixed rate until 05/24/2026; 3 mo. USD SOFR + 1.290% thereafter)(9) | 1,394,329 | |
| 2,700,000 | 4.58%, 06/19/2029, (4.58% fixed rate until 06/19/2028; 3 mo. USD LIBOR + 1.535% thereafter)(9) | 3,027,015 | |
| JP Morgan Chase & Co. | |||
| 2,285,000 | 1.56%, 12/10/2025, (1.56% fixed rate until 12/10/2024; 3 mo. USD LIBOR + 1.140% thereafter)(9) | 2,288,558 | |
| 2,250,000 | 2.55%, 11/08/2032, (2.55% fixed rate until 11/08/2031; 3 mo. USD SOFR + 1.180% thereafter)(9) | 2,268,272 | |
| 955,000 | 2.58%, 04/22/2032, (2.58% fixed rate until 04/22/2031; 3 mo. USD SOFR + 1.250% thereafter)(9) | 968,369 | |
| 390,000 | 2.96%, 05/13/2031, (2.96% fixed rate until 05/13/2030; 3 mo. USD SOFR + 2.515% thereafter)(9) | 404,207 | |
| 1,700,000 | 3.11%, 04/22/2041, (3.11% fixed rate until 04/22/2040; 3 mo. USD SOFR + 2.460% thereafter)(9) | 1,765,485 | |
| Shares or Principal Amount | Market Value† | ||
| CORPORATE BONDS - 29.2% - (continued) | |||
| Commercial Banks - 5.2% - (continued) | |||
| $ 575,000 | 3.11%, 04/22/2051, (3.11% fixed rate until 04/22/2050; 3 mo. USD SOFR + 2.440% thereafter)(9) | $ 596,383 | |
| 3,905,000 | 3.16%, 04/22/2042, (3.16% fixed rate until 04/22/2041; 3 mo. USD SOFR + 1.460% thereafter)(9) | 4,088,081 | |
| 1,025,000 | 3.51%, 01/23/2029, (3.51% fixed rate until 01/23/2028; 3 mo. USD LIBOR + 0.945% thereafter)(9) | 1,098,849 | |
| 1,655,000 | 3.70%, 05/06/2030, (3.70% fixed rate until 05/06/2029; 3 mo. USD LIBOR + 1.160% thereafter)(9) | 1,810,296 | |
| 4,480,000 | 3.96%, 01/29/2027, (3.96% fixed rate until 01/29/2026; 3 mo. USD LIBOR + 1.245% thereafter)(9) | 4,842,987 | |
| 2,230,000 | 4.01%, 04/23/2029, (4.00% fixed rate until 04/23/2028; 3 mo. USD LIBOR + 1.120% thereafter)(9) | 2,463,276 | |
| Morgan Stanley | |||
| 335,000 | 1.59%, 05/04/2027, (1.59% fixed rate until 05/04/2026; 3 mo. USD SOFR + 0.879% thereafter)(9) | 331,603 | |
| 4,595,000 | 1.79%, 02/13/2032, (1.79% fixed rate until 02/13/2031; 3 mo. USD SOFR + 1.034% thereafter)(9) | 4,354,361 | |
| 2,540,000 | 1.93%, 04/28/2032, (1.93% fixed rate until 04/28/2031; 3 mo. USD SOFR + 1.020% thereafter)(9) | 2,429,836 | |
| 2,090,000 | 2.24%, 07/21/2032, (2.24% fixed rate until 07/21/2031; 3 mo. USD SOFR + 1.178% thereafter)(9) | 2,046,573 | |
| 240,000 | 2.51%, 10/20/2032, (2.51% fixed rate until 10/20/2031; 3 mo. USD SOFR + 1.200% thereafter)(9) | 240,050 | |
| 155,000 | 2.70%, 01/22/2031, (2.70% fixed rate until 01/22/2030; 3 mo. USD SOFR + 1.143% thereafter)(9) | 158,736 | |
| 2,000,000 | 3.59%, 07/22/2028, (3.59% fixed rate until 07/22/2027; 3 mo. USD LIBOR + 1.340% thereafter)(9) | 2,157,619 | |
| 1,475,000 | 3.63%, 01/20/2027 | 1,600,110 | |
| 1,095,000 | 4.00%, 07/23/2025 | 1,187,216 | |
| 80,000 | PNC Financial Services Group, Inc. 2.55%, 01/22/2030 | 82,323 | |
| 1,435,000 | Santander Holdings USA, Inc. 3.70%, 03/28/2022 | 1,441,145 | |
| 1,860,000 | Truist Bank 2.25%, 03/11/2030 | 1,857,019 | |
| 1,273,000 | UBS Group AG 2.65%, 02/01/2022(1) | 1,275,228 | |
| 2,685,000 | UniCredit S.p.A. 6.57%, 01/14/2022(1) | 2,688,893 | |
| Wells Fargo & Co. | |||
| 325,000 | 2.41%, 10/30/2025, (2.41% fixed rate until 10/30/2024; 3 mo. USD SOFR + 1.087% thereafter)(9) | 333,002 | |
| 2,125,000 | 3.00%, 04/22/2026 | 2,233,312 | |
| 665,000 | 3.00%, 10/23/2026 | 699,056 | |
| 1,840,000 | 3.75%, 01/24/2024 | 1,933,499 | |
| 155,000 | 4.90%, 11/17/2045 | 195,518 | |
| 765,000 | 5.01%, 04/04/2051, (5.01% fixed rate until 04/04/2050; 3 mo. USD SOFR + 4.502% thereafter)(9) | 1,048,292 | |
| 214,000 | 5.61%, 01/15/2044 | 290,379 | |
| 119,093,327 | |||
| 87 |
December 31, 2021
| Shares or Principal Amount | Market Value† | ||
| CORPORATE BONDS - 29.2% - (continued) | |||
| Commercial Services - 1.2% | |||
| Ashtead Capital, Inc. | |||
| $ 1,190,000 | 4.00%, 05/01/2028(1) | $ 1,244,111 | |
| 4,990,000 | 4.38%, 08/15/2027(1) | 5,168,143 | |
| Gartner, Inc. | |||
| 635,000 | 3.63%, 06/15/2029(1) | 642,017 | |
| 3,345,000 | 3.75%, 10/01/2030(1) | 3,419,928 | |
| Global Payments, Inc. | |||
| 475,000 | 2.15%, 01/15/2027 | 477,183 | |
| 1,965,000 | 3.20%, 08/15/2029 | 2,048,513 | |
| Howard University | |||
| 1,000,000 | 2.70%, 10/01/2029 | 1,014,682 | |
| 1,000,000 | 2.90%, 10/01/2031 | 1,043,422 | |
| 720,000 | 3.48%, 10/01/2041 | 719,994 | |
| 2,315,000 | IHS Markit Ltd. 4.13%, 08/01/2023 | 2,419,175 | |
| Service Corp. International | |||
| 2,500,000 | 3.38%, 08/15/2030 | 2,456,625 | |
| 385,000 | 4.63%, 12/15/2027 | 401,844 | |
| 4,561,000 | 5.13%, 06/01/2029 | 4,891,673 | |
| United Rentals North America, Inc. | |||
| 315,000 | 4.00%, 07/15/2030 | 323,663 | |
| 445,000 | 4.88%, 01/15/2028 | 467,639 | |
| 26,738,612 | |||
| Construction Materials - 0.3% | |||
| 3,266,000 | Builders FirstSource, Inc. 5.00%, 03/01/2030(1) | 3,502,785 | |
| Standard Industries, Inc. | |||
| 805,000 | 3.38%, 01/15/2031(1) | 775,449 | |
| 3,370,000 | 4.38%, 07/15/2030(1) | 3,437,804 | |
| 7,716,038 | |||
| Diversified Financial Services - 1.0% | |||
| 2,320,000 | AerCap Ireland Capital DAC / AerCap Global Aviation Trust 3.30%, 01/30/2032 | 2,368,264 | |
| 4,485,000 | BOC Aviation USA Corp. 1.63%, 04/29/2024(1) | 4,478,717 | |
| 1,725,000 | Capital One Financial Corp. 3.90%, 01/29/2024 | 1,815,547 | |
| 241,000 | GE Capital International Funding Co. 4.42%, 11/15/2035 | 288,024 | |
| 7,400,000 | GTP Acquisition Partners LLC 3.48%, 06/15/2050(1) | 7,693,662 | |
| 1,000,000 | Mastercard, Inc. 2.95%, 03/15/2051 | 1,038,794 | |
| 4,220,000 | Power Finance Corp. Ltd. 3.95%, 04/23/2030(1) | 4,360,373 | |
| 22,043,381 | |||
| Electric - 2.2% | |||
| 1,235,000 | Alabama Power Co. 3.45%, 10/01/2049 | 1,313,467 | |
| Berkshire Hathaway Energy Co. | |||
| 705,000 | 1.65%, 05/15/2031 | 668,763 | |
| 215,000 | 3.25%, 04/15/2028 | 230,195 | |
| Cleco Corporate Holdings LLC | |||
| 1,215,000 | 3.38%, 09/15/2029 | 1,236,812 | |
| 75,000 | 4.97%, 05/01/2046 | 90,857 | |
| 1,155,000 | Commonwealth Edison Co. 3.65%, 06/15/2046 | 1,283,192 | |
| 1,050,000 | Consolidated Edison Co of New York Inc 3.20%, 12/01/2051 | 1,053,484 | |
| 1,525,000 | Duke Energy Carolinas LLC 4.25%, 12/15/2041 | 1,801,635 | |
| 2,595,000 | Duke Energy Corp. 2.55%, 06/15/2031 | 2,600,988 | |
| Duke Energy Indiana LLC | |||
| 1,110,000 | 2.75%, 04/01/2050 | 1,083,879 | |
| Shares or Principal Amount | Market Value† | ||
| CORPORATE BONDS - 29.2% - (continued) | |||
| Electric - 2.2% - (continued) | |||
| $ 780,000 | 3.25%, 10/01/2049 | $ 810,041 | |
| 670,000 | Duke Energy Progress LLC 4.38%, 03/30/2044 | 806,520 | |
| 1,120,000 | Duquesne Light Holdings, Inc. 2.78%, 01/07/2032(1) | 1,107,934 | |
| 1,865,000 | Enel Finance International N.V. 1.38%, 07/12/2026(1) | 1,817,215 | |
| Evergy, Inc. | |||
| 730,000 | 2.45%, 09/15/2024 | 748,923 | |
| 715,000 | 2.90%, 09/15/2029 | 732,536 | |
| 2,745,000 | Exelon Corp. 3.95%, 06/15/2025 | 2,933,791 | |
| FirstEnergy Corp. | |||
| 285,000 | 1.60%, 01/15/2026 | 275,737 | |
| 675,000 | 2.25%, 09/01/2030 | 650,531 | |
| 1,870,000 | 3.40%, 03/01/2050 | 1,832,600 | |
| 820,000 | 5.35%, 07/15/2047 | 976,077 | |
| 1,835,000 | Georgia Power Co. 4.30%, 03/15/2042 | 2,094,894 | |
| 1,465,000 | IPALCO Enterprises, Inc. 3.70%, 09/01/2024 | 1,532,687 | |
| 1,370,000 | ITC Holdings Corp. 2.95%, 05/14/2030(1) | 1,400,219 | |
| 1,075,000 | Jersey Central Power & Light Co. 2.75%, 03/01/2032(1) | 1,090,704 | |
| MidAmerican Energy Co. | |||
| 210,000 | 3.15%, 04/15/2050 | 220,643 | |
| 215,000 | 3.65%, 08/01/2048 | 242,514 | |
| 1,705,000 | NRG Energy, Inc. 2.45%, 12/02/2027(1) | 1,690,624 | |
| 1,130,000 | Oglethorpe Power Corp. 5.05%, 10/01/2048 | 1,430,455 | |
| Pacific Gas and Electric Co. | |||
| 3,780,000 | 2.50%, 02/01/2031 | 3,602,615 | |
| 2,930,000 | 4.95%, 07/01/2050 | 3,201,185 | |
| PacifiCorp | |||
| 306,000 | 4.13%, 01/15/2049 | 353,747 | |
| 360,000 | 4.15%, 02/15/2050 | 427,408 | |
| 2,070,000 | Puget Energy, Inc. 3.65%, 05/15/2025 | 2,188,271 | |
| Sempra Energy | |||
| 1,615,000 | 3.40%, 02/01/2028 | 1,720,447 | |
| 720,000 | 3.80%, 02/01/2038 | 791,867 | |
| 205,000 | 4.00%, 02/01/2048 | 228,821 | |
| Southern California Edison Co. | |||
| 1,550,000 | 2.85%, 08/01/2029 | 1,603,315 | |
| 511,000 | 4.00%, 04/01/2047 | 565,302 | |
| Southern Co. | |||
| 625,000 | 2.95%, 07/01/2023 | 640,111 | |
| 1,830,000 | 3.70%, 04/30/2030 | 1,992,145 | |
| 51,073,151 | |||
| Electronics - 0.0% | |||
| 580,000 | Imola Merger Corp. 4.75%, 05/15/2029(1) | 594,277 | |
| Energy-Alternate Sources - 0.1% | |||
| 1,085,000 | FS Luxembourg S.a.r.l. 10.00%, 12/15/2025(1) | 1,189,442 | |
| 845,000 | Investment Energy Resources Ltd. 6.25%, 04/26/2029(1) | 907,327 | |
| 2,096,769 | |||
| Engineering & Construction - 0.2% | |||
| 1,615,000 | IHS Holding Ltd. Co. 6.25%, 11/29/2028(1) | 1,631,150 | |
| 3,212,319 | International Airport Finance S.A. 12.00%, 03/15/2033(1) | 3,453,243 | |
| 5,084,393 | |||
| 88 |
December 31, 2021
| Shares or Principal Amount | Market Value† | ||
| CORPORATE BONDS - 29.2% - (continued) | |||
| Entertainment - 0.2% | |||
| $ 4,525,000 | WMG Acquisition Corp. 3.88%, 07/15/2030(1) | $ 4,598,531 | |
| Environmental Control - 0.3% | |||
| Clean Harbors, Inc. | |||
| 5,434,000 | 4.88%, 07/15/2027(1) | 5,597,020 | |
| 116,000 | 5.13%, 07/15/2029(1) | 122,960 | |
| 5,719,980 | |||
| Food - 0.3% | |||
| Conagra Brands, Inc. | |||
| 615,000 | 4.30%, 05/01/2024 | 654,528 | |
| 411,000 | 4.85%, 11/01/2028 | 474,477 | |
| 335,000 | 5.40%, 11/01/2048 | 452,617 | |
| 1,715,000 | JBS Finance Luxembourg Sarl 2.50%, 01/15/2027(1) | 1,695,723 | |
| 1,325,000 | Kellogg Co. 3.40%, 11/15/2027 | 1,428,437 | |
| 3,070,000 | NBM U.S. Holdings, Inc. 7.00%, 05/14/2026(1) | 3,219,693 | |
| 7,925,475 | |||
| Food Service - 0.0% | |||
| 160,000 | Aramark Services, Inc. 5.00%, 02/01/2028(1) | 165,400 | |
| Forest Products & Paper - 0.1% | |||
| 1,485,000 | Suzano Austria GmbH 3.13%, 01/15/2032 | 1,436,752 | |
| Gas - 0.1% | |||
| NiSource, Inc. | |||
| 1,090,000 | 3.49%, 05/15/2027 | 1,170,772 | |
| 1,005,000 | 3.60%, 05/01/2030 | 1,084,262 | |
| 2,255,034 | |||
| Healthcare - Products - 0.8% | |||
| Alcon Finance Corp. | |||
| 1,164,000 | 2.75%, 09/23/2026(1) | 1,203,650 | |
| 915,000 | 3.00%, 09/23/2029(1) | 956,033 | |
| 290,000 | Avantor Funding, Inc. 4.63%, 07/15/2028(1) | 302,325 | |
| 6,160,000 | Baxter International, Inc. 2.54%, 02/01/2032(1) | 6,230,370 | |
| Boston Scientific Corp. | |||
| 1,030,000 | 1.90%, 06/01/2025 | 1,041,965 | |
| 2,880,000 | 3.75%, 03/01/2026 | 3,095,380 | |
| 690,000 | Hill-Rom Holdings, Inc. 4.38%, 09/15/2027(1) | 721,050 | |
| 4,410,000 | Hologic, Inc. 4.63%, 02/01/2028(1) | 4,630,500 | |
| 570,000 | Teleflex, Inc. 4.25%, 06/01/2028(1) | 587,208 | |
| 18,768,481 | |||
| Healthcare - Services - 0.7% | |||
| 1,335,000 | Anthem, Inc. 3.50%, 08/15/2024 | 1,409,976 | |
| Centene Corp. | |||
| 95,000 | 3.38%, 02/15/2030 | 96,920 | |
| 435,000 | 4.25%, 12/15/2027 | 453,488 | |
| 5,230,000 | 4.63%, 12/15/2029 | 5,640,346 | |
| 360,000 | CommonSpirit Health 3.35%, 10/01/2029 | 383,157 | |
| 710,000 | HCA, Inc. 3.50%, 09/01/2030 | 750,381 | |
| 920,000 | Humana, Inc. 2.15%, 02/03/2032 | 890,680 | |
| Kaiser Foundation Hospitals | |||
| 865,000 | 2.81%, 06/01/2041 | 872,191 | |
| 1,430,000 | 3.00%, 06/01/2051 | 1,477,450 | |
| 990,000 | Sutter Health 3.36%, 08/15/2050 | 1,041,284 | |
| Shares or Principal Amount | Market Value† | ||
| CORPORATE BONDS - 29.2% - (continued) | |||
| Healthcare - Services - 0.7% - (continued) | |||
| UnitedHealth Group, Inc. | |||
| $ 1,600,000 | 2.75%, 05/15/2040 | $ 1,628,952 | |
| 190,000 | 3.50%, 08/15/2039 | 211,217 | |
| 14,856,042 | |||
| Home Builders - 0.2% | |||
| 2,465,000 | PulteGroup, Inc. 5.50%, 03/01/2026 | 2,802,755 | |
| 540,000 | Taylor Morrison Communities, Inc. 5.13%, 08/01/2030(1) | 594,000 | |
| 575,000 | Toll Brothers Finance Corp. 4.88%, 11/15/2025 | 634,656 | |
| 4,031,411 | |||
| Insurance - 1.0% | |||
| 4,045,000 | American International Group, Inc. 2.50%, 06/30/2025 | 4,172,575 | |
| 1,515,000 | Aon Corp. 2.20%, 11/15/2022 | 1,534,545 | |
| 1,780,000 | Athene Global Funding 2.65%, 10/04/2031(1) | 1,758,281 | |
| Brighthouse Financial, Inc. | |||
| 885,000 | 3.85%, 12/22/2051 | 879,252 | |
| 2,035,000 | 5.63%, 05/15/2030 | 2,430,488 | |
| 2,685,000 | Chubb INA Holdings, Inc. 3.05%, 12/15/2061 | 2,752,233 | |
| 3,390,000 | Equitable Financial Life Global Funding 1.80%, 03/08/2028(1) | 3,336,334 | |
| 1,300,000 | Marsh & McLennan Cos., Inc. 4.75%, 03/15/2039 | 1,624,979 | |
| 345,000 | MGIC Investment Corp. 5.75%, 08/15/2023 | 363,544 | |
| 1,910,000 | New York Life Global Funding 2.00%, 01/22/2025(1) | 1,950,212 | |
| Unum Group | |||
| 165,000 | 4.13%, 06/15/2051 | 168,056 | |
| 1,215,000 | 4.50%, 12/15/2049 | 1,296,576 | |
| 35,000 | Voya Financial, Inc. 4.80%, 06/15/2046 | 43,482 | |
| 1,035,000 | Willis North America, Inc. 3.60%, 05/15/2024 | 1,084,191 | |
| 23,394,748 | |||
| Internet - 0.5% | |||
| 990,000 | Alibaba Group Holding Ltd. 3.40%, 12/06/2027 | 1,048,695 | |
| 1,505,000 | Amazon.com, Inc. 3.88%, 08/22/2037 | 1,771,153 | |
| Go Daddy Operating Co. LLC | |||
| 770,000 | 3.50%, 03/01/2029(1) | 762,323 | |
| 3,190,000 | 5.25%, 12/01/2027(1) | 3,297,663 | |
| 4,490,000 | NortonLifeLock, Inc. 5.00%, 04/15/2025(1) | 4,524,236 | |
| 11,404,070 | |||
| Iron/Steel - 0.2% | |||
| 285,000 | Commercial Metals Co. 5.38%, 07/15/2027 | 296,400 | |
| EUR 1,755,000 | Metinvest B.V. 5.63%, 06/17/2025(1) | 1,975,329 | |
| Vale Overseas Ltd. | |||
| $ 1,115,000 | 3.75%, 07/08/2030 | 1,154,036 | |
| 1,560,000 | 6.25%, 08/10/2026 | 1,805,716 | |
| 5,231,481 | |||
| IT Services - 0.6% | |||
| Apple, Inc. | |||
| 370,000 | 2.20%, 09/11/2029 | 379,064 | |
| 2,000,000 | 2.65%, 02/08/2051 | 1,974,186 | |
| 885,000 | 3.45%, 02/09/2045 | 990,867 | |
| 6,750,000 | Booz Allen Hamilton, Inc. 3.88%, 09/01/2028(1) | 6,868,125 | |
| 89 |
December 31, 2021
| Shares or Principal Amount | Market Value† | ||
| CORPORATE BONDS - 29.2% - (continued) | |||
| IT Services - 0.6% - (continued) | |||
| $ 1,460,000 | Kyndryl Holdings, Inc. 3.15%, 10/15/2031(1) | $ 1,417,843 | |
| 1,070,000 | Leidos, Inc. 3.63%, 05/15/2025 | 1,136,254 | |
| 12,766,339 | |||
| Lodging - 0.0% | |||
| 975,000 | Las Vegas Sands Corp. 3.50%, 08/18/2026 | 987,417 | |
| Machinery - Construction & Mining - 0.0% | |||
| 590,000 | BWX Technologies, Inc. 4.13%, 04/15/2029(1) | 597,375 | |
| Machinery-Diversified - 0.1% | |||
| 1,380,000 | Otis Worldwide Corp. 2.57%, 02/15/2030 | 1,401,207 | |
| Media - 1.4% | |||
| CCO Holdings LLC / CCO Holdings Capital Corp. | |||
| 150,000 | 4.25%, 02/01/2031(1) | 151,317 | |
| 500,000 | 4.50%, 08/15/2030(1) | 511,595 | |
| 150,000 | 5.13%, 05/01/2027(1) | 154,500 | |
| Charter Communications Operating LLC / Charter Communications Operating Capital | |||
| 3,680,000 | 6.48%, 10/23/2045 | 5,039,446 | |
| 380,000 | 6.83%, 10/23/2055 | 545,241 | |
| Comcast Corp. | |||
| 2,914,000 | 2.94%, 11/01/2056(1) | 2,787,875 | |
| 651,000 | 2.99%, 11/01/2063(1) | 620,776 | |
| 305,000 | 3.20%, 07/15/2036 | 325,941 | |
| 10,000 | 3.25%, 11/01/2039 | 10,578 | |
| 1,495,000 | Cox Communications, Inc. 2.60%, 06/15/2031(1) | 1,495,017 | |
| CSC Holdings LLC | |||
| 4,740,000 | 3.38%, 02/15/2031(1) | 4,437,825 | |
| 400,000 | 4.13%, 12/01/2030(1) | 390,500 | |
| 430,000 | 5.50%, 04/15/2027(1) | 444,513 | |
| Discovery Communications LLC | |||
| 840,000 | 3.80%, 03/13/2024 | 881,220 | |
| 19,000 | 3.95%, 06/15/2025 | 20,246 | |
| 1,970,000 | 4.00%, 09/15/2055 | 2,072,300 | |
| 826,000 | 5.30%, 05/15/2049 | 1,037,466 | |
| 555,000 | DISH DBS Corp. 5.88%, 11/15/2024 | 569,619 | |
| Sirius XM Radio, Inc. | |||
| 3,550,000 | 3.13%, 09/01/2026(1) | 3,551,029 | |
| 590,000 | 4.13%, 07/01/2030(1) | 590,000 | |
| 780,000 | Time Warner Cable LLC 6.55%, 05/01/2037 | 1,022,563 | |
| 3,900,000 | Time Warner Entertainment Co., L.P. 8.38%, 07/15/2033 | 5,684,880 | |
| 550,000 | Videotron Ltd. 5.38%, 06/15/2024(1) | 588,500 | |
| 32,932,947 | |||
| Miscellaneous Manufacturing - 0.0% | |||
| 340,000 | Ingersoll-Rand Luxembourg Finance S.A. 4.50%, 03/21/2049 | 422,091 | |
| Office/Business Equipment - 0.3% | |||
| CDW LLC / CDW Finance Corp. | |||
| 485,000 | 2.67%, 12/01/2026 | 496,747 | |
| 5,548,000 | 3.25%, 02/15/2029 | 5,597,544 | |
| 450,000 | 3.28%, 12/01/2028 | 460,912 | |
| Shares or Principal Amount | Market Value† | ||
| CORPORATE BONDS - 29.2% - (continued) | |||
| Office/Business Equipment - 0.3% - (continued) | |||
| $ 430,000 | 3.57%, 12/01/2031 | $ 447,200 | |
| 280,000 | Xerox Holdings Corp. 5.50%, 08/15/2028(1) | 295,050 | |
| 7,297,453 | |||
| Oil & Gas - 1.4% | |||
| 270,000 | Apache Corp. 4.88%, 11/15/2027 | 294,300 | |
| BP Capital Markets America, Inc. | |||
| 720,000 | 2.94%, 06/04/2051 | 693,855 | |
| 490,000 | 3.06%, 06/17/2041 | 497,294 | |
| 910,000 | 3.38%, 02/08/2061 | 939,065 | |
| 1,760,000 | 3.63%, 04/06/2030 | 1,945,508 | |
| 790,000 | Continental Resources, Inc. 5.75%, 01/15/2031(1) | 930,320 | |
| 1,665,000 | Ecopetrol S.A. 4.63%, 11/02/2031 | 1,618,713 | |
| Energean Israel Finance Ltd. | |||
| 860,000 | 4.50%, 03/30/2024(1)(7) | 864,300 | |
| 735,000 | 4.88%, 03/30/2026(1)(7) | 728,569 | |
| 695,000 | 5.88%, 03/30/2031(1)(7) | 681,100 | |
| Equinor ASA | |||
| 930,000 | 1.75%, 01/22/2026 | 936,103 | |
| 675,000 | 3.63%, 04/06/2040 | 751,790 | |
| 850,000 | 3.70%, 04/06/2050 | 976,586 | |
| 1,530,000 | Exxon Mobil Corp. 4.23%, 03/19/2040 | 1,813,750 | |
| Hess Corp. | |||
| 942,000 | 7.13%, 03/15/2033 | 1,260,067 | |
| 715,000 | 7.30%, 08/15/2031 | 952,949 | |
| 2,045,000 | Leviathan Bond Ltd. 6.50%, 06/30/2027(1)(7) | 2,190,440 | |
| Lundin Energy Finance B.V. | |||
| 775,000 | 2.00%, 07/15/2026(1) | 770,006 | |
| 2,470,000 | 3.10%, 07/15/2031(1) | 2,490,359 | |
| 1,730,000 | Marathon Petroleum Corp. 4.70%, 05/01/2025 | 1,888,048 | |
| Occidental Petroleum Corp. | |||
| 5,000 | 3.20%, 08/15/2026 | 5,153 | |
| 10,000 | 3.40%, 04/15/2026 | 10,250 | |
| 35,000 | 3.50%, 08/15/2029 | 35,908 | |
| 660,000 | 4.10%, 02/15/2047 | 646,800 | |
| 26,000 | 6.13%, 01/01/2031 | 31,684 | |
| 10,000 | 6.38%, 09/01/2028 | 11,873 | |
| Qatar Petroleum | |||
| 2,085,000 | 2.25%, 07/12/2031(1) | 2,065,334 | |
| 905,000 | 3.30%, 07/12/2051(1) | 931,578 | |
| 614,000 | Saudi Arabian Oil Co. 2.88%, 04/16/2024(1) | 633,763 | |
| Shell International Finance B.V. | |||
| 485,000 | 2.88%, 11/26/2041 | 486,805 | |
| 620,000 | 3.00%, 11/26/2051 | 632,488 | |
| 720,000 | 3.25%, 04/06/2050 | 768,952 | |
| Sunoco L.P. / Sunoco Finance Corp. | |||
| 200,000 | 4.50%, 04/30/2030(1) | 204,983 | |
| 250,000 | 6.00%, 04/15/2027 | 260,725 | |
| 2,320,000 | Tullow Oil plc 7.00%, 03/01/2025(1) | 1,893,816 | |
| 135,000 | Viper Energy Partners L.P. 5.38%, 11/01/2027(1) | 139,388 | |
| 31,982,622 | |||
| Oil & Gas Services - 0.0% | |||
| 555,000 | Halliburton Co. 4.85%, 11/15/2035 | 653,185 | |
| 90 |
December 31, 2021
| Shares or Principal Amount | Market Value† | ||
| CORPORATE BONDS - 29.2% - (continued) | |||
| Packaging & Containers - 0.3% | |||
| $ 400,000 | Ardagh Packaging Finance plc / Ardagh Holdings USA, Inc. 4.13%, 08/15/2026(1) | $ 409,000 | |
| 4,650,000 | Ball Corp. 4.00%, 11/15/2023 | 4,853,437 | |
| 695,000 | Owens-Brockway Glass Container, Inc. 5.88%, 08/15/2023(1) | 728,013 | |
| 218,966 | TricorBraun Holdings, Inc. 3.75%, 03/03/2028 | 217,201 | |
| 6,207,651 | |||
| Pharmaceuticals - 1.0% | |||
| AbbVie, Inc. | |||
| 625,000 | 3.20%, 11/21/2029 | 668,870 | |
| 680,000 | 4.63%, 10/01/2042 | 835,116 | |
| 3,390,000 | Astrazeneca Finance LLC 1.75%, 05/28/2028(8) | 3,372,799 | |
| 360,000 | Bausch Health Cos., Inc. 5.75%, 08/15/2027(1) | 373,680 | |
| 2,515,000 | Bayer U.S. Finance LLC 4.25%, 12/15/2025(1) | 2,721,453 | |
| Bristol-Myers Squibb Co. | |||
| 2,090,000 | 0.75%, 11/13/2025 | 2,036,222 | |
| 855,000 | 2.55%, 11/13/2050 | 812,139 | |
| 3,760,000 | Cigna Corp. 1.25%, 03/15/2026 | 3,709,330 | |
| CVS Health Corp. | |||
| 435,000 | 4.13%, 04/01/2040 | 500,701 | |
| 1,050,000 | 5.13%, 07/20/2045 | 1,368,993 | |
| Merck & Co., Inc. | |||
| 300,000 | 1.90%, 12/10/2028 | 301,497 | |
| 1,185,000 | 2.15%, 12/10/2031 | 1,189,266 | |
| 310,000 | 2.75%, 12/10/2051 | 308,355 | |
| 430,000 | Organon & Co. 4.13%, 04/30/2028(1) | 436,987 | |
| 2,979,000 | Teva Pharmaceutical Finance Netherlands B.V. 3.15%, 10/01/2026 | 2,800,260 | |
| 735,000 | Teva Pharmaceutical Finance Netherlands III B.V. 4.75%, 05/09/2027 | 727,650 | |
| 22,163,318 | |||
| Pipelines - 0.9% | |||
| 215,000 | DCP Midstream Operating L.P. 5.60%, 04/01/2044 | 267,460 | |
| Energy Transfer Operating L.P. | |||
| 1,095,000 | 4.95%, 06/15/2028 | 1,232,680 | |
| 1,390,000 | 5.25%, 04/15/2029 | 1,593,415 | |
| 175,000 | 5.30%, 04/01/2044 | 200,945 | |
| 180,000 | 5.35%, 05/15/2045 | 207,295 | |
| 2,190,000 | 6.13%, 12/15/2045 | 2,731,652 | |
| Enterprise Products Operating LLC | |||
| 175,000 | 3.30%, 02/15/2053 | 174,748 | |
| 570,000 | 4.25%, 02/15/2048 | 647,342 | |
| 665,000 | 4.95%, 10/15/2054 | 842,052 | |
| 125,000 | EQM Midstream Partners L.P. 6.50%, 07/01/2027(1) | 140,000 | |
| Galaxy Pipeline Assets Bidco Ltd. | |||
| 2,375,000 | 2.16%, 03/31/2034(1) | 2,327,785 | |
| 5,635,000 | 2.63%, 03/31/2036(1) | 5,505,352 | |
| 1,115,000 | 2.94%, 09/30/2040(1) | 1,109,665 | |
| 135,000 | MPLX L.P. 1.75%, 03/01/2026 | 133,712 | |
| 895,000 | NGPL PipeCo LLC 3.25%, 07/15/2031(1) | 910,126 | |
| 280,000 | Targa Resources Partners L.P. / Targa Resources Partners Finance Corp. 4.88%, 02/01/2031 | 304,066 | |
| Shares or Principal Amount | Market Value† | ||
| CORPORATE BONDS - 29.2% - (continued) | |||
| Pipelines - 0.9% - (continued) | |||
| Venture Global Calcasieu Pass LLC | |||
| $ 415,000 | 3.88%, 08/15/2029(1) | $ 430,563 | |
| 155,000 | 4.13%, 08/15/2031(1) | 164,300 | |
| 670,000 | Western Midstream Operating L.P. 5.30%, 02/01/2030 | 737,683 | |
| 19,660,841 | |||
| Real Estate Investment Trusts - 0.9% | |||
| American Tower Corp. | |||
| 745,000 | 1.45%, 09/15/2026 | 729,377 | |
| 465,000 | 1.50%, 01/31/2028 | 445,235 | |
| 1,085,000 | 2.40%, 03/15/2025 | 1,114,500 | |
| EPR Properties | |||
| 735,000 | 3.60%, 11/15/2031 | 727,992 | |
| 1,020,000 | 3.75%, 08/15/2029 | 1,030,352 | |
| 1,955,000 | 4.95%, 04/15/2028 | 2,111,036 | |
| 760,000 | Equinix, Inc. 2.00%, 05/15/2028 | 746,661 | |
| GLP Capital L.P. / GLP Financing II, Inc. | |||
| 890,000 | 3.25%, 01/15/2032 | 894,797 | |
| 1,060,000 | 4.00%, 01/15/2031 | 1,131,009 | |
| 1,025,000 | 5.30%, 01/15/2029 | 1,163,580 | |
| 1,535,000 | 5.75%, 06/01/2028 | 1,772,372 | |
| Realty Income Corp. | |||
| 120,000 | 2.20%, 06/15/2028 | 121,224 | |
| 145,000 | 2.85%, 12/15/2032 | 150,657 | |
| 465,000 | 3.40%, 01/15/2028 | 501,860 | |
| SBA Tower Trust | |||
| 2,240,000 | 2.84%, 01/15/2050(1) | 2,298,579 | |
| 4,540,000 | 3.45%, 03/15/2048(1) | 4,561,972 | |
| 160,000 | VICI Properties L.P. / VICI Note Co., Inc. 4.25%, 12/01/2026(1) | 166,635 | |
| 19,667,838 | |||
| Retail - 0.8% | |||
| 1011778 BC ULC / New Red Finance, Inc. | |||
| 150,000 | 3.50%, 02/15/2029(1) | 148,455 | |
| 620,000 | 3.88%, 01/15/2028(1) | 627,911 | |
| 485,000 | AutoZone, Inc. 3.63%, 04/15/2025 | 517,392 | |
| FirstCash, Inc. | |||
| 3,352,000 | 4.63%, 09/01/2028(1) | 3,348,715 | |
| 1,735,000 | 5.63%, 01/01/2030(1) | 1,767,618 | |
| Gap, Inc. | |||
| 2,041,000 | 3.63%, 10/01/2029(1) | 2,018,753 | |
| 3,324,000 | 3.88%, 10/01/2031(1)(8) | 3,278,295 | |
| 371,257 | Great Outdoors Group, LLC 4.50%, 03/06/2028 | 371,335 | |
| 1,655,000 | Home Depot, Inc. 3.30%, 04/15/2040 | 1,799,152 | |
| 270,000 | KFC Holding Co. / Pizza Hut Holdings LLC / Taco Bell of America LLC 4.75%, 06/01/2027(1) | 279,113 | |
| 550,000 | Lithia Motors, Inc. 4.63%, 12/15/2027(1) | 578,490 | |
| McDonald's Corp. | |||
| 1,035,000 | 3.35%, 04/01/2023 | 1,065,535 | |
| 1,020,000 | 3.63%, 09/01/2049 | 1,129,736 | |
| 315,000 | Suburban Propane Partners L.P. / Suburban Energy Finance Corp. 5.88%, 03/01/2027 | 325,238 | |
| 300,000 | Yum! Brands, Inc. 3.63%, 03/15/2031 | 298,875 | |
| 17,554,613 | |||
| Semiconductors - 1.0% | |||
| Broadcom, Inc. | |||
| 110,000 | 2.60%, 02/15/2033(1) | 107,367 | |
| 3,535,000 | 3.19%, 11/15/2036(1) | 3,534,641 | |
| 91 |
December 31, 2021
| Shares or Principal Amount | Market Value† | ||
| CORPORATE BONDS - 29.2% - (continued) | |||
| Semiconductors - 1.0% - (continued) | |||
| $ 2,650,000 | 3.42%, 04/15/2033(1) | $ 2,781,252 | |
| 270,000 | 4.30%, 11/15/2032 | 303,781 | |
| Entegris, Inc. | |||
| 225,000 | 3.63%, 05/01/2029(1) | 225,563 | |
| 460,000 | 4.38%, 04/15/2028(1) | 472,650 | |
| 1,575,000 | Intel Corp. 3.10%, 02/15/2060 | 1,580,988 | |
| Marvell Technology, Inc. | |||
| 2,180,000 | 2.45%, 04/15/2028 | 2,212,773 | |
| 1,300,000 | 2.95%, 04/15/2031 | 1,326,061 | |
| 2,545,000 | Microchip Technology, Inc. 2.67%, 09/01/2023 | 2,599,457 | |
| 1,570,000 | NVIDIA Corp. 3.50%, 04/01/2040 | 1,769,092 | |
| NXP B.V. / NXP Funding LLC | |||
| 425,000 | 4.63%, 06/01/2023(1) | 444,814 | |
| 2,372,000 | 4.88%, 03/01/2024(1) | 2,548,426 | |
| 786,000 | 5.35%, 03/01/2026(1) | 888,446 | |
| 1,080,000 | 5.55%, 12/01/2028(1) | 1,294,427 | |
| 355,000 | Sensata Technologies B.V. 5.00%, 10/01/2025(1) | 385,175 | |
| 22,474,913 | |||
| Software - 1.4% | |||
| 7,134,000 | Black Knight InfoServ LLC 3.63%, 09/01/2028(1) | 7,124,655 | |
| CDK Global, Inc. | |||
| 150,000 | 4.88%, 06/01/2027 | 155,250 | |
| 4,231,000 | 5.25%, 05/15/2029(1) | 4,484,860 | |
| 2,120,000 | Fair Isaac Corp. 4.00%, 06/15/2028(1) | 2,178,406 | |
| 560,000 | IQVIA, Inc. 5.00%, 05/15/2027(1) | 579,768 | |
| Microsoft Corp. | |||
| 131,000 | 2.68%, 06/01/2060 | 131,179 | |
| 530,000 | 2.92%, 03/17/2052 | 564,996 | |
| 619,000 | 3.04%, 03/17/2062 | 665,245 | |
| 1,460,000 | MSCI, Inc. 4.00%, 11/15/2029(1) | 1,525,700 | |
| 3,075,000 | Open Text Corp. 3.88%, 12/01/2029(1) | 3,113,438 | |
| 600,000 | Open Text Holdings, Inc. 4.13%, 12/01/2031(1) | 606,000 | |
| Oracle Corp. | |||
| 1,900,000 | 2.88%, 03/25/2031 | 1,914,202 | |
| 3,615,000 | 3.85%, 04/01/2060 | 3,584,189 | |
| 880,000 | 3.95%, 03/25/2051 | 916,927 | |
| 1,005,000 | 4.10%, 03/25/2061 | 1,051,833 | |
| 3,245,000 | SS&C Technologies, Inc. 5.50%, 09/30/2027(1) | 3,391,025 | |
| 31,987,673 | |||
| Telecommunications - 1.8% | |||
| 4,255,000 | Apple, Inc. 1.40%, 08/05/2028 | 4,168,935 | |
| AT&T, Inc. | |||
| 2,975,000 | 3.50%, 02/01/2061 | 2,938,009 | |
| 3,459,000 | 3.55%, 09/15/2055 | 3,485,431 | |
| 1,680,000 | 3.65%, 06/01/2051 | 1,746,318 | |
| 1,266,000 | 3.80%, 12/01/2057 | 1,323,328 | |
| Nokia Oyj | |||
| 3,175,000 | 4.38%, 06/12/2027 | 3,429,000 | |
| 575,000 | 6.63%, 05/15/2039 | 795,656 | |
| 2,785,000 | NTT Finance Corp. 1.16%, 04/03/2026(1) | 2,733,696 | |
| 425,000 | Sprint Corp. 7.13%, 06/15/2024 | 477,128 | |
| Telecom Italia Capital S.A. | |||
| 265,000 | 6.00%, 09/30/2034 | 280,280 | |
| 160,000 | 7.72%, 06/04/2038 | 188,043 | |
| 3,085,000 | Telefonica Celular del Paraguay S.A. 5.88%, 04/15/2027(1) | 3,192,975 | |
| Shares or Principal Amount | Market Value† | ||
| CORPORATE BONDS - 29.2% - (continued) | |||
| Telecommunications - 1.8% - (continued) | |||
| T-Mobile USA, Inc. | |||
| $ 679,000 | 2.05%, 02/15/2028 | $ 674,530 | |
| 1,360,000 | 2.70%, 03/15/2032(1) | 1,370,229 | |
| 2,745,000 | 3.50%, 04/15/2025 | 2,909,419 | |
| 1,475,000 | 3.88%, 04/15/2030 | 1,615,310 | |
| 1,195,000 | 4.50%, 04/15/2050 | 1,403,449 | |
| 2,050,000 | VEON Holdings B.V. 3.38%, 11/25/2027(1) | 2,000,964 | |
| Verizon Communications, Inc. | |||
| 360,000 | 2.65%, 11/20/2040 | 343,071 | |
| 1,338,000 | 4.27%, 01/15/2036 | 1,571,800 | |
| 2,770,000 | 4.40%, 11/01/2034 | 3,230,800 | |
| 165,000 | 4.50%, 08/10/2033 | 194,230 | |
| 540,000 | Vmed UK Financing plc 4.25%, 01/31/2031(1) | 529,200 | |
| 1,015,000 | Vodafone Group plc 6.15%, 02/27/2037 | 1,378,638 | |
| 41,980,439 | |||
| Transportation - 0.2% | |||
| 985,000 | Canadian Pacific Railway Co. 2.45%, 12/02/2031 | 1,003,884 | |
| Union Pacific Corp. | |||
| 2,600,000 | 2.38%, 05/20/2031 | 2,653,179 | |
| 740,000 | 2.97%, 09/16/2062 | 735,057 | |
| 4,392,120 | |||
| Trucking & Leasing - 0.3% | |||
| 3,775,000 | DAE Funding LLC 1.55%, 08/01/2024(1) | 3,746,688 | |
| Penske Truck Leasing Co. L.P. / PTL Finance Corp. | |||
| 2,115,000 | 2.70%, 11/01/2024(1) | 2,179,847 | |
| 1,890,000 | 4.00%, 07/15/2025(1) | 2,029,256 | |
| 7,955,791 | |||
| Water - 0.0% | |||
| 355,000 | American Water Capital Corp. 4.15%, 06/01/2049 | 420,477 | |
| Total Corporate Bonds (cost $646,570,416) | $ 665,754,111 | ||
| FOREIGN GOVERNMENT OBLIGATIONS - 6.8% | |||
| Angola - 0.1% | |||
| Angolan Government International Bond | |||
| 1,600,000 | 8.00%, 11/26/2029(7) | $ 1,575,616 | |
| 910,000 | 8.25%, 05/09/2028(7) | 912,912 | |
| 2,488,528 | |||
| Argentina - 0.0% | |||
| Argentine Republic Government International Bond | |||
| 69,782 | 1.00%, 07/09/2029 | 25,297 | |
| 2,046,884 | 1.13%, 07/09/2035(3)(4) | 655,023 | |
| 680,320 | |||
| Benin - 0.1% | |||
| EUR 2,640,000 | Benin Government International Bond 4.95%, 01/22/2035(1) | 2,868,973 | |
| Bermuda - 0.0% | |||
| $ 735,000 | Bermuda Government International Bond 2.38%, 08/20/2030(1) | 733,162 | |
| 92 |
December 31, 2021
| Shares or Principal Amount | Market Value† | ||
| FOREIGN GOVERNMENT OBLIGATIONS - 6.8% - (continued) | |||
| Brazil - 0.8% | |||
| BRL 47,432,000 | Brazil Notas do Tesouro Nacional 10.00%, 01/01/2031 | $ 8,141,621 | |
| $ 9,365,000 | Brazilian Government International Bond 3.88%, 06/12/2030 | 9,084,050 | |
| 17,225,671 | |||
| Chile - 0.4% | |||
| Chile Government International Bond | |||
| EUR 4,930,000 | 1.25%, 01/22/2051 | 5,044,967 | |
| $ 615,000 | 2.55%, 07/27/2033 | 598,088 | |
| 1,740,000 | 3.10%, 05/07/2041 | 1,702,590 | |
| 505,000 | 3.25%, 09/21/2071 | 467,125 | |
| 7,812,770 | |||
| Colombia - 0.5% | |||
| Colombia Government International Bond | |||
| 6,545,000 | 3.88%, 04/25/2027 | 6,594,087 | |
| 2,685,000 | 5.00%, 06/15/2045 | 2,423,213 | |
| 395,000 | 5.20%, 05/15/2049 | 363,297 | |
| 1,180,000 | 5.63%, 02/26/2044 | 1,144,706 | |
| 10,525,303 | |||
| Croatia - 0.2% | |||
| EUR 4,555,000 | Croatia Government International Bond 1.50%, 06/17/2031(7) | 5,366,095 | |
| Dominican Republic - 0.2% | |||
| $ 4,890,000 | Dominican Republic International Bond 6.40%, 06/05/2049(1) | 5,134,549 | |
| Egypt - 0.1% | |||
| Egypt Government International Bond | |||
| 840,000 | 7.63%, 05/29/2032(1) | 794,296 | |
| 720,000 | 8.50%, 01/31/2047(7) | 637,171 | |
| 595,000 | 8.88%, 05/29/2050(1) | 539,296 | |
| 1,970,763 | |||
| Ghana - 0.0% | |||
| 418,000 | Ghana Government International Bond 6.38%, 02/11/2027(1) | 351,931 | |
| Hungary - 0.3% | |||
| EUR 5,610,000 | Hungary Government International Bond 1.63%, 04/28/2032(7) | 6,659,145 | |
| Indonesia - 0.3% | |||
| Indonesia Government International Bond | |||
| 5,235,000 | 1.10%, 03/12/2033 | 5,747,165 | |
| 240,000 | 2.15%, 07/18/2024(7) | 285,661 | |
| 470,000 | 2.63%, 06/14/2023(7) | 554,032 | |
| 6,586,858 | |||
| Ivory Coast - 0.1% | |||
| 1,965,000 | Ivory Coast Government International Bond 4.88%, 01/30/2032(7) | 2,149,097 | |
| Jordan - 0.1% | |||
| $ 1,830,000 | Jordan Government International Bond 5.85%, 07/07/2030(7) | 1,848,538 | |
| Macedonia - 0.2% | |||
| North Macedonia Government International Bond | |||
| EUR 1,825,000 | 2.75%, 01/18/2025(7) | 2,122,957 | |
| 2,165,000 | 3.68%, 06/03/2026(1) | 2,609,662 | |
| 4,732,619 | |||
| Shares or Principal Amount | Market Value† | ||
| FOREIGN GOVERNMENT OBLIGATIONS - 6.8% - (continued) | |||
| Mexico - 1.3% | |||
| MXN 308,198,500 | Mexican Bonos 7.75%, 05/29/2031 | $ 15,215,226 | |
| Mexico Government International Bond | |||
| EUR 885,000 | 1.13%, 01/17/2030 | 976,237 | |
| 6,185,000 | 1.45%, 10/25/2033 | 6,533,497 | |
| $ 1,350,000 | 3.77%, 05/24/2061 | 1,242,162 | |
| 1,140,000 | 4.28%, 08/14/2041 | 1,181,325 | |
| 2,990,000 | 4.75%, 04/27/2032 | 3,380,195 | |
| 28,528,642 | |||
| Morocco - 0.1% | |||
| EUR 2,865,000 | Morocco Government International Bond 2.00%, 09/30/2030(7) | 3,168,090 | |
| Oman - 0.2% | |||
| $ 3,495,000 | Oman Government International Bond 6.75%, 01/17/2048(1) | 3,551,269 | |
| Panama - 0.3% | |||
| Panama Government International Bond | |||
| 5,000,000 | 3.87%, 07/23/2060 | 5,000,000 | |
| 815,000 | 4.30%, 04/29/2053 | 874,911 | |
| 530,000 | 4.50%, 04/16/2050 | 583,800 | |
| 6,458,711 | |||
| Philippines - 0.3% | |||
| Philippine Government International Bond | |||
| EUR 4,855,000 | 1.20%, 04/28/2033 | 5,484,125 | |
| 1,010,000 | 1.75%, 04/28/2041 | 1,141,803 | |
| 6,625,928 | |||
| Romania - 0.4% | |||
| Romanian Government International Bond | |||
| 2,970,000 | 2.63%, 12/02/2040(1) | 3,008,517 | |
| 1,315,000 | 2.75%, 04/14/2041(7) | 1,335,449 | |
| 1,315,000 | 3.38%, 02/08/2038(7) | 1,501,858 | |
| 3,241,000 | 4.63%, 04/03/2049(7) | 4,159,968 | |
| 10,005,792 | |||
| Russia - 0.3% | |||
| RUB 636,260,000 | Russian Federal Bond - OFZ 5.90%, 03/12/2031 | 7,200,644 | |
| Saudi Arabia - 0.2% | |||
| EUR 3,295,000 | Saudi Government International Bond 2.00%, 07/09/2039(7) | 3,959,864 | |
| Senegal - 0.1% | |||
| Senegal Government International Bond | |||
| 785,000 | 4.75%, 03/13/2028(7) | 905,948 | |
| $ 2,115,000 | 6.25%, 05/23/2033(7) | 2,174,576 | |
| 3,080,524 | |||
| Serbia - 0.1% | |||
| EUR 3,030,000 | Serbia International Bond 1.65%, 03/03/2033(1) | 3,207,723 | |
| United Arab Emirates - 0.1% | |||
| $ 2,455,000 | Finance Department Government of Sharjah 3.63%, 03/10/2033(1) | 2,405,571 | |
| Total Foreign Government Obligations (cost $166,401,567) | $ 155,327,080 | ||
| 93 |
December 31, 2021
| Shares or Principal Amount | Market Value† | ||
| MUNICIPAL BONDS - 1.4% | |||
| Development - 0.3% | |||
| $ 5,880,000 | New York Transportation Dev Corp. Rev 4.25%, 09/01/2035 | $ 6,419,419 | |
| Education - 0.2% | |||
| Chicago, IL, Board of Education, GO | |||
| 365,000 | 6.04%, 12/01/2029 | 417,163 | |
| 1,115,000 | 6.14%, 12/01/2039 | 1,376,967 | |
| 2,315,000 | 6.32%, 11/01/2029 | 2,751,314 | |
| 4,545,444 | |||
| General - 0.5% | |||
| 720,000 | Chicago, IL, Transit Auth 3.91%, 12/01/2040 | 799,574 | |
| 4,130,000 | Florida State Board of Administration Finance Co. 1.26%, 07/01/2025 | 4,109,859 | |
| 5,445,000 | Philadelphia, PA, Auth Industrial Dev, (NATL Insured) 6.55%, 10/15/2028 | 6,842,379 | |
| 11,751,812 | |||
| General Obligation - 0.1% | |||
| State of Illinois, GO | |||
| 1,951,346 | 4.95%, 06/01/2023 | 2,026,111 | |
| 280,000 | 5.00%, 01/01/2023 | 290,714 | |
| 980,000 | 5.95%, 04/01/2022 | 992,837 | |
| 3,309,662 | |||
| Transportation - 0.2% | |||
| 2,790,000 | Metropolitan Transportation Auth, NY, Rev 6.81%, 11/15/2040 | 3,969,978 | |
| Utility - Electric - 0.1% | |||
| 749,000 | Municipal Electric Auth, GA 6.64%, 04/01/2057 | 1,140,313 | |
| Total Municipal Bonds (cost $29,340,362) | $ 31,136,628 | ||
| SENIOR FLOATING RATE INTERESTS - 4.4%(10) | |||
| Advertising - 0.0% | |||
| ABG Intermediate Holdings 2 LLC | |||
| 197,910 | 0.00%, 12/08/2028(11) | $ 196,921 | |
| 31,045 | 0.00%, 12/08/2028(11)(12) | 30,890 | |
| 31,045 | 0.00%, 12/21/2028(11) | 30,889 | |
| 303,025 | Clear Channel Outdoor Holdings, Inc. 3.63%, 08/21/2026, 1 mo. USD LIBOR + 3.500%(3) | 298,607 | |
| 225,423 | Terrier Media Buyer, Inc. 3.60%, 12/17/2026, 1 mo. USD LIBOR + 3.500%(3) | 224,239 | |
| 781,546 | |||
| Aerospace/Defense - 0.0% | |||
| 556,587 | TransDigm, Inc. 2.35%, 12/09/2025, 1 mo. USD LIBOR + 2.250%(3) | 548,450 | |
| Airlines - 0.1% | |||
| 245,000 | AAdvantage Loyalty IP Ltd. 5.50%, 04/20/2028, 1 mo. USD LIBOR + 4.750%(3) | 253,443 | |
| 145,000 | Air Canada 4.25%, 08/11/2028, 1 mo. USD LIBOR + 3.500%(3) | 144,404 | |
| 274,400 | Kestrel Bidco, Inc. 4.00%, 12/11/2026, 3 mo. USD LIBOR + 3.000%(3) | 265,638 | |
| Shares or Principal Amount | Market Value† | ||
| SENIOR FLOATING RATE INTERESTS - 4.4%(10) - (continued) | |||
| Airlines - 0.1% - (continued) | |||
| $ 180,000 | Mileage Plus Holdings LLC 6.25%, 06/21/2027, 1 mo. USD LIBOR + 5.250%(3) | $ 189,563 | |
| 210,000 | SkyMiles IP Ltd. 4.75%, 10/20/2027, 3 mo. USD LIBOR + 3.750%(3) | 221,813 | |
| 258,050 | United Airlines, Inc. 4.50%, 04/21/2028, 1 mo. USD LIBOR + 3.750%(3) | 258,401 | |
| 1,333,262 | |||
| Apparel - 0.0% | |||
| 243,775 | Birkenstock GmbH & Co. KG 3.75%, 04/28/2028, 1 mo. USD LIBOR + 3.750%(3) | 242,861 | |
| Auto Parts & Equipment - 0.1% | |||
| 149,250 | Adient U.S. LLC 3.60%, 04/08/2028, 1 mo. USD LIBOR + 3.500%(3) | 149,095 | |
| Clarios Global L.P. | |||
| EUR 686,394 | 3.25%, 04/30/2026, 3 mo. EURIBOR + 3.250%(3) | 776,575 | |
| $ 401,474 | 3.35%, 04/30/2026, 1 mo. USD LIBOR + 3.250%(3) | 398,764 | |
| First Brands Group LLC | |||
| 82,870 | 6.00%, 03/30/2027, 1 mo. USD LIBOR + 5.000%(3) | 83,119 | |
| 155,000 | 9.50%, 03/30/2028, 1 mo. USD LIBOR + 8.500%(3) | 155,485 | |
| 1,563,038 | |||
| Chemicals - 0.2% | |||
| 3,501,358 | Axalta Coating Systems U.S. Holdings, Inc. 1.97%, 06/01/2024, 3 mo. USD LIBOR + 1.750%(3) | 3,496,981 | |
| 450,000 | Diamond (BC) B.V. 3.50%, 09/29/2028, 1 mo. USD LIBOR + 3.000%(3) | 447,890 | |
| 99,250 | NIC Acquisition Corp. 4.50%, 12/29/2027, 1 mo. USD LIBOR + 3.750%(3) | 97,761 | |
| Starfruit Finco B.V | |||
| 74,726 | 3.10%, 10/01/2025, 1 mo. USD LIBOR + 2.750%(3) | 74,399 | |
| EUR 94,413 | 3.25%, 10/01/2025, 3 mo. EURIBOR + 3.000%(3) | 106,173 | |
| $ 251,863 | Tronox Finance LLC 2.45%, 03/13/2028, 1 mo. USD LIBOR + 2.250%(3) | 249,385 | |
| 4,472,589 | |||
| Commercial Services - 0.5% | |||
| 287,825 | AlixPartners LLP 3.25%, 02/04/2028, 1 mo. USD LIBOR + 2.750%(3) | 286,490 | |
| 205,215 | Allied Universal Holdco LLC 4.25%, 05/12/2028, 1 mo. USD LIBOR + 3.750%(3) | 204,318 | |
| 320,000 | APX Group, Inc. 4.00%, 07/10/2028, 1 mo. USD LIBOR + 3.500%(3) | 319,111 | |
| 478,387 | AVSC Holding Corp. 4.25%, 03/03/2025, 3 mo. USD LIBOR + 3.250%(3) | 438,203 | |
| Belron Finance U.S. LLC | |||
| 196,246 | 2.44%, 10/30/2026, 1 mo. USD LIBOR + 2.250%(3) | 194,691 | |
| 119,100 | 3.25%, 04/13/2028, 1 mo. USD LIBOR + 2.750%(3) | 118,921 | |
| 108,886 | Ensemble RCM LLC 3.88%, 08/03/2026, 3 mo. USD LIBOR + 3.750%(3) | 108,704 | |
| 94 |
December 31, 2021
| Shares or Principal Amount | Market Value† | ||
| SENIOR FLOATING RATE INTERESTS - 4.4%(10) - (continued) | |||
| Commercial Services - 0.5% - (continued) | |||
| $ 448,875 | MPH Acquisition Holdings LLC 4.75%, 08/17/2028, 1 mo. USD LIBOR + 4.250%(3) | $ 437,375 | |
| 165,000 | PECF USS Intermediate Holding III Corporation 0.00%, 12/15/2028(11) | 165,060 | |
| EUR 105,975 | Techem Verwaltungsgesellschaft 675 mbH 2.38%, 07/15/2025, 3 mo. EURIBOR + 2.375%(3) | 118,390 | |
| $ 3,153,119 | Trans Union LLC 1.85%, 11/16/2026, 1 mo. USD LIBOR + 1.750%(3) | 3,121,588 | |
| Verisure Holding AB | |||
| EUR 260,000 | 3.25%, 07/20/2026, 3 mo. EURIBOR + 3.250%(3) | 293,976 | |
| 570,000 | 3.25%, 03/27/2028, 3 mo. EURIBOR + 3.250%(3) | 644,149 | |
| $ 4,108,950 | WEX, Inc. 2.35%, 03/31/2028, 1 mo. USD LIBOR + 2.250%(3) | 4,083,269 | |
| 113,400 | WW International, Inc. 4.00%, 04/13/2028, 1 mo. USD LIBOR + 3.500%(3) | 112,124 | |
| 10,646,369 | |||
| Construction Materials - 0.2% | |||
| 338,300 | ACProducts, Inc. 4.75%, 05/17/2028, 1 mo. USD LIBOR + 4.250%(3) | 333,225 | |
| 240,000 | Chamberlain Group, Inc. 4.00%, 11/03/2028, 1 mo. USD LIBOR + 4.000%(3) | 239,700 | |
| 426,356 | Cornerstone Building Brands, Inc. 3.75%, 04/12/2028, 1 mo. USD LIBOR + 3.250%(3) | 424,757 | |
| 109,182 | CP Atlas Buyer, Inc. 4.25%, 11/23/2027, 1 mo. USD LIBOR + 3.750%(3) | 108,582 | |
| 3,790,352 | Ingersoll-Rand Services Co. 1.85%, 03/01/2027, 1 mo. USD LIBOR + 1.750%(3) | 3,745,588 | |
| 593,654 | Quikrete Holdings, Inc. 2.60%, 02/01/2027, 1 mo. USD LIBOR + 2.500%(3) | 586,405 | |
| 211,282 | Standard Industries, Inc. 3.00%, 09/22/2028, 1 mo. USD LIBOR + 2.500%(3) | 211,371 | |
| 5,649,628 | |||
| Distribution/Wholesale - 0.2% | |||
| 4,463,176 | American Builders & Contractors Supply Co., Inc. 2.10%, 01/15/2027, 1 mo. USD LIBOR + 2.000%(3) | 4,429,702 | |
| Diversified Financial Services - 0.2% | |||
| 150,350 | Aretec Group, Inc. 4.35%, 10/01/2025, 3 mo. USD LIBOR + 4.250%(3) | 150,287 | |
| 614,352 | Blackhawk Network Holdings, Inc. 3.10%, 06/15/2025, 3 mo. USD LIBOR + 3.000%(3) | 609,744 | |
| 630,647 | Deerfield Dakota Holding LLC 4.75%, 04/09/2027, 1 mo. USD LIBOR + 3.750%(3) | 630,943 | |
| 2,472,581 | Fleetcor Technologies Operating Co. LLC 1.85%, 04/28/2028, 1 mo. USD LIBOR + 1.750%(3) | 2,441,056 | |
| Shares or Principal Amount | Market Value† | ||
| SENIOR FLOATING RATE INTERESTS - 4.4%(10) - (continued) | |||
| Diversified Financial Services - 0.2% - (continued) | |||
| $ 136,150 | Minotaur Acquisition, Inc. 4.85%, 03/27/2026, 3 mo. USD LIBOR + 4.750%(3) | $ 135,299 | |
| 220,000 | Setanta Aircraft Leasing Designated Activity Company 2.14%, 11/05/2028(3) | 219,725 | |
| 4,187,054 | |||
| Electrical Components & Equipment - 0.0% | |||
| 100,000 | Anticimex International AB 0.00%, 11/16/2028, 1 mo. USD LIBOR + 3.500%(3)(11) | 99,656 | |
| Electronics - 0.0% | |||
| 164,175 | Ingram Micro, Inc. 4.00%, 06/30/2028, 1 mo. USD LIBOR + 3.500%(3) | 164,093 | |
| EUR 100,000 | Zephyr German BidCo GmbH 3.75%, 03/10/2028, 3 mo. EURIBOR + 3.750%(3) | 113,960 | |
| 278,053 | |||
| Engineering & Construction - 0.1% | |||
| $ 228,850 | Artera Services LLC 4.50%, 03/06/2025, 1 mo. USD LIBOR + 3.500%(3) | 221,126 | |
| 716,250 | Brand Energy & Infrastructure Services, Inc. 5.25%, 06/21/2024, 3 mo. USD LIBOR + 4.250%(3) | 699,440 | |
| 440,157 | Brown Group Holding LLC 3.00%, 06/07/2028, 1 mo. USD LIBOR + 2.750%(3) | 439,057 | |
| 195,000 | II-VI Incorporated 0.00%, 12/01/2028(11) | 194,512 | |
| 1,554,135 | |||
| Entertainment - 0.1% | |||
| Crown Finance U.S., Inc. | |||
| EUR 32,602 | 2.63%, 02/28/2025, 3 mo. EURIBOR + 2.625%(3) | 28,240 | |
| $ 181,321 | 3.50%, 02/28/2025, 1 mo. USD LIBOR + 2.500%(3) | 139,868 | |
| 9,531 | 9.25%, 05/23/2024, 1 mo. USD LIBOR + 8.250%(3) | 10,115 | |
| 795,546 | Delta (LUX) S.a.r.l. 3.50%, 02/01/2024, 3 mo. USD LIBOR + 2.500%(3) | 794,217 | |
| 617,500 | Golden Entertainment, Inc. 3.75%, 10/21/2024, 3 mo. USD LIBOR + 3.000%(3) | 615,444 | |
| 125,877 | Penn National Gaming, Inc. 3.00%, 10/15/2025, 3 mo. USD LIBOR + 2.250%(3) | 125,680 | |
| 444,231 | Scientific Games International, Inc. 2.85%, 08/14/2024, 1 mo. USD LIBOR + 2.750%(3) | 442,356 | |
| 339,543 | UFC Holdings LLC 3.50%, 04/29/2026, 1 mo. USD LIBOR + 2.750%(3) | 337,662 | |
| 220,969 | William Morris Endeavor Entertainment LLC 2.86%, 05/18/2025, 3 mo. USD LIBOR + 2.750%(3) | 215,942 | |
| 2,709,524 | |||
| Environmental Control - 0.0% | |||
| 105,000 | Covanta Holding Corporation 0.00%, 11/30/2028(11) | 105,053 | |
| 95 |
December 31, 2021
| Shares or Principal Amount | Market Value† | ||
| SENIOR FLOATING RATE INTERESTS - 4.4%(10) - (continued) | |||
| Food - 0.1% | |||
| $ 182,583 | B&G Foods, Inc. 2.60%, 10/10/2026, 1 mo. USD LIBOR + 2.500%(3) | $ 182,173 | |
| Froneri International Ltd. | |||
| 162,525 | 2.35%, 01/29/2027, 1 mo. USD LIBOR + 2.250%(3) | 160,217 | |
| EUR 170,000 | 2.38%, 01/29/2027, 3 mo. EURIBOR + 2.625%(3) | 189,283 | |
| $ 481,091 | Hostess Brands LLC 3.00%, 08/03/2025, 1 mo. USD LIBOR + 2.250%(3) | 479,238 | |
| ��244,375 | U.S. Foods, Inc. 2.10%, 09/13/2026, 3 mo. USD LIBOR + 2.000%(3) | 241,443 | |
| 1,252,354 | |||
| Food Service - 0.0% | |||
| Aramark Services, Inc. | |||
| 111,920 | 1.85%, 03/11/2025, 1 mo. USD LIBOR + 1.750%(3) | 110,415 | |
| 102,575 | 1.85%, 01/15/2027, 1 mo. USD LIBOR + 1.750%(3) | 100,985 | |
| 211,400 | |||
| Gas - 0.0% | |||
| 521,625 | UGI Energy Services LLC 3.85%, 08/13/2026, 1 mo. USD LIBOR + 3.750%(3) | 521,625 | |
| Hand/Machine Tools - 0.0% | |||
| 220,339 | Alliance Laundry Systems LLC 4.25%, 10/08/2027, 1 mo. USD LIBOR + 3.500%(3) | 220,236 | |
| Healthcare - Products - 0.1% | |||
| Avantor Funding, Inc. | |||
| EUR 174,125 | 2.50%, 06/12/2028, 1 mo. EURIBOR + 2.750%(3) | 197,349 | |
| $ 496,256 | 2.75%, 11/08/2027, 1 mo. USD LIBOR + 2.250%(3) | 495,636 | |
| 221,456 | Coty, Inc. 2.35%, 04/07/2025, 3 mo. USD LIBOR + 2.250%(3) | 218,411 | |
| 119,400 | Insulet Corp. 3.75%, 05/04/2028, 1 mo. USD LIBOR + 3.250%(3) | 119,326 | |
| 395,000 | Medline Industries, Inc. 3.75%, 10/23/2028, 1 mo. USD LIBOR + 3.250%(3) | 394,826 | |
| 535,503 | Sunshine Luxembourg S.a.r.l. 4.50%, 10/01/2026, 1 mo. USD LIBOR + 3.750%(3) | 537,180 | |
| 1,962,728 | |||
| Healthcare - Services - 0.3% | |||
| ADMI Corp. | |||
| 243,163 | 3.88%, 12/23/2027, 1 mo. USD LIBOR + 3.125%(3) | 241,441 | |
| 179,550 | 4.00%, 12/23/2027, 1 mo. USD LIBOR + 3.500%(3) | 179,072 | |
| EUR 285,000 | Biogroup-LCD 3.00%, 01/28/2028, 3 mo. EURIBOR + 3.500%(3) | 321,413 | |
| $ 266,750 | Envision Healthcare Corp. 3.85%, 10/10/2025, 3 mo. USD LIBOR + 3.750%(3) | 213,859 | |
| 99,244 | eResearchTechnology, Inc. 5.50%, 02/04/2027, 1 mo. USD LIBOR + 4.500%(3) | 99,492 | |
| Shares or Principal Amount | Market Value† | ||
| SENIOR FLOATING RATE INTERESTS - 4.4%(10) - (continued) | |||
| Healthcare - Services - 0.3% - (continued) | |||
| EyeCare Partners LLC | |||
| $ 39,000 | 0.00%, 11/15/2028, 1 mo. USD LIBOR + 3.750%(3)(11)(12) | $ 38,815 | |
| 245,995 | 3.97%, 02/18/2027, 1 mo. USD LIBOR + 3.750%(3) | 244,381 | |
| 156,000 | 4.25%, 11/15/2028, 1 mo. USD LIBOR + 3.750%(3) | 155,259 | |
| 98,005 | ICON Luxembourg S.a r.l. 2.75%, 07/03/2028, 1 mo. USD LIBOR + 2.500%(3) | 97,964 | |
| IQVIA, Inc. | |||
| 3,367,266 | 1.85%, 03/07/2024, 1 mo. USD LIBOR + 1.750%(3) | 3,359,690 | |
| EUR 197,032 | 2.00%, 06/11/2025, 1 mo. EURIBOR + 2.000%(3) | 222,264 | |
| 145,000 | LGC Group Holdings Ltd. 3.00%, 04/21/2027, 3 mo. EURIBOR + 3.000%(3) | 161,424 | |
| $ 294,275 | MED ParentCo L.P. 4.35%, 08/31/2026, 1 mo. USD LIBOR + 4.250%(3) | 293,415 | |
| 282,862 | Surgery Center Holdings, Inc. 4.50%, 08/31/2026, 1 mo. USD LIBOR + 3.750%(3) | 282,509 | |
| 5,910,998 | |||
| Insurance - 0.2% | |||
| 320,426 | Acrisure LLC 3.72%, 02/15/2027, 1 mo. USD LIBOR + 3.500%(3) | 316,421 | |
| Asurion LLC | |||
| 297,031 | 3.23%, 11/03/2023, 1 mo. USD LIBOR + 3.125%(3) | 296,077 | |
| 592,595 | 3.35%, 12/23/2026, 1 mo. USD LIBOR + 3.250%(3) | 588,151 | |
| 180,000 | 5.35%, 01/31/2028, 1 mo. USD LIBOR + 5.250%(3) | 180,450 | |
| 280,000 | 5.35%, 01/20/2029, 1 mo. USD LIBOR + 5.250%(3) | 278,659 | |
| Hub International Ltd. | |||
| 99,748 | 0.00%, 04/25/2025, 1 mo. USD LIBOR + 3.250%(3)(11) | 99,654 | |
| 414,567 | 2.87%, 04/25/2025, 1 mo. USD LIBOR + 2.750%(3) | 409,481 | |
| Sedgwick Claims Management Services, Inc. | |||
| 276,450 | 3.35%, 12/31/2025, 3 mo. USD LIBOR + 3.250%(3) | 274,089 | |
| 536,250 | 3.85%, 09/03/2026, 1 mo. USD LIBOR + 3.750%(3) | 535,354 | |
| 512,263 | USI, Inc. 3.22%, 05/16/2024, 3 mo. USD LIBOR + 3.000%(3) | 507,965 | |
| 3,486,301 | |||
| Internet - 0.2% | |||
| EUR 160,000 | Adevinta ASA 3.00%, 06/26/2028, 3 mo. EURIBOR + 3.250%(3) | 182,564 | |
| $ 179,100 | Endure Digital Inc. 4.25%, 02/10/2028, 3 mo. USD LIBOR + 3.500%(3) | 177,422 | |
| Go Daddy Operating Co. LLC | |||
| 3,464,323 | 1.85%, 02/15/2024, 1 mo. USD LIBOR + 1.750%(3) | 3,440,281 | |
| 201,925 | 2.10%, 08/10/2027, 1 mo. USD LIBOR + 2.000%(3) | 200,126 | |
| 96 |
December 31, 2021
| Shares or Principal Amount | Market Value† | ||
| SENIOR FLOATING RATE INTERESTS - 4.4%(10) - (continued) | |||
| Internet - 0.2% - (continued) | |||
| $ 170,000 | Proofpoint, Inc. 3.75%, 08/31/2028, 1 mo. USD LIBOR + 3.250%(3) | $ 169,164 | |
| 130,275 | Rodan & Fields LLC 4.11%, 06/16/2025, 3 mo. USD LIBOR + 4.000%(3) | 71,295 | |
| 155,000 | Shutterfly, Inc. 5.75%, 09/25/2026, 1 mo. USD LIBOR + 5.000%(3) | 153,063 | |
| 4,393,915 | |||
| IT Services - 0.2% | |||
| 218,350 | Peraton Corp. 4.50%, 02/01/2028, 1 mo. USD LIBOR + 3.750%(3) | 218,272 | |
| 3,373,911 | Science Applications International Corp. 1.98%, 10/31/2025, 1 mo. USD LIBOR + 1.875%(3) | 3,369,289 | |
| 866,324 | Tempo Acquisition LLC 3.75%, 11/02/2026, 1 mo. USD LIBOR + 3.250%(3) | 867,138 | |
| 4,454,699 | |||
| Leisure Time - 0.0% | |||
| Carnival Corp. | |||
| 221,625 | 3.75%, 06/30/2025, 1 mo. USD LIBOR + 3.000%(3) | 219,409 | |
| 250,000 | 4.00%, 10/18/2028, 6 mo. USD LIBOR + 4.000%(3) | 247,500 | |
| 223,875 | Hayward Industries, Inc. 3.00%, 05/12/2028, 1 mo. USD LIBOR + 2.500%(3) | 222,709 | |
| 194,025 | MajorDrive Holdings LLC 4.50%, 05/12/2028, 1 mo. USD LIBOR + 4.000%(3) | 193,782 | |
| 92,727 | SRAM LLC 3.25%, 05/18/2028, 1 mo. USD LIBOR + 2.750%(3) | 92,611 | |
| 976,011 | |||
| Lodging - 0.0% | |||
| 260,185 | Boyd Gaming Corp. 2.35%, 09/15/2023, 3 mo. USD LIBOR + 2.250%(3) | 259,860 | |
| Caesars Resort Collection LLC | |||
| 427,355 | 2.85%, 12/23/2024, 3 mo. USD LIBOR + 2.750%(3) | 424,684 | |
| 167,875 | 3.60%, 07/21/2025, 1 mo. USD LIBOR + 3.500%(3) | 167,833 | |
| 852,377 | |||
| Machinery - Construction & Mining - 0.0% | |||
| 261,954 | Brookfield WEC Holdings, Inc. 3.25%, 08/01/2025, 1 mo. USD LIBOR + 2.750%(3) | 259,743 | |
| Machinery-Diversified - 0.0% | |||
| 345,647 | Vertical U.S. Newco, Inc. 4.00%, 07/30/2027, 1 mo. USD LIBOR + 3.500%(3) | 345,598 | |
| Media - 0.2% | |||
| 143,187 | Banijay Entertainment S.A.S 3.84%, 03/01/2025, 1 mo. USD LIBOR + 3.750%(3) | 142,472 | |
| 338,300 | Cable One, Inc. 2.10%, 05/03/2028, 1 mo. USD LIBOR + 2.000%(3) | 338,019 | |
| 1,192,417 | Charter Communications Operating LLC 1.86%, 02/01/2027, 1 mo. USD LIBOR + 1.750%(3) | 1,180,302 | |
| Shares or Principal Amount | Market Value† | ||
| SENIOR FLOATING RATE INTERESTS - 4.4%(10) - (continued) | |||
| Media - 0.2% - (continued) | |||
| $ 434,511 | CSC Holdings LLC 2.61%, 04/15/2027, 1 mo. USD LIBOR + 2.500%(3) | $ 428,536 | |
| E.W. Scripps Co. | |||
| 296,212 | 3.31%, 05/01/2026, 1 mo. USD LIBOR + 2.563%(3) | 295,332 | |
| 83,375 | 3.75%, 01/07/2028, 1 mo. USD LIBOR + 3.000%(3) | 83,259 | |
| 436,432 | Gray Television, Inc. 2.60%, 01/02/2026, 3 mo. USD LIBOR + 2.500%(3) | 432,657 | |
| 3,490 | Houghton Mifflin Harcourt Publishing Co. 7.25%, 11/22/2024, 1 mo. USD LIBOR + 6.250%(3) | 3,482 | |
| 99,747 | MH Sub LLC 4.75%, 09/13/2024, 1 mo. USD LIBOR + 3.750%(3) | 99,851 | |
| 183,281 | Sinclair Television Group, Inc. 2.61%, 09/30/2026, 1 mo. USD LIBOR + 2.500%(3) | 178,699 | |
| 320,000 | Telenet Financing USD LLC 2.11%, 04/30/2028, 6 mo. USD LIBOR + 2.000%(3) | 314,000 | |
| 575,000 | UPC Financing Partnership 3.11%, 01/31/2029, 1 mo. USD LIBOR + 3.000%(3) | 572,723 | |
| EUR 260,000 | Virgin Media Bristol LLC 3.25%, 01/31/2029, 3 mo. EURIBOR + 3.250%(3) | 295,474 | |
| 4,364,806 | |||
| Miscellaneous Manufacturing - 0.0% | |||
| 345,986 | CeramTec AcquiCo GmbH 2.50%, 03/07/2025, 3 mo. EURIBOR + 2.500%(3) | 392,262 | |
| $ 120,937 | LTI Holdings, Inc. 3.60%, 09/06/2025, 3 mo. USD LIBOR + 3.500%(3) | 119,342 | |
| 270,151 | Momentive Performance Materials USA LLC 3.36%, 05/15/2024, 3 mo. USD LIBOR + 3.250%(3) | 269,700 | |
| 781,304 | |||
| Oil & Gas Services - 0.0% | |||
| 719,758 | PES Holdings LLC 0.00%, 12/31/2022, 3 mo. USD LIBOR + 6.990%(3)(11)(13) | 28,790 | |
| Packaging & Containers - 0.1% | |||
| 339,150 | Berlin Packaging LLC 4.25%, 03/11/2028, 1 mo. USD LIBOR + 3.750%(3) | 338,472 | |
| 539,610 | Flex Acquisition Co., Inc. 4.00%, 03/02/2028, 1 mo. USD LIBOR + 3.500%(3) | 538,148 | |
| 100,000 | Pretium PKG Holdings, Inc. 4.50%, 10/02/2028, 1 mo. USD LIBOR + 4.500%(3) | 99,713 | |
| 334,783 | Proampac PG Borrower LLC 4.50%, 11/03/2025, 1 mo. USD LIBOR + 3.750%(3) | 334,782 | |
| 1,311,115 | |||
| Pharmaceuticals - 0.3% | |||
| 320,251 | Bausch Health Cos., Inc. 3.10%, 06/02/2025, 3 mo. USD LIBOR + 3.000%(3) | 318,570 | |
| 487,243 | Change Healthcare Holdings LLC 3.50%, 03/01/2024, 1 mo. USD LIBOR + 2.500%(3) | 486,687 | |
| 97 |
December 31, 2021
| Shares or Principal Amount | Market Value† | ||
| SENIOR FLOATING RATE INTERESTS - 4.4%(10) - (continued) | |||
| Pharmaceuticals - 0.3% - (continued) | |||
| $ 3,853,510 | Elanco Animal Health, Inc. 1.85%, 08/01/2027, 1 mo. USD LIBOR + 1.750%(3) | $ 3,799,329 | |
| 786,292 | Endo Luxembourg Finance Co. S.a r.l. 5.75%, 03/27/2028, 1 mo. USD LIBOR + 5.000%(3) | 763,097 | |
| 351,835 | Gainwell Acquisition Corp. 4.75%, 10/01/2027, 1 mo. USD LIBOR + 4.000%(3) | 352,362 | |
| 124,062 | Horizon Therapeutics USA, Inc. 2.25%, 03/15/2028, 1 mo. USD LIBOR + 2.000%(3) | 123,530 | |
| 24,418 | ICON Luxembourg S.a r.l. 2.75%, 07/03/2028, 1 mo. USD LIBOR + 2.500%(3) | 24,408 | |
| 278,600 | Jazz Financing Lux S.a.r.l. 4.00%, 05/05/2028, 1 mo. USD LIBOR + 3.500%(3) | 279,489 | |
| 347,100 | Organon & Co. 3.50%, 06/02/2028, 1 mo. USD LIBOR + 3.000%(3) | 347,173 | |
| 98,295 | Pathway Vet Alliance LLC 3.85%, 03/31/2027, 1 mo. USD LIBOR + 3.750%(3) | 97,891 | |
| 6,592,536 | |||
| Pipelines - 0.0% | |||
| 151,575 | BCP Raptor LLC 5.25%, 06/24/2024, 3 mo. USD LIBOR + 4.250%(3) | 151,217 | |
| 231,104 | BCP Renaissance Parent LLC 4.50%, 10/31/2024, 3 mo. USD LIBOR + 3.500%(3) | 230,455 | |
| 295,509 | Medallion Midland Acquisition LLC 4.50%, 10/18/2028, 3 mo. USD LIBOR + 3.750%(3) | 293,884 | |
| 306,236 | NorthRiver Midstream Finance L.P. 3.38%, 10/01/2025, 3 mo. USD LIBOR + 3.250%(3) | 305,470 | |
| 981,026 | |||
| Real Estate - 0.0% | |||
| EUR 110,000 | Blitz GmbH 3.50%, 04/28/2028, 3 mo. EURIBOR + 3.500%(3) | 124,664 | |
| Retail - 0.5% | |||
| $ 5,937,442 | B.C. Unlimited Liability Co. 1.85%, 11/19/2026, 1 mo. USD LIBOR + 1.750%(3) | 5,848,381 | |
| EG Group Ltd. | |||
| 144,280 | 4.75%, 03/31/2026, 1 mo. USD LIBOR + 4.250%(3) | 145,182 | |
| EUR 130,000 | 7.00%, 04/10/2027, 3 mo. EURIBOR + 7.000%(3) | 148,338 | |
| $ 104,475 | Foundation Building Materials Holding Co. LLC 3.75%, 02/03/2028, 1 mo. USD LIBOR + 3.250%(3) | 103,654 | |
| 700,968 | Harbor Freight Tools USA, Inc. 3.25%, 10/19/2027, 1 mo. USD LIBOR + 2.750%(3) | 698,879 | |
| 227,700 | IRB Holding Corp. 4.25%, 12/15/2027, 1 mo. USD LIBOR + 3.250%(3) | 227,486 | |
| 1,893,251 | KFC Holding Co. 1.85%, 03/15/2028, 1 mo. USD LIBOR + 1.750%(3) | 1,886,548 | |
| 453,553 | LBM Acquisition LLC 4.50%, 12/17/2027, 1 mo. USD LIBOR + 3.750%(3) | 449,090 | |
| Shares or Principal Amount | Market Value† | ||
| SENIOR FLOATING RATE INTERESTS - 4.4%(10) - (continued) | |||
| Retail - 0.5% - (continued) | |||
| $ 326,700 | Les Schwab Tire Centers 4.00%, 11/02/2027, 1 mo. USD LIBOR + 3.250%(3) | $ 325,746 | |
| 333,325 | Michaels Cos., Inc. 5.00%, 04/15/2028, 1 mo. USD LIBOR + 4.250%(3) | 330,052 | |
| 159,600 | PetSmart, Inc. 4.50%, 02/11/2028, 1 mo. USD LIBOR + 3.750%(3) | 159,700 | |
| 488,775 | SRS Distribution, Inc. 4.25%, 06/02/2028, 1 mo. USD LIBOR + 3.750%(3) | 487,216 | |
| 376,460 | Staples, Inc. 5.13%, 04/16/2026, 3 mo. USD LIBOR + 5.000%(3) | 363,114 | |
| 237,600 | White Cap Buyer LLC 4.50%, 10/19/2027, 1 mo. USD LIBOR + 4.000%(3) | 237,626 | |
| 11,411,012 | |||
| Semiconductors - 0.0% | |||
| 320,000 | MKS Instruments, Inc. 0.00%, 10/21/2028, 1 mo. USD LIBOR + 2.250%(11) | 319,120 | |
| Software - 0.4% | |||
| EUR 125,000 | Concorde Midco Ltd. 4.00%, 03/01/2028, 3 mo. EURIBOR + 4.000%(3) | 142,638 | |
| $ 438,400 | DCert Buyer, Inc. 4.10%, 10/16/2026, 3 mo. USD LIBOR + 4.000%(3) | 437,256 | |
| 729,208 | Dun & Bradstreet Corp. 3.35%, 02/06/2026, 1 mo. USD LIBOR + 3.250%(3) | 725,824 | |
| 335,383 | Epicor Software Corp. 4.00%, 07/30/2027, 1 mo. USD LIBOR + 3.250%(3) | 334,921 | |
| 499,715 | Finastra USA, Inc. 4.50%, 06/13/2024, 3 mo. USD LIBOR + 3.500%(3) | 497,136 | |
| 788,212 | Hyland Software, Inc. 4.25%, 07/01/2024, 1 mo. USD LIBOR + 3.500%(3) | 790,577 | |
| 380,000 | Mitchell International, Inc. 4.25%, 10/15/2028, 1 mo. USD LIBOR + 3.750%(3) | 377,427 | |
| 98,745 | Navicure, Inc. 4.10%, 10/22/2026, 1 mo. USD LIBOR + 4.000%(3) | 98,580 | |
| 324,187 | Polaris Newco LLC 4.50%, 06/02/2028, 1 mo. USD LIBOR + 4.000%(3) | 323,883 | |
| 235,543 | Quest Software U.S. Holdings, Inc. 4.38%, 05/16/2025, 3 mo. USD LIBOR + 4.250%(3) | 235,103 | |
| 304,237 | RealPage, Inc. 3.75%, 04/24/2028, 1 mo. USD LIBOR + 3.250%(3) | 303,145 | |
| 998,220 | SS&C European Holdings S.a.r.l. 1.85%, 04/16/2025, 1 mo. USD LIBOR + 1.750%(3) | 986,121 | |
| 2,383,388 | SS&C Technologies, Inc. 1.85%, 04/16/2025, 1 mo. USD LIBOR + 1.750%(3) | 2,355,262 | |
| Ultimate Software Group, Inc. | |||
| 202,954 | 3.75%, 05/04/2026 | 201,748 | |
| 136,850 | 3.85%, 05/04/2026, 3 mo. USD LIBOR + 3.750%(3) | 136,337 | |
| 539,055 | Zelis Healthcare Corp. 3.60%, 09/30/2026, 1 mo. USD LIBOR + 3.500%(3) | 534,937 | |
| 8,480,895 | |||
| Telecommunications - 0.1% | |||
| 676,488 | Altice France S.A. 3.81%, 01/31/2026, 3 mo. USD LIBOR + 3.688%(3) | 669,892 | |
| 166,600 | CenturyLink, Inc. 2.35%, 03/15/2027, 1 mo. USD LIBOR + 2.250%(3) | 164,564 | |
| 98 |
December 31, 2021
| Shares or Principal Amount | Market Value† | ||
| SENIOR FLOATING RATE INTERESTS - 4.4%(10) - (continued) | |||
| Telecommunications - 0.1% - (continued) | |||
| $ 243,162 | Frontier Communications Corp. 4.50%, 05/01/2028, 1 mo. USD LIBOR + 3.750%(3) | $ 242,676 | |
| 202,397 | Level 3 Financing, Inc. 1.85%, 03/01/2027, 1 mo. USD LIBOR + 1.750%(3) | 199,614 | |
| Lorca Finco plc | |||
| EUR 310,000 | 0.00%, 09/17/2027, 1 mo. USD LIBOR + 3.750%(3)(11) | 351,131 | |
| 200,000 | 4.25%, 09/17/2027, 3 mo. EURIBOR + 4.250%(3) | 227,700 | |
| $ 154,800 | Zacapa LLC 4.72%, 07/02/2025, 3 mo. USD LIBOR + 4.500%(3) | 154,735 | |
| Zayo Group Holdings, Inc. | |||
| 258,329 | 3.10%, 03/09/2027, 1 mo. USD LIBOR + 3.000%(3) | 254,669 | |
| EUR 98,250 | 3.25%, 03/09/2027, 3 mo. EURIBOR + 3.250%(3) | 110,679 | |
| 2,375,660 | |||
| Transportation - 0.0% | |||
| $ 260,000 | First Student Bidco, Inc. 3.50%, 07/21/2028, 1 mo. USD LIBOR + 3.000%(3) | 258,809 | |
| Total Senior Floating Rate Interests (cost $101,648,671) | $ 100,478,642 | ||
| U.S. GOVERNMENT AGENCIES - 39.2% | |||
| Mortgage-Backed Agencies - 39.2% | |||
| FHLMC - 3.2% | |||
| 65,966 | 0.00%, 11/15/2036(6)(14) | $ 59,962 | |
| 19,934,026 | 0.60%, 03/25/2027(2)(5) | 564,892 | |
| 4,900,201 | 0.64%, 10/25/2026(2)(5) | 128,192 | |
| 17,276,514 | 0.72%, 12/25/2030(2)(5) | 988,512 | |
| 10,385,470 | 0.75%, 06/25/2027(2)(5) | 375,248 | |
| 4,258,704 | 0.88%, 11/25/2030(2)(5) | 287,395 | |
| 7,826,309 | 1.03%, 10/25/2030(2)(5) | 598,137 | |
| 12,871,806 | 1.12%, 06/25/2030(2)(5) | 1,070,462 | |
| 6,266,404 | 1.57%, 05/25/2030(2)(5) | 715,108 | |
| 832,518 | 1.75%, 10/15/2042 | 834,396 | |
| 1,485,120 | 1.95%, 09/25/2049, 1 mo. USD LIBOR + 1.850%(1)(3) | 1,488,846 | |
| 2,453,933 | 2.00%, 03/01/2051 | 2,449,784 | |
| 3,684,753 | 2.45%, 02/25/2049, 1 mo. USD LIBOR + 2.350%(1)(3) | 3,714,943 | |
| 396,761 | 2.50%, 05/15/2028(5) | 21,995 | |
| 691,122 | 2.55%, 03/25/2049, 1 mo. USD LIBOR + 2.450%(1)(3) | 698,159 | |
| 957,542 | 3.00%, 03/15/2028(5) | 57,363 | |
| 1,141,272 | 3.00%, 08/01/2029 | 1,205,728 | |
| 450,879 | 3.00%, 05/15/2032(5) | 18,896 | |
| 3,187,121 | 3.00%, 10/01/2032 | 3,350,215 | |
| 461,830 | 3.00%, 03/15/2033(5) | 40,883 | |
| 2,074,732 | 3.00%, 04/01/2033 | 2,180,412 | |
| 2,521,399 | 3.00%, 11/01/2036 | 2,644,515 | |
| 1,486,951 | 3.00%, 01/01/2037 | 1,559,947 | |
| 4,225,000 | 3.00%, 08/15/2043 | 4,366,689 | |
| 769,188 | 3.00%, 05/15/2046 | 795,272 | |
| 4,680,164 | 3.00%, 11/01/2046 | 4,939,270 | |
| 1,248,100 | 3.00%, 12/01/2046 | 1,316,730 | |
| 486,582 | 3.25%, 11/15/2041 | 516,771 | |
| 142,321 | 3.50%, 06/15/2026(5) | 1,159 | |
| 189,258 | 3.50%, 09/15/2026(5) | 9,921 | |
| 264,491 | 3.50%, 03/15/2027(5) | 13,233 | |
| Shares or Principal Amount | Market Value† | ||
| U.S. GOVERNMENT AGENCIES - 39.2% - (continued) | |||
| Mortgage-Backed Agencies - 39.2% - (continued) | |||
| FHLMC - 3.2% - (continued) | |||
| $ 1,560,647 | 3.50%, 05/15/2034(5) | $ 130,357 | |
| 1,942,563 | 3.50%, 08/01/2034 | 2,078,704 | |
| 1,039,849 | 3.50%, 03/15/2041(5) | 56,674 | |
| 432,834 | 3.50%, 06/01/2046 | 462,058 | |
| 1,734,858 | 3.50%, 10/01/2047 | 1,837,380 | |
| 634,227 | 3.50%, 12/01/2047 | 678,562 | |
| 9,217,402 | 3.50%, 03/01/2048 | 9,786,852 | |
| 214,627 | 3.50%, 08/01/2048 | 229,111 | |
| 1,365,172 | 4.00%, 08/01/2025 | 1,433,923 | |
| 549,061 | 4.00%, 12/15/2026(5) | 24,834 | |
| 951,204 | 4.00%, 07/15/2027(5) | 43,025 | |
| 457,152 | 4.00%, 03/15/2028(5) | 23,465 | |
| 253,066 | 4.00%, 06/15/2028(5) | 14,659 | |
| 577,397 | 4.00%, 07/15/2030(5) | 53,256 | |
| 1,866,169 | 4.00%, 05/25/2040(5) | 223,239 | |
| 1,566,114 | 4.00%, 05/01/2042 | 1,714,384 | |
| 571,032 | 4.00%, 08/01/2042 | 627,367 | |
| 873,324 | 4.00%, 09/01/2042 | 954,981 | |
| 64,878 | 4.00%, 07/01/2044 | 69,252 | |
| 185,285 | 4.00%, 06/01/2045 | 203,177 | |
| 596,174 | 4.00%, 02/01/2046 | 647,294 | |
| 165,272 | 4.00%, 09/01/2048 | 176,543 | |
| 276,304 | 4.50%, 09/01/2044 | 301,564 | |
| 1,507,359 | 4.75%, 07/15/2039 | 1,671,941 | |
| 12,990 | 5.00%, 02/01/2023 | 14,121 | |
| 34,209 | 5.00%, 08/01/2023 | 37,188 | |
| 45,134 | 5.00%, 03/01/2028 | 49,166 | |
| 18,483 | 5.00%, 08/01/2029 | 20,318 | |
| 27,661 | 5.00%, 07/01/2030 | 30,805 | |
| 177,313 | 5.00%, 03/01/2031 | 194,839 | |
| 290,566 | 5.00%, 05/01/2031 | 319,288 | |
| 442,219 | 5.00%, 09/01/2031 | 485,370 | |
| 310,803 | 5.00%, 11/01/2031 | 341,142 | |
| 103,558 | 5.00%, 07/01/2032 | 113,777 | |
| 596,795 | 5.00%, 09/15/2033(5) | 94,657 | |
| 4,552 | 5.00%, 12/01/2034 | 4,963 | |
| 8,464 | 5.00%, 11/01/2035 | 9,581 | |
| 19,011 | 5.00%, 03/01/2039 | 21,316 | |
| 164,706 | 5.00%, 08/01/2039 | 186,912 | |
| 7,376 | 5.00%, 09/01/2039 | 8,285 | |
| 9,627 | 5.00%, 12/01/2039 | 10,924 | |
| 7,745 | 5.00%, 04/01/2041 | 8,779 | |
| 19,105 | 5.00%, 04/01/2044 | 21,650 | |
| 10,593 | 5.00%, 05/01/2044 | 11,648 | |
| 10,995 | 5.00%, 05/01/2047 | 12,092 | |
| 725,807 | 5.00%, 02/15/2048(5) | 141,776 | |
| 25,068 | 5.00%, 08/01/2048 | 27,385 | |
| 9,498 | 5.00%, 11/01/2048 | 10,356 | |
| 1,079,020 | 5.00%, 03/01/2049 | 1,181,213 | |
| 18,638 | 5.50%, 03/01/2028 | 20,460 | |
| 45,370 | 5.50%, 04/01/2033 | 51,308 | |
| 506,185 | 5.50%, 05/01/2034 | 574,528 | |
| 362 | 5.50%, 11/01/2035 | 399 | |
| 9,693 | 5.50%, 05/01/2037 | 11,099 | |
| 25,439 | 5.50%, 11/01/2037 | 29,134 | |
| 46,021 | 5.50%, 02/01/2038 | 52,757 | |
| 18,477 | 5.50%, 04/01/2038 | 21,182 | |
| 23,130 | 5.50%, 06/01/2038 | 26,478 | |
| 2,579,494 | 5.50%, 08/01/2038 | 2,878,711 | |
| 268,457 | 5.50%, 09/01/2038 | 307,345 | |
| 4,958 | 5.50%, 12/01/2039 | 5,679 | |
| 66,147 | 5.50%, 02/01/2040 | 75,724 | |
| 221,223 | 5.50%, 05/01/2040 | 253,360 | |
| 99 |
December 31, 2021
| Shares or Principal Amount | Market Value† | ||
| U.S. GOVERNMENT AGENCIES - 39.2% - (continued) | |||
| Mortgage-Backed Agencies - 39.2% - (continued) | |||
| FHLMC - 3.2% - (continued) | |||
| $ 221,719 | 5.50%, 08/01/2040 | $ 253,807 | |
| 1,098,189 | 5.50%, 06/01/2041 | 1,257,325 | |
| 936,638 | 5.50%, 10/15/2046(5) | 176,951 | |
| 1,082 | 6.00%, 07/01/2029 | 1,190 | |
| 121,708 | 6.00%, 10/01/2032 | 139,978 | |
| 56,076 | 6.00%, 11/01/2032 | 61,733 | |
| 158,938 | 6.00%, 12/01/2032 | 182,790 | |
| 12,293 | 6.00%, 11/01/2033 | 14,160 | |
| 23,416 | 6.00%, 01/01/2034 | 26,996 | |
| 12,312 | 6.00%, 02/01/2034 | 14,182 | |
| 122,735 | 6.00%, 08/01/2034 | 141,783 | |
| 136,659 | 6.00%, 09/01/2034 | 156,696 | |
| 165,322 | 6.00%, 01/01/2035 | 182,947 | |
| 991,533 | 6.00%, 11/01/2037 | 1,149,506 | |
| 142 | 6.50%, 08/01/2032 | 157 | |
| 446,343 | 6.50%, 07/15/2036 | 499,268 | |
| 92,871 | 6.50%, 12/01/2037 | 106,476 | |
| 71 | 7.50%, 09/01/2029 | 75 | |
| 72,487,372 | |||
| FNMA - 5.8% | |||
| 78,065 | 0.00%, 03/25/2036(6)(14) | 69,594 | |
| 662,220 | 0.00%, 06/25/2036(6)(14) | 617,443 | |
| 532,174 | 0.00%, 06/25/2041(6)(14) | 486,123 | |
| 8,424,516 | 0.33%, 01/25/2030(2)(5) | 165,989 | |
| 11,719,667 | 1.44%, 05/25/2029(2)(5) | 1,062,768 | |
| 1,664,719 | 1.45%, 05/25/2046(2)(5) | 87,857 | |
| 1,215,044 | 1.62%, 06/25/2055(2)(5) | 66,149 | |
| 1,322,354 | 1.64%, 08/25/2044(2)(5) | 70,576 | |
| 1,726,083 | 1.70%, 04/25/2055(3)(5) | 86,449 | |
| 1,438,911 | 1.75%, 12/25/2042 | 1,436,595 | |
| 875,936 | 2.00%, 09/25/2039 | 881,825 | |
| 69,862 | 2.00%, 08/25/2043 | 69,962 | |
| 16,151,932 | 2.00%, 03/01/2051 | 16,124,617 | |
| 392,968 | 2.50%, 06/25/2028(5) | 19,864 | |
| 2,605,544 | 2.50%, 09/01/2040 | 2,684,647 | |
| 106,747 | 2.50%, 01/01/2043 | 109,827 | |
| 2,651,601 | 2.50%, 02/01/2043 | 2,733,874 | |
| 936,062 | 2.50%, 03/01/2043 | 965,033 | |
| 1,965,068 | 2.50%, 05/01/2043 | 2,011,561 | |
| 1,561,438 | 2.50%, 06/01/2043 | 1,609,730 | |
| 730,753 | 2.50%, 04/01/2045 | 749,397 | |
| 7,796,968 | 2.50%, 11/01/2051 | 8,028,615 | |
| 4,225,000 | 2.50%, 12/01/2051 | 4,354,836 | |
| 714,526 | 3.00%, 02/25/2027(5) | 26,763 | |
| 326,553 | 3.00%, 09/25/2027(5) | 19,072 | |
| 2,175,619 | 3.00%, 01/25/2028(5) | 119,587 | |
| 3,565,353 | 3.00%, 04/25/2033(5) | 226,930 | |
| 827,175 | 3.00%, 08/01/2033 | 868,637 | |
| 1,755,475 | 3.00%, 03/01/2037 | 1,845,078 | |
| 557,250 | 3.00%, 05/25/2047 | 569,007 | |
| 1,502,789 | 3.00%, 09/01/2048 | 1,575,119 | |
| 1,905,935 | 3.00%, 08/25/2049 | 1,977,708 | |
| 1,636,297 | 3.00%, 10/01/2051 | 1,701,630 | |
| 453,242 | 3.24%, 12/01/2026 | 486,254 | |
| 362,415 | 3.50%, 05/25/2027(5) | 22,645 | |
| 582,951 | 3.50%, 10/25/2027(5) | 40,023 | |
| 751,225 | 3.50%, 05/25/2030(5) | 63,938 | |
| 206,810 | 3.50%, 08/25/2030(5) | 14,756 | |
| 351,468 | 3.50%, 02/25/2031(5) | 19,488 | |
| 453,346 | 3.50%, 09/25/2035(5) | 45,545 | |
| 3,148,437 | 3.50%, 11/25/2039(5) | 341,190 | |
| Shares or Principal Amount | Market Value† | ||
| U.S. GOVERNMENT AGENCIES - 39.2% - (continued) | |||
| Mortgage-Backed Agencies - 39.2% - (continued) | |||
| FNMA - 5.8% - (continued) | |||
| $ 900,751 | 3.50%, 10/01/2044 | $ 970,261 | |
| 877,404 | 3.50%, 02/01/2045 | 941,858 | |
| 803,318 | 3.50%, 01/01/2046 | 858,016 | |
| 628,207 | 3.50%, 03/01/2046 | 671,596 | |
| 1,412,036 | 3.50%, 09/01/2046 | 1,505,427 | |
| 610,179 | 3.50%, 10/01/2046 | 650,013 | |
| 458,470 | 3.50%, 10/25/2046(5) | 75,370 | |
| 758,287 | 3.50%, 11/01/2046 | 809,232 | |
| 1,104,058 | 3.50%, 05/01/2047 | 1,176,513 | |
| 2,278,883 | 3.50%, 09/01/2047 | 2,416,824 | |
| 438,275 | 3.50%, 12/01/2047 | 469,134 | |
| 1,442,718 | 3.50%, 01/01/2048 | 1,525,752 | |
| 349,363 | 3.50%, 02/01/2048 | 372,603 | |
| 426,793 | 3.50%, 02/25/2048 | 441,092 | |
| 1,631,942 | 3.50%, 07/01/2048 | 1,738,446 | |
| 12,375,000 | 3.50%, 02/25/2049(15) | 13,031,455 | |
| 5,446,720 | 3.50%, 09/01/2057 | 5,842,989 | |
| 3,150,356 | 3.50%, 05/01/2058 | 3,395,494 | |
| 3,333,832 | 3.50%, 12/25/2058 | 3,571,327 | |
| 1,832,416 | 3.74%, 06/01/2026 | 1,992,062 | |
| 544,611 | 4.00%, 06/01/2025 | 571,749 | |
| 220,174 | 4.00%, 10/01/2025 | 231,226 | |
| 182,561 | 4.00%, 04/25/2032(5) | 18,906 | |
| 1,756,738 | 4.00%, 10/01/2040 | 1,924,131 | |
| 752,071 | 4.00%, 11/01/2040 | 825,895 | |
| 517,068 | 4.00%, 12/01/2040 | 567,021 | |
| 271,529 | 4.00%, 02/01/2041 | 297,984 | |
| 749,169 | 4.00%, 03/01/2041 | 822,622 | |
| 1,875,500 | 4.00%, 06/01/2041 | 2,039,806 | |
| 314,016 | 4.00%, 03/25/2042(5) | 33,657 | |
| 369,784 | 4.00%, 08/01/2042 | 406,105 | |
| 763,787 | 4.00%, 09/01/2042 | 838,783 | |
| 196,340 | 4.00%, 11/25/2042(5) | 26,414 | |
| 105,848 | 4.00%, 03/01/2045 | 115,667 | |
| 622,607 | 4.00%, 07/01/2045 | 683,620 | |
| 173,643 | 4.00%, 05/01/2046 | 187,064 | |
| 659,580 | 4.00%, 06/01/2046 | 715,597 | |
| 672,532 | 4.00%, 04/01/2047 | 735,250 | |
| 1,837,217 | 4.00%, 10/01/2047 | 1,967,510 | |
| 1,075,222 | 4.00%, 09/01/2048 | 1,145,318 | |
| 128,507 | 4.50%, 04/01/2025 | 134,138 | |
| 199,490 | 4.50%, 07/25/2027(5) | 8,768 | |
| 545,178 | 4.50%, 09/01/2035 | 600,510 | |
| 1,532,164 | 4.50%, 08/01/2040 | 1,683,961 | |
| 1,534,518 | 4.50%, 10/01/2040 | 1,693,846 | |
| 705,299 | 4.50%, 10/01/2041 | 778,790 | |
| 1,810,511 | 4.50%, 08/25/2043(5) | 296,643 | |
| 635,992 | 4.50%, 09/01/2043 | 701,617 | |
| 947,305 | 4.50%, 04/01/2049 | 1,015,897 | |
| 3,509,420 | 4.50%, 01/01/2051 | 3,896,652 | |
| 42,364 | 5.00%, 06/01/2022 | 43,631 | |
| 73,727 | 5.00%, 06/01/2025 | 76,081 | |
| 278,634 | 5.00%, 04/25/2038 | 301,131 | |
| 958,371 | 5.00%, 02/01/2049 | 1,047,956 | |
| 131,395 | 5.00%, 03/01/2049 | 143,901 | |
| 5,219 | 5.50%, 06/01/2022 | 5,240 | |
| 121,151 | 5.50%, 06/01/2033 | 136,891 | |
| 81,128 | 5.50%, 08/01/2033 | 91,704 | |
| 628,913 | 5.50%, 09/01/2033 | 711,454 | |
| 576,779 | 5.50%, 12/01/2033 | 653,274 | |
| 402,624 | 5.50%, 01/01/2034 | 455,575 | |
| 2,206,859 | 5.50%, 11/01/2035 | 2,511,184 | |
| 100 |
December 31, 2021
| Shares or Principal Amount | Market Value† | ||
| U.S. GOVERNMENT AGENCIES - 39.2% - (continued) | |||
| Mortgage-Backed Agencies - 39.2% - (continued) | |||
| FNMA - 5.8% - (continued) | |||
| $ 599,651 | 5.50%, 04/01/2036 | $ 676,067 | |
| 469,170 | 5.50%, 09/01/2036 | 527,974 | |
| 37,212 | 5.50%, 01/01/2037 | 42,506 | |
| 339,541 | 5.50%, 04/25/2037 | 385,638 | |
| 1,931,654 | 5.50%, 11/25/2040(5) | 289,590 | |
| 92,718 | 5.50%, 05/25/2042(2)(5) | 9,523 | |
| 1,311,263 | 5.50%, 06/25/2042(5) | 270,333 | |
| 1,664,482 | 5.50%, 08/25/2044(5) | 318,973 | |
| 59 | 6.00%, 03/01/2022 | 59 | |
| 259,709 | 6.00%, 12/01/2032 | 290,313 | |
| 181,095 | 6.00%, 01/01/2033 | 202,410 | |
| 24,845 | 6.00%, 02/01/2033 | 27,329 | |
| 285,505 | 6.00%, 03/01/2033 | 322,671 | |
| 485,537 | 6.00%, 02/01/2037 | 562,354 | |
| 1,308,859 | 6.00%, 01/25/2042(5) | 166,404 | |
| 1,012,992 | 6.00%, 09/25/2047(5) | 214,932 | |
| 164 | 6.50%, 05/01/2031 | 180 | |
| 683 | 6.50%, 09/01/2031 | 770 | |
| 830 | 6.50%, 07/01/2032 | 926 | |
| 806 | 7.00%, 07/01/2029 | 915 | |
| 76 | 7.00%, 12/01/2030 | 78 | |
| 262 | 7.00%, 02/01/2032 | 267 | |
| 112 | 7.00%, 03/01/2032 | 131 | |
| 1,482 | 7.00%, 09/01/2032 | 1,586 | |
| 201 | 7.50%, 10/01/2022 | 205 | |
| 914 | 7.50%, 06/01/2027 | 1,018 | |
| 8,375 | 7.50%, 03/01/2030 | 9,284 | |
| 6,757 | 7.50%, 04/01/2030 | 7,183 | |
| 717 | 7.50%, 06/01/2030 | 806 | |
| 1,241 | 7.50%, 07/01/2030 | 1,391 | |
| 377 | 7.50%, 08/01/2030 | 422 | |
| 11,372 | 7.50%, 05/01/2031 | 12,762 | |
| 4,604 | 7.50%, 06/01/2031 | 4,677 | |
| 860 | 7.50%, 08/01/2031 | 950 | |
| 17,505 | 7.50%, 09/01/2031 | 17,738 | |
| 135 | 7.50%, 05/01/2032 | 155 | |
| 132,423,854 | |||
| GNMA - 7.0% | |||
| 686,327 | 1.75%, 09/20/2043 | 691,187 | |
| 551,144 | 2.00%, 01/20/2042 | 558,969 | |
| 681,358 | 2.50%, 12/16/2039 | 699,437 | |
| 1,160,254 | 2.50%, 07/20/2041 | 1,185,487 | |
| 2,721,411 | 2.50%, 09/20/2051 | 2,791,952 | |
| 8,948,445 | 2.50%, 10/20/2051 | 9,180,394 | |
| 20,115,000 | 2.50%, 01/21/2052(15) | 20,610,803 | |
| 380,717 | 3.00%, 09/20/2028(5) | 21,777 | |
| 4,056,168 | 3.00%, 05/20/2035(5) | 249,636 | |
| 368,551 | 3.00%, 02/16/2043(5) | 42,324 | |
| 2,150,364 | 3.00%, 03/15/2045 | 2,242,901 | |
| 104,731 | 3.00%, 04/15/2045 | 109,123 | |
| 1,523,495 | 3.00%, 07/15/2045 | 1,584,637 | |
| 35,426 | 3.00%, 08/15/2045 | 36,822 | |
| 725,220 | 3.00%, 10/20/2047 | 746,982 | |
| 38,190,000 | 3.00%, 07/20/2049(15) | 39,528,142 | |
| 8,836,579 | 3.00%, 12/20/2051 | 9,180,596 | |
| 153,028 | 3.50%, 02/16/2027(5) | 8,750 | |
| 404,848 | 3.50%, 03/20/2027(5) | 24,450 | |
| 317,855 | 3.50%, 07/20/2040(5) | 13,005 | |
| 455,335 | 3.50%, 02/20/2041(5) | 13,490 | |
| 976,018 | 3.50%, 04/20/2042(5) | 55,968 | |
| 1,974,595 | 3.50%, 10/20/2042(5) | 297,673 | |
| Shares or Principal Amount | Market Value† | ||
| U.S. GOVERNMENT AGENCIES - 39.2% - (continued) | |||
| Mortgage-Backed Agencies - 39.2% - (continued) | |||
| GNMA - 7.0% - (continued) | |||
| $ 220,019 | 3.50%, 11/15/2042 | $ 236,986 | |
| 5,929 | 3.50%, 12/15/2042 | 6,344 | |
| 140,938 | 3.50%, 02/15/2043 | 150,813 | |
| 7,697 | 3.50%, 03/15/2043 | 8,232 | |
| 1,016,174 | 3.50%, 04/15/2043 | 1,083,294 | |
| 2,650,567 | 3.50%, 05/15/2043 | 2,814,767 | |
| 180,931 | 3.50%, 05/20/2043(5) | 24,422 | |
| 870,725 | 3.50%, 07/20/2043(5) | 108,410 | |
| 2,040,589 | 3.50%, 06/20/2046 | 2,149,719 | |
| 516,562 | 3.50%, 07/20/2046 | 544,161 | |
| 535,803 | 3.50%, 10/20/2046 | 564,857 | |
| 2,125,454 | 3.50%, 02/20/2047 | 2,234,908 | |
| 638,283 | 3.50%, 08/20/2047 | 670,430 | |
| 447,989 | 3.50%, 11/20/2047 | 471,183 | |
| 556,195 | 3.50%, 03/20/2048 | 585,080 | |
| 1,780,882 | 3.50%, 07/20/2049 | 1,856,655 | |
| 13,175,000 | 3.50%, 01/21/2052(15) | 13,721,557 | |
| 1,369,680 | 3.88%, 08/15/2042 | 1,499,216 | |
| 102,027 | 4.00%, 12/16/2026(5) | 4,897 | |
| 1,560,125 | 4.00%, 05/20/2029(5) | 87,055 | |
| 2,140,856 | 4.00%, 07/20/2040 | 2,319,308 | |
| 2,416,955 | 4.00%, 09/20/2040 | 2,618,313 | |
| 3,777,505 | 4.00%, 10/20/2040 | 4,091,762 | |
| 999,569 | 4.00%, 12/20/2040 | 1,094,390 | |
| 247,589 | 4.00%, 05/16/2042(5) | 29,131 | |
| 2,715,957 | 4.00%, 09/16/2042(5) | 554,193 | |
| 366,944 | 4.00%, 03/20/2043(5) | 58,639 | |
| 166,358 | 4.00%, 01/20/2044(5) | 26,526 | |
| 1,231,305 | 4.00%, 01/16/2046(5) | 148,901 | |
| 1,188,201 | 4.00%, 03/20/2047(5) | 136,222 | |
| 561,268 | 4.00%, 11/20/2047 | 606,600 | |
| 1,611,807 | 4.00%, 03/20/2048 | 1,726,157 | |
| 4,390,919 | 4.00%, 07/20/2048 | 4,655,452 | |
| 146,133 | 4.50%, 11/15/2039 | 163,879 | |
| 696,861 | 4.50%, 05/15/2040 | 788,116 | |
| 2,444,205 | 4.50%, 05/20/2040 | 2,679,896 | |
| 97,849 | 4.50%, 07/15/2041 | 108,423 | |
| 603,840 | 4.50%, 04/20/2045(5) | 98,630 | |
| 2,222,651 | 4.50%, 08/20/2045(5) | 350,982 | |
| 218,891 | 4.50%, 01/20/2046 | 240,752 | |
| 1,752,534 | 4.50%, 01/20/2047(5) | 183,858 | |
| 1,597,639 | 4.50%, 05/20/2048(5) | 209,306 | |
| 2,545,000 | 4.50%, 01/21/2052(15) | 2,688,256 | |
| 1,476,535 | 5.00%, 02/16/2040(5) | 260,081 | |
| 284,572 | 5.00%, 05/20/2040 | 321,488 | |
| 750,364 | 5.00%, 06/15/2041 | 860,970 | |
| 928,912 | 5.00%, 10/16/2041(5) | 152,997 | |
| 1,092,033 | 5.00%, 03/15/2044 | 1,252,131 | |
| 323,294 | 5.00%, 01/16/2047(5) | 61,235 | |
| 4,400,000 | 5.00%, 01/21/2052(15) | 4,950,688 | |
| 305,791 | 5.50%, 03/15/2033 | 341,402 | |
| 466,203 | 5.50%, 04/15/2033 | 529,372 | |
| 535,885 | 5.50%, 05/15/2033 | 611,291 | |
| 611,556 | 5.50%, 10/20/2034 | 705,959 | |
| 1,303,628 | 5.50%, 03/20/2039(5) | 163,165 | |
| 1,092,160 | 5.50%, 02/16/2047(5) | 180,466 | |
| 670,822 | 5.50%, 02/20/2047(5) | 116,059 | |
| 688 | 6.00%, 12/15/2023 | 755 | |
| 550 | 6.00%, 01/15/2029 | 605 | |
| 646 | 6.00%, 04/15/2029 | 714 | |
| 19,054 | 6.00%, 12/15/2031 | 21,024 | |
| 572 | 6.00%, 10/15/2032 | 665 | |
| 101 |
December 31, 2021
| Shares or Principal Amount | Market Value† | ||
| U.S. GOVERNMENT AGENCIES - 39.2% - (continued) | |||
| Mortgage-Backed Agencies - 39.2% - (continued) | |||
| GNMA - 7.0% - (continued) | |||
| $ 10,951 | 6.00%, 06/15/2033 | $ 12,441 | |
| 507 | 6.00%, 03/15/2034 | 559 | |
| 26,995 | 6.00%, 08/15/2034 | 31,371 | |
| 50,660 | 6.00%, 09/15/2034 | 56,355 | |
| 25,988 | 6.00%, 02/15/2035 | 30,067 | |
| 199,789 | 6.00%, 12/15/2035 | 222,705 | |
| 22,868 | 6.00%, 02/15/2036 | 25,161 | |
| 100,621 | 6.00%, 03/15/2036 | 116,095 | |
| 15,749 | 6.00%, 04/15/2036 | 17,325 | |
| 42,681 | 6.00%, 05/15/2036 | 48,482 | |
| 116,430 | 6.00%, 06/15/2036 | 133,562 | |
| 41,427 | 6.00%, 07/15/2036 | 45,629 | |
| 17,462 | 6.00%, 08/15/2036 | 19,266 | |
| 96,871 | 6.00%, 02/15/2037 | 111,995 | |
| 472 | 6.00%, 05/15/2037 | 539 | |
| 202,841 | 6.00%, 06/15/2037 | 233,955 | |
| 156,434 | 6.00%, 07/15/2037 | 180,242 | |
| 34,343 | 6.00%, 08/15/2037 | 39,629 | |
| 51,140 | 6.00%, 10/15/2037 | 59,289 | |
| 25,055 | 6.00%, 11/15/2037 | 28,697 | |
| 36,190 | 6.00%, 12/15/2037 | 40,707 | |
| 94,604 | 6.00%, 01/15/2038 | 108,059 | |
| 4,278 | 6.00%, 02/15/2038 | 4,732 | |
| 10,295 | 6.00%, 05/15/2038 | 11,452 | |
| 2,471 | 6.00%, 06/15/2038 | 2,786 | |
| 14,385 | 6.00%, 08/15/2038 | 16,236 | |
| 55,016 | 6.00%, 09/15/2038 | 61,479 | |
| 72,565 | 6.00%, 10/15/2038 | 82,369 | |
| 141,596 | 6.00%, 11/15/2038 | 161,874 | |
| 28,375 | 6.00%, 12/15/2038 | 32,262 | |
| 828 | 6.00%, 01/15/2039 | 941 | |
| 33,343 | 6.00%, 08/15/2039 | 37,153 | |
| 35,163 | 6.00%, 11/15/2039 | 40,070 | |
| 12,774 | 6.00%, 02/15/2040 | 14,055 | |
| 457,510 | 6.00%, 06/15/2040 | 521,758 | |
| 86,325 | 6.00%, 07/15/2040 | 100,217 | |
| 1,075,731 | 6.00%, 09/20/2040(5) | 205,787 | |
| 449,276 | 6.00%, 06/15/2041 | 514,767 | |
| 997,488 | 6.00%, 02/20/2046(5) | 156,382 | |
| 16,838 | 6.50%, 06/15/2028 | 18,474 | |
| 371 | 6.50%, 07/15/2028 | 407 | |
| 1,180 | 6.50%, 08/15/2028 | 1,294 | |
| 9,714 | 6.50%, 09/15/2028 | 10,664 | |
| 630 | 6.50%, 10/15/2028 | 691 | |
| 1,029 | 6.50%, 11/15/2028 | 1,129 | |
| 3,787 | 6.50%, 12/15/2028 | 4,155 | |
| 12,362 | 6.50%, 02/15/2029 | 13,563 | |
| 95,103 | 6.50%, 03/15/2029 | 104,342 | |
| 21,904 | 6.50%, 04/15/2029 | 24,100 | |
| 7,217 | 6.50%, 05/15/2029 | 7,918 | |
| 98,816 | 6.50%, 06/15/2029 | 108,416 | |
| 4,062 | 6.50%, 07/15/2029 | 4,456 | |
| 111 | 6.50%, 03/15/2031 | 122 | |
| 146,195 | 6.50%, 04/15/2031 | 160,412 | |
| 29,592 | 6.50%, 05/15/2031 | 33,473 | |
| 5,714 | 6.50%, 06/15/2031 | 6,328 | |
| 140,267 | 6.50%, 07/15/2031 | 154,219 | |
| 20,352 | 6.50%, 08/15/2031 | 22,329 | |
| 68,435 | 6.50%, 09/15/2031 | 75,085 | |
| 89,732 | 6.50%, 10/15/2031 | 98,450 | |
| 210,693 | 6.50%, 11/15/2031 | 231,205 | |
| Shares or Principal Amount | Market Value† | ||
| U.S. GOVERNMENT AGENCIES - 39.2% - (continued) | |||
| Mortgage-Backed Agencies - 39.2% - (continued) | |||
| GNMA - 7.0% - (continued) | |||
| $ 39,432 | 6.50%, 12/15/2031 | 43,326 | |
| 136,508 | 6.50%, 01/15/2032 | 149,827 | |
| 26,748 | 6.50%, 02/15/2032 | 30,229 | |
| 30,109 | 6.50%, 03/15/2032 | $ 33,034 | |
| 121,276 | 6.50%, 04/15/2032 | 135,563 | |
| 554 | 6.50%, 05/15/2032 | 611 | |
| 14,824 | 6.50%, 06/15/2032 | 16,264 | |
| 1,115 | 7.00%, 06/20/2030 | 1,128 | |
| 404 | 7.00%, 02/15/2031 | 428 | |
| 156 | 7.00%, 06/15/2031 | 167 | |
| 93 | 7.00%, 08/15/2031 | 102 | |
| 317 | 8.50%, 11/15/2024 | 318 | |
| 159,824,929 | |||
| UMBS - 23.2% | |||
| 2,480,000 | 1.50%, 01/14/2052(15) | 2,396,106 | |
| 232,386,000 | 2.00%, 07/25/2051(15) | 231,786,881 | |
| 114,475,000 | 2.00%, 02/14/2052(15) | 113,952,353 | |
| 15,975,000 | 2.50%, 01/18/2037(15) | 16,517,276 | |
| 110,018,000 | 2.50%, 07/25/2051(15) | 112,300,014 | |
| 51,537,000 | 3.00%, 01/13/2052(15) | 53,415,282 | |
| 900,000 | 4.00%, 01/14/2052(15) | 957,516 | |
| 531,325,428 | |||
| Total U.S. Government Agencies (cost $890,900,899) | $ 896,061,583 | ||
| U.S. GOVERNMENT SECURITIES - 22.8% | |||
| U.S. Treasury Securities - 22.8% | |||
| U.S. Treasury Bonds - 13.8% | |||
| 1,715,275 | 0.13%, 02/15/2051(16) | $ 2,032,735 | |
| 9,020,813 | 0.88%, 02/15/2047(16) | 12,189,901 | |
| 2,035,214 | 1.00%, 02/15/2048(16)(17) | 2,855,461 | |
| 4,005,000 | 1.25%, 05/15/2050 | 3,417,391 | |
| 35,290,000 | 1.75%, 08/15/2041 | 34,325,039 | |
| 1,490,000 | 1.88%, 02/15/2041 | 1,479,465 | |
| 7,650,000 | 1.88%, 02/15/2051 | 7,603,383 | |
| 18,965,000 | 2.00%, 11/15/2041 | 19,243,549 | |
| 5,795,000 | 2.00%, 08/15/2051 | 5,934,442 | |
| 7,090,000 | 2.25%, 08/15/2046 | 7,526,201 | |
| 14,805,000 | 2.38%, 05/15/2051 | 16,424,297 | |
| 78,145,000 | 2.88%, 08/15/2045 | 92,088,999 | |
| 6,175,000 | 3.00%, 02/15/2047 | 7,501,419 | |
| 18,440,000 | 3.13%, 02/15/2043 | 22,297,994 | |
| 20,715,000 | 3.13%, 08/15/2044(17)(18) | 25,243,170 | |
| 26,860,000 | 3.38%, 05/15/2044(17)(19) | 33,930,685 | |
| 16,575,000 | 3.75%, 11/15/2043 | 21,991,658 | |
| 316,085,789 | |||
| U.S. Treasury Notes - 9.0% | |||
| 5,975,386 | 0.38%, 01/15/2027(16)(17) | 6,573,742 | |
| 66,230,000 | 0.63%, 05/15/2030(17) | 61,989,728 | |
| 13,360,000 | 0.63%, 08/15/2030 | 12,472,812 | |
| 20,360,000 | 0.88%, 11/15/2030(17) | 19,378,584 | |
| 40,215,000 | 1.25%, 08/15/2031 | 39,366,715 | |
| 64,680,000 | 1.63%, 05/15/2031(17) | 65,569,350 | |
| 205,350,931 | |||
| Total U.S. Government Securities (cost $531,996,161) | $ 521,436,720 | ||
| 102 |
December 31, 2021
| Shares or Principal Amount | Market Value† | ||
| COMMON STOCKS - 0.0% | |||
| Diversified Financials - 0.0% | |||
| 30,559 | Philadelphia Energy Solutions*(20)(21) | $ — | |
| Energy - 0.0% | |||
| 64,657 | Ascent Resources - Marcellus LLC Class A(20)(21) | 77,589 | |
| 6,767 | Foresight Energy LLC* | 87,975 | |
| 206,275,142 | KCA Deutag*(20)(21)(22) | — | |
| 165,564 | |||
| Total Common Stocks (cost $3,317,133) | $ 165,564 | ||
| PREFERRED STOCKS - 0.1% | |||
| Banks - 0.1% | |||
| 2,242 | U.S. Bancorp Series A, 1.23%(3)(23) | $ 2,152,320 | |
| Total Preferred Stocks (cost $1,591,820) | $ 2,152,320 | ||
| WARRANTS - 0.0% | |||
| Energy - 0.0% | |||
| 16,740 | Ascent Resources - Marcellus LLC Expires 3/30/2023*(20)(21) | $ 352 | |
| Total Warrants (cost $1,339) | $ 352 | ||
| Total Long-Term Investments (Cost $2,883,190,463) | $ 2,879,288,720 | ||
| SHORT-TERM INVESTMENTS - 0.7% | |||
| Repurchase Agreements - 0.7% | |||
| $ 15,117,913 | Fixed Income Clearing Corp. Repurchase Agreement dated 12/31/2021 at 0.020%, due on 01/03/2022 with a maturity value of $15,117,938; collateralized by U.S. Treasury Bond at 1.750%, maturing 08/15/2041, with a market value of $15,420,298 | $ 15,117,913 | |
| Securities Lending Collateral - 0.0% | |||
| 13,759 | Fidelity Investments Money Market Funds, Government Portfolio, Institutional Class, 0.01%(24) | 13,759 | |
| Shares or Principal Amount | Market Value† | ||
| SHORT-TERM INVESTMENTS - 0.7% - (continued) | |||
| Securities Lending Collateral - 0.0% - (continued) | |||
| 360,280 | Goldman Sachs Financial Square Funds, Government Fund, Institutional Class, 0.03%(24) | $ 360,280 | |
| 20,990 | Invesco Government & Agency Portfolio, Institutional Class, 0.03%(24) | 20,990 | |
| 395,029 | |||
| Total Short-Term Investments (cost $15,512,942) | $ 15,512,942 | ||
| Total Investments Excluding Purchased Options (cost $2,898,703,405) | 126.8% | $ 2,894,801,662 | |
| Total Purchased Options (cost $2,626,157) | 0.0% | $ 194,062 | |
| Total Investments (cost $2,901,329,562) | 126.8% | $ 2,894,995,724 | |
| Other Assets and Liabilities | (26.8)% | (611,464,710) | |
| Total Net Assets | 100.0% | $ 2,283,531,014 | |
| Note: | Percentage of investments as shown is the ratio of the total market value to total net assets. |
| The Fund may refer to any one or more of the industry classifications used by one or more widely recognized market indices, ratings group and/or as defined by Fund management. Industry classifications may not be identical across all security types. | |
| Equity industry classifications used in this report are the Global Industry Classification Standard, which was developed by and is the exclusive property and service mark of MSCI, Inc. and Standard & Poor’s. | |
| For Fund compliance purposes, the Fund may not use the same classification system. These classifications are used for financial reporting purposes. | |
| See “Glossary” for abbreviation descriptions. |
| * | Non-income producing. |
| (1) | Security was purchased pursuant to Rule 144A under the Securities Act of 1933 and may be sold in transactions that are exempt from registration (typically only to qualified institutional buyers) or in a public offering registered under the Securities Act of 1933. At December 31, 2021, the aggregate value of these securities was $662,712,524, representing 29.0% of net assets. |
| (2) | Variable or floating rate security, which interest rate adjusts periodically based on changes in current interest rates and prepayments on the underlying pool of assets. Rate shown is the rate in effect as of period end. |
| (3) | Variable rate securities; the rate reported is the coupon rate in effect at December 31, 2021. Base lending rates may be subject to a floor or cap. |
| (4) | Security is a “step-up” bond where coupon increases or steps up at a predetermined date. Rate shown is current coupon rate. |
| (5) | Securities disclosed are interest-only strips. |
| (6) | Security is a zero-coupon bond. |
| 103 |
December 31, 2021
| (7) | Security is exempt from registration under Regulation S under the Securities Act of 1933, which exempts from registration securities offered and sold outside of the United States. Security may not be offered or sold in the United States except pursuant to an exemption from, or in a transaction not subject to, the registration requirements of the Securities Act of 1933. At December 31, 2021, the aggregate value of these securities was $45,551,819, representing 2.0% of net assets. |
| (8) | Represents entire or partial securities on loan. See Note 8 in the accompanying Notes to Financial Statements for securities lending information. |
| (9) | Fixed to variable rate investment. The rate shown reflects the fixed rate in effect at December 31, 2021. Rate will reset at a future date. Base lending rates may be subject to a floor or cap. |
| (10) | Senior floating rate interests generally pay interest rates which are periodically adjusted by reference to a base short-term, floating lending rate plus a premium. The base lending rates are primarily the LIBOR, and secondarily the prime rate offered by one or more major United States banks (the "Prime Rate") and the certificate of deposit rate or other base lending rates used by commercial lenders. Senior floating rate interests often require prepayments from excess cash flows or permit the borrower to repay at its election. The rate at which the borrower repays cannot be predicted with accuracy. As a result, the actual remaining maturity may be substantially less than the stated maturities shown. Base lending rates may be subject to a floor or cap. Unless otherwise noted, the interest rate disclosed for these securities represents the rate in effect as of December 31, 2021. |
| (11) | Represents an unsettled loan commitment. The coupon rate will be determined at time of settlement. |
| (12) | This security, or a portion of this security, has unfunded loan commitments. As of December 31, 2021, the aggregate value of the unfunded commitment was $69,705, which rounds to 0.0% of total net assets. |
| (13) | Non-income producing. For long-term debt securities, items identified are in default as to payment of interest and/or principal. |
| (14) | Securities disclosed are principal-only strips. |
| (15) | Represents or includes a TBA transaction. |
| (16) | The principal amount for these securities are adjusted for inflation and the interest payments equal a fixed percentage of the inflation-adjusted principal amount. |
| (17) | All, or a portion of the security, was pledged as collateral in connection with OTC swap contracts. As of December 31, 2021, the market value of securities pledged was $4,348,720. |
| (18) | All, or a portion of the security, was pledged as collateral in connection with futures contracts. As of December 31, 2021, the market value of securities pledged was $7,433,422. |
| (19) | All, or a portion of the security, was pledged as collateral in connection with centrally cleared swap contracts. As of December 31, 2021, the market value of securities pledged was $4,547,672. |
| (20) | These securities are valued in good faith at fair value as determined under policies and procedures established by and under the supervision of the Board of Directors. At December 31, 2021, the aggregate fair value of these securities are $77,941, which represented 0.0% of total net assets. This amount excludes securities that are principally traded in certain foreign markets and whose prices are adjusted pursuant to a third party pricing service methodology approved by the Board of Directors. |
| (21) | Investment valued using significant unobservable inputs. |
| (22) | Investment in securities not registered under the Securities Act of 1933 (excluding securities acquired pursuant to Rule 144A and Regulation S). At the end of the period, the value of such restricted securities amounted to $0 or 0.0% of net assets. |
| Period Acquired | Security Name | Shares/ Par Value | Total Cost | Market Value | ||||
| 03/2011 | KCA Deutag | 206,275,142 | $ 2,795,441 | $ — |
| (23) | Perpetual maturity security. Maturity date shown is the next call date or final legal maturity date, whichever comes first. |
| (24) | Current yield as of period end. |
| OTC Swaptions Outstanding at December 31, 2021 | ||||||||||||||||||
| Description | Counter- party | Exercise Price/ FX Rate/Rate | Pay/ Receive Floating Rate | Expiration Date | Notional Amount | Market Value† | Premiums Paid (Received) by Fund | Unrealized Appreciation/ (Depreciation) | ||||||||||
| Purchased swaptions: | ||||||||||||||||||
| Put | ||||||||||||||||||
| 3 Month USD-LIBOR-BBA-Interest Rate Swap Expiring 03/14/22* | CBK | 2.20% | Pay | 03/14/2022 | USD | 73,850,000 | $ 95,122 | $ 1,316,376 | $ (1,221,254) | |||||||||
| 3 Month USD-LIBOR-BBA-Interest Rate Swap Expiring 03/14/22* | BOA | 2.20% | Pay | 03/14/2022 | USD | 76,820,000 | 98,940 | 1,309,781 | (1,210,841) | |||||||||
| Total Put | $ 194,062 | $ 2,626,157 | $ (2,432,095) | |||||||||||||||
| Written swaptions: | ||||||||||||||||||
| Put | ||||||||||||||||||
| 3 Month USD-LIBOR-BBA-Interest Rate Swap Expiring 03/14/22* | BOA | 1.50% | Receive | 03/14/2022 | USD | (76,820,000) | $ (400,600) | $ (768,200) | $ 367,600 | |||||||||
| 3 Month USD-LIBOR-BBA-Interest Rate Swap Expiring 03/14/22* | CBK | 1.50% | Receive | 03/14/2022 | USD | (73,850,000) | (385,123) | (812,350) | 427,227 | |||||||||
| Total Put | $ (785,723) | $ (1,580,550) | $ 794,827 | |||||||||||||||
| * | Swaptions with forward premiums. |
| 104 |
December 31, 2021
| Futures Contracts Outstanding at December 31, 2021 | ||||||||
| Description | Number of Contracts | Expiration Date | Current Notional Amount | Value and Unrealized Appreciation/ (Depreciation) | ||||
| Long position contracts: | ||||||||
| U.S. Treasury 2-Year Note Future | 765 | 03/31/2022 | $ 166,901,485 | $ (117,250) | ||||
| U.S. Treasury 5-Year Note Future | 630 | 03/31/2022 | 76,215,235 | 25,636 | ||||
| U.S. Treasury 10-Year Note Future | 1,738 | 03/22/2022 | 226,754,687 | 148,768 | ||||
| Total | $ 57,154 | |||||||
| Short position contracts: | ||||||||
| Euro-BTP Future | 247 | 03/08/2022 | $ 41,340,595 | $ 489,775 | ||||
| Euro-BUND Future | 224 | 03/08/2022 | 43,703,448 | 581,228 | ||||
| Euro-BUXL 30-Year Bond Future | 67 | 03/08/2022 | 15,770,019 | 719,886 | ||||
| U.S. Treasury 10-Year Ultra Bond Future | 1,122 | 03/22/2022 | 164,302,875 | (1,984,714) | ||||
| U.S. Treasury Long Bond Futures | 561 | 03/22/2022 | 90,005,437 | (621,730) | ||||
| U.S. Treasury Ultra Bond Future | 172 | 03/22/2022 | 33,905,500 | (7,197) | ||||
| Total | $ (822,752) | |||||||
| Total futures contracts | $ (765,598) | |||||||
| TBA Sale Commitments Outstanding at December 31, 2021 | ||||||||
| Description | Principal Amount | Maturity Date | Market Value† | Unrealized Appreciation/ (Depreciation) | ||||
| GNMA, 2.00% | $ 19,410,000 | 01/21/2052 | $ (19,595,002) | $ 24,260 | ||||
| GNMA, 4.00% | 5,154,000 | 01/20/2052 | (5,428,209) | 4,429 | ||||
| UMBS, 1.50% | 11,995,000 | 01/19/2037 | (12,032,484) | 3,749 | ||||
| UMBS, 5.00% | 2,459,500 | 01/14/2052 | (2,680,471) | 1,192 | ||||
| UMBS, 5.50% | 10,750,000 | 01/14/2052 | (11,786,367) | 26,875 | ||||
| UMBS, 6.00% | 3,300,000 | 01/14/2052 | (3,631,547) | 3,609 | ||||
| Total TBA sale commitments (proceeds receivable $55,218,194) | $ (55,154,080) | $ 64,114 | ||||||
| At December 31, 2021, the aggregate market value of TBA Sale Commitments represents (2.4)% of total net assets. | ||||||||
| OTC Credit Default Swap Contracts Outstanding at December 31, 2021 | |||||||||||||||||||
| Reference Entity | Counter- party | Notional Amount(1) | (Pay)/Receive Fixed Rate | Expiration Date | Periodic Payment Frequency | Upfront Premiums Paid | Upfront Premiums Received | Market Value† | Unrealized Appreciation/ (Depreciation) | ||||||||||
| Credit default swaps on indices: | |||||||||||||||||||
| Buy protection: | |||||||||||||||||||
| ABX.HE.AAA.07 | GSC | USD | 1,302,009 | (0.09%) | 08/25/2037 | Monthly | $ 216,952 | $ — | $ 56,304 | $ (160,648) | |||||||||
| ABX.HE.AAA.07 | CSI | USD | 3,164,927 | (0.09%) | 08/25/2037 | Monthly | 606,374 | — | 136,863 | (469,511) | |||||||||
| ABX.HE.PENAAA.06 | MSC | USD | 349,010 | (0.11%) | 05/25/2046 | Monthly | 31,215 | — | 25,556 | (5,659) | |||||||||
| ABX.HE.PENAAA.06 | JPM | USD | 796,762 | (0.11%) | 05/25/2046 | Monthly | 71,092 | — | 58,343 | (12,749) | |||||||||
| ABX.HE.PENAAA.06 | GSC | USD | 327,044 | (0.11%) | 05/25/2046 | Monthly | 76,253 | — | 23,948 | (52,305) | |||||||||
| Total | $ 1,001,886 | $ — | $ 301,014 | $ (700,872) | |||||||||||||||
| Sell protection: | |||||||||||||||||||
| ABX.HE.AAA.07 | MSC | USD | 1,302,008 | 0.09% | 08/25/2037 | Monthly | $ 9,722 | $ — | $ (56,300) | $ (66,022) | |||||||||
| ABX.HE.AAA.07 | MSC | USD | 3,164,925 | 0.09% | 08/25/2037 | Monthly | 23,797 | — | (136,853) | (160,650) | |||||||||
| ABX.HE.PENAAA.06 | BCLY | USD | 1,472,821 | 0.11% | 05/25/2046 | Monthly | — | (32,710) | (107,847) | (75,137) | |||||||||
| CMBX.NA.BB.8 | GSC | USD | 816,537 | 5.00% | 10/17/2057 | Monthly | — | (180,649) | (308,299) | (127,650) | |||||||||
| CMBX.NA.BB.8 | MSC | USD | 2,201,266 | 5.00% | 10/17/2057 | Monthly | — | (543,937) | (831,129) | (287,192) | |||||||||
| CMBX.NA.BB.8 | CSI | USD | 2,422,549 | 5.00% | 10/17/2057 | Monthly | — | (598,576) | (914,678) | (316,102) | |||||||||
| 105 |
December 31, 2021
| OTC Credit Default Swap Contracts Outstanding at December 31, 2021 – (continued) | |||||||||||||||||||
| Reference Entity | Counter- party | Notional Amount(1) | (Pay)/Receive Fixed Rate | Expiration Date | Periodic Payment Frequency | Upfront Premiums Paid | Upfront Premiums Received | Market Value† | Unrealized Appreciation/ (Depreciation) | ||||||||||
| Credit default swaps on indices – (continued): | |||||||||||||||||||
| Sell protection – (continued): | |||||||||||||||||||
| CMBX.NA.BBB-.6 | MSC | USD | 424,617 | 3.00% | 05/11/2063 | Monthly | $ — | $ (57,815) | $ (118,550) | $ (60,735) | |||||||||
| CMBX.NA.BBB-.6 | GSC | USD | 1,343,787 | 3.00% | 05/11/2063 | Monthly | — | (137,361) | (375,177) | (237,816) | |||||||||
| Total | $ 33,519 | $ (1,551,048) | $ (2,848,833) | $ (1,331,304) | |||||||||||||||
| Total OTC credit default swap contracts | $ 1,035,405 | $ (1,551,048) | $ (2,547,819) | $ (2,032,176) | |||||||||||||||
| (1) | The maximum potential amount the Fund could be required to pay as a seller of credit protection or receive as a buyer of credit protection if a credit event occurs as defined under the terms of that particular swap agreement. |
| Centrally Cleared Credit Default Swap Contracts Outstanding at December 31, 2021 | |||||||||||||||
| Reference Entity | Notional Amount | (Pay)/Receive Fixed Rate | Expiration Date | Periodic Payment Frequency | Cost Basis | Value † | Unrealized Appreciation/ (Depreciation) | ||||||||
| Credit default swaps on indices: | |||||||||||||||
| Buy protection: | |||||||||||||||
| CDX.EM.35.V1 | USD | 16,930,000 | (1.00%) | 06/20/2026 | Quarterly | $ 463,832 | $ 557,571 | $ 93,739 | |||||||
| Sell protection: | |||||||||||||||
| CDX.NA.HY.37.V1 | USD | 14,740,000 | 5.00% | 12/20/2026 | Quarterly | $ 1,286,240 | $ 1,380,136 | $ 93,896 | |||||||
| Credit default swaps on single-name issues: | |||||||||||||||
| Sell protection: | |||||||||||||||
| Panama Republic (BBB) | USD | 3,230,000 | 1.00% | 06/20/2026 | Quarterly | $ 23,474 | $ 43,135 | $ 19,661 | |||||||
| Total | $ 23,474 | $ 43,135 | $ 19,661 | ||||||||||||
| Total centrally cleared credit default swap contracts | $ 1,773,546 | $ 1,980,842 | $ 207,296 | ||||||||||||
| Foreign Currency Contracts Outstanding at December 31, 2021 | ||||||||||
| Amount and Description of Currency to be Purchased | Amount and Description of Currency to be Sold | Counterparty | Settlement Date | Appreciation/ (Depreciation) | ||||||
| 3,697,656 | USD | 21,060,000 | BRL | DEUT | 03/16/2022 | $ (12,616) | ||||
| 5,291,583 | USD | 4,690,704 | EUR | DEUT | 01/31/2022 | (52,098) | ||||
| 70,997,631 | USD | 62,604,000 | EUR | DEUT | 03/16/2022 | (389,397) | ||||
| 9,529,539 | USD | 203,570,000 | MXN | BNP | 03/16/2022 | (279,545) | ||||
| 4,562,133 | USD | 343,540,000 | RUB | MSC | 03/16/2022 | 65,904 | ||||
| Total foreign currency contracts | $ (667,752) | |||||||||
| 106 |
December 31, 2021
| Description | Total | Level 1 | Level 2 | Level 3(1) | ||||
| Assets | ||||||||
| Asset & Commercial Mortgage-Backed Securities | $ 506,775,720 | $ — | $ 506,775,720 | $ — | ||||
| Corporate Bonds | 665,754,111 | — | 665,754,111 | — | ||||
| Foreign Government Obligations | 155,327,080 | — | 155,327,080 | — | ||||
| Municipal Bonds | 31,136,628 | — | 31,136,628 | — | ||||
| Senior Floating Rate Interests | 100,478,642 | — | 100,478,642 | — | ||||
| U.S. Government Agencies | 896,061,583 | — | 896,061,583 | — | ||||
| U.S. Government Securities | 521,436,720 | — | 521,436,720 | — | ||||
| Common Stocks | ||||||||
| Diversified Financials | — | — | — | — | ||||
| Energy | 165,564 | 87,975 | — | 77,589 | ||||
| Preferred Stocks | 2,152,320 | 2,152,320 | — | — | ||||
| Warrants | 352 | — | — | 352 | ||||
| Short-Term Investments | 15,512,942 | 395,029 | 15,117,913 | — | ||||
| Purchased Options | 194,062 | — | 194,062 | — | ||||
| Foreign Currency Contracts(2) | 65,904 | — | 65,904 | — | ||||
| Futures Contracts(2) | 1,965,293 | 1,965,293 | — | — | ||||
| Swaps - Credit Default(2) | 207,296 | — | 207,296 | — | ||||
| Total | $ 2,897,234,217 | $ 4,600,617 | $ 2,892,555,659 | $ 77,941 | ||||
| Liabilities | ||||||||
| Foreign Currency Contracts(2) | $ (733,656) | $ — | $ (733,656) | $ — | ||||
| Futures Contracts(2) | (2,730,891) | (2,730,891) | — | — | ||||
| Swaps - Credit Default(2) | (2,032,176) | — | (2,032,176) | — | ||||
| TBA Sale Commitments | (55,154,080) | — | (55,154,080) | — | ||||
| Written Options | (785,723) | — | (785,723) | — | ||||
| Total | $ (61,436,526) | $ (2,730,891) | $ (58,705,635) | $ — |
| (1) | For the year December 31, 2021, investments valued at $54,666 were transferred out of Level 3 due to a vendor providing prices that are based on market activity which has been determined to be significant observable input. There were no transfers into Level 3. |
| (2) | Derivative instruments (excluding purchased and written options, if applicable) are valued at the unrealized appreciation/(depreciation) on the investments. |
| 107 |
December 31, 2021
| Shares or Principal Amount | Market Value† | ||
| ASSET & COMMERCIAL MORTGAGE-BACKED SECURITIES - 33.1% | |||
| Asset-Backed - Automobile - 20.8% | |||
| American Credit Acceptance Receivables Trust | |||
| $ 1,131,068 | 0.33%, 06/13/2025(1) | $ 1,128,810 | |
| 777,736 | 0.35%, 05/13/2024(1) | 777,607 | |
| 596,890 | 0.37%, 10/15/2024(1) | 596,579 | |
| 3,224,336 | 0.45%, 09/15/2025(1) | 3,219,934 | |
| AmeriCredit Automobile Receivables Trust | |||
| 984,009 | 0.26%, 11/18/2024 | 982,283 | |
| 331,189 | 0.28%, 06/18/2024 | 331,093 | |
| 1,374,353 | 0.42%, 03/18/2024 | 1,374,482 | |
| 545,072 | 2.06%, 04/18/2024 | 546,827 | |
| 26,436 | 2.97%, 11/20/2023 | 26,463 | |
| ARI Fleet Lease Trust | |||
| 625,000 | 0.37%, 03/15/2030(1) | 622,004 | |
| 224,768 | 1.77%, 08/15/2028(1) | 225,626 | |
| 777,159 | Avid Automobile Receivables Trust 0.61%, 01/15/2025(1) | 776,129 | |
| CarMax Auto Owner Trust | |||
| 1,388,478 | 0.22%, 02/15/2024 | 1,388,155 | |
| 1,740,000 | 0.29%, 09/16/2024 | 1,737,402 | |
| 1,513,861 | 0.31%, 01/16/2024 | 1,513,626 | |
| 91,931 | 0.49%, 06/15/2023 | 91,939 | |
| 647,259 | 2.18%, 08/15/2024 | 654,284 | |
| 1,371,036 | 3.05%, 03/15/2024 | 1,382,526 | |
| Carvana Auto Receivables Trust | |||
| 776,190 | 0.28%, 11/08/2023 | 776,053 | |
| 913,964 | 0.28%, 03/11/2024 | 913,762 | |
| 2,205,341 | 0.30%, 07/10/2024 | 2,204,524 | |
| 370,090 | 0.32%, 03/10/2028 | 369,544 | |
| 1,217,495 | 0.35%, 06/12/2028 | 1,212,580 | |
| 1,529,000 | 0.38%, 01/10/2025 | 1,525,599 | |
| 798,369 | 0.70%, 01/10/2028 | 793,170 | |
| 1,530,000 | 0.82%, 04/10/2025 | 1,529,845 | |
| 2,235,000 | 0.83%, 09/11/2028 | 2,233,446 | |
| Chesapeake Funding LLC | |||
| 1,059,167 | 0.34%, 04/15/2033, 1 mo. USD LIBOR + 0.230%(1)(2) | 1,059,822 | |
| 832,631 | 0.87%, 08/16/2032(1) | 833,590 | |
| 902,423 | 1.95%, 09/15/2031(1) | 907,804 | |
| 1,127,298 | 2.94%, 04/15/2031(1) | 1,135,622 | |
| 255,663 | 3.39%, 01/15/2031(1) | 258,882 | |
| 1,231,658 | CIG Auto Receivables Trust 0.69%, 04/14/2025(1) | 1,228,403 | |
| CPS Auto Receivables Trust | |||
| 1,194,085 | 0.33%, 07/15/2024(1) | 1,193,342 | |
| 424,450 | 0.35%, 01/16/2024(1) | 424,380 | |
| 695,930 | 0.37%, 03/17/2025(1) | 695,455 | |
| 3,240,432 | 0.61%, 10/15/2025(1) | 3,236,608 | |
| 3,399,492 | Credit Acceptance Auto Loan Trust 2.38%, 11/15/2028(1) | 3,429,550 | |
| Drive Auto Receivables Trust | |||
| 1,335,000 | 0.35%, 03/17/2025 | 1,331,234 | |
| 374,480 | 0.36%, 12/15/2023 | 374,419 | |
| 1,465,000 | 0.79%, 10/15/2025 | 1,459,918 | |
| DT Auto Owner Trust | |||
| 2,287,455 | 0.33%, 04/15/2025(1) | 2,282,268 | |
| 1,264,611 | 0.35%, 01/15/2025(1) | 1,263,681 | |
| 1,313,397 | 0.41%, 03/17/2025(1) | 1,311,255 | |
| 493,903 | 0.54%, 04/15/2024(1) | 494,005 | |
| 2,156,545 | 0.56%, 09/15/2025(1) | 2,154,560 | |
| Enterprise Fleet Financing LLC | |||
| 1,295,000 | 0.48%, 05/20/2027(1) | 1,283,024 | |
| 1,013,032 | 1.78%, 12/22/2025(1) | 1,020,651 | |
| 2,218,591 | 2.06%, 05/20/2025(1) | 2,235,432 | |
| Shares or Principal Amount | Market Value† | ||
| ASSET & COMMERCIAL MORTGAGE-BACKED SECURITIES - 33.1% - (continued) | |||
| Asset-Backed - Automobile - 20.8% - (continued) | |||
| $ 604,526 | 2.29%, 02/20/2025(1) | $ 603,290 | |
| 160,639 | 2.98%, 10/20/2024(1) | 161,103 | |
| 596 | 3.38%, 05/20/2024(1) | 597 | |
| 643,116 | Enterprise Fleet Funding LLC 0.44%, 12/21/2026(1) | 639,563 | |
| Exeter Automobile Receivables Trust | |||
| 1,185,000 | 0.30%, 10/15/2024 | 1,183,590 | |
| 1,590,591 | 0.34%, 03/15/2024 | 1,589,998 | |
| 1,230,000 | 0.35%, 02/18/2025 | 1,226,435 | |
| 1,045,849 | FHF Trust 0.83%, 12/15/2026(1) | 1,038,565 | |
| First Investors Auto Owner Trust | |||
| 3,081,086 | 0.45%, 03/16/2026(1) | 3,075,109 | |
| 3,100,559 | 0.48%, 03/15/2027(1) | 3,084,237 | |
| 105,758 | 2.21%, 09/16/2024(1) | 105,961 | |
| Flagship Credit Auto Trust | |||
| 1,569,429 | 0.31%, 06/16/2025(1) | 1,565,877 | |
| 1,954,236 | 0.36%, 07/15/2027(1) | 1,938,106 | |
| 2,312,448 | 0.37%, 12/15/2026(1) | 2,303,776 | |
| 1,923,470 | 0.53%, 04/15/2025(1) | 1,921,230 | |
| 176,193 | 0.70%, 04/15/2025(1) | 176,334 | |
| 3,204,769 | 0.81%, 07/17/2026(1) | 3,197,438 | |
| 264,352 | 1.90%, 08/15/2024(1) | 265,540 | |
| 110,624 | 2.33%, 02/15/2024(1) | 110,794 | |
| Ford Credit Auto Owner Trust | |||
| 1,022,604 | 0.17%, 10/15/2023 | 1,022,146 | |
| 1,058,823 | 0.25%, 09/15/2023 | 1,058,782 | |
| 1,500,000 | 2.36%, 03/15/2029(1) | 1,519,005 | |
| Foursight Capital Automobile Receivables Trust | |||
| 1,257,427 | 0.40%, 08/15/2024(1) | 1,257,033 | |
| 1,256,662 | 0.40%, 04/15/2025(1) | 1,252,278 | |
| GLS Auto Receivables Issuer Trust | |||
| 1,001,571 | 0.31%, 11/15/2024(1) | 999,703 | |
| 1,345,531 | 0.34%, 05/15/2024(1) | 1,345,434 | |
| 3,043,869 | 0.42%, 01/15/2025(1) | 3,041,052 | |
| 444,539 | 0.52%, 02/15/2024(1) | 444,619 | |
| 3,475,000 | 0.84%, 07/15/2025 | 3,473,703 | |
| GM Financial Automobile Leasing Trust | |||
| 163,598 | 0.35%, 11/21/2022 | 163,599 | |
| 464,000 | 0.45%, 08/21/2023 | 464,063 | |
| 9,965 | 0.71%, 10/20/2022 | 9,967 | |
| GM Financial Consumer Automobile Receivables Trust | |||
| 1,035,539 | 0.23%, 11/16/2023 | 1,035,316 | |
| 1,069,272 | 0.27%, 06/17/2024 | 1,068,893 | |
| 199,449 | 0.35%, 07/17/2023 | 199,456 | |
| GM Financial Leasing Trust | |||
| 499,876 | 0.17%, 04/20/2023 | 499,710 | |
| 785,369 | 0.22%, 07/20/2023 | 784,825 | |
| 620,777 | Honda Auto Receivables Owner Trust 0.27%, 02/21/2023 | 620,684 | |
| Hyundai Auto Lease Securitization Trust | |||
| 1,231,133 | 0.25%, 04/17/2023(1) | 1,230,949 | |
| 452,943 | 0.36%, 01/17/2023(1) | 452,948 | |
| Hyundai Auto Receivables Trust | |||
| 745,926 | 0.23%, 02/15/2024 | 745,459 | |
| 815,694 | 0.26%, 09/15/2023 | 815,649 | |
| 150,192 | 0.38%, 03/15/2023 | 150,198 | |
| 144,347 | 1.51%, 04/17/2023 | 144,410 | |
| Mercedes-Benz Auto Lease Trust | |||
| 2,290,000 | 0.22%, 01/16/2024 | 2,287,775 | |
| 202,357 | 0.31%, 02/15/2023 | 202,333 | |
| 811,129 | Nissan Auto Lease Trust 0.34%, 12/15/2022 | 811,206 | |
| 108 |
December 31, 2021
| Shares or Principal Amount | Market Value† | ||
| ASSET & COMMERCIAL MORTGAGE-BACKED SECURITIES - 33.1% - (continued) | |||
| Asset-Backed - Automobile - 20.8% - (continued) | |||
| $ 478,387 | Prestige Auto Receivables Trust 0.52%, 02/15/2024(1) | $ 478,426 | |
| 782,331 | Santander Consumer Auto Receivables Trust 0.23%, 11/15/2023(1) | 782,160 | |
| Santander Drive Auto Receivables Trust | |||
| 426,834 | 0.28%, 04/15/2024 | 426,759 | |
| 583,196 | 0.29%, 05/15/2024 | 583,017 | |
| 995,000 | 0.33%, 03/17/2025 | 991,244 | |
| 585,000 | 0.34%, 02/18/2025 | 584,235 | |
| Santander Retail Auto Lease Trust | |||
| 1,809,575 | 0.31%, 01/22/2024(1) | 1,805,908 | |
| 1,889,600 | 0.32%, 02/20/2024(1) | 1,884,852 | |
| 1,571,695 | 0.42%, 11/20/2023(1) | 1,570,882 | |
| 206,736 | Securitized Term Auto Receivables Trust 2.99%, 02/27/2023(1) | 207,234 | |
| Tesla Auto Lease Trust | |||
| 1,508,506 | 0.36%, 03/20/2025(1) | 1,505,297 | |
| 1,535,000 | 0.36%, 09/22/2025(1) | 1,525,815 | |
| 190,131 | 0.55%, 05/22/2023(1) | 190,170 | |
| Toyota Auto Receivables Owner Trust | |||
| 898,653 | 0.23%, 05/15/2023 | 898,647 | |
| 140,740 | 0.36%, 02/15/2023 | 140,746 | |
| 2,100,000 | Toyota Lease Owner Trust 0.25%, 03/20/2024(1) | 2,093,609 | |
| 369,134 | United Auto Credit Securitization Trust 0.34%, 07/10/2023(1) | 369,086 | |
| Volkswagen Auto Lease Trust | |||
| 3,125,646 | 0.27%, 04/20/2023 | 3,125,038 | |
| 425,125 | 1.99%, 11/21/2022 | 425,941 | |
| Westlake Automobile Receivables Trust | |||
| 1,732,906 | 0.32%, 04/15/2025(1) | 1,728,221 | |
| 2,631,997 | 0.39%, 10/15/2024(1) | 2,629,116 | |
| 3,085,691 | 0.56%, 05/15/2024(1) | 3,086,356 | |
| 705,316 | 0.93%, 02/15/2024(1) | 706,016 | |
| 3,575,000 | 0.95%, 06/16/2025(1) | 3,565,649 | |
| 555,565 | Wheels SPV 2 LLC 0.51%, 08/20/2029(1) | 554,973 | |
| World Omni Auto Receivables Trust | |||
| 727,462 | 0.35%, 12/15/2023 | 727,553 | |
| 87,293 | 0.55%, 07/17/2023 | 87,308 | |
| World Omni Automobile Lease Securitization Trust | |||
| 3,126,288 | 0.21%, 04/15/2024 | 3,118,563 | |
| 422,510 | 0.32%, 09/15/2023 | 422,448 | |
| 274,518 | World Omni Select Auto Trust 0.47%, 06/17/2024 | 274,579 | |
| 146,326,783 | |||
| Asset-Backed - Credit Card - 0.2% | |||
| 1,150,000 | Evergreen Credit Card Trust 1.90%, 09/16/2024(1) | 1,161,749 | |
| Asset-Backed - Finance & Insurance - 3.7% | |||
| 287,754 | American Credit Acceptance Receivables Trust 0.53%, 03/13/2024(1) | 287,784 | |
| 596,969 | BWAY Mortgage Trust 2.81%, 03/10/2033(1) | 610,932 | |
| 3,455,000 | Credit Acceptance Auto Loan Trust 2.01%, 02/15/2029(1) | 3,482,284 | |
| DLL LLC | |||
| 1,335,000 | 0.35%, 09/20/2024(1) | 1,332,255 | |
| 3,648,559 | 0.36%, 05/17/2024(1) | 3,641,195 | |
| 15,249 | 2.89%, 04/20/2023(1) | 15,270 | |
| 1,935,000 | Dllmt 2021-1 LLC 0.60%, 03/20/2024(1) | 1,930,423 | |
| 1,590,000 | Donlen Fleet Lease Funding LLC 0.56%, 12/11/2034(1) | 1,580,742 | |
| Shares or Principal Amount | Market Value† | ||
| ASSET & COMMERCIAL MORTGAGE-BACKED SECURITIES - 33.1% - (continued) | |||
| Asset-Backed - Finance & Insurance - 3.7% - (continued) | |||
| $ 110,897 | Ellington Financial Mortgage Trust 2.74%, 11/25/2059(1)(3) | $ 111,569 | |
| 744,381 | FCI Funding LLC 1.13%, 04/15/2033(1) | 741,716 | |
| 636,340 | GM Financial Consumer Automobile Receivables Trust 0.26%, 11/16/2023 | 636,299 | |
| 742,000 | GMF Floorplan Owner Revolving Trust 2.70%, 04/15/2024(1) | 746,948 | |
| 100,512 | John Deere Owner Trust 0.41%, 03/15/2023 | 100,515 | |
| Kubota Credit Owner Trust | |||
| 1,410,000 | 0.26%, 06/17/2024(1) | 1,404,228 | |
| 1,864,265 | 0.31%, 04/15/2024(1) | 1,860,023 | |
| 304,818 | 0.41%, 06/15/2023(1) | 304,843 | |
| MMAF Equipment Finance LLC | |||
| 1,110,000 | 0.30%, 04/15/2024(1) | 1,108,720 | |
| 418,347 | 0.38%, 08/14/2023(1) | 418,042 | |
| 7,839 | 2.07%, 10/12/2022(1) | 7,844 | |
| Verizon Owner Trust | |||
| 4,000,000 | 0.41%, 04/21/2025 | 3,981,705 | |
| 1,084,735 | 2.33%, 12/20/2023 | 1,091,995 | |
| 92,546 | 2.93%, 09/20/2023 | 93,053 | |
| 3,611 | 3.23%, 04/20/2023 | 3,616 | |
| Volvo Financial Equipment LLC | |||
| 235,882 | 0.37%, 04/17/2023(1) | 235,911 | |
| 573,771 | 2.04%, 11/15/2023(1) | 577,376 | |
| 26,305,288 | |||
| Commercial Mortgage-Backed Securities - 0.1% | |||
| 785,000 | Morgan Stanley Bank of America Merrill Lynch Trust 3.79%, 08/15/2045 | 791,348 | |
| Other Asset-Backed Securities - 3.5% | |||
| 1,534,420 | Amur Equipment Finance Receivables LLC 0.75%, 11/20/2026(1) | 1,527,461 | |
| 1,090,000 | Atalaya Equipment Leasing Trust 1.23%, 05/15/2026(1) | 1,087,878 | |
| CCG Receivables Trust | |||
| 946,344 | 0.30%, 06/14/2027(1) | 941,599 | |
| 1,230,000 | 0.54%, 03/14/2029(1) | 1,222,343 | |
| 1,535,000 | CNH Equipment Trust 0.22%, 08/15/2024 | 1,531,681 | |
| 1,277,918 | Crossroads Asset Trust 0.82%, 03/20/2024(1) | 1,277,861 | |
| Dell Equipment Finance Trust | |||
| 1,024,440 | 0.33%, 05/22/2026(1) | 1,023,618 | |
| 710,000 | 0.33%, 12/22/2026(1) | 707,702 | |
| 990,000 | Dext ABS 2021-1 LLC 1.12%, 02/15/2028(1) | 986,732 | |
| GreatAmerica Leasing Receivables Funding LLC | |||
| 3,240,571 | 0.27%, 06/15/2023(1) | 3,237,019 | |
| 1,680,000 | 0.38%, 03/15/2024(1) | 1,673,240 | |
| HPEFS Equipment Trust | |||
| 994,620 | 0.27%, 03/20/2031(1) | 993,637 | |
| 1,465,000 | 0.30%, 09/20/2028(1) | 1,461,668 | |
| 303,124 | 0.65%, 07/22/2030(1) | 303,173 | |
| Marlette Funding Trust | |||
| 711,021 | 0.51%, 09/15/2031(1) | 709,469 | |
| 330,645 | 0.60%, 06/16/2031(1) | 330,563 | |
| 314,630 | New York City, NY Tax Lien 2.19%, 11/10/2032(1) | 315,125 | |
| 1,040,000 | PFS Financing Corp. 1.21%, 06/15/2024(1) | 1,043,358 | |
| SCF Equipment Leasing | |||
| 1,759,347 | 0.42%, 08/20/2026(1) | 1,757,700 | |
| 583,743 | 0.68%, 10/20/2025(1) | 583,921 | |
| SoFi Consumer Loan Program Trust | |||
| 503,985 | 0.49%, 09/25/2030(1) | 501,983 | |
| 109 |
December 31, 2021
| Shares or Principal Amount | Market Value† | ||
| ASSET & COMMERCIAL MORTGAGE-BACKED SECURITIES - 33.1% - (continued) | |||
| Other Asset-Backed Securities - 3.5% - (continued) | |||
| $ 152,691 | 2.02%, 01/25/2029(1) | $ 153,288 | |
| 27,855 | 2.45%, 08/25/2028(1) | 27,885 | |
| Towd Point Mortgage Trust | |||
| 434,729 | 0.69%, 02/25/2057, 1 mo. USD LIBOR + 0.600%(1)(2) | 434,503 | |
| 804,981 | 2.75%, 06/25/2057(1)(3) | 818,061 | |
| 24,651,468 | |||
| Packaging & Containers - 0.2% | |||
| 1,240,950 | Tricolor Auto Securitization Trust 0.74%, 04/15/2024(1) | 1,240,078 | |
| Whole Loan Collateral CMO - 4.6% | |||
| 1,120,999 | Angel Oak Mortgage Trust 2.53%, 01/26/2065(1)(3) | 1,124,084 | |
| Angel Oak Mortgage Trust LLC | |||
| 276,513 | 2.99%, 07/26/2049(1)(3) | 277,589 | |
| 595,243 | 3.92%, 11/25/2048(1)(3) | 599,173 | |
| BRAVO Residential Funding Trust | |||
| 603,067 | 0.94%, 02/25/2049(1)(3) | 598,331 | |
| 1,109,388 | 0.97%, 03/25/2060(1)(3) | 1,097,481 | |
| 2,151,439 | 1.70%, 04/26/2060(1)(3) | 2,157,781 | |
| 548,513 | Bunker Hill Loan Depositary Trust 2.72%, 11/25/2059(1)(4) | 552,779 | |
| 1,408,028 | COLT 2021-5 Mortgage Loan Trust 1.73%, 11/26/2066(1)(3) | 1,402,859 | |
| COLT Mortgage Loan Trust | |||
| 2,200,833 | 1.11%, 10/25/2066(1)(3) | 2,170,763 | |
| 702,189 | 1.33%, 10/26/2065(1)(3) | 702,092 | |
| 2,503,836 | 1.40%, 10/25/2066(1)(3) | 2,488,317 | |
| 253,504 | 1.51%, 04/27/2065(1)(3) | 253,480 | |
| 2,329,196 | CSMC 2019-AFC1 Trust 2.57%, 07/25/2049(1)(4) | 2,348,783 | |
| 583,972 | Ellington Financial Mortgage Trust 0.93%, 06/25/2066(1)(3) | 572,807 | |
| GCAT Trust | |||
| 3,836,493 | 1.26%, 07/25/2066(1)(3) | 3,806,829 | |
| 1,045,000 | 1.92%, 08/25/2066(3) | 1,045,229 | |
| MFRA Trust | |||
| 649,410 | 1.01%, 01/26/2065(1)(3) | 645,947 | |
| 886,867 | 1.03%, 11/25/2064(1)(3) | 878,467 | |
| New Residential Mortgage Loan Trust | |||
| 2,236,300 | 1.16%, 11/27/2056(1)(3) | 2,222,115 | |
| 632,345 | 4.00%, 08/27/2057(1)(3) | 662,163 | |
| 56,821 | OBX Trust 0.75%, 06/25/2057, 1 mo. USD LIBOR + 0.650%(1)(2) | 56,862 | |
| 249,410 | Residential Mortgage Loan Trust 2.38%, 01/26/2060(1)(3) | 250,447 | |
| 8,996 | Sequoia Mortgage Trust 3.50%, 02/25/2050(1)(3) | 8,992 | |
| 2,580,728 | SG Residential Mortgage Trust 1.16%, 07/25/2061(1)(3) | 2,551,315 | |
| Starwood Mortgage Residential Trust | |||
| 542,320 | 0.94%, 05/25/2065(1)(3) | 538,141 | |
| 322,878 | 2.28%, 02/25/2050(1)(3) | 323,898 | |
| Verus Securitization Trust | |||
| 1,639,527 | 1.63%, 10/25/2066(1)(3) | 1,634,890 | |
| 349,020 | 2.64%, 11/25/2059(1)(4) | 352,381 | |
| Shares or Principal Amount | Market Value† | ||
| ASSET & COMMERCIAL MORTGAGE-BACKED SECURITIES - 33.1% - (continued) | |||
| Whole Loan Collateral CMO - 4.6% - (continued) | |||
| $ 547,339 | 2.69%, 11/25/2059(1)(3) | $ 553,434 | |
| 198,451 | 2.78%, 07/25/2059(1)(4) | 199,124 | |
| 32,076,553 | |||
| Total Asset & Commercial Mortgage-Backed Securities (cost $233,199,088) | $ 232,553,267 | ||
| CORPORATE BONDS - 31.9% | |||
| Agriculture - 0.1% | |||
| 675,000 | Cargill, Inc. 1.38%, 07/23/2023(1) | $ 680,352 | |
| Apparel - 0.1% | |||
| 775,000 | VF Corp. 2.05%, 04/23/2022 | 778,937 | |
| Auto Manufacturers - 2.6% | |||
| American Honda Finance Corp. | |||
| 2,000,000 | 0.25%, 01/21/2022, 3 mo. USD LIBOR + 0.120%(2) | 2,000,100 | |
| 2,050,000 | 0.40%, 10/21/2022(5) | 2,047,534 | |
| General Motors Financial Co., Inc. | |||
| 1,500,000 | 0.67%, 10/15/2024(2)(5) | 1,498,817 | |
| 1,000,000 | 3.55%, 07/08/2022 | 1,014,523 | |
| 485,000 | PACCAR Financial Corp. 0.80%, 06/08/2023 | 485,429 | |
| Toyota Motor Credit Corp. | |||
| 1,650,000 | 0.35%, 10/14/2022 | 1,647,620 | |
| 1,500,000 | 0.37%, 04/06/2023, 1 mo. USD SOFR + 0.320%(2)(5) | 1,499,431 | |
| 2,000,000 | 0.38%, 01/11/2024, 1 mo. USD SOFR + 0.330%(2) | 1,999,306 | |
| 2,000,000 | 0.40%, 06/13/2023 | 1,999,801 | |
| 1,525,000 | 1.15%, 05/26/2022 | 1,529,801 | |
| Volkswagen Group of America Finance LLC | |||
| 1,600,000 | 0.75%, 11/23/2022(1) | 1,599,762 | |
| 750,000 | 3.13%, 05/12/2023(1) | 771,084 | |
| 18,093,208 | |||
| Beverages - 0.6% | |||
| 2,275,000 | Coca-Cola European Partners plc 0.50%, 05/05/2023(1) | 2,256,336 | |
| 1,750,000 | JDE Peet's N.V. 0.80%, 09/24/2024(1) | 1,715,093 | |
| 3,971,429 | |||
| Biotechnology - 0.3% | |||
| 2,250,000 | Royalty Pharma plc 0.75%, 09/02/2023 | 2,236,056 | |
| Chemicals - 0.1% | |||
| 430,000 | International Flavors & Fragrances, Inc. 0.70%, 09/15/2022(1) | 430,021 | |
| Commercial Banks - 13.9% | |||
| Bank of America Corp. | |||
| 1,875,000 | 0.59%, 05/28/2024, 3 mo. USD BSBY3M + 0.430%(2) | 1,875,009 | |
| 1,525,000 | 0.74%, 04/22/2025, 1 mo. USD SOFR + 0.690%(2) | 1,530,316 | |
| 1,250,000 | 0.81%, 10/24/2024, (0.81% fixed rate until 10/24/2023; 1 mo. USD SOFR + 0.740% thereafter)(6) | 1,241,804 | |
| Bank of Montreal | |||
| 2,200,000 | 0.31%, 09/15/2023, 1 mo. USD SOFR + 0.265%(2) | 2,197,035 | |
| 2,200,000 | 0.40%, 09/15/2023 | 2,184,335 | |
| 110 |
December 31, 2021
| Shares or Principal Amount | Market Value† | ||
| CORPORATE BONDS - 31.9% - (continued) | |||
| Commercial Banks - 13.9% - (continued) | |||
| Bank of New York Mellon Corp. | |||
| $ 750,000 | 0.31%, 04/26/2024, 1 mo. USD SOFR + 0.260%(2) | $ 749,632 | |
| 640,000 | 1.95%, 08/23/2022 | 646,237 | |
| 3,675,000 | Bank of Nova Scotia 0.43%, 07/31/2024, 1 mo. USD SOFR + 0.380%(2) | 3,672,097 | |
| 675,000 | Barclays Bank plc 1.70%, 05/12/2022 | 677,290 | |
| 3,518,000 | BPCE S.A. 3.00%, 05/22/2022(1) | 3,551,365 | |
| 900,000 | Canadian Imperial Bank of Commerce 0.85%, 03/17/2023, 1 mo. USD SOFR + 0.800%(2) | 904,631 | |
| 350,000 | Capital One NA 2.15%, 09/06/2022 | 353,314 | |
| Citigroup, Inc. | |||
| 2,300,000 | 2.70%, 10/27/2022 | 2,336,224 | |
| 2,250,000 | 4.50%, 01/14/2022 | 2,252,625 | |
| 1,550,000 | Cooperatieve Rabobank UA 0.35%, 01/12/2024, 1 mo. USD SOFR + 0.300%(2) | 1,548,956 | |
| Credit Suisse AG | |||
| 3,675,000 | 0.43%, 08/09/2023, 1 mo. USD SOFR + 0.380%(2) | 3,674,996 | |
| 750,000 | 0.50%, 02/04/2022, 3 mo. USD SOFR + 0.450%(2) | 750,136 | |
| 1,550,000 | 3.57%, 01/09/2023(1) | 1,550,439 | |
| 2,525,000 | Deutsche Bank AG 0.55%, 11/08/2023, 1 mo. USD SOFR + 0.500%(2) | 2,522,330 | |
| 750,000 | Fifth Third Bancorp 1.63%, 05/05/2023 | 757,333 | |
| 705,000 | Fifth Third Bank NA 1.80%, 01/30/2023(5) | 712,193 | |
| Goldman Sachs Group, Inc. | |||
| 1,150,000 | 0.46%, 01/27/2023, 1 mo. USD SOFR + 0.410%(2) | 1,150,028 | |
| 1,500,000 | 0.55%, 09/10/2024, 3 mo. USD SOFR + 0.500%(2) | 1,497,978 | |
| 1,765,000 | 0.63%, 11/17/2023, (0.63% fixed rate until 11/17/2022; 1 mo. USD SOFR + 0.538% thereafter)(6) | 1,760,520 | |
| 1,425,000 | 1.22%, 12/06/2023 | 1,428,266 | |
| 1,425,000 | HSBC Holdings plc 0.63%, 11/22/2024, 1 mo. USD SOFR + 0.580%(2) | 1,424,180 | |
| 525,000 | Huntington National Bank 1.80%, 02/03/2023 | 530,301 | |
| JP Morgan Chase & Co. | |||
| 2,000,000 | 0.58%, 06/01/2025, 1 mo. USD SOFR + 0.535%(2) | 2,002,135 | |
| 1,900,000 | 0.63%, 03/16/2024, 3 mo. USD SOFR + 0.580%(2) | 1,903,001 | |
| KeyBank NA | |||
| 1,250,000 | 0.37%, 06/14/2024, 1 mo. USD SOFR + 0.320%(2) | 1,249,378 | |
| 2,000,000 | 0.39%, 01/03/2024, 1 mo. USD SOFR + 0.340%(2) | 1,997,974 | |
| 1,350,000 | 1.25%, 03/10/2023 | 1,358,146 | |
| 1,150,000 | Macquarie Bank Ltd. 0.44%, 12/16/2022(1) | 1,147,890 | |
| 1,500,000 | Macquarie Group Ltd. 0.76%, 10/14/2025(1)(2) | 1,501,665 | |
| Mizuho Financial Group, Inc. | |||
| 1,100,000 | 0.81%, 05/25/2024, 3 mo. USD LIBOR + 0.630%(2) | 1,104,066 | |
| 2,762,000 | 2.95%, 02/28/2022 | 2,772,550 | |
| Morgan Stanley | |||
| 1,125,000 | 0.73%, 04/05/2024, (0.73% fixed rate until 04/05/2023; 1 mo. USD SOFR + 0.616% thereafter)(6) | 1,121,598 | |
| 1,800,000 | 0.75%, 01/20/2023, 3 mo. USD SOFR + 0.700%(2) | 1,800,279 | |
| 4,190,000 | 2.75%, 05/19/2022 | 4,227,501 | |
| 1,025,000 | 4.88%, 11/01/2022 | 1,059,570 | |
| Shares or Principal Amount | Market Value† | ||
| CORPORATE BONDS - 31.9% - (continued) | |||
| Commercial Banks - 13.9% - (continued) | |||
| $ 675,000 | National Australia Bank Ltd. 1.88%, 12/13/2022 | $ 683,423 | |
| National Bank of Canada | |||
| 3,725,000 | 0.54%, 08/06/2024, 1 mo. USD SOFR + 0.490%(2) | 3,732,757 | |
| 875,000 | 0.90%, 08/15/2023, (0.90% fixed rate until 08/15/2022; 12 mo. USD CMT + 0.770% thereafter)(6) | 875,683 | |
| 1,290,000 | NatWest Markets plc 0.58%, 08/12/2024, 1 mo. USD SOFR + 0.530%(1)(2) | 1,290,067 | |
| 875,000 | Nordea Bank Abp 1.00%, 06/09/2023(1) | 877,822 | |
| 875,000 | PNC Bank NA 0.49%, 02/24/2023, 3 mo. USD LIBOR + 0.325%(2) | 875,326 | |
| Royal Bank of Canada | |||
| 1,925,000 | 0.35%, 01/19/2024, 1 mo. USD SOFR + 0.300%(2) | 1,922,740 | |
| 1,475,000 | 0.39%, 10/07/2024(2) | 1,475,000 | |
| 2,200,000 | Sumitomo Mitsui Trust Bank Ltd. 0.49%, 09/16/2024, 1 mo. USD SOFR + 0.440%(1)(2) | 2,196,413 | |
| 1,566,000 | Synchrony Bank 3.00%, 06/15/2022 | 1,579,624 | |
| Toronto-Dominion Bank | |||
| 2,700,000 | 0.29%, 01/06/2023, 1 mo. USD SOFR + 0.240%(2) | 2,701,589 | |
| 2,200,000 | 0.40%, 09/10/2024, 1 mo. USD SOFR + 0.350%(2) | 2,200,000 | |
| 750,000 | 0.50%, 09/28/2023, 1 mo. USD SOFR + 0.450%(2) | 752,225 | |
| 675,000 | 0.53%, 01/27/2023, 1 mo. USD SOFR + 0.480%(2) | 676,831 | |
| 1,500,000 | Truist Financial Corp. 0.45%, 06/09/2025, 1 mo. USD SOFR + 0.400%(2) | 1,495,828 | |
| UBS AG | |||
| 1,875,000 | 0.37%, 06/01/2023, 1 mo. USD SOFR + 0.320%(1)(2) | 1,874,200 | |
| 2,200,000 | 0.50%, 08/09/2024, 1 mo. USD SOFR + 0.450%(1)(2) | 2,201,900 | |
| 3,425,000 | UBS Group AG 2.65%, 02/01/2022(1) | 3,430,995 | |
| 97,567,746 | |||
| Construction Materials - 0.1% | |||
| 1,030,000 | Martin Marietta Materials, Inc. 0.65%, 07/15/2023 | 1,026,389 | |
| Diversified Financial Services - 0.4% | |||
| 785,000 | AIG Global Funding 0.80%, 07/07/2023(1) | 783,712 | |
| 1,500,000 | Capital One Financial Corp. 1.15%, 03/09/2022, 3 mo. USD LIBOR + 0.950%(2) | 1,501,095 | |
| 805,000 | Nasdaq, Inc. 0.45%, 12/21/2022 | 803,841 | |
| 3,088,648 | |||
| Electric - 2.7% | |||
| 2,400,000 | Cleco Power LLC 0.70%, 06/15/2023, 3 mo. USD LIBOR + 0.500%(1)(2) | 2,398,163 | |
| 445,000 | Consumers Energy Co. 0.35%, 06/01/2023 | 442,038 | |
| 2,400,000 | DTE Energy Co. 0.55%, 11/01/2022 | 2,395,957 | |
| 825,000 | Duke Energy Corp. 0.30%, 06/10/2023, 1 mo. USD SOFR + 0.250%(2) | 824,097 | |
| 2,275,000 | Florida Power & Light Co. 0.30%, 05/10/2023, 1 mo. USD SOFR + 0.250%(2) | 2,268,412 | |
| 1,520,000 | Mississippi Power Co. 0.35%, 06/28/2024, 1 mo. USD SOFR + 0.300%(2) | 1,514,346 | |
| 1,070,000 | National Rural Utilities Cooperative Finance Corp. 1.75%, 01/21/2022 | 1,070,710 | |
| 111 |
December 31, 2021
| Shares or Principal Amount | Market Value† | ||
| CORPORATE BONDS - 31.9% - (continued) | |||
| Electric - 2.7% - (continued) | |||
| NextEra Energy Capital Holdings, Inc. | |||
| $ 2,675,000 | 0.43%, 02/22/2023, 3 mo. USD LIBOR + 0.270%(2) | $ 2,670,482 | |
| 1,085,000 | 0.59%, 03/01/2023, 1 mo. USD SOFR + 0.540%(2) | 1,086,640 | |
| 780,000 | Oklahoma Gas and Electric Co. 0.55%, 05/26/2023 | 774,911 | |
| 2,115,000 | PPL Electric Utilities Corp. 0.38%, 06/24/2024, 1 mo. USD SOFR + 0.330%(2) | 2,109,865 | |
| 1,500,000 | Southern California Edison Co. 0.52%, 12/02/2022, 1 mo. USD SOFR + 0.470% | 1,501,370 | |
| 19,056,991 | |||
| Electronics - 0.2% | |||
| Honeywell International, Inc. | |||
| 200,000 | 0.48%, 08/19/2022 | 200,003 | |
| 1,000,000 | 2.15%, 08/08/2022 | 1,008,732 | |
| 1,208,735 | |||
| Food - 0.9% | |||
| 2,223,000 | Campbell Soup Co. 2.50%, 08/02/2022 | 2,246,660 | |
| 1,475,000 | Conagra Brands, Inc. 0.50%, 08/11/2023 | 1,462,446 | |
| 1,750,000 | Mondelez International Holdings Netherlands B.V. 2.13%, 09/19/2022(1) | 1,768,352 | |
| 750,000 | Mondelez International, Inc. 0.63%, 07/01/2022 | 750,842 | |
| 6,228,300 | |||
| Gas - 0.6% | |||
| 3,175,000 | CenterPoint Energy, Inc. 0.67%, 03/02/2023, 3 mo. USD LIBOR + 0.500%(2) | 3,167,605 | |
| 1,325,000 | ONE Gas, Inc. 0.81%, 03/11/2023, 3 mo. USD LIBOR + 0.610%(2) | 1,325,057 | |
| 4,492,662 | |||
| Healthcare - Products - 0.6% | |||
| 2,600,000 | PerkinElmer, Inc. 0.55%, 09/15/2023 | 2,578,230 | |
| 1,215,000 | Stryker Corp. 0.60%, 12/01/2023 | 1,208,535 | |
| 680,000 | Thermo Fisher Scientific, Inc. 0.58%, 10/18/2024(2) | 680,922 | |
| 4,467,687 | |||
| Healthcare - Services - 0.4% | |||
| 1,945,000 | Humana, Inc. 0.65%, 08/03/2023 | 1,935,087 | |
| 820,000 | UnitedHealth Group, Inc. 0.55%, 05/15/2024 | 813,621 | |
| 2,748,708 | |||
| Insurance - 3.5% | |||
| Athene Global Funding | |||
| 3,500,000 | 0.61%, 08/19/2024, 1 mo. USD SOFR + 0.560%(1)(2) | 3,499,035 | |
| 2,620,000 | 0.75%, 05/24/2024, 1 mo. USD SOFR + 0.700%(1)(2) | 2,625,234 | |
| Brighthouse Financial Global Funding | |||
| 1,625,000 | 0.81%, 04/12/2024, 3 mo. USD SOFR + 0.760%(1)(2) | 1,632,799 | |
| 1,500,000 | 1.20%, 12/15/2023 | 1,499,760 | |
| 2,650,000 | Equitable Financial Life Global Funding 0.44%, 04/06/2023, 1 mo. USD SOFR + 0.390%(1)(2) | 2,653,456 | |
| 1,425,000 | Jackson Financial, Inc. 1.13%, 11/22/2023(1) | 1,422,529 | |
| MassMutual Global Funding II | |||
| 1,550,000 | 0.41%, 04/12/2024, 1 mo. USD SOFR + 0.360%(1)(2) | 1,554,248 | |
| 848,000 | 0.85%, 06/09/2023(1) | 849,021 | |
| 950,000 | 2.25%, 07/01/2022(1) | 959,048 | |
| Shares or Principal Amount | Market Value† | ||
| CORPORATE BONDS - 31.9% - (continued) | |||
| Insurance - 3.5% - (continued) | |||
| $ 2,500,000 | Metropolitan Life Global Funding I 3.00%, 01/10/2023(1) | $ 2,559,725 | |
| 875,000 | New York Life Global Funding 1.10%, 05/05/2023(1)(5) | 878,891 | |
| 650,000 | Pacific Life Global Funding II 0.50%, 09/23/2023(1) | 645,727 | |
| 645,000 | Principal Life Global Funding 0.50%, 04/12/2024, 1 mo. USD SOFR + 0.450%(1)(2)(5) | 645,148 | |
| 2,500,000 | Principal Life Global Funding II 0.43%, 08/23/2024, 1 mo. USD SOFR + 0.380%(1)(2) | 2,497,336 | |
| 420,000 | Protective Life Global Funding 1.08%, 06/09/2023(1) | 420,971 | |
| 24,342,928 | |||
| IT Services - 0.1% | |||
| 875,000 | Apple, Inc. 0.75%, 05/11/2023 | 877,457 | |
| Machinery - Construction & Mining - 0.2% | |||
| 1,100,000 | Caterpillar Financial Services Corp. 0.32%, 09/13/2024, 1 mo. USD SOFR + 0.270%(2) | 1,101,494 | |
| Machinery-Diversified - 0.2% | |||
| 1,060,000 | Otis Worldwide Corp. 0.58%, 04/05/2023, 3 mo. USD LIBOR + 0.450%(2) | 1,060,029 | |
| Media - 0.2% | |||
| 1,250,000 | Fox Corp. 3.67%, 01/25/2022 | 1,252,467 | |
| Miscellaneous Manufacturing - 0.2% | |||
| 645,000 | Carlisle Cos., Inc. 0.55%, 09/01/2023(5) | 639,284 | |
| 1,090,000 | Siemens Financieringsmaatschappij N.V. 0.40%, 03/11/2023(1) | 1,086,714 | |
| 1,725,998 | |||
| Oil & Gas - 0.3% | |||
| 1,125,000 | Chevron USA, Inc. 0.33%, 08/12/2022 | 1,124,125 | |
| 1,300,000 | Pioneer Natural Resources Co. 0.55%, 05/15/2023 | 1,295,142 | |
| 2,419,267 | |||
| Pharmaceuticals - 1.7% | |||
| 2,200,000 | AbbVie, Inc. 3.45%, 03/15/2022 | 2,202,013 | |
| 1,690,000 | AmerisourceBergen Corp. 0.74%, 03/15/2023 | 1,685,702 | |
| 3,000,000 | AstraZeneca plc 0.30%, 05/26/2023(5) | 2,986,877 | |
| 1,323,000 | Bristol-Myers Squibb Co. 3.25%, 02/20/2023 | 1,357,887 | |
| 4,000,000 | GlaxoSmithKline Capital plc 2.88%, 06/01/2022 | 4,032,838 | |
| 12,265,317 | |||
| Pipelines - 0.1% | |||
| 1,015,000 | Southern Natural Gas Co. LLC 0.63%, 04/28/2023(1) | 1,009,147 | |
| Real Estate Investment Trusts - 0.3% | |||
| 590,000 | American Tower Corp. 2.25%, 01/15/2022 | 590,317 | |
| 1,220,000 | Public Storage 0.52%, 04/23/2024, 1 mo. USD SOFR + 0.470%(2) | 1,218,456 | |
| 1,808,773 | |||
| Retail - 0.2% | |||
| 1,620,000 | 7-Eleven, Inc. 0.63%, 02/10/2023(1) | 1,613,977 | |
| Semiconductors - 0.6% | |||
| 1,120,000 | Analog Devices, Inc. 0.30%, 10/01/2024, 1 mo. USD SOFR + 0.250%(2) | 1,121,085 | |
| 112 |
December 31, 2021
| Shares or Principal Amount | Market Value† | ||
| CORPORATE BONDS - 31.9% - (continued) | |||
| Semiconductors - 0.6% - (continued) | |||
| $ 1,035,000 | Qorvo, Inc. 1.75%, 12/15/2024 | $ 1,035,666 | |
| 2,285,000 | Skyworks Solutions, Inc. 0.90%, 06/01/2023 | 2,273,430 | |
| 4,430,181 | |||
| Software - 0.3% | |||
| 1,525,000 | Fidelity National Information Services, Inc. 0.38%, 03/01/2023 | 1,517,550 | |
| 295,000 | Roper Technologies, Inc. 0.45%, 08/15/2022 | 294,755 | |
| 1,812,305 | |||
| Telecommunications - 0.4% | |||
| 1,000,000 | AT&T, Inc. 0.69%, 03/25/2024, 3 mo. USD SOFR + 0.640%(2) | 1,000,283 | |
| 1,525,000 | NTT Finance Corp. 0.37%, 03/03/2023(1) | 1,518,767 | |
| 2,519,050 | |||
| Total Corporate Bonds (cost $224,427,336) | $ 224,314,259 | ||
| MUNICIPAL BONDS - 0.3% | |||
| Tobacco - 0.2% | |||
| 1,260,000 | Golden State, CA, Tobacco Securitization Corp. 0.50%, 06/01/2022 | $ 1,260,799 | |
| Utilities - 0.1% | |||
| 1,085,000 | Long Island, NY, Power Auth 0.36%, 03/01/2023 | 1,080,402 | |
| Total Municipal Bonds (cost $2,345,000) | $ 2,341,201 | ||
| U.S. GOVERNMENT AGENCIES - 0.9% | |||
| Mortgage-Backed Agencies - 0.9% | |||
| FHLMC - 0.4% | |||
| 1,265,042 | 1.00%, 05/15/2041 | $ 1,265,183 | |
| 893,724 | 1.75%, 04/15/2027 | 903,494 | |
| 215,846 | 3.00%, 05/15/2043 | 219,557 | |
| 117,678 | 3.50%, 05/15/2042 | 118,846 | |
| 228,460 | 3.50%, 11/15/2042 | 230,528 | |
| 294,093 | 3.50%, 05/15/2044 | 295,512 | |
| 3,033,120 | |||
| FNMA - 0.3% | |||
| 1,171,497 | 1.75%, 09/25/2041 | 1,183,536 | |
| 216,485 | 3.00%, 07/25/2041 | 218,167 | |
| 249,348 | 3.00%, 08/25/2041 | 251,301 | |
| 1,653,004 | |||
| GNMA - 0.2% | |||
| 710,248 | 1.70%, 10/20/2045 | 716,652 | |
| 174,031 | 1.80%, 05/20/2041 | 174,293 | |
| 677,535 | 2.50%, 09/20/2046 | 689,614 | |
| 1,580,559 | |||
| Total U.S. Government Agencies (cost $6,284,576) | $ 6,266,683 | ||
| U.S. GOVERNMENT SECURITIES - 6.8% | |||
| Other Direct Federal Obligations - 1.5% | |||
| FFCB - 0.6% | |||
| 4,500,000 | 0.53%, 01/18/2022 | $ 4,500,623 | |
| 4,500,623 | |||
| Shares or Principal Amount | Market Value† | ||
| U.S. GOVERNMENT SECURITIES - 6.8% - (continued) | |||
| Other Direct Federal Obligations - 1.5% - (continued) | |||
| FHLB - 0.9% | |||
| $ 6,000,000 | 0.25%, 06/03/2022 | $ 6,003,070 | |
| 6,003,070 | |||
| U.S. Treasury Securities - 5.3% | |||
| U.S. Treasury Notes - 5.3% | |||
| 7,250,000 | 0.13%, 01/31/2023 | 7,225,078 | |
| 5,000,000 | 1.13%, 02/28/2022 | 5,008,274 | |
| 25,000,000 | 1.88%, 08/31/2022 | 25,261,719 | |
| Total U.S. Government Securities (cost $48,027,725) | $ 47,998,764 | ||
| Total Long-Term Investments (Cost $514,283,725) | $ 513,474,174 | ||
| SHORT-TERM INVESTMENTS - 27.0% | |||
| Commercial Paper - 2.7% | |||
| 3,700,000 | Credit Industriel et Commercial/New York 0.20%, 01/31/2022(7) | $ 3,699,368 | |
| 2,250,000 | Credit Suisse NY 0.19%, 04/08/2022(7) | 2,248,438 | |
| 3,645,000 | HSBC USA, Inc. 0.25%, 06/10/2022(7) | 3,637,991 | |
| 3,795,000 | Landesbank Baden-Wur 0.18%, 01/07/2022(7) | 3,794,867 | |
| 2,735,000 | Standard Chartered Bank 0.24%, 10/06/2022(7) | 2,725,864 | |
| 3,000,000 | Svenska Handlsbnkn A 0.24%, 03/16/2022(7) | 2,999,094 | |
| 19,105,622 | |||
| Foreign Government Obligations - 2.4% | |||
| 4,000,000 | Bank of Nova Scotia 0.23%, 04/07/2022 | 4,000,028 | |
| 2,500,000 | Canadian Imperial Bank of Commerce 0.23%, 04/08/2022 | 2,500,297 | |
| 2,000,000 | Cooperatieve Centrale 0.21%, 03/16/2022 | 2,000,207 | |
| 2,275,000 | Standard Chartered 0.24%, 03/04/2022 | 2,274,878 | |
| 2,250,000 | Toronto-Dominion Bank 0.23%, 03/17/2022 | 2,250,274 | |
| 3,650,000 | Westpac Banking Corp. 0.18%, 09/06/2022, 1 mo. USD SOFR + 0.130%(2) | 3,647,907 | |
| 16,673,591 | |||
| Repurchase Agreements - 1.0% | |||
| 7,097,330 | Fixed Income Clearing Corp. Repurchase Agreement dated 12/31/2021 at 0.020%,due on 1/03/2022 with a maturity value of $7,097,342; collateralized by U.S. Treasury Bond at 2.000%, maturing 11/15/2041, with a market value of $7,239,356 | 7,097,330 | |
| Securities Lending Collateral - 0.4% | |||
| 81,830 | Fidelity Investments Money Market Funds, Government Portfolio, Institutional Class, 0.01%(8) | 81,830 | |
| 2,142,678 | Goldman Sachs Financial Square Funds, Government Fund, Institutional Class, 0.03%(8) | 2,142,678 | |
| 124,835 | Invesco Government & Agency Portfolio, Institutional Class, 0.03%(8) | 124,835 | |
| 2,349,343 | |||
| U.S. Treasury Securities - 20.5% | |||
| U.S. Treasury Bills – 17.0% | |||
| 20,000,000 | 0.05%, 03/01/2022(7) | 19,998,197 | |
| 10,000,000 | 0.06%, 04/28/2022(7) | 9,997,564 | |
| 7,500,000 | 0.06%, 05/19/2022(7) | 7,497,231 | |
| 10,000,000 | 0.07%, 05/26/2022(7) | 9,996,266 | |
| 113 |
December 31, 2021
| Shares or Principal Amount | Market Value† | ||
| SHORT-TERM INVESTMENTS - 27.0% - (continued) | |||
| U.S. Treasury Securities - 20.5% - (continued) | |||
| U.S. Treasury Bills – 17.0% - (continued) | |||
| $ 5,000,000 | 0.08%, 08/11/2022(7) | $ 4,993,965 | |
| 10,000,000 | 0.09%, 06/02/2022(7) | 9,995,573 | |
| 8,000,000 | 0.11%, 06/09/2022(7) | 7,996,162 | |
| 5,000,000 | 0.16%, 06/23/2022(7) | 4,996,022 | |
| 7,175,000 | 0.16%, 11/03/2022(7) | 7,158,984 | |
| 5,000,000 | 0.21%, 06/30/2022(7) | 4,995,426 | |
| 20,750,000 | 0.24%, 12/01/2022(7) | 20,695,654 | |
| 11,000,000 | 0.40%, 12/29/2022(7) | 10,958,567 | |
| 119,279,611 | |||
| U.S. Treasury Cash Management Bills – 3.5% | |||
| 5,000,000 | 0.06%, 03/15/2022(7) | 4,999,576 | |
| 5,000,000 | 0.06%, 03/22/2022(7) | 4,999,263 | |
| 10,000,000 | 0.08%, 04/05/2022(7) | 9,998,135 | |
| 5,000,000 | 0.09%, 04/19/2022(7) | 4,998,970 | |
| 24,995,944 | |||
| 144,275,555 | |||
| Total Short-Term Investments (cost $189,528,356) | $ 189,501,441 | ||
| Total Investments (cost $703,812,081) | 100.0% | $ 702,975,615 | |
| Other Assets and Liabilities | 0.0% | 35,467 | |
| Total Net Assets | 100.0% | $ 703,011,082 | |
| Note: | Percentage of investments as shown is the ratio of the total market value to total net assets. |
| The Fund may refer to any one or more of the industry classifications used by one or more widely recognized market indices, ratings group and/or as defined by Fund management. Industry classifications may not be identical across all security types. |
| (1) | Security was purchased pursuant to Rule 144A under the Securities Act of 1933 and may be sold in transactions that are exempt from registration (typically only to qualified institutional buyers) or in a public offering registered under the Securities Act of 1933. At December 31, 2021, the aggregate value of these securities was $227,257,781, representing 32.3% of net assets. |
| (2) | Variable rate securities; the rate reported is the coupon rate in effect at December 31, 2021. Base lending rates may be subject to a floor or cap. |
| (3) | Variable or floating rate security, which interest rate adjusts periodically based on changes in current interest rates and prepayments on the underlying pool of assets. Rate shown is the rate in effect as of period end. |
| (4) | Security is a “step-up” bond where coupon increases or steps up at a predetermined date. Rate shown is current coupon rate. |
| (5) | Represents entire or partial securities on loan. See Note 8 in the accompanying Notes to Financial Statements for securities lending information. |
| (6) | Fixed to variable rate investment. The rate shown reflects the fixed rate in effect at December 31, 2021. Rate will reset at a future date. Base lending rates may be subject to a floor or cap. |
| (7) | The rate shown represents current yield to maturity. |
| (8) | Current yield as of period end. |
| † | See Significant Accounting Policies of accompanying Notes to Financial Statements regarding valuation of investments. |
| Description | Total | Level 1 | Level 2 | Level 3(1) | ||||
| Assets | ||||||||
| Asset & Commercial Mortgage-Backed Securities | $ 232,553,267 | $ — | $ 232,553,267 | $ — | ||||
| Corporate Bonds | 224,314,259 | — | 224,314,259 | — | ||||
| Municipal Bonds | 2,341,201 | — | 2,341,201 | — | ||||
| U.S. Government Agencies | 6,266,683 | — | 6,266,683 | — | ||||
| U.S. Government Securities | 47,998,764 | — | 47,998,764 | — | ||||
| Short-Term Investments | 189,501,441 | 2,349,343 | 187,152,098 | — | ||||
| Total | $ 702,975,615 | $ 2,349,343 | $ 700,626,272 | $ — |
| (1) | For the year ended December 31, 2021, there were no transfers in and out of Level 3. |
| 114 |
| Counterparty Abbreviations: | |
| BCLY | Barclays |
| BNP | BNP Paribas Securities Services |
| BOA | Bank of America Securities LLC |
| CBK | Citibank NA |
| CSI | Credit Suisse International |
| DEUT | Deutsche Bank Securities, Inc. |
| GSC | Goldman Sachs & Co. |
| HSBC | HSBC Bank USA |
| JPM | JP Morgan Chase & Co. |
| MSC | Morgan Stanley |
| RBS | RBS Greenwich Capital |
| UBS | UBS AG |
| WEST | Westpac International |
| Currency Abbreviations: | |
| BRL | Brazil Real |
| EUR | Euro Member Countries |
| MXN | Mexican Peso |
| RUB | Russia Ruble |
| USD | United States Dollar |
| Index Abbreviations: | |
| CMT | Constant Maturity Treasury Index |
| MTA | Monthly Treasury Average Index |
| S&P | Standard & Poor's |
| Municipal Abbreviations: | |
| Auth | Authority |
| Dev | Development |
| GO | General Obligation |
| PA | Port Authority |
| Rev | Revenue |
| Other Abbreviations: | |
| ACWI | All Country World Index |
| ADR | American Depositary Receipt |
| AGM | Assured Guaranty Municipal |
| CD | Certificate of Deposit |
| CLO | Collateralized Loan Obligation |
| CMO | Collateralized Mortgage Obligation |
| ETF | Exchange-Traded Fund |
| EURIBOR | Euro Interbank Offered Rate |
| FFCB | Federal Farm Credit Bank |
| FHLB | Federal Home Loan Bank |
| FHLMC | Federal Home Loan Mortgage Corp. |
| FNMA | Federal National Mortgage Association |
| GNMA | Government National Mortgage Association |
| LIBOR | London Interbank Offered Rate |
| NATL | National Public Finance Guarantee Corp. |
| REIT | Real Estate Investment Trust |
| SOFR | Secured Overnight Financing Rate |
| TBA | To Be Announced |
| UMBS | Uniform Mortgage-Backed Securities |
| 115 |
December 31, 2021
| Hartford Balanced HLS Fund | Hartford Capital Appreciation HLS Fund | Hartford Disciplined Equity HLS Fund | Hartford Dividend and Growth HLS Fund | Hartford Healthcare HLS Fund | Hartford International Opportunities HLS Fund | ||||||
| Assets: | |||||||||||
| Investments in securities, at market value(1) | $ 2,188,373,670 | $ 4,460,477,545 | $ 3,450,627,582 | $ 4,032,485,115 | $ 204,128,744 | $ 1,144,106,237 | |||||
| Repurchase agreements | 15,592,417 | 58,420,800 | 19,661,557 | 72,902,802 | 2,707,778 | 20,328,588 | |||||
| Cash | 4,119,731 | 15,448,902 | 5,198,936 | 19,250,049 | 714,980 | 5,424,056 | |||||
| Cash collateral held for securities on loan | 16,025 | 1,248,627 | — | — | 99,363 | — | |||||
| Foreign currency | — | 24 | — | — | 39 | 51,811 | |||||
| Receivables: | |||||||||||
| Investment securities sold | 5,045,639 | 18,095,621 | — | — | — | 28,717,129 | |||||
| Fund shares sold | 8,419 | 168,964 | 21,718 | 135,307 | 22,106 | 315,214 | |||||
| Dividends and interest | 4,432,251 | 3,675,281 | 1,632,379 | 3,890,459 | 82,966 | 560,961 | |||||
| Securities lending income | 144 | 7,116 | — | 8 | 7,023 | 303 | |||||
| Variation margin on futures contracts | — | 2,591,750 | — | — | — | — | |||||
| Tax reclaims | 946,145 | 258,296 | 344,315 | 945,903 | 44,484 | 1,702,095 | |||||
| Other assets | 13,408 | 22,452 | 19,261 | 19,787 | 5,204 | 9,424 | |||||
| Total assets | 2,218,547,849 | 4,560,415,378 | 3,477,505,748 | 4,129,629,430 | 207,812,687 | 1,201,215,818 | |||||
| Liabilities: | |||||||||||
| Obligation to return securities lending collateral | 320,500 | 24,972,542 | — | — | 1,987,259 | — | |||||
| Payables: | |||||||||||
| Investment securities purchased | 6,894,108 | 20,524,061 | — | — | 60,851 | — | |||||
| Fund shares redeemed | 1,226,934 | 1,664,836 | 4,150,277 | 2,053,029 | 172,423 | 23,337,154 | |||||
| Investment management fees | 1,097,412 | 2,418,610 | 1,639,281 | 2,152,652 | 144,443 | 703,606 | |||||
| Transfer agent fees | 980 | 1,477 | 1,468 | 1,058 | 1,006 | 1,217 | |||||
| Accounting services fees | 56,099 | 113,560 | 84,684 | 97,689 | 7,297 | 33,809 | |||||
| Board of Directors' fees | 9,932 | 21,007 | 15,324 | 17,899 | 988 | 5,606 | |||||
| Variation margin on futures contracts | 8,247 | — | — | — | — | — | |||||
| Distribution fees | 8,896 | 17,982 | 16,263 | 16,112 | 1,389 | 3,845 | |||||
| Accrued expenses | 121,691 | 279,177 | 303,161 | 200,941 | 46,248 | 133,490 | |||||
| Total liabilities | 9,744,799 | 50,013,252 | 6,210,458 | 4,539,380 | 2,421,904 | 24,218,727 | |||||
| Net assets | $ 2,208,803,050 | $ 4,510,402,126 | $ 3,471,295,290 | $ 4,125,090,050 | $ 205,390,783 | $ 1,176,997,091 | |||||
| Summary of Net Assets: | |||||||||||
| Capital stock and paid-in-capital | $ 1,320,143,334 | $ 2,924,253,134 | $ 2,015,292,269 | $ 1,920,063,596 | $ 111,294,750 | $ 768,245,438 | |||||
| Distributable earnings (loss) | 888,659,716 | 1,586,148,992 | 1,456,003,021 | 2,205,026,454 | 94,096,033 | 408,751,653 | |||||
| Net assets | $ 2,208,803,050 | $ 4,510,402,126 | $ 3,471,295,290 | $ 4,125,090,050 | $ 205,390,783 | $ 1,176,997,091 | |||||
| Shares authorized | 9,500,000,000 | 5,450,000,000 | 3,610,000,000 | 4,000,000,000 | 800,000,000 | 2,625,000,000 | |||||
| Par value | $ 0.0010 | $ 0.0010 | $ 0.0010 | $ 0.0010 | $ 0.0010 | $ 0.0010 | |||||
| Class IA: Net asset value per share | $ 35.47 | $ 54.26 | $ 20.85 | $ 27.58 | $ 23.57 | $ 20.90 | |||||
| Shares outstanding | 54,940,627 | 73,468,972 | 143,746,549 | 132,496,858 | 6,998,016 | 50,935,421 | |||||
| Net Assets | $ 1,948,846,440 | $ 3,986,182,313 | $ 2,997,803,015 | $ 3,654,207,927 | $ 164,964,260 | $ 1,064,639,674 | |||||
| Class IB: Net asset value per share | $ 36.18 | $ 53.10 | $ 20.51 | $ 27.38 | $ 21.47 | $ 21.21 | |||||
| Shares outstanding | 7,185,504 | 9,098,097 | 18,771,737 | 17,196,016 | 1,882,941 | 5,296,742 | |||||
| Net Assets | $ 259,956,610 | $ 483,113,072 | $ 385,018,230 | $ 470,882,123 | $ 40,426,523 | $ 112,357,417 | |||||
| Class IC: Net asset value per share | $ — | $ 53.33 | $ 20.85 | $ — | $ — | $ — | |||||
| Shares outstanding | — | 770,820 | 4,243,606 | — | — | — | |||||
| Net Assets | $ — | $ 41,106,741 | $ 88,474,045 | $ — | $ — | $ — | |||||
| Cost of investments | $ 1,545,833,555 | $ 3,395,361,646 | $ 2,163,726,862 | $ 2,267,276,703 | $ 149,150,795 | $ 920,959,787 | |||||
| Cost of foreign currency | $ — | $ 24 | $ — | $ — | $ 39 | $ 51,902 | |||||
| (1) Includes Investment in securities on loan, at market value | $ 308,892 | $ 27,998,325 | $ — | $ — | $ 2,194,538 | $ — |
| 116 |
December 31, 2021
| Hartford MidCap HLS Fund | Hartford Small Cap Growth HLS Fund | Hartford Small Company HLS Fund | Hartford Stock HLS Fund | Hartford Total Return Bond HLS Fund | Hartford Ultrashort Bond HLS Fund | ||||||
| Assets: | |||||||||||
| Investments in securities, at market value(1) | $ 2,113,820,237 | $ 1,376,011,669 | $ 641,873,795 | $ 1,642,506,029 | $ 2,879,877,811 | $ 695,878,285 | |||||
| Repurchase agreements | 1,507,681 | 5,265,851 | 9,988,699 | 13,339,853 | 15,117,913 | 7,097,330 | |||||
| Cash | 404,255 | 1,421,687 | 2,637,401 | 3,522,301 | 7,579,489 | 1,908,902 | |||||
| Cash collateral due from broker on swap contracts | — | — | — | — | 520,000 | — | |||||
| Cash collateral held for securities on loan | 566,732 | 477,272 | 133,908 | — | 20,791 | 123,650 | |||||
| Foreign currency | — | — | — | — | 611,007 | — | |||||
| Unrealized appreciation on foreign currency contracts | — | — | — | — | 65,904 | — | |||||
| Receivables: | |||||||||||
| Investment securities sold | 7,655,722 | — | — | — | 194,434,067 | — | |||||
| Fund shares sold | 241,810 | 6,096,510 | 21,326 | 10,618 | 181,841 | 58,364 | |||||
| Dividends and interest | 1,019,352 | 352,630 | 182,939 | 1,584,426 | 13,848,052 | 907,448 | |||||
| Securities lending income | 6,537 | 2,013 | 1,980 | — | 543 | 433 | |||||
| Variation margin on centrally cleared swap contracts | — | — | — | — | 19,358 | — | |||||
| Tax reclaims | — | — | — | 367,173 | — | 814 | |||||
| OTC swap contracts premiums paid | — | — | — | — | 1,035,405 | — | |||||
| Other assets | 12,823 | 13,173 | 7,143 | 10,518 | 14,196 | 7,432 | |||||
| Total assets | 2,125,235,149 | 1,389,640,805 | 654,847,191 | 1,661,340,918 | 3,113,326,377 | 705,982,658 | |||||
| Liabilities: | |||||||||||
| Unrealized depreciation on foreign currency contracts | — | — | — | — | 733,656 | — | |||||
| Obligation to return securities lending collateral | 11,334,645 | 9,545,435 | 2,678,152 | — | 415,820 | 2,472,993 | |||||
| Unrealized depreciation on OTC swap contracts | — | — | — | — | 2,032,176 | — | |||||
| TBA sale commitments, at market value | — | — | — | — | 55,154,080 | — | |||||
| Unfunded loan commitments | — | — | — | — | 14,333 | — | |||||
| Payables: | |||||||||||
| Investment securities purchased | 8,387,455 | 67,078 | 911,523 | — | 766,636,473 | — | |||||
| Fund shares redeemed | 814,710 | 483,269 | 136,292 | 11,599,479 | 553,544 | 124,746 | |||||
| Investment management fees | 1,169,000 | 694,486 | 397,446 | 655,557 | 908,734 | 239,932 | |||||
| Transfer agent fees | 1,302 | 1,240 | 990 | 956 | 994 | 955 | |||||
| Accounting services fees | 56,152 | 38,531 | 20,729 | 41,928 | 59,827 | 21,317 | |||||
| Board of Directors' fees | 10,084 | 6,566 | 3,104 | 7,217 | 10,742 | 3,378 | |||||
| Variation margin on futures contracts | — | — | — | — | 725,137 | — | |||||
| Distribution fees | 4,450 | 7,506 | 2,056 | 4,869 | 8,137 | 3,331 | |||||
| Written options | — | — | — | — | 785,723 | — | |||||
| Accrued expenses | 145,142 | 53,485 | 74,659 | 125,178 | 204,939 | 104,924 | |||||
| OTC swap contracts premiums received | — | — | — | — | 1,551,048 | — | |||||
| Total liabilities | 21,922,940 | 10,897,596 | 4,224,951 | 12,435,184 | 829,795,363 | 2,971,576 | |||||
| Net assets | $ 2,103,312,209 | $ 1,378,743,209 | $ 650,622,240 | $ 1,648,905,734 | $ 2,283,531,014 | $ 703,011,082 | |||||
| Summary of Net Assets: | |||||||||||
| Capital stock and paid-in-capital | $ 1,203,244,792 | $ 816,045,813 | $ 453,348,771 | $ 745,180,607 | $ 2,218,546,545 | $ 714,061,231 | |||||
| Distributable earnings (loss) | 900,067,417 | 562,697,396 | 197,273,469 | 903,725,127 | 64,984,469 | (11,050,149) | |||||
| Net assets | $ 2,103,312,209 | $ 1,378,743,209 | $ 650,622,240 | $ 1,648,905,734 | $ 2,283,531,014 | $ 703,011,082 | |||||
| Shares authorized | 2,400,000,000 | 700,000,000 | 1,500,000,000 | 4,000,000,000 | 5,000,000,000 | 14,000,000,000 | |||||
| Par value | $ 0.0010 | $ 0.0010 | $ 0.0010 | $ 0.0010 | $ 0.0010 | $ 0.0010 | |||||
| Class IA: Net asset value per share | $ 40.31 | $ 36.60 | $ 24.57 | $ 113.91 | $ 11.29 | $ 10.00 | |||||
| Shares outstanding | 48,953,682 | 31,522,122 | 24,039,518 | 13,222,708 | 181,232,635 | 60,590,760 | |||||
| Net Assets | $ 1,973,241,670 | $ 1,153,859,815 | $ 590,596,757 | $ 1,506,205,801 | $ 2,045,579,073 | $ 605,732,121 | |||||
| Class IB: Net asset value per share | $ 38.35 | $ 34.77 | $ 21.25 | $ 113.84 | $ 11.22 | $ 9.99 | |||||
| Shares outstanding | 3,391,336 | 6,466,925 | 2,824,752 | 1,253,461 | 21,208,814 | 9,741,768 | |||||
| Net Assets | $ 130,070,539 | $ 224,883,394 | $ 60,025,483 | $ 142,699,933 | $ 237,951,941 | $ 97,278,961 | |||||
| Class IC: Net asset value per share | $ — | $ — | $ — | $ — | $ — | $ — | |||||
| Shares outstanding | — | — | — | — | — | — | |||||
| Net Assets | $ — | $ — | $ — | $ — | $ — | $ — | |||||
| Cost of investments | $ 1,391,578,690 | $ 992,736,295 | $ 545,724,379 | $ 894,803,968 | $ 2,901,329,562 | $ 703,812,081 |
| 117 |
December 31, 2021
| Hartford MidCap HLS Fund | Hartford Small Cap Growth HLS Fund | Hartford Small Company HLS Fund | Hartford Stock HLS Fund | Hartford Total Return Bond HLS Fund | Hartford Ultrashort Bond HLS Fund | ||||||
| Cost of foreign currency | $ — | $ — | $ — | $ — | $ 611,413 | $ — | |||||
| Proceeds of TBA sale commitments | $ — | $ — | $ — | $ — | $ 55,218,194 | $ — | |||||
| Written option contracts premiums received | $ — | $ — | $ — | $ — | $ 1,580,550 | $ — | |||||
| (1) Includes Investment in securities on loan, at market value | $ 12,000,070 | $ 9,144,778 | $ 2,503,492 | $ — | $ 403,472 | $ 2,420,035 |
| 118 |
For the Year Ended December 31, 2021
| Hartford Balanced HLS Fund | Hartford Capital Appreciation HLS Fund | Hartford Disciplined Equity HLS Fund | Hartford Dividend and Growth HLS Fund | Hartford Healthcare HLS Fund | Hartford International Opportunities HLS Fund | ||||||
| Investment Income: | |||||||||||
| Dividends | $ 26,459,645 | $ 58,081,059 | $ 41,226,138 | $ 78,783,296 | $ 1,833,149 | $ 24,593,907 | |||||
| Interest | 14,778,435 | 30,543 | 4,507 | 20,583 | 1,298 | 3,218 | |||||
| Securities lending | 228,523 | 358,407 | 16,510 | 35,026 | 33,890 | 151,305 | |||||
| Less: Foreign tax withheld | (155,073) | (347,719) | (141,104) | (669,703) | (33,954) | (2,184,793) | |||||
| Total investment income, net | 41,311,530 | 58,122,290 | 41,106,051 | 78,169,202 | 1,834,383 | 22,563,637 | |||||
| Expenses: | |||||||||||
| Investment management fees | 13,426,307 | 29,282,645 | 18,739,518 | 24,355,572 | 1,808,918 | 8,605,819 | |||||
| Administrative services fees | |||||||||||
| Class IC | — | 103,635 | 209,950 | — | — | — | |||||
| Transfer agent fees | |||||||||||
| Class IA | 5,131 | 7,728 | 5,403 | 4,348 | 4,806 | 6,639 | |||||
| Class IB | 684 | 942 | 715 | 570 | 1,196 | 726 | |||||
| Class IC | — | 79 | 158 | — | — | — | |||||
| Distribution fees | |||||||||||
| Class IB | 633,512 | 1,227,976 | 937,037 | 1,118,865 | 106,045 | 306,230 | |||||
| Class IC | — | 103,635 | 209,950 | — | — | — | |||||
| Custodian fees | 24,183 | 29,455 | 9,217 | 13,265 | 11,286 | 60,402 | |||||
| Registration and filing fees | 12,884 | 18,093 | 29,092 | 15,122 | 12,854 | 14,578 | |||||
| Accounting services fees | 321,108 | 664,001 | 484,413 | 561,436 | 38,766 | 192,561 | |||||
| Board of Directors' fees | 53,274 | 113,829 | 85,637 | 97,369 | 5,198 | 30,847 | |||||
| Audit and tax fees | 34,591 | 40,410 | 48,043 | 19,014 | 25,916 | 35,944 | |||||
| Other expenses | 236,922 | 347,465 | 354,521 | 311,962 | 41,373 | 114,823 | |||||
| Total expenses (before waivers, reimbursements and fees paid indirectly) | 14,748,596 | 31,939,893 | 21,113,654 | 26,497,523 | 2,056,358 | 9,368,569 | |||||
| Management fee waivers | (646,074) | — | — | — | — | — | |||||
| Commission recapture | (513) | (18,293) | (2,399) | (16,009) | (671) | (5,843) | |||||
| Total waivers, reimbursements and fees paid indirectly | (646,587) | (18,293) | (2,399) | (16,009) | (671) | (5,843) | |||||
| Total expenses | 14,102,009 | 31,921,600 | 21,111,255 | 26,481,514 | 2,055,687 | 9,362,726 | |||||
| Net Investment Income (Loss) | 27,209,521 | 26,200,690 | 19,994,796 | 51,687,688 | (221,304) | 13,200,911 | |||||
| Net Realized Gain (Loss) on Investments, Other Financial Instruments and Foreign Currency Transactions on: | |||||||||||
| Investments | 231,964,763 | 606,871,318 | 244,076,253 | 405,950,817 | 37,726,229 | 194,074,717 | |||||
| Investments in affiliated investments | 20,391,975 | 14,727,736 | — | — | — | — | |||||
| Futures contracts | 634,948 | 18,503,271 | — | — | — | — | |||||
| Other foreign currency transactions | (10,935) | (75,105) | 826 | (905) | (3,451) | (525,654) | |||||
| Net Realized Gain (Loss) on Investments, Other Financial Instruments and Foreign Currency Transactions | 252,980,751 | 640,027,220 | 244,077,079 | 405,949,912 | 37,722,778 | 193,549,063 | |||||
| Net Changes in Unrealized Appreciation (Depreciation) of Investments, Other Financial Instruments and Foreign Currency Transactions of: | |||||||||||
| Investments | 115,121,487 | (29,839,048) | 486,699,667 | 605,398,488 | (16,622,537) | (112,658,513) | |||||
| Investments in affiliated investments | (11,414,971) | (8,244,256) | — | — | — | — | |||||
| Futures contracts | (115,681) | (2,163,279) | — | — | — | — | |||||
| Translation of other assets and liabilities in foreign currencies | (18,104) | (17,915) | (19,981) | (6,950) | (1,577) | (88,261) | |||||
| Net Changes in Unrealized Appreciation (Depreciation) of Investments, Other Financial Instruments and Foreign Currency Transactions | 103,572,731 | (40,264,498) | 486,679,686 | 605,391,538 | (16,624,114) | (112,746,774) | |||||
| Net Gain (Loss) on Investments, Other Financial Instruments and Foreign Currency Transactions | 356,553,482 | 599,762,722 | 730,756,765 | 1,011,341,450 | 21,098,664 | 80,802,289 | |||||
| Net Increase (Decrease) in Net Assets Resulting from Operations | $ 383,763,003 | $ 625,963,412 | $ 750,751,561 | $ 1,063,029,138 | $ 20,877,360 | $ 94,003,200 |
| 119 |
For the Year Ended December 31, 2021
| Hartford MidCap HLS Fund | Hartford Small Cap Growth HLS Fund | Hartford Small Company HLS Fund | Hartford Stock HLS Fund | Hartford Total Return Bond HLS Fund | Hartford Ultrashort Bond HLS Fund | ||||||
| Investment Income: | |||||||||||
| Dividends | $ 30,429,685 | $ 7,259,397 | $ 1,505,125 | $ 28,678,459 | $ 85,379 | $ — | |||||
| Interest | 1,144 | 2,504 | 3,834 | 4,834 | 60,385,901 | 4,333,903 | |||||
| Securities lending | 124,346 | 227,404 | 125,741 | 505 | 52,959 | 12,331 | |||||
| Less: Foreign tax withheld | (5,240) | — | — | (92,339) | (459) | — | |||||
| Total investment income, net | 30,549,935 | 7,489,305 | 1,634,700 | 28,591,459 | 60,523,780 | 4,346,234 | |||||
| Expenses: | |||||||||||
| Investment management fees | 15,122,366 | 8,749,052 | 4,733,330 | 7,459,221 | 10,947,766 | 2,961,696 | |||||
| Transfer agent fees | |||||||||||
| Class IA | 5,181 | 6,426 | 5,284 | 5,181 | 4,041 | 3,741 | |||||
| Class IB | 329 | 1,172 | 590 | 489 | 494 | 610 | |||||
| Distribution fees | |||||||||||
| Class IB | 345,771 | 553,705 | 162,673 | 336,253 | 631,543 | 257,901 | |||||
| Custodian fees | 17,448 | 12,027 | 10,498 | 7,522 | 40,213 | 5,648 | |||||
| Registration and filing fees | 20,890 | 24,840 | 14,410 | 12,884 | 17,590 | 14,462 | |||||
| Accounting services fees | 340,948 | 221,635 | 108,487 | 236,585 | 348,319 | 121,611 | |||||
| Board of Directors' fees | 57,687 | 37,045 | 16,710 | 38,470 | 57,593 | 19,215 | |||||
| Audit and tax fees | 16,173 | 21,508 | 30,831 | 21,886 | 47,854 | 34,402 | |||||
| Other expenses | 170,501 | 71,634 | 66,884 | 168,136 | 175,455 | 77,122 | |||||
| Total expenses (before waivers, reimbursements and fees paid indirectly) | 16,097,294 | 9,699,044 | 5,149,697 | 8,286,627 | 12,270,868 | 3,496,408 | |||||
| Commission recapture | (5,519) | (13,316) | (18,003) | (652) | — | — | |||||
| Total waivers, reimbursements and fees paid indirectly | (5,519) | (13,316) | (18,003) | (652) | — | — | |||||
| Total expenses | 16,091,775 | 9,685,728 | 5,131,694 | 8,285,975 | 12,270,868 | 3,496,408 | |||||
| Net Investment Income (Loss) | 14,458,160 | (2,196,423) | (3,496,994) | 20,305,484 | 48,252,912 | 849,826 | |||||
| Net Realized Gain (Loss) on Investments, Other Financial Instruments and Foreign Currency Transactions on: | |||||||||||
| Investments | 245,445,022 | 180,586,224 | 89,782,143 | 134,014,659 | 12,874,277 | 83,217 | |||||
| Investments in affiliated investments | — | — | 8,741,457 | 16,450,099 | — | — | |||||
| Purchased options contracts | — | — | — | — | 107,845 | — | |||||
| Futures contracts | — | — | — | — | 4,468,542 | — | |||||
| Written options contracts | — | — | — | — | 2,423,476 | — | |||||
| Swap contracts | — | — | — | — | (612,363) | — | |||||
| Foreign currency contracts | — | — | — | — | 7,156,600 | — | |||||
| Other foreign currency transactions | — | — | (1,001) | (26,878) | (77,760) | — | |||||
| Net Realized Gain (Loss) on Investments, Other Financial Instruments and Foreign Currency Transactions | 245,445,022 | 180,586,224 | 98,522,599 | 150,437,880 | 26,340,617 | 83,217 | |||||
| Net Changes in Unrealized Appreciation (Depreciation) of Investments, Other Financial Instruments and Foreign Currency Transactions of: | |||||||||||
| Investments | (32,664,947) | (121,278,577) | (84,530,508) | 187,477,676 | (93,639,901) | (3,079,240) | |||||
| Investments in affiliated investments | — | — | (4,893,274) | (9,208,399) | — | — | |||||
| Purchased options contracts | — | — | — | — | (2,447,117) | — | |||||
| Futures contracts | — | — | — | — | (1,619,670) | — | |||||
| Written options contracts | — | — | — | — | 683,367 | — | |||||
| Swap contracts | — | — | — | — | (126,489) | — | |||||
| Foreign currency contracts | — | — | — | — | (226,327) | — | |||||
| Translation of other assets and liabilities in foreign currencies | — | — | — | (10,742) | (15,084) | — | |||||
| Net Changes in Unrealized Appreciation (Depreciation) of Investments, Other Financial Instruments and Foreign Currency Transactions | (32,664,947) | (121,278,577) | (89,423,782) | 178,258,535 | (97,391,221) | (3,079,240) | |||||
| Net Gain (Loss) on Investments, Other Financial Instruments and Foreign Currency Transactions | 212,780,075 | 59,307,647 | 9,098,817 | 328,696,415 | (71,050,604) | (2,996,023) | |||||
| Net Increase (Decrease) in Net Assets Resulting from Operations | $ 227,238,235 | $ 57,111,224 | $ 5,601,823 | $ 349,001,899 | $ (22,797,692) | $ (2,146,197) |
| 120 |
For the Year Ended December 31, 2021
| Hartford Balanced HLS Fund | Hartford Capital Appreciation HLS Fund | ||||||
| For the Year Ended December 31, 2021 | For the Year Ended December 31, 2020 | For the Year Ended December 31, 2021 | For the Year Ended December 31, 2020 | ||||
| Operations: | |||||||
| Net investment income (loss) | $ 27,209,521 | $ 30,999,767 | $ 26,200,690 | $ 35,954,391 | |||
| Net realized gain (loss) on investments, other financial instruments and foreign currency transactions | 252,980,751 | 105,739,585 | 640,027,220 | 361,872,953 | |||
| Net changes in unrealized appreciation (depreciation) of investments, other financial instruments and foreign currency transactions | 103,572,731 | 71,167,903 | (40,264,498) | 432,607,900 | |||
| Net Increase (Decrease) in Net Assets Resulting from Operations | 383,763,003 | 207,907,255 | 625,963,412 | 830,435,244 | |||
| Distributions to Shareholders: | |||||||
| Class IA | (119,966,739) | (117,833,855) | (365,171,166) | (302,064,553) | |||
| Class IB | (15,083,504) | (15,165,622) | (44,137,344) | (36,702,247) | |||
| Class IC | — | — | (3,670,162) | (2,791,605) | |||
| Total distributions | (135,050,243) | (132,999,477) | (412,978,672) | (341,558,405) | |||
| Capital Share Transactions: | |||||||
| Sold | 19,404,321 | 19,191,198 | 18,949,877 | 38,136,392 | |||
| Issued on reinvestment of distributions | 135,050,243 | 132,999,477 | 412,978,672 | 341,558,405 | |||
| Redeemed | (246,585,564) | (271,723,464) | (685,786,998) | (675,171,430) | |||
| Net increase (decrease) from capital share transactions | (92,131,000) | (119,532,789) | (253,858,449) | (295,476,633) | |||
| Net Increase (Decrease) in Net Assets | 156,581,760 | (44,625,011) | (40,873,709) | 193,400,206 | |||
| Net Assets: | |||||||
| Beginning of period | 2,052,221,290 | 2,096,846,301 | 4,551,275,835 | 4,357,875,629 | |||
| End of period | $ 2,208,803,050 | $ 2,052,221,290 | $ 4,510,402,126 | $ 4,551,275,835 | |||
| 121 |
For the Year Ended December 31, 2021
| Hartford Disciplined Equity HLS Fund | Hartford Dividend and Growth HLS Fund | ||||||
| For the Year Ended December 31, 2021 | For the Year Ended December 31, 2020 | For the Year Ended December 31, 2021 | For the Year Ended December 31, 2020 | ||||
| Operations: | |||||||
| Net investment income (loss) | $ 19,994,796 | $ 9,088,303 | $ 51,687,688 | $ 58,007,815 | |||
| Net realized gain (loss) on investments, other financial instruments and foreign currency transactions | 244,077,079 | 51,370,005 | 405,949,912 | 149,565,472 | |||
| Net changes in unrealized appreciation (depreciation) of investments, other financial instruments and foreign currency transactions | 486,679,686 | 349,898,974 | 605,391,538 | 43,580,460 | |||
| Net Increase (Decrease) in Net Assets Resulting from Operations | 750,751,561 | 410,357,282 | 1,063,029,138 | 251,153,747 | |||
| Distributions to Shareholders: | |||||||
| Class IA | (135,827,680) | (49,655,221) | (212,103,066) | (188,906,611) | |||
| Class IB | (16,888,930) | (6,547,645) | (26,602,277) | (23,940,435) | |||
| Class IC | (3,591,357) | (117,970) (1) | — | — | |||
| Total distributions | (156,307,967) | (56,320,836) | (238,705,343) | (212,847,046) | |||
| Capital Share Transactions: | |||||||
| Sold | 42,335,797 | 20,261,442 | 74,291,931 | 101,254,488 | |||
| Issued in merger | — | 2,330,083,048 | — | 318,148,909 | |||
| Issued on reinvestment of distributions | 156,307,967 | 56,320,836 | 238,705,342 | 212,846,267 | |||
| Redeemed | (467,143,407) | (269,263,242) | (534,531,726) | (457,811,881) | |||
| Net increase (decrease) from capital share transactions | (268,499,643) | 2,137,402,084 | (221,534,453) | 174,437,783 | |||
| Net Increase (Decrease) in Net Assets | 325,943,951 | 2,491,438,530 | 602,789,342 | 212,744,484 | |||
| Net Assets: | |||||||
| Beginning of period | 3,145,351,339 | 653,912,809 | 3,522,300,708 | 3,309,556,224 | |||
| End of period | $ 3,471,295,290 | $ 3,145,351,339 | $ 4,125,090,050 | $ 3,522,300,708 | |||
| (1) | Commenced operations on September 18, 2020. |
| 122 |
For the Year Ended December 31, 2021
| Hartford Healthcare HLS Fund | Hartford International Opportunities HLS Fund | ||||||
| For the Year Ended December 31, 2021 | For the Year Ended December 31, 2020 | For the Year Ended December 31, 2021 | For the Year Ended December 31, 2020 | ||||
| Operations: | |||||||
| Net investment income (loss) | $ (221,304) | $ 59,592 | $ 13,200,911 | $ 6,344,840 | |||
| Net realized gain (loss) on investments, other financial instruments and foreign currency transactions | 37,722,778 | 24,202,866 | 193,549,063 | (5,696,457) | |||
| Net changes in unrealized appreciation (depreciation) of investments, other financial instruments and foreign currency transactions | (16,624,114) | 18,492,173 | (112,746,774) | 191,329,983 | |||
| Net Increase (Decrease) in Net Assets Resulting from Operations | 20,877,360 | 42,754,631 | 94,003,200 | 191,978,366 | |||
| Distributions to Shareholders: | |||||||
| Class IA | (17,932,280) | (32,813,968) | (11,313,509) | (18,153,869) | |||
| Class IB | (4,820,147) | (7,990,682) | (844,741) | (2,009,265) | |||
| Total distributions | (22,752,427) | (40,804,650) | (12,158,250) | (20,163,134) | |||
| Capital Share Transactions: | |||||||
| Sold | 9,147,479 | 24,636,180 | 84,841,774 | 67,889,363 | |||
| Issued on reinvestment of distributions | 22,752,427 | 40,804,650 | 12,158,250 | 20,163,134 | |||
| Redeemed | (58,667,250) | (66,609,342) | (240,510,393) | (249,890,183) | |||
| Net increase (decrease) from capital share transactions | (26,767,344) | (1,168,512) | (143,510,369) | (161,837,686) | |||
| Net Increase (Decrease) in Net Assets | (28,642,411) | 781,469 | (61,665,419) | 9,977,546 | |||
| Net Assets: | |||||||
| Beginning of period | 234,033,194 | 233,251,725 | 1,238,662,510 | 1,228,684,964 | |||
| End of period | $ 205,390,783 | $ 234,033,194 | $ 1,176,997,091 | $ 1,238,662,510 | |||
| 123 |
For the Year Ended December 31, 2021
| Hartford MidCap HLS Fund | Hartford Small Cap Growth HLS Fund | ||||||
| For the Year Ended December 31, 2021 | For the Year Ended December 31, 2020 | For the Year Ended December 31, 2021 | For the Year Ended December 31, 2020 | ||||
| Operations: | |||||||
| Net investment income (loss) | $ 14,458,160 | $ 1,284,602 | $ (2,196,423) | $ (1,774,390) | |||
| Net realized gain (loss) on investments, other financial instruments and foreign currency transactions | 245,445,022 | 311,611,737 | 180,586,224 | 113,430,677 | |||
| Net changes in unrealized appreciation (depreciation) of investments, other financial instruments and foreign currency transactions | (32,664,947) | 190,989,463 | (121,278,577) | 249,828,980 | |||
| Net Increase (Decrease) in Net Assets Resulting from Operations | 227,238,235 | 503,885,802 | 57,111,224 | 361,485,267 | |||
| Distributions to Shareholders: | |||||||
| Class IA | (326,587,296) | (177,950,463) | (96,064,439) | (32,246,764) | |||
| Class IB | (22,511,283) | (5,921,123) | (18,818,914) | (13,179,751) | |||
| Total distributions | (349,098,579) | (183,871,586) | (114,883,353) | (45,426,515) | |||
| Capital Share Transactions: | |||||||
| Sold | 93,898,635 | 284,296,985 | 166,860,534 | 444,343,670 | |||
| Issued in merger | — | 337,780,470 | — | — | |||
| Issued on reinvestment of distributions | 349,098,579 | 183,871,586 | 111,731,037 | 40,017,923 | |||
| Redeemed | (735,775,940) | (708,217,628) | (267,121,215) | (710,495,275) | |||
| Net increase (decrease) from capital share transactions | (292,778,726) | 97,731,413 | 11,470,356 | (226,133,682) | |||
| Net Increase (Decrease) in Net Assets | (414,639,070) | 417,745,629 | (46,301,773) | 89,925,070 | |||
| Net Assets: | |||||||
| Beginning of period | 2,517,951,279 | 2,100,205,650 | 1,425,044,982 | 1,335,119,912 | |||
| End of period | $ 2,103,312,209 | $ 2,517,951,279 | $ 1,378,743,209 | $ 1,425,044,982 | |||
| 124 |
For the Year Ended December 31, 2021
| Hartford Small Company HLS Fund | Hartford Stock HLS Fund | ||||||
| For the Year Ended December 31, 2021 | For the Year Ended December 31, 2020 | For the Year Ended December 31, 2021 | For the Year Ended December 31, 2020 | ||||
| Operations: | |||||||
| Net investment income (loss) | $ (3,496,994) | $ (1,687,287) | $ 20,305,484 | $ 21,548,207 | |||
| Net realized gain (loss) on investments, other financial instruments and foreign currency transactions | 98,522,599 | 82,511,370 | 150,437,880 | 48,823,869 | |||
| Net changes in unrealized appreciation (depreciation) of investments, other financial instruments and foreign currency transactions | (89,423,782) | 87,911,371 | 178,258,535 | 87,381,686 | |||
| Net Increase (Decrease) in Net Assets Resulting from Operations | 5,601,823 | 168,735,454 | 349,001,899 | 157,753,762 | |||
| Distributions to Shareholders: | |||||||
| Class IA | (74,970,751) | (57,898,706) | (68,675,432) | (105,830,872) | |||
| Class IB | (8,598,956) | (7,955,937) | (6,107,664) | (9,984,197) | |||
| Total distributions | (83,569,707) | (65,854,643) | (74,783,096) | (115,815,069) | |||
| Capital Share Transactions: | |||||||
| Sold | 153,657,577 | 46,390,011 | 8,673,799 | 13,251,527 | |||
| Issued on reinvestment of distributions | 83,569,708 | 65,854,643 | 74,783,096 | 115,815,069 | |||
| Redemption-in-kind | — | 8,160,448 | — | — | |||
| Redeemed | (117,299,075) | (238,957,153) | (198,538,490) | (190,830,898) | |||
| Net increase (decrease) from capital share transactions | 119,928,210 | (118,552,051) | (115,081,595) | (61,764,302) | |||
| Net Increase (Decrease) in Net Assets | 41,960,326 | (15,671,240) | 159,137,208 | (19,825,609) | |||
| Net Assets: | |||||||
| Beginning of period | 608,661,914 | 624,333,154 | 1,489,768,526 | 1,509,594,135 | |||
| End of period | $ 650,622,240 | $ 608,661,914 | $ 1,648,905,734 | $ 1,489,768,526 | |||
| 125 |
For the Year Ended December 31, 2021
| Hartford Total Return Bond HLS Fund | Hartford Ultrashort Bond HLS Fund | ||||||
| For the Year Ended December 31, 2021 | For the Year Ended December 31, 2020 | For the Year Ended December 31, 2021 | For the Year Ended December 31, 2020 | ||||
| Operations: | |||||||
| Net investment income (loss) | $ 48,252,912 | $ 51,547,449 | $ 849,826 | $ 4,862,024 | |||
| Net realized gain (loss) on investments, other financial instruments and foreign currency transactions | 26,340,617 | 78,124,747 | 83,217 | 367,845 | |||
| Net changes in unrealized appreciation (depreciation) of investments, other financial instruments and foreign currency transactions | (97,391,221) | 47,163,033 | (3,079,240) | 1,107,664 | |||
| Net Increase (Decrease) in Net Assets Resulting from Operations | (22,797,692) | 176,835,229 | (2,146,197) | 6,337,533 | |||
| Distributions to Shareholders: | |||||||
| Class IA | (102,070,091) | (73,659,677) | (4,440,122) | (9,308,313) | |||
| Class IB | (11,750,831) | (8,000,272) | (540,587) | (1,220,637) | |||
| Total distributions | (113,820,922) | (81,659,949) | (4,980,709) | (10,528,950) | |||
| Capital Share Transactions: | |||||||
| Sold | 215,962,547 | 264,927,545 | 61,157,138 | 107,159,346 | |||
| Issued in merger | — | 227,469,835 | — | 339,951,431 | |||
| Issued on reinvestment of distributions | 113,820,922 | 81,659,949 | 4,980,709 | 10,528,950 | |||
| Redeemed | (286,519,818) | (379,866,776) | (123,624,931) | (136,555,061) | |||
| Net increase (decrease) from capital share transactions | 43,263,651 | 194,190,553 | (57,487,084) | 321,084,666 | |||
| Net Increase (Decrease) in Net Assets | (93,354,963) | 289,365,833 | (64,613,990) | 316,893,249 | |||
| Net Assets: | |||||||
| Beginning of period | 2,376,885,977 | 2,087,520,144 | 767,625,072 | 450,731,823 | |||
| End of period | $ 2,283,531,014 | $ 2,376,885,977 | $ 703,011,082 | $ 767,625,072 | |||
| 126 |
| — Selected Per-Share Data(1) — | — Ratios and Supplemental Data — | |||||||||||||||||||||||||||
| Class | Net Asset Value at Beginning of Period | Net Investment Income (Loss) | Net Realized and Unrealized Gain (Loss) on Investments | Total from Investment Operations | Dividends from Net Investment Income | Distributions from Capital Gains | Total Dividends and Distributions | Net Asset Value at End of Period | Total Return(2) | Net Assets at End of Period (000s) | Ratio of Expenses to Average Net Assets Before Adjust- ments(3) | Ratio of Expenses to Average Net Assets After Adjust- ments(3) | Ratio of Net Investment Income (Loss) to Average Net Assets | Portfolio Turnover | ||||||||||||||
| Hartford Balanced HLS Fund | ||||||||||||||||||||||||||||
| For the Year Ended December 31, 2021 | ||||||||||||||||||||||||||||
| IA | $ 31.56 | $ 0.44 | $ 5.70 | $ 6.14 | $ (0.35) | $ (1.88) | $ (2.23) | $ 35.47 | 19.64% | $ 1,948,846 | 0.66% | 0.63% | 1.29% | 48% (4) | ||||||||||||||
| IB | 32.15 | 0.36 | 5.81 | 6.17 | (0.26) | (1.88) | (2.14) | 36.18 | 19.37 | 259,957 | 0.91 | 0.88 | 1.04 | 48 (4) | ||||||||||||||
| For the Year Ended December 31, 2020 | ||||||||||||||||||||||||||||
| IA | $ 30.27 | $ 0.48 | $ 2.92 | $ 3.40 | $ (0.51) | $ (1.60) | $ (2.11) | $ 31.56 | 11.62% | $ 1,809,745 | 0.66% | 0.63% | 1.63% | 43% (4) | ||||||||||||||
| IB | 30.80 | 0.41 | 2.97 | 3.38 | (0.43) | (1.60) | (2.03) | 32.15 | 11.35 | 242,476 | 0.91 | 0.88 | 1.38 | 43 (4) | ||||||||||||||
| For the Year Ended December 31, 2019 | ||||||||||||||||||||||||||||
| IA | $ 27.47 | $ 0.54(5) | $ 5.47(5) | $ 6.01 | $ (0.56) | $ (2.65) | $ (3.21) | $ 30.27 | 22.80% | $ 1,849,582 | 0.66% | 0.63% | 1.81% (5) | 38% | ||||||||||||||
| IB | 27.91 | 0.47 (5) | 5.55 (5) | 6.02 | (0.48) | (2.65) | (3.13) | 30.80 | 22.47 | 247,264 | 0.91 | 0.88 | 1.56 (5) | 38 | ||||||||||||||
| For the Year Ended December 31, 2018 | ||||||||||||||||||||||||||||
| IA | $ 31.02 | $ 0.59 | $ (2.12) | $ (1.53) | $ (0.61) | $ (1.41) | $ (2.02) | $ 27.47 | (5.24)% | $ 1,717,759 | 0.66% | 0.63% | 1.92% | 31% | ||||||||||||||
| IB | 31.48 | 0.52 | (2.15) | (1.63) | (0.53) | (1.41) | (1.94) | 27.91 | (5.50) | 229,790 | 0.91 | 0.88 | 1.67 | 31 | ||||||||||||||
| For the Year Ended December 31, 2017 | ||||||||||||||||||||||||||||
| IA | $ 27.46 | $ 0.55 | $ 3.72 | $ 4.27 | $ (0.71) | $ — | $ (0.71) | $ 31.02 | 15.59% | $ 2,095,246 | 0.66% | 0.63% | 1.86% | 26% | ||||||||||||||
| IB | 27.86 | 0.48 | 3.77 | 4.25 | (0.63) | — | (0.63) | 31.48 | 15.30 | 277,735 | 0.91 | 0.88 | 1.61 | 26 | ||||||||||||||
| Hartford Capital Appreciation HLS Fund | ||||||||||||||||||||||||||||
| For the Year Ended December 31, 2021 | ||||||||||||||||||||||||||||
| IA | $ 51.85 | $ 0.33 | $ 7.27 | $ 7.60 | $ (0.26) | $ (4.93) | $ (5.19) | $ 54.26 | 14.76% | $ 3,986,182 | 0.67% | 0.67% | 0.61% | 58% | ||||||||||||||
| IB | 50.85 | 0.19 | 7.11 | 7.30 | (0.12) | (4.93) | (5.05) | 53.10 | 14.45 | 483,113 | 0.92 | 0.92 | 0.36 | 58 | ||||||||||||||
| IC | 51.08 | 0.06 | 7.14 | 7.20 | (0.02) | (4.93) | (4.95) | 53.33 | 14.18 | 41,107 | 1.17 | 1.17 | 0.11 | 58 | ||||||||||||||
| For the Year Ended December 31, 2020 | ||||||||||||||||||||||||||||
| IA | $ 46.05 | $ 0.42 | $ 9.37 | $ 9.79 | $ (0.45) | $ (3.54) | $ (3.99) | $ 51.85 | 21.91% | $ 4,024,340 | 0.68% | 0.68% | 0.91% | 80% | ||||||||||||||
| IB | 45.24 | 0.30 | 9.18 | 9.48 | (0.33) | (3.54) | (3.87) | 50.85 | 21.62 | 487,576 | 0.93 | 0.93 | 0.66 | 80 | ||||||||||||||
| IC | 45.45 | 0.19 | 9.20 | 9.39 | (0.22) | (3.54) | (3.76) | 51.08 | 21.32 | 39,361 | 1.18 | 1.18 | 0.41 | 80 | ||||||||||||||
| For the Year Ended December 31, 2019 | ||||||||||||||||||||||||||||
| IA | $ 39.89 | $ 0.48 | $ 11.47 | $ 11.95 | $ (0.53) | $ (5.26) | $ (5.79) | $ 46.05 | 31.28% | $ 3,847,850 | 0.68% | 0.68% | 1.06% | 56% | ||||||||||||||
| IB | 39.28 | 0.36 | 11.28 | 11.64 | (0.42) | (5.26) | (5.68) | 45.24 | 30.96 | 474,982 | 0.93 | 0.93 | 0.81 | 56 | ||||||||||||||
| IC | 39.54 | 0.25 | 11.34 | 11.59 | (0.42) | (5.26) | (5.68) | 45.45 | 30.63 | 35,043 | 1.18 | 1.18 | 0.56 | 56 | ||||||||||||||
| For the Year Ended December 31, 2018 | ||||||||||||||||||||||||||||
| IA | $ 48.16 | $ 0.49 | $ (3.33) | $ (2.84) | $ (0.43) | $ (5.00) | $ (5.43) | $ 39.89 | (6.96)% | $ 3,543,187 | 0.67% | 0.67% | 1.03% | 73% | ||||||||||||||
| IB | 47.48 | 0.37 | (3.26) | (2.89) | (0.31) | (5.00) | (5.31) | 39.28 | (7.18) | 432,334 | 0.92 | 0.92 | 0.77 | 73 | ||||||||||||||
| IC | 47.76 | 0.25 | (3.26) | (3.01) | (0.21) | (5.00) | (5.21) | 39.54 | (7.41) | 27,679 | 1.17 | 1.17 | 0.53 | 73 | ||||||||||||||
| For the Year Ended December 31, 2017 | ||||||||||||||||||||||||||||
| IA | $ 42.05 | $ 0.43 | $ 8.83 | $ 9.26 | $ (0.54) | $ (2.61) | $ (3.15) | $ 48.16 | 22.14% | $ 4,457,603 | 0.68% | 0.68% | 0.91% | 75% | ||||||||||||||
| IB | 41.50 | 0.30 | 8.70 | 9.00 | (0.41) | (2.61) | (3.02) | 47.48 | 21.82 | 569,615 | 0.93 | 0.93 | 0.66 | 75 | ||||||||||||||
| IC | 41.76 | 0.19 | 8.74 | 8.93 | (0.32) | (2.61) | (2.93) | 47.76 | 21.50 | 29,979 | 1.18 | 1.18 | 0.41 | 75 | ||||||||||||||
| Hartford Disciplined Equity HLS Fund | ||||||||||||||||||||||||||||
| For the Year Ended December 31, 2021 | ||||||||||||||||||||||||||||
| IA | $ 17.40 | $ 0.13 | $ 4.29 | $ 4.42 | $ (0.12) | $ (0.85) | $ (0.97) | $ 20.85 | 25.52% | $ 2,997,803 | 0.60% | 0.60% | 0.64% | 14% | ||||||||||||||
| IB | 17.13 | 0.08 | 4.21 | 4.29 | (0.06) | (0.85) | (0.91) | 20.51 | 25.21 | 385,018 | 0.85 | 0.85 | 0.39 | 14 | ||||||||||||||
| IC | 17.40 | 0.03 | 4.28 | 4.31 | (0.01) | (0.85) | (0.86) | 20.85 | 24.92 | 88,474 | 1.10 | 1.10 | 0.14 | 14 | ||||||||||||||
| For the Year Ended December 31, 2020 | ||||||||||||||||||||||||||||
| IA | $ 15.97 | $ 0.12 | $ 2.64 | $ 2.76 | $ (0.06) | $ (1.27) | $ (1.33) | $ 17.40 | 18.04% | $ 2,701,619 | 0.66% | 0.66% | 0.75% | 23% | ||||||||||||||
| IB | 15.76 | 0.08 | 2.60 | 2.68 | (0.04) | (1.27) | (1.31) | 17.13 | 17.78 | 365,246 | 0.91 | 0.91 | 0.50 | 23 | ||||||||||||||
| IC (6) | 15.34 | 0.01 | 2.08 | 2.09 | (0.03) | — | (0.03) | 17.40 | 13.60 (7) | 78,487 | 1.11 (8) | 1.11 (8) | 0.23 (8) | 23 | ||||||||||||||
| 127 |
| — Selected Per-Share Data(1) — | — Ratios and Supplemental Data — | |||||||||||||||||||||||||||
| Class | Net Asset Value at Beginning of Period | Net Investment Income (Loss) | Net Realized and Unrealized Gain (Loss) on Investments | Total from Investment Operations | Dividends from Net Investment Income | Distributions from Capital Gains | Total Dividends and Distributions | Net Asset Value at End of Period | Total Return(2) | Net Assets at End of Period (000s) | Ratio of Expenses to Average Net Assets Before Adjust- ments(3) | Ratio of Expenses to Average Net Assets After Adjust- ments(3) | Ratio of Net Investment Income (Loss) to Average Net Assets | Portfolio Turnover | ||||||||||||||
| Hartford Disciplined Equity HLS Fund – (continued) | ||||||||||||||||||||||||||||
| For the Year Ended December 31, 2019 | ||||||||||||||||||||||||||||
| IA | $ 13.59 | $ 0.13 | $ 4.26 | $ 4.39 | $ (0.14) | $ (1.87) | $ (2.01) | $ 15.97 | 34.12% | $ 573,688 | 0.78% | 0.78% | 0.82% | 15% | ||||||||||||||
| IB | 13.44 | 0.09 | 4.20 | 4.29 | (0.10) | (1.87) | (1.97) | 15.76 | 33.76 | 80,224 | 1.03 | 1.03 | 0.57 | 15 | ||||||||||||||
| For the Year Ended December 31, 2018 | ||||||||||||||||||||||||||||
| IA | $ 15.43 | $ 0.11 | $ (0.27) | $ (0.16) | $ (0.11) | $ (1.57) | $ (1.68) | $ 13.59 | (1.99)% | $ 501,718 | 0.78% | 0.78% | 0.72% | 22% | ||||||||||||||
| IB | 15.27 | 0.07 | (0.26) | (0.19) | (0.07) | (1.57) | (1.64) | 13.44 | (2.23) | 68,462 | 1.03 | 1.03 | 0.47 | 22 | ||||||||||||||
| For the Year Ended December 31, 2017 | ||||||||||||||||||||||||||||
| IA | $ 14.30 | $ 0.15 | $ 2.83 | $ 2.98 | $ (0.14) | $ (1.71) | $ (1.85) | $ 15.43 | 21.92% | $ 613,037 | 0.78% | 0.78% | 1.00% | 30% | ||||||||||||||
| IB | 14.17 | 0.11 | 2.80 | 2.91 | (0.10) | (1.71) | (1.81) | 15.27 | 21.63 | 84,377 | 1.03 | 1.03 | 0.76 | 30 | ||||||||||||||
| Hartford Dividend and Growth HLS Fund | ||||||||||||||||||||||||||||
| For the Year Ended December 31, 2021 | ||||||||||||||||||||||||||||
| IA | $ 22.19 | $ 0.35 | $ 6.67 | $ 7.02 | $ (0.34) | $ (1.29) | $ (1.63) | $ 27.58 | 32.00% | $ 3,654,208 | 0.66% | 0.66% | 1.36% | 21% | ||||||||||||||
| IB | 22.04 | 0.28 | 6.62 | 6.90 | (0.27) | (1.29) | (1.56) | 27.38 | 31.68 | 470,882 | 0.91 | 0.91 | 1.12 | 21 | ||||||||||||||
| For the Year Ended December 31, 2020 | ||||||||||||||||||||||||||||
| IA | $ 22.08 | $ 0.40 | $ 1.18 | $ 1.58 | $ (0.39) | $ (1.08) | $ (1.47) | $ 22.19 | 7.77% | $ 3,109,772 | 0.68% | 0.68% | 1.95% | 24% | ||||||||||||||
| IB | 21.96 | 0.34 | 1.16 | 1.50 | (0.34) | (1.08) | (1.42) | 22.04 | 7.45 | 412,528 | 0.93 | 0.93 | 1.70 | 24 | ||||||||||||||
| For the Year Ended December 31, 2019 | ||||||||||||||||||||||||||||
| IA | $ 19.91 | $ 0.41 | $ 4.91 | $ 5.32 | $ (0.40) | $ (2.75) | $ (3.15) | $ 22.08 | 28.60% | $ 2,916,542 | 0.68% | 0.68% | 1.85% | 19% | ||||||||||||||
| IB | 19.82 | 0.35 | 4.89 | 5.24 | (0.35) | (2.75) | (3.10) | 21.96 | 28.30 | 393,014 | 0.93 | 0.93 | 1.60 | 19 | ||||||||||||||
| For the Year Ended December 31, 2018 | ||||||||||||||||||||||||||||
| IA | $ 23.95 | $ 0.43 | $ (1.45) | $ (1.02) | $ (0.44) | $ (2.58) | $ (3.02) | $ 19.91 | (5.32)% | $ 2,604,425 | 0.68% | 0.68% | 1.84% | 28% | ||||||||||||||
| IB | 23.85 | 0.37 | (1.44) | (1.07) | (0.38) | (2.58) | (2.96) | 19.82 | (5.56) | 356,601 | 0.93 | 0.93 | 1.59 | 28 | ||||||||||||||
| For the Year Ended December 31, 2017 | ||||||||||||||||||||||||||||
| IA | $ 22.10 | $ 0.41 | $ 3.48 | $ 3.89 | $ (0.38) | $ (1.66) | $ (2.04) | $ 23.95 | 18.36% | $ 3,179,540 | 0.68% | 0.68% | 1.75% | 25% | ||||||||||||||
| IB | 22.01 | 0.35 | 3.47 | 3.82 | (0.32) | (1.66) | (1.98) | 23.85 | 18.11 | 440,111 | 0.93 | 0.93 | 1.50 | 25 | ||||||||||||||
| Hartford Healthcare HLS Fund | ||||||||||||||||||||||||||||
| For the Year Ended December 31, 2021 | ||||||||||||||||||||||||||||
| IA | $ 23.88 | $ (0.01) | $ 2.44 | $ 2.43 | $ (0.06) | $ (2.68) | $ (2.74) | $ 23.57 | 10.01% | $ 164,964 | 0.92% | 0.92% | (0.05)% | 51% | ||||||||||||||
| IB | 21.97 | (0.07) | 2.25 | 2.18 | — | (2.68) | (2.68) | 21.47 | 9.76 | 40,427 | 1.17 | 1.17 | (0.30) | 51 | ||||||||||||||
| For the Year Ended December 31, 2020 | ||||||||||||||||||||||||||||
| IA | $ 23.67 | $ 0.02 | $ 4.94 | $ 4.96 | $ (0.13) | $ (4.62) | $ (4.75) | $ 23.88 | 23.10% | $ 190,371 | 0.91% | 0.91% | 0.07% | 42% | ||||||||||||||
| IB | 22.12 | (0.04) | 4.58 | 4.54 | (0.07) | (4.62) | (4.69) | 21.97 | 22.79 | 43,662 | 1.16 | 1.16 | (0.18) | 42 | ||||||||||||||
| For the Year Ended December 31, 2019 | ||||||||||||||||||||||||||||
| IA | $ 20.56 | $ 0.03 | $ 6.31 | $ 6.34 | $ — | $ (3.23) | $ (3.23) | $ 23.67 | 33.95% | $ 191,260 | 0.91% | 0.91% | 0.11% | 42% | ||||||||||||||
| IB | 19.44 | (0.03) | 5.94 | 5.91 | — | (3.23) | (3.23) | 22.12 | 33.68 | 41,992 | 1.16 | 1.16 | (0.16) | 42 | ||||||||||||||
| For the Year Ended December 31, 2018 | ||||||||||||||||||||||||||||
| IA | $ 22.46 | $ — | $ (0.41) | $ (0.41) | $ (0.02) | $ (1.47) | $ (1.49) | $ 20.56 | (2.67)% | $ 249,144 | 0.89% | 0.89% | (0.01)% | 29% | ||||||||||||||
| IB | 21.35 | (0.06) | (0.38) | (0.44) | — | (1.47) | (1.47) | 19.44 | (2.96) | 36,576 | 1.14 | 1.14 | (0.26) | 29 | ||||||||||||||
| For the Year Ended December 31, 2017 | ||||||||||||||||||||||||||||
| IA | $ 21.46 | $ 0.01 | $ 4.69 | $ 4.70 | $ — | $ (3.70) | $ (3.70) | $ 22.46 | 22.26% | $ 290,603 | 0.89% | 0.89% | 0.04% | 18% | ||||||||||||||
| IB | 20.60 | (0.05) | 4.50 | 4.45 | — | (3.70) | (3.70) | 21.35 | 21.96 | 44,796 | 1.14 | 1.14 | (0.21) | 18 | ||||||||||||||
| 128 |
| — Selected Per-Share Data(1) — | — Ratios and Supplemental Data — | |||||||||||||||||||||||||||
| Class | Net Asset Value at Beginning of Period | Net Investment Income (Loss) | Net Realized and Unrealized Gain (Loss) on Investments | Total from Investment Operations | Dividends from Net Investment Income | Distributions from Capital Gains | Total Dividends and Distributions | Net Asset Value at End of Period | Total Return(2) | Net Assets at End of Period (000s) | Ratio of Expenses to Average Net Assets Before Adjust- ments(3) | Ratio of Expenses to Average Net Assets After Adjust- ments(3) | Ratio of Net Investment Income (Loss) to Average Net Assets | Portfolio Turnover | ||||||||||||||
| Hartford International Opportunities HLS Fund | ||||||||||||||||||||||||||||
| For the Year Ended December 31, 2021 | ||||||||||||||||||||||||||||
| IA | $ 19.58 | $ 0.22 | $ 1.31 | $ 1.53 | $ (0.21) | $ — | $ (0.21) | $ 20.90 | 7.82% | $ 1,064,640 | 0.73% | 0.73% | 1.09% | 95% | ||||||||||||||
| IB | 19.86 | 0.18 | 1.32 | 1.50 | (0.15) | — | (0.15) | 21.21 | 7.57 | 112,357 | 0.98 | 0.98 | 0.84 | 95 | ||||||||||||||
| For the Year Ended December 31, 2020 | ||||||||||||||||||||||||||||
| IA | $ 16.56 | $ 0.10 | $ 3.24 | $ 3.34 | $ (0.32) | $ — | $ (0.32) | $ 19.58 | 20.45% | $ 1,095,213 | 0.76% | 0.76% | 0.61% | 107% | ||||||||||||||
| IB | 16.80 | 0.06 | 3.27 | 3.33 | (0.27) | — | (0.27) | 19.86 | 20.09 | 143,449 | 1.01 | 1.01 | 0.36 | 107 | ||||||||||||||
| For the Year Ended December 31, 2019 | ||||||||||||||||||||||||||||
| IA | $ 13.91 | $ 0.27 | $ 3.30 | $ 3.57 | $ (0.30) | $ (0.62) | $ (0.92) | $ 16.56 | 26.43% | $ 1,093,030 | 0.74% | 0.74% | 1.74% | 88% | ||||||||||||||
| IB | 14.09 | 0.24 | 3.35 | 3.59 | (0.26) | (0.62) | (0.88) | 16.80 | 26.14 | 135,655 | 0.99 | 0.99 | 1.48 | 88 | ||||||||||||||
| For the Year Ended December 31, 2018 | ||||||||||||||||||||||||||||
| IA | $ 17.46 | $ 0.26 | $ (3.49) | $ (3.23) | $ (0.32) | $ — | $ (0.32) | $ 13.91 | (18.74)% | $ 1,000,295 | 0.73% | 0.73% | 1.55% | 80% | ||||||||||||||
| IB | 17.68 | 0.22 | (3.53) | (3.31) | (0.28) | — | (0.28) | 14.09 | (18.96) | 120,635 | 0.98 | 0.98 | 1.28 | 80 | ||||||||||||||
| For the Year Ended December 31, 2017 | ||||||||||||||||||||||||||||
| IA | $ 14.14 | $ 0.24 | $ 3.31 | $ 3.55 | $ (0.23) | $ — | $ (0.23) | $ 17.46 | 25.25% | $ 1,418,078 | 0.73% | 0.73% | 1.46% | 91% | ||||||||||||||
| IB | 14.31 | 0.21 | 3.35 | 3.56 | (0.19) | — | (0.19) | 17.68 | 24.99 | 162,442 | 0.98 | 0.98 | 1.28 | 91 | ||||||||||||||
| Hartford MidCap HLS Fund | ||||||||||||||||||||||||||||
| For the Year Ended December 31, 2021 | ||||||||||||||||||||||||||||
| IA | $ 43.44 | $ 0.29 | $ 3.97 | $ 4.26 | $ — | $ (7.39) | $ (7.39) | $ 40.31 | 9.91% | $ 1,973,242 | 0.69% | 0.69% | 0.65% | 28% | ||||||||||||||
| IB | 41.76 | 0.15 | 3.83 | 3.98 | — | (7.39) | (7.39) | 38.35 | 9.62 | 130,071 | 0.94 | 0.94 | 0.37 | 28 | ||||||||||||||
| For the Year Ended December 31, 2020 | ||||||||||||||||||||||||||||
| IA | $ 38.17 | $ 0.03 | $ 8.90 | $ 8.93 | $ (0.02) | $ (3.64) | $ (3.66) | $ 43.44 | 25.10% | $ 2,377,320 | 0.70% | 0.70% | 0.07% | 50% | ||||||||||||||
| IB | 36.90 | (0.04) | 8.54 | 8.50 | — | (3.64) | (3.64) | 41.76 | 24.80 | 140,632 | 0.95 | 0.95 | (0.11) | 50 | ||||||||||||||
| For the Year Ended December 31, 2019 | ||||||||||||||||||||||||||||
| IA | $ 33.77 | $ 0.05 | $ 10.56 | $ 10.61 | $ (0.07) | $ (6.14) | $ (6.21) | $ 38.17 | 32.87% | $ 2,045,156 | 0.69% | 0.69% | 0.12% | 29% | ||||||||||||||
| IB | 32.85 | (0.05) | 10.24 | 10.19 | — | (6.14) | (6.14) | 36.90 | 32.49 | 55,049 | 0.94 | 0.94 | (0.12) | 29 | ||||||||||||||
| For the Year Ended December 31, 2018 | ||||||||||||||||||||||||||||
| IA | $ 40.10 | $ 0.01 | $ (2.35) | $ (2.34) | $ (0.01) | $ (3.98) | $ (3.99) | $ 33.77 | (7.44)% | $ 1,768,712 | 0.69% | 0.69% | 0.03% | 35% | ||||||||||||||
| IB | 39.18 | (0.09) | (2.26) | (2.35) | — | (3.98) | (3.98) | 32.85 | (7.65) | 46,186 | 0.94 | 0.94 | (0.22) | 35 | ||||||||||||||
| For the Year Ended December 31, 2017 | ||||||||||||||||||||||||||||
| IA | $ 33.83 | $ 0.01 | $ 8.11 | $ 8.12 | $ — | $ (1.85) | $ (1.85) | $ 40.10 | 24.47% | $ 2,156,044 | 0.70% | 0.70% | 0.02% | 36% | ||||||||||||||
| IB | 33.17 | (0.08) | 7.94 | 7.86 | — | (1.85) | (1.85) | 39.18 | 24.17 | 58,850 | 0.95 | 0.95 | (0.23) | 36 | ||||||||||||||
| Hartford Small Cap Growth HLS Fund | ||||||||||||||||||||||||||||
| For the Year Ended December 31, 2021 | ||||||||||||||||||||||||||||
| IA | $ 38.15 | $ (0.04) | $ 1.68 | $ 1.64 | $ — | $ (3.19) | $ (3.19) | $ 36.60 | 4.02% | $ 1,153,860 | 0.63% | 0.63% | (0.11)% | 44% | ||||||||||||||
| IB | 36.48 | (0.13) | 1.61 | 1.48 | — | (3.19) | (3.19) | 34.77 | 3.76 | 224,883 | 0.88 | 0.88 | (0.36) | 44 | ||||||||||||||
| For the Year Ended December 31, 2020 | ||||||||||||||||||||||||||||
| IA | $ 29.72 | $ (0.02) | $ 9.57 | $ 9.55 | $ — | $ (1.12) | $ (1.12) | $ 38.15 | 33.20% | $ 1,224,012 | 0.67% | 0.67% | (0.07)% | 61% | ||||||||||||||
| IB | 28.53 | (0.09) | 9.16 | 9.07 | — | (1.12) | (1.12) | 36.48 | 32.89 | 201,033 | 0.92 | 0.92 | (0.34) | 61 | ||||||||||||||
| For the Year Ended December 31, 2019 | ||||||||||||||||||||||||||||
| IA | $ 26.76 | $ 0.03 | $ 8.61 | $ 8.64 | $ — | $ (5.68) | $ (5.68) | $ 29.72 | 35.81% | $ 954,063 | 0.64% | 0.64% | 0.11% | 42% | ||||||||||||||
| IB | 25.95 | (0.04) | 8.30 | 8.26 | — | (5.68) | (5.68) | 28.53 | 35.45 | 381,057 | 0.89 | 0.89 | (0.14) | 42 | ||||||||||||||
| For the Year Ended December 31, 2018 | ||||||||||||||||||||||||||||
| IA | $ 32.13 | $ (0.01) | $ (3.27) | $ (3.28) | $ — | $ (2.09) | $ (2.09) | $ 26.76 | (11.70)% | $ 803,907 | 0.64% | 0.64% | (0.03)% | 86% | ||||||||||||||
| IB | 31.28 | (0.09) | (3.15) | (3.24) | — | (2.09) | (2.09) | 25.95 | (11.89) | 312,475 | 0.89 | 0.89 | (0.28) | 86 | ||||||||||||||
| 129 |
| — Selected Per-Share Data(1) — | — Ratios and Supplemental Data — | |||||||||||||||||||||||||||
| Class | Net Asset Value at Beginning of Period | Net Investment Income (Loss) | Net Realized and Unrealized Gain (Loss) on Investments | Total from Investment Operations | Dividends from Net Investment Income | Distributions from Capital Gains | Total Dividends and Distributions | Net Asset Value at End of Period | Total Return(2) | Net Assets at End of Period (000s) | Ratio of Expenses to Average Net Assets Before Adjust- ments(3) | Ratio of Expenses to Average Net Assets After Adjust- ments(3) | Ratio of Net Investment Income (Loss) to Average Net Assets | Portfolio Turnover | ||||||||||||||
| Hartford Small Cap Growth HLS Fund – (continued) | ||||||||||||||||||||||||||||
| For the Year Ended December 31, 2017 | ||||||||||||||||||||||||||||
| IA | $ 26.77 | $ (0.02) | $ 5.39 | $ 5.37 | $ (0.01) | $ — | $ (0.01) | $ 32.13 | 20.07% | $ 960,690 | 0.65% | 0.65% | (0.06)% | 51% | ||||||||||||||
| IB | 26.12 | (0.09) | 5.25 | 5.16 | — | — | — | 31.28 | 19.75 | 374,342 | 0.90 | 0.90 | (0.31) | 51 | ||||||||||||||
| Hartford Small Company HLS Fund | ||||||||||||||||||||||||||||
| For the Year Ended December 31, 2021 | ||||||||||||||||||||||||||||
| IA | $ 27.44 | $ (0.14) | $ 0.66 | $ 0.52 | $ — | $ (3.39) | $ (3.39) | $ 24.57 | 1.56% | $ 590,597 | 0.77% | 0.77% | (0.51)% | 111% | ||||||||||||||
| IB | 24.23 | (0.19) | 0.60 | 0.41 | — | (3.39) | (3.39) | 21.25 | 1.30 | 60,025 | 1.02 | 1.02 | (0.79) | 111 | ||||||||||||||
| For the Year Ended December 31, 2020 | ||||||||||||||||||||||||||||
| IA | $ 20.45 | $ (0.07) | $ 10.38 | $ 10.31 | $ — | $ (3.32) | $ (3.32) | $ 27.44 | 55.52% | $ 540,764 | 0.81% | 0.81% | (0.32)% | 105% | ||||||||||||||
| IB | 18.44 | (0.11) | 9.22 | 9.11 | — | (3.32) | (3.32) | 24.23 | 55.03 | 67,898 | 1.06 | 1.06 | (0.56) | 105 | ||||||||||||||
| For the Year Ended December 31, 2019 | ||||||||||||||||||||||||||||
| IA | $ 18.38 | $ (0.05) | $ 6.36 | $ 6.31 | $ — | $ (4.24) | $ (4.24) | $ 20.45 | 37.00% | $ 572,642 | 0.79% | 0.79% | (0.23)% | 79% | ||||||||||||||
| IB | 16.94 | (0.09) | 5.83 | 5.74 | — | (4.24) | (4.24) | 18.44 | 36.77 | 51,691 | 1.04 | 1.04 | (0.49) | 79 | ||||||||||||||
| For the Year Ended December 31, 2018 | ||||||||||||||||||||||||||||
| IA | $ 20.42 | $ (0.10) | $ (0.46) | $ (0.56) | $ — | $ (1.48) | $ (1.48) | $ 18.38 | (4.23)% | $ 473,098 | 0.78% | 0.78% | (0.47)% | 100% | ||||||||||||||
| IB | 18.97 | (0.15) | (0.40) | (0.55) | — | (1.48) | (1.48) | 16.94 | (4.51) | 46,402 | 1.03 | 1.03 | (0.73) | 100 | ||||||||||||||
| For the Year Ended December 31, 2017 | ||||||||||||||||||||||||||||
| IA | $ 16.16 | $ (0.06) | $ 4.32 | $ 4.26 | $ — | $ — | $ — | $ 20.42 | 26.36% | $ 551,010 | 0.78% | 0.78% | (0.33)% | 107% | ||||||||||||||
| IB | 15.05 | (0.10) | 4.02 | 3.92 | — | — | — | 18.97 | 26.05 | 57,193 | 1.03 | 1.03 | (0.58) | 107 | ||||||||||||||
| Hartford Stock HLS Fund | ||||||||||||||||||||||||||||
| For the Year Ended December 31, 2021 | ||||||||||||||||||||||||||||
| IA | $ 95.52 | $ 1.38 | $ 22.20 | $ 23.58 | $ (1.30) | $ (3.89) | $ (5.19) | $ 113.91 | 24.98% | $ 1,506,206 | 0.51% | 0.51% | 1.32% | 15% | ||||||||||||||
| IB | 95.48 | 1.12 | 22.15 | 23.27 | (1.02) | (3.89) | (4.91) | 113.84 | 24.67 | 142,700 | 0.76 | 0.76 | 1.07 | 15 | ||||||||||||||
| For the Year Ended December 31, 2020 | ||||||||||||||||||||||||||||
| IA | $ 92.58 | $ 1.39 | $ 9.21 | $ 10.60 | $ (1.48) | $ (6.18) | $ (7.66) | $ 95.52 | 12.08% | $ 1,360,099 | 0.52% | 0.52% | 1.57% | 15% | ||||||||||||||
| IB | 92.57 | 1.17 | 9.17 | 10.34 | (1.25) | (6.18) | (7.43) | 95.48 | 11.79 | 129,670 | 0.77 | 0.77 | 1.32 | 15 | ||||||||||||||
| For the Year Ended December 31, 2019 | ||||||||||||||||||||||||||||
| IA | $ 78.10 | $ 1.43 | $ 22.40 | $ 23.83 | $ (1.46) | $ (7.89) | $ (9.35) | $ 92.58 | 31.22% | $ 1,375,643 | 0.51% | 0.51% | 1.59% | 15% | ||||||||||||||
| IB | 78.11 | 1.20 | 22.39 | 23.59 | (1.24) | (7.89) | (9.13) | 92.57 | 30.89 | 133,951 | 0.76 | 0.76 | 1.34 | 15 | ||||||||||||||
| For the Year Ended December 31, 2018 | ||||||||||||||||||||||||||||
| IA | $ 79.57 | $ 1.31 | $ (1.45) | $ (0.14) | $ (1.33) | $ — | $ (1.33) | $ 78.10 | (0.14)% | $ 1,201,873 | 0.51% | 0.51% | 1.60% | 22% | ||||||||||||||
| IB | 79.54 | 1.10 | (1.43) | (0.33) | (1.10) | — | (1.10) | 78.11 | (0.38) | 120,176 | 0.76 | 0.76 | 1.34 | 22 | ||||||||||||||
| For the Year Ended December 31, 2017 | ||||||||||||||||||||||||||||
| IA | $ 67.55 | $ 1.30 | $ 12.10 | $ 13.40 | $ (1.38) | $ — | $ (1.38) | $ 79.57 | 19.85% | $ 1,378,245 | 0.52% | 0.52% | 1.76% | 14% | ||||||||||||||
| IB | 67.53 | 1.11 | 12.08 | 13.19 | (1.18) | — | (1.18) | 79.54 | 19.54 | 143,370 | 0.77 | 0.77 | 1.51 | 14 | ||||||||||||||
| Hartford Total Return Bond HLS Fund | ||||||||||||||||||||||||||||
| For the Year Ended December 31, 2021 | ||||||||||||||||||||||||||||
| IA | $ 11.98 | $ 0.24 | $ (0.35) | $ (0.11) | $ (0.29) | $ (0.29) | $ (0.58) | $ 11.29 | (0.95)% | $ 2,045,579 | 0.50% | 0.50% | 2.09% | 61% (9) | ||||||||||||||
| IB | 11.91 | 0.21 | (0.35) | (0.14) | (0.26) | (0.29) | (0.55) | 11.22 | (1.18) | 237,952 | 0.75 | 0.75 | 1.84 | 61 (9) | ||||||||||||||
| For the Year Ended December 31, 2020 | ||||||||||||||||||||||||||||
| IA | $ 11.44 | $ 0.29 | $ 0.73 | $ 1.02 | $ (0.45) | $ (0.03) | $ (0.48) | $ 11.98 | 9.03% | $ 2,110,986 | 0.51% | 0.51% | 2.45% | 62% (9) | ||||||||||||||
| IB | 11.38 | 0.26 | 0.72 | 0.98 | (0.42) | (0.03) | (0.45) | 11.91 | 8.71 | 265,900 | 0.76 | 0.76 | 2.19 | 62 (9) | ||||||||||||||
| 130 |
| — Selected Per-Share Data(1) — | — Ratios and Supplemental Data — | |||||||||||||||||||||||||||
| Class | Net Asset Value at Beginning of Period | Net Investment Income (Loss) | Net Realized and Unrealized Gain (Loss) on Investments | Total from Investment Operations | Dividends from Net Investment Income | Distributions from Capital Gains | Total Dividends and Distributions | Net Asset Value at End of Period | Total Return(2) | Net Assets at End of Period (000s) | Ratio of Expenses to Average Net Assets Before Adjust- ments(3) | Ratio of Expenses to Average Net Assets After Adjust- ments(3) | Ratio of Net Investment Income (Loss) to Average Net Assets | Portfolio Turnover | ||||||||||||||
| Hartford Total Return Bond HLS Fund – (continued) | ||||||||||||||||||||||||||||
| For the Year Ended December 31, 2019 | ||||||||||||||||||||||||||||
| IA | $ 10.76 | $ 0.36(10) | $ 0.77(10) | $ 1.13 | $ (0.45) | $ — | $ (0.45) | $ 11.44 | 10.65% | $ 1,873,182 | 0.51% | 0.51% | 3.16% (10) | 61% | ||||||||||||||
| IB | 10.70 | 0.33 (10) | 0.77 (10) | 1.10 | (0.42) | — | (0.42) | 11.38 | 10.32 | 214,338 | 0.76 | 0.76 | 2.91 (10) | 61 | ||||||||||||||
| For the Year Ended December 31, 2018 | ||||||||||||||||||||||||||||
| IA | $ 11.32 | $ 0.35 | $ (0.43) | $ (0.08) | $ (0.44) | $ (0.04) | $ (0.48) | $ 10.76 | (0.81)% | $ 1,871,299 | 0.51% | 0.51% | 3.23% | 53% | ||||||||||||||
| IB | 11.25 | 0.33 | (0.43) | (0.10) | (0.41) | (0.04) | (0.45) | 10.70 | (0.91) | 215,123 | 0.76 | 0.76 | 2.98 | 53 | ||||||||||||||
| For the Year Ended December 31, 2017 | ||||||||||||||||||||||||||||
| IA | $ 11.09 | $ 0.34 | $ 0.23 | $ 0.57 | $ (0.34) | $ — | $ (0.34) | $ 11.32 | 5.16% | $ 2,157,506 | 0.51% | 0.51% | 2.99% | 89% | ||||||||||||||
| IB | 11.03 | 0.31 | 0.22 | 0.53 | (0.31) | — | (0.31) | 11.25 | 4.80 | 248,785 | 0.76 | 0.76 | 2.74 | 89 | ||||||||||||||
| Hartford Ultrashort Bond HLS Fund | ||||||||||||||||||||||||||||
| For the Year Ended December 31, 2021 | ||||||||||||||||||||||||||||
| IA | $ 10.09 | $ 0.02 | $ (0.04) | $ (0.02) | $ (0.07) | $ — | $ (0.07) | $ 10.00 | (0.19)% | $ 605,732 | 0.44% | 0.44% | 0.15% | 73% | ||||||||||||||
| IB | 10.09 | (0.01) | (0.04) | (0.05) | (0.05) | ��� | (0.05) | 9.99 | (0.46) | 97,279 | 0.69 | 0.69 | (0.10) | 73 | ||||||||||||||
| For the Year Ended December 31, 2020 | ||||||||||||||||||||||||||||
| IA | $ 10.19 | $ 0.10 | $ 0.05 | $ 0.15 | $ (0.25) | $ — | $ (0.25) | $ 10.09 | 1.44% | $ 657,375 | 0.46% | 0.46% | 0.95% | 76% | ||||||||||||||
| IB | 10.18 | 0.07 | 0.06 | 0.13 | (0.22) | — | (0.22) | 10.09 | 1.27 | 110,250 | 0.71 | 0.71 | 0.67 | 76 | ||||||||||||||
| For the Year Ended December 31, 2019 | ||||||||||||||||||||||||||||
| IA | $ 10.10 | $ 0.23 | $ 0.05 | $ 0.28 | $ (0.19) | $ — | $ (0.19) | $ 10.19 | 2.81% | $ 393,590 | 0.45% | 0.45% | 2.21% | 70% | ||||||||||||||
| IB | 10.09 | 0.20 | 0.06 | 0.26 | (0.17) | — | (0.17) | 10.18 | 2.54 | 57,142 | 0.70 | 0.70 | 1.96 | 70 | ||||||||||||||
| For the Year Ended December 31, 2018 | ||||||||||||||||||||||||||||
| IA | $ 10.06 | $ 0.18 | $ (0.02) | $ 0.16 | $ (0.12) | $ — | $ (0.12) | $ 10.10 | 1.57% | $ 437,160 | 0.45% | 0.45% | 1.77% | 51% | ||||||||||||||
| IB | 10.05 | 0.15 | (0.02) | 0.13 | (0.09) | — | (0.09) | 10.09 | 1.27 | 64,859 | 0.70 | 0.70 | 1.52 | 51 | ||||||||||||||
| For the Year Ended December 31, 2017 | ||||||||||||||||||||||||||||
| IA | $ 10.04 | $ 0.10 | $ —(11) | $ 0.10 | $ (0.08) | $ — | $ (0.08) | $ 10.06 | 1.01% | $ 460,643 | 0.45% | 0.45% | 1.00% | 60% | ||||||||||||||
| IB | 10.02 | 0.07 | 0.01 (11) | 0.08 | (0.05) | — | (0.05) | 10.05 | 0.80 | 65,424 | 0.70 | 0.70 | 0.75 | 60 | ||||||||||||||
| FINANCIAL HIGHLIGHTS FOOTNOTES | |
| (1) | Information presented relates to a share outstanding throughout the indicated period. Net investment income (loss) per share amounts are calculated based on average shares outstanding unless otherwise noted. |
| (2) | The figures do not include sales charges or other fees which may be applied at the variable contract level or by a qualified pension or retirement plan. Any such additional sales charges or other fees would lower the Fund’s performance. |
| (3) | Adjustments include waivers and reimbursements, if applicable. Ratios do not include fees paid indirectly (see Expenses in the accompanying Notes to Financial Statements). |
| (4) | Portfolio turnover excludes TBA roll transactions. Had TBA roll transactions been included, the portfolio turnover rate would have been 49% and 48% for the fiscal years ended December 31, 2021 and December 31, 2020, respectively. |
| (5) | FASB issued ASU 2017-08 to amend the amortization period to the earliest call date for purchased callable debt securities held at a premium. Effective January 1, 2019, the Fund amended its amortization policy and the effect of this change for the year ended December 31, 2019 was an increase to net investment income per share for less than $0.005, decrease to net realized and unrealized gain (loss) on investments for less than $(0.005) and a decrease to ratio of net investment income to average net assets for less than 0.005% for each class of shares. Per share data and ratios for periods prior to December 31, 2019 have not been restated to reflect this change in presentation. |
| (6) | Commenced operations on September 18, 2020. |
| (7) | Not annualized. |
| (8) | Annualized. |
| (9) | Portfolio turnover excludes TBA roll transactions. Had TBA roll transactions been included, the portfolio turnover rate would have been 494% and 564% for the fiscal years ended December 31, 2021 and December 31, 2020, respectively. |
| (10) | FASB issued ASU 2017-08 to amend the amortization period to the earliest call date for purchased callable debt securities held at a premium. Effective January 1, 2019, the Fund amended its amortization policy and the effect of this change for the year ended December 31, 2019 was a decrease to net investment income per share for less than $(0.005), increase to net realized and unrealized gain (loss) on investments for less than $0.005 and a decrease to ratio of net investment income to average net assets of (0.01)% for each class of shares. Per share data and ratios for periods prior to December 31, 2019 have not been restated to reflect this change in presentation. |
| (11) | Per share amount was not in accord with the net realized and unrealized gain (loss) for the period because of the timing of transactions in shares of the Fund and the amount and timing of per-share net realized and unrealized gain (loss) on such shares. |
| 131 |
December 31, 2021
| 1. | Organization: |
| Hartford Series Fund, Inc. and Hartford HLS Series Fund II, Inc. (each, a "Company" and collectively, the “Companies”) are each an open-end registered management investment company comprised of eleven and one series, respectively, as of December 31, 2021. Financial statements for the series of each Company listed below (each, a "Fund" and collectively, the "Funds") are included in this report. | |
| Hartford Series Fund, Inc.: |
| Hartford Balanced HLS Fund (the "Balanced HLS Fund") |
| Hartford Capital Appreciation HLS Fund (the "Capital Appreciation HLS Fund") |
| Hartford Disciplined Equity HLS Fund (the "Disciplined Equity HLS Fund") |
| Hartford Dividend and Growth HLS Fund (the "Dividend and Growth HLS Fund") |
| Hartford Healthcare HLS Fund (the "Healthcare HLS Fund") |
| Hartford International Opportunities HLS Fund (the "International Opportunities HLS Fund") |
| Hartford MidCap HLS Fund (the "MidCap HLS Fund") |
| Hartford Small Company HLS Fund (the "Small Company HLS Fund") |
| Hartford Stock HLS Fund (the "Stock HLS Fund") |
| Hartford Total Return Bond HLS Fund (the "Total Return Bond HLS Fund") |
| Hartford Ultrashort Bond HLS Fund (the "Ultrashort Bond HLS Fund") |
| Hartford HLS Series Fund II, Inc.: |
| Hartford Small Cap Growth HLS Fund (the "Small Cap Growth HLS Fund") |
| 2. | Significant Accounting Policies: |
| The following is a summary of significant accounting policies of each Fund used in the preparation of its financial statements, which are in accordance with United States Generally Accepted Accounting Principles (“U.S. GAAP”). The preparation of financial statements in accordance with U.S. GAAP may require management to make estimates and assumptions that affect the reported amounts of assets and liabilities and disclosure of contingent assets and liabilities at the date of the financial statements and the reported amounts of increases and decreases in net assets from operations during the reporting period. Actual results could differ from those estimates. |
| a) | Determination of Net Asset Value – The NAV of each class of each Fund’s shares is determined as of the close of regular trading on the New York Stock Exchange (the "Exchange") (normally 4:00 p.m. Eastern Time) (the “NYSE Close”) on each day that the Exchange is open ("Valuation Date"). If the Exchange is closed due to weather or other extraordinary circumstances on a day it would typically be open for business, each Fund may treat such day as a typical business day and accept purchase and redemption orders and calculate each Fund’s NAV in accordance with applicable law. The NAV of each class of each Fund's shares is determined by dividing the value of the Fund’s net assets attributable to the class of shares by the number of shares outstanding for that class. Information that becomes known to the Funds after the NAV has been calculated on a particular day will not generally be used to retroactively adjust the NAV determined earlier that day. |
| b) | Investment Valuation and Fair Value Measurements – For purposes of calculating the NAV of each class of each Fund, portfolio securities and other assets held in the Fund’s portfolio for which market prices are readily available are valued at market value. Market value is generally determined on the basis of official close price or last reported trade price. If no trades were reported, market value is based on |
| 132 |
December 31, 2021
| prices obtained from a quotation reporting system, established market makers (including evaluated prices), or independent pricing services. Pricing vendors may use matrix pricing or valuation models that utilize certain inputs and assumptions to derive values, including transaction data, credit quality information, general market conditions, news, and other factors and assumptions. | |
| If market prices are not readily available or are deemed unreliable, a Fund will use the fair value of the security or other instrument as determined in good faith under policies and procedures established by and under the supervision of the Board of Directors of the respective Company (the “Board of Directors”) (“Valuation Procedures”). Market prices are considered not readily available where there is an absence of current or reliable market-based data (e.g., trade information or broker quotes), including where events occur after the close of the relevant market, but prior to the NYSE Close, that materially affect the values of a Fund’s portfolio holdings or assets. In addition, market prices are considered not readily available when, due to extraordinary circumstances, the exchanges or markets on which the securities or other instruments trade do not open for trading for the entire day and no other market prices are available. Fair value pricing is subjective in nature and the use of fair value pricing by a Fund may cause the NAV of its shares to differ significantly from the NAV that would have been calculated using market prices at the close of the exchange on which a portfolio holding is primarily traded. There can be no assurance that a Fund could obtain the fair value assigned to an investment if the Fund were to sell the investment at approximately the time at which the Fund determines its NAV. | |
| Prices of foreign equities that are principally traded on certain foreign markets will generally be adjusted daily pursuant to a fair value pricing service in order to reflect an adjustment for the factors occurring after the close of certain foreign markets but before the NYSE Close. Securities and other instruments that are primarily traded on foreign markets may trade on days that are not business days of the Funds. The value of the foreign securities or other instruments in which a Fund invests may change on days when a shareholder will not be able to purchase, redeem or exchange shares of the Fund. | |
| Fixed income investments (other than short-term obligations) and non-exchange traded derivatives held by a Fund are normally valued at prices supplied by independent pricing services in accordance with the Valuation Procedures. Short-term investments maturing in 60 days or less are generally valued at amortized cost which approximates fair value. | |
| Exchange-traded derivatives, such as options, futures and options on futures, are valued at the last sale price determined by the exchange where such instruments principally trade as of the close of such exchange (“Exchange Close”). If a last sale price is not available, the value will be the mean of the most recently quoted bid and ask prices as of the Exchange Close. If a mean of the bid and ask prices cannot be calculated for the day, the value will be the most recently quoted bid price as of the Exchange Close. Over-the-counter derivatives are normally valued based on prices supplied by independent pricing services in accordance with the Valuation Procedures. | |
| Investments valued in currencies other than U.S. dollars are converted to U.S. dollars using the prevailing spot currency exchange rates obtained from independent pricing services for calculation of the NAV. As a result, the NAV of a Fund’s shares may be affected by changes in the value of currencies in relation to the U.S. dollar. The value of securities or other instruments traded in markets outside the United States or denominated in currencies other than the U.S. dollar may be affected significantly on a day that the Exchange is closed and the market value may change on days when an investor is not able to purchase, redeem or exchange shares of a Fund. | |
| Foreign currency contracts represent agreements to exchange currencies on specific future dates at predetermined rates. Foreign currency contracts are valued using foreign currency exchange rates and forward rates as provided by an independent pricing service on the Valuation Date. | |
| Investments in investment companies that are not listed or traded on an exchange ("Non-Traded Funds"), if any, are valued at the respective NAV of each Non-Traded Fund on the Valuation Date. Shares of investment companies listed and traded on an exchange are valued in the same manner as any exchange-listed equity security. Such Non-Traded Funds and listed investment companies may use fair value pricing as disclosed in their prospectuses. | |
| Financial instruments for which prices are not available from an independent pricing service may be valued using market quotations obtained from one or more dealers that make markets in the respective financial instrument in accordance with the Valuation Procedures. | |
| U.S. GAAP defines fair value as the price that a Fund would receive to sell an asset or pay to transfer a liability in an orderly transaction between market participants. The U.S. GAAP fair value measurement standards require disclosure of a fair value hierarchy for each major category of assets and liabilities. Various inputs are used in determining the fair value of each Fund’s investments. These inputs are summarized into three broad hierarchy levels. This hierarchy is based on whether the valuation inputs are observable or unobservable. These levels are: |
| • | Level 1 – Quoted prices in active markets for identical investments. Level 1 may include exchange traded instruments, such as domestic equities, some foreign equities, options, futures, mutual funds, exchange traded funds, rights and warrants. |
| • | Level 2 – Observable inputs other than Level 1 prices, such as quoted prices for similar investments; quoted prices in markets that are not active; or other inputs that are observable or can be corroborated by observable market data. Level 2 may include debt investments |
| 133 |
December 31, 2021
| that are traded less frequently than exchange traded instruments and which are valued using independent pricing services; foreign equities, which are principally traded on certain foreign markets and are adjusted daily pursuant to a fair value pricing service in order to reflect an adjustment for the factors occurring after the close of certain foreign markets but before the NYSE Close; senior floating rate interests, which are valued using an aggregate of dealer bids; short-term investments, which are valued at amortized cost; and swaps, which are valued based upon the terms of each swap contract. | |
| • | Level 3 – Significant unobservable inputs that are supported by limited or no market activity. Level 3 may include financial instruments whose values are determined using indicative market quotes or require significant management judgment or estimation. These unobservable valuation inputs may include estimates for current yields, maturity/duration, prepayment speed, and indicative market quotes for comparable investments along with other assumptions relating to credit quality, collateral value, complexity of the investment structure, general market conditions and liquidity. This category may include investments where trading has been halted or there are certain restrictions on trading. While these investments are priced using unobservable inputs, the valuation of these investments reflects the best available data and management believes the prices are a reasonable representation of exit price. |
| c) | Investment Transactions and Investment Income – Investment transactions are recorded as of the trade date (the date the order to buy or sell is executed) for financial reporting purposes. Investments purchased or sold on a when-issued or delayed-delivery basis may be settled a month or more after the trade date. Realized gains and losses are determined on the basis of identified cost. |
| The trade date for senior floating rate interests purchased in the primary loan market is considered the date on which the loan allocations are determined. The trade date for senior floating rate interests purchased in the secondary loan market is the date on which the transaction is entered into. | |
| Dividend income from domestic securities is accrued on the ex-dividend date. In general, dividend income from foreign securities is recorded on the ex-date; however, dividend notifications in certain foreign jurisdictions may not be available in a timely manner and as a result, a Fund will record the dividend as soon as the relevant details (i.e., rate per share, payment date, shareholders of record, etc.) are publicly available. | |
| Interest income, including amortization of premium, accretion of discounts, inflation adjustments and additional principal received in-kind in lieu of cash, is accrued on a daily basis. Paydown gains and losses on mortgage-related and other asset-backed securities are included in interest income in the Statements of Operations, as applicable. |
| d) | Taxes – A Fund may be subject to taxes imposed on realized gains on securities of certain foreign countries in which such Fund invests. A Fund may also be subject to taxes withheld on foreign dividends and interest from securities in which a Fund invests. The amount of any foreign taxes withheld and foreign tax expense is included on the accompanying Statements of Operations as a reduction to net investment income or net realized or unrealized gain (loss) on investments in these securities, if applicable. |
| e) | Foreign Currency Transactions – Assets and liabilities denominated in currencies other than U.S. dollars are translated into U.S. dollars at the exchange rates in effect on the Valuation Date. Purchases and sales of investments, income and expenses are translated into U.S. dollars at the exchange rates on the dates of such transactions. |
| A Fund does not isolate that portion of portfolio investment valuation resulting from fluctuations in the foreign currency exchange rates from the fluctuations arising from changes in the market prices of investments held. Exchange rate fluctuations are included with the net realized and unrealized gain or loss on investments in the accompanying financial statements. | |
| Net realized foreign exchange gains or losses arise from sales of foreign currencies and the difference between asset and liability amounts initially stated in foreign currencies and the U.S. dollar value of the amounts actually received or paid. Net unrealized foreign exchange gains or losses arise from changes in the value of other assets and liabilities at the end of the reporting period, resulting from changes in the exchange rates. |
| 134 |
December 31, 2021
| f) | Joint Trading Account – A Fund may invest cash balances into a joint trading account that may be invested in one or more repurchase agreements. |
| g) | Fund Share Valuation and Dividend Distributions to Shareholders – Orders for each class of each Fund’s shares are executed in accordance with the investment instructions of the contract holders and plan participants. The NAV of each class of each Fund’s shares is determined as of the close of business on each business day of the Exchange (see Note 2(a)). The NAV is determined separately for each class of shares of a Fund by dividing the Fund's net assets attributable to that class by the number of shares of the class outstanding. Each class of shares offered by a Fund has equal rights as to assets and voting privileges (except that shareholders of a class have exclusive voting rights regarding any matter relating solely to that class of shares). Income and non-class specific expenses are allocated daily to each class on the basis of the relative net assets of the class of the Fund. Realized and unrealized gains and losses are allocated daily based on the relative net assets of each class of shares of each Fund. |
| Orders for the purchase of a Fund's shares received prior to the close of the Exchange on any day the Exchange is open for business are priced at the NAV determined as of the close of the Exchange. Orders received after the close of the Exchange, or on a day on which the Exchange and/or the Funds are not open for business, are priced at the next determined NAV. | |
| Dividends are declared pursuant to a policy adopted by the respective Company's Board of Directors. Dividends and/or distributions to shareholders are recorded on ex-date. The policy of each Fund is to pay dividends from net investment income and realized gains, if any, at least once a year. Income dividends and capital gains distributions are determined in accordance with federal income tax regulations, which may differ from U.S. GAAP with respect to character and timing (see Federal Income Taxes: Distributions and Components of Distributable Earnings and Reclassification of Capital Accounts notes). |
| 3. | Securities and Other Investments: |
| a) | Restricted Securities – Each Fund may invest in securities that are subject to legal or contractual restrictions on resale. These securities generally may be resold in transactions exempt from registration or to the public if the securities are registered. Disposal of these securities may involve time-consuming negotiations and expense, and prompt sale at an acceptable price may be difficult. Information regarding restricted securities, if applicable, is included at the end of each Fund's Schedule of Investments. |
| b) | Investments Purchased on a When-Issued or Delayed-Delivery Basis – Delivery and payment for investments that have been purchased by a Fund on a forward commitment, or when-issued or delayed-delivery basis, take place beyond the customary settlement period. A Fund may dispose of or renegotiate a delayed-delivery transaction after it is entered into, and may sell delayed-delivery investments before they are delivered, which may result in a realized gain or loss. During this period, such investments are subject to market fluctuations, and a Fund identifies investments segregated in its records with a value at least equal to the amount of the commitment. See each Fund’s Schedule of Investments, if applicable, for when-issued or delayed-delivery investments as of December 31, 2021. |
| In connection with a Fund's ability to purchase investments on a when-issued or forward commitment basis, the Fund may enter into to-be announced (“TBA”) commitments. TBA commitments are forward agreements for the purchase or sale of mortgage-backed securities for a fixed price, with payment and delivery on an agreed-upon future settlement date. The specific securities to be delivered are not identified at the trade date; however, delivered securities must meet specified terms, including issuer, rate and mortgage terms. Although a Fund may enter into TBA commitments with the intention of acquiring or delivering securities for its portfolio, the Fund can extend the settlement date, roll the transaction, or dispose of a commitment prior to settlement if deemed appropriate to do so. If the TBA commitment is closed through the acquisition of an offsetting TBA commitment, a Fund realizes a gain or loss. In a TBA roll transaction, a Fund generally purchases or sells the initial TBA commitment prior to the agreed upon settlement date and enters into a new TBA commitment for future delivery or receipt of the mortgage-backed securities. TBA commitments involve a risk of loss if the value of the security to be purchased or sold declines or increases, respectively, prior to settlement date. These transactions are excluded from a Fund's portfolio turnover rate. See each Fund's Schedule of Investments, if applicable, for TBA commitments as of December 31, 2021. |
| c) | Senior Floating Rate Interests – Certain Funds may invest in senior floating rate interests. Senior floating rate interests generally hold the most senior position in the capital structure of a business entity (the “Borrower”), are typically secured by specific collateral and have a claim on the assets and/or stock of the Borrower that is senior to that held by subordinated debt holders and stockholders of the Borrower. Senior floating rate interests are typically structured and administered by a financial institution that acts as the agent of the lenders participating in the senior floating rate interest. A Fund may invest in multiple series or tranches of a senior floating rate interest, which may have varying terms and carry different associated risks. A Fund may also enter into unfunded loan commitments, which are contractual obligations for future funding. Unfunded loan commitments may include revolving credit facilities, which may obligate the Fund to supply additional cash to the Borrower on demand. Unfunded loan commitments represent a future obligation in full. A Fund may receive a commitment fee based on the undrawn portion of the underlying line of credit portion of a senior floating rate interest. In certain circumstances, a Fund may receive various fees upon the restructure of a senior floating rate interest by a borrower. Fees earned/paid may be recorded as a component of income or realized gain/loss in the Statements of Operations. |
| 135 |
December 31, 2021
| d) | Mortgage-Related and Other Asset-Backed Securities – A Fund may invest in mortgage-related and other asset-backed securities. These securities include mortgage pass-through securities, collateralized mortgage obligations, commercial mortgage-backed securities, stripped mortgage-backed securities, asset-backed securities, collateralized debt obligations and other securities that directly or indirectly represent a participation in, or are secured by and payable from, mortgage loans on real property. Mortgage-related securities are created from pools of residential or commercial mortgage loans, including mortgage loans made by savings and loan institutions, mortgage bankers, commercial banks and others. Asset-backed securities are created from many types of assets, including auto loans, credit card receivables, home equity loans, and student loans. These securities provide a monthly payment that consists of both interest and principal payments. Interest payments may be determined by fixed or adjustable rates. The rate of prepayments on underlying mortgages will affect the price and volatility of a mortgage-related security, and may have the effect of shortening or extending the effective duration of the security relative to what was anticipated at the time of purchase. The timely payment of principal and interest of certain mortgage-related securities is guaranteed by the full faith and credit of the United States Government. Mortgage-related and other asset-backed securities created and guaranteed by non-governmental issuers, including government-sponsored corporations, may be supported by various forms of insurance or guarantees, but there can be no assurance that the private insurers or guarantors can meet their obligations under the insurance policies or guarantee arrangements. See each Fund's Schedule of Investments, if applicable, for mortgage-related and other asset-backed securities as of December 31, 2021. |
| e) | Inflation-Indexed Bonds – A Fund may invest in inflation-indexed bonds. Inflation-indexed bonds are fixed income investments whose principal value is periodically adjusted to the rate of inflation. The interest rate on these bonds is generally fixed at issuance at a rate lower than typical bonds. Over the life of an inflation-indexed bond, however, interest will be paid based on a principal value, which is adjusted for inflation. Any increase or decrease in the principal amount of an inflation-indexed bond will be included as interest income on the Statements of Operations, even though investors do not receive the principal amount until maturity. See each Fund's Schedule of Investments, if applicable, for inflation-indexed bonds as of December 31, 2021. |
| f) | Repurchase Agreements – A repurchase agreement is an agreement between two parties whereby one party sells the other a security at a specified price with a commitment to repurchase the security later at an agreed-upon price, date and interest payment. Each Fund is permitted to enter into fully collateralized repurchase agreements. Each Company's Board of Directors has delegated to the sub-adviser the responsibility of evaluating the creditworthiness of the banks and securities dealers with which the Funds will engage in repurchase agreements. The sub-adviser will monitor such transactions to ensure that the value of underlying collateral will be at least equal to the total amount of the repurchase obligation as required by the valuation provision of the repurchase agreement, including the accrued interest. Repurchase agreements carry the risk that the market value of the securities declines below the repurchase price. A Fund could also lose money if it is unable to recover the securities and the value of any collateral held or assets segregated by the Fund to cover the transaction is less than the value of the securities. In the event the borrower commences bankruptcy proceedings, a court may characterize the transaction as a loan. If a Fund has not perfected a security interest in the underlying collateral, the Fund may be required to return the underlying collateral to the borrower’s estate and be treated as an unsecured creditor. As an unsecured creditor, the Fund could lose some or all of the principal and interest involved in the transaction. See each Fund's Schedule of Investments, if applicable, for repurchase agreements as of December 31, 2021. |
| g) | Special Purpose Acquisition Companies - A Fund may invest in special purpose acquisition companies (“SPACs”) or similar special purpose entities. SPACs are collective investment structures that pool funds in order to seek potential acquisition opportunities. SPACs and similar entities may be blank check companies with no operating history or ongoing business other than to seek a potential acquisition. Because SPACs and similar entities have no operating history or ongoing business other than seeking acquisitions, the value of their securities is particularly dependent on the ability of the entity’s management to identify and complete a profitable acquisition. Some SPACs may pursue acquisitions only within certain industries or regions, which may increase the volatility of their securities’ prices. In addition, these securities, which are typically traded in the OTC market, may be considered illiquid and/or be subject to restrictions on resale. A Fund may enter into a contingent commitment with a SPAC to purchase shares of private investments in public equity investments (“PIPE”) if and when the SPAC completes its merger or acquisition; however if the commitment expires, then no shares are purchased. Purchased PIPE shares will be restricted from trading until the registration statement for the shares is declared effective. Upon registration, the shares can be freely sold; however, in certain circumstances, the issuer may have the right to temporarily suspend trading of the shares in the first year after the merger. |
| 136 |
December 31, 2021
| 4. | Financial Derivative Instruments: |
| The following disclosures contain information on how and why a Fund may use derivative instruments, the credit-risk-related contingent features in certain derivative instruments, and how derivative instruments affect a Fund’s financial position and results of operations. The location and fair value amounts of these instruments on the Statements of Assets and Liabilities and the realized gains and losses and changes in unrealized gains and losses on the Statements of Operations, each categorized by type of derivative contract, are included in the following Additional Derivative Instrument Information footnote. The derivative instruments outstanding as of period-end are disclosed in the notes to the Schedules of Investments, if applicable. The amounts of realized gains and losses and changes in unrealized gains and losses on derivative instruments during the period are disclosed in the Statements of Operations. |
| a) | Futures Contracts – A Fund may enter into futures contracts. A futures contract is an agreement between two parties to buy or sell an asset at a set price on a future date. A Fund may use futures contracts to manage risk or obtain exposure to the investment markets, commodities, or movements in interest rates and currency values. The primary risks associated with the use of futures contracts are the imperfect correlation between the change in market value of the investments held by a Fund and the prices of futures contracts and the possibility of an illiquid market. Upon entering into a futures contract, a Fund is required to deposit with a futures commission merchant (“FCM”) an amount of cash or U.S. Government or Agency Obligations in accordance with the initial margin requirements of the broker or exchange. Futures contracts are marked to market daily and an appropriate amount equal to the change in value (“variation margin”) is paid or received by a Fund. Gains or losses are recognized but not considered realized until the contracts expire or are closed. Futures contracts involve, to varying degrees, risk of loss in excess of the variation margin disclosed on the Statements of Assets and Liabilities. |
| During the year ended December 31, 2021, each of Balanced HLS Fund, Capital Appreciation HLS Fund and Total Return Bond HLS Fund had used Futures Contracts. |
| b) | Foreign Currency Contracts – A Fund may enter into foreign currency contracts that obligate the Fund to purchase or sell currencies at specified future dates. Foreign currency contracts may be used in connection with settling purchases or sales of securities to hedge the currency exposure associated with some or all of a Fund’s investments and/or as part of an investment strategy. Foreign currency contracts are marked to market daily and the change in value is recorded by a Fund as an unrealized gain or loss. A Fund will record a realized gain or loss when the foreign currency contract is settled. |
| Foreign currency contracts involve elements of market risk in excess of the amounts reflected in the Statements of Assets and Liabilities. In addition, risks may arise upon entering into these contracts from the potential inability of the counterparties to meet the terms of the contracts and from unanticipated movements in the value of the foreign currencies relative to the U.S. dollar. Upon entering into a foreign currency contract, a Fund may be required to post margin equal to its outstanding exposure thereunder. | |
| During the year ended December 31, 2021, each of Capital Appreciation HLS Fund and Total Return Bond HLS Fund had used Foreign Currency Contracts. |
| c) | Options Contracts – An option contract is a contract sold by one party to another party that offers the buyer the right, but not the obligation, to buy (call) or sell (put) an investment or other financial asset at an agreed-upon price during a specific period of time or on a specific date. Option contracts are either over-the-counter ("OTC") options or executed in a registered exchange (“exchange-traded options”). A Fund may write (sell) covered call and put options on futures, swaps (“swaptions”), securities, commodities or currencies. “Covered” means that so long as a Fund is obligated as the writer of an option, it will own either the underlying investments or currency or an option to purchase the same underlying investments or currency having an expiration date of the covered option and an exercise price equal to or less than the exercise price of the covered option, or will segregate or earmark cash or other liquid investments having, for written call options, a value equal to the greater of the exercise price or the market value of the underlying instrument and, for written put options, a value equal to the exercise price. Writing put options may increase a Fund’s exposure to the underlying instrument. Writing call options may decrease a Fund’s exposure to the underlying instrument. Premiums received from writing options that expire are treated as realized gains. Premiums received from writing options that are exercised or closed are added to the proceeds or offset amounts paid on the underlying futures, swaps, investments or currency transactions to determine the realized gain or loss. A Fund, as a writer of an option, has no control over whether the underlying instrument may be sold (call) or purchased (put) and as a result bears the market risk of an unfavorable change in the price of the instrument underlying the written option. There is the risk a Fund may not be able to enter into a closing transaction because of an illiquid market. A Fund may also purchase put and call options. Purchasing call options may increase a Fund’s exposure to the underlying instrument. Purchasing put options may decrease a Fund’s exposure to the underlying instrument. A Fund pays a premium, which is included on the Fund’s Statements of Assets and Liabilities as an investment and is subsequently marked to market to reflect the current value of the option. Premiums paid for purchasing options that expire are treated as realized losses. Certain options may be purchased with premiums to be determined on a future date. The premiums for these options are based upon implied volatility parameters at specified terms. The risk associated with purchasing put and call options is generally limited to the premium paid. Premiums paid for purchasing options that are exercised or closed are added to the amounts paid or offset against the proceeds on the underlying investment transaction to determine the realized gain or loss. Entering into OTC options also exposes a Fund to counterparty risk. Counterparty risk is the possibility that the |
| 137 |
December 31, 2021
| counterparty to the agreements may default on its obligation to perform or disagree as to the meaning of the contractual terms in the agreements. |
| d) | Swap Contracts – A Fund may invest in swap contracts. Swap contracts are agreements to exchange or swap investment cash flows, assets, foreign currencies or market-linked returns at specified future intervals. Swap contracts are either privately negotiated in the over-the-counter market (“OTC swaps”) or cleared through a central counterparty or derivatives clearing organization (“centrally cleared swaps”). A Fund may enter into credit default, total return, cross-currency, interest rate, inflation and other forms of swap contracts to manage its exposure to credit, currency, interest rate, commodity and inflation risk. Swap contracts are also used to gain exposure to certain markets. In connection with these contracts, investments or cash may be identified as collateral or margin in accordance with the terms of the respective swap contracts and/or master netting arrangement to provide assets of value and recourse in the event of default or bankruptcy/insolvency. |
| Swaps are valued in accordance with the Valuation Procedures. Changes in market value, if any, are reflected as a component of net changes in unrealized appreciation or depreciation on the Statements of Operations. Daily changes in valuation of centrally cleared swaps, if any, are recorded as a receivable or payable for the change in value (“variation margin”) on the Statements of Assets and Liabilities. Realized gains or losses on centrally cleared swaps are recorded upon the termination of the swaps. OTC swap payments received or paid at the beginning of the measurement period are reflected as such on the Statements of Assets and Liabilities and represent premiums paid or received upon entering into the swap contract to compensate for differences between the stated terms of the swap contract and prevailing market conditions (credit spreads, currency exchange rates, interest rates and other relevant factors). These upfront premiums are recorded as realized gains or losses on the Statements of Operations upon termination or maturity of the swap. A liquidation payment received or made at the termination or maturity of the swap is recorded as a realized gain or loss on the Statements of Operations. Net periodic payments received or paid by a Fund are included as part of realized gains or losses on the Statements of Operations. | |
| Entering into these contracts involves, to varying degrees, elements of liquidation, counterparty, credit and market risk in excess of the amounts recognized on the Statements of Assets and Liabilities. Such risks involve the possibility that there will be no liquid market for these contracts, that the counterparty to the contracts may default on its obligation to perform or disagree as to the meaning of contractual terms in the contracts, and that there may be unfavorable changes in market conditions (credit spreads, currency exchange rates, interest rates and other relevant factors). | |
| A Fund’s maximum risk of loss from counterparty risk for OTC swaps is the net value of the discounted cash flows to be received from the counterparty over the contract’s remaining life, and current market value, to the extent that amount is positive. The risk is mitigated by having a master netting arrangement between a Fund and the counterparty, which allows for the netting of payments made or received (although such amounts are presented on a gross basis within the Statements of Assets and Liabilities, as applicable) as well as the posting of collateral to a Fund to cover the Fund’s exposure to the counterparty. In a centrally cleared swap, while a Fund enters into an agreement with a clearing broker to execute contracts with a counterparty, the performance of the swap is guaranteed by the central clearinghouse, which reduces the Fund’s exposure to counterparty risk. However, the Fund is still exposed to a certain amount of counterparty risk through the clearing broker and clearinghouse. The clearinghouse attempts to minimize this risk to its participants through the use of mandatory margin requirements, daily cash settlements and other procedures. Likewise, the clearing broker reduces its risk through margin requirements and required segregation of customer balances. | |
| Credit Default Swap Contracts – The credit default swap market allows a Fund to manage credit risk through buying and selling credit protection on a specific issuer, asset or basket of assets. Certain credit default swaps involve the exchange of a fixed rate premium for protection against the loss in value of an underlying investment or index in the event of a credit event, such as payment default or bankruptcy. | |
| Under a credit default swap contract, one party acts as guarantor by receiving the fixed periodic payment in exchange for the commitment to purchase the underlying investment at par if the defined credit event occurs. Upon the occurrence of a defined credit event, the difference between the value of the reference obligation and the swap’s notional amount is recorded as realized gain or loss on swap transactions in the Statements of Operations. A “buyer” of credit protection agrees to pay a counterparty to assume the credit risk of an issuer upon the occurrence of certain events. The “seller” of the protection receives periodic payments and agrees to assume the credit risk of an issuer upon the occurrence of certain events. Although specified events are contract specific, credit events are generally defined as bankruptcy, failure to pay, restructuring, obligation acceleration, obligation default or repudiation/moratorium. A “seller’s” exposure is limited to the total notional amount of the credit default swap contract. These potential amounts would be partially offset by any recovery values of the respective referenced obligations or upfront payments received upon entering into the contract. | |
| Implied credit spreads, represented in absolute terms, utilized in determining the market value of credit default swap contracts on corporate issues, sovereign government issues or U.S. municipal issues as of year-end are disclosed in the notes to the Schedules of Investments, as applicable, and serve as an indicator of the current status of the payment/performance risk and represent the likelihood or risk of default |
| 138 |
December 31, 2021
| for the credit derivative. The implied credit spread of a particular referenced entity reflects the cost of buying/selling protection and there may also be upfront payments required to be made to enter into the contract. Wider credit spreads represent a deterioration of the referenced entity’s credit soundness and a greater likelihood or risk of default or other credit event occurring as defined under the terms of the contract. For credit default swap contracts on credit indices, the quoted market prices and resulting values serve as the indicator of the current status of the payment/performance risk. Increasing market values, in absolute terms when compared to the notional amount of the swap, represent a deterioration of the referenced equity’s credit soundness and a greater likelihood or risk of default or other credit event occurring as defined under the terms of the contract. | |
| During the year ended December 31, 2021, Total Return Bond HLS Fund had used Credit Default Swap Contracts. | |
| Interest Rate Swap Contracts – Certain Funds are subject to interest rate risk exposure in the normal course of pursuing its investment objectives. A Fund may use interest rate swaps to hedge interest rate and duration risk across a portfolio at particular duration points to maintain its ability to generate income at prevailing market rates. In a typical interest rate swap, one party agrees to make regular payments equal to a floating interest rate, based on a specified interest rate or benchmark, multiplied by a notional amount, in return for payments equal to a fixed rate multiplied by the same amount, for a specific period of time. The net interest received or paid on interest rate swap contracts is recorded as a realized gain or loss. Interest rate swaps are marked to market daily and the change, if any, is recorded as an unrealized gain or loss in the Statements of Operations. When the interest rate swap contract is terminated early, a Fund records a realized gain or loss equal to the difference between the current market value and the upfront premium or cost. | |
| If an interest rate swap contract provides for payments in different currencies, the parties might agree to exchange the notional amount as well. Interest rate swaps may also depend on other prices or rates, such as the value of an index. The risks of interest rate swaps include changes in market conditions, which will affect the value of the contract or the cash flows and the possible inability of the counterparty to fulfill its obligations under the contract. A Fund’s maximum risk of loss from counterparty credit risk is the discounted net value of the cash flows to be received from the counterparty over the contract’s remaining life, to the extent that amount is positive. |
| e) | Additional Derivative Instrument Information: |
| Balanced HLS Fund | |
| The Effect of Derivative Instruments on the Statement of Assets and Liabilities as of December 31, 2021: | |||||||||||
| Risk Exposure Category | |||||||||||
| Interest Rate Contracts | Foreign Currency Contracts | Credit Contracts | Equity Contracts | Commodity Contracts | Total | ||||||
| Assets: | |||||||||||
| Unrealized appreciation on futures contracts(1) | $ 46,474 | $ — | $ — | $ — | $ — | $ 46,474 | |||||
| Total | $ 46,474 | $ — | $ — | $ — | $ — | $ 46,474 | |||||
| Liabilities: | |||||||||||
| Unrealized depreciation on futures contracts(1) | $ 171,163 | $ — | $ — | $ — | $ — | $ 171,163 | |||||
| Total | $ 171,163 | $ — | $ — | $ — | $ — | $ 171,163 | |||||
| (1) | Amount represents the cumulative appreciation and depreciation on futures contracts as disclosed within the Schedule of Investments under the open “Futures Contracts” section. Only current day’s variation margin, if any, is reported within the Statement of Assets and Liabilities. |
| The Effect of Derivative Instruments on the Statement of Operations for the year ended December 31, 2021: | |||||||||||
| Risk Exposure Category | |||||||||||
| Interest Rate Contracts | Foreign Currency Contracts | Credit Contracts | Equity Contracts | Commodity Contracts | Total | ||||||
| Realized Gain (Loss) on Derivatives Recognized as a Result of Operations: | |||||||||||
| Net realized gain (loss) on futures contracts | $ 634,948 | $ — | $ — | $ — | $ — | $ 634,948 | |||||
| Total | $ 634,948 | $ — | $ — | $ — | $ — | $ 634,948 | |||||
| Net Change in Unrealized Appreciation (Depreciation) on Derivatives Recognized as a Result of Operations: | |||||||||||
| Net change in unrealized appreciation (depreciation) of futures contracts | $ (115,681) | $ — | $ — | $ — | $ — | $ (115,681) | |||||
| Total | $ (115,681) | $ — | $ — | $ — | $ — | $ (115,681) | |||||
| 139 |
December 31, 2021
| Derivative Description | Average Notional Par, Contracts or Face Amount | |
| Futures Contracts Number of Long Contracts | 83 | |
| Futures Contracts Number of Short Contracts | (83) |
| The Effect of Derivative Instruments on the Statement of Assets and Liabilities as of December 31, 2021: | |||||||||||
| Risk Exposure Category | |||||||||||
| Interest Rate Contracts | Foreign Currency Contracts | Credit Contracts | Equity Contracts | Commodity Contracts | Total | ||||||
| Liabilities: | |||||||||||
| Unrealized depreciation on futures contracts(1) | $ — | $ — | $ — | $ 257,154 | $ — | $ 257,154 | |||||
| Total | $ — | $ — | $ — | $ 257,154 | $ — | $ 257,154 | |||||
| (1) | Amount represents the cumulative appreciation and depreciation on futures contracts as disclosed within the Schedule of Investments under the open “Futures Contracts” section. Only current day’s variation margin, if any, is reported within the Statement of Assets and Liabilities. |
| The Effect of Derivative Instruments on the Statement of Operations for the year ended December 31, 2021: | |||||||||||
| Risk Exposure Category | |||||||||||
| Interest Rate Contracts | Foreign Currency Contracts | Credit Contracts | Equity Contracts | Commodity Contracts | Total | ||||||
| Realized Gain (Loss) on Derivatives Recognized as a Result of Operations: | |||||||||||
| Net realized gain (loss) on futures contracts | $ — | $ — | $ — | $ 18,503,271 | $ — | $ 18,503,271 | |||||
| Total | $ — | $ — | $ — | $ 18,503,271 | $ — | $ 18,503,271 | |||||
| Net Change in Unrealized Appreciation (Depreciation) on Derivatives Recognized as a Result of Operations: | |||||||||||
| Net change in unrealized appreciation (depreciation) of futures contracts | $ — | $ — | $ — | $ (2,163,279) | $ — | $ (2,163,279) | |||||
| Total | $ — | $ — | $ — | $ (2,163,279) | $ — | $ (2,163,279) | |||||
| Derivative Description | Average Notional Par, Contracts or Face Amount | |
| Futures Contracts Number of Long Contracts | 248 |
| 140 |
December 31, 2021
| The Effect of Derivative Instruments on the Statement of Assets and Liabilities as of December 31, 2021: | |||||||||||
| Risk Exposure Category | |||||||||||
| Interest Rate Contracts | Foreign Currency Contracts | Credit Contracts | Equity Contracts | Commodity Contracts | Total | ||||||
| Assets: | |||||||||||
| Investments in securities, at value (purchased options), market value | $ 194,062 | $ — | $ — | $ — | $ — | $ 194,062 | |||||
| Unrealized appreciation on futures contracts(1) | 1,965,293 | — | — | — | — | 1,965,293 | |||||
| Unrealized appreciation on foreign currency contracts | — | 65,904 | — | — | — | 65,904 | |||||
| Unrealized appreciation on swap contracts(2) | — | — | 207,296 | — | — | 207,296 | |||||
| Total | $ 2,159,355 | $ 65,904 | $ 207,296 | $ — | $ — | $ 2,432,555 | |||||
| Liabilities: | |||||||||||
| Unrealized depreciation on futures contracts(1) | $ 2,730,891 | $ — | $ — | $ — | $ — | $ 2,730,891 | |||||
| Unrealized depreciation on foreign currency contracts | — | 733,656 | — | — | — | 733,656 | |||||
| Written options, market value | 785,723 | — | — | — | — | 785,723 | |||||
| Unrealized depreciation on swap contracts(2) | — | — | 2,032,176 | — | — | 2,032,176 | |||||
| Total | $ 3,516,614 | $ 733,656 | $ 2,032,176 | $ — | $ — | $ 6,282,446 | |||||
| (1) | Amount represents the cumulative appreciation and depreciation on futures contracts as disclosed within the Schedule of Investments under the open “Futures Contracts” section. Only current day’s variation margin, if any, is reported within the Statement of Assets and Liabilities. |
| (2) | Amount represents the cumulative appreciation and depreciation on centrally cleared swaps, if applicable, as disclosed within the Schedule of Investments. Only the current day’s variation margin, if any, are reported within the Statements of Assets and Liabilities. OTC swaps are reported within the Statement of Assets and Liabilities within Unrealized appreciation and depreciation on OTC swap contracts, if applicable. |
| The Effect of Derivative Instruments on the Statement of Operations for the year ended December 31, 2021: | |||||||||||
| Risk Exposure Category | |||||||||||
| Interest Rate Contracts | Foreign Currency Contracts | Credit Contracts | Equity Contracts | Commodity Contracts | Total | ||||||
| Realized Gain (Loss) on Derivatives Recognized as a Result of Operations: | |||||||||||
| Net realized gain (loss) on purchased options contracts | $ 107,845 | $ — | $ — | $ — | $ — | $ 107,845 | |||||
| Net realized gain (loss) on futures contracts | 4,468,542 | — | — | — | — | 4,468,542 | |||||
| Net realized gain (loss) on written options contracts | 2,423,476 | — | — | — | — | 2,423,476 | |||||
| Net realized gain (loss) on swap contracts | 87,787 | — | (700,150) | — | — | (612,363) | |||||
| Net realized gain (loss) on foreign currency contracts | — | 7,156,600 | — | — | — | 7,156,600 | |||||
| Total | $ 7,087,650 | $ 7,156,600 | $ (700,150) | $ — | $ — | $ 13,544,100 | |||||
| Net Change in Unrealized Appreciation (Depreciation) on Derivatives Recognized as a Result of Operations: | |||||||||||
| Net change in unrealized appreciation (depreciation) of investments in purchased options contracts | $ (2,447,117) | $ — | $ — | $ — | $ — | $ (2,447,117) | |||||
| Net change in unrealized appreciation (depreciation) of futures contracts | (1,619,670) | — | — | — | — | (1,619,670) | |||||
| Net change in unrealized appreciation (depreciation) of written options contracts | 683,367 | — | — | — | — | 683,367 | |||||
| Net change in unrealized appreciation (depreciation) of swap contracts | (72,454) | — | (54,035) | — | — | (126,489) | |||||
| Net change in unrealized appreciation (depreciation) of foreign currency contracts | — | (226,327) | — | — | — | (226,327) | |||||
| Total | $ (3,455,874) | $ (226,327) | $ (54,035) | $ — | $ — | $ (3,736,236) | |||||
| 141 |
December 31, 2021
| Derivative Description | Average Notional Par, Contracts or Face Amount | |
| Purchased Options at Notional Amount | $ 129,229,250 | |
| Futures Contracts Number of Long Contracts | 1,547 | |
| Futures Contracts Number of Short Contracts | (3,360) | |
| Written Options at Notional Amount | $ (247,040,500) | |
| Swap Contracts at Notional Amount | 1,279,041,959 | |
| Foreign Currency Contracts Purchased at Contract Amount | $ 3,243,491 | |
| Foreign Currency Contracts Sold at Contract Amount | $ 94,122,328 |
| f) | Balance Sheet Offsetting Information – Set forth below are tables which disclose both gross information and net information about instruments and transactions eligible for offset in the financial statements, and instruments and transactions that are subject to a master netting arrangement, as well as amounts related to margin, reflected as financial collateral (including cash collateral), held at clearing brokers, counterparties and a Fund's custodian. The master netting arrangements allow the clearing brokers to net any collateral held in or on behalf of a Fund, or liabilities or payment obligations of the clearing brokers to a Fund, against any liabilities or payment obligations of a Fund to the clearing brokers. A Fund is required to deposit financial collateral (including cash collateral) at the Fund's custodian on behalf of clearing brokers and counterparties to continually meet the original and maintenance requirements established by the clearing brokers and counterparties. Such requirements are specific to the respective clearing broker or counterparty. Certain master netting arrangements may not be enforceable in a bankruptcy. |
| The following tables present a Fund's derivative assets and liabilities, presented on a gross basis as no amounts are netted within the Statements of Assets and Liabilities, by counterparty net of amounts available for offset under a master netting agreement or similar agreement ("MNA") and net of the related collateral received/pledged by a Fund as of December 31, 2021: | |
| Balanced HLS Fund | ||||
| Derivative Financial Instruments: | Assets | Liabilities | ||
| Futures contracts | $ 46,474 | $ (171,163) | ||
| Total gross amount of derivative assets and liabilities in the Statement of Assets and Liabilities | 46,474 | (171,163) | ||
| Derivatives not subject to a MNA | (46,474) | 171,163 | ||
| Total gross amount of assets and liabilities subject to MNA or similar agreements | $ — | $ — |
| Capital Appreciation HLS Fund | ||||
| Derivative Financial Instruments: | Assets | Liabilities | ||
| Futures contracts | $ — | $ (257,154) | ||
| Total gross amount of derivative assets and liabilities in the Statement of Assets and Liabilities | — | (257,154) | ||
| Derivatives not subject to a MNA | — | 257,154 | ||
| Total gross amount of assets and liabilities subject to MNA or similar agreements | $ — | $ — |
| Total Return Bond HLS Fund | ||||
| Derivative Financial Instruments: | Assets | Liabilities | ||
| Foreign currency contracts | $ 65,904 | $ (733,656) | ||
| Futures contracts | 1,965,293 | (2,730,891) | ||
| Purchased options | 194,062 | — | ||
| Swap contracts | 207,296 | (2,032,176) | ||
| Written options | — | (785,723) | ||
| Total gross amount of derivative assets and liabilities in the Statement of Assets and Liabilities | 2,432,555 | (6,282,446) | ||
| Derivatives not subject to a MNA | (2,172,589) | 2,730,891 | ||
| Total gross amount of assets and liabilities subject to MNA or similar agreements | $ 259,966 | $ (3,551,555) |
| 142 |
December 31, 2021
| Counterparty | Gross Amount of Assets | Financial Instruments and Derivatives Available for Offset | Non-cash Collateral Received | Cash Collateral Received | Net Amount of Assets | |||||
| Bank of America Securities LLC | $ 98,940 | $ (98,940) | $ — | $ — | $ — | |||||
| Citibank NA | 95,122 | (95,122) | — | — | — | |||||
| Morgan Stanley | 65,904 | (65,904) | — | — | — | |||||
| Total | $ 259,966 | $ (259,966) | $ — | $ — | $ — | |||||
| Counterparty | Gross Amount of Liabilities | Financial Instruments and Derivatives Available for Offset | Non-cash Collateral Pledged | Cash Collateral Pledged | Net Amount of Liabilities | |||||
| Bank of America Securities LLC | $ (400,600) | $ 98,940 | $ 301,660 | $ — | $ — | |||||
| Barclays | (75,137) | — | 75,137 | — | — | |||||
| BNP Paribas Securities Services | (279,545) | — | — | — | (279,545) | |||||
| Citibank NA | (385,123) | 95,122 | 290,001 | — | — | |||||
| Credit Suisse International | (785,613) | — | 785,613 | — | — | |||||
| Deutsche Bank Securities, Inc. | (454,111) | — | — | — | (454,111) | |||||
| Goldman Sachs & Co. | (578,419) | — | 554,563 | — | (23,856) | |||||
| JP Morgan Chase & Co. | (12,749) | — | — | — | (12,749) | |||||
| Morgan Stanley | (580,258) | 65,904 | 514,354 | — | — | |||||
| Total | $ (3,551,555) | $ 259,966 | $ 2,521,328 | $ — | $ (770,261) |
| 5. | Principal Risks: |
| A Fund’s investments expose it to various types of risks associated with financial instruments and the markets. A Fund may be exposed to the risks described below. Each Fund’s prospectus provides details of its principal risks. | |
| The market values of equity securities, such as common stocks and preferred stocks, or equity related derivative investments, such as futures and options, may decline due to general market conditions which are not specifically related to a particular company, such as real or perceived adverse economic conditions, changes in the general outlook for corporate earnings, changes in interest or currency rates or adverse investor sentiment generally. The market value of equity securities may also decline due to factors which affect a particular industry or industries, such as labor shortages or increased production costs and competitive conditions within an industry. Equity securities and equity related investments generally have greater market price volatility than fixed income securities. The extent of each Fund’s exposure to market risk is the market value of the investments held as shown in the Fund’s Schedule of Investments. | |
| A widespread health crisis, such as a global pandemic, could cause substantial market volatility, exchange trading suspensions or restrictions and closures of securities exchanges and businesses, impact the ability to complete redemptions, and adversely impact Fund performance. The current ongoing outbreak of COVID-19, a respiratory disease caused by a novel coronavirus, has negatively affected the worldwide economy, created supply chain disruptions and labor shortages, and impacted the financial health of individual companies and the market in significant and unforeseen ways. The future impact of the ongoing COVID-19 pandemic remains unclear. The effects to public health, business and market conditions resulting from COVID-19 pandemic may have a significant negative impact on the performance of a Fund’s investments, including exacerbating other pre-existing political, social and economic risks. | |
| Certain investments held by a Fund expose the Fund to various risks which may include, but are not limited to, interest rate, prepayment, and extension risks. Interest rate risk is the risk that fixed income securities will decline in value because of changes in interest rates. As nominal interest rates rise, the values of certain fixed income securities held by a Fund are likely to decrease. A nominal interest rate can be described as the sum of a real interest rate and an expected inflation rate. Fixed income securities with longer durations tend to be more sensitive to changes in interest rates, usually making them more volatile than securities with shorter durations. Duration is useful primarily as a measure of the sensitivity of a fixed income security’s market price to interest rate (i.e., yield) movements. Senior floating rate interests and securities subject to prepayment and extension risk generally offer less potential for gains when interest rates decline. Rising interest rates may cause prepayments to occur at a slower than expected rate, thereby effectively lengthening the maturity of the security and making the security more sensitive to interest rate changes. Prepayment and extension risk are major risks of mortgage-backed securities, senior floating rate interests and certain asset-backed securities. For certain asset-backed securities, the actual maturity may be less than the stated maturity shown in the Schedule of Investments, if applicable. As a result, the timing of income recognition relating to these securities may vary based upon the actual maturity. |
| 143 |
December 31, 2021
| Investing in the securities of non-U.S. issuers, whether directly or indirectly, involves certain considerations and risks not typically associated with securities of U.S. issuers. Such risks include, but are not limited to: generally less liquid and less efficient securities markets; generally greater price volatility; exchange rate fluctuations; imposition of restrictions on the expatriation of funds or other protectionist measures; less publicly available information about issuers; the imposition of withholding or other taxes; higher transaction and custody costs; settlement delays and risk of loss attendant in settlement procedures; difficulties in enforcing contractual obligations; less regulation of securities markets; different accounting, disclosure and reporting requirements; more substantial governmental involvement in the economy; higher inflation rates; and greater social, economic and political uncertainties. Non-U.S. issuers may also be affected by political, social, economic or diplomatic developments in a foreign country or region or the U.S. (including the imposition of sanctions, tariffs, or other governmental restrictions). These risks are heightened for investments in issuers from countries with less developed markets. | |
| Securities lending involves the risk that a Fund may lose money because the borrower of the loaned securities fails to return the securities in a timely manner or at all. A Fund could also lose money in the event of a decline in the value of the collateral provided for the loaned securities or a decline in the value of any investments made with cash collateral. These events could also trigger adverse tax consequences for a Fund that lends its holdings. | |
| Credit risk depends largely on the perceived financial health of bond issuers. In general, the credit rating is inversely related to the credit risk of the issuer. Higher rated bonds generally are deemed to have less credit risk, while lower or unrated bonds are deemed to have higher risk of default. The share price, yield and total return of a fund that holds securities with higher credit risk may be more volatile than those of a fund that holds bonds with lower credit risk. A Fund may be exposed to counterparty risk, or the risk that an institution or other entity with which a Fund has unsettled or open transactions will default. | |
| The use of certain London Interbank Offered Rates (collectively, “LIBOR”) was generally phased out by the end of 2021, and some regulated entities (such as banks) will cease to enter into new LIBOR-based contracts beginning January 1, 2022. However, it is expected that the most widely used tenors of U.S. LIBOR may continue to be provided on a representative basis until mid-2023. There remains uncertainty regarding the future use of LIBOR and the nature of any replacement rate. As such, the potential effect of a transition away from LIBOR on a Fund or the LIBOR-based instruments in which the Fund invests cannot yet be determined. The transition process away from LIBOR may involve, among other things, increased volatility or illiquidity in markets for instruments that currently rely on LIBOR. The transition process may also result in a reduction in the value of certain instruments held by a Fund or reduce the effectiveness of related Fund transactions, such as hedges. Volatility, the potential reduction in value, and/or the hedge effectiveness of financial instruments may be heightened for financial instruments that do not include fallback provisions that address the cessation of LIBOR. Any potential effects of the transition away from LIBOR on a Fund or on financial instruments in which a Fund invests, as well as other unforeseen effects, could result in losses to the Fund, and the use of an alternative reference rate may adversely affect a Fund's performance. Since the usefulness of LIBOR as a benchmark or reference rate could deteriorate during the transition period, these effects could occur prior to and/or subsequent to mid-2023. |
| 6. | Federal Income Taxes: |
| a) | Each Fund intends to continue to qualify as a Regulated Investment Company ("RIC") under Subchapter M of the Internal Revenue Code (“IRC”) by distributing substantially all of its taxable net investment income and net realized capital gains to its shareholders each year. Each Fund has distributed substantially all of its income and capital gains in prior years, if applicable, and intends to distribute substantially all of its income and capital gains during the calendar year ending December 31, 2021. Accordingly, no provision for federal income or excise taxes has been made in the accompanying financial statements. Distributions from short-term capital gains are treated as ordinary income distributions for federal income tax purposes. |
| b) | Net Investment Income (Loss), Net Realized Gains (Losses) and Distributions – Net investment income (loss) and net realized gains (losses) may differ for financial statement and tax purposes primarily because of losses deferred due to wash sale adjustments, foreign currency gains and losses, adjustments related to Passive Foreign Investment Companies ("PFICs"), Real Estate Investment Trusts ("REITs"), RICs, certain derivatives, losses deferred due to straddle adjustments and partnerships. The character of distributions made during the year from net investment income or net realized gains may differ from their ultimate characterization for federal income tax purposes. Also, due to the timing of dividend distributions, the fiscal year in which amounts are distributed may differ from the year that the income or realized gains (losses) were recorded by each Fund. |
| 144 |
December 31, 2021
| c) | Distributions and Components of Distributable Earnings – The tax character of distributions paid by each Fund for the years ended December 31, 2021 and December 31, 2020 are as follows: |
| For the Year Ended December 31, 2021 | For the Year Ended December 31, 2020 | |||||||
| Fund | Ordinary Income | Long-Term Capital Gains | Ordinary Income | Long-Term Capital Gains | ||||
| Balanced HLS Fund | $ 52,273,431 | $ 82,776,812 | $ 50,832,628 | $ 82,166,849 | ||||
| Capital Appreciation HLS Fund | 207,737,303 | 205,241,369 | 191,666,268 | 149,892,137 | ||||
| Disciplined Equity HLS Fund | 114,174,313 | 42,133,654 | 9,178,888 | 47,141,948 | ||||
| Dividend and Growth HLS Fund | 88,570,001 | 150,135,342 | 60,331,989 | 152,515,057 | ||||
| Healthcare HLS Fund | 7,027,048 | 15,725,379 | 5,101,511 | 35,703,139 | ||||
| International Opportunities HLS Fund | 12,158,250 | — | 20,163,134 | — | ||||
| MidCap HLS Fund | 54,082,515 | 295,016,064 | 40,062,076 | 143,809,510 | ||||
| Small Cap Growth HLS Fund | 53,904,308 | 60,979,045 | 10,977,025 | 34,449,490 | ||||
| Small Company HLS Fund | 43,622,804 | 39,946,903 | 24,748,672 | 41,105,971 | ||||
| Stock HLS Fund | 25,547,866 | 49,235,230 | 25,949,611 | 89,865,458 | ||||
| Total Return Bond HLS Fund | 113,820,922 | — | 81,659,949 | — | ||||
| Ultrashort Bond HLS Fund | 4,980,709 | — | 10,528,950 | — | ||||
| Fund | Undistributed Ordinary Income | Undistributed Long-Term Capital Gains | Accumulated Capital and Other Losses | Other Temporary Differences | Unrealized Appreciation (Depreciation) on Investments | Total Accumulated Earnings (Deficit) | ||||||
| Balanced HLS Fund | $ 17,358,679 | $ 222,399,021 | $ — | $ (1,209,079) | $ 650,111,095 | $ 888,659,716 | ||||||
| Capital Appreciation HLS Fund | 41,623,661 | 457,370,168 | — | — | 1,087,155,163 | 1,586,148,992 | ||||||
| Disciplined Equity HLS Fund | 11,909,195 | 145,037,979 | — | — | 1,299,055,847 | 1,456,003,021 | ||||||
| Dividend and Growth HLS Fund | 9,794,384 | 361,050,555 | — | — | 1,834,181,515 | 2,205,026,454 | ||||||
| Healthcare HLS Fund | 3,816,287 | 33,341,888 | — | — | 56,937,858 | 94,096,033 | ||||||
| International Opportunities HLS Fund | 40,966,948 | 136,368,618 | — | — | 231,416,087 | 408,751,653 | ||||||
| MidCap HLS Fund | 11,869,255 | 202,220,594 | — | — | 685,977,568 | 900,067,417 | ||||||
| Small Cap Growth HLS Fund | 7,803,162 | 170,614,826 | — | — | 384,279,408 | 562,697,396 | ||||||
| Small Company HLS Fund | 12,021,998 | 81,892,619 | — | — | 103,358,852 | 197,273,469 | ||||||
| Stock HLS Fund | 7,209,234 | 139,323,155 | — | — | 757,192,738 | 903,725,127 | ||||||
| Total Return Bond HLS Fund | 61,202,387 | 18,943,062 | — | (9,551,796) | (5,609,184) | 64,984,469 | ||||||
| Ultrashort Bond HLS Fund | 1,268,063 | — | (11,481,746) | — | (836,466) | (11,050,149) |
| d) | Reclassification of Capital Accounts – The Funds may record reclassifications in their capital accounts. These reclassifications have no impact on the total net assets of the Funds. The reclassifications are a result of permanent differences between U.S. GAAP and tax accounting for such items as adjustments to prior year accumulated balances. Adjustments are made to reflect the impact these items have on current and future distributions to shareholders. Therefore, the source of the Funds’ distributions may be shown in the accompanying Statements of Changes in Net Assets as from distributable earnings or from capital depending on the type of book and tax differences that exist. For the year ended December 31, 2021, the following Funds recorded reclassifications to increase (decrease) the accounts listed below: |
| Fund | Paid-in-Capital | Distributable Earnings (Loss) | ||
| Balanced HLS Fund | $ (12,033) | $ 12,033 | ||
| Capital Appreciation HLS Fund | (20,694) | 20,694 | ||
| Disciplined Equity HLS Fund | (6,968) | 6,968 | ||
| Small Company HLS Fund | 13,996 | (13,996) |
| e) | Capital Loss Carryforward – Under the Regulated Investment Company Modernization Act of 2010, funds are permitted to carry forward capital losses for an unlimited period. |
| 145 |
December 31, 2021
| At December 31, 2021 (tax year end), each Fund's capital loss carryforwards for U.S. federal income tax purposes were as follows: | |
| Fund | Short-Term Capital Loss Carryforward with No Expiration | Long-Term Capital Loss Carryforward with No Expiration | ||
| Ultrashort Bond HLS Fund* | $ 293,691 | $ 11,188,055 |
| * | Future utilization of losses are subject to limitation under current tax laws. |
| f) | Tax Basis of Investments – The aggregate cost of investments for federal income tax purposes at December 31, 2021 is different from book purposes primarily due to wash sale loss deferrals, Passive Foreign Investment Companies ("PFICs") mark-to-market adjustments, partnership adjustments and non-taxable distributions from underlying investments. The net unrealized appreciation/(depreciation) on investments for tax purposes, which consists of gross unrealized appreciation and depreciation was also different from book purposes primarily due to wash sale loss deferrals and mark-to-market adjustments on swaps, forwards, futures, PFICs, partnership adjustments and nontaxable distributions from underlying investments. Both the cost and unrealized appreciation and depreciation for federal income tax purposes are disclosed below: |
| Fund | Tax Cost | Gross Unrealized Appreciation | Gross Unrealized (Depreciation) | Net Unrealized Appreciation (Depreciation) | ||||
| Balanced HLS Fund | $ 1,553,905,509 | $ 669,238,472 | $ (19,177,894) | $ 650,060,578 | ||||
| Capital Appreciation HLS Fund | 3,431,706,866 | 1,184,167,868 | (96,976,389) | 1,087,191,479 | ||||
| Disciplined Equity HLS Fund | 2,171,249,094 | 1,311,241,926 | (12,201,881) | 1,299,040,045 | ||||
| Dividend and Growth HLS Fund | 2,271,213,957 | 1,848,102,215 | (13,928,255) | 1,834,173,960 | ||||
| Healthcare HLS Fund | 149,900,194 | 66,906,387 | (9,970,059) | 56,936,328 | ||||
| International Opportunities HLS Fund | 933,046,460 | 250,510,494 | (19,122,129) | 231,388,365 | ||||
| MidCap HLS Fund | 1,429,350,350 | 765,698,086 | (79,720,518) | 685,977,568 | ||||
| Small Cap Growth HLS Fund | 996,998,112 | 486,036,450 | (101,757,042) | 384,279,408 | ||||
| Small Company HLS Fund | 548,503,642 | 143,522,764 | (40,163,912) | 103,358,852 | ||||
| Stock HLS Fund | 898,667,043 | 757,795,282 | (616,443) | 757,178,839 | ||||
| Total Return Bond HLS Fund | 2,901,420,489 | 51,758,900 | (59,756,819) | (7,997,919) | ||||
| Ultrashort Bond HLS Fund | 703,812,081 | 311,760 | (1,148,226) | (836,466) |
| g) | Accounting for Uncertainty in Income Taxes – Pursuant to provisions set forth by U.S. GAAP, Hartford Funds Management Company, LLC ("HFMC") reviews each Fund’s tax positions for all open tax years. As of December 31, 2021, HFMC had reviewed the open tax years and concluded that there was no reason to record a liability for net unrecognized tax obligations relating to uncertain income tax positions. Each Fund files U.S. tax returns. Although the statute of limitations for examining a Fund’s U.S. tax returns remains open for 3 years, no examination is currently in progress. The Funds recognize interest and penalties, if any, related to unrecognized tax benefits as income tax expense on the Statements of Operations. During the year ended December 31, 2021, the Funds did not incur any interest or penalties. HFMC is not aware of any tax positions for which it is reasonably possible that the total amounts of unrecognized tax obligations will significantly change in the next twelve months. |
| 7. | Expenses: |
| a) | Investment Management Agreement – HFMC serves as each Fund’s investment manager. Each Company, on behalf of its respective Funds, has entered into an Investment Management Agreement with HFMC. HFMC is an indirect subsidiary of The Hartford Financial Services Group, Inc. (“The Hartford”). HFMC has overall investment supervisory responsibility for each Fund. In addition, HFMC provides administrative personnel, services, equipment, facilities and office space for proper operation of each Fund. HFMC has contracted with Wellington Management Company LLP (“Wellington Management”) under a sub-advisory agreement and Wellington Management performs the daily investment of the assets of each Fund, in accordance with the Fund’s investment objective and policies. HFMC pays a sub-advisory fee to Wellington Management out of its management fee. |
| The schedule below reflects the rates of compensation paid to HFMC for investment management services rendered as of December 31, 2021; the rates are accrued daily and paid monthly based on each Fund’s average daily net assets, at the following annual rates: | |
| 146 |
December 31, 2021
| Fund | Management Fee Rates | |
| Balanced HLS Fund* | 0.6800% on first $250 million and; | |
| 0.6550% on next $250 million and; | ||
| 0.6450% on next $500 million and; | ||
| 0.5950% on next $4 billion and; | ||
| 0.5925% on next $5 billion and; | ||
| 0.5900% over $10 billion | ||
| Capital Appreciation HLS Fund | 0.7750% on first $250 million and; | |
| 0.7250% on next $250 million and; | ||
| 0.6750% on next $500 million and; | ||
| 0.6250% on next $1.5 billion and; | ||
| 0.6200% on next $2.5 billion and; | ||
| 0.6150% on next $5 billion and; | ||
| 0.6100% over $10 billion | ||
| Disciplined Equity HLS Fund | 0.6000% on first $1 billion and; | |
| 0.5500% on next $4 billion and; | ||
| 0.5300% on next $5 billion and; | ||
| 0.5000% over $10 billion | ||
| Dividend and Growth HLS Fund | 0.6900% on first $250 million and; | |
| 0.6425% on next $250 million and; | ||
| 0.6325% on next $500 million and; | ||
| 0.6250% on next $1.5 billion and; | ||
| 0.6200% on next $2.5 billion and; | ||
| 0.6150% on next $5 billion and; | ||
| 0.6100% over $10 billion | ||
| Healthcare HLS Fund | 0.8500% on first $250 million and; | |
| 0.8000% on next $250 million and; | ||
| 0.7500% on next $4.5 billion and; | ||
| 0.7475% on next $5 billion and; | ||
| 0.7450% over $10 billion | ||
| International Opportunities HLS Fund | 0.7750% on first $250 million and; | |
| 0.7250% on next $250 million and; | ||
| 0.6750% on next $500 million and; | ||
| 0.6250% on next $1.5 billion and; | ||
| 0.6200% on next $2.5 billion and; | ||
| 0.6150% on next $5 billion and; | ||
| 0.6100% over $10 billion | ||
| MidCap HLS Fund | 0.7750% on first $250 million and; | |
| 0.7250% on next $250 million and; | ||
| 0.6750% on next $500 million and; | ||
| 0.6250% on next $4 billion and; | ||
| 0.6225% on next $5 billion and; | ||
| 0.6200% over $10 billion | ||
| Small Cap Growth HLS Fund | 0.7000% on first $100 million and; | |
| 0.6000% on next $4.9 billion and; | ||
| 0.5800% on next $5 billion and; | ||
| 0.5700% over $10 billion | ||
| Small Company HLS Fund | 0.7750% on first $250 million and; | |
| 0.7250% on next $250 million and; | ||
| 0.6750% on next $500 million and; | ||
| 0.6000% on next $500 million and; | ||
| 0.5500% on next $3.5 billion and; | ||
| 0.5300% on next $5 billion and; | ||
| 0.5200% over $10 billion | ||
| Stock HLS Fund | 0.5250% on first $250 million and; | |
| 0.5000% on next $250 million and; | ||
| 0.4750% on next $500 million and; | ||
| 0.4500% on next $4 billion and; | ||
| 0.4475% on next $5 billion and; | ||
| 0.4450% over $10 billion |
| 147 |
December 31, 2021
| Fund | Management Fee Rates | |
| Total Return Bond HLS Fund | 0.5250% on first $250 million and; | |
| 0.5000% on next $250 million and; | ||
| 0.4750% on next $500 million and; | ||
| 0.4500% on next $1.5 billion and; | ||
| 0.4450% on next $2.5 billion and; | ||
| 0.4300% on next $5 billion and; | ||
| 0.4200% over $10 billion | ||
| Ultrashort Bond HLS Fund | 0.4000% on first $5 billion and; | |
| 0.3800% on next $5 billion and; | ||
| 0.3700% over $10 billion |
| b) | Accounting Services Agreement – HFMC provides the Funds with accounting services pursuant to a fund accounting agreement by and between each Company, on behalf of its respective Funds, and HFMC. HFMC has delegated certain accounting and administrative service functions to State Street Bank and Trust Company (“State Street”). In consideration of services rendered and expenses assumed pursuant to the fund accounting agreement, each Fund pays HFMC a fee. Effective May 1, 2021, the fund accounting fee schedule as set forth in the fund accounting agreement by and between each Company, on behalf of its respective Funds, and HFMC, was revised. Effective May 1, 2021, the fund accounting fee for each Fund is equal to the greater of: (A) the sum of (i) the sub-accounting fee payable by HFMC with respect to the Fund; (ii) the fee payable for tax preparation services for the Fund; and (iii) the amount of expenses that HFMC allocates for providing the fund accounting services to the Fund; plus a target profit margin; or (B) $40,000 per year; provided, however, that to the extent the annual amount of the fund accounting fee exceeds 0.02% of the Fund’s average net assets (calculated during its current fiscal year), HFMC shall waive such portion of the fund accounting fee. For the period January 1, 2021 through April 30, 2021, HFMC received the following fee with respect to each Fund: any sub-accounting fee payable by HFMC plus the amount of expenses that HFMC allocates for providing the fund accounting services. |
| c) | Operating Expenses – Allocable expenses incurred by each Company are allocated to each series within such Company, and allocated to classes within each such series, in proportion to the average daily net assets of such series and classes, except where allocation of certain expenses is more fairly made directly to a Fund or to specific classes within a Fund. |
| d) | Fees Paid Indirectly – Hartford HLS Series Fund II, Inc., on behalf of Hartford Small Cap Growth HLS Fund, and Hartford Series Fund, Inc., on behalf of its series except Total Return Bond HLS Fund and Ultrashort Bond HLS Fund, have entered into agreements with State Street Global Markets, LLC and Russell Implementation Services, Inc. to partially recapture non-discounted trade commissions. Such rebates are used to pay a portion of the Funds’ expenses. For the year ended December 31, 2021, these amounts, if any, are included in the Statements of Operations. |
| The ratio of expenses to average net assets in the accompanying financial highlights excludes the reduction in expenses related to fees paid indirectly. The annualized expense ratio after waivers reflecting the reduction for fees paid indirectly for the period is as follows: | |
| Fund | Class IA | Class IB | Class IC | |||
| Balanced HLS Fund | 0.63% | 0.88% | N/A | |||
| Capital Appreciation HLS Fund | 0.67% | 0.92% | 1.17% | |||
| Disciplined Equity HLS Fund | 0.60% | 0.85% | 1.10% | |||
| Dividend and Growth HLS Fund | 0.66% | 0.91% | N/A | |||
| Healthcare HLS Fund | 0.92% | 1.17% | N/A | |||
| International Opportunities HLS Fund | 0.73% | 0.98% | N/A | |||
| MidCap HLS Fund | 0.69% | 0.94% | N/A | |||
| Small Cap Growth HLS Fund | 0.63% | 0.88% | N/A | |||
| Small Company HLS Fund | 0.77% | 1.02% | N/A | |||
| Stock HLS Fund | 0.51% | 0.76% | N/A | |||
| Total Return Bond HLS Fund | 0.50% | 0.75% | N/A | |||
| Ultrashort Bond HLS Fund | 0.44% | 0.69% | N/A |
| e) | Distribution Plans for Class IB and Class IC Shares – Hartford Funds Distributors, LLC ("HFD"), an indirect subsidiary of The Hartford, is the principal underwriter and distributor of each Fund. Each Company, on behalf of its respective Funds, has adopted a Distribution Plan pursuant to Rule 12b-1 of the 1940 Act for Class IB shares and Hartford Series Fund, Inc., on behalf of certain Funds, has adopted a Distribution Plan pursuant to Rule 12b-1 of the 1940 Act for Class IC shares. |
| 148 |
December 31, 2021
| Pursuant to the Class IB Distribution Plans, a Fund may pay HFD a fee of up to 0.25% of the average daily net assets of the Fund attributable to its Class IB shares for distribution financing activities and shareholder account servicing activities. The entire amount of the fee may be used for shareholder servicing expenses and/or distribution expenses. Pursuant to the Class IC Distribution Plans, a Fund may pay HFD a fee of up to 0.25% of the average daily net assets of the Fund attributable to its Class IC shares for distribution financing activities. | |
| Each Board has the authority to suspend or reduce these payments at any point in time. The distribution fees paid during the period can be found on the Statements of Operations. Each Fund's 12b-1 fees are accrued daily and paid monthly or at such other intervals as the respective Company's Board of Directors may determine. |
| f) | Administrative Services Fee for Class IC Shares – Certain Funds may pay an administrative services fee to third party insurance companies annually up to 0.25% of the average daily net assets of the Fund attributable to its Class IC shares for recordkeeping and/or other administrative services provided to such Class IC shares. The total administrative services fees paid during the period are shown on the Statements of Operations. These fees are accrued daily and paid monthly. |
| g) | Other Related Party Transactions – Certain officers of each Company are directors and/or officers of HFMC and/or The Hartford or its subsidiaries. For the year ended December 31, 2021, a portion of each Company’s Chief Compliance Officer’s (“CCO”) compensation was paid by all of the investment companies in the Hartford fund complex. The portion allocated to each Fund, as represented in other expenses on the Statements of Operations, is outlined in the table below. |
| Fund | CCO Compensation Paid by Fund | |
| Balanced HLS Fund | $ 3,718 | |
| Capital Appreciation HLS Fund | 7,845 | |
| Disciplined Equity HLS Fund | 5,714 | |
| Dividend and Growth HLS Fund | 6,696 | |
| Healthcare HLS Fund | 363 | |
| International Opportunities HLS Fund | 2,124 | |
| MidCap HLS Fund | 3,842 | |
| Small Cap Growth HLS Fund | 2,451 | |
| Small Company HLS Fund | 1,137 | |
| Stock HLS Fund | 2,696 | |
| Total Return Bond HLS Fund | 3,994 | |
| Ultrashort Bond HLS Fund | 1,264 |
| Fund | Class IA | Class IB | Class IC | |||
| Balanced HLS Fund | 0.00%* | 0.00%* | N/A | |||
| Capital Appreciation HLS Fund | 0.00%* | 0.00%* | 0.00%* | |||
| Disciplined Equity HLS Fund | 0.00%* | 0.00%* | 0.00%* | |||
| Dividend and Growth HLS Fund | 0.00%* | 0.00%* | N/A | |||
| Healthcare HLS Fund | 0.00%* | 0.00%* | N/A | |||
| International Opportunities HLS Fund | 0.00%* | 0.00%* | N/A | |||
| MidCap HLS Fund | 0.00%* | 0.00%* | N/A | |||
| Small Cap Growth HLS Fund | 0.00%* | 0.00%* | N/A | |||
| Small Company HLS Fund | 0.00%* | 0.00%* | N/A | |||
| Stock HLS Fund | 0.00%* | 0.00%* | N/A | |||
| Total Return Bond HLS Fund | 0.00%* | 0.00%* | N/A | |||
| Ultrashort Bond HLS Fund | 0.00%* | 0.00%* | N/A |
| * | Percentage rounds to zero. |
| 149 |
December 31, 2021
| 8. | Securities Lending: |
| Each Company has entered into a securities lending agency agreement (“lending agreement”) with Citibank, N.A. (“Citibank”). A Fund may lend portfolio securities to certain borrowers in U.S. and non-U.S. markets in an amount not to exceed one-third (33 1/3%) of the value of its total assets. A Fund may lend portfolio securities, provided that the borrower provides collateral that is maintained in an amount at least equal to the current market value of the securities loaned. Cash collateral is invested for the benefit of a Fund by the Fund’s lending agent pursuant to collateral investment guidelines. The collateral is marked to market daily, in an amount at least equal to the current market value of the securities loaned. | |
| A Fund is subject to certain risks while its securities are on loan, including the following: (i) the risk that the borrower defaults on the loan and the collateral is inadequate to cover the Fund’s loss; (ii) the risk that the earnings on the collateral invested are not sufficient to pay fees incurred in connection with the loan; (iii) the Fund could lose money in the event of a decline in the value of the collateral provided for loaned securities or a decline in the value of any investments made with cash collateral; (iv) the risk that the borrower may use the loaned securities to cover a short sale, which may in turn place downward pressure on the market prices of the loaned securities; (v) the risk that return of loaned securities could be delayed and interfere with portfolio management decisions; (vi) the risk that any efforts to restrict or recall the securities for purposes of voting may not be effective; and (vii) operational risks (i.e., the risk of losses resulting from problems in the settlement and accounting process – especially so in certain international markets). These events could also trigger adverse tax consequences for the Fund. | |
| A Fund retains loan fees and the interest on cash collateral investments but is required to pay the borrower a rebate for the use of cash collateral. In cases where the lent security is of high value to borrowers, there may be a negative rebate (i.e., a net payment from the borrower to the applicable Fund). Upon termination of a loan, a Fund is required to return to the borrower an amount equal to the cash collateral, plus any rebate owed to the borrowers. | |
| The net income earned on the securities lending (after payment of rebates and Citibank’s fee) is included on the Statements of Operations as Investment Income from securities lending. A Fund also receives payments from the borrower during the period of the loan, equivalent to dividends and interest earned on the securities loaned, which are recorded as Investment Income from dividends or interest, respectively, on the Statements of Operations. | |
| The following table presents for each Fund that lends its portfolio securities the market value of the securities on loan; the collateral posted by the borrower; and the net amount, if any, due from the borrower in the event of default as of December 31, 2021. | |
| Fund | Investment Securities on Loan, at market value, Presented on the Statements of Assets and Liabilities | Collateral Posted by Borrower(1) | Net Amount(2) | |||
| Balanced HLS Fund | $ 308,892 | $ (308,892) | $ — | |||
| Capital Appreciation HLS Fund | 27,998,325 | (27,998,325) (3) | — | |||
| Disciplined Equity HLS Fund | — | — | — | |||
| Dividend and Growth HLS Fund | — | — | — | |||
| Healthcare HLS Fund | 2,194,538 | (2,194,538) (3) | — | |||
| International Opportunities HLS Fund | — | — | — | |||
| MidCap HLS Fund | 12,000,070 | (12,000,070) (3) | — | |||
| Small Cap Growth HLS Fund | 9,144,778 | (9,144,778) | — | |||
| Small Company HLS Fund | 2,503,492 | (2,503,492) | — | |||
| Stock HLS Fund | — | — | — | |||
| Total Return Bond HLS Fund | 403,472 | (403,472) | — | |||
| Ultrashort Bond HLS Fund | 2,420,035 | (2,420,035) | — |
| (1) | It is each Fund’s policy to obtain additional collateral from, or return excess collateral to, the borrower by the end of the next business day following the valuation date of the securities loaned. Therefore, the value of the collateral held may be temporarily less than that required under the lending contract due to timing. Pursuant to the lending agreement, the borrower will provide collateral in an amount at least equal to the current market value of securities loaned. Collateral received in excess or in deficit of the market value of securities loaned is not presented in this table. |
| (2) | Net amount represents the net amount receivable due from the borrower in the event of default. |
| (3) | Includes non-cash collateral of $5,184,405, $353,638 and $1,090,768 for Capital Appreciation HLS Fund, Healthcare HLS Fund and MidCap HLS Fund, respectively. |
| 9. | Secured Borrowings: |
| The following tables reflect a breakdown of transactions accounted for as secured borrowings, the gross obligation by the type of collateral pledged, and the remaining contractual maturity of those transactions as of December 31, 2021. |
| 150 |
December 31, 2021
| Certain Transfers Accounted For As Secured Borrowings | |
| Remaining Contractual Maturity of the Agreements | |
| Overnight and Continuous | < 30 days | Between 30 & 90 days | > 90 days | Total | |||||
| Balanced HLS Fund | |||||||||
| Securities Lending Transactions(1) | |||||||||
| Corporate Bonds | $ 320,500 | $ — | $ — | $ — | $ 320,500 | ||||
| Total Borrowings | $ 320,500 | $ — | $ — | $ — | $ 320,500 | ||||
| Gross amount of recognized liabilities for securities lending transactions | $ 320,500 | ||||||||
| Capital Appreciation HLS Fund | |||||||||
| Securities Lending Transactions(1) | |||||||||
| Common Stocks | $ 23,556,216 | $ — | $ — | $ — | $ 23,556,216 | ||||
| Exchange-Traded Funds | 1,416,326 | — | — | — | 1,416,326 | ||||
| Total Borrowings | $ 24,972,542 | $ — | $ — | $ — | $ 24,972,542 | ||||
| Gross amount of recognized liabilities for securities lending transactions | $ 24,972,542 | ||||||||
| Healthcare HLS Fund | |||||||||
| Securities Lending Transactions(1) | |||||||||
| Common Stocks | $ 1,987,259 | $ — | $ — | $ — | $ 1,987,259 | ||||
| Total Borrowings | $ 1,987,259 | $ — | $ — | $ — | $ 1,987,259 | ||||
| Gross amount of recognized liabilities for securities lending transactions | $ 1,987,259 | ||||||||
| MidCap HLS Fund | |||||||||
| Securities Lending Transactions(1) | |||||||||
| Common Stocks | $ 11,334,645 | $ — | $ — | $ — | $ 11,334,645 | ||||
| Total Borrowings | $ 11,334,645 | $ — | $ — | $ — | $ 11,334,645 | ||||
| Gross amount of recognized liabilities for securities lending transactions | $ 11,334,645 | ||||||||
| Small Cap Growth HLS Fund | |||||||||
| Securities Lending Transactions(1) | |||||||||
| Common Stocks | $ 9,545,435 | $ — | $ — | $ — | $ 9,545,435 | ||||
| Total Borrowings | $ 9,545,435 | $ — | $ — | $ — | $ 9,545,435 | ||||
| Gross amount of recognized liabilities for securities lending transactions | $ 9,545,435 | ||||||||
| Small Company HLS Fund | |||||||||
| Securities Lending Transactions(1) | |||||||||
| Common Stocks | $ 2,678,152 | $ — | $ — | $ — | $ 2,678,152 | ||||
| Total Borrowings | $ 2,678,152 | $ — | $ — | $ — | $ 2,678,152 | ||||
| Gross amount of recognized liabilities for securities lending transactions | $ 2,678,152 | ||||||||
| Total Return Bond HLS Fund | |||||||||
| Securities Lending Transactions(1) | |||||||||
| Corporate Bonds | $ 415,820 | $ — | $ — | $ — | $ 415,820 | ||||
| Total Borrowings | $ 415,820 | $ — | $ — | $ — | $ 415,820 | ||||
| Gross amount of recognized liabilities for securities lending transactions | $ 415,820 | ||||||||
| Ultrashort Bond HLS Fund | |||||||||
| Securities Lending Transactions(1) | |||||||||
| Corporate Bonds | $ 2,472,993 | $ — | $ — | $ — | $ 2,472,993 | ||||
| Total Borrowings | $ 2,472,993 | $ — | $ — | $ — | $ 2,472,993 | ||||
| Gross amount of recognized liabilities for securities lending transactions | $ 2,472,993 | ||||||||
| (1) | Amount represents the payable for cash collateral received on securities on loan. This will generally be in the “Overnight and Continuous” column as the securities are typically callable on demand. |
| 151 |
December 31, 2021
| 10. | Affiliated Security Transactions: |
| If a Fund owns 5% or more of the outstanding voting securities, either directly or indirectly, of a particular issuer, the 1940 Act deems such an issuer to be an “affiliate” of the Fund. As of and during the year ended December 31, 2021, Balanced HLS Fund, Capital Appreciation HLS Fund, Small Company HLS Fund, and Stock HLS Fund owned 5% or more of the outstanding voting securities of the issuers identified in the table below: | |
| A summary of affiliated security transactions for the year ended December 31, 2021 follows: | |
| Affiliated Investments | Beginning Value as of January 1, 2021 | Purchases at Cost | Proceeds from Sales | Net Realized Gain/(Loss) on Sales | Return of Capital | Change in Unrealized Appreciation/ (Depreciation) | Ending Value as of December 31, 2021 | Shares as of December 31, 2021 | Dividend Income | Capital Gains Distribution | ||||||||||
| Balanced HLS Fund | ||||||||||||||||||||
| Allstar Co.(1) | $ 13,925,618 | $ — | $ — | $ — | $ (2,510,647) | $ (11,414,971) | $ — | 11,702,200 | $ — | $ 20,391,975 | ||||||||||
| Capital Appreciation HLS Fund | ||||||||||||||||||||
| Allstar Co.(1) | 10,057,523 | — | — | — | (1,813,267) | (8,244,256) | — | 8,451,700 | — | 14,727,736 | ||||||||||
| Small Company HLS Fund | ||||||||||||||||||||
| Allstar Co.(1) | 5,969,516 | — | — | — | (1,076,242) | (4,893,274) | — | 5,016,400 | — | 8,741,457 | ||||||||||
| Stock HLS Fund | ||||||||||||||||||||
| Allstar Co.(1) | 11,233,719 | — | — | — | (2,025,320) | (9,208,399) | — | 9,440,100 | — | 16,450,099 | ||||||||||
| (1) | Allstar Co. is a Delaware limited liability company that was created for the purpose of investing in Academy Sports & Outdoors, Inc. As a result of the Funds’ holdings in Allstar Co., the Funds previously had indirect exposure to Academy Sports & Outdoors, Inc.; however, no Fund has direct or indirect exposure to 5% or more of the outstanding voting securities of Academy Sports & Outdoors, Inc. |
| 11. | Investment Transactions: |
| For the year ended December 31, 2021, the cost of purchases and proceeds from sales of investment securities (excluding short-term investments) were as follows: | |
| Fund | Cost of Purchases Excluding U.S. Government Obligations | Sales Proceeds Excluding U.S. Government Obligations | Cost of Purchases For U.S. Government Obligations | Sales Proceeds For U.S. Government Obligations | Total Cost of Purchases | Total Sales Proceeds | ||||||
| Balanced HLS Fund | $ 662,016,977 | $ 896,299,830 | $ 350,172,308 | $ 266,324,103 | $ 1,012,189,285 | $ 1,162,623,933 | ||||||
| Capital Appreciation HLS Fund | 2,574,073,594 | 3,136,361,729 | — | — | 2,574,073,594 | 3,136,361,729 | ||||||
| Disciplined Equity HLS Fund | 467,488,500 | 877,194,500 | — | — | 467,488,500 | 877,194,500 | ||||||
| Dividend and Growth HLS Fund | 783,054,437 | 1,222,409,644 | — | — | 783,054,437 | 1,222,409,644 | ||||||
| Healthcare HLS Fund | 105,985,702 | 152,374,171 | — | — | 105,985,702 | 152,374,171 | ||||||
| International Opportunities HLS Fund | 1,136,044,747 | 1,298,929,330 | — | — | 1,136,044,747 | 1,298,929,330 | ||||||
| MidCap HLS Fund | 630,106,952 | 1,236,134,693 | — | — | 630,106,952 | 1,236,134,693 | ||||||
| Small Cap Growth HLS Fund | 628,319,495 | 739,062,089 | — | — | 628,319,495 | 739,062,089 | ||||||
| Small Company HLS Fund | 740,002,694 | 696,960,887 | — | — | 740,002,694 | 696,960,887 | ||||||
| Stock HLS Fund | 228,445,697 | 362,028,560 | — | — | 228,445,697 | 362,028,560 | ||||||
| Total Return Bond HLS Fund | 800,134,758 | 755,306,797 | 618,164,556 | 654,330,673 | 1,418,299,314 | 1,409,637,470 | ||||||
| Ultrashort Bond HLS Fund | 370,389,771 | 326,972,214 | 7,226,494 | 80,646,692 | 377,616,265 | 407,618,906 |
| 12. | Capital Share Transactions: |
| The following information is for the years ended December 31, 2021 and December 31, 2020: | |
| For the Year Ended December 31, 2021 | For the Year Ended December 31, 2020 | ||||||
| Shares | Amount | Shares | Amount | ||||
| Balanced HLS Fund | |||||||
| Class IA | |||||||
| Shares Sold | 457,915 | $ 15,479,313 | 463,624 | $ 13,833,883 | |||
| Shares Issued for Reinvested Dividends | 3,425,101 | 119,966,738 | 3,884,716 | 117,833,855 | |||
| Shares Redeemed | (6,287,063) | (215,544,694) | (8,115,089) | (236,999,427) | |||
| Net Increase (Decrease) | (2,404,047) | (80,098,643) | (3,766,749) | (105,331,689) | |||
| 152 |
December 31, 2021
| For the Year Ended December 31, 2021 | For the Year Ended December 31, 2020 | ||||||
| Shares | Amount | Shares | Amount | ||||
| Class IB | |||||||
| Shares Sold | 112,530 | $ 3,925,008 | 182,220 | $ 5,357,315 | |||
| Shares Issued for Reinvested Dividends | 422,802 | 15,083,505 | 492,030 | 15,165,622 | |||
| Shares Redeemed | (891,295) | (31,040,870) | (1,160,144) | (34,724,037) | |||
| Net Increase (Decrease) | (355,963) | (12,032,357) | (485,894) | (14,201,100) | |||
| Total Net Increase (Decrease) | (2,760,010) | $ (92,131,000) | (4,252,643) | $ (119,532,789) | |||
| Capital Appreciation HLS Fund | |||||||
| Class IA | |||||||
| Shares Sold | 255,573 | $ 14,142,931 | 721,760 | $ 30,111,727 | |||
| Shares Issued for Reinvested Dividends | 6,650,692 | 365,171,165 | 6,153,343 | 302,064,553 | |||
| Shares Redeemed | (11,044,984) | (606,497,393) | (12,824,006) | (588,774,139) | |||
| Net Increase (Decrease) | (4,138,719) | (227,183,297) | (5,948,903) | (256,597,859) | |||
| Class IB | |||||||
| Shares Sold | 43,594 | $ 2,359,693 | 77,971 | $ 3,386,267 | |||
| Shares Issued for Reinvested Dividends | 821,145 | 44,137,345 | 763,653 | 36,702,247 | |||
| Shares Redeemed | (1,355,478) | (73,088,089) | (1,752,071) | (79,080,131) | |||
| Net Increase (Decrease) | (490,739) | (26,591,051) | (910,447) | (38,991,617) | |||
| Class IC | |||||||
| Shares Sold | 45,793 | $ 2,447,253 | 109,094 | $ 4,638,398 | |||
| Shares Issued for Reinvested Dividends | 68,001 | 3,670,162 | 57,916 | 2,791,605 | |||
| Shares Redeemed | (113,501) | (6,201,516) | (167,473) | (7,317,160) | |||
| Net Increase (Decrease) | 293 | (84,101) | (463) | 112,843 | |||
| Total Net Increase (Decrease) | (4,629,165) | $ (253,858,449) | (6,859,813) | $ (295,476,633) | |||
| Disciplined Equity HLS Fund | |||||||
| Class IA | |||||||
| Shares Sold | 1,663,382 | $ 33,292,862 | 871,713 | $ 13,103,167 | |||
| Issued in Merger | — | — | 129,357,267 | 1,984,198,184 | |||
| Shares Issued for Reinvested Dividends | 6,617,855 | 135,827,681 | 3,082,442 | 49,655,221 | |||
| Shares Redeemed | (19,810,004) | (384,986,454) | (13,965,491) | (222,397,851) | |||
| Net Increase (Decrease) | (11,528,767) | (215,865,911) | 119,345,931 | 1,824,558,721 | |||
| Class IB | |||||||
| Shares Sold | 324,708 | $ 6,143,847 | 349,171 | $ 5,277,671 | |||
| Issued in Merger | — | — | 18,002,182 | 271,721,336 | |||
| Shares Issued for Reinvested Dividends | 837,081 | 16,888,929 | 414,463 | 6,547,645 | |||
| Shares Redeemed | (3,717,207) | (70,621,920) | (2,529,397) | (39,629,490) | |||
| Net Increase (Decrease) | (2,555,418) | (47,589,144) | 16,236,419 | 243,917,162 | |||
| Class IC(1) | |||||||
| Shares Sold | 151,589 | $ 2,899,088 | 117,394 | $ 1,880,604 | |||
| Issued in Merger | — | — | 4,834,998 | 74,163,528 | |||
| Shares Issued for Reinvested Dividends | 175,273 | 3,591,357 | 6,875 | 117,970 | |||
| Shares Redeemed | (594,392) | (11,535,033) | (448,131) | (7,235,901) | |||
| Net Increase (Decrease) | (267,530) | (5,044,588) | 4,511,136 | 68,926,201 | |||
| Total Net Increase (Decrease) | (14,351,715) | $ (268,499,643) | 140,093,486 | $ 2,137,402,084 | |||
| Dividend and Growth HLS Fund | |||||||
| Class IA | |||||||
| Shares Sold | 2,617,098 | $ 66,133,728 | 4,782,749 | $ 93,344,076 | |||
| Issued in Merger | — | — | 13,589,222 | 269,867,004 | |||
| Shares Issued for Reinvested Dividends | 7,954,897 | 212,103,064 | 9,126,278 | 188,905,832 | |||
| Shares Redeemed | (18,239,087) | (462,665,200) | (19,396,365) | (392,709,464) | |||
| Net Increase (Decrease) | (7,667,092) | (184,428,408) | 8,101,884 | 159,407,448 | |||
| Class IB | |||||||
| Shares Sold | 319,100 | $ 8,158,203 | 408,486 | $ 7,910,412 | |||
| Issued in Merger | — | — | 2,450,597 | 48,281,905 | |||
| Shares Issued for Reinvested Dividends | 1,006,413 | 26,602,278 | 1,166,860 | 23,940,435 | |||
| Shares Redeemed | (2,845,813) | (71,866,526) | (3,207,847) | (65,102,417) | |||
| Net Increase (Decrease) | (1,520,300) | (37,106,045) | 818,096 | 15,030,335 | |||
| Total Net Increase (Decrease) | (9,187,392) | $ (221,534,453) | 8,919,980 | $ 174,437,783 | |||
| 153 |
December 31, 2021
| For the Year Ended December 31, 2021 | For the Year Ended December 31, 2020 | ||||||
| Shares | Amount | Shares | Amount | ||||
| Healthcare HLS Fund | |||||||
| Class IA | |||||||
| Shares Sold | 322,091 | $ 7,881,697 | 983,895 | $ 22,817,641 | |||
| Shares Issued for Reinvested Dividends | 751,248 | 17,932,280 | 1,521,984 | 32,813,967 | |||
| Shares Redeemed | (2,048,469) | (50,217,556) | (2,612,369) | (58,049,269) | |||
| Net Increase (Decrease) | (975,130) | (24,403,579) | (106,490) | (2,417,661) | |||
| Class IB | |||||||
| Shares Sold | 56,645 | $ 1,265,782 | 83,624 | $ 1,818,539 | |||
| Shares Issued for Reinvested Dividends | 221,514 | 4,820,147 | 402,553 | 7,990,683 | |||
| Shares Redeemed | (382,752) | (8,449,694) | (396,797) | (8,560,073) | |||
| Net Increase (Decrease) | (104,593) | (2,363,765) | 89,380 | 1,249,149 | |||
| Total Net Increase (Decrease) | (1,079,723) | $ (26,767,344) | (17,110) | $ (1,168,512) | |||
| International Opportunities HLS Fund | |||||||
| Class IA | |||||||
| Shares Sold | 3,936,792 | $ 80,038,883 | 3,733,213 | $ 58,178,266 | |||
| Shares Issued for Reinvested Dividends | 538,739 | 11,313,509 | 1,070,393 | 18,153,869 | |||
| Shares Redeemed | (9,478,500) | (195,536,187) | (14,857,669) | (224,032,772) | |||
| Net Increase (Decrease) | (5,002,969) | (104,183,795) | (10,054,063) | (147,700,637) | |||
| Class IB | |||||||
| Shares Sold | 232,495 | $ 4,802,891 | 622,719 | $ 9,711,097 | |||
| Shares Issued for Reinvested Dividends | 39,603 | 844,741 | 116,682 | 2,009,265 | |||
| Shares Redeemed | (2,197,023) | (44,974,206) | (1,593,271) | (25,857,411) | |||
| Net Increase (Decrease) | (1,924,925) | (39,326,574) | (853,870) | (14,137,049) | |||
| Total Net Increase (Decrease) | (6,927,894) | $ (143,510,369) | (10,907,933) | $ (161,837,686) | |||
| MidCap HLS Fund | |||||||
| Class IA | |||||||
| Shares Sold | 2,012,927 | $ 90,221,529 | 7,840,237 | $ 280,770,150 | |||
| Issued in Merger | — | — | 7,689,933 | 268,563,986 | |||
| Shares Issued for Reinvested Dividends | 8,032,535 | 326,587,296 | 4,755,353 | 177,950,463 | |||
| Shares Redeemed | (15,818,246) | (708,636,645) | (19,145,157) | (692,739,283) | |||
| Net Increase (Decrease) | (5,772,784) | (291,827,820) | 1,140,366 | 34,545,316 | |||
| Class IB | |||||||
| Shares Sold | 86,166 | $ 3,677,106 | 101,031 | $ 3,526,835 | |||
| Issued in Merger | — | — | 2,059,953 | 69,216,484 | |||
| Shares Issued for Reinvested Dividends | 581,007 | 22,511,283 | 160,481 | 5,921,123 | |||
| Shares Redeemed | (643,424) | (27,139,295) | (445,822) | (15,478,345) | |||
| Net Increase (Decrease) | 23,749 | (950,906) | 1,875,643 | 63,186,097 | |||
| Total Net Increase (Decrease) | (5,749,035) | $ (292,778,726) | 3,016,009 | $ 97,731,413 | |||
| Small Cap Growth HLS Fund | |||||||
| Class IA | |||||||
| Shares Sold | 2,998,379 | $ 117,411,118 | 12,905,007 | $ 408,467,832 | |||
| Shares Issued for Reinvested Dividends | 2,452,802 | 92,912,123 | 905,166 | 26,838,172 | |||
| Shares Redeemed | (6,010,367) | (234,174,612) | (13,831,962) | (401,010,236) | |||
| Net Increase (Decrease) | (559,186) | (23,851,371) | (21,789) | 34,295,768 | |||
| Class IB | |||||||
| Shares Sold | 1,325,139 | $ 49,449,416 | 1,326,101 | $ 35,875,838 | |||
| Shares Issued for Reinvested Dividends | 522,602 | 18,818,914 | 464,566 | 13,179,751 | |||
| Shares Redeemed | (891,158) | (32,946,603) | (9,636,215) | (309,485,039) | |||
| Net Increase (Decrease) | 956,583 | 35,321,727 | (7,845,548) | (260,429,450) | |||
| Total Net Increase (Decrease) | 397,397 | $ 11,470,356 | (7,867,337) | $ (226,133,682) | |||
| 154 |
December 31, 2021
| For the Year Ended December 31, 2021 | For the Year Ended December 31, 2020 | ||||||
| Shares | Amount | Shares | Amount | ||||
| Small Company HLS Fund | |||||||
| Class IA | |||||||
| Shares Sold | 5,233,825 | $ 150,382,644 | 1,913,031 | $ 40,535,223 | |||
| Shares Issued for Reinvested Dividends | 2,972,671 | 74,970,752 | 2,771,599 | 57,898,706 | |||
| Shares Redeemed | (3,872,989) | (105,093,771) | (131,137,236) | (224,841,016) | |||
| Shares Redeemed-In-Kind | — | — | 118,163,289 | 8,160,448 | |||
| Net Increase (Decrease) | 4,333,507 | 120,259,625 | (8,289,317) | (118,246,639) | |||
| Class IB | |||||||
| Shares Sold | 135,452 | $ 3,274,933 | 306,996 | $ 5,854,788 | |||
| Shares Issued for Reinvested Dividends | 393,905 | 8,598,956 | 430,749 | 7,955,937 | |||
| Shares Redeemed | (506,515) | (12,205,304) | (739,598) | (14,116,137) | |||
| Net Increase (Decrease) | 22,842 | (331,415) | (1,853) | (305,412) | |||
| Total Net Increase (Decrease) | 4,356,349 | $ 119,928,210 | (8,291,170) | $ (118,552,051) | |||
| Stock HLS Fund | |||||||
| Class IA | |||||||
| Shares Sold | 55,616 | $ 5,776,596 | 128,003 | $ 11,104,343 | |||
| Shares Issued for Reinvested Dividends | 629,577 | 68,675,433 | 1,177,561 | 105,830,873 | |||
| Shares Redeemed | (1,701,027) | (178,915,945) | (1,925,885) | (170,878,722) | |||
| Net Increase (Decrease) | (1,015,834) | (104,463,916) | (620,321) | (53,943,506) | |||
| Class IB | |||||||
| Shares Sold | 27,490 | $ 2,897,203 | 24,218 | $ 2,147,184 | |||
| Shares Issued for Reinvested Dividends | 56,154 | 6,107,663 | 111,445 | 9,984,196 | |||
| Shares Redeemed | (188,205) | (19,622,545) | (224,707) | (19,952,176) | |||
| Net Increase (Decrease) | (104,561) | (10,617,679) | (89,044) | (7,820,796) | |||
| Total Net Increase (Decrease) | (1,120,395) | $ (115,081,595) | (709,365) | $ (61,764,302) | |||
| Total Return Bond HLS Fund | |||||||
| Class IA | |||||||
| Shares Sold | 17,362,479 | $ 202,243,907 | 20,755,656 | $ 245,650,273 | |||
| Issued in Merger | — | — | 14,803,748 | 174,093,559 | |||
| Shares Issued for Reinvested Dividends | 8,985,043 | 102,070,091 | 6,284,955 | 73,659,677 | |||
| Shares Redeemed | (21,379,820) | (248,112,336) | (29,332,474) | (340,396,565) | |||
| Net Increase (Decrease) | 4,967,702 | 56,201,662 | 12,511,885 | 153,006,944 | |||
| Class IB | |||||||
| Shares Sold | 1,176,316 | $ 13,718,640 | 1,645,801 | $ 19,277,272 | |||
| Issued in Merger | — | — | 4,561,022 | 53,376,276 | |||
| Shares Issued for Reinvested Dividends | 1,038,977 | 11,750,831 | 685,542 | 8,000,272 | |||
| Shares Redeemed | (3,332,136) | (38,407,482) | (3,405,677) | (39,470,211) | |||
| Net Increase (Decrease) | (1,116,843) | (12,938,011) | 3,486,688 | 41,183,609 | |||
| Total Net Increase (Decrease) | 3,850,859 | $ 43,263,651 | 15,998,573 | $ 194,190,553 | |||
| Ultrashort Bond HLS Fund | |||||||
| Class IA | |||||||
| Shares Sold | 5,105,215 | $ 51,424,355 | 8,591,367 | $ 87,618,814 | |||
| Issued in Merger | — | — | 28,051,003 | 283,115,967 | |||
| Shares Issued for Reinvested Dividends | 443,126 | 4,440,122 | 922,529 | 9,308,313 | |||
| Shares Redeemed | (10,077,259) | (101,439,362) | (11,084,794) | (112,618,470) | |||
| Net Increase (Decrease) | (4,528,918) | (45,574,885) | 26,480,105 | 267,424,624 | |||
| Class IB | |||||||
| Shares Sold | 967,714 | $ 9,732,783 | 1,920,976 | $ 19,540,532 | |||
| Issued in Merger | — | — | 5,629,838 | 56,835,464 | |||
| Shares Issued for Reinvested Dividends | 53,951 | 540,587 | 120,975 | 1,220,637 | |||
| Shares Redeemed | (2,205,754) | (22,185,569) | (2,358,660) | (23,936,591) | |||
| Net Increase (Decrease) | (1,184,089) | (11,912,199) | 5,313,129 | 53,660,042 | |||
| Total Net Increase (Decrease) | (5,713,007) | $ (57,487,084) | 31,793,234 | $ 321,084,666 | |||
| (1) | Commenced operations on September 18, 2020. |
| 155 |
December 31, 2021
| 13. | Fund Reorganizations: |
| At a meeting held on June 16-17, 2020, the Boards of Directors of each Company approved an Agreement and Plan of Reorganization that provided for the reorganization of each Acquired Fund (each an “Acquired Fund”) identified below into the corresponding Acquiring Fund identified below (each an “Acquiring Fund”) (each a “Reorganization” and collectively, the “Reorganizations”). | |
| Pursuant to the terms of an Agreement and Plan of Reorganization, after the close of business on the dates set forth in the table below, each Acquired Fund transferred all of its assets to the corresponding Acquiring Fund, in exchange for shares of the corresponding Acquiring Fund and the assumption of all of the liabilities of the Acquired Fund by the corresponding Acquiring Fund. | |
| Acquired Fund | Corresponding Acquiring Fund | Closing Date |
| Global Growth HLS Fund | Disciplined Equity HLS Fund | September 18, 2020 |
| Growth Opportunities HLS Fund | Disciplined Equity HLS Fund | September 18, 2020 |
| Value HLS Fund | Dividend and Growth HLS Fund | September 18, 2020 |
| MidCap Growth HLS Fund | MidCap HLS Fund | September 18, 2020 |
| MidCap Value HLS Fund | MidCap HLS Fund | September 18, 2020 |
| High Yield HLS Fund | Total Return Bond HLS Fund | September 25, 2020 |
| U.S. Government Securities HLS Fund | Ultrashort Bond HLS Fund | September 25, 2020 |
| a) | Disciplined Equity HLS Fund - After the close of business on September 18, 2020, the consummation of the Reorganization was accomplished by a tax-free exchange of shares of the Disciplined Equity HLS Fund in the following amounts: |
| Share Class | Net Assets of the Global Growth HLS Fund as of the close of business on September 18, 2020 ("Reorganization Date") | Shares of the Global Growth HLS Fund as of the Reorganization Date | Net Assets of the Growth Opportunities HLS Fund as of the Reorganization Date | Shares of the Growth Opportunities HLS Fund as of the Reorganization Date | Value of Shares Issued by the Disciplined Equity HLS Fund | Shares Issued by the Disciplined Equity HLS Fund | Net Assets of the Disciplined Equity HLS Fund immediately after the Reorganization | |||||||
| Class IA | $ 468,474,190 | 21,571,308 | $ 1,515,723,995 | 48,679,642 | $ 1,984,198,185 | 129,357,267 | $ 2,526,977,916 | |||||||
| Class IB | 84,268,146 | 3,938,551 | 187,453,189 | 6,692,667 | 271,721,335 | 18,002,182 | 346,159,731 | |||||||
| Class IC | — | — | 74,163,528 | 2,550,987 | 74,163,528 | 4,834,998 | 74,163,528 | |||||||
| $ 552,742,336 | 25,509,859 | $ 1,777,340,712 | 57,923,296 | $ 2,330,083,048 | 152,194,447 | $ 2,947,301,175 |
| Net investment income | $ 8,042,586 |
| Net realized and unrealized gain (loss) on investments | 1,080,476,058 |
| Net increase (decrease) in net assets from operations | $ 1,088,518,644 |
| 156 |
December 31, 2021
| b) | Dividend and Growth HLS Fund - After the close of business on September 18, 2020, the consummation of the Reorganization was accomplished by a tax-free exchange of shares of the Dividend and Growth HLS Fund in the following amounts: |
| Share Class | Net Assets of the Value HLS Fund as of the close of business on September 18, 2020 ("Reorganization Date") | Shares of the Value HLS Fund as of the Reorganization Date | Value of Shares Issued by the Dividend and Growth HLS Fund | Shares Issued by the Dividend and Growth HLS Fund | Net Assets of the Dividend and Growth HLS Fund immediately after the Reorganization | |||||
| Class IA | $ 269,867,004 | 25,055,740 | $ 269,867,004 | 13,589,222 | $ 2,847,310,971 | |||||
| Class IB | 48,281,905 | 4,490,676 | 48,281,905 | 2,450,597 | 381,074,892 | |||||
| $ 318,148,909 | 29,546,416 | $ 318,148,909 | 16,039,819 | $ 3,228,385,863 |
| Net investment income | $ 62,746,262 |
| Net realized and unrealized gain (loss) on investments | 139,173,545 |
| Net increase (decrease) in net assets from operations | $ 201,919,807 |
| c) | MidCap HLS Fund - After the close of business on September 18, 2020, the consummation of the Reorganization was accomplished by a tax-free exchange of shares of the MidCap HLS Fund in the following amounts: |
| Share Class | Net Assets of the MidCap Growth HLS Fund as of the close of business on September 18, 2020 ("Reorganization Date") | Shares of the MidCap Growth HLS Fund as of the Reorganization Date | Net Assets of the MidCap Value HLS Fund as of the Reorganization Date | Shares of the MidCap Value HLS Fund as of the Reorganization Date | Value of Shares Issued by the MidCap HLS Fund | Shares Issued by the MidCap HLS Fund | Net Assets of the MidCap HLS Fund immediately after the Reorganization | |||||||
| Class IA | $ 84,920,061 | 13,187,029 | $ 183,643,925 | 22,130,494 | $ 268,563,986 | 7,689,933 | $ 1,968,833,578 | |||||||
| Class IB | 14,916,313 | 2,347,644 | 54,300,171 | 6,589,510 | 69,216,484 | 2,059,953 | 115,904,203 | |||||||
| $ 99,836,374 | 15,534,673 | $ 237,944,096 | 28,720,004 | $ 337,780,470 | 9,749,886 | $ 2,084,737,781 |
| 157 |
December 31, 2021
| Net investment income | $ 2,086,167 |
| Net realized and unrealized gain (loss) on investments | 450,580,925 |
| Net increase (decrease) in net assets from operations | $ 452,667,092 |
| d) | Total Return Bond HLS Fund - After the close of business on September 25, 2020, the consummation of the Reorganization was accomplished by a tax-free exchange of shares of the Total Return Bond HLS Fund in the following amounts: |
| Share Class | Net Assets of the High Yield HLS Fund as of the close of business on September 25, 2020 ("Reorganization Date") | Shares of the High Yield HLS Fund as of the Reorganization Date | Value of Shares Issued by the Total Return Bond HLS Fund | Shares Issued by the Total Return Bond HLS Fund | Net Assets of the Total Return Bond HLS Fund immediately after the Reorganization | |||||
| Class IA | $ 174,093,559 | 23,403,628 | $ 174,093,559 | 14,803,748 | $ 2,039,139,061 | |||||
| Class IB | 53,376,276 | 7,301,141 | 53,376,276 | 4,561,022 | 268,126,588 | |||||
| $ 227,469,835 | 30,704,769 | $ 227,469,835 | 19,364,770 | $ 2,307,265,649 |
| Net investment income | $ 58,472,946 |
| Net realized and unrealized gain (loss) on investments | 119,351,581 |
| Net increase (decrease) in net assets from operations | $ 177,824,527 |
| e) | Ultrashort Bond HLS Fund - After the close of business on September 25, 2020, the consummation of the Reorganization was accomplished by a tax-free exchange of shares of the Ultrashort Bond HLS Fund in the following amounts: |
| Share Class | Net Assets of the U.S. Government Securities HLS Fund as of the close of business on September 25, 2020 ("Reorganization Date") | Shares of the U.S. Government Securities HLS Fund as of the Reorganization Date | Value of Shares Issued by the Ultrashort Bond HLS Fund | Shares Issued by the Ultrashort Bond HLS Fund | Net Assets of the Ultrashort Bond HLS Fund immediately after the Reorganization | |||||
| Class IA | $ 283,115,967 | 26,838,069 | $ 283,115,967 | 28,051,003 | $ 675,575,692 | |||||
| Class IB | 56,835,464 | 5,378,683 | 56,835,464 | 5,629,838 | 111,836,168 | |||||
| $ 339,951,431 | 32,216,752 | $ 339,951,431 | 33,680,841 | $ 787,411,860 |
| 158 |
December 31, 2021
| Net investment income | $ 8,662,369 |
| Net realized and unrealized gain (loss) on investments | 16,133,324 |
| Net increase (decrease) in net assets from operations | $ 24,795,693 |
| 14. | Line of Credit: |
| Each Fund participates in a committed line of credit pursuant to a credit agreement dated March 4, 2021. Each Fund may borrow under the line of credit for temporary or emergency purposes. The Funds (together with certain other Hartford Funds) may borrow up to $350 million in the aggregate, subject to asset coverage and other limitations specified in the credit agreement. The interest rate on borrowings varies depending on the nature of the loan. The facility also charges certain fees, such as an upfront fee and a commitment fee. From January 1, 2021 through March 4, 2021, the Funds (together with certain other Hartford Funds) had a similar agreement that enabled them to participate in a $350 million committed line of credit. The fees incurred by the Funds in connection with the committed lines of credit during the period appear in the Statements of Operations under “Other expenses.” During and as of the year ended December 31, 2021, none of the Funds had borrowings under this facility. |
| 15. | Indemnifications: |
| Under each Company’s organizational documents, the Company shall indemnify its officers and directors to the full extent required or permitted under Maryland General Corporation Law and federal securities laws. In addition, each Company, on behalf of its respective Funds, may enter into contracts that contain a variety of indemnifications. Each Company’s maximum exposure under these arrangements is unknown. However, as of the date of these financial statements, each Company has not had prior claims or losses pursuant to these contracts and expects the risk of loss to be remote. |
| 16. | Recent Accounting Pronouncement: |
| In March 2020, FASB issued Accounting Standards Update (“ASU”) No. 2020-04, Reference Rate Reform (Topic 848); Facilitation of the Effects of Reference Rate Reform on Financial Reporting, which provides optional guidance for a limited period of time to ease the potential burden in accounting for (or recognizing the effects of) reference rate reform. The guidance is applicable to contracts referencing LIBOR or another reference rate that is expected to be discontinued due to reference rate reform. The ASU is effective as of March 12, 2020 and generally can be applied through December 31, 2022. Management is evaluating the underlying securities referencing LIBOR or another reference rate that is expected to be discontinued over the period of time the ASU is effective. |
| 17. | Change in Independent Registered Public Accounting Firm: |
| On November 6, 2019, the Companies, on behalf of their respective Funds, dismissed Ernst & Young LLP (“EY”) as the Funds’ independent registered public accounting firm effective upon the issuance of EY’s report on the Funds’ financial statements as of and for the fiscal year ended December 31, 2019. EY’s report on the Funds’ financial statements for the fiscal periods ended December 31, 2018 and December 31, 2019 contained no adverse opinion or disclaimer of opinion nor was EY’s report qualified or modified as to uncertainty, audit scope or accounting principles. During the Funds’ fiscal periods ended on December 31, 2018 and December 31, 2019 and through February 26, 2020 (the “Covered Period”), (i) there were no disagreements with EY on any matter of accounting principles or practices, financial statement disclosure or auditing scope or procedure, which disagreements, if not resolved to the satisfaction of EY, would have caused it to make reference to the subject matter of the disagreements in connection with its reports on the Funds’ financial statements for the Covered Period, and (ii) there were no “reportable events” of the kind described in Item 304(a)(1)(v) of Regulation S-K under the Securities Exchange Act of 1934, as amended. |
| 159 |
December 31, 2021
| 18. | Subsequent Events: |
| Management has evaluated all subsequent transactions and events through the date on which these financial statements were issued and has determined that no additional items require disclosure in these financial statements. |
| 160 |
| 161 |
| NAME, YEAR OF BIRTH AND ADDRESS(1) | POSITION HELD WITH EACH COMPANY | TERM OF OFFICE(2) AND LENGTH OF TIME SERVED | PRINCIPAL OCCUPATION(S) DURING PAST 5 YEARS | NUMBER OF PORTFOLIOS IN FUND COMPLEX(3) OVERSEEN BY DIRECTOR | OTHER DIRECTORSHIPS FOR PUBLIC COMPANIES AND OTHER REGISTERED INVESTMENT COMPANIES HELD BY DIRECTOR | |||||
| NON-INTERESTED DIRECTORS | ||||||||||
| HILARY E. ACKERMANN (1956) | Director | Since 2014 | Ms. Ackermann served as Chief Risk Officer at Goldman Sachs Bank USA from October 2008 to November 2011. | 77 | Ms. Ackermann served as a Director of Dynegy, Inc. from October 2012 until its acquisition by Vistra Energy Corporation (“Vistra”) in 2018, and since that time she has served as a Director of Vistra. Ms. Ackermann serves as a Director of Credit Suisse Holdings (USA), Inc. from January 2017 to present. | |||||
| ROBIN C. BEERY (1967) | Director | Since 2017 | Ms. Beery has served as a consultant to ArrowMark Partners (an alternative asset manager) since March of 2015 and since November 2018 has been employed by ArrowMark Partners as a Senior Advisor. Previously, she was Executive Vice President, Head of Distribution, for Janus Capital Group, and Chief Executive Officer and President of the Janus Mutual Funds (a global asset manager) from September 2009 to August 2014. | 77 | Ms. Beery serves as an independent Director of UMB Financial Corporation (January 2015 to present), has chaired the Compensation Committee since April 2017, and serves on the Audit Committee and the Risk Committee. | |||||
| DERRICK D. CEPHAS (1952) | Director | Since 2020 | Mr. Cephas currently serves as Of Counsel to Squire Patton Boggs LLP, an international law firm with 45 offices in 20 countries. Until his retirement in October 2020, Mr. Cephas was a Partner of Weil, Gotshal & Manges LLP, an international law firm headquartered in New York, where he served as the Head of the Financial Institutions Practice (April 2011 to October 2020). | 77 | Mr. Cephas currently serves as a Director of Signature Bank, a New York-based commercial bank, and is a member of the Credit Committee, Examining Committee and Risk Committee. Mr. Cephas currently serves as a Director of Claros Mortgage Trust, Inc., a real estate investment trust. | |||||
| 162 |
| NAME, YEAR OF BIRTH AND ADDRESS(1) | POSITION HELD WITH EACH COMPANY | TERM OF OFFICE(2) AND LENGTH OF TIME SERVED | PRINCIPAL OCCUPATION(S) DURING PAST 5 YEARS | NUMBER OF PORTFOLIOS IN FUND COMPLEX(3) OVERSEEN BY DIRECTOR | OTHER DIRECTORSHIPS FOR PUBLIC COMPANIES AND OTHER REGISTERED INVESTMENT COMPANIES HELD BY DIRECTOR | |||||
| CHRISTINE R. DETRICK (1958) | Director and Chair of the Board | Director since 2016; Chair of the Board since 2021 | From 2002 until 2012, Ms. Detrick was a Senior Partner, Leader of the Financial Services Practice, and a Senior Advisor at Bain & Company ("Bain"). Before joining Bain, she served in various senior management roles for other financial services firms and was a consultant at McKinsey and Company. | 77 | Ms. Detrick serves as a Director and Chair of the Nominating and Governance Committee of Reinsurance Group of America (“RGA”) (from January 2014 to present). She has announced her plans not to stand for re-election as a member of RGA’s board of directors and will no longer serve in such capacity as of May 25, 2022. Ms. Detrick also currently serves as a Director of Charles River Associates (May 2020 to present); currently serves as a Director of Capital One Financial Corporation (since November 2021); and currently serves as a Director of Altus Power, Inc (since December 2021). | |||||
| JOHN J. GAUTHIER(4) (1961) | Director | Since 2022 | Mr. Gauthier currently is the Principal Owner of JJG Advisory, LLC, an investment consulting firm, and Co-Founder and Principal Owner of Talcott Capital Partners (a placement agent for investment managers serving insurance companies). From 2008 to 2018, Mr. Gauthier served as a Senior Vice President (2008-2010), Executive Vice President (2010-2012), and President (2012-2018) of Allied World Financial Services (a global provider of property, casualty and specialty insurance and reinsurance solutions). | 77 | Mr. Gauthier serves as a Director of Reinsurance Group of America, Inc. (from 2018 to present) and chairs the Investment Committee and is a member of the Audit and Risk Committees. | |||||
| ANDREW A. JOHNSON (1962) | Director | Since 2020 | Mr. Johnson currently serves as a Diversity and Inclusion Advisor at Neuberger Berman, a private, global investment management firm. Prior to his current role, Mr. Johnson served as Chief Investment Officer and Head of Global Investment Grade Fixed Income at Neuberger Berman (January 2009 to December 2018). | 77 | Mr. Johnson currently serves as a Director of AGNC Investment Corp., a real estate investment trust. | |||||
| PAUL L. ROSENBERG (1953) | Director | Since 2020 | Mr. Rosenberg is a Partner of The Bridgespan Group, a global nonprofit consulting firm that is a social impact advisor to nonprofits, non-governmental organizations, philanthropists and institutional investors (October 2007 to present). | 77 | None | |||||
| DAVID SUNG (1953) | Director | Since 2017 | Mr. Sung was a Partner at Ernst & Young LLP from October 1995 to July 2014. | 77 | Mr. Sung serves as a Trustee of Ironwood Institutional Multi-Strategy Fund, LLC and Ironwood Multi-Strategy Fund, LLC (October 2015 to present). |
| 163 |
| NAME, YEAR OF BIRTH AND ADDRESS(1) | POSITION HELD WITH EACH COMPANY | TERM OF OFFICE(2) AND LENGTH OF TIME SERVED | PRINCIPAL OCCUPATION(S) DURING PAST 5 YEARS | NUMBER OF PORTFOLIOS IN FUND COMPLEX(3) OVERSEEN BY DIRECTOR | OTHER DIRECTORSHIPS FOR PUBLIC COMPANIES AND OTHER REGISTERED INVESTMENT COMPANIES HELD BY DIRECTOR | |||||
| OFFICERS AND INTERESTED DIRECTORS | ||||||||||
| JAMES E. DAVEY(5) (1964) | Director, President and Chief Executive Officer | President and Chief Executive Officer since 2010; Director since 2012 | Mr. Davey serves as Executive Vice President of The Hartford Financial Services Group, Inc. Mr. Davey has served in various positions within The Hartford and its subsidiaries and joined The Hartford in 2002. Additionally, Mr. Davey serves as Director, Chairman, President, and Senior Managing Director for Hartford Funds Management Group, Inc. ("HFMG"). Mr. Davey also serves as President, Manager, Chairman of the Board, and Senior Managing Director for Hartford Funds Management Company, LLC (“HFMC”); Manager, Chairman of the Board, and President of Lattice Strategies LLC (“Lattice”); Chairman of the Board, Manager, and Senior Managing Director of Hartford Funds Distributors, LLC (“HFD”); and Chairman of the Board, President and Senior Managing Director of Hartford Administrative Services Company (“HASCO”), each of which is an affiliate of HFMG. | 77 | None | |||||
| ANDREW S. DECKER (1963) | AML Compliance Officer | Since 2015 | Mr. Decker serves as Chief Compliance Officer and AML Compliance Officer of HASCO (since April 2015) and Vice President of HASCO (since April 2018). Mr. Decker serves as AML Officer of HFD (since May 2015). Mr. Decker also serves as Vice President of HFMG (since April 2018). Prior to joining The Hartford, Mr. Decker served as Vice President and AML Officer at Janney Montgomery Scott (a broker dealer) from April 2011 to January 2015. | N/A | N/A | |||||
| AMY N. FURLONG (1979) | Vice President | Since 2018 | Ms. Furlong serves as Vice President and Assistant Treasurer of HFMC (since September 2019). From 2018 through March 15, 2021, Ms. Furlong served as the Treasurer of each Company. Ms. Furlong has served in various positions within The Hartford and its subsidiaries in connection with the operation of the Hartford Funds. Ms. Furlong joined The Hartford in 2004. | N/A | N/A | |||||
| WALTER F. GARGER (1965) | Vice President and Chief Legal Officer | Since 2016 | Mr. Garger serves as Secretary, Managing Director and General Counsel of HFMG, HFMC, HFD, and HASCO (since 2013). Mr. Garger also serves as Secretary and General Counsel of Lattice (since July 2016). Mr. Garger has served in various positions within The Hartford and its subsidiaries in connection with the operation of the Hartford Funds. Mr. Garger joined The Hartford in 1995. | N/A | N/A | |||||
| THEODORE J. LUCAS (1966) | Vice President | Since 2017 | Mr. Lucas serves as Executive Vice President of HFMG (since July 2016) and as Executive Vice President of Lattice (since June 2017). Previously, Mr. Lucas served as Managing Partner of Lattice (2003 to 2016). | N/A | N/A | |||||
| JOSEPH G. MELCHER (1973) | Vice President and Chief Compliance Officer | Since 2013 | Mr. Melcher serves as Executive Vice President of HFMG and HASCO (since December 2013). Mr. Melcher also serves as Executive Vice President (since December 2013) and Chief Compliance Officer (since December 2012) of HFMC, serves as Executive Vice President and Chief Compliance Officer of Lattice (since July 2016), serves as Executive Vice President of HFD (since December 2013), and has served as President and Chief Executive Officer of HFD (from April 2018 to June 2019). | N/A | N/A | |||||
| VERNON J. MEYER (1964) | Vice President | Since 2006 | Mr. Meyer serves as Managing Director and Chief Investment Officer of HFMC and Managing Director of HFMG (since 2013). Mr. Meyer also serves as Senior Vice President-Investments of Lattice (since March 2019). Mr. Meyer has served in various positions within The Hartford and its subsidiaries in connection with the operation of the Hartford Funds. Mr. Meyer joined The Hartford in 2004. | N/A | N/A | |||||
| 164 |
| NAME, YEAR OF BIRTH AND ADDRESS(1) | POSITION HELD WITH EACH COMPANY | TERM OF OFFICE(2) AND LENGTH OF TIME SERVED | PRINCIPAL OCCUPATION(S) DURING PAST 5 YEARS | NUMBER OF PORTFOLIOS IN FUND COMPLEX(3) OVERSEEN BY DIRECTOR | OTHER DIRECTORSHIPS FOR PUBLIC COMPANIES AND OTHER REGISTERED INVESTMENT COMPANIES HELD BY DIRECTOR | |||||
| DAVID A. NAAB (1985) | Vice President and Treasurer | Since 2021 | Mr. Naab serves as Vice President and Assistant Treasurer of HFMC (since June 2021). Prior to joining HFMC in 2021, Mr. Naab served in various positions as an associate, senior associate, manager, senior manager, and director within the investment management, financial services, and asset & wealth management practice groups of PricewaterhouseCoopers, LLP from 2007 to 2020. | N/A | N/A | |||||
| ALICE A. PELLEGRINO (1960) | Vice President and Assistant Secretary | Since 2016 | Ms. Pellegrino serves as Vice President of HFMG (since December 2013). Ms. Pellegrino also serves as Vice President and Assistant Secretary of Lattice (since June 2017). Ms. Pellegrino is a Senior Counsel and has served in various positions within The Hartford and its subsidiaries in connection with the operation of the Hartford Funds. Ms. Pellegrino joined The Hartford in 2007. | N/A | N/A | |||||
| THOMAS R. PHILLIPS (1960) | Vice President and Secretary | Since 2017 | Mr. Phillips is Deputy General Counsel for HFMG and currently serves as a Senior Vice President (since June 2021) and Assistant Secretary (since June 2017) for HFMG. Mr. Phillips also serves as Vice President of HFMC (since June 2021). Prior to joining HFMG in 2017, Mr. Phillips was a Director and Chief Legal Officer of Saturna Capital Corporation from 2014–2016. Prior to that, Mr. Phillips was a Partner and Deputy General Counsel of Lord, Abbett & Co. LLC. | N/A | N/A |
| (1) | The address for each officer and Director is c/o Hartford Funds 690 Lee Road, Wayne, Pennsylvania 19087. |
| (2) | Term of Office: Each Director holds an indefinite term until his or her retirement, resignation, removal, or death. Directors generally must retire no later than December 31 of the year in which the Director turns 75 years of age. Each Fund officer generally serves until his or her resignation, removal, or death. |
| (3) | The portfolios of the “Fund Complex” are operational series of The Hartford Mutual Funds, Inc., The Hartford Mutual Funds II, Inc., Hartford Series Fund, Inc., Hartford HLS Series Fund II, Inc., Lattice Strategies Trust and Hartford Funds Exchange-Traded Trust. |
| (4) | Effective December 31, 2021, Lynn S. Birdsong and Lemma W. Senbet, Ph.D retired as members of the Board of Directors of each company. The Board of Directors of each Company elected John J. Gauthier as a member of each Board of Directors effective January 1, 2022. |
| (5) | “Interested person,” as defined in the 1940 Act, of each Company because of the person’s affiliation with, or equity ownership of, HFMC, HFD or affiliated companies. |
| 165 |
| 166 |
| 167 |
| 168 |
| 169 |
| 170 |
| • | The Board noted that the Fund’s performance was in the 3rd quintile of its performance universe for the 1-year period, the 1st quintile for the 3-year period, and the 2nd quintile for the 5-year period. The Board also noted that the Fund’s performance was above its custom blended benchmark for the 1-year period and below its custom blended benchmark for the 3- and 5-year periods. The Board noted recent changes to the Fund’s portfolio management team. |
| • | The Board noted that the Fund’s contractual management fee and its total expenses (less 12b-1 and shareholder service fees) were in the 3rd quintile of its expense group, while its actual management fee was in the 4th quintile. The Board noted that the Fund has a voluntary management fee waiver of 0.03% through December 31, 2021, which resulted in HFMC reimbursing the Fund for certain expenses. |
| • | The Board noted that the Fund’s performance was in the 3rd quintile of its performance universe for the 1-year period and the 2nd quintile for the 3-and 5-year periods. The Board also noted that the Fund’s performance was below its benchmark for the 1-, 3-, and 5-year periods. |
| • | The Board noted that the Fund’s contractual management fee and actual management fee were in the 3rd quintile of its expense group, while its total expenses (less 12b-1 and shareholder service fees) were in the 2nd quintile. |
| • | The Board noted that the Fund’s performance was in the 2nd quintile of its performance universe for the 1- and 5-year periods and the 1st quintile for the 3-year period. The Board also noted that the Fund’s performance was in line with its benchmark for the 1- and 5-year periods and above its benchmark for the 3-year period. |
| • | The Board noted that the Fund’s contractual management fee, actual management fee, and total expenses (less 12b-1 and shareholder service fees) were in the 2nd quintile of its expense group. In considering the Fund’s expenses, the Board noted the shareholder savings expected to result from a contractual investment management fee reduction implemented towards the end of 2020. |
| • | The Board noted that the Fund’s performance was in the 2nd quintile of its performance universe for the 1-year period and the 1st quintile for the 3- and 5-year periods. The Board also noted that the Fund’s performance was below its benchmark for the 1-, 3-, and 5-year periods. |
| 171 |
| • | The Board noted that the Fund’s contractual management fee, actual management fee, and its total expenses (less 12b-1 and shareholder service fees) were in the 1st quintile of its expense group. In considering the Fund’s expenses, the Board noted the shareholder savings expected to result from a contractual investment management fee reduction implemented towards the end of 2020. |
| • | The Board noted that the Fund’s performance was in the 2nd quintile of its performance universe for the 1-, 3-, and 5-year periods. The Board also noted that the Fund’s performance was above its benchmark for the 1-, 3-, and 5-year periods. The Board noted recent and upcoming changes to the Fund’s portfolio management team. |
| • | The Board noted that the Fund’s contractual management fee and total expenses (less 12b-1 and shareholder service fees) were in the 2nd quintile of its expense group, while its actual management fee was in the 3rd quintile. |
| • | The Board noted that the Fund’s performance was in the 1st quintile of its performance universe for the 1-year period, the 4th quintile for the 3-year period, and the 3rd quintile for the 5-year period. The Board also noted that the Fund’s performance was above its benchmark for the 1- and 3-year periods and in line with its benchmark for the 5-year period. |
| • | The Board noted that the Fund’s contractual management fee, actual management fee, and its total expenses (less 12b-1 and shareholder service fees) were in the 1st quintile of its expense group. |
| • | The Board noted that the Fund’s performance was in the 3rd quintile of its performance universe for the 1-year period, the 5th quintile for the 3-year period, and the 4th quintile for the 5-year period. The Board also noted that the Fund’s performance was below its benchmark for the 1-year period and above its benchmark for the 3- and 5-year periods. |
| • | The Board noted that the Fund’s contractual management fee, its actual management fee, and its total expenses (less 12b-1 and shareholder service fees) were in the 1st quintile of its expense group. |
| • | The Board noted that the Fund’s performance was in the 4th quintile of its performance universe for the 1-, 3-, and 5-year periods. The Board also noted that the Fund’s performance was below its benchmark for the 1-year period and in line with its benchmark for the 3- and 5-year periods. |
| • | The Board noted that the Fund’s contractual management fee, actual management fee, and total expenses (less 12b-1 and shareholder service fees) were in the 1st quintile of its expense group. |
| • | The Board noted that the Fund’s performance was in the 1st quintile of its performance universe for the 1- and 3-year periods and the 2nd quintile for the 5-year period. The Board also noted that the Fund’s performance was above its benchmark for the 1-, 3-, and 5-year periods. |
| • | The Board noted that the Fund’s contractual management fee and its total expenses (less 12b-1 and shareholder service fees) were in the 1st quintile of its expense group, while its actual management fee was in the 2nd quintile. |
| • | The Board noted that the Fund’s performance was in the 5th quintile of its performance universe for the 1-year period, the 3rd quintile for the 3-year period, and the 4th quintile for the 5-year period. The Board also noted that the Fund’s performance was below its benchmark for the 1-, 3-, and 5-year periods. |
| • | The Board noted that the Fund’s contractual management fee, its actual management fee, and its total expenses (less 12b-1 and shareholder service fees) were in the 1st quintile of its expense group. |
| 172 |
| • | The Board noted that the Fund’s performance was in the 1st quintile of its performance universe for the 1-, 3-, and 5-year periods. The Board also noted that the Fund’s performance was above its benchmark for the 1-, 3-, and 5-year periods. |
| • | The Board noted that the Fund’s contractual management fee and its total expenses (less 12b-1 and shareholder service fees) were in the 2nd quintile of its expense group, while its actual management fee was in the 3rd quintile. |
| • | The Board noted that the Fund’s performance was in the 3rd quintile of its performance universe for the 1-year period and the 2nd quintile for the 3- and 5-year periods. The Board also noted that the Fund’s performance was above its benchmark for the 1-year period and in line with its benchmark for the 3- and 5-year periods. |
| • | The Board noted that the Fund’s contractual management fee and actual management fee were in the 1st quintile of its expense group, while its total expenses (less 12b-1 and shareholder service fees) were in the 2nd quintile. |
| 173 |
| a) | management; |
| b) | use; and |
| c) | protection; |
| a) | service your Transactions with us; and |
| b) | support our business functions. |
| a) | You; |
| b) | your Transactions with us; and |
| c) | third parties such as a consumer-reporting agency. |
| a) | your name; |
| b) | your address; |
| c) | your income; |
| d) | your payment; or |
| e) | your credit history; |
| a) | our insurance companies; |
| b) | our employee agents; |
| c) | our brokerage firms; and |
| d) | our administrators. |
| a) | market our products; or |
| b) | market our services; |
| a) | independent agents; |
| b) | brokerage firms; |
| c) | insurance companies; |
| d) | administrators; and |
| e) | service providers; |
| a) | taking surveys; |
| b) | marketing our products or services; or |
| c) | offering financial products or services under a joint agreement |
| a) | cookies; |
| b) | pixel tagging; or |
| c) | other technologies; |
| a) | “opt-out;” or |
| b) | “opt-in;” |
| a) | your authorization; or |
| b) | as otherwise allowed or required by law. |
| a) | underwriting policies; |
| b) | paying claims; |
| c) | developing new products; or |
| d) | advising customers of our products and services. |
| a) | the confidentiality; and |
| b) | the integrity of; |
| a) | secured files; |
| b) | user authentication; |
| c) | encryption; |
| d) | firewall technology; and |
| e) | the use of detection software. |
| a) | identify information to be protected; |
| b) | provide an adequate level of protection for that data; and |
| c) | grant access to protected data only to those people who must use |
| a) | credit history; |
| b) | income; |
| c) | financial benefits; or |
| d) | policy or claim information. |
| a) | your medical records; or |
| b) | information about your illness, disability or injury. |
| a) | Personal Financial Information; and |
| b) | Personal Health Information. |
| a) | your Application; |
| b) | your request for us to pay a claim; and |
| c) | your request for us to take an action on your account. |
| a) | asking about; |
| b) | applying for; or |
| c) | obtaining; |

(b) Not applicable
Item 2. Code of Ethics.
The registrant, as of the end of the period covered by this report, has adopted a code of ethics that applies to the registrant’s principal executive officer, principal financial officer, principal accounting officer or controller, or persons performing similar functions, regardless of whether these individuals are employed by the registrant or a third party. There have been no amendments, during the period covered by this report, to a provision of the code of ethics that applies to the registrant’s principal executive officer, principal financial officer, principal accounting officer or controller, or persons performing similar functions, regardless of whether these individuals are employed by the registrant or a third party, and that relates to any element of the code of ethics description. The registrant has not granted any waivers, including an implicit waiver, from a provision of the code of ethics that applies to the registrant’s principal executive officer, principal financial officer, principal accounting officer or controller, or persons performing similar functions, regardless of whether these individuals are employed by the registrant or a third party, that relates to one or more of the items set forth in paragraph (b) of this item’s instructions. A copy of the code of ethics is filed herewith.
Item 3. Audit Committee Financial Expert.
The Board of Directors of the registrant (the “Board”) has designated David Sung as an Audit Committee Financial Expert. Mr. Sung is considered by the Board to be an independent director.
Item 4. Principal Accountant Fees and Services.
| (a) | Audit Fees: The aggregate fees billed for each of the last two fiscal years for professional services rendered by the principal accountant for the audit of the registrant’s annual financial statements or services that are normally provided by the accountant in connection with statutory and regulatory filings or engagements for those fiscal years were: |
$293,000 for the fiscal year ended December 31, 2020; $274,352 for the fiscal year ended December 31, 2021.
| (b) | Audit Related Fees: The aggregate fees billed in each of the last two fiscal years for assurance and related services by the principal accountant that are reasonably related to the performance of the audit of the registrant’s financial statements and are not reported under paragraph (a) of this Item were: |
$15,000 for the fiscal year ended December 31, 2020; $14,000 for the fiscal year ended December 31, 2021. Audit-related services were principally in connection with consents for the registration statements relating to Fund mergers.
| (c) | Tax Fees: The aggregate fees billed in each of the last two fiscal years for professional services rendered by the principal accountant for tax compliance, tax advice, and tax planning were: |
$77,332 for the fiscal year ended December 31, 2020; $69,105 for the fiscal year ended December 31, 2021. Tax-related services were principally in connection with, but not limited to, general tax services and excise tax services.
| (d) | All Other Fees: The aggregate fees billed in each of the last two fiscal years for products and services provided by the principal accountant, other than the services reported in paragraphs (a) through (c) of this Item were: |
$0 for the fiscal year ended December 31, 2020; $13,223 for the fiscal year ended December 31, 2021. These fees were principally in connection with, but not limited to, general audit related products and services and an accounting research tool subscription.
| (e) | (1) The Pre-Approval Policies and Procedures (the “Policy”) adopted by the Audit Committee of the registrant (also, the “Fund”) sets forth the procedures pursuant to which services performed by the independent registered public accounting firm for the registrant may be pre-approved. The following summarizes the pre-approval requirements under the Policy. |
| a) | The Audit Committee must pre-approve all audit services and non-audit services that the independent registered public accounting firm provides to the Fund. |
| b) | The Audit Committee must pre-approve any engagement of the independent registered public accounting firm to provide non-audit services to any Service Affiliate (which is defined to include any entity controlling, controlled by, or under common control with the investment adviser that provides ongoing services to the Fund) during the period of the independent registered public accounting firm’s engagement to provide audit services to the Fund, if the non-audit services to the Service Affiliate directly impact the Fund’s operations and financial reporting. |
| c) | The Audit Committee, from time to time, may designate one or more of its members who are Independent Directors (each a “Designated Member”) to consider, on the Audit Committee’s behalf, any non-audit services, whether to the Fund or to any Service Affiliate, that have not been pre-approved by the Audit Committee. The Designated Member also shall review, on the Audit Committee’s behalf, any proposed material change in the nature or extent of any non-audit services previously approved. In considering any requested non-audit services or proposed material change in such services, the Designated Member shall not authorize services which would exceed $50,000 in fees for such services. |
| d) | The independent registered public accounting firm may not provide specified prohibited non-audit services set forth in the Policy to the Fund, the Fund’s investment adviser, the Service Affiliates or any other member of the investment company complex. |
| (e) | (2) One hundred percent of the services described in items 4(b) through 4(d) were approved in accordance with the Audit Committee’s Pre-Approval Policy. As a result, none of such services was approved pursuant to paragraph (c)(7)(i)(C) of Rule 2-01 of Regulation S-X. |
| (f) | None of the hours expended on the principal accountant’s engagement to audit the registrant’s financial statements for the year ended December 31, 2021, were attributed to work performed by persons other than the principal accountant’s full-time, permanent employees. |
| (g) | The aggregate non-audit fees billed by the registrant’s accountant for services rendered to the registrant, and rendered to the registrant’s investment adviser (not including any sub-adviser whose role is primarily portfolio management and is subcontracted with or overseen by another investment adviser), and any entity controlling, controlled by, or under common control with the adviser that provides ongoing services to the registrant for each of the last two fiscal years of the registrant were: |
The aggregate non-audit fees billed by the registrant’s accountant for services rendered to the registrant: $92,332 for fiscal year ended December 31, 2020; $96,328 for the fiscal year ended December 31, 2021.
The aggregate non-audit fees billed by the registrant’s accountant for services rendered to the registrant’s investment adviser (not including any sub-adviser whose role is primarily portfolio management and is subcontracted with or overseen by another investment adviser), and any entity controlling, controlled by, or under common control with the adviser was $0 for the fiscal year ended December 31, 2020 and $325,000 for the fiscal year ended December 31, 2021.
| (h) | The registrant’s audit committee of the board of directors has considered whether the provision of non-audit services that were rendered to the registrant’s investment adviser (not including any sub-adviser whose role is primarily portfolio management and is subcontracted with or overseen by another investment adviser), |
and any entity controlling, controlled by, or under common control with the investment adviser that provides ongoing services to the registrant that were not pre-approved pursuant to paragraph (c)(7)(ii) of Rule 2-01 of Regulation S-X is compatible with maintaining the principal accountant’s independence.
Item 5. Audit Committee of Listed Registrants.
Not applicable.
Item 6. Investments.
| (a) | The Schedule of Investments in securities of unaffiliated issuers as of the close of the reporting period is included as part of the annual report filed under Item 1 of this form. |
| (b) | Not applicable. |
Item 7. Disclosure of Proxy Voting Policies and Procedures for Closed-End Management Investment Companies.
Not applicable.
Item 8. Portfolio Managers of Closed-End Management Investment Companies.
Not applicable.
Item 9. Purchases of Equity Securities by Closed-End Management Investment Company and Affiliated Purchasers.
Not applicable.
Item 10. Submission of Matters to a Vote of Security Holders.
There have been no material changes to the procedures by which the shareholders may recommend nominees to the registrant’s board of directors, where those changes were implemented after the registrant last provided disclosure in response to the requirements of Item 407(c)(2)(iv) of Regulation S-K (17 CFR 229.407) (as required by Item 22(b)(15) of Schedule 14A (17 CFR 240.14a-101)), or this Item.
Item 11. Controls and Procedures.
| (a) | The registrant’s principal executive and principal financial officers, or persons performing similar functions, have concluded that the registrant’s disclosure controls and procedures (as defined in Rule 30a-3(c) under the Investment Company Act of 1940, as amended (the “1940 Act”) (17 CFR 270.30a-3(c))) are generally effective to provide reasonable assurance, as of a date within 90 days of the filing date of the report that includes the disclosure required by this paragraph, based on their evaluation of these controls and procedures required by Rule 30a-3(b) under the 1940 Act (17 CFR 270.30a-3(b)) and Rules 13a-15(b) or 15d-15(b) under the Securities Exchange Act of 1934, as amended (17 CFR 240.13a-15(b) or 240.15d-15(b)). |
| (b) | There were no changes in the registrant’s internal control over financial reporting (as defined in Rule 30a-3(d) under the 1940 Act (17 CFR 270.30a-3(d)) that occurred during the period covered by this report that have materially affected, or are reasonably likely to materially affect, the registrant’s internal control over financial reporting. |
Item 12. Disclosure of Securities Lending Activities for Closed-End Management Investment Companies.
Not applicable.
Item 13. Exhibits.
(a)(1) Code of Ethics is filed herewith.
(a)(3) Not applicable
(a)(4) Not applicable
SIGNATURES
Pursuant to the requirements of the Securities Exchange Act of 1934 and the Investment Company Act of 1940, the registrant has duly caused this report to be signed on its behalf by the undersigned, thereunto duly authorized.
| HARTFORD SERIES FUND, INC. | ||||||
| Date: February 28, 2022 | By: | /s/ James E. Davey | ||||
| James E. Davey | ||||||
| President and Chief Executive Officer | ||||||
Pursuant to the requirements of the Securities Exchange Act of 1934 and the Investment Company Act of 1940, this report has been signed below by the following persons on behalf of the registrant and in the capacities and on the dates indicated.
| Date: February 28, 2022 | By: | /s/ James E. Davey | ||||
| James E. Davey | ||||||
| President and Chief Executive Officer |
| Date: February 28, 2022 | By: | /s/ David A. Naab | ||||
| David A. Naab | ||||||
| Treasurer | ||||||
| (Principal Financial Officer and Principal Accounting Officer) |