Exhibit (c)(2)
|

Presentation to the Special Committee
November 10, 2010
1
|
Disclaimer
This presentation has been prepared by Greenhill & Co., LLC (“Greenhill”) for the use of the Special Committee of the Board of Directors of Wesco Financial Corporation (the “Company”), is for information only and may not be used for any purpose or disclosed to any other person without Greenhill’s prior written consent. These materials are not intended to be and do not constitute a recommendation to any person or entity as to whether to acquire or dispose of or take any other action in respect of any securities of the Company or any other person. In preparing these analyses, Greenhill has relied on publicly available information and other information provided to it by the Company and its representatives and has assumed, without independent verification, the accuracy and completeness of all such information. Greenhill does not assume any responsibility or liability therefor. No representation or warranty, express or implied, is made in relation to the accuracy or completeness of the information presented herein or its suitability for any particular purpose. Greenhill has not conducted any evaluation or appraisal of any assets or liabilities of the Company or any other person referred to in this presentation. Greenhill does not have any obligation to update the information in this presentation.
|
Summary Agenda
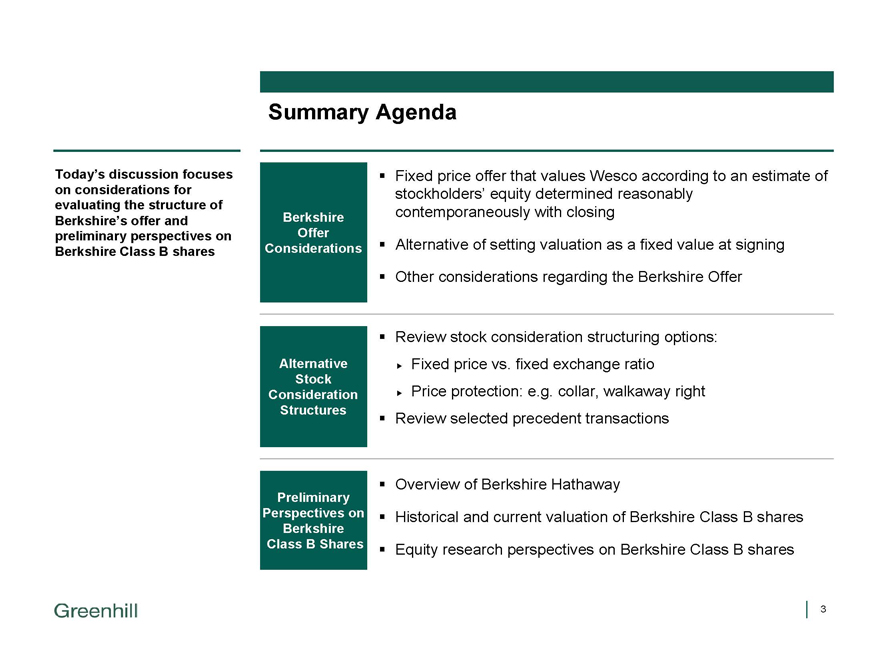
Today’s discussion focuses on considerations for evaluating the structure of Berkshire’s offer and preliminary perspectives on Berkshire Class B shares
Berkshire Offer Considerations
Alternative Stock Consideration Structures
Preliminary Perspectives on Berkshire Class B Shares
Fixed price offer that values Wesco according to an estimate of stockholders’ equity determined reasonably contemporaneously with closing
Alternative of setting valuation as a fixed value at signing
Other considerations regarding the Berkshire Offer
Review stock consideration structuring options:
Fixed price vs. fixed exchange ratio
Price protection: e.g. collar, walkaway right
Review selected precedent transactions
Overview of Berkshire Hathaway
Historical and current valuation of Berkshire Class B shares
Equity research perspectives on Berkshire Class B shares
3
|
Table of Contents
1. Berkshire Offer Considerations
2. Alternative Stock Consideration Structures
3. Preliminary Perspectives on Berkshire Class B Shares
|
Summary of Berkshire Offer
Berkshire’s offer price is equal to an estimate of Wesco’s book value per share based upon:
Wesco’s latest reported stockholders’ equity (letter references the September 30, 2010 stockholders’ equity assuming a 2010 closing); plus
Estimate of retained earnings from October 1, 2010 to the date of the special meeting; plus
Changes in the fair value of investment securities as of a date shortly before the special meeting, adjusted to reflect associated changes in deferred tax liability
Accretion of interest or dividend income would be counted in retained earnings or changes in investment securities but not both
Per share value then would be obtained by dividing that amount by the number of shares of Wesco outstanding, assumed to be 7,119,807
Structured as election of cash or stock
Stockholders to elect either cash or Berkshire Class B common stock (not subject to proration)
If transaction is properly structured, receipt of Class B common stock should be tax free to Wesco stockholders
Exchange ratio for Class B common stock is unspecified, but would be determined by dividing the cash price per share by the VWAP for Class B common stock over an unspecified period ending shortly before the special meeting
Source: Letter to the Board of Directors of Wesco Financial Corporation from Warren Buffett dated September 1, 2010
|
Berkshire Offer Considerations
Estimated Closing Book Value vs. Fixed Price at Signing
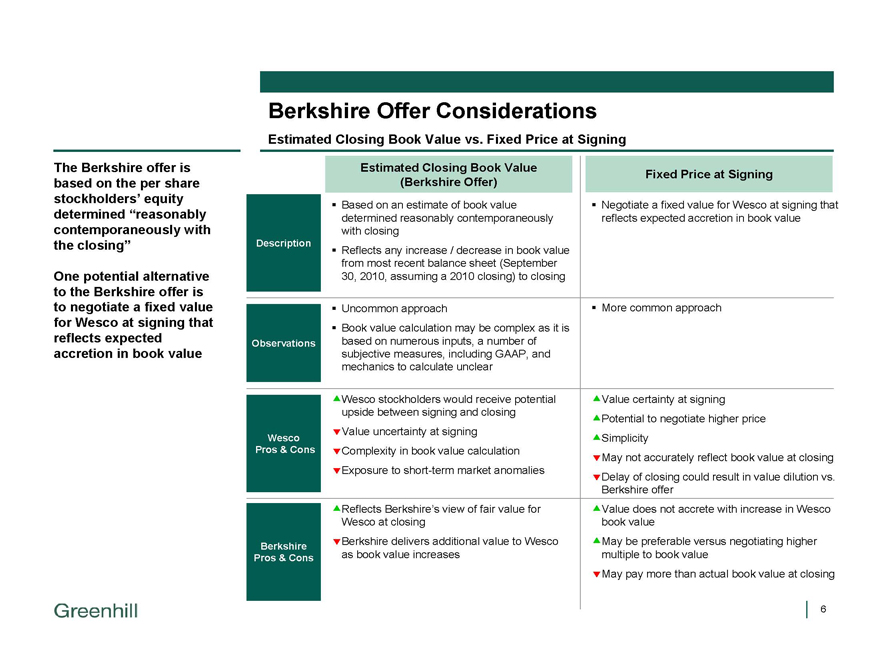
The Berkshire offer is based on the per share stockholders’ equity determined “reasonably contemporaneously with the closing”
One potential alternative to the Berkshire offer is to negotiate a fixed value for Wesco at signing that reflects expected accretion in book value
Description
Observations
Wesco Pros & Cons
Berkshire Pros & Cons
Estimated Closing Book Value (Berkshire Offer) Based on an estimate of book value determined reasonably contemporaneously with closing
Fixed Price at Signing
Negotiate a fixed value for Wesco at signing that reflects expected accretion in book value
Reflects any increase / decrease in book value from most recent balance sheet (September 30, 2010, assuming a 2010 closing) to closing
More common approach
Uncommon approach
Book value calculation may be complex as it is based on numerous inputs, a number of subjective measures, including GAAP, and mechanics to calculate unclear
Delay of closing could result in value dilution vs. Berkshire offer
Simplicity
Wesco stockholders would receive potential upside between signing and closing
Value certainty at signing
Value uncertainty at signing
Potential to negotiate higher price
Complexity in book value calculation
Exposure to short-term market anomalies
May not accurately reflect book value at closing
Reflects Berkshire’s view of fair value for Wesco at closing
Value does not accrete with increase in Wesco book value
Berkshire delivers additional value to Wesco as book value increases
May be preferable versus negotiating higher multiple to book value
May pay more than actual book value at closing
|
Table of Contents
1. Berkshire Offer Considerations
2. Alternative Stock Consideration Structures
3. Preliminary Perspectives on Berkshire Class B Shares
|
Stock Consideration Structures
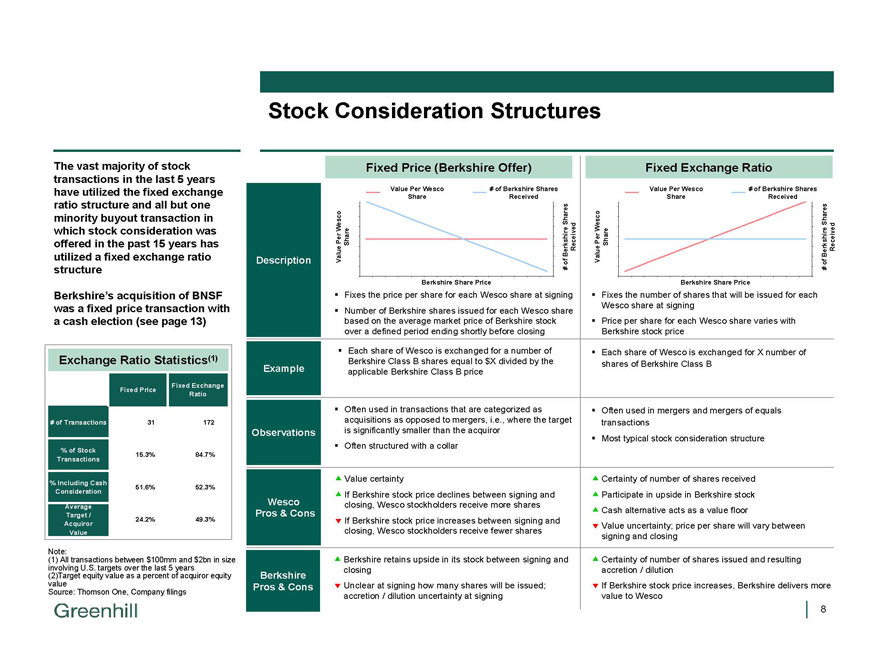
The vast majority of stock transactions in the last 5 years have utilized the fixed exchange ratio structure and all but one minority buyout transaction in which stock consideration was offered in the past 15 years has utilized a fixed exchange ratio structure
Berkshire’s acquisition of BNSF was a fixed price transaction with a cash election (see page 13)
Exchange Ratio Statistics(1)
Fixed Price
Fixed Exchange
Ratio
# of Transactions
31
172
% of Stock
15.3%
84.7%
Transactions
% Including Cash
51.6%
52.3%
Consideration
Average
Target /
24.2%
49.3%
Acquiror
Value
Note:
(1) All transactions between $100mm and $2bn in size involving U.S. targets over the last 5 years (2)Target equity value as a percent of acquiror equity value Source: Thomson One, Company filings
Description Example Observations
Wesco Pros & Cons
Berkshire Pros & Cons
Fixes the price per share for each Wesco share at signing Number of Berkshire shares issued for each Wesco share based on the average market price of Berkshire stock over a defined period ending shortly before closing
Each share of Wesco is exchanged for a number of Berkshire Class B shares equal to $X divided by the applicable Berkshire Class B price
Often used in transactions that are categorized as acquisitions as opposed to mergers, i.e., where the target is significantly smaller than the acquiror Often structured with a collar
Value certainty
If Berkshire stock price declines between signing and closing, Wesco stockholders receive more shares If Berkshire stock price increases between signing and closing, Wesco stockholders receive fewer shares
Berkshire retains upside in its stock between signing and closing Unclear at signing how many shares will be issued; accretion / dilution uncertainty at signing
Fixes the number of shares that will be issued for each Wesco share at signing Price per share for each Wesco share varies with Berkshire stock price
Each share of Wesco is exchanged for X number of shares of Berkshire Class B
Often used in mergers and mergers of equals transactions Most typical stock consideration structure
Certainty of number of shares received Participate in upside in Berkshire stock Cash alternative acts as a value floor
Value uncertainty; price per share will vary between signing and closing
Certainty of number of shares issued and resulting accretion / dilution If Berkshire stock price increases, Berkshire delivers more value to Wesco
Fixed Price (Berkshire Offer)
Value Per Wesco # of Berkshire Shares Share Received Shares Wesco Per Share Berkshire Received Value of # Value
Berkshire Share Price
Fixed Exchange Ratio
Value Per Wesco # of Berkshire Shares Share Received Shares Wesco Per Share Berkshire Received Value of # Value
Berkshire Share Price
|
Price Protection: Collars
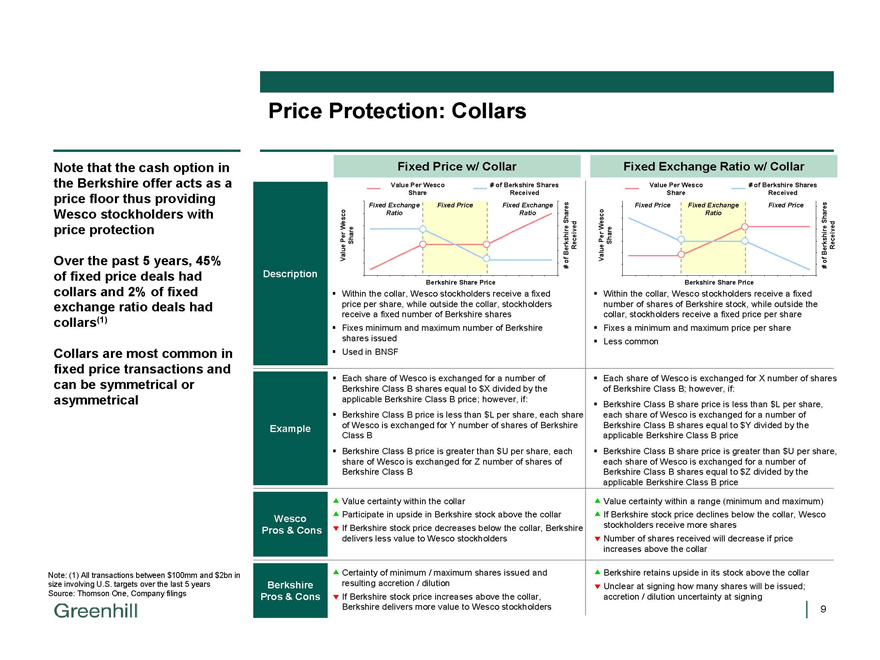
Note that the cash option in the Berkshire offer acts as a price floor thus providing Wesco stockholders with price protection
Over the past 5 years, 45% of fixed price deals had collars and 2% of fixed exchange ratio deals had collars(1)
Collars are most common in fixed price transactions and can be symmetrical or asymmetrical
Note: (1) All transactions between $100mm and $2bn in size involving U.S. targets over the last 5 years Source: Thomson One, Company filings
Description
Example
Wesco Pros & Cons
Berkshire Pros & Cons
Within the collar, Wesco stockholders receive a fixed price per share, while outside the collar, stockholders receive a fixed number of Berkshire shares Fixes minimum and maximum number of Berkshire shares issued Used in BNSF
Each share of Wesco is exchanged for a number of Berkshire Class B shares equal to $X divided by the applicable Berkshire Class B price; however, if: Berkshire Class B price is less than $L per share, each of Wesco is exchanged for Y number of shares of Berkshire Class B
Berkshire Class B price is greater than $U per share, each share of Wesco is exchanged for Z number of shares of Berkshire Class B
Value certainty within the collar
Participate in upside in Berkshire stock above the collar If Berkshire stock price decreases below the collar, Berkshire delivers less value to Wesco stockholders
Certainty of minimum / maximum shares issued and resulting accretion / dilution If Berkshire stock price increases above the collar, Berkshire delivers more value to Wesco stockholders
Within the collar, Wesco stockholders receive a fixed number of shares of Berkshire stock, while outside the collar, stockholders receive a fixed price per share Fixes a minimum and maximum price per share Less common
Each share of Wesco is exchanged for X number of shares of Berkshire Class B; however, if: Berkshire Class B share price is less than $L per share, each share of Wesco is exchanged for a number of Berkshire Class B shares equal to $Y divided by the applicable Berkshire Class B price Berkshire Class B share price is greater than $U per share, each share of Wesco is exchanged for a number of Berkshire Class B shares equal to $Z divided by the applicable Berkshire Class B price
Value certainty within a range (minimum and maximum) If Berkshire stock price declines below the collar, Wesco stockholders receive more shares Number of shares received will decrease if price increases above the collar
Berkshire retains upside in its stock above the collar Unclear at signing how many shares will be issued; accretion / dilution uncertainty at signing
Fixed Price w/ Collar
Value Per Wesco # of Berkshire Shares Share Received
Fixed Exchange Fixed Price Fixed Exchange Ratio Ratio Shares Wesco Per Share Berkshire Received Value of#
Berkshire Share Price
Value Per Wesco # of Berkshire Shares Share Received
Fixed Price Fixed Exchange Fixed Price
Ratio Shares Wesco Per Share Berkshire Received Value of#
Berkshire Share Price
|
Collar Precedents
Transactions with Collars Since 1998
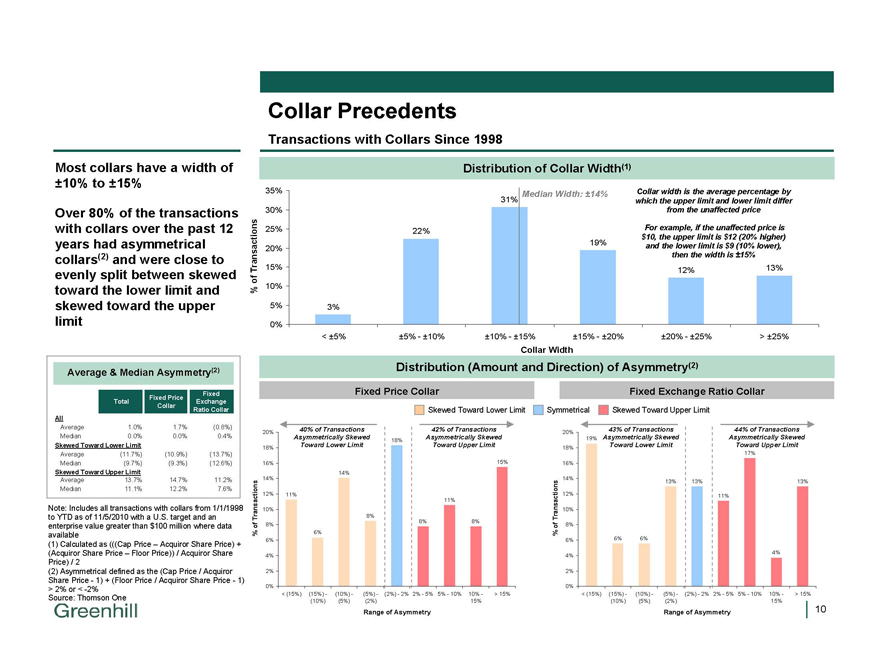
Most collars have a width of ±10% to ±15%
Over 80% of the transactions with collars over the past 12 years had asymmetrical collars(2) and were close to evenly split between skewed toward the lower limit and skewed toward the upper limit
Average & Median Asymmetry(2)
Fixed Price
Fixed
Total
Exchange
Collar
Ratio Collar
All
Average
1.0%
1.7%
(0.8%)
Median
0.0%
0.0%
0.4%
Skewed Toward Lower Limit
Average
(11.7%)
(10.9%)
(13.7%)
Median
(9.7%)
(9.3%)
(12.6%)
Skewed Toward Upper Limit
Average
13.7%
14.7%
11.2%
Median
11.1%
12.2%
7.6%
Note: Includes all transactions with collars from 1/1/1998 to YTD as of 11/5/2010 with a U.S. target and an enterprise value greater than $100 million where data available (1) Calculated as (((Cap Price – Acquiror Share Price) + (Acquiror Share Price – Floor Price)) / Acquiror Share Price) / 2 (2) Asymmetrical defined as the (Cap Price / Acquiror Share Price—1) + (Floor Price / Acquiror Share Price—1)
> 2% or < -2% Source: Thomson One
Distribution of Collar Width(1)
35% Median Width: ±14% Collar width is the average percentage by 31% which the upper limit and lower limit differ 30% from the unaffected price
25% 22% For example, if the unaffected price is $10, the upper limit is $12 (20% higher) 19% and the lower limit is $9 (10% lower), 20% then the width is ±15%
Transactions 15% 12% 13% % of
10%
5% 3% 0%
< ±5% ±5%—±10% ±10%—±15% ±15%—±20% ±20%—±25% > ±25%
Collar Width
Distribution (Amount and Direction) of Asymmetry(2)
Fixed Price Collar
40% of Transactions 42% of Transactions
20%
Asymmetrically Skewed Asymmetrically Skewed
18%
18% Toward Lower Limit Toward Upper Limit
16% 15% 14% 14%
12% 11%
11% 10%
Transactions 8%
8% 8% of 8%
% 6% 6%
4%
2%
0%
< (15%) (15%)—(10%)—(5%)—(2%)—2% 2%—5% 5%—10% 10%—> 15% (10%) (5%) (2%) 15%
Range of Asymmetry
Fixed Exchange Ratio Collar
Skewed Toward Lower Limit Symmetrical Skewed Toward Upper Limit
43% of Transactions 44% of Transactions
20%
19% Asymmetrically Skewed Asymmetrically Skewed 18% Toward Lower Limit Toward Upper Limit
17% 16%
14%
13% 13% 13%
12% 11%
Transactions 10% of 8% %
6% 6% 6%
4% 4%
2%
0%
< (15%) (15%)—(10%)—(5%)—(2%)—2% 2%—5% 5%—10% 10%—> 15% (10%) (5%) (2%) 15%
Range of AsymmetryG
|
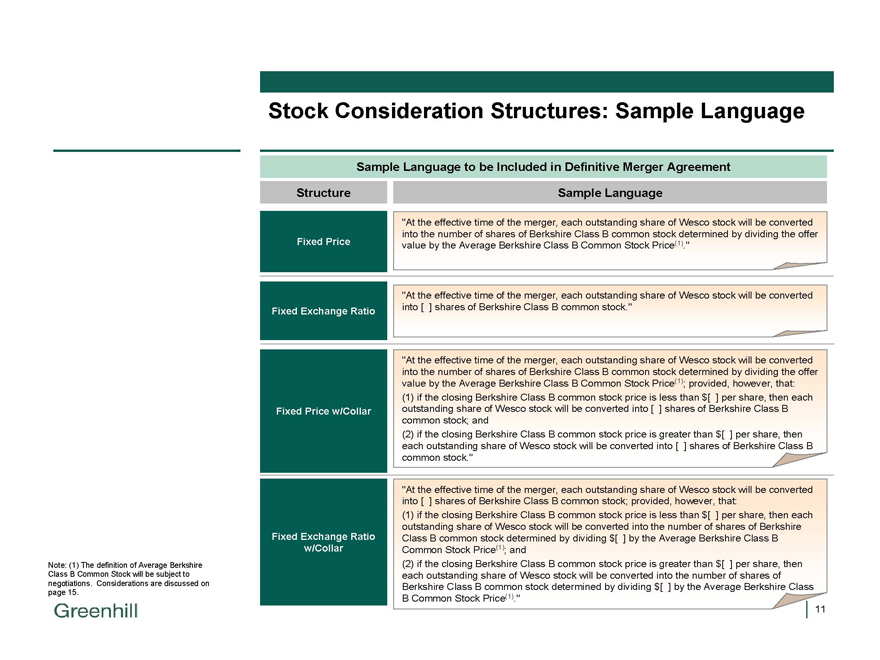
Stock Consideration Structures: Sample Language
Note: (1) The definition of Average Berkshire Class B Common Stock will be subject to negotiations. Considerations are discussed on page 15.
Sample Language to be Included in Definitive Merger Agreement
Structure
Sample Language
“At the effective time of the merger, each outstanding share of Wesco stock will be converted
into the number of shares of Berkshire Class B common stock determined by dividing the offer
Fixed Price
value by the Average Berkshire Class B Common Stock Price(1).”
“At the effective time of the merger, each outstanding share of Wesco stock will be converted
Fixed Exchange Ratio
into [ ] shares of Berkshire Class B common stock.”
“At the effective time of the merger, each outstanding share of Wesco stock will be converted
into the number of shares of Berkshire Class B common stock determined by dividing the offer
value by the Average Berkshire Class B Common Stock Price(1); provided, however, that:
(1) |
| if the closing Berkshire Class B common stock price is less than $[ ] per share, then each |
Fixed Price w/Collar
outstanding share of Wesco stock will be converted into [ ] shares of Berkshire Class B
common stock; and
(2) |
| if the closing Berkshire Class B common stock price is greater than $[ ] per share, then |
each outstanding share of Wesco stock will be converted into [ ] shares of Berkshire Class B
common stock.”
“At the effective time of the merger, each outstanding share of Wesco stock will be converted
into [ ] shares of Berkshire Class B common stock; provided, however, that:
(1) |
| if the closing Berkshire Class B common stock price is less than $[ ] per share, then each |
outstanding share of Wesco stock will be converted into the number of shares of Berkshire
Fixed Exchange Ratio
Class B common stock determined by dividing $[ ] by the Average Berkshire Class B
w/Collar
Common Stock Price(1); and
(2) |
| if the closing Berkshire Class B common stock price is greater than $[ ] per share, then |
each outstanding share of Wesco stock will be converted into the number of shares of
Berkshire Class B common stock determined by dividing $[ ] by the Average Berkshire Class
B Common Stock Price(1).”
|
Walkaway and Top-Up Rights
A walkaway right allows a target to terminate a transaction if the acquiror’s stock price falls below a certain level or by a certain percentage
Can be used with or without a collar
Can be mutual or one-sided
Can include a top-up right for the acquiror, which allows the acquiror to cancel the walkaway right if it is willing to add shares or cash to the deal to increase the value to the walkaway threshold or a greater amount
Walkaway rights are typically structured at ranges substantially greater than the width of the collar
The following issues must be addressed when structuring top-up rights: The form of consideration used to top-up (cash or stock) The level to which an acquiror would be required to top-up Who makes the decision to top-up (acquiror or target)
|
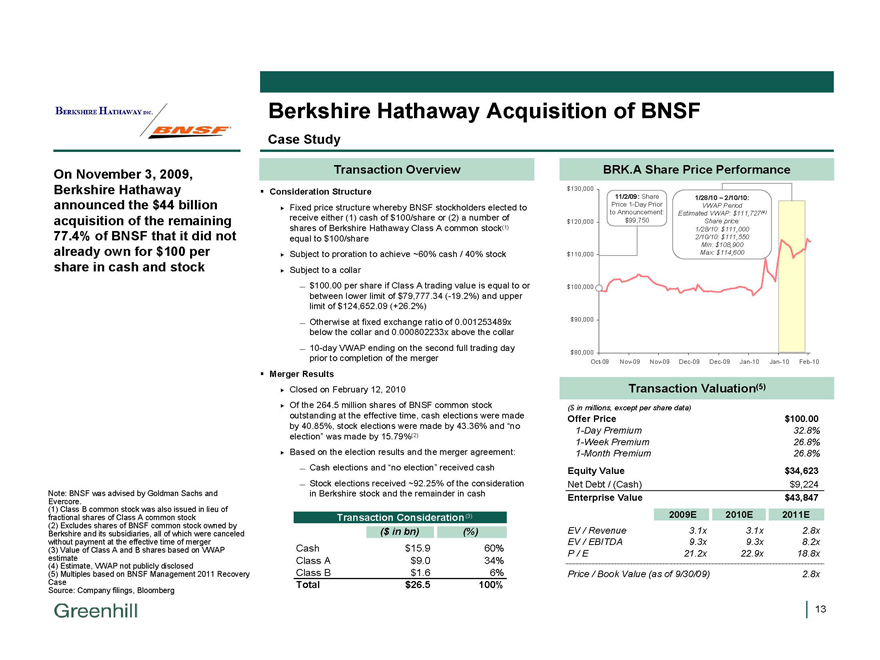
Berkshire Hathaway Acquisition of BNSF
Case Study
On November 3, 2009, Berkshire Hathaway announced the $44 billion acquisition of the remaining 77.4% of BNSF that it did not already own for $100 per share in cash and stock
Note: BNSF was advised by Goldman Sachs and Evercore.
(1) Class B common stock was also issued in lieu of fractional shares of Class A common stock (2) Excludes shares of BNSF common stock owned by Berkshire and its subsidiaries, all of which were canceled without payment at the effective time of merger (3) Value of Class A and B shares based on VWAP estimate (4) Estimate, VWAP not publicly disclosed (5) Multiples based on BNSF Management 2011 Recovery Case Source: Company filings, Bloomberg
Transaction Overview
Consideration Structure
Fixed price structure whereby BNSF stockholders elected to receive either (1) cash of $100/share or (2) a number of shares of Berkshire Hathaway Class A common stock(1) equal to $100/share Subject to proration to achieve ~60% cash / 40% stock Subject to a collar
— $100.00 per share if Class A trading value is equal to or between lower limit of $79,777.34 (-19.2%) and upper limit of $124,652.09 (+26.2%)
— Otherwise at fixed exchange ratio of 0.001253489x below the collar and 0.000802233x above the collar
— 10-day VWAP ending on the second full trading day prior to completion of the merger
Merger Results
Closed on February 12, 2010
Of the 264.5 million shares of BNSF common stock outstanding at the effective time, cash elections were made by 40.85%, stock elections were made by 43.36% and “no election” was made by 15.79%(2) Based on the election results and the merger agreement:
— Cash elections and “no election” received cash
— Stock elections received ~92.25% of the consideration in Berkshire stock and the remainder in cash
Transaction Consideration (3)
($ in bn)(%)
Cash $15.9 60%
Class A $9.0 34%
Class B $1.6 6%
Total $26.5 100%
BRK.A Share Price Performance
$130,000
11/2/09: Share 1/28/10 – 2/10/10:
Price 1-Day Prior VWAP Period to Announcement: Estimated VWAP: $111,727(4) $120,000 $99,750 Share price: 1/28/10: $111,000 2/10/10: $111,550 Min: $108,900 $110,000 Max: $114,600
$100,000
$90,000
$80,000
Oct-09 Nov-09 Nov-09 Dec-09 Dec-09 Jan-10 Jan-10 Feb-10
Transaction Valuation(5)
($ in millions, except per share data)
Offer Price $100.00
1-Day Premium 32.8%
1-Week Premium 26.8%
1-Month Premium 26.8%
Equity Value $34,623
Net Debt / (Cash) $9,224
Enterprise Value $43,847
2009E 2010E 2011E
EV / Revenue 3.1x 3.1x 2.8x
EV / EBITDA 9.3x 9.3x 8.2x
P / E 21.2x 22.9x 18.8x
Price / Book Value (as of 9/30/09) 2.8x
|
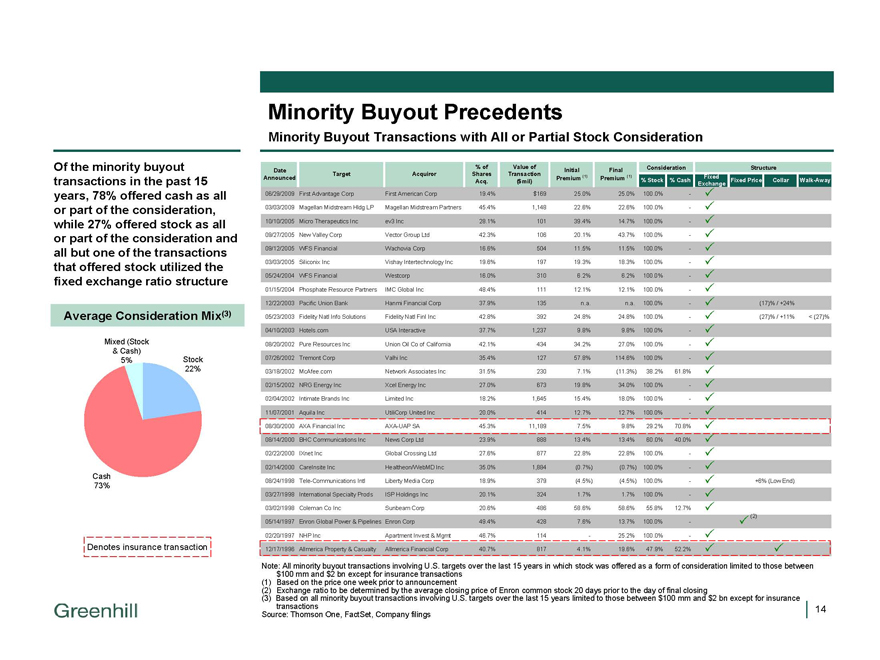
Minority Buyout Precedents
Minority Buyout Transactions with All or Partial Stock Consideration
Of the minority buyout transactions in the past 15 years, 78% offered cash as all or part of the consideration, while 27% offered stock as all or part of the consideration and all but one of the transactions that offered stock utilized the fixed exchange ratio structure
Average Consideration Mix(3)
Mixed (Stock
& Cash)
5% Stock 22%
Cash 73%
Denotes insurance transaction
Date% of Value of Initial Final Consideration Structure
Announced Target Acquiror Shares Transaction Premium (1) Premium (1) Fixed
Acq.($mil)% Stock % Cash Exchange Fixed Price Collar Walk-Away
06/29/2009 First Advantage Corp First American Corp 19.4% $169 25.0% 25.0% 100.0%—
03/03/2009 Magellan Midstream Hldg LP Magellan Midstream Partners 45.4% 1,148 22.6% 22.6% 100.0%—
10/10/2005 Micro Therapeutics Inc ev3 Inc 28.1% 101 39.4% 14.7% 100.0%—
09/27/2005 New Valley Corp Vector Group Ltd 42.3% 106 20.1% 43.7% 100.0%—
09/12/2005 WFS Financial Wachovia Corp 16.6% 504 11.5% 11.5% 100.0%—
03/03/2005 Siliconix Inc Vishay Intertechnology Inc 19.6% 197 19.3% 18.3% 100.0%—
05/24/2004 WFS Financial Westcorp 16.0% 310 6.2% 6.2% 100.0%—
01/15/2004 Phosphate Resource Partners IMC Global Inc 48.4% 111 12.1% 12.1% 100.0%—
12/22/2003 Pacific Union Bank Hanmi Financial Corp 37.9% 135 n.a. n.a. 100.0%—(17)% / +24%
05/23/2003 Fidelity Natl Info Solutions Fidelity Natl Finl Inc 42.8% 392 24.8% 24.8% 100.0%—(27)% / +11% < (27)%
04/10/2003 Hotels.com USA Interactive 37.7% 1,237 9.8% 9.8% 100.0%—
08/20/2002 Pure Resources Inc Union Oil Co of California 42.1% 434 34.2% 27.0% 100.0%—
07/26/2002 Tremont Corp Valhi Inc 35.4% 127 57.8% 114.6% 100.0%—
03/18/2002 McAfee.com Network Associates Inc 31.5% 230 7.1%(11.3%) 38.2% 61.8%
02/15/2002 NRG Energy Inc Xcel Energy Inc 27.0% 673 19.8% 34.0% 100.0%—
02/04/2002 Intimate Brands Inc Limited Inc 18.2% 1,645 15.4% 18.0% 100.0%��
11/07/2001 Aquila Inc UtiliCorp United Inc 20.0% 414 12.7% 12.7% 100.0%—
08/30/2000 AXA Financial Inc AXA-UAP SA 45.3% 11,189 7.5% 9.8% 29.2% 70.8%
08/14/2000 BHC Communications Inc News Corp Ltd 23.9% 888 13.4% 13.4% 60.0% 40.0%
02/22/2000 IXnet Inc Global Crossing Ltd 27.6% 877 22.8% 22.8% 100.0%—
02/14/2000 CareInsite Inc Healtheon/WebMD Inc 35.0% 1,884(0.7%)(0.7%) 100.0%—
08/24/1998 Tele-Communications Intl Liberty Media Corp 18.9% 379(4.5%)(4.5%) 100.0%— +6% (Low End)
03/27/1998 International Specialty Prods ISP Holdings Inc 20.1% 324 1.7% 1.7% 100.0%—
03/02/1998 Coleman Co Inc Sunbeam Corp 20.6% 486 58.6% 58.6% 55.8% 12.7%
(2) |
|
05/14/1997 Enron Global Power & Pipelines Enron Corp 49.4% 428 7.6% 13.7% 100.0%—
02/20/1997 NHP Inc Apartment Invest & Mgmt 46.7% 114—25.2% 100.0%—
12/17/1996 Allmerica Property & Casualty Allmerica Financial Corp 40.7% 817 4.1% 19.6% 47.9% 52.2%
Note: All minority buyout transactions involving U.S. targets over the last 15 years in which stock was offered as a form of consideration limited to those between $100 mm and $2 bn except for insurance transactions (1) Based on the price one week prior to announcement (2) Exchange ratio to be determined by the average closing price of Enron common stock 20 days prior to the day of final closing (3) Based on all minority buyout transactions involving U.S. targets over the last 15 years limited to those between $100 mm and $2 bn except for insurance transactions Source: Thomson One, FactSet, Company filings
|
Other Considerations
Methodology for calculating Berkshire Class B common stock price
Offer proposes VWAP of Berkshire Class B common stock over an unspecified period ending shortly before the special meeting
Discuss length of measurement period as well as when price is determined relative to stockholder vote
Voting / election of consideration timing and mechanics
Based on our discussions with Skadden, SEC considerations include: Formulaic offer price could prolong SEC review period Factors the SEC may consider include:
– Whether formula has legitimate business purpose
– Disclosure stockholders will receive about the formula
– The ability of stockholders to change their vote before the meeting
|
Table of Contents
1. Berkshire Offer Considerations
2. Alternative Stock Consideration Structures
3. Preliminary Perspectives on Berkshire Class B Shares
|
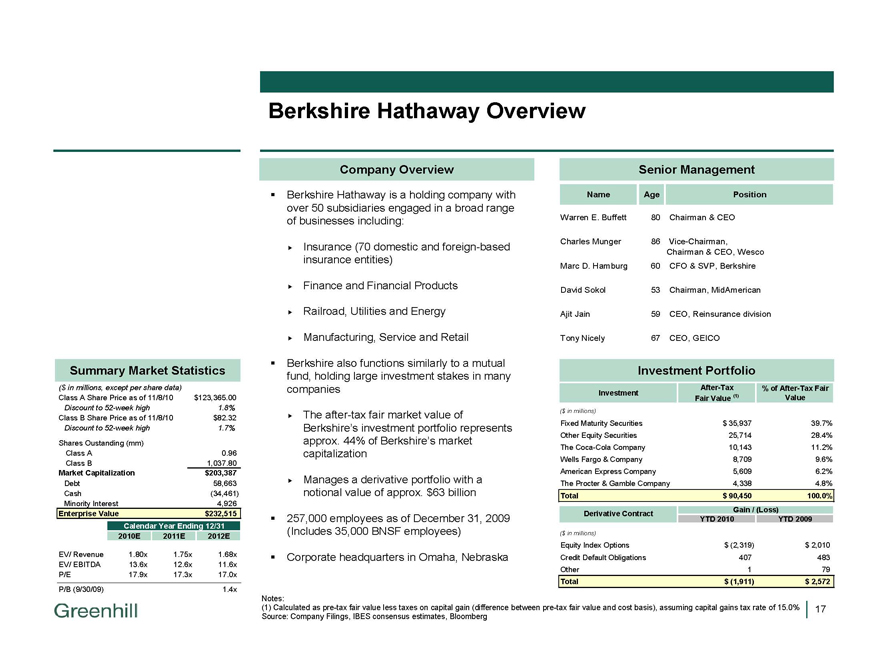
Berkshire Hathaway Overview
Summary Market Statistics
($ in millions, except per share data)
Class A Share Price as of 11/8/10
$123,365.00
Discount to 52-week high
1.8%
Class B Share Price as of 11/8/10
$82.32
Discount to 52-week high
1.7%
Shares Oustanding (mm)
Class A
0.96
Class B
1,037.80
Market Capitalization
$203,387
Debt
58,663
Cash
(34,461)
Minority Interest
4,926
Enterprise Value
$232,515
Calendar Year Ending 12/31
2010E
2011E
2012E
EV/ Revenue
1.80x
1.75x
1.68x
EV/ EBITDA
13.6x
12.6x
11.6x
P/E
17.9x
17.3x
17.0x
P/B (9/30/09)
1.4x
Company Overview
Berkshire Hathaway is a holding company with over 50 subsidiaries engaged in a broad range of businesses including:
Insurance (70 domestic and foreign-based insurance entities)
Finance and Financial Products Railroad, Utilities and Energy Manufacturing, Service and Retail
Berkshire also functions similarly to a mutual fund, holding large investment stakes in many companies
The after-tax fair market value of
Berkshire’s investment portfolio represents approx. 44% of Berkshire’s market capitalization
Manages a derivative portfolio with a notional value of approx. $63 billion
257,000 employees as of December 31, 2009 (Includes 35,000 BNSF employees)
Corporate headquarters in Omaha, Nebraska
Senior Management
Name Age Position
Warren E. Buffett 80 Chairman & CEO
Charles Munger 86 Vice-Chairman,
Chairman & CEO, Wesco
Marc D. Hamburg 60 CFO & SVP, Berkshire
David Sokol 53 Chairman, MidAmerican
Ajit Jain 59 CEO, Reinsurance division
Tony Nicely 67 CEO, GEICO
Investment Portfolio
After-Tax% of After-Tax Fair
Investment Fair Value (1) Value
($ in millions)
Fixed Maturity Securities $ 35,937 39.7%
Other Equity Securities 25,714 28.4%
The Coca-Cola Company 10,143 11.2%
Wells Fargo & Company 8,709 9.6%
American Express Company 5,609 6.2%
The Procter & Gamble Company 4,338 4.8%
Total $ 90,450 100.0%
Derivative Contract Gain / (Loss)
YTD 2010 YTD 2009
($ in millions)
Equity Index Options $ (2,319) $ 2,010
Credit Default Obligations 407 483
Other 1 79
Total $ (1,911) $ 2,572
Notes:
(1) Calculated as pre-tax fair value less taxes on capital gain (difference between pre-tax fair value and cost basis), assuming capital gains tax rate of 15.0% Source: Company Filings, IBES consensus estimates, Bloomberg
|
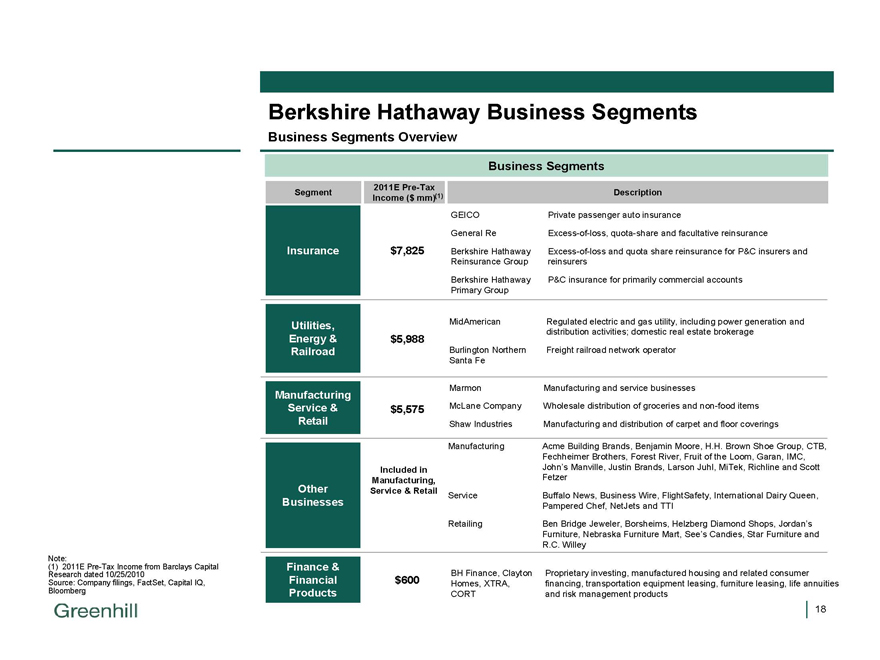
Berkshire Hathaway Business Segments
Business Segments Overview
Note:
(1) 2011E Pre-Tax Income from Barclays Capital Research dated 10/25/2010 Source: Company filings, FactSet, Capital IQ, Bloomberg
Business Segments
2011E Pre-Tax
Segment Description
Income ($ mm)(1)
GEICO Private passenger auto insurance
General Re Excess-of-loss, quota-share and facultative reinsurance
Insurance $7,825 Berkshire Hathaway Excess-of-loss and quota share reinsurance for P&C insurers and
Reinsurance Group reinsurers
Berkshire Hathaway P&C insurance for primarily commercial accounts
Primary Group
Utilities, MidAmerican Regulated electric and gas utility, including power generation and
distribution activities; domestic real estate brokerage
Energy & $5,988
Railroad Burlington Northern Freight railroad network operator
Santa Fe
Marmon Manufacturing and service businesses
Manufacturing
Service & $5,575 McLane Company Wholesale distribution of groceries and non-food items
Retail Shaw Industries Manufacturing and distribution of carpet and floor coverings
Manufacturing Acme Building Brands, Benjamin Moore, H.H. Brown Shoe Group, CTB,
Fechheimer Brothers, Forest River, Fruit of the Loom, Garan, IMC,
Included in John’s Manville, Justin Brands, Larson Juhl, MiTek, Richline and Scott
Manufacturing, Fetzer
Other Service & Retail Service Buffalo News, Business Wire, FlightSafety, International Dairy Queen,
Businesses Pampered Chef, NetJets and TTI
Retailing Ben Bridge Jeweler, Borsheims, Helzberg Diamond Shops, Jordan’s
Furniture, Nebraska Furniture Mart, See’s Candies, Star Furniture and
R.C. Willey
Finance & BH Finance, Clayton Proprietary investing, manufactured housing and related consumer
Financial $600 Homes, XTRA, financing, transportation equipment leasing, furniture leasing, life annuities
Products CORT and risk management products
|
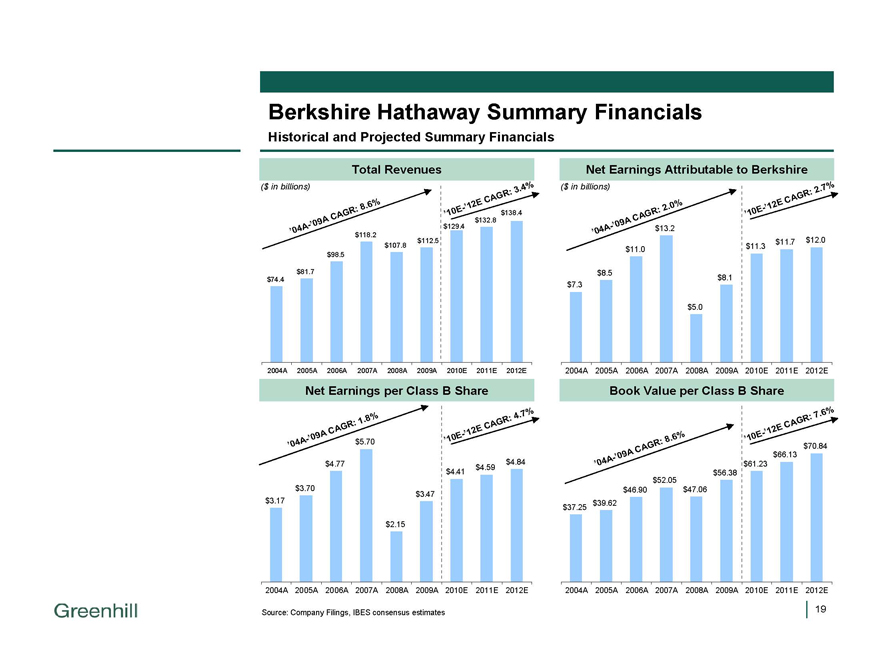
Berkshire Hathaway Summary Financials
Historical and Projected Summary Financials
Total Revenues
($ in billion)
‘04A-’09A CAGR: 8.6% ‘10E-’12E CAGR: 3.4%
$74.4 $81.7 $98.5 $118.2 $107.8 $112.5 $129.4 $132.8 $138.4
2004A 2005A 2006A 2007A 2008A 2009A 2010E 2011E 2012E
Net Earnings per Class B Share
‘04A-’09A CAGR: 1.8% ‘10E-’12E CAGR: 4.7%
$3.17 $3.70 $4.77 $5.70 $2.15 $3.47 $4.41 $4.59 $4.84
2004A 2005A 2006A 2007A 2008A 2009A 2010E 2011E 2012E
Net Earnings Attributable to Berkshire
($ in billion)
‘04A-’09A CAGR: 2.0% ‘10E-’12E CAGR: 2.7%
$7.3 $8.5 $11.0 $13.2 $5.0 $8.1 $11.3 $11.7 $12.0
2004A 2005A 2006A 2007A 2008A 2009A 2010E 2011E 2012E
Book Value per Class B Share
‘04A-’09A CAGR: 8.6% ‘10E-’12E CAGR: 7.6%
$37.25 $39.62 $46.90 $52.05 $47.06 $56.38 $61.23 $66.13 $70.84
2004A 2005A 2006A 2007A 2008A 2009A 2010E 2011E 2012E
Source: Company Filings, IBES consensus estimates
19
|
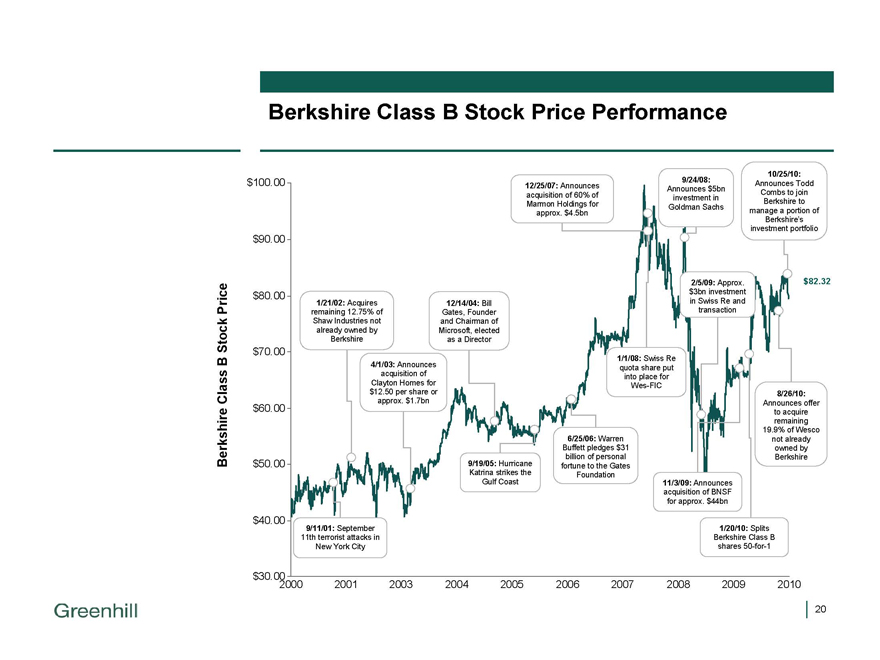
Berkshire Class B Stock Price Performance
Berkshire Class B Stock Price
$100.00 $90.00 $80.00 $70.00 $60.00 $50.00 $40.00 $30.00
2000 2001 2003 2004 2005 2006 2007 2008 2009 2010
12/25/07: Announces acquisition of 60% of Marmon Holdings for approx. $4.5bn
9/24/08:
Announces $5bn investment in Goldman Sachs
10/25/10:
Announces Todd Combs to join Berkshire to manage a portion of Berkshire’s investment portfolio
1/21/02: Acquires remaining 12.75% of Shaw Industries not already owned by Berkshire
12/14/04: Bill Gates, Founder and Chairman of Microsoft, elected as a Director
4/1/03: Announces acquisition of Clayton Homes for $12.50 per share or approx. $1.7bn
9/11/01: September 11th terrorist attacks in New York City
9/19/05: Hurricane Katrina strikes the Gulf Coast
6/25/06: Warren Buffett pledges $31 billion of personal fortune to the Gates Foundation
1/1/08: Swiss Re quota share put into place for Wes-FIC
2/5/09: Approx. $3bn investment in Swiss Re and transaction
11/3/09: Announces acquisition of BNSF for approx. $44bn
8/26/10:
Announces offer to acquire remaining 19.9% of Wesco not already owned by Berkshire
1/20/10: Splits Berkshire Class B shares 50-for-1
$82.32
|
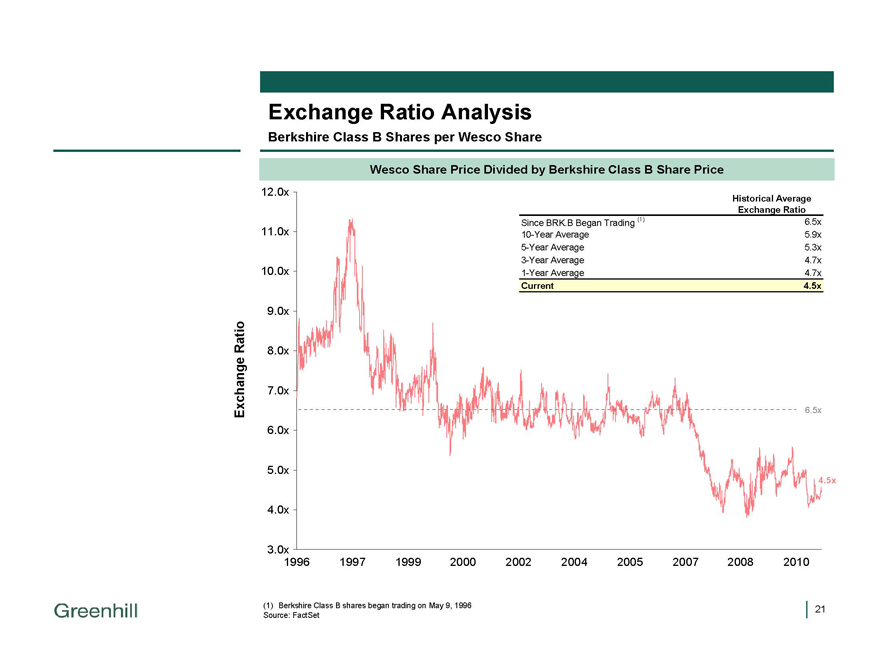
Exchange Ratio Analysis
Berkshire Class B Shares per Wesco Share
Wesco Share Price Divided by Berkshire Class B Share Price
Historical Average
Exchange Ratio
Since BRK.B Began Trading (1) 6.5x
10-Year Average 5.9x
5-Year Average 5.3x
3-Year Average 4.7x
1-Year Average 4.7x
Current 4.5x
Exchange Ratio
12.0x 11.0x 10.0x 9.0x 8.0x 7.0x 6.0x 5.0x 4.0x 3.0x
6.5x
(1) |
| Berkshire Class B shares began trading on May 9, 1996 Source: FactSet |
21
1996 1997 1999 2000 2002 2004 2005 2007 2008 2010
|
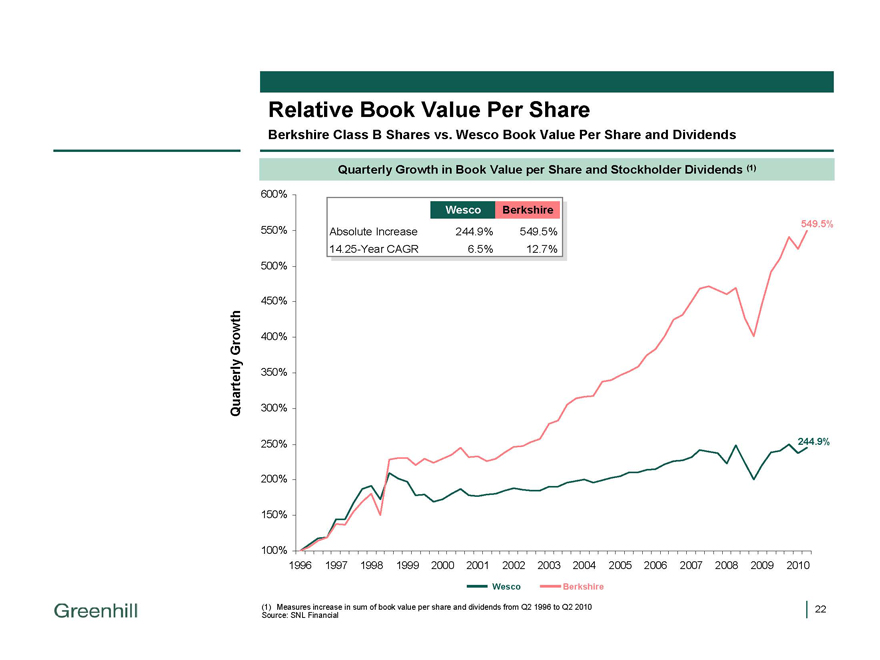
Relative Book Value Per Share
Berkshire Class B Shares vs. Wesco Book Value Per Share and Dividends
Quarterly Growth in Book Value per Share and Stockholder Dividends (1)
Wesco Berkshire
Absolute Increase 244.9% 549.5%
14.25-Year CAGR 6.5% 12.7%
Quarterly Growth
600% 550% 500% 450% 400% 350% 300% 250% 200% 150% 100% 549.5% 244.9%
1996 1997 1998 1999 2000 2001 2002 2003 2004 2005 2006 2007 2008 2009 2010
(1) Measures increase in sum of book value per share and dividends from Q2 1996 to Q2 2010 Source: SNL Financial
Wesco, Berkshire
22
|
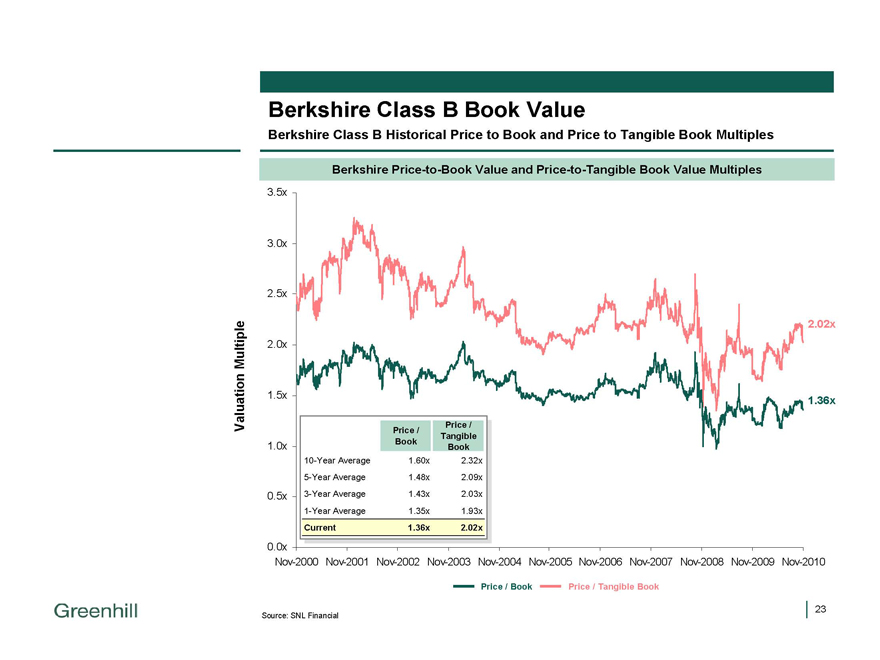
Berkshire Class B Book Value
Berkshire Class B Historical Price to Book and Price to Tangible Book Multiples
Berkshire Price-to-Book Value and Price-to-Tangible Book Value Multiples
Valuation Multiple
3.5x 3.0x 2.5x 2.0x 1.5x 1.0x 0.5x 0.0x
Nov-2000 Nov-2001 Nov-2002 Nov-2003 Nov-2004 Nov-2005 Nov-2006 Nov-2007 Nov-2008 Nov-2009 Nov-2010
Price / Price /
Book Tangible
Book
10-Year Average 1.60x 2.32x
5-Year Average 1.48x 2.09x
3-Year Average 1.43x 2.03x
1-Year Average 1.35x 1.93x
Current 1.36x 2.02x
Price / Book Price / Tangible Book
Source: SNL Financial
2.02X 1.36X
23
|
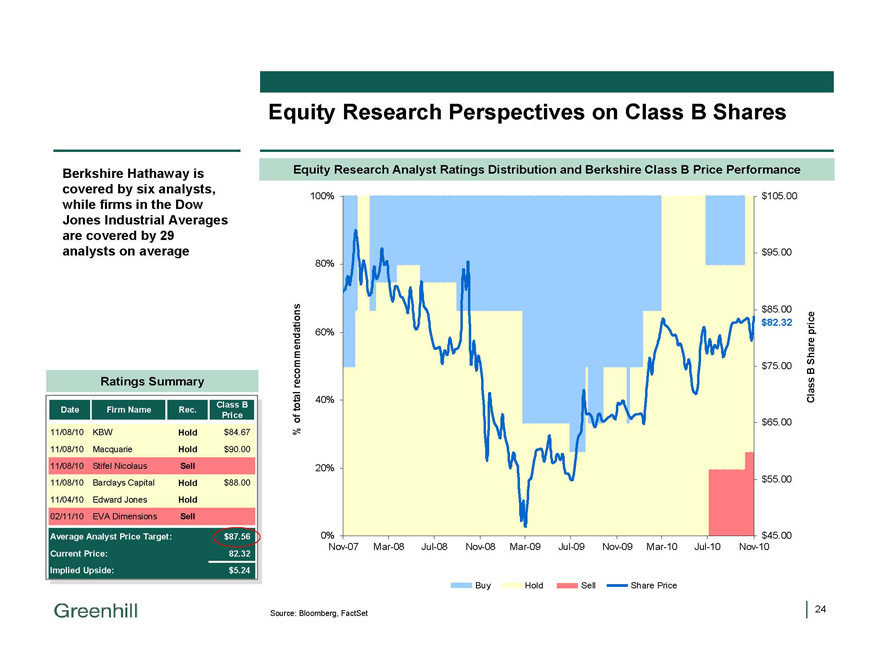
Equity Research Perspectives on Class B Shares
Berkshire Hathaway is covered by six analysts, while firms in the Dow Jones Industrial Averages are covered by 29 analysts on average
Ratings Summary
Class B
Date Firm Name Rec. Price
11/08/10 KBW Hold $84.67
11/08/10 Macquarie Hold $90.00
11/08/10 Stifel Nicolaus Sell
11/08/10 Barclays Capital Hold $88.00
11/04/10 Edward Jones Hold
02/11/10 EVA Dimensions Sell
Average Analyst Price Target: $87.56
Current Price: 82.32
Implied Upside: $5.24
% ofEquity Research Analyst Ratings Distribution and Berkshire Class B Price Performance
total recommendations
100% 80% 60% 40% 20% 0%
Nov-07 Mar-08 Jul-08 Nov-08 Mar-09 Jul-09 Nov-09 Mar-10 Jul-10 Nov-10
$105.00
$95.00
$85.00 $82.32
$75.00 $65.00 $55.00 $45.00
Class B Share price
Buy Hold Sell Share Price
Source: Bloomberg, FactSet
24
|
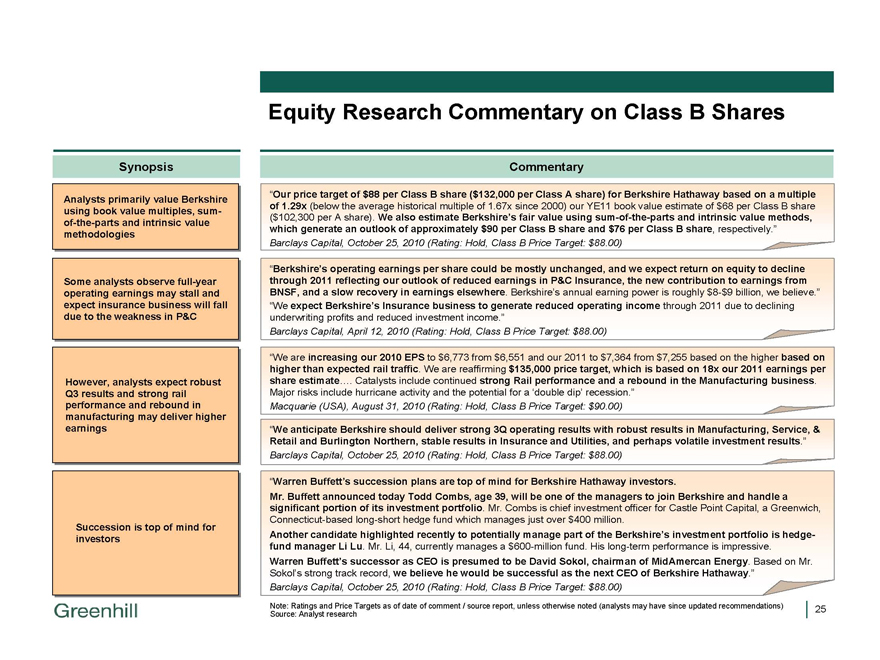
Equity Research Commentary on Class B Shares
Synopsis
Commentary
Analysts primarily value Berkshire using book value multiples, sum - of the parts and intrinsic value methodologies
Some analysts observe full-year operating earnings may stall and expect insurance business will fall due to the weakness in P&C
However, analysts expect robust Q3 results and strong rail performance and rebound in manufacturing may deliver higher earnings
Succession is top of mind for investors
“Our price target of $88 per Class B share ($132,000 per Class A share) for Berkshire Hathaway based on a multiple
of 1.29x (below the average historical multiple of 1.67x since 2000) our YE11 book value estimate of $68 per Class B share
($102,300 per A share). We also estimate Berkshire’s fair value using sum-of-the-parts and intrinsic value methods,
which generate an outlook of approximately $90 per Class B share and $76 per Class B share, respectively.”
Barclays Capital, October 25, 2010 (Rating: Hold, Class B Price Target: $88.00)
“Berkshire’s operating earnings per share could be mostly unchanged, and we expect return on equity to decline
through 2011 reflecting our outlook of reduced earnings in P&C Insurance, the new contribution to earnings from
BNSF, and a slow recovery in earnings elsewhere. Berkshire’s annual earning power is roughly $8-$9 billion, we believe.”
“We expect Berkshire’s Insurance business to generate reduced operating income through 2011 due to declining
underwriting profits and reduced investment income.”
Barclays Capital, April 12, 2010 (Rating: Hold, Class B Price Target: $88.00)
“We are increasing our 2010 EPS to $6,773 from $6,551 and our 2011 to $7,364 from $7,255 based on the higher based on
higher than expected rail traffic. We are reaffirming $135,000 price target, which is based on 18x our 2011 earnings per
share estimate…. Catalysts include continued strong Rail performance and a rebound in the Manufacturing business.
Major risks include hurricane activity and the potential for a ‘double dip’ recession.”
Macquarie (USA), August 31, 2010 (Rating: Hold, Class B Price Target: $90.00)
“We anticipate Berkshire should deliver strong 3Q operating results with robust results in Manufacturing, Service, &
Retail and Burlington Northern, stable results in Insurance and Utilities, and perhaps volatile investment results.”
Barclays Capital, October 25, 2010 (Rating: Hold, Class B Price Target: $88.00)
“Warren Buffett’s succession plans are top of mind for Berkshire Hathaway investors.
Mr. Buffett announced today Todd Combs, age 39, will be one of the managers to join Berkshire and handle a
significant portion of its investment portfolio. Mr. Combs is chief investment officer for Castle Point Capital, a Greenwich,
Connecticut-based long-short hedge fund which manages just over $400 million.
Another candidate highlighted recently to potentially manage part of the Berkshire’s investment portfolio is hedge-
fund manager Li Lu. Mr. Li, 44, currently manages a $600-million fund. His long-term performance is impressive.
Warren Buffett’s successor as CEO is presumed to be David Sokol, chairman of MidAmercan Energy. Based on Mr.
Sokol’s strong track record, we believe he would be successful as the next CEO of Berkshire Hathaway.”
Barclays Capital, October 25, 2010 (Rating: Hold, Class B Price Target: $88.00)
Note: Ratings and Price Targets as of date of comment / source report, unless otherwise noted (analysts may have since updated recommendations)
Source: Analyst research
25
|
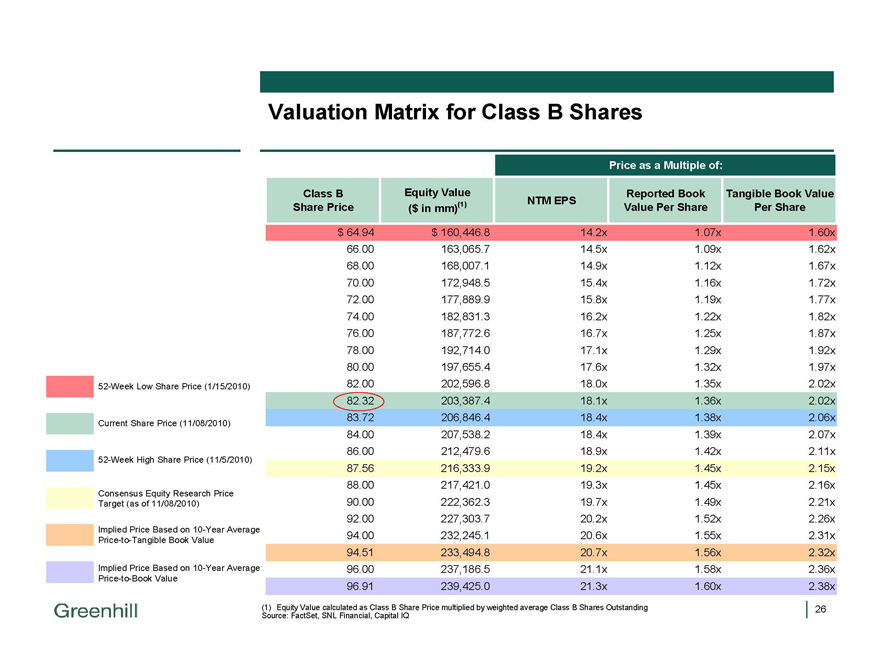
Valuation Matrix for Class B Shares
52-Week Low Share Price (1/15/2010) Current Share Price (11/08/2010)
52-Week High Share Price (11/5/2010)
Consensus Equity Research Price Target (as of 11/08/2010)
Implied Price Based on 10-Year Average Price-to-Tangible Book Value
Implied Price Based on 10-Year Average Price-to-Book Value
Price as a Multiple of:
Class B Equity Value Reported Book Tangible Book Value
NTM EPS
Share Price ($ in mm)(1) Value Per Share Per Share
$ 64.94 $ 160,446.8 14.2x 1.07x 1.60x
66.00 |
| 163,065.7 14.5x 1.09x 1.62x |
68.00 |
| 168,007.1 14.9x 1.12x 1.67x |
70.00 |
| 172,948.5 15.4x 1.16x 1.72x |
72.00 |
| 177,889.9 15.8x 1.19x 1.77x |
74.00 |
| 182,831.3 16.2x 1.22x 1.82x |
76.00 |
| 187,772.6 16.7x 1.25x 1.87x |
78.00 |
| 192,714.0 17.1x 1.29x 1.92x |
80.00 |
| 197,655.4 17.6x 1.32x 1.97x |
82.00 |
| 202,596.8 18.0x 1.35x 2.02x |
82.32 |
| 203,387.4 18.1x 1.36x 2.02x |
83.72 |
| 206,846.4 18.4x 1.38x 2.06x |
84.00 |
| 207,538.2 18.4x 1.39x 2.07x |
86.00 |
| 212,479.6 18.9x 1.42x 2.11x |
87.56 |
| 216,333.9 19.2x 1.45x 2.15x |
88.00 |
| 217,421.0 19.3x 1.45x 2.16x |
90.00 |
| 222,362.3 19.7x 1.49x 2.21x |
92.00 |
| 227,303.7 20.2x 1.52x 2.26x |
94.00 |
| 232,245.1 20.6x 1.55x 2.31x |
94.51 |
| 233,494.8 20.7x 1.56x 2.32x |
96.00 |
| 237,186.5 21.1x 1.58x 2.36x |
96.91 |
| 239,425.0 21.3x 1.60x 2.38x |
(1) Equity Value calculated as Class B Share Price multiplied by weighted average Class B Shares Outstanding Source: FactSet, SNL Financial, Capital IQ
26