 Investor Presentation Investor Presentation November 2012 November 2012 Exhibit 99.1 |
 Disclaimer 2 This presentation contains “forward-looking statements” concerning First BanCorp’s (the “Corporation”) future economic performance. The words or phrases “would be,” “will allow,” “intends to,” “will likely result,” “are expected to,” “expect,” “anticipate,” “look forward,” “should,” “believes” and similar expressions are meant to identify “forward- looking statements” within the meaning of Section 27A of the Private Securities Litigation Reform Act of 1995, and are subject to the safe harbor created by such section. The Corporation wishes to caution readers not to place undue reliance on any such “forward-looking statements,” which speak only as of the date made, and to advise readers that various factors, including, but not limited to, uncertainty about whether the Corporation and FirstBank Puerto Rico (“FirstBank” or “the Bank”) will be able to fully comply with the written agreement dated June 3, 2010 that the Corporation entered into with the Federal Reserve Bank of New York (the “FED”) and the order dated June 2, 2010 (the “Order”)that FirstBank entered into with the FDIC and the Office of the Commissioner of Financial Institutions of Puerto Rico that, among other things, require FirstBank to maintain certain capital levels and reduce its special mention, classified, delinquent and non-performing assets; the risk of being subject to possible additional regulatory actions; uncertainty as to the availability of certain funding sources, such as retail brokered CDs; the Corporation’s reliance on brokered CDs and its ability to obtain, on a periodic basis, approval from the FDIC to issue brokered CDs to fund operations and provide liquidity in accordance with the terms of the Order; the risk of not being able to fulfill the Corporation’s cash obligations or resume paying dividends to the Corporation’s stockholders in the future due to the Corporation’s inability to receive approval from the FED to receive dividends from FirstBank or FirstBank’s failure to generate sufficient cash flow to make a dividend payment to the Corporation; the strength or weakness of the real estate markets and of the consumer and commercial credit sectors and their impact on the credit quality of the Corporation’s loans and other assets, including the Corporation’s construction and commercial real estate loan portfolios, which have contributed and may continue to contribute to, among other things, the high levels of non-performing assets, charge-offs and the provision expense and may subject the Corporation to further risk from loan defaults and foreclosures; adverse changes in general economic conditions in the United States and in Puerto Rico, including the interest rate scenario, market liquidity, housing absorption rates, real estate prices and disruptions in the U.S. capital markets, which may reduce interest margins, impact funding sources and affect demand for all of the Corporation’s products and services and the value of the Corporation’s assets; an adverse change in the Corporation’s ability to attract new clients and retain existing ones; a decrease in demand for the Corporation’s products and services and lower revenues and earnings because of the continued recession in Puerto Rico and the current fiscal problems and budget deficit of the Puerto Rico government; uncertainty about regulatory and legislative changes for financial services companies in Puerto Rico, the United States and the U.S. and British Virgin Islands, which could affect the Corporation’s financial performance and could cause the Corporation’s actual results for future periods to differ materially from prior results and anticipated or projected results; uncertainty about the effectiveness of the various actions undertaken to stimulate the United States economy and stabilize the United States’ financial markets, and the impact such actions may have on the Corporation’s business, financial condition and results of operations; changes in the fiscal and monetary policies and regulations of the federal government, including those determined by the Federal Reserve System, the FDIC, government-sponsored housing agencies and regulators in Puerto Rico and the U.S. and British Virgin Islands; the risk of possible failure or circumvention of controls and procedures and the risk that the Corporation’s risk management policies may not be adequate; the risk that the FDIC may further increase the deposit insurance premium and/or require special assessments to replenish its insurance fund, causing an additional increase in the Corporation’s non-interest expense; risks of not being able to recover the assets pledged to Lehman Brothers Special Financing, Inc.; the impact on the Corporation’s results of operations and financial condition associated with acquisitions and dispositions; a need to recognize additional impairments on financial instruments or goodwill relating to acquisitions; risks that downgrades in the credit ratings of the Corporation’s long-term senior debt will adversely affect the Corporation’s ability to access necessary external funds; the impact of the Dodd-Frank Wall Street Reform and Consumer Protection Act on the Corporation’s businesses, business practices and cost of operations; and general competitive factors and industry consolidation. The Corporation does not undertake, and specifically disclaims any obligation, to update any “forward- looking statements” to reflect occurrences or unanticipated events or circumstances after the date of such statements except as required by the federal securities laws. Investors should refer to the Corporation’s Annual Report on Form 10-K for the year ended December 31, 2011 for a discussion of such factors and certain risks and uncertainties to which the Corporation is subject. |
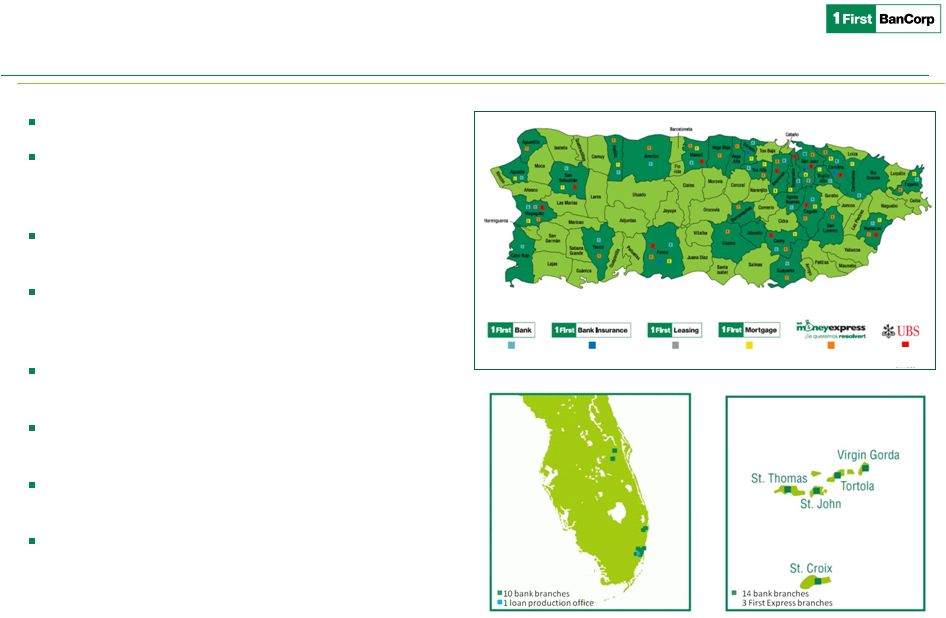 Franchise Overview Founded in 1948 (64 years) Headquartered in San Juan, Puerto Rico with operations in PR, Eastern Caribbean (Virgin Islands) and Florida A well diversified operation with over 650,000 retail & commercial customers 2nd largest financial holding company in Puerto Rico with attractive business mix and substantial loan market share A leading bank in the Virgin Islands with over 40% market share Small presence in Florida serving south Florida region 151 ATM machines and largest ATM network in the Eastern Caribbean Region ~2,500 FTE employees As of September 30, 2012 Eastern Caribbean Region or ECR includes United States and British Virgin Islands FTE = Full Time Equivalent Well diversified with significant competitive strengths 3 Total Assets - $13.1B Total Deposits - $9.9B Total Loans - $10.3B Puerto Rico: 86% of Assets 48 branches 5 branches 2 branches 38 branches 26 branches 8 In-branch offices Eastern Caribbean: 7% of Assets Florida: 7% of Assets |
 Franchise Overview Strong and uniquely positioned market franchise in densely populated operating footprints Strong market share in loan portfolios facilitates customer relationship expansion and cross sell to increase deposit share Unique challenger to Puerto Rico’s largest player 4 Puerto Rico Total Assets 1 Puerto Rico Total Loans 1 Puerto Rico Deposits, Net of Brokered 1 ($ in millions) Portfolio Balance Market Share Portfolio Balance Market Share Portfolio Balance Market Share 1 Banco Popular $24,914 35.5% 1 Banco Popular $18,889 36.8% 1 Banco Popular $17,647 43.5% 2 FirstBank $10,410 14.9% 2 FirstBank $8,693 16.9% 2 Banco Santander $5,008 12.3% 6 Scotiabank $7,614 10.9% 3 Scotiabank $5,461 10.6% 3 FirstBank $4,214 10.4% 3 Banco Santander $6,725 9.6% 4 Banco Santander $5,229 10.2% 4 Scotiabank $3,555 8.8% 4 Oriental Bank $6,338 9.0% 5 Doral Bank $4,149 8.1% 5 Citibank $2,912 7.2% 5 Doral Bank $5,647 8.1% 6 BBVA $3,706 7.2% 6 BBVA $2,778 6.8% 7 BBVA $5,007 7.1% 7 Other $2,570 5.0% 7 Oriental Bank $2,084 5.1% 8 Citibank $2,904 4.1% 8 Oriental Bank $1,711 3.3% 8 Doral Bank $1,916 4.7% 9 Banco Cooperativo $532 0.8% 9 Citibank $726 1.4% 9 Banco Cooperativo $458 1.1% 10 BBU $8 0.0% 10 Banco Cooperativo $167 0.3% 10 BBU $17 0.0% Total $70,099 100% Total $51,302 100% Total $40,589 100% Institutions Institutions Institutions Puerto Rico ECR Florida Banking Branches 48 14 11 Wholesale Banking Retail Banking Consumer Lending 2 Mortgage Banking Insurance Retail Brokerage 3 Wholesale Brokerage 4 1 Puerto Rico only; 2 FirstBank acquired the FirstBank-branded credit card portfolio of $391MM book balance as of June 30, 2012; 3 Provided through alliance with UBS; 4 Established primarily for municipal financing Source: PR Market Share Report prepared with data provided by the Commissioner of Financial Institutions of Puerto Rico as of 6/30/2012 |
 5 Building Franchise Value Executing strategic plan toward sustained profitability During the recent cycle (consolidations, capital raise, economic challenges), Management focused on strengthening the franchise and succeeded in solidifying its strong #2 position in PR Improving risk profile; focusing on reducing NPAs Executing on opportunities to reduce cost of funds Expanding products mix and maximizing cross selling opportunities Growing core deposits Sustaining well diversified loan production across multiple line of businesses and geographies Managing expenses carefully; continued focus on operational excellence Strong capital base to support execution of Strategic Plan Proactive approach to risk management Enhanced BOD talent with additional financial and risk management expertise In compliance with Regulatory Agreements Risk Management Capital Franchise Value Balance Sheet |
 Core Franchise is Strong 1 Non-GAAP financial measure 2 Fair value adjustments on derivatives and financial liabilities measured at fair value 3 See reconciliation on page 18 4 See reconciliation on page 19 Focus on core operating metrics and continued improvement in PTPP earnings 6 ($ in millions, except per share results) 3Q 2012 Highlights Net income of $19.1MM Improvement of $13.5MM in pre-tax pre-provision income Improvement of 54 bps in net-interest margin reaching 3.98% for the quarter compared to 3.44% in the last quarter Total non-performing assets decreased for the tenth consecutive quarter, decreasing by $48.8MM Capital remains strong with total capital ratio, tier 1 and leverage reaching 17.5%, 16.2% and 12.7%, respectively Income Statement 2Q 2011 3Q 2011 4Q 2011 1Q 2012 2Q 2012 3Q 2012 Net interest income, excluding valuations 95.6 $ 96.8 $ 100.3 $ 101.6 $ 108.2 $ 125.3 $ Valuations (2) (1.2) (2.5) (1.7) 0.3 0.5 0.2 GAAP Net Interest Income 94.4 94.3 98.6 101.9 108.7 125.5 Provision for loan and lease losses 59.2 46.4 42.0 36.2 24.9 29.0 Non-interest income 40.4 18.4 13.0 14.7 16.5 17.3 Equity in (losses) gains of unconsolidated entities (1.5) (4.4) 1.7 (6.2) (2.5) (2.2) Non-interest expense 86.4 83.0 85.9 85.2 86.9 91.8 Pre-tax net loss (12.3) (21.1) (14.6) (11.0) 10.9 19.8 Income tax (expense) benefit (2.6) (2.9) (0.2) (2.1) (1.5) (0.8) Net income (loss) (14.9) $ (24.0) $ (14.8) $ (13.1) $ 9.4 $ 19.1 $ Adjusted Pre-tax pre-provision earnings (3) 30.0 $ 29.1 $ 28.5 $ 34.8 $ 37.9 $ 51.4 $ Net Interest Margin, excluding valuations (%) 2.64% 2.82% 2.99% 3.20% 3.44% 3.98% Net (loss) income per common share-basic (4) (1.04) $ (1.46) $ 1.36 $ (0.06) $ 0.05 $ 0.09 $ |
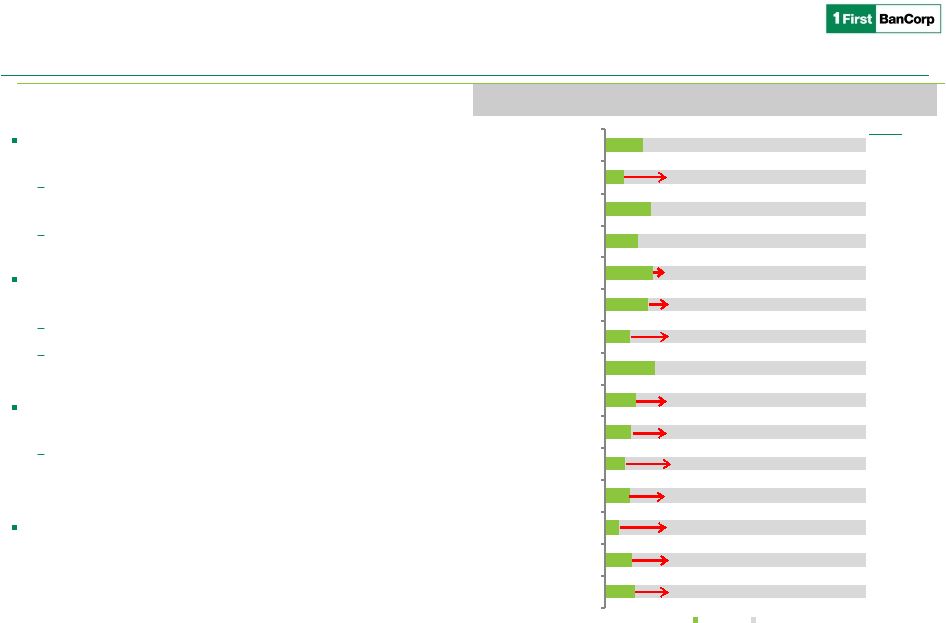 Building Franchise Value Targeted strategies for growth 7 Market Share in Main Market Puerto Rico Opportunities for ongoing market share gains on selected products based on fair share of market Largest opportunity on deposit products, electronic banking & transaction services Selected loan products growth for balanced risk/return to manage risk concentration and diversify income sources Acquired FirstBank-branded credit card portfolio from FIA Card Services, N.A. Diversifies revenue stream and loan portfolio composition Opportunity to broaden and deepen relationships Florida Expansion prospects in Florida given long term demographic trends Continue focus in core deposit growth, commercial and transaction banking and conforming residential mortgages Virgin Islands Solidify leadership position by further increasing customer share of wallet 15% 7% 18% 13% 19% 17% 10% 19% 12% 10% 8% 10% 6% 10% 12% 85% 93% 82% 87% 81% 83% 90% 81% 88% 90% 92% 90% 94% 90% 89% Assets First Bank Other Banks 2 3 4 4 2 2 3 4 3 4 2 5 2 4 5 Rank 15% 7% 18% 13% 19% 17% 10% 19% 12% 10% 8% 10% 6% 10% 12% 85% 93% 82% 87% 81% 83% 90% 81% 88% 90% 92% 90% 94% 90% 89% 2 3 4 4 2 2 3 4 3 4 2 5 2 4 5 Rank 1 Mortgage Originations Construction Personal Loans Commercial Loans Auto/Leasing Credit Cards Insurance ACH Transactions POS Terminals ATM Terminals Debit Cards Deposits Branches Small Personal Loans 1 Puerto Rico only Source: Office of the Commissioner of Financial Institutions of Puerto Rico as of 6/30/2012 and internal reports; commercial loans include loans collateralized by real estate; Insurance share is for income information included in regulatory reports filed by banks for the year 2009 |
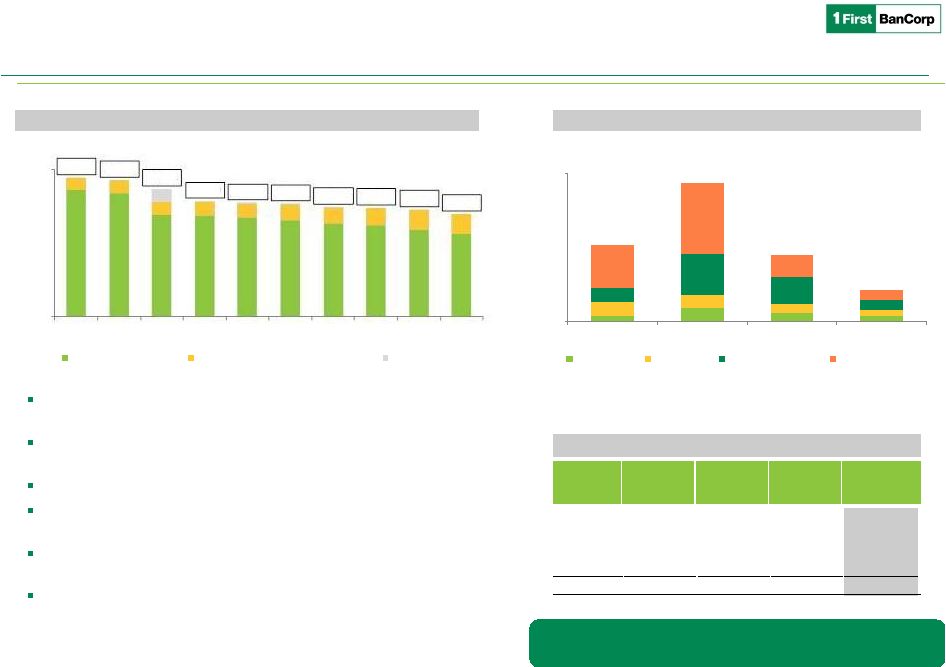
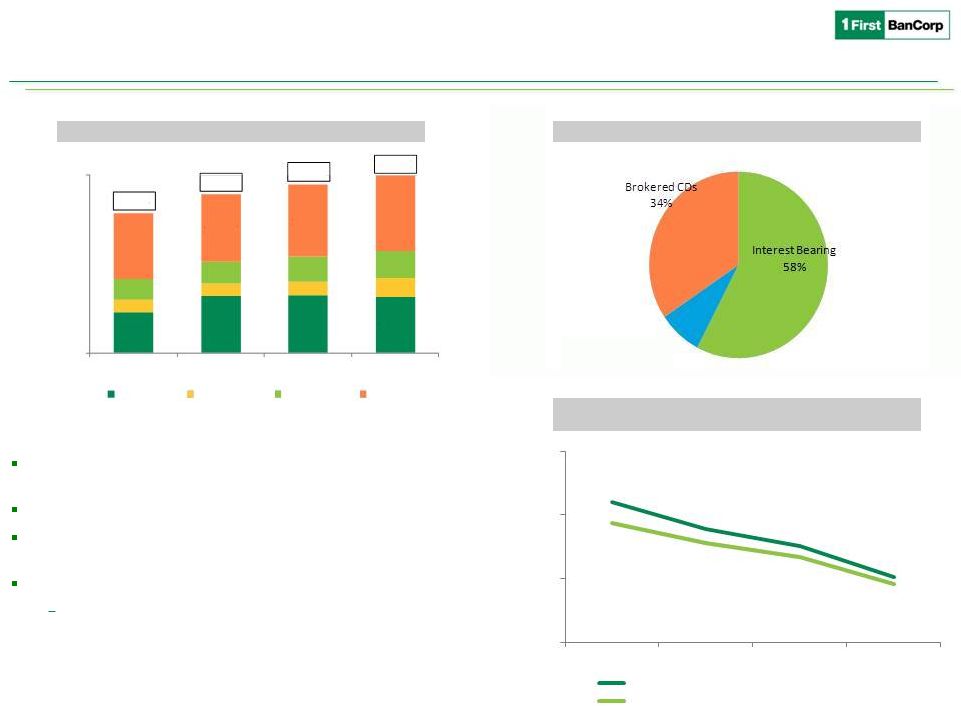 1 Net of Brokered CDs Building Franchise Value Successful deposits growth over recent years 8 ($ in millions) Core deposit growth strategy continues providing positive results; $54MM during 3Q2012 and $1.4B since 2009 Focus remains on cross-selling opportunities Cost of interest bearing deposits, net of brokered CDs, decreased to 1.03% from 1.51% in 2011 Reduced reliance on brokered CDs 34% of deposits are brokered CDs, down from 60% in 2009 $1,505 $2,090 $2,126 $2,056 $448 $470 $481 $679 $774 $763 $915 $1,005 $2,381 $2,477 $2,654 $2,748 $5,108 $5,800 $6,176 $6,488 $- $6,500 2009 2010 2011 Sep 2012 CDs & IRAs Government Commercial Retail 2.20% 1.79% 1.51% 1.03% 1.87% 1.56% 1.34% 0.91% 0.00% 1.00% 2.00% 3.00% 2009 2010 2011 3Q 2012 Interest Bearing Deposits, Net of Brokered CDs Total Deposits, Net of Brokered CDs Non-interest Bearing 8% Deposits, Net of Brokered CDs Total Deposit Composition Cost of Deposits 1 |
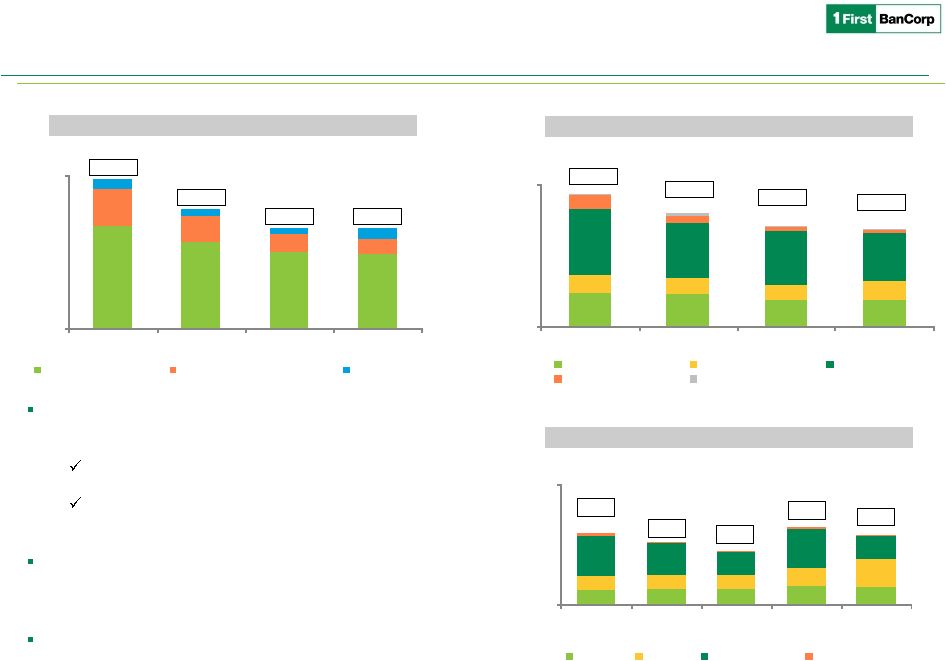 Well Diversified Loan Portfolio Continued focus on originations that meet risk appetite and pricing targets to optimize the portfolio: Size of the portfolio should remain constant. Continued focus on NPL reduction strategies while selectively replacing with performing loans. Reentered credit card business with the acquisition of $406MM credit card portfolio of ~140K active FirstBank- branded credit cards in May 2012 Expanding products mix in commercial and small & middle market business Strong Origination Capabilities 9 ($ in millions) Loan Portfolio Asset Composition Loan Originations $148 $160 $162 $194 $187 $149 $163 $160 $202 $304 $446 $344 $237 $426 $253 $25 $14 $10 $16 $12 $768 $680 $569 $838 $755 $- $1,300 3Q 2011 4Q 2011 1Q 2012 2Q 2012 3Q 2012 Residential Consumer Commercial & CRE Construction $3,596 $3,417 $2,874 $2,763 $1,898 $1,716 $1,562 $1,986 $6,942 $5,822 $5,695 $5,087 $1,493 $701 $428 $353 $20 $301 $16 $68 $13,949 $11,957 $10,575 $10,257 $- $15,000 2009 2010 2011 Sep 2012 Residential Consumer Commercial & CRE Construction Loans Held for Sale $13,421 $11,403 $10,081 $9,811 $4,867 $3,369 $2,244 $1,887 $1,340 $821 $802 $1,442 $19,628 $15,593 $13,127 $13,140 $0 $20,000 2009 2010 2011 Sep 2012 Total loans, net of ALLL Investments & Money Markets Cash & Other |
 Improved Risk Profile 10 ($ in millions) Allowance coverage ratio of 4.4% Net Charge-offs Non-performing Assets Reduced NPLs by 39% since peak in 1Q 2010 and stabilized migration to NPL Reduced exposure to construction loans by 77% since peak , a major driver of losses Decreasing charge-off trend Heightened focus on opportunistic loan sales, organic workouts, and OREO disposition through Special Assets Group OREO increased $9.7MM mainly due to foreclosed commercial properties as a result of SAGs workout / legal strategies Commercial NPLs are being carried at 58% of unpaid principal balance, net of specific reserves $29 $63 $39 $27 $61 $54 $37 $24 $60 $180 $118 $48 $183 $313 $101 $39 $333 $610 $295 $138 $- $650 2009 2010 2011 3Q 2012 YTD Residential Consumer Commercial & CRE Construction 1 As of September 30, 2012 ² From December 31, 2008 to September 30, 2012 ³ Net Carrying Amount = % of carrying value net of reserves and accumulated charge-offs $1,701 $1,669 $1,562 $1,410 $1,390 $1,377 $1,337 $1,332 $1,308 $1,259 $ - $1,800 Jun 10 Sep 10 Dec 10 Mar 11 Jun 11 Sep 11 Dec 11 Mar 12 Jun 12 Sep 12 Non-performing Loans Repossessed Assets & Investment Sec. Loans Held for Sale 1 2 Book Value Accumulated Charge-offs Reserves Net Carrying Amount 2 C & I $230.5 $94.2 $56.7 53.5% Construction 189.5 129.7 36.9 47.8% CRE 231.2 18.2 39.6 76.8% Total $651.1 $242.1 $133.2 58.0% Commercial Non-performing Loans 1 Proactively Managing Asset Quality |
 11 Continued focus on execution of Strategic Plan Executing on Strategic Plan to further Strengthen Core Franchise Achieve additional reduction of NPAs and classified assets Continue to execute core deposit strategic plan Rebuild and grow pre-tax pre-provision income - $2.4B in Brokered CDs maturing in the next 12 months with avg. cost of 1.89%; new issuance at current rates could range between 75-125 bps - Core deposit pricing reduction Execute process improvement and efficiency initiatives Core Franchise is Strong Q3 2012 PTPP Income $51.4 million up 77% from Q3 2011 Re-energizing loan production in key focus areas to gain market share: consumer, auto, residential mortgages & small commercial Maximize fee income growth Enhance credit card business to increase revenues & cross sell opportunity Further reductions in funding costs Increase OREO disposition efficiency |
 Summary of Investment Opportunity Strong and uniquely positioned franchise with strengthened capital base Growing pre-tax, pre-provision earnings with opportunities for improvement Executing on our strategic plan Continued improvements in asset quality Core-deposit plan Disciplined ongoing expense management Fully reserved deferred tax asset of $360.0 MM that will accrete to capital as the Corporation turns to profitability Committed management team with proven execution skills Attractive valuation on a pro-forma tangible book value basis 12 Confident that our core franchise is strong and will continue to improve |
 Exhibits Exhibits Investor Presentation Investor Presentation November 2012 November 2012 |
 14 Stock Profile Trading Symbol: • FBP Exchange: • NYSE Share Price (11/12/12): • $4.01 Shares Outstanding: • 206,179,368 Market Capitalization (11/12/12): • $827 MM 1 Yr. Average Daily Volume: • 247,955 Price (11/12/12) to Tangible Book (9/30/2012): • 0. 598x Beneficial Owner Amount Percent of Class Entities affiliated with Thomas H. Lee Partners, L.P. 50,684,485 24.59% Entities affiliated with Oaktree Capital Management, L.P. 50,684,485 24.59% Wellington Management Company, LLP. 20,336,087 9.87% United States Department of the Treasury 1 34,227,696 16.50% 5% or more Beneficial Ownership Includes the U.S. Treasury warrant that entitles it to purchase up to 1,285,899 shares of Common Stock at an exercise price of $3.29 per share, as adjusted as a result of the issuance of shares of Common Stock in the Corporation’s recently completed $525MMprivate placement of Common Stock (the “Capital Raise”). The exercise price and the number of shares issuable upon exercise of the warrant are subject to further adjustments under certain circumstances to prevent dilution. The warrant has a 10-year term from its issue date and is exercisable in whole or in part at any time. 1 |
 Economic Environment Continues to Stabilize 15 GDB - Economic Activity Index Puerto Rico GNP & Yearly % Growth 2000 – 2011 2 2.1% 2.7% 1.9% 0.5% -1.2% -2.9% -4.0% -3.8% -1.5% 0.9% 1.1% -5% -4% -3% -2% -1% 0% 1% 2% 3% 4% 5,600.0 5,800.0 6,000.0 6,200.0 6,400.0 6,600.0 6,800.0 7,000.0 7,200.0 2003 2004 2005 2006 2007 2008 2009 2010 2011 2012 Est. 2013 Est. Real GNP Growth Puerto Rico Economic Activity Index continues to reflect stabilization with certain improving trends Government efforts to control fiscal imbalances have been showing results The deficit as of January 2009 was $3B; it was reduced to $2.1B in 2010, to $1B in 2011, to $610 MM in 2012 and is projected at $332 MM for fiscal year 2013 Public/private partnerships (PPPs) are in process to improve physical/functional infrastructure and build strategic/regional projects to jump-start the economy – PPP for Toll Roads PR-22 and PR-5 / $1.4B investment – PPP for Modernization and New construction of Schools / $756 MM investment – Luis Muñoz Marín International Airport In July 2011, Commonwealth issued bonds of $300 MM for infrastructure projects to continue stimulating the economy Despite the recent Moody’s downgrade of PR’s General Obligation Bond and other associated credits, investors continued to show their confidence by purchasing more than $2B in bonds for the Schools of the 21st Century Projects, Housing incentives enacted in Puerto Rico were extended up to December 2012 Retail Sales show a stable trend over the last two years New car sales have shown a positive year over year trend since December 2009 Stabilization of the banking system was reflected in financial results and a leveling of assets in the overall system In April 2012, Moody's placed on review for downgrade certain ratings of three Puerto Rican banks due to a weakened economy The Puerto Rico Electric Power Authority (PREPA) concluded the sale of a $650 MM bond issue in April 2012 On July 18, 2012 Moody’s downgraded Puerto Rico’s Sales Tax Financing Corporation’s (COFINA) outstanding sales tax revenue bonds from Aa2 to Aa3 and the outstanding subordinate sales tax revenue bonds from A1 to A3 S&P revised in July 26, 2012 the outlook for Puerto Rico Employees Retirement System to negative from stable, mainly due to fiscal and budgetary challenges During 2012 the Government has been accessing the market to take advantage of the low rate environment and reduce their borrowing cost. More than $6B have been issued to refund existing debt and reduce borrowings cost 1 GDB Puerto Rico (www.bgfpr.com). Index and its indicators are subject to monthly revisions. Data used for GDB-EAI is adjusted for seasonality and variability 2 PR Planning Board (www.jp.gobierno.pr). GNP in millions and at constant prices of 1954. Estimate as of April 19, 2012. Years are from July 1 to June 30 of next year (fiscal year) |
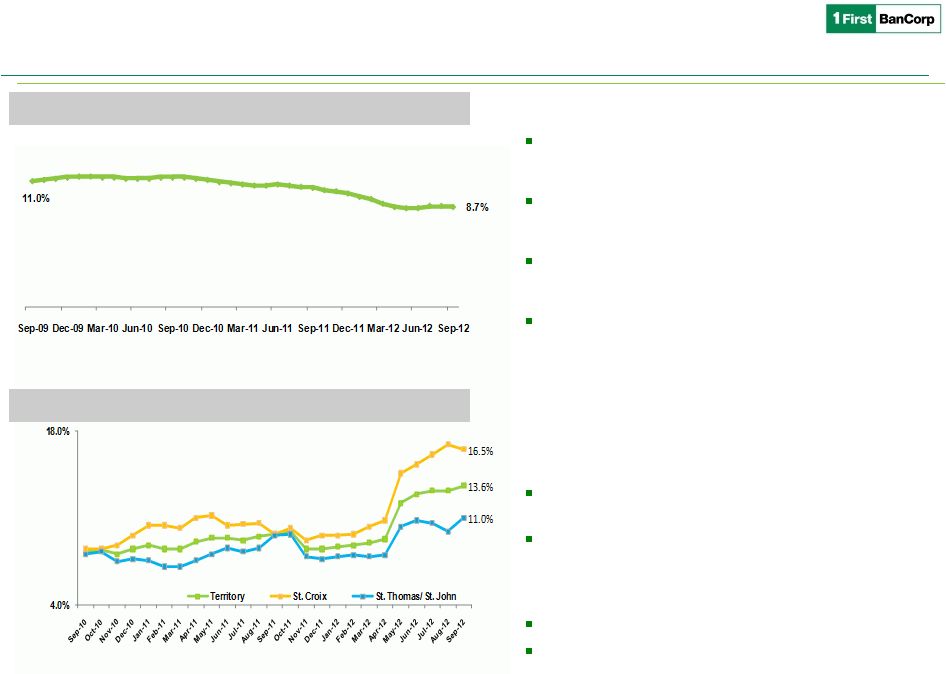 Economic Environment Continues to Stabilize 16 US Virgin Island’s Unemployment Rate Florida Unemployment Rate Florida Number of homes sold increased (2) 2% in September 2012 compared to the same month last year. Median sales price increased 7.4% to $145,000 Unemployment rate* for September 2012 was 8.7%. It reflects a 1.7% point decrease compared to September 2011 Total number of tourist visitors for the 2Q2012 increased by 1.3% when compared to 2Q11, reaching 22.1million Number of total residential building permits issued increased (3) 128% in September 2012 versus September 2011 Virgin Islands Unemployment rate for September increased to 13.6% from 9.7% in September 2011 255,971 cruise passengers arrived in the 3Q 2012, representing a decrease of 13.8% over same period, last year. In 3Q 2012, air visitor arrivals increased 5.9% when compared on a year-over-year(YoY) basis. During 2Q 2012, hotel occupancy rate decreased 5.7% Total building permit values experienced a YoY increase of 28% during 2Q2012 ¹ Bureau of Labor Statistics ² Florida Realtors ³ US Census 4 VI Bureau of Economic Research * Seasonally adjusted, preliminary data provided by the U.S. Bureau of Labor Statistics 3 1 |
 Non-performing Assets 1 Collateral pledged with Lehman Brothers Special Financing, Inc. 17 ($ in millions) Sep 2012 Jun 2012 Mar 2012 % change Non-performing loans Residential mortgage 320.9 $ 333.0 $ 341.2 $ 0.9% Commercial mortgage 231.2 239.9 244.4 1.7% Commercial & Industrial 230.5 255.3 263.6 -2.4% Construction 189.5 202.1 231.1 -9.3% Consumer Loans & Finance Leases 36.1 35.4 39.1 -1.3% Total non-performing loans 1,008.0 1,065.7 1,119.4 -2.1% REO 177.0 167.3 135.9 18.9% Other repossessed property 9.8 10.6 12.5 -18.8% Other assets 64.5 64.5 64.5 0.0% Total non-performing assets 1,259.4 1,308.2 1,332.3 -0.4% 1 |
  18 Adjusted Pre-tax, Pre-provision Income Reconciliation ($ in thousands) 3Q 2012 2Q 2012 1Q 2012 4Q 2011 3Q 2011 2Q 2011 Loss before income taxes 19,834 $ 10,901 $ (11,049) $ (14,600) $ (21,158) $ (12,318) $ Add: Provision for loan and lease losses 28,952 24,884 36,197 41,987 46,446 59,184 Less: Net loss (gain) on sale and OTTI of investment securities 547 143 1,207 1,014 (12,156) (21,342) Add: Unrealized (gain) loss on derivatives instruments and liabilities measured at fair value (170) (506) (283) 1,746 2,555 1,162 Add: Contingency adjustment - tax credits - - 2,489 - - - Add: Loss on early extinguishment of repurchase agreement - - - - 9,012 1,823 Add: Equity in losses (earnings) of unconsolidated entities 2,199 2,491 6,236 (1,666) 4,357 1,536 Adjusted Pre-tax, pre-provision income 51,362 $ 37,913 $ 34,797 $ 28,481 $ 29,056 $ 30,045 $ Quarter Ended |
 1 Excess of carrying amount of the Series G Preferred Stock exchanged over the fair value of new common shares issued in the fourth quarter of 2011 19 Reconciliation of the Earnings (Loss) per Common Share ($ in thousands, except per share information) 3Q 2012 2Q 2012 1Q 2012 4Q 2011 3Q 2011 2Q 2011 Net income (loss) 19,073 $ 9,356 $ (13,182) $ (14,842) $ (24,046) $ (14,924) $ Cumulative convertible preferred stock dividend (Series G) - - - (997) (5,302) (5,302) Preferred stock discount accretion (Series G) - - - (145) (1,795) (1,979) Favorable impact from issuing common stock in exchange for Series G preferred stock, net of issuance costs 1 - - - 277,995 - - 19,073 $ 9,356 $ (13,182) $ 262,011 $ (31,143) $ (22,205) $ Convertible preferred stock dividends and accretion - - 1,142 - - 19,073 $ 9,356 $ (13,182) $ 263,153 $ (31,143) $ (22,205) $ Average common shares outstanding 205,415 205,415 205,217 192,546 21,303 21,303 Average potential common shares 508 537 - 2,195 - - 205,923 205,952 205,217 194,741 21,303 21,303 Basic (loss) earnings per common share 0.09 $ 0.05 $ (0.06) $ 1.36 $ (1.46) $ (1.04) $ Diluted (loss) earnings per common share 0.09 $ 0.05 $ (0.06) $ 1.35 $ (1.46) $ (1.04) $ Net (loss) income attributable to common stockholders - basic Net (loss) income attributable to common stockholders Average common shares outstanding - - diluted assuming dilution |