As filed with the Securities and Exchange Commission on February 9, 2004
UNITED STATES
SECURITIES AND EXCHANGE COMMISSION
Washington, D.C. 20549
SECURITIES AND EXCHANGE COMMISSION
Washington, D.C. 20549
FORM N-CSR
CERTIFIED SHAREHOLDER REPORT OF REGISTERED MANAGEMENT INVESTMENT COMPANIES
Investment Company Act file number 811-08769.
Badgley Funds, Inc.
(Exact name of registrant as specified in charter)
P.O. Box 701, Milwaukee, Wisconsin 53201-0701
(Address of principal executive offices) (Zip code)
(Address of principal executive offices) (Zip code)
Kirkland & Ellis LLP, 200 East Randolph Street, Chicago, IL 60601
(Name and address of agent for service)
(Name and address of agent for service)
1-877-BADGLEY (1-877-223-4539)
Registrant's telephone number, including area code
Date of fiscal year end: May 31, 2004
Date of reporting period: November 30, 2003
Item 1. Report to Stockholders.
S E M I - A N N U A L R E P O R T
November 30, 2003
Badgley Funds, Inc.

Badgley Growth Fund
Ticker BMFGX

Badgley Balanced Fund
Ticker BMFBX
P.O. Box 701, Milwaukee, Wisconsin 53201-0701 n 1-877-BADGLEY
www.badgleyfunds.com
TABLE OF CONTENTS | |
3 | Letter to Shareholders |
4 | Performance Graphs |
6 | Statements of Assets and Liabilities |
7 | Statements of Operations |
8 | Statements of Changes in Net Assets |
10 | Financial Highlights |
12 | Schedule of Investments |
22 | Notes to the Financial Statements |
| This report is not authorized unless accompanied or preceded by a prospectus for the Badgley Funds. The Badgley Funds are distributed by Rafferty Capital Markets, LLC. The date of first use of this semi-annual report is February 9, 2004. | |
| 2 BADGLEY FUNDS SEMI-ANNUAL REPORT | ||
Badgley Funds, Inc.
SEMI-ANNUAL REPORT
November 30, 2003
Dear Fellow Shareholders:
Thank you for your investment in the Badgley Funds, Inc. We sincerely appreciate the trust and confidence you continue to place in the Badgley Funds and in the team of portfolio managers at the Funds’ Investment Adviser, Seattle-based Badgley, Phelps and Bell, Inc. (BP&B), who guide our Funds’ portfolios.
This Semi-Annual Report reviews the activities of the Badgley Growth Fund (BMFGX) and the Badgley Balanced Fund (BMFBX) for the six months ended November 30, 2003.
New Independent Director Victor E. Parker.
We are very pleased to announce the addition of highly respected Northwest businessman, Victor E. Parker, to our Board of Directors. Mr. Parker has joined the Board as an independent director (bringing that total to four of six directors) and also joins our Audit Committee. Please visit the News section of our web site, www.badgleyfunds.com , for more information about Mr. Parker.
Positive Returns.
The total returns for the Funds for the six months ended November 30, 2003 were positive at 9.27% for the Badgley Growth Fund and 3.87% for the Badgley Balanced Fund (non-annualized). Benchmark performance for the same period was 10.80% for the S&P 500 Index and –0.89% for the Lehman Brothers Intermediate Government-Credit Bond Index. Please refer to the graphs in the following pages for more detailed performance information.
Staying Focused Through Transformation.
The year 2003 is shaping up to be one of transformations, especially the resumption of strong economic growth in the face of so much uncertainty. One transformation that appears not to have taken place following the bull-to-bear-to-bull market of the last few years is the very short-term outlook of many investors. With few exceptions, the market reflects that many investors do not appear to concern themselves with the strength of the underlying businesses and consistency of fundamentals of the securities they purchase.
We believe one of the pockets of under-valuation was among high-quality companies with consistently rising earnings. This appears especially true in the first half of calendar year 2003. Generally recognized as having an S&P ranking of ‘‘A’’ or better, these stocks make up nearly 70% of the Badgley Funds equity holdings and were largely ignored during early 2003 as the market ‘‘rotated’’ to lower-quality stocks with cyclical earnings. The impact of this investor myopia on your Funds is that, despite the solid fundamentals of the securities in which your Funds are invested and strong six month returns, your Funds’ relative performance has been more heavily influenced by the current market cycle and less influenced by the longer-term success of the u nderlying businesses of the companies selected by your Funds’ Adviser. Our portfolio management team at BP&B continues to believe that the recent phenomenon of lower-quality out-performance will subside and that the performance of the Badgley Funds, with time, will more fully reflect the quality and strength of underlying earnings relative to the broader market. Always with a focus on quality and fundamentals, the Funds’ Adviser will not be changing its strategy, but will stay focused on implementing the investment principles that have done so well for its clients over the past 37 years and have been implemented in the Funds since inception.
Portfolio Turnover Remains Low.
Annualized portfolio turnover remained low during this last six months and continued to remain lower than comparable growth and balanced mutual funds. Turnover rates for the six months ended November 30, 2003, which have an impact on taxable accounts and a smaller impact on fund expenses, were 17.03% for the Badgley Balanced Fund and 18.57% for the Badgley Growth Fund.
Thank You.
Especially during these turbulent times, thank you for investing in the Badgley Funds.
Please visit www.badgleyfunds.com for more detailed information. We welcome your comments, suggestions and questions. Please contact us toll free at 1.877.223.4539, in writing or via email.
Sincerely,
Badgley Funds, Inc.

SCOTT R. VOKEY
President
scottv@badgley.com

LISA P. GUZMAN
Treasurer and Secretary
lisag@badgley.com
BADGLEY FUNDS SEMI-ANNUAL REPORT 3 | ||
Badgley Funds, Inc.
SEMI-ANNUAL REPORT
November 30, 2003
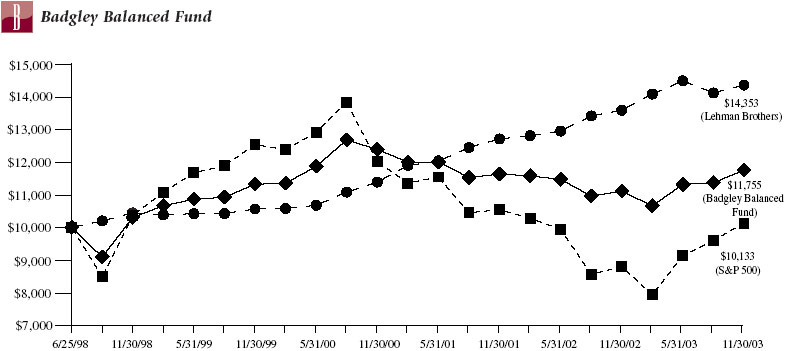
THIS CHART ASSUMES AN INITIAL GROSS INVESTMENT OF $10,000 MADE ON 6/25/98 (COMMENCEMENT OF OPERATIONS). RETURNS SHOWN INCLUDE THE REINVESTMENT OF ALL DIVIDENDS AND DISTRIBUTIONS. IN THE ABSENCE OF FEE WAIVERS AND REIMBURSEMENTS, TOTAL RETURN WOULD BE REDUCED. PAST PERFORMANCE IS NOT PREDICTIVE OF FUTURE PERFORMANCE. THIS CHART AND TABLE BELOW DOES NOT REFLECT THE DEDUCTION OF TAXES THAT A SHAREHOLDER WOULD PAY ON FUND DISTRIBUTIONS OR THE REDEMPTION OF FUND SHARES. INVESTMENT RETURN AND PRINCIPAL VALUE WILL FLUCTUATE, SO THAT YOUR SHARES, WHEN REDEEMED, MAY BE WORTH MORE OR LESS THAN THE ORIGINAL COST.
LEHMAN BROTHERS INTERMEDIATE GOV’T./CREDIT BOND INDEX — An unmanaged market value-weighted index composed of all bonds that are investment grade (rated Baa or higher by Moody’s or BBB or higher by S&P, if unrated by Moody’s). All issues have maturities between one and ten years and outstanding par value of at least $150 million.
S&P 500 INDEX — An unmanaged capitalization-weighted index of 500 stocks designed to measure performance of the broad domestic economy through changes in the aggregate market value of the 500 stocks which represent all major industries.
For the period 6/25/98 through 6/30/98 the returns for the Lehman Brothers Intermediate Gov’t./Credit Bond Index and S&P 500 Index were calculated by prorating the total return for June 1998.
Average Annual Total Return through November 30, 2003 | ||||
Since Inception | ||||
One Year | Five Year | June 25, 1998 | ||
--t-- | Badgley Balanced Fund | 5.83% | 2.66% | 3.02% |
--l-- | Lehman Brothers Intermediate | |||
--n-- | Gov’t./Credit Bond Index | 5.66% | 6.55% | 6.87% |
| S&P 500 Index | 15.09% | –0.47% | 0.24% | |
| 4 BADGLEY FUNDS SEMI-ANNUAL REPORT | ||
Badgley Funds, Inc.
SEMI-ANNUAL REPORT
November 30, 2003
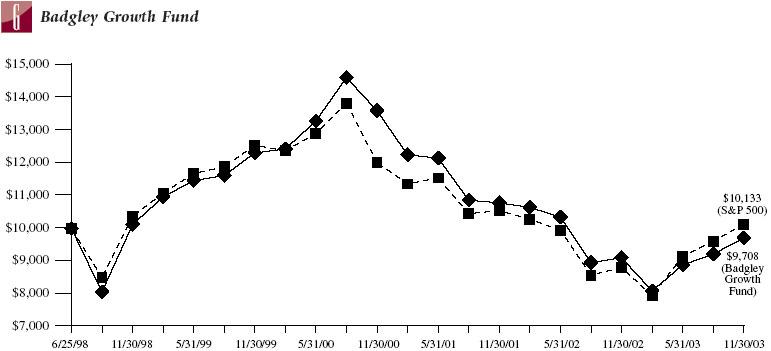
THIS CHART ASSUMES AN INITIAL GROSS INVESTMENT OF $10,000 MADE ON 6/25/98 (COMMENCEMENT OF OPERATIONS). RETURNS SHOWN INCLUDE THE REINVESTMENT OF ALL DIVIDENDS AND DISTRIBUTIONS. IN THE ABSENCE OF FEE WAIVERS AND REIMBURSEMENTS, TOTAL RETURN WOULD BE REDUCED. PAST PERFORMANCE IS NOT PREDICTIVE OF FUTURE PERFORMANCE. THIS CHART AND TABLE BELOW DOES NOT REFLECT THE DEDUCTION OF TAXES THAT A SHAREHOLDER WOULD PAY ON FUND DISTRIBUTIONS OR THE REDEMPTION OF FUND SHARES. INVESTMENT RETURN AND PRINCIPAL VALUE WILL FLUCTUATE, SO THAT YOUR SHARES, WHEN REDEEMED, MAY BE WORTH MORE OR LESS THAN THE ORIGINAL COST.
S&P 500 INDEX — An unmanaged capitalization-weighted index of 500 stocks designed to measure performance of the broad domestic economy through changes in the aggregate market value of the 500 stocks which represent all major industries.
For the period 6/25/98 through 6/30/98 the returns for the S&P 500 Index were calculated by prorating the total return for June 1998.
Average Annual Total Return through November 30, 2003 | ||||
Since Inception | ||||
One Year | Five Year | June 25, 1998 | ||
--t-- | Badgley Growth Fund | 6.62% | –0.83% | –0.54% |
--n-- | S&P 500 Index | 15.09% | –0.47% | 0.24% |
BADGLEY FUNDS SEMI-ANNUAL REPORT 5 | ||
Badgley Funds, Inc.
STATEMENTS OF ASSETS AND LIABILITIES (UNAUDITED)
November 30, 2003
| Balanced Fund | Growth Fund | ||||||
| ASSETS: | |||||||
| Investments, at market value | |||||||
(cost of $26,912,061 and $16,485,005, respectively) | $ | 30,473,881 | $ | 19,780,068 | |||
| Interest receivable | 216,454 | 321 | |||||
| Receivable from Adviser | 20,379 | 26,226 | |||||
| Dividends receivable | 10,141 | 12,903 | |||||
| Other assets | 16,669 | 16,722 | |||||
Total assets | 30,737,524 | 19,836,240 | |||||
| LIABILITIES: | |||||||
| Payable for securities purchased | 182,460 | — | |||||
| Accrued expenses and other liabilities | 131,660 | 84,906 | |||||
Total liabilities | 314,120 | 84,906 | |||||
| NET ASSETS | $ | 30,423,404 | $ | 19,751,334 | |||
| NET ASSETS CONSIST OF: | |||||||
| Capital stock | $ | 30,982,968 | $ | 22,668,643 | |||
| Accumulated undistributed net investment income (loss) | 72,105 | (42,326 | ) | ||||
| Accumulated net realized loss on investments | (4,193,489 | ) | (6,170,046 | ) | |||
| Net unrealized appreciation/depreciation on investments | 3,561,820 | 3,295,063 | |||||
Total net assets | $ | 30,423,404 | $ | 19,751,334 | |||
| Shares outstanding (par value of $0.01, 500,000,000 shares authorized) | 2,863,286 | 2,041,936 | |||||
| Net Asset Value, Redemption Price and Offering Price Per Share | $ | 10.63 | $ | 9.67 | |||
| 6 BADGLEY FUNDS SEMI-ANNUAL REPORT See Notes to the Financial Statements | ||
Badgley Funds, Inc.
STATEMENTS OF OPERATIONS (UNAUDITED)
For the Six-Months Ended November 30, 2003
| Balanced Fund | Growth Fund | ||||||
| INVESTMENT INCOME: | |||||||
| Interest income | $ | 333,751 | $ | 1,657 | |||
| Dividend income | 77,761 | 93,371 | |||||
Total investment income | 411,512 | 95,028 | |||||
| EXPENSES: | |||||||
| Investment advisory fees | 132,940 | 91,576 | |||||
| Professional fees | 48,170 | 48,158 | |||||
| Distribution fees | 36,928 | 22,894 | |||||
| Shareholder servicing and accounting fees | 28,429 | 26,637 | |||||
| Administration fees | 15,457 | 15,392 | |||||
| Federal and state registration fees | 9,033 | 9,042 | |||||
| Reports to shareholders | 5,010 | 7,407 | |||||
| Directors’ fees and expenses | 4,194 | 4,212 | |||||
| Custody fees | 3,579 | 3,441 | |||||
| Amortization of organization costs | 336 | 335 | |||||
| Other | 4,197 | 3,867 | |||||
| Total expenses before waiver and reimbursement from Adviser | 288,273 | 232,961 | |||||
| Less: Waiver of expenses and reimbursement from Adviser | (96,257 | ) | (95,607 | ) | |||
Net expenses | 192,016 | 137,354 | |||||
| NET INVESTMENT INCOME (LOSS) | 219,496 | (42,326 | ) | ||||
| REALIZED AND UNREALIZED GAIN (LOSS) ON INVESTMENTS: | |||||||
| Net realized loss on investments | (352,264 | ) | (496,467 | ) | |||
| Change in unrealized appreciation/depreciation on investments | 1,233,381 | 2,175,762 | |||||
Net realized and unrealized gain on investments | 881,117 | 1,679,295 | |||||
| NET INCREASE IN NET ASSETS RESULTING FROM OPERATIONS | $ | 1,100,613 | $ | 1,636,969 | |||
| See Notes to the Financial Statements BADGLEY FUNDS SEMI-ANNUAL REPORT 7 | ||
Badgley Funds, Inc.
STATEMENTS OF CHANGES IN NET ASSETS
Badgley Balanced Fund
| Six-Months Ended | |||||||
| November 30, 2003 | Year Ended | ||||||
| (Unaudited) | May 31, 2003 | ||||||
| OPERATIONS: | |||||||
| Net investment income | $ | 219,496 | $ | 495,523 | |||
| Net realized loss on investments | (352,264 | ) | (1,430,992 | ) | |||
| Change in unrealized appreciation/ depreciation on investments | 1,233,381 | 584,708 | |||||
Net increase (decrease) in net assets resulting from operations | 1,100,613 | (350,761 | ) | ||||
| DISTRIBUTIONS TO SHAREHOLDERS: | |||||||
| From net investment income | (217,001 | ) | (522,723 | ) | |||
Net distributions to shareholders | (217,001 | ) | (522,723 | ) | |||
| CAPITAL SHARE TRANSACTIONS: | |||||||
| Proceeds from shares sold | 2,047,052 | 3,859,913 | |||||
| Proceeds from shares issued to holders in reinvestment of dividends | 199,220 | 483,397 | |||||
| Cost of shares redeemed | (1,902,327 | ) | (2,862,049 | ) | |||
Net increase in net assets resulting from capital share transactions | 343,945 | 1,481,261 | |||||
| TOTAL INCREASE IN NET ASSETS | 1,227,557 | 607,777 | |||||
| NET ASSETS: | |||||||
| Beginning of period | 29,195,847 | 28,588,070 | |||||
| End of period (including undistributed net investment income of | |||||||
$72,105 and $69,610, respectively) | $ | 30,423,404 | $ | 29,195,847 | |||
| 8 BADGLEY FUNDS SEMI-ANNUAL REPORT See Notes to the Financial Statements | ||
Badgley Funds, Inc.
STATEMENTS OF CHANGES IN NET ASSETS
Badgley Growth Fund
| Six-Months Ended |
|
|
| ||||
|
| November 30, 2003 |
|
| Year Ended |
| |
|
| (Unaudited) |
|
| May 31, 2003 | ||
| OPERATIONS: | |||||||
| Net investment loss | $ | (42,326 | ) | $ | (78,460 | ) | |
| Net realized loss on investments | (496,467 | ) | (2,198,598 | ) | |||
| Change in unrealized appreciation/depreciation on investments | 2,175,762 | (186,055 | ) | ||||
Net increase (decrease) in net assets resulting from operations | 1,636,969 | (2,463,113 | ) | ||||
| CAPITAL SHARE TRANSACTIONS: | |||||||
| Proceeds from shares sold | 2,702,159 | 5,000,481 | |||||
| Cost of shares redeemed | (1,265,941 | ) | (3,399,045 | ) | |||
Net increase in net assets resulting from capital share transactions | 1,436,218 | 1,601,436 | |||||
| TOTAL INCREASE (DECREASE) IN NET ASSETS | 3,073,187 | (861,677 | ) | ||||
| NET ASSETS: | |||||||
| Beginning of period | 16,678,147 | 17,539,824 | |||||
| End of period | $ | 19,751,334 | $ | 16,678,147 | |||
| See Notes to the Financial Statements BADGLEY FUNDS SEMI-ANNUAL REPORT 9 | ||
Badgley Funds, Inc.
FINANCIAL HIGHLIGHTS
For a fund share outstanding throughout the period
| Badgley Balanced Fund | |||||||||||||||||||
| |||||||||||||||||||
| Six-Months Ended | Year Ended May 31, | June 25, 19981 | ||||||||||||||||
|
| November 30, 2003 | Through | ||||||||||||||||
| (Unaudited) | 2003 | 2002 | 2001 | 2000 | May 31, 1999 | |||||||||||||
| PER SHARE DATA: | |||||||||||||||||||
| Net asset value, beginning of | |||||||||||||||||||
period | $ | 10.31 | $ | 10.65 | $ | 11.36 | $ | 11.47 | $ | 10.69 | $ | 10.00 | |||||||
| Income from investment | |||||||||||||||||||
operations: | |||||||||||||||||||
Net investment income | 0.08 | 0.18 | 0.21 | 0.24 | 0.20 | 0.18 | |||||||||||||
Net realized and unrealized | |||||||||||||||||||
gain (loss) on | |||||||||||||||||||
investments | 0.32 | (0.33 | ) | (0.71 | ) | (0.11 | ) | 0.78 | 0.68 | ||||||||||
Total from investment | |||||||||||||||||||
operations | 0.40 | (0.15 | ) | (0.50 | ) | 0.13 | 0.98 | 0.86 | |||||||||||
| Less: | |||||||||||||||||||
| Dividends from net investment | |||||||||||||||||||
income | (0.08 | ) | (0.19 | ) | (0.21 | ) | (0.24 | ) | (0.20 | ) | (0.17 | ) | |||||||
| Dividends from net realized | |||||||||||||||||||
gains | — | — | — | (0.00) | 2 | — | — | ||||||||||||
Total distributions | (0.08 | ) | (0.19 | ) | (0.21 | ) | (0.24 | ) | (0.20 | ) | (0.17 | ) | |||||||
| Net asset value, end of period | $ | 10.63 | $ | 10.31 | $ | 10.65 | $ | 11.36 | $ | 11.47 | $ | 10.69 | |||||||
| TOTAL RETURN | 3.87% | 3 | –1.33 | % | –4.44 | % | 1.13 | % | 9.23 | % | 8.66% | 3 | |||||||
| SUPPLEMENTAL DATA AND RATIOS: | |||||||||||||||||||
| Net assets, end of period | $ | 30,423,404 | $ | 29,195,847 | $ | 28,588,070 | $ | 30,017,183 | $ | 24,286,086 | $ | 16,524,409 | |||||||
| Ratio of net expense to average | |||||||||||||||||||
net assets: | |||||||||||||||||||
Before expense reimbursement | 1.95% | 4 | 1.82 | % | 1.72 | % | 1.80 | % | 1.98 | % | 3.83% | 4 | |||||||
After expense reimbursement | 1.30% | 4 | 1.30 | % | 1.30 | % | 1.30 | % | 1.30 | % | 1.30% | 4 | |||||||
| Ratio of net investment income | |||||||||||||||||||
(loss) to average net assets: | |||||||||||||||||||
Before expense reimbursement | 0.83% | 4 | 1.26 | % | 1.48 | % | 1.57 | % | 1.24 | % | (0.80)% | 4 | |||||||
After expense reimbursement | 1.48% | 4 | 1.78 | % | 1.90 | % | 2.07 | % | 1.92 | % | 1.73% | 4 | |||||||
| Portfolio turnover rate | 17.03% | 32.08 | % | 35.98 | % | 35.70 | % | 28.78 | % | 16.17% | |||||||||
1 Commencement of operations.
2 Amount less than $(0.01) per share.
3 Not annualized.
4 Annualized.
| 10 BADGLEY FUNDS SEMI-ANNUAL REPORT See Notes to the Financial Statements | ||
Badgley Funds, Inc.
FINANCIAL HIGHLIGHTS
For a fund share outstanding throughout the period
| Badgley Growth Fund | |||||||||||||||||||
| Six-Months Ended | Year Ended May 31, | June 25, 19981 | ||||||||||||||||
| November 30, 2003 | Through | ||||||||||||||||||
| (Unaudited) | 2003 | 2002 | 2001 | 2000 | May 31, 1999 | ||||||||||||||
| PER SHARE DATA: | |||||||||||||||||||
| Net asset value, beginning of period | $ | 8.85 | $ | 10.31 | $ | 12.10 | $ | 13.23 | $ | 11.42 | $ | 10.00 | |||||||
| Income from investment operations: | |||||||||||||||||||
Net investment loss | (0.02 | ) | (0.04 | ) | (0.07 | ) | (0.07 | ) | (0.08 | ) | (0.02 | ) | |||||||
Net realized and unrealized gain | |||||||||||||||||||
(loss) on investments | 0.84 | (1.42 | ) | (1.72 | ) | (1.06 | ) | 1.89 | 1.48 | ||||||||||
Total from investment | |||||||||||||||||||
operations | 0.82 | (1.46 | ) | (1.79 | ) | (1.13 | ) | 1.81 | 1.46 | ||||||||||
| Less: | |||||||||||||||||||
| Dividends from net investment | |||||||||||||||||||
income | — | — | — | — | (0.00) | 2 | (0.04 | ) | |||||||||||
| Net asset value, end of period | $ | 9.67 | $ | 8.85 | $ | 10.31 | $ | 12.10 | $ | 13.23 | $ | 11.42 | |||||||
| TOTAL RETURN | 9.27% | 3 | –14.16 | % | –14.79 | % | –8.54 | % | 15.86 | % | 14.65% | 3 | |||||||
| SUPPLEMENTAL DATA AND RATIOS: | |||||||||||||||||||
| Net assets, end of period | $ | 19,751,334 | $ | 16,678,147 | $ | 17,539,824 | $ | 18,784,323 | $ | 12,251,424 | $ | 6,503,740 | |||||||
| Ratio of net expense to average net | |||||||||||||||||||
assets: | |||||||||||||||||||
Before expense reimbursement | 2.54% | 4 | 2.43 | % | 2.23 | % | 2.33 | % | 2.84 | % | 6.12% | 4 | |||||||
After expense reimbursement | 1.50% | 4 | 1.50 | % | 1.50 | % | 1.50 | % | 1.50 | % | 1.50% | 4 | |||||||
| Ratio of net investment loss to | |||||||||||||||||||
average net assets: | |||||||||||||||||||
Before expense reimbursement | (1.50)% | 4 | (1.42) | % | (1.41) | % | (1.57) | % | (2.06) | % | (5.22)% | 4 | |||||||
After expense reimbursement | (0.46)% | 4 | (0.49) | % | (0.68) | % | (0.74) | % | (0.72) | % | (0.60)% | 4 | |||||||
| Portfolio turnover rate | 18.57% | 29.52 | % | 39.51 | % | 27.21 | % | 25.88 | % | 30.28% | |||||||||
1 Commencement of operations.
2 Amount less than $(0.01) per share.
3 Not annualized.
4 Annualized.
| See Notes to the Financial Statements BADGLEY FUNDS SEMI-ANNUAL REPORT 11 | ||
Badgley Funds, Inc.
SCHEDULE OF INVESTMENTS (UNAUDITED)
November 30, 2003
Badgley Balanced Fund
Number of Shares | Value | |||||
| 6,500 | LONG-TERM INVESTMENTS — 96.1% COMMON STOCKS — 50.3% Advertising — 1.7% Omnicom Group Inc. | $ | 517,790 | |||
| 19,875 | Chemical — Specialty — 1.7% Ecolab Inc. | 521,123 | ||||
7,350 13,950 | Computers — 2.8% Affiliated Computer Services, Inc. — Class A* Dell Inc.* | 368,529 481,275 | ||||
| 849,804 | ||||||
| 20,437 | Consumer Finance — 1.7% MBNA Corporation | 501,115 | ||||
14,450 6,750 | Diversified Conglomerates — 3.1% General Electric Company 3M Co. | 414,281 533,520 | ||||
| 947,801 | ||||||
7,225 14,150 | Drugs — 2.8% Johnson & Johnson Pfizer Inc. | 356,120 474,733 | ||||
| 830,853 | ||||||
8,800 11,150 | Financials — Diversified — 3.2% Citigroup Inc. State Street Corporation | 413,952 568,204 | ||||
| 982,156 | ||||||
| 5,625 | Financial Services — 1.3% Fannie Mae | 393,750 | ||||
| 10,950 | Food & Beverage — 1.8% PepsiCo, Inc. | 526,914 | ||||
| 12 BADGLEY FUNDS SEMI-ANNUAL REPORT See Notes to the Financial Statements | ||
Badgley Funds, Inc.
SCHEDULE OF INVESTMENTS (UNAUDITED) (CONTINUED)
November 30, 2003
Badgley Balanced Fund
Number of Shares | Value | |||||
| 17,550 | Food Wholesale Distribution — 2.1% Sysco Corporation | $ | 637,416 | |||
8,325 7,300 | Freight Transportation — 2.8% Expeditors International of Washington, Inc. United Parcel Service, Inc. | 325,008 531,221 | ||||
| 856,229 | ||||||
| 6,350 | Industrial Gas — 1.5% Praxair, Inc. | 455,803 | ||||
13,325 8,700 | Insurance — Multi — 3.2% AFLAC Incorporated American International Group, Inc. | 479,300 504,165 | ||||
| 983,465 | ||||||
5,550 7,350 | Medical — Wholesale Drug Distribution — 2.5% Amgen Inc.* Cardinal Health, Inc. | 319,180 449,379 | ||||
| 768,559 | ||||||
| 5,950 | Motorcycles — 0.9% Harley-Davidson, Inc. | 280,662 | ||||
| 20,125 | Networking Equipment — 1.5% Cisco Systems, Inc.* | 456,033 | ||||
| 21,150 | Restaurants — 2.2% Starbucks Corporation* | 678,281 | ||||
| 7,048 | Retail — Arts & Crafts — 1.1% Michaels Stores, Inc. | 333,018 | ||||
| See Notes to the Financial Statements BADGLEY FUNDS SEMI-ANNUAL REPORT 13 | ||
Badgley Funds, Inc.
SCHEDULE OF INVESTMENTS (UNAUDITED) (CONTINUED)
November 30, 2003
Badgley Balanced Fund
Number of Shares | Value | |||||
7,050 10,350 10,525 4,975 | Retail — Discount — 4.6% Colgate-Palmolive Company Costco Wholesale Corporation* Walgreen Co. Wal-Mart Stores, Inc. | $370,125 370,737 387,425 276,809 | ||||
| 1,405,096 | ||||||
| 9,400 | Semiconductors — 1.0% Intel Corporation | 314,242 | ||||
| 11,575 | Services — Data Processing — 1.5% Paychex, Inc. | 445,290 | ||||
| 9,675 | Services — Diversified — 1.5% Cintas Corporation | 452,209 | ||||
6,200 14,175 | Software — 2.1% Electronic Arts Inc.* Microsoft Corporation | 274,226 364,298 | ||||
| 638,524 | ||||||
| 11,475 | Surgical/Medical Instruments — 1.7% Medtronic, Inc. | 518,670 | ||||
| Total Common Stocks (Cost $12,378,508) | 15,294,803 | |||||
Principal Amount | ||||||||
| $ | 400,000 | CORPORATE BONDS AND NOTES — 20.6% Chemical — Specialty — 1.5% Ecolab Inc. 6.875%, 2/1/11 | 444,617 | |||||
| 200,000 | Computers — 0.7% IBM Corporation 5.375%, 2/1/09 | 214,488 | ||||||
| 14 BADGLEY FUNDS SEMI-ANNUAL REPORT See Notes to the Financial Statements | ||
Badgley Funds, Inc.
SCHEDULE OF INVESTMENTS (UNAUDITED) (CONTINUED)
November 30, 2003
Badgley Balanced Fund
Principal Amount | Value | |||||||
| $ | 170,000 | Diversified Financial Services — 6.2% American General Finance 5.375%, 9/1/09 | $ | 180,125 | ||||
| 200,000 | Bank of America Corp. 4.750%, 10/15/06 | 209,891 | ||||||
| 300,000 | Bank of America Corp. 5.250%, 2/1/07 | 318,967 | ||||||
| 500,000 | Citigroup Inc. 7.250%, 10/1/10 | 579,468 | ||||||
| 525,000 | General Electric Capital Corporation 7.375%, 1/19/10 | 610,847 | ||||||
| 1,899,298 | ||||||||
| 140,000 | Electric — 0.5% Emerson Electric Co. 7.875%, 6/1/05 | 151,822 | ||||||
| 100,000 | Food & Beverage — 0.4% PepsiCo, Inc. 5.750%, 1/15/08 | 108,353 | ||||||
| 500,000 | Food Wholesale Distribution — 1.8% Sysco Corporation 7.000%, 5/1/06 | 551,345 | ||||||
| 500,000 | Insurance — 1.8% Washington Mutual Inc. 5.625%, 1/15/07 | 535,664 | ||||||
| 300,000 | Medical — Drugs — 1.1% Abbott Laboratories 5.625%, 7/1/06 | 321,312 | ||||||
| 200,000 | Multimedia — 0.7% The Walt Disney Company 7.300%, 2/8/05 | 212,231 | ||||||
| See Notes to the Financial Statements BADGLEY FUNDS SEMI-ANNUAL REPORT 15 | ||
Badgley Funds, Inc.
SCHEDULE OF INVESTMENTS (UNAUDITED) (CONTINUED)
November 30, 2003
Badgley Balanced Fund
Principal Amount | Value | |||||||
| $ | 400,000 | Retail — Discount — 1.4% Costco Wholesale Corporation 7.125%, 6/15/05 | $ | 429,916 | ||||
225,000 425,000 | Retail — Home Improvement — 2.3% The Home Depot, Inc. 5.375%, 4/1/06 Target Corporation 6.350%, 1/15/11 | 239,125 472,308 | ||||||
| 711,433 | ||||||||
| 125,000 | Services — Diversified — 0.4% Cintas Corporation 5.125%, 6/1/07 | 132,690 | ||||||
| 500,000 | Telecommunications Services — 1.8% SBC Communications Inc. 6.625%, 7/15/07 | 554,089 | ||||||
| Total Corporate Bonds and Notes (Cost $5,872,667) | 6,267,258 | |||||||
750,000 450,000 | GOVERNMENT SECURITIES — 25.2% U.S. Treasury Obligations — 13.9% U.S. Treasury Bonds — 4.3% 6.000%, 8/15/09 4.375%, 8/15/12 | 844,541 456,310 | ||||||
| 1,300,851 | ||||||||
450,000 750,000 650,000 250,000 | U.S. Treasury Notes — 9.6% 6.500%, 8/15/05 5.625%, 2/15/06 5.500%, 2/15/08 3.250%, 8/15/08 | 485,174 806,602 712,842 249,639 | ||||||
| 16 BADGLEY FUNDS SEMI-ANNUAL REPORT See Notes to the Financial Statements | ||
Badgley Funds, Inc.
SCHEDULE OF INVESTMENTS (UNAUDITED) (CONTINUED)
November 30, 2003
Badgley Balanced Fund
Principal Amount | Value | |||||||
| $ | 355,000 250,000 | U.S. Treasury Notes (cont.) 6.500%, 2/15/10 5.750%, 8/15/10 | $ | 410,067 278,584 | ||||
| 2,942,908 | ||||||||
| Total U.S. Treasury Obligations (Cost $4,075,969) | 4,243,759 | |||||||
| 450,000 | Government Agency — 11.3% Federal Home Loan Bank (FHLB) — 1.6% 5.750%, 5/15/12 | 487,311 | ||||||
| 875,000 | Federal Home Loan Mortgage (FHLMC) — 3.1% 5.250%, 1/15/06 | 928,534 | ||||||
720,000 100,000 625,000 | Federal National Mortgage Association (FNMA) — 5.2% 5.250%, 4/15/07 5.250%, 1/15/09 6.625%, 9/15/09 | 771,046 107,087 711,423 | ||||||
| 1,589,556 | ||||||||
| 425,000 | Freddie Mac — 1.4%*** 3.500%, 2/13/08 | 426,979 | ||||||
| Total Government Agency (Cost $3,349,236) | 3,432,380 | |||||||
| Total Government Securities (Cost $7,425,205) | 7,676,139 | |||||||
| Total Long-Term Investments (Cost $25,676,380) | 29,238,200 | |||||||
| 1,235,681 | SHORT-TERM INVESTMENTS — 4.1% Variable Rate Demand Notes** — 4.1% U.S. Bank Demand Note, 0.869% | 1,235,681 | ||||||
| Total Short-Term Investments (Cost $1,235,681) | 1,235,681 | |||||||
| TOTAL INVESTMENTS — 100.2% (Cost $26,912,061) | 30,473,881 | |||||||
| Liabilities in excess of other assets — (0.2)% | (50,477) | |||||||
| TOTAL NET ASSETS — 100.0% | $30,423,404 | |||||||
| *— | Non-income producing security. |
| **— | Variable rate security. The rates listed are as of November 30, 2003. |
| ***— | Callable security. |
| See Notes to the Financial Statements BADGLEY FUNDS SEMI-ANNUAL REPORT 17 | ||
Badgley Funds, Inc.
SCHEDULE OF INVESTMENTS (UNAUDITED)
November 30, 2003
Badgley Growth Fund
Number of Shares | Value | |||||
| 8,225 | LONG-TERM INVESTMENTS — 97.8% COMMON STOCKS — 97.8% Advertising — 3.3% Omnicom Group Inc. | $ | 655,204 | |||
| 24,975 | Chemical — Specialty — 3.3% Ecolab Inc. | 654,845 | ||||
9,250 17,525 | Computers — 5.4% Affiliated Computer Services, Inc. — Class A* Dell Inc.* | 463,795 604,613 | ||||
| 1,068,408 | ||||||
| 25,687 | Consumer Finance — 3.2% MBNA Corporation | 629,845 | ||||
18,275 8,475 | Diversified Conglomerates — 6.0% General Electric Company 3M Co. | 523,944 669,864 | ||||
| 1,193,808 | ||||||
9,125 17,900 | Drugs — 5.3% Johnson & Johnson Pfizer Inc. | 449,771 600,545 | ||||
| 1,050,316 | ||||||
11,200 14,100 | Financials Diversified — 6.3% Citigroup Inc. State Street Corporation | 526,848 718,536 | ||||
| 1,245,384 | ||||||
| 7,075 | Financial Services — 2.5% Fannie Mae | 495,250 | ||||
| 13,875 | Food & Beverage — 3.4% PepsiCo, Inc. | 667,665 | ||||
| 18 BADGLEY FUNDS SEMI-ANNUAL REPORT See Notes to the Financial Statements | ||
Badgley Funds, Inc.
SCHEDULE OF INVESTMENTS (UNAUDITED) (CONTINUED)
November 30, 2003
Badgley Growth Fund
Number of Shares | Value | |||||
| 22,175 | Food Wholesale Distribution — 4.1% Sysco Corporation | $ | 805,396 | |||
10,550 9,175 | Freight Transportation — 5.5% Expeditors International of Washington, Inc. United Parcel Service, Inc. | 411,872 667,665 | ||||
| 1,079,537 | ||||||
| 8,075 | Industrial Gas — 2.9% Praxair, Inc. | 579,623 | ||||
16,850 11,000 | Insurance — Multi — 6.3% AFLAC Incorporated American International Group, Inc. | 606,095 637,450 | ||||
| 1,243,545 | ||||||
7,000 9,250 | Medical — Wholesale Drug Distribution — 4.9% Amgen Inc.* Cardinal Health, Inc. | 402,570 565,545 | ||||
| 968,115 | ||||||
| 7,550 | Motorcycles — 1.8% Harley-Davidson, Inc. | 356,133 | ||||
| 25,450 | Networking Equipment — 2.9% Cisco Systems, Inc.* | 576,697 | ||||
| 26,775 | Restaurants — 4.3% Starbucks Corporation* | 858,674 | ||||
| 8,883 | Retail — Arts & Crafts — 2.1% Michaels Stores, Inc. | 419,722 | ||||
| See Notes to the Financial Statements BADGLEY FUNDS SEMI-ANNUAL REPORT 19 | ||
Badgley Funds, Inc.
SCHEDULE OF INVESTMENTS (UNAUDITED) (CONTINUED)
November 30, 2003
Badgley Growth Fund
Number of Shares | Value | |||||
8,950 13,100 13,225 6,475 | Retail — Discount — 9.1% Colgate-Palmolive Company Costco Wholesale Corporation* Walgreen Co. Wal-Mart Stores, Inc. | $469,875 469,242 486,812 360,269 | ||||
| 1,786,198 | ||||||
| 11,650 | Semiconductors — 2.0% Intel Corporation | 389,460 | ||||
| 14,650 | Services — Data Processing — 2.9% Paychex, Inc. | 563,585 | ||||
| 12,225 | Services — Diversified — 2.9% Cintas Corporation | 571,397 | ||||
7,850 17,925 | Software — 4.1% Electronic Arts Inc.* Microsoft Corporation | 347,206 460,672 | ||||
| 807,878 | ||||||
| 14,475 | Surgical/Medical Instruments — 3.3% Medtronic, Inc. | 654,270 | ||||
| Total Common Stocks (Cost $16,025,892) | 19,320,955 | |||||
| Total Long-Term Investments (Cost $16,025,892) | 19,320,955 | |||||
| 20 BADGLEY FUNDS SEMI-ANNUAL REPORT See Notes to the Financial Statements | ||
Badgley Funds, Inc.
SCHEDULE OF INVESTMENTS (UNAUDITED) (CONTINUED)
November 30, 2003
Badgley Growth Fund
Principal Amount | Value | |||||||
| $ | 459,113 | SHORT-TERM INVESTMENTS — 2.3% Variable Rate Demand Notes** — 2.3% U.S. Bank Demand Note, 0.869% | $ | 459,113 | ||||
| Total Short-Term Investments (Cost $459,113) | 459,113 | |||||||
TOTAL INVESTMENTS — 100.1% (Cost $16,485,005) | 19,780,068 | |||||||
| Liabilities in excess of other assets — (0.1)% | (28,734) | |||||||
| TOTAL NET ASSETS — 100.0% | $19,751,334 | |||||||
| *— | Non-income producing security. |
| **— | Variable rate security. The rates listed are as of November 30, 2003. |
| See Notes to the Financial Statements BADGLEY FUNDS SEMI-ANNUAL REPORT 21 | ||
Badgley Funds, Inc.
NOTES TO THE FINANCIAL STATEMENTS (UNAUDITED)
November 30, 2003
1. Organization
Badgley Funds, Inc. (the ‘‘Corporation’’) was incorporated on April 28, 1998, as a Maryland Corporation and is registered as an open-end management investment company under the Investment Company Act of 1940. The Badgley Balanced Fund (the ‘‘Balanced Fund’’) and the Badgley Growth Fund (the ‘‘Growth Fund’’) (collectively referred to as the ‘‘Funds’’) are separate, diversified investment portfolios of the Corporation. The principal investment objective of the Balanced Fund is to seek long-term capital appreciation and income. The principal investment objective of the Growth Fund is to seek long-term capital appreciation. The Funds commenced operations on June 25, 1998.
2. Significant Accounting Policies
The following is a summary of significant accounting policies consistently followed by the Funds in the preparation of their financial statements. These policies are in conformity with accounting principles generally accepted in the United States of America.
a) Investment Valuation — Securities listed on the NASDAQ National Market are valued at the NASDAQ Official Closing Price (‘‘NOCP’’). Other securities traded on a national securities exchange (including options on indices so traded) are valued at the last sales price at the close of that exchange where primarily traded. Exchange-traded securities for which there were no transactions and NASDAQ-tr aded securities for which there is no NOCP are valued at the mean of the bid and ask prices. Securities for which market quotations are not readily available are valued at fair value as determined in good faith by the Board of Directors. Debt securities maturing in 60 days or less are valued at amortized cost, which approximates fair value. Debt securities having maturities over 60 days or for which amortized cost is not deemed to reflect fair value may be priced by independent pricing services that use prices provided by market makers or estimates of market values obtained from yield data relating to instruments or securities with similar characteristics.
b) Federal Income Taxes — No provision for federal income taxes has been made since the Funds have complied to date with the provisions of the Internal Revenue Code applicable to regulated investment companies and intend to continue to so comply in future years and to distribute substantially all of the Funds’ investment company net taxable income and net realized gains to shareholders.
c) Income and Expenses — The Funds are charged for those expenses that are directly attributable to each portfolio, such as advisory, administration and certain shareholder service fees. Expenses that are not directly attributable to a portfolio are typically allocated among the Funds in proportion to their respective net assets, number of shareholder accounts or net sales, where applicable.
d) Distributions to Shareholders — Dividends from net investment income of the Balanced Fund are declared and paid quarterly. Dividends from net investment income of the Growth Fund are declared and paid annually. The Funds’ net realized capital gains, if any, are distributed at least annually. Permanent financial reporting and tax differences have been reclassified in the capital accounts.
| 22 BADGLEY FUNDS SEMI-ANNUAL REPORT | ||
e) Organization Costs — The costs incurred in connection with the organization, initial registration and public offering of shares, aggregating $26,461 for the Balanced Fund and Growth Fund each, have been paid by the Funds. These costs have been amortized over the period of benefit of sixty months from the Funds’ commencement of operations.
f) Use of Estimates — The preparation of financial statements in conformity with accounting principles generally accepted in the United States of America requires management to make estimates and assumptions that affect the amounts reported in the financial statements. Actual results could differ from those estimates.
g) Other — Investment and shareholder transactions are recorded on trade date. The Funds determine the gain or loss realized from the investment transactions by comparing the original cost of the security lot sold with the net sales proceeds. Dividend income is recognized on the ex-dividend date, and interest income is recognized on an accrual basis.
3. Capital Share Transactions
Transactions in shares of the Funds for the six-months ended November 30, 2003, were as follows:
| Balanced Fund | Growth Fund | ||
Shares sold | 195,363 | 294,190 | |
| Shares issued to holders in reinvestment of dividends | 19,341 | — | |
| Shares redeemed | (182,007) | (137,763) | |
Net increase | 32,697 | 156,427 | |
| Transactions in shares of the Funds for the year ended May 31, 2003, were as follows: | |||
| Balanced Fund | Growth Fund | ||
Shares sold | 384,736 | 581,042 | |
| Shares issued to holders in reinvestment of dividends | 48,794 | — | |
| Shares redeemed | (286,159) | (396,641) | |
| Net increase | 147,371 | 184,401 | |
4. Investment Transactions and Income Tax Information
The aggregate purchases and sales of investments, excluding short-term investments, by the Funds for the six-months ended November 30, 2003, were as follows:
| Balanced Fund | Growth Fund | |||
Purchases | ||||
U.S. Government | $1,246,282 | $ — | ||
Other | 3,605,973 | 4,646,901 | ||
| Sales | ||||
U.S. Government | 488,263 | — | ||
Other | 4,503,145 | 3,320,753 | ||
BADGLEY FUNDS SEMI-ANNUAL REPORT 23 | ||
At November 30, 2003, gross unrealized appreciation and depreciation of investments for tax purposes were as follows:
| Balanced Fund | Growth Fund | ||
| Appreciation | $3,738,039 | $3,516,262 | |
| (Depreciation) | (176,219) | (221,199) | |
| Net appreciation on investments | $3,561,820 | $3,295,063 | |
At November 30, 2003, the cost of investments for federal income tax purposes was $26,912,061 and $16,485,005 for the Balanced Fund and the Growth Fund, respectively.
At May 31, 2003, the Fund’s most recently completed fiscal year end, the Balanced Fund and the Growth Fund had accumulated net realized capital loss carryovers of $2,888,599 and $3,987,227, respectively. The capital loss carryovers for the Balanced Fund of $61,004, $731,270 and $2,096,325 expire in 2009, 2010 and 2011, respectively. The capital loss carryovers for the Growth Fund of $1,864, $50,467, $57,182, $1,343,882 and $2,533,832 expire in 2007, 2008, 2009, 2910 and 2011, respectively. In addition, the Balanced Fund and the Growth Fund realized, on a tax basis, post-October losses through May 31, 2003 of $653,124 and $1,192,809, respectively. These losses are not recognized for tax purposes until the first day of the following fiscal year.
As of May 31, 2003, the Fund’s most recently completed fiscal year end, the components of distributable earnings on a tax basis were as follows:
| Balanced Fund | Growth Fund | |||
| Undistributed ordinary income | $69,610 | $ | — | |
| Undistributed long-term gains | — | — | ||
| Total distributable earnings on a tax basis | $69,610 | $ | — | |
For the six months ended November 30, 2003, the components of distributions on a tax basis were as follows:
| Balanced Fund | Growth Fund | |||
| Ordinary Income | $217,001 | $ | — | |
Long-term gains | — | — | ||
| Total distributions paid | $217,001 | $ | — | |
For the year ended May 31, 2003, the components of distributions on a tax basis were as follows:
| Balanced Fund | Growth Fund | |||
Ordinary income | $522,723 | $ | — | |
| Long-term gains | — | — | ||
| Total distributions paid | $522,723 | $ | — | |
5. Investment Advisory and Other Agreements
The Corporation has an Investment Advisory Agreement (the ‘‘Agreement’’) with Badgley, Phelps and Bell, Inc. (the ‘‘Adviser’’), with whom certain Officers and Directors of the Corporation are affiliated, to furnish
| 24 BADGLEY SEMI-ANNUAL REPORT | ||
investment advisory services to the Funds. Under the terms of the Agreement, the Corporation, on behalf of the Funds, compensates the Adviser for its management services at the annual rate of 0.90% of the Balanced Fund’s average daily net assets and 1.00% of the Growth Fund’s average daily net assets. The advisory fee is accrued daily and paid monthly.
The Adviser has agreed to waive its management fee and/or reimburse the Funds’ other expenses to the extent necessary to ensure that the Balanced Fund’s total operating expenses do not exceed 1.30% of its average daily net assets and that the Growth Fund’s total operating expenses do not exceed 1.50% of its average daily net assets. Any such waiver or reimbursement is subject to later adjustment during the term of the Agreement to allow the Adviser to recoup amounts waived or reimbursed to the extent actual fees and expenses for a period are less than the expense limitation caps, provided, however, that the Adviser shall only be entitled to recoup such amounts for a period of three years from the date such amount was waived or reimbursed. For the six-months ended November 30, 2003, the Adviser waived/reimbursed expenses of $96,257 and $95,607 for the Balanced Fund and Growth Fund, respectively. Waived/reimbursed e xpenses subject to potential recovery by year of expiration are as follows:
| Year of Expiration | Balanced Fund | Growth Fund | |
| 5/31/2004 | $138,359 | $128,792 | |
| 5/31/2005 | 123,485 | 127,555 | |
| 5/31/2006 | 145,963 | 148,381 | |
The Corporation, on behalf of each of the Funds, has adopted a plan pursuant to Rule 12b-1 under the 1940 Act (the ‘‘12b-1 Plan’’), which authorizes it to compensate Rafferty Capital Markets, LLC, an unaffiliated distributor, (the ‘‘Distributor’’) a distribution and shareholder servicing fee of 0.25% of each Fund’s average daily net assets (computed on an annual basis) subject to a minimum of $18,000 for the Corporation, which is allocated to the Funds based on each of their net assets. All or a portion of the fee may be used by the Distributor to pay costs of printing reports and prospectuses for potential investors and the costs of other distribution and shareholder servicing expenses. Currently, the Adviser has a Related Party Agr eement with Rafferty Capital Markets, LLC, which allows the Adviser to be reimbursed for the cost of marketing the Funds. The Adviser incurred marketing related expenses for the Balanced Fund and the Growth Fund in the amount of $40,265 and $42,799, respectively. The Adviser was reimbursed $16,380 and $10,232 for the Balanced Fund and Growth Fund, respectively. During the six-months ended November 30, 2003, the Balanced Fund and Growth Fund incurred expenses of $36,928 and $22,894 respectively, pursuant to the 12b-1 Plan.
U.S. Bank, N.A., a subsidiary of U.S. Bancorp, a publicly held bank holding company, serves as custodian for the Funds. U.S. Bancorp Fund Services, LLC, a wholly owned limited liability company of U.S. Bank, N.A., serves as transfer agent, administrator and accounting services agent for the Funds.
BADGLEY FUNDS SEMI-ANNUAL REPORT 25 | ||
| DIRECTORS | CUSTODIAN |
| Graham S. Anderson | U.S. Bank, N.A. |
| Frank S. Bayley | 425 Walnut Street |
| J. Kevin Callaghan | Cincinnati, Ohio 45202 |
| Victor E. Parker | |
| Steven C. Phelps | |
| Madelyn B. Smith | ADMINISTRATOR, TRANSFER AGENT |
| AND DIVIDEND-DISBURSING AGENT | |
| PRINCIPAL OFFICERS | |
| U.S. Bancorp Fund Services, LLC | |
| Third Floor | |
Scott R. Vokey, President | 615 East Michigan Street |
Lisa P. Guzman, Treasurer and Secretary | Milwaukee, Wisconsin 53202 |
| INVESTMENT ADVISER | INDEPENDENT ACCOUNTANTS |
| Badgley, Phelps and Bell, Inc. | PricewaterhouseCoopers LLP |
| 1420 Fifth Avenue | 100 East Wisconsin Avenue, Suite 1500 |
| Seattle, Washington 98101 | Milwaukee, Wisconsin 53202 |
| DISTRIBUTOR | LEGAL COUNSEL |
| Rafferty Capital Markets, LLC | Kirkland & Ellis LLP |
| 59 Hilton Avenue, Suite 101 | 200 East Randolph Street |
| Garden City, New York 11530 | Chicago, Illinois 60601 |
Item 2. Code of Ethics.
Not applicable for semi-annual reports.
Item 3. Audit Committee Financial Expert.
Not applicable for semi-annual reports.
Item 4. Principal Accountant Fees and Services.
Not applicable for semi-annual reports.
Item 5. Audit Committee of Listed Registrants.
Not applicable to open-end investment companies.
Item 6. [Reserved]
Item 7. Disclosure of Proxy Voting Policies and Procedures for Closed-End Management Investment Companies.
Not applicable to open-end investment companies.
Item 8. [Reserved]
Item 9. Controls and Procedures.
(a) The Registrant’s President/Chief Executive Officer and Treasurer/Chief Financial Officer have concluded that the Registrant's disclosure controls and procedures (as defined in Rule 30a-3(c) under the Investment Company Act of 1940 (the “Act”)) are effective as of a date within 90 days of the filing date of the report that includes the disclosure required by this paragraph, based on the evaluation of these controls and procedures required by Rule 30a-3(b) under the Act.
(b) There were no changes in the Registrant's internal control over financial reporting (as defined in Rule 30a-3(d) under the Act) that occurred during the Registrant's last fiscal half-year that has materially affected, or is reasonably likely to materially affect, the registrant's internal control over financial reporting.
Item 10. Exhibits.
(a) (1) Any code of ethics or amendment thereto. Not applicable.
(2) Certifications pursuant to Section 302 of the Sarbanes-Oxley Act of 2002. Filed herewith.
(b) Certification pursuant to Section 906 of the Sarbanes-Oxley Act of 2002. Filed herewith.
SIGNATURES
Pursuant to the requirements of the Securities Exchange Act of 1934 and the Investment Company Act of 1940, the registrant has duly caused this report to be signed on its behalf by the undersigned, thereunto duly authorized.
| (Registrant) | Badgley Funds, Inc. |
| By | /s/ Scott R. Vokey |
| (Signature and Title) | Scott R. Vokey President |
| Date: February 9, 2004 | |
Pursuant to the requirements of the Securities Exchange Act of 1934 and the Investment Company Act of 1940, this report has been signed below by the following persons on behalf of the registrant and in the capacities and on the dates indicated.
| (Registrant) | Badgley Funds, Inc. |
| By | /s/ Lisa Guzman |
| (Signature and Title) | Lisa Guzman Treasurer |
| Date: February 9, 2004 | |