Filed by Enterprise Products Partners L.P.
Pursuant to Rule 425 under the Securities Act of 1933
Subject Company: Oiltanking Partners, L.P.
Commission File No.: 001-35230
Enterprise Products Partners L.P. (the “Partnership”) is filing an investor presentation that discloses a variety of financial, operating and general information regarding the Partnership. In addition, this material contains references to the proposed merger of Oiltanking Partners, L.P. with a subsidiary of the Partnership. The presentation will be posted on the Partnership’s website,www.enterpriseproducts.com.
 ENTERPRISE PRODUCTS PARTNERS L.P. RBC CAPITAL MARKETS MLP CONFERENCE November 19, 2014 Mike Creel CEO enterpriseproducts.com © ALL RIGHTS RESERVED. ENTERPRISE PRODUCTS PARTNERS L.P. |
 © ALL RIGHTS RESERVED. ENTERPRISE PRODUCTS PARTNERS L.P. 2 FORWARD–LOOKING STATEMENTS This presentation contains forward-looking statements based on the beliefs of the company, as well as assumptions made by, and information currently available to our management team. When used in this presentation, words such as “anticipate,” “project,” “expect,” “plan,” “seek,” “goal,” “estimate,” “forecast,” “intend,” “could,” “should,” “will,” “believe,” “may,” “potential” and similar expressions and statements regarding our plans and objectives for future operations, are intended to identify forward-looking statements. Although management believes that the expectations reflected in such forward-looking statements are reasonable, it can give no assurance that such expectations will prove to be correct. You should not put undue reliance on any forward-looking statements, which speak only as of their dates. Forward-looking statements are subject to risks and uncertainties that may cause actual results to differ materially from those expected, including insufficient cash from operations, adverse market conditions, governmental regulations, the possibility that tax or other costs or difficulties related thereto will be greater than expected, the impact of competition and other risk factors discussed in our latest filings with the Securities and Exchange Commission. All forward-looking statements attributable to Enterprise or any person acting on our behalf are expressly qualified in their entirety by the cautionary statements contained herein, in such filings and in our future periodic reports filed with the Securities and Exchange Commission. Except as required by law, we do not intend to update or revise our forward-looking statements, whether as a result of new information, future events or otherwise. |
 © ALL RIGHTS RESERVED. ENTERPRISE PRODUCTS PARTNERS L.P. 3 ADDITIONAL INFORMATION This communication does not constitute an offer to buy or solicitation of an offer to sell any securities. In furtherance of the proposed merger of Oiltanking Partners, L.P. (“Oiltanking”) with a wholly-owned subsidiary of Enterprise, Enterprise and Oiltanking will file one or more registration statements, proxy statements or other documents with the SEC. This communication is not a substitute for any proxy statement, registration statement, prospectus or other document Enterprise and/or Oiltanking may file with the SEC in connection with the proposed merger. INVESTORS AND SECURITY HOLDERS OF ENTERPRISE AND OILTANKING ARE URGED TO READ THE PROXY STATEMENT/PROSPECTUS, REGISTRATION STATEMENT AND OTHER DOCUMENTS FILED WITH THE SEC CAREFULLY IN THEIR ENTIRETY WHEN THEY BECOME AVAILABLE AS THEY WILL CONTAIN IMPORTANT INFORMATION ABOUT THE PROPOSED MERGER. Any definitive proxy statement/prospectus (when available) will be mailed to unitholders of Oiltanking. Investors and security holders will be able to obtain free copies of these documents (when available) and other documents filed with the SEC by Enterprise and/or Oiltanking through the web site maintained by the SEC at http://www.sec.gov. Copies of the registration statement and the definitive proxy statement/prospectus and the SEC filings that will be incorporated by reference in the proxy statement/prospectus may also be obtained for free by directing a request to: (i) Investor Relations: Enterprise Products Partners L.P., (713) 381-6500, or (ii) Investor Relations, Oiltanking Partners, L.P., (281) 457-7900. Enterprise, Oiltanking and their respective general partners, and the directors and certain of the management of the respective general partners, may be deemed to be “participants” in the solicitation of proxies from the unitholders of Oiltanking in connection with the proposed merger. Information about the directors and executive officers of the respective general partners of Enterprise and Oiltanking is set forth in each company’s Annual Report on Form 10-K for the year ended December 31, 2013, filed with the SEC on March 3, 2014 and February 25, 2014, respectively, and in subsequent statements of changes in beneficial ownership on file with the SEC. These documents can be obtained free of charge from the sources listed above. Other information regarding the persons who may be participants in the proxy solicitation and a description of their direct and indirect interests, by security holdings or otherwise, will be contained in the proxy statement/prospectus and other relevant materials to be filed with the SEC when they become available. |
 © ALL RIGHTS RESERVED. ENTERPRISE PRODUCTS PARTNERS L.P. 4 ENTERPRISE PRODUCTS PARTNERS L.P. EPD is one of the largest publicly traded midstream energy partnerships with a firm value of $90 billion One of the largest integrated midstream energy systems Diversified sources of cash flow History of successful execution / clear visibility to growth Consistent distribution growth: 6.2% compound annual growth rate (CAGR) over 41 consecutive quarters Financial flexibility • Highest credit rating among MLPs: Baa1 / BBB+ • Margin of safety with average distribution coverage of 1.4+x and $6.4 billion of retained DCF since 2010 Simple investor-friendly structure • No GP IDRs results in a lower cost of capital • Significant insider ownership: owns >36% of EPD units |
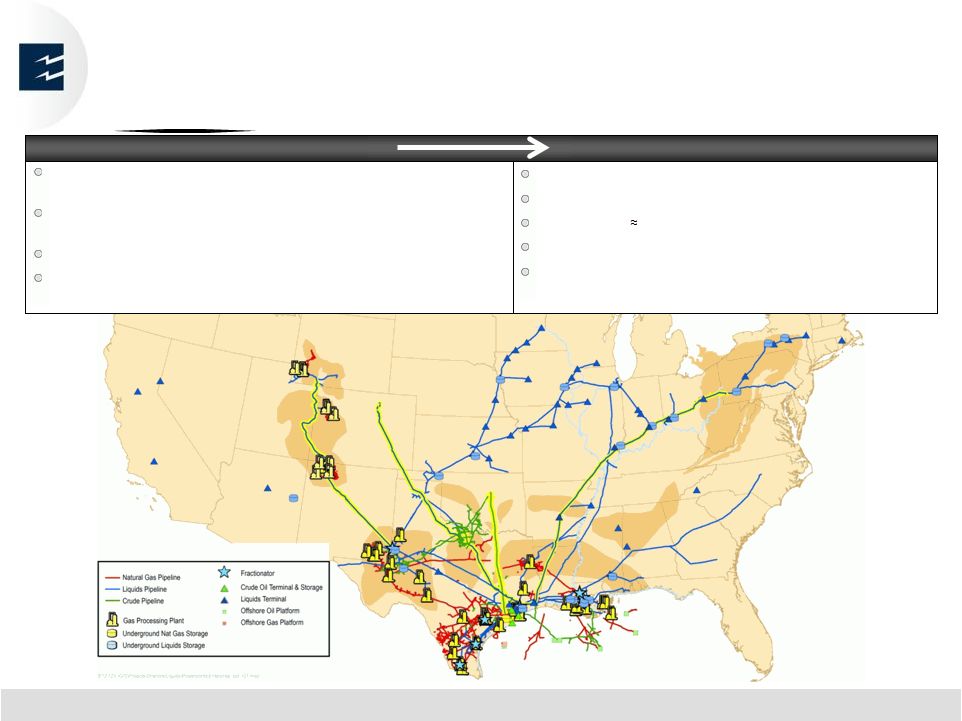 © ALL RIGHTS RESERVED. ENTERPRISE PRODUCTS PARTNERS L.P. 5 EPD TODAY: NATURAL GAS, NGL CRUDE OIL, REFINED PRODUCTS AND PETROCHEMICALS Pipelines: 52,000 miles of natural gas, NGL, crude oil, refined products and petrochemical pipelines Storage: 220 MMBbls of NGL, refined products, petrochemical and crude oil, and 14 Bcf of natural gas storage capacity Processing: 24 natural gas processing plants; 22 fractionators Exports: added refined products export terminal; expanding World Scale LPG export facilities and adding ethane exports 2016 Connected to U.S. major shale basins Connected to every U.S. ethylene cracker Connected to 90% of refineries East of Rockies Pipeline connected to 22 Gulf Coast PGP customers Connected to the “First and Last Mile” for supplies and markets through extensive marine and trucking fleets Asset Overview Asset Overview Connectivity Connectivity Note: includes Oiltanking assets S , |
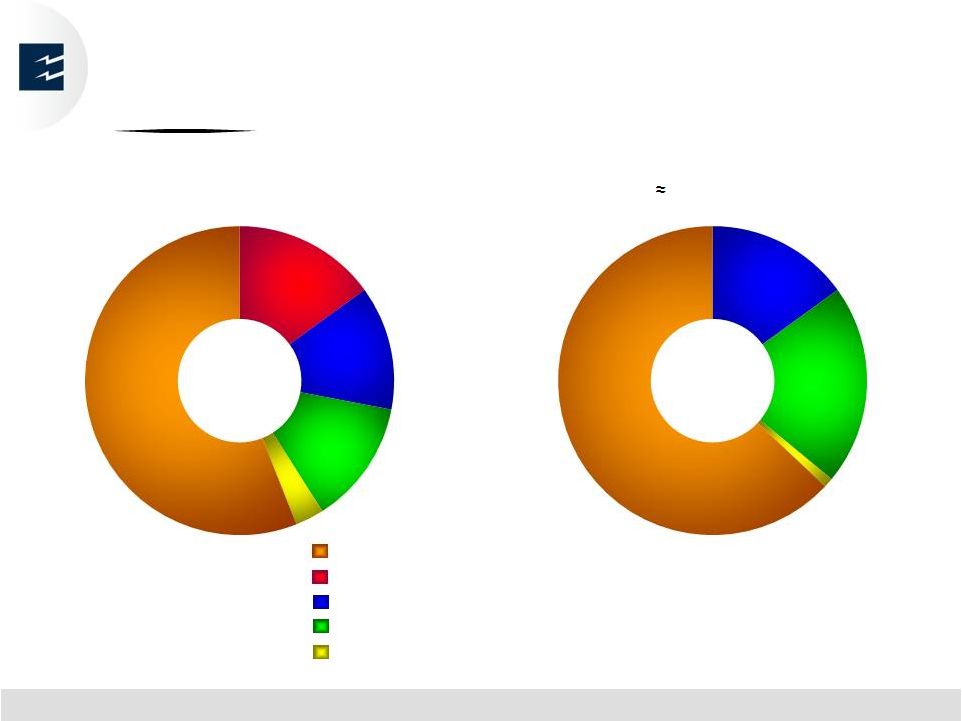 © ALL RIGHTS RESERVED. ENTERPRISE PRODUCTS PARTNERS L.P. 6 GEOGRAPHIC AND BUSINESS DIVERSIFICATION PROVIDE MULTIPLE EARNINGS STREAMS $5.2 Billion Gross Operating Margin For 12 months ended September 30, 2014 4 Year Growth Capital Allocation 2013–2016E (1) $12.5 Billion NGL Pipelines & Services Onshore Natural Gas Pipelines & Services Petrochemical & Refined Products Services Onshore Crude Oil Pipelines & Services Offshore Pipelines & Services 15% 21% 1% 63% 15% 13% 13% 3% 56% Growth capital projects either result in additional revenue from existing assets or from expansion of our asset base through construction of new facilities. (1) |
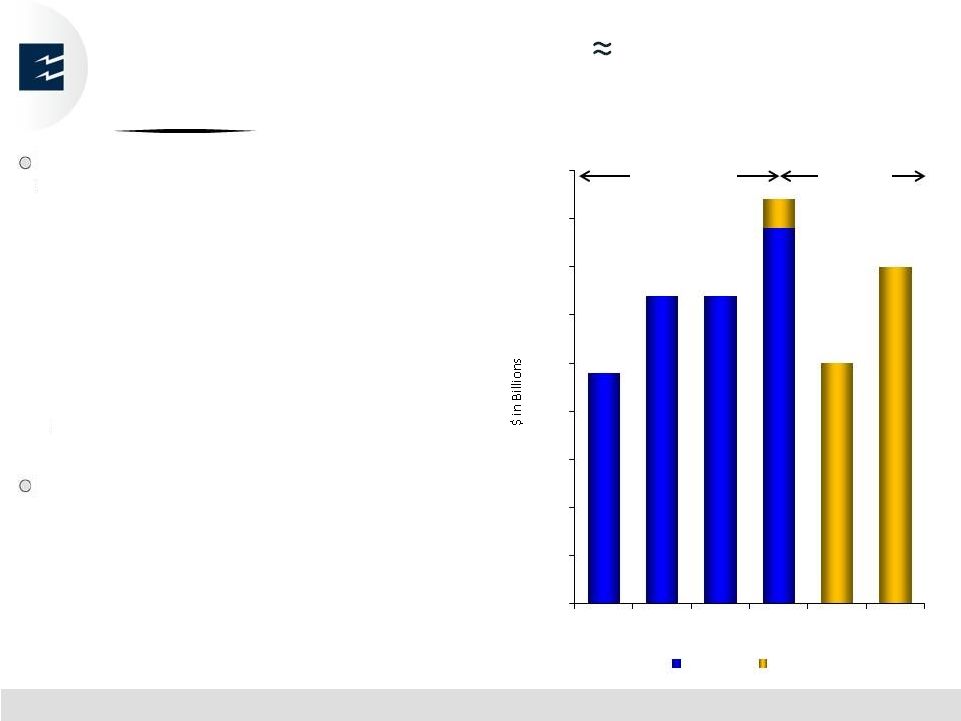 © ALL RIGHTS RESERVED. ENTERPRISE PRODUCTS PARTNERS L.P. 7 VISIBILITY TO GROWTH: $20B PROJECTS Recently Completed / Under Construction Projects completed since 2011: $12.7 Billion approximately 3% under budget • Pipelines: 4,200 miles of natural gas, NGL and crude oil pipelines • Gas Processing: Yoakum – 3 processing trains • NGL Fractionators: Mont Belvieu 5–8 • LPG export expansions: 4 MMBbls/Mo • ECHO Crude Oil Storage • Gulf of Mexico crude oil pipeline • Seaway Looping / ECHO to Port Arthur pipeline / Jones Creek to ECHO Projects under construction: $6.3 Billion • Export terminals: LPG / ethane / refined products • Aegis Ethane Header Pipeline (partially complete) • Propane dehydrogenization facility (PDH) • South Eddy (Permian) gas processing facility • 9 th NGL fractionator at Mont Belvieu • ECHO Crude Oil Storage $12.7B Completed $6.3B Under Construction $2.4 $3.2 $3.2 $0.3 $2.5 $3.5 Organic Growth Capital Projects $3.9 Note: excludes Oiltanking projects $0.0 $0.5 $1.0 $1.5 $2.0 $2.5 $3.0 $3.5 $4.0 $4.5 2011 2012 2013 2014 2015 2016 Actual Estimated Year of Completion |
 © ALL RIGHTS RESERVED. ENTERPRISE PRODUCTS PARTNERS L.P. 8 VISIBILITY TO GROWTH: MAJOR CAPITAL PROJECTS $6.2B In-Service in 2013 / 3Q14; $6.3B Under Construction In Service Date 2013 1Q 2014 2Q 2014 3Q 2014 4Q 2014 2015 2016 NGL Pipeline & Services Eagle Ford Yoakum gas processing facility (phase III – additional 300 MMcf/d) Done NGL export facility expansion at Houston Ship Channel Done Mont Belvieu DIB expansion Done Eagle Ford 20" P/L from Yoakum to Needville and 24" P/L from Needville to Alvin Done Eagle Ford Phase II mixed NGL pipeline and lateral Done Mont Belvieu (JV) NGL fractionators 7 & 8 Done Texas Express (JV) NGL pipeline and gathering system – Skellytown to Mont Belvieu Done Mont Belvieu Mixed NGL pipeline expansions & pump upgrades Done Mid-America NGL pipeline expansion – Rocky Mountain segment Done ATEX Express ethane pipeline – Marcellus / Utica (2016) Done Front Range (JV) NGL pipeline Done South Carlsbad expansion – 60 mile pipeline (1Q 2014) Done Mont Belvieu natural gasoline system (4Q 2014) Aegis ethane pipeline – 270 miles (1Q-4Q 2015) NGL export facility on Gulf Coast (6.0–6.5 MMBbl/mo) (4Q 2015) Ethane export facility on Gulf Coast (2016) Mont Belvieu Frac 9 - 85MBPD (1Q 2016) Permian South Eddy gas plant - 200MMcf/d (1Q 2016) Onshore Crude Oil Pipelines & Services North Loop extension of West Texas Crude system (21 miles of 10" P/L) Done Avalon–Bone Spring gathering pipeline (Permian Basin Phase II) Done Eagle Ford (JV) – crude oil pipeline (3Q 2013), expansion to 470 MBPD (2Q 2015) Done Seaway (JV) crude oil laterals Done Done Seaway (JV) crude oil looping (up to 850 MBPD) Done ECHO storage expansion 900MBbls (capacity increase to 1.6 MMBbls) Done ECHO addt'l 4 MMBbl (total capacity 6.5 MMBbls) and 55 miles of 36" pipelines (1Q-2Q 2015) Rancho II crude oil 30" pipeline (3Q 2015) Midland Tank Farm storage expansion - 400 MBbls (2Q 2015) Petrochemical & Refined Products Services MTBV Propylene Splitter IV expansion Done Diluent service to Chicago area (Southern Lights & Cochin P/L connections) Done Done Refined products export dock Done Done Propane Dehydrogenation Unit ("PDH") (2016) Other Offshore Pipelines & Services Lucius (JV) crude oil pipeline SEKCO (3Q 2014) Done Value of capital placed in service ($ Billions) 2.3 $ 2.5 $ 0.9 $ 0.5 $ - $ - $ - $ Value of remaining capital projects to be put in service - $ - $ - $ - $ 0.3 $ 2.5 $ 3.5 $ |
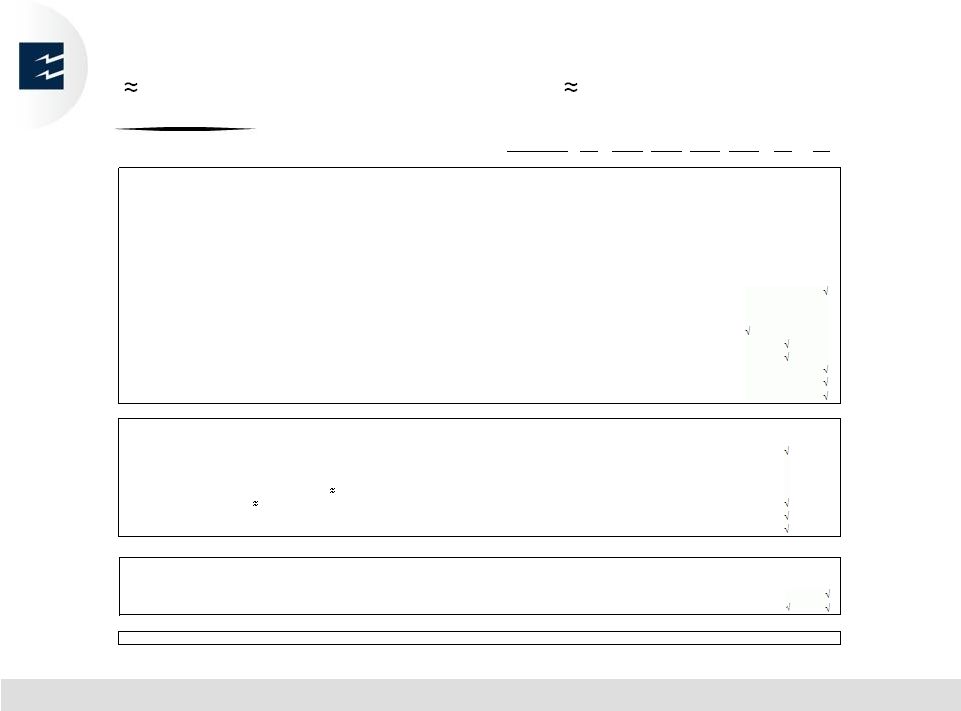
 © ALL RIGHTS RESERVED. ENTERPRISE PRODUCTS PARTNERS L.P. 9 VISIBILITY TO GROWTH Additional Opportunities Under Development • Purity and mixed NGL pipelines from growing supply areas • Expansion of natural gas processing facilities in growing basins • NGL storage in market area • Pipelines to serve growing onshore and Gulf of Mexico supply areas • ECHO supply aggregation and blending • Gathering and storage projects • Marine and truck logistics Crude Oil NGLs Supply-side Opportunities NGLs Crude Oil and Condensate Natural Gas Refined Products and Petrochemicals Demand-side Opportunities • Pipeline and storage projects to serve expanding petrochemical industry • Water access for exports • Marine and truck logistics • ECHO storage, blending and distribution projects to serve U.S. Gulf Coast refiners • Provide water access for North America destinations and exports • Pipeline projects to serve industrial expansion in Texas and Louisiana • Pipeline projects to serve growing usage in power generation • Pipeline projects to serve LNG and Mexico export markets • Distribution pipelines to serve expanding petrochemical industry • Water access for refined products, gasoline additives and polymer grade propylene exports • Motor gasoline additive blending • Marine logistics |
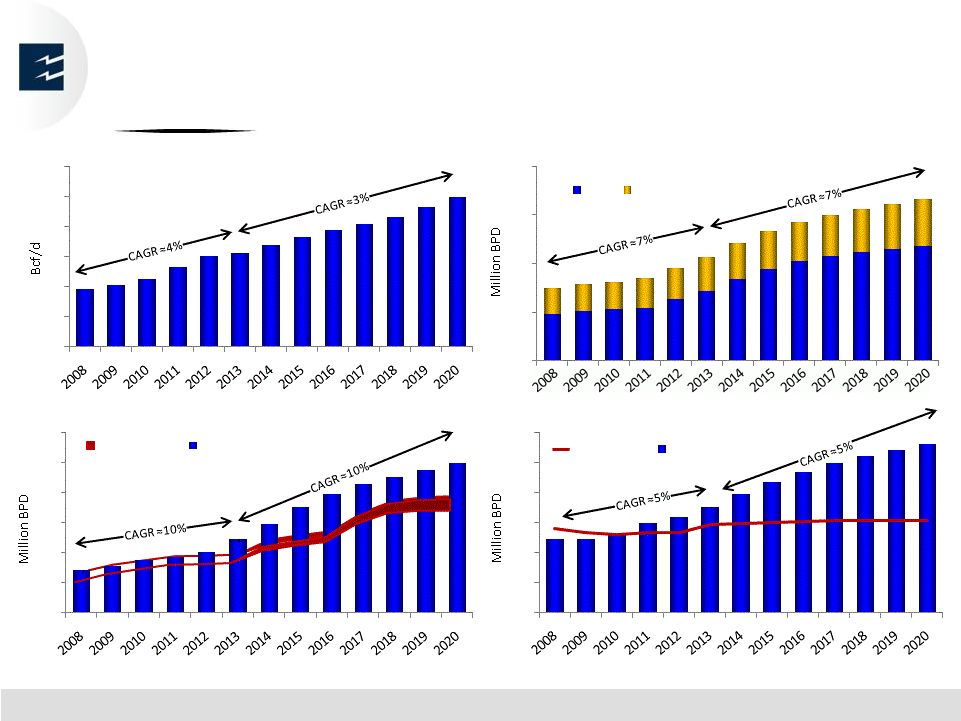 © ALL RIGHTS RESERVED. ENTERPRISE PRODUCTS PARTNERS L.P. 10 40 50 60 70 80 90 100 U.S. Natural Gas POTENTIAL ENERGY PRODUCTION GROWTH 0.7 2.5 1.2 59 90 71 7.5 16.7 10.7 1.2 2.8 1.8 Source: EPD Fundamentals * Includes refinery production and imports 0 5 10 15 20 North American Crude Oil & Condensate U.S. Canada 0.0 0.5 1.0 1.5 2.0 2.5 3.0 U.S. Ethane U.S. Demand Production 0.0 0.5 1.0 1.5 2.0 2.5 3.0 U.S. LPG U.S. Demand Production * |
 PROJECTS OVERVIEW enterpriseproducts.com © ALL RIGHTS RESERVED. ENTERPRISE PRODUCTS PARTNERS L.P. |
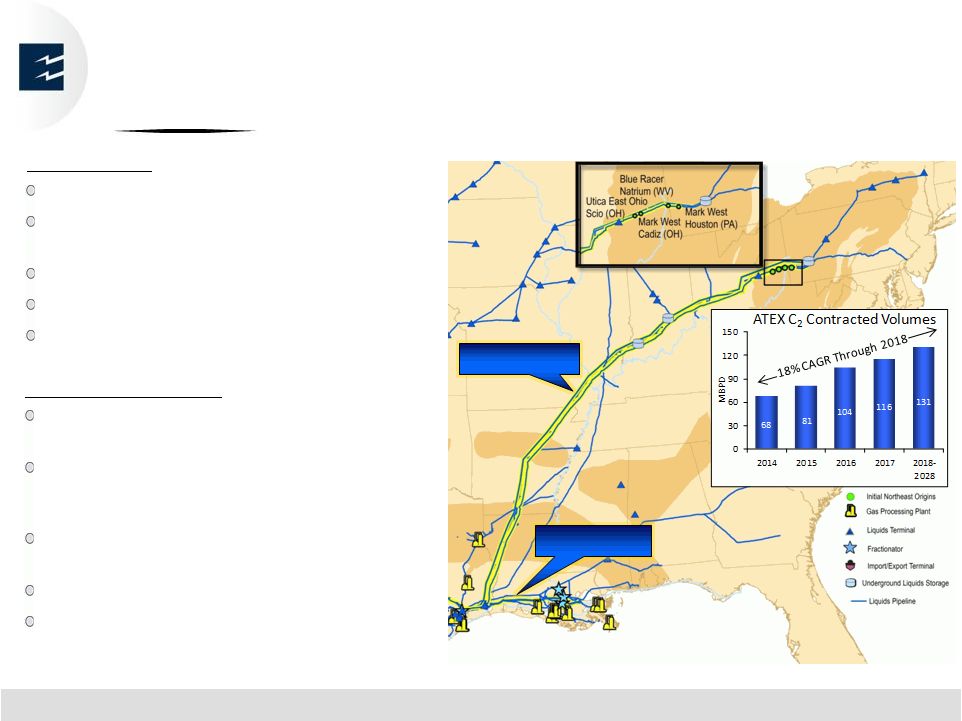 © ALL RIGHTS RESERVED. ENTERPRISE PRODUCTS PARTNERS L.P. 12 MAJOR NGL CAPITAL GROWTH PROJECTS ATEX and Aegis Ethane Pipelines ATEX Pipeline Initial Origins Aegis Pipeline ATEX Pipeline 1,265-mile, 16” and 20” pipeline Initial capacity 125 MBPD, expandable to 265 MBPD Connected to 4 NGL fractionators 15 year ship-or-pay commitments In-service January 2014 Aegis Ethane Pipeline 270-mile, 20” pipeline with capacity up to 425 MBPD Creates header pipeline from Corpus Christi to Louisiana, when combined with existing South Texas ethane pipeline Will deliver ethane to at least 6 petrochemical customers Received commitments in excess of 200 MBPD First segment to Beaumont completed September 2014; remaining 2 segments expected in-service in phases throughout 2015 |
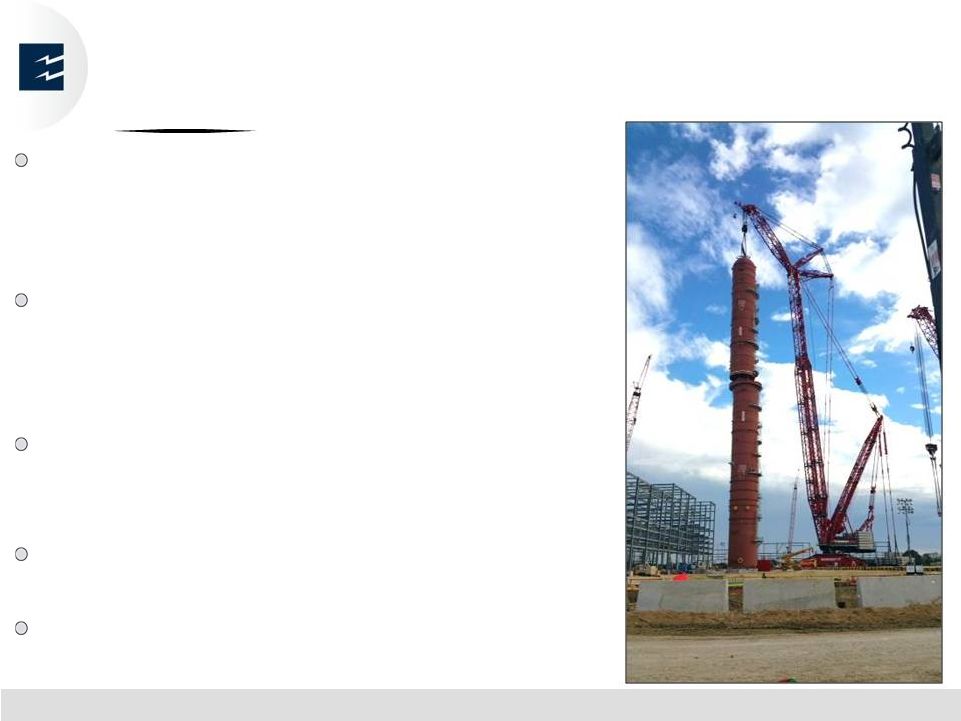 © ALL RIGHTS RESERVED. ENTERPRISE PRODUCTS PARTNERS L.P. 13 EPD PDH FACILITY UPDATE Propylene production from ethylene crackers decreased by 5.4 billion lbs. or 37% since 2010 due to the decline in cracking naphtha Capacity to produce up to 1.65 billion pounds per year of polymer grade propylene (25 MBPD) • Will consume 35 MBPD of propane 100% of capacity is contracted under fee-based contracts that average 15 years with investment grade companies Integrated with EPD’s existing facilities to provide reliability and flexibility Completion expected in mid-2016 • 60% of costs locked in |
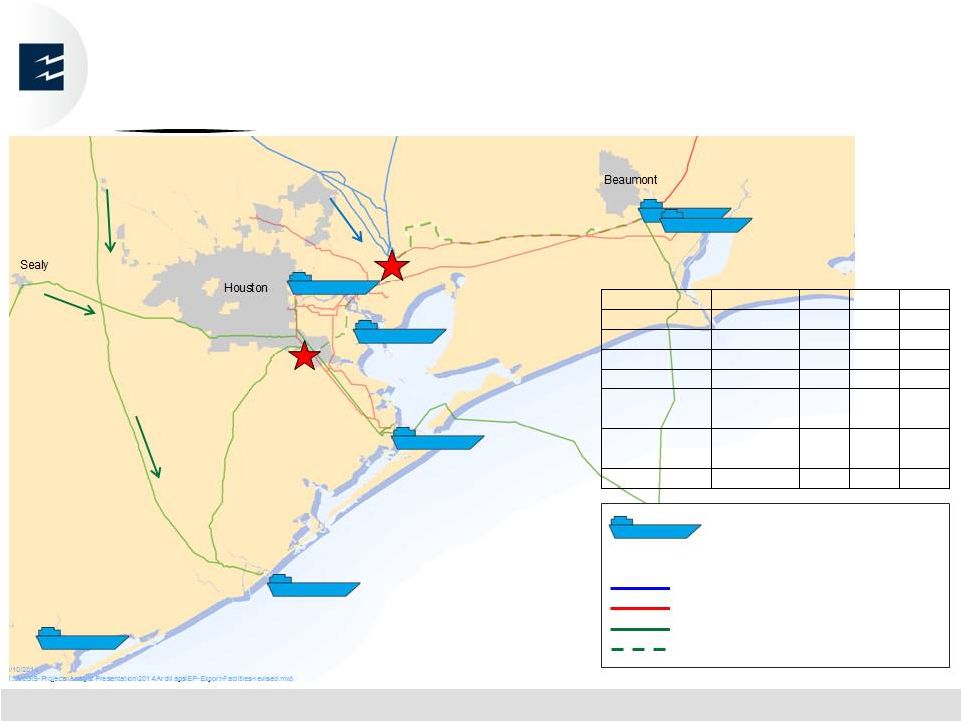  EXPORT CAPACITY: LINKING U.S. SUPPLIES TO GROWING GLOBAL DEMAND Corpus Christi Texas City Morgan’s Point OTI Freeport / Jones Creek ECHO Mont Belvieu Source: EPD Fundamentals OTI EPD Product Docks Berths U/C OILT - Beaumont Multi 2 4 2 EPD - Beaumont Refined 1 0 1 OILT - Houston Multi 8 2 1 Morgan's Point Ethane 0 0 2 Texas City Condensate, Crude 2 0 0 Freeport / Jones Creek Crude 1 0 0 Corpus Christi Crude 1 0 0 Refined Products Crude Oil NGLs Crude Oil – Under Construction (U/C) Dock / Berth Terminal Pipeline Corridors © ALL RIGHTS RESERVED. ENTERPRISE PRODUCTS PARTNERS L.P. 14 |
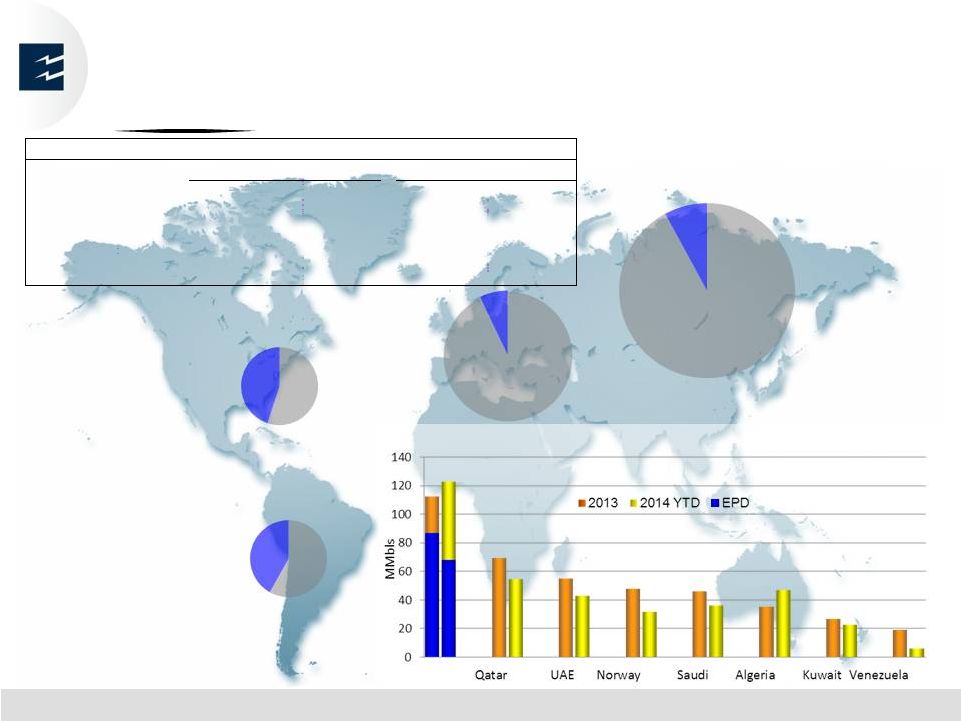  U.S. BECOMES LARGEST EXPORTER OF PROPANE Propane Exports by Destination as of October 2014 South America 43 MMBbls 42% EPD Mexico, Caribbean & Central America Total Waterborne Imports: 50 MMBbls 45% EPD Source: Waterborne Europe / North Africa 122 MMBbls 7% EPD Far East 224 MMBbls 8% EPD Top Propane Exporters in 2013 and 2014 YTD 15 © ALL RIGHTS RESERVED. ENTERPRISE PRODUCTS PARTNERS L.P. % of Cargoes Loaded % of Destination Market North America 33% 45% South America 26% 42% Europe / North Africa 13% 7% Far East 26% 8% Other 2% 4% 2014 YTD Propane Exports (from EPD Facility) by Destination Region: 68 MMBbls USA |
 © ALL RIGHTS RESERVED. ENTERPRISE PRODUCTS PARTNERS L.P. 16 EPD BOOKING CARGOES / BUILDING CAPACITY 2,000 LPG Cargoes Scheduled Through 2024 - 2 4 6 8 10 12 14 16 2010 2011 2012 2013 2014E 2015E 2016E 2017E 2018E 2019E 2020E 2021E 2022E 2023E 2024E Historical & Contracted Future LPG Loadings vs. Capacity Average monthly loadings per year Operational Capacity Existing Capacity: 7.5 MMBbls/mo Expansion 1Q 2015: +1.5 MMBbls/mo Expansion 4Q 2015: +7.0 MMBbls/mo Ultimate Capacity: 16.0 MMBbls/mo |
 © ALL RIGHTS RESERVED. ENTERPRISE PRODUCTS PARTNERS L.P. 17 NEW MARKETS DEVELOP FOR U.S. ETHANE EPD Ethane Export Facility at Morgan’s Point, TX Supported by long-term contracts Combined operating rate 200 MBPD across two Source: EPD Fundamentals Shipbuilders Response to Increased Ethane Demand Market Potential Estimated Ethane / Ethylene Vessel Capacity (1) (1) # of vessels (125+ MBbls capacity per vessel); confirmed shipbuilding orders only 0 2 4 6 8 10 12 14 5 14 29 48 2014 2015 2016 2017 docks Evaluating possible expansion Expected to begin operations 3Q 2016 Europe vs. Caribbean / South America vs. Asia Ultimate waterborne capacity needed will be dependent on roundtrip transit times to end- use market Power generation Fuel Market 300 MBPD ethane demand generated by converting 25% of NW Europe operating capacity to ethane feedstock $330 million per year advantage for a 1.5 billion lb. per year cracker (gross, before costs of logistics and transport) (MTBV) (NEW) Price per Gallon $0.24 $1.56 Ethylene Costs ($ per pound) $0.11 $0.33 Ethane Naphtha NW Europe example (as of 11/11/14): Ethylene cracker feedstock – displacing current crude oil derivative feedstocks or new demand |
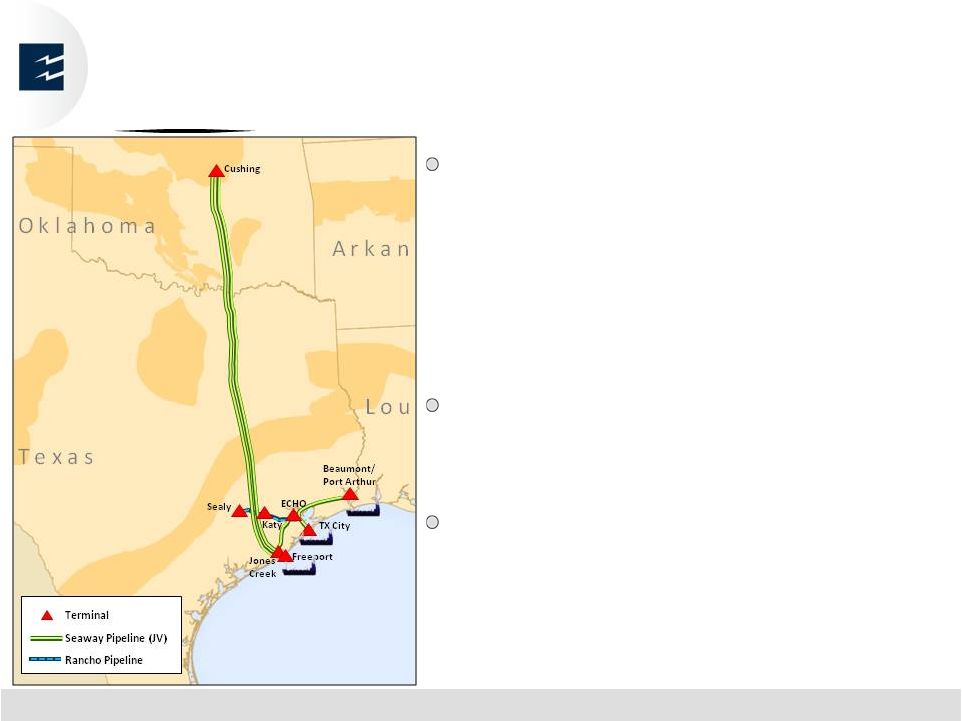 © ALL RIGHTS RESERVED. ENTERPRISE PRODUCTS PARTNERS L.P. 18 SEAWAY CRUDE OIL PIPELINE EXPANSION COMPLETED Seaway Loop: 512 mile, 30” parallel pipeline along existing pipeline; completed June 2014 • Linefill is underway • Expect volumes to reach Jones Creek in early December Jones Creek to ECHO Lateral: 65 mile, 36” pipeline; completed January 2014 ECHO to Port Arthur Lateral: 100 mile, 30” pipeline from ECHO to Beaumont / Port Arthur; completed July 2014 |
 © ALL RIGHTS RESERVED. ENTERPRISE PRODUCTS PARTNERS L.P. 19 EPD & SEAWAY’S GULF COAST CRUDE SYSTEM Access to 8 MMBPD Refining and Water |
 OILTANKING enterpriseproducts.com © ALL RIGHTS RESERVED. ENTERPRISE PRODUCTS PARTNERS L.P. |
 © ALL RIGHTS RESERVED. ENTERPRISE PRODUCTS PARTNERS L.P. 21 ACQUISITION OF OILTANKING (OILT) OVERVIEW AND RATIONALE On October 1, 2014, EPD acquired OILT’s GP and related IDRs, 15.9 million OILT common units and 38.9 million OILT subordinated units (which converted one-to- one to common units on November 17, 2014) for $4.41 billion of consideration consisting of $2.21 billion of cash and 54.8 million newly issued EPD common units On November 11, 2014, EPD and OILT executed merger agreement in which EPD would issue 1.3 EPD common units for each OILT common unit ( $1.4 billion) Merger requires approval of holders of simple majority of OILT common units; EPD has agreed to vote its then 54.8 million common units (66% of total OILT common units) in favor of the merger Total consideration of $6.0 billion plus $228 million of OILT debt Merger expected to be completed in first quarter of 2015 Combines EPD’s integrated system of midstream energy infrastructure and access to supplies of NGL, crude oil and refined products with OILT’s access to waterborne markets and storage Expected to be accretive to EPD’s distributable cash flow per unit in 2016 |
 © ALL RIGHTS RESERVED. ENTERPRISE PRODUCTS PARTNERS L.P. 22 ACQUISITION OF OILT PRINCIPLE DRIVERS OF VALUE CREATION At least $30 million of synergies and cost savings from the complete integration of OILT’s business into Enterprise’s system as well as public company cost savings Opportunities for new business and repurposing existing assets for “best use” to meet the growing demand for export and logistical services for petroleum products related to increase in North American crude oil and NGL production from the shale and non-conventional plays Secures ownership and control of OILT’s assets that are essential to EPD’s midstream • EPD is OILT’s largest customer, representing 31% of total 2013 revenues; • EPD accounted for 40% of OILT’s 2013 earnings before interest, taxes, interest depreciation and amortization (per EPD estimates) • OILT provides essential dock and storage services to EPD LPG export and octane enhancement businesses, which accounted for 10% of EPD’s 2013 gross operating margin • Upon completion of EPD’s LPG export facility in 2016, EPD assets with a value of $1.5 billion would be located on land owned by OILT |
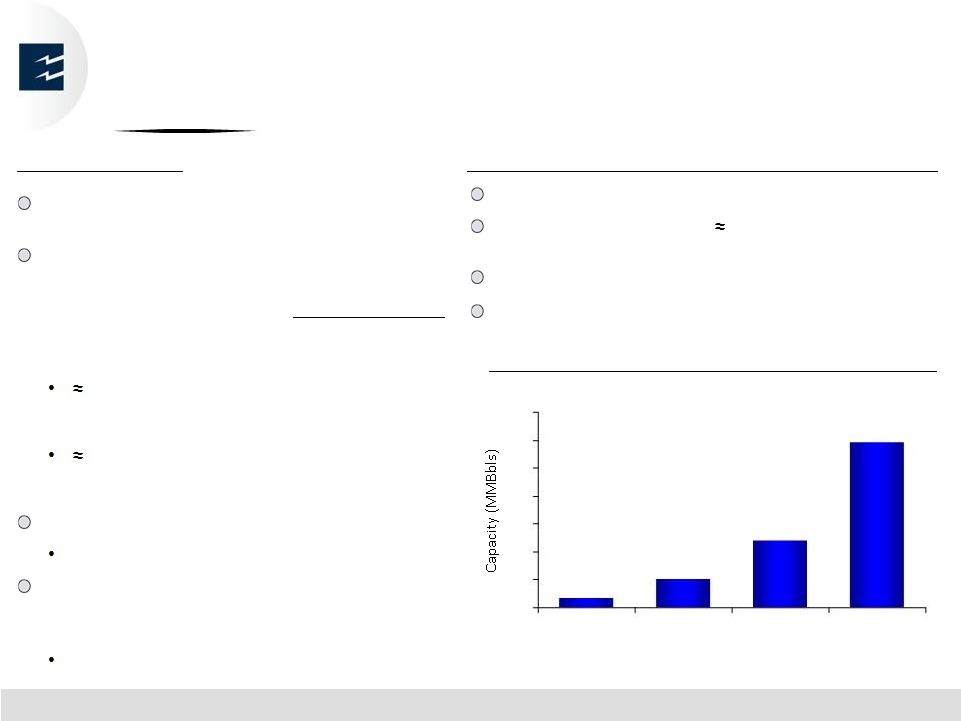
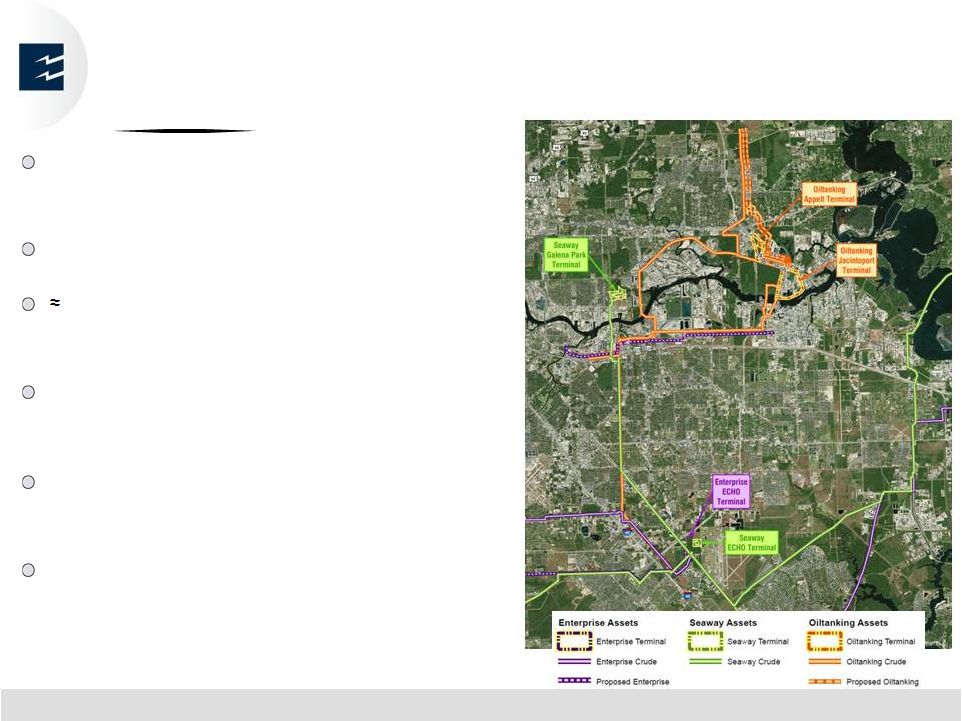 © ALL RIGHTS RESERVED. ENTERPRISE PRODUCTS PARTNERS L.P. 23 OILT HOUSTON ASSET OVERVIEW 13.2 MMBbls of storage at main site 6.7 MMBbls at Appelt site 100 miles of pipeline in Houston area 7 ship docks (post expansion) and 3 barge docks Hosts EPD’s expanding LPG refrigeration facility Provides critical services for EPD’s LPG, methanol and octane enhancement business |
 © ALL RIGHTS RESERVED. ENTERPRISE PRODUCTS PARTNERS L.P. 24 OILT BEAUMONT ASSET OVERVIEW Two sites with 5.5 MMBbls of storage 4 ship docks (post expansion), 2 barge docks Significant land for expansion Adjacent to EPD’s storage facility Near EPD’s refined products marine terminal at Port of Beaumont |
 FINANCIAL enterpriseproducts.com © ALL RIGHTS RESERVED. ENTERPRISE PRODUCTS PARTNERS L.P. |
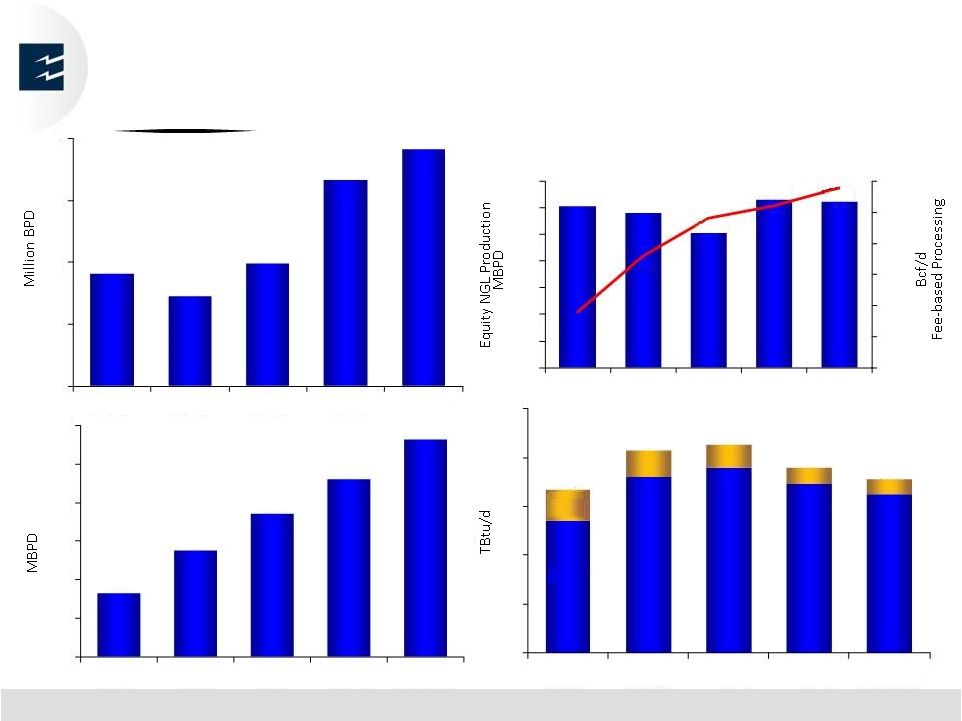 SOLID OPERATING PERFORMANCE… Equity NGL Production & Fee-based Processing Natural Gas Pipeline Volumes Offshore Onshore 12.7 Liquids Pipeline Volumes 4.2 4.0 4.3 5.0 5.2 3.3 3.8 4.3 4.8 5.3 2010 2011 2012 2013 9M 2014 126 125 2.9 2 2.5 3 3.5 4 4.5 5 0 20 40 60 80 100 120 140 2010 2011 2012 2013 9M 2014 NGL / Propylene Fractionation & Butane Isomerization / DIB Volumes 665 777 872 961 1,066 500 600 700 800 900 1,000 1,100 2010 2011 2012 2013 9M 2014 6 8 10 12 14 16 2010 2011 2012 2013 9M 2014 14.3 14.5 13.6 13.2 © ALL RIGHTS RESERVED. ENTERPRISE PRODUCTS PARTNERS L.P. 26 4.9 4.6 3.8 101 4.4 116 121 |
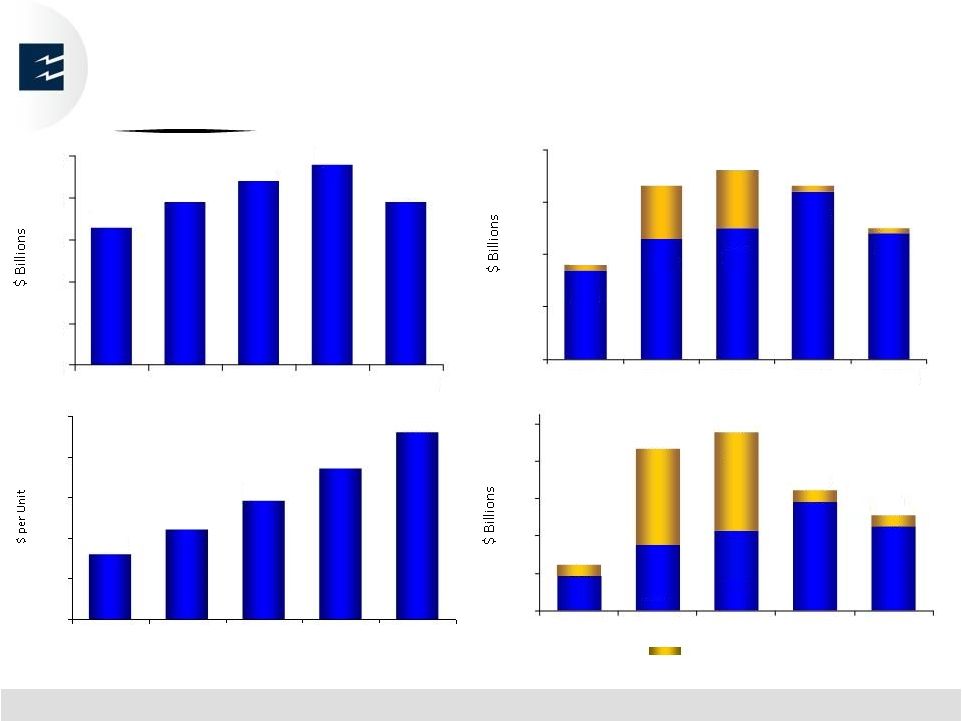 …DRIVES STRONG FINANCIAL RESULTS (1) Each period noted includes non-recurring transactions (e.g., proceeds from asset sales and property damage insurance claims and payments to settle interest rate hedges). (2) Retained DCF represents the amount of distributable cash flow for each period that was retained by the general partner for reinvestment in capital projects and other reasons. Annualized Non-recurring items Retained DCF / Coverage (1,2) $0.0 $1.0 $2.0 $3.0 $4.0 $5.0 $3.3 $3.9 $4.4 $4.8 $3.9 2010 2011 2012 2013 9M 2014 Gross Operating Margin $0.5 $1.5 $2.5 $3.5 $4.5 $2.3 $3.8 $4.1 $3.8 $3.0 2010 2011 2012 2013 9M 2014 Distributable Cash Flow (“DCF”) $0.0 $0.4 $0.8 $1.2 $1.6 $2.0 $1.9 2010 2011 2012 2013 9M 2014 $0.8 1.4x 1.9x $0.4 1.2x 1.9x $0.7 1.4x 1.3x $1.2 1.5x 1.5x $0.9 1.4x 1.5x $0.5 $1.7 $1.3 $1.0 Distributions Declared (Adjusted for 2-for-1 Split in August 2014) $1.16 $1.22 $1.29 $1.37 $1.46 $1.00 $1.10 $1.20 $1.30 $1.40 $1.50 2010 2011 2012 2013 3Q 2014 © ALL RIGHTS RESERVED. ENTERPRISE PRODUCTS PARTNERS L.P. 27 $2.2 $2.8 $3.0 $3.7 $2.9 (1) |
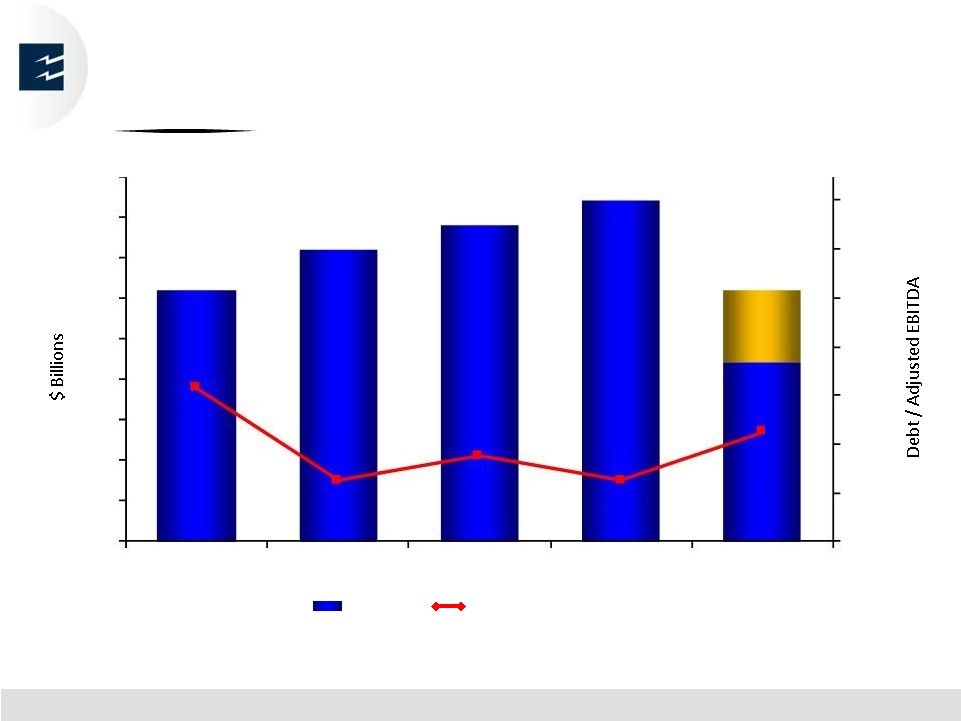 © ALL RIGHTS RESERVED. ENTERPRISE PRODUCTS PARTNERS L.P. 28 HISTORY OF FINANCIAL DISCIPLINE WHILE EXECUTING GROWTH STRATEGY capital expenditures. (2) Coverage ratio reflects total debt adjusted for the average 50% equity credit that the rating agencies ascribe to the Junior Subordinated Notes (3) Debt leverage ratio presented reflects historical data for the 12 months ended September 30, 2014 and should not be inferred as a projection of such ratio for the 12 months ended December 31, 2014. (4) Growth capital spending estimate for the 12 months ended December 31, 2014, includes actuals for the 9 months ended September 30, 2014. Total Growth Capex (1) & Debt Leverage (2) Actual Debt Leverage Ratio (4) (3) $3.1 $3.6 $3.9 $4.2 $3.1 3.9x 3.5x 3.6x 3.5x 3.7x 3.3x 3.5x 3.7x 3.9x 4.1x 4.3x 4.5x 4.7x $0.0 $0.5 $1.0 $1.5 $2.0 $2.5 $3.0 $3.5 $4.0 $4.5 2010 2011 2012 2013 2014E Represents cash used in investing activities as presented on our Statements of Consolidated Cash Flows before changes in restricted cash, proceeds from asset sales and related transactions, and sustaining (1) |
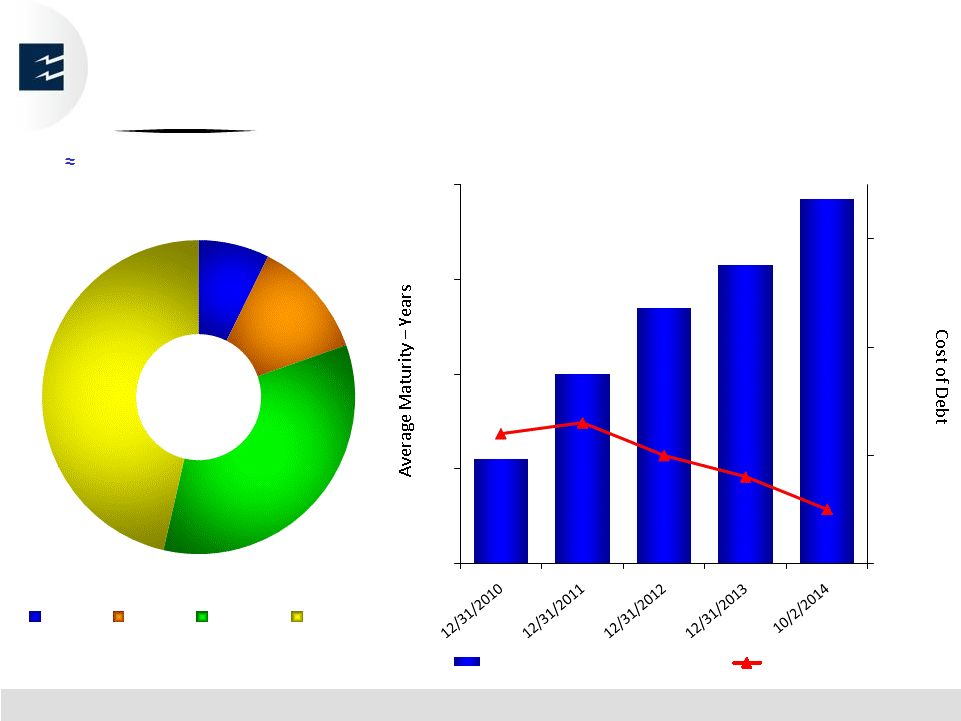 © ALL RIGHTS RESERVED. ENTERPRISE PRODUCTS PARTNERS L.P. 29 STRENGTHENING DEBT PORTFOLIO Extending Maturities Without Increasing Costs 98.9% Fixed Rate Debt $15.9 Billion Notes Issued 2009 – 10/2/2014 7.3% 12.3% 34.0% 46.4% 3 Year 5 Year 10 Year 30+ Year 9.2 11.0 12.4 13.3 14.7 5.7% 5.8% 5.5% 5.3% 5.0% 4.5% 5.5% 6.5% 7.5% 7 9 11 13 15 Average Maturity to First Call Date Average Cost of Debt |
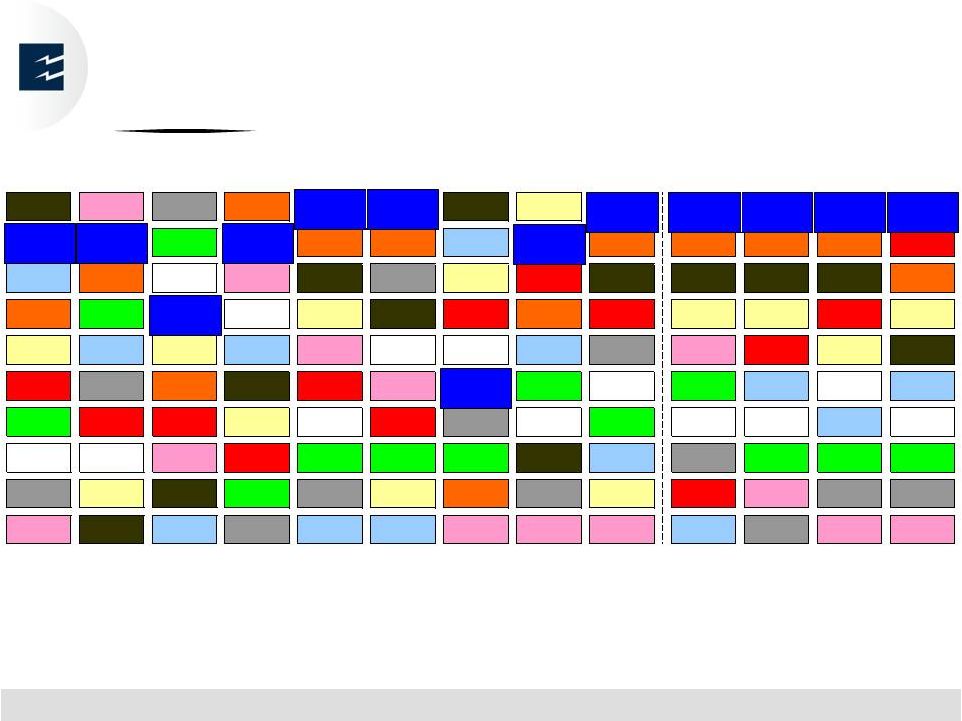 © ALL RIGHTS RESERVED. ENTERPRISE PRODUCTS PARTNERS L.P. 30 EPD TOTAL RETURN Compared to 9 Other Asset Classes (1) CAGR calculations based upon closing prices ending the last trading day of the third quarter for each period. Commodities: S&P World Commodity Index; EPD: Enterprise Products Partners L.P.; Hedge Funds: CS Tremont Hedge Fund; High Yield: Vanguard High Yield US Corporate Fund; IG Bonds: Vanguard Intermediate Term US Investment Grade Fund; MLP Index: Alerian Index; Non-US Equity: MSCI Daily Total Return EAFE Index; REIT: DJ Equity REIT Index; S&P 500: S&P 500 Index; Small Cap Equity: Russell 2000 Index Past results may not be indicative of future performance. Source: Bloomberg L.P. REIT Commodities IG Bonds MLP Index EPD EPD REIT Small Cap Equity EPD EPD EPD EPD EPD 35.4% 40.7% -6.1% 76.4% 41.0% 17.8% 19.6% 38.8% 25.3% 22.7% 20.3% 29.8% 32.0% EPD EPD Hedge Funds EPD MLP Index MLP Index Non-US Equity EPD MLP Index MLP Index MLP Index MLP Index S&P 500 29.3% 16.9% -19.1% 64.7% 35.9% 13.9% 17.9% 38.4% 19.5% 18.3% 16.2% 23.6% 23.0% Non-US Equity MLP Index High Yield Commodities REIT IG Bonds Small Cap Equity S&P 500 REIT REIT REIT REIT MLP Index 26.9% 12.7% -21.3% 50.3% 27.7% 7.4% 16.3% 32.4% 13.4% 11.8% 8.5% 15.9% 22.9% MLP Index Hedge Funds EPD High Yield Small Cap Equity REIT S&P 500 MLP Index S&P 500 Small Cap Equity Small Cap Equity S&P 500 Small Cap Equity 26.1% 12.6% -30.1% 39.2% 26.9% 7.5% 16.0% 27.6% 8.3% 7.9% 8.2% 15.7% 21.3% Small Cap Equity Non-US Equity Small Cap Equity Non-US Equity Commodities High Yield High Yield Non-US Equity IG Bonds Commodities S&P 500 Small Cap Equity REIT 18.4% 11.6% -33.8% 32.5% 20.4% 7.3% 14.3% 23.3% 4.4% 7.6% 8.1% 14.3% 17.0% S&P 500 IG Bonds MLP Index REIT S&P 500 Commodities EPD Hedge Funds High Yield Hedge Funds Non-US Equity High Yield Non-US Equity 15.8% 6.2% -36.9% 28.5% 15.1% 2.1% 13.4% 9.7% 3.5% 7.4% 6.8% 9.4% 14.2% Hedge Funds S&P 500 S&P 500 Small Cap Equity High Yield S&P 500 IG Bonds High Yield Hedge Funds High Yield High Yield Non-US Equity High Yield 13.9% 5.5% -37.0% 27.2% 12.5% 2.1% 9.2% 4.7% 3.4% 6.4% 6.7% 7.0% 9.5% High Yield High Yield Commodities S&P 500 Hedge Funds Hedge Funds Hedge Funds REIT Non-US Equity IG Bonds Hedge Funds Hedge Funds Hedge Funds 8.5% 1.9% -42.8% 26.5% 10.9% -2.5% 7.7% 2.7% -1.0% 6.3% 6.3% 6.4% 7.2% IG Bonds Small Cap Equity REIT Hedge Funds IG Bonds Small Cap Equity MLP Index IG Bonds Small Cap Equity S&P 500 Commodities IG Bonds IG Bonds 4.3% -1.6% -37.6% 18.6% 10.6% -4.2% 4.8% -1.4% -4.4% 4.9% 5.5% 6.3% 4.6% Commodities REIT Non-US Equity IG Bonds Non-US Equity Non-US Equity Commodities Commodities Commodities Non-US Equity IG Bonds Commodities Commodities 0.4% -15.6% -43.1% 17.9% 8.2% -11.7% 0.3% -2.2% -9.2% 4.3% 5.4% 4.4% -1.0% 2006 2007 2008 2009 2010 2011 2012 2013 9M 2014 15-Year CAGR ¹ 10-Year CAGR ¹ 5-Year CAGR ¹ 3-Year CAGR ¹ |
 NON–GAAP RECONCILIATIONS enterpriseproducts.com © ALL RIGHTS RESERVED. ENTERPRISE PRODUCTS PARTNERS L.P. |
 © ALL RIGHTS RESERVED. ENTERPRISE PRODUCTS PARTNERS L.P. 32 GROSS OPERATING MARGIN We evaluate segment performance based on the non-GAAP financial measure of gross operating margin. Gross operating margin (either in total or by individual segment) is an important performance measure of the core profitability of our operations. This measure forms the basis of our internal financial reporting and is used by our management in deciding how to allocate capital resources among business segments. The following table reconciles non-GAAP gross operating margin to operating income, which is the most directly comparable GAAP financial measure to gross operating margin (dollars in millions): Note: Gross Operating Margin has been presented as if EPD were Enterprise GP Holdings for all periods prior to the Holdings Merger, which was completed in November 2010. For the Nine For the Twelve Months Ended Months Ended 2010 2011 2012 2013 September 30, 2014 September 30, 2014 Gross operating margin by segment: NGL Pipelines & Services 1,732.6 $ 2,184.2 $ 2,468.5 $ 2,514.4 $ 2,172.4 $ 2,909.8 $ Onshore Natural Gas Pipelines & Services 527.2 675.3 775.5 789.0 618.8 805.9 Onshore Crude Oil Pipelines & Services 113.7 234.0 387.7 742.7 534.5 697.6 Offshore Pipelines & Services 297.8 228.2 173.0 146.1 120.0 148.0 Petrochemical & Refined Products Services 584.5 535.2 579.9 625.9 482.4 657.6 Other Investments (2.8) 14.8 2.4 - - - Total gross operating margin (non-GAAP) 3,253.0 3,871.7 4,387.0 4,818.1 3,928.1 5,218.9 Adjustments to reconcile non-GAAP gross operating margin to GAAP operating income: Subtract depreciation, amortization and accretion expense amounts not reflected in gross operating margin (936.3) (958.7) (1,061.7) (1,148.9) (936.5) (1,233.7) Subtract impairment charges not reflected in gross operating margin (8.4) (27.8) (63.4) (92.6) (18.2) (57.5) Subtract operating lease expenses paid by EPCO not reflected in gross operating margin (0.7) (0.3) - - - - Add net gains attributable to asset sales and insurance recoveries not reflected in gross operating margin 44.4 156.0 17.6 83.4 99.0 114.0 Subtract non-refundable deferred revenues attributable to shipper make-up rights on new pipeline projects reflected in gross operating margin - - - (4.4) (66.8) (71.2) Subtract general and administrative costs not reflected in gross operating margin (204.8) (181.8) (170.3) (188.3) (150.9) (200.3) Operating income (GAAP) 2,147.2 $ 2,859.1 $ 3,109.2 $ 3,467.3 $ 2,854.7 $ 3,770.2 $ For the Year Ended December 31, |
 © ALL RIGHTS RESERVED. ENTERPRISE PRODUCTS PARTNERS L.P. 33 For the Nine For the Twelve Months Ended Months Ended 2010 2011 2012 2013 September 30, 2014 September 30, 2014 Net income (GAAP) 1,383.7 $ 2,088.3 $ 2,428.0 $ 2,607.1 $ 2,152.4 $ 2,858.1 $ Adjustments to GAAP net income to derive non-GAAP Adjusted EBITDA: Subtract equity in income of unconsolidated affiliates (62.0) (46.4) (64.3) (167.3) (179.1) (220.3) Add distributions received from unconsolidated affiliates 191.9 156.4 116.7 251.6 260.7 324.7 Add interest expense, including related amortization 741.9 744.1 771.8 802.5 679.6 877.7 Add provision for or subtract benefit from income taxes, as applicable 26.1 27.2 (17.2) 57.5 22.5 33.8 Add depreciation, amortization and accretion in costs and expenses 974.5 990.5 1,094.9 1,185.4 966.2 1,272.5 Adjusted EBITDA (non-GAAP) 3,256.1 3,960.1 4,329.9 4,736.8 3,902.3 5,146.5 Adjustments to non-GAAP Adjusted EBITDA to derive GAAP net cash flows provided by operating activities: Subtract interest expense, including related amortization, reflected in (741.9) (744.1) (771.8) (802.5) (679.6) (877.7) Adjusted EBITDA Add benefit from or subtract provision for income taxes reflected in Adjusted EBITDA (26.1) (27.2) 17.2 (57.5) (22.5) (33.8) Subtract net gains attributable to asset sales and insurance recoveries (46.7) (155.7) (86.4) (83.3) (99.0) (113.9) Add deferred income tax expense or subtract benefit, as applicable 7.9 12.1 (66.2) 37.9 2.6 8.4 Add impairment charges 8.4 27.8 63.4 92.6 18.2 57.5 Add or subtract the net effect of changes in operating accounts, as applicable (190.4) 266.9 (582.5) (97.6) (435.8) (19.5) Add or subtract miscellaneous non-cash and other amounts to reconcile non-GAAP Adjusted EBITDA with GAAP net cash flows provided by operating activities 32.7 (9.4) (12.7) 39.1 18.2 36.2 Net cash flows provided by operating activities (GAAP) 2,300.0 $ 3,330.5 $ 2,890.9 $ 3,865.5 $ 2,704.4 $ 4,203.7 $ For the Year Ended December 31, ADJUSTED EBITDA Adjusted EBITDA is commonly used as a supplemental financial measure by our management and external users of our financial statements, such as investors, commercial banks, research analysts and ratings agencies to assess: (1) the financial performance of our assets without regard to financing methods, capital structures or historical cost basis; (2) the ability of our assets to generate cash sufficient to pay interest and support our indebtedness; and (3) the viability of projects and the overall rates of return on alternative investment opportunities. Since adjusted EBITDA excludes some, but not all, items that affect net income or loss and because these measures may vary among other companies, the adjusted EBITDA data included in this presentation may not be comparable to similarly titled measures of other companies. The following table reconciles non-GAAP adjusted EBITDA to net cash flows provided by operating activities, which is the most directly comparable GAAP financial measure to adjusted EBITDA (dollars in millions): Note: Adjusted EBITDA has been presented as if EPD were Enterprise GP Holdings for all periods prior to the Holdings Merger, which was completed in November 2010. |
 © ALL RIGHTS RESERVED. ENTERPRISE PRODUCTS PARTNERS L.P. 34 For the Nine Months Ended 2010 2011 2012 2013 September 30, 2014 Net income attributable to limited partners (GAAP) 1,266.7 $ 2,046.9 $ 2,419.9 $ 2,596.9 $ 2,127.6 $ Adjustments to GAAP net income attributable to limited partners to derive non-GAAP distributable cash flow: Add depreciation, amortization and accretion expenses 980.2 1,007.0 1,104.9 1,217.6 992.4 Add distributions received from unconsolidated affiliates 128.2 156.4 116.7 251.6 260.7 Subtract equity in income of unconsolidated affiliates (69.0) (46.4) (64.3) (167.3) (179.1) Subtract sustaining capital expenditures (240.3) (296.4) (366.2) (291.7) (262.0) Subtract net gains from asset sales and insurance recoveries (46.7) (155.7) (86.4) (83.3) (99.0) Add cash proceeds from asset sales and insurance recoveries 105.9 1,053.8 1,198.8 280.6 121.5 Add gains or subtract losses from the monetization of interest rate derivative instruments 1.3 (23.2) (147.8) (168.8) - Add deferred income tax expenses or subtract benefit, as applicable 7.9 12.1 (66.2) 37.9 2.6 Add impairment charges 8.4 27.8 63.4 92.6 18.2 Add or subtract other miscellaneous adjustments to derive non-GAAP distributable cash flow, as applicable 113.8 (25.8) (39.5) (15.7) 32.7 Distributable cash flow (non-GAAP) 2,256.4 3,756.5 4,133.3 3,750.4 3,015.6 Adjustments to non-GAAP distributable cash flow to derive GAAP net cash flows provided by operating activities: Add sustaining capital expenditures reflected in distributable cash flow 240.3 296.4 366.2 291.7 262.0 Subtract cash proceeds from asset sales and insurance recoveries reflected in distributable cash flow (105.9) (1,053.8) (1,198.8) (280.6) (121.5) Add losses or subtract gains from the monetization of interest rate derivative instruments (1.3) 23.2 147.8 168.8 - Add or subtract the net effect of changes in operating accounts, as applicable (202.1) 266.9 (582.5) (97.6) (435.8) Add miscellaneous non-cash and other amounts to reconcile non-GAAP distributable cash flow with GAAP net cash flows provided by operating activities 112.6 41.3 24.9 32.8 (15.9) Net cash flows provided by operating activities (GAAP) 2,300.0 $ 3,330.5 $ 2,890.9 $ 3,865.5 $ 2,704.4 $ For the Year Ended December 31, DISTRIBUTABLE CASH FLOW Distributable cash flow is an important non-GAAP financial measure for our limited partners since it serves as an indicator of our success in providing a cash return on investment. Specifically, this financial measure indicates to investors whether or not we are generating cash flows at a level that can sustain or support an increase in our quarterly cash distributions. Distributable cash flow is also a quantitative standard used by the investment community with respect to publicly traded partnerships because the value of a partnership unit is, in part, measured by its yield, which is based on the amount of cash distributions a partnership can pay to a unitholder. The following table reconciles non-GAAP Distributable Cash Flow to net cash flows provided by operating activities, which is the most directly comparable GAAP financial measure to distributable cash flow (dollars in millions): Note: Distributable Cash Flow for the period prior to the fourth quarter of 2010 is presented based on the historical results of EPD prior to the Holdings merger. |
 © ALL RIGHTS RESERVED. ENTERPRISE PRODUCTS PARTNERS L.P. 35 CONTACT INFORMATION Randy Burkhalter – Vice President, Investor Relations • (713) 381-6812 • rburkhalter@eprod.com |