Delaware | 13-4018068 | |
(State or other jurisdiction of incorporation or organization) | (I.R.S. Employer Identification No.) |
c/o Ceres Managed Futures LLC 522 Fifth Avenue New York , New York 10036 |
| (Address of principal executive offices) (Zip Code) |
(855) 672-4468 |
| (Registrant’s telephone number, including area code) |
| Title of each class | Trading Symbol(s) | Name of each exchange on which registered | ||
| N/A | N/A | N/A |
Large accelerated filer | Accelerated filer | Non-accelerated filerX | ||||
Smaller reporting company | Emerging growth company |
PART I
Item 1. Business.
(a) General Development of Business. Ceres Classic L.P. (formerly, Managed Futures Premier Graham L.P.) (the “Partnership”) was formed on July 15, 1998 under the Delaware Revised Uniform Limited Partnership Act to engage primarily in the speculative trading of futures contracts, options on futures and forward contracts, forward contracts on physical commodities and other commodity interests, including, but not limited to, foreign currencies, financial instruments, metals, energy, and agricultural products (collectively, “Futures Interests”). The Futures Interests that are traded by the Partnership are volatile and involve a high degree of risk. The General Partner (as defined below) may also determine to invest up to all of the Partnership’s assets in United States (“U.S.”) Treasury bills and/or money market mutual funds, including money market mutual funds managed by Morgan Stanley or its affiliates. The Partnership commenced trading operations on March 1, 1999.
Ceres Managed Futures LLC, a Delaware limited liability company, acts as the general partner (“Ceres” or the “General Partner”) and commodity pool operator of the Partnership. The General Partner is a wholly-owned subsidiary of Morgan Stanley Domestic Holdings, Inc. (“MSD Holdings”). MSD Holdings is ultimately owned by Morgan Stanley. Morgan Stanley is a publicly held company whose shares are listed on the New York Stock Exchange. Morgan Stanley is engaged in various financial services and other businesses. Morgan Stanley Smith Barney LLC is doing business as Morgan Stanley Wealth Management (“Morgan Stanley Wealth Management”). This entity currently serves as the placement agent to the Partnership (the “Placement Agent”). Morgan Stanley Wealth Management is a principal subsidiary of MSD Holdings.
As of December 31, 2022, all trading decisions were made for the Partnership by Graham Capital Management, L.P. (“Graham”), Winton Capital Management Limited (“WCM”), EMC Capital Advisors, LLC (“EMC”) and Campbell & Company, LP (“Campbell”), as the commodity trading advisors to the Partnership (each, a “Trading Advisor” and collectively, the “Trading Advisors”). Each Trading Advisor is allocated a portion of the Partnership’s assets to manage. Prior to January 1, 2021, Graham was the sole trading advisor to the Partnership, and managed the assets of the Partnership pursuant to its K4D-15V Program, Graham’s proprietary, trend-following trading program. Ceres is responsible for selecting additional commodity trading advisors from time to time and for replacing Trading Advisors as it deems necessary. Trading advisors can be added, removed or replaced at any time by Ceres, or Ceres may determine to adjust the allocation of assets to each Trading Advisor, without the consent of, or advance notice to, the Limited Partners. A description of the trading activities and focus of the Trading Advisors is included under “Item 7. Management’s Discussion and Analysis of Financial Condition and Results of Operations.”
As of January 1, 2021, the Partnership invested a portion of its assets in CMF Winton Master L.P., organized in New York as a limited partnership (“CMF Winton” or the “Trading Company”). The Partnership and any other feeder fund investing in the Trading Company constitute the limited partners of the Trading Company. The Trading Company is managed by Ceres Managed Futures LLC. CMF Winton has a single account with WCM. The Trading Company may and will, among other things, trade, buy, sell, spread, or otherwise acquire, hold or dispose of Futures Interests (as defined below).
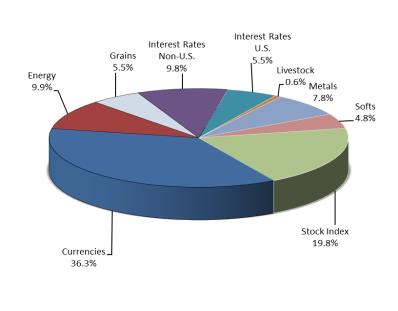
For the period January 1, 2022 through December 31, 2022, the approximate average market sector distribution for the Partnership was as follows:
1
2
At December 31, 2022 and 2021, the Partnership owned 100% of CMF Winton. It is the Partnership’s intention to continue to invest in the Trading Company. The performance of the Partnership is directly affected by the performance of the Trading Company. Expenses to investors as a result of investment in the Trading Company are approximately the same as they would be if the Partnership traded directly and redemption rights are not affected.
During the years ended December 31, 2022, 2021 and 2020, the Partnership’s commodity broker was Morgan Stanley & Co. LLC (“MS&Co.”), a registered futures commission merchant. MS&Co. also acted as the counterparty on all trading of foreign currency forward contracts. MS&Co. is a wholly-owned subsidiary of Morgan Stanley. As of January 1, 2021, JPMorgan Chase Bank, N.A. (“JPM”) acts as prime broker in connection with foreign exchange forward and swap transactions for the Trading Company.
Effective October 2, 2020, the Partnership changed its name from Managed Futures Premier Graham L.P. to Ceres Classic L.P.
The General Partner, on behalf of the Partnership, has entered into a management agreement (the “Management Agreement”) with Graham. The Management Agreement provides that Graham has sole discretion in determining the investments of the assets of the Partnership allocated to Graham by the General Partner. Pursuant to the Management Agreement, the Partnership pays Graham a flat-rate monthly fee. Effective as of January 1, 2021, the management fee payable by the Partnership to Graham is equal to 1/12th of 1.25% (a 1.25% annual rate) of the Partnership’s net assets as of the first day of each month. From February 1, 2019 to December 31, 2020, the management fee payable by the Partnership to Graham was equal to 1/12th of the 1.35% (1.35% annual rate) of the Partnership’s net assets as of the first day of each month. From April 1, 2014 to January 31, 2019, the management fee payable by the Partnership to Graham was equal to 1/12th of 1.75% (1.75% annual rate) of the Partnership’s net assets as of the first day of each month.
Effective as of January 1, 2021, the Partnership pays WCM a flat-rate monthly fee equal to 1/12th of 1.5% (a 1.5% annual rate) of the Partnership’s net assets allocated to WCM as at the beginning of the relevant month, which will be equal to the prior month end net assets, net of all fees and expenses for the previous month, and decreased by any redemptions for such prior month end and increased by any subscriptions for the current month.
Effective as of January 1, 2021, the Partnership pays Campbell a flat rate monthly fee equal to 1/12th of 1.25% (a 1.25% annual rate) of the beginning of the month net asset value allocated to Campbell.
Effective as of January 1, 2021, the Partnership pays EMC a flat rate monthly fee equal to 1/12th of 0.875% (a 0.875% annual rate) of the beginning of the month net asset value allocated to EMC.
In addition, the Partnership pays Graham an annual incentive fee. Effective February 1, 2019, the Partnership pays Graham an incentive fee equal to 18% of trading profits experienced by the Partnership as of the end of such period. Prior to February 1, 2019, the Partnership paid Graham an incentive fee equal to 20% of trading profits experienced by the Partnership as of the end of each calendar month.
Effective as of January 1, 2021, the Partnership pays WCM a quarterly incentive fee equal to 20% of new trading profits (as defined in the applicable management agreement) earned by WCM in each quarterly period. Pursuant to the management agreement with WCM, no incentive fee will be paid to WCM with respect to the Partnership until it has (i) recouped a certain loss carryforward and (ii) earned new trading profits (as defined in the applicable management agreement) from and after January 1, 2021. The loss carryforward applied to the Partnership will be adjusted according to the Partnership’s assets allocated to WCM as of January 1, 2021.
Effective as of January 1, 2021, the Partnership pays Campbell a quarterly incentive fee equal to 20% of trading profits (as defined in the applicable management agreement) earned by Campbell in each quarterly period.
Effective as of January 1, 2021, the Partnership pays EMC a quarterly incentive fee equal to 20% of trading profits (as defined in the applicable management agreement) earned by EMC in each quarterly period.
Trading profits represent the amount by which profits from trading in Futures Interests exceed losses after ongoing placement agent fees, management and administrative and General Partner’s fees, as applicable, are deducted. When Graham experiences losses with respect to net assets as of the end of a calendar year or month, as applicable, Graham must recover such losses before Graham is eligible for an incentive fee in the future. Cumulative trading losses are adjusted on a pro-rated basis for the amount of each month’s net redemptions.
3
The Trading Company has entered into a foreign exchange brokerage account agreement and a futures brokerage account agreement with MS&Co. The Partnership has also entered into a futures brokerage account agreement with MS&Co. Pursuant to these agreements, the Partnership, directly or indirectly through its investment in the Trading Company, pays MS&Co. (or will reimburse MS&Co., if previously paid) its allocable share of all trading fees for the clearing and, where applicable, execution of transactions as well as exchange, user, give-up, floor brokerage and National Futures Association fees (collectively, the “clearing fees”).
The Partnership has also entered into a selling agreement with Morgan Stanley Wealth Management (as amended, the “Selling Agreement”). Pursuant to the Selling Agreement, Morgan Stanley Wealth Management is paid a monthly ongoing selling agent fee at the rates described below. The ongoing selling agent fee received by Morgan Stanley Wealth Management is shared with the properly registered/exempted financial advisors of Morgan Stanley Wealth Management who sell Class A Units.
The Trading Company entered into certain agreements with JPM in connection with trading in forward foreign currency contracts on behalf of the Trading Company and, indirectly, the Partnership. These agreements include a foreign exchange and bullion authorization agreement (“FX Agreement”), an International Swap Dealers Association, Inc. master agreement (“Master Agreement”), a schedule to the Master Agreement, a 2016 credit support annex for variation margin to the schedule and an institutional account agreement. Under the FX Agreement, JPM charges a fee on the aggregate foreign currency transactions entered into on behalf of the Trading Company during a month.
As of November 1, 2018, the Partnership entered into an alternative investment placement agent agreement (the “Harbor Selling Agreement”), by and among the Partnership, the General Partner, Morgan Stanley Distribution Inc. (“MSDI”), and Harbor Investment Advisory, LLC, a Maryland limited liability company (“Harbor”), which supersedes and replaces the alternative investment selling agent agreement, dated January 19, 2018, between the Partnership, the General Partner and Harbor. Pursuant to the Harbor Selling Agreement, MSDI and Harbor have been appointed as a non-exclusive selling agent and sub-selling agent, respectively, of the Partnership for the purpose of finding eligible investors for units of limited partnership interest (“Unit(s)”) through offerings that are exempt from registration under the Securities Act of 1933, as amended (the “Securities Act”), pursuant to Section 4(a)(2) thereof and Rule 506 of Regulation D promulgated thereunder and for Harbor to serve as an investment advisor to its customers investing in one or more of the partnerships party to the Harbor Selling Agreement; provided, that, included within such appointment, Harbor will provide certain services to certain holders of Units of the Partnership, who had acquired such Units prior to such holders becoming clients of Harbor.
The Harbor Selling Agreement continues in effect until September 30, 2023 unless terminated in certain circumstances as set forth in the Harbor Selling Agreement, including by any party on thirty days’ prior written notice, after which the General Partner or the Partnership may, in its sole discretion, renew the Harbor Selling Agreement for additional one year periods. Pursuant to the Harbor Selling Agreement, effective as of January 1, 2021, the Partnership pays Harbor an ongoing placement agent fee equal to 1/12th of 0.75% (a 0.75% annual rate) of the net asset value per Unit for certain holders of Class A Units in the Partnership. From July 1, 2020 to December 31, 2020, the Partnership paid Harbor an ongoing placement agent fee equal to 1/12th of 1.00% (a 1.00% annual rate) of the net asset value per Unit for certain holders of Class A Units in the Partnership, as set forth in the Harbor Selling Agreement. Prior to July 1, 2020, the Partnership paid Harbor an ongoing placement agent fee equal to 1/12th of 2.00% (a 2.00% annual rate) of the net asset value per Unit for certain holders for Class A Units in the Partnership, as set forth in the Harbor Selling Agreement.
As of December 31, 2022, units of limited partnership interest (“Unit(s)”) of the Partnership are being offered in two share classes (each, a “Class” or collectively, the “Classes”) in a private placement pursuant to Regulation D under the Securities Act. A Limited Partner will initially receive Class A Units in the Partnership, provided, that certain investors (other than ERISA/IRA investors) who subscribe for Units on a consulting basis, the General Partner and certain employees of Morgan Stanley and/or its subsidiaries (and their family members) may be designated to hold Class Z Units. The Partnership previously offered Units in Class D, however, no Limited Partners hold Class D Units as of December 31, 2022, and Class D Units are no longer offered.
Each of Class A and Z Units of the Partnership have the same investment exposure and rights except for the amount of the ongoing placement agent fee charged to each Class of Units. Class Z Units are not subject to an ongoing placement agent fee.
The Partnership began the year at a net asset value per Class A Unit of $22.22 and increased 26.4% to $28.08 per Class A Unit and a net asset value per Class Z Unit of $9.46 and increased 27.3% to $12.04 per Class Z Unit on December 31, 2022. For a more detailed description of the Partnership’s business, see subparagraph (c).
4
The General Partner has delegated certain administrative functions to SS&C Technologies, Inc., a Delaware corporation, currently doing business as SS&C GlobeOp (the “Administrator”). Pursuant to a master services agreement, the Administrator furnishes certain administrative, accounting, regulatory reporting, tax and other services as agreed from time to time. In addition, the Administrator maintains certain books and records of the Partnership.
(b) [Reserved.]
(c) Narrative Description of Business. For financial information reporting purposes, the Partnership is deemed to engage in one industry segment, the speculative trading of Futures Interests. The relevant financial information is presented in “Part II. Item 8. Financial Statements and Supplementary Data.” The Partnership is in the business of speculative trading of Futures Interests pursuant to trading instructions provided by the Trading Advisors. See Item 1(a) above for a complete description of the Partnership’s business. The information requested in Section 101(c)(1)(i) through (v) and Section 101(c)(2)(i) of Regulation S-K is not applicable to the Partnership. Additionally, the Partnership does not have any employees. The directors and officers of the General Partner are listed in “Part III. Item 10. Directors, Executive Officers and Corporate Governance.”
(d) [Reserved.]
(e) Available Information. The Partnership files an Annual Report on Form 10-K, Quarterly Reports on Form 10-Q, Current Reports on Form 8-K, and all amendments to these reports with the Securities and Exchange Commission (“SEC”). The Partnership does not maintain an internet website; however the SEC maintains an internet site that contains reports, proxy and information statements, and other information regarding issuers that file electronically with the SEC. The Partnership’s SEC filings are available to the public from the EDGAR database on the SEC’s website at http://www.sec.gov. The Partnership’s CIK number is 0001066656. As of the date hereof, the Partnership does not have an internet address.
5
Item 1A. Risk Factors.
This section includes some of the principal risks that investors will face with an investment in the Partnership.
THE UNITS IN THE PARTNERSHIP ARE SPECULATIVE AND INVOLVE A HIGH DEGREE OF RISK. THEY ARE SUITABLE ONLY FOR PERSONS WHO CAN AFFORD TO LOSE THEIR ENTIRE INVESTMENT.
Risks Relating to the Partnership and the Offering of Units
You should not rely on past performance of the General Partner or the Trading Advisors in deciding to purchase Units. The past investment performance of other entities managed by the General Partner and the Trading Advisors is not necessarily indicative of the Partnership’s or a Trading Company’s future results. No assurance can be given that the General Partner will succeed in meeting the investment objectives of the Partnership. You may lose all or substantially all of your investment in the Partnership.
The Partnership and the Trading Company incur substantial charges. The Partnership and the Trading Company must pay substantial charges, and must generate profits and interest income which exceed their respective fixed costs in order to avoid depletion of the Partnership’s assets. The Partnership and the Trading Company are required to pay certain expenses and fees, including monthly management fees to the Trading Advisors, regardless of their performance. In addition, the Partnership pays each Trading Advisor an incentive fee of between 18% to 20% of Trading Profits, or New Trading Profits, as set forth in the applicable advisory agreement, if any, earned by the relevant Trading Advisor. Limited partners in the Partnership will be indirectly responsible for the expenses paid by the Partnership and the Trading Company.
Incentive fees may be paid by the Partnership even if the Partnership sustains trading losses. The Partnership pays each Trading Advisor an incentive fee based upon the Trading Profits or New Trading Profits, as set forth in the applicable advisory agreement, that it generates for the Partnership. To the extent that the Partnership pays one or more Trading Advisors an incentive fee, these trading profits include unrealized appreciation on open positions. Accordingly, it is possible that the Partnership will pay an incentive fee on trading profits that do not become realized. Also, each Trading Advisor will retain all incentive fees paid to it, even if it incurs a subsequent loss after payment of an incentive fee. Certain of the incentive fees may be paid quarterly, such that it is possible that an incentive fee may be paid to a Trading Advisor during a year in which the assets of the Partnership suffer a loss for the year. Because the Trading Advisors receive an incentive fee based on the Trading Profits or New Trading Profits, as applicable, the Trading Advisors may have an incentive to make investments that are riskier than would be the case in the absence of such an incentive fee being paid to the Trading Advisors based on Trading Profits or New Trading Profits, as applicable.
Restricted investment liquidity in the Units. There is no secondary market for the Units, and you generally may not redeem your Units other than as of the last business day of each month. Your right to receive payment for a redemption of some or all of your Units is dependent upon (a) the Partnership having sufficient assets to pay its liabilities on the redemption date, and (b) the General Partner’s receipt of your request for redemption in such manner as determined by the General Partner no later than 3:00 P.M., New York City time, on the third business day before the end of the month, although the General Partner may accept requests for redemption at other times in its sole discretion. The General Partner will not permit a transfer, sale, pledge or assignment of Units unless it is satisfied that the transfer, sale, pledge or assignment would not be in violation of Delaware law or applicable federal, state, or foreign securities laws and notwithstanding any transfer, sale, pledge or assignment, the Partnership will continue to be classified as a partnership rather than as an association or publicly traded partnership taxable as a corporation under the Internal Revenue Code of 1986, as amended (the “Code”). No transfer, sale, pledge or assignment of Units will be effective or recognized by the Partnership if the transfer, sale, pledge or assignment would result in the termination of the Partnership for U.S. federal income tax purposes. Any attempt to transfer, sell, pledge or assign Units in violation of the limited partnership agreement of the Partnership, as amended (the “Partnership Agreement”) will be ineffective.
General Partner redemptions. The General Partner is required to maintain a capital contribution at least equal to the greater of: (a) 1% of aggregate capital contributions to the Partnership (including the General Partner’s contribution) and (b) $25,000. The General Partner may otherwise redeem any portion of its investment in the Partnership at any time without notice to the limited partners. For any such redemption, the General Partner will redeem its Units at the end of the month in the same manner as any limited partner would follow to redeem Units. Additionally, the General Partner has the right to redeem Units it holds in the event redemptions for limited partners are suspended.
6
The Partnership’s structure has conflicts of interest.
| • | The General Partner, Morgan Stanley Investment Management, the Placement Agent, MSDI and MS&Co. are affiliates. As a result, the fees and other compensation received by these parties and other terms relating to the operation of the Partnership and the sale of Units have not been negotiated independently. The officers and directors of the General Partner are also employees of Morgan Stanley or one of its subsidiaries and may have a conflict of interest between their responsibility to the General Partner and the commodity pools it operates. Some of the compensation for such officers and directors of the General Partner may be based in part on the profitability of Morgan Stanley and its managed futures business operated by the General Partner. |
| • | Employees of the Placement Agent receive a significant portion of the ongoing placement agent fee paid by the Partnership (except for consulting clients, from which the Placement Agent, serving in its role as investment adviser, receives the fees and expenses described in such consulting client’s consulting agreement). Therefore, these employees have a conflict of interest in making recommendations regarding the purchase or redemption of Units. |
| • | MS&Co. can benefit from bid/ask spreads to the extent that the Trading Advisors for the Partnership execute over-the-counter (“OTC”) foreign exchange trades with MS&Co. and bid/ask spreads are charged. |
| • | The Trading Advisors, the General Partner, Morgan Stanley and its affiliates and subsidiaries may trade Futures Interests for their own accounts, and thereby compete with the Partnership and the Trading Company for positions. There are potential incentives for such persons and, in particular, investment personnel, to favor the proprietary accounts over the client accounts (including the Partnership’s or the Trading Company’s accounts), including, without limitation, with respect to allocation of investments, time and attention. There may be cases where certain proprietary accounts trade ahead of, or opposite, trades for the Partnership (or the Trading Company). Also, the other commodity pools managed by the General Partner and the Trading Advisors may compete with the Partnership and the Trading Company for Futures Interests. These conflicts can result in less favorable prices on the Partnership’s and the Trading Company’s transactions. These pools may also pay lower fees, including lower commodity brokerage fees and/or commissions, than the Partnership pays. The records of trading in such accounts, and any written policies relating to such trading, will not be made available to limited partners for inspection. |
| • | For excess cash which is not invested, MS&Co. and the General Partner retain any interest earned on cash in the Partnership’s and the Trading Company’s account in excess of the rate specified in the Partnership’s Annual Report to Limited Partners for the year ended December 31, 2022. Depending on the current market interest rates, that could create an incentive for the General Partner to retain excess cash in cash instead of direct investments in permitted investments. |
| • | The General Partner may purchase shares from money market mutual funds affiliated and/or unaffiliated with the General Partner. |
No specific policies regarding conflicts of interest have been adopted by the General Partner, Morgan Stanley Wealth Management, MSDI, the Partnership, the Trading Company or any of their affiliates, and investors will be dependent on the good faith of, and legal and fiduciary obligations imposed on, the parties involved with such conflicts to resolve them equitably.
“Master-feeder” structure. Certain of the Trading Advisors may invest the assets of the Partnership through master-feeder structures which presents certain unique risks to investors. Smaller feeder funds (including the Partnership, as applicable) investing in a Trading Company may be materially affected by the actions of larger feeder funds investing in the Trading Company. For example, if a larger feeder fund withdraws from the Trading Company, the remaining feeder funds may experience higher pro rata operating expenses, thereby producing lower returns. Such Trading Company’s portfolio may become less diverse due to a withdrawal by a larger feeder fund, resulting in increased volatility and risk. In addition, advisory and other fees are charged at the level of each individual feeder fund and, therefore, such fees may differ from those of the Partnership. The Partnership may withdraw its investments in the Trading Company at any time, provided that all liabilities, contingent or otherwise, of the Trading Company, except any liability to the limited partners on account of their capital contributions, have been paid or there remains property in the Trading Company sufficient to pay them. In such event, the General Partner would consider what action might be taken, including retaining the Trading Company’s trading advisor to manage that portion of the Partnership’s assets directly.
An investment in Units may not diversify an overall portfolio. Because Futures Interests have historically performed independently of traditional investments in equities and bonds, the General Partner believes that managed futures funds like the Partnership can diversify a traditional portfolio of equities and bonds. However, the General Partner cannot assure you that the Partnership will perform with a significant degree of non- or low-correlation to your other investments in the future. You may lose your entire investment in the Partnership.
7
Neither the Partnership nor the Trading Company is a registered investment company. The Partnership and the Trading Company are not registered investment companies. The Partnership and the Trading Company are not required to register, and are not registered, as investment companies under the Investment Company Act of 1940, as amended (the “Investment Company Act”). Accordingly, investors will not have the protections afforded by the Investment Company Act (which, among other matters, requires investment companies to have a majority of disinterested directors and regulates the relationship between the trading advisor(s) and the investment company).
Risks Related to Regulation of the Partnership and General Partner
The Federal Reserve Board’s regulation of Morgan Stanley could affect the activities of the Partnership and the Trading Company. As a bank holding company (“BHC”) that has elected financial holding company (“FHC”) status under the Bank Holding Company Act of 1956 (“BHCA”), Morgan Stanley and its affiliates are subject to comprehensive, consolidated supervision and regulation by the Board of Governors of the Federal Reserve System (“Federal Reserve”). Since the General Partner is a subsidiary of Morgan Stanley, the Federal Reserve will treat the Partnership as an affiliate of Morgan Stanley. As a result, the Partnership will be subject to the BHCA and the Federal Reserve’s implementing regulations and interpretations, which are subject to change.
A significant focus of the regulatory framework that applies to Morgan Stanley is to ensure that Morgan Stanley and its subsidiaries operate in a safe and sound manner, with sufficient capital, earnings and liquidity to allow Morgan Stanley to serve as a source of financial and managerial strength to Morgan Stanley Bank, N.A. and Morgan Stanley Private Bank, National Association (the “Banks”). These Banks must remain well capitalized and well managed if Morgan Stanley is to maintain its FHC status and continue to engage in the widest range of permissible financial activities. In addition, the general exercise by the Federal Reserve of its regulatory, supervisory and enforcement authority with respect to Morgan Stanley and certain provisions of the Dodd-Frank Wall Street Reform and Consumer Protection Act (the “Dodd-Frank Act”) could result in the need for Morgan Stanley to change its business practices or the scope of its current lines of business, including certain limited divestitures. Although such changes could have an impact on and consequences for Morgan Stanley, the General Partner, the Partnership and the Trading Company any limited divestiture should not directly involve the Partnership.
The Units are not being offered by the Banks, and as such: (1) are not insured by the Federal Deposit Insurance Corporation (“FDIC”), (2) are not deposits or other obligations of the Banks, (3) are not guaranteed by the Banks, and (4) involve investment risks, including possible loss of principal.
Assets held in accounts at U.S. banks may not be fully insured. The assets of the Partnership and the Trading Company that are deposited with commodity brokers, FX counterparties or their affiliates may be placed in deposit accounts at U.S. banks. The FDIC insures deposits held at insured depository institutions for up to $250,000 (including principal and accrued interest) for each insurable capacity (e.g., individual accounts, joint accounts, corporate accounts, etc.), though deposits in separate branches of an insured institution are not separately insured. If the FDIC were to become receiver of insured U.S. bank holding deposit accounts that were established by a commodity broker or one of its affiliates, then it is uncertain whether the commodity broker, the affiliate involved, the Partnership, the Trading Company or the investor would be able to reclaim cash in the deposit accounts above $250,000.
Other federal agencies, including the SEC and the Commodity Futures Trading Commission (“CFTC”), regulate certain activities of the Partnership and General Partner. Regulatory changes other than banking regulations could adversely affect the Partnership by restricting its trading activities and/or increasing the costs or taxes to which the investors are subject. The Dodd-Frank Act, among other things, grants the CFTC and SEC broad rulemaking authority to implement various provisions of the Dodd-Frank Act, including comprehensive regulation of the OTC derivatives market and certain foreign exchange transactions. The implementation of the Dodd-Frank Act could adversely affect the Partnership by increasing transaction and/or regulatory compliance costs. In addition, greater regulatory scrutiny may increase the Partnership’s and the General Partner’s exposure to potential liabilities. Increased regulatory oversight can also impose administrative burdens on the General Partner, including, without limitation, responding to investigations and implementing new policies and procedures. As a result, the General Partner’s time, attention and resources may be diverted from portfolio management activities.
Other potentially adverse regulatory initiatives could develop suddenly and without notice.
8
The General Partner may determine to invest up to all of the Partnership’s and/or the Trading Company’s assets in U.S. Treasury bills and/or money market mutual fund securities. The General Partner has, at times, invested a portion, and may determine to invest all or a portion of the Partnership’s and the Trading Company’s assets in U.S. Treasury bills and/or money market mutual funds, including money market mutual funds managed by Morgan Stanley or its affiliates. The Partnership and/or the Trading Company, as applicable, will retain all interest income earned on U.S. Treasury bills and money market mutual fund securities purchased.
In the event that the General Partner is required to liquidate U.S. Treasury bills before they mature, to meet redemption requests or otherwise, the Partnership and/or the Trading Company may incur a loss on such U.S. Treasury bills and/or may be subject to additional fees or other costs. The General Partner will endeavor to maintain sufficient cash in the Partnership’s and the Trading Company’s accounts in order to meet margin requirements and avoid early liquidation of U.S. Treasury bills.
Although a money market mutual fund currently seeks to preserve the value of each of its shares at $1.00 per share, it is possible to incur losses when investing in a money market mutual fund. An investment in a money market mutual fund is not insured or guaranteed by any government agency. A money market mutual fund may experience significant pressures from, among other things, shareholder redemptions, issuer credit downgrades and illiquid markets. Historically, there have been some money market mutual funds that have “broken the buck,” which means that, upon redemption, investors in those funds did not receive $1.00 per share for their investments in those funds. Recent rule amendments adopted by the SEC require certain money market mutual funds to implement floating net asset values that will not preserve the value of each of its shares at $1.00 per share. The implementation of these rule amendments may impact the Partnership’s use of these money market mutual funds for capital preservation purposes.
Allowing investments by benefit plan investors may result in adverse consequences under ERISA or the Code. It is the current intent of the General Partner to conduct its operations so that the assets of each class of equity interests in the Partnership should not be deemed to constitute the “plan assets” of Benefit Plan Investors. If, however, the Partnership were deemed to hold “plan assets” of Benefit Plan Investors: (i) ERISA’s fiduciary standards may apply to the Partnership and might materially affect the operations of the Partnership, and (ii) any transaction with the Partnership could be deemed a transaction with each benefit plan investor and may cause transactions into which the Partnership might enter in the ordinary course of business to constitute prohibited transactions under ERISA and/or § 4975 of the Code. In order to avoid having the assets of the Partnership treated as “plan assets,” the General Partner intends to restrict the acquisition and/or redemption of Units, and such restrictions could delay or preclude the ability to transfer or redeem Units, or cause Units to lose value. However, there can be no assurances that this strategy will be successful.
Risks Relating to Futures Interests Trading and the Futures Interests Markets
Futures Interests trading is speculative and volatile. The rapid fluctuations in the market prices of Futures Interests make an investment in the Partnership volatile. Volatility is caused by, among other things, changes in supply and demand relationships; weather; agricultural, trade, fiscal, monetary and exchange control programs; domestic and foreign political and economic events and policies; and changes in interest rates. If a Trading Advisor incorrectly predicts the direction of prices in Futures Interests, large losses may occur. The Partnership’s performance will be volatile on a monthly and an annual basis. The Partnership could lose all or substantially all of its assets.
The Partnership’s and the Trading Company’s Futures Interests trading is highly leveraged such that small changes in the price of the Partnership’s or a Trading Company’s positions may result in substantial losses. The Trading Advisors for the Partnership and the Trading Company use substantial leverage in trading. Trading Futures Interests involves substantial leverage, which could result in immediate and substantial losses. Due to the low margin deposits normally required in trading Futures Interests (typically between 1% and 15% of the value of the contract purchased or sold), an extremely high degree of leverage is typical of a Futures Interests trading account. As a result, a relatively small price movement in Futures Interests may result in immediate and substantial losses to the investor. For example, if 10% of the face value of a contract is deposited as margin for that contract, a 10% decrease in the value of the contract would cause a total loss of the margin deposit. A decrease of more than 10% in the value of the contract would cause a loss greater than the amount of the margin deposit.
The gross leverage employed by each Trading Advisor in its trading can vary substantially from month to month. This gross leverage, expressed as the underlying absolute value of the Partnership’s and the Trading Company’s positions compared to the average net assets of the Partnership, is anticipated to range from two times the Partnership’s net assets to fifteen times the Partnership’s net assets. Under certain conditions, however, the Partnership’s gross leverage could exceed (or be less than) such range. The amount of margin required to be deposited with respect to an individual futures contract is determined by the exchange upon which the contract is traded and the commodity broker or FX counterparty at which the position is held and may be changed at any time.
9
Options trading can be more volatile than futures trading, and purchasing and writing options could result in trading losses. The Partnership and the Trading Company may trade options on futures. Although successful options trading requires many of the same skills as successful futures trading, the risks are different. Successful options trading requires a trader to assess accurately near-term market volatility because that volatility is immediately reflected in the price of outstanding options. Correct assessment of market volatility can therefore be of much greater significance in trading options than it is in many long-term futures strategies where volatility does not have as great an effect on the price of a futures contract. Specific market movements of the commodities or futures contracts underlying an option cannot accurately be predicted. The purchaser of an option may lose the entire premium paid for the option. The writer, or seller, of a put option collects a premium and risks losing the difference between the strike price and the market price of the underlying commodity or futures contract (less the premium received) if the option buyer exercises its put option, as well as any commissions and fees. The writer, or seller, of a call option has unlimited risk. A call option writer collects a premium and risks losing the difference between the price it would have to pay to obtain the underlying commodity or futures contract and the strike price (less the premium received) if the option buyer exercises its call option.
Market illiquidity may cause less favorable trade prices. Although the Trading Advisors for the Partnership and the Trading Company generally will purchase and sell actively traded contracts where last trade price information and quoted prices are readily available, the price at which a sale or purchase occurs may differ from the price expected because there may be a delay between receiving a quote and executing a trade, particularly in circumstances where a market has limited trading volume and prices are often quoted for relatively limited quantities. In addition, most U.S. futures exchanges have established “daily price fluctuation limits” which preclude the execution of trades at prices outside of the limit, and, from time to time, the CFTC or the exchanges may suspend trading in market disruption circumstances. In these cases it is possible that the Partnership and the Trading Company could be required to maintain a losing position that it otherwise would execute and incur significant losses or be unable to establish a position and miss a profit opportunity.
Factors that can contribute to market illiquidity for exchange-traded contracts include:
| • | exchange-imposed price fluctuation limits; |
| • | limits on the number of contracts speculative traders may hold in most commodity markets; and |
| • | market disruptions. |
The General Partner expects that non-exchange traded contracts will be traded for commodity interests for which there is generally a liquid underlying market. Such markets, however, may experience periods of illiquidity and are also subject to market disruptions.
Since the Trading Advisors already manage sizable assets in the commodity markets, it is possible that the Partnership may encounter illiquid situations. It is impossible to quantify the frequency or magnitude of these risks, however, especially because the conditions often occur unexpectedly.
Trading on non-U.S. exchanges presents greater risks to the Partnership than trading on U.S. exchanges. The Partnership and the Trading Company may trade on exchanges located outside the United States. Trading on U.S. exchanges is subject to CFTC regulation and oversight, including, for example, minimum capital requirements for commodity brokers, segregation of customer funds, regulation of trading practices on the exchanges, prohibitions against trading ahead of customer orders, prohibitions against filling orders off exchanges, prescribed risk disclosure statements, testing and licensing of industry sales personnel and other industry professionals, and recordkeeping requirements, and other requirements and restrictions for the purpose of preventing price manipulation and other disruptions to market integrity, avoiding systemic risk, preventing fraud and promoting innovation, competition and financial integrity of transactions. Trading on non-U.S. exchanges (other than swap execution facilities registered as such with the CFTC) is not regulated by the CFTC or any other U.S. governmental agency or instrumentality and may be subject to regulations that are different from those to which U.S. exchange trading is subject, may provide less protection to investors than trading on U.S. exchanges, and may be less vigorously enforced than regulations in the U.S.
Trading on non-U.S. exchanges involves some risks that trading on U.S. exchanges does not, such as:
Lack of Investor Protection Regulation
The rights of the Partnership and the Trading Company in the event of the insolvency or bankruptcy of a non-U.S. market, broker or bank are likely to differ from rights that the Partnership and the Trading Company would have in the United States and these rights may be more limited than in the case of failures of U.S. markets, brokers or banks.
10
Possible Governmental Intervention
Generally, non-U.S. brokers are not subject to the jurisdiction of the CFTC or any other U.S. regulator. In addition, the Partnership’s and the Trading Company’s assets held outside of the United States to margin transactions on non-U.S. exchanges are held in accordance with the client assets protection regime and the insolvency laws of the applicable jurisdiction. A non-U.S. government might halt trading in a market and/or take possession of the Partnership’s and the Trading Company’s assets maintained in its country in which case the assets may never be recovered. The General Partner might have little or no notice that such events were happening. In such circumstances, the General Partner may not be able to obtain the Partnership’s assets.
Relatively New Markets
Some non-U.S. exchanges on which the Partnership and the Trading Company are permitted to trade may be in developmental stages so that prior price histories may not be indicative of current price patterns.
Exchange-Rate Exposure
The Partnership is valued in U.S. dollars. Contracts on non-U.S. exchanges are usually traded in the local currency. The Partnership’s and the Trading Company’s assets held in connection with contracts priced and settled in a foreign currency may be held in a non-U.S. depository in accounts denominated in a foreign currency. Changes in the value of the local currency relative to the U.S. dollar could cause losses to the Partnership even if the contract traded is profitable.
Risks Associated with Affiliates
The Partnership’s and the Trading Company’s clearing broker may use affiliates to carry and clear transactions on non-U.S. exchanges. While the use of affiliates can provide certain benefits, it can also pose certain risks. In particular, if a clearing broker or an affiliated non-U.S. broker were to fail, it is likely that all of its affiliated companies would fail or be placed in administration within a relatively brief period of time. Each of these companies would be liquidated in accordance with the bankruptcy laws of the local jurisdiction. Moreover, return of the Partnership’s or the Trading Company’s assets held at affiliated non-U.S. brokers would be delayed, perhaps for a significant period of time, and would be subject to additional administrative costs. If, on the other hand, a clearing broker had cleared its customers’ non-U.S. futures and options transactions through unaffiliated foreign brokers, such broker likely would not have failed and the clearing broker’s bankruptcy trustee could have directed the non-U.S. broker to liquidate all of the Partnership’s or the Trading Company’s positions and return the balance to the trustee for distribution to the Partnership or the Trading Company.
The percentage of the Partnership’s and the Trading Company’s positions which are traded on non-U.S. exchanges can vary significantly from month to month. The average percentage of the Partnership’s and the Trading Company’s positions which are expected to be traded on non-U.S. exchanges in any given month is anticipated to range from 35% to 50% of the Partnership’s and the Trading Company’s positions, but could be greater or less than such expected range during any time period.
The unregulated nature of uncleared trades in the OTC markets creates counterparty risks that do not exist in futures trading on exchanges or in cleared swaps. Unlike futures contracts and cleared swaps, uncleared trades, such as forward contracts, some swaps and some OTC “spot” contracts are entered into between private parties off an exchange or other trading platform and are not subject to clearing. As a result, the performance of those contracts is not guaranteed by an exchange or its clearinghouse and the Partnership and the Trading Company are at risk with respect to the ability of the counterparty to perform on the contract, including the creditworthiness of the counterparty. Trading of foreign exchange spot contracts or foreign exchange forwards and foreign exchange swaps (as such terms are defined in the Dodd-Frank Act), and of uncleared swaps is not regulated or is subject to limited regulation; therefore, there are limited or no specific standards or regulatory supervision of trade pricing and other trading activities that occur in those markets. The Partnership trades such contracts, directly and indirectly, with MS&Co. and JPM and is at risk with respect to the creditworthiness and trading practices of each of MS&Co. and JPM as the counterparty to the contracts. See “—Trading Swaps Creates Distinctive Risks” below.
The relative exposure of the Partnership to contracts that are not cleared by a registered clearing firm as of December 31, 2022 was approximately 29%, all of which represents OTC foreign exchange spot and forward transactions. As of January 1, 2023, the General Partner anticipates that the relative exposure of the Partnership to such contracts will be between approximately 8.1% and 40.6%.
11
Forward foreign currency and spot contracts historically were not regulated when traded between certain “eligible contract participants” and are subject to credit risk. The Partnership and the Trading Company may trade forward contracts in foreign currencies and may engage in spot commodity transactions (transactions in physical commodities). These contracts, unlike futures contracts and options on futures, historically were not regulated by the CFTC when traded between certain “eligible contract participants,” as defined in the Commodity Exchange Act, as amended (the “Commodity Exchange Act”) The Partnership and the Trading Company currently are eligible swap participants. On July 21, 2010, the then President signed into law major financial services reform legislation in the form of the Dodd-Frank Act. The Dodd-Frank Act includes foreign currency forwards and foreign currency swaps (as such terms are defined in the Dodd-Frank Act) in the definition of “swap,” and therefore, contemplates that certain of these contracts may be exchange-traded, cleared by a clearinghouse and regulated by the CFTC. Currently, forward foreign currency contracts are regulated by the CFTC (although a limited category of forward foreign currency contracts have been excluded from regulation under the Dodd-Frank Act). Spot contracts generally are not included in the Dodd-Frank Act’s definition of “swap.” Regulation could entail increased costs, and among other things, result in additional recordkeeping and reporting requirements. Furthermore, although the Dodd-Frank Act contemplates that certain forward foreign currency contracts may be exchange-traded and cleared by a clearinghouse, these transactions are not currently exchange-traded so that, generally, no clearinghouse or exchange stands ready to meet the obligations of the contract. Thus, the Partnership and the Trading Company face the risk that its counterparties may not perform their obligations. This risk may cause some or all of the Partnership’s and the Trading Company’s gains, in fact, never to be realized.
The percentage of the Partnership’s and the Trading Company’s positions that are expected to constitute foreign currency forwards and foreign currency swaps can vary substantially from month to month.
Trading swaps creates distinctive risks. The Trading Advisors may trade in certain swaps. Unlike futures and options on futures contracts, most swap contracts currently are not traded on or cleared by an exchange or clearinghouse. The CFTC currently requires only a limited class of swap contracts (certain interest rate and credit default swaps) to be cleared by a clearinghouse and executed on an exchange or swap execution facility. Inter-affiliate swaps that meet certain criteria are exempt from the CFTC’s mandatory clearing and exchange trading requirements. In accordance with the Dodd-Frank Act, the CFTC will in the future determine which other classes of swap contracts will be required to be cleared by a clearinghouse and executed on an exchange or swap execution facility. Until such time as these transactions are cleared, the Partnership and the Trading Company will be subject to a greater risk of counterparty default on its swaps. Because swaps do not generally involve the delivery of underlying assets or principal, the amount payable upon default and early termination is usually calculated by reference to the current market value of the contract. Swap dealers and major swap participants require the Partnership and the Trading Company to deposit initial margin and variation margin as collateral to support the Partnership’s and the Trading Company’s obligation under the swap agreement but may not themselves provide collateral for the benefit of the Partnership and the Trading Company (except to the extent required, beginning September 1, 2016, under the rules finalized by the CFTC and the prudential regulators as described below). If the counterparty to such a swap defaults, the Partnership and the Trading Company would be a general unsecured creditor for any termination amounts owed by the counterparty to the Partnership and the Trading Company as well as for any collateral deposits in excess of the amounts owed by the Partnership and the Trading Company to the counterparty, which would likely result in losses to the Partnership and the Trading Company.
There are no limitations on daily price movements in swaps. Speculative position limits are not currently applicable to swaps, but in the future may be applicable for swaps on certain commodities. In addition, participants in the swap markets are not required to make continuous markets in the swaps they trade, and determining a market value for calculation of termination amounts can lead to uncertain results.
Trading of swaps has been and will continue to be subject to substantial change under the Dodd-Frank Act and related regulatory action. Under the Dodd-Frank Act, many commodity swaps may be required to be cleared through central clearing parties and executed on exchanges or other organized trading platforms. Security-based swaps will be subject to similar requirements. The CFTC and the prudential regulators that oversee swap dealers finalized rules regarding margin for uncleared swaps that imposed certain requirements beginning September 1, 2016 that may adversely impact the manner in which such swaps are traded and/or settled or increase the costs of such trades. Uncleared swaps will generally be subject to initial and variation margin requirements which may require the Partnership and the Trading Company to post collateral to swap dealers and collect collateral from swap dealers. Additional regulatory requirements will apply to all swaps, whether subject to mandatory clearing or not. These include collateral and capital requirements, reporting obligations, speculative position limits for certain swaps, and other regulatory requirements. Swaps which are not offered for clearing by a clearing house will continue to be traded bi-laterally. Such bi-lateral transactions will remain subject to many of the risks discussed in the preceding paragraphs.
Non-U.S. depositories are not subject to U.S. regulation. The Partnership’s and the Trading Company’s assets held in these depositories are subject to the risk that events could occur which would hinder or prevent the availability of these funds for distribution to customers including the Partnership. Such events may include actions by the government of the jurisdiction in which the depository is located including expropriation, taxation, moratoria and political or diplomatic events.
12
Implementation of legislation is not complete. Rules implementing the Dodd-Frank Act and similar legislation in other countries are not yet complete. The impact of future rules on transactions of the type undertaken by the Partnership and the Trading Company is not certain.
Changes in regulation of swaps could lead to increased costs. As the Dodd-Frank Act and related rules, as well as analogous legislation and regulations in other countries, are implemented and market infrastructure adapts to the changes, the cost of engaging in trading of swaps and other products could increase, reducing the profits from those trades.
Central clearing parties could fail. Central clearing parties are highly capitalized. Cleared transactions are supported by initial and variation margin. As a result, failure of a central clearing party is highly unlikely. If a central clearing party were to fail, however, the impact on the financial system in general and on the Partnership’s and the Trading Company’s positions in particular is uncertain and could affect a large portion of the market.
Deregistration of the commodity pool operator or a commodity trading advisor could disrupt operations. The General Partner is a registered commodity pool operator and each Trading Advisor is registered with the CFTC as a commodity trading advisor. If the CFTC were to terminate, suspend, revoke or not renew the registration of the General Partner, the General Partner would withdraw as general partner of the Partnership. The limited partners would then determine whether to select a replacement general partner or to dissolve the Partnership. If the CFTC were to terminate, suspend, revoke or not renew the registration of any Trading Advisor, the General Partner would terminate the Trading Advisor’s advisory agreement(s) with the Partnership. The General Partner could reallocate the Partnership’s assets managed by the relevant Trading Advisor to new trading advisor(s) or terminate the Partnership. No action is currently pending or threatened against the General Partner or any Trading Advisor.
The Partnership and the Trading Company are subject to speculative position limits. The CFTC and U.S. futures exchanges have established speculative position limits (referred to as “position limits”) on the maximum net long or net short position, which any person or group of persons may hold or control in particular futures and options on futures. Most exchanges also limit the amount of fluctuation in commodity futures contract prices on a single trading day. Therefore, a Trading Advisor may have to modify its trading instructions or reduce the size of its position in one or more futures or option contracts in order to avoid exceeding such position limits, which could adversely affect the profitability of the Partnership. The futures exchange may amend or adjust these position limits or the interpretation of how such limits are applied, adversely affecting the profitability of the Partnership. In addition, in October 2011, the CFTC adopted rules governing position limits on futures (and options on futures) on a number of agricultural, energy and metals commodities, as well as on swaps that perform a significant price discovery function with respect to those futures and options. In September 2012, the CFTC’s rules were vacated by the United States District Court for the District of Columbia and remanded to the CFTC for further consideration. The CFTC proposed revised position limits rules late in 2013. The comment period for the rules closed in February 2014, and the CFTC subsequently reopened comment periods for comments about certain issues related to futures and options contracts on agricultural commodities only. The CFTC re-proposed revised position limits rules late in 2016, and the comment period for the rules closed in February 2017. In January 2020, the CFTC re-proposed new rules regarding speculative position limits. These rules were adopted on October 15, 2020 and will be effective 60 days after publication in the Federal Register (the “Effective Date”). These rules will impose position limits on certain futures and option contracts and physical commodity swaps that are “economically equivalent” to such contracts and may require the Trading Advisors to alter the trading strategies they employ on behalf of the Partnership or the Trading Company, and such impact may have an adverse effect on the Trading Company’s and the Partnership’s performance. Compliance with the rules is required: (i) as of the Effective Date for legacy core agricultural futures contracts, (ii) as of January 1, 2022 for certain obligations, including, among others, with respect to federal speculative position limits for non-legacy core referenced futures contracts not previously subject to federal position limits, and (iii) January 1, 2023 for certain obligations, including, among others, with respect to federal speculative position limits for economically equivalent swaps.
The Partnership and the Trading Company have credit risk to the commodity brokers and the FX counterparties. The Partnership and the Trading Company have credit risk because the commodity brokers act as the futures commission merchants for futures transactions or the FX counterparties (for the Trading Company) on OTC transactions, with respect to most of the Partnership’s and the Trading Company’s assets. The Partnership has indirect credit risk to JPM on OTC transactions, with respect to the Trading Company’s assets, to the extent that the Partnership indirectly trades foreign exchange forward contracts through the Trading Company. As such, in the event that either MS&Co., in its capacity as a commodity broker and an FX counterparty, or JPM, in its capacity as an FX counterparty (to the extent that the Partnership indirectly trades foreign exchange forward contracts through the Trading Company, is unable to perform, the Partnership’s and/or the Trading Company’s assets are at risk and, in such event, the Partnership and/or the Trading Company may only recover a portion of its investment or nothing at all. Exchange-traded futures and futures-styled option contracts are fair-valued on a daily basis, with variations in value credited or charged to the Partnership’s or the Trading Company’s account on a daily basis.
13
The commodity brokers, as futures commission merchants for the Partnership’s and the Trading Company’s exchange-traded contracts, are required, pursuant to CFTC regulations, to segregate from their own assets, and for the sole benefit of their commodity customers, all funds held by them with respect to exchange-traded futures and futures-styled option contracts, including an amount equal to the net unrealized gain on all open futures and futures-styled option contracts. Similar requirements apply with respect to funds held in connection with cleared swap contracts. In the event of a shortfall in segregated customer funds held by the futures commission merchant, the Partnership’s and/or the Trading Company’s assets on account with the futures commission merchant may be at risk in the event of the futures commission merchant’s bankruptcy or insolvency, and in such event, the Partnership and/or the Trading Company may only recover a portion of the available customer funds. If no property is available for distribution, the Partnership and/or the Trading Company would not recover any of its assets. With respect to the Partnership’s OTC foreign exchange contracts with MS&Co. and the Partnership’s indirect trading of foreign exchange forward contracts and uncleared swaps with JPM, prior to the implementation of the Dodd-Frank Act’s provisions, there was no requirement to segregate funds held with respect to such contracts. The CFTC and the prudential regulators that oversee swap dealers finalized rules regarding margin for uncleared swaps that imposed certain requirements beginning September 1, 2016 that may adversely impact the manner in which such swaps are traded and/or settled or increase the costs of such trades. Uncleared swaps will generally be subject to initial and variation margin requirements which may require the Partnership or the Trading Company, to the extent that it trades uncleared swap contracts, to post collateral to swap dealers and collect collateral from swap dealers. Any initial margin that may be required to be posted by a swap dealer or the Partnership or the Trading Company must be segregated and held by an independent third party custodian and cannot be rehypothecated. Variation margin is not required to be segregated and may be rehypothecated. There may also be costs and delays involved in negotiating the custodial arrangement and related contractual terms.
Risks Relating to the Trading Advisors
You should not rely on the past performance of the Trading Advisors in deciding to purchase Units. Since the future performance of a Trading Advisor is unpredictable, each Trading Advisor’s past performance is not necessarily indicative of future results.
Reliance on the Trading Advisors to trade successfully. Each Trading Advisor is responsible for making all Futures Interests trading decisions on behalf of the Partnership and/or the Trading Company. The General Partner has no control over the specific trades that the Trading Advisors may make, leverage used, risks and/or concentrations assumed or whether the Trading Advisors will act in accordance with the disclosure documents or descriptive materials furnished by them to the General Partner. The General Partner can provide no assurance that the trading programs employed by the Trading Advisors will be successful. The Trading Advisors, in turn, are dependent upon the services of a limited number of persons to develop and refine their trading approaches and strategies and execute the trading transactions. The loss of the services of any Trading Advisor’s principals or key employees, or the failure of those principals or key employees to function effectively as a team, may have an adverse effect on the Trading Advisor’s ability to manage their trading activities successfully, or may cause a Trading Advisor to cease operations entirely. This, in turn, could negatively affect the Partnership’s performance.
Market factors may adversely influence the trading programs. Often, the most unprofitable market conditions for the Partnership and the Trading Company are those in which prices “whipsaw,” that is, such price moves quickly upward (or downward), then reverses, then moves upward (or downward) again, then reverses again. In such conditions, the Trading Advisors may establish positions based on incorrectly identifying both the brief upward or downward price movements as trends, whereas in fact no trends sufficient to generate profits develop.
You will not be aware of changes to the trading programs. Because of the proprietary nature of the Trading Advisor’s trading programs, you generally will not be advised if adjustments are made to trading programs in order to accommodate additional assets under management or for any other reason.
Single-advisor funds lack the diversity of multi-advisor funds. Prior to January 1, 2021, the Partnership has been managed by a single trading advisor. Therefore, the Partnership lacked the potential benefit of trading advisor diversification available in funds that are managed by more than one trading advisor.
Possible consequences of using multiple Trading Advisors. As of January 1, 2021, the Partnership will be managed by multiple trading advisors. Each Trading Advisor makes trading decisions independent of the other Trading Advisors for the Partnership. Thus, it is possible that the Partnership could hold opposite positions in the same or similar futures, forwards, and options, thereby offsetting any potential for profit from these positions. Each such position would cost the Partnership transactional expenses (such as brokerage commissions and NFA fees) but could not generate any recognized gain or loss. Moreover, the General Partner may reallocate the Partnership’s assets among the current Trading Advisors, terminate one or more or select additional Trading Advisors at any time. Any such reallocation could adversely affect the performance of the Partnership or any one Trading Advisor.
14
Increasing the assets managed by a Trading Advisor may adversely affect performance. The rates of return achieved by a trading advisor often diminish as the assets under its management increase. This can occur for many reasons, including the inability of the trading advisor to execute larger position sizes at desired prices and because of the need to adjust the trading advisor’s trading program to avoid exceeding speculative position limits. These are limits established by the CFTC and the exchanges on the number of speculative futures and option contracts in a commodity that one trader may own or control. The Trading Advisors have not agreed to limit the amount of additional assets that they will manage.
The Partnership’s use of an increased rate of leverage could affect performance. The General Partner and certain Trading Advisors have agreed that such Trading Advisors will trade the Partnership’s and/or the Trading Company’s assets pursuant to a trading program, which will employ greater leverage than certain of the Trading Advisor’s other trading programs. This increased leverage could result in increased gain or loss and trading volatility, as compared to other accounts employing certain of the Trading Advisor’s other trading programs.
A Trading Advisor may terminate its advisory agreement. Generally, the advisory agreements with the Trading Advisors have initial one-year terms, each of which renew for additional one-year terms annually, unless terminated by the General Partner or the Trading Advisor. In the event that an advisory agreement is not renewed, the General Partner may not be able to enter into an arrangement with that Trading Advisor or another trading advisor on terms substantially similar to the advisory agreements.
Disadvantages of replacing or switching Trading Advisors. A Trading Advisor generally is required to recoup previous trading losses before it can earn performance-based compensation. However, the General Partner may elect to replace a Trading Advisor if such Trading Advisor has a “loss carry-forward.” In that case, the Partnership would lose the “free ride” of any potential recoupment of the prior losses. In addition, the new trading advisor(s) would earn performance-based compensation on the first dollars of investment profits. The effect of the replacement of, or the reallocation of assets away from, Trading Advisors therefore could be significant.
Partnership performance may be hindered by increased competition for positions. Assets in managed futures have grown substantially, which has resulted in increased trading competition. Since futures are traded in an auction-like market, the more competition there is for some contracts, the more difficult it may be for the Partnership or the Trading Company to obtain the best prices.
You will not have access to the Partnership’s positions and must rely on the General Partner to monitor the Trading Advisors. As a limited partner, you will not have access to the Partnership’s or the Trading Company’s trade positions. Consequently, you will not know whether the Trading Advisors are adhering to the Partnership’s trading policies and must rely on the ability of the General Partner to monitor trading and protect your investment.
Taxation Risks
You may have tax liability attributable to your interest in the Partnership even if you have received no distributions and redeemed no Units and even if the Partnership generated a loss. If the Partnership has profit for a taxable year, the profit will be includible in your taxable income, whether or not cash or other property is actually distributed to you by the Partnership. The General Partner presently does not intend to make any distributions from the Partnership. Accordingly, it is anticipated that U.S. federal income taxes on your allocable share of the Partnership’s profits will exceed the amount of distributions to you, if any, for a taxable year, so that you must be prepared to fund any tax liability from redemptions of Units or other sources. In addition, the Partnership may have capital losses from trading activities that cannot be deducted against the Partnership’s ordinary income (e.g., interest income, periodic net swap payments) so that you may have to pay taxes on ordinary income even if the Partnership generates a net loss.
The Partnership’s tax returns could be audited. The Internal Revenue Service (“IRS”) could audit the Partnership’s U.S. federal income tax returns. If an audit results in an adjustment to the Partnership’s tax return, limited partners in the Partnership could be required to file amended returns and pay additional tax. Pursuant to newly effective legislation, audits of the Partnership generally will be conducted at the Partnership level and any adjustment that results in additional tax (including interest and penalties thereon) will be assessed and collected at the Partnership level in the current taxable year, with the current partners indirectly bearing such cost, unless the Partnership is eligible to and makes an election to issue adjusted K-1s to those partners that were partners in the taxable year subject to audit. Therefore, unless the Partnership elects otherwise, the Partnership may be directly responsible in the current taxable year for the income tax liability resulting from an audit adjustment that relates to a prior taxable year in which a current limited partner did not own an interest in the Partnership or in which the limited partner’s ownership percentage has since changed. Limited Partners should consult with their tax advisers regarding the potential implications of this audit regime.
15
You will recognize short-term capital gain. Profits on futures contracts traded in regulated U.S. and some non-U.S. exchanges, foreign currency contracts traded in the interbank market, and U.S. and some non-U.S. exchange-traded options on commodities are generally taxed as short-term capital gain to the extent of 40% of gains with respect to Section 1256 contracts and at least 50% of the gain arising from a mixed straddle account and are currently taxed at a maximum marginal ordinary U.S. federal income tax rate of 37% for non-corporate taxpayers.
Limitations on deductions for fund expenses. Special rules apply to deductions of investment advisory expenses by non-corporate taxpayers. Under tax legislation commonly known as the Tax Cuts and Jobs Act, enacted on December 22, 2017 as Public Law 115-97, no deduction for such expenses, or for other miscellaneous itemized deductions, is permitted for tax years between 2018 and 2025.
For tax years beginning after December 31, 2025, deductions for such expenses are subject to certain limitations for U.S. federal income tax purposes, and are not allowed for alternative minimum tax purposes. The IRS could take the position that certain Partnership expenses are investment advisory expenses and thus subject Partnership investors to disallowance of, or limitations on, deductions of allocated Partnership expenses.
Prospective investors should discuss these issues with their personal tax advisors.
Tax laws are subject to change at any time. Tax laws and court and IRS interpretations thereof are subject to change at any time, possibly with retroactive effect. Prospective investors are urged to discuss scheduled and potential tax law changes with their own tax advisors.
Non-U.S. investors may face exchange rate risk and local tax consequences. Non-U.S. investors should note that Units are denominated in U.S. dollars and that changes in rates of exchange between currencies may cause the value of their investment to decrease or to increase. Non-U.S. investors should consult their own tax advisors concerning the applicable U.S. and non-U.S. tax implications of this investment.
Non-U.S. investors have reporting responsibilities and the Partnership may need to withhold taxes. The Partnership is required to impose a withholding tax of 30% on income allocable to certain non-U.S. investors that is attributable to certain U.S. investments, unless such investors satisfy certain reporting requirements. A number of non-U.S. countries have negotiated intergovernmental agreements with the U.S. Department of the Treasury regarding the implementation of this reporting and withholding regime, with some agreements potentially providing for information exchange from the U.S. authorities to non-U.S. revenue authorities regarding the U.S. financial accounts of non-U.S. persons. An investor’s failure to document appropriately its compliance with the reporting rules may cause the investor to be subject to this U.S. withholding tax.
General Risk Factors
The General Partner, the Partnership and its service providers (including the Trading Advisors) and their respective operations are potentially vulnerable to cyber-security attacks or incidents. Like other business enterprises, the use of the internet and other electronic media and technology exposes the General Partner, the Partnership and its service providers, and their respective operations, to potential risks from cyber-security attacks or incidents (collectively, “cyber events”). Cyber events may include, for example, unauthorized access to systems, networks or devices, infection from computer viruses or other malicious software code, mishandling or misuse of information and attacks which shut down, disable, slow or otherwise disrupt operations, business processes or website access or functionality. In addition to intentional cyber events, unintentional cyber events can occur. Unintentional cyber events may include, for example, the inadvertent release of confidential information, the mishandling or misuse of information and/or technological limitations or hardware failures (in the markets or otherwise) that constrain the Partnership’s and/or the Trading Company’s ability to gather, process and communicate information efficiently and securely, without interruption.
Any cyber event could adversely affect the Partnership’s business, financial condition or results of operations and cause the Partnership to incur financial loss and expense, as well as face exposure to regulatory penalties or legal claims, reputational damage and additional costs associated with corrective measures. A cyber-security breach could also jeopardize a limited partner’s personal, confidential, proprietary or other information processed and stored in, and transmitted through, the general partner’s or a service provider’s computer systems. A cyber event may cause the Partnership or its service providers to lose proprietary information, suffer data corruption, lose operational capacity (such as, for example, the loss of the ability to process transactions, calculate the Partnership’s net asset value, or allow investors to transact business) and/or fail to comply with applicable privacy and other laws. Among other potentially harmful effects, cyber events also may result in theft, unauthorized monitoring and failures in the physical infrastructure or operating systems that support the Partnership or its service providers.
The nature of malicious cyber-attacks is becoming increasingly sophisticated and neither the General Partner nor the Partnership can control the cyber systems and cyber-security systems of the advisor or other third-party service providers.
16
The continuing spread of a new strain of coronavirus, which causes the viral disease known as COVID-19, may adversely affect our investments and operations. Since its discovery in December 2019, a new strain of coronavirus, which causes the viral disease known as COVID-19, has spread from China to many other countries, including the United States. The outbreak has been declared a pandemic by the World Health Organization, and the U.S. Health and Human Services Secretary has declared a public health emergency in the United States in response to the outbreak.
The COVID-19 pandemic and related voluntary and government-imposed social and business restrictions has impacted global economic conditions and adversely affected various industries (including, but not limited to, transportation, hospitality and entertainment), resulting in volatility in the global financial markets, disruption in global supply chains, increased unemployment, and operational challenges such as the temporary and permanent closures of businesses, sheltering-in-place directives and increased remote work protocols. If the pandemic continues to be prolonged or the actions of governments and central banks are unsuccessful, including actions to facilitate the comprehensive distribution of effective vaccines, the adverse impact on the global economy will deepen.
Given the continuing development of this situation, it is not possible to accurately predict how the market disruptions caused by COVID-19 will further impact the U.S. and other world economies or the value of the Partnership’s/Trading Company’s investments, or for how long the effects of such events will continue. Nevertheless, the novel coronavirus continues to present material uncertainty and risk with respect to the Partnership’s/Trading Company’s investments and operations.
On February 22, 2022, the United States and several European nations announced sanctions against Russia in response to Russia’s mobilization of forces and threat of invasion of the Ukraine, and governments around the world imposed, and may in the future impose, additional sanctions on Russia in response to its continued escalation of this conflict. On February 24, 2022, Russian President Putin commenced a full-scale invasion of Russia’s pre-positioned forces into the Ukraine. The conflict has created volatility in the price of various commodities and may have a negative impact on business activity globally, and therefore could adversely affect the performance of the Partnership’s/Trading Company’s investments. Furthermore, uncertainties regarding the conflict between the two nations and the varying involvement of the United States and other NATO countries preclude prediction as to the ultimate impact on global economic and market conditions, and, as a result, presents material uncertainty and risk with respect to the Partnership/Trading Company and the performance of their investments or operations, and the ability of the Partnership to achieve its investment objectives. Additionally, to the extent that investors, service providers and/or other third parties have material operations or assets in Russia or Ukraine, they may have their operations disrupted and/or suffer adverse consequences related to the ongoing conflict.
Item 1B. Unresolved Staff Comments. Not applicable.
Item 2. Properties.
The Partnership’s executive and administrative offices are located within the offices of the General Partner. The General Partner’s offices utilized by the Partnership are located at 522 Fifth Avenue, New York, NY 10036.
17
Item 3. Legal Proceedings.
This section describes the major pending legal proceedings, other than ordinary routine litigation incidental to the business, to which MS&Co. or its subsidiaries is a party or to which any of their property is subject. There are no material legal proceedings pending against the Partnership or the General Partner.
On June 1, 2011, Morgan Stanley & Co. Incorporated converted from a Delaware corporation to a Delaware limited liability company. As a result of that conversion, Morgan Stanley & Co. Incorporated is now named Morgan Stanley & Co. LLC (“MS&Co.” or “the Company”).
MS&Co. is a wholly-owned, indirect subsidiary of Morgan Stanley, a Delaware holding company. Morgan Stanley files periodic reports with the SEC as required by the Securities Exchange Act of 1934, as amended (the “Exchange Act”) which include current descriptions of material litigation and material proceedings and investigations, if any, by governmental and/or regulatory agencies or self-regulatory organizations concerning Morgan Stanley and its subsidiaries, including MS&Co. As a consolidated subsidiary of Morgan Stanley, MS&Co. does not file its own periodic reports with the SEC that contain descriptions of material litigation, proceedings and investigations. As a result, we refer you to the “Legal Proceedings” section of Morgan Stanley’s SEC 10-K filings for 2021, 2020, 2019, 2018, and 2017. In addition, MS&Co. annually prepares an Audited, Consolidated Statement of Financial Condition (“Audited Financial Statement”) that is publicly available on Morgan Stanley’s website at www.morganstanley.com. We refer you to the Commitments, Guarantees and Contingencies – Legal section of MS&Co.’s 2021 Audited Financial Statement.
In addition to the matters described in those filings, in the normal course of business, each of Morgan Stanley and MS&Co. has been named, from time to time, as a defendant in various legal actions, including arbitrations, class actions, and other litigation, as well as being subject to regulatory investigations arising in connection with its activities as a global diversified financial services institution. Certain of the legal actions or regulatory investigations include claims for substantial penalties, compensatory and/or punitive damages or claims for indeterminate amounts of penalties or damages.
MS&Co. is a Delaware limited liability company with its main business office located at 1585 Broadway, New York, New York 10036. Among other registrations and memberships, MS&Co. is registered as a futures commission merchant and is a member of the National Futures Association.
During the preceding five years, the following administrative, civil, or criminal actions pending, on appeal or concluded against MS&Co. or any of its principals are material within the meaning of CFTC Rule 4.24(l)(2) or 4.34(k)(2):
Regulatory and Governmental Matters.
The Company has been responding to subpoenas and other requests for information from the Enforcement Division of the U.S. Securities and Exchange Commission and the United States Attorney’s Office for the Southern District of New York in connection with their investigations into various aspects of the Company’s blocks business, certain related sales and trading practices, and applicable controls (the “Investigations”). The Investigations are focused on whether the Company and/or its employees shared and/or used information regarding impending block transactions in violation of federal securities laws and regulations. The Company is continuing to cooperate with the Investigations and is responding to the requests. The Company also faces potential civil liability arising from claims that have been or may be asserted by, among others, block transaction participants who contend they were harmed or disadvantaged including, among other things, as a result of a share price decline allegedly caused by the activities of the Company and/or its employees, or as a result of the Company’s and/or its employees’ failure to adhere to applicable laws and regulations. In addition, the Company has responded to demands from shareholders under Section 220 of the Delaware General Corporation Law for books and records concerning the Investigations.
18
On September 30, 2020, the SEC entered into a settlement order with MS&Co. settling an administrative action which relates to MS&Co.’s violations of the order marking requirements of Regulation SHO of the Exchange Act resulting from its improper use of aggregation units in structuring the Firm’s equity swaps business. The order found that MS&Co. improperly operated its equity swaps business without netting certain “long” and “short” positions as required by Rule 200(c) of Regulation SHO. The order found that the long exposure to an equity security (the “Long Unit”) and the short exposure to an equity security (the “Short Unit”) were not independent from one another and did not have separate trading strategies or objectives without regard to each other, and that the Long and Short Units were not eligible for the exception in Rule 200(f) of Regulation SHO. The order found that MS&Co. willfully violated Section 200(g) of Regulation SHO. MS&Co. consented, without admitting or denying the findings and without adjudication of any issue of law or fact, to a censure; to cease and desist from committing or causing future violations; to pay a civil penalty of $5 million; and to comply with the undertaking enumerated in the order.
The Firm has reached agreements in principle with two regulatory agencies—the SEC for $125 million and the CFTC for $75 million— to resolve record-keeping related investigations by those agencies relating to business communications on messaging platforms that had not been approved by the Firm. The Company was one of the entities involved in these investigations, and has recognized a provision of $63 million in anticipation of concluding the settlement with the SEC. On September 27, 2022, the Firm’s settlements with the SEC and the CFTC became effective.
Civil Litigation
On August 18, 2009, Relators Roger Hayes and C. Talbot Heppenstall, Jr., filed a qui tam action in New Jersey state court styled State of New Jersey ex. rel. Hayes v. Bank of America Corp., et al. The complaint, filed under seal pursuant to the New Jersey False Claims Act, alleged that the Company and several other underwriters of municipal bonds had defrauded New Jersey issuers by misrepresenting that they would achieve the best price or lowest cost of capital in connection with certain municipal bond issuances. On March 17, 2016, the court entered an order unsealing the complaint. On November 17, 2017, Relators filed an amended complaint to allege the Company mispriced certain bonds issued in twenty-three bond offerings between 2008 and 2017, having a total par amount of $6,946 million. The complaint seeks, among other relief, treble damages. On February 22, 2018, the Company moved to dismiss the amended complaint, and on July 17, 2018, the court denied the Company’s motion. On October 13, 2021, following a series of voluntary and involuntary dismissals, Relators limited their claims to certain bonds issued in five offerings the Company underwrote between 2008 and 2011, having a total par amount of $3,856 million.
On May 17, 2013, plaintiff in IKB International S.A. in Liquidation, et al. v. Morgan Stanley, et al. filed a complaint against MS&Co. and certain affiliates in the Supreme Court of the State of New York County (“Supreme Court of NY”). The complaint alleges that defendants made material misrepresentations and omissions in the sale to plaintiff of certain mortgage pass-through certificates backed by securitization trusts containing residential mortgage loans. The total amount of certificates allegedly sponsored, underwritten and/or sold by MS&Co. to plaintiff was approximately $133 million. The complaint alleges causes of action against MS&Co. for common law fraud, fraudulent concealment, aiding and abetting fraud, and negligent misrepresentation, and seeks, among other things, compensatory and punitive damages. On October 29, 2014, the court granted in part and denied in part MS&Co.’s motion to dismiss. All claims regarding four certificates were dismissed. After these dismissals, the remaining amount of certificates allegedly issued by MS&Co. or sold to plaintiff by MS&Co. was approximately $116 million. On August 11, 2016, the Appellate Division, First Department (“First Department”) affirmed the trial court’s decision denying in part MS&Co.’s motion to dismiss the complaint. On July 15, 2022, MS&Co. filed a motion for summary judgment. At December 25, 2019, the current unpaid balance of the mortgage pass-through certificates at issue in this action was approximately $22 million, and the certificates had incurred actual losses of $58 million. Based on currently available information, MS&Co. believes it could incur a loss in this action up to the difference between the $22 million unpaid balance of these certificates (plus any losses incurred) and their fair market value at the time of a judgment against MS&Co., or upon sale, plus pre- and post-judgment interest, fees and costs. MS&Co. may be entitled to be indemnified for some of these losses and to an offset for interest received by the plaintiff prior to a judgment.
19
In August of 2017, MS&Co. was named as a defendant in a purported antitrust class action in the United States District Court for the Southern District of New York (“SDNY”) styled Iowa Public Employees’ Retirement System et al. v. Bank of America Corporation et al. Plaintiffs allege, inter alia, that MS&Co., together with a number of other financial institution defendants, violated U.S. antitrust laws and New York state law in connection with their alleged efforts to prevent the development of electronic exchange-based platforms for securities lending. The class action complaint was filed on behalf of a purported class of borrowers and lenders who entered into stock loan transactions with the defendants. The class action complaint seeks, among other relief, certification of the class of plaintiffs and treble damages. On September 27, 2018, the court denied the defendants’ motion to dismiss the class action complaint. Plaintiffs’ motion for class certification was referred by the District Court to a magistrate judge who, on June 30, 2022, issued a report and recommendation that the District Court certify a class. The motion for class certification and the parties’ objections to the report and recommendation are pending before the District Court.
On August 13, 2021, the plaintiff in Camelot Event Driven Fund, a Series of Frank Funds Trust v. Morgan Stanley & Co. LLC, et al. filed in the Supreme Court of NY a purported class action complaint alleging violations of the federal securities laws against ViacomCBS (“Viacom”), certain of its officers and directors, and the underwriters, including the Company, of two March 2021 Viacom offerings: a $1,700 Viacom Class B Common Stock offering and a $1,000 offering of 5.75% Series A Mandatory Convertible Preferred Stock (collectively, the “Offerings”). The complaint alleges, inter alia, that the Viacom offering documents for both issuances contained material omissions because they did not disclose that certain of the underwriters, including the Company, had prime brokerage relationships and served as counterparties to certain derivative transactions with Archegos Capital Management LP, (“Archegos”), a fund with significant exposure to Viacom securities across multiple prime brokers. The complaint, which seeks, among other things, unspecified compensatory damages, alleges that the offering documents did not adequately disclose the risks associated with Archegos’s concentrated Viacom positions at the various prime brokers, including that the unwind of those positions could have a deleterious impact on the stock price of Viacom. On November 5, 2021, the complaint was amended to add allegations that defendants failed to disclose that certain underwriters, including the Company, had intended to unwind Archegos’s Viacom positions while simultaneously distributing the Offerings. On February 6, 2023, the court issued a decision denying the motions to dismiss as to the Company and the other underwriters, but granted the motion to dismiss as to Viacom and the Viacom individual defendants. On February 15 2023, the underwriters, including the Firm, filed their Notices of Appeal of the denial of their motions to dismiss.
Settled Civil Litigation
On July 15, 2010, China Development Industrial Bank (“CDIB”) filed a complaint against MS&Co., styled China Development Industrial Bank v. Morgan Stanley & Co. Incorporated et al., in the Supreme Court of NY. The complaint related to a $275 million credit default swap (“CDS”) referencing the super senior portion of the STACK 2006-1 CDO. The complaint asserted claims for common law fraud, fraudulent inducement and fraudulent concealment and alleges that MS&Co. misrepresented the risks of the STACK 2006-1 CDO to CDIB, and that MS&Co knew that the assets backing the CDO were of poor quality when it entered into the CDS with CDIB. On March 22, 2021, the parties entered into a settlement agreement. On April 16, 2021, the court entered a stipulation of voluntary discontinuance, with prejudice.
On October 15, 2010, the Federal Home Loan Bank of Chicago filed a complaint against MS&Co. and other defendants in the Circuit Court of the State of Illinois, styled Federal Home Loan Bank of Chicago v. Bank of America Funding Corporation et al. A corrected amended complaint was filed on April 8, 2011, which alleges that defendants made untrue statements and material omissions in the sale to plaintiff of a number of mortgage pass-through certificates backed by securitization trusts containing residential mortgage loans and asserts claims under Illinois law. The total amount of certificates allegedly sold to plaintiff by MS&Co. at issue in the action was approximately $203 million. The complaint seeks, among other things, to rescind the plaintiff’s purchase of such certificates. On November 4, 2021, the Firm entered into an agreement to settle the litigation.
On April 20, 2011, the Federal Home Loan Bank of Boston filed a complaint against MS&Co. and other defendants in the Superior Court of the Commonwealth of Massachusetts styled Federal Home Loan Bank of Boston v. Ally Financial, Inc. F/K/A GMAC LLC et al. An amended complaint was filed on June 29, 2012 and alleged that defendants made untrue statements and material omissions in the sale to plaintiff of certain mortgage pass-through certificates backed by securitization trusts containing residential mortgage loans. The total amount of certificates allegedly issued by MS&Co. or sold to plaintiff by MS&Co. was approximately $385 million. The amended complaint raised claims under the Massachusetts Uniform Securities Act, the Massachusetts Consumer Protection Act and common law and sought, among other things, to rescind the plaintiff’s purchase of such certificates. On November 25, 2013, July 16, 2014, and May 19, 2015, respectively, the plaintiff voluntarily dismissed its claims against MS&Co. with respect to three of the securitizations at issue. After these voluntary dismissals, the remaining amount of certificates allegedly issued by MS&Co. or sold to plaintiff by MS&Co. was approximately $332 million. On July 13, 2018, the parties reached an agreement in principle to settle the litigation.
20
On May 3, 2013, plaintiffs in Deutsche Zentral-Genossenschaftsbank AG et al. v. Morgan Stanley et al. filed a complaint against MS&Co., certain affiliates, and other defendants in the Supreme Court of NY. The complaint alleged that defendants made material misrepresentations and omissions in the sale to plaintiffs of certain mortgage pass-through certificates backed by securitization trusts containing residential mortgage loans. The total amount of certificates allegedly sponsored, underwritten and/or sold by MS&Co. to plaintiff was approximately $634 million. The complaint alleged causes of action against MS&Co. for common law fraud, fraudulent concealment, aiding and abetting fraud, negligent misrepresentation, and rescission and sought, among other things, compensatory and punitive damages. On June 26, 2018, the parties entered into an agreement to settle the litigation.
On April 1, 2016, the California Attorney General’s Office filed an action against MS&Co. in California state court styled California v. Morgan Stanley, et al., on behalf of California investors, including the California Public Employees’ Retirement System and the California Teachers’ Retirement System. The complaint alleged that MS&Co. made misrepresentations and omissions regarding residential mortgage-backed securities and notes issued by the Cheyne SIV, and asserted violations of the California False Claims Act and other state laws and sought treble damages, civil penalties, disgorgement, and injunctive relief. On April 24, 2019, the parties reached an agreement to settle the litigation.
Beginning on March 25, 2019, MS&Co. was named as a defendant in a series of putative class action complaints filed in the United States District Court for the SDNY, the first of which is styled Alaska Electrical Pension Fund v. BofA Secs., Inc., et al. Each complaint alleged a conspiracy to fix prices and restrain competition in the market for unsecured bonds issued by the following Government-Sponsored Enterprises: the Federal National Mortgage Association; the Federal Home Loan Mortgage Corporation; the Federal Farm Credit Banks Funding Corporation; and the Federal Home Loan Banks. The purported class period for each suit is from January 1, 2012 to June 1, 2018. Each complaint raised a claim under Section 1 of the Sherman Act and sought, among other things, injunctive relief and treble compensatory damages. On May 23, 2019, plaintiffs filed a consolidated amended class action complaint styled In re GSE Bonds Antitrust Litigation, with a purported class period from January 1, 2009 to January 1, 2016. On June 13, 2019, the defendants filed a joint motion to dismiss the consolidated amended complaint. On August 29, 2019, the court denied MS&Co.’s motion to dismiss. On December 15, 2019, MS&Co. and certain other defendants entered into a stipulation of settlement to resolve the action as against each of them in its entirety. On June 16, 2020, the court granted final approval of the settlement.
Additional lawsuits containing claims similar to those described above may be filed in the future. In the course of its business, MS&Co., as a major futures commission merchant, is party to various civil actions, claims and routine regulatory investigations and proceedings that the General Partner believes do not have a material effect on the business of MS&Co. MS&Co. may establish reserves from time to time in connections with such actions.
21
Item 4. Mine Safety Disclosures. Not applicable.
22
PART II
Item 5. Market for Registrant’s Common Equity, Related Stockholder Matters and Issuer Purchases of Equity Securities.
| (a) | Market Information. The Partnership has issued no stock. There is no public market for the Units. |
| (b) | Holders. The number of holders of Units as of February 28, 2023 was 3,565 for Class A Units and 3 for Class Z Units. |
| (c) | Distributions. No distributions have been made by the Partnership since it commenced trading operations on March 1, 1999. Ceres has sole discretion to decide what distributions, if any, shall be made to investors in the Partnership. Ceres does not intend to declare distributions in the foreseeable future. |
| (d) | Securities Authorized for Issuance under Equity Compensation Plans. None. |
| (e) | Performance Graph. Not applicable. |
| (f) | Recent Sales of Unregistered Securities; Use of Proceeds from Registered Securities. The Registrant’s Units of limited partnership interest are being offered in a private placement pursuant to Regulation D under the Securities Act, and are being sold only to persons and entities who are accredited investors as the term is defined in Rule 501(a) of Regulation D. In determining the applicability of the exemption, the General Partner relied on the fact that the Units were purchased by accredited investors. |
The aggregate proceeds of unregistered securities sold to the limited partners through December 31, 2022 was $238,091,559. The Partnership received $627,786 in consideration from the sale of Units to the General Partner.
Proceeds of net offering were used for the trading of Futures Interests.
| (g) | Purchases of Equity Securities by the Issuer and Affiliated Purchasers. |
The following chart sets forth the purchases of Units by the Partnership.
| Period | Class A (a) Total Units Purchased* | Class A (b) Average Price Paid per Unit** | (c) Total Number of Units Announced Plans or Programs | (d) Maximum Number (or Approximate Dollar Value) of Units that May Yet Be Purchased Under the Plans or Programs | ||||||
| October 1, 2022 - October 31, 2022 | 40,453.515 | $ | 30.68 | N/A | N/A | |||||
| November 1, 2022 - November 30, 2022 | 31,789.537 | $ | 28.88 | N/A | N/A | |||||
| December 1, 2022 - December 31, 2022 | 36,454.695 | $ | 28.08 | N/A | N/A | |||||
| 108,697.747 | $ | 29.28 | ||||||||
| * | Generally, limited partners are permitted to redeem their Units as of the end of each month on three business days’ notice to the General Partner. Under certain circumstances, the General Partner can compel redemption, although to date the General Partner has not exercised this right. Purchases of Units by the Partnership reflected in the chart above were made in the ordinary course of the Partnership’s business in connection with effecting redemptions for limited partners. |
| ** | Redemptions of Units are effected as of the last day of each month at the net asset value per Unit as of that day. |
Item 6. [Reserved].
23
Item 7. Management’s Discussion and Analysis of Financial Condition and Results of Operations.
Liquidity. The Partnership/Trading Company deposits its assets with MS&Co. as its clearing commodity broker in separate Futures Interests trading accounts established for the Trading Advisors. Such assets are used as margin to engage in trading and may be used as margin solely for the Partnership’s/Trading Company’s trading. The assets are held either in non-interest bearing bank accounts or in securities and instruments permitted by the CFTC for investment of customer segregated or secured funds. Since the Partnership’s/Trading Company’s sole purpose is to trade in futures, forwards and options, it is expected that the Partnership/Trading Company will continue to own such liquid assets for margin purposes.
The Partnership’s/Trading Company’s investment in Futures Interests and U.S. Treasury bills may, from time to time, be illiquid. Most U.S. futures exchanges limit fluctuations in prices during a single day by regulations referred to as “daily price fluctuation limits” or “daily limits.” Trades may not be executed at prices beyond the daily limit. If the price for a particular futures or option contract has increased or decreased by an amount equal to the daily limit, positions in that futures or option contract can neither be taken nor liquidated unless traders are willing to effect trades at or within the limit. Futures prices have occasionally moved the daily limit for several consecutive days with little or no trading. These market conditions could prevent the Partnership from promptly liquidating its futures or option contracts and result in restrictions on redemptions.
There is no limitation on daily price movements in trading forward contracts on foreign currencies. The markets for some world currencies have low trading volume and are illiquid, which may prevent the Partnership/Trading Company from trading in potentially profitable markets or prevent the Partnership/Trading Company from promptly liquidating unfavorable positions in such markets, subjecting it to substantial losses. Either of these market conditions could result in restrictions on redemptions. For the periods covered by this report, illiquidity has not materially affected the Partnership’s/Trading Company’s assets. There are no known material trends, demands, commitments, events, or uncertainties at the present time that are reasonably likely to result in the Partnership’s/Trading Company’s liquidity increasing or decreasing in any material way.
Capital Resources. The Partnership does not have, nor does it expect to have, any capital assets. The Partnership’s only assets are its (i) investment in the Trading Company, (ii) redemptions receivable from the Trading Company, (iii) equity in trading account, consisting of restricted and unrestricted cash, net unrealized appreciation on open futures contracts, net unrealized appreciation on open forward contracts and investment in U.S. Treasury bills, at fair value, as applicable, and (iv) interest receivable. Redemptions, exchanges and sales of Units in the future will affect the amount of funds available for investments in Futures Interests and U.S. Treasury bills in subsequent periods. It is not possible to estimate the amount, and therefore the impact, of future inflows and outflows of Units.
There are no known material trends, favorable or unfavorable, that would affect, nor any expected material changes to, the Partnership’s capital resource arrangements at the present time.
Results of Operations
General. The Partnership’s results depend on the Trading Advisors and the ability of the Trading Advisors’ trading programs to take advantage of price movements in the futures, forwards and options markets.
In allocating substantially all of the assets of the Partnership among the Trading Advisors, the General Partner considers, among other factors, the Trading Advisors’ past performance, trading style, volatility of markets traded and fee requirements. The General Partner may modify or terminate the allocation of assets to the Trading Advisors and allocate assets to additional advisors at any time.
As of December 31, 2022 and September 30, 2022, the Partnership’s assets were allocated among the Advisors in the following approximate percentages:
Advisor | December 31, 2022 | December 31, 2022 (percentage of Partners’ Capital) | September 30, 2022 | September 30, 2022 (percentage of Partners’ Capital) | ||||||||||||
Campbell | $ | 36,124,199 | 23% | $ | 40,624,217 | 24% | ||||||||||
EMC | 11,990,218 | 8% | 15,190,037 | 9% | ||||||||||||
Graham | 43,217,250 | 27% | 51,148,965 | 30% | ||||||||||||
WCM | 49,555,523 | 31% | 54,191,489 | 31% | ||||||||||||
Unallocated | 16,753,858 | 11% | 11,208,519 | 6% | ||||||||||||
24
Graham Capital Management L.P.
The K4D quantitative investment program has its origin in Graham’s legacy trend-following trading systems, dating as far back as 1995. Graham’s trend systems are designed to participate selectively in potential profit opportunities that can occur during periods of price trends in a diverse number of U.S. and international markets. The trend systems establish positions in markets where the price action of a particular market signals the computerized systems used by Graham that a potential trend in prices is occurring. The trend systems also employ proprietary risk management and trade filter strategies that seek to benefit from sustained price trends while reducing risk and volatility exposure. Each K4D program trades the same quantitative models in the same proportion, and differs only with respect to the annual volatility range targeted (with the K4D-10V Program targeting an annual volatility range of 8% to 12%; the K4D-15V Program targeting an annual volatility range of 12% to 18%; and the K4D-20V Program targeting an annual volatility range of 16% to 24%).
Winton Capital Management Limited
The portion of the Partnership’s assets that was allocated to Winton for trading are not invested in commodity interests directly. Winton’s allocation of the Partnership’s assets was invested in Winton Master. Winton trades the Diversified Macro Strategies (formerly, the Winton Futures Program), a proprietary, systematic trading program, on behalf of Winton Master.
The investment objective of the Diversified Macro Strategies is to achieve long-term investment growth.
The Diversified Macro Strategies (formerly, the Winton Futures Program) follows a disciplined investment process that is based on statistical analysis of historical data. The initial stage of the process involves collecting, cleaning and organizing large amounts of data. The Diversified Macro Strategies uses a wide variety of data inputs including factors that are intrinsic to markets, such as price, volume and open interest; and those that are external to markets, such as economic statistics, industrial and commodity data and public company financial data. Winton conducts statistical research into the data in an attempt to quantify the probability of particular markets rising or falling, conditional on a variety of quantifiable factors. Winton’s research is used to develop mathematical models that attempt to forecast market returns, the variability or volatility associated with such returns (often described as “risk”), and the correlation between markets and transaction costs. These forecasts are used in investment strategies that determine what positions should be held to maximize profit within a certain range of risk. As a result of Winton’s research, Winton expects that the investments made in accordance with this process will have an improved chance of being successful, which is expected to lead to profits over the long-term.
Winton’s investment programs are operated as automated, computer-based investment systems. The programs are modified over time as Winton monitors its operation and undertakes further research. Changes to the programs occur as a result of, amongst other things, the discovery of new relationships, changes in market liquidity, the availability of new data or the reinterpretation of existing data.
Most of Winton’s investment decisions are made strictly in accordance with the output of the programs. However, Winton may, in exceptional circumstances (such as the occurrence of events that fall outside the input parameters of the programs), make investment decisions based on other factors and take action to override the output of the programs to seek to protect the interests of investors.
EMC Capital Advisors, LLC
EMC will trade its Classic Program for the Partnership. EMC’s investment strategies are technical rather than fundamental in nature. In other words, they are developed from analysis of patterns of actual monthly, weekly and daily price movements and are not based on analysis of fundamental supply and demand factors, general economic factors, or anticipated world events. EMC relies on historical analysis of these price patterns to interpret current market behavior and to evaluate technical indicators for trade initiations and liquidations. EMC’s investment strategies used in its program are trend-following. This means that initiation and liquidation of positions in a particular market are generally in the direction of the price trend in that market, although at times counter-trend elements also may be employed. EMC employs an investment strategy which utilizes a blend of systems (or, stated another way, a number of systems simultaneously). The strategies are diversified in that its program follows a number of Futures Interests and often invests in more than ten different interests at one time.
Campbell & Company, LP
Campbell will trade the Partnerships assets in accordance with its Campbell Managed Futures Portfolio, a proprietary, systematic trading system. Campbell’s trading models are designed to detect and exploit medium-term to long-term price changes, while also applying risk management and portfolio management principles.
25
Campbell believes that utilizing multiple trading models provides an important level of diversification and is most beneficial when multiple contracts of each market are traded. Every trading model may not trade every market. It is possible that one trading model may signal a long position while another trading model signals a short position in the same market. It is Campbell’s intention to offset those signals to reduce unnecessary trading, but if the signals are not simultaneous, both trades will be taken and since it is unlikely that both positions would prove profitable, in retrospect, one or both trades will appear to have been unnecessary. It is Campbell’s policy to follow trades signaled by each trading model independent of the other models.
For the period from January 1, 2022 through December 31, 2022, the average allocation by commodity market sector for CMF Winton was as follows:
| CMF Winton | ||||
Currencies | 33.1 | % | ||
Energy | 9.3 | % | ||
Grains | 5.0 | % | ||
Indices | 15.8 | % | ||
Interest Rates U.S. | 6.3 | % | ||
Interest Rates Non-U.S. | 10.5 | % | ||
Livestock | 1.4 | % | ||
Metals | 11.2 | % | ||
Softs | 7.4 | % | ||
The following presents a summary of the Partnership’s operations for the years ended December 31, 2022, 2021 and 2020, and a general discussion of its trading activities during each period. It is important to note, however, that the Trading Advisors trade in various markets at different times and that prior activity in a particular market does not mean that such market will be actively traded by the Trading Advisors or will be profitable in the future. Consequently, the results of operations of the Partnership are difficult to discuss other than in the context of the Trading Advisors’ trading activities on behalf of the Partnership during the period in question. Past performance is no guarantee of future results.
The Partnership’s results of operations set forth in the financial statements are prepared in accordance with accounting principles generally accepted in the United States of America (“GAAP”), which require the use of certain accounting policies that affect the amounts reported in these financial statements, including the following: the contracts the Partnership trade are accounted for on a trade-date basis and marked to market on a daily basis. The difference between their original contract value and market value is recorded in the Statements of Income and Expenses as “Net change in unrealized gains (losses) on open contracts” and recorded as “Net realized gains (losses) on closed contracts” when open positions are closed out. The sum of these amounts constitutes the Partnership’s trading results. The market value of a futures contract is the settlement price on the exchange on which that futures contract is traded on a particular day. The value of a foreign currency forward contract is based on the spot rate as of approximately 3:00 P.M. (E.T.), the close of the business day. Interest income, as well as management fees, administrative and General Partner’s fees and ongoing placement agent fees of the Partnership are recorded on an accrual basis.
The General Partner believes that, based on the nature of the operations of the Partnership, no assumptions relating to the application of critical accounting policies other than those presently used could reasonably affect reported amounts.
No forecast can be made as to the level of redemptions in any given period. A limited partner may require the Partnership to redeem its Units at the net asset value per Unit as of the end of any month on three business days’ notice to the General Partner. There is no fee charged to limited partners in connection with redemptions. Redemptions are generally funded out of the Partnership’s cash holdings. For the year ended December 31, 2022, 536,923.121 limited partner Units of Class A were redeemed totaling $14,660,370 and 24,916.944 General Partner Units of Class Z were redeemed totaling $300,000. For the year ended December 31, 2021, 1,046,833.899 limited partner Units of Class A were redeemed totaling $23,024,929 and 145,102.254 General Partner Units of Class Z were redeemed totaling $1,285,094. For the year ended December 31, 2020, 871,818.455 limited partner Units of Class A were redeemed totaling $17,276,664.
The Partnership continues to offer Units for each Class at their net asset value per Unit as of the end of each month. For the year ended December 31, 2022, there were no additional subscriptions of limited partner Units of Class A, General Partner Units of Class Z and limited partner Units of Class Z. For the year ended December 31, 2021, there were subscriptions of 4,259,217.890 limited partner Units of Class A totaling $89,741,721, 206,904.961 General Partner Units of Class Z totaling $1,841,454 and 11,079.649 limited partner Units of Class Z totaling $99,016. For the year ended December 31, 2020, there were subscriptions of 1,155.802 limited partner Units of Class A totaling $25,000.
26
For the year ended December 31, 2022, the net asset value per Unit for Class A increased 26.4% from $22.22 to $28.08. For the year ended December 31, 2022, the net asset value per Unit for Class Z increased 27.3% from $9.46 to $12.04. For the year ended December 31, 2021, the net asset value per Unit for Class A increased 5.5% from $21.07 to $22.22. For the year ended December 31, 2021, the net asset value per Unit for Class Z increased 6.3% from $8.90 to $9.46. For the year ended December 31, 2020, the net asset value per Unit for Class A decreased 5.1% from $22.21 to $21.07. For the year ended December 31, 2020, the net asset value per Unit for Class Z decreased 3.7% from $9.24 to $8.90.
The Partnership experienced a net trading gain of $42,184,779 before fees and expenses for the year ended December 31, 2022. Gains were primarily attributable to the Partnership’s trading of Futures Interests in the currencies, energy, grains, U.S. and non-U.S. interest rates and metals sectors and were partially offset by losses in the indices, livestock and softs sectors. The net trading gain (or loss) realized from the Partnership is disclosed under “Item 8. Financial Statements and Supplementary Data.”
During the first quarter of 2022, the Partnership’s most notable gains were experienced during January, February and March from long positions in crude oil and its refined products as prices surged higher in the lead up to and subsequent invasion of Ukraine by Russia. Additional gains were recorded during March from short positions in U.S. fixed income futures as bond prices retreated amid a push by the U.S. Federal Reserve to raise interest rates in its efforts to combat rising inflation. Within the currencies, gains were achieved during March from short positions in the Japanese yen versus the U.S. dollar as the value of the yen weakened as the Bank of Japan indicated it would maintain a dovish stance on monetary easing. Additional gains in the currency markets were recorded throughout the first quarter from short positions in the euro relative to the U.S. dollar. Within the agricultural sector, gains were recorded during January and February from long positions in corn and soybean futures as inflationary pressures pushed grain prices higher. In the metals, profits were recorded from long positions in aluminum and nickel futures throughout the quarter. The Partnership’s overall trading gains for the first quarter were partially offset by trading losses recorded during January within the global stock index markets from long positions in U.S. equity index futures as global stock prices retreated.
During the second quarter of 2022, the Partnership’s most significant gains were achieved in currencies during April and June from short positions in the euro and Japanese yen versus the U.S. dollar as the Fed announced aggressive policies on raising interest rates towards fighting inflation, thus pushing the value of the dollar higher versus its major counterparts. Within the global fixed income markets, gains were recorded during April and June from short positions in U.S. and European fixed income futures. Within the energies, gains were achieved from long positions across the energy complex as supply shortfalls pushed prices higher. A portion of the Partnership’s gains for the second quarter was offset by losses incurred within the agricultural markets during June from long positions in corn, soybeans, and cotton futures as prices reversed lower off their previous highs. Within the metals sector, losses were recorded during April and May from long positions in industrial metals as the continuation of the war between Russia and Ukraine and renewed COVID lockdowns in China spurred concerns for weakening global industrial output. Further losses were incurred during April and May from positions in European and Asian equity index futures.
During the third quarter of 2022, the Partnership’s most significant gains were achieved within the currency sector during August and September from long positions in the U.S. dollar versus the Japanese yen, euro, and British pound as the value of the dollar continued to rally amid signs of rising interest rates. Further gains were recorded during August and September from short positions in U.S. Treasury note and European bond futures as fixed income prices fell as central bank policies to raise interest rates to battle inflation remained a priority in both regions. Within the metals sector, gains were recorded during August from short positions in gold and silver futures as precious metals prices fell. The Partnership’s gains for the third quarter were partially offset by losses incurred within the energy sector during August and September from long positions in crude oil and its refined products as prices declined amid global recession fears and government efforts to curb rising energy prices. Within the agricultural complex, losses were recorded throughout the third quarter from long positions in the livestock, grains and soft commodities markets as prices reversed lower following a prolonged bullish trend. Further losses were incurred within the global stock index sector during July and August from long positions in U.S. and European equity index futures as stock prices declined amid investor concerns of a potential global recession.
During the fourth quarter of 2022, the Partnership’s most notable losses were incurred during November and December from short positions in the Japanese yen versus the U.S. dollar as the relative value of the dollar weakened. Additional losses were experienced during November and December from short positions in gold and silver futures as demand for precious metals increased amid the weakened dollar. An easing of global energy prices during November and December resulted in losses from long positions in crude oil and many of its refined products. A portion of the Partnership’s losses for the fourth quarter was offset by gains achieved within the global interest rate sector during December from positions in both European and U.S. fixed income futures as inflationary and geopolitical events added directional volatility to the global bond markets. Gains were also recorded during October from long positions in the grains markets as drought conditions in South America threatened crops.
27
The Partnership experienced a net trading gain of $14,499,858 before fees and expenses for the year ended December 31, 2021. Gains were primarily attributable to the Partnership’s trading of Futures Interests in the currencies, energy, grains, indices, metals and softs sectors and were partially offset by losses in the U.S. and non-U.S. interest rates and livestock sectors.
During the first quarter of 2021, the Partnership’s most notable gains were experienced during February and March from long positions in U.S., Asian, and European equity index futures as stock prices rallied on an optimistic outlook for global economic growth. Within the agricultural sector, gains were achieved during January and February from long positions in corn and soybean futures as prices advanced on strengthening consumer demand. Within the energy sector, gains were achieved during February from long futures positions in crude oil and its refined products as prices surged on an outlook for increased global demand. Additional gains were experienced within the currency markets primarily during March from short positions in the Japanese yen versus the U.S. dollar as the relative value of the dollar advanced. The Partnership’s overall trading gains for the first quarter were partially offset by trading losses recorded during January and February from long positions in U.S., Australian, Canadian and European bond futures as interest rates moved higher, pressuring prices lower. Within the metals sector, losses were incurred during January and March from long positions in gold and silver futures as the stronger U.S. dollar reduced demand for precious metals.
During the second quarter of 2021, the Partnership’s most significant gains were achieved within the energy sector during April, May, and June from long futures positions in crude oil and its refined products, natural gas, and carbon emissions as prices surged higher amid optimism for a rebound in global economic strength. Within the global stock index markets, gains were experienced during April, May, and June from long positions in U.S. equity index futures as prices advanced on steady investor demand for risk assets. Gains within the agricultural sector were recorded during April from long positions in corn, wheat, and soybean futures. Additional gains were achieved within the metals sector during April and May from long positions in copper futures as prices moved higher amid signs of tightening global stockpiles. A portion of the Partnership’s gains for the second quarter was offset by losses incurred within the global fixed income sector during April, May, and June from short positions in U.S. and European fixed income futures as central banks signaled they would remain committed to easing policies. Further losses were experienced within the currency markets during April from short positions in the euro and Japanese yen versus the U.S. dollar as the relative value of the dollar trended lower.
During the third quarter of 2021, the Partnership’s most significant trading gains were achieved within the energy sector during September from long positions in natural gas and crude oil futures as supply chain constrictions boosted global energy prices. Within the currency markets, gains were recorded during September from short positions in the euro, Japanese yen, Australian dollar and Swiss franc versus the U.S. dollar. Within the agricultural markets, gains were experienced during August from long positions in sugar futures and during September from long positions in cotton futures as commodity prices were boosted by inflationary pressures. Smaller gains were recorded within the metals sector during July from long positions in nickel futures. The Partnership’s trading gains for the third quarter were offset by trading losses incurred within the global fixed income sector during September from long positions in European, U.S., and Australian fixed income futures as prices declined amid an expectation for central banks to begin to taper asset purchases. Further losses were recorded during September within the global stock index sector from long positions in U.S. equity index futures as concerns over the strength of the global economy weighed on stock prices.
During the fourth quarter of 2021, the Partnership’s most notable losses were incurred within the global fixed income markets during October from long positions in European and U.S. fixed income futures as bond prices fell on an outlook for global central banks to curtail easing measures to combat growing inflation. Within the energies, losses were experienced during November from long positions in crude oil and its refined products as the discovery of a new COVID-19 variant caused energy prices to reverse dramatically lower late in the month. Additional losses were incurred within the metals during November from positions in both industrial and precious metals. A portion of the Partnership’s losses for the fourth quarter was offset by gains achieved within the global stock index markets during October and December from long positions in U.S. equity index futures as bullish momentum boosted stock prices. Within the currencies, gains were recorded during November from positions in the Australian dollar and euro. Smaller gains were achieved within the agricultural sector during October and December from long positions in corn futures as increased consumer demand pushed prices higher.
The results of operations for the twelve months ended 2020 are discussed under “Item 7. Management’s Discussion and Analysis of Financial Condition and Results of Operations.” in the Partnership’s Annual Report on Form 10-K for the fiscal year ended December 31, 2020.
28
The Partnership receives monthly interest on 100% of its average daily equity maintained in cash in the Partnership’s account during each month at a rate equal to 100% of the monthly average of the 4-week U.S. Treasury bill discount rate. Prior to January 1, 2021, the Partnership received monthly interest on 100% of the average daily equity maintained in cash in the Partnership’s account during each month at a rate equal to 80% of the monthly average of the 4-week U.S. Treasury bill discount rate. For the avoidance of doubt, the Partnership will not receive interest on amounts in the futures brokerage account that are committed to margin. Any interest earned on the Partnership’s cash account in excess of the amounts described above, if any, will be retained by MS&Co. and/or shared with the General Partner. All interest earned on U.S. Treasury bills and money market fund securities will be retained by the Partnership, as applicable. Interest income for the three and twelve months ended December 31, 2022 increased by $1,226,208 and $2,152,197, respectively, as compared to the corresponding periods in 2021. The increase in interest income was primarily due to higher average net assets during the three and twelve months ended December 31, 2022 as compared to the corresponding periods in 2021. Interest earned by the Partnership will increase the net asset value of the Partnership. The amount of interest income earned by the Partnership depends on (1) the average daily equity maintained in cash in the Partnership’s accounts, (2) the amount of U.S. Treasury bills and/or money market mutual fund securities held by the Partnership and (3) interest rates over which none of the Partnership or MS&Co. has control.
Certain clearing fees are based on the number of trades executed by the Trading Advisors for the Partnership. Accordingly, they must be compared in relation to the number of trades executed during the period. Clearing fees for the three and twelve months ended December 31, 2022 decreased by $36,921 and $179,619, respectively, as compared to the corresponding periods in 2021. The decrease in these clearing fees was primarily due to a decrease in the number of trades made by the Partnership during the three and twelve months ended December 31, 2022 as compared to the corresponding periods in 2021.
Ongoing placement agent fees are calculated as a percentage of the Partnership’s Class A adjusted net assets on the first day of each month and are affected by trading performance, subscriptions, and redemptions. Accordingly, they must be compared in relation to the fluctuations in the monthly net asset values. Ongoing placement agent fees for the three and twelve months ended December 31, 2022 increased by $50,180 and $92,814, respectively, as compared to the corresponding periods in 2021. The increase was primarily due to an increase in average net assets of Class A during the three and twelve months ended December 31, 2022 as compared to the corresponding periods in 2021. As of January 1, 2021, the Partnership pays Morgan Stanley Wealth Management, or any other placement agent or sub-placement agent, an annualized rate equal to 0.75% with respect to Class A Units.
General Partner fees are paid to the General Partner for administering the business and affairs of the Partnership. The General Partner’s fees are calculated as a percentage of the Partnership’s adjusted net asset value as of the beginning of each month and are affected by trading performance and redemptions. Accordingly, they must be compared in relation to the fluctuations in the monthly net asset values. General Partner’s fees for the three and twelve months ended December 31, 2022 increased by $50,850 and $93,600, respectively, as compared to the corresponding periods in 2021. The increase was primarily due to an increase in average net assets during the three and twelve months ended December 31, 2022 as compared to the corresponding periods in 2021. Effective July 1, 2020, there was a reduction in the General Partner fee rate from 1/12th of 2.00% to 1/12th of 1.75%. Effective January 1, 2021, the Partnership pays the General Partner a monthly administrative fee equal to 1/12th of 0.75% (a 0.75% annual rate) of the Partnership’s net assets (plus “notional” funds, if any) as of the beginning of each month. Prior to January 1, 2021, the General Partner paid or reimbursed the Partnership for all fees and costs charged or incurred by the commodity brokers for trades executed on behalf of the Partnership, and for all ordinary administrative and offering expenses. Effective January 1, 2021, the Partnership directly pays the brokerage fees and other transaction-related fees and expenses, as incurred and also pays its ongoing administrative, operating, offering and organizational expenses (including, but not limited to, periodic legal, accounting, administrative, filing, reporting and data processing fees) and its pro rata share of such expenses of any trading company to which the Partnership has allocated assets.
Management fees are calculated as a percentage of the Partnership’s adjusted net asset value as of the beginning of each month and are affected by trading performance and redemptions. Accordingly, they must be compared in relation to the fluctuations in the monthly net asset values. Management fees for the three and twelve months ended December 31, 2022 increased by $92,400 and $51,885, respectively, as compared to the corresponding periods in 2021. The increase was primarily due to an increase in average net assets during the three and twelve months ended December 31, 2022 as compared to the corresponding periods in 2021.
Incentive fees are based on the new trading profits generated by the Trading Advisors at the end of the year as defined in the management agreements among the Partnership, the General Partner and the relevant Trading Advisor. Trading performance for the three and twelve months ended December 31, 2022 resulted in incentive fees of $0 and $3,536,416, respectively. Trading performance for the three and twelve months ended December 31, 2021 resulted in incentive fees of $81,002 and $1,258,266, respectively. To the extent that a Trading Advisor incurs a loss for the Partnership, the Trading Advisor will not be paid incentive fees until such Trading Advisor recovers any net loss incurred and earns additional new trading profits for the Partnership.
29
The Partnership pays professional fees, which generally include professional fees made up of legal and accounting expenses, as well as certain offering costs and filing, administrative, reporting and data processing fees. Professional fees for the years ended December 31, 2022 and 2021 were $400,174 and $537,889, respectively.
For an analysis of unrealized gains and losses by contract type and a further description of 2022 trading results, refer to the Partnership’s Annual Report to limited partners for the year ended December 31, 2022, which is included in “Item 8. Financial Statements and Supplementary Data.” of this Form 10-K.
The Partnership’s gains and losses are allocated among its partners for income tax purposes.
Market Risk.
The Partnership is a party to financial instruments with elements of off-balance sheet market and credit risk. The Partnership trades futures contracts, options on futures contracts and forward contracts on physical commodities and other commodity interests, including, but not limited to, foreign currencies, financial instruments, metals, energy, and agricultural products. In entering into these contracts, the Partnership is subject to the market risk that such contracts may be significantly influenced by market conditions, such as interest rate volatility, resulting in such contracts being less valuable. If the markets should move against all of the positions held by the Partnership at the same time, and the Trading Advisors were unable to offset positions of the Partnership, the Partnership could lose all of its assets and the limited partners would realize a loss equal to 100% of their capital accounts.
In addition to the Trading Advisors’ internal controls, each Trading Advisor must comply with the Partnership’s trading policies that include standards for liquidity and leverage that must be maintained. Each Trading Advisor and Ceres monitor the Partnership’s trading activities to ensure compliance with the trading policies and Ceres can require the Trading Advisors to modify positions of the Partnership if Ceres believes they violate the Partnership’s trading policies.
Credit Risk.
In addition to market risk, in entering into futures, forward and option contracts, there is a credit risk to the Partnership that the counterparty on a contract will not be able to meet its obligations to the Partnership. The ultimate counterparty or guarantor of the Partnership for futures, forward and option contracts traded in the United States, and most foreign exchanges on which the Partnership trades, is the clearinghouse associated with such exchange. In general, a clearinghouse is backed by the membership of the exchange and will act in the event of non-performance by one of its members or one of its member’s customers, which should significantly reduce this credit risk. There is no assurance that a clearinghouse, exchange, or other exchange member will meet its obligations to the Partnership, and Ceres and the commodity broker will not indemnify the Partnership against a default by such parties. Further, the law is unclear as to whether a commodity broker has any obligation to protect its customers from loss in the event of an exchange or clearinghouse defaulting on trades effected for the broker’s customers. In cases where the Partnership trades off-exchange forward contracts with a counterparty, the sole recourse of the Partnership will be the forward contract’s counterparty.
Ceres deals with these credit risks of the Partnership in several ways. First, Ceres monitors the Partnership’s credit exposure to each exchange on a daily basis. The commodity broker informs the Partnership, as with all of their customers, of the Partnership’s net margin requirements for all of its existing open positions, and Ceres has installed a system which permits it to monitor the Partnership’s potential net credit exposure, exchange by exchange, by adding the unrealized trading gains on each exchange, if any, to the Partnership’s margin liability thereon.
Second, the Partnership’s trading policies limit the amount of its net assets that can be committed at any given time to futures contracts and require a minimum amount of diversification in the Partnership’s trading, usually over several different products and exchanges. Historically, the Partnership’s exposure to any one exchange has typically amounted to only a small percentage of its total net assets and, on those relatively few occasions where the Partnership’s credit exposure climbs above such level, Ceres deals with the situation on a case by case basis, carefully weighing whether the increased level of credit exposure remains appropriate. Material changes to the trading policies may be made only with the prior written approval of the limited partners owning more than 50% of Units then outstanding.
Third, with respect to non-exchange-traded forward contract trading, the Partnership trades with only those counterparties which Ceres, together with MS&Co., has determined to be creditworthy. The Partnership presently deals with MS&Co. as the sole counterparty on all trading of foreign currency forward contracts.
30
For additional information, see Note 4, “Financial Instruments” under “Notes to Financial Statements” in the Partnership’s Annual Report to limited partners for the year ended December 31, 2022, which is included in “Item 8. Financial Statements and Supplementary Data.” of this Form 10-K.
Inflation has not been a major factor in the Partnership’s operations.
Critical Accounting Estimates.
The preparation of financial statements in conformity with GAAP requires the General Partner to make estimates and assumptions that affect the reported amounts of assets and liabilities and disclosures of contingent assets and liabilities at the date of the financial statements and the reported amounts of income and expenses during the reporting period. As a result, actual results could differ from these estimates. A summary of the Partnership’s significant accounting policies is described in Note 2, “Basis of Presentation and Summary of Significant Account Policies” under “Notes to Financial Statements” in the Partnership’s Annual Report to limited partners for the year ended December 31, 2022, which is included in “Item 8. Financial Statements and Supplementary Data.” of this Form 10-K.
The Partnership’s most significant accounting policy is the valuation of its investments in Futures Interests and U.S. Treasury bills, as applicable. The fair value of exchange-traded futures, option and forward contracts is determined by the various exchanges, and reflects the settlement price for each contract as of the close of business on the last business day of the reporting period. The fair value of foreign currency forward contracts is extrapolated on a forward basis from the spot prices quoted as of approximately 3:00 P.M. (E.T.) on the last business day of the reporting period from various exchanges. The fair value of non-exchange-traded foreign currency option contracts is calculated by applying an industry standard model application for options valuation of foreign currency options, using as inputs the spot prices, interest rates, and option implied volatilities quoted as of approximately 3:00 P.M. (E.T.) on the last business day of the reporting period. U.S. Treasury bills are valued at the last available bid prices received from independent pricing services as of the close of the last business day of the reporting period.
Item 7A. Quantitative and Qualitative Disclosures About Market Risk.
The Partnership and Trading Company are commodity pools engaged primarily in the speculative trading of Futures Interests. The market-sensitive instruments held by the Partnership are acquired for speculative trading purposes only and, as a result, all or substantially all of the Partnership’s assets are at risk of trading loss. Unlike an operating company, the risk of market-sensitive instruments is inherent to the primary business activity of the Partnership.
The Futures Interests on such contracts traded by the Partnership involve varying degrees of related market risk. Market risk is often dependent upon changes in the level or volatility of held interest rates, exchange rates, and prices of financial instruments and commodities, factors that result in frequent changes in the fair value of the Partnership’s open positions, and consequently in its earnings, whether realized or unrealized, and cash flow. Gains and losses on open positions of exchange-traded futures, exchange-traded forward and exchange-traded futures-styled option contracts are settled daily through variation margin. Gains and losses on non-exchange-traded forward currency contracts and forward currency option contracts are settled upon termination of the contract. Gains and losses on non-exchange-traded forward currency option contracts are settled on an agreed-upon settlement date.
The Partnership’s total market risk may increase or decrease as it is influenced by a wide variety of factors, including, but not limited to, the diversification among the Partnership’s open positions, the volatility present within the markets, and the liquidity of the markets.
The face value of the market sector instruments held by the Partnership is typically many times the applicable margin requirements. Margin requirements generally range between 2% and 15% of contract face value. Additionally, the use of leverage causes the face value of the market sector instruments held by the Partnership typically to be many times the total capitalization of the Partnership.
The Partnership’s past performance is no guarantee of its future results. Any attempt to numerically quantify the Partnership’s market risk is limited by the uncertainty of its speculative trading. The Partnership’s speculative trading and use of leverage may cause future losses and volatility (i.e., “risk of ruin”) that far exceed the Partnership’s experience to date as discussed under the “Partnership’s and the Trading Company’s Value at Risk in Different Market Sectors” section and significantly exceed the Value at Risk tables disclosed.
Limited partners will not be liable for losses exceeding the current net asset value of their investment.
31
Quantifying the Partnership’s and the Trading Company’s Trading Value at Risk
The following quantitative disclosures regarding the Partnership’s/Trading Company’s market risk exposures contain “forward-looking statements” within the meaning of the safe harbor from civil liability provided for such statements by the Private Securities Litigation Reform Act of 1995 (set forth in Section 27A of the Securities Act and Section 21E of the Securities Exchange Act of 1934, as amended (the “Exchange Act”)). All quantitative disclosures in this section are deemed to be forward-looking statements for purposes of the safe harbor, except for statements of historical fact.
The Partnership/Trading Company accounts for open positions on the basis of fair value accounting principles. Any loss in the market value of the Partnership’s open positions is directly reflected in the Partnership’s/Trading Company’s earnings and cash flow.
The Partnership’s/Trading Company’s risk exposure in the market sectors traded by the Trading Advisors is estimated below in terms of Value at Risk. Please note that the Value at Risk model is used to numerically quantify market risk for historic reporting purposes only and is not utilized by either Ceres or the Trading Advisors in their daily risk management activities.
Value at Risk is a measure of the maximum amount which the Partnership/Trading Company could reasonably be expected to lose in a given market sector. However, the inherent uncertainty of the Partnership’s/Trading Company’s speculative trading and the recurrence of market movements far exceeding expectations in the markets traded by the Partnership/Trading Company could result in actual trading or non-trading losses far beyond the indicated Value at Risk or the Partnership’s/Trading Company’s experience to date (i.e., “risk of ruin”). In light of the foregoing, as well as the risks and uncertainties intrinsic to all future projections, the inclusion of the quantification in this section should not be considered to constitute any assurance or representation that the Partnership’s/Trading Company’s losses in any market sector will be limited to Value at Risk or by the Partnership’s/Trading Company’s attempts to manage its market risk.
Exchange margin requirements have been used by the Partnership/Trading Company as the measure of its Value at Risk. Margin requirements are set by exchanges to equal or exceed the maximum losses reasonably expected to be incurred in the fair value of any given contract in 95% - 99% of any one-day interval. The margin levels are established by dealers and exchanges using historical price studies as well as an assessment of current market volatility (including the implied volatility of the options on a given futures contract) and economic fundamentals to provide a probabilistic estimate of the maximum expected near-term one-day price fluctuation.
The Partnership’s and the Trading Company’s Value at Risk in Different Market Sectors
Value at Risk tables represent a probabilistic assessment of the risk of loss in market sensitive instruments. The first trading Value at Risk table reflects the market sensitive instruments held by the Partnership directly and through its investments in the Trading Company. The remaining trading Value at Risk tables reflect the market sensitive instruments held by the Partnership directly (i.e. in the managed accounts in the Partnership’s name traded by certain Trading Advisors) and indirectly by the Trading Company separately. There have been no material changes in the trading Value at Risk information previously disclosed in the Form 10-K for the year ended December 31, 2021.
32
The following table indicates the trading Value at Risk associated with the Partnership’s open positions by market category as of December 31, 2022. As of December 31, 2022, the Partnership’s total capitalization was $157,641,048.
| December 31, 2022 | ||||||||
Market Sector | Value at Risk | % of Total Capitalization | ||||||
Currencies | $ | 7,903,175 | 5.01 | % | ||||
Energy | 1,421,469 | 0.90 | ||||||
Grains | 1,283,398 | 0.81 | ||||||
Indices | 6,000,297 | 3.81 | ||||||
Interest Rates U.S. | 1,568,852 | 1.00 | ||||||
Interest Rates Non-U.S. | 3,204,334 | 2.03 | ||||||
Livestock | 175,421 | 0.11 | ||||||
Metals | 1,308,078 | 0.83 | ||||||
Softs | 1,506,361 | 0.96 | ||||||
|
|
|
|
| ||||
Total | $ | 24,371,385 | 15.46 | % | ||||
|
|
|
|
| ||||
The following table indicates the trading Value at Risk associated with the Partnership’s open positions by market category as of December 31, 2021. As of December 31, 2021, the Partnership’s total capitalization was $136,910,662.
| December 31, 2021 | ||||||||
Market Sector | Value at Risk | % of Total Capitalization | ||||||
Currencies | $ | 9,938,577 | 7.26 | % | ||||
Energy | 1,962,300 | 1.43 | ||||||
Grains | 895,075 | 0.65 | ||||||
Indices | 5,607,494 | 4.10 | ||||||
Interest Rates U.S. | 880,975 | 0.64 | ||||||
Interest Rates Non-U.S. | 1,964,317 | 1.43 | ||||||
Livestock | 107,098 | 0.08 | ||||||
Metals | 1,612,016 | 1.18 | ||||||
Softs | 1,148,256 | 0.84 | ||||||
|
|
|
|
| ||||
Total | $ | 24,116,108 | 17.61 | % | ||||
|
|
|
|
| ||||
33
The following tables indicate the trading Value at Risk associated with the Partnership’s/Trading Company’s open positions by market category as of December 31, 2022 and 2021, and the highest, lowest and average values during the twelve months ended December 31, 2022 and 2021, as applicable. All open position trading risk exposures of the Partnership have been included in calculating the figures set forth below.
As of December 31, 2022, the Partnership’s total capitalization was $157,641,048.
| December 31, 2022 | ||||||||||||||||||||
| Twelve Months Ended December 31, 2022 | ||||||||||||||||||||
Market Sector | Value at Risk | % of Total Capitalization | High Value at Risk | Low Value at Risk | Average Value at Risk* | |||||||||||||||
Currencies | $ | 7,254,981 | 4.60 | % | $ | 9,072,484 | $ | 482,032 | $ | 5,926,990 | ||||||||||
Energy | 1,154,988 | 0.73 | 2,495,372 | 713,894 | 1,561,544 | |||||||||||||||
Grains | 913,813 | 0.58 | 1,286,439 | 433,472 | 855,219 | |||||||||||||||
Indices | 5,195,015 | 3.29 | 7,264,482 | 1,418,059 | 3,424,394 | |||||||||||||||
Interest Rates U.S. | 1,080,204 | 0.69 | 1,242,478 | 412,516 | 806,983 | |||||||||||||||
Interest Rates Non-U.S. | 2,331,119 | 1.48 | 2,734,726 | 677,182 | 1,541,348 | |||||||||||||||
Livestock | 85,991 | 0.05 | 144,815 | 17,243 | 60,328 | |||||||||||||||
Metals | 911,945 | 0.58 | 1,763,746 | 282,198 | 1,058,390 | |||||||||||||||
Softs | 768,676 | 0.49 | 961,359 | 384,147 | 648,677 | |||||||||||||||
|
|
|
|
| ||||||||||||||||
Total | $ | 19,696,732 | 12.49 | % | ||||||||||||||||
|
|
|
|
| ||||||||||||||||
* Annual average of daily Values at Risk.
As of December 31, 2021, the Partnership’s total capitalization was $136,910,662.
| December 31, 2021 | ||||||||||||||||||||
| Twelve Months Ended December 31, 2021 | ||||||||||||||||||||
Market Sector | Value at Risk | % of Total Capitalization | High Value at Risk | Low Value at Risk | Average Value at Risk* | |||||||||||||||
Currencies | $ | 8,317,348 | 6.08 | % | $ | 13,635,401 | $ | 4,566,053 | $ | 8,999,297 | ||||||||||
Energy | 1,593,108 | 1.16 | 2,835,997 | 626,844 | 1,922,632 | |||||||||||||||
Grains | 665,748 | 0.49 | 1,484,057 | 432,300 | 834,033 | |||||||||||||||
Indices | 4,644,663 | 3.39 | 8,845,039 | 3,501,465 | 5,836,564 | |||||||||||||||
Interest Rates U.S. | 771,654 | 0.56 | 2,046,828 | 321,052 | 933,536 | |||||||||||||||
Interest Rates Non-U.S. | 1,713,543 | 1.25 | 4,518,263 | 1,198,940 | 2,403,480 | |||||||||||||||
Livestock | 39,970 | 0.03 | 172,920 | - | 56,817 | |||||||||||||||
Metals | 1,196,578 | 0.88 | 2,352,311 | 750,206 | 1,413,570 | |||||||||||||||
Softs | 807,669 | 0.59 | 1,163,097 | 145,390 | 675,120 | |||||||||||||||
|
|
|
|
| ||||||||||||||||
Total | $ | 19,750,281 | 14.43 | % | ||||||||||||||||
|
|
|
|
| ||||||||||||||||
* Annual average of daily Values at Risk.
34
As of December 31, 2022, the Trading Company’s total capitalization was $49,402,783 and the Partnership owned 100% of the Trading Company. The Partnership invests a portion of its assets in the Trading Company. The Trading Company’s Value at Risk as of December 31, 2022 was as follows:
| December 31, 2022 | ||||||||||||||||||||
| Twelve Months Ended December 31, 2022 | ||||||||||||||||||||
Market Sector | Value at Risk | % of Total Capitalization | High Value at Risk | Low Value at Risk | Average Value at Risk* | |||||||||||||||
Currencies | $ | 648,194 | 1.31 | % | $ | 2,446,867 | $ | 631,176 | $ | 1,655,803 | ||||||||||
Energy | 266,481 | 0.54 | 871,851 | 105,629 | 471,630 | |||||||||||||||
Grains | 369,585 | 0.75 | 499,620 | 90,640 | 252,207 | |||||||||||||||
Indices | 805,282 | 1.63 | 1,156,070 | 237,224 | 783,593 | |||||||||||||||
Interest Rates U.S. | 488,648 | 0.99 | 501,160 | 118,450 | 315,235 | |||||||||||||||
Interest Rates Non-U.S. | 873,215 | 1.77 | 873,215 | 242,793 | 522,139 | |||||||||||||||
Livestock | 89,430 | 0.18 | 124,795 | 23,320 | 69,858 | |||||||||||||||
Metals | 396,133 | 0.80 | 882,549 | 315,801 | 559,015 | |||||||||||||||
Softs | 737,685 | 1.49 | 744,499 | 179,313 | 367,055 | |||||||||||||||
|
|
|
|
| ||||||||||||||||
Total | $ | 4,674,653 | 9.46 | % | ||||||||||||||||
|
|
|
|
| ||||||||||||||||
* Annual average of daily Values at Risk.
As of December 31, 2021, the Trading Company’s total capitalization was $41,317,749 and the Partnership owned 100% of the Trading Company. The Partnership invests a portion of its assets in the Trading Company. The Trading Company’s Value at Risk as of December 31, 2021 was as follows:
| December 31, 2021 | ||||||||||||||||||||
| Twelve Months Ended December 31, 2021 | ||||||||||||||||||||
Market Sector | Value at Risk | % of Total Capitalization | High Value at Risk | Low Value at Risk | Average Value at Risk* | |||||||||||||||
Currencies | $ | 1,621,229 | 3.92 | % | $ | 3,262,014 | $ | 1,100,239 | $ | 1,624,292 | ||||||||||
Energy | 369,192 | 0.89 | 887,874 | 206,987 | 605,441 | |||||||||||||||
Grains | 229,327 | 0.56 | 559,815 | 74,101 | 239,339 | |||||||||||||||
Indices | 962,831 | 2.33 | 1,386,812 | 657,048 | 921,128 | |||||||||||||||
Interest Rates U.S. | 109,321 | 0.27 | 323,621 | 18,802 | 152,556 | |||||||||||||||
Interest Rates Non-U.S. | 250,774 | 0.61 | 887,489 | 172,632 | 402,042 | |||||||||||||||
Livestock | 67,128 | 0.16 | 189,970 | 38,473 | 123,981 | |||||||||||||||
Metals | 415,438 | 1.01 | 735,993 | 297,131 | 441,668 | |||||||||||||||
Softs | 340,587 | 0.82 | 517,670 | 182,078 | 308,123 | |||||||||||||||
|
|
|
|
| ||||||||||||||||
Total | $ | 4,365,827 | 10.57 | % | ||||||||||||||||
|
|
|
|
| ||||||||||||||||
* Annual average of daily Values at Risk.
Limitations on Value at Risk as an Assessment of Market Risk
Value at Risk models permit estimation of a portfolio’s aggregate market risk exposure, incorporating a range of varied market risks, reflect risk reduction due to portfolio diversification or hedging activities, and can cover a wide range of portfolio assets. However, Value at Risk measures should be viewed in light of the methodology’s limitations, which include, but may not be limited to, the following:
| • | past changes in market risk factors will not always result in accurate predictions of the distributions and correlations of future market movements; |
| • | changes in portfolio value caused by market movements may differ from those of the Value at Risk model; |
| • | Value at Risk results reflect past market fluctuations applied to current trading positions while future risk depends on future positions; |
| • | Value at Risk using a one-day time horizon does not fully capture the market risk of positions that cannot be liquidated or hedged within one day; and |
| • | the historical market risk factor data used for Value at Risk estimation may provide only limited insight into losses that could be incurred under certain unusual market movements. |
35
Non-Trading Risk
The Partnership has non-trading market risk on its foreign cash balances not needed for margin. These balances and any market risk they may represent are immaterial.
A decline in short-term interest rates would result in a decline in the Partnership’s cash management income. This cash flow risk is not considered to be material.
Materiality, as used throughout this section, is based on an assessment of reasonably possible market movements and any associated potential losses, taking into account the leverage, optionality and multiplier features of the Partnership’s market-sensitive instruments, in relation to the Partnership’s net assets.
Qualitative Disclosures Regarding Primary Trading Risk Exposures
The following qualitative disclosures regarding the Partnership’s market risk exposures – except for (i) those disclosures that are statements of historical fact and (ii) the descriptions of how the Partnership manages its primary market risk exposures – constitute forward-looking statements within the meaning of Section 27A of the Securities Act and Section 21E of the Exchange Act. The Partnership’s primary market risk exposures, as well as the strategies used and to be used by Ceres and the Trading Advisors for managing such exposures, are subject to numerous uncertainties, contingencies and risks, any one of which could cause the actual results of the Partnership’s risk controls to differ materially from the objectives of such strategies. Government interventions, defaults and expropriations, illiquid markets, the emergence of dominant fundamental factors, political upheavals, changes in historical price relationships, an influx of new market participants, increased regulation and many other factors could result in material losses, as well as in material changes to the risk exposures and the risk management strategies of the Partnership. Investors must be prepared to lose all or substantially all of their investment in the Partnership.
The Trading Advisors, in general, tend to utilize trading system(s) to take positions when market opportunities develop, and Ceres anticipates that the Trading Advisors will continue to do so.
The following were the primary trading risk exposures of the Partnership as of December 31, 2022, by market sector. It may be anticipated, however, that these market exposures will vary materially over time.
Stock Indices. The Partnership’s primary equity exposure is to equity price risk in the G20 countries. The stock index futures traded by the Partnership are limited to futures on broadly based indices. As of December 31, 2022, the Partnership’s primary exposures were in the DAX (Germany), FTSE 100 (United Kingdom), Hang Seng (Hong Kong), CAC 40 (France), NASDAQ 100 (U.S.), Nikkei 225 (Japan), TOPIX (Japan), SPI 200 (Australia), AEX (European Union), S&P CNX NIFTY 50 (India), and S&P 500 (U.S.) stock indices. Overall, the Partnership is primarily exposed to the risk of adverse price trends or static markets in the major U.S., European, and Pacific Rim indices. (Static markets would not cause major market changes but would make it difficult for the Partnership to avoid being “whipsawed” into numerous small losses.)
Interest Rates. Interest rate movements directly affect the price of the futures positions held by the Partnership and indirectly the value of its stock index and currency positions. Interest rate movements in one country as well as relative interest rate movements between countries can materially affect the Partnership’s profitability. The Partnership’s primary interest rate exposure is to interest rate fluctuations in the United States and other G7 countries. However, the Partnership may also take futures positions on the government debt of smaller economies – e.g., Australia and New Zealand.
Currencies. The Partnership’s currency exposure is to exchange rate fluctuations, primarily fluctuations that disrupt the historical pricing relationships between different currencies and currency pairs. These fluctuations are influenced by interest rate changes, as well as political and general economic conditions. The General Partner does not anticipate that the risk profile of the Partnership’s currency sector will change significantly in the future.
Commodities:
Energy. The Partnership’s primary energy market exposure is to oil and natural gas price movements, often resulting from political developments in the Middle East, weather conditions, and other factors contributing to supply and demand. Further energy market exposure is to carbon emission allowances markets which are subject to price movements driven by geopolitical events, climate related regulation, and supply and demand related factors. Energy prices can be volatile and substantial profits and losses have been experienced and are expected to continue in this market.
36
Metals. The Partnership’s primary metals exposure as of December 31, 2022 was to fluctuations in the price of copper, silver, aluminum, zinc, lead, platinum, palladium, nickel and gold.
Softs. The Partnership’s trading risk exposure in soft commodities is primarily to agricultural-related price movements, which are often directly affected by severe or unexpected weather conditions, as well as geopolitical events and supply/demand factors. Sugar, cocoa, coffee, and cotton accounted for the majority of the Partnership’s soft commodity exposure as of December 31, 2022.
Grains. The Partnership’s trading risk exposure in grains is primarily to agricultural-related price movements, which are often directly affected by severe or unexpected weather conditions. The soybean complex, corn and wheat accounted for the Partnership’s primary grain exposure as of December 31, 2022.
Livestock. The Partnership’s primary risk exposure in livestock is to fluctuations in cattle and hog prices.
Qualitative Disclosures Regarding Non-Trading Risk Exposure
The following was the only non-trading risk exposure of the Partnership as of December 31, 2022.
Foreign Currency Balances. The Partnership may hold various foreign currency balances. The Trading Advisors regularly convert foreign currency balances to U.S. dollars in an attempt to control the Partnership’s non-trading risk.
Qualitative Disclosures Regarding Means of Managing Risk Exposure
Ceres monitors and attempts to mitigate the Partnership’s risk exposure on a daily basis through financial, credit and risk management monitoring systems and accordingly, believes that it has effective procedures for evaluating and limiting the credit and market risks to which the Partnership may be subject. These monitoring systems generally allow Ceres to statistically analyze actual trading results with risk-adjusted performance indicators and correlation statistics. In addition, online monitoring systems provide account analysis of futures, forward and option contracts by sector, margin requirements, gain and loss transactions and collateral positions.
Ceres monitors the Partnership’s performance and the concentration of open positions, and consults with the Trading Advisors concerning the Partnership’s overall risk profile. If Ceres felt it necessary to do so, Ceres could require the Trading Advisors to close out positions as well as enter positions traded on behalf of the Partnership. However, any such intervention would be a highly unusual event. Ceres primarily relies on the Trading Advisors’ own risk control policies while maintaining a general supervisory overview of the Partnership’s market risk exposures.
The Trading Advisors apply their own risk management policies to their trading. The Trading Advisors often follow diversification guidelines, margin limits and stop loss points to exit a position. The Trading Advisors’ research of risk management often suggests ongoing modifications to their trading programs.
As part of Ceres’s risk management, Ceres periodically meets with the Trading Advisors to discuss their risk management and to look for any material changes to the Trading Advisors’ portfolio balance and trading techniques. The Trading Advisors are required to notify Ceres of any material changes to their programs.
37
 | ||
| By: | Patrick T. Egan | |
| President and Director | ||
Ceres Managed Futures LLC General Partner, | ||
| Ceres Classic L.P. |
Ceres Managed Futures LLC |
| 522 Fifth Avenue |
New York, NY 10036 (855) 672-4468 |
| (i) | pertain to the maintenance of records that, in reasonable detail, accurately and fairly reflect the transactions and dispositions of the assets of the Partnership; |
| (ii) | provide reasonable assurance that transactions are recorded as necessary to permit preparation of financial statements in accordance with accounting principles generally accepted in the United States of America, and that receipts and expenditures of the Partnership are being made only in accordance with authorizations of Management and the directors of Ceres; and |
| (iii) | provide reasonable assurance regarding prevention or timely detection and correction of unauthorized acquisition, use or disposition of the Partnership’s assets that could have a material effect on the financial statements. |
 |  | |||
| Patrick T. Egan | Brooke Lambert | |||
| President and Director | Chief Financial Officer | |||
| Ceres Managed Futures LLC | Ceres Managed Futures LLC | |||
| General Partner, | General Partner, | |||
| Ceres Classic L.P. | Ceres Classic L.P. |
 | Ernst & Young LLP 200 Clarendon Street Boston, MA 02116 | Tel: +1 617 266 2000 Fax: +1 617 266 5843 www.ey.com |

December 31, 2022 | December 31, 2021 | |||||||
Assets: | ||||||||
Investment in the Trading Company (1) , at fair value (Note 7) | $ | 49,515,860 | $ | 41,318,675 | ||||
| Redemptions receivable from the Trading Company | 135,251 | 114,506 | ||||||
| Equity in trading account: | ||||||||
| Unrestricted cash (Note 2f) | 88,944,724 | 77,949,156 | ||||||
| Restricted cash (Note 2f) | 19,875,426 | 19,943,752 | ||||||
| Net unrealized appreciation on open futures contracts | 170,573 | 729,070 | ||||||
| Net unrealized appreciation on open forward contracts | 453,392 | - | ||||||
| Total equity in trading account | 109,444,115 | 98,621,978 | ||||||
| Interest receivable (Note 2i) | 291,679 | 2,625 | ||||||
| Total assets | $ | 159,386,905 | $ | 140,057,784 | ||||
Liabilities and Partners’ Capital: | ||||||||
| Liabilities: | ||||||||
| Net unrealized depreciation on open forward contracts | $ | - | $ | 421,170 | ||||
| Accrued expenses: | ||||||||
| Administrative and General Partner’s fees (Note 2j) | 102,153 | 85,905 | ||||||
| Management fees (Note 3) | 159,450 | 133,980 | ||||||
| Incentive fees (Note 3) | - | 81,002 | ||||||
| Professional fees | 160,606 | 139,228 | ||||||
| Redemptions payable to General Partner (Notes 2o and 2p) | 300,000 | 200,000 | ||||||
| Redemptions payable to Limited Partners (Notes 2o and 2p) | 1,023,648 | 2,085,837 | ||||||
| Total liabilities | 1,745,857 | 3,147,122 | ||||||
| Partners’ Capital: | ||||||||
| General Partner, Class Z, 138,422.641 and 163,339.585 Units outstanding at December 31, 2022 and 2021, respectively | 1,667,285 | 1,545,437 | ||||||
| Limited Partners, Class A, 5,549,158.868 and 6,086,081.989 Units outstanding at December 31, 2022 and 2021, respectively | 155,840,325 | 135,260,404 | ||||||
| Limited Partners, Class Z, 11,079.649 Units outstanding at December 31, 2022 and 2021 | 133,438 | 104,821 | ||||||
| Total partners’ capital (net asset value) | 157,641,048 | 136,910,662 | ||||||
| Total liabilities and partners’ capital | $ | 159,386,905 | $ | 140,057,784 | ||||
| Net asset value per Unit: | ||||||||
| Class A | $ | 28.08 | $ | 22.22 | ||||
| Class Z | $ | 12.04 | $ | 9.46 | ||||
Notional ($)/ Number of Contracts | Fair Value | % of Partners’ Capital | ||||||||||
Futures Contracts Purchased | ||||||||||||
| Currencies | 117 | $ | (6,725 | ) | (0.00) | %* | ||||||
| Energy | 96 | 531,723 | 0.34 | |||||||||
| Grains | 341 | 244,568 | 0.16 | |||||||||
| Indices | 663 | (1,846,990 | ) | (1.17) | ||||||||
| Interest Rates U.S. | 95 | (182,234 | ) | (0.12) | ||||||||
Interest Rates Non-U.S. | 337 | (741,033 | ) | (0.47) | ||||||||
| Livestock | 55 | 50,980 | 0.03 | |||||||||
| Metals | 33 | 53,655 | 0.03 | |||||||||
| Softs | 240 | 30,538 | 0.02 | |||||||||
| Total futures contracts purchased | (1,865,518 | ) | (1.18) | |||||||||
Futures Contracts Sold | ||||||||||||
| Currencies | 32 | (29,521 | ) | (0.02) | ||||||||
| Energy | 30 | 77,875 | 0.05 | |||||||||
| Grains | 129 | (55,088 | ) | (0.02) | ||||||||
| Indices | 150 | 300,983 | 0.19 | |||||||||
| Interest Rates U.S. | 508 | 288,883 | 0.18 | |||||||||
Interest Rates Non-U.S. | 1,331 | 1,566,169 | 0.99 | |||||||||
| Livestock | 18 | (12,550 | ) | (0.01) | ||||||||
| Metals | 18 | (27,988 | ) | (0.02) | ||||||||
| Softs | 96 | (72,672 | ) | (0.05) | ||||||||
| Total futures contracts sold | 2,036,091 | 1.29 | ||||||||||
| Net unrealized appreciation on open futures contracts | $ | 170,573 | 0.11 | % | ||||||||
Unrealized Appreciation on Open Forward Contracts | ||||||||||||
| Currencies | $ | 181,925,437 | $ | 2,005,546 | 1.27 | % | ||||||
| Metals | 142 | 469,150 | 0.30 | |||||||||
| Total unrealized appreciation on open forward contracts | 2,474,696 | 1.57 | ||||||||||
Unrealized Depreciation on Open Forward Contracts | ||||||||||||
| Currencies | $ | 162,560,678 | (1,604,184 | ) | (1.02) | |||||||
| Metals | 138 | (417,120 | ) | (0.26) | ||||||||
| Total unrealized depreciation on open forward contracts | (2,021,304 | ) | (1.28) | |||||||||
| Net unrealized appreciation on open forward contracts | $ | 453,392 | 0.29 | % | ||||||||
Investment in the Trading Company | ||||||||||||
| CMF Winton Master L.P. | $ | 49,515,860 | 31.41 | % | ||||||||
Notional ($)/ Number of Contracts | Fair Value | % of Partners’ Capital | ||||||||||
Futures Contracts Purchased | ||||||||||||
| Currencies | 88 | $ | (30,119 | ) | (0.02) | % | ||||||
| Energy | 243 | 599,385 | 0.44 | |||||||||
| Grains | 353 | 56,336 | 0.04 | |||||||||
| Indices | 308 | 601,764 | 0.44 | |||||||||
| Interest Rates U.S. | 354 | 13,617 | 0.01 | |||||||||
Interest Rates Non-U.S. | 777 | (417,936 | ) | (0.31) | ||||||||
| Livestock | 18 | 16,250 | 0.01 | |||||||||
| Metals | 15 | 11,287 | 0.01 | |||||||||
| Softs | 178 | 44,914 | 0.03 | |||||||||
| Total futures contracts purchased | 895,498 | 0.65 | ||||||||||
Futures Contracts Sold | ||||||||||||
| Currencies | 166 | (135,560 | ) | (0.10) | ||||||||
| Energy | 10 | (47,947 | ) | (0.03) | ||||||||
| Grains | 37 | 63,863 | 0.05 | |||||||||
| Indices | 226 | (434,419 | ) | (0.32) | ||||||||
| Interest Rates U.S. | 177 | 2,047 | 0.00 | * | ||||||||
Interest Rates Non-U.S. | 875 | 487,345 | 0.36 | |||||||||
| Livestock | 5 | (4,670 | ) | (0.00) | * | |||||||
| Metals | 53 | (103,026 | ) | (0.08) | ||||||||
| Softs | 62 | 5,939 | 0.00 | * | ||||||||
| Total futures contracts sold | (166,428 | ) | (0.12) | |||||||||
| Net unrealized appreciation on open futures contracts | $ | 729,070 | 0.53 | % | ||||||||
Unrealized Appreciation on Open Forward Contracts | ||||||||||||
| Currencies | $ | 167,807,766 | $ | 1,744,966 | 1.27 | % | ||||||
| Metals | 172 | 822,726 | 0.60 | |||||||||
| Total unrealized appreciation on open forward contracts | 2,567,692 | 1.87 | ||||||||||
Unrealized Depreciation on Open Forward Contracts | ||||||||||||
| Currencies | $ | 198,478,850 | (2,224,046 | ) | (1.62) | |||||||
| Metals | 150 | (764,816 | ) | (0.56) | ||||||||
| Total unrealized depreciation on open forward contracts | (2,988,862 | ) | (2.18 ) | |||||||||
| Net unrealized depreciation on open forward contracts | $ | (421,170 | ) | (0.31) | % | |||||||
Investment in the Trading Company | ||||||||||||
| CMF Winton Master L.P. | $ | 41,318,675 | 30.18 | % | ||||||||
2022 | 2021 | 2020 | ||||||||||
Investment Income: | ||||||||||||
| Interest income (Note 2i) | $ | 1,578,766 | $ | 34,382 | $ | 205,700 | ||||||
| Interest income allocated from the Trading Company (Note 2i) | 620,422 | 12,609 | - | |||||||||
| Total investment income | 2,199,188 | 46,991 | 205,700 | |||||||||
Expenses: | ||||||||||||
| Expenses allocated from the Trading Company | 218,139 | 181,956 | - | |||||||||
| Clearing fees | 225,124 | 404,743 | 138,627 | |||||||||
| Administrative and General Partner’s fees (Note 2j) | 1,200,220 | 1,106,620 | 1,293,326 | |||||||||
| Ongoing placement agent fees (Note 2k) | 1,184,946 | 1,092,132 | 1,039,045 | |||||||||
| Management fees (Note 3) | 1,928,192 | 1,876,307 | 927,355 | |||||||||
| Incentive fees (Note 3) | 3,536,416 | 1,258,266 | - | |||||||||
| Professional fees | 400,174 | 537,889 | 91 | |||||||||
| Total expenses | 8,693,211 | 6,457,913 | 3,398,444 | |||||||||
| Expenses reimbursed by the General Partner | - | - | (138,718 | ) | ||||||||
| Net expenses | 8,693,211 | 6,457,913 | 3,259,726 | |||||||||
| Net investment loss | (6,494,023 | ) | (6,410,922 | ) | (3,054,026 | ) | ||||||
Trading Results: | ||||||||||||
| Net gains (losses) on trading of commodity interests: | ||||||||||||
| Net realized gains (losses) on closed contracts | 29,411,384 | 13,614,870 | (8,587,761 | ) | ||||||||
| Net realized gains (losses) on closed contracts allocated from the Trading Company | 11,294,485 | 7,151,945 | - | |||||||||
| Net change in unrealized gains (losses) on open contracts | 329,007 | (4,073,094 | ) | 6,236,177 | ||||||||
| Net change in unrealized gains (losses) on open contracts allocated from the Trading Company | 1,149,903 | (2,193,863 | ) | - | ||||||||
| Total trading results | 42,184,779 | 14,499,858 | (2,351,584 | ) | ||||||||
| Net income (loss) | $ | 35,690,756 | $ | 8,088,936 | $ | (5,405,610 | ) | |||||
| Net income (loss) per Unit (Note 8)*: | ||||||||||||
| Class A | $ | 5.86 | $ | 1.15 | $ | (1.14 | ) | |||||
| Class Z | $ | 2.58 | $ | 0.56 | $ | (0.34 | ) | |||||
| Weighted average Units outstanding: | ||||||||||||
| Class A | 5,794,885.155 | 6,578,607.865 | 3,411,677.656 | |||||||||
| Class Z | 174,419.234 | 206,191.102 | 101,536.878 | |||||||||
| * | Represents the change in net asset value per Unit. |
Class A | Class Z | Total | ||||||||||||||||||||||
Amount | Units | Amount | Units | Amount | Units | |||||||||||||||||||
| Partners’ Capital, December 31, 2019 | $ | 83,168,125 | 3,744,360.651 | $ | 938,707 | 101,536.878 | $ | 84,106,832 | 3,845,897.529 | |||||||||||||||
| Subscriptions - Limited Partners | 25,000 | 1,155.802 | - | - | 25,000 | 1,155.802 | ||||||||||||||||||
| Redemptions - Limited Partners | (17,276,664 | ) | (871,818.455 | ) | - | - | (17,276,664 | ) | (871,818.455 | ) | ||||||||||||||
| Net income (loss) | (5,370,968 | ) | - | (34,642 | ) | - | (5,405,610 | ) | - | |||||||||||||||
| Partners’ Capital, December 31, 2020 | 60,545,493 | 2,873,697.998 | 904,065 | 101,536.878 | 61,449,558 | 2,975,234.876 | ||||||||||||||||||
| Subscriptions - General Partner | - | - | 1,841,454 | 206,904.961 | 1,841,454 | 206,904.961 | ||||||||||||||||||
| Subscriptions - Limited Partners | 89,741,721 | 4,259,217.890 | 99,016 | 11,079.649 | 89,840,737 | 4,270,297.539 | ||||||||||||||||||
| Redemptions - General Partner | - | - | (1,285,094 | ) | (145,102.254 | ) | (1,285,094 | ) | (145,102.254 | ) | ||||||||||||||
| Redemptions - Limited Partners | (23,024,929 | ) | (1,046,833.899 | ) | - | - | (23,024,929 | ) | (1,046,833.899 | ) | ||||||||||||||
| Net income (loss) | 7,998,119 | - | 90,817 | - | 8,088,936 | - | ||||||||||||||||||
| Partners’ Capital, December 31, 2021 | 135,260,404 | 6,086,081.989 | 1,650,258 | 174,419.234 | 136,910,662 | 6,260,501.223 | ||||||||||||||||||
| Redemptions - General Partner | - | - | (300,000 | ) | (24,916.944 | ) | (300,000 | ) | (24,916.944 | ) | ||||||||||||||
| Redemptions - Limited Partners | (14,660,370 | ) | (536,923.121 | ) | - | - | (14,660,370 | ) | (536,923.121 | ) | ||||||||||||||
| Net income (loss) | 35,240,291 | - | 450,465 | - | 35,690,756 | - | ||||||||||||||||||
| Partners’ Capital, December 31, 2022 | $ | 155,840,325 | 5,549,158.868 | $ | 1,800,723 | 149,502.290 | $ | 157,641,048 | 5,698,661.158 | |||||||||||||||
2. | Basis of Presentation and Summary of Significant Accounting Policies: |
| a. | Use of Estimates. |
| b. | Profit Allocation. |
| c. | Statement of Cash Flows. “Statement of Cash Flows.” |
| d. | Partnership’s Investment in the Trading Company. |
| e. | Partnership’s Investments. ate. G ains or losses are realized when contracts are liquidated and are determined using thefirst-in, first-out method. Net unrealized gains or losses on open contracts are included as a component of equity in trading account in the Statements of Financial Condition. Net realized gains or losses and net change in unrealized gains or losses are included in the Statements of Income and Expenses. The Partnership does not isolate the portion of the results of operations arising from the effect of changes in foreign exchange rates on investments from fluctuations from changes in market prices of investments held. Such fluctuations are included in total trading results in the Statements of Income and Expenses. |
| f. | Partnership’s Cash. ember 31, 2022 and 2021, respectively. |
| g. | Foreign Currency Transactions and Translation. |
| h. | Income Taxes. “Income Taxes,” “more-likely-than-not” of being sustained “when challenged” or “when examined” by the applicable tax authority. Tax positions determined not to meet themore-likely-than-not threshold would be recorded as a tax benefit or liability in the Statements of Financial Condition for the current year. If a tax position does not meet the minimum statutory threshold to avoid the incurring of penalties, an expense for the amount of the statutory penalty and interest, if applicable, shall be recognized in the Partnership’s Statements of Income and Expenses in the years in which the position is claimed or expected to be claimed. The General Partner has concluded that there are no significant uncertain tax positions that would require recognition in the financial statements. The Partnership files U.S. federal and various state and local tax returns. No income tax returns are currently under examination. The 2019 through 2022 tax years remain subject to examination by U.S. federal and most state tax authorities. |
| i. | Revenue Recognition. 4-week U.S. Treasury bill discount rate. As of January 1, 2021, the Partnership will receive monthly interest on 100% of the average daily equity maintained in cash in the Partnership’s account during each month at a rate equal to 100% of the monthly average of the4-week U.S. Treasury bill discount rate. MS&Co. and Ceres retain any interest earned on such uninvested cash in excess of the interest paid to the Partnership. For purposes of these interest credits, daily funds do not include monies due to the Partnership on or with respect to futures, forward, or option contracts that have not been received. |
| j. | General Partner’s Fee. mont hly administrative fee equal to 1/12th of 0.75% (a 0.75% annual rate) of the Partnership’s net assets (plus “notional” funds, if any) as of the beginning of each month, as described in the Partnership’s Memorandum. From July 1, 2020 to December 31, 2020, the Partnership paid the General Partner a monthly administrative and General Partner’s fee equal to 1/12th of 1.75% (1.75% annual rate) of the Partnership’s net assets (plus “notional” funds, if any) as of the first day of each month. Prior to July 1, 2020, the Partnership paid the General Partner a monthly administrative and General Partner’s fee equal to 1/12th of 2% (2% annual rate) of the Partnership’s net assets (plus “notional” funds, if any) as of the first day of each month. Prior to January 1, 2021, the General Partner then paid or reimbursed the Partnership for all fees and costs charged or incurred by the commodity brokers for trades executed on behalf of the Partnership, and for all ordinary administrative and offering expenses. |
| Effective January 1, 2021, the Partnership directly pays the brokerage fees and other transaction-related fees and expenses, as incurred and also pays its ongoing administrative, operating, offering and organizational expenses (including, but not limited to, periodic legal, accounting, administrative, filing, reporting and data processing fees) and its pro rata share of such expenses of any trading company to which the Partnership has allocated assets. |
| k. | Placement Agent Fees. sub-placement agent, an annualized rate equal to 0.75% with respect to Class A Units. |
From July 1, 2020 to December 31, 2020, the Partnership paid Morgan Stanley Wealth Management, or any other placement agent or sub-placement agent, an annualized rate equal to 1.00% with respect to Class A Units. Prior to July 1, 2020, the Partnership paid Morgan Stanley Wealth Management, or any other placement agent orsub-placement agent, an annualized rate equal to 2.00% with respect to Class A Units. The Placement Agent pays a portion of the ongoing placement agent fees it receives from the Partnership to the Morgan Stanley Financial Advisor or Private Wealth Advisor responsible for selling the Units to the relevant limited partners. Certain limited partners (other than ERISA/IRA investors) may be deemed to hold Class Z Units. Class Z Units are not subject to ongoing placement agent fees. |
As of November 1, 2018, the Partnership entered into an alternative investment placement agent agreement (the “Harbor Selling Agreement”), by and among the Partnership, the General Partner, Morgan Stanley Distribution Inc. (“MSDI”), and Harbor Investment Advisory, LLC, a Maryland limited liability company (“Harbor”), which supersedes and replaces the alternative investment selling agent agreement, dated January 19, 2018, between the Partnership, the General Partner and Harbor. Pursuant to the Harbor Selling Agreement, MSDI and Harbor have been appointed as a non-exclusive selling agent andsub-selling agent, respectively, of the Partnership for the purpose of finding eligible investors for units of limited partnership interest (“Unit(s)”) through offerings that are exempt from registration under the Securities Act of 1933, as amended, pursuant to Section 4(a)(2) thereof and Rule 506 of Regulation D promulgated thereunder and for Harbor to serve as an investment advisor to its customers investing in one or more of the partnerships party to the Harbor Selling Agreement; provided, that, included within such appointment, Harbor will provide certain services to certain holders of Units of the Partnership, who had acquired such Units prior to such holders becoming clients of Harbor. The Harbor Selling Agreement continues in effect until September 30, 2023 unless terminated in certain circumstances as set forth in the Harbor Selling Agreement, including by any party on thirty days’ prior written notice, after which the General Partner or the Partnership may, in its sole discretion, renew the Harbor Selling Agreement for additional one year periods. Pursuant to the Harbor Selling Agreement, effective as of January 1, 2021, the Partnership pays Harbor an ongoing placement agent fee equal to 1/12th of 0.75% (a 0.75% annual rate) of the net asset value per Unit for certain holders of Class A Units in the Partnership, as set forth in the Harbor Selling Agreement. From July 1, 2020 to December 31, 2020, the Partnership paid Harbor an ongoing placement agent fee equal to 1/12th of 1.00% (a 1.00% annual rate) of the net asset value per Unit for certain holders of Class A Units in the Partnership, as set forth in the Harbor Selling Agreement. Prior to July 1, 2020, the Partnership paid Harbor an ongoing placement agent fee equal to 1/12th of 2.00% (a 2.00% annual rate) of the net asset value per Unit for certain holders for Class A Units in the Partnership, as set forth in the Harbor Selling Agreement. |
| l. | Continuing Offering. |
| m. | Equity in Trading Account. |
| n. | Investment Company Status. 2013-08, “Financial Services—Investment Companies (Topic 946): Amendments to the Scope, Measurement and Disclosure Requirements,” |
| o. | Redemptions. |
| p. | Exchanges. |
| q. | Distributions. pro-rata basis at the sole discretion of Ceres. No distributions have been made to date. Ceres does not intend to make any distributions of the Partnership’s profits. |
| r. | Dissolution of the Partnership. |
| s. | Net Income (Loss) per Unit. “Financial Services – Investment Companies.” |
3. | Trading Advisors: |
4. | Financial Instrument Risks: |
5. | Trading Activities: |
Gross Amounts Offset in the Statements of Financial Condition | Amounts Presented in the Statements of Financial Condition | Gross Amounts Not Offset in the Statements of Financial Condition | ||||||||||||||||||||||
December 31, 2022 | Gross Amounts Recognized | Financial Instruments | Cash Collateral Received/ Pledged* | Net Amount | ||||||||||||||||||||
Assets | ||||||||||||||||||||||||
| Futures | $ | 3,786,495 | $ | (3,615,922 | ) | $ | 170,573 | $ | - | $ | - | $ | 170,573 | |||||||||||
| Forwards | 2,474,696 | (2,021,304 | ) | 453,392 | - | - | 453,392 | |||||||||||||||||
| Total assets | $ | 6,261,191 | $ | (5,637,226 | ) | $ | 623,965 | $ | - | $ | - | $ | 623,965 | |||||||||||
Liabilities | ||||||||||||||||||||||||
| Futures | $ | (3,615,922 | ) | $ | 3,615,922 | $ | - | $ | - | $ | - | $ | - | |||||||||||
| Forwards | (2,021,304 | ) | 2,021,304 | - | - | - | - | |||||||||||||||||
| Total liabilities | $ | (5,637,226 | ) | $ | 5,637,226 | $ | - | $ | - | $ | - | $ | - | |||||||||||
| Net fair value | $ | 623,965 | * | |||||||||||||||||||||
Gross Amounts Offset in the Statements of Financial Condition | Amounts Presented in the Statements of Financial Condition | Gross Amounts Not Offset in the Statements of Financial Condition | ||||||||||||||||||||||
December 31, 2021 | Gross Amounts Recognized | Financial Instruments | Cash Collateral Received/ Pledged* | Net Amount | ||||||||||||||||||||
Assets | ||||||||||||||||||||||||
| Futures | $ | 2,679,698 | $ | (1,950,628 | ) | $ | 729,070 | $ | - | $ | - | $ | 729,070 | |||||||||||
| Forwards | 2,567,692 | (2,567,692 | ) | - | - | - | - �� | |||||||||||||||||
| Total assets | $ | 5,247,390 | $ | (4,518,320 | ) | $ | 729,070 | $ | - | $ | - | $ | 729,070 | |||||||||||
Liabilities | ||||||||||||||||||||||||
| Futures | $ | (1,950,628 | ) | $ | 1,950,628 | $ | - | $ | - | $ | - | $ | - | |||||||||||
| Forwards | (2,988,862 | ) | 2,567,692 | (421,170 | ) | - | 421,170 | - | ||||||||||||||||
| Total liabilities | $ | (4,939,490 | ) | $ | 4,518,320 | $ | (421,170 | ) | $ | - | $ | 421,170 | $ | - | ||||||||||
| Net fair value | $ | 729,070 | * | |||||||||||||||||||||
| * | In the event of default by the Partnership, MS&Co., the Partnership’s commodity futures broker and the sole counterparty to the Partnership’s non-exchange-traded contracts, as applicable, has the right to offset the Partnership’s obligation with the Partnership’s cash and/or U.S. Treasury bills held by MS&Co., thereby minimizing MS&Co.’s risk of loss. In certain instances, MS&Co. may not post collateral and as such, in the event of default by MS&Co., the Partnership is exposed to the amount shown in the Statements of Financial Condition. In the case of exchange-traded contracts, the Partnership’s exposure to counterparty risk may be reduced since the exchange’s clearinghouse interposes its credit between buyer and seller and the clearinghouse’s guarantee funds may be available in the event of a default. In some instances, the actual collateral received and/or pledged may be more than the amount shown due to overcollateralization. |
December 31, 2022 | ||||
Assets | ||||
Futures Contracts | ||||
| Currencies | $ | 31,641 | ||
| Energy | 660,818 | |||
| Grains | 532,838 | |||
| Indices | 394,363 | |||
| Interest Rates U.S. | 318,625 | |||
Interest Rates Non-U.S. | 1,615,714 | |||
| Livestock | 51,880 | |||
| Metals | 63,530 | |||
| Softs | 117,086 | |||
| Total unrealized appreciation on open futures contracts | 3,786,495 | |||
Liabilities | ||||
Futures Contracts | ||||
| Currencies | (67,887) | |||
| Energy | (51,220) | |||
| Grains | (343,358) | |||
| Indices | (1,940,370) | |||
| Interest Rates U.S. | (211,976) | |||
Interest Rates Non-U.S. | (790,578) | |||
| Livestock | (13,450) | |||
| Metals | (37,863) | |||
| Softs | (159,220) | |||
| Total unrealized depreciation on open futures contracts | (3,615,922) | |||
| Net unrealized appreciation on open futures contracts | $ | 170,573 | * | |
Assets | ||||
Forward Contracts | ||||
| Currencies | $ | 2,005,546 | ||
| Metals | 469,150 | |||
| Total unrealized appreciation on open forward contracts | 2,474,696 | |||
Liabilities | ||||
Forward Contracts | ||||
| Currencies | (1,604,184) | |||
| Metals | (417,120) | |||
| Total unrealized depreciation on open forward contracts | (2,021,304) | |||
| Net unrealized appreciation on open forward contracts | $ | 453,392 | ** | |
| * | This amount is in “Net unrealized appreciation on open futures contracts” in the Statements of Financial Condition. |
| ** | This amount is in “Net unrealized appreciation on open forward contracts” in the Statements of Financial Condition. |
December 31, 2021 | ||||
Assets | ||||
Futures Contracts | ||||
| Currencies | $ | 27,947 | ||
| Energy | 667,615 | |||
| Grains | 277,755 | |||
| Indices | 654,155 | |||
| Interest Rates U.S. | 125,562 | |||
Interest Rates Non-U.S. | 699,662 | |||
| Livestock | 16,490 | |||
| Metals | 58,181 | |||
| Softs | 152,331 | |||
| Total unrealized appreciation on open futures contracts | 2,679,698 | |||
Liabilities | ||||
Futures Contracts | ||||
| Currencies | (193,626) | |||
| Energy | (116,177) | |||
| Grains | (157,556) | |||
| Indices | (486,810) | |||
| Interest Rates U.S. | (109,898) | |||
Interest Rates Non-U.S. | (630,253) | |||
| Livestock | (4,910) | |||
| Metals | (149,920) | |||
| Softs | (101,478) | |||
| Total unrealized depreciation on open futures contracts | (1,950,628) | |||
| Net unrealized appreciation on open futures contracts | $ | 729,070 | * | |
Assets | ||||
Forward Contracts | ||||
| Currencies | $ | 1,744,966 | ||
| Metals | 822,726 | |||
| Total unrealized appreciation on open forward contracts | 2,567,692 | |||
Liabilities | ||||
Forward Contracts | ||||
| Currencies | (2,224,046) | |||
| Metals | (764,816) | |||
| Total unrealized depreciation on open forward contracts | (2,988,862) | |||
| Net unrealized depreciation on open forward contracts | $ | (421,170) | ** | |
| * | This amount is in “Net unrealized appreciation on open futures contracts” in the Statements of Financial Condition. |
| ** | This amount is in “Net unrealized depreciation on open forward contracts” in the Statements of Financial Condition. |
Sector | 2022 | 2021 | 2020 | |||||||||
| Currencies | $ | 10,675,253 | $ | 2,285,525 | $ | (4,430,163) | ||||||
| Energy | 8,460,214 | 8,868,835 | (1,895,131) | |||||||||
| Grains | 1,189,266 | 2,837,873 | 1,236,867 | |||||||||
| Indices | (2,499,428) | 5,799,611 | (15,340,684) | |||||||||
| Interest Rates U.S. | 5,425,496 | (5,368,158) | 10,530,542 | |||||||||
Interest Rates Non-U.S. | 7,026,148 | (6,655,091) | 2,788,538 | |||||||||
| Livestock | (209,595) | (425,918) | - | |||||||||
| Metals | 267,087 | 414,121 | 5,858,105 | |||||||||
| Softs | (594,050) | 1,784,978 | (1,099,658) | |||||||||
| Total | $ | 29,740,391 | *** | $ | 9,541,776 | *** | $ | (2,351,584) | *** | |||
December 31, 2022 | Total | Level 1 | Level 2 | Level 3 | ||||||||||||
Assets | ||||||||||||||||
| Futures | $ | 3,786,495 | $ | 3,786,495 | $ | - | $ | - | ||||||||
| Forwards | 2,474,696 | - | 2,474,696 | - | ||||||||||||
| Total assets | $ | 6,261,191 | $ | 3,786,495 | $ | 2,474,696 | $ | - | ||||||||
Liabilities | ||||||||||||||||
| Futures | $ | 3,615,922 | $ | 3,615,922 | $ | - | $ | - | ||||||||
| Forwards | 2,021,304 | - | 2,021,304 | - | ||||||||||||
| Total liabilities | $ | 5,637,226 | $ | 3,615,922 | $ | 2,021,304 | $ | - | ||||||||
December 31, 2021 | Total | Level 1 | Level 2 | Level 3 | ||||||||||||
Assets | ||||||||||||||||
| Futures | $ | 2,679,698 | $ | 2,679,698 | $ | - | $ | - | ||||||||
| Forwards | 2,567,692 | - | 2,567,692 | - | ||||||||||||
| Total assets | $ | 5,247,390 | $ | 2,679,698 | $ | 2,567,692 | $ | - | ||||||||
Liabilities | ||||||||||||||||
| Futures | $ | 1,950,628 | $ | 1,950,628 | $ | - | $ | - | ||||||||
| Forwards | 2,988,862 | - | 2,988,862 | - | ||||||||||||
| Total liabilities | $ | 4,939,490 | $ | 1,950,628 | $ | 2,988,862 | $ | - | ||||||||
7. | Investment in the Trading Company: |
December 31, 2022 | ||||||||||||
Total Assets | Toal Liabilities | Total Capital | ||||||||||
| CMF Winton | $ | 49,558,467 | $ | 155,684 | $ | 49,402,783 | ||||||
December 31, 2021 | ||||||||||||
Total Assets | Toal Liabilities | Total Capital | ||||||||||
| CMF Winton | $ | 41,512,628 | $ | 194,879 | $ | 41,317,749 | ||||||
For the year ended December 31, 2022 | ||||||||||||
Net Investment Income (Loss) | Total Trading Results | Net Income (Loss) | ||||||||||
| CMF Winton | $ | 402,283 | $ | 12,444,388 | $ | 12,846,671 | ||||||
For the year ended December 31, 2021 | ||||||||||||
Net Investment Income (Loss) | Total Trading Results | Net Income (Loss) | ||||||||||
| CMF Winton | $ | (169,347) | $ | 4,958,082 | $ | 4,788,735 | ||||||
December 31, 2022 | For the year ended December 31, 2022 | |||||||||||||||||||||||||||
% of | Expenses | Net | ||||||||||||||||||||||||||
Partners’ | Fair | Income | Clearing | Professional | Income | Investment | Redemptions | |||||||||||||||||||||
Funds | Capital | Value | (Loss) | Fees | Fees | (Loss) | Objective | Permitted | ||||||||||||||||||||
| CMF Winton | 31.41 | % | $ | 49,515,860 | $ | 13,064,810 | $ | 150,054 | $ | 68,085 | $ | 12,846,671 | Commodity Portfolio | Monthly | ||||||||||||||
December 31, 2021 | For the year ended December 31, 2021 | |||||||||||||||||||||||||||
% of | Expenses | Net | ||||||||||||||||||||||||||
Partners’ | Fair | Income | Clearing | Professional | Income | Investment | Redemptions | |||||||||||||||||||||
Funds | Capital | Value | (Loss) | Fees | Fees | (Loss) | Objective | Permitted | ||||||||||||||||||||
CMF Winton (a) | 30.18 | % | $ | 41,318,675 | $ | 4,970,691 | $ | 145,256 | $ | 36,700 | $ | 4,788,735 | Commodity Portfolio | Monthly | ||||||||||||||
8. | Financial Highlights: |
2022 | 2021 | 2020 | ||||||||||||||||||
Class A | Class Z | Class A | Class Z | Class A | ||||||||||||||||
| Per Unit Performance (for a unit outstanding throughout the year):* | ||||||||||||||||||||
| Net realized and unrealized gains (losses) | $ | 6.97 | $ | 2.96 | $ | 2.11 | $ | 0.90 | $ | (0.25) | ||||||||||
| Net investment loss | (1.11) | (0.38) | (0.96) | (0.34) | (0.89) | |||||||||||||||
| Increase (decrease) for the year | 5.86 | 2.58 | 1.15 | 0.56 | (1.14) | |||||||||||||||
| Net asset value per Unit, beginning of year | 22.22 | 9.46 | 21.07 | 8.90 | 22.21 | |||||||||||||||
| Net asset value per Unit, end of year | $ | 28.08 | $ | 12.04 | $ | 22.22 | $ | 9.46 | $ | 21.07 | ||||||||||
2022 | 2021 | 2020 | ||||||||||||||||||
Class A | Class Z | Class A | Class Z | Class A | ||||||||||||||||
| Ratios to Average Limited Partners’ Capital: | ||||||||||||||||||||
| Net investment loss ** | (4.1) | % | (3.2) | % | (4.6) | % | (3.6) | % | (4.5) | % | ||||||||||
| Operating expenses | 3.2 | % | 2.5 | % | 3.7 | % | 2.8 | % | 5.0 | % | ||||||||||
| Expenses reimbursed by the General Partner | - | % | - | % | - | % | - | % | (0.2) | % | ||||||||||
| Incentive fees | 2.2 | % | 2.2 | % | 0.9 | % | 0.8 | % | - | % | ||||||||||
| Total expenses | 5.4 | % | 4.7 | % | 4.6 | % | 3.6 | % | 4.8 | % | ||||||||||
| Total return: | ||||||||||||||||||||
| Total return before incentive fees | 29.1 | % | 29.9 | % | 6.4 | % | 7.2 | % | (5.1) | % | ||||||||||
| Incentive fees | (2.7) | % | (2.6) | % | (0.9) | % | (0.9) | % | - | % | ||||||||||
| Total return after incentive fees | 26.4 | % | 27.3 | % | 5.5 | % | 6.3 | % | (5.1) | % | ||||||||||
| * | Net investment loss per Unit is calculated by dividing the interest income less total expenses by the average number of Units outstanding during the year. The net realized and unrealized gains (losses) per Unit is a balancing amount necessary to reconcile the change in net asset value per Unit with the other per unit information. |
| ** | Interest income less total expenses. |
9. | Subsequent Events: |
For the period from October 1, 2022 to December 31, 2022 | For the period from July 1, 2022 to September 30, 2022 | For the period from April 1, 2022 to June 30, 2022 | For the period from January 1, 2022 to March 31, 2022 | |||||||||||||
| Total investment income | $ | 1,240,801 | $ | 731,894 | $ | 200,741 | $ | 25,752 | ||||||||
| Total expenses | (1,379,618 | ) | (2,141,245 | ) | (2,313,830 | ) | (2,858,518 | ) | ||||||||
| Total trading results | (11,100,519 | ) | 8,259,437 | 16,160,243 | 28,865,618 | |||||||||||
| Net income (loss) | $ | (11,239,336 | ) | $ | 6,850,086 | $ | 14,047,154 | $ | 26,032,852 | |||||||
| Increase (decrease) in net asset value per Unit: | ||||||||||||||||
| Class A | $ | (1.99 | ) | $ | 1.20 | $ | 2.37 | $ | 4.28 | |||||||
| Class Z | $ | (0.83 | ) | $ | 0.53 | $ | 1.04 | $ | 1.84 | |||||||
For the period from October 1, 2021 to December 31, 2021 | For the period from July 1, 2021 to September 30, 2021 | For the period from April 1, 2021 to June 30, 2021 | For the period from January 1, 2021 to March 31, 2021 | |||||||||||||
| Total investment income | $ | 14,593 | $ | 13,088 | $ | 4,922 | $ | 14,388 | ||||||||
| Total expenses | (1,305,486 | ) | (1,563,328 | ) | (1,735,810 | ) | (1,853,289 | ) | ||||||||
| Total trading results | (1,502,185 | ) | 1,210,774 | 8,462,282 | 6,328,987 | |||||||||||
| Net income (loss) | $ | (2,793,078 | ) | $ | (339,466 | ) | $ | 6,731,394 | $ | 4,490,086 | ||||||
| Increase (decrease) in net asset value per Unit: | ||||||||||||||||
| Class A | $ | (0.45 | ) | $ | (0.05 | ) | $ | 0.99 | $ | 0.66 | ||||||
| Class Z | $ | (0.17 | ) | $ | (0.01 | ) | $ | 0.44 | $ | 0.30 | ||||||
Item 9. Changes in and Disagreements with Accountants on Accounting and Financial Disclosure.
Not applicable.
Item 9A. Controls and Procedures.
The Partnership’s disclosure controls and procedures are designed to ensure that information required to be disclosed by the Partnership on the reports that it files or submits under the Exchange Act is recorded, processed, summarized and reported within the time periods expected in the SEC’s rules and forms. Disclosure controls and procedures include controls and procedures designed to ensure that information required to be disclosed by the Partnership in the reports it files is accumulated and communicated to management, including the President (the General Partner’s principal executive officer) and Chief Financial Officer (“CFO”) (the General Partner’s principal financial officer) of the General Partner, to allow for timely decisions regarding required disclosure and appropriate SEC filings.
The General Partner is responsible for ensuring that there is an adequate and effective process for establishing, maintaining and evaluating disclosure controls and procedures for the Partnership’s external disclosures.
The General Partner’s President and CFO have evaluated the effectiveness of the Partnership’s disclosure controls and procedures (as defined in Rules 13a-15(e) and 15d-15(e) under the Exchange Act) as of December 31, 2022 and, based on that evaluation, the General Partner’s President and CFO have concluded that, at that date, the Partnership’s disclosure controls and procedures were effective.
The Partnership’s internal control over financial reporting is a process under the supervision of the General Partner’s President and CFO to provide reasonable assurance regarding the reliability of financial reporting and the preparation of financial statements in accordance with GAAP. These controls include policies and procedures that:
| • | pertain to the maintenance of records that, in reasonable detail, accurately and fairly reflect the transactions and dispositions of the assets of the Partnership; |
| • | provide reasonable assurance that (i) transactions are recorded as necessary to permit preparation of financial statements in accordance with GAAP, and (ii) the Partnership’s receipts are handled and expenditures are made only pursuant to authorizations of the General Partner; and |
| • | provide reasonable assurance regarding prevention or timely detection and correction of unauthorized acquisition, use or disposition of the Partnership’s assets that could have a material effect on the financial statements. |
The Annual Report for the year ended December 31, 2022, included in “Item 8. Financial Statements and Supplementary Data.”, includes the General Partner’s report on internal control over financial reporting.
There were no changes in the Partnership’s internal control over financial reporting during the fiscal quarter ended December 31, 2022, that materially affected, or are reasonably likely to materially affect, the Partnership’s internal control over financial reporting.
Item 9B. Other Information.
Certain impacts to public health conditions particular to the coronavirus (COVID-19) outbreak that occurred after December 31, 2021 could impact the operations and financial performance of the Partnership investments subsequent to December 31, 2022. The extent of the impact to the financial performance of the Partnership investments will depend on future developments, including (i) the duration and spread of the outbreak, (ii) the restrictions and advisories, (iii) the effects on the financial markets, and (iv) the effects on the economy overall, all of which are highly uncertain and cannot be predicted. If the financial performance of the Partnership investments is impacted because of these factors for an extended period, the Partnership performance may be adversely affected.
64
PART III
Item 10. Directors, Executive Officers and Corporate Governance.
The Partnership has no directors or executive officers and its affairs are managed by its General Partner. Investment decisions are made by the Trading Advisors.
The directors and executive officers of the General Partner are Patrick T. Egan (President and Chairman of the Board of Directors of the General Partner), Brooke Lambert (Chief Financial Officer), Steven Ross (Director), Victoria Eckstein (Director) and Tatiana Segal (Director). Each director holds office until the earlier of his or her death, resignation or removal. Vacancies on the board of directors may be filled by either (i) the majority vote of the remaining directors or (ii) MSD Holdings, as the sole member of the General Partner. The officers of the General Partner are designated by the General Partner’s board of directors. Each officer will hold office until his or her successor is designated and qualified or until his or her death, resignation or removal.
Directors of the General Partner are responsible for overall corporate governance of the General Partner and meet periodically to consider strategic decisions regarding the General Partner’s activities. Under CFTC rules, each Director of the General Partner is deemed to be a principal of the General Partner and, as a result, is listed as such with the NFA. Patrick T. Egan and Steven Ross serve on the General Partner’s Investment Committee and are the trading principals responsible for allocation decisions (or responsible for supervising those who are).
Patrick T. Egan, age 54, has been a Director of the General Partner since December 2010. Since December 2010, Mr. Egan has been a principal and registered as an associated person of the General Partner, and is an associate member of NFA. Since October 2014, Mr. Egan has served as President of the General Partner and Chairman of the Board of Directors. Since August 2013, Mr. Egan has been registered as a swap associated person of the General Partner. From September 2013 to May 2014, Mr. Egan served as a Vice President of Morgan Stanley Strategies LLC (formerly, Morgan Stanley GWM Feeder Strategies LLC), which acts as a general partner to multiple alternative investment entities, and Morgan Stanley AI GP LLC (formerly, Morgan Stanley HedgePremier GP LLC), which acts as a general partner and administrative agent to numerous hedge fund feeder funds. From September 2013 to May 2014, Mr. Egan was registered as an associated person and listed as a principal of each such entity. Since January 2013, each such entity has been registered as a commodity pool operator with the CFTC. Mr. Egan was responsible for overseeing the implementation of certain CFTC and NFA regulatory requirements applicable to such entities. From June 2009 to December 2014, Mr. Egan was employed by Morgan Stanley Smith Barney LLC, a financial services firm, where his responsibilities included serving as Executive Director and as Co-Chief Investment Officer for Morgan Stanley Managed Futures from June 2009 through June 2011 and as Chief Risk Officer for Morgan Stanley Managed Futures from June 2011 through October 2014. Since October 2014, Mr. Egan has been responsible for management of the day-to-day operations of Morgan Stanley Managed Futures. Since January 2015, Mr. Egan has been employed by the General Partner. From November 2010 to October 2014, Mr. Egan was registered as an associated person of Morgan Stanley Smith Barney LLC. From April 2007 through June 2009, Mr. Egan was employed by MS & Co., a financial services firm, where his responsibilities included serving as Head of Due Diligence and Manager Research for Morgan Stanley’s Managed Futures Department. From April 2007 through June 2009, Mr. Egan was registered as an associated person of MS & Co. From March 1993 through April 2007, Mr. Egan was employed by Morgan Stanley DW Inc., a financial services firm, where his initial responsibilities included serving as an analyst and manager within the Managed Futures Department (with primary responsibilities for product development, due diligence, investment analysis and risk management of the firm’s commodity pools) and later included serving as Head of Due Diligence and Manager Research for Morgan Stanley’s Managed Futures Department. From February 1998 through April 2007, Mr. Egan was registered as an associated person of Morgan Stanley DW Inc. From August 1991 through March 1993, Mr. Egan was employed by Dean Witter Intercapital, the asset management arm of Dean Witter Reynolds, Inc., where his responsibilities included serving as a mutual fund administration associate. Mr. Egan also served as a Director from November 2004 through October 2006, and from November 2006 through October 2008 of the Managed Funds Association’s Board of Directors, a position he was elected to by industry peers for two consecutive two-year terms. Mr. Egan earned his Bachelor of Business Administration degree with a concentration in Finance in May 1991 from the University of Notre Dame.
Brooke Lambert, age 39, has been the Chief Financial Officer, Treasurer and a principal of the General Partner since May 2022. Ms. Lambert has been employed by Morgan Stanley Investment Management, a financial services firm, since July 2014, where her responsibilities include serving as a Vice President and managing the accounting, financial reporting and regulatory reporting of the commodity pools operated by the General Partner. From July 2009 to July 2014, Ms. Lambert was employed by Morgan Stanley Smith Barney, a financial services firm, where her responsibilities included serving as a Vice President responsible for the accounting, financial reporting and regulatory reporting of the commodity pools operated by the General Partner. Before joining Morgan Stanley, Ms. Lambert was employed by Citigroup Alternative Investments, a financial services firm, from January 2006 through July 2009, where her responsibilities included serving as an Assistant Vice President responsible for the accounting, financial reporting and regulatory reporting of Citigroup Alternative Investments’ managed futures funds. Ms. Lambert earned her Bachelor of Science in Finance in May 2005 from Towson University.
65
Steven Ross, age 51, has been a principal of the General Partner since July 2014 and a Director of the General Partner since February 2016. Mr. Ross has been employed by Morgan Stanley Investment Management, a financial services firm, since September 2005, where his responsibilities include serving as an Assistant Treasurer of Morgan Stanley with respect to certain investment vehicles publicly offered by Morgan Stanley. Mr. Ross is also an Executive Director of the Morgan Stanley Fund Administration Group where he is responsible for finance and accounting matters for certain private funds offered by Morgan Stanley. Before joining Morgan Stanley Investment Management, Mr. Ross was employed by JPMorgan Investor Services Co., a financial services firm, from December 1997 through September 2005, where his responsibilities included serving as a Vice President responsible for the accounting of certain funds sponsored by JPMorgan Chase & Co. and other large fund families serviced by JPMorgan Investor Services Co. From April 1997 to December 1997, Mr. Ross was employed by Investors Bank & Trust, a financial services firm, where his responsibilities included performing mutual fund accounting for financial services firms. Mr. Ross began his career at Putnam Investments LLC, a financial services firm, where he was responsible for providing broker services for certain funds sponsored by Putnam Investments LLC from August 1996 to April 1997. Mr. Ross received a B.S. in Accounting from Rhode Island College in May 1995.
Victoria Eckstein, age 41, has been a Director of the General Partner since June 30, 2022, and a principal of the General Partner since July 14, 2022. Since November 2022, Ms. Eckstein has served as Chief Operating Officer of Calvert Research and Management, an investment management company focused on responsible investments. Since December 2020, Ms. Eckstein has served as a Managing Director of Morgan Stanley Investment Management Inc. (“MSIM”), and from December 2020 to November 2022 served as Chief Operating Officer of the Solutions & Multi-Asset Group at MSIM, a collection of business units offering alpha-centric, multi-asset or multi-manager investment solutions. From December 2016 to December 2020, Ms. Eckstein served as an Executive Director of MSIM and from April 2010 to December 2016, Ms. Eckstein served as a Vice President of MSIM. From April 2010 to December 2020, Ms. Eckstein primarily managed the day-to-day non-investment functions of the Portfolio Solutions Group, a business unit offering multi-asset, multi-manager managed portfolios. From January 2007 to April 2010, Ms. Eckstein was employed by Morgan Stanley Smith Barney LLC, a financial services firm, where her responsibilities included trade execution, portfolio analysis, external manager selection and research coverage. Ms. Eckstein received her Juris Doctorate from the Benjamin N. Cardozo School of Law in 2006 and her Bachelor of Arts, magna cum laude, from Brandeis University in 2003.
Tatiana Segal, age 54, has been a Director of the General Partner since June 30, 2022, and a principal of the General Partner since July 1, 2022. She has also been a principal of MSIM since October 31, 2019. Ms. Segal joined MSIM as a Managing Director and Head of Risk Management in August 2019. She is responsible for risk management across MSIM business units and risk categories, including investment, operational, and franchise risk, and is a member of the Investment Management Operating Committee and a chair of the Investment Management Risk Committee. In June 2022, in addition to her original role, Tatiana was appointed as Global Head of Non-Financial Risk for Investment Management to manage existing and emergent non-financial risks across the division. She has since been appointed a member of Morgan Stanley’s NFR Steering Committee and Enterprise Controls Committee. From August 2011 to August 2019, Tatiana was a partner and Head of Risk Management at SkyBridge Capital Management, a global alternative investments firm, where she was also a member of the Manager Selection, Portfolio Allocation and Real Estate Investment Committees. Prior to joining SkyBridge in August 2011, she was a Managing Director and Chief Risk Officer at Cerberus Capital Management, LLC from January 2009 through July 2011. Before joining Cerberus, Ms. Segal was Managing Director and Chief Risk Officer for Diamond Lake Investment Group from February 2008 through September 2008. From May 2006 through January 2008, Ms. Segal was a Senior Risk Manager at Citigroup Alternative Investments, where she was responsible for independent risk oversight of a multi-billion hedge fund and fund of funds portfolio. From October 2000 through April 2006, Ms. Segal was a Director of Market Risk at Nomura Securities, Inc. Prior to joining Nomura Securities, she was Risk Manager at BNP Paribas from January 1999 through October 2000 and a Risk Manager at Goldman, Sachs & Co., Ltd. from October 1995 through January 1999. Ms. Segal started her career at BlackRock Financial Management, Inc. from January 1993 through September 1995, as a portfolio analyst within BlackRock’s Institutional Accounts Division. Ms. Segal graduated from Columbia University in January 1993 with a Bachelor’s Degree in Economics. Ms. Segal is a Co-Chair of Risk Peer Advisory Group NY for 100 Women in Finance, as well as a contributing member of the council of The Directors and Chief Risk Officers. She serves as a board member of the Tenement Museum.
The Partnership has not adopted a code of ethics that applies to officers because it has no officers. In addition, the Partnership has not adopted any procedures by which investors may recommend nominees to the Partnership’s board of directors and has not established an audit committee because it has no board of directors.
66
Item 11. Executive Compensation.
The Partnership has no directors and executive officers. As a limited partnership, the business of the Partnership is managed by Ceres, which is responsible for the administration of the business affairs of the Partnership. Effective January 1, 2021, the Partnership pays the General Partner a monthly administrative fee equal to 1/12 of 0.75% (a 0.75% annual rate) of the Partnership’s net assets (plus “notional” funds, if any) as of the beginning of each month. From July 1, 2020 to December 31, 2020, the Partnership paid Ceres an administrative and General Partner’s fee equal to an annual rate of 1.75% (paid monthly) of the Partnership’s net assets (plus “notional” funds, if any) as of the first day of each month. Prior to July 1, 2020, the Partnership paid Ceres an administrative and General Partner’s fee equal to an annual rate of 2.00% (paid monthly) of the Partnership’s net assets (plus “notional” funds, if any) as of the first day of each month. Prior to January 1, 2021, the General Partner paid or reimbursed the Partnership for all fees and costs charged or incurred by the commodity brokers for trades executed on behalf of the Partnership, and for all ordinary administrative and offering expenses. Effective January 1, 2021, the Partnership directly pays the brokerage fees and other transaction-related fees and expenses, as incurred and also pays its ongoing administrative, operating, offering and organizational expenses (including, but not limited to, periodic legal, accounting, administrative, filing, reporting and data processing fees) and its pro rata share of such expenses of any trading company to which the Partnership has allocated assets.
Item 12. Security Ownership of Certain Beneficial Owners and Management and Related Stockholder Matters.
| (a) | Security Ownership of Certain Beneficial Owners – As of February 28, 2023, the Partnership knows of no person who beneficially owns more than 5% of the Units outstanding. |
| (b) | Security Ownership of Management – Under the terms of the Partnership Agreement, the Partnership’s affairs are managed by the General Partner. The following table indicates securities owned by management as of December 31, 2022: |
| (1) Title of Class | (2) Name of Beneficial Owner | (3) Amount and Nature of Beneficial Ownership | (4) Percent of Class | |||
Class Z Units | General Partner | 138,422.641 | 92.6% |
| (c) | Changes in Control – None. |
67
Item 13. Certain Relationships and Related Transactions, and Director Independence.
| (a) | Transactions with Related Persons. None. |
| (b) | Review, Approval or Ratification of Transactions with Related Persons. Not applicable. |
| (c) | Promoters and Certain Control Persons. MS&Co., Morgan Stanley Wealth Management and the General Partner could be considered promoters for purposes of Item 404(c) of Regulation S-K. The nature and the amounts of compensation each promoter received or will receive, if any, from the Partnership are set forth under “Item 1. Business.”, “Item 8. Financial Statements and Supplementary Data.” and “Item 11. Executive Compensation.” |
Item 14. Principal Accountant Fees and Services.
Effective January 1, 2021, the Partnership directly pays all of its accounting fees, as incurred, and its pro rata share of such expenses of any trading company to which the Partnership has allocated assets. Prior to January 1, 2021, the General Partner paid or reimbursed the Partnership for all accounting fees.
(1) Audit Fees. The aggregate fees billed for each of the last two fiscal years for professional services rendered by Ernst & Young LLP (“EY”) for the years ended December 31, 2022 and 2021 for the audit of the Partnership’s annual financial statements, review of financial statements included in the Partnership’s Forms 10-Q and 10-K and other services normally provided in connection with regulatory filings or engagements were:
2022 | $ | 135,000 | ||
2021 | $ | 106,200 |
(2) Audit-Related Fees. None.
(3) Tax Fees. The Partnership did not pay EY any amounts in 2022 and 2021 for professional services in connection with tax compliance, tax advice, and tax planning.
(4) All Other Fees. None.
(5) Not Applicable.
(6) Not Applicable.
68
PART IV
Item 15. Exhibits, Financial Statement Schedules.
(a) (1) Financial Statements:
Statements of Financial Condition at December 31, 2022 and 2021.
Condensed Schedule of Investments at December 31, 2022 and 2021.
Statements of Income and Expenses for the years ended December 31, 2022, 2021 and 2020.
Statements of Changes in Partners’ Capital for the years ended December 31, 2022, 2021 and 2020.
Notes to Financial Statements.
(2) Exhibits:
| 3.01 |
| 3.02 |
| 3.03 |
| 3.04 |
| 3.05 |
| 3.06 |
| 3.07 |
| 3.08 |
| 4.01 |
| 10.01 |
| 10.01(a) |
69
| 10.01(b) |
| 10.01(c) |
| 10.02 |
| 10.03 |
| 10.04 |
| 10.04(a) |
| 10.04(b) |
| 10.05 |
| 10.05(a) |
| 10.06 |
| 10.07 |
| 10.08 |
| 10.09 |
| 10.09(a) |
70
| 10.09(b) |
| 10.10 |
| 10.11 |
| 10.12 |
| 10.13 |
| 10.14 |
| 10.14(a) |
| 10.14(b) |
| 10.15 |
| 10.16 |
| 10.17 |
| 10.17(a) |
| 10.17(b) |
71
The exhibits required to be filed by Item 601 of Regulations S-K are incorporated herein by reference.
31.1 — Rule 13a-14(a)/15d-14(a) Certification (Certification of President and Director).
31.2 — Rule 13a-14(a)/15d-14(a) Certification (Certification of Chief Financial Officer).
32.1 — Section 1350 Certification (Certification of President and Director).
32.2 — Section 1350 Certification (Certification of Chief Financial Officer).
99.1 Financial Statements of CMF Winton Master L.P.
101.INS Inline XBRL Instance Document.
101.SCH Inline XBRL Taxonomy Extension Schema Document.
101.CAL Inline XBRL Taxonomy Extension Calculation Linkbase Document.
101.LAB Inline XBRL Taxonomy Extension Label Linkbase Document.
101.PRE Inline XBRL Taxonomy Extension Label Linkbase Document.
101.DEF Inline XBRL Taxonomy Extension Definition Document.
104. Cover Page Interactive Data File (formatted as Inline XBRL and contained in Exhibit 101).
72
SIGNATURES
Pursuant to the requirements of Section 13 or 15(d) of the Securities Exchange Act of 1934, the registrant has duly caused this report to be signed on its behalf by the undersigned, thereunto duly authorized.
| CERES CLASSIC L.P. | ||
| By: | Ceres Managed Futures LLC | |
| (General Partner) | ||
| By: | /s/ Patrick T. Egan | |
| Patrick T. Egan | ||
| President and Director | ||
| Date: March 24, 2023 | ||
Pursuant to the requirements of the Securities Exchange Act of 1934, this report has been signed below by the following persons on behalf of the registrant and in the capacities and on the dates indicated.
/s/ Patrick T. Egan | /s/ Steven Ross | /s/ Tatiana Segal | ||
| Patrick T. Egan | Steven Ross | Tatiana Segal | ||
| President and Director | Director | Director | ||
| Ceres Managed Futures LLC | Ceres Managed Futures LLC | Ceres Managed Futures LLC | ||
| Date: March 24, 2023 | Date: March 24, 2023 | Date: March 24, 2023 | ||
/s/ Brooke Lambert | /s/ Victoria Eckstein | |||
| Brooke Lambert | Victoria Eckstein | |||
| Chief Financial Officer | Director | |||
| (Principal Accounting Officer) | Ceres Managed Futures LLC | |||
| Ceres Managed Futures LLC | Date: March 24, 2023 | |||
| Date: March 24, 2023 | ||||
Supplemental Information to be Furnished With Reports Filed Pursuant to Section 15(d) of the Act by Registrants Which Have Not Registered Securities Pursuant to Section 12 of the Act.
Annual Report to limited partners.
No proxy material has been sent to limited partners.
73