EXHIBIT 99.1


AGENDA
2001 ANALYST MEETING
NOVEMBER 14, HOUSTON, TX
| 7:30 a.m. | Continental Breakfast | ||||||||
| Texas Room, Omni Westside | |||||||||
| 8:00 a.m. | Welcome | ||||||||
| Tom Henkel, Vice President, Investor Relations | |||||||||
| 8:05 a.m. | Overview of Conoco Strategies | ||||||||
| Archie Dunham, Chairman, President & CEO | |||||||||
| 8:25 a.m. | Q&A | ||||||||
| 8:40 a.m. | Financial Overview | ||||||||
| Bob Goldman, Sr. Vice President, Finance, & CFO | |||||||||
| 8:55 a.m. | Upstream | ||||||||
| Overview | |||||||||
| Rob McKee, Executive Vice President, Exploration Production | |||||||||
| Exploration & Production, Conoco Canada | |||||||||
| Henry Sykes, President, Conoco Canada Limited | |||||||||
| Exploration & Production, United States, Northern South America, Europe, Southeast Asia, Middle East | |||||||||
| Gary Merriman, President, Exploration Production United States & South America | |||||||||
| 10:00 a.m. | Break | ||||||||
| 10:15 a.m. | Global Exploration Review | ||||||||
| Roger Pinkerton, General Manager, Global Exploration | |||||||||
| 10:40 a.m. | Upstream Q&A | ||||||||
| 10:55 a.m. | Downstream | ||||||||
| Overview | |||||||||
| Jim Nokes, Executive Vice President, Refining, Marketing, Supply & Transportation | |||||||||
| Refining & Marketing North America | |||||||||
| Richard Severance, President, Downstream, North America | |||||||||
| Refining & Marketing International | |||||||||
| Rick Hamm, President, Refining & Marketing Europe | |||||||||
| Carbon Businesses | |||||||||
| Carin Knickel, Vice President, Carbon Businesses | |||||||||
| 12:10 p.m. | Final Q&A | ||||||||
| 12:30 p.m. | Informal Lunch with further Q&A | ||||||||
| 1:30 p.m. | Adjourn | ||||||||
1
| Forward-Looking Statement Disclaimer These presentations contain forward-looking statements about Conoco’s exploration, production, refining, and other operating and financial plans and earnings results. These statements are not guarantees of future performance, involve certain risks, uncertainties, and assumptions that are difficult to predict, and are based upon assumptions as to future events that may not prove accurate. Actual outcomes and results may differ materially from what is expressed herein. Among the factors that could cause such differences are changes in crude oil and natural gas prices; changes in refining and marketing margins; potential failure to achieve, and potential delays in achieving, expected reserve or production levels from existing and future oil and gas development projects due to operating hazards, drilling risks, and the inherent uncertainties in interpreting engineering data relating to underground accumulations of oil and gas; unsuccessful exploratory drilling activities; unexpected delays or difficulties in constructing or repairing company manufacturing and refining facilities; general domestic and international economic and political conditions; the ability to meet government regulations; potential disruption or interruption of the Company’s facilities due to accidents or political events and other matters detailed in Conoco’s publicly available filings with the Securities and Exchange Commission. |
| Cautionary Note to U.S. Investors The United States Securities and Exchange Commission permits oil and gas companies, in their filings with the SEC, to disclose only proved reserves that a company has demonstrated by actual production or conclusive formation tests to be economically and legally producible under existing economic and operating conditions. Syncrude proven reserves are distinguished from proved oil and natural gas reserves because SEC regulations define syncrude as mining-related and not part of conventional oil and natural gas reserves. We use certain terms in these presentations, such as “probable reserves”, “recoverable reserves”, “potential reserves” and “in place” reserves that the SEC’s guidelines strictly prohibit us from including in filings with the SEC. U.S. investors are urged to consider closely the disclosure in our Form 10-K, File No. 1-14521, available from us at 600 North Dairy Ashford Road, Houston, Texas 77079. You can also obtain this form from the SEC by calling 1-800-SEC-0330 and from the Internet at http://www.conoco.com/investor/ |
2
NOTES
| |
| |
| |
| |
| |
| |
| |
| |
| |
| |
| |
| |
| |
| |
| |
| |
4
NOTES
| |
| |
| |
| |
| |
| |
| |
| |
| |
| |
| |
| |
| |
| |
| |
| |
5
NOTES
| |
| |
| |
| |
| |
| |
| |
| |
| |
| |
| |
| |
| |
| |
| |
| |
6
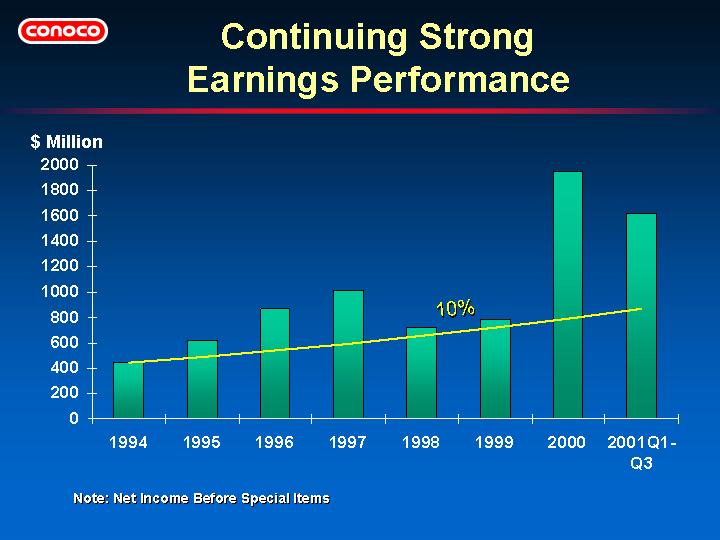
| • | Year-to-date record earnings of $1.6 billion | ||
| • | Significantly exceeding our 10% average growth target | ||
| • | Emphasis on long-life Upstream projects complemented by strong Downstream operations is paying off. |
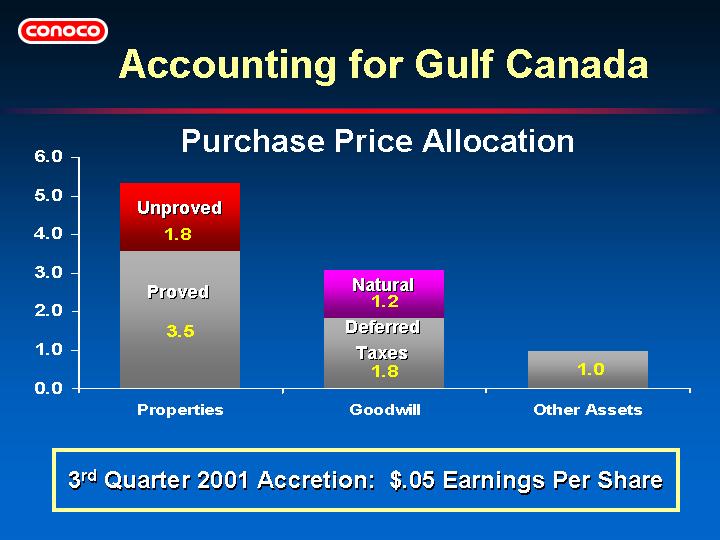
| • | Acquisition cost was $4.6 billion for stock and $2 billion for assumption of debt, preferred shares, and minority interest. | ||
| • | Total purchase cost for accounting purposes is $9.5 billion due to fair value write-up of assets and deferred taxes. | ||
| • | Unproved properties and goodwill are not currently amortized. |
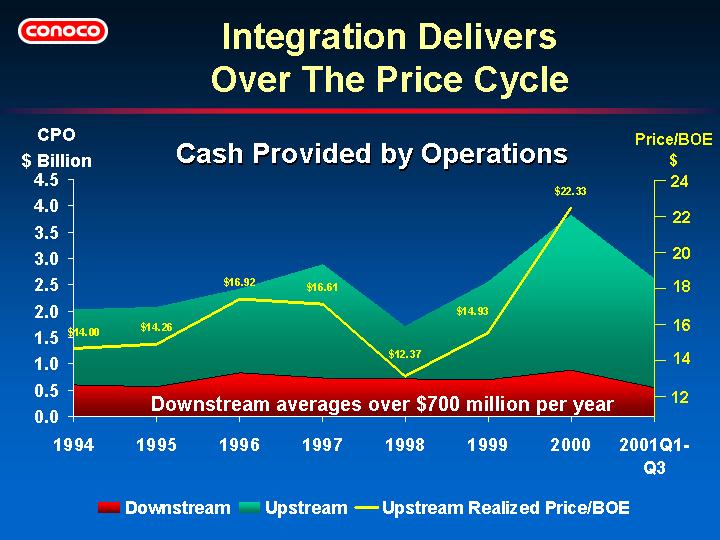
| • | Strong correlation between price and Upstream cash generation | ||
| • | Solid downstream performance under a variety of commodity prices | ||
| • | Hedging program mitigates possible lower prices in 2002 |
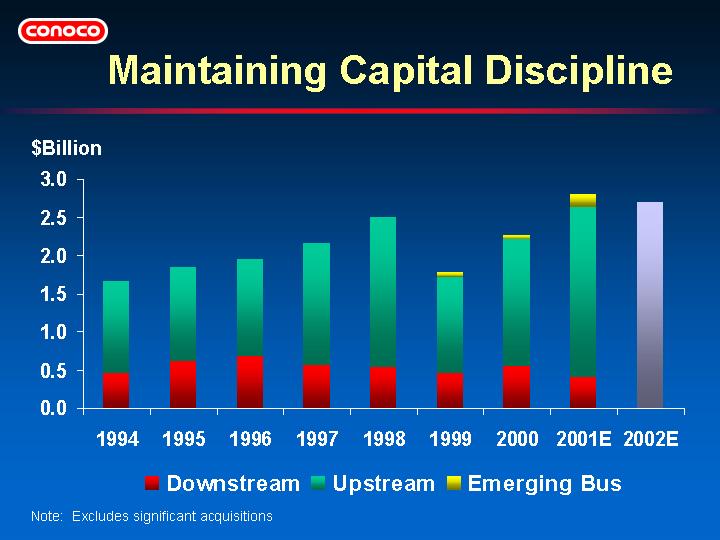
| • | Forecast for 2001 capital budget is about $2.8 billion including Gulf Canada. | ||
| • | Combined Conoco and Gulf Canada forecast for 2001 was $3.0 billion at time of acquisition. | ||
| • | Planned reduction of ~ $300 million in 2002 vs 2001 from: | ||
 | Portfolio rationalization | ||
| Highgrading combined exploration and exploitation opportunities | ||
| Reduced spending |
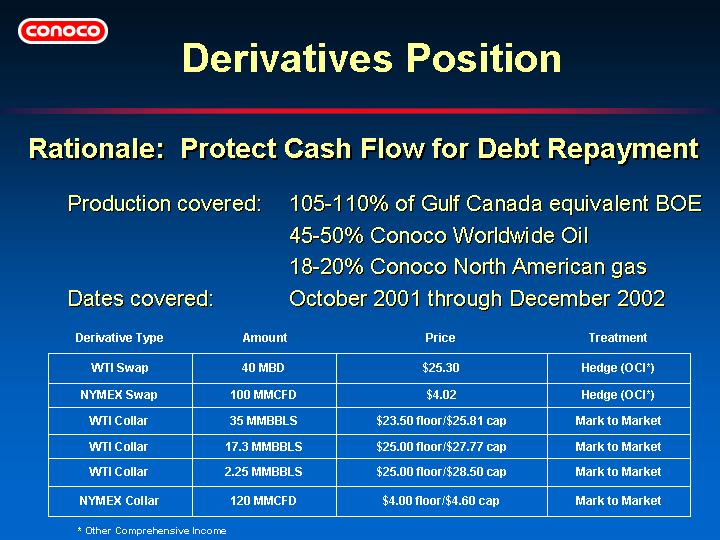
| • | Hedging program designed to protect cash flow generation during debt repayment period. | ||
| • | All derivatives are marked to market. |
| • | Quarterly Results to date from Hedging Position: |
| 2nd Qtr | 3rd Qtr | YTD | ||||||||||
Crude Oil | ||||||||||||
| Earnings ($MM) | 5.2 | 30.4 | 35.6 | |||||||||
| Other Comprehensive Income | 7.9 | 24.1 | 32.0 | |||||||||
| Total | 13.1 | 54.5 | 67.6 | |||||||||
| WTI Forward Price | $ | 25.03 | $ | 23.46 | $ | 23.46 | ||||||
Natural Gas | ||||||||||||
| Earnings ($MM) | 18.7 | 23.2 | 41.9 | |||||||||
| Other Comprehensive Income | 13.6 | 22.2 | 35.8 | |||||||||
| Total | 32.3 | 45.4 | 77.7 | |||||||||
| NYMEX Forward Price | $ | 3.57 | $ | 2.77 | $ | 2.77 | ||||||
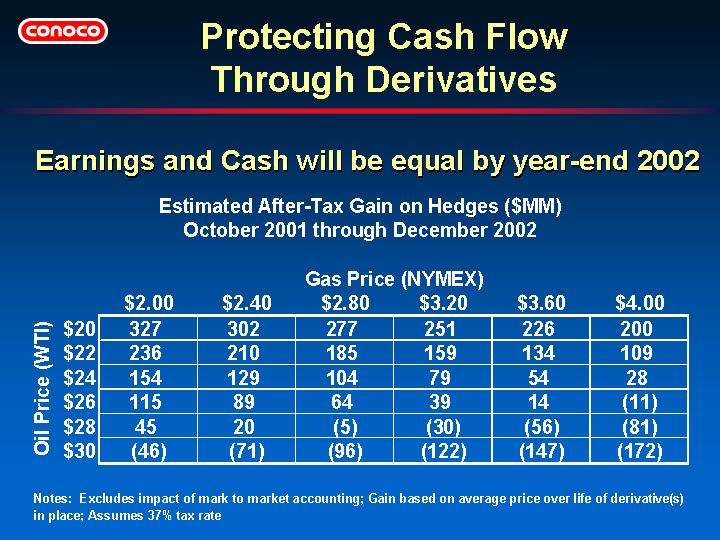
| • | Assuming hedges are in place through expiration in December 2002, the earnings and cash flow will be equal at that time. |
| Mark to Market earnings have been recognized in 2001. |
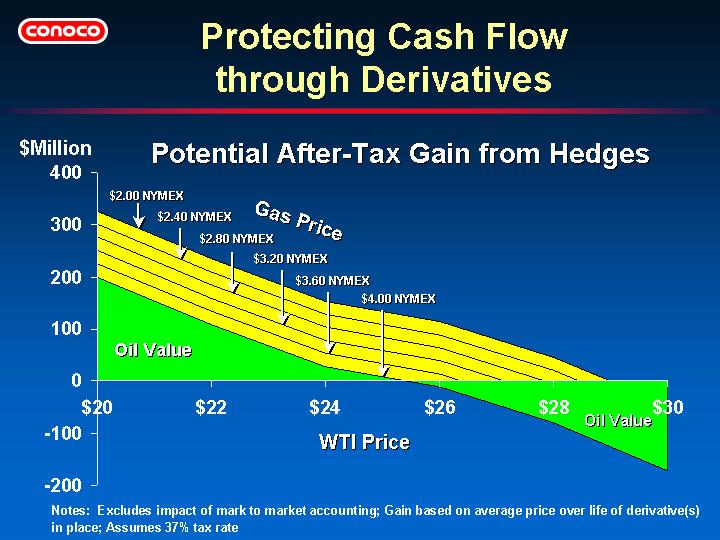
| • | A graphical display of the chart on page 15 |
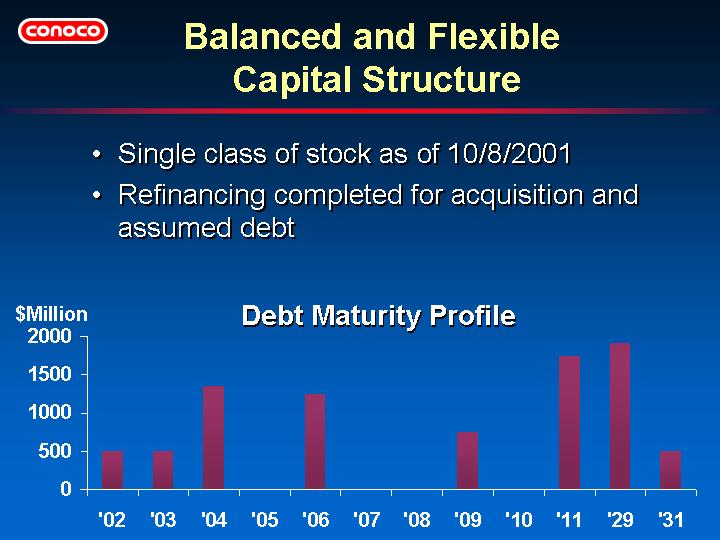
Conoco Capital Structure
| Instrument | Amount ($MM) | |||
| 5.90% senior notes, due 2004 | 1,348 | |||
| 6.35% senior notes, due 2009* | 750 | |||
| 6.95% senior notes, due 2029* | 1,900 | |||
| 5.45% senior notes, due 2006 (CFC) | 1,250 | |||
| 6.35% senior notes, due 2011 (CFC) | 1,750 | |||
| 7.25% senior notes, due 2031 (CFC) | 500 | |||
| FRN, 3-month LIBOR + 77, 12 month maturity* | 500 | |||
| FRN, 3-month LIBOR + 85, 18 month maturity* | 500 | |||
| Commercial Paper outstanding 9/30/01 | 1,044 | |||
| Other Misc. Debt Instruments | 109 | |||
Total as of 9/30/2001 | 9,651 | |||
| * Interest rate swaps have been executed on a portion of this debt. | ||||
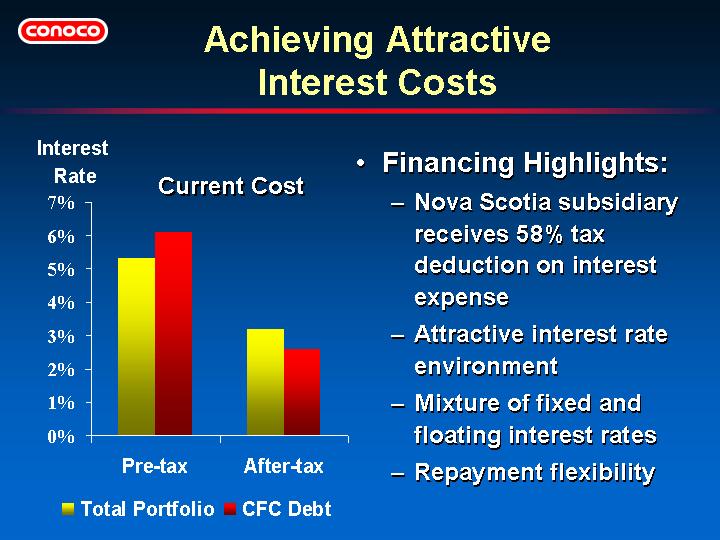
| • | Nova Scotia subsidiary Conoco Funding Company (CFC) provides very low after tax borrowing cost. | ||
| • | Total portfolio is nearly 200 basis points lower after tax for total debt than compared to pre-acquisition levels. | ||
| • | Additional benefit gained from using interest rate swaps on long term debt. |
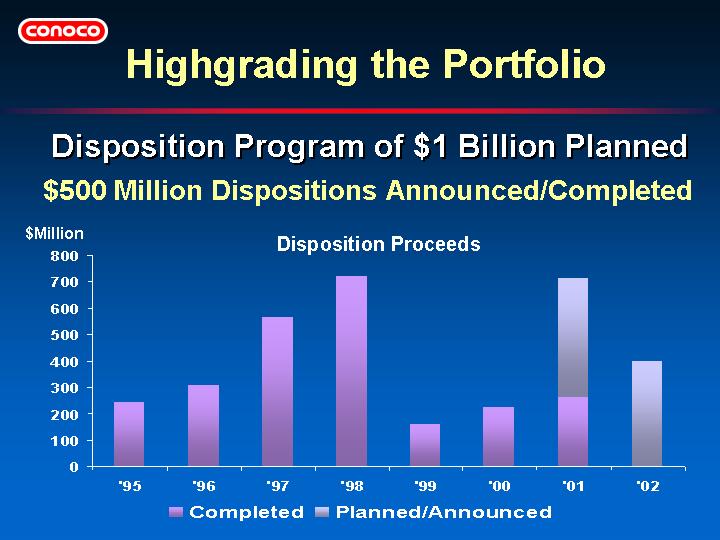
| • | Over $500 million of dispositions announced or completed to date, including: |
| • | Gulf of Mexico shelf | ||
| • | Pocahontas Gas Partnership | ||
| • | Mature US onshore in Permian Basin and Wyoming | ||
| • | Citcon Refinery | ||
| • | Spain Marketing |
| • | Additional US assets for sale (see Randall & Dewey website) |
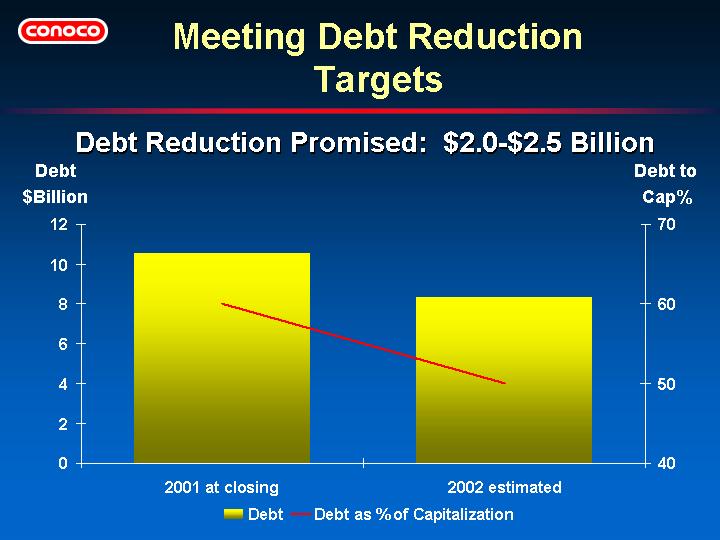
| • | We have made significant progress on debt reduction. |
| • | Debt at closing: | $10.5 Billion | |||
| • | Debt at end of 3rd quarter: | $9.7 Billion | |||
| • | Debt by year end 2002: | $8.0 - $8.5 Billion |
| • | Debt reduction will be derived from free cash flow, disposition proceeds, capital reductions, realization of synergies, cost effective asset monetizations, and potential hedging gains. | ||
| • | Timing of receipt of sales proceeds will determine pace of reduction. | ||
| • | Hedging program will help protect cash flow in lower price environment. |
This Page Intentionally Blank
| • | Conoco Upstream has been a premier performer to date. | ||
| • | 2001 has been a transformational year with the Gulf Canada acquisition. | ||
| • | We are bigger, stronger and better with outstanding prospects going forward. |
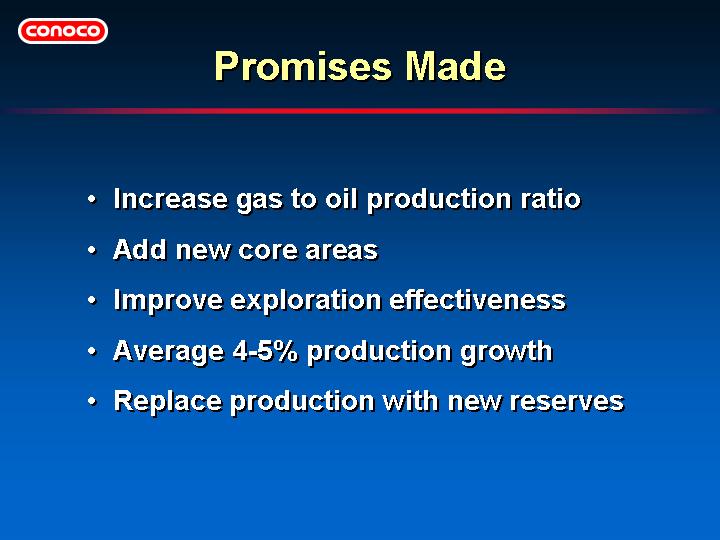
| • | We have set bold, focused, value-based objectives that we have achieved. |
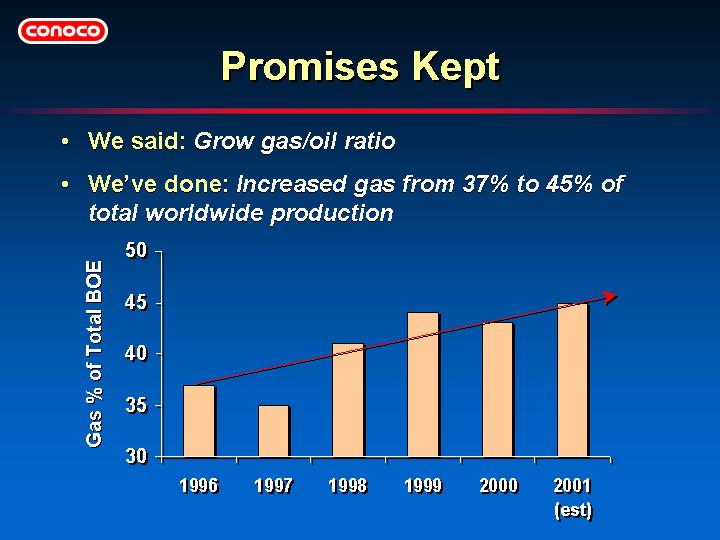
| • | We’ve increased gas production as a percentage of worldwide production from 37% to 45% since 1996. |
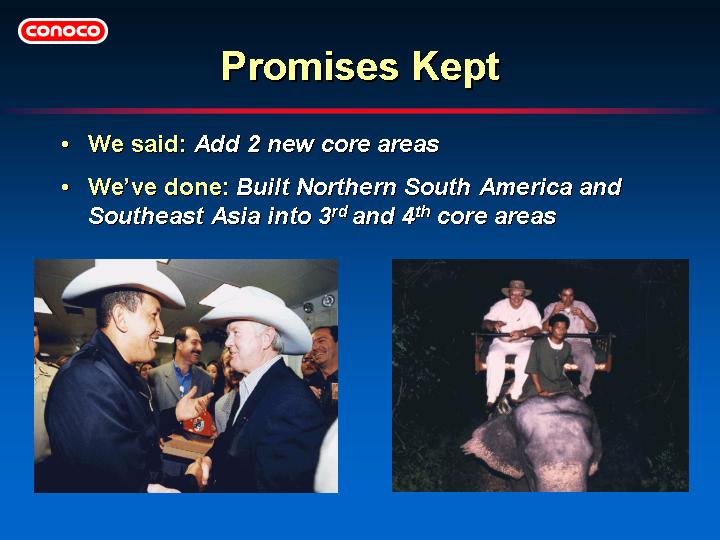
| • | We set out to build 2 new core areas and we’ve done just that. |
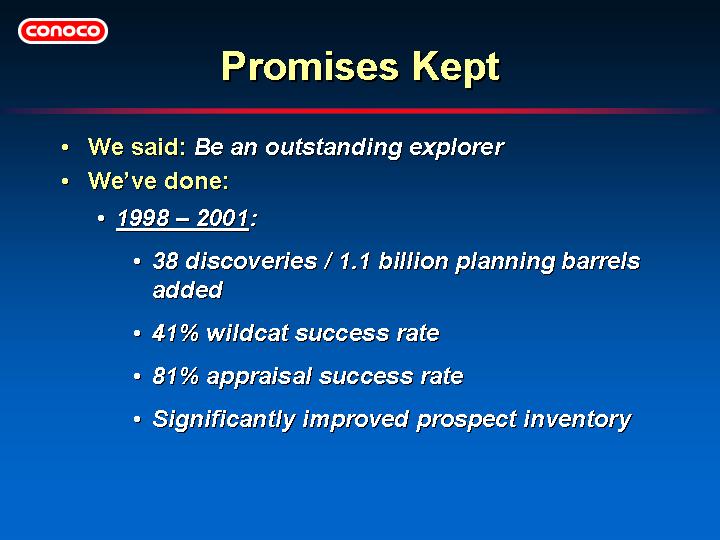
| • | We have significantly improved our effectiveness when it comes to exploration, and in the process reduced dry hole costs as a percentage of our total exploration costs. |
| • | Making more/bigger discoveries | ||
| • | Drilling fewer/cheaper dry holes |
| • | Added significant opportunities |
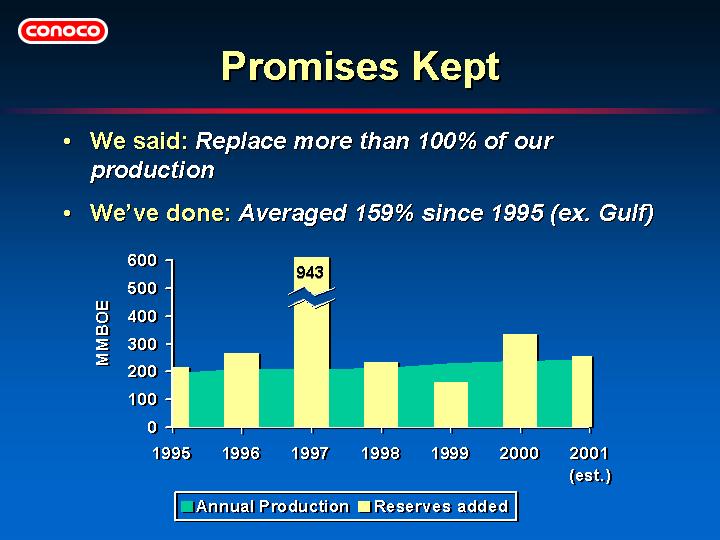
| • | Since 1995, we’ve grown production, and in total, we’ve booked more reserves than we’ve produced. | ||
| • | We’ve replaced produced reserves by almost 160% on average. |
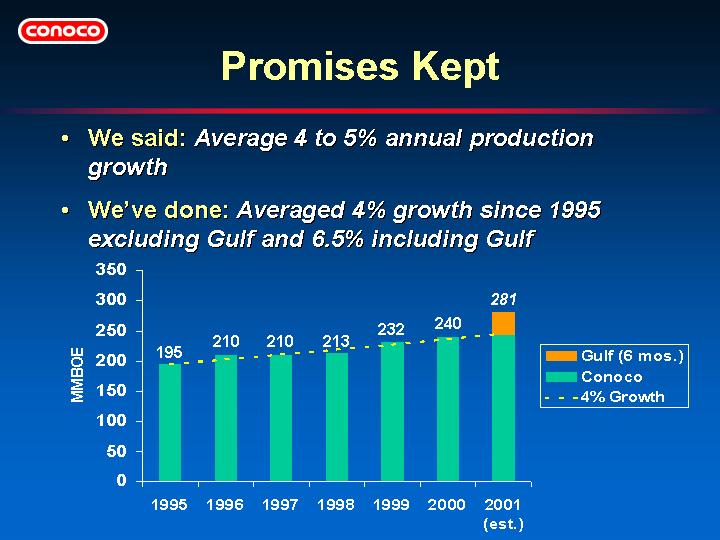
| • | Since 1995 we’ve averaged about 4% annual production growth, excluding volumes from Gulf Canada. | ||
| • | Since the IPO, we’ve averaged 4.5% production growth. | ||
| • | With Gulf Canada volumes for the second half of 2001, we expect to have averaged around 10% per year since 1998 and 6.5% since 1995. |
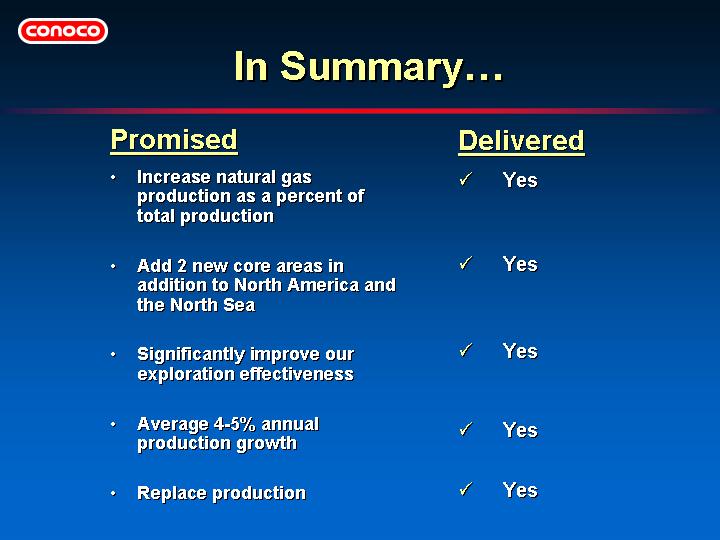
| • | We’ve done everything we said we would do. | ||
| • | Accomplishing these strategic goals has consistently allowed us to be recognized as a top performer, and frequently #1, in many industry studies. |
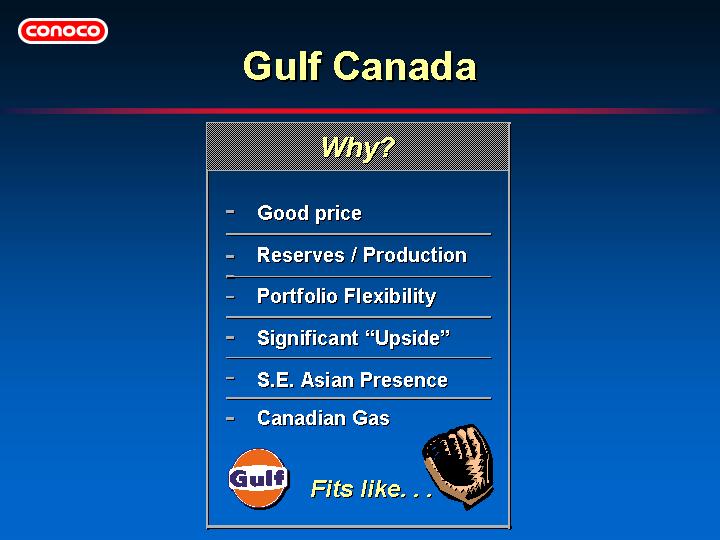
| • | The Gulf Canada acquisition fit us like a glove. | ||
| • | Given the size of the deal, coupled with recent terrorist acts and general price declines, this year has changed a few things for us in the very near term. |
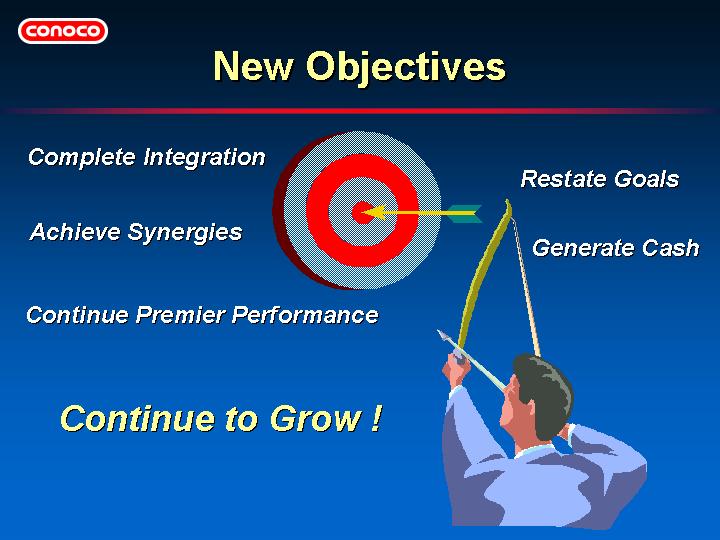
| • | Near term, we’ll complete the integration, high-grade our portfolio, reduce debt, and restate our goals. | ||
| • | Going forward, we’ll continue our premier performance and continue to grow through the drill bit and commercial deals. |
| • | The Gulf deal allows us to high-grade our asset and opportunity portfolios. | ||
| • | Our process will focus on strategic value and growth potential as two of the many considerations we will take into account. |
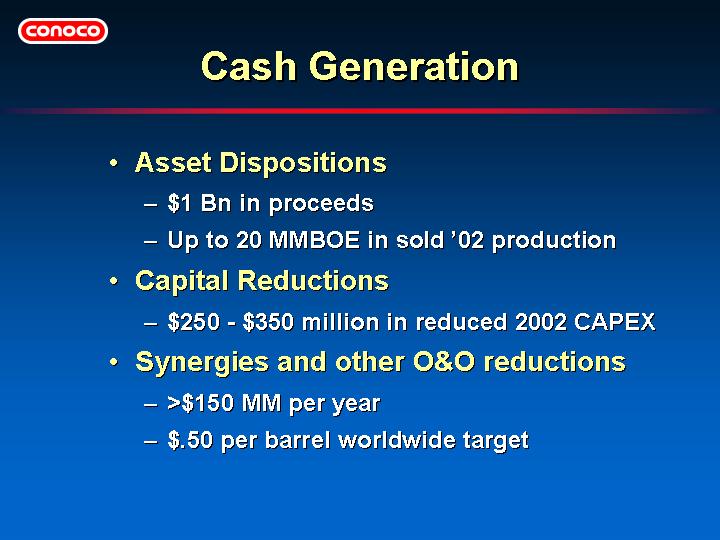
| • | Cash generation for debt repayment will be achieved through: |
| • | $1 Bn in asset dispositions | ||
| • | Capital reductions of about 300 million in 2002 compared to total of Conoco and Gulf Canada upstream budgets for 2001 | ||
| • | >$150 MM in synergies | ||
| • | Other O&O reductions |
| • | Of the total capex reduction, $100 - $150 million is exploration capex. |
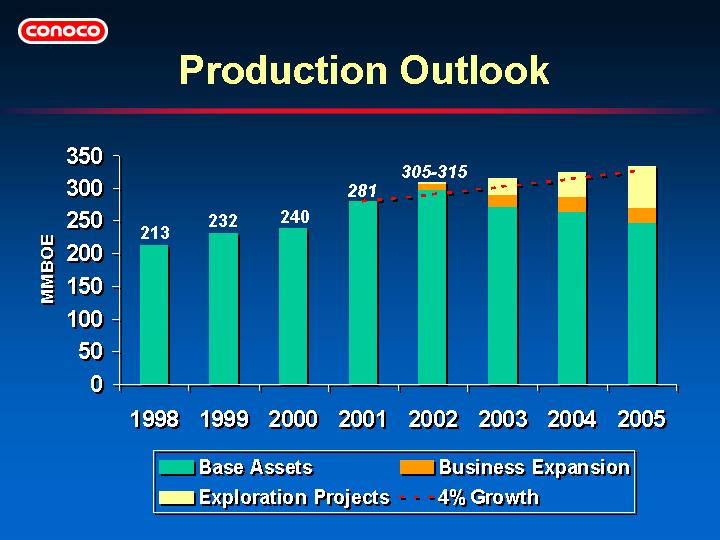
| • | Based on the reduced near-term spending to help pay off debt and the possibility of other dispositions, we are targeting 4% average growth through 2005. The potential exists for a higher rate after 2005 as multiple, existing discoveries are developed. | ||
| • | Starting from this new base, we remain confident that we can deliver the targeted growth ... and the series of slides that follow indicate the sources of growth year-by-year. |
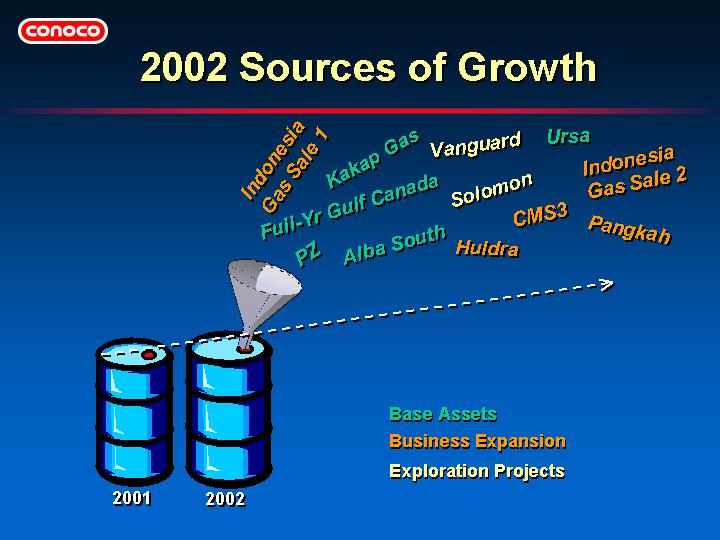
| • | See appendix for details |
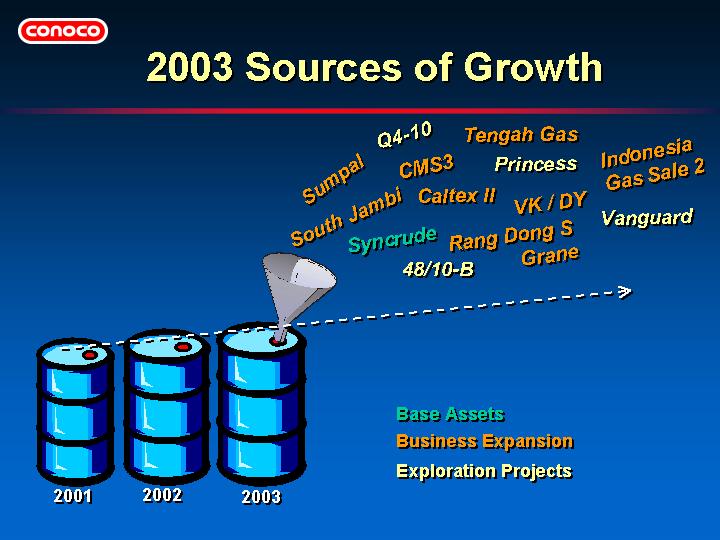
| • | See appendix for details |

| • | See appendix for details |
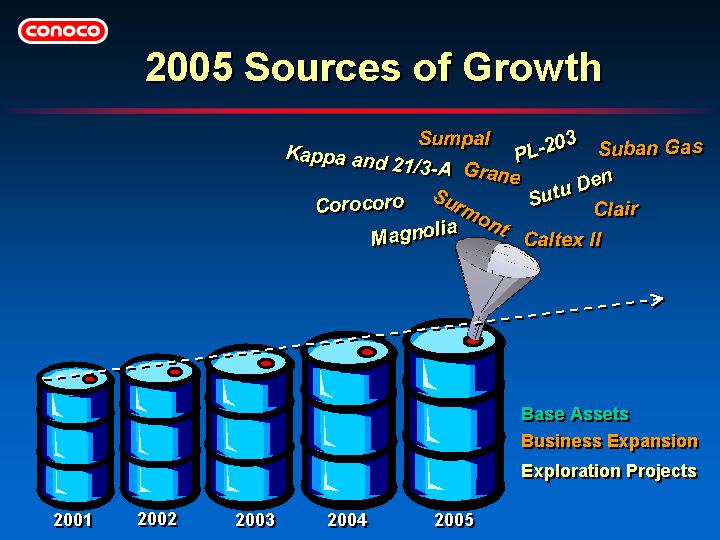
| • | See appendix for details |
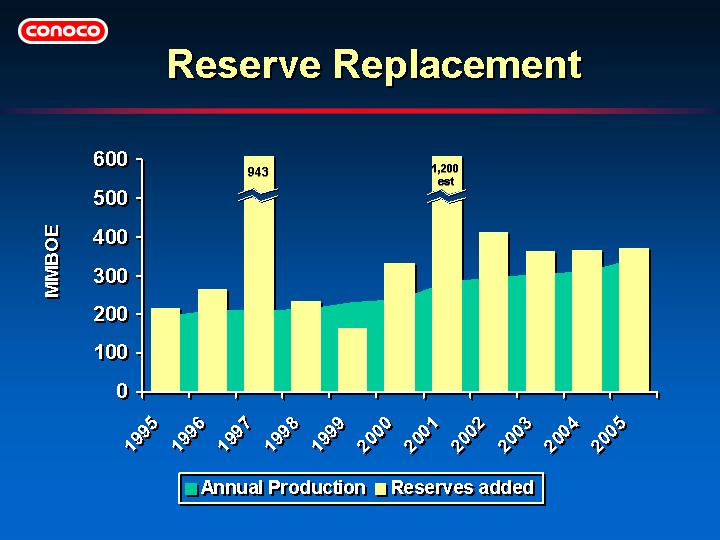
| • | Since the IPO in 1998, we’ve consistently grown production, and in total, we’ve booked more reserves than we’ve produced. | ||
| • | Since 1995, we’ve replaced produced reserves by roughly 160% on average. |
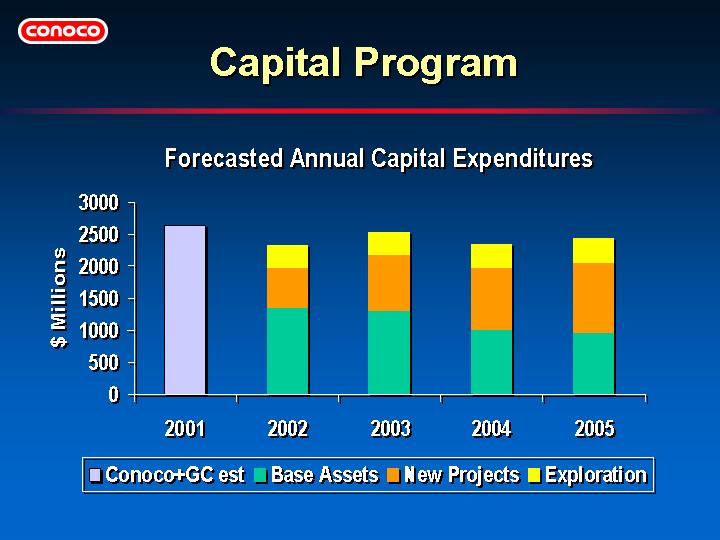
| • | Our CAPEX levels needed to carry out this program will average around $2.4 Bn per year. |
| • | In conclusion: |
| • | We have done what we promised. | ||
| • | We have added significant assets and opportunities through Gulf Canada. | ||
| • | We have lots of opportunities due to our exploration and commercial efforts. |
| • | The future is bright ... we’re bigger, stronger and better than ever before. |
This Page Intentionally Blank
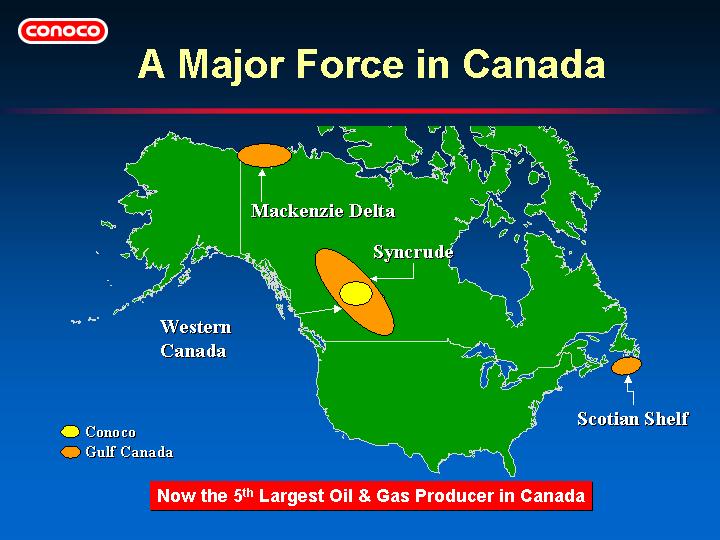
| • | A new company of substantial size, flexibility and great potential | ||
| • | 5th largest oil and gas producer in Canada at over 177,000 boe/d net after royalty (2001 estimated) includes Petrovera and Syncrude | ||
| • | An enviable and well positioned portfolio | ||
| • | Substantial undeveloped acreage: 5.6 MM net western Canada, >500,000 gross acres in the far North, and >4 MM net acres on the Scotian Shelf |
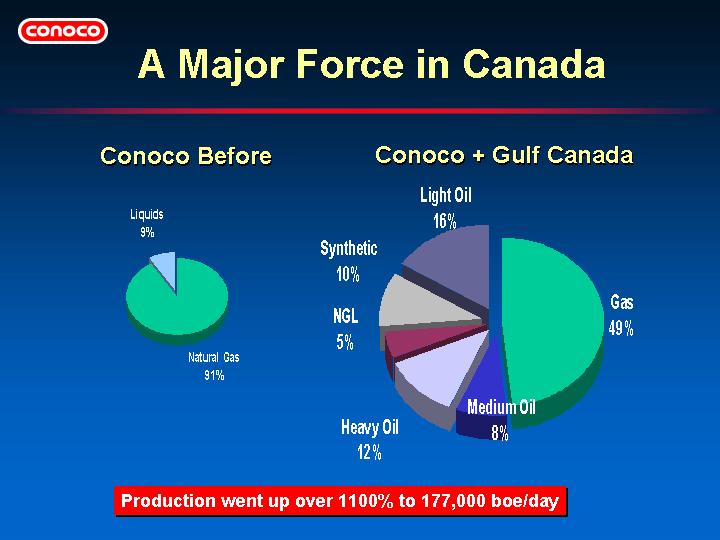
| • | Before: 2001 estimated production 83.1 mmcf/d natural gas and 1.3 mbbl/d liquids | ||
| • | After: 2001 estimated production 513.9 mmcf/d natural gas and 91.7 mbbl/d liquids |
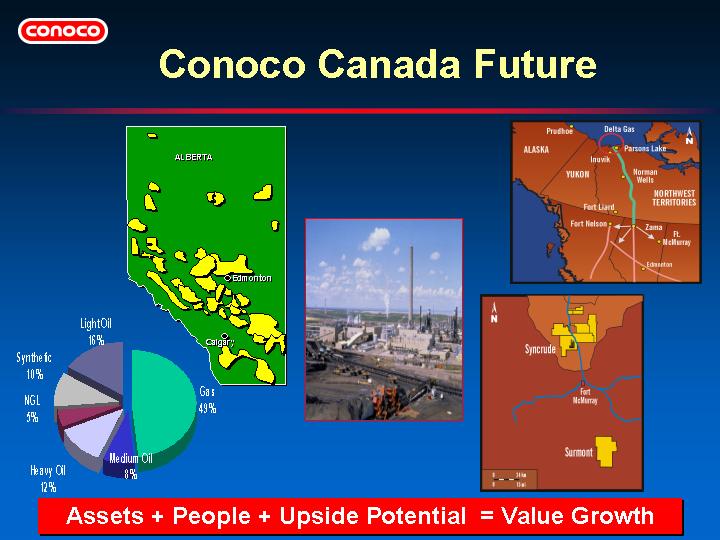
| • | 28.45 mboe/d light crude | ||
| • | 14.48 mboe/d medium crude | ||
| • | 6.69 mboe/d heavy crude | ||
| • | 9.7 mboe/d NGL | ||
| • | 18.2 mboe/d Syncrude | ||
| • | 503.4 mmcf/d (83.9 mboe/d) natural gas | ||
| • | Petrovera 14.2 mbbl/d heavy conventional oil and 10.5 mmcf/d gas |
| • | Chart does not include Ecuador 3.8 mbbl/d of heavy oil. | ||
| • | Proforma reserves are 1,638 mmboes proven (excluding Syncrude) and 1,922 mmboes (including Syncrude). |
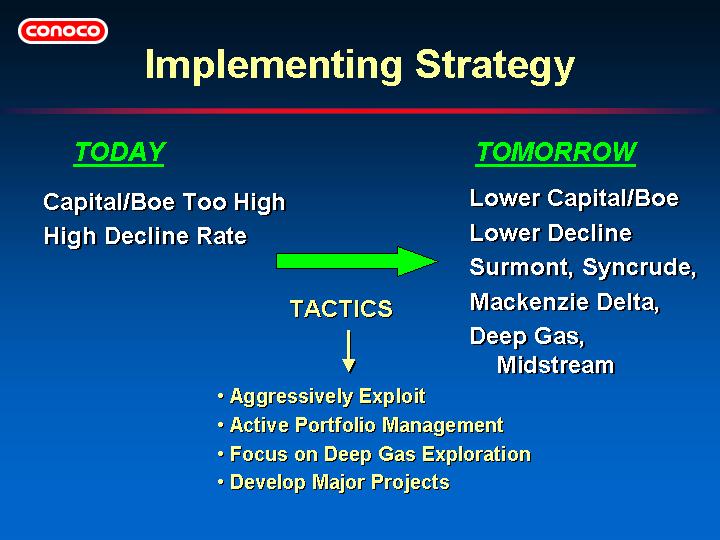
| • | Our production/reserve life (approx. 12x) is currently at the top of the Canadian industry allowing us to have an aggressive exploitation program. | ||
| • | Gas exploration focused towards long life, low decline. We will pursue shallow gas on a discretionary basis timed to commodity prices. | ||
| • | Aggressive moves to bring our projects forward. Target first gas from MacKenzie in 2007, decision in 2002 on Surmont, Syncrude doubles production by 2007. | ||
| • | Very active, disciplined portfolio management | ||
| • | Strong focus on sustainable long-term value |
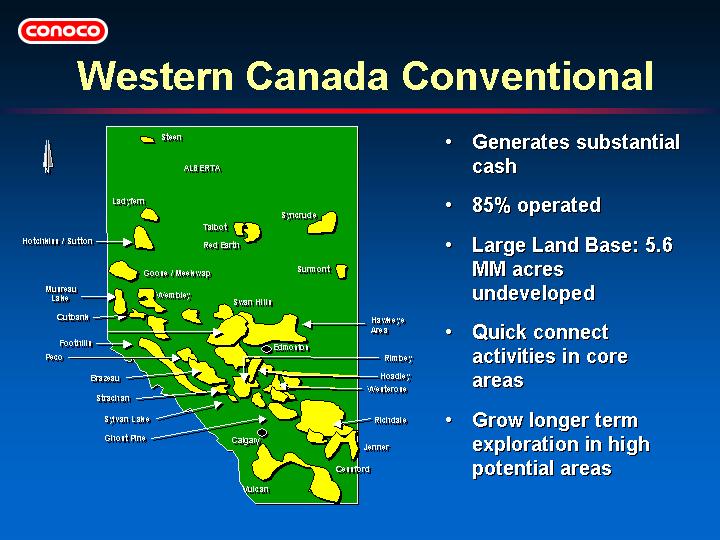
| • | Western Canada is our economic engine, expected net cash flow of roughly US $300 MM for 2002; the “bridge” to our longer term projects. | ||
| • | Many optimization and exploitation opportunities; quick connect discretionary shallow gas; opportunities for focused exploration; well diversified across commodities and geology | ||
| • | Remaining potential is very large. | ||
| • | Exploration is focused on Devonian Play and Foothills. | ||
| • | Basin decline rates are currently high due to focus on shallow gas in recent years. | ||
| • | Oil production is getting heavier. | ||
| • | F&D costs to the US $6.50/boe level due to high levels of exploitation activity driven by gas prices and shallow gas activity. |

| • | For 2002, US $240 MM for Development, the balance to Exploration | ||
| • | Shallow Gas in SE Alberta: |
| • | 180 Gross wells in 2001 added 23.4 Bcf of net reserves | ||
| • | Rates of Return well in excess of 15% using current strip pricing | ||
| • | Short payout, declines flatten out to 13%/yr | ||
| • | F&D costs top quartile for Canada projects |
| • | Substantial shallow gas inventory |
| • | High profitability per barrel; low DD&A/bbl | ||
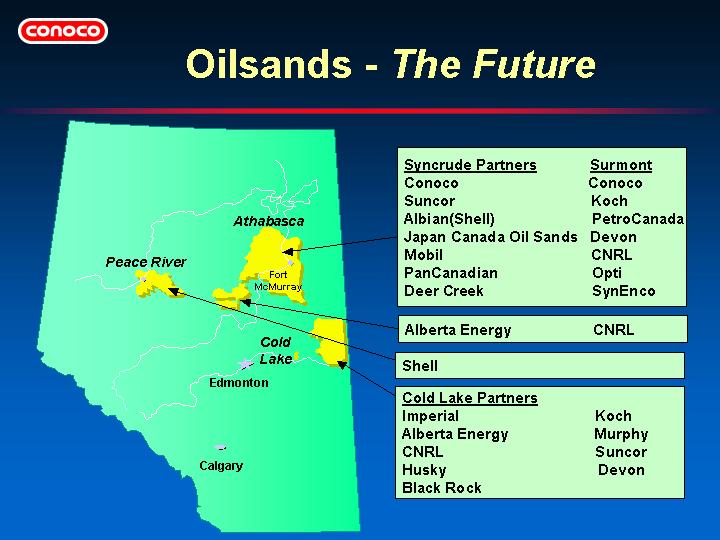
| • | Largest untapped source of oil on the North American continent | ||
| • | Plans point to 900,000 bbl/d by 2005 and 1.8 MM bbl/d by 2010 | ||
| • | Infrastructure constraints on growth | ||
| • | Integrated producers have an advantage - experience, technology and research | ||
| • | Conoco very established in all 3 areas |
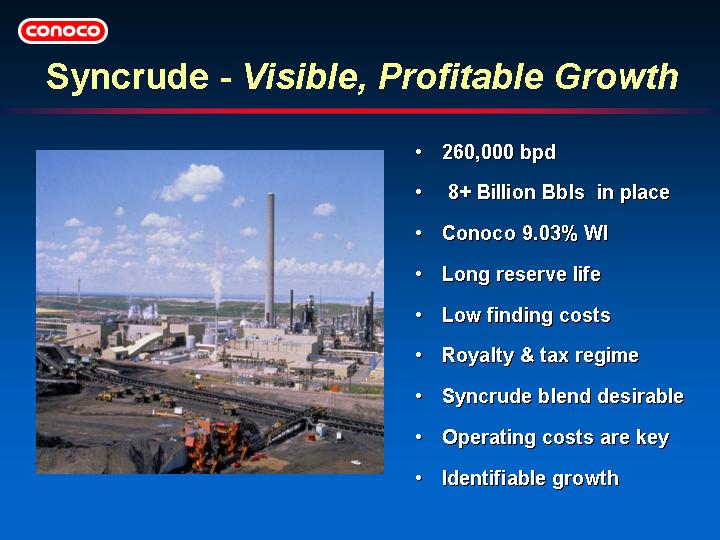
| • | Syncrude Plant installed capacity capable of 90+ MM bbls/yr |
| • | Strong, focused effort on improving reliability & reducing costs | ||
| • | 2001 production expected to be 82.5 MM bbls/yr | ||
| • | 2002 forecast at 85-90 MM bbls/yr, 90+ MM bbls/yr realistic for post-2002 |
| • | Embarked on Stage 3 growth project to 130+ MM bbls/yr by 2005 |
| • | Doubles Aurora North mine | ||
| • | Adds 3rd coker, hydrotreating capacity & peripherals | ||
| • | Product quality & environmental improvement | ||
| • | US $2.72 Bn investment |
| • | Royalty Regime 1% till capital payout, 25% of net revenues thereafter | ||
| • | Federal tax write-off for capex in excess of 5% of project revenues. |
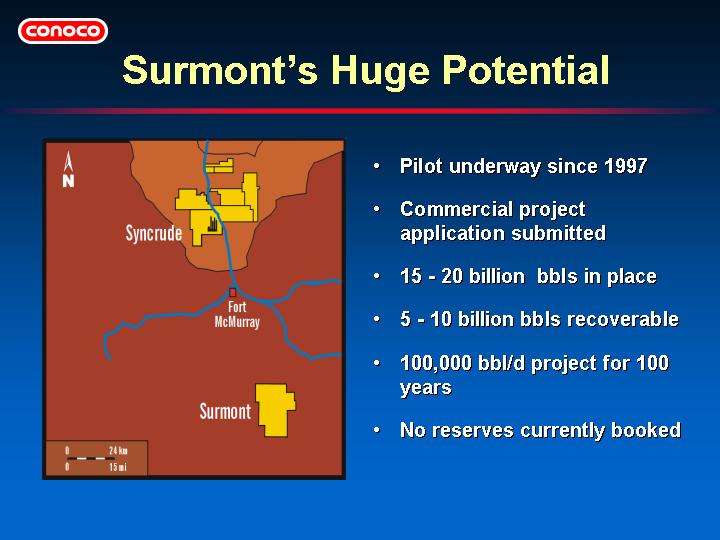
| • | April 2001 application for 100K bbl/d - 4 phases of 25,000 bbl/d each | ||
| • | 8 degree API crude | ||
| • | Conoco is 43.5% owner and is operator; partners are Total/Fina/Elf and Anderson. | ||
| • | Regulatory approval expected Spring 2002; Commercial Decision Phase 1 - Q3 2002; Start up/ first production Q4 2004 at 25,000 bbl/day | ||
| • | Phase 1 (2002-2004) capital of US $223 MM | ||
| • | Phase 2 capital (2005-2005) US $138 MM for a further 25,000 bbl/d | ||
| • | Full 100,000 bbl/d by 2012 |
| • | Important not only for us and but also for the future of northern Canada | ||
| • | Substantial assets | ||
| • | 15 additional blocks contain an estimated 200 MM net barrels of oil and 500 net Bcf of gas | ||
| • | Our first production target is 2007; Regulatory approval by end of 2004; Construction start in 2005 and drilling in late 2005 | ||
| • | Current projections and futures markets for gas prices support economics | ||
| • | Significantly cheaper than Alaska natural gas pipeline from North Slope |
| • | 3 companies successfully integrating - Crestar, Gulf Canada, and Conoco | ||
| • | Synergies: US $150 MM very achievable |
| • | Downstream integration | ||
| • | Gulf’s exploitation skill-set | ||
| • | Exploration | ||
| • | Upgrading expertise, R&D |
This Page Intentionally Blank
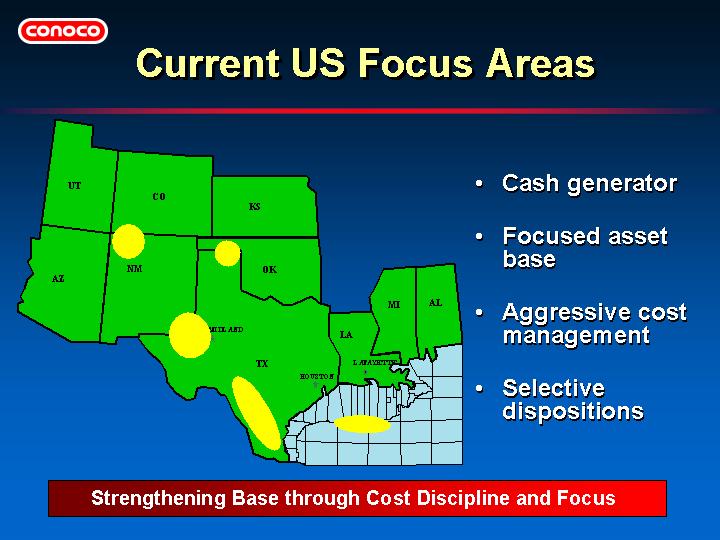
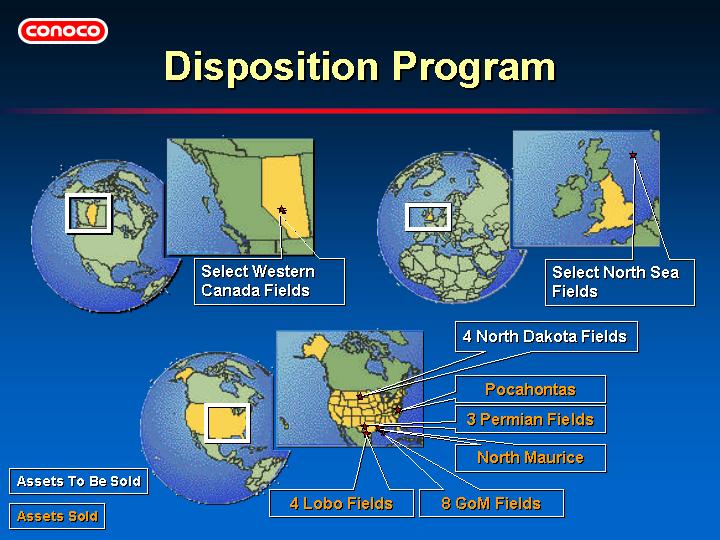
| • | Reduced number of fields by half from over 150 in 1995 to roughly 70 now without significant reduction in production | ||
| • | Now, post Gulf Canada, divesting non-strategic onshore and GoM shallow water properties (see disposition program slide on page 34) | ||
| • | Disposition efforts ahead of schedule with excellent results |
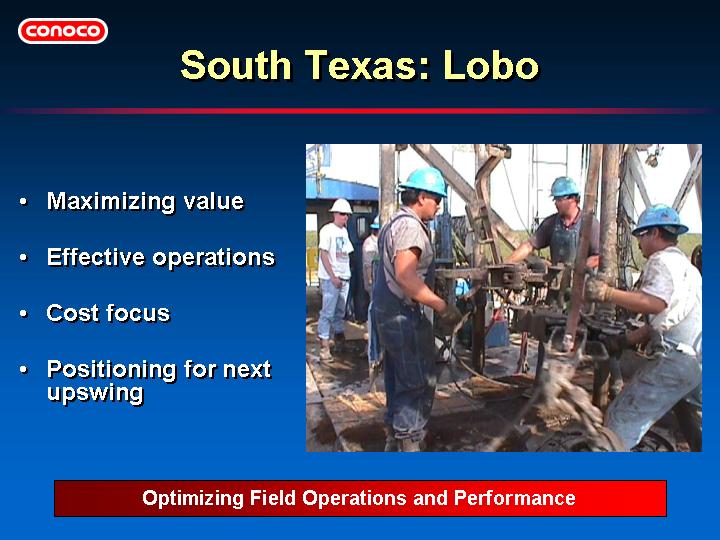
| • | South Texas cost leadership position | ||
| • | Over 500 drilling locations remaining | ||
| • | Reducing rig count from 10 to 8 results in 25 MMCFD less production in 2002 | ||
| • | Optimizing field operations, reducing costs and building stronger inventory of drilling prospects |
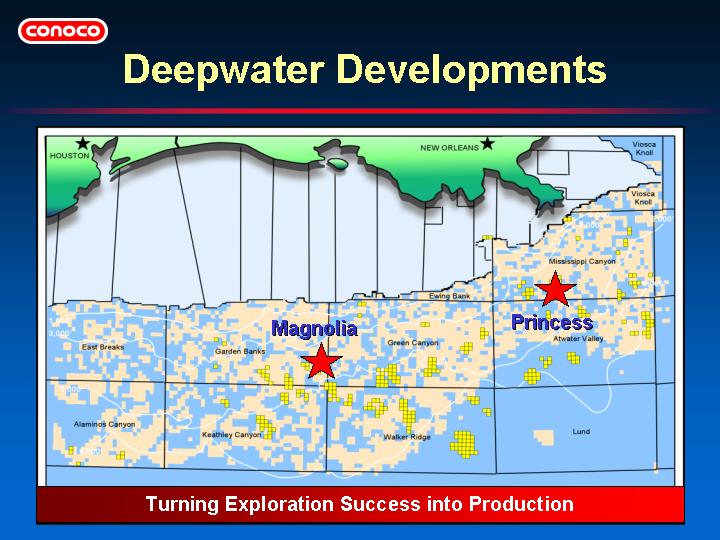
| • | Magnolia and Princess underpin near to mid-term production growth in deepwater GoM | ||
| • | Magnolia: Conoco 75% WI; operator | ||
| • | Princess: Conoco 16% WI | ||
| • | Net production from Magnolia and Princess of 40 MBOED by 2006 |
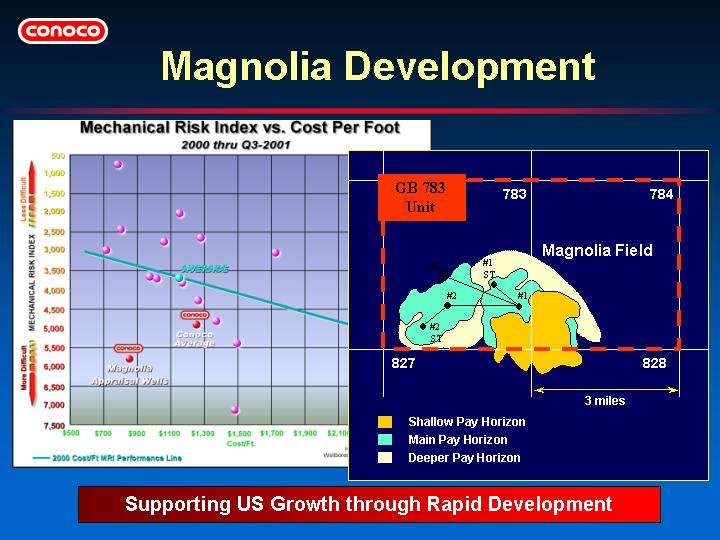
| • | Drilled 3 appraisal wells in 2001 | ||
| • | Top quartile drilling performance | ||
| • | Project sanction 2001Q4 | ||
| • | First oil 2004 | ||
| • | Estimated recoverable hydrocarbons exceed 150 MMBOE (gross) | ||
| • | Strategically positioned to capture first mover advantages with early infrastructure in an active area |
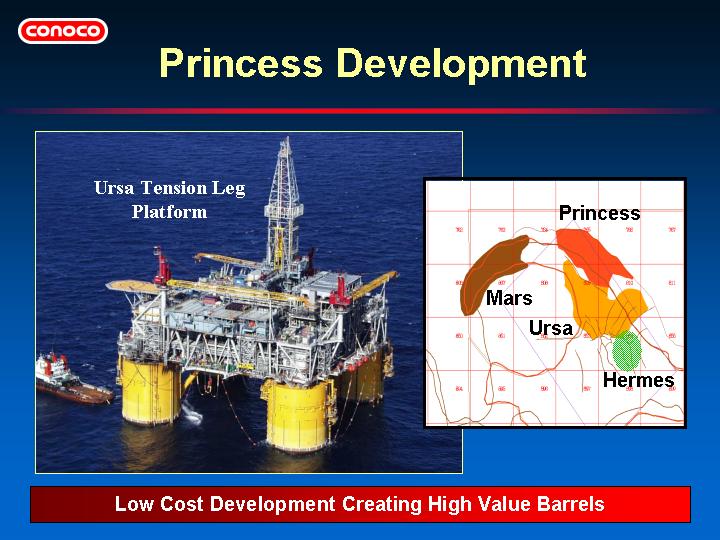
| • | First production 2002Q2 from a well drilled off the Ursa TLP | ||
| • | Three sub-sea wells to be tied back to Ursa | ||
| • | Estimate recoverable hydrocarbons up to 200 MMBOE (gross) | ||
| • | High value, low cost development opportunity | ||
| • | Future exploration upside potential at Princess and Hermes |
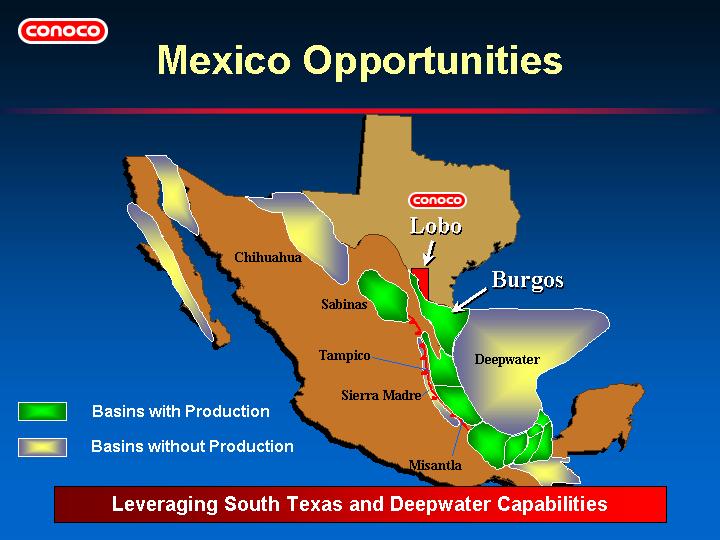
| • | Government moving quickly with energy reform; foreign operator participation likely in 2002 | ||
| • | Burgos Basin first to open, and in early stage of life cycle | ||
| • | Pemex seeking operator to provide all Upstream services from seismic acquisition and drilling to gas gathering and processing | ||
| • | Creating value through service contract | ||
| • | Conoco uniquely positioned to leverage South Texas knowledge and GoM deepwater expertise |
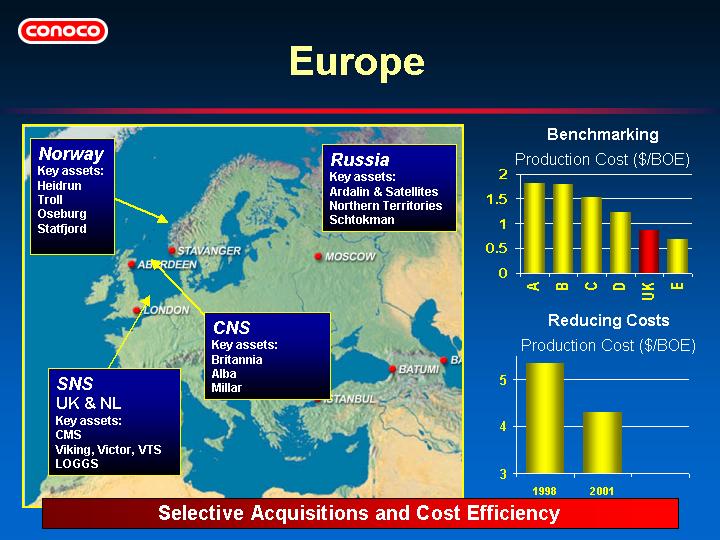
| • | Significant core area with established track record for delivering superior business performance | ||
| • | Aggressively rationalizing assets from Saga UK acquisition | ||
| • | Placed 2nd in McKinsey benchmarking study for production cost per barrel for UK Southern North Sea | ||
| • | Reduced production cost per barrel by $1/boe from 1998 to 2001 |
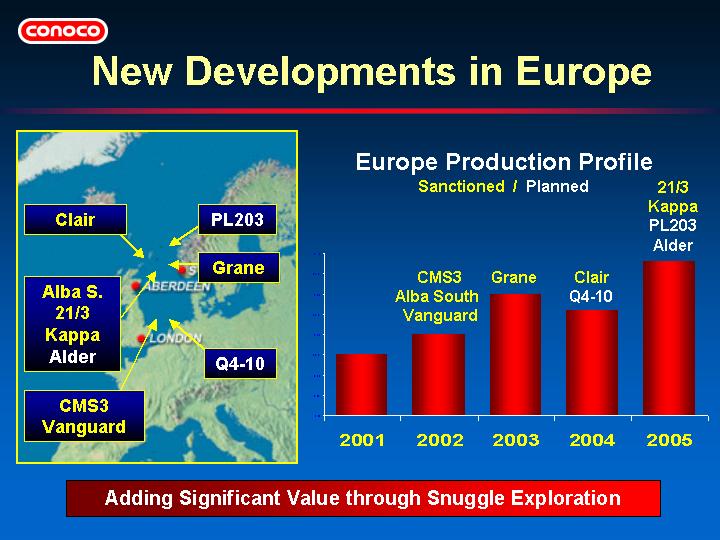
| • | 10 new oil and gas fields to be brought on production by 2005; 8 near existing infrastructure | ||
| • | Snuggle exploration added $5.80 per after-tax dollar invested from 1998-2001 | ||
| • | Participating in 2 major long-life field developments, Clair (UK) and Grane (Norway) | ||
| • | North Sea production to grow 3% per year through 2005 | ||
| • | Longer term growth potential from northern Norway exploration, Russia and the Caspian |
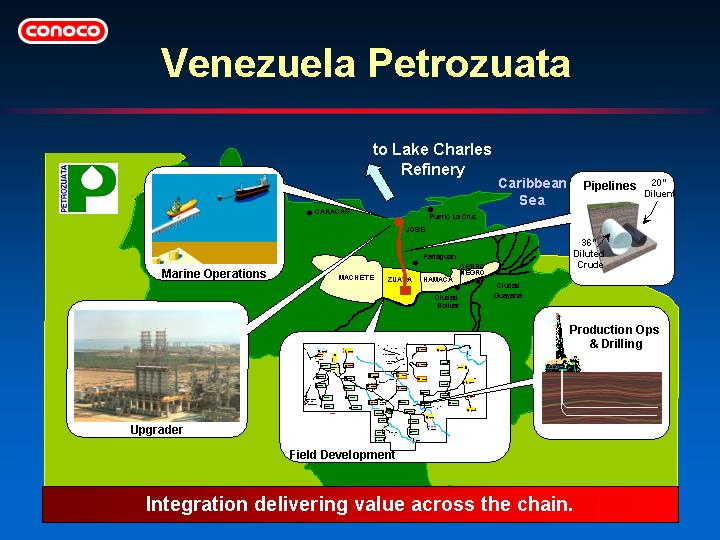
| • | Completion Test on track; wells and upgrader currently exceeding expectations | ||
| • | Petrozuata to provide more than 30 years of profitable cash and earnings | ||
| • | Huge resource base enables production rates across project life without decline | ||
| • | Leveraging position into additional prospective opportunities |
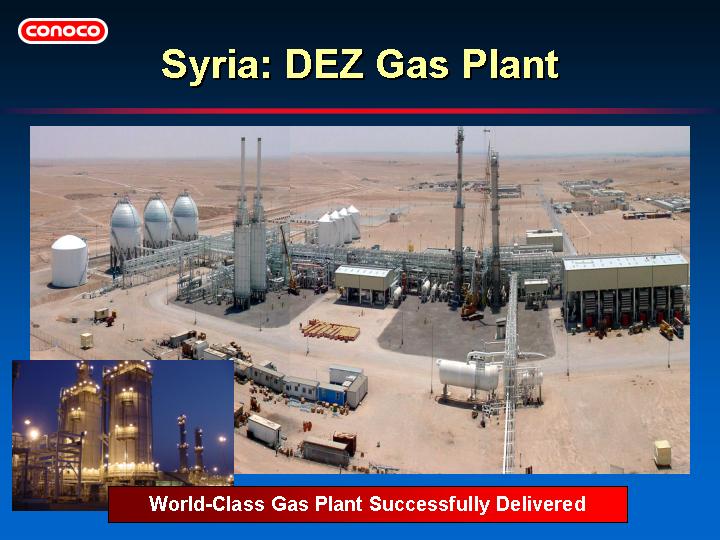
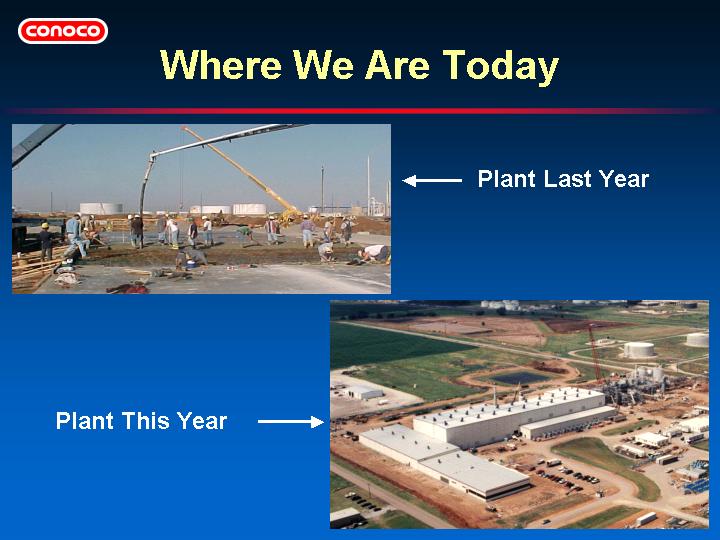
| • | Plant completed within original budget and 6 months ahead of schedule | ||
| • | First gas achieved August 2001 | ||
| • | Plant to gather 175 MMCFD of previously flared gas and will recycle 280 MMCFD from nearby field | ||
| • | Delivering value without booking reserves or owning production |
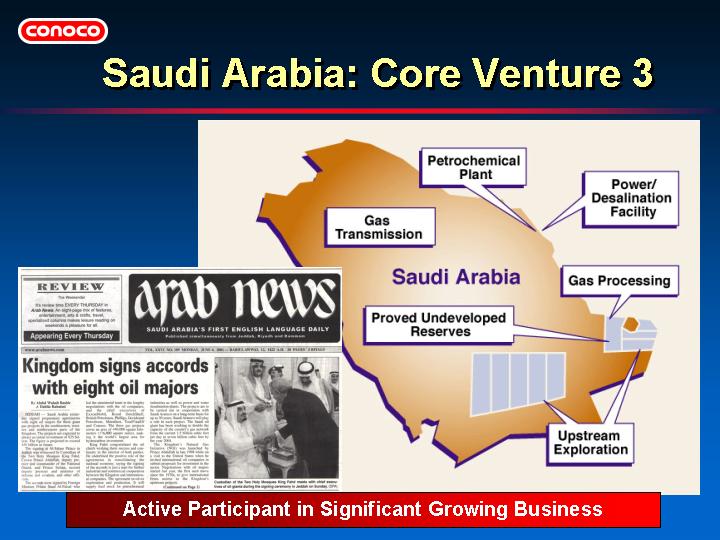
| • | Natural gas development that spans value chain from wellhead to market | ||
| • | Conoco has lead role in gas processing and transmission | ||
| • | Exploration includes 70,000 square miles | ||
| • | Conoco has been awarded 30% equity position | ||
| • | Negotiations progressing well | ||
| • | Creating value without booking reserves |
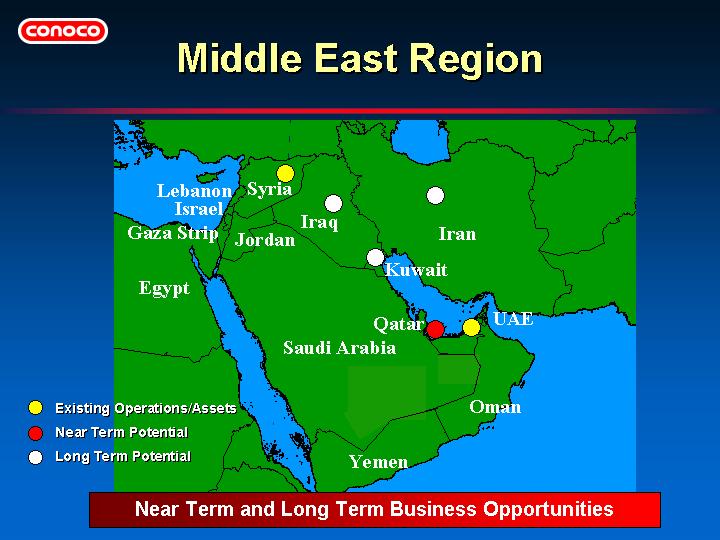
| • | Short-listed for Dolphin gas project | ||
| • | Huge regional gas potential | ||
| • | Conoco well respected in region | ||
| • | Reputation opening doors and creating new potential opportunities | ||
| • | Potential to become 5th core area |
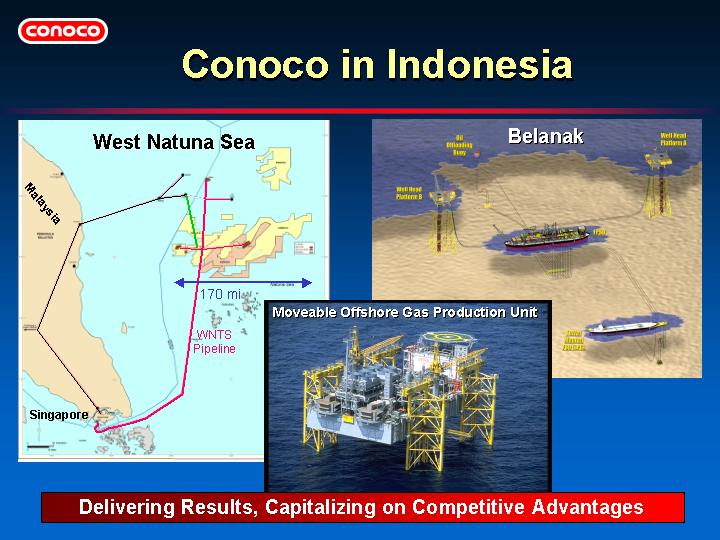
| • | First gas from Block B delivered to Singapore in June 2001; 1st gas sale for 1 TCF | ||
| • | 2nd gas sale from Block B signed in March 2001 for 1.5 TCF to Malaysia | ||
| • | Combined peak production from both contracts to reach 390 MMCFD (gross) | ||
| • | Belanak field development on track for first production in 2004 | ||
| • | Additional snuggle exploration potential exists in Block B |
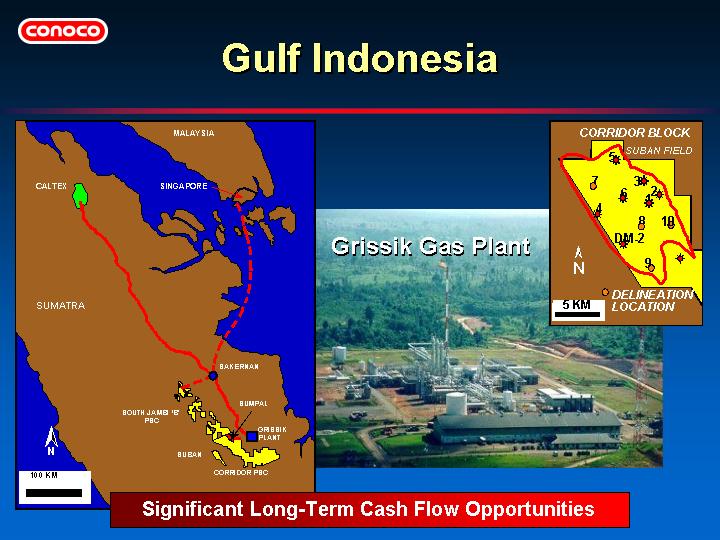
| • | 4 long term gas sales contracts in place today: |
| • | Kakap for 0.5 TCF | ||
| • | Caltex I for 1.2 TCF | ||
| • | Caltex II for 1.1 TCF | ||
| • | Sumatra-to-Singapore for 2.3 TCF |
| • | Additional uncontracted gas of 3+ TCF from Suban field | ||
| • | Recent exploration discoveries offshore East Java |
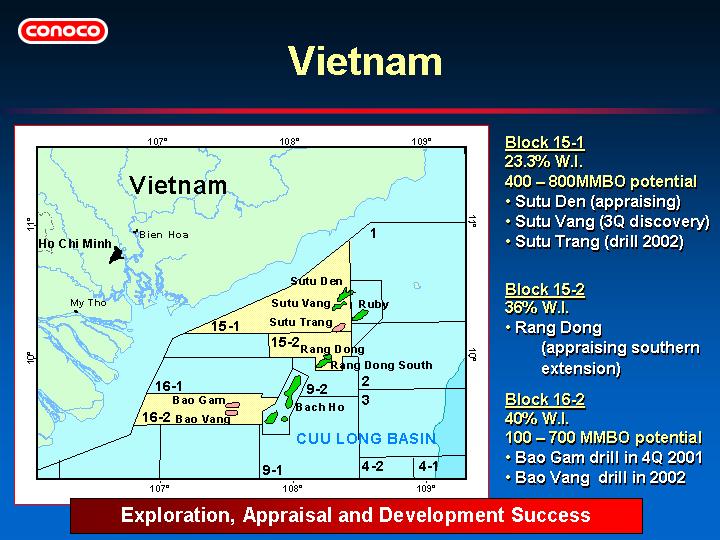
| • | Block 15-2: increasing production to over 60 MBOPD | ||
| • | Block 15-2: developing southern field extension; will sanction project for gas lift, water injection and gas export by 2001Q4 | ||
| • | Block 16-2: currently drilling first exploration well | ||
| • | Block 15-1: Sutu Den field declared commercial in August 2001; Sutu Vang discovery announced in October 2001 |
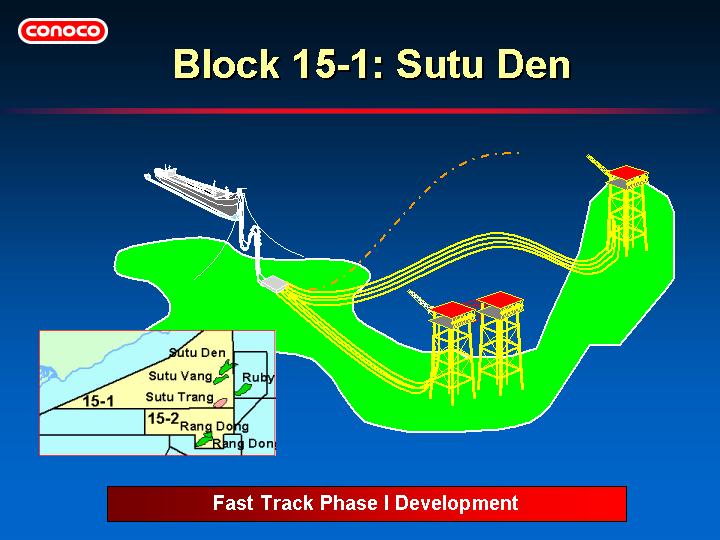
| • | Aggressively moving from discovery to production | ||
| • | Phase I project sanction 2001Q4 with first oil 2004 | ||
| • | Expected peak production rate 55 MBOPD | ||
| • | Second recent discovery, Sutu Vang, not in base plan; likely to tie to Sutu Den infrastructure in future |
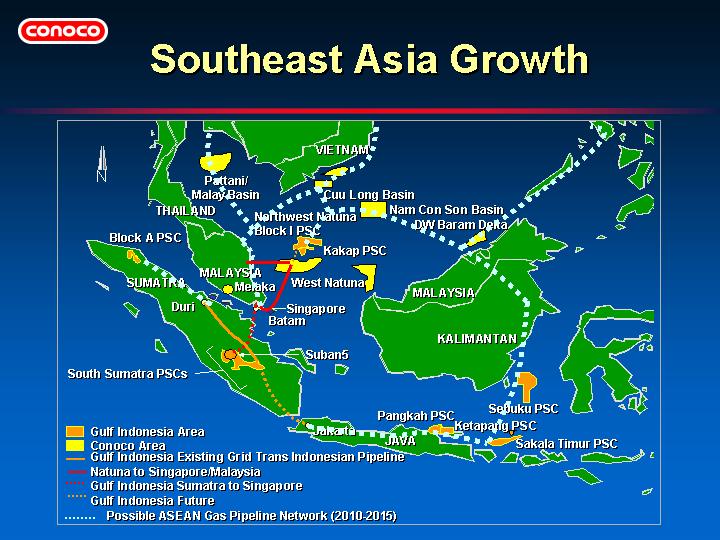
| • | 19 million undeveloped acres | ||
| • | Equity interests in region projected to yield 50 MMBOE in 2006 | ||
| • | Huge upside not included in base plan, including 4 TCF of uncontracted gas | ||
| • | Leveraging global gas expertise to play a leading role in developing future ASEAN gas grid |

| • | Gulf of Mexico, North Sea and SE Asia underpin current growth projections | ||
| • | Additional growth opportunities beyond base plan include Saudi CV3, Dolphin, Mexico, the recent Vietnam discovery, Indonesia uncontracted gas, and more snuggle exploration | ||
| • | Building from capabilities and focusing on positions of strength |
This Page Intentionally Blank
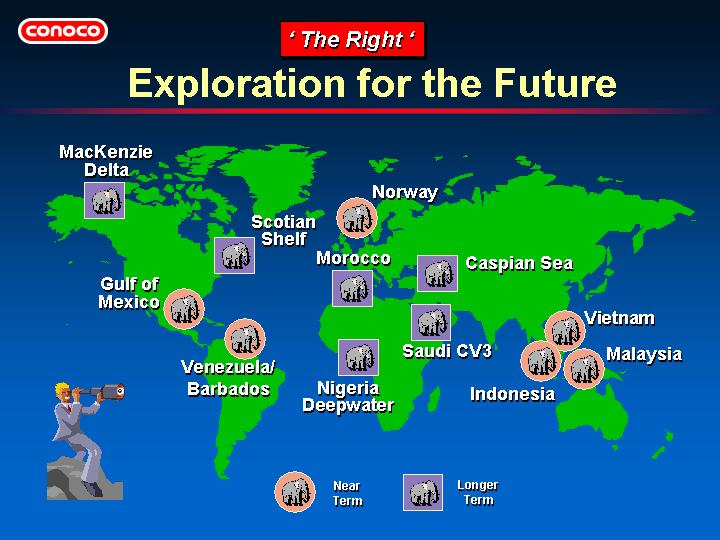
| • | Conoco is turning in a fourth consecutive year of strong exploration performance — one of the best track records in the industry. | ||
| • | We have an established strategy that is focused on relatively low risk, high potential, proven basins. | ||
| • | Our quantitative management processes and experienced exploration team allow us to compare and make global decisions objectively and consistently. | ||
| • | Success is being realized from the many excellent discoveries over the last four years, and from several significant opportunities that are truly world-class. | ||
| • | We have positioned ourselves to continue to increase the amount of annual planning barrels we find on a yearly basis. |
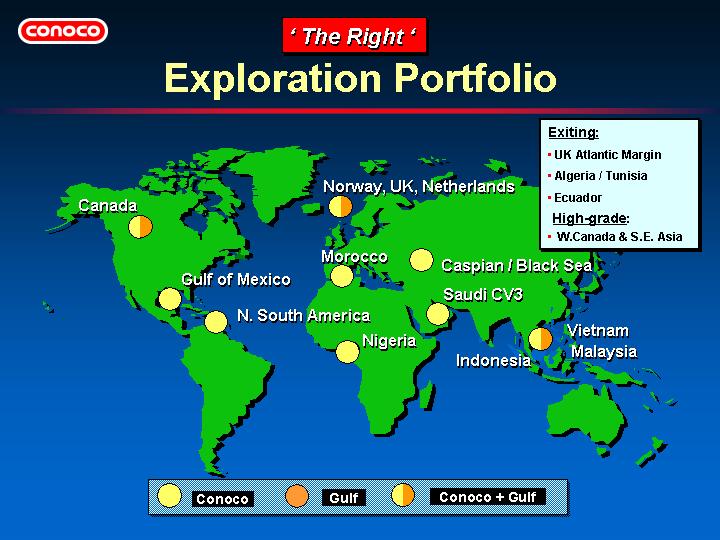
| • | Key to sustaining exploration performance is maintaining a robust, diverse portfolio. | ||
| • | The addition of Gulf Canada has brought in several good opportunities and has allowed us to high-grade the portfolio. | ||
| • | Work is continuing to further high-grade the portfolio, especially in Western Canada and Southeast Asia. | ||
| • | Excellent balance of oil and gas, North America and International. |
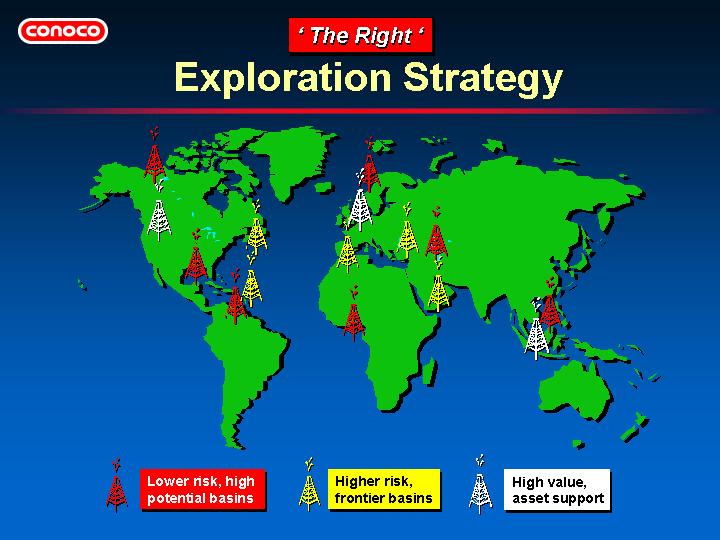
| • | Focus on lower risk, high potential, proven basins — GoM Deepwater, MacKenzie Delta, Venezuela, Norway, Caspian, Nigeria, Indonesia, Vietnam, Malaysia. | ||
| • | Selectively pursue large positions in frontier basins — Scotian Shelf, Barbados, Morocco, Saudi Arabia, Black Sea. | ||
| • | Support high value-per-barrel asset exploration — Canada, North Sea, Indonesia. | ||
| • | Apply the best technology. Our world class drillship, Pathfinder, continues to set the standard for deepwater drilling in the GoM. Recent press releases highlight our seismic processing and imaging capabilities that are important for geologic risk assessment. | ||
| • | $500MM budget (2002 onward). Combined annual budgets for Conoco and Gulf Canada in 001 would have been approximately $650MM. |
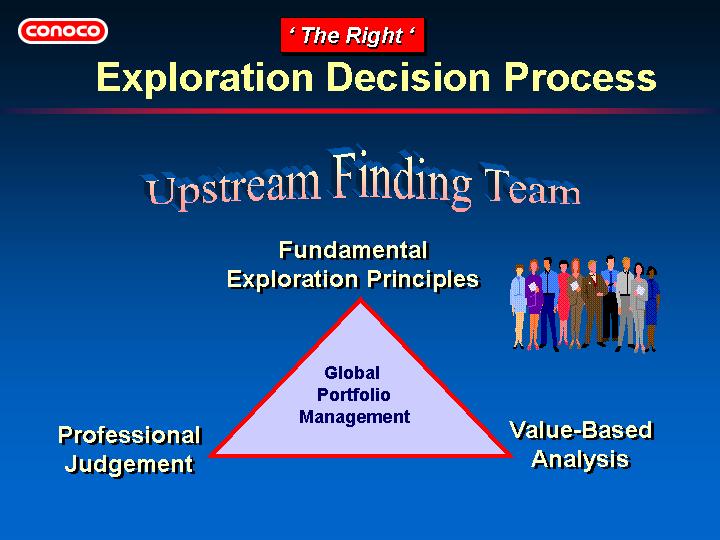
| • | Conoco’s Upstream Finding Team consists of ten of our top senior exploration managers; averaging over 20 years in industry experience. | ||
| • | They provide global strategic direction and portfolio management decisions based on a set of fundamental principles, quantitative analysis, direct comparison, and experience. | ||
| • | Our sophisticated, proprietary analysis tools provide us with accurate value assessments of risk and reward for globally comparing each opportunity. |
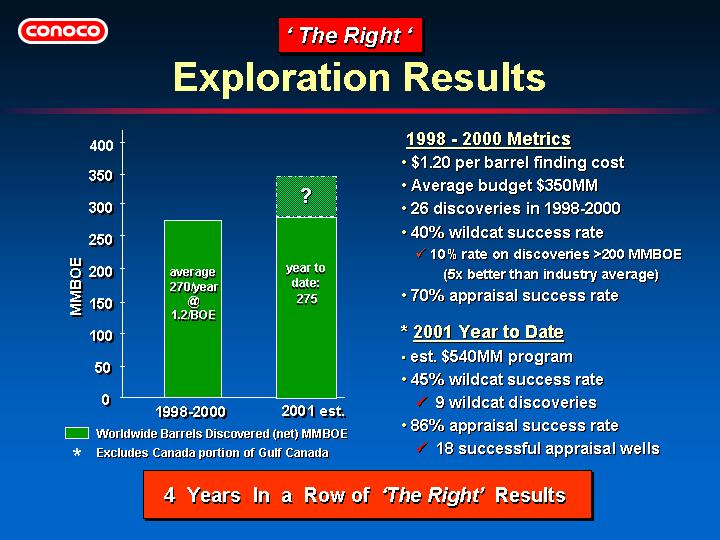
| • | Conoco’s exploration effort has delivered very strong results four years in a row — rarely seen in industry. | ||
| • | We have discovered over 3 Billion BOEs gross since 1998, net to Conoco over 1 Billion BOEs. | ||
| • | $1.20/bbl finding cost metric | ||
| • | Our exploration wildcat success rate has averaged over 40% while our appraisal drilling success rate is over 80%. | ||
| • | On significant discoveries (>200 mmboe) it’s 10%, which is five times industry average. |
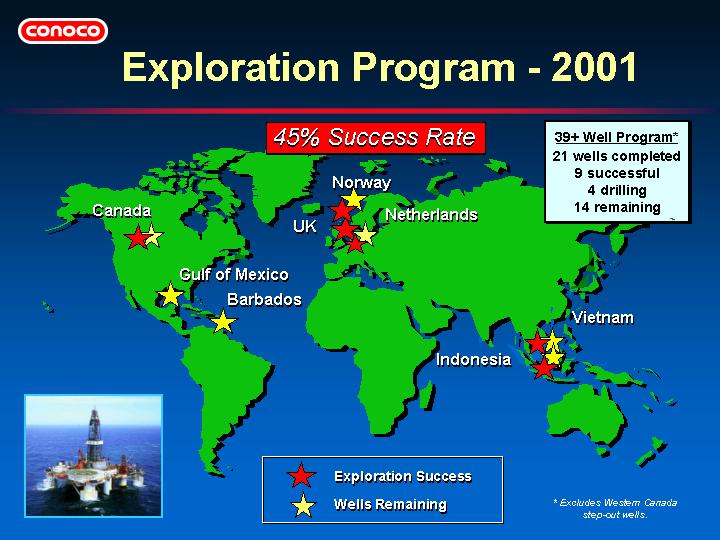
| • | More wildcat discoveries made this year giving us a 45% wildcat success rate to date. | ||
| • | Largest discoveries have been in Vietnam, Indonesia and Netherlands. | ||
| • | Large discovery in Canada is from first prospect targeting deep gas in Alberta Foothills. | ||
| • | Several high impact wells drilling in 4th Qtr. — Kate in GoM, Havsule in Norway, Sandy Lane in Barbados, and Bao Gam in Vietnam. |
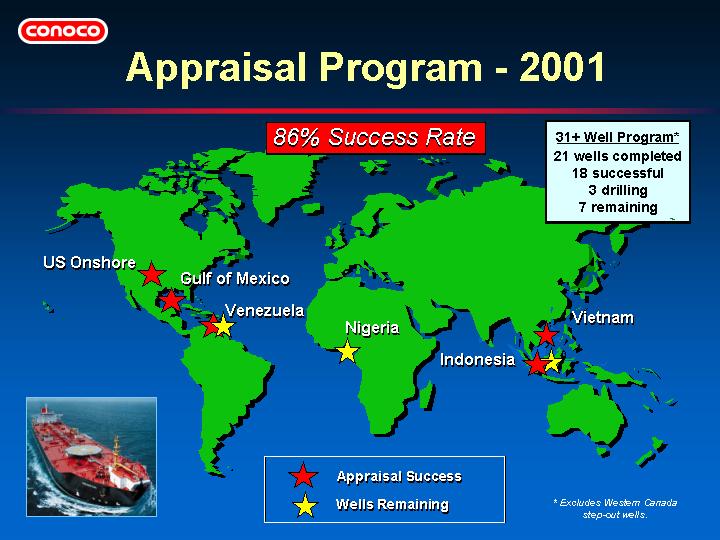
| • | Major effort in 2001 to progress discoveries toward production — especially through our appraisal program. | ||
| • | Highly successful appraisal programs on Magnolia in GoM, Sutu Den in Vietnam, Corocoro in Venezuela, and Suban and Block B in Indonesia. | ||
| • | Appraisal program in Corocoro will extend into 2002, including an extended well test. | ||
| • | Nigeria appraisal well on Chota discovery on OPL 220 is being drilled by Shell and their partners on the OPL219 side of the discovery. We will receive the well data. |
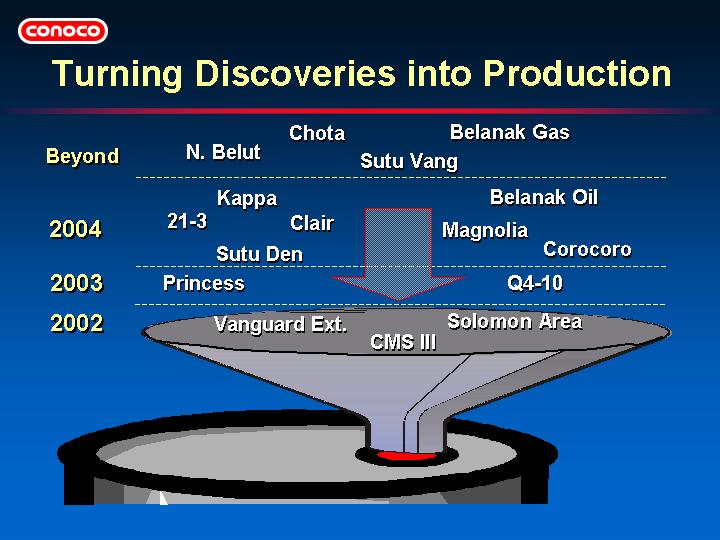
| Development | Equity | P50 Size | 1st Production | ||||||||||||
| Vanguard Ext | 50% | 18 MMBOE | 2002 | ||||||||||||
| Solomon Area | 60-100% | 30 MMBOE | 2002 | ||||||||||||
| CMS III | 56% | 72 MMBOE | 2002 | ||||||||||||
| Q4-10 | 44% | >70 MMBOE | 2003 | ||||||||||||
| Princess | 16% | >200 MMBOE | 2003 | ||||||||||||
| Grane | 6.4% | 791 MMBOE | 2003 | ||||||||||||
| Clair | 24% | 250 MMBOE | 2004 | ||||||||||||
| Magnolia | 75% | >150 MMBOE | 2004 | ||||||||||||
| Sutu Den | 23.3% | >250 MMBOE | 2004 | ||||||||||||
| Kappa | 83% | 49 MMBOE | 2004 | ||||||||||||
| 21/3 | 75% | 65 MMBOE | 2004 | ||||||||||||
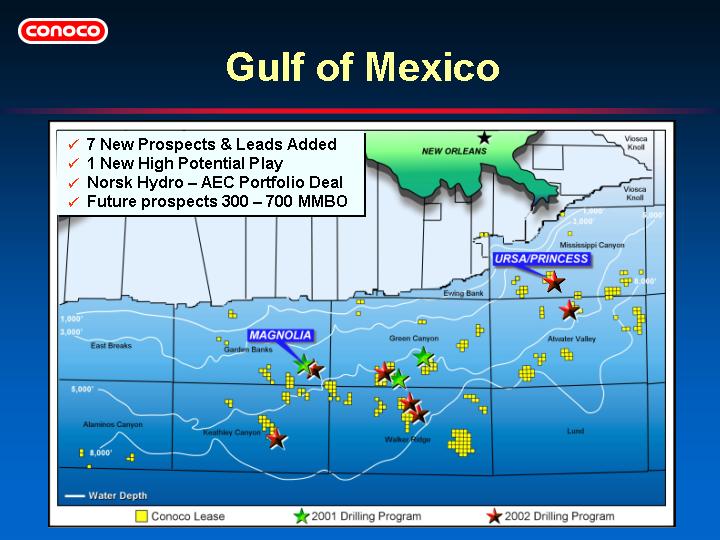
| • | Our Gulf of Mexico deepwater program remains 3-5 exploration wells per year. | ||
| • | The GoM deepwater prospect portfolio is strong and getting stronger with time. Prospects going forward are primarily Miocene turtles in both the prolific eastern GoM trend and in the central GoM. | ||
| • | Norsk Hydro — AEC Portfolio Deal: Conoco’s strategy upon entering deepwater GoM in 1996 was to acquire large prospective acreage positions at high working interest levels and bring in partners for terms deemed favorable to Conoco. We recently announced two joint venture agreements which has secured our target working interest (W.I.) and cost interest levels in exploration prospects included in the two agreements. Conoco will remain operator of all the prospects it currently operates, retaining W.I. that range from 25 to 60%. AEC and Norsk Hydro will provide funding that Conoco will use to offset its portion of the well costs. |
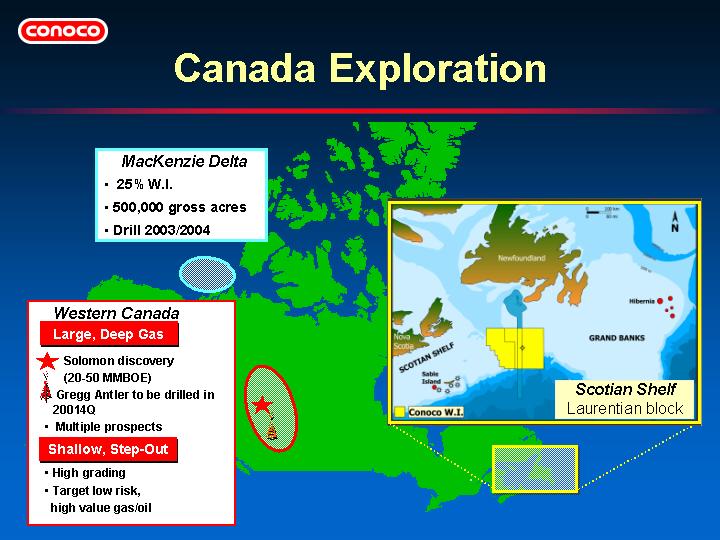
| • | Gulf Canada acquisition added many new opportunities ranging from low risk, step-out prospects in Western Canada, to large gas prospects in the MacKenzie Delta, to giant oil potential on the Scotian Shelf. | ||
| • | Solomon discovery tested 17MMCFG/day and is expected to be on production early 2002. Multiple development locations to be drilled in 2002. W.I. 100%. | ||
| • | Shallow step-out drilling in Western Canada being characterized to concentrate on highest value opportunities. | ||
| • | Alberta Energy Company operates exploration venture in MacKenzie Delta. Additional seismic is being used to map prospects for drilling in 2003/2004. | ||
| • | Laurentian Block offshore east coast has been a positive surprise. Complete geologic evaluation is underway to quantify potential in preparation for possible drilling in 2004. | ||
| • | 8.2 million gross acres with W.I. ranging from 10% on the west block to 35% in the central block and 80% in the eastern block. |
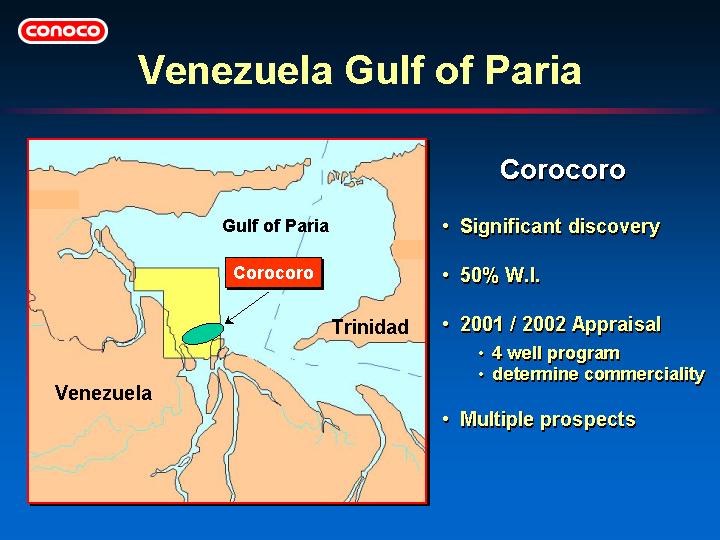
| • | Corocoro discovery well drilled in 1998. Significant accumulation of light oil and natural gas. | ||
| • | Appraisal drilling is progressing as planned. Have now drilled two out of four planned appraisal wells. An extended well test (EWT) is scheduled to carry in to next year. | ||
| • | Multiple prospects on the block and other regional opportunities continue to create the possibility of building a large business. |
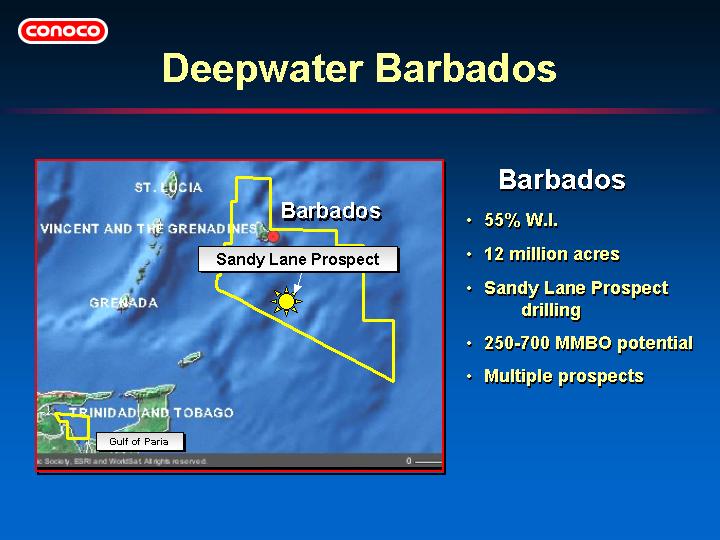
| • | Excellent example of maintaining a high potential, high risk opportunity as a low cost option. | ||
| • | Gross acreage at 45,500 sq kms (nearly 2,000 GoM Blocks)! | ||
| • | Conoco entered into an exploration license with Barbados on May 17, 1996. | ||
| • | Total/Fina/Elf farmed-in and now holds 45%. | ||
| • | 11,000 km (approx) of 2D seismic, sea-bed cores, and limited 3D seismic have been acquired. | ||
| • | Have entered into the drilling phase with the Sandy Lane prospect. | ||
| • | Have 5 years to explore the license. | ||
| • | Excellent fiscal terms. |
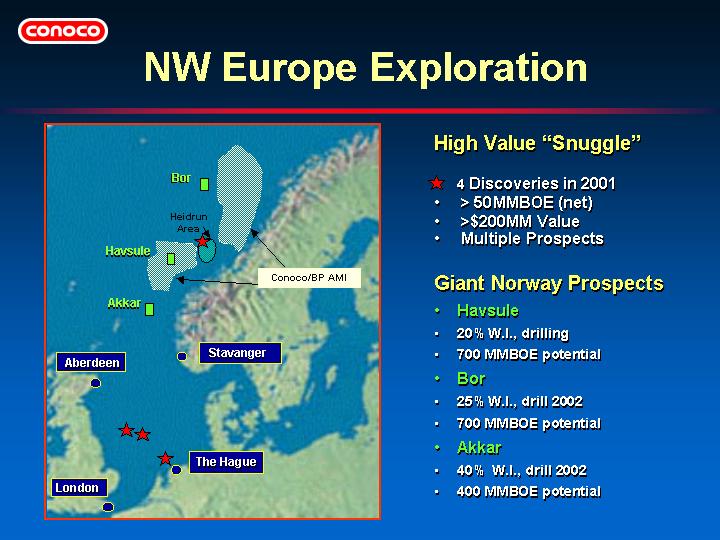
| • | High value, asset exploration continues to be highly successful in NW Europe. Although prospect size is modest, value per barrel can exceed $6/BOE. Focus on cycle time reductions is bringing some discoveries on stream in less than 18 months. | ||
| • | Netherlands Q4-10 discovery — largest discovery in past decade off the coast of the Netherlands. Conoco has 46% of this 76 MMBOE discovery. | ||
| • | Norway 16th round and the mini-round in 2001 have allowed us to build a portfolio of giant prospects in deepwater Norway. | ||
| • | Conoco and BP have entered into an AMI for exploration activities for 17th and 18th Mid-Norway License Rounds. The AMI is for a 5 year duration and covers an area of 120,000 sq. km. Conoco will operate the Northern block and BP will operate the Southern block. Working interest will be 60:40 split in favor of operator. |
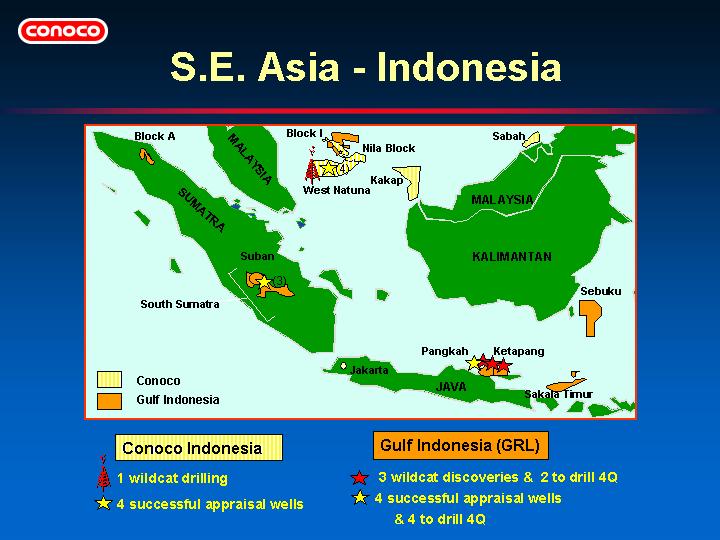
| • | 3 wildcat successes this year in GRL’s - Ketapang Block (W.I. 50%) in east Java (Bukit Tua-1, Jenggolo-1, and Payang-1). Estimated potential is greater than 200 MMBO and 1 TCFG. | ||
| • | 8 appraisal successes this year — 4 in Conoco’s Block B (W.I. 40%), 3 in GRL’s Suban Field (W.I. 54%) and one in GRL’s Ketapang Block (W.I. 50%). | ||
| • | Nila Block acquired this year, 65% W.I., covers 5271 sq. km., 2D and 3D seismic planned for 2002. | ||
| • | Looking forward to next year’s wildcat program which includes 2 wells in Conoco’s Block B with estimated potential of 100 to 230 MMBOE and 6 GRL wells with estimated potential of greater than 500 MMBOE (W.I. ranging from 20% to 100%). The Teram prospect in the Ketapang Block and Kusan prospect in the Sebuku block are key wells for 2002. | ||
| • | Sabah exploration will continue next year with 2 wildcats on Block G with 180-450MMBOE potential each. | ||
| • | Appraisal program for 2002 will focus on Block B with 2 wells, several more wells in the Suban Field, and 2 wells to appraise the Bukit Tua discovery made this year. |
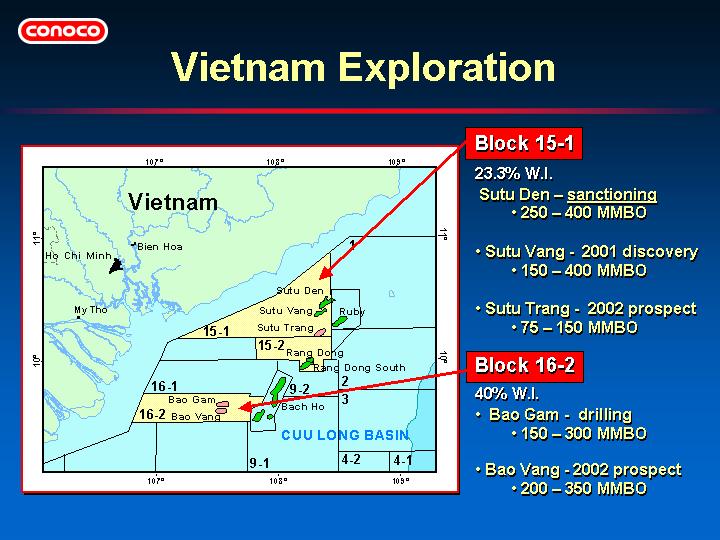
| • | Sutu Vang 1X was tested in October of this year at a stabilized rate of 11,388 bopd. The discovery is 4 miles southwest of the Sutu Den discovery made last year. Both discoveries produce from fractured basement. | ||
| • | After a highly successful appraisal program in 2001, Sutu Den was declared commercial in August of this year with first production expected in 2004. | ||
| • | Bao Gam and Bao Vang on Block 16-2 are also fractured basement prospects. Bao Gam spud in October of this year and Bao Vang will be drilled next year. |

| Key 2002 Wildcat Wells | MMBOE | |||||||
| • GoM Deepwater: | Spa | 700 - 1500 | ||||||
| Voss | 300 - 700 | |||||||
| Witch | 170 - 400 | |||||||
| Hermes | 180 - 400 | |||||||
| • Norway: | Bor | 700 - 1500 | ||||||
| Akkar | 400 - 800 | |||||||
| • Vietnam: | Sutu Trang | 75 - 150 | ||||||
| Bao Vang | 200 - 350 | |||||||
| • Sabah: | Leban | 180 - 450 | ||||||
| Pinitukadan | 180 - 450 | |||||||
| • | We continue to build a strong portfolio of near term drilling prospects as well as large, long term opportunities that can sustain the program. | ||
| • | We will continue to use our disciplined processes to high-grade the portfolio so that resources are focused on the highest value opportunities. |
| • | 4 consecutive years of strong results. | ||
| • | We are adding discoveries that are filling the development cupboard. | ||
| • | Our future prospects and opportunities are excellent. |
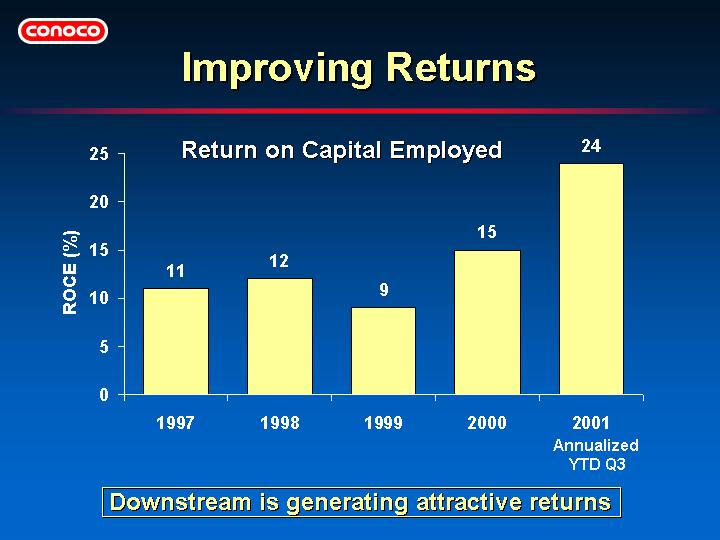
| • | Downstream focus on low-capital initiatives to increase earnings is resulting in higher returns. | ||
| • | Strong 2001 returns achieved despite incident at Humber refinery this spring (2% ROCE impairment). | ||
| • | 2001 Q3 YTD annualized ROCE — U.S. 33%, International 13% |
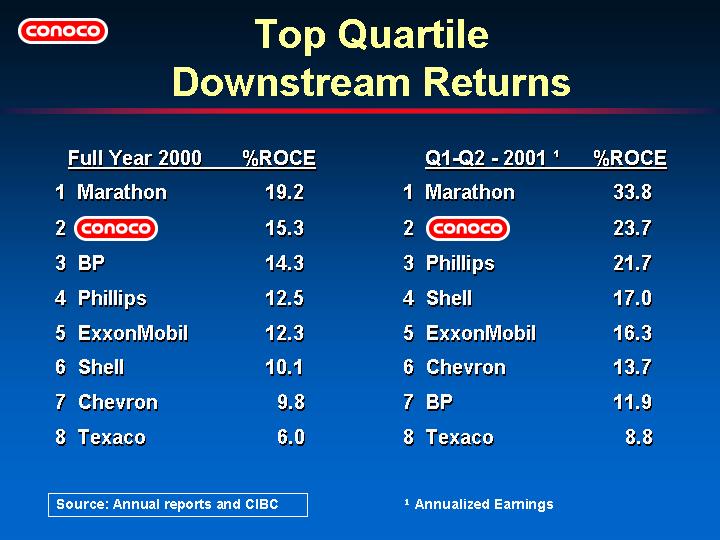
| • | Record Q2 earnings of $227 MM (before special items) for Downstream. | ||
| • | Conoco achieved its overall return versus competitors despite Humber refinery being down most of Q2. | ||
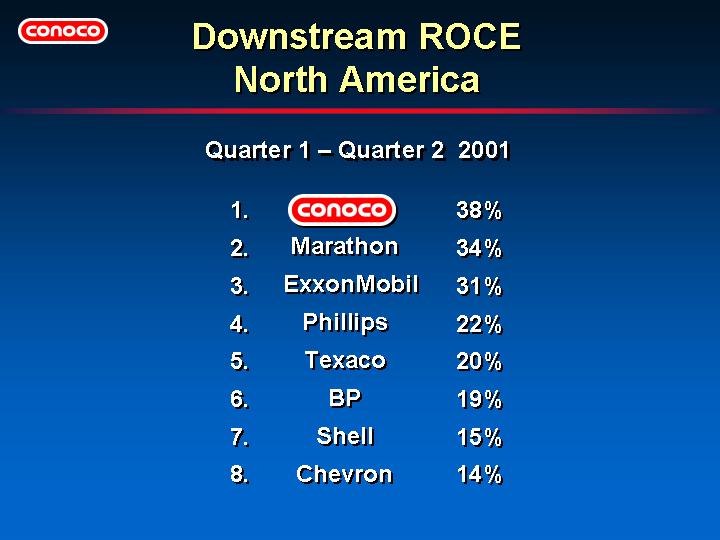
| • | On their own, Conoco’s U.S. operations achieved a 38% ROCE (through Q2) and were ranked #1 among the eight majors. U.S. operations still rank #1 even if all the independent R&Ms are included. |
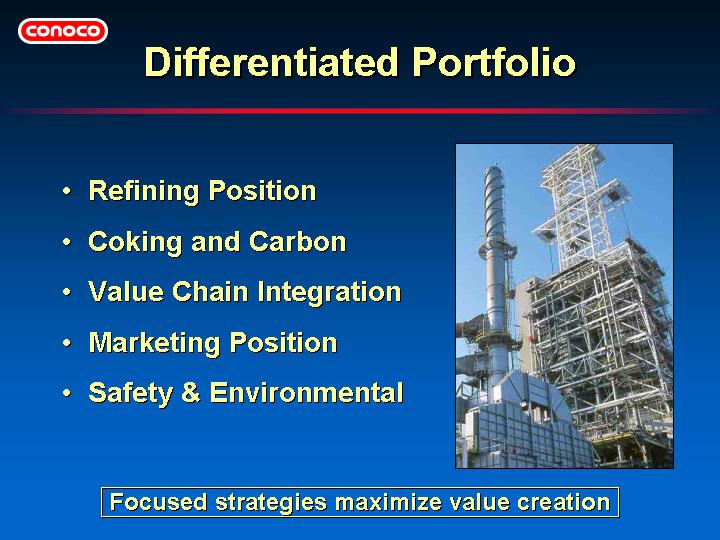
| • | Four of Conoco’s nine refineries are top quartile in the latest Solomon Study; three more are second quartile; representing 97% of Conoco’s refining capacity. | ||
| • | Conoco refineries are designed to process a high proportion of heavy, acidic and synthetic crudes, which provide strong margins versus sweet crudes. | ||
| • | Premium cokes and other specialty products provide additional upgrades. | ||
| • | Strong product differentials are generated from operations in inland markets. | ||
| • | Conoco has led the API in safety performance in 16 of the last 22 years. |
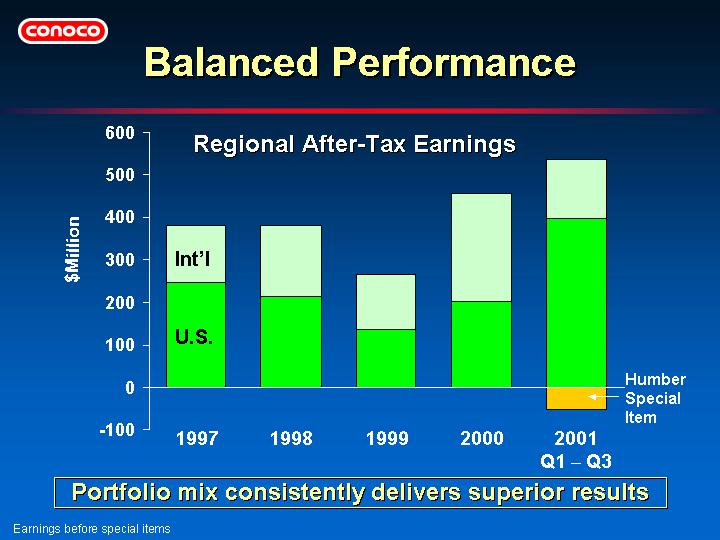
| • | Downstream’s portfolio is balanced between U.S. and International operations to take advantage of shifting margins. | ||
| • | Earnings from non-fuels such as lubricants, specialty products and petroleum cokes also help combat earnings volatility. |
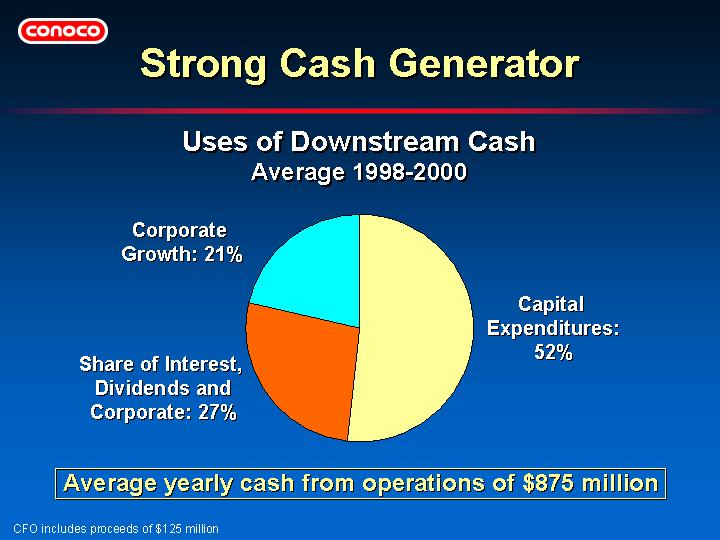
| • | Downstream’s plans for capital expenditures are to equally fund stay-in-business projects, clean fuels projects and growth projects. | ||
| • | Clean fuels expenditures are primarily in the U.S. and are easily manageable with available cash. Peak expenditures anticipated in 2005. |
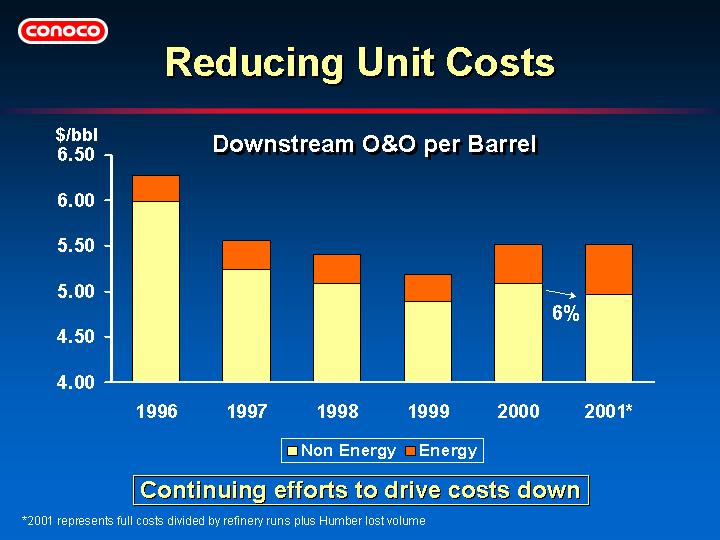
| • | O&O costs are flat for 2001 versus 2000, with non-energy costs down 6%. | ||
| • | Energy costs are decreasing versus earlier in 2001. | ||
| • | There is an opportunity to take costs down to a new, lower level. | ||
| • | Emphasis on asset utilization, strategic sourcing and work processes will continue to drive costs down. |
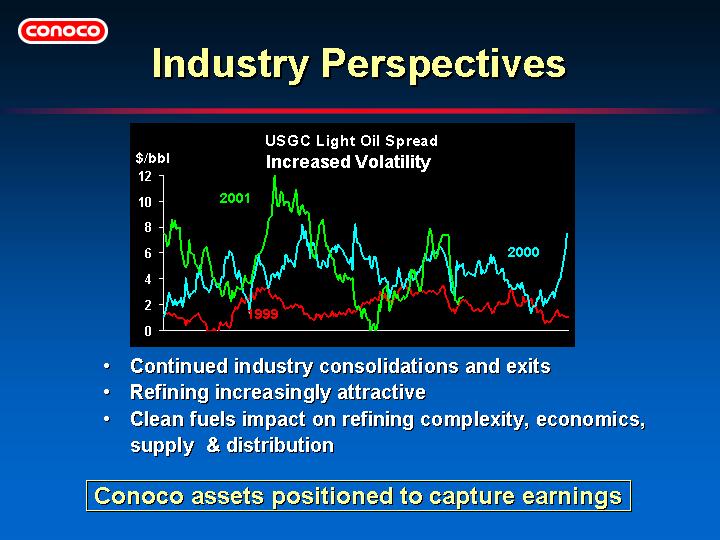
| • | Higher refinery utilization rates, increased imports, new fuel specs and constrained distribution systems indicate continued high volatility. | ||
| • | Volatility brings opportunities to capture higher margins. | ||
| • | Conoco has strong assets, integrated distribution systems and a global trading organization to seize higher refining margins and heavy/light differentials. |
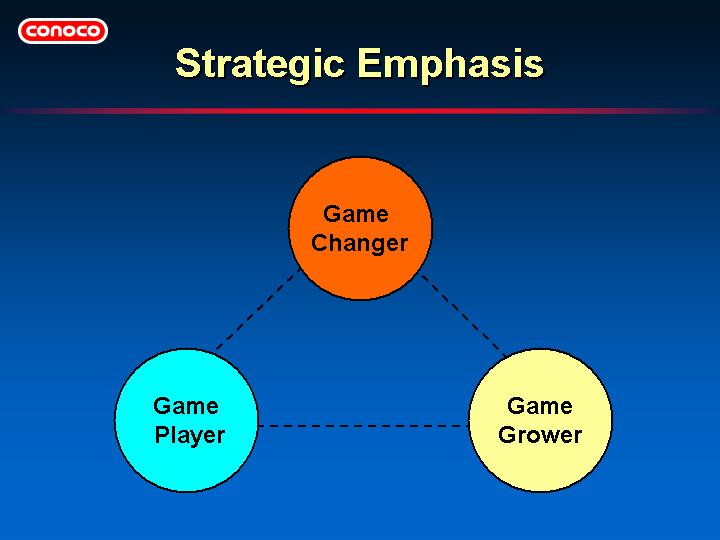
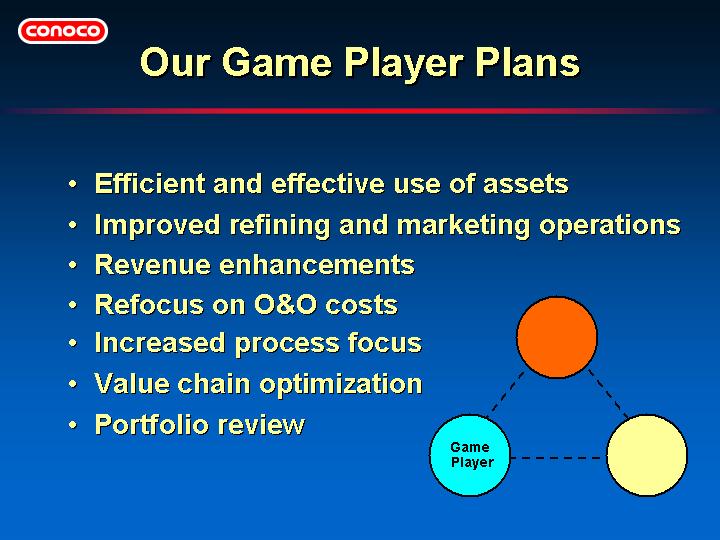
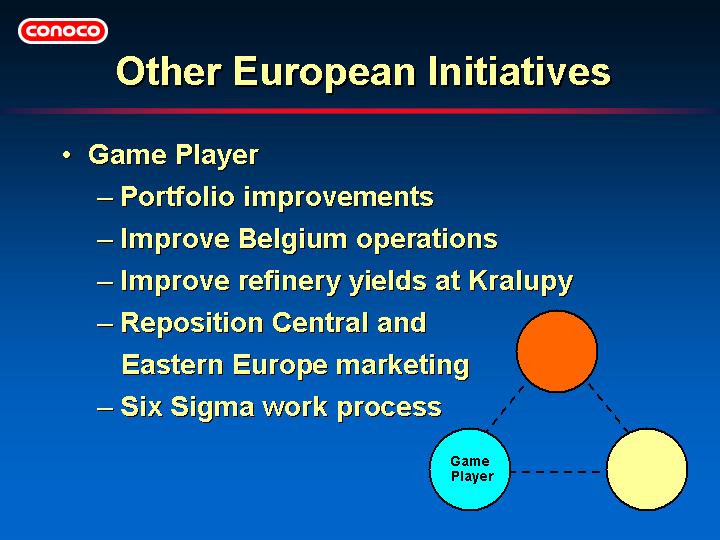
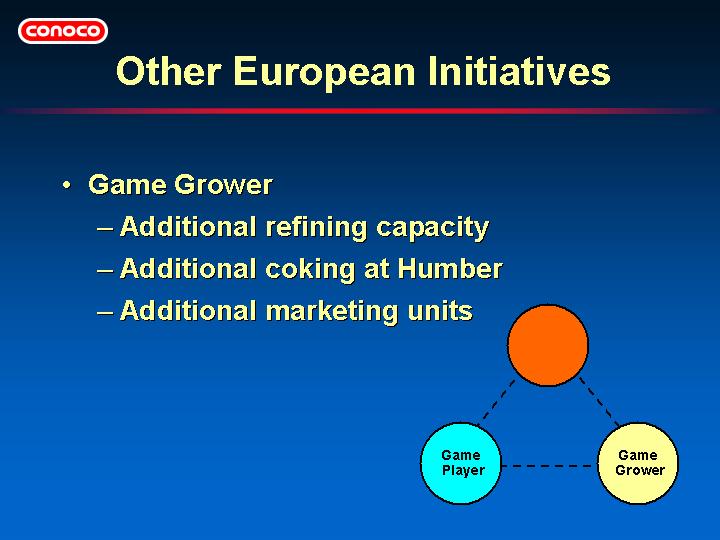
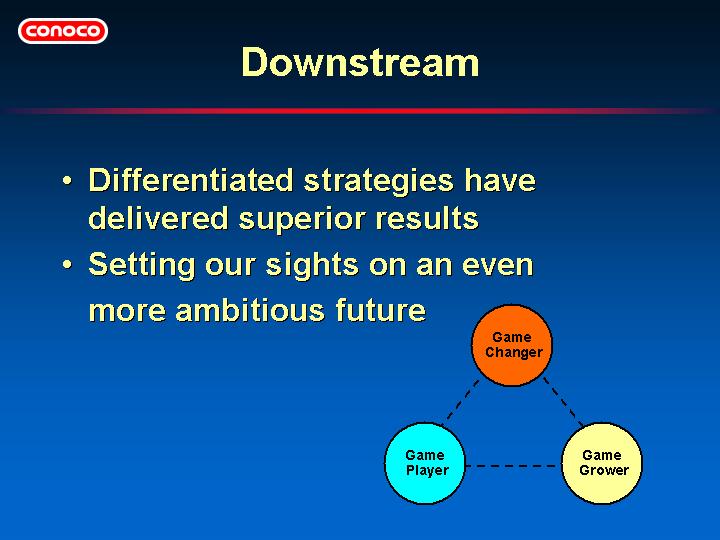
| • | Game Player — ensuring that we stay competitive with our base business, including operational improvements in refining and marketing. | ||
| • | Game Grower — innovatively or incrementally growing our existing businesses, including asset leveraged J/Vs and selective growth of marketing and premium coke volumes. | ||
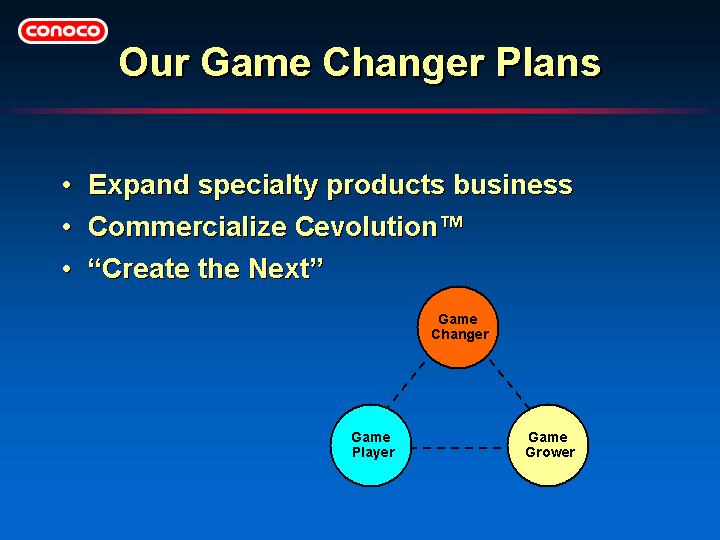
| • | Game Changer — developing and generating new business ideas based on our core competencies, particularly associated with carbon. |
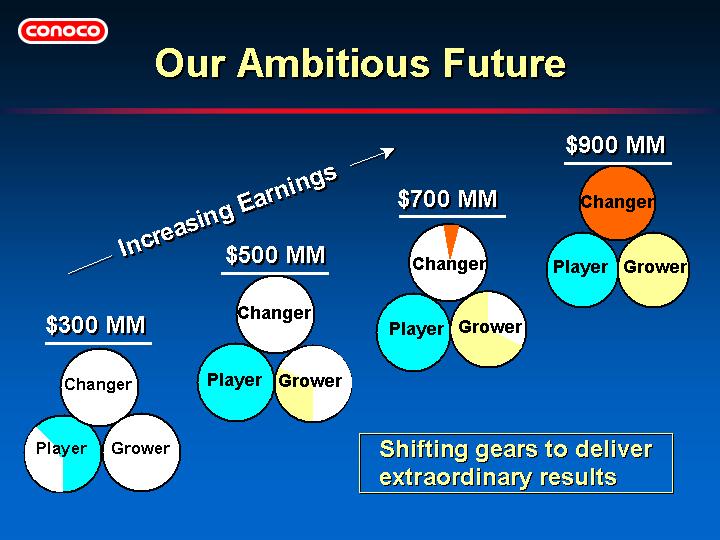
| • | Downstream’s earnings have grown from a $300 MM business to $500 MM through strategies such as continuous improvement and selective growth. | ||
| • | Downstream has the potential to reach the $700 MM ATOI level by 2004 by focusing on continued operational excellence and low-capital growth. | ||
| • | Although the path is not yet clearly defined, Downstream has a long-term vision of achieving $900 MM mid-cycle earnings by 2006-2007 through innovative projects and initiatives. | ||
| • | Earnings contributions from Cevolution™ will beadditive to these aspirations. |


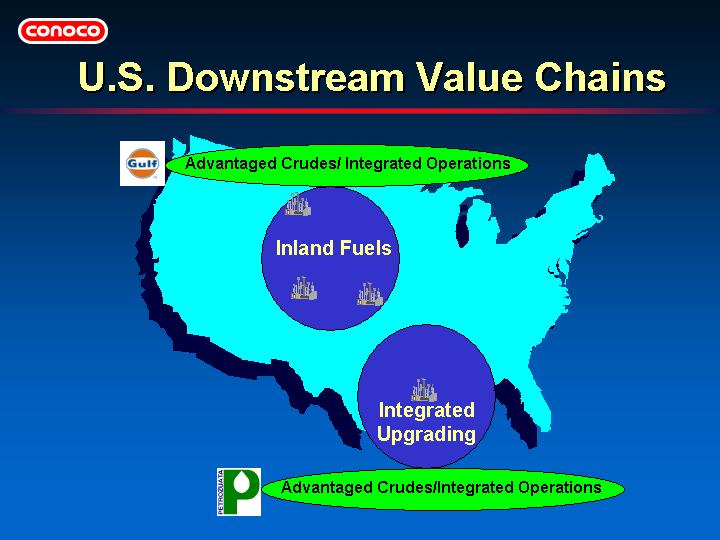
| • | Inland business is focused on niche fuels markets. | ||
| • | Gulf Coast business focused on complex conversion of heavy crudes into a range of fuels and specialty products. | ||
| • | Gulf Coast business is integrated with upstream via the Petrozuata heavy oil project. | ||
| • | Conoco’s U.S. refineries have the potential to unlock the Upstream value of heavy oil reserves acquired with Gulf Canada. |
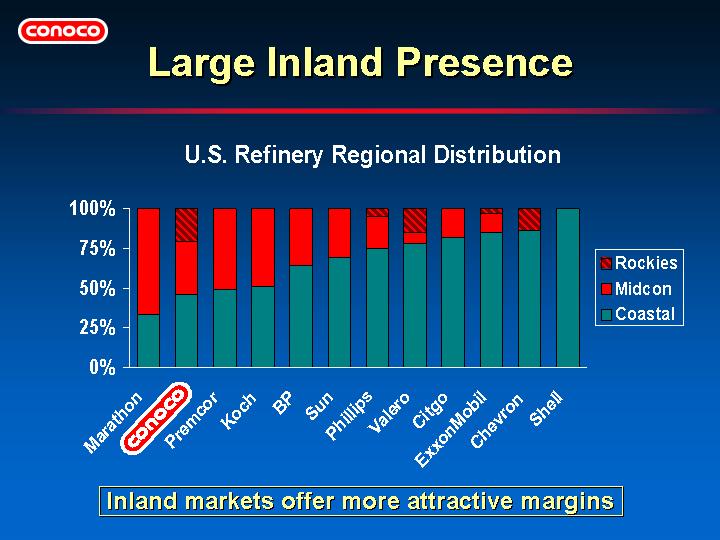
| • | Inland markets enjoy a substantial price differential vs. East & Gulf Coasts. | ||
| • | Over 50% of Conoco’s US refining capacity is located in these inland markets. | ||
| • | Supply tightness and more stringent regulations are likely to contribute to increased volatility and higher average inland product differentials. | ||
| • | Each one cent per gallon increase in differentials is worth $30MM/Yr ATOI to Conoco. |

| • | Conoco is a leading player in this region. Region comprises 12% of total U.S. demand. | ||
| • | The majors are not focused on growing in this market. | ||
| • | Strong demand growth exists in these inland markets with limited inbound logistics. | ||
| • | Very focused approach to growing market share in key markets rat her than trying to be in all markets. | ||
| • | Conoco possesses strong integrated refining and marketing operations with strong distribution logistics. |
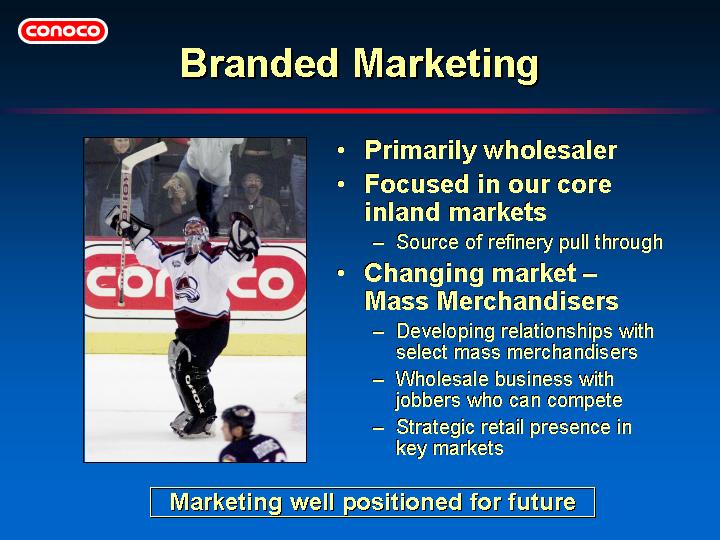
| • | Part of very strong ROCE is attributable to low retail investment. Retail accounts for only 8% of Conoco’s branded sales. | ||
| • | Conoco has had 12% volume growth in branded-gasoline since 1999. | ||
| • | Establishing mass merchandiser venture in Salt lake City. | ||
| • | Conoco is strengthening jobber relationships, upgrading image and providing new technology to compete in the new environment. | ||
| • | Truck stop JV (Flying J) ensures ratable diesel pull-through from refineries. |
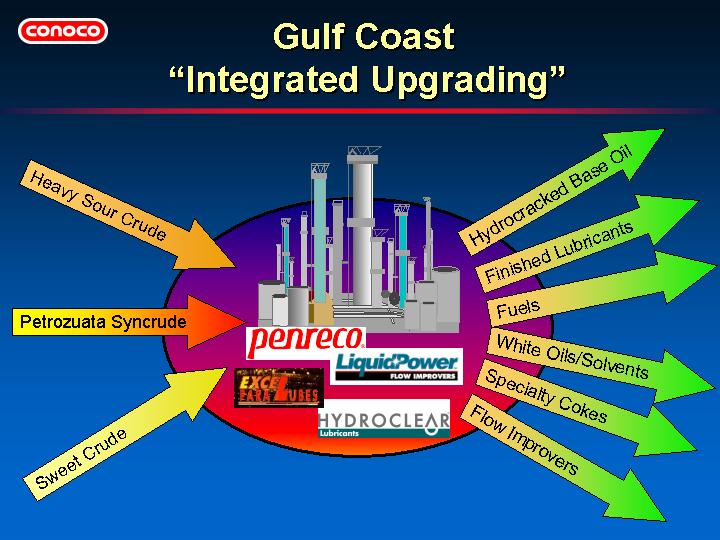
| • | Lake Charles refinery has capability to convert heavy, acidic and synthetic crudes into fuels and a diversified slate of specialty products and petroleum cokes. | ||
| • | Specialty products provide a source of higher unit margins, and specialty product revenues are generally not tied to crude prices, thus providing some stability to earnings. | ||
| • | Lake Charles complex is managed to optimize multiple value chains. |
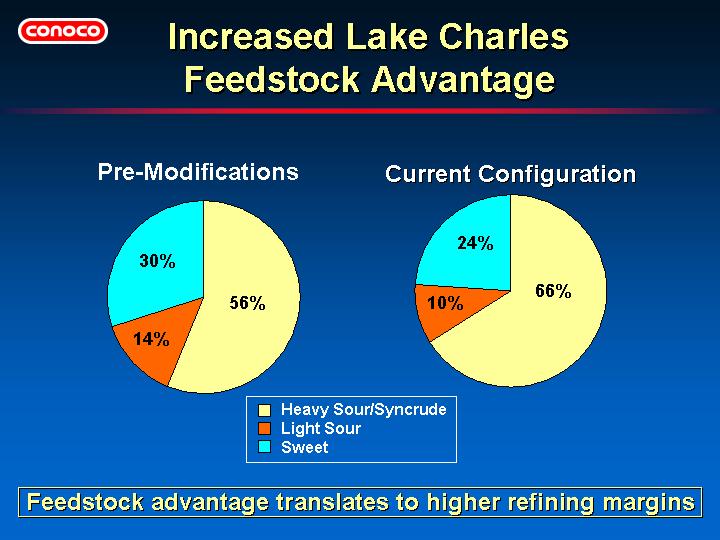
| • | Earnings enhancement has been achieved through increased heavy/sour crude processing vs. light/sour and sweet crudes. | ||
| • | Syncrude processing commenced in 2001, with rates of up to 60 MBD, and optimization of integrated syncrude operations is still continuing. | ||
| • | Syncrude processing is worth $20-25MM/Yr ATOI full cycle margins. |
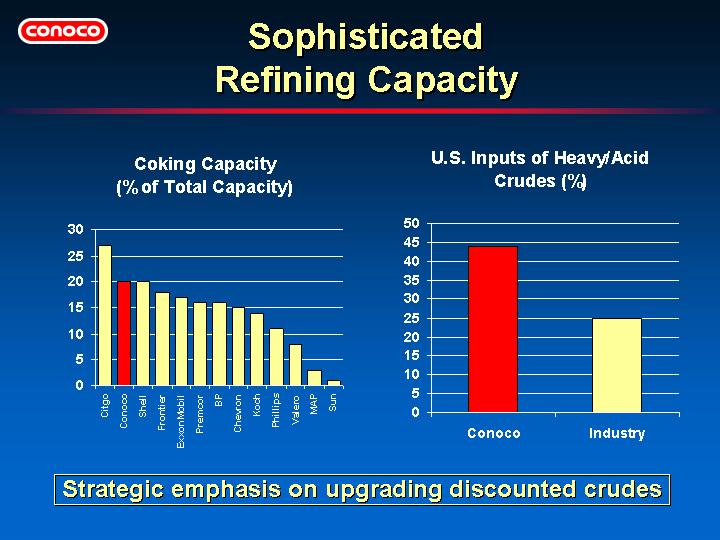
| • | Conoco U.S. refining has one of the highest proportions of coking capacity in the industry, which allows upgrading heavy/acid crudes to valuable light oils such as gasoline and distillates. | ||
| • | 25% of coking capacity is dedicated to the production of high-value specialty cokes. | ||
| • | Ability to process heavy/acid crude is significantly above industry average. | ||
| • | Sulfur recovery modifications at Ponca City refinery in late 2001 will increase price- advantaged crude runs by about 10 MBD. |
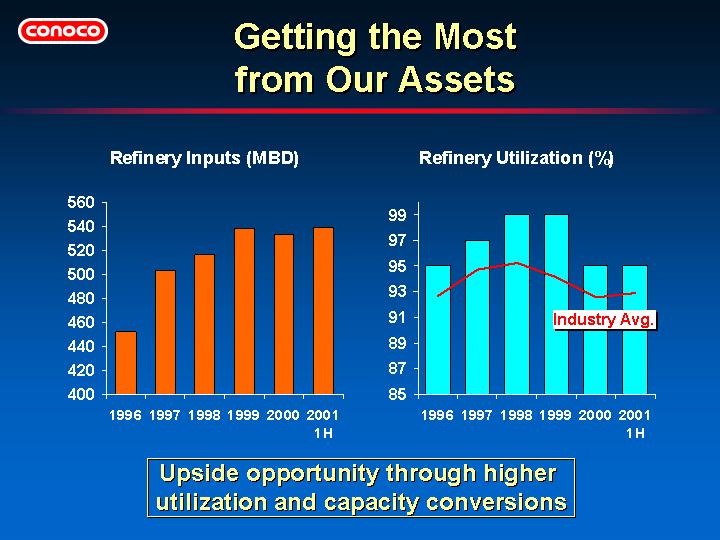
| • | Refinery inputs have increased nearly 20% since 1996. | ||
| • | Focus is shifting to increasing conversion capacity. | ||
| • | Future utilization rates are expected to improve. Petrozuata modification turnarounds and other upsets were experienced in 2000 and 2001. |
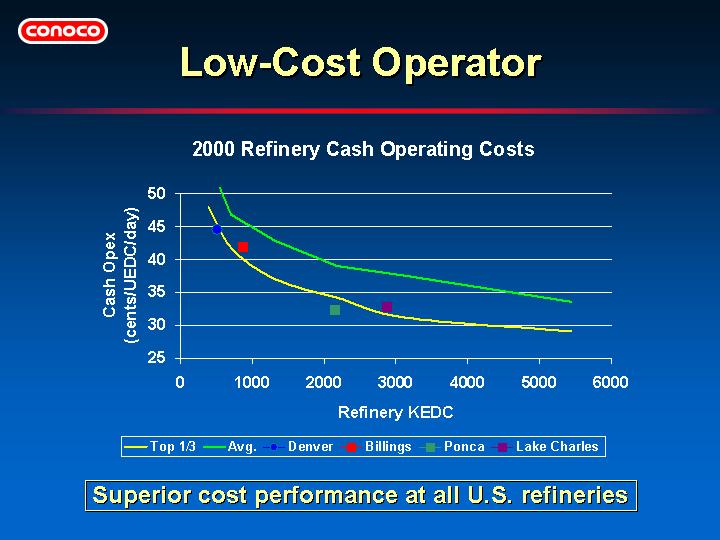
| • | Conoco refineries are very cost competitive when compared with the top third of competitors. | ||
| • | The 1998 Solomon Study showed high costs at the Denver plant, and this issue was addressed. The 2000 Solomon Study confirms that the Denver refinery is now cost competitive. | ||
| • | Conoco expects to reduce costs even further using Six Sigma techniques. |
| • | Rigorous financial accounting is in place to ensure benefits are actually delivered. | ||
| • | Six Sigma technique is implemented by looking at business processes in multiple discrete “projects” on which to focus improvement efforts. | ||
| • | Average project expected to take three months to complete and deliver $250,000 in benefits. |
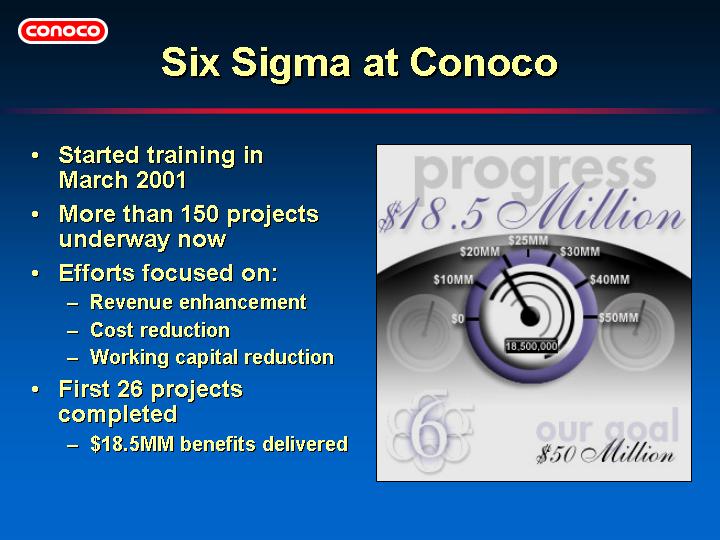
| • | Over 100 professionals are dedicated to business improvement through Six Sigma. | ||
| • | Little or no capital is required. | ||
| • | High ROCE impact from projects. | ||
| • | This process can be leveraged to other parts of Conoco. |
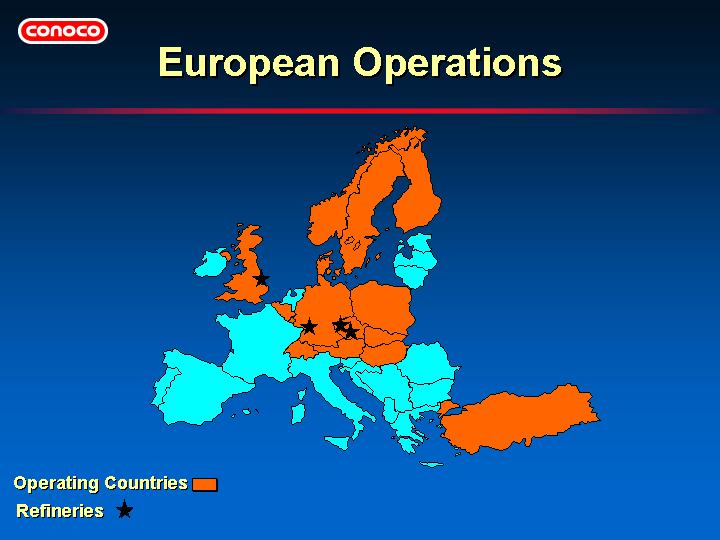
| • | Conoco operates in 15 countries in Europe with exposure to growth areas. | ||
| • | Total of 310 MBD of crude distillation capacity in Europe. |
| • | Humber refinery in UK wholly owned | ||
| • | MiRO refinery in Germany (18.75% joint venture) | ||
| • | Kralupy and Litvinov refineries in Czech Republic (16.33% joint venture) |
| • | Nearly 2000 branded service stations plus 850 more in joint ventures in Europe. |

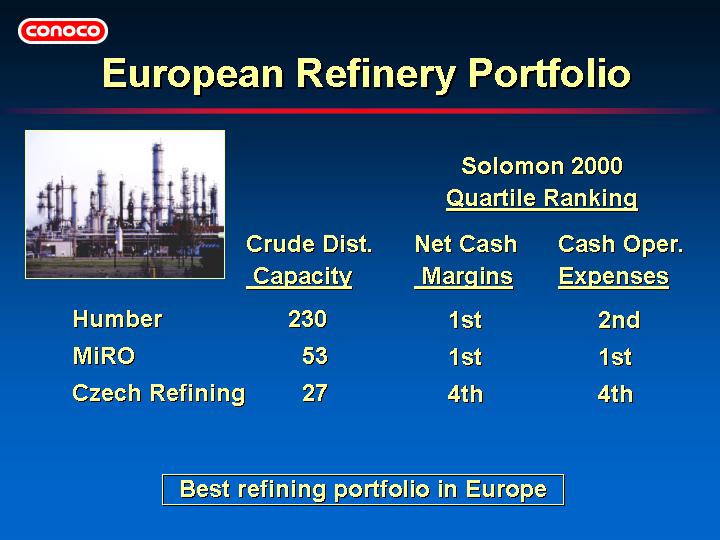
| • | Humber and MiRO refineries continue to rank in top 10% of a group of 97 European refineries for net cash margin in Solomon Study. | ||
| • | Solomon Study was conducted prior to start-up of new cat cracker in Czech Refining plant at Kralupy. |
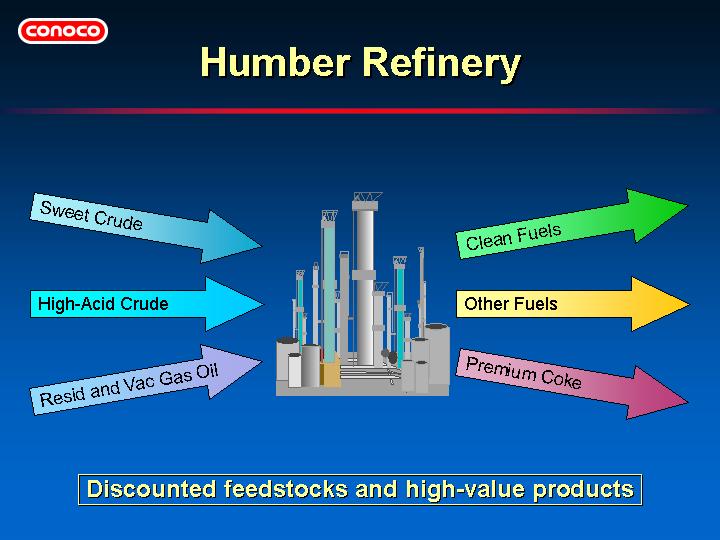
| • | Conoco’s Humber is highest conversion refinery in Europe. | ||
| • | Good logistics with water access to feedstocks and markets. | ||
| • | Products meet U.S. Clean Fuels specs and are periodically exported to U.S. markets. | ||
| • | Coking includes high-value graphite and anode cokes. | ||
| • | Humber is supported by strong commercial and wholesale marketing. |
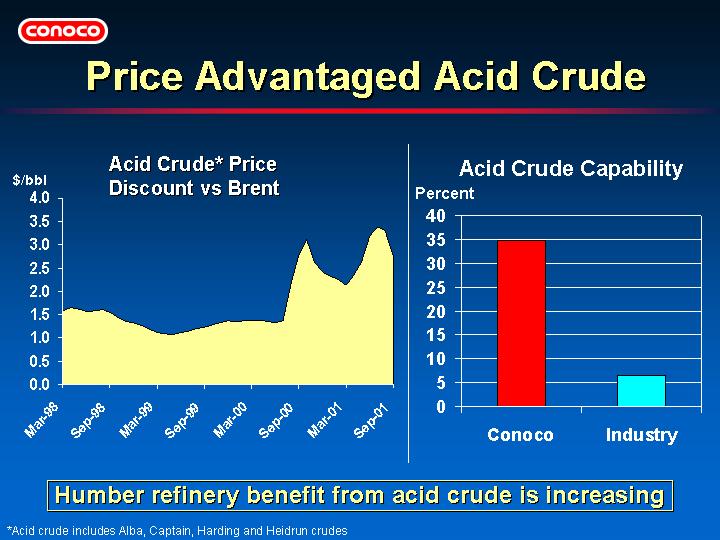
| • | High-acid crude market oversupply is increasing. | ||
| • | High-acid crudes receive discounts of as much as $3.50 per barrel versus running Brent crude, depending on the crude quality. | ||
| • | Price discount growing with increased supply and limited market capability to process. | ||
| • | Humber hasmuch better capability to process high-acid crude than industry average. |
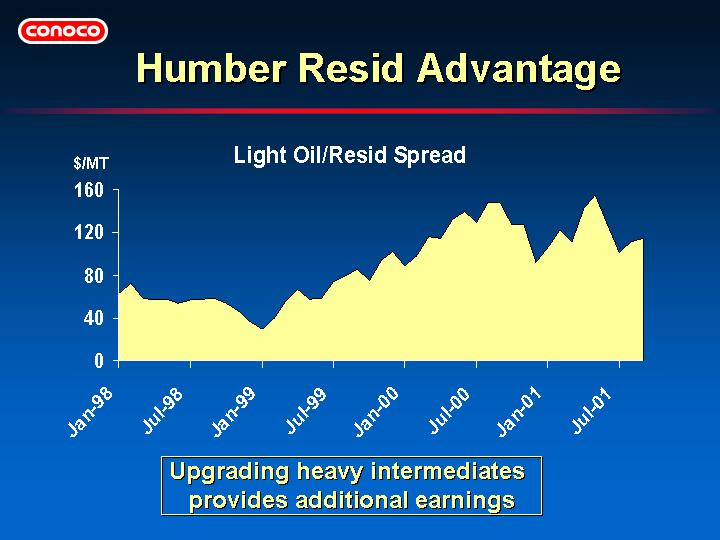
| • | Superior conversion capability makes running 55-60 MBD resid possible. | ||
| • | Note: A $10/MT increase in light oil/resid spread represents $14 ATOI. | ||
| • | Humber benefits (as does the rest of the industry) during periods of high cracking margins. These high margin periods create excess resid, driving down resid prices, and therefore Humber enjoys the benefits of light oil/resid margins much longer than other refiners. |
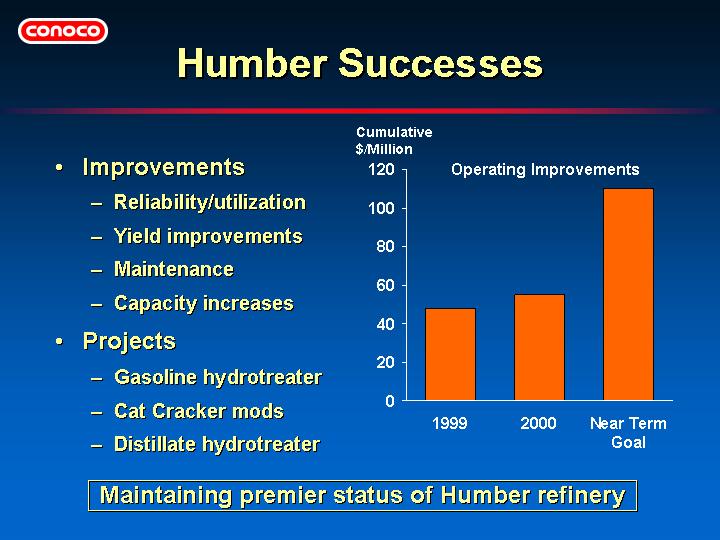
| • | Good track record of increasing improvements. Incident in May did not impact goal and improvement focus. | ||
| • | Future improvements include maintenance savings, increased efficiency and energy conservation projects. | ||
| • | Hydrotreater projects for clean fuels and cat cracker improvements were completed in summer 2001 and could be worth $50 MM ATOI under current market conditions. |
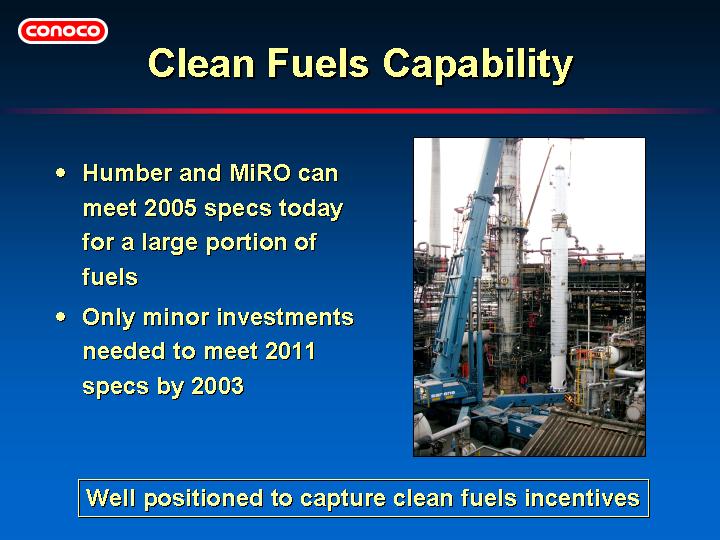
| • | Gasoline and on-road diesel specification for sulfur of 50 ppm take effect in 2005, but Germany and U.K. are offering tax incentives beginning in 2001 for early production. | ||
| • | European Union proposing 10 ppm for both products beginning January 2011 but expect substantial amount to be produced by 2006. Germany is offering tax incentives for production of 10 ppm gasoline and on-road diesel by early 2003 and the U.K. is expected to follow. |
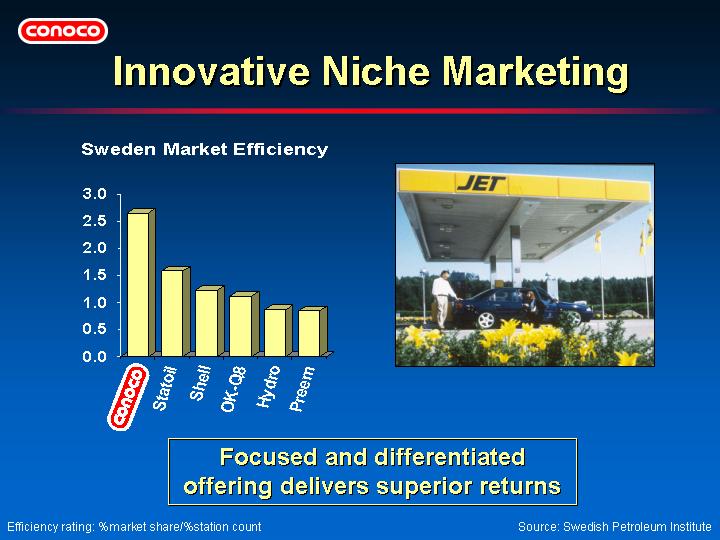
| • | Conoco employs unattended concept throughout Scandinavia. | ||
| • | Approach similar to Southwest Airlines, with infrastructure efficiency, low cost, and low priced offering yielding one of best industry net margins. | ||
| • | Strategy tailored to meet price conscious consumer without use of rebates. | ||
| • | Differentiated marketing has resulted in best marketing efficiency in Sweden. |
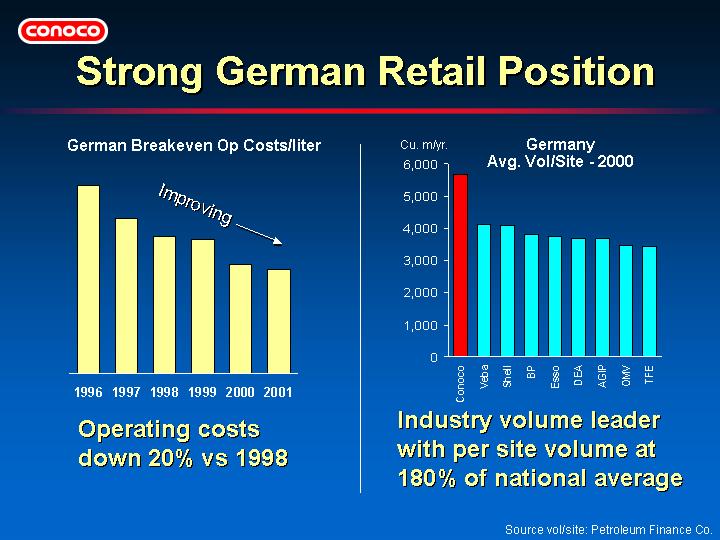
| • | Refinery wholesale margins balance retail margins during market volatility. | ||
| • | Gasoline sales up 12% in 2000 as Conoco added market share even during German price war. Volume maintained in 2001. |
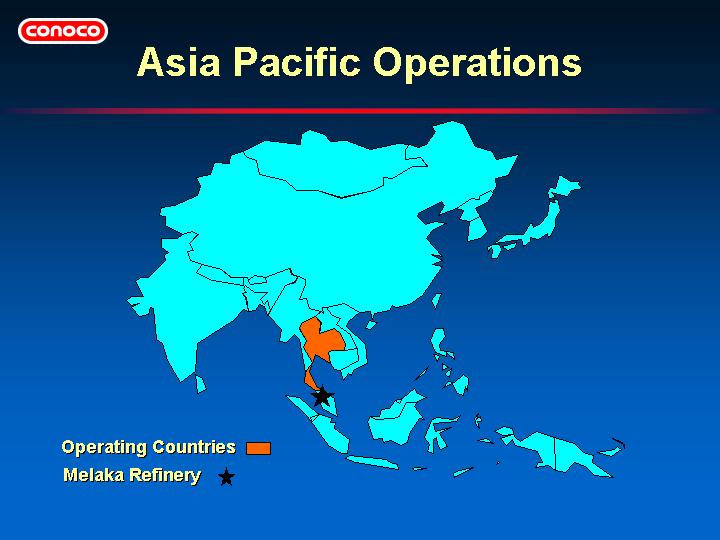
| • | Conoco operates in Thailand and Malaysia in potentially high-growth Asia Pacific region. | ||
| • | Refining capacity is 47 MBD (based on 40% ownership of Melaka). |
| (NOTE: Melaka refinery in Malaysia ownership is increasing to 47%) |
| • | Conoco operates 123 stations in Thailand and 10 in Malaysia. |
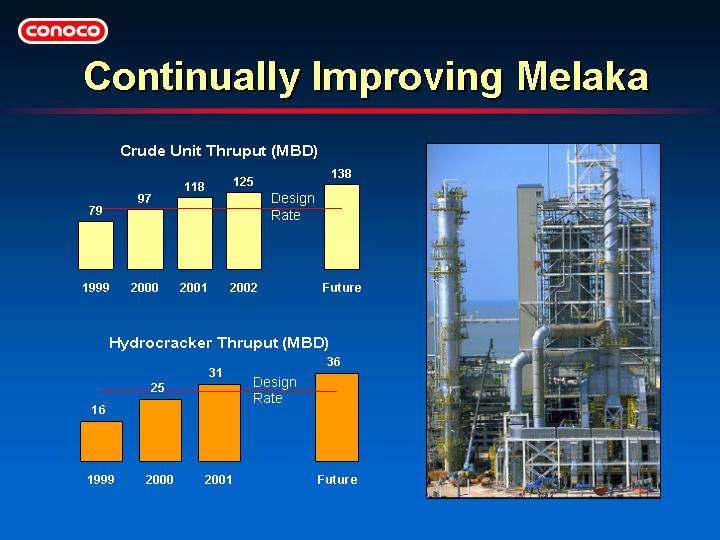
| • | One of the strongest refineries in the region; ranks in first quartile for net cash margin in latest Solomon Study. | ||
| • | Solomon Study also identified opportunities for further operational improvements. | ||
| • | New isomerization unit came online in fall 2001 to improve octane capability. | ||
| • | Melaka is already positioned to supply clean fuels to the U.S., and has already sold some blending components for export to the U.S. |
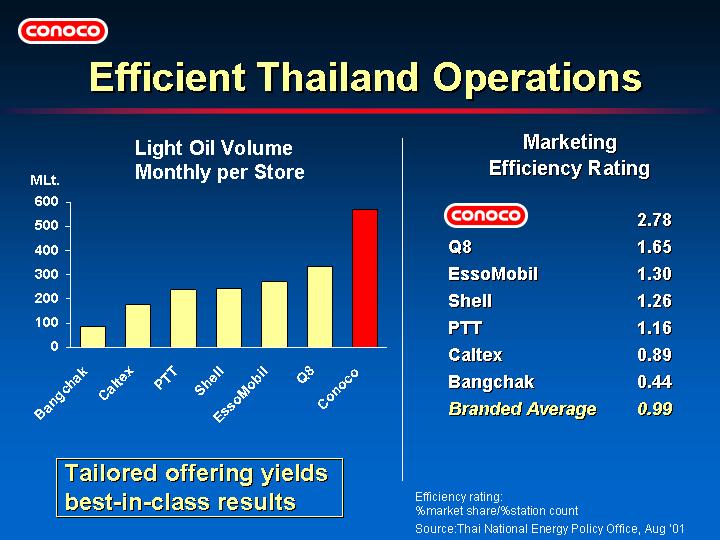
| • | Lowest breakeven costs of any operator in Thailand. | ||
| • | Growing at increasing pace, with 148 stores targeted by year-end 2002. | ||
| • | Strong brand equity and customer loyalty. | ||
| • | Market efficiency gap versus competition continues to widen. |
[CONOCO LOGO]
| Malaysia – Starting Strong | ||
| • | Market Characteristics |
| – | Few competitors | |||
| – | High entry barriers | [PHOTO OF PROJET | ||
| – | Regulated margins | SERVICE STATION] | ||
| • | Early results (per store vs 6 majors) |
| – | Volume – 120% | ||
| – | Convenience product revenue – 250% |
Leveraging successful Thailand offering
| • | Targeting 150 stores by 2010. | ||
| • | Offering modeled after successful Thailand operations. | ||
| • | High fuel and convenience product revenues will drive breakeven to profitable level with regulated margins. |
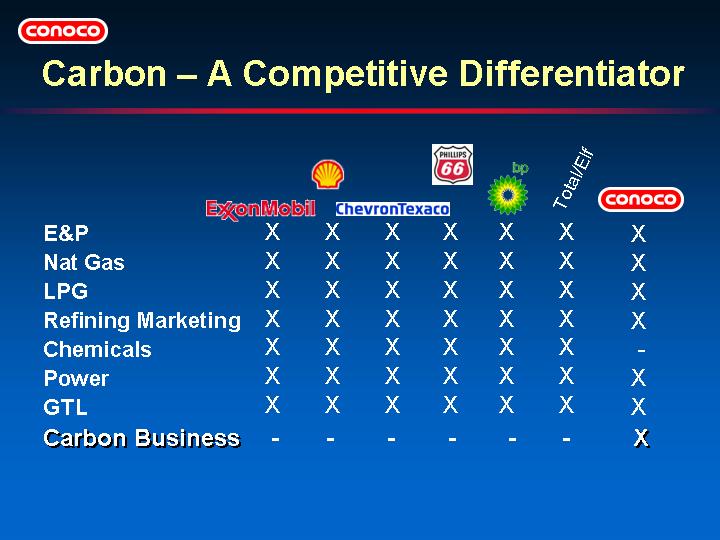
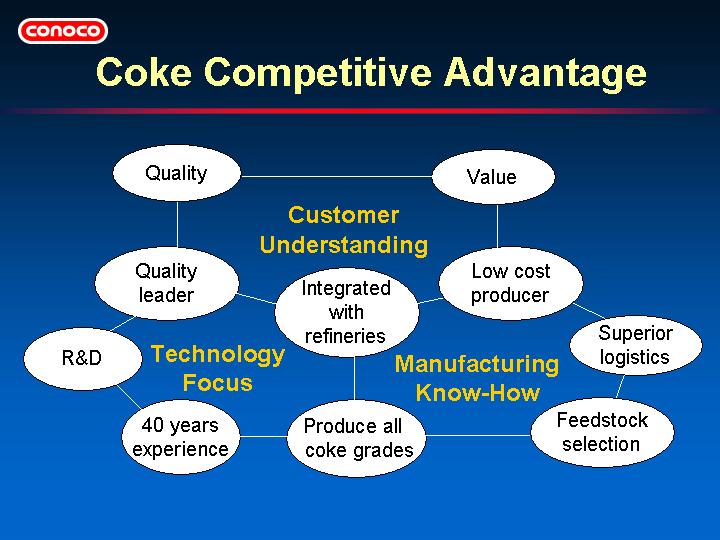
| • | Most oil companies believe carbon is just a waste product that remains when all the valuable light oils have been extracted. | ||
| • | At Conoco, there is significant value in the carbon itself. |
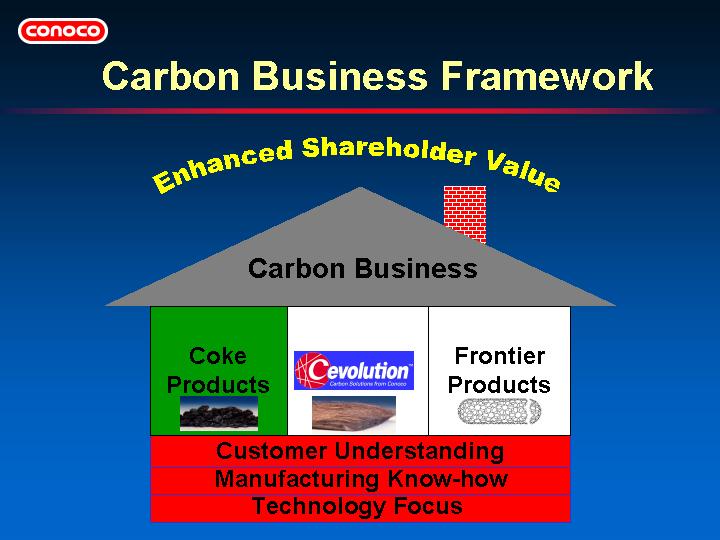
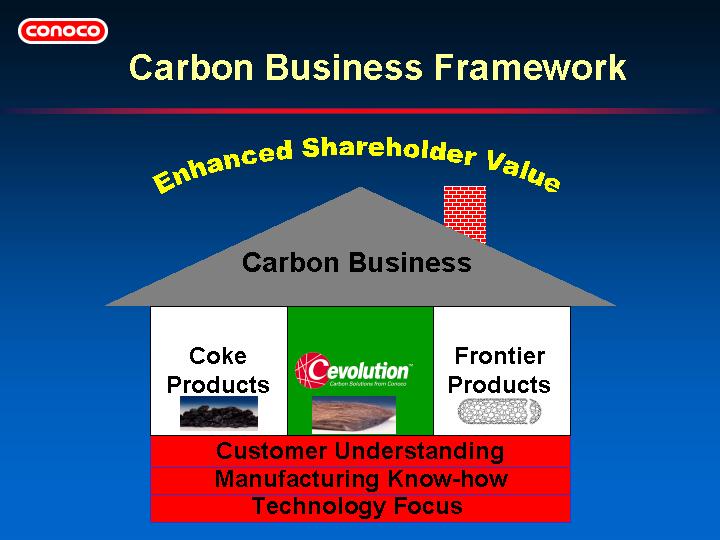
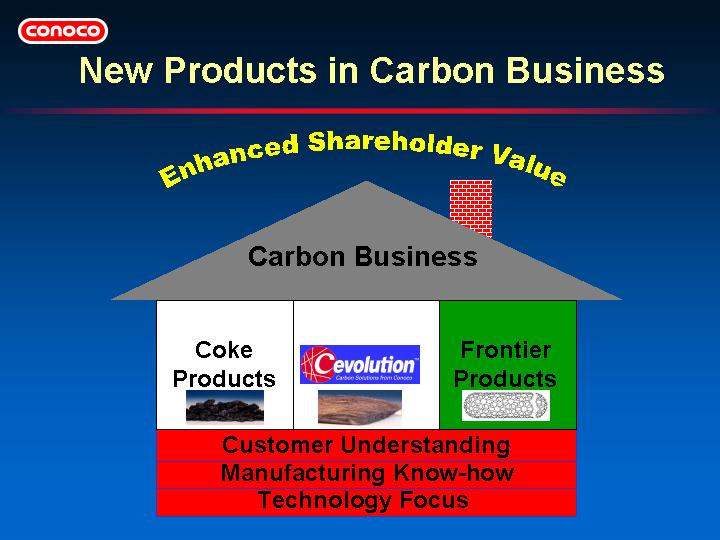
| • | All of Conoco’s carbon businesses are built on a common foundation of: |
| Technology | ||
| Manufacturing know-how | ||
| Customer focus |
| • | Cokers at 6 of 9 Conoco refineries. | ||
| • | Conoco is the only company that operates cokers and licenses coking technology. | ||
| • | One third of the world’s delayed cokers use Conoco technology, including five of the six cokers licensed worldwide since 1997. |
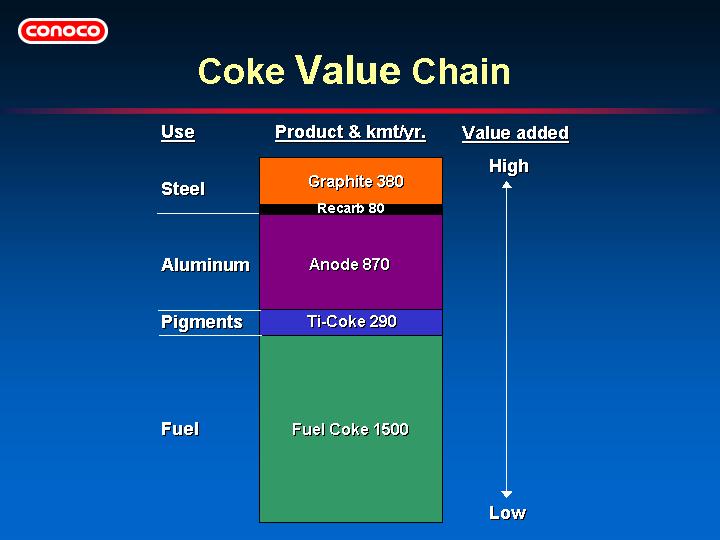
| • | Conoco is the only producer of Coke to supply all grades of coke worldwide. | ||
| • | Conoco is the market leader in graphite coke, supplying over 45% of the world demand for use in the steel industry. | ||
| • | Coke, in total, provides Conoco with asignificant uplift of profitability over alternative processes. |
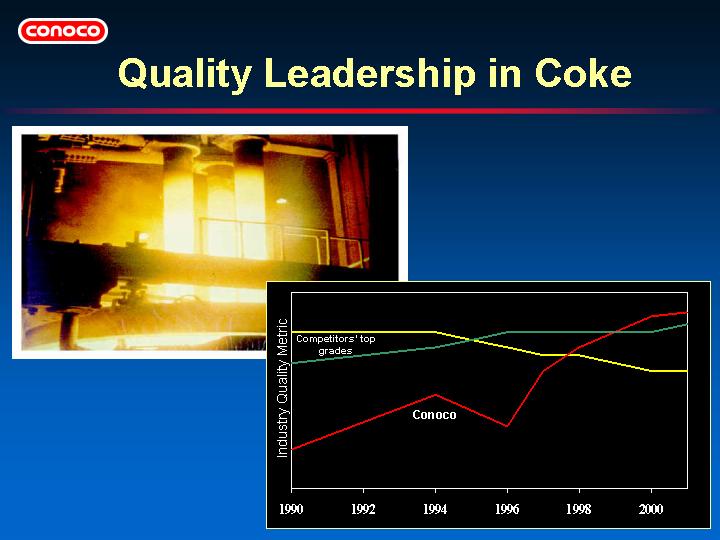
| • | Typical utilization of graphite coke is in massive electrodes used in electric arc furnaces to melt and recycle steel. | ||
| • | Conoco’s quality has significantly improved since 1990. | ||
| • | Decline in quality in mid-90’s was caused by focusing on costs instead of quality. | ||
| • | Today, we are both the low cost and the high quality leader. |
| • | Conoco is the only petroleum coke producer that is fully integrated with refineries and uses its coking assets to produce multiple coke products. | ||
| • | Multiple manufacturing and supply points, plus being the only graphite coke producer in Europe, provide superior logistics to customers. | ||
| • | Focus on technology and manufacturing know-how to produce the quality and value that customers demand and will pay for. |
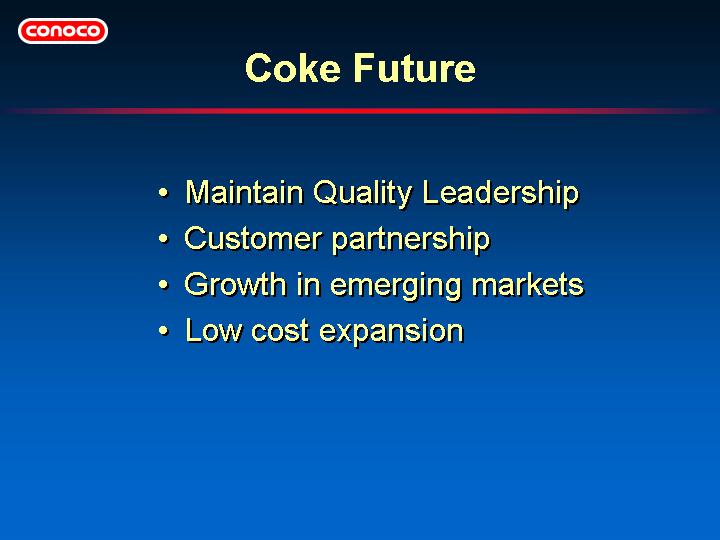
| • | We are committed to insuring Conoco’s profitable leadership in the coke industry. |
| • | Cevolution has the step change potential to generate more than half a billion dollars of ATOI per year by the early part of the next decade. |
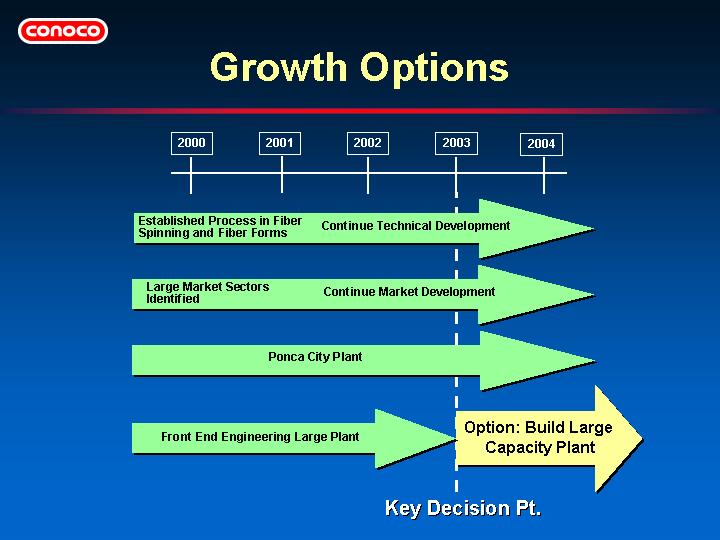
| • | Future growth is series of options that would be exercised at appropriate stage gates as key uncertainties were reduced. |
| • | Number of employees has grown from 75 to 200. | ||
| • | Conoco’s hired the best carbon and marketing experts from a variety of companies. | ||
| • | Organizational diversity accelerates our progress in the markets and industries in which we are working. |

| • | David Smith, formerly with Chrysler’s Liberty Center for Advanced Technologies, currently, Vice President of Emerging Technologies at Exide Batteries | ||
| • | David Stewart, President of Stewart Automotive Research | ||
| • | David Gaul, General Manager of Owens Corning Manufacturing solutions | ||
| • | Surendra Shah, Director of the Center for Advanced Concrete at Northwestern University | ||
| • | Alan Stone, an automotive design/engineer with over 30 years international experience | ||
| • | Transcript in the Appendix |
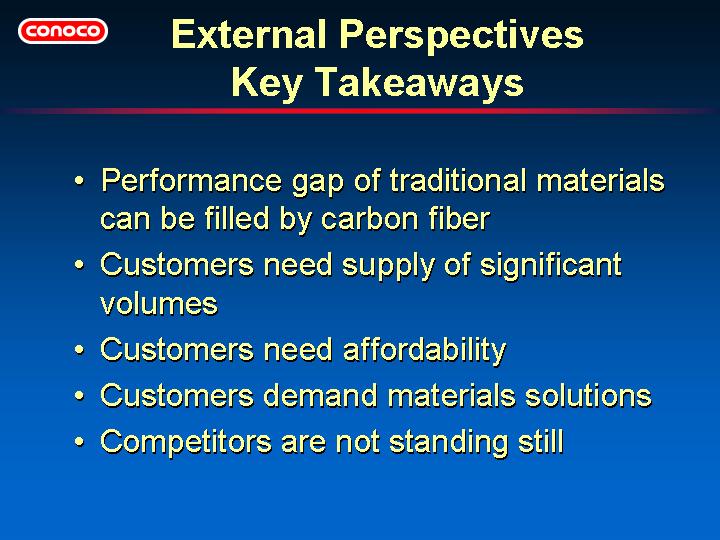
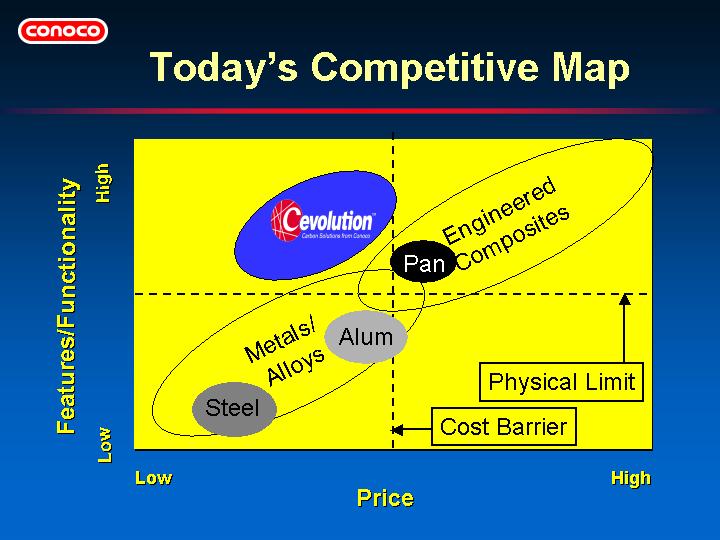
| • | This slide compares metals and composites on a price versus performance matrix. | ||
| • | Metals are at limits of physical performance. | ||
| • | Engineered composites are more flexible but too costly. | ||
| • | Cevolution is filling this price/performance gap — affordable performance. |
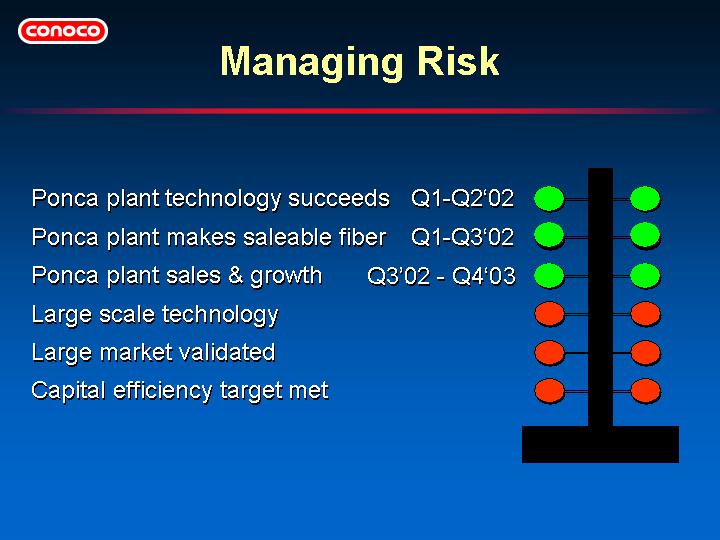
| • | Short-term business focus is on insuring that the Ponca plant is reliable and delivers salable fiber. | ||
| • | Long term business targets are to insure scalability for the next plant, validate new markets, and achieve capital efficiency goals. |
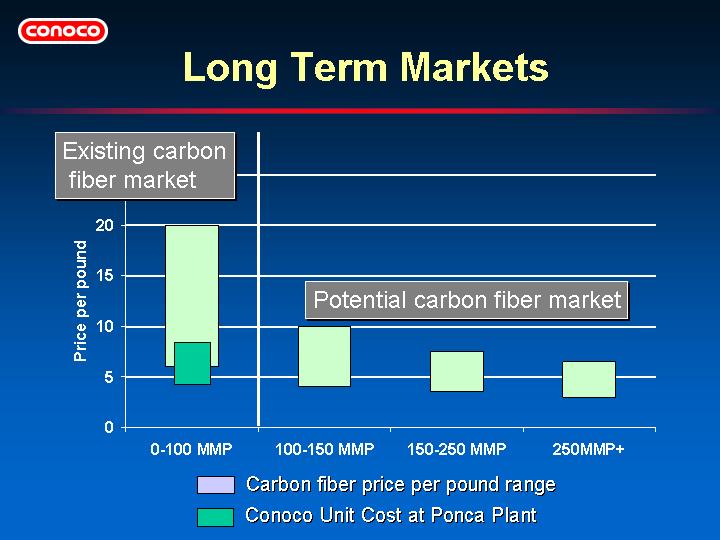
| • | Business model is ‘Mass production will enable profitable use of pitch-based carbon fiber in new, high volume markets’. | ||
| • | Initial cost structure at Ponca will be somewhere in the range of $5.00 to $9.00 per pound including depreciation, depending upon run rate. |
| • | We have recently formed Frontier Products organization to focus on other emerging opportunities in carbon based material science. |
Appendix
IR Gram on Commodity Price Hedging
Upstream Growth Sources 2002-2005
Exploration Discoveries
Mackenzie Delta: Significant Gas Upside
Syncrude Governance Structure
Refinery Input Volumes
Downstream Supplemental Data
North America, European, and Asia Pacific Marketing
Refinery Input Capacities and Nelson Complexity Factors
Downstream Price Drivers — History
Cevolution Quotes
161
Conoco IR Gram on Commodity Price Hedging
October 2001
This Conoco “IR Gram” provides information regarding the company’s Commodity Price hedging activities undertaken in connection with the recently completed Gulf Canada acquisition. The substantial increase in the Company’s borrowing level associated with the acquisition prompted the decision to implement a cash flow hedge program to:
| (1) | provide more certainty around near term returns from the acquisition; | ||
| (2) | enable reduction of debt by some $2.0 to $2.5 billion to proceed as planned; and | ||
| (3) | to generally maintain capital spending programs associated with our long-term growth plans. |
The price exposure hedged to date covers about 40% of Conoco’s Worldwide Crude Oil production and about 20% of Conoco’s North American Natural Gas production during the period from October 1, 2001 through December 31, 2002. The production covered is equivalent to about 107% of Gulf Canada’s production on a barrel of oil equivalent basis. Finally, even though the period covered starts on October 1, 2001, we were required to report certain gains and losses beginning in the 2nd quarter when the coverage was initiated, and will also report gains and losses in the 3rd quarter.
Conoco’s hedging program uses a combination of cashless collars and more straightforward swaps. The instruments used to accomplish the primary goal of protecting the company’s cash flows during the 15-month period are not intended to nor will they necessarily smooth quarterly earnings during the period.
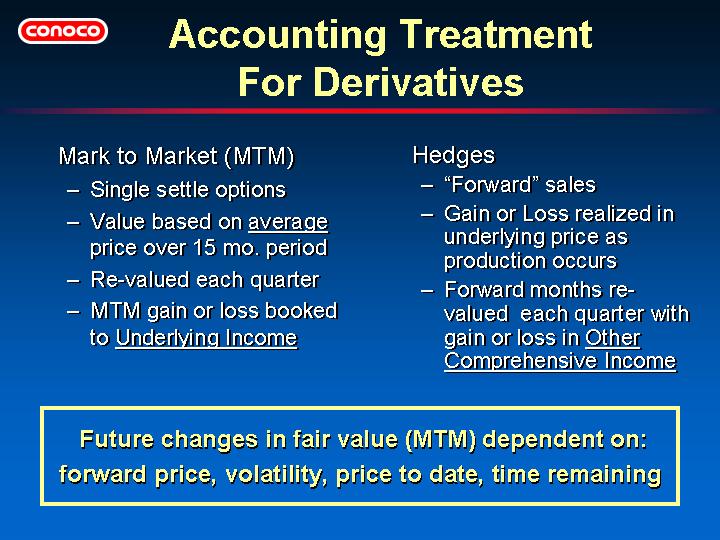
Accounting and Reporting
Before describing the hedges themselves, it is important understand the two basic methods for accounting for derivative instruments used as cash flow hedges as required by Financial Accounting Statements 133/138, “Accounting for Derivative Instruments and Hedging Activities” which became effective on January 1st, 2001. Under the rules, all derivatives must be recorded on the balance sheet at fair value. Conoco uses independent third party market quotations for fair value of all derivatives on the balance sheet. The timing of income recognition differs depending on the accounting treatment required, either “Mark to Market” or “Hedge” accounting:
| • | “Mark to Market” accounting requires that any change in fair value of the derivative during any reporting period be included currently in underlying net income and earnings per share. The change in fair value is recorded in “Other Income” on the Income Statement, and never affects realizations. Because Conoco entered into these derivative instruments beginning in the second quarter, we began reporting any change in the fair value of the outstanding derivatives in earnings at that time. | |
| • | “Hedge” accounting matches the gain or loss on the derivative instrument with the timing of income recognition for the underlying or hedged item. It therefore does not get reported on the Income Statement until the derivative instrument is settled when the underlying hedged volumes are produced. |
Rigorous criteria must be met to qualify for “hedge” accounting treatment including a requirement that the pricing mechanism for the derivative must closely match the pricing mechanism for the underlying hedged item (the crude oil or natural gas production). If the criteria for “hedge” accounting are met, then for all reporting periods prior to the settlement date, the derivative is recorded on the balance sheet at fair value. Prior to the time that any of the underlying hedged volumes are produced (in this case, before October 1, 2001), any quarterly changes in fair value are recorded in “Other Comprehensive Income” in the equity section of the balance sheet. As these underlying volumes are produced, the cumulative gain or loss on the derivatives associated with those volumes is transferred to net income through realizations.
162
Importantly, these collars are “single settle” or “average price” options whose final value is determined by comparing the average price during the 15-month period with the strike price. Because the pricing for the underlying commodities is monthly average prices, the collars do not qualify for hedge accounting. Quarterly changes in the fair value of these options prior to December 31, 2002 are recognized in current net income and reported as “Other Income” on the income statement. In the second quarter, the company reported a net gain of $24 million for such derivatives.
Hedge Accounting:
| Crude Oil |
| 18.3 Million barrels WTI Swaps at $25.30 |
| Natural Gas |
| 100,000 MM BTU/day NYMEX Swaps at $4.02 |
During each reporting period, changes in fair value of these swaps are recorded in “Other Comprehensive Income” (OCI) in the equity portion of the Balance Sheet. As production of the hedged volumes commences in October 2001, a proportional amount of the gain or loss previously recorded in OCI is then removed from OCI and recognized each period in Net Income and EPS. These amounts included in Net Income will also be incorporated into revenue and in the realized price statistics that are part of our quarterly financial reporting. In the second quarter, the company reported a gain of $22 million in “Other Comprehensive Income”. Beginning in October, a portion of this gain adjusted for future valuation adjustments will be included in Net Income through changes in realizations.
Future Changes in Fair Value
The fair value of an option is influenced by a number of factors including the current forward price, the strike price, market volatility, the actual price during the portion of the option life to-date, and time remaining in the contract. Therefore, it will be a challenge to forecast the quarterly impact on net income or earnings per share. As time progresses through the 15-month contracts, more of the pricing will be known and the volatility should be reduced. Since it is impossible to forecast quarter-end prices, our third quarter earnings guidance did not include an estimate of any hedging gains or losses to underlying income since the second quarter.
The swaps do change in fair value somewhat directly with the change in the forward prices. The impact in any quarter on net income starting in October will be the difference between swap price and the quarterly average NYMEX price on a proportional amount of the hedged volumes. Although the impact to earnings in any quarter is not a linear relationship given the different derivatives, the program is expected to provide significant downside protection during the period if prices decline.
For all the derivatives currently in our hedging portfolio, if crude oil averaged $20/bbl and natural gas averaged $1.80 over the entire 15 month period, the company would recognize about a $500 million pretax benefit to cash flow at year end 2002. We would also have the same benefit in earnings in aggregate over the life of the derivatives, which began with second quarter 2001. The apportionment of the earnings effect across the quarters would depend upon the particular pattern of prices over time.
[Note: You will recall that Conoco purchased puts at the end of 2000 with a strike price of $22.00 for roughly one-third of our global crude oil production (including equity volumes) for the last nine months of 2001. Like the mark to market derivatives discussed above, these puts are “single settle” or “average price” put options whose final value will be determined by comparing the average price during the last nine months of this year with the $22.00 strike price. Because crude oil prices for the second and third quarter of this year were so high, these put options will expire worthless. There will be no further impact on Conoco’s income since these puts were essentially written off in the first half of 2001.]
163
Upstream Growth Sources 2002-2005
| First | Peak/Plateau | |||||
| Project/Field | Location | Production | Production | |||
| Petrozuata WNS Gas Sale 1 Alba South CMS3 WNS Gas Sale 2 Huldra Kakap Gas | Venezuela Indonesia UK UK Indonesia Norway Gulf Indonesia | Currently Currently 2002 2002 2002 2002 2002 | 2003 2004 2005 2003 Beyond 2004 2003 Beyond 2002 | |||
| Pangkah | Gulf Indonesia | 2002 | 2006 | |||
| Solomon Area Suban (Caltex II) | Canada Gulf Indonesia | 2002 2002 | Beyond 2002 2005 | |||
| Vanguard Ext. 48/10B Grane Princess | UK UK Norway Gulf of Mexico | 2002 2003 2003 2003 | 2003 2005 2005-2009 2004 | |||
| Q4-10 Rang Dong South Sumpal and S. Jambi | Netherlands Vietnam Gulf Indonesia | 2003 2003 2003 | 2004 2004 2010 | |||
| Tengah Gas | Gulf Indonesia | 2003 | Beyond 2003 | |||
| VK/DY Belanak Clair Corocoro Magnolia | Russia Indonesia UK Venezuela Gulf of Mexico | 2003 2004 2004 2004 2004 | Beyond 2003 Beyond 2005 2006-2008 2006 Beyond 2004 | |||
| PL-203 Suban (excl. Caltex II) | Norway Gulf Indonesia | 2004 2004 | 2005-2007 2008 | |||
| Surmont Sutu Den Alder Kappa-21/3A Sutu Vang N. Belut GSA2 | Canada Vietnam UK UK Vietnam Indonesia | 2004 2004 2005 2005 Beyond 2004 Beyond 2005 | Beyond 2005 2006-2010 2005 2005 2006-2010 |
164
Exploration Discoveries
| Date | W.I. | Potential | ||||||||||
| GoM — Magnolia | 1999 | 75 | % | Significant | ||||||||
| GoM — Princess | 2000 | 16 | % | Significant | ||||||||
Gulf Indonesia — Bukit Tua | 2001 | 50 | % | Significant | ||||||||
Gulf Indonesia — Jenggolo | 2001 | 50 | % | Significant | ||||||||
Gulf Indonesia — Payang | 2001 | 50 | % | Significant | ||||||||
| Indonesia — Belanak | 1999 | 40 | % | Significant | ||||||||
| Indonesia — Belut (3) | 1998, 1999 | 40 | % | Significant | ||||||||
| Nigeria — Chota | 1998 | 48 | % | Significant | ||||||||
| Venezuela — Corocoro | 1998 | 50 | % | Significant | ||||||||
| Vietnam — Sutu Den | 2000 | 23 | % | Significant | ||||||||
Vietnam — Sutu Vang | 2001 | 23 | % | Significant | ||||||||
| Canada — Cabin Creek | 2000 | 50 | % | Medium | ||||||||
Canada — Solomon (2) | 2001 | 60 | % | Medium | ||||||||
| Canada — Stolberg LC | 2000 | 33 | % | Medium | ||||||||
| GoM — K2 | 1999 | 11 | % | Medium | ||||||||
| Indonesia — Gregg Antler | 1998 | 50 | % | Medium | ||||||||
| Indonesia — Kaci | 1998 | 40 | % | Medium | ||||||||
| Indonesia — Keong | 1999 | 40 | % | Medium | ||||||||
| Indonesia — Kerisi | 1999 | 40 | % | Medium | ||||||||
| Indonesia — Siput | 2000 | 40 | % | Medium | ||||||||
Netherlands — Q4-10 | 2001 | 46 | % | Medium | ||||||||
| Norway — Heidrun NF | 2000 | 18 | % | Medium | ||||||||
Norway — PL095 Alpha | 2001 | 20 | % | Medium | ||||||||
| Norway — PL203 | 1998 | 20 | % | Medium | ||||||||
UK - 44/22a — K | 2001 | 60 | % | Medium | ||||||||
| UK — Errol | 1998 | 60 | % | Medium | ||||||||
| UK — GBOU - 21/3a | 1999 | 80 | % | Medium | ||||||||
| UK — Kappa | 1999 | 85 | % | Medium | ||||||||
UK — Vanguard Ext | 2001 | 50 | % | Medium | ||||||||
| UK — Suilven | 1998 | 33 | % | Medium | ||||||||
| UK — Viking E+ (Vixen) | 1999 | 50 | % | Medium | ||||||||
| US — China Draw | 1999 | 100 | % | Medium | ||||||||
| US — Onshore (2) | 1998 | 50 | % | Medium | ||||||||
| Vietnam — Rang Dong S | 1999 | 36 | % | Medium | ||||||||
Significant = Potential > 200MMBOE
Medium = < 100MMBOE
165
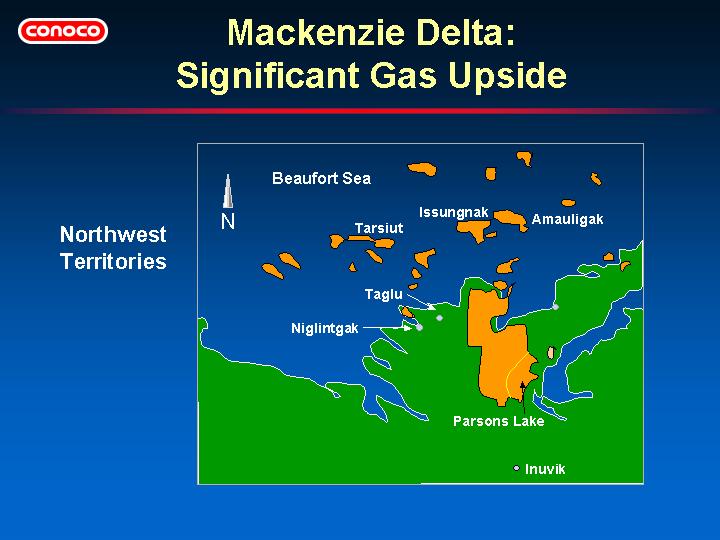
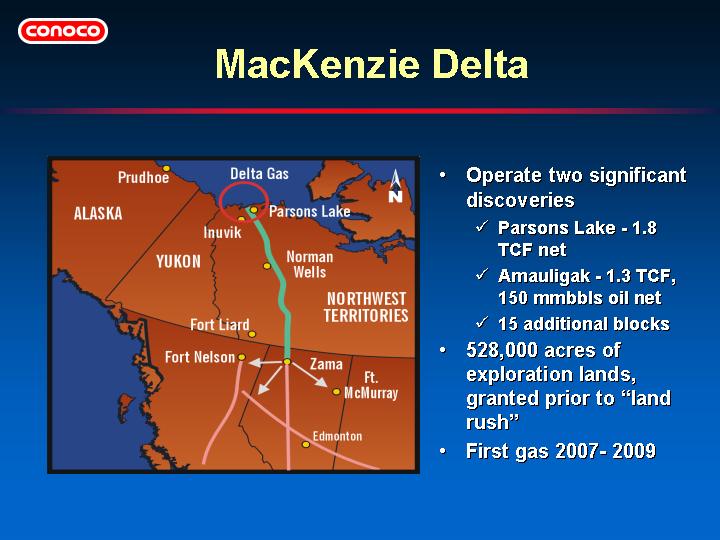
Conoco operates two significant discoveries in the area
| • | The Parsons Lake gas field SDL #32, which covers over 74,000 gross acres, is located in the south east area of the large block of gold colored Conoco interest lands. 1.3 tcf net of proved and probable reserves. Conoco holds a 75% interest in the Parsons Lake discovery. | ||
| • | Amauligak is located in the offshore area in the upper right area of the slide. This field is located 70 km northwest of Tuktoyaktuk. We have 1.3 tcf of net gas and 150 mmbbls of net oil in the proved and probable reserve category at Amauligak. Conoco holds a 50% interest and is the operator of the field. |
Immediately to the north of Parsons Lake, in gold, are Exploration Licences 384 and 385. Conoco holds a 25% interest in these two EL’s, which total almost 530,000 acres. This exploration acreage was granted before the “land rush” [which began in 1999].
Conoco has interests in 15 additional blocks with 200 MM net BBl and 500 net BCF gas. Included in these blocks is a 29% interest in the 1 tcf Issugnak discovery, which is located about 25 km Southwest of Amauligak, and a 50% interest in the 150 mmbbl Tarsiut discovery, located 100 km West of Amauligak.
166

This Page Intentionally Blank
Conoco
Refinery Input Volumes
Barrels per Day
| United States | 1998 | 1999 | 2000 | |||||||||||||
Lake Charles Refinery | ||||||||||||||||
| Low Sulfur Crude | 66,300 | 51,600 | 64,500 | |||||||||||||
| High Sulfur Crude | PA | 150,800 | 182,900 | 145,700 | ||||||||||||
| Total Crude | 217,100 | 234,500 | 210,200 | |||||||||||||
| Other Feedstocks | PA | 24,100 | 19,600 | 24,800 | ||||||||||||
| Total Refinery Inputs | 241,200 | 254,100 | 235,000 | |||||||||||||
Ponca City Refinery | ||||||||||||||||
| Low Sulfur Crude | 121,900 | 132,500 | 149,400 | |||||||||||||
| High Sulfur Crude | PA | 44,900 | 40,600 | 31,200 | ||||||||||||
| Total Crude | 166,800 | 173,100 | 180,700 | |||||||||||||
| Other Feedstocks | 3,500 | 3,100 | 1,400 | |||||||||||||
| Total Refinery Inputs | 170,300 | 176,200 | 182,000 | |||||||||||||
Denver Refinery | ||||||||||||||||
| Low Sulfur Crude | 25,100 | 27,100 | 26,300 | |||||||||||||
| High Sulfur Crude | PA | 25,100 | 28,100 | 31,300 | ||||||||||||
| Total Crude | 50,100 | 55,200 | 57,600 | |||||||||||||
| Other Feedstocks | 100 | 400 | 100 | |||||||||||||
| Total Refinery Inputs | 50,200 | 55,600 | 57,700 | |||||||||||||
Billings Refinery | ||||||||||||||||
| Low Sulfur Crude | 3,500 | 2,600 | 3,000 | |||||||||||||
| High Sulfur Crude | PA | 48,500 | 46,400 | 53,800 | ||||||||||||
| Total Crude | 52,000 | 49,000 | 56,800 | |||||||||||||
| Other Feedstocks | 3,000 | 2,800 | 3,300 | |||||||||||||
| Total Refinery Inputs | 55,000 | 51,800 | 60,100 | |||||||||||||
North America | ||||||||||||||||
| Low Sulfur Crude | 216,800 | 213,800 | 243,200 | |||||||||||||
| High Sulfur Crude | 269,300 | 298,000 | 262,000 | |||||||||||||
| Total Crude | 486,000 | 511,800 | 505,300 | |||||||||||||
| Other Feedstocks | 30,700 | 25,900 | 29,600 | |||||||||||||
| Total Refinery Inputs | 516,700 | 537,700 | 534,800 | |||||||||||||
| Price Advantaged Feedstocks (Denoted by PA) | 293,400 | 317,600 | 286,800 | |||||||||||||
| Price Advantaged Feedstocks as % of total inputs | 57 | % | 59 | % | 54 | % | ||||||||||
169
Conoco
Downstream Supplemental Data
| 1997 | 1998 | 1999 | 2000 | |||||||||||||||
Financials | ||||||||||||||||||
| Earnings Before Special Items ($ Millions) | ||||||||||||||||||
| United States | 246 | 214 | 137 | 201 | ||||||||||||||
| International | 135 | 168 | 129 | 254 | ||||||||||||||
| Total Downstream | 381 | 382 | 266 | 455 | ||||||||||||||
| Overhead and Operating costs before special items | 1,596 | 1,627 | 1,657 | 1,755 | ||||||||||||||
| Special Items — cost (reduction) | (9 | ) | 61 | 28 | 25 | |||||||||||||
| Total Overhead and Operating costs | 1,587 | 1,688 | 1,685 | 1,780 | ||||||||||||||
| O&O (before special items)/refinery input barrel | 5.60 | 5.41 | 5.19 | 5.51 | ||||||||||||||
| Depreciation, Depletion & Amortization | 333 | 272 | 268 | 275 | ||||||||||||||
| Return on Capital Employed (before special items) | ||||||||||||||||||
| United States | 14.7 | 13.6 | 8.9 | 12.9 | ||||||||||||||
| International | 8.8 | 10.9 | 8.8 | 18.0 | ||||||||||||||
| Total Downstream | 11.9 | 12.3 | 8.9 | 15.4 | ||||||||||||||
| Capital Expenditures | ||||||||||||||||||
| United States | 172 | 189 | 207 | 322 | ||||||||||||||
| International | 201 | 208 | 186 | 195 | ||||||||||||||
| Total Downstream | 373 | 397 | 393 | 517 | ||||||||||||||
| Investment in Affiliate | ||||||||||||||||||
| United States | 55 | 12 | 7 | 22 | ||||||||||||||
| International | 130 | 124 | 62 | 6 | ||||||||||||||
| Total Downstream | 185 | 136 | 69 | 28 | ||||||||||||||
Prices ($/bbl) | ||||||||||||||||||
| USGC Light Oil Spread | 3.32 | 2.45 | 1.82 | 4.40 | ||||||||||||||
| WTI/Maya Differential | 5.68 | 5.70 | 4.81 | 7.21 | ||||||||||||||
| U.S. Underlying Earnings | 1.30 | 1.10 | 0.64 | 0.94 | ||||||||||||||
| Brent Cracking Margin | 1.42 | 1.25 | 0.25 | 1.92 | ||||||||||||||
| Light Oil/Resid Spread ($/MT) | 83 | 56 | 68 | 122 | ||||||||||||||
| European Underlying Earnings | 1.48 | 1.95 | 1.46 | 2.59 | ||||||||||||||
| Singapore 3-2-1 Spread | 6.21 | 3.87 | 2.55 | 6.33 | ||||||||||||||
170
Conoco
Downstream Supplemental Data
| 1997 | 1998 | 1999 | 2000 | ||||||||||||||||
Total RMS&T Refinery Inputs (MBD) | 780 | 823 | 874 | 871 | |||||||||||||||
| United States | 503 | 516 | 538 | 533 | |||||||||||||||
| Crude Oil & Condensate | 476 | 485 | 512 | 504 | |||||||||||||||
| Other Feedstocks | 27 | 31 | 26 | 29 | |||||||||||||||
| Europe | 277 | 300 | 304 | 299 | |||||||||||||||
| Crude Oil & Condensate | 209 | 239 | 251 | 274 | |||||||||||||||
| Other Feedstocks | 68 | 61 | 53 | 25 | |||||||||||||||
| Asia Pacific | — | 7 | 32 | 39 | |||||||||||||||
| Crude Oil & Condensate | — | 7 | 32 | 39 | |||||||||||||||
| Other Feedstocks | — | — | — | — | |||||||||||||||
% Refinery Utilization | |||||||||||||||||||
| United States | 99 | 99 | 99 | 95 | |||||||||||||||
| Europe | 83 | 98 | 96 | 89 | |||||||||||||||
| Asia Pacific | — | — | 71 | 87 | |||||||||||||||
Sales of Refined Products(1) | |||||||||||||||||||
| United States | 576 | 572 | 606 | 669 | |||||||||||||||
| Motor gasoline | 249 | 262 | 289 | 292 | |||||||||||||||
| No 1 Distillate/Commercial Jet Fuel(2) | 59 | 58 | 56 | 68 | |||||||||||||||
| Middle Distillates | 191 | 203 | 204 | 206 | |||||||||||||||
| Residual Fuel Oil & Asphalt | 25 | 17 | 19 | 10 | |||||||||||||||
| Other | 52 | 32 | 38 | 98 | |||||||||||||||
| Europe | 344 | 373 | 410 | 427 | |||||||||||||||
| Motor gasoline | 132 | 159 | 163 | 179 | |||||||||||||||
| Middle Distillates | 154 | 154 | 176 | 178 | |||||||||||||||
| Residual Fuel Oil & Asphalt | 20 | 17 | 15 | 15 | |||||||||||||||
| Other | 38 | 43 | 56 | 55 | |||||||||||||||
| Asia Pacific | 7 | 9 | 11 | 49 | |||||||||||||||
| Motor gasoline | 3 | 4 | 4 | 15 | |||||||||||||||
| Middle Distillates | 3 | 4 | 6 | 27 | |||||||||||||||
| Residual Fuel Oil & Asphalt | — | — | — | — | |||||||||||||||
| Other | 1 | 1 | 1 | 7 | |||||||||||||||
Petroleum Coke Sales (000’s Metric tons)(3) | |||||||||||||||||||
| United States | |||||||||||||||||||
| Specialty Coke | 757 | 668 | 508 | 452 | |||||||||||||||
| Fuel Coke | 1,095 | 1,160 | 1,573 | 1,569 | |||||||||||||||
| Europe | |||||||||||||||||||
| Specialty Coke | 647 | 690 | 637 | 760 | |||||||||||||||
| Fuel Coke | 22 | 53 | 58 | 42 | |||||||||||||||
| Asia Pacific | |||||||||||||||||||
| Specialty Coke | 68 | 65 | 47 | 72 | |||||||||||||||
| Fuel Coke | — | — | — | 126 | |||||||||||||||
| (1) | Excludes LPG and Natural Gasoline in Upstream. | |
| (2) | 1999 volumes are commercial jet only. Other No. 1 distillates in 1999 were included in middle distillate volumes. 1999 and prior are not restated. | |
| (3) | 1999 reflects sales volumes versus production volumes reported for prior years. Prior years were production versus sales and have not been restated. |
171
Conoco North America Marketing
Branded Stations
Year End 2000
| State | Units | |||||
| * | Alabama | 166 | ||||
| * | Arkansas | 152 | ||||
| Arizona | 7 | |||||
| California | 4 | |||||
| * | Colorado | 477 | ||||
| Florida | 14 | |||||
| * | Georgia | 108 | ||||
| * | Idaho | 38 | ||||
| * | Iowa | 147 | ||||
| Illinois | 12 | |||||
| Indiana | 3 | |||||
| * | Kansas | 286 | ||||
| Kentucky | 14 | |||||
| * | Louisiana | 258 | ||||
| Maryland | 1 | |||||
| * | Minnesota | 313 | ||||
| * | Mississippi | 109 | ||||
| * | Missouri | 467 | ||||
| * | Montana | 231 | ||||
| * | Nebraska | 115 | ||||
| Nevada | 6 | |||||
| New Jersey | 1 | |||||
| * | New Mexico | 95 | ||||
| New York | 1 | |||||
| North Carolina | 6 | |||||
| * | North Dakota | 82 | ||||
| Ohio | 3 | |||||
| * | Oklahoma | 398 | ||||
| Oregon | 2 | |||||
| Pennsylvania | 1 | |||||
| South Carolina | 20 | |||||
| * | South Dakota | 78 | ||||
| * | Tennessee | 92 | ||||
| * | Texas | 933 | ||||
| * | Utah | 79 | ||||
| Virginia | 11 | |||||
| * | Washington | 95 | ||||
| * | Wisconsin | 62 | ||||
| * | Wyoming | 125 | ||||
| Total | 5,012 | |||||
| * | Indicates primary marketing state Totals include Conoco/Flying J units which also carry the Conoco brand |
172
Conoco European Marketing
Retail Store Count
Year End 2000
| Country | Total | Owned | Other | ||||||||||
| United Kingdom | 553 | 185 | 368 | ||||||||||
| Germany | 711 | 443 | 268 | ||||||||||
| Austria | 78 | 78 | — | ||||||||||
| Belgium/Luxembourg | 260 | 213 | 47 | ||||||||||
| Denmark | 55 | 55 | — | ||||||||||
| Sweden | 144 | 144 | — | ||||||||||
| Norway | 32 | 32 | — | ||||||||||
| Finland | 33 | 33 | — | ||||||||||
| Czech Republic | 50 | 48 | 2 | ||||||||||
| Poland | 43 | 43 | — | ||||||||||
| Slovakia | 12 | 12 | — | ||||||||||
| Hungary | 25 | 25 | — | ||||||||||
Total | 1,996 | 1,311 | 685 | ||||||||||
| Joint Ventures | Gross | Ownership | ||||||
| Switzerland | 93 | 49.0 | % | |||||
| Spain* | 121 | 50.0 | % | |||||
| Turkey-Tabas | 750 | 27.6 | % | |||||
| Total Joint Ventures | 964 | |||||||
| Grand Total (Gross) | 2,960 | |||||||
| * | Spain has subsequently been sold |
Conoco Asia Pacific Marketing
Retail Store Count
Year End 2000
| Country | Units | ||||
| Thailand | 115 | ||||
| Malaysia | 4 | ||||
Total | 119 | ||||
173
Conoco
Refinery Unit Capacities and Nelson Complexity Factors
As of 1-1-2001
| UNITED STATES | EUROPE | ASIA | ||||||||||||||||||||||||||||||||||||||||||||
| Refinery | Lake Charles | Ponca City | Denver | Billings | Humber | MIRO | Litvinov | Kralupy | Melak | |||||||||||||||||||||||||||||||||||||
| LA | OK | CO | MT | UK | Germany | Czech | Czech | Malaysia | ||||||||||||||||||||||||||||||||||||||
| Notes | 1 | 6.7 | 2 | 3.4 | 3.4 | 5 | ||||||||||||||||||||||||||||||||||||||||
| NELSON COMPLEXITY FACTOR | OGJ | 12.2 | 8.5 | 6.9 | 11.5 | 13.9 | 9.4 | 6.3 | 4.5 | 9.2 | ||||||||||||||||||||||||||||||||||||
Process | BPCD | Codes | ||||||||||||||||||||||||||||||||||||||||||||
| Crude Distillation | Feed Capacity | 245,000 | 174,000 | 57,500 | 55,100 | 186,000 | 285,000 | 110,000 | 68,000 | 95,000 | ||||||||||||||||||||||||||||||||||||
| Vacuum Distillation | Feed Capacity | 163,000 | 52,200 | 25,000 | 26,600 | 185,000 | 130,000 | 47,500 | 58,900 | |||||||||||||||||||||||||||||||||||||
| Delayed Coking | Feed Capacity | 65,000 | 23,950 | 16,470 | 68,000 | 26,000 | 18,900 | |||||||||||||||||||||||||||||||||||||||
| Thermal Cracking/Visbreaking | Feed Capacity | 11,300 | 40,000 | 24,000 | 13,925 | |||||||||||||||||||||||||||||||||||||||||
| Catalytic Cracking | Feed Capacity | 48,000 | 54,300 | 19,000 | 18,450 | 50,000 | 87,000 | |||||||||||||||||||||||||||||||||||||||
| Hydrocracking | Feed Capacity | 29,000 | 47,000 | 25,000 | 28,500 | |||||||||||||||||||||||||||||||||||||||||
| Catalytic Reforming | Feed Capacity | 45,200 | 40,400 | 9,600 | 13,500 | 31,000 | 18,432 | 9,440 | 23,400 | |||||||||||||||||||||||||||||||||||||
| Hydrotreating — Reformer Feed | Feed Capacity | 1 | 46,700 | 40,400 | 9,600 | 53,000 | 21,785 | 23,400 | ||||||||||||||||||||||||||||||||||||||
| Hydrotreating — Naphtha | Feed Capacity | 2,3 | 10,800 | 76,000 | 16,600 | |||||||||||||||||||||||||||||||||||||||||
| Hydrotreating — Mid. Distillate | Feed Capacity | 4 | 33,600 | 12,800 | 12,500 | 14,400 | 36,586 | 25,500 | ||||||||||||||||||||||||||||||||||||||
| Hydrotreating — Diesel | Feed Capacity | 5 | 48,500 | 18,900 | 31,500 | |||||||||||||||||||||||||||||||||||||||||
| Hydrotreating — Other Distillate | Feed Capacity | 6,7 | 37,800 | 30,300 | 8,100 | 128,000 | 120,000 | |||||||||||||||||||||||||||||||||||||||
| Hydrotreating — FCC Feed | Feed Capacity | 8 | 11,200 | 12,000 | 74,000 | |||||||||||||||||||||||||||||||||||||||||
| Hydrotreating — VGO | Feed Capacity | 9 | 19,800 | 28,000 | ||||||||||||||||||||||||||||||||||||||||||
| Hydrotreating — Post FCC Naptha | Feed Capacity | 12 | 7,000 | |||||||||||||||||||||||||||||||||||||||||||
| Hydrotreating — Other | Feed Capacity | 13 | ||||||||||||||||||||||||||||||||||||||||||||
| Alkylation | Prodn. Capacity | 10,300 | 13,600 | 6,480 | 14,000 | 12,000 | ||||||||||||||||||||||||||||||||||||||||
| Catalytic Polymerization | Prodn. Capacity | 5,300 | 1,500 | 2,600 | 3,500 | |||||||||||||||||||||||||||||||||||||||||
| Isomerization — C4 | Prodn. Capacity | 1 | 7,350 | 3,420 | ||||||||||||||||||||||||||||||||||||||||||
| Isomerization — C5 | Prodn. Capacity | 2 | 2,645 | 4,400 | ||||||||||||||||||||||||||||||||||||||||||
| Isomerization — C5/C6 | Prodn. Capacity | 3 | 16,000 | 16,000 | 8,100 | |||||||||||||||||||||||||||||||||||||||||
| Aromatics — BTX | Prodn. Capacity | 1 | 4,500 | 670 | ||||||||||||||||||||||||||||||||||||||||||
| Aromatics — Hydrodealkylation | Prodn. Capacity | 2,3,4 | 2,500 | |||||||||||||||||||||||||||||||||||||||||||
| Oxygenates — MTBE | Prodn. Capacity | 1,300 | 1,200 | 4,000 | 2,024 | |||||||||||||||||||||||||||||||||||||||||
| Hydrogen (MMcfd) | Prodn. Capacity | 110 | 10 | 31 | 74 | |||||||||||||||||||||||||||||||||||||||||
| Lubes | Prodn. Capacity | 11,500 | ||||||||||||||||||||||||||||||||||||||||||||
| Asphalt | Prodn. Capacity | 9,800 | 14,000 | 8,150 | ||||||||||||||||||||||||||||||||||||||||||
| OGJ Codes are unit codes used by Oil & Gas Journal |
| Notes: | Capacities as of January 1, 2001 in Barrels per calendar day | |||
| 1 | Lake Charles Lube Oil Hydrocracker is jointly (50%) owned with Pennzoil-Quaker State | |||
| 2 | Conoco ownership 18.75% (figures represent refinery totals) | |||
| 3 | Conoco ownership 16.33% (figures represent refinery totals) | |||
| 4 | Two refineries are operated as one plant with connecting pipelines | |||
| 5 | Conoco ownership 40% (figures represent refinery totals) | |||
| 6 | Humber also charges resid to the vacuum unit as a first charge | |||
| 7 | Humber’s official crude distillation capacity is 230,000 BPD and reflects all inputs to crude distillation units. |
174
Downstream Price Drivers — History
| Jan | Feb | Mar | Apr | May | Jun | Jul | Aug | Sep | Oct | Nov | Dec | Year | ||||||||||||||||||||||||||||
Light Oil Spread | ||||||||||||||||||||||||||||||||||||||||
| 1996 | 2.35 | 3.18 | 2.85 | 3.19 | 3.92 | 2.37 | 2.75 | 2.44 | 1.71 | 2.72 | 4.24 | 2.38 | 2.84 | |||||||||||||||||||||||||||
| 1997 | 2.72 | 3.31 | 3.54 | 3.96 | 3.66 | 3.28 | 3.97 | 5.58 | 3.34 | 1.92 | 2.19 | 2.34 | 3.32 | |||||||||||||||||||||||||||
| 1998 | 2.40 | 2.51 | 2.53 | 3.26 | 4.06 | 3.82 | 2.63 | 1.73 | 1.85 | 2.48 | 1.08 | 1.11 | 2.45 | |||||||||||||||||||||||||||
| 1999 | 1.03 | 0.46 | 2.14 | 2.35 | 1.26 | 1.45 | 2.43 | 3.09 | 2.40 | 1.75 | 2.28 | 1.17 | 1.82 | |||||||||||||||||||||||||||
| 2000 | 2.52 | 4.03 | 4.25 | 4.56 | 6.20 | 6.18 | 4.14 | 4.65 | 4.95 | 4.80 | 3.22 | 3.34 | 4.40 | |||||||||||||||||||||||||||
| 2001 | 6.50 | 4.34 | 4.19 | 9.69 | 7.73 | 3.28 | 1.81 | 4.48 | 3.59 | |||||||||||||||||||||||||||||||
WTI/Maya | ||||||||||||||||||||||||||||||||||||||||
| 1996 | 4.03 | 3.71 | 4.65 | 5.30 | 4.65 | 4.67 | 5.16 | 4.80 | 4.64 | 3.96 | 4.73 | 5.82 | 4.68 | |||||||||||||||||||||||||||
| 1997 | 6.54 | 6.50 | 6.09 | 5.38 | 5.67 | 5.18 | 5.31 | 4.95 | 5.07 | 5.37 | 5.49 | 6.63 | 5.68 | |||||||||||||||||||||||||||
| 1998 | 7.09 | 6.83 | 7.44 | 6.19 | 5.51 | 5.09 | 4.96 | 5.07 | 5.39 | 5.00 | 4.77 | 5.09 | 5.70 | |||||||||||||||||||||||||||
| 1999 | 4.89 | 4.97 | 4.81 | 4.56 | 5.03 | 4.82 | 4.71 | 3.84 | 4.38 | 4.42 | 5.28 | 5.97 | 4.81 | |||||||||||||||||||||||||||
| 2000 | 5.92 | 5.97 | 6.20 | 5.51 | 5.62 | 6.40 | 6.98 | 7.38 | 7.64 | 7.92 | 10.23 | 10.77 | 7.21 | |||||||||||||||||||||||||||
| 2001 | 10.77 | 10.62 | 10.37 | 11.80 | 10.99 | 8.82 | 8.03 | 8.29 | 6.72 | |||||||||||||||||||||||||||||||
Brent Cracking Margin | ||||||||||||||||||||||||||||||||||||||||
| 1996 | 0.70 | 1.50 | 1.14 | 1.86 | 2.34 | 1.10 | 1.41 | 1.04 | 1.48 | 1.56 | 2.08 | 0.80 | 1.35 | |||||||||||||||||||||||||||
| 1997 | 1.04 | 0.69 | 1.26 | 2.09 | 1.40 | 1.63 | 0.84 | 2.31 | 1.90 | 1.09 | 1.48 | 1.27 | 1.42 | |||||||||||||||||||||||||||
| 1998 | 1.12 | 1.75 | 1.47 | 1.88 | 0.64 | 1.88 | 1.96 | 0.81 | 0.49 | 1.30 | 1.20 | 0.48 | 1.25 | |||||||||||||||||||||||||||
| 1999 | (0.05 | ) | 0.21 | 0.36 | 0.02 | (0.07 | ) | (0.17 | ) | (0.14 | ) | 1.50 | 0.48 | 0.78 | (0.25 | ) | 0.27 | 0.25 | ||||||||||||||||||||||
| 2000 | 0.08 | (0.21 | ) | 2.33 | 4.30 | 1.99 | 3.22 | 2.08 | 1.37 | 2.57 | 3.65 | 0.00 | 1.71 | 1.92 | ||||||||||||||||||||||||||
| 2001 | 0.67 | (0.25 | ) | 1.54 | 3.96 | 2.72 | (0.38 | ) | 0.12 | 0.11 | 1.36 | |||||||||||||||||||||||||||||
Light Oil/Resid Spread | ||||||||||||||||||||||||||||||||||||||||
| 1996 | 47 | 63 | 70 | 75 | 76 | 74 | 80 | 88 | 96 | 100 | 88 | 83 | 78 | |||||||||||||||||||||||||||
| 1997 | 101 | 90 | 85 | 86 | 93 | 77 | 79 | 92 | 85 | 75 | 61 | 69 | 83 | |||||||||||||||||||||||||||
| 1998 | 63 | 73 | 59 | 57 | 58 | 54 | 57 | 58 | 58 | 54 | 47 | 37 | 56 | |||||||||||||||||||||||||||
| 1999 | 30 | 40 | 55 | 67 | 58 | 59 | 74 | 79 | 86 | 75 | 94 | 103 | 68 | |||||||||||||||||||||||||||
| 2000 | 89 | 98 | 116 | 115 | 133 | 140 | 129 | 148 | 148 | 127 | 127 | 92 | 122 | |||||||||||||||||||||||||||
| 2001 | 106 | 123 | 112 | 143 | 155 | 128 | 102 | 112 | 115 | |||||||||||||||||||||||||||||||
Singapore 3-2-1 | ||||||||||||||||||||||||||||||||||||||||
| 1996 | 7.21 | 8.67 | 8.09 | 7.75 | 9.54 | 6.83 | 6.00 | 5.43 | 5.72 | 6.50 | 8.14 | 8.44 | 7.36 | |||||||||||||||||||||||||||
| 1997 | 5.96 | 7.31 | 9.65 | 9.65 | 6.32 | 5.89 | 4.74 | 4.90 | 5.19 | 5.13 | 5.44 | 4.31 | 6.21 | |||||||||||||||||||||||||||
| 1998 | 5.06 | 5.11 | 5.01 | 5.87 | 4.71 | 4.45 | 3.81 | 2.01 | 2.16 | 2.98 | 2.28 | 2.92 | 3.87 | |||||||||||||||||||||||||||
| 1999 | 3.76 | 2.82 | 2.27 | 2.76 | 2.12 | 2.12 | 2.48 | 3.38 | 2.41 | 2.53 | 2.01 | 1.96 | 2.55 | |||||||||||||||||||||||||||
| 2000 | 4.82 | 5.63 | 7.76 | 5.05 | 3.52 | 4.25 | 7.21 | 10.65 | 8.47 | 6.48 | 3.93 | 7.75 | 6.33 | |||||||||||||||||||||||||||
| 2001 | 6.16 | 4.04 | 4.41 | 6.60 | 5.87 | 3.30 | 3.74 | 3.60 | 5.26 | |||||||||||||||||||||||||||||||
175
Conoco Cevolution Quotes
10-18-01
David Smith
There are several marketplaces that are looking at moving away from traditional materials and moving into composite materials — especially carbon-based composite materials — because they offer stiffness, strength, no corrosion problems, and a whole raft of mechanical properties as well as thermal properties that give them an advantage over traditional materials.
Dave Gaul
Traditional materials are at the top of their learning curve. Composites and different composite systems that are now being made available — like Cevolution is making available — allows you to fill gaps that aren’t there today, and allows us potentially to get on a different learning curve in terms of materials performance.
Surendra Shah
Right now in the US, 10% of all ready-mix concrete has some types of fiber. That’s a huge market. The ready-mix concrete is — we are thinking about 50 billion dollars. So, as far as I’m concerned, there should be fibers — one type or different amounts, well designed — in all concrete. Because wherever there is concrete there is cracking, and fibers can control it.
David Smith
Today’s vehicles are 3600 lbs. of steel. The ideal car would be something that’s the same size but maybe is 2000 lbs. of carbon fiber and plastic reinforced panels. That will get you a huge improvement in fuel efficiency and is something that’s being pushed for with the new café standards, which will also be extending to trucks. You’ll see pick-up beds in trucks go all plastic, you’ll see cabs and hoods and fenders and everything else that currently is done in stamped steel be replaced with injection molded carbon fiber reinforced components.
Alan Stone
Nobody in the automotive industry buys carbon fiber. Nobody in the automotive industry buys steel. They buy a part, which has a function. If you make it in steel, you have to get 27 different stampings and weld them all together. If you make it in plastic, you can mold it in a single shot. So, functionality’s great. The problem is that if you put plastic with no reinforcement it’s not stiff enough — it doesn’t have the stiffness. And currently if you get the stiffness with carbon fiber, it costs you too much money.
176
David Stewart
The automotive industry has flirted with carbon fiber composites for quite a long time. We’ve seen that they have tremendous performance in racing applications and such. But there really hasn’t been a high-volume source for carbon fiber that could meet the needs of the auto industry. The sheer volume that would be required just for replacing an exterior body panel set for one mass-production vehicle is a substantial fraction of the worldwide capacity of carbon fiber today, so what’s missing is a high-volume source of the material.
Alan Stone
...Don’t forget the steel industry are not sitting still, they’re producing thin-walled, high-strength steel. Aluminum is coming along as a competitor. And so everybody is trying to fill the gap which is being created by legislation and energy consumption pressures. And, really the automotive industry is just sitting back and saying, “Hey guys, we’ve got this problem, what are you gonna do about it?”, they’re just saying, “We need a solution.”
Dave Gaul
I think the industry needs to band together... in more alliances, focus on solutions. For example, at Owens Corning we don’t necessarily — from a composites standpoint — even though we’re the world’s leader in glass fiber — we really look at ourselves as a composites solutions leader, and that’s what we’re focusing on. And that’s what I see with Cevolution as well.
177