At the December Meeting, the Board, including a majority of the Independent Directors, also approved a revised fee schedule with respect to the Subadvisory Agreement with T. Rowe Price Associates, Inc. (“T. Rowe”) relating to the Equity Income Fund and Growth & Income Fund, effective January 1, 2006. Each fee schedule was revised to provide for a reduction in the rate of fee payable by each Fund for assets between $251 million and $500 million and for assets above $500 million.
At the January Meeting, the Board, including a majority of the Independent Directors, approved the continuance of the Advisory Agreements between the Adviser and each Fund. In addition, the Board, including a majority of the Independent Directors, approved the continuance of the subadvisory arrangements, and approved Investment Subadvisory Agreements, with respect to the following subadvisers and Funds (may be referred to collectively as the “Sub-Advised Funds”): Payden & Rygel Investment Counsel (Short-Term Bond Fund); STW Fixed-Income Management, Ltd. (Short-Term Bond Fund); Mellon (US Government Securities Fund, Asset Allocation Fund and each of the Index Funds); T. Rowe (Equity Income Fund, Growth & Income Fund and Aggressive Opportunities Fund); Barrow, Hanley, Mewhinney & Strauss, Inc. (Equity Income Fund); Southeastern Asset Management, Inc. (Equity Income Fund and Aggressive Opportunities Fund); Capital Guardian (Growth & Income Fund and International Fund); Wellington Management Company, LLP (“Wellington”) (Growth & Income Fund); Fidelity Management & Research Company (Growth Fund); Tukman Capital Management (Growth Fund); Peregrine Capital Management, Inc. (“Peregrine”) (Growth Fund); and Artisan (International Fund). In reaching its decisions, the Board considered the information furnished and discussed throughout the year at regularly scheduled Board meetings and reviewed and considered the information provided specifically in relation to the annual consideration of the approval of the Advisory Agreements and Subadvisory Agreements.
Information furnished at Board meetings throughout the year included, but was not limited to, the Adviser’s analysis of, and presentations given by the Adviser on, each Fund’s investment performance and the investment performance of the subadvisers, the strategies being used to achieve stated objectives and various reports on the monitoring of the subadvisers, compliance and other services provided by the Adviser and its affiliates. In preparation for the January Meeting, the Directors requested and received information compiled by Lipper Inc., an independent provider of investment company data, on the investment performance over various time periods and the fees and expenses of each Fund as compared to a comparable group of funds (“peer group”). Additionally, in response to specific requests from the Independent Directors in connection with the January Meeting, the Adviser furnished, and the Board considered, a wide variety of information and reports concerning the Adviser and the subadvisers, including: (1) the nature, extent and quality of services provided to the Funds by the Adviser (and its affiliates) and by the subadvisers; (2) the level of the advisory and subadvisory fees that are charged to each Fund and a comparison with the fees charged to other clients; (3) profitability information of the Adviser and its affiliate, Vantagepoint Transfer Agents, LLC (“VTA”), and, to the extent available, certain profitability information of the subadvisers; (4) the Adviser’s and subadvisers’ compliance programs; and (5) any “fall out” or ancillary benefits enjoyed by the Adviser or its affiliates and the subadvisers as a result of the relationship with the Funds. In addition to evaluating, among other things, the written information provided by the Adviser, the Board also evaluated the answers to questions posed by the Board to representatives of the Adviser at the January Meeting.
In considering the information and materials described above, the Independent Directors received assistance from and met separately with their independent legal counsel and were provided with a written description of their statutory responsibilities and the legal standards that are applicable to approvals of advisory agreements. Although the Advisory Agreements and Subadvisory Agreements for all of the Funds were considered at the same Board meeting, the Directors addressed each Fund separately during the January Meeting. In view of the broad scope and variety of factors and information, the Directors did not find it practicable to, and did not, assign relative weights to the specific factors considered in reaching their conclusions and determinations to approve the Advisory Agreements and Subadvisory Agreements for an additional year. Rather, the approval determinations were made on the basis of each Director’s business judgment after consideration of all of the factors taken in their entirety. Although not meant to be all-inclusive, the following discusses some of the factors relevant to the Board’s decisions to approve the Advisory Agreements and Subadvisory Agreements.
In examining the nature, extent and quality of the services to be provided by the Adviser, the Directors considered the qualifications, experience and capability of the Adviser’s management and other personnel and the extent of care and conscientiousness with which the Adviser performs its duties. In this regard, the Directors considered, among other
VANTAGEPOINT FUNDS
Additional Information (Unaudited)—(Continued)
matters: (a) the asset allocation services provided, and the monitoring of the performance of the underlying Funds performed, by the Adviser with respect to the Model Portfolio Funds and the Milestone Funds; (b) the performance monitoring and on-going due diligence performed with respect to the underlying mutual fund in which the Money Market Fund invests; (c) the subadviser selection and fee negotiation process whereby the Adviser seeks to achieve an appropriate and competitive level of fee and fee structure, and the Adviser’s on-going monitoring of the appropriateness and competitiveness of each subadvisory fee and fee structure; (d) the process by which the Adviser evaluates and monitors the subadvisers, including with respect to portfolio security brokerage and trading practices; (e) the Adviser’s ability and willingness to identify instances where there may be a need to replace a subadviser, reallocate assets or both and to efficiently and economically effect such changes; (f) the cash management services provided to the Sub-Advised Funds; and (g) the nature of the non-investment advisory services provided to the Funds, such as the supervision of the Funds’ other third-party service providers by the Adviser or its affiliates.
The Board also considered the nature, extent and quality of the services provided to the Funds by the Adviser’s affiliates, including transfer agency and distribution services. The Board took into account the extensive shareholder services provided by VTA in order to satisfy the needs of the Funds’ shareholders.
With respect to the nature, extent and quality of the investment advisory services provided by each subadviser to the Sub-Advised Funds, the Directors considered each subadviser’s investment management process in managing the assets allocated to it, including the experience and capability of the subadviser’s management and other personnel responsible for the portfolio management of the applicable Fund and compliance with the Fund’s investment policies and restrictions. The Directors also considered the favorable assessment provided by the Adviser as to the nature and quality of the services provided by each subadviser to the Sub-Advised Funds.
Based on the totality of the information considered, the Directors concluded that the Funds were likely to benefit from the nature, extent and quality of the Adviser’s and the subadvisers’ services, as applicable, as well as the services of the Adviser’s affiliates, and that the Adviser and its affiliates as well as the subadvisers have the ability to continue to provide these services based on their respective experience, operations and resources.
Investment Performance
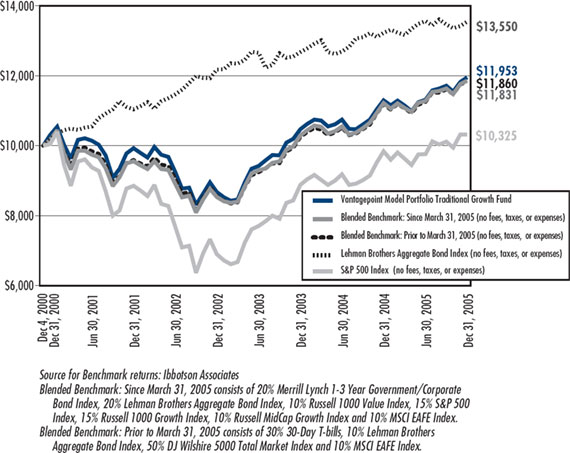
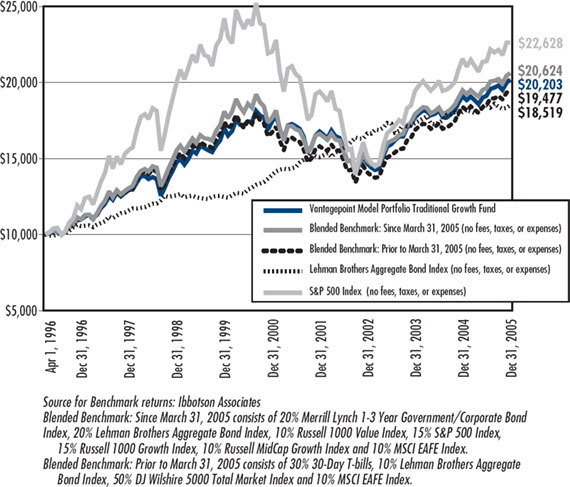
The Board placed emphasis on the investment performance of each of the Funds. While consideration was given to performance reports and discussions held at prior Board meetings, particular attention was given to the performance reports provided specifically for the January Meeting. In particular, the Directors reviewed the performance of each Fund over a five-year period ending June 30, 2005, or shorter period, as applicable, relative to its stated investment objective, benchmark and peer group.
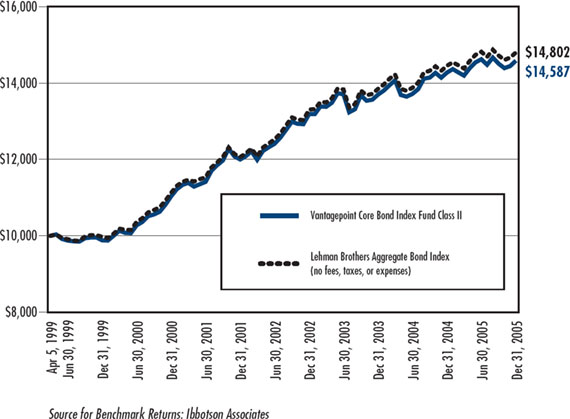
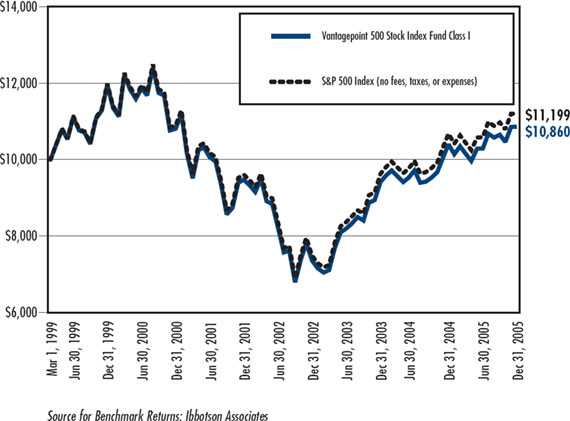
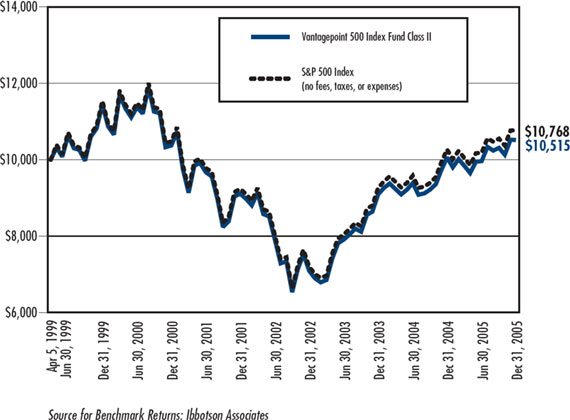
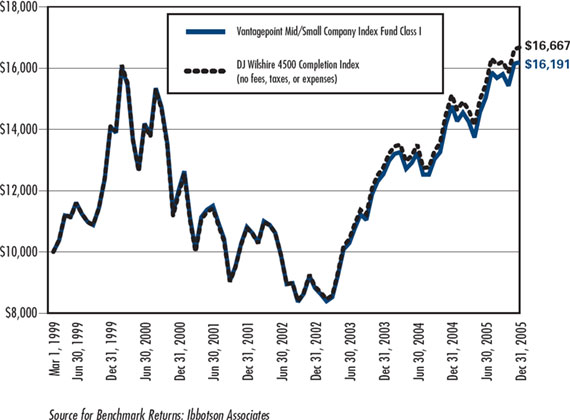
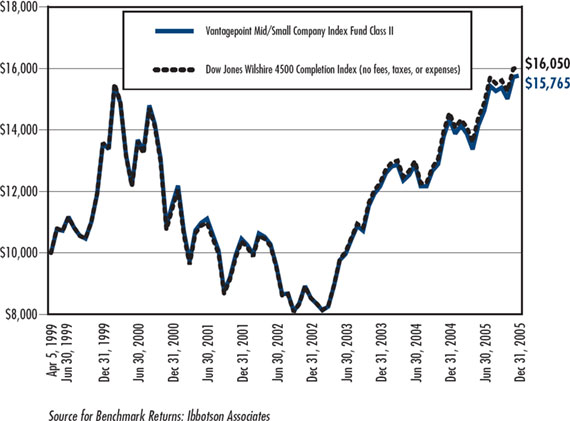
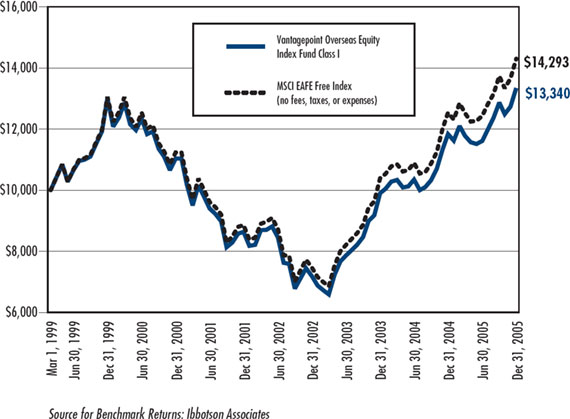
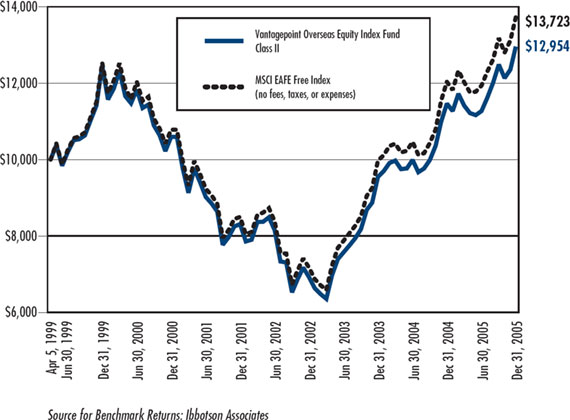
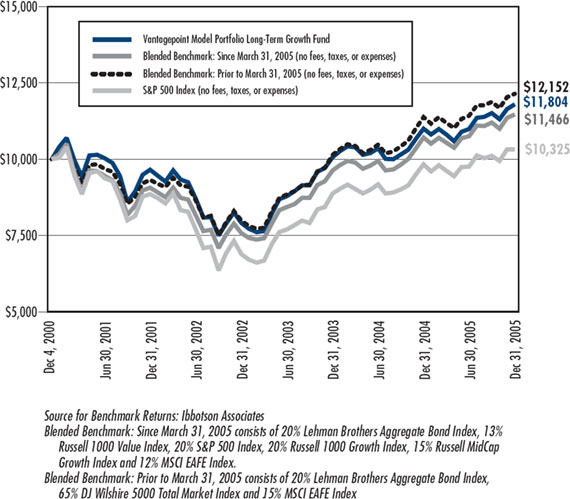
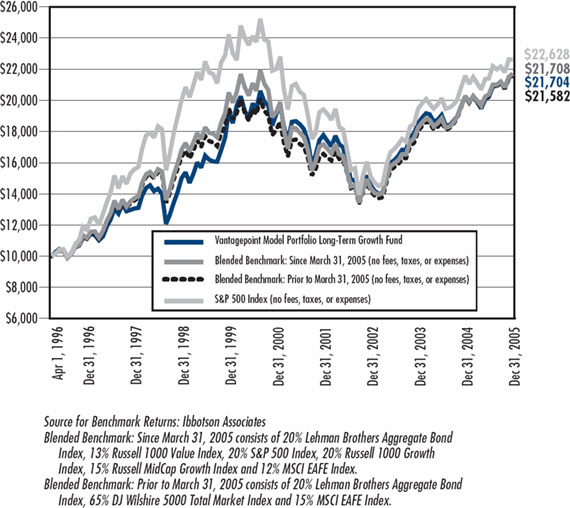
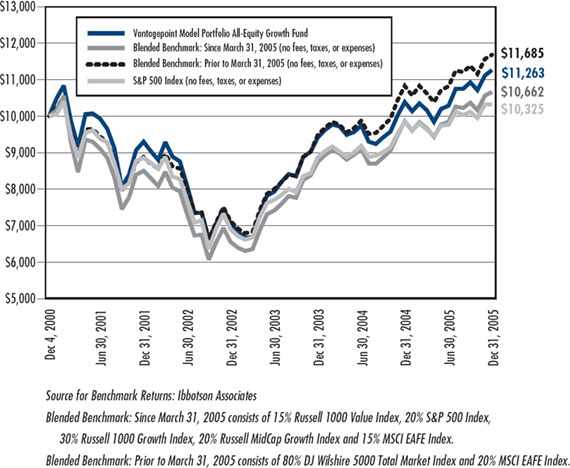
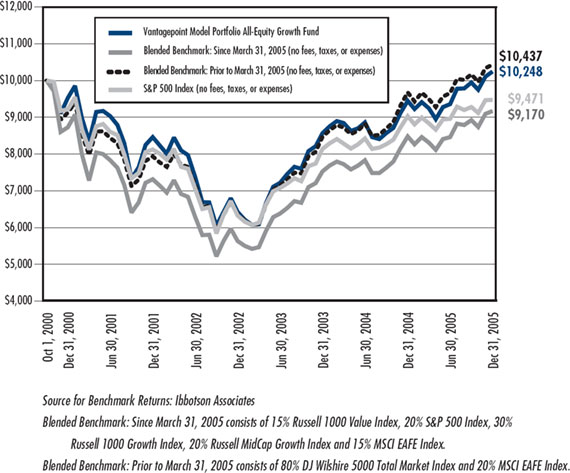
In reviewing the performance of the Funds, the Directors considered that the performance of each of the following Funds exceeded or was in line with the median of its peer group for the periods reviewed: Money Market Fund, Short-Term Bond Fund, Asset Allocation Fund (except for the one-year period), Equity Income Fund, Growth & Income Fund, Aggressive Opportunities Fund (for the one, two and three-year periods), Core Bond Index Fund, 500 Stock Index Fund, Mid/Small Company Index Fund (for the one, two and three-year periods), Overseas Equity Index Fund (except for the one-year period and, for Class I, the five-year period), Model Portfolio Traditional Growth Fund (except for the one-year period), Model Portfolio Long-Term Growth Fund (for the one and four-year periods) and Model Portfolio All-Equity Growth Fund (except for the three-year period).
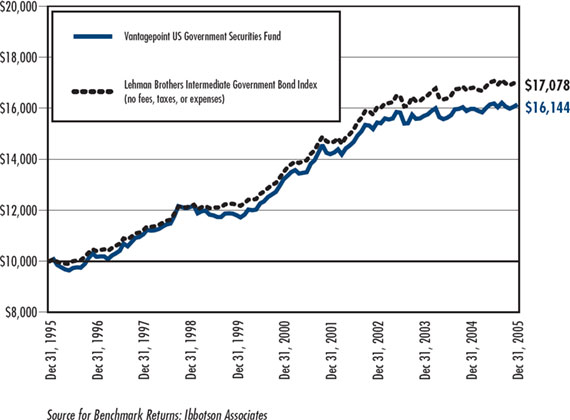
With regard to the relative performance of the US Government Securities Fund, the Directors considered the Adviser’s explanation regarding the impact of the Fund’s investment restrictions and sector allocation limits (which relate to the Fund’s enhanced index strategy established in late 2004 and serve to limit sector and credit risk) on performance versus its peer group, and how this investment strategy is designed to meet the expectations of the Fund’s shareholder base.
With regard to the performance of the Growth Fund relative to its peer group, the Directors considered the changes to the Fund’s structure implemented in May 2005, which included the addition of three new subadvisers, in order to improve the Fund’s performance. The Directors also considered that the Growth Fund’s performance for the quarter ended September 30, 2005 exceeded the performance of the Fund’s benchmark and Morningstar peer group.
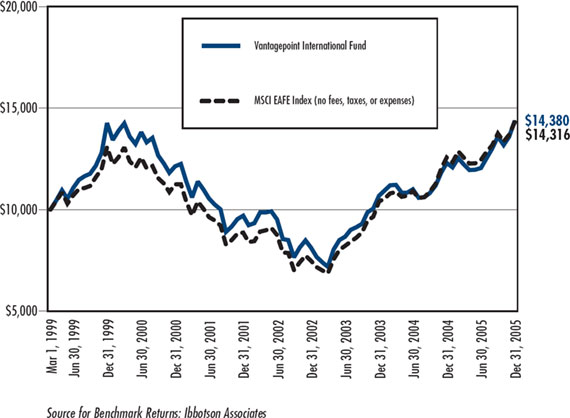
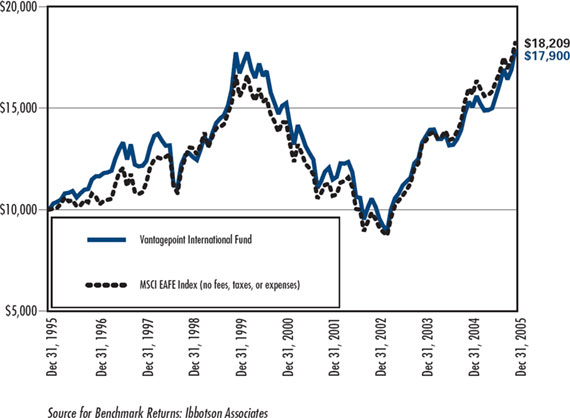
With regard to performance of the International Fund relative to its peer group, the Directors considered the subadvisory changes approved by the Board at its December Meeting, which included the addition of two new subadvisers, in order to improve the performance of the Fund.
171
VANTAGEPOINT FUNDS
Additional Information (Unaudited)—(Continued)
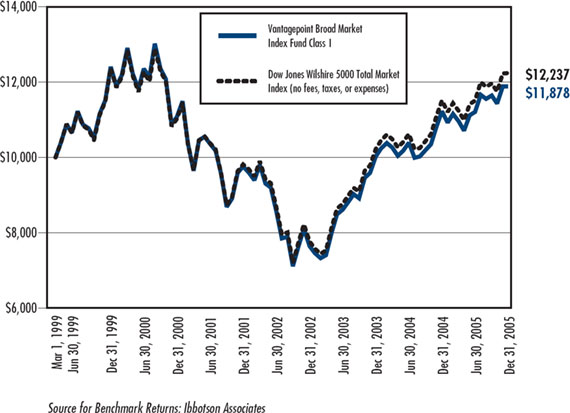
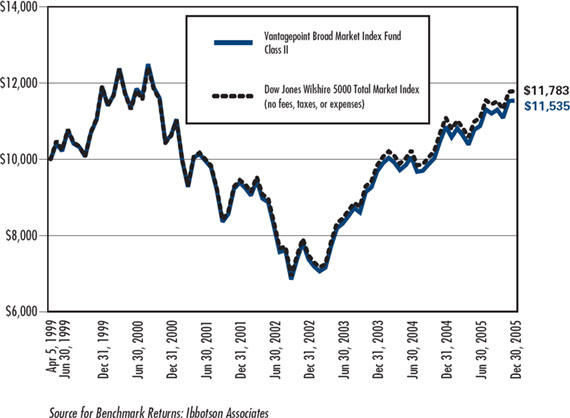
With regard to the performance of the Broad Market Index Fund relative to its peer group, the Directors considered the Adviser’s explanation that the peer group identified by Lipper Inc. and against which the Fund’s performance was compared represents an actively managed group of funds that primarily invests in mid-cap stocks, while the Fund is a passively managed fund investing primarily in larger cap stocks. The Directors also considered the Adviser’s explanation that, while the Fund underperformed its benchmark, the Dow Jones Wilshire 5000 Total Market Index, this underperformance was largely due to the impact of the Fund’s expenses, and noted that the Fund does not employ any enhancement strategies due to the risks involved in respect of such strategies.
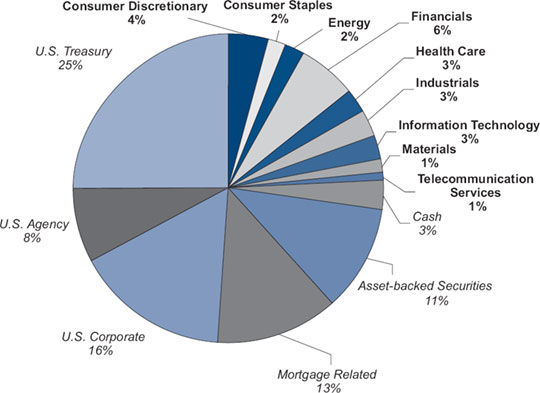
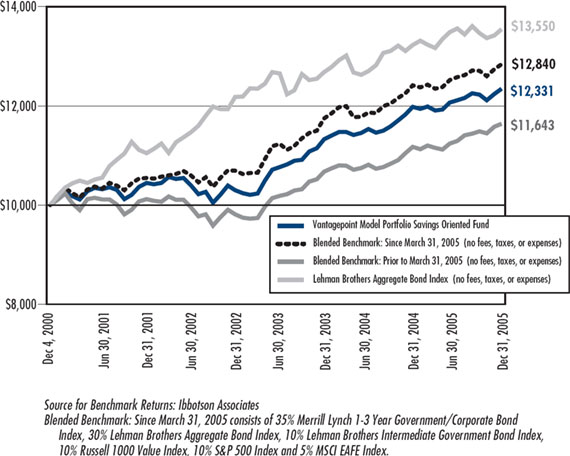
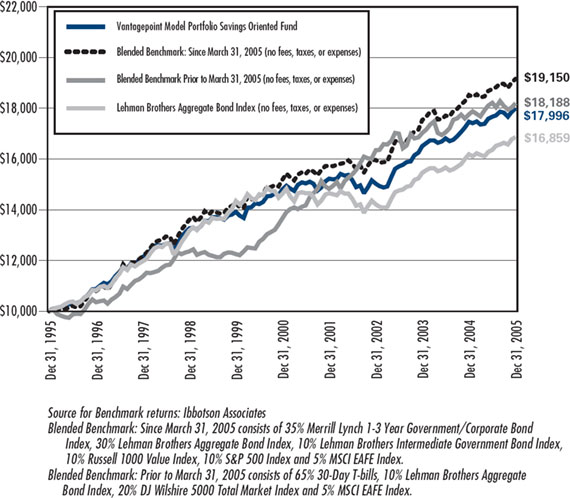
With respect to the performance of the Model Portfolio Savings Oriented Fund, the Directors considered the Adviser’s explanation that the Fund’s performance relative to its peer group is largely due to the Fund’s allocation to the Company’s stable value fund prior to November 2004, and that stable value funds underperformed core bond funds by over 2% over the five-year period ending June 30, 2005.
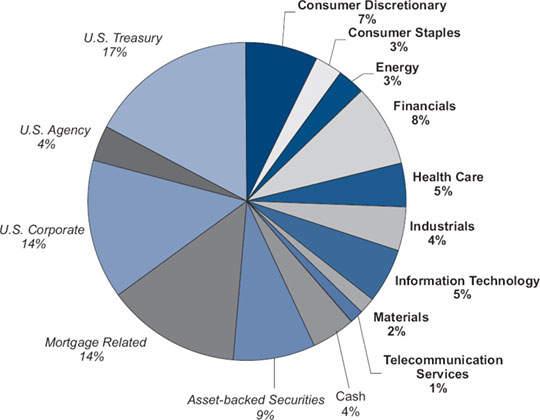
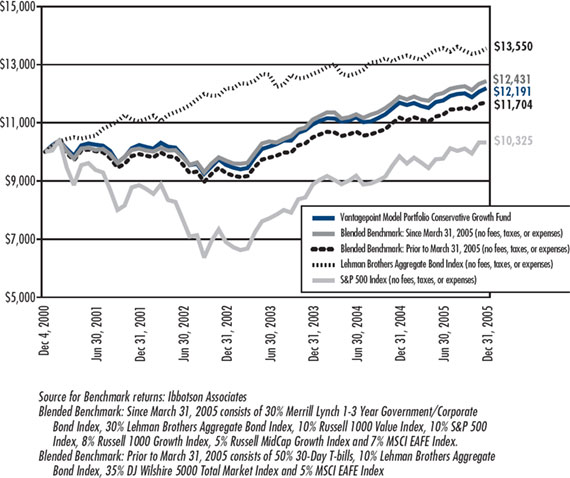
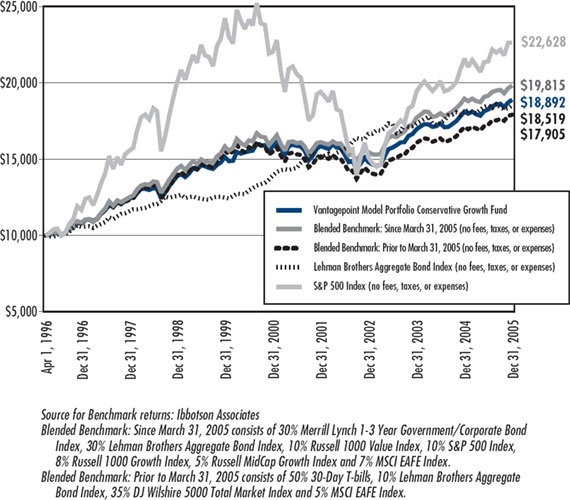
With respect to the performance of the Model Portfolio Conservative Growth Fund, the Directors considered the Adviser’s explanation that the Fund’s performance relative to its peer group was due to the Fund’s below-average allocation to equities versus its peer group (and equities outperformed bonds by over 2% during the three-year period ending June 30, 2005). The Directors also noted that the Fund’s performance for the four-year period ending June 30, 2005 was above the median of its peer group.
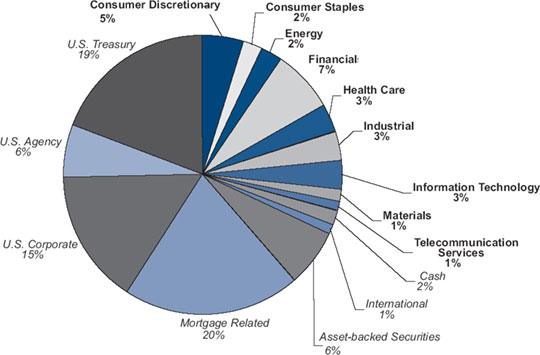
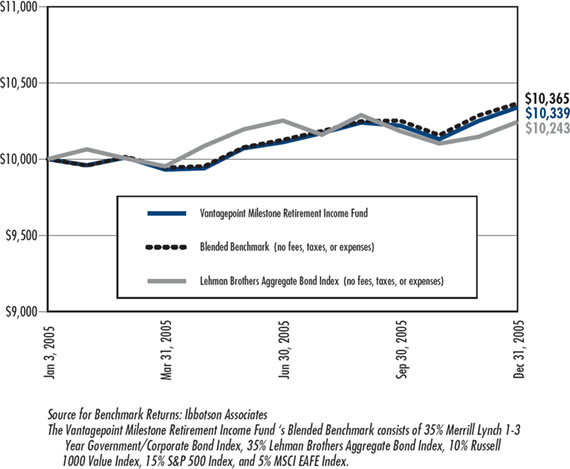
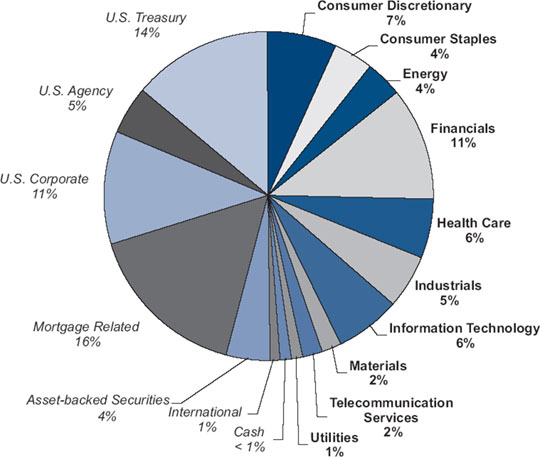
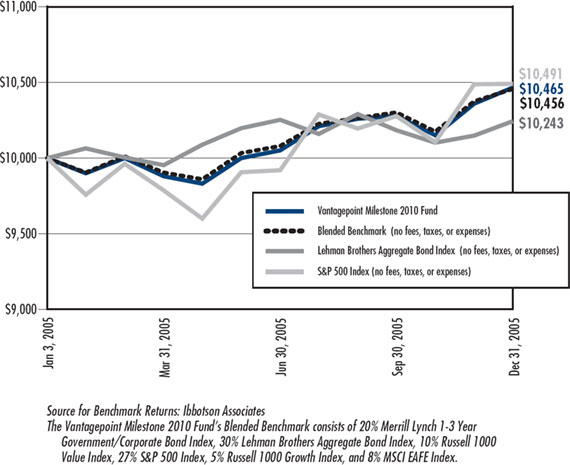
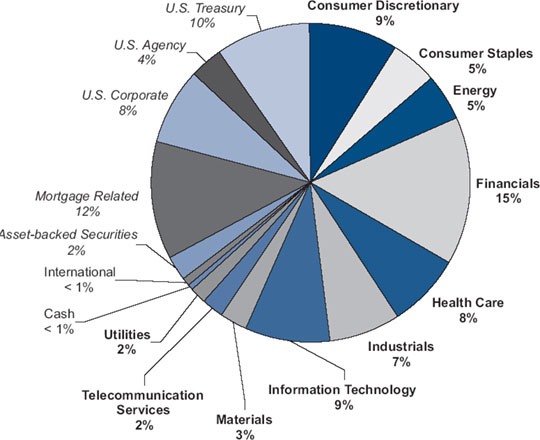
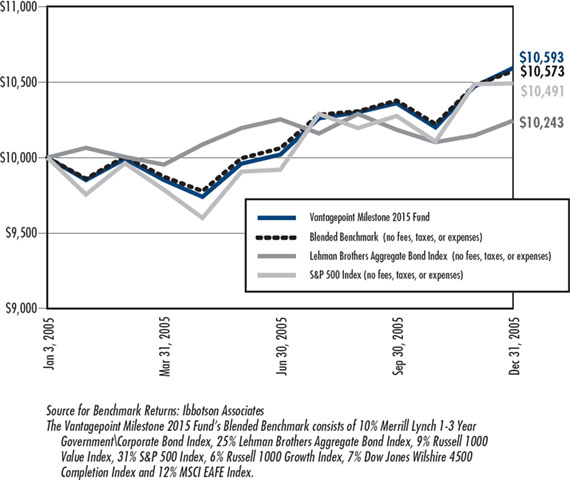
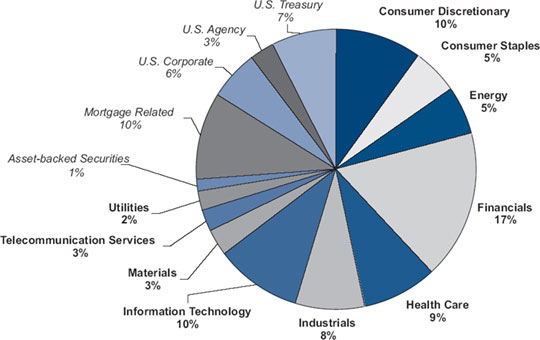
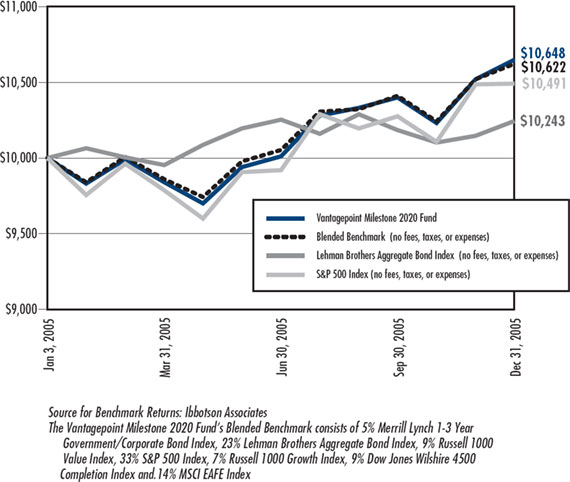
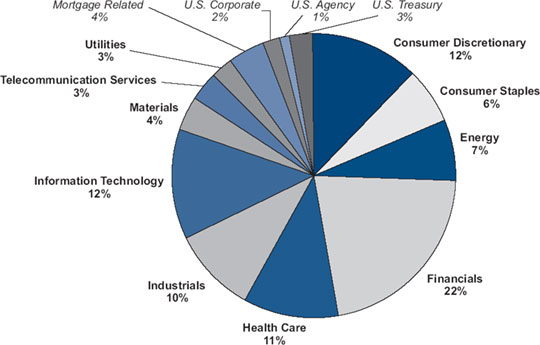
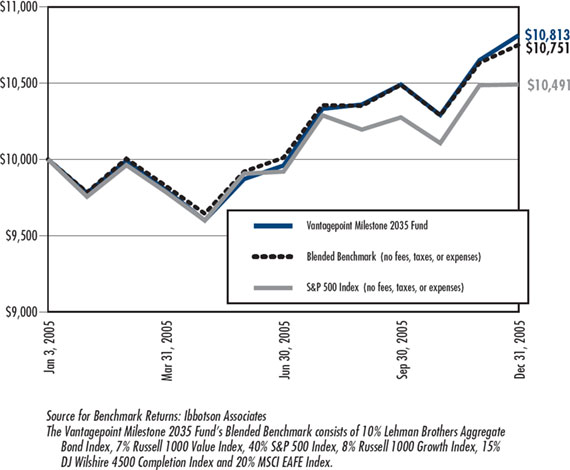
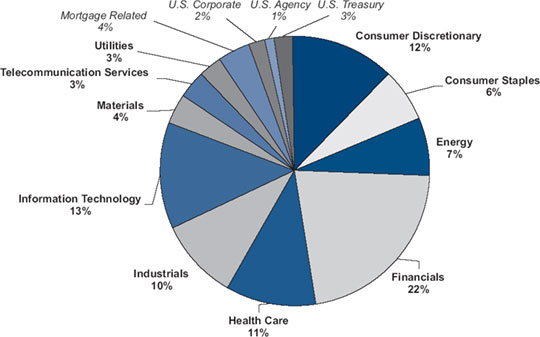
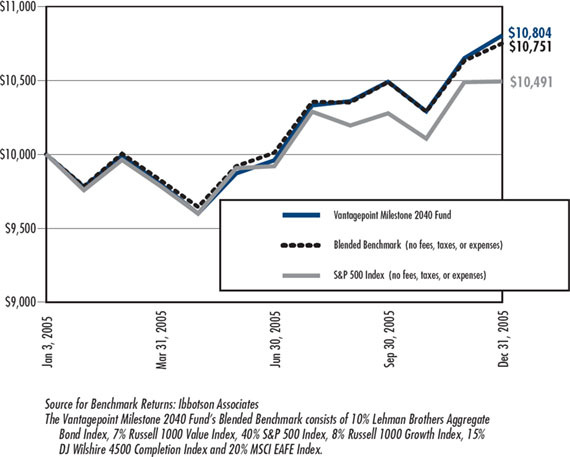
With respect to the performance of the Milestone Funds, the Directors acknowledged that these Funds have operated for a limited period of time and noted that the performance of the Milestone 2010 Fund and Retirement Income Fund exceeded the median of their respective peer group for the six-month period ending June 30, 2005. The Directors considered the Adviser’s explanation that the underperformance of each of the other Milestone Funds relative to the median of its respective peer group for the six-month period ending June 30, 2005, was generally attributable to the asset class mix of each Fund compared to its peer group, and the performance of each market segment relative to other segments. The Directors further considered the Adviser’s report that each Milestone Fund outperformed its respective Morningstar category peer average for its first full year of performance.
To further enhance the performance of the Aggressive Opportunities Fund, the Directors also considered the modifications to the Fund’s portfolio structure recommended by the Adviser, including the addition of two new subadvisers, which were presented for approval at the January Meeting. The Directors’ consideration of these new subadvisory arrangements for the Aggressive Opportunities Fund is described below.
For the Sub-Advised Funds, the Directors also considered the Adviser’s conclusions, and the reasons supporting the Adviser’s conclusions, that the performance record of each subadviser with respect to the assets of the Fund it manages supports approval of its Subadvisory Agreement.
Fund Expenses, Costs of Services, Economies of Scale and Related Benefits
Management Fees and Expenses. The Board considered the fees payable under each Advisory Agreement and under each Subadvisory Agreement for the Sub-Advised Funds. The Board reviewed the information compiled by Lipper Inc. comparing each Fund’s contractual management fee rate (at common asset levels) and actual management fee rate (which included the effect of any fee waivers) as a percentage of total assets— these fee rates include advisory and administrative service fees—to other funds in its peer group. Based on the data provided on management fee rates, on a Fund-by-Fund basis, the Board noted that: (i) each Fund’s contractual management fee rate was lower than or equal to the median of its expense peer group; and (ii) except as indicated, the actual management fees of each of the following Funds were lower than or equal to the median of its expense peer group—Money Market Fund, Short-Term Bond Fund, US Government Securities Fund, Asset Allocation Fund, Equity Income Fund, Growth & Income Fund, Growth Fund, Aggressive Opportunities Fund, International Fund, Core Bond Index Fund (actual management fees for Class I were above the median), 500 Stock Index Fund (actual management fees for Class I were above the median), Broad Market Index Fund, Mid/Small Company Index Fund (actual management fees for Class I were above the median), Overseas Equity Index Fund, Model Portfolio Savings Oriented Fund and Model Portfolio Traditional Growth Fund.
The Board further noted that the actual management fees of the following Funds were above the median of their expense peer group: Model Portfolio Conservative Growth Fund, Model Portfolio Long-Term Growth Fund, Model Portfolio All-Equity Growth Fund and each of the Milestone Funds. With respect to the Model Portfolio Funds, the Board further
172
VANTAGEPOINT FUNDS
Additional Information (Unaudited)—(Continued)
considered that the fee schedule for these Funds was amended effective July 1, 2005 to incorporate “breakpoints” (i.e., reductions in the management fee rate as assets increase) and that the Model Portfolio Long-Term Growth Fund and Traditional Growth Fund are at asset levels where they are benefiting from the implementation of these breakpoints.
The Board also reviewed the information compiled by Lipper Inc. comparing each Fund’s total expense ratio to other funds in its peer group. Based on this comparative expense data, the Board noted that actual total expense ratios for each Fund were below the median of its expense peer group, except for the Class I shares of each of the Mid/Small Company Index Fund and Overseas Equity Index Fund. The Directors further noted the Adviser’s current agreement to limit certain expenses of each Milestone Fund until April 30, 2006, and, after that, the Adviser’s intention to limit the overall expenses of each Milestone Fund until April 30, 2007.
With regard to the Sub-Advised Funds, the Directors also considered VIA’s assessment, which was based in part on information provided by the subadvisers, that each subadvisory fee reflects the lowest available fee schedule from the respective subadviser for “like accounts.” For this purpose, the term “like accounts” was used by the Adviser generally to describe other portfolios managed by a subadviser that have the same investment objective and other characteristics similar to the portfolio being managed for the Fund by the subadviser.
The foregoing comparisons assisted the Directors in determining to approve each Advisory Agreement and Subadvisory Agreement by providing them with a basis for evaluating each Fund’s management fee and expense ratio on a relative basis.
The Directors noted that revised subadvisory fee schedules had been previously approved by the Board for T. Rowe relating to the Equity Income Fund and Growth & Income Fund (effective January 1, 2006) and Peregrine relating to the Growth Fund (effective May 23, 2005), which reflect a reduction in the subadvisory fee rates to be paid to each subadviser by the relevant Fund. With respect to the Subadvisory Agreement with Southeastern for the Aggressive Opportunities Fund, the Directors also considered the revised subadvisory fee schedule presented to the Board for approval, which reflected a reduction in fee rate in light of the Adviser’s recommendation to change Southeastern’s investment mandate from global to domestic in connection with the other subadviser changes presented at the January Meeting for that Fund.
For each Sub-Advised Fund, the Directors also considered the Adviser’s conclusion that the compensation payable to each subadviser under its respective Subadvisory Agreement is fair and reasonable in light of the nature and quality of the services to be provided to the Fund.
Profitability. The Board reviewed the materials it received from the Adviser regarding its revenues and expenses in connection with the services provided to each Fund and the Funds as a whole. The Directors also considered information regarding VTA’s fees and net margin levels relating to the services it provides to each Fund and the Funds as a whole. The materials provided in this regard showed, and the Directors acknowledged, that the Adviser and VTA experienced positive net margins with respect to certain Funds and did not with respect to other Funds. The Directors were satisfied with the overall net margin levels. With respect to the Sub-Advised Funds, the Directors reviewed the subadviser profitability information to the extent available, and took into account the Adviser’s on-going monitoring of the appropriateness and competitiveness of each subadvisory fee and fee structure, as well as the Adviser’s assessment that the subadvisory fee rates charged by each subadviser reflects the lowest available fee schedule from the subadviser for like accounts.
Economies of Scale. With respect to whether economies of scale are realized by the Adviser as a Fund’s assets increase and whether management fee levels reflect these economies of scale for the benefit of Fund investors, the Board considered, on a Fund-by-Fund basis, the current level of management fee charged and fee structure and concluded that the Adviser’s fee structure with respect to each Fund was appropriate at this time. The Directors also acknowledged that they will continue to seek and review information from the Adviser relating to economies of scale. With respect to the Model Portfolio Funds, the Directors considered that the Adviser’s fee schedule for these Funds was amended effective July 1, 2005 to incorporate breakpoints to account for economies of scale to be experienced by the Adviser as assets increase for the benefit of Fund shareholders.
With regard to each Sub-Advised Fund, the Directors considered that the fee schedule relating to each Subadvisory Agreement (except for the Subadvisory Agreement with Artisan) currently includes breakpoints and these Sub-Advised Funds and their shareholders will benefit from reduced subadvisory fee rates as the assets managed by the relevant subadviser increase, and that this represents a recognition that economies are being passed on by the subadviser to the
173
VANTAGEPOINT FUNDS
Additional Information (Unaudited)—(Continued)
Fund’s shareholders. The Directors further considered the appropriateness of each subadvisory fee structure in light of the Adviser’s assessment that each subadvisory fee reflects the lowest available fee schedule from the respective subadviser for like accounts.
“Fall Out” or Ancillary Benefits. The Board considered whether there were any “fall-out” or ancillary benefits that may accrue to the Adviser and its affiliates and the subadvisers as a result of their relationship with the Funds. Based on the information provided by the Adviser, the Directors noted that there did not appear to be any significant benefits in this regard. The Board also considered that certain subadvisers may direct Fund brokerage transactions to certain brokers to obtain research and other services. However, the Directors noted that the subadvisers are required to select brokers who meet the Funds’ requirements for seeking best execution, and that the Adviser monitors and evaluates the subadvisers’ trade execution with respect to Fund brokerage transactions on a regular basis and provides reports to the Board in this regard. The Board concluded that the benefits accruing to the subadvisers by virtue of their relationship to the Funds are reasonable.
After evaluation of the comparative performance, fee and expense information and the profitability, ancillary benefits and other considerations as described above, and in light of the nature, extent and quality of services to be provided by the Adviser and each subadviser, the Board concluded that the level of fees to be paid to the Adviser with respect to each Fund, and each subadviser with respect to the Sub-Advised Funds, is reasonable.
In summary, based on the various considerations discussed above, the Board determined that approval of the Advisory Agreement with respect to each Fund and the Subadvisory Agreement with respect to each Sub-Advised Fund was in the best interests of the applicable Fund. As a result, the Board, including a majority of the Independent Directors, approved each Advisory Agreement and Subadvisory Agreement.
Consideration of Initial Subadvisory Agreements with TimesSquare Capital Management, LLC and Legg Mason Capital Management, Inc. for the Aggressive Opportunities Fund
At the January Meeting, the Board, including a majority of the Independent Directors, also approved initial Subadvisory Agreements among the Company, the Adviser and each of TimesSquare Capital Management, LLC (“TimesSquare”) and Legg Mason Capital Management, Inc. (“Legg Mason”), relating to the Aggressive Opportunities Fund.
With respect to the Board’s consideration of the respective Subadvisory Agreements with TimesSquare and Legg Mason, the Directors received written information in advance of the January Meeting from the Adviser, which included: (1) the Adviser’s rationale for recommending modifications to the portfolio structure of the Aggressive Opportunities Fund; (2) the process by which the Adviser selected and recommended for Board approval TimesSquare and Legg Mason as subadvisers of the Aggressive Opportunities Fund; (3) the nature and quality of the services that TimesSquare and Legg Mason would provide to the Aggressive Opportunities Fund; (4) each proposed subadviser’s experience, reputation, investment management business, personnel and operations; (5) each proposed subadviser’s brokerage and trading policies and practices; (6) the level of subadvisory fees to be charged to the Aggressive Opportunities Fund by TimesSquare and Legg Mason and a comparison of those fees to the: (a) standard separate account fee schedule charged by each of TimesSquare and Legg Mason for managing mid-cap growth equity accounts and mid-cap core equity accounts, respectively; and (b) fees charged by a group of separate account investment managers utilizing an active mid-cap growth equity mandate with respect to TimesSquare and an active mid-cap core equity mandate with respect to Legg Mason; (7) TimesSquare’s and Legg Mason’s compliance programs; (8) TimesSquare’s and Legg Mason’s historical performance returns utilizing a mid-cap growth equity mandate and a mid-cap core equity mandate, respectively, and such performance compared to a relevant benchmark; (9) the Aggressive Opportunities Fund’s projected total expense ratio compared to a group of mid-cap growth mutual funds similar in investment objective to the Fund and with a minimum of $100 million in assets; and (10) each proposed subadviser’s financial condition.
In considering the information and materials described above, the Independent Directors received assistance from and met separately with their independent legal counsel and were provided with a written description of their statutory responsibilities and the legal standards that are applicable to approvals of advisory agreements.
In determining whether to approve each Subadvisory Agreement, the Directors considered the information received in advance of the January Meeting, the presentations made by, and discussions held with, TimesSquare, Legg Mason, the Adviser’s personnel and the Company’s CCO at the January Meeting, as well as a variety of factors, and reached the following conclusions:
174
VANTAGEPOINT FUNDS
Additional Information (Unaudited)—(Continued)
Nature, Extent and Quality of Services. With respect to the nature, extent and quality of the services expected to be provided by TimesSquare and Legg Mason under their respective Subadvisory Agreements, the Directors considered the specific investment process to be employed by each of TimesSquare and Legg Mason in managing the assets of the Aggressive Opportunities Fund to be allocated to them; the qualifications of TimesSquare’s and Legg Mason’s respective investment management teams with regard to implementing a mid-cap growth equity mandate and a mid-cap core equity mandate, respectively; each proposed subadviser’s overall favorable performance record as compared to a relevant benchmark; the subadvisers’ infrastructure and whether it appears to adequately support a mid-cap growth equity strategy for TimesSquare and a mid-cap core equity strategy for Legg Mason; and the Adviser’s review process and favorable assessment as to the nature, quality and extent of the subadvisory services expected to be provided by each of TimesSquare and Legg Mason to the Aggressive Opportunities Fund. The Directors acknowledged that TimesSquare and Legg Mason each has a successful performance record as a mid-cap growth equity manager and a mid-cap core equity manager, respectively; each has an experienced portfolio management team; and each appears to have adequate infrastructure and support staff to seek to achieve favorable results implementing a mid-cap growth equity mandate, with respect to TimesSquare, and a mid-cap core equity mandate, with respect to Legg Mason, for the Aggressive Opportunities Fund. The Directors concluded that the nature, extent and quality of the subadvisory services expected to be provided by each of Legg Mason and TimesSquare were appropriate for the Aggressive Opportunities Fund in light of its investment objective and, thus, supported a decision to approve each Subadvisory Agreement.
Investment Performance. The Directors evaluated TimesSquare’s and Legg Mason’s historical investment performance record in managing assets utilizing a mid-cap growth equity mandate, with respect to TimesSquare, and a mid-cap core equity mandate, with respect to Legg Mason, and considered each performance record versus a relevant benchmark. The Directors concluded that the historical investment performance record of each of TimesSquare and Legg Mason supported approval of each Subadvisory Agreement with TimesSquare and Legg Mason, respectively.
Subadvisory Fees, Expense Ratio Impact and Economies of Scale. In evaluating each proposed subadvisory fee, the Directors reviewed TimesSquare’s and Legg Mason’s subadvisory fee schedules and breakpoints. They considered that, based on the amount of assets proposed to be allocated to the proposed subadvisers at current asset levels, and taking into account the other proposed subadviser changes, it was projected there would be no increase in overall subadvisory fees for the Aggressive Opportunities Fund, and there would, in fact, be a decrease in overall subadvisory fees and the Fund’s total expense ratio.
The Directors considered comparisons of the subadvisory fees to be charged by TimesSquare and Legg Mason to the Aggressive Opportunities Fund with each subadviser’s standard fee schedule for managing an investment mandate similar to the mandate the subadviser is to employ on behalf of the Fund. The Directors also considered that, according to the information provided, the proposed fee schedule for TimesSquare reflects the lowest fee currently charged by the subadviser to other mid-cap growth accounts of comparable size, and the proposed fee schedule for Legg Mason reflects the lowest fee currently charged by the subadviser to other mid-cap accounts. Additionally, the services each subadviser is to provide to the Aggressive Opportunities Fund appeared to be comparable to those each subadviser provides to such other advisory clients. The Directors reviewed information provided by the Adviser (which was based on an independent third-party source) on the fees charged to accounts with assets comparable to the amount of assets to be allocated initially to TimesSquare and Legg Mason by a group of separate account investment managers that employ an active mid-cap growth equity mandate, with respect to TimesSquare, and an active mid-cap core equity mandate, with respect to Legg Mason. According to the information provided, the effective fee rate to be paid by the Aggressive Opportunities Fund to each of TimesSquare and Legg Mason would be below the median fee charged by such managers and in the first quartile (lowest fee quartile) of all active mid-cap growth equity managers with respect to TimesSquare and of all active mid-cap core equity managers with respect to Legg Mason. Referring to data compiled by Lipper Inc., an independent provider of investment company data, the Directors also noted that the projected investment advisory fee for the Aggressive Opportunities Fund, taking into account all of the proposed subadviser changes, was lower than the median investment advisory fee of a selected group of investment companies with a similar investment objective classification. The Directors also considered information provided by the Adviser on the total expense ratios of a group of mid-cap growth mutual funds with investment objectives similar to the Aggressive Opportunities Fund and with minimum assets of $100 million, which showed that, if TimesSquare and Legg Mason each served as a subadviser to the Aggressive Opportunities Fund at the proposed fee rates and asset allocation levels, and taking into account the other proposed subadviser changes, the Fund’s projected total expense ratio would continue to be below the average and median expense ratios of such funds.
175
VANTAGEPOINT FUNDS
Additional Information (Unaudited)—(Continued)
The foregoing comparisons assisted the Directors in considering each Subadvisory Agreement by providing them with a basis for evaluating TimesSquare’s and Legg Mason’s fees, including in light of the Aggressive Opportunities Fund’s projected overall investment advisory fee and total expense ratio, on a relative basis. Based on this information, the Directors concluded that TimesSquare’s and Legg Mason’s subadvisory fees each appeared to be within a reasonable range for the services to be provided.
The Directors also reviewed the information provided by Legg Mason regarding the estimated profits to be realized from the subadviser’s relationship with the Aggressive Opportunities Fund; the Directors were informed that such information was not available with respect to TimesSquare. In reviewing the extent to which economies of scale may be realized by TimesSquare and Legg Mason as the assets of the Aggressive Opportunities Fund to be managed by each subadviser grow, and whether the proposed fee levels reflect these economies, the Directors considered that the proposed fee schedule for each of TimesSquare and Legg Mason included breakpoints, which indicated that the proposed subadvisory fee rates for both TimesSquare and Legg Mason are intended to capture certain anticipated economies of scale for the benefit of the Aggressive Opportunities Fund’s shareholders in connection with the services to be provided, and concluded that the proposed fee schedules for TimesSquare and Legg Mason were appropriate at this time.
Other Considerations. The Directors considered the Adviser’s judgment that the addition of TimesSquare and Legg Mason as complementary subadvisers to the Aggressive Opportunities Fund would add value by enhancing the benefits of the Fund’s multi-management approach. In this regard, the Directors considered that the addition of these subadvisers, along with the Adviser’s recommendations to terminate Wellington and to retain Southeastern, while reducing the assets allocated to Southeastern and changing its mandate from global to domestic, should serve to move the Aggressive Opportunities Fund’s portfolio characteristics closer to those of its benchmark and peers, increase portfolio diversification, and help to reduce the volatility and improve the risk profile of the Fund while increasing its potential for positive returns. The Directors also considered information from the Adviser concerning its strategy to efficiently and economically effect the subadviser transitions. The Directors concluded that these considerations supported approval of each Subadvisory Agreement.
The Directors considered the selection and due diligence process employed by the Adviser in deciding to recommend TimesSquare and Legg Mason as subadvisers to the Aggressive Opportunities Fund and also considered the Adviser’s conclusion that the fees to be paid to each of TimesSquare and Legg Mason for their respective services to the Fund are reasonable and appropriate in light of the nature and quality of services to be provided by each subadviser and the reasons supporting that conclusion. The Directors concluded that the Adviser’s recommendations and conclusions supported approval of each Subadvisory Agreement.
The Directors also considered the potential “fall-out” or ancillary benefits that may accrue to TimesSquare and Legg Mason due to each subadviser’s relationship with the Aggressive Opportunities Fund. The Directors considered that each subadviser may direct the Aggressive Opportunities Fund’s brokerage transactions to certain brokers to obtain research and other services. However, the Directors noted that all subadvisers are required to select brokers who meet the Aggressive Opportunities Fund’s requirements for seeking best execution, and that the Adviser monitors and evaluates the subadvisers’ trade execution with respect to Fund brokerage transactions on a regular basis and provides reports to the Board in this regard. The Directors concluded that the potential benefits accruing to each subadviser by virtue of its relationship to the Fund are reasonable.
Conclusion. After full consideration of the foregoing factors, with no single factor identified as being of paramount importance, the Directors, including a majority of the Independent Directors, concluded that the initial approval of each Subadvisory Agreement is in the best interests of the Aggressive Opportunities Fund and its shareholders, and approved the Subadvisory Agreement with, and the fee to be paid to, each of TimesSquare and Legg Mason.
G. Householding
Only one copy of this Annual Report may be mailed to households, even if more than one person in a household is a shareholders of record; unless The Vantagepoint Funds has received instructions to the contrary. If you need additional copies of this Annual Report, please contact The Vantagepoint Funds toll free at 1-800-669-7400 or in writing at 777 North Capitol Street, NE, Suite 600; Washington, D.C. 20002. If you do not want this mailing of this Annual Report to be combined with those for other members of your household, contact the Vantagepoint Funds in writing at 777 North Capitol Street, NE, Suite 600, Washington, D.C. 20002 or toll free at 1-800-669-7400.
176
VANTAGEPOINT FUNDS
Additional Information (Unaudited)—(Continued)
H. Other Available Information
A description of the Company’s proxy voting policies and procedures and the proxy voting record for the 12-month period ended June 30, 2005 are available without charge, upon request, by calling 1-800-669-7400, on the Company’s website at www.icmarc.org or by accessing the Securities and Exchange Commission’s website at www.sec.gov.
The Company files its complete schedule of portfolio holdings with the SEC for the first and third quarters of each fiscal year on Form N-Q; the Company’s Forms N-Q are available on the SEC’s website at www.sec.gov and may be reviewed and copied at the SEC’s Public Reference Room in Washington, D.C. Information on the operation of the Public Reference Room may be obtained by calling 1-800-SEC-0330.
177
SCHEDULE OF INVESTMENTS
December 31, 2005
| | | | | | | |
| | |
Vantagepoint
Money Market Fund | | Shares | | Value | |
| | |
|
MUTUAL FUNDS—99.0% | | | | | | | |
| | |
AIM Short-Term Investments
Trust Liquid Assets Portfolio
(Cost $141,546,781) | | | 141,546,781 | | $ | 141,546,781 | |
| | | | | | | |
TOTAL INVESTMENTS—99.0% | | | | | | | |
(Cost $141,546,781) | | | | | | 141,546,781 | |
Other assets less liabilities—1.0% | | | | | | 1,432,310 | |
| | | | | | | |
|
NET ASSETS—100.0% | | | | | $ | 142,979,091 | |
| | | | | | | |
| | |
178 | See accompanying notes to financial statements. | |
SCHEDULE OF INVESTMENTS
December 31, 2005
| | | | | | | | | | |
| | | | | | | | | | | |
Vantagepoint Short-Term | | | | | | | |
Bond Fund | | | | | | | |
| | | | | | | | | | | |
|
Coupon
Rate | | Maturity
Date | | | | Face | | | Value | |
| | | | | | | | | | | |
| | | | | | | | | | |
CORPORATE OBLIGATIONS—26.2% | | | | | | | |
| | | | | | | | | | | |
Automotive—0.7% | | | | | | | |
DaimlerChrysler North America Holding Corporation, Guaranteed Note | | | | | | | |
4.750% | | 01/15/2008 | | | $ | 1,205,000 | | $ | 1,194,577 | |
DaimlerChrysler North America Holding Corporation, Guaranteed Note | | | | | | | |
4.050% | | 06/04/2008 | | | | 1,640,000 | | | 1,597,435 | |
General Motors Acceptance Corporation, Global Note | | | | | | | |
5.125% | | 05/09/2008 | | † | | 1,250,000 | | | 1,113,383 | |
| | | | | | | | | | |
| | | | | | | | | 3,905,395 | |
| | | | | | | | | | |
Banking—4.3% | | | | | | | |
Bank of America Corporation, Subordinated Note | | | | | | | |
6.375% | | 02/15/2008 | | | | 5,000,000 | | | 5,151,170 | |
Bank of America Corporation, Subordinated Note | | | | | | | |
6.250% | | 04/01/2008 | | | | 1,500,000 | | | 1,542,938 | |
Citigroup, Inc., Note | | | | | | | |
6.200% | | 03/15/2009 | | | | 5,105,000 | | | 5,299,000 | |
Eksportfinans A/S, Note, (MTN) (Norway) | | | | | | | |
4.750% | | 12/15/2008 | | | | 5,100,000 | | | 5,112,077 | |
Household Finance Corporation, Note | | | | | | | |
6.400% | | 06/17/2008 | | | | 6,000,000 | | | 6,193,332 | |
| | | | | | | | | | |
| | | | | | | | | 23,298,517 | |
| | | | | | | | | | |
Beverages, Food & Tobacco—1.1% | | | | | | | |
Diageo Capital PLC, Global Note (United Kingdom) | | | | | | | |
3.375% | | 03/20/2008 | | | | 2,640,000 | | | 2,557,215 | |
Kellogg Co., Senior Note | | | | | | | |
2.875% | | 06/01/2008 | | | | 2,860,000 | | | 2,726,469 | |
Smithfield Foods, Inc., Senior Note | | | | | | | |
8.000% | | 10/15/2009 | | | | 625,000 | | | 662,500 | |
| | | | | | | | | | |
| | | | | | | | | 5,946,184 | |
| | | | | | | | | | |
Chemicals—0.1% | | | | | | | |
Lyondell Chemical Co., Series A, Senior Secured Note | | | | | | | |
9.625% | | 05/01/2007 | | | | 625,000 | | | 655,469 | |
| | | | | | | | | | |
Commercial Services—0.3% | | | | | | | |
Allied Waste North America, Senior Note | | | | | | | |
8.500% | | 12/01/2008 | | | | 620,000 | | | 654,100 | |
Service Corp. International, Note | | | | | | | |
7.700% | | 04/15/2009 | | | | 800,000 | | | 844,000 | |
| | | | | | | | | | |
| | | | | | | | | 1,498,100 | |
| | | | | | | | | | |
Communications—0.5% | | | | | | | |
Motorola, Inc., Senior Note | | | | | | | |
4.608% | | 11/16/2007 | | | | 2,172,000 | | | 2,159,389 | |
PanAmSat Corporation, Note | | | | | | | |
6.375% | | 01/15/2008 | | | | 625,000 | | | 628,125 | |
| | | | | | | | | | |
| | | | | | | | | 2,787,514 | |
| | | | | | | | | | |
Computer Software & Processing—0.1% | | | | | | | |
Unisys Corp., Senior Note | | | | | | | |
6.875% | | 03/15/2010 | | † | | 620,000 | | | 576,600 | |
| | | | | | | | | | |
Electric Utilities—0.1% | | | | | | | |
PSEG Energy Holdings LLC, Senior Note | | | | | | | |
8.625% | | 02/15/2008 | | | | 625,000 | | | 653,125 | |
| | | | | | | | | | |
Financial Services—9.3% | | | | | | | |
CIT Group, Inc., Senior Note | | | | | | | |
5.750% | | 09/25/2007 | | | | 6,000,000 | | | 6,085,939 | |
| | | | | | | | | | |
| | | | | | | | | | | |
| | | | | | | | | | |
Coupon
Rate | | Maturity
Date | | | | Face | | | Value | |
| | | | | | | | | | | |
Citicorp, Subordinated Note | | | | | | | |
7.125% | | 05/15/2006 | | | $ | 2,326,000 | | $ | 2,344,655 | |
Countrywide Home Loans, Inc., Note, (MTN) | | | | | | | |
3.250% | | 05/21/2008 | | | | 2,640,000 | | | 2,536,546 | |
General Electric Capital Corporation, Note, (FRN) | | | | | | | |
4.625% | | 09/15/2009 | | | | 5,955,000 | | | 5,900,291 | |
General Electric Capital Corporation, Note, (MTN) | | | | | | | |
4.250% | | 01/15/2008 | | | | 2,790,000 | | | 2,758,883 | |
Household Finance Corporation, Note | | | | | | | |
5.750% | | 01/30/2007 | | | | 3,280,000 | | | 3,307,896 | |
Merrill Lynch & Co., Inc., Note, (MTN) | | | | | | | |
4.831% | | 10/27/2008 | | | | 2,540,000 | | | 2,536,495 | |
MSW Energy Holdings LLC/MSW Energy Finance Co., Inc., Senior Secured Note | | | | | | | |
7.375% | | 09/01/2010 | | | | 625,000 | | | 645,313 | |
Nomura Asset Securities Corporation | | | | | | | |
6.590% | | 03/15/2030 | | | | 6,000,000 | | | 6,204,899 | |
Principal Life Global Funding I, Note 144A (MTN) | | | | | | | |
5.125% | | 06/28/2007 | | * | | 2,750,000 | | | 2,751,268 | |
SLM Corporation, Series A, Note (MTN) | | | | | | | |
5.625% | | 04/10/2007 | | | | 3,300,000 | | | 3,320,760 | |
TIAA Global Markets 144A | | | | | | | |
3.875% | | 01/22/2008 | | * | | 6,000,000 | | | 5,886,594 | |
Wells Fargo & Company, Note | | | | | | | |
4.125% | | 03/10/2008 | | | | 3,560,000 | | | 3,508,344 | |
Wells Fargo & Company, Senior Note | | | | | | | |
4.000% | | 08/15/2008 | | | | 2,585,000 | | | 2,538,268 | |
| | | | | | | | | | |
| | | | | | | | | 50,326,151 | |
| | | | | | | | | | |
Forest Products & Paper—0.1% | | | | | | | |
Georgia-Pacific Corp., Note | | | | | | | |
7.500% | | 05/15/2006 | | | | 625,000 | | | 632,031 | |
| | | | | | | | | | |
Health Care Providers—0.1% | | | | | | | |
HCA, Inc., Note | | | | | | | |
5.250% | | 11/06/2008 | | | | 625,000 | | | 619,890 | |
| | | | | | | | | | |
Heavy Machinery—0.5% | | | | | | | |
John Deere Capital Corporation, Global Note | | | | | | | |
3.900% | | 01/15/2008 | | | | 2,820,000 | | | 2,766,104 | |
| | | | | | | | | | |
Home Construction, Furnishings & Appliances—0.1% | | | | | | | |
KB Home, Senior Subordinated Note | | | | | | | |
8.625% | | 12/15/2008 | | | | 625,000 | | | 666,983 | |
| | | | | | | | | | |
Household Products—0.1% | | | | | | | |
Owens Brockway Glass Container, Inc., Senior Secured Note | | | | | | | |
8.875% | | 02/15/2009 | | | | 625,000 | | | 655,469 | |
| | | | | | | | | | |
Insurance—1.4% | | | | | | | |
Allstate Financial Global Funding, Secured Note 144A | | | | | | | |
5.250% | | 02/01/2007 | | * | | 4,500,000 | | | 4,511,534 | |
UnitedHealth Group, Inc., Note | | | | | | | |
3.375% | | 08/15/2007 | | | | 3,180,000 | | | 3,109,108 | |
| | | | | | | | | | |
| | | | | | | | | 7,620,642 | |
| | | | | | | | | | |
Lodging—0.1% | | | | | | | |
MGM Mirage, Senior Note | | | | | | | |
6.000% | | 10/01/2009 | | | | 220,000 | | | 219,725 | |
| | | | | | | | | | |
Media—Broadcasting & Publishing—1.4% | | | | | | | |
Echostar DBS Corporation, Note | | | | | | | |
5.750% | | 10/01/2008 | | | | 625,000 | | | 615,625 | |
| | |
| See accompanying notes to financial statements. | 179 |
SCHEDULE OF INVESTMENTS—(Continued)
December 31, 2005
| | | | | | | | | | |
| | | | | | |
Vantagepoint Short-Term
Bond Fund |
| | | | | | |
|
Coupon
Rate | | Maturity
Date | | | Face | | Value | |
| | | | | | |
|
CORPORATE OBLIGATIONS—(Continued) | | | | | | | |
| | | | | | |
Gannett Co., Inc., Senior Note | | | | | | | |
4.125% | 06/15/2008 | | | $ | 3,430,000 | | $ | 3,343,543 | |
Time Warner, Inc., Guaranteed Note | | | | | | | |
6.150% | | 05/01/2007 | | | | 3,280,000 | | | 3,321,748 | |
| | | | | | | | | | |
| | | | | | | | | 7,280,916 | |
| | | | | | | | | | |
Retailers—0.4% | | | | | | | |
Fred Meyer, Inc., Note | | | | | | | |
7.450% | | 03/01/2008 | | | | 2,120,000 | | | 2,210,096 | |
| | | | | | | | | | |
Telephone Systems—5.0% | | | | | | | |
America Movil SA de CV, Guaranteed Senior Note (Mexico) | | | | | | | |
4.125% | | 03/01/2009 | | | | 1,200,000 | | | 1,169,400 | |
AT&T Wireless Services, Inc., Note | | | | | | | |
7.500% | | 05/01/2007 | | | | 2,970,000 | | | 3,071,063 | |
BellSouth Corp., Note | | | | | | | |
4.200% | | 09/15/2009 | | | | 7,200,000 | | | 6,999,869 | |
Deutsche Telekom International Finance BV, Global Note (Netherlands) | | | | | | | |
3.875% | | 07/22/2008 | | | | 2,600,000 | | | 2,540,980 | |
Rogers Wireless Communications, Inc., Senior Secured Note (FRN) (Canada) | | | | | | | |
7.616% | | 12/15/2010 | | # | | 625,000 | | | 648,438 | |
Sprint Capital Corporation, Note | | | | | | | |
6.000% | | 01/15/2007 | | | | 3,270,000 | | | 3,302,792 | |
Telecom Italia Capital SA, Series A, Senior Note (Luxembourg) | | | | | | | |
4.000% | | 11/15/2008 | | | | 2,970,000 | | | 2,882,201 | |
Verizon Wireless Capital LLC, Note | | | | | | | |
5.375% | | 12/15/2006 | | | | 3,280,000 | | | 3,291,552 | |
Vodafone Group PLC, Note (United Kingdom) | | | | | | | |
3.950% | | 01/30/2008 | | | | 3,460,000 | | | 3,401,149 | |
| | | | | | | | | | |
| | | | | | | | | 27,307,444 | |
| | | | | | | | | | |
Transportation—0.5% | | | | | | | |
CSX Corp., Note | | | | | | | |
6.250% | | 10/15/2008 | | | | 2,500,000 | | | 2,580,380 | |
Royal Caribbean Cruises, Ltd., Senior Note | | | | | | | |
7.000% | | 10/15/2007 | | | | 310,000 | | | 319,130 | |
| | | | | | | | | | |
| | | | | | | | | 2,899,510 | |
| | | | | | | | | | |
TOTAL CORPORATE OBLIGATIONS | | | | | | | |
(Cost $144,370,568) | | | | | | 142,525,865 | |
| | | | | | | | | | |
| | | | | | | | | | |
| | | | | | |
U.S. GOVERNMENT AGENCY OBLIGATIONS—12.3% | | | | | | | |
| | | | | | |
Mortgage Backed—7.8% | | | | | | | |
Federal Home Loan Mortgage Corporation | | | | | | | |
4.404% | | 10/01/2034 | | | | 6,870,232 | | | 6,745,970 | |
Federal Home Loan Mortgage Corporation, Series 2885, Class DK | | | | | | | |
3.500% | | 10/15/2012 | | | | 5,168,842 | | | 5,088,433 | |
Federal National Mortgage Association | | | | | | | |
5.168% | | 10/01/2034 | | | | 8,188,469 | | | 8,231,614 | |
5.106% | | 09/01/2034 | | | | 872,118 | | | 873,473 | |
5.036% | | 10/01/2034 | | | | 10,273,743 | | | 10,301,498 | |
5.017% | | 09/01/2034 | | | | 717,975 | | | 720,033 | |
4.818% | | 10/01/2034 | | | | 1,303,860 | | | 1,301,736 | |
Federal National Mortgage Association, Series 2004-81, Class KG | | | | | | | |
3.500% | | 05/25/2012 | | | | 4,777,452 | | | 4,706,577 | |
FHLMC, Series 2891, Class LN | | | | | | | |
4.250% | | 06/15/2024 | | | | 4,252,661 | | | 4,197,993 | |
| | | | | | | | | | |
| | | | | | | | | 42,167,327 | |
| | | | | | | | | | |
| | | | | | | | | | |
| | | | | | | | | | | |
Coupon
Rate | | Maturity
Date | | | Face | | Value | |
| | | | | | | | | | | |
U.S. Government Agencies—4.5% | | | | | | | |
Federal Home Loan Bank | | | | | | | |
4.375% | | 10/03/2008 | | | $ | 5,100,000 | | $ | 5,029,747 | |
4.180% | | 01/11/2006 | | †† | | 16,500,000 | | | 16,478,926 | |
3.620% | | 01/11/2006 | | †† | | 3,000,000 | | | 2,996,682 | |
| | | | | | | | | | |
| | | | | | | | | 24,505,355 | |
| | | | | | | | | | |
| | | | | | | | | | |
TOTAL U.S. GOVERNMENT AGENCY OBLIGATIONS | | | | | | | |
(Cost $67,344,834) | | | | | | 66,672,682 | |
| | | | | | | | | | |
| | | | | | | | | | |
| | | | | | | | | | | |
U.S. TREASURY OBLIGATIONS—29.0% | | | | | | | |
| | | | | | | | | | | |
U.S. Treasury Notes—29.0% | | | | | | | |
U.S. Treasury Note | | | | | | | |
4.250% | | 10/31/2007 | | | | 13,400,000 | | | 13,364,932 | |
4.125% | | 08/15/2008 | | | | 3,707,000 | | | 3,687,742 | |
4.000% | | 09/30/2007 | | | | 1,250,000 | | | 1,241,700 | |
3.625% | | 06/30/2007 | | | | 76,205,000 | | | 75,359,658 | |
3.500% | | 05/31/2007 | | | | 25,928,000 | | | 25,609,993 | |
3.375% | | 12/15/2008- | | | | | | | | |
| | 10/15/2009 | | | | 11,100,000 | | | 10,767,205 | |
3.000% | | 11/15/2007 | | | | 2,170,000 | | | 2,116,599 | |
2.875% | | 11/30/2006 | | ** | | 5,000,000 | | | 4,932,230 | |
2.500% | | 10/31/2006 | | | | 21,150,000 | | | 20,830,275 | |
| | | | | | | | | | |
TOTAL U.S. TREASURY OBLIGATIONS | | | | | | | |
(Cost $158,889,152) | | | | | | 157,910,334 | |
| | | | | | | | | | |
| | | | | | | | | | |
| | | | | | | | | | | |
ASSET BACKED SECURITIES—16.6% | | | | | | | |
| | | | | | | | | | | |
Automotive—8.2% | | | | | | | |
BMW Vehicle Owner Trust, Series 2003-A, Class A4 | | | | | | | |
2.530% | | 02/25/2008 | | | | 1,184,343 | | | 1,174,415 | |
Capital Auto Receivables Asset Trust, Series 2002-5, Class A4 | | | | | | | |
2.920% | | 04/15/2008 | | | | 525,187 | | | 525,129 | |
Capital Auto Receivables Asset Trust, Series 2004-2, Class A3 | | | | | | | |
3.580% | | 01/15/2009 | | | | 6,100,000 | | | 5,988,126 | |
Chase Manhattan Auto Owner Trust, Series 2004-A, Class A3 | | | | | | | |
2.080% | | 05/15/2008 | | | | 4,801,678 | | | 4,750,484 | |
Daimler Chrysler Auto Trust, Series 2003-B, Class A-4 | | | | | | | |
2.860% | | 03/09/2009 | | | | 6,010,000 | | | 5,889,737 | |
Daimler Chrysler Auto Trust, Series 2005-A, Class A3 | | | | | | | |
3.490% | | 12/08/2008 | | | | 1,000,000 | | | 987,442 | |
Ford Credit Auto Owner Trust, Series 2005-A, Class A3 | | | | | | | |
3.480% | | 11/15/2008 | | | | 2,400,000 | | | 2,371,162 | |
Ford Credit Auto Owner Trust, Series 2005-A, Class B | | | | | | | |
3.880% | | 01/15/2010 | | | | 2,600,000 | | | 2,533,356 | |
Honda Auto Receivables Owner Trust, Series 2003-2, Class A4 | | | | | | | |
2.160% | | 10/21/2008 | | | | 750,000 | | | 737,189 | |
Honda Auto Receivables Owner Trust, Series 2003-4, Class A4 | | | | | | | |
2.790% | | 03/16/2009 | | | | 6,860,000 | | | 6,713,249 | |
Nissan Auto Receivables Owner Trust, Series 2003-C, Class A-5 | | | | | | | |
3.210% | | 03/16/2009 | | | | 2,040,000 | | | 1,993,867 | |
Nissan Auto Receivables Owner Trust, Series 2004-A, Class A4 | | | | | | | |
2.760% | | 07/15/2009 | | | | 5,000,000 | | | 4,847,544 | |
| |
180 | See accompanying notes to financial statements. |
SCHEDULE OF INVESTMENTS—(Continued)
December 31, 2005
| | | | | | | | | | |
| | | | | | | | |
Vantagepoint Short-Term
Bond Fund |
| | | | | | | | |
|
Coupon
Rate | | Maturity
Date | | | Face | | Value | |
| | | | | | | | |
|
ASSET BACKED SECURITIES—(Continued) | | | | | | | |
| | | | | | | | |
USAA Auto Owner Trust, Series 2004-3, Class A4 | | | | | | | |
3.530% | | 06/15/2011 | | | $ | 6,000,000 | | $ | 5,849,192 | |
| | | | | | | | | | |
| | | | | | | | | 44,360,892 | |
| | | | | | | | | | |
Credit Cards—4.6% | | | | | | | |
Bank One Issuance Trust, Series 2004-1A, Class A | | | | | | | |
3.450% | | 10/17/2011 | | | | 7,000,000 | | | 6,734,498 | |
Citibank Credit Card Issuance Trust, Series 2003-A3, Class A3 | | | | | | | |
3.100% | | 03/10/2010 | | | | 5,445,000 | | | 5,255,190 | |
Citibank Credit Card Issuance Trust, Series 2003-A5, Class A5 | | | | | | | |
2.500% | | 04/07/2008 | | | | 1,300,000 | | | 1,293,298 | |
Citibank Credit Card Issuance Trust, Series 2004-A1, Class A1 | | | | | | | |
2.550% | | 01/20/2009 | | | | 1,000,000 | | | 977,298 | |
Discover Card Master Trust I, Series 2000-9, Class A | | | | | | | |
6.350% | | 07/15/2008 | | | | 1,125,000 | | | 1,126,496 | |
MBNA Credit Card Master Note Trust, Series 2003-A1, Class A | | | | | | | |
3.300% | | 07/15/2010 | | | | 5,545,000 | | | 5,383,604 | |
MBNA Credit Card Master Note Trust, Series 2005-5A, Class A5 | | | | | | | |
4.369% | | 12/15/2010 | | # | | 2,500,000 | | | 2,501,227 | |
MBNA Credit Card Master Note Trust, Series 2005-A7, Class A7 | | | | | | | |
4.300% | | 02/15/2011 | | | | 1,000,000 | | | 988,443 | |
MBNA Master Credit Card Trust, Series 2003-A11, Class A11 | | | | | | | |
3.650% | | 03/15/2011 | | | | 1,000,000 | | | 971,149 | |
| | | | | | | | | | |
| | | | | | | | | 25,231,203 | |
| | | | | | | | | | |
Utilities—3.8% | | | | | | | |
California Infrastructure PG&E-1, Series 1997-1, Class A8 | | | | | | | |
6.480% | | 12/26/2009 | | | | 6,000,000 | | | 6,151,938 | |
California Infrastructure SCE-1, Series 1997-1, Class A7 | | | | | | | |
6.420% | | 12/26/2009 | | | | 6,450,000 | | | 6,607,606 | |
Comed Transitional Funding Trust, Series 1998-1, Class A6 | | | | | | | |
5.630% | | 06/25/2009 | | | | 669,740 | | | 674,453 | |
Peco Energy Transition Trust, Series 2000-A, Class A3 | | | | | | | |
7.625% | | 03/01/2010 | | | | 6,689,000 | | | 7,209,873 | |
| | | | | | | | | | |
| | | | | | | | | 20,643,870 | |
| | | | | | | | | | |
TOTAL ASSET BACKED SECURITIES | | | | | | | |
(Cost $92,197,853) | | | | | | 90,235,965 | |
| | | | | | | | | | |
| | | | | | | | | | |
| | | | | | | | |
NON-U.S. GOVERNMENT MORTGAGE-BACKED SECURITIES—10.7% | | | | | | | |
| | | | | | | | |
Mortgage Backed—10.7% | | | | | | | |
Bank of America Mortgage Securities, Series 2004-L, Class 1A1 | | | | | | | |
4.215% | | 01/25/2035 | | | | 5,790,729 | | | 5,735,045 | |
Bear Stearns Commercial Mortgage Securities, Series 2004-PWR3, Class A2 | | | | | | | |
3.869% | | 02/11/2041 | | | | 3,100,000 | | | 2,983,961 | |
| | | | | | | | | | |
| | | | | | | | | |
Coupon
Rate | | Maturity
Date | | | Face | | Value | |
| | | | | | | | | |
Countrywide Home Loan Mortgage Pass Through Trust, Series 2004-19, Class A1 | | | | | | | |
5.500% | | 10/25/2034 | | | $ | 1,202,167 | | $ | 1,200,154 | |
Countrywide Home Loan Mortgage Pass Through Trust, Series 2004-25, Class 3A1 | | | | | | | |
5.493% | | 02/25/2035 | | | | 4,266,202 | | | 4,357,333 | |
Countrywide Home Loan Mortgage Pass Through Trust, Series 2004-7, Class 6A1 | | | | | | | |
5.299% | | 05/25/2034 | | | | 2,622,284 | | | 2,682,069 | |
GSR Mortgage Loan Trust, Series 2005-AR6, Class 2A1 | | | | | | | |
4.541% | | 10/25/2035 | | | | 5,662,965 | | | 5,573,865 | |
GSR Mortgage Loan Trust, Series 2004-11, Class 2A2 | | | | | | | |
4.800% | | 09/25/2034 | | | | 4,133,919 | | | 4,101,349 | |
Harborview Mortgage Loan Trust, Series 2005-14, Class 3A1A | | | | | | | |
5.420% | | 12/19/2035 | | # | | 7,524,900 | | | 7,517,268 | |
MLCC Mortgage Investors, Inc., Series 2004-1, Class 2A2 | | | | | | | |
4.744% | | 12/25/2034 | | | | 4,927,784 | | | 4,875,041 | |
Provident Funding Mortgage Loan Trust, Series 2004-1, Class 1A1 | | | | | | | |
4.053% | | 04/25/2034 | | # | | 1,015,670 | | | 984,471 | |
Structured Adjustable Rate Mortgage Loan Trust, Series 2005-11, Class 3A | | | | | | | |
5.429% | | 05/25/2035 | | | | 6,770,310 | | | 6,790,302 | |
Structured Asset Mortgage Investments, Inc., Series 2004-AR5, Class IIA1 | | | | | | | |
5.947% | | 10/19/2034 | | | | 1,964,138 | | | 1,993,169 | |
Thornburg Mortgage Securities Trust, Series 2004-1, Class II2A | | | | | | | |
3.324% | | 03/25/2044 | | # | | 1,398,332 | | | 1,352,246 | |
Wells Fargo Mortgage Backed Securities Trust, Series 2004-Z, Class 2A1 | | | | | | | |
4.579% | | 12/25/2034 | | # | | 3,116,494 | | | 3,073,842 | |
Wells Fargo Mortgage Backed Securities Trust, Series 2005-AR9, Class IIA1 | | | | | | | |
4.362% | | 05/25/2035 | | | | 5,049,210 | | | 4,986,497 | |
| | | | | | | | | | |
TOTAL NON-U.S. GOVERNMENT MORTGAGE-BACKED SECURITIES | | | | | | | |
(Cost $58,777,616) | | | | | | 58,206,612 | |
| | | | | | | | | | |
| | | | | | | | | | |
| | | | | | | | | |
CASH EQUIVALENTS—0.3% | | | | | | | |
| | | | | | | | | |
Institutional Money Market Funds—0.0% | | | | | | | |
American Beacon Funds | †† | | 7,090 | | | 7,090 | |
BGI Institutional Fund | †† | | 92,172 | | | 92,172 | |
Goldman Sachs Financial Square Prime Obligations Fund | †† | | 7,090 | | | 7,090 | |
Merrimac Cash Fund— Premium Class | †† | | 11,344 | | | 11,344 | |
| | | | | | | | | | |
| | | | | | 117,696 | |
| | | | | | | | | | |
Bank & Certificate Deposits/ Offshore Time Deposits—0.3% | | | | | | | |
Abbey National PLC | | | | | | | |
4.290% | | 01/11/2006 | | †† | | 35,451 | | | 35,448 | |
Bank of Nova Scotia | | | | | | | |
4.250% | | 01/27/2006 | | †† | | 49,631 | | | 49,631 | |
Barclays | | | | | | | |
4.410% | | 02/27/2006 | | †† | | 35,451 | | | 35,451 | |
Barclays | | | | | | | |
4.270% | | 01/25/2006 | | †† | | 35,451 | | | 35,451 | |
BNP Paribas | | | | | | | |
4.220% | | 01/24/2006 | | †† | | 35,451 | | | 35,451 | |
Branch Banker & Trust | | | | | | | |
4.260% | | 01/11/2006 | | †† | | 35,451 | | | 35,451 | |
| |
See accompanying notes to financial statements. | 181 |
SCHEDULE OF INVESTMENTS—(Continued)
December 31, 2005
| | | | | | | | | | |
| | | | | | | | | | | |
Vantagepoint Short-Term
Bond Fund | |
| | | | | | | | | | | |
|
Coupon
Rate | | Maturity
Date | | | Face | | Value | |
| | | | | | | | | | | |
CASH EQUIVALENTS—(Continued) | | | | | | | |
| | | | | | | | | | | |
CIESCO | | | | | | | |
4.305% | | 01/06/2006 | | †† | $ | 42,541 | | $ | 42,541 | |
Dexia Group | | | | | | | |
4.250% | | 01/09/2006 | | †† | | 70,902 | | | 70,902 | |
Fairway Finance | | | | | | | |
4.280% | | 01/30/2006 | | †† | | 28,361 | | | 28,361 | |
Falcon Asset Securitization Corporation | | | | | | | |
4.307% | | 02/02/2006 | | †† | | 35,163 | | | 35,163 | |
Fortis Bank | | | | | | | |
4.350% | | 01/03/2006 | | †† | | 35,451 | | | 35,451 | |
Greyhawk Funding | | | | | | | |
4.355% | | 01/06/2006 | | †† | | 28,361 | | | 28,361 | |
Greyhawk Funding | | | | | | | |
4.278% | | 01/24/2006 | | †† | | 21,270 | | | 21,270 | |
Jupiter Securitization Corporation | | | | | | | |
4.266% | | 01/05/2006 | | †† | | 17,016 | | | 17,016 | |
Jupiter Securitization Corporation | | | | | | | |
4.257% | | 01/04/2006 | | †† | | 21,270 | | | 21,270 | |
Liberty Street | | | | | | | |
4.266% | | 01/05/2006 | | †† | | 35,191 | | | 35,191 | |
Merrill Lynch & Company, Inc. | | | | | | | |
4.240% | | 01/03/2006 | | †† | | 141,803 | | | 141,803 | |
National Australia Bank | | | | | | | |
4.156% | | 01/03/2006 | | †† | | 19,892 | | | 19,892 | |
Paradigm Funding LLC | | | | | | | |
4.303% | | 01/03/2006 | | †† | | 45,866 | | | 45,866 | |
Paradigm Funding LLC | | | | | | | |
4.297% | | 01/09/2006 | | †† | | 28,361 | | | 28,361 | |
Prefco | | | | | | | |
4.312% | | 01/04/2006 | | †† | | 21,270 | | | 21,270 | |
Rabobank Nederland | | | | | | | |
4.150% | | 01/03/2006 | | †† | | 35,451 | | | 35,451 | |
Ranger Funding | | | | | | | |
4.291% | | 01/18/2006 | | †† | | 28,361 | | | 28,361 | |
Royal Bank of Canada | | | | | | | |
4.250% | | 01/24/2006 | | †† | | 49,631 | | | 49,631 | |
Royal Bank of Canada | | | | | | | |
4.220% | | 01/20/2006 | | †† | | 35,451 | | | 35,451 | |
Royal Bank of Scotland | | | | | | | |
4.310% | | 02/01/2006 | | †† | | 70,902 | | | 70,902 | |
Royal Bank of Scotland | | | | | | | |
4.250% | | 01/23/2006 | | †† | | 35,451 | | | 35,451 | |
Skandinaviska Enskilda Banken AB | | | | | | | |
4.300% | | 01/17/2006 | | †† | | 21,270 | | | 21,270 | |
Skandinaviska Enskilda Banken AB | | | | | | | |
4.230% | | 01/03/2006 | | †† | | 35,451 | | | 35,451 | |
Societe Generale | | | | | | | |
4.280% | | 01/30/2006 | | †† | | 28,361 | | | 28,361 | |
The Bank of the West | | | | | | | |
4.290% | | 01/25/2006 | | †† | | 35,451 | | | 35,451 | |
UBS AG | | | | | | | |
4.260% | | 01/10/2006 | | †† | | 35,451 | | | 35,451 | |
UBS AG | | | | | | | |
4.255% | | 01/18/2006 | | †† | | 42,541 | | | 42,541 | |
Wells Fargo | | | | | | | |
4.290% | | 01/30/2006 | | †† | | 56,721 | | | 56,721 | |
Wells Fargo | | | | | | | |
4.270% | | 01/03/2006 | | †† | | 35,451 | | | 35,451 | |
Yorktown Capital LLC | | | | | | | |
4.330% | | 01/04/2006 | | †† | | 31,744 | | | 31,744 | |
Yorktown Capital LLC | | | | | | | |
4.266% | | 01/05/2006 | | †† | | 35,191 | | | 35,191 | |
| | | | | | | | | | |
| | | | | | | | | 1,432,480 | |
| | | | | | | | | | |
| | | | | | | | | | |
| �� | | | | | | | | |
Coupon
Rate | | Maturity
Date | | | Face | | Value | |
|
| | | | | | | | | |
Floating Rate Instruments/Master Notes—0.0% | | | | | | | |
Bank of America | | | | | | | | |
4.270% | | 01/17/2006 | | †† | $ | 28,361 | | $ | 28,361 | |
Bank of America | | | | | | | | |
4.230% | | 01/20/2006 | | †† | | 35,451 | | | 35,451 | |
Credit Suisse First Boston Corporation | | | | | | | |
4.175% | | 03/10/2006 | | †† | | 28,361 | | | 28,361 | |
Rabobank Nederland | | | | | | | |
4.100% | | 05/31/2006 | | †† | | 35,451 | | | 35,451 | |
| | | | | | | | | | |
| | | | | | | | | 127,624 | |
| | | | | | | | | | |
TOTAL CASH EQUIVALENTS | | | | | | | |
(Cost $1,677,800) | | | | | | 1,677,800 | |
| | | | | | | | | | |
| | | | | | | | | | |
| | | | | | | | |
REPURCHASE AGREEMENTS—3.9% | | | | | | | |
| | | | | | | | |
IBT Repurchase Agreement dated 12/30/05 due 1/03/06, with a maturity value of $21,060,474 and an effective yield of 3.65% collateralized by the U.S. Government Agency Obligation with rates ranging from 4.88% to 7.24%, maturity dates ranging from 06/25/2019 to 03/25/2033 and an aggregate market value of $22,104,533. | | | 21,051,936 | | | 21,051,936 | |
| | | | | | | | | | |
|
TOTAL INVESTMENTS—99.0% | | | | | | | |
(Cost $544,309,759) | | | | | | 538,281,194 | |
Other assets less liabilities—1.0% | | | | | | 5,631,822 | |
| | | | | | | | | | |
NET ASSETS—100.0% | | | | | $ | 543,913,016 | |
| | | | | | | |
Notes to the Schedule of Investments:
MTN Medium Term Note
| |
† | Denotes all or a portion of security on loan. |
| |
* | Security exempt from registration under Rule 144A of the Securities Act of 1933. These securities may be resold in transactions exempt from registration, normally to qualified buyers. 144A securities represent 2.44% of Total Investments. |
| |
# | Rate is subject to change. Rate shown reflects current rate. |
| |
†† | Represents collateral received from securities lending transactions. |
| |
** | Security has been pledged as collateral for futures contracts. |
| |
182 | See accompanying notes to financial statements. |
SCHEDULE OF INVESTMENTS
December 31, 2005
| | | | | | | | | | |
| |
Vantagepoint US Government
Securities Fund | | | | | | | |
| |
|
Coupon
Rate | | Maturity
Date | | | Face | | Value | |
| |
|
U.S. GOVERNMENT AGENCY OBLIGATIONS—42.5% | | | | | | | |
| |
U.S. Government Agencies—40.2% | | | | | | | |
Federal Farm Credit Bank | | | | | | | |
3.750% | | 01/15/2009 | | | $ | 1,050,000 | | $ | 1,022,421 | |
3.000% | | 12/17/2007 | | | | 700,000 | | | 679,561 | |
Federal Home Loan Bank | | | | | | | |
5.750% | | 05/15/2012 | | | | 625,000 | | | 658,997 | |
4.500% | | 11/15/2012- | | | | | | | | |
| | 09/16/2013 | | | | 1,310,000 | | | 1,289,243 | |
4.000% | | 03/10/2008 | | | | 800,000 | | | 788,466 | |
3.625% | | 01/15/2008 | | | | 1,400,000 | | | 1,371,759 | |
3.000% | | 04/15/2009 | | | | 1,650,000 | | | 1,565,381 | |
2.875% | | 02/15/2007 | | | | 3,000,000 | | | 2,938,878 | |
2.750% | | 03/14/2008 | | | | 1,500,000 | | | 1,439,580 | |
2.625% | | 02/16/2007- | | | | | | | | |
| | 07/15/2008 | | | | 2,500,000 | | | 2,392,633 | |
Federal Home Loan Mortgage Corporation | | | | | | | |
6.625% | | 09/15/2009 | | | | 1,400,000 | | | 1,488,638 | |
6.250% | | 03/05/2012 | | | | 250,000 | | | 253,868 | |
6.000% | | 06/15/2011 | | | | 900,000 | | | 953,734 | |
5.750% | | 03/15/2009 | | | | 1,700,000 | | | 1,751,444 | |
5.500% | | 09/15/2011 | | | | 600,000 | | | 621,791 | |
5.125% | | 10/15/2008 | | | | 1,300,000 | | | 1,314,249 | |
5.000% | | 01/30/2014 | | | | 400,000 | | | 394,893 | |
4.875% | | 03/15/2007 | | | | 2,000,000 | | | 2,002,820 | |
4.750% | | 12/08/2010 | | | | 200,000 | | | 199,884 | |
4.500% | | 04/18/2007- | | | | | | | | |
| | 01/15/2015 | | | | 4,500,000 | | | 4,442,475 | |
4.375% | | 11/16/2007- | | | | | | | | |
| | 07/30/2009 | | | | 2,900,000 | | | 2,875,582 | |
4.125% | | 09/01/2009- | | | | | | | | |
| | 02/24/2011 | | | | 900,000 | | | 873,034 | |
4.000% | | 06/12/2013 | | | | 400,000 | | | 378,754 | |
3.875% | | 01/12/2009 | | | | 400,000 | | | 390,155 | |
3.500% | | 09/15/2007- | | | | | | | | |
| | 04/01/2008 | | | | 3,750,000 | | | 3,674,726 | |
3.300% | | 09/14/2007 | | | | 300,000 | | | 292,750 | |
3.250% | | 11/02/2007- | | | | | | | | |
| | 02/25/2008 | | | | 1,300,000 | | | 1,261,243 | |
3.050% | | 01/19/2007 | | | | 700,000 | | | 687,983 | |
2.850% | | 02/23/2007 | | | | 500,000 | | | 489,577 | |
2.700% | | 03/16/2007 | | | | 500,000 | | | 487,926 | |
2.400% | | 03/29/2007 | | | | 200,000 | | | 194,413 | |
Federal National Mortgage Association | | | | | | | |
7.125% | | 06/15/2010 | | | | 1,700,000 | | | 1,861,315 | |
6.625% | | 10/15/2007- | | | | | | | | |
| | 11/15/2010 | | | | 2,950,000 | | | 3,106,745 | |
6.000% | | 05/15/2011 | | | | 600,000 | | | 635,309 | |
5.375% | | 11/15/2011 | | | | 650,000 | | | 669,920 | |
5.250% | | 01/15/2009- | | | | | | | | |
| | 08/01/2012 | | | | 1,200,000 | | | 1,216,669 | |
4.750% | | 02/21/2013 | | | | 400,000 | | | 395,750 | |
4.375% | | 09/15/2012- | | | | | | | | |
| | 10/15/2015 | | | | 1,550,000 | | | 1,501,801 | |
4.250% | | 07/15/2007 | | | | 3,550,000 | | | 3,524,848 | |
4.125% | | 04/15/2014 | | | | 800,000 | | | 764,191 | |
4.000% | | 01/26/2009 | | | | 300,000 | | | 293,903 | |
3.875% | | 11/17/2008 | | | | 400,000 | | | 390,248 | |
3.750% | | 09/15/2008 | | | | 1,200,000 | | | 1,170,384 | |
3.375% | | 12/15/2008 | | | | 300,000 | | | 289,344 | |
3.250% | | 01/15/2008 | | | | 2,000,000 | | | 1,943,826 | |
3.125% | | 12/15/2007- | | | | | | | | |
| | 03/16/2009 | | | | 3,950,000 | | | 3,805,536 | |
| | | | | | | | | | |
| | | | | | | | | 60,746,647 | |
| | | | | | | | | | |
| | | | | | | |
| |
Coupon
Rate | | Maturity
Date | | | Face | | Value | |
| |
U.S. Government Agencies—Mortgage Backed—2.3% | | | | | | | |
Federal Home Loan Mortgage Corporation | | | | | | | |
6.500% | | 04/01/2035 | | | $ | 183,402 | | $ | 188,051 | |
6.000% | | 04/01/2017- | | | | | | | | |
| | 10/01/2017 | | | | 2,194,954 | | | 2,241,262 | |
Federal National Mortgage Association | | | | | | | |
7.500% | | 01/01/2034 | | | | 395,626 | | | 414,530 | |
7.000% | | 02/01/2013 | | | | 227,375 | | | 236,009 | |
6.500% | | 05/01/2035 | | | | 194,855 | | | 199,990 | |
6.000% | | 12/01/2013- | | | | | | | | |
| | 10/01/2017 | | | | 247,238 | | | 252,741 | |
| | | | | | | | | | |
| | | | | | | | | 3,532,583 | |
| | | | | | | | | | |
TOTAL U.S. GOVERNMENT AGENCY OBLIGATIONS | | | | | | | |
(Cost $65,035,007) | | | | | | 64,279,230 | |
| | | | | | | | | | |
|
| |
U.S. TREASURY OBLIGATIONS—56.3% | | | | | | | |
| |
U.S. Treasury Bonds—3.5% | | | | | | | |
U.S. Treasury Bond | | | | | | | |
14.000% | | 11/15/2011 | | | | 800,000 | | | 864,750 | |
12.000% | | 08/15/2013 | | | | 1,000,000 | | | 1,186,719 | |
5.750% | | 08/15/2010 | | | | 1,840,000 | | | 1,947,167 | |
5.000% | | 08/15/2011 | | † | | 1,200,000 | | | 1,238,953 | |
| | | | | | | | | | |
| | | | | | | | | 5,237,589 | |
| | | | | | | | | | |
U.S. Treasury Notes—52.8% | | | | | | | |
U.S. Treasury Note | | | | | | | |
6.625% | | 05/15/2007 | | | | 300,000 | | | 308,813 | |
6.500% | | 02/15/2010 | | | | 3,200,000 | | | 3,452,877 | |
6.000% | | 08/15/2009 | | | | 1,705,000 | | | 1,797,443 | |
5.500% | | 05/15/2009 | | | | 1,000,000 | | | 1,034,805 | |
5.000% | | 02/15/2011 | | | | 2,200,000 | | | 2,266,603 | |
4.375% | | 12/15/2010- | | | | | | | | |
| | 08/15/2012 | | | | 3,500,000 | | | 3,501,563 | |
4.250% | | 10/31/2007- | | | | | | | | |
| | 08/15/2015 | | † | | 15,200,000 | | | 15,079,088 | |
4.125% | | 05/15/2015 | | † | | 1,650,000 | | | 1,614,358 | |
4.000% | | 08/31/2007- | | | | | | | | |
| | 02/15/2015 | | † | | 11,230,000 | | | 11,018,085 | |
3.875% | | 05/15/2009- | | | | | | | | |
| | 02/15/2013 | | | | 6,550,000 | | | 6,401,088 | |
3.750% | | 05/15/2008 | | | | 4,200,000 | | | 4,141,595 | |
3.625% | | 07/15/2009 | | | | 2,200,000 | | | 2,146,892 | |
3.500% | | 05/31/2007- | | | | | | | | |
| | 02/15/2010 | | † | | 7,600,000 | | | 7,410,306 | |
3.375% | | 02/28/2007- | | | | | | | | |
| | 12/15/2008 | | † | | 6,580,000 | | | 6,427,160 | |
3.250% | | 01/15/2009 | | | | 1,580,000 | | | 1,530,317 | |
3.125% | | 01/31/2007- | | | | | | | | |
| | 10/15/2008 | | † | | 4,410,000 | | | 4,269,445 | |
3.000% | | 11/15/2007- | | | | | | | | |
| | 02/15/2008 | | † | | 6,000,000 | | | 5,844,241 | |
2.250% | | 02/15/2007 | | | | 1,700,000 | | | 1,659,958 | |
| | | | | | | | | | |
| | | | | | | | | 79,904,637 | |
| | | | | | | | | | |
TOTAL U.S. TREASURY OBLIGATIONS | | | | | | | |
(Cost $86,569,770) | | | | | | 85,142,226 | |
| | | | | | | |
| |
See accompanying notes to financial statements. | 183 |
SCHEDULE OF INVESTMENTS—(Continued)
December 31, 2005
| | | | | | | | | | |
| |
Vantagepoint US Government
Securities Fund | | | | | | | |
| |
|
Coupon
Rate | | Maturity
Date | | | Face | | Value | |
| |
|
CASH EQUIVALENTS—17.9% | | | | | | | |
| |
Institutional Money Market Funds—1.2% | | | | | | | |
American Beacon Funds | | †† | $ | 114,596 | | $ | 114,596 | |
BGI Institutional Fund | | †† | | 1,489,765 | | | 1,489,765 | |
Goldman Sachs Financial Square Prime Obligations Fund | | †† | | 114,597 | | | 114,597 | |
Merrimac Cash Fund— Premium Class | | †† | | 183,356 | | | 183,356 | |
| | | | | | | | |
| | | | | | | | | 1,902,314 | |
| | | | | | | |
Bank & Certificate Deposits/Offshore Time Deposits—15.3% | | | | | | | |
Abbey National PLC | | | | | | | | |
4.290% | | 01/11/2006 | | †† | | 572,984 | | | 572,984 | |
Bank of Nova Scotia | | | | | | | |
4.250% | | 01/27/2006 | | †† | | 802,181 | | | 802,181 | |
Barclays | | | | | | | | | | |
4.410% | | 02/27/2006 | | †† | | 572,987 | | | 572,987 | |
Barclays | | | | | | | | | | |
4.270% | | 01/25/2006 | | †† | | 572,987 | | | 572,987 | |
BNP Paribas | | | | | | | | |
4.220% | | 01/24/2006 | | †† | | 572,987 | | | 572,987 | |
Branch Banker &Trust | | | | | | | |
4.260% | | 01/11/2006 | | †† | | 572,987 | | | 572,987 | |
CIESCO | | | | | | | | | | |
4.305% | | 01/06/2006 | | †† | | 687,584 | | | 687,584 | |
Dexia Group | | | | | | | | |
4.250% | | 01/09/2006 | | †† | | 1,145,973 | | | 1,145,973 | |
Fairway Finance | | | | | | | |
4.280% | | 01/30/2006 | | †† | | 458,389 | | | 458,389 | |
Falcon Asset Securitization Corporation | | | | | | | |
4.307% | | 02/02/2006 | | †† | | 568,344 | | | 568,344 | |
Fortis Bank | | | | | | | |
4.350% | | 01/03/2006 | | †† | | 572,987 | | | 572,987 | |
Greyhawk Funding | | | | | | | |
4.355% | | 01/06/2006 | | †† | | 458,389 | | | 458,389 | |
Greyhawk Funding | | | | | | | |
4.278% | | 01/24/2006 | | †† | | 343,792 | | | 343,792 | |
Jupiter Securitization Corporation | | | | | | | |
4.266% | | 01/05/2006 | | †† | | 275,034 | | | 275,034 | |
Jupiter Securitization Corporation | | | | | | | |
4.257% | | 01/04/2006 | | †† | | 343,792 | | | 343,792 | |
Liberty Street | | | | | | | | |
4.266% | | 01/05/2006 | | †† | | 568,793 | | | 568,793 | |
Merrill Lynch & Company, Inc. | | | | | | | |
4.240% | | 01/03/2006 | | †† | | 2,291,947 | | | 2,291,947 | |
National Australia Bank | | | | | | | |
4.156% | | 01/03/2006 | | †† | | 321,519 | | | 321,519 | |
Paradigm Funding LLC | | | | | | | |
4.303% | | 01/03/2006 | | †† | | 741,332 | | | 741,332 | |
Paradigm Funding LLC | | | | | | | |
4.297% | | 01/09/2006 | | †† | | 458,389 | | | 458,389 | |
Prefco | | | | | | | | | | |
4.312% | | 01/04/2006 | | †† | | 343,792 | | | 343,792 | |
Rabobank Nederland | | | | | | | |
4.150% | | 01/03/2006 | | †† | | 572,987 | | | 572,987 | |
Ranger Funding | | | | | | | |
4.291% | | 01/18/2006 | | †† | | 458,389 | | | 458,389 | |
Royal Bank of Canada | | | | | | | |
4.250% | | 01/24/2006 | | †† | | 802,181 | | | 802,181 | |
Royal Bank of Canada | | | | | | | |
4.220% | | 01/20/2006 | | †† | | 572,987 | | | 572,987 | |
|
| |
Coupon
Rate | | Maturity
Date | | | Face | | Value | |
| |
Royal Bank of Scotland | | | | | | | |
4.310% | | 02/01/2006 | | †† | $ | 1,145,973 | | $ | 1,145,973 | |
Royal Bank of Scotland | | | | | | | |
4.250% | | 01/23/2006 | | †† | | 572,987 | | | 572,987 | |
Skandinaviska Enskilda Banken AB | | | | | | | |
4.300% | | 01/17/2006 | | †† | | 343,792 | | | 343,792 | |
Skandinaviska Enskilda Banken AB | | | | | | | |
4.230% | | 01/03/2006 | | †† | | 572,987 | | | 572,987 | |
Societe Generale | | | | | | | |
4.280% | | 01/30/2006 | | †† | | 458,389 | | | 458,389 | |
The Bank of the West | | | | | | | |
4.290% | | 01/25/2006 | | †† | | 572,987 | | | 572,987 | |
UBS AG | | | | | | | | | | |
4.260% | | 01/10/2006 | | †† | | 572,987 | | | 572,987 | |
UBS AG | | | | | | | | | | |
4.255% | | 01/18/2006 | | †† | | 687,584 | | | 687,584 | |
Wells Fargo | | | | | | | |
4.290% | | 01/30/2006 | | †† | | 916,779 | | | 916,779 | |
Wells Fargo | | | | | | | |
4.270% | | 01/03/2006 | | †† | | 572,987 | | | 572,987 | |
Yorktown Capital LLC | | | | | | | |
4.330% | | 01/04/2006 | | †† | | 513,075 | | | 513,075 | |
Yorktown Capital LLC | | | | | | | |
4.266% | | 01/05/2006 | | †† | | 568,793 | | | 568,793 | |
| | | | | | | | | | |
| | | | | | | | | 23,153,033 | |
| | | | | | | | | | |
Floating Rate Instruments/Master Notes—1.4% | | | | | | | |
Bank of America | | | | | | | |
4.270% | | 01/17/2006 | | †† | | 458,389 | | | 458,389 | |
Bank of America | | | | | | | |
4.230% | | 01/20/2006 | | †† | | 572,987 | | | 572,987 | |
Credit Suisse First Boston Corporation | | | | | | | |
4.175% | | 03/10/2006 | | †† | | 458,389 | | | 458,389 | |
Rabobank Nederland | | | | | | | |
4.100% | | 05/31/2006 | | †† | | 572,987 | | | 572,988 | |
| | | | | | | | | | |
| | | | | | | | | 2,062,753 | |
| | | | | | | | | | |
TOTAL CASH EQUIVALENTS | | | | | | | |
(Cost $27,118,100) | | | | | | 27,118,100 | |
| | | | | | | | | | |
| | | | | | | | | | |
| |
REPURCHASE AGREEMENTS—0.2% | | | | | | | |
| |
IBT Repurchase Agreementdated 12/30/05 due 1/03/06,with a maturity value of$340,281 and an effectiveyield of 3.65% collateralizedby a U.S. GovernmentObligation with a rate of5.50%, maturity of 11/01/34and an aggregate market value of $357,150. | | | 340,143 | | | 340,143 | |
| | | | | | | | | | |
| | | | | | | | | | |
TOTAL INVESTMENTS—116.9% | | | | | | | |
(Cost $179,063,020) | | | | | | 176,879,699 | |
Other assets less liabilities—(16.9%) | | | | | | (25,545,124 | ) |
| | | | | | | | | | |
NET ASSETS—100.0% | | | | | $ | 151,334,575 | |
| | | | | | | |
Notes to the Schedule of Investments:
| |
† | Denotes all or a portion of security on loan. |
| |
†† | Represents collateral received from securities lending transactions. |
| |
184 | See accompanying notes to financial statements. |
SCHEDULE OF INVESTMENTS
December 31, 2005
| | | | | | | |
| |
Vantagepoint Asset
Allocation Fund | | Shares | | Value | |
| |
|
COMMON STOCKS—87.8% | | | | | | | |
| |
Advertising—0.2% | | | | | | | |
Interpublic Group, Inc. | *† | | 24,700 | | $ | 238,355 | |
Monster Worldwide, Inc. | *† | | 7,000 | | | 285,740 | |
Omnicom Group | | | 10,800 | | | 919,404 | |
| | | | | | | | | | |
| | | | | | | | | 1,443,499 | |
| | | | | | | | | | |
Aerospace & Defense—1.3% | | | | | | | |
Goodrich Corporation | | | 6,600 | | | 271,260 | |
Boeing Company (The) | | | 47,092 | | | 3,307,742 | |
General Dynamics Corporation | | | 11,510 | | | 1,312,715 | |
Honeywell International, Inc. | | | 49,025 | | | 1,826,181 | |
Lockheed Martin Corporation | | | 21,380 | | | 1,360,409 | |
Northrop Grumman Corporation | | | 20,192 | | | 1,213,741 | |
Textron, Inc. | | | 7,500 | | | 577,350 | |
| | | | | | | |
| | | | | | 9,869,398 | |
| | | | | | | | | | |
Airlines—0.1% | | | | | | | |
Southwest Airlines Company | | | 41,472 | | | 681,385 | |
| | | | | | | | | | |
Apparel Retailers—0.3% | | | | | | | |
Gap, Inc. (The) | | | 33,327 | | | 587,888 | |
Kohl’s Corporation | * | | 19,800 | | | 962,280 | |
Ltd. Brands | | | 20,000 | | | 447,000 | |
Nordstrom, Inc. | | | 13,580 | | | 507,892 | |
| | | | | | | |
| | | | | | | | | 2,505,060 | |
| | | | | | | | | | |
Automotive—0.6% | | | | | | | |
Autonation, Inc. | * | | 10,300 | | | 223,819 | |
Dana Corporation | | | 9,424 | | | 67,664 | |
Ford Motor Company | | | 106,246 | | | 820,219 | |
General Motors Corporation | † | | 32,400 | | | 629,208 | |
Genuine Parts Company | | | 9,525 | | | 418,338 | |
Goodyear Tire & Rubber Company (The) | *† | | 10,600 | | | 184,228 | |
Harley-Davidson, Inc. | | | 15,700 | | | 808,393 | |
ITT Industries, Inc. | | | 5,100 | | | 524,382 | |
Navistar International Corporation | * | | 4,200 | | | 120,204 | |
Paccar, Inc. | | | 9,722 | | | 673,054 | |
| | | | | | | |
| | | | | | | | | 4,469,509 | |
| | | | | | | | | | |
Banking—10.3% | | | | | | | |
American Express Company | | | 71,130 | | | 3,660,350 | |
AmSouth Bancorp | | | 19,300 | | | 505,853 | |
BB&T Corporation | | | 31,200 | | | 1,307,592 | |
Bank of America Corporation | † | | 230,306 | | | 10,628,622 | |
Bank of New York Company, Inc. (The) | | | 43,900 | | | 1,398,215 | |
Capital One Financial Corporation | | | 17,250 | | | 1,490,400 | |
CIT Group, Inc. | | | 11,700 | | | 605,826 | |
Citigroup, Inc. | † | | 291,768 | | | 14,159,501 | |
Comerica, Inc. | | | 9,650 | | | 547,734 | |
Compass Bancshares, Inc. | | | 6,800 | | | 328,372 | |
Fifth Third Bancorp | † | | 31,888 | | | 1,202,815 | |
First Horizon National Corporation | | | 6,900 | | | 265,236 | |
Golden West Financial Corporation | | | 15,170 | | | 1,001,220 | |
Huntington Bancshares, Inc. | † | | 12,536 | | | 297,730 | |
JP Morgan Chase & Company | | | 201,339 | | | 7,991,145 | |
KeyCorp | | | 23,100 | | | 760,683 | |
M&T Bank Corporation | | | 4,930 | | | 537,616 | |
MBNA Corporation | | | 72,040 | | | 1,956,606 | |
Marshall & IIsley Corporation | † | | 11,700 | | | 503,568 | |
Mellon Financial Corporation | | | 23,700 | | | 811,725 | |
National City Corporation | | | 32,600 | | | 1,094,382 | |
North Fork Bancorp, Inc. | | | 27,450 | | | 751,032 | |
| | | | | |
| |
| | Shares | | Value | |
| |
Northern Trust Corporation | | | 10,650 | | $ | 551,883 | |
PNC Financial Services Group, Inc. | | | 16,700 | | | 1,032,561 | |
Regions Financial Corporation | | | 26,336 | | | 899,638 | |
SLM Corporation | | | 23,900 | | | 1,316,651 | |
Sovereign Bancorp, Inc. | | | 21,100 | | | 456,182 | |
State Street Corporation | | | 18,500 | | | 1,025,640 | |
Suntrust Banks, Inc. | | | 20,770 | | | 1,511,225 | |
Synovus Financial Corporation | | | 17,700 | | | 478,077 | |
U.S. Bancorp | | | 104,205 | | | 3,114,687 | |
Wachovia Corporation | | | 90,381 | | | 4,777,540 | |
Washington Mutual, Inc. | | | 56,862 | | | 2,473,497 | |
Wells Fargo & Company | | | 96,760 | | | 6,079,431 | |
Zions Bancorp | | | 6,000 | | | 453,360 | |
| | | | | | | |
| | | | | | | | | 75,976,595 | |
| | | | | | | | | | |
Beverages, Food & Tobacco—4.4% | | | | | | | |
Altria Group, Inc. | | | 119,830 | | | 8,953,698 | |
Anheuser-Busch Companies, Inc. | | | 44,540 | | | 1,913,438 | |
Archer-Daniels-Midland Company | | | 37,324 | | | 920,410 | |
Brown-Forman Corporation Class B | | | 5,080 | | | 352,146 | |
Campbell Soup Company | | | 10,730 | | | 319,432 | |
Coca-Cola Company (The) | | | 118,990 | | | 4,796,487 | |
Coca-Cola Enterprises, Inc. | | | 17,260 | | | 330,874 | |
ConAgra Foods, Inc. | † | | 29,600 | | | 600,288 | |
Constellation Brands, Inc. Class A | * | | 11,230 | | | 294,563 | |
General Mills, Inc. | | | 20,600 | | | 1,015,992 | |
H.J. Heinz Company | | | 19,350 | | | 652,482 | |
Hershey Foods Corporation | | | 11,070 | | | 611,617 | |
Kellogg Company | | | 14,700 | | | 635,334 | |
McCormick & Company, Inc. | | | 7,500 | | | 231,900 | |
Molson Coors Brewing Company—Class B | | | 3,760 | | | 251,882 | |
Pepsi Bottling Group, Inc. | | | 9,110 | | | 260,637 | |
Pepsico, Inc. | | | 95,750 | | | 5,656,910 | |
Reynolds American, Inc. | † | | 4,980 | | | 474,743 | |
Safeway, Inc. | † | | 25,700 | | | 608,062 | |
Sara Lee Corporation | | | 43,700 | | | 825,930 | |
Supervalu, Inc. | | | 7,500 | | | 243,600 | |
Sysco Corporation | | | 35,700 | | | 1,108,485 | |
Tyson Foods, Inc. Class A | | | 14,400 | | | 246,240 | |
UST, Inc. | † | | 9,100 | | | 371,553 | |
WM Wrigley Jr. Company | | | 10,310 | | | 685,512 | |
| | | | | | | |
| | | | | | | | | 32,362,215 | |
| | | | | | | | | | |
Building Materials—1.2% | | | | | | | |
Home Depot, Inc. | | | 122,700 | | | 4,966,896 | |
Louisiana-Pacific Corporation | † | | 6,800 | | | 186,796 | |
Lowe’s Companies, Inc. | † | | 44,680 | | | 2,978,369 | |
Patterson Companies, Inc. | * | | 8,000 | | | 267,200 | |
Vulcan Materials Company | | | 5,600 | | | 379,400 | |
| | | | | | | |
| | | | | | | | | 8,778,661 | |
| | | | | | | | | | |
| | | | | | | | | | |
Chemicals—1.3% | | | | | | | |
Air Products & Chemicals, Inc. | | | 12,500 | | | 739,875 | |
Avery Dennison Corporation | † | | 6,100 | | | 337,147 | |
Cooper Tire & Rubber Company | † | | 4,700 | | | 72,004 | |
Dow Chemical Company (The) | | | 55,336 | | | 2,424,824 | |
Eastman Chemical Company | | | 4,475 | | | 230,865 | |
Ecolab, Inc. | | | 11,540 | | | 418,556 | |
EI Du Pont de Nemours & Company | | | 53,400 | | | 2,269,500 | |
Hercules, Inc. | * | | 6,900 | | | 77,970 | |
International Flavors & Fragrances, Inc. | | | 5,200 | | | 174,200 | |
Monsanto Company | | | 15,449 | | | 1,197,761 | |
PPG Industries, Inc. | | | 9,824 | | | 568,810 | |
Praxair, Inc. | | | 18,530 | | | 981,349 | |
| | | | | | | |
| | | | | | 9,492,861 | |
| | | | | | | |
| |
See accompanying notes to financial statements. | 185 |
SCHEDULE OF INVESTMENTS—(Continued)
December 31, 2005
| | | | | | | | | | |
| |
Vantagepoint Asset
Allocation Fund | | Shares | | Value | |
| |
|
COMMON STOCKS—(Continued) | | | | | | | |
| |
Commercial Services—0.9% | | | | | | | |
Allied Waste Industries, Inc. | *† | | 14,200 | | $ | 124,108 | |
Apollo Group, Inc. Class A | * | | 8,810 | | | 532,653 | |
CCE Spinco, Inc. | * | | 1 | | | 10 | |
Cendant Corporation | | | 59,400 | | | 1,024,650 | |
Cintas Corporation | | | 8,500 | | | 350,030 | |
Convergys Corporation | * | | 7,600 | | | 120,460 | |
Equifax, Inc. | | | 7,500 | | | 285,150 | |
Fluor Corporation | | | 5,000 | | | 386,300 | |
H&R Block, Inc. | † | | 19,600 | | | 481,180 | |
Moody’s Corporation | | | 14,500 | | | 890,590 | |
Paychex, Inc. | | | 19,050 | | | 726,186 | |
Robert Half International, Inc. | | | 9,500 | | | 359,955 | |
RR Donnelley & Sons Company | | | 11,900 | | | 407,099 | |
Ryder System, Inc. | | | 3,800 | | | 155,876 | |
Waste Management, Inc. | | | 32,227 | | | 978,089 | |
| | | | | | | |
| | | | | | 6,822,336 | |
| | | | | | | |
Communications—1.7% | | | | | | | |
ADC Telecommunications, Inc. | * | | 6,971 | | | 155,733 | |
Andrew Corporation | * | | 9,787 | | | 105,015 | |
Avaya, Inc. | * | | 27,068 | | | 288,816 | |
Ciena Corporation | * | | 30,600 | | | 90,882 | |
Comverse Technology, Inc. | * | | 10,700 | | | 284,513 | |
Corning, Inc. | * | | 87,650 | | | 1,723,199 | |
L-3 Communications Holdings, Inc. | | | 6,800 | | | 505,580 | |
Lucent Technologies, Inc. | *† | | 249,419 | | | 663,455 | |
Motorola, Inc. | | | 141,490 | | | 3,196,259 | |
Network Appliance, Inc. | *† | | 20,600 | | | 556,200 | |
Qualcomm, Inc. | | | 94,600 | | | 4,075,368 | |
Scientific-Atlanta, Inc. | | | 8,400 | | | 361,788 | |
Tellabs, Inc. | * | | 25,200 | | | 274,680 | |
| | | | | | | |
| | | | | | 12,281,488 | |
| | | | | | | |
Computer Software & Processing—4.5% | | | | | | | |
Adobe Systems, Inc. | | | 34,600 | | | 1,278,816 | |
Affiliated Computer Services, Inc. Class A | * | | 7,500 | | | 443,850 | |
Autodesk, Inc. | | | 13,100 | | | 562,645 | |
Automatic Data Processing, Inc. | | | 32,900 | | | 1,509,781 | |
BMC Software, Inc. | * | | 12,300 | | | 252,027 | |
Citrix Systems, Inc. | * | | 8,900 | | | 256,142 | |
Computer Associates International, Inc. | † | | 27,695 | | | 780,722 | |
Computer Sciences Corporation | * | | 10,300 | | | 521,592 | |
Compuware Corporation | * | | 23,000 | | | 206,310 | |
Electronic Arts, Inc. | * | | 17,300 | | | 904,963 | |
Electronic Data Systems Corporation | | | 29,100 | | | 699,564 | |
First Data Corporation | | | 44,236 | | | 1,902,590 | |
Fiserv, Inc. | * | | 10,600 | | | 458,662 | |
IMS Health, Inc. | | | 13,125 | | | 327,075 | |
Intuit, Inc. | * | | 10,900 | | | 580,970 | |
Mercury Interactive Corporation | * | | 5,100 | | | 141,729 | |
Microsoft Corporation | | | 527,850 | | | 13,803,277 | |
NCR Corporation | * | | 10,200 | | | 346,188 | |
Novell, Inc. | * | | 22,400 | | | 197,792 | |
Nvidia Corporation | * | | 9,500 | | | 347,320 | |
Oracle Corporation | * | | 216,220 | | | 2,640,046 | |
Parametric Technology Corporation | * | | 18,300 | | | 111,630 | |
Siebel Systems, Inc. | | | 30,200 | | | 319,516 | |
Sun Microsystems, Inc. | * | | 190,200 | | | 796,938 | |
Symantec Corporation | * | | 63,968 | | | 1,119,440 | |
|
| |
| | Shares | | Value | |
| |
Unisys Corporation | * | | 20,200 | | $ | 117,766 | |
Yahoo!, Inc. | * | | 71,900 | | | 2,817,042 | |
| | | | | | | |
| | | | | | 33,444,393 | |
| | | | | | | |
Computers & Information—4.5% | | | | | | | |
3M Company | | | 43,950 | | | 3,406,125 | |
Apple Computer, Inc. | * | | 48,600 | | | 3,493,854 | |
Cisco Systems, Inc. | * | | 354,950 | | | 6,076,744 | |
Dell, Inc. | * | | 136,200 | | | 4,084,638 | |
EMC Corporation | * | | 138,150 | | | 1,881,603 | |
Gateway, Inc. | * | | 20,900 | | | 52,459 | |
Hewlett-Packard Company | | | 164,186 | | | 4,700,645 | |
International Business Machines Corporation | | | 91,480 | | | 7,519,656 | |
International Game Technology | | | 19,100 | | | 587,898 | |
Jabil Circuit, Inc. | * | | 9,890 | | | 366,820 | |
Lexmark International, Inc. | * | | 6,800 | | | 304,844 | |
Pitney Bowes, Inc. | | | 12,900 | | | 545,025 | |
Solectron Corporation | * | | 53,300 | | | 195,078 | |
Symbol Technologies, Inc. | | | 12,800 | | | 164,096 | |
| | | | | | | |
| | | | | | 33,379,485 | |
| | | | | | | |
Containers & Packaging—0.1% | | | | | | | |
Ball Corporation | | | 6,000 | | | 238,320 | |
Sealed Air Corporation | *† | | 4,565 | | | 256,416 | |
| | | | | | | |
| | | | | | 494,736 | |
| | | | | | | |
Cosmetics & Personal Care—1.9% | | | | | | | |
Alberto Culver Company Class B | † | | 4,800 | | | 219,600 | |
Avon Products, Inc. | | | 27,200 | | | 776,560 | |
Clorox Company | | | 8,400 | | | 477,876 | |
Colgate-Palmolive Company | | | 29,700 | | | 1,629,045 | |
Procter & Gamble Company | | | 192,861 | | | 11,162,795 | |
| | | | | | | |
| | | | | | | | | 14,265,876 | |
| | | | | | | | | | |
Diversified—2.9% | | | | | | | |
General Electric Company | | | 606,760 | | | 21,266,938 | |
| | | | | | | |
Electric Utilities—2.9% | | | | | | | |
AES Corporation (The) | * | | 36,500 | | | 577,795 | |
Allegheny Energy, Inc. | * | | 9,300 | | | 294,345 | |
Ameren Corporation | | | 11,700 | | | 599,508 | |
American Electric Power Company, Inc. | | | 22,660 | | | 840,459 | |
CMS Energy Corporation | *† | | 11,100 | | | 161,061 | |
Centerpoint Energy, Inc. | † | | 17,726 | | | 227,779 | |
Cinergy Corporation | | | 11,400 | | | 484,044 | |
Consolidated Edison, Inc. | † | | 14,000 | | | 648,620 | |
Constellation Energy Group, Inc. | | | 10,000 | | | 576,000 | |
DTE Energy Company | | | 10,200 | | | 440,538 | |
Dominion Resources, Inc. | | | 19,571 | | | 1,510,881 | |
Duke Energy Corporation | † | | 52,924 | | | 1,452,764 | |
Edison International | | | 18,700 | | | 815,507 | |
Entergy Corporation | | | 12,100 | | | 830,665 | |
Exelon Corporation | | | 38,424 | | | 2,041,851 | |
FPL Group, Inc. | | | 22,700 | | | 943,412 | |
FirstEnergy Corporation | | | 18,873 | | | 924,588 | |
KeySpan Corporation | | | 10,000 | | | 356,900 | |
NiSource, Inc. | | | 14,602 | | | 304,598 | |
PG&E Corporation | | | 20,410 | | | 757,619 | |
PPL Corporation | | | 21,200 | | | 623,280 | |
Pinnacle West Capital Corporation | | | 5,700 | | | 235,695 | |
Progress Energy, Inc. | | | 14,400 | | | 632,448 | |
Public Service Enterprise Group, Inc. | | | 14,400 | | | 935,568 | |
Sempra Energy | | | 14,669 | | | 657,758 | |
Southern Company (The) | † | | 42,800 | | | 1,477,884 | |
| |
186 | See accompanying notes to financial statements. |
SCHEDULE OF INVESTMENTS—(Continued)
December 31, 2005
| | | | | | | |
| |
Vantagepoint Asset
Allocation Fund | | Shares | | Value | |
| |
|
COMMON STOCKS—(Continued) | | | | | | | |
| |
TXU Corporation | | | 27,594 | | $ | 1,384,943 | |
TECO Energy, Inc. | | | 12,300 | | | 211,314 | |
Xcel Energy, Inc. | † | | 21,870 | | | 403,720 | |
| | | | | | | |
| | | | | | 21,351,544 | |
| | | | | | | |
Electrical Equipment—0.3% | | | | | | | |
Cooper Industries Ltd. Class A | | | 5,500 | | | 401,500 | |
Emerson Electric Company | | | 23,300 | | | 1,740,510 | |
| | | | | | | |
| | | | | | 2,142,010 | |
| | | | | | | |
Electronics—2.9% | | | | | | | |
Advanced Micro Devices, Inc. | * | | 22,100 | | | 676,260 | |
Agilent Technologies, Inc. | * | | 24,349 | | | 810,578 | |
Altera Corporation | * | | 20,800 | | | 385,424 | |
American Power Conversion Corporation | | | 10,800 | | | 237,600 | |
Analog Devices, Inc. | | | 21,200 | | | 760,444 | |
Applied Micro Circuits Corporation | * | | 17,700 | | | 45,489 | |
Broadcom Corporation Class A | * | | 16,380 | | | 772,317 | |
Freescale Semiconductor, Inc. Class B | * | | 22,553 | | | 567,659 | |
Intel Corporation | | | 347,940 | | | 8,684,582 | |
JDS Uniphase Corporation | * | | 84,700 | | | 199,892 | |
LSI Logic Corporation | *† | | 22,700 | | | 181,600 | |
Linear Technology Corporation | | | 17,200 | | | 620,404 | |
Maxim Integrated Products, Inc. | | | 18,820 | | | 682,037 | |
Micron Technology, Inc. | *† | | 33,600 | | | 447,216 | |
Molex, Inc. | † | | 8,275 | | | 214,736 | |
National Semiconductor Corporation | | | 20,000 | | | 519,600 | |
Novellus Systems, Inc. | * | | 7,400 | | | 178,488 | |
PMC-Sierra, Inc. | * | | 10,900 | | | 84,039 | |
QLogic Corporation | * | | 5,200 | | | 169,052 | |
Raytheon Company | | | 25,600 | | | 1,027,840 | |
Rockwell Collins, Inc. | | | 9,700 | | | 450,759 | |
Sanmina-SCI Corporation | * | | 28,400 | | | 120,984 | |
Teradyne, Inc. | * | | 11,200 | | | 163,184 | |
Texas Instruments, Inc. | | | 94,000 | | | 3,014,580 | |
Xilinx, Inc. | | | 20,010 | | | 504,452 | |
| | | | | | | |
| | | | | | 21,519,216 | |
| | | | | | | |
Entertainment & Leisure—1.6% | | | | | | | |
Eastman Kodak Company | † | | 15,800 | | | 369,720 | |
Harrah’s Entertainment, Inc. | | | 10,560 | | | 752,822 | |
Hasbro, Inc. | | | 9,775 | | | 197,259 | |
Mattel, Inc. | | | 23,578 | | | 373,004 | |
News Corporation, Inc. Class A | | | 140,450 | | | 2,183,997 | |
Time Warner, Inc. | | | 269,030 | | | 4,691,883 | |
Walt Disney Company | | | 111,800 | | | 2,679,846 | |
Xerox Corporation | * | | 55,100 | | | 807,215 | |
| | | | | | | |
| | | | | | 12,055,746 | |
| | | | | | | |
Financial Services—3.2% | | | | | | | |
Ameriprise Financial, Inc. | | | 14,226 | | | 583,266 | |
Bear Stearns Companies, Inc. (The) | | | 6,333 | | | 731,651 | |
Charles Schwab Corporation (The) | | | 61,822 | | | 906,929 | |
Countrywide Financial Corporation | | | 34,098 | | | 1,165,811 | |
E*Trade Financial Corporation | * | | 23,500 | | | 490,210 | |
Federal Home Loan Mortgage Corporation | | | 39,600 | | | 2,587,860 | |
Federal National Mortgage Association | | | 55,500 | | | 2,708,955 | |
Federated Investors, Inc. Class B | | | 5,700 | | | 211,128 | |
Franklin Resources, Inc. | | | 8,500 | | | 799,085 | |
Goldman Sachs Group, Inc. | | | 26,080 | | | 3,330,677 | |
|
| |
| | Shares | | Value | |
| |
Janus Capital Group, Inc. | | | 14,000 | | $ | 260,820 | |
Lehman Brothers Holdings, Inc. | | | 15,500 | | | 1,986,635 | |
Merrill Lynch & Company, Inc. | | | 53,070 | | | 3,594,431 | |
Morgan Stanley | | | 62,730 | | | 3,559,300 | |
T. Rowe Price Group, Inc. | | | 7,410 | | | 533,742 | |
| | | | | | | |
| | | | | | 23,450,500 | |
| | | | | | | |
Food Retailers—0.4% | | | | | | | |
Albertson’s, Inc. | † | | 20,242 | | | 432,167 | |
Kroger Company | * | | 41,100 | | | 775,968 | |
Starbucks Corporation | * | | 45,000 | | | 1,350,450 | |
Whole Foods Market, Inc. | | | 6,800 | | | 526,252 | |
| | | | | | | |
| | | | | | 3,084,837 | |
| | | | | | | |
Forest Products & Paper—0.6% | | | | | | | |
Bemis Company | | | 6,800 | | | 189,448 | |
International Paper Company | † | | 27,602 | | | 927,703 | |
Kimberly Clark Corporation | | | 27,020 | | | 1,611,743 | |
MeadWestvaco Corporation | | | 11,014 | | | 308,722 | |
Pactiv Corporation | * | | 8,100 | | | 178,200 | |
Temple-Inland, Inc. | | | 6,800 | | | 304,980 | |
Weyerhaeuser Company | | | 13,800 | | | 915,492 | |
| | | | | | | |
| | | | | | 4,436,288 | |
| | | | | | | |
Health Care Providers—1.3% | | | | | | | |
Caremark Rx, Inc. | * | | 25,800 | | | 1,336,182 | |
Coventry Health Care, Inc. | * | | 9,240 | | | 526,310 | |
Express Scripts, Inc. | *† | | 8,600 | | | 720,680 | |
HCA, Inc. | | | 24,867 | | | 1,255,783 | |
Health Management Associates, Inc. Class A | | | 13,200 | | | 289,872 | |
Laboratory Corporation of America Holdings | *† | | 7,700 | | | 414,645 | |
Manor Care, Inc. | | | 4,700 | | | 186,919 | |
Tenet Healthcare Corporation | * | | 25,550 | | | 195,713 | |
UnitedHealth Group, Inc. | | | 76,800 | | | 4,772,352 | |
| | | | | | | |
| | | | | | 9,698,456 | |
| | | | | | | |
Heavy Construction—0.1% | | | | | | | |
Centex Corporation | † | | 7,400 | | | 529,026 | |
Lennar Corporation Class A | † | | 7,900 | | | 482,058 | |
| | | | | | | |
| | | | | | 1,011,084 | |
| | | | | | | |
Heavy Machinery—2.0% | | | | | | | |
American Standard Companies, Inc. | | | 10,150 | | | 405,492 | |
Applied Materials, Inc. | | | 92,400 | | | 1,657,656 | |
Baker Hughes, Inc. | | | 19,180 | | | 1,165,760 | |
Black & Decker Corporation | | | 4,800 | | | 417,408 | |
Caterpillar, Inc. | | | 38,400 | | | 2,218,368 | |
Cummins, Inc. | † | | 2,600 | | | 233,298 | |
Deere & Company | † | | 13,800 | | | 939,918 | |
Dover Corporation | | | 11,200 | | | 453,488 | |
Eaton Corporation | | | 8,400 | | | 563,556 | |
Ingersoll-Rand Company Class A | | | 19,300 | | | 779,141 | |
National-Oilwell Varco, Inc. | * | | 9,910 | | | 621,357 | |
Pall Corporation | | | 7,666 | | | 205,909 | |
Parker Hannifin Corporation | | | 6,525 | | | 430,389 | |
Rockwell Automation, Inc. | | | 10,200 | | | 603,432 | |
Stanley Works (The) | | | 4,400 | | | 211,376 | |
United Technologies Corporation | | | 58,710 | | | 3,282,476 | |
W.W. Grainger, Inc. | | | 4,300 | | | 305,730 | |
| | | | | | | |
| | | | | | 14,494,754 | |
| | | | | | | |
Home Construction, Furnishings & Appliances—0.5% | | | | | | | |
DR Horton, Inc. | | | 15,600 | | | 557,388 | |
Johnson Controls, Inc. | | | 11,010 | | | 802,739 | |
KB Home | † | | 4,400 | | | 319,704 | |
| |
See accompanying notes to financial statements. | 187 |
SCHEDULE OF INVESTMENTS—(Continued)
December 31, 2005
| | | | | | | |
| |
Vantagepoint Asset
Allocation Fund | | Shares | | Value | |
| |
|
COMMON STOCKS—(Continued) | | | | | | | |
| |
Leggett & Platt, Inc. | † | | 10,700 | | $ | 245,672 | |
Masco Corporation | † | | 25,400 | | | 766,826 | |
Maytag Corporation | | | 5,000 | | | 94,100 | |
Pulte Homes, Inc. | | | 12,340 | | | 485,702 | |
Whirlpool Corporation | † | | 3,600 | | | 301,536 | |
| | | | | | | |
| | | | | | 3,573,667 | |
| | | | | | | |
Household Products—0.4% | | | | | | | |
Fortune Brands, Inc. | | | 8,100 | | | 631,962 | |
Illinois Tool Works, Inc. | † | | 12,040 | | | 1,059,400 | |
Newell Rubbermaid, Inc. | | | 15,060 | | | 358,127 | |
Rohm & Haas Company | | | 9,095 | | | 440,380 | |
Snap-On, Inc. | † | | 3,650 | | | 137,094 | |
| | | | | | | |
| | | | | | 2,626,963 | |
| | | | | | | |
Industrial—Diversified—0.5% | | | | | | | |
Tyco International Ltd. | | | 116,049 | | | 3,349,174 | |
| | | | | | | |
Insurance—5.2% | | | | | | | |
ACE Ltd. (Bermuda) | | | 18,500 | | | 988,640 | |
Aflac, Inc. | | | 28,300 | | | 1,313,686 | |
Aetna, Inc. | | | 16,874 | | | 1,591,387 | |
Allstate Corporation (The) | | | 37,938 | | | 2,051,308 | |
AMBAC Financial Group, Inc. | | | 6,250 | | | 481,625 | |
American International Group, Inc. | | | 148,740 | | | 10,148,530 | |
AON Corporation | | | 18,225 | | | 655,189 | |
Chubb Corporation | | | 11,360 | | | 1,109,304 | |
Cigna Corporation | | | 7,370 | | | 823,229 | |
Cincinnati Financial Corporation | | | 9,639 | | | 430,671 | |
Genworth Financial, Inc. Class A | | | 21,700 | | | 750,386 | |
Hartford Financial Services Group, Inc. | | | 17,200 | | | 1,477,308 | |
Humana, Inc. | * | | 9,500 | | | 516,135 | |
Jefferson Pilot Corporation | | | 7,687 | | | 437,621 | |
Lincoln National Corporation | | | 9,800 | | | 519,694 | |
Loews Corporation | | | 8,120 | | | 770,182 | |
MBIA, Inc. | † | | 7,850 | | | 472,256 | |
MGIC Investment Corporation | † | | 5,400 | | | 355,428 | |
Marsh & McLennan Companies, Inc. | | | 30,700 | | | 975,032 | |
Metlife, Inc. | † | | 43,310 | | | 2,122,190 | |
Principal Financial Group | | | 16,050 | | | 761,252 | |
Progressive Corporation (The) | † | | 11,080 | | | 1,293,922 | |
Prudential Financial, Inc. | | | 29,500 | | | 2,159,105 | |
Safeco Corporation | | | 7,600 | | | 429,400 | |
St. Paul Travelers Companies | | | 39,816 | | | 1,778,581 | |
Torchmark Corporation | | | 6,200 | | | 344,720 | |
UnumProvident Corporation | | | 16,418 | | | 373,510 | |
WellPoint, Inc. | * | | 36,900 | | | 2,944,251 | |
XL Capital Ltd. Class A (Bermuda) | | | 10,050 | | | 677,169 | |
| | | | | | | |
| | | | | | 38,751,711 | |
| | | | | | | |
Lodging—0.3% | | | | | | | |
Hilton Hotels Corporation | | | 18,800 | | | 453,268 | |
Marriott International, Inc. Class A | | | 9,720 | | | 650,948 | |
Starwood Hotels & Resorts Worldwide, Inc. | | | 12,500 | | | 798,250 | |
| | | | | | | |
| | | | | | 1,902,466 | |
| | | | | | | |
Media—Broadcasting & Publishing—1.5% | | | | | | | |
Clear Channel | | | | | | | |
Communications, Inc. | | | 31,070 | | | 977,152 | |
Comcast Corporation Class A | *† | | 125,880 | | | 3,267,845 | |
Dow Jones & Company, Inc. | | | 3,390 | | | 120,311 | |
E.W. Scripps Company Class A | † | | 4,900 | | | 235,298 | |
Gannett Company, Inc. | | | 14,130 | | | 855,854 | |
|
| |
| | Shares | | Value | |
| |
Knight-Ridder, Inc. | † | | 4,400 | | $ | 278,520 | |
McGraw-Hill Companies, Inc. (The) | | | 21,200 | | | 1,094,556 | |
Meredith Corporation | | | 2,700 | | | 141,318 | |
New York Times Company Class A | † | | 8,200 | | | 216,890 | |
Tribune Company | | | 15,167 | | | 458,953 | |
Univision Communications, Inc. Class A | * | | 13,350 | | | 392,357 | |
Viacom, Inc. Class B | | | 89,691 | | | 2,923,927 | |
| | | | | | | |
| | | | | | 10,962,981 | |
| | | | | | | |
Medical Supplies—3.5% | | | | | | | |
Allergan, Inc. | | | 7,500 | | | 809,700 | |
Applera Corporation—Applied Biosystems Group | | | 11,300 | | | 300,128 | |
Bausch & Lomb, Inc. | | | 2,806 | | | 190,527 | |
Baxter International, Inc. | | | 35,700 | | | 1,344,105 | |
Becton, Dickinson & Company | | | 14,000 | | | 841,120 | |
Biomet, Inc. | | | 14,025 | | | 512,894 | |
Boston Scientific Corporation | * | | 33,880 | | | 829,721 | |
C.R. Bard, Inc. | | | 6,000 | | | 395,520 | |
Fisher Scientific International | * | | 7,000 | | | 433,020 | |
Guidant Corporation | | | 18,900 | | | 1,223,775 | |
Johnson & Johnson | | | 171,128 | | | 10,284,793 | |
Kla-Tencor Corporation | † | | 11,320 | | | 558,416 | |
Medtronic, Inc. | | | 69,410 | | | 3,995,934 | |
Millipore Corporation | * | | 2,900 | | | 191,516 | |
PerkinElmer, Inc. | | | 7,800 | | | 183,768 | |
Quest Diagnostics, Inc. | | | 9,500 | | | 489,060 | |
St. Jude Medical, Inc. | * | | 21,000 | | | 1,054,200 | |
Stryker Corporation | | | 16,700 | | | 741,981 | |
Tektronix, Inc. | | | 4,500 | | | 126,945 | |
Thermo Electron Corporation | * | | 9,100 | | | 274,183 | |
Waters Corporation | * | | 6,600 | | | 249,480 | |
Zimmer Holdings, Inc. | * | | 13,890 | | | 936,742 | |
| | | | | | | |
| | | | | | 25,967,528 | |
| | | | | | | |
Metals—0.8% | | | | | | | |
Alcoa, Inc. | | | 49,060 | | | 1,450,704 | |
Allegheny Technologies, Inc. | | | 5,183 | | | 187,003 | |
Danaher Corporation | | | 14,210 | | | 792,634 | |
Engelhard Corporation | | | 7,537 | | | 227,241 | |
Newmont Mining Corporation | | | 25,568 | | | 1,365,331 | |
Nucor Corporation | | | 9,100 | | | 607,152 | |
Phelps Dodge Corporation | | | 5,828 | | | 838,474 | |
United States Steel Corporation | | | 6,520 | | | 313,416 | |
| | | | | | | |
| | | | | | 5,781,955 | |
| | | | | | | |
Mining—0.1% | | | | | | | |
Freeport-McMoran Copper & Gold, Inc. Class B | | | 10,600 | | | 570,280 | |
| | | | | | | |
Oil & Gas—8.0% | | | | | | | |
Amerada Hess Corporation | | | 4,600 | | | 583,372 | |
Anadarko Petroleum Corporation | | | 13,370 | | | 1,266,808 | |
Apache Corporation | | | 18,892 | | | 1,294,480 | |
Ashland, Inc. | | | 4,400 | | | 254,760 | |
BJ Services Company | † | | 17,800 | | | 652,726 | |
Burlington Resources, Inc. | | | 21,904 | | | 1,888,125 | |
Chevron Texaco Corporation | | | 129,180 | | | 7,333,549 | |
ConocoPhillips | | | 79,818 | | | 4,643,811 | |
Devon Energy Corporation | | | 25,988 | | | 1,625,290 | |
Dynegy, Inc. Class A | *† | | 16,600 | | | 80,344 | |
EOG Resources, Inc. | | | 13,900 | | | 1,019,843 | |
EL Paso Corporation | † | | 36,277 | | | 441,128 | |
Exxon Mobil Corporation | | | 358,728 | | | 20,149,752 | |
Halliburton Company | † | | 29,110 | | | 1,803,656 | |
Kerr-McGee Corporation | | | 6,857 | | | 623,027 | |
| |
188 | See accompanying notes to financial statements. |
SCHEDULE OF INVESTMENTS—(Continued)
December 31, 2005
| | | | | | | |
| |
Vantagepoint Asset
Allocation Fund | | Shares | | Value | |
| |
|
COMMON STOCKS—(Continued) | | | | | | | |
| |
Kinder Morgan, Inc. | | | 5,800 | | $ | 533,310 | |
Marathon Oil Corporation | | | 20,997 | | | 1,280,187 | |
Murphy Oil Corporation | | | 9,400 | | | 507,506 | |
Nabors Industries Ltd. | * | | 9,000 | | | 681,750 | |
Nicor, Inc. | † | | 2,900 | | | 113,999 | |
Noble Corporation | † | | 7,700 | | | 543,158 | |
Occidental Petroleum Corporation | | | 22,890 | | | 1,828,453 | |
Peoples Energy Corporation | | | 2,300 | | | 80,661 | |
Rowan Companies, Inc. | | | 6,200 | | | 220,968 | |
Schlumberger Ltd. | † | | 33,700 | | | 3,273,955 | |
Sunoco, Inc. | † | | 8,200 | | | 642,716 | |
Transocean, Inc. | * | | 18,811 | | | 1,310,939 | |
Valero Energy Corporation | | | 35,060 | | | 1,809,096 | |
Weatherford International Ltd. | * | | 20,020 | | | 724,724 | |
Williams Companies, Inc. | | | 32,100 | | | 743,757 | |
XTO Energy, Inc. | | | 20,666 | | | 908,064 | |
| | | | | | | |
| | | | | | 58,863,914 | |
| | | | | | | |
Pharmaceuticals—6.1% | | | | | | | |
Abbott Laboratories | | | 89,100 | | | 3,513,213 | |
AmerisourceBergen Corporation | † | | 12,200 | | | 505,080 | |
Amgen, Inc. | * | | 70,744 | | | 5,578,872 | |
Biogen Idec, Inc. | * | | 18,930 | | | 858,097 | |
Bristol-Myers Squibb Company | | | 112,100 | | | 2,576,058 | |
Cardinal Health, Inc. | | | 24,550 | | | 1,687,813 | |
Chiron Corporation | * | | 6,980 | | | 310,331 | |
Eli Lilly & Company | † | | 65,000 | | | 3,678,350 | |
Forest Laboratories, Inc. | * | | 19,500 | | | 793,260 | |
Genzyme Corporation | * | | 14,700 | | | 1,040,466 | |
Gilead Sciences, Inc. | * | | 26,130 | | | 1,375,222 | |
Hospira, Inc. | * | | 8,650 | | | 370,047 | |
King Pharmaceuticals, Inc. | * | | 13,066 | | | 221,077 | |
McKesson Corporation | | | 17,689 | | | 912,576 | |
Medco Health Solutions, Inc. | * | | 17,455 | | | 973,989 | |
MedImmune, Inc. | * | | 13,600 | | | 476,272 | |
Merck & Company, Inc. | | | 125,900 | | | 4,004,879 | |
Mylan Laboratories | | | 12,500 | | | 249,500 | |
Pfizer, Inc. | | | 424,112 | | | 9,890,292 | |
Schering-Plough Corporation | | | 84,600 | | | 1,763,910 | |
Sigma Aldrich Corporation | | | 3,800 | | | 240,502 | |
Watson Pharmaceuticals, Inc. | * | | 5,900 | | | 191,809 | |
Wyeth | | | 76,900 | | | 3,542,783 | |
| | | | | | | |
| | | | | | 44,754,398 | |
| | | | | | | |
Real Estate—0.7% | | | | | | | |
Apartment Investment & Management Company REIT Class A | † | | 5,900 | | | 223,433 | |
Archstone-Smith Trust REIT | | | 12,100 | | | 506,869 | |
Equity Office Properties Trust REIT | | | 23,500 | | | 712,755 | |
Equity Residential REIT | | | 16,100 | | | 629,832 | |
Plum Creek Timber Company, Inc. REIT | † | | 10,800 | | | 389,340 | |
Prologis REIT | | | 14,200 | | | 663,424 | |
Public Storage, Inc. REIT | | | 4,800 | | | 325,056 | |
Simon Property Group, Inc. REIT | † | | 10,540 | | | 807,680 | |
Vornado Realty Trust REIT | | | 6,800 | | | 567,596 | |
| | | | | | | |
| | | | | | 4,825,985 | |
| | | | | | | |
Restaurants—0.5% | | | | | | | |
Darden Restaurants, Inc. | | | 7,700 | | | 299,376 | |
McDonald’s Corporation | | | 71,600 | | | 2,414,352 | |
Wendy’s International, Inc. | | | 6,200 | | | 342,612 | |
Yum! Brands, Inc. | | | 16,200 | | | 759,456 | |
| | | | | | | |
| | | | | | 3,815,796 | |
| | | | | | | |
Retailers—3.6% | | | | | | | |
|
| |
| | Shares | | Value | |
| |
Amazon.Com, Inc. | *† | | 17,600 | | $ | 829,840 | |
Autozone, Inc. | * | | 3,210 | | | 294,518 | |
Bed Bath & Beyond, Inc. | * | | 16,400 | | | 592,860 | |
Best Buy Company, Inc. | | | 23,915 | | | 1,039,824 | |
Big Lots, Inc. | * | | 7,200 | | | 86,472 | |
CVS Corporation | | | 46,600 | | | 1,231,172 | |
Circuit City Stores, Inc. | | | 10,300 | | | 232,677 | |
Costco Wholesale Corporation | † | | 27,476 | | | 1,359,238 | |
Dillard’s, Inc. Class A | | | 4,200 | | | 104,244 | |
Dollar General Corporation | | | 18,570 | | | 354,130 | |
eBay, Inc. | * | | 65,730 | | | 2,842,823 | |
Family Dollar Stores, Inc. | | | 9,400 | | | 233,026 | |
Federated Department Stores | | | 15,652 | | | 1,038,197 | |
JC Penney Company, Inc. (Holding Company) | | | 13,820 | | | 768,392 | |
Office Depot, Inc. | * | | 17,400 | | | 546,360 | |
OfficeMax, Inc. | | | 4,070 | | | 103,215 | |
RadioShack Corporation | | | 7,700 | | | 161,931 | |
Sears Holdings Corporation | *† | | 5,912 | | | 683,013 | |
Sherwin-Williams Company (The) | | | 7,130 | | | 323,845 | |
Staples, Inc. | | | 40,950 | | | 929,975 | |
TJX Companies, Inc. | | | 27,700 | | | 643,471 | |
Target Corporation | | | 50,400 | | | 2,770,488 | |
Tiffany & Company | | | 8,100 | | | 310,149 | |
Walgreen Company | | | 58,600 | | | 2,593,636 | |
Wal-Mart Stores, Inc. | | | 143,100 | | | 6,697,080 | |
| | | | | | | |
| | | | | | 26,770,576 | |
| | | | | | | |
Telecommunications—0.0% | | | | | | | |
Citizens Communications Company | | | 18,800 | | | 229,924 | |
| | | | | | | |
Telephone Systems—2.6% | | | | | | | |
Alltel Corporation | | | 21,880 | | | 1,380,628 | |
AT&T, Inc. | | | 224,634 | | | 5,501,287 | |
BellSouth Corporation | | | 105,000 | | | 2,845,500 | |
CenturyTel, Inc. | | | 7,700 | | | 255,332 | |
Qwest Communications International, Inc. | * | | 87,429 | | | 493,974 | |
Sprint Nextel Corp. | | | 169,959 | | | 3,970,242 | |
Verizon Communications, Inc. | | | 158,471 | | | 4,773,147 | |
| | | | | | | |
| | | | | | 19,220,110 | |
| | | | | | | |
Textiles, Clothing & Fabrics—0.3% | | | | | | | |
Coach, Inc. | * | | 21,800 | | | 726,812 | |
Jones Apparel Group, Inc. | | | 6,700 | | | 205,824 | |
Liz Claiborne, Inc. | † | | 5,800 | | | 207,756 | |
Nike, Inc. Class B | | | 10,960 | | | 951,218 | |
Reebok International Ltd. | | | 3,000 | | | 174,690 | |
VF Corporation | | | 5,100 | | | 282,234 | |
| | | | | | | |
| | | | | | 2,548,534 | |
| | | | | | | |
Transportation—1.7% | | | | | | | |
Brunswick Corporation | | | 5,800 | | | 235,828 | |
Burlington Northern Santa Fe Corporation | | | 21,256 | | | 1,505,350 | |
CSX Corporation | | | 12,500 | | | 634,625 | |
Carnival Corporation | | | 24,830 | | | 1,327,660 | |
FedEx Corporation | | | 17,340 | | | 1,792,783 | |
Norfolk Southern Corporation | | | 23,400 | | | 1,049,022 | |
Sabre Holdings Corporation | | | 6,930 | | | 167,082 | |
Union Pacific Corporation | | | 15,200 | | | 1,223,752 | |
United Parcel Service, Inc. Class B | | | 63,500 | | | 4,772,025 | |
| | | | | | | |
| | | | | | 12,708,127 | |
| | | | | | | |
TOTAL COMMON STOCKS | | | | | | | |
(Cost $571,847,732) | | | | | | 648,002,959 | |
| | | | | | | |
| |
See accompanying notes to financial statements. | 189 |
SCHEDULE OF INVESTMENTS—(Continued)
December 31, 2005
| | | | | | | | | | |
| |
Vantagepoint Asset
Allocation Fund | | | | | | | |
| |
|
Coupon
Rate | | Maturity
Date | | | Face | | Value | |
| |
|
U.S. TREASURY OBLIGATIONS—0.8% | | | | | | | |
| |
U.S. Treasury Bills—0.8% | | | | | | | |
U.S. Treasury Bill | | | | | | | |
3.925% | | 03/09/2006 | | ** | | | | | | |
(Cost $5,955,517) | | $ | 6,000,000 | | $ | 5,955,516 | |
| | | | | | | |
|
| |
| | | | | | | | | | |
| | | | | Shares | | Value | |
| |
RIGHTS—0.0% | | | | | | | |
| |
Computers & Information—0.0% | | | | | | | |
Seagate Technology, Inc. | | | | | | | |
(Cost $—) | | d | | 10,600 | | | — | |
| | | | | | | | |
|
| |
Coupon
Rate | | Maturity
Date | | | Face | | Value | |
| |
COMMERCIAL PAPER—7.4% | | | | | | | |
| |
Banking—2.0% | | | | | | | |
Westpac Banking Corp., 144A (Australia) | | | | | | | |
4.330% | | 03/01/2006 | | *** | $ | 15,000,000 | | | 14,891,750 | |
| | | | | | | | | | |
| | | | | | | | | | |
Financial Services—5.4% | | | | | | | |
Barclays U.S. Funding Corp. | | | | | | | |
4.370% | | 03/21/2006 | | | | 20,000,000 | | | 19,805,778 | |
Govco, Inc., 144A | | | | | | | |
4.370% | | 03/13/2006 | | *** | | 20,000,000 | | | 19,825,200 | |
| | | | | | | | | | |
| | | | | | | | | 39,630,978 | |
| | | | | | | | | | |
TOTAL COMMERCIAL PAPER | | | | | | | |
(Cost $54,522,728) | | | | | | 54,522,728 | |
| | | | | | | | | | |
|
| |
CASH EQUIVALENTS—8.8% | | | | | | | |
| |
Institutional Money Market Funds—0.6% | | | | | | | |
American Beacon Funds | †† | | 274,323 | | | 274,323 | |
BGI Institutional Fund | †† | | 3,566,193 | | | 3,566,193 | |
Goldman Sachs Financial Square Prime Obligations Fund | †† | | 274,323 | | | 274,323 | |
Merrimac Cash Fund—Premium Class | †† | | 438,916 | | | 438,916 | |
| | | | | | | |
| | | | | | | | | 4,553,755 | |
| | | | | | | | | | |
Bank & Certificate Deposits/Offshore Time Deposits—7.5% | | | | | | | |
Abbey National PLC | | | | | | | |
4.290% | | 01/11/2006 | | †† | | 1,371,607 | | | 1,371,607 | |
Bank of Nova Scotia | | | | | | | |
4.250% | | 01/27/2006 | | †† | | 1,920,258 | | | 1,920,258 | |
Barclays | | | | | | | | | | |
4.410% | | 02/27/2006 | | †† | | 1,371,613 | | | 1,371,613 | |
Barclays | | | | | | | | | | |
4.270% | | 01/25/2006 | | †† | | 1,371,613 | | | 1,371,613 | |
BNP Paribas | | | | | | | |
4.220% | | 01/24/2006 | | †† | | 1,371,613 | | | 1,371,613 | |
Branch Banker &Trust | | | | | | | |
4.260% | | 01/11/2006 | | †† | | 1,371,613 | | | 1,371,613 | |
CIESCO | | | | | | | | | | |
4.305% | | 01/06/2006 | | †† | | 1,645,935 | | | 1,645,935 | |
Dexia Group | | | | | | | | | | |
4.250% | | 01/09/2006 | | †† | | 2,743,225 | | | 2,743,225 | |
|
| |
| | Shares | | Value | |
| |
Fairway Finance | | | | | | | |
4.280% | | 01/30/2006 | | †† | $ | 1,097,290 | | $ | 1,097,290 | |
Falcon Asset Securitization Corporation | | | | | | | |
4.307% | | 02/02/2006 | | †† | | 1,360,498 | | | 1,360,498 | |
Fortis Bank | | | | | | | | | | |
4.350% | | 01/03/2006 | | †† | | 1,371,613 | | | 1,371,613 | |
Greyhawk Funding | | | | | | | |
4.355% | | 01/06/2006 | | †† | | 1,097,290 | | | 1,097,290 | |
Greyhawk Funding | | | | | | | |
4.278% | | 01/24/2006 | | †† | | 822,968 | | | 822,968 | |
Jupiter Securitization Corporation | | | | | | | |
4.266% | | 01/05/2006 | | †† | | 658,374 | | | 658,374 | |
Jupiter Securitization Corporation | | | | | | | |
4.257% | | 01/04/2006 | | †† | | 822,968 | | | 822,968 | |
Liberty Street | | | | | | | |
4.266% | | 01/05/2006 | | †† | | 1,361,573 | | | 1,361,573 | |
Merrill Lynch & Company, Inc. | | | | | | | |
4.240% | | 01/03/2006 | | †† | | 5,486,451 | | | 5,486,451 | |
National Australia Bank | | | | | | | |
4.156% | | 01/03/2006 | | †† | | 769,650 | | | 769,650 | |
Paradigm Funding LLC | | | | | | | |
4.303% | | 01/03/2006 | | †† | | 1,774,597 | | | 1,774,597 | |
Paradigm Funding LLC | | | | | | | |
4.297% | | 01/09/2006 | | †† | | 1,097,290 | | | 1,097,290 | |
Prefco | | | | | | | | | | |
4.312% | | 01/04/2006 | | †† | | 822,968 | | | 822,968 | |
Rabobank Nederland | | | | | | | |
4.150% | | 01/03/2006 | | †† | | 1,371,613 | | | 1,371,613 | |
Ranger Funding | | | | | | | |
4.291% | | 01/18/2006 | | †† | | 1,097,290 | | | 1,097,290 | |
Royal Bank of Canada | | | | | | | |
4.250% | | 01/24/2006 | | †† | | 1,920,258 | | | 1,920,258 | |
Royal Bank of Canada | | | | | | | |
4.220% | | 01/20/2006 | | †† | | 1,371,613 | | | 1,371,613 | |
Royal Bank of Scotland | | | | | | | |
4.310% | | 02/01/2006 | | †† | | 2,743,225 | | | 2,743,225 | |
Royal Bank of Scotland | | | | | | | |
4.250% | | 01/23/2006 | | †† | | 1,371,613 | | | 1,371,613 | |
Skandinaviska Enskilda Banken AB | | | | | | | |
4.300% | | 01/17/2006 | | †† | | 822,968 | | | 822,968 | |
Skandinaviska Enskilda Banken AB | | | | | | | |
4.230% | | 01/03/2006 | | †† | | 1,371,613 | | | 1,371,613 | |
Societe Generale | | | | | | | |
4.280% | | 01/30/2006 | | †† | | 1,097,290 | | | 1,097,290 | |
The Bank of the West | | | | | | | |
4.290% | | 01/25/2006 | | †† | | 1,371,613 | | | 1,371,613 | |
UBS AG | | | | | | | | | | |
4.260% | | 01/10/2006 | | †† | | 1,371,613 | | | 1,371,613 | |
UBS AG | | | | | | | | | | |
4.255% | | 01/18/2006 | | †† | | 1,645,935 | | | 1,645,935 | |
Wells Fargo | | | | | | | | | | |
4.290% | | 01/30/2006 | | †† | | 2,194,580 | | | 2,194,580 | |
Wells Fargo | | | | | | | | | | |
4.270% | | 01/03/2006 | | †† | | 1,371,613 | | | 1,371,613 | |
Yorktown Capital LLC | | | | | | | |
4.330% | | 01/04/2006 | | †† | | 1,228,197 | | | 1,228,197 | |
Yorktown Capital LLC | | | | | | | |
4.266% | | 01/05/2006 | | †† | | 1,361,573 | | | 1,361,573 | |
| | | | | | | | | | |
| | | | | | | | | 55,423,614 | |
| | | | | | | | | | |
Floating Rate Instruments/Master Notes—0.7% | | | | | | | |
Bank of America | | | | | | | |
4.270% | | 01/17/2006 | | †† | | 1,097,290 | | | 1,097,290 | |
Bank of America | | | | | | | |
4.230% | | 01/20/2006 | | †† | | 1,371,613 | | | 1,371,613 | |
| |
190 | See accompanying notes to financial statements. |
SCHEDULE OF INVESTMENTS—(Continued)
December 31, 2005
| | | | | | | | | | |
| |
Vantagepoint Asset
Allocation Fund | | | | | | | |
| |
|
Coupon
Rate | | Maturity
Date | | | Face | | Value | |
| |
|
CASH EQUIVALENTS—(Continued) | | | | | | | |
| |
Credit Suisse First Boston Corporation | | | | | | | |
4.175% | | 03/10/2006 | | †† | $ | 1,097,290 | | $ | 1,097,290 | |
Rabobank Nederland | | | | | | | |
4.100% | | 05/31/2006 | | †† | | 1,371,613 | | | 1,371,613 | |
| | | | | | | | | | |
| | | | | | | | | 4,937,806 | |
| | | | | | | | | | |
TOTAL CASH EQUIVALENTS | | | | | | | |
(Cost $64,915,175) | | | | | | 64,915,175 | |
| | | | | | | | | | |
TOTAL INVESTMENTS—104.8% | | | | | | | |
(Cost $697,241,152) | | | | | | 773,396,378 | |
Other assets less liabilities—(4.8%) | | | | | | (35,613,631) | |
| | | | | | | | | | |
NET ASSETS—100.0% | | | | | $ | 737,782,747 | |
| | | | | | | |
Notes to the Schedule of Investments:
| |
REIT | Real Estate Investment Trust |
|
* | Non-income producing security. |
|
† | Denotes all or a portion of security on loan. |
|
** | Security has been pledged as collateral for futures contracts. |
|
†† | Represents collateral received from securities lending transactions. |
|
*** | Security exempt from registration under Rule 144A of the Securities Act of 1933. These securities may be resold in transactions exempt from registration, normally to qualified buyers. 144A securities represent 4.49% of Total Investments. |
|
d | Security has no market value at 12/31/2005. |
| |
See accompanying notes to financial statements. | 191 |
SCHEDULE OF INVESTMENTS
December 31, 2005
| | | | | | | |
| | | | | | | | |
Vantagepoint
Equity Income Fund | | Shares | | Value | |
| | | | | | |
|
COMMON STOCKS—95.3% | | | | | | | |
| | | | | | | | |
| | | | | | | |
Aerospace & Defense—1.1% | | | | | | | |
Honeywell International, Inc. | | | 297,000 | | $ | 11,063,250 | |
Lockheed Martin Corporation | | | 50,000 | | | 3,181,500 | |
| | | | | | | |
| | | | | | 14,244,750 | |
| | | | | | | |
Automotive—1.7% | | | | | | | |
Ford Motor Company | | | 200,000 | | | 1,544,000 | |
General Motors Corporation | † | | 804,000 | | | 15,613,680 | |
Genuine Parts Company | | | 90,552 | | | 3,977,044 | |
| | | | | | | |
| | | | | | 21,134,724 | |
| | | | | | | |
Banking—9.0% | | | | | | | |
American Express Company | | | 50,000 | | | 2,573,000 | |
Bank of America Corporation | | | 275,984 | | | 12,736,662 | |
Capital One Financial Corporation | | | 67,600 | | | 5,840,640 | |
Citigroup, Inc. | † | | 291,269 | | | 14,135,285 | |
JP Morgan Chase & Company | | | 250,000 | | | 9,922,500 | |
KeyCorp | | | 100,000 | | | 3,293,000 | |
MBNA Corporation | | | 454,000 | | | 12,330,640 | |
Mellon Financial Corporation | | | 150,000 | | | 5,137,500 | |
Northern Trust Corporation | | | 40,000 | | | 2,072,800 | |
PNC Financial Services Group, Inc. | | | 100,000 | | | 6,183,000 | |
SLM Corporation | | | 162,300 | | | 8,941,107 | |
State Street Corporation | | | 110,000 | | | 6,098,400 | |
Suntrust Banks, Inc. | | | 40,000 | | | 2,910,400 | |
Wachovia Corporation | | | 134,704 | | | 7,120,453 | |
Washington Mutual, Inc. | | | 230,945 | | | 10,046,108 | |
Wells Fargo & Company | | | 67,400 | | | 4,234,742 | |
| | | | | | | |
| | | | | | 113,576,237 | |
| | | | | | | |
Beverages, Food & Tobacco—6.3% | | | | | | | |
Altria Group, Inc. | | | 180,800 | | | 13,509,376 | |
Anheuser-Busch Companies, Inc. | † | | 448,000 | | | 19,246,080 | |
Campbell Soup Company | | | 99,712 | | | 2,968,426 | |
Coca-Cola Company (The) | | | 120,000 | | | 4,837,200 | |
ConAgra Foods, Inc. | † | | 338,900 | | | 6,872,892 | |
General Mills, Inc. | | | 80,022 | | | 3,946,685 | |
H.J. Heinz Company | | | 158,849 | | | 5,356,388 | |
Imperial Tobacco Group PLC (United Kingdom) | | | 192,200 | | | 11,626,178 | |
Kraft Foods, Inc. Class A | † | | 100,000 | | | 2,814,000 | |
McCormick & Company, Inc. | | | 75,000 | | | 2,319,000 | |
UST, Inc. | † | | 160,137 | | | 6,538,394 | |
| | | | | | | |
| | | | | | 80,034,619 | |
| | | | | | | |
Building Materials—3.7% | | | | | | | |
Cemex SA de CV ADR (Mexico) | † | | 598,537 | | | 35,511,200 | |
Hanson PLC Sponsored ADR (United Kingdom) | | | 154,000 | | | 8,454,600 | |
Home Depot, Inc. | | | 70,000 | | | 2,833,600 | |
| | | | | | | |
| | | | | | 46,799,400 | |
| | | | | | | |
Chemicals—0.9% | | | | | | | |
Avery Dennison Corporation | † | | 85,000 | | | 4,697,950 | |
Dow Chemical Company (The) | | | 39,771 | | | 1,742,765 | |
EI Du Pont de Nemours &Company | | | 61,446 | | | 2,611,455 | |
Hercules, Inc. | * | | 48,000 | | | 542,400 | |
International Flavors & Fragrances, Inc. | | | 70,000 | | | 2,345,000 | |
| | | | | | | |
| | | | | | 11,939,570 | |
| | | | | | | |
Commercial Services—1.6% | | | | | | | |
Waste Management, Inc. | | | 663,200 | | | 20,128,120 | |
| | | | | | | |
| | | | | | | |
| | | | | | | | |
| | | | | |
| | Shares | | Value | |
| | | | | | |
Communications—0.0% | | | | | | | |
Lucent Technologies, Inc. | †* | | 200,000 | | $ | 532,000 | |
| | | | | | | |
| | | | | | | |
Computer Software & Processing—0.4% | | | | | | | |
Microsoft Corporation | | | 200,000 | | | 5,230,000 | |
| | | | | | | |
| | | | | | | |
Computers & Information—3.4% | | | | | | | |
Dell, Inc. | * | | 953,000 | | | 28,580,470 | |
Hewlett-Packard Company | | | 200,000 | | | 5,726,000 | |
International Business Machines Corporation | | | 60,000 | | | 4,932,000 | |
Pitney Bowes, Inc. | | | 85,900 | | | 3,629,275 | |
| | | | | | | |
| | | | | | 42,867,745 | |
| | | | | | | |
Cosmetics & Personal Care—0.6% | | | | | | | |
Avon Products, Inc. | | | 100,000 | | | 2,855,000 | |
Colgate-Palmolive Company | | | 90,000 | | | 4,936,500 | |
| | | | | | | |
| | | | | | 7,791,500 | |
| | | | | | | |
Diversified—0.8% | | | | | | | |
General Electric Company | | | 275,000 | | | 9,638,750 | |
| | | | | | | |
| | | | | | | |
Electric Utilities—2.8% | | | | | | | |
Cinergy Corporation | | | 190,400 | | | 8,084,384 | |
Duke Energy Corporation | † | | 341,000 | | | 9,360,450 | |
Entergy Corporation | | | 112,600 | | | 7,729,990 | |
FirstEnergy Corporation | | | 50,000 | | | 2,449,500 | |
NiSource, Inc. | † | | 130,000 | | | 2,711,800 | |
Progress Energy, Inc. | † | | 100,000 | | | 4,392,000 | |
| | | | | | | |
| | | | | | 34,728,124 | |
| | | | | | | |
Electrical Equipment—1.1% | | | | | | | |
Cooper Industries Ltd. Class A | | | 75,000 | | | 5,475,000 | |
Emerson Electric Company | | | 110,700 | | | 8,269,290 | |
| | | | | | | |
| | | | | | 13,744,290 | |
| | | | | | | |
Electronics—4.9% | | | | | | | |
American Power Conversion Corporation | | | 293,600 | | | 6,459,200 | |
Analog Devices, Inc. | | | 125,000 | | | 4,483,750 | |
Intel Corporation | | | 175,000 | | | 4,368,000 | |
Koninklijke (Royal) Philips Electronics NV NY Shares (Netherlands) | | | 1,039,000 | | | 32,312,900 | |
Raytheon Company | | | 100,000 | | | 4,015,000 | |
Sony Corporation ADR (Japan) | | | 125,000 | | | 5,100,000 | |
Texas Instruments, Inc. | | | 150,000 | | | 4,810,500 | |
| | | | | | | |
| | | | | | 61,549,350 | |
| | | | | | | |
Entertainment & Leisure—4.9% | | | | | | | |
Discovery Holding Company Class A | †* | | 1,209,800 | | | 18,328,470 | |
Eastman Kodak Company | † | | 135,741 | | | 3,176,339 | |
Mattel, Inc. | | | 603,100 | | | 9,541,042 | |
Time Warner, Inc. | † | | 250,000 | | | 4,360,000 | |
Walt Disney Company | | | 1,054,000 | | | 25,264,380 | |
Xerox Corporation | * | | 51,000 | | | 747,150 | |
| | | | | | | |
| | | | | | 61,417,381 | |
| | | | | | | |
Financial Services—1.3% | | | | | | | |
Charles Schwab Corporation (The) | | | 284,200 | | | 4,169,214 | |
Federal National Mortgage Association | | | 40,806 | | | 1,991,741 | |
| |
192 | See accompanying notes to financial statements. |
SCHEDULE OF INVESTMENTS—(Continued)
December 31, 2005
| | | | | | | |
| | | | | | |
Vantagepoint
Equity Income Fund | | Shares | | Value | |
| | | | | | |
|
COMMON STOCKS—(Continued) | | | | | | | |
| | | | | | | | |
Janus Capital Group, Inc. | | | 150,000 | | $ | 2,794,500 | |
Morgan Stanley | | | 120,000 | | | 6,808,800 | |
| | | | | | | |
| | | | | | 15,764,255 | |
| | | | | | | |
Forest Products & Paper—0.7% | | | | | | | |
International Paper Company | | | 150,000 | | | 5,041,500 | |
Kimberly Clark Corporation | | | 45,259 | | | 2,699,699 | |
MeadWestvaco Corporation | | | 50,000 | | | 1,401,500 | |
| | | | | | | |
| | | | | | 9,142,699 | |
| | | | | | | |
Health Care Providers—0.7% | | | | | | | |
HCA, Inc. | | | 164,500 | | | 8,307,250 | |
| | | | | | | |
| | | | | | | |
Heavy Machinery—1.4% | | | | | | | |
Baker Hughes, Inc. | | | 57,500 | | | 3,494,850 | |
Pall Corporation | | | 120,000 | | | 3,223,200 | |
Stanley Works (The) | | | 222,700 | | | 10,698,508 | |
| | | | | | | |
| | | | | | 17,416,558 | |
| | | | | | | |
Home Construction, Furnishings & Appliances—0.3% | | | | | | | |
Whirlpool Corporation | † | | 40,000 | | | 3,350,400 | |
| | | | | | | |
| | | | | | | |
Household Products—1.2% | | | | | | | |
Fortune Brands, Inc. | | | 37,765 | | | 2,946,425 | |
Illinois Tool Works, Inc. | † | | 91,900 | | | 8,086,281 | |
Newell Rubbermaid, Inc. | † | | 185,000 | | | 4,399,300 | |
| | | | | | | |
| | | | | | 15,432,006 | |
| | | | | | | |
Industrial—Diversified—0.6% | | | | | | | |
Tyco International Ltd. | | | 273,756 | | | 7,900,598 | |
| | | | | | | |
| | | | | | | |
Insurance—10.7% | | | | | | | |
Allstate Corporation (The) | | | 147,600 | | | 7,980,732 | |
American International Group, Inc. | | | 142,414 | | | 9,716,907 | |
AON Corporation | | | 766,000 | | | 27,537,700 | |
Chubb Corporation | | | 33,000 | | | 3,222,450 | |
Cigna Corporation | | | 41,800 | | | 4,669,060 | |
Fairfax Financial Holdings Ltd. (Canada) | † | | 110,000 | | | 15,769,600 | |
Hartford Financial Services Group, Inc. | | | 126,700 | | | 10,882,263 | |
Lincoln National Corporation | | | 49,690 | | | 2,635,061 | |
MGIC Investment Corporation | † | | 134,100 | | | 8,826,462 | |
Marsh & McLennan Companies, Inc. | | | 140,000 | | | 4,446,400 | |
Safeco Corporation | | | 70,000 | | | 3,955,000 | |
St. Paul Travelers Companies | | | 169,306 | | | 7,562,899 | |
UnumProvident Corporation | † | | 105,000 | | | 2,388,750 | |
WellPoint, Inc. | * | | 207,900 | | | 16,588,341 | |
XL Capital Ltd. Class A (Bermuda) | | | 124,100 | | | 8,361,858 | |
| | | | | | | |
| | | | | | 134,543,483 | |
| | | | | | | |
Lodging—0.3% | | | | | | | |
Starwood Hotels & Resorts Worldwide, Inc. | | | 50,000 | | | 3,193,000 | |
| | | | | | | |
| | | | | | | |
Media—Broadcasting & Publishing—8.1% | | | | | | | |
Comcast Corporation Class A | †* | | 135,000 | | | 3,504,600 | |
Comcast Corporation Special Class A | * | | 711,000 | | | 18,265,590 | |
DIRECTV Group, Inc. (The) | * | | 1,508,000 | | | 21,292,960 | |
| | | | | | | |
| | | | | | |
| | | | | |
| | Shares | | Value | |
| | | | | | |
Dow Jones & Company, Inc. | † | | 98,000 | | $ | 3,478,020 | |
Gannett Company, Inc. | | | 126,500 | | | 7,662,105 | |
Knight-Ridder, Inc. | † | | 188,000 | | | 11,900,400 | |
Liberty Media Corporation Class A | * | | 2,803,000 | | | 22,059,610 | |
New York Times Company Class A | † | | 160,000 | | | 4,232,000 | |
Tribune Company | | | 150,000 | | | 4,539,000 | |
Viacom, Inc. Class B | | | 140,000 | | | 4,564,000 | |
| | | | | | | |
| | | | | | 101,498,285 | |
| | | | | | | |
| | | | | | | |
Medical Supplies—1.5% | | | | | | | |
Baxter International, Inc. | | | 312,600 | | | 11,769,390 | |
Boston Scientific Corporation | * | | 150,000 | | | 3,673,500 | |
Johnson & Johnson | | | 60,000 | | | 3,606,000 | |
| | | | | | | |
| | | | | | 19,048,890 | |
| | | | | | | |
| | | | | | | |
Metals—0.3% | | | | | | | |
Alcoa, Inc. | | | 125,000 | | | 3,696,250 | |
| | | | | | | |
| | | | | | | |
Oil & Gas—7.4% | | | | | | | |
Amerada Hess Corporation | | | 75,000 | | | 9,511,500 | |
Anadarko Petroleum Corporation | | | 52,000 | | | 4,927,000 | |
BP Amoco PLC ADR (United Kingdom) | | | 236,156 | | | 15,165,938 | |
Chevron Texaco Corporation | | | 293,800 | | | 16,679,026 | |
ConocoPhillips | | | 196,700 | | | 11,444,006 | |
Exxon Mobil Corporation | | | 124,760 | | | 7,007,769 | |
Marathon Oil Corporation | | | 213,000 | | | 12,986,610 | |
Occidental Petroleum Corporation | | | 153,000 | | | 12,221,640 | |
Royal Dutch Shell PLC Class A ADR (United Kingdom) | | | 60,781 | | | 3,737,424 | |
| | | | | | | |
| | | | | | 93,680,913 | |
| | | | | | | |
| | | | | | | |
Pharmaceuticals—4.3% | | | | | | | |
Abbott Laboratories | | | 75,000 | | | 2,957,250 | |
Bristol-Myers Squibb Company | | | 413,900 | | | 9,511,422 | |
MedImmune, Inc. | * | | 75,000 | | | 2,626,500 | |
Merck & Company, Inc. | | | 175,000 | | | 5,566,750 | |
Pfizer, Inc. | | | 511,900 | | | 11,937,508 | |
Schering-Plough Corporation | | | 464,300 | | | 9,680,655 | |
Wyeth | | | 264,200 | | | 12,171,694 | |
| | | | | | | |
| | | | | | 54,451,779 | |
| | | | | | | |
| | | | | | | |
Real Estate—0.3% | | | | | | | |
Simon Property Group, Inc. REIT | † | | 50,000 | | | 3,831,500 | |
| | | | | | | |
| | | | | | | |
Restaurants—2.3% | | | | | | | |
McDonald’s Corporation | | | 150,000 | | | 5,058,000 | |
Yum! Brands, Inc. | | | 517,000 | | | 24,236,960 | |
| | | | | | | |
| | | | | | 29,294,960 | |
| | | | | | | |
| | | | | | | |
Retailers—1.5% | | | | | | | |
Dollar General Corporation | | | 334,800 | | | 6,384,636 | |
JC Penney Company, Inc. (Holding Company) | † | | 95,600 | | | 5,315,360 | |
RadioShack Corporation | | | 200,000 | | | 4,206,000 | |
Wal-Mart Stores, Inc. | | | 75,000 | | | 3,510,000 | |
| | | | | | | |
| | | | | | 19,415,996 | |
| | | | | | | |
| | | | | | | |
Telecommunications—1.3% | | | | | | | |
Nokia Corporation ADR (Finland) | | | 924,600 | | | 16,920,180 | |
| | | | | | | |
| |
See accompanying notes to financial statements. | 193 |
SCHEDULE OF INVESTMENTS—(Continued)
December 31, 2005
| | | | | | | |
| | | | | | |
Vantagepoint
Equity Income Fund | | Shares | | Value | |
| | | | | | |
|
COMMON STOCKS—(Continued) | | | | | | | |
| | | | | | | | |
Telephone Systems—3.9% | | | | | | | |
Alltel Corporation | | | 80,000 | | $ | 5,048,000 | |
AT&T, Inc. | | | 252,942 | | | 6,194,550 | |
Qwest Communications International, Inc. | †* | | 630,000 | | | 3,559,500 | |
Sprint Nextel Corp. | | | 765,000 | | | 17,870,400 | |
Verizon Communications, Inc. | | | 529,741 | | | 15,955,799 | |
| | | | | | | |
| | | | | | 48,628,249 | |
| | | | | | | |
Transportation—4.0% | | | | | | | |
Burlington Northern Santa Fe Corporation | | | 159,500 | | | 11,295,790 | |
Carnival Corporation | | | 91,000 | | | 4,865,770 | |
FedEx Corporation | | | 237,000 | | | 24,503,430 | |
Norfolk Southern Corporation | | | 84,540 | | | 3,789,928 | |
Union Pacific Corporation | | | 75,997 | | | 6,118,519 | |
| | | | | | | |
| | | | | | 50,573,437 | |
| | | | | | | |
TOTAL COMMON STOCKS | | | | | | | |
(Cost $1,005,161,446) | | | | | | 1,201,447,248 | |
| | | | | | | |
| | | | | | | | | | |
| | | | | | | | | | | |
|
Coupon
Rate | | Maturity
Date | | | Face | | Value | |
| | | | | | | | | | | |
|
CORPORATE OBLIGATIONS—1.0% | | | | | | | |
| | | | | | | | | | | |
Telephone Systems—1.0% | | | | | | | |
Level 3 Communications, Inc., Senior Note | | | | | | | |
9.125% | | 05/01/2008 | | † | $ | 2,575,000 | | | 2,356,125 | |
Level 3 Communications, Inc., Senior Note, Step-Up | | | | | | | |
10.500% | | 12/01/2008 | | † | | 10,670,000 | | | 9,763,050 | |
| | | | | | | | | | |
TOTAL CORPORATE OBLIGATIONS | | | | | | | |
(Cost $10,565,527) | | | | | | 12,119,175 | |
| | | | | | | | | | |
| | | | | | | |
| | | | | | | | |
CONVERTIBLE DEBT OBLIGATIONS—0.3% | | | | | | | |
| | | | | | | | |
Telephone Systems—0.3% | | | | | | | |
Level 3 Communications, Inc., Subordinated Note, Convertible | | | | | | | |
6.000% | | 03/15/2010 | | † | | | | | | |
(Cost $3,361,085) | | | 5,760,000 | | | 3,722,400 | |
| | | | | | | | | | |
| | | | | | | |
| | | | | | | | | | | |
COMMERCIAL PAPER—1.4% | | | | | | | |
| | | | | | | | |
Banking—0.4% | | | | | | | |
Preferred Receivables Funding, 144A | | | | | | | |
4.330% | | 02/08/2006 | | ** | | 5,000,000 | | | 4,976,546 | |
| | | | | | | | | | |
| | | | | | | | | | |
Financial Services—1.0% | | | | | | | |
Alpine Securitization Corp., 144A | | | | | | | |
4.230% | | 01/05/2006 | | ** | | 4,175,000 | | | 4,172,547 | |
Fairway Finance Corp., 144A | | | | | | | |
4.280% | | 01/06/2006 | | ** | | 5,200,000 | | | 5,196,291 | |
Old Line Funding Corp., 144A | | | | | | | |
4.220% | | 01/13/2006 | | ** | | 2,250,000 | | | 2,246,571 | |
Park Avenue Receivables Corp., 144A | | | | | | | |
4.330% | | 01/12/2006 | | ** | | 800,000 | | | 798,845 | |
| | | | | | | | | | |
| | | | | | | | | 12,414,254 | |
| | | | | | | | | | |
TOTAL COMMERCIAL PAPER | | | | | | | |
(Cost $17,390,800) | | | | | | 17,390,800 | |
| | | | | | | |
| | | | | | | | | | |
| | | | | | | | | |
Coupon
Rate | | Maturity
Date | | | Face | | Value | |
| | | | | | | | | |
CASH EQUIVALENTS—13.9% | | | | | | | |
| | | | | | | | |
Institutional Money Market Funds—1.0% | | | | | | | |
American Beacon Funds | †† | $ | 743,372 | | $ | 743,372 | |
BGI Institutional Fund | †† | | 9,663,839 | | | 9,663,839 | |
Goldman Sachs Financial Square Prime Obligations Fund | †† | | 743,372 | | | 743,372 | |
Merrimac Cash Fund—Premium Class | †† | | 1,189,396 | | | 1,189,396 | |
| | | | | | | |
| | | | | | | | | 12,339,979 | |
| | | | | | | | | | |
Bank & Certificate Deposits/
Offshore Time Deposits—11.9% | | | | | | | |
Abbey National PLC | | | | | | | |
4.290% | | 01/11/2006 | | †† | | 3,716,856 | | | 3,716,856 | |
Bank of Nova Scotia | | | | | | | |
4.250% | | 01/27/2006 | | †† | | 5,203,605 | | | 5,203,605 | |
Barclays | | | | | | | |
4.410% | | 02/27/2006 | | †† | | 3,716,861 | | | 3,716,861 | |
Barclays | | | | | | | |
4.270% | | 01/25/2006 | | †† | | 3,716,861 | | | 3,716,861 | |
BNP Paribas | | | | | | | |
4.220% | | 01/24/2006 | | †† | | 3,716,861 | | | 3,716,861 | |
Branch Banker &Trust | | | | | | | |
4.260% | | 01/11/2006 | | †† | | 3,716,861 | | | 3,716,861 | |
CIESCO | | | | | | | |
4.305% | | 01/06/2006 | | †† | | 4,460,233 | | | 4,460,233 | |
Dexia Group | | | | | | | |
4.250% | | 01/09/2006 | | †† | | 7,433,721 | | | 7,433,721 | |
Fairway Finance | | | | | | | |
4.280% | | 01/30/2006 | | †† | | 2,973,489 | | | 2,973,489 | |
Falcon Asset Securitization Corporation | | | | | | | |
4.307% | | 02/02/2006 | | †† | | 3,686,741 | | | 3,686,741 | |
Fortis Bank | | | | | | | |
4.350% | | 01/03/2006 | | †† | | 3,716,861 | | | 3,716,861 | |
Greyhawk Funding | | | | | | | |
4.355% | | 01/06/2006 | | †† | | 2,973,489 | | | 2,973,489 | |
Greyhawk Funding | | | | | | | |
4.278% | | 01/24/2006 | | †† | | 2,230,117 | | | 2,230,117 | |
Jupiter Securitization Corporation | | | | | | | |
4.266% | | 01/05/2006 | | †† | | 1,784,093 | | | 1,784,093 | |
Jupiter Securitization Corporation | | | | | | | |
4.257% | | 01/04/2006 | | †† | | 2,230,117 | | | 2,230,117 | |
Liberty Street | | | | | | | |
4.266% | | 01/05/2006 | | †† | | 3,689,655 | | | 3,689,655 | |
Merrill Lynch & Company, Inc. | | | | | | | |
4.240% | | 01/03/2006 | | †† | | 14,867,444 | | | 14,867,444 | |
National Australia Bank | | | | | | | |
4.156% | | 01/03/2006 | | †† | | 2,085,634 | | | 2,085,634 | |
Paradigm Funding LLC | | | | | | | |
4.303% | | 01/03/2006 | | †† | | 4,808,887 | | | 4,808,887 | |
Paradigm Funding LLC | | | | | | | |
4.297% | | 01/09/2006 | | †† | | 2,973,489 | | | 2,973,489 | |
Prefco | | | | | | | |
4.312% | | 01/04/2006 | | †† | | 2,230,117 | | | 2,230,117 | |
Rabobank Nederland | | | | | | | |
4.150% | | 01/03/2006 | | †† | | 3,716,861 | | | 3,716,861 | |
Ranger Funding | | | | | | | |
4.291% | | 01/18/2006 | | †† | | 2,973,489 | | | 2,973,489 | |
Royal Bank of Canada | | | | | | | |
4.250% | | 01/24/2006 | | †† | | 5,203,605 | | | 5,203,605 | |
Royal Bank of Canada | | | | | | | |
4.220% | | 01/20/2006 | | †† | | 3,716,861 | | | 3,716,861 | |
Royal Bank of Scotland | | | | | | | |
4.310% | | 02/01/2006 | | †† | | 7,433,721 | | | 7,433,721 | |
| |
194 | See accompanying notes to financial statements. |
SCHEDULE OF INVESTMENTS—(Continued)
December 31, 2005
| | | | | | | | | | |
| | | | | | | | |
Vantagepoint
Equity Income Fund | | | | | | | |
| | | | | | | | |
|
Coupon
Rate | | Maturity
Date | | | Face | | Value | |
| | | | | | | | | |
|
CASH EQUIVALENTS—(Continued) | | | | | | | |
| | | | | | | | | |
Royal Bank of Scotland | | | | | | | |
4.250% | | 01/23/2006 | | †† | $ | 3,716,861 | | $ | 3,716,861 | |
Skandinaviska Enskilda Banken AB | | | | | | | |
4.300% | | 01/17/2006 | | †† | | 2,230,117 | | | 2,230,117 | |
Skandinaviska Enskilda Banken AB | | | | | | | |
4.230% | | 01/03/2006 | | †† | | 3,716,861 | | | 3,716,861 | |
Societe Generale | | | | | | | |
4.280% | | 01/30/2006 | | †† | | 2,973,489 | | | 2,973,489 | |
The Bank of the West | | | | | | | |
4.290% | | 01/25/2006 | | †† | | 3,716,861 | | | 3,716,861 | |
UBS AG | | | | | | | |
4.260% | | 01/10/2006 | | †† | | 3,716,861 | | | 3,716,861 | |
UBS AG | | | | | | | |
4.255% | | 01/18/2006 | | †† | | 4,460,233 | | | 4,460,233 | |
Wells Fargo | | | | | | | |
4.290% | | 01/30/2006 | | †† | | 5,946,978 | | | 5,946,978 | |
Wells Fargo | | | | | | | |
4.270% | | 01/03/2006 | | †† | | 3,716,861 | | | 3,716,861 | |
Yorktown Capital LLC | | | | | | | |
4.330% | | 01/04/2006 | | †† | | 3,328,226 | | | 3,328,226 | |
Yorktown Capital LLC | | | | | | | |
4.266% | | 01/05/2006 | | †† | | 3,689,655 | | | 3,689,655 | |
| | | | | | | | | | |
| | | | | | | | | 150,189,532 | |
| | | | | | | | | | |
Floating Rate Instruments/Master Notes—1.0% | | | | | | | |
Bank of America | | | | | | | |
4.270% | | 01/17/2006 | | †† | | 2,973,489 | | | 2,973,489 | |
Bank of America | | | | | | | |
4.230% | | 01/20/2006 | | †† | | 3,716,861 | | | 3,716,861 | |
Credit Suisse First Boston Corporation | | | | | | | |
4.175% | | 03/10/2006 | | †† | | 2,973,489 | | | 2,973,489 | |
Rabobank Nederland | | | | | | | |
4.100% | | 05/31/2006 | | †† | | 3,716,861 | | | 3,716,861 | |
| | | | | | | | | | |
| | | | | | | | | 13,380,700 | |
| | | | | | | | | | |
TOTAL CASH EQUIVALENTS | | | | | | | |
(Cost $175,910,211) | | | | | | 175,910,211 | |
| | | | | | | | | | |
| | | | | | | |
| | | | | | | | |
REPURCHASE AGREEMENTS—1.9% | | | | | | | |
| | | | | | | | |
IBT Repurchase Agreement dated 12/30/05 due 1/03/06, with a maturity value $24,390,020 and an effective yield of 3.65% collateralized by U.S. Government Obligations with rates ranging from 4.639% to 7.375%, maturity dates ranging from 07/25/2014 to 08/01/2035 and an aggregate market value of $25,599,139. | | | 24,380,133 | | | 24,380,133 | |
| | | | | | | | | | |
TOTAL INVESTMENTS—113.8% | | | | | | | |
(Cost $1,236,769,202) | | | | | | 1,434,969,967 | |
Other assets less liabilities—(13.8%) | | | | | | (174,500,415 | ) |
| | | | | | | | | | |
NET ASSETS—100.0% | | | | | $ | 1,260,469,552 | |
| | | | | | | |
| | | | | | | | | | |
| | | | | | | | |
Notes to the Schedule of Investments: | | | | | | | |
|
ADR | | American Depositary Receipt | | | | | | | |
| | | | | | | | | |
REIT | | Real Estate Investment Trust | | | | | | | |
| | | | | | | | | |
† | | Denotes all or a portion of security on loan. | | | | | | | |
| | | | | | | | | |
* | | Non-income producing security. | | | | | | | |
| | | | | | | | | |
** | | Security exempt from registration under Rule 144A of the Securities Act of 1933. These securities may be resold in transactions exempt from registration, normally to qualified buyers. 144A securities represent 1.38% of Total Investments. | | | | | | | |
| | | | | | | | | |
†† | | Represents collateral received from securities lending transactions. | | | | | | | |
| |
See accompanying notes to financial statements. | 195 |
SCHEDULE OF INVESTMENTS
December 31, 2005
| | | | | | | |
| | |
Vantagepoint Growth &
Income Fund | | | Shares | | | Value | |
| | |
| |
COMMON STOCKS—96.7% | | | | | | | |
| | |
Advertising—0.3% | | | | | | | |
Monster Worldwide, Inc. | *† | | 19,000 | | $ | 775,580 | |
Omnicom Group | † | | 22,900 | | | 1,949,477 | |
| | | | | | | |
| | | | | | 2,725,057 | |
| | | | | | | |
Aerospace & Defense—1.3% | | | | | | | |
Boeing Company (The) | | | 10,500 | | | 737,520 | |
General Dynamics Corporation | | | 81,700 | | | 9,317,885 | |
Honeywell International, Inc. | | | 55,000 | | | 2,048,750 | |
Lockheed Martin Corporation | | | 25,000 | | | 1,590,750 | |
| | | | | | | |
| | | | | | 13,694,905 | |
| | | | | | | |
Airlines—0.6% | | | | | | | |
Southwest Airlines Company | | | 349,100 | | | 5,735,713 | |
| | | | | | | |
Apparel Retailers—0.3% | | | | | | | |
Kohl’s Corporation | * | | 65,000 | | | 3,159,000 | |
| | | | | | | |
Automotive—0.1% | | | | | | | |
Autonation, Inc. | * | | 56,100 | | | 1,219,053 | |
| | | | | | | |
Banking—13.3% | | | | | | | |
American Express Company | | | 75,000 | | | 3,859,500 | |
AmeriCredit Corporation | * | | 38,800 | | | 994,444 | |
Bank of America Corporation | † | | 261,800 | | | 12,082,070 | |
Capital One Financial Corporation | | | 9,300 | | | 803,520 | |
Citigroup, Inc. | | | 545,750 | | | 26,485,247 | |
Fifth Third Bancorp | | | 33,200 | | | 1,252,304 | |
Golden West Financial Corporation | | | 176,900 | | | 11,675,400 | |
Hudson City Bancorp, Inc. | | | 142,400 | | | 1,725,888 | |
IndyMac Bancorp, Inc. | † | | 34,500 | | | 1,346,190 | |
JP Morgan Chase & Company | | | 371,536 | | | 14,746,264 | |
Mellon Financial Corporation | | | 70,000 | | | 2,397,500 | |
National City Corporation | | | 77,200 | | | 2,591,604 | |
Northern Trust Corporation | | | 50,000 | | | 2,591,000 | |
PNC Financial Services Group, Inc. | | | 50,200 | | | 3,103,866 | |
SLM Corporation | | | 228,700 | | | 12,599,083 | |
State Street Corporation | | | 125,000 | | | 6,930,000 | |
Suntrust Banks, Inc. | | | 43,600 | | | 3,172,336 | |
U.S. Bancorp | | | 154,000 | | | 4,603,060 | |
UBS AG (Switzerland) | | | 17,000 | | | 1,610,715 | |
Washington Mutual, Inc. | | | 196,000 | | | 8,526,000 | |
Wells Fargo & Company | | | 187,900 | | | 11,805,757 | |
| | | | | | | |
| | | | | | 134,901,748 | |
| | | | | | | |
Beverages, Food & Tobacco—4.4% | | | | | | | |
Altria Group, Inc. | | | 113,403 | | | 8,473,472 | |
Anheuser-Busch Companies, Inc. | | | 51,484 | | | 2,211,753 | |
Campbell Soup Company | | | 173,200 | | | 5,156,164 | |
Coca-Cola Company (The) | | | 68,700 | | | 2,769,297 | |
H.J. Heinz Company | | | 16,700 | | | 563,124 | |
Kellogg Company | | | 91,400 | | | 3,950,308 | |
Kraft Foods, Inc. Class A | † | | 57,600 | | | 1,620,864 | |
Pepsi Bottling Group, Inc. | | | 12,500 | | | 357,625 | |
Pepsico, Inc. | | | 185,900 | | | 10,982,972 | |
Safeway, Inc. | † | | 133,300 | | | 3,153,878 | |
Sara Lee Corporation | | | 45,200 | | | 854,280 | |
Sysco Corporation | | | 67,500 | | | 2,095,875 | |
Unilever NV (Netherlands) | | | 36,400 | | | 2,498,860 | |
| | | | | | | |
| | | | | | 44,688,472 | |
| | | | | | | |
| | | | | | | |
| | |
| | | Shares | | | Value | |
| | |
Building Materials—1.1% | | | | | | | |
Home Depot, Inc. | | | 115,000 | | $ | 4,655,200 | |
Lowe’s Companies, Inc. | † | | 98,700 | | | 6,579,342 | |
| | | | | | | |
| | | | | | 11,234,542 | |
| | | | | | | |
Chemicals—2.0% | | | | | | | |
Air Products & Chemicals, Inc. | | | 10,900 | | | 645,171 | |
Dow Chemical Company (The) | | | 136,700 | | | 5,990,194 | |
EI Du Pont de Nemours & Company | | | 147,200 | | | 6,256,000 | |
Huntsman Corporation | * | | 163,300 | | | 2,812,026 | |
Methanex Corporation (Canada) | | | 32,300 | | | 605,302 | |
Monsanto Company | | | 40,000 | | | 3,101,200 | |
Potash Corporation of Saskatchewan, Inc. (Canada) | † | | 7,400 | | | 593,628 | |
| | | | | | | |
| | | | | | 20,003,521 | |
| | | | | | | |
Commercial Services—1.3% | | | | | | | |
Accenture Ltd. Class A (Bermuda) | | | 45,000 | | | 1,299,150 | |
Allied Waste Industries, Inc. | *† | | 92,200 | | | 805,828 | |
Apollo Group, Inc. Class A | * | | 34,000 | | | 2,055,640 | |
CCE Spinco, Inc. | * | | 6,700 | | | 87,770 | |
Cintas Corporation | † | | 46,000 | | | 1,894,280 | |
Fluor Corporation | | | 60,800 | | | 4,697,408 | |
Paychex, Inc. | | | 30,000 | | | 1,143,600 | |
Siemens AG Sponsored ADR (Germany) | † | | 9,000 | | | 770,310 | |
| | | | | | | |
| | | | | | 12,753,986 | |
| | | | | | | |
Communications—0.9% | | | | | | | |
American Tower Corporation Class A | *† | | 28,400 | | | 769,640 | |
Corning, Inc. | * | | 94,900 | | | 1,865,734 | |
Motorola, Inc. | | | 101,100 | | | 2,283,849 | |
Qualcomm, Inc. | | | 104,200 | | | 4,488,936 | |
| | | | | | | |
| | | | | | 9,408,159 | |
| | | | | | | |
Computer Software & Processing—5.3% | | | | | | | |
Adobe Systems, Inc. | | | 172,900 | | | 6,390,384 | |
Affiliated Computer Services, Inc.Class A | * | | 44,800 | | | 2,651,264 | |
Automatic Data Processing, Inc. | | | 91,500 | | | 4,198,935 | |
Checkfree Corporation | *† | | 14,759 | | | 677,438 | |
First Data Corporation | | | 65,000 | | | 2,795,650 | |
Fiserv, Inc. | * | | 30,000 | | | 1,298,100 | |
Google, Inc. Class A | * | | 7,000 | | | 2,904,020 | |
Intuit, Inc. | * | | 50,000 | | | 2,665,000 | |
Juniper Networks, Inc. | * | | 60,000 | | | 1,338,000 | |
Microsoft Corporation | | | 683,000 | | | 17,860,450 | |
Oracle Corporation | * | | 170,000 | | | 2,075,700 | |
SAP AG ADR (Germany) | | | 81,200 | | | 3,659,684 | |
Sun Microsystems, Inc. | * | | 176,300 | | | 738,697 | |
Yahoo!, Inc. | * | | 111,900 | | | 4,384,242 | |
| | | | | | | |
| | | | | | 53,637,564 | |
| | | | | | | |
Computers & Information—3.2% | | | | | | | |
Cisco Systems, Inc. | * | | 515,450 | | | 8,824,504 | |
Dell, Inc. | * | | 189,500 | | | 5,683,105 | |
EMC Corporation | * | | 170,000 | | | 2,315,400 | |
Hewlett-Packard Company | | | 47,100 | | | 1,348,473 | |
International Business Machines Corporation | | | 9,400 | | | 772,680 | |
International Game Technology | | | 95,000 | | | 2,924,100 | |
Jabil Circuit, Inc. | * | | 75,000 | | | 2,781,750 | |
Lexmark International, Inc. | * | | 28,200 | | | 1,264,206 | |
Pitney Bowes, Inc. | | | 18,600 | | | 785,850 | |
| | |
196 | See accompanying notes to financial statements. | |
SCHEDULE OF INVESTMENTS—(Continued)
December 31, 2005
| | | | | | | |
| | |
Vantagepoint Growth &
Income Fund | | | Shares | | | Value | |
| | |
| |
COMMON STOCKS—(Continued) | | | | | | | |
| | |
Sandisk Corporation | * | | 77,200 | | $ | 4,849,704 | |
Seagate Technology (Cayman Islands) | † | | 50,100 | | | 1,001,499 | |
| | | | | | | |
| | | | | | 32,551,271 | |
| | | | | | | |
Cosmetics & Personal Care—1.0% | | | | | | | |
Avon Products, Inc. | | | 167,900 | | | 4,793,545 | |
Procter & Gamble Company | | | 102,075 | | | 5,908,101 | |
| | | | | | | |
| | | | | | 10,701,646 | |
| | | | | | | |
Diversified—2.5% | | | | | | | |
General Electric Company | | | 722,700 | | | 25,330,635 | |
| | | | | | | |
Electric Utilities—3.2% | | | | | | | |
AES Corporation (The) | * | | 138,600 | | | 2,194,038 | |
Consolidated Edison, Inc. | † | | 68,400 | | | 3,168,972 | |
Constellation Energy Group, Inc. | | | 31,600 | | | 1,820,160 | |
Dominion Resources, Inc. | | | 62,450 | | | 4,821,140 | |
Entergy Corporation | | | 21,000 | | | 1,441,650 | |
Exelon Corporation | † | | 101,100 | | | 5,372,454 | |
FPL Group, Inc. | | | 68,600 | | | 2,851,016 | |
PPL Corporation | | | 112,600 | | | 3,310,440 | |
SCANA Corporation | | | 76,700 | | | 3,020,446 | |
Southern Company (The) | † | | 44,500 | | | 1,536,585 | |
TXU Corporation | | | 55,400 | | | 2,780,526 | |
| | | | | | | |
| | | | | | 32,317,427 | |
| | | | | | | |
Electrical Equipment—0.3% | | | | | | | |
Cooper Industries Ltd. Class A | | | 33,500 | | | 2,445,500 | |
Emerson Electric Company | | | 9,600 | | | 717,120 | |
| | | | | | | |
| | | | | | 3,162,620 | |
| | | | | | | |
Electronics—3.7% | | | | | | | |
Agilent Technologies, Inc. | * | | 24,872 | | | 827,989 | |
Altera Corporation | * | | 209,600 | | | 3,883,888 | |
Analog Devices, Inc. | | | 75,000 | | | 2,690,250 | |
Fairchild Semiconductor International, Inc. | *† | | 48,800 | | | 825,208 | |
Flextronics International Ltd. (Singapore) | * | | 183,900 | | | 1,919,916 | |
Freescale Semiconductor, Inc. Class A | * | | 87,200 | | | 2,196,568 | |
Intel Corporation | | | 284,700 | | | 7,106,112 | |
International Rectifier Corporation | * | | 71,600 | | | 2,284,040 | |
JDS Uniphase Corporation | * | | 158,000 | | | 372,880 | |
Linear Technology Corporation | | | 68,600 | | | 2,474,402 | |
Maxim Integrated Products, Inc. | | | 92,000 | | | 3,334,080 | |
Novellus Systems, Inc. | * | | 15,400 | | | 371,448 | |
PMC-Sierra, Inc. | * | | 60,300 | | | 464,913 | |
Silicon Laboratories, Inc. | *† | | 20,100 | | | 736,866 | |
Teradyne, Inc. | * | | 70,300 | | | 1,024,271 | |
Texas Instruments, Inc. | | | 86,000 | | | 2,758,020 | |
Xilinx, Inc. | | | 185,300 | | | 4,671,413 | |
| | | | | | | |
| | | | | | 37,942,264 | |
| | | | | | | |
Entertainment & Leisure—1.3% | | | | | | | |
Harrah’s Entertainment, Inc. | | | 37,000 | | | 2,637,730 | |
Time Warner, Inc. | | | 599,300 | | | 10,451,792 | |
Walt Disney Company | | | 6,900 | | | 165,393 | |
| | | | | | | |
| | | | | | 13,254,915 | |
| | | | | | | |
Financial Services—3.7% | | | | | | | |
Ameriprise Financial, Inc. | | | 15,000 | | | 615,000 | |
Berkshire Hathaway, Inc. Class A | * | | 30 | | | 2,658,600 | |
| | | | | | | |
| | |
| | | Shares | | | Value | |
| | |
Charles Schwab Corporation (The) | | | 160,000 | | $ | 2,347,200 | |
Federal Home Loan Mortgage Corporation | | | 44,300 | | | 2,895,005 | |
Federal National Mortgage Association | | | 75,500 | | | 3,685,155 | |
Franklin Resources, Inc. | | | 55,000 | | | 5,170,550 | |
Goldman Sachs Group, Inc. | | | 84,900 | | | 10,842,579 | |
Legg Mason, Inc. | | | 40,000 | | | 4,787,600 | |
Merrill Lynch & Company, Inc. | | | 46,000 | | | 3,115,580 | |
Morgan Stanley | | | 25,000 | | | 1,418,500 | |
| | | | | | | |
| | | | | | 37,535,769 | |
| | | | | | | |
Forest Products & Paper—0.4% | | | | | | | |
International Paper Company | † | | 24,700 | | | 830,167 | |
Kimberly Clark Corporation | | | 48,700 | | | 2,904,955 | |
| | | | | | | |
| | | | | | 3,735,122 | |
| | | | | | | |
Health Care Providers—1.9% | | | | | | | |
Caremark Rx, Inc. | * | | 52,000 | | | 2,693,080 | |
DaVita, Inc. | * | | 40,500 | | | 2,050,920 | |
Lincare Holdings, Inc. | * | | 34,500 | | | 1,445,895 | |
UnitedHealth Group, Inc. | | | 220,000 | | | 13,670,800 | |
| | | | | | | |
| | | | | | 19,860,695 | |
| | | | | | | |
Heavy Machinery—4.0% | | | | | | | |
American Standard Companies, Inc. | | | 73,800 | | | 2,948,310 | |
Applied Materials, Inc. | | | 467,700 | | | 8,390,538 | |
Baker Hughes, Inc. | † | | 105,200 | | | 6,394,056 | |
Caterpillar, Inc. | | | 215,000 | | | 12,420,550 | |
Deere & Company | | | 30,000 | | | 2,043,300 | |
Ingersoll-Rand Company Class A | | | 4,500 | | | 181,665 | |
Rockwell Automation, Inc. | | | 70,300 | | | 4,158,948 | |
United Technologies Corporation | | | 83,000 | | | 4,640,530 | |
| | | | | | | |
| | | | | | 41,177,897 | |
| | | | | | | |
Home Construction, Furnishings & | | | | | | | |
Appliances—0.1% | | | | | | | |
Leggett & Platt, Inc. | | | 47,500 | | | 1,090,600 | |
| | | | | | | |
| | | | | | | |
Household Products—0.3% | | | | | | | |
Illinois Tool Works, Inc. | † | | 35,500 | | | 3,123,645 | |
| | | | | | | |
| | | | | | | |
Industrial—Diversified—0.6% | | | | | | | |
Tyco International Ltd. | | | 219,500 | | | 6,334,770 | |
| | | | | | | |
| | | | | | | |
Insurance—6.4% | | | | | | | |
ACE Ltd. (Bermuda) | | | 97,700 | | | 5,221,088 | |
Allstate Corporation (The) | | | 60,100 | | | 3,249,607 | |
American International Group, Inc. | | | 345,700 | | | 23,587,111 | |
Chubb Corporation | | | 70,100 | | | 6,845,265 | |
Everest Re Group Ltd. (Bermuda) | | | 5,800 | | | 582,030 | |
Hartford Financial Services Group, Inc. | | | 48,300 | | | 4,148,487 | |
Marsh & McLennan Companies, Inc. | | | 73,000 | | | 2,318,480 | |
RenaissanceRe Holdings, Ltd. (Bermuda) | | | 3,400 | | | 149,974 | |
WellPoint, Inc. | * | | 222,900 | | | 17,785,191 | |
XL Capital Ltd. Class A (Bermuda) | | | 23,000 | | | 1,549,740 | |
| | | | | | | |
| | | | | | 65,436,973 | |
| | | | | | | |
Lodging—0.1% | | | | | | | |
Starwood Hotels & Resorts Worldwide, Inc. | | | 13,800 | | | 881,268 | |
| | | | | | | |
| | |
| See accompanying notes to financial statements. | 197 |
SCHEDULE OF INVESTMENTS—(Continued)
December 31, 2005
| | | | | | | |
| | |
Vantagepoint Growth &
Income Fund | | | Shares | | | Value | |
| | |
| |
COMMON STOCKS—(Continued) | | | | | | | |
| | |
| | | | | | | |
Media—Broadcasting & Publishing—1.8% | | | | | | | |
Cablevision Systems Corporation Class A | *† | | 25,881 | | $ | 607,427 | |
Clear Channel Communications, Inc. | | | 53,600 | | | 1,685,720 | |
Comcast Corporation Class A | *† | | 203,900 | | | 5,293,244 | |
Comcast Corporation Special Class A | * | | 40,000 | | | 1,027,600 | |
DIRECTV Group, Inc. (The) | * | | 20,100 | | | 283,812 | |
E.W. Scripps Company Class A | † | | 40,000 | | | 1,920,800 | |
Gannett Company, Inc. | | | 33,200 | | | 2,010,924 | |
IAC/InterActiveCorp | * | | 25,000 | | | 707,750 | |
McGraw-Hill Companies, Inc. (The) | | | 17,000 | | | 877,710 | |
Viacom, Inc. Class B | | | 133,200 | | | 4,342,320 | |
| | | | | | | |
| | | | | | 18,757,307 | |
| | | | | | | |
Medical Supplies—3.8% | | | | | | | |
Allergan, Inc. | † | | 71,000 | | | 7,665,160 | |
Baxter International, Inc. | | | 183,300 | | | 6,901,245 | |
Beckman Coulter, Inc. | | | 29,500 | | | 1,678,550 | |
Biomet, Inc. | † | | 43,000 | | | 1,572,510 | |
Credence Systems Corporation | * | | 20,900 | | | 145,464 | |
Johnson & Johnson | | | 70,000 | | | 4,207,000 | |
Kla-Tencor Corporation | † | | 96,000 | | | 4,735,680 | |
Medtronic, Inc. | | | 113,100 | | | 6,511,167 | |
Quest Diagnostics, Inc. | | | 20,000 | | | 1,029,600 | |
St. Jude Medical, Inc. | * | | 40,000 | | | 2,008,000 | |
Stryker Corporation | † | | 30,000 | | | 1,332,900 | |
Thermo Electron Corporation | * | | 25,700 | | | 774,341 | |
| | | | | | | |
| | | | | | 38,561,617 | |
| | | | | | | |
Metals—3.4% | | | | | | | |
Alcoa, Inc. | | | 436,200 | | | 12,898,434 | |
Cameco Corporation (Canada) | † | | 89,000 | | | 5,641,710 | |
Danaher Corporation | † | | 176,100 | | | 9,822,858 | |
Newmont Mining Corporation | | | 23,000 | | | 1,228,200 | |
Precision Castparts Corporation | | | 91,600 | | | 4,745,796 | |
| | | | | | | |
| | | | | | 34,336,998 | |
| | | | | | | |
Oil & Gas—7.3% | | | | | | | |
BJ Services Company | † | | 30,700 | | | 1,125,769 | |
Chevron Texaco Corporation | | | 31,572 | | | 1,792,342 | |
ConocoPhillips | | | 114,200 | | | 6,644,156 | |
Exxon Mobil Corporation | | | 369,600 | | | 20,760,432 | |
GlobalSantaFe Corporation | | | 131,000 | | | 6,307,650 | |
Halliburton Company | † | | 17,600 | | | 1,090,496 | |
Kinder Morgan Management LLC | * | | 5,067 | | | 230,346 | |
Kinder Morgan, Inc. | | | 13,626 | | | 1,252,911 | |
MDU Resources Group, Inc. | | | 23,200 | | | 759,568 | |
Occidental Petroleum Corporation | | | 103,000 | | | 8,227,640 | |
Royal Dutch Shell PLC Class A ADR (United Kingdom) | | | 93,700 | | | 5,761,613 | |
Royal Dutch Shell PLC—Class B, ADR (United Kingdom) | † | | 21,356 | | | 1,378,103 | |
Schlumberger Ltd. | † | | 104,600 | | | 10,161,890 | |
Smith International, Inc. | | | 100,000 | | | 3,711,000 | |
Total Fina SA ADR (France) | † | | 10,000 | | | 1,264,000 | |
Transocean, Inc. | * | | 16,300 | | | 1,135,947 | |
Weatherford International Ltd. | * | | 52,800 | | | 1,911,360 | |
Williams Companies, Inc. | | | 25,200 | | | 583,884 | |
| | | | | | | |
| | | | | | 74,099,107 | |
| | | | | | | |
| | | | | | | |
| | |
| | | Shares | | | Value | |
| | |
Pharmaceuticals—6.8% | | | | | | | |
Abbott Laboratories | | | 40,000 | | $ | 1,577,199 | |
AmerisourceBergen Corporation | † | | 57,800 | | | 2,392,920 | |
Amgen, Inc. | * | | 93,700 | | | 7,389,182 | |
AstraZeneca Group PLC ADR (United Kingdom) | | | 194,300 | | | 9,442,980 | |
Biogen Idec, Inc. | * | | 20,000 | | | 906,600 | |
Cardinal Health, Inc. | | | 16,000 | | | 1,100,000 | |
Eli Lilly & Company | † | | 32,000 | | | 1,810,880 | |
Endo Pharmaceuticals Holdings, Inc. | * | | 22,200 | | | 671,772 | |
Forest Laboratories, Inc. | * | | 178,700 | | | 7,269,516 | |
Genentech, Inc. | * | | 50,000 | | | 4,625,000 | |
ImClone Systems, Inc. | *† | | 44,200 | | | 1,513,408 | |
McKesson Corporation | | | 49,600 | | | 2,558,864 | |
Medco Health Solutions, Inc. | * | | 41,200 | | | 2,298,960 | |
Millennium Pharmaceuticals, Inc. | *† | | 86,200 | | | 836,140 | |
Omnicare, Inc. | | | 24,000 | | | 1,373,280 | |
Pfizer, Inc. | | | 366,986 | | | 8,558,113 | |
Sepracor, Inc. | *† | | 14,900 | | | 768,840 | |
Teva Pharmaceutical Industries Ltd. ADR (Israel) | † | | 82,000 | | | 3,526,820 | |
Wyeth | | | 221,700 | | | 10,213,719 | |
| | | | | | | |
| | | | | | 68,834,193 | |
| | | | | | | |
Real Estate—0.4% | | | | | | | |
General Growth Properties, Inc. REIT | | | 22,610 | | | 1,062,444 | |
Host Marriott Corporation REIT | | | 171,300 | | | 3,246,135 | |
| | | | | | | |
| | | | | | 4,308,579 | |
| | | | | | | |
Restaurants—0.4% | | | | | | | |
McDonald’s Corporation | | | 115,900 | | | 3,908,148 | |
| | | | | | | |
| | | | | | | |
Retailers—4.1% | | | | | | | |
Amazon.Com, Inc. | *† | | 38,000 | | | 1,791,700 | |
Best Buy Company, Inc. | † | | 64,500 | | | 2,804,460 | |
CVS Corporation | | | 473,900 | | | 12,520,438 | |
Costco Wholesale Corporation | † | | 33,500 | | | 1,657,245 | |
Dollar General Corporation | | | 136,000 | | | 2,593,520 | |
Dollar Tree Stores, Inc. | *† | | 59,300 | | | 1,419,642 | |
eBay, Inc. | * | | 91,300 | | | 3,948,725 | |
RadioShack Corporation | | | 29,500 | | | 620,385 | |
Target Corporation | | | 142,500 | | | 7,833,225 | |
Wal-Mart Stores, Inc. | | | 100,000 | | | 4,680,000 | |
Williams-Sonoma, Inc. | * | | 34,900 | | | 1,505,935 | |
| | | | | | | |
| | | | | | 41,375,275 | |
| | | | | | | |
Telecommunications—0.3% | | | | | | | |
Nokia Corporation ADR (Finland) | | | 150,000 | | | 2,745,000 | |
| | | | | | | |
| | | | | | | |
Telephone Systems—2.9% | | | | | | | |
AT&T, Inc. | | | 312,969 | | | 7,664,611 | |
BellSouth Corporation | | | 186,900 | | | 5,064,990 | |
Qwest Communications International, Inc. | *† | | 240,000 | | | 1,356,000 | |
Sprint Nextel Corp. | | | 497,500 | | | 11,621,600 | |
TELUS Corporation Non-Voting Shares (Canada) | | | 47,000 | | | 1,892,220 | |
Verizon Communications, Inc. | | | 60,300 | | | 1,816,236 | |
| | | | | | | |
| | | | | | 29,415,657 | |
| | | | | | | |
Textiles, Clothing & Fabrics—0.4% | | | | | | | |
Nike, Inc. Class B | | | 45,500 | | | 3,948,945 | |
| | | | | | | |
| | |
198 | See accompanying notes to financial statements. | |
SCHEDULE OF INVESTMENTS—(Continued)
December 31, 2005
| | | | | | | | | | |
| | |
Vantagepoint Growth &
Income Fund | | | Shares | | | Value | |
| | |
| | | | | | | |
COMMON STOCKS—(Continued) | | | | | | | |
| | |
Transportation—1.5% | | | | | | | |
CSX Corporation | | | 53,900 | | $ | 2,736,503 | |
Carnival Corporation | | | 99,400 | | | 5,314,918 | |
Expedia, Inc. | * | | 26,649 | | | 638,510 | |
Union Pacific Corporation | | | 5,700 | | | 458,907 | |
United Parcel Service, Inc. Class B | | | 82,700 | | | 6,214,905 | |
| | | | | | | |
| | | | | | 15,363,743 | |
| | | | | | | |
TOTAL COMMON STOCKS
(Cost $815,582,319) | | | | | | 983,253,806 | |
| | | | | | | |
| | | | | | | | | | |
| | |
Coupon
Rate | | Maturity
Date | | | | Face | | | Value | |
| | |
COMMERCIAL PAPER—1.5% | | | | | | | |
| | | | | | | |
| | |
Banking—0.2% | | | | | | | |
MassMutual Funding LLC, 144A | | | | | | | |
4.290% | | 01/27/2006 | | ** | $ | 2,000,000 | | | 1,993,565 | |
| | | | | | | | | | |
| | | | | | | | | | |
Financial Services—1.3% | | | | | | | |
Alpine Securitization Corp., 144A | | | | | | | |
4.230% | | 01/05/2006 | | ** | | 2,000,000 | | | 1,998,825 | |
Fairway Finance Corp., 144A | | | | | | | |
4.160% | | 01/17/2006 | | ** | | 2,500,000 | | | 2,495,089 | |
Falcon Asset Securitization Corp., 144A | | | | | | | |
4.250% | | 01/05/2006 | | ** | | 1,000,000 | | | 999,410 | |
Old Line Funding Corp., 144A | | | | | | | |
4.220% | | 01/13/2006 | | ** | | 2,900,000 | | | 2,895,581 | |
Park Avenue Receivables Corp., 144A | | | | | | | |
4.300% | | 01/20/2006 | | ** | | 1,855,000 | | | 1,850,569 | |
Yorktown Capital LLC | | | | | | | |
4.340% | | 01/12/2006 | | | | 2,500,000 | | | 2,496,383 | |
| | | | | | | | | | |
| | | | | | | | | 12,735,857 | |
| | | | | | | | | | |
TOTAL COMMERCIAL PAPER
(Cost $14,729,422) | | | | | | 14,729,422 | |
|
| | | | | | | | | | |
CASH EQUIVALENTS—9.5% | | | | | | | |
| | |
| |
Institutional Money Market Funds—0.7% | | | | | | | |
American Beacon Funds | †† | | 407,981 | | | 407,981 | |
BGI Institutional Fund | †† | | 5,303,759 | | | 5,303,759 | |
Goldman Sachs Financial Square Prime Obligations Fund | †† | | 407,981 | | | 407,981 | |
Merrimac Cash Fund—Premium Class | †† | | 652,770 | | | 652,770 | |
| | | | | | | |
| | | | | | 6,772,491 | |
| | | | | | | |
Bank & Certificate Deposits/ Offshore Time Deposits—8.1% | | | | | | | |
Abbey National PLC | | | | | | | |
4.290% | | 01/11/2006 | | †† | | 2,039,907 | | | 2,039,907 | |
Bank of Nova Scotia | | | | | | | |
4.250% | | 01/27/2006 | | †† | | 2,855,870 | | | 2,855,870 | |
Barclays | | | | | | | |
4.410% | | 02/27/2006 | | †† | | 2,039,907 | | | 2,039,907 | |
Barclays | | | | | | | |
4.270% | | 01/25/2006 | | †† | | 2,039,907 | | | 2,039,907 | |
BNP Paribas | | | | | | | |
4.220% | | 01/24/2006 | | †† | | 2,039,907 | | | 2,039,907 | |
| | | | | | | | | | |
| | |
Coupon
Rate | | Maturity
Date | | | | Face | | | Value | |
| | |
Branch Banker & Trust | | | | | | | |
4.260% | | 01/11/2006 | | †† | $ | 2,039,907 | | $ | 2,039,907 | |
CIESCO | | | | | | | |
4.305% | | 01/06/2006 | | †† | | 2,447,888 | | | 2,447,888 | |
Dexia Group | | | | | | | |
4.250% | | 01/09/2006 | | †† | | 4,079,814 | | | 4,079,814 | |
Fairway Finance | | | | | | | |
4.280% | | 01/30/2006 | | †† | | 1,631,926 | | | 1,631,926 | |
Falcon Asset Securitization Corporation | | | | | | | |
4.307% | | 02/02/2006 | | †† | | 2,023,377 | | | 2,023,377 | |
Fortis Bank | | | | | | | |
4.350% | | 01/03/2006 | | †† | | 2,039,907 | | | 2,039,907 | |
Greyhawk Funding | | | | | | | |
4.355% | | 01/06/2006 | | †† | | 1,631,926 | | | 1,631,926 | |
Greyhawk Funding | | | | | | | |
4.278% | | 01/24/2006 | | †† | | 1,223,944 | | | 1,223,944 | |
Jupiter Securitization Corporation | | | | | | | |
4.266% | | 01/05/2006 | | †† | | 979,156 | | | 979,156 | |
Jupiter Securitization Corporation | | | | | | | |
4.257% | | 01/04/2006 | | †† | | 1,223,944 | | | 1,223,944 | |
Liberty Street | | | | | | | |
4.266% | | 01/05/2006 | | †† | | 2,024,975 | | | 2,024,975 | |
Merrill Lynch & Company, Inc. | | | | | | | |
4.240% | | 01/03/2006 | | †† | | 8,159,629 | | | 8,159,629 | |
National Australia Bank | | | | | | | |
4.156% | | 01/03/2006 | | †† | | 1,144,649 | | | 1,144,649 | |
Paradigm Funding LLC | | | | | | | |
4.303% | | 01/03/2006 | | †† | | 2,639,239 | | | 2,639,239 | |
Paradigm Funding LLC | | | | | | | |
4.297% | | 01/09/2006 | | †† | | 1,631,926 | | | 1,631,926 | |
Prefco | | | | | | | |
4.312% | | 01/04/2006 | | †† | | 1,223,944 | | | 1,223,944 | |
Rabobank Nederland | | | | | | | |
4.150% | | 01/03/2006 | | †† | | 2,039,907 | | | 2,039,907 | |
Ranger Funding | | | | | | | |
4.291% | | 01/18/2006 | | †† | | 1,631,926 | | | 1,631,926 | |
Royal Bank of Canada | | | | | | | |
4.250% | | 01/24/2006 | | †† | | 2,855,870 | | | 2,855,870 | |
Royal Bank of Canada | | | | | | | |
4.220% | | 01/20/2006 | | †† | | 2,039,907 | | | 2,039,907 | |
Royal Bank of Scotland | | | | | | | |
4.310% | | 02/01/2006 | | †† | | 4,079,814 | | | 4,079,814 | |
Royal Bank of Scotland | | | | | | | |
4.250% | | 01/23/2006 | | †† | | 2,039,907 | | | 2,039,907 | |
Skandinaviska Enskilda Banken AB | | | | | | | |
4.300% | | 01/17/2006 | | †† | | 1,223,944 | | | 1,223,944 | |
Skandinaviska Enskilda Banken AB | | | | | | | |
4.230% | | 01/03/2006 | | †† | | 2,039,907 | | | 2,039,907 | |
Societe Generale | | | | | | | |
4.280% | | 01/30/2006 | | †† | | 1,631,926 | | | 1,631,926 | |
The Bank of the West | | | | | | | |
4.290% | | 01/25/2006 | | †† | | 2,039,907 | | | 2,039,907 | |
UBS AG | | | | | | | |
4.260% | | 01/10/2006 | | †† | | 2,039,907 | | | 2,039,907 | |
UBS AG | | | | | | | |
4.255% | | 01/18/2006 | | †† | | 2,447,888 | | | 2,447,888 | |
Wells Fargo | | | | | | | |
4.290% | | 01/30/2006 | | †† | | 3,263,851 | | | 3,263,851 | |
Wells Fargo | | | | | | | |
4.270% | | 01/03/2006 | | †† | | 2,039,907 | | | 2,039,907 | |
Yorktown Capital LLC | | | | | | | |
4.330% | | 01/04/2006 | | †† | | 1,826,615 | | | 1,826,615 | |
Yorktown Capital LLC | | | | | | | |
4.266% | | 01/05/2006 | | †† | | 2,024,975 | | | 2,024,975 | |
| | | | | | | | | | |
| | | | | | | | | 82,427,807 | |
| | | | | | | | | | |
| | |
| See accompanying notes to financial statements. | 199 |
SCHEDULE OF INVESTMENTS —(Continued)
December 31, 2005
| | | | | | | | | | |
| | |
Vantagepoint Growth &
Income Fund | | | | | | | |
| | |
|
Coupon
Rate | | Maturity
Date | | | | Face | | | Value | |
| | |
| | | | | | | |
CASH EQUIVALENTS—(Continued) | | | | | | | |
| | |
Floating Rate Instruments/Master Notes—0.7% | | | | | | | |
Bank of America | | | | | | | |
4.270% | | 01/17/2006 | | †† | $ | 1,631,926 | | $ | 1,631,932 | |
Bank of America | | | | | | | |
4.230% | | 01/20/2006 | | †† | | 2,039,907 | | | 2,039,907 | |
Credit Suisse First Boston Corporation | | | | | | | |
4.175% | | 03/10/2006 | | †† | | 1,631,926 | | | 1,631,926 | |
Rabobank Nederland | | | | | | | |
4.100% | | 05/31/2006 | | †† | | 2,039,907 | | | 2,039,907 | |
| | | | | | | | | | |
| | | | | | | | | 7,343,672 | |
| | | | | | | | | | |
TOTAL CASH EQUIVALENTS
(Cost $96,543,970) | | | | | | 96,543,970 | |
| | | | | | | |
|
| | |
REPURCHASE AGREEMENTS—1.8% | | | | | | | |
| | |
IBT Repurchase Agreement dated 12/30/2005 due 01/03/2006, with a maturity value of $18,660,103 and an effective yield of 3.65%collateralized by U.S. Government Obligations with rates ranging from 4.127% to 8.00%, maturity dates ranging from04/13/2012 to 07/01/2035and an aggregate market value of $18,781,864. | | | 18,652,539 | | | 18,652,539 | |
| | | | | | | |
TOTAL INVESTMENTS—109.5% | | | | | | | |
(Cost $945,508,250) | | | | | | 1,113,179,737 | |
Other assets less liabilities—(9.5%) | | | | | | (96,348,314 | ) |
| | | | | | | |
NET ASSETS—100.0% | | | | | $ | 1,016,831,423 | |
| | | | | | | |
Notes to the Schedule of Investments:
| |
ADR | American Depositary Receipt |
| |
REIT | Real Estate Investment Trust |
| |
* | Non-income producing security. |
| |
† | Denotes all or a portion of security on loan. |
| |
** | Security exempt from registration under Rule 144A of the Securities Act of 1933. These securities may be resold in transactions exempt from registration, normally to qualified buyers. 144A securities represent 1.10% of Total Investments. |
| |
†† | Represents collateral received from securities lending transactions. |
| | |
200 | See accompanying notes to financial statements. | |
SCHEDULE OF INVESTMENTS
December 31, 2005
| | | | | | | |
| | |
Vantagepoint
Growth Fund | | | Shares | | | Value | |
| | |
| | | | | | | |
COMMON STOCKS—97.7% | | | | | | | |
| | |
Advertising—0.1% | | | | | | | |
Aquantive, Inc. | * | | 4,300 | | $ | 108,532 | |
Getty Images, Inc. | *† | | 8,800 | | | 785,576 | |
Monster Worldwide, Inc. | * | | 42,400 | | | 1,730,768 | |
Valueclick, Inc. | * | | 22,700 | | | 411,097 | |
| | | | | | | |
| | | | | | 3,035,973 | |
| | | | | | | |
Aerospace & Defense—0.6% | | | | | | | |
Boeing Company (The) | | | 108,200 | | | 7,599,968 | |
European Aeronautic Defense and Space Company (Netherlands) | † | | 37,200 | | | 1,397,073 | |
Lockheed Martin Corporation | | | 46,900 | | | 2,984,247 | |
Northrop Grumman Corporation | | | 60,700 | | | 3,648,677 | |
Textron, Inc. | | | 4,800 | | | 369,504 | |
| | | | | | | |
| | | | | | 15,999,469 | |
| | | | | | | |
Apparel Retailers—1.1% | | | | | | | |
Abercrombie & Fitch Company Class A | † | | 27,500 | | | 1,792,450 | |
Buckle, Inc. (The) | | | 6,500 | | | 209,560 | |
Chico’s FAS, Inc. | * | | 67,900 | | | 2,982,847 | |
Citi Trends, Inc. | * | | 11,004 | | | 469,761 | |
Dress Barn, Inc. | *† | | 99,000 | | | 3,822,390 | |
Kohl’s Corporation | * | | 409,000 | | | 19,877,400 | |
Nordstrom, Inc. | | | 20,900 | | | 781,660 | |
Payless Shoesource, Inc. | * | | 14,700 | | | 368,970 | |
| | | | | | | |
| | | | | | 30,305,038 | |
| | | | | | | |
Automotive—1.0% | | | | | | | |
Autoliv, Inc. | | | 62,400 | | | 2,834,208 | |
Autonation, Inc. | * | | 74,300 | | | 1,614,539 | |
Dongfeng Motor Group Co., Ltd.—Class H (China) | | | 896,000 | | | 225,339 | |
Harley-Davidson, Inc. | † | | 277,200 | | | 14,273,028 | |
ITT Industries, Inc. | | | 93,100 | | | 9,572,542 | |
| | | | | | | |
| | | | | | 28,519,656 | |
| | | | | | | |
Banking—2.8% | | | | | | | |
American Express Company | | | 137,000 | | | 7,050,020 | |
AmeriCredit Corporation | * | | 144,600 | | | 3,706,098 | |
Bank of America Corporation | | | 76,500 | | | 3,530,475 | |
Bank of Hawaii Corporation | | | 22,300 | | | 1,149,342 | |
Citigroup, Inc. | | | 386,700 | | | 18,766,551 | |
Downey Financial Corporation | | | 5,600 | | | 382,984 | |
Fremont General Corporation | | | 20,600 | | | 478,538 | |
Golden West Financial Corporation | | | 42,300 | | | 2,791,800 | |
Hudson City Bancorp, Inc. | | | 72,600 | | | 879,912 | |
Nelnet, Inc. Class A | *† | | 12,900 | | | 524,772 | |
SLM Corporation | | | 8,600 | | | 473,774 | |
State Street Corporation | | | 4,300 | | | 238,392 | |
UnionBanCal Corporation | | | 13,200 | | | 907,104 | |
Washington Mutual, Inc. | | | 25,400 | | | 1,104,900 | |
Wells Fargo & Company | | | 588,600 | | | 36,981,738 | |
| | | | | | | |
| | | | | | 78,966,400 | |
| | | | | | | |
Beverages, Food & Tobacco—3.5% | | | | | | | |
Altria Group, Inc. | | | 89,900 | | | 6,717,328 | |
Anheuser-Busch Companies, Inc. | | | 547,300 | | | 23,512,008 | |
Archer-Daniels-Midland Company | | | 134,800 | | | 3,324,168 | |
Coca-Cola Company (The) | | | 586,600 | | | 23,645,846 | |
Constellation Brands, Inc. Class A | * | | 34,000 | | | 891,820 | |
Dean Foods Company | * | | 23,400 | | | 881,244 | |
Flowers Foods, Inc. | | | 15,900 | | | 438,204 | |
| | | | | | | |
| | |
| | | Shares | | | Value | |
| | |
Hershey Foods Corporation | | | 26,400 | | $ | 1,458,600 | |
Pepsico, Inc. | | | 630,000 | | | 37,220,400 | |
Supervalu, Inc. | | | 26,200 | | | 850,976 | |
Tootsie Roll Industries, Inc. | | | 2,400 | | | 69,432 | |
Tyson Foods, Inc. Class A | | | 29,700 | | | 507,870 | |
| | | | | | | |
| | | | | | 99,517,896 | |
| | | | | | | |
Building Materials—1.7% | | | | | | | |
Carbo Ceramics, Inc. | | | 4,900 | | | 276,948 | |
Cemex SA de CV ADR (Mexico) | | | 8,400 | | | 498,372 | |
Champion Enterprises, Inc. | * | | 555,000 | | | 7,559,100 | |
Florida Rock Industries, Inc. | | | 5,900 | | | 289,454 | |
Home Depot, Inc. | | | 374,100 | | | 15,143,568 | |
Lowe’s Companies, Inc. | † | | 287,200 | | | 19,144,752 | |
Tech Data Corporation | * | | 17,400 | | | 690,432 | |
Vulcan Materials Company | † | | 57,500 | | | 3,895,625 | |
| | | | | | | |
| | | | | | 47,498,251 | |
| | | | | | | |
Chemicals—1.5% | | | | | | | |
Aber Diamond Corp. (Canada) | † | | 18,400 | | | 677,672 | |
Air Products & Chemicals, Inc. | | | 20,100 | | | 1,189,719 | |
Church & Dwight, Inc. | | | 33,100 | | | 1,093,293 | |
Ecolab, Inc. | | | 238,700 | | | 8,657,649 | |
Monsanto Company | | | 64,200 | | | 4,977,426 | |
Mosaic Company (The) | *† | | 50,400 | | | 737,352 | |
Potash Corporation of Saskatchewan, Inc. (Canada)† | | | 169,040 | | | 13,560,389 | |
Praxair, Inc. | | | 198,900 | | | 10,533,744 | |
USEC, Inc. | | | 124,400 | | | 1,486,580 | |
| | | | | | | |
| | | | | | 42,913,824 | |
| | | | | | | |
Coal—1.1% | | | | | | | |
Alpha Natural Resources, Inc. | * | | 74,300 | | | 1,427,303 | |
Consol Energy, Inc. | | | 219,600 | | | 14,313,528 | |
Peabody Energy Corporation | † | | 173,800 | | | 14,324,596 | |
| | | | | | | |
| | | | | | 30,065,427 | |
| | | | | | | |
Commercial Services—3.3% | | | | | | | |
ABB, Ltd., Sponsored ADR | | | | | | | |
(Switzerland) | *† | | 212,900 | | | 2,069,382 | |
Accenture Ltd. Class A (Bermuda) | | | 278,400 | | | 8,037,408 | |
American Ecology Corp. | | | 10,500 | | | 151,515 | |
Apollo Group, Inc. Class A | *† | | 141,300 | | | 8,542,998 | |
CCE Spinco, Inc. | *† | | 4,213 | | | 55,184 | |
CDI Corporation | | | 8,100 | | | 221,940 | |
Celgene Corporation | * | | 263,000 | | | 17,042,400 | |
Cintas Corporation | † | | 340,500 | | | 14,021,790 | |
Clean Harbors, Inc. | *† | | 34,600 | | | 996,826 | |
Corporate Executive Board Company | | | 7,100 | | | 636,870 | |
Cytyc Corporation | * | | 20,000 | | | 564,600 | |
Digitas, Inc. | * | | 135,750 | | | 1,699,590 | |
Dollar Thrifty Automotive Group, Inc. | * | | 19,500 | | | 703,365 | |
Equifax, Inc. | | | 6,900 | | | 262,338 | |
Fluor Corporation | | | 18,400 | | | 1,421,584 | |
Forrester Research, Inc. | * | | 12,684 | | | 237,825 | |
FTI Consulting, Inc. | *† | | 9,500 | | | 260,680 | |
Jacobs Engineering Group, Inc. | * | | 11,700 | | | 794,079 | |
JGC Corporation (Japan) | | | 63,000 | | | 1,200,254 | |
MoneyGram International, Inc. | | | 14,600 | | | 380,768 | |
Paychex, Inc. | | | 552,850 | | | 21,074,642 | |
Pharmaceutical Product Development, Inc. | | | 6,400 | | | 396,480 | |
Republic Services, Inc. | | | 171,800 | | | 6,451,090 | |
| | |
| See accompanying notes to financial statements. | 201 |
SCHEDULE OF INVESTMENTS —(Continued)
December 31, 2005
| | | | | | | |
| | |
Vantagepoint
Growth Fund | | | Shares | | | Value | |
| | |
| | | | | | | |
COMMON STOCKS—(Continued) | | | | | | | |
| | |
Robert Half International, Inc. † | | | 56,000 | | $ | 2,121,840 | |
Ryder System, Inc. | † | | 15,900 | | | 652,218 | |
Washington Group International, Inc. | | | 44,897 | | | 2,378,194 | |
| | | | | | | |
| | | | | | 92,375,860 | |
| | | | | | | |
Communications—1.7% | | | | | | | |
American Tower Corporation Class A | *† | | 60,100 | | | 1,628,710 | |
Avaya, Inc. | * | | 797,300 | | | 8,507,191 | |
Ciena Corporation | * | | 427,700 | | | 1,270,269 | |
Comverse Technology, Inc. | * | | 33,400 | | | 888,106 | |
Corning, Inc. | * | | 110,600 | | | 2,174,396 | |
Foundry Networks, Inc. | * | | 23,500 | | | 324,535 | |
L-3 Communications Holdings, Inc. | | | 10,100 | | | 750,935 | |
Marvell Technology Group Ltd. (Bermuda) | * | | 5,800 | | | 325,322 | |
Motorola, Inc. | | | 204,900 | | | 4,628,691 | |
Powerwave Technologies, Inc. | *† | | 38,400 | | | 482,688 | |
Qualcomm, Inc. | | | 499,300 | | | 21,509,844 | |
XM Satellite Radio Holdings, Inc. Class A | *† | | 232,000 | | | 6,328,960 | |
| | | | | | | |
| | | | | | 48,819,647 | |
| | | | | | | |
Computer Software & Processing—12.0% | | | | | | | |
Activision, Inc. | | | 290,887 | | | 3,996,787 | |
Aspen Technology, Inc. | * | | 14,400 | | | 113,040 | |
Autodesk, Inc. | | | 274,000 | | | 11,768,300 | |
Automatic Data Processing, Inc. | | | 777,700 | | | 35,688,653 | |
Blue Coat Systems, Inc. | * | | 9,500 | | | 434,340 | |
Cerner Corporation | *† | | 29,700 | | | 2,700,027 | |
Checkfree Corporation | *† | | 15,400 | | | 706,860 | |
Citrix Systems, Inc. | * | | 117,900 | | | 3,393,162 | |
Cognos, Inc. (Canada) | *† | | 36,700 | | | 1,273,857 | |
Computer Associates International, Inc. | † | | 494,400 | | | 13,937,136 | |
Computer Sciences Corporation * | | | 63,300 | | | 3,205,512 | |
Electronic Arts, Inc. | * | | 361,300 | | | 18,899,603 | |
Electronic Data Systems Corporation | | | 13,900 | | | 334,156 | |
Factset Research Systems, Inc. | | | 23,000 | | | 946,680 | |
Fair Isaac Corporation | | | 54,700 | | | 2,416,099 | |
First Data Corporation | | | 459,200 | | | 19,750,192 | |
Fiserv, Inc. | * | | 104,000 | | | 4,500,080 | |
Gartner Group, Inc. Class A | * | | 20,200 | | | 260,580 | |
Google, Inc. Class A | * | | 139,750 | | | 57,976,685 | |
Infosys Technologies Sponsored ADR (India) | | | 55,200 | | | 4,463,472 | |
Intergraph Corporation | * | | 45,800 | | | 2,281,298 | |
Linktone, Ltd., ADR (Cayman Islands) | * | | 106,600 | | | 1,108,640 | |
McAfee, Inc. | * | | 194,700 | | | 5,282,211 | |
Microsoft Corporation | | | 3,236,070 | | | 84,623,230 | |
NAVTEQ Corporation | * | | 83,500 | | | 3,663,145 | |
Oracle Corporation | * | | 323,800 | | | 3,953,598 | |
Quality Systems, Inc. | | | 4,300 | | | 330,068 | |
SAP AG ADR (Germany) | † | | 233,000 | | | 10,501,310 | |
Symantec Corporation | * | | 41,700 | | | 729,750 | |
Synopsys, Inc. | * | | 17,300 | | | 347,038 | |
Tencent Holdings, Ltd. (Cayman Islands) | | | 190,000 | | | 202,931 | |
Vignette Corporation | * | | 31,800 | | | 518,658 | |
Websense, Inc. | * | | 800 | | | 52,512 | |
Yahoo!, Inc. | * | | 954,200 | | | 37,385,556 | |
| | | | | | | |
| | | | | | 337,745,166 | |
| | | | | | | |
| | | | | | | |
| | |
| | | Shares | | | Value | |
| | |
Computers—0.0% | | | | | | | |
Acer, Inc. (Taiwan) | | | 68,000 | | $ | 170,975 | |
| | | | | | | |
| | | | | | | |
Computers & Information—5.3% | | | | | | | |
Apple Computer, Inc. | * | | 35,400 | | | 2,544,906 | |
Cisco Systems, Inc. | * | | 2,251,300 | | | 38,542,256 | |
Dell, Inc. | * | | 989,200 | | | 29,666,108 | |
EMC Corporation | * | | 715,600 | | | 9,746,472 | |
Hewlett-Packard Company | | | 120,200 | | | 3,441,326 | |
International Business Machines Corporation | | | 534,800 | | | 43,960,560 | |
International Game Technology | | | 435,500 | | | 13,404,690 | |
Komag, Inc. | * | | 6,300 | | | 218,358 | |
ScanSource, Inc. | * | | 5,600 | | | 306,208 | |
Thomson Corporation (Canada) | | | 43,800 | | | 1,515,480 | |
Western Digital Corporation | * | | 273,200 | | | 5,084,252 | |
| | | | | | | |
| | | | | | 148,430,616 | |
| | | | | | | |
Cosmetics & Personal Care—1.0% | | | | | | | |
Colgate-Palmolive Company | | | 47,700 | | | 2,616,345 | |
Procter & Gamble Company | | | 427,535 | | | 24,745,726 | |
| | | | | | | |
| | | | | | 27,362,071 | |
| | | | | | | |
Diversified—2.3% | | | | | | | |
General Electric Company | | | 1,816,300 | | | 63,661,315 | |
| | | | | | | |
| | | | | | | |
Electric Utilities—0.2% | | | | | | | |
Black Hills Corporation | | | 5,500 | | | 190,355 | |
PG&E Corporation | † | | 91,000 | | | 3,377,920 | |
TXU Corporation | | | 44,100 | | | 2,213,379 | |
| | | | | | | |
| | | | | | 5,781,654 | |
| | | | | | | |
Electrical Equipment—0.3% | | | | | | | |
Emerson Electric Company | | | 60,500 | | | 4,519,350 | |
Energizer Holdings, Inc. | * | | 73,800 | | | 3,674,502 | |
| | | | | | | |
| | | | | | 8,193,852 | |
| | | | | | | |
Electronics—4.5% | | | | | | | |
ASM Lithography Holdings | | | | | | | |
NV New York Registered | | | | | | | |
Shares (Netherlands) | *† | | 240,621 | | | 4,831,670 | |
Advanced Micro Devices, Inc. | * | | 250,200 | | | 7,656,120 | |
Agilent Technologies, Inc. | * | | 18,000 | | | 599,220 | |
ATI Technologies, Inc. (Canada) | * | | 11,600 | | | 197,084 | |
Avnet, Inc. | * | | 51,100 | | | 1,223,334 | |
Emcor Group, Inc. | * | | 6,100 | | | 411,933 | |
Flir Systems, Inc. | *† | | 155,800 | | | 3,479,014 | |
Freescale Semiconductor, Inc. Class B | * | | 128,100 | | | 3,224,277 | |
Garmin Ltd. (Cayman Islands) | † | | 141,149 | | | 9,365,236 | |
Intel Corporation | | | 1,692,100 | | | 42,234,816 | |
Linear Technology Corporation | | | 355,000 | | | 12,804,850 | |
Maxim Integrated Products, Inc. | | | 282,000 | | | 10,219,680 | |
Micron Technology, Inc. | *† | | 207,100 | | | 2,756,501 | |
National Semiconductor Corporation | | | 90,600 | | | 2,353,788 | |
Raytheon Company | | | 12,000 | | | 481,800 | |
Rockwell Collins, Inc. | | | 27,200 | | | 1,263,984 | |
Siliconware Precision Industries Co., ADR (Taiwan) | † | | 43,700 | | | 303,278 | |
Texas Instruments, Inc. | | | 696,100 | | | 22,323,927 | |
| | | | | | | |
| | | | | | 125,730,512 | |
| | | | | | | |
| | |
202 | See accompanying notes to financial statements. | |
SCHEDULE OF INVESTMENTS —(Continued)
December 31, 2005
| | | | | | | |
| | |
Vantagepoint
Growth Fund | | | Shares | | | Value | |
| | |
| |
COMMON STOCKS—(Continued) | | | | | | | |
| | |
Entertainment & Leisure—0.9% | | | | | | | |
International Speedway Corporation Class A | | | 33,440 | | $ | 1,601,776 | |
International Speedway Corporation Class B | | | 37,800 | | | 1,795,500 | |
Li Ning Co., Ltd. (Cayman Islands) | | | 296,000 | | | 209,955 | |
Penn National Gaming, Inc. | * | | 14,400 | | | 474,480 | |
Time Warner, Inc. | | | 214,800 | | | 3,746,112 | |
Walt Disney Company | | | 717,800 | | | 17,205,666 | |
| | | | | | | |
| | | | | | 25,033,489 | |
| | | | | | | |
Financial Services—7.6% | | | | | | | |
Ameritrade Holding Corporation | * | | 147,939 | | | 3,550,536 | |
Charles Schwab | | | | | | | |
Corporation (The) | | | 1,985,950 | | | 29,133,886 | |
Chicago Mercantile Exchange | † | | 16,900 | | | 6,210,581 | |
Countrywide Financial Corporation | | | 399,500 | | | 13,658,905 | |
Credit Suisse Group, Sponsored ADR (Switzerland) | † | | 10,100 | | | 514,595 | |
E*Trade Financial Corporation | * | | 210,300 | | | 4,386,858 | |
Federal Agricultural Mortgage Corporation | | | 9,700 | | | 290,321 | |
Franklin Resources, Inc. | | | 264,200 | | | 24,837,442 | |
GFI Group, Inc. | * | | 21,400 | | | 1,015,002 | |
Goldman Sachs Group, Inc. | | | 647,400 | | | 82,679,454 | |
IntercontinentalExchange, Inc. | * | | 30,500 | | | 1,108,675 | |
International Securities Exchange, Inc. | *† | | 2,850 | | | 78,432 | |
Legg Mason, Inc. | | | 188,100 | | | 22,513,689 | |
Merrill Lynch & Company, Inc. | | | 126,700 | | | 8,581,391 | |
Moody’s Corporation | | | 115,400 | | | 7,087,868 | |
Nasdaq Stock Market Inc. | *† | | 179,800 | | | 6,325,364 | |
New Century Financial Corporation REIT | † | | 9,000 | | | 324,630 | |
Nomura Holdings, Inc., ADR (Japan) | † | | 8,900 | | | 171,058 | |
optionsXpress Holdings, Inc. | | | 84,500 | | | 2,074,475 | |
| | | | | | | |
| | | | | | 214,543,162 | |
| | | | | | | |
Food Retailers—0.4% | | | | | | | |
Albertson’s, Inc. | | | 15,100 | | | 322,385 | |
Kroger Company | * | | 16,900 | | | 319,072 | |
Starbucks Corporation | * | | 45,400 | | | 1,362,454 | |
Whole Foods Market, Inc. | | | 104,200 | | | 8,064,038 | |
| | | | | | | |
| | | | | | 10,067,949 | |
| | | | | | | |
Forest Products & Paper—0.2% | | | | | | | |
Martin Marietta Materials, Inc. | | | 81,600 | | | 6,260,352 | |
Stella-Jones, Inc. (Canada) | | | 3,000 | | | 36,120 | |
Stella-Jones, Inc. (Canada) | | | 13,800 | | | 165,482 | |
| | | | | | | |
| | | | | | 6,461,954 | |
| | | | | | | |
Health Care Providers—2.1% | | | | | | | |
American Retirement | | | | | | | |
Corporation | * | | 9,100 | | | 228,683 | |
Caremark Rx, Inc. | * | | 142,400 | | | 7,374,896 | |
Edwards Lifesciences Corporation | *† | | 36,500 | | | 1,518,765 | |
Express Scripts, Inc. | * | | 125,800 | | | 10,542,040 | |
HCA, Inc. | | | 154,200 | | | 7,787,100 | |
Horizon Health Corp. | * | | 22,400 | | | 506,912 | |
Psychiatric Solutions, Inc. | * | | 30,260 | | | 1,777,472 | |
| | | | | | | |
| | |
| | | Shares | | | Value | |
| | |
Radiation Therapy Services, Inc. | * | | 5,100 | | $ | 180,081 | |
UnitedHealth Group, Inc. | | | 494,070 | | | 30,701,510 | |
| | | | | | | |
| | | | | | 60,617,459 | |
| | | | | | | |
Heavy Construction—0.0% | | | | | | | |
Foster Wheeler, Ltd. (Bermuda) * | | | 23,800 | | | 875,364 | |
Perini Corp. | * | | 10,700 | | | 258,405 | |
| | | | | | | |
| | | | | | 1,133,769 | |
| | | | | | | |
Heavy Machinery—1.8% | | | | | | | |
American Standard | | | | | | | |
Companies, Inc. | | | 43,800 | | | 1,749,810 | |
Bucyrus International, Inc. Class A | † | | 16,200 | | | 853,740 | |
Caterpillar, Inc. | | | 288,300 | | | 16,655,091 | |
Chicago Bridge & Iron Company NV NY Shares (Netherlands) | | | 493,900 | | | 12,451,219 | |
Hexagon AB—Class B (Sweden) | | | 4,700 | | | 140,351 | |
Joy Global, Inc. | | | 277,875 | | | 11,115,000 | |
Lam Research Corporation | *† | | 24,300 | | | 867,024 | |
Stewart & Stevenson Services | | | 11,600 | | | 245,108 | |
Toro Company | | | 14,500 | | | 634,665 | |
UNOVA, Inc. | * | | 191,300 | | | 6,465,940 | |
| | | | | | | |
| | | | | | 51,177,948 | |
| | | | | | | |
Home Construction, Furnishings & Appliances—0.3% | | | | | | | |
Johnson Controls, Inc. | | | 115,200 | | | 8,399,232 | |
| | | | | | | |
| | | | | | | |
Household Products—0.3% | | | | | | | |
Newell Rubbermaid, Inc. | | | 319,200 | | | 7,590,576 | |
| | | | | | | |
| | | | | | | |
Insurance—5.8% | | | | | | | |
Aetna, Inc. | | | 351,000 | | | 33,102,810 | |
Allstate Corporation (The) | | | 40,200 | | | 2,173,614 | |
American Equity Investment Life Holding Co. | † | | 11,600 | | | 151,380 | |
American International Group, Inc. | | | 1,028,750 | | | 70,191,613 | |
Arch Capital Group Ltd. (Bermuda) | * | | 4,200 | | | 229,950 | |
Aspen Insurance Holdings, Ltd. (Bermuda) | | | 17,400 | | | 411,858 | |
Cigna Corporation | | | 24,300 | | | 2,714,310 | |
Genworth Financial, Inc. Class A | | | 92,800 | | | 3,209,024 | |
HCC Insurance Holdings, Inc. | | | 5,700 | | | 169,176 | |
Health Net, Inc. | * | | 129,900 | | | 6,696,345 | |
Humana, Inc. | * | | 322,300 | | | 17,510,559 | |
Leucadia National Corporation | | | 77,900 | | | 3,697,134 | |
Loews Corporation | | | 42,500 | | | 4,031,125 | |
MBIA, Inc. | | | 59,300 | | | 3,567,488 | |
Metlife, Inc. | | | 30,200 | | | 1,479,800 | |
Montpelier Re Holdings, Ltd. (Bermuda) | † | | 20,660 | | | 390,474 | |
Progressive Corporation (The) | † | | 23,300 | | | 2,720,974 | |
Prudential Financial, Inc. | | | 19,600 | | | 1,434,524 | |
Swiss Reinsurance (Switzerland) | | | 3,570 | | | 260,042 | |
WellPoint, Inc. | * | | 73,300 | | | 5,848,607 | |
White Mountains Insurance Group Ltd. | | | 800 | | | 446,840 | |
WR Berkley Corporation | | | 50,800 | | | 2,419,096 | |
XL Capital Ltd. Class A (Bermuda) | | | 14,300 | | | 963,534 | |
Zenith National Insurance Corporation | | | 16,100 | | | 742,532 | |
| | | | | | | |
| | | | | | 164,562,809 | |
| | | | | | | |
| | |
| See accompanying notes to financial statements. | 203 |
SCHEDULE OF INVESTMENTS —(Continued)
December 31, 2005
| | | | | | | |
| | |
Vantagepoint
Growth Fund | | | Shares | | | Value | |
| | |
| | | | | | | |
COMMON STOCKS—(Continued) | | | | | | | |
| | |
Lodging—0.6% | | | | | | | |
Choice Hotels International, Inc. | † | | 45,900 | | $ | 1,916,784 | |
Hilton Hotels Corporation | | | 451,800 | | | 10,892,898 | |
Kerzner International, Ltd. (Bahama Islands) | * | | 2,200 | | | 151,250 | |
MGM Mirage, Inc. | * | | 41,300 | | | 1,514,471 | |
Marriott International, Inc. Class A | | | 22,400 | | | 1,500,128 | |
Vail Resorts, Inc. | *† | | 15,400 | | | 508,662 | |
| | | | | | | |
| | | | | | 16,484,193 | |
| | | | | | | |
Media—Broadcasting & Publishing—2.3% | | | | | | | |
Clear Channel Communications, Inc. | | | 33,700 | | | 1,059,865 | |
Comcast Corporation Class A | *† | | 53,000 | | | 1,375,880 | |
DIRECTV Group, Inc. (The) | * | | 912,700 | | | 12,887,324 | |
Gannett Company, Inc. | † | | 456,200 | | | 27,632,034 | |
IAC/InterActiveCorp | * | | 376,300 | | | 10,653,053 | |
Liberty Media Corporation Class A | * | | 476,900 | | | 3,753,203 | |
McGraw-Hill Companies, Inc. (The) | | | 37,200 | | | 1,920,636 | |
Playboy Enterprises, Inc. Class B | * | | 23,300 | | | 323,637 | |
Television Broadcasts Ltd. (Hong Kong) | | | 27,000 | | | 143,375 | |
VNU NV (Netherlands) | | | 51,300 | | | 1,693,171 | |
Viacom, Inc. Class B | | | 118,100 | | | 3,850,060 | |
| | | | | | | |
| | | | | | 65,292,238 | |
| | | | | | | |
Medical Equipment & Supplies—0.1% | | | | | | | |
Abaxis, Inc. | * | | 5,700 | | | 93,936 | |
Hologic, Inc. | * | | 83,800 | | | 3,177,696 | |
Intermagnetics General Corporation | * | | 7,400 | | | 236,060 | |
| | | | | | | |
| | | | | | 3,507,692 | |
| | | | | | | |
Medical Supplies—4.7% | | | | | | | |
Allergan, Inc. | † | | 52,000 | | | 5,613,920 | |
Applera Corporation—Applied Biosystems Group | | | 21,700 | | | 576,352 | |
Baxter International, Inc. | | | 93,200 | | | 3,508,980 | |
C.R. Bard, Inc. | | | 33,000 | | | 2,175,360 | |
Fisher Scientific International | * | | 124,500 | | | 7,701,570 | |
Foxhollow Technologies, Inc. | * | | 5,300 | | | 157,887 | |
Guidant Corporation | | | 17,300 | | | 1,120,175 | |
Haemonetics Corporation | * | | 27,300 | | | 1,333,878 | |
Inamed Corporation | * | | 11,400 | | | 999,552 | |
Johnson & Johnson | | | 648,600 | | | 38,980,860 | |
Kla-Tencor Corporation | | | 11,900 | | | 587,027 | |
Medtronic, Inc. | | | 966,200 | | | 55,624,134 | |
Mentor Corporation | † | | 33,800 | | | 1,557,504 | |
Oakley, Inc. | † | | 45,100 | | | 662,519 | |
St. Jude Medical, Inc. | * | | 89,000 | | | 4,467,800 | |
Zimmer Holdings, Inc. | * | | 114,900 | | | 7,748,856 | |
| | | | | | | |
| | | | | | 132,816,374 | |
| | | | | | | |
Metals—1.1% | | | | | | | |
Allegheny Technologies, Inc. | | | 115,000 | | | 4,149,200 | |
Cameco Corporation (Canada) | † | | 73,200 | | | 4,640,148 | |
Quanex Corporation | † | | 13,100 | | | 654,607 | |
RTI International Metals, Inc. | * | | 162,800 | | | 6,178,260 | |
Shaw Group, Inc. (The) | *† | | 86,600 | | | 2,519,194 | |
| | | | | | | |
| | |
| | | Shares | | | Value | |
| | |
Titanium Metals Corporation | *† | | 218,101 | | $ | 13,797,069 | |
Watts Water Technologies, Inc. Class A | | | 4,700 | | | 142,363 | |
| | | | | | | |
| | | | | | 32,080,841 | |
| | | | | | | |
Metals & Mining—0.4% | | | | | | | |
Inco Ltd. (Canada) | † | | 259,100 | | | 11,288,987 | |
| | | | | | | |
Mining—0.1% | | | | | | | |
Freeport-McMoran Copper & Gold, Inc. Class B | † | | 41,700 | | | 2,243,460 | |
| | | | | | | |
Miscellaneous—0.0% | | | | | | | |
Li & Fung Ltd. (Hong Kong) | | | 324,000 | | | 623,422 | |
| | | | | | | |
Oil & Gas—3.4% | | | | | | | |
Apache Corporation | | | 110,500 | | | 7,571,460 | |
BJ Services Company | † | | 32,400 | | | 1,188,108 | |
Burlington Resources, Inc. | | | 29,100 | | | 2,508,420 | |
ConocoPhillips | | | 202,900 | | | 11,804,722 | |
Devon Energy Corporation | | | 18,800 | | | 1,175,752 | |
Diamond Offshore Drilling, Inc. | † | | 8,800 | | | 612,128 | |
EOG Resources, Inc. | † | | 8,900 | | | 652,993 | |
Frontier Oil Corporation | | | 74,500 | | | 2,795,985 | |
Halliburton Company | † | | 67,000 | | | 4,151,320 | |
Headwaters, Inc. | *† | | 21,500 | | | 761,960 | |
Helmerich & Payne, Inc. | | | 54,900 | | | 3,398,859 | |
Nabors Industries Ltd. | * | | 50,500 | | | 3,825,375 | |
Newfield Exploration Company | * | | 16,800 | | | 841,176 | |
Occidental Petroleum Corporation | | | 99,100 | | | 7,916,108 | |
Plains Exploration & Production Company | *† | | 51,300 | | | 2,038,149 | |
Quicksilver Resources, Inc. | *† | | 22,724 | | | 954,635 | |
Rowan Companies, Inc. | | | 41,900 | | | 1,493,316 | |
Schlumberger Ltd. | † | | 26,600 | | | 2,584,190 | |
Smith International, Inc. | † | | 590,600 | | | 21,917,166 | |
Sunoco, Inc. | | | 48,900 | | | 3,832,782 | |
Tesoro Petroleum Corporation | | | 20,300 | | | 1,249,465 | |
Tetra Technologies, Inc. | * | | 8,600 | | | 262,472 | |
Tidewater, Inc. | † | | 72,300 | | | 3,214,458 | |
Valero Energy Corporation | | | 184,400 | | | 9,515,040 | |
Williams Companies, Inc. | | | 41,700 | | | 966,189 | |
| | | | | | | |
| | | | | | 97,232,228 | |
| | | | | | | |
Pharmaceuticals—6.5% | | | | | | | |
Alcon, Inc. (Switzerland) | | | 2,000 | | | 259,200 | |
AmerisourceBergen Corporation | † | | 88,400 | | | 3,659,760 | |
Amgen, Inc. | *† | | 392,000 | | | 30,913,120 | |
Barr Pharmaceuticals, Inc. | * | | 11,400 | | | 710,106 | |
Biogen Idec, Inc. | * | | 317,300 | | | 14,383,209 | |
Cardinal Health, Inc. | | | 47,300 | | | 3,251,875 | |
Cubist Pharmaceuticals, Inc. | * | | 7,200 | | | 153,000 | |
Endo Pharmaceuticals Holdings, Inc. | * | | 35,600 | | | 1,077,256 | |
Genentech, Inc. | * | | 453,300 | | | 41,930,250 | |
Genzyme Corporation | * | | 144,700 | | | 10,241,866 | |
Gilead Sciences, Inc. | * | | 259,300 | | | 13,646,959 | |
Hospira, Inc. | * | | 16,500 | | | 705,870 | |
Invitrogen Corporation | * | | 25,800 | | | 1,719,312 | |
KOS Pharmaceuticals, Inc. | *† | | 29,200 | | | 1,510,516 | |
McKesson Corporation | | | 35,000 | | | 1,805,650 | |
Medco Health Solutions, Inc. | * | | 37,000 | | | 2,064,600 | |
Merck & Company, Inc. | | | 120,400 | | | 3,829,924 | |
Meridian Bioscience, Inc. | | | 20,600 | | | 414,884 | |
| | |
204 | See accompanying notes to financial statements. | |
SCHEDULE OF INVESTMENTS —(Continued)
December 31, 2005
| | | | | | | |
| | |
Vantagepoint
Growth Fund | | | Shares | | | Value | |
| | |
| | | | | | | |
COMMON STOCKS—(Continued) | | | | | | | |
| | |
Neurocrine Biosciences, Inc. | * | | 13,000 | | $ | 815,490 | |
Omnicare, Inc. | | | 285,000 | | | 16,307,700 | |
Pfizer, Inc. | | | 734,200 | | | 17,121,544 | |
Quidel Corp. | * | | 8,200 | | | 88,232 | |
Roche Holding AG (Switzerland) | | | 26,353 | | | 3,938,784 | |
Schering-Plough Corporation | | | 308,000 | | | 6,421,800 | |
Sigma Aldrich Corporation | | | 8,400 | | | 531,636 | |
Teva Pharmaceutical Industries Ltd. ADR (Israel) | † | | 63,100 | | | 2,713,931 | |
Vertex Pharmaceuticals, Inc. | * | | 17,100 | | | 473,157 | |
Watson Pharmaceuticals, Inc. | * | | 32,400 | | | 1,053,324 | |
| | | | | | | |
| | | | | | 181,742,955 | |
| | | | | | | |
Real Estate—0.1% | | | | | | | |
CB Richard Ellis Group, Inc. Class A | * | | 20,000 | | | 1,177,000 | |
Prologis REIT | | | 26,400 | | | 1,233,408 | |
Sinochem Hong Kong Holding, Ltd. (Bermuda) | | | 1,069,200 | | | 198,305 | |
| | | | | | | |
| | | | | | 2,608,713 | |
| | | | | | | |
Restaurants—0.4% | | | | | | | |
Buffalo Wild Wings, Inc. | *† | | 17,300 | | | 574,533 | |
Cheesecake Factory (The) | *† | | 69,227 | | | 2,588,398 | |
Darden Restaurants, Inc. | | | 103,900 | | | 4,039,632 | |
Luby’s, Inc. | * | | 25,300 | | | 336,490 | |
Red Robin Gourmet Burgers, Inc. | *† | | 5,700 | | | 290,472 | |
Yum! Brands, Inc. | | | 48,600 | | | 2,278,368 | |
| | | | | | | |
| | | | | | 10,107,893 | |
| | | | | | | |
Retailers—7.5% | | | | | | | |
Amazon.Com, Inc. | *† | | 633,000 | | | 29,845,950 | |
Circuit City Stores, Inc. | | | 188,700 | | | 4,262,733 | |
Coldwater Creek, Inc. | * | | 8,900 | | | 271,717 | |
Costco Wholesale Corporation | | | 33,800 | | | 1,672,086 | |
Dillard’s, Inc. Class A | † | | 43,900 | | | 1,089,598 | |
eBay, Inc. | * | | 1,536,400 | | | 66,449,300 | |
Fastenal Company | † | | 341,400 | | | 13,379,466 | |
Longs Drug Stores Corporation | | | 101,500 | | | 3,693,585 | |
MarineMax, Inc. | * | | 13,300 | | | 419,881 | |
Men’s Wearhouse, Inc. | * | | 24,400 | | | 718,336 | |
Office Depot, Inc. | * | | 41,300 | | | 1,296,820 | |
Stride Rite Corporation | | | 11,300 | | | 153,228 | |
Takashimaya Company Ltd. (Japan) | | | 45,000 | | | 718,965 | |
Target Corporation | | | 339,300 | | | 18,651,321 | |
Walgreen Company | | | 220,700 | | | 9,768,182 | |
Wal-Mart Stores, Inc. | | | 1,119,100 | | | 52,373,880 | |
Williams-Sonoma, Inc. | *† | | 151,700 | | | 6,545,855 | |
| | | | | | | |
| | | | | | 211,310,903 | |
| | | | | | | |
Retirement/Aged Care—0.0% | | | | | | | |
Capital Senior Living Corp. | * | | 24,400 | | | 252,296 | |
Emeritus Corp. | * | | 10,000 | | | 209,500 | |
| | | | | | | |
| | | | | | 461,796 | |
| | | | | | | |
Telecommunications—1.8% | | | | | | | |
Nokia Corporation ADR (Finland) | | | 2,724,200 | | | 49,852,860 | |
| | | | | | | |
| | | | | | | |
| | |
| | | Shares | | | Value | |
| | |
Telephone Systems—0.6% | | | | | | | |
Global Payments, Inc. | | | 87,300 | | $ | 4,069,053 | |
Sprint Nextel Corp. | | | 526,900 | | | 12,308,384 | |
Verizon Communications, Inc. | | | 11,800 | | | 355,416 | |
| | | | | | | |
| | | | | | 16,732,853 | |
| | | | | | | |
Textiles, Clothing & Fabrics—1.2% | | | | | | | |
Coach, Inc. | * | | 120,800 | | | 4,027,472 | |
Nike, Inc. Class B | | | 102,600 | | | 8,904,654 | |
Phillips-Van Heusen Corporation | | | 11,500 | | | 372,600 | |
Polo Ralph Lauren Corporation | | | 18,600 | | | 1,044,204 | |
Puma AG Rudolf Dassler Sport (Germany) | | | 65,675 | | | 19,011,819 | |
Quiksilver, Inc. | * | | 136,600 | | | 1,890,544 | |
| | | | | | | |
| | | | | | 35,251,293 | |
| | | | | | | |
Transportation—3.5% | | | | | | | |
Alexander & Baldwin, Inc. | | | 138,759 | | | 7,526,288 | |
Burlington Northern Santa Fe Corporation | | | 62,400 | | | 4,419,168 | |
CSX Corporation | | | 70,300 | | | 3,569,131 | |
Carnival Corporation | | | 166,200 | | | 8,886,714 | |
Expedia, Inc. | *† | | 825,000 | | | 19,767,000 | |
Expeditors International Washington, Inc. | | | 4,300 | | | 290,293 | |
FedEx Corporation | | | 95,600 | | | 9,884,084 | |
Florida East Coast Industries | | | 15,600 | | | 660,972 | |
Forward Air Corporation | | | 27,975 | | | 1,025,284 | |
Hornbeck Offshore Services, Inc. | * | | 2,900 | | | 94,830 | |
HUB Group, Inc. Class A | * | | 32,240 | | | 1,139,684 | |
Kansas City Southern | *† | | 208,000 | | | 5,081,440 | |
Kirby Corporation | * | | 19,900 | | | 1,038,183 | |
Laidlaw International, Inc. | | | 81,147 | | | 1,885,045 | |
Landstar System, Inc. | | | 104,992 | | | 4,382,366 | |
Norfolk Southern Corporation | | | 285,100 | | | 12,781,033 | |
Overseas Shipholding Group | | | 7,200 | | | 362,808 | |
Shun TAK Holdings, Ltd. (Hong Kong) | | | 374,000 | | | 343,634 | |
Thor Industries, Inc. | | | 81,660 | | | 3,272,116 | |
UTI Worldwide, Inc. (Luxembourg) | | | 55,222 | | | 5,126,810 | |
United Parcel Service, Inc. Class B | | | 98,200 | | | 7,379,730 | |
| | | | | | | |
| | | | | | 98,916,613 | |
| | | | | | | |
TOTAL COMMON STOCKS
(Cost $2,402,099,718) | | | | | | 2,753,237,263 | |
| | | | | | | |
| | | | | | | | | | |
| | |
Coupon
Rate | | Maturity
Date | | | | Face | | | Value | |
| | |
CASH EQUIVALENTS—10.2% | | | | | | | |
| | |
Institutional Money Market Funds—0.7% | | | | | | | |
American Beacon Funds | †† | $ | 1,214,784 | | | 1,214,784 | �� |
BGI Institutional Fund | †† | | 15,792,166 | | | 15,792,166 | |
Goldman Sachs Financial Square Prime Obligations Fund | †† | | 1,214,782 | | | 1,214,782 | |
Merrimac Cash Fund—Premium Class | †† | | 1,943,651 | | | 1,943,651 | |
| | | | | | | |
| | | | | | 20,165,383 | |
| | | | | | | |
| | |
| See accompanying notes to financial statements. | 205 |
SCHEDULE OF INVESTMENTS—(Continued)
December 31, 2005
| | | | | | | | | | |
| | |
Vantagepoint
Growth Fund | | | | | | | |
| | |
|
Coupon
Rate | | Maturity
Date | | | | Face | | | Value | |
| | |
| | | | | | | |
CASH EQUIVALENTS—(Continued) | | | | | | | |
| | |
Bank & Certificate Deposits/Offshore Time Deposits—8.7% | | | | | | | |
Abbey National PLC | | | | | | | |
4.290% | | 01/11/2006 | | †† | $ | 6,073,910 | | $ | 6,073,910 | |
Bank of Nova Scotia | | | | | | | |
4.250% | | 01/27/2006 | | †† | | 8,503,474 | | | 8,503,474 | |
Barclays | | | | | | | |
4.410% | | 02/27/2006 | | †† | | 6,073,910 | | | 6,073,910 | |
Barclays | | | | | | | |
4.270% | | 01/25/2006 | | †† | | 6,073,911 | | | 6,073,911 | |
BNP Paribas | | | | | | | |
4.220% | | 01/24/2006 | | †† | | 6,073,910 | | | 6,073,910 | |
Branch Banker &Trust | | | | | | | |
4.260% | | 01/11/2006 | | †† | | 6,073,910 | | | 6,073,910 | |
CIESCO | | | | | | | |
4.305% | | 01/06/2006 | | †† | | 7,288,692 | | | 7,288,692 | |
Dexia Group | | | | | | | |
4.250% | | 01/09/2006 | | †† | | 12,147,820 | | | 12,147,820 | |
Fairway Finance | | | | | | | |
4.280% | | 01/30/2006 | | †† | | 4,859,128 | | | 4,859,128 | |
Falcon Asset Securitization Corporation | | | | | | | |
4.307% | | 02/02/2006 | | †† | | 6,024,691 | | | 6,024,691 | |
Fortis Bank | | | | | | | |
4.350% | | 01/03/2006 | | †† | | 6,073,911 | | | 6,073,911 | |
Greyhawk Funding | | | | | | | |
4.355% | | 01/06/2006 | | †† | | 4,859,128 | | | 4,859,128 | |
Greyhawk Funding | | | | | | | |
4.278% | | 01/24/2006 | | †† | | 3,644,346 | | | 3,644,346 | |
Jupiter Securitization Corporation | | | | | | | |
4.266% | | 01/05/2006 | | †† | | 2,915,477 | | | 2,915,477 | |
Jupiter Securitization Corporation | | | | | | | |
4.257% | | 01/04/2006 | | †† | | 3,644,346 | | | 3,644,346 | |
Liberty Street | | | | | | | |
4.266% | | 01/05/2006 | | †† | | 6,029,453 | | | 6,029,453 | |
Merrill Lynch & Company, Inc. | | | | | | | |
4.240% | | 01/03/2006 | | †† | | 24,295,641 | | | 24,295,641 | |
National Australia Bank | | | | | | | |
4.156% | | 01/03/2006 | | †† | | 3,408,240 | | | 3,408,240 | |
Paradigm Funding LLC | | | | | | | |
4.303% | | 01/03/2006 | | †† | | 7,858,445 | | | 7,858,445 | |
Paradigm Funding LLC | | | | | | | |
4.297% | | 01/09/2006 | | †† | | 4,859,128 | | | 4,859,128 | |
Prefco | | | | | | | |
4.312% | | 01/04/2006 | | †† | | 3,644,346 | | | 3,644,346 | |
Rabobank Nederland | | | | | | | |
4.150% | | 01/03/2006 | | †† | | 6,073,911 | | | 6,073,911 | |
Ranger Funding | | | | | | | |
4.291% | | 01/18/2006 | | †† | | 4,859,128 | | | 4,859,128 | |
Royal Bank of Canada | | | | | | | |
4.250% | | 01/24/2006 | | †† | | 8,503,474 | | | 8,503,474 | |
Royal Bank of Canada | | | | | | | |
4.220% | | 01/20/2006 | | †† | | 6,073,910 | | | 6,073,910 | |
Royal Bank of Scotland | | | | | | | |
4.310% | | 02/01/2006 | | †† | | 12,147,820 | | | 12,147,820 | |
Royal Bank of Scotland | | | | | | | |
4.250% | | 01/23/2006 | | †† | | 6,073,910 | | | 6,073,910 | |
Skandinaviska Enskilda Banken AB | | | | | | | |
4.300% | | 01/17/2006 | | †† | | 3,644,346 | | | 3,644,346 | |
Skandinaviska Enskilda Banken AB | | | | | | | |
4.230% | | 01/03/2006 | | †† | | 6,073,910 | | | 6,073,910 | |
Societe Generale | | | | | | | |
4.280% | | 01/30/2006 | | †† | | 4,859,128 | | | 4,859,128 | |
The Bank of the West | | | | | | | |
4.290% | | 01/25/2006 | | †† | | 6,073,910 | | | 6,073,910 | |
| | | | | | | | | | |
| | |
Coupon
Rate | | Maturity
Date | | | | Face | | | Value | |
| | |
UBS AG | | | | | | | |
4.260% | | 01/10/2006 | | †† | $ | 6,073,910 | | $ | 6,073,910 | |
UBS AG | | | | | | | |
4.255% | | 01/18/2006 | | †† | | 7,288,692 | | | 7,288,692 | |
Wells Fargo | | | | | | | |
4.290% | | 01/30/2006 | | †† | | 9,718,257 | | | 9,718,257 | |
Wells Fargo | | | | | | | |
4.270% | | 01/03/2006 | | †† | | 6,073,908 | | | 6,073,908 | |
Yorktown Capital LLC | | | | | | | |
4.330% | | 01/04/2006 | | †† | | 5,438,821 | | | 5,438,821 | |
Yorktown Capital LLC | | | | | | | |
4.266% | | 01/05/2006 | | †† | | 6,029,451 | | | 6,029,451 | |
| | | | | | | | | | |
| | | | | | | | | 245,432,303 | |
| | | | | | | | | | |
Floating Rate Instruments/Master Notes—0.8% | | | | | | | |
Bank of America | | | | | | | |
4.270% | | 01/17/2006 | | †† | | 4,859,128 | | | 4,859,128 | |
Bank of America | | | | | | | |
4.230% | | 01/20/2006 | | †† | | 6,073,910 | | | 6,073,910 | |
Credit Suisse First Boston Corporation | | | | | | | |
4.175% | | 03/10/2006 | | †† | | 4,859,128 | | | 4,859,128 | |
Rabobank Nederland | | | | | | | |
4.100% | | 05/31/2006 | | †† | | 6,073,910 | | | 6,073,910 | |
| | | | | | | | | | |
| | | | | | | | | 21,866,076 | |
| | | | | | | | | | |
TOTAL CASH EQUIVALENTS
(Cost $287,463,762) | | | | | | 287,463,762 | |
| | | | | | | | | | |
|
| | |
REPURCHASE AGREEMENTS—2.3% | | | | | | | |
| | |
IBT Repurchase Agreement dated 12/31/2005 due 01/03/2006, with a maturity value of $63,694,911 and an effective yield of 3.65% collateralized by U.S. Goverment Obligations with rates ranging from 4.057% to 7.875%, maturity dates ranging from 05/25/2015 to 12/15/2034 and an aggregate market value of $66,852,542. | | | 63,669,090 | | | 63,669,090 | |
| | | | | | | | | | |
TOTAL INVESTMENTS—110.2% | | | | | | | |
(Cost $2,753,232,570) | | | | | | 3,104,370,115 | |
Other assets less liabilities—(10.2%) | | | | | | (287,567,582 | ) |
| | | | | | | |
| | | | | | | |
NET ASSETS—100.0% | | | | | $ | 2,816,802,533 | |
| | | | | | | |
| |
Notes to the Schedule of Investments: |
| |
ADR | American Depositary Receipt |
| |
REIT | Real Estate Investment Trust |
| |
* | Non-income producing security. |
| |
† | Denotes all or a portion of security on loan. |
| |
†† | Represents collateral received from securities lending transactions. |
| | |
206 | See accompanying notes to financial statements. | |
SCHEDULE OF INVESTMENTS
December 31, 2005
| | | | | | | |
| | | | | | | | |
Vantagepoint Aggressive
Opportunities Fund | | Shares | | Value | |
| | | | | | |
|
COMMON STOCKS—94.6% | | | | | | | |
| | | | | | | | |
|
Advertising—0.4% | | | | | | | |
Hakuhodo DY Holdings, Inc. (Japan) | Ø | | 26,800 | | $ | 1,890,909 | |
Maiden Group PLC (United Kingdom) | | | 183,992 | | | 297,194 | |
Marchex, Inc. Class B | *† | | 134,900 | | | 3,033,901 | |
| | | | | | | |
| | | | | | 5,222,004 | |
| | | | | | | |
Aerospace & Defense—0.5% | | | | | | | |
Armor Holdings, Inc. | *† | | 40,300 | | | 1,718,795 | |
MTU Aero Engines Holding AG (Germany) | Ø* | | 140,400 | | | 4,335,519 | |
| | | | | | | |
| | | | | | 6,054,314 | |
| | | | | | | |
Airlines—0.1% | | | | | | | |
AirAsia Berhad (Malaysia) | * | | 2,623,700 | | | 1,103,233 | |
| | | | | | | |
|
Apparel Retailers—1.5% | | | | | | | |
AnnTaylor Stores Corporation | * | | 134,400 | | | 4,639,488 | |
Charming Shoppes, Inc. | Ø* | | 149,500 | | | 1,973,400 | |
Christopher & Banks Corporation | | | 269,000 | | | 5,051,820 | |
Eddie Bauer Holdings, Inc. | Ø*† | | 227,000 | | | 3,405,000 | |
Finish Line Class A | | | 191,100 | | | 3,328,962 | |
Under Armour, Inc.—Class A | *† | | 21,132 | | | 809,567 | |
| | | | | | | |
| | | | | | 19,208,237 | |
| | | | | | | |
Automotive—2.0% | | | | | | | |
Brembo SpA (Italy) | | | 213,136 | | | 1,605,226 | |
General Motors Corporation | † | | 638,000 | | | 12,389,960 | |
Group 1 Automotive, Inc. | Ø* | | 62,500 | | | 1,964,375 | |
Oshkosh Truck Corporation | | | 216,500 | | | 9,653,735 | |
| | | | | | | |
| | | | | | 25,613,296 | |
| | | | | | | |
Banking—1.7% | | | | | | | |
77 Bank Ltd. (The) (Japan) | Ø | | 264,800 | | | 2,019,365 | |
Cattles PLC (United Kingdom) | Ø | | 489,552 | | | 2,767,145 | |
First Republic Bank | | | 49,600 | | | 1,835,696 | |
FirstFed Financial Corporation | * | | 33,500 | | | 1,826,420 | |
Gunma Bank Ltd. (Japan) | Ø | | 289,000 | | | 2,133,676 | |
Investors Financial Services Corporation | | | 40,300 | | | 1,484,249 | |
KNBT Bancorp, Inc. | | | 117,000 | | | 1,905,930 | |
Krung Thai Bank PCL (Thailand) | ‡ | | 6,372,100 | | | 1,694,046 | |
PFF Bancorp, Inc. | Ø | | 75,420 | | | 2,301,818 | |
RHB Capital Berhad (Malaysia) | | | 1,634,300 | | | 954,563 | |
TMB Bank PCL (Thailand) | *‡ | | 14,478,200 | | | 1,518,445 | |
Verwalt & Privat-Bank AG (Liechtenstein) | | | 5,600 | | | 933,383 | |
| | | | | | | |
| | | | | | 21,374,736 | |
| | | | | | | |
Beverages, Food & Tobacco—1.0% | | | | | | | |
AWB Ltd. (Australia) | | | 434,721 | | | 1,951,653 | |
Carlsberg AS Class B (Germany) | | | 19,830 | | | 1,060,633 | |
Coca-Cola West Japan Company Ltd. (Japan) | Ø | | 73,000 | | | 1,703,722 | |
Gold Kist, Inc. | * | | 113,500 | | | 1,696,825 | |
Morinaga & Co., Ltd. (Japan) | Ø | | 921,900 | | | 2,878,092 | |
Northern Foods PLC (United Kingdom) | | | 652,036 | | | 1,693,625 | |
Premium Standard Farms, Inc. | | | 100,500 | | | 1,503,480 | |
| | | | | | | |
| | | | | | 12,488,030 | |
| | | | | | | |
| | | | | | | |
| | | | | | | | |
|
| | Shares | | Value | |
| | | | | | |
|
Bio-Technology—0.3% | | | | | | | |
deCODE genetics, Inc. | *† | | 428,500 | | $ | 3,539,410 | |
| | | | | | | |
|
Building Materials—3.2% | | | | | | | |
Cemex SA de CV (Mexico) | | | 3,138,166 | | | 18,604,952 | |
Cemex SA de CV ADR (Mexico) | † | | 204,394 | | | 12,126,696 | |
Interline Brands, Inc. | * | | 252,300 | | | 5,739,825 | |
Praktiker Bau- und Heimwerkermaerkte AG (Germany) | * | | 63,333 | | | 1,138,712 | |
Sumitomo Osaka Cement Company Ltd. (Japan) | Ø | | 624,400 | | | 1,827,090 | |
| | | | | | | |
| | | | | | 39,437,275 | |
| | | | | | | |
Chemicals—1.0% | | | | | | | |
Ciba Specialty Chemicals AG (Switzerland) | | | 15,600 | | | 1,006,399 | |
EMS-Chemie Holding AG (Switzerland) | | | 15,265 | | | 1,347,054 | |
Rhodia SA (France) | Ø* | | 1,168,370 | | | 2,486,948 | |
SGL Carbon AG (Germany) | *† | | 72,762 | | | 1,196,227 | |
Taiyo Ink Manufacturing Company Ltd. (Japan) | Ø | | 61,400 | | | 2,968,290 | |
Tokyo Ohka Kogyo Company Ltd. (Japan) | Ø | | 50,100 | | | 1,441,085 | |
Yule Catto & Company PLC (United Kingdom) | Ø | | 442,135 | | | 2,012,528 | |
| | | | | | | |
| | | | | | 12,458,531 | |
| | | | | | | |
Coal—0.1% | | | | | | | |
Grande Cache Coal Corp. (Canada) | * | | 419,700 | | | 1,182,709 | |
| | | | | | | |
|
Commercial Services—10.2% | | | | | | | |
Advisory Board Company (The) | * | | 106,800 | | | 5,091,156 | |
American Reprographics Co. | Ø* | | 93,300 | | | 2,370,753 | |
Apollo Group, Inc. Class A | * | | 182,300 | | | 11,021,858 | |
Applera Corporation Celera Genomics Group | * | | 133,600 | | | 1,464,256 | |
Ariad Pharmaceuticals, Inc. | Ø*† | | 396,800 | | | 2,321,280 | |
BISYS Group, Inc. (The) | * | | 82,000 | | | 1,148,820 | |
Bacou Dalloz SA (France) | | | 13,346 | | | 1,151,518 | |
Cegedim SA (France) | | | 10,323 | | | 890,465 | |
Corinthian Colleges, Inc. | Ø* | | 175,000 | | | 2,061,500 | |
CV Therapeutics, Inc. | Ø*† | | 100,000 | | | 2,473,000 | |
Digitas, Inc. | * | | 270,900 | | | 3,391,668 | |
Education Management Corporation | * | | 246,500 | | | 8,260,215 | |
Exelixis, Inc. | Ø* | | 254,425 | | | 2,396,683 | |
FKI PLC (United Kingdom) | | | 820,400 | | | 1,637,462 | |
Grupo Aeroportuario del Sureste SA de CV, ADR (Mexico) | † | | 53,500 | | | 1,730,190 | |
Heartland Payment Systems, Inc. | * | | 12,000 | | | 259,920 | |
Incyte Corporation | * | | 319,400 | | | 1,705,596 | |
Korn Ferry International | * | | 383,000 | | | 7,158,270 | |
Laureate Education, Inc. | * | | 121,700 | | | 6,390,467 | |
Leighton Holdings Ltd. (Australia) | | | 52,677 | | | 690,679 | |
Maximus, Inc. | | | 50,100 | | | 1,838,169 | |
Mobile Mini, Inc. | * | | 105,100 | | | 4,981,740 | |
Navigant Consulting, Inc. | * | | 206,800 | | | 4,545,464 | |
Nishimatsu Construction Company Ltd. (Japan) | ؆ | | 210,000 | | | 861,857 | |
| | |
| See accompanying notes to financial statements. | 207 |
SCHEDULE OF INVESTMENTS—(Continued)
December 31, 2005
| | | | | | | |
| | | | | | | | |
Vantagepoint Aggressive
Opportunities Fund | | Shares | | Value | |
| | | | | | | | |
|
COMMON STOCKS—(Continued) | | | | | | | |
| | | | | | | | |
|
Qiagen NV (Netherlands) | *† | | 143,415 | | $ | 1,675,044 | |
Regis Corporation | | | 43,300 | | | 1,670,081 | |
Rentech, Inc. | Ø* | | 653,500 | | | 2,489,835 | |
Resources Connection, Inc. | * | | 160,100 | | | 4,172,206 | |
Ritchie Brothers Auctioneers, Inc. (Canada) | ؆ | | 47,100 | | | 1,989,975 | |
Senomyx, Inc. | * | | 334,523 | | | 4,054,419 | |
Symyx Technologies, Inc. | * | | 167,300 | | | 4,565,617 | |
Sypris Solutions, Inc. | | | 97,900 | | | 977,042 | |
TAC Acquisition Corp. | Ø | | 373,000 | | | 2,331,250 | |
Toppan Forms Company Ltd. (Japan) | Ø | | 137,000 | | | 1,966,617 | |
United Rentals, Inc. | Ø*† | | 94,700 | | | 2,215,033 | |
Waste Connections, Inc. | * | | 138,600 | | | 4,776,156 | |
Waste Management, Inc. | | | 557,000 | | | 16,904,950 | |
Wright Express Corporation | Ø* | | 100,500 | | | 2,211,000 | |
| | | | | | | |
| | | | | | 127,842,211 | |
| | | | | | | |
Communications—0.4% | | | | | | | |
EFJ, Inc. | * | | 73,400 | | | 745,010 | |
New Skies Satellites Holdings, Ltd. (Bermuda) | | | 41,800 | | | 909,986 | |
SBA Communications Corporation | * | | 116,200 | | | 2,079,980 | |
SeaChange International, Inc. | * | | 218,500 | | | 1,726,150 | |
| | | | | | | |
| | | | | | 5,461,126 | |
| | | | | | | |
Computer Software & Processing—4.3% | | | | | | | |
Activision, Inc. | * | | 216,399 | | | 2,973,322 | |
Agile Software Corporation | * | | 307,500 | | | 1,838,850 | |
Altiris, Inc. | * | | 76,400 | | | 1,290,396 | |
Blackbaud, Inc. | | | 102,471 | | | 1,750,205 | |
CNET Networks, Inc. | *† | | 260,800 | | | 3,831,152 | |
Dassault Systemes SA (France) | Ø | | 40,000 | | | 2,247,082 | |
Digital Insight Corporation | * | | 31,300 | | | 1,002,226 | |
Factset Research Systems, Inc. | † | | 92,700 | | | 3,815,532 | |
Global Cash Access, Inc. | * | | 44,400 | | | 647,796 | |
Jack Henry & Associates, Inc. | | | 317,900 | | | 6,065,532 | |
Kronos, Inc. | *† | | 62,700 | | | 2,624,622 | |
Matrix One, Inc. | * | | 360,600 | | | 1,799,394 | |
Misys PLC (United Kingdom) | | | 216,550 | | | 887,516 | |
Motive, Inc. | * | | 204,400 | | | 631,596 | |
MYOB Ltd. (Australia) | | | 1,984,254 | | | 1,543,922 | |
National Instruments Corporation | | | 79,300 | | | 2,541,565 | |
OBIC Business Consultants Ltd. (Japan) | Ø | | 48,950 | | | 2,684,767 | |
Obic Company Ltd. (Japan) | Ø | | 12,800 | | | 2,819,234 | |
Open Solutions, Inc. | *† | | 201,700 | | | 4,622,964 | |
RSA Security, Inc. | *† | | 206,700 | | | 2,321,241 | |
RightNow Technologies, Inc. | *† | | 186,200 | | | 3,437,252 | |
Skillsoft PLC ADR (Ireland) | * | | 420,600 | | | 2,313,300 | |
Teleca AB Class B (Sweden) | * | | 23,050 | | | 103,515 | |
Unit 4 Agresso NV (Netherlands) | * | | 32,536 | | | 467,133 | |
| | | | | | | |
| | | | | | 54,260,114 | |
| | | | | | | |
Computers & Information—2.1% | | | | | | | |
Dell, Inc. | * | | 701,000 | | | 21,022,990 | |
Dot Hill Systems Corporation | * | | 222,500 | | | 1,541,925 | |
Iomega Corporation | * | | 404,000 | | | 1,005,960 | |
Nuance Communications, Inc. | Ø*† | | 369,200 | | | 2,816,996 | |
| | | | | | | |
| | | | | | 26,387,871 | |
| | | | | | | |
| | | | | | | |
| | | | | | | | |
| | Shares | | Value | |
| | | | | | | | |
|
Cosmetics & Personal Care—0.2% | | | | | | | |
Milbon Company Ltd. (Japan) | Ø | | 36,840 | | $ | 1,185,917 | |
Uni-Charm Corporation (Japan) | Ø | | 23,500 | | | 1,056,049 | |
| | | | | | | |
| | | | | | 2,241,966 | |
| | | | | | | |
Diversified Operations—0.2% | | | | | | | |
MG Technologies AG (Germany) | * | | 216,263 | | | 2,670,255 | |
| | | | | | | |
|
Electric Utilities—0.3% | | | | | | | |
AEM SpA (Italy) | † | | 928,900 | | | 1,764,958 | |
KFX, Inc. | Ø*† | | 126,000 | | | 2,155,860 | |
| | | | | | | |
| | | | | | 3,920,818 | |
| | | | | | | |
Electrical Equipment—0.3% | | | | | | | |
GrafTech International Ltd. | Ø* | | 323,800 | | | 2,014,036 | |
Munters AB (Sweden) | Ø | | 81,900 | | | 2,253,507 | |
| | | | | | | |
| | | | | | 4,267,543 | |
| | | | | | | |
Electronics—6.1% | | | | | | | |
Adaptec, Inc. | Ø* | | 405,500 | | | 2,360,010 | |
Cymer, Inc. | *† | | 118,900 | | | 4,222,139 | |
EDO Corporation | | | 56,900 | | | 1,539,714 | |
Elmos Semiconductor (Germany) | | | 88,979 | | | 940,327 | |
Enplas Corp. (Japan) | Ø | | 35,800 | | | 992,086 | |
Hutchinson Technology, Inc. | Ø* | | 83,700 | | | 2,381,265 | |
Imation Corporation | Ø | | 44,500 | | | 2,050,115 | |
Integrated Device Technology, Inc. | * | | 311,300 | | | 4,102,934 | |
International Rectifier Corporation | * | | 22,000 | | | 701,800 | |
Koninklijke (Royal) Philips Electronics NV NY Shares (Netherlands) | | | 278,000 | | | 8,645,800 | |
Koninklijke Philips Electronics NV (Netherlands) | | | 897,000 | | | 27,743,617 | |
Kontron AG (Germany) | * | | 105,418 | | | 925,972 | |
Leadis Technology, Inc. | * | | 197,400 | | | 1,016,610 | |
Minebea Company Ltd. (Japan) | Ø | | 311,500 | | | 1,667,601 | |
OSI Systems, Inc. | Ø*† | | 121,500 | | | 2,234,385 | |
PMC-Sierra, Inc. | *† | | 338,900 | | | 2,612,919 | |
Radstone Technology PLC (United Kingdom) | | | 171,927 | | | 734,185 | |
Semtech Corporation | * | | 280,000 | | | 5,112,800 | |
Silicon Laboratories, Inc. | *† | | 114,100 | | | 4,182,906 | |
Spatialight, Inc. | *† | | 381,500 | | | 1,323,805 | |
Ultra Electronics Holdings PLC (United Kingdom) | | | 57,200 | | | 973,143 | |
| | | | | | | |
| | | | | | 76,464,133 | |
| | | | | | | |
|
Entertainment & Leisure—2.3% | | | | | | | |
Discovery Holding Company Class A | * | | 192,710 | | | 2,919,557 | |
EMI Group PLC (United Kingdom) | | | 214,600 | | | 893,453 | |
Walt Disney Company | | | 827,000 | | | 19,823,190 | |
WMS Industries, Inc. | *† | | 183,100 | | | 4,593,979 | |
| | | | | | | |
| | | | | | 28,230,179 | |
| | | | | | | |
Financial Services—2.9% | | | | | | | |
American Home Mortgage Investment Corporation REIT | † | | 54,000 | | | 1,758,780 | |
Canaccord Capital, Inc. (Canada) | ؆ | | 194,000 | | | 2,474,227 | |
| | |
208 | See accompanying notes to financial statements. | |
SCHEDULE OF INVESTMENTS—(Continued)
December 31, 2005
| | | | | | | |
| | | | | | | | |
Vantagepoint Aggressive
Opportunities Fund | | Shares | | Value | |
| | | | | | | | |
|
COMMON STOCKS—(Continued) | | | | | | | |
| | | | | | | | |
|
CapitalSource, Inc. | † | | 116,600 | | $ | 2,611,840 | |
Certegy, Inc. | | | 161,300 | | | 6,542,328 | |
D Carnegie AB (Sweden) | | | 75,500 | | | 1,110,714 | |
DiamondRock Hospitality Co. REIT | | | 109,000 | | | 1,303,640 | |
Dundee Real Estate Investment Trust REIT (Canada) | | | 51,000 | | | 1,122,655 | |
Dundee Wealth Management, Inc. (Canada) | | | 188,000 | | | 1,624,771 | |
Education Realty Trust, Inc. REIT | Ø | | 186,500 | | | 2,403,985 | |
GMP Capital Corporation (Canada) | | | 77,326 | | | 1,186,880 | |
GS Holdings Corp. (South Korea) | * | | 38,290 | | | 890,431 | |
IntercontinentalExchange, Inc. | Ø* | | 58,000 | | | 2,108,300 | |
Medical Properties Trust, Inc. REIT | | | 56,000 | | | 547,680 | |
Medical Properties Trust, Inc. REIT | ‡ | | 102,500 | | | 1,002,450 | |
MFA Mortgage Investments, Inc. REIT | | | 247,000 | | | 1,407,900 | |
MLP AG (Germany) | | | 37,597 | | | 774,697 | |
Nasdaq Stock Market Inc. | Ø*† | | 62,000 | | | 2,181,160 | |
OPTI Canada, Inc. 144A (Canada) | Ø* ** | | 89,200 | | | 2,916,286 | |
optionsXpress Holdings, Inc. | † | | 76,400 | | | 1,875,620 | |
Value Line, Inc. | | | 21,200 | | | 746,452 | |
| | | | | | | |
| | | | | | 36,590,796 | |
| | | | | | | |
Food Retailers—1.1% | | | | | | | |
Familymart Company Ltd. (Japan) | Ø | | 73,100 | | | 2,470,833 | |
Ministop Co., Ltd. (Japan) | Ø | | 49,200 | | | 1,121,055 | |
Panera Bread Company Class A | *† | | 89,900 | | | 5,904,632 | |
Pantry, Inc. (The) | * | | 86,600 | | | 4,069,334 | |
| | | | | | | |
| | | | | | 13,565,854 | |
| | | | | | | |
Forest Products & Paper—0.3% | | | | | | | |
M-real Oyj—Class B (Finland) | Ø | | 401,600 | | | 1,998,795 | |
PaperlinX Ltd. (Australia) | | | 593,542 | | | 1,667,954 | |
| | | | | | | |
| | | | | | 3,666,749 | |
| | | | | | | |
Health Care Providers—2.6% | | | | | | | |
Amsurg Corporation | * | | 64,450 | | | 1,473,327 | |
BioMerieux (France) | | | 30,029 | | | 1,576,034 | |
Coventry Health Care, Inc. | * | | 296,850 | | | 16,908,576 | |
DaVita, Inc. | * | | 191,900 | | | 9,717,816 | |
MedCath Corporation | *† | | 82,500 | | | 1,530,375 | |
Rotech Healthcare, Inc. | *† | | 52,000 | | | 871,520 | |
Symbion, Inc. | * | | 40,300 | | | 926,900 | |
| | | | | | | |
| | | | | | 33,004,548 | |
| | | | | | | |
Heavy Construction—0.5% | | | | | | | |
Blount International, Inc. | * | | 85,500 | | | 1,362,015 | |
Hellenic Technodomiki Tev SA (Greece) | Ø | | 318,310 | | | 2,042,678 | |
Multiplex Group (Australia) | | | 384,100 | | | 883,188 | |
YTL Corporation Berhad (Malaysia) | | | 1,014,300 | | | 1,435,780 | |
| | | | | | | |
| | | | | | 5,723,661 | |
| | | | | | | |
Heavy Machinery—3.8% | | | | | | | |
Actuant Corporation Class A | * | | 260,300 | | | 14,524,740 | |
Agco Corporation | ؆ | | 145,300 | | | 2,407,621 | |
| | | | | | | |
| | | | | | | | |
|
| | Shares | | Value | |
| | | | | | | | |
Asyst Technologies, Inc. | * | | 324,000 | | $ | 1,853,280 | |
Chofu Seisakusho Company Ltd. (Japan) | Ø | | 43,000 | | | 951,792 | |
Disco Corporation (Japan) | ؆ | | 63,000 | | | 3,351,957 | |
Entegris, Inc. | * | | 379,300 | | | 3,573,006 | |
FMC Technologies, Inc. | *† | | 169,000 | | | 7,253,480 | |
Grant Prideco, Inc. | * | | 99,600 | | | 4,394,352 | |
Hydril | * | | 53,200 | | | 3,330,320 | |
Modec, Inc. (Japan) | ؆ | | 40,300 | | | 1,264,182 | |
Terex Corporation | * | | 32,500 | | | 1,930,500 | |
Union Tool Company (Japan) | ؆ | | 55,200 | | | 2,618,553 | |
| | | | | | | |
| | | | | | 47,453,783 | |
| | | | | | | |
Home Construction, Furnishings & Appliances—0.9% | | | | | | | |
Parkervision, Inc. | *† | | 169,700 | | | 1,544,270 | |
Standard-Pacific Corporation | | | 38,600 | | | 1,420,480 | |
Toll Brothers, Inc. | *† | | 232,000 | | | 8,036,480 | |
| | | | | | | |
| | | | | | 11,001,230 | |
| | | | | | | |
Industrial—Diversified—1.1% | | | | | | | |
Roper Industries, Inc. | | | 248,600 | | | 9,822,186 | |
Yankee Candle Company, Inc. | Ø | | 158,800 | | | 4,065,280 | |
| | | | | | | |
| | | | | | 13,887,466 | |
| | | | | | | |
Insurance—10.8% | | | | | | | |
AON Corporation | | | 825,100 | | | 29,662,345 | |
Baloise Holding Ltd. Class R (Switzerland) | | | 33,223 | | | 1,932,060 | |
Benfield Group Ltd. (Bermuda) | | | 292,678 | | | 1,805,094 | |
Fairfax Financial Holdings Ltd. (Canada) | † | | 166,880 | | | 23,923,917 | |
Fuji Fire & Marine Insurance (Japan) | Ø | | 302,600 | | | 1,154,110 | |
HCC Insurance Holdings, Inc. | Ø | | 69,250 | | | 2,055,340 | |
Helvetia Patria (Switzerland) | † | | 8,435 | | | 1,777,163 | |
Infinity Property & Casualty Corporation | | | 51,400 | | | 1,912,594 | |
Jardine Lloyd Thompson Group PLC (United Kingdom) | Ø | | 301,386 | | | 2,577,163 | |
Kansas City Life Insurance Company | | | 31,300 | | | 1,567,504 | |
Millea Holdings, Inc. (Japan) | Ø | | 1,820 | | | 31,396,789 | |
Nipponkoa Insurance Company Ltd. (Japan) | Ø | | 4,027,000 | | | 32,286,192 | |
Platinum Underwriters Holdings Ltd. (Bermuda) | | | 59,930 | | | 1,862,025 | |
TrygVesta AS (Denmark) | * | | 22,650 | | | 1,140,323 | |
| | | | | | | |
| | | | | | 135,052,619 | |
| | | | | | | |
Lodging—0.8% | | | | | | | |
Resorts World Berhad (Malaysia) | Ø | | 687,400 | | | 2,038,495 | |
Station Casinos, Inc. | | | 116,800 | | | 7,919,040 | |
| | | | | | | |
| | | | | | 9,957,535 | |
| | | | | | | |
Media—Broadcasting & Publishing—10.2% | | | | | | | |
Comcast Corporation Special Class A | * | | 796,000 | | | 20,449,240 | |
DIRECTV Group, Inc. (The) | * | | 1,251,000 | | | 17,664,120 | |
Emap PLC (United Kingdom) | | | 127,200 | | | 1,889,462 | |
GCAP Media PLC (United Kingdom) | Ø | | 513,112 | | | 2,558,546 | |
Gray Television, Inc. | Ø | | 201,800 | | | 1,981,676 | |
Liberty Media Corporation Class A | * | | 2,409,100 | | | 18,959,617 | |
LIN TV Corporation Class A | * | | 175,200 | | | 1,951,728 | |
M6—Metropole Television (France) | | | 36,000 | | | 995,537 | |
| | |
| See accompanying notes to financial statements. | 209 |
SCHEDULE OF INVESTMENTS—(Continued)
December 31, 2005
| | | | | | | |
| | | | | | | | |
Vantagepoint Aggressive
Opportunities Fund | | Shares | | Value | |
| | | | | | |
|
COMMON STOCKS—(Continued) | | | | | | | |
| | | | | | | | |
|
Nexstar Broadcasting Group, Inc. Class A | * | | 174,500 | | $ | 874,245 | |
Shaw Communications, Inc. Class B (Canada) | Ø*† | | 1,203,400 | | | 26,089,712 | |
SKY Perfect Communications, Inc. (Japan) | Ø | | 1,966 | | | 1,536,508 | |
Vivendi Universal SA (France) | Ø | | 719,700 | | | 22,449,480 | |
Vivendi Universal SA ADR (France) | Ø | | 250,300 | | | 7,866,929 | |
Wolters Kluwer NV (Netherlands) | Ø | | 103,700 | | | 2,089,653 | |
| | | | | | | |
| | | | | | 127,356,453 | |
| | | | | | | |
Medical Equipment & Supplies—0.3% | | | | | | | |
Sorin SpA (Italy) | *† | | 884,397 | | | 1,776,725 | |
SSL International PLC (United Kingdom) | Ø | | 374,190 | | | 1,963,172 | |
| | | | | | | |
| | | | | | 3,739,897 | |
| | | | | | | |
Medical Supplies—1.7% | | | | | | | |
Bio-Rad Laboratories, Inc. Class A | Ø* | | 37,600 | | | 2,460,544 | |
Biosite, Inc. | Ø*† | | 42,000 | | | 2,364,180 | |
Credence Systems Corporation | * | | 203,500 | | | 1,416,360 | |
FEI Company | * | | 233,900 | | | 4,483,863 | |
Hamamatsu Photonics KK (Japan) | ؆ | | 68,200 | | | 1,996,457 | |
Hogy Medical Company Ltd. (Japan) | ؆ | | 34,500 | | | 1,859,025 | |
MKS Instruments, Inc. | * | | 111,500 | | | 1,994,735 | |
PolyMedica Corporation | ؆ | | 64,700 | | | 2,165,509 | |
Respironics, Inc. | * | | 69,700 | | | 2,583,779 | |
| | | | | | | |
| | | | | | 21,324,452 | |
| | | | | | | |
Metals—1.1% | | | | | | | |
African Rainbow Minerals, Ltd. (South Africa) | * | | 143,800 | | | 949,398 | |
Carpenter Technology Corporation | Ø | | 32,900 | | | 2,318,463 | |
Cleveland-Cliffs, Inc. | † | | 20,700 | | | 1,833,399 | |
First Quantum Minerals Ltd. (Canada) | Ø | | 81,000 | | | 2,584,368 | |
NCI Building Systems, Inc. | *† | | 42,500 | | | 1,805,400 | |
Simpson Manufacturing Company, Inc. | | | 39,500 | | | 1,435,825 | |
Steel Dynamics, Inc. | ؆ | | 57,800 | | | 2,052,478 | |
Wheeling-Pittsburgh Corporation | *† | | 125,400 | | | 1,131,108 | |
| | | | | | | |
| | | | | | 14,110,439 | |
| | | | | | | |
Miscellaneous—0.2% | | | | | | | |
Bangkok Expressway PCL (Thailand) | ‡ | | 1,757,000 | | | 912,783 | |
Hagemeyer NV (Netherlands) | Ø*† | | 648,764 | | | 2,098,444 | |
| | | | | | | |
| | | | | | 3,011,227 | |
| | | | | | | |
Oil & Gas—3.2% | | | | | | | |
Alon USA Energy, Inc. | * | | 76,600 | | | 1,505,190 | |
Basic Energy Services, Inc. | * | | 76,500 | | | 1,526,175 | |
Bill Barrett Corporation | * | | 98,000 | | | 3,783,780 | |
Bronco Drilling Co., Inc. | * | | 57,000 | | | 1,311,570 | |
Cabot Oil & Gas Corporation | | | 43,250 | | | 1,950,575 | |
China Oilfield Services Ltd. (China) | | | 3,291,900 | | | 1,323,989 | |
| | | | | |
| | | | | | |
| | Shares | | Value | |
| | | | | | |
Compton Petroleum Corp. (Canada) | * | | 110,000 | | $ | 1,611,135 | |
Denbury Resources, Inc. | * | | 75,600 | | | 1,722,168 | |
Encore Acquisition Company | Ø* | | 187,649 | | | 6,012,274 | |
Hercules Offshore, Inc. | * | | 61,200 | | | 1,738,692 | |
Japan Petroleum Exploration Company (Japan) | ؆ | | 65,600 | | | 4,139,261 | |
OPTI Canada, Inc. (Canada) | * | | 3,600 | | | 117,698 | |
Penn Virginia Corporation | | | 34,000 | | | 1,951,600 | |
Stone Energy Corporation | Ø*† | | 56,000 | | | 2,549,680 | |
Swift Energy Company | * | | 30,500 | | | 1,374,635 | |
Synenco Energy, Inc.—Class A (Canada) | * | | 28,000 | | | 408,668 | |
Syntroleum Corporation | *† | | 197,700 | | | 1,785,231 | |
Union Drilling, Inc. | * | | 26,000 | | | 377,780 | |
Western Oil Sands, Inc. Class A (Canada) | * | | 77,656 | | | 1,849,776 | |
W-H Energy Services, Inc. | * | | 74,300 | | | 2,457,844 | |
| | | | | | | |
| | | | | | 39,497,721 | |
| | | | | | | |
Pharmaceuticals—5.0% | | | | | | | |
Abgenix, Inc. | Ø*† | | 158,500 | | | 3,409,335 | |
Alkermes, Inc. | *† | | 149,700 | | | 2,862,264 | |
Altana AG (Germany) | | | 22,800 | | | 1,231,372 | |
Array BioPharma, Inc. | * | | 260,200 | | | 1,824,002 | |
Atherogenics, Inc. | *† | | 108,900 | | | 2,179,089 | |
Bachem AG Class B (Switzerland) | | | 20,170 | | | 1,152,911 | |
Cambridge Antibody Technology Group (United Kingdom) | * | | 116,400 | | | 1,400,346 | |
Cephalon, Inc. | *† | | 58,900 | | | 3,813,186 | |
Cubist Pharmaceuticals, Inc. | * | | 283,800 | | | 6,030,750 | |
Dr. Reddy’s Laboratories, Ltd., ADR (India) | | | 70,600 | | | 1,524,960 | |
Encysive Pharmaceuticals, Inc. | Ø*† | | 294,000 | | | 2,319,660 | |
Far East Pharmaceutical Tech (Hong Kong) | *‡d | | 6,152,600 | | | — | |
Henry Schein, Inc. | *† | | 188,000 | | | 8,204,320 | |
Human Genome Sciences, Inc. | *† | | 203,500 | | | 1,741,960 | |
Immucor, Inc. | * | | 140,700 | | | 3,286,752 | |
Kobayashi Pharmaceutical Company Ltd. (Japan) | Ø | | 117,400 | | | 3,513,802 | |
Medicines Company | *† | | 80,500 | | | 1,404,725 | |
Mochida Pharmaceutical Company Ltd. (Japan) | ؆ | | 259,300 | | | 2,134,350 | |
NBTY, Inc. | Ø* | | 134,600 | | | 2,187,250 | |
Neurocrine Biosciences, Inc. | * | | 82,600 | | | 5,181,498 | |
Omnicare, Inc. | | | 84,900 | | | 4,857,978 | |
Shionogi & Company Ltd. (Japan) | | | 94,600 | | | 1,330,309 | |
Viropharma, Inc. | * | | 49,100 | | | 910,805 | |
| | | | | | | |
| | | | | | 62,501,624 | |
| | | | | | | |
Real Estate—0.4% | | | | | | | |
Acadia Realty Trust REIT | | | 93,000 | | | 1,864,650 | |
Housevalues, Inc. | *† | | 147,600 | | | 1,923,228 | |
Mirvac Group (Australia) | | | 349,400 | | | 1,053,790 | |
| | | | | | | |
| | | | | | 4,841,668 | |
| | | | | | | |
Restaurants—0.5% | | | | | | | |
Luminar PLC (United Kingdom) | | | 122,500 | | | 1,022,669 | |
PF Chang’s China Bistro, Inc. | *† | | 88,300 | | | 4,382,329 | |
Sodexho Alliance SA (France) | | | 23,900 | | | 980,207 | |
| | | | | | | |
| | | | | | 6,385,205 | |
| | | | | | | |
| | |
210 | See accompanying notes to financial statements. | |
SCHEDULE OF INVESTMENTS—(Continued)
December 31, 2005
| | | | | | | |
| | | | | | | | |
| | | | | | | |
Vantagepoint Aggressive
Opportunities Fund | | Shares | | Value | |
| | | | | | | | |
|
COMMON STOCKS—(Continued) | | | | | | | |
| | | | | | | | |
|
Retailers—3.4% | | | | | | | |
AC Moore Arts & Crafts, Inc. | *† | | 177,700 | | $ | 2,585,533 | |
Belluna Co., Ltd. (Japan) | ؆ | | 28,400 | | | 1,223,591 | |
GameStop Corp.—Class A | Ø*† | | 69,200 | | | 2,201,944 | |
Harvey Norman Holdings Ltd. (Australia) | | | 357,200 | | | 763,828 | |
Kesa Electricals PLC (United Kingdom) | | | 229,000 | | | 1,025,849 | |
MarineMax, Inc. | * | | 104,400 | | | 3,295,908 | |
Matsumotokiyoshi Company Ltd. (Japan) | Ø | | 32,900 | | | 1,043,999 | |
O’Reilly Automotive, Inc. | * | | 387,200 | | | 12,394,272 | |
Petco Animal Supplies, Inc. | * | | 236,200 | | | 5,184,590 | |
School Specialty, Inc. | *† | | 187,700 | | | 6,839,788 | |
Tuesday Morning Corporation | † | | 150,100 | | | 3,140,092 | |
UNY Company Ltd. (Japan) | Ø | | 156,800 | | | 2,472,862 | |
| | | | | | | |
| | | | | | 42,172,256 | |
| | | | | | | |
Telecommunications—0.7% | | | | | | | |
KDDI Corporation (Japan) | Ø | | 1,483 | | | 8,587,504 | |
| | | | | | | |
| | | | | | | |
Telephone Systems—3.0% | | | | | | | |
Adtran, Inc. | | | 121,900 | | | 3,625,306 | |
Fairpoint Communications, Inc. | ؆ | | 244,500 | | | 2,533,020 | |
NTT DoCoMo, Inc. (Japan) | Ø | | 8,500 | | | 12,948,020 | |
Nextel Partners, Inc. Class A | * | | 73,700 | | | 2,059,178 | |
NII Holdings, Inc. Class B | *† | | 354,200 | | | 15,471,456 | |
RCN Corp. | *† | | 64,500 | | | 1,512,525 | |
| | | | | | | |
| | | | | | 38,149,505 | |
| | | | | | | |
Textiles, Clothing & Fabrics—0.3% | | | | | | | |
Gildan Activewear, Inc. (Canada) | Ø* | | 46,500 | | | 1,992,525 | |
Timberland Company Class A | Ø* | | 68,900 | | | 2,242,695 | |
| | | | | | | |
| | | | | | 4,235,220 | |
| | | | | | | |
Transportation—1.4% | | | | | | | |
Adsteam Marine Ltd. (Australia) | | | 964,816 | | | 1,314,469 | |
American Commercial Lines, Inc. | * | | 23,900 | | | 723,931 | |
Aries Maritime Transport, Ltd. (Bermuda) | | | 148,500 | | | 1,934,955 | |
Arlington Tankers Ltd. (Bermuda) | Ø | | 103,500 | | | 2,251,125 | |
Beijing Capital International Airport Company Ltd. (China) | | | 2,473,900 | | | 1,131,418 | |
FirstGroup PLC (United Kingdom) | Ø | | 447,208 | | | 3,081,993 | |
Freightcar America, Inc. | Ø | | 43,000 | | | 2,067,440 | |
Maritrans, Inc. | | | 46,800 | | | 1,217,736 | |
Railpower Technologies Corporation (Canada) | * | | 208,300 | | | 1,152,564 | |
Railpower Technologies Corporation 144A (Canada) | ‡** | | 183,600 | | | 1,015,894 | |
Sinotrans Ltd. Class H (China) | | | 3,806,700 | | | 1,540,554 | |
| | | | | | | |
| | | | | | 17,432,079 | |
| | | | | | | |
Transportation Equipment Leasing—0.2% | | | | | | | |
TAL International Group, Inc. | Ø* | | 123,500 | | | 2,550,275 | |
| | | | | | | |
|
TOTAL COMMON STOCKS
(Cost $909,665,931) | | | | | | 1,185,227,757 | |
| | | | | | | |
| | | | | | | |
| | | | | | |
| | Shares | | Value | |
| | | | | | |
|
PREFERRED STOCKS—0.1% | | | | | | | |
| | | | | | | | |
|
Financial Services—0.1% | | | | | | | |
Medical Properties Trust, Inc. Preferred, 144A (Cost $754,890) | *‡** | | 73,500 | | $ | 718,830 | |
| | | | | | | |
| | | | | | | | | | |
| | | | | | | | | | | |
|
Coupon
Rate | | Maturity
Date | | | | Face | | | Value | |
| | | | | | | | | | | |
|
COMMERCIAL PAPER—0.7% | | | | | | | |
| | | | | | | | |
|
Banking—0.3% | | | | | | | |
Preferred Receivables Funding, 144A | | | | | | | |
4.300% | | 01/20/2006 | | ** | $ | 3,000,000 | | | 2,992,833 | |
| | | | | | | | | | |
| | | | | | | | | | |
|
Financial Services—0.4% | | | | | | | |
Fairway Finance Corp., 144A | | | | | | | |
4.320% | | 01/23/2006 | | ** | | 1,250,000 | | | 1,246,550 | |
Falcon Asset Securitization Corp., 144A | | | | | | | |
4.320% | | 01/17/2006 | | ** | | 1,500,000 | | | 1,496,940 | |
Park Avenue Receivables Corp., 144A | | | | | | | |
4.330% | | 01/12/2006 | | ** | | 2,400,000 | | | 2,396,536 | |
| | | | | | | | | | |
| | | | | | | | | 5,140,026 | |
| | | | | | | | | | |
|
TOTAL COMMERCIAL PAPER
(Cost $8,132,859) | | | | | | 8,132,859 | |
| | | | | | | |
|
| | | | | | | | |
CASH EQUIVALENTS—18.4% | | | | | | | |
| | | | | | | | |
|
Institutional Money Market Funds—1.3% | | | | | | | |
American Beacon Funds | †† | | 973,422 | | | 973,422 | |
BGI Institutional Fund | †† | | 12,654,484 | | | 12,654,484 | |
Goldman Sachs Financial Square Prime Obligations Fund | †† | | 973,422 | | | 973,422 | |
Merrimac Cash Fund—Premium Class | †† | | 1,557,475 | | | 1,557,475 | |
| | | | | | | |
| | | | | | | | | 16,158,803 | |
| | | | | | | | | | |
Bank & Certificate Deposits/Offshore Time Deposits—15.7% | | | | | | | |
Abbey National PLC | | | | | | | |
4.290% | | 01/11/2006 | | †† | | 4,867,109 | | | 4,867,109 | |
Bank of Nova Scotia | | | | | | | |
4.250% | | 01/27/2006 | | †† | | 6,813,953 | | | 6,813,953 | |
Barclays | | | | | | | |
4.410% | | 02/27/2006 | | †† | | 4,867,109 | | | 4,867,109 | |
Barclays | | | | | | | |
4.270% | | 01/25/2006 | | †† | | 4,867,109 | | | 4,867,109 | |
BNP Paribas | | | | | | | |
4.220% | | 01/24/2006 | | †† | | 4,867,109 | | | 4,867,109 | |
Branch Banker &Trust | | | | | | | |
4.260% | | 01/11/2006 | | †† | | 4,867,109 | | | 4,867,109 | |
CIESCO | | | | | | | |
4.305% | | 01/06/2006 | | †† | | 5,840,531 | | | 5,840,531 | |
Dexia Group | | | | | | | |
4.250% | | 01/09/2006 | | †† | | 9,734,219 | | | 9,734,219 | |
Fairway Finance | | | | | | | |
4.280% | | 01/30/2006 | | †† | | 3,893,688 | | | 3,893,688 | |
Falcon Asset Securitization Corporation | | | | | | | |
4.307% | | 02/02/2006 | | †† | | 4,827,670 | | | 4,827,670 | |
Fortis Bank | | | | | | | |
4.350% | | 01/03/2006 | | †† | | 4,867,109 | | | 4,867,109 | |
Greyhawk Funding | | | | | | | |
4.355% | | 01/06/2006 | | †† | | 3,893,688 | | | 3,893,688 | |
| | |
| See accompanying notes to financial statements. | 211 |
SCHEDULE OF INVESTMENTS—(Continued)
December 31, 2005
| | | | | | | | | | |
| | | | | | | | |
Vantagepoint Aggressive
Opportunities Fund | | | | | | | |
| | | | | | | | |
|
Coupon
Rate | | Maturity
Date | | | Face | | Value | |
| | | | | | | | | |
|
CASH EQUIVALENTS—(Continued) | | | | | | | |
| | | | | | | | |
|
Greyhawk Funding | | | | | | | |
4.278% | | 01/24/2006 | | †† | $ | 2,920,266 | | $ | 2,920,266 | |
Jupiter Securitization Corporation | | | | | | | |
4.266% | | 01/05/2006 | | †† | | 2,336,212 | | | 2,336,213 | |
Jupiter Securitization Corporation | | | | | | | |
4.257% | | 01/04/2006 | | †† | | 2,920,266 | | | 2,920,266 | |
Liberty Street | | | | | | | |
4.266% | | 01/05/2006 | | †† | | 4,831,485 | | | 4,831,485 | |
Merrill Lynch & Company, Inc. | | | | | | | |
4.240% | | 01/03/2006 | | †† | | 19,468,437 | | | 19,468,437 | |
National Australia Bank | | | | | | | |
4.156% | | 01/03/2006 | | †† | | 2,731,071 | | | 2,731,071 | |
Paradigm Funding LLC | | | | | | | |
4.303% | | 01/03/2006 | | †† | | 6,297,082 | | | 6,297,082 | |
Paradigm Funding LLC | | | | | | | |
4.297% | | 01/09/2006 | | †† | | 3,893,687 | | | 3,893,688 | |
Prefco | | | | | | | |
4.312% | | 01/04/2006 | | †† | | 2,920,266 | | | 2,920,266 | |
Rabobank Nederland | | | | | | | |
4.150% | | 01/03/2006 | | †† | | 4,867,109 | | | 4,867,109 | |
Ranger Funding | | | | | | | |
4.291% | | 01/18/2006 | | †† | | 3,893,688 | | | 3,893,688 | |
Royal Bank of Canada | | | | | | | |
4.250% | | 01/24/2006 | | †† | | 6,813,953 | | | 6,813,953 | |
Royal Bank of Canada | | | | | | | |
4.220% | | 01/20/2006 | | †† | | 4,867,109 | | | 4,867,109 | |
Royal Bank of Scotland | | | | | | | |
4.310% | | 02/01/2006 | | †† | | 9,734,219 | | | 9,734,219 | |
Royal Bank of Scotland | | | | | | | |
4.250% | | 01/23/2006 | | †† | | 4,867,109 | | | 4,867,109 | |
Skandinaviska Enskilda Banken AB | | | | | | | |
4.300% | | 01/17/2006 | | †† | | 2,920,266 | | | 2,920,266 | |
Skandinaviska Enskilda Banken AB | | | | | | | |
4.230% | | 01/03/2006 | | †† | | 4,867,109 | | | 4,867,109 | |
Societe Generale | | | | | | | |
4.280% | | 01/30/2006 | | †† | | 3,893,687 | | | 3,893,687 | |
The Bank of the West | | | | | | | |
4.290% | | 01/25/2006 | | †† | | 4,867,109 | | | 4,867,109 | |
UBS AG | | | | | | | |
4.260% | | 01/10/2006 | | †† | | 4,867,109 | | | 4,867,109 | |
UBS AG | | | | | | | |
4.255% | | 01/18/2006 | | †† | | 5,840,531 | | | 5,840,531 | |
Wells Fargo | | | | | | | |
4.290% | | 01/30/2006 | | †† | | 7,787,375 | | | 7,787,375 | |
Wells Fargo | | | | | | | |
4.270% | | 01/03/2006 | | †† | | 4,867,109 | | | 4,867,109 | |
Yorktown Capital LLC | | | | | | | |
4.330% | | 01/04/2006 | | †† | | 4,358,204 | | | 4,358,204 | |
Yorktown Capital LLC | | | | | | | |
4.266% | | 01/05/2006 | | †† | | 4,831,485 | | | 4,831,485 | |
| | | | | | | | | | |
| | | | | | | | | 196,668,348 | |
| | | | | | | | | | |
| | | | | | | |
| | | | | | | | | |
|
Coupon
Rate | | Maturity
Date | | | Face | | Value | |
| | | | | | | | | | | |
|
Floating Rate Instruments/Master Notes—1.4% | | | | | | | |
Bank of America | | | | | | | |
4.270% | | 01/17/2006 | | †† | $ | 3,893,687 | | $ | 3,893,687 | |
Bank of America | | | | | | | |
4.230% | | 01/20/2006 | | †† | | 4,867,109 | | | 4,867,109 | |
Credit Suisse First Boston Corporation | | | | | | | |
4.175% | | 03/10/2006 | | †† | | 3,893,687 | | | 3,893,687 | |
Rabobank Nederland | | | | | | | |
4.100% | | 05/31/2006 | | †† | | 4,867,109 | | | 4,867,109 | |
| | | | | | | | | | |
| | | | | | | | | 17,521,592 | |
| | | | | | | | | | |
|
TOTAL CASH EQUIVALENTS
(Cost $230,348,743) | | | | | | 230,348,743 | |
| | | | | | | |
|
| | | | | | | | |
REPURCHASE AGREEMENTS—2.9% | | | | | | | |
| | | | | | | | |
IBT Repurchase Agreement dated 12/30/05 due 01/03/06, with a maturity value of $36,734,378 and an effective yield of 3.65% collateralized by the U.S. Government Agency Obligations with rates ranging from 3.519% to 7.375%, maturity dates ranging from 7/1/16 to 1/1/34 and an aggregate market value of $39,555,461. | | | 36,719,490 | | | 36,719,490 | |
| | | | | | | |
|
TOTAL INVESTMENTS—116.7%
(Cost $1,185,621,913) | | | | | | 1,461,147,679 | |
Other assets less liabilities—(16.7%) | | | | | | (208,734,344 | ) |
| | | | | | | |
NET ASSETS—100.0% | | | | | $ | 1,252,413,335 | |
| | | | | | | |
| |
Notes to the Schedule of Investments: |
|
|
ADR | American Depositary Receipt |
|
REIT | Real Estate Investment Trust |
|
Ø | Security has been pledged as collateral for forward foreign currency exchange contracts. |
|
* | Non-income producing security. |
|
† | Denotes all or a portion of security on loan. |
|
‡ | Security valued at fair value as determined by policies approved by the board of directors. |
|
†† | Represents collateral received from securities lending transactions. |
|
** | Security exempt from registration under Rule 144A of the Securities Act of 1933. These securities may be resold in transactions exempt from registration, normally to qualified buyers. 144A securities represent 0.87% of Total Investments. |
|
d | Security has no market value at 12/31/2005. |
| | |
212 | See accompanying notes to financial statements. | |
SCHEDULE OF INVESTMENTS
December 31, 2005
| | | | | | | |
| |
Vantagepoint
International Fund | | Shares | | Value | |
| |
|
COMMON STOCKS—96.2% | | | | | | | |
| |
Australia—0.8% | | | | | | | |
Amcor Ltd. | | | 124,870 | | $ | 680,940 | |
Brambles Industries Ltd. | | | 58,371 | | | 432,361 | |
Foster’s Group Ltd. | | | 158,548 | | | 647,793 | |
Insurance Australia Group Ltd. | | | 79,509 | | | 315,047 | |
Macquarie Bank Ltd. | | | 9,840 | | | 489,427 | |
Promina Group Ltd. | | | 94,200 | | | 333,540 | |
Rinker Group Ltd. | | | 135,955 | | | 1,628,199 | |
Wesfarmers Ltd. | | | 19,100 | | | 515,901 | |
Woolworths Ltd. | | | 62,215 | | | 767,034 | |
| | | | | | | |
| | | | | | 5,810,242 | |
| | | | | | | |
Austria—0.5% | | | | | | | |
Erste Bank der Oesterreichischen Sparkassen AG | | | 13,800 | | | 763,863 | |
Raiffeisen International Bank Holding AG | * | | 4,800 | | | 312,772 | |
Telekom Austria AG | | | 24,654 | | | 550,938 | |
Wiener Staedtische Allgemeine Versicherung AG | | | 27,321 | | | 1,598,789 | |
| | | | | | | |
| | | | | | 3,226,362 | |
| | | | | | | |
Belgium—2.3% | | | | | | | |
Fortis | | | 335,600 | | | 10,635,415 | |
Interbrew | | | 114,210 | | | 4,945,966 | |
UCB SA | | | 19,400 | | | 908,177 | |
| | | | | | | |
| | | | | | 16,489,558 | |
| | | | | | | |
Brazil—0.2% | | | | | | | |
Telesp Celular Partcipacoes SA ADR | | | 372,318 | | | 1,407,362 | |
| | | | | | | |
| | | | | | | |
Canada—3.4% | | | | | | | |
Abitibi-Consolidated, Inc. | | | 71,000 | | | 283,392 | |
Alcan Aluminum Ltd. | | | 85,000 | | | 3,477,173 | |
Cameco Corporation | | | 28,500 | | | 1,801,298 | |
Canadian Natural Resources, Ltd. | | | 26,000 | | | 1,283,409 | |
Canadian Tire Corp.-Class A | | | 2,400 | | | 142,952 | |
Corus Entertainment, Inc. Class B | | | 4,200 | | | 112,240 | |
EnCana Corporation | | | 136,600 | | | 6,149,633 | |
Inco Ltd. | | | 39,100 | | | 1,703,587 | |
Loblaw Cos., Ltd. | | | 10,700 | | | 516,624 | |
Manulife Financial Corporation | | | 15,000 | | | 877,131 | |
Methanex Corp. | | | 27,300 | | | 511,159 | |
Noranda, Inc. | | | 28,842 | | | 852,290 | |
Potash Corporation of Saskatchewan, Inc. (foreign shares) | | | 25,700 | | | 2,049,396 | |
Rogers Communications, Inc.— Class B | | | 10,400 | | | 438,270 | |
Suncor Energy, Inc. | | | 21,400 | | | 1,343,938 | |
Telus Corporation | | | 23,300 | | | 955,150 | |
Telus Corporation Non-voting Shares | | | 35,000 | | | 1,399,101 | |
Toronto-Dominion Bank | | | 14,400 | | | 753,980 | |
| | | | | | | |
| | | | | | 24,650,723 | |
| | | | | | | |
China—0.2% | | | | | | | |
China Construction Bank—Class H, 144A | * * * | | 3,838,500 | | | 1,336,654 | |
| | | | | | | |
| | | | | | | |
| |
| | Shares | | Value | |
| |
Denmark—0.2% | | | | | | | |
Novo Nordisk A/S Class B | | | 18,600 | | $ | 1,042,373 | |
Vestas Wind Systems A/S | * | | 26,900 | | | 438,246 | |
| | | | | | | |
| | | | | | 1,480,619 | |
| | | | | | | |
Finland—0.4% | | | | | | | |
Fortum Oyj | | | 93,900 | | | 1,753,395 | |
Nokia Oyj | | | 34,800 | | | 635,562 | |
Stora Enso Oyj Class R | | | 42,400 | | | 571,487 | |
| | | | | | | |
| | | | | | 2,960,444 | |
| | | | | | | |
France—7.9% | | | | | | | |
Accor SA | | | 47,500 | | | 2,601,276 | |
Air Liquide | | | 5,445 | | | 1,042,672 | |
AXA | | | 141,768 | | | 4,559,413 | |
BNP Paribas | | | 75,300 | | | 6,057,762 | |
Bouygues SA | | | 97,900 | | | 4,764,767 | |
Carrefour SA | | | 123,258 | | | 5,744,918 | |
Cie Generale D’Optique Essilor International SA | | | 8,900 | | | 715,080 | |
Dassault Systemes SA | | | 11,700 | | | 657,271 | |
Groupe Danone | | | 12,700 | | | 1,327,715 | |
JC Decaux SA | * | | 66,763 | | | 1,549,555 | |
LVMH Moet Hennessy Louis Vuitton SA | | | 42,700 | | | 3,775,018 | |
Lafarge SA | | | 19,600 | | | 1,755,220 | |
L’Oreal SA | | | 13,300 | | | 983,866 | |
PagesJaunes SA | | | 118,391 | | | 3,068,671 | |
Pinault-Printemps-Redoute SA | | | 36,101 | | | 4,049,821 | |
Renault SA | | | 7,500 | | | 608,147 | |
Safran SA | | | 80,702 | | | 1,921,714 | |
Sanofi-Synthelabo SA | | | 63,758 | | | 5,558,767 | |
Schneider Electric SA | | | 32,500 | | | 2,886,164 | |
Societe Generale Class A | | | 8,900 | | | 1,089,224 | |
Total SA | | | 2,600 | | | 652,942 | |
Veolia Environnement | | | 20,400 | | | 918,858 | |
Vivendi Universal SA | | | 21,700 | | | 676,884 | |
| | | | | | | |
| | | | | | 56,965,725 | |
| | | | | | | |
Germany—7.2% | | | | | | | |
Allianz AG | | | 57,585 | | | 8,674,481 | |
Altana AG | | | 7,700 | | | 415,858 | |
Bayer AG | | | 57,600 | | | 2,399,487 | |
Bayerische Motoren Werke AG | | | 16,900 | | | 735,609 | |
Commerzbank AG | | | 189,100 | | | 5,783,978 | |
DaimlerChrysler AG | | | 35,900 | | | 1,822,191 | |
Deutsche Bank AG | | | 11,200 | | | 1,078,325 | |
Deutsche Boerse AG | | | 5,389 | | | 548,902 | |
Deutsche Post AG | | | 187,697 | | | 4,522,313 | |
Heidelberger Druckmaschinen | | | 28,434 | | | 1,084,212 | |
Infineon Technologies AG | * | | 61,900 | | | 561,530 | |
Infineon Technologies AG ADR | * | | 31,800 | | | 289,380 | |
RWE AG | | | 26,916 | | | 1,977,791 | |
SAP AG | | | 24,306 | | | 4,361,478 | |
SAP AG ADR | | | 7,700 | | | 347,039 | |
Siemens AG | | | 96,593 | | | 8,233,771 | |
E.ON AG | | | 73,234 | | | 7,535,742 | |
Volkswagen AG | | | 25,900 | | | 1,358,137 | |
| | | | | | | |
| | | | | | 51,730,224 | |
| | | | | | | |
Greece—0.1% | | | | | | | |
OPAP SA | | | 20,000 | | | 686,710 | |
| | | | | | | |
| | |
| See accompanying notes to financial statements. | 213 |
| | |
SCHEDULE OF INVESTMENTS — (Continued)
December 31, 2005
| | | | | | | |
| |
Vantagepoint
International Fund | | | Shares | | | Value | |
| |
|
COMMON STOCKS—(Continued) | | | | | | | |
| |
| | | | | | | |
Hong Kong—3.0% | | | | | | | |
Cheung Kong Holdings Ltd. | | | 152,200 | | $ | 1,557,919 | |
China Merchants Holdings International Co., Ltd. | | | 206,000 | | | 447,084 | |
China Mobile Ltd. | | | 2,047,200 | | | 9,702,393 | |
Esprit Holdings Ltd. | | | 41,500 | | | 294,370 | |
Hang Lung Development Co. | | | 237,000 | | | 502,948 | |
Hang Lung Properties Ltd. | | | 237,000 | | | 369,277 | |
Hong Kong & China Gas | | | 280,000 | | | 597,227 | |
Li & Fung Ltd. | | | 578,000 | | | 1,112,153 | |
MTR Corporation | | | 782,800 | | | 1,536,932 | |
PCCW Ltd. | | | 899,000 | | | 551,808 | |
Sun Hung Kai Properties Ltd. | | | 493,400 | | | 4,792,046 | |
| | | | | | | |
| | | | | | 21,464,157 | |
| | | | | | | |
Ireland—0.2% | | | | | | | |
CRH PLC | | | 36,021 | | | 1,053,795 | |
CRH PLC | | | 9,200 | | | 269,507 | |
| | | | | | | |
| | | | | | 1,323,302 | |
| | | | | | | |
Israel—0.1% | | | | | | | |
Teva Pharmaceutical Industries Ltd. ADR | | | 16,500 | | | 709,665 | |
| | | | | | | |
Italy—3.1% | | | | | | | |
Assicurazioni Generali SpA | | | 128,524 | | | 4,473,206 | |
Banca Intesa SpA | | | 91,380 | | | 482,540 | |
ENI-Ente Nazionale Idrocarburi SpA | | | 177,543 | | | 4,940,461 | |
Saipem SpA | | | 382,681 | | | 6,256,723 | |
UniCredito Italiano SpA | | | 864,065 | | | 5,932,096 | |
| | | | | | | |
| | | | | | 22,085,026 | |
| | | | | | | |
Japan—26.2% | | | | | | | |
Advantest Corporation | | | 13,400 | | | 1,354,220 | |
Aeon Company Ltd. | | | 119,900 | | | 3,061,550 | |
Aiful Corporation | | | 9,600 | | | 802,707 | |
Bridgestone Corporation | | | 134,000 | | | 2,793,950 | |
Canon, Inc. | | | 22,500 | | | 1,321,089 | |
Chugai Pharmaceutical Company Ltd. | | | 125,300 | | | 2,696,669 | |
Credit Saison Company Ltd. | | | 263,800 | | | 13,151,416 | |
Daiichi Sankyo Co., Ltd. | * | | 85,900 | | | 1,657,457 | |
Daiwa House Industry Company Ltd. | | | 66,000 | | | 1,032,002 | |
Fanuc Ltd. | | | 29,600 | | | 2,514,881 | |
Hirose Electric Company Ltd. | | | 8,900 | | | 1,184,156 | |
Honda Motor Company Ltd. | | | 76,100 | | | 4,393,116 | |
Hoya Corporation | | | 26,400 | | | 949,157 | |
Japan Tobacco, Inc. | | | 198 | | | 2,895,731 | |
Jupiter Telecommunications Co. | * | | 5,390 | | | 4,306,517 | |
Kansai Electric Power Company, Inc. (The) | | | 72,500 | | | 1,555,777 | |
Kao Corporation | | | 46,000 | | | 1,232,244 | |
Keyence Corporation | | | 11,300 | | | 3,214,364 | |
Millea Holdings, Inc. | | | 110 | | | 1,897,608 | |
Mitsubishi Corporation | | | 357,100 | | | 7,886,325 | |
Mitsubishi Estate Company Ltd. | | | 453,000 | | | 9,382,667 | |
Mitsubishi Heavy Industries Ltd. | | | 278,600 | | | 1,231,224 | |
Mitsubishi Tokyo Financial Group, Inc. | | | 700 | | | 9,534,850 | |
Mitsui & Company Ltd. | | | 202,900 | | | 2,607,660 | |
Mitsui Fudosan Company Ltd. | | | 146,000 | | | 2,956,622 | |
Mitsui Sumitomo Insurance Company Ltd. | | | 64,420 | | | 790,119 | |
| | | | | | | |
| |
| | | Shares | | | Value | |
| |
Mizuho Financial Group, Inc. | | | 1,450 | | $ | 11,511,813 | |
Murata Manufacturing Company Ltd. | | | 8,800 | | | 565,210 | |
NGK Spark Plug Company Ltd. | | | 48,000 | | | 1,041,211 | |
Nidec Corporation | | | 10,200 | | | 867,979 | |
Nikon Corporation | | | 49,000 | | | 773,587 | |
Nintendo Company Ltd. | | | 15,600 | | | 1,889,431 | |
Nippon Electric Glass Company Ltd. | | | 80,000 | | | 1,755,237 | |
Nippon Steel Corporation | | | 200,000 | | | 709,590 | |
Nippon Telegraph & Telephone Corporation | | | 210 | | | 953,289 | |
Nissan Motor Company Ltd. | | | 183,700 | | | 1,874,353 | |
Nitto Denko Corporation | | | 40,300 | | | 3,140,671 | |
NTT Data Corporation | | | 78 | | | 387,343 | |
Obayashi Corporation | | | 78,000 | | | 573,085 | |
Omron Corporation | | | 22,500 | | | 519,724 | |
ORIX Corporation | | | 50,700 | | | 12,907,938 | |
Ricoh Company Ltd. | | | 56,000 | | | 980,792 | |
Rohm Company Ltd. | | | 17,600 | | | 1,924,565 | |
Sega Sammy Holdings, Inc. | | | 256,008 | | | 8,581,901 | |
Sekisui House Ltd. | | | 29,000 | | | 364,331 | |
Shimamura Company Ltd. | | | 4,200 | | | 580,530 | |
Shin-Etsu Chemical Company Ltd. | | | 19,700 | | | 1,048,912 | |
SMC Corporation | | | 40,800 | | | 5,832,084 | |
Softbank Corporation | | | 235,200 | | | 9,936,050 | |
Sompo Japan Insurance, Inc. | | | 97,700 | | | 1,323,697 | |
Sumco Corp. | * | | 2,000 | | | 105,000 | |
Sumitomo Corporation | | | 217,000 | | | 2,809,053 | |
Sumitomo Mitsui Financial Group, Inc. | | | 834 | | | 8,812,914 | |
Sumitomo Realty &Development Company Ltd. | | | 39,000 | | | 847,272 | |
Suzuki Motor Corporation | | | 128,800 | | | 2,393,458 | |
T&D Holdings, Inc. | | | 10,550 | | | 700,654 | |
TDK Corporation | | | 600 | | | 42,600 | |
Takeda Chemical Industries Ltd. | | | 29,400 | | | 1,593,412 | |
Tokyo Electric Power Company, Inc. (The) | | | 25,900 | | | 629,900 | |
Tokyo Electron Ltd. | | | 47,100 | | | 2,959,244 | |
Tokyo Gas Company Ltd. | | | 162,000 | | | 721,269 | |
Tokyu Corporation | | | 186,000 | | | 1,315,086 | |
Trend Micro, Inc. | * | | 32,500 | | | 1,234,876 | |
Uni-Charm Corporation | | | 11,200 | | | 503,308 | |
Ushio, Inc. | | | 32,200 | | | 752,554 | |
Yahoo Japan Corporation | | | 1,476 | | | 2,239,520 | |
Yamada Denki Company Ltd. | | | 19,200 | | | 2,400,828 | |
Yamanouchi Pharmaceutical Company Ltd. | | | 23,900 | | | 934,281 | |
Yamato Transport Company Ltd. | | | 120,200 | | | 1,999,035 | |
| | | | | | | |
| | | | | | 189,441,665 | |
| | | | | | | |
Luxembourg—0.8% | | | | | | | |
RTL Group | | | 20,400 | | | 1,632,769 | |
Societe Europeenne des Satellites | | | 45,200 | | | 773,995 | |
Stolt Offshore SA | * | | 285,500 | | | 3,328,263 | |
| | | | | | | |
| | | | | | 5,735,027 | |
| | | | | | | |
Mexico—2.1% | | | | | | | |
America Movil SA de CV ADR | | | 140,500 | | | 4,111,030 | |
Grupo Televisa SA ADR | | | 85,300 | | | 6,866,650 | |
Wal-Mart de Mexico SA de CV—Class V | | | 792,500 | | | 4,395,225 | |
| | | | | | | |
| | | | | | 15,372,905 | |
| | | | | | | |
| | |
214 | See accompanying notes to financial statements. | |
SCHEDULE OF INVESTMENTS — (Continued)
December 31, 2005
| | | | | | | |
| |
Vantagepoint
International Fund | | | Shares | | | Value | |
| |
|
COMMON STOCKS—(Continued) | | | | | | | |
| |
| | | | | | | |
Netherlands—5.3% | | | | | | | |
ABN AMRO Holding NV | | | 109,740 | | $ | 2,853,144 | |
ASM Lithography Holdings NV | * | | 312,505 | | | 6,237,557 | |
ASM Lithography Holdings NV New York Registered Shares | * | | 59,900 | | | 1,202,792 | |
Aegon NV | | | 171,946 | | | 2,797,809 | |
Heineken Holding NV—Class A | | | 25,843 | | | 756,062 | |
Heineken NV | | | 67,650 | | | 2,136,276 | |
ING Groep NV | | | 227,118 | | | 7,846,140 | |
Royal KPN NV | | | 447,300 | | | 4,466,767 | |
Reed Elsevier NV | | | 55,800 | | | 774,533 | |
Royal Dutch Shell PLC—Class A | | | 225,172 | | | 6,856,026 | |
Royal Numico NV | * | | 18,200 | | | 751,698 | |
TNT NV | | | 33,500 | | | 1,043,312 | |
Unilever NV | | | 8,500 | | | 579,003 | |
| | | | | | | |
| | | | | | 38,301,119 | |
| | | | | | | |
Norway—0.1% | | | | | | | |
Aker ASA Class A | * | | 600 | | | 17,541 | |
DNB NOR ASA | | | 56,900 | | | 603,751 | |
Norske Skogindustrier ASA | | | 23,571 | | | 372,863 | |
| | | | | | | |
| | | | | | 994,155 | |
| | | | | | | |
Portugal—0.5% | | | | | | | |
Banco Comercial Portugues SA Class R | | | 1,180,730 | | | 3,246,230 | |
Portugal Telecom SGPS SA | | | 35,800 | | | 360,569 | |
| | | | | | | |
| | | | | | 3,606,799 | |
| | | | | | | |
Russia—1.6% | | | | | | | |
AFK Sistema, Sponsored GDR, 144A | *** | | 86,118 | | | 2,023,773 | |
OAO Lukoil Holding ADR | | | 161,000 | | | 9,579,500 | |
| | | | | | | |
| | | | | | 11,603,273 | |
| | | | | | | |
Singapore—2.0% | | | | | | | |
DBS Group Holdings Ltd. | | | 70,000 | | | 693,471 | |
Keppel Corporation Ltd. | | | 517,200 | | | 3,412,357 | |
Singapore Airlines Ltd. | | | 663,700 | | | 4,935,332 | |
Singapore Telecommunications Ltd. | | | 3,020,460 | | | 4,729,452 | |
United Overseas Bank Ltd. | | | 68,000 | | | 596,661 | |
| | | | | | | |
| | | | | | 14,367,273 | |
| | | | | | | |
South Africa—0.5% | | | | | | | |
Sasol, Ltd. | | | 106,900 | | | 3,833,323 | |
| | | | | | | |
South Korea—2.8% | | | | | | | |
Hana Financial Group, Inc. | | | 78,750 | | | 3,623,741 | |
Kookmin Bank | * | | 100,950 | | | 7,660,177 | |
Kookmin Bank ADR | * | | 2,000 | | | 149,420 | |
Samsung Electronics Company Ltd. GDR | | | 16,705 | | | 5,504,297 | |
Shinhan Financial Group Company Ltd. | * | | 87,590 | | | 3,546,886 | |
| | | | | | | |
| | | | | | 20,484,521 | |
| | | | | | | |
Spain—3.4% | | | | | | | |
Altadis SA | | | 17,500 | | | 789,887 | |
Banco Bilbao Vizcaya Argentaria SA | | | 404,113 | | | 7,185,118 | |
Banco Santander Central Hispano SA | | | 233,200 | | | 3,062,328 | |
| | | | | | | |
| |
| | | Shares | | | Value | |
| |
Iberdrola SA | | | 35,900 | | $ | 977,437 | |
Inditex SA | | | 101,114 | | | 3,289,697 | |
Promotora de Informaciones SA | | | 177,374 | | | 3,011,148 | |
Repsol YPF SA | | | 135,700 | | | 3,955,863 | |
Telefonica SA | | | 139,623 | | | 2,090,055 | |
| | | | | | | |
| | | | | | 24,361,533 | |
| | | | | | | |
Sweden—0.6% | | | | | | | |
Assa Abloy AB Class B | | | 42,300 | | | 664,710 | |
Atlas Copco AB—Class A | | | 48,000 | | | 1,067,158 | |
Telefonaktiebolaget LM Ericsson ADR | | | 16,500 | | | 567,600 | |
Telefonaktiebolaget LM Ericsson Class B | | | 688,500 | | | 2,367,655 | |
| | | | | | | |
| | | | | | 4,667,123 | |
| | | | | | | |
Switzerland—9.1% | | | | | | | |
Adecco SA | | | 12,300 | | | 564,955 | |
Compagnie Financiere Richemont AG Class A | | | 98,053 | | | 4,254,987 | |
Credit Suisse Group | | | 46,992 | | | 2,386,096 | |
Givaudan | | | 930 | | | 627,903 | |
Holcim Ltd. | | | 52,248 | | | 3,545,336 | |
Nestle SA | | | 37,066 | | | 11,034,073 | |
Nobel Biocare Holding AG | | | 1,711 | | | 375,444 | |
Novartis AG | | | 192,814 | | | 10,080,877 | |
Roche Holding AG | | | 63,372 | | | 9,471,735 | |
Swiss Reinsurance | | | 103,574 | | | 7,544,422 | |
Swisscom AG | | | 4,765 | | | 1,496,847 | |
Synthes, Inc. | | | 7,724 | | | 866,522 | |
UBS AG | | | 142,926 | | | 13,541,943 | |
| | | | | | | |
| | | | | | 65,791,140 | |
| | | | | | | |
Taiwan—0.5% | | | | | | | |
Chunghwa Telecom Company Ltd. ADR | | | 123,600 | | | 2,268,060 | |
Taiwan Semiconductor Manufacturing Company Ltd. ADR | | | 131,051 | | | 1,298,715 | |
| | | | | | | |
| | | | | | 3,566,775 | |
| | | | | | | |
United Kingdom—11.0% | | | | | | | |
Anglo American PLC | | | 32,800 | | | 1,117,730 | |
ARM Holdings PLC | | | 80,000 | | | 165,838 | |
AstraZeneca Group PLC | | | 74,184 | | | 3,611,855 | |
AstraZeneca PLC | | | 35,100 | | | 1,704,063 | |
Barclays PLC | | | 114,499 | | | 1,199,781 | |
BHP Billiton PLC | | | 49,628 | | | 811,271 | |
Brambles Industries PLC | | | 68,200 | | | 488,769 | |
British Sky Broadcasting PLC | | | 529,801 | | | 4,505,498 | |
Cadbury Schweppes PLC | | | 297,700 | | | 2,809,593 | |
Carnival PLC | | | 68,875 | | | 3,907,739 | |
Diageo PLC | | | 43,800 | | | 632,240 | |
HSBC Holdings PLC | | | 104,800 | | | 1,678,337 | |
HBOS PLC | | | 238,000 | | | 4,055,844 | |
ITV PLC | | | 2,074,042 | | | 4,012,166 | |
Kingfisher PLC | | | 1,844,936 | | | 7,514,966 | |
Lloyds TSB Group PLC | | | 120,800 | | | 1,010,315 | |
Morrison WM Supermarkets | | | 1,144,868 | | | 3,803,629 | |
Northern Rock PLC | | | 39,000 | | | 631,513 | |
Pearson PLC | | | 109,500 | | | 1,293,431 | |
Reed Elsevier PLC | | | 274,000 | | | 2,568,025 | |
Rio Tinto PLC | | | 16,600 | | | 757,754 | |
Rolls-Royce Group PLC | * | | 98,500 | | | 724,103 | |
Royal Bank of Scotland Group PLC | | | 241,200 | | | 7,270,320 | |
Royal Dutch Shell PLC Class A ADR | | | 8,400 | | | 516,516 | |
| | |
| See accompanying notes to financial statements. | 215 |
SCHEDULE OF INVESTMENTS — (Continued)
December 31, 2005
| | | | | | | |
| |
Vantagepoint
International Fund | | | Shares | | | Value | |
| |
|
COMMON STOCKS—(Continued) | | | | | | | |
| |
Royal Dutch Shell PLC—Class B | | | 27,641 | | $ | 884,631 | |
Scottish & Southern Energy PLC | | | 64,700 | | | 1,126,871 | |
Smith & Nephew PLC | | | 69,754 | | | 640,921 | |
Standard Chartered PLC | | | 98,800 | | | 2,195,920 | |
Tesco PLC | | | 803,642 | | | 4,575,430 | |
TI Automotive Ltd. | | d | 70,000 | | | — | |
Unilever PLC | | | 245,700 | | | 2,439,473 | |
Vodafone Group PLC | | | 4,047,516 | | | 8,699,919 | |
Wolseley PLC | | | 31,200 | | | 657,093 | |
Xstrata PLC | | | 45,750 | | | 1,069,024 | |
Yell Group PLC | | | 60,500 | | | 556,799 | |
| | | | | | | |
| | | | | | 79,637,377 | |
| | | | | | | |
United States—0.1% | | | | | | | |
News Corp., Inc., CDI | | | 27,311 | | | 428,657 | |
| | | | | | | |
TOTAL COMMON STOCKS | | | | | | | |
(Cost $522,071,377) | | | | | | 694,519,438 | |
| | | | | | | |
|
| |
PREFERRED STOCKS—0.5% | | | | | | | |
| |
Germany—0.5% | | | | | | | |
ProSieben SAT.1 Media AG (Cost $3,552,530) | | | 202,008 | | | 3,872,959 | |
| | | | | | | |
|
| |
| | | Face | | | Value | |
| |
REPURCHASE AGREEMENTS—3.6% | | | | | | | |
| |
United States—3.6% | | | | | | | |
IBT Repurchase Agreement dated 12/30/05 due 1/03/06, with a maturity value of $25,661,231 and an effective yield of 3.65% collateralized by U.S. Government Obligations with rates ranging from 3.987% to 7.375%, maturity dates ranging from 04/25/2014 to 10/01/2041 and an aggregate market value of $26,933,369. | | $ | 25,650,827 | | $ | 25,650,827 | |
| | | | | | | |
| | | | | | | |
TOTAL INVESTMENTS—100.3% | | | | | | | |
(Cost $551,274,734) | | | | | | 724,043,224 | |
Other assets less liabilities—(0.3%) | | | | | | (1,881,788 | ) |
| | | | | | | |
| | | | | | | |
NET ASSETS—100.0% | | | | | $ | 722,161,436 | |
| | | | | | | |
| |
Notes to the Schedule of Investments: |
|
ADR | American Depositary Receipt |
|
GDR | Global Depositary Receipt |
|
* | Non-income producing security. |
|
** | Security exempt from registration under Rule 144A of the Securities Act of 1933. These securities may be resold in transactions exempt from registration, normally to qualified buyers. 144A securities represent 0.46% of Total Investments. |
|
d | Security has no market value at 12/31/2005. |
| | | | |
| |
Percentage of Portfolio by Industry (unaudited): | | | | |
Banking | | | 19.4 | % |
Financial Services | | | 7.8 | % |
Oil & Gas | | | 7.3 | % |
Insurance | | | 6.1 | % |
Pharmaceuticals | | | 5.6 | % |
Electronics | | | 5.1 | % |
Commercial Services | | | 4.8 | % |
Media—Broadcasting & Publishing | | | 4.7 | % |
Beverages, Food & Tobacco | | | 4.4 | % |
Telephone Systems | | | 4.2 | % |
Retailers | | | 3.1 | % |
Real Estate | | | 2.8 | % |
Telecommunications | | | 2.4 | % |
Transportation | | | 2.4 | % |
Food Retailers | | | 2.0 | % |
Automotive | | | 2.0 | % |
Electric Utilities | | | 1.9 | % |
Entertainment & Leisure | | | 1.6 | % |
Chemicals | | | 1.5 | % |
Heavy Machinery | | | 1.2 | % |
Building Materials | | | 1.0 | % |
Miscellaneous | | | 1.0 | % |
Metals & Mining | | | 0.9 | % |
Computer Software & Processing | | | 0.9 | % |
Metals | | | 0.7 | % |
Airlines | | | 0.7 | % |
Advertising | | | 0.6 | % |
Communications | | | 0.6 | % |
Computers & Information | | | 0.6 | % |
Apparel Retailers | | | 0.5 | % |
Cosmetics & Personal Care | | | 0.4 | % |
Lodging | | | 0.4 | % |
Electrical Equipment | | | 0.3 | % |
Forest Products & Paper | | | 0.2 | % |
Medical Supplies | | | 0.2 | % |
Construction | | | 0.2 | % |
Home Construction, Furnishings & Appliances | | | 0.2 | % |
Mining | | | 0.2 | % |
Containers & Packaging | | | 0.1 | % |
Industrial—Diversified | | | 0.1 | % |
Medical Equipment & Supplies | | | 0.1 | % |
Aerospace & Defense | | | 0.1 | % |
| | | | |
TOTAL INVESTMENTS | | | 100.3 | % |
Other assets less liabilities | | | (0.3 | %) |
| | | | |
TOTAL NET ASSETS | | | 100.0 | % |
| | | | |
| | |
216 | See accompanying notes to financial statements. | |
SCHEDULE OF INVESTMENTS
December 31, 2005
| | | | | | | | | | |
| | | | | | | | | | | |
Vantagepoint Core Bond | | | | | | | |
Index Fund | | | | | | | |
| | | | | | | | |
|
Coupon
Rate | | Maturity
Date | | | Face | | Value | |
| | | | | | | | | | | |
|
CORPORATE OBLIGATIONS—20.8% | | | | | | | |
| | | | | | | | |
Aerospace & Defense—0.4% | | | | | | | |
Boeing Capital Corporation, Senior Note | | | | | | | |
6.100% | | 03/01/2011 | | | $ | 500,000 | | $ | 527,394 | |
Boeing Company (The), Note | | | | | | | |
6.125% | | 02/15/2033 | | | | 100,000 | | | 110,329 | |
Boeing Company (The), Note | | | | | | | |
5.125% | | 02/15/2013 | | | | 250,000 | | | 252,450 | |
Lockheed Martin Corporation, Note | | | | | | | |
8.500% | | 12/01/2029 | | | | 500,000 | | | 683,533 | |
Northrop Grumman Corporation, Note | | | | | | | |
7.750% | | 02/15/2031 | | | | 250,000 | | | 320,617 | |
Raytheon Company, Note | | | | | | | |
6.150% | | 11/01/2008 | | | | 1,000,000 | | | 1,038,494 | |
Textron Financial Corporation, Note | | | | | | | |
6.000% | | 11/20/2009 | | | | 200,000 | | | 207,407 | |
United Technologies Corporation, Note | | | | | | | |
4.875% | | 05/01/2015 | | | | 500,000 | | | 496,027 | |
| | | | | | | | | | |
| | | | | | | | | 3,636,251 | |
| | | | | | | | | | |
Airlines—0.1% | | | | | | | |
American Airlines, Inc., Series 1999-1, Class A2 | | | | | | | |
7.024% | | 10/15/2009 | | | | 157,000 | | | 161,069 | |
Continental Airlines, Inc., Series 1998-1, Class 1A | | | | | | | |
6.648% | | 09/15/2017 | | | | 615,930 | | | 602,270 | |
FedEx Corporation, Note | | | | | | | |
9.650% | | 06/15/2012 | | | | 150,000 | | | 186,388 | |
| | | | | | | | | | |
| | | | | | | | | 949,727 | |
| | | | | | | | | | |
Automotive—0.2% | | | | | | | |
DaimlerChrysler North America Holding Corporation, Guaranteed Note | | | | | | | |
7.200% | | 09/01/2009 | | | | 350,000 | | | 370,438 | |
DaimlerChrysler North America Holding Corporation, Guaranteed Note | | | | | | | |
4.050% | | 06/04/2008 | | | | 500,000 | | | 487,023 | |
DaimlerChrysler North America Holding Corporation, Note | | | | | | | |
8.500% | | 01/18/2031 | | | | 350,000 | | | 424,727 | |
DaimlerChrysler North America Holding Corporation, Senior Note | | | | | | | |
6.500% | | 11/15/2013 | | | | 500,000 | | | 524,329 | |
| | | | | | | | | | |
| | | | | | | | | 1,806,517 | |
| | | | | | | | | | |
Banking—4.9% | | | | | | | |
ABN AMRO Bank NV, Global Subordinated Note | �� | | | | | | |
7.125% | | 06/18/2007 | | | | 250,000 | | | 257,385 | |
American Express Company, Note | | | | | | | |
3.750% | | 11/20/2007 | | | | 150,000 | | | 147,309 | |
American Express Credit Corporation, Note | | | | | | | |
3.000% | | 05/16/2008 | | | | 250,000 | | | 239,724 | |
Asian Development Bank, Global Note (Supra National) | | | | | | | |
6.750% | | 06/11/2007 | | | | 750,000 | | | 772,456 | |
Asian Development Bank/Pasig, Global Note (Supra National) | | | | | | | |
4.250% | | 10/20/2014 | | | | 1,000,000 | | | 978,473 | |
Associates Corporate of North America, Senior Note | | | | | | | |
6.950% | | 11/01/2018 | | | | 250,000 | | | 288,427 | |
Associates Corporate of North America, Subordinated Note | | | | | | | |
6.875% | | 11/15/2008 | | | | 410,000 | | | 431,896 | |
Bank of America Corporation, Global Note | | | | | | | |
5.250% | | 02/01/2007 | | | | 1,000,000 | | | 1,004,223 | |
Bank of America Corporation, Senior Note | | | | | | | |
5.875% | | 02/15/2009 | | | | 1,000,000 | | | 1,027,798 | |
| | | | | | | | | | |
| | | | | | | | | | | |
Coupon
Rate | | Maturity
Date | | | Face | | Value | |
| | | | | | | | | | | |
Bank of America Corporation, Subordinated Note | | | | | | | |
7.750% | | 08/15/2015 | | | $ | 750,000 | | $ | 893,099 | |
Bank of America Corporation, Subordinated Note | | | | | | | |
6.800% | | 03/15/2028 | | | | 500,000 | | | 574,592 | |
Bank of America Corporation, Subordinated Note | | | | | | | |
6.250% | | 04/01/2008 | | | | 750,000 | | | 771,469 | |
Bank of New York Company, Inc. (The), Subordinated Note | | | | | | | |
5.500% | | 12/01/2017 | | | | 250,000 | | | 256,854 | |
Bank One Corporation, Subordinated Note | | | | | | | |
5.900% | | 11/15/2011 | | | | 750,000 | | | 780,929 | |
Bank One NA, Note | | | | | | | |
3.700% | | 01/15/2008 | | | | 350,000 | | | 342,811 | |
Bank One NA, Note, (MTN) | | | | | | | |
5.500% | | 03/26/2007 | | | | 750,000 | | | 754,949 | |
BankBoston Corporation, Subordinated Note, (MTN), (FRN) | | | | | | | |
6.500% | | 12/19/2007 | | | | 400,000 | | | 413,508 | |
Bayerische Landesbank Girozentrale, Note | | | | | | | |
2.875% | | 10/15/2008 | | | | 250,000 | | | 238,765 | |
BB&T Corporation, Note | | | | | | | |
5.250% | | 11/01/2019 | | | | 500,000 | | | 498,655 | |
Branch Banking & Trust Company | | | | | | | |
5.200% | | 12/23/2015 | | | | 150,000 | | | 150,653 | |
BSCH Issuances Ltd., Subordinated Note (Cayman Islands) | | | | | | | |
7.625% | | 09/14/2010 | | | | 350,000 | | | 388,012 | |
Capital One Bank, Note | | | | | | | |
4.875% | | 05/15/2008 | | | | 1,000,000 | | | 996,479 | |
Capital One Bank, Note, (MTN) | | | | | | | |
5.125% | | 02/15/2014 | | | | 500,000 | | | 492,839 | |
CIT Group, Inc., Global Senior Note | | | | | | | |
5.000% | | 02/13/2014 | | | | 500,000 | | | 489,881 | |
CIT Group, Inc., Senior Note | | | | | | | |
7.750% | | 04/02/2012 | | | | 350,000 | | | 397,444 | |
CIT Group, Inc., Senior Note, (MTN) | | | | | | | |
4.750% | | 12/15/2010 | | | | 1,000,000 | | | 984,416 | |
Corporacion Andina de Fomento, Note (Supra National) | | | | | | | |
6.875% | | 03/15/2012 | | | | 150,000 | | | 163,427 | |
Deutsche Bank Financial, Inc., Note, Convertible, (MTN) | | | | | | | |
5.375% | | 03/02/2015 | | | | 250,000 | | | 254,142 | |
Duke Capital Corporation, Senior Note | | | | | | | |
4.370% | | 03/01/2009 | | | | 250,000 | | | 244,192 | |
European Investment Bank, Global Note (Supra National) | | | | | | | |
4.625% | | 03/01/2007 | | | | 750,000 | | | 749,991 | |
European Investment Bank, Global Note (Supra National) | | | | | | | |
3.500% | | 03/14/2008 | | | | 1,250,000 | | | 1,223,824 | |
European Investment Bank, Global Note (Supra National) | | | | | | | |
3.125% | | 10/15/2007 | | | | 1,000,000 | | | 976,032 | |
European Investment Bank, Global Note (Supra National) | | | | | | | |
2.375% | | 06/15/2007 | | | | 550,000 | | | 533,562 | |
European Investment Bank, Note (Supra National) | | | | | | | |
4.625% | | 05/15/2014 | | | | 500,000 | | | 503,561 | |
First Union Institutional Trust I Capital Securities, Note | | | | | | | |
8.040% | | 12/01/2026 | | | | 1,000,000 | | | 1,061,125 | |
FleetBoston Financial Corporation, Senior Note | | | | | | | |
6.875% | | 01/15/2028 | | | | 150,000 | | | 173,281 | |
General Electric Capital Corporation, Note, (MTN), (FRN) | | | | | | | |
5.875% | | 02/15/2012 | | | | 500,000 | | | 522,192 | |
Household Finance Corporation, Note | | | | | | | |
8.000% | | 07/15/2010 | | | | 750,000 | | | 837,484 | |
Household Finance Corporation, Note | | | | | | | |
6.500% | | 11/15/2008 | | | | 350,000 | | | 364,508 | |
Household Finance Corporation, Note | | | | | | | |
6.400% | | 06/17/2008 | | | | 250,000 | | | 258,055 | |
Household Finance Corporation, Note | | | | | | | |
6.375% | | 11/27/2012 | | | | 1,000,000 | | | 1,064,065 | |
Household Finance Corporation, Note | | | | | | | |
4.125% | | 12/15/2008 | | | | 1,000,000 | | | 977,123 | |
| | |
| See accompanying notes to financial statements. | 217 |
SCHEDULE OF INVESTMENTS—(Continued)
December 31, 2005
| | | | | | | | | | |
| | | | | | | | | | | |
Vantagepoint Core Bond | | | | | | | |
Index Fund | | | | | | | |
| | | | | | | | |
|
Coupon
Rate | | Maturity
Date | | | Face | | Value | |
| | | | | | | | | | | |
|
CORPORATE OBLIGATIONS—(Continued) | | | | | | | |
| | | | | | | | | | | |
HSBC Holdings PLC, Note (United Kingdom) | | | | | | | |
5.250% | | 12/12/2012 | | | $ | 150,000 | | $ | 150,734 | |
ING Capital Funding Trust III | | | | | | | |
8.439% | | 12/31/2049 | | | | 150,000 | | | 170,731 | |
Inter-American Development Bank (Supra National) | | | | | | | |
7.375% | | 01/15/2010 | | | | 750,000 | | | 826,139 | |
Inter-American Development Bank, Note, (MTN) (Supra National) | | | | | | | |
3.375% | | 03/17/2008 | | | | 1,000,000 | | | 974,318 | |
International Bank for Reconstruction & Development, Note | | | | | | | |
7.625% | | 01/19/2023 | | | | 500,000 | | | 655,092 | |
International Bank for Reconstruction & Development, Note (Supra National) | | | | | | | |
3.625% | | 05/21/2013 | | | | 150,000 | | | 143,902 | |
International Bank for Reconstruction & Development, Note, (MTN), (FRN) (Supra National) | | | | | | | |
4.125% | | 08/12/2009 | | | | 350,000 | | | 346,723 | |
JPMorgan Chase & Company, Global Subordinated Note | | | | | | | |
5.125% | | 09/15/2014 | | | | 750,000 | | | 743,721 | |
Key Bank National Association, Subordinated Note, (MTN) | | | | | | | |
5.800% | | 07/01/2014 | | | | 500,000 | | | 520,377 | |
KfW—Kreditanstalt fuer Wiederaufbau, Global Note (Denmark) | | | | | | | |
3.250% | | 03/30/2009 | | | | 1,000,000 | | | 960,807 | |
KFW—Kreditanstalt fuer Wiederaufbau, Global Note (Germany) | | | | | | | |
2.700% | | 03/01/2007 | | | | 250,000 | | | 243,916 | |
KFW—Kreditanstalt fuer Wiederaufbau, Note (Germany) | | | | | | | |
3.375% | | 01/23/2008 | | | | 500,000 | | | 488,330 | |
KFW International Finance, Inc., Guaranteed Global Note | | | | | | | |
4.750% | | 01/24/2007 | | | | 350,000 | | | 349,531 | |
KFW International Finance, Inc., Note | | | | | | | |
8.000% | | 02/15/2010 | | | | 250,000 | | | 278,669 | |
Korea Development Bank, Note (South Korea) | | | | | | | |
5.750% | | 09/10/2013 | | | | 500,000 | | | 518,920 | |
Kreditanstalt fuer Wiederaufbau, Global Note (Germany) | | | | | | | |
4.250% | | 06/15/2010 | | | | 1,000,000 | | | 983,884 | |
Kreditanstalt fuer Wiederaufbau, Global Note (Germany) | | | | | | | |
4.125% | | 10/15/2014 | | | | 1,000,000 | | | 967,709 | |
Kreditanstalt fuer Wiederaufbau, Note (Germany) | | | | | | | |
3.250% | | 07/16/2007 | | | | 1,000,000 | | | 979,643 | |
Landwirtschaftliche Rentenbank, Note (Germany) | | | | | | | |
4.875% | | 03/12/2007 | | | | 500,000 | | | 500,730 | |
Landwirtschaftliche Rentenbank, Note (Germany) | | | | | | | |
3.250% | | 06/16/2008 | | | | 300,000 | | | 290,048 | |
Marshall & Ilsley Corporation, Senior Note | | | | | | | |
4.375% | | 08/01/2009 | | | | 500,000 | | | 491,433 | |
MBNA America Bank, Note | | | | | | | |
5.375% | | 01/15/2008 | | | | 850,000 | | | 857,785 | |
Mellon Financial Company, Note | | | | | | | |
6.375% | | 02/15/2010 | | | | 350,000 | | | 368,988 | |
National City Bank of Ohio, Senior Note, (MTN) | | | | | | | |
3.300% | | 05/15/2008 | | | | 350,000 | | | 338,157 | |
National City Corporation, Subordinated Note | | | | | | | |
6.875% | | 05/15/2019 | | | | 500,000 | | | 568,434 | |
National Rural Utilities Cooperative Finance Corporation, Note | | | | | | | |
3.875% | | 02/15/2008 | | | | 400,000 | | | 391,581 | |
PNC Funding Corporation, Subordinated Note | | | | | | | |
5.250% | | 11/15/2015 | | | | 200,000 | | | 199,777 | |
Popular North America, Inc., Note, (MTN), (FRN) | | | | | | | |
4.250% | | 04/01/2008 | | | | 100,000 | | | 98,133 | |
Royal Bank of Scotland Group PLC, Global Note (United Kingdom) | | | | | | | |
5.000% | | 10/01/2014 | | | | 750,000 | | | 744,047 | |
| | | | | | | | | | |
| | | | | | | | | | | |
Coupon
Rate | | Maturity
Date | | | Face | | Value | |
| | | | | | | | | | | |
Royal Bank of Scotland Group PLC, Note (FRN) (United Kingdom) | | | | | | | |
7.648% | | 08/29/2049 | | | $ | 500,000 | | $ | 605,716 | |
Sanwa Bank Ltd., Note | | | | | | | |
7.400% | | 06/15/2011 | | | | 250,000 | | | 276,371 | |
SLM Corporation, Note | | | | | | | |
3.950% | | 08/15/2008 | | | | 1,150,000 | | | 1,122,653 | |
SLM Corporation, Note, (MTN), (FRN) | | | | | | | |
5.000% | | 10/01/2013 | | † | | 500,000 | | | 494,970 | |
SouthTrust Corporation, Subordinated Note | | | | | | | |
5.800% | | 06/15/2014 | | | | 750,000 | | | 782,086 | |
Suntrust Banks, Inc., Note | | | | | | | |
5.050% | | 07/01/2007 | | | | 350,000 | | | 350,867 | |
Suntrust Banks, Inc., Subordinated Note | | | | | | | |
5.200% | | 01/17/2017 | | | | 250,000 | | | 249,185 | |
Swiss Bank Corporation, Subordinated Note | | | | | | | |
7.000% | | 10/15/2015 | | | | 100,000 | | | 114,151 | |
U.S. Bank NA, Note | | | | | | | |
4.800% | | 04/15/2015 | | | | 250,000 | | | 245,172 | |
Wachovia Corporation, Senior Note | | | | | | | |
5.250% | | 08/01/2014 | | | | 1,000,000 | | | 1,003,038 | |
Washington Mutual Bank FA, Global Subordinated Note, (MTN) | | | | | | | |
5.650% | | 08/15/2014 | | | | 250,000 | | | 253,598 | |
Wells Fargo & Company, Note | | | | | | | |
5.125% | | 02/15/2007 | | | | 750,000 | | | 751,761 | |
Wells Fargo & Company, Note | | | | | | | |
5.000% | | 11/15/2014 | | | | 750,000 | | | 744,722 | |
Wells Fargo & Company, Series J, Note, (MTN) | | | | | | | |
4.200% | | 01/15/2010 | | | | 500,000 | | | 487,210 | |
Wells Fargo & Company, Subordinated Note | | | | | | | |
7.550% | | 06/21/2010 | | | | 750,000 | | | 829,149 | |
Wells Fargo Bank NA, Note | | | | | | | |
6.450% | | 02/01/2011 | | | | 1,000,000 | | | 1,066,887 | |
Wells Fargo Financial, Inc., Note | | | | | | | |
5.500% | | 08/01/2012 | | | | 750,000 | | | 771,618 | |
Zions Bancorporation, Subordinated Note | | | | | | | |
6.000% | | 09/15/2015 | | | | 500,000 | | | 523,480 | |
| | | | | | | | | | |
| | | | | | | | | 50,304,503 | |
| | | | | | | | | | |
Beverages, Food & Tobacco—0.9% | | | | | | | |
Altria Group, Inc., Note | | | | | | | |
7.750% | | 01/15/2027 | | | | 350,000 | | | 416,673 | |
Altria Group, Inc., Note | | | | | | | |
7.000% | | 11/04/2013 | | | | 400,000 | | | 438,363 | |
Anheuser-Busch Companies, Inc., Note | | | | | | | |
6.800% | | 01/15/2031 | | | | 350,000 | | | 412,776 | |
Archer-Daniels Midland Company, Note | | | | | | | |
8.375% | | 04/15/2017 | | | | 350,000 | | | 443,017 | |
Bottling Group LLC, Series B, Senior Note | | | | | | | |
4.125% | | 06/15/2015 | | | | 250,000 | | | 233,954 | |
Bunge, Ltd. Finance Corporation, Guaranteed Senior Note | | | | | | | |
5.350% | | 04/15/2014 | | | | 500,000 | | | 495,364 | |
Campbell Soup Company, Note | | | | | | | |
4.875% | | 10/01/2013 | | | | 250,000 | | | 244,895 | |
Cia Brasileira de Bebidas, Guaranteed Note (Brazil) | | | | | | | |
8.750% | | 09/15/2013 | | | | 100,000 | | | 117,375 | |
Coca-Cola Enterprises, Inc., Note | | | | | | | |
8.500% | | 02/01/2022 | | | | 150,000 | | | 197,695 | |
ConAgra Foods, Inc., Note | | | | | | | |
6.750% | | 09/15/2011 | | | | 250,000 | | | 266,608 | |
ConAgra Foods, Inc., Senior Note | | | | | | | |
7.125% | | 10/01/2026 | | | | 500,000 | | | 553,429 | |
Coors Brewing Company, Senior Note | | | | | | | |
6.375% | | 05/15/2012 | | | | 500,000 | | | 530,533 | |
| | |
218 | See accompanying notes to financial statements. | |
SCHEDULE OF INVESTMENTS—(Continued)
December 31, 2005
| | | | | | | | | | |
| | | | | | | | | | | |
Vantagepoint Core Bond | | | | | | | |
Index Fund | | | | | | | |
| | | | | | | | | | | |
|
Coupon
Rate | | Maturity
Date | | | | Face | | | Value | |
| | | | | | | | | | | |
|
CORPORATE OBLIGATIONS—(Continued) | | | | | | | |
| | | | | | | | | | | |
Corn Products International, Inc., Senior Note | | | | | | | |
8.250% | | 07/15/2007 | | | $ | 250,000 | | $ | 261,306 | |
Diageo Capital PLC, Guaranteed Note (United Kingdom) | | | | | | | |
4.375% | | 05/03/2010 | | | | 500,000 | | | 488,159 | |
General Mills, Inc., Note | | | | | | | |
5.125% | | 02/15/2007 | | | | 350,000 | | | 349,793 | |
HJ Heinz Company, Guaranteed Note | | | | | | | |
6.625% | | 07/15/2011 | | | | 250,000 | | | 265,939 | |
Kellogg Company, Note | | | | | | | |
6.600% | | 04/01/2011 | | | | 750,000 | | | 803,833 | |
Kraft Foods, Inc., Global Note | | | | | | | |
6.500% | | 11/01/2031 | | | | 100,000 | | | 110,375 | |
Kraft Foods, Inc., Global Note | | | | | | | |
5.625% | | 11/01/2011 | | | | 350,000 | | | 359,542 | |
Kraft Foods, Inc., Note | | | | | | | |
5.250% | | 06/01/2007 | | | | 1,000,000 | | | 1,004,397 | |
Sara Lee Corporation, Senior Note | | | | | | | |
2.750% | | 06/15/2008 | | | | 250,000 | | | 236,579 | |
Supervalu, Inc., Note | | | | | | | |
7.875% | | 08/01/2009 | | | | 350,000 | | | 370,931 | |
Tyson Foods, Inc., Note | | | | | | | |
8.250% | | 10/01/2011 | | | | 250,000 | | | 282,592 | |
Unilever Capital Corporation, Note | | | | | | | |
7.125% | | 11/01/2010 | | | | 500,000 | | | 544,981 | |
| | | | | | | | | | |
| | | | | | | | | 9,429,109 | |
| | | | | | | | | | |
Building Materials—0.1% | | | | | | | |
Hanson Australia Funding Ltd., Note (Australia) | | | | | | | |
5.250% | | 03/15/2013 | | | | 100,000 | | | 99,277 | |
Home Depot, Inc., Senior Note | | | | | | | |
4.625% | | 08/15/2010 | | | | 500,000 | | | 497,312 | |
| | | | | | | | | | |
| | | | | | | | | 596,589 | |
| | | | | | | | | | |
Chemicals—0.2% | | | | | | | |
Dow Chemical Company, Note | | | | | | | |
7.375% | | 11/01/2029 | | | | 250,000 | | | 302,129 | |
Dow Chemical Company, Note | | | | | | | |
6.000% | | 10/01/2012 | | | | 150,000 | | | 157,865 | |
Du Pont (E.I.) de Nemours & Company, Note | | | | | | | |
6.875% | | 10/15/2009 | | | | 150,000 | | | 159,783 | |
EI Du Pont de Nemours & Company, Note | | | | | | | |
4.750% | | 11/15/2012 | | | | 500,000 | | | 492,713 | |
Potash Corporation of Saskatchewan, Note (Canada) | | | | | | | |
4.875% | | 03/01/2013 | | | | 500,000 | | | 488,289 | |
Praxair, Inc., Note | | | | | | | |
3.950% | | 06/01/2013 | | | | 150,000 | | | 140,610 | |
Rohm & Haas Company, Note | | | | | | | |
7.850% | | 07/15/2029 | | | | 150,000 | | | 193,712 | |
| | | | | | | | | | |
| | | | | | | | | 1,935,101 | |
| | | | | | | | | | |
Commercial Services—0.2% | | | | | | | |
Cendant Corporation, Senior Note | | | | | | | |
7.375% | | 01/15/2013 | | | | 250,000 | | | 279,693 | |
Cendant Corporation, Senior Note | | | | | | | |
6.250% | | 03/15/2010 | | | | 150,000 | | | 155,368 | |
Midamerican Energy Holdings Company, Senior Note | | | | | | | |
3.500% | | 05/15/2008 | | | | 150,000 | | | 144,808 | |
Monsanto Company, Note, 144A | | | | | | | |
5.500% | | 08/15/2025 | | * | | 500,000 | | | 486,816 | |
PHH Corporation, Note | | | | | | | |
7.125% | | 03/01/2013 | | | | 100,000 | | | 105,736 | |
RR Donnelley & Sons Co., Note | | | | | | | |
4.950% | | 04/01/2014 | | | | 550,000 | | | 514,367 | |
| | | | | | | | | | |
| | | | | | | | | 1,686,788 | |
| | | | | | | | | | |
| | | | | | | | | | |
| | | | | | | | | | | |
Coupon
Rate | | Maturity
Date | | | | Face | | | Value | |
| | | | | | | | | | | |
Communications—0.1% | | | | | | | |
Motorola, Inc., Note | | | | | | | |
7.500% | | 05/15/2025 | | | $ | 500,000 | | $ | 603,262 | |
News America Holdings, Inc., Note | | | | | | | |
8.000% | | 10/17/2016 | | | | 150,000 | | | 177,156 | |
News America Holdings, Inc., Note | | | | | | | |
7.600% | | 10/11/2015 | | | | 350,000 | | | 400,220 | |
SBC Communications, Inc., Global Note | | | | | | | |
6.250% | | 03/15/2011 | | | | 250,000 | | | 261,653 | |
| | | | | | | | | | |
| | | | | | | | | 1,442,291 | |
| | | | | | | | | | |
Computer Software & Processing—0.0% | | | | | | | |
Computer Sciences Corporation, Senior Note | | | | | | | |
7.375% | | 06/15/2011 | | | | 100,000 | | | 107,449 | |
Electronic Data Systems Corporation, Series B, Senior Note | | | | | | | |
6.500% | | 08/01/2013 | | | | 150,000 | | | 154,386 | |
| | | | | | | | | | |
| | | | | | | | | 261,835 | |
| | | | | | | | | | |
Computers & Information—0.3% | | | | | | | |
Hewlett-Packard Company, Global Note | | | | | | | |
5.500% | | 07/01/2007 | | | | 350,000 | | | 352,953 | |
International Business Machines Corporation, Note | | | | | | | |
7.000% | | 10/30/2025 | | | | 500,000 | | | 593,500 | |
International Business Machines Corporation, Note | | | | | | | |
4.750% | | 11/29/2012 | | | | 250,000 | | | 248,345 | |
International Business Machines Corporation, Note, (MTN) | | | | | | | |
4.375% | | 06/01/2009 | | | | 1,000,000 | | | 988,231 | |
Pitney Bowes, Inc., Global Note, (MTN) | | | | | | | |
4.750% | | 01/15/2016 | | | | 200,000 | | | 193,108 | |
Pitney Bowes, Inc., Senior Note | | | | | | | |
5.000% | | 03/15/2015 | | | | 500,000 | | | 494,343 | |
| | | | | | | | | | |
| | | | | | | | | 2,870,480 | |
| | | | | | | | | | |
Cosmetics & Personal Care—0.2% | | | | | | | |
Procter & Gamble Company, Global Note | | | | | | | |
6.875% | | 09/15/2009 | | | | 750,000 | | | 802,174 | |
Procter & Gamble Company, Note | | | | | | | |
5.800% | | 08/15/2034 | | | | 250,000 | | | 266,178 | |
Procter & Gamble Company, Note | | | | | | | |
4.750% | | 06/15/2007 | | | | 1,000,000 | | | 1,001,298 | |
| | | | | | | | | | |
| | | | | | | | | 2,069,650 | |
| | | | | | | | | | |
Diversified—0.1% | | | | | | | |
General Electric Company | | | | | | | |
5.000% | | 02/01/2013 | | | | 800,000 | | | 800,764 | |
| | | | | | | | | | |
Electric Utilities—1.3% | | | | | | | |
Alabama Power Company, Senior Note | | | | | | | |
5.500% | | 10/15/2017 | | | | 150,000 | | | 153,105 | |
Alabama Power Company, Series X, Senior Note | | | | | | | |
3.125% | | 05/01/2008 | | | | 250,000 | | | 240,402 | |
Alliant Energy Resources, Inc., Guaranteed Senior Note | | | | | | | |
9.750% | | 01/15/2013 | | | | 250,000 | | | 311,297 | |
American Electric Power Company, Inc., Series C, Senior Note | | | | | | | |
5.375% | | 03/15/2010 | | | | 250,000 | | | 252,246 | |
Arizona Public Service Company, Note | | | | | | | |
6.500% | | 03/01/2012 | | | | 150,000 | | | 160,383 | |
Cincinnati Gas & Electric Company, Note | | | | | | | |
5.700% | | 09/15/2012 | | | | 150,000 | | | 154,173 | |
Columbus Southern Power Company, Series A, Senior Note | | | | | | | |
5.500% | | 03/01/2013 | | | | 150,000 | | | 152,999 | |
| | |
| See accompanying notes to financial statements. | 219 |
SCHEDULE OF INVESTMENTS—(Continued)
December 31, 2005
| | | | | | | | | | |
| | | | | | | | | | | |
Vantagepoint Core Bond | | | | | | | |
Index Fund | | | | | | | |
| | | | | | | | |
|
Coupon
Rate | | Maturity
Date | | | | Face | | | Value | |
| | | | | | | | | | | |
|
CORPORATE OBLIGATIONS—(Continued) | | | | | | | |
| | | | | | | | | | | |
Consolidated Edison Company of New York, Inc., Note | | | | | | | |
4.875% | | 02/01/2013 | | | $ | 200,000 | | $ | 198,507 | |
Consolidated Edison Company of New York, Note | | | | | | | |
5.300% | | 03/01/2035 | | | | 500,000 | | | 484,037 | |
Constellation Energy Group, Inc., Note | | | | | | | |
7.600% | | 04/01/2032 | | | | 150,000 | | | 181,021 | |
Consumers Energy Co., Note | | | | | | | |
5.500% | | 08/15/2016 | | | | 150,000 | | | 148,909 | |
Dominion Resources, Inc., Senior Note | | | | | | | |
8.125% | | 06/15/2010 | | | | 350,000 | | | 389,383 | |
Dominion Resources, Inc., Series A, Senior Note | | | | | | | |
7.195% | | 09/15/2014 | | | | 350,000 | | | 389,476 | |
Dominion Resources, Inc., Virginia, Series 03B, Senior Note | | | | | | | |
4.125% | | 02/15/2008 | | | | 500,000 | | | 490,972 | |
DTE Energy Company, Note | | | | | | | |
7.050% | | 06/01/2011 | | | | 350,000 | | | 377,554 | |
Duke Energy Corporation, Senior Note | | | | | | | |
6.450% | | 10/15/2032 | | | | 500,000 | | | 538,781 | |
Duke Energy Field Services Corporation LLC, Note | | | | | | | |
7.875% | | 08/16/2010 | | | | 350,000 | | | 387,457 | |
Entergy Gulf States, Inc., Note | | | | | | | |
3.600% | | 06/01/2008 | | | | 100,000 | | | 96,216 | |
Exelon Corp., Senior Note | | | | | | | |
4.900% | | 06/15/2015 | | | | 350,000 | | | 334,654 | |
Exelon Generation Company LLC, Senior Note | | | | | | | |
6.950% | | 06/15/2011 | | | | 500,000 | | | 539,731 | |
FirstEnergy Corporation, Series B, Note | | | | | | | |
6.450% | | 11/15/2011 | | | | 175,000 | | | 185,726 | |
FirstEnergy Corporation, Series C, Note | | | | | | | |
7.375% | | 11/15/2031 | | | | 175,000 | | | 207,144 | |
Florida Power & Light Company, Note | | | | | | | |
5.625% | | 04/01/2034 | | | | 50,000 | | | 50,591 | |
Florida Power & Light Company, Note | | | | | | | |
4.850% | | 02/01/2013 | | | | 150,000 | | | 148,923 | |
FPL Group Capital, Inc., Guaranteed Note | | | | | | | |
7.375% | | 06/01/2009 | | | | 100,000 | | | 107,566 | |
Jersey Central Power & Light, Global Note | | | | | | | |
5.625% | | 05/01/2016 | | | | 500,000 | | | 515,921 | |
KeySpan Corporation, Note | | | | | | | |
7.625% | | 11/15/2010 | | | | 350,000 | | | 389,471 | |
Midamerican Energy Company, Note | | | | | | | |
6.750% | | 12/30/2031 | | | | 250,000 | | | 286,815 | |
Midamerican Energy Holdings Company, Senior Note, Class D | | | | | | | |
5.000% | | 02/15/2014 | | | | 150,000 | | | 146,660 | |
NiSource Finance Corporation, Guaranteed Note | | | | | | | |
7.875% | | 11/15/2010 | | | | 50,000 | | | 55,455 | |
Northern States Power Company, Series A, Note | | | | | | | |
8.000% | | 08/28/2012 | | | | 150,000 | | | 175,628 | |
Oncor Electric Delivery Company, Senior Secured Note | | | | | | | |
6.375% | | 05/01/2012 | | | | 350,000 | | | 369,553 | |
Ontario Electricity Financial Corporation, Note (Canada) | | | | | | | |
7.450% | | 03/31/2013 | | | | 350,000 | | | 406,773 | |
Pacific Gas & Electric Company, Note | | | | | | | |
6.050% | | 03/01/2034 | | | | 500,000 | | | 519,255 | |
Pacific Gas & Electric Company, Note | | | | | | | |
4.800% | | 03/01/2014 | | | | 500,000 | | | 488,075 | |
Peco Energy Company, Note | | | | | | | |
3.500% | | 05/01/2008 | | | | 150,000 | | | 145,206 | |
| | | | | | | | | | |
| | | | | | | | | | | |
Coupon
Rate | | Maturity
Date | | | | Face | | | Value | |
| | | | | | | | | | | |
Progress Energy, Inc., Senior Note | | | | | | | |
7.750% | | 03/01/2031 | | | $ | 250,000 | | $ | 300,801 | |
Progress Energy, Inc., Senior Note | | | | | | | |
7.100% | | 03/01/2011 | | | | 400,000 | | | 432,035 | |
PSEG Power LLC, Senior Note | | | | | | | |
8.625% | | 04/15/2031 | | | | 500,000 | | | 659,906 | |
Public Service Company of Colorado, Series 12, Note | | | | | | | |
4.875% | | 03/01/2013 | | | | 200,000 | | | 199,081 | |
Public Service Electric & Gas Company, Note | | | | | | | |
5.125% | | 09/01/2012 | | | | 150,000 | | | 150,442 | |
Scottish Power PLC, Note (United Kingdom) | | | | | | | |
5.375% | | 03/15/2015 | | | | 500,000 | | | 501,180 | |
South Carolina Electric & Gas Company, Note | | | | | | | |
5.300% | | 05/15/2033 | | | | 150,000 | | | 147,416 | |
Southern California Edison Company, Note | | | | | | | |
6.650% | | 04/01/2029 | | | | 500,000 | | | 557,172 | |
TXU Electric Delivery Company, Note | | | | | | | |
7.000% | | 09/01/2022 | | | | 250,000 | | | 278,575 | |
TXU Energy Company LLC, Senior Note | | | | | | | |
7.000% | | 03/15/2013 | | | | 150,000 | | | 160,076 | |
Wisconsin Electric Power, Note | | | | | | | |
5.625% | | 05/15/2033 | | | | 250,000 | | | 253,629 | |
| | | | | | | | | | |
| | | | | | | | | 13,820,378 | |
| | | | | | | | | | |
Electrical Equipment—0.0% | | | | | | | |
Emerson Electric Company, Note | | | | | | | |
5.000% | | 12/15/2014 | | | | 150,000 | | | 150,478 | |
| | | | | | | | | | |
Electronics—0.0% | | | | | | | |
Arrow Electronics, Inc., Note | | | | | | | |
6.875% | | 07/01/2013 | | | | 250,000 | | | 267,387 | |
| | | | | | | | | | |
Entertainment & Leisure—0.1% | | | | | | | |
News America Holdings, Guaranteed Senior Note | | | | | | | |
7.750% | | 12/01/2045 | | | | 200,000 | | | 230,070 | |
Time Warner, Inc., Note | | | | | | | |
6.875% | | 05/01/2012 | | | | 150,000 | | | 159,877 | |
Walt Disney Company, Note, (MTN), (FRN) | | | | | | | |
7.000% | | 03/01/2032 | | | | 500,000 | | | 574,634 | |
Walt Disney Company, Note, (MTN), (FRN) | | | | | | | |
6.375% | | 03/01/2012 | | | | 250,000 | | | 264,766 | |
| | | | | | | | | | |
| | | | | | | | | 1,229,347 | |
| | | | | | | | | | |
Environmental—0.1% | | | | | | | |
USA Waste Services, Inc., Senior Note | | | | | | | |
7.000% | | 07/15/2028 | | | | 550,000 | | | 621,509 | |
| | | | | | | | | | |
Financial Services—4.3% | | | | | | | |
Abbey National PLC, Note (United Kingdom) | | | | | | | |
7.950% | | 10/26/2029 | | | | 250,000 | | | 325,083 | |
Allstate Life Global Fund Trust, Series 2004-1, Note (MTN) | | | | | | | |
4.500% | | 05/29/2009 | | | | 250,000 | | | 246,673 | |
Amvescap PLC, Senior Note | | | | | | | |
5.375% | | 02/27/2013 | | | | 100,000 | | | 98,692 | |
Bank of Tokyo-Mitsubishi Ltd. (The), Global Senior Subordinated Note (Japan) | | | | | | | |
8.400% | | 04/15/2010 | | | | 250,000 | | | 280,992 | |
Bear Stearns Companies (The), Inc., Note | | | | | | | |
7.625% | | 12/07/2009 | | | | 1,000,000 | | | 1,091,831 | |
Bear Stearns Companies, Inc., (The), Global Note | | | | | | | |
5.700% | | 01/15/2007 | | | | 900,000 | | | 907,358 | |
Bear Stearns Companies, Inc., (The), Note | | | | | | | |
5.700% | | 11/15/2014 | | | | 50,000 | | | 51,659 | |
| | |
220 | See accompanying notes to financial statements. | |
SCHEDULE OF INVESTMENTS—(Continued)
December 31, 2005
| | | | | | | | | | |
| | | | | | | | | | | |
Vantagepoint Core Bond | | | | | | | |
Index Fund | | | | | | | |
| | | | | | | | | | | |
|
Coupon
Rate | | Maturity
Date | | | | Face | | | Value | |
| | | | | | | | | | | |
|
CORPORATE OBLIGATIONS—(Continued) | | | | | | | |
| | | | | | | | | | | |
Bear Stearns Companies, Inc., (The), Note | | | | | | | |
2.875% | | 07/02/2008 | | | $ | 1,000,000 | | $ | 952,468 | |
Berkshire Hathaway Finance Corp., Guaranteed Senior Note | | | | | | | |
4.125% | | 01/15/2010 | | | | 500,000 | | | 486,312 | |
BHP Finance USA Ltd., Guaranteed Senior Note | | | | | | | |
4.800% | | 04/15/2013 | | | | 150,000 | | | 148,152 | |
Cingular Wireless LLC, Senior Note | | | | | | | |
6.500% | | 12/15/2011 | | | | 250,000 | | | 267,851 | |
Citigroup, Inc., Global Note | | | | | | | |
5.850% | | 12/11/2034 | | | | 500,000 | | | 522,570 | |
Citigroup, Inc., Global Senior Note | | | | | | | |
6.500% | | 01/18/2011 | | | | 1,000,000 | | | 1,066,647 | |
Citigroup, Inc., Global Senior Note | | | | | | | |
6.000% | | 02/21/2012 | | | | 350,000 | | | 367,810 | |
Citigroup, Inc., Global Subordinated Note | | | | | | | |
6.625% | | 06/15/2032 | | | | 150,000 | | | 170,059 | |
Citigroup, Inc., Global Subordinated Note | | | | | | | |
5.625% | | 08/27/2012 | | | | 150,000 | | | 154,820 | |
Citigroup, Inc., Subordinated Note | | | | | | | |
5.000% | | 09/15/2014 | | | | 913,000 | | | 900,282 | |
Countrywide Financial Corporation, Note | | | | | | | |
4.250% | | 12/19/2007 | | | | 1,000,000 | | | 986,536 | |
Countrywide Home Loans, Inc., Note, (FRN), (MTN) | | | | | | | |
5.625% | | 05/15/2007 | | | | 300,000 | | | 302,649 | |
Credit Suisse First Boston USA, Inc., Global Note | | | | | | | |
4.875% | | 01/15/2015 | | | | 1,000,000 | | | 974,835 | |
Credit Suisse First Boston USA, Inc., Note | | | | | | | |
6.500% | | 01/15/2012 | | | | 350,000 | | | 374,890 | |
Credit Suisse First Boston USA, Inc., Note | | | | | | | |
6.125% | | 11/15/2011 | | | | 1,000,000 | | | 1,051,032 | |
Credit Suisse First Boston USA, Inc., Note | | | | | | | |
5.750% | | 04/15/2007 | | | | 800,000 | | | 808,586 | |
Credit Suisse First Boston USA, Inc., Note | | | | | | | |
5.500% | | 08/15/2013 | | | | 150,000 | | | 153,251 | |
Credit Suisse First Boston USA, Inc., Senior Global Note | | | | | | | |
5.125% | | 01/15/2014 | | | | 500,000 | | | 498,916 | |
EOP Operating, LP, Guaranteed Note | | | | | | | |
7.000% | | 07/15/2011 | | | | 350,000 | | | 375,050 | |
EOP Operating, LP, Guaranteed Note | | | | | | | |
4.750% | | 03/15/2014 | | | | 500,000 | | | 473,282 | |
EOP Operating, LP, Note | | | | | | | |
7.875% | | 07/15/2031 | | | | 500,000 | | | 591,787 | |
EOP Operating, LP, Note | | | | | | | |
6.800% | | 01/15/2009 | | | | 500,000 | | | 523,155 | |
ERP Operating, LP, Note | | | | | | | |
5.200% | | 04/01/2013 | | | | 250,000 | | | 248,644 | |
Ford Motor Credit Company, Global Note | | | | | | | |
7.875% | | 06/15/2010 | | † | | 750,000 | | | 675,527 | |
Ford Motor Credit Company, Note | | | | | | | |
5.800% | | 01/12/2009 | | | | 1,000,000 | | | 872,918 | |
General Electric Capital Corporation, Note | | | | | | | |
6.500% | | 12/10/2007 | | | | 750,000 | | | 773,015 | |
General Electric Capital Corporation, Note | | | | | | | |
6.000% | | 06/15/2012 | | | | 1,000,000 | | | 1,054,597 | |
General Electric Capital Corporation, Note | | | | | | | |
3.500% | | 05/01/2008 | | | | 250,000 | | | 242,971 | |
General Electric Capital Corporation, Note, (FRN) | | | | | | | |
4.625% | | 09/15/2009 | | | | 1,000,000 | | | 990,813 | |
General Electric Capital Corporation, Note, (MTN) | | | | | | | |
6.750% | | 03/15/2032 | | | | 750,000 | | | 883,313 | |
General Electric Capital Corporation, Note, (MTN), (FRN) | | | | | | | |
5.375% | | 03/15/2007 | | | | 1,600,000 | | | 1,610,512 | |
Goldman Sachs Group, Inc., Global Note | | | | | | | |
5.125% | | 01/15/2015 | | | | 500,000 | | | 495,229 | |
| | | | | | | | | | |
| | | | | | | | | | | |
Coupon
Rate | | Maturity
Date | | | | Face | | | Value | |
| | | | | | | | | | | |
Goldman Sachs Group, Inc., Guaranteed Note | | | | | | | |
6.345% | | 02/15/2034 | | | $ | 500,000 | | $ | 527,029 | |
Goldman Sachs Group, Inc., Note | | | | | | | |
6.875% | | 01/15/2011 | | | | 250,000 | | | 269,605 | |
Goldman Sachs Group, Inc., Senior Note | | | | | | | |
6.600% | | 01/15/2012 | | | | 650,000 | | | 699,093 | |
Goldman Sachs Group, Inc., Senior Note | | | | | | | |
6.125% | | 02/15/2033 | | | | 700,000 | | | 737,144 | |
Goldman Sachs Group, Inc., Senior Note | | | | | | | |
5.700% | | 09/01/2012 | | | | 250,000 | | | 257,524 | |
Goldman Sachs Group, Inc., Senior Note | | | | | | | |
5.150% | | 01/15/2014 | | | | 500,000 | | | 497,516 | |
Goldman Sachs Group, Inc., Senior Note | | | | | | | |
4.125% | | 01/15/2008 | | | | 800,000 | | | 788,096 | |
Goldman Sachs Group, Inc., Series B, Note, (MTN) | | | | | | | |
7.350% | | 10/01/2009 | | | | 750,000 | | | 808,033 | |
Honeywell International, Inc., Note | | | | | | | |
6.125% | | 11/01/2011 | | | | 250,000 | | | 264,207 | |
Household Finance Corporation | | | | | | | |
6.375% | | 10/15/2011 | | | | 1,000,000 | | | 1,058,354 | |
Household Finance Corporation, Note | | | | | | | |
5.750% | | 01/30/2007 | | | | 1,050,000 | | | 1,058,930 | |
John Deere Capital Corporation, Note | | | | | | | |
7.000% | | 03/15/2012 | | | | 350,000 | | | 387,067 | |
JP Morgan & Company, Inc., Note | | | | | | | |
6.000% | | 01/15/2009 | | | | 350,000 | | | 359,549 | |
JP Morgan Chase & Company, Global Subordinated Note | | | | | | | |
5.750% | | 01/02/2013 | | | | 1,750,000 | | | 1,807,334 | |
JP Morgan Chase & Company, Note | | | | | | | |
6.750% | | 02/01/2011 | | | | 750,000 | | | 804,172 | |
Lehman Brothers Holdings, Inc., Note | | | | | | | |
7.875% | | 08/15/2010 | | | | 1,000,000 | | | 1,116,590 | |
Lehman Brothers Holdings, Inc., Note | | | | | | | |
4.000% | | 01/22/2008 | | | | 850,000 | | | 836,328 | |
Lehman Brothers Holdings, Inc., Note, (MTN), (FRN) | | | | | | | |
6.625% | | 01/18/2012 | | | | 750,000 | | | 810,761 | |
Merrill Lynch & Comapny, Inc., Note, (MTN) | | | | | | | |
5.450% | | 07/15/2014 | | | | 500,000 | | | 509,030 | |
Merrill Lynch & Company, Inc., Note | | | | | | | |
6.000% | | 02/17/2009 | | | | 1,000,000 | | | 1,031,965 | |
Merrill Lynch & Company, Inc., Note, (MTN) | | | | | | | |
4.125% | | 09/10/2009 | | | | 500,000 | | | 485,555 | |
Merrill Lynch & Company, Inc., Note, (MTN) | | | | | | | |
3.700% | | 04/21/2008 | | | | 250,000 | | | 243,703 | |
Merrill Lynch & Company, Inc., Note | | | | | | | |
6.875% | | 11/15/2018 | | | | 250,000 | | | 285,907 | |
Morgan Stanley, Note | | | | | | | |
8.000% | | 06/15/2010 | | | | 750,000 | | | 835,835 | |
Morgan Stanley, Note | | | | | | | |
7.250% | | 04/01/2032 | | | | 100,000 | | | 120,412 | |
Morgan Stanley, Note | | | | | | | |
5.800% | | 04/01/2007 | | | | 350,000 | | | 353,673 | |
Morgan Stanley, Note | | | | | | | |
4.750% | | 04/01/2014 | | | | 1,000,000 | | | 960,676 | |
Morgan Stanley, Note | | | | | | | |
3.875% | | 01/15/2009 | | | | 750,000 | | | 728,453 | |
National Rural Utilities Cooperative Finance Corporation, Note | | | | | | | |
7.250% | | 03/01/2012 | | | | 500,000 | | | 558,344 | |
Pepco Holdings, Inc., Note | | | | | | | |
6.450% | | 08/15/2012 | | | | 150,000 | | | 158,044 | |
Residential Capital Corporation, Note | | | | | | | |
6.375% | | 06/30/2010 | | | | 350,000 | | | 355,984 | |
Rio Tinto Finance USA, Ltd., Guaranteed Note (Australia) | | | | | | | |
2.625% | | 09/30/2008 | | | | 100,000 | | | 94,256 | |
Swiss Bank Corporation of New York, Note, (MTN), (FRN) | | | | | | | |
7.375% | | 06/15/2017 | | | | 100,000 | | | 118,167 | |
| | |
| See accompanying notes to financial statements. | 221 |
SCHEDULE OF INVESTMENTS—(Continued)
December 31, 2005
| | | | | | | | | | |
| | | | | | | | | | | |
Vantagepoint Core Bond | | | | | | | |
Index Fund | | | | | | | |
| | | | | | | | | | | |
|
Coupon
Rate | | Maturity
Date | | | | Face | | | Value | |
| | | | | | | | | | | |
|
CORPORATE OBLIGATIONS—(Continued) | | | | | | | |
| | | | | | | | | | | |
U.S. Bank National Association, Note, (MTN), (FRN) | | | | | | | |
6.375% | | 08/01/2011 | | | $ | 750,000 | | $ | 801,813 | |
Washington Mutual, Inc., Senior Note | | | | | | | |
4.375% | | 01/15/2008 | | | | 1,000,000 | | | 988,531 | |
| | | | | | | | | | |
| | | | | | | | | 44,718,447 | |
| | | | | | | | | | |
Food Retailers—0.1% | | | | | | | |
Albertson’s, Inc., Note | | | | | | | |
7.500% | | 02/15/2011 | | | | 250,000 | | | 255,441 | |
Kroger Co. (The), Senior Note | | | | | | | |
7.500% | | 04/01/2031 | | | | 200,000 | | | 223,944 | |
Safeway, Inc., Note | | | | | | | |
7.500% | | 09/15/2009 | | | | 800,000 | | | 855,146 | |
| | | | | | | | | | |
| | | | | | | | | 1,334,531 | |
| | | | | | | | | | |
Forest Products & Paper—0.2% | | | | | | | |
International Paper Company, Note | | | | | | | |
6.750% | | 09/01/2011 | | | | 600,000 | | | 639,020 | |
Kimberly Clark Corporation, Note | | | | | | | |
5.625% | | 02/15/2012 | | | | 250,000 | | | 260,966 | |
MeadWestvaco Corporation, Note | | | | | | | |
6.850% | | 04/01/2012 | | | | 150,000 | | | 159,738 | |
Weyerhaeuser Company, Note | | | | | | | |
7.375% | | 03/15/2032 | | | | 750,000 | | | 836,337 | |
Weyerhaeuser Company, Note | | | | | | | |
6.750% | | 03/15/2012 | | | | 100,000 | | | 106,273 | |
| | | | | | | | | | |
| | | | | | | | | 2,002,334 | |
| | | | | | | | | | |
Health Care Providers—0.1% | | | | | | | |
UnitedHealth Group, Inc., Note | | | | | | | |
3.750% | | 02/10/2009 | | | | 1,150,000 | | | 1,113,623 | |
| | | | | | | | | | |
Heavy Construction—0.1% | | | | | | | |
Centex Corporation, Senior Note | | | | | | | |
4.750% | | 01/15/2008 | | | | 100,000 | | | 99,003 | |
Centex Corporation, Senior Note | | | | | | | |
4.550% | | 11/01/2010 | | | | 1,000,000 | | | 959,552 | |
Lennar Corporation, Series B, Senior Note | | | | | | | |
5.500% | | 09/01/2014 | | | | 500,000 | | | 483,563 | |
| | | | | | | | | | |
| | | | | | | | | 1,542,118 | |
| | | | | | | | | | |
Heavy Machinery—0.1% | | | | | | | |
Caterpillar, Inc., Senior Note | | | | | | | |
7.250% | | 09/15/2009 | | | | 750,000 | | | 808,764 | |
Cooper Industries, Inc., Guaranteed Senior Note | | | | | | | |
5.500% | | 11/01/2009 | | | | 100,000 | | | 101,905 | |
Deere & Company, Global Note | | | | | | | |
6.950% | | 04/25/2014 | | | | 250,000 | | | 282,327 | |
United Technologies Corporation, Note | | | | | | | |
6.700% | | 08/01/2028 | | | | 150,000 | | | 173,637 | |
United Technologies Corporation, Note | | | | | | | |
6.100% | | 05/15/2012 | | | | 50,000 | | | 53,077 | |
| | | | | | | | | | |
| | | | | | | | | 1,419,710 | |
| | | | | | | | | | |
Home Construction, Furnishings & Appliances—0.1% | | | | | | | |
MDC Holdings, Inc., Senior Note | | | | | | | |
5.500% | | 05/15/2013 | | | | 500,000 | | | 485,079 | |
Newell Rubbermaid, Inc., Note | | | | | | | |
4.625% | | 12/15/2009 | | | | 100,000 | | | 97,871 | |
| | | | | | | | | | |
| | | | | | | | | | | |
Coupon
Rate | | Maturity
Date | | | | Face | | | Value | |
| | | | | | | | | | | |
Pulte Homes, Inc., Senior Note | | | | | | | |
7.875% | | 08/01/2011 | | | $ | 350,000 | | $ | 384,936 | |
| | | | | | | | | | |
| | | | | | | | | 967,886 | |
| | | | | | | | | | |
Industrial—Diversified—0.1% | | | | | | | |
Tyco International Group SA, Guaranteed Note (Luxembourg) | | | | | | | |
6.750% | | 02/15/2011 | | | | 500,000 | | | 526,261 | |
Tyco International Group SA, Note (Luxembourg) | | | | | | | |
6.125% | | 11/01/2008 | | | | 1,000,000 | | | 1,021,431 | |
| | | | | | | | | | |
| | | | | | | | | 1,547,692 | |
| | | | | | | | | | |
Insurance—1.0% | | | | | | | |
Allstate Corporation (The), Senior Note | | | | | | | |
7.200% | | 12/01/2009 | | | | 750,000 | | | 808,280 | |
Allstate Corporation (The), Senior Note | | | | | | | |
5.350% | | 06/01/2033 | | | | 500,000 | | | 476,675 | |
American General Finance Corporation, Senior Note, (MTN) | | | | | | | |
5.375% | | 10/01/2012 | | | | 650,000 | | | 654,220 | |
American International Group, Inc., Global Senior Note | | | | | | | |
4.250% | | 05/15/2013 | | | | 100,000 | | | 95,261 | |
American International Group, Inc., Note, 144A | | | | | | | |
5.050% | | 10/01/2015 | | *† | | 750,000 | | | 737,471 | |
Anthem, Inc., Note | | | | | | | |
6.800% | | 08/01/2012 | | | | 150,000 | | | 163,869 | |
Assurant, Inc., Global Note | | | | | | | |
5.625% | | 02/15/2014 | | | | 500,000 | | | 507,232 | |
Assurant, Inc., Senior Note | | | | | | | |
6.750% | | 02/15/2034 | | | | 650,000 | | | 708,737 | |
Axa Company (France) | | | | | | | |
8.600% | | 12/15/2030 | | | | 250,000 | | | 335,093 | |
AXA Financial, Inc., Senior Note | | | | | | | |
7.750% | | 08/01/2010 | | | | 100,000 | | | 110,837 | |
Cincinnati Financial Corp., Senior Note | | | | | | | |
6.125% | | 11/01/2034 | | | | 500,000 | | | 518,868 | |
General Electric Global Insurance Holding Corporation, Note | | | | | | | |
7.500% | | 06/15/2010 | | | | 150,000 | | | 164,043 | |
Genworth Financial, Inc., Note | | | | | | | |
5.750% | | 05/15/2014 | | | | 500,000 | | | 522,730 | |
Hartford Life, Inc., Senior Note | | | | | | | |
7.375% | | 03/01/2031 | | | | 150,000 | | | 183,922 | |
MetLife, Inc., Note | | | | | | | |
5.000% | | 11/24/2013 | | | | 500,000 | | | 495,483 | |
MetLife, Inc., Senior Note | | | | | | | |
6.500% | | 12/15/2032 | | | | 100,000 | | | 110,888 | |
Progressive Corporation (The), Senior Note | | | | | | | |
6.625% | | 03/01/2029 | | | | 150,000 | | | 169,340 | |
Protective Life Secured Trust, Note, (MTN) | | | | | | | |
4.000% | | 04/01/2011 | | | | 400,000 | | | 384,094 | |
Prudential Financial, Inc., Note, (MTN) | | | | | | | |
5.100% | | 09/20/2014 | | | | 500,000 | | | 498,531 | |
Prudential Financial, Inc., Note, (MTN), (FRN) | | | | | | | |
3.750% | | 05/01/2008 | | | | 100,000 | | | 97,525 | |
Radian Group, Inc., Senior Note | | | | | | | |
5.625% | | 02/15/2013 | | | | 100,000 | | | 100,436 | |
Safeco Corporation, Senior Note | | | | | | | |
4.875% | | 02/01/2010 | | | | 150,000 | | | 149,032 | |
Travelers Property Casualty Corporation, Note | | | | | | | |
7.750% | | 04/15/2026 | | | | 500,000 | | | 609,310 | |
UnitedHealth Group, Inc., Note | | | | | | | |
5.000% | | 08/15/2014 | | | | 500,000 | | | 498,417 | |
WellPoint, Inc., Note | | | | | | | |
5.950% | | 12/15/2034 | | | | 750,000 | | | 775,856 | |
| | | | | | | | | | |
| | | | | | | | | 9,876,150 | |
| | | | | | | | | | |
| | |
222 | See accompanying notes to financial statements. | |
SCHEDULE OF INVESTMENTS—(Continued)
December 31, 2005
| | | | | | | | | | |
| | | | | | | | | | | |
Vantagepoint Core Bond | | | | | | | |
Index Fund | | | | | | | |
| | | | | | | | | | | |
|
Coupon
Rate | | Maturity
Date | | | | Face | | | Value | |
| | | | | | | | | | | |
|
CORPORATE OBLIGATIONS—(Continued) | | | | | | | |
| | | | | | | | | | | |
Lodging—0.1% | | | | | | | |
Harrah’s Operating Company, Inc., Guaranteed Senior Note | | | | | | | |
5.500% | | 07/01/2010 | | | $ | 250,000 | | $ | 250,146 | |
Harrah’s Operating Company, Inc., Guaranteed Senior Note | | | | | | | |
5.375% | | 12/15/2013 | | | | 250,000 | | | 244,331 | |
Hilton Hotels Corporation, Note | | | | | | | |
7.625% | | 12/01/2012 | | | | 250,000 | | | 269,987 | |
| | | | | | | | | | |
| | | | | | | | | 764,464 | |
| | | | | | | | | | |
Media—Broadcasting & Publishing—0.6% | | | | | | | |
British Sky Broadcasting PLC, Note (United Kingdom) | | | | | | | |
8.200% | | 07/15/2009 | | | | 250,000 | | | 273,447 | |
Clear Channel Communications, Inc., Global Note | | | | | | | |
4.250% | | 05/15/2009 | | | | 250,000 | | | 240,499 | |
Comcast Cable Communications Corporation, Note | | | | | | | |
8.375% | | 05/01/2007 | | | | 500,000 | | | 521,569 | |
Comcast Cable Communications Holdings, Inc., Note | | | | | | | |
9.455% | | 11/15/2022 | | | | 400,000 | | | 525,319 | |
Comcast Cable Communications Holdings, Inc., Note | | | | | | | |
8.375% | | 03/15/2013 | | | | 500,000 | | | 579,539 | |
Comcast Corporation, Note | | | | | | | |
7.050% | | 03/15/2033 | | | | 500,000 | | | 541,492 | |
COX Communications, Inc., Note | | | | | | | |
5.500% | | 10/01/2015 | | | | 75,000 | | | 72,929 | |
COX Communications, Inc., Note | | | | | | | |
5.450% | | 12/15/2014 | | | | 300,000 | | | 293,252 | |
COX Communications, Inc., Note | | | | | | | |
4.625% | | 06/01/2013 | | | | 250,000 | | | 233,253 | |
Time Warner Entertainment Company, LP, Senior Note | | | | | | | |
8.375% | | 03/15/2023 | | | | 1,000,000 | | | 1,159,101 | |
Time Warner, Inc., Note | | | | | | | |
7.625% | | 04/15/2031 | | | | 500,000 | | | 558,476 | |
Viacom, Inc., Senior Note | | | | | | | |
7.875% | | 07/30/2030 | | | | 250,000 | | | 286,303 | |
Viacom, Inc., Senior Note | | | | | | | |
6.625% | | 05/15/2011 | | | | 1,000,000 | | | 1,042,665 | |
Viacom, Inc., Senior Note | | | | | | | |
5.625% | | 08/15/2012 | | | | 50,000 | | | 49,711 | |
| | | | | | | | | | |
| | | | | | | | | 6,377,555 | |
| | | | | | | | | | |
Metals—0.2% | | | | | | | |
Alcan, Inc., Note (Canada) | | | | | | | |
6.125% | | 12/15/2033 | | | | 150,000 | | | 154,066 | |
Alcan, Inc., Senior Note (Canada) | | | | | | | |
4.875% | | 09/15/2012 | | | | 350,000 | | | 343,240 | |
Alcoa, Inc., Note | | | | | | | |
7.375% | | 08/01/2010 | | | | 750,000 | | | 822,766 | |
Masco Corporation, Senior Note | | | | | | | |
5.875% | | 07/15/2012 | | | | 250,000 | | | 253,904 | |
| | | | | | | | | | |
| | | | | | | | | 1,573,976 | |
| | | | | | | | | | |
Oil & Gas—1.4% | | | | | | | |
Alberta Energy Ltd., Note | | | | | | | |
7.375% | | 11/01/2031 | | | | 400,000 | | | 491,780 | |
Amerada Hess Corp., Note | | | | | | | |
7.300% | | 08/15/2031 | | | | 250,000 | | | 290,224 | |
Amerada Hess Corporation | | | | | | | |
6.650% | | 08/15/2011 | | | | 150,000 | | | 161,372 | |
Apache Finance Canada Corporation, Note (Canada) | | | | | | | |
7.750% | | 12/15/2029 | | | | 150,000 | | | 196,434 | |
Burlington Resources Finance Company, Guaranteed Note (Canada) | | | | | | | |
7.200% | | 08/15/2031 | | | | 150,000 | | | 186,121 | |
| | | | | | | | | | |
| | | | | | | | | | | |
Coupon
Rate | | Maturity
Date | | | | Face | | | Value | |
| | | | | | | | | | | |
Canadian Natural Resources Ltd., Note (Canada) | | | | | | | |
5.450% | | 10/01/2012 | | | $ | 250,000 | | $ | 255,331 | |
CenterPoint Energy Resources Corp., Series B, Senior Note | | | | | | | |
7.875% | | 04/01/2013 | | | | 350,000 | | | 400,820 | |
Chevron Phillips Chemical Company LLC, Note | | | | | | | |
5.375% | | 06/15/2007 | | | | 350,000 | | | 351,269 | |
Conoco, Inc., Note | | | | | | | |
6.950% | | 04/15/2029 | | | | 750,000 | | | 908,018 | |
Consolidated Natural Gas Company, Senior Note | | | | | | | |
5.000% | | 03/01/2014 | | | | 250,000 | | | 244,728 | |
Devon Financing Corporation ULC, Note | | | | | | | |
7.875% | | 09/30/2031 | | | | 500,000 | | | 637,341 | |
Devon Financing Corporation ULC, Note | | | | | | | |
6.875% | | 09/30/2011 | | | | 750,000 | | | 821,355 | |
Enbridge Energy Partners, LP, Note | | | | | | | |
4.000% | | 01/15/2009 | | | | 50,000 | | | 48,254 | |
Enterprise Products Operating, LP, Note | | | | | | | |
4.950% | | 06/01/2010 | | | | 150,000 | | | 147,233 | |
Enterprise Products Operating, LP, Series B, Senior Note | | | | | | | |
5.600% | | 10/15/2014 | | | | 150,000 | | | 150,140 | |
Enterprise Products Partners, LP, Senior Note | | | | | | | |
6.875% | | 03/01/2033 | | | | 150,000 | | | 159,405 | |
Kinder Morgan Energy Partners, LP, Note | | | | | | | |
6.750% | | 03/15/2011 | | | | 500,000 | | | 533,126 | |
Kinder Morgan Energy Partners, LP, Note | | | | | | | |
5.350% | | 08/15/2007 | | | | 350,000 | | | 351,008 | |
Kinder Morgan, Inc., Note | | | | | | | |
7.250% | | 03/01/2028 | | | | 150,000 | | | 168,408 | |
Kinder Morgan, Inc., Senior Note | | | | | | | |
6.500% | | 09/01/2012 | | | | 250,000 | | | 265,204 | |
Lasmo USA, Inc., Senior Note (United Kingdom) | | | | | | | |
6.750% | | 12/15/2007 | | | | 100,000 | | | 103,510 | |
Marathon Oil Corporation, Note | | | | | | | |
6.125% | | 03/15/2012 | | | | 350,000 | | | 371,610 | |
Nexen, Inc., Note (Canada) | | | | | | | |
5.050% | | 11/20/2013 | | | | 250,000 | | | 246,809 | |
Norsk Hydro AS, Note (Norway) | | | | | | | |
6.360% | | 01/15/2009 | | | | 450,000 | | | 468,502 | |
Occidental Petroleum Corporation, Note | | | | | | | |
7.200% | | 04/01/2028 | | | | 250,000 | | | 303,206 | |
Occidental Petroleum Corporation, Senior Note | | | | | | | |
7.375% | | 11/15/2008 | | | | 400,000 | | | 427,560 | |
Pemex Project Funding Master Trust, Guaranteed Note, 144A | | | | | | | |
9.875% | | 12/02/2008 | | * | | 350,000 | | | 389,375 | |
Pemex Project Funding Master Trust, Note | | | | | | | |
9.125% | | 10/13/2010 | | | | 350,000 | | | 403,725 | |
Pemex Project Funding Master Trust, Note | | | | | | | |
8.625% | | 02/01/2022 | | | | 250,000 | | | 308,750 | |
Pemex Project Funding Master Trust, Note | | | | | | | |
7.375% | | 12/15/2014 | | | | 350,000 | | | 389,725 | |
Petro-Canada, Senior Note (Canada) | | | | | | | |
5.950% | | 05/15/2035 | | | | 250,000 | | | 254,491 | |
Phillips 66 Capital Trust II, Note | | | | | | | |
8.000% | | 01/15/2037 | | | | 750,000 | | | 798,421 | |
Southern California Gas Company, Note | | | | | | | |
4.800% | | 10/01/2012 | | | | 100,000 | | | 99,024 | |
Suncor Energy, Inc., Note | | | | | | | |
7.150% | | 02/01/2032 | | | | 500,000 | | | 611,836 | |
Texaco Capital, Inc., Note | | | | | | | |
5.500% | | 01/15/2009 | | | | 350,000 | | | 359,293 | |
TransCanada Pipelines Ltd., Note (Canada) | | | | | | | |
4.000% | | 06/15/2013 | | | | 250,000 | | | 234,746 | |
Transocean, Inc., Note (Cayman Islands) | | | | | | | |
7.375% | | 04/15/2018 | | | | 100,000 | | | 117,809 | |
| | |
| See accompanying notes to financial statements. | 223 |
SCHEDULE OF INVESTMENTS—(Continued)
December 31, 2005
| | | | | | | | | | |
| | | | | | | | | | | |
Vantagepoint Core Bond | | | | | | | |
Index Fund | | | | | | | |
| | | | | | | | | | | |
|
Coupon
Rate | | Maturity
Date | | | | Face | | | Value | |
| | | | | | | | | | | |
|
CORPORATE OBLIGATIONS—(Continued) | | | | | | | |
| | | | | | | | | | | |
Union Oil Company of California, Guaranteed Senior Note | | | | | | | |
5.050% | | 10/01/2012 | | | $ | 100,000 | | $ | 101,890 | |
Union Pacific Resources Group, Inc., Note | | | | | | | |
7.150% | | 05/15/2028 | | | | 350,000 | | | 406,076 | |
Valero Energy Corporation, Note | | | | | | | |
4.750% | | 06/15/2013 | | | | 500,000 | | | 486,056 | |
XTO Energy, Inc., Senior Note | | | | | | | |
4.900% | | 02/01/2014 | | | | 750,000 | | | 733,601 | |
| | | | | | | | | | |
| | | | | | | | | 14,383,586 | |
| | | | | | | | | | |
Pharmaceuticals—0.5% | | | | | | | |
Abbott Laboratories, Note | | | | | | | |
3.500% | | 02/17/2009 | | | | 250,000 | | | 241,149 | |
American Home Products Corporation, Senior Note | | | | | | | |
6.950% | | 03/15/2011 | | | | 250,000 | | | 269,986 | |
Bristol-Myers Squibb Company, Note | | | | | | | |
5.750% | | 10/01/2011 | | | | 850,000 | | | 878,930 | |
Eli Lilly & Company, Note | | | | | | | |
6.770% | | 01/01/2036 | | | | 250,000 | | | 301,229 | |
Eli Lilly & Company, Note | | | | | | | |
2.900% | | 03/15/2008 | | | | 150,000 | | | 144,037 | |
Genentech, Inc., Senior Note | | | | | | | |
5.250% | | 07/15/2035 | | | | 600,000 | | | 580,336 | |
Genentech, Inc., Senior Note | | | | | | | |
4.750% | | 07/15/2015 | | | | 200,000 | | | 194,987 | |
Genentech, Inc., Senior Note | | | | | | | |
4.400% | | 07/15/2010 | | | | 100,000 | | | 98,328 | |
GlaxoSmithKline Capital, Inc., Guaranteed Note | | | | | | | |
4.375% | | 04/15/2014 | | | | 500,000 | | | 480,142 | |
Johnson & Johnson, Note | | | | | | | |
4.950% | | 05/15/2033 | | | | 200,000 | | | 195,733 | |
Merck & Company, Inc., Note | | | | | | | |
4.750% | | 03/01/2015 | | | | 250,000 | | | 239,528 | |
Merck & Company, Inc., Senior Note | | | | | | | |
4.375% | | 02/15/2013 | | | | 200,000 | | | 190,110 | |
Pharmacia Corporation, Note | | | | | | | |
6.500% | | 12/01/2018 | | | | 350,000 | | | 394,303 | |
Schering-Plough Corporation, Senior Note | | | | | | | |
6.750% | | 12/01/2033 | | | | 250,000 | | | 285,631 | |
Wyeth, Note | | | | | | | |
5.500% | | 03/15/2013 | | | | 100,000 | | | 101,526 | |
Wyeth, Senior Note | | | | | | | |
6.500% | | 02/01/2034 | | | | 250,000 | | | 276,141 | |
Wyeth, Senior Note | | | | | | | |
5.500% | | 02/01/2014 | | | | 250,000 | | | 253,648 | |
| | | | | | | | | | |
| | | | | | | | | 5,125,744 | |
| | | | | | | | | | |
Real Estate—0.1% | | | | | | | |
Archstone Smith Trust REIT, Senior Note | | | | | | | |
5.000% | | 08/15/2007 | | | | 100,000 | | | 99,983 | |
Boston Properties, Inc. REIT | | | | | | | |
6.250% | | 01/15/2013 | | | | 750,000 | | | 787,906 | |
Camden Property Trust REIT, Note | | | | | | | |
5.000% | | 06/15/2015 | | | | 200,000 | | | 192,347 | |
Simon Property Group, LP REIT, Note | | | | | | | |
6.350% | | 08/28/2012 | | | | 250,000 | | | 265,188 | |
| | | | | | | | | | |
| | | | | | | | | 1,345,424 | |
| | | | | | | | | | |
| | | | | | | | | | |
| | | | | | | | | | | |
Coupon
Rate | | Maturity
Date | | | | Face | | | Value | |
| | | | | | | | | | | |
Restaurants—0.0% | | | | | | | |
McDonald’s Corporation, Note, (MTN), (FRN) | | | | | | | |
3.875% | | 08/15/2007 | | | $ | 250,000 | | $ | 246,227 | |
Yum! Brands, Inc., Senior Note | | | | | | | |
7.700% | | 07/01/2012 | | | | 250,000 | | | 276,589 | |
| | | | | | | | | | |
| | | | | | | | | 522,816 | |
| | | | | | | | | | |
Retailers—0.6% | | | | | | | |
Costco Wholesale Corporation, Senior Note | | | | | | | |
5.500% | | 03/15/2007 | | | | 250,000 | | | 251,541 | |
CVS Corporation, Note | | | | | | | |
4.875% | | 09/15/2014 | | | | 530,000 | | | 512,459 | |
Federated Department Stores, Inc., Senior Note | | | | | | | |
6.900% | | 04/01/2029 | | | | 500,000 | | | 545,661 | |
Federated Department Stores, Inc., Senior Note | | | | | | | |
6.300% | | 04/01/2009 | | | | 253,000 | | | 261,094 | |
Fred Meyer, Inc., Note | | | | | | | |
7.450% | | 03/01/2008 | | | | 750,000 | | | 781,874 | |
Limited Brands, Note | | | | | | | |
5.250% | | 11/01/2014 | | | | 250,000 | | | 236,378 | |
May Department Stores Company (The), Note | | | | | | | |
7.900% | | 10/15/2007 | | | | 250,000 | | | 260,396 | |
May Department Stores Company (The), Note | | | | | | | |
5.750% | | 07/15/2014 | | | | 250,000 | | | 255,313 | |
Target Corporation, Note | | | | | | | |
7.000% | | 07/15/2031 | | | | 350,000 | | | 425,648 | |
Wal-Mart Stores, Inc., Note | | | | | | | |
7.550% | | 02/15/2030 | | | | 750,000 | | | 959,987 | |
Wal-Mart Stores, Inc., Note | | | | | | | |
6.875% | | 08/10/2009 | | | | 750,000 | | | 798,843 | |
Wal-Mart Stores, Inc., Note | | | | | | | |
4.550% | | 05/01/2013 | | | | 500,000 | | | 488,154 | |
Wal-Mart Stores, Inc., Note | | | | | | | |
4.125% | | 02/15/2011 | | | | 250,000 | | | 241,819 | |
| | | | | | | | | | |
| | | | | | | | | 6,019,167 | |
| | | | | | | | | | |
Telecommunications—0.1% | | | | | | | |
Verizon Global Funding Corporation | | | | | | | |
7.375% | | 09/01/2012 | | | | 1,000,000 | | | 1,116,724 | |
| | | | | | | | | | |
Telephone Systems—1.5% | | | | | | | |
Alltel Corporation, Senior Note | | | | | | | |
7.000% | | 07/01/2012 | | | | 250,000 | | | 275,222 | |
America Movil SA de CV, Guaranteed Senior Note (Mexico) | | | | | | | |
5.500% | | 03/01/2014 | | | | 100,000 | | | 99,010 | |
AT&T Wireless Services, Inc., Senior Note | | | | | | | |
8.750% | | 03/01/2031 | | | | 250,000 | | | 332,191 | |
AT&T Wireless Services, Inc., Senior Note | | | | | | | |
7.875% | | 03/01/2011 | | | | 750,000 | | | 842,443 | |
Bellsouth Capital Funding Corporation, Note | | | | | | | |
7.875% | | 02/15/2030 | | | | 900,000 | | | 1,089,725 | |
BellSouth Corporation, Note | | | | | | | |
6.875% | | 10/15/2031 | | | | 350,000 | | | 385,412 | |
BellSouth Corporation, Note | | | | | | | |
6.000% | | 10/15/2011 | | | | 250,000 | | | 260,202 | |
British Telecommunications PLC, Note (United Kingdom) | | | | | | | |
8.875% | | 12/15/2030 | | | | 150,000 | | | 201,285 | |
British Telecommunications PLC, Note (United Kingdom) | | | | | | | |
8.375% | | 12/15/2010 | | | | 500,000 | | | 569,765 | |
Deutsche Telekom International Finance BV, Guaranteed Note (Netherlands) | | | | | | | |
8.250% | | 06/15/2030 | | | | 750,000 | | | 956,750 | |
| | |
224 | See accompanying notes to financial statements. | |
SCHEDULE OF INVESTMENTS—(Continued)
December 31, 2005
| | | | | | | | | | |
| | | | | | | | | | | |
Vantagepoint Core Bond | | | | | | | |
Index Fund | | | | | | | |
| | | | | | | | | | | |
|
Coupon
Rate | | Maturity
Date | | | | Face | | | Value | |
| | | | | | | | | | | |
|
CORPORATE OBLIGATIONS—(Continued) | | | | | | | |
| | | | | | | | | | | |
Deutsche Telekom International Finance BV, Note (Netherlands) | | | | | | | |
8.000% | | 06/15/2010 | | | $ | 700,000 | | $ | 794,383 | |
France Telecom SA, Global Step Note (France) | | | | | | | |
8.500% | | 03/01/2031 | | | | 500,000 | | | 669,159 | |
France Telecom SA, Global Step Note (France) | | | | | | | |
7.750% | | 03/01/2011 | | | | 100,000 | | | 111,814 | |
GTE Corporation, Note | | | | | | | |
7.510% | | 04/01/2009 | | | | 200,000 | | | 212,472 | |
Royal KPN NV, Note (Netherlands) | | | | | | | |
8.000% | | 10/01/2010 | | | | 350,000 | | | 384,769 | |
SBC Communications, Inc., Global Note | | | | | | | |
6.150% | | 09/15/2034 | | | | 500,000 | | | 503,923 | |
SBC Communications, Inc., Global Note | | | | | | | |
5.100% | | 09/15/2014 | | | | 500,000 | | | 489,288 | |
Sprint Capital Corporation, Guaranteed Note | | | | | | | |
6.375% | | 05/01/2009 | | | | 750,000 | | | 779,003 | |
Sprint Capital Corporation, Note | | | | | | | |
8.375% | | 03/15/2012 | | | | 850,000 | | | 986,334 | |
Sprint Capital Corporation, Note | | | | | | | |
6.875% | | 11/15/2028 | | | | 500,000 | | | 547,980 | |
Sprint Capital Corporation, Note | | | | | | | |
6.125% | | 11/15/2008 | | | | 1,000,000 | | | 1,028,982 | |
Telecom Italia Capital SA, Guaranteed Senior Note (Luxembourg) | | | | | | | |
6.000% | | 09/30/2034 | | | | 250,000 | | | 241,645 | |
Telecom Italia Capital SA, Series B, Senior Note (Luxembourg) | | | | | | | |
5.250% | | 11/15/2013 | | | | 350,000 | | | 343,992 | |
Telefonica Europe BV (Netherlands) | | | | | | | |
8.250% | | 09/15/2030 | | | | 350,000 | | | 436,358 | |
TELUS Corporation, Note (Canada) | | | | | | | |
7.500% | | 06/01/2007 | | | | 500,000 | | | 516,489 | |
Verizon Global Funding Corporation, Note | | | | | | | |
7.750% | | 12/01/2030 | | | | 750,000 | | | 894,183 | |
Verizon Pennsylvania, Inc., Note, Class A | | | | | | | |
5.650% | | 11/15/2011 | | | | 350,000 | | | 349,420 | |
Verizon Virginia, Inc., Note | | | | | | | |
4.625% | | 03/15/2013 | | | | 250,000 | | | 231,913 | |
Vodafone Group PLC, Note (United Kingdom) | | | | | | | |
7.875% | | 02/15/2030 | | | | 250,000 | | | 313,028 | |
Vodafone Group PLC, Note (United Kingdom) | | | | | | | |
7.750% | | 02/15/2010 | | | | 550,000 | | | 602,929 | |
| | | | | | | | | | |
| | | | | | | | | 15,450,069 | |
| | | | | | | | | | |
Transportation—0.4% | | | | | | | |
Burlington Northern Santa Fe Corporation, Note | | | | | | | |
7.125% | | 12/15/2010 | | | | 750,000 | | | 817,144 | |
Canadian National Railway Company, Note (Canada) | | | | | | | |
4.400% | | 03/15/2013 | | | | 585,000 | | | 561,544 | |
CSX Corporation, Note | | | | | | | |
6.750% | | 03/15/2011 | | | | 300,000 | | | 321,845 | |
Norfolk Southern Corporation, Note | | | | | | | |
7.700% | | 05/15/2017 | | | | 350,000 | | | 418,488 | |
Norfolk Southern Corporation, Note | | | | | | | |
7.050% | | 05/01/2037 | | | | 500,000 | | | 598,753 | |
Union Pacific Corporation, Note, (MTN), (FRN) | | | | | | | |
6.790% | | 11/09/2007 | | | | 750,000 | | | 774,465 | |
| | | | | | | | | | |
| | | | | | | | | | | |
Coupon
Rate | | Maturity
Date | | | | Face | | | Value | |
| | | | | | | | | | | |
Union Pacific Corporation, Note | | | | | | | |
6.625% | | 02/01/2029 | | | $ | 250,000 | | $ | 283,221 | |
| | | | | | | | | | |
| | | | | | | | | 3,775,460 | |
| | | | | | | | | | |
TOTAL CORPORATE OBLIGATIONS
(Cost $214,478,571) | | | | | | 214,856,180 | |
| | | | | | | | | | |
| | | | | | | |
| | | | | | | | | | | |
U.S. GOVERNMENT AGENCY OBLIGATIONS—46.1% | | | | | | | |
| | | | | | | | |
U.S. Government Agencies—11.3% | | | | | | | |
Federal Home Loan Bank | | | | | | | |
6.750% | | 08/15/2007 | | | | 700,000 | | | 721,628 | |
5.945% | | 07/28/2008 | | | | 2,000,000 | | | 2,055,048 | |
5.750% | | 05/15/2012 | | | | 1,375,000 | | | 1,449,793 | |
5.250% | | 06/18/2014 | | | | 5,500,000 | | | 5,678,129 | |
4.375% | | 03/17/2010 | | | | 825,000 | | | 814,172 | |
4.000% | | 03/10/2008 | | | | 500,000 | | | 492,792 | |
3.625% | | 06/20/2007 | | | | 4,200,000 | | | 4,135,223 | |
3.000% | | 04/15/2009 | | | | 6,000,000 | | | 5,692,296 | |
2.750% | | 03/14/2008 | | | | 1,750,000 | | | 1,679,510 | |
2.625% | | 02/16/2007 | | | | 4,500,000 | | | 4,396,946 | |
Federal Home Loan Mortgage Corporation | | | | | | | |
6.750% | | 09/15/2029 | | | | 770,000 | | | 955,355 | |
6.250% | | 07/15/2032 | | | | 500,000 | | | 597,195 | |
6.000% | | 06/15/2011 | | | | 3,900,000 | | | 4,132,850 | |
5.750% | | 04/15/2008-
01/15/2012 | | | | 2,550,000 | | | 2,624,693 | |
5.200% | | 03/05/2019 | | | | 200,000 | | | 195,642 | |
5.125% | | 07/15/2012 | | | | 2,000,000 | | | 2,039,372 | |
5.000% | | 01/30/2014 | | | | 600,000 | | | 592,340 | |
4.750% | | 12/08/2010 | | | | 500,000 | | | 499,710 | |
4.500% | | 08/04/2008-
01/15/2015 | | | | 4,600,000 | | | 4,516,351 | |
4.375% | | 11/16/2007-
03/01/2010 | | | | 5,030,000 | | | 4,969,315 | |
4.250% | | 06/23/2008 | | | | 1,000,000 | | | 984,661 | |
4.125% | | 09/01/2009-
02/24/2011 | | | | 5,150,000 | | | 5,033,260 | |
4.000% | | 09/22/2009 | | | | 560,000 | | | 543,201 | |
3.625% | | 09/15/2008 | | | | 4,260,000 | | | 4,144,673 | |
3.500% | | 09/15/2007-
04/01/2008 | | | | 8,360,000 | | | 8,198,181 | |
3.300% | | 09/14/2007 | | | | 300,000 | | | 292,750 | |
3.250% | | 11/02/2007 | | | | 500,000 | | | 485,518 | |
2.875% | | 05/15/2007 | | | | 4,750,000 | | | 4,633,929 | |
2.850% | | 02/23/2007 | | | | 1,000,000 | | | 979,153 | |
2.400% | | 03/29/2007 | | | | 1,000,000 | | | 972,067 | |
Federal National Mortgage Association | | | | | | | |
7.250% | | 01/15/2010 | | | | 2,800,000 | | | 3,053,504 | |
6.625% | | 09/15/2009-
11/15/2030 | | | | 5,450,000 | | | 5,946,046 | |
6.375% | | 06/15/2009 | | | | 394,000 | | | 414,248 | |
6.250% | | 05/15/2029 | | | | 2,240,000 | | | 2,647,366 | |
6.000% | | 05/15/2011 | | | | 1,500,000 | | | 1,588,274 | |
5.500% | | 03/15/2011 | | | | 1,400,000 | | | 1,448,734 | |
4.750% | | 02/21/2013 | | | | 600,000 | | | 593,626 | |
4.625% | | 06/01/2010-
10/15/2013 | | | | 7,000,000 | | | 6,922,020 | |
4.500% | | 08/04/2008-
10/15/2008 | | | | 5,500,000 | | | 5,468,273 | |
4.375% | | 07/17/2013 | | | | 600,000 | | | 580,304 | |
4.250% | | 09/15/2007 | | | | 2,830,000 | | | 2,808,042 | |
3.650% | | 11/30/2007 | | | | 1,000,000 | | | 980,688 | |
3.250% | | 01/15/2008 | | | | 4,000,000 | | | 3,887,652 | |
3.000% | | 03/02/2007 | | | | 1,000,000 | | | 980,338 | |
2.625% | | 01/19/2007 | | | | 1,000,000 | | | 978,553 | |
0.000% | | 06/01/2017 | | | | 1,000,000 | | | 572,842 | |
| | |
| See accompanying notes to financial statements. | 225 |
SCHEDULE OF INVESTMENTS— (Continued)
December 31, 2005
| | | | | | | | | | |
| | | | | | | | | | | |
Vantagepoint Core Bond
Index Fund | | | | | | | | |
| | | | | | | | | | | |
|
Coupon
Rate | | Maturity
Date | | | | Face | | | Value | |
| | | | | | | | | | | |
|
U.S. GOVERNMENT AGENCY OBLIGATIONS—(Continued) | | | | | | | |
| | | | | | | | | | | |
Financing Corporation, Note | | | | | | | | |
9.650% | | 11/02/2018 | | | $ | 500,000 | | $ | 720,846 | |
8.600% | | 09/26/2019 | | | | 500,000 | | | 675,754 | |
Tennessee Valley Authority | | | | | | | | |
6.250% | | 12/15/2017 | | | | 1,200,000 | | | 1,345,014 | |
| | | | | | | | | | |
| | | | | | | | | 116,117,877 | |
| | | | | | | | | | |
U.S. Government Agencies—Mortgage Backed—34.8% | | | | | | | |
Federal Home Loan Mortgage Corporation | | | | | | | |
7.500% | | 06/01/2027-
10/01/2029 | | | | 926,598 | | | 974,927 | |
7.000% | | 02/01/2016-
11/01/2033 | | | | 2,327,106 | | | 2,426,020 | |
6.500% | | 05/01/2008-
07/01/2035 | | | | 12,830,700 | | | 13,182,556 | |
6.000% | | 11/01/2016-
12/01/2033 | | | | 14,563,521 | | | 14,760,651 | |
5.500% | | 02/01/2018-
11/01/2035 | | | | 41,786,927 | | | 41,578,799 | |
5.000% | | 05/01/2018-
10/01/2035 | | | | 47,870,457 | | | 46,760,702 | |
4.500% | | 07/01/2011-
11/01/2034 | | | | 21,081,836 | | | 20,449,343 | |
| | | | | | | | | | |
4.000% | | 04/01/2009-
05/01/2019 | | | | 3,423,386 | | | 3,275,188 | |
3.500% | | 05/01/2011 | | | | 76,117 | | | 72,541 | |
Federal Home Loan Mortgage Corporation TBA | | | | | | | |
5.000% | | 01/01/2036 | | | | 2,200,000 | | | 2,129,186 | |
Federal National Mortgage Association | | | | | | | |
7.500% | | 06/01/2030-
07/01/2031 | | | | 93,889 | | | 98,471 | |
7.000% | | 03/01/2030-
10/01/2034 | | | | 2,516,707 | | | 2,627,057 | |
6.500% | | 02/01/2017-
11/01/2033 | | | | 8,081,291 | | | 8,307,702 | |
6.000% | | 04/01/2014-
10/01/2035 | | | | 21,993,220 | | | 22,249,032 | |
5.500% | | 01/01/2018-
12/01/2035 | | | | 56,692,905 | | | 56,319,975 | |
5.000% | | 03/01/2018-
11/01/2035 | | | | 57,397,099 | | | 55,981,740 | |
4.500% | | 08/01/2011-
08/01/2035 | | | | 17,950,108 | | | 17,324,667 | |
4.000% | | 07/01/2011-
11/01/2019 | | | | 5,912,111 | | | 5,663,158 | |
Federal National Mortgage Association TBA | | | | | | | |
6.000% | | 01/01/2032 | | | | 3,900,000 | | | 3,935,342 | |
5.500% | | 01/01/2035 | | | | 4,300,000 | | | 4,257,000 | |
5.000% | | 01/01/2019-
01/01/2035 | | | | 3,700,000 | | | 3,645,529 | |
Government National Mortgage Association | | | | | | | |
7.500% | | 12/15/2029-
05/15/2032 | | | | 1,360,579 | | | 1,431,476 | |
7.000% | | 09/15/2031 | | | | 996,869 | | | 1,047,180 | |
6.500% | | 03/15/2026-
10/15/2032 | | | | 3,187,029 | | | 3,331,960 | |
6.000% | | 02/15/2033-
11/15/2034 | | | | 5,964,021 | | | 6,112,886 | |
| | | | | | | | | | |
| | | | | | | | | | | |
Coupon
Rate | | Maturity
Date | | | | Face | | | Value | |
| | | | | | | | | | | |
5.500% | | 03/15/2033-
12/15/2035 | | | $ | 13,416,722 | | $ | 13,518,650 | |
5.000% | | 05/15/2033-
12/15/2035 | | | | 8,051,417 | | | 7,955,808 | |
| | | | | | | | | | |
| | | | | | | | | 359,417,546 | |
| | | | | | | | | | |
TOTAL U.S. GOVERNMENT AGENCY OBLIGATIONS
(Cost $482,934,619) | | | | | | 475,535,423 | |
| | | | | | | |
| | | | | | | | | | | |
U.S. TREASURY OBLIGATIONS—24.7% | | | | | | | |
| | | | | | | | |
U.S. Treasury Bonds—7.7% | | | | | | | |
U.S. Treasury Bond | | | | | | | | |
13.875% | | 05/15/2011 | | | | 600,000 | | | 620,672 | |
13.250% | | 05/15/2014 | | | | 850,000 | | | 1,082,755 | |
11.750% | | 11/15/2014 | | † | | 500,000 | | | 629,688 | |
11.250% | | 02/15/2015 | | | | 500,000 | | | 752,969 | |
10.375% | | 11/15/2012 | | † | | 300,000 | | | 331,641 | |
9.875% | | 11/15/2015 | | | | 1,550,000 | | | 2,214,927 | |
9.250% | | 02/15/2016 | | | | 4,700,000 | | | 6,514,825 | |
9.125% | | 05/15/2018 | | | | 1,000,000 | | | 1,430,391 | |
8.750% | | 05/15/2017 | | | | 1,100,000 | | | 1,510,868 | |
8.125% | | 08/15/2019 | | | | 4,830,000 | | | 6,554,088 | |
8.000% | | 11/15/2021 | | † | | 4,810,000 | | | 6,628,218 | |
7.875% | | 02/15/2021 | | | | 3,500,000 | | | 4,737,852 | |
7.625% | | 02/15/2025 | | | | 600,000 | | | 826,922 | |
7.500% | | 11/15/2024 | | | | 1,350,000 | | | 1,835,947 | |
7.250% | | 05/15/2016- | | | | | | | | |
| | 08/15/2022 | | | | 5,100,000 | | | 6,486,965 | |
7.125% | | 02/15/2023 | | | | 2,425,000 | | | 3,137,724 | |
6.500% | | 11/15/2026 | | | | 3,150,000 | | | 3,937,503 | |
6.250% | | 05/15/2030 | | † | | 4,160,000 | | | 5,167,827 | |
6.125% | | 11/15/2027 | | | | 2,600,000 | | | 3,138,283 | |
6.000% | | 02/15/2026 | | | | 2,000,000 | | | 2,359,064 | |
5.750% | | 08/15/2010 | | | | 8,310,000 | | | 8,793,999 | |
5.375% | | 02/15/2031 | | † | | 1,741,000 | | | 1,956,177 | |
5.250% | | 02/15/2029 | | | | 3,130,000 | | | 3,416,470 | |
5.000% | | 08/15/2011 | | † | | 5,100,000 | | | 5,265,551 | |
| | | | | | | | | | |
| | | | | | | | | 79,331,326 | |
| | | | | | | | | | |
| | | | | | | | | | |
U.S. Treasury Notes—17.0% | | | | | | | |
U.S. Treasury Note | | | | | | | |
6.125% | | 08/15/2007 | | | | 4,350,000 | | | 4,466,567 | |
6.000% | | 08/15/2009 | | | | 4,470,000 | | | 4,712,359 | |
5.625% | | 05/15/2008 | | | | 4,800,000 | | | 4,932,379 | |
5.500% | | 02/15/2008- | | | | | | | | |
| | 05/15/2009 | | | | 5,000,000 | | | 5,149,807 | |
4.875% | | 02/15/2012 | | | | 2,095,000 | | | 2,151,550 | |
4.750% | | 11/15/2008 | | | | 9,100,000 | | | 9,190,290 | |
4.375% | | 05/15/2007- | | | | | | | | |
| | 08/15/2012 | | | | 12,170,000 | | | 12,168,730 | |
4.250% | | 10/31/2007- | | | | | | | | |
| | 11/15/2014 | | † | | 15,750,000 | | | 15,613,794 | |
4.125% | | 05/15/2015 | | † | | 6,630,000 | | | 6,486,785 | |
4.000% | | 08/31/2007- | | | | | | | | |
| | 02/15/2015 | | † | | 41,960,000 | | | 41,261,013 | |
3.875% | | 02/15/2013 | | † | | 5,900,000 | | | 5,720,469 | |
3.750% | | 05/15/2008 | | | | 2,400,000 | | | 2,366,626 | |
3.625% | | 07/15/2009- | | | | | | | | |
| | 05/15/2013 | | | | 4,910,000 | | | 4,706,399 | |
3.500% | | 12/15/2009 | | † | | 4,170,000 | | | 4,041,481 | |
3.375% | | 02/28/2007- | | | | | | | | |
| | 10/15/2009 | | | | 6,500,000 | | | 6,344,571 | |
3.250% | | 01/15/2009 | | † | | 7,630,000 | | | 7,390,075 | |
3.125% | | 01/31/2007- | | | | | | | | |
| | 04/15/2009 | | | | 9,070,000 | | | 8,891,743 | |
3.000% | | 11/15/2007- | | | | | | | | |
| | 02/15/2008 | | † | | 19,420,000 | | | 18,922,317 | |
| | |
226 | See accompanying notes to financial statements. | |
SCHEDULE OF INVESTMENTS— (Continued)
December 31, 2005
| | | | | | | | | | |
| | | | | | | | | | | |
Vantagepoint Core Bond
Index Fund | | | | | | | | |
| | | | | | | | | | | |
|
Coupon
Rate | | Maturity
Date | | | | Face | | | Value | |
| | | | | | | | | | | |
|
U.S. TREASURY OBLIGATIONS—(Continued) | | | | | | | |
| | | | | | | | |
2.750% | | 08/15/2007 | | † | $ | 7,700,000 | | $ | 7,503,296 | |
2.625% | | 05/15/2008 | | | | 3,500,000 | | | 3,363,283 | |
| | | | | | | | | | |
| | | | | | | | | 175,383,534 | |
| | | | | | | | | | |
| | | | | | | | | | |
TOTAL U.S. TREASURY OBLIGATIONS
(Cost $255,588,455) | | | | | | 254,714,860 | |
| | | | | | | |
| | | | | | | | |
MUNICIPAL OBLIGATIONS—0.3% | | | | | | | |
| | | | | | | | |
Financial Services—0.3% | | | | | | | |
Illinois State (Illinois) | | | | | | | |
5.100% | | 06/01/2033 | | | | 1,100,000 | | | 1,086,492 | |
New Jersey Economic Development Authority (New Jersey) | | | | | | | |
7.425% | | 02/15/2029 | | | | 500,000 | | | 644,705 | |
New Jersey State Turnpike Authority (New Jersey) | | | | | | | |
4.252% | | 01/01/2016 | | | | 550,000 | | | 522,246 | |
Oregon State (Oregon) | | | | | | | |
5.762% | | 06/01/2023 | | | | 200,000 | | | 214,352 | |
| | | | | | | | | | |
TOTAL MUNICIPAL OBLIGATIONS
(Cost $2,331,635) | | | | | | 2,467,795 | |
| | | | | | | |
| | | | | | | | |
SOVEREIGN DEBT OBLIGATIONS—1.8% | | | | | | | |
| | | | | | | | |
Government Issued—1.8% | | | | | | | |
British Columbia (Province of) (Canada) | | | | | | | |
6.500% | | 01/15/2026 | | | | 150,000 | | | 179,305 | |
Canadian Government (Canada) | | | | | | | |
5.250% | | 11/05/2008 | | | | 250,000 | | | 255,841 | |
Hydro Quebec (Canada) | | | | | | | |
6.300% | | 05/11/2011 | | | | 350,000 | | | 373,772 | |
Hydro-Quebec (Canada) | | | | | | | |
8.050% | | 07/07/2024 | | | | 500,000 | | | 671,602 | |
Italian Republic (Italy) | | | | | | | |
6.875% | | 09/27/2023 | | | | 750,000 | | | 897,090 | |
Italian Republic (Italy) | | | | | | | |
6.000% | | 02/22/2011 | | | | 1,550,000 | | | 1,643,350 | |
Italian Republic (Italy) | | | | | | | |
5.375% | | 06/15/2033 | | | | 500,000 | | | 511,146 | |
Italian Republic (Italy) | | | | | | | |
4.375% | | 06/15/2013 | | | | 1,000,000 | | | 981,542 | |
Italian Republic (Italy) | | | | | | | |
3.750% | | 12/14/2007 | | | | 500,000 | | | 491,408 | |
Italian Republic (Italy) | | | | | | | |
3.250% | | 05/15/2009 | | | | 500,000 | | | 477,891 | |
Malaysia Government (Malaysia) | | | | | | | |
8.750% | | 06/01/2009 | | | | 500,000 | | | 559,054 | |
Malaysia Government (Malaysia) | | | | | | | |
7.500% | | 07/15/2011 | | | | 250,000 | | | 280,151 | |
New Brunswick Province (Canada) | | | | | | | |
3.500% | | 10/23/2007 | | | | 150,000 | | | 146,893 | |
Nova Scotia Province (Canada) | | | | | | | |
5.750% | | 02/27/2012 | | | | 350,000 | | | 366,333 | |
Ontario Province (Canada) | | | | | | | |
5.500% | | 10/01/2008 | | | | 550,000 | | | 560,999 | |
Ontario Province (Canada) | | | | | | | |
3.625% | | 10/21/2009 | | | | 250,000 | | | 239,497 | |
Ontario Province (Canada) | | | | | | | |
3.282% | | 03/28/2008 | | | | 250,000 | | | 241,958 | |
People’s Republic of China (China) | | | | | | | |
4.750% | | 10/29/2013 | | | | 250,000 | | | 245,409 | |
Quebec Province (Canada) | | | | | | | | |
7.500% | | 09/15/2029 | | | | 200,000 | | | 263,518 | |
| | | | | | | | | | |
| | | | | | | | | | | |
Coupon
Rate | | Maturity
Date | | | | Face | | | Value | |
| | | | | | | | | | | |
Quebec Province (Canada) | | | | | | | | |
6.125% | | 01/22/2011 | | | $ | 850,000 | | $ | 899,461 | |
Quebec Province (Canada) | | | | | | | |
5.750% | | 02/15/2009 | | | | 850,000 | | | 875,456 | |
Region of Lombardy (Italy) | | | | | | | | |
5.804% | | 10/25/2032 | | | | 100,000 | | | 108,201 | |
Republic of Chile (Chile) | | | | | | | | |
5.500% | | 01/15/2013 | | | | 150,000 | | | 153,600 | |
Republic of Finland (Finland) | | | | | | | | |
6.950% | | 02/15/2026 | | | | 150,000 | | | 186,360 | |
Republic of Korea (South Korea) | | | | | | | | |
8.875% | | 04/15/2008 | | | | 250,000 | | | 274,081 | |
Republic of Poland (Poland) | | | | | | | | |
5.250% | | 01/15/2014 | | | | 200,000 | | | 203,900 | |
Republic of South Africa (South Africa) | | | | | | | |
7.375% | | 04/25/2012 | | | | 250,000 | | | 278,750 | |
Saskatchewan Province (Canada) | | | | | | | |
7.375% | | 07/15/2013 | | | | 230,000 | | | 268,769 | |
State of Israel (Israel) | | | | | | | |
5.125% | | 03/01/2014 | | | | 250,000 | | | 249,587 | |
United Mexican States (Mexico) | | | | | | | | |
9.875% | | 01/15/2007 | | | | 150,000 | | | 158,137 | |
United Mexican States (Mexico) | | | | | | | | |
8.625% | | 03/12/2008 | | | | 1,000,000 | | | 1,078,000 | |
United Mexican States (Mexico) | | | | | | | | |
8.375% | | 01/14/2011 | | | | 500,000 | | | 571,250 | |
United Mexican States (Mexico) | | | | | | | | |
8.300% | | 08/15/2031 | | | | 500,000 | | | 643,750 | |
United Mexican States (Mexico) | | | | | | | | |
8.125% | | 12/30/2019 | | | | 750,000 | | | 922,500 | |
United Mexican States (Mexico) | | | | | | | | |
7.500% | | 04/08/2033 | | | | 400,000 | | | 474,600 | |
United Mexican States (Mexico) | | | | | | | | |
6.625% | | 03/03/2015 | | | | 500,000 | | | 548,750 | |
United Mexican States (Mexico) | | | | | | | | |
6.375% | | 01/16/2013 | | | | 1,150,000 | | | 1,224,750 | |
| | | | | | | | | | |
TOTAL SOVEREIGN DEBT OBLIGATIONS
(Cost $18,169,624) | | | | | | 18,506,661 | |
| | | | | | | | | | |
| | | | | | | | | | |
| | | | | | | | |
ASSET BACKED SECURITIES—1.6% | | | | | | | |
| | | | | | | | |
Automotive—0.7% | | | | | | | |
AmeriCredit Automobile Receivables Trust,
Series 2003-D-M, Class A-4 | | | | | | | |
2.840% | | 08/06/2010 | | | | 1,000,000 | | | 983,402 | |
Honda Auto Receivables Owner Trust,
Series 2004-1, Class A4 | | | | | | | |
3.060% | | 10/21/2009 | | | | 1,000,000 | | | 975,333 | |
Household Auto Receivables Trust,
Series 2002-3, Class A4A | | | | | | | |
3.440% | | 05/18/2009 | | | | 1,585,200 | | | 1,572,691 | |
WFS Financial Owner Trust,
Series 2003-3, Class A4 | | | | | | | |
3.250% | | 05/20/2011 | | | | 900,000 | | | 886,392 | |
WFS Financial Owner Trust,
Series 2004-4, Class A4 | | | | | | | |
3.440% | | 05/17/2012 | | | | 2,750,000 | | | 2,677,294 | |
| | | | | | | | | | |
| | | | | | | | | 7,095,112 | |
| | | | | | | | | | |
Credit Cards—0.6% | | | | | | | |
Bank One Issuance Trust,
Series 2003-A7, Class A7 | | | | | | | |
3.350% | | 03/15/2011 | | | | 1,500,000 | | | 1,450,006 | |
Capital One Master Trust,
Series 2001-8, Class A | | | | | | | |
4.600% | | 08/17/2009 | | | | 400,000 | | | 399,377 | |
| | |
| See accompanying notes to financial statements. | 227 |
SCHEDULE OF INVESTMENTS — (Continued)
December 31, 2005
| | | | | | | | | | |
| | | | | | | | |
Vantagepoint Core Bond
Index Fund | | | | | | | |
| | | | | | | | | | | |
|
Coupon
Rate | | Maturity
Date | | | | Face | | | Value | |
| | | | | | | | | | | |
|
ASSET BACKED SECURITIES— (Continued) | | | | | | | |
| | | | | | | | |
Citibank Credit Card Issuance Trust,
Series 2001-A6, Class A6 | | | | | | | |
5.650% | | 06/16/2008 | | | $ | 1,975,000 | | $ | 1,983,622 | |
Citibank Credit Card Master Trust I,
Series 1999-2, Class A | | | | | | | |
5.875% | | 03/10/2011 | | | | 1,500,000 | | | 1,546,725 | |
MBNA Master Credit Card Trust,
Series 1999-B, Class A | | | | | | | |
5.900% | | 08/15/2011 | | | | 825,000 | | | 852,901 | |
| | | | | | | | | | |
| | | | | | | | | 6,232,631 | |
| | | | | | | | | | |
Electric Utilities—0.3% | | | | | | | |
Detroit Edison Securitization Funding LLC,
Series 2001-1, Class A6 | | | | | | | |
6.620% | | 03/01/2016 | | | | 2,700,000 | | | 2,996,596 | |
| | | | | | | | | | |
TOTAL ASSET BACKED SECURITIES
(Cost $16,782,454) | | | | | | 16,324,339 | |
| | | | | | | | | | |
|
| | | | | | | | |
NON-U.S. GOVERNMENT MORTGAGE-BACKED
SECURITIES—3.7% | | | | | | | |
| | | | | | | | |
Mortgage Backed—3.7% | | | | | | | |
Banc of America Commercial Mortgage, Inc.,
Series 2002-2, Class A3 | | | | | | | |
5.118% | | 07/11/2043 | | | | 500,000 | | | 501,244 | |
Banc of America Commercial Mortgage, Inc.,
Series 2004-2, Class A3 | | | | | | | |
4.050% | | 11/10/2038 | | | | 3,000,000 | | | 2,870,939 | |
Banc of America Commercial Mortgage, Inc.,
Series 2004-6, Class A5 | | | | | | | |
4.811% | | 12/10/2042 | | | | 500,000 | | | 487,804 | |
Citigroup Commercial Mortgage Trust,
Series 2004-C1, Class A3 | | | | | | | |
5.251% | | 04/15/2040 | | | | 750,000 | | | 754,536 | |
CS First Boston Mortgage Securities Corporation,
Series 1998-C2, Class A2 | | | | | | | |
6.300% | | 11/11/2030 | | | | 407,000 | | | 420,071 | |
CS First Boston Mortgage Securities Corporation,
Series 2003-C5, Class A2 | | | | | | | |
3.808% | | 12/15/2036 | | | | 1,000,000 | | | 971,367 | |
First Union National Bank Commercial Mortgage,
Series 2001-C3, Class A2 | | | | | | | |
6.180% | | 08/15/2033 | | | | 763,699 | | | 769,119 | |
GE Capital Commercial Mortgage Corporation,
Series 2001-A, Class A2 | | | | | | | |
6.531% | | 05/15/2033 | | | | 3,500,000 | | | 3,722,135 | |
GE Capital Commercial Mortgage Corporation,
Series 2004-C1, Class A2 | | | | | | | |
3.915% | | 11/10/2038 | | | | 1,000,000 | | | 961,164 | |
GMAC Commercial Mortgage Securities, Inc.,
Series 2000-C1, Class A2 | | | | | | | |
7.724% | | 03/15/2033 | | | | 1,707,000 | | | 1,858,524 | |
GMAC Commercial Mortgage Securities, Inc.,
Series 2004-C1, Class A3 | | | | | | | |
4.776% | | 03/10/2038 | | | | 1,000,000 | | | 978,466 | |
JP Morgan Chase Commercial Mortgage Securities Corporation,
Series 2003-CIBC7, Class A3 | | | | | | | |
4.449% | | 01/12/2038 | | | | 2,000,000 | | | 1,945,038 | |
JP Morgan Chase Commercial Mortgage Securities Corporation,
Series 2004-CB9, Class A4 | | | | | | | |
5.380% | | 06/12/2041 | | | | 750,000 | | | 768,562 | |
JP Morgan Chase Commercial Mortgage Securities Corporation,
Series 2004-CIBC10, Class AJ | | | | | | | |
4.951% | | 01/12/2037 | | | | 1,750,000 | | | 1,708,551 | |
| | | | | | | | | | |
| | | | | | | | | | | |
Coupon
Rate | | Maturity
Date | | | | Face | | | Value | |
| | | | | | | | | | | |
LB Commercial Mortgage Trust,
Series 1991-C1, Class A2 | | | | | | | |
6.780% | | 06/15/2031 | | | $ | 6,000,000 | | $ | 6,302,879 | |
LB-UBS Commercial Mortgage Trust,
Series 2002-C4, Class A5 | | | | | | | |
4.853% | | 09/15/2031 | | | | 1,500,000 | | | 1,477,930 | |
LB-UBS Commercial Mortgage Trust,
Series 2003-C8, Class A2 | | | | | | | |
4.207% | | 11/15/2027 | | | | 1,000,000 | | | 978,919 | |
LB-UBS Commercial Mortgage Trust,
Series 2004-C7, Class A6 | | | | | | | |
4.786% | | 10/15/2029 | | | | 1,000,000 | | | 974,068 | |
Merrill Lynch Mortgage Trust,
Series 2002-MW1, Class A3 | | | | | | | |
5.403% | | 07/12/2034 | | | | 500,000 | | | 506,505 | |
Morgan Stanley Capital I,
Series 1997-C1, Class B | | | | | | | |
7.690% | | 02/15/2020 | | | | 818,486 | | | 823,179 | |
Morgan Stanley Capital I,
Series 2004-HQ3, Class A4 | | | | | | | |
4.800% | | 01/13/2041 | | | | 750,000 | | | 733,112 | |
Morgan Stanley Capital I,
Series 2004-T13, Class A2 | | | | | | | |
3.940% | | 09/13/2045 | | | | 1,000,000 | | | 959,945 | |
Morgan Stanley Capital I,
Series 2004-T15, Class A2 | | | | | | | |
4.690% | | 06/13/2041 | | | | 500,000 | | | 492,546 | |
Mortgage Capital Funding, Inc.,
Series 1998-MC2, Class A2 | | | | | | | |
6.423% | | 06/18/2030 | | | | 531,808 | | | 545,974 | |
Wachovia Bank Commercial Mortgage Trust,
Series 2002-C2, Class A3 | | | | | | | |
4.440% | | 11/15/2034 | | | | 3,000,000 | | | 2,946,923 | |
Wachovia Bank Commercial Mortgage Trust,
Series 2003-C5, Class A2 | | | | | | | |
3.989% | | 06/15/2035 | | | | 750,000 | | | 699,044 | |
Wachovia Bank Commercial Mortgage Trust,
Series 2003-C9, Class A4 | | | | | | | |
5.012% | | 12/15/2035 | | | | 750,000 | | | 743,341 | |
Wachovia Bank Commercial Mortgage Trust,
Series 2004-C11, Class A5 | | | | | | | |
5.215% | | 01/15/2041 | | | | 500,000 | | | 500,319 | |
Wachovia Bank Commercial Mortgage Trust,
Series 2004-C12, Class A4 | | | | | | | |
5.234% | | 08/15/2041 | | | | 750,000 | | | 758,562 | |
| | | | | | | | | | |
| | | | | | | |
TOTAL NON-U.S. GOVERNMENT MORTGAGE-BACKED SECURITIES
(Cost $39,000,510) | | | | | | 38,160,766 | |
| | | | | | | | | | |
|
| | | | | | | | | | | |
CASH EQUIVALENTS—7.4% | | | | | | | |
| | | | | | | | |
Institutional Money Market Funds—0.5% | | | | | | | |
American Beacon Funds | †† | | 323,996 | | | 323,996 | |
BGI Institutional Fund | †† | | 4,211,951 | | | 4,211,951 | |
Goldman Sachs Financial Square | | | | | | | |
Prime Obligations Fund | †† | | 323,996 | | | 323,996 | |
Merrimac Cash Fund— | | | | | | | |
Premium Class | †† | | 518,394 | | | 518,394 | |
| | | | | | | |
| | | | | | | | | 5,378,337 | |
| | | | | | | | | | |
Bank & Certificate Deposits/Offshore Time Deposits—6.3% | | | | | | | |
Abbey National PLC | | | | | | | |
4.290% | | 01/11/2006 | | †† | | 1,619,981 | | | 1,619,982 | |
Bank of Nova Scotia | | | | | | | |
4.250% | | 01/27/2006 | | †† | | 2,267,974 | | | 2,267,974 | |
| | |
228 | See accompanying notes to financial statements. | |
SCHEDULE OF INVESTMENTS — (Continued)
December 31, 2005
| | | | | | | | | | |
| | | | | | | | | | | |
Vantagepoint Core Bond
Index Fund | | | | | | | |
| | | | | | | | | | | |
|
Coupon
Rate | | Maturity
Date | | | | Face | | | Value | |
| | | | | | | | | | | |
|
CASH EQUIVALENTS—(continued) | | | | | | | |
| | | | | | | | |
Barclays | | | | | | | | |
4.410% | | 02/27/2006 | | †† | $ | 1,619,981 | | $ | 1,619,981 | |
Barclays | | | | | | | | |
4.270% | | 01/25/2006 | | †† | | 1,619,981 | | | 1,619,981 | |
BNP Paribas | | | | | | | | |
4.220% | | 01/24/2006 | | †† | | 1,619,981 | | | 1,619,981 | |
Branch Banker &Trust | | | | | | | | |
4.260% | | 01/11/2006 | | †† | | 1,619,981 | | | 1,619,981 | |
CIESCO | | | | | | | | |
4.305% | | 01/06/2006 | | †† | | 1,943,978 | | | 1,943,978 | |
Dexia Group | | | | | | | | |
4.250% | | 01/09/2006 | | †† | | 3,239,963 | | | 3,239,963 | |
Fairway Finance | | | | | | | | |
4.280% | | 01/30/2006 | | †† | | 1,295,985 | | | 1,295,985 | |
Falcon Asset Securitization Corporation | | | | | | | |
4.307% | | 02/02/2006 | | †† | | 1,606,854 | | | 1,606,854 | |
Fortis Bank | | | | | | | |
4.350% | | 01/03/2006 | | †† | | 1,619,981 | | | 1,619,981 | |
Greyhawk Funding | | | | | | | |
4.355% | | 01/06/2006 | | †† | | 1,295,985 | | | 1,295,985 | |
Greyhawk Funding | | | | | | | | |
4.278% | | 01/24/2006 | | †† | | 971,989 | | | 971,989 | |
Jupiter Securitization Corporation | | | | | | | |
4.266% | | 01/05/2006 | | †† | | 777,591 | | | 777,591 | |
Jupiter Securitization Corporation | | | | | | | |
4.257% | | 01/04/2006 | | †† | | 971,989 | | | 971,989 | |
Liberty Street | | | | | | | | |
4.266% | | 01/05/2006 | | †† | | 1,608,124 | | | 1,608,124 | |
Merrill Lynch & Company, Inc. | | | | | | | |
4.240% | | 01/03/2006 | | †† | | 6,479,925 | | | 6,479,925 | |
National Australia Bank | | | | | | | | |
4.156% | | 01/03/2006 | | †† | | 909,017 | | | 909,017 | |
Paradigm Funding LLC | | | | | | | |
4.303% | | 01/03/2006 | | †† | | 2,095,937 | | | 2,095,937 | |
Paradigm Funding LLC | | | | | | | | |
4.297% | | 01/09/2006 | | †† | | 1,295,985 | | | 1,295,985 | |
Prefco | | | | | | | | |
4.312% | | 01/04/2006 | | †† | | 971,989 | | | 971,989 | |
Rabobank Nederland | | | | | | | | |
4.150% | | 01/03/2006 | | †† | | 1,619,981 | | | 1,619,981 | |
Ranger Funding | | | | | | | | |
4.291% | | 01/18/2006 | | †† | | 1,295,985 | | | 1,295,985 | |
Royal Bank of Canada | | | | | | | |
4.250% | | 01/24/2006 | | †† | | 2,267,974 | | | 2,267,974 | |
Royal Bank of Canada | | | | | | | |
4.220% | | 01/20/2006 | | †† | | 1,619,981 | | | 1,619,981 | |
Royal Bank of Scotland | | | | | | | |
4.310% | | 02/01/2006 | | †† | | 3,239,963 | | | 3,239,963 | |
Royal Bank of Scotland | | | | | | | |
4.250% | | 01/23/2006 | | †† | | 1,619,981 | | | 1,619,981 | |
Skandinaviska Enskilda Banken AB | | | | | | | |
4.300% | | 01/17/2006 | | †† | | 971,989 | | | 971,989 | |
Skandinaviska Enskilda Banken AB | | | | | | | |
4.230% | | 01/03/2006 | | †† | | 1,619,981 | | | 1,619,981 | |
Societe Generale | | | | | | | |
4.280% | | 01/30/2006 | | †† | | 1,295,985 | | | 1,295,985 | |
The Bank of the West | | | | | | | |
4.290% | | 01/25/2006 | | †† | | 1,619,981 | | | 1,619,981 | |
UBS AG | | | | | | | | | | |
4.260% | | 01/10/2006 | | †† | | 1,619,981 | | | 1,619,981 | |
UBS AG | | | | | | | | | | |
4.255% | | 01/18/2006 | | †† | | 1,943,978 | | | 1,943,978 | |
| | | | | | |
| | | | | | | | | | |
| | | | | | | | | | | |
Coupon
Rate | | Maturity
Date | | | | Face | | | Value | |
| | | | | | | | | | | |
Wells Fargo | | | | | | | | |
4.290% | | 01/30/2006 | | †† | | $ 2,591,970 | | $ | 2,591,970 | |
Wells Fargo | | | | | | | | |
4.270% | | 01/03/2006 | | †† | | 1,619,981 | | | 1,619,981 | |
Yorktown Capital LLC | | | | | | | | |
4.330% | | 01/04/2006 | | †† | | 1,450,596 | | | 1,450,596 | |
Yorktown Capital LLC | | | | | | | | |
4.266% | | 01/05/2006 | | †† | | 1,608,124 | | | 1,608,124 | |
| | | | | | | | | | |
| | | | | | | | | 65,459,603 | |
| | | | | | | | | | |
Floating Rate Instruments/Master Notes—0.6% | | | | | | | |
Bank of America | | | | | | | | |
4.270% | | 01/17/2006 | | †† | | 1,295,985 | | | 1,295,985 | |
Bank of America | | | | | | | �� | |
4.230% | | 01/20/2006 | | †† | | 1,619,981 | | | 1,619,981 | |
Credit Suisse First Boston Corporation | | | | | | | |
4.175% | | 03/10/2006 | | †† | | 1,295,985 | | | 1,295,985 | |
Rabobank Nederland | | | | | | | | |
4.100% | | 05/31/2006 | | †† | | 1,619,981 | | | 1,619,981 | |
| | | | | | | | | | |
| | | | | | | | | 5,831,932 | |
| | | | | | | | | | |
TOTAL CASH EQUIVALENTS
(Cost $76,669,872) | | | | | | 76,669,872 | |
| | | | | | | | | | |
| | | | | | | | | | |
| | | | | | | | | | | |
REPURCHASE AGREEMENTS—1.2% | | | | | | | |
| | | | | | | | |
IBT Repurchase Agreement dated 12/30/05 due 01/03/06, with a maturity value of $12,537,286 and an effective yield of 3.65% collateralized by U.S. Government Obligations with rates ranging from 4.9194% to 7.875%, maturity dates ranging from of 09/25/14 to 12/15/31 and an aggregate market value of $13,158,814. | | | 12,532,204 | | | 12,532,204 | |
| | | | | | | | | | |
TOTAL INVESTMENTS—107.6%
(Cost $1,118,487,944) | | | | | | 1,109,768,100 | |
Other assets less liabilities—(7.6%) | | | | | | (78,372,330) | |
| | | | | | | | | | |
NET ASSETS—100.0% | | | | | | | $1,031,395,770 | |
| | | | | | | | | | |
| | | | | | | | | | |
| | | | | | | | | | |
| | |
Notes to the Schedule of Investments: |
|
FRN | | Floating Rate Note |
| | |
MTN | | Medium Term Note |
| | |
REIT | | Real Estate Investment Trust |
| | |
TBA | | To Be Announced |
| | |
† | | Denotes all or a portion of security on loan. |
| | |
†† | | Represents collateral received from securities lending transactions. |
| | |
* | | Security exempt from registration under Rule 144A of the Securities Act of 1933. These securities may be resold in transactions exempt from registration, normally to qualified buyers. 144A securities represent 0.15% of Total Investments. |
| | |
| See accompanying notes to financial statements. | 229 |
SCHEDULE OF INVESTMENTS
December 31, 2005
| | | | | | | |
| | | | | | | | |
Vantagepoint 500 | | | | | | | |
Stock Index Fund | | Shares | | Value | |
| | | | | | |
|
COMMON STOCKS—98.7% | | | | | | | |
| | | | | | | | |
|
Advertising—0.2% | | | | | | | |
Interpublic Group, Inc. | *† | | 13,428 | | $ | 129,580 | |
Monster Worldwide, Inc. | *† | | 3,572 | | | 145,809 | |
Omnicom Group | | | 5,537 | | | 471,365 | |
| | | | | | | |
| | | | | | 746,754 | |
| | | | | | | |
Aerospace & Defense—1.5% | | | | | | | |
Goodrich Corporation | | | 3,725 | | | 153,097 | |
Boeing Company (The) | | | 25,149 | | | 1,766,466 | |
General Dynamics Corporation | | | 6,061 | | | 691,257 | |
Honeywell International, Inc. | | | 26,409 | | | 983,735 | |
Lockheed Martin Corporation | | | 11,068 | | | 704,257 | |
Northrop Grumman Corporation | | | 10,878 | | | 653,877 | |
Textron, Inc. | | | 4,027 | | | 309,998 | |
| | | | | | | |
| | | | | | 5,262,687 | |
| | | | | | | |
Airlines—0.1% | | | | | | | |
Southwest Airlines Company | | | 21,649 | | | 355,693 | |
| | | | | | | |
Apparel Retailers—0.4% | | | | | | | |
Gap, Inc. (The) | | | 18,174 | | | 320,589 | |
Kohl’s Corporation | * | | 10,470 | | | 508,842 | |
Ltd. Brands | | | 10,963 | | | 245,023 | |
Nordstrom, Inc. | | | 6,656 | | | 248,934 | |
| | | | | | | |
| | | | | | 1,323,388 | |
| | | | | | | |
Automotive—0.7% | | | | | | | |
Autonation, Inc. | * | | 5,626 | | | 122,253 | |
Dana Corporation | | | 4,708 | | | 33,803 | |
Ford Motor Company | | | 57,278 | | | 442,186 | |
General Motors Corporation | † | | 17,657 | | | 342,899 | |
Genuine Parts Company | | | 5,410 | | | 237,607 | |
Goodyear Tire & Rubber Company (The) | *† | | 5,556 | | | 96,563 | |
Harley-Davidson, Inc. | † | | 8,404 | | | 432,722 | |
ITT Industries, Inc. | | | 2,921 | | | 300,337 | |
Navistar International Corporation | * | | 2,176 | | | 62,277 | |
Paccar, Inc. | | | 5,372 | | | 371,904 | |
| | | | | | | |
| | | | | | 2,442,551 | |
| | | | | | | |
Banking—11.6% | | | | | | | |
American Express Company | | | 38,036 | | | 1,957,333 | |
AmSouth Bancorp | | | 11,018 | | | 288,782 | |
BB&T Corporation | | | 16,708 | | | 700,232 | |
Bank of America Corporation | † | | 122,772 | | | 5,665,928 | |
Bank of New York Company, Inc. (The) | | | 23,767 | | | 756,979 | |
Capital One Financial Corporation | | | 8,801 | | | 760,406 | |
CIT Group, Inc. | | | 6,087 | | | 315,185 | |
Citigroup, Inc. | | | 155,896 | | | 7,565,633 | |
Comerica, Inc. | | | 5,263 | | | 298,728 | |
Compass Bancshares, Inc. | | | 4,000 | | | 193,160 | |
Fifth Third Bancorp | † | | 16,962 | | | 639,807 | |
First Horizon National Corporation | † | | 3,674 | | | 141,229 | |
Golden West Financial Corporation | | | 7,771 | | | 512,886 | |
Huntington Bancshares, Inc. | † | | 7,147 | | | 169,741 | |
JP Morgan Chase & Company | | | 107,331 | | | 4,259,967 | |
KeyCorp | | | 12,773 | | | 420,615 | |
M&T Bank Corporation | | | 2,431 | | | 265,101 | |
MBNA Corporation | | | 38,722 | | | 1,051,690 | |
Marshall & IIsley Corporation | † | | 6,557 | | | 282,213 | |
| | | | | | | |
| | | | | | |
| | | | | |
| | Shares | | Value | |
| | | | | | |
Mellon Financial Corporation | | | 13,012 | | $ | 445,661 | |
National City Corporation | | | 17,291 | | | 580,459 | |
North Fork Bancorp, Inc. | | | 14,553 | | | 398,170 | |
Northern Trust Corporation | | | 5,818 | | | 301,489 | |
PNC Financial Services Group, Inc. | | | 8,880 | | | 549,050 | |
Regions Financial Corporation | | | 14,002 | | | 478,308 | |
SLM Corporation | | | 12,776 | | | 703,830 | |
Sovereign Bancorp, Inc. | | | 10,480 | | | 226,578 | |
State Street Corporation | | | 10,082 | | | 558,946 | |
Suntrust Banks, Inc. | | | 11,077 | | | 805,963 | |
Synovus Financial Corporation | | | 9,554 | | | 258,054 | |
U.S. Bancorp | | | 56,005 | | | 1,673,989 | |
Wachovia Corporation | | | 48,383 | | | 2,557,525 | |
Washington Mutual, Inc. | | | 30,415 | | | 1,323,053 | |
Wells Fargo & Company | | | 51,497 | | | 3,235,557 | |
Zions Bancorp | | | 2,846 | | | 215,044 | |
| | | | | | | |
| | | | | | 40,557,291 | |
| | | | | | | |
Beverages, Food & Tobacco—4.9% | | | | | | | |
Altria Group, Inc. | | | 63,420 | | | 4,738,742 | |
Anheuser-Busch Companies, Inc. | | | 23,642 | | | 1,015,660 | |
Archer-Daniels-Midland Company | | | 19,681 | | | 485,333 | |
Brown-Forman Corporation Class B | | | 2,464 | | | 170,804 | |
Campbell Soup Company | | | 5,775 | | | 171,922 | |
Coca-Cola Company (The) | | | 63,705 | | | 2,567,949 | |
Coca-Cola Enterprises, Inc. | | | 9,430 | | | 180,773 | |
ConAgra Foods, Inc. | | | 15,594 | | | 316,246 | |
Constellation Brands, Inc. Class A | * | | 5,780 | | | 151,609 | |
General Mills, Inc. | | | 11,152 | | | 550,017 | |
H.J. Heinz Company | | | 10,333 | | | 348,429 | |
Hershey Foods Corporation | | | 5,550 | | | 306,637 | |
Kellogg Company | | | 7,975 | | | 344,679 | |
McCormick & Company, Inc. | | | 4,395 | | | 135,893 | |
Molson Coors Brewing Company—Class B | | | 1,673 | | | 112,074 | |
Pepsi Bottling Group, Inc. | | | 4,086 | | | 116,900 | |
Pepsico, Inc. | | | 51,232 | | | 3,026,787 | |
Reynolds American, Inc. | † | | 2,675 | | | 255,008 | |
Safeway, Inc. | † | | 13,907 | | | 329,040 | |
Sara Lee Corporation | | | 24,524 | | | 463,504 | |
Supervalu, Inc. | | | 4,247 | | | 137,943 | |
Sysco Corporation | | | 19,236 | | | 597,278 | |
Tyson Foods, Inc. Class A | † | | 7,900 | | | 135,090 | |
UST, Inc. | † | | 5,151 | | | 210,315 | |
WM Wrigley Jr. Company | | | 5,631 | | | 374,405 | |
| | | | | | | |
| | | | | | 17,243,037 | |
| | | | | | | |
Building Materials—1.3% | | | | | | | |
Home Depot, Inc. | | | 65,664 | | | 2,658,079 | |
Louisiana-Pacific Corporation | † | | 3,355 | | | 92,162 | |
Lowe’s Companies, Inc. | | | 23,882 | | | 1,591,974 | |
Patterson Companies, Inc. | * | | 3,500 | | | 116,900 | |
Vulcan Materials Company | † | | 3,221 | | | 218,223 | |
| | | | | | | |
| | | | | | 4,677,338 | |
| | | | | | | |
Chemicals—1.4% | | | | | | | |
Air Products & Chemicals, Inc. | | | 6,726 | | | 398,112 | |
Avery Dennison Corporation | † | | 3,207 | | | 177,251 | |
Cooper Tire & Rubber Company | † | | 2,340 | | | 35,849 | |
Dow Chemical Company (The) | | | 29,536 | | | 1,294,268 | |
Eastman Chemical Company | | | 2,451 | | | 126,447 | |
Ecolab, Inc. | | | 5,738 | | | 208,117 | |
| | |
230 | See accompanying notes to financial statements. | |
SCHEDULE OF INVESTMENTS—(Continued)
December 31, 2005
| | | | | | | |
| | | | | | | | |
Vantagepoint 500 | | | | | | | |
Stock Index Fund | | | Shares | | | Value | |
| | | | | | | | |
|
COMMON STOCKS—(Continued) | | | | | | | |
| | | | | | | | |
|
EI Du Pont de Nemours & Company | | | 28,050 | | $ | 1,192,125 | |
Hercules, Inc. | * | | 3,515 | | | 39,720 | |
International Flavors & Fragrances, Inc. | | | 2,365 | | | 79,228 | |
Monsanto Company | | | 8,297 | | | 643,266 | |
PPG Industries, Inc. | | | 5,081 | | | 294,190 | |
Praxair, Inc. | | | 9,796 | | | 518,796 | |
| | | | | | | |
| | | | | | 5,007,369 | |
| | | | | | | |
Commercial Services—1.0% | | | | | | | |
Allied Waste Industries, Inc. | *† | | 7,839 | | | 68,513 | |
Apollo Group, Inc. Class A | *† | | 4,409 | | | 266,568 | |
Cendant Corporation | | | 31,880 | | | 549,930 | |
Cintas Corporation | | | 4,114 | | | 169,415 | |
Convergys Corporation | * | | 4,528 | | | 71,769 | |
Equifax, Inc. | | | 3,865 | | | 146,947 | |
Fluor Corporation | | | 2,599 | | | 200,799 | |
H&R Block, Inc. | | | 10,232 | | | 251,196 | |
Moody’s Corporation | | | 7,678 | | | 471,583 | |
Paychex, Inc. | | | 10,422 | | | 397,287 | |
Robert Half International, Inc. | † | | 5,293 | | | 200,552 | |
RR Donnelley & Sons Company | | | 6,781 | | | 231,978 | |
Ryder System, Inc. | † | | 2,030 | | | 83,271 | |
Waste Management, Inc. | | | 17,095 | | | 518,833 | |
| | | | | | | |
| | | | | | 3,628,641 | |
| | | | | | | |
Communications—1.9% | | | | | | | |
ADC Telecommunications, Inc. | * | | 3,642 | | | 81,362 | |
Andrew Corporation | * | | 4,865 | | | 52,201 | |
Avaya, Inc. | * | | 13,317 | | | 142,092 | |
Ciena Corporation | * | | 15,008 | | | 44,574 | |
Comverse Technology, Inc. | * | | 6,104 | | | 162,305 | |
Corning, Inc. | * | | 44,970 | | | 884,110 | |
L-3 Communications Holdings, Inc. | | | 3,523 | | | 261,935 | |
Lucent Technologies, Inc. | *† | | 138,279 | | | 367,822 | |
Motorola, Inc. | | | 75,654 | | | 1,709,024 | |
Network Appliance, Inc. | *† | | 11,224 | | | 303,048 | |
Qualcomm, Inc. | | | 49,999 | | | 2,153,957 | |
Scientific-Atlanta, Inc. | | | 4,807 | | | 207,037 | |
Tellabs, Inc. | * | | 12,229 | | | 133,296 | |
| | | | | | | |
| | | | | | 6,502,763 | |
| | | | | | | |
Computer Software & Processing—5.1% | | | | | | | |
Adobe Systems, Inc. | | | 17,058 | | | 630,464 | |
Affiliated Computer Services, Inc. Class A | * | | 3,980 | | | 235,536 | |
Autodesk, Inc. | | | 7,066 | | | 303,485 | |
Automatic Data Processing, Inc. | | | 17,724 | | | 813,354 | |
BMC Software, Inc. | * | | 6,466 | | | 132,488 | |
Citrix Systems, Inc. | * | | 5,196 | | | 149,541 | |
Computer Associates International, Inc. | | | 14,066 | | | 396,521 | |
Computer Sciences Corporation | * | | 5,832 | | | 295,332 | |
Compuware Corporation | * | | 12,167 | | | 109,138 | |
Electronic Arts, Inc. | * | | 9,238 | | | 483,240 | |
Electronic Data Systems Corporation | | | 16,012 | | | 384,928 | |
First Data Corporation | | | 23,793 | | | 1,023,337 | |
Fiserv, Inc. | * | | 5,668 | | | 245,254 | |
IMS Health, Inc. | | | 6,732 | | | 167,761 | |
Intuit, Inc. | * | | 5,466 | | | 291,338 | |
| | | | | | | |
| | | | | | | | |
| | | | | | | |
| | | Shares | | | Value | |
| | | | | | | | |
Mercury Interactive Corporation | * | | 2,850 | | $ | 79,202 | |
Microsoft Corporation | | | 281,565 | | | 7,362,925 | |
NCR Corporation | * | | 5,590 | | | 189,725 | |
Novell, Inc. | * | | 11,821 | | | 104,379 | |
Nvidia Corporation | * | | 5,134 | | | 187,699 | |
Oracle Corporation | * | | 115,518 | | | 1,410,475 | |
Parametric Technology Corporation | * | | 8,439 | | | 51,478 | |
Siebel Systems, Inc. | | | 16,000 | | | 169,280 | |
Sun Microsystems, Inc. | * | | 103,203 | | | 432,421 | |
Symantec Corporation | * | | 32,790 | | | 573,825 | |
Unisys Corporation | * | | 10,465 | | | 61,011 | |
Yahoo!, Inc. | * | | 38,400 | | | 1,504,512 | |
| | | | | | | |
| | | | | | 17,788,649 | |
| | | | | | | |
Computers & Information—5.1% | | | | | | | |
3M Company | | | 23,450 | | | 1,817,375 | |
Apple Computer, Inc. | * | | 25,417 | | | 1,827,228 | |
Cisco Systems, Inc. | * | | 190,326 | | | 3,258,381 | |
Dell, Inc. | * | | 73,532 | | | 2,205,225 | |
EMC Corporation | * | | 73,383 | | | 999,476 | |
Gateway, Inc. | * | | 10,279 | | | 25,800 | |
Hewlett-Packard Company | | | 87,873 | | | 2,515,804 | |
International Business Machines Corporation | | | 48,784 | | | 4,010,045 | |
International Game Technology | | | 10,262 | | | 315,864 | |
Jabil Circuit, Inc. | * | | 5,122 | | | 189,975 | |
Lexmark International, Inc. | * | | 3,468 | | | 155,470 | |
Pitney Bowes, Inc. | | | 6,896 | | | 291,356 | |
Solectron Corporation | * | | 29,567 | | | 108,215 | |
Symbol Technologies, Inc. | | | 7,303 | | | 93,624 | |
| | | | | | | |
| | | | | | 17,813,838 | |
| | | | | | | |
Containers & Packaging—0.1% | | | | | | | |
Ball Corporation | | | 3,568 | | | 141,721 | |
Sealed Air Corporation | *† | | 2,691 | | | 151,153 | |
| | | | | | | |
| | | | | | 292,874 | |
| | | | | | | |
Cosmetics & Personal Care—2.2% | | | | | | | |
Alberto Culver Company Class B | † | | 2,202 | | | 100,742 | |
Avon Products, Inc. | | | 14,618 | | | 417,344 | |
Clorox Company | | | 4,566 | | | 259,760 | |
Colgate-Palmolive Company | | | 15,870 | | | 870,470 | |
Procter & Gamble Company | | | 103,498 | | | 5,990,464 | |
| | | | | | | |
| | | | | | 7,638,780 | |
| | | | | | | |
Diversified—3.2% | | | | | | | |
General Electric Company | | | 323,966 | | | 11,355,008 | |
| | | | | | | |
|
Electric Utilities—3.3% | | | | | | | |
AES Corporation (The) | * | | 19,714 | | | 312,073 | |
Allegheny Energy, Inc. | * | | 4,824 | | | 152,680 | |
Ameren Corporation | | | 6,170 | | | 316,151 | |
American Electric Power Company, Inc. | | | 12,209 | | | 452,832 | |
CMS Energy Corporation | *† | | 7,199 | | | 104,457 | |
Centerpoint Energy, Inc. | † | | 9,695 | | | 124,581 | |
Cinergy Corporation | | | 6,127 | | | 260,152 | |
Consolidated Edison, Inc. | | | 7,439 | | | 344,649 | |
Constellation Energy Group, Inc. | | | 5,597 | | | 322,387 | |
DTE Energy Company | | | 5,330 | | | 230,203 | |
Dominion Resources, Inc. | † | | 10,409 | | | 803,575 | |
Duke Energy Corporation | † | | 28,286 | | | 776,451 | |
Edison International | | | 9,898 | | | 431,652 | |
Entergy Corporation | | | 6,303 | | | 432,701 | |
| | |
| See accompanying notes to financial statements. | 231 |
SCHEDULE OF INVESTMENTS —(Continued)
December 31, 2005
| | | | | | | |
| | | | | | | | |
Vantagepoint 500 | | | | | | | |
Stock Index Fund | | | Shares | | | Value | |
| | | | | | | | |
|
COMMON STOCKS—(Continued) | | | | | | | |
| | | | | | | | |
|
Exelon Corporation | † | | 20,645 | | $ | 1,097,075 | |
FPL Group, Inc. | | | 11,946 | | | 496,476 | |
FirstEnergy Corporation | | | 10,244 | | | 501,854 | |
KeySpan Corporation | | | 5,636 | | | 201,149 | |
NiSource, Inc. | | | 8,413 | | | 175,495 | |
PG&E Corporation | | | 10,328 | | | 383,375 | |
PPL Corporation | | | 11,828 | | | 347,743 | |
Pinnacle West Capital Corporation | † | | 2,891 | | | 119,543 | |
Progress Energy, Inc. | | | 7,759 | | | 340,775 | |
Public Service Enterprise Group, Inc. | | | 7,446 | | | 483,767 | |
Sempra Energy | † | | 7,751 | | | 347,555 | |
Southern Company (The) | † | | 23,031 | | | 795,260 | |
TXU Corporation | | | 14,642 | | | 734,882 | |
TECO Energy, Inc. | | | 5,950 | | | 102,221 | |
Xcel Energy, Inc. | † | | 12,731 | | | 235,014 | |
| | | | | | | |
| | | | | | 11,426,728 | |
| | | | | | | |
Electrical Equipment—0.3% | | | | | | | |
Cooper Industries Ltd. Class A | | | 2,956 | | | 215,788 | |
Emerson Electric Company | | | 12,625 | | | 943,088 | |
| | | | | | | |
| | | | | | 1,158,876 | |
| | | | | | | |
Electronics—3.3% | | | | | | | |
Advanced Micro Devices, Inc. | * | | 12,536 | | | 383,602 | |
Agilent Technologies, Inc. | * | | 13,839 | | | 460,700 | |
Altera Corporation | * | | 11,395 | | | 211,149 | |
American Power Conversion Corporation | | | 5,418 | | | 119,196 | |
Analog Devices, Inc. | | | 11,610 | | | 416,451 | |
Applied Micro Circuits Corporation | * | | 9,726 | | | 24,996 | |
Broadcom Corporation Class A | * | | 8,569 | | | 404,028 | |
Freescale Semiconductor, Inc. Class B | * | | 12,267 | | | 308,760 | |
Intel Corporation | | | 186,157 | | | 4,646,479 | |
JDS Uniphase Corporation | * | | 45,346 | | | 107,017 | |
LSI Logic Corporation | *† | | 12,007 | | | 96,056 | |
Linear Technology Corporation | | | 9,592 | | | 345,983 | |
Maxim Integrated Products, Inc. | | | 10,205 | | | 369,829 | |
Micron Technology, Inc. | *† | | 19,238 | | | 256,058 | |
Molex, Inc. | † | | 4,262 | | | 110,599 | |
National Semiconductor Corporation | | | 10,068 | | | 261,567 | |
Novellus Systems, Inc. | * | | 4,373 | | | 105,477 | |
PMC-Sierra, Inc. | * | | 5,469 | | | 42,166 | |
QLogic Corporation | * | | 2,292 | | | 74,513 | |
Raytheon Company | | | 13,679 | | | 549,212 | |
Rockwell Collins, Inc. | | | 5,606 | | | 260,511 | |
Sanmina-SCI Corporation | * | | 16,779 | | | 71,479 | |
Teradyne, Inc. | *† | | 6,358 | | | 92,636 | |
Texas Instruments, Inc. | | | 49,713 | | | 1,594,296 | |
Xilinx, Inc. | † | | 10,839 | | | 273,251 | |
| | | | | | | |
| | | | | | 11,586,011 | |
| | | | | | | |
Entertainment & Leisure—1.9% | | | | | | | |
Eastman Kodak Company | † | | 8,976 | | | 210,038 | |
Harrah’s Entertainment, Inc. | | | 5,744 | | | 409,490 | |
Hasbro, Inc. | | | 5,527 | | | 111,535 | |
Mattel, Inc. | | | 12,914 | | | 204,299 | |
News Corporation, Inc. Class A | | | 74,950 | | | 1,165,473 | |
Time Warner, Inc. | | | 143,988 | | | 2,511,151 | |
| | | | | | | |
| | | | | | | | |
| | | | | | | |
| | | Shares | | | Value | |
| | | | | | | | |
Walt Disney Company | | | 61,575 | | $ | 1,475,953 | |
Xerox Corporation | * | | 29,117 | | | 426,564 | |
| | | | | | | |
| | | | | | 6,514,503 | |
| | | | | | | |
Financial Services—3.6% | | | | | | | |
Ameriprise Financial, Inc. | | | 7,701 | | | 315,749 | |
Bear Stearns Companies, Inc. (The) | | | 3,405 | | | 393,380 | |
Charles Schwab Corporation (The) | | | 31,601 | | | 463,587 | |
Countrywide Financial Corporation | | | 18,100 | | | 618,839 | |
E*Trade Financial Corporation | * | | 11,500 | | | 239,890 | |
Federal Home Loan Mortgage Corporation | | | 21,092 | | | 1,378,362 | |
Federal National Mortgage Association | | | 29,646 | | | 1,447,021 | |
Federated Investors, Inc. Class B | | | 2,799 | | | 103,675 | |
Franklin Resources, Inc. | | | 4,642 | | | 436,394 | |
Goldman Sachs Group, Inc. | | | 14,256 | | | 1,820,634 | |
Janus Capital Group, Inc. | | | 6,553 | | | 122,082 | |
Lehman Brothers Holdings, Inc. | | | 8,351 | | | 1,070,348 | |
Merrill Lynch & Company, Inc. | | | 28,392 | | | 1,922,990 | |
Morgan Stanley | | | 33,285 | | | 1,888,591 | |
T. Rowe Price Group, Inc. | | | 3,942 | | | 283,942 | |
| | | | | | | |
| | | | | | 12,505,484 | |
| | | | | | | |
Food Retailers—0.5% | | | | | | | |
Albertson’s, Inc. | † | | 11,517 | | | 245,888 | |
Kroger Company | * | | 21,895 | | | 413,378 | |
Starbucks Corporation | * | | 23,570 | | | 707,336 | |
Whole Foods Market, Inc. | | | 3,600 | | | 278,604 | |
| | | | | | | |
| | | | | | 1,645,206 | |
| | | | | | | |
Forest Products & Paper—0.7% | | | | | | | |
Bemis Company | | | 3,365 | | | 93,749 | |
International Paper Company | † | | 15,213 | | | 511,309 | |
Kimberly Clark Corporation | | | 14,549 | | | 867,848 | |
MeadWestvaco Corporation | | | 5,462 | | | 153,100 | |
Pactiv Corporation | * | | 4,478 | | | 98,516 | |
Temple-Inland, Inc. | | | 3,438 | | | 154,194 | |
Weyerhaeuser Company | | | 7,461 | | | 494,963 | |
| | | | | | | |
| | | | | | 2,373,679 | |
| | | | | | | |
Health Care Providers—1.5% | | | | | | | |
Caremark Rx, Inc. | * | | 13,722 | | | 710,662 | |
Coventry Health Care, Inc. | * | | 5,100 | | | 290,496 | |
Express Scripts, Inc. | * | | 4,374 | | | 366,541 | |
HCA, Inc. | | | 12,901 | | | 651,501 | |
Health Management Associates, Inc. Class A | | | 7,595 | | | 166,786 | |
Laboratory Corporation of America Holdings | *† | | 4,140 | | | 222,939 | |
Manor Care, Inc. | | | 2,002 | | | 79,620 | |
Tenet Healthcare Corporation | * | | 14,819 | | | 113,514 | |
UnitedHealth Group, Inc. | | | 41,134 | | | 2,556,067 | |
| | | | | | | |
| | | | | | 5,158,126 | |
| | | | | | | |
Heavy Construction—0.1% | | | | | | | |
Centex Corporation | † | | 4,036 | | | 288,534 | |
Lennar Corporation Class A | | | 3,600 | | | 219,672 | |
| | | | | | | |
| | | | | | 508,206 | |
| | | | | | | |
Heavy Machinery—2.2% | | | | | | | |
American Standard Companies, Inc. | | | 5,509 | | | 220,085 | |
Applied Materials, Inc. | | | 50,163 | | | 899,924 | |
Baker Hughes, Inc. | | | 10,503 | | | 638,372 | |
| | |
232 | See accompanying notes to financial statements. | |
SCHEDULE OF INVESTMENTS —(Continued)
December 31, 2005
| | | | | | | |
| | | | | | | | |
Vantagepoint 500 | | | | | | | |
Stock Index Fund | | | Shares | | | Value | |
| | | | | | | | |
|
COMMON STOCKS—(Continued) | | | | | | | |
| | | | | | | | |
Black & Decker Corporation | † | | 2,461 | | $ | 214,009 | |
Caterpillar, Inc. | | | 20,702 | | | 1,195,955 | |
Cummins, Inc. | | | 1,339 | | | 120,148 | |
Deere & Company | | | 7,329 | | | 499,178 | |
Dover Corporation | | | 6,414 | | | 259,703 | |
Eaton Corporation | | | 4,413 | | | 296,068 | |
Ingersoll-Rand Company Class A | | | 10,236 | | | 413,227 | |
National-Oilwell Varco, Inc. | * | | 5,295 | | | 331,997 | |
Pall Corporation | | | 3,958 | | | 106,312 | |
Parker Hannifin Corporation | | | 3,755 | | | 247,680 | |
Rockwell Automation, Inc. | | | 5,356 | | | 316,861 | |
Stanley Works (The) | | | 2,127 | | | 102,181 | |
United Technologies Corporation | | | 31,398 | | | 1,755,462 | |
W.W. Grainger, Inc. | | | 2,254 | | | 160,259 | |
| | | | | | | |
| | | | | | 7,777,421 | |
| | | | | | | |
Home Construction, Furnishings & Appliances—0.5% | | | | | | | |
DR Horton, Inc. | | | 8,206 | | | 293,200 | |
Johnson Controls, Inc. | | | 5,919 | | | 431,554 | |
KB Home | | | 2,308 | | | 167,699 | |
Leggett & Platt, Inc. | † | | 6,076 | | | 139,505 | |
Masco Corporation | | | 12,939 | | | 390,628 | |
Maytag Corporation | | | 2,488 | | | 46,824 | |
Pulte Homes, Inc. | | | 6,758 | | | 265,995 | |
Whirlpool Corporation | † | | 2,005 | | | 167,939 | |
| | | | | | | |
| | | | | | 1,903,344 | |
| | | | | | | |
Household Products—0.4% | | | | | | | |
Fortune Brands, Inc. | | | 4,419 | | | 344,770 | |
Illinois Tool Works, Inc. | † | | 6,315 | | | 555,657 | |
Newell Rubbermaid, Inc. | | | 8,690 | | | 206,648 | |
Rohm & Haas Company | | | 4,355 | | | 210,869 | |
Snap-On, Inc. | † | | 1,846 | | | 69,336 | |
| | | | | | | |
| | | | | | 1,387,280 | |
| | | | | | | |
Industrial—Diversified—0.5% | | | | | | | |
Tyco International Ltd. | | | 62,015 | | | 1,789,753 | |
| | | | | | | |
|
Insurance—5.9% | | | | | | | |
ACE Ltd. (Bermuda) | | | 8,736 | | | 466,852 | |
Aflac, Inc. | | | 15,310 | | | 710,690 | |
Aetna, Inc. | | | 8,851 | | | 834,738 | |
Allstate Corporation (The) | | | 20,089 | | | 1,086,212 | |
AMBAC Financial Group, Inc. | | | 3,384 | | | 260,771 | |
American International Group, Inc. | | | 79,278 | | | 5,409,138 | |
AON Corporation | | | 9,930 | | | 356,984 | |
Chubb Corporation | | | 6,086 | | | 594,298 | |
Cigna Corporation | | | 3,854 | | | 430,492 | |
Cincinnati Financial Corporation | | | 5,083 | | | 227,108 | |
Genworth Financial, Inc. Class A | | | 10,600 | | | 366,548 | |
Hartford Financial Services Group, Inc. | | | 9,162 | | | 786,924 | |
Humana, Inc. | * | | 5,100 | | | 277,083 | |
Jefferson Pilot Corporation | | | 4,267 | | | 242,920 | |
Lincoln National Corporation | | | 5,387 | | | 285,673 | |
Loews Corporation | | | 4,114 | | | 390,213 | |
MBIA, Inc. | | | 4,034 | | | 242,685 | |
MGIC Investment Corporation | | | 2,777 | | | 182,782 | |
Marsh & McLennan Companies, Inc. | | | 16,339 | | | 518,927 | |
Metlife, Inc. | | | 23,147 | | | 1,134,203 | |
Principal Financial Group | | | 8,726 | | | 413,874 | |
Progressive Corporation (The) | † | | 6,016 | | | 702,548 | |
Prudential Financial, Inc. | | | 15,698 | | | 1,148,937 | |
| | | | | | | |
| | | | | | | | |
| | | | | | | |
| | | Shares | | | Value | |
| | | | | | | | |
Safeco Corporation | | | 3,918 | | $ | 221,367 | |
St. Paul Travelers Companies | | | 20,567 | | | 918,728 | |
Torchmark Corporation | | | 3,284 | | | 182,590 | |
UnumProvident Corporation | † | | 9,377 | | | 213,327 | |
WellPoint, Inc. | * | | 19,560 | | | 1,560,692 | |
XL Capital Ltd. Class A (Bermuda) | | | 4,346 | | | 292,833 | |
| | | | | | | |
| | | | | | 20,460,137 | |
| | | | | | | |
Lodging—0.3% | | | | | | | |
Hilton Hotels Corporation | | | 9,822 | | | 236,808 | |
Marriott International, Inc. Class A | | | 5,181 | | | 346,972 | |
Starwood Hotels & Resorts Worldwide, Inc. | | | 6,705 | | | 428,181 | |
| | | | | | | |
| | | | | | 1,011,961 | |
| | | | | | | |
Media—Broadcasting & Publishing—1.7% | | | | | | | |
Clear Channel Communications, Inc. | | | 16,434 | | | 516,849 | |
Comcast Corporation Class A | *† | | 67,318 | | | 1,747,575 | |
Dow Jones & Company, Inc. | † | | 2,056 | | | 72,967 | |
E.W. Scripps Company Class A | † | | 1,800 | | | 86,436 | |
Gannett Company, Inc. | | | 7,393 | | | 447,794 | |
Knight-Ridder, Inc. | | | 2,030 | | | 128,499 | |
McGraw-Hill Companies, Inc. (The) | | | 11,354 | | | 586,207 | |
Meredith Corporation | | | 1,189 | | | 62,232 | |
New York Times Company Class A | † | | 4,417 | | | 116,830 | |
Tribune Company | | | 7,992 | | | 241,838 | |
Univision Communications, Inc. Class A | * | | 6,880 | | | 202,203 | |
Viacom, Inc. Class B | | | 48,560 | | | 1,583,056 | |
| | | | | | | |
| | | | | | 5,792,486 | |
| | | | | | | |
Medical Supplies—4.0% | | | | | | | |
Allergan, Inc. | | | 3,930 | | | 424,283 | |
Applera Corporation—Applied Biosystems Group | | | 5,986 | | | 158,988 | |
Bausch & Lomb, Inc. | | | 1,661 | | | 112,782 | |
Baxter International, Inc. | | | 19,205 | | | 723,068 | |
Becton, Dickinson & Company | | | 7,580 | | | 455,406 | |
Biomet, Inc. | | | 7,495 | | | 274,092 | |
Boston Scientific Corporation | * | | 17,883 | | | 437,955 | |
C.R. Bard, Inc. | | | 3,184 | | | 209,889 | |
Fisher Scientific International | * | | 3,600 | | | 222,696 | |
Guidant Corporation | | | 10,181 | | | 659,220 | |
Johnson & Johnson | | | 90,844 | | | 5,459,724 | |
Kla-Tencor Corporation | † | | 6,165 | | | 304,119 | |
Medtronic, Inc. | | | 37,130 | | | 2,137,574 | |
Millipore Corporation | *† | | 1,546 | | | 102,098 | |
PerkinElmer, Inc. | | | 4,019 | | | 94,688 | |
Quest Diagnostics, Inc. | | | 5,260 | | | 270,785 | |
St. Jude Medical, Inc. | * | | 11,090 | | | 556,718 | |
Stryker Corporation | | | 9,104 | | | 404,491 | |
Tektronix, Inc. | | | 2,676 | | | 75,490 | |
Thermo Electron Corporation | * | | 5,157 | | | 155,380 | |
Waters Corporation | * | | 3,586 | | | 135,551 | |
Zimmer Holdings, Inc. | * | | 7,657 | | | 516,388 | |
| | | | | | | |
| | | | | | 13,891,385 | |
| | | | | | | |
Metals—0.9% | | | | | | | |
Alcoa, Inc. | | | 26,604 | | | 786,680 | |
Allegheny Technologies, Inc. | | | 2,556 | | | 92,220 | |
Danaher Corporation | | | 7,201 | | | 401,672 | |
Engelhard Corporation | | | 3,972 | | | 119,756 | |
Newmont Mining Corporation | | | 13,582 | | | 725,279 | |
| | |
| See accompanying notes to financial statements. | 233 |
SCHEDULE OF INVESTMENTS—(Continued)
December 31, 2005
| | | | | | | |
| | | | | | | | |
Vantagepoint 500 | | | | | | | |
Stock Index Fund | | | Shares | | | Value | |
| | | | | | | | |
|
COMMON STOCKS—(Continued) | | | | | | | |
| | | | | | | | |
Nucor Corporation | | | 4,760 | | $ | 317,587 | |
Phelps Dodge Corporation | | | 2,940 | | | 422,978 | |
United States Steel Corporation | | | 3,516 | | | 169,014 | |
| | | | | | | |
| | | | | | 3,035,186 | |
| | | | | | | |
Mining—0.1% | | | | | | | |
Freeport-McMoran Copper & | | | | | | | |
Gold, Inc. Class B | | | 5,578 | | | 300,096 | |
| | | | | | | |
|
Oil & Gas—9.0% | | | | | | | |
Amerada Hess Corporation | | | 2,417 | | | 306,524 | |
Anadarko Petroleum Corporation | | | 7,322 | | | 693,760 | |
Apache Corporation | | | 9,963 | | | 682,665 | |
Ashland, Inc. | | | 2,173 | | | 125,817 | |
BJ Services Company | † | | 9,826 | | | 360,319 | |
Burlington Resources, Inc. | | | 11,642 | | | 1,003,540 | |
Chevron Texaco Corporation | | | 68,830 | | | 3,907,479 | |
ConocoPhillips | | | 42,702 | | | 2,484,402 | |
Devon Energy Corporation | | | 13,846 | | | 865,929 | |
Dynegy, Inc. Class A | *† | | 7,665 | | | 37,099 | |
EOG Resources, Inc. | | | 7,355 | | | 539,636 | |
EL Paso Corporation | † | | 19,255 | | | 234,141 | |
Exxon Mobil Corporation | | | 191,504 | | | 10,756,780 | |
Halliburton Company | † | | 15,473 | | | 958,707 | |
Kerr-McGee Corporation | | | 3,451 | | | 313,558 | |
Kinder Morgan, Inc. | | | 2,886 | | | 265,368 | |
Marathon Oil Corporation | | | 11,237 | | | 685,120 | |
Murphy Oil Corporation | | | 5,100 | | | 275,349 | |
Nabors Industries Ltd. | * | | 4,942 | | | 374,357 | |
Nicor, Inc. | † | | 1,395 | | | 54,837 | |
Noble Corporation | † | | 4,237 | | | 298,878 | |
Occidental Petroleum Corporation | | | 12,226 | | | 976,613 | |
Peoples Energy Corporation | † | | 1,166 | | | 40,892 | |
Rowan Companies, Inc. | | | 3,489 | | | 124,348 | |
Schlumberger Ltd. | † | | 18,026 | | | 1,751,226 | |
Sunoco, Inc. | † | | 4,228 | | | 331,391 | |
Transocean, Inc. | * | | 10,031 | | | 699,060 | |
Valero Energy Corporation | | | 18,680 | | | 963,888 | |
Weatherford International Ltd. | * | | 8,600 | | | 311,320 | |
Williams Companies, Inc. | | | 17,295 | | | 400,725 | |
XTO Energy, Inc. | | | 10,933 | | | 480,396 | |
| | | | | | | |
| | | | | | 31,304,124 | |
| | | | | | | |
Pharmaceuticals—6.8% | | | | | | | |
Abbott Laboratories | | | 47,659 | | | 1,879,194 | |
AmerisourceBergen Corporation | † | | 6,418 | | | 265,705 | |
Amgen, Inc. | * | | 37,658 | | | 2,969,710 | |
Biogen Idec, Inc. | * | | 10,474 | | | 474,786 | |
Bristol-Myers Squibb Company | | | 59,882 | | | 1,376,088 | |
Cardinal Health, Inc. | | | 13,040 | | | 896,500 | |
Chiron Corporation | * | | 3,235 | | | 143,828 | |
Eli Lilly & Company | † | | 34,746 | | | 1,966,276 | |
Forest Laboratories, Inc. | * | | 10,316 | | | 419,655 | |
Genzyme Corporation | * | | 7,897 | | | 558,950 | |
Gilead Sciences, Inc. | * | | 13,910 | | | 732,083 | |
Hospira, Inc. | * | | 4,680 | | | 200,210 | |
King Pharmaceuticals, Inc. | * | | 7,638 | | | 129,235 | |
McKesson Corporation | | | 9,367 | | | 483,244 | |
Medco Health Solutions, Inc. | * | | 9,258 | | | 516,596 | |
MedImmune, Inc. | * | | 7,440 | | | 260,549 | |
Merck & Company, Inc. | | | 67,303 | | | 2,140,908 | |
Mylan Laboratories | | | 6,000 | | | 119,760 | |
| | | | | | | |
| | | | | | | | |
| | | | | | | |
| | | Shares | | | Value | |
| | | | | | | | |
Pfizer, Inc. | | | 225,201 | | $ | 5,251,687 | |
Schering-Plough Corporation | | | 44,889 | | | 935,936 | |
Sigma Aldrich Corporation | | | 2,196 | | | 138,985 | |
Watson Pharmaceuticals, Inc. | * | | 3,419 | | | 111,152 | |
Wyeth | | | 41,113 | | | 1,894,076 | |
| | | | | | | |
| | | | | | 23,865,113 | |
| | | | | | | |
Real Estate—0.7% | | | | | | | |
Apartment Investment & Management Company REIT Class A | † | | 2,984 | | | 113,004 | |
Archstone-Smith Trust REIT | | | 6,200 | | | 259,718 | |
Equity Office Properties Trust REIT | | | 12,428 | | | 376,941 | |
Equity Residential REIT | | | 8,722 | | | 341,205 | |
Plum Creek Timber Company, Inc. REIT | † | | 5,794 | | | 208,874 | |
Prologis REIT | | | 7,698 | | | 359,651 | |
Public Storage, Inc. REIT | † | | 2,500 | | | 169,300 | |
Simon Property Group, Inc. REIT | † | | 5,554 | | | 425,603 | |
Vornado Realty Trust REIT | | | 3,700 | | | 308,839 | |
| | | | | | | |
| | | | | | 2,563,135 | |
| | | | | | | |
Restaurants—0.6% | | | | | | | |
Darden Restaurants, Inc. | | | 3,972 | | | 154,431 | |
McDonald’s Corporation | | | 38,263 | | | 1,290,228 | |
Wendy’s International, Inc. | | | 3,708 | | | 204,904 | |
Yum! Brands, Inc. | | | 8,674 | | | 406,637 | |
| | | | | | | |
| | | | | | 2,056,200 | |
| | | | | | | |
Retailers—4.0% | | | | | | | |
Amazon.Com, Inc. | *† | | 8,700 | | | 410,205 | |
Autozone, Inc. | * | | 1,646 | | | 151,021 | |
Bed Bath & Beyond, Inc. | * | | 8,977 | | | 324,519 | |
Best Buy Company, Inc. | | | 12,303 | | | 534,934 | |
Big Lots, Inc. | * | | 3,704 | | | 44,485 | |
CVS Corporation | | | 24,792 | | | 655,005 | |
Circuit City Stores, Inc. | | | 4,766 | | | 107,664 | |
Costco Wholesale Corporation | † | | 14,607 | | | 722,608 | |
Dillard’s, Inc. Class A | † | | 1,726 | | | 42,839 | |
Dollar General Corporation | | | 9,870 | | | 188,221 | |
eBay, Inc. | * | | 33,995 | | | 1,470,284 | |
Family Dollar Stores, Inc. | | | 5,061 | | | 125,462 | |
Federated Department Stores | | | 8,021 | | | 532,033 | |
JC Penney Company, Inc. (Holding Company) | † | | 7,833 | | | 435,515 | |
Office Depot, Inc. | * | | 9,514 | | | 298,740 | |
OfficeMax, Inc. | | | 2,397 | | | 60,788 | |
RadioShack Corporation | | | 3,908 | | | 82,185 | |
Sears Holdings Corporation | *† | | 3,057 | | | 353,175 | |
Sherwin-Williams Company (The) | | | 3,384 | | | 153,701 | |
Staples, Inc. | | | 22,357 | | | 507,727 | |
TJX Companies, Inc. | | | 14,038 | | | 326,103 | |
Target Corporation | | | 27,095 | | | 1,489,412 | |
Tiffany & Company | | | 4,243 | | | 162,464 | |
Walgreen Company | | | 31,310 | | | 1,385,781 | |
Wal-Mart Stores, Inc. | | | 76,252 | | | 3,568,594 | |
| | | | | | | |
| | | | | | 14,133,465 | |
| | | | | | | |
Telecommunications—0.0% | | | | | | | |
Citizens Communications Company | | | 10,409 | | | 127,302 | |
| | | | | | | |
|
Telephone Systems—2.9% | | | | | | | |
Alltel Corporation | | | 11,652 | | | 735,241 | |
| | |
234 | See accompanying notes to financial statements. | |
SCHEDULE OF INVESTMENTS—(Continued)
December 31, 2005
| | | | | | | |
| | | | | | | | |
Vantagepoint 500 | | | | | | | |
Stock Index Fund | | | Shares | | | Value | |
| | | | | | | | |
|
COMMON STOCKS—(Continued) | | | | | | | |
| | | | | | | | |
AT&T, Inc. | | | 119,954 | | $ | 2,937,673 | |
BellSouth Corporation | | | 56,128 | | | 1,521,069 | |
CenturyTel, Inc. | | | 4,207 | | | 139,504 | |
Qwest Communications International, Inc. | *† | | 45,657 | | | 257,962 | |
Sprint Nextel Corp. | | | 89,932 | | | 2,100,812 | |
Verizon Communications, Inc. | | | 84,828 | | | 2,555,019 | |
| | | | | | | |
| | | | | | 10,247,280 | |
| | | | | | | |
Textiles, Clothing & Fabrics—0.4% | | | | | | | |
Coach, Inc. | * | | 11,868 | | | 395,679 | |
Jones Apparel Group, Inc. | | | 3,500 | | | 107,520 | |
Liz Claiborne, Inc. | † | | 3,456 | | | 123,794 | |
Nike, Inc. Class B | | | 5,805 | | | 503,816 | |
Reebok International Ltd. | | | 1,524 | | | 88,743 | |
VF Corporation | | | 2,652 | | | 146,762 | |
| | | | | | | |
| | | | | | 1,366,314 | |
| | | | | | | |
Transportation—1.9% | | | | | | | |
Brunswick Corporation | | | 2,897 | | | 117,792 | |
Burlington Northern Santa Fe Corporation | | | 11,392 | | | 806,781 | |
CSX Corporation | | | 6,778 | | | 344,119 | |
Carnival Corporation | | | 13,165 | | | 703,933 | |
FedEx Corporation | | | 9,249 | | | 956,254 | |
Norfolk Southern Corporation | | | 12,304 | | | 551,588 | |
Sabre Holdings Corporation | | | 3,944 | | | 95,090 | |
Union Pacific Corporation | | | 8,080 | | | 650,521 | |
United Parcel Service, Inc. Class B | | | 33,967 | | | 2,552,620 | |
| | | | | | | |
| | | | | | 6,778,698 | |
| | | | | | | |
TOTAL COMMON STOCKS
(Cost $187,528,368) | | | | | | 345,304,160 | |
| | | | | | | |
| | | | | | | | | | |
| | | | | | | | | | | |
Coupon
Rate | | Maturity
Date | | | | Face | | | Value | |
| | | | | | | | | | | |
U.S. TREASURY OBLIGATIONS—0.1% | | | | | | | |
| | | | | | | | |
U.S. Treasury Bills—0.1% | | | | | | | |
U.S. Treasury Bill | | | | | | | |
3.925% | | 03/09/2006 | | | | | | | | |
(Cost $297,776) | ** | $ | 300,000 | | | 297,776 | |
|
| | | | | | | |
| | | | | | | | |
CASH EQUIVALENTS—7.4% | | | | | | | |
| | | | | | | | |
Institutional Money Market Funds—0.5% | | | | | | | |
American Beacon Funds | †† | | 109,899 | | | 109,899 | |
BGI Institutional Fund | †† | | 1,428,683 | | | 1,428,683 | |
Goldman Sachs Financial Square Prime Obligations Fund | †† | | 109,899 | | | 109,899 | |
Merrimac Cash Fund—Premium Class | †† | | 175,838 | | | 175,838 | |
| | | | | | | |
| | | | | | 1,824,319 | |
| | | | | | | |
Bank & Certificate Deposits/ Offshore Time Deposits—6.3% | | | | | | | |
Abbey National PLC | | | | | | | |
4.290% | | 01/11/2006 | | †† | | 549,494 | | | 549,488 | |
Bank of Nova Scotia | | | | | | | |
4.250% | | 01/27/2006 | | †† | | 769,291 | | | 769,291 | |
Barclays | | | | | | | |
4.410% | | 02/27/2006 | | †† | | 549,494 | | | 549,494 | |
Barclays | | | | | | | |
4.270% | | 01/25/2006 | | †† | | 549,494 | | | 549,494 | |
| | | | | | | | | | |
| | | | | | | | | | | |
|
Coupon
Rate | | Maturity
Date | | | | Face | | | Value | |
| | | | | | | | | | | |
BNP Paribas | | | | | | | |
4.220% | | 01/24/2006 | | †† | $ | 549,494 | | $ | 549,494 | |
Branch Banker &Trust | | | | | | | |
4.260% | | 01/11/2006 | | †† | | 549,494 | | | 549,494 | |
CIESCO | | | | | | | |
4.305% | | 01/06/2006 | | †† | | 659,392 | | | 659,392 | |
Dexia Group | | | | | | | |
4.250% | | 01/09/2006 | | †† | | 1,098,987 | | | 1,098,987 | |
Fairway Finance | | | | | | | |
4.280% | | 01/30/2006 | | †† | | 439,595 | | | 439,595 | |
Falcon Asset Securitization Corporation | | | | | | | |
4.307% | | 02/02/2006 | | †† | | 545,041 | | | 545,041 | |
Fortis Bank | | | | | | | |
4.350% | | 01/03/2006 | | †† | | 549,494 | | | 549,494 | |
Greyhawk Funding | | | | | | | |
4.355% | | 01/06/2006 | | †† | | 439,595 | | | 439,595 | |
Greyhawk Funding | | | | | | | |
4.278% | | 01/24/2006 | | †† | | 329,696 | | | 329,696 | |
Jupiter Securitization Corporation | | | | | | | |
4.266% | | 01/05/2006 | | †† | | 263,757 | | | 263,757 | |
Jupiter Securitization Corporation | | | | | | | |
4.257% | | 01/04/2006 | | †† | | 329,696 | | | 329,696 | |
Liberty Street | | | | | | | |
4.266% | | 01/05/2006 | | †† | | 545,472 | | | 545,472 | |
Merrill Lynch & Company, Inc. | | | | | | | |
4.240% | | 01/03/2006 | | †† | | 2,197,975 | | | 2,197,975 | |
National Australia Bank | | | | | | | |
4.156% | | 01/03/2006 | | †† | | 308,336 | | | 308,336 | |
Paradigm Funding LLC | | | | | | | |
4.303% | | 01/03/2006 | | †† | | 710,937 | | | 710,937 | |
Paradigm Funding LLC | | | | | | | |
4.297% | | 01/09/2006 | | †† | | 439,595 | | | 439,595 | |
Prefco | | | | | | | |
4.312% | | 01/04/2006 | | †† | | 329,696 | | | 329,696 | |
Rabobank Nederland | | | | | | | |
4.150% | | 01/03/2006 | | †† | | 549,494 | | | 549,494 | |
Ranger Funding | | | | | | | |
4.291% | | 01/18/2006 | | †† | | 439,595 | | | 439,595 | |
Royal Bank of Canada | | | | | | | |
4.250% | | 01/24/2006 | | †† | | 769,291 | | | 769,291 | |
Royal Bank of Canada | | | | | | | |
4.220% | | 01/20/2006 | | †† | | 549,494 | | | 549,494 | |
Royal Bank of Scotland | | | | | | | |
4.310% | | 02/01/2006 | | †† | | 1,098,987 | | | 1,098,987 | |
Royal Bank of Scotland | | | | | | | |
4.250% | | 01/23/2006 | | †† | | 549,494 | | | 549,494 | |
Skandinaviska Enskilda Banken AB | | | | | | | |
4.300% | | 01/17/2006 | | †† | | 329,696 | | | 329,696 | |
Skandinaviska Enskilda Banken AB | | | | | | | |
4.230% | | 01/03/2006 | | †† | | 549,494 | | | 549,494 | |
Societe Generale | | | | | | | |
4.280% | | 01/30/2006 | | †† | | 439,595 | | | 439,595 | |
The Bank of the West | | | | | | | |
4.290% | | 01/25/2006 | | †† | | 549,494 | | | 549,494 | |
UBS AG | | | | | | | |
4.260% | | 01/10/2006 | | †† | | 549,494 | | | 549,494 | |
UBS AG | | | | | | | |
4.255% | | 01/18/2006 | | †† | | 659,392 | | | 659,392 | |
Wells Fargo | | | | | | | |
4.290% | | 01/30/2006 | | †† | | 879,190 | | | 879,190 | |
Wells Fargo | | | | | | | |
4.270% | | 01/03/2006 | | †† | | 549,494 | | | 549,494 | |
Yorktown Capital LLC | | | | | | | |
4.330% | | 01/04/2006 | | †† | | 492,039 | | | 492,039 | |
Yorktown Capital LLC | | | | | | | |
4.266% | 01/05/2006 | | †† | | 545,472 | | | 545,472 | |
| | | | | | | | | |
| | | | | | | | | 22,203,734 | |
| | | | | | | | | | |
| | |
| See accompanying notes to financial statements. | 235 |
SCHEDULE OF INVESTMENTS —(Continued)
December 31, 2005
| | | | | | | | | | |
| | |
Vantagepoint 500 | |
Stock Index Fund | |
| | | | | | | | | | | |
|
Coupon
Rate | | Maturity
Date | | | | Face | | | Value | |
| | | | | | | | | | | |
|
CASH EQUIVALENTS—(Continued) | | | | | | | |
| | | | | | | | |
|
Floating Rate Instruments/Master Notes—0.6% | | | | | | | |
Bank of America | | | | | | | |
4.270% | | 01/17/2006 | | †† | $ | 439,595 | | $ | 439,595 | |
Bank of America | | | | | | | |
4.230% | | 01/20/2006 | | †† | | 549,494 | | | 549,494 | |
Credit Suisse First Boston Corporation | | | | | | | |
4.175% | | 03/10/2006 | | †† | | 439,595 | | | 439,595 | |
Rabobank Nederland | | | | | | | |
4.100% | | 05/31/2006 | | †† | | 549,494 | | | 549,494 | |
| | | | | | | | | | |
| | | | | | | | | 1,978,178 | |
| | | | | | | | | | |
TOTAL CASH EQUIVALENTS
(Cost $26,006,231) | | | | | | 26,006,231 | |
| | | | | | | | | | |
|
| | | | | | | | |
|
REPURCHASE AGREEMENTS—1.2% | | | | | | | |
| | | | | | | | |
IBT Repurchase Agreement dated 12/30/05 due 1/03/06, with a maturity value of $4,247,512 and an effective yield of 3.65% collateralized by the U.S. Government Agency Obligation with a rate of 5.50%, a maturity date of 03/01/2035 and an aggregate market value of $4,458,079. | | | 4,245,790 | | | 4,245,790 | |
| | | | | | | | | | |
|
TOTAL INVESTMENTS—107.4%
(Cost $218,078,165) | | | | | | 375,853,957 | |
Other assets less liabilities—(7.4%) | | | | | | (25,974,259 | ) |
| | | | | | | | | | |
|
NET ASSETS—100.0% | | | | | $ | 349,879,698 | |
| | | | | | | |
Notes to the Schedule of Investments:
REIT Real Estate Investment Trust
| |
* | Non-income producing security. |
|
† | Denotes all or a portion of security on loan. |
|
** | Security has been pledged as collateral for futures contracts. |
|
†† | Represents collateral received from securities lending transactions. |
| | |
236 | See accompanying notes to financial statements. | |
SCHEDULE OF INVESTMENTS
December 31, 2005
| | | | | | | |
| | | | | | | | |
Vantagepoint Broad | | | | | | | |
Market Index Fund | | | Shares | | | Value | |
| | | | | | | | |
|
COMMON STOCKS—98.5% | | | | | | | |
| | | | | | | | |
Advertising—0.3% | | | | | | | |
24/7 Real Media, Inc. | * | | 273 | | $ | 2,004 | |
Aquantive, Inc. | *† | | 2,027 | | | 51,161 | |
Catalina Marketing Corporation | | | 2,131 | | | 54,021 | |
Getty Images, Inc. | *† | | 1,742 | | | 155,508 | |
Interpublic Group, Inc. | *† | | 17,203 | | | 166,009 | |
Jupitermedia Corporation | * | | 1,450 | | | 21,431 | |
Lamar Advertising Company | * | | 3,479 | | | 160,521 | |
Monster Worldwide, Inc. | *† | | 4,681 | | | 191,078 | |
Omnicom Group | † | | 7,385 | | | 628,685 | |
Valueclick, Inc. | * | | 4,058 | | | 73,490 | |
| | | | | | | |
| | | | | | 1,503,908 | |
| | | | | | | |
| | | | | | | |
Aerospace & Defense—1.1% | | | | | | | |
AAR Corporation | * | | 1,489 | | | 35,662 | |
Alliant Techsystems, Inc. | * | | 1,550 | | | 118,063 | |
Armor Holdings, Inc. | † | | 1,500 | | | 63,975 | |
Goodrich Corporation | | | 4,882 | | | 200,650 | |
Boeing Company (The) | | | 29,809 | | | 2,093,784 | |
Fairchild Corporation (The) Class A | * | | 3,265 | | | 8,326 | |
Gencorp, Inc. | *† | | 1,629 | | | 28,915 | |
General Dynamics Corporation | | | 6,805 | | | 776,110 | |
Heico Corporation | † | | 705 | | | 18,245 | |
Heico Corporation Class A | | | 878 | | | 18,017 | |
Honeywell International, Inc. | | | 31,671 | | | 1,179,745 | |
Kreisler Manufacturing Corporation | * | | 1,250 | | | 8,750 | |
Lockheed Martin Corporation | | | 14,210 | | | 904,182 | |
Northrop Grumman Corporation | | | 14,000 | | | 841,540 | |
Orbital Sciences Corporation | *† | | 2,123 | | | 27,259 | |
Sequa Corporation Class A | * | | 510 | | | 35,215 | |
Textron, Inc. | | | 4,843 | | | 372,814 | |
Triumph Group, Inc. | * | | 822 | | | 30,093 | |
| | | | | | | |
| | | | | | 6,761,345 | |
| | | | | | | |
| | | | | | | |
Airlines—0.2% | | | | | | | |
AMR Corporation | *† | | 6,672 | | | 148,319 | |
Air T, Inc. | † | | 1,352 | | | 14,548 | |
Airnet Systems, Inc. | * | | 2,609 | | | 8,897 | |
Airtran Holdings, Inc. | * | | 3,168 | | | 50,783 | |
Alaska Air Group, Inc. | * | | 1,343 | | | 47,972 | |
Continental Airlines, Inc. Class B | *† | | 2,723 | | | 58,000 | |
ExpressJet Holdings, Inc. | * | | 2,636 | | | 21,325 | |
Frontier Airlines, Inc. | *† | | 1,369 | | | 12,650 | |
JetBlue Airways Corporation | * | | 6,414 | | | 98,647 | |
Mesa Air Group, Inc. | *† | | 847 | | | 8,860 | |
Midwest Air Group, Inc. | *† | | 915 | | | 5,161 | |
Offshore Logistics, Inc. | * | | 982 | | | 28,674 | |
Petroleum Helicopters | * | | 774 | | | 24,172 | |
Skywest, Inc. | | | 2,390 | | | 64,195 | |
Southwest Airlines Company | | | 30,863 | | | 507,079 | |
US Airways Group, Inc. | *† | | 572 | | | 21,244 | |
World Air Holdings, Inc. | * | | 2,821 | | | 27,138 | |
| | | | | | | |
| | | | | | 1,147,664 | |
| | | | | | | |
| | | | | | | |
Apparel Retailers—0.6% | | | | | | | |
Abercrombie & Fitch Company Class A | † | | 3,982 | | | 259,547 | |
Aeropostale, Inc. | * | | 2,403 | | | 63,199 | |
American Eagle Outfitters, Inc. | | | 5,824 | | | 133,836 | |
AnnTaylor Stores Corporation | * | | 2,733 | | | 94,343 | |
Bebe Stores, Inc. | | | 790 | | | 11,084 | |
Big Dog Holdings, Inc. | * | | 1,620 | | | 11,972 | |
| | | | | | | |
| | | | | | | | |
| | | | | | | |
| | | Shares | | | Value | |
| | | | | | | | |
Buckle, Inc. (The) | | | 1,115 | | $ | 35,948 | |
Burlington Coat Factory Warehouse Corporation | | | 877 | | | 35,264 | |
Carter’s, Inc. | * | | 738 | | | 43,431 | |
Casual Male Retail Group, Inc. | * | | 1,930 | | | 11,831 | |
Cato Corporation Class A | | | 1,761 | | | 37,773 | |
Charlotte Russe Holding, Inc. | * | | 1,100 | | | 22,913 | |
Charming Shoppes, Inc. | * | | 3,138 | | | 41,422 | |
Chico’s FAS, Inc. | * | | 7,236 | | | 317,877 | |
Children’s Place | * | | 1,144 | | | 56,536 | |
Christopher & Banks Corporation | | | 1,528 | | | 28,696 | |
Claire’s Stores, Inc. | | | 3,855 | | | 112,643 | |
Dress Barn, Inc. | *† | | 950 | | | 36,679 | |
Finish Line Class A | | | 1,604 | | | 27,942 | |
Gap, Inc. (The) | | | 25,472 | | | 449,326 | |
HOT Topic, Inc. | *† | | 1,824 | | | 25,992 | |
JOS A. Bank Clothiers, Inc. | *† | | 462 | | | 20,055 | |
Kohl’s Corporation | * | | 12,808 | | | 622,469 | |
Ltd. Brands | | | 14,843 | | | 331,741 | |
Nordstrom, Inc. | | | 10,104 | | | 377,890 | |
Pacific Sunwear of California, Inc. | *† | | 3,025 | | | 75,383 | |
Payless Shoesource, Inc. | * | | 2,964 | | | 74,396 | |
Ross Stores, Inc. | † | | 6,350 | | | 183,515 | |
Stage Stores, Inc. | | | 1,491 | | | 44,402 | |
Talbots, Inc. | | | 375 | | | 10,432 | |
Too, Inc. | * | | 1,485 | | | 41,892 | |
Urban Outfitters, Inc. | *† | | 5,012 | | | 126,854 | |
Wet Seal, Inc. (The) Class A | *† | | 1,246 | | | 5,532 | |
Wilsons The Leather Experts, Inc. | * | | 819 | | | 2,973 | |
| | | | | | | |
| | | | | | 3,775,788 | |
| | | | | | | |
| | | | | | | |
Automotive—0.8% | | | | | | | |
A.O. Smith Corporation | | | 1,341 | | | 47,069 | |
Adesa, Inc. | | | 4,131 | | | 100,879 | |
Aftermarket Technology Corporation | * | | 603 | | | 11,722 | |
American Axle & Manufacturing Holdings, Inc. | † | | 2,113 | | | 38,731 | |
America’s Car Mart, Inc. | * | | 354 | | | 5,848 | |
Amerigon, Inc. | * | | 2,107 | | | 12,305 | |
ArvinMeritor, Inc. | | | 2,791 | | | 40,162 | |
Asbury Automotive Group, Inc. | * | | 1,342 | | | 22,089 | |
Autonation, Inc. | * | | 8,512 | | | 184,966 | |
BorgWarner, Inc. | | | 2,274 | | | 137,873 | |
Carmax, Inc. | *† | | 4,258 | | | 117,861 | |
Clarcor, Inc. | | | 2,354 | | | 69,937 | |
Coachmen Industries, Inc. | | | 705 | | | 8,326 | |
Copart, Inc. | * | | 3,582 | | | 82,601 | |
Dana Corporation | | | 6,169 | | | 44,293 | |
Dura Automotive Systems, Inc. | * | | 599 | | | 1,342 | |
Federal Signal Corporation | | | 2,159 | | | 32,407 | |
Ford Motor Company | | | 74,379 | | | 574,206 | |
General Motors Corporation | † | | 17,970 | | | 348,977 | |
Genuine Parts Company | | | 7,620 | | | 334,670 | |
Goodyear Tire & Rubber Company (The) | *† | | 7,281 | | | 126,544 | |
Group 1 Automotive, Inc. | * | | 1,068 | | | 33,567 | |
Harley-Davidson, Inc. | | | 12,173 | | | 626,788 | |
Harsco Corporation | | | 1,823 | | | 123,071 | |
ITT Industries, Inc. | | | 4,028 | | | 414,159 | |
Jarden Corporation | *† | | 1,771 | | | 53,396 | |
JLG Industries, Inc. | † | | 1,781 | | | 81,320 | |
Keystone Automotive Industries, Inc. | * | | 1,743 | | | 54,870 | |
Lear Corporation | † | | 2,741 | | | 78,009 | |
Lithia Motors, Inc. Class A | | | 862 | | | 27,101 | |
Monaco Coach Corporation | | | 1,376 | | | 18,301 | |
| | |
| See accompanying notes to financial statements. | 237 |
SCHEDULE OF INVESTMENTS —(Continued)
December 31, 2005
| | | | | | | |
| | | | | | | | |
Vantagepoint Broad | | | | | | | |
Market Index Fund | | | Shares | | | Value | |
| | | | | | | | |
|
COMMON STOCKS—(Continued) | | | | | | | |
| | | | | | | | |
Navistar International Corporation | * | | 2,851 | | $ | 81,596 | |
Oshkosh Truck Corporation | | | 2,868 | | | 127,884 | |
Paccar, Inc. | | | 7,562 | | | 523,517 | |
PEP Boys-Manny Moe & Jack | | | 2,200 | | | 32,758 | |
Proliance International, Inc. | * | | 2,239 | | | 11,844 | |
Sonic Automotive, Inc. | | | 1,649 | | | 36,740 | |
Sports Resorts International, Inc. | * | | 4,374 | | | 3,587 | |
Strattec Security Corporation | * | | 123 | | | 4,972 | |
Superior Industries International, Inc. | † | | 1,102 | | | 24,531 | |
Tenneco Automotive, Inc. | * | | 1,600 | | | 31,376 | |
Titan International, Inc. | † | | 1,085 | | | 18,716 | |
TRW Automotive Holdings Corporation | * | | 900 | | | 23,715 | |
United Auto Group, Inc. | | | 1,777 | | | 67,881 | |
Visteon Corporation | *† | | 5,429 | | | 33,986 | |
Wabash National Corporation | | | 1,395 | | | 26,575 | |
Winnebago Industries, Inc. | † | | 1,432 | | | 47,657 | |
| | | | | | | |
| | | | | | 4,950,725 | |
| | | | | | | |
| | | | | | | |
Banking—10.8% | | | | | | | |
1st Source Corporation | | | 1,073 | | | 26,981 | |
Advanta Corporation Class A | | | 1,446 | | | 43,568 | |
Alabama National Bancorp | | | 575 | | | 37,237 | |
Alliance Bankshares Corporation | * | | 647 | | | 10,358 | |
AMB Financial Corporation | | | 1,125 | | | 15,187 | |
Amcore Financial, Inc. | | | 1,313 | | | 39,928 | |
American Express Company | | | 44,975 | | | 2,314,413 | |
AmeriCredit Corporation | * | | 6,437 | | | 164,980 | |
AmSouth Bancorp | | | 14,570 | | | 381,880 | |
Anchor Bancorp Wisconsin, Inc. | | | 1,411 | | | 42,810 | |
Associated Banc Corporation | | | 5,110 | | | 166,331 | |
Astoria Financial Corporation | | | 4,671 | | | 137,327 | |
BB&T Corporation | | | 22,954 | | | 962,002 | |
Banc Corporation | * | | 895 | | | 10,212 | |
BancFirst Corporation | | | 321 | | | 25,359 | |
Bancorpsouth, Inc. | | | 3,611 | | | 79,695 | |
BancTrust Financial Group, Inc. | | | 1,600 | | | 32,160 | |
Bank Mutual Corporation | | | 3,756 | | | 39,814 | |
Bank of America Corporation | | | 165,210 | | | 7,624,442 | |
Bank of Hawaii Corporation | | | 2,494 | | | 128,541 | |
Bank of New York Company, Inc. (The) | | | 31,499 | | | 1,003,243 | |
BankAtlantic Bancorp, Inc. Class A | | | 2,210 | | | 30,940 | |
Bankunited Financial Corporation Class A | | | 793 | | | 21,070 | |
Bay View Capital Corporation | * | | 277 | | | 4,931 | |
Blue River Bancshares, Inc. | * | | 2,545 | | | 13,234 | |
BOK Financial Corporation | | | 1,765 | | | 80,184 | |
Boston Private Financial Holdings, Inc. | | | 1,297 | | | 39,455 | |
Brookline Bancorp, Inc. | | | 3,765 | | | 53,350 | |
Bryn Mawr Bank Corporation | | | 1,058 | | | 22,853 | |
Capital Bank Corporation | † | | 1,282 | | | 19,679 | |
Capital City Bank Group, Inc. | | | 1,113 | | | 38,165 | |
Capital Crossing Bank | * | | 1,680 | | | 56,112 | |
Capital One Financial Corporation | | | 12,245 | | | 1,057,968 | |
Capitol Federal Financial | | | 2,115 | | | 69,668 | |
Cardinal Financial Corporation | | | 1,142 | | | 12,562 | |
Cascade Bancorp | | | 1,753 | | | 40,337 | |
Cascade Financial Corporation | | | 851 | | | 15,108 | |
Cathay General Bancorp | | | 2,082 | | | 74,827 | |
Central Pacific Financial Corporation | | | 929 | | | 33,370 | |
CFS Bancorp, Inc. | | | 1,873 | | | 26,784 | |
Charter Financial Corporation | | | 350 | | | 12,498 | |
| | | | | | | |
| | | | | | | | |
| | | | | | | |
| | | Shares | | | Value | |
| | | | | | | | |
Chemical Financial Corporation | | | 1,552 | | $ | 49,292 | |
Chittenden Corporation | | | 2,222 | | | 61,794 | |
CIT Group, Inc. | | | 8,482 | | | 439,198 | |
Citigroup, Inc. | | | 212,865 | | | 10,330,338 | |
Citizens Banking Corporation | | | 2,069 | | | 57,415 | |
City Bank, Lynnwood, WA | | | 1,097 | | | 39,020 | |
City Holding Company | | | 250 | | | 8,987 | |
City National Corporation | | | 2,199 | | | 159,296 | |
Coastal Financial Corporation | | | 1,775 | | | 22,826 | |
CoBiz, Inc. | | | 1,063 | | | 19,378 | |
Colonial BancGroup, Inc. (The) | | | 5,643 | | | 134,416 | |
Comerica, Inc. | | | 6,877 | | | 390,339 | |
Commerce Bancorp, Inc. | † | | 6,314 | | | 217,265 | |
Commerce Bancshares, Inc. | | | 3,436 | | | 179,084 | |
Commercial Capital Bancorp, Inc. | † | | 1,127 | | | 19,294 | |
Community Bank System, Inc. | | | 1,402 | | | 31,615 | |
Community Trust Bancorp, Inc. | | | 665 | | | 20,449 | |
Compass Bancshares, Inc. | | | 4,769 | | | 230,295 | |
CompuCredit Corporation | * | | 83 | | | 3,194 | |
Corus Bankshares, Inc. | † | | 351 | | | 19,751 | |
Cullen/Frost Bankers, Inc. | | | 2,502 | | | 134,307 | |
CVB Financial Corporation | | | 2,971 | | | 60,341 | |
Dime Community Bancshares | | | 1,638 | | | 23,931 | |
Downey Financial Corporation | | | 1,038 | | | 70,989 | |
Eastern Virginia Bankshares, Inc. | | | 700 | | | 14,910 | |
East-West Bancorp, Inc. | † | | 2,200 | | | 80,278 | |
Equitex, Inc. | * | | 528 | | | 2,698 | |
Euronet Worldwide, Inc. | * | | 1,056 | | | 29,357 | |
Farmers Capital Bank Corporation | | | 1,113 | | | 34,214 | |
Fidelity Bankshares, Inc. | | | 2,263 | | | 74,000 | |
Fidelity Southern Corporation | | | 1,381 | | | 24,720 | |
Fifth Third Bancorp | † | | 20,049 | | | 756,248 | |
Financial Federal Corporation | † | | 1,009 | | | 44,850 | |
Financial Institutions, Inc. | | | 749 | | | 14,695 | |
First Bancorp North Carolina | | | 643 | | | 12,963 | |
First Bancorp Puerto Rico | | | 3,246 | | | 40,283 | |
First Charter Corporation | | | 843 | | | 19,945 | |
First Citizens BancShares, Inc. Class A | | | 454 | | | 79,187 | |
First Commonwealth Financial Corporation | | | 5,133 | | | 66,370 | |
First Community Bancorp | | | 894 | | | 48,607 | |
First Financial Bancorp | | | 1,895 | | | 33,200 | |
First Financial Bankshares, Inc. | | | 333 | | | 11,675 | |
First Financial Service Corporation | | | 333 | | | 9,644 | |
First Horizon National Corporation | † | | 5,607 | | | 215,533 | |
First Merchants Corporation | | | 874 | | | 22,724 | |
First Midwest Bancorp, Inc. | | | 2,002 | | | 70,190 | |
First Niagara Financial Group, Inc. | | | 4,099 | | | 59,313 | |
First Oak Brook Bancshares Class A | | | 771 | | | 21,549 | |
First of Long Island Corporation (The) | | | 493 | | | 20,841 | |
First Republic Bank | | | 1,336 | | | 49,445 | |
FirstBank NW Corporation | | | 199 | | | 6,350 | |
FirstFed Financial Corporation | *† | | 922 | | | 50,267 | |
FirstMerit Corporation | | | 3,895 | | | 100,919 | |
Flagstar Bancorp, Inc. | | | 2,110 | | | 30,384 | |
FMS Financial Corporation | | | 500 | | | 8,779 | |
FNB Corporation | | | 3,344 | | | 58,052 | |
Fremont General Corporation | † | | 2,929 | | | 68,041 | |
Frontier Financial Corporation | | | 1,503 | | | 48,096 | |
Fulton Financial Corporation | | | 6,222 | | | 109,507 | |
Glacier Bancorp, Inc. | | | 1,181 | | | 35,489 | |
Gold Banc Corporation, Inc. | | | 1,334 | | | 24,305 | |
Golden West Financial Corporation | | | 13,210 | | | 871,860 | |
Greater Bay Bancorp | | | 2,213 | | | 56,697 | |
Hallwood Group, Inc. | | | 100 | | | 7,788 | |
| | |
238 | See accompanying notes to financial statements. | |
SCHEDULE OF INVESTMENTS—(Continued)
December 31, 2005
| | | | | | | |
| | | | | | | | |
Vantagepoint Broad | | | | | | | |
Market Index Fund | | | Shares | | | Value | |
| | | | | | | | |
|
COMMON STOCKS—(Continued) | | | | | | | |
| | | | | | | | |
Hancock Holding Company | | | 1,752 | | $ | 66,243 | |
Harbor Florida Bancshares, Inc. | | | 491 | | | 18,192 | |
Harleysville National Corporation | | | 1,153 | | | 22,022 | |
Harrington West Financial Group, Inc. | | | 1,171 | | | 19,500 | |
Heritage Financial Corporation | | | 332 | | | 8,107 | |
Home City Financial Corporation | | | 434 | | | 6,781 | |
Horizon Financial Services Corporation | | | 450 | | | 6,750 | |
Hudson City Bancorp, Inc. | | | 25,794 | | | 312,623 | |
Hudson United Bancorp | | | 2,196 | | | 91,529 | |
Huntington Bancshares, Inc. | † | | 9,498 | | | 225,578 | |
Independence Community Bank Corporation | | | 3,416 | | | 135,718 | |
Independent Bank Corporation (Massachusetts) | | | 874 | | | 24,935 | |
Independent Bank Corporation (Michigan) | | | 1,980 | | | 53,915 | |
IndyMac Bancorp, Inc. | | | 2,523 | | | 98,447 | |
Integra Bank Corporation | | | 848 | | | 18,096 | |
International Bancshares Corporation | | | 2,953 | | | 86,700 | |
Investors Financial Services Corporation | | | 2,840 | | | 104,597 | |
Irwin Financial Corporation | | | 1,296 | | | 27,760 | |
JP Morgan Chase & Company | | | 143,836 | | | 5,708,851 | |
KeyCorp | | | 17,394 | | | 572,784 | |
KNBT Bancorp, Inc. | | | 1,002 | | | 16,323 | |
M&T Bank Corporation | | | 3,475 | | | 378,949 | |
MBNA Corporation | | | 47,220 | | | 1,282,495 | |
MAF Bancorp, Inc. | | | 1,245 | | | 51,518 | |
Main Street Banks, Inc. | | | 500 | | | 13,615 | |
Main Street Trust, Inc. | | | 291 | | | 8,686 | |
Marshall & IIsley Corporation | † | | 8,095 | | | 348,409 | |
Matrix Bancorp, Inc. | * | | 973 | | | 18,381 | |
MB Financial, Inc. | | | 760 | | | 26,904 | |
Medallion Financial Corporation | | | 958 | | | 10,787 | |
Mellon Financial Corporation | | | 17,152 | | | 587,456 | |
Mercantile Bankshares Corporation | | | 3,471 | | | 195,903 | |
Merchants Bancshares, Inc. | | | 571 | | | 13,728 | |
Midsouth Bancorp, Inc. | | | 399 | | | 10,769 | |
MidWestOne Financial Group, Inc. | | | 582 | | | 10,450 | |
Mitcham Industries, Inc. | * | | 1,100 | | | 19,217 | |
NASB Financial, Inc. | | | 528 | | | 20,782 | |
National City Corporation | | | 22,634 | | | 759,823 | |
National Penn Bancshares, Inc. | | | 1,628 | | | 31,013 | |
NBT Bancorp, Inc. | | | 1,000 | | | 21,590 | |
Nelnet, Inc. Class A | *† | | 481 | | | 19,567 | |
Netbank, Inc. | | | 2,850 | | | 20,463 | |
New York Community Bancorp, Inc. | † | | 10,860 | | | 179,407 | |
NewAlliance Bancshares, Inc. | † | | 4,600 | | | 66,884 | |
North Fork Bancorp, Inc. | | | 19,396 | | | 530,675 | |
Northern States Financial Corporation | | | 772 | | | 14,591 | |
Northern Trust Corporation | | | 8,643 | | | 447,880 | |
Northwest Bancorp, Inc. | | | 2,048 | | | 43,540 | |
Ocwen Financial Corporation | * | | 3,358 | | | 29,215 | |
Old National Bancorp | | | 3,552 | | | 76,865 | |
PNC Financial Services Group, Inc. | | | 11,751 | | | 726,564 | |
Pacific Capital Bancorp | | | 1,724 | | | 61,340 | |
Pacific Premier Bancorp, Inc. | * | | 976 | | | 11,517 | |
Park National Corporation | | | 728 | | | 74,722 | |
Parkvale Financial Corporation | | | 616 | | | 17,371 | |
Peoples Bancorp, Inc. | | | 814 | | | 23,223 | |
People’s Bank | | | 2,509 | | | 77,930 | |
Peoples Financial Corporation | | | 883 | | | 14,879 | |
PFF Bancorp, Inc. | | | 1,096 | | | 33,450 | |
| | | | | | | |
| | | | | | | | |
| | | | | | | |
| | | Shares | | | Value | |
| | | | | | | | |
Popular, Inc. (Puerto Rico) | | | 10,296 | | $ | 217,760 | |
Premier Community Bankshares, Inc. | | | 933 | | | 21,459 | |
PrivateBancorp, Inc. | | | 1,200 | | | 42,684 | |
Provident Bankshares Corporation | | | 1,369 | | | 46,231 | |
Provident Financial Services, Inc. | | | 943 | | | 17,455 | |
Provident New York Bancorp | | | 3,670 | | | 40,407 | |
R&G Financial Corporation Class B (Puerto Rico) | | | 1,555 | | | 20,526 | |
Regions Financial Corporation | | | 20,065 | | | 685,420 | |
Republic Bancorp, Inc. | | | 3,754 | | | 44,673 | |
Republic Bancorp, Inc. Class A | | | 1,455 | | | 31,210 | |
Riverview Bancorp, Inc. | | | 1,300 | | | 30,303 | |
Royal Bancshares of Pennsylvania Class A | | | 840 | | | 19,466 | |
S&T Bancorp, Inc. | | | 1,868 | | | 68,780 | |
Sandy Spring Bancorp, Inc. | | | 344 | | | 11,999 | |
Santander Bancorp (Puerto Rico) | | | 1,280 | | | 32,154 | |
Shore Bancshares, Inc. | | | 551 | | | 17,478 | |
Simmons First National Corporation Class A | | | 911 | | | 25,235 | |
Sky Financial Group, Inc. | | | 4,278 | | | 119,014 | |
SLM Corporation | | | 17,109 | | | 942,535 | |
South Financial Group, Inc. (The) | | | 2,799 | | | 77,084 | |
SouthFirst Bancshares, Inc. | | | 400 | | | 4,740 | |
Sovereign Bancorp, Inc. | | | 16,036 | | | 346,698 | |
State Street Corporation | | | 13,568 | | | 752,210 | |
Sterling Bancorp, NY | | | 1,476 | | | 29,121 | |
Sterling Bancshares, Inc. | | | 1,615 | | | 24,936 | |
Sterling Financial Corporation (Pennsylvania) | | | 1,557 | | | 30,829 | |
Sterling Financial Corporation (Washington) | | | 2,263 | | | 56,530 | |
Student Loan Corporation | | | 207 | | | 43,311 | |
Suffolk Bancorp | | | 1,100 | | | 37,147 | |
Suntrust Banks, Inc. | | | 14,998 | | | 1,091,254 | |
Susquehanna Bancshares, Inc. | | | 2,932 | | | 69,430 | |
SVB Financial Group | *† | | 1,437 | | | 67,309 | |
Synovus Financial Corporation | | | 10,920 | | | 294,949 | |
TCF Financial Corporation | | | 6,104 | | | 165,663 | |
TD Banknorth, Inc. | | | 3,906 | | | 113,469 | |
Texas Regional Bancshares, Inc. Class A | | | 2,100 | | | 59,430 | |
Tompkins Trustco, Inc. | | | 605 | | | 27,104 | |
Trustco Bank Corporation | | | 3,435 | | | 42,663 | |
Trustmark Corporation | | | 2,435 | | | 66,889 | |
U.S. Bancorp | | | 76,134 | | | 2,275,645 | |
UCBH Holdings, Inc. | | | 3,652 | | | 65,298 | |
UMB Financial Corporation | | | 995 | | | 63,590 | |
Umpqua Holdings Corporation | | | 1,151 | | | 32,838 | |
UnionBanCal Corporation | | | 2,177 | | | 149,603 | |
United Bankshares, Inc. | | | 2,134 | | | 75,202 | |
United Community Banks, Inc. | | | 2,188 | | | 58,332 | |
United Tennessee Bankshares, Inc. | | | 550 | | | 11,773 | |
Unizan Financial Corporation | | | 1,593 | | | 42,310 | |
Valley National Bancorp | | | 4,907 | | | 118,259 | |
W Holding Company, Inc. (Puerto Rico) | | | 8,055 | | | 66,293 | |
WFS Financial, Inc. | * | | 82 | | | 6,244 | |
Wachovia Corporation | | | 64,864 | | | 3,428,711 | |
Washington Federal, Inc. | | | 3,379 | | | 77,683 | |
Washington Mutual, Inc. | | | 41,544 | | | 1,807,164 | |
Washington Trust Bancorp, Inc. | | | 500 | | | 13,090 | |
Webster Financial Corporation | | | 2,393 | | | 112,232 | |
Wells Fargo & Company | | | 69,112 | | | 4,342,307 | |
Wesbanco, Inc. | | | 1,699 | | | 51,667 | |
Westamerica Bancorporation | | | 1,628 | | | 86,398 | |
Westcorp | | | 1,052 | | | 70,074 | |
| | |
| See accompanying notes to financial statements. | 239 |
SCHEDULE OF INVESTMENTS —(Continued)
December 31, 2005
| | | | | | | |
| | | | | | | | |
Vantagepoint Broad | | | | | | | |
Market Index Fund | | | Shares | | | Value | |
| | | | | | | | |
|
COMMON STOCKS—(Continued) | | | | | | | |
| | | | | | | | |
Westfield Financial, Inc. | | | 1,240 | | $ | 29,772 | |
Whitney Holding Corporation | | | 2,372 | | | 65,359 | |
Willow Grove Bancorp, Inc. | | | 508 | | | 7,686 | |
Wilmington Trust Corporation | | | 3,204 | | | 124,668 | |
Wintrust Financial Corporation | | | 1,017 | | | 55,833 | |
World Acceptance Corporation | * | | 639 | | | 18,211 | |
Zions Bancorp | | | 5,063 | | | 382,560 | |
| | | | | | | |
| | | | | | 64,446,716 | |
| | | | | | | |
| | | | | | | |
Beverages, Food & Tobacco—4.3% | | | | | | | |
Altria Group, Inc. | | | 84,685 | | | 6,327,663 | |
American Italian Pasta Company Class A | | | 721 | | | 4,903 | |
Anheuser-Busch Companies, Inc. | † | | 31,510 | | | 1,353,670 | |
Archer-Daniels-Midland Company | | | 25,537 | | | 629,742 | |
Bridgford Foods Corporation | * | | 559 | | | 3,762 | |
Brown-Forman Corporation Class B | | | 2,437 | | | 168,933 | |
Bunge Ltd. | † | | 4,700 | | | 266,067 | |
Campbell Soup Company | | | 11,026 | | | 328,244 | |
Central European Distribution Corporation | *† | | 435 | | | 17,461 | |
Chiquita Brands International, Inc. | | | 2,150 | | | 43,021 | |
Coca-Cola Bottling Company Consolidated | | | 437 | | | 18,791 | |
Coca-Cola Company (The) | | | 90,429 | | | 3,645,193 | |
Coca-Cola Enterprises, Inc. | | | 10,775 | | | 206,557 | |
ConAgra Foods, Inc. | † | | 21,479 | | | 435,594 | |
Constellation Brands, Inc. Class A | * | | 8,096 | | | 212,358 | |
Corn Products International, Inc. | | | 3,164 | | | 75,588 | |
Dean Foods Company | * | | 6,281 | | | 236,542 | |
Del Monte Foods Company | * | | 8,204 | | | 85,568 | |
Delta & Pine Land Company | | | 1,668 | | | 38,381 | |
Dreyer’s Grand Ice Cream Holdings, Inc. | | | 1,200 | | | 99,456 | |
Farmer Brothers Company | | | 930 | | | 17,986 | |
Flowers Foods, Inc. | | | 2,760 | | | 76,066 | |
Fresh Del Monte Produce, Inc. (Cayman Islands) | | | 567 | | | 12,911 | |
General Mills, Inc. | | | 14,393 | | | 709,863 | |
Green Mountain Coffee Roasters, Inc. | * | | 500 | | | 20,300 | |
Griffin Land & Nurseries, Inc. | * | | 650 | | | 16,968 | |
H.J. Heinz Company | | | 15,302 | | | 515,983 | |
Hain Celestial Group, Inc. | * | | 1,426 | | | 30,174 | |
Hansen Natural Corporation | *† | | 670 | | | 52,803 | |
Hershey Foods Corporation | | | 7,400 | | | 408,850 | |
Hormel Foods Corporation | | | 3,195 | | | 104,413 | |
JM Smucker Company (The) | | | 2,614 | | | 115,016 | |
Kellogg Company | | | 10,337 | | | 446,765 | |
Kraft Foods, Inc. Class A | † | | 11,257 | | | 316,772 | |
Lancaster Colony Corporation | | | 1,389 | | | 51,462 | |
Lance, Inc. | | | 1,370 | | | 25,523 | |
Loews Corp.—Carolina Group | | | 2,900 | | | 127,571 | |
M&F Worldwide Corporation | * | | 780 | | | 12,730 | |
Margo Caribe, Inc. (Puerto Rico) | * | | 1,322 | | | 9,254 | |
McCormick & Company, Inc. | | | 5,759 | | | 178,068 | |
Molson Coors Brewing Company— Class B | | | 2,911 | | | 195,008 | |
Peet’s Coffee & Tea, Inc. | *† | | 637 | | | 19,333 | |
Pepsi Bottling Group, Inc. | | | 7,106 | | | 203,303 | |
PepsiAmericas, Inc. | | | 3,031 | | | 70,501 | |
Pepsico, Inc. | | | 68,839 | | | 4,067,008 | |
Performance Food Group Company | * | | 1,907 | | | 54,102 | |
Pilgrim’s Pride Corporation | | | 2,476 | | | 82,104 | |
| | | | | | | |
| | | | | | | | |
| | | | | | | |
| | | Shares | | | Value | |
| | | | | | | | |
Poore Brothers, Inc. | * | | 5,272 | | $ | 14,867 | |
Ralcorp Holdings, Inc. | * | | 1,228 | | | 49,009 | |
Reynolds American, Inc. | † | | 3,712 | | | 353,865 | |
Safeway, Inc. | † | | 17,256 | | | 408,277 | |
Sanderson Farms, Inc. | | | 864 | | | 26,378 | |
Sara Lee Corporation | | | 32,793 | | | 619,788 | |
Scheid Vineyards, Inc. Class A | * | | 1,626 | | | 11,707 | |
Seaboard Corporation | | | 18 | | | 27,198 | |
Smart & Final, Inc. | * | | 1,915 | | | 24,665 | |
Smithfield Foods, Inc. | * | | 4,682 | | | 143,269 | |
Supervalu, Inc. | | | 5,566 | | | 180,784 | |
Sysco Corporation | | | 26,855 | | | 833,848 | |
Tootsie Roll Industries, Inc. | | | 540 | | | 15,622 | |
Topps Company, Inc. (The) | | | 2,255 | | | 16,755 | |
TreeHouse Foods, Inc. | *† | | 1,256 | | | 23,512 | |
Tyson Foods, Inc. Class A | | | 10,231 | | | 174,950 | |
UST, Inc. | † | | 6,881 | | | 280,951 | |
United Natural Foods, Inc. | * | | 1,912 | | | 50,477 | |
Universal Corporation | | | 1,078 | | | 46,742 | |
Vector Group Ltd. | † | | 2,168 | | | 39,393 | |
WM Wrigley Jr. Company | | | 6,126 | | | 407,318 | |
| | | | | | | |
| | | | | | 25,887,706 | |
| | | | | | | |
| | | | | | | |
Building Materials—1.2% | | | | | | | |
Amcol International Corporation | | | 1,186 | | | 24,337 | |
Andersons, Inc. | | | 1,050 | | | 45,234 | |
Carbo Ceramics, Inc. | | | 1,137 | | | 64,263 | |
Champion Enterprises, Inc. | * | | 2,559 | | | 34,854 | |
Chemed Corporation | | | 1,162 | | | 57,728 | |
Chindex International, Inc. | *† | | 548 | | | 2,789 | |
Comfort Systems USA, Inc. | | | 2,179 | | | 20,047 | |
Conceptus, Inc. | * | | 1,047 | | | 13,213 | |
Digi International, Inc. | * | | 1,976 | | | 20,728 | |
Eagle Materials, Inc. | † | | 861 | | | 105,352 | |
ElkCorp | | | 938 | | | 31,573 | |
EP Medsystems, Inc. | * | | 5,240 | | | 15,248 | |
Florida Rock Industries, Inc. | | | 2,697 | | | 132,315 | |
Home Depot, Inc. | | | 87,614 | | | 3,546,615 | |
Ikon Office Solutions, Inc. | | | 5,770 | | | 60,066 | |
Ingram Micro, Inc. Class A | * | | 6,500 | | | 129,545 | |
Insight Enterprises, Inc. | * | | 2,054 | | | 40,279 | |
Integrated Electrical Services, Inc. | *† | | 1,846 | | | 1,015 | |
Jewett-Cameron Trading Ltd. (Canada) | * | | 1,050 | | | 9,292 | |
Lafarge North America, Inc. | | | 1,276 | | | 70,206 | |
Louisiana-Pacific Corporation | † | | 4,396 | | | 120,758 | |
Lowe’s Companies, Inc. | | | 28,530 | | | 1,901,810 | |
Med-Design Corporation | * | | 1,163 | | | 570 | |
Microtek Medical Holdings, Inc. | * | | 1,250 | | | 4,350 | |
Neoforma, Inc. | * | | 885 | | | 8,761 | |
Nyer Medical Group, Inc. | * | | 2,532 | | | 7,596 | |
Owens & Minor, Inc. | | | 1,623 | | | 44,681 | |
PSS World Medical, Inc. | * | | 3,574 | | | 53,038 | |
Patterson Companies, Inc. | * | | 5,546 | | | 185,236 | |
Performance Technologies, Inc. | * | | 793 | | | 6,495 | |
Precis, Inc. | * | | 3,538 | | | 5,449 | |
Programmers Paradise, Inc. | | | 1,787 | | | 21,390 | |
Quanta Services, Inc. | *† | | 4,702 | | | 61,925 | |
Rock of Ages Corporation | | | 1,387 | | | 5,992 | |
Tech Data Corporation | * | | 2,057 | | | 81,622 | |
USG Corporation | *† | | 1,674 | | | 108,810 | |
Vulcan Materials Company | | | 4,221 | | | 285,973 | |
| | | | | | | |
| | | | | | 7,329,155 | |
| | | | | | | |
| | |
240 | See accompanying notes to financial statements. | |
SCHEDULE OF INVESTMENTS —(Continued)
December 31, 2005
| | | | | | | |
| | | | | | | | |
Vantagepoint Broad | | | | | | | |
Market Index Fund | | | Shares | | | Value | |
| | | | | | | | |
|
COMMON STOCKS—(Continued) | | | | | | | |
| | | | | | | | |
Chemicals—1.5% | | | | | | | |
A. Schulman, Inc. | | | 1,444 | | $ | 31,075 | |
AEP Industries, Inc. | * | | 372 | | | 9,300 | |
Air Products & Chemicals, Inc. | | | 9,030 | | | 534,486 | |
Airgas, Inc. | | | 3,075 | | | 101,167 | |
Albemarle Corporation | | | 1,856 | | | 71,178 | |
Applied Films Corporation | * | | 564 | | | 11,714 | |
Arch Chemicals, Inc. | | | 1,211 | | | 36,209 | |
Atlantis Plastics, Inc. Class A | | | 417 | | | 3,023 | |
Avery Dennison Corporation | † | | 4,185 | | | 231,305 | |
Cabot Corporation | | | 2,693 | | | 96,409 | |
Cabot Microelectronics Corporation | * | | 1,049 | | | 30,767 | |
Chemtura Corporation | | | 8,873 | | | 112,687 | |
Church & Dwight, Inc. | | | 2,569 | | | 84,854 | |
Cooper Tire & Rubber Company | † | | 3,066 | | | 46,971 | |
Cytec Industries, Inc. | | | 1,644 | | | 78,304 | |
Dow Chemical Company (The) | | | 38,798 | | | 1,700,128 | |
Eastman Chemical Company | | | 3,211 | | | 165,655 | |
Ecolab, Inc. | | | 8,093 | | | 293,533 | |
EI Du Pont de Nemours & Company | | | 40,562 | | | 1,723,885 | |
Empire Financial Holding Company | * | | 1,550 | | | 5,642 | |
FMC Corporation | * | | 1,668 | | | 88,688 | |
Female Health Company (The) | *† | | 4,531 | | | 7,793 | |
Georgia Gulf Corporation | | | 1,268 | | | 38,573 | |
HB Fuller Company | | | 1,285 | | | 41,210 | |
Hercules, Inc. | * | | 4,606 | | | 52,048 | |
Huntsman Corporation | * | | 2,600 | | | 44,772 | |
International Flavors & Fragrances, Inc. | | | 3,885 | | | 130,147 | |
International Smart Sourcing, Inc. | * | | 8,975 | | | 2,872 | |
Landec Corporation | * | | 986 | | | 7,671 | |
LSB Industries, Inc. | * | | 1,411 | | | 8,678 | |
Lubrizol Corporation | | | 1,819 | | | 78,999 | |
Lyondell Chemical Company | † | | 7,868 | | | 187,416 | |
MacDermid, Inc. | | | 1,456 | | | 40,622 | |
Minerals Technologies, Inc. | | | 868 | | | 48,513 | |
Monsanto Company | | | 10,773 | | | 835,231 | |
Mosaic Company (The) | *† | | 4,509 | | | 65,967 | |
Myers Industries, Inc. | | | 1,716 | | | 25,019 | |
NL Industries, Inc. | | | 2,111 | | | 29,744 | |
NuCo2, Inc. | * | | 1,261 | | | 35,157 | |
Olin Corporation | | | 2,796 | | | 55,025 | |
OM Group, Inc. | * | | 1,147 | | | 21,518 | |
Omnova Solutions, Inc. | * | | 6,478 | | | 31,094 | |
PPG Industries, Inc. | | | 7,052 | | | 408,311 | |
Penford Corporation | | | 785 | | | 9,577 | |
Pharmos Corporation | * | | 1,375 | | | 2,764 | |
PolyOne Corporation | * | | 2,862 | | | 18,403 | |
Praxair, Inc. | | | 13,493 | | | 714,589 | |
Scotts Company (The) Class A | | | 1,662 | | | 75,189 | |
Sensient Technologies Corporation | | | 2,027 | | | 36,283 | |
Spartech Corporation | | | 1,451 | | | 31,849 | |
Stepan Company | | | 556 | | | 14,951 | |
SurModics, Inc. | *† | | 675 | | | 24,968 | |
Trex Company, Inc. | *† | | 731 | | | 20,505 | |
Tupperware Corporation | | | 2,427 | | | 54,365 | |
Unifi, Inc. | * | | 2,629 | | | 7,992 | |
USEC, Inc. | | | 2,637 | | | 31,512 | |
Valhi, Inc. | | | 511 | | | 9,453 | |
Wellman, Inc. | | | 1,509 | | | 10,231 | |
West Pharmaceutical Services, Inc. | | | 1,704 | | | 42,651 | |
| | | | | | | |
| | | | | | 8,758,642 | |
| | | | | | | |
| | | | | | | |
| | | | | | | | |
| | | | | | | |
| | | Shares | | | Value | |
| | | | | | | | |
Coal—0.2% | | | | | | | |
Alpha Natural Resources, Inc. | * | | 1,280 | | $ | 24,589 | |
Arch Coal, Inc. | † | | 2,058 | | | 163,611 | |
Consol Energy, Inc. | | | 3,731 | | | 243,187 | |
Peabody Energy Corporation | | | 5,212 | | | 429,573 | |
Penn Virginia Resource Partners, LP | | | 800 | | | 44,456 | |
| | | | | | | |
| | | | | | 905,416 | |
| | | | | | | |
| | | | | | | |
Commercial Services—2.2% | | | | | | | |
Aaron Rents, Inc. | | | 1,939 | | | 40,874 | |
ABM Industries, Inc. | | | 2,291 | | | 44,789 | |
Accelrys, Inc. | * | | 1,145 | | | 9,194 | |
Accenture Ltd. Class A (Bermuda) | | | 19,300 | | | 557,191 | |
ACCO Brands Corporation | * | | 1,319 | | | 32,315 | |
Administaff, Inc. | | | 1,143 | | | 48,063 | |
Advisory Board Company (The) | * | | 950 | | | 45,286 | |
Advo, Inc. | | | 1,276 | | | 35,958 | |
Affymetrix, Inc. | *† | | 2,525 | | | 120,569 | |
Akamai Technologies, Inc. | * | | 5,664 | | | 112,884 | |
Allied Waste Industries, Inc. | *† | | 13,285 | | | 116,111 | |
Ambassadors International, Inc. | | | 523 | | | 8,106 | |
Amerco, Inc. | | | 805 | | | 58,000 | |
AMN Healthcare Services, Inc. | * | | 1,507 | | | 29,808 | |
Amylin Pharmaceuticals, Inc. | *† | | 3,885 | | | 155,089 | |
Angelica Corporation | | | 510 | | | 8,435 | |
Antigenics, Inc. | *† | | 1,707 | | | 8,125 | |
APAC Customer Services, Inc. | * | | 1,972 | | | 3,609 | |
Apollo Group, Inc. Class A | *† | | 6,518 | | | 394,078 | |
Applera Corporation Celera Genomics Group | * | | 3,028 | | | 33,187 | |
Ariad Pharmaceuticals, Inc. | *† | | 1,662 | | | 9,723 | |
Artemis International Solutions Corporation | * | | 555 | | | 777 | |
Asset Acceptance Capital Corporation | * | | 27 | | | 606 | |
Axonyx, Inc. | * | | 2,772 | | | 2,301 | |
BISYS Group, Inc. (The) | * | | 5,178 | | | 72,544 | |
Bandag, Inc. | | | 1,000 | | | 42,670 | |
Barrett Business Services, Inc. | * | | 3,900 | | | 97,461 | |
BearingPoint, Inc. | * | | 8,105 | | | 63,705 | |
Bowne & Company, Inc. | | | 1,575 | | | 23,373 | |
Bright Horizons Family Solutions, Inc. | * | | 1,208 | | | 44,756 | |
Brink’s Company (The) | | | 2,360 | | | 113,068 | |
Career Education Corporation | *† | | 4,167 | | | 140,511 | |
CCE Spinco, Inc. | *† | | 2,705 | | | 35,435 | |
CDI Corporation | | | 1,131 | | | 30,989 | |
Celgene Corporation | * | | 6,706 | | | 434,549 | |
Cendant Corporation | | | 44,243 | | | 763,192 | |
Central Parking Corporation | | | 1,898 | | | 26,041 | |
Cenveo, Inc. | * | | 2,792 | | | 36,743 | |
Cintas Corporation | | | 6,587 | | | 271,253 | |
Ciphergen Biosystems, Inc. | * | | 1,500 | | | 1,770 | |
Coinstar, Inc. | *† | | 1,075 | | | 24,542 | |
Consolidated Graphics, Inc. | * | | 776 | | | 36,736 | |
Convergys Corporation | * | | 5,933 | | | 94,038 | |
Corinthian Colleges, Inc. | * | | 3,624 | | | 42,691 | |
Corporate Executive Board Company | | | 1,507 | | | 135,178 | |
Courier Corporation | | | 424 | | | 14,560 | |
CRA International, Inc. | * | | 986 | | | 47,022 | |
CuraGen Corporation | * | | 1,768 | | | 5,445 | |
CV Therapeutics, Inc. | *† | | 1,424 | | | 35,216 | |
Cytyc Corporation | * | | 4,240 | | | 119,695 | |
DataTRAK International, Inc. | *† | | 3,924 | | | 39,201 | |
DeVry, Inc. | * | | 2,980 | | | 59,600 | |
| | |
| See accompanying notes to financial statements. | 241 |
SCHEDULE OF INVESTMENTS —(Continued)
December 31, 2005
| | | | | | | |
| | | | | | | | |
Vantagepoint Broad | | | | | | | |
Market Index Fund | | | Shares | | | Value | |
| | | | | | | | |
|
COMMON STOCKS—(Continued) | | | | | | | |
| | | | | | | | |
DiamondCluster International, Inc. Class A | * | | 1,431 | | $ | 11,362 | |
Digitas, Inc. | * | | 2,891 | | | 36,195 | |
Diversa Corporation | * | | 1,790 | | | 8,592 | |
Dollar Thrifty Automotive Group, Inc. | * | | 1,057 | | | 38,126 | |
Dun & Bradstreet Company | * | | 2,641 | | | 176,841 | |
Duratek, Inc. | * | | 1,215 | | | 18,140 | |
EGL, Inc. | * | | 1,861 | | | 69,918 | |
Edgewater Technology, Inc. | * | | 1,533 | | | 9,045 | |
Education Management Corporation | * | | 3,086 | | | 103,412 | |
eFunds Corporation | * | | 2,250 | | | 52,740 | |
Ennis Business Forms, Inc. | | | 695 | | | 12,628 | |
EntreMed, Inc. | * | | 1,390 | | | 2,697 | |
EPIQ Systems, Inc. | *† | | 725 | | | 13,441 | |
Equifax, Inc. | | | 4,973 | | | 189,073 | |
eResearch Technology, Inc. | *† | | 2,056 | | | 31,046 | |
Escala Group, Inc. | *† | | 951 | | | 19,286 | |
Exact Sciences Corporation | * | | 1,250 | | | 2,762 | |
Exelixis, Inc. | * | | 2,695 | | | 25,387 | |
First Aviation Services, Inc. | * | | 1,818 | | | 7,999 | |
First Consulting Group, Inc. | * | | 1,097 | | | 6,439 | |
Fluor Corporation | | | 3,405 | | | 263,070 | |
Forrester Research, Inc. | * | | 963 | | | 18,056 | |
FTI Consulting, Inc. | *† | | 1,735 | | | 47,608 | |
G&K Services, Inc. Class A | | | 1,008 | | | 39,564 | |
Gene Logic, Inc. | * | | 950 | | | 3,182 | |
Gen-Probe, Inc. | * | | 1,849 | | | 90,213 | |
Gevity HR, Inc. | | | 964 | | | 24,794 | |
H&R Block, Inc. | | | 13,798 | | | 338,741 | |
Harris Interactive, Inc. | * | | 2,730 | | | 11,766 | |
Healthcare Services Group, Inc. | | | 2,490 | | | 51,568 | |
Heidrick & Struggles International, Inc. | * | | 865 | | | 27,723 | |
Hewitt Associates, Inc. Class A | *† | | 2,317 | | | 64,899 | |
Icos Corporation | * | | 2,748 | | | 75,927 | |
I-many, Inc. | * | | 951 | | | 1,331 | |
Incyte Corporation | * | | 3,102 | | | 16,565 | |
Internet Capital Group, Inc. | * | | 49 | | | 403 | |
iPayment, Inc. | * | | 691 | | | 28,690 | |
IPIX Corporation | *† | | 1,024 | | | 1,700 | |
Iron Mountain, Inc. | *† | | 4,764 | | | 201,136 | |
Isis Pharmaceuticals, Inc. | * | | 2,216 | | | 11,612 | |
ITT Educational Services, Inc. | * | | 1,873 | | | 110,713 | |
Jacobs Engineering Group, Inc. | * | | 1,919 | | | 130,243 | |
John H. Harland Company | | | 1,281 | | | 48,166 | |
Kelly Services, Inc. Class A | | | 1,173 | | | 30,756 | |
Kforce.com, Inc. | * | | 297 | | | 3,315 | |
Korn Ferry International | * | | 1,624 | | | 30,353 | |
Kosan Biosciences, Inc. | * | | 2,000 | | | 8,880 | |
Labor Ready, Inc. | * | | 2,485 | | | 51,738 | |
Landauer, Inc. | | | 598 | | | 27,562 | |
Laureate Education, Inc. | * | | 1,885 | | | 98,981 | |
Learning Tree International, Inc. | * | | 766 | | | 9,828 | |
LECG Corporation | * | | 73 | | | 1,269 | |
Lexicon Genetics, Inc. | * | | 2,343 | | | 8,552 | |
LifeCell Corporation | * | | 1,119 | | | 21,339 | |
Lionbridge Technologies, Inc. | * | | 1,165 | | | 8,178 | |
Luminex Corporation | * | | 1,070 | | | 12,433 | |
Magellan Health Services, Inc. | * | | 1,400 | | | 44,030 | |
Management Network Group, Inc. | * | | 1,600 | | | 3,824 | |
Manpower, Inc. | | | 3,593 | | | 167,074 | |
Maxim Pharmaceuticals, Inc. | * | | 3,682 | | | 4,050 | |
| | | | | | | |
| | | | | | | | |
| | | | | | | |
| | | Shares | | | Value | |
| | | | | | | | |
Maximus, Inc. | | | 1,052 | | $ | 38,598 | |
Maxygen, Inc. | * | | 1,231 | | | 9,245 | |
Medical Staffing Network Holdings, Inc. | * | | 1,686 | | | 9,054 | |
Midas, Inc. | * | | 1,277 | | | 23,446 | |
Millennium Cell, Inc. | * | | 1,700 | | | 2,227 | |
Mobile Mini, Inc. | * | | 1,000 | | | 47,400 | |
MoneyGram International, Inc. | | | 3,750 | | | 97,800 | |
Monogram Biosciences, Inc. | * | | 2,414 | | | 4,514 | |
Moody’s Corporation | | | 10,748 | | | 660,142 | |
MPS Group, Inc. | * | | 3,706 | | | 50,661 | |
MPW Industrial Services Group, Inc. | * | | 547 | | | 1,050 | |
MSGI Security Solutions, Inc. | * | | 938 | | | 4,202 | |
MTC Technologies, Inc. | * | | 619 | | | 16,948 | |
Myriad Genetics, Inc. | *† | | 1,210 | | | 25,168 | |
NCO Group, Inc. | * | | 1,314 | | | 22,233 | |
National Research Corporation | | | 1,250 | | | 21,625 | |
Navigant Consulting, Inc. | * | | 2,313 | | | 50,840 | |
NDCHealth Corporation | * | | 1,464 | | | 28,153 | |
NeoPharm, Inc. | *† | | 964 | | | 10,402 | |
NetRatings, Inc. | * | | 1,164 | | | 14,352 | |
Neurogen Corporation | * | | 1,872 | | | 12,336 | |
Omnicell, Inc. | * | | 783 | | | 9,357 | |
On Assignment, Inc. | * | | 1,243 | | | 13,561 | |
Online Resources Corporation | * | | 700 | | | 7,735 | |
Opsware, Inc. | * | | 2,730 | | | 18,537 | |
Oscient Pharmaceuticals Corporation | * | | 1,510 | | | 3,428 | |
Overland Storage, Inc. | * | | 481 | | | 3,858 | |
Paychex, Inc. | | | 13,545 | | | 516,335 | |
PDI, Inc. | * | | 703 | | | 9,490 | |
Pegasystems, Inc. | * | | 2,141 | | | 15,651 | |
Perma-Fix Environmental Services | * | | 5,502 | | | 9,188 | |
Per-Se Technologies, Inc. | * | | 1,329 | | | 31,045 | |
Pfsweb, Inc. | * | | 5,683 | | | 6,820 | |
Pharmaceutical Product Development, Inc. | | | 2,368 | | | 146,698 | |
PHH Corporation | * | | 2,212 | | | 61,980 | |
Portfolio Recovery Associates, Inc. | *† | | 504 | | | 23,406 | |
Possis Medical, Inc. | * | | 1,278 | | | 12,716 | |
Pre-Paid Legal Services, Inc. | † | | 779 | | | 29,766 | |
Presstek, Inc. | *† | | 945 | | | 8,543 | |
PRG-Schultz International, Inc. | * | | 1,911 | | | 1,166 | |
Princeton Review, Inc. | * | | 818 | | | 4,213 | |
Ramtron International Corporation | * | | 1,920 | | | 3,840 | |
RCM Technologies, Inc. | * | | 1,593 | | | 8,124 | |
Regeneration Technologies, Inc. | * | | 807 | | | 5,770 | |
Regis Corporation | | | 1,818 | | | 70,120 | |
Rent-A-Center, Inc. | * | | 3,377 | | | 63,690 | |
Rent-Way, Inc. | * | | 1,060 | | | 6,773 | |
Republic Services, Inc. | | | 5,629 | | | 211,369 | |
Res-Care, Inc. | * | | 1,222 | | | 21,226 | |
Resources Connection, Inc. | * | | 2,060 | | | 53,684 | |
Rewards Network, Inc. | * | | 1,127 | | | 7,213 | |
Robert Half International, Inc. | † | | 7,107 | | | 269,284 | |
Rollins, Inc. | | | 661 | | | 13,028 | |
RR Donnelley & Sons Company | | | 8,887 | | | 304,024 | |
Ryder System, Inc. | † | | 2,660 | | | 109,113 | |
Savient Pharmaceuticals, Inc. | * | | 1,389 | | | 5,195 | |
Sequenom, Inc. | * | | 1,843 | | | 1,253 | |
Service Corporation International | | | 11,775 | | | 96,319 | |
ServiceMaster Company (The) | | | 11,826 | | | 141,321 | |
| | |
242 | See accompanying notes to financial statements. | |
SCHEDULE OF INVESTMENTS —(Continued)
December 31, 2005
| | | | | | | |
| | | | | | | | |
Vantagepoint Broad | | | | | | | |
Market Index Fund | | | Shares | | | Value | |
| | | | | | | | |
|
COMMON STOCKS—(Continued) | | | | | | |
| | | | | | | |
SFBC International, Inc. | *† | | 576 | | $ | 9,222 | |
Sitel Corporation | * | | 2,384 | | | 7,438 | |
Sotheby’s Holdings, Inc. Class A | * | | 2,623 | | | 48,158 | |
Sourcecorp, Inc. | * | | 748 | | | 17,937 | |
Spherion Corporation | * | | 2,689 | | | 26,917 | |
Standard Register Company (The) | | | 1,650 | | | 26,086 | |
StarTek, Inc. | | | 994 | | | 17,892 | |
Stericycle, Inc. | * | | 1,569 | | | 92,383 | |
Strayer Education, Inc. | | | 551 | | | 51,629 | |
SupportSoft, Inc. | * | | 1,562 | | | 6,592 | |
Symyx Technologies, Inc. | * | | 1,374 | | | 37,496 | |
Synagro Technologies, Inc. | | | 3,224 | | | 13,638 | |
Tejon Ranch Company | * | | 762 | | | 30,419 | |
TeleTech Holdings, Inc. | * | | 2,738 | | | 32,993 | |
Telik, Inc. | *† | | 1,748 | | | 29,699 | |
Tetra Tech, Inc. | * | | 2,114 | | | 33,126 | |
TRC Companies, Inc. | * | | 327 | | | 3,581 | |
Trimeris, Inc. | * | | 1,214 | | | 13,949 | |
United Rentals, Inc. | *† | | 3,294 | | | 77,047 | |
Universal Compression Holdings, Inc. | * | | 1,492 | | | 61,351 | |
Universal Technical Institute, Inc. | * | | 418 | | | 12,933 | |
URS Corporation | * | | 1,582 | | | 59,499 | |
Valassis Communications, Inc. | * | | 2,236 | | | 65,001 | |
Varsity Group, Inc. | * | | 2,747 | | | 11,675 | |
Vertrue, Inc. | *† | | 749 | | | 26,462 | |
Viad Corporation | | | 937 | | | 27,482 | |
Volt Information Sciences, Inc. | * | | 833 | | | 15,844 | |
Waste Connections, Inc. | * | | 1,575 | | | 54,274 | |
Waste Industries USA, Inc. | | | 1,296 | | | 16,692 | |
Waste Management, Inc. | | | 22,871 | | | 694,135 | |
Watson Wyatt & Company Holdings | | | 1,600 | | | 44,640 | |
Weight Watchers International, Inc. | * | | 1,826 | | | 90,259 | |
Westaff, Inc. | * | | 942 | | | 4,663 | |
Wind River Systems, Inc. | * | | 3,206 | | | 47,353 | |
World Fuel Services Corporation | | | 960 | | | 32,371 | |
Wright Express Corporation | * | | 1,750 | | | 38,500 | |
Xanser Corporation | * | | 1,100 | | | 3,234 | |
| | | | | | | |
| | | | | | 13,059,828 | |
| | | | | | | |
| | | | | | | |
Communications—2.0% | | | | | | | |
Ace*Comm Corporation | * | | 3,033 | | | 9,524 | |
ADC Telecommunications, Inc. | * | | 4,773 | | | 106,629 | |
Airnet Communications Corporation | * | | 131 | | | 130 | |
AltiGen Communications, Inc. | * | | 4,109 | | | 6,287 | |
American Tower Corporation Class A | *† | | 15,861 | | | 429,833 | |
Anadigics, Inc. | * | | 957 | | | 5,742 | |
Andrea Electronics Corporation | * | | 1,298 | | | 47 | |
Andrew Corporation | * | | 6,376 | | | 68,414 | |
Anixter International, Inc. | | | 1,723 | | | 67,404 | |
Applied Innovation, Inc. | * | | 500 | | | 1,655 | |
Applied Signal Technology, Inc. | | | 1,237 | | | 28,080 | |
Arris Group, Inc. | * | | 2,896 | | | 27,425 | |
Avaya, Inc. | * | | 17,294 | | | 184,527 | |
Avici Systems, Inc. | * | | 711 | | | 2,780 | |
Avistar Communications Corporation | * | | 774 | | | 1,192 | |
Blonder Tongue Laboratories | * | | 2,285 | | | 4,456 | |
Broadwing Corporation | * | | 1,358 | | | 8,216 | |
CalAmp Corporation | * | | 550 | | | 5,769 | |
| | | | | | | |
| | | | | | | | |
| | | | | | | |
| | | Shares | | | Value | |
| | | | | | | | |
Carrier Access Corporation | * | | 1,178 | | $ | 5,819 | |
C-COR.net Corporation | * | | 1,547 | | | 7,518 | |
Centillium Communications, Inc. | * | | 1,588 | | | 5,558 | |
Checkpoint Systems, Inc. | * | | 1,441 | | | 35,521 | |
Ciena Corporation | * | | 19,667 | | | 58,411 | |
Comtech Telecommunications | * | | 1,350 | | | 41,229 | |
Comverse Technology, Inc. | * | | 7,999 | | | 212,693 | |
Corning, Inc. | * | | 57,683 | | | 1,134,048 | |
Crown Castle International Corporation | * | | 8,983 | | | 241,733 | |
CT Communications, Inc. | | | 214 | | | 2,598 | |
Cubic Corporation | | | 1,692 | | | 33,772 | |
Digital Lightwave, Inc. | * | | 2,931 | | | 616 | |
Ditech Communications Corporation | * | | 1,360 | | | 11,356 | |
EndWave Corporation | *† | | 911 | | | 10,732 | |
Foundry Networks, Inc. | * | | 5,421 | | | 74,864 | |
Glenayre Technologies, Inc. | * | | 2,143 | | | 6,965 | |
Harmonic, Inc. | * | | 2,820 | | | 13,677 | |
Harris Corporation | | | 6,090 | | | 261,931 | |
Hungarian Telephone & Cable Corporation | * | | 712 | | | 11,072 | |
ID Systems, Inc. | * | | 2,016 | | | 48,082 | |
InterDigital Communications Corporation | * | | 2,803 | | | 51,351 | |
International Electronics, Inc. | * | | 1,150 | | | 2,265 | |
Inter-Tel, Inc. | | | 1,334 | | | 26,106 | |
InterVoice, Inc. | * | | 1,395 | | | 11,104 | |
Intraware, Inc. | * | | 783 | | | 5,285 | |
L-3 Communications Holdings, Inc. | | | 5,024 | | | 373,534 | |
Lifeline Systems, Inc. | * | | 1,214 | | | 44,384 | |
Lucent Technologies, Inc. | *† | | 174,603 | | | 464,444 | |
Marvell Technology Group Ltd. (Bermuda) | * | | 9,250 | | | 518,832 | |
McData Corporation Class A | * | | 5,654 | | | 21,485 | |
MDI, Inc. | * | | 271 | | | 252 | |
Metro One Telecommunications | * | | 957 | | | 345 | |
Mindspeed Technologies, Inc. | *† | | 4,009 | | | 9,421 | |
Motorola, Inc. | | | 101,990 | | | 2,303,954 | |
Network Appliance, Inc. | *† | | 14,316 | | | 386,532 | |
NMS Communications Corporation | * | | 1,250 | | | 4,362 | |
On2 Technologies, Inc. | * | | 4,620 | | | 4,897 | |
Openwave Systems, Inc. | *† | | 2,570 | | | 44,898 | |
Peco II, Inc. | * | | 657 | | | 1,176 | |
Plantronics, Inc. | | | 1,826 | | | 51,676 | |
Polycom, Inc. | * | | 4,177 | | | 63,908 | |
Powerwave Technologies, Inc. | *† | | 2,434 | | | 30,595 | |
Premiere Global Services, Inc. | * | | 2,174 | | | 17,675 | |
Qualcomm, Inc. | | | 67,198 | | | 2,894,890 | |
SBA Communications Corporation | * | | 1,350 | | | 24,165 | |
Scientific-Atlanta, Inc. | | | 6,300 | | | 271,341 | |
SeaChange International, Inc. | * | | 958 | | | 7,568 | |
Sirius Satellite Radio, Inc. | *† | | 47,469 | | | 318,042 | |
Socket Communications, Inc. | * | | 1,300 | | | 1,469 | |
Sonus Networks, Inc. | * | | 10,700 | | | 39,804 | |
Spectralink Corporation | | | 1,133 | | | 13,449 | |
Standard Microsystems Corporation | * | | 806 | | | 23,124 | |
Stratex Networks, Inc. | * | | 2,680 | | | 9,594 | |
Tekelec | * | | 2,569 | | | 35,709 | |
Tellabs, Inc. | * | | 19,143 | | | 208,659 | |
Terayon Corporation | * | | 2,830 | | | 6,537 | |
Tollgrade Communications, Inc. | * | | 601 | | | 6,569 | |
Tut Systems, Inc. | * | | 1,414 | | | 4,228 | |
Ulticom, Inc. | * | | 1,583 | | | 15,529 | |
| | |
| See accompanying notes to financial statements. | 243 |
SCHEDULE OF INVESTMENTS —(Continued)
December 31, 2005
| | | | | | | |
| | | | | | | | |
Vantagepoint Broad | | | | | | | |
Market Index Fund | | | Shares | | | Value | |
| | | | | | | | |
|
|