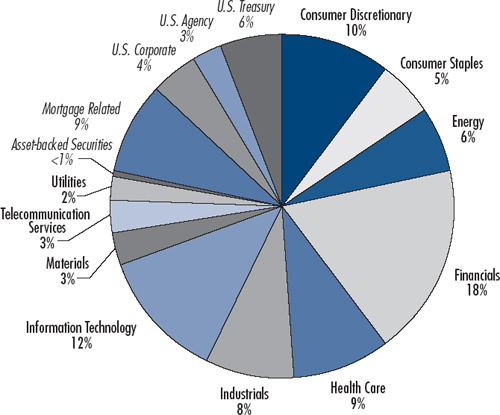
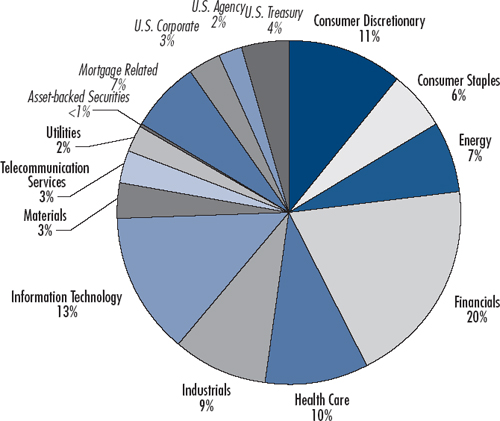
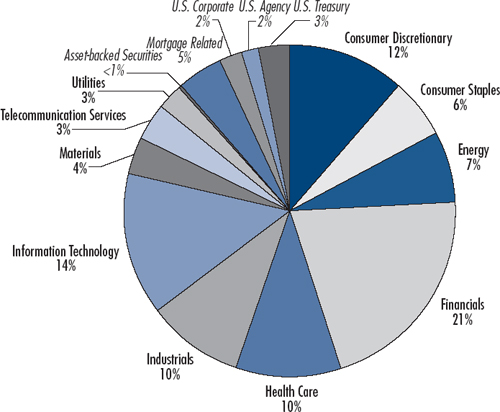
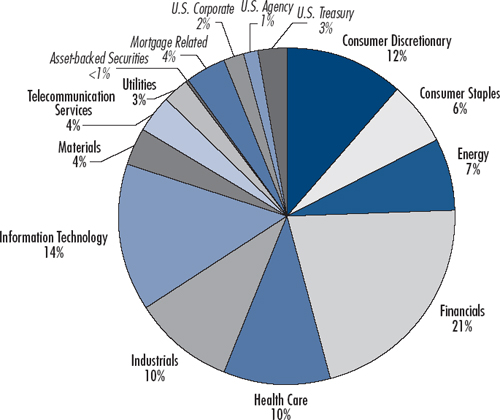
The Milestone Funds invest entirely in underlying funds. VIA may make, subject to the supervision of the Board of Directors, allocation changes to the underlying funds based on its periodic analysis to identify the allocation of assets among the different funds of the Company. The Milestone Funds are designed to serve as investing vehicles for retirement assets. Each fund, except for the Milestone Retirement Income Fund, invests in a professionally selected combination of equity and fixed income underlying funds that is believed to be appropriate given the time remaining until a Milestone Fund’s stated retirement date. VIA adjusts the asset allocation of each “dated” Milestone Fund to become more conservative as the designated year approaches. Each Milestone Fund has a different degree of potential risk and reward and is diversified among various underlying funds in differing allocations. The underlying funds of each Milestone Fund and the current target percentage investment in each underlying fund as of December 31, 2006 were as follows:
VANTAGEPOINT FUNDS
NOTES TO THE FINANCIAL STATEMENTS—(Continued)
Transition of Income Preservation Fund to Short-Term Bond Fund
On November 8, 2004, the name, investment objective, investment strategies and certain subadvisers of the Income Preservation Fund were changed. Pacific Investment Management Company, LLC (“PIMCO”) and Wellington Management Company, LLP (“Wellington”) were terminated in September 2004 as subadvisers. STW Fixed Income became a subadviser in November 2004 and Payden & Rygel continued as a subadviser. The Board took these actions because it concluded that it was not likely that the fund would be able to continue, over the long term, to follow its investment strategy of using wrapper agreements to seek to preserve capital and maintain a stable net asset value per share. The Board’s conclusion was based on, among other things, the regulatory uncertainty, at the time regarding the method of valuing wrapper agreements.
In early August 2004, at the direction of VIA, the fund’s investment adviser, the average duration of the fund’s portfolio was shortened to approximately 1.5 years, as permitted by the fund’s investment guidelines. Beginning in early September 2004, those portions of the fund’s portfolio subadvised by Wellington and PIMCO were placed under the management of the fund’s remaining subadviser, Payden & Rygel. In order to seek to maintain a stable net asset value, Payden & Rygel invested the fund’s assets in a portfolio of short-term fixed income instruments with less than 60 days to maturity (“Interim Portfolio”). Payden & Rygel constructed the Interim Portfolio and continued to subadvise the portfolio, subject to VIA’s oversight. Shortly before the November 8, 2004 conversion took place, the Interim Portfolio matured and the fund’s assets were primarily invested in cash and cash equivalents for a brief period of time. By investing its assets in this manner, the fund was able to maintain a stable net asset value of $100 per share until the November 8, 2004 conversion.
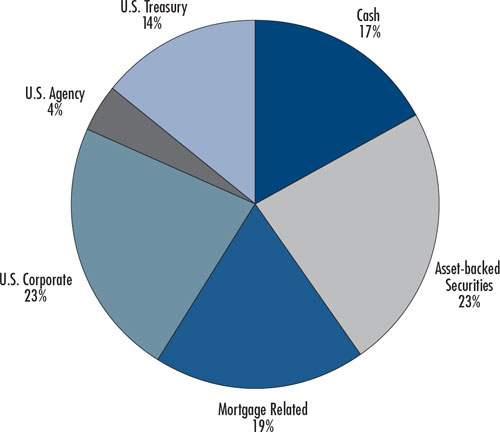
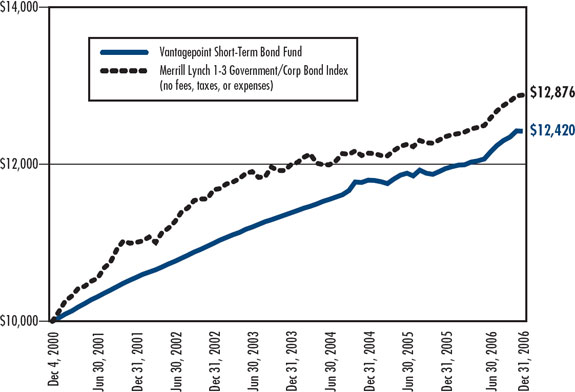
The Short-Term Bond Fund retains the historical performance, the ticker symbol, and cusip number of the Income Preservation Fund. While the fund’s goal is to seek total return that is consistent with preservation of capital, there is no assurance that the fund will be able to do so. As a short-term bond fund, the fund’s investment returns are expected to be more volatile and will vary depending on market conditions, particularly over the short-term. The fund’s net asset value will fluctuate. Information statements related to the changes were sent to shareholders on October 15, 2004 and February 14, 2005. The changes were also disclosed in supplements to the prospectus dated May 1, 2004 as amended on September 1, 2004 and November 8, 2004.
Subadviser Changes from December 16, 2005 through December 8, 2006
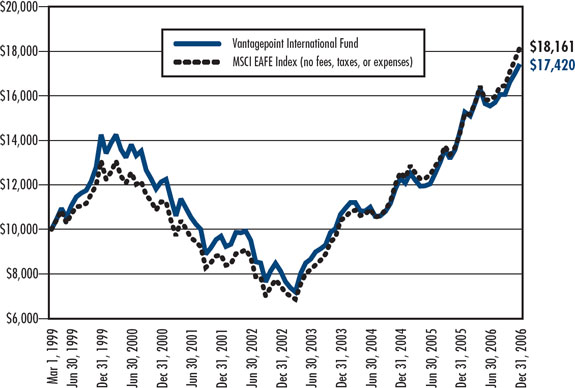
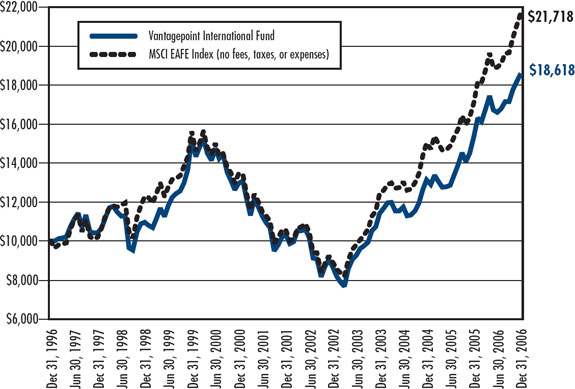
At a meeting held on December 16, 2005, the Board approved the appointment of GlobeFlex Capital, LP and Walter Scott & Partners Limited (“WSPL”) as additional subadvisers to the Vantagepoint International Fund, which became effective January 3, 2006. Artisan Partners Limited Partnership and Capital Guardian Trust Company continue to serve as subadvisers to the International Fund. In a transition phase, which began on or about January 4, 2006, the Vantagepoint International Fund’s assets were transitioned and reallocated to and among the fund’s four subadvisers.
At the meeting held on December 16, 2005, the Board also approved new fee schedules with T. Rowe Price Associates Inc. (“T. Rowe Price”) relating to its services as a subadviser to the Vantagepoint Growth & Income and the Vantagepoint Equity Income Funds, which reflected a reduction in the subadvisory fee rates to be paid to T. Rowe Price. These changes, became effective on January 1, 2006.
At a meeting held on January 19, 2006, the Board approved the termination of Wellington Management Company, LLP as a subadviser to the Vantagepoint Aggressive Opportunities Fund, and the appointment of Legg Mason Capital Management, Inc. and TimesSquare Capital Management, LLC as additional subadvisers to the Vantagepoint Aggressive Opportunities Fund, which became effective January 25, 2006.
At a meeting held on May 19, 2006, the Board approved the termination of the subadvisory agreement with Fidelity Management & Research Company for the Vantagepoint Growth Fund. Goldman Sachs Asset Management, L.P., Legg Mason Capital Management, Inc., Peregrine Capital Management, Inc., Tukman Capital Management, Inc. and Westfield Capital Management Company, LLC continue to serve as subadvisers to the Vantagepoint Growth Fund.
At a meeting held on September 22, 2006, the Board approved a new subadvisory agreement for the Vantagepoint International Fund with WSPL due to the acquisition of WSPL by Mellon International Limited. The terms of the new subadvisory agreement are substantially identical to the prior subadvisory agreement. The new subadvisory agreement became effective October 2, 2006.
143
VANTAGEPOINT FUNDS
NOTES TO THE FINANCIAL STATEMENTS—(Continued)
At a meeting held on December 8, 2006, the Board approved new fee schedules with Mellon Capital Management Corporation relating to the Vantagepoint Core Bond Index, Vantagepoint Overseas Equity Index and Vantagepoint US Government Securities Funds wherein an additional breakpoint was added to each schedule. These revised fee schedules were effective September 14, 2006.
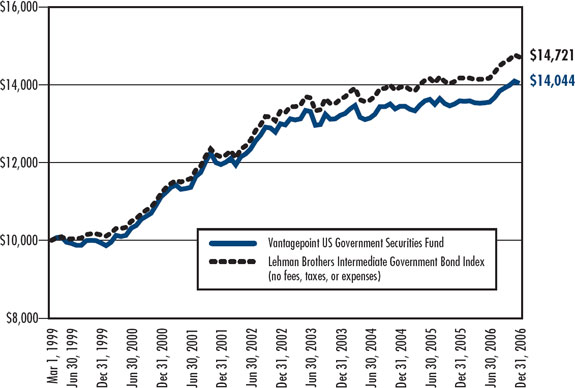
At a meeting held on December 8, 2006, the Board approved the appointment of Pacific Investment Management Company, LLC and Fischer Francis Trees & Watts, Inc. to serve as subadvisers to the Vantagepoint US Government Securities Fund in conjunction with a change in that fund’s name and principal investment strategy to be effective May 1, 2007.
2. | | Significant Accounting Policies |
The Company’s significant accounting policies are consistently applied in the preparation of its financial statements in accordance with accounting principles generally accepted in the United States of America. Management makes estimates and assumptions in the preparation of financial statements that affect the reported amounts of assets and liabilities, including the disclosure of contingent assets and liabilities at the date of the financial statements as well as the revenue and expense amounts during the reporting period. Actual results could differ from those estimates. Certain prior year amounts have been reclassified to conform to the current year presentation.
Investment Policy and Security Valuation
The equity securities held by each fund normally are valued at the last reported sale price on the exchange on which the security is principally traded. Securities for which the primary market is the National Association of Securities Dealers Automated Quotations National Market System (“Nasdaq”) are valued at the Nasdaq Official Closing Price. Equity securities not traded on an exchange or on Nasdaq normally are valued at the last reported sale price in the over-the-counter market. If a non-exchange traded security does not trade on a particular day, then the security is normally valued at the mean between the highest bid price and the lowest priced offer obtained from quotation services believed to be reliable. Fixed income debt securities, such as commercial paper, bankers’ acceptances and U.S. Treasury Bills, with a remaining maturity of less than 60 days, are valued at amortized cost. Prices for other fixed income securities are normally obtained from a commercial pricing service that may use pricing matrices or other methodologies designed to identify the value of fixed income securities. Any security for which market value as described above is not readily available is valued at fair value as determined in good faith in accordance with policies approved by the Company’s Board (“Valuation Procedures”). The types of securities for which such fair value pricing may be necessary include, but are not limited to: foreign securities, as discussed below; securities of an issuer that entered into a restructuring; securities whose trading has been halted or suspended; fixed-income securities for which there is no current market value quotation; and securities that are restricted as to transfer or resale. The need to fair value a Fund’s portfolio securities may also result from low trading volume in foreign markets or thinly traded domestic securities, such as certain small capitalization securities. The valuation of certain foreign equity securities is described below.
Shares of the underlying funds in which the Model Portfolio Funds and Milestone Funds invest are valued by using the underlying funds’ respective net asset values (NAVs) for the purpose of purchasing and/or redeeming orders placed that day.
The Money Market Fund invests all of its assets in the Institutional Class of the AIM Short-Term Investments Trust Liquid Assets Portfolio (“AIM Portfolio”). The AIM Portfolio uses the amortized cost method to value its portfolio securities in accordance with Rule 2a-7 under the 1940 Act. Amortized cost, which is a security’s historical cost adjusted for amortization of discount or premium, if any, approximates market value. On any given business day, the shares of the AIM Portfolio are valued by the Money Market Fund using the AIM Portfolio’s NAV for purchase and/or redemption orders placed that day.
Valuation of Foreign Equity Securities
For foreign equity securities held by the funds and principally traded in markets outside North and South America, the Board has approved the use of a third party fair valuation service. The service uses a multifactor model to calculate a factor that is then applied to adjust the market price for each such security. Additionally, the Board has approved the use of the fair value prices provided by this service on a daily basis without a market trigger or confidence interval filter.
144
VANTAGEPOINT FUNDS
NOTES TO THE FINANCIAL STATEMENTS—(Continued)
In the event prices for such foreign securities are not available through the service or another fair value pricing service approved by the Board, the securities may be priced at the average of two or more independent broker-dealer quotations or at the fair value of the security in accordance with the Company’s valuation procedures.
When Issued Securities
When issued securities or “To Be Announced” securities are sometimes held by the funds. The funds maintain security positions and cash positions such that sufficient liquid assets will be available to make payments for such securities purchased.
Foreign Currency
The accounting records of the funds are maintained in U.S. dollars. Investment securities and other assets and liabilities denominated in foreign currencies are translated into U.S. dollars at the prevailing rates of exchange using the “Reuters” snap-shot at 12 pm Eastern Time each day. Purchases and sales of securities, income receipts and expense payments are translated into U.S. dollars at the prevailing exchange rate on the respective dates of such transactions. Unrealized gains and losses, not relating to securities, that result from changes in foreign currency exchange rates, have been included in unrealized appreciation/(depreciation) of securities. Net realized foreign currency gains and losses include foreign currency gains and losses resulting from changes in exchange rates between trade date and settlement date on investment securities transactions, gains and losses on foreign currency transactions, and the difference between the amounts of interest and dividends recorded on the books of the funds and the amounts actually received. The portion of foreign currency gains and losses related to fluctuations in exchange rates between the initial purchase trade date and subsequent sale trade date is included in realized gains/(losses) from security transactions.
Security Transactions and Income Recognition
Security transactions are accounted for on the date the securities are purchased or sold (trade date). Dividend income is recognized on the ex-dividend date net of applicable taxes withheld by foreign countries, and interest income is accrued daily. Realized gains or losses are reported on the basis of identified cost of securities delivered. Bond discounts and premiums are amortized for both financial reporting and tax purposes.
Dividends and Distributions to Shareholders
Dividends from net investment income are declared and paid monthly to shareholders of the Core Bond Index, the Short-Term Bond and US Government Securities Funds. Dividends from net investment income are declared daily and paid monthly to shareholders of the Money Market Fund. Prior to November 2004, dividends from net investment income were declared daily and paid monthly to shareholders of the Short-Term Bond Fund. For the remaining Actively Managed, Index, Model Portfolio and the Milestone Funds, dividends from net investment income are declared and paid annually to shareholders. Distributions from any net realized capital gains are generally declared and paid annually to shareholders. Income and capital gain distributions are determined in accordance with income tax regulations which may differ from accounting principles generally accepted in the United States of America. These differences are primarily due to differing treatments of income and gains on various investment securities held by the funds, dividends payable, and differing characterization of distributions made by each fund as a whole. Net investment income per share calculations in the Financial Highlights were not affected by these reclassifications.
Permanent book and tax differences, if any, relating to shareholder distributions will result in reclassifications among paid-in capital, net investment income or realized gains. These include net operating losses not utilized during the current year, commission adjustments, paydown gains and losses, bond premium amortization or foreign currency gains and losses, taxable overdistributions or returns of capital, recharacterized distributions, and adjustments relating to dispositions of Real Estate Investment Trust and Passive Foreign Investment Company securities. These reclassifications have no effect on net assets or net asset values per share. Any taxable income or gain remaining at fiscal year end is distributed in the following year.
145
VANTAGEPOINT FUNDS
NOTES TO THE FINANCIAL STATEMENTS—(Continued)
Fund
| | | | Paid-in capital
Increase/(decrease)
| | Undistributed
Net investment income
Increase/(decrease)
| | Accumulated net realized
Gain/(loss)
Increase/(decrease)
|
|---|
| Short-Term Bond | | | | $ | (2,017,222 | ) | | $ | 2,454,469 | | | $ | (437,247 | ) |
| US Government Securities | | | | | (443,330 | ) | | | 447,222 | | | | (3,892 | ) |
| Asset Allocation | | | | | (1 | ) | | | (74,730 | ) | | | 74,731 | |
| Equity Income | | | | | (705,420 | ) | | | 7,455 | | | | 697,965 | |
| Growth & Income | | | | | — | | | | (13,632 | ) | | | 13,632 | |
| Growth | | | | | 6,950 | | | | 378,423 | | | | (385,373 | ) |
| Aggressive Opportunities | | | | | (6,412,798 | ) | | | 14,613,930 | | | | (8,201,132 | ) |
| International | | | | | — | | | | 4,524,637 | | | | (4,524,637 | ) |
| Core Bond Index | | | | | (4,329,783 | ) | | | 8,838,226 | | | | (4,508,443 | ) |
| 500 Stock Index | | | | | 15,296,437 | | | | (42,583 | ) | | | (15,253,854 | ) |
| Broad Market Index | | | | | 16,340,064 | | | | (216,027 | ) | | | (16,124,037 | ) |
| Mid/Small Company Index | | | | | 3,754,840 | | | | (145,457 | ) | | | (3,609,383 | ) |
| Overseas Equity Index | | | | | 963,876 | | | | 773,604 | | | | (1,737,480 | ) |
| Model Portfolio Savings Oriented | | | | | — | | | | 176,512 | | | | (176,512 | ) |
| Model Portfolio Conservative Growth | | | | | — | | | | 314,997 | | | | (314,997 | ) |
| Model Portfolio Traditional Growth | | | | | — | | | | 727,267 | | | | (727,267 | ) |
| Model Portfolio Long-Term Growth | | | | | — | | | | 1,017,380 | | | | (1,017,380 | ) |
| Model Portfolio All-Equity Growth | | | | | — | | | | 710,000 | | | | (710,000 | ) |
| Milestone Retirement Income | | | | | — | | | | 13,361 | | | | (13,361 | ) |
| Milestone 2010 | | | | | — | | | | 28,813 | | | | (28,813 | ) |
| Milestone 2015 | | | | | — | | | | 45,739 | | | | (45,739 | ) |
| Milestone 2020 | | | | | — | | | | 33,141 | | | | (33,141 | ) |
| Milestone 2025 | | | | | — | | | | 25,833 | | | | (25,833 | ) |
| Milestone 2030 | | | | | — | | | | 12,612 | | | | (12,612 | ) |
| Milestone 2035 | | | | | — | | | | 6,947 | | | | (6,947 | ) |
| Milestone 2040 | | | | | — | | | | 5,168 | | | | (5,168 | ) |
Federal Income Taxes
Each fund intends to qualify as a regulated investment company under Subchapter M of the Internal Revenue Code for federal tax purposes. Accordingly, each fund intends to make distributions of substantially all of its net investment company taxable income and any net realized capital gains (after reduction for capital loss carry forwards) sufficient to relieve it from all, or substantially all, federal income and excise taxes. Therefore, no provision for federal income or excise taxes was required.
At December 31, 2006, the components of distributable earnings on a tax basis were as follow:
Fund
| | | | Undistributed
Ordinary
Income
| | Undistributed
Long-Term Gain
| | Total Distributable
Earnings
|
|---|
| Asset Allocation | | | | $ | 1,344,161 | | | $ | 4,408,163 | | | $ | 5,752,324 | |
| Equity Income | | | | | 1,224,426 | | | | 8,124,161 | | | | 9,348,587 | |
| Growth & Income | | | | | 475,448 | | | | 3,524,686 | | | | 4,000,134 | |
| Growth | | | | | 425,909 | | | | — | | | | 425,909 | |
| Aggressive Opportunities | | | | | — | | | | 17,974,352 | | | | 17,974,352 | |
| International | | | | | 976,880 | | | | 7,190,158 | | | | 8,167,038 | |
| 500 Stock Index | | | | | 96,471 | | | | — | | | | 96,471 | |
| Broad Market Index | | | | | 5,335,207 | | | | — | | | | 5,335,207 | |
| Mid/Small Company Index | | | | | 463,912 | | | | 2,898,779 | | | | 3,362,691 | |
| Overseas Equity Index | | | | | 352,884 | | | | — | | | | 352,884 | |
| Model Portfolio Savings Oriented | | | | | 483,907 | | | | 3,966,748 | | | | 4,450,655 | |
146
VANTAGEPOINT FUNDS
NOTES TO THE FINANCIAL STATEMENTS—(Continued)
Fund
| | | | Undistributed
Ordinary
Income
| | Undistributed
Long-Term Gain
| | Total Distributable
Earnings
|
|---|
| Model Portfolio Conservative Growth | | | | $ | 3,978 | | | $ | 7,606,855 | | | $ | 7,610,833 | |
| Model Portfolio Traditional Growth | | | | | 386,298 | | | | 31,267,605 | | | | 31,653,903 | |
| Model Portfolio Long-Term Growth | | | | | 2,317,321 | | | | 36,859,156 | | | | 39,176,477 | |
| Model Portfolio All-Equity Growth | | | | | — | | | | 16,661,843 | | | | 16,661,843 | |
| Milestone Retirement Income | | | | | 5,969 | | | | 353,778 | | | | 359,747 | |
| Milestone 2010 | | | | | 13,339 | | | | 1,177,906 | | | | 1,191,245 | |
| Milestone 2015 | | | | | 17,640 | | | | 2,524,861 | | | | 2,542,501 | |
| Milestone 2020 | | | | | 10,452 | | | | 2,038,669 | | | | 2,049,121 | |
| Milestone 2025 | | | | | 6,418 | | | | 1,756,360 | | | | 1,762,778 | |
| Milestone 2030 | | | | | 2,513 | | | | 1,007,674 | | | | 1,010,187 | |
| Milestone 2035 | | | | | 1,278 | | | | 712,320 | | | | 713,598 | |
| Milestone 2040 | | | | | 637 | | | | 550,641 | | | | 551,278 | |
The tax character of distributions paid during 2006 were as follows:
Fund
| | | | Distributions
Paid from
Ordinary
Income
| | Distributions
Paid from
Long-Term
Capital Gains
| | Return of
Capital
| | Total
Distributions
|
|---|
| Money Market | | | | $ | 8,107,656 | | | $ | — | | | $ | — | | | $ | 8,107,656 | |
| Short-Term Bond | | | | | 22,130,500 | | | | — | | | | 2,019,872 | | | | 24,150,372 | |
| US Government Securities | | | | | 5,508,157 | | | | — | | | | 455,973 | | | | 5,964,130 | |
| Asset Allocation | | | | | 18,337,426 | | | | 6,163,706 | | | | — | | | | 24,501,132 | |
| Equity Income | | | | | 28,093,658 | | | | 59,593,608 | | | | — | | | | 87,687,266 | |
| Growth & Income | | | | | 9,346,498 | | | | 46,001,308 | | | | — | | | | 55,347,806 | |
| Growth | | | | | 8,373,928 | | | | — | | | | — | | | | 8,373,928 | |
| Aggressive Opportunities | | | | | 5,004,797 | | | | 29,960,480 | | | | — | | | | 34,965,277 | |
| International | | | | | 14,695,091 | | | | 92,620,774 | | | | — | | | | 107,315,865 | |
| Core Bond Index | | | | | 53,329,343 | | | | — | | | | 4,430,044 | | | | 57,759,387 | |
| 500 Stock Index | | | | | 5,931,027 | | | | — | | | | — | | | | 5,931,027 | |
| Broad Market Index | | | | | 8,937,381 | | | | — | | | | — | | | | 8,937,381 | |
| Mid/Small Company Index | | | | | 1,584,268 | | | | 6,640,691 | | | | — | | | | 8,224,959 | |
| Overseas Equity Index | | | | | 3,950,594 | | | | — | | | | — | | | | 3,950,594 | |
| Model Portfolio Savings Oriented | | | | | 9,669,543 | | | | 3,859,279 | | | | — | | | | 13,528,822 | |
| Model Portfolio Conservative Growth | | | | | 15,391,031 | | | | — | | | | — | | | | 15,391,031 | |
| Model Portfolio Traditional Growth | | | | | 27,189,258 | | | | 1,688,035 | | | | — | | | | 28,877,293 | |
| Model Portfolio Long-Term Growth | | | | | 18,812,941 | | | | 2,925,344 | | | | — | | | | 21,738,285 | |
| Model Portfolio All-Equity Growth | | | | | 3,077,699 | | | | 4,489,157 | | | | — | | | | 7,566,856 | |
| Milestone Retirement Income | | | | | 686,561 | | | | 131,043 | | | | — | | | | 817,604 | |
| Milestone 2010 | | | | | 1,200,887 | | | | 300,212 | | | | — | | | | 1,501,099 | |
| Milestone 2015 | | | | | 1,585,005 | | | | 462,830 | | | | — | | | | 2,047,835 | |
| Milestone 2020 | | | | | 998,341 | | | | 217,260 | | | | — | | | | 1,215,601 | |
| Milestone 2025 | | | | | 693,628 | | | | 131,352 | | | | — | | | | 824,980 | |
| Milestone 2030 | | | | | 340,921 | | | | 80,038 | | | | — | | | | 420,959 | |
| Milestone 2035 | | | | | 180,575 | | | | 93,183 | | | | — | | | | 273,758 | |
| Milestone 2040 | | | | | 217,067 | | | | 66,920 | | | | — | | | | 283,987 | |
147
VANTAGEPOINT FUNDS
NOTES TO THE FINANCIAL STATEMENTS—(Continued)
At December 31, 2006, the following funds had net capital loss carryovers:
| | | | Expiring December 31,
| |
|---|
Fund
| | | | 2010
| | 2011
| | 2013
| | 2014
|
|---|
| Short-Term Bond | | | | $ | — | | | $ | — | | | $ | 4,249,873 | | | $ | 2,774,086 | |
| US Government Securities | | | | $ | — | | | $ | — | | | $ | 1,398,401 | | | $ | 1,993,824 | |
| Growth | | | | $ | 343,326,253 | | | $ | 82,974,331 | | | $ | — | | | $ | — | |
| Core Bond Index | | | | $ | — | | | $ | — | | | $ | 4,825,601 | | | $ | 8,705,385 | |
| 500 Stock Index | | | | $ | 13,186,037 | | | $ | 3,056,924 | | | $ | — | �� | | $ | — | |
| Broad Market Index | | | | $ | 16,264,728 | | | $ | 7,417,767 | | | $ | — | | | $ | — | |
| Overseas Equity Index | | | | $ | 539,589 | | | $ | 807,785 | | | $ | 269,787 | | | $ | — | |
At December 31, 2006, the following funds elected to defer post-October 31 net capital losses and currency losses of:
Fund
| | | | Capital
Losses
| | Currency
Losses
|
|---|
| Short-Term Bond | | | | $ | 356,064 | | | $ | — | |
| US Government Securities | | | | | 116,826 | | | | — | |
| Aggressive Opportunities | | | | | — | | | | 2,157 | |
| Core Bond Index | | | | | 200,291 | | | | — | |
| Overseas Equity Index | | | | | 229,277 | | | | — | |
Futures Contracts
Certain funds may purchase futures contracts to gain exposure to market changes as this may be more efficient or cost effective than actually buying the securities. A futures contract is an agreement between two parties to buy and sell a security at a set price. Pursuant to the contract, the fund agrees to receive from or pay to the broker an amount of cash equal to the daily fluctuation in the value of the contract. Such receipts or payments are known as “variation margin” and are recorded by the fund as unrealized gains or losses. When the contract is closed, the fund records a gain or loss equal to the difference between the value of the contract at the time it was opened and the value at the time it was closed. Risks of entering into futures contracts include the possibility that there may be an illiquid market and that a change in the value of the contracts may not correlate with changes in the value of the underlying securities. The amounts of risk under such futures contracts may exceed the amounts reflected in the financial statements. As of December 31, 2006, the following funds had the following open futures contracts outstanding:
Short-Term Bond Fund
Number of
Contracts
| | | | Exchange
| | Contract
| | Expiration Date
| | Underlying
Face Amount
at Value
| | Net
Unrealized
Depreciation
|
|---|
| 121 | | | | CBT | | U.S. 2 Year Treasury Note | | April 2007 | | $ | 24,687,782 | | | $ | (90,751 | ) |
| | | | | | | | | Total Unrealized Depreciation | | $ | (90,751 | ) |
Asset Allocation Fund
Number of
Contracts
| | | | Exchange
| | Contract
| | Expiration Date
| | Underlying
Face Amount
at Value
| | Net
Unrealized
Appreciation
|
|---|
| 1,752 | | | | CME | | E-MINI S&P 500 Index | | March 2007 | | $ | 125,127,840 | | | $ | 476,285 | |
| 29 | | | | CME | | S&P 500 Index | | March 2007 | | $ | 10,355,900 | | | | 39,475 | |
| | | | | | | | | Total Unrealized Appreciation | | $ | 515,760 | |
148
VANTAGEPOINT FUNDS
NOTES TO THE FINANCIAL STATEMENTS—(Continued)
500 Stock Index Fund
Number of
Contracts
| | | | Exchange
| | Contract
| | Expiration Date
| | Underlying
Face Amount
at Value
| | Net
Unrealized
Appreciation
|
|---|
| 160 | | | | CME | | E-MINI S&P 500 Index | | March 2007 | | $ | 11,427,200 | | | $ | 3,045 | |
| | | | | | | | | Total Unrealized Appreciation | | $ | 3,045 | |
Broad Market Index Fund
Number of
Contracts
| | | | Exchange
| | Contract
| | Expiration Date
| | Underlying
Face Amount
at Value
| | Net
Unrealized
Depreciation
|
|---|
| 24 | | | | CME | | E-MINI Russell Index | | March 2007 | | $ | 1,907,760 | | | $ | (14,740 | ) |
| 146 | | | | CME | | E-MINI S&P 500 Index | | March 2007 | | $ | 10,427,320 | | | | (2,253 | ) |
| | | | | | | | | Total Unrealized Depreciation | | $ | (16,993 | ) |
Mid/Small Company Index Fund
Number of
Contracts
| | | | Exchange
| | Contract
| | Expiration Date
| | Underlying
Face Amount
at Value
| | Net
Unrealized
Depreciation
|
|---|
| 15 | | | | CME | | E-MINI Russell Index | | March 2007 | | $ | 1,192,350 | | | $ | (5,020 | ) |
| 14 | | | | CME | | E-MINI S&P Mid 400 Index | | March 2007 | | $ | 1,135,819 | | | | (15,721 | ) |
| | | | | | | | | Total Unrealized Depreciation | | $ | (20,741 | ) |
Overseas Equity Index Fund
Number of
Contracts
| | | | Exchange
| | Contract
| | Expiration Date
| | Underlying
Face Amount
at Value
| | Net
Unrealized
Appreciation
|
|---|
| 71 | | | | EUX | | DJ STOXX 50 Eurodollar | | March 2007 | | $ | 3,895,940 | | | $ | 40,756 | |
| 27 | | | | LIF | | FTSE 100 Index | | March 2007 | | $ | 3,287,074 | | | | 9,274 | |
| 21 | | | | TSE | | Topix Index | | March 2007 | | $ | 2,968,619 | | | | 92,673 | |
| | | | | | | | | Total Unrealized Appreciation | | $ | 142,703 | |
Forward Foreign Currency Exchange Contracts
A forward foreign currency exchange contract is an agreement to pay or receive specific amounts of a currency at a future date in exchange for another currency at an agreed upon exchange rate. Certain funds may use forward foreign currency exchange contracts to hedge certain foreign currency assets and liabilities. Such contracts are recorded at market value and marked to market daily. Risks of entering into forward foreign currency exchange contracts include the possibility that there may be an illiquid market and that a change in the value of the contracts may not correlate with changes in the value of the underlying securities. The amount at risk for such forward foreign currency exchange contracts may exceed the amount reflected in the financial statements. Realized and unrealized gains or losses on forward foreign currency exchange contracts are reflected in the accompanying financial statements. As of December 31, 2006, the funds had the following open forward foreign currency exchange contracts outstanding:
149
VANTAGEPOINT FUNDS
NOTES TO THE FINANCIAL STATEMENTS—(Continued)
International Fund
Currency
| | | | Exchange
Date
| | Foreign Currency
Cost/Proceeds (U.S.$)
| | U.S. Dollar Value
at December 31, 2006
| | Net Unrealized
Gain/(Loss)
|
|---|
Purchase Contracts | | | | | | | | | | | | | | | | |
| Australian Dollar | | | | 01/25/2007 | | $ | 1,255,808 | | | $ | 1,308,470 | | | $ | 52,662 | |
| British Pound Sterling | | | | 01/03/2007 | | | 107,435 | | | | 107,110 | | | | (325 | ) |
| Euro | | | | 01/02/2007 | | | 500,245 | | | | 501,461 | | | | 1,216 | |
| | | | | 01/03/2007 | | | 424,940 | | | | 425,973 | | | | 1,033 | |
| Japanese Yen | | | | 01/04/2007 | | | 285,858 | | | | 284,984 | | | | (874 | ) |
| | | | | 01/05/2007 | | | 246,387 | | | | 246,035 | | | | (352 | ) |
| | | | | 01/09/2007 | | | 475,968 | | | | 476,223 | | | | 255 | |
| | | | | 01/11/2007 | | | 999,590 | | | | 974,130 | | | | (25,460 | ) |
| Singapore Dollar | | | | 01/04/2007 | | | 102,198 | | | | 102,195 | | | | (3 | ) |
| | | | | | | Net Gain on Purchase Contracts | | $ | 28,152 | |
Sale Contracts | | | | | | | | | | | | | | | | |
| British Pound Sterling | | | | 01/02/2007 | | $ | 40,996 | | | $ | 41,037 | | | $ | (41 | ) |
| | | | | 01/04/2007 | | | 4,990 | | | | 4,987 | | | | 3 | |
| Canadian Dollar | | | | 01/02/2007 | | | 1,379 | | | | 1,380 | | | | (1 | ) |
| Danish Krone | | | | 01/02/2007 | | | 9,784 | | | | 9,833 | | | | (49 | ) |
| | | | | 01/03/2007 | | | 29,646 | | | | 29,723 | | | | (77 | ) |
| | | | | 01/04/2007 | | | 14,873 | | | | 14,877 | | | | (4 | ) |
| Euro | | | | 01/02/2007 | | | 90,466 | | | | 90,975 | | | | (509 | ) |
| | | | | 01/11/2007 | | | 999,589 | | | | 1,036,003 | | | | (36,414 | ) |
| | | | | 01/25/2007 | | | 1,255,808 | | | | 1,315,699 | | | | (59,891 | ) |
| Hong Kong Dollar | | | | 01/02/2007 | | | 347,590 | | | | 347,331 | | | | 259 | |
| Japanese Yen | | | | 01/05/2007 | | | 49,885 | | | | 49,814 | | | | 71 | |
| | | | | | | Net Loss on Sale Contracts | | $ | (96,653 | ) |
| | | | | | | Net Unrealized Loss on
Forward Foreign Currency Contracts | | $ | (68,501 | ) |
Overseas Equity Index Fund
Currency
| | | | Exchange
Date
| | Foreign Currency
Cost/Proceeds (U.S.$)
| | U.S. Dollar Value
at December 31, 2006
| | Net Unrealized
Loss
|
|---|
Purchase Contracts | | | | | | | | | | | | | | | | |
| British Pound Sterling | | | | 03/15/2007 | | $ | 3,336,157 | | | $ | 3,324,980 | | | $ | (11,177 | ) |
| Euro | | | | 03/15/2007 | | | 3,689,740 | | | | 3,674,021 | | | | (15,719 | ) |
| Japanese Yen | | | | 03/15/2007 | | | 2,922,030 | | | | 2,844,204 | | | | (77,826 | ) |
| | | | | | | Net Loss on Purchase Contracts | | $ | (104,722 | ) |
| | | | | | | Net Unrealized Loss on
Forward Foreign Currency Contracts | | $ | (104,722 | ) |
Option Contracts
The Short-Term Bond Fund may use options to obtain exposure to fixed income sectors without incurring leverage. The International and Aggressive Opportunities Funds may use options for currency management. Purchases of put and call options are recorded as an investment, the value of which is marked to market at each valuation date. When a purchased option expires, the fund will realize a loss equal to the premium paid. When a fund enters into a closing sale transaction, the fund will realize a gain or loss depending on whether the sales proceeds from the closing sale transaction are greater or less than the cost of the option. When a fund exercises a put option, it will realize a gain or
150
VANTAGEPOINT FUNDS
NOTES TO THE FINANCIAL STATEMENTS—(Continued)
loss from the sale of the underlying security and the proceeds from such sale will be decreased by the premium originally paid. When a fund exercises a call option, the cost of the security which the fund purchases upon exercise will be increased by the premium originally paid.
When a fund writes a call or put option, an amount equal to the premium received by the fund is recorded as a liability, the value of which is marked to market at each valuation date. When a written option expires, the fund realizes a gain equal to the amount of the premium originally received. When a fund enters into a closing purchase transaction, the fund realizes a gain (or loss if the cost of the closing purchase transaction exceeds the premium originally received when the option was sold/written) without regard to any unrealized gain or loss on the underlying security, and the liability related to such option is eliminated. When a call option is exercised, the fund realizes a gain or loss from the sale of the underlying security and the proceeds from such sale are increased by the amount of the premium originally received. When a put option is exercised, the amount of the premium originally received will reduce the cost of the security which the fund purchased upon exercise.
Options written are reported as a liability in the Statement of Assets and Liabilities. Gains and losses are reported in the Statement of Operations. There are no other transaction fees associated with option contracts other than the premium paid or received. The risk in writing a call option is that the fund gives up the opportunity for profit if the market price of the security increases and the option is exercised. The risk in writing a put option is that the fund may incur a loss if the market price of the security decreases and the option is exercised. The risk in buying an option is that the fund pays a premium whether or not the option is exercised.
At December 31, 2006, there were no written options. In addition, there were no written options in 2005.
Repurchase Agreements
Transactions involving purchases of securities under agreements to resell such securities at a specified price and time (“repurchase agreements”) are treated as collateralized financing transactions and are recorded at their contracted resale amounts. These repurchase agreements, if any, are detailed in each fund’s Schedule of Investments. The funds require that the cash investment be fully collateralized based on values that are marked to market daily. The collateral is generally held by an agent bank. It is VIA’s responsibility to value collateral daily and to obtain additional collateral as necessary to maintain the value at equal to or greater than 102% of market value. The repurchase agreements are collateralized by U.S. Government securities. If the custodian or counterparty becomes bankrupt, the funds’ realization of collateral might be delayed, or the funds may incur a cost or possible losses of principal and income in selling the collateral.
3. | | Agreements and Other Transactions with Affiliates |
VIA, a wholly owned subsidiary of ICMA-RC, provides investment advisory services to each of the funds. Pursuant to Master Advisory Agreements, VIA is entitled to receive 0.10% of the average daily net assets of each Actively Managed, Model Portfolio and Milestone Funds and 0.05% of the average daily net assets of the Index Funds. For these services, VIA received $13,749,229 in aggregate for the year ended December 31, 2006.
Effective July 1, 2005 the advisory fee paid to VIA for each Model Portfolio Fund is calculated as follows:
| | • 0.10% on the first $500 million of net assets |
| | • 0.09% on the next $500 million of net assets |
| | • 0.08% on net assets over $1 billion. |
VIA and the Company contract with one or more subadvisers (“Subadvisers”) for the day-to-day management of each of the funds other than the Money Market, Model Portfolio and Milestone Funds. Each Subadviser is paid a fee by the funds during the year based on average net assets under management. The fee structure for many of the Subadvisers provides for a range of fees so that as average net assets of a fund increase the rate of fee paid decreases. With other subadvisers, one fee is applicable to all levels of assets under management. Additional information about each Subadviser’s fee are presented in the funds’ Prospectus and Statement of Additional Information. Presented below are the fees paid by the funds to Subadvisers during the year ended December 31, 2006. Fees are shown as an annual percentage of average net assets under management as well as total dollars paid. The total dollars below represent amounts paid to the Subadvisers for services performed during the period of July 1, 2005 through September 30, 2006.
151
VANTAGEPOINT FUNDS
NOTES TO THE FINANCIAL STATEMENTS—(Continued)
Fund
| | | | Subadviser
| | Contractual Fee
as a Percentage of
Average Daily
Net Assets
| | Dollars Paid
|
|---|
| Short-Term Bond | | | | Payden & Rygel | | | 0.10 | % | | $ | 256,334 | |
| | | | | STW Fixed Income Management Ltd. | | | 0.18 | % | | | 500,840 | |
| |
| US Government Securities | | | | Mellon Capital Management Corporation (1) | | | 0.06 | % | | | 104,960 | |
| |
| Asset Allocation | | | | Mellon Capital Management Corporation | | | 0.23 | % | | | 1,704,554 | |
| |
| Equity Income | | | | Barrow, Hanley, Mewhinney & Strauss, Inc. | | | 0.24 | % | | | 1,051,322 | |
| | | | | T. Rowe Price Associates, Inc. | | | 0.37 | % | | | 1,614,472 | |
| | | | | Southeastern Asset Management, Inc. | | | 0.53 | % | | | 2,149,763 | |
| |
| Growth & Income | | | | Capital Guardian Trust Company (2) | | | 0.24 | % | | | 813,268 | |
| | | | | T. Rowe Price Associates, Inc. | | | 0.38 | % | | | 1,283,233 | |
| | | | | Wellington Management Company, LLP | | | 0.28 | % | | | 961,982 | |
| |
| Growth (3) | | | | Fidelity Management & Research Company (4) | | | 0.62 | % | | | 1,673,807 | |
| | | | | Goldman Sachs Asset Management, L.P. | | | 0.22 | % | | | 590,063 | |
| | | | | Legg Mason Capital Management, Inc. | | | 0.39 | % | | | 1,847,322 | |
| | | | | Peregrine Capital Management | | | 0.36 | % | | | 2,307,851 | |
| | | | | Tukman Capital Management, Inc. | | | 0.50 | % | | | 2,408,849 | |
| | | | | Westfield Capital Management Company, LLC | | | 0.33 | % | | | 1,439,600 | |
| |
| Aggressive Opportunities (5) | | | | Legg Mason Capital Management, Inc. | | | 0.39 | % | | | 766,902 | |
| | | | | Southeastern Asset Management, Inc. | | | 0.55 | % | | | 1,909,788 | |
| | | | | TimesSquare Capital Management, LLC | | | 0.50 | % | | | 1,070,427 | |
| | | | | T. Rowe Price Associates, Inc. | | | 0.58 | % | | | 2,403,730 | |
| | | | | Wellington Management Company, LLP (6) | | | 0.68 | % | | | 976,449 | |
| |
| International | | | | Artisan Partners Limited Partnership | | | 0.70 | % | | | 1,781,753 | |
| | | | | Capital Guardian Trust Company (7) | | | 0.41 | % | | | 1,301,556 | |
| | | | | GlobeFlex Capital, LP | | | 0.40 | % | | | 396,712 | |
| | | | | Walter Scott & Partners Limited | | | 0.54 | % | | | 552,903 | |
| |
| Core Bond Index | | | | Mellon Capital Management Corporation (1) | | | 0.02 | % | | | 290,638 | |
| |
| 500 Stock Index | | | | Mellon Capital Management Corporation | | | 0.02 | % | | | 73,038 | |
| |
| Broad Market Index | | | | Mellon Capital Management Corporation | | | 0.02 | % | | | 133,434 | |
| |
| Mid/Small Company Index | | | | Mellon Capital Management Corporation | | | 0.04 | % | | | 79,500 | |
| |
| Overseas Equity Index | | | | Mellon Capital Management Corporation (1) | | | 0.08 | % | | | 81,593 | |
| (1) | | Effective September 14, 2006, the Board approved an additional breakpoint to the fee schedule of Mellon Capital Management Corporation. |
| (2) | | Minimum fee of $167,500 per year. |
| (3) | | At a meeting held on May 19, 2006, the Board approved the termination of the subadvisory agreement with Fidelity Management & Research Company for the Growth Fund. Goldman Sachs Asset Management, L.P., Legg Mason Capital Management, Inc., Peregrine Capital Management, Inc., Tukman Capital Management, Inc. and Westfield Capital Management Company, LLC continue to serve as subadvisers to the Growth Fund. In a transition phase that began on May 30, 2006, the Growth Fund’s assets were transitioned and reallocated to and among the five remaining subadvisers. |
| (4) | | From May 1, 2001 to June 30, 2006, FMR Co. Inc. served as a sub-subadviser to this fund and was compensated from the fees paid to this subadviser. Fee included is from October 1, 2005 to March 31, 2006. |
| (5) | | At a meeting held on January 19, 2006, the Board approved the termination of the subadvisory agreement with Wellington for the Aggressive Opportunities Fund and approved the appointment of Legg Mason Capital Management, Inc. and TimesSquare Capital Management, LLC as additional subadvisers to the Aggressive Opportunities Fund, which became effective January 25, 2006. The fees paid to Wellington for the period October 1, 2005 to February 28, 2006 were $976,449. |
152
VANTAGEPOINT FUNDS
NOTES TO THE FINANCIAL STATEMENTS—(Continued)
| (6) | | From June 7, 2004 through February 28, 2006, Wellington Management International Ltd served as a sub-subadviser to this fund, and was compensated from the fees paid to this subadviser. |
| (7) | | Minimum fee of $337,500 per year. |
Expenses
The Model Portfolio and Milestone Funds incur fees and expenses indirectly as shareholders in their respective underlying funds and the Money Market Fund incurs fees and expenses indirectly as a shareholder of the AIM Portfolio. Because the underlying funds have varied expense and fee levels and the Model Portfolio, Milestone and Money Market Funds may own different proportions of such funds at different times, the amount of fees and expenses indirectly incurred by the Model Portfolio, Milestone, and Money Market Funds will vary.
Fee Waivers
From March 1, 1999 until May 1, 2002, VIA voluntarily agreed to waive any fees that would result in total fund expenses of the Money Market Fund exceeding an annual rate of 0.55% of average net assets.
If the aggregate advisory fees of the Growth Fund exceed 0.54% because of subadvisory changes, VIA will waive its advisory fee or reimburse expenses to the extent necessary on any resulting increase in subadvisory fees payable by the Growth Fund. This commitment will continue until such time as shareholders approve an increase in this limit. For the year ended December 31, 2006, no waiver or reimbursement was necessary to comply with the 0.54% maximum subadvisory fee rate.
From January 3, 2005 until April 30, 2006, VIA contractually agreed to waive fees and/or reimburse expenses to each of the Milestone Funds limiting the direct operating expenses to no more than 0.05% of the Fund’s average daily net assets on an annualized basis. From May 1, 2006 through April 30 2007, VIA contractually agreed to limit each Fund’s total fund gross operating expenses, which includes the expenses of the underlying funds, to the following percentages:
| Milestone Retirement Income | | | | 0.81% |
| Milestone 2010 | | | | 0.88% |
| Milestone 2015 | | | | 0.91% |
| Milestone 2020 | | | | 0.93% |
| Milestone 2025 | | | | 0.95% |
| Milestone 2030 | | | | 0.97% |
| Milestone 2035 | | | | 0.99% |
| Milestone 2040 | | | | 0.99% |
For the year ended December 31, 2006, VIA reimbursed each fund as follows:
| Milestone Retirement Income | | | | $62,838 |
| Milestone 2010 | | | | $49,873 |
| Milestone 2015 | | | | $40,332 |
| Milestone 2020 | | | | $45,412 |
| Milestone 2025 | | | | $50,574 |
| Milestone 2030 | | | | $57,703 |
| Milestone 2035 | | | | $61,297 |
| Milestone 2040 | | | | $63,317 |
T. Rowe Price voluntarily waives a portion of its aggregate subadvisory fees for the Growth & Income, Equity Income and Aggressive Opportunities Funds. This voluntary fee waiver was first implemented on May 1, 2003. Through September 30, 2005, 2.5% of the aggregate fees were waived on total assets managed between $250 million and $500 million and 5% of the aggregate fees were waived on total assets managed in excess of $500 million. Effective October 1, 2005, 2.5% of the aggregate fees were waived on the first $500 million of assets managed and 5% on assets managed in excess of $500 million. For the year ended December 31, 2006, this voluntary fee waiver totaled $223,816 of which $67,507 was allocated to the Equity Income Fund, $54,771 to the Growth & Income Fund and $101,538 to the Aggressive Opportunities Fund.
153
VANTAGEPOINT FUNDS
NOTES TO THE FINANCIAL STATEMENTS—(Continued)
4. | | Investment Portfolio Transactions |
Purchases and sales of investments, exclusive of short-term securities, for each fund for the year ended December 31, 2006 were as follows:
| | | | U.S. Government Obligations
| | Other Securities
| |
|---|
Fund
| | | | Purchases at Cost
| | Sales Proceeds
| | Purchases at Cost
| | Sales Proceeds
|
|---|
| Short-Term Bond | | | | $ | 420,729,672 | | | $ | 488,618,551 | | | $ | 279,031,264 | | | $ | 159,733,972 | |
| US Government Securities | | | | | 98,013,272 | | | | 103,390,613 | | | | — | | | | — | |
| Asset Allocation | | | | | 72,830,582 | | | | 72,347,622 | | | | 23,341,599 | | | | 120,936,620 | |
| Equity Income | | | | | | | | | | | | | 226,494,659 | | | | 300,800,790 | |
| Growth & Income | | | | | | | | | | | | | 427,276,302 | | | | 398,729,782 | |
| Growth | | | | | | | | | | | | | 1,707,157,812 | | | | 2,015,770,958 | |
| Aggressive Opportunities | | | | | | | | | | | | | 1,108,003,308 | | | | 1,135,200,757 | |
| International | | | | | | | | | | | | | 724,673,605 | | | | 573,971,939 | |
| Core Bond Index | | | | | 410,996,266 | | | | 239,977,824 | | | | 84,464,497 | | | | 62,515,071 | |
| 500 Stock Index | | | | | | | | | | | | | 14,317,093 | | | | 24,407,530 | |
| Broad Market Index | | | | | | | | | | | | | 13,682,822 | | | | 52,655,255 | |
| Mid/Small Company Index | | | | | | | | | | | | | 35,341,693 | | | | 34,661,850 | |
| Overseas Equity Index | | | | | | | | | | | | | 46,434,322 | | | | 2,856,780 | |
| Model Portfolio Savings Oriented | | | | | | | | | | | | | 38,153,550 | | | | 31,872,051 | |
| Model Portfolio Conservative Growth | | | | | | | | | | | | | 66,663,517 | | | | 49,652,070 | |
| Model Portfolio Traditional Growth | | | | | | | | | | | | | 207,609,019 | | | | 75,874,116 | |
| Model Portfolio Long-Term Growth | | | | | | | | | | | | | 245,742,625 | | | | 77,629,099 | |
| Model Portfolio All-Equity Growth | | | | | | | | | | | | | 154,016,355 | | | | 21,486,880 | |
| Milestone Retirement Income | | | | | | | | | | | | | 13,398,904 | | | | 4,338,226 | |
| Milestone 2010 | | | | | | | | | | | | | 25,957,377 | | | | 5,483,116 | |
| Milestone 2015 | | | | | | | | | | | | | 45,932,968 | | | | 5,938,323 | |
| Milestone 2020 | | | | | | | | | | | | | 35,029,313 | | | | 2,113,591 | |
| Milestone 2025 | | | | | | | | | | | | | 28,699,504 | | | | 1,216,407 | |
| Milestone 2030 | | | | | | | | | | | | | 15,433,929 | | | | 538,070 | |
| Milestone 2035 | | | | | | | | | | | | | 12,417,930 | | | | 1,098,781 | |
| Milestone 2040 | | | | | | | | | | | | | 10,826,205 | | | | 1,671,040 | |
5. | | Tax Basis Unrealized Appreciation (Depreciation) |
At December 31, 2006, net unrealized appreciation (depreciation) on investments was as follows:
Fund
| | | | Federal
Income Tax
Cost
| | Gross
Unrealized
Appreciation
| | Gross
Unrealized
Depreciation
| | Tax Basis
Net Unrealized
Appreciation/
(Depreciation)
|
|---|
| Money Market | | | | $ | 216,767,333 | | | $ | — | | | $ | — | | | $ | — | |
| Short-Term Bond | | | | | 586,349,950 | | | | 216,856 | | | | 4,294,643 | | | | (4,077,787 | ) |
| US Government Securities | | | | | 163,844,777 | | | | — | | | | 1,704,301 | | | | (1,704,301 | ) |
| Asset Allocation | | | | | 646,618,448 | | | | 150,032,002 | | | | 35,182,969 | | | | 114,849,033 | |
| Equity Income | | | | | 1,306,602,858 | | | | 342,921,062 | | | | 42,048,711 | | | | 300,872,351 | |
| Growth & Income | | | | | 1,046,560,735 | | | | 227,004,964 | | | | 13,272,061 | | | | 213,732,903 | |
| Growth | | | | | 2,768,705,102 | | | | 329,878,607 | | | | 57,293,299 | | | | 272,585,308 | |
| Aggressive Opportunities | | | | | 1,497,694,988 | | | | 285,228,995 | | | | 42,699,707 | | | | 242,529,288 | |
| International | | | | | 917,406,211 | | | | 202,424,074 | | | | 11,736,536 | | | | 190,687,538 | |
| Core Bond Index | | | | | 1,332,160,406 | | | | — | | | | 16,799,453 | | | | (16,799,453 | ) |
| 500 Stock Index | | | | | 231,895,438 | | | | 203,518,398 | | | | 17,233,045 | | | | 186,285,353 | |
| Broad Market Index | | | | | 461,243,173 | | | | 268,525,781 | | | | 34,198,889 | | | | 234,326,892 | |
154
VANTAGEPOINT FUNDS
NOTES TO THE FINANCIAL STATEMENTS—(Continued)
Fund
| | | | Federal
Income Tax
Cost
| | Gross
Unrealized
Appreciation
| | Gross
Unrealized
Depreciation
| | Tax Basis
Net Unrealized
Appreciation/
(Depreciation)
|
|---|
| Mid/Small Company Index | | | | $ | 164,201,477 | | | $ | 71,298,962 | | | $ | 13,430,074 | | | $ | 57,868,888 | |
| Overseas Equity Index | | | | | 120,602,653 | | | | 48,654,477 | | | | 1,642,613 | | | | 47,011,864 | |
| Model Portfolio Savings Oriented | | | | | 287,298,504 | | | | 11,753,073 | | | | 6,719,583 | | | | 5,033,490 | |
| Model Portfolio Conservative Growth | | | | | 526,072,156 | | | | 34,263,113 | | | | 10,300,995 | | | | 23,962,118 | |
| Model Portfolio Traditional Growth | | | | | 1,229,604,949 | | | | 117,124,913 | | | | 15,588,296 | | | | 101,536,617 | |
| Model Portfolio Long-Term Growth | | | | | 1,290,611,595 | | | | 192,267,798 | | | | 11,824,125 | | | | 180,443,673 | |
| Model Portfolio All-Equity Growth | | | | | 398,313,174 | | | | 72,624,090 | | | | — | | | | 72,624,090 | |
| Milestone Retirement Income | | | | | 22,395,609 | | | | 299,047 | | | | 148,994 | | | | 150,053 | |
| Milestone 2010 | | | | | 47,351,338 | | | | 1,445,352 | | | | 290,465 | | | | 1,154,887 | |
| Milestone 2015 | | | | | 81,137,615 | | | | 3,608,604 | | | | 362,976 | | | | 3,245,628 | |
| Milestone 2020 | | | | | 59,466,654 | | | | 3,166,950 | | | | 207,426 | | | | 2,959,524 | |
| Milestone 2025 | | | | | 46,383,218 | | | | 2,566,294 | | | | 122,828 | | | | 2,443,466 | |
| Milestone 2030 | | | | | 24,684,254 | | | | 1,387,132 | | | | 48,196 | | | | 1,338,936 | |
| Milestone 2035 | | | | | 15,749,508 | | | | 683,731 | | | | 10,107 | | | | 673,624 | |
| Milestone 2040 | | | | | 12,405,113 | | | | 296,098 | | | | 2,099 | | | | 293,999 | |
6. | | Portfolio Securities Loaned |
Certain funds lend securities to approved brokers to earn additional income. As of December 31, 2006, certain funds had loaned securities, which were collateralized by cash, cash equivalents, or U.S. Government Obligations. Each fund receives compensation in connection with the securities lending program. Collateral is maintained over the life of the loan in an amount not less than 102% of the value of the loaned securities for domestic securities and 105% for foreign securities, as determined by the funds at the close of business each day. Any additional collateral required due to changes in the value of securities is delivered to the funds the next business day. Although the collateral mitigates risk, the funds could experience a delay in recovering their securities and a possible loss of income or value if the borrower fails to return the securities. The funds have the right under the securities lending agreement to recover the securities from the borrower on demand. The risks to the funds associated with securities lending are that the borrower may not provide additional collateral when required or return the securities when due.
The funds will be indemnified by its custodian for securities lending programs conducted through the custodian if at the time of a default by a borrower some or all of the loaned securities have not been returned by the borrower. The custodian, as soon as practicable after the time of default, shall purchase and deposit in the funds’ account securities of the same issuer, class, denomination, and with the same dividend and other economic benefits as, and equal in number to the unreturned loaned securities to the extent that such securities are reasonably available on the open market. If the custodian is unable to purchase replacement securities, it will credit to the funds’ account an amount equal to the market value of the unreturned loaned securities.
The market value of the securities on loan and the value of the related collateral as of December 31, 2006, were as follows:
Fund
| | | | Securities on Loan
| | Collateral
| | Collateralization
%
|
|---|
| Short-Term Bond | | | | $ | 1,251,289 | | | $ | 1,284,000 | | | | 103 | % |
| US Government Securities | | | | | 20,352,738 | | | | 20,862,291 | | | | 103 | % |
| Asset Allocation | | | | | 30,609,426 | | | | 31,652,960 | | | | 103 | % |
| Equity Income | | | | | 147,252,943 | | | | 152,661,476 | | | | 104 | % |
| Growth & Income | | | | | 83,216,987 | | | | 85,983,285 | | | | 103 | % |
| Growth | | | | | 245,814,192 | | | | 253,771,293 | | | | 103 | % |
| Aggressive Opportunities | | | | | 361,575,576 | | | | 375,393,623 | | | | 104 | % |
| International | | | | | 51,983,953 | | | | 54,805,598 | | | | 105 | % |
| Core Bond Index | | | | | 153,429,930 | | | | 157,983,375 | | | | 103 | % |
| 500 Stock Index | | | | | 22,668,918 | | | | 23,462,122 | | | | 104 | % |
155
VANTAGEPOINT FUNDS
NOTES TO THE FINANCIAL STATEMENTS—(Continued)
Fund
| | | | Securities on Loan
| | Collateral
| | Collateralization
%
|
|---|
| Broad Market Index | | | | $ | 48,671,925 | | | $ | 50,551,966 | | | | 104 | % |
| Mid/Small Company Index | | | | | 34,728,540 | | | | 36,165,191 | | | | 104 | % |
| Overseas Equity Index | | | | | 5,853,546 | | | | 6,184,106 | | | | 106 | % |
7. | | Transactions with Affiliated Funds |
At December 31, 2006 the Model Portfolio and Milestone Funds held investments in a number of underlying funds. The figures presented below represent the percentage of shares outstanding in each of the underlying funds owned by the Model Portfolio and Milestone Funds as of that date:
Underlying Fund
| | | | Model
Portfolio
Savings
Oriented
| | Model
Portfolio
Conservative
Growth
| | Model
Portfolio
Traditional
Growth
| | Model
Portfolio
Long-Term
Growth
| | Model
Portfolio
All-Equity
Growth
|
|---|
| Short-Term Bond | | | | | 16.82 | % | | | 27.10 | % | | | 43.37 | % | | | — | | | | — | |
| US Government Securities | | | | | 20.45 | % | | | — | | | | — | | | | — | | | | — | |
| Equity Income | | | | | 2.00 | % | | | 3.57 | % | | | 8.38 | % | | | 11.82 | % | | | 4.44 | % |
| Growth & Income | | | | | 2.49 | % | | | 4.45 | % | | | 15.79 | % | | | 23.03 | % | | | 7.12 | % |
| Growth | | | | | — | | | | 1.48 | % | | | 6.66 | % | | | 9.68 | % | | | 4.66 | % |
| Aggressive Opportunities | | | | | — | | | | 2.01 | % | | | 9.75 | % | | | 16.01 | % | | | 6.76 | % |
| International | | | | | 1.41 | % | | | 4.52 | % | | | 16.84 | % | | | 23.50 | % | | | 9.51 | % |
| Core Bond Index | | | | | 8.84 | % | | | 16.63 | % | | | 26.59 | % | | | 29.45 | % | | | — | |
Underlying Fund
| | | | Milestone
Retirement
Income
| | Milestone
2010
| | Milestone
2015
| | Milestone
2020
| | Milestone
2025
|
|---|
| Short-Term Bond | | | | | 1.30 | % | | | 1.96 | % | | | 1.81 | % | | | 0.67 | % | | | 0.12 | % |
| Equity Income | | | | | 0.15 | % | | | 0.33 | % | | | 0.53 | % | | | 0.38 | % | | | 0.30 | % |
| Growth & Income | | | | | 0.29 | % | | | 0.96 | % | | | 2.13 | % | | | 1.75 | % | | | 1.49 | % |
| Growth | | | | | — | | | | 0.06 | % | | | 0.17 | % | | | 0.14 | % | | | 0.12 | % |
| International | | | | | 0.11 | % | | | 0.33 | % | | | 0.87 | % | | | 0.80 | % | | | 0.72 | % |
| Core Bond Index | | | | | 0.80 | % | | | 1.55 | % | | | 2.27 | % | | | 1.47 | % | | | 1.03 | % |
| Mid/Small Index | | | | | — | | | | — | | | | 5.24 | % | | | 6.65 | % | | | 6.44 | % |
Underlying Fund
| | | | Milestone
2030
| | Milestone
2035
| | Milestone
2040
| |
| |
|
|---|
| Equity Income | | | | | 0.15 | % | | | 0.08 | % | | | 0.06 | % | | | | | | | | |
| Growth & Income | | | | | 0.84 | % | | | 0.55 | % | | | 0.43 | % | | | | | | | | |
| Growth | | | | | 0.07 | % | | | 0.05 | % | | | 0.04 | % | | | | | | | | |
| International | | | | | 0.43 | % | | | 0.30 | % | | | 0.24 | % | | | | | | | | |
| Core Bond Index | | | | | 0.44 | % | | | 0.19 | % | | | 0.13 | % | | | | | | | | |
| Mid/Small Index | | | | | 4.09 | % | | | 3.00 | % | | | 2.42 | % | | | | | | | | |
8. | | Control Persons and Principal Holders of Securities |
As of December 31, 2006, a majority of the voting shares of all funds, except the Money Market Fund, were held either directly, or indirectly through the Model Portfolio and the Milestone Funds, by the VantageTrust, a group trust sponsored and maintained by the VantageTrust Company (“Trust Company”). The VantageTrust was established for the purpose of holding and investing the assets of public sector retirement and deferred compensation plans. The Trust Company, a New Hampshire non-depository banking corporation, has the power to vote the shares of the funds directly held by the VantageTrust and has the power to direct the vote of the shares of the Model Portfolio Funds and the Milestone Funds under the proxy voting policy adopted by VIA, the funds’ adviser, and is therefore considered a “control” person of the funds for purposes of the 1940 Act. Both the Trust Company and VIA are wholly-owned subsidiaries of ICMA-RC. As a control person of all the funds, the Trust Company may possess the ability to control the outcome of matters submitted to the vote of shareholders.
156
VANTAGEPOINT FUNDS
NOTES TO THE FINANCIAL STATEMENTS—(Continued)
The following represents the percentage of shares outstanding in each of the funds held directly or indirectly by the VantageTrust and by employer clients that have adopted the VantageTrust as of December 31, 2006:
Fund
| | | | % Owned
By the
VantageTrust
|
|---|
| Money Market | | | | | 39.50 | % |
| Short-Term Bond | | | | | 86.03 | % |
| US Government Securities | | | | | 94.57 | % |
| Asset Allocation | | | | | 97.59 | % |
| Equity Income | | | | | 94.45 | % |
| Growth & Income | | | | | 94.40 | % |
| Growth | | | | | 97.95 | % |
| Aggressive Opportunities | | | | | 96.87 | % |
| International Fund | | | | | 95.78 | % |
| Core Bond Index Class I | | | | | 92.18 | % |
| Core Bond Index Class II | | | | | 100.00 | % |
| 500 Stock Index Class I | | | | | 88.64 | % |
| 500 Stock Index Class II | | | | | 100.00 | % |
| Broad Market Index Class I | | | | | 90.02 | % |
| Broad Market Index Class II | | | | | 92.23 | % |
| Mid/Small Co Index Class I | | | | | 85.75 | % |
| Mid/Small Co Index Class II | | | | | 100.00 | % |
| Overseas Equity Index Class I | | | | | 85.93 | % |
| Overseas Equity Index Class II | | | | | 100.00 | % |
| Model Portfolio Savings Oriented | | | | | 88.66 | % |
| Model Portfolio Conservative Growth | | | | | 91.24 | % |
| Model Portfolio Traditional Growth | | | | | 95.09 | % |
| Model Portfolio Long-Term Growth | | | | | 96.83 | % |
| Model Portfolio All-Equity Growth | | | | | 95.01 | % |
| Milestone Retirement Income | | | | | 80.85 | % |
| Milestone 2010 | | | | | 87.83 | % |
| Milestone 2015 | | | | | 90.77 | % |
| Milestone 2020 | | | | | 94.26 | % |
| Milestone 2025 | | | | | 92.92 | % |
| Milestone 2030 | | | | | 90.25 | % |
| Milestone 2035 | | | | | 89.69 | % |
| Milestone 2040 | | | | | 89.12 | % |
157
VANTAGEPOINT FUNDS
NOTES TO THE FINANCIAL STATEMENTS—(Continued)
VIA has entered into agreements with brokers whereby the brokers will rebate a portion of the funds’ brokerage commissions on behalf of certain funds. Such amounts, under these agreements, are included in net realized gain (loss) on the sale of investments presented in the Statement of Operations. For the year ended December 31, 2006, the Funds recaptured the following amounts of brokerage commissions:
Fund
| | | | | Recaptured
Brokerage
Commissions
|
|---|
| Equity Income | | | | | $ 44,293 | |
| Growth & Income | | | | | 62,010 | |
| Growth | | | | | 447,977 | |
| Aggressive Opportunities | | | | | 319,857 | |
| International | | | | | 212,742 | |
10. | | Additional Distributions in Prior Years |
In order to comply with requirements of the Internal Revenue Code applicable to regulated investment companies, the Short-Term Bond Fund, formerly the Income Preservation Fund, was required to distribute accumulated net realized gains, if any, on an annual basis. When such distributions were made, the immediate effect was a corresponding reduction in the net asset value per share. Given the objective of the fund to maintain a stable net asset value per share, the fund declared a reverse stock split immediately subsequent to the distribution at a rate that caused the total number of shares held by each shareholder, including shares acquired on reinvestment of that distribution, to remain the same as before the distribution was paid and reinstated the same net asset value of $100 per share as before the distribution. The last such distribution and reverse stock split occurred on December 31, 2003. The Income Preservation Fund’s transition to the Short-Term Bond Fund eliminated the need for this distribution procedure.
11. | | Stock Split in the Short-Term Bond Fund |
On October 28, 2005, a “stock split” was processed in the Vantagepoint Short-Term Bond Fund. Specifically, there was a “10 for 1” split meaning that the shares outstanding were increased by a multiple of 10 and the NAV was divided by 10. Therefore, this action had no impact on the aggregate value of the shares outstanding. The record date (shareholders of record on this date were affected) was Thursday, October 27, 2005. The payable date (the date the stock split posted to shareholder accounts) was Friday, October 28, 2005. The ex-date (the date the NAV changed to reflect the split) was Friday, October 28, 2005. Share transactions, shares outstanding, NAVs, and per share ratios for prior years in the Statement of Changes in Net Assets and the Financial Highlights have been restated to reflect historical application of the “10 for 1” split in order to present these items on a basis comparable to the current year, as required by generally accepted accounting principles.
12. | | Recently Issued Accounting Pronouncements |
In June 2006, the Financial Accounting Standards Board issued Interpretation No. 48 (“FIN 48”), “Accounting for Uncertainty in Income Taxes,” which establishes guidelines for recognizing and measuring the benefits of tax return positions in financial statements. FIN 48 will become effective for the Company during their fiscal year ending December 31, 2007. Management is continuing to evaluate the Company’s tax positions in preparation for the implementation of FIN 48, and based on the analysis performed to date, does not believe that the adoption of FIN 48 will have any material impact on the Company’s financial statements.
In September 2006, the FASB issued Statement of Financial Accounting Standards No. 157, (“FAS 157”) “Fair Value Measurements.” FAS 157 defines fair value, establishes a framework for measuring fair value in accordance with generally accepted accounting principles and expands disclosure about fair value measurements. FAS 157 is effective for fiscal years beginning after November 15, 2007. Management is currently evaluating the impact the adoption of FAS 157 will have on the Company’s financial statement disclosures.
158
Vantagepoint Funds
Additional Information (Unaudited)
For corporate shareholders, a portion of the ordinary dividends paid during the fund’s year ended December 31, 2006 qualified for the dividends received deduction as follows:
| Asset Allocation | | | | | 68.14 | % |
| Equity Income | | | | | 70.46 | % |
| Growth & Income | | | | | 100.00 | % |
| Growth | | | | | 100.00 | % |
| Aggressive Opportunities | | | | | 10.63 | % |
| 500 Stock Index | | | | | 100.00 | % |
| Broad Market Index | | | | | 96.92 | % |
| Mid/Small Company Index | | | | | 64.03 | % |
| Model Portfolio Savings Oriented | | | | | 6.65 | % |
| Model Portfolio Conservative Growth | | | | | 8.21 | % |
| Model Portfolio Traditional Growth | | | | | 13.85 | % |
| Model Portfolio Long-Term Growth | | | | | 25.09 | % |
| Model Portfolio All-Equity Growth | | | | | 61.65 | % |
| Milestone Retirement Income | | | | | 7.72 | % |
| Milestone 2010 | | | | | 14.98 | % |
| Milestone 2015 | | | | | 22.54 | % |
| Milestone 2020 | | | | | 28.36 | % |
| Milestone 2025 | | | | | 33.91 | % |
| Milestone 2030 | | | | | 39.38 | % |
| Milestone 2035 | | | | | 45.43 | % |
| Milestone 2040 | | | | | 29.73 | % |
Pursuant to Section 852 of the Internal Revenue Code, the funds designate the following capital gain dividends for the year ended December 31, 2006:
| | | | Long Term
Capital Gain Dividend
|
|---|
| Asset Allocation | | | | $ | 6,163,706 | |
| Equity Income | | | | | 59,593,608 | |
| Growth & Income | | | | | 46,001,308 | |
| Aggressive Opportunities | | | | | 29,960,480 | |
| International | | | | | 92,620,774 | |
| Mid/Small Company Index | | | | | 6,640,691 | |
| Model Portfolio Savings Oriented | | | | | 3,859,279 | |
| Model Portfolio Traditional Growth | | | | | 1,688,035 | |
| Model Portfolio Long-Term Growth | | | | | 2,925,344 | |
| Model Portfolio All-Equity Growth | | | | | 4,489,157 | |
| Milestone Retirement Income | | | | | 131,043 | |
| Milestone 2010 | | | | | 300,212 | |
| Milestone 2015 | | | | | 462,830 | |
| Milestone 2020 | | | | | 217,260 | |
| Milestone 2025 | | | | | 131,352 | |
| Milestone 2030 | | | | | 80,038 | |
| Milestone 2035 | | | | | 93,183 | |
| Milestone 2040 | | | | | 66,920 | |
For the year ended December 31, 2006, dividends from foreign countries were $19,288,154 and $3,349,798 for the International and the Overseas Equity Index Funds, respectively. Taxes paid to foreign countries that qualify for the foreign tax credit were $1,483,653 and $90,774 for the International and the Overseas Equity Index Funds, respectively.
159
Vantagepoint Funds
Additional Information (Unaudited)—(Continued)
All other Vantagepoint Funds treat any foreign taxes paid as expenses and therefore reduce net investment company taxable income by these amounts.
The following table summarizes the percentage of income received by the funds in 2006 from various obligors:
Fund
| | | | U.S. Treasury
Obligations
| | GNMA
| | FNMA
| | FHLMC
| | Other
U.S. Government
Agency
|
|---|
| Short-Term Bond | | | | | 23.81 | % | | | 0.00 | % | | | 4.55 | % | | | 2.34 | % | | | 3.13 | % |
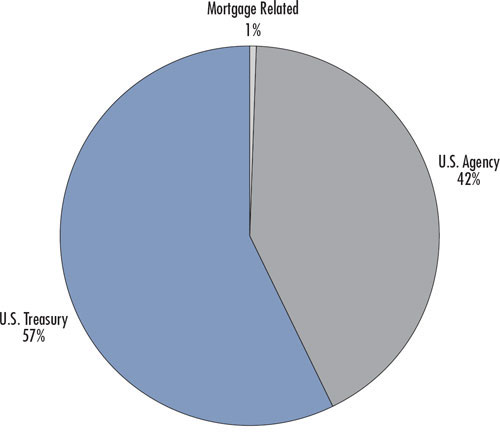
| US Government Securities | | | | | 50.84 | % | | | 0.00 | % | | | 14.12 | % | | | 15.75 | % | | | 9.93 | % |
| Asset Allocation | | | | | 3.03 | % | | | 0.00 | % | | | 0.00 | % | | | 0.00 | % | | | 0.00 | % |
| Core Bond Index | | | | | 22.61 | % | | | 3.41 | % | | | 21.66 | % | | | 17.60 | % | | | 2.18 | % |
| 500 Stock Index | | | | | 0.23 | % | | | 0.00 | % | | | 0.00 | % | | | 0.00 | % | | | 0.00 | % |
| Broad Market Index | | | | | 0.14 | % | | | 0.00 | % | | | 0.00 | % | | | 0.00 | % | | | 0.00 | % |
| Mid/Small Company Index | | | | | 0.36 | % | | | 0.00 | % | | | 0.00 | % | | | 0.00 | % | | | 0.00 | % |
| Overseas Equity Index | | | | | 0.59 | % | | | 0.00 | % | | | 0.00 | % | | | 0.00 | % | | | 0.00 | % |
D. | | Qualified Dividend Income |
The following percentages are estimates of dividend income received by the funds through December 31, 2006 that qualify for a reduced tax rate pursuant to the Jobs and Growth Tax Relief Reconciliation Act of 2003:
Fund
| | | | Percent of Qualified
Dividend Income
|
|---|
| Asset Allocation | | | | | 63.65 | % |
| Equity Income* | | | | | 81.72 | |
| Growth & Income | | | | | 100.00 | |
| Growth | | | | | 100.00 | |
| International | | | | | 81.81 | |
| 500 Stock Index | | | | | 100.00 | |
| Broad Market Index | | | | | 100.00 | |
| Mid/Small Company Index | | | | | 73.58 | |
| Overseas Equity Index | | | | | 67.57 | |
| Model Portfolio Savings Oriented | | | | | 8.96 | |
| Model Portfolio Conservative Growth | | | | | 12.41 | |
| Model Portfolio Traditional Growth | | | | | 21.93 | |
| Model Portfolio Long-Term Growth | | | | | 44.93 | |
| Model Portfolio All-Equity Growth | | | | | 100.00 | |
| Milestone Retirement Income | | | | | 10.84 | |
| Milestone 2010 | | | | | 18.00 | |
| Milestone 2015 | | | | | 29.30 | |
| Milestone 2020 | | | | | 38.61 | |
| Milestone 2025 | | | | | 47.37 | |
| Milestone 2030 | | | | | 54.41 | |
| Milestone 2035 | | | | | 67.30 | |
| Milestone 2040 | | | | | 43.15 | |
| * | | The Percent of Qualified Dividend Income for the Equity Income Fund consists of 68.86% and 12.86% of qualified ordinary dividends and qualified short-term gains, respectively. The Percent of Qualified Dividend Income listed for all other funds consists entirely of qualified ordinary dividends. |
160
Vantagepoint Funds
Additional Information (Unaudited)—(Continued)
Name, Address,*
and Age
|
|
|
| Positions
Held with
the Company
|
| Term of Office
and Length of
Time Served
|
| Principal
Occupation(s)
During Past Five Years
|
| Other
Directorships
Held By
Director
|
|---|
| N. Anthony Calhoun (59) | | | | Director, Audit Committee Member and Chair, Investment Committee and Nominating Committee Member | | Term expires October, 2011
Director since November, 1998 | | Secretary to Senate Finance Committee/Minority, State of New York Legislature (January 2007- present); Retired (October 2005-January 2007); Deputy Chief Financial Officer and Treasurer—District of Columbia (2001-2005); Deputy Executive Director & Chief Financial Officer—Pension Benefit Guaranty Corp. (1993-2001) | | N/A |
| Donna K. Gilding (66) | | | | Director, Investment Committee Member and Chair, and Nominating Committee Member | | Term expires October, 2011
Director since November, 1998 | | Chief Investment Officer—Lowenhaupt Global Advisors, LLC (Sept. 2006-present); Chief Investment Officer—Lowenhaupt & Chasnoff (2005-Sept. 2006) (wealth management law firm); Chief Investment Officer—Progress Investment Management Company (2001-2005); Chief Investment Officer—New York City Comptroller’s Office (1993-2001) | | N/A |
| Arthur R. Lynch (52) | | | | Chair of the Board and Director, Audit Committee Member, Investment Committee Member, and Nominating Committee Member | | Term expires October, 2011
Director since November, 1998 | | Deputy City Manager—City of Glendale, Arizona (2005-present); Chief Financial Officer—City of Glendale, Arizona (1985-2005) | | N/A |
| Timothy M. O’Brien (57) | | | | Director, Audit Committee Member, Investment Committee Member, and Nominating Committee Member | | Term expires October, 2009
Director since September 2005 | | Independent Consultant (pension consulting)
(2003-present); Chief Executive Officer—American Humane Association (1999-2003); Consultant—William Mercer Consulting (investment and fiduciary consulting) (1995-1999) | | N/A |
161
Vantagepoint Funds
Additional Information (Unaudited)—(Continued)
Interested Directors and Officers
Name, Address,*
and Age
|
|
|
| Positions
Held with
the Company
|
| Term of Office
and Length of
Time Served
|
| Principal
Occupation(s)
During Past Five Years
|
| Other
Directorships
Held By
Director
|
|---|
| Alison D. Rudolf (54)** | | | | Director | | Term expires October, 2007
Director since May, 2004 | | Township Manager—Lower Moreland Twp, PA (1982-present) | | Director—ICMA Retirement
Corporation (2003-present); |
| |
| Robin L. Wiessmann (53)** | | | | Director and Investment Committee Member | | Term expires October, 2009
Director since November, 1998 | | Director, Merrill, Lynch, Pierce, Fenner & Smith Incorporated, (2006 to present); Consultant—Brown Wiessmann Group (Financial Services Consulting) (2002-2006) | | Director—ICMA Retirement
Corporation from January, 1994-
December, 2001. |
| |
| Joan McCallen (54)*** | | | | President and Principal Executive Officer | | Since
September, 2003 | | Chief Executive Officer—ICMA Retirement Corporation (Aug. 2003-present); President and Manager—Vantagepoint Investment Advisers, LLC; ICMA-RC Services, LLC (broker-dealer); President and Manager—Vantagepoint Transfer Agents, LLC (2003-present); Director and President, VantageTrust Company (2003-present); Executive Vice President and Chief Operations Officer ICMA—Retirement Corporation (1997-2003) | | N/A
|
| |
| Bruce James Rohrbacher (54)*** | | | | Vice President and Chief Compliance Officer | | Since
September, 2004 | | Senior Vice President and Chief Compliance Officer—ICMA Retirement Corporation (2004 to present); Senior Vice President and Chief Compliance Officer, Vantagepoint Investment Advisers, LLC (2004-present) and Chief Compliance Officer, ICMA-RC Services, LLC (broker-dealer) (2004 to present); Director of Compliance and Internal Audit—Frank Russell Company (financial services) (1996-2004) | | N/A
|
| |
| Gerard P. Maus (55)*** | | | | Treasurer and Principal Financial Officer | | Since
December, 2004 | | Senior Vice President and Chief Financial Officer—ICMA Retirement Corporation (2004 to present); Senior Vice President and Treasurer—Vantagepoint Investment Advisers, LLC (2004-present); Manager and Treasurer, Vantagepoint Transfer Agents, LLC and ICMA-RC Services, LLC (broker-dealer) (2004-present); Chief Financial Officer and Chief Administrative Officer—SoundView Technology Group (2002-2004); Chief Financial Officer, Treasurer, Director, Member—SoundView Technology Group Internal Companies (2002-2004); Chief Operating Officer— Advanced Technology Ventures (2001-2002) | | N/A
|
| |
| Angela Montez (39) *** | | | | Secretary | | Since
December, 2006 | | Vice President, Assistant Secretary and Acting General Counsel—ICMA Retirement Corporation (2006-present) Corporate Counsel—ICMA Retirement Corporation (2000—2006); Secretary—Vantagepoint Investment Advisers, LLC, Vantagepoint Transfer Agents, LLC and ICMA-RC Services, LLC(broker-dealer) (2006—present) | | N/A
|
| * | | The business address for each Director and Officer is 777 N. Capitol Street NE, Washington, D.C. 20002. |
| ** | | Ms. Rudolf is considered an interested Director because she is a director of ICMA Retirement Corporation. Ms. Wiessmann is considered an interested person because of her position with a broker dealer who has previously and may in the future execute fund trades. |
| *** | | Ms. McCallen and Ms. Montez and Messrs. Rohrbacher and Maus are considered to be “interested persons” of the Company, as that term is defined under the 1940 Act due to their positions as officers of VIA and RC Services, the distributor of the funds, and ICMA-Retirement Corporation, the parent company of VIA and RC Services. |
Aggregate compensation that was paid to the directors during the year ended December 31, 2006 totaled $101,480. Executive officers do not receive any compensation from the Company, except the Company pays a portion of the cash
162
Vantagepoint Funds
Additional Information (Unaudited)—(Continued)
compensation of the Chief Compliance Officer of the Company. The amount during the year ended December 31, 2006 totaled $204,650.
The Statement of Additional Information includes additional information about the Board and is available, without charge, upon request, by calling 1-800-669-7400. And on the company’s website at www.icmarc.org
F. | | Directors’ Consideration of Investments Advisory and Subadvisory Agreements |
Vantagepoint International Fund
At a meeting held on September 22, 2006 (“September Meeting”), the Board of Directors (“Board”) of The Vantagepoint Funds (“Company”) approved a new investment subadvisory agreement (“New Subadvisory Agreement”) with Walter Scott & Partners, Limited (“WSPL”), one of the subadvisers of the Vantagepoint International Fund (“International Fund”), due to the acquisition of WSPL by Mellon International Limited (“Mellon International”), which was completed on October 2, 2006. Upon completion of the acquisition, Mellon International acquired 100% of the outstanding voting securities of WSPL, which constituted a “change of control” of WSPL under applicable provisions of the Investment Company Act of 1940 (“1940 Act”). The 1940 Act provides that a “change of control” of a fund’s adviser or subadviser results in an “assignment,” and a consequent automatic termination, of the investment advisory agreement between the fund and the adviser or subadviser, as the case may be. Accordingly, as a result of the acquisition, the prior investment subadvisory agreement dated January 3, 2006 among Vantagepoint Investment Advisers, LLC (“Adviser”), the International Fund’s investment adviser, the Company and WSPL terminated on October 2, 2006. At the September Meeting, in anticipation of the pending acquisition and consequent immediate termination of the prior investment subadvisory agreement with WSPL, the Board, including a majority of the Directors who are not “interested persons,” as defined in the Investment Company Act of 1940 (“Independent Directors”), approved the New Subadvisory Agreement with WSPL, having terms substantively identical to the terms of the prior investment subadvisory agreement except for the effective date. Before approving the New Subadvisory Agreement with WSPL, the Board considered the recommendations of, and supporting analyses and data presented by, the Adviser.
With respect to the Board’s consideration of the New Subadvisory Agreement with WSPL, the Directors received written information in advance of the September Meeting from the Adviser, which included: (1) the conclusions reached by the Adviser as a result of the due diligence it conducted relating to the acquisition; (2) the nature and quality of the services that WSPL would provide to the International Fund; (3) WSPL’s experience, reputation, investment management business, personnel and operations; (4) WSPL’s brokerage and trading policies and practices; (5) the level of subadvisory fees to be charged to the International Fund by WSPL and a comparison of those fees to the: (a) standard fee schedule charged by WSPL for managing international equity accounts and the fee WSPL charges to other U.S. registered mutual funds with a similar investment mandate to that of the International Fund; and (b) fees charged by a group of active separate account investment managers utilizing an international equity mandate; (6) WSPL’s compliance program; (7) WSPL’s historical performance returns utilizing an international equity mandate and such performance compared to a relevant benchmark; and (8) WSPL’s investment performance as a subadviser to the International Fund.
In considering the information and materials described above, the Independent Directors received assistance from and met separately with their independent legal counsel and were provided with a written description of their statutory responsibilities and the legal standards that are applicable to approvals of advisory agreements.
In determining whether to approve the New Subadvisory Agreement, the Directors considered the information received in advance of the September Meeting, the presentations made by and discussions held with the personnel of the Adviser, and discussions with representatives of WSPL and Mellon International, at the September Meeting, as well as a variety of factors and reached the following conclusions.
Nature, Extent and Quality of Services. With respect to the nature, extent and quality of the investment advisory services to be provided by WSPL to the International Fund following the acquisition, the Directors considered WSPL’s investment management process in managing the International Fund’s assets allocated to it, including the experience and capability of WSPL’s management and other personnel responsible for the portfolio management of the International Fund. The Directors also considered that WSPL and Mellon International each represented to the Board at the September Meeting that there would be no material change in the nature, quality or scope of the investment advisory
163
Vantagepoint Funds
Additional Information (Unaudited)—(Continued)
services provided by WSPL to the International Fund as a result of the acquisition. The Directors considered Mellon International’s representations that it has no present intention of changing the investment management practices or principles or any personnel of WSPL or altering the fees that are charged to the International Fund for the services rendered by WSPL. The Directors also took into account the information provided regarding the retention and incentive tools put into place by Mellon International that are designed to retain the key employees of WSPL after the acquisition.
The Directors further considered that WSPL represented to the Adviser that they do not plan to make any changes in operations or key personnel as a result of the acquisition and intend to continue managing the International Fund in the same manner as they are currently. The Directors also considered that the Adviser does not anticipate any material changes to the nature and quality of the services provided by WSPL following the acquisition. Based on the information considered, the Directors concluded that the International Fund was likely to continue to benefit from the nature, extent and quality of WSPL’s services, and that WSPL has the ability to continue to provide these services after the acquisition.
Investment Performance. The Directors considered the data provided regarding WSPL’s historical investment performance record in managing their clients’ assets utilizing an international equity mandate versus a relevant benchmark. The Directors also considered WSPL’s investment performance with respect to managing the assets of the International Fund and the Adviser’s favorable assessment of such performance. The Directors concluded that the investment performance record of WSPL supported approval of the New Subadvisory Agreement with WSPL.
Subadvisory Fees and Economies of Scale. In evaluating the subadvisory fee, the Directors considered that the subadvisory fee payable under the New Subadvisory Agreement is the same as the subadvisory fee payable under the current subadvisory agreement with WSPL. The Directors also considered comparisons of the subadvisory fees charged by WSPL to the International Fund with WSPL’s standard fee schedule, and its fee schedule for other U.S. registered mutual funds, for managing an investment mandate similar to the mandate the subadviser employs on behalf of the International Fund. The Directors also considered the Adviser’s assessment that the International Fund’s fee schedule at the current level of assets allocated to WSPL is competitive with WSPL’s standard fee schedule and WSPL’s fee schedule for other U.S. registered mutual funds advised by WSPL that have a similar investment mandate. The services WSPL provides to the International Fund appeared to be comparable to those it provides to such other advisory clients. The Directors reviewed information provided by the Adviser (which was based on an independent third-party source) on the fees charged by a group of separate account investment managers that employ an active international equity mandate. According to the information provided, the effective fee rate to be paid by the International Fund to WSPL at current asset levels is below the median fee charged by such managers. The foregoing comparisons assisted the Directors in considering the New Subadvisory Agreement by providing them with a basis for evaluating WSPL’s fees on a relative basis. Based on this information, the Directors concluded that WSPL’s subadvisory fees appeared to be within a reasonable range for the services provided.
The Directors also reviewed the information provided by WSPL regarding the estimated profits to be realized with respect to WSPL’s relationship with the International Fund. In reviewing the extent to which economies of scale may be realized by WSPL as the assets of the International Fund to be managed by WSPL grow, and whether the proposed fee levels reflect these economies, the Directors considered that WSPL’s fee schedule includes breakpoints, which indicated that the subadvisory fee rate is intended to capture certain anticipated economies of scale for the benefit of the International Fund’s shareholders in connection with the services to be provided.
Other Considerations. The Directors considered the due diligence process engaged in by the Adviser in connection with the acquisition and in deciding to recommend that the Board approve the New Subadvisory Agreement with WSPL. The Directors also considered the Adviser’s conclusion that the fees to be paid by WSPL for its services to the International Fund continue to be reasonable and appropriate in light of the nature and quality of services to be provided by WSPL. The Directors concluded that the Adviser’s recommendations and conclusions supported approval of the New Subadvisory Agreement.
The Directors also considered the potential “fall-out” or ancillary benefits that may accrue to WSPL due to its relationship with the International Fund, and noted that WSPL does not consider there to be any material fall-out benefits accruing to WSPL by virtue of its relationship with the International Fund.
Conclusion. After full consideration of the foregoing factors, with no single factor identified as being of paramount importance, the Directors, including a majority of the Independent Directors, concluded that the approval of the New
164
Vantagepoint Funds
Additional Information (Unaudited)—(Continued)
Subadvisory Agreement with WSPL is in the best interests of the International Fund and its shareholders, and approved the New Subadvisory Agreement with, and the fee to be paid to, WSPL.
Vantagepoint US Government Securities Fund
At the December 8, 2006 meeting of the Board (“December Meeting”), the Adviser recommended and the Board approved the implementation of a new principal investment strategy for the Vantagepoint US Government Securities Fund (“Fund”), effective May 1, 2007. The new principal investment strategy provides that the Fund will invest, under normal circumstances, at least 80% of its net assets in inflation-adjusted U.S. and non-U.S. debt securities. In connection with this change in investment strategy, the Board approved, effective May 1, 2007: (i) a change in the name of the Fund to the Inflation Protected Securities Fund; (ii) two new Investment Subadvisory Agreements (each a “Subadvisory Agreement”) among the Company, the Adviser and each of Fischer Francis Trees & Watts, Inc. (“FFTW”) and Pacific Investment Management Company, LLC (“PIMCO”); and (iii) the termination of the existing investment subadvisory agreement with the Fund’s current subadviser, Mellon Capital Management, LLC (“Mellon”).
With respect to the Board’s consideration of the respective Subadvisory Agreements with FFTW and PIMCO, the Directors received written information in advance of the December Meeting from the Adviser, which included: (1) the Adviser’s rationale for the change in the principal investment strategy of the Fund; (2) the process by which the Adviser selected and recommended for Board approval FFTW and PIMCO as subadvisers of the Fund to implement the new investment strategy; (3) the nature, extent and quality of the services that FFTW and PIMCO would provide to the Fund; (4) each proposed subadviser’s experience, reputation, investment management business, personnel and operations; (5) each proposed subadviser’s brokerage and trading policies and practices; (6) the level of subadvisory fees to be charged to the Fund by FFTW and PIMCO and a comparison of those fees to the: (a) fees charged by each of FFTW and PIMCO to manage other inflation protected securities accounts; and (b) fees charged by a group of active separate account investment managers utilizing an inflation protected securities mandate; (7) FFTW’s and PIMCO’s compliance programs; (8) FFTW’s and PIMCO’s historical performance returns utilizing an inflation protected securities mandate, and such performance compared to a relevant benchmark; (9) the Fund’s expected overall investment advisory fee and total expense ratio, taking into account the change in subadvisers, as compared to a group of inflation protected bond mutual funds; and (10) each proposed subadviser’s financial condition.
In considering the information and materials described above, the Independent Directors received assistance from and met separately with their independent legal counsel and were provided with a written description of their statutory responsibilities and the legal standards that are applicable to approvals of advisory agreements.
In determining whether to approve each Subadvisory Agreement, the Directors considered the information received in advance of the December Meeting, the presentations made by, and discussions held with, the personnel of the Adviser, FFTW (and its affiliate) and PIMCO at the December Meeting, as well as a variety of factors, and reached the following conclusions:
Nature, Extent and Quality of Services. With respect to the nature, extent and quality of the services expected to be provided by FFTW and PIMCO under their respective Subadvisory Agreements, the Directors considered the specific investment process to be employed by each of FFTW and PIMCO in managing the assets of the Fund to be allocated to them; the qualifications of FFTW’s and PIMCO’s respective investment management teams with regard to implementing an inflation protected securities mandate; each proposed subadviser’s performance record as compared to a relevant benchmark; each proposed subadviser’s infrastructure and whether it appears to adequately support an inflation protected securities strategy; and the Adviser’s review process and favorable assessment as to the nature, quality and extent of the subadvisory services expected to be provided by each of FFTW and PIMCO to the Fund. The Directors acknowledged that FFTW and PIMCO each has a successful performance record as an inflation protected securities manager and each has an experienced portfolio management team, and appears to have adequate infrastructure and support staff to seek to achieve favorable results implementing an inflation protected securities mandate for the Fund.
With regard to FFTW, the Directors also considered that, at the end of 2006, BNP Paribas Asset Management (“BNPP AM”), who held a majority economic interest and a minority voting interest in FFTW at the time of the December Meeting, would acquire the remainder of FFTW and that FFTW would become a wholly-owned subsidiary of BNPP AM. The Directors considered that the Adviser does not expect any change to the investment management process, philosophy and resources or infrastructure following the acquisition of FFTW by BNPP AM. The Directors further
165
Vantagepoint Funds
Additional Information (Unaudited)—(Continued)
considered that the Adviser believes the acquisition to be a positive development for clients of FFTW and the acquisition will not affect the ability of FFTW to continue to provide successful investment management services to its clients. The Directors considered that FFTW does not expect the acquisition to affect the services to be provided to the Fund. They also considered the long-term, equity-related incentive plan that will be put into place to align the interests of key employees with the long-term success of FFTW.
In addition, the Directors considered that representatives of FFTW and BNPP AM each represented to the Board at the December Meeting that FFTW would retain day-to-day operational and management independence and that FFTW’s investment process would remain autonomous following the acquisition.
The Directors concluded that the nature, extent and quality of the subadvisory services expected to be provided by each of FFTW and PIMCO were appropriate for the Fund in light of its new principal investment strategy, which will become effective May 1, 2007, and, thus, supported a decision to approve each Subadvisory Agreement.
Investment Performance. The Directors evaluated FFTW’s and PIMCO’s historical investment performance record in managing their clients’ assets utilizing an inflation protected securities mandate, and considered each performance record versus a relevant benchmark. The Directors concluded that the historical investment performance record of each of FFTW and PIMCO supported approval of each Subadvisory Agreement with FFTW and PIMCO, respectively.
Subadvisory Fees, Expense Ratio Impact and Economies of Scale. In evaluating each proposed subadvisory fee, the Directors reviewed FFTW’s and PIMCO’s subadvisory fee schedules. The Directors considered comparisons of the subadvisory fees to be charged by FFTW and PIMCO to the Fund with each subadviser’s fee schedule for managing an investment mandate similar to the mandate the subadviser is to employ on behalf of the Fund. The Directors considered that, according to the information provided, the proposed fee schedule for FFTW reflected the lowest fee rate currently charged by the subadviser to other accounts for which the subadviser provides advisory services utilizing a similar mandate, and the proposed fee schedule for PIMCO is lower than its standard fee for managing U.S. registered mutual funds with a similar, although broader, investment mandate. Additionally, the nature of the subadvisory services each subadviser is to provide to the Fund appeared to be comparable to those each subadviser provides to such other subadvisory clients. The Directors reviewed information provided by the Adviser (which was based on an independent third-party source) on the fees charged to accounts with assets comparable to the amount of assets to be allocated initially to FFTW and PIMCO by a group of U.S. separate account investment managers that employ a similar investment mandate to the investment mandate the proposed subadvisers are to employ for the Fund. According to the information provided, the effective fee rate to be paid by the Fund to FFTW at current asset levels would be below the median fee charged by such managers; and the effective fee rate to be paid by the Fund to PIMCO at current asset levels is in line with (one basis point higher than) the median fee charged by (and in the third quartile of) such managers.
The Directors considered that there would be a ten basis point increase in overall subadvisory fees, and, therefore, the total expense ratio of the Fund, associated with the appointment of FFTW and PIMCO due to the implementation of the new investment strategy, which, unlike the current investment strategy, will be actively managed. The Directors also considered that the Adviser expects this increase in subadvisory fee to be offset by the expected return to be provided by each proposed subadviser. Referring to data provided by the Adviser and compiled by Morningstar, Inc. (“Morningstar”), an independent provider of investment company data, the Directors also noted that the expected total investment advisory fee for the Fund, taking into account the proposed subadviser changes, was lower than the median investment advisory fee of a group of investment companies categorized as inflation protected bond funds. The Directors also considered information provided by the Adviser and compiled by Morningstar on the total expense ratios of a group of investment companies categorized as inflation protected bond funds, which showed that, if FFTW and PIMCO each served as a subadviser to the Fund at the proposed subadvisory fee rates and asset allocation levels, the Fund’s expected total expense ratio would be below the average and median expense ratios of such funds.
The foregoing comparisons assisted the Directors in considering each Subadvisory Agreement by providing them with a basis for evaluating FFTW’s and PIMCO’s fees, including in light of the Fund’s expected overall investment advisory fee and total expense ratio, on a relative basis. Based on this information, the Directors concluded that FFTW’s and PIMCO’s subadvisory fees each appeared to be within a reasonable range for the services to be provided.
The Directors also reviewed the information provided by FFTW and PIMCO regarding the estimated profits to be realized from the subadvisers’ relationship with the Fund. In reviewing the extent to which economies of scale may be
166
Vantagepoint Funds
Additional Information (Unaudited)—(Continued)
realized by FFTW and PIMCO as the assets of the Fund to be managed by each subadviser grow, and whether the proposed fee levels reflect these economies, the Directors considered that FFTW’s proposed fee schedule includes breakpoints, which indicates that the proposed subadvisory fee rate is intended to capture certain anticipated economies of scale for the benefit of the Fund’s shareholders in connection with the services to be provided. With respect to PIMCO, the Directors considered that, although the proposed subadvisory fee schedule does not include breakpoints, PIMCO takes into account economies of scale in determining its fee schedules, which suggests that the Fund’s proposed subadvisory fee rate reflects certain anticipated economies of scale for the benefit of the Fund’s shareholders in connection with the services to be provided. The Directors concluded that the proposed fee schedules with respect to each proposed subadviser are appropriate at this time.
Other Considerations. The Directors considered the selection and due diligence process employed by the Adviser in deciding to recommend FFTW and PIMCO as subadvisers to the Fund to implement the Fund’s new principal investment strategy and also considered the Adviser’s conclusion that the fees to be paid to each of FFTW and PIMCO for their respective services to the Fund are reasonable and appropriate in light of the nature and quality of services to be provided by each subadviser and the reasons supporting that conclusion. The Directors also considered information from the Adviser concerning its strategy to efficiently and economically effect the subadviser transitions. The Directors concluded that the Adviser’s recommendations and conclusions supported approval of each Subadvisory Agreement.
The Directors also considered the potential “fall-out” or ancillary benefits that may accrue to FFTW and PIMCO due to each subadviser’s relationship with the Fund and that each proposed subadviser does not expect any “fall-out” benefits by virtue of its relationship to the Fund.
Conclusion. After full consideration of the foregoing factors, with no single factor identified as being of paramount importance, the Directors, including a majority of the Independent Directors, concluded that the initial approval of each Subadvisory Agreement is in the best interests of the Fund and its shareholders, and approved the Subadvisory Agreement with, and the fee to be paid to, each of FFTW and PIMCO.
Vantagepoint Core Bond Index Fund, Vantagepoint Overseas Equity Index Fund and Vantagepoint US Government Securities Fund
At the December Meeting, the Board, including a majority of the Independent Directors, approved a revised fee schedule to the existing investment subadvisory agreements with Mellon for each of the following funds: Vantagepoint Core Bond Index Fund, Vantagepoint Overseas Equity Index Fund and Vantagepoint US Government Securities Fund. The revised fee schedule for each fund provides an additional breakpoint of 0.01% of average net assets when the respective fund’s assets managed by Mellon are above $1 billion, effective as of September 14, 2006. In approving the revised fee schedules with Mellon, the Board received, and took into consideration, a written representation from Mellon that there will be no change in the nature, quality or quantity of services Mellon provides to each fund.
Only one copy of this Annual Report may be mailed to households, even if more than one person in a household is a shareholder of record, unless The Vantagepoint Funds has received instructions to the contrary. If you need additional copies of this Annual Report or you do not want this mailing of this Annual Report to be combined with those for other members of your household please contact The Vantagepoint Funds toll free at 1-800-669-7400 or in writing at 777 North Capitol Street, NE, Suite 600; Washington, D.C. 20002.
H. | | Other Available Information |
A description of the Company’s proxy voting policies and procedures and the proxy voting record for the 12-month period ended June 30, 2006 are available without charge, upon request, by calling 1-800-669-7400, on the Company’s website at www.icmarc.org or by accessing the Securities and Exchange Commission’s website at www.sec.gov.
The Company files its complete schedule of portfolio holdings with the SEC for the first and third quarters of each fiscal year on Form N-Q; the Company’s Forms N-Q are available on the SEC’s website at www.sec.gov and may be reviewed and copied at the SEC’s Public Reference Room in Washington, D.C. Information on the operation of the Public Reference Room may be obtained by calling 1-800-SEC-0330.
167
SCHEDULE OF INVESTMENTS
December 31, 2006
Vantagepoint Money
Market Fund
|
| Shares
|
| Value
|
|
|---|
MUTUAL FUNDS—99.5% |
AIM Short-Term Investments Trust Liquid Assets Portfolio
| | | | | | | |
| (Cost $216,767,333) | | 216,767,333 | | | $ | 216,767,333 | |
TOTAL INVESTMENTS—99.5%
| | | |
| (Cost $216,767,333) | | | | | | | | 216,767,333 | |
| Other assets less liabilities—0.5% | | 1,003,945 | |
NET ASSETS—100.0% | $ | 217,771,278 | |
See accompanying notes to financial statements.
168
SCHEDULE OF INVESTMENTS
December 31, 2006
Vantagepoint Short-Term
Bond Fund
Coupon
Rate
|
|
|
| Maturity
Date
|
|
|
| Face
|
|
| Value
|
|
|---|
CORPORATE OBLIGATIONS—27.5% |
Automotive—0.4% | | | |
| DaimlerChrysler North America Holding Corporation, Guaranteed Note |
| 4.050% | | | | 06/04/2008 | | | | $ | 1,640,000 | | | $ | 1,605,509 | |
| General Motors Acceptance Corporation, Global Note |
| 5.125% | | | | 05/09/2008 | | | | | 729,000 | | | | 721,437 | |
| | | 2,326,946 | |
Banking—15.4% | | | |
| American Express Centurion Bank, Note |
| 5.480% | | | | 12/17/2009 | | # | | | 2,410,000 | | | | 2,417,989 | |
| Bank of America Corporation, Subordinated Note |
| 6.625% | | | | 10/15/2007 | | | | | 5,000,000 | | | | 5,039,765 | |
| Bank of America Corporation, Subordinated Note |
| 6.600% | | | | 05/15/2010 | | | | | 400,000 | | | | 415,577 | |
| Bank of America Corporation, Subordinated Note |
| 6.375% | | | | 02/15/2008 | | | | | 930,000 | | | | 938,883 | |
| Bank One NA, Note | | | |
| 3.700% | | | | 01/15/2008 | | | | | 1,000,000 | | | | 984,177 | |
| CIT Group, Inc., Global Note | | | |
| 4.250% | | | | 02/01/2010 | | | | | 380,000 | | | | 368,298 | |
| CIT Group, Inc., Note, (MTN) | | | |
| 5.493% | | | | 08/17/2009 | | | | | 3,200,000 | | | | 3,205,162 | |
| CIT Group, Inc., Senior Note | | | |
| 5.750% | | | | 09/25/2007 | | | | | 6,000,000 | | | | 6,019,308 | |
| Citigroup, Inc., Global Note | | | |
| 3.625% | | | | 02/09/2009 | | | | | 4,000,000 | | | | 3,883,644 | |
| Citigroup, Inc., Note | | | |
| 6.200% | | | | 03/15/2009 | | | | | 4,750,000 | | | | 4,845,594 | |
| Eksportfinans A/S, Note, (MTN) (Norway) | | | |
| 4.750% | | | | 12/15/2008 | | | | | 5,100,000 | | | | 5,075,948 | |
| Eksportfinans A/S, Note, (MTN) (Norway) | | | |
| 4.375% | | | | 07/15/2009 | | | | | 2,500,000 | | | | 2,457,077 | |
| General Electric Capital Corp., Note, (MTN) | | | |
| 4.875% | | | | 10/21/2010 | | | | | 5,810,000 | | | | 5,753,800 | |
| Household Finance Corporation, Note | | | |
| 6.400% | | | | 06/17/2008 | | | | | 6,000,000 | | | | 6,094,032 | |
| Inter-American Development Bank, Global Note (Supra National) | | | |
| 5.375% | | | | 11/18/2008 | | | | | 2,000,000 | | | | 2,014,726 | |
| Inter-American Development Bank, Note (Supra National) |
| 6.375% | | | | 10/22/2007 | | | | | 2,136,000 | | | | 2,155,053 | |
| Kreditanstalt fuer Wiederaufbau, Global Note (Germany) |
| 5.250% | | | | 05/19/2009 | | | | | 3,885,000 | | | | 3,904,596 | |
| Kreditanstalt fuer Wiederaufbau, Note (Germany) |
| 4.875% | | | | 10/19/2009 | | | | | 2,975,000 | | | | 2,966,283 | |
| MBNA Corp., Senior Note, (MTN) |
| 6.250% | | | | 01/17/2007 | | | | | 1,500,000 | | | | 1,500,440 | |
| Nomura Asset Securities Corporation |
| 6.590% | | | | 03/15/2030 | | | | | 5,948,978 | | | | 6,024,252 | |
| Santander US Debt SA Unipersonal, Senior Note, 144A (Spain) |
| 5.426% | | | | 11/20/2009 | | * | | | 2,500,000 | | | | 2,501,728 | |
| SLM Corporation, Note, (MTN) |
| 4.000% | | | | 01/15/2009 | | | | | 3,175,000 | | | | 3,105,988 | |
| SLM Corporation, Note, (MTN) |
| 3.625% | | | | 03/17/2008 | | | | | 7,890,000 | | | | 7,729,091 | |
| Wachovia Bank NA, Bank Note |
| 7.800% | | | | 08/18/2010 | | | | | 6,500,000 | | | | 6,997,263 | |
| Wells Fargo & Company, Note |
| 4.125% | | | | 03/10/2008 | | | | | 3,560,000 | | | | 3,514,489 | |
| Wells Fargo & Company, Senior Note |
| 4.000% | | | | 08/15/2008 | | | | | 2,585,000 | | | | 2,533,191 | |
| Wells Fargo & Company, Series J, Note, (MTN) |
| 4.200% | | | | 01/15/2010 | | | | $ | 1,000,000 | | | $ | 974,880 | |
| | | 93,421,234 | |
Beverages, Food & Tobacco—0.7% | | | |
| Kellogg Co., Senior Note |
| 2.875% | | | | 06/01/2008 | | | | | 2,860,000 | | | | 2,761,402 | |
| Smithfield Foods, Inc., Senior Note |
| 8.000% | | | | 10/15/2009 | | | | | 1,275,000 | | | | 1,338,750 | |
| | | 4,100,152 | |
Commercial Services—0.2% | | | |
| Allied Waste North America, Senior Note |
| 8.500% | | | | 12/01/2008 | | | | | 1,265,000 | | | | 1,336,156 | |
Communications—0.1% | | | |
| Intelsat Subsidiary Holding Co., Ltd., Guaranteed Senior Note (Bermuda) | | | |
| 10.484% | | | | 01/15/2012 | | # | | | 790,000 | | | | 800,863 | |
Computer Software & Processing—0.2% | | | |
| Unisys Corp., Senior Note |
| 6.875% | | | | 03/15/2010 | | | | | 1,390,000 | | | | 1,372,625 | |
Computers & Information—0.4% | | | |
| Hewlett-Packard Co., Note |
| 5.496% | | | | 05/22/2009 | | # | | | 2,500,000 | | | | 2,505,623 | |
Electric Utilities—0.1% | | | |
| PSEG Energy Holdings LLC, Senior Note |
| 8.625% | | | | 02/15/2008 | | | | | 521,000 | | | | 536,630 | |
Financial Services—3.7% | | | |
| ASIF Global Financing, Senior Note 144A |
| 3.850% | | | | 11/26/2007 | | * | | | 1,600,000 | | | | 1,578,899 | |
| Merrill Lynch & Co., Inc., Note, (MTN) |
| 4.831% | | | | 10/27/2008 | | | | | 2,540,000 | | | | 2,524,849 | |
| MSW Energy Holdings LLC/MSW Energy Finance Co., Inc., Senior Secured Note | | | |
| 7.375% | | | | 09/01/2010 | | | | | 1,295,000 | | | | 1,327,375 | |
| Principal Life Global Funding I, Note 144A (MTN) |
| 5.125% | | | | 06/28/2007 | | * | | | 2,750,000 | | | | 2,746,442 | |
| Principal Life Global Funding I, Note, 144A |
| 3.625% | | | | 04/30/2008 | | * | | | 550,000 | | | | 536,790 | |
| Svensk Exportkredit AB, Note (Sweden) |
| 4.625% | | | | 02/17/2009 | | | | | 7,760,000 | | | | 7,677,798 | |
| TIAA Global Markets 144A |
| 3.875% | | | | 01/22/2008 | | * | | | 6,000,000 | | | | 5,901,822 | |
| | | 22,293,975 | |
Home Construction, Furnishings & Appliances—0.2% | | | |
| KB Home, Senior Subordinated Note |
| 8.625% | | | | 12/15/2008 | | † | | | 1,260,000 | | | | 1,315,460 | |
Insurance—1.1% | | | |
| Allstate Financial Global Funding, Secured Note 144A |
| 5.250% | | | | 02/01/2007 | | * | | | 4,500,000 | | | | 4,499,712 | |
| American International Group, Inc., Note |
| 4.700% | | | | 10/01/2010 | | | | | 2,040,000 | | | | 2,006,185 | |
| | | 6,505,897 | |
Lodging—0.2% | | | |
| MGM Mirage, Senior Note |
| 6.000% | | | | 10/01/2009 | | | | | 1,320,000 | | | | 1,323,300 | |
See accompanying notes to financial statements.
169
SCHEDULE OF INVESTMENTS—(Continued)
December 31, 2006
Vantagepoint Short-Term
Bond Fund
Coupon
Rate
|
|
|
| Maturity
Date
|
|
|
| Face
|
| Value
|
|---|
CORPORATE OBLIGATIONS—(Continued) |
Media—Broadcasting & Publishing—0.8% |
| Echostar DBS Corporation, Note |
| 5.750% | | | | 10/01/2008 | | | | $ | 1,345,000 | | | $ | 1,343,319 | |
| Gannett Co., Inc., Senior Note |
| 4.125% | | | | 06/15/2008 | | | | | 3,430,000 | | | | 3,362,508 | |
| | | 4,705,827 | |
Pharmaceuticals—0.2% | | | |
| Abbott Laboratories, Note |
| 5.375% | | | | 05/15/2009 | | | | | 1,050,000 | | | | 1,056,810 | | | |
Telecommunications—0.2% | | | |
| Ameritech Capital Funding, Note |
| 6.250% | | | | 05/18/2009 | | | | | 1,570,000 | | | | 1,589,372 | | | |
Telephone Systems—3.0% | | | |
| America Movil SA de CV, Guaranteed Senior Note (Mexico) |
| 4.125% | | | | 03/01/2009 | | | | | 1,200,000 | | | | 1,173,668 | |
| America Movil SA de CV, Senior Note, 144A (Mexico) |
| 5.466% | | | | 06/27/2008 | | *‡ | | | 1,565,000 | | | | 1,563,448 | |
| BellSouth Corp., Note |
| 4.200% | | | | 09/15/2009 | | | | | 3,150,000 | | | | 3,064,153 | |
| Deutsche Telekom International Finance BV, Global Note (Netherlands) | | | |
| 3.875% | | | | 07/22/2008 | | | | | 2,600,000 | | | | 2,545,631 | |
| SBC Communications, Inc., Global Note |
| 4.125% | | | | 09/15/2009 | | | | | 5,505,000 | | | | 5,350,111 | |
| Sprint Capital Corporation, Guaranteed Note |
| 6.375% | | | | 05/01/2009 | | | | | 1,550,000 | | | | 1,581,880 | |
Telecom Italia Capital SA,
Series A, Senior Note (Luxembourg) |
| 4.000% | | | | 11/15/2008 | | | | | 2,970,000 | | | | 2,893,621 | |
| | | 18,172,512 | |
Transportation—0.6% | | | |
| CSX Corporation, Note |
| 6.250% | | | | 10/15/2008 | | | | | 2,500,000 | | | | 2,536,138 | |
| Royal Caribbean Cruises, Ltd., Senior Note |
| 7.000% | | | | 10/15/2007 | | | | | 1,305,000 | | | | 1,323,365 | |
| | | 3,859,503 | |
TOTAL CORPORATE OBLIGATIONS | | | |
| (Cost $168,013,120) | | 167,222,885 | |
| |
U.S. GOVERNMENT AGENCY OBLIGATIONS—5.6% |
U.S. Government Agencies—Mortgage Backed—5.6% |
| Federal Home Loan Mortgage Corporation |
| 5.392% | | | | 03/01/2036 | | #‡ | | | 4,969,182 | | | | 4,954,042 | |
| 4.395% | | | | 10/01/2034 | | # | | | 5,780,930 | | | | 5,701,946 | |
Federal Home Loan Mortgage Corporation,
Series 2885, Class DK |
| 3.500% | | | | 10/15/2012 | | | | | 3,015,247 | | | | 2,975,553 | |
| Federal National Mortgage Association |
| 5.107% | | | | 10/01/2034 | | # | | | 5,623,114 | | | | 5,606,710 | |
| 5.095% | | | | 09/01/2034 | | # | | | 615,248 | | | | 613,707 | |
| 5.017% | | | | 09/01/2034 | | # | | | 527,060 | | | | 524,149 | |
| 4.993% | | | | 10/01/2034 | | # | | | 7,235,312 | | | | 7,208,513 | |
| 4.765% | | | | 10/01/2034 | | # | | | 967,758 | | | | 958,350 | |
Federal National Mortgage Association,
Series 2004-81, Class KG |
| 3.500% | | | | 05/25/2012 | | | | | 2,511,394 | | | | 2,480,731 | |
FHLMC,
Series 2891, Class LN |
| 4.250% | | | | 06/15/2024 | | | | $ | 3,267,164 | | | $ | 3,222,613 | |
TOTAL U.S. GOVERNMENT AGENCY OBLIGATIONS
|
| (Cost $34,767,611) | | 34,246,314 | |
| |
U.S. TREASURY OBLIGATIONS—12.7% |
U.S. Treasury Notes—12.7% | | | |
| U.S. Treasury Note |
| 4.875% | | | | 08/15/2009 | | ** | | | 29,129,000 | | | | 29,225,737 | |
| 4.625% | | | | 11/15/2009 | | | | | 15,271,000 | | | | 15,228,058 | |
| 4.250% | | | | 11/15/2014 | | | | | 33,762,000 | | | | 32,762,341 | |
TOTAL U.S. TREASURY OBLIGATIONS
| | | |
| (Cost $77,883,083) | | 77,216,136 | |
| |
SOVEREIGN DEBT OBLIGATIONS—0.9% |
Government Issued—0.9% | | | |
| New Brunswick Province (Canada) |
| 3.500% | | | | 10/23/2007 | | | | | 2,678,000 | | | | 2,639,512 | |
| Ontario Electricity Financial Corp. (Canada) |
| 6.100% | | | | 01/30/2008 | | | | | 2,949,000 | | | | 2,972,041 | |
TOTAL SOVEREIGN DEBT OBLIGATIONS
|
| (Cost $5,620,746) | | 5,611,553 | |
| |
ASSET BACKED SECURITIES—23.1% |
Automotive—15.7% | | | |
Capital Auto Receivables Asset Trust,
Series 2004-2, Class A3 |
| 3.580% | | | | 01/15/2009 | | | | | 6,100,000 | | | | 6,034,053 | |
Capital Auto Receivables Asset Trust,
Series 2006-SN1A, Class A4A, 144A |
| 5.320% | | | | 03/20/2010 | | * | | | 3,400,000 | | | | 3,405,973 | |
Capital One Prime Auto Receivables Trust,
Series 2006-2, Class A4 |
| 4.940% | | | | 07/15/2012 | | | | | 7,000,000 | | | | 6,975,166 | |
Carmax Auto Owner Trust,
Series 2005-2, Class B |
| 4.490% | | | | 01/15/2011 | | | | | 6,000,000 | | | | 5,912,635 | |
Chase Manhattan Auto Owner Trust,
Series 2006-B, Class A3 |
| 5.130% | | | | 05/15/2011 | | | | | 2,200,000 | | | | 2,201,358 | |
Chase Manhattan Auto Owner Trust,
Series 2006-B, Class A4 |
| 5.110% | | | | 04/15/2014 | | | | | 2,200,000 | | | | 2,205,305 | |
Daimler Chrysler Auto Trust,
Series 2003-B, Class A-4 |
| 2.860% | | | | 03/09/2009 | | | | | 3,594,902 | | | | 3,563,993 | |
Daimler Chrysler Auto Trust,
Series 2004-C, Class A4 |
| 3.280% | | | | 12/08/2009 | | | | | 800,000 | | | | 784,795 | |
Daimler Chrysler Auto Trust,
Series 2005-A, Class A3 |
| 3.490% | | | | 12/08/2008 | | | | | 565,386 | | | | 562,684 | |
Ford Credit Auto Owner Trust,
Series 2005-A, Class A3 |
| 3.480% | | | | 11/15/2008 | | | | | 1,304,975 | | | | 1,297,663 | |
Ford Credit Auto Owner Trust,
Series 2005-A, Class B | | | |
| 3.880% | | | | 01/15/2010 | | | | | 2,600,000 | | | | 2,555,457 | |
Ford Credit Auto Owner Trust,
Series 2006-A, Class A3 |
| 5.050% | | | | 03/15/2010 | | | | | 1,065,000 | | | | 1,062,753 | |
See accompanying notes to financial statements.
170
SCHEDULE OF INVESTMENTS—(Continued)
December 31, 2006
Vantagepoint Short-Term
Bond Fund
Coupon
Rate
|
|
|
| Maturity
Date
|
|
|
| Face
|
| Value
|
|---|
ASSET BACKED SECURITIES—(Continued) |
Ford Credit Auto Owner Trust,
Series 2006-B, Class A2B |
| 5.340% | | | | 07/15/2009 | | | | $ | 2,200,000 | | | $ | 2,201,758 | |
Ford Credit Auto Owner Trust,
Series 2006-B, Class A3 |
| 5.260% | | | | 10/15/2010 | | | | | 4,150,000 | | | | 4,155,448 | |
Harley-Davidson Motorcycle Trust,
Series 2006-3, Class A3 |
| 5.240% | | | | 01/15/2012 | | | | | 3,060,000 | | | | 3,065,808 | |
Harley-Davidson Motorcycle Trust,
Series 2006-3, Class A4 |
| 5.220% | | | | 06/15/2013 | | | | | 3,900,000 | | | | 3,917,350 | |
Hertz Vehicle Financing LLC,
Series 2004-1A, Class A4, 144A |
| 3.230% | | | | 05/25/2009 | | * | | | 5,000,000 | | | | 4,802,027 | |
Honda Auto Receivables Owner Trust,
Series 2003-4, Class A4 |
| 2.790% | | | | 03/16/2009 | | | | | 4,118,209 | | | | 4,082,362 | |
Household Automotive Trust,
Series 2006-1, Class A3 |
| 5.430% | | | | 06/17/2011 | | | | | 3,800,000 | | | | 3,816,040 | |
Long Beach Auto Receivables Trust,
Series 2006-B, Class A3 |
| 5.170% | | | | 08/15/2011 | | | | | 4,350,000 | | | | 4,352,554 | |
Nissan Auto Receivables Owner Trust,
Series 2003-C, Class A-5 |
| 3.210% | | | | 03/16/2009 | | | | | 2,040,000 | | | | 2,016,680 | |
Nissan Auto Receivables Owner Trust,
Series 2004-A, Class A4 |
| 2.760% | | | | 07/15/2009 | | | | | 4,638,890 | | | | 4,561,937 | |
Nissan Auto Receivables Owner Trust,
Series 2005-B, Class A4 |
| 4.180% | | | | 10/15/2010 | | | | | 1,000,000 | | | | 982,605 | |
Triad Auto Receivables Owner Trust,
Series 2006-A, Class A3 |
| 4.770% | | | | 01/12/2011 | | | | | 3,189,000 | | | | 3,172,195 | |
USAA Auto Owner Trust,
Series 2004-3, Class A4 |
| 3.530% | | | | 06/15/2011 | | | | | 6,000,000 | | | | 5,884,609 | |
USAA Auto Owner Trust,
Series 2006-4, Class A2 |
| 5.160% | | | | 11/16/2009 | | | | | 1,000,000 | | | | 999,641 | |
Wachovia Auto Owner Trust,
Series 2004-B, Class A4 |
| 3.440% | | | | 03/21/2011 | | | | | 2,600,000 | | | | 2,543,495 | |
Wachovia Auto Owner Trust,
Series 2005-B, Class A4 |
| 4.840% | | | | 04/20/2011 | | | | | 4,525,000 | | | | 4,502,394 | |
Wachovia Auto Owner Trust,
Series 2006-1, Class A4, 144A |
| 5.080% | | | | 04/20/2012 | | * | | | 4,000,000 | | | | 3,995,596 | |
| | | 95,614,334 | |
Credit Cards—3.0% | | | |
Capital One Multi-Asset Execution Trust,
Ser. 2003-A4, Class A4 |
| 3.650% | | | | 07/15/2011 | | | | | 4,800,000 | | | | 4,687,548 | |
Citibank Credit Card Issuance Trust,
Series 2003-A8, Class A8 |
| 3.500% | | | | 08/16/2010 | | | | | 4,270,000 | | | | 4,162,587 | |
GE Capital Credit Card Master Note Trust,
Series 2006-1, Class A |
| 5.080% | | | | 09/15/2012 | | | | | 9,100,000 | | | | 9,117,355 | |
| | | 17,967,490 | |
Equipment—1.4% | | | |
GE Dealer Floorplan Master Note Trust,
Series 2006-1, Class A |
| 5.360% | | | | 04/20/2011 | | | | $ | 5,150,000 | | | $ | 5,155,752 | |
John Deere Owner Trust,
Series 2003-A, Class A4 |
| 2.440% | | | | 06/15/2010 | | | | | 3,180,964 | | | | 3,179,233 | |
| | | 8,334,985 | |
Utilities—3.0% | | | |
California Infrastructure PG&E-1,
Series 1997-1, Class A8 |
| 6.480% | | | | 12/26/2009 | | | | | 4,351,500 | | | | 4,386,886 | |
California Infrastructure SCE-1,
Series 1997-1, Class A7 |
| 6.420% | | | | 12/26/2009 | | | | | 5,044,176 | | | | 5,079,149 | |
Comed Transitional Funding Trust,
Series 1998-1, Class A6 |
| 5.630% | | | | 06/25/2009 | | | | | 223,247 | | | | 223,518 | |
Peco Energy Transition Trust,
Series 2000-A, Class A3 |
| 7.625% | | | | 03/01/2010 | | | | | 7,164,000 | | | | 7,519,812 | |
PG&E Energy Recovery Funding LLC,
Series 2005-1, Class A2 |
| 3.870% | | | | 06/25/2011 | | | | | 958,396 | | | | 942,932 | |
| | | 18,152,297 | |
TOTAL ASSET BACKED SECURITIES
| | | |
| (Cost $141,369,541) | | 140,069,106 | |
| |
NON-U.S. GOVERNMENT MORTGAGE-BACKED SECURITIES—12.7% |
Mortgage Backed—12.7% | | | |
Bank of America Mortgage Securities,
Series 2004-L, Class 1A1 |
| 4.193% | | | | 01/25/2035 | | # | | | 4,421,777 | | | | 4,386,532 | |
Bear Stearns Commercial Mortgage Securities,
Series 2004-PWR3, Class A2 |
| 3.869% | | | | 02/11/2041 | | | | | 5,490,000 | | | | 5,345,145 | |
Countrywide Home Loan Mortgage Pass Through Trust,
Series 2004-25, Class 3A1 |
| 6.477% | | | | 02/25/2035 | | # | | | 2,906,806 | | | | 2,942,787 | |
| Credit Suisse First Boston Mortgage Securities Corporation, Series 2004-C3, Class A3 |
| 4.302% | | | | 07/15/2036 | | | | | 1,000,000 | | | | 977,265 | |
First Horizon Asset Securities, Inc.,
Series 2005-AR4, Class IIA1 |
| 5.340% | | | | 10/25/2035 | | # | | | 4,893,856 | | | | 4,879,463 | |
GE Capital Commercial Mortgage Corporation,
Series 2005-C1, Class A2 |
| 4.353% | | | | 06/10/2048 | | | | | 4,910,000 | | | | 4,792,905 | |
GSR Mortgage Loan Trust,
Series 2005-AR6, Class 2A1 |
| 4.540% | | | | 10/25/2035 | | | | | 4,960,588 | | | | 4,875,854 | |
GSR Mortgage Loan Trust,
Series 2004-11, Class 2A2 |
| 4.782% | | | | 09/25/2034 | | # | | | 3,398,646 | | | | 3,378,163 | |
Harborview Mortgage Loan Trust,
Series 2005-14, Class 3A1A |
| 5.319% | | | | 12/19/2035 | | # | | | 6,604,832 | | | | 6,595,166 | |
LB-UBS Commercial Mortgage Trust,
Series 2003-C7, Class A1 |
| 3.334% | | | | 09/15/2027 | | | | | 3,755,964 | | | | 3,667,734 | |
LB-UBS Commercial Mortgage Trust,
Series 2003-C8, Class A2 |
| 4.207% | | | | 11/15/2027 | | | | | 5,800,000 | | | | 5,677,365 | |
See accompanying notes to financial statements.
171
SCHEDULE OF INVESTMENTS—(Continued)
December 31, 2006
Vantagepoint Short-Term
Bond Fund
Coupon
Rate
|
|
|
| Maturity
Date
|
|
|
| Face
|
| Value
|
|---|
NON-U.S. GOVERNMENT MORTGAGE-BACKED SECURITIES—(Continued) |
MLCC Mortgage Investors, Inc.,
Series 2004-1, Class 2A2 |
| 4.729% | | | | 12/25/2034 | | # | | $ | 4,327,379 | | | $ | 4,274,796 | |
PNC Mortgage Acceptance Corp.,
Series 2001-C1, Class A1 |
| 5.910% | | | | 03/12/2034 | | | | | 2,747,109 | | | | 2,767,548 | |
Provident Funding Mortgage Loan Trust,
Series 2004-1, Class 1A1 |
| 4.049% | | | | 04/25/2034 | | # | | | 867,729 | | | | 852,937 | |
Structured Adjustable Rate Mortgage Loan Trust,
Series 2005-11, Class 3A |
| 5.402% | | | | 05/25/2035 | | # | | | 5,359,167 | | | | 5,374,765 | |
Structured Asset Mortgage Investments, Inc.,
Series 2004-AR5, Class IIA1 |
| 7.270% | | | | 10/19/2034 | | # | | | 1,010,787 | | | | 1,020,823 | |
Thornburg Mortgage Securities Trust,
Series 2004-1, Class II2A |
| 3.312% | | | | 03/25/2044 | | # | | | 1,136,439 | | | | 1,103,407 | |
Wachovia Bank Commercial Mortgage Trust,
Series 2005-C16, Class A2 |
| 4.380% | | | | 10/15/2041 | | | | | 5,490,000 | | | | 5,363,196 | |
Wells Fargo Mortgage Backed Securities Trust,
Series 2004-S, Class B1 |
| 3.539% | | | | 09/25/2034 | | # | | | 2,068,789 | | | | 1,972,185 | |
Wells Fargo Mortgage Backed Securities Trust,
Series 2004-Z, Class 2A1 |
| 4.577% | | | | 12/25/2034 | | # | | | 2,723,123 | | | | 2,697,172 | |
Wells Fargo Mortgage Backed Securities Trust,
Series 2005-AR9, Class IIA1 |
| 4.362% | | | | 05/25/2035 | | # | | | 4,284,257 | | | | 4,206,715 | |
TOTAL NON-U.S. GOVERNMENT
MORTGAGE-BACKED SECURITIES
| | | |
| (Cost $77,511,339) | | 77,151,923 | |
| |
CERTIFICATES OF DEPOSIT—1.5% |
Banking—1.5% | | | |
| Barclays Bank PLC, NY CD |
| 5.325% | | | | 04/03/2007 | | | | | | | | | | |
| (Cost $9,000,556) | | 9,000,000 | | | | 9,000,556 | |
| |
COMMERCIAL PAPER—9.1% |
Banking—7.2% | | | |
| BNP Paribas Finance, Inc. | | | |
| 5.225% | | | | 02/22/2007 | | | | | 8,795,000 | | | | 8,726,069 | |
| Dexia Delaware LLC | | | |
| 5.235% | | | | 02/22/2007 | | | | | 8,795,000 | | | | 8,725,937 | |
| HBOS Treasury Services | | | |
| 5.240% | | | | 03/14/2007 | | | | | 6,000,000 | | | | 5,935,373 | |
| HSBC PLC | | | |
| 5.220% | | | | 04/23/2007 | | | | | 3,000,000 | | | | 2,950,410 | |
| JPMorgan Chase & Co. | | | |
| 5.200% | | | | 03/28/2007 | | | | | 8,740,000 | | | | 8,628,905 | |
| Societe Generale North America, Inc. | | | |
| 5.220% | | | | 03/27/2007 | | | | | 8,893,000 | | | | 8,780,815 | |
| | | 43,747,509 | |
Commercial Services—1.4% | | | |
| Siemens Capital Co. LLC (Georgia) | | | |
| 5.220% | | | | 02/22/2007 | | | | | 8,795,000 | | | | 8,726,135 | | | |
Financial Services—0.5% | | | |
| General Electric Capital Corp. | | | |
| 5.200% | | | | 01/16/2007 | | | | $ | 3,000,000 | | | $ | 2,992,634 | | | |
TOTAL COMMERCIAL PAPER
| | | |
| (Cost $55,466,278) | | 55,466,278 | |
| |
CASH EQUIVALENTS—0.2% |
Bank & Certificate Deposits/
Offshore Time Deposits—0.2% |
| Abbey National PLC | | | |
| 5.280% | | | | 01/05/2007 | | †† | | | 19,407 | | | | 19,407 | |
| BancoBilbao Vizcaya Argentaria SA | | | |
| 5.310% | | | | 01/03/2007 | | †† | | | 19,407 | | | | 19,407 | |
| Bank Of Nova Scotia | | | |
| 5.300% | | | | 02/27/2007 | | †† | | | 24,260 | | | | 24,260 | |
| Bank Of Nova Scotia | | | |
| 5.290% | | | | 01/30/2007 | | †† | | | 9,703 | | | | 9,703 | |
| Bank Of Nova Scotia | | | |
| 5.290% | | | | 02/06/2007 | | †† | | | 14,557 | | | | 14,557 | |
| Barclays | | | |
| 5.320% | | | | 02/13/2007 | | †† | | | 9,703 | | | | 9,703 | |
| Barclays | | | |
| 5.310% | | | | 02/20/2007 | | †† | | | 24,258 | | | | 24,258 | |
| Barclays | | | |
| 5.300% | | | | 01/02/2007 | | †† | | | 24,258 | | | | 24,258 | |
| Barton Capital LLC | | | |
| 5.300% | | | | 01/17/2007 | | †† | | | 9,704 | | | | 9,704 | |
| Barton Capital LLC | | | |
| 5.300% | | | | 01/17/2007 | | †† | | | 14,555 | | | | 14,555 | |
| Calyon | | | |
| 5.310% | | | | 02/16/2007 | | †† | | | 9,705 | | | | 9,705 | |
| Calyon | | | |
| 5.300% | | | | 02/05/2007 | | †† | | | 29,112 | | | | 29,112 | |
| Canadian Imperial Bank of Commerce | | | |
| 5.310% | | | | 01/29/2007 | | †† | | | 29,112 | | | | 29,112 | |
| Charta LLC | | | |
| 5.300% | | | | 01/31/2007 | | †† | | | 19,003 | | | | 19,003 | |
| CIESCO | | | |
| 5.310% | | | | 01/04/2007 | | †† | | | 12,634 | | | | 12,634 | |
| Citigroup | | | |
| 5.310% | | | | 03/16/2007 | | †† | | | 9,703 | | | | 9,703 | |
| Clipper Receivables Corp | | | |
| 5.300% | | | | 01/31/2007 | | †† | | | 9,703 | | | | 9,703 | |
| Compass Securitization | | | |
| 5.300% | | | | 01/09/2007 | | †† | | | 14,555 | | | | 14,555 | |
| CRC Funding LLC | | | |
| 5.340% | | | | 01/23/2007 | | †† | | | 4,854 | | | | 4,854 | |
| CRC Funding LLC | | | |
| 5.300% | | | | 01/10/2007 | | †† | | | 14,166 | | | | 14,166 | |
| Credit Suisse First Boston Corporation | | | |
| 5.300% | | | | 01/05/2007 | | †† | | | 9,703 | | | | 9,703 | |
| Credit Suisse First Boston Corporation | | | |
| 5.300% | | | | 01/12/2007 | | †† | | | 19,407 | | | | 19,407 | |
| Dexia Group | | | |
| 5.290% | | | | 01/16/2007 | | †† | | | 24,258 | | | | 24,258 | |
| Fairway Finance | | | |
| 5.300% | | | | 01/09/2007 | | †† | | | 11,644 | | | | 11,644 | |
| Falcon Asset Securitization Corporation | | | |
| 5.340% | | | | 01/22/2007 | | †† | | | 9,703 | | | | 9,703 | |
| Fortis Bank | | | |
| 5.320% | | | | 01/03/2007 | | †† | | | 9,703 | | | | 9,703 | |
| Fortis Bank | | | |
| 5.300% | | | | 01/02/2007 | | †† | | | 9,703 | | | | 9,703 | |
| Fortis Bank | | | |
| 5.300% | | | | 01/24/2007 | | †† | | | 33,962 | | | | 33,962 | |
See accompanying notes to financial statements.
172
SCHEDULE OF INVESTMENTS—(Continued)
December 31, 2006
Vantagepoint Short-Term
Bond Fund
Coupon
Rate
|
|
|
| Maturity
Date
|
|
|
| Face
|
| Value
|
|---|
CASH EQUIVALENTS—(Continued) |
| Fortis Bank | | | |
| 5.300% | | | | 01/26/2007 | | †† | | $ | 38,814 | | | $ | 38,814 | |
| General Electric Capital Corporation | | | |
| 5.300% | | | | 01/26/2007 | | †† | | | 19,407 | | | | 19,407 | |
| Greyhawk Funding | | | |
| 5.310% | | | | 01/12/2007 | | †† | | | 9,703 | | | | 9,703 | |
| HBOS Halifax Bank of Scotland | | | |
| 5.310% | | | | 03/14/2007 | | †† | | | 24,258 | | | | 24,258 | |
| HBOS Halifax Bank of Scotland | | | |
| 5.300% | | | | 01/08/2007 | | †† | | | 9,703 | | | | 9,703 | |
| Kitty Hawk Funding Corp | | | |
| 5.340% | | | | 01/10/2007 | | †† | | | 14,555 | | | | 14,555 | |
| Lexington Parker Cap Comp | | | |
| 5.300% | | | | 01/05/2007 | | †† | | | 9,703 | | | | 9,703 | |
| Liberty Street | | | |
| 5.310% | | | | 01/17/2007 | | †† | | | 9,703 | | | | 9,703 | |
| Lloyds TSB Bank | | | |
| 5.300% | | | | 02/26/2007 | | †† | | | 9,703 | | | | 9,703 | |
| Marshall & Ilsley Bank Corporation | | | |
| 5.300% | | | | 03/19/2007 | | †† | | | 9,703 | | | | 9,703 | |
| Merrill Lynch & Co | | | |
| 5.300% | | | | 01/02/2007 | | †† | | | 169,809 | | | | 169,809 | |
| Morgan Stanley & Co | | | |
| 5.300% | | | | 01/02/2007 | | †† | | | 118,972 | | | | 118,972 | |
| Old Line Funding LLC | | | |
| 5.350% | | | | 01/04/2007 | | †† | | | 9,703 | | | | 9,703 | |
| Paradigm Funding LLC | | | |
| 5.310% | | | | 01/17/2007 | | †† | | | 9,703 | | | | 9,703 | |
| Park Avenue Receivables Corp | | | |
| 5.330% | | | | 01/18/2007 | | †† | | | 9,703 | | | | 9,703 | |
| Rabobank Nederland | | | |
| 5.250% | | | | 01/02/2007 | | †† | | | 29,110 | | | | 29,110 | |
| Ranger Funding | | | |
| 5.330% | | | | 02/08/2007 | | †† | | | 9,703 | | | | 9,703 | |
| Ranger Funding | | | |
| 5.320% | | | | 01/04/2007 | | †† | | | 9,703 | | | | 9,703 | |
| Royal Bank of Canada | | | |
| 5.310% | | | | 02/14/2007 | | †† | | | 19,407 | | | | 19,407 | |
| Royal Bank of Scotland | | | |
| 5.310% | | | | 01/11/2007 | | †† | | | 9,703 | | | | 9,703 | |
| Royal Bank of Scotland | | | |
| 5.290% | | | | 01/16/2007 | | †† | | | 14,555 | | | | 14,555 | |
| Royal Bank of Scotland | | | |
| 5.290% | | | | 02/09/2007 | | †† | | | 9,703 | | | | 9,703 | |
| Royal Bank of Scotland | | | |
| 5.280% | | | | 01/11/2007 | | †† | | | 24,258 | | | | 24,258 | |
| Sheffiled Receivables Corp | | | |
| 5.360% | | | | 01/11/2007 | | †† | | | 14,555 | | | | 14,555 | |
| Sheffiled Receivables Corp | | | |
| 5.300% | | | | 01/12/2007 | | †† | | | 9,703 | | | | 9,703 | |
| Societe Generale | | | |
| 5.310% | | | | 01/02/2007 | | †† | | | 24,258 | | | | 24,258 | |
| Societe Generale | | | |
| 5.290% | | | | 02/01/2007 | | †† | | | 24,258 | | | | 24,258 | |
| Societe Generale | | | |
| 5.270% | | | | 01/19/2007 | | †† | | | 24,258 | | | | 24,258 | |
| Svenska Handlesbanken | | | |
| 5.250% | | | | 01/02/2007 | | †† | | | 11,136 | | | | 11,136 | |
| Three Pillars Funding LLC | | | |
| 5.380% | | | | 01/02/2007 | | †† | | | 14,519 | | | | 14,519 | |
| UBS AG | | | |
| 5.300% | | | | 01/04/2007 | | †† | | | 9,703 | | | | 9,703 | |
| UBS AG | | | |
| 5.290% | | | | 01/02/2007 | | †† | | | 19,407 | | | | 19,407 | |
| Variable Funding Capital Co | | | |
| 5.310% | | | | 02/02/2007 | | †† | | $ | 9,703 | | | $ | 9,703 | |
| Variable Funding Capital Co | | | |
| 5.290% | | | | 01/04/2007 | | †† | | | 9,703 | | | | 9,703 | |
| Yorktown Capital LLC | | | |
| 5.330% | | | | 01/16/2007 | | †† | | | 9,703 | | | | 9,703 | |
| Yorktown Capital LLC | | | |
| 5.300% | | | | 01/10/2007 | | †† | | | 9,703 | | | | 9,703 | |
| | | 1,240,335 | |
Floating Rate Instruments/Master Notes—0.0% |
| Bank of America | | | |
| 5.310% | | | | 07/10/2007 | | †† | | | 24,258 | | | | 24,258 | |
| Bank of America | | | |
| 5.270% | | | | 01/09/2007 | | †† | | | 19,407 | | | | 19,407 | |
| | | 43,665 | |
TOTAL CASH EQUIVALENTS
| | | |
| (Cost $1,284,000) | | 1,284,000 | |
| |
REPURCHASE AGREEMENTS—2.5% |
| Investors Bank & Trust Repurchase Agreement dated 12/29/06 due 1/02/07, with a maturity value of $15,011,164 and effective yield of 4.65% collateralized by the U.S. Government Agency Obligation with a rate of 4.24%, maturity date of 4/01/2035 and an aggregate market value of $15,753,583. | | 15,003,412 | | | | 15,003,412 | |
TOTAL INVESTMENTS—95.8%
| | | |
| (Cost $585,919,686) | | 582,272,163 | |
| Other assets less liabilities—4.2% | | 25,400,941 | |
NET ASSETS—100.0% | $ | 607,673,104 | |
Notes to the Schedule of Investments:
| # | | Rate is subject to change. Rate shown reflects current rate. |
| * | | Security exempt from registration under Rule 144A of the Securities Act of 1933. These securities may be resold in transactions exempt from registration, normally to qualified buyers. 144A securities represent 5.42% of Total Investments. |
| † | | Denotes all or a portion of security on loan. |
| ‡ | | Security valued at fair value as determined by policies approved by the board of directors. |
| ** | | Security has been pledged as collateral for futures contracts. |
| †† | | Represents collateral received from securities lending transactions. |
See accompanying notes to financial statements.
173
SCHEDULE OF INVESTMENTS
December 31, 2006
Vantagepoint US Government
Securities Fund
Coupon
Rate
|
|
|
| Maturity
Date
|
|
|
| Face
|
| Value
|
|---|
U.S. GOVERNMENT AGENCY OBLIGATIONS—42.3% |
U.S. Government Agencies—41.5% | | | |
| Federal Farm Credit Bank | | | |
| 3.750% | | | | 01/15/2009 | | | | $ | 1,050,000 | | | $ | 1,024,650 | |
| Federal Home Loan Bank | | | |
| 5.750% | | | | 05/15/2012 | | † | | | 625,000 | | | | 649,326 | |
| 5.375% | | | | 05/18/2016 | | | | | 1,225,000 | | | | 1,260,580 | |
| 5.000% | | | | 09/18/2009 | | | | | 700,000 | | | | 701,094 | |
| 4.900% | | | | 07/24/2008 | | | | | 300,000 | | | | 299,295 | |
| 4.750% | | | | 01/11/2008 | | | | | 250,000 | | | | 248,904 | |
| 4.625% | | | | 02/18/2011 | | | | | 400,000 | | | | 396,198 | |
| 4.500% | | | | 11/15/2012-09/16/2013 | | | | | 1,310,000 | | | | 1,278,675 | |
| 4.100% | | | | 06/13/2008 | | | | | 400,000 | | | | 394,602 | |
| 4.000% | | | | 03/10/2008 | | | | | 800,000 | | | | 789,473 | |
| 3.875% | | | | 01/15/2010 | | | | | 750,000 | | | | 729,754 | |
| 3.625% | | | | 01/15/2008-
11/14/2008 | | | | | 3,400,000 | | | | 3,328,917 | |
| 3.000% | | | | 04/15/2009 | | | | | 1,650,000 | | | | 1,583,193 | |
| 2.750% | | | | 03/14/2008 | | | | | 2,500,000 | | | | 2,431,017 | |
| 2.625% | | | | 07/15/2008 | | | | | 2,000,000 | | | | 1,929,728 | |
| Federal Home Loan Mortgage Corporation | | | |
| 6.625% | | | | 09/15/2009 | | | | | 1,400,000 | | | | 1,458,997 | |
| 6.250% | | | | 03/05/2012 | | | | | 250,000 | | | | 250,384 | |
| 6.000% | | | | 06/15/2011-
09/19/2016 | | | | | 1,400,000 | | | | 1,417,890 | |
| 5.750% | | | | 03/15/2009 | | | | | 1,800,000 | | | | 1,828,651 | |
| 5.500% | | | | 09/15/2011 | | | | | 600,000 | | | | 614,064 | |
| 5.450% | | | | 11/21/2013 | | | | | 250,000 | | | | 249,691 | |
| 5.400% | | | | 02/28/2011 | | | | | 125,000 | | | | 125,043 | |
| 5.350% | | | | 11/14/2011 | | | | | 600,000 | | | | 599,710 | |
| 5.250% | | | | 01/05/2011-
11/05/2012 | | | | | 550,000 | | | | 547,632 | |
| 5.125% | | | | 04/18/2008-
02/01/2011 | | | | | 3,100,000 | | | | 3,102,715 | |
| 5.050% | | | | 01/26/2015 | | | | | 120,000 | | | | 120,170 | |
| 5.000% | | | | 02/08/2008-
01/30/2014 | | | | | 1,100,000 | | | | 1,097,322 | |
| 4.900% | | | | 11/03/2008 | | | | | 300,000 | | | | 299,183 | |
| 4.875% | | | | 02/17/2009 | | | | | 2,000,000 | | | | 1,995,656 | |
| 4.750% | | | | 09/22/2010-
01/19/2016 | | | | | 2,150,000 | | | | 2,133,976 | |
| 4.500% | | | | 01/15/2013-
01/15/2015 | | | | | 2,950,000 | | | | 2,869,074 | |
| 4.375% | | | | 07/30/2009 | | | | | 500,000 | | | | 493,204 | |
| 4.125% | | | | 09/01/2009-
02/24/2011 | | | | | 900,000 | | | | 875,527 | |
| 4.000% | | | | 06/12/2013 | | | | | 400,000 | | | | 377,446 | |
| 3.875% | | | | 01/12/2009 | | | | | 100,000 | | | | 97,721 | |
| 3.625% | | | | 09/15/2008 | | | | | 2,500,000 | | | | 2,443,250 | |
| 3.500% | | | | 04/01/2008 | | | | | 200,000 | | | | 195,985 | |
| 3.250% | | | | 02/25/2008 | | | | | 500,000 | | | | 488,943 | |
| Federal National Mortgage Association | | | |
| 6.625% | | | | 11/15/2010 | | | | | 1,930,000 | | | | 2,045,732 | |
| 6.125% | | | | 07/17/2013 | | | | | 250,000 | | | | 252,615 | |
| 6.070% | | | | 05/12/2016 | | | | | 300,000 | | | | 302,065 | |
| 6.000% | | | | 05/15/2011 | | | | | 800,000 | | | | 833,784 | |
| 5.375% | | | | 11/15/2011-
07/15/2016 | | | | | 2,430,000 | | | | 2,490,128 | |
| 5.250% | | | | 06/15/2008-
08/01/2012 | | | | | 4,590,000 | | | | 4,608,101 | |
| 5.125% | | | | 04/15/2011 | | | | | 675,000 | | | | 680,475 | |
| 5.100% | | | | 02/22/2008-
01/18/2011 | | | | | 300,000 | | | | 299,220 | |
| 5.000% | | | | 09/15/2008-
04/15/2015 | | | | $ | 1,500,000 | | | $ | 1,500,751 | |
| 4.875% | | | | 01/11/2008 | | | | | 450,000 | | | | 448,582 | |
| 4.500% | | | | 06/01/2010-
02/15/2011 | | | | | 600,000 | | | | 591,325 | |
| 4.375% | | | | 09/15/2012-
10/15/2015 | | | | | 1,100,000 | | | | 1,065,258 | |
| 4.125% | | | | 04/15/2014 | | | | | 400,000 | | | | 379,808 | |
| 4.000% | | | | 01/26/2009 | | | | | 300,000 | | | | 294,180 | |
| 3.750% | | | | 09/15/2008 | | | | | 400,000 | | | | 391,662 | |
| 3.375% | | | | 12/15/2008 | | | | | 900,000 | | | | 872,940 | |
| 3.250% | | | | 01/15/2008-
02/15/2009 | | | | | 1,425,000 | | | | 1,390,332 | |
| | | 59,174,598 | |
U.S. Government Agencies—Mortgage Backed—0.8% |
| Federal Home Loan Mortgage Corporation | | | |
| 6.500% | | | | 04/01/2035 | | | | | 132,409 | | | | 135,185 | |
| 5.000% | | | | 11/01/2017 | | | | | 56,625 | | | | 55,820 | |
| Federal National Mortgage Association | | | |
| 7.500% | | | | 01/01/2034 | | | | | 352,081 | | | | 365,041 | |
| 7.000% | | | | 02/01/2013 | | | | | 154,791 | | | | 159,418 | |
| 6.500% | | | | 05/01/2035 | | | | | 169,000 | | | | 172,586 | |
| 6.000% | | | | 12/01/2013-
10/01/2017 | | | | | 188,859 | | | | 191,815 | |
| | | 1,079,865 | |
TOTAL U.S. GOVERNMENT AGENCY OBLIGATIONS
| | | |
| (Cost $60,638,359) | | 60,254,463 | |
| |
U.S. TREASURY OBLIGATIONS—56.3% |
U.S. Treasury Bonds—5.4% | | | |
| U.S. Treasury Bond | | | |
| 12.000% | | | | 08/15/2013 | | | | | 700,000 | | | | 777,711 | |
| 11.750% | | | | 11/15/2014 | | | | | 500,000 | | | | 592,969 | |
| 11.250% | | | | 02/15/2015 | | | | | 850,000 | | | | 1,221,411 | |
| 10.625% | | | | 08/15/2015 | | | | | 800,000 | | | | 1,131,875 | |
| 5.750% | | | | 08/15/2010 | | | | | 1,840,000 | | | | 1,904,041 | |
| 5.000% | | | | 08/15/2011 | | † | | | 1,940,000 | | | | 1,967,736 | |
| | | 7,595,743 | |
U.S. Treasury Notes—50.9% | | | |
| U.S. Treasury Note | | | |
| 6.500% | | | | 02/15/2010 | | | | | 2,100,000 | | | | 2,206,724 | |
| 6.000% | | | | 08/15/2009 | | | | | 1,705,000 | | | | 1,757,016 | |
| 5.500% | | | | 05/15/2009 | | † | | | 680,000 | | | | 691,582 | |
| 5.125% | | | | 06/30/2011-
05/15/2016 | | † | | | 4,100,000 | | | | 4,192,849 | |
| 5.000% | | | | 02/15/2011 | | † | | | 1,770,000 | | | | 1,792,679 | |
| 4.875% | | | | 05/31/2008-
08/15/2016 | | † | | | 4,900,000 | | | | 4,919,338 | |
| 4.750% | | | | 05/15/2014 | | | | | 1,500,000 | | | | 1,504,337 | |
| 4.625% | | | | 02/29/2008-
11/15/2016 | | † | | | 6,700,000 | | | | 6,671,323 | |
| 4.500% | | | | 02/15/2009-
02/15/2016 | | | | | 4,350,000 | | | | 4,313,164 | |
| 4.375% | | | | 01/31/2008-
08/15/2012 | | † | | | 4,670,000 | | | | 4,617,394 | |
| 4.250% | | | | 10/15/2010-
08/15/2015 | | | | | 9,640,000 | | | | 9,412,361 | |
| 4.125% | | | | 05/15/2015 | | | | | 1,650,000 | | | | 1,584,838 | |
| 4.000% | | | | 11/15/2012-
02/15/2015 | | | | | 5,100,000 | | | | 4,884,905 | |
| 3.875% | | | | 05/15/2009-
02/15/2013 | | † | | | 5,050,000 | | | | 4,912,318 | |
| 3.750% | | | | 05/15/2008 | | † | | | 2,700,000 | | | | 2,659,503 | |
See accompanying notes to financial statements.
174
SCHEDULE OF INVESTMENTS—(Continued)
December 31, 2006
Vantagepoint US Government
Securities Fund
Coupon
Rate
|
|
|
| Maturity
Date
|
|
|
| Face
|
| Value
|
|---|
U.S. TREASURY OBLIGATIONS—(Continued) |
| 3.625% | | | | 07/15/2009 | | | | $ | 1,530,000 | | | $ | 1,490,137 | |
| 3.500% | | | | 11/15/2009-
02/15/2010 | | | | | 4,580,000 | | | | 4,427,115 | |
| 3.375% | | | | 11/15/2008-
12/15/2008 | | | | | 3,980,000 | | | | 3,878,028 | |
| 3.125% | | | | 09/15/2008-
10/15/2008 | | | | | 6,150,000 | | | | 5,978,835 | |
| 3.000% | | | | 02/15/2008 | | † | | | 700,000 | | | | 685,180 | |
| | | 72,579,626 | |
TOTAL U.S. TREASURY OBLIGATIONS
| | | |
| (Cost $81,240,380) | | 80,175,369 | |
| |
CASH EQUIVALENTS—14.6% |
Bank & Certificate Deposits/
Offshore Time Deposits—14.1% |
| Abbey National PLC | | | |
| 5.280% | | | | 01/05/2007 | | †† | | | 315,319 | | | | 315,319 | |
| BancoBilbao Vizcaya Argentaria SA | | | |
| 5.310% | | | | 01/03/2007 | | †† | | | 315,319 | | | | 315,319 | |
| Bank Of Nova Scotia | | | |
| 5.300% | | | | 02/27/2007 | | †† | | | 394,149 | | | | 394,149 | |
| Bank Of Nova Scotia | | | |
| 5.290% | | | | 01/30/2007 | | †† | | | 157,659 | | | | 157,659 | |
| Bank Of Nova Scotia | | | |
| 5.290% | | | | 02/06/2007 | | †† | | | 236,489 | | | | 236,489 | |
| Barclays | | | |
| 5.320% | | | | 02/13/2007 | | †† | | | 157,659 | | | | 157,659 | |
| Barclays | | | |
| 5.310% | | | | 02/20/2007 | | †† | | | 394,149 | | | | 394,149 | |
| Barclays | | | |
| 5.300% | | | | 01/02/2007 | | †† | | | 394,149 | | | | 394,149 | |
| Barton Capital LLC | | | |
| 5.300% | | | | 01/17/2007 | | †† | | | 157,659 | | | | 157,659 | |
| Barton Capital LLC | | | |
| 5.300% | | | | 01/17/2007 | | †† | | | 236,489 | | | | 236,489 | |
| Calyon | | | |
| 5.310% | | | | 02/16/2007 | | †† | | | 157,659 | | | | 157,659 | |
| Calyon | | | |
| 5.300% | | | | 02/05/2007 | | †† | | | 472,978 | | | | 472,978 | |
| Canadian Imperial Bank of Commerce | | | |
| 5.310% | | | | 01/29/2007 | | †† | | | 472,978 | | | | 472,978 | |
| Charta LLC | | | |
| 5.300% | | | | 01/31/2007 | | †† | | | 308,754 | | | | 308,754 | |
| CIESCO | | | |
| 5.310% | | | | 01/04/2007 | | †† | | | 205,281 | | | | 205,281 | |
| Citigroup | | | |
| 5.310% | | | | 03/16/2007 | | †† | | | 157,659 | | | | 157,659 | |
| Clipper Receivables Corp | | | |
| 5.300% | | | | 01/31/2007 | | †† | | | 157,659 | | | | 157,659 | |
| Compass Securitization | | | |
| 5.300% | | | | 01/09/2007 | | †† | | | 236,489 | | | | 236,489 | |
| CRC Funding LLC | | | |
| 5.340% | | | | 01/23/2007 | | †† | | | 78,830 | | | | 78,830 | |
| CRC Funding LLC | | | |
| 5.300% | | | | 01/10/2007 | | †† | | | 230,154 | | | | 230,154 | |
| Credit Suisse First Boston Corporation | | | |
| 5.300% | | | | 01/05/2007 | | †† | | | 157,659 | | | | 157,659 | |
| Credit Suisse First Boston Corporation | | | |
| 5.300% | | | | 01/12/2007 | | †† | | | 315,319 | | | | 315,319 | |
| Dexia Group | | | |
| 5.290% | | | | 01/16/2007 | | †† | | | 394,149 | | | | 394,149 | |
| Fairway Finance | | | |
| 5.300% | | | | 01/09/2007 | | †† | | $ | 189,191 | | | $ | 189,191 | |
| Falcon Asset Securitization Corporation | | | |
| 5.340% | | | | 01/22/2007 | | †† | | | 157,659 | | | | 157,659 | |
| Fortis Bank | | | |
| 5.320% | | | | 01/03/2007 | | †† | | | 157,659 | | | | 157,659 | |
| Fortis Bank | | | |
| 5.300% | | | | 01/02/2007 | | †† | | | 157,660 | | | | 157,660 | |
| Fortis Bank | | | |
| 5.300% | | | | 01/24/2007 | | †† | | | 551,808 | | | | 551,808 | |
| Fortis Bank | | | |
| 5.300% | | | | 01/26/2007 | | †† | | | 630,638 | | | | 630,638 | |
| General Electric Capital Corporation | | | |
| 5.300% | | | | 01/26/2007 | | †† | | | 315,320 | | | | 315,320 | |
| Greyhawk Funding | | | |
| 5.310% | | | | 01/12/2007 | | †† | | | 157,659 | | | | 157,659 | |
| HBOS Halifax Bank of Scotland | | | |
| 5.310% | | | | 03/14/2007 | | †† | | | 394,150 | | | | 394,150 | |
| HBOS Halifax Bank of Scotland | | | |
| 5.300% | | | | 01/08/2007 | | †† | | | 157,659 | | | | 157,659 | |
| Kitty Hawk Funding Corp | | | |
| 5.340% | | | | 01/10/2007 | | †† | | | 236,489 | | | | 236,489 | |
| Lexington Parker Cap Comp | | | |
| 5.300% | | | | 01/05/2007 | | †† | | | 157,659 | | | | 157,659 | |
| Liberty Street | | | |
| 5.310% | | | | 01/17/2007 | | †† | | | 157,660 | | | | 157,660 | |
| Lloyds TSB Bank | | | |
| 5.300% | | | | 02/26/2007 | | †† | | | 157,659 | | | | 157,659 | |
| Marshall & Ilsley Bank Corporation | | | |
| 5.300% | | | | 03/19/2007 | | †† | | | 157,659 | | | | 157,659 | |
| Merrill Lynch & Co | | | |
| 5.300% | | | | 01/02/2007 | | †† | | | 2,759,040 | | | | 2,759,040 | |
| Morgan Stanley & Co | | | |
| 5.300% | | | | 01/02/2007 | | †† | | | 1,933,048 | | | | 1,933,048 | |
| Old Line Funding LLC | | | |
| 5.350% | | | | 01/04/2007 | | †† | | | 157,661 | | | | 157,661 | |
| Paradigm Funding LLC | | | |
| 5.310% | | | | 01/17/2007 | | †† | | | 157,659 | | | | 157,659 | |
| Park Avenue Receivables Corp | | | |
| 5.330% | | | | 01/18/2007 | | †† | | | 157,659 | | | | 157,659 | |
| Rabobank Nederland | | | |
| 5.250% | | | | 01/02/2007 | | †† | | | 472,978 | | | | 472,978 | |
| Ranger Funding | | | |
| 5.330% | | | | 02/08/2007 | | †† | | | 157,659 | | | | 157,659 | |
| Ranger Funding | | | |
| 5.320% | | | | 01/04/2007 | | †† | | | 157,659 | | | | 157,659 | |
| Royal Bank of Canada | | | |
| 5.310% | | | | 02/14/2007 | | †† | | | 315,319 | | | | 315,319 | |
| Royal Bank of Scotland | | | |
| 5.310% | | | | 01/11/2007 | | †† | | | 157,659 | | | | 157,659 | |
| Royal Bank of Scotland | | | |
| 5.290% | | | | 01/16/2007 | | †† | | | 236,489 | | | | 236,489 | |
| Royal Bank of Scotland | | | |
| 5.290% | | | | 02/09/2007 | | †† | | | 157,659 | | | | 157,659 | |
| Royal Bank of Scotland | | | |
| 5.280% | | | | 01/11/2007 | | †† | | | 394,149 | | | | 394,149 | |
| Sheffiled Receivables Corp | | | |
| 5.360% | | | | 01/11/2007 | | †† | | | 236,489 | | | | 236,489 | |
| Sheffiled Receivables Corp | | | |
| 5.300% | | | | 01/12/2007 | | †† | | | 157,659 | | | | 157,659 | |
| Societe Generale | | | |
| 5.310% | | | | 01/02/2007 | | †† | | | 394,149 | | | | 394,149 | |
| Societe Generale | | | |
| 5.290% | | | | 02/01/2007 | | †† | | | 394,149 | | | | 394,149 | |
| Societe Generale | | | |
| 5.270% | | | | 01/19/2007 | | †† | | | 394,149 | | | | 394,149 | |
| Svenska Handlesbanken | | | |
| 5.250% | | | | 01/02/2007 | | †† | | | 180,936 | | | | 180,936 | |
See accompanying notes to financial statements.
175
SCHEDULE OF INVESTMENTS—(Continued)
December 31, 2006
Vantagepoint US Government
Securities Fund
Coupon
Rate
|
|
|
| Maturity
Date
|
|
|
| Face
|
| Value
|
|---|
CASH EQUIVALENTS—(Continued) |
| Three Pillars Funding LLC | | | |
| 5.380% | | | | 01/02/2007 | | †† | | $ | 235,900 | | | $ | 235,900 | |
| UBS AG | | | |
| 5.300% | | | | 01/04/2007 | | †† | | | 157,659 | | | | 157,659 | |
| UBS AG | | | |
| 5.290% | | | | 01/02/2007 | | †† | | | 315,319 | | | | 315,319 | |
| Variable Funding Capital Co | | | |
| 5.310% | | | | 02/02/2007 | | †† | | | 157,659 | | | | 157,659 | |
| Variable Funding Capital Co | | | |
| 5.290% | | | | 01/04/2007 | | †† | | | 157,660 | | | | 157,660 | |
| Yorktown Capital LLC | | | |
| 5.330% | | | | 01/16/2007 | | †† | | | 157,660 | | | | 157,660 | |
| Yorktown Capital LLC | | | |
| 5.300% | | | | 01/10/2007 | | †† | | | 157,660 | | | | 157,660 | |
| | | 20,152,823 | |
Floating Rate Instruments/Master Notes—0.5% |
| Bank of America | | | |
| 5.310% | | | | 07/10/2007 | | †† | | | 394,149 | | | | 394,149 | |
| Bank of America | | | |
| 5.270% | | | | 01/09/2007 | | †† | | | 315,319 | | | | 315,319 | |
| | | 709,468 | |
TOTAL CASH EQUIVALENTS
| | | |
| (Cost $20,862,291) | | 20,862,291 | |
| |
REPURCHASE AGREEMENTS—0.6% |
| IBT Repurchase Agreement dated 12/29/2006 due 01/02/2007, with a maturity value of $848,792 and an effective yield of 4.65% collateralized by a U.S. Government Obligation with a rate of 5.125%, maturity date of 10/20/2022 and an aggregate market value of $890,771. | | 848,353 | | | | 848,353 | |
TOTAL INVESTMENTS—113.8%
| | | |
| (Cost $163,589,383) | | | | | | | | 162,140,476 | |
| Other assets less liabilities—(13.8%) | | (19,600,843 | ) |
NET ASSETS—100.0% | $ | 142,539,633 | |
Notes to the Schedule of Investments:
| † | | Denotes all or a portion of security on loan. |
| †† | | Represents collateral received from securities lending transactions. |
See accompanying notes to financial statements.
176
SCHEDULE OF INVESTMENTS
December 31, 2006
Vantagepoint Asset
Allocation Fund
|
|
|
|
|
|
|
| Shares
|
| Value
|
|---|
COMMON STOCKS—82.6% |
Advertising—0.2% | | | |
| Interpublic Group, Inc. | *† | | | 21,356 | | | $ | 261,397 | |
| Monster Worldwide, Inc. | * | | | 6,200 | | | | 289,168 | |
| Omnicom Group | | 8,800 | | | | 919,952 | |
| | | 1,470,517 | |
Aerospace & Defense—1.8% | | | |
| Goodrich Corporation | | 5,900 | | | | 268,745 | |
| Boeing Company (The) | | 39,392 | | | | 3,499,585 | |
| General Dynamics Corporation | | 19,720 | | | | 1,466,182 | |
| Honeywell International, Inc. | | 40,825 | | | | 1,846,923 | |
| Lockheed Martin Corporation | | 17,580 | | | | 1,618,591 | |
| Northrop Grumman Corporation | | 17,292 | | | | 1,170,668 | |
| Textron, Inc. | | 6,500 | | | | 609,505 | |
| United Technologies Corporation | | 49,910 | | | | 3,120,373 | |
| | | 13,600,572 | |
Airlines—0.3% | | | |
| FedEx Corporation | | 14,940 | | | | 1,622,783 | |
| Southwest Airlines Company | | 37,172 | | | | 569,475 | |
| | | 2,192,258 | |
Apparel Retailers—0.4% | | | |
| Gap (The), Inc. | | 28,227 | | | | 550,426 | |
| Kohl’s Corporation | * | | | 17,000 | | | | 1,163,310 | |
| Ltd. Brands, Inc. | | 17,100 | | | | 494,874 | |
| Nordstrom, Inc. | | 10,780 | | | | 531,885 | |
| | | 2,740,495 | |
Automotive—0.6% | | | |
| Autonation, Inc. | * | | | 6,800 | | | | 144,976 | |
| Ford Motor Company | † | | | 91,746 | | | | 689,012 | |
| General Motors Corporation | | 27,800 | | | | 854,016 | |
| Genuine Parts Company | | 8,525 | | | | 404,341 | |
| Goodyear Tire & Rubber Company (The) | *† | | | 8,600 | | | | 180,514 | |
| Harley-Davidson, Inc. | | 13,400 | | | | 944,298 | |
| ITT Corporation | | 9,100 | | | | 517,062 | |
| Paccar, Inc. | † | | | 12,483 | | | | 810,147 | |
| | | 4,544,366 | |
Banking—10.3% | | | |
| American Express Company | | 60,930 | | | | 3,696,623 | |
| BB&T Corporation | | 26,300 | | | | 1,155,359 | |
| Bank of America Corporation | | 224,705 | | | | 11,997,000 | |
| Bank of New York Company, Inc. (The) | | 37,900 | | | | 1,492,123 | |
| Capital One Financial Corporation | | 20,713 | | | | 1,591,173 | |
| CIT Group, Inc. | | 9,800 | | | | 546,546 | |
| Citigroup, Inc. | | 245,568 | | | | 13,678,138 | |
| Comerica, Inc. | | 8,050 | | | | 472,374 | |
| Commerce Bancorp, Inc., NJ | † | | | 8,537 | | | | 301,100 | |
| Compass Bancshares, Inc. | | 6,100 | | | | 363,865 | |
| Fannie Mae | | 48,400 | | | | 2,874,476 | |
| Fifth Third Bancorp | † | | | 27,288 | | | | 1,116,898 | |
| First Horizon National Corporation | | 6,200 | | | | 259,036 | |
| Freddie Mac | | 34,000 | | | | 2,308,600 | |
| Huntington Bancshares, Inc. | † | | | 12,536 | | | | 297,730 | |
| JPMorgan Chase & Company | | 172,739 | | | | 8,343,294 | |
| Keycorp | | 19,900 | | | | 756,797 | |
| M&T Bank Corporation | | 3,930 | | | | 480,089 | |
| Marshall & IIsley Corporation | | 12,000 | | | | 577,320 | |
| Mellon Financial Corporation | | 20,400 | | | | 859,860 | |
| National City Corporation | | 31,300 | | | | 1,144,328 | |
| Northern Trust Corporation | | 9,150 | | | $ | 555,313 | |
| PNC Financial Services Group, Inc. | | 14,400 | | | | 1,066,176 | |
| Regions Financial Corporation | | 35,991 | | | | 1,346,063 | |
| SLM Corporation | | 20,500 | | | | 999,785 | |
| Sovereign Bancorp, Inc. | † | | | 18,480 | | | | 469,207 | |
| State Street Corporation | | 16,400 | | | | 1,106,016 | |
| SunTrust Banks, Inc. | | 18,270 | | | | 1,542,901 | |
| Synovus Financial Corporation | | 15,400 | | | | 474,782 | |
| U.S. Bancorp | | 88,605 | | | | 3,206,615 | |
| Wachovia Corporation | | 94,412 | | | | 5,376,763 | |
| Washington Mutual, Inc. | | 47,762 | | | | 2,172,693 | |
| Wells Fargo & Company | | 168,020 | | | | 5,974,791 | |
| Zions Bancorporation | | 5,100 | | | | 420,444 | |
| | | 79,024,278 | |
Beverages, Food & Tobacco—4.2% | | | |
| Altria Group, Inc. | | 104,340 | | | | 8,954,459 | |
| Anheuser-Busch Companies, Inc. | | 38,140 | | | | 1,876,488 | |
| Archer-Daniels-Midland Company | | 32,124 | | | | 1,026,683 | |
| Brown-Forman Corporation Class B | | 4,080 | | | | 270,259 | |
| Campbell Soup Company | | 10,630 | | | | 413,401 | |
| Coca-Cola Company (The) | | 101,290 | | | | 4,887,242 | |
| Coca-Cola Enterprises, Inc. | | 14,960 | | | | 305,483 | |
| ConAgra Foods, Inc. | | 25,500 | | | | 688,500 | |
| Constellation Brands, Inc. Class A | * | | | 9,730 | | | | 282,365 | |
| Dean Foods Company | * | | | 6,000 | | | | 253,680 | |
| General Mills, Inc. | | 17,500 | | | | 1,008,000 | |
| Hershey Company (The) | † | | | 8,770 | | | | 436,746 | |
| HJ Heinz Company | | 16,450 | | | | 740,414 | |
| Kellogg Company | | 12,400 | | | | 620,744 | |
| McCormick & Company, Inc. | | 6,500 | | | | 250,640 | |
| Molson Coors Brewing Company Class B | | 2,660 | | | | 203,330 | |
| Pepsi Bottling Group, Inc. | | 6,610 | | | | 204,315 | |
| Pepsico, Inc. | | 81,450 | | | | 5,094,697 | |
| Reynolds American, Inc. | † | | | 8,360 | | | | 547,329 | |
| Safeway, Inc. | | 22,100 | | | | 763,776 | |
| Sara Lee Corporation | | 37,400 | | | | 636,922 | |
| Supervalu, Inc. | | 9,801 | | | | 350,386 | |
| Sysco Corporation | | 30,500 | | | | 1,121,180 | |
| Tyson Foods, Inc. Class A | † | | | 12,400 | | | | 203,980 | |
| UST, Inc. | † | | | 8,000 | | | | 465,600 | |
| WM Wrigley Jr. Company | | 10,887 | | | | 563,076 | |
| | | 32,169,695 | |
Building Materials—0.9% | | | |
| Home Depot, Inc. | | 102,800 | | | | 4,128,448 | |
| Lowe’s Companies, Inc. | | 76,960 | | | | 2,397,304 | |
| Vulcan Materials Company | † | | | 4,900 | | | | 440,363 | |
| | | 6,966,115 | |
Chemicals—1.1% | | | |
| Air Products & Chemicals, Inc. | | 11,000 | | | | 773,080 | |
| Avery Dennison Corporation | | 5,400 | | | | 366,822 | |
| Dow Chemical Company (The) | | 47,636 | | | | 1,902,582 | |
| Eastman Chemical Company | | 3,975 | | | | 235,757 | |
| EI Du Pont de Nemours & Company | | 45,300 | | | | 2,206,563 | |
| Hercules, Inc. | * | | | 5,000 | | | | 96,550 | |
| International Flavors & Fragrances, Inc. | | 4,300 | | | | 211,388 | |
| Monsanto Company | | 26,498 | | | | 1,391,940 | |
| PPG Industries, Inc. | | 8,124 | | | | 521,642 | |
| Praxair, Inc. | | 15,830 | | | | 939,194 | |
| | | 8,645,518 | |
See accompanying notes to financial statements.
177
SCHEDULE OF INVESTMENTS—(Continued)
December 31, 2006
Vantagepoint Asset
Allocation Fund
|
|
|
|
|
|
|
| Shares
|
| Value
|
|---|
COMMON STOCKS—(Continued) |
Coal—0.1% | | | |
| Consol Energy, Inc. | | 8,636 | | | $ | 277,475 | |
| Peabody Energy Corporation | † | | | 12,903 | | | | 521,410 | |
| | | 798,885 | |
Commercial Services—0.6% | | | |
| Allied Waste Industries, Inc. | * | | | 11,900 | | | | 146,251 | |
| Cintas Corporation | | 6,800 | | | | 270,028 | |
| Convergys Corporation | * | | | 7,600 | | | | 180,728 | |
| Equifax, Inc. | | 6,400 | | | | 259,840 | |
| Fluor Corporation | † | | | 4,300 | | | | 351,095 | |
| H&R Block, Inc. | † | | | 16,100 | | | | 370,944 | |
| Moody’s Corporation | | 12,000 | | | | 828,720 | |
| Paychex, Inc. | | 16,450 | | | | 650,433 | |
| Robert Half International, Inc. | † | | | 8,400 | | | | 311,808 | |
| RR Donnelley & Sons Company | | 10,600 | | | | 376,724 | |
| Ryder System, Inc. | | 3,100 | | | | 158,286 | |
| Waste Management, Inc. | | 27,127 | | | | 997,460 | |
| | | 4,902,317 | |
Communications—1.2% | | | |
| ADC Telecommunications, Inc. | * | | | 5,571 | | | | 80,946 | |
| Avaya, Inc. | * | | | 20,468 | | | | 286,143 | |
| Ciena Corporation | * | | | 4,371 | | | | 121,120 | |
| Comverse Technology, Inc. | * | | | 10,700 | | | | 225,877 | |
| Corning, Inc. | * | | | 76,050 | | | | 1,422,895 | |
| L-3 Communications Holdings, Inc. | | 6,000 | | | | 490,680 | |
| Motorola, Inc. | | 122,990 | | | | 2,528,674 | |
| Network Appliance, Inc. | * | | | 18,400 | | | | 722,752 | |
| Qualcomm, Inc. | | 81,500 | | | | 3,079,885 | |
| Tellabs, Inc. | * | | | 22,200 | | | | 227,772 | |
| | | 9,186,744 | |
Computer Software & Processing—4.7% | | | |
| Adobe Systems, Inc. | * | | | 29,500 | | | | 1,213,040 | |
| Affiliated Computer Services, Inc. Class A | *† | | | 5,800 | | | | 283,272 | |
| Autodesk, Inc. | * | | | 11,400 | | | | 461,244 | |
| Automatic Data Processing, Inc. | | 28,500 | | | | 1,403,625 | |
| BMC Software, Inc. | * | | | 10,500 | | | | 338,100 | |
| CA, Inc. | | 22,416 | | | | 507,722 | |
| Citrix Systems, Inc. | * | | | 8,900 | | | | 240,745 | |
| Cognizant Technology Solutions Corporation | * | | | 6,912 | | | | 533,330 | |
| Computer Sciences Corporation | * | | | 9,200 | | | | 491,004 | |
| Compuware Corporation | * | | | 18,800 | | | | 156,604 | |
| Electronic Arts, Inc. | * | | | 14,900 | | | | 750,364 | |
| Electronic Data Systems Corporation | | 25,300 | | | | 697,015 | |
| Fidelity National Information Services, Inc. | | 7,869 | | | | 315,468 | |
| First Data Corporation | | 37,736 | | | | 963,023 | |
| Fiserv, Inc. | * | | | 9,100 | | | | 477,022 | |
| Google, Inc. Class A | * | | | 10,661 | | | | 4,909,177 | |
| IMS Health, Inc. | | 9,825 | | | | 269,991 | |
| Intuit, Inc. | * | | | 17,400 | | | | 530,874 | |
| Juniper Networks, Inc. | * | | | 26,268 | | | | 497,516 | |
| Microsoft Corporation | | 430,853 | | | | 12,865,271 | |
| NCR Corporation | * | | | 9,000 | | | | 384,840 | |
| Novell, Inc. | * | | | 18,800 | | | | 116,560 | |
| Nvidia Corporation | * | | | 16,800 | | | | 621,768 | |
| Oracle Corporation | * | | | 198,720 | | | | 3,406,061 | |
| Sun Microsystems, Inc. | * | | | 170,200 | | | | 922,484 | |
| Symantec Corporation | * | | | 48,368 | | | | 1,008,473 | |
| Unisys Corporation | * | | | 15,700 | | | | 123,088 | |
| VeriSign, Inc. | * | | | 11,800 | | | $ | 283,790 | |
| Yahoo!, Inc. | *† | | | 62,100 | | | | 1,586,034 | |
| | | 36,357,505 | |
Computers & Information—3.4% | | | |
| 3M Company | | 37,150 | | | | 2,895,100 | |
| Apple Computer, Inc. | * | | | 42,300 | | | | 3,588,732 | |
| Dell, Inc. | * | | | 113,400 | | | | 2,845,206 | |
| EMC Corporation | * | | | 112,350 | | | | 1,483,020 | |
| Hewlett-Packard Company | | 136,286 | | | | 5,613,620 | |
| International Business Machines Corporation | | 75,660 | | | | 7,350,369 | |
| International Game Technology | | 16,600 | | | | 766,920 | |
| Jabil Circuit, Inc. | | 8,590 | | | | 210,885 | |
| Lexmark International, Inc. | * | | | 5,300 | | | | 387,960 | |
| Pitney Bowes, Inc. | | 11,200 | | | | 517,328 | |
| SanDisk Corporation | * | | | 11,000 | | | | 473,330 | |
| Solectron Corporation | * | | | 45,000 | | | | 144,900 | |
| Symbol Technologies, Inc. | | 12,800 | | | | 191,232 | |
| | | 26,468,602 | |
Containers & Packaging—0.1% | | | |
| Ball Corporation | | 5,100 | | | | 222,360 | |
| Sealed Air Corporation | | 3,965 | | | | 257,408 | |
| Temple-Inland, Inc. | | 5,500 | | | | 253,165 | |
| | | 732,933 | |
Cosmetics & Personal Care—1.8% | | | |
| Avon Products, Inc. | | 22,200 | | | | 733,488 | |
| Clorox Company | | 7,400 | | | | 474,710 | |
| Colgate-Palmolive Company | | 25,400 | | | | 1,657,096 | |
| Ecolab, Inc. | † | | | 8,940 | | | | 404,088 | |
| Estee Lauder Companies (The), Inc., Class A | † | | | 5,670 | | | | 231,449 | |
| Procter & Gamble Company | | 157,851 | | | | 10,145,084 | |
| | | 13,645,915 | |
Education—0.0% | | | |
| Apollo Group, Inc. Class A | *† | | | 6,910 | | | | 269,283 | | | |
Electric Utilities—2.8% | | | |
| AES Corporation (The) | * | | | 32,300 | | | | 711,892 | |
| Allegheny Energy, Inc. | * | | | 8,000 | | | | 367,280 | |
| Ameren Corporation | † | | | 10,100 | | | | 542,673 | |
American Electric Power
Company, Inc. | | 19,360 | | | | 824,349 | |
| CMS Energy Corporation | * | | | 11,100 | | | | 185,370 | |
| Centerpoint Energy, Inc. | † | | | 15,226 | | | | 252,447 | |
| Consolidated Edison, Inc. | | 12,100 | | | | 581,647 | |
| Constellation Energy Group, Inc. | | 8,800 | | | | 606,056 | |
| DTE Energy Company | † | | | 8,700 | | | | 421,167 | |
| Dominion Resources, Inc. | | 17,571 | | | | 1,473,153 | |
| Duke Energy Corporation | | 62,508 | | | | 2,075,891 | |
| Dynegy, Inc. Class A | * | | | 17,193 | | | | 124,477 | |
| Edison International | | 16,000 | | | | 727,680 | |
| Entergy Corporation | | 10,200 | | | | 941,664 | |
| Exelon Corporation | | 32,824 | | | | 2,031,477 | |
| FPL Group, Inc. | † | | | 19,900 | | | | 1,082,958 | |
| FirstEnergy Corporation | | 16,273 | | | | 979,797 | |
| KeySpan Corporation | | 8,600 | | | | 354,148 | |
| NiSource, Inc. | | 13,302 | | | | 320,578 | |
| PG&E Corporation | | 17,010 | | | | 805,083 | |
| PPL Corporation | | 18,700 | | | | 670,208 | |
| Pinnacle West Capital Corporation | | 4,900 | | | | 248,136 | |
| Progress Energy, Inc. | | 12,400 | | | | 608,592 | |
| Public Service Enterprise Group, Inc. | | 12,300 | | | | 816,474 | |
| Sempra Energy | | 12,669 | | | | 709,084 | |
See accompanying notes to financial statements.
178
SCHEDULE OF INVESTMENTS—(Continued)
December 31, 2006
Vantagepoint Asset
Allocation Fund
|
|
|
|
|
|
|
| Shares
|
| Value
|
|---|
COMMON STOCKS—(Continued) |
| Southern Company (The) | | 36,500 | | | $ | 1,345,390 | |
| TXU Corporation | | 22,794 | | | | 1,235,663 | |
| TECO Energy, Inc. | † | | | 10,200 | | | | 175,746 | |
| Xcel Energy, Inc. | † | | | 19,870 | | | | 458,202 | |
| | | 21,677,282 | |
Electrical Equipment—2.8% | | | |
| Cooper Industries, Ltd. Class A (Bermuda) | | 4,500 | | | | 406,935 | |
| Emerson Electric Company | | 40,400 | | | | 1,780,428 | |
| General Electric Company | | 513,660 | | | | 19,113,289 | |
| | | 21,300,652 | |
Electronics—3.4% | | | |
| Advanced Micro Devices, Inc. | * | | | 25,700 | | | | 522,995 | |
| Agilent Technologies, Inc. | * | | | 21,049 | | | | 733,558 | |
| Altera Corporation | * | | | 17,700 | | | | 348,336 | |
| American Power Conversion Corporation | | 7,900 | | | | 241,661 | |
| Analog Devices, Inc. | | 18,000 | | | | 591,660 | |
| Broadcom Corporation Class A | * | | | 22,870 | | | | 738,930 | |
| Cisco Systems, Inc. | * | | | 302,550 | | | | 8,268,692 | |
| Eastman Kodak Company | † | | | 14,100 | | | | 363,780 | |
| Intel Corporation | | 286,740 | | | | 5,806,485 | |
| JDS Uniphase Corporation | *† | | | 10,587 | | | | 176,379 | |
| LSI Logic Corporation | * | | | 19,300 | | | | 173,700 | |
| Linear Technology Corporation | † | | | 15,000 | | | | 454,800 | |
| Maxim Integrated Products, Inc. | | 15,820 | | | | 484,408 | |
| Micron Technology, Inc. | * | | | 35,800 | | | | 499,768 | |
| Molex, Inc. | | 6,975 | | | | 220,619 | |
| National Semiconductor Corporation | | 16,600 | | | | 376,820 | |
| Novellus Systems, Inc. | *† | | | 6,200 | | | | 213,404 | |
| PMC-Sierra, Inc. | *† | | | 10,900 | | | | 73,139 | |
| QLogic Corporation | * | | | 8,800 | | | | 192,896 | |
| Raytheon Company | | 21,900 | | | | 1,156,320 | |
| Rockwell Collins, Inc. | | 8,500 | | | | 537,965 | |
| Sanmina-SCI Corporation | * | | | 28,400 | | | | 97,980 | |
| Teradyne, Inc. | *† | | | 9,400 | | | | 140,624 | |
| Texas Instruments, Inc. | | 75,100 | | | | 2,162,880 | |
| Xerox Corporation | * | | | 47,800 | | | | 810,210 | |
| Xilinx, Inc. | | 16,910 | | | | 402,627 | |
| | | 25,790,636 | |
Entertainment & Leisure—1.6% | | | |
| Harrah’s Entertainment, Inc. | | 9,060 | | | | 749,443 | |
| Hasbro, Inc. | | 8,275 | | | | 225,494 | |
| Mattel, Inc. | | 19,078 | | | | 432,307 | |
| News Corporation, Inc. Class A | | 118,050 | | | | 2,535,714 | |
| Time Warner, Inc. | | 200,567 | | | | 4,368,349 | |
| Walt Disney Company | | 104,165 | | | | 3,569,735 | |
| | | 11,881,042 | |
Environmental—0.0% | | | |
| Tektronix, Inc. | | 4,500 | | | | 131,265 | | | |
Financial Services—3.1% | | | |
| Ameriprise Financial, Inc. | | 12,326 | | | | 671,767 | |
| Bear Stearns Companies, Inc. (The) | | 5,833 | | | | 949,496 | |
| Charles Schwab Corporation (The) | | 50,722 | | | | 980,963 | |
| Chicago Mercantile Exchange | † | | | 1,693 | | | | 863,007 | |
| Countrywide Financial Corporation | | 30,798 | | | | 1,307,375 | |
| E*Trade Financial Corporation | * | | | 20,600 | | | | 461,852 | |
| Federated Investors, Inc. Class B | | 3,800 | | | | 128,364 | |
| Franklin Resources, Inc. | | 7,990 | | | | 880,258 | |
| Goldman Sachs Group, Inc. | | 21,480 | | | | 4,282,038 | |
| Janus Capital Group, Inc. | | 10,400 | | | | 224,536 | |
| Legg Mason, Inc. | | 6,460 | | | $ | 614,023 | |
| Lehman Brothers Holdings, Inc. | | 26,600 | | | | 2,077,992 | |
| Merrill Lynch & Company, Inc. | | 44,270 | | | | 4,121,537 | |
| Morgan Stanley | | 52,830 | | | | 4,301,947 | |
| Principal Financial Group | | 13,750 | | | | 807,125 | |
| T Rowe Price Group, Inc. | | 13,020 | | | | 569,885 | |
| Western Union Company (The) | | 37,736 | | | | 846,041 | |
| | | 24,088,206 | |
Food Retailers—0.3% | | | |
| Kroger Company (The) | | 35,700 | | | | 823,599 | |
| Starbucks Corporation | * | | | 37,600 | | | | 1,331,792 | |
| Whole Foods Market, Inc. | † | | | 6,800 | | | | 319,124 | |
| | | 2,474,515 | |
Forest Products & Paper—0.5% | | | |
| Bemis Company | | 5,700 | | | | 193,686 | |
| International Paper Company | | 24,202 | | | | 825,288 | |
| Kimberly-Clark Corporation | | 22,620 | | | | 1,537,029 | |
| MeadWestvaco Corporation | | 8,814 | | | | 264,949 | |
| Pactiv Corporation | * | | | 6,900 | | | | 246,261 | |
| Weyerhaeuser Company | | 12,000 | | | | 847,800 | |
| | | 3,915,013 | |
Health Care Providers—0.4% | | | |
| Caremark Rx, Inc. | | 22,100 | | | | 1,262,131 | |
| Coventry Health Care, Inc. | * | | | 7,840 | | | | 392,392 | |
| Express Scripts, Inc. | * | | | 7,200 | | | | 515,520 | |
| Health Management Associates, Inc. Class A | | 11,800 | | | | 249,098 | |
| Laboratory Corporation Of America Holdings | *† | | | 6,200 | | | | 455,514 | |
| Manor Care, Inc. | | 3,900 | | | | 182,988 | |
| Tenet Healthcare Corporation | *† | | | 25,550 | | | | 178,084 | |
| | | 3,235,727 | |
Heavy Construction—0.1% | | | |
| Centex Corporation | † | | | 6,000 | | | | 337,620 | |
| Lennar Corporation Class A | | 6,700 | | | | 351,482 | |
| | | 689,102 | |
Heavy Machinery—1.3% | | | |
| American Standard Companies, Inc. | | 8,750 | | | | 401,188 | |
| Applied Materials, Inc. | | 70,300 | | | | 1,297,035 | |
| Black & Decker Corporation | | 3,800 | | | | 303,886 | |
| Caterpillar, Inc. | | 33,000 | | | | 2,023,890 | |
| Cummins, Inc. | | 2,550 | | | | 301,359 | |
| Deere & Company | † | | | 11,700 | | | | 1,112,319 | |
| Dover Corporation | | 10,000 | | | | 490,200 | |
| Eaton Corporation | | 7,300 | | | | 548,522 | |
| Ingersoll-Rand Company Class A (Bermuda) | | 16,100 | | | | 629,993 | |
| National-Oilwell Varco, Inc. | * | | | 8,610 | | | | 526,760 | |
| Pall Corporation | | 6,566 | | | | 226,855 | |
| Parker Hannifin Corporation | | 5,925 | | | | 455,514 | |
| Rockwell Automation, Inc. | | 8,700 | | | | 531,396 | |
| Stanley Works (The) | | 3,800 | | | | 191,102 | |
| Terex Corporation | * | | | 4,860 | | | | 313,859 | |
| WW Grainger, Inc. | | 3,800 | | | | 265,772 | |
| | | 9,619,650 | |
Home Construction, Furnishings & Appliances—0.4% |
| DR Horton, Inc. | | 13,400 | | | | 354,966 | |
| Harman International Industries, Inc. | | 3,200 | | | | 319,712 | |
| Johnson Controls, Inc. | † | | | 9,510 | | | | 817,099 | |
| KB Home | | 3,800 | | | | 194,864 | |
| Leggett & Platt, Inc. | | 9,000 | | | | 215,100 | |
See accompanying notes to financial statements.
179
SCHEDULE OF INVESTMENTS—(Continued)
December 31, 2006
Vantagepoint Asset
Allocation Fund
|
|
|
|
|
|
|
| Shares
|
| Value
|
|---|
COMMON STOCKS—(Continued) |
| Masco Corporation | † | | | 20,500 | | | $ | 612,335 | |
| Pulte Homes, Inc. | | 10,540 | | | | 349,085 | |
| Whirlpool Corporation | † | | | 3,798 | | | | 315,310 | |
| | | 3,178,471 | |
Household Products—0.3% | | | |
| Fortune Brands, Inc. | † | | | 7,200 | | | | 614,808 | |
| Illinois Tool Works, Inc. | | 20,780 | | | | 959,828 | |
| Newell Rubbermaid, Inc. | | 13,460 | | | | 389,667 | |
| Rohm & Haas Company | † | | | 7,095 | | | | 362,696 | |
| Snap-On, Inc. | | 2,850 | | | | 135,774 | |
| | | 2,462,773 | |
Industrial—Diversified—0.4% | | | |
| Tyco International Ltd. (Bermuda) | | 99,149 | | | | 3,014,130 | | | |
Insurance—5.0% | | | |
| ACE, Ltd. (Cayman Islands) | | 15,900 | | | | 963,063 | |
| Aflac, Inc. | | 24,500 | | | | 1,127,000 | |
| Aetna, Inc. | | 26,748 | | | | 1,154,979 | |
| Allstate Corporation (The) | | 31,738 | | | | 2,066,461 | |
| AMBAC Financial Group, Inc. | | 5,150 | | | | 458,711 | |
| American International Group, Inc. | | 129,440 | | | | 9,275,670 | |
| AON Corporation | | 15,825 | | | | 559,256 | |
| Chubb Corporation | | 20,220 | | | | 1,069,840 | |
| Cigna Corporation | | 5,370 | | | | 706,531 | |
| Cincinnati Financial Corporation | | 8,539 | | | | 386,902 | |
| Genworth Financial, Inc. Class A | | 21,840 | | | | 747,146 | |
Hartford Financial Services
Group, Inc. | | 15,700 | | | | 1,464,967 | |
| Humana, Inc. | * | | | 8,000 | | | | 442,480 | |
| Lincoln National Corporation | | 14,004 | | | | 929,866 | |
| Loews Corporation | | 21,970 | | | | 911,096 | |
| MBIA, Inc. | | 6,550 | | | | 478,543 | |
| MGIC Investment Corporation | | 4,300 | | | | 268,922 | |
| Marsh & McLennan Companies, Inc. | | 26,900 | | | | 824,754 | |
| Metlife, Inc. | | 37,310 | | | | 2,201,663 | |
| Progressive Corporation (The) | | 38,720 | | | | 937,798 | |
| Prudential Financial, Inc. | | 24,300 | | | | 2,086,398 | |
| Safeco Corporation | | 5,600 | | | | 350,280 | |
| St. Paul Travelers Companies | | 34,216 | | | | 1,837,057 | |
| Torchmark Corporation | | 5,100 | | | | 325,176 | |
| UnitedHealth Group, Inc. | | 66,700 | | | | 3,583,791 | |
| UnumProvident Corporation | | 16,318 | | | | 339,088 | |
| WellPoint, Inc. | * | | | 31,070 | | | | 2,444,898 | |
XL Capital Ltd. Class A
(Cayman Islands) | | 8,550 | | | | 615,771 | |
| | | 38,558,107 | |
Lodging—0.3% | | | |
| Hilton Hotels Corporation | | 19,200 | | | | 670,080 | |
| Marriott International, Inc. Class A | | 16,840 | | | | 803,605 | |
| Starwood Hotels & Resorts Worldwide, Inc. | | 10,600 | | | | 662,500 | |
| Wyndham Worldwide Corporation | * | | | 9,920 | | | | 317,638 | |
| | | 2,453,823 | |
Media—Broadcasting & Publishing—1.6% |
| CBS Corporation Class B | † | | | 38,045 | | | | 1,186,243 | |
| Clear Channel Communications, Inc. | | 25,470 | | | | 905,204 | |
| Comcast Corporation Class A | * | | | 104,380 | | | | 4,418,405 | |
| DIRECTV Group (The), Inc. | * | | | 37,946 | | | | 946,373 | |
| Dow Jones & Company, Inc. | † | | | 3,390 | | | | 128,820 | |
| EW Scripps Company Class A | | 4,200 | | | | 209,748 | |
| Gannett Company, Inc. | | 11,730 | | | | 709,196 | |
| IAC/InterActiveCorporation | *† | | | 10,777 | | | $ | 400,473 | |
McGraw-Hill Companies,
Inc. (The) | | 18,100 | | | | 1,231,162 | |
| Meredith Corporation | | 2,100 | | | | 118,335 | |
New York Times Company
Class A | † | | | 7,000 | | | | 170,520 | |
| Tribune Company | † | | | 10,067 | | | | 309,862 | |
| Univision Communications, Inc. Class A | *† | | | 11,850 | | | | 419,727 | |
| Viacom, Inc. Class B | * | | | 35,645 | | | | 1,462,514 | |
| | | 12,616,582 | |
Medical Supplies—3.0% | | | |
| Allergan, Inc. | | 7,500 | | | | 898,050 | |
| Applera Corporation—Applied Biosystems Group | | 9,000 | | | | 330,210 | |
| Bausch & Lomb, Inc. | | 2,806 | | | | 146,080 | |
| Baxter International, Inc. | | 31,900 | | | | 1,479,841 | |
| Becton Dickinson & Company | | 12,200 | | | | 855,830 | |
| Biomet, Inc. | | 12,225 | | | | 504,526 | |
| Boston Scientific Corporation | * | | | 56,830 | | | | 976,339 | |
| CR Bard, Inc. | † | | | 5,100 | | | | 423,147 | |
| Johnson & Johnson | | 144,928 | | | | 9,568,147 | |
| Kla-Tencor Corporation | | 9,820 | | | | 488,545 | |
| Medtronic, Inc. | | 57,310 | | | | 3,066,658 | |
| Millipore Corporation | *† | | | 2,500 | | | | 166,500 | |
| Patterson Cos., Inc. | * | | | 6,800 | | | | 241,468 | |
| PerkinElmer, Inc. | | 6,400 | | | | 142,272 | |
| St. Jude Medical, Inc. | * | | | 18,000 | | | | 658,080 | |
| Stryker Corporation | | 14,400 | | | | 793,584 | |
| Thermo Fisher Scientific, Inc. | * | | | 20,200 | | | | 914,858 | |
| Waters Corporation | * | | | 5,100 | | | | 249,747 | |
| Zimmer Holdings, Inc. | * | | | 12,190 | | | | 955,452 | |
| | | 22,859,334 | |
Metals—0.8% | | | |
| Alcoa, Inc. | | 42,860 | | | | 1,286,229 | |
| Allegheny Technologies, Inc. | | 4,683 | | | | 424,654 | |
| Danaher Corporation | | 11,710 | | | | 848,272 | |
| Newmont Mining Corporation | | 21,968 | | | | 991,855 | |
| Nucor Corporation | | 15,200 | | | | 830,832 | |
| Phelps Dodge Corporation | | 10,056 | | | | 1,203,904 | |
| United States Steel Corporation | | 5,820 | | | | 425,675 | |
| | | 6,011,421 | |
Mining—0.1% | | | |
| Freeport-McMoran Copper & Gold, Inc. Class B | † | | | 9,650 | | | | 537,795 | | | |
Oil & Gas—8.1% | | | |
| Anadarko Petroleum Corporation | | 22,740 | | | | 989,645 | |
| Apache Corporation | | 16,292 | | | | 1,083,581 | |
| Ashland, Inc. | | 3,400 | | | | 235,212 | |
| Baker Hughes, Inc. | | 16,380 | | | | 1,222,931 | |
| BJ Services Company | | 15,900 | | | | 466,188 | |
| Chesapeake Energy Corporation | † | | | 20,400 | | | | 592,620 | |
| Chevron Corporation | | 108,980 | | | | 8,013,299 | |
| ConocoPhillips | | 81,919 | | | | 5,894,072 | |
| Devon Energy Corporation | | 21,688 | | | | 1,454,831 | |
| EOG Resources, Inc. | | 11,900 | | | | 743,155 | |
| El Paso Corporation | † | | | 35,077 | | | | 535,977 | |
| Exxon Mobil Corporation | | 291,187 | | | | 22,313,660 | |
| Halliburton Company | | 50,820 | | | | 1,577,961 | |
| Hess Corporation | | 13,200 | | | | 654,324 | |
| Kinder Morgan, Inc. | | 5,200 | | | | 549,900 | |
| Marathon Oil Corporation | | 17,997 | | | | 1,664,723 | |
| Murphy Oil Corporation | † | | | 8,710 | | | | 442,904 | |
| Nabors Industries Ltd. | *† | | | 15,500 | | | | 461,590 | |
See accompanying notes to financial statements.
180
SCHEDULE OF INVESTMENTS—(Continued)
December 31, 2006
Vantagepoint Asset
Allocation Fund
|
|
|
|
|
|
|
| Shares
|
| Value
|
|---|
COMMON STOCKS—(Continued) |
| Nicor, Inc. | † | | | 2,200 | | | $ | 102,960 | |
| Noble Corporation (Cayman Islands) | | 6,700 | | | | 510,205 | |
| Occidental Petroleum Corporation | | 42,380 | | | | 2,069,415 | |
| Peoples Energy Corporation | | 2,300 | | | | 102,511 | |
| Questar Corporation | | 4,111 | | | | 341,419 | |
| Rowan Companies., Inc. | | 5,400 | | | | 179,280 | |
Schlumberger Ltd.
(Netherland Antilles) | | 58,700 | | | | 3,707,492 | |
| Smith International, Inc. | † | | | 9,937 | | | | 408,113 | |
| Sunoco, Inc. | | 6,600 | | | | 411,576 | |
Transocean, Inc.
(Cayman Islands) | * | | | 14,911 | | | | 1,206,151 | |
| Valero Energy Corporation | | 30,560 | | | | 1,563,450 | |
| Weatherford International Ltd. (Bermuda) | * | | | 17,120 | | | | 715,445 | |
| Williams Companies, Inc. | | 29,300 | | | | 765,316 | |
| XTO Energy, Inc. | | 17,866 | | | | 840,595 | |
| | | 61,820,501 | |
Pharmaceuticals—5.5% | | | |
| Abbott Laboratories | | 76,400 | | | | 3,721,444 | |
| AmerisourceBergen Corporation | | 10,300 | | | | 463,088 | |
| Amgen, Inc. | * | | | 57,894 | | | | 3,954,739 | |
| Barr Pharmaceuticals, Inc. | * | | | 5,200 | | | | 260,624 | |
| Biogen Idec, Inc. | * | | | 16,930 | | | | 832,787 | |
| Bristol-Myers Squibb Company | | 97,900 | | | | 2,576,728 | |
| Cardinal Health, Inc. | | 20,750 | | | | 1,336,923 | |
| Celgene Corporation | *† | | | 18,401 | | | | 1,058,610 | |
| Eli Lilly & Company | | 49,100 | | | | 2,558,110 | |
| Forest Laboratories, Inc. | * | | | 16,000 | | | | 809,600 | |
| Genzyme Corporation | * | | | 12,800 | | | | 788,224 | |
| Gilead Sciences, Inc. | * | | | 22,730 | | | | 1,475,859 | |
| Hospira, Inc. | * | | | 7,950 | | | | 266,961 | |
| King Pharmaceuticals, Inc. | * | | | 11,466 | | | | 182,539 | |
| McKesson Corporation | | 15,089 | | | | 765,012 | |
| Medco Health Solutions, Inc. | * | | | 14,955 | | | | 799,195 | |
| MedImmune, Inc. | *† | | | 12,600 | | | | 407,862 | |
| Merck & Company, Inc. | | 107,600 | | | | 4,691,360 | |
| Mylan Laboratories | | 10,800 | | | | 215,568 | |
| Pfizer, Inc. | | 360,412 | | | | 9,334,671 | |
| Quest Diagnostics, Inc. | | 8,000 | | | | 424,000 | |
| Schering-Plough Corporation | | 72,800 | | | | 1,720,992 | |
| Sigma Aldrich Corporation | † | | | 3,300 | | | | 256,476 | |
| Watson Pharmaceuticals, Inc. | * | | | 4,800 | | | | 124,944 | |
| Wyeth | | 66,900 | | | | 3,406,548 | |
| | | 42,432,864 | |
Real Estate—1.0% | | | |
| Apartment Investment & Management Company REIT Class A | † | | | 4,400 | | | | 246,488 | |
| Archstone-Smith Trust REIT | † | | | 10,500 | | | | 611,205 | |
| Boston Properties, Inc. REIT | | 5,800 | | | | 648,904 | |
| CB Richard Ellis Group, Inc. Class A | * | | | 8,899 | | | | 295,447 | |
| Equity Office Properties Trust REIT | | 18,300 | | | | 881,511 | |
| Equity Residential REIT | | 14,300 | | | | 725,725 | |
| Kimco Realty Corporation REIT | † | | | 11,100 | | | | 498,945 | |
Plum Creek Timber Company,
Inc. REIT | | 9,100 | | | | 362,635 | |
| Prologis REIT | | 12,000 | | | | 729,240 | |
| Public Storage, Inc. REIT | | 5,720 | | | | 557,700 | |
| Realogy Corporation | * | | | 12,400 | | | | 375,968 | |
| Simon Property Group, Inc. REIT | | 10,700 | | | | 1,083,803 | |
| Vornado Realty Trust REIT | † | | | 6,300 | | | | 765,450 | |
| | | 7,783,021 | |
Restaurants—0.5% | | | |
| Darden Restaurants, Inc. | | 6,500 | | | $ | 261,105 | |
| McDonald’s Corporation | | 61,800 | | | | 2,739,594 | |
| Wendy’s International, Inc. | | 5,600 | | | | 185,304 | |
| Yum! Brands, Inc. | | 13,600 | | | | 799,680 | |
| | | 3,985,683 | |
Retailers—3.2% | | | |
| Amazon.Com, Inc. | *† | | | 15,200 | | | | 599,792 | |
| Autozone, Inc. | * | | | 2,710 | | | | 313,168 | |
| Bed Bath & Beyond, Inc. | * | | | 13,800 | | | | 525,780 | |
| Best Buy Company, Inc. | | 20,015 | | | | 984,538 | |
| Big Lots, Inc. | * | | | 5,200 | | | | 119,184 | |
| CVS Corporation | | 40,200 | | | | 1,242,582 | |
| Circuit City Stores, Inc. | | 7,400 | | | | 140,452 | |
| Costco Wholesale Corporation | | 23,276 | | | | 1,230,602 | |
| Dillard’s, Inc. Class A | † | | | 2,900 | | | | 101,413 | |
| Dollar General Corporation | | 15,570 | | | | 250,054 | |
| eBay, Inc. | * | | | 57,730 | | | | 1,735,941 | |
| Family Dollar Stores, Inc. | | 8,200 | | | | 240,506 | |
| Federated Department Stores | | 26,704 | | | | 1,018,224 | |
| JC Penney Company, Inc. | | 11,420 | | | | 883,451 | |
| Nike, Inc. Class B | | 9,360 | | | | 926,921 | |
| Office Depot, Inc. | * | | | 14,500 | | | | 553,465 | |
| OfficeMax, Inc. | | 3,370 | | | | 167,321 | |
| RadioShack Corporation | † | | | 6,100 | | | | 102,358 | |
| Sears Holdings Corporation | *† | | | 4,302 | | | | 722,435 | |
| Sherwin-Williams Company (The) | | 5,430 | | | | 345,239 | |
| Staples, Inc. | | 35,850 | | | | 957,195 | |
| TJX Companies., Inc. | | 22,700 | | | | 646,496 | |
| Target Corporation | | 43,200 | | | | 2,464,560 | |
| Tiffany & Company | | 7,000 | | | | 274,680 | |
| Walgreen Company | | 49,800 | | | | 2,285,322 | |
| Wal-Mart Stores, Inc. | | 122,900 | | | | 5,675,522 | |
| | | 24,507,201 | |
Telephone Systems—2.9% | | | |
| Alltel Corporation | | 19,080 | | | | 1,153,958 | |
| AT&T, Inc. | | 190,834 | | | | 6,822,316 | |
| BellSouth Corporation | | 90,300 | | | | 4,254,033 | |
| CenturyTel, Inc. | | 5,600 | | | | 244,496 | |
| Citizens Communications Company | | 16,200 | | | | 232,794 | |
| Embarq Corporation | | 7,297 | | | | 383,530 | |
| Qwest Communications International, Inc. | * | | | 76,329 | | | | 638,874 | |
| Sprint Nextel Corporation | | 145,959 | | | | 2,757,166 | |
| Verizon Communications, Inc. | | 145,371 | | | | 5,413,616 | |
| Windstream Corporation | | 22,027 | | | | 313,224 | |
| | | 22,214,007 | |
Textiles, Clothing & Fabrics—0.2% | | | |
| Coach, Inc. | * | | | 18,900 | | | | 811,944 | |
| Jones Apparel Group, Inc. | | 5,600 | | | | 187,208 | |
| Liz Claiborne, Inc. | | 5,000 | | | | 217,300 | |
| VF Corporation | | 4,300 | | | | 352,944 | |
| | | 1,569,396 | |
Transportation—1.3% | | | |
| Brunswick Corporation | | 4,900 | | | | 156,310 | |
| Burlington Northern Santa Fe Corporation | | 18,356 | | | | 1,354,856 | |
| CSX Corporation | | 21,600 | | | | 743,688 | |
| Carnival Corporation | † | | | 22,130 | | | | 1,085,477 | |
| Norfolk Southern Corporation | | 20,300 | | | | 1,020,887 | |
| Sabre Holdings Corporation | | 6,930 | | | | 220,998 | |
| Union Pacific Corporation | | 13,400 | | | | 1,233,068 | |
See accompanying notes to financial statements.
181
SCHEDULE OF INVESTMENTS—(Continued)
December 31, 2006
Vantagepoint Asset
Allocation Fund
|
|
|
|
|
|
|
| Shares
|
| Value
|
|---|
COMMON STOCKS—(Continued) |
| United Parcel Service, Inc. Class B | | 53,700 | | | $ | 4,026,426 | |
| | | 9,841,710 | |
TOTAL COMMON STOCKS
| | | |
| (Cost $503,110,306) | | 634,365,907 | |
| |
Coupon
Rate
|
|
|
| Maturity
Date
|
|
|
| Face
|
| Value
|
|---|
U.S. TREASURY OBLIGATIONS—0.8% |
U.S. Treasury Bills—0.8% | | | |
| U.S. Treasury Bill | | | |
| 4.845% | | | | 03/08/2007 | | ** | | | | | | | | |
| (Cost $6,440,514) | $ | 6,500,000 | | | | 6,440,514 | |
| |
|
|
|
|
|
|
|
| Shares
|
| Value
|
|---|
RIGHTS—0.0% |
Computers & Information—0.0% | | | |
| Seagate Technology, Inc. | *d | | | | | | | | |
| (Cost $—) | | 10,600 | | | | — | |
| |
Coupon
Rate
|
|
|
| Maturity
Date
|
|
|
| Face
|
| Value
|
|---|
COMMERCIAL PAPER—11.6% |
Financial Services—11.6% | | | |
| Grampian Funding LLC, 144A | | | |
| 5.250% | | | | 03/20/2007 | | *** | | $ | 30,000,000 | | | | 29,650,000 | |
| Lexington Parker Capital CP, 144A | | | |
| 5.240% | | | | 03/15/2007 | | *** | | | 30,000,000 | | | | 29,672,500 | |
| Simba Funding Corporation | | | |
| 5.240% | | | | 03/12/2007 | | | | | 30,000,000 | | | | 29,685,600 | |
TOTAL COMMERCIAL PAPER
| | | |
| (Cost $89,008,100) | | 89,008,100 | |
| |
CASH EQUIVALENTS—4.1% |
Bank & Certificate Deposits/
Offshore Time Deposits—4.0% | | | |
| Abbey National PLC | | | |
| 5.280% | | | | 01/05/2007 | | †† | | | 478,412 | | | | 478,412 | |
| BancoBilbao Vizcaya Argentaria SA | | | |
| 5.310% | | | | 01/03/2007 | | †† | | | 478,412 | | | | 478,412 | |
| Bank Of Nova Scotia | | | |
| 5.300% | | | | 02/27/2007 | | †† | | | 598,016 | | | | 598,016 | |
| Bank Of Nova Scotia | | | |
| 5.290% | | | | 01/30/2007 | | †† | | | 239,206 | | | | 239,206 | |
| Bank Of Nova Scotia | | | |
| 5.290% | | | | 02/06/2007 | | †† | | | 358,809 | | | | 358,809 | |
| Barclays | | | |
| 5.320% | | | | 02/13/2007 | | †† | | | 239,206 | | | | 239,206 | |
| Barclays | | | |
| 5.310% | | | | 02/20/2007 | | †† | | | 598,015 | | | | 598,015 | |
| Barclays | | | |
| 5.300% | | | | 01/02/2007 | | †† | | | 598,015 | | | | 598,015 | |
| Barton Capital LLC | | | |
| 5.300% | | | | 01/17/2007 | | †† | | | 239,206 | | | | 239,206 | |
| Barton Capital LLC | | | |
| 5.300% | | | | 01/17/2007 | | †† | | | 358,809 | | | | 358,809 | |
|
Coupon
Rate
|
|
|
| Maturity
Date
|
|
|
| Face
|
| Value
|
|---|
| Calyon | | | |
| 5.310% | | | | 02/16/2007 | | †† | | $ | 239,206 | | | $ | 239,206 | |
| Calyon | | | |
| 5.300% | | | | 02/05/2007 | | †† | | | 717,618 | | | | 717,618 | |
| Canadian Imperial Bank of Commerce | | | |
| 5.310% | | | | 01/29/2007 | | †† | | | 717,618 | | | | 717,618 | |
| Charta LLC | | | |
| 5.300% | | | | 01/31/2007 | | †† | | | 468,451 | | | | 468,451 | |
| CIESCO | | | |
| 5.310% | | | | 01/04/2007 | | †† | | | 311,459 | | | | 311,459 | |
| Citigroup | | | |
| 5.310% | | | | 03/16/2007 | | †† | | | 239,206 | | | | 239,206 | |
| Clipper Receivables Corp | | | |
| 5.300% | | | | 01/31/2007 | | †† | | | 239,206 | | | | 239,206 | |
| Compass Securitization | | | |
| 5.300% | | | | 01/09/2007 | | †† | | | 358,809 | | | | 358,809 | |
| CRC Funding LLC | | | |
| 5.340% | | | | 01/23/2007 | | †† | | | 119,603 | | | | 119,603 | |
| CRC Funding LLC | | | |
| 5.300% | | | | 01/10/2007 | | †† | | | 349,198 | | | | 349,198 | |
| Credit Suisse First Boston Corporation | | | |
| 5.300% | | | | 01/05/2007 | | †† | | | 239,206 | | | | 239,206 | |
| Credit Suisse First Boston Corporation | | | |
| 5.300% | | | | 01/12/2007 | | †† | | | 478,412 | | | | 478,412 | |
| Dexia Group | | | |
| 5.290% | | | | 01/16/2007 | | †† | | | 598,015 | | | | 598,015 | |
| Fairway Finance | | | |
| 5.300% | | | | 01/09/2007 | | †† | | | 287,047 | | | | 287,047 | |
| Falcon Asset Securitization Corporation | | | |
| 5.340% | | | | 01/22/2007 | | †† | | | 239,206 | | | | 239,206 | |
| Fortis Bank | | | |
| 5.320% | | | | 01/03/2007 | | †† | | | 239,206 | | | | 239,206 | |
| Fortis Bank | | | |
| 5.300% | | | | 01/02/2007 | | †† | | | 239,206 | | | | 239,206 | |
| Fortis Bank | | | |
| 5.300% | | | | 01/24/2007 | | †† | | | 837,221 | | | | 837,221 | |
| Fortis Bank | | | |
| 5.300% | | | | 01/26/2007 | | †† | | | 956,824 | | | | 956,824 | |
| General Electric Capital Corporation | | | |
| 5.300% | | | | 01/26/2007 | | †† | | | 478,412 | | | | 478,412 | |
| Greyhawk Funding | | | |
| 5.310% | | | | 01/12/2007 | | †† | | | 239,206 | | | | 239,206 | |
| HBOS Halifax Bank of Scotland | | | |
| 5.310% | | | | 03/14/2007 | | †† | | | 598,015 | | | | 598,015 | |
| HBOS Halifax Bank of Scotland | | | |
| 5.300% | | | | 01/08/2007 | | †† | | | 239,206 | | | | 239,206 | |
| Kitty Hawk Funding Corp | | | |
| 5.340% | | | | 01/10/2007 | | †† | | | 358,809 | | | | 358,809 | |
| Lexington Parker Cap Comp | | | |
| 5.300% | | | | 01/05/2007 | | †† | | | 239,206 | | | | 239,206 | |
| Liberty Street | | | |
| 5.310% | | | | 01/17/2007 | | †† | | | 239,206 | | | | 239,206 | |
| Lloyds TSB Bank | | | |
| 5.300% | | | | 02/26/2007 | | †† | | | 239,206 | | | | 239,206 | |
| Marshall & Ilsley Bank Corporation | | | |
| 5.300% | | | | 03/19/2007 | | †† | | | 239,206 | | | | 239,206 | |
| Merrill Lynch & Co | | | |
| 5.300% | | | | 01/02/2007 | | †† | | | 4,186,107 | | | | 4,186,107 | |
| Morgan Stanley & Co | | | |
| 5.300% | | | | 01/02/2007 | | †† | | | 2,932,885 | | | | 2,932,885 | |
| Old Line Funding LLC | | | |
| 5.350% | | | | 01/04/2007 | | †† | | | 239,206 | | | | 239,206 | |
| Paradigm Funding LLC | | | |
| 5.310% | | | | 01/17/2007 | | †† | | | 239,206 | | | | 239,206 | |
| Park Avenue Receivables Corp | | | |
| 5.330% | | | | 01/18/2007 | | †† | | | 239,206 | | | | 239,206 | |
| Rabobank Nederland | | | |
| 5.250% | | | | 01/02/2007 | | †† | | | 717,618 | | | | 717,618 | |
See accompanying notes to financial statements.
182
SCHEDULE OF INVESTMENTS—(Continued)
December 31, 2006
Vantagepoint Asset
Allocation Fund
Coupon
Rate
|
|
|
| Maturity
Date
|
|
|
| Face
|
| Value
|
|---|
CASH EQUIVALENTS—(Continued) |
| Ranger Funding | | | |
| 5.330% | | | | 02/08/2007 | | †† | | $ | 239,206 | | | $ | 239,206 | |
| Ranger Funding | | | |
| 5.320% | | | | 01/04/2007 | | †† | | | 239,206 | | | | 239,206 | |
| Royal Bank of Canada | | | |
| 5.310% | | | | 02/14/2007 | | †† | | | 478,414 | | | | 478,414 | |
| Royal Bank of Scotland | | | |
| 5.310% | | | | 01/11/2007 | | †† | | | 239,208 | | | | 239,208 | |
| Royal Bank of Scotland | | | |
| 5.290% | | | | 01/16/2007 | | †† | | | 358,811 | | | | 358,811 | |
| Royal Bank of Scotland | | | |
| 5.290% | | | | 02/09/2007 | | †† | | | 239,208 | | | | 239,208 | |
| Royal Bank of Scotland | | | |
| 5.280% | | | | 01/11/2007 | | †† | | | 598,017 | | | | 598,017 | |
| Sheffiled Receivables Corp | | | |
| 5.360% | | | | 01/11/2007 | | †† | | | 358,809 | | | | 358,809 | |
| Sheffiled Receivables Corp | | | |
| 5.300% | | | | 01/12/2007 | | †† | | | 239,206 | | | | 239,206 | |
| Societe Generale | | | |
| 5.310% | | | | 01/02/2007 | | †† | | | 598,015 | | | | 598,015 | |
| Societe Generale | | | |
| 5.290% | | | | 02/01/2007 | | †† | | | 598,015 | | | | 598,015 | |
| Societe Generale | | | |
| 5.270% | | | | 01/19/2007 | | †† | | | 598,015 | | | | 598,015 | |
| Svenska Handlesbanken | | | |
| 5.250% | | | | 01/02/2007 | | †† | | | 274,523 | | | | 274,523 | |
| Three Pillars Funding LLC | | | |
| 5.380% | | | | 01/02/2007 | | †† | | | 357,915 | | | | 357,915 | |
| UBS AG | | | |
| 5.300% | | | | 01/04/2007 | | †† | | | 239,206 | | | | 239,206 | |
| UBS AG | | | |
| 5.290% | | | | 01/02/2007 | | †† | | | 478,412 | | | | 478,412 | |
| Variable Funding Capital Co | | | |
| 5.310% | | | | 02/02/2007 | | †† | | | 239,206 | | | | 239,206 | |
| Variable Funding Capital Co | | | |
| 5.290% | | | | 01/04/2007 | | †† | | | 239,206 | | | | 239,206 | |
| Yorktown Capital LLC | | | |
| 5.330% | | | | 01/16/2007 | | †† | | | 239,206 | | | | 239,206 | |
| Yorktown Capital LLC | | | |
| 5.300% | | | | 01/10/2007 | | †† | | | 239,206 | | | | 239,206 | |
| | | 30,576,533 | |
Floating Rate Instruments/Master Notes—0.1% |
| Bank of America | | | |
| 5.310% | | | | 07/10/2007 | | †† | | | 598,015 | | | | 598,015 | |
| Bank of America | | | |
| 5.270% | | | | 01/09/2007 | | †† | | | 478,412 | | | | 478,412 | |
| | | 1,076,427 | |
TOTAL CASH EQUIVALENTS
| | | |
| (Cost $31,652,960) | | 31,652,960 | |
TOTAL INVESTMENTS—99.1%
| | | |
| (Cost $630,211,880) | | 761,467,481 | |
| Other assets less liabilities—0.9% | | 6,914,013 | |
NET ASSETS—100.0% | $ | 768,381,494 | |
Notes to the Schedule of Investments:
| REIT | | Real Estate Investment Trust |
| * | | Non-income producing security. |
| † | | Denotes all or a portion of security on loan. |
| ** | | Security has been pledged as collateral for futures contracts. |
| *** | | Security exempt from registration under Rule 144A of the Securities Act of 1933. These securities may be resold in transactions exempt from registration, normally to qualified buyers. 144A securities represent 7.79% of Total Investments. |
| †† | | Represents collateral received from securities lending transactions. |
| d | | Security has no market value at 12/31/2006. |
See accompanying notes to financial statements.
183
SCHEDULE OF INVESTMENTS
December 31, 2006
Vantagepoint Equity
Income Fund
|
|
|
|
|
|
|
| Shares
|
| Value
|
|---|
COMMON STOCKS—93.6% |
Aerospace & Defense—1.0% | | | |
| Honeywell International, Inc. | | 314,800 | | | $ | 14,241,552 | | | |
Airlines—1.4% | | | |
| FedEx Corporation | | 190,000 | | | | 20,637,800 | | | |
Automotive—2.1% | | | |
| Ford Motor Company | † | | | 200,000 | | | | 1,502,000 | |
| General Motors Corporation | † | | | 804,000 | | | | 24,698,880 | |
| Genuine Parts Company | | 90,552 | | | | 4,294,881 | |
| | | 30,495,761 | |
Banking—9.3% | | | |
| American Express Company | | 50,000 | | | | 3,033,500 | |
| Bank of America Corporation | | 440,492 | | | | 23,517,868 | |
| Capital One Financial Corporation | | 112,000 | | | | 8,603,840 | |
| Citigroup, Inc. | | 332,369 | | | | 18,512,953 | |
| Fannie Mae | | 40,806 | | | | 2,423,468 | |
| Fifth Third Bancorp | † | | | 75,000 | | | | 3,069,750 | |
| JPMorgan Chase & Company | | 250,000 | | | | 12,075,000 | |
| Keycorp | | 100,000 | | | | 3,803,000 | |
| Mellon Financial Corporation | † | | | 150,000 | | | | 6,322,500 | |
| National City Corporation | | 75,000 | | | | 2,742,000 | |
| PNC Financial Services Group, Inc. | | 75,000 | | | | 5,553,000 | |
| SLM Corporation | | 249,200 | | | | 12,153,484 | |
| State Street Corporation | | 110,000 | | | | 7,418,400 | |
| SunTrust Banks, Inc. | | 40,000 | | | | 3,378,000 | |
| Wachovia Corporation | | 166,004 | | | | 9,453,928 | |
| Washington Mutual, Inc. | | 215,745 | | | | 9,814,240 | |
| Wells Fargo & Company | | 126,000 | | | | 4,480,560 | |
| | | 136,355,491 | |
Beverages, Food & Tobacco—4.7% | | | |
| Altria Group, Inc. | | 168,900 | | | | 14,494,998 | |
| Anheuser-Busch Companies, Inc. | | 125,000 | | | | 6,150,000 | |
| Campbell Soup Company | | 99,712 | | | | 3,877,800 | |
| Coca-Cola Company (The) | | 120,000 | | | | 5,790,000 | |
| General Mills, Inc. | | 80,022 | | | | 4,609,267 | |
| Hershey Company (The) | | 50,000 | | | | 2,490,000 | |
| HJ Heinz Company | | 121,000 | | | | 5,446,210 | |
| Imperial Tobacco Group PLC (United Kingdom) | | 179,600 | | | | 14,193,788 | |
| McCormick & Company, Inc. | | 75,000 | | | | 2,892,000 | |
| UST, Inc. | † | | | 153,337 | | | | 8,924,213 | |
| | | 68,868,276 | |
Building Materials—2.5% | | | |
| Cemex SAB de CV (Mexico) | †* | | | 731,166 | | | | 24,735,346 | |
| Hanson PLC Sponsored ADR (United Kingdom) | | 106,700 | | | | 8,076,123 | |
| Home Depot, Inc. | | 85,000 | | | | 3,413,600 | |
| | | 36,225,069 | |
Chemicals—1.6% | | | |
| Avery Dennison Corporation | | 85,000 | | | | 5,774,050 | |
| Dow Chemical Company (The) | | 39,771 | | | | 1,588,454 | |
EI Du Pont de Nemours
& Company | | 268,646 | | | | 13,085,747 | |
International Flavors &
Fragrances, Inc. | | 70,000 | | | | 3,441,200 | |
| | | 23,889,451 | |
Commercial Services—0.3% | | | |
| H&R Block, Inc. | † | | | 50,000 | | | | 1,152,000 | |
| Waste Management, Inc. | | 100,000 | | | | 3,677,000 | |
| | | 4,829,000 | |
Communications—0.5% | | | |
| L-3 Communications Holdings, Inc. | | 56,300 | | | $ | 4,604,214 | |
| Motorola, Inc. | | 100,000 | | | | 2,056,000 | |
| | | 6,660,214 | |
Computer Software & Processing—0.4% | | | |
| Microsoft Corporation | | 200,000 | | | | 5,972,000 | | | |
Computers & Information—4.8% | | | |
| 3M Company | | 95,300 | | | | 7,426,729 | |
| Dell, Inc. | * | | | 2,104,000 | | | | 52,789,360 | |
| International Business Machines Corporation | | 60,000 | | | | 5,829,000 | |
| Pitney Bowes, Inc. | | 98,700 | | | | 4,558,953 | |
| | | 70,604,042 | |
Cosmetics & Personal Care—0.6% | | | |
| Avon Products, Inc. | | 100,000 | | | | 3,304,000 | |
| Colgate-Palmolive Company | | 80,000 | | | | 5,219,200 | |
| | | 8,523,200 | |
Electric Utilities—3.3% | | | |
| Dominion Resources, Inc. | | 86,200 | | | | 7,227,008 | |
| Duke Energy Corporation | | 594,024 | | | | 19,727,537 | |
| Entergy Corporation | | 105,200 | | | | 9,712,064 | |
| FirstEnergy Corporation | | 50,000 | | | | 3,010,500 | |
| NiSource, Inc. | | 130,000 | | | | 3,133,000 | |
| Progress Energy, Inc. | | 100,000 | | | | 4,908,000 | |
| | | 47,718,109 | |
Electrical Equipment—1.8% | | | |
Cooper Industries, Ltd.
Class A (Bermuda) | | 75,000 | | | | 6,782,250 | |
| Emerson Electric Company | | 206,800 | | | | 9,113,676 | |
| General Electric Company | | 275,000 | | | | 10,232,750 | |
| | | 26,128,676 | |
Electronics—3.6% | | | |
| American Power Conversion Corporation | | 181,100 | | | | 5,539,849 | |
| Analog Devices, Inc. | | 125,000 | | | | 4,108,750 | |
| Eastman Kodak Company | † | | | 135,741 | | | | 3,502,118 | |
| Intel Corporation | | 175,000 | | | | 3,543,750 | |
| Koninklijke (Royal) Philips Electronics NV NY Shares (Netherlands) | † | | | 660,000 | | | | 24,802,800 | |
| Raytheon Company | | 100,000 | | | | 5,280,000 | |
| Sony Corporation ADR (Japan) | † | | | 125,000 | | | | 5,353,750 | |
| Texas Instruments, Inc. | | 125,000 | | | | 3,600,000 | |
| Xerox Corporation | * | | | 51,000 | | | | 864,450 | |
| | | 56,595,467 | |
Entertainment & Leisure—4.8% | | | |
| Discovery Holding Company Class A | †* | | | 1,209,800 | | | | 19,465,682 | |
| Mattel, Inc. | | 423,700 | | | | 9,601,042 | |
| Time Warner, Inc. | | 250,000 | | | | 5,445,000 | |
| Walt Disney Company | | 1,054,000 | | | | 36,120,580 | |
| | | 70,632,304 | |
Financial Services—1.0% | | | |
| Charles Schwab Corporation (The) | | 250,000 | | | | 4,835,000 | |
| Morgan Stanley | | 120,000 | | | | 9,771,600 | |
| | | 14,606,600 | |
See accompanying notes to financial statements.
184
SCHEDULE OF INVESTMENTS—(Continued)
December 31, 2006
Vantagepoint Equity
Income Fund
|
|
|
|
|
|
|
| Shares
|
| Value
|
|---|
COMMON STOCKS—(Continued) |
Forest Products & Paper—0.7% | | | |
| International Paper Company | | 150,000 | | | $ | 5,115,000 | |
| Kimberly-Clark Corporation | | 45,259 | | | | 3,075,349 | |
| MeadWestvaco Corporation | | 75,000 | | | | 2,254,500 | |
| | | 10,444,849 | |
Heavy Machinery—1.3% | | | |
| Ingersoll-Rand Company Class A (Bermuda) | | 50,000 | | | | 1,956,500 | |
| Pall Corporation | | 120,000 | | | | 4,146,000 | |
| Stanley Works (The) | | 247,600 | | | | 12,451,804 | |
| | | 18,554,304 | |
Home Construction, Furnishings & Appliances—0.1% | | | |
| Masco Corporation | † | | | 75,000 | | | | 2,240,250 | | | |
Household Products—1.6% | | | |
| Fortune Brands, Inc. | † | | | 37,765 | | | | 3,224,753 | |
| Illinois Tool Works, Inc. | | 325,800 | | | | 15,048,702 | |
| Newell Rubbermaid, Inc. | | 185,000 | | | | 5,355,750 | |
| | | 23,629,205 | |
Industrial—Diversified—0.1% | | | |
| Tyco International Ltd. (Bermuda) | | 50,000 | | | | 1,520,000 | | | |
Insurance—9.9% | | | |
| Allstate Corporation (The) | | 111,000 | | | | 7,227,210 | |
| American International Group, Inc. | | 245,814 | | | | 17,615,031 | |
| AON Corporation | † | | | 766,000 | | | | 27,070,440 | |
| Fairfax Financial Holdings Ltd. (Canada) | † | | | 110,000 | | | | 21,835,000 | |
Hartford Financial Services
Group, Inc. | | 106,500 | | | | 9,937,515 | |
| Lincoln National Corporation | | 49,690 | | | | 3,299,416 | |
| MGIC Investment Corporation | † | | | 125,300 | | | | 7,836,262 | |
Marsh & McLennan
Companies, Inc. | | 140,000 | | | | 4,292,400 | |
| Progressive Corporation (The) | | 50,000 | | | | 1,211,000 | |
| St. Paul Travelers Companies | | 163,806 | | | | 8,794,744 | |
| UnitedHealth Group, Inc. | | 212,300 | | | | 11,406,879 | |
| UnumProvident Corporation | | 105,000 | | | | 2,181,900 | |
| WellPoint, Inc. | * | | | 194,200 | | | | 15,281,598 | |
XL Capital Ltd. Class A
(Cayman Islands) | | 95,900 | | | | 6,906,718 | |
| | | 144,896,113 | |
Media—Broadcasting & Publishing—8.9% |
| CBS Corporation Class B | | 70,000 | | | | 2,182,600 | |
| Comcast Corporation Special Class A | * | | | 584,000 | | | | 24,457,920 | |
| DIRECTV Group (The), Inc. | * | | | 1,099,000 | | | | 27,409,060 | |
| Dow Jones & Company, Inc. | † | | | 98,000 | | | | 3,724,000 | |
| Gannett Company, Inc. | | 174,800 | | | | 10,568,408 | |
| Liberty Media Corporation Interactive Class A | * | | | 1,193,250 | | | | 25,738,402 | |
| Liberty Media Holdings Corporation Capital Class A | * | | | 258,050 | | | | 25,283,739 | |
New York Times Company
Class A | † | | | 160,000 | | | | 3,897,600 | |
| Tribune Company | † | | | 150,000 | | | | 4,617,000 | |
| Viacom, Inc. Class B | * | | | 70,000 | | | | 2,872,100 | |
| | | 130,750,829 | |
Medical Supplies—1.4% | | | |
| Baxter International, Inc. | | 299,300 | | | $ | 13,884,527 | |
| Boston Scientific Corporation | * | | | 175,000 | | | | 3,006,500 | |
| Johnson & Johnson | | 60,000 | | | | 3,961,200 | |
| | | 20,852,227 | |
Metals—0.3% | | | |
| Alcoa, Inc. | | 125,000 | | | | 3,751,250 | | | |
Oil & Gas—8.7% | | | |
BP Amoco PLC ADR
(United Kingdom) | | 109,356 | | | | 7,337,788 | |
| Chesapeake Energy Corporation | † | | | 777,000 | | | | 22,571,850 | |
| Chevron Corporation | | 139,758 | | | | 10,276,406 | |
| ConocoPhillips | | 187,400 | | | | 13,483,430 | |
| Exxon Mobil Corporation | | 124,760 | | | | 9,560,359 | |
| Hess Corporation | | 225,000 | | | | 11,153,250 | |
| Marathon Oil Corporation | | 141,300 | | | | 13,070,250 | |
| Murphy Oil Corporation | † | | | 40,000 | | | | 2,034,000 | |
| Occidental Petroleum Corporation | | 246,600 | | | | 12,041,478 | |
| Pioneer Natural Resources Company | | 527,000 | | | | 20,916,630 | |
| Royal Dutch Shell PLC—Class A ADR (United Kingdom) | | 65,781 | | | | 4,656,637 | |
| | | 127,102,078 | |
Pharmaceuticals—5.0% | | | |
| Abbott Laboratories | | 75,000 | | | | 3,653,250 | |
| Bristol-Myers Squibb Company | | 605,100 | | | | 15,926,232 | |
| Eli Lilly & Company | | 75,000 | | | | 3,907,500 | |
| MedImmune, Inc. | †* | | | 75,000 | | | | 2,427,750 | |
| Merck & Company, Inc. | | 175,000 | | | | 7,630,000 | |
| Pfizer, Inc. | | 653,200 | | | | 16,917,880 | |
| Schering-Plough Corporation | † | | | 442,300 | | | | 10,455,972 | |
| Wyeth | | 253,400 | | | | 12,903,128 | |
| | | 73,821,712 | |
Restaurants—2.1% | | | |
| Yum! Brands, Inc. | | 517,000 | | | | 30,399,600 | | | |
Retailers—1.4% | | | |
| Dollar General Corporation | | 496,400 | | | | 7,972,184 | |
| JC Penney Company, Inc. | | 79,000 | | | | 6,111,440 | |
| RadioShack Corporation | † | | | 200,000 | | | | 3,356,000 | |
| Wal-Mart Stores, Inc. | | 75,000 | | | | 3,463,500 | |
| | | 20,903,124 | |
Telephone Systems—6.2% | | | |
| Alltel Corporation | | 80,000 | | | | 4,838,400 | |
| AT&T, Inc. | † | | | 252,942 | | | | 9,042,676 | |
Nokia Corporation Sponsored
ADR (Finland) | | 874,300 | | | | 17,765,776 | |
| Qwest Communications International, Inc. | †* | | | 600,000 | | | | 5,022,000 | |
| Sprint Nextel Corporation | † | | | 1,711,000 | | | | 32,320,790 | |
| Verizon Communications, Inc. | | 546,741 | | | | 20,360,635 | |
| Windstream Corporation | | 82,714 | | | | 1,176,193 | |
| | | 90,526,470 | |
Transportation—2.2% | | | |
| Burlington Northern Santa Fe Corporation | | 147,300 | | | | 10,872,213 | |
| Carnival Corporation | † | | | 200,600 | | | | 9,839,430 | |
| Norfolk Southern Corporation | | 84,540 | | | | 4,251,517 | |
| Union Pacific Corporation | | 75,997 | | | | 6,993,244 | |
| | | 31,956,404 | |
TOTAL COMMON STOCKS
| | | |
| (Cost $1,048,571,171) | | 1,374,331,427 | |
See accompanying notes to financial statements.
185
SCHEDULE OF INVESTMENTS—(Continued)
December 31, 2006
Vantagepoint Equity
Income Fund
Coupon
Rate
|
|
|
| Maturity
Date
|
|
|
| Face
|
| Value
|
|---|
COMMERCIAL PAPER—1.6% |
Banking—1.2% | �� | | |
| Atlantic Asset Securities Corporation 144A | | | |
| 5.310% | | | | 01/30/2007 | | ** | | $ | 5,000,000 | | | $ | 4,977,138 | |
| Jupiter Securitization Corporation 144A | | | |
| 5.300% | | | | 01/22/2007 | | ** | | | 8,000,000 | | | | 7,972,911 | |
| Old Line Funding LLC 144A | | | |
| 5.290% | | | | 01/31/2007 | | ** | | | 5,000,000 | | | | 4,976,489 | |
| | | 17,926,538 | |
Financial Services—0.4% | | | |
| Falcon Asset Securitization Corporation 144A | | | |
| 5.310% | | | | 01/25/2007 | | ** | | | 5,000,000 | | | | 4,980,825 | |
TOTAL COMMERCIAL PAPER
| | | |
| (Cost $22,907,362) | | 22,907,363 | |
| |
CASH EQUIVALENTS—10.4% |
Bank & Certificate Deposits/
Offshore Time Deposits—10.0% | | | |
| Abbey National PLC | | | |
| 5.280% | | | | 01/05/2007 | | †† | | | 2,307,371 | | | | 2,307,371 | |
| BancoBilbao Vizcaya Argentaria SA | | | |
| 5.310% | | | | 01/03/2007 | | †† | | | 2,307,371 | | | | 2,307,371 | |
| Bank Of Nova Scotia | | | |
| 5.300% | | | | 02/27/2007 | | †† | | | 2,884,214 | | | | 2,884,214 | |
| Bank Of Nova Scotia | | | |
| 5.290% | | | | 01/30/2007 | | †† | | | 1,153,686 | | | | 1,153,686 | |
| Bank Of Nova Scotia | | | |
| 5.290% | | | | 02/06/2007 | | †† | | | 1,730,529 | | | | 1,730,529 | |
| Barclays | | | |
| 5.320% | | | | 02/13/2007 | | †† | | | 1,153,686 | | | | 1,153,686 | |
| Barclays | | | |
| 5.310% | | | | 02/20/2007 | | †† | | | 2,884,214 | | | | 2,884,214 | |
| Barclays | | | |
| 5.300% | | | | 01/02/2007 | | †† | | | 2,884,214 | | | | 2,884,214 | |
| Barton Capital LLC | | | |
| 5.300% | | | | 01/17/2007 | | †† | | | 1,153,684 | | | | 1,153,684 | |
| Barton Capital LLC | | | |
| 5.300% | | | | 01/17/2007 | | †† | | | 1,730,529 | | | | 1,730,529 | |
| Calyon | | | |
| 5.310% | | | | 02/16/2007 | | †† | | | 1,153,686 | | | | 1,153,686 | |
| Calyon | | | |
| 5.300% | | | | 02/05/2007 | | †† | | | 3,461,057 | | | | 3,461,057 | |
| Canadian Imperial Bank of Commerce | | | |
| 5.310% | | | | 01/29/2007 | | †† | | | 3,461,057 | | | | 3,461,057 | |
| Charta LLC | | | |
| 5.300% | | | | 01/31/2007 | | †† | | | 2,259,329 | | | | 2,259,329 | |
| CIESCO | | | |
| 5.310% | | | | 01/04/2007 | | †† | | | 1,502,157 | | | | 1,502,157 | |
| Citigroup | | | |
| 5.310% | | | | 03/16/2007 | | †† | | | 1,153,686 | | | | 1,153,686 | |
| Clipper Receivables Corp | | | |
| 5.300% | | | | 01/31/2007 | | †† | | | 1,153,686 | | | | 1,153,686 | |
| Compass Securitization | | | |
| 5.300% | | | | 01/09/2007 | | †† | | | 1,730,529 | | | | 1,730,529 | |
| CRC Funding LLC | | | |
| 5.340% | | | | 01/23/2007 | | †† | | | 576,843 | | | | 576,843 | |
| CRC Funding LLC | | | |
| 5.300% | | | | 01/10/2007 | | †† | | | 1,684,172 | | | | 1,684,172 | |
| Credit Suisse First Boston Corporation | | | |
| 5.300% | | | | 01/05/2007 | | †† | | | 1,153,686 | | | | 1,153,686 | |
| Credit Suisse First Boston Corporation | | | |
| 5.300% | | | | 01/12/2007 | | †† | | $ | 2,307,371 | | | $ | 2,307,371 | |
| Dexia Group | | | |
| 5.290% | | | | 01/16/2007 | | †† | | | 2,884,214 | | | | 2,884,214 | |
| Fairway Finance | | | |
| 5.300% | | | | 01/09/2007 | | †† | | | 1,384,423 | | | | 1,384,423 | |
| Falcon Asset Securitization Corporation | | | |
| 5.340% | | | | 01/22/2007 | | †† | | | 1,153,686 | | | | 1,153,686 | |
| Fortis Bank | | | |
| 5.320% | | | | 01/03/2007 | | †† | | | 1,153,686 | | | | 1,153,686 | |
| Fortis Bank | | | |
| 5.300% | | | | 01/02/2007 | | †† | | | 1,153,686 | | | | 1,153,686 | |
| Fortis Bank | | | |
| 5.300% | | | | 01/24/2007 | | †† | | | 4,037,900 | | | | 4,037,900 | |
| Fortis Bank | | | |
| 5.300% | | | | 01/26/2007 | | †† | | | 4,614,742 | | | | 4,614,742 | |
| General Electric Capital Corporation | | | |
| 5.300% | | | | 01/26/2007 | | †† | | | 2,307,371 | | | | 2,307,371 | |
| Greyhawk Funding | | | |
| 5.310% | | | | 01/12/2007 | | †† | | | 1,153,686 | | | | 1,153,686 | |
| HBOS Halifax Bank of Scotland | | | |
| 5.310% | | | | 03/14/2007 | | †† | | | 2,884,214 | | | | 2,884,214 | |
| HBOS Halifax Bank of Scotland | | | |
| 5.300% | | | | 01/08/2007 | | †† | | | 1,153,686 | | | | 1,153,686 | |
| Kitty Hawk Funding Corp | | | |
| 5.340% | | | | 01/10/2007 | | †† | | | 1,730,529 | | | | 1,730,529 | |
| Lexington Parker Cap Comp | | | |
| 5.300% | | | | 01/05/2007 | | †† | | | 1,153,686 | | | | 1,153,686 | |
| Liberty Street | | | |
| 5.310% | | | | 01/17/2007 | | †† | | | 1,153,686 | | | | 1,153,686 | |
| Lloyds TSB Bank | | | |
| 5.300% | | | | 02/26/2007 | | †† | | | 1,153,686 | | | | 1,153,686 | |
| Marshall & Ilsley Bank Corporation | | | |
| 5.300% | | | | 03/19/2007 | | †† | | | 1,153,686 | | | | 1,153,686 | |
| Merrill Lynch & Co | | | |
| 5.300% | | | | 01/02/2007 | | †† | | | 20,189,495 | | | | 20,189,495 | |
| Morgan Stanley & Co | | | |
| 5.300% | | | | 01/02/2007 | | †† | | | 14,145,237 | | | | 14,145,237 | |
| Old Line Funding LLC | | | |
| 5.350% | | | | 01/04/2007 | | †† | | | 1,153,686 | | | | 1,153,686 | |
| Paradigm Funding LLC | | | |
| 5.310% | | | | 01/17/2007 | | †† | | | 1,153,686 | | | | 1,153,686 | |
| Park Avenue Receivables Corp | | | |
| 5.330% | | | | 01/18/2007 | | †† | | | 1,153,686 | | | | 1,153,686 | |
| Rabobank Nederland | | | |
| 5.250% | | | | 01/02/2007 | | †† | | | 3,461,057 | | | | 3,461,057 | |
| Ranger Funding | | | |
| 5.330% | | | | 02/08/2007 | | †† | | | 1,153,686 | | | | 1,153,686 | |
| Ranger Funding | | | |
| 5.320% | | | | 01/04/2007 | | †† | | | 1,153,686 | | | | 1,153,686 | |
| Royal Bank of Canada | | | |
| 5.310% | | | | 02/14/2007 | | †† | | | 2,307,371 | | | | 2,307,371 | |
| Royal Bank of Scotland | | | |
| 5.310% | | | | 01/11/2007 | | †† | | | 1,153,682 | | | | 1,153,682 | |
| Royal Bank of Scotland | | | |
| 5.290% | | | | 01/16/2007 | | †† | | | 1,730,527 | | | | 1,730,527 | |
| Royal Bank of Scotland | | | |
| 5.290% | | | | 02/09/2007 | | †† | | | 1,153,682 | | | | 1,153,682 | |
| Royal Bank of Scotland | | | |
| 5.280% | | | | 01/11/2007 | | †† | | | 2,884,212 | | | | 2,884,212 | |
| Sheffiled Receivables Corp | | | |
| 5.360% | | | | 01/11/2007 | | †† | | | 1,730,529 | | | | 1,730,529 | |
| Sheffiled Receivables Corp | | | |
| 5.300% | | | | 01/12/2007 | | †† | | | 1,153,686 | | | | 1,153,686 | |
| Societe Generale | | | |
| 5.310% | | | | 01/02/2007 | | †† | | | 2,884,214 | | | | 2,884,214 | |
| Societe Generale | | | |
| 5.290% | | | | 02/01/2007 | | †† | | | 2,884,212 | | | | 2,884,212 | |
See accompanying notes to financial statements.
186
SCHEDULE OF INVESTMENTS—(Continued)
December 31, 2006
Vantagepoint Equity
Income Fund
Coupon
Rate
|
|
|
| Maturity
Date
|
|
|
| Face
|
| Value
|
|---|
CASH EQUIVALENTS—(Continued) |
| Societe Generale | | | |
| 5.270% | | | | 01/19/2007 | | †† | | $ | 2,884,212 | | | $ | 2,884,212 | |
| Svenska Handlesbanken | | | |
| 5.250% | | | | 01/02/2007 | | †† | | | 1,324,016 | | | | 1,324,016 | |
| Three Pillars Funding LLC | | | |
| 5.380% | | | | 01/02/2007 | | †† | | | 1,726,218 | | | | 1,726,218 | |
| UBS AG | | | |
| 5.300% | | | | 01/04/2007 | | †† | | | 1,153,684 | | | | 1,153,684 | |
| UBS AG | | | |
| 5.290% | | | | 01/02/2007 | | †† | | | 2,307,369 | | | | 2,307,369 | |
| Variable Funding Capital Co | | | |
| 5.310% | | | | 02/02/2007 | | †† | | | 1,153,686 | | | | 1,153,686 | |
| Variable Funding Capital Co | | | |
| 5.290% | | | | 01/04/2007 | | †† | | | 1,153,686 | | | | 1,153,686 | |
| Yorktown Capital LLC | | | |
| 5.330% | | | | 01/16/2007 | | †† | | | 1,153,682 | | | | 1,153,682 | |
| Yorktown Capital LLC | | | |
| 5.300% | | | | 01/10/2007 | | †† | | | 1,153,684 | | | | 1,153,684 | |
| | | 147,469,895 | |
Floating Rate Instruments/Master Notes—0.4% |
| Bank of America | | | |
| 5.310% | | | | 07/10/2007 | | †† | | | 2,884,212 | | | | 2,884,212 | |
| Bank of America | | | |
| 5.270% | | | | 01/09/2007 | | †† | | | 2,307,369 | | | | 2,307,369 | |
| | | 5,191,581 | |
TOTAL CASH EQUIVALENTS
| | | |
| (Cost $152,661,476) | | 152,661,476 | |
| |
REPURCHASE AGREEMENTS—3.9% |
| IBT Repurchase Agreement dated 12/29/2006 due 01/02/2007, with a maturity value of $57,604,690 and an effective yield of 4.65% collateralized by U.S. Government Obligations with rates ranging from 4.29% to 8.875% maturity dates ranging from 01/25/2017 to 06/01/2034 and an aggregate market value of $60,453,690. | | 57,574,943 | | | | 57,574,943 | |
TOTAL INVESTMENTS—109.5% | | | |
| (Cost $1,281,714,952) | | 1,607,475,209 | |
| Other assets less liabilities—(9.5%) | | (139,521,753 | ) |
NET ASSETS—100.0% | $ | 1,467,953,456 | |
Notes to the Schedule of Investments:
| ADR | | American Depositary Receipt |
| † | | Denotes all or a portion of security on loan. |
| * | | Non-income producing security. |
| ** | | Security exempt from registration under Rule 144A of the Securities Act of 1933. These securities may be resold in transactions exempt from registration, normally to qualified buyers. 144A securities represent 1.43% of Total Investments. |
| †† | | Represents collateral received from securities lending transactions. |
See accompanying notes to financial statements.
187
SCHEDULE OF INVESTMENTS
December 31, 2006
Vantagepoint Growth &
Income Fund
|
|
|
|
|
|
|
| Shares
|
| Value
|
|---|
COMMON STOCKS—97.1% |
Advertising—0.4% | | | |
| Getty Images, Inc. | *† | | | 44,400 | | | $ | 1,901,208 | |
| Monster Worldwide, Inc. | * | | | 42,400 | | | | 1,977,536 | |
| Omnicom Group | | 8,900 | | | | 930,406 | |
| | | 4,809,150 | |
Aerospace & Defense—2.1% | | | |
| Goodrich Corporation | | 82,700 | | | | 3,766,985 | |
| General Dynamics Corporation | | 171,300 | | | | 12,736,155 | |
| Textron, Inc. | | 28,400 | | | | 2,663,068 | |
| United Technologies Corporation | | 79,500 | | | | 4,970,340 | |
| | | 24,136,548 | |
Airlines—0.3% | | | |
| FedEx Corporation | | 7,300 | | | | 792,926 | |
| Southwest Airlines Company | | 207,900 | | | | 3,185,028 | |
| | | 3,977,954 | |
Apparel Retailers—0.9% | | | |
| Gap (The), Inc. | | 185,900 | | | | 3,625,050 | |
| Kohl’s Corporation | * | | | 96,900 | | | | 6,630,867 | |
| Urban Outfitters, Inc. | *† | | | 26,100 | | | | 601,083 | |
| | | 10,857,000 | |
Automotive—0.1% | | | |
| Ford Motor Company | † | | | 34,600 | | | | 259,846 | |
| General Motors Corporation | † | | | 37,000 | | | | 1,136,640 | |
| Harley-Davidson, Inc. | | 3,900 | | | | 274,833 | |
| | | 1,671,319 | |
Banking—12.6% | | | |
| American Express Company | | 99,500 | | | | 6,036,665 | |
| AmeriCredit Corporation | *† | | | 31,400 | | | | 790,338 | |
| Bank of America Corporation | | 281,200 | | | | 15,013,268 | |
| Bank of New York Company, Inc. (The) | | 104,400 | | | | 4,110,228 | |
| Capital One Financial Corporation | | 18,300 | | | | 1,405,806 | |
| Citigroup, Inc. | | 416,950 | | | | 23,224,115 | |
| Commerce Bancorp, Inc., NJ | † | | | 18,600 | | | | 656,022 | |
| Compass Bancshares, Inc. | | 10,100 | | | | 602,465 | |
| Deutsche Boerse AG (Germany) | | 6,929 | | | | 1,273,242 | |
| Fannie Mae | | 54,000 | | | | 3,207,060 | |
| Fifth Third Bancorp | † | | | 46,600 | | | | 1,907,338 | |
| Freddie Mac | | 35,500 | | | | 2,410,450 | |
| Hudson City Bancorp, Inc. | | 142,400 | | | | 1,976,512 | |
| IndyMac Bancorp, Inc. | † | | | 17,100 | | | | 772,236 | |
| JPMorgan Chase & Company | | 287,136 | | | | 13,868,669 | |
| Mellon Financial Corporation | | 46,300 | | | | 1,951,545 | |
| Northern Trust Corporation | | 54,400 | | | | 3,301,536 | |
| PNC Financial Services Group, Inc. | | 55,600 | | | | 4,116,624 | |
| SLM Corporation | | 261,200 | | | | 12,738,724 | |
| State Street Corporation | | 166,600 | | | | 11,235,504 | |
| SunTrust Banks, Inc. | | 37,000 | | | | 3,124,650 | |
| U.S. Bancorp | | 109,600 | | | | 3,966,424 | |
| Wachovia Corporation | | 211,180 | | | | 12,026,701 | |
| Washington Mutual, Inc. | | 149,100 | | | | 6,782,559 | |
| Wells Fargo & Company | | 344,300 | | | | 12,243,308 | |
| | | 148,741,989 | |
Beverages, Food & Tobacco—5.1% | | | |
| Altria Group, Inc. | | 139,703 | | | | 11,989,311 | |
| Anheuser-Busch Companies, Inc. | | 18,584 | | | | 914,333 | |
| Campbell Soup Company | | 121,500 | | | | 4,725,135 | |
| Coca-Cola Company (The) | | 39,000 | | | | 1,881,750 | |
| HJ Heinz Company | | 16,700 | | | $ | 751,667 | |
| Kellogg Company | | 83,600 | | | | 4,185,016 | |
| Kraft Foods, Inc. Class A | † | | | 57,600 | | | | 2,056,320 | |
| Pepsico, Inc. | | 207,500 | | | | 12,979,125 | |
| Safeway, Inc. | † | | | 164,600 | | | | 5,688,576 | |
| Sara Lee Corporation | | 214,300 | | | | 3,649,529 | |
| Sysco Corporation | | 104,700 | | | | 3,848,772 | |
| Tyson Foods, Inc. Class A | † | | | 302,500 | | | | 4,976,125 | |
| Unilever NV (Netherlands) | | 67,100 | | | | 1,828,475 | |
| | | 59,474,134 | |
Building Materials—1.0% | | | |
| Home Depot, Inc. | | 119,700 | | | | 4,807,152 | |
| Lowe’s Companies, Inc. | | 212,400 | | | | 6,616,260 | |
| | | 11,423,412 | |
Chemicals—1.8% | | | |
| Air Products & Chemicals, Inc. | | 10,900 | | | | 766,052 | |
| Dow Chemical Company (The) | | 167,700 | | | | 6,697,938 | |
EI Du Pont de Nemours &
Company | | 142,500 | | | | 6,941,175 | |
| Huntsman Corporation | *† | | | 96,700 | | | | 1,834,399 | |
| Methanex Corporation (Canada) | † | | | 32,300 | | | | 884,051 | |
| Monsanto Company | | 59,900 | | | | 3,146,547 | |
| NOVA Chemicals Corporation (Canada) | † | | | 3,700 | | | | 103,230 | |
| Potash Corporation of Saskatchewan, Inc. (Canada) | | 7,400 | | | | 1,061,752 | |
| | | 21,435,144 | |
Coal—0.1% | | | |
| Arch Coal, Inc. | | 44,000 | | | | 1,321,320 | | | |
Commercial Services—0.6% | | | |
| Fluor Corporation | † | | | 60,800 | | | | 4,964,320 | |
| Paychex, Inc. | | 29,900 | | | | 1,182,246 | |
| Siemens AG Sponsored ADR (Germany) | † | | | 9,000 | | | | 886,950 | |
| | | 7,033,516 | |
Communications—1.8% | | | |
| American Tower Corporation Class A | * | | | 157,200 | | | | 5,860,416 | |
| Corning, Inc. | * | | | 319,700 | | | | 5,981,587 | |
| Motorola, Inc. | | 223,500 | | | | 4,595,160 | |
| Qualcomm, Inc. | | 65,400 | | | | 2,471,466 | |
| Telefonaktiebolaget LM Ericsson ADR (Sweden) | † | | | 50,000 | | | | 2,011,500 | |
| | | 20,920,129 | |
Computer Software & Processing—6.3% | | | |
| Adobe Systems, Inc. | * | | | 67,200 | | | | 2,763,264 | |
| Affiliated Computer Services, Inc. Class A | *† | | | 39,900 | | | | 1,948,716 | |
| Autodesk, Inc. | * | | | 54,400 | | | | 2,201,024 | |
| Automatic Data Processing, Inc. | �� | 115,600 | | | | 5,693,300 | |
| Electronic Arts, Inc. | * | | | 4,300 | | | | 216,548 | |
| Google, Inc. Class A | * | | | 35,200 | | | | 16,208,896 | |
| Intuit, Inc. | * | | | 41,500 | | | | 1,266,165 | |
| Juniper Networks, Inc. | * | | | 165,100 | | | | 3,126,994 | |
| Microsoft Corporation | | 745,900 | | | | 22,272,574 | |
| NAVTEQ Corporation | *† | | | 16,000 | | | | 559,520 | |
| Oracle Corporation | * | | | 211,600 | | | | 3,626,824 | |
| SAP AG ADR (Germany) | † | | | 55,000 | | | | 2,920,500 | |
| Sun Microsystems, Inc. | * | | | 1,196,700 | | | | 6,486,114 | |
| Yahoo!, Inc. | *† | | | 165,600 | | | | 4,229,424 | |
| | | 73,519,863 | |
See accompanying notes to financial statements.
188
SCHEDULE OF INVESTMENTS—(Continued)
December 31, 2006
Vantagepoint Growth &
Income Fund
|
|
|
|
|
|
|
| Shares
|
| Value
|
|---|
COMMON STOCKS—(Continued) |
Computers & Information—3.3% | | | |
| Apple Computer, Inc. | * | | | 51,700 | | | $ | 4,386,228 | |
| Dell, Inc. | * | | | 137,100 | | | | 3,439,839 | |
| EMC Corporation | * | | | 584,500 | | | | 7,715,400 | |
| Hewlett-Packard Company | | 128,800 | | | | 5,305,272 | |
| International Business Machines Corporation | | 9,400 | | | | 913,210 | |
| International Game Technology | | 89,000 | | | | 4,111,800 | |
| Jabil Circuit, Inc. | | 64,800 | | | | 1,590,840 | |
| Pitney Bowes, Inc. | | 97,800 | | | | 4,517,382 | |
| SanDisk Corporation | * | | | 100,600 | | | | 4,328,818 | |
| Seagate Technology (Cayman Islands) | | 104,200 | | | | 2,761,300 | |
| | | 39,070,089 | |
Cosmetics & Personal Care—0.7% | | | |
| Avon Products, Inc. | | 61,634 | | | | 2,036,387 | |
| Procter & Gamble Company | | 99,175 | | | | 6,373,977 | |
| | | 8,410,364 | |
Electric Utilities—1.9% | | | |
| AES Corporation (The) | * | | | 82,800 | | | | 1,824,912 | |
| Dominion Resources, Inc. | | 53,150 | | | | 4,456,096 | |
| Entergy Corporation | | 20,300 | | | | 1,874,096 | |
| Exelon Corporation | | 94,300 | | | | 5,836,227 | |
| FPL Group, Inc. | † | | | 82,200 | | | | 4,473,324 | |
| NiSource, Inc. | | 37,200 | | | | 896,520 | |
| SCANA Corporation | | 70,100 | | | | 2,847,462 | |
| | | 22,208,637 | |
Electrical Equipment—3.4% | | | |
| Cooper Industries, Ltd. Class A (Bermuda) | | 21,700 | | | | 1,962,331 | |
| Emerson Electric Company | | 27,400 | | | | 1,207,518 | |
| General Electric Company | | 1,001,500 | | | | 37,265,815 | |
| | | 40,435,664 | |
Electronics—5.3% | | | |
| Agilent Technologies, Inc. | * | | | 19,472 | | | | 678,599 | |
| Altera Corporation | * | | | 183,000 | | | | 3,601,440 | |
| Analog Devices, Inc. | | 72,300 | | | | 2,376,501 | |
| Cisco Systems, Inc. | * | | | 765,050 | | | | 20,908,816 | |
| Fairchild Semiconductor International, Inc. | * | | | 48,800 | | | | 820,328 | |
| Flextronics International Ltd. (Singapore) | *† | | | 256,600 | | | | 2,945,768 | |
| Garmin Ltd. (Cayman Islands) | † | | | 6,100 | | | | 339,526 | |
| Intel Corporation | | 330,600 | | | | 6,694,650 | |
| International Rectifier Corporation | * | | | 62,600 | | | | 2,411,978 | |
| Linear Technology Corporation | | 82,400 | | | | 2,498,368 | |
| Marvell Technology Group Ltd. (Bermuda) | *† | | | 206,000 | | | | 3,953,140 | |
| Maxim Integrated Products, Inc. | | 135,800 | | | | 4,158,196 | |
| Qimonda AG, ADR (Germany) | * | | | 36,300 | | | | 635,613 | |
| Rockwell Collins, Inc. | | 21,000 | | | | 1,329,090 | |
| Silicon Laboratories, Inc. | *† | | | 22,000 | | | | 762,300 | |
| Teradyne, Inc. | *† | | | 50,800 | | | | 759,968 | |
| Texas Instruments, Inc. | | 68,100 | | | | 1,961,280 | |
| Xilinx, Inc. | | 238,700 | | | | 5,683,447 | |
| | | 62,519,008 | |
Entertainment & Leisure—1.0% | | | |
| Time Warner, Inc. | | 393,300 | | | | 8,566,074 | |
| Walt Disney Company | | 105,100 | | | | 3,601,777 | |
| | | 12,167,851 | |
Financial Services—5.0% | | | |
| Ameriprise Financial, Inc. | | 6,200 | | | $ | 337,900 | |
| Berkshire Hathaway, Inc. Class A | * | | | 22 | | | | 2,419,780 | |
| Charles Schwab Corporation (The) | | 190,900 | | | | 3,692,006 | |
| Chicago Mercantile Exchange | † | | | 3,800 | | | | 1,937,050 | |
| Countrywide Financial Corporation | | 48,700 | | | | 2,067,315 | |
| E*Trade Financial Corporation | * | | | 123,900 | | | | 2,777,838 | |
| Franklin Resources, Inc. | | 49,600 | | | | 5,464,432 | |
| Goldman Sachs Group, Inc. | | 73,400 | | | | 14,632,290 | |
| IntercontinentalExchange, Inc. | * | | | 6,800 | | | | 733,720 | |
| Legg Mason, Inc. | † | | | 41,300 | | | | 3,925,565 | |
| Lehman Brothers Holdings, Inc. | | 9,600 | | | | 749,952 | |
| Merrill Lynch & Company, Inc. | | 59,000 | | | | 5,492,900 | |
| Morgan Stanley | | 49,000 | | | | 3,990,070 | |
| UBS AG (Switzerland) | | 87,400 | | | | 5,285,344 | |
| UBS AG (Switzerland) | | 93,400 | | | | 5,634,822 | |
| | | 59,140,984 | |
Forest Products & Paper—0.3% | | | |
| International Paper Company | | 24,700 | | | | 842,270 | |
| Kimberly-Clark Corporation | | 44,500 | | | | 3,023,775 | |
| | | 3,866,045 | |
Health Care—Products—0.1% | | | |
| Alcon, Inc. (Switzerland) | † | | | 7,500 | | | | 838,275 | | | |
Health Care Providers—1.0% | | | |
| Caremark Rx, Inc. | | 104,700 | | | | 5,979,417 | |
| DaVita, Inc. | * | | | 38,400 | | | | 2,184,192 | |
| Express Scripts, Inc. | * | | | 32,600 | | | | 2,334,160 | |
| Lincare Holdings, Inc. | * | | | 31,300 | | | | 1,246,992 | |
| | | 11,744,761 | |
Heavy Construction—0.0% | | | |
| Lennar Corporation Class A | † | | | 9,100 | | | | 477,386 | | | |
Heavy Machinery—2.1% | | | |
| American Standard Companies, Inc. | | 143,000 | | | | 6,556,550 | |
| Applied Materials, Inc. | | 550,800 | | | | 10,162,260 | |
| Deere & Company | † | | | 42,800 | | | | 4,068,996 | |
| Joy Global, Inc. | | 22,300 | | | | 1,077,982 | |
| National-Oilwell Varco, Inc. | * | | | 54,800 | | | | 3,352,664 | |
| | | 25,218,452 | |
Home Construction, Furnishings & Appliances—0.7% | | | |
| DR Horton, Inc. | | 50,500 | | | | 1,337,745 | |
| Harman International Industries, Inc. | | 40,000 | | | | 3,996,400 | |
| Johnson Controls, Inc. | | 13,700 | | | | 1,177,104 | |
| Leggett & Platt, Inc. | | 47,500 | | | | 1,135,250 | |
| | | 7,646,499 | |
Household Products—0.6% | | | |
| Fortune Brands, Inc. | † | | | 14,000 | | | | 1,195,460 | |
| Illinois Tool Works, Inc. | | 97,500 | | | | 4,503,525 | |
| Jarden Corporation | *† | | | 18,100 | | | | 629,699 | |
| Rohm & Haas Company | † | | | 6,700 | | | | 342,504 | |
| | | 6,671,188 | |
Industrial—Diversified—0.3% | | | |
| Tyco International Ltd. (Bermuda) | | 102,500 | | | | 3,116,000 | | | |
Insurance—6.4% | | | |
| ACE, Ltd. (Cayman Islands) | | 94,300 | | | | 5,711,751 | |
| Aflac, Inc. | | 18,500 | | | | 851,000 | |
| Aetna, Inc. | | 158,000 | | | | 6,822,440 | |
| Allstate Corporation (The) | | 63,700 | | | | 4,147,507 | |
See accompanying notes to financial statements.
189
SCHEDULE OF INVESTMENTS—(Continued)
December 31, 2006
Vantagepoint Growth &
Income Fund
|
|
|
|
|
|
|
| Shares
|
| Value
|
|---|
COMMON STOCKS—(Continued) |
| American International Group, Inc. | | 224,400 | | | $ | 16,080,504 | |
| Chubb Corporation | | 115,500 | | | | 6,111,105 | |
| Hartford Financial Services Group, Inc. | | 29,200 | | | | 2,724,652 | |
| Humana, Inc. | * | | | 13,600 | | | | 752,216 | |
| Marsh & McLennan Companies, Inc. | | 100,200 | | | | 3,072,132 | |
| Prudential Financial, Inc. | | 41,400 | | | | 3,554,604 | |
| RenaissanceRe Holdings Ltd. (Bermuda) | | 3,400 | | | | 204,000 | |
| UnitedHealth Group, Inc. | | 222,300 | | | | 11,944,179 | |
| WellPoint, Inc. | * | | | 146,000 | | | | 11,488,740 | |
| XL Capital Ltd. Class A (Cayman Islands) | | 25,000 | | | | 1,800,500 | |
| | | 75,265,330 | |
Lodging—1.2% | | | |
| Las Vegas Sands Corporation | * | | | 40,700 | | | | 3,641,836 | |
| MGM MIRAGE | * | | | 21,500 | | | | 1,233,025 | |
| Marriott International, Inc. Class A | | 63,800 | | | | 3,044,536 | |
| Starwood Hotels & Resorts Worldwide, Inc. | | 13,800 | | | | 862,500 | |
| Wynn Resorts Ltd. | † | | | 53,000 | | | | 4,974,050 | |
| | | 13,755,947 | |
Media—Broadcasting & Publishing—1.3% |
| Cablevision Systems Corporation Class A | | 36,781 | | | | 1,047,523 | |
| CBS Corporation Class B | | 41,900 | | | | 1,306,442 | |
| Clear Channel Communications, Inc. | | 59,400 | | | | 2,111,076 | |
| Comcast Corporation Class A | * | | | 111,900 | | | | 4,736,727 | |
| Gannett Company, Inc. | | 30,300 | | | | 1,831,938 | |
| Grupo Televisa SA ADR (Mexico) | | 68,400 | | | | 1,847,484 | |
| Idearc, Inc. | * | | | 3,015 | | | | 86,380 | |
| Viacom, Inc. Class B | * | | | 70,500 | | | | 2,892,615 | |
| | | 15,860,185 | |
Medical Supplies—3.6% | | | |
| Allergan, Inc. | | 53,700 | | | | 6,430,038 | |
| Baxter International, Inc. | | 190,900 | | | | 8,855,851 | |
| Beckman Coulter, Inc. | | 53,500 | | | | 3,199,300 | |
| Boston Scientific Corporation | * | | | 196,900 | | | | 3,382,742 | |
| Johnson & Johnson | | 23,800 | | | | 1,571,276 | |
| Kla-Tencor Corporation | † | | | 96,000 | | | | 4,776,000 | |
| Medtronic, Inc. | | 137,000 | | | | 7,330,870 | |
| St. Jude Medical, Inc. | * | | | 67,200 | | | | 2,456,832 | |
| Stryker Corporation | | 57,100 | | | | 3,146,781 | |
| Thermo Fisher Scientific, Inc. | * | | | 20,300 | | | | 919,387 | |
| | | 42,069,077 | |
Metals—2.1% | | | |
| Alcoa, Inc. | | 156,600 | | | | 4,699,566 | |
| Barrick Gold Corporation (Canada) | † | | | 45,800 | | | | 1,406,060 | |
| Cameco Corporation (Canada) | † | | | 105,300 | | | | 4,259,385 | |
| Danaher Corporation | | 177,500 | | | | 12,858,100 | |
| Newmont Mining Corporation | | 23,000 | | | | 1,038,450 | |
| | | 24,261,561 | |
Oil & Gas—7.8% | | | |
| Anadarko Petroleum Corporation | | 17,200 | | | | 748,544 | |
| Baker Hughes, Inc. | | 101,700 | | | | 7,592,922 | |
| BJ Services Company | † | | | 62,200 | | | | 1,823,704 | |
| Chevron Corporation | | 81,172 | | | | 5,968,577 | |
| EOG Resources, Inc. | | 30,800 | | | | 1,923,460 | |
| Exxon Mobil Corporation | | 263,800 | | | | 20,214,994 | |
| GlobalSantaFe Corporation | | 64,700 | | | $ | 3,803,066 | |
| Halliburton Company | | 153,400 | | | | 4,763,070 | |
| Kinder Morgan, Inc. | | 17,226 | | | | 1,821,650 | |
| MDU Resources Group, Inc. | | 34,800 | | | | 892,272 | |
| Murphy Oil Corporation | † | | | 31,600 | | | | 1,606,860 | |
| Occidental Petroleum Corporation | | 188,300 | | | | 9,194,689 | |
| Royal Dutch Shell PLC—Class A ADR (United Kingdom) | | 71,300 | | | | 5,047,327 | |
| Royal Dutch Shell PLC—Class B, ADR (United Kingdom) | | 21,356 | | | | 1,519,479 | |
| Schlumberger Ltd. (Netherland Antilles) | | 213,200 | | | | 13,465,712 | |
| Smith International, Inc. | † | | | 124,100 | | | | 5,096,787 | |
| Total Fina SA ADR (France) | | 32,600 | | | | 2,344,592 | |
| Transocean, Inc. (Cayman Islands) | * | | | 9,100 | | | | 736,099 | |
| Weatherford International Ltd. (Bermuda) | * | | | 63,400 | | | | 2,649,486 | |
| XTO Energy, Inc. | | 21,300 | | | | 1,002,165 | |
| | | 92,215,455 | |
Pharmaceuticals—6.5% | | | |
| Abbott Laboratories | | 79,700 | | | | 3,882,187 | |
| Amgen, Inc. | * | | | 101,900 | | | | 6,960,789 | |
| AstraZeneca Group PLC ADR (United Kingdom) | | 140,600 | | | | 7,529,130 | |
| Bristol-Myers Squibb Company | | 65,100 | | | | 1,713,432 | |
| Cardinal Health, Inc. | | 7,800 | | | | 502,554 | |
| Celgene Corporation | *† | | | 56,000 | | | | 3,221,680 | |
| Eli Lilly & Company | | 32,000 | | | | 1,667,200 | |
Endo Pharmaceuticals
Holdings, Inc. | * | | | 22,200 | | | | 612,276 | |
| Forest Laboratories, Inc. | * | | | 178,700 | | | | 9,042,220 | |
| Genentech, Inc. | * | | | 53,200 | | | | 4,316,116 | |
| Gilead Sciences, Inc. | * | | | 72,600 | | | | 4,713,918 | |
| ImClone Systems, Inc. | *† | | | 62,700 | | | | 1,677,852 | |
| McKesson Corporation | | 18,800 | | | | 953,160 | |
| Medco Health Solutions, Inc. | * | | | 54,900 | | | | 2,933,856 | |
| Millennium Pharmaceuticals, Inc. | *† | | | 86,200 | | | | 939,580 | |
| Novartis AG (Switzerland) | | 50,500 | | | | 2,898,895 | |
| Pfizer, Inc. | | 118,500 | | | | 3,069,150 | |
| Roche Holding AG (Switzerland) | | 20,776 | | | | 3,714,365 | |
| Sepracor, Inc. | *† | | | 72,800 | | | | 4,483,024 | |
Teva Pharmaceutical Industries
Ltd. ADR (Israel) | | 68,400 | | | | 2,125,872 | |
| Wyeth | | 190,800 | | | | 9,715,536 | |
| | | 76,672,792 | |
Real Estate—0.7% | | | |
| Douglas Emmett, Inc. REIT | | 21,400 | | | | 569,026 | |
| General Growth Properties, Inc. REIT | | 16,110 | | | | 841,425 | |
| Host Hotels & Resorts Inc. | † | | | 296,345 | | | | 7,275,270 | |
| | | 8,685,721 | |
Restaurants—0.5% | | | |
| Cheesecake Factory (The) | * | | | 20,600 | | | | 506,760 | |
| McDonald’s Corporation | �� | 116,600 | | | | 5,168,878 | |
| | | 5,675,638 | |
Retailers—3.7% | | | |
| Amazon.Com, Inc. | *† | | | 93,600 | | | | 3,693,456 | |
| Bed Bath & Beyond, Inc. | * | | | 40,000 | | | | 1,524,000 | |
| Best Buy Company, Inc. | | 48,000 | | | | 2,361,120 | |
| CVS Corporation | | 340,800 | | | | 10,534,128 | |
| Costco Wholesale Corporation | | 12,600 | | | | 666,162 | |
| Dollar Tree Stores, Inc. | * | | | 43,600 | | | | 1,312,360 | |
| eBay, Inc. | * | | | 162,600 | | | | 4,889,382 | |
See accompanying notes to financial statements.
190
SCHEDULE OF INVESTMENTS—(Continued)
December 31, 2006
Vantagepoint Growth &
Income Fund
|
|
|
|
|
|
|
| Shares
|
| Value
|
|---|
COMMON STOCKS—(Continued) |
| Federated Department Stores | | 95,700 | | | $ | 3,649,041 | |
| Target Corporation | | 196,000 | | | | 11,181,800 | |
| Wal-Mart Stores, Inc. | | 63,900 | | | | 2,950,902 | |
| Williams-Sonoma, Inc. | † | | | 21,100 | | | | 663,384 | |
| | | 43,425,735 | |
Telephone Systems—3.6% | | | |
| America Movil SA de CV ADR (Mexico) | | 80,500 | | | | 3,640,210 | |
| AT&T, Inc. | | 267,769 | | | | 9,572,742 | |
| BellSouth Corporation | | 143,500 | | | | 6,760,285 | |
Nokia Corporation Sponsored
ADR (Finland) | | 141,700 | | | | 2,879,344 | |
| Qwest Communications International, Inc. | * | | | 115,400 | | | | 965,898 | |
| Rogers Communications, Inc. (Canada) | † | | | 40,200 | | | | 2,395,920 | |
| Sprint Nextel Corporation | | 297,100 | | | | 5,612,219 | |
| TELUS Corporation Non-Voting Shares (Canada) | † | | | 21,600 | | | | 964,872 | |
| Verizon Communications, Inc. | | 250,900 | | | | 9,343,516 | |
| | | 42,135,006 | |
Textiles, Clothing & Fabrics—0.2% | | | |
| Coach, Inc. | * | | | 2,000 | | | | 85,920 | |
| Hanesbrands, Inc. | * | | | 84,837 | | | | 2,003,850 | |
| | | 2,089,770 | |
Transportation—0.7% | | | |
| Carnival Corporation | | 12,700 | | | | 622,935 | |
| Expeditors International Washington, Inc. | | 9,200 | | | | 372,600 | |
| Norfolk Southern Corporation | | 8,800 | | | | 442,552 | |
| Union Pacific Corporation | | 8,100 | | | | 745,362 | |
| United Parcel Service, Inc. Class B | | 73,600 | | | | 5,518,528 | |
| | | 7,701,977 | |
TOTAL COMMON STOCKS
| | | |
| (Cost $916,444,843) | | 1,142,666,875 | |
| |
Coupon
Rate
|
|
|
| Maturity
Date
|
|
|
| Face
|
| Value
|
|---|
CONVERTIBLE DEBT OBLIGATIONS—0.1% |
Automotive—0.1% | | | |
| Ford Motor Company | | | |
| 4.250% | | | | 12/15/2036 | | | | | | | | | | |
| (Cost $923,698) | $ | 918,000 | | | | 985,702 | |
| |
COMMERCIAL PAPER—0.2% |
Banking—0.2% | | | |
| Jupiter Securitization Corporation 144A | | | | | | | | | |
| 5.300% | | | | 01/22/2007 | | | | | | | | | | |
| (Cost $1,993,228)** | | 2,000,000 | | | | 1,993,228 | |
| |
CASH EQUIVALENTS—7.3% |
Bank & Certificate Deposits/
Offshore Time Deposits—7.1% | | | |
| Abbey National PLC | | | |
| 5.280% | | | | 01/05/2007 | | | †† | | | | 1,299,575 | | | | 1,299,575 | |
| BancoBilbao Vizcaya Argentaria SA | | | |
| 5.310% | | | | 01/03/2007 | | †† | | $ | 1,299,575 | | | $ | 1,299,575 | |
| Bank Of Nova Scotia | | | |
| 5.300% | | | | 02/27/2007 | | †† | | | 1,624,470 | | | | 1,624,470 | |
| Bank Of Nova Scotia | | | |
| 5.290% | | | | 01/30/2007 | | †† | | | 649,787 | | | | 649,787 | |
| Bank Of Nova Scotia | | | |
| 5.290% | | | | 02/06/2007 | | †† | | | 974,681 | | | | 974,681 | |
| Barclays | | | |
| 5.320% | | | | 02/13/2007 | | †† | | | 649,787 | | | | 649,787 | |
| Barclays | | | |
| 5.310% | | | | 02/20/2007 | | †† | | | 1,624,470 | | | | 1,624,470 | |
| Barclays | | | |
| 5.300% | | | | 01/02/2007 | | †† | | | 1,624,469 | | | | 1,624,469 | |
| Barton Capital LLC | | | |
| 5.300% | | | | 01/17/2007 | | †† | | | 649,789 | | | | 649,789 | |
| Barton Capital LLC | | | |
| 5.300% | | | | 01/17/2007 | | †† | | | 974,683 | | | | 974,683 | |
| Calyon | | | |
| 5.310% | | | | 02/16/2007 | | †† | | | 649,789 | | | | 649,789 | |
| Calyon | | | |
| 5.300% | | | | 02/05/2007 | | †† | | | 1,949,365 | | | | 1,949,365 | |
| Canadian Imperial Bank of Commerce | | | |
| 5.310% | | | | 01/29/2007 | | †† | | | 1,949,365 | | | | 1,949,365 | |
| Charta LLC | | | |
| 5.300% | | | | 01/31/2007 | | †† | | | 1,272,518 | | | | 1,272,518 | |
| CIESCO | | | |
| 5.310% | | | | 01/04/2007 | | †† | | | 846,058 | | | | 846,058 | |
| Citigroup | | | |
| 5.310% | | | | 03/16/2007 | | †† | | | 649,789 | | | | 649,789 | |
| Clipper Receivables Corp | | | |
| 5.300% | | | | 01/31/2007 | | †† | | | 649,789 | | | | 649,789 | |
| Compass Securitization | | | |
| 5.300% | | | | 01/09/2007 | | †† | | | 974,683 | | | | 974,683 | |
| CRC Funding LLC | | | |
| 5.340% | | | | 01/23/2007 | | †† | | | 324,894 | | | | 324,894 | |
| CRC Funding LLC | | | |
| 5.300% | | | | 01/10/2007 | | †† | | | 948,574 | | | | 948,574 | |
| Credit Suisse First Boston Corporation | | | |
| 5.300% | | | | 01/05/2007 | | †† | | | 649,789 | | | | 649,789 | |
| Credit Suisse First Boston Corporation | | | |
| 5.300% | | | | 01/12/2007 | | †† | | | 1,299,577 | | | | 1,299,577 | |
| Dexia Group | | | |
| 5.290% | | | | 01/16/2007 | | †† | | | 1,624,471 | | | | 1,624,471 | |
| Fairway Finance | | | |
| 5.300% | | | | 01/09/2007 | | †† | | | 779,746 | | | | 779,746 | |
| Falcon Asset Securitization Corporation | | | |
| 5.340% | | | | 01/22/2007 | | †† | | | 649,789 | | | | 649,789 | |
| Fortis Bank | | | |
| 5.320% | | | | 01/03/2007 | | †† | | | 649,789 | | | | 649,789 | |
| Fortis Bank | | | |
| 5.300% | | | | 01/02/2007 | | †† | | | 649,789 | | | | 649,789 | |
| Fortis Bank | | | |
| 5.300% | | | | 01/24/2007 | | †† | | | 2,274,260 | | | | 2,274,260 | |
| Fortis Bank | | | |
| 5.300% | | | | 01/26/2007 | | †† | | | 2,599,153 | | | | 2,599,153 | |
| General Electric Capital Corporation | | | |
| 5.300% | | | | 01/26/2007 | | †† | | | 1,299,577 | | | | 1,299,577 | |
| Greyhawk Funding | | | |
| 5.310% | | | | 01/12/2007 | | †† | | | 649,789 | | | | 649,789 | |
| HBOS Halifax Bank of Scotland | | | |
| 5.310% | | | | 03/14/2007 | | †† | | | 1,624,471 | | | | 1,624,471 | |
| HBOS Halifax Bank of Scotland | | | |
| 5.300% | | | | 01/08/2007 | | †† | | | 649,789 | | | | 649,789 | |
| Kitty Hawk Funding Corp | | | |
| 5.340% | | | | 01/10/2007 | | †† | | | 974,683 | | | | 974,683 | |
| Lexington Parker Cap Comp | | | |
| 5.300% | | | | 01/05/2007 | | †† | | | 649,789 | | | | 649,789 | |
See accompanying notes to financial statements.
191
SCHEDULE OF INVESTMENTS—(Continued)
December 31, 2006
Vantagepoint Growth &
Income Fund
Coupon
Rate
|
|
|
| Maturity
Date
|
|
|
| Face
|
| Value
|
|---|
CASH EQUIVALENTS—(Continued) |
| Liberty Street | | | |
| 5.310% | | | | 01/17/2007 | | †† | | $ | 649,789 | | | $ | 649,789 | |
| Lloyds TSB Bank | | | |
| 5.300% | | | | 02/26/2007 | | †† | | | 649,789 | | | | 649,789 | |
| Marshall & Ilsley Bank Corporation | | | |
| 5.300% | | | | 03/19/2007 | | †† | | | 649,789 | | | | 649,789 | |
| Merrill Lynch & Co | | | |
| 5.300% | | | | 01/02/2007 | | †† | | | 11,371,298 | | | | 11,371,298 | |
| Morgan Stanley & Co | | | |
| 5.300% | | | | 01/02/2007 | | †† | | | 7,967,000 | | | | 7,967,000 | |
| Old Line Funding LLC | | | |
| 5.350% | | | | 01/04/2007 | | †† | | | 649,789 | | | | 649,789 | |
| Paradigm Funding LLC | | | |
| 5.310% | | | | 01/17/2007 | | †† | | | 649,789 | | | | 649,789 | |
| Park Avenue Receivables Corp | | | |
| 5.330% | | | | 01/18/2007 | | †† | | | 649,789 | | | | 649,789 | |
| Rabobank Nederland | | | |
| 5.250% | | | | 01/02/2007 | | †† | | | 1,949,365 | | | | 1,949,365 | |
| Ranger Funding | | | |
| 5.330% | | | | 02/08/2007 | | †† | | | 649,789 | | | | 649,789 | |
| Ranger Funding | | | |
| 5.320% | | | | 01/04/2007 | | †† | | | 649,789 | | | | 649,789 | |
| Royal Bank of Canada | | | |
| 5.310% | | | | 02/14/2007 | | †† | | | 1,299,577 | | | | 1,299,577 | |
| Royal Bank of Scotland | | | |
| 5.310% | | | | 01/11/2007 | | †† | | | 649,789 | | | | 649,789 | |
| Royal Bank of Scotland | | | |
| 5.290% | | | | 01/16/2007 | | †† | | | 974,683 | | | | 974,683 | |
| Royal Bank of Scotland | | | |
| 5.290% | | | | 02/09/2007 | | †† | | | 649,789 | | | | 649,789 | |
| Royal Bank of Scotland | | | |
| 5.280% | | | | 01/11/2007 | | †† | | | 1,624,471 | | | | 1,624,471 | |
| Sheffiled Receivables Corp | | | |
| 5.360% | | | | 01/11/2007 | | †† | | | 974,683 | | | | 974,683 | |
| Sheffiled Receivables Corp | | | |
| 5.300% | | | | 01/12/2007 | | †† | | | 649,789 | | | | 649,789 | |
| Societe Generale | | | |
| 5.310% | | | | 01/02/2007 | | †† | | | 1,624,471 | | | | 1,624,471 | |
| Societe Generale | | | |
| 5.290% | | | | 02/01/2007 | | †† | | | 1,624,471 | | | | 1,624,471 | |
| Societe Generale | | | |
| 5.270% | | | | 01/19/2007 | | †† | | | 1,624,471 | | | | 1,624,471 | |
| Svenska Handlesbanken | | | |
| 5.250% | | | | 01/02/2007 | | †† | | | 745,724 | | | | 745,724 | |
| Three Pillars Funding LLC | | | |
| 5.380% | | | | 01/02/2007 | | †† | | | 972,254 | | | | 972,254 | |
| UBS AG | | | |
| 5.300% | | | | 01/04/2007 | | †† | | | 649,789 | | | | 649,789 | |
| UBS AG | | | |
| 5.290% | | | | 01/02/2007 | | †† | | | 1,299,577 | | | | 1,299,577 | |
| Variable Funding Capital Co | | | |
| 5.310% | | | | 02/02/2007 | | †† | | | 649,789 | | | | 649,789 | |
| Variable Funding Capital Co | | | |
| 5.290% | | | | 01/04/2007 | | †† | | | 649,789 | | | | 649,789 | |
| Yorktown Capital LLC | | | |
| 5.330% | | | | 01/16/2007 | | †† | | | 649,789 | | | | 649,789 | |
| Yorktown Capital LLC | | | |
| 5.300% | | | | 01/10/2007 | | †† | | | 649,789 | | | | 649,789 | |
| | | 83,059,240 | |
Floating Rate Instruments/Master Notes—0.2% |
| Bank of America | | | |
| 5.310% | | | | 07/10/2007 | | †† | | $ | 1,624,470 | | | $ | 1,624,470 | |
| Bank of America | | | |
| 5.270% | | | | 01/09/2007 | | †† | | | 1,299,575 | | | | 1,299,575 | |
| | | 2,924,045 | |
TOTAL CASH EQUIVALENTS
| | | |
| (Cost $85,983,285) | | 85,983,285 | |
| |
REPURCHASE AGREEMENTS—2.4% |
| IBT Repurchase Agreement dated 12/29/2006 due 01/02/1007, with a maturity value of $28,679,358 and an effective yield of 4.65% collateralized by U.S. Government Obligations with rates ranging from 4.404% to 5.038%, maturity dates ranging from 12/01/2018 to 10/01/2034 and an aggregate market value of $30,097,775. | | 28,664,548 | | | | 28,664,548 | |
TOTAL INVESTMENTS—107.1%
| | | |
| (Cost $1,034,009,602) | | 1,260,293,638 | |
| Other assets less liabilities—(7.1%) | | (83,679,690 | ) |
NET ASSETS—100.0% | $ | 1,176,613,948 | |
Notes to the Schedule of Investments:
| ADR | | American Depositary Receipt |
| REIT | | Real Estate Investment Trust |
| * | | Non-income producing security. |
| † | | Denotes all or a portion of security on loan. |
| †† | | Represents collateral received from securities lending transactions. |
| ** | | Security exempt from registration under Rule 144A of the Securities Act of 1933. These securities may be resold in transactions exempt from registration, normally to qualified buyers. 144A securities represent 0.16% of Total Investments. |
See accompanying notes to financial statements.
192
SCHEDULE OF INVESTMENTS
December 31, 2006
Vantagepoint
Growth Fund
|
|
|
|
|
|
|
| Shares
|
| Value
|
|---|
COMMON STOCKS—97.2% |
Aerospace & Defense—0.4% | | | |
| Boeing Company (The) | | 76,528 | | | $ | 6,798,748 | |
| Lockheed Martin Corporation | | 14,400 | | | | 1,325,808 | |
| Northrop Grumman Corporation | | 49,300 | | | | 3,337,610 | |
| United Technologies Corporation | | 11,600 | | | | 725,232 | |
| | | 12,187,398 | |
Airlines—0.5% | | | |
| FedEx Corporation | | 119,900 | | | | 13,023,538 | | | |
Apparel Retailers—0.6% | | | |
| American Eagle Outfitters, Inc. | | 50,400 | | | | 1,572,984 | |
| Kohl’s Corporation | * | | | 224,600 | | | | 15,369,378 | |
| Payless Shoesource, Inc. | * | | | 23,000 | | | | 754,860 | |
| | | 17,697,222 | |
Automotive—0.4% | | | |
| Autoliv, Inc. | | 33,827 | | | | 2,039,768 | |
| Autonation, Inc. | * | | | 109,148 | | | | 2,327,035 | |
| ITT Corporation | | 130,600 | | | | 7,420,692 | |
| United Auto Group, Inc. | | 18,906 | | | | 445,614 | |
| | | 12,233,109 | |
Banking—3.8% | | | |
| American Express Company | | 144,800 | | | | 8,785,016 | |
| AmeriCredit Corporation | *† | | | 106,200 | | | | 2,673,054 | |
| Citigroup, Inc. | | 614,700 | | | | 34,238,790 | |
| Hudson City Bancorp, Inc. | | 117,291 | | | | 1,627,999 | |
| JPMorgan Chase & Company | | 240,200 | | | | 11,601,660 | |
| Wachovia Corporation | | 35,914 | | | | 2,045,302 | |
| Wells Fargo & Company | | 1,294,000 | | | | 46,014,640 | |
| | | 106,986,461 | |
Beverages, Food & Tobacco—4.4% | | | |
| Altria Group, Inc. | | 42,846 | | | | 3,677,044 | |
| Anheuser-Busch Companies, Inc. | | 627,600 | | | | 30,877,920 | |
| Archer-Daniels-Midland Company | | 90,000 | | | | 2,876,400 | |
| Coca-Cola Company (The) | | 680,100 | | | | 32,814,825 | |
| Hansen Natural Corporation | * | | | 35,900 | | | | 1,209,112 | |
| Nestle SA-Sponsored ADR (Switzerland) | | 133,300 | | | | 11,820,857 | |
| Pepsico, Inc. | | 579,000 | | | | 36,216,450 | |
| Safeway, Inc. | | 55,600 | | | | 1,921,536 | |
| UST, Inc. | † | | | 40,478 | | | | 2,355,820 | |
| | | 123,769,964 | |
Building Materials—1.8% | | | |
| Home Depot, Inc. | | 800,905 | | | | 32,164,345 | |
| Lowe’s Companies, Inc. | † | | | 592,300 | | | | 18,450,145 | |
| Wesco International, Inc. | * | | | 5,000 | | | | 294,050 | |
| | | 50,908,540 | |
Chemicals—0.5% | | | |
| Monsanto Company | | 94,370 | | | | 4,957,256 | |
| Praxair, Inc. | | 140,400 | | | | 8,329,932 | |
| | | 13,287,188 | |
Commercial Services—2.6% | | | |
| Accenture Ltd. Class A (Bermuda) | | 435,200 | | | | 16,071,936 | |
| Cintas Corporation | † | | | 351,100 | | | | 13,942,181 | |
| Manpower, Inc. | | 51,849 | | | | 3,885,046 | |
| Moody’s Corporation | | 48,600 | | | | 3,356,316 | |
| Paychex, Inc. | | 746,650 | | | | 29,522,541 | |
| Republic Services, Inc. | | 58,000 | | | $ | 2,358,860 | |
| Waste Management, Inc. | | 69,492 | | | | 2,555,221 | |
| | | 71,692,101 | |
Communications—2.6% | | | |
| Corning, Inc. | * | | | 404,900 | | | | 7,575,679 | |
| Motorola, Inc. | | 122,700 | | | | 2,522,712 | |
| Nortel Networks Corp. (Canada) | * | | | 98,200 | | | | 2,624,886 | |
| Polycom, Inc. | * | | | 43,900 | | | | 1,356,949 | |
| Qualcomm, Inc. | | 1,097,400 | | | | 41,470,746 | |
XM Satellite Radio Holdings,
Inc. Class A | *† | | | 1,128,900 | | | | 16,312,605 | |
| | | 71,863,577 | |
Computer Software & Processing—12.8% |
| Automatic Data Processing, Inc. | | 945,500 | | | | 46,565,875 | |
| Cadence Design Systems, Inc. | * | | | 122,100 | | | | 2,186,811 | |
| Computer Sciences Corporation | * | | | 59,185 | | | | 3,158,703 | |
| Electronic Arts, Inc. | *† | | | 547,000 | | | | 27,546,920 | |
| First Data Corporation | | 484,700 | | | | 12,369,544 | |
| Google, Inc. Class A | * | | | 162,150 | | | | 74,666,832 | |
| Intuit, Inc. | * | | | 109,300 | | | | 3,334,743 | |
| Microsoft Corporation | | 3,423,110 | | | | 102,214,065 | |
| Nvidia Corporation | * | | | 268,900 | | | | 9,951,989 | |
| Oracle Corporation | * | | | 27,400 | | | | 469,636 | |
| Sun Microsystems, Inc. | * | | | 448,100 | | | | 2,428,702 | |
| Symantec Corporation | * | | | 343,900 | | | | 7,170,315 | |
| Synopsys, Inc. | * | | | 69,438 | | | | 1,856,078 | |
| Yahoo!, Inc. | * | | | 2,400,900 | | | | 61,318,986 | |
| | | 355,239,199 | |
Computers & Information—3.7% | | | |
| Apple Computer, Inc. | * | | | 3,900 | | | | 330,876 | |
| Dell, Inc. | * | | | 1,249,200 | | | | 31,342,428 | |
| EMC Corporation | * | | | 517,100 | | | | 6,825,720 | |
| Hewlett-Packard Company | | 165,700 | | | | 6,825,183 | |
International Business
Machines Corporation | | 496,800 | | | | 48,264,120 | |
| International Game Technology | | 9,300 | | | | 429,660 | |
| Lexmark International, Inc. | * | | | 50,400 | | | | 3,689,280 | |
| Tech Data Corporation | * | | | 9,100 | | | | 344,617 | |
| Western Digital Corporation | * | | | 173,300 | | | | 3,545,718 | |
| | | 101,597,602 | |
Cosmetics & Personal Care—1.0% | | | |
| Colgate-Palmolive Company | | 15,792 | | | | 1,030,270 | |
| Ecolab, Inc. | † | | | 106,000 | | | | 4,791,200 | |
Estee Lauder Companies
(The), Inc., Class A | | 9,667 | | | | 394,607 | |
| Procter & Gamble Company | | 320,900 | | | | 20,624,243 | |
| | | 26,840,320 | |
Electric Utilities—0.2% | | | |
| PG&E Corporation | | 42,600 | | | | 2,016,258 | |
| TXU Corporation | | 74,627 | | | | 4,045,530 | |
| | | 6,061,788 | |
Electrical Equipment—3.6% | | | |
| Emerson Electric Company | | 72,800 | | | | 3,208,296 | |
| Energizer Holdings, Inc. | * | | | 45,754 | | | | 3,248,076 | |
| General Electric Company | | 2,552,805 | | | | 94,989,874 | |
| | | 101,446,246 | |
Electronics—5.8% | | | |
| Atmel Corporation | * | | | 209,200 | | | | 1,265,660 | |
| Cisco Systems, Inc. | * | | | 2,373,100 | | | | 64,856,823 | |
See accompanying notes to financial statements.
193
SCHEDULE OF INVESTMENTS—(Continued)
December 31, 2006
Vantagepoint
Growth Fund
|
|
|
|
|
|
|
| Shares
|
| Value
|
|---|
COMMON STOCKS—(Continued) |
Infineon Technologies AG
ADR (Germany) | *† | | | 360,600 | | | $ | 5,059,218 | |
| Intel Corporation | | 1,399,100 | | | | 28,331,775 | |
| Intersil Corporation Class A | † | | | 85,900 | | | | 2,054,728 | |
| LSI Logic Corporation | * | | | 36,700 | | | | 330,300 | |
| Linear Technology Corporation | † | | | 408,100 | | | | 12,373,592 | |
| Micron Technology, Inc. | * | | | 244,300 | | | | 3,410,428 | |
| Raytheon Company | | 30,600 | | | | 1,615,680 | |
| Texas Instruments, Inc. | | 1,322,200 | | | | 38,079,360 | |
| Xilinx, Inc. | † | | | 181,300 | | | | 4,316,753 | |
| | | 161,694,317 | |
Entertainment & Leisure—1.0% | | | |
| Time Warner, Inc. | | 418,000 | | | | 9,104,040 | |
| Walt Disney Company | | 567,500 | | | | 19,448,225 | |
| | | 28,552,265 | |
Environmental—0.0% | | | |
| Tektronix, Inc. | | 14,300 | | | | 417,131 | | | |
Financial Services—10.5% | | | |
Berkshire Hathaway, Inc.,
Class B | *† | | | 1,794 | | | | 6,576,804 | |
| Charles Schwab Corporation (The) | | 2,052,550 | | | | 39,696,317 | |
| Countrywide Financial Corporation | † | | | 872,400 | | | | 37,033,380 | |
| Franklin Resources, Inc. | | 260,100 | | | | 28,655,217 | |
| Goldman Sachs Group, Inc. | | 659,200 | | | | 131,411,520 | |
| Legg Mason, Inc. | † | | | 313,400 | | | | 29,788,670 | |
| Merrill Lynch & Company, Inc. | | 44,259 | | | | 4,120,513 | |
| Morgan Stanley | | 17,400 | | | | 1,416,882 | |
| NTL, Inc. | | 175,700 | | | | 4,434,668 | |
| Nuveen Investments, Inc. Class A | | 6,800 | | | | 352,784 | |
| SEI Investments Company | | 11,509 | | | | 685,476 | |
| T Rowe Price Group, Inc. | | 12,770 | | | | 558,943 | |
| Western Union Company (The) | | 394,700 | | | | 8,849,174 | |
| | | 293,580,348 | |
Food Retailers—0.2% | | | |
| Starbucks Corporation | * | | | 125,500 | | | | 4,445,210 | | | |
Health Care—Products—0.4% | | | |
| Alcon, Inc. (Switzerland) | | 89,400 | | | | 9,992,238 | | | |
Health Care Providers—0.1% | | | |
| Caremark Rx, Inc. | | 63,056 | | | | 3,601,128 | | | |
Heavy Machinery—1.2% | | | |
| Caterpillar, Inc. | | 235,400 | | | | 14,437,082 | |
| Lam Research Corporation | *† | | | 187,700 | | | | 9,501,374 | |
| National-Oilwell Varco, Inc. | * | | | 109,900 | | | | 6,723,682 | |
| Terex Corporation | * | | | 43,900 | | | | 2,835,062 | |
| | | 33,497,200 | |
Household Products—0.4% | | | |
| Newell Rubbermaid, Inc. | | 332,800 | | | | 9,634,560 | |
| RPM, Inc. | | 16,800 | | | | 350,952 | |
| | | 9,985,512 | |
Industrial—Diversified—0.0% | | | |
| Tyco International Ltd. (Bermuda) | | 13,200 | | | | 401,280 | | | |
Insurance—5.9% | | | |
| Aetna, Inc. | | 731,500 | | | | 31,586,170 | |
| Allstate Corporation (The) | | 151,900 | | | | 9,890,209 | |
| AMBAC Financial Group, Inc. | | 6,500 | | | | 578,955 | |
American International
Group, Inc. | | 1,412,050 | | | $ | 101,187,503 | |
| Axis Capital Holdings Ltd. (Bermuda) | | 13,100 | | | | 437,147 | |
| Humana, Inc. | * | | | 58,400 | | | | 3,230,104 | |
| Loews Corporation | | 84,200 | | | | 3,491,774 | |
| MBIA, Inc. | † | | | 49,375 | | | | 3,607,337 | |
| UnitedHealth Group, Inc. | | 178,300 | | | | 9,580,059 | |
| WR Berkley Corporation | | 16,800 | | | | 579,765 | |
| | | 164,169,023 | |
Lodging—0.7% | | | |
| Choice Hotels International, Inc. | | 8,500 | | | | 357,850 | |
| Hilton Hotels Corporation | | 475,300 | | | | 16,587,970 | |
| Marriott International, Inc. Class A | | 81,300 | | | | 3,879,636 | |
| | | 20,825,456 | |
Media—Broadcasting & Publishing—3.1% |
| CBS Corporation Class B | | 111,063 | | | | 3,462,944 | |
| Clear Channel Communications, Inc. | | 80,466 | | | | 2,859,762 | |
| Comcast Corporation Class A | * | | | 370,287 | | | | 15,674,249 | |
| DIRECTV Group (The), Inc. | * | | | 20,100 | | | | 501,294 | |
| Gannett Company, Inc. | | 490,600 | | | | 29,661,676 | |
| IAC/InterActiveCorporation | *† | | | 754,100 | | | | 28,022,356 | |
| Liberty Media Holdings Corporation Capital Class A | * | | | 5,000 | | | | 489,900 | |
| McGraw-Hill Companies, Inc. (The) | | 66,170 | | | | 4,500,883 | |
| | | 85,173,064 | |
Medical Supplies—4.6% | | | |
| Applera Corporation—Applied Biosystems Group | | 41,500 | | | | 1,522,635 | |
| Becton Dickinson & Company | | 42,900 | | | | 3,009,435 | |
| Boston Scientific Corporation | * | | | 788,700 | | | | 13,549,866 | |
| Johnson & Johnson | | 704,000 | | | | 46,478,080 | |
| Medtronic, Inc. | † | | | 834,700 | | | | 44,664,797 | |
| Thermo Fisher Scientific, Inc. | * | | | 380,100 | | | | 17,214,729 | |
| Waters Corporation | * | | | 40,055 | | | | 1,961,493 | |
| | | 128,401,035 | |
Metals—0.7% | | | |
| Commercial Metals Company | | 86,300 | | | | 2,226,540 | |
| Newmont Mining Corporation | | 11,700 | | | | 528,255 | |
| Phelps Dodge Corporation | | 141,500 | | | | 16,940,380 | |
| Southern Copper Corporation | † | | | 7,000 | | | | 377,230 | |
| | | 20,072,405 | |
Oil & Gas—1.5% | | | |
| Anadarko Petroleum Corporation | | 9,300 | | | | 404,736 | |
| Ashland, Inc. | | 5,100 | | | | 352,818 | |
| ConocoPhillips | | 179,600 | | | | 12,922,220 | |
| Devon Energy Corporation | | 47,700 | | | | 3,199,716 | |
| Exxon Mobil Corporation | | 62,000 | | | | 4,751,060 | |
| Marathon Oil Corporation | | 3,800 | | | | 351,500 | |
| Occidental Petroleum Corporation | | 125,600 | | | | 6,133,048 | |
| Schlumberger Ltd. (Netherland Antilles) | | 33,500 | | | | 2,115,860 | |
| Suncor Energy, Inc. (Canada) | † | | | 112,700 | | | | 8,893,157 | |
| Tidewater, Inc. | | 9,485 | | | | 458,695 | |
| XTO Energy, Inc. | | 24,100 | | | | 1,133,905 | |
| | | 40,716,715 | |
Pharmaceuticals—7.8% | | | |
| AmerisourceBergen Corporation | | 74,208 | | | | 3,336,392 | |
| Amgen, Inc. | * | | | 418,300 | | | | 28,574,073 | |
| Biogen Idec, Inc. | *† | | | 308,200 | | | | 15,160,358 | |
See accompanying notes to financial statements.
194
SCHEDULE OF INVESTMENTS—(Continued)
December 31, 2006
Vantagepoint
Growth Fund
|
|
|
|
|
|
|
| Shares
|
| Value
|
|---|
COMMON STOCKS—(Continued) |
| Celgene Corporation | *† | | | 542,400 | | | $ | 31,204,272 | |
| Cephalon, Inc. | *† | | | 18,700 | | | | 1,316,667 | |
Elan Corporation PLC
ADR (Ireland) | *† | | | 1,213,800 | | | | 17,903,550 | |
| Forest Laboratories, Inc. | * | | | 23,000 | | | | 1,163,800 | |
| Genentech, Inc. | * | | | 311,700 | | | | 25,288,221 | |
| Gen-Probe, Inc. | * | | | 39,674 | | | | 2,077,727 | |
| Genzyme Corporation | * | | | 249,600 | | | | 15,370,368 | |
| Gilead Sciences, Inc. | * | | | 109,900 | | | | 7,135,807 | |
| King Pharmaceuticals, Inc. | * | | | 39,700 | | | | 632,024 | |
| McKesson Corporation | | 70,800 | | | | 3,589,560 | |
| Merck & Company, Inc. | | 88,500 | | | | 3,858,600 | |
Novartis AG, ADR
(Switzerland) | | 156,000 | | | | 8,960,640 | |
| Omnicare, Inc. | † | | | 255,500 | | | | 9,869,965 | |
| Pfizer, Inc. | | 119,200 | | | | 3,087,280 | |
| Schering-Plough Corporation | | 424,500 | | | | 10,035,180 | |
Shire Pharmaceuticals Group
PLC (United Kingdom) | † | | | 199,000 | | | | 12,290,240 | |
| Wyeth | | 336,900 | | | | 17,154,948 | |
| | | 218,009,672 | |
Real Estate—0.2% | | | |
| Equity Office Properties Trust REIT | | 7,163 | | | | 345,042 | |
| Jones Lang Lasalle, Inc. | | 21,082 | | | | 1,943,128 | |
| SL Green Realty Corporation REIT | | 15,873 | | | | 2,107,617 | |
| | | 4,395,787 | |
Restaurants—0.1% | | | |
| Darden Restaurants, Inc. | † | | | 65,800 | | | | 2,643,186 | | | |
Retailers—9.3% | | | |
| Amazon.Com, Inc. | *† | | | 1,232,500 | | | | 48,634,450 | |
| CVS Corporation | | 494,100 | | | | 15,272,631 | |
| Circuit City Stores, Inc. | † | | | 128,000 | | | | 2,429,440 | |
| Costco Wholesale Corporation | | 79,000 | | | | 4,176,730 | |
| Dillard’s, Inc. Class A | † | | | 60,400 | | | | 2,112,188 | |
| eBay, Inc. | * | | | 2,327,600 | | | | 69,990,932 | |
| Fastenal Company | † | | | 352,100 | | | | 12,633,348 | |
| Nike, Inc. Class B | | 168,900 | | | | 16,726,167 | |
| Office Depot, Inc. | * | | | 93,573 | | | | 3,571,681 | |
| TJX Companies., Inc. | | 92,000 | | | | 2,620,160 | |
| Target Corporation | | 432,200 | | | | 24,657,010 | |
| Wal-Mart Stores, Inc. | | 1,200,500 | | | | 55,439,090 | |
| | | 258,263,827 | |
Telephone Systems—2.6% | | | |
| AT&T, Inc. | | 9,800 | | | | 350,350 | |
| Embarq Corporation | | 12,414 | | | | 652,480 | |
| Global Payments, Inc. | | 46,300 | | | | 2,143,690 | |
Nokia Corporation Sponsored
ADR (Finland) | | 3,034,500 | | | | 61,661,040 | |
| Sprint Nextel Corporation | | 31,200 | | | | 589,368 | |
| Verizon Communications, Inc. | | 185,400 | | | | 6,904,296 | |
| | | 72,301,224 | |
Transportation—2.2% | | | |
| CSX Corporation | | 101,900 | | | | 3,508,417 | |
Canadian Pacific Railway
Ltd. (Canada) | † | | | 174,200 | | | | 9,190,792 | |
| CH Robinson Worldwide, Inc. | | 163,600 | | | | 6,689,604 | |
| Expedia, Inc. | * | | | 820,300 | | | | 17,209,894 | |
Expeditors International
Washington, Inc. | | 15,900 | | | | 643,950 | |
| Norfolk Southern Corporation | | 231,300 | | | | 11,632,077 | |
| Overseas Shipholding Group | | 16,600 | | | | 934,580 | |
| Union Pacific Corporation | | 31,975 | | | $ | 2,942,340 | |
| United Parcel Service, Inc. Class B | | 119,000 | | | | 8,922,620 | |
| | | 61,674,274 | |
TOTAL COMMON STOCKS
| | | |
| (Cost $2,352,487,715) | | $ 2,707,646,550 | |
| |
WARRANTS—0.0% |
Financial Services—0.0% | | | |
Raytheon Co. Warrants,
Expires 6/16/2011 | | | |
| (Cost $) | | 556 | | | | 9,963 | |
| |
Coupon
Rate
|
|
|
| Maturity
Date
|
|
|
| Face
|
| Value
|
|---|
CASH EQUIVALENTS—9.1% |
Bank & Certificate Deposits/
Offshore Time Deposits—8.8% |
| Abbey National PLC | | | |
| 5.280% | | | | 01/05/2007 | | †† | | $ | 3,835,575 | | | | 3,835,575 | |
| BancoBilbao Vizcaya Argentaria SA | | | |
| 5.310% | | | | 01/03/2007 | | †† | | | 3,835,573 | | | | 3,835,573 | |
| Bank Of Nova Scotia | | | |
| 5.300% | | | | 02/27/2007 | | †† | | | 4,794,466 | | | | 4,794,466 | |
| Bank Of Nova Scotia | | | |
| 5.290% | | | | 01/30/2007 | | †† | | | 1,917,786 | | | | 1,917,786 | |
| Bank Of Nova Scotia | | | |
| 5.290% | | | | 02/06/2007 | | †† | | | 2,876,680 | | | | 2,876,680 | |
| Barclays | | | |
| 5.320% | | | | 02/13/2007 | | †† | | | 1,917,786 | | | | 1,917,786 | |
| Barclays | | | |
| 5.310% | | | | 02/20/2007 | | †† | | | 4,794,466 | | | | 4,794,466 | |
| Barclays | | | |
| 5.300% | | | | 01/02/2007 | | †† | | | 4,794,466 | | | | 4,794,466 | |
| Barton Capital LLC | | | |
| 5.300% | | | | 01/17/2007 | | †† | | | 1,917,786 | | | | 1,917,786 | |
| Barton Capital LLC | | | |
| 5.300% | | | | 01/17/2007 | | †† | | | 2,876,679 | | | | 2,876,679 | |
| Calyon | | | |
| 5.310% | | | | 02/16/2007 | | †† | | | 1,917,788 | | | | 1,917,788 | |
| Calyon | | | |
| 5.300% | | | | 02/05/2007 | | †† | | | 5,753,362 | | | | 5,753,362 | |
| Canadian Imperial Bank of Commerce | | | |
| 5.310% | | | | 01/29/2007 | | †† | | | 5,753,362 | | | | 5,753,362 | |
| Charta LLC | | | |
| 5.300% | | | | 01/31/2007 | | †† | | | 3,755,714 | | | | 3,755,714 | |
| CIESCO | | | |
| 5.310% | | | | 01/04/2007 | | †† | | | 2,497,058 | | | | 2,497,058 | |
| Citigroup | | | |
| 5.310% | | | | 03/16/2007 | | †† | | | 1,917,788 | | | | 1,917,788 | |
| Clipper Receivables Corp | | | |
| 5.300% | | | | 01/31/2007 | | †† | | | 1,917,788 | | | | 1,917,788 | |
| Compass Securitization | | | |
| 5.300% | | | | 01/09/2007 | | †† | | | 2,876,681 | | | | 2,876,681 | |
| CRC Funding LLC | | | |
| 5.340% | | | | 01/23/2007 | | †† | | | 958,894 | | | | 958,894 | |
| CRC Funding LLC | | | |
| 5.300% | | | | 01/10/2007 | | †† | | | 2,799,624 | | | | 2,799,624 | |
| Credit Suisse First Boston Corporation | | | |
| 5.300% | | | | 01/05/2007 | | †† | | | 1,917,788 | | | | 1,917,788 | |
| Credit Suisse First Boston Corporation | | | |
| 5.300% | | | | 01/12/2007 | | †† | | | 3,835,574 | | | | 3,835,574 | |
| Dexia Group | | | |
| 5.290% | | | | 01/16/2007 | | †† | | | 4,794,468 | | | | 4,794,468 | |
See accompanying notes to financial statements.
195
SCHEDULE OF INVESTMENTS—(Continued)
December 31, 2006
Vantagepoint
Growth Fund
Coupon
Rate
|
|
|
| Maturity
Date
|
|
|
| Face
|
| Value
|
|---|
CASH EQUIVALENTS—(Continued) |
| Fairway Finance | | | |
| 5.300% | | | | 01/09/2007 | | †† | | $ | 2,301,345 | | | $ | 2,301,345 | |
| Falcon Asset Securitization Corporation | | | |
| 5.340% | | | | 01/22/2007 | | †† | | | 1,917,786 | | | | 1,917,786 | |
| Fortis Bank | | | |
| 5.320% | | | | 01/03/2007 | | †† | | | 1,917,788 | | | | 1,917,788 | |
| Fortis Bank | | | |
| 5.300% | | | | 01/02/2007 | | †† | | | 1,917,788 | | | | 1,917,788 | |
| Fortis Bank | | | |
| 5.300% | | | | 01/24/2007 | | †† | | | 6,712,256 | | | | 6,712,256 | |
| Fortis Bank | | | |
| 5.300% | | | | 01/26/2007 | | †† | | | 7,671,149 | | | | 7,671,149 | |
| General Electric Capital Corporation | | | |
| 5.300% | | | | 01/26/2007 | | †† | | | 3,835,574 | | | | 3,835,574 | |
| Greyhawk Funding | | | |
| 5.310% | | | | 01/12/2007 | | †† | | | 1,917,788 | | | | 1,917,788 | |
| HBOS Halifax Bank of Scotland | | | |
| 5.310% | | | | 03/14/2007 | | †† | | | 4,794,468 | | | | 4,794,468 | |
| HBOS Halifax Bank of Scotland | | | |
| 5.300% | | | | 01/08/2007 | | †† | | | 1,917,788 | | | | 1,917,788 | |
| Kitty Hawk Funding Corp | | | |
| 5.340% | | | | 01/10/2007 | | †† | | | 2,876,681 | | | | 2,876,681 | |
| Lexington Parker Cap Comp | | | |
| 5.300% | | | | 01/05/2007 | | †† | | | 1,917,788 | | | | 1,917,788 | |
| Liberty Street | | | |
| 5.310% | | | | 01/17/2007 | | †† | | | 1,917,788 | | | | 1,917,788 | |
| Lloyds TSB Bank | | | |
| 5.300% | | | | 02/26/2007 | | †† | | | 1,917,788 | | | | 1,917,788 | |
| Marshall & Ilsley Bank Corporation | | | |
| 5.300% | | | | 03/19/2007 | | †† | | | 1,917,788 | | | | 1,917,788 | |
| Merrill Lynch & Co | | | |
| 5.300% | | | | 01/02/2007 | | †† | | | 33,561,278 | | | | 33,561,278 | |
| Morgan Stanley & Co | | | |
| 5.300% | | | | 01/02/2007 | | †† | | | 23,513,823 | | | | 23,513,823 | |
| Old Line Funding LLC | | | |
| 5.350% | | | | 01/04/2007 | | †† | | | 1,917,788 | | | | 1,917,788 | |
| Paradigm Funding LLC | | | |
| 5.310% | | | | 01/17/2007 | | †† | | | 1,917,788 | | | | 1,917,788 | |
| Park Avenue Receivables Corp | | | |
| 5.330% | | | | 01/18/2007 | | †† | | | 1,917,788 | | | | 1,917,788 | |
| Rabobank Nederland | | | |
| 5.250% | | | | 01/02/2007 | | †† | | | 5,753,362 | | | | 5,753,362 | |
| Ranger Funding | | | |
| 5.330% | | | | 02/08/2007 | | †† | | | 1,917,788 | | | | 1,917,788 | |
| Ranger Funding | | | |
| 5.320% | | | | 01/04/2007 | | †† | | | 1,917,788 | | | | 1,917,788 | |
| Royal Bank of Canada | | | |
| 5.310% | | | | 02/14/2007 | | †† | | | 3,835,574 | | | | 3,835,574 | |
| Royal Bank of Scotland | | | |
| 5.310% | | | | 01/11/2007 | | †† | | | 1,917,788 | | | | 1,917,788 | |
| Royal Bank of Scotland | | | |
| 5.290% | | | | 01/16/2007 | | †† | | | 2,876,681 | | | | 2,876,681 | |
| Royal Bank of Scotland | | | |
| 5.290% | | | | 02/09/2007 | | †† | | | 1,917,788 | | | | 1,917,788 | |
| Royal Bank of Scotland | | | |
| 5.280% | | | | 01/11/2007 | | †† | | | 4,794,468 | | | | 4,794,468 | |
| Sheffiled Receivables Corp | | | |
| 5.360% | | | | 01/11/2007 | | †† | | | 2,876,681 | | | | 2,876,681 | |
| Sheffiled Receivables Corp | | | |
| 5.300% | | | | 01/12/2007 | | †† | | | 1,917,788 | | | | 1,917,788 | |
| Societe Generale | | | |
| 5.310% | | | | 01/02/2007 | | †† | | | 4,794,468 | | | | 4,794,468 | |
| Societe Generale | | | |
| 5.290% | | | | 02/01/2007 | | †† | | | 4,794,468 | | | | 4,794,468 | |
| Societe Generale | | | |
| 5.270% | | | | 01/19/2007 | | †† | | $ | 4,794,468 | | | $ | 4,794,468 | |
| Svenska Handlesbanken | | | |
| 5.250% | | | | 01/02/2007 | | †† | | | 2,200,931 | | | | 2,200,931 | |
| Three Pillars Funding LLC | | | |
| 5.380% | | | | 01/02/2007 | | †† | | | 2,869,516 | | | | 2,869,516 | |
| UBS AG | | | |
| 5.300% | | | | 01/04/2007 | | †† | | | 1,917,788 | | | | 1,917,788 | |
| UBS AG | | | |
| 5.290% | | | | 01/02/2007 | | †† | | | 3,835,574 | | | | 3,835,574 | |
| Variable Funding Capital Co | | | |
| 5.310% | | | | 02/02/2007 | | †† | | | 1,917,788 | | | | 1,917,788 | |
| Variable Funding Capital Co | | | |
| 5.290% | | | | 01/04/2007 | | †† | | | 1,917,788 | | | | 1,917,788 | |
| Yorktown Capital LLC | | | |
| 5.330% | | | | 01/16/2007 | | †† | | | 1,917,788 | | | | 1,917,788 | |
| Yorktown Capital LLC | | | |
| 5.300% | | | | 01/10/2007 | | †† | | | 1,917,788 | | | | 1,917,788 | |
| | | 245,141,251 | |
Floating Rate Instruments/Master Notes—0.3% |
| Bank of America | | | |
| 5.310% | | | | 07/10/2007 | | †† | | | 4,794,468 | | | | 4,794,468 | |
| Bank of America | | | |
| 5.270% | | | | 01/09/2007 | | †† | | | 3,835,574 | | | | 3,835,574 | |
| | | 8,630,042 | |
TOTAL CASH EQUIVALENTS
| | | |
| (Cost $253,771,293) | | 253,771,293 | |
| |
REPURCHASE AGREEMENTS—2.9% |
| IBT Repurchase Agreement dated 12/29/2006 due 01/02/2007, with a maturity value of $79,903,867 and an effective yield of 4.65% collateralized by U.S. Government Obligations with rates ranging from 4.28% to 9.13%, maturity dates ranging from 07/18/2018 to 03/01/2005 and an aggregate market value of $83,855,735. | | 79,862,604 | | | | 79,862,604 | |
TOTAL INVESTMENTS—109.2%
| | | |
| (Cost $2,686,121,611) | | 3,041,290,410 | |
| Other assets less liabilities—(9.2%) | | (257,495,906 | ) |
NET ASSETS—100.0% | $ | 2,783,794,504 | |
Notes to the Schedule of Investments:
| ADR | | American Depositary Receipt |
| REIT | | Real Estate Investment Trust |
| * | | Non-income producing security. |
| † | | Denotes all or a portion of security on loan. |
| †† | | Represents collateral received from securities lending transactions. |
See accompanying notes to financial statements.
196
SCHEDULE OF INVESTMENTS
December 31, 2006
Vantagepoint Aggressive
Opportunities Fund
|
|
|
|
|
|
|
| Shares
|
| Value
|
|---|
COMMON STOCKS—97.2% |
Advertising—1.6% | | | |
| 24/7 Real Media, Inc. | * | | | 335,000 | | | $ | 3,031,749 | |
| Aquantive, Inc. | * | | | 235,300 | | | | 5,802,496 | |
Focus Media Holding, Ltd.,
ADR (Cayman Islands) | * | | | 51,900 | | | | 3,445,641 | |
| Lamar Advertising Company | * | | | 86,800 | | | | 5,675,852 | |
| Marchex, Inc. Class B | *† | | | 134,900 | | | | 1,804,962 | |
| Monster Worldwide, Inc. | * | | | 55,800 | | | | 2,602,512 | |
| | | 22,363,212 | |
Aerospace & Defense—0.3% | | | |
| Empresa Brasileira de Aeronautica SA, Sponsored ADR (Brazil) | † | | | 93,300 | | | | 3,863,553 | | | |
Apparel Retailers—1.1% | | | |
| AnnTaylor Stores Corporation | * | | | 114,500 | | | | 3,760,180 | |
Christopher & Banks
Corporation | | 261,900 | | | | 4,887,054 | |
| Urban Outfitters, Inc. | *† | | | 271,730 | | | | 6,257,942 | |
| | | 14,905,176 | |
Automotive—2.7% | | | |
| Autoliv, Inc. | | 124,300 | | | | 7,495,290 | |
| General Motors Corporation | † | | | 638,000 | | | | 19,599,360 | |
| Oshkosh Truck Corporation | | 210,800 | | | | 10,206,936 | |
| | | 37,301,586 | |
Banking—1.1% | | | |
| Investors Financial Services Corporation | | 288,700 | | | | 12,318,829 | |
| Texas Capital Bancshares, Inc. | * | | | 105,900 | | | | 2,105,292 | |
| | | 14,424,121 | |
Building Materials—2.5% | | | |
| Cemex SAB de CV (Mexico) | * | | | 420,370 | | | | 14,221,117 | |
| Interline Brands, Inc. | * | | | 320,500 | | | | 7,201,635 | |
| Martin Marietta Materials, Inc. | | 44,300 | | | | 4,603,213 | |
| Vulcan Materials Company | † | | | 86,000 | | | | 7,728,820 | |
| | | 33,754,785 | |
Chemicals—1.1% | | | |
| Agrium, Inc. (Canada) | † | | | 108,200 | | | | 3,407,218 | |
| Nalco Holding Company | * | | | 173,287 | | | | 3,545,452 | |
Potash Corporation of
Saskatchewan, Inc. (Canada) | | 12,650 | | | | 1,815,022 | |
| UAP Holding Corporation | † | | | 229,200 | | | | 5,771,256 | |
| | | 14,538,948 | |
Commercial Services—7.6% | | | |
| Accenture Ltd. Class A (Bermuda) | | 231,500 | | | | 8,549,295 | |
| Administaff, Inc. | † | | | 51,300 | | | | 2,194,101 | |
| Advisory Board Company (The) | * | | | 127,200 | | | | 6,810,288 | |
| AerCap Holdings NV (Netherlands) | * | | | 69,700 | | | | 1,615,646 | |
| American Reprographics Co. | * | | | 119,500 | | | | 3,980,545 | |
Corporate Executive
Board Company | † | | | 144,900 | | | | 12,707,730 | |
| Cytyc Corporation | * | | | 191,100 | | | | 5,408,130 | |
| Digitas, Inc. | * | | | 267,100 | | | | 3,581,811 | |
| Dun & Bradstreet Company | * | | | 56,900 | | | | 4,710,751 | |
Heartland Payment
Systems, Inc. | † | | | 161,700 | | | | 4,568,025 | |
| Korn Ferry International | *† | | | 377,200 | | | | 8,660,512 | |
|
| Mobile Mini, Inc. | * | | | 206,100 | | | $ | 5,552,334 | |
| Moody’s Corporation | | 53,100 | | | | 3,667,086 | |
| Navigant Consulting, Inc. | *† | | | 285,300 | | | | 5,637,528 | |
| Resources Connection, Inc. | * | | | 218,900 | | | | 6,969,776 | |
| Stericycle, Inc. | * | | | 45,100 | | | | 3,405,050 | |
| Waste Connections, Inc. | * | | | 164,000 | | | | 6,814,200 | |
| WebSideStory, Inc. | *† | | | 125,400 | | | | 1,587,564 | |
Weight Watchers
International, Inc. | | 101,600 | | | | 5,337,048 | |
| Wind River Systems, Inc. | * | | | 245,000 | | | | 2,511,250 | |
| | | 104,268,670 | |
Communications—2.0% | | | |
| American Tower Corporation Class A | * | | | 332,400 | | | | 12,391,872 | |
| Comverse Technology, Inc. | * | | | 131,800 | | | | 2,782,298 | |
| SBA Communications Corporation | * | | | 295,600 | | | | 8,129,000 | |
XM Satellite Radio
Holdings, Inc. Class A | *† | | | 313,300 | | | | 4,527,185 | |
| | | 27,830,355 | |
Computer Software & Processing—11.1% | | | |
| Activision, Inc. | *† | | | 868,199 | | | | 14,967,751 | |
| Adobe Systems, Inc. | * | | | 79,500 | | | | 3,269,040 | |
| Alliance Data Systems Corporation | * | | | 150,600 | | | | 9,407,982 | |
| Amdocs Ltd. | *† | | | 385,600 | | | | 14,942,000 | |
| Bottomline Technologies, Inc. | * | | | 145,700 | | | | 1,668,265 | |
| CNET Networks, Inc. | *† | | | 1,429,899 | | | | 12,997,782 | |
| Choicepoint, Inc. | * | | | 135,000 | | | | 5,316,300 | |
| Citrix Systems, Inc. | * | | | 160,100 | | | | 4,330,705 | |
| DST Systems, Inc. | *† | | | 101,610 | | | | 6,363,834 | |
| Factset Research Systems, Inc. | | 197,600 | | | | 11,160,448 | |
| Fidelity National Information Services, Inc. | † | | | 69,300 | | | | 2,778,237 | |
| Global Cash Access, Inc. | * | | | 141,100 | | | | 2,290,053 | |
| IMS Health, Inc. | | 128,800 | | | | 3,539,424 | |
| IHS, Inc.—Class A | * | | | 36,200 | | | | 1,429,176 | |
| Jack Henry & Associates, Inc. | | 312,500 | | | | 6,687,500 | |
| Juniper Networks, Inc. | * | | | 398,600 | | | | 7,549,484 | |
| Kronos, Inc. | * | | | 61,500 | | | | 2,259,510 | |
Lenovo Group, Ltd.
(Hong Kong) | | 9,609,100 | | | | 3,898,767 | |
| LivePerson, Inc. | * | | | 381,600 | | | | 1,995,768 | |
| Nvidia Corporation | * | | | 70,100 | | | | 2,594,401 | |
| Open Solutions, Inc. | *† | | | 35,000 | | | | 1,317,400 | |
| Red Hat, Inc. | * | | | 347,600 | | | | 7,994,800 | |
| RightNow Technologies, Inc. | *† | | | 288,700 | | | | 4,971,414 | |
| Skillsoft PLC ADR (Ireland) | * | | | 405,300 | | | | 2,516,913 | |
| Take-Two Interactive Software, Inc. | *† | | | 411,300 | | | | 7,304,688 | |
| Taleo Corp.—Class A | * | | | 214,500 | | | | 2,932,215 | |
| Verint Systems, Inc. | * | | | 70,400 | | | | 2,413,312 | |
| Websense, Inc. | * | | | 109,900 | | | | 2,509,017 | |
| | | 151,406,186 | |
Computers & Information—1.9% | | | |
| Dell, Inc. | * | | | 891,000 | | | | 22,355,190 | |
| Isilon Systems, Inc. | * | | | 5,400 | | | | 149,040 | |
| Micros Systems, Inc. | * | | | 50,600 | | | | 2,666,620 | |
| Rackable Systems, Inc. | *† | | | 33,100 | | | | 1,025,107 | |
| | | 26,195,957 | |
Education—1.0% | | | |
| Apollo Group, Inc. Class A | *† | | | 147,200 | | | | 5,736,384 | |
| Laureate Education, Inc. | * | | | 157,700 | | | | 7,668,951 | |
| | | 13,405,335 | |
See accompanying notes to financial statements.
197
SCHEDULE OF INVESTMENTS—(Continued)
December 31, 2006
Vantagepoint Aggressive
Opportunities Fund
|
|
|
|
|
|
|
| Shares
|
| Value
|
|---|
COMMON STOCKS—(Continued) |
Electrical Equipment—0.4% | | | |
| Ametek, Inc. | | 125,850 | | | $ | 4,007,064 | |
| Moog, Inc. Class A | * | | | 41,900 | | | | 1,600,161 | |
| | | 5,607,225 | |
Electronics—3.7% | | | |
| Analog Devices, Inc. | | 239,700 | | | | 7,878,939 | |
| Arrow Electronics, Inc. | * | | | 54,600 | | | | 1,722,630 | |
| Broadcom Corporation Class A | * | | | 60,300 | | | | 1,948,293 | |
| Cymer, Inc. | *† | | | 45,799 | | | | 2,012,866 | |
| DRS Technologies, Inc. | | 105,400 | | | | 5,552,472 | |
| Integrated Device Technology, Inc. | * | | | 306,300 | | | | 4,741,524 | |
| Intersil Corporation Class A | † | | | 149,600 | | | | 3,578,432 | |
| IPG Photonics Corp. | * | | | 5,500 | | | | 132,000 | |
Marvell Technology Group
Ltd. (Bermuda) | *† | | | 116,400 | | | | 2,233,716 | |
| Microchip Technology, Inc. | | 119,800 | | | | 3,917,460 | |
| National Semiconductor Corporation | † | | | 260,900 | | | | 5,922,430 | |
| PMC-Sierra, Inc. | *† | | | 517,300 | | | | 3,471,083 | |
| Semtech Corporation | * | | | 272,300 | | | | 3,558,961 | |
| Silicon Laboratories, Inc. | * | | | 113,400 | | | | 3,929,310 | |
| | | 50,600,116 | |
Entertainment & Leisure—3.7% | | | |
| Discovery Holding Company Class A | * | | | 192,710 | | | | 3,100,704 | |
International Speedway
Corporation Class A | | 89,800 | | | | 4,583,392 | |
| Pool Corporation | † | | | 240,100 | | | | 9,404,717 | |
| Walt Disney Company | | 767,000 | | | | 26,285,090 | |
| WMS Industries, Inc. | *† | | | 217,600 | | | | 7,585,536 | |
| | | 50,959,439 | |
Financial Services—2.8% | | | |
| Bear Stearns Companies, Inc. (The) | | 61,600 | | | | 10,027,248 | |
| Countrywide Financial Corporation | | 144,386 | | | | 6,129,186 | |
| Legg Mason, Inc. | | 30,500 | | | | 2,899,025 | |
| Nasdaq Stock Market Inc. | * | | | 44,500 | | | | 1,370,155 | |
| NTL, Inc. | | 293,700 | | | | 7,412,988 | |
| Nuveen Investments, Inc. Class A | | 106,000 | | | | 5,499,280 | |
| SEI Investments Company | | 87,700 | | | | 5,223,412 | |
| | | 38,561,294 | |
Food Retailers—0.8% | | | |
Panera Bread Company
Class A | *† | | | 126,000 | | | | 7,044,660 | |
| Pantry, Inc. (The) | *† | | | 92,100 | | | | 4,313,964 | |
| | | 11,358,624 | |
Health Care Providers—5.2% | | | |
| Coventry Health Care, Inc. | * | | | 293,050 | | | | 14,667,152 | |
| DaVita, Inc. | * | | | 535,100 | | | | 30,436,488 | |
| Edwards Lifesciences Corporation | * | | | 80,700 | | | | 3,796,128 | |
| Healthways, Inc. | *† | | | 74,500 | | | | 3,554,395 | |
| Laboratory Corporation Of America Holdings | *† | | | 70,300 | | | | 5,164,941 | |
| LCA-Vision, Inc. | † | | | 77,200 | | | | 2,652,592 | |
| Lincare Holdings, Inc. | * | | | 157,800 | | | | 6,286,752 | |
| Symbion, Inc. | * | | | 112,500 | | | | 2,082,375 | |
| VCA Antech, Inc. | * | | | 79,000 | | | | 2,543,010 | |
| | | 71,183,833 | |
|
Heavy Machinery—2.7% | | | |
| Actuant Corporation Class A | * | | | 252,400 | | | $ | 12,026,860 | |
| Entegris, Inc. | * | | | 453,300 | | | | 4,904,706 | |
| FMC Technologies, Inc. | * | | | 164,000 | | | | 10,107,320 | |
| Grant Prideco, Inc. | * | | | 97,900 | | | | 3,893,483 | |
| Hydril | * | | | 83,000 | | | | 6,240,770 | |
| | | 37,173,139 | |
Home Construction, Furnishings & Appliances—1.5% |
| Meritage Homes Corporation | *† | | | 174,000 | | | | 8,303,280 | |
| Standard-Pacific Corporation | † | | | 120,100 | | | | 3,217,479 | |
| Toll Brothers, Inc. | *† | | | 172,500 | | | | 5,559,675 | |
| Williams Scotsman International, Inc. | * | | | 150,500 | | | | 2,952,810 | |
| | | 20,033,244 | |
Industrial—Diversified—1.2% | | | |
| Roper Industries, Inc. | | 323,400 | | | | 16,247,616 | | | |
Insurance—8.8% | | | |
| AMBAC Financial Group, Inc. | | 157,250 | | | | 14,006,257 | |
| AON Corporation | † | | | 540,600 | | | | 19,104,804 | |
| Centene Corporation | *† | | | 124,000 | | | | 3,046,680 | |
Fairfax Financial Holdings
Ltd. (Canada) | † | | | 118,880 | | | | 23,597,680 | |
| HCC Insurance Holdings, Inc. | | 91,500 | | | | 2,936,235 | |
| HealthExtras, Inc. | * | | | 53,200 | | | | 1,282,120 | |
| Infinity Property & Casualty Corporation | | 50,600 | | | | 2,448,534 | |
| Markel Corporation | * | | | 7,400 | | | | 3,552,740 | |
| Millea Holdings, Inc. (Japan) | | 272,000 | | | | 9,632,562 | |
| Montpelier Re Holdings, Ltd. (Bermuda) | † | | | 424,300 | | | | 7,896,223 | |
Nipponkoa Insurance
Company Ltd. (Japan) | | 1,260,000 | | | | 10,181,076 | |
| Radian Group, Inc. | | 56,500 | | | | 3,045,915 | |
Security Capital Assurance
Ltd. (Bermuda) | | 141,200 | | | | 3,929,596 | |
| WellPoint, Inc. | * | | | 105,900 | | | | 8,333,271 | |
| XL Capital Ltd. Class A (Cayman Islands) | | 101,700 | | | | 7,324,434 | |
| | | 120,318,127 | |
Lodging—0.5% | | | |
| Station Casinos, Inc. | † | | | 76,100 | | | | 6,215,087 | | | |
Media—Broadcasting & Publishing—4.8% |
| Central European Media Enterprises Ltd. | *† | | | 46,100 | | | | 3,227,000 | |
| Comcast Corporation Special Class A | * | | | 138,000 | | | | 5,779,440 | |
| DIRECTV Group (The), Inc. | *† | | | 1,147,000 | | | | 28,606,180 | |
| Liberty Media Corporation Interactive Class A | * | | | 602,275 | | | | 12,991,072 | |
| Liberty Media Holdings Corporation Capital Class A | * | | | 120,455 | | | | 11,802,181 | |
| Meredith Corporation | | 55,700 | | | | 3,138,695 | |
| | | 65,544,568 | |
Medical Supplies—2.4% | | | |
| Advanced Medical Optics, Inc. | *† | | | 194,400 | | | | 6,842,880 | |
| Biomet, Inc. | | 87,500 | | | | 3,611,125 | |
| FEI Company | *† | | | 275,900 | | | | 7,275,483 | |
| Kla-Tencor Corporation | | 33,600 | | | | 1,671,600 | |
| Respironics, Inc. | * | | | 139,900 | | | | 5,281,225 | |
| Thermo Fisher Scientific, Inc. | * | | | 161,800 | | | | 7,327,922 | |
| | | 32,010,235 | |
See accompanying notes to financial statements.
198
SCHEDULE OF INVESTMENTS—(Continued)
December 31, 2006
Vantagepoint Aggressive
Opportunities Fund
|
|
|
|
|
|
|
| Shares
|
| Value
|
|---|
COMMON STOCKS—(Continued) |
Metals—1.1% | | | |
| United States Steel Corporation | | 211,800 | | | $ | 15,491,052 | | | |
Oil & Gas—2.1% | | | |
| Bill Barrett Corporation | *† | | | 96,400 | | | | 2,623,044 | |
| BJ Services Company | | 198,400 | | | | 5,817,088 | |
| Denbury Resources, Inc. | * | | | 143,300 | | | | 3,982,307 | |
| Encore Acquisition Company | *† | | | 138,999 | | | | 3,409,645 | |
| GlobalSantaFe Corporation | | 80,800 | | | | 4,749,424 | |
| Range Resources Corporation | | 171,400 | | | | 4,706,644 | |
| W-H Energy Services, Inc. | * | | | 72,800 | | | | 3,544,632 | |
| | | 28,832,784 | |
Pharmaceuticals—6.2% | | | |
| Affymetrix, Inc. | *† | | | 271,300 | | | | 6,256,178 | |
| Alexion Pharmaceuticals, Inc. | *† | | | 74,400 | | | | 3,005,016 | |
| Alkermes, Inc. | * | | | 147,500 | | | | 1,972,075 | |
| Amylin Pharmaceuticals, Inc. | *† | | | 116,800 | | | | 4,212,976 | |
| Atherogenics, Inc. | *† | | | 108,900 | | | | 1,079,199 | |
| Cell Genesys, Inc. | *† | | | 286,700 | | | | 971,913 | |
| Cephalon, Inc. | *† | | | 58,100 | | | | 4,090,821 | |
| Cubist Pharmaceuticals, Inc. | *† | | | 100,400 | | | | 1,818,244 | |
| CV Therapeutics, Inc. | *† | | | 163,700 | | | | 2,285,252 | |
| deCODE genetics, Inc. | *† | | | 419,300 | | | | 1,899,429 | |
| Exelixis, Inc. | * | | | 230,700 | | | | 2,076,300 | |
| Far East Pharmaceutical Tech (Hong Kong) | *‡d | | | 6,152,600 | | | | — | |
| Henry Schein, Inc. | *† | | | 186,200 | | | | 9,120,076 | |
| Immucor, Inc. | * | | | 159,000 | | | | 4,647,570 | |
| Medicines Company | * | | | 107,800 | | | | 3,419,416 | |
| Medicis Pharmaceutical Corporation Class A | † | | | 440,900 | | | | 15,488,817 | |
| Myriad Genetics, Inc. | *† | | | 68,300 | | | | 2,137,790 | |
| New River Pharmaceuticals, Inc. | *† | | | 51,000 | | | | 2,790,210 | |
| Senomyx, Inc. | *† | | | 328,523 | | | | 4,267,514 | |
Shire Pharmaceuticals Group
PLC (United Kingdom) | | 91,600 | | | | 5,657,216 | |
| Symyx Technologies, Inc. | * | | | 163,600 | | | | 3,532,124 | |
Valeant Pharmaceuticals
International | | 242,000 | | | | 4,172,080 | |
| | | 84,900,216 | |
Real Estate—1.8% | | | |
| CapitalSource, Inc. | † | | | 566,700 | | | | 15,476,577 | |
| CB Richard Ellis Group, Inc. Class A | * | | | 158,100 | | | | 5,248,920 | |
| St. Joe Company (The) | † | | | 68,100 | | | | 3,648,117 | |
| | | 24,373,614 | |
Restaurants—0.4% | | | |
| PF Chang’s China Bistro, Inc. | *† | | | 151,300 | | | | 5,806,894 | | | |
Retailers—5.0% | | | |
| AC Moore Arts & Crafts, Inc. | *† | | | 174,000 | | | | 3,770,580 | |
| Advance Auto Parts, Inc. | | 91,300 | | | | 3,246,628 | |
| Amazon.Com, Inc. | * | | | 477,000 | | | | 18,822,420 | |
| Autozone, Inc. | * | | | 44,000 | | | | 5,084,640 | |
| Bed Bath & Beyond, Inc. | * | | | 85,700 | | | | 3,265,170 | |
| Blue Nile, Inc. | *† | | | 40,600 | | | | 1,497,734 | |
| Fastenal Company | | 95,300 | | | | 3,419,364 | |
| MarineMax, Inc. | *† | | | 100,200 | | | | 2,598,186 | |
| O’Reilly Automotive, Inc. | *† | | | 347,000 | | | | 11,124,820 | |
| School Specialty, Inc. | *† | | | 118,621 | | | | 4,447,101 | |
| Sears Holdings Corporation | *† | | | 46,800 | | | | 7,859,124 | |
| Tiffany & Company | | 77,800 | | | | 3,052,872 | |
| | | 68,188,639 | |
|
Telephone Systems—6.5% | | | |
| Adtran, Inc. | | 120,100 | | | $ | 2,726,270 | |
| KDDI Corporation (Japan) | | 1,483 | | | | 10,066,257 | |
| Level 3 Communications, Inc. | *† | | | 2,887,200 | | | | 16,168,320 | |
| NTT DoCoMo, Inc. (Japan) | | 1,765 | | | | 2,792,461 | |
| NeuStar, Inc. Class A | *† | | | 204,000 | | | | 6,617,760 | |
| NII Holdings, Inc. Class B | *† | | | 394,045 | | | | 25,392,260 | |
| Sprint Nextel Corporation | † | | | 1,329,300 | | | | 25,110,477 | |
| | | 88,873,805 | |
Textiles, Clothing & Fabrics—0.2% | | | |
| Iconix Brand Group, Inc. | * | | | 38,600 | | | | 748,454 | |
| Mohawk Industries, Inc. | *† | | | 32,000 | | | | 2,395,520 | |
| | | 3,143,974 | |
Transportation—1.4% | | | |
| Expedia, Inc. | *† | | | 592,000 | | | | 12,420,160 | |
| Thor Industries, Inc. | † | | | 45,600 | | | | 2,005,944 | |
UTI Worldwide, Inc.
(Luxembourg) | | 144,100 | | | | 4,308,590 | |
| | | 18,734,694 | |
TOTAL COMMON STOCKS
| | | |
| (Cost $1,083,958,110) | | 1,328,416,103 | |
| |
Coupon
Rate
|
|
|
| Maturity
Date
|
|
|
| Face
|
| Value
|
|---|
COMMERCIAL PAPER—0.1% |
Financial Services—0.1% | | | |
| Falcon Asset Securitization Corporation 144A | | | |
| 5.310% | | | | 01/25/2007 | | ** | | | | | | | | |
| (Cost $1,992,330) | $ | 2,000,000 | | | | 1,992,330 | |
| |
CASH EQUIVALENTS—27.5% |
Bank & Certificate Deposits/
Offshore Time Deposits—26.5% |
| Abbey National PLC | | | |
| 5.280% | | | | 01/05/2007 | | †† | | | 5,673,811 | | | $ | 5,673,811 | |
| BancoBilbao Vizcaya Argentaria SA | | | |
| 5.310% | | | | 01/03/2007 | | †† | | | 5,673,810 | | | | 5,673,810 | |
| Bank Of Nova Scotia | | | |
| 5.300% | | | | 02/27/2007 | | †† | | | 7,092,263 | | | | 7,092,263 | |
| Bank Of Nova Scotia | | | |
| 5.290% | | | | 01/30/2007 | | †† | | | 2,836,906 | | | | 2,836,906 | |
| Bank Of Nova Scotia | | | |
| 5.290% | | | | 02/06/2007 | | †† | | | 4,255,358 | | | | 4,255,358 | |
| Barclays | | | |
| 5.320% | | | | 02/13/2007 | | †† | | | 2,836,906 | | | | 2,836,906 | |
| Barclays | | | |
| 5.310% | | | | 02/20/2007 | | †† | | | 7,092,263 | | | | 7,092,263 | |
| Barclays | | | |
| 5.300% | | | | 01/02/2007 | | †† | | | 7,092,263 | | | | 7,092,263 | |
| Barton Capital LLC | | | |
| 5.300% | | | | 01/17/2007 | | †† | | | 2,836,906 | | | | 2,836,906 | |
| Barton Capital LLC | | | |
| 5.300% | | | | 01/17/2007 | | †† | | | 4,255,358 | | | | 4,255,358 | |
| Calyon | | | |
| 5.310% | | | | 02/16/2007 | | †† | | | 2,836,906 | | | | 2,836,906 | |
| Calyon | | | |
| 5.300% | | | | 02/05/2007 | | †† | | | 8,510,715 | | | | 8,510,715 | |
| Canadian Imperial Bank of Commerce | | | |
| 5.310% | | | | 01/29/2007 | | †† | | | 8,510,715 | | | | 8,510,715 | |
| Charta LLC | | | |
| 5.300% | | | | 01/31/2007 | | †† | | | 5,555,677 | | | | 5,555,677 | |
See accompanying notes to financial statements.
199
SCHEDULE OF INVESTMENTS—(Continued)
December 31, 2006
Vantagepoint Aggressive
Opportunities Fund
Coupon
Rate
|
|
|
| Maturity
Date
|
|
|
| Face
|
| Value
|
|---|
CASH EQUIVALENTS—(Continued) |
| CIESCO | | | |
| 5.310% | | | | 01/04/2007 | | †† | | $ | 3,693,797 | | | $ | 3,693,797 | |
| Citigroup | | | |
| 5.310% | | | | 03/16/2007 | | †† | | | 2,836,906 | | | | 2,836,906 | |
| Clipper Receivables Corp | | | |
| 5.300% | | | | 01/31/2007 | | †† | | | 2,836,906 | | | | 2,836,906 | |
| Compass Securitization | | | |
| 5.300% | | | | 01/09/2007 | | †† | | | 4,255,358 | | | | 4,255,358 | |
| CRC Funding LLC | | | |
| 5.340% | | | | 01/23/2007 | | †† | | | 1,418,453 | | | | 1,418,453 | |
| CRC Funding LLC | | | |
| 5.300% | | | | 01/10/2007 | | †† | | | 4,141,370 | | | | 4,141,370 | |
| Credit Suisse First Boston Corporation | | | |
| 5.300% | | | | 01/05/2007 | | †† | | | 2,836,906 | | | | 2,836,906 | |
| Credit Suisse First Boston Corporation | | | |
| 5.300% | | | | 01/12/2007 | | †† | | | 5,673,810 | | | | 5,673,810 | |
| Dexia Group | | | |
| 5.290% | | | | 01/16/2007 | | †† | | | 7,092,263 | | | | 7,092,263 | |
| Fairway Finance | | | |
| 5.300% | | | | 01/09/2007 | | †† | | | 3,404,287 | | | | 3,404,287 | |
| Falcon Asset Securitization Corporation | | | |
| 5.340% | | | | 01/22/2007 | | †† | | | 2,836,906 | | | | 2,836,906 | |
| Fortis Bank | | | |
| 5.320% | | | | 01/03/2007 | | †† | | | 2,836,906 | | | | 2,836,906 | |
| Fortis Bank | | | |
| 5.300% | | | | 01/02/2007 | | †† | | | 2,836,906 | | | | 2,836,906 | |
| Fortis Bank | | | |
| 5.300% | | | | 01/24/2007 | | †† | | | 9,929,169 | | | | 9,929,169 | |
| Fortis Bank | | | |
| 5.300% | | | | 01/26/2007 | | †† | | | 11,347,622 | | | | 11,347,622 | |
| General Electric Capital Corporation | | | |
| 5.300% | | | | 01/26/2007 | | †† | | | 5,673,810 | | | | 5,673,810 | |
| Greyhawk Funding | | | |
| 5.310% | | | | 01/12/2007 | | †† | | | 2,836,906 | | | | 2,836,906 | |
| HBOS Halifax Bank of Scotland | | | |
| 5.310% | | | | 03/14/2007 | | †† | | | 7,092,263 | | | | 7,092,263 | |
| HBOS Halifax Bank of Scotland | | | |
| 5.300% | | | | 01/08/2007 | | †† | | | 2,836,906 | | | | 2,836,906 | |
| Kitty Hawk Funding Corp | | | |
| 5.340% | | | | 01/10/2007 | | †† | | | 4,255,358 | | | | 4,255,358 | |
| Lexington Parker Cap Comp | | | |
| 5.300% | | | | 01/05/2007 | | †† | | | 2,836,906 | | | | 2,836,906 | |
| Liberty Street | | | |
| 5.310% | | | | 01/17/2007 | | †† | | | 2,836,906 | | | | 2,836,906 | |
| Lloyds TSB Bank | | | |
| 5.300% | | | | 02/26/2007 | | †† | | | 2,836,906 | | | | 2,836,906 | |
| Marshall & Ilsley Bank Corporation | | | |
| 5.300% | | | | 03/19/2007 | | †† | | | 2,836,906 | | | | 2,836,906 | |
| Merrill Lynch & Co | | | |
| 5.300% | | | | 01/02/2007 | | †† | | | 49,645,843 | | | | 49,645,843 | |
| Morgan Stanley & Co | | | |
| 5.300% | | | | 01/02/2007 | | †† | | | 34,783,033 | | | | 34,783,033 | |
| Old Line Funding LLC | | | |
| 5.350% | | | | 01/04/2007 | | †† | | | 2,836,906 | | | | 2,836,906 | |
| Paradigm Funding LLC | | | |
| 5.310% | | | | 01/17/2007 | | †† | | | 2,836,906 | | | | 2,836,906 | |
| Park Avenue Receivables Corp | | | |
| 5.330% | | | | 01/18/2007 | | †† | | | 2,836,906 | | | | 2,836,906 | |
| Rabobank Nederland | | | |
| 5.250% | | | | 01/02/2007 | | †† | | | 8,510,715 | | | | 8,510,715 | |
| Ranger Funding | | | |
| 5.330% | | | | 02/08/2007 | | †† | | | 2,836,906 | | | | 2,836,906 | |
| Ranger Funding | | | |
| 5.320% | | | | 01/04/2007 | | †† | | $ | 2,836,906 | | | $ | 2,836,906 | |
| Royal Bank of Canada | | | |
| 5.310% | | | | 02/14/2007 | | †† | | | 5,673,810 | | | | 5,673,810 | |
| Royal Bank of Scotland | | | |
| 5.310% | | | | 01/11/2007 | | †† | | | 2,836,906 | | | | 2,836,906 | |
| Royal Bank of Scotland | | | |
| 5.290% | | | | 01/16/2007 | | †† | | | 4,255,358 | | | | 4,255,358 | |
| Royal Bank of Scotland | | | |
| 5.290% | | | | 02/09/2007 | | †† | | | 2,836,906 | | | | 2,836,906 | |
| Royal Bank of Scotland | | | |
| 5.280% | | | | 01/11/2007 | | †† | | | 7,092,263 | | | | 7,092,263 | |
| Sheffiled Receivables Corp | | | |
| 5.360% | | | | 01/11/2007 | | †† | | | 4,255,358 | | | | 4,255,358 | |
| Sheffiled Receivables Corp | | | |
| 5.300% | | | | 01/12/2007 | | †† | | | 2,836,906 | | | | 2,836,906 | |
| Societe Generale | | | |
| 5.310% | | | | 01/02/2007 | | †† | | | 7,092,263 | | | | 7,092,263 | |
| Societe Generale | | | |
| 5.290% | | | | 02/01/2007 | | †† | | | 7,092,263 | | | | 7,092,263 | |
| Societe Generale | | | |
| 5.270% | | | | 01/19/2007 | | †† | | | 7,092,263 | | | | 7,092,263 | |
| Svenska Handlesbanken | | | |
| 5.250% | | | | 01/02/2007 | | †† | | | 3,255,746 | | | | 3,255,746 | |
| Three Pillars Funding LLC | | | |
| 5.380% | | | | 01/02/2007 | | †† | | | 4,244,758 | | | | 4,244,758 | |
| UBS AG | | | |
| 5.300% | | | | 01/04/2007 | | †† | | | 2,836,906 | | | | 2,836,906 | |
| UBS AG | | | |
| 5.290% | | | | 01/02/2007 | | †† | | | 5,673,810 | | | | 5,673,810 | |
| Variable Funding Capital Co | | | |
| 5.310% | | | | 02/02/2007 | | †† | | | 2,836,906 | | | | 2,836,906 | |
| Variable Funding Capital Co | | | |
| 5.290% | | | | 01/04/2007 | | †† | | | 2,836,906 | | | | 2,836,906 | |
| Yorktown Capital LLC | | | |
| 5.330% | | | | 01/16/2007 | | †† | | | 2,836,906 | | | | 2,836,906 | |
| Yorktown Capital LLC | | | |
| 5.300% | | | | 01/10/2007 | | †† | | | 2,836,906 | | | | 2,836,906 | |
| | | 362,627,550 | |
Floating Rate Instruments/Master Notes—1.0% |
| Bank of America | | | |
| 5.310% | | | | 07/10/2007 | | †† | | | 7,092,263 | | | | 7,092,263 | |
| Bank of America | | | |
| 5.270% | | | | 01/09/2007 | | †† | | | 5,673,810 | | | | 5,673,810 | |
| | | 12,766,073 | |
TOTAL CASH EQUIVALENTS
| | | |
| (Cost $375,393,623) | | | | | | 375,393,623 | |
See accompanying notes to financial statements.
200
SCHEDULE OF INVESTMENTS
December 31, 2006
Vantagepoint Aggressive
Opportunities Fund
|
|
|
|
|
|
|
| Face
|
| Value
|
|---|
REPURCHASE AGREEMENTS—2.5% |
| IBT Repurchase Agreement dated 12/29/06 due 01/02/07, with a maturity value of 34,440,004 and an effective yield of 4.65% collateralized by U.S. Government Agency Obligations with rates ranging from 4.32% to 7.875%, maturity dates ranging from 02/25/2030 to 08/01/2034 and an aggregate market value of $36,143,330. | $ | 34,422,220 | | | $ | 34,422,220 | |
TOTAL INVESTMENTS—127.3%
| | | |
| (Cost $1,495,766,283) | | 1,740,224,276 | |
| Other assets less liabilities—(27.3%) | | (373,516,001 | ) |
NET ASSETS—100.0% | $ | 1,366,708,275 | |
Notes to the Schedule of Investments:
| ADR | | American Depositary Receipt |
| * | | Non-income producing security. |
| † | | Denotes all or a portion of security on loan. |
| ‡ | | Security valued at fair value as determined by policies approved by the board of directors. |
| ** | | Security exempt from registration under Rule 144A of the Securities Act of 1933. These securities may be resold in transactions exempt from registration, normally to qualified buyers. 144A securities represent 0.11% of Total Investments. |
| †† | | Represents collateral received from securities lending transactions. |
| d | | Security has no market value at 12/31/2006. |
|
See accompanying notes to financial statements.
201
SCHEDULE OF INVESTMENTS
December 31, 2006
Vantagepoint
International Fund
|
|
|
|
|
|
|
| Shares
|
| Value
|
|---|
COMMON STOCKS—96.6% |
Australia—2.7% | | | |
| Amcor Ltd. | | 92,256 | | | $ | 526,386 | |
| Austal, Ltd. | | 182,000 | | | | 492,254 | |
| AXA Asia Pacific Holdings Ltd. | | 88,600 | | | | 506,976 | |
| Brambles Ltd. | * | | | 126,571 | | | | 1,274,789 | |
| Foster’s Group Ltd. | | 151,148 | | | | 822,831 | |
| Insurance Australia Group Ltd. | | 264,284 | | | | 1,317,678 | |
| Macquarie Bank Ltd. | | 40,780 | | | | 2,530,377 | |
| Promina Group Ltd. | | 32,956 | | | | 179,300 | |
| Publishing & Broadcasting Ltd. | | 360,147 | | | | 6,026,602 | |
| QBE Insurance Group Ltd. | | 155,500 | | | | 3,522,091 | |
| Rinker Group Ltd. | | 136,177 | | | | 1,924,671 | |
| Rio Tinto Ltd. | | 10,300 | | | | 598,628 | |
| Telstra Corporation Ltd. | | 225,481 | | | | 735,578 | |
| Woodside Petroleum Ltd. | | 213,000 | | | | 6,370,327 | |
| Woolworths Ltd. | | 84,761 | | | | 1,593,864 | |
| | | 28,422,352 | |
Austria—0.4% | | | |
| Erste Bank der Oesterreichischen Sparkassen AG | | 9,100 | | | | 696,737 | |
| Raiffeisen International Bank Holding AG | * | | | 4,800 | | | | 729,839 | |
| Telekom Austria AG | | 25,500 | | | | 680,882 | |
| Wiener Staedtische Allgemeine Versicherung AG | | 34,447 | | | | 2,417,509 | |
| | | 4,524,967 | |
Belgium—1.1% | | | |
| Fortis | | 173,885 | | | | 7,400,005 | |
| KBC Groep NV | | 25,800 | | | | 3,158,294 | |
| UCB SA | † | | | 20,800 | | | | 1,425,366 | |
| Umicore | | 161 | | | | 27,356 | |
| | | 12,011,021 | |
Bermuda—0.6% | | | |
| Guoco Group, Ltd. | | 80,000 | | | | 985,315 | |
| Jardine Matheson Holdings, Ltd. | | 16,800 | | | | 359,520 | |
| NWS Holdings, Ltd. | | 693,396 | | | | 1,586,266 | |
| SeaDrill Ltd. | * | | | 182,600 | | | | 3,064,469 | |
| Vtech Holdings, Ltd. | | 133,000 | | | | 819,046 | |
| | | 6,814,616 | |
Brazil—0.1% | | | |
| Vivo Participacoes SA, ADR | * | | | 212,518 | | | | 871,324 | | | |
Canada—4.4% | | | |
| Abitibi-Consolidated, Inc. | | 71,000 | | | | 182,137 | |
| Akita Drilling, Ltd.—Class A | | 13,300 | | | | 189,992 | |
| Alcan Aluminum Ltd. | | 76,900 | | | | 3,746,199 | |
| Barrick Gold Corporation | | 90,100 | | | | 2,766,070 | |
| Cameco Corporation | † | | | 76,600 | | | | 3,101,986 | |
Canadian Imperial Bank
of Commerce | | 9,100 | | | | 767,475 | |
| Canadian Natural Resources, Ltd. | | 56,400 | | | | 3,007,387 | |
| Canadian Oil Sands Trust | | 20,100 | | | | 562,362 | |
| COM DEV International, Ltd. | * | | | 169,600 | | | | 939,999 | |
| Empire Co., Ltd.—Class A | | 40,500 | | | | 1,435,421 | |
| EnCana Corporation | | 10,800 | | | | 497,214 | |
| Finning International, Inc. | | 18,200 | | | | 746,238 | |
| First Quantum Minerals Ltd. | | 13,900 | | | | 748,338 | |
| Inmet Mining Corporation | | 30,800 | | | | 1,649,203 | |
| Laperriere & Verreault Group | * | | | 32,900 | | | | 860,924 | |
| Manulife Financial Corporation | † | | | 21,000 | | | | 708,979 | |
| Methanex Corp. | † | | | 27,300 | | | | 747,175 | |
|
| Nortel Networks Corp. | * | | | 27,000 | | | $ | 721,710 | |
| Pason Systems, Inc. | | 10,600 | | | | 120,592 | |
Potash Corporation of
Saskatchewan, Inc. (foreign shares) | | 23,300 | | | | 3,338,424 | |
| Research In Motion, Ltd. | * | | | 27,100 | | | | 3,464,373 | |
Rogers Communications,
Inc.—Class B | | 20,800 | | | | 619,244 | |
| Royal Bank of Canada | | 14,400 | | | | 685,685 | |
Shaw Communications,
Inc.—Class B | | 22,700 | | | | 718,851 | |
| Suncor Energy, Inc. | | 96,200 | | | | 7,575,992 | |
| Teck CominCo, Ltd.—Class B | † | | | 26,600 | | | | 2,006,040 | |
| Telus Corporation | † | | | 55,100 | | | | 2,530,095 | |
Telus Corporation
Non-voting Shares | | 17,900 | | | | 799,054 | |
| Toronto-Dominion Bank | | 9,600 | | | | 574,246 | |
| | | 45,811,405 | |
Cayman Islands—0.1% | | | |
Foxconn International
Holdings Ltd. | * | | | 173,000 | | | | 564,160 | | | |
China—0.2% | | | |
China Life Insurance Co.,
Ltd.—Class H | | 389,000 | | | | 1,327,577 | |
Industrial and Commercial Bank of China Asia,
Ltd.—Class H | * | | | 1,273,000 | | | | 790,353 | |
| | | 2,117,930 | |
Denmark—0.2% | | | |
| Codan A/S | | 6,200 | | | | 601,245 | |
| Novo Nordisk A/S Class B | | 23,300 | | | | 1,940,146 | |
| | | 2,541,391 | |
Finland—1.5% | | | |
| Fortum Oyj | | 215,891 | | | | 6,131,180 | |
| Neste Oil Oyj | | 15,600 | | | | 472,709 | |
| Nokia Oyj | | 200,400 | | | | 4,069,388 | |
| Sampo Oyj | | 104,400 | | | | 2,788,251 | |
| Stora Enso Oyj Class R | | 37,400 | | | | 589,686 | |
| UPM-Kymmene Oyj | | 77,900 | | | | 1,962,571 | |
| | | 16,013,785 | |
France—10.4% | | | |
| Accor SA | | 14,500 | | | | 1,121,184 | |
| Air France | | 49,000 | | | | 2,056,943 | |
| Air Liquide | | 4,018 | | | | 951,997 | |
| Alstom | * | | | 28,937 | | | | 3,905,369 | |
| Assurances Generales de France | | 16,800 | | | | 2,612,222 | |
| AXA | | 121,571 | | | | 4,900,528 | |
| BNP Paribas | | 57,070 | | | | 6,208,335 | |
| Bouygues SA | | 174,136 | | | | 11,148,902 | |
| Carrefour SA | | 81,157 | | | | 4,911,820 | |
| Cie Generale D’Optique Essilor International SA | | 56,900 | | | | 6,108,468 | |
| Dassault Systemes SA | | 11,600 | | | | 613,196 | |
| Electricite de France | * | | | 53,946 | | | | 3,922,448 | |
| Groupe Danone | | 7,100 | | | | 1,073,647 | |
| Haulotte Group | | 17,900 | | | | 475,511 | |
| LVMH Moet Hennessy Louis Vuitton SA | | 81,341 | | | | 8,556,377 | |
| Lafarge SA | | 14,800 | | | | 2,199,874 | |
| L’Oreal SA | | 65,900 | | | | 6,587,260 | |
| Michelin (C.G.D.E.) Class B | | 10,100 | | | | 964,749 | |
| PagesJaunes SA | | 18,853 | | | | 374,659 | |
| Pernod-Ricard SA | | 3,000 | | | | 687,749 | |
See accompanying notes to financial statements.
202
SCHEDULE OF INVESTMENTS—(Continued)
December 31, 2006
Vantagepoint
International Fund
|
|
|
|
|
|
|
| Shares
|
| Value
|
|---|
COMMON STOCKS—(Continued) |
| Provimi SA | | 10,126 | | | $ | 433,797 | |
| Renault SA | | 14,100 | | | | 1,688,274 | |
| Rhodia SA | *† | | | 228,100 | | | | 793,220 | |
| Sanofi-Synthelabo SA | | 76,600 | | | | 7,062,332 | |
| Schneider Electric SA | | 26,200 | | | | 2,899,499 | |
| Societe Generale Class A | | 28,830 | | | | 4,877,008 | |
Societe Television Francaise1 | † | | | 128,000 | | | | 4,743,344 | |
| Technip SA | † | | | 41,953 | | | | 2,877,552 | |
| Thales SA | | 27,500 | | | | 1,368,595 | |
| Total SA | † | | | 86,640 | | | | 6,234,177 | |
| Veolia Environment | | 26,630 | | | | 2,030,837 | |
| Vinci SA | † | | | 23,003 | | | | 2,931,670 | |
| Vivendi Universal SA | | 44,100 | | | | 1,720,031 | |
| | | 109,041,574 | |
Germany—5.1% | | | |
| Allianz AG | | 62,137 | �� | | | 12,629,332 | |
| Bayer AG | | 13,100 | | | | 699,599 | |
| Bayerische Motoren Werke AG | | 21,113 | | | | 1,210,110 | |
| Carlsberg AS Class B | | 9,950 | | | | 985,300 | |
| Commerzbank AG | | 24,281 | | | | 918,133 | |
| Continental AG | | 5,600 | | | | 648,722 | |
| DaimlerChrysler AG | | 34,200 | | | | 2,100,983 | |
| Deutsche Bank AG | | 8,700 | | | | 1,155,786 | |
| Deutsche Post AG | | 109,659 | | | | 3,300,927 | |
| Fraport AG | † | | | 27,957 | | | | 1,988,027 | |
| IVG Immobilien AG | | 22,536 | | | | 964,598 | |
| Kloeckner & Co. AG | * | | | 13,700 | | | | 589,576 | |
| MAN AG | | 5,900 | | | | 530,963 | |
Muenchener
Rueckversicherungs AG | | 18,900 | | | | 3,241,970 | |
| RWE AG | | 56,929 | | | | 6,243,166 | |
| Salzgitter AG | | 36,900 | | | | 4,780,422 | |
| SAP AG | | 42,800 | | | | 2,269,710 | |
| SAP AG ADR | † | | | 7,700 | | | | 408,870 | |
| Siemens AG | † | | | 38,400 | | | | 3,768,449 | |
| E.ON AG | | 20,666 | | | | 2,790,732 | |
| Volkswagen AG | † | | | 22,200 | | | | 2,515,344 | |
| | | 53,740,719 | |
Greece—0.1% | | | |
| OPAP SA | | 15,270 | | | | 589,669 | | | |
Hong Kong—5.9% | | | |
| Bank of East Asia Ltd. | | 260,600 | | | | 1,470,846 | |
| China Merchants Holdings International Co., Ltd. | | 671,400 | | | | 2,746,046 | |
| China Mobile Ltd. | | 1,073,600 | | | | 9,252,891 | |
| China Resources Enterprise | | 14,100 | | | | 40,371 | |
| China Unicom Ltd. | | 1,913,400 | | | | 2,828,123 | |
| CLP Holdings Ltd. | | 770,000 | | | | 5,682,750 | |
| CNOOC, Ltd. | | 7,350,000 | | | | 6,966,964 | |
| Hang Lung Properties Ltd. | | 411,000 | | | | 1,030,914 | |
Hengan International
Group Co., Ltd. | | 346,000 | | | | 856,463 | |
| Hong Kong & China Gas | | 2,200,000 | | | | 4,945,841 | |
| Hutchison Whampoa Ltd. | | 844,100 | | | | 8,556,238 | |
| Li & Fung Ltd. | | 346,400 | | | | 1,075,341 | |
| MTR Corporation | | 552,100 | | | | 1,386,162 | |
| Sino Land Company | | 1,812,000 | | | | 4,213,535 | |
| Sun Hung Kai Properties Ltd. | | 393,600 | | | | 4,507,607 | |
| Swire Pacific Ltd. Class A | | 568,322 | | | | 6,093,085 | |
| Wing Lung Bank | | 45,000 | | | | 471,146 | |
| | | | | | | 62,124,323 | |
|
Ireland—0.3% | | | |
| CRH PLC | | 47,321 | | | $ | 1,967,910 | |
| Depfa Bank PLC | | 44,500 | | | | 794,552 | |
| | | 2,762,462 | |
Israel—0.0% | | | |
Teva Pharmaceutical Industries
Ltd. ADR | | 16,500 | | | | 512,820 | | | |
Italy—2.3% | | | |
| Banca Intesa SpA | * | | | 280,694 | | | | 2,161,652 | |
| Banca Italease | | 9,500 | | | | 551,420 | |
| Capitalia SpA | | 54,000 | | | | 509,504 | |
| ENI SpA | | 133,019 | | | | 4,473,960 | |
| Esprinet SpA | | 39,000 | | | | 734,872 | |
| Fiat SpA | * | | | 96,900 | | | | 1,848,530 | |
| IFIL-Investments SpA | | 216,300 | | | | 1,767,178 | |
| Mediobanca SpA | | 92,095 | | | | 2,169,868 | |
| Saipem SpA | | 123,095 | | | | 3,193,747 | |
| SanPaolo IMI SpA | | 22,000 | | | | 510,527 | |
| Telecom Italia RNC | | 538,550 | | | | 1,363,779 | |
| Telecom Italia SpA | | 216,212 | | | | 651,379 | |
| UniCredito Italiano SpA | † | | | 534,004 | | | | 4,667,956 | |
| | | 24,604,372 | |
Japan—27.0% | | | |
| Advantest Corporation | | 97,800 | | | | 5,605,925 | |
| Aeon Company Ltd. | | 70,200 | | | | 1,518,118 | |
| Aiful Corporation | | 44,500 | | | | 1,247,675 | |
| Astellas Pharma, Inc. | | 115,000 | | | | 5,212,298 | |
| Bank of Yokohama Ltd. (The) | | 20,000 | | | | 156,180 | |
| Bosch Corporation | | 146,000 | | | | 768,939 | |
| Bridgestone Corporation | | 29,000 | | | | 647,087 | |
| Canon, Inc. | | 192,750 | | | | 10,850,487 | |
Chugai Pharmaceutical
Company Ltd. | | 107,400 | | | | 2,210,846 | |
| Commuture Corp. | | 82,000 | | | | 726,172 | |
| Credit Saison Company Ltd. | | 172,100 | | | | 5,911,083 | |
| D&M Holdings, Inc. | | 176,000 | | | | 665,235 | |
| Daikin Industries Ltd. | | 137,000 | | | | 4,757,295 | |
| Daimaru, Inc. | | 5,000 | | | | 67,815 | |
Daito Trust Construction
Company Ltd. | | 94,000 | | | | 4,314,767 | |
Daiwa House Industry
Company Ltd. | | 40,000 | | | | 693,110 | |
| Denso Corporation | | 130,800 | | | | 5,185,668 | |
| Eisai Company Ltd. | | 99,000 | | | | 5,437,901 | |
| Fanuc Ltd. | | 101,500 | | | | 9,960,133 | |
| Fuji Corp., Ltd. | | 205,100 | | | | 1,245,237 | |
| Fuji Heavy Industries, Ltd. | | 70,000 | | | | 359,292 | |
Fuji Machine Manufacturing
Co., Ltd. | | 32,000 | | | | 617,339 | |
| Futaba Industrial Co., Ltd. | | 37,000 | | | | 904,309 | |
| Hirose Electric Company Ltd. | | 40,700 | | | | 4,614,878 | |
| Honda Motor Company Ltd. | | 208,000 | | | | 8,208,554 | |
| Hoya Corporation | | 165,800 | | | | 6,461,547 | |
| Idemitsu Kosan Co., Ltd. | * | | | 6,900 | | | | 694,522 | |
| Inpex Holdings, Inc. | * | | | 97 | | | | 796,736 | |
| Itochu Corporation | | 378,000 | | | | 3,098,096 | |
| Izumiya Co., Ltd. | | 110,000 | | | | 785,373 | |
| Jaccs Co., Ltd. | | 38,000 | | | | 234,530 | |
| Japan Tobacco, Inc. | | 1,163 | | | | 5,620,599 | |
| Jupiter Telecommunications Co. | * | | | 4,127 | | | | 3,326,128 | |
| Kao Corporation | | 47,000 | | | | 1,264,655 | |
| Keiyo Co., Ltd. | | 70,000 | | | | 422,322 | |
| Keyence Corporation | | 29,340 | | | | 7,241,346 | |
| Kumagai Gumi Co., Ltd. | * | | | 153,000 | | | | 287,982 | |
| Maeda Corporation | † | | | 104,000 | | | | 393,827 | |
See accompanying notes to financial statements.
203
SCHEDULE OF INVESTMENTS—(Continued)
December 31, 2006
Vantagepoint
International Fund
|
|
|
|
|
|
|
| Shares
|
| Value
|
|---|
COMMON STOCKS—(Continued) |
| Marubeni Corporation | | 325,000 | | | $ | 1,646,393 | |
| Millea Holdings, Inc. | | 200,000 | | | | 7,082,766 | |
| Ministop Co., Ltd. | | 31,300 | | | | 534,623 | |
| Mitsubishi Corporation | | 117,100 | | | | 2,199,886 | |
| Mitsubishi Electric Corporation | | 75,000 | | | | 683,347 | |
| Mitsubishi Estate Company Ltd. | | 389,100 | | | | 10,052,831 | |
| Mitsubishi Heavy Industries Ltd. | | 425,000 | | | | 1,927,933 | |
Mitsubishi UFJ Financial
Group, Inc. | | 772 | | | | 9,576,069 | |
| Mitsui & Company Ltd. | | 255,000 | | | | 3,820,407 | |
| Mitsui Fudosan Company Ltd. | | 91,300 | | | | 2,224,172 | |
| Mitsui O.S.K. Lines Ltd. | | 78,000 | | | | 770,283 | |
| Mitsui Sumitomo Insurance Company Ltd. | | 39,420 | | | | 429,966 | |
| Mizuho Financial Group, Inc. | | 800 | | | | 5,705,654 | |
Murata Manufacturing
Company Ltd. | | 5,900 | | | | 398,054 | |
| NTT DoCoMo, Inc. | | 4,826 | | | | 7,635,364 | |
| NAC Co., Ltd. | | 22,600 | | | | 356,518 | |
| NGK Spark Plug Company Ltd. | | 36,000 | | | | 676,326 | |
| Nikko Cordial Corporation | | 310,000 | | | | 3,554,657 | |
| Nintendo Company Ltd. | | 10,300 | | | | 2,666,217 | |
| Nippon Electric Glass Company Ltd. | | 67,000 | | | | 1,404,721 | |
| Nippon Mining Holdings, Inc. | | 87,000 | | | | 625,160 | |
Nippon Telegraph &
Telephone Corporation | † | | | 154 | | | | 759,353 | |
| Nissan Motor Company Ltd. | | 273,900 | | | | 3,304,653 | |
| Nitto Denko Corporation | | 98,000 | | | | 4,894,878 | |
| Nomura Holdings, Inc. | | 38,000 | | | | 716,770 | |
| NTT Data Corporation | | 297 | | | | 1,486,654 | |
| NTT Urban Development Corp. | | 295 | | | | 570,134 | |
| Odakyu Electric Railway Company Ltd. | † | | | 100,000 | | | | 638,341 | |
| Oriental Yeast Co., Ltd. | | 114,000 | | | | 668,482 | |
| ORIX Corporation | | 38,880 | | | | 11,273,472 | |
| Rohm Company Ltd. | �� | 62,300 | | | | 6,197,170 | |
| Sawai Pharmaceutical Co., Ltd. | † | | | 19,000 | | | | 777,936 | |
| Secom Company Ltd. | | 98,000 | | | | 5,073,259 | |
| Shimamura Company Ltd. | | 42,300 | | | | 4,845,868 | |
| Shin-Etsu Chemical Company Ltd. | | 96,800 | | | | 6,460,716 | |
| SMC Corporation | | 14,300 | | | | 2,023,542 | |
| SNT Corporation | | 91,000 | | | | 438,762 | |
| Softbank Corporation | *† | | | 306,000 | | | | 5,927,589 | |
| Sompo Japan Insurance, Inc. | | 56,700 | | | | 690,590 | |
| Sony Corporation | | 68,000 | | | | 2,911,749 | |
| Star Micronics Co., Ltd. | | 44,000 | | | | 879,355 | |
| Sumitomo Chemical Company Ltd. | | 45,000 | | | | 348,187 | |
| Sumitomo Corporation | | 168,000 | | | | 2,514,598 | |
Sumitomo Mitsui Financial
Group, Inc. | | 882 | | | | 9,029,245 | |
| Sumitomo Realty & Development Company Ltd. | | 46,000 | | | | 1,474,543 | |
| Sumitomo Trust & Banking Company Ltd. (The) | | 130,000 | | | | 1,360,982 | |
| Suzuki Motor Corporation | | 123,000 | | | | 3,466,605 | |
| T&D Holdings, Inc. | | 8,250 | | | | 544,587 | |
| TDK Corporation | † | | | 25,000 | | | | 1,990,264 | |
| Taisei Corporation | † | | | 672,650 | | | | 2,047,245 | |
Takeda Pharmaceutical
Company Ltd. | | 99,100 | | | | 6,791,064 | |
| TOA Corporation | | 58,000 | | | | 426,469 | |
Tokyo Electric Power Company,
Inc. (The) | | 36,300 | | | | 1,172,572 | |
| Tokyo Electron Ltd. | | 29,200 | | | | 2,296,512 | |
| Tokyo Gas Company Ltd. | † | | | 194,000 | | | | 1,029,910 | |
| Tokyu Corporation | | 155,000 | | | | 991,651 | |
| Toshiba Corporation | | 392,000 | | | | 2,546,976 | |
|
Toyo Machinery & Metal
Co., Ltd. | | 53,000 | | | $ | 400,222 | |
| Toyota Motor Corporation | | 8,100 | | | | 542,040 | |
| Trend Micro, Inc. | *† | | | 29,000 | | | | 850,584 | |
| UMC Japan | * | | | 1,792 | | | | 387,445 | |
| Unipres Corporation | | 56,000 | | | | 438,552 | |
| Ushio, Inc. | | 21,400 | | | | 439,329 | |
| Yahoo Japan Corporation | | 3,666 | | | | 1,453,492 | |
| Yamada Denki Company Ltd. | | 20,490 | | | | 1,738,999 | |
| Yamato International, Inc. | | 53,000 | | | | 448,079 | |
| Yamato Transport Company Ltd. | | 102,200 | | | | 1,568,329 | |
| | | 283,323,107 | |
Luxembourg—0.3% | | | |
| Acergy SA | * | | | 63,900 | | | | 1,219,150 | |
| RTL Group | | 11,653 | | | | 1,301,484 | |
| SES Global | | 28,900 | | | | 502,810 | |
| | | 3,023,444 | |
Mexico—1.1% | | | |
| America Movil SA de CV ADR | † | | | 102,600 | | | | 4,639,572 | |
| Grupo Televisa SA ADR | | 148,600 | | | | 4,013,686 | |
Wal-Mart de Mexico SA de
CV—Class V | | 723,200 | | | | 3,185,257 | |
| | | 11,838,515 | |
Netherlands—3.5% | | | |
| ABN AMRO Holding NV | | 68,374 | | | | 2,191,901 | |
| ASM Lithography Holdings NV New York Registered Shares | *† | | | 24,800 | | | | 610,824 | |
| ASML Holdings NV | * | | | 187,976 | | | | 4,638,791 | |
| Aegon NV | | 68,947 | | | | 1,308,345 | |
| Heineken Holding NV—Class A | | 38,143 | | | | 1,549,335 | |
| Heineken NV | | 21,050 | | | | 1,000,114 | |
| ING Groep NV | | 303,122 | | | | 13,393,957 | |
| Royal KPN NV | | 159,900 | | | | 2,269,477 | |
| Koninklijke BAM Groep NV | † | | | 47,500 | | | | 919,753 | |
| Reed Elsevier NV | | 76,200 | | | | 1,297,399 | |
| Royal Dutch Shell PLC—Class A | | 111,870 | | | | 3,941,320 | |
| Royal Numico NV | * | | | 14,977 | | | | 804,240 | |
| Unilever NV | | 61,324 | | | | 1,672,214 | |
| Univar NV | | 19,700 | | | | 1,100,776 | |
| | | 36,698,446 | |
Norway—0.2% | | | |
| DNB NOR ASA | | 49,500 | | | | 700,464 | |
| Norske Skogindustrier ASA | *† | | | 23,571 | | | | 404,458 | |
| Renewable Energy Corp. AS | * | | | 8,300 | | | | 150,651 | |
| Telenor ASA | | 33,400 | | | | 625,904 | |
| | | 1,881,477 | |
Russia—0.6% | | | |
| NovaTek OAO, Sponsored GDR | | 15,005 | | | | 952,818 | |
| OAO Lukoil Holding ADR | † | | | 34,710 | | | | 3,052,745 | |
| Unified Energy System GDR | | 22,819 | | | | 2,490,694 | |
| | | 6,496,257 | |
Singapore—1.6% | | | |
| DBS Group Holdings Ltd. | | 421,000 | | | | 6,179,083 | |
| Keppel Corporation Ltd. | | 225,200 | | | | 2,574,199 | |
| SembCorp Industries Ltd. | | 214,600 | | | | 535,568 | |
| Singapore Airlines Ltd. | | 363,200 | | | | 4,134,747 | |
| Singapore Telecommunications Ltd. | | 1,101,392 | | | | 2,348,259 | |
| United Overseas Bank Ltd. | | 68,000 | | | | 857,448 | |
| | | 16,629,304 | |
See accompanying notes to financial statements.
204
SCHEDULE OF INVESTMENTS—(Continued)
December 31, 2006
Vantagepoint
International Fund
|
|
|
|
|
|
|
| Shares
|
| Value
|
|---|
COMMON STOCKS—(Continued) |
South Africa—0.4% | | | |
| ABSA Group, Ltd. | | 48,700 | | | $ | 862,420 | |
| Sasol, Ltd. | | 83,700 | | | | 3,070,510 | |
| | | 3,932,930 | |
South Korea—1.5% | | | |
| Hana Financial Group, Inc. | | 56,719 | | | | 2,979,051 | |
| Kookmin Bank | * | | | 62,999 | | | | 5,065,247 | |
| Kookmin Bank ADR | * | | | 9,500 | | | | 766,080 | |
| Samsung Electronics Company Ltd. GDR, 144A | ** | | | 9,865 | | | | 3,245,585 | |
| Shinhan Financial Group Company Ltd. | * | | | 72,740 | | | | 3,715,215 | |
| | | 15,771,178 | |
Spain—2.4% | | | |
| Altadis SA | | 24,300 | | | | 1,269,469 | |
Banco Bilbao Vizcaya
Argentaria SA | | 175,200 | | | | 4,209,127 | |
Banco Santander Central
Hispano SA | | 309,900 | | | | 5,770,474 | |
Gamesa Corporation
Tecnologica SA | | 26,125 | | | | 716,763 | |
| Grupo Catalana Occidente SA | | 23,000 | | | | 832,803 | |
| Iberdrola SA | | 10,400 | | | | 453,366 | |
| Inditex SA | | 144,309 | | | | 7,762,547 | |
| Repsol YPF SA | | 87,800 | | | | 3,025,056 | |
| Telefonica SA | | 62,939 | | | | 1,336,194 | |
| | | 25,375,799 | |
Sweden—1.6% | | | |
| Alfa Laval AB | | 13,400 | | | | 603,462 | |
| Assa Abloy AB Class B | | 31,300 | | | | 680,036 | |
| Atlas Copco AB—Class A | † | | | 19,400 | | | | 650,470 | |
| Hennes & Mauritz AB Class B | | 89,000 | | | | 4,494,934 | |
| Nordea Bank AB | | 278,800 | | | | 4,292,229 | |
| Telefonaktiebolaget LM Ericsson Class B | | 1,305,500 | | | | 5,256,883 | |
| TeliaSonera AB | | 91,400 | | | | 749,102 | |
| | | 16,727,116 | |
Switzerland—7.9% | | | |
| Adecco SA | | 67,655 | | | | 4,607,723 | |
| Compagnie Financiere Richemont AG Class A | | 83,654 | | | | 4,851,459 | |
| Credit Suisse Group | | 32,741 | | | | 2,280,951 | |
Elektrizitaets-Gesellschaft
Laufenburg AG | | 500 | | | | 529,075 | |
| Geberit AG | | 800 | | | | 1,228,477 | |
| Holcim Ltd. | | 37,401 | | | | 3,417,899 | |
| Julius Baer Holding AG | * | | | 3,200 | | | | 350,638 | |
| Nestle SA | | 46,433 | | | | 16,457,962 | |
| Novartis AG | | 241,925 | | | | 13,887,427 | |
| OC Oerlikon Corp. AG | * | | | 3,300 | | | | 1,625,591 | |
| Petroplus Holdings AG | * | | | 6,326 | | | | 383,897 | |
| Roche Holding AG | | 55,172 | | | | 9,863,734 | |
| Roche Holding AG | | 4,175 | | | | 846,986 | |
| Swatch Group AG Class B | | 1,664 | | | | 366,358 | |
| Swiss Reinsurance | | 114,429 | | | | 9,690,803 | |
| Swisscom AG | | 3,927 | | | | 1,481,818 | |
| UBS AG | | 164,821 | | | | 9,967,228 | |
| Vontobel Holding AG | | 13,500 | | | | 582,213 | |
| | | 82,420,239 | |
|
Taiwan—0.4% | | | |
| Taiwan Semiconductor Manufacturing Company Ltd. | | 131,000 | | | $ | 268,884 | |
Taiwan Semiconductor Manufacturing Company
Ltd. ADR | † | | | 353,373 | | | | 3,862,367 | |
| | | 4,131,251 | |
United Kingdom—12.7% | | | |
| Anglo American PLC | | 8,100 | | | | 394,319 | |
| ARM Holdings PLC | | 249,100 | | | | 611,105 | |
| AstraZeneca Group PLC | | 88,384 | | | | 4,740,071 | |
| AstraZeneca PLC | | 58,300 | | | | 3,125,289 | |
| BG Group PLC | | 540,000 | | | | 7,344,972 | |
| BAE Systems PLC | | 461,200 | | | | 3,835,333 | |
| Barclays PLC | | 234,156 | | | | 3,344,244 | |
| BHP Billiton PLC | | 122,028 | | | | 2,235,342 | |
| BP PLC | | 510,900 | | | | 5,698,743 | |
| British Energy Group PLC | * | | | 156,700 | | | | 1,661,421 | |
| Cadbury Schweppes PLC | | 271,582 | | | | 2,901,492 | |
| Carnival PLC | | 49,883 | | | | 2,520,666 | |
| Centrica PLC | | 850,000 | | | | 5,883,754 | |
| Charles Taylor Consulting PLC | | 118,900 | | | | 911,058 | |
| Corus Group PLC | | 71,300 | | | | 737,187 | |
| DTZ Holdings PLC | | 93,200 | | | | 1,520,794 | |
| easyJet PLC | * | | | 89,800 | | | | 1,075,434 | |
| Elementis PLC | | 533,300 | | | | 867,387 | |
| HSBC Holdings PLC | | 129,513 | | | | 2,357,800 | |
HSBC Holdings PLC
(foreign shares) | | 84,000 | | | | 1,537,138 | |
| HBOS PLC | | 214,100 | | | | 4,734,359 | |
| Imperial Chemical Industries PLC | | 68,200 | | | | 602,605 | |
| ITE Group PLC | | 195,100 | | | | 664,227 | |
| Johnston Press PLC | | 74,900 | | | | 574,046 | |
| Kingfisher PLC | | 1,804,109 | | | | 8,414,359 | |
| Lloyds TSB Group PLC | | 247,390 | | | | 2,781,854 | |
| Micro Focus International PLC | | 192,500 | | | | 785,960 | |
| MJ Gleeson Group PLC | | 51,700 | | | | 389,257 | |
| Morgan Sindall PLC | | 39,200 | | | | 1,018,597 | |
| Morrison WM Supermarkets | | 1,854,252 | | | | 9,231,577 | |
| National Grid PLC | | 56,000 | | | | 810,742 | |
| Pearson PLC | | 41,700 | | | | 628,676 | |
| Persimmon PLC | | 16,400 | | | | 489,455 | |
| Reckitt Benckiser PLC | | 124,000 | | | | 5,658,163 | |
| Reed Elsevier PLC | | 158,300 | | | | 1,736,721 | |
| Rio Tinto PLC | | 117,500 | | | | 6,228,858 | |
| Robert Walters PLC | | 87,100 | | | | 557,148 | |
Royal Bank of Scotland
Group PLC | | 206,800 | | | | 8,050,617 | |
Royal Dutch Shell PLC—
Class A ADR | | 8,400 | | | | 594,636 | |
| Royal Dutch Shell PLC—Class B | | 105,069 | | | | 3,674,571 | |
| SABMiller PLC | | 35,900 | | | | 824,544 | |
| Scottish & Southern Energy PLC | | 64,700 | | | | 1,965,413 | |
| Smith & Nephew PLC | | 57,700 | | | | 602,069 | |
| Standard Chartered PLC | | 86,200 | | | | 2,511,847 | |
| Tesco PLC | | 123,400 | | | | 975,441 | |
| TI Automotive Ltd. | d | | | 70,000 | | | | — | |
| Vedanta Resources PLC | | 48,500 | | | | 1,155,492 | |
| Vislink PLC | | 37,200 | | | | 73,762 | |
| Vodafone Group PLC | | 2,487,243 | | | | 6,870,934 | |
| Wilmington Group PLC | | 143,550 | | | | 661,216 | |
| Xstrata PLC | | 121,866 | | | | 6,065,758 | |
| Yell Group PLC | | 76,500 | | | | 852,010 | |
| | | 133,488,463 | |
TOTAL COMMON STOCKS | | | |
| (Cost $812,402,861) | | 1,014,806,416 | |
See accompanying notes to financial statements.
205
SCHEDULE OF INVESTMENTS—(Continued)
December 31, 2006
Vantagepoint
International Fund
|
|
|
|
|
|
|
| Shares
|
| Value
|
|---|
PURCHASED OPTIONS—0.0% |
Europe—0.0% | | | |
Eurodollar Put, Expires
01/31/2007,
Strike 1.2125 | | | | | | | | | |
| (Cost $706,260)‡ | | | | 23,700,000 | | | $ | — | |
| |
Coupon
Rate
|
|
|
| Maturity
Date
|
|
|
| Face
|
| Value
|
|---|
CASH EQUIVALENTS—5.2% |
Bank & Certificate Deposits/Offshore Time Deposits—5.0% | | | |
| Abbey National PLC | | | |
| 5.280% | | | | 01/05/2007 | | †† | | $ | 828,348 | | | | 828,348 | |
| BancoBilbao Vizcaya Argentaria SA | | | |
| 5.310% | | | | 01/03/2007 | | †† | | | 828,348 | | | | 828,348 | |
| Bank Of Nova Scotia | | | |
| 5.300% | | | | 02/27/2007 | | †† | | | 1,035,436 | | | | 1,035,436 | |
| Bank Of Nova Scotia | | | |
| 5.290% | | | | 02/06/2007 | | †† | | | 621,261 | | | | 621,261 | |
| Bank Of Nova Scotia | | | |
| 5.290% | | | | 01/30/2007 | | †† | | | 414,174 | | | | 414,174 | |
| Barclays | | | |
| 5.320% | | | | 02/13/2007 | | †† | | | 414,174 | | | | 414,174 | |
| Barclays | | | |
| 5.310% | | | | 02/20/2007 | | †† | | | 1,035,436 | | | | 1,035,436 | |
| Barclays | | | |
| 5.300% | | | | 01/02/2007 | | †† | | | 1,035,436 | | | | 1,035,436 | |
| Barton Capital LLC | | | |
| 5.300% | | | | 01/17/2007 | | †† | | | 414,174 | | | | 414,174 | |
| Barton Capital LLC | | | |
| 5.300% | | | | 01/17/2007 | | †† | | | 621,261 | | | | 621,261 | |
| Calyon | | | |
| 5.310% | | | | 02/16/2007 | | †† | | | 414,174 | | | | 414,174 | |
| Calyon | | | |
| 5.300% | | | | 02/05/2007 | | †† | | | 1,242,521 | | | | 1,242,521 | |
| Canadian Imperial Bank of Commerce | | | |
| 5.310% | | | | 01/29/2007 | | †† | | | 1,242,521 | | | | 1,242,521 | |
| Charta LLC | | | |
| 5.300% | | | | 01/31/2007 | | †† | | | 811,102 | | | | 811,102 | |
| CIESCO | | | |
| 5.310% | | | | 01/04/2007 | | †† | | | 539,276 | | | | 539,276 | |
| Citigroup | | | |
| 5.310% | | | | 03/16/2007 | | †† | | | 414,174 | | | | 414,174 | |
| Clipper Receivables Corp | | | |
| 5.300% | | | | 01/31/2007 | | †† | | | 414,174 | | | | 414,174 | |
| Compass Securitization | | | |
| 5.300% | | | | 01/09/2007 | | †† | | | 621,261 | | | | 621,261 | |
| CRC Funding LLC | | | |
| 5.340% | | | | 01/23/2007 | | †† | | | 207,087 | | | | 207,087 | |
| CRC Funding LLC | | | |
| 5.300% | | | | 01/10/2007 | | †† | | | 604,619 | | | | 604,619 | |
| Credit Suisse First Boston Corporation | | | |
| 5.300% | | | | 01/12/2007 | | †† | | | 828,348 | | | | 828,348 | |
| Credit Suisse First Boston Corporation | | | |
| 5.300% | | | | 01/05/2007 | | †† | | | 414,174 | | | | 414,174 | |
| Dexia Group | | | |
| 5.290% | | | | 01/16/2007 | | †† | | | 1,035,436 | | | | 1,035,436 | |
| Fairway Finance | | | |
| 5.300% | | | | 01/09/2007 | | †† | | | 497,009 | | | | 497,009 | |
| Falcon Asset Securitization Corporation | | | |
| 5.340% | | | | 01/22/2007 | | †† | | | 414,174 | | | | 414,174 | |
| Fortis Bank | | | |
| 5.320% | | | | 01/03/2007 | | †† | | | 414,174 | | | | 414,174 | |
|
| Fortis Bank | | | |
| 5.300% | | | | 01/26/2007 | | †† | | $ | 1,656,696 | | | $ | 1,656,696 | |
| Fortis Bank | | | |
| 5.300% | | | | 01/24/2007 | | †† | | | 1,449,609 | | | | 1,449,609 | |
| Fortis Bank | | | |
| 5.300% | | | | 01/02/2007 | | †† | | | 414,174 | | | | 414,174 | |
| General Electric Capital Corporation | | | |
| 5.300% | | | | 01/26/2007 | | †† | | | 828,348 | | | | 828,348 | |
| Greyhawk Funding | | | |
| 5.310% | | | | 01/12/2007 | | †† | | | 414,174 | | | | 414,174 | |
| HBOS Halifax Bank of Scotland | | | |
| 5.310% | | | | 03/14/2007 | | †† | | | 1,035,436 | | | | 1,035,436 | |
| HBOS Halifax Bank of Scotland | | | |
| 5.300% | | | | 01/08/2007 | | †† | | | 414,174 | | | | 414,174 | |
| Kitty Hawk Funding Corp | | | |
| 5.340% | | | | 01/10/2007 | | †† | | | 621,261 | | | | 621,261 | |
| Lexington Parker Cap Comp | | | |
| 5.300% | | | | 01/05/2007 | | †† | | | 414,174 | | | | 414,174 | |
| Liberty Street | | | |
| 5.310% | | | | 01/17/2007 | | †† | | | 414,174 | | | | 414,174 | |
| Lloyds TSB Bank | | | |
| 5.300% | | | | 02/26/2007 | | †† | | | 414,174 | | | | 414,174 | |
| Marshall & Ilsley Bank Corporation | | | |
| 5.300% | | | | 03/19/2007 | | †† | | | 414,174 | | | | 414,174 | |
| Merrill Lynch & Co | | | |
| 5.300% | | | | 01/02/2007 | | †† | | | 7,248,046 | | | | 7,248,046 | |
| Morgan Stanley & Co | | | |
| 5.300% | | | | 01/02/2007 | | †† | | | 5,078,152 | | | | 5,078,152 | |
| Old Line Funding LLC | | | |
| 5.350% | | | | 01/04/2007 | | †† | | | 414,174 | | | | 414,174 | |
| Paradigm Funding LLC | | | |
| 5.310% | | | | 01/17/2007 | | †† | | | 414,174 | | | | 414,174 | |
| Park Avenue Receivables Corp | | | |
| 5.330% | | | | 01/18/2007 | | †† | | | 414,174 | | | | 414,174 | |
| Rabobank Nederland | | | |
| 5.250% | | | | 01/02/2007 | | †† | | | 1,242,521 | | | | 1,242,521 | |
| Ranger Funding | | | |
| 5.330% | | | | 02/08/2007 | | †† | | | 414,174 | | | | 414,174 | |
| Ranger Funding | | | |
| 5.320% | | | | 01/04/2007 | | †† | | | 414,174 | | | | 414,174 | |
| Royal Bank of Canada | | | |
| 5.310% | | | | 02/14/2007 | | †† | | | 828,348 | | | | 828,348 | |
| Royal Bank of Scotland | | | |
| 5.310% | | | | 01/11/2007 | | †† | | | 414,174 | | | | 414,174 | |
| Royal Bank of Scotland | | | |
| 5.290% | | | | 02/09/2007 | | †† | | | 414,174 | | | | 414,174 | |
| Royal Bank of Scotland | | | |
| 5.290% | | | | 01/16/2007 | | †† | | | 621,261 | | | | 621,261 | |
| Royal Bank of Scotland | | | |
| 5.280% | | | | 01/11/2007 | | †† | | | 1,035,436 | | | | 1,035,436 | |
| Sheffiled Receivables Corp | | | |
| 5.360% | | | | 01/11/2007 | | †† | | | 621,261 | | | | 621,261 | |
| Sheffiled Receivables Corp | | | |
| 5.300% | | | | 01/12/2007 | | †† | | | 414,174 | | | | 414,174 | |
| Societe Generale | | | |
| 5.310% | | | | 01/02/2007 | | †† | | | 1,035,436 | | | | 1,035,436 | |
| Societe Generale | | | |
| 5.290% | | | | 02/01/2007 | | †† | | | 1,035,436 | | | | 1,035,436 | |
| Societe Generale | | | |
| 5.270% | | | | 01/19/2007 | | †† | | | 1,035,436 | | | | 1,035,436 | |
| Svenska Handlesbanken | | | |
| 5.250% | | | | 01/02/2007 | | †† | | | 475,323 | | | | 475,323 | |
| Three Pillars Funding LLC | | | |
| 5.380% | | | | 01/02/2007 | | †† | | | 619,713 | | | | 619,713 | |
| UBS AG | | | |
| 5.300% | | | | 01/04/2007 | | †† | | | 414,174 | | | | 414,174 | |
| UBS AG | | | |
| 5.290% | | | | 01/02/2007 | | †† | | | 828,347 | | | | 828,347 | |
See accompanying notes to financial statements.
206
SCHEDULE OF INVESTMENTS—(Continued)
December 31, 2006
Vantagepoint
International Fund
Coupon
Rate
|
|
|
| Maturity
Date
|
|
|
| Face
|
| Value
|
|---|
CASH EQUIVALENTS—(Continued) |
| Variable Funding Capital Co | | | |
| 5.310% | | | | 02/02/2007 | | †† | | $ | 414,173 | | | $ | 414,173 | |
| Variable Funding Capital Co | | | |
| 5.290% | | | | 01/04/2007 | | †† | | | 414,173 | | | | 414,173 | |
| Yorktown Capital LLC | | | |
| 5.330% | | | | 01/16/2007 | | †† | | | 414,173 | | | | 414,173 | |
| Yorktown Capital LLC | | | |
| 5.300% | | | | 01/10/2007 | | †† | | | 414,173 | | | | 414,173 | |
| | | 52,941,814 | |
Floating Rate Instruments/Master Notes—0.2% |
| Bank of America | | | |
| 5.310% | | | | 07/10/2007 | | †† | | | 1,035,436 | | | | 1,035,436 | |
| Bank of America | | | |
| 5.270% | | | | 01/09/2007 | | †† | | | 828,348 | | | | 828,348 | |
| | | 1,863,784 | |
TOTAL CASH EQUIVALENTS
|
| (Cost $54,805,598) | | | | | | | | 54,805,598 | |
| |
REPURCHASE AGREEMENTS—3.7% |
United States—3.7% | | | |
| IBT Repurchase Agreement dated 12/29/2006 due 01/02/2007, with a maturity value of 38,501,617 and an effective yield of 4.65% collateralized by U.S. Government Obligations with rates ranging from 4.039% to 9.125%, maturity dates ranging from 10/25/2015 to 05/15/2035 and an aggregate market value of $40,405,821 | | 38,481,735 | | | | 38,481,735 | |
TOTAL INVESTMENTS—105.5%
| | | |
| (Cost $906,396,454) | | 1,108,093,749 | |
| Other assets less liabilities—(5.5%) | | (58,262,799 | ) |
NET ASSETS—100.0% | $ | 1,049,830,950 | |
Notes to the Schedule of Investments:
| ADR | | American Depositary Receipt |
| GDR | | Global Depositary Receipt |
| * | | Non-income producing security. |
| † | | Denotes all or a portion of security on loan. |
| ** | | Security exempt from registration under Rule 144A of the Securities Act of 1933. These securities may be resold in transactions exempt from registration, normally to qualified buyers. 144A securities represent 0.29% of Total Investments. |
| ‡ | | Security valued at fair value as determined by policies approved by the board of directors. |
| †† | | Represents collateral received from securities lending transactions. |
| d | | Security has no market value at 12/31/2006. |
Percentage of Portfolio by Industry (unaudited):
| Banking | | | | 14.4% |
| Oil & Gas | | | | 9.1% |
| Electronics | | | | 6.7% |
| Insurance | | | | 6.5% |
| Pharmaceuticals | | | | 6.2% |
| Telephone Systems | | | | 5.0% |
| Bank & Certificate Deposits/Offshore Time Deposits | 5.0% |
| Commercial Services | | | | 4.4% |
| Financial Services | | | | 4.3% |
| Metals | | | | 4.1% |
| Miscellaneous | | | | 3.9% |
| Beverages, Food & Tobacco | | | | 3.5% |
| Automotive | | | | 3.4% |
| Real Estate | | | | 3.1% |
| Electric Utilities | | | | 2.7% |
| Media—Broadcasting & Publishing | | | | 2.6% |
| Retailers | | | | 2.1% |
| Chemicals | | | | 1.9% |
| Transportation | | | | 1.7% |
| Apparel Retailers | | | | 1.7% |
| Food Retailers | | | | 1.6% |
| Heavy Machinery | | | | 1.5% |
| Cosmetics & Personal Care | | | | 1.3% |
| Communications | | | | 1.2% |
| Medical Supplies | | | | 1.2% |
| Building Materials | | | | 1.1% |
| Computers & Information | | | | 1.0% |
| Airlines | | | | 0.7% |
| Computer Software & Processing | | | | 0.6% |
| Heavy Construction | | | | 0.6% |
| Aerospace & Defense | | | | 0.5% |
| Distribution/Wholesale | | | | 0.4% |
| Home Construction, Furnishings & Appliances | | | | 0.3% |
| Forest Products & Paper | | | | 0.3% |
| Entertainment & Leisure | | | | 0.3% |
| Water Companies | | | | 0.2% |
| Floating Rate Instruments/Master Notes | | | | 0.2% |
| Telecommunications | | | | 0.1% |
| Lodging | | | | 0.1% |
| Containers & Packaging | | | | 0.0% |
| Advertising | | | | 0.0% |
| Electrical Equipment | | | | 0.0% |
TOTAL INVESTMENTS | | | | 105.5% |
| Other assets less liabilities | | | | (5.5)% |
TOTAL NET ASSETS | | | | 100.0% |
See accompanying notes to financial statements.
207
SCHEDULE OF INVESTMENTS
December 31, 2006
Vantagepoint Core Bond
Index Fund
Coupon
Rate
|
|
|
| Maturity
Date
|
|
|
| Face
|
| Value
|
|---|
CORPORATE OBLIGATIONS—20.5% |
Advertising—0.1% | | | |
| Omnicom Group, Inc., Note |
| 5.900% | | | | 04/15/2016 | | | | $ | 500,000 | | | $ | 506,181 | | | |
Aerospace & Defense—0.5% |
| Boeing Capital Corporation, Senior Note | | | |
| 6.100% | | | | 03/01/2011 | | | | | 500,000 | | | | 517,028 | |
| Boeing Company (The), Note | | | |
| 6.125% | | | | 02/15/2033 | | | | | 100,000 | | | | 108,236 | |
| Boeing Company (The), Note | | | |
| 5.125% | | | | 02/15/2013 | | | | | 250,000 | | | | 248,142 | |
| General Dynamics Corp., Note | | | |
| 4.250% | | | | 05/15/2013 | | | | | 1,000,000 | | | | 946,304 | |
| Honeywell International, Inc., Note | | | |
| 7.500% | | | | 03/01/2010 | | | | | 1,000,000 | | | | 1,067,044 | |
| Honeywell International, Inc., Note | | | |
| 6.125% | | | | 11/01/2011 | | | | | 250,000 | | | | 259,249 | |
| Lockheed Martin Corporation, Note | | | |
| 6.150% | | | | 09/01/2036 | | | | | 750,000 | | | | 790,732 | |
| Northrop Grumman Corporation, Note | | | |
| 7.750% | | | | 02/15/2031 | | | | | 750,000 | | | | 932,452 | |
| Textron Financial Corporation, Note | | | |
| 6.000% | | | | 11/20/2009 | | | | | 200,000 | | | | 204,393 | |
| United Technologies Corporation, Note | | | |
| 6.700% | | | | 08/01/2028 | | | | | 150,000 | | | | 168,580 | |
| United Technologies Corporation, Note | | | |
| 6.100% | | | | 05/15/2012 | | | | | 50,000 | | | | 51,988 | |
| United Technologies Corporation, Note | | | |
| 4.875% | | | | 05/01/2015 | | | | | 500,000 | | | | 482,819 | |
| | | 5,776,967 | |
Airlines—0.1% |
American Airlines, Inc.,
Series 1999-1, Class A2 |
| 7.024% | | | | 10/15/2009 | | | | | 157,000 | | | | 163,574 | |
Continental Airlines, Inc.,
Series 1998-1, Class 1A |
| 6.648% | | | | 09/15/2017 | | | | | 583,202 | | | | 605,437 | |
| FedEx Corporation, Note |
| 9.650% | | | | 06/15/2012 | | | | | 150,000 | | | | 178,829 | |
| | | 947,840 | |
Automotive—0.2% |
| DaimlerChrysler North America Holding Corporation, Guaranteed Note |
| 7.200% | | | | 09/01/2009 | | | | | 350,000 | | | | 363,294 | |
| DaimlerChrysler North America Holding Corporation, Guaranteed Note |
| 4.050% | | | | 06/04/2008 | | | | | 500,000 | | | | 489,484 | |
| DaimlerChrysler North America Holding Corporation, Note |
| 8.500% | | | | 01/18/2031 | | | | | 1,100,000 | | | | 1,313,161 | |
DaimlerChrysler North America Holding Corporation,
Senior Note |
| 6.500% | | | | 11/15/2013 | | | | | 500,000 | | | | 514,059 | |
| | | 2,679,998 | |
Banking—4.5% |
| American Express Company, Note |
| 6.800% | | | | 09/01/2066 | | | | | 1,000,000 | | | | 1,068,236 | |
| American Express Credit Corporation, Note |
| 3.000% | | | | 05/16/2008 | | | | | 250,000 | | | | 242,721 | |
| Asian Development Bank/Pasig, Global Note (Supra National) |
| 4.250% | | | | 10/20/2014 | | | | | 1,000,000 | | | | 948,680 | |
|
| Associates Corporate of North America, Senior Note |
| 6.950% | | | | 11/01/2018 | | | | $ | 250,000 | | | $ | 280,605 | |
| Associates Corporate of North America, Subordinated Note |
| 6.875% | | | | 11/15/2008 | | | | | 410,000 | | | | 421,291 | |
| BAC Capital Trust XI, Guaranteed Note |
| 6.625% | | | | 05/23/2036 | | | | | 500,000 | | | | 541,410 | |
| Bank of America Corporation, Note, 144A |
| 5.420% | | | | 03/15/2017 | | * | | | 700,000 | | | | 691,047 | |
| Bank of America Corporation, Senior Note |
| 5.875% | | | | 02/15/2009 | | | | | 1,000,000 | | | | 1,014,540 | |
| Bank of America Corporation, Subordinated Note |
| 7.750% | | | | 08/15/2015 | | | | | 750,000 | | | | 864,260 | |
| Bank of America Corporation, Subordinated Note |
| 6.800% | | | | 03/15/2028 | | | | | 500,000 | | | | 556,243 | |
| Bank of New York Company, Inc. (The), Subordinated Note |
| 5.500% | | | | 12/01/2017 | | | | | 250,000 | | | | 250,193 | |
| Bank One Corporation, Subordinated Note |
| 5.900% | | | | 11/15/2011 | | | | | 750,000 | | | | 765,996 | |
| Bank One NA, Note |
| 3.700% | | | | 01/15/2008 | | | | | 350,000 | | | | 344,462 | |
| Bayerische Landesbank Girozentrale, Note |
| 2.875% | | | | 10/15/2008 | | | | | 250,000 | | | | 239,866 | |
| BB&T Corporation, Note |
| 5.250% | | | | 11/01/2019 | | | | | 500,000 | | | | 483,928 | |
| Branch Banking & Trust Company |
| 5.200% | | | | 12/23/2015 | | | | | 150,000 | | | | 147,639 | |
| BSCH Issuances Ltd., Subordinated Note (Cayman Islands) |
| 7.625% | | | | 09/14/2010 | | | | | 350,000 | | | | 378,434 | |
| Capital One Bank, Note |
| 4.875% | | | | 05/15/2008 | | | | | 1,000,000 | | | | 994,160 | |
| Capital One Bank, Note, (MTN) |
| 5.125% | | | | 02/15/2014 | | | | | 500,000 | | | | 492,485 | |
| CIT Group, Inc., Global Senior Note |
| 5.000% | | | | 02/13/2014 | | | | | 500,000 | | | | 483,924 | |
| CIT Group, Inc., Senior Note |
| 7.750% | | | | 04/02/2012 | | | | | 350,000 | | | | 386,296 | |
| CIT Group, Inc., Senior Note, (MTN) |
| 4.750% | | | | 12/15/2010 | | | | | 1,000,000 | | | | 980,196 | |
| Corporacion Andina de Fomento, Note (Supra National) |
| 6.875% | | | | 03/15/2012 | | | | | 150,000 | | | | 159,722 | |
| Deutsche Bank Financial, Inc., Note, Convertible, (MTN) |
| 5.375% | | | | 03/02/2015 | | | | | 250,000 | | | | 249,384 | |
| European Investment Bank, Global Note (Supra National) |
| 4.125% | | | | 09/15/2010 | | | | | 1,500,000 | | | | 1,462,047 | |
| European Investment Bank, Global Note (Supra National) |
| 3.500% | | | | 03/14/2008 | | | | | 1,250,000 | | | | 1,226,035 | |
| European Investment Bank, Note (Supra National) |
| 4.625% | | | | 05/15/2014 | | | | | 500,000 | | | | 489,656 | |
| First Union Institutional Trust I Capital Securities, Note |
| 8.040% | | | | 12/01/2026 | | | | | 1,000,000 | | | | 1,042,827 | |
| FleetBoston Financial Corporation, Senior Note |
| 6.875% | | | | 01/15/2028 | | | | | 150,000 | | | | 168,550 | |
| Household Finance Corporation, Note |
| 8.000% | | | | 07/15/2010 | | | | | 750,000 | | | | 815,351 | |
| Household Finance Corporation, Note |
| 6.500% | | | | 11/15/2008 | | | | | 350,000 | | | | 357,939 | |
| Household Finance Corporation, Note |
| 6.400% | | | | 06/17/2008 | | | | | 250,000 | | | | 253,918 | |
| Household Finance Corporation, Note |
| 6.375% | | | | 11/27/2012 | | | | | 1,000,000 | | | | 1,054,271 | |
| Household Finance Corporation, Note |
| 4.125% | | | | 12/15/2008 | | | | | 1,000,000 | | | | 980,594 | |
| HSBC Bank USA NA, Senior Note, (MTN) |
| 3.875% | | | | 09/15/2009 | | | | | 1,500,000 | | | | 1,455,295 | |
| HSBC Holdings PLC, Note (United Kingdom) |
| 5.250% | | | | 12/12/2012 | | | | | 150,000 | | | | 149,637 | |
| ING Capital Funding Trust III |
| 8.439% | | | | 12/31/2049 | | | | | 150,000 | | | | 165,705 | |
See accompanying notes to financial statements.
208
SCHEDULE OF INVESTMENTS—(Continued)
December 31, 2006
Vantagepoint Core Bond
Index Fund
Coupon
Rate
|
|
|
| Maturity
Date
|
|
|
| Face
|
| Value
|
|---|
CORPORATE OBLIGATIONS—(Continued) |
| Inter-American Development Bank (Supra National) |
| 7.375% | | �� | | 01/15/2010 | | | | $ | 750,000 | | | $ | 801,274 | |
Inter-American Development Bank,
Global Note (Supra National) |
| 5.375% | | | | 11/18/2008 | | † | | | 2,000,000 | | | | 2,014,726 | |
Inter-American Development Bank,
Note, (MTN) (Supra National) |
| 3.375% | | | | 03/17/2008 | | | | | 1,000,000 | | | | 979,470 | |
| International Bank for Reconstruction & Development, Note |
| 7.625% | | | | 01/19/2023 | | | | | 1,000,000 | | | | 1,273,687 | |
International Bank for Reconstruction & Development,
Note (Supra National) |
| 3.625% | | | | 05/21/2013 | | | | | 150,000 | | | | 140,359 | |
International Bank for Reconstruction & Development,
Note, (MTN) (Supra National) |
| 4.125% | | | | 08/12/2009 | | | | | 350,000 | | | | 343,726 | |
| International Finance Corp., Note (Supra National) |
| 5.125% | | | | 05/02/2011 | | | | | 1,000,000 | | | | 1,005,961 | |
| JPMorgan Chase & Company, Global Subordinated Note |
| 5.125% | | | | 09/15/2014 | | | | | 750,000 | | | | 738,646 | |
| Key Bank National Association, Subordinated Note, (MTN) |
| 5.800% | | | | 07/01/2014 | | | | | 1,500,000 | | | | 1,524,165 | |
KFW—Kreditanstalt fuer Wiederaufbau,
Global Note (Denmark) |
| 3.250% | | | | 03/30/2009 | | | | | 1,000,000 | | | | 961,783 | |
| KFW—Kreditanstalt fuer Wiederaufbau, Note (Germany) |
| 3.375% | | | | 01/23/2008 | | | | | 500,000 | | | | 489,386 | |
| KFW International Finance, Inc., Note |
| 8.000% | | | | 02/15/2010 | | | | | 250,000 | | | | 269,573 | |
| Korea Development Bank, Note (South Korea) |
| 5.750% | | | | 09/10/2013 | | | | | 500,000 | | | | 512,646 | |
| Kreditanstalt fuer Wiederaufbau, Global Note (Germany) |
| 4.250% | | | | 06/15/2010 | | | | | 1,000,000 | | | | 977,430 | |
| Kreditanstalt fuer Wiederaufbau, Global Note (Germany) |
| 4.125% | | | | 10/15/2014 | | | | | 1,000,000 | | | | 949,129 | |
| Landwirtschaftliche Rentenbank, Global Note (Germany) |
| 4.875% | | | | 11/16/2015 | | | | | 1,000,000 | | | | 981,749 | |
| Landwirtschaftliche Rentenbank, Note (Germany) |
| 3.250% | | | | 06/16/2008 | | | | | 300,000 | | | | 292,101 | |
| Marshall & Ilsley Corporation, Senior Note |
| 4.375% | | | | 08/01/2009 | | | | | 500,000 | | | | 489,318 | |
| MBNA America Bank, Note |
| 5.375% | | | | 01/15/2008 | | | | | 850,000 | | | | 849,045 | |
| Mellon Financial Company, Note |
| 6.375% | | | | 02/15/2010 | | | | | 350,000 | | | | 363,619 | |
| National City Bank of Ohio, Senior Note, (MTN) |
| 3.300% | | | | 05/15/2008 | | | | | 350,000 | | | | 340,171 | |
| National City Corporation, Subordinated Note |
| 6.875% | | | | 05/15/2019 | | | | | 500,000 | | | | 551,810 | |
| National Rural Utilities Cooperative Finance Corporation, Note |
| 7.250% | | | | 03/01/2012 | | | | | 500,000 | | | | 543,927 | |
| National Rural Utilities Cooperative Finance Corporation, Note |
| 3.875% | | | | 02/15/2008 | | | | | 400,000 | | | | 393,914 | |
| PNC Funding Corporation, Subordinated Note |
| 5.250% | | | | 11/15/2015 | | | | | 200,000 | | | | 196,997 | |
| Popular North America, Inc., Note, (MTN) |
| 4.250% | | | | 04/01/2008 | | | | | 100,000 | | | | 98,554 | |
| Royal Bank of Canada, Note (Canada) |
| 5.650% | | | | 07/20/2011 | | | | | 500,000 | | | | 510,016 | |
Royal Bank of Scotland Group PLC,
Global Note (United Kingdom) |
| 5.000% | | | | 10/01/2014 | | | | | 750,000 | | | | 728,957 | |
|
Royal Bank of Scotland Group PLC,
Note (FRN) (United Kingdom) |
| 7.648% | | | | 08/29/2049 | | | | $ | 500,000 | | | $ | 588,810 | |
| Sanwa Bank Ltd., Note |
| 7.400% | | | | 06/15/2011 | | | | | 250,000 | | | | 270,347 | |
| SLM Corporation, Note |
| 3.950% | | | | 08/15/2008 | | | | | 1,150,000 | | | | 1,125,549 | |
| SLM Corporation, Note, (MTN) |
| 5.000% | | | | 10/01/2013 | | | | | 500,000 | | | | 488,247 | |
| SouthTrust Corporation, Subordinated Note |
| 5.800% | | | | 06/15/2014 | | | | | 750,000 | | | | 762,503 | |
| Suntrust Banks, Inc., Subordinated Note |
| 5.200% | | | | 01/17/2017 | | | | | 250,000 | | | | 243,866 | |
| Swiss Bank Corporation, Subordinated Note |
| 7.000% | | | | 10/15/2015 | | | | | 100,000 | | | | 111,099 | |
| U.S. Bank NA, Note |
| 4.800% | | | | 04/15/2015 | | | | | 250,000 | | | | 239,742 | |
| Wachovia Corporation, Senior Note |
| 5.250% | | | | 08/01/2014 | | | | | 1,000,000 | | | | 989,344 | |
Washington Mutual Bank FA,
Global Subordinated Note, (MTN) |
| 5.650% | | | | 08/15/2014 | | | | | 250,000 | | | | 250,729 | |
| Washington Mutual, Inc., Note |
| 4.000% | | | | 01/15/2009 | | | | | 1,000,000 | | | | 975,451 | |
| Wells Fargo & Company, Note |
| 5.000% | | | | 11/15/2014 | | | | | 750,000 | | | | 729,629 | |
| Wells Fargo & Company, Series J, Note, (MTN) |
| 4.200% | | | | 01/15/2010 | | | | | 500,000 | | | | 487,440 | |
| Wells Fargo & Company, Subordinated Note |
| 7.550% | | | | 06/21/2010 | | | | | 750,000 | | | | 804,454 | |
| Wells Fargo Bank NA, Note |
| 6.450% | | | | 02/01/2011 | | | | | 1,000,000 | | | | 1,045,248 | |
| Wells Fargo Financial, Inc., Note |
| 5.500% | | | | 08/01/2012 | | | | | 750,000 | | | | 759,701 | |
| Zions Bancorporation, Subordinated Note |
| 6.000% | | | | 09/15/2015 | | | | | 500,000 | | | | 510,019 | |
| | | 52,311,860 | |
Beverages, Food & Tobacco—0.6% |
| Altria Group, Inc., Note |
| 7.750% | | | | 01/15/2027 | | | | | 350,000 | | | | 425,683 | |
| Altria Group, Inc., Note |
| 7.000% | | | | 11/04/2013 | | | | | 400,000 | | | | 435,200 | |
| Anheuser-Busch Companies, Inc., Note |
| 6.800% | | | | 01/15/2031 | | | | | 350,000 | | | | 384,198 | |
| Archer-Daniels Midland Company, Note |
| 8.375% | | | | 04/15/2017 | | | | | 350,000 | | | | 425,549 | |
| Bottling Group LLC, Series B, Senior Note |
| 4.125% | | | | 06/15/2015 | | | | | 250,000 | | | | 227,568 | |
| Bunge, Ltd. Finance Corporation, Guaranteed Senior Note |
| 5.350% | | | | 04/15/2014 | | | | | 500,000 | | | | 481,266 | |
| Campbell Soup Company, Note |
| 4.875% | | | | 10/01/2013 | | | | | 250,000 | | | | 241,411 | |
| Cia Brasileira de Bebidas, Guaranteed Note (Brazil) |
| 8.750% | | | | 09/15/2013 | | | | | 100,000 | | | | 117,000 | |
| Coca-Cola Enterprises, Inc., Note |
| 8.500% | | | | 02/01/2022 | | | | | 150,000 | | | | 190,725 | |
| ConAgra Foods, Inc., Note |
| 6.750% | | | | 09/15/2011 | | | | | 97,000 | | | | 102,256 | |
| ConAgra Foods, Inc., Note, 144A |
| 5.819% | | | | 06/15/2017 | | * | | | 153,000 | | | | 151,630 | |
| ConAgra Foods, Inc., Senior Note |
| 7.125% | | | | 10/01/2026 | | | | | 500,000 | | | | 550,065 | |
| Coors Brewing Company, Senior Note |
| 6.375% | | | | 05/15/2012 | | | | | 500,000 | | | | 517,991 | |
| Diageo Capital PLC, Guaranteed Note (United Kingdom) |
| 4.375% | | | | 05/03/2010 | | | | | 500,000 | | | | 486,713 | |
See accompanying notes to financial statements.
209
SCHEDULE OF INVESTMENTS—(Continued)
December 31, 2006
Vantagepoint Core Bond
Index Fund
Coupon
Rate
|
|
|
| Maturity
Date
|
|
|
| Face
|
| Value
|
|---|
CORPORATE OBLIGATIONS—(Continued) |
| HJ Heinz Company, Guaranteed Note |
| 6.625% | | | | 07/15/2011 | | | | $ | 250,000 | | | $ | 260,275 | |
| Kellogg Company, Note |
| 6.600% | | | | 04/01/2011 | | | | | 750,000 | | | | 787,251 | |
| Kraft Foods, Inc., Global Note |
| 6.500% | | | | 11/01/2031 | | | | | 100,000 | | | | 108,101 | |
| Kraft Foods, Inc., Global Note |
| 5.625% | | | | 11/01/2011 | | | | | 350,000 | | | | 354,090 | |
| Sara Lee Corporation, Senior Note |
| 2.750% | | | | 06/15/2008 | | | | | 250,000 | | | | 240,299 | |
| Unilever Capital Corporation, Note |
| 7.125% | | | | 11/01/2010 | | | | | 500,000 | | | | 531,555 | |
| | | 7,018,826 | |
Building Materials—0.2% |
| CRH America, Inc., Note |
| 6.000% | | | | 09/30/2016 | | | | | 750,000 | | | | 758,432 | |
| Hanson Australia Funding Ltd., Note (Australia) |
| 5.250% | | | | 03/15/2013 | | | | | 100,000 | | | | 97,655 | |
| Home Depot, Inc., Senior Note |
| 4.625% | | | | 08/15/2010 | | | | | 500,000 | | | | 489,888 | |
| Lafarge SA, Note (France) |
| 6.500% | | | | 07/15/2016 | | | | | 750,000 | | | | 784,481 | |
| | | 2,130,456 | |
Chemicals—0.2% |
| Dow Chemical Company, Note |
| 7.375% | | | | 11/01/2029 | | | | | 250,000 | | | | 289,817 | |
| Dow Chemical Company, Note |
| 6.000% | | | | 10/01/2012 | | | | | 150,000 | | | | 154,305 | |
| Du Pont (E.I.) de Nemours & Company, Note |
| 6.875% | | | | 10/15/2009 | | | | | 150,000 | | | | 156,696 | |
| EI Du Pont de Nemours & Company, Note |
| 4.750% | | | | 11/15/2012 | | | | | 500,000 | | | | 484,370 | |
| Monsanto Co., Note |
| 5.500% | | | | 08/15/2035 | | | | | 500,000 | | | | 479,457 | |
| Potash Corporation of Saskatchewan, Note (Canada) |
| 4.875% | | | | 03/01/2013 | | | | | 500,000 | | | | 482,997 | |
| Praxair, Inc., Note |
| 3.950% | | | | 06/01/2013 | | | | | 150,000 | | | | 138,801 | |
| Rohm & Haas Company, Note |
| 7.850% | | | | 07/15/2029 | | | | | 150,000 | | | | 181,599 | |
| | | 2,368,042 | |
Commercial Services—0.1% |
| PHH Corporation, Note |
| 7.125% | | | | 03/01/2013 | | | | | 100,000 | | | | 104,232 | |
| RR Donnelley & Sons Co., Note |
| 4.950% | | | | 04/01/2014 | | | | | 550,000 | | | | 507,977 | |
| USA Waste Services, Inc., Senior Note |
| 7.000% | | | | 07/15/2028 | | | | | 550,000 | | | | 591,966 | |
| | | 1,204,175 | |
Communications—0.1% |
| Motorola, Inc., Note |
| 7.500% | | | | 05/15/2025 | | | | | 500,000 | | | | 581,499 | |
|
Computer Software & Processing—0.0% | | | |
| Computer Sciences Corporation, Senior Note |
| 7.375% | | | | 06/15/2011 | | | | $ | 100,000 | | | $ | 106,474 | |
Electronic Data Systems Corporation,
Series B, Senior Note |
| 6.500% | | | | 08/01/2013 | | | | | 150,000 | | | | 151,210 | |
| | | 257,684 | |
Computers & Information—0.3% |
| International Business Machines Corp., Note, (MTN) |
| 3.800% | | | | 02/01/2008 | | | | | 1,000,000 | | | | 984,505 | |
| International Business Machines Corporation, Note |
| 7.000% | | | | 10/30/2025 | | | | | 500,000 | | | | 570,305 | |
| International Business Machines Corporation, Note |
| 4.750% | | | | 11/29/2012 | | | | | 250,000 | | | | 244,374 | |
| International Business Machines Corporation, Note, (MTN) |
| 4.375% | | | | 06/01/2009 | | | | | 1,000,000 | | | | 983,355 | |
| Pitney Bowes, Inc., Global Note, (MTN) |
| 4.750% | | | | 01/15/2016 | | | | | 200,000 | | | | 189,364 | |
| Pitney Bowes, Inc., Senior Note |
| 5.000% | | | | 03/15/2015 | | | | | 500,000 | | | | 482,522 | |
| | | 3,454,425 | |
Cosmetics & Personal Care—0.1% |
| Procter & Gamble Company, Global Note |
| 6.875% | | | | 09/15/2009 | | | | | 750,000 | | | | 782,946 | |
| Procter & Gamble Company, Note |
| 5.800% | | | | 08/15/2034 | | | | | 250,000 | | | | 258,580 | |
| | | 1,041,526 | |
Electric Utilities—1.4% |
| Alabama Power Company, Senior Note |
| 5.500% | | | | 10/15/2017 | | | | | 150,000 | | | | 150,192 | |
| Alabama Power Company, Series X, Senior Note |
| 3.125% | | | | 05/01/2008 | | | | | 250,000 | | | | 242,981 | |
| American Electric Power Company, Inc., Series C, Senior Note |
| 5.375% | | | | 03/15/2010 | | | | | 250,000 | | | | 249,950 | |
| Arizona Public Service Company, Note |
| 6.500% | | | | 03/01/2012 | | | | | 150,000 | | | | 155,126 | |
| Cincinnati Gas & Electric Company, Note |
| 5.700% | | | | 09/15/2012 | | | | | 150,000 | | | | 151,589 | |
| Columbus Southern Power Company, Series A, Senior Note |
| 5.500% | | | | 03/01/2013 | | | | | 150,000 | | | | 149,733 | |
| Consolidated Edison Company of New York, Inc., Note |
| 4.875% | | | | 02/01/2013 | | | | | 200,000 | | | | 195,496 | |
| Consolidated Edison Company of New York, Note |
| 5.300% | | | | 03/01/2035 | | | | | 500,000 | | | | 458,363 | |
| Constellation Energy Group, Inc., Note |
| 7.600% | | | | 04/01/2032 | | | | | 150,000 | | | | 175,737 | |
| Consumers Energy Co., Note |
| 5.500% | | | | 08/15/2016 | | | | | 150,000 | | | | 147,543 | |
| Dominion Resources, Inc., Senior Note |
| 8.125% | | | | 06/15/2010 | | | | | 350,000 | | | | 379,836 | |
| Dominion Resources, Inc., Series A, Senior Note |
| 7.195% | | | | 09/15/2014 | | | | | 350,000 | | | | 384,632 | |
| Dominion Resources, Inc., Virginia, Series 03B, Senior Note |
| 4.125% | | | | 02/15/2008 | | | | | 500,000 | | | | 492,668 | |
| DTE Energy Company, Note |
| 7.050% | | | | 06/01/2011 | | | | | 350,000 | | | | 371,240 | |
| Duke Capital Corporation, Senior Note |
| 4.370% | | | | 03/01/2009 | | | | | 250,000 | | | | 244,511 | |
| Duke Energy Corporation, Senior Note |
| 6.450% | | | | 10/15/2032 | | | | | 500,000 | | | | 536,835 | |
| Duke Energy Field Services Corporation LLC, Note |
| 7.875% | | | | 08/16/2010 | | | | | 350,000 | | | | 376,771 | |
See accompanying notes to financial statements.
210
SCHEDULE OF INVESTMENTS—(Continued)
December 31, 2006
Vantagepoint Core Bond
Index Fund
Coupon
Rate
|
|
|
| Maturity
Date
|
|
|
| Face
|
| Value
|
|---|
CORPORATE OBLIGATIONS—(Continued) |
| Entergy Gulf States, Inc., Note |
| 3.600% | | | | 06/01/2008 | | | | $ | 100,000 | | | $ | 97,392 | |
| Exelon Corp., Senior Note |
| 4.900% | | | | 06/15/2015 | | | | | 350,000 | | | | 330,686 | |
| Exelon Generation Company LLC, Senior Note |
| 6.950% | | | | 06/15/2011 | | | | | 500,000 | | | | 527,236 | |
| FirstEnergy Corporation, Series B, Note |
| 6.450% | | | | 11/15/2011 | | | �� | | 175,000 | | | | 182,681 | |
| FirstEnergy Corporation, Series C, Note |
| 7.375% | | | | 11/15/2031 | | | | | 175,000 | | | | 199,902 | |
| Florida Power & Light Co., Note |
| 4.950% | | | | 06/01/2035 | | | | | 500,000 | | | | 446,227 | |
| Florida Power & Light Company, Note |
| 5.625% | | | | 04/01/2034 | | | | | 50,000 | | | | 49,343 | |
| Florida Power & Light Company, Note |
| 4.850% | | | | 02/01/2013 | | | | | 150,000 | | | | 146,962 | |
| FPL Group Capital, Inc., Guaranteed Note |
| 7.375% | | | | 06/01/2009 | | | | | 100,000 | | | | 104,700 | |
| Jersey Central Power & Light, Global Note |
| 5.625% | | | | 05/01/2016 | | | | | 500,000 | | | | 498,593 | |
| KeySpan Corporation, Note |
| 7.625% | | | | 11/15/2010 | | | | | 350,000 | | | | 376,416 | |
| Midamerican Energy Company, Note |
| 6.750% | | | | 12/30/2031 | | | | | 250,000 | | | | 277,940 | |
| Midamerican Energy Holdings Company, Senior Note |
| 3.500% | | | | 05/15/2008 | | | | | 150,000 | | | | 146,303 | |
| Midamerican Energy Holdings Company, Senior Note, Class D |
| 5.000% | | | | 02/15/2014 | | | | | 150,000 | | | | 144,660 | |
| National Grid PLC |
| 6.300% | | | | 08/01/2016 | | | | | 500,000 | | | | 518,771 | |
| NiSource Finance Corporation, Guaranteed Note |
| 7.875% | | | | 11/15/2010 | | | | | 50,000 | | | | 53,988 | |
| Northern States Power Company, Series A, Note |
| 8.000% | | | | 08/28/2012 | | | | | 150,000 | | | | 169,151 | |
| Oncor Electric Delivery Company, Senior Secured Note |
| 6.375% | | | | 05/01/2012 | | | | | 350,000 | | | | 360,696 | |
| Ontario Electricity Financial Corporation, Note (Canada) |
| 7.450% | | | | 03/31/2013 | | | | | 350,000 | | | | 392,771 | |
| Pacific Gas & Electric Company, Note |
| 6.050% | | | | 03/01/2034 | | | | | 500,000 | | | | 505,970 | |
| Pacific Gas & Electric Company, Note |
| 4.800% | | | | 03/01/2014 | | | | | 1,000,000 | | | | 959,951 | |
| Peco Energy Company, Note |
| 3.500% | | | | 05/01/2008 | | | | | 150,000 | | | | 146,496 | |
| Pepco Holdings, Inc., Note |
| 6.450% | | | | 08/15/2012 | | | | | 150,000 | | | | 155,698 | |
| Progress Energy, Inc., Senior Note |
| 7.750% | | | | 03/01/2031 | | | | | 250,000 | | | | 301,391 | |
| Progress Energy, Inc., Senior Note |
| 7.100% | | | | 03/01/2011 | | | | | 188,000 | | | | 200,391 | |
| PSEG Power LLC, Senior Note |
| 8.625% | | | | 04/15/2031 | | | | | 500,000 | | | | 640,524 | |
| Public Service Company of Colorado, Series 12, Note |
| 4.875% | | | | 03/01/2013 | | | | | 200,000 | | | | 195,131 | |
| Public Service Electric & Gas Company, Note |
| 5.125% | | | | 09/01/2012 | | | | | 150,000 | | | | 148,152 | |
| Scottish Power PLC, Note (United Kingdom) |
| 5.375% | | | | 03/15/2015 | | | | | 500,000 | | | | 494,160 | |
| South Carolina Electric & Gas Company, Note |
| 5.300% | | | | 05/15/2033 | | | | | 150,000 | | | | 141,465 | |
| Southern California Edison Company, Note |
| 6.650% | | | | 04/01/2029 | | | | | 500,000 | | | | 540,203 | |
| TXU Electric Delivery Company, Note |
| 7.000% | | | | 09/01/2022 | | | | | 650,000 | | | | 700,872 | |
|
| TXU Energy Company LLC, Senior Note |
| 7.000% | | | | 03/15/2013 | | | | $ | 150,000 | | | $ | 157,150 | |
| Virginia Electric and Power Co., Senior Note |
| 6.000% | | | | 01/15/2036 | | | | | 600,000 | | | | 599,167 | |
| Wisconsin Electric Power, Note |
| 5.625% | | | | 05/15/2033 | | | | | 250,000 | | | | 245,432 | |
| | | 16,019,774 | |
Electrical Equipment—0.1% |
| Cooper Industries, Inc., Guaranteed Senior Note |
| 5.500% | | | | 11/01/2009 | | | | | 100,000 | | | | 100,535 | |
| Emerson Electric Company, Note |
| 5.000% | | | | 12/15/2014 | | | | | 150,000 | | | | 146,399 | |
| General Electric Company |
| 5.000% | | | | 02/01/2013 | | | | | 800,000 | | | | 792,145 | |
| | | 1,039,079 | |
Electronics—0.2% |
| Arrow Electronics, Inc., Note |
| 6.875% | | | | 07/01/2013 | | | | | 250,000 | | | | 261,139 | |
| Cisco Systems, Inc., Senior Note |
| 5.500% | | | | 02/22/2016 | | | | | 1,000,000 | | | | 1,002,418 | |
| Raytheon Company, Note |
| 6.150% | | | | 11/01/2008 | | | | | 1,000,000 | | | | 1,013,232 | |
| | | 2,276,789 | |
Entertainment & Leisure—0.3% |
| News America Holdings, Guaranteed Senior Note |
| 7.750% | | | | 12/01/2045 | | | | | 200,000 | | | | 229,278 | |
| News America Holdings, Inc., Note |
| 8.000% | | | | 10/17/2016 | | | | | 150,000 | | | | 172,577 | |
| News America Holdings, Inc., Note |
| 7.600% | | | | 10/11/2015 | | | | | 350,000 | | | | 392,387 | |
| News America, Inc., Note |
| 5.300% | | | | 12/15/2014 | | | | | 500,000 | | | | 492,315 | |
| Time Warner, Inc., Note |
| 7.625% | | | | 04/15/2031 | | | | | 1,000,000 | | | | 1,120,426 | |
| Time Warner, Inc., Note |
| 6.875% | | | | 05/01/2012 | | | | | 150,000 | | | | 158,689 | |
| Walt Disney Company, Note, (MTN) |
| 7.000% | | | | 03/01/2032 | | | | | 500,000 | | | | 579,212 | |
| Walt Disney Company, Note, (MTN) |
| 6.375% | | | | 03/01/2012 | | | | | 250,000 | | | | 262,296 | |
| | | 3,407,180 | |
Financial Services—3.9% |
| Abbey National PLC, Note (United Kingdom) |
| 7.950% | | | | 10/26/2029 | | | | | 250,000 | | | | 317,485 | |
| Allstate Life Global Fund Trust, Series 2004-1, Note (MTN) |
| 4.500% | | | | 05/29/2009 | | | | | 250,000 | | | | 246,435 | |
| Amvescap PLC, Senior Note |
| 5.375% | | | | 02/27/2013 | | | | | 100,000 | | | | 99,092 | |
| Bank of Tokyo-Mitsubishi Ltd. (The), Global Senior Subordinated Note (Japan) |
| 8.400% | | | | 04/15/2010 | | | | | 250,000 | | | | 272,230 | |
| Bear Stearns Companies (The), Inc., Note |
| 7.625% | | | | 12/07/2009 | | | | | 1,000,000 | | | | 1,065,264 | |
| Bear Stearns Companies, Inc., (The), Note |
| 5.700% | | | | 11/15/2014 | | | | | 50,000 | | | | 50,836 | |
| Bear Stearns Companies, Inc., (The), Note |
| 2.875% | | | | 07/02/2008 | | | | | 1,000,000 | | | | 966,474 | |
| Berkshire Hathaway Finance Corp., Guaranteed Senior Note |
| 4.850% | | | | 01/15/2015 | | | | | 1,000,000 | | | | 970,511 | |
| Berkshire Hathaway Finance Corp., Guaranteed Senior Note |
| 4.125% | | | | 01/15/2010 | | | | | 500,000 | | | | 486,283 | |
| BHP Finance USA Ltd., Guaranteed Senior Note |
| 4.800% | | | | 04/15/2013 | | | | | 150,000 | | | | 145,387 | |
See accompanying notes to financial statements.
211
SCHEDULE OF INVESTMENTS—(Continued)
December 31, 2006
Vantagepoint Core Bond
Index Fund
Coupon
Rate
|
|
|
| Maturity
Date
|
|
|
| Face
|
| Value
|
|---|
CORPORATE OBLIGATIONS—(Continued) |
| Citigroup, Inc., Global Note |
| 5.850% | | | | 12/11/2034 | | | | $ | 500,000 | | | $ | 509,341 | |
| Citigroup, Inc., Global Senior Note |
| 6.500% | | | | 01/18/2011 | | | | | 1,000,000 | | | | 1,047,223 | |
| Citigroup, Inc., Global Senior Note |
| 6.000% | | | | 02/21/2012 | | | | | 350,000 | | | | 361,274 | |
| Citigroup, Inc., Global Subordinated Note |
| 6.625% | | | | 06/15/2032 | | | | | 150,000 | | | | 166,242 | |
| Citigroup, Inc., Global Subordinated Note |
| 5.625% | | | | 08/27/2012 | | | | | 150,000 | | | | 152,353 | |
| Citigroup, Inc., Subordinated Note |
| 5.000% | | | | 09/15/2014 | | | | | 2,513,000 | | | | 2,457,551 | |
| Countrywide Financial Corp., Note |
| 6.250% | | | | 05/15/2016 | | | | | 500,000 | | | | 510,514 | |
| Credit Suisse First Boston USA, Inc., Global Note |
| 4.875% | | | | 01/15/2015 | | | | | 1,000,000 | | | | 971,315 | |
| Credit Suisse First Boston USA, Inc., Note |
| 6.500% | | | | 01/15/2012 | | | | | 350,000 | | | | 368,219 | |
| Credit Suisse First Boston USA, Inc., Note |
| 6.125% | | | | 11/15/2011 | | | | | 1,000,000 | | | | 1,036,536 | |
| Credit Suisse First Boston USA, Inc., Note |
| 5.500% | | | | 08/15/2013 | | | | | 150,000 | | | | 152,179 | |
| Credit Suisse First Boston USA, Inc., Senior Global Note |
| 5.125% | | | | 01/15/2014 | | | | | 500,000 | | | | 495,727 | |
| EOP Operating, LP, Guaranteed Note |
| 7.000% | | | | 07/15/2011 | | | | | 350,000 | | | | 379,131 | |
| EOP Operating, LP, Guaranteed Note |
| 4.750% | | | | 03/15/2014 | | | | | 500,000 | | | | 496,062 | |
| EOP Operating, LP, Note |
| 7.875% | | | | 07/15/2031 | | | | | 500,000 | | | | 590,993 | |
| EOP Operating, LP, Note |
| 6.800% | | | | 01/15/2009 | | | | | 500,000 | | | | 516,917 | |
| Export-Import Bank Of Korea (South Korea) |
| 5.125% | | | | 03/16/2015 | | | | | 500,000 | | | | 490,042 | |
| General Electric Capital Corp., Note |
| 4.125% | | | | 09/01/2009 | | | | | 1,000,000 | | | | 975,602 | |
| General Electric Capital Corp., Note, (MTN) |
| 5.450% | | | | 01/15/2013 | | | | | 1,000,000 | | | | 1,010,853 | |
| General Electric Capital Corporation, Note |
| 6.000% | | | | 06/15/2012 | | | | | 1,000,000 | | | | 1,036,368 | |
| General Electric Capital Corporation, Note |
| 4.625% | | | | 09/15/2009 | | | | | 1,000,000 | | | | 987,839 | |
| General Electric Capital Corporation, Note |
| 3.500% | | | | 05/01/2008 | | | | | 250,000 | | | | 244,540 | |
| General Electric Capital Corporation, Note, (MTN) |
| 6.750% | | | | 03/15/2032 | | | | | 750,000 | | | | 861,731 | |
| General Electric Capital Corporation, Note, (MTN) |
| 5.875% | | | | 02/15/2012 | | | | | 500,000 | | | | 514,722 | |
| Goldman Sachs Group, Inc., Global Note |
| 5.125% | | | | 01/15/2015 | | | | | 500,000 | | | | 489,332 | |
| Goldman Sachs Group, Inc., Guaranteed Note |
| 6.345% | | | | 02/15/2034 | | | | | 500,000 | | | | 507,767 | |
| Goldman Sachs Group, Inc., Note |
| 6.875% | | | | 01/15/2011 | | | | | 250,000 | | | | 264,875 | |
| Goldman Sachs Group, Inc., Senior Note |
| 6.600% | | | | 01/15/2012 | | | | | 650,000 | | | | 687,886 | |
| Goldman Sachs Group, Inc., Senior Note |
| 6.125% | | | | 02/15/2033 | | † | | | 700,000 | | | | 715,611 | |
| Goldman Sachs Group, Inc., Senior Note |
| 5.700% | | | | 09/01/2012 | | | | | 250,000 | | | | 254,915 | |
| Goldman Sachs Group, Inc., Senior Note |
| 5.150% | | | | 01/15/2014 | | | | | 500,000 | | | | 493,270 | |
| Goldman Sachs Group, Inc., Senior Note |
| 4.125% | | | | 01/15/2008 | | | | | 800,000 | | | | 791,055 | |
|
| Goldman Sachs Group, Inc., Series B, Note, (MTN) |
| 7.350% | | | | 10/01/2009 | | | | $ | 750,000 | | | $ | 791,675 | |
| Household Finance Corporation |
| 6.375% | | | | 10/15/2011 | | | | | 1,750,000 | | | | 1,831,827 | |
| John Deere Capital Corporation, Note |
| 7.000% | | | | 03/15/2012 | | | | | 350,000 | | | | 374,956 | |
| JP Morgan & Company, Inc., Note |
| 6.000% | | | | 01/15/2009 | | | | | 350,000 | | | | 355,145 | |
| JP Morgan Chase & Company, Global Subordinated Note |
| 5.750% | | | | 01/02/2013 | | | | | 1,750,000 | | | | 1,783,224 | |
| JP Morgan Chase & Company, Note |
| 6.750% | | | | 02/01/2011 | | | | | 750,000 | | | | 789,183 | |
| Lehman Brothers Holdings, Inc., Note |
| 7.875% | | | | 08/15/2010 | | | | | 1,000,000 | | | | 1,080,568 | |
| Lehman Brothers Holdings, Inc., Note |
| 4.000% | | | | 01/22/2008 | | | | | 850,000 | | | | 838,502 | |
| Lehman Brothers Holdings, Inc., Note, (MTN) |
| 6.625% | | | | 01/18/2012 | | | | | 750,000 | | | | 793,289 | |
| Merrill Lynch & Company, Inc., Note, (MTN) |
| 5.450% | | | | 07/15/2014 | | | | | 500,000 | | | | 503,439 | |
| Merrill Lynch & Company, Inc., Note |
| 6.000% | | | | 02/17/2009 | | | | | 1,000,000 | | | | 1,016,791 | |
| Merrill Lynch & Company, Inc., Note, (MTN) |
| 4.125% | | | | 09/10/2009 | | | | | 500,000 | | | | 487,021 | |
| Merrill Lynch & Company, Inc., Note, (MTN) |
| 3.700% | | | | 04/21/2008 | | | | | 250,000 | | | | 244,688 | |
| Merrill Lynch & Company, Inc., Subordinated Note |
| 6.220% | | | | 09/15/2026 | | | | | 1,000,000 | | | | 1,033,409 | |
| Merrill Lynch & Company., Inc., Note |
| 6.875% | | | | 11/15/2018 | | | | | 250,000 | | | | 278,280 | |
| Morgan Stanley, Note |
| 8.000% | | | | 06/15/2010 | | | | | 750,000 | | | | 815,709 | |
| Morgan Stanley, Note |
| 7.250% | | | | 04/01/2032 | | | | | 100,000 | | | | 117,817 | |
| Morgan Stanley, Note |
| 4.750% | | | | 04/01/2014 | | | | | 1,000,000 | | | | 957,567 | |
| Morgan Stanley, Note |
| 3.875% | | | | 01/15/2009 | | | | | 2,750,000 | | | | 2,682,958 | |
| Residential Capital Corp., Note |
| 6.875% | | | | 06/30/2015 | | | | | 500,000 | | | | 519,174 | |
| Residential Capital Corp., Senior Note |
| 6.000% | | | | 02/22/2011 | | | | | 550,000 | | | | 549,456 | |
| Residential Capital Corporation, Note |
| 6.375% | | | | 06/30/2010 | | | | | 350,000 | | | | 354,347 | |
| Rio Tinto Finance USA, Ltd., Guaranteed Note (Australia) |
| 2.625% | | | | 09/30/2008 | | | | | 100,000 | | | | 95,692 | |
| Swiss Bank Corporation of New York, Note, (MTN) |
| 7.375% | | | | 06/15/2017 | | | | | 100,000 | | | | 115,153 | |
| U.S. Bank National Association, Note, (MTN) |
| 6.375% | | | | 08/01/2011 | | | | | 750,000 | | | | 783,692 | |
| Washington Mutual, Inc., Senior Note |
| 4.375% | | | | 01/15/2008 | | | | | 1,000,000 | | | | 989,974 | |
| | | 45,341,518 | |
Food Retailers—0.1% |
| Kroger Co. (The), Senior Note |
| 7.500% | | | | 04/01/2031 | | | | | 700,000 | | | | 787,994 | |
| Safeway, Inc., Note |
| 7.500% | | | | 09/15/2009 | | | | | 800,000 | | | | 840,035 | |
| | | 1,628,029 | |
Forest Products & Paper—0.1% |
| Kimberly Clark Corporation, Note |
| 5.625% | | | | 02/15/2012 | | | | �� | 250,000 | | | | 254,451 | |
| MeadWestvaco Corporation, Note |
| 6.850% | | | | 04/01/2012 | | | | | 150,000 | | | | 157,359 | |
See accompanying notes to financial statements.
212
SCHEDULE OF INVESTMENTS—(Continued)
December 31, 2006
Vantagepoint Core Bond
Index Fund
Coupon
Rate
|
|
|
| Maturity
Date
|
|
|
| Face
|
| Value
|
|---|
CORPORATE OBLIGATIONS—(Continued) |
| Weyerhaeuser Company, Note |
| 7.375% | | | | 03/15/2032 | | | | $ | 750,000 | | | $ | 785,154 | |
| Weyerhaeuser Company, Note |
| 6.750% | | | | 03/15/2012 | | | | | 100,000 | | | | 104,991 | |
| | | 1,301,955 | |
Heavy Construction—0.1% |
| Centex Corporation, Senior Note |
| 4.750% | | | | 01/15/2008 | | | | | 100,000 | | | | 99,073 | |
| Centex Corporation, Senior Note |
| 4.550% | | | | 11/01/2010 | | | | | 1,000,000 | | | | 963,391 | |
| Lennar Corporation, Series B, Senior Note |
| 5.500% | | | | 09/01/2014 | | | | | 500,000 | | | | 480,848 | |
| | | 1,543,312 | |
Heavy Machinery—0.1% |
| Caterpillar, Inc., Senior Note |
| 7.250% | | | | 09/15/2009 | | | | | 750,000 | | | | 787,939 | |
| Deere & Company, Global Note |
| 6.950% | | | | 04/25/2014 | | | | | 250,000 | | | | 272,360 | |
| | | 1,060,299 | |
Home Construction, Furnishings & Appliances—0.1% |
| Masco Corporation, Senior Note |
| 5.875% | | | | 07/15/2012 | | | | | 250,000 | | | | 250,569 | |
| MDC Holdings, Inc., Senior Note |
| 5.500% | | | | 05/15/2013 | | | | | 500,000 | | | | 478,682 | |
| Newell Rubbermaid, Inc., Note |
| 4.625% | | | | 12/15/2009 | | | | | 100,000 | | | | 97,735 | |
| Pulte Homes, Inc., Senior Note |
| 7.875% | | | | 08/01/2011 | | | | | 350,000 | | | | 379,227 | |
| | | 1,206,213 | |
Household Products—0.0% |
| Fortune Brands, Inc., Note |
| 5.375% | | | | 01/15/2016 | | | | | 500,000 | | | | 474,936 | | | |
Industrial—Diversified—0.1% |
| Tyco International Group SA, Guaranteed Note (Luxembourg) |
| 6.750% | | | | 02/15/2011 | | | | | 500,000 | | | | 527,674 | |
| Tyco International Group SA, Note (Luxembourg) |
| 6.125% | | | | 11/01/2008 | | | | | 1,000,000 | | | | 1,012,810 | |
| | | 1,540,484 | |
Insurance—1.2% |
| Allstate Corporation (The), Senior Note |
| 7.200% | | | | 12/01/2009 | | | | | 750,000 | | | | 790,589 | |
| Allstate Corporation (The), Senior Note |
| 5.350% | | | | 06/01/2033 | | | | | 500,000 | | | | 470,812 | |
| American General Finance Corporation, Senior Note, (MTN) |
| 5.375% | | | | 10/01/2012 | | | | | 650,000 | | | | 648,990 | |
| American International Group, Inc., Global Senior Note |
| 4.250% | | | | 05/15/2013 | | | | | 100,000 | | | | 93,895 | |
| American International Group, Inc., Note |
| 6.250% | | | | 05/01/2036 | | | | | 500,000 | | | | 533,080 | |
| American International Group, Inc., Note |
| 5.050% | | | | 10/01/2015 | | | | | 750,000 | | | | 730,552 | |
| Anthem, Inc., Note |
| 6.800% | | | | 08/01/2012 | | | | | 150,000 | | | | 159,286 | |
| Assurant, Inc., Global Note |
| 5.625% | | | | 02/15/2014 | | | | | 500,000 | | | | 499,370 | |
| Assurant, Inc., Senior Note |
| 6.750% | | | | 02/15/2034 | | | | | 650,000 | | | | 700,632 | |
|
| Axa Company (France) |
| 8.600% | | | | 12/15/2030 | | | | $ | 250,000 | | | $ | 325,085 | |
| AXA Financial, Inc., Senior Note |
| 7.750% | | | | 08/01/2010 | | | | | 100,000 | | | | 107,791 | |
| Cincinnati Financial Corp., Senior Note |
| 6.125% | | | | 11/01/2034 | | | | | 500,000 | | | | 510,856 | |
| General Electric Global Insurance Holding Corporation, Note |
| 7.500% | | | | 06/15/2010 | | | | | 150,000 | | | | 160,199 | |
| Genworth Financial, Inc., Note |
| 5.750% | | | | 06/15/2014 | | | | | 500,000 | | | | 510,230 | |
| Hartford Financial Services Group, Inc., Senior Note |
| 6.100% | | | | 10/01/2041 | | | | | 150,000 | | | | 152,276 | |
| ING Groep NV, Secured Note (Netherlands) |
| 5.775% | | | | 12/08/2049 | | | | | 1,000,000 | | | | 991,230 | |
| International Lease Finance Corp., Note, (MTN) |
| 5.450% | | | | 03/24/2011 | | | | | 1,000,000 | | | | 1,004,293 | |
| Marsh & McLennan Cos., Inc., Senior Note |
| 5.750% | | | | 09/15/2015 | | | | | 1,000,000 | | | | 985,473 | |
| MetLife, Inc., Note |
| 5.000% | | | | 11/24/2013 | | | | | 500,000 | | | | 489,950 | |
| MetLife, Inc., Senior Note |
| 6.500% | | | | 12/15/2032 | | | | | 100,000 | | | | 108,704 | |
| Progressive Corporation (The), Senior Note |
| 6.625% | | | | 03/01/2029 | | | | | 150,000 | | | | 166,509 | |
| Protective Life Secured Trust, Note, (MTN) |
| 4.000% | | | | 04/01/2011 | | | | | 400,000 | | | | 381,094 | |
| Prudential Financial, Inc., Note, (MTN) |
| 5.100% | | | | 09/20/2014 | | | | | 500,000 | | | | 489,159 | |
| Prudential Financial, Inc., Note, (MTN) |
| 3.750% | | | | 05/01/2008 | | | | | 100,000 | | | | 97,667 | |
| Radian Group, Inc., Senior Note |
| 5.625% | | | | 02/15/2013 | | | | | 100,000 | | | | 100,130 | |
| Safeco Corporation, Senior Note |
| 4.875% | | | | 02/01/2010 | | | | | 150,000 | | | | 148,476 | |
| Travelers Property Casualty Corporation, Note |
| 7.750% | | | | 04/15/2026 | | | | | 500,000 | | | | 598,148 | |
| UnitedHealth Group, Inc., Note |
| 5.000% | | | | 08/15/2014 | | | | | 500,000 | | | | 485,456 | |
| UnitedHealth Group, Inc., Note |
| 3.750% | | | | 02/10/2009 | | | | | 1,150,000 | | | | 1,114,677 | |
| WellPoint, Inc., Note |
| 5.950% | | | | 12/15/2034 | | | | | 750,000 | | | | 740,414 | |
| | | 14,295,023 | |
Media—Broadcasting & Publishing—0.7% |
| British Sky Broadcasting PLC, Note (United Kingdom) |
| 8.200% | | | | 07/15/2009 | | | | | 250,000 | | | | 266,352 | |
| Comcast Cable Communications Holdings, Inc., Note |
| 9.455% | | | | 11/15/2022 | | | | | 400,000 | | | | 519,157 | |
| Comcast Cable Communications Holdings, Inc., Note |
| 8.375% | | | | 03/15/2013 | | | | | 500,000 | | | | 570,232 | |
| Comcast Corp., Note |
| 5.850% | | | | 01/15/2010 | | | | | 1,000,000 | | | | 1,014,650 | |
| Comcast Corp., Note |
| 5.650% | | | | 06/15/2035 | | | | | 500,000 | | | | 455,391 | |
| Comcast Corp., Note |
| 5.300% | | | | 01/15/2014 | | | | | 500,000 | | | | 490,437 | |
| Comcast Corporation, Note |
| 7.050% | | | | 03/15/2033 | | | | | 500,000 | | | | 536,301 | |
| COX Communications, Inc., Note |
| 5.500% | | | | 10/01/2015 | | | | | 75,000 | | | | 72,792 | |
| COX Communications, Inc., Note |
| 5.450% | | | | 12/15/2014 | | | | | 300,000 | | | | 292,734 | |
| COX Communications, Inc., Note |
| 4.625% | | | | 06/01/2013 | | | | | 250,000 | | | | 235,556 | |
| Time Warner Entertainment Company, LP, Senior Note |
| 8.375% | | | | 03/15/2023 | | | | | 1,000,000 | | | | 1,175,918 | |
See accompanying notes to financial statements.
213
SCHEDULE OF INVESTMENTS—(Continued)
December 31, 2006
Vantagepoint Core Bond
Index Fund
Coupon
Rate
|
|
|
| Maturity
Date
|
|
|
| Face
|
| Value
|
|---|
CORPORATE OBLIGATIONS—(Continued) |
| Viacom, Inc., Senior Note |
| 7.875% | | | | 07/30/2030 | | | | $ | 250,000 | | | $ | 262,699 | |
| Viacom, Inc., Senior Note |
| 6.625% | | | | 05/15/2011 | | | | | 1,000,000 | | | | 1,033,841 | |
| Viacom, Inc., Senior Note |
| 6.250% | | | | 04/30/2016 | | | | | 1,000,000 | | | | 994,806 | |
| Viacom, Inc., Senior Note |
| 5.625% | | | | 08/15/2012 | | | | | 50,000 | | | | 49,382 | |
| | | 7,970,248 | |
Medical Supplies—0.0% |
| Johnson & Johnson, Note |
| 4.950% | | | | 05/15/2033 | | | | | 200,000 | | | | 188,886 | | | |
Metals—0.2% |
| Alcan, Inc., Note (Canada) |
| 6.125% | | | | 12/15/2033 | | | | | 150,000 | | | | 148,820 | |
| Alcan, Inc., Senior Note (Canada) |
| 4.875% | | | | 09/15/2012 | | | | | 350,000 | | | | 339,884 | |
| Alcoa, Inc., Note |
| 7.375% | | | | 08/01/2010 | | | | | 750,000 | | | | 800,162 | |
| Vale Overseas, Ltd., Guaranteed Note (Cayman Islands) |
| 6.875% | | | | 11/21/2036 | | | | | 600,000 | | | | 618,388 | |
| | | 1,907,254 | |
Oil & Gas—1.4% |
| Alberta Energy Ltd., Note |
| 7.375% | | | | 11/01/2031 | | | | | 400,000 | | | | 451,378 | |
| Amerada Hess Corp., Note |
| 7.300% | | | | 08/15/2031 | | | | | 250,000 | | | | 279,853 | |
| Amerada Hess Corporation |
| 6.650% | | | | 08/15/2011 | | | | | 150,000 | | | | 156,345 | |
| Anadarko Petroleum Corp., Senior Note |
| 6.450% | | | | 09/15/2036 | | | | | 850,000 | | | | 861,771 | |
| Apache Finance Canada Corporation, Note (Canada) |
| 7.750% | | | | 12/15/2029 | | | | | 150,000 | | | | 183,012 | |
Burlington Resources Finance Company,
Guaranteed Note (Canada) |
| 7.200% | | | | 08/15/2031 | | | | | 150,000 | | | | 176,338 | |
| Canadian Natural Resources Ltd., Note (Canada) |
| 5.450% | | | | 10/01/2012 | | | | | 250,000 | | | | 247,398 | |
| Canadian Natural Resources, Ltd., Note (Canada) |
| 5.850% | | | | 02/01/2035 | | | | | 500,000 | | | | 461,894 | |
CenterPoint Energy Resources Corp.,
Series B, Senior Note |
| 7.875% | | | | 04/01/2013 | | | | | 850,000 | | | | 944,259 | |
| Conoco, Inc., Note |
| 6.950% | | | | 04/15/2029 | | | | | 1,250,000 | | | | 1,424,094 | |
| Consolidated Natural Gas Company, Senior Note |
| 5.000% | | | | 03/01/2014 | | | | | 250,000 | | | | 241,480 | |
| Devon Financing Corporation ULC, Note |
| 7.875% | | | | 09/30/2031 | | | | | 500,000 | | | | 603,368 | |
| Devon Financing Corporation ULC, Note |
| 6.875% | | | | 09/30/2011 | | | | | 750,000 | | | | 793,864 | |
| Enbridge Energy Partners, LP, Note |
| 4.000% | | | | 01/15/2009 | | | | | 50,000 | | | | 48,480 | |
| Enterprise Products Operating, LP, Note |
| 4.950% | | | | 06/01/2010 | | | | | 150,000 | | | | 147,581 | |
Enterprise Products Operating, LP,
Series B, Senior Note |
| 5.600% | | | | 10/15/2014 | | | | | 150,000 | | | | 147,549 | |
| Enterprise Products Partners, LP, Senior Note |
| 6.875% | | | | 03/01/2033 | | | | | 150,000 | | | | 157,109 | |
|
| Kinder Morgan Energy Partners, LP, Note |
| 6.750% | | | | 03/15/2011 | | | | $ | 500,000 | | | $ | 520,716 | |
| Kinder Morgan, Inc., Note |
| 7.250% | | | | 03/01/2028 | | | | | 150,000 | | | | 145,107 | |
| Kinder Morgan, Inc., Senior Note |
| 6.500% | | | | 09/01/2012 | | | | | 750,000 | | | | 754,436 | |
| Marathon Oil Corporation, Note |
| 6.125% | | | | 03/15/2012 | | | | | 350,000 | | | | 360,841 | |
| Nexen, Inc., Note (Canada) |
| 5.050% | | | | 11/20/2013 | | | | | 250,000 | | | | 241,632 | |
| Norsk Hydro AS, Note (Norway) |
| 6.360% | | | | 01/15/2009 | | | | | 450,000 | | | | 458,814 | |
| Occidental Petroleum Corporation, Note |
| 7.200% | | | | 04/01/2028 | | | | | 250,000 | | | | 289,535 | |
| Pemex Project Funding Master Trust, Guaranteed Note |
| 9.375% | | | | 12/02/2008 | | | | | 350,000 | | | | 375,375 | |
| Pemex Project Funding Master Trust, Note |
| 9.125% | | | | 10/13/2010 | | | | | 350,000 | | | | 393,400 | |
| Pemex Project Funding Master Trust, Note |
| 8.625% | | | | 02/01/2022 | | | | | 750,000 | | | | 928,875 | |
| Pemex Project Funding Master Trust, Note |
| 7.375% | | | | 12/15/2014 | | | | | 350,000 | | | | 386,225 | |
| Petro-Canada, Senior Note (Canada) |
| 5.950% | | | | 05/15/2035 | | | | | 250,000 | | | | 237,847 | |
| Phillips 66 Capital Trust II, Note |
| 8.000% | | | | 01/15/2037 | | | | | 750,000 | | | | 780,387 | |
| Southern California Gas Company, Note |
| 4.800% | | | | 10/01/2012 | | | | | 100,000 | | | | 97,387 | |
| Suncor Energy, Inc., Note |
| 7.150% | | | | 02/01/2032 | | | | | 500,000 | | | | 580,519 | |
| Texaco Capital, Inc., Note |
| 5.500% | | | | 01/15/2009 | | | | | 350,000 | | | | 353,238 | |
| TransCanada Corp., Senior Note (Canada) |
| 5.850% | | | | 03/15/2036 | | | | | 500,000 | | | | 489,000 | |
| TransCanada Pipelines Ltd., Note (Canada) |
| 4.000% | | | | 06/15/2013 | | | | | 250,000 | | | | 230,732 | |
| Transocean, Inc., Note (Cayman Islands) |
| 7.375% | | | | 04/15/2018 | | | | | 100,000 | | | | 109,986 | |
| Union Pacific Resources Group, Inc., Note |
| 7.150% | | | | 05/15/2028 | | | | | 350,000 | | | | 380,945 | |
| Valero Energy Corporation, Note |
| 4.750% | | | | 06/15/2013 | | | | | 500,000 | | | | 474,764 | |
| XTO Energy, Inc., Senior Note |
| 4.900% | | | | 02/01/2014 | | | | | 750,000 | | | | 716,021 | |
| | | 16,631,555 | |
Pharmaceuticals—0.6% |
| Abbott Laboratories, Note |
| 5.875% | | | | 05/15/2016 | | | | | 1,000,000 | | | | 1,031,882 | |
| Abbott Laboratories, Note |
| 3.500% | | | | 02/17/2009 | | | | | 250,000 | | | | 242,044 | |
| American Home Products Corporation, Senior Note |
| 6.950% | | | | 03/15/2011 | | | | | 250,000 | | | | 265,750 | |
| Eli Lilly & Company, Note |
| 6.770% | | | | 01/01/2036 | | | | | 250,000 | | | | 287,921 | |
| Eli Lilly & Company, Note |
| 2.900% | | | | 03/15/2008 | | | | | 150,000 | | | | 146,049 | |
| Genentech, Inc., Senior Note |
| 5.250% | | | | 07/15/2035 | | | | | 600,000 | | | | 560,152 | |
| Genentech, Inc., Senior Note |
| 4.750% | | | | 07/15/2015 | | | | | 200,000 | | | | 191,797 | |
| Genentech, Inc., Senior Note |
| 4.400% | | | | 07/15/2010 | | | | | 100,000 | | | | 97,842 | |
| GlaxoSmithKline Capital, Inc., Guaranteed Note |
| 4.375% | | | | 04/15/2014 | | | | | 500,000 | | | | 472,098 | |
| Merck & Company, Inc., Note |
| 4.750% | | | | 03/01/2015 | | | | | 250,000 | | | | 238,525 | |
See accompanying notes to financial statements.
214
SCHEDULE OF INVESTMENTS—(Continued)
December 31, 2006
Vantagepoint Core Bond
Index Fund
Coupon
Rate
|
|
|
| Maturity
Date
|
|
|
| Face
|
| Value
|
|---|
CORPORATE OBLIGATIONS—(Continued) |
| Merck & Company, Inc., Senior Note |
| 4.375% | | | | 02/15/2013 | | | | $ | 200,000 | | | $ | 190,119 | |
| Pharmacia Corporation, Note |
| 6.500% | | | | 12/01/2018 | | | | | 350,000 | | | | 383,958 | |
| Schering-Plough Corp., Senior Note |
| 5.550% | | | | 12/01/2013 | | | | | 1,000,000 | | | | 1,004,322 | |
| Schering-Plough Corporation, Senior Note |
| 6.750% | | | | 12/01/2033 | | | | | 250,000 | | | | 272,032 | |
| Wyeth, Note |
| 5.500% | | | | 03/15/2013 | | | | | 100,000 | | | | 100,778 | |
| Wyeth, Senior Note |
| 6.500% | | | | 02/01/2034 | | | | | 250,000 | | | | 272,834 | |
| Wyeth, Senior Note |
| 5.500% | | | | 02/01/2014 | | | | | 1,250,000 | | | | 1,258,239 | |
| | | 7,016,342 | |
Real Estate—0.2% |
| Boston Properties, Inc. REIT |
| 6.250% | | | | 01/15/2013 | | | | | 750,000 | | | | 781,520 | |
| Camden Property Trust REIT, Note |
| 5.000% | | | | 06/15/2015 | | | | | 200,000 | | | | 192,090 | |
| ERP Operating, LP, Note |
| 5.200% | | | | 04/01/2013 | | | | | 250,000 | | | | 247,539 | |
| ERP Operating, LP, Senior Note |
| 5.375% | | | | 08/01/2016 | | | | | 500,000 | | | | 495,690 | |
| Simon Property Group, LP REIT, Note |
| 6.350% | | | | 08/28/2012 | | | | | 250,000 | | | | 260,529 | |
| | | 1,977,368 | |
Restaurants—0.0% |
| Yum! Brands, Inc., Senior Note |
| 7.700% | | | | 07/01/2012 | | | | | 250,000 | | | | 273,602 | | | |
Retailers—0.5% |
| CVS Corporation, Note |
| 4.875% | | | | 09/15/2014 | | | | | 530,000 | | | | 507,405 | |
| Federated Department Stores, Inc., Senior Note |
| 6.900% | | | | 04/01/2029 | | | | | 500,000 | | | | 507,635 | |
| Federated Department Stores, Inc., Senior Note |
| 6.300% | | | | 04/01/2009 | | | | | 253,000 | | | | 257,350 | |
| Fred Meyer, Inc., Note |
| 7.450% | | | | 03/01/2008 | | | | | 750,000 | | | | 766,448 | |
| Limited Brands, Note |
| 5.250% | | | | 11/01/2014 | | | | | 250,000 | | | | 237,904 | |
| May Department Stores Company (The), Note |
| 5.750% | | | | 07/15/2014 | | | | | 250,000 | | | | 244,914 | |
| Target Corporation, Note |
| 7.000% | | | | 07/15/2031 | | | | | 350,000 | | | | 406,095 | |
| Wal-Mart Stores, Inc., Note |
| 7.550% | | | | 02/15/2030 | | | | | 750,000 | | | | 912,399 | |
| Wal-Mart Stores, Inc., Note |
| 6.875% | | | | 08/10/2009 | | | | | 750,000 | | | | 781,833 | |
| Wal-Mart Stores, Inc., Note |
| 4.550% | | | | 05/01/2013 | | | | | 500,000 | | | | 482,592 | |
| Wal-Mart Stores, Inc., Note |
| 4.125% | | | | 02/15/2011 | | | | | 250,000 | | | | 240,686 | |
| | | 5,345,261 | |
Telephone Systems—1.9% |
| Alltel Corporation, Senior Note |
| 7.000% | | | | 07/01/2012 | | | | | 250,000 | | | | 260,018 | |
| America Movil SA de CV, Guaranteed Senior Note (Mexico) |
| 5.500% | | | | 03/01/2014 | | | | | 100,000 | | | | 98,002 | |
|
| AT&T Wireless Services, Inc., Senior Note |
| 8.750% | | | | 03/01/2031 | | | | $ | 250,000 | | | $ | 325,834 | |
| AT&T Wireless Services, Inc., Senior Note |
| 7.875% | | | | 03/01/2011 | | | | | 750,000 | | | | 818,804 | |
| Bellsouth Capital Funding Corporation, Note |
| 7.875% | | | | 02/15/2030 | | | | | 900,000 | | | | 1,048,074 | |
| BellSouth Corporation, Note |
| 6.875% | | | | 10/15/2031 | | | | | 350,000 | | | | 371,833 | |
| BellSouth Corporation, Note |
| 6.000% | | | | 10/15/2011 | | | | | 250,000 | | | | 256,758 | |
| British Telecommunications PLC, Note (United Kingdom) |
| 8.875% | | | | 12/15/2030 | | | | | 150,000 | | | | 205,775 | |
| British Telecommunications PLC, Note (United Kingdom) |
| 8.375% | | | | 12/15/2010 | | | | | 2,000,000 | | | | 2,233,900 | |
| Cingular Wireless LLC, Senior Note |
| 6.500% | | | | 12/15/2011 | | | | | 250,000 | | | | 262,237 | |
Deutsche Telekom International Finance BV,
Guaranteed Note (Netherlands) |
| 8.250% | | | | 06/15/2030 | | | | | 750,000 | | | | 924,665 | |
Deutsche Telekom International Finance BV,
Note, Step Bond (Netherlands) |
| 8.000% | | | | 06/15/2010 | | | | | 700,000 | | | | 758,554 | |
| Embarq Corp., Note |
| 7.082% | | | | 06/01/2016 | | | | | 500,000 | | | | 509,879 | |
| France Telecom SA, Global Step Note (France) |
| 8.500% | | | | 03/01/2031 | | | | | 500,000 | | | | 658,311 | |
| France Telecom SA, Global Step Note (France) |
| 7.750% | | | | 03/01/2011 | | | | | 100,000 | | | | 109,024 | |
| GTE Corporation, Note |
| 7.510% | | | | 04/01/2009 | | | | | 200,000 | | | | 208,695 | |
| Koninklijve KPN NV, Note (Netherlands) |
| 8.000% | | | | 10/01/2010 | | | | | 350,000 | | | | 377,950 | |
| SBC Communications, Inc., Global Note |
| 6.250% | | | | 03/15/2011 | | | | | 250,000 | | | | 258,339 | |
| SBC Communications, Inc., Global Note |
| 6.150% | | | | 09/15/2034 | | | | | 500,000 | | | | 493,399 | |
| SBC Communications, Inc., Global Note |
| 5.300% | | | | 11/15/2010 | | | | | 1,250,000 | | | | 1,251,251 | |
| SBC Communications, Inc., Global Note |
| 5.100% | | | | 09/15/2014 | | | | | 500,000 | | | | 486,236 | |
| Sprint Capital Corporation, Guaranteed Note |
| 6.375% | | | | 05/01/2009 | | | | | 750,000 | | | | 765,426 | |
| Sprint Capital Corporation, Note |
| 8.375% | | | | 03/15/2012 | | | | | 850,000 | | | | 945,679 | |
| Sprint Capital Corporation, Note |
| 6.875% | | | | 11/15/2028 | | | | | 500,000 | | | | 501,913 | |
| Sprint Capital Corporation, Note |
| 6.125% | | | | 11/15/2008 | | | | | 1,000,000 | | | | 1,012,258 | |
Telecom Italia Capital SA, Guaranteed
Senior Note (Luxembourg) |
| 6.000% | | | | 09/30/2014 | | | | | 250,000 | | | | 227,466 | |
Telecom Italia Capital SA, Guaranteed
Senior Note (Luxembourg) |
| 4.950% | | | | 09/30/2014 | | | | | 1,500,000 | | | | 1,391,844 | |
Telecom Italia Capital SA, Series B,
Senior Note (Luxembourg) |
| 5.250% | | | | 11/15/2013 | | | | | 350,000 | | | | 334,193 | |
Telefonica Emisones SAU, Guaranteed
Senior Note (Spain) |
| 6.421% | | | | 06/20/2016 | | | | | 500,000 | | | | 516,721 | |
| Telefonica Europe BV (Netherlands) |
| 8.250% | | | | 09/15/2030 | | | | | 350,000 | | | | 418,182 | |
| Verizon Global Funding Corporation |
| 7.375% | | | | 09/01/2012 | | | | | 1,000,000 | | | | 1,094,595 | |
| Verizon Global Funding Corporation, Note |
| 7.750% | | | | 12/01/2030 | | | | | 750,000 | | | | 882,326 | |
| Verizon Pennsylvania, Inc., Note, Class A |
| 5.650% | | | | 11/15/2011 | | | | | 350,000 | | | | 351,609 | |
See accompanying notes to financial statements.
215
SCHEDULE OF INVESTMENTS—(Continued)
December 31, 2006
Vantagepoint Core Bond
Index Fund
Coupon
Rate
|
|
|
| Maturity
Date
|
|
|
| Face
|
| Value
|
|---|
CORPORATE OBLIGATIONS—(Continued) |
| Verizon Virginia, Inc., Note |
| 4.625% | | | | 03/15/2013 | | | | $ | 250,000 | | | $ | 235,086 | |
| Vodafone Group PLC, Note (United Kingdom) |
| 7.875% | | | | 02/15/2030 | | | | | 250,000 | | | | 294,155 | |
| Vodafone Group PLC, Note (United Kingdom) |
| 7.750% | | | | 02/15/2010 | | | | | 550,000 | | | | 586,530 | |
| | | 21,475,521 | |
Transportation—0.3% |
| Burlington Northern Santa Fe Corporation, Note |
| 7.125% | | | | 12/15/2010 | | | | | 750,000 | | | | 799,106 | |
| Canadian National Railway Company, Note (Canada) |
| 4.400% | | | | 03/15/2013 | | | | | 585,000 | | | | 557,080 | |
| CSX Corporation, Note |
| 6.750% | | | | 03/15/2011 | | | | | 300,000 | | | | 315,285 | |
| Norfolk Southern Corp., Note |
| 5.257% | | | | 09/17/2014 | | | | | 500,000 | | | | 496,252 | |
| Norfolk Southern Corporation, Note |
| 7.700% | | | | 05/15/2017 | | | | | 350,000 | | | | 407,804 | |
| Norfolk Southern Corporation., Note |
| 7.050% | | | | 05/01/2037 | | | | | 500,000 | | | | 577,539 | |
| Union Pacific Corporation, Note |
| 6.625% | | | | 02/01/2029 | | | | | 250,000 | | | | 272,745 | |
| | | 3,425,811 | |
TOTAL CORPORATE OBLIGATIONS
| | | |
| (Cost $239,053,835) | | 237,625,918 | |
| |
U.S. GOVERNMENT AGENCY
OBLIGATIONS—45.6% |
U.S. Government Agencies—10.8% |
| Federal Home Loan Bank |
| 5.945% | | | | 07/28/2008 | | | | | 2,000,000 | | | | 2,023,464 | |
| 5.750% | | | | 05/15/2012 | | † | | | 5,225,000 | | | | 5,428,367 | |
| 5.375% | | | | 05/18/2016 | | | | | 2,000,000 | | | | 2,058,090 | |
| 5.250% | | | | 06/18/2014 | | | | | 2,500,000 | | | | 2,544,747 | |
| 4.900% | | | | 07/24/2008 | | | | | 350,000 | | | | 349,177 | |
| 4.375% | | | | 03/17/2010 | | | | | 825,000 | | | | 811,802 | |
| 4.100% | | | | 06/13/2008 | | | | | 3,250,000 | | | | 3,206,141 | |
| 4.000% | | | | 03/10/2008 | | | | | 500,000 | | | | 493,420 | |
| 3.625% | | | | 11/14/2008 | | | | | 2,500,000 | | | | 2,438,495 | |
| 3.000% | | | | 04/15/2009 | | | | | 8,000,000 | | | | 7,676,088 | |
| 2.750% | | | | 03/14/2008 | | | | | 1,750,000 | | | | 1,701,712 | |
| 2.625% | | | | 07/15/2008 | | | | | 3,250,000 | | | | 3,135,808 | |
| Federal Home Loan Mortgage Corporation |
| 7.000% | | | | 03/15/2010 | | | | | 2,630,000 | | | | 2,790,617 | |
| 6.750% | | | | 09/15/2029 | | | | | 660,000 | | | | 795,825 | |
| 6.250% | | | | 07/15/2032 | | † | | | 1,050,000 | | | | 1,212,496 | |
| 6.000% | | | | 06/15/2011-
09/19/2016 | | | | | 1,200,000 | | | | 1,209,380 | |
| 5.750% | | | | 04/15/2008-
01/15/2012 | | | | | 3,150,000 | | | | 3,188,666 | |
| 5.625% | | | | 11/23/2035 | | | | | 130,000 | | | | 125,697 | |
| 5.500% | | | | 04/24/2009-
07/18/2016 | | | | | 6,640,000 | | | | 6,877,624 | |
| 5.450% | | | | 09/02/2011-
11/21/2013 | | | | | 1,100,000 | | | | 1,098,057 | |
| 5.400% | | | | 02/28/2011-
03/09/2011 | | | | | 900,000 | | | | 900,012 | |
| 5.375% | | | | 05/22/2008 | | | | | 2,700,000 | | | | 2,700,202 | |
| 5.250% | | | | 02/24/2011 | | | | | 600,000 | | | | 600,279 | |
| 5.200% | | | | 03/05/2019 | | | | | 200,000 | | | | 194,875 | |
|
| 5.125% | | | | 07/15/2012 | | | | $ | 2,000,000 | | | $ | 2,016,684 | |
| 5.050% | | | | 01/26/2015 | | | | | 300,000 | | | | 300,426 | |
| 5.000% | | | | 02/08/2008-
01/30/2014 | | | | | 1,100,000 | | | | 1,097,413 | |
| 4.900% | | | | 11/03/2008 | | | | | 400,000 | | | | 398,911 | |
| 4.750% | | | | 12/08/2010 | | | | | 500,000 | | | | 496,733 | |
| 4.625% | | | | 02/21/2008 | | | | | 1,500,000 | | | | 1,491,153 | |
| 4.500% | | | | 08/04/2008-
11/01/2035 | | | | | 4,260,068 | | | | 4,154,632 | |
| 4.375% | | | | 01/25/2010-
07/17/2015 | | | | | 4,600,000 | | | | 4,490,068 | |
| 4.250% | | | | 06/23/2008 | | | | | 1,000,000 | | | | 988,615 | |
| 4.125% | | | | 09/01/2009-
02/24/2011 | | | | | 5,150,000 | | | | 5,031,103 | |
| 4.000% | | | | 09/22/2009 | | | | | 560,000 | | | | 546,770 | |
| 3.625% | | | | 09/15/2008 | | | | | 2,260,000 | | | | 2,208,698 | |
| Federal National Mortgage Association |
| 7.250% | | | | 01/15/2010 | | | | | 2,800,000 | | | | 2,980,933 | |
| 7.125% | | | | 06/15/2010 | | | | | 1,500,000 | | | | 1,604,877 | |
| 6.625% | | | | 09/15/2009-
11/15/2030 | | | | | 5,750,000 | | | | 6,175,257 | |
| 6.375% | | | | 06/15/2009 | | | | | 394,000 | | | | 406,725 | |
| 6.250% | | | | 05/15/2029 | | | | | 2,240,000 | | | | 2,554,738 | |
| 6.125% | | | | 07/17/2013 | | | | | 500,000 | | | | 505,231 | |
| 6.070% | | | | 05/12/2016 | | | | | 700,000 | | | | 704,819 | |
| 6.000% | | | | 05/15/2011 | | | | | 2,500,000 | | | | 2,605,575 | |
| 5.700% | | | | 10/05/2021 | | | | | 300,000 | | | | 296,368 | |
| 5.500% | | | | 03/15/2011 | | | | | 1,400,000 | | | | 1,430,958 | |
| 5.280% | | | | 02/27/2009 | | | | | 1,400,000 | | | | 1,399,640 | |
| 5.250% | | | | 04/04/2008 | | | | | 900,000 | | | | 899,690 | |
| 5.100% | | | | 02/22/2008 | | | | | 500,000 | | | | 499,636 | |
| 5.000% | | | | 01/23/2009 | | | | | 750,000 | | | | 749,992 | |
| 4.875% | | | | 01/11/2008-
12/15/2016 | | | | | 1,500,000 | | | | 1,489,163 | |
| 4.625% | | | | 10/15/2013 | | | | | 5,800,000 | | | | 5,690,426 | |
| 4.500% | | | | 10/15/2008 | | | | | 3,000,000 | | | | 2,974,494 | |
| 4.375% | | | | 03/15/2013 | | | | | 1,450,000 | | | | 1,405,463 | |
| 4.125% | | | | 05/15/2010 | | | | | 1,200,000 | | | | 1,171,198 | |
| 3.250% | | | | 01/15/2008-
02/15/2009 | | | | | 9,700,000 | | | | 9,443,435 | |
| 0.000% | | | | 06/01/2017 | | | | | 1,000,000 | | | | 589,262 | |
| Financing Corporation, Note |
| 9.650% | | | | 11/02/2018 | | | | | 500,000 | | | | 699,806 | |
| 8.600% | | | | 09/26/2019 | | | | | 500,000 | | | | 660,575 | |
| Tennessee Valley Authority |
| 6.250% | | | | 12/15/2017 | | | | | 1,200,000 | | | | 1,323,832 | |
| | | 125,044,340 | |
U.S. Government Agencies—Mortgage Backed—34.8% |
| Federal Home Loan Mortgage Corporation |
| 7.500% | | | | 06/01/2027-
10/01/2029 | | | | | 722,480 | | | | 754,663 | |
| 7.000% | | | | 02/01/2016-
02/01/2037 | | | | | 2,391,531 | | | | 2,458,121 | |
| 6.500% | | | | 05/01/2008-
10/01/2036 | | | | | 13,353,101 | | | | 13,649,807 | |
| 6.000% | | | | 11/01/2016-
09/01/2036 | | | | | 20,705,376 | | | | 20,898,311 | |
| 5.500% | | | | 02/01/2018-
12/01/2036 | | | | | 46,801,295 | | | | 46,404,900 | |
| 5.000% | | | | 05/01/2018-
04/01/2036 | | | | | 46,567,072 | | | | 45,224,620 | |
| 4.500% | | | | 07/01/2011-
09/01/2036 | | | | | 20,318,097 | | | | 19,514,498 | |
| 4.000% | | | | 04/01/2009-
12/01/2020 | | | | | 4,171,515 | | | | 3,938,223 | |
| 3.500% | | | | 05/01/2011 | | | | | 66,986 | | | | 63,499 | |
See accompanying notes to financial statements.
216
SCHEDULE OF INVESTMENTS—(Continued)
December 31, 2006
Vantagepoint Core Bond
Index Fund
Coupon
Rate
|
|
|
| Maturity
Date
|
|
|
| Face
|
| Value
|
|---|
U.S. GOVERNMENT AGENCY
OBLIGATIONS—(Continued) |
| Federal Home Loan Mortgage Corporation TBA |
| 6.000% | | | | 02/01/2037 | | | | $ | 3,000,000 | | | $ | 3,020,625 | |
| 5.000% | | | | 02/01/2037 | | | | | 1,000,000 | | | | 964,688 | |
| Federal National Mortgage Association |
| 7.500% | | | | 06/01/2030-
07/01/2031 | | | | | 80,502 | | | | 83,969 | |
| 7.000% | | | | 03/01/2030-
10/01/2036 | | | | | 4,866,434 | | | | 5,000,647 | |
| 6.500% | | | | 02/01/2017-
09/01/2036 | | | | | 11,485,977 | | | | 11,731,903 | |
| 6.000% | | | | 04/01/2014-
10/01/2036 | | | | | 41,609,007 | | | | 41,945,213 | |
| 5.500% | | | | 01/01/2018-
03/01/2036 | | | | | 64,246,627 | | | | 63,664,358 | |
| 5.000% | | | | 03/01/2018-
11/01/2036 | | | | | 60,687,602 | | | | 58,963,692 | |
| 4.500% | | | | 08/01/2011-
07/01/2035 | | | | | 17,715,386 | | | | 16,947,718 | |
| 4.000% | | | | 07/01/2011-
12/01/2018 | | | | | 5,482,451 | | | | 5,194,995 | |
| Federal National Mortgage Association TBA |
| 6.500% | | | | 02/01/2037 | | | | | 1,000,000 | | | | 1,018,438 | |
| 5.500% | | | | 02/01/2037 | | | | | 2,000,000 | | | | 1,975,624 | |
| 4.500% | | | | 02/01/2022 | | | | | 1,000,000 | | | | 964,062 | |
| Government National Mortgage Association |
| 7.500% | | | | 12/15/2029-
05/15/2032 | | | | | 1,012,620 | | | | 1,057,250 | |
| 7.000% | | | | 09/15/2031 | | | | | 752,336 | | | | 777,901 | |
| 6.500% | | | | 03/15/2026-
06/15/2036 | | | | | 4,713,889 | | | | 4,841,751 | |
| 6.000% | | | | 02/15/2033-
11/15/2036 | | | | | 9,841,229 | | | | 9,986,915 | |
| 5.500% | | | | 03/15/2033-
06/15/2036 | | | | | 13,750,205 | | | | 13,698,700 | |
| 5.000% | | | | 05/15/2033-
12/15/2035 | | | | | 7,893,388 | | | | 7,683,538 | |
| Government National Mortgage Association TBA |
| 5.500% | | | | 02/01/2037 | | | | | 1,000,000 | | | | 994,688 | |
| 5.000% | | | | 02/01/2037 | | | | | 1,000,000 | | | | 972,188 | |
| | | 404,395,505 | |
TOTAL U.S. GOVERNMENT AGENCY OBLIGATIONS |
| (Cost $536,168,407) | | 529,439,845 | |
| |
U.S. TREASURY OBLIGATIONS—24.3% |
U.S. Treasury Bonds—7.4% |
| U.S. Treasury Bond |
| 13.250% | | | | 05/15/2014 | | | | | 850,000 | | | | 1,010,272 | |
| 11.750% | | | | 11/15/2014 | | | | | 500,000 | | | | 592,969 | |
| 11.250% | | | | 02/15/2015 | | | | | 500,000 | | | | 718,477 | |
| 10.375% | | | | 11/15/2012 | | | | | 300,000 | | | | 313,430 | |
| 9.875% | | | | 11/15/2015 | | † | | | 1,550,000 | | | | 2,124,348 | |
| 9.125% | | | | 05/15/2018 | | † | | | 2,000,000 | | | | 2,751,408 | |
| 8.750% | | | | 05/15/2017-
05/15/2020 | | † | | | 7,190,000 | | | | 9,738,208 | |
| 8.500% | | | | 02/15/2020 | | † | | | 2,500,000 | | | | 3,377,150 | |
| 8.125% | | | | 08/15/2019 | | † | | | 5,990,000 | | | | 7,827,714 | |
| 8.000% | | | | 11/15/2021 | | | | | 2,000,000 | | | | 2,651,876 | |
| 7.875% | | | | 02/15/2021 | | | | | 3,500,000 | | | | 4,559,026 | |
| 7.625% | | | | 02/15/2025 | | | | | 1,600,000 | | | | 2,118,126 | |
| 7.500% | | | | 11/15/2024 | | | | | 1,350,000 | | | | 1,764,598 | |
|
| 7.250% | | | | 05/15/2016-
08/15/2022 | | | | $ | 5,580,000 | | | $ | 6,831,044 | |
| 7.125% | | | | 02/15/2023 | | | | | 2,425,000 | | | | 3,019,506 | |
| 6.500% | | | | 11/15/2026 | | | | | 1,150,000 | | | | 1,381,797 | |
| 6.250% | | | | 05/15/2030 | | † | | | 2,910,000 | | | | 3,467,448 | |
| 6.125% | | | | 11/15/2027 | | † | | | 4,100,000 | | | | 4,758,243 | |
| 6.000% | | | | 02/15/2026 | | † | | | 1,750,000 | | | | 1,985,294 | |
| 5.750% | | | | 08/15/2010 | | | | | 2,360,000 | | | | 2,442,140 | |
| 5.375% | | | | 02/15/2031 | | † | | | 2,841,000 | | | | 3,044,089 | |
| 5.250% | | | | 02/15/2029 | | | | | 3,880,000 | | | | 4,070,364 | |
| 5.000% | | | | 08/15/2011 | | † | | | 15,560,000 | | | | 15,782,461 | |
| | | 86,329,988 | |
U.S. Treasury Notes—16.9% |
| U.S. Treasury Note |
| 6.000% | | | | 08/15/2009 | | | | | 4,470,000 | | | | 4,606,371 | |
| 5.625% | | | | 05/15/2008 | | | | | 3,440,000 | | | | 3,472,522 | |
| 5.500% | | | | 02/15/2008-
05/15/2009 | | | | | 5,000,000 | | | | 5,062,816 | |
| 5.125% | | | | 05/15/2016 | | † | | | 500,000 | | | | 515,176 | |
| 5.000% | | | | 07/31/2008-
02/15/2011 | | † | | | 15,740,000 | | | | 15,827,657 | |
| 4.875% | | | | 08/31/2008-
02/15/2012 | | † | | | 39,805,000 | | | | 40,049,875 | |
| 4.750% | | | | 11/15/2008 | | † | | | 9,100,000 | | | | 9,091,118 | |
| 4.625% | | | | 02/29/2008-
11/15/2016 | | † | | | 9,080,000 | | | | 9,036,094 | |
| 4.500% | | | | 02/28/2011-
02/15/2036 | | † | | | 11,910,000 | | | | 11,672,129 | |
| 4.375% | | | | 01/31/2008 | | † | | | 8,000,000 | | | | 7,949,688 | |
| 4.250% | | | | 01/15/2011-
08/15/2015 | | † | | | 13,850,000 | | | | 13,465,410 | |
| 4.125% | | | | 08/15/2008-
05/15/2015 | | † | | | 8,630,000 | | | | 8,347,076 | |
| 4.000% | | | | 03/15/2010-
02/15/2015 | | | | | 26,090,000 | | | | 25,454,303 | |
| 3.875% | | | | 02/15/2013 | | † | | | 1,350,000 | | | | 1,292,467 | |
| 3.750% | | | | 05/15/2008 | | | | | 5,650,000 | | | | 5,565,256 | |
| 3.625% | | | | 07/15/2009-
05/15/2013 | | | | | 2,910,000 | | | | 2,821,306 | |
| 3.500% | | | | 12/15/2009 | | | | | 5,770,000 | | | | 5,579,550 | |
| 3.375% | | | | 12/15/2008-
10/15/2009 | | | | | 7,380,000 | | | | 7,155,944 | |
| 3.250% | | | | 01/15/2009 | | | | | 7,630,000 | | | | 7,405,876 | |
| 3.125% | | | | 04/15/2009 | | | | | 1,570,000 | | | | 1,514,928 | |
| 3.000% | | | | 02/15/2008 | | † | | | 6,100,000 | | | | 5,970,857 | |
| 2.625% | | | | 05/15/2008 | | | | | 4,100,000 | | | | 3,978,923 | |
| | | 195,835,342 | |
TOTAL U.S. TREASURY OBLIGATIONS
| | | |
| (Cost $284,491,332) | | 282,165,330 | |
| |
MUNICIPAL OBLIGATIONS—0.2% |
Financial Services—0.2% |
| Illinois State (Illinois) |
| 5.100% | | | | 06/01/2033 | | | | | 1,100,000 | | | | 1,054,240 | |
| New Jersey Economic Development Authority (New Jersey) |
| 7.425% | | | | 02/15/2029 | | | | | 500,000 | | | | 619,785 | |
| New Jersey State Turnpike Authority (New Jersey) |
| 4.252% | | | | 01/01/2016 | | | | | 25,000 | | | | 23,311 | |
| New Jersey State Turnpike Authority (New Jersey) |
| 4.252% | | | | 01/01/2016 | | | | | 525,000 | | | | 494,266 | |
| Oregon State (Oregon) |
| 5.762% | | | | 06/01/2023 | | | | | 200,000 | | | | 205,826 | |
TOTAL MUNICIPAL OBLIGATIONS
| | | |
| (Cost $2,333,086) | | 2,397,428 | |
See accompanying notes to financial statements.
217
SCHEDULE OF INVESTMENTS—(Continued)
December 31, 2006
Vantagepoint Core Bond
Index Fund
Coupon
Rate
|
|
|
| Maturity
Date
|
|
|
| Face
|
| Value
|
|---|
SOVEREIGN DEBT OBLIGATIONS—1.7% |
Government Issued—1.7% |
| British Columbia (Province of) (Canada) |
| 6.500% | | | | 01/15/2026 | | | | $ | 150,000 | | | $ | 171,211 | |
| Canadian Government (Canada) |
| 5.250% | | | | 11/05/2008 | | | | | 250,000 | | | | 251,329 | |
| Hydro Quebec (Canada) |
| 6.300% | | | | 05/11/2011 | | | | | 350,000 | | | | 366,186 | |
| Hydro-Quebec (Canada) |
| 8.050% | | | | 07/07/2024 | | | | | 500,000 | | | | 649,496 | |
| Italian Republic (Italy) |
| 6.875% | | | | 09/27/2023 | | | | | 750,000 | | | | 868,046 | |
| Italian Republic (Italy) |
| 6.000% | | | | 02/22/2011 | | | | | 1,550,000 | | | | 1,601,200 | |
| Italian Republic (Italy) |
| 5.375% | | | | 06/15/2033 | | | | | 500,000 | | | | 494,761 | |
| Italian Republic (Italy) |
| 4.375% | | | | 06/15/2013 | | | | | 1,000,000 | | | | 961,478 | |
| Italian Republic (Italy) |
| 3.250% | | | | 05/15/2009 | | | | | 500,000 | | | | 480,837 | |
| Malaysia Government (Malaysia) |
| 8.750% | | | | 06/01/2009 | | | | | 500,000 | | | | 538,861 | |
| Malaysia Government (Malaysia) |
| 7.500% | | | | 07/15/2011 | | | | | 250,000 | | | | 272,360 | |
| Nova Scotia Province (Canada) |
| 5.750% | | | | 02/27/2012 | | | | | 350,000 | | | | 360,745 | |
| Ontario Province (Canada) |
| 5.500% | | | | 10/01/2008 | | | | | 550,000 | | | | 553,379 | |
| Ontario Province (Canada) |
| 5.450% | | | | 04/27/2016 | | | | | 1,000,000 | | | | 1,028,371 | |
| Ontario Province (Canada) |
| 4.500% | | | | 02/03/2015 | | | | | 400,000 | | | | 387,266 | |
| Ontario Province (Canada) |
| 3.625% | | | | 10/21/2009 | | | | | 250,000 | | | | 240,834 | |
| Ontario Province (Canada) |
| 3.282% | | | | 03/28/2008 | | | | | 250,000 | | | | 244,044 | |
| People’s Republic of China (China) |
| 4.750% | | | | 10/29/2013 | | | | | 250,000 | | | | 245,026 | |
| Quebec Province (Canada) |
| 7.500% | | | | 09/15/2029 | | | | | 600,000 | | | | 763,630 | |
| Quebec Province (Canada) |
| 6.125% | | | | 01/22/2011 | | | | | 850,000 | | | | 878,994 | |
| Quebec Province (Canada) |
| 5.750% | | | | 02/15/2009 | | | | | 850,000 | | | | 862,079 | |
| Region of Lombardy (Italy) |
| 5.804% | | | | 10/25/2032 | | | | | 100,000 | | | | 103,733 | |
| Republic of Chile (Chile) |
| 5.500% | | | | 01/15/2013 | | | | | 150,000 | | | | 151,485 | |
| Republic of Finland (Finland) |
| 6.950% | | | | 02/15/2026 | | | | | 150,000 | | | | 179,300 | |
| Republic of Korea (South Korea) |
| 8.875% | | | | 04/15/2008 | | | | | 250,000 | | | | 262,151 | |
| Republic of Korea (South Korea) |
| 4.875% | | | | 09/22/2014 | | | | | 1,000,000 | | | | 971,572 | |
| Republic of Poland (Poland) |
| 5.250% | | | | 01/15/2014 | | | | | 200,000 | | | | 200,718 | |
| Republic of Poland (Poland) |
| 5.000% | | | | 10/19/2015 | | | | | 300,000 | | | | 296,271 | |
| Republic of South Africa (South Africa) |
| 7.375% | | | | 04/25/2012 | | | | | 250,000 | | | | 269,375 | |
| Saskatchewan Province (Canada) |
| 7.375% | | | | 07/15/2013 | | | | | 230,000 | | | | 258,834 | |
| State of Israel (Israel) |
| 5.125% | | | | 03/01/2014 | | | | | 250,000 | | | | 244,079 | |
|
| United Mexican States (Mexico) |
| 8.375% | | | | 01/14/2011 | | | | $ | 500,000 | | | $ | 557,500 | |
| United Mexican States (Mexico) |
| 8.300% | | | | 08/15/2031 | | | | | 500,000 | | | | 640,500 | |
| United Mexican States (Mexico) |
| 8.125% | | | | 12/30/2019 | | | | | 750,000 | | | | 913,125 | |
| United Mexican States (Mexico) |
| 7.500% | | | | 04/08/2033 | | | | | 400,000 | | | | 473,000 | |
| United Mexican States (Mexico) |
| 6.625% | | | | 03/03/2015 | | | | | 185,000 | | | | 199,060 | |
| United Mexican States (Mexico) |
| 6.375% | | | | 01/16/2013 | | | | | 679,000 | | | | 715,666 | |
| United Mexican States (Mexico) |
| 5.875% | | | | 01/15/2014 | | | | | 1,000,000 | | | | 1,028,500 | |
TOTAL SOVEREIGN DEBT OBLIGATIONS |
| (Cost $19,506,234) | | 19,685,002 | |
| |
ASSET BACKED SECURITIES—1.0% |
Automotive—0.4% |
AmeriCredit Automobile Receivables Trust,
Series 2003-D-M, Class A-4 |
| 2.840% | | | | 08/06/2010 | | | | | 585,282 | | | | 579,604 | |
Honda Auto Receivables Owner Trust,
Series 2004-1, Class A4 |
| 3.060% | | | | 10/21/2009 | | | | | 1,000,000 | | | | 987,494 | |
WFS Financial Owner Trust,
Series 2004-4, Class A4 |
| 3.440% | | | | 05/17/2012 | | | | | 2,750,000 | | | | 2,689,027 | |
| | | 4,256,125 | |
Credit Cards—0.3% |
Bank One Issuance Trust,
Series 2003-A7, Class A7 |
| 3.350% | | | | 03/15/2011 | | | | | 1,500,000 | | | | 1,463,505 | |
Citibank Credit Card Master Trust I,
Series 1999-2, Class A |
| 5.875% | | | | 03/10/2011 | | | | | 1,500,000 | | | | 1,524,483 | |
MBNA Master Credit Card Trust,
Series 1999-B, Class A |
| 5.900% | | | | 08/15/2011 | | | | | 825,000 | | | | 840,121 | |
| | | 3,828,109 | |
Electric Utilities—0.3% |
Detroit Edison Securitization Funding LLC,
Series 2001-1, Class A6 |
| 6.620% | | | | 03/01/2016 | | | | | 2,700,000 | | | | 2,942,719 | | | |
TOTAL ASSET BACKED SECURITIES
| | | |
| (Cost $11,383,403) | | 11,026,953 | |
| |
NON-U.S. GOVERNMENT MORTGAGE-BACKED SECURITIES—5.4% |
Mortgage Backed—5.4% |
Banc of America Commercial Mortgage, Inc.,
Series 2002-2, Class A3 |
| 5.118% | | | | 07/11/2043 | | | | | 500,000 | | | | 497,265 | |
Banc of America Commercial Mortgage, Inc.,
Series 2004-2, Class A3 |
| 4.050% | | | | 11/10/2038 | | | | | 3,000,000 | | | | 2,879,419 | |
Banc of America Commercial Mortgage, Inc.,
Series 2004-6, Class A5 |
| 4.811% | | | | 12/10/2042 | | | | | 500,000 | | | | 483,749 | |
Banc of America Commercial Mortgage, Inc.,
Series 2005-4, Class A2 |
| 4.764% | | | | 07/10/2045 | | | | | 1,750,000 | | | | 1,727,248 | |
See accompanying notes to financial statements.
218
SCHEDULE OF INVESTMENTS—(Continued)
December 31, 2006
Vantagepoint Core Bond
Index Fund
Coupon
Rate
|
|
|
| Maturity
Date
|
|
|
| Face
|
| Value
|
|---|
NON-U.S. GOVERNMENT MORTGAGE-BACKED SECURITIES—(Continued) |
Banc of America Commercial Mortgage, Inc.,
Series 2005-6, Class AM, (FRN) |
| 5.180% | | | | 09/10/2047 | | | | $ | 1,000,000 | | | $ | 993,402 | |
Citigroup Commercial Mortgage Trust,
Series 2004-C1, Class A3 |
| 5.251% | | | | 04/15/2040 | | | | | 750,000 | | | | 750,243 | |
Citigroup Commercial Mortgage Trust,
Series 2005-C3, Class AM |
| 4.830% | | | | 05/15/2043 | | | | | 1,500,000 | | | | 1,445,198 | |
Citigroup/Deutsche Bank Commercial Mortgage Trust,
Series 2005-C1, Class A4, (FRN) |
| 5.226% | | | | 07/15/2044 | | | | | 900,000 | | | | 898,505 | |
Citigroup/Deutsche Bank Commercial Mortgage Trust,
Series 2006-CD3, Class A5 |
| 5.617% | | | | 10/15/2048 | | | | | 1,500,000 | | | | 1,529,003 | |
CS First Boston Mortgage Securities Corp.,
Series 2004-C2, Class A2 |
| 5.416% | | | | 05/15/2036 | | | | | 2,000,000 | | | | 2,010,460 | |
CS First Boston Mortgage Securities Corp.,
Series 2005-C2, Class A4 |
| 4.832% | | | | 04/15/2037 | | | | | 1,750,000 | | | | 1,693,053 | |
CS First Boston Mortgage Securities Corp.,
Series 2005-C5, Class A3 |
| 5.100% | | | | 08/15/2038 | | | | | 2,650,000 | | | | 2,624,261 | |
CS First Boston Mortgage Securities Corporation,
Series 1998-C2, Class A2 |
| 6.300% | | | | 11/11/2030 | | | | | 383,301 | | | | 388,780 | |
CS First Boston Mortgage Securities Corporation,
Series 2003-C5, Class A2 |
| 3.808% | | | | 12/15/2036 | | | | | 1,000,000 | | | | 975,976 | |
First Union National Bank Commercial Mortgage,
Series 2001-C3, Class A2 |
| 6.180% | | | | 08/15/2033 | | | | | 78,415 | | | | 78,523 | |
GE Capital Commercial Mortgage Corp.,
Series 2005-C2, Class A4 |
| 4.978% | | | | 05/10/2043 | | | | | 1,000,000 | | | | 977,546 | |
GE Capital Commercial Mortgage Corp.,
Series 2005-C4, Class AM, (FRN) |
| 5.334% | | | | 11/10/2045 | | | | | 2,000,000 | | | | 1,999,032 | |
GE Capital Commercial Mortgage Corporation,
Series 2001-A, Class A2 |
| 6.531% | | | | 05/15/2033 | | | | | 3,500,000 | | | | 3,663,711 | |
GE Capital Commercial Mortgage Corporation,
Series 2004-C1, Class A2 |
| 3.915% | | | | 11/10/2038 | | | | | 1,000,000 | | | | 965,914 | |
GMAC Commercial Mortgage Securities, Inc.,
Series 2000-C1, Class A2 |
| 7.724% | | | | 03/15/2033 | | | | | 1,707,000 | | | | 1,808,009 | |
GMAC Commercial Mortgage Securities, Inc.,
Series 2004-C1, Class A3 |
| 4.776% | | | | 03/10/2038 | | | | | 1,000,000 | | | | 974,950 | |
GMAC Commercial Mortgage Securities, Inc.,
Series 2004-C3, Class D |
| 5.044% | | | | 12/10/2041 | | | | | 250,000 | | | | 242,428 | |
| JP Morgan Chase Commercial Mortgage Securities Corp., Series 2003-ML1, Class A2 |
| 4.767% | | | | 03/12/2039 | | | | | 1,000,000 | | | | 973,503 | |
| JP Morgan Chase Commercial Mortgage Securities Corp., Series 2005-CIBC13, Class AM, (FRN) |
| 5.335% | | | | 01/12/2043 | | | | | 900,000 | | | | 902,669 | |
| JP Morgan Chase Commercial Mortgage Securities Corp., Series 2005-LDP2, Class A4 |
| 4.738% | | | | 07/15/2042 | | | | | 935,000 | | | | 898,439 | |
|
| JP Morgan Chase Commercial Mortgage Securities Corp., Series 2005-LDP2, Class E |
| 4.981% | | | | 07/15/2042 | | | | $ | 750,000 | | | $ | 722,633 | |
| JP Morgan Chase Commercial Mortgage Securities Corp., Series 2005-LDP3, Class A4B |
| 4.996% | | | | 08/15/2042 | | | | | 1,075,000 | | | | 1,048,115 | |
| JP Morgan Chase Commercial Mortgage Securities Corp., Series 2005-LDP4, Class A4 |
| 4.918% | | | | 10/15/2042 | | | | | 1,565,000 | | | | 1,520,297 | |
| JP Morgan Chase Commercial Mortgage Securities Corporation, Series 2003-CIBC7, Class A3 |
| 4.449% | | | | 01/12/2038 | | | | | 2,000,000 | | | | 1,945,518 | |
| JP Morgan Chase Commercial Mortgage Securities Corporation, Series 2004-CB9, Class A4, (FRN) |
| 5.377% | | | | 06/12/2041 | | | | | 750,000 | | | | 759,804 | |
| JP Morgan Chase Commercial Mortgage Securities Corporation, Series 2004-CIBC10, Class AJ |
| 4.951% | | | | 01/12/2037 | | | | | 1,750,000 | | | | 1,701,695 | |
| LB Commercial Mortgage Trust, Series 1991-C1, Class A2 |
| 6.780% | | | | 06/15/2031 | | | | | 5,979,623 | | | | 6,133,402 | |
LB-UBS Commercial Mortgage Trust,
Series 2002-C4, Class A5 |
| 4.853% | | | | 09/15/2031 | | | | | 1,500,000 | | | | 1,474,246 | |
LB-UBS Commercial Mortgage Trust,
Series 2003-C8, Class A2 |
| 4.207% | | | | 11/15/2027 | | | | | 1,000,000 | | | | 978,856 | |
LB-UBS Commercial Mortgage Trust,
Series 2004-C7, Class A6 |
| 4.786% | | | | 10/15/2029 | | | | | 1,000,000 | | | | 968,595 | |
Merrill Lynch Mortgage Trust,
Series 2002-MW1, Class A3 |
| 5.403% | | | | 07/12/2034 | | | | | 500,000 | | | | 503,243 | |
Merrill Lynch/Countrywide Commercial Mortgage Trust,
Series 2006-1, Class A3, (FRN) |
| 5.484% | | | | 02/12/2039 | | | | | 750,000 | | | | 759,307 | |
Merrill Lynch/Countrywide Commercial Mortgage Trust,
Series 2006-1, Class A4, (FRN) |
| 5.434% | | | | 02/12/2039 | | | | | 1,500,000 | | | | 1,518,963 | |
Morgan Stanley Capital I,
Series 2004-HQ3, Class A4 |
| 4.800% | | | | 01/13/2041 | | | | | 750,000 | | | | 727,759 | |
Morgan Stanley Capital I,
Series 2004-T13, Class A2 |
| 3.940% | | | | 09/13/2045 | | | | | 1,000,000 | | | | 965,447 | |
Morgan Stanley Capital I,
Series 2004-T15, Class A2 |
| 4.690% | | | | 06/13/2041 | | | | | 500,000 | | | | 492,459 | |
Mortgage Capital Funding, Inc.,
Series 1998-MC2, Class A2 |
| 6.423% | | | | 06/18/2030 | | | | | 471,200 | | | | 475,089 | |
Wachovia Bank Commercial Mortgage Trust,
Series 2002-C2, Class A3 |
| 4.440% | | | | 11/15/2034 | | | | | 3,000,000 | | | | 2,943,455 | |
Wachovia Bank Commercial Mortgage Trust,
Series 2003-C5, Class A2 |
| 3.989% | | | | 06/15/2035 | | | | | 750,000 | | | | 699,722 | |
Wachovia Bank Commercial Mortgage Trust,
Series 2003-C9, Class A4 |
| 5.012% | | | | 12/15/2035 | | | | | 750,000 | | | | 736,779 | |
Wachovia Bank Commercial Mortgage Trust,
Series 2004-C11, Class A5 |
| 5.215% | | | | 01/15/2041 | | | | | 500,000 | | | | 496,145 | |
Wachovia Bank Commercial Mortgage Trust,
Series 2004-C12, Class A4, (FRN) |
| 5.233% | | | | 07/15/2041 | | | | | 750,000 | | | | 751,784 | |
Wachovia Bank Commercial Mortgage Trust,
Series 2004-C15, Class B |
| 4.892% | | | | 10/15/2041 | | | | | 1,000,000 | | | | 964,787 | |
See accompanying notes to financial statements.
219
SCHEDULE OF INVESTMENTS—(Continued)
December 31, 2006
Vantagepoint Core Bond
Index Fund
Coupon
Rate
|
|
|
| Maturity
Date
|
|
|
| Face
|
| Value
|
|---|
NON-U.S. GOVERNMENT MORTGAGE-BACKED SECURITIES���(Continued) |
Wachovia Bank Commercial Mortgage Trust,
Series 2006-C26, Class AJ, (FRN) |
| 5.992% | | | | 06/15/2045 | | | | $ | 1,000,000 | | | $ | 1,048,972 | |
TOTAL NON-U.S. GOVERNMENT
MORTGAGE-BACKED SECURITIES |
| (Cost $63,435,986) | | 62,718,358 | |
| |
CASH EQUIVALENTS—13.6% |
Bank & Certificate Deposits/
Offshore Time Deposits—13.1% |
| Abbey National PLC |
| 5.280% | | | | 01/05/2007 | | †† | | | 2,387,808 | | | | 2,387,808 | |
| BancoBilbao Vizcaya Argentaria SA |
| 5.310% | | | | 01/03/2007 | | †† | | | 2,387,808 | | | | 2,387,808 | |
| Bank Of Nova Scotia |
| 5.300% | | | | 02/27/2007 | | †† | | | 2,984,759 | | | | 2,984,759 | |
| Bank Of Nova Scotia |
| 5.290% | | | | 01/30/2007 | | †† | | | 1,193,904 | | | | 1,193,904 | |
| Bank Of Nova Scotia |
| 5.290% | | | | 02/06/2007 | | †† | | | 1,790,856 | | | | 1,790,856 | |
| Barclays |
| 5.320% | | | | 02/13/2007 | | †† | | | 1,193,904 | | | | 1,193,904 | |
| Barclays |
| 5.310% | | | | 02/20/2007 | | †† | | | 2,984,759 | | | | 2,984,759 | |
| Barclays |
| 5.300% | | | | 01/02/2007 | | †† | | | 2,984,759 | | | | 2,984,759 | |
| Barton Capital LLC |
| 5.300% | | | | 01/17/2007 | | †† | | | 1,193,904 | | | | 1,193,904 | |
| Barton Capital LLC |
| 5.300% | | | | 01/17/2007 | | †† | | | 1,790,856 | | | | 1,790,856 | |
| Calyon |
| 5.310% | | | | 02/16/2007 | | †† | | | 1,193,904 | | | | 1,193,904 | |
| Calyon |
| 5.300% | | | | 02/05/2007 | | †† | | | 3,581,711 | | | | 3,581,711 | |
| Canadian Imperial Bank of Commerce |
| 5.310% | | | | 01/29/2007 | | †† | | | 3,581,711 | | | | 3,581,711 | |
| Charta LLC |
| 5.300% | | | | 01/31/2007 | | †† | | | 2,338,091 | | | | 2,338,091 | |
| CIESCO |
| 5.310% | | | | 01/04/2007 | | †† | | | 1,554,524 | | | | 1,554,524 | |
| Citigroup |
| 5.310% | | | | 03/16/2007 | | †† | | | 1,193,904 | | | | 1,193,904 | |
| Clipper Receivables Corp |
| 5.300% | | | | 01/31/2007 | | †† | | | 1,193,904 | | | | 1,193,904 | |
| Compass Securitization |
| 5.300% | | | | 01/09/2007 | | †† | | | 1,790,856 | | | | 1,790,856 | |
| CRC Funding LLC |
| 5.340% | | | | 01/23/2007 | | †† | | | 596,952 | | | | 596,952 | |
| CRC Funding LLC |
| 5.300% | | | | 01/10/2007 | | †† | | | 1,742,884 | | | | 1,742,884 | |
| Credit Suisse First Boston Corporation |
| 5.300% | | | | 01/05/2007 | | †† | | | 1,193,904 | | | | 1,193,904 | |
| Credit Suisse First Boston Corporation |
| 5.300% | | | | 01/12/2007 | | †† | | | 2,387,808 | | | | 2,387,808 | |
| Dexia Group |
| 5.290% | | | | 01/16/2007 | | †† | | | 2,984,759 | | | | 2,984,759 | |
| Fairway Finance |
| 5.300% | | | | 01/09/2007 | | †† | | | 1,432,685 | | | | 1,432,685 | |
| Falcon Asset Securitization Corporation |
| 5.340% | | | | 01/22/2007 | | †† | | | 1,193,904 | | | | 1,193,904 | |
|
| Fortis Bank |
| 5.320% | | | | 01/03/2007 | | †† | | $ | 1,193,904 | | | $ | 1,193,904 | |
| Fortis Bank |
| 5.300% | | | | 01/02/2007 | | †† | | | 1,193,904 | | | | 1,193,904 | |
| Fortis Bank |
| 5.300% | | | | 01/24/2007 | | †† | | | 4,178,663 | | | | 4,178,663 | |
| Fortis Bank |
| 5.300% | | | | 01/26/2007 | | †† | | | 4,775,615 | | | | 4,775,615 | |
| General Electric Capital Corporation |
| 5.300% | | | | 01/26/2007 | | †† | | | 2,387,808 | | | | 2,387,808 | |
| Greyhawk Funding |
| 5.310% | | | | 01/12/2007 | | †† | | | 1,193,904 | | | | 1,193,904 | |
| HBOS Halifax Bank of Scotland |
| 5.310% | | | | 03/14/2007 | | †† | | | 2,984,759 | | | | 2,984,759 | |
| HBOS Halifax Bank of Scotland |
| 5.300% | | | | 01/08/2007 | | †† | | | 1,193,904 | | | | 1,193,904 | |
| Kitty Hawk Funding Corp |
| 5.340% | | | | 01/10/2007 | | †† | | | 1,790,856 | | | | 1,790,856 | |
| Lexington Parker Cap Comp |
| 5.300% | | | | 01/05/2007 | | †† | | | 1,193,904 | | | | 1,193,904 | |
| Liberty Street |
| 5.310% | | | | 01/17/2007 | | †† | | | 1,193,904 | | | | 1,193,904 | |
| Lloyds TSB Bank |
| 5.300% | | | | 02/26/2007 | | †† | | | 1,193,904 | | | | 1,193,904 | |
| Marshall & Ilsley Bank Corporation |
| 5.300% | | | | 03/19/2007 | | †† | | | 1,193,904 | | | | 1,193,904 | |
| Merrill Lynch & Co |
| 5.300% | | | | 01/02/2007 | | †† | | | 20,893,316 | | | | 20,893,316 | |
| Morgan Stanley & Co |
| 5.300% | | | | 01/02/2007 | | †† | | | 14,638,351 | | | | 14,638,351 | |
| Old Line Funding LLC |
| 5.350% | | | | 01/04/2007 | | †† | | | 1,193,904 | | | | 1,193,904 | |
| Paradigm Funding LLC |
| 5.310% | | | | 01/17/2007 | | †† | | | 1,193,904 | | | | 1,193,904 | |
| Park Avenue Receivables Corp |
| 5.330% | | | | 01/18/2007 | | †† | | | 1,193,904 | | | | 1,193,904 | |
| Rabobank Nederland |
| 5.250% | | | | 01/02/2007 | | †† | | | 3,581,711 | | | | 3,581,711 | |
| Ranger Funding |
| 5.330% | | | | 02/08/2007 | | †† | | | 1,193,904 | | | | 1,193,904 | |
| Ranger Funding |
| 5.320% | | | | 01/04/2007 | | †† | | | 1,193,904 | | | | 1,193,904 | |
| Royal Bank of Canada |
| 5.310% | | | | 02/14/2007 | | †† | | | 2,387,808 | | | | 2,387,808 | |
| Royal Bank of Scotland |
| 5.310% | | | | 01/11/2007 | | †† | | | 1,193,904 | | | | 1,193,904 | |
| Royal Bank of Scotland |
| 5.290% | | | | 01/16/2007 | | †† | | | 1,790,856 | | | | 1,790,856 | |
| Royal Bank of Scotland |
| 5.290% | | | | 02/09/2007 | | †† | | | 1,193,904 | | | | 1,193,904 | |
| Royal Bank of Scotland |
| 5.280% | | | | 01/11/2007 | | †† | | | 2,984,759 | | | | 2,984,759 | |
| Sheffiled Receivables Corp |
| 5.360% | | | | 01/11/2007 | | †† | | | 1,790,856 | | | | 1,790,856 | |
| Sheffiled Receivables Corp |
| 5.300% | | | | 01/12/2007 | | †† | | | 1,193,904 | | | | 1,193,904 | |
| Societe Generale |
| 5.310% | | | | 01/02/2007 | | †† | | | 2,984,759 | | | | 2,984,759 | |
| Societe Generale |
| 5.290% | | | | 02/01/2007 | | †† | | | 2,984,759 | | | | 2,984,759 | |
| Societe Generale |
| 5.270% | | | | 01/19/2007 | | †† | | | 2,984,759 | | | | 2,984,759 | |
| Svenska Handlesbanken |
| 5.250% | | | | 01/02/2007 | | †† | | | 1,370,172 | | | | 1,370,172 | |
| Three Pillars Funding LLC |
| 5.380% | | | | 01/02/2007 | | †† | | | 1,786,395 | | | | 1,786,395 | |
See accompanying notes to financial statements.
220
SCHEDULE OF INVESTMENTS—(Continued)
December 31, 2006
Vantagepoint Core Bond
Index Fund
Coupon
Rate
|
|
|
| Maturity
Date
|
|
|
| Face
|
| Value
|
|---|
CASH EQUIVALENTS—(Continued) |
| UBS AG |
| 5.300% | | | | 01/04/2007 | | †† | | $ | 1,193,904 | | | $ | 1,193,904 | |
| UBS AG |
| 5.290% | | | | 01/02/2007 | | †† | | | 2,387,808 | | | | 2,387,808 | |
| Variable Funding Capital Co |
| 5.310% | | | | 02/02/2007 | | †† | | | 1,193,904 | | | | 1,193,904 | |
| Variable Funding Capital Co |
| 5.290% | | | | 01/04/2007 | | †† | | | 1,193,904 | | | | 1,193,904 | |
| Yorktown Capital LLC |
| 5.330% | | | | 01/16/2007 | | †† | | | 1,193,902 | | | | 1,193,902 | |
| Yorktown Capital LLC |
| 5.300% | | | | 01/10/2007 | | †† | | | 1,193,902 | | | | 1,193,902 | |
| | | 152,610,808 | |
Floating Rate Instruments/Master Notes—0.5% |
| Bank of America |
| 5.310% | | | | 07/10/2007 | | †† | | | 2,984,759 | | | | 2,984,759 | |
| Bank of America |
| 5.270% | | | | 01/09/2007 | | †† | | | 2,387,808 | | | | 2,387,808 | |
| | | 5,372,567 | |
TOTAL CASH EQUIVALENTS
| | | |
| (Cost $157,983,375) | | 157,983,375 | |
| |
REPURCHASE AGREEMENTS—1.1% | | | |
IBT Repurchase Agreement dated 12/29/2006 due
01/02/2007, with a maturity value of $12,325,109 and
an effective yield of 4.65% collateralized by U.S. Government Obligation with a rate of 4.193%, maturity of 05/01/2033 and an aggregate market value $12,934,682. | | 12,318,744 | | | | 12,318,744 | |
TOTAL INVESTMENTS—113.4% | | | |
| (Cost $1,326,674,402) | | | | | | 1,315,360,953 | |
| Other assets less liabilities—(13.4%) | | (155,389,572 | ) |
NET ASSETS—100.0% | $ | 1,159,971,381 | |
Notes to the Schedule of Investments:
| FRN | | Floating Rate Note |
| MTN | | Medium Term Note |
| REIT | | Real Estate Investment Trust |
| * | | Security exempt from registration under Rule 144A of the Securities Act of 1933. These securities may be resold in transactions exempt from registration, normally to qualified buyers. 144A securities represent 0.06% of Total Investments. |
| † | | Denotes all or a portion of security on loan. |
| †† | | Represents collateral received from securities lending transactions. |
See accompanying notes to financial statements.
221
SCHEDULE OF INVESTMENTS
December 31, 2006
Vantagepoint 500
Stock Index Fund
|
|
|
|
|
|
|
| Shares
|
| Value
|
|---|
COMMON STOCKS—97.0% |
Advertising—0.2% |
| Interpublic Group, Inc. | *† | | | 13,428 | | | $ | 164,359 | |
| Monster Worldwide, Inc. | * | | | 3,572 | | | | 166,598 | |
| Omnicom Group | | 5,102 | | | | 533,363 | |
| | | 864,320 | |
Aerospace & Defense—2.1% |
| Goodrich Corporation | | 3,725 | | | | 169,674 | |
| Boeing Company (The) | | 23,771 | | | | 2,111,816 | |
| General Dynamics Corporation | | 12,122 | | | | 901,271 | |
| Honeywell International, Inc. | | 24,440 | | | | 1,105,666 | |
| Lockheed Martin Corporation | | 10,668 | | | | 982,203 | |
| Northrop Grumman Corporation | | 10,578 | | | | 716,131 | |
| Textron, Inc. | | 3,736 | | | | 350,325 | |
| United Technologies Corporation | | 30,398 | | | | 1,900,483 | |
| | | 8,237,569 | |
Airlines—0.3% |
| FedEx Corporation | | 9,229 | | | | 1,002,454 | |
| Southwest Airlines Company | | 22,759 | | | | 348,668 | |
| | | 1,351,122 | |
Apparel Retailers—0.4% |
| Gap (The), Inc. | † | | | 16,874 | | | | 329,043 | |
| Kohl’s Corporation | * | | | 9,749 | | | | 667,124 | |
| Ltd. Brands, Inc. | | 10,263 | | | | 297,011 | |
| Nordstrom, Inc. | | 6,656 | | | | 328,407 | |
| | | 1,621,585 | |
Automotive—0.7% |
| Autonation, Inc. | * | | | 4,218 | | | | 89,928 | |
| Ford Motor Company | † | | | 55,078 | | | | 413,636 | |
| General Motors Corporation | † | | | 16,757 | | | | 514,775 | |
| Genuine Parts Company | | 5,410 | | | | 256,596 | |
| Goodyear Tire & Rubber Company (The) | *† | | | 5,556 | | | | 116,620 | |
| Harley-Davidson, Inc. | | 7,789 | | | | 548,891 | |
| ITT Corporation | | 5,442 | | | | 309,214 | |
| Paccar, Inc. | † | | | 7,458 | | | | 484,024 | |
| | | 2,733,684 | |
Banking—12.1% |
| American Express Company | | 36,332 | | | | 2,204,262 | |
| BB&T Corporation | | 16,108 | | | | 707,624 | |
| Bank of America Corporation | | 135,558 | | | | 7,237,442 | |
Bank of New York Company,
Inc. (The) | | 22,867 | | | | 900,274 | |
| Capital One Financial Corporation | | 13,275 | | | | 1,019,785 | |
| CIT Group, Inc. | | 6,087 | | | | 339,472 | |
| Citigroup, Inc. | | 148,081 | | | | 8,248,112 | |
| Comerica, Inc. | | 4,863 | | | | 285,361 | |
| Commerce Bancorp, Inc., NJ | † | | | 5,556 | | | | 195,960 | |
| Compass Bancshares, Inc. | | 3,600 | | | | 214,740 | |
| Fannie Mae | | 28,946 | | | | 1,719,103 | |
| Fifth Third Bancorp | | 16,462 | | | | 673,790 | |
| First Horizon National Corporation | † | | | 3,674 | | | | 153,500 | |
| Freddie Mac | | 20,592 | | | | 1,398,197 | |
| Huntington Bancshares, Inc. | | 7,147 | | | | 169,741 | |
| JPMorgan Chase & Company | | 103,944 | | | | 5,020,495 | |
| Keycorp | | 12,073 | | | | 459,136 | |
| M&T Bank Corporation | | 2,431 | | | | 296,971 | |
| Marshall & IIsley Corporation | | 7,337 | | | | 352,983 | |
| Mellon Financial Corporation | | 12,412 | | | | 523,166 | |
| National City Corporation | | 17,831 | | | | 651,901 | |
|
| Northern Trust Corporation | | 5,418 | | | $ | 328,818 | |
| PNC Financial Services Group, Inc. | | 8,880 | | | | 657,475 | |
| Regions Financial Corporation | | 22,149 | | | | 828,373 | |
| SLM Corporation | | 12,376 | | | | 603,578 | |
| Sovereign Bancorp, Inc. | † | | | 11,004 | | | | 279,392 | |
| State Street Corporation | | 9,782 | | | | 659,698 | |
| SunTrust Banks, Inc. | | 10,877 | | | | 918,563 | |
| Synovus Financial Corporation | | 9,554 | | | | 294,550 | |
| U.S. Bancorp | | 53,130 | | | | 1,922,775 | |
| Wachovia Corporation | | 57,549 | | | | 3,277,416 | |
| Washington Mutual, Inc. | | 28,775 | | | | 1,308,975 | |
| Wells Fargo & Company | | 100,794 | | | | 3,584,235 | |
| Zions Bancorporation | | 3,246 | | | | 267,600 | |
| | | 47,703,463 | |
Beverages, Food & Tobacco—4.9% |
| Altria Group, Inc. | | 62,683 | | | | 5,379,455 | |
| Anheuser-Busch Companies, Inc. | | 23,142 | | | | 1,138,586 | |
| Archer-Daniels-Midland Company | | 19,681 | | | | 629,005 | |
Brown-Forman Corporation
Class B | | 2,464 | | | | 163,215 | |
| Campbell Soup Company | | 6,505 | | | | 252,979 | |
| Coca-Cola Company (The) | | 60,977 | | | | 2,942,140 | |
| Coca-Cola Enterprises, Inc. | | 8,053 | | | | 164,442 | |
| ConAgra Foods, Inc. | | 15,594 | | | | 421,038 | |
Constellation Brands, Inc.
Class A | * | | | 5,780 | | | | 167,736 | |
| Dean Foods Company | * | | | 4,192 | | | | 177,238 | |
| General Mills, Inc. | | 10,752 | | | | 619,315 | |
| Hershey Company (The) | † | | | 5,550 | | | | 276,390 | |
| HJ Heinz Company | | 10,333 | | | | 465,088 | |
| Kellogg Company | | 7,575 | | | | 379,204 | |
| McCormick & Company, Inc. | | 3,895 | | | | 150,191 | |
| Molson Coors Brewing Company Class B | | 1,252 | | | | 95,703 | |
| Pepsi Bottling Group, Inc. | | 4,086 | | | | 126,298 | |
| Pepsico, Inc. | | 49,632 | | | | 3,104,482 | |
| Reynolds American, Inc. | | 4,950 | | | | 324,076 | |
| Safeway, Inc. | | 13,907 | | | | 480,626 | |
| Sara Lee Corporation | | 23,124 | | | | 393,802 | |
| Supervalu, Inc. | | 6,343 | | | | 226,762 | |
| Sysco Corporation | | 18,436 | | | | 677,707 | |
| Tyson Foods, Inc. Class A | † | | | 7,900 | | | | 129,955 | |
| UST, Inc. | † | | | 5,151 | | | | 299,788 | |
| WM Wrigley Jr. Company | | 6,663 | | | | 344,610 | |
| | | 19,529,831 | |
Building Materials—1.1% |
| Home Depot, Inc. | | 61,741 | | | | 2,479,519 | |
| Lowe’s Companies, Inc. | † | | | 45,645 | | | | 1,421,842 | |
| Vulcan Materials Company | † | | | 3,021 | | | | 271,497 | |
| | | 4,172,858 | |
Chemicals—1.3% |
| Air Products & Chemicals, Inc. | | 6,726 | | | | 472,703 | |
| Avery Dennison Corporation | | 2,698 | | | | 183,275 | |
| Dow Chemical Company (The) | | 28,836 | | | | 1,151,710 | |
| Eastman Chemical Company | | 2,451 | | | | 145,369 | |
| EI Du Pont de Nemours & Company | | 27,450 | | | | 1,337,089 | |
| Hercules, Inc. | * | | | 3,515 | | | | 67,875 | |
International Flavors &
Fragrances, Inc. | | 2,365 | | | | 116,263 | |
| Monsanto Company | | 15,994 | | | | 840,165 | |
| PPG Industries, Inc. | | 5,081 | | | | 326,251 | |
| Praxair, Inc. | | 9,796 | | | | 581,197 | |
| | | 5,221,897 | |
See accompanying notes to financial statements.
222
SCHEDULE OF INVESTMENTS—(Continued)
December 31, 2006
Vantagepoint 500
Stock Index Fund
|
|
|
|
|
|
|
| Shares
|
| Value
|
|---|
COMMON STOCKS—(Continued) |
Coal—0.1% |
| Consol Energy, Inc. | | 5,595 | | | $ | 179,767 | |
| Peabody Energy Corporation | † | | | 7,589 | | | | 306,671 | |
| | | 486,438 | |
Commercial Services—0.8% |
| Allied Waste Industries, Inc. | * | | | 6,039 | | | | 74,219 | |
| Cintas Corporation | | 4,114 | | | | 163,367 | |
| Convergys Corporation | * | | | 4,528 | | | | 107,676 | |
| Equifax, Inc. | | 3,865 | | | | 156,919 | |
| Fluor Corporation | † | | | 2,599 | | | | 212,208 | |
| H&R Block, Inc. | † | | | 10,232 | | | | 235,745 | |
| Moody’s Corporation | | 7,378 | | | | 509,525 | |
| Paychex, Inc. | | 9,822 | | | | 388,362 | |
| Robert Half International, Inc. | † | | | 5,293 | | | | 196,476 | |
| RR Donnelley & Sons Company | | 6,781 | | | | 240,997 | |
| Ryder System, Inc. | | 2,030 | | | | 103,652 | |
| Waste Management, Inc. | | 16,395 | | | | 602,844 | |
| | | 2,991,990 | |
Communications—1.4% |
| ADC Telecommunications, Inc. | * | | | 3,642 | | | | 52,918 | |
| Avaya, Inc. | * | | | 13,317 | | | | 186,172 | |
| Ciena Corporation | * | | | 2,144 | | | | 59,410 | |
| Comverse Technology, Inc. | * | | | 6,104 | | | | 128,855 | |
| Corning, Inc. | * | | | 46,470 | | | | 869,454 | |
L-3 Communications
Holdings, Inc. | | 3,523 | | | | 288,111 | |
| Motorola, Inc. | | 73,254 | | | | 1,506,102 | |
| Network Appliance, Inc. | *† | | | 11,224 | | | | 440,879 | |
| Qualcomm, Inc. | | 49,384 | | | | 1,866,221 | |
| Tellabs, Inc. | * | | | 12,229 | | | | 125,470 | |
| | | 5,523,592 | |
Computer Software & Processing—5.5% |
| Adobe Systems, Inc. | * | | | 17,242 | | | | 708,991 | |
| Affiliated Computer Services, Inc. Class A | *† | | | 3,680 | | | | 179,731 | |
| Autodesk, Inc. | * | | | 7,066 | | | | 285,890 | |
| Automatic Data Processing, Inc. | | 16,558 | | | | 815,481 | |
| BMC Software, Inc. | * | | | 6,466 | | | | 208,205 | |
| CA, Inc. | | 12,124 | | | | 274,609 | |
| Citrix Systems, Inc. | * | | | 5,196 | | | | 140,552 | |
| Cognizant Technology Solutions Corporation | * | | | 4,324 | | | | 333,640 | |
| Computer Sciences Corporation | * | | | 5,432 | | | | 289,906 | |
| Compuware Corporation | * | | | 12,167 | | | | 101,351 | |
| Electronic Arts, Inc. | * | | | 9,238 | | | | 465,226 | |
| Electronic Data Systems Corporation | | 16,012 | | | | 441,131 | |
| Fidelity National Information Services, Inc. | | 3,976 | | | | 159,398 | |
| First Data Corporation | | 22,793 | | | | 581,677 | |
| Fiserv, Inc. | * | | | 5,132 | | | | 269,019 | |
| Google, Inc. Class A | * | | | 6,374 | | | | 2,935,100 | |
| IMS Health, Inc. | | 6,032 | | | | 165,759 | |
| Intuit, Inc. | * | | | 10,113 | | | | 308,548 | |
| Juniper Networks, Inc. | * | | | 17,005 | | | | 322,075 | |
| Microsoft Corporation | | 260,861 | | | | 7,789,309 | |
| NCR Corporation | * | | | 5,590 | | | | 239,028 | |
| Novell, Inc. | * | | | 11,821 | | | | 73,290 | |
| Nvidia Corporation | * | | | 10,268 | | | | 380,019 | |
| Oracle Corporation | * | | | 120,642 | | | | 2,067,804 | |
| Sun Microsystems, Inc. | * | | | 103,203 | | | | 559,360 | |
| Symantec Corporation | *† | | | 29,439 | | | | 613,803 | |
|
| Unisys Corporation | * | | | 10,465 | | | $ | 82,046 | |
| VeriSign, Inc. | * | | | 7,800 | | | | 187,590 | |
| Yahoo!, Inc. | *† | | | 37,700 | | | | 962,858 | |
| | | 21,941,396 | |
Computers & Information—4.0% |
| 3M Company | | 22,750 | | | | 1,772,907 | |
| Apple Computer, Inc. | * | | | 25,717 | | | | 2,181,830 | |
| Dell, Inc. | * | | | 67,891 | | | | 1,703,385 | |
| EMC Corporation | * | | | 68,526 | | | | 904,543 | |
| Hewlett-Packard Company | | 81,970 | | | | 3,376,344 | |
| International Business Machines Corporation | | 45,556 | | | | 4,425,765 | |
| International Game Technology | | 10,262 | | | | 474,104 | |
| Jabil Circuit, Inc. | | 5,122 | | | | 125,745 | |
| Lexmark International, Inc. | * | | | 2,870 | | | | 210,084 | |
| Pitney Bowes, Inc. | | 6,896 | | | | 318,526 | |
| SanDisk Corporation | * | | | 6,917 | | | | 297,639 | |
| Solectron Corporation | * | | | 29,567 | | | | 95,206 | |
| Symbol Technologies, Inc. | | 7,303 | | | | 109,107 | |
| | | 15,995,185 | |
Containers & Packaging—0.1% |
| Ball Corporation | | 3,168 | | | | 138,125 | |
| Sealed Air Corporation | | 2,391 | | | | 155,224 | |
| Temple-Inland, Inc. | | 3,438 | | | | 158,251 | |
| | | 451,600 | |
Cosmetics & Personal Care—2.1% |
| Avon Products, Inc. | | 13,350 | | | | 441,084 | |
| Clorox Company | | 4,566 | | | | 292,909 | |
| Colgate-Palmolive Company | | 15,470 | | | | 1,009,263 | |
| Ecolab, Inc. | † | | | 5,738 | | | | 259,358 | |
| Estee Lauder Companies (The), Inc., Class A | † | | | 3,640 | | | | 148,585 | |
| Procter & Gamble Company | | 95,086 | | | | 6,111,177 | |
| | | 8,262,376 | |
Education—0.0% | | | |
| Apollo Group, Inc. Class A | *† | | | 4,409 | | | | 171,819 | | | |
Electric Utilities—3.3% | | | |
| AES Corporation (The) | * | | | 19,714 | | | | 434,497 | |
| Allegheny Energy, Inc. | * | | | 4,824 | | | | 221,470 | |
| Ameren Corporation | † | | | 6,170 | | | | 331,514 | |
American Electric Power
Company, Inc. | | 11,609 | | | | 494,311 | |
| CMS Energy Corporation | * | | | 7,199 | | | | 120,223 | |
| Centerpoint Energy, Inc. | † | | | 9,695 | | | | 160,743 | |
| Consolidated Edison, Inc. | | 7,439 | | | | 357,593 | |
| Constellation Energy Group, Inc. | | 5,297 | | | | 364,804 | |
| DTE Energy Company | † | | | 5,330 | | | | 258,025 | |
| Dominion Resources, Inc. | | 10,409 | | | | 872,691 | |
| Duke Energy Corporation | | 37,412 | | | | 1,242,453 | |
| Dynegy, Inc. Class A | * | | | 12,555 | | | | 90,898 | |
| Edison International | | 9,898 | | | | 450,161 | |
| Entergy Corporation | | 6,303 | | | | 581,893 | |
| Exelon Corporation | | 19,945 | | | | 1,234,396 | |
| FPL Group, Inc. | † | | | 11,946 | | | | 650,101 | |
| FirstEnergy Corporation | | 9,744 | | | | 586,686 | |
| KeySpan Corporation | | 5,136 | | | | 211,500 | |
| NiSource, Inc. | | 8,413 | | | | 202,753 | |
| PG&E Corporation | | 10,328 | | | | 488,824 | |
| PPL Corporation | | 11,228 | | | | 402,412 | |
| Pinnacle West Capital Corporation | | 2,891 | | | | 146,400 | |
| Progress Energy, Inc. | | 7,759 | | | | 380,812 | |
Public Service Enterprise
Group, Inc. | | 7,446 | | | | 494,265 | |
See accompanying notes to financial statements.
223
SCHEDULE OF INVESTMENTS—(Continued)
December 31, 2006
Vantagepoint 500
Stock Index Fund
|
|
|
|
|
|
|
| Shares
|
| Value
|
|---|
COMMON STOCKS—(Continued) |
| Sempra Energy | | 7,751 | | | $ | 433,823 | |
| Southern Company (The) | | 22,131 | | | | 815,749 | |
| TXU Corporation | | 13,742 | | | | 744,954 | |
| TECO Energy, Inc. | † | | | 5,950 | | | | 102,518 | |
| Xcel Energy, Inc. | † | | | 12,731 | | | | 293,577 | |
| | | 13,170,046 | |
Electrical Equipment—3.3% | | | |
| Cooper Industries, Ltd. Class A (Bermuda) | | 2,656 | | | | 240,182 | |
| Emerson Electric Company | | 24,650 | | | | 1,086,325 | |
| General Electric Company | | 310,680 | | | | 11,560,403 | |
| | | 12,886,910 | |
Electronics—4.0% | | | |
| Advanced Micro Devices, Inc. | * | | | 16,617 | | | | 338,156 | |
| Agilent Technologies, Inc. | * | | | 12,539 | | | | 436,984 | |
| Altera Corporation | * | | | 11,395 | | | | 224,254 | |
| American Power Conversion Corporation | | 5,418 | | | | 165,737 | |
| Analog Devices, Inc. | | 11,110 | | | | 365,186 | |
| Broadcom Corporation Class A | * | | | 14,124 | | | | 456,346 | |
| Cisco Systems, Inc. | * | | | 182,770 | | | | 4,995,104 | |
| Eastman Kodak Company | † | | | 8,976 | | | | 231,581 | |
| Intel Corporation | | 172,654 | | | | 3,496,244 | |
| JDS Uniphase Corporation | *† | | | 5,668 | | | | 94,429 | |
| LSI Logic Corporation | * | | | 12,007 | | | | 108,063 | |
| Linear Technology Corporation | † | | | 8,992 | | | | 272,637 | |
| Maxim Integrated Products, Inc. | | 9,705 | | | | 297,167 | |
| Micron Technology, Inc. | * | | | 21,838 | | | | 304,858 | |
| Molex, Inc. | | 4,262 | | | | 134,807 | |
National Semiconductor
Corporation | | 8,732 | | | | 198,216 | |
| Novellus Systems, Inc. | *† | | | 3,413 | | | | 117,475 | |
| PMC-Sierra, Inc. | *† | | | 5,469 | | | | 36,697 | |
| QLogic Corporation | * | | | 4,584 | | | | 100,481 | |
| Raytheon Company | | 13,679 | | | | 722,251 | |
| Rockwell Collins, Inc. | | 5,106 | | | | 323,159 | |
| Sanmina-SCI Corporation | * | | | 16,779 | | | | 57,888 | |
| Teradyne, Inc. | *† | | | 6,358 | | | | 95,116 | |
| Texas Instruments, Inc. | | 45,795 | | | | 1,318,896 | |
| Xerox Corporation | * | | | 29,117 | | | | 493,533 | |
| Xilinx, Inc. | | 10,839 | | | | 258,077 | |
| | | 15,643,342 | |
Entertainment & Leisure—1.8% | | | |
| Harrah’s Entertainment, Inc. | | 5,444 | | | | 450,328 | |
| Hasbro, Inc. | | 5,527 | | | | 150,611 | |
| Mattel, Inc. | | 11,814 | | | | 267,705 | |
| News Corporation, Inc. Class A | | 69,806 | | | | 1,499,433 | |
| Time Warner, Inc. | | 121,649 | | | | 2,649,515 | |
| Walt Disney Company | | 62,500 | | | | 2,141,875 | |
| | | 7,159,467 | |
Environmental—0.0% | | | |
| Tektronix, Inc. | | 2,676 | | | | 78,059 | | | |
Financial Services—3.7% | | | |
| Ameriprise Financial, Inc. | | 7,301 | | | | 397,905 | |
| Bear Stearns Companies, Inc. (The) | | 3,605 | | | | 586,822 | |
| Charles Schwab Corporation (The) | | 31,601 | | | | 611,163 | |
| Chicago Mercantile Exchange | | 1,065 | | | | 542,884 | |
| Countrywide Financial Corporation | | 18,100 | | | | 768,345 | |
| E*Trade Financial Corporation | * | | | 12,800 | | | | 286,976 | |
|
| Federated Investors, Inc. Class B | | 2,799 | | | $ | 94,550 | |
| Franklin Resources, Inc. | | 4,882 | | | | 537,850 | |
| Goldman Sachs Group, Inc. | | 12,913 | | | | 2,574,207 | |
| Janus Capital Group, Inc. | | 6,553 | | | | 141,479 | |
| Legg Mason, Inc. | | 3,983 | | | | 378,584 | |
| Lehman Brothers Holdings, Inc. | | 16,302 | | | | 1,273,512 | |
| Merrill Lynch & Company, Inc. | | 26,513 | | | | 2,468,360 | |
| Morgan Stanley | | 32,285 | | | | 2,628,968 | |
| Principal Financial Group | † | | | 8,326 | | | | 488,736 | |
| T Rowe Price Group, Inc. | | 7,884 | | | | 345,083 | |
| Western Union Company (The) | | 22,793 | | | | 511,019 | |
| | | 14,636,443 | |
Food Retailers—0.4% | | | |
| Kroger Company (The) | | 21,895 | | | | 505,118 | |
| Starbucks Corporation | * | | | 22,870 | | | | 810,055 | |
| Whole Foods Market, Inc. | † | | | 4,200 | | | | 197,106 | |
| | | 1,512,279 | |
Forest Products & Paper—0.6% | | | |
| Bemis Company | | 3,365 | | | | 114,343 | |
| International Paper Company | | 13,498 | | | | 460,282 | |
| Kimberly-Clark Corporation | | 13,949 | | | | 947,835 | |
| MeadWestvaco Corporation | | 5,462 | | | | 164,188 | |
| Pactiv Corporation | * | | | 4,478 | | | | 159,820 | |
| Weyerhaeuser Company | | 7,461 | | | | 527,120 | |
| | | 2,373,588 | |
Health Care Providers—0.5% | | | |
| Caremark Rx, Inc. | | 12,717 | | | | 726,268 | |
| Coventry Health Care, Inc. | * | | | 4,800 | | | | 240,240 | |
| Express Scripts, Inc. | * | | | 4,071 | | | | 291,484 | |
Health Management Associates,
Inc. Class A | | 7,595 | | | | 160,330 | |
| Laboratory Corporation Of America Holdings | *† | | | 3,640 | | | | 267,431 | |
| Manor Care, Inc. | † | | | 2,002 | | | | 93,934 | |
| Tenet Healthcare Corporation | *† | | | 14,819 | | | | 103,288 | |
| | | 1,882,975 | |
Heavy Construction—0.1% | | | |
| Centex Corporation | † | | | 3,736 | | | | 210,225 | |
| Lennar Corporation Class A | † | | | 4,253 | | | | 223,112 | |
| | | 433,337 | |
Heavy Machinery—1.5% | | | |
American Standard
Companies, Inc. | | 5,509 | | | | 252,588 | |
| Applied Materials, Inc. | | 41,384 | | | | 763,535 | |
| Black & Decker Corporation | | 2,261 | | | | 180,812 | |
| Caterpillar, Inc. | | 19,585 | | | | 1,201,148 | |
| Cummins, Inc. | | 1,660 | | | | 196,179 | |
| Deere & Company | † | | | 6,878 | | | | 653,891 | |
| Dover Corporation | | 6,014 | | | | 294,806 | |
| Eaton Corporation | | 4,413 | | | | 331,593 | |
Ingersoll-Rand Company
Class A (Bermuda) | | 9,736 | | | | 380,970 | |
| National-Oilwell Varco, Inc. | * | | | 5,295 | | | | 323,948 | |
| Pall Corporation | | 3,958 | | | | 136,749 | |
| Parker Hannifin Corporation | | 3,755 | | | | 288,684 | |
| Rockwell Automation, Inc. | | 5,356 | | | | 327,144 | |
| Stanley Works (The) | | 2,127 | | | | 106,967 | |
| Terex Corporation | * | | | 2,399 | | | | 154,927 | |
| WW Grainger, Inc. | | 2,254 | | | | 157,645 | |
| | | 5,751,586 | |
See accompanying notes to financial statements.
224
SCHEDULE OF INVESTMENTS—(Continued)
December 31, 2006
Vantagepoint 500
Stock Index Fund
|
|
|
|
|
|
|
| Shares
|
| Value
|
|---|
COMMON STOCKS—(Continued) |
Home Construction, Furnishings & Appliances—0.5% |
| DR Horton, Inc. | | 8,206 | | | $ | 217,377 | |
Harman International
Industries, Inc. | | 2,000 | | | | 199,820 | |
| Johnson Controls, Inc. | † | | | 5,919 | | | | 508,560 | |
| KB Home | | 2,308 | | | | 118,354 | |
| Leggett & Platt, Inc. | | 5,276 | | | | 126,096 | |
| Masco Corporation | † | | | 11,772 | | | | 351,630 | |
| Pulte Homes, Inc. | | 6,258 | | | | 207,265 | |
| Whirlpool Corporation | † | | | 2,302 | | | | 191,112 | |
| | | 1,920,214 | |
Household Products—0.4% | | | |
| Fortune Brands, Inc. | † | | | 4,419 | | | | 377,338 | |
| Illinois Tool Works, Inc. | | 12,230 | | | | 564,904 | |
| Newell Rubbermaid, Inc. | | 7,990 | | | | 231,311 | |
| Rohm & Haas Company | † | | | 4,355 | | | | 222,628 | |
| Snap-On, Inc. | | 1,846 | | | | 87,943 | |
| | | 1,484,124 | |
Industrial—Diversified—0.5% | | | |
| Tyco International Ltd. (Bermuda) | | 60,225 | | | | 1,830,840 | | | |
Insurance—5.9% | | | |
| ACE, Ltd. (Cayman Islands) | | 9,836 | | | | 595,767 | |
| Aflac, Inc. | | 14,910 | | | | 685,860 | |
| Aetna, Inc. | | 16,306 | | | | 704,093 | |
| Allstate Corporation (The) | | 18,798 | | | | 1,223,938 | |
| AMBAC Financial Group, Inc. | | 3,084 | | | | 274,692 | |
| American International Group, Inc. | | 77,818 | | | | 5,576,438 | |
| AON Corporation | | 9,430 | | | | 333,256 | |
| Chubb Corporation | | 12,172 | | | | 644,021 | |
| Cigna Corporation | | 3,285 | | | | 432,207 | |
| Cincinnati Financial Corporation | | 5,083 | | | | 230,311 | |
| Genworth Financial, Inc. Class A | | 13,920 | | | | 476,203 | |
Hartford Financial Services
Group, Inc. | | 9,593 | | | | 895,123 | |
| Humana, Inc. | * | | | 5,100 | | | | 282,081 | |
| Lincoln National Corporation | | 8,535 | | | | 566,724 | |
| Loews Corporation | | 13,392 | | | | 555,366 | |
| MBIA, Inc. | | 4,034 | | | | 294,724 | |
| MGIC Investment Corporation | | 2,777 | | | | 173,674 | |
Marsh & McLennan
Companies, Inc. | | 16,339 | | | | 500,954 | |
| Metlife, Inc. | | 22,837 | | | | 1,347,611 | |
| Progressive Corporation (The) | | 22,969 | | | | 556,309 | |
| Prudential Financial, Inc. | | 14,698 | | | | 1,261,970 | |
| Safeco Corporation | | 3,618 | | | | 226,306 | |
| St. Paul Travelers Companies | | 20,567 | | | | 1,104,242 | |
| Torchmark Corporation | | 2,839 | | | | 181,015 | |
| UnitedHealth Group, Inc. | | 40,734 | | | | 2,188,638 | |
| UnumProvident Corporation | | 9,377 | | | | 194,854 | |
| WellPoint, Inc. | * | | | 18,519 | | | | 1,457,260 | |
XL Capital Ltd. Class A
(Cayman Islands) | | 5,346 | | | | 385,019 | |
| | | 23,348,656 | |
Lodging—0.4% | | | |
| Hilton Hotels Corporation | | 11,052 | | | | 385,715 | |
| Marriott International, Inc. Class A | | 10,468 | | | | 499,533 | |
| Starwood Hotels & Resorts Worldwide, Inc. | | 6,705 | | | | 419,063 | |
| Wyndham Worldwide Corporation | * | | | 6,076 | | | | 194,554 | |
| | | 1,498,865 | |
|
Media—Broadcasting & Publishing—1.9% |
| CBS Corporation Class B | † | | | 23,580 | | | $ | 735,224 | |
Clear Channel
Communications, Inc. | | 15,334 | | | | 544,970 | |
| Comcast Corporation Class A | * | | | 62,603 | | | | 2,649,985 | |
| DIRECTV Group (The), Inc. | * | | | 21,474 | | | | 535,562 | |
| Dow Jones & Company, Inc. | † | | | 2,056 | | | | 78,128 | |
| EW Scripps Company Class A | | 2,500 | | | | 124,850 | |
| Gannett Company, Inc. | | 7,093 | | | | 428,843 | |
| IAC/InterActiveCorporation | *† | | | 5,620 | | | | 208,839 | |
McGraw-Hill Companies,
Inc. (The) | | 10,854 | | | | 738,289 | |
| Meredith Corporation | | 1,189 | | | | 67,000 | |
New York Times Company
Class A | † | | | 4,417 | | | | 107,598 | |
| Tribune Company | † | | | 5,581 | | | | 171,783 | |
| Univision Communications, Inc. Class A | * | | | 7,739 | | | | 274,115 | |
| Viacom, Inc. Class B | * | | | 21,147 | | | | 867,661 | |
| | | 7,532,847 | |
Medical Supplies—3.5% | | | |
| Allergan, Inc. | | 4,430 | | | | 530,448 | |
| Applera Corporation—Applied Biosystems Group | | 5,286 | | | | 193,943 | |
| Bausch & Lomb, Inc. | | 1,661 | | | | 86,472 | |
| Baxter International, Inc. | | 19,805 | | | | 918,754 | |
| Becton Dickinson & Company | | 7,580 | | | | 531,737 | |
| Biomet, Inc. | | 7,495 | | | | 309,319 | |
| Boston Scientific Corporation | * | | | 35,004 | | | | 601,369 | |
| CR Bard, Inc. | † | | | 3,184 | | | | 264,176 | |
| Johnson & Johnson | | 87,595 | | | | 5,783,022 | |
| Kla-Tencor Corporation | | 5,865 | | | | 291,784 | |
| Medtronic, Inc. | | 34,356 | | | | 1,838,390 | |
| Millipore Corporation | *† | | | 1,546 | | | | 102,964 | |
| Patterson Cos., Inc. | * | | | 3,500 | | | | 124,285 | |
| PerkinElmer, Inc. | | 4,019 | | | | 89,342 | |
| St. Jude Medical, Inc. | * | | | 10,452 | | | | 382,125 | |
| Stryker Corporation | † | | | 8,604 | | | | 474,166 | |
| Thermo Fisher Scientific, Inc. | * | | | 12,357 | | | | 559,649 | |
| Waters Corporation | * | | | 3,186 | | | | 156,018 | |
| Zimmer Holdings, Inc. | * | | | 7,357 | | | | 576,642 | |
| | | 13,814,605 | |
Metals—0.9% | | | |
| Alcoa, Inc. | | 25,904 | | | | 777,379 | |
| Allegheny Technologies, Inc. | | 2,816 | | | | 255,355 | |
| Danaher Corporation | | 7,201 | | | | 521,640 | |
| Newmont Mining Corporation | | 13,582 | | | | 613,227 | |
| Nucor Corporation | | 9,520 | | | | 520,363 | |
| Phelps Dodge Corporation | | 6,180 | | | | 739,870 | |
| United States Steel Corporation | | 3,716 | | | | 271,788 | |
| | | 3,699,622 | |
Mining—0.1% | | | |
| Freeport-McMoran Copper & Gold, Inc. Class B | † | | | 5,578 | | | | 310,862 | | | |
Oil & Gas—9.5% | | | |
| Anadarko Petroleum Corporation | | 13,644 | | | | 593,787 | |
| Apache Corporation | | 9,963 | | | | 662,639 | |
| Ashland, Inc. | | 2,173 | | | | 150,328 | |
| Baker Hughes, Inc. | | 9,795 | | | | 731,295 | |
| BJ Services Company | | 8,811 | | | | 258,339 | |
| Chesapeake Energy Corporation | † | | | 11,188 | | | | 325,011 | |
| Chevron Corporation | | 65,803 | | | | 4,838,495 | |
| ConocoPhillips | | 49,611 | | | | 3,569,511 | |
See accompanying notes to financial statements.
225
SCHEDULE OF INVESTMENTS—(Continued)
December 31, 2006
Vantagepoint 500
Stock Index Fund
|
|
|
|
|
|
|
| Shares
|
| Value
|
|---|
COMMON STOCKS—(Continued) |
| Devon Energy Corporation | | 13,246 | | | $ | 888,542 | |
| EOG Resources, Inc. | | 7,355 | | | | 459,320 | |
| El Paso Corporation | † | | | 19,255 | | | | 294,216 | |
| Exxon Mobil Corporation | | 176,754 | | | | 13,544,659 | |
| Halliburton Company | | 30,946 | | | | 960,873 | |
| Hess Corporation | | 7,251 | | | | 359,432 | |
| Kinder Morgan, Inc. | | 3,186 | | | | 336,920 | |
| Marathon Oil Corporation | | 10,937 | | | | 1,011,673 | |
| Murphy Oil Corporation | † | | | 5,510 | | | | 280,184 | |
| Nabors Industries Ltd. | *† | | | 9,284 | | | | 276,478 | |
| Nicor, Inc. | † | | | 1,395 | | | | 65,286 | |
Noble Corporation
(Cayman Islands) | | 4,237 | | | | 322,648 | |
| Occidental Petroleum Corporation | | 25,652 | | | | 1,252,587 | |
| Peoples Energy Corporation | | 1,166 | | | | 51,969 | |
| Questar Corporation | | 2,634 | | | | 218,754 | |
| Rowan Companies., Inc. | † | | | 3,489 | | | | 115,835 | |
Schlumberger Ltd.
(Netherland Antilles) | | 36,396 | | | | 2,298,771 | |
| Smith International, Inc. | † | | | 6,087 | | | | 249,993 | |
| Sunoco, Inc. | | 3,836 | | | | 239,213 | |
Transocean, Inc.
(Cayman Islands) | * | | | 9,377 | | | | 758,506 | |
| Valero Energy Corporation | | 18,680 | | | | 955,669 | |
| Weatherford International Ltd. (Bermuda) | * | | | 10,600 | | | | 442,974 | |
| Williams Companies, Inc. | | 17,295 | | | | 451,745 | |
| XTO Energy, Inc. | | 10,933 | | | | 514,398 | |
| | | 37,480,050 | |
Pharmaceuticals—6.5% | | | |
| Abbott Laboratories | | 45,694 | | | | 2,225,755 | |
| AmerisourceBergen Corporation | | 6,418 | | | | 288,553 | |
| Amgen, Inc. | * | | | 35,021 | | | | 2,392,285 | |
| Barr Pharmaceuticals, Inc. | * | | | 3,200 | | | | 160,384 | |
| Biogen Idec, Inc. | *† | | | 10,074 | | | | 495,540 | |
| Bristol-Myers Squibb Company | | 59,202 | | | | 1,558,197 | |
| Cardinal Health, Inc. | | 12,087 | | | | 778,765 | |
| Celgene Corporation | *† | | | 11,261 | | | | 647,845 | |
| Eli Lilly & Company | | 29,397 | | | | 1,531,584 | |
| Forest Laboratories, Inc. | * | | | 9,616 | | | | 486,570 | |
| Genzyme Corporation | * | | | 7,897 | | | | 486,297 | |
| Gilead Sciences, Inc. | * | | | 13,910 | | | | 903,176 | |
| Hospira, Inc. | * | | | 4,680 | | | | 157,154 | |
| King Pharmaceuticals, Inc. | * | | | 7,638 | | | | 121,597 | |
| McKesson Corporation | | 8,889 | | | | 450,672 | |
| Medco Health Solutions, Inc. | * | | | 8,736 | | | | 466,852 | |
| MedImmune, Inc. | *† | | | 7,440 | | | | 240,833 | |
| Merck & Company, Inc. | | 65,403 | | | | 2,851,571 | |
| Mylan Laboratories | | 6,000 | | | | 119,760 | |
| Pfizer, Inc. | | 218,366 | | | | 5,655,679 | |
| Quest Diagnostics, Inc. | | 4,860 | | | | 257,580 | |
| Schering-Plough Corporation | † | | | 44,889 | | | | 1,061,176 | |
| Sigma Aldrich Corporation | † | | | 1,896 | | | | 147,357 | |
| Watson Pharmaceuticals, Inc. | * | | | 2,919 | | | | 75,982 | |
| Wyeth | | 40,593 | | | | 2,066,996 | |
| | | 25,628,160 | |
Real Estate—1.2% | | | |
| Apartment Investment & Management Company REIT Class A | † | | | 2,984 | | | | 167,164 | |
| Archstone-Smith Trust REIT | | 6,200 | | | | 360,902 | |
| Boston Properties, Inc. REIT | † | | | 3,513 | | | | 393,034 | |
|
| CB Richard Ellis Group, Inc. Class A | * | | | 4,986 | | | $ | 165,535 | |
| Equity Office Properties Trust REIT | | 10,387 | | | | 500,342 | |
| Equity Residential REIT | | 8,722 | | | | 442,642 | |
| Kimco Realty Corporation REIT | † | | | 6,400 | | | | 287,680 | |
Plum Creek Timber Company,
Inc. REIT | | 5,794 | | | | 230,891 | |
| Prologis REIT | | 7,198 | | | �� | 437,422 | |
| Public Storage, Inc. REIT | | 3,559 | | | | 347,003 | |
| Realogy Corporation | * | | | 6,044 | | | | 183,254 | |
Simon Property Group,
Inc. REIT | | 6,730 | | | | 681,682 | |
| Vornado Realty Trust REIT | † | | | 3,500 | | | | 425,250 | |
| | | 4,622,801 | |
Restaurants—0.6% | | | |
| Darden Restaurants, Inc. | | 3,972 | | | | 159,555 | |
| McDonald’s Corporation | | 36,643 | | | | 1,624,384 | |
| Wendy’s International, Inc. | | 3,408 | | | | 112,771 | |
| Yum! Brands, Inc. | | 8,174 | | | | 480,631 | |
| | | 2,377,341 | |
Retailers—3.7% | | | |
| Amazon.Com, Inc. | *† | | | 9,300 | | | | 366,978 | |
| Autozone, Inc. | * | | | 1,646 | | | | 190,212 | |
| Bed Bath & Beyond, Inc. | * | | | 8,277 | | | | 315,354 | |
| Best Buy Company, Inc. | | 12,303 | | | | 605,185 | |
| Big Lots, Inc. | * | | | 3,704 | | | | 84,896 | |
| CVS Corporation | | 24,792 | | | | 766,321 | |
| Circuit City Stores, Inc. | | 4,766 | | | | 90,459 | |
| Costco Wholesale Corporation | | 14,007 | | | | 740,550 | |
| Dillard’s, Inc. Class A | † | | | 1,726 | | | | 60,358 | |
| Dollar General Corporation | | 9,870 | | | | 158,512 | |
| eBay, Inc. | * | | | 34,985 | | | | 1,051,999 | |
| Family Dollar Stores, Inc. | | 5,061 | | | | 148,439 | |
| Federated Department Stores | | 16,042 | | | | 611,681 | |
| JC Penney Company, Inc. | | 6,658 | | | | 515,063 | |
| Nike, Inc. Class B | | 5,805 | | | | 574,869 | |
| Office Depot, Inc. | * | | | 8,714 | | | | 332,613 | |
| OfficeMax, Inc. | | 2,397 | | | | 119,011 | |
| RadioShack Corporation | † | | | 3,908 | | | | 65,576 | |
| Sears Holdings Corporation | *† | | | 2,466 | | | | 414,115 | |
| Sherwin-Williams Company (The) | | 3,384 | | | | 215,155 | |
| Staples, Inc. | | 22,357 | | | | 596,932 | |
| TJX Companies., Inc. | | 14,038 | | | | 399,802 | |
| Target Corporation | | 25,658 | | | | 1,463,789 | |
| Tiffany & Company | | 4,243 | | | | 166,495 | |
| Walgreen Company | | 30,210 | | | | 1,386,337 | |
| Wal-Mart Stores, Inc. | | 73,629 | | | | 3,400,187 | |
| | | 14,840,888 | |
Telephone Systems—3.4% | | | |
| Alltel Corporation | | 11,652 | | | | 704,713 | |
| AT&T, Inc. | | 116,272 | | | | 4,156,724 | |
| BellSouth Corporation | | 54,631 | | | | 2,573,666 | |
| CenturyTel, Inc. | | 3,293 | | | | 143,772 | |
| Citizens Communications Company | | 10,409 | | | | 149,577 | |
| Embarq Corporation | | 4,416 | | | | 232,105 | |
| Qwest Communications International, Inc. | * | | | 45,657 | | | | 382,149 | |
| Sprint Nextel Corporation | | 92,034 | | | | 1,738,522 | |
| Verizon Communications, Inc. | | 87,328 | | | | 3,252,095 | |
| Windstream Corporation | | 14,143 | | | | 201,113 | |
| | | 13,534,436 | |
See accompanying notes to financial statements.
226
SCHEDULE OF INVESTMENTS—(Continued)
December 31, 2006
Vantagepoint 500
Stock Index Fund
|
|
|
|
|
|
|
| Shares
|
| Value
|
|---|
COMMON STOCKS—(Continued) |
Textiles, Clothing & Fabrics—0.2% | | | |
| Coach, Inc. | * | | | 11,268 | | | $ | 484,073 | |
| Jones Apparel Group, Inc. | | 3,500 | | | | 117,005 | |
| Liz Claiborne, Inc. | | 3,056 | | | | 132,814 | |
| VF Corporation | | 2,652 | | | | 217,676 | |
| | | 951,568 | |
Transportation—1.5% | | | |
| Brunswick Corporation | | 2,897 | | | | 92,414 | |
| Burlington Northern Santa Fe Corporation | | 11,092 | | | | 818,701 | |
| CSX Corporation | | 13,515 | | | | 465,321 | |
| Carnival Corporation | † | | | 13,165 | | | | 645,743 | |
| Norfolk Southern Corporation | | 12,304 | | | | 618,768 | |
| Sabre Holdings Corporation | | 3,944 | | | | 125,774 | |
| Union Pacific Corporation | | 7,880 | | | | 725,118 | |
| United Parcel Service, Inc. Class B | | 32,338 | | | | 2,424,703 | |
| | | 5,916,542 | |
TOTAL COMMON STOCKS
| | | |
| (Cost $196,895,507) | | 383,581,178 | |
| |
Coupon
Rate
|
|
|
| Maturity
Date
|
|
|
| Face
|
| Value
|
|---|
U.S. TREASURY OBLIGATIONS—0.2% |
U.S. Treasury Bills—0.2% | | | |
| U.S. Treasury Bill | | | |
| 4.850% | | | | 03/08/2007 | | ** | | | | | | | | |
| (Cost $535,053) | | | $ | 540,000 | | | | 535,053 | |
| |
CASH EQUIVALENTS—5.9% |
Bank & Certificate Deposits/
Offshore Time Deposits—5.7% |
| Abbey National PLC | | | |
| 5.280% | | | | 01/05/2007 | | †† | | | 354,613 | | | | 354,613 | |
| BancoBilbao Vizcaya Argentaria SA | | | |
| 5.310% | | | | 01/03/2007 | | †† | | | 354,613 | | | | 354,613 | |
| Bank Of Nova Scotia | | | |
| 5.300% | | | | 02/27/2007 | | †† | | | 443,267 | | | | 443,267 | |
| Bank Of Nova Scotia | | | |
| 5.290% | | | | 01/30/2007 | | †† | | | 177,307 | | | | 177,307 | |
| Bank Of Nova Scotia | | | |
| 5.290% | | | | 02/06/2007 | | †† | | | 265,960 | | | | 265,960 | |
| Barclays | | | |
| 5.320% | | | | 02/13/2007 | | ��† | | | 177,307 | | | | 177,307 | |
| Barclays | | | |
| 5.310% | | | | 02/20/2007 | | †† | | | 443,267 | | | | 443,267 | |
| Barclays | | | |
| 5.300% | | | | 01/02/2007 | | †† | | | 443,267 | | | | 443,267 | |
| Barton Capital LLC | | | |
| 5.300% | | | | 01/17/2007 | | †† | | | 177,307 | | | | 177,307 | |
| Barton Capital LLC | | | |
| 5.300% | | | | 01/17/2007 | | †† | | | 265,960 | | | | 265,960 | |
| Calyon | | | |
| 5.310% | | | | 02/16/2007 | | †† | | | 177,307 | | | | 177,307 | |
| Calyon | | | |
| 5.300% | | | | 02/05/2007 | | †† | | | 531,920 | | | | 531,920 | |
| Canadian Imperial Bank of Commerce | | | |
| 5.310% | | | | 01/29/2007 | | †† | | | 531,920 | | | | 531,920 | |
| Charta LLC | | | |
| 5.300% | | | | 01/31/2007 | | †† | | | 347,230 | | | | 347,230 | |
| CIESCO | | | |
| 5.310% | | | | 01/04/2007 | | †† | | | 230,862 | | | | 230,862 | |
|
| Citigroup | | | |
| 5.310% | | | | 03/16/2007 | | †† | | $ | 177,307 | | | $ | 177,307 | |
| Clipper Receivables Corp | | | |
| 5.300% | | | | 01/31/2007 | | †† | | | 177,307 | | | | 177,307 | |
| Compass Securitization | | | |
| 5.300% | | | | 01/09/2007 | | †† | | | 265,960 | | | | 265,960 | |
| CRC Funding LLC | | | |
| 5.340% | | | | 01/23/2007 | | †† | | | 88,653 | | | | 88,653 | |
| CRC Funding LLC | | | |
| 5.300% | | | | 01/10/2007 | | †† | | | 258,836 | | | | 258,836 | |
| Credit Suisse First Boston Corporation | | | |
| 5.300% | | | | 01/05/2007 | | †† | | | 177,307 | | | | 177,307 | |
| Credit Suisse First Boston Corporation | | | |
| 5.300% | | | | 01/12/2007 | | †† | | | 354,613 | | | | 354,613 | |
| Dexia Group | | | |
| 5.290% | | | | 01/16/2007 | | †† | | | 443,267 | | | | 443,267 | |
| Fairway Finance | | | |
| 5.300% | | | | 01/09/2007 | | †† | | | 212,768 | | | | 212,768 | |
| Falcon Asset Securitization Corporation | | | |
| 5.340% | | | | 01/22/2007 | | †† | | | 177,307 | | | | 177,307 | |
| Fortis Bank | | | |
| 5.320% | | | | 01/03/2007 | | †† | | | 177,307 | | | | 177,307 | |
| Fortis Bank | | | |
| 5.300% | | | | 01/02/2007 | | †† | | | 177,307 | | | | 177,307 | |
| Fortis Bank | | | |
| 5.300% | | | | 01/24/2007 | | †† | | | 620,574 | | | | 620,574 | |
| Fortis Bank | | | |
| 5.300% | | | | 01/26/2007 | | †† | | | 709,227 | | | | 709,227 | |
| General Electric Capital Corporation | | | |
| 5.300% | | | | 01/26/2007 | | †† | | | 354,613 | | | | 354,613 | |
| Greyhawk Funding | | | |
| 5.310% | | | | 01/12/2007 | | †† | | | 177,307 | | | | 177,307 | |
| HBOS Halifax Bank of Scotland | | | |
| 5.310% | | | | 03/14/2007 | | †† | | | 443,267 | | | | 443,267 | |
| HBOS Halifax Bank of Scotland | | | |
| 5.300% | | | | 01/08/2007 | | †† | | | 177,307 | | | | 177,307 | |
| Kitty Hawk Funding Corp | | | |
| 5.340% | | | | 01/10/2007 | | †† | | | 265,960 | | | | 265,960 | |
| Lexington Parker Cap Comp | | | |
| 5.300% | | | | 01/05/2007 | | †† | | | 177,307 | | | | 177,307 | |
| Liberty Street | | | |
| 5.310% | | | | 01/17/2007 | | †† | | | 177,307 | | | | 177,307 | |
| Lloyds TSB Bank | | | |
| 5.300% | | | | 02/26/2007 | | †† | | | 177,307 | | | | 177,307 | |
| Marshall & Ilsley Bank Corporation | | | |
| 5.300% | | | | 03/19/2007 | | †† | | | 177,307 | | | | 177,307 | |
| Merrill Lynch & Co | | | |
| 5.300% | | | | 01/02/2007 | | †† | | | 3,102,868 | | | | 3,102,868 | |
| Morgan Stanley & Co | | | |
| 5.300% | | | | 01/02/2007 | | †† | | | 2,173,942 | | | | 2,173,942 | |
| Old Line Funding LLC | | | |
| 5.350% | | | | 01/04/2007 | | †† | | | 177,307 | | | | 177,307 | |
| Paradigm Funding LLC | | | |
| 5.310% | | | | 01/17/2007 | | †† | | | 177,307 | | | | 177,307 | |
| Park Avenue Receivables Corp | | | |
| 5.330% | | | | 01/18/2007 | | †† | | | 177,307 | | | | 177,307 | |
| Rabobank Nederland | | | |
| 5.250% | | | | 01/02/2007 | | †† | | | 531,920 | | | | 531,920 | |
| Ranger Funding | | | |
| 5.330% | | | | 02/08/2007 | | †† | | | 177,307 | | | | 177,307 | |
| Ranger Funding | | | |
| 5.320% | | | | 01/04/2007 | | †† | | | 177,307 | | | | 177,307 | |
| Royal Bank of Canada | | | |
| 5.310% | | | | 02/14/2007 | | †† | | | 354,613 | | | | 354,613 | |
| Royal Bank of Scotland | | | |
| 5.310% | | | | 01/11/2007 | | †† | | | 177,307 | | | | 177,307 | |
| Royal Bank of Scotland | | | |
| 5.290% | | | | 01/16/2007 | | †† | | | 265,960 | | | | 265,960 | |
See accompanying notes to financial statements.
227
SCHEDULE OF INVESTMENTS—(Continued)
December 31, 2006
Vantagepoint 500
Stock Index Fund
Coupon
Rate
|
|
|
| Maturity
Date
|
|
|
| Face
|
| Value
|
|---|
CASH EQUIVALENTS—(Continued) |
| Royal Bank of Scotland | | | |
| 5.290% | | | �� | 02/09/2007 | | †† | | $ | 177,307 | | | $ | 177,307 | |
| Royal Bank of Scotland | | | |
| 5.280% | | | | 01/11/2007 | | †† | | | 443,267 | | | | 443,267 | |
| Sheffiled Receivables Corp | | | |
| 5.360% | | | | 01/11/2007 | | †† | | | 265,960 | | | | 265,960 | |
| Sheffiled Receivables Corp | | | |
| 5.300% | | | | 01/12/2007 | | †† | | | 177,307 | | | | 177,307 | |
| Societe Generale | | | |
| 5.310% | | | | 01/02/2007 | | †† | | | 443,267 | | | | 443,267 | |
| Societe Generale | | | |
| 5.290% | | | | 02/01/2007 | | †† | | | 443,267 | | | | 443,267 | |
| Societe Generale | | | |
| 5.270% | | | | 01/19/2007 | | †† | | | 443,267 | | | | 443,267 | |
| Svenska Handlesbanken | | | |
| 5.250% | | | | 01/02/2007 | | †† | | | 203,484 | | | | 203,484 | |
| Three Pillars Funding LLC | | | |
| 5.380% | | | | 01/02/2007 | | †† | | | 265,298 | | | | 265,298 | |
| UBS AG | | | |
| 5.300% | | | | 01/04/2007 | | †† | | | 177,307 | | | | 177,307 | |
| UBS AG | | | |
| 5.290% | | | | 01/02/2007 | | †† | | | 354,613 | | | | 354,613 | |
| Variable Funding Capital Co | | | |
| 5.310% | | | | 02/02/2007 | | †† | | | 177,307 | | | | 177,306 | |
| Variable Funding Capital Co | | | |
| 5.290% | | | | 01/04/2007 | | †† | | | 177,307 | | | | 177,306 | |
| Yorktown Capital LLC | | | |
| 5.330% | | | | 01/16/2007 | | †† | | | 177,307 | | | | 177,306 | |
| Yorktown Capital LLC | | | |
| 5.300% | | | | 01/10/2007 | | †† | | | 177,307 | | | | 177,306 | |
| | | 22,664,242 | |
Floating Rate Instruments/Master Notes—0.2% |
| Bank of America | | | |
| 5.310% | | | | 07/10/2007 | | †† | | | 443,267 | | | | 443,267 | |
| Bank of America | | | |
| 5.270% | | | | 01/09/2007 | | †† | | | 354,613 | | | | 354,613 | |
| | | 797,880 | |
TOTAL CASH EQUIVALENTS
| | | |
| (Cost $23,462,122) | | 23,462,122 | |
| |
REPURCHASE AGREEMENTS—2.7% |
| Investors Bank & Trust Repurchase Agreement date 12/29/2006 due 01/02/2007 with maturity value of 10,607,916 and an effective yield of 4.65% collateralized by a U.S. Government obligation with a rate of 4.142%, a maturity date of 05/01/2034 and an aggregate market value of 11,132,560 | | 10,602,438 | | | | 10,602,438 | |
TOTAL INVESTMENTS—105.8% | | | |
| (Cost $231,495,120) | | 418,180,791 | |
| Other assets less liabilities—(5.8%) | | (22,811,520 | ) |
NET ASSETS—100.0% | $ | 395,369,271 | |
Notes to the Schedule of Investments:
| REIT | | Real Estate Investment Trust |
| * | | Non-income producing security. |
| † | | Denotes all or a portion of security on loan. |
| ** | | Security has been pledged as collateral for futures contracts. |
| †† | | Represents collateral received from securities lending transactions. |
See accompanying notes to financial statements.
228
SCHEDULE OF INVESTMENTS
December 31, 2006
Vantagepoint Broad
Market Index Fund
|
|
|
|
|
|
|
| Shares
|
| Value
|
|---|
COMMON STOCKS—98.1% |
Advertising—0.3% | | | |
| 24/7 Real Media, Inc. | * | | | 273 | | | $ | 2,471 | |
| Aquantive, Inc. | * | | | 2,027 | | | | 49,986 | |
| Catalina Marketing Corporation | | 2,131 | | | | 58,602 | |
| Clear Channel Outdoor Holdings, Inc. Class A | * | | | 2,500 | | | | 69,775 | |
| Getty Images, Inc. | *† | | | 1,742 | | | | 74,592 | |
| Interpublic Group, Inc. | *† | | | 17,203 | | | | 210,565 | |
| Jupitermedia Corporation | * | | | 1,450 | | | | 11,484 | |
| Lamar Advertising Company | * | | | 3,479 | | | | 227,492 | |
| Monster Worldwide, Inc. | * | | | 4,681 | | | | 218,322 | |
| Omnicom Group | | 6,610 | | | | 691,009 | |
| Valueclick, Inc. | * | | | 4,058 | | | | 95,891 | |
| | | 1,710,189 | |
Aerospace & Defense—1.6% | | | |
| AAR Corporation | *† | | | 1,489 | | | | 43,464 | |
| Alliant Techsystems, Inc. | *† | | | 1,550 | | | | 121,194 | |
| Armor Holdings, Inc. | *† | | | 1,500 | | | | 82,275 | |
| Goodrich Corporation | | 4,882 | | | | 222,375 | |
| BE Aerospace, Inc. | * | | | 2,393 | | | | 61,452 | |
| Boeing Company (The) | | 27,705 | | | | 2,461,312 | |
Fairchild Corporation (The)
Class A | * | | | 3,265 | | | | 7,150 | |
| Gencorp, Inc. | *† | | | 1,629 | | | | 22,839 | |
| General Dynamics Corporation | | 13,610 | | | | 1,011,903 | |
| Heico Corporation Class A | | 878 | | | | 28,605 | |
| Honeywell International, Inc. | | 29,167 | | | | 1,319,515 | |
| Kreisler Manufacturing Corporation | * | | | 1,250 | | | | 12,037 | |
| Lockheed Martin Corporation | | 13,135 | | | | 1,209,339 | |
| Northrop Grumman Corporation | | 12,770 | | | | 864,529 | |
| Orbital Sciences Corporation | * | | | 2,123 | | | | 39,148 | |
| Sequa Corporation Class A | * | | | 510 | | | | 58,681 | |
| Textron, Inc. | | 4,107 | | | | 385,113 | |
| Triumph Group, Inc. | | 822 | | | | 43,097 | |
| United Technologies Corporation | | 36,395 | | | | 2,275,415 | |
| | | 10,269,443 | |
Agriculture, Forestry & Fishing—0.0% | | | |
| Andersons, Inc. | | 700 | | | | 29,673 | |
| Griffin Land & Nurseries, Inc. | * | | | 650 | | | | 21,092 | |
| Margo Caribe, Inc. (Puerto Rico) | *† | | | 1,022 | | | | 5,493 | |
| Pilgrim’s Pride Corporation | | 2,476 | | | | 72,869 | |
| Seaboard Corporation | † | | | 18 | | | | 31,770 | |
| Terra Industries, Inc. | *† | | | 2,513 | | | | 30,106 | |
| Tractor Supply Company | *† | | | 1,549 | | | | 69,256 | |
| | | 260,259 | |
Airlines—0.4% | | | |
| AMR Corporation | * | | | 6,672 | | | | 201,695 | |
| Air T, Inc. | | 1,352 | | | | 11,898 | |
| Airnet Systems, Inc. | * | | | 2,609 | | | | 7,723 | |
| Airtran Holdings, Inc. | *† | | | 3,168 | | | | 37,192 | |
| Alaska Air Group, Inc. | * | | | 1,343 | | | | 53,048 | |
Atlas Air Worldwide
Holdings, Inc. | * | | | 600 | | | | 26,700 | |
| Bristow Group, Inc. | * | | | 982 | | | | 35,440 | |
Continental Airlines, Inc.
Class B | *† | | | 2,723 | | | | 112,324 | |
| ExpressJet Holdings, Inc. | * | | | 2,636 | | | | 21,352 | |
| FedEx Corporation | | 11,378 | | | | 1,235,878 | |
| Frontier Airlines Holdings, Inc. | *† | | | 1,369 | | | | 10,131 | |
| JetBlue Airways Corporation | * | | | 6,414 | | | | 91,079 | |
| Mesa Air Group, Inc. | *† | | | 847 | | | | 7,259 | |
|
| Midwest Air Group, Inc. | *† | | | 915 | | | $ | 10,522 | |
| PHI, Inc. | * | | | 774 | | | | 25,333 | |
| Skywest, Inc. | | 2,390 | | | | 60,969 | |
| Southwest Airlines Company | | 30,863 | | | | 472,821 | |
| UAL Corporation | * | | | 3,500 | | | | 154,000 | |
| US Airways Group, Inc. | *† | | | 2,272 | | | | 122,347 | |
| | | 2,697,711 | |
Apparel Retailers—0.6% | | | |
| Abercrombie & Fitch Company Class A | | 3,982 | | | | 277,267 | |
| Aeropostale, Inc. | * | | | 2,403 | | | | 74,181 | |
| American Eagle Outfitters, Inc. | | 8,736 | | | | 272,651 | |
| AnnTaylor Stores Corporation | * | | | 2,733 | | | | 89,752 | |
| Bebe Stores, Inc. | | 790 | | | | 15,634 | |
| Big Dog Holdings, Inc. | * | | | 1,620 | | | | 26,568 | |
| Buckle, Inc. (The) | | 1,115 | | | | 56,698 | |
| Carter’s, Inc. | * | | | 1,476 | | | | 37,638 | |
| Casual Male Retail Group, Inc. | * | | | 1,930 | | | | 25,186 | |
| Cato Corporation Class A | | 1,761 | | | | 40,345 | |
| Charlotte Russe Holding, Inc. | * | | | 1,100 | | | | 33,825 | |
| Charming Shoppes, Inc. | * | | | 3,138 | | | | 42,457 | |
| Chico’s FAS, Inc. | * | | | 7,236 | | | | 149,713 | |
| Children’s Place | *† | | | 1,144 | | | | 72,667 | |
| Christopher & Banks Corporation | | 1,528 | | | | 28,512 | |
| Claire’s Stores, Inc. | | 3,855 | | | | 127,755 | |
| Dress Barn, Inc. | *† | | | 1,900 | | | | 44,327 | |
| Finish Line Class A | | 1,604 | | | | 22,905 | |
| Gap (The), Inc. | † | | | 25,472 | | | | 496,704 | |
| HOT Topic, Inc. | *† | | | 1,824 | | | | 24,332 | |
| JOS A. Bank Clothiers, Inc. | *† | | | 577 | | | | 16,935 | |
| Kohl’s Corporation | * | | | 11,796 | | | | 807,200 | |
| Ltd. Brands, Inc. | | 12,957 | | | | 374,976 | |
| Nordstrom, Inc. | | 8,394 | | | | 414,160 | |
Pacific Sunwear of
California, Inc. | *† | | | 3,025 | | | | 59,230 | |
| Payless Shoesource, Inc. | * | | | 2,964 | | | | 97,278 | |
| Ross Stores, Inc. | | 6,350 | | | | 186,055 | |
| Stage Stores, Inc. | | 1,491 | | | | 45,311 | |
| Talbots, Inc. | | 375 | | | | 9,037 | |
| Tween Brands, Inc. | *† | | | 1,485 | | | | 59,296 | |
| Urban Outfitters, Inc. | *† | | | 5,012 | | | | 115,426 | |
| Wet Seal, Inc. (The) Class A | * | | | 1,246 | | | | 8,311 | |
| Wilsons The Leather Experts, Inc. | * | | | 819 | | | | 1,671 | |
| | | 4,154,003 | |
Automotive—0.9% | | | |
| A.O. Smith Corporation | | 1,341 | | | | 50,368 | |
| Adesa, Inc. | | 4,131 | | | | 114,635 | |
| Aftermarket Technology Corporation | * | | | 603 | | | | 12,832 | |
| American Axle & Manufacturing Holdings, Inc. | † | | | 2,113 | | | | 40,126 | |
| America’s Car Mart, Inc. | *† | | | 354 | | | | 4,198 | |
| Amerigon, Inc. | * | | | 2,107 | | | | 20,354 | |
| ArvinMeritor, Inc. | | 2,791 | | | | 50,880 | |
| Asbury Automotive Group, Inc. | | 1,342 | | | | 31,618 | |
| Autonation, Inc. | * | | | 5,363 | | | | 114,339 | |
| BorgWarner, Inc. | | 2,274 | | | | 134,211 | |
| Carmax, Inc. | *† | | | 4,258 | | | | 228,357 | |
| Clarcor, Inc. | | 2,354 | | | | 79,589 | |
| Coachmen Industries, Inc. | | 705 | | | | 7,755 | |
| Copart, Inc. | * | | | 3,582 | | | | 107,460 | |
| Federal Signal Corporation | | 2,159 | | | | 34,630 | |
| Ford Motor Company | † | | | 74,379 | | | | 558,586 | |
| General Motors Corporation | | 16,347 | | | | 502,180 | |
| Genuine Parts Company | | 7,620 | | | | 361,417 | |
See accompanying notes to financial statements.
229
SCHEDULE OF INVESTMENTS—(Continued)
December 31, 2006
Vantagepoint Broad
Market Index Fund
|
|
|
|
|
|
|
| Shares
|
| Value
|
|---|
COMMON STOCKS—(Continued) |
| Goodyear Tire & Rubber Company (The) | *† | | | 7,281 | | | $ | 152,828 | |
| Group 1 Automotive, Inc. | | 1,068 | | | | 55,237 | |
| Harley-Davidson, Inc. | | 10,663 | | | | 751,422 | |
| Harsco Corporation | | 1,823 | | | | 138,730 | |
| ITT Corporation | | 8,056 | | | | 457,742 | |
Keystone Automotive
Industries, Inc. | * | | | 1,743 | | | | 59,245 | |
| Lear Corporation | † | | | 2,741 | | | | 80,942 | |
| Lithia Motors, Inc. Class A | | 862 | | | | 24,791 | |
| LKQ Corporation | * | | | 3,500 | | | | 80,465 | |
| Monaco Coach Corporation | | 1,376 | | | | 19,484 | |
| Navistar International Corporation | * | | | 2,851 | | | | 95,309 | |
| Oshkosh Truck Corporation | | 2,868 | | | | 138,869 | |
| Paccar, Inc. | † | | | 9,902 | | | | 642,640 | |
| PEP Boys-Manny Moe & Jack | | 2,200 | | | | 32,692 | |
| Proliance International, Inc. | * | | | 2,239 | | | | 10,299 | |
| Sonic Automotive, Inc. | | 1,649 | | | | 47,887 | |
| Strattec Security Corporation | * | | | 123 | | | | 5,732 | |
Superior Industries
International, Inc. | † | | | 1,102 | | | | 21,236 | |
| Tenneco Automotive, Inc. | * | | | 1,600 | | | | 39,552 | |
| Titan International, Inc. | † | | | 1,085 | | | | 21,863 | |
| TRW Automotive Holdings Corporation | * | | | 900 | | | | 23,283 | |
| United Auto Group, Inc. | | 1,654 | | | | 38,985 | |
| Visteon Corporation | * | | | 5,429 | | | | 46,038 | |
| Wabash National Corporation | | 1,395 | | | | 21,064 | |
| Winnebago Industries, Inc. | † | | | 1,432 | | | | 47,127 | |
| | | 5,506,997 | |
Banking—11.1% | | | |
| 1st Source Corporation | | 1,180 | | | | 37,913 | |
| Advanta Corporation Class A | | 1,446 | | | | 57,565 | |
| Alabama National Bancorp | | 575 | | | | 39,520 | |
| Alliance Bankshares Corporation | * | | | 744 | | | | 11,644 | |
| Amcore Financial, Inc. | | 1,313 | | | | 42,896 | |
| American Express Company | | 42,027 | | | | 2,549,778 | |
| AmeriCredit Corporation | *† | | | 6,437 | | | | 162,019 | |
| Anchor Bancorp Wisconsin, Inc. | | 1,411 | | | | 40,665 | |
| Associated Banc Corporation | | 5,110 | | | | 178,237 | |
| Astoria Financial Corporation | | 4,671 | | | | 140,877 | |
| BB&T Corporation | | 20,879 | | | | 917,214 | |
| BancFirst Corporation | | 642 | | | | 34,668 | |
| Bancorpsouth, Inc. | | 3,611 | | | | 96,847 | |
| BancTrust Financial Group, Inc. | | 1,600 | | | | 40,832 | |
| Bank Mutual Corporation | | 3,756 | | | | 45,485 | |
| Bank of America Corporation | | 178,464 | | | | 9,528,193 | |
| Bank of Hawaii Corporation | | 2,494 | | | | 134,551 | |
| Bank of New York Company, Inc. (The) | | 29,648 | | | | 1,167,242 | |
| BankAtlantic Bancorp, Inc. Class A | | 2,210 | | | | 30,520 | |
| Bankunited Financial Corporation Class A | �� | 793 | | | | 22,172 | |
| Blue River Bancshares, Inc. | | 2,545 | | | | 15,563 | |
| BOK Financial Corporation | | 1,765 | | | | 97,040 | |
Boston Private Financial
Holdings, Inc. | | 1,297 | | | | 36,588 | |
| Brookline Bancorp, Inc. | | 3,765 | | | | 49,585 | |
| Bryn Mawr Bank Corporation | | 1,058 | | | | 25,011 | |
| Capital Bank Corporation | | 1,282 | | | | 22,050 | |
| Capital City Bank Group, Inc. | | 1,113 | | | | 39,289 | |
| Capital One Financial Corporation | | 17,661 | | | | 1,356,718 | |
| Capitol Federal Financial | † | | | 2,115 | | | | 81,258 | |
| Cardinal Financial Corporation | | 1,142 | | | | 11,705 | |
|
| Cascade Bancorp | † | | | 2,191 | | | $ | 67,987 | |
| Cascade Financial Corporation | | 1,063 | | | | 18,145 | |
| Cathay General Bancorp | | 2,082 | | | | 71,850 | |
| Centennial Bank Holdings, Inc. | * | | | 5,300 | | | | 50,138 | |
Central Pacific Financial
Corporation | | 929 | | | | 36,008 | |
| CFS Bancorp, Inc. | | 1,873 | | | | 27,439 | |
| Charter Financial Corporation | | 350 | | | | 18,032 | |
| Chemical Financial Corporation | | 1,552 | | | | 51,682 | |
| Chittenden Corporation | | 2,222 | | | | 68,193 | |
| CIT Group, Inc. | | 8,482 | | | | 473,041 | |
| Citigroup, Inc. | | 194,411 | | | | 10,828,693 | |
| Citizens Banking Corporation | † | | | 2,069 | | | | 54,828 | |
| City Bank, Lynnwood, WA | | 1,646 | | | | 58,909 | |
| City Holding Company | | 250 | | | | 10,222 | |
| City National Corporation | | 2,199 | | | | 156,569 | |
| Coastal Financial Corporation | | 1,952 | | | | 32,696 | |
| CoBiz, Inc. | | 1,063 | | | | 23,429 | |
| Colonial BancGroup, Inc. (The) | | 5,643 | | | | 145,251 | |
| Comerica, Inc. | | 6,877 | | | | 403,542 | |
| Commerce Bancorp, Inc., NJ | † | | | 6,314 | | | | 222,695 | |
| Commerce Bancshares, Inc. | | 3,607 | | | | 174,615 | |
| Community Bank System, Inc. | | 1,402 | | | | 32,246 | |
| Community Trust Bancorp, Inc. | | 665 | | | | 27,617 | |
| Compass Bancshares, Inc. | | 4,769 | | | | 284,471 | |
| CompuCredit Corporation | *† | | | 83 | | | | 3,304 | |
| Corus Bankshares, Inc. | † | | | 702 | | | | 16,195 | |
| Cullen/Frost Bankers, Inc. | | 2,502 | | | | 139,662 | |
| CVB Financial Corporation | | 3,713 | | | | 53,690 | |
| Dime Community Bancshares | | 1,638 | | | | 22,948 | |
| Downey Financial Corporation | † | | | 1,038 | | | | 75,338 | |
| Eastern Virginia Bankshares, Inc. | | 700 | | | | 15,792 | |
| East-West Bancorp, Inc. | | 2,200 | | | | 77,924 | |
| Euronet Worldwide, Inc. | *† | | | 1,056 | | | | 31,353 | |
| Fannie Mae | | 37,770 | | | | 2,243,160 | |
| Farmers Capital Bank Corporation | | 1,113 | | | | 37,987 | |
| Fidelity Bankshares, Inc. | | 2,263 | | | | 89,773 | |
| Fidelity Southern Corporation | | 1,381 | | | | 25,700 | |
| Fifth Third Bancorp | | 18,257 | | | | 747,259 | |
| Financial Federal Corporation | † | | | 1,513 | | | | 44,497 | |
| Financial Institutions, Inc. | | 749 | | | | 17,264 | |
| First Bancorp North Carolina | | 643 | | | | 14,043 | |
| First Bancorp Puerto Rico | | 3,246 | | | | 30,934 | |
| First Charter Corporation | † | | | 843 | | | | 20,738 | |
First Citizens BancShares, Inc.
Class A | | 254 | | | | 51,471 | |
| First Commonwealth Financial Corporation | | 5,133 | | | | 68,936 | |
| First Community Bancorp | | 894 | | | | 46,729 | |
| First Financial Bancorp | † | | | 1,895 | | | | 31,476 | |
| First Financial Bankshares, Inc. | | 333 | | | | 13,939 | |
| First Financial Service Corporation | | 366 | | | | 11,273 | |
| First Horizon National Corporation | | 5,607 | | | | 234,260 | |
First Marblehead
Corporation (The) | † | | | 2,764 | | | | 151,053 | |
| First Merchants Corporation | | 874 | | | | 23,764 | |
| First Midwest Bancorp, Inc. | | 2,002 | | | | 77,437 | |
| First Niagara Financial Group, Inc. | | 4,099 | | | | 60,911 | |
First of Long Island
Corporation (The) | | 493 | | | | 21,618 | |
| First Republic Bank | † | | | 1,336 | | | | 52,211 | |
| FirstFed Financial Corporation | *† | | | 922 | | | | 61,746 | |
| FirstMerit Corporation | | 3,895 | | | | 94,025 | |
| Flagstar Bancorp, Inc. | | 2,110 | | | | 31,312 | |
| FMS Financial Corporation | | 500 | | | | 15,850 | |
| FNB Corporation | | 3,344 | | | | 61,095 | |
| Freddie Mac | | 26,933 | | | | 1,828,751 | |
| Fremont General Corporation | | 2,929 | | | | 47,479 | |
See accompanying notes to financial statements.
230
SCHEDULE OF INVESTMENTS—(Continued)
December 31, 2006
Vantagepoint Broad
Market Index Fund
|
|
|
|
|
|
|
| Shares
|
| Value
|
|---|
COMMON STOCKS—(Continued) |
| Frontier Financial Corporation | † | | | 2,254 | | | $ | 65,884 | |
| Fulton Financial Corporation | | 6,533 | | | | 109,101 | |
| Glacier Bancorp, Inc. | | 1,771 | | | | 43,283 | |
| Great Lakes Bancorp, Inc. | * | | | 277 | | | | 3,889 | |
| Greater Bay Bancorp | | 2,213 | | | | 58,268 | |
| Hallwood Group, Inc. | * | | | 100 | | | | 12,250 | |
| Hancock Holding Company | | 1,752 | | | | 92,576 | |
| Hanmi Financial Corporation | | 3,600 | | | | 81,108 | |
| Harleysville National Corporation | | 1,210 | | | | 23,365 | |
Harrington West Financial
Group, Inc. | | 1,171 | | | | 20,200 | |
| Heritage Financial Corporation | | 332 | | | | 8,144 | |
| Horizon Financial Services Corporation | | 450 | | | | 5,985 | |
| Hudson City Bancorp, Inc. | | 20,250 | | | | 281,070 | |
| Huntington Bancshares, Inc. | | 8,571 | | | | 203,561 | |
| Independent Bank Corporation (Massachusetts) | | 874 | | | | 31,490 | |
| Independent Bank Corporation (Michigan) | | 2,079 | | | | 52,578 | |
| IndyMac Bancorp, Inc. | † | | | 2,523 | | | | 113,939 | |
| Integra Bank Corporation | | 848 | | | | 23,337 | |
| International Bancshares Corporation | | 2,953 | | | | 91,277 | |
| Investors Financial Services Corporation | | 2,840 | | | | 121,183 | |
| Irwin Financial Corporation | † | | | 1,296 | | | | 29,328 | |
| JPMorgan Chase & Company | | 135,836 | | | | 6,560,879 | |
| Keycorp | | 15,774 | | | | 599,885 | |
| KNBT Bancorp, Inc. | | 1,002 | | | | 16,763 | |
| M&T Bank Corporation | | 3,475 | | | | 424,506 | |
| MAF Bancorp, Inc. | | 1,245 | | | | 55,639 | |
| Marshall & IIsley Corporation | | 8,572 | | | | 412,399 | |
| MB Financial, Inc. | | 931 | | | | 35,034 | |
| Medallion Financial Corporation | | 958 | | | | 11,850 | |
| Mellon Financial Corporation | | 17,152 | | | | 722,957 | |
| Mercantile Bankshares Corporation | | 5,206 | | | | 243,589 | |
| Merchants Bancshares, Inc. | | 571 | | | | 13,133 | |
| Midsouth Bancorp, Inc. | † | | | 498 | | | | 15,518 | |
| Mid-State Bancshares | | 1,700 | | | | 61,863 | |
MidWestOne Financial
Group, Inc. | | 582 | | | | 11,605 | |
| Mitcham Industries, Inc. | * | | | 1,100 | | | | 13,145 | |
| NASB Financial, Inc. | | 528 | | | | 21,833 | |
| National City Corporation | | 23,233 | | | | 849,398 | |
| National Penn Bancshares, Inc. | | 1,676 | | | | 33,939 | |
| NBT Bancorp, Inc. | | 1,000 | | | | 25,510 | |
| Nelnet, Inc. Class A | * | | | 481 | | | | 13,160 | |
| Netbank, Inc. | | 2,850 | | | | 13,224 | |
New York Community
Bancorp, Inc. | | 10,860 | | | | 174,846 | |
| NewAlliance Bancshares, Inc. | | 4,600 | | | | 75,440 | |
| Northern States Financial Corporation | | 772 | | | | 15,247 | |
| Northern Trust Corporation | | 7,513 | | | | 455,964 | |
| Northwest Bancorp, Inc. | | 2,048 | | | | 56,238 | |
| Ocwen Financial Corporation | *† | | | 3,358 | | | | 53,258 | |
| Old National Bancorp | | 3,552 | | | | 67,204 | |
| PNC Financial Services Group, Inc. | | 11,751 | | | | 870,044 | |
| Pacific Capital Bancorp | | 1,724 | | | | 57,892 | |
| Pacific Premier Bancorp, Inc. | * | | | 976 | | | | 11,888 | |
| Park National Corporation | | 728 | | | | 72,072 | |
| Parkvale Financial Corporation | | 616 | | | | 19,558 | |
| Peoples Bancorp, Inc. | | 814 | | | | 24,176 | |
| People’s Bank | † | | | 2,509 | | | | 111,952 | |
| Peoples Financial Corporation | | 883 | | | | 23,841 | |
| PFF Bancorp, Inc. | | 1,096 | | | | 37,823 | |
| Popular, Inc. (Puerto Rico) | | 10,296 | | | | 184,813 | |
|
Premier Community
Bankshares, Inc. | | 933 | | | $ | 18,548 | |
| PrivateBancorp, Inc. | † | | | 1,200 | | | | 49,956 | |
| Prosperity Bancshares, Inc. | | 2,300 | | | | 79,373 | |
| Provident Bankshares Corporation | | 1,369 | | | | 48,736 | |
| Provident Financial Services, Inc. | | 943 | | | | 17,097 | |
| Provident New York Bancorp | | 3,670 | | | | 54,977 | |
R&G Financial Corporation
Class B (Puerto Rico) | | 1,555 | | | | 11,896 | |
| Regions Financial Corporation | | 28,179 | | | | 1,053,895 | |
| Republic Bancorp, Inc. | | 3,754 | | | | 50,529 | |
| Republic Bancorp, Inc. Class A | | 1,527 | | | | 38,312 | |
| Riverview Bancorp, Inc. | | 2,600 | | | | 39,520 | |
| Royal Bancshares of Pennsylvania Class A | | 882 | | | | 23,179 | |
| S&T Bancorp, Inc. | | 1,868 | | | | 64,764 | |
| Sandy Spring Bancorp, Inc. | | 344 | | | | 13,134 | |
| Santander Bancorp (Puerto Rico) | † | | | 1,280 | | | | 22,848 | |
| Shore Bancshares, Inc. | | 826 | | | | 24,912 | |
| Signature Bank of New York | * | | | 1,900 | | | | 58,862 | |
Simmons First National
Corporation Class A | | 911 | | | | 28,742 | |
| Sky Financial Group, Inc. | | 4,278 | | | | 122,094 | |
| SLM Corporation | | 16,037 | | | | 782,124 | |
| South Financial Group, Inc. (The) | | 2,799 | | | | 74,425 | |
| SouthFirst Bancshares, Inc. | | 400 | | | | 5,600 | |
| Sovereign Bancorp, Inc. | † | | | 12,496 | | | | 317,273 | |
| State Street Corporation | | 13,568 | | | | 915,026 | |
| Sterling Bancorp, NY | | 1,476 | | | | 29,077 | |
| Sterling Bancshares, Inc. | | 2,422 | | | | 31,534 | |
| Sterling Financial Corporation (Pennsylvania) | | 1,557 | | | | 36,854 | |
| Sterling Financial Corporation (Washington) | | 2,577 | | | | 87,128 | |
| Student Loan Corporation | | 207 | | | | 42,911 | |
| Suffolk Bancorp | | 1,100 | | | | 41,943 | |
| SunTrust Banks, Inc. | | 14,045 | | | | 1,186,100 | |
| Susquehanna Bancshares, Inc. | | 2,932 | | | | 78,812 | |
| SVB Financial Group | * | | | 1,437 | | | | 66,993 | |
| Synovus Financial Corporation | | 10,920 | | | | 336,664 | |
| TCF Financial Corporation | | 6,104 | | | | 167,372 | |
| TD Banknorth, Inc. | | 4,054 | | | | 130,863 | |
| Tompkins Trustco, Inc. | | 665 | | | | 30,224 | |
| Trustco Bank Corporation | | 3,435 | | | | 38,197 | |
| Trustmark Corporation | | 2,435 | | | | 79,649 | |
| U.S. Bancorp | | 69,469 | | | | 2,514,083 | |
| UCBH Holdings, Inc. | | 3,652 | | | | 64,129 | |
| UMB Financial Corporation | | 1,990 | | | | 72,655 | |
| Umpqua Holdings Corporation | | 1,151 | | | | 33,874 | |
| UnionBanCal Corporation | | 2,177 | | | | 133,341 | |
| United Bankshares, Inc. | | 2,134 | | | | 82,479 | |
| United Community Banks, Inc. | | 2,188 | | | | 70,716 | |
| United Western Bancorp, Inc. | * | | | 973 | | | | 19,450 | |
| Valley National Bancorp | | 5,152 | | | | 136,580 | |
| W Holding Company, Inc. (Puerto Rico) | † | | | 8,055 | | | | 48,008 | |
| Wachovia Corporation | | 74,687 | | | | 4,253,425 | |
| Washington Federal, Inc. | | 3,379 | | | | 79,508 | |
| Washington Mutual, Inc. | † | | | 37,457 | | | | 1,703,919 | |
| Washington Trust Bancorp, Inc. | | 500 | | | | 13,945 | |
| Webster Financial Corporation | | 2,393 | | | | 116,587 | |
| Wells Fargo & Company | | 123,315 | | | | 4,385,081 | |
| Wesbanco, Inc. | | 1,699 | | | | 56,967 | |
| Westamerica Bancorporation | | 1,628 | | | | 82,426 | |
| Western Alliance Bancorp | * | | | 1,400 | | | | 48,678 | |
| Westfield Financial, Inc. | | 1,240 | | | | 42,904 | |
| Whitney Holding Corporation | | 2,371 | | | | 77,342 | |
| Willow Financial Bancorp Inc. | | 508 | | | | 7,579 | |
See accompanying notes to financial statements.
231
SCHEDULE OF INVESTMENTS—(Continued)
December 31, 2006
Vantagepoint Broad
Market Index Fund
|
|
|
|
|
|
|
| Shares
|
| Value
|
|---|
COMMON STOCKS—(Continued) |
| Wilmington Trust Corporation | | 3,204 | | | $ | 135,113 | |
| Wintrust Financial Corporation | | 1,017 | | | | 48,836 | |
| World Acceptance Corporation | * | | | 639 | | | | 30,001 | |
| Zions Bancorporation | | 4,153 | | | | 342,373 | |
| | | 71,884,883 | |
Beverages, Food & Tobacco—4.4% | | | |
| Alliance One International, Inc. | * | | | 2,000 | | | | 14,120 | |
| Altria Group, Inc. | | 80,960 | | | | 6,947,987 | |
| American Italian Pasta Company Class A | *† | | | 721 | | | | 6,417 | |
| Anheuser-Busch Companies, Inc. | | 28,258 | | | | 1,390,294 | |
| Archer-Daniels-Midland Company | | 23,265 | | | | 743,549 | |
| Bridgford Foods Corporation | * | | | 559 | | | | 3,505 | |
Brown-Forman Corporation
Class B | | 2,437 | | | | 161,427 | |
| Bunge Ltd. | | 4,700 | | | | 340,797 | |
| Campbell Soup Company | | 11,026 | | | | 428,801 | |
| Central European Distribution Corporation | *† | | | 652 | | | | 19,364 | |
Chiquita Brands
International, Inc. | † | | | 2,150 | | | | 34,335 | |
| Coca-Cola Bottling Company Consolidated | | 437 | | | | 29,904 | |
| Coca-Cola Company (The) | | 84,149 | | | | 4,060,189 | |
| Coca-Cola Enterprises, Inc. | | 10,775 | | | | 220,025 | |
| ConAgra Foods, Inc. | | 21,479 | | | | 579,933 | |
| Constellation Brands, Inc. Class A | * | | | 8,096 | | | | 234,946 | |
| Corn Products International, Inc. | | 3,164 | | | | 109,285 | |
| Dean Foods Company | * | | | 6,281 | | | | 265,561 | |
| Del Monte Foods Company | | 8,204 | | | | 90,490 | |
| Delta & Pine Land Company | | 1,668 | | | | 67,471 | |
| Farmer Brothers Company | | 930 | | | | 19,855 | |
| Flowers Foods, Inc. | | 2,760 | | | | 74,492 | |
| Fresh Del Monte Produce, Inc. (Cayman Islands) | | 567 | | | | 8,454 | |
| General Mills, Inc. | | 14,393 | | | | 829,037 | |
Green Mountain Coffee
Roasters, Inc. | * | | | 500 | | | | 24,615 | |
| Hain Celestial Group, Inc. | * | | | 1,426 | | | | 44,505 | |
| Hansen Natural Corporation | * | | | 2,680 | | | | 90,262 | |
| Hershey Company (The) | † | | | 6,420 | | | | 319,716 | |
| HJ Heinz Company | | 12,672 | | | | 570,367 | |
| Hormel Foods Corporation | | 3,195 | | | | 119,301 | |
| Inventure Group, Inc. (The) | * | | | 5,272 | | | | 12,916 | |
| JM Smucker Company (The) | | 2,614 | | | | 126,701 | |
| Kellogg Company | | 10,337 | | | | 517,470 | |
| Kraft Foods, Inc. Class A | † | | | 9,578 | | | | 341,935 | |
| Lancaster Colony Corporation | | 1,389 | | | | 61,547 | |
| Lance, Inc. | | 1,370 | | | | 27,510 | |
Loews Corporation—Carolina
Group | | 2,900 | | | | 187,688 | |
| M&F Worldwide Corporation | * | | | 780 | | | | 19,703 | |
| McCormick & Company, Inc. | | 5,759 | | | | 222,067 | |
| Molson Coors Brewing Company Class B | | 2,911 | | | | 222,517 | |
| Peet’s Coffee & Tea, Inc. | * | | | 637 | | | | 16,715 | |
| Pepsi Bottling Group, Inc. | | 5,177 | | | | 160,021 | |
| PepsiAmericas, Inc. | | 3,031 | | | | 63,590 | |
| Pepsico, Inc. | | 64,903 | | | | 4,059,683 | |
| Performance Food Group Company | * | | | 1,907 | | | | 52,709 | |
| Ralcorp Holdings, Inc. | * | | | 1,228 | | | | 62,493 | |
| Reynolds American, Inc. | † | | | 6,595 | | | | 431,775 | |
| Safeway, Inc. | | 17,256 | | | | 596,367 | |
| Sanderson Farms, Inc. | † | | | 864 | | | | 26,171 | |
| Sara Lee Corporation | | 29,377 | | | | 500,290 | |
|
| Smart & Final, Inc. | * | | | 1,915 | | | $ | 36,193 | |
| Smithfield Foods, Inc. | * | | | 4,682 | | | | 120,140 | |
| Supervalu, Inc. | | 8,154 | | | | 291,505 | |
| Sysco Corporation | | 24,091 | | | | 885,585 | |
| Tootsie Roll Industries, Inc. | | 556 | | | | 18,181 | |
| Topps Company, Inc. (The) | | 2,255 | | | | 20,069 | |
| TreeHouse Foods, Inc. | *† | | | 1,256 | | | | 39,187 | |
| Tyson Foods, Inc. Class A | † | | | 10,231 | | | | 168,300 | |
| UST, Inc. | † | | | 6,881 | | | | 400,474 | |
| United Natural Foods, Inc. | *† | | | 1,912 | | | | 68,679 | |
| Universal Corporation | | 1,078 | | | | 52,833 | |
| Vector Group Ltd. | † | | | 2,276 | | | | 40,399 | |
| WM Wrigley Jr. Company | | 7,657 | | | | 396,020 | |
| | | 28,096,437 | |
Building Materials—1.0% | | | |
| Amcol International Corporation | | 1,186 | | | | 32,900 | |
| Beacon Roofing Supply, Inc. | *† | | | 2,570 | | | | 48,367 | |
| Building Material Holding Corporation | † | | | 1,800 | | | | 44,442 | |
| Carbo Ceramics, Inc. | † | | | 1,137 | | | | 42,490 | |
| Carlisle Companies, Inc. | | 1,226 | | | | 96,241 | |
| Champion Enterprises, Inc. | * | | | 2,559 | | | | 23,952 | |
| Eagle Materials, Inc. | | 2,083 | | | | 90,048 | |
| ElkCorp | | 938 | | | | 38,542 | |
| Florida Rock Industries, Inc. | | 2,697 | | | | 116,106 | |
| Home Depot, Inc. | | 80,722 | | | | 3,241,796 | |
| Interline Brands, Inc. | * | | | 982 | | | | 22,066 | |
| Jewett-Cameron Trading Ltd. (Canada) | * | | | 1,050 | | | | 14,726 | |
| Louisiana-Pacific Corporation | | 4,396 | | | | 94,646 | |
| Lowe’s Companies, Inc. | | 60,510 | | | | 1,884,886 | |
| Martin Marietta Materials, Inc. | | 1,737 | | | | 180,492 | |
| Numerex Corporation Class A | * | | | 1,800 | | | | 16,938 | |
| Owens Corning, Inc. | *† | | | 1,100 | | | | 32,890 | |
| Rock of Ages Corporation | * | | | 1,387 | | | | 5,659 | |
| US Home Systems, Inc. | * | | | 1,291 | | | | 14,666 | |
| USG Corporation | *† | | | 3,348 | | | | 183,470 | |
| Vulcan Materials Company | † | | | 3,294 | | | | 296,032 | |
| Wesco International, Inc. | * | | | 1,550 | | | | 91,155 | |
| | | 6,612,510 | |
Chemicals—1.5% | | | |
| A. Schulman, Inc. | | 1,444 | | | | 32,129 | |
| AEP Industries, Inc. | * | | | 372 | | | | 19,832 | |
| Air Products & Chemicals, Inc. | | 8,040 | | | | 565,051 | |
| Airgas, Inc. | | 3,075 | | | | 124,599 | |
| Albemarle Corporation | | 1,856 | | | | 133,261 | |
| Arch Chemicals, Inc. | | 1,211 | | | | 40,338 | |
| Atlantis Plastics, Inc. Class A | *† | | | 417 | | | | 1,359 | |
| Avery Dennison Corporation | | 4,185 | | | | 284,287 | |
| Cabot Corporation | | 2,693 | | | | 117,334 | |
| Cabot Microelectronics Corporation | *† | | | 1,049 | | | | 35,603 | |
| Celanese Corporation Class A | | 5,993 | | | | 155,099 | |
| CF Industries Holdings, Inc. | | 3,400 | | | | 87,176 | |
| Chemtura Corporation | | 8,873 | | | | 85,447 | |
| Church & Dwight, Inc. | | 2,569 | | | | 109,568 | |
Compass Minerals
International, Inc. | | 2,200 | | | | 69,432 | |
| Cooper Tire & Rubber Company | † | | | 3,066 | | | | 43,844 | |
| Cytec Industries, Inc. | † | | | 1,644 | | | | 92,902 | |
| Dow Chemical Company (The) | | 38,798 | | | | 1,549,592 | |
| Eastman Chemical Company | | 3,211 | | | | 190,444 | |
| EI Du Pont de Nemours & Company | | 35,860 | | | | 1,746,741 | |
| Empire Financial Holding Company | * | | | 1,550 | | | | 4,898 | |
See accompanying notes to financial statements.
232
SCHEDULE OF INVESTMENTS—(Continued)
December 31, 2006
Vantagepoint Broad
Market Index Fund
|
|
|
|
|
|
|
| Shares
|
| Value
|
|---|
COMMON STOCKS—(Continued) |
| FMC Corporation | | 1,668 | | | $ | 127,685 | |
| Female Health Company (The) | *† | | | 4,531 | | | | 6,978 | |
| Georgia Gulf Corporation | | 1,268 | | | | 24,485 | |
| HB Fuller Company | | 2,570 | | | | 66,357 | |
| Hercules, Inc. | * | | | 4,606 | | | | 88,942 | |
| Huntsman Corporation | *† | | | 2,600 | | | | 49,322 | |
International Flavors &
Fragrances, Inc. | | 3,885 | | | | 190,987 | |
| Koppers Holdings, Inc. | | 2,000 | | | | 52,140 | |
| Landec Corporation | * | | | 986 | | | | 10,609 | |
| LSB Industries, Inc. | *† | | | 1,411 | | | | 16,339 | |
| Lubrizol Corporation | | 1,819 | | | | 91,186 | |
| Lyondell Chemical Company | | 7,868 | | | | 201,185 | |
| MacDermid, Inc. | | 1,456 | | | | 49,650 | |
| Minerals Technologies, Inc. | | 868 | | | | 51,030 | |
| Monsanto Company | | 21,546 | | | | 1,131,811 | |
| Mosaic Company (The) | * | | | 4,509 | | | | 96,312 | |
| Myers Industries, Inc. | | 1,716 | | | | 26,873 | |
| NewMarket Corporation | | 1,200 | | | | 70,860 | |
| NL Industries, Inc. | | 2,111 | | | | 21,828 | |
| NuCo2, Inc. | * | | | 1,261 | | | | 31,008 | |
| Olin Corporation | | 2,796 | | | | 46,190 | |
| OM Group, Inc. | * | | | 1,147 | | | | 51,936 | |
| Omnova Solutions, Inc. | * | | | 6,478 | | | | 29,669 | |
| PPG Industries, Inc. | | 7,052 | | | | 452,809 | |
| Penford Corporation | | 785 | | | | 13,580 | |
| Pharmos Corporation | * | | | 1,375 | | | | 2,530 | |
| PolyOne Corporation | * | | | 2,862 | | | | 21,465 | |
| Praxair, Inc. | | 12,623 | | | | 748,923 | |
Scotts Miracle-Gro Company
(The) Class A | | 1,662 | | | | 85,842 | |
| Sensient Technologies Corporation | | 2,027 | | | | 49,864 | |
| Spartech Corporation | | 1,451 | | | | 38,045 | |
| SurModics, Inc. | *† | | | 675 | | | | 21,006 | |
| Trex Company, Inc. | *† | | | 731 | | | | 16,733 | |
| Tronox, Inc. Class B | | 829 | | | | 13,090 | |
| Tupperware Corporation | | 2,427 | | | | 54,874 | |
| UAP Holding Corporation | † | | | 2,800 | | | | 70,504 | |
| Unifi, Inc. | * | | | 2,629 | | | | 6,441 | |
| USEC, Inc. | * | | | 2,637 | | | | 33,543 | |
| Valhi, Inc. | | 511 | | | | 13,276 | |
| W.R. Grace & Company | *† | | | 4,200 | | | | 83,160 | |
| Wellman, Inc. | | 1,509 | | | | 4,814 | |
| West Pharmaceutical Services, Inc. | | 1,704 | | | | 87,296 | |
| | | 9,840,113 | |
Coal—0.2% | | | |
| Alpha Natural Resources, Inc. | * | | | 1,280 | | | | 18,214 | |
| Arch Coal, Inc. | | 4,116 | | | | 123,603 | |
| Consol Energy, Inc. | | 7,462 | | | | 239,754 | |
| Evergreen Energy, Inc. | *† | | | 4,989 | | | | 49,341 | |
| International Coal Group, Inc. | *† | | | 4,900 | | | | 26,705 | |
| James River Coal Company | *† | | | 1,500 | | | | 13,920 | |
| Massey Energy Company | | 3,053 | | | | 70,921 | |
| Natural Resource Partners, LP | | 1,000 | | | | 57,950 | |
| Peabody Energy Corporation | | 10,424 | | | | 421,234 | |
| Penn Virginia Resource Partners, LP | | 1,600 | | | | 41,616 | |
| | | 1,063,258 | |
Commercial Services—1.9% | | | |
| Aaron Rents, Inc. | † | | | 1,939 | | | | 55,804 | |
| ABM Industries, Inc. | | 2,291 | | | | 52,029 | |
| Accenture Ltd. Class A (Bermuda) | | 19,300 | | | | 712,749 | |
| ACCO Brands Corporation | * | | | 1,319 | | | | 34,914 | |
| Administaff, Inc. | † | | | 1,143 | | | | 48,886 | |
| Advisory Board Company (The) | * | | | 950 | | | | 50,863 | |
|
| Advo, Inc. | | 1,276 | | | $ | 41,598 | |
| Akamai Technologies, Inc. | *† | | | 5,664 | | | | 300,872 | |
| Allied Waste Industries, Inc. | * | | | 7,625 | | | | 93,711 | |
| Amerco, Inc. | * | | | 805 | | | | 70,043 | |
| American Railcar Industries, Inc. | | 1,200 | | | | 40,848 | |
| AMN Healthcare Services, Inc. | * | | | 1,507 | | | | 41,503 | |
| Angelica Corporation | | 510 | | | | 13,158 | |
| APAC Customer Services, Inc. | * | | | 1,972 | | | | 7,395 | |
| Avis Budget Group, Inc. | | 4,424 | | | | 95,957 | |
| BISYS Group, Inc. (The) | * | | | 5,178 | | | | 66,848 | |
| Bandag, Inc. | | 1,000 | | | | 50,430 | |
| Barrett Business Services, Inc. | | 2,203 | | | | 51,594 | |
| BearingPoint, Inc. | *† | | | 8,105 | | | | 63,786 | |
| Bowne & Company, Inc. | | 1,575 | | | | 25,105 | |
| Brink’s Company (The) | | 2,360 | | | | 150,851 | |
| CDI Corporation | | 1,131 | | | | 28,162 | |
| Central Parking Corporation | † | | | 1,898 | | | | 34,164 | |
| Cenveo, Inc. | * | | | 2,792 | | | | 59,190 | |
| Chemed Corporation | | 1,162 | | | | 42,971 | |
| Cintas Corporation | | 5,365 | | | | 213,044 | |
| Clean Harbors, Inc. | * | | | 1,207 | | | | 58,431 | |
| Coinstar, Inc. | * | | | 1,075 | | | | 32,863 | |
| Comfort Systems USA, Inc. | | 2,179 | | | | 27,543 | |
| Consolidated Graphics, Inc. | * | | | 776 | | | | 45,838 | |
| Convergys Corporation | * | | | 5,933 | | | | 141,087 | |
| Corporate Executive Board Company | † | | | 1,507 | | | | 132,164 | |
Corrections Corporation
of America | * | | | 2,850 | | | | 128,905 | |
| Courier Corporation | | 424 | | | | 16,523 | |
| CRA International, Inc. | *† | | | 986 | | | | 51,666 | |
| Cytyc Corporation | * | | | 4,240 | | | | 119,992 | |
| Daktronics, Inc. | | 927 | | | | 34,160 | |
| Diamond Management & Technology Consultants, Inc. | | 1,431 | | | | 17,802 | |
| Digitas, Inc. | * | | | 2,891 | | | | 38,768 | |
| Dollar Thrifty Automotive Group, Inc. | * | | | 1,057 | | | | 48,210 | |
| Dun & Bradstreet Company | * | | | 2,641 | | | | 218,648 | |
| EGL, Inc. | * | | | 1,861 | | | | 55,421 | |
| Edgewater Technology, Inc. | * | | | 1,533 | | | | 9,367 | |
| eFunds Corporation | * | | | 2,250 | | | | 61,875 | |
| Ennis Business Forms, Inc. | | 695 | | | | 17,000 | |
| EPIQ Systems, Inc. | *† | | | 725 | | | | 12,303 | |
| Equifax, Inc. | | 4,973 | | | | 201,904 | |
| eResearch Technology, Inc. | *† | | | 2,056 | | | | 13,837 | |
| Escala Group, Inc. | *† | | | 951 | | | | 7,313 | |
| First Aviation Services, Inc. | * | | | 1,818 | | | | 6,545 | |
| First Consulting Group, Inc. | * | | | 1,097 | | | | 15,095 | |
| Fluor Corporation | † | | | 3,405 | | | | 278,018 | |
| Forrester Research, Inc. | * | | | 963 | | | | 26,107 | |
| FTI Consulting, Inc. | *† | | | 1,735 | | | | 48,389 | |
| G&K Services, Inc. Class A | | 1,008 | | | | 39,201 | |
| Geo Group, Inc. (The) | * | | | 1,228 | | | | 46,075 | |
| Gevity HR, Inc. | | 964 | | | | 22,837 | |
| H&E Equipment Services, Inc. | * | | | 1,600 | | | | 39,632 | |
| H&R Block, Inc. | † | | | 11,402 | | | | 262,702 | |
| Harris Interactive, Inc. | * | | | 2,730 | | | | 13,759 | |
| Healthcare Services Group, Inc. | | 2,490 | | | | 72,110 | |
| Heidrick & Struggles International, Inc. | * | | | 865 | | | | 36,641 | |
| Hewitt Associates, Inc. Class A | * | | | 2,317 | | | | 59,663 | |
| Icos Corporation | * | | | 2,748 | | | | 92,855 | |
| I-many, Inc. | * | | | 951 | | | | 1,569 | |
| Inergy, LP | | 1,700 | | | | 50,677 | |
| Infrasource Services, Inc. | * | | | 3,401 | | | | 74,040 | |
| inVentiv Health, Inc. | * | | | 2,100 | | | | 74,235 | |
| Iron Mountain, Inc. | *† | | | 4,764 | | | | 196,944 | |
See accompanying notes to financial statements.
233
SCHEDULE OF INVESTMENTS—(Continued)
December 31, 2006
Vantagepoint Broad
Market Index Fund
|
|
|
|
|
|
|
| Shares
|
| Value
|
|---|
COMMON STOCKS—(Continued) |
| Jacobs Engineering Group, Inc. | * | | | 1,919 | | | $ | 156,475 | |
| John H. Harland Company | | 1,281 | | | | 64,306 | |
| Kelly Services, Inc. Class A | | 1,173 | | | | 33,947 | |
| Kforce.com, Inc. | * | | | 297 | | | | 3,614 | |
| Korn Ferry International | *† | | | 1,624 | | | | 37,287 | |
| Labor Ready, Inc. | * | | | 2,485 | | | | 45,550 | |
| Landauer, Inc. | | 598 | | | | 31,377 | |
| Lazare Kaplan International | * | | | 1,139 | | | | 11,333 | |
| LECG Corporation | * | | | 73 | | | | 1,349 | |
| Lionbridge Technologies, Inc. | * | | | 1,165 | | | | 7,503 | |
Macquarie Infrastructure
Company Trust | | 2,000 | | | | 70,960 | |
| Magellan Health Services, Inc. | * | | | 1,400 | | | | 60,508 | |
Management Network
Group, Inc. | * | | | 1,600 | | | | 2,400 | |
| Manpower, Inc. | | 3,593 | | | | 269,223 | |
| MasterCard, Inc. Class A | † | | | 2,238 | | | | 220,421 | |
| Maximus, Inc. | | 1,052 | | | | 32,381 | |
| Medical Staffing Network Holdings, Inc. | * | | | 1,686 | | | | 9,897 | |
| Metal Management, Inc. | | 1,800 | | | | 68,130 | |
| Midas, Inc. | * | | | 1,277 | | | | 29,371 | |
| Millennium Cell, Inc. | *† | | | 1,700 | | | | 1,598 | |
| Mobile Mini, Inc. | * | | | 2,000 | | | | 53,880 | |
| MoneyGram International, Inc. | | 3,750 | | | | 117,600 | |
| Moody’s Corporation | | 9,284 | | | | 641,153 | |
| MPS Group, Inc. | * | | | 3,706 | | | | 52,551 | |
| MTC Technologies, Inc. | * | | | 619 | | | | 14,577 | |
| National Research Corporation | | 1,250 | | | | 28,575 | |
| Navigant Consulting, Inc. | *† | | | 2,313 | | | | 45,705 | |
| NetRatings, Inc. | * | | | 1,164 | | | | 20,382 | |
| Omnicell, Inc. | * | | | 783 | | | | 14,587 | |
| On Assignment, Inc. | * | | | 1,243 | | | | 14,605 | |
| Online Resources Corporation | * | | | 700 | | | | 7,147 | |
| Opsware, Inc. | *† | | | 2,730 | | | | 24,079 | |
| Overland Storage, Inc. | * | | | 481 | | | | 2,164 | |
| Paychex, Inc. | | 13,545 | | | | 535,569 | |
| PDI, Inc. | * | | | 703 | | | | 7,135 | |
| Pegasystems, Inc. | | 2,141 | | | | 21,132 | |
| Perma-Fix Environmental Services | * | | | 5,502 | | | | 12,765 | |
| Per-Se Technologies, Inc. | *† | | | 1,658 | | | | 46,059 | |
| Pfsweb, Inc. | * | | | 5,683 | | | | 6,251 | |
| PHH Corporation | * | | | 2,212 | | | | 63,860 | |
Portfolio Recovery
Associates, Inc. | *† | | | 504 | | | | 23,532 | |
| Possis Medical, Inc. | * | | | 1,278 | | | | 17,227 | |
| Pre-Paid Legal Services, Inc. | *† | | | 779 | | | | 30,482 | |
| Presstek, Inc. | * | | | 945 | | | | 6,010 | |
| Quanta Services, Inc. | *† | | | 4,702 | | | | 92,488 | |
| RCM Technologies, Inc. | * | | | 1,593 | | | | 9,542 | |
| Regis Corporation | | 1,818 | | | | 71,884 | |
| Rent-A-Center, Inc. | *† | | | 3,377 | | | | 99,655 | |
| Republic Services, Inc. | | 5,629 | | | | 228,931 | |
| Resources Connection, Inc. | * | | | 2,060 | | | | 65,590 | |
| Rewards Network, Inc. | * | | | 1,127 | | | | 7,833 | |
| Robert Half International, Inc. | † | | | 7,107 | | | | 263,812 | |
| Rollins, Inc. | | 661 | | | | 14,615 | |
| RR Donnelley & Sons Company | | 8,887 | | | | 315,844 | |
| Ryder System, Inc. | | 2,660 | | | | 135,820 | |
| Sally Beauty Company, Inc. | * | | | 3,659 | | | | 28,540 | |
| Service Corporation International | | 11,775 | | | | 120,694 | |
| ServiceMaster Company (The) | | 11,826 | | | | 155,039 | |
| Shaw Group, Inc. (The) | * | | | 2,182 | | | | 73,097 | |
| Sitel Corporation | * | | | 2,384 | | | | 10,060 | |
| Sotheby’s Holdings, Inc. Class A | | 2,623 | | | | 81,365 | |
| Spherion Corporation | * | | | 2,689 | | | | 19,979 | |
|
| Standard Register Company (The) | | 1,650 | | | $ | 19,800 | |
| StarTek, Inc. | | 994 | | | | 13,459 | |
Steiner Leisure, Ltd.
(Bahama Islands) | * | | | 1,503 | | | | 68,386 | |
| Stericycle, Inc. | * | | | 1,569 | | | | 118,459 | |
| SupportSoft, Inc. | * | | | 1,562 | | | | 8,560 | |
| Synagro Technologies, Inc. | | 3,224 | | | | 14,250 | |
| Tejon Ranch Company | *† | | | 762 | | | | 42,550 | |
| TeleTech Holdings, Inc. | * | | | 2,738 | | | | 65,383 | |
| Tetra Tech, Inc. | * | | | 2,114 | | | | 38,242 | |
| TRC Companies, Inc. | * | | | 327 | | | | 2,822 | |
| United Rentals, Inc. | *† | | | 3,294 | | | | 83,766 | |
Universal Compression
Holdings, Inc. | * | | | 1,492 | | | | 92,668 | |
| URS Corporation | * | | | 1,582 | | | | 67,789 | |
| Valassis Communications, Inc. | * | | | 2,236 | | | | 32,422 | |
| Varsity Group, Inc. | * | | | 2,747 | | | | 4,862 | |
| Vertrue, Inc. | *† | | | 749 | | | | 28,769 | |
| Viad Corporation | | 937 | | | | 38,042 | |
| Volt Information Sciences, Inc. | * | | | 833 | | | | 41,825 | |
| Waste Connections, Inc. | * | | | 1,575 | | | | 65,441 | |
| Waste Industries USA, Inc. | | 1,296 | | | | 39,554 | |
| Waste Management, Inc. | | 20,986 | | | | 771,655 | |
| Watson Wyatt Worldwide Inc. | | 1,600 | | | | 72,240 | |
Weight Watchers
International, Inc. | | 1,826 | | | | 95,920 | |
| Westaff, Inc. | * | | | 942 | | | | 5,172 | |
| Wind River Systems, Inc. | *† | | | 3,206 | | | | 32,861 | |
| World Fuel Services Corporation | | 960 | | | | 42,682 | |
| Wright Express Corporation | * | | | 1,750 | | | | 54,547 | |
| Xanser Corporation | * | | | 1,100 | | | | 5,346 | |
| | | 12,122,106 | |
Communications—1.5% | | | |
| Ace*Comm Corporation | * | | | 3,033 | | | | 3,791 | |
| ADC Telecommunications, Inc. | * | | | 4,773 | | | | 69,352 | |
| AltiGen Communications, Inc. | * | | | 4,109 | | | | 6,698 | |
| American Tower Corporation Class A | * | | | 15,861 | | | | 591,298 | |
| Anadigics, Inc. | *† | | | 957 | | | | 8,479 | |
| Andrew Corporation | *† | | | 6,376 | | | | 65,226 | |
| Applied Innovation, Inc. | * | | | 500 | | | | 1,605 | |
| Applied Signal Technology, Inc. | | 1,237 | | | | 17,392 | |
| Arris Group, Inc. | * | | | 2,896 | | | | 36,229 | |
| Avaya, Inc. | * | | | 17,294 | | | | 241,770 | |
| Avici Systems, Inc. | *† | | | 711 | | | | 5,510 | |
| Avistar Communications Corporation | * | | | 774 | | | | 1,393 | |
| Blonder Tongue Laboratories | * | | | 2,285 | | | | 3,884 | |
| Broadwing Corporation | * | | | 1,358 | | | | 21,212 | |
| CalAmp Corporation | * | | | 550 | | | | 4,642 | |
| Carrier Access Corporation | * | | | 1,178 | | | | 7,728 | |
| C-COR.net Corporation | * | | | 1,547 | | | | 17,234 | |
Centillium
Communications, Inc. | * | | | 1,588 | | | | 3,398 | |
| Checkpoint Systems, Inc. | * | | | 1,441 | | | | 29,108 | |
| Ciena Corporation | * | | | 2,809 | | | | 77,837 | |
| Comtech Telecommunications | * | | | 1,350 | | | | 51,394 | |
| Comverse Technology, Inc. | * | | | 7,999 | | | | 168,859 | |
| Corning, Inc. | * | | | 57,683 | | | | 1,079,249 | |
| Crown Castle International Corporation | * | | | 8,983 | | | | 290,151 | |
| CT Communications, Inc. | | 214 | | | | 4,905 | |
| Cubic Corporation | | 1,692 | | | | 36,716 | |
| Ditech Networks, Inc. | * | | | 1,360 | | | | 9,411 | |
| EndWave Corporation | * | | | 911 | | | | 9,866 | |
| Foundry Networks, Inc. | * | | | 5,421 | | | | 81,207 | |
| Glenayre Technologies, Inc. | * | | | 2,143 | | | | 5,465 | |
See accompanying notes to financial statements.
234
SCHEDULE OF INVESTMENTS—(Continued)
December 31, 2006
Vantagepoint Broad
Market Index Fund
|
|
|
|
|
|
|
| Shares
|
| Value
|
|---|
COMMON STOCKS—(Continued) |
| Harmonic, Inc. | * | | | 2,820 | | | $ | 20,501 | |
| Harris Corporation | | 6,090 | | | | 279,287 | |
| Hungarian Telephone & Cable Corporation | * | | | 712 | | | | 10,751 | |
| ID Systems, Inc. | *† | | | 2,016 | | | | 37,941 | |
| Integrated Telecom Express, Inc. | ‡d | | | 1,103 | | | | — | |
| InterDigital Communications Corporation | *† | | | 2,803 | | | | 94,041 | |
| Inter-Tel, Inc. | | 1,334 | | | | 29,561 | |
| InterVoice, Inc. | * | | | 1,395 | | | | 10,686 | |
| Intraware, Inc. | * | | | 783 | | | | 5,129 | |
L-3 Communications
Holdings, Inc. | | 5,024 | | | | 410,863 | |
| McData Corporation Class A | * | | | 5,654 | | | | 31,380 | |
| Mindspeed Technologies, Inc. | * | | | 4,009 | | | | 7,657 | |
| Motorola, Inc. | | 95,635 | | | | 1,966,256 | |
| Network Appliance, Inc. | *† | | | 14,316 | | | | 562,332 | |
| NMS Communications Corporation | * | | | 1,250 | | | | 2,562 | |
| On2 Technologies, Inc. | * | | | 4,620 | | | | 5,544 | |
| Openwave Systems, Inc. | * | | | 2,570 | | | | 23,721 | |
| Plantronics, Inc. | | 1,826 | | | | 38,711 | |
| Polycom, Inc. | * | | | 4,177 | | | | 129,111 | |
| Powerwave Technologies, Inc. | * | | | 2,434 | | | | 15,699 | |
| Premiere Global Services, Inc. | * | | | 2,174 | | | | 20,523 | |
| Qualcomm, Inc. | | 64,472 | | | | 2,436,397 | |
| SBA Communications Corporation | * | | | 1,350 | | | | 37,125 | |
| SeaChange International, Inc. | * | | | 958 | | | | 9,791 | |
| Sirius Satellite Radio, Inc. | *† | | | 47,469 | | | | 168,040 | |
| Socket Communications, Inc. | * | | | 1,300 | | | | 1,456 | |
| Sonus Networks, Inc. | * | | | 10,700 | | | | 70,513 | |
| Spectralink Corporation | * | | | 1,133 | | | | 9,744 | |
| Standard Microsystems Corporation | * | | | 806 | | | | 22,552 | |
| Stratex Networks, Inc. | * | | | 2,680 | | | | 12,944 | |
| Syntax-Brillian Corporation | *† | | | 180 | | | | 1,546 | |
| Tekelec | * | | | 2,569 | | | | 38,098 | |
| TeleCorp PCS, Inc. | ‡ | | | 5,507 | | | | — | |
| Tellabs, Inc. | * | | | 19,143 | | | | 196,407 | |
| Tollgrade Communications, Inc. | * | | | 601 | | | | 6,353 | |
| Tut Systems, Inc. | *† | | | 1,414 | | | | 1,584 | |
| Ulticom, Inc. | * | | | 1,583 | | | | 15,181 | |
Universal Security
Instruments, Inc. | * | | | 1,866 | | | | 52,136 | |
| Utstarcom, Inc. | *† | | | 4,555 | | | | 39,856 | |
| Verso Technologies, Inc. | * | | | 1,618 | | | | 1,861 | |
| Viasat, Inc. | * | | | 1,190 | | | | 35,474 | |
| Westell Technologies, Inc. Class A | * | | | 1,821 | | | | 4,552 | |
XM Satellite Radio Holdings,
Inc. Class A | *† | | | 8,921 | | | | 128,908 | |
| Zhone Technologies, Inc. | * | | | 3,915 | | | | 5,129 | |
| Zix Corporation | * | | | 1,015 | | | | 1,208 | |
| Zoom Telephonics, Inc. | * | | | 2,711 | | | | 3,036 | |
| | | 9,953,156 | |
Computer Software & Processing—5.7% | | | |
| 3D Systems Corporation | *† | | | 1,158 | | | | 18,482 | |
| Activision, Inc. | *† | | | 9,514 | | | | 164,021 | |
| Actuate Corporation | * | | | 2,084 | | | | 12,379 | |
| Acxiom Corporation | | 3,451 | | | | 88,518 | |
| Adobe Systems, Inc. | * | | | 22,505 | | | | 925,406 | |
| Advent Software, Inc. | *† | | | 1,451 | | | | 51,206 | |
| Affiliated Computer Services, Inc. Class A | *† | | | 4,289 | | | | 209,475 | |
| Agile Software Corporation | * | | | 2,086 | | | | 12,829 | |
|
| Alliance Data Systems Corporation | * | | | 1,955 | | | $ | 122,129 | |
| Altiris, Inc. | * | | | 974 | | | | 24,720 | |
American Access
Technologies, Inc. | * | | | 1,400 | | | | 1,274 | |
| American Software, Inc. Class A | | 1,950 | | | | 13,513 | |
| AMICAS, Inc. | * | | | 1,846 | | | | 5,427 | |
| answerthink, Inc. | * | | | 1,140 | | | | 3,511 | |
| Ansys, Inc. | * | | | 1,198 | | | | 52,101 | |
| Applix, Inc. | * | | | 6,240 | | | | 70,824 | |
| Arbitron, Inc. | | 1,298 | | | | 56,385 | |
| Ariba, Inc. | * | | | 2,075 | | | | 16,060 | |
| Art Technology Group, Inc. | * | | | 8,333 | | | | 19,416 | |
| Aspen Technology, Inc. | *† | | | 1,529 | | | | 16,850 | |
| At Road, Inc. | * | | | 1,947 | | | | 14,213 | |
| Audible, Inc. | * | | | 1,213 | | | | 9,619 | |
| Autobytel, Inc. | * | | | 1,384 | | | | 4,844 | |
| Autodesk, Inc. | * | | | 9,258 | | | | 374,579 | |
| Automatic Data Processing, Inc. | | 22,994 | | | | 1,132,454 | |
| Avocent Corporation | * | | | 2,007 | | | | 67,937 | |
| BEA Systems, Inc. | * | | | 16,581 | | | | 208,589 | |
| BMC Software, Inc. | * | | | 9,391 | | | | 302,390 | |
| Bankrate, Inc. | *† | | | 1,083 | | | | 41,100 | |
| Blackbaud, Inc. | | 2,650 | | | | 68,900 | |
| Blackboard, Inc. | *† | | | 1,400 | | | | 42,056 | |
| Blue Coat Systems, Inc. | * | | | 536 | | | | 12,837 | |
| Borland Software Corporation | * | | | 2,936 | | | | 15,972 | |
| Brady Corporation Class A | | 2,402 | | | | 89,547 | |
| CA, Inc. | | 17,506 | | | | 396,511 | |
| CMGI, Inc. | * | | | 10,077 | | | | 13,503 | |
| CNET Networks, Inc. | *† | | | 5,501 | | | | 50,004 | |
| CSG Systems International, Inc. | * | | | 2,153 | | | | 57,550 | |
| CACI International, Inc. Class A | * | | | 1,198 | | | | 67,687 | |
| Cadence Design Systems, Inc. | *† | | | 10,745 | | | | 192,443 | |
| Callidus Software, Inc. | * | | | 172 | | | | 1,084 | |
| Captaris, Inc. | * | | | 1,164 | | | | 9,044 | |
| Carreker Corporation | * | | | 1,681 | | | | 12,843 | |
| Ceridian Corporation | * | | | 6,177 | | | | 172,832 | |
| Cerner Corporation | *† | | | 3,044 | | | | 138,502 | |
| Checkfree Corporation | *† | | | 3,356 | | | | 134,777 | |
| Choicepoint, Inc. | * | | | 3,112 | | | | 122,551 | |
| Chordiant Software, Inc. | * | | | 4,648 | | | | 15,385 | |
| Ciber, Inc. | * | | | 2,444 | | | | 16,570 | |
| Citrix Systems, Inc. | * | | | 6,809 | | | | 184,183 | |
| Clinical Data, Inc. | *† | | | 1,332 | | | | 21,379 | |
Cogent Communications
Group, Inc. | * | | | 95 | | | | 1,541 | |
| Cognex Corporation | | 2,023 | | | | 48,188 | |
| Cognizant Technology Solutions Corporation | * | | | 5,276 | | | | 407,096 | |
| Computer Horizons Corporation | * | | | 1,347 | | | | 6,088 | |
| Computer Sciences Corporation | * | | | 6,597 | | | | 352,082 | |
| Compuware Corporation | * | | | 15,945 | | | | 132,822 | |
| Concur Technologies, Inc. | *† | | | 2,083 | | | | 33,411 | |
| Corillian Corporation | * | | | 1,471 | | | | 5,546 | |
| CoStar Group, Inc. | *† | | | 770 | | | | 41,241 | |
| Covansys Corporation | * | | | 1,477 | | | | 33,897 | |
| Cybersource Corporation | * | | | 1,281 | | | | 14,117 | |
| DST Systems, Inc. | *† | | | 2,794 | | | | 174,988 | |
| DealerTrack Holdings, Inc. | * | | | 1,800 | | | | 52,956 | |
| Deluxe Corporation | | 2,098 | | | | 52,870 | |
| Dendrite International, Inc. | * | | | 1,587 | | | | 16,997 | |
| Digital Insight Corporation | * | | | 1,463 | | | | 56,311 | |
| Digital River, Inc. | * | | | 1,627 | | | | 90,770 | |
| DocuCorp International, Inc. | * | | | 449 | | | | 4,571 | |
| Earthlink, Inc. | * | | | 5,814 | | | | 41,279 | |
| ebix.com, Inc. | * | | | 1,754 | | | | 49,024 | |
| Echelon Corporation | *† | | | 1,769 | | | | 14,152 | |
See accompanying notes to financial statements.
235
SCHEDULE OF INVESTMENTS—(Continued)
December 31, 2006
Vantagepoint Broad
Market Index Fund
|
|
|
|
|
|
|
| Shares
|
| Value
|
|---|
COMMON STOCKS—(Continued) |
| Eclipsys Corporation | *† | | | 1,846 | | | $ | 37,954 | |
| eCollege.com, Inc. | *† | | | 635 | | | | 9,938 | |
| Electro Rent Corporation | * | | | 950 | | | | 15,865 | |
| Electronic Arts, Inc. | * | | | 12,060 | | | | 607,342 | |
Electronic Data Systems
Corporation | | 22,135 | | | | 609,819 | |
| Electronics for Imaging | * | | | 2,638 | | | | 70,118 | |
| Embarcadero Technologies, Inc. | * | | | 1,252 | | | | 7,662 | |
| Emdeon Corporation | *† | | | 12,459 | | | | 154,367 | |
| Entrust Technologies, Inc. | * | | | 2,200 | | | | 9,394 | |
| Epicor Software Corporation | * | | | 1,693 | | | | 22,872 | |
| ePresence, Inc. | ‡d | | | 1,173 | | | | — | |
| eSpeed, Inc. Class A | * | | | 1,470 | | | | 12,833 | |
| Evolving Systems, Inc. | * | | | 1,054 | | | | 1,233 | |
| F5 Networks, Inc. | * | | | 1,332 | | | | 98,848 | |
| Factset Research Systems, Inc. | | 1,490 | | | | 84,155 | |
| Fair Isaac Corporation | | 3,039 | | | | 123,535 | |
| FalconStor Software, Inc. | * | | | 1,373 | | | | 11,876 | |
| Fidelity National Information Services, Inc. | | 11,188 | | | | 448,527 | |
| First Data Corporation | | 29,639 | | | | 756,387 | |
| Fiserv, Inc. | * | | | 7,444 | | | | 390,214 | |
| Gartner Group, Inc. Class A | * | | | 1,179 | | | | 23,332 | |
| Gerber Scientific, Inc. | * | | | 1,608 | | | | 20,196 | |
| Google, Inc. Class A | * | | | 8,642 | | | | 3,979,468 | |
| Hypercom Corporation | * | | | 1,992 | | | | 12,649 | |
| Hyperion Solutions Corporation | * | | | 2,527 | | | | 90,820 | |
| IMS Health, Inc. | | 7,150 | | | | 196,482 | |
| iGate Capital Corporation | * | | | 1,397 | | | | 9,611 | |
| Informatica Corporation | * | | | 3,171 | | | | 38,718 | |
| Inforte Corporation | * | | | 1,897 | | | | 7,095 | |
| Infospace, Inc. | * | | | 1,323 | | | | 27,135 | |
| InfoUSA, Inc. | | 1,708 | | | | 20,342 | |
| Integral Systems, Inc. | | 631 | | | | 14,620 | |
| Interactive Data Corporation | | 1,521 | | | | 36,565 | |
| Interactive Intelligence, Inc. | * | | | 950 | | | | 21,299 | |
| Internap Network Services Corporation | *† | | | 1,169 | | | | 23,228 | |
| Interwoven, Inc. | * | | | 1,908 | | | | 27,990 | |
| Intuit, Inc. | * | | | 13,074 | | | | 398,888 | |
| JDA Software Group, Inc. | * | | | 1,256 | | | | 17,295 | |
| Jack Henry & Associates, Inc. | | 3,591 | | | | 76,847 | |
| Juniper Networks, Inc. | * | | | 21,310 | | | | 403,611 | |
| Keane, Inc. | * | | | 2,631 | | | | 31,335 | |
| Keynote Systems, Inc. | * | | | 1,400 | | | | 14,840 | |
| Knot, Inc. (The) | *† | | | 2,304 | | | | 60,457 | |
| Kronos, Inc. | * | | | 1,283 | | | | 47,137 | |
| Lawson Software, Inc. | * | | | 8,700 | | | | 64,293 | |
| LivePerson, Inc. | * | | | 3,333 | | | | 17,432 | |
| Looksmart | * | | | 500 | | | | 2,230 | |
| Magma Design Automation, Inc. | * | | | 1,429 | | | | 12,761 | |
| Manhattan Associates, Inc. | * | | | 1,346 | | | | 40,488 | |
| Mantech International Corporation Class A | * | | | 1,217 | | | | 44,822 | |
| Mapinfo Corporation | * | | | 811 | | | | 10,584 | |
| McAfee, Inc. | * | | | 6,724 | | | | 190,827 | |
| Mediware Information Systems | * | | | 1,088 | | | | 9,096 | |
| Mentor Graphics Corporation | * | | | 2,745 | | | | 49,492 | |
| Microsoft Corporation | | 346,771 | | | | 10,354,582 | |
| MicroStrategy, Inc. Class A | *† | | | 513 | | | | 58,487 | |
| MIVA, Inc. | * | | | 990 | | | | 3,356 | |
Mobius Management
Systems, Inc. | * | | | 878 | | | | 5,839 | |
| Move, Inc. | * | | | 7,362 | | | | 40,565 | |
| NCR Corporation | * | | | 7,848 | | | | 335,580 | |
| Napster, Inc. | * | | | 1,145 | | | | 4,156 | |
|
National Instruments
Corporation | | 3,414 | | | $ | 92,997 | |
| Navisite, Inc. | *† | | | 3,725 | | | | 25,963 | |
| NAVTEQ Corporation | *† | | | 3,700 | | | | 129,389 | |
| Neoware Inc. | * | | | 900 | | | | 11,889 | |
| NetFlix, Inc. | *† | | | 679 | | | | 17,559 | |
| Netscout Systems, Inc. | * | | | 1,250 | | | | 10,375 | |
| Netsmart Technologies, Inc. | * | | | 505 | | | | 8,201 | |
| NIC, Inc. | * | | | 2,450 | | | | 12,176 | |
| Novell, Inc. | * | | | 15,492 | | | | 96,050 | |
| NVE Corporation | *† | | | 348 | | | | 10,691 | |
| Nvidia Corporation | * | | | 13,456 | | | | 498,007 | |
| Open Solutions, Inc. | * | | | 312 | | | | 11,744 | |
| Oracle Corporation | * | | | 157,223 | | | | 2,694,802 | |
| Packeteer, Inc. | * | | | 1,900 | | | | 25,840 | |
| Parametric Technology Corporation | * | | | 4,423 | | | | 79,702 | |
| PDF Solutions, Inc. | * | | | 974 | | | | 14,074 | |
Perot Systems Corporation
Class A | * | | | 4,359 | | | | 71,444 | |
| Phoenix Technologies Ltd. | * | | | 907 | | | | 4,081 | |
| Plato Learning, Inc. | * | | | 1,825 | | | | 9,873 | |
| Progress Software Corporation | * | | | 1,322 | | | | 36,923 | |
| QAD, Inc. | | 1,363 | | | | 11,436 | |
| Quality Systems, Inc. | | 768 | | | | 28,623 | |
| Quest Software, Inc. | *† | | | 3,847 | | | | 56,359 | |
| Radiant Systems, Inc. | * | | | 1,019 | | | | 10,638 | |
| Radisys Corporation | * | | | 961 | | | | 16,020 | |
| RealNetworks, Inc. | * | | | 5,844 | | | | 63,933 | |
| Red Hat, Inc. | *† | | | 7,251 | | | | 166,773 | |
| Renaissance Learning, Inc. | | 1,353 | | | | 23,989 | |
| S1 Corporation | * | | | 2,636 | | | | 14,524 | |
| Saba Software, Inc. | * | | | 1,576 | | | | 9,818 | |
| SafeNet, Inc. | * | | | 1,099 | | | | 26,310 | |
| Salesforce.com, Inc. | * | | | 2,200 | | | | 80,190 | |
| Sapient Corporation | *† | | | 4,150 | | | | 22,783 | |
| Scientific Learning Corporation | * | | | 3,145 | | | | 17,266 | |
| SCO Group, Inc. (The) | *† | | | 997 | | | | 1,127 | |
| Secure Computing Corporation | * | | | 1,554 | | | | 10,194 | |
| Sonic Foundry, Inc. | * | | | 1,200 | | | | 5,640 | |
| SonicWall, Inc. | * | | | 2,442 | | | | 20,562 | |
| SPSS, Inc. | * | | | 690 | | | | 20,748 | |
| SRA International, Inc. Class A | * | | | 1,664 | | | | 44,495 | |
| Stratasys, Inc. | *† | | | 891 | | | | 27,986 | |
| SumTotal Systems, Inc. | * | | | 317 | | | | 1,918 | |
| Sun Microsystems, Inc. | * | | | 135,549 | | | | 734,676 | |
| Sybase, Inc. | * | | | 3,825 | | | | 94,477 | |
| Sykes Enterprises, Inc. | * | | | 1,423 | | | | 25,102 | |
| Symantec Corporation | *† | | | 38,372 | | | | 800,056 | |
| SYNNEX Corporation | * | | | 104 | | | | 2,282 | |
| Synopsys, Inc. | * | | | 6,501 | | | | 173,772 | |
| Synplicity, Inc. | * | | | 1,050 | | | | 6,573 | |
| Syntel, Inc. | | 1,554 | | | | 41,647 | |
Take-Two Interactive
Software, Inc. | *† | | | 2,643 | | | | 46,940 | |
| Talx Corporation | | 1,039 | | | | 28,521 | |
| Technology Solutions Company | * | | | 108 | | | | 744 | |
| THQ, Inc. | *† | | | 2,914 | | | | 94,763 | |
| 3Com Corporation | * | | | 14,501 | | | | 59,599 | |
| TIBCO Software, Inc. | * | | | 8,337 | | | | 78,701 | |
| Total System Services, Inc. | † | | | 1,651 | | | | 43,570 | |
| Tradestation Group, Inc. | *† | | | 1,690 | | | | 23,237 | |
| Transaction Systems Architects, Inc. Class A | * | | | 1,298 | | | | 42,276 | |
| Trizetto Group, Inc. | *† | | | 1,550 | | | | 28,473 | |
| Tumbleweed Communications Corporation | * | | | 1,102 | | | | 2,898 | |
| Ultimate Software Group, Inc. | * | | | 1,242 | | | | 28,889 | |
See accompanying notes to financial statements.
236
SCHEDULE OF INVESTMENTS—(Continued)
December 31, 2006
Vantagepoint Broad
Market Index Fund
|
|
|
|
|
|
|
| Shares
|
| Value
|
|---|
COMMON STOCKS—(Continued) |
| Unisys Corporation | * | | | 13,714 | | | $ | 107,518 | |
| United Online, Inc. | † | | | 2,509 | | | | 33,320 | |
Vasco Data Security
International, Inc. | * | | | 3,804 | | | | 45,077 | |
| Verint Systems, Inc. | * | | | 1,152 | | | | 39,491 | |
| VeriSign, Inc. | * | | | 10,106 | | | | 243,049 | |
| Versant Corporation | * | | | 330 | | | | 4,495 | |
| Viewpoint Corporation | * | | | 1,140 | | | | 764 | |
| Vignette Corporation | * | | | 737 | | | | 12,581 | |
| Vitria Technology, Inc. | * | | | 1,150 | | | | 3,093 | |
Wave Systems Corporation
Class A | *† | | | 1,004 | | | | 2,580 | |
| WebEx Communications, Inc. | * | | | 1,743 | | | | 60,813 | |
| Webmethods, Inc. | * | | | 2,153 | | | | 15,846 | |
| Websense, Inc. | * | | | 1,958 | | | | 44,701 | |
| Witness Systems, Inc. | * | | | 1,980 | | | | 34,709 | |
| XETA Technologies, Inc. | * | | | 1,946 | | | | 6,110 | |
| Yahoo!, Inc. | * | | | 50,447 | | | | 1,288,416 | |
| | | 36,666,718 | |
Computers & Information—3.6% | | | |
| 3M Company | | 27,011 | | | | 2,104,967 | |
| Apple Computer, Inc. | * | | | 33,280 | | | | 2,823,475 | |
| Authentidate Holding Corporation | * | | | 1,023 | | | | 1,637 | |
| Black Box Corporation | | 865 | | | | 36,321 | |
| Brocade Communications Systems, Inc. | * | | | 9,768 | | | | 80,195 | |
| CDW Corporation | | 2,743 | | | | 192,888 | |
| Ciprico, Inc. | * | | | 1,658 | | | | 10,031 | |
| Cirrus Logic, Inc. | * | | | 2,946 | | | | 20,268 | |
| Concurrent Computer Corporation | * | | | 1,901 | | | | 3,441 | |
| Cray, Inc. | * | | | 714 | | | | 8,482 | |
| Dataram Corporation | | 1,175 | | | | 4,923 | |
| Datawatch Corporation | * | | | 3,500 | | | | 9,135 | |
| Dell, Inc. | * | | | 78,317 | | | | 1,964,974 | |
| Diebold, Inc. | † | | | 3,079 | | | | 143,481 | |
| Digi International, Inc. | * | | | 1,976 | | | | 27,249 | |
| Dot Hill Systems Corporation | * | | | 1,396 | | | | 5,486 | |
| EMC Corporation | * | | | 89,450 | | | | 1,180,740 | |
| Emulex Corporation | * | | | 3,408 | | | | 66,490 | |
| Extreme Networks, Inc. | * | | | 4,491 | | | | 18,817 | |
| Focus Enhancements, Inc. | * | | | 5,319 | | | | 8,298 | |
| Gateway, Inc. | * | | | 13,470 | | | | 27,075 | |
| Global Imaging Systems, Inc. | * | | | 1,890 | | | | 41,485 | |
Global Payment
Technologies, Inc. | * | | | 1,270 | | | | 1,778 | |
| Hewlett-Packard Company | | 109,000 | | | | 4,489,710 | |
| Ikon Office Solutions, Inc. | | 5,770 | | | | 94,455 | |
| InFocus Corporation | * | | | 1,636 | | | | 4,368 | |
| Ingram Micro, Inc. Class A | * | | | 6,500 | | | | 132,665 | |
| Insight Enterprises, Inc. | * | | | 2,054 | | | | 38,759 | |
| International Business Machines Corporation | | 59,479 | | | | 5,778,385 | |
| International Game Technology | | 13,866 | | | | 640,609 | |
| Iomega Corporation | * | | | 1,865 | | | | 6,583 | |
| Iteris, Inc. | * | | | 4,263 | | | | 10,231 | |
| Jabil Circuit, Inc. | | 8,287 | | | | 203,446 | |
| Lexmark International, Inc. | * | | | 4,019 | | | | 294,191 | |
| MTI Technology Corporation | * | | | 3,844 | | | | 2,883 | |
| Micros Systems, Inc. | * | | | 1,714 | | | | 90,328 | |
| MTM Technologies, Inc. | * | | | 500 | | | | 770 | |
| Netgear, Inc. | * | | | 1,206 | | | | 31,657 | |
| Network Engines, Inc. | * | | | 1,329 | | | | 3,455 | |
| Nuance Communications, Inc. | *† | | | 4,541 | | | | 52,040 | |
|
| Palm, Inc. | *† | | | 4,574 | | | $ | 64,448 | |
| Paxar Corporation | * | | | 1,971 | | | | 45,451 | |
| Performance Technologies, Inc. | * | | | 793 | | | | 4,750 | |
| Pitney Bowes, Inc. | | 9,192 | | | | 424,578 | |
| Planar Systems, Inc. | * | | | 785 | | | | 7,591 | |
| Precis, Inc. | * | | | 3,538 | | | | 7,076 | |
| ProQuest Company | * | | | 1,332 | | | | 13,919 | |
| Quantum Corporation | * | | | 6,681 | | | | 15,500 | |
| Rackable Systems, Inc. | *† | | | 1,843 | | | | 57,078 | |
| Safeguard Scientifics, Inc. | * | | | 4,073 | | | | 9,857 | |
| SanDisk Corporation | * | | | 8,969 | | | | 385,936 | |
| ScanSource, Inc. | * | | | 1,126 | | | | 34,230 | |
| Scientific Games Corporation Class A | * | | | 2,517 | | | | 76,089 | |
| SCM Microsystems, Inc. | * | | | 1,494 | | | | 4,706 | |
Seagate Technology
(Cayman Islands) | | 20,081 | | | | 532,147 | |
| SimpleTech, Inc. | * | | | 1,055 | | | | 13,377 | |
| Solectron Corporation | * | | | 44,284 | | | | 142,594 | �� |
| Symbol Technologies, Inc. | | 9,570 | | | | 142,976 | |
| Tech Data Corporation | * | | | 2,057 | | | | 77,899 | |
| TransAct Technologies, Inc. | * | | | 888 | | | | 7,344 | |
| VA Software Corporation | * | | | 2,018 | | | | 10,151 | |
| VitalStream Holdings, Inc. | * | | | 250 | | | | 2,510 | |
| Wayside Technology Group, Inc. | † | | | 1,787 | | | | 27,019 | |
| Web.com, Inc. | * | | | 705 | | | | 2,954 | |
| Western Digital Corporation | * | | | 8,154 | | | | 166,831 | |
| Zebra Technologies Corporation Class A | * | | | 2,988 | | | | 103,953 | |
| | | 23,037,135 | |
Containers & Packaging—0.2% | | | |
| Ball Corporation | | 4,676 | | | | 203,874 | |
| Crown Holdings, Inc. | * | | | 6,844 | | | | 143,176 | |
| Greif, Inc. Class A | | 426 | | | | 50,438 | |
| Libbey, Inc. | | 749 | | | | 9,243 | |
| Owens-IIlinois, Inc. | *† | | | 6,064 | | | | 111,881 | |
| Sealed Air Corporation | | 3,527 | | | | 228,973 | |
| Silgan Holdings, Inc. | | 454 | | | | 19,940 | |
| Sonoco Products Company | | 3,353 | | | | 127,615 | |
| Temple-Inland, Inc. | | 4,506 | | | | 207,411 | |
| | | 1,102,551 | |
Cosmetics & Personal Care—1.7% | | | |
| 1-800 Contacts, Inc. | * | | | 502 | | | | 8,188 | |
| Alberto-Culver Company | | 3,659 | | | | 78,486 | |
| Avon Products, Inc. | | 17,888 | | | | 591,020 | |
| Chattem, Inc. | *† | | | 872 | | | | 43,670 | |
| Clorox Company | | 6,558 | | | | 420,696 | |
| Colgate-Palmolive Company | | 20,694 | | | | 1,350,077 | |
| Ecolab, Inc. | † | | | 8,093 | | | | 365,804 | |
| Elizabeth Arden, Inc. | * | | | 1,017 | | | | 19,374 | |
| Estee Lauder Companies (The), Inc., Class A | † | | | 5,057 | | | | 206,427 | |
| Procter & Gamble Company | | 124,151 | | | | 7,979,185 | |
| Quaker Chemical Corporation | | 483 | | | | 10,660 | |
| Stepan Company | | 556 | | | | 17,609 | |
| | | 11,091,196 | |
Education—0.1% | | | |
| Ambassadors International, Inc. | | 523 | | | | 23,859 | |
| Apollo Group, Inc. Class A | *† | | | 5,517 | | | | 214,997 | |
| Career Education Corporation | * | | | 4,167 | | | | 103,258 | |
| Corinthian Colleges, Inc. | * | | | 3,624 | | | | 49,395 | |
| DeVry, Inc. | | 2,980 | | | | 83,440 | |
| ITT Educational Services, Inc. | * | | | 1,873 | | | | 124,311 | |
| Laureate Education, Inc. | * | | | 1,885 | | | | 91,668 | |
See accompanying notes to financial statements.
237
SCHEDULE OF INVESTMENTS—(Continued)
December 31, 2006
Vantagepoint Broad
Market Index Fund
|
|
|
|
|
|
|
| Shares
|
| Value
|
|---|
COMMON STOCKS—(Continued) |
| Learning Tree International, Inc. | * | | | 766 | | | $ | 6,810 | |
| Princeton Review, Inc. | * | | | 818 | | | | 4,319 | |
| Strayer Education, Inc. | | 551 | | | | 58,434 | |
| Universal Technical Institute, Inc. | *† | | | 418 | | | | 9,284 | |
| | | 769,775 | |
Electric Utilities—3.2% | | | |
| AES Corporation (The) | * | | | 25,835 | | | | 569,403 | |
| Allegheny Energy, Inc. | * | | | 5,273 | | | | 242,083 | |
| Allete, Inc. | | 1,243 | | | | 57,849 | |
| Alliant Energy Corporation | | 4,491 | | | | 169,625 | |
| Ameren Corporation | † | | | 8,429 | | | | 452,890 | |
American Electric Power
Company, Inc. | | 16,393 | | | | 698,014 | |
| Aquila, Inc. | * | | | 7,275 | | | | 34,192 | |
| Avista Corporation | | 1,759 | | | | 44,520 | |
| Black Hills Corporation | | 2,041 | | | | 75,395 | |
| CMS Energy Corporation | * | | | 6,681 | | | | 111,573 | |
| Centerpoint Energy, Inc. | † | | | 12,705 | | | | 210,649 | |
| Central Vermont Public Service Corporation | | 540 | | | | 12,717 | |
| CH Energy Group, Inc. | | 694 | | | | 36,643 | |
| Cleco Corporation | | 2,109 | | | | 53,210 | |
| Consolidated Edison, Inc. | | 9,476 | | | | 455,511 | |
| Constellation Energy Group, Inc. | | 7,642 | | | | 526,305 | |
| DTE Energy Company | † | | | 6,985 | | | | 338,144 | |
| Dominion Resources, Inc. | | 14,361 | | | | 1,204,026 | |
| DPL, Inc. | | 5,037 | | | | 139,928 | |
| Duke Energy Corporation | | 47,382 | | | | 1,573,556 | |
| Duquesne Light Holdings, Inc. | | 2,789 | | | | 55,362 | |
| Dynegy, Inc. Class A | * | | | 15,654 | | | | 113,335 | |
| Edison International | | 12,022 | | | | 546,761 | |
| EL Paso Electric Company | * | | | 1,748 | | | | 42,599 | |
Empire District Electric
Company (The) | | 1,197 | | | | 29,554 | |
| Energy East Corporation | | 5,959 | | | | 147,783 | |
| Entergy Corporation | | 8,044 | | | | 742,622 | |
| Exelon Corporation | | 26,142 | | | | 1,617,928 | |
| FPL Group, Inc. | † | | | 14,666 | | | | 798,124 | |
| FirstEnergy Corporation | | 12,802 | | | | 770,808 | |
| Great Plains Energy, Inc. | † | | | 2,828 | | | | 89,930 | |
| Green Mountain Power Corporation | | 1,811 | | | | 61,375 | |
| Hawaiian Electric Industries, Inc. | | 3,066 | | | | 83,242 | |
| Idacorp, Inc. | | 1,515 | | | | 58,555 | |
| KeySpan Corporation | | 7,299 | | | | 300,573 | |
| MGE Energy, Inc. | | 1,559 | | | | 57,028 | |
| Mirant Corporation | * | | | 10,625 | | | | 335,431 | |
| NiSource, Inc. | | 10,893 | | | | 262,521 | |
| Northeast Utilities | | 5,201 | | | | 146,460 | |
| NRG Energy, Inc. | *† | | | 4,000 | | | | 224,040 | |
| NSTAR | | 4,374 | | | | 150,291 | |
| OGE Energy Corporation | | 3,358 | | | | 134,320 | |
| Otter Tail Corporation | | 1,095 | | | | 34,120 | |
| PG&E Corporation | | 13,709 | | | | 648,847 | |
| PPL Corporation | | 14,691 | | | | 526,525 | |
| Pepco Holdings, Inc. | | 7,066 | | | | 183,787 | |
| Pinnacle West Capital Corporation | | 3,789 | | | | 191,875 | |
| Plug Power, Inc. | * | | | 2,704 | | | | 10,519 | |
| PNM Resources, Inc. | | 2,169 | | | | 67,456 | |
| Portland General Electric Company | | 1,100 | | | | 29,975 | |
| Progress Energy, Inc. | | 10,169 | | | | 499,095 | |
| Public Service Enterprise Group, Inc. | | 9,757 | | | | 647,670 | |
| Puget Energy, Inc. | | 3,548 | | | | 89,977 | |
| Reliant Energy, Inc. | * | | | 11,470 | | | | 162,989 | |
| SCANA Corporation | | 4,791 | | | | 194,610 | |
| Sempra Energy | | 8,687 | | | | 486,211 | |
|
| Sierra Pacific Resources | * | | | 3,864 | | | $ | 65,031 | |
| Southern Company (The) | | 30,082 | | | | 1,108,823 | |
| TXU Corporation | | 17,958 | | | | 973,503 | |
| TECO Energy, Inc. | † | | | 7,797 | | | | 134,342 | |
| UIL Holdings Corporation | | 1,496 | | | | 63,116 | |
| Unisource Energy Corporation | | 1,571 | | | | 57,389 | |
| Unitil Corporation | | 420 | | | | 10,647 | |
| Westar Energy, Inc. | | 4,032 | | | | 104,671 | |
| Wisconsin Energy Corporation | | 4,564 | | | | 216,607 | |
| WPS Resources Corporation | | 1,431 | | | | 77,317 | |
| Xcel Energy, Inc. | † | | | 16,552 | | | | 381,689 | |
| | | 20,741,666 | |
Electrical Equipment—2.8% | | | |
| Active Power, Inc. | * | | | 1,093 | | | | 2,864 | |
| Acuity Brands, Inc. | | 1,873 | | | | 97,471 | |
| Aeroflex, Inc. | * | | | 2,811 | | | | 32,945 | |
| Ametek, Inc. | | 4,234 | | | | 134,811 | |
| AZZ, Inc. | * | | | 1,031 | | | | 52,787 | |
| Baldor Electric Company | | 1,338 | | | | 44,716 | |
| BSML, Inc. | *† | | | 1,080 | | | | 1,879 | |
| C&D Technologies, Inc. | † | | | 1,159 | | | | 5,494 | |
| Capstone Turbine Corporation | *† | | | 2,450 | | | | 3,013 | |
| Cataytica Energy Systems, Inc. | * | | | 852 | | | | 1,764 | |
| Cooper Industries, Ltd. Class A (Bermuda) | | 3,973 | | | | 359,278 | |
| Distributed Energy Systems Corporation | * | | | 3,756 | | | | 13,522 | |
| Electro Scientific Industries, Inc. | * | | | 1,421 | | | | 28,619 | |
| Emerson Electric Company | | 32,010 | | | | 1,410,681 | |
| Energizer Holdings, Inc. | * | | | 1,856 | | | | 131,757 | |
| Energy Conversion Devices, Inc. | *† | | | 781 | | | | 26,538 | |
| Evans & Sutherland Computer Corporation | * | | | 1,882 | | | | 7,961 | |
| Franklin Electric Company, Inc. | | 902 | | | | 46,354 | |
| FuelCell Energy, Inc. | *† | | | 1,938 | | | | 12,519 | |
| General Electric Company | | 406,733 | | | | 15,134,535 | |
| Genlyte Group, Inc. | * | | | 1,102 | | | | 86,077 | |
| GrafTech International Ltd. | * | | | 3,487 | | | | 24,130 | |
| Greatbatch, Inc. | * | | | 942 | | | | 25,359 | |
| Lincoln Electric Holdings, Inc. | | 1,877 | | | | 113,408 | |
| Littelfuse, Inc. | * | | | 909 | | | | 28,979 | |
| LSI Industries, Inc. | | 1,083 | | | | 21,498 | |
| Medis Technologies Ltd. | *† | | | 704 | | | | 12,271 | |
| Moog, Inc. Class A | * | | | 1,446 | | | | 55,223 | |
| Powell Industries, Inc. | * | | | 1,045 | | | | 32,991 | |
| Quantum Fuel Systems Technologies Worldwide, Inc. | *† | | | 2,809 | | | | 4,494 | |
| Regal-Beloit Corporation | | 1,272 | | | | 66,793 | |
| Servotronics, Inc. | * | | | 705 | | | | 5,883 | |
| Spectrum Brands, Inc. | *† | | | 1,490 | | | | 16,241 | |
| Superconductor Technologies | * | | | 208 | | | | 368 | |
| Tech/Ops Sevcon, Inc. | | 719 | | | | 5,680 | |
| Teleflex, Inc. | | 1,322 | | | | 85,348 | |
| Thomas & Betts Corporation | * | | | 2,428 | | | | 114,796 | |
| Trans-Lux Corporation | | 866 | | | | 6,833 | |
| Ultralife Batteries, Inc. | *† | | | 416 | | | | 4,580 | |
| Universal Display Corporation | *† | | | 1,350 | | | | 20,263 | |
| Universal Electronics, Inc. | * | | | 639 | | | | 13,432 | |
| Valence Technology, Inc. | *† | | | 6,972 | | | | 11,504 | |
| Vicor Corporation | | 1,380 | | | | 15,332 | |
| | | 18,320,991 | |
Electronics—4.1% | | | |
| 8X8, Inc. | * | | | 3,048 | | | | 3,566 | |
| AVX Corporation | † | | | 2,270 | | | | 33,573 | |
| Actel Corporation | * | | | 1,140 | | | | 20,702 | |
| Adaptec, Inc. | * | | | 3,850 | | | | 17,941 | |
See accompanying notes to financial statements.
238
SCHEDULE OF INVESTMENTS—(Continued)
December 31, 2006
Vantagepoint Broad
Market Index Fund
|
|
|
|
|
|
|
| Shares
|
| Value
|
|---|
COMMON STOCKS—(Continued) |
| Advanced Energy Industries, Inc. | * | | | 1,428 | | | $ | 26,946 | |
| Advanced Micro Devices, Inc. | * | | | 21,447 | | | | 436,446 | |
| Agere Systems, Inc. | * | | | 6,929 | | | | 132,829 | |
| Agilent Technologies, Inc. | * | | | 16,481 | | | | 574,363 | |
| Agilysys, Inc. | | 1,335 | | | | 22,348 | |
Alliance Fiber Optic
Products, Inc. | * | | | 4,817 | | | | 9,730 | |
| Altera Corporation | * | | | 14,718 | | | | 289,650 | |
| American Power Conversion Corporation | | 8,237 | | | | 251,970 | |
| American Superconductor Corporation | *† | | | 1,147 | | | | 11,252 | |
| AMIS Holdings, Inc. | * | | | 850 | | | | 8,984 | |
| Amkor Technology, Inc. | *† | | | 7,211 | | | | 67,351 | |
| Amphenol Corporation Class A | | 3,688 | | | | 228,951 | |
| Analog Devices, Inc. | | 15,241 | | | | 500,972 | |
| Anaren, Inc. | * | | | 813 | | | | 14,439 | |
| Anixter International, Inc. | * | | | 1,723 | | | | 93,559 | |
| Applied Micro Circuits Corporation | * | | | 12,746 | | | | 45,376 | |
| Arrow Electronics, Inc. | * | | | 4,585 | | | | 144,657 | |
| Atheros Communications, Inc. | * | | | 2,700 | | | | 57,564 | |
| Atmel Corporation | * | | | 18,733 | | | | 113,335 | |
| ATMI, Inc. | *† | | | 1,559 | | | | 47,596 | |
| Avanex Corporation | * | | | 5,030 | | | | 9,507 | |
| Avnet, Inc. | *† | | | 5,129 | | | | 130,943 | |
| AXT, Inc. | * | | | 946 | | | | 4,465 | |
| Barnes Group, Inc. | | 2,018 | | | | 43,892 | |
| Bel Fuse, Inc. Class A | | 545 | | | | 16,443 | |
| Belden CDT, Inc. | | 1,894 | | | | 74,036 | |
| Benchmark Electronics, Inc. | *† | | | 2,520 | | | | 61,387 | |
| Broadcom Corporation Class A | * | | | 16,147 | | | | 521,710 | |
| California Micro Devices Corporation | * | | | 745 | | | | 3,263 | |
| Caliper Life Sciences, Inc. | * | | | 867 | | | | 4,959 | |
| Catalyst Semiconductor, Inc. | * | | | 2,415 | | | | 8,308 | |
| Catapult Communications Corporation | * | | | 750 | | | | 6,735 | |
| Ceradyne, Inc. | *† | | | 1,867 | | | | 105,486 | |
| Ceva, Inc. | * | | | 692 | | | | 4,477 | |
| Cisco Systems, Inc. | * | | | 240,426 | | | | 6,570,843 | |
| Concord Camera Corporation | * | | | 572 | | | | 2,574 | |
| Conexant Systems, Inc. | * | | | 20,460 | | | | 41,738 | |
| Cree, Inc. | *† | | | 3,097 | | | | 53,640 | |
| CTS Corporation | | 1,580 | | | | 24,806 | |
| Cymer, Inc. | * | | | 1,498 | | | | 65,837 | |
| Cypress Semiconductor Corporation | *† | | | 4,876 | | | | 82,258 | |
| DRS Technologies, Inc. | | 1,486 | | | | 78,282 | |
| Diodes, Inc. | * | | | 1,600 | | | | 56,768 | |
| Dolby Laboratories, Inc. Class A | * | | | 1,370 | | | | 42,497 | |
| DSP Group, Inc. | * | | | 1,194 | | | | 25,910 | |
| Eastman Kodak Company | † | | | 11,893 | | | | 306,839 | |
| EDO Corporation | † | | | 1,198 | | | | 28,441 | |
| Emcor Group, Inc. | * | | | 1,454 | | | | 82,660 | |
| Emcore Corporation | *† | | | 1,219 | | | | 6,741 | |
| EMS Technologies, Inc. | * | | | 960 | | | | 19,229 | |
| ESCO Technologies, Inc. | * | | | 1,222 | | | | 55,528 | |
| ESS Technology | * | | | 1,759 | | | | 1,812 | |
| Esterline Technologies Corporation | * | | | 1,049 | | | | 42,201 | |
| Exar Corporation | * | | | 1,758 | | | | 22,854 | |
| Fairchild Semiconductor International, Inc. | * | | | 4,903 | | | | 82,419 | |
| Finisar Corporation | *† | | | 6,855 | | | | 22,142 | |
| Flir Systems, Inc. | *† | | | 2,804 | | | | 89,251 | |
| FSI International, Inc. | * | | | 1,479 | | | | 7,794 | |
|
| Garmin Ltd. (Cayman Islands) | † | | | 4,774 | | | $ | 265,721 | |
| HEI, Inc. | * | | | 1,050 | | | | 1,586 | |
| HI/FN, Inc. | * | | | 681 | | | | 3,637 | |
| Hutchinson Technology, Inc. | *† | | | 1,149 | | | | 27,082 | |
| Imation Corporation | | 1,564 | | | | 72,617 | |
| Innovex, Inc. | * | | | 1,922 | | | | 3,344 | |
Integrated Device
Technology, Inc. | * | | | 8,168 | | | | 126,441 | |
| Integrated Silicon Solutions, Inc. | * | | | 1,269 | | | | 7,297 | |
| Intel Corporation | | 227,315 | | | | 4,603,129 | |
| International Rectifier Corporation | * | | | 2,631 | | | | 101,372 | |
| Intersil Corporation Class A | | 5,757 | | | | 137,707 | |
| IXYS Corporation | * | | | 1,329 | | | | 11,828 | |
| JDS Uniphase Corporation | *† | | | 7,444 | | | | 124,017 | |
| Kemet Corporation | * | | | 3,407 | | | | 24,871 | |
| KVH Industries, Inc. | * | | | 375 | | | | 3,979 | |
| LSI Logic Corporation | * | | | 15,734 | | | | 141,606 | |
| Lattice Semiconductor Corporation | * | | | 4,395 | | | | 28,480 | |
Lightpath Technologies, Inc.
Class A | *† | | | 1,526 | | | | 7,203 | |
| Linear Technology Corporation | | 12,363 | | | | 374,846 | |
| MIPS Technologies, Inc. Class A | * | | | 2,228 | | | | 18,492 | |
| MRV Communications, Inc. | * | | | 4,567 | | | | 16,167 | |
| Magnetek, Inc. | * | | | 1,406 | | | | 7,944 | |
| Marvell Technology Group Ltd. (Bermuda) | *† | | | 18,500 | | | | 355,015 | |
| Mattson Technology, Inc. | * | | | 1,760 | | | | 16,403 | |
| Maxim Integrated Products, Inc. | | 12,341 | | | | 377,881 | |
| Maxwell Technologies, Inc. | *† | | | 370 | | | | 5,162 | |
| MEMC Electronics Materials, Inc. | * | | | 5,481 | | | | 214,526 | |
| Mercury Computer Systems, Inc. | * | | | 963 | | | | 12,866 | |
| Merix Corporation | * | | | 674 | | | | 6,261 | |
| Methode Electronics, Inc. | | 1,383 | | | | 14,978 | |
| Micrel, Inc. | * | | | 3,731 | | | | 40,220 | |
| Microchip Technology, Inc. | | 8,640 | | | | 282,528 | |
| Micron Technology, Inc. | * | | | 25,902 | | | | 361,592 | |
| Microsemi Corporation | * | | | 2,474 | | | | 48,614 | |
| Mobility Electronics, Inc. | * | | | 674 | | | | 2,258 | |
| Molex, Inc. | † | | | 5,599 | | | | 177,096 | |
| Moscow CableCom Corporation | * | | | 1,900 | | | | 20,102 | |
| MoSys, Inc. | * | | | 1,251 | | | | 11,572 | |
| Nashua Corporation | * | | | 1,541 | | | | 12,898 | |
| National Semiconductor Corporation | | 14,384 | | | | 326,517 | |
| Novellus Systems, Inc. | *† | | | 6,320 | | | | 217,534 | |
| Nu Horizons Electronics Corporation | *† | | | 1,207 | | | | 12,420 | |
| Omnivision Technologies, Inc. | *† | | | 2,354 | | | | 32,132 | |
| ON Semiconductor Corporation | *† | | | 4,276 | | | | 32,369 | |
| Oplink Communications, Inc. | * | | | 758 | | | | 15,584 | |
| Optelecom, Inc. | *† | | | 819 | | | | 8,591 | |
| OSI Systems, Inc. | *† | | | 867 | | | | 18,146 | |
| Park Electrochemical Corporation | | 1,086 | | | | 27,856 | |
| Pericom Semiconductor Corporation | * | | | 1,023 | | | | 11,734 | |
| Photronics, Inc. | * | | | 1,388 | | | | 22,680 | |
| Pixelworks, Inc. | * | | | 1,927 | | | | 4,413 | |
| Plexus Corporation | * | | | 1,884 | | | | 44,990 | |
| PLX Technology, Inc. | * | | | 1,050 | | | | 13,692 | |
| Power-One, Inc. | * | | | 3,459 | | | | 25,182 | |
| QLogic Corporation | * | | | 7,842 | | | | 171,897 | |
| Quicklogic Corporation | * | | | 1,050 | | | | 3,119 | |
| RF Micro Devices, Inc. | * | | | 7,206 | | | | 48,929 | |
| Rambus, Inc. | *† | | | 4,071 | | | | 77,064 | |
| Raytheon Company | | 18,171 | | | | 959,429 | |
| Research Frontiers, Inc. | *† | | | 752 | | | | 4,113 | |
See accompanying notes to financial statements.
239
SCHEDULE OF INVESTMENTS—(Continued)
December 31, 2006
Vantagepoint Broad
Market Index Fund
|
|
|
|
|
|
|
| Shares
|
| Value
|
|---|
COMMON STOCKS—(Continued) |
| Rockwell Collins, Inc. | | 7,347 | | | $ | 464,992 | |
| Rogers Corporation | * | | | 803 | | | | 47,497 | |
| Sanmina-SCI Corporation | * | | | 21,464 | | | | 74,051 | |
| Semtech Corporation | * | | | 2,970 | | | | 38,818 | |
| Sigmatel, Inc. | * | | | 797 | | | | 3,491 | |
| Sigmatron International, Inc. | * | | | 282 | | | | 2,594 | |
| Silicon Image, Inc. | * | | | 2,948 | | | | 37,499 | |
| Silicon Laboratories, Inc. | *† | | | 2,124 | | | | 73,597 | |
| Silicon Storage Technology, Inc. | * | | | 3,793 | | | | 17,106 | |
| Sirenza Microdevices, Inc. | * | | | 525 | | | | 4,127 | |
| Skyworks Solutions, Inc. | * | | | 5,822 | | | | 41,220 | |
| Sonic Solutions, Inc. | *† | | | 889 | | | | 14,491 | |
| Spansion LLC Class A | * | | | 1,900 | | | | 28,234 | |
| Spectrum Control, Inc. | * | | | 1,195 | | | | 11,615 | |
| Spire Corporation | *† | | | 2,500 | | | | 20,700 | |
| Stratos International, Inc. | * | | | 973 | | | | 7,395 | |
| Sycamore Networks, Inc. | * | | | 9,917 | | | | 37,288 | |
| Synaptics, Inc. | * | | | 1,057 | | | | 31,382 | |
| Technitrol, Inc. | | 1,866 | | | | 44,579 | |
| Tegal Corporation | * | | | 312 | | | | 1,931 | |
| Teledyne Technologies, Inc. | * | | | 1,228 | | | | 49,280 | |
| Terabeam, Inc. | * | | | 2,197 | | | | 4,372 | |
| Teradyne, Inc. | *† | | | 7,938 | | | | 118,752 | |
| Tessera Technologies, Inc. | *† | | | 1,560 | | | | 62,930 | |
| Texas Instruments, Inc. | | 59,784 | | | | 1,721,779 | |
| Transmeta Corporation | * | | | 5,029 | | | | 5,582 | |
| Transwitch Corporation | * | | | 2,483 | | | | 3,476 | |
| Trident Microsystems, Inc. | * | | | 3,018 | | | | 54,867 | |
| Trimble Navigation Ltd. | * | | | 2,072 | | | | 105,113 | |
| Triquint Semiconductor, Inc. | * | | | 4,918 | | | | 22,131 | |
| TTM Technologies, Inc. | * | | | 1,639 | | | | 18,570 | |
| Tvia, Inc. | * | | | 4,026 | | | | 4,308 | |
| Tyler Technologies, Inc. | * | | | 1,886 | | | | 26,517 | |
Varian Semiconductor
Equipment Associates, Inc. | * | | | 2,245 | | | | 102,192 | |
| Virage Logic Corporation | * | | | 901 | | | | 8,370 | |
| Vishay Intertechnology, Inc. | * | | | 6,172 | | | | 83,569 | |
| Xerox Corporation | * | | | 36,218 | | | | 613,895 | |
| Xilinx, Inc. | | 15,105 | | | | 359,650 | |
| Zoran Corporation | * | | | 1,650 | | | | 24,057 | |
| | | 26,502,521 | |
Entertainment & Leisure—1.7% | | | |
| Avid Technology, Inc. | *† | | | 1,448 | | | | 53,952 | |
| Bally Technologies, Inc. | * | | | 1,971 | | | | 36,818 | |
| Bally Total Fitness Holding Corporation | *† | | | 1,306 | | | | 3,200 | |
| Blockbuster, Inc. Class A | * | | | 7,850 | | | | 41,527 | |
| Callaway Golf Company | | 2,881 | | | | 41,515 | |
| Cedar Fair, LP | | 2,300 | | | | 63,986 | |
| Churchill Downs, Inc. | | 638 | | | | 27,268 | |
| Discovery Holding Company Class A | * | | | 10,903 | | | | 175,429 | |
| Dover Downs Gaming & Entertainment, Inc. | | 1,710 | | | | 22,863 | |
| Dover Motorsports, Inc. | | 1,645 | | | | 8,735 | |
| DreamWorks Animation SKG, Inc. Class A | *† | | | 1,300 | | | | 38,337 | |
| Gaylord Entertainment Company | * | | | 1,772 | | | | 90,248 | |
| Harrah’s Entertainment, Inc. | | 7,234 | | | | 598,396 | |
| Hasbro, Inc. | | 7,242 | | | | 197,345 | |
| Hollywood Media Corporation | * | | | 1,494 | | | | 6,290 | |
| Image Entertainment, Inc. | * | | | 299 | | | | 1,044 | |
International Speedway
Corporation Class A | | 1,190 | | | | 60,738 | |
| Jakks Pacific, Inc. | *† | | | 925 | | | | 20,202 | |
|
| K2, Inc. | * | | | 2,544 | | | $ | 33,555 | |
| Leapfrog Enterprises, Inc. | *† | | | 1,261 | | | | 11,954 | |
| Live Nation, Inc. | *† | | | 2,705 | | | | 60,592 | |
| Macrovision Corporation | * | | | 2,053 | | | | 58,018 | |
| Mattel, Inc. | | 16,641 | | | | 377,085 | |
| Multimedia Games, Inc. | *† | | | 1,202 | | | | 11,539 | |
| National Lampoon, Inc. | * | | | 3,300 | | | | 7,392 | |
| Nautilus Group, Inc. | † | | | 1,359 | | | | 19,026 | |
| New Frontier Media, Inc. | * | | | 3,808 | | | | 36,595 | |
| News Corporation, Inc. Class A | | 91,998 | | | | 1,976,117 | |
| Penn National Gaming, Inc. | * | | | 2,586 | | | | 107,629 | |
| Pinnacle Entertainment, Inc. | * | | | 1,629 | | | | 53,985 | |
| Pool Corporation | † | | | 2,434 | | | | 95,340 | |
| RC2 Corporation | * | | | 1,650 | | | | 72,600 | |
Regal Entertainment Group
Class A | † | | | 2,743 | | | | 58,481 | |
| Six Flags, Inc. | *† | | | 3,814 | | | | 19,985 | |
| Speedway Motorsports, Inc. | | 149 | | | | 5,722 | |
Steinway Musical
Instruments, Inc. | * | | | 683 | | | | 21,166 | |
| Time Warner, Inc. | | 158,821 | | | | 3,459,121 | |
| Walt Disney Company | | 76,460 | | | | 2,620,284 | |
| Westwood One, Inc. | | 4,247 | | | | 29,984 | |
| WMS Industries, Inc. | *† | | | 1,269 | | | | 44,237 | |
World Wrestling
Entertainment, Inc. | | 1,030 | | | | 16,789 | |
| | | 10,685,089 | |
Environmental—0.1% | | | |
| Aetrium, Inc. | * | | | 614 | | | | 2,186 | |
| Analogic Corporation | | 593 | | | | 33,291 | |
| Cohu, Inc. | | 859 | | | | 17,317 | |
| Credence Systems Corporation | * | | | 2,727 | | | | 14,180 | |
| Dionex Corporation | * | | | 1,031 | | | | 58,468 | |
| Formfactor, Inc. | * | | | 1,417 | | | | 52,783 | |
| Frequency Electronics, Inc. | | 821 | | | | 9,811 | |
| Itron, Inc. | * | | | 955 | | | | 49,507 | |
| Ixia | * | | | 2,330 | | | | 22,368 | |
| LTX Corporation | * | | | 2,405 | | | | 13,468 | |
| MKS Instruments, Inc. | * | | | 2,455 | | | | 55,434 | |
| Mine Safety Appliances Company | | 1,444 | | | | 52,923 | |
| MTS Systems Corporation | | 1,342 | | | | 51,828 | |
| OI Corporation | | 1,600 | | | | 18,240 | |
| Orbit International Corporation | * | | | 2,812 | | | | 22,946 | |
| Photon Dynamics, Inc. | * | | | 659 | | | | 7,704 | |
| Rudolph Technologies, Inc. | * | | | 1,247 | | | | 19,852 | |
| Tektronix, Inc. | | 3,804 | | | | 110,963 | |
| Therma-Wave, Inc. | * | | | 757 | | | | 901 | |
| Thermogenesis | * | | | 4,316 | | | | 18,602 | |
| Veeco Instruments, Inc. | * | | | 1,294 | | | | 24,237 | |
| White Electronic Designs Corporation | * | | | 514 | | | | 2,796 | |
| X-Rite, Inc. | | 1,890 | | | | 23,247 | |
| | | 683,052 | |
Financial Services—4.0% | | | |
| Accredited Home Lenders Holding Company | * | | | 729 | | | | 19,887 | |
| Affiliated Managers Group | *† | | | 1,354 | | | | 142,346 | |
| AG Edwards, Inc. | | 3,542 | | | | 224,173 | |
| AllianceBernstein Holding, LP | | 1,100 | | | | 88,440 | |
| Ameriprise Financial, Inc. | | 9,235 | | | | 503,308 | |
| Ampal American Israel Corporation Class A | * | | | 1,391 | | | | 6,663 | |
Bear Stearns Companies,
Inc. (The) | | 4,068 | | | | 662,189 | |
Berkshire Hathaway, Inc.
Class A | * | | | 40 | | | | 4,399,600 | |
See accompanying notes to financial statements.
240
SCHEDULE OF INVESTMENTS—(Continued)
December 31, 2006
Vantagepoint Broad
Market Index Fund
|
|
|
|
|
|
|
| Shares
|
| Value
|
|---|
COMMON STOCKS—(Continued) |
| BlackRock, Inc. | † | | | 539 | | | $ | 81,874 | |
| Calamos Asset Management, Inc. Class A | | 1,800 | | | | 48,294 | |
| Catskill Litigation Trust | *‡d | | | 582 | | | | — | |
| Cbot Holdings, Inc. Class A | *† | | | 1,430 | | | | 216,602 | |
| Charles Schwab Corporation (The) | | 40,347 | | | | 780,311 | |
| CharterMac | | 1,905 | | | | 40,900 | |
| Cherokee, Inc. | | 994 | | | | 42,653 | |
| Chicago Mercantile Exchange | † | | | 1,115 | | | | 568,371 | |
Countrywide Financial
Corporation | | 24,520 | | | | 1,040,874 | |
Diamond Hill Investment
Group, Inc. | * | | | 1,310 | | | | 109,686 | |
Doral Financial Corporation
(Puerto Rico) | | 4,427 | | | | 12,706 | |
| E*Trade Financial Corporation | * | | | 14,978 | | | | 335,807 | |
| Eaton Vance Corporation | | 5,282 | | | | 174,359 | |
| Federated Investors, Inc. Class B | | 4,508 | | | | 152,280 | |
| Franklin Resources, Inc. | | 6,114 | | | | 673,579 | |
| GAMCO Investors, Inc. Class A | | 558 | | | | 21,461 | |
| Goldman Sachs Group, Inc. | | 14,402 | | | | 2,871,039 | |
| IntercontinentalExchange, Inc. | * | | | 1,933 | | | | 208,571 | |
Investment Technology
Group, Inc. | * | | | 2,078 | | | | 89,105 | |
| Janus Capital Group, Inc. | | 9,990 | | | | 215,684 | |
| Jefferies Group, Inc. | | 4,678 | | | | 125,464 | |
| Kent Financial Services, Inc. | * | | | 2,200 | | | | 5,192 | |
Knight Capital Group, Inc.
Class A | * | | | 4,630 | | | | 88,757 | |
| LaBranche & Company, Inc. | *† | | | 2,588 | | | | 25,440 | |
| Lazard, Ltd. Class A (Bermuda) | † | | | 1,519 | | | | 71,909 | |
| Legg Mason, Inc. | | 5,250 | | | | 499,013 | |
| Lehman Brothers Holdings, Inc. | | 21,084 | | | | 1,647,082 | |
| Merrill Lynch & Company, Inc. | | 35,777 | | | | 3,330,839 | |
| Morgan Stanley | | 38,240 | | | | 3,113,883 | |
| Nasdaq Stock Market Inc. | *† | | | 3,400 | | | | 104,686 | |
| Navidec Financial Services, Inc. | ‡ | | | 2,119 | | | | — | |
| NexCen Brands, Inc. | * | | | 1,368 | | | | 9,891 | |
| NTL, Inc. | † | | | 8,979 | | | | 226,630 | |
| Nuveen Investments, Inc. Class A | | 2,324 | | | | 120,569 | |
| NYSE Group, Inc. | *† | | | 2,070 | | | | 201,204 | |
| Principal Financial Group | | 11,001 | | | | 645,759 | |
| Raymond James Financial, Inc. | | 3,472 | | | | 105,236 | |
| SEI Investments Company | | 2,959 | | | | 176,238 | |
| Siebert Financial Corporation | | 1,469 | | | | 5,685 | |
| Superior Bancorp | † | | | 895 | | | | 10,149 | |
| SWS Group, Inc. | | 882 | | | | 31,487 | |
| T Rowe Price Group, Inc. | | 10,332 | | | | 452,232 | |
| TD Ameritrade Holding Corporation | | 9,311 | | | | 150,652 | |
| Value Line, Inc. | | 573 | | | | 26,043 | |
| Waddell & Reed Financial, Inc. Class A | | 3,971 | | | | 108,647 | |
| Western Union Company (The) | | 31,890 | | | | 714,974 | |
| Westwood Holdings Group, Inc. | | 1,027 | | | | 23,652 | |
| | | 25,752,075 | |
Food Retailers—0.3% | | | |
| Arden Group, Inc. Class A | | 260 | | | | 32,191 | |
| Kroger Company (The) | | 26,279 | | | | 606,257 | |
| Panera Bread Company Class A | *† | | | 1,250 | | | | 69,888 | |
| Pantry, Inc. (The) | *† | | | 1,200 | | | | 56,208 | |
| Pathmark Stores, Inc. | * | | | 950 | | | | 10,593 | |
| Ruddick Corporation | | 1,967 | | | | 54,584 | |
| Starbucks Corporation | * | | | 29,904 | | | | 1,059,200 | |
| Weis Markets, Inc. | | 382 | | | | 15,322 | |
|