The Vantagepoint Funds benefited from these market gains at levels indicative of their asset class and style focus.
A discussion of each Fund’s 2007 investment results follows, beginning on page 8.
As mentioned above, U.S. domestic equity markets began 2007 by extending gains from the prior four years. As the year progressed, performance generally trended upward until mid-July. Mid-year, U.S. equity market volatility increased substantially and markets dipped in late July and early August, largely triggered by turmoil in the subprime mortgage market and the ensuing concerns that weakness would spread to other risk-based assets. The equity markets recovered to new highs in early October, followed by a downward drift through year-end as markets reflected the spreading impact of subprime issues, recession concerns and declining investor confidence. Corporate earnings growth for the broad market turned negative for the first time in several years. While the markets welcomed initial Federal Reserve interest rate cuts in the Fall, the third cut on December 11, 2007, of 0.25%, was met with general disappointment as investors generally felt the rate cut was insufficient to bolster the economic slump.
There was broad dispersion between equity market returns across different market segments and investment styles. Following an eight year preference for value-oriented stocks, growth-oriented stocks performed relatively better as their valuations appeared attractive. While growth stocks provided positive returns, with large-capitalization stocks leading mid- and small-capitalization
stocks, value stocks produced negative returns for the year. As a result of financial market stress in the latter half of the year, the Financial sector was hardest hit, producing a negative 16.20% return in 2007 (within the Russell 1000 Index). Consumer Discretionary and Homebuilding-related stocks were also among the hardest hit. Among sectors performing relatively well, Energy, Integrated Oils and Technology stocks were among the highest performers. These differences explain in large part the relative performance of individual investments and mutual funds in 2007.
International Equity Returns Aided by Weaker Dollar
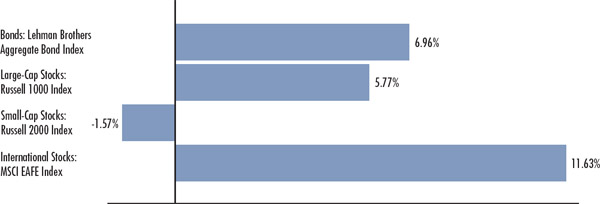
International markets followed a pattern of returns throughout the year similar to those of the U.S. market. International markets, measured by the Morgan Stanley Capital International (MSCI) Europe Australasia Far East (EAFE) Index, posted the fifth consecutive year of positive returns. They outperformed the U.S. equity market for the sixth consecutive year, albeit at lower absolute levels. For U.S. Dollar based investors, the majority of international returns during 2007 were due to the declining value of the U.S. dollar relative to foreign currencies. As a result, while the MSCI EAFE rose 11.63% in U.S. Dollar terms, the MSCI EAFE rose 3.97% in local currency terms, with the difference reflecting the declining value of the U.S. Dollar relative to other currencies. The Pacific Rim countries, excluding Japan, provided the highest returns with a positive 31.73%, followed by European markets with a positive 14.39%, and Japan lagging with a negative 4.14% return. Emerging markets, which are not reflected in the MSCI EAFE Index, generally led developed foreign markets as globalization and strong commodities prices bolstered emerging market economies across the globe.
Bonds Benefit from Lower Interest Rates and Investor Risk Aversion
Bond market performance in 2007 was a tale of two halves. The first half of the year saw solid job growth, a short lived infla-tion scare, gradually higher U.S. Treasury rates and slightly wider sector spreads. While housing market problems began to more visibly impact the financial markets, the Federal Reserve maintained its hold on the Federal Funds target rate, reflecting its concern about inflationary pressures. The second half of 2007 saw slower job creation, the Federal Reserve’s move to provide more liquidity following escalating subprime issues, and significantly lower U.S. Treasury rates. Interest rates decreased and U.S. Treasury prices dramatically increased due to investors’ flight-to-quality, sparked by stock market volatility and weakness in the housing market, particularly the subprime mortgage market. The Federal Reserve cut the Federal Funds target rate three times starting with a 0.50% cut in September, which was quickly followed by two 0.25% moves during the fourth quarter, ending with a rate of 4.25%.
All major fixed income markets saw positive returns during the year aided by the decrease in U.S. Treasury rates, but the discrepancies among sectors were rather large. The Lehman Brothers Aggregate Bond Index returned 6.96% for the year, the Lehman Brothers Mortgage-Backed Index followed closely behind at 6.90%, and the Lehman Brothers Investment Grade Corporate Index returned 4.56%. Treasury Inflation Protected Securities provided meaningfully higher returns — 11.64% as measured by the Lehman Brothers U.S. TIPS Index — benefiting from investors’ inflation fears. Given short-term interest rate levels over the course of the year, shorter-term bonds and money market funds produced relatively attractive results in the 4-5% range. Lower quality and sectors associated with the subprime mortgage market, including Asset Backed and High Yield securities, provided meaningfully lower, albeit positive, returns. As in other capital market results, the dispersion of returns across segments of the bond market largely explains the relative performance of individual securities and fixed income mutual funds in 2007.
The Vantagepoint Funds’ 2007 Enhancements
Consistent with The Vantagepoint Fund’s contribution to helping investors build retirement security for themselves and their families, The Vantagepoint Funds added three new funds during 2007, updated two existing funds, and increased the asset class and investment strategy diversification within the Model Portfolio Funds and the Milestone Funds.
In October, the Vantagepoint Select Value Fund, a mid-capitalization value equity fund with the objective of offering long-term growth from dividend income and capital appreciation, was funded. The Fund’s portfolio allocation is divided equally between three complementary subadvisers: Goldman Sachs Asset Management, L.P., WEDGE Capital Management L.L.P., and Systematic Financial Management, L.P.
The Vantagepoint Discovery Fund, a small-capitalization blend equity fund with the objective of offering long-term capital growth, was funded in October. The Fund’s portfolio allocation is divided equally between Wellington Management Company LLP, and Payden & Rygel.
The Vantagepoint Diversified Assets Fund, a multi-strategy fund, with the objective of offering long-term capital growth, was funded in October and is available exclusively through the Model Portfolio Funds and the Milestone Funds. The Fund’s portfolio is allocated among four subadvisers: Drake Capital Management, LLC; Analytic Investors, LLC; Payden & Rygel; and Mellon Capital Management Corporation.
4
Concurrent with the October commencement of operations of the three new Vantagepoint Funds, the Vantagepoint Model Portfolio Funds’ and the Vantagepoint Milestone Funds’ portfolios were re-optimized to include allocations to the above three new Funds, as appropriate for each Milestone Fund and Model Portfolio Fund.
In May, the Vantagepoint US Government Securities Fund was transitioned to become the Vantagepoint Inflation Protected Securities Fund, with the same objective of offering current income, but with a new strategy. As such, the Fund became primarily invested in inflation adjusted fixed income securities that seek to offer inflation protection. The Fund’s subadviser line-up was altered coincident with the change, and at year-end was comprised of Pacific Investment Management Company and BlackRock Financial Management, Inc.
Also in May, the name of the Vantagepoint Short-Term Bond Fund changed to the Vantagepoint Low Duration Bond Fund and it underwent a change to its principal investment strategy to better reflect the type of bonds in which the Fund invests. The Fund’s investment objective remained unchanged.
We continue to seek to manage The Vantagepoint Funds with the goal of producing above-average results over the longer-term, with below-average volatility over the shorter-term. By using independent third-party subadvisers to manage certain Funds’ assets, we have the flexibility to seek managers who we believe show potential to provide consistency of style and results. Investors can feel comfortable that The Vantagepoint Funds are managed with the ultimate goal in mind – investor success.
Sincerely,
Vantagepoint Investment Advisers, LLC
The information herein was obtained from various sources; we do not guarantee its accuracy or completeness. Neither the information nor any opinion expressed constitutes an offer, or an invitation to make an offer, to buy or sell any securities. This information is intended for educational purposes only and is not to be construed as investment advice, nor does it have regard to the individual investment objectives, financial situation or the particular needs of any specific person who may receive this report. Investors should seek financial advice regarding the appropriateness of investing in any securities or using any investment strategies discussed here and should understand that statements regarding future prospects may not be realized. Investors should note that returns, if any, from investing in securities, will fluctuate and that each security price or value may rise or fall. Accordingly, investors may receive back less than originally invested. Past performance is not an indicator of future performance. The Vantagepoint Funds are distributed by ICMA-RC Services, LLC, a wholly owned broker-dealer subsidiary of ICMA-RC and member FINRA/SIPC. 1-800-669-7400.
5
Shareholder Expenses
As a shareholder of a Vantagepoint Fund, you incur ongoing expenses, such as advisory fees, investor services fees, fund services fees and other fund expenses. The following example is intended to help you understand your ongoing expenses (in dollars and cents) of investing in a fund and to compare these expenses with the ongoing expenses of investing in other mutual funds.
The example is based on an investment of $1,000 invested at the beginning of the period and held for the entire period from July 1, 2007 to December 31, 2007.
Actual Expenses
The first section in the example below provides information about the actual account values and actual expenses. You may use the information in this line, together with the amount you invested, to estimate the expenses that you paid over the period. Simply divide your account value by $1,000 (for example, an $8,600 account value divided by $1,000 = 8.6), then multiply the result by the number for your fund under the heading entitled “Expenses Paid During Period” to estimate the expenses you paid on your account during this period.
Hypothetical Example for Comparison Purposes
The second section in the example below provides information about the hypothetical account values and hypothetical expenses based on each fund’s actual expense ratio and an assumed rate of return of 5% per year before expenses, which is not the fund’s actual return. The hypothetical account values and expenses may not be used to estimate the actual ending account balance or expenses you paid for the period. You may use this information to compare the ongoing costs of investing in your fund and other funds. To do so, compare this 5% hypothetical example with the 5% hypothetical examples that appear in the shareholder reports of the other funds.
| | | | | | | | | | | | | | | | | |
ACTUAL | | | | HYPOTHETICAL |
| | | | | |
Beginning
Account
Value
7/01/07 | | Ending
Account
Value
12/31/07 | | 2007
Annualized
Expense
Ratio | | Expenses
Paid
During
Period* | | Vantagepoint
Funds | | Beginning
Account
Value
7/01/07 | | Ending
Account
Value
12/31/07 | | 2007
Annualized
Expense
Ratio | | Expenses
Paid
During
Period* |
| | | | | | | | | | | | | | | | | |
$1,000.00 | | $ | 1,023.20 | | 0.62% | | $3.18 | | Money Market*** | | $1,000.00 | | $1,022.20 | | 0.62% | | $3.18 |
$1,000.00 | | $ | 1,033.20 | | 0.65% | | $3.35 | | Low Duration Bond | | $1,000.00 | | $1,022.00 | | 0.65% | | $3.33 |
$1,000.00 | | $ | 1,094.90 | | 0.71% | | $3.77 | | Inflation Protected Securities | | $1,000.00 | | $1,021.70 | | 0.71% | | $3.64 |
$1,000.00 | | $ | 999.40 | | 0.74% | | $3.75 | | Asset Allocation | | $1,000.00 | | $1,021.60 | | 0.74% | | $3.79 |
$1,000.00 | | $ | 945.90 | | 0.87% | | $4.29 | | Equity Income | | $1,000.00 | | $1,020.90 | | 0.87% | | $4.46 |
$1,000.00 | | $ | 984.40 | | 0.80% | | $4.02 | | Growth & Income | | $1,000.00 | | $1,021.30 | | 0.80% | | $4.10 |
$1,000.00 | | $ | 1,014.20 | | 0.87% | | $4.44 | | Growth | | $1,000.00 | | $1,020.90 | | 0.87% | | $4.46 |
$1,000.00 | | $ | 941.50 | | 1.04% | | $1.71 | | Select Value** | | $1,000.00 | | $1,006.70 | | 1.04% | | $1.77 |
$1,000.00 | | $ | 947.00 | | 1.02% | | $5.03 | | Aggressive Opportunities | | $1,000.00 | | $1,020.20 | | 1.02% | | $5.22 |
$1,000.00 | | $ | 935.40 | | 1.07% | | $1.76 | | Discovery** | | $1,000.00 | | $1,006.70 | | 1.07% | | $1.82 |
$1,000.00 | | $ | 1,028.10 | | 1.10% | | $5.65 | | International | | $1,000.00 | | $1,019.80 | | 1.10% | | $5.63 |
$1,000.00 | | $ | 999.30 | | 1.04% | | $1.77 | | Diversified Assets** | | $1,000.00 | | $1,006.70 | | 1.04% | | $1.77 |
$1,000.00 | | $ | 1,056.90 | | 0.44% | | $2.29 | | Core Bond Index Class I | | $1,000.00 | | $1,023.10 | | 0.44% | | $2.26 |
$1,000.00 | | $ | 1,058.90 | | 0.24% | | $1.25 | | Core Bond Index Class II | | $1,000.00 | | $1,024.30 | | 0.24% | | $1.23 |
$1,000.00 | | $ | 984.80 | | 0.45% | | $2.26 | | 500 Stock Index Class I | | $1,000.00 | | $1,023.00 | | 0.45% | | $2.31 |
$1,000.00 | | $ | 984.70 | | 0.25% | | $1.26 | | 500 Stock Index Class II | | $1,000.00 | | $1,024.20 | | 0.25% | | $1.28 |
$1,000.00 | | $ | 979.30 | | 0.44% | | $2.21 | | Broad Market Index Class I | | $1,000.00 | | $1,023.10 | | 0.44% | | $2.26 |
$1,000.00 | | $ | 980.70 | | 0.24% | | $1.20 | | Broad Market Index Class II | | $1,000.00 | | $1,023.10 | | 0.24% | | $1.23 |
$1,000.00 | | $ | 960.80 | | 0.50% | | $2.48 | | Mid / Small Company Index Class I | | $1,000.00 | | $1,022.80 | | 0.50% | | $2.56 |
$1,000.00 | | $ | 961.90 | | 0.30% | | $1.49 | | Mid / Small Company Index Class II | | $1,000.00 | | $1,023.80 | | 0.30% | | $1.54 |
$1,000.00 | | $ | 999.50 | | 0.61% | | $3.09 | | Overseas Equity Index Class I | | $1,000.00 | | $1,022.30 | | 0.61% | | $3.13 |
$1,000.00 | | $ | 1,000.30 | | 0.41% | | $2.08 | | Overseas Equity Index Class II | | $1,000.00 | | $1,023.30 | | 0.41% | | $2.10 |
$1,000.00 | | $ | 1,029.80 | | 0.83% | | $4.27 | | Model Portfolio Savings Oriented*** | | $1,000.00 | | $1,021.10 | | 0.83% | | $4.25 |
$1,000.00 | | $ | 1,021.00 | | 0.86% | | $4.40 | | Model Portfolio Conservative Growth*** | | $1,000.00 | | $1,021.00 | | 0.86% | | $4.40 |
$1,000.00 | | $ | 1,009.90 | | 0.92% | | $4.69 | | Model Portfolio Traditional Growth*** | | $1,000.00 | | $1,020.70 | | 0.92% | | $4.71 |
$1,000.00 | | $ | 1,002.70 | | 0.98% | | $4.97 | | Model Portfolio Long-Term Growth*** | | $1,000.00 | | $1,020.40 | | 0.98% | | $5.02 |
$1,000.00 | | $ | 986.70 | | 1.08% | | $5.44 | | Model Portfolio All-Equity Growth*** | | $1,000.00 | | $1,019.90 | | 1.08% | | $5.53 |
$1,000.00 | | $ | 1,025.40 | | 0.81% | | $4.16 | | Milestone Retirement Income*** | | $1,000.00 | | $1,021.20 | | 0.81% | | $4.15 |
6
| | | | | | | | | | | | | | | | | | | | | | | | | | | | |
ACTUAL | | | | HYPOTHETICAL |
| | | |
|
Beginning
Account
Value
7/01/07 | | Ending
Account
Value
12/31/07 | | 2007
Annualized
Expense
Ratio | | Expenses
Paid
During
Period* | | Vantagepoint
Funds | | Beginning
Account
Value
7/01/07 | | Ending
Account
Value
12/31/07 | | 2007
Annualized
Expense
Ratio | | Expenses
Paid
During
Period* | |
| |
| |
| |
| |
| |
| |
| |
| |
| |
$1,000.00 | | $ | 1,020.10 | | | 0.88 | % | | $ | 4.51 | | | Milestone 2010*** | | $ | 1,000.00 | | $ | 1,020.90 | | | 0.88 | % | | $ | 4.51 | | |
$1,000.00 | | $ | 1,013.10 | | | 0.90 | % | | $ | 4.59 | | | Milestone 2015*** | | $ | 1,000.00 | | $ | 1,020.80 | | | 0.90 | % | | $ | 4.61 | | |
$1,000.00 | | $ | 1,008.70 | | | 0.93 | % | | $ | 4.73 | | | Milestone 2020*** | | $ | 1,000.00 | | $ | 1,020.60 | | | 0.93 | % | | $ | 4.76 | | |
$1,000.00 | | $ | 1,004.00 | | | 0.95 | % | | $ | 4.82 | | | Milestone 2025*** | | $ | 1,000.00 | | $ | 1,020.50 | | | 0.95 | % | | $ | 4.86 | | |
$1,000.00 | | $ | 999.60 | | | 0.97 | % | | $ | 4.92 | | | Milestone 2030*** | | $ | 1,000.00 | | $ | 1,020.40 | | | 0.97 | % | | $ | 4.97 | | |
$1,000.00 | | $ | 996.80 | | | 0.99 | % | | $ | 5.01 | | | Milestone 2035*** | | $ | 1,000.00 | | $ | 1,020.30 | | | 0.99 | % | | $ | 5.07 | | |
$1,000.00 | | $ | 996.20 | | | 0.99 | % | | $ | 5.01 | | | Milestone 2040*** | | $ | 1,000.00 | | $ | 1,020.30 | | | 0.99 | % | | $ | 5.07 | | |
| |
| |
* | Expenses are calculated using each Fund’s annualized expense ratio (as disclosed in the table), multiplied by the average account value over the period, multiplied by [number of days in most recent fiscal half-year divided by total number of days in fiscal year e.g. 185/365] (to reflect the one-half year period). |
| |
** | Commenced operaions on October 30, 2007. |
| |
*** | This fund invests in one or more other mutual funds. The annualized expense ratio includes this fund’s proportionate share of the expense ratio of such other mutual fund(s). |
7
Vantagepoint Money Market Fund
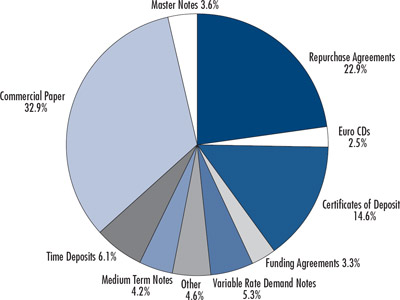
The Vantagepoint Money Market Fund’s objective is to seek maximum current income, consistent with maintaining liquidity and a stable share price of $1.00. The principal investment strategy is to invest substantially all of its assets in the AIM Short-Term Investments Trust Liquid Assets Portfolio, a registered money market mutual fund, which invests in high-quality, U.S. dollar denominated short-term debt obligations. The underlying portfolio of the AIM Short-Term Investments Trust Liquid Assets Portfolio consists of certificates of deposit, bankers’ acceptances and time deposits from U.S. and foreign banks, commercial paper, master notes, securities issued by the U.S. Government and its agency, municipal securities, and repurchase agreements.
Performance
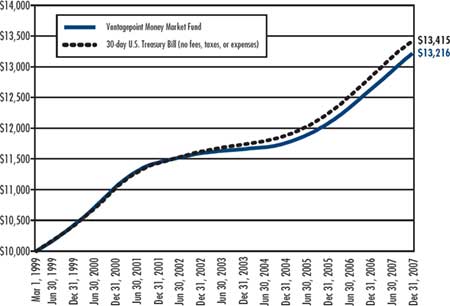
The Vantagepoint Money Market Fund’s total return for the year was 4.75%. The Fund’s unmanaged market benchmark, the 30-day U.S. Treasury Bill, returned 4.66%, while the Fund’s peer group benchmark, the MFR Prime Retail Average, returned 4.58%.
Commentary
The major U.S. fixed income sectors provided positive returns for the year 2007, with U.S. Treasury and higher quality securities outperforming higher risk sectors.
Interest rates increased modestly during the first half of 2007 and generally declined in the second half of the year, beginning early in the third quarter. Investor preference for higher quality securities, particularly U.S. Treasuries, increased, as market values for riskier securities, particularly subprime mortgage related securities, declined, as housing prices continued to decline and economic concerns increased.
In response to increasing economic concerns, stable core inflation, and the increased volatility in security markets, the Federal Reserve lowered the Federal Funds interest rate three times in the second half of the year. The three reductions lowered the Federal Funds rate by a total of one percent, from 5.25% to 4.25%. Interest rates decreased more for shorter-term securities than for longer-term, resulting in a steeper yield curve. The two-year U.S. Treasury yield decreased from 4.81% at the beginning of 2007 to 3.05% at year end, and the ten-year U.S. Treasury yield decreased from 4.70% to 4.02%, with all of the decrease occurring in the second half of the year, following modest increases during the first half of the year.
The Fund’s yield declined during the year in response to the Fed’s rate reductions. The Fund closed the year with a 7-day effective yield of 4.31% and a 7-day current yield of 4.22%, down from a 7-day effective yield of 4.85% and a 7-day current yield of 4.74%, respectively, at the end of 2006.
The Fund’s 0.09% outperformance relative to its benchmark in 2007 was due to the Fund’s credit exposure, as yields for non-Treasury Bills, e.g., commercial paper yields were generally higher than 30-day Treasury Bill yields. The Fund’s 0.17% outperformance relative to the MFR Prime Retail Average was due primarily to the Fund’s below-average expense ratio.
The Fund’s underlying investment, the AIM Short-Term Investments Trust Liquid Assets Portfolio, strives to maintain a weighted average maturity of 90 days or less. At the end of 2007, this fund’s weighted average maturity was 36 days, down from 38 days at the beginning of the year. During 2007, this underlying fund eliminated all exposure to structured investment vehicles. The underlying fund also reduced its exposure to asset-backed securities, repurchase agreements and variable rate demand notes, while increasing its exposure to certificates of deposit and commercial paper.
8
Vantagepoint Money Market Fund
Portfolio Holdings as of December 31, 2007*
* These are the reported holdings of the underlying portfolio of the AIM Short-Term Investments Trust Liquid Assets Portfolio.
9
|
Vantagepoint Money Market Fund vs. 30-day U.S. Treasury Bill:
Growth of $10,000 Invested March 1, 1999* |
| |
Source for Benchmark Returns: lbbotson Associates
| |
Vantagepoint Money Market Fund
Total Return for the periods ended December 31, 2007* |
| |
| |
One Year | 4.75% |
| |
Three Years | 3.98% |
| |
Five Years | 2.66% |
| |
Since Inception | 3.20% |
| |
Fund Inception Date | March 1, 1999 |
* Past performance does not guarantee future results. Investment returns will fluctuate. An investment in the Fund is not insured or guaranteed by the Federal Deposit Insurance Corporation or any other government agency. While the Fund seeks to maintain a stable net asset value of $1 per share, there is no guarantee that it will do so and it is still possible to lose money by investing in the Fund. All returns reflect reinvested dividends but do not include the deduction of taxes that a shareholder would pay on fund distributions or the redemption of fund shares. Please consult the current prospectus carefully before investing any money. The Vantagepoint Funds are distributed by ICMA-RC Services, LLC, a wholly owned broker-dealer subsidiary of ICMA-RC, and member FINRA/SIPC. 800-669-7400.
The Fund’s market benchmark is the 30-day U.S. Treasury Bill, an unmanaged benchmark that does not reflect the cost of portfolio management or trading. The Fund’s portfolio differs significantly from the market index, which is a single security.
10
Vantagepoint Low Duration Bond Fund
The Vantagepoint Low Duration Bond Fund’s objective is to seek total return that is consistent with preservation of capital. The principal investment strategy is to invest, under normal market conditions, at least 80% of assets in bonds of varying maturities. The Fund also normally invests at least 65% of its assets in debt securities with more than one year to maturity, and seeks to maintain a maximum portfolio effective duration of three years.
Performance
The Fund’s total return was 5.24% in 2007. The Fund’s market benchmark, the Merrill Lynch 1-3 Year Government/ Corporate Bond Index, returned 6.87%. The Morningstar Short-Term Bond Funds Category Average, a group of mutual funds with similar investment objectives, returned 4.29%.
Commentary
In May 2007 the Fund’s name became Low Duration Bond Fund, having previously been named the Short-Term Bond Fund. The Fund’s principal investment strategy was changed to better reflect the types of bonds in which the Fund invests. The Fund’s objective was not changed.
The major U.S. fixed income sectors provided positive returns for the year 2007, with U.S. Treasury and higher quality securities outperforming higher risk sectors.
U.S. Treasury rates increased modestly during the first half of the year, generally resulting in negative fixed income market returns in the second quarter, as the economy produced job growth and concerns rose regarding the possibility of increased inflation. The Fund maintained a positive return in the second quarter due primarily to its low duration.
In contrast, rates generally declined in the second half of the year, beginning early in the third quarter. While declining interest rates generally increase the market value of fixed income securities, increased delinquency and default rates for subprime mortgages, along with rating agency downgrades of certain securities, led to significantly reduced market values for mortgage related securities and increased market volatility. Investor preference for higher quality securities, particularly U.S. Treasuries, increased as market values for riskier securities, particularly subprime mortgage-related securities declined, as housing prices continued to decline and economic concerns increased.
In response to increasing economic concerns, stable core inflation, and the increased volatility in security markets, the Federal Reserve lowered the Federal Funds interest rate three times in the second half of the year. The three reductions lowered the Federal Funds rate by a total of one percent, from 5.25% to 4.25%. Interest rates decreased more for shorter-term securities than for longer-term, resulting in a steeper yield curve. The two-year U.S. Treasury yield decreased from 4.81% at the beginning of 2007 to 3.05% at year end, and the ten-year U.S. Treasury yield decreased from 4.70% to 4.02%, with all of the decrease occurring in the second half of the year, following modest increases during the first half of the year. However, the Fund’s absolute performance for 2007 benefited from the general decline in interest rates.
The Fund’s relative overweight exposure to the Financial sector, asset-backed securities, and collateralized mortgage obligations led to underperformance versus the Fund’s market benchmark during the period. Yield curve steepening also negatively impacted the Fund as a result of the Fund’s barbelled maturity structure, while a slightly longer duration was a positive contributor to relative performance. The impact of Fund expenses also detracted from relative performance as benchmark returns do not reflect expenses.
Given market factors, the Fund outperformed the average of its peer group, the Morningstar Short-Term Bond Funds Category, primarily as a result of its concentration at the high end of the credit quality spectrum and its below-average expense ratio.
In VIA’s view, the Fund’s subadvisers, Payden & Rygel and STW Fixed Income Management Ltd., have different, but complementary, approaches to short-term bond investing.
11
| |
Subadviser Data | |
| |
Payden & Rygel | |
| |
| |
Founded: | 1983 |
Investment Style: | Broad-based short duration bond management |
| |
STW Fixed Income Management Ltd. |
| |
| |
Founded: | 1977 |
Investment Style: | Short duration bond management |
Vantagepoint Low Duration Bond Fund
Asset Allocation as of December 31, 2007
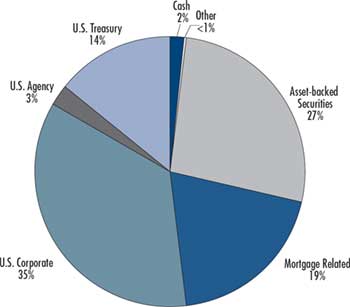
Due to rounding, pie chart allocations may not equal 100%.
12
|
Vantagepoint Low Duration Bond Fund vs. Merrill Lynch 1-3 Government/Corporate Bond Index:
Growth of $10,000 Invested December 4, 2000* |
| |
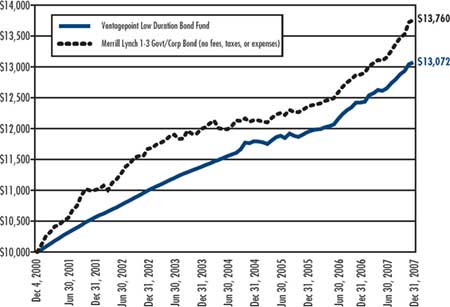
Source for Benchmark Returns: lbbotson Associates
| |
Vantagepoint Low Duration Bond Fund
Total Return for the periods ended December 31, 2007* |
| |
| |
One Year | 5.24% |
| |
Three Years | 3.49% |
| |
Five Years | 3.52% |
| |
Since Inception | 3.87% |
| |
Fund Inception Date | December 4, 2000 |
* On November 8, 2004, the Fund underwent changes to its investment objective, strategies and investment subadvisers. Performance prior to November 8, 2004, should not be considered representative of the performance of the Fund as currently managed. While the Fund’s goal is to achieve long-term investment results similar to those achieved prior to November 8, 2004, there is no assurance that the Fund will be able to do so. On May 1, 2007, the Fund underwent changes to its name and principal investment strategy. Performance prior to May 1, 2007, should not be considered representative of the Fund as currently managed.
Past performance does not guarantee future results. Investment returns and principal value will fluctuate so that shares, when redeemed, may be worth more or less than their original cost. All returns reflect reinvested dividends but do not include the deduction of taxes that a shareholder would pay on fund distributions or the redemption of fund shares. Please consult the current prospectus carefully before investing any money. The Vantagepoint Funds are distributed by ICMA-RC Services, LLC, a wholly owned broker-dealer subsidiary of ICMA-RC, and member FINRA/ SIPC. 800-669-7400.
The Fund’s benchmark is the Merrill Lynch 1-3 Year Government/Corporate Bond Index (“Merrill 1-3”). The Merrill 1-3 tracks the performance of U.S. dollar-denominated investment grade Government and corporate public debt issued in the U.S. domestic bond market with maturities ranging between 1 and 3 years. The index is unmanaged and does not reflect the costs of portfolio management or trading. The Fund’s portfolio may differ significantly from the securities in the market index.
13
Vantagepoint Inflation Protected Securities Fund
The Vantagepoint Inflation Protected Securities Fund’s objective is to offer current income. The principal investment strategy is to invest, under normal circumstances, at least 80% of its net assets in inflation adjusted U.S. and non-U.S. fixed income securities. The Fund will, under normal circumstances, invest at least 50% of its net assets in U.S. Treasury inflation protected securities.
Performance
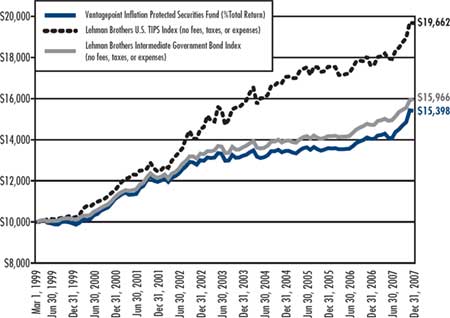
The Fund’s total return was 9.64% in 2007. The Fund’s market benchmark is the Lehman Brothers U.S. TIPS Index.* The Lehman Brothers U.S. TIPS Index returned 11.64% and the Fund’s former market benchmark, Lehman Brothers
Intermediate Government Bond Index, returned 8.46%. The Morningstar Inflation-Protected Bond Fund Category Average, a group of mutual funds with similar investment objectives, returned 9.86%. Its former peer group of mutual funds with similar investment objectives, the Morningstar Intermediate Government Bond Funds Category Average, returned 6.09%.
Commentary
On May 1, 2007, the Fund underwent changes to its name, principal investment strategies and its subadvisers. Before May 1, 2007, the Inflation Protected Securities Fund was named the US Government Securities Fund and invested at least 80% of its assets in securities issued by the U.S. Treasury, U.S. Government agencies, and U.S. Government-sponsored enterprises, including mortgage-backed securities. The Fund now invests at least 80% of its net assets in inflation adjusted U.S. and non-U.S. fixed income securities.
The major U.S. fixed income sectors provided positive returns for the year 2007, with U.S. Treasury and higher quality securities outperforming higher risk sectors.
U.S. Treasury rates increased modestly during the first half of the year, generally resulting in negative fixed income market returns in the second quarter, as the economy produced job growth and concerns increased regarding the possibility of increased inflation. The Fund’s return was modestly positive for the first half of the year.
In contrast, rates generally declined in the second half of the year, beginning early in the third quarter, and market volatility increased. Declining interest rates generally increase the market value of fixed income securities. Investor preference for higher quality securities, particularly U.S. Treasuries, increased as market values for riskier securities, particularly subprime mortgage-related securities, declined, as housing prices continued to decline and economic concerns increased.
In response to increasing economic concerns, stable core inflation, and the increased volatility in security markets, the Federal Reserve lowered the Federal Funds interest rate three times in the second half of the year. The three reductions lowered the Federal Funds rate by a total of one percent, from 5.25% to 4.25%. Interest rates decreased more for shorter-term securities than for longer-term, resulting in a steeper yield curve. The two-year U.S. Treasury yield decreased from 4.81% at the beginning of 2007 to 3.05% at year end, and the ten-year U.S. Treasury yield decreased from 4.70% to 4.02%, with all of the decrease occurring in the second half of the year, following modest increases during the first half of the year.
The yield difference between similar maturity nominal U.S. Treasuries and high quality inflation protected securities, including Treasury Inflation Protected Securities (TIPS), widened. In general, a widening yield spread between securities of similar quality may, in VIA’s view, signal that inflation-related concerns have increased. TIPS are one type of inflation protected security in which the Fund may invest, and the Fund may invest in other inflation protected securities. The five-year maturity U.S. Treasury bonds began the year with a yield advantage of 2.23% over the five-year TIPS, and ended the year with a yield advantage of 2.34%.
The Fund’s performance benefited from three market trends noted above: increasing investor preference for higher quality securities such as U.S. Treasuries, the general decline in market interest rates and the increased difference between the yields for U.S. Treasuries and inflation protected securities. However, the Fund underperformed its new benchmark for 2007 because it was not invested primarily in inflation protected securities until May 1, 2007.
The Fund has two subadvisers, Pacific Investment Management Company (“PIMCO”) and BlackRock Financial Management, Inc. (“BlackRock”). BlackRock was funded and began active management in the fourth quarter. BlackRock provides the Fund with additional diversification benefits, as VIA believes its investment style complements that of PIMCO’s.
* Prior to May 1, 2007, the Fund compared its performance to the Lehman Brothers Intermediate Government Bond Index, an unmanaged market value weighted index of U.S. Government fixed rate debt securities with maturities between one and 10 years. The Fund changed the index to which it compares its performance because the Lehman Brothers U.S. TIPS Index is considered to better reflect the market sectors in which the Fund invests following the change of the Fund’s investment strategy.
14
| |
Subadviser Data | |
| |
Pacific Investment Management Company |
| |
| |
Founded: | 1971 |
Investment Style: | Fixed-Income – Inflation Protected Securities |
| |
BlackRock Financial Management, Inc. |
| |
| |
Founded: | 1988 |
Investment Style: | Fixed-Income – Inflation Protected Securities |
Vantagepoint Inflation Protected Securities Fund
Asset Allocation as of December 31, 2007
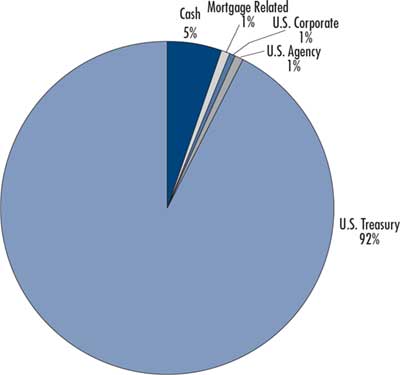
Due to rounding, pie chart allocations may not equal 100%.
15
|
Vantagepoint Inflation Protected Securities Fund vs. Lehman Brothers U.S. TIPS Index
and Lehman Brothers Intermediate Government Bond Index:
Growth of $10,000 Invested March 1, 1999* |
| |
Source for Benchmark Returns: lbbotson Associates
| |
Vantagepoint Inflation Protected Securities Fund
Average Annual Total Return for the periods ended December 31, 2007* |
| |
| |
One Year | 9.64% |
| |
Three Years | 4.62% |
| |
Five Years | 3.45% |
| |
Ten Years | 5.17% |
| |
Fund Inception Date | July 1, 1992 |
| |
Fund Registration Date | March 1, 1999 |
* Past performance does not guarantee future results. Investment returns and principal value will fluctuate so that shares, when redeemed, may be worth more or less than their original cost. Performance information for periods prior to March 1, 1999, when the Fund began operating, is of a commingled fund that had the same investment objectives and policies as the Fund at that time and was advised by an affiliate of the Fund’s adviser. This past performance was adjusted at the time of the Fund’s registration to reflect the expenses of the Fund. The commingled fund was not a registered mutual fund so it was not subject to the same investment and tax restrictions as the Fund. If it had been, the commingled fund’s performance may have been lower. All returns assume reinvested dividends and do not reflect the deduction of taxes that a shareholder would pay on fund distributions or the redemption of fund shares. Please consult the current prospectus carefully before investing any money. The Vantagepoint Funds are distributed by ICMA-RC Services, LLC, a wholly owned broker-dealer subsidiary of ICMA-RC, and member FINRA/ SIPC. 800-669-7400.
The Lehman Brothers U.S. TIPS Index consists of all U.S. Treasury inflation protected securities rated investment grade or better, having at least one year to final maturity and at least $250 million par amount outstanding. An index is not available for direct investment, is unmanaged, and does not reflect the costs of portfolio management or trading. The Fund’s portfolio may differ significantly from the securities held in the indexes.
On May 1, 2007, the Fund underwent changes to its name, principal investment strategies, and investment subadvisers. Performance prior to May 1, 2007 should not be considered representative of the performance of the Fund as currently managed.
16
Vantagepoint Asset Allocation Fund
The Vantagepoint Asset Allocation Fund’s objective is to offer long-term capital growth at a lower level of risk than an all-equity portfolio. The principal investment strategy is to tactically allocate assets among common stocks, U.S. Treasury securities and investment grade short-term debt instruments in proportions determined by the subadviser based on relative expected returns and risk for each asset class. Under normal circumstances, the Fund invests 40% to 70% of its assets in common stocks; however, the Fund’s investments in common stocks may range from as little as 0% to as much as 100% of Fund assets. The Fund invests the rest of its assets in short-term debt instruments and U.S. Treasury obligations.
Performance
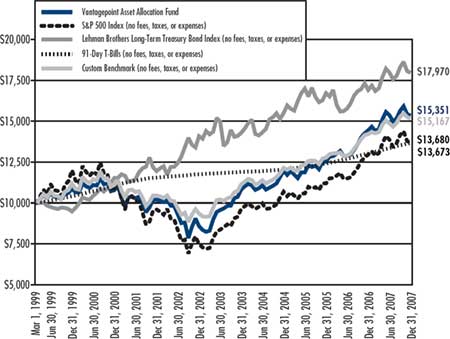
The Fund’s total return was 6.25% for 2007. The Fund’s market benchmarks, the S&P 500 Index, the Lehman Brothers Long-Term Treasury Bond Index, and 91-Day U.S. Treasury Bills, returned 5.49%, 9.81% and 5.00%, respectively, for the year. The Fund’s custom benchmark, a blend of 65% S&P 500 Index, 25% Lehman Brothers Long-Term Treasury Bond Index and 10% 91-Day U.S. Treasury Bills, returned 6.72%. The Fund’s peer group benchmark, the Morningstar Moderate Allocation Funds Category Average, a group of mutual funds with similar investment objectives, returned 5.99%.
Commentary
U.S. stocks generally provided positive returns for the fifth consecutive year, although not uniformly between investment styles and across market capitalizations. In the second half of the year, increasing softness in employment, credit availability, housing, and manufacturing contributed to dampened investor confidence and led to increased volatility in the U.S. equity markets. Increasing investor preference for lower risk assets throughout the second half of the year was reflected in generally higher returns for larger capitalization stocks compared to mid- and smaller-capitalization stocks.
The major U.S. fixed income sectors provided positive returns for the year, with U.S. Treasury and higher quality securities outperforming higher risk sectors.
U.S. Treasury rates increased modestly during the first half of the year, generally resulting in negative fixed income market returns in the second quarter, as the economy produced job growth and concerns increased regarding the possibility of increased inflation.
In contrast, rates generally declined in the second half of the year, beginning early in the third quarter. While declining interest rates generally increase the market value of fixed income securities, increased delinquency and default rates for subprime mortgages, along with rating agency downgrades of certain securities, led to significantly reduced market values for mortgage-related securities and increased market volatility. The Federal Reserve lowered the Federal Funds interest rate three times in the second half of the year as economic concerns increased. The three reductions lowered the Federal Funds rate by a total of one percent, from 5.25% to 4.25%. The two-year U.S. Treasury yield decreased from 4.81% at the beginning of 2007 to 3.05% at year end, and the ten-year U.S. Treasury yield decreased from 4.70% to 4.02%, with all of the decrease occurring in the second half of the year, following modest increases during the first half of the year.
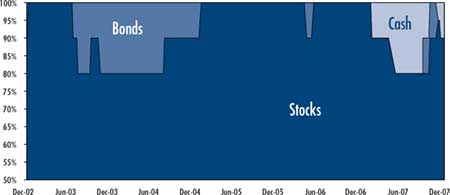
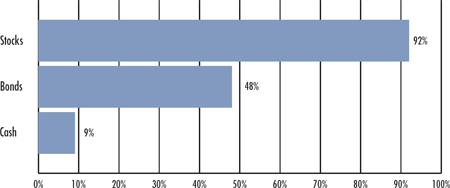
The Fund’s overweight allocation to stocks throughout the year detracted from relative performance, as the Fund slightly underperformed its custom benchmark. However, the Fund slightly outperformed its Morningstar peer group for the period. The Fund began 2007 with a 100% allocation to stocks. Due to market volatility, there were several asset mix shifts throughout the year. The weighting for stocks briefly reached its lowest level since 2003 at 80% in May, and shifted back to the 90% level as the subadviser sought to capture expected returns. Bond and cash exposure fluctuated between 0% and 20% of the Fund during the year. The Fund ended the year at 90% stocks, 0% bonds, and 10% cash.
The year-end 90% allocation to stocks reflects the subadviser’s expectation of favorable stock opportunities relative to those from bonds and cash. Should conditions change that outlook, VIA believes the Fund has the ability to quickly alter its allocation between stocks, bonds and cash for the benefit of the Fund’s investors.
17
| |
Subadviser Data | |
| |
Mellon Capital Management Corporation |
| |
| |
Founded: | 1983 |
Investment Style: | Tactical asset allocation |
Vantagepoint Asset Allocation Fund
Allocation of Assets for the 5 Years Ended December 31, 2007
|
Vantagepoint Asset Allocation Fund vs. S&P 500 Index vs. Lehman Brothers Long-Term
Treasury Bond Index vs. 91-Day T-Bills vs. Custom Benchmark:
Growth of $10,000 Invested March 1, 1999* |
| |
Source for Benchmark Returns: lbbotson Associates
18
| |
Vantagepoint Asset Allocation Fund
Average Annual Total Return for the periods ended December 31, 2007* |
| |
| |
One Year | 6.25% |
| |
Three Years | 8.66% |
| |
Five Years | 12.32% |
| |
Ten Years | 6.48% |
| |
Fund Inception Date | December 1, 1974 |
| |
Fund Registration Date | March 1, 1999 |
* Past performance does not guarantee future results. Investment returns and principal value will fluctuate so that shares, when redeemed, may be worth more or less than their original cost. Performance information for periods prior to March 1, 1999, when the Fund began operating, is of a commingled fund that had the same investment objectives and policies as the Fund and was advised by an affiliate of the Fund’s adviser. This past performance was adjusted at the time of the Fund’s registration to reflect the expenses of the Fund. The commingled fund was not a registered mutual fund so it was not subject to the same investment and tax restrictions as the Fund. If it had been, the commingled fund’s performance may have been lower. All returns assume reinvested dividends and do not reflect the deduction of taxes that a shareholder would pay on fund distributions or the redemption of fund shares. Please consult the current prospectus carefully before investing any money. The Vantagepoint Funds are distributed by ICMA-RC Services, LLC, a wholly owned broker-dealer subsidiary of ICMA-RC, and member FINRA/SIPC. 800-669-7400.
The Fund’s custom blended benchmark is comprised of 65% S&P 500 Index, 25% Lehman Brothers Long-Term Treasury Bond Index and 10% 91-Day Treasury Bills. The S&P 500 Index consists of 500 companies representing larger capitalization stocks traded in the U.S. The Lehman Brothers Long-Term Treasury Bond Index consists of all Treasury obligations with maturities of 10 years or greater. The indexes are unmanaged and do not reflect the costs of portfolio management or trading. The Fund’s portfolio may differ significantly from the securities in the indexes.
19
Vantagepoint Equity Income Fund
The Vantagepoint Equity Income Fund seeks long-term capital growth with consistency derived from dividend yield. The principal investment strategy is to invest, under normal circumstances, at least 80% of its net assets in equity securities. The Fund seeks to invest primarily in the common stocks of companies that are expected to pay dividends at above-market levels. The Fund may invest across companies of all sizes but generally focuses on large-capitalization companies, which tend to have the most stable long-term earnings and dividend-paying records. The Fund may also invest in investment and below investment grade bonds, convertible securities and securities of foreign issuers.
Performance
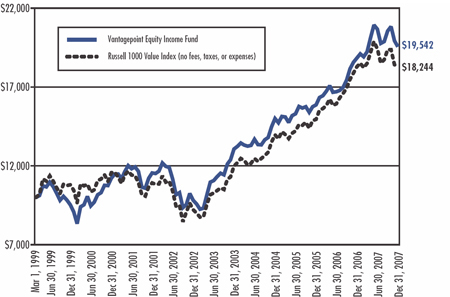
The Vantagepoint Equity Income Fund’s total return was 3.76% in 2007. Its market benchmark, the Russell 1000 Value Index, lost 0.17%, while the Morningstar Large Value Funds Category Average, a group of mutual funds with similar investment objectives, returned 1.42%.
Commentary
U.S. stocks generally provided positive returns, for the fifth consecutive year, although not uniformly between investment styles and across market capitalizations. In the second half of the year, increasing softness in employment, credit availability, housing, and manufacturing contributed to dampened investor confidence and led to increased volatility in the U.S. equity markets. Increasing investor preference for lower risk assets throughout the second half of the year was reflected in generally higher returns for larger capitalization stocks compared to smaller capitalization stocks. Larger and mid capitalization stocks generally outperformed smaller capitalization stocks; and, investors showed a general preference for growth oriented stocks as their valuations appeared increasingly attractive relative to value oriented stocks.
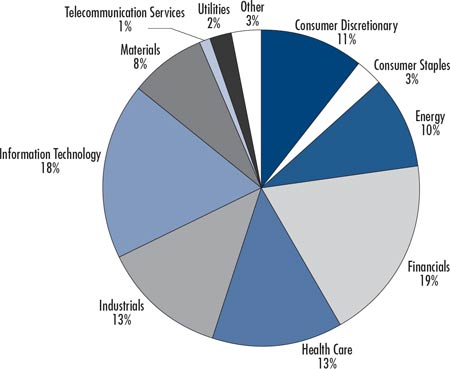
The Fund outperformed its market benchmark and peer group universe for 2007. Relative strength in the Financials, Consumer Discretionary, Information Technology, and Healthcare sectors aided Fund performance the most for the year ended December 31, 2007:
| | |
| • | The Fund’s allocation to the Financials sector, in addition to strong stock picking, was the most significant contributor to relative performance. The Fund was invested in sub-sectors having less exposure to the credit and subprime mortgage-related markets. While every Financials sub-sector posted a loss for the year, the Fund’s aggregate loss in the Financials sector was approximately one half of that suffered by the benchmark. |
| | |
| • | The Fund’s overweight to the underperforming Consumer Discretionary sector was offset by strong stock selection, resulting in a modestly positive return to the Fund, contrasted to significantly negative performance within the benchmark. The Fund’s investments in Household Durables, Hotels and Restaurants and Leisure sub-sectors contributed to relative performance. |
| | |
| • | The Information Technology sector contributed to relative performance, primarily as the result of good stock picking. On a relative basis, the Fund’s holdings outperformed the benchmark’s holdings in most sub-sectors. |
| | |
Fund holdings in several sectors underperformed during the year relative to the benchmark, detracting from overall performance: |
|
| • | The Telecommunications Services sector generated weak relative performance due primarily to poor stock selection. Share price weakness in the Wireless sub-sector and Diversified Telecommunications sector were the primary contributors to underperformance. |
| | |
| • | Stock selection in the Materials sector detracted from relative performance. |
| | |
| • | Fund holdings in the Energy sector contributed strongly on an absolute basis, while being a moderate detractor on a relative basis due to the Fund’s underweight position. |
Benefiting from its multi-management structure, the Fund has achieved a favorable performance record versus the benchmark and its large value peer universe. However, past performance is not a guarantee of future returns. The Fund’s subadvisers continue to seek out those undervalued investment options offering attractive value opportunities to build overall portfolio strength for long-term shareholders.
20
| |
Subadviser Data
| |
Barrow, Hanley, Mewhinney & Strauss, Inc. |
| |
Founded:
|
1979
|
Investment Style:
| Contrarian value |
Southeastern Asset Management, Inc.
|
| |
Founded:
|
1975
|
Investment Style: | Special situations value |
T. Rowe Price Associates, Inc.
|
| |
Founded:
|
1937
|
Investment Style: | Relative yield value |
Vantagepoint Equity Income Fund
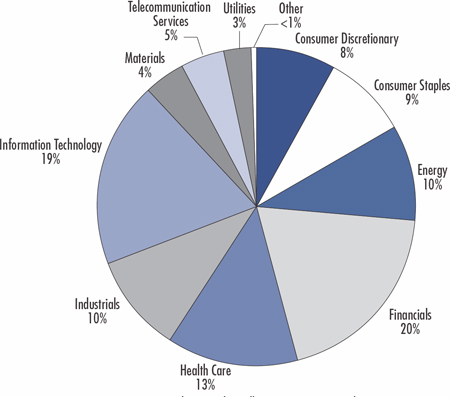
Sector Allocation as of December 31, 2007
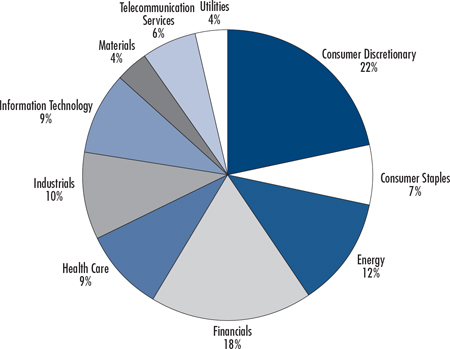
Due to rounding, pie chart allocations may not equal 100%.
21
|
Vantagepoint Equity Income Fund vs. Russell 1000 Value Index: |
Growth of $10,000 Invested March 1, 1999* |
| |
Source for Benchmark Returns: Ibbotson Associates
| |
Vantagepoint Equity Income Fund |
Average Annual Total Return for the periods ended December 31, 2007* |
| |
| |
One Year | 3.76% |
| |
Three Years | 9.22% |
| |
Five Years | 14.76% |
| |
Ten Years | 8.08% |
| |
Fund Inception Date | April 1, 1994 |
| |
Fund Registration Date | March 1, 1999 |
* Past performance does not guarantee future results. Investment returns and principal value will fluctuate so that shares, when redeemed, may be worth more or less than their original cost. Performance information for periods prior to March 1, 1999, when the Fund began operating, is of a commingled fund that had the same investment objectives and policies as the Fund and was advised by an affiliate of the Fund’s adviser. This past performance was adjusted at the time of the Fund’s registration to reflect the expenses of the Fund. The commingled fund was not a registered mutual fund so it was not subject to the same investment and tax restrictions as the Fund. If it had been, the commingled fund’s performance may have been lower. All returns assume reinvested dividends and do not reflect the deduction of taxes that a shareholder would pay on fund distributions or the redemption of fund shares. Please consult the current prospectus carefully before investing any money. The Vantagepoint Funds are distributed by ICMA-RC Services, LLC, a wholly owned broker-dealer subsidiary of ICMA-RC, and member FINRA/SIPC. 800-669-7400.
The Fund’s market benchmark, the Russell 1000 Value Index, consists of a subset of the Russell 1000 Index that includes stocks with lower price-to-book ratios and lower forecasted growth values. The index is unmanaged and does not reflect the costs of portfolio management or trading. The Fund’s portfolio may differ significantly from the securities in the market index.
22
Vantagepoint Growth & Income Fund
The Vantagepoint Growth & Income Fund’s objective is to offer long-term capital growth and current income. The principal investment strategy is to invest primarily in common stocks that the Fund’s subadvisers believe offer the potential for capital appreciation and, secondarily, current income by investing in dividend-paying stocks. The Fund may also invest in bonds, convertible securities and the securities of foreign issuers.
Performance
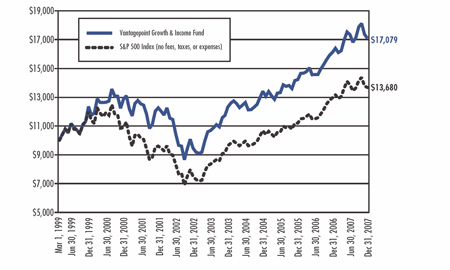
The Fund’s total return was 5.98% in 2007. The S&P 500 Index, the Fund’s market benchmark, gained 5.49%. The Morningstar Large Blend Funds Category Average, a group of mutual funds with similar investment objectives, advanced 6.16%.
Commentary
U.S. stocks generally provided positive returns, for the fifth consecutive year, although not uniformly between investment styles and across market capitalizations. In the second half of the year, increasing softness in employment, credit availability, housing, and manufacturing contributed to dampened investor confidence and led to increased volatility in the U.S. equity markets. Increasing investor preference for lower risk assets throughout the second half of the year was reflected in generally higher returns for larger capitalization stocks compared to smaller capitalization stocks. Larger and mid-capitalization stocks generally outperformed smaller capitalization stocks; and, investors showed a general preference for growth oriented stocks as their valuations appeared increasingly attractive relative to value oriented stocks.
For the year, the Fund outperformed its market benchmark and performed in-line with peers. The relative strength in the Consumer Discretionary, Materials, Financials and Industrials sectors aided Fund performance for most of the year:
| | |
| • | While the Consumer Discretionary sector was weak in 2007, reflecting the slowdown in the economy, the Fund outperformed within the sector through good stock selection, principally in Internet and Catalog companies, and by an underweight in Media companies. |
| | |
| • | The Materials sector was one the strongest sectors in terms of absolute performance, and the Fund outperformed by overweighting Chemical companies. |
| | |
| • | The Financials sector was the weakest for the year in terms of absolute performance. Relative outperformance primarily reflected minimized holdings of the Financial Services and Commercial Banking companies most affected by weakness in the credit markets. |
| | |
| • | Stock selection in the Industrials sector contributed to performance, primarily from robust Construction companies’ performance, and provided both absolute return and relative outperformance. |
| | |
While adding to the Fund’s overall return, the Fund’s underweight positions in both the Energy and Consumer Staples sectors represented the greatest detractors from relative performance: |
| | |
| • | The Energy sector produced the highest return within the benchmark, buoyed by high energy prices. Fund holdings generated strong returns on an absolute basis, but were a moderate detractor versus the benchmark due to an underweight position. |
| | |
| • | The Consumer Staples sector performed well, as is expected during periods of economic slowdown. The Fund’s slight sector underweight detracted from relative performance, while contributing to absolute performance. |
The Fund blends three complementary styles of investing – value, growth and core. Three subadvisers implement this blended strategy, each managing one of the three styles, with a view towards providing favorable results with more consistency over time than a single style fund.
23
| |
Subadviser Data | |
Capital Guardian Trust Company
|
| |
Founded:
|
1968
|
Investment Style: | Selected opportunities |
| |
T. Rowe Price Associates, Inc. |
| |
Founded:
|
1937
|
Investment Style: | Blue chip growth |
| |
Wellington Management Company, LLP |
| |
Founded:
|
1928
|
Investment Style: | Yield-focused value |
Vantagepoint Growth & Income Fund
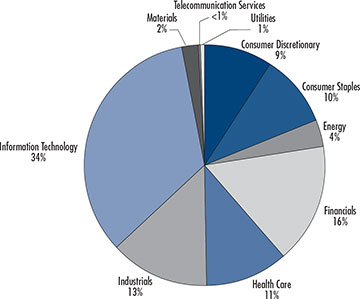
Sector Allocation as of December 31, 2007
Due to rounding, pie chart allocations may not equal 100%.
24
|
Vantagepoint Growth & Income Fund vs. S&P 500 Index: |
Growth of $10,000 Invested March 1, 1999* |
| |
Source for Benchmark Returns: Ibbotson Associates
| |
Vantagepoint Growth & Income Fund |
Average Annual Total Return for the periods ended December 31, 2007* |
| |
| |
One Year | 5.98% |
| |
Three Years | 8.38% |
| |
Five Years | 12.58% |
| |
Since Inception | 9.03% |
| |
Fund Inception Date | October 2, 1998 |
| |
Fund Registration Date | March 1, 1999 |
* Past performance does not guarantee future results. Investment returns and principal value will fluctuate so that shares, when redeemed, may be worth more or less than their original cost. Performance information for periods prior to March 1, 1999, when the Fund began operating, is of a commingled fund that had the same investment objectives and policies as the Fund and was advised by an affiliate of the Fund’s adviser. This past performance was adjusted at the time of the Fund’s registration to reflect the expenses of the Fund. The commingled fund was not a registered mutual fund so it was not subject to the same investment and tax restrictions as the Fund. If it had been, the commingled fund’s performance may have been lower. All returns assume reinvested dividends and do not reflect the deduction of taxes that a shareholder would pay on fund distributions or the redemption of fund shares. Please consult the current prospectus carefully before investing any money. The Vantagepoint Funds are distributed by ICMA-RC Services, LLC, a wholly owned broker-dealer subsidiary of ICMA-RC, and member FINRA/SIPC. 800-669-7400.
The Fund’s market benchmark, the S&P 500 Index, consists of 500 companies representing larger capitalization stocks traded in the U.S. The index is unmanaged and does not reflect the costs of portfolio management or trading. The Fund’s portfolio may differ significantly from the securities in the market index.
25
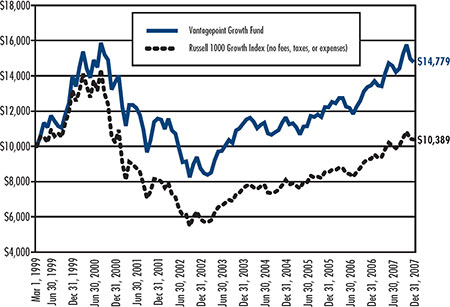
Vantagepoint Growth Fund
The Vantagepoint Growth Fund’s objective is to offer long-term capital growth. The principal investment strategy is to invest primarily in common stocks that are considered by the Fund’s subadvisers to have above-average potential for growth. The Fund may also invest in bonds, convertible securities and securities of foreign issuers.
Performance
The Vantagepoint Growth Fund’s total return was 9.81% in 2007. The Fund’s market benchmark, the Russell 1000 Growth Index, gained 11.81% for the year; the Morningstar Large Growth Category Average, a group of mutual funds with similar investment objectives and the Fund’s peer group benchmark, returned 13.35%.
Commentary
U.S. stocks generally provided positive returns, for the fifth consecutive year, although not uniformly between investment styles and across market capitalizations. Investors showed a general preference for growth oriented stocks as their valuations appeared increasingly attractive relative to value oriented stocks; and, larger and mid-capitalization stocks generally outperformed smaller capitalization stocks. In the second half of the year, increasing softness in employment, credit availability, housing, and manufacturing contributed to dampened investor confidence and led to increased volatility in the U.S. equity markets. Increasing investor preference for lower risk assets throughout the second half of the year was reflected in generally higher returns for larger capitalization stocks compared to smaller capitalization stocks.
The Fund underperformed both its market benchmark and its large-capitalization growth peer group category average in 2007. Financial, Healthcare and Energy stocks adversely impacted performance, while Technology, Industrial and Consumer Discretionary stocks contributed to the Fund’s return:
| | |
| • | Financial sector stocks underperformed as the subprime mortgage crisis impacted Real Estate Management firms and Mortgage Finance companies in addition to Commercial Banks and Diversified Financial companies. |
| | |
| • | Healthcare sector stocks lagged the overall market’s performance. Several leading Biotechnology stocks experienced adverse Federal Drug Administration rulings and slowing sales of key drugs, while Healthcare Providers suffered from an uncertain future due to the upcoming presidential election in 2008. |
| | |
| • | Energy stocks experienced another strong year as oil approached $100 a barrel. While the Fund’s Energy holdings outpaced the benchmark and peers, an underweight position relative to the benchmark hindered performance. |
| | |
| • | The Technology sector was the largest contributor to absolute returns for the Fund in 2007. The Software and Computer industries benefited from increased capital spending by corporations, and Internet Software stocks extended their strong 2006 performance. |
| | |
| • | The Fund’s Industrial holdings were a positive source of return for the Fund. Several of the Fund’s alternative energy stocks experienced sizable returns as rising oil prices prompted investment in renewable energy sources. Construction and Engineering stocks were also a source of outperformance. |
| | |
| • | While the Consumer Discretionary sector was the weakest performing sector for the market, the Fund earned a positive return through strong stock selection, avoiding Leisure and traditional Retail stocks and focusing on Consumer Service and Internet Retail stocks. |
At year-end, the Fund’s investment management strategies continue to complement one another by providing five different styles of growth investing. This multi-management approach seeks to position the Fund for attractive long-term investment opportunities.
26
| |
Subadviser Data | |
| |
Goldman Sachs Asset Management, L.P. |
| | |
|
Founded: | 1988 |
Investment Style: | Structured growth |
| |
Legg Mason Capital Management, Inc. |
| | |
|
Founded: | 1982 |
Investment Style: | Opportunistic growth |
| |
Peregrine Capital Management, Inc. | |
| | |
|
Founded: | 1984 |
Investment Style: | Concentrated growth |
| |
Tukman Grossman Capital Management, Inc. |
| | |
|
Founded: | 1980 |
Investment Style: | Contrarian growth |
| |
Westfield Capital Management Company, LLC |
| | |
|
Founded: | 1989 |
Investment Style: | Thematic growth |
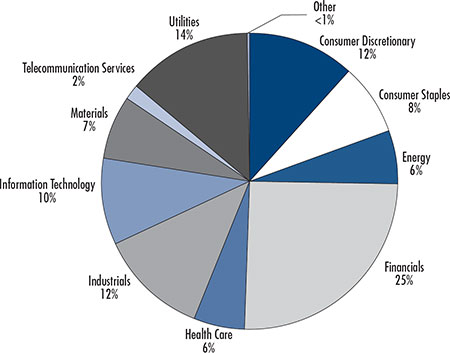
Vantagepoint Growth Fund
Sector Allocation as of December 31, 2007
Due to rounding, pie chart allocations may not equal 100%.
27
|
Vantagepoint Growth Fund vs. Russell 1000 Growth Index: |
Growth of $10,000 Invested March 1, 1999* |
| |
Source for Benchmark Returns: Ibbotson Associates
| |
Vantagepoint Growth Fund | |
Average Annual Total Return for the periods ended December 31, 2007* |
| |
|
One Year | 9.81% |
|
Three Years | 8.26% |
|
Five Years | 11.02% |
|
Ten Years | 5.56% |
|
Fund Inception Date | April 1, 1983 |
|
Fund Registration Date | March 1, 1999 |
* Past performance does not guarantee future results. Investment returns and principal value will fluctuate so that shares, when redeemed, may be worth more or less than their original cost. Performance information for periods prior to March 1, 1999, when the Fund began operating, is of a commingled fund that had the same investment objectives and policies as the Fund and was advised by an affiliate of the Fund’s adviser. This past performance was adjusted at the time of the Fund’s registration to reflect the expenses of the Fund. The commingled fund was not a registered mutual fund so it was not subject to the same investment and tax restrictions as the Fund. If it had been, the commingled fund’s performance may have been lower. All returns assume reinvested dividends and do not reflect the deduction of taxes that a shareholder would pay on fund distributions or the redemption of fund shares. Please consult the current prospectus carefully before investing any money. The Vantagepoint Funds are distributed by ICMA-RC Services, LLC, a wholly owned broker-dealer subsidiary of ICMA-RC, and member FINRA/SIPC. 800-669-7400.
The Fund’s market benchmark, the Russell 1000 Growth Index consists of a subset of the Russell 1000 Index that includes stocks with higher price-to-book ratios and higher forecasted growth values. The index is unmanaged and does not reflect the costs of portfolio management or trading. The Fund’s portfolio may differ significantly from the securities in the market index.
28
Vantagepoint Select Value Fund
The Vantagepoint Select Value Fund’s objective is to offer long-term growth from dividend income and capital appreciation. The principal investment strategy is to invest, under normal circumstances, primarily in common stocks of mid-capitalization U.S. companies that the Fund’s subadvisers believe present attractive investment opportunities at favorable prices in relation to intrinsic worth of the issuer. The Fund may also invest in preferred stocks, stocks of foreign issuers and convertible securities.
Performance
Because the Fund has not been in operation for a full calendar year, no performance information is included in this annual report.
| |
Subadviser Data | |
| |
Goldman Sachs Asset Management, L.P. |
| | |
|
Founded: | 1988 |
Investment Style: | Quantitative structured value |
| |
WEDGE Capital Management, L.L.P. |
| | |
|
Founded: | 1984 |
Investment Style: | Concentrated traditional value |
| |
Systematic Financial Management, L.P. |
| | |
|
Founded: | 1982 |
Investment Style: | Relative value |
Vantagepoint Select Value Fund
Sector Allocation as of December 31, 2007
Due to rounding, pie chart allocations may not equal 100%.
29
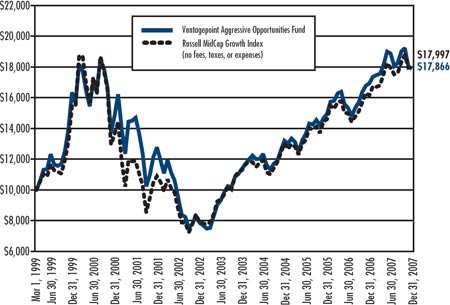
Vantagepoint Aggressive Opportunities Fund
The Vantagepoint Aggressive Opportunities Fund’s objective is to offer high long-term capital appreciation. The principal investment strategy is to invest, under normal circumstances, primarily in common stocks of small- to medium-capitalization U.S. and foreign companies that the Fund’s subadvisers believe offer the opportunity for high capital appreciation. The Fund may also invest in debt instruments, preferred stock, foreign stocks and bonds, convertible securities and derivatives such as futures and options.
Performance
The Vantagepoint Aggressive Opportunities Fund’s total return was 5.53% in 2007. The Fund’s market benchmark, the Russell MidCap Growth Index, gained 11.43%, while the Morningstar Mid-Cap Growth Funds Category Average, a group of mutual funds with similar investment objectives, returned 15.09%.
Commentary
U.S. stocks generally provided positive returns, for the fifth consecutive year, although not uniformly between investment styles and across market capitalizations. Larger and mid-capitalization stocks generally outperformed smaller capitalization stocks; and, investors showed a general preference for growth oriented stocks as their valuations appeared increasingly attractive relative to value oriented stocks. In the second half of the year, increasing softness in employment, credit availability, housing, and manufacturing contributed to dampened investor confidence and led to increased volatility in the U.S. equity markets. Increasing investor preference for lower risk assets throughout the second half of the year was reflected in generally higher returns for larger capitalization stocks compared to smaller capitalization stocks.
The Fund underperformed its market benchmark and peer group category average, while producing the fifth consecutive calendar year of positive absolute performance. Fund overweight allocations to the Information Technology and Healthcare sectors aided performance. Stock selection in the Financials, Energy and Industrial sectors detracted from relative performance:
| |
• | An overweight to the Information Technology sector and stock selection resulted in strong absolute and relative performance. Merger and acquisition activity in the Internet Software and Service industry benefited Fund performance. |
| |
• | Strong stock selection and an overweight position in Healthcare related stocks added to positive absolute and relative performance. In particular, Healthcare Providers and Service industry holdings were supported by valuation expansion, fundamental performance, and premium acquisition buyouts. |
| |
• | An underweight allocation to the Industrial sector and stock selection detracted from relative performance, while providing a positive absolute return. |
| |
• | Strong stock selection in the Energy sector contributed to absolute performance. |
| |
• | An overweight exposure to the Financials sector detracted from performance. |
The Aggressive Opportunities Fund experienced a minor portfolio reallocation among three of its subadvisers during October 2007. This adjustment reduced the Fund’s exposure to small-capitalization stocks. The reallocation resulted in Fund characteristics more closely correlated to the Fund’s market benchmark, the Russell MidCap Growth Index.
In VIA’s view, the Fund’s four subadvisers, which employ distinct, yet complementary investing styles, remain committed to their respective strategies. This multi-management approach seeks to position the Fund for attractive long-term investment opportunities.
30
| |
Subadviser Data | |
| |
Legg Mason Capital Management, Inc. |
| |
|
Founded: | 1982 |
Investment Style: | Opportunistic growth |
| |
T. Rowe Price Associates, Inc. |
| |
|
Founded: | 1937 |
Investment Style: | Emerging growth |
| |
TimesSquare Capital Management, LLC |
| |
|
Founded: | 2004 |
Investment Style: | Growth opportunities |
| |
Southeastern Asset Management, Inc. |
| |
|
Founded: | 1975 |
Investment Style: | Special situations |
Vantagepoint Aggressive Opportunities Fund
Sector Allocation as of December 31, 2007
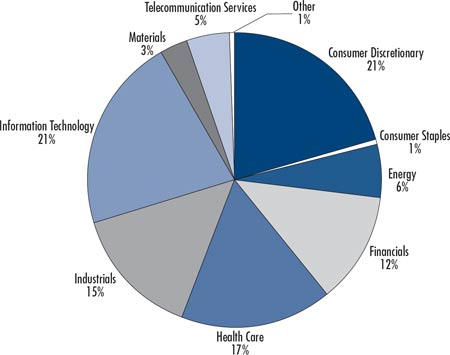
Due to rounding, pie chart allocations may not equal 100%.
31
|
Vantagepoint Aggressive Opportunities Fund vs. Russell MIDCAP Growth Index: |
Growth of $10,000 Invested March 1, 1999* |
| |
Source for Benchmark Returns: Ibbotson Associates
| |
Vantagepoint Aggressive Opportunities Fund |
Average Annual Total Return for the periods ended December 31, 2007* |
| |
|
One Year | 5.53% |
| |
Three Years | 10.64% |
| |
Five Years | 17.84% |
| |
Ten Years | 6.84% |
| |
Fund Inception Date | October 1, 1994 |
| |
Fund Registration Date | March 1, 1999 |
* Past performance does not guarantee future results. Investment returns and principal value will fluctuate so that shares, when redeemed, may be worth more or less than their original cost. Performance information for periods prior to March 1, 1999, when the Fund began operating, is of a commingled fund that had the same investment objectives and policies as the Fund and was advised by an affiliate of the Fund’s adviser. This past performance was adjusted at the time of the Fund’s registration to reflect the expenses of the Fund. The commingled fund was not a registered mutual fund so it was not subject to the same investment and tax restrictions as the Fund. If it had been, the commingled fund’s performance may have been lower. All returns assume reinvested dividends and do not reflect the deduction of taxes that a shareholder would pay on fund distributions or the redemption of fund shares. Please consult the current prospectus carefully before investing any money. The Vantagepoint Funds are distributed by ICMA-RC Services, LLC, a wholly owned broker-dealer subsidiary of ICMA-RC, and member FINRA/SIPC. 800-669-7400.
The Fund’s market benchmark, the Russell MidCap Growth Index is a subset of the Russell MidCap Index that includes companies with higher price-to-book ratios and higher forecasted growth values. The index is unmanaged and does not reflect the costs of portfolio management or trading. The Fund’s portfolio may differ significantly from the securities in the market index.
32
Vantagepoint Discovery Fund
The Vantagepoint Discovery Fund’s objective is to offer long-term capital growth. The principal investment strategy is to invest, under normal circumstances, in a combination of U.S. common stocks of small capitalization companies, Russell 2000 Index futures contracts and fixed income securities.
Performance
Because the Fund has not been in operation for a full calendar year, no performance information is included in the annual report.
Subadviser Data
| |
Wellington Management Company, LLP |
| |
|
Founded: | 1928 |
Investment Style: | Diversified small-cap blend |
| |
Payden & Rygel | |
| | |
| |
Founded: | 1983 |
Investment Style: | Enhanced index |
Vantagepoint Discovery Fund
Sector Allocation as of December 31, 2007*
*The Sector Allocation reflected in this pie chart was calculated using the
actual equity securities held by the Fund and blending them with the
sectors represented in the Russell 2000 Index futures held by this Fund.
Due to rounding, pie chart allocations may not equal 100%.
33
Vantagepoint Discovery Fund Asset Class Exposure
as of December 31, 2007*
* Portfolio exposures represent the market value of physical securities and the measurement of exposure through the derivative instruments held by the Fund as a percent of the Fund’s net assets. For the purpose of displaying this allocation information, exposure through derivatives is measured based on the value of the underlying assets, rate or index represented by the derivative. This measurement is different from the valuation used for the purposes of calculating the Fund’s net asset value. This measurement method is intended to reflect the “economic exposure ” of the derivative – effectively, the market exposure, to the Fund. This may result in a total percentage reflected in the chart that exceeds 100%.
34
Vantagepoint International Fund
The Vantagepoint International Fund’s objective is to offer long-term capital growth and diversification by country. The principal investment strategy is to invest primarily in the common stocks of companies headquartered outside the United States. The Fund will invest, under normal circumstances, at least 80% of its assets in foreign equity securities. The Fund may also invest in U.S. or foreign bonds, U.S. stocks, convertible securities and derivatives, including futures and options.
Performance
The Vantagepoint International Fund’s total return was 12.46% in 2007. The Fund’s market benchmark, the Morgan Stanley Capital International (MSCI) Europe, Australasia and Far East (EAFE) Index, returned 11.63%. The Morningstar Foreign Large Blend Category Average, a group of mutual funds with similar investment objectives, returned 12.71%.
Commentary
International stocks as measured by the MSCI EAFE Index, provided positive returns, producing the fifth consecutive year of double-digit gains in U.S. Dollar terms, and the sixth consecutive year outperforming U.S. stocks as measured by the S&P 500 Index. Emerging market stocks led developed markets stocks for the seventh consecutive year, while growth stocks outperformed value stocks for the first time since calendar year 1999. International large-capitalization stocks outperformed small-capitalization stocks, continuing the outperformance that began in 2006 following seven years of small-capitalization stock outperformance.
Greater Asia produced positive results in U.S. Dollar denominated terms; however, Japan was a negative contributor to Fund performance in absolute and relative terms. Greater Europe produced positive absolute results for the Fund, with continental Europe outperforming the United Kingdom. However, Fund holdings in Greater Europe underperformed the benchmark. Fund exposures in Canada, China, and Mexico were significant contributors to Fund performance through both stock performance and currency valuation changes.
Market gains were achieved in all but one sector, with eight of the ten sectors realizing returns in excess of 10%. Material stocks surpassed all others as global economic growth created increased demand for chemicals and commodities.
The Fund’s outperformance relative to its market benchmark was also partially explained by its modest, opportunistic growth bias. This bias hindered performance in recent years when the market favored value-oriented stocks and strategies.
The International Fund experienced a minor restructuring during September 2007, as a result of continued asset allocation research and manager due diligence. The modest reallocation of assets across the Fund’s four subadvisers had the effect of reducing the Fund’s exposure to Japan and simultaneously increasing smaller market-cap stock exposure.
The Fund’s subadvisers take a long-term approach toward investing. Each of the Fund’s four subadvisers uses a distinct investment strategy to select among countries and companies. In VIA’s view, through their complementary approaches, they seek opportunities offering attractive risk and return qualities that are expected to serve investors well over full market cycles.
35
Subadviser Data
| |
Artisan Partners Limited Partnership |
| |
|
Founded: | 1995 |
Investment Style: | International growth opportunities |
| |
Capital Guardian Trust Company |
| |
|
Founded: | 1968 |
Investment Style: | Core International equity – blend of value and growth |
| |
GlobeFlex Capital, LP |
| |
|
Founded: | 1994 |
Investment Style: | Diversified International all-cap |
| |
Walter Scott & Partners Limited |
| |
|
Founded: | 1983 |
Investment Style: | Concentrated International growth |
Vantagepoint International Fund
Sector Allocation as of December 31, 2007
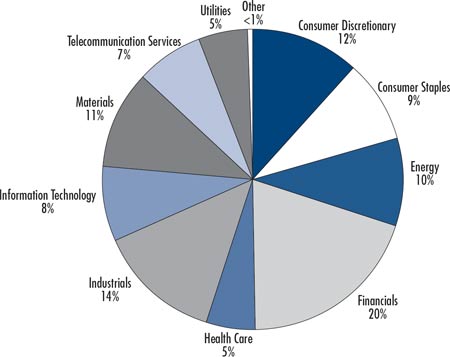
Due to rounding, pie chart allocations may not equal 100%.
36
|
Vantagepoint International Fund vs. MSCI EAFE Index:
Growth of $10,000 Invested March 1, 1999* |
| |
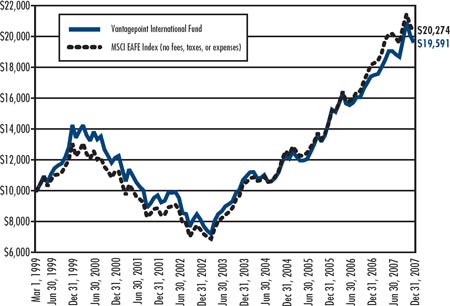
Source for Benchmark Returns: Ibbotson Associates
| |
Vantagepoint International Fund |
Average Annual Total Return for the periods ended December 31, 2007* |
| |
|
One Year | 12.46% |
| |
Three Years | 16.77% |
| |
Five Years | 19.23% |
| |
Ten Years | 7.20% |
| |
Fund Inception Date | October 1, 1994 |
| |
Fund Registration Date | March 1, 1999 |
*Past performance does not guarantee future results. Investment returns and principal value will fluctuate so that shares, when redeemed, may be worth more or less than their original cost. Performance information for periods prior to March 1, 1999, when the Fund began operating, is of a commingled fund that had the same investment objectives and policies as the Fund and was advised by an affiliate of the Fund’s adviser. This past performance was adjusted at the time of the Fund’s registration to reflect the expenses of the Fund. The commingled fund was not a registered mutual fund so it was not subject to the same investment and tax restrictions as the Fund. If it had been, the commingled fund’s performance may have been lower. All returns assume reinvested dividends and do not reflect the deduction of taxes that a shareholder would pay on fund distributions or the redemption of fund shares. Please consult the current prospectus carefully before investing any money. The Vantagepoint Funds are distributed by ICMA-RC Services, LLC, a wholly owned broker-dealer subsidiary of ICMA-RC, and member FINRA/SIPC. 800-669-7400.
The Fund’s market benchmark, the MSCI EAFE Index, is a free float-adjusted market capitalization index that is designed to measure the equity market performance of developed markets, excluding the U.S. and Canada. The index is unmanaged and does not reflect the costs of portfolio management or trading. The Fund’s portfolio may differ significantly from the securities in the market index.
37
Vantagepoint Diversified Assets Fund
The Vantagepoint Diversified Assets Fund’s objective is to offer long-term capital growth. The Fund uses several principal investment strategies to seek to achieve its objective. The Fund allocates a portion of its assets to investments in derivative instruments that give it investment exposure to the global equity, bond and currency markets. Another portion of the Fund’s portfolio invests in short and intermediate maturity U.S. and foreign fixed income securities. The Fund also invests a portion of its assets in high quality, short-term fixed income securities.
Performance
Because the Fund has not been in operation for a full calendar year, no performance information is included in the annual report.
Subadviser Data
| |
Drake Management, LLC |
| |
|
Founded: | 2001 |
Investment Style: | Global fixed income |
| |
Analytic Investors, LLC |
| |
|
Founded: | 1970 |
Investment Style: | Global tactical asset allocation |
| |
Mellon Capital Management Corporation |
| |
|
Founded: | 1983 |
Investment Style: | Global tactical asset allocation |
| |
Payden & Rygel |
| |
|
Founded: | 1983 |
Investment Style: | Short-duration fixed income |
Vantagepoint Diversified Assets Fund Asset Class Exposure
as of December 31, 2007*
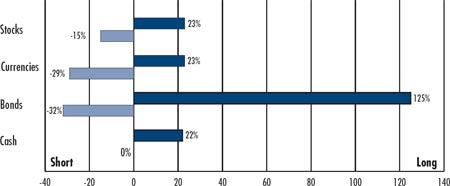
*Portfolio exposures represent the market value of physical securities and the measurement of exposure through the derivative instruments held by the Fund as a percent of the Fund’s net assets. For the purpose of displaying this allocation information, exposure through derivatives is measured based on the value of the underlying assets, rate or index represented by the derivative. This measurement is different from the valuation used for the purposes of calculating the Fund’s net asset value. This measurement method is intended to reflect the “economic exposure ” of the derivative – effectively, the market exposure, to the Fund. This may result in a total percentage reflected in the chart that exceeds 100%.
In its use of derivative instruments, the Fund may take both long positions (the values of which move in the same direction as the prices of the underlying investments, pools of investments, indexes or currencies) and short positions (the values of which move in the opposite direction as the prices of the underlying investments, pools of investments, indexes or currencies). These long and short positions are reflected in the chart above.
38
Vantagepoint Index Funds
The Vantagepoint Index Funds follow an indexed or “passively managed” approach to investing. The Funds invest in securities that are selected to approximate the investment characteristics and performance of their respective benchmarks. To minimize transaction costs, the Index Funds, with the exception of the Vantagepoint 500 Stock Index Fund, use sampling techniques to approximate their benchmarks’ characteristics using fewer securities than are contained in the Index. The Vantagepoint 500 Stock Index Fund seeks to invest, under normal circumstances, at least 90% of its net assets in a portfolio that consists of stocks in the S&P 500 Index, weighted to seek to replicate the investment characteristics and performance of the index.
| | |
| • | The Vantagepoint Core Bond Index Fund’s objective is to offer current income by approximating the performance of the Lehman Brothers Aggregate Bond Index. |
| | |
| • | The Vantagepoint 500 Stock Index Fund’s objective is to offer long-term capital growth by approximating the performance of the S&P 500 Index. |
| | |
| • | The Vantagepoint Broad Market Index Fund’s objective is to offer long-term capital growth by approximating the performance of the Dow Jones Wilshire 5000 Composite Index. |
| | |
| • | The Vantagepoint Mid/Small Company Index Fund’s objective is to offer long-term capital growth by approximating the performance of the Dow Jones Wilshire 4500 Completion Index. |
| | |
| • | The Vantagepoint Overseas Equity Index Fund’s objective is to offer long-term capital growth and diversification by approximating the performance of the Morgan Stanley Capital International (MSCI) Europe Australasia Far East (EAFE) Free Index. |
Performance & Commentary
The major U.S. stock indexes generally provided positive returns for the fifth consecutive year, although not uniformly and with greater variability between investment styles and across market capitalizations than in recent years. In the second half of the year, increasing softness in employment, housing, and manufacturing contributed to increased concerns regarding a potential recession. Those concerns, along with the increasing delinquency and default rates for subprime mortgages, led to increased volatility in the U.S. equity markets. Increasing investor preference for lower risk assets throughout the second half of the year led to increased performance differences between large-capitalization and small-capitalization stocks. Large- and mid-capitalization stocks generally outperformed smaller capitalization stocks.
The major U.S. fixed income sectors provided positive returns, with U.S. Treasury and higher quality securities outperforming higher risk sectors.
U.S. Treasury rates increased modestly during the first half of the year, generally resulting in negative fixed income market returns in the second quarter, as the economy produced job growth and concerns increased regarding the possibility of increased inflation.
In contrast, rates generally declined in the second half of the year, beginning early in the third quarter. While declining interest rates generally increase the market value of fixed income securities, increased delinquency and default rates for subprime mortgages, along with rating agency downgrades of certain securities, led to significantly reduced market values for subprime mortgage-related securities and increased market volatility.
In response to increasing economic concerns, stable core inflation, and the increased volatility in security markets, the Federal Reserve lowered the Federal Funds interest rate three times in the second half of the year. The three reductions lowered the Federal Funds rate by a total of one percent, from 5.25% to 4.25%. Interest rates decreased more for shorter-term securities than for longer-term, resulting in a steeper yield curve. The Core Bond Index Fund’s total return was 6.52% for Class I Shares and 6.71% for Class II Shares compared to its market benchmark, the Lehman Brothers Aggregate Bond Index, which returned 6.96% for the same period.
The Vantagepoint 500 Stock Index Fund’s total return was 5.06% for Class I Shares and 5.22% for Class II Shares. The Fund’s market benchmark is the S&P 500 Index, which gained 5.49%. The Vantagepoint Broad Market Index Fund’s total return was 5.15% for Class I Shares and 5.35% for Class II Shares. The Fund’s market benchmark is the Dow Jones Wilshire 5000 Composite Index (FA), which rose 5.62%. The Vantagepoint Mid/Small Company Index Fund’s total return was 4.98% for Class I Shares and 5.20% for Class II Shares. The Fund’s market benchmark is the Dow Jones Wilshire 4500 Completion Index (FA), which measures the performance of small- and mid-sized companies and gained 5.38%.
39
Major international stock indexes experienced positive returns in 2007 augmented for U.S. investors by a depreciating U.S. Dollar. The Vantagepoint Overseas Equity Index Fund’s total return was 10.17% for Class I Shares and 10.37% for Class II Shares. The MSCI EAFE Free Index, which comprises larger stocks in developed markets, rose 11.63% in U.S. Dollar terms.
As of December 31, 2007, each Index Fund invested in an indexed portfolio managed by Mellon Capital Management Corporation.
Subadviser Data
| |
Mellon Capital Management Corporation |
| |
|
Founded: | 1983 |
Investment Style: | Index portfolio |
Vantagepoint Core Bond Index Fund
Asset Allocation as of December 31, 2007
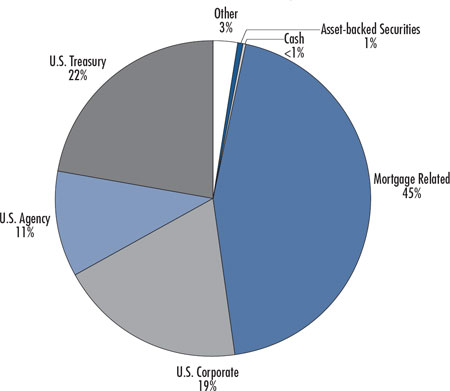
Due to rounding, pie chart allocations may not equal 100%.
40
|
Vantagepoint Core Bond Index Fund Class I vs. Lehman Brothers Aggregate Bond Index:
Growth of $10,000 Invested March 1, 1999* |
| |
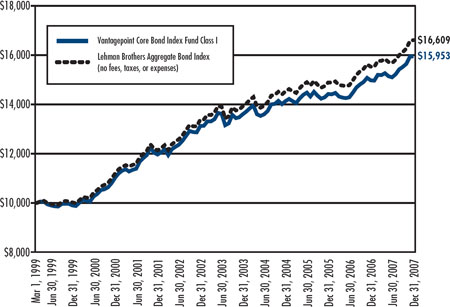
|
Source for Benchmark Returns: Ibbotson Associates |
|
Vantagepoint Core Bond Index Fund Class II vs. Lehman Brothers Aggregate Bond Index:
Growth of $10,000 Invested April 5, 1999* |
| |
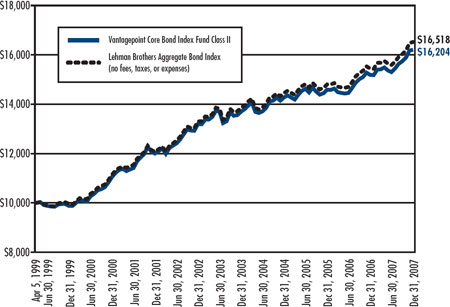
Source for Benchmark Returns: Ibbotson Associates
41
| | |
Vantagepoint Core Bond Index Fund | | |
Average Annual Total Return for the periods ended December 31, 2007* | |
| |
| | | | | | | |
| | Class I Shares | | Class II Shares | |
| | | | | |
One Year | | | | 6.52 | % | | | | 6.71 | % | |
Three Years | | | | 4.09 | % | | | | 4.31 | % | |
Five Years | | | | 3.98 | % | | | | 4.21 | % | |
Ten Years | | �� | | 5.44 | % | | | | — | | |
Since Inception | | | | — | | | | | 5.67 | % | |
| | | | | | | | | | | |
Fund Inception Date | | | | June 2, 1997 | | | | June 2, 1997 | |
Offering Date | | | | March 1, 1999 | | | | April 5, 1999 | |
* Past performance does not guarantee future results. Investment returns and principal value will fluctuate so that shares, when redeemed, may be worth more or less than their original cost. Performance information for periods prior to March 1, 1999, when the Fund began operating, is of a commingled fund that had the same investment objectives and policies as the Fund and was advised by an affiliate of the Fund’s adviser. This past performance was adjusted at the time of the Fund’s registration to reflect the expenses of the Fund. The commingled fund was not a registered mutual fund so it was not subject to the same investment and tax restrictions as the Fund. If it had been, the commingled fund’s performance may have been lower. All returns assume reinvested dividends and do not reflect the deduction of taxes that a shareholder would pay on fund distributions or the redemption of fund shares. Please consult the current prospectus carefully before investing any money. The Vantagepoint Funds are distributed by ICMA-RC Services, LLC, a wholly owned broker-dealer subsidiary of ICMA-RC, and member FINRA/SIPC. 800-669-7400.
The Fund’s benchmark, the Lehman Brothers Aggregate Bond Index, consists of all investment-grade U.S. fixed income securities. The index is unmanaged and does not reflect the costs of portfolio management or trading. The Fund’s portfolio may differ significantly from the securities in the market index.
42
Vantagepoint 500 Stock Index Fund
Sector Allocation as of December 31, 2007
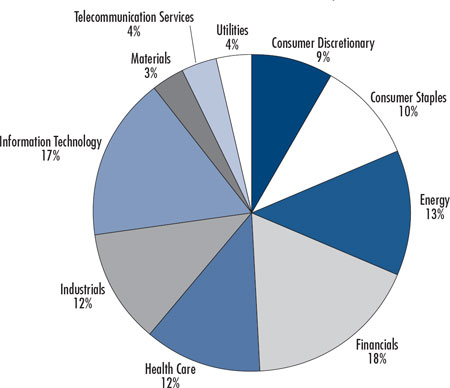
Due to rounding, pie chart allocations may not equal 100%.
|
Vantagepoint 500 Stock Index Fund Class I vs. S&P 500 Index:
Growth of $10,000 Invested March 1, 1999* |
| |
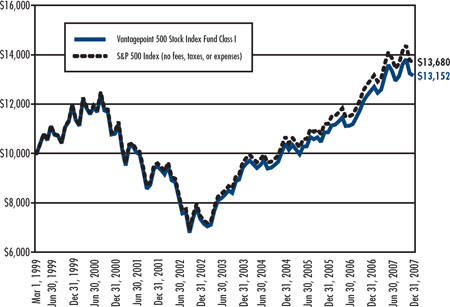
Source for Benchmark Returns: Ibbotson Associates
43
|
Vantagepoint 500 Stock Index Fund Class II vs. S&P 500 Index:
Growth of $10,000 Invested April 5, 1999* |
| |
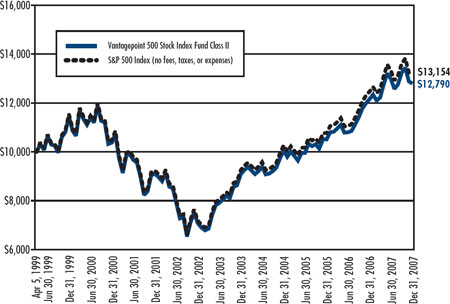
Source for Benchmark Returns: Ibbotson Associates
| | |
Vantagepoint 500 Stock Index Fund | | |
Average Annual Total Return for the periods ended December 31, 2007* | |
| |
|
| | | | | | | | | | | |
| | Class I Shares | | Class II Shares | |
| | | | | |
| | | | | | | | | | | |
One Year | | | | 5.06 | % | | | | 5.22 | % | |
Three Years | | | | 8.14 | % | | | | 8.35 | % | |
Five Years | | | | 12.33 | % | | | | 12.52 | % | |
Ten Years | | | | 5.44 | % | | | | — | | |
Since Inception | | | | — | | | | | 2.85 | % | |
| | | | | | | | | | | |
Fund Inception Date | | | | June 2, 1997 | | | | June 2, 1997 | |
Offering Date | | | | March 1, 1999 | | | | April 5, 1999 | |
* Past performance does not guarantee future results. Investment returns and principal value will fluctuate so that shares, when redeemed, may be worth more or less than their original cost. Performance information for periods prior to March 1, 1999, when the Fund began operating, is of a commingled fund that had the same investment objectives and policies as the Fund and was advised by an affiliate of the Fund’s adviser. This past performance was adjusted at the time of the Fund’s registration to reflect the expenses of the Fund. The commingled fund was not a registered mutual fund so it was not subject to the same investment and tax restrictions as the Fund. If it had been, the commingled fund’s performance may have been lower. All returns assume reinvested dividends and do not reflect the deduction of taxes that a shareholder would pay on fund distributions or the redemption of fund shares. Please consult the current prospectus carefully before investing any money. The Vantagepoint Funds are distributed by ICMA-RC Services, LLC, a wholly owned broker-dealer subsidiary of ICMA-RC, and member FINRA/SIPC. 800-669-7400.
The Fund’s benchmark, the S&P 500 Index, consists of 500 companies representing larger capitalization stocks traded in the U.S. The index is unmanaged and does not reflect the costs of portfolio management or trading.
44
Vantagepoint Broad Market Index Fund
Sector Allocation as of December 31, 2007
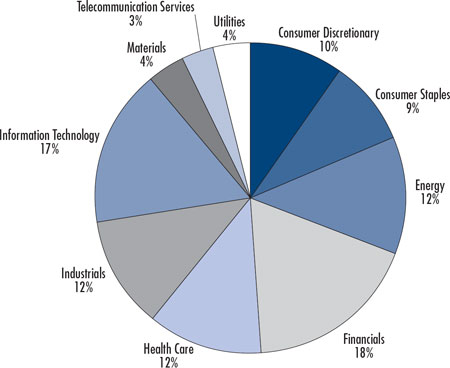
Due to rounding, pie chart allocations may not equal 100%.
|
Vantagepoint Broad Market Index fund Class I vs. Dow Jones Wilshire 5000 Composite Index(FA):
Growth of $10,000 Invested Marchl 1, 1999* |
| |
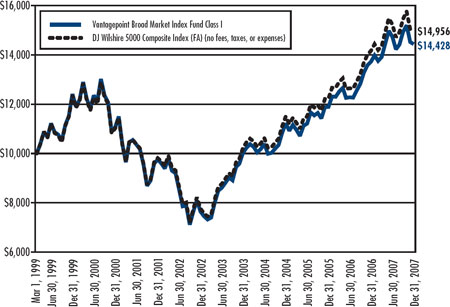
Source for Benchmark Returns: Ibbotson Associates
45
|
Vantagepoint Broad Market Index fund Class II vs. Dow Jones Wilshire 5000 Composite Index(FA):
Growth of $10,000 Invested April 5, 1999* |
| |
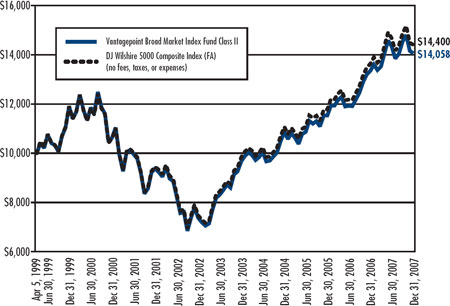
Source for Benchmark Returns: Ibbotson Associates
|
Vantagepoint Broad Market Index Fund
Average Annual Total Return for the periods ended December 31, 2007* |
| |
| | | | | | | |
| | Class I Shares | | Class II Shares | |
| | | | | |
| | | | | |
One Year | | 5.15% | | | 5.35% | | |
Three Years | | 8.74% | | | 9.00% | | |
Five Years | | 13.54% | | | 13.77% | | |
Ten Years | | 5.82% | | | — | |
Since Inception | | — | | 3.97% | | |
| | | | | |
Fund Inception Date | | October 1, 1994 | | October 1, 1994 | |
Offering Date | | March 1, 1999 | | April 5, 1999 | |
* Past performance does not guarantee future results. Investment returns and principal value will fluctuate so that shares, when redeemed, may be worth more or less than their original cost. Performance information for periods prior to March 1, 1999, when the Fund began operating, is of a commingled fund that had the same investment objectives and policies as the Fund and was advised by an affiliate of the Fund’s adviser. This past performance was adjusted at the time of the Fund’s registration to reflect the expenses of the Fund. The commingled fund was not a registered mutual fund so it was not subject to the same investment and tax restrictions as the Fund. If it had been, the commingled fund’s performance may have been lower. All returns assume reinvested dividends and do not reflect the deduction of taxes that a shareholder would pay on fund distributions or the redemption of fund shares. Please consult the current prospectus carefully before investing any money. The Vantagepoint Funds are distributed by ICMA-RC Services, LLC, a wholly owned broker-dealer subsidiary of ICMA-RC, and member FINRA/SIPC. 800-669-7400.
The Dow Jones Wilshire 5000 Composite Index consists of all common equity securities of companies domiciled in the U.S. for which daily pricing is available. This index is calculated using two different weighing methodologies: full market capitalization (full-cap) and float-adjusted market capitalization (float-adjusted). The full-cap methodology weights each of the constituents according to its total, or full, market capitalization. The float-adjusted methodology adjusts an individual stock’s market capitalization to account for shares that may be restricted or otherwise unavailable for purchase and first became available in 2004. The growth of $10,000 invested in the Dow Jones Wilshire 5000 Composite Index as shown in the chart has been calculated using the performance of the full-cap methodology from fund registration in 1999 to September 2004 and using the float-adjusted methodology after September 2004. Since the float-adjusted methodology became available in 2004, it has been considered a more appropriate comparison of fund performance. Had the growth of $10,000 in the Dow Jones Wilshire 5000 Composite Index been calculated solely using the full-cap methodology for the entire period it would have been $15,679 and $15,096 for Class I and Class II, respectively.
46
Vantagepoint Mid/Small Company Index Fund
Sector Allocation as of December 31, 2007
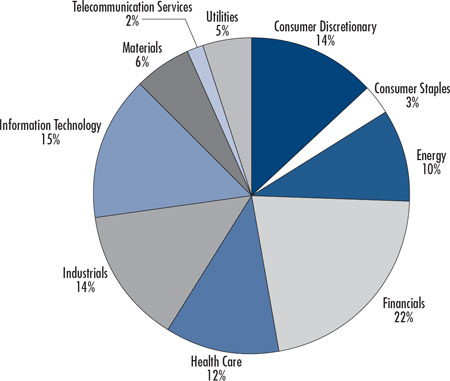
Due to rounding, pie chart allocations may not equal 100%.
|
Vantagepoint Mid/Small Company Index Fund Class I vs. Dow Jones Wilshires 4500
Completion Index (FA): Growth of $10,000 Invested March 1, 1999* |
| |
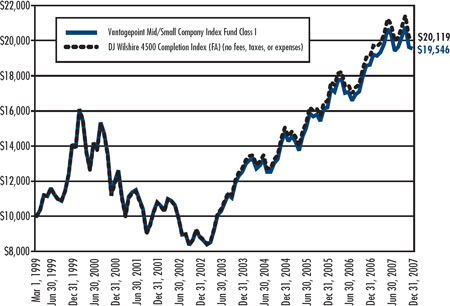
Source for Benchmark Returns: Ibbotson Associates
47
|
Vantagepoint Mid/Small Company Index Fund Class II vs. Dow Jones Wilshires 4500
Completion Index (FA): Growth of $10,000 Invested April 5, 1999* |
| |
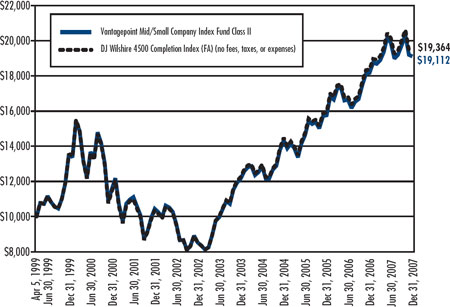
Source for Benchmark Returns: Ibbotson Associates
|
Vantagepoint Mid/Small Company Index Fund
Average Annual Total Return for the periods ended December 31, 2007* |
| |
| | | | | | | |
| | Class I Shares | | Class II Shares | |
| | | | | |
| | | | | |
One Year | | 4.98% | | | 5.20% | | |
Three Years | | 9.79% | | | 10.03% | | |
Five Years | | 17.27% | | | 17.50% | | |
Ten Years | | 7.07% | | | — | |
Since Inception | | — | | 7.68% | | |
| | | | | | |
Fund Inception Date | | June 2, 1997 | | April 5, 1999 | |
Offering Date | | March 1, 1999 | | April 5, 1999 | |
* Past performance does not guarantee future results. Investment returns and principal value will fluctuate so that shares, when redeemed, may be worth more or less than their original cost. Performance information for periods prior to March 1, 1999, when the Fund began operating, is of a commingled fund that had the same investment objectives and policies as the Fund and was advised by an affiliate of the Fund’s adviser. This past performance was adjusted at the time of the Fund’s registration to reflect the expenses of the Fund. The commingled fund was not a registered mutual fund so it was not subject to the same investment and tax restrictions as the Fund. If it had been, the commingled fund’s performance may have been lower. All returns assume reinvested dividends and do not reflect the deduction of taxes that a shareholder would pay on fund distributions or the redemption of fund shares. Please consult the current prospectus carefully before investing any money. The Vantagepoint Funds are distributed by ICMA-RC Services, LLC, a wholly owned broker-dealer subsidiary of ICMA-RC, and member FINRA/SIPC. 800-669-7400.
The Dow Jones Wilshire 4500 Completion Index consists of all common equity securities of companies domiciled in the U.S. for which daily pricing is available less the 500 stocks in the S&P 500 Index. This index is calculated using two different weighing methodologies: full market capitalization (full-cap) and float-adjusted market capitalization (float-adjusted). The full-cap methodology weights each of the constituents according to its total, or full, market capitalization. The float-adjusted methodology adjusts an individual stock’s market capitalization to account for shares that may be restricted or otherwise unavailable for purchase and first became available in 2004. The growth of $10,000 invested in the Dow Jones Wilshire 4500 Completion Index as shown in the chart has been calculated using the performance of the full-cap methodology from fund registration in 1999 to September 2004 and using the float-adjusted methodology after September 2004. Since the float-adjusted methodology became available in 2004, it has been considered a more appropriate comparison of fund performance. Had the growth of $10,000 in the Dow Jones Wilshire 4500 Completion Index been calculated solely using the full-cap methodology for the entire period it would have been $20,440 and $19,673 for Class I and Class II, respectively.
48
Vantagepoint Overseas Equity Index Fund
Sector Allocation as of December 31, 2007
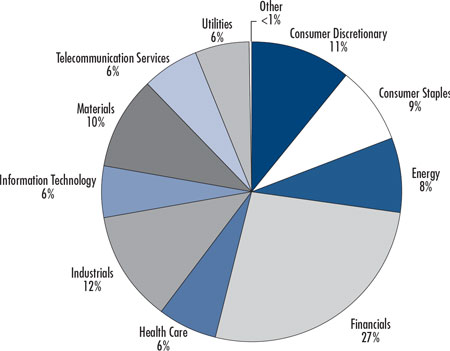
Due to rounding, pie chart allocations may not equal 100%.
|
Vantagepoint Overseas Equity Index Fund Class I vs. MSCI EAFE Free Index:
Growth of $10,000 Invested March 1, 1999* |
| |
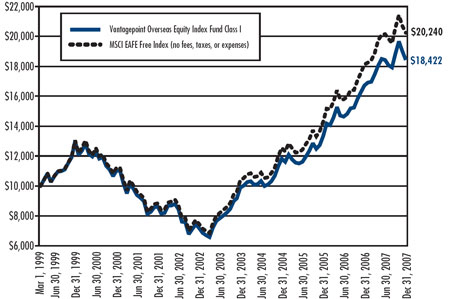
Source for Benchmark Returns: Ibbotson Associates
49
|
Vantagepoint Overseas Equity Index Fund Class II vs. MSCI EAFE Free Index: |
Growth of $10,000 Invested April 5, 1999* |
| |
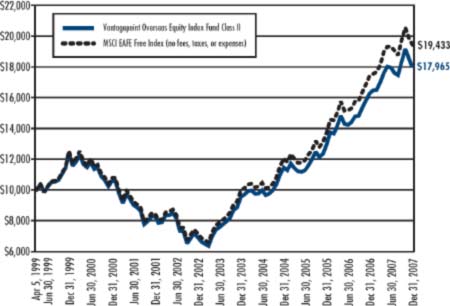
Source for Benchmark Returns: Ibbotson Associates
| |
Vantagepoint Overseas Equity Index Fund |
Average Annual Total Return for the periods ended December 31, 2007* |
| | |
| | | | | |
| | Class I Shares | | Class II Shares | |
| | | | | |
| | | | | |
One Year | | 10.17% | | 10.37% | |
Three Years | | 15.90% | | 16.16% | |
Five Years | | 20.73% | | 21.00% | |
Ten Years | | 7.92% | | — | |
Since Inception | | — | | 6.92% | |
| | | | | |
Fund Inception Date | | June 2, 1997 | | April 5, 1999 | |
Offering Date | | March 1, 1999 | | April 5, 1999 | |
* Past performance does not guarantee future results. Investment returns and principal value will fluctuate so that shares, when redeemed, may be worth more or less than their original cost. Performance information for periods prior to March 1, 1999, when the Fund began operating, is of a commingled fund that had the same investment objectives and policies as the Fund and was advised by an affiliate of the Fund’s adviser. This past performance was adjusted at the time of the Fund’s registration to reflect the expenses of the Fund. The commingled fund was not a registered mutual fund so it was not subject to the same investment and tax restrictions as the Fund. If it had been, the commingled fund’s performance may have been lower. All returns assume reinvested dividends and do not reflect the deduction of taxes that a shareholder would pay on fund distributions or the redemption of fund shares. Please consult the current prospectus carefully before investing any money. The Vantagepoint Funds are distributed by ICMA-RC Services, LLC, a wholly owned broker-dealer subsidiary of ICMA-RC, and member FINRA/SIPC. 800-669-7400.
The Fund’s benchmark, the MSCI EAFE Free Index, a free float adjusted market capitalization index that is designed to measure developed market equity performance excluding the U.S. and Canada. The index is unmanaged and does not reflect the costs of portfolio management or trading. The Fund’s portfolio may differ significantly from the securities in the market index.
50
Vantagepoint Model Portfolio Savings Oriented Fund
The Vantagepoint Model Portfolio Savings Oriented Fund’s objective is to offer capital preservation, reasonable current income and some capital growth while seeking to limit risk. The principal investment strategy is to invest in a combination of underlying Vantagepoint Funds to seek to obtain exposure to approximately 65% fixed income investments, 25% equity investments and 10% investments in asset classes and strategies that have historically exhibited a low correlation to traditional fixed income and equity investments (“multi-strategy Funds”). The investment strategy is implemented by investing in the following Vantagepoint Funds at target allocation within the percentage ranges indicated:
| |
Fixed Income | |
Vantagepoint Low Duration Bond Fund | 38%-48% |
Vantagepoint Core Bond Index Fund | 8%-18% |
Vantagepoint Inflation Protected Securities Fund | 4%-14% |
| |
Equity | |
Vantagepoint Equity Income Fund | 5%-15% |
Vantagepoint Growth & Income Fund | 5%-15% |
Vantagepoint International Fund | 0%-10% |
| |
Multi-Strategy | |
Vantagepoint Diversified Assets Fund | 0%-10% |
Performance
The Vantagepoint Model Portfolio Savings Oriented Fund’s total return was 6.15% in 2007. The Fund’s market benchmarks, the S&P 500 Index and the Lehman Brothers Intermediate Aggregate Bond Index* returned 5.49% and 7.02%, respectively, for the year. The Fund’s custom benchmark returned 6.75%. The Fund’s custom benchmark is composed of market indexes that reflect the general performance of the primary asset classes in which the Fund invests.
Commentary
The Fund’s performance in 2007 was driven by the weighting and performance of the component Funds in which the Fund invests. Please refer to each component Fund’s commentary, with the exception of the Diversified Assets Fund, within this report for more information.
The Low Duration Bond Fund returned 5.24%, the Core Bond Index Fund (Class I) gained 6.52%, and the Inflation Protected Securities Fund returned 9.64%. International equity markets generated higher returns than did U.S. domestic equity markets, and larger capitalization and growth oriented stocks led smaller capitalization and value oriented stocks for the year; with returns for the component funds reflecting these market results. The Equity Income Fund returned 3.76%, the International Fund earned 12.46%, and the Growth & Income Fund returned 5.98%.
As part of a re-optimization, the allocations to the underlying funds were modified in late October. The prior asset class target allocation of 75% fixed income Funds and 25% equity Funds was modified to 65% fixed income Funds, 25% equity Funds, and 10% multi-strategy Funds. At this time, allocations were made to one new Vantagepoint Fund – the Diversified Assets Fund. The shift in allocation is expected to enhance the Fund’s diversification through the inclusion of alternative asset classes and strategies that have historically tended to exhibit a low correlation to traditional asset classes such as bonds and stocks.
The conservative positioning of the Fund continues to seek to provide investors with a balanced and diversified approach to offering capital preservation and reasonable current income while offering some opportunity for capital growth.
* Prior to October 30, 2007, the Fund compared its performance to the Lehman Brothers Aggregate Bond Index, an unmanaged index which consists of all investment-grade U.S. fixed income securities. The Fund changed the index to which it compares the performance of its fixed income exposure because the Lehman Brothers Intermediate Aggregate Bond Index better represents the average duration of the Fund’s fixed income exposure.
51
Vantagepoint Model Portfolio Savings Oriented Fund
Underlying Fund Allocation as of December 31, 2007
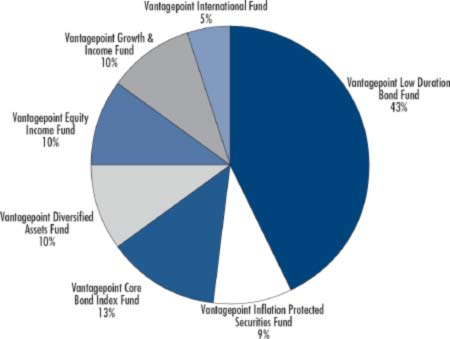
Due to rounding, pie chart allocations may not equal 100%.
|
Vantagepoint Model Portfolio Savings Oriented Fund vs. S&P 500 Index, Lehman Brothers |
Intermediate Aggregate Bond Index, Lehman Brothers Aggregate Bond Index, and |
Custom Benchmark: Growth of $10,000 Invested December 4, 2000* |
| |
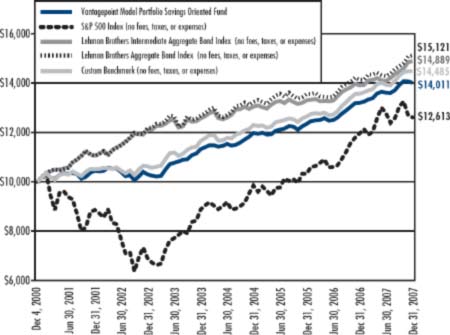
Source for Benchmark Returns: Ibbotson Associates
52
|
Vantagepoint Model Portfolio Savings Oriented Fund |
Average Annual Total Return for the periods ended December 31, 2007* |
| |
| |
One Year | 6.15% |
| |
Three Years | 5.36% |
| |
Five Years | 6.34% |
| |
Ten Years | 5.33% |
| |
Fund Inception Date | February 9, 1995 |
| |
Fund Registration Date | December 4, 2000 |
* Past performance does not guarantee future results. Investment returns and principal value will fluctuate so that shares, when redeemed, may be worth more or less than their original cost. Performance information for periods prior to December 4, 2000, when the Fund began operating, is of a commingled fund that had the same investment objectives and policies as the Fund and was advised by an affiliate of the Fund’s adviser. This past performance was adjusted at the time of the Fund’s registration to reflect the expenses of the Fund. The commingled fund was not a registered mutual fund so it was not subject to the same investment and tax restrictions as the Fund. If it had been, the commingled fund’s performance may have been lower. All returns assume reinvested dividends and do not reflect the deduction of taxes that a shareholder would pay on fund distributions or the redemption of fund shares. Please consult the current prospectus carefully before investing any money. The Vantagepoint Funds are distributed by ICMA-RC Services, LLC, a wholly owned broker-dealer subsidiary of ICMA-RC, and member FINRA/ SIPC. 800-669-7400.
The S&P 500 Index consists of 500 companies representing larger capitalization stocks traded in the U.S. The Lehman Brothers Intermediate Aggregate Bond Index is an unmanaged index comprised of U.S. government, mortgage, corporate and asset-backed securities with maturities of one to 10 years. The custom benchmark is composed of market indexes that reflect the general performance of the primary asset classes in which the Fund invests, in weighted percentages that correspond to the historical target allocation to those asset classes for the Fund. Those asset class benchmarks are the Lehman Brothers Intermediate Aggregate Bond Index for the fixed income asset class and the S&P 500 Index for the equity asset class. Should the target allocations for the Fund between those asset classes change, the percentage allocations to the corresponding indexes will also change when calculating the custom benchmark. A Fund’s portfolio may differ significantly from the securities held in the indexes. An index is not available for direct investment, is unmanaged, and does not reflect the costs of portfolio management or trading.
53
Vantagepoint Model Portfolio Conservative Growth Fund
The Vantagepoint Model Portfolio Conservative Growth Fund’s objective is to offer reasonable current income and capital preservation, with modest potential for capital growth. The principal investment strategy is to invest in a combination of underlying Vantagepoint Funds to seek to obtain exposure to approximately 50% fixed income investments, 40% equity investments, and 10% investments in asset classes and strategies that have historically exhibited a low correlation to traditional fixed income and equity investments (“multi-strategy Funds”). This investment strategy is implemented by investing in the following Vantagepoint Funds at target allocation within the percentage ranges indicated:
| |
Fixed Income | |
Vantagepoint Low Duration Bond Fund | 18%-28% |
Vantagepoint Core Bond Index Fund | 16%-26% |
Vantagepoint Inflation Protected Securities Fund | 2%-12% |
| |
Equity | |
Vantagepoint Equity Income Fund | 6%-16% |
Vantagepoint Growth & Income Fund | 4%-14% |
Vantagepoint Growth Fund | 1%-11% |
Vantagepoint Select Value Fund | 0%-10% |
Vantagepoint Aggressive Opportunities Fund | 0%-10% |
Vantagepoint International Fund | 3%-13% |
| |
Multi-Strategy | |
Vantagepoint Diversified Assets Fund | 0%-10% |
Performance
The Vantagepoint Model Portfolio Conservative Growth Fund’s total return was 6.57% in 2007. The Fund’s market benchmarks, the S&P 500 Index and the Lehman Brothers Intermediate Aggregate Bond Index* returned 5.49% and 7.02%, respectively, for the year. The Fund’s custom benchmark returned 6.55%. The Fund’s custom benchmark is composed of market indexes that reflect the general performance of the primary asset classes in which the Fund invests.
Commentary
The Fund’s performance in 2007 was driven by the weighting and performance of the component Funds in which the Fund invests. Please refer to each component Fund’s commentary, with the exception of the Select Value and Diversified Assets Funds, within this report for more information.
The Low Duration Bond Fund returned 5.24%, the Core Bond Index Fund (Class I) gained 6.52%, and the Inflation Protected Securities Fund returned 9.64%. International equity markets generated higher returns than did U.S. domestic equity markets, and larger capitalization and growth oriented stocks led smaller capitalization and value oriented stocks for the year; with returns for the component funds reflecting these market results. The Equity Income Fund returned 3.76% and the International Fund gained 12.46%. The remaining underlying equity Funds, excluding the Select Value Fund, earned returns ranging from 5.53% to 9.81%.
As part of a re-optimization, allocations to the underlying funds were modified in late October. The prior asset class target allocation of 60% fixed income Funds and 40% equity Funds was modified to 50% fixed income Funds, 40% equity Funds, and 10% multi-strategy Funds. At this time, allocations were made to the Inflation Protected Securities Fund, and two new Vantagepoint Funds – the Select Value Fund and the Diversified Assets Fund. The shift in allocation is intended to enhance the Fund’s diversification through the inclusion of new equity styles and of alternative asset classes and strategies that have historically tended to exhibit a low correlation to traditional bonds and stocks.
The conservative positioning of the Fund continues to seek to provide investors with a balanced and diversified approach to offering reasonable current income and capital preservation while offering modest potential for capital growth.
* Prior to October 30, 2007, the Fund compared its performance to the Lehman Brothers Aggregate Bond Index, an unmanaged index which consists of all investment-grade U.S. fixed income securities. The Fund changed the index to which it compares the performance of its fixed income exposure because the Lehman Brothers Intermediate Aggregate Bond Index better represents the average duration of the Fund’s fixed income exposure.
54
Vantagepoint Model Portfolio Conservative Growth Fund
Underlying Fund Allocation as of December 31, 2007
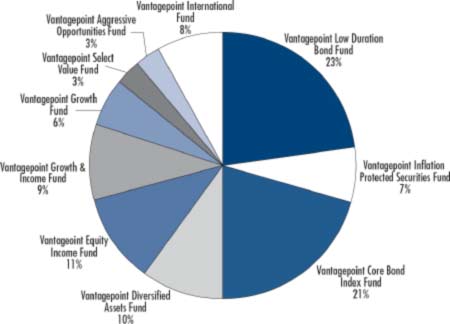
Due to rounding, pie chart allocations may not equal 100%.
|
Vantagepoint Model Portfolio Savings Oriented Fund vs. S&P 500 Index, |
LehmanBrothers Intermediate Aggregate Bond Index, Lehman Brothers Aggregate |
Bond Index, And Custom Benchmark: Growth Of$10,000 Invested December 4, 2000* |
| |
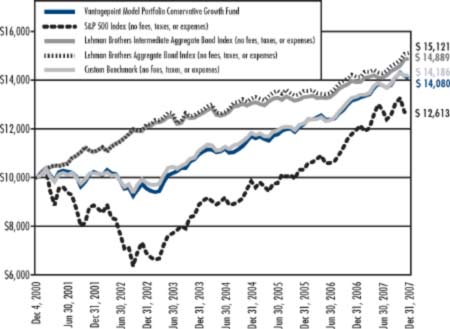
Source for Benchmark Returns: Ibbotson Associates
55
|
Vantagepoint Model Portfolio Conservative Growth Fund |
Average Annual Total Return for the periods ended December 31, 2007* |
| |
| |
One Year | 6.57% |
| |
Three Years | 6.41% |
| |
Five Years | 8.07% |
| |
Ten Years | 5.79% |
| |
Fund Inception Date | April 1, 1996 |
| |
Fund Registration Date | December 4, 2000 |
* Past performance does not guarantee future results. Investment returns and principal value will fluctuate so that shares, when redeemed, may be worth more or less than their original cost. Performance information for periods prior to December 4, 2000, when the Fund began operating, is of a commingled fund that had the same investment objectives and policies as the Fund and was advised by an affiliate of the Fund’s adviser. This past performance was adjusted at the time of the Fund’s registration to reflect the expenses of the Fund. The commingled fund was not a registered mutual fund so it was not subject to the same investment and tax restrictions as the Fund. If it had been, the commingled fund’s performance may have been lower. All returns assume reinvested dividends and do not reflect the deduction of taxes that a shareholder would pay on fund distributions or the redemption of fund shares. Please consult the current prospectus carefully before investing any money. The Vantagepoint Funds are distributed by ICMA-RC Services, LLC, a wholly owned broker-dealer subsidiary of ICMA-RC, and member FINRA/ SIPC. 800-669-7400.
The S&P 500 Index consists of 500 companies representing larger capitalization stocks traded in the U.S. The Lehman Brothers Intermediate Aggregate Bond Index is an unmanaged index comprised of U.S. government, mortgage, corporate and asset-backed securities with maturities of one to 10 years. The custom benchmark is composed of market indexes that reflect the general performance of the primary asset classes in which the Fund invests, in weighted percentages that correspond to the historical target allocation to those asset classes for the Fund. Those asset class benchmarks are the Lehman Brothers Intermediate Aggregate Bond Index for the fixed income asset class and the S&P 500 Index for the equity asset class. Should the target allocations for the Fund between those asset classes change, the percentage allocations to the corresponding indexes will also change when calculating the custom benchmark. A Fund’s portfolio may differ significantly from the securities held in the indexes. An index is not available for direct investment, is unmanaged, and does not reflect the costs of portfolio management or trading.
56
Vantagepoint Model Portfolio Traditional Growth Fund
The Vantagepoint Model Portfolio Traditional Growth Fund’s objective is to offer moderate capital growth and reasonable current income. The principal investment strategy of the Fund is to invest in a combination of Vantagepoint Funds to seek to obtain exposure to approximately 30% fixed income investments, 60% equity investments, and 10% investments in asset classes and strategies that have historically exhibited a low correlation to traditional fixed income and equity investments (“multi-strategy Funds”). The investment strategy is implemented by investing in the Vantagepoint Funds at target allocations within the percentage ranges indicated:
| |
Fixed Income | |
Vantagepoint Low Duration Bond Fund | 3%-13% |
Vantagepoint Core Bond Index Fund | 13%-23% |
Vantagepoint Inflation Protected Securities Fund | 0%-10% |
| |
Equity | |
Vantagepoint Equity Income Fund | 7%-17% |
Vantagepoint Growth & Income Fund | 7%-17% |
Vantagepoint Growth Fund | 5%-15% |
Vantagepoint Select Value Fund | 0%-10% |
Vantagepoint Aggressive Opportunities Fund | 0%-10% |
Vantagepoint Discovery Fund | 0%-10% |
Vantagepoint International Fund | 7%-17% |
| |
Multi-Strategy | |
Vantagepoint Diversified Assets Fund | 0%-10% |
Performance
The Vantagepoint Model Portfolio Traditional Growth Fund’s total return was 7.03% in 2007. The Fund’s market benchmarks, the S&P 500 Index and the Lehman Brothers Intermediate Aggregate Bond Index* returned 5.49% and 7.02%, respectively, for the year. The Fund’s custom benchmark returned 6.24%. The Fund’s custom benchmark is composed of market indexes that reflect the general performance of the primary asset classes in which the Fund invests.
Commentary
The Fund’s performance in 2007 was driven by the weighting and performance of the component Funds in which the Fund invests. Please refer to each component Fund’s commentary, with the exception of the Select Value, Discovery and Diversified Assets Funds within this report for more information.
The Low Duration Bond Fund returned 5.24%, the Core Bond Index Fund (Class I) gained 6.52%, and the Inflation Protected Securities Fund returned 9.64%. International equity markets generated higher returns than did U.S. domestic equity markets, and larger capitalization and growth oriented stocks led smaller capitalization and value oriented stocks for the year, with returns for the component funds reflecting these market results. The Equity Income Fund rose 3.76% and the International Fund gained 12.46%. The remaining underlying equity Funds, excluding the Select Value and Discovery Funds, earned returns ranging from 5.53% to 9.81%.
As part of a re-optimization, allocations to the underlying funds were modified in late October. The prior asset class target allocation of 40% fixed income Funds and 60% equity Funds was modified to 30% fixed income Funds, 60% equity Funds, and 10% multi-strategy Funds. At this time, allocations were made to the Inflation Protected Securities Fund as well as three new Vantagepoint Funds – the Select Value, Discovery, and Diversified Assets Funds. The shift in allocation is intended to enhance the Fund’s diversification through the inclusion of new equity styles and of alternative asset classes and strategies that have historically tended to exhibit a low correlation to traditional bonds and stocks.
The positioning of the Fund continues to seek to provide investors with a balanced and diversified approach to offering moderate capital growth and reasonable current income.
* Prior to October 30, 2007, the Fund compared its performance to the Lehman Brothers Aggregate Bond Index, an unmanaged index which consists of all investment-grade U.S. fixed income securities. The Fund changed the index to which it compares the performance of its fixed income exposure because the Lehman Brothers Intermediate Aggregate Bond Index better represents the average duration of the Fund’s fixed income exposure.
57
Vantagepoint Model Portfolio Traditional Growth Fund
Underlying Fund Allocation as of December 31, 2007
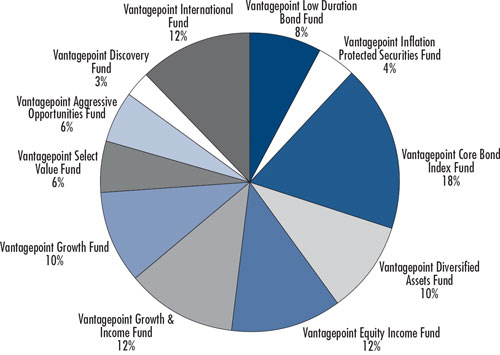
Due to rounding, pie chart allocations may not equal 100%.
|
Vantagepoint Model Portfolio Traditional Growth Fund vs. S&P 500 Index, Lehman Brothers Intermediate Aggregate Bond Index, Lehman Brothers Aggregate Bond Index, and Custom Benchmark: Growth of $10,000 Invested December 4, 2000* |
| |
|
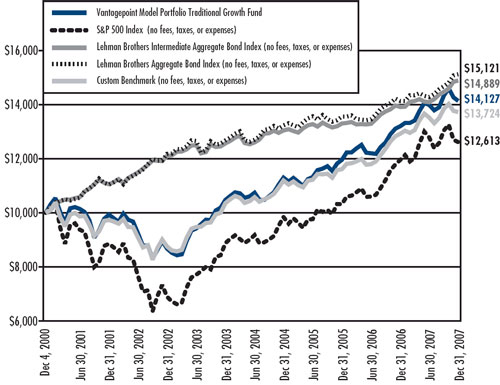
|
Source for Benchmark Returns: Ibbotson Associates
58
| | |
Vantagepoint Model Portfolio Traditional Growth Fund |
Average Annual Total Return for the periods ended December 31, 2007* |
| |
| | | |
One Year | 7.03 | % |
| | |
Three Years | 7.73 | % |
| | |
Five Years | 10.24 | % |
| | |
Ten Years | 6.32 | % |
| | |
Fund Inception Date | April 1, 1996 |
| |
Fund Registration Date | December 4, 2000 |
* Past performance does not guarantee future results. Investment returns and principal value will fluctuate so that shares, when redeemed, may be worth more or less than their original cost. Performance information for periods prior to December 4, 2000, when the Fund began operating, is of a commingled fund that had the same investment objectives and policies as the Fund and was advised by an affiliate of the Fund’s adviser. This past performance was adjusted at the time of the Fund’s registration to reflect the expenses of the Fund. The commingled fund was not a registered mutual fund so it was not subject to the same investment and tax restrictions as the Fund. If it had been, the commingled fund’s performance may have been lower. All returns assume reinvested dividends and do not reflect the deduction of taxes that a shareholder would pay on fund distributions or the redemption of fund shares. Please consult the current prospectus carefully before investing any money. The Vantagepoint Funds are distributed by ICMA-RC Services, LLC, a wholly owned broker-dealer subsidiary of ICMA-RC, and member FINRA/ SIPC. 800-669-7400.
The S&P 500 Index consists of 500 companies representing larger capitalization stocks traded in the U.S. The Lehman Brothers Intermediate Aggregate Bond Index is an unmanaged index comprised of U.S. government, mortgage, corporate and asset-backed securities with maturities of one to 10 years. The custom benchmark is composed of market indexes that reflect the general performance of the primary asset classes in which the Fund invests, in weighted percentages that correspond to the historical target allocation to those asset classes for the Fund. Those asset class benchmarks are the Lehman Brothers Intermediate Aggregate Bond Index for the fixed income asset class and the S&P 500 Index for the equity asset class. Should the target allocations for the Fund between those asset classes change, the percentage allocations to the corresponding indexes will also change when calculating the custom benchmark. A Fund’s portfolio may differ significantly from the securities held in the indexes. An index is not available for direct investment, is unmanaged, and does not reflect the costs of portfolio management or trading.
59
Vantagepoint Model Portfolio Long-Term Growth Fund
The Vantagepoint Model Portfolio Long-Term Growth Fund’s objective is to offer high long-term capital growth and modest current income. The principal investment strategy of the Fund to invest in a combination of underlying Vantagepoint Funds to seek to obtain exposure to approximately 15% fixed income investments, 75% equity investments, and 10% investments in asset classes and strategies that have historically exhibited a low correlation to traditional fixed income and equity investments (“multi-strategy Funds”). The investment strategy is implemented by investing in the Vantagepoint Funds at target allocations within the percentage ranges indicated:
| |
Fixed Income | |
Vantagepoint Core Bond Index Fund | 10%-20% |
| |
Equity | |
Vantagepoint Equity Income Fund | 8%-18% |
Vantagepoint Growth & Income Fund | 8%-18% |
Vantagepoint Growth Fund | 7%-17% |
Vantagepoint Select Value Fund | 4%-14% |
Vantagepoint Aggressive Opportunities Fund | 4%-14% |
Vantagepoint Discovery Fund | 0%-10% |
Vantagepoint International Fund | 11%-21% |
| |
Multi-Strategy | |
Vantagepoint Diversified Assets Fund | 0%-10% |
Performance
The Vantagepoint Model Portfolio Long-Term Growth Fund’s total return was 7.74% in 2007. The Fund’s market benchmarks, the S&P 500 Index and the Lehman Brothers Intermediate Aggregate Bond Index* returned 5.49% and 7.02%, respectively, for the year. The Fund’s custom benchmark returned 6.27%. The Fund’s custom benchmark is composed of market indexes that reflect the general performance of the primary asset classes in which the Fund invests.
Commentary
The Fund’s performance in 2007 was driven by the weighting and performance of the component Funds in which the Fund invests. Please refer to each component Fund’s commentary, with the exception of the Select Value, Discovery, and Diversified Assets Funds within this report for more information.
The Core Bond Index Fund (Class I), representing 15% of total Fund assets, gained 6.52%. International equity markets generated higher returns than did U.S. domestic equity markets, and larger capitalization and growth oriented stocks led smaller capitalization and value oriented stocks for the year, with returns for the component funds reflecting these market results. The Equity Income Fund returned 3.76% and the International Fund gained 12.46%. The remaining underlying equity Funds, excluding the Select Value and Discovery Funds, earned returns ranging from 5.53% to 9.81%.
As part of a re-optimization, allocations to the underlying funds were modified in late October. The prior asset class target allocation of 20% fixed income Funds and 80% equity Funds was modified to 15% fixed income Funds, 75% equity Funds, and 10% multi-strategy Funds. At this time, allocations were made to three new Vantagepoint Funds – the Select Value, Discovery, and Diversified Assets Funds. The shift in allocations is expected to enhance the Fund’s diversification through the inclusion of new equity styles and of alternative asset classes and strategies that have historically tended to exhibit a low correlation to traditional bonds and stocks.
The positioning of the Fund continues to seek to provide investors with a balanced and diversified approach to offering high long-term capital growth and current income.
* Prior to October 30, 2007, the Fund compared its performance to the Lehman Brothers Aggregate Bond Index, an unmanaged index which consists of all investment-grade U.S. fixed income securities. The Fund changed the index to which it compares the performance of its fixed income exposure because the Lehman Brothers Intermediate Aggregate Bond Index better represents the average duration of the Fund’s fixed income exposure.
60
Vantagepoint Model Portfolio Long-Term Growth Fund
Underlying Fund Allocation as of December 31, 2007
Due to rounding, pie chart allocations may not equal 100%.
|
Vantagepoint Model Portfolio Long-Term Growth Fund vs. S&P 500 Index, Lehman Brothers Intermediate Aggregate Bond Index, Lehman Brothers Aggregate Bond Index, and Custom Benchmark: Growth of $10,000 Invested December 4, 2000* |
| |
|
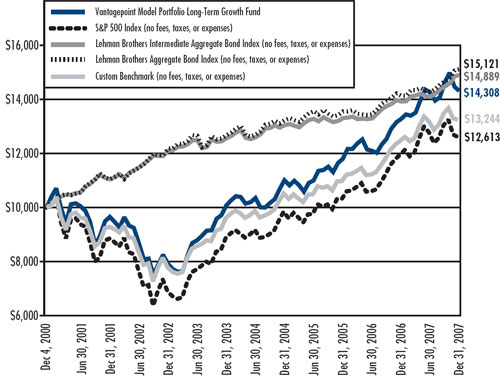
|
Source for Benchmark Returns: Ibbotson Associates
61
| | |
Vantagepoint Model Portfolio Long-Term Growth Fund |
Average Annual Total Return for the periods ended December 31, 2007* |
| |
| | |
One Year | 7.74% | |
| | |
Three Years | 9.14% | |
| | |
Five Years | 12.56% | |
| | |
Ten Years | 7.25% | |
| | |
Fund Inception Date | April 1, 1996 |
| |
Fund Registration Date | December 4, 2000 |
* Past performance does not guarantee future results. Investment returns and principal value will fluctuate so that shares, when redeemed, may be worth more or less than their original cost. Performance information for periods prior to December 4, 2000, when the Fund began operating, is of a commingled fund that had the same investment objectives and policies as the Fund and was advised by an affiliate of the Fund’s adviser. This past performance was adjusted at the time of the Fund’s registration to reflect the expenses of the Fund. The commingled fund was not a registered mutual fund so it was not subject to the same investment and tax restrictions as the Fund. If it had been, the commingled fund’s performance may have been lower. All returns assume reinvested dividends and do not reflect the deduction of taxes that a shareholder would pay on fund distributions or the redemption of fund shares. Please consult the current prospectus carefully before investing any money. The Vantagepoint Funds are distributed by ICMA-RC Services, LLC, a wholly owned broker-dealer subsidiary of ICMA-RC, and member FINRA/ SIPC. 800-669-7400.
The S&P 500 Index consists of 500 companies representing larger capitalization stocks traded in the U.S. The Lehman Brothers Intermediate Aggregate Bond Index is an unmanaged index comprised of U.S. government, mortgage, corporate and asset-backed securities with maturities of one to 10 years. The custom benchmark is composed of market indexes that reflect the general performance of the primary asset classes in which the Fund invests, in weighted percentages that correspond to the historical target allocation to those asset classes for the Fund. Those asset class benchmarks are the Lehman Brothers Intermediate Aggregate Bond Index for the fixed income asset class and the S&P 500 Index for the equity asset class. Should the target allocations for the Fund between those asset classes change, the percentage allocations to the corresponding indexes will also change when calculating the custom benchmark. A Fund’s portfolio may differ significantly from the securities held in the indexes. An index is not available for direct investment, is unmanaged, and does not reflect the costs of portfolio management or trading.
62
Vantagepoint Model Portfolio All-Equity Growth Fund
The Vantagepoint Model Portfolio All-Equity Growth Fund’s objective is to offer high long-term capital growth. The principal investment strategy of the Fund is to invest, under normal circumstances, 100% in equity Funds whose assets are invested, under normal circumstances, at least 80% in equity securities. The investment strategy is implemented by investing in The Vantagepoint Funds in the approximate target percentages indicated:
| |
Equity | |
Vantagepoint Equity Income Fund | 13%-23% |
Vantagepoint Growth & Income Fund | 12%-22% |
Vantagepoint Growth Fund | 12%-22% |
Vantagepoint Select Value Fund | 5%-15% |
Vantagepoint Aggressive Opportunities Fund | 5%-15% |
Vantagepoint Discovery Fund | 4%-14% |
Vantagepoint International Fund | 15%-25% |
Performance
The Vantagepoint Model Portfolio All-Equity Growth Fund returned 7.75% in 2007. The Fund’s market benchmarks, the S&P 500 Index and the MSCI EAFE Index, returned 5.49% and 11.63% for the year. The Fund’s custom benchmark returned 6.80%. The Fund’s custom benchmark is composed of market indexes that reflect the general performance of the asset classes in which the Fund invests.
Commentary
The Fund’s performance in 2007 was driven by the weighting and performance of the component Funds in which the Fund invests. Please refer to each component Fund’s commentary with the exception of the Select Value and Discovery Funds, within this report for more information.
International equity markets generated higher returns than did U.S. domestic equity markets, and larger capitalization and growth oriented stocks led smaller capitalization and value oriented stocks for the year; with returns for the component Funds reflecting these market results. The Equity Income Fund returned 3.76% and the International Fund gained 12.46%. The remaining underlying equity Funds, excluding the Select Value and Discovery Funds, earned returns ranging from 5.53% to 9.81%.
As part of a re-optimization, allocations to the underlying Funds were modified in late October. At this time, allocations were made to two new Vantagepoint Funds – the Select Value Fund and the Discovery Fund. The reallocation is expected to enhance the Fund’s diversification through the inclusion of additional segments of the equity markets.
The positioning of the Fund continues to seek to provide investors with a balanced and diversified approach to offering high long-term capital growth.
63
Vantagepoint Model Portfolio All-Equity Growth Fund
Underlying Fund Allocation as of December 31, 2007
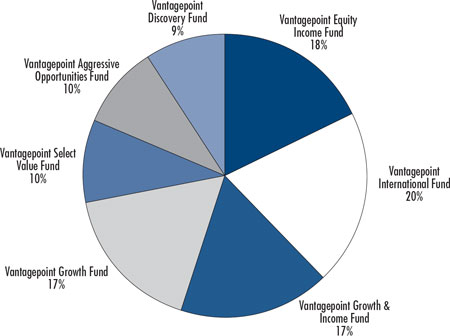
Due to rounding, pie chart allocations may not equal 100%.
|
Vantagepoint Model Portfolio All-Equity Growth Fund vs. S&P 500 Index, MSCI EAFE Index, and Custom Benchmark: Growth of $10,000 Invested December 4, 2000* |
| |
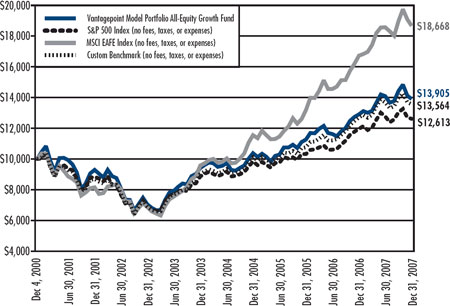
Source for Benchmark Returns: Ibbotson Associates
64
| |
Vantagepoint Model Portfolio All-Equity Growth Fund
Average Annual Total Return for the periods ended December 31, 2007* |
| |
| |
One Year | 7.75% |
| |
Three Years | 10.23% |
| |
Five Years | 14.51% |
| |
Since Inception | 3.30% |
| |
Fund Inception Date | October 1, 2000 |
| |
Fund Registration Date | December 4, 2000 |
*Past performance does not guarantee future results. Investment returns and principal value will fluctuate so that shares, when redeemed, may be worth more or less than their original cost. Performance information for periods prior to December 4, 2000, when the Fund began operating, is of a commingled fund that had the same investment objectives and policies as the Fund and was advised by an affiliate of the Fund’s adviser. This past performance was adjusted at the time of the Fund’s registration to reflect the expenses of the Fund. The commingled fund was not a registered mutual fund so it was not subject to the same investment and tax restrictions as the Fund. If it had been, the commingled fund’s performance may have been lower. All returns assume reinvested dividends and do not reflect the deduction of taxes that a shareholder would pay on fund distributions or the redemption of fund shares. Please consult the current prospectus carefully before investing any money. The Vantagepoint Funds are distributed by ICMA-RC Services, LLC, a wholly owned broker-dealer subsidiary of ICMA-RC, and member FINRA/ SIPC. 800-669-7400.
The S&P 500 Index consists of 500 companies representing larger capitalization stocks traded in the U.S. The Morgan Stanley Capital International Europe Asia Far East (MSCI EAFE) Index is a free float-adjusted market capitalization index that is designed to measure the equity market performance of developed markets, excluding the U.S. and Canada. The custom benchmark is composed of market indexes that reflect the general performance of the primary asset classes in which the Fund invests, in weighted percentages that correspond to the historical target allocation to those asset classes for the Fund. Those asset class benchmarks are the S&P 500 Index and the MSCI EAFE Index. Should the target allocations for the Fund between those asset classes change, the percentage allocations to the corresponding indexes will also change when calculating the custom benchmark. A Fund’s portfolio may differ significantly from the securities held in the indexes. An index is not available for direct investment, is unmanaged, and does not reflect the costs of portfolio management or trading.
65
Vantagepoint Milestone Retirement Income Fund
The Vantagepoint Milestone Retirement Income Fund’s objective is to seek to offer current income and opportunities for capital growth that have limited risk. This Fund may be appropriate for participants who are very close to retirement or are already in retirement.
The principal investment strategy is to seek to invest to obtain exposure to approximately 60% in fixed income investments, approximately 30% in equity investments, and 10% investments in asset classes and strategies that have historically exhibited a low correlation to traditional fixed income and equity investments (“multi-strategy Funds”). The investment strategy is implemented by investing in the following Vantagepoint Funds at target allocation within the percentage ranges indicated:
| |
Fixed Income | |
Vantagepoint Low Duration Bond Fund | 35%-45% |
Vantagepoint Core Bond Index Fund | 6%-16% |
Vantagepoint Inflation Protected Securities Fund | 4%-14% |
| |
Equity | |
Vantagepoint Equity Income Fund | 7%-17% |
Vantagepoint Growth & Income Fund | 7%-17% |
Vantagepoint International Fund | 1%-11% |
| |
Multi-Strategy | |
Vantagepoint Diversified Assets Fund | 0%-10% |
Performance
The Vantagepoint Milestone Retirement Income Fund’s total return was 6.05% in 2007. The Fund’s market benchmarks, the S&P 500 Index and the Lehman Brothers Intermediate Aggregate Bond Index* returned 5.49% and 7.02%, respectively, for the year. The Fund’s custom benchmark returned 6.68%. The Fund’s custom benchmark is composed of market indexes that reflect the general performance of the primary asset classes in which the Fund invests.
Commentary
The Fund’s performance in 2007 was driven by the weighting and performance of the component Funds in which the Fund invests. Please refer to each component Fund’s commentary, with the exception of the Diversified Assets Fund, within this report for more information.
The Low Duration Bond Fund returned 5.24%, the Core Bond Index Fund (Class I) gained 6.52%, and the Inflation Protected Securities Fund returned 9.64%. Among equities, international markets generated higher returns than domestic and growth stocks led value stocks for the year; the returns for the equity Funds reflect these market trends. The Equity Income Fund returned 3.76%, the Growth & Income Fund earned 5.98%, and the International Fund gained 12.46%.
As part of a re-optimization, allocations among the underlying funds were modified in late October. The prior asset class target allocation of 70% fixed income Funds and 30% equity Funds was modified to 60% fixed income Funds, 30% equity Funds, and 10% multi-strategy Funds. At this time, allocations were made to the Inflation Protected Securities Fund and a new Vantagepoint Fund – the Diversified Assets Fund. The reallocation is intended to enhance the Fund’s diversification through the inclusion of alternative asset classes and strategies that have historically tended to exhibit a low correlation to traditional bonds and stocks.
* Prior to October 30, 2007, the Fund compared its performance to the Lehman Brothers Aggregate Bond Index, an unmanaged index which consists of all investment-grade U.S. fixed income securities. The Fund changed the index to which it compares the performance of its fixed income exposure because the Lehman Brothers Intermediate Aggregate Bond Index better represents the average duration of the Fund’s fixed income exposure.
66
Vantagepoint Milestone Retirement Income Fund
Underlying Fund Allocation as of December 31, 2007
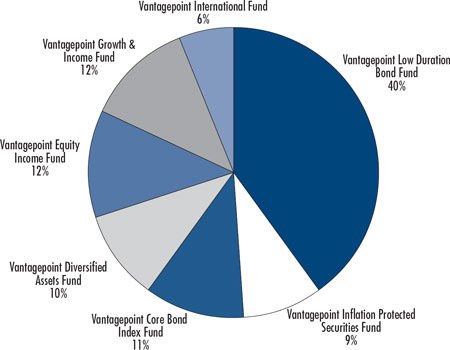
Due to rounding, pie chart allocations may not equal 100%.
|
Vantagepoint Milestone Retirement Income Fund vs. S&P 500 Index, Lehman Brothers Intermediate Aggregate Bond Index, Lehman Brothers Aggregate Bond Index, and Custom Benchmark: Growth of $10,000 Invested January 3, 2005* |
| |
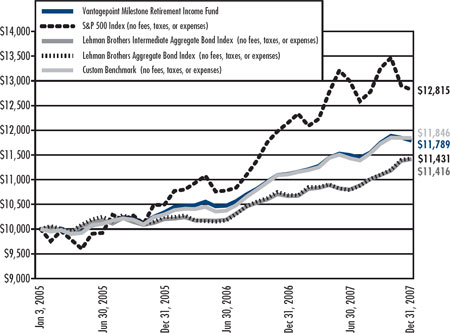
Source for Benchmark Returns: Ibbotson Associates
67
| |
Vantagepoint Milestone Retirement Income Fund
Average Annual Total Return for the periods ended December 31, 2007* |
| |
| |
One Year | 6.05% |
| |
Three Years | 5.64% |
| |
Since Inception | 5.64% |
| |
Fund Inception Date | January 3, 2005 |
*Past performance does not guarantee future results. Investment returns and principal value will fluctuate so that shares, when redeemed, may be worth more or less than their original cost. All returns assume reinvested dividends and do not reflect the deduction of taxes that a shareholder would pay on fund distributions or the redemption of fund shares. Please consult the current prospectus carefully before investing any money. The Vantagepoint Funds are distributed by ICMA-RC Services, LLC, a wholly owned broker-dealer subsidiary of ICMA-RC, and member FINRA/ SIPC. 800-669-7400.
The S&P 500 Index consists of 500 companies representing larger capitalization stocks traded in the U.S. The Lehman Brothers Intermediate Aggregate Bond Index is an unmanaged index comprised of U.S. government, mortgage, corporate and asset-backed securities with maturities of one to 10 years. The custom benchmark is composed of market indexes that reflect the general performance of the primary asset classes in which the Fund invests, in weighted percentages that correspond to the historical target allocation to those asset classes for the Fund. Those asset class benchmarks are the Lehman Brothers Intermediate Aggregate Bond Index for the fixed income asset class and the S&P 500 Index for the equity asset class. Should the target allocations for the Fund between those asset classes change, the percentage allocations to the corresponding indexes will also change when calculating the custom benchmark. A Fund’s portfolio may differ significantly from the securities held in the indexes. An index is not available for direct investment, is unmanaged, and does not reflect the costs of portfolio management or trading.
68
Vantagepoint Milestone 2010 Fund
The Vantagepoint Milestone 2010 Fund’s objective is to offer high total return consistent with the Fund’s current asset allocation. The Fund’s principal investment strategy is to invest in a combination of equity Funds, fixed income Funds, and, beginning in October 2007, the Fund began to allocate up to 10% of its assets to certain underlying Funds to gain exposure to asset classes and strategies that have historically exhibited a low correlation to traditional fixed income and equity investments (“multi-strategy Funds”) by investing in The Vantagepoint Funds using an asset allocation strategy designed for investors expecting to retire around the year 2010.
At year-end, the Fund was invested in nine Vantagepoint Funds at target allocations within the percentage ranges indicated:
| |
Fixed Income | |
Vantagepoint Low Duration Bond Fund | 25%-35% |
Vantagepoint Core Bond Index Fund | 6%-16% |
Vantagepoint Inflation Protected Securities Fund | 3%-13% |
| |
Equity | |
Vantagepoint Equity Income Fund | 10%-20% |
Vantagepoint Growth & Income Fund | 6%-16% |
Vantagepoint Growth Fund | 0%-10% |
Vantagepoint Mid/Small Company Index Fund | 0%-10% |
Vantagepoint International Fund | 3%-13% |
| |
Multi-Strategy | |
Vantagepoint Diversified Assets Fund | 0%-10% |
As time elapses, the Fund’s allocation to equity Funds will periodically decrease and the Fund’s allocation to fixed income Funds and multi-strategy Funds will correspondingly increase so that by June 30 of the year 2010, the Fund’s asset allocation will be approximately 30% equity Funds, 60% fixed income Funds, and 10% multi-strategy Funds.
Performance
The Vantagepoint Milestone 2010 Fund’s total return was 6.43% in 2007. The Fund’s market benchmarks, the S&P 500 Index and the Lehman Brothers Intermediate Aggregate Bond Index* returned 5.49% and 7.02%, respectively, for the year. The Fund’s custom benchmark returned 6.64%. The Fund’s custom benchmark is composed of market indexes that reflect the general performance of the primary asset classes in which the Fund invests.
Commentary
The Fund’s performance in 2007 was driven by the weighting and performance of the component Funds in which the Fund invests. Please refer to each component Fund’s commentary, with the exception of the Diversified Assets Fund, within this report for more information.
The Low Duration Bond Fund returned 5.24%, the Core Bond Index Fund (Class I) gained 6.52%, and the Inflation Protected Securities Fund returned 9.64%. Among equities, international markets generated higher returns than domestic, and larger-cap and growth stocks led smaller-cap and value stocks for the year; the returns for the equity Funds reflect these market trends. The Equity Income Fund returned 3.76% and the International Fund gained 12.46%. The remaining underlying equity Funds earned returns ranging from 4.98% to 9.81%.
As part of a re-optimization, allocations among the underlying funds were modified in late October. The prior asset class target allocation of 58% fixed income Funds and 42% equity Funds was modified to 48% fixed income Funds, 42% equity Funds, and 10% multi-strategy Funds. At this time, allocations were made to the Inflation Protected Securities Fund and a new Vantagepoint Fund – the Diversified Assets Fund. The shift in allocation is intended to enhance the Fund’s diversification through the inclusion of alternative asset classes and strategies that have historically tended to exhibit a low correlation to traditional bonds and stocks.
* Prior to October 30, 2007, the Fund compared its performance to the Lehman Brothers Aggregate Bond Index, an unmanaged index which consists of all investment-grade U.S. fixed income securities. The Fund changed the index to which it compares the performance of its fixed income exposure because the Lehman Brothers Intermediate Aggregate Bond Index better represents the average duration of the Fund’s fixed income exposure.
69
Vantagepoint Milestone 2010 Fund
Underlying Fund Allocation as of December 31, 2007
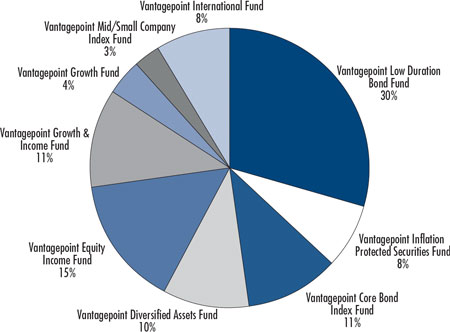
Due to rounding, pie chart allocations may not equal 100%.
|
Vantagepoint Milestone 2010 Fund vs. S&P 500 Index, Lehman Brothers Intermediate Aggregate Bond Index, Lehman Brothers Aggregate Bond Index, and Custom Benchmark: Growth of $10,000 Invested January 3, 2005* |
| |

Source for Benchmark Returns: Ibbotson Associates
70
| |
Vantagepoint Milestone 2010 Fund
Average Annual Total Return for the periods ended December 31, 2007* |
| |
| |
One Year | 6.43% |
| |
Three Years | 6.66% |
| |
Since Inception | 6.66% |
| |
Fund Inception Date | January 3, 2005 |
*Past performance does not guarantee future results. Investment returns and principal value will fluctuate so that shares, when redeemed, may be worth more or less than their original cost. All returns assume reinvested dividends and do not reflect the deduction of taxes that a shareholder would pay on fund distributions or the redemption of fund shares. Please consult the current prospectus carefully before investing any money. The Vantagepoint Funds are distributed by ICMA-RC Services, LLC, a wholly owned broker-dealer subsidiary of ICMA-RC, and member FINRA/ SIPC. 800-669-7400.
The S&P 500 Index consists of 500 companies representing larger capitalization stocks traded in the U.S. The Lehman Brothers Intermediate Aggregate Bond Index is an unmanaged index comprised of U.S. government, mortgage, corporate and asset-backed securities with maturities of one to 10 years. The custom benchmark is composed of market indexes that reflect the general performance of the primary asset classes in which the Fund invests, in weighted percentages that correspond to the historical target allocation to those asset classes for the Fund. Those asset class benchmarks are the Lehman Brothers Intermediate Aggregate Bond Index for the fixed income asset class and the S&P 500 Index for the equity asset class. Should the target allocations for the Fund between those asset classes change, the percentage allocations to the corresponding indexes will also change when calculating the custom benchmark. A Fund’s portfolio may differ significantly from the securities held in the indexes. An index is not available for direct investment, is unmanaged, and does not reflect the costs of portfolio management or trading.
71
Vantagepoint Milestone 2015 Fund
The Vantagepoint Milestone 2015 Fund’s objective is to offer high total return consistent with the Fund’s current asset allocation. The Fund’s principal investment strategy is to invest in a combination of equity Funds, fixed income Funds, and, beginning in October 2007, the Fund began to allocate up to 10% of its assets to certain underlying Funds to gain exposure to asset classes and strategies that have historically exhibited a low correlation to traditional fixed income and equity investments (“multi-strategy Funds”) by investing in The Vantagepoint Funds using an asset allocation strategy designed for investors expecting to retire around the year 2015.
At year-end, the Fund was invested in nine Vantagepoint Funds at target allocations within the percentage ranges indicated:
| | |
Fixed Income | | |
Vantagepoint Low Duration Bond Fund | | 10%-20% |
Vantagepoint Core Bond Index Fund | | 12%-22% |
Vantagepoint Inflation Protected Securities Fund | | 0%-10% |
| | |
Equity | | |
Vantagepoint Equity Income Fund | | 14%-24% |
Vantagepoint Growth & Income Fund | | 6%-16% |
Vantagepoint Growth Fund | | 3%-13% |
Vantagepoint Mid/Small Company Index Fund | | 2%-12% |
Vantagepoint International Fund | | 6%-16% |
| | |
Multi-Strategy | | |
Vantagepoint Diversified Assets Fund | | 0%-10% |
As time elapses, the Fund’s allocation to equity Funds will periodically decrease and the Fund’s allocation to fixed income Funds and multi-strategy Funds will correspondingly increase so that by June 30 of the year 2015, the Fund’s asset allocation will be approximately 30% equity Funds, 60% fixed income Funds, and 10% multi-strategy Funds.
Performance
The Vantagepoint Milestone 2015 Fund’s total return was 6.88% in 2007. The Fund’s market benchmarks, the S&P 500 Index and the Lehman Brothers Intermediate Aggregate Bond Index* returned 5.49% and 7.02%, respectively, for the year. The Fund’s custom benchmark returned 6.57%. The Fund’s custom benchmark is composed of market indexes that reflect the general performance of the primary asset classes in which the Fund invests.
Commentary
The Fund’s performance in 2007 was driven by the weighting and performance of the component Funds in which the Fund invests. Please refer to each component Fund’s commentary, with the exception of the Diversified Assets Fund, within this report for more information.
The Low Duration Bond Fund returned 5.24%, the Core Bond Index Fund (Class I) gained 6.52%, and the Inflation Protected Securities Fund returned 9.64%. Among equities, international markets generated higher returns than domestic, and larger-cap and growth stocks led smaller-cap and value stocks for the year; the returns for the equity funds reflect these market trends. The Equity Income Fund returned 3.76% and the International Fund gained 12.46%. The remaining underlying equity Funds earned returns ranging from 4.98% to 9.81%.
As part of a re-optimization, allocations among the underlying funds were modified in late October. The prior asset class target allocation of 41% fixed income Funds and 59% equity Funds was modified to 34% fixed income Funds, 56% equity Funds, and 10% multi-strategy Funds. At this time, allocations were made to the Inflation Protected Securities Fund and a new Vantagepoint Fund – the Diversified Assets Fund. The shift in allocation is intended to enhance the Fund’s diversification through the inclusion of alternative asset classes and strategies that have historically tended to exhibit a low correlation to traditional bonds and stocks.
* Prior to October 30, 2007, the Fund compared its performance to the Lehman Brothers Aggregate Bond Index, an unmanaged index which consists of all investment-grade U.S. fixed income securities. The Fund changed the index to which it compares the performance of its fixed income exposure because the Lehman Brothers Intermediate Aggregate Bond Index better represents the average duration of the Fund’s fixed income exposure.
72
Vantagepoint Milestone 2015 Fund
Underlying Fund Allocation as of December 31, 2007
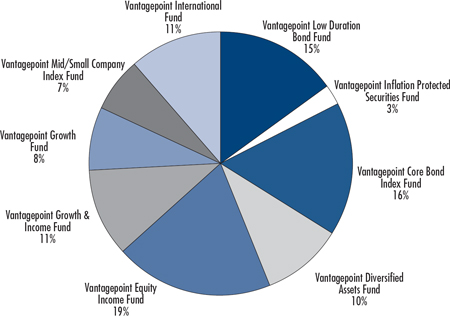
Due to rounding, pie chart allocations may not equal 100%.
| |
Vantagepoint Milestone 2015 Fund vs. S&P 500 Index, Lehman Brothers Intermediate Aggregate Bond Index, Lehman Brothers Aggregate Bond Index, And Custom Benchmark: Growth of $10,000 Invested January 3, 2005* |
| |
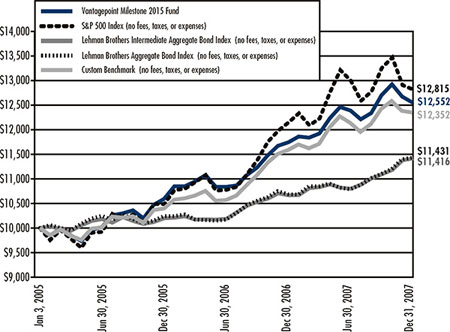
Source for Benchmark Returns: Ibbotson Associates
73
|
Vantagepoint Milestone 2015 Fund |
Average Annual Total Return for the periods ended December 31, 2007* |
| |
| |
One Year | 6.88% |
| |
Three Years | 7.87% |
| |
Since Inception | 7.87% |
| |
Fund Inception Date | January 3, 2005 |
* Past performance does not guarantee future results. Investment returns and principal value will fluctuate so that shares, when redeemed, may be worth more or less than their original cost. All returns assume reinvested dividends and do not reflect the deduction of taxes that a shareholder would pay on fund distributions or the redemption of fund shares. Please consult the current prospectus carefully before investing any money. The Vantagepoint Funds are distributed by ICMA-RC Services, LLC, a wholly owned broker-dealer subsidiary of ICMA-RC, and member FINRA/ SIPC. 800-669-7400.
The S&P 500 Index consists of 500 companies representing larger capitalization stocks traded in the U.S. The Lehman Brothers Intermediate Aggregate Bond Index is an unmanaged index comprised of U.S. government, mortgage, corporate and asset-backed securities with maturities of one to 10 years. The custom benchmark is composed of market indexes that reflect the general performance of the primary asset classes in which the Fund invests, in weighted percentages that correspond to the historical target allocation to those asset classes for the Fund. Those asset class benchmarks are the Lehman Brothers Intermediate Aggregate Bond Index for the fixed income asset class and the S&P 500 Index for the equity asset class. Should the target allocations for the Fund between those asset classes change, the percentage allocations to the corresponding indexes will also change when calculating the custom benchmark. A Fund’s portfolio may differ significantly from the securities held in the indexes. An index is not available for direct investment, is unmanaged, and does not reflect the costs of portfolio management or trading.
74
Vantagepoint Milestone 2020 Fund
The Vantagepoint Milestone 2020 Fund’s objective is to offer high total return consistent with the Fund’s current asset allocation. The Fund’s principal investment strategy is to invest in a combination of equity Funds, fixed income Funds, and, beginning in October 2007, the Fund began to allocate up to 10% of its assets to certain underlying Funds to gain exposure to asset classes and strategies that have historically exhibited a low correlation to traditional fixed income and equity investments (“multi-strategy Funds”) by investing in The Vantagepoint Funds using an asset allocation strategy designed for investors expecting to retire around the year 2020.
At year-end, the Fund was invested in eight Vantagepoint Funds at target allocations within the percentage ranges indicated:
| |
Fixed Income | |
Vantagepoint Low Duration Bond Fund | 2%-12% |
Vantagepoint Core Bond Index Fund | 13%-23% |
| |
Equity | |
Vantagepoint Equity Income Fund | 17%-27% |
Vantagepoint Growth & Income Fund | 7%-17% |
Vantagepoint Growth Fund | 4%-14% |
Vantagepoint Mid/Small Company Index Fund | 5%-15% |
Vantagepoint International Fund | 8%-18% |
| |
Multi-Strategy | |
Vantagepoint Diversified Assets Fund | 0%-10% |
As time elapses, the Fund’s allocation to equity Funds will periodically decrease and the Fund’s allocation to fixed income Funds and multi-strategy Funds will correspondingly increase so that by June 30 of the year 2020, the Fund’s asset allocation will be approximately 30% equity Funds, 60% fixed income Funds, and 10% multi-strategy Funds.
Performance
The Vantagepoint Milestone 2020 Fund’s total return was 7.17% in 2007. The Fund’s market benchmarks, the S&P 500 Index and the Lehman Brothers Intermediate Aggregate Bond Index* returned 5.49% and 7.02%, respectively, for the year. The Fund’s custom benchmark returned 6.47%. The Fund’s custom benchmark is composed of market indexes that reflect the general performance of the primary asset classes in which the Fund invests.
Commentary
The Fund’s performance in 2007 was driven by the weighting and performance of the component Funds in which the Fund invests. Please refer to each component Fund’s commentary, with the exception of the Diversified Assets Fund, within this report for more information.
The Low Duration Bond Fund returned 5.24% and the Core Bond Index Fund (Class I) gained 6.52%. Among equities, international markets generated higher returns than domestic, and larger-cap and growth stocks led smaller-cap and value stocks for the year; the returns for the equity Funds reflect these market trends. The Equity Income Fund rose 3.76% and the International Fund gained 12.46%. The remaining underlying equity Funds earned returns ranging from 4.98% to 9.81%.
As part of a re-optimization, allocations among the underlying Funds were modified in late October. The prior asset class target allocation of approximately 30% fixed income Funds and 70% equity Funds was modified to approximately 25% fixed income Funds, 65% equity Funds, and 10% multi-strategy Funds. At this time, an allocation was made to a new Vantagepoint Fund – the Diversified Assets Fund. The shift in allocation is intended to enhance the Fund’s diversification through the inclusion of alternative asset classes and strategies that have historically tended to exhibit a low correlation to traditional bonds and stocks.
* Prior to October 30, 2007, the Fund compared its performance to the Lehman Brothers Aggregate Bond Index, an unmanaged index which consists of all investment-grade U.S. fixed income securities. The Fund changed the index to which it compares the performance of its fixed income exposure because the Lehman Brothers Intermediate Aggregate Bond Index better represents the average duration of the Fund’s fixed income exposure.
75
Vantagepoint Milestone 2020 Fund Underlying Fund
Allocation as of December 31, 2007
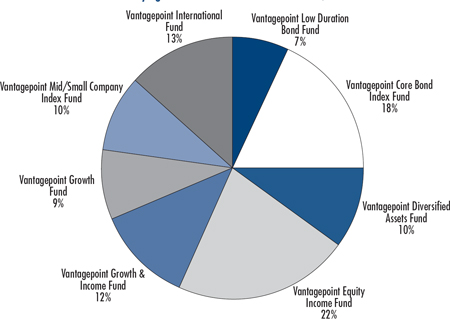
Due to rounding, pie chart allocations may not equal 100%.
|
Vantagepoint Milestone 2020 Fund vs. S&P 500 Index, Lehman Brothers Intermediate Aggregate Bond Index, Lehman Brothers Aggregate Bond Index, and Custom Benchmark: Growth of $10,000 Invested January 3, 2005* |
| |
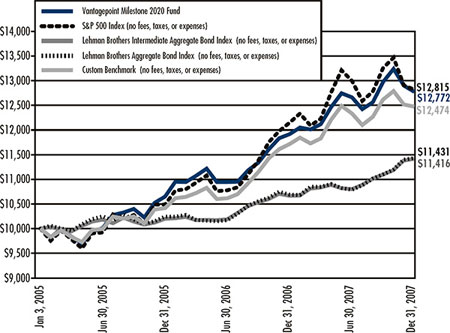
Source for Benchmark Returns: Ibbotson Associates
76
|
Vantagepoint Milestone 2020 Fund |
Average Annual Total Return for the periods ended December 31, 2007* |
| |
| |
One Year | 7.17% |
Three Years
|
8.50%
|
Since Inception | 8.50% |
Fund Inception Date
|
January 3, 2005
|
* Past performance does not guarantee future results. Investment returns and principal value will fluctuate so that shares, when redeemed, may be worth more or less than their original cost. All returns assume reinvested dividends and do not reflect the deduction of taxes that a shareholder would pay on fund distributions or the redemption of fund shares. Please consult the current prospectus carefully before investing any money. The Vantagepoint Funds are distributed by ICMA-RC Services, LLC, a wholly owned broker-dealer subsidiary of ICMA-RC, and member FINRA/ SIPC. 800-669-7400.
The S&P 500 Index consists of 500 companies representing larger capitalization stocks traded in the U.S. The Lehman Brothers Intermediate Aggregate Bond Index is an unmanaged index comprised of U.S. government, mortgage, corporate and asset-backed securities with maturities of one to 10 years. The custom benchmark is composed of market indexes that reflect the general performance of the primary asset classes in which the Fund invests, in weighted percentages that correspond to the historical target allocation to those asset classes for the Fund. Those asset class benchmarks are the Lehman Brothers Intermediate Aggregate Bond Index for the fixed income asset class and the S&P 500 Index for the equity asset class. Should the target allocations for the Fund between those asset classes change, the percentage allocations to the corresponding indexes will also change when calculating the custom benchmark. A Fund’s portfolio may differ significantly from the securities held in the indexes. An index is not available for direct investment, is unmanaged, and does not reflect the costs of portfolio management or trading.
77
Vantagepoint Milestone 2025 Fund
The Vantagepoint Milestone 2025 Fund’s objective is to offer high total return consistent with the Fund’s current asset allocation. The Fund’s principal investment strategy is to invest in a combination of equity Funds, fixed income Funds, and, beginning in October 2007, the Fund began to allocate up to 10% of its assets to certain underlying Funds to gain exposure to asset classes and strategies that have historically exhibited a low correlation to traditional fixed income and equity investments (“multi-strategy Funds”) by investing in The Vantagepoint Funds using an asset allocation strategy designed for investors expecting to retire around the year 2025.
At year-end, the Fund was invested in eight Vantagepoint Funds at target allocations within the percentage ranges indicated:
| | | |
Fixed Income | | | |
Vantagepoint Low Duration Bond Fund | | 0%-10 | % |
Vantagepoint Core Bond Index Fund | | 10%-20 | % |
| | | |
Equity | | | |
Vantagepoint Equity Income Fund | | 18%-28 | % |
Vantagepoint Growth & Income Fund | | 8%-18 | % |
Vantagepoint Growth Fund | | 5%-15 | % |
Vantagepoint Mid/Small Company Index Fund | | 7%-17 | % |
Vantagepoint International Fund | | 10%-20 | % |
| | | |
Multi-Strategy | | | |
Vantagepoint Diversified Assets Fund | | 0%-10 | % |
As time elapses, the Fund’s allocation to equity Funds will periodically decrease and the Fund’s allocation to fixed income Funds and multi-strategy Funds will correspondingly increase so that by June 30 of the year 2025, the Fund’s asset allocation will be approximately 30% equity Funds, 60% fixed income Funds and 10% multi-strategy Funds.
Performance
The Vantagepoint Milestone 2025 Fund’s total return was 7.17% in 2007. The Fund’s market benchmarks, the S&P 500 Index and the Lehman Brothers Intermediate Aggregate Bond Index* returned 5.49% and 7.02%, respectively, for the year. The Fund’s custom benchmark returned 6.28%. The Fund’s custom benchmark is composed of market indexes that reflect the general performance of the primary asset classes in which the Fund invests.
Commentary
The Fund’s performance in 2007 was driven by the weighting and performance of the component Funds in which the Fund invests. Please refer to each component Fund’s commentary, with the exception of the Diversified Assets Fund, within this report for more information.
The Low Duration Bond Fund returned 5.24% and the Core Bond Index Fund (Class I) gained 6.52%. Among equities, international markets generated higher returns than domestic, and larger-cap and growth stocks led smaller-cap and value stocks for the year; the returns for the equity Funds reflect these market trends. The Equity Income Fund returned 3.76% and the International Fund gained 12.46%. The remaining underlying equity Funds earned returns ranging from 4.98% to 9.81%.
As part of a re-optimization, allocations among the underlying Funds were modified in late October. The prior asset class target allocation of 23% fixed income Funds and 77% equity Funds was modified to approximately 17% fixed income Funds, 73% equity Funds, and 10% multi-strategy Funds. At this time, an allocation was made to a new Vantagepoint Fund – the Diversified Assets Fund. The shift in allocation is intended to enhance the Fund’s diversification through the inclusion of alternative asset classes and strategies that have historically tended to exhibit a low correlation to traditional bonds and stocks.
* Prior to October 30, 2007, the Fund compared its performance to the Lehman Brothers Aggregate Bond Index, an unmanaged index which consists of all investment-grade U.S. fixed income securities. The Fund changed the index to which it compares the performance of its fixed income exposure because the Lehman Brothers Intermediate Aggregate Bond Index better represents the average duration of the Fund’s fixed income exposure.
78
Vantagepoint Milestone 2025 Fund
Underlying Fund Allocation as of December 31, 2007
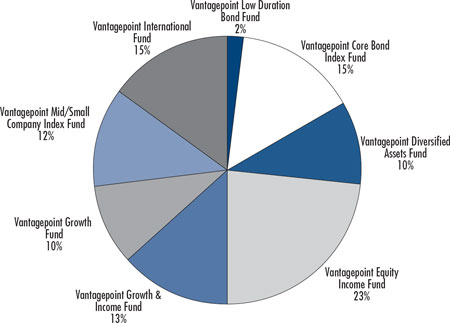
Due to rounding, pie chart allocations may not equal 100%.
|
Vantagepoint Milestone 2025 Fund vs. S&P 500 Index, Lehman Brothers Intermediate
Aggregate Bond Index, Lehman Brothers Aggregate Bond Index, and Custom Benchmark:
Growth of $10,000 Invested January 3, 2005* |
| |
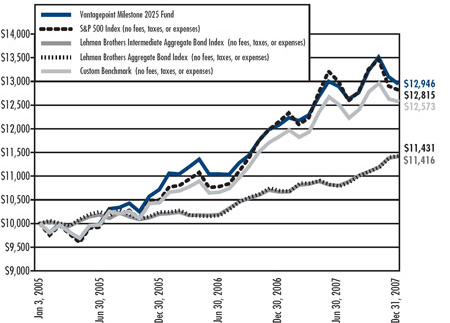
Source for Benchmark Returns: Ibbotson Associates
79
|
Vantagepoint Milestone 2025 Fund |
Average Annual Total Return for the periods ended December 31, 2007* |
| |
| | | |
One Year | | 7.17% | |
| | | |
Three Years | | 8.99% | |
| | | |
Since Inception | | 8.99% | |
| | | |
Fund Inception Date | | January 3, 2005 | |
*Past performance does not guarantee future results. Investment returns and principal value will fluctuate so that shares, when redeemed, may be worth more or less than their original cost. All returns assume reinvested dividends and do not reflect the deduction of taxes that a shareholder would pay on fund distributions or the redemption of fund shares. Please consult the current prospectus carefully before investing any money. The Vantagepoint Funds are distributed by ICMA-RC Services, LLC, a wholly owned broker-dealer subsidiary of ICMA-RC, and member FINRA/ SIPC. 800-669-7400.
The S&P 500 Index consists of 500 companies representing larger capitalization stocks traded in the U.S. The Lehman Brothers Intermediate Aggregate Bond Index is an unmanaged index comprised of U.S. government, mortgage, corporate and asset-backed securities with maturities of one to 10 years. The custom benchmark is composed of market indexes that reflect the general performance of the primary asset classes in which the Fund invests, in weighted percentages that correspond to the historical target allocation to those asset classes for the Fund. Those asset class benchmarks are the Lehman Brothers Intermediate Aggregate Bond Index for the fixed income asset class and the S&P 500 Index for the equity asset class. Should the target allocations for the Fund between those asset classes change, the percentage allocations to the corresponding indexes will also change when calculating the custom benchmark. A Fund’s portfolio may differ significantly from the securities held in the indexes. An index is not available for direct investment, is unmanaged, and does not reflect the costs of portfolio management or trading.
80
Vantagepoint Milestone 2030 Fund
The Vantagepoint Milestone 2030 Fund’s objective is to offer high total return consistent with the Fund’s current asset allocation. The Fund’s principal investment strategy is to invest in a combination of equity Funds, fixed income Funds, and, beginning in October 2007, the Fund began to allocate up to 10% of its assets to certain underlying Funds to gain exposure to asset classes and strategies that have historically exhibited a low correlation to traditional fixed income and equity investments (“multi-strategy Funds”) by investing in The Vantagepoint Funds using an asset allocation strategy designed for investors expecting to retire around the year 2030.
At year-end the Fund was invested in seven Vantagepoint Funds at target allocations within the percentage ranges indicated:
| | | |
Fixed Income | | | |
Vantagepoint Core Bond Index Fund | | 8%-18 | % |
| | | |
Equity | | | |
Vantagepoint Equity Income Fund | | 20%-30 | % |
Vantagepoint Growth & Income Fund | | 9%-19 | % |
Vantagepoint Growth Fund | | 6%-16 | % |
Vantagepoint Mid/Small Company Index Fund | | 10%-20 | % |
Vantagepoint International Fund | | 11%-21 | % |
| | | |
Multi-Strategy | | | |
Vantagepoint Diversified Assets Fund | | 0%-10 | % |
As time elapses, the Fund’s allocation to equity Funds will periodically decrease and the Fund’s allocation to fixed income Funds and multi-strategy Funds will correspondingly increase so that by June 30 of the year 2030, the Fund’s asset allocation will be approximately 30% equity Funds, 60% fixed income Funds, and 10% multi-strategy Funds.
Performance
The Vantagepoint Milestone 2030 Fund’s total return was 7.11% in 2007. The Fund’s market benchmarks, the S&P 500 Index and the Lehman Brothers Intermediate Aggregate Bond Index* returned 5.49% and 7.02%, respectively, for the year. The Fund’s custom benchmark returned 6.05%. The Fund’s custom benchmark is composed of market indexes that reflect the general performance of the primary asset classes in which the Fund invests.
Commentary
The Fund’s performance in 2007 was driven by the weighting and performance of the component Funds in which the Fund invests. Please refer to each component Fund’s commentary, with the exception of the Diversified Assets Fund, within this report for more information.
The Core Bond Index Fund (Class I) gained 6.52%. Among equities, international markets generated higher returns than domestic, and larger-cap and growth stocks led smaller-cap and value stocks for the year; the returns for the equity funds reflect these market trends. The Equity Income Fund returned 3.76% and the International Fund gained 12.46%. The remaining underlying equity Funds earned returns ranging from 4.98% to 9.81%.
As part of a re-optimization, allocations among the underlying Funds were modified in late October. The prior asset class target allocation of 17% fixed income Funds and 83% equity Funds was modified to approximately 12% fixed income Funds, 81% equity Funds, and 7% multi-strategy Funds. At this time, an allocation was made to a new Vantagepoint Fund – the Diversified Assets Fund. The shift in allocation is intended to enhance the Fund’s diversification through the inclusion of alternative asset classes and strategies that have historically tended to exhibit a low correlation to traditional bonds and stocks.
* Prior to October 30, 2007, the Fund compared its performance to the Lehman Brothers Aggregate Bond Index, an unmanaged index which consists of all investment-grade U.S. fixed income securities. The Fund changed the index to which it compares the performance of its fixed income exposure because the Lehman Brothers Intermediate Aggregate Bond Index better represents the average duration of the Fund’s fixed income exposure.
81
Vantagepoint Milestone 2030 Fund
Underlying Fund Allocation as of December 31, 2007
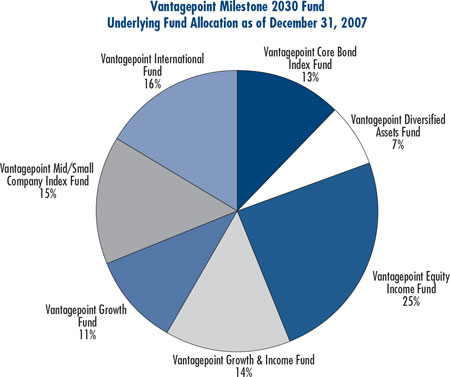
Due to rounding, pie chart allocations may not equal 100%.
|
Vantagepoint Milestone 2030 Fund vs. S&P 500 Index, Lehman Brothers Intermediate
Aggregate Bond Index, Lehman Brothers Aggregate Bond Index, and Custom Benchmark:
Growth of $10,000 Invested January 3, 2005* |
| |
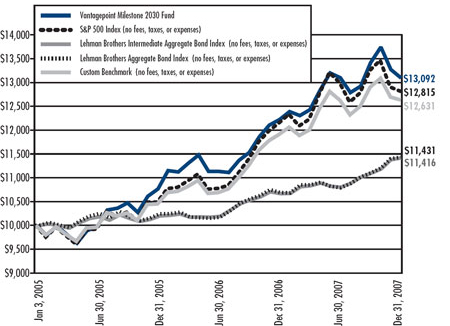
Source for Benchmark Returns: Ibbotson Associates
82
|
Vantagepoint Milestone 2030 Fund |
Average Annual Total Return for the periods ended December 31, 2007* |
| |
| | | |
One Year | | 7.11% | |
| | | |
Three Years | | 9.40% | |
| | | |
Since Inception | | 9.40% | |
| | | |
Fund Inception Date | | January 3, 2005 | |
*Past performance does not guarantee future results. Investment returns and principal value will fluctuate so that shares, when redeemed, may be worth more or less than their original cost. All returns assume reinvested dividends and do not reflect the deduction of taxes that a shareholder would pay on fund distributions or the redemption of fund shares. Please consult the current prospectus carefully before investing any money. The Vantagepoint Funds are distributed by ICMA-RC Services, LLC, a wholly owned broker-dealer subsidiary of ICMA-RC, and member FINRA/ SIPC. 800-669-7400.
The S&P 500 Index consists of 500 companies representing larger capitalization stocks traded in the U.S. The Lehman Brothers Intermediate Aggregate Bond Index is an unmanaged index comprised of U.S. government, mortgage, corporate and asset-backed securities with maturities of one to 10 years. The custom benchmark is composed of market indexes that reflect the general performance of the primary asset classes in which the Fund invests, in weighted percentages that correspond to the historical target allocation to those asset classes for the Fund. Those asset class benchmarks are the Lehman Brothers Intermediate Aggregate Bond Index for the fixed income asset class and the S&P 500 Index for the equity asset class. Should the target allocations for the Fund between those asset classes change, the percentage allocations to the corresponding indexes will also change when calculating the custom benchmark. A Fund’s portfolio may differ significantly from the securities held in the indexes. An index is not available for direct investment, is unmanaged, and does not reflect the costs of portfolio management or trading.
83
Vantagepoint Milestone 2035 Fund
The Vantagepoint Milestone 2035 Fund’s objective is to offer high total return consistent with the Fund’s current asset allocation. The Fund’s principal investment strategy is to invest in a combination of equity Funds, fixed income Funds, and, beginning in October 2007, the Fund began to allocate up to 10% of its assets to certain underlying Funds to gain exposure to asset classes and strategies that have historically exhibited a low correlation to traditional fixed income and equity investments (“multi-strategy Funds”) by investing in The Vantagepoint Funds using an asset allocation strategy designed for investors expecting to retire around the year 2035.
At year-end the Fund was invested in seven Vantagepoint Funds at target allocations within percentage ranges indicated:
| |
Fixed Income | |
Vantagepoint Core Bond Index Fund | 6%-16% |
| |
Equity | |
Vantagepoint Equity Income Fund | 21%-31% |
Vantagepoint Growth & Income Fund | 10%-20% |
Vantagepoint Growth Fund | 7%-17% |
Vantagepoint Mid/Small Company Index Fund | 13%-23% |
Vantagepoint International Fund | 13%-23% |
| |
Multi-Strategy | |
Vantagepoint Diversified Assets Fund | 0%-10% |
As time elapses, the Fund’s allocation to equity Funds will periodically decrease and the Fund’s allocation to fixed income funds and multi-strategy funds will correspondingly increase so that by June 30 of the year 2035, the Fund’s asset allocation will be approximately 30% equity funds, 60% fixed income funds, and 10% multi-strategy funds.
Performance
The Vantagepoint Milestone 2035 Fund’s total return was 7.25% in 2007. The Fund’s market benchmarks, the S&P 500 Index and the Lehman Brothers Intermediate Aggregate Bond Index* returned 5.49% and 7.02%, respectively, for the year. The Fund’s custom benchmark returned 5.82%. The Fund’s custom benchmark is composed of market indexes that reflect the general performance of the primary asset classes in which the Fund invests.
Commentary
The Fund’s performance in 2007 was driven by the weighting and performance of the component Funds in which the Fund invests. Please refer to each component Fund’s commentary, with the exception of the Diversified Assets Fund, within this report for more information.
The Core Bond Index Fund (Class I) gained 6.52%. Among equities, international markets generated higher returns than domestic, and larger-cap and growth stocks led smaller-cap and value stocks for the year; the returns for the equity funds reflect these market trends. The Equity Income Fund returned 3.76% and the International Fund gained 12.46%. The remaining underlying equity Funds earned returns ranging from 4.98% to 9.81%.
As part of a re-optimization, allocations to the underlying funds were modified in late October. The prior asset class target allocation of 12% fixed income Funds and 88% equity Funds was modified to approximately 11% fixed income Funds, 87% equity Funds, and 2% multi-strategy Funds. At this time, an allocation was made to a new Vantagepoint Fund – the Diversified Assets Fund. The shift in allocation is intended to enhance the Fund’s diversification through the inclusion of alternative asset classes and strategies that have historically tended to exhibit a low correlation to traditional bonds and stocks.
* Prior to October 30, 2007, the Fund compared its performance to the Lehman Brothers Aggregate Bond Index, an unmanaged index which consists of all investment-grade U.S. fixed income securities. The Fund changed the index to which it compares the performance of its fixed income exposure because the Lehman Brothers Intermediate Aggregate Bond Index better represents the average duration of the Fund’s fixed income exposure.
84
Vantagepoint Milestone 2035 Fund
Underlying Fund Allocation as of December 31, 2007
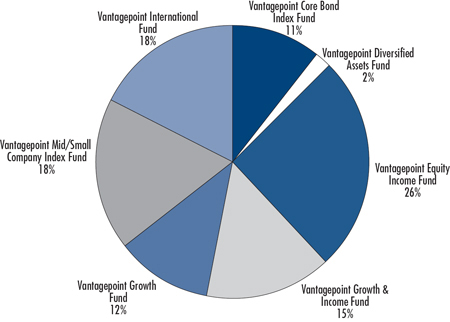
Due to rounding, pie chart allocations may not equal 100%.
|
Vantagepoint Milestone 2035 Fund vs. S&P 500 Index, Lehman Brothers Intermediate
Aggregate Band Index, Lehman Brothers Aggregate Bond Index, and Custom Benchmark:
Growth of $10,000 Invested January 3, 2005* |
| |
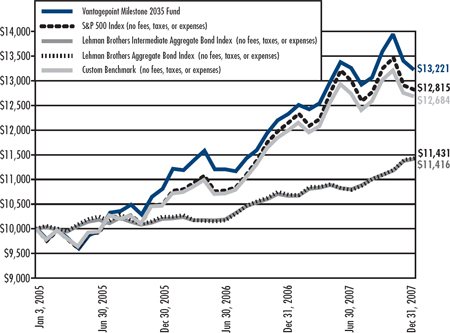
Source for Benchmark Returns: Ibbotson Associates
85
|
Vantagepoint Milestone 2035 Fund |
Average Annual Total Return for the periods ended December 31, 2007* |
| |
| |
One Year | 7.25% |
Three Years
|
9.75%
|
Since Inception | 9.75% |
Fund Inception Date
|
January 3, 2005
|
*Past performance does not guarantee future results. Investment returns and principal value will fluctuate so that shares, when redeemed, may be worth more or less than their original cost. All returns assume reinvested dividends and do not reflect the deduction of taxes that a shareholder would pay on fund distributions or the redemption of fund shares. Please consult the current prospectus carefully before investing any money. The Vantagepoint Funds are distributed by ICMA-RC Services, LLC, a wholly owned broker-dealer subsidiary of ICMA-RC, and member FINRA/ SIPC. 800-669-7400.
The S&P 500 Index consists of 500 companies representing larger capitalization stocks traded in the U.S. The Lehman Brothers Intermediate Aggregate Bond Index is an unmanaged index comprised of U.S. government, mortgage, corporate and asset-backed securities with maturities of one to 10 years. The custom benchmark is composed of market indexes that reflect the general performance of the primary asset classes in which the Fund invests, in weighted percentages that correspond to the historical target allocation to those asset classes for the Fund. Those asset class benchmarks are the Lehman Brothers Intermediate Aggregate Bond Index for the fixed income asset class and the S&P 500 Index for the equity asset class. Should the target allocations for the Fund between those asset classes change, the percentage allocations to the corresponding indexes will also change when calculating the custom benchmark. A Fund’s portfolio may differ significantly from the securities held in the indexes. An index is not available for direct investment, is unmanaged, and does not reflect the costs of portfolio management or trading.
86
Vantagepoint Milestone 2040 Fund
The Vantagepoint Milestone 2040 Fund’s objective is to offer high total return consistent with the Fund’s current asset allocation. The Fund’s principal investment strategy is to invest in a combination of equity Funds, fixed income Funds, and to certain underlying Funds to gain exposure to asset classes and strategies that have historically exhibited a low correlation to traditional fixed income and equity investments (“multi-strategy Funds”) by investing in The Vantagepoint Funds using an asset allocation strategy designed for investors expecting to retire around the year 2040.
At year-end the Fund was invested in six Vantagepoint Funds at target allocations within the percentage ranges indicated:
| |
Fixed Income | |
Vantagepoint Core Bond Index Fund | 5%-15% |
| |
Equity | |
Vantagepoint Equity Income Fund | 21%-31% |
Vantagepoint Growth & Income Fund | 10%-20% |
Vantagepoint Growth Fund | 7%-17% |
Vantagepoint Mid/Small Company Index Fund | 14%-24% |
Vantagepoint International Fund | 13%-23% |
As time elapses, the Fund’s allocation to equity funds will decrease and the Fund’s allocation to fixed income Funds and multi-strategy Funds will increase so that by June 30 of the year 2040, the Fund’s asset allocation will be approximately 30% equity Funds 60% fixed income Funds, and 10% multi-strategy Funds.
Performance
The Vantagepoint Milestone 2040 Fund’s total return was 7.23% in 2007. The Fund’s market benchmarks, the S&P 500 Index and the MSCI EAFE Index* returned 5.49% and 11.63%, respectively, for the year. The Fund’s custom benchmark returned 6.74%. The Fund’s custom benchmark is composed of market indexes that reflect the general performance of the primary asset classes in which the Fund invests.
Commentary
The Fund’s performance in 2007 was driven by the weighting and performance of the component Funds in which the Fund invests. Please refer to each component Fund’s commentary within this report for more information.
The Core Bond Index Fund (Class I) gained 6.52%. Among equities, international markets generated higher returns than domestic, and larger-cap and growth stocks led smaller-cap and value stocks for the year; the returns for the equity funds reflect these market trends. The Equity Income Fund returned 3.76% and the International Fund gained 12.46%. The remaining underlying equity Funds earned returns ranging from 4.98% to 9.81%.
As part of a re-optimization, allocations to the underlying Funds were modified in late October. The shift in allocation is intended to enhance the Fund’s diversification through greater balance between growth and value styles as well as broader exposure to small- and mid-cap stocks.
* Prior to October 30, 2007, the Fund compared its performance to the Lehman Brothers Aggregate Bond Index, an unmanaged index which consists of all investment-grade U.S. fixed income securities. The Fund changed the index to which it compares the performance of its fixed income exposure because the MSCI EAFE Index better represents the Fund’s asset allocation.
87
Vantagepoint Milestone 2040 Fund
Underlying Fund Allocation as of December 31, 2007
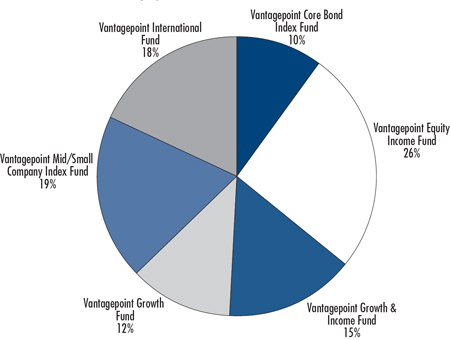
Due to rounding, pie chart allocations may not equal 100%.
|
Vantagepoint Milestone 2040 Fund vs. S&P 500 Index, MSCI EAFE Index,
Lehman Brothers Aggregate Bond Index, and Custom Benchmark:
Growth of $10,000 Invested January 3, 2005* |
| |
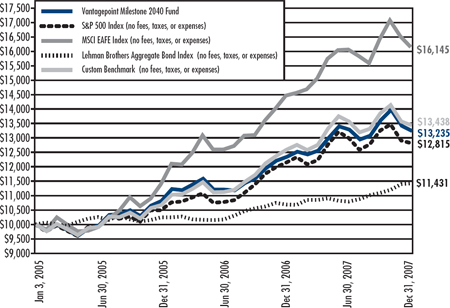
Source for Benchmark Returns: Ibbotson Associates
88
|
Vantagepoint Milestone 2040 Fund |
Average Annual Total Return for the periods ended December 31, 2007* |
| |
| |
One Year | 7.23% |
Three Years
|
9.79%
|
Since Inception | 9.79% |
Fund Inception Date
|
January 3, 2005
|
*Past performance does not guarantee future results. Investment returns and principal value will fluctuate so that shares, when redeemed, may be worth more or less than their original cost. All returns assume reinvested dividends and do not reflect the deduction of taxes that a shareholder would pay on fund distributions or the redemption of fund shares. Please consult the current prospectus carefully before investing any money. The Vantagepoint Funds are distributed by ICMA-RC Services, LLC, a wholly owned broker-dealer subsidiary of ICMA-RC, and member FINRA/ SIPC. 800-669-7400.
The S&P 500 Index consists of 500 companies representing larger capitalization stocks traded in the U.S. The Morgan Stanley Capital International Europe Asia Far East (MSCI EAFE) Index is a free float-adjusted market capitalization index that is designed to measure the equity market performance of developed markets, excluding the U.S. and Canada. The custom benchmark is composed of market indexes that reflect the general performance of the primary asset classes in which the Fund invests, in weighted percentages that correspond to the historical target allocation to those asset classes for the Fund. Those asset class benchmarks are the S&P 500 Index and the MSCI EAFE Index. Should the target allocations for the Fund between those asset classes change, the percentage allocations to the corresponding indexes will also change when calculating the custom benchmark. A Fund’s portfolio may differ significantly from the securities held in the indexes. An index is not available for direct investment, is unmanaged, and does not reflect the costs of portfolio management or trading.
89
This page intentionally left blank
90
Report of Independent Registered Public Accounting Firm
To the Shareholders and Board of Directors
of The Vantagepoint Funds:
In our opinion, the accompanying statements of assets and liabilities, including the schedules of investments and the related statements of operations and changes in net assets and the financial highlights present fairly, in all material respects, the financial position of the Money Market Fund, Low Duration Bond Fund, Inflation Protected Securities Fund, Asset Allocation Fund, Equity Income Fund, Growth & Income Fund, Growth Fund, Select Value Fund, Aggressive Opportunities Fund, Discovery Fund, International Fund, Diversified Assets Fund, Core Bond Index Fund, 500 Stock Index Fund, Broad Market Index Fund, Mid/Small Company Index Fund, Overseas Equity Index Fund, Milestone Retirement Income Fund, Milestone 2010 Fund, Milestone 2015 Fund, Milestone 2020 Fund, Milestone 2025 Fund, Milestone 2030 Fund, Milestone 2035 Fund, Milestone 2040 Fund, Model Portfolio Savings Oriented Fund, Model Portfolio Conservative Growth Fund, Model Portfolio Traditional Growth Fund, Model Portfolio Long-Term Growth Fund, and Model Portfolio All-Equity Growth Fund (hereafter referred to as the “Funds”) at December 31, 2007, and the results of each of their operations for the year then ended and changes in each of their net assets for each of the fiscal periods presented, and the financial highlights for each of the fiscal periods presented, in conformity with accounting principles generally accepted in the United States of America. These financial statements and financial highlights (hereafter referred to as “financial statements”) are the responsibility of the Funds’ management; our responsibility is to express an opinion on these financial statements based on our audits. We conducted our audits of these financial statements in accordance with the standards of the Public Company Accounting Oversight Board (United States). Those standards require that we plan and perform the audits to obtain reasonable assurance about whether the financial statements are free of material misstatement. An audit includes examining, on a test basis, evidence supporting the amounts and disclosures in the financial statements, assessing the accounting principles used and significant estimates made by management, and evaluating the overall financial statement presentation. We believe that our audits, which included confirmation of securities at December 31, 2007 by correspondence with the custodian and brokers, and confirmation of the underlying funds by correspondence with the transfer agent, provide a reasonable basis for our opinion.
PricewaterhouseCoopers LLP
Baltimore, Maryland
February 29, 2008
91
VANTAGEPOINT FUNDS
Statements of Assets and Liabilities
December 31, 2007
| | | | Money
Market
| | Low
Duration
Bond(1)
| | Inflation
Protected
Securities(2)
| | Asset
Allocation
| | Equity
Income
|
|---|
ASSETS:
| | | | | | | | | | | | | | | | | | | | | | |
| Securities, at market value† | | | | $ | 304,391,144 | | | $ | 498,504,356 | | | $ | 272,093,090 | | | $ | 764,096,921 | | | $ | 1,892,472,735 | |
| Cash | | | | | — | | | | 6,034,818 | | | | — | | | | 13,605,360 | | | | — | |
| Cash denominated in foreign currencies | | | | | — | | | | — | | | | 142,465 | | | | — | | | | — | |
Receivable for:
| | | | | | | | | | | | | | | | | | | | | | |
| Dividends | | | | | 1,218,174 | | | | — | | | | — | | | | 903,481 | | | | 2,024,365 | |
| Interest | | | | | — | | | | 3,683,843 | | | | 2,388,944 | | | | 49,212 | | | | 1,310,434 | |
| Investments sold | | | | | — | | | | 129,775 | | | | 459,253 | | | | 148,199 | | | | 2,605,334 | |
| Fund shares sold | | | | | 1,330,560 | | | | 111,056 | | | | 71,234 | | | | 12,239 | | | | 1,235,771 | |
| Variation margin on futures contracts | | | | | — | | | | 30,938 | | | | 14,370 | | | | — | | | | — | |
| Gross unrealized gain on forward foreign currency exchange contracts | | | | | — | | | | — | | | | 1,099 | | | | — | | | | — | |
| Total Assets | | | | | 306,939,878 | | | | 508,494,786 | | | | 275,170,455 | | | | 778,815,412 | | | | 1,899,648,639 | |
LIABILITIES:
| | | | | | | | | | | | | | | | | | | | | | |
Payable for:
| | | | | | | | | | | | | | | | | | | | | | |
| Investments purchased | | | | | — | | | | — | | | | — | | | | 212,398 | | | | 2,591,691 | |
| Fund shares redeemed | | | | | — | | | | 240,133 | | | | 320,056 | | | | 80,986 | | | | 442,401 | |
| Variation margin on futures contracts | | | | | — | | | | — | | | | — | | | | 518,750 | | | | — | |
| Collateral for securities loaned | | | | | — | | | | 668,100 | | | | — | | | | 20,791,600 | | | | 159,318,560 | |
| Swap interest payable | | | | | — | | | | — | | | | 59,504 | | | | — | | | | — | |
Accrued Expenses:
| | | | | | | | | | | | | | | | | | | | | | |
| Administrative services fees | | | | | 3,253 | | | | 7,969 | | | | 4,277 | | | | 12,041 | | | | 27,546 | |
| Advisory fees | | | | | 25,599 | | | | 42,904 | | | | 23,023 | | | | 64,519 | | | | 148,296 | |
| Subadviser fees | | | | | — | | | | 198,758 | | | | 99,433 | | | | 454,347 | | | | 1,710,597 | |
| Options written, at value | | | | | — | | | | — | | | | 339,192 | | | | — | | | | — | |
| Other accrued expense | | | | | 111,651 | | | | 216,649 | | | | 116,286 | | | | 351,904 | | | | 659,570 | |
| Gross unrealized loss on forward foreign currency exchange contracts | | | | | — | | | | — | | | | 3 | | | | — | | | | — | |
| Total Liabilities | | | | | 140,503 | | | | 1,374,513 | | | | 961,774 | | | | 22,486,545 | | | | 164,898,661 | |
| NET ASSETS | | | | $ | 306,799,375 | | | $ | 507,120,273 | | | $ | 274,208,681 | | | $ | 756,328,867 | | | $ | 1,734,749,978 | |
NET ASSETS REPRESENTED BY:
| | | | | | | | | | | | | | | | | | | | | | |
| Paid-in capital | | | | $ | 306,799,375 | | | $ | 513,086,387 | | | $ | 270,330,260 | | | $ | 623,147,691 | | | $ | 1,458,625,719 | |
| Net unrealized appreciation on investments, futures contracts, foreign currency transactions, written options and swaps | | | | | — | | | | 1,907,213 | | | | 8,183,974 | | | | 133,668,663 | | | | 268,567,334 | |
| Undistributed net investment income (loss) | | | | | — | | | | — | | | | 13,182 | | | | 96,200 | | | | — | |
| Accumulated net realized loss on investments, futures contracts, foreign currency transactions, written options and swaps | | | | | — | | | | (7,873,327 | ) | | | (4,318,735 | ) | | | (583,687 | ) | | | 7,556,925 | |
| NET ASSETS | | | | $ | 306,799,375 | | | $ | 507,120,273 | | | $ | 274,208,681 | | | $ | 756,328,867 | | | $ | 1,734,749,978 | |
CAPITAL SHARES:
| | | | | | | | | | | | | | | | | | | | | | |
| Net Assets | | | | $ | 306,799,375 | | | $ | 507,120,273 | | | $ | 274,208,681 | | | $ | 756,328,867 | | | $ | 1,734,749,978 | |
| Shares Outstanding | | | | | 306,799,375 | | | | 51,607,444 | | | | 26,212,989 | | | | 88,688,615 | | | | 177,347,097 | |
| Net Asset Value, offering and redemption price per share (net assets divided by shares outstanding) | | | | $ | 1.00 | | | $ | 9.83 | | | $ | 10.46 | | | $ | 8.53 | | | $ | 9.78 | |
| Cost of investments | | | | $ | 304,391,144 | | | $ | 496,651,283 | | | $ | 263,979,927 | | | $ | 629,090,237 | | | $ | 1,623,905,181 | |
| Cost of cash denominated in foreign currencies | | | | $ | — | | | $ | — | | | $ | 143,165 | | | $ | — | | | $ | — | |
|
† Includes securities on loan with market values of (Note 6):
| | | | $ | — | | | $ | 652,472 | | | $ | — | | | $ | 19,964,207 | | | $ | 147,981,040 | |
| (1) | | Formerly Short-Term Bond Fund. |
| (2) | | Formerly US Government Securities Fund. |
See Notes to Financial Statements.
92
VANTAGEPOINT FUNDS
Statements of Assets and Liabilities
December 31, 2007
| | | | Growth &
Income
| | Growth
| | Select
Value
| | Aggressive
Opportunities
|
|---|
ASSETS:
| | | | | | | | | | | | | | | | | | |
| Securities, at market value† | | | | $ | 1,150,015,841 | | | $ | 2,702,379,132 | | | $ | 283,648,228 | | | $ | 1,477,997,046 | |
| Cash | | | | | 290,964 | | | | 45 | | | | 13,062,772 | | | | 1,181,282 | |
Receivable for:
| | | | | | | | | | | | | | | | | | |
| Dividends | | | | | 1,414,738 | | | | 2,567,675 | | | | 679,711 | | | | 1,192,669 | |
| Interest | | | | | 48,624 | | | | 86,727 | | | | 34,926 | | | | 441,933 | |
| Investments sold | | | | | 354,455 | | | | 18,729,591 | | | | 1,175,773 | | | | 1,332,997 | |
| Fund shares sold | | | | | 725,347 | | | | 469,428 | | | | 223,444 | | | | 118,294 | |
| Recoverable foreign taxes | | | | | 8,691 | | | | 31 | | | | — | | | | — | |
| Total Assets | | | | | 1,152,858,660 | | | | 2,724,232,629 | | | | 298,824,854 | | | | 1,482,264,221 | |
LIABILITIES:
| | | | | | | | | | | | | | | | | | |
Payable for:
| | | | | | | | | | | | | | | | | | |
| Investments purchased | | | | | 4,357,830 | | | | 17,569,597 | | | | 4,277,006 | | | | 3,244,521 | |
| Fund shares redeemed | | | | | 87,052 | | | | 410,032 | | | | — | | | | 423,031 | |
| Collateral for securities loaned | | | | | 45,271,680 | | | | 134,521,203 | | | | — | | | | 321,587,851 | |
Accrued Expenses:
| | | | | | | | | | | | | | | | | | |
| Administrative services fees | | | | | 17,254 | | | | 40,878 | | | | 8,913 | | | | 18,035 | |
| Advisory fees | | | | | 92,889 | | | | 220,069 | | | | 25,206 | | | | 97,091 | |
| Subadviser fees | | | | | 888,738 | | | | 2,566,670 | | | | 226,157 | | | | 1,659,156 | |
| Other accrued expense | | | | | 442,756 | | | | 1,059,642 | | | | 130,195 | | | | 489,051 | |
| Total Liabilities | | | | | 51,158,199 | | | | 156,388,091 | | | | 4,667,477 | | | | 327,518,736 | |
| NET ASSETS | | | | $ | 1,101,700,461 | | | $ | 2,567,844,538 | | | $ | 294,157,377 | | | $ | 1,154,745,485 | |
NET ASSETS REPRESENTED BY:
| | | | | | | | | | | | | | | | | | |
| Paid-in capital | | | | $ | 949,327,746 | | | $ | 2,457,075,927 | | | $ | 313,224,311 | | | $ | 1,001,005,979 | |
| Net unrealized appreciation (depreciation) on investments, futures contracts and foreign currency transactions | | | | | 157,351,197 | | | | 392,128,212 | | | | (15,229,407 | ) | | | 129,129,424 | |
| Undistributed net investment income | | | | | 3,613 | | | | 527,836 | | | | — | | | | 1,056,032 | |
| Accumulated net realized gain (loss) on investments and foreign currency transactions | | | | | (4,982,095 | ) | | | (281,887,437 | ) | | | (3,837,527 | ) | | | 23,554,050 | |
| NET ASSETS | | | | $ | 1,101,700,461 | | | $ | 2,567,844,538 | | | $ | 294,157,377 | | | $ | 1,154,745,485 | |
CAPITAL SHARES:
| | | | | | | | | | | | | | | | | | |
| Net Assets | | | | $ | 1,101,700,461 | | | $ | 2,567,844,538 | | | $ | 294,157,377 | | | $ | 1,154,745,485 | |
| Shares Outstanding | | | | | 104,338,105 | | | | 245,768,024 | | | | 31,357,980 | | | | 102,579,840 | |
Net Asset Value, offering and redemption price per share
(net assets divided by shares outstanding) | | | | $ | 10.56 | | | $ | 10.45 | | | $ | 9.38 | | | $ | 11.26 | |
| Cost of investments | | | | $ | 992,665,542 | | | $ | 2,310,250,920 | | | $ | 298,877,635 | | | $ | 1,348,867,958 | |
|
† Includes securities on loan with market values of (Note 6):
| | | | $ | 43,288,783 | | | $ | 129,294,690 | | | $ | — | | | $ | 306,325,637 | |
See Notes to Financial Statements.
93
VANTAGEPOINT FUNDS
Statements of Assets and Liabilities
December 31, 2007
| | | | Discovery
| | International
| | Diversified
Assets
|
|---|
ASSETS:
| | | | | | | | | | | | | | |
| Securities, at market value† | | | | $ | 160,870,742 | | | $ | 1,182,204,518 | | | $ | 363,222,876 | |
| Cash | | | | | 15,943,475 | | | | — | | | | 103,093,268 | |
| Cash denominated in foreign currencies | | | | | 12,861 | | | | 540,073 | | | | — | |
Receivable for:
| | | | | | | | | | | | | | |
| Dividends | | | | | 139,797 | | | | 751,377 | | | | — | |
| Interest | | | | | 871,181 | | | | 59,106 | | | | 1,688,281 | |
| Investments sold | | | | | 625,827 | | | | 3,253,737 | | | | — | |
| Fund shares sold | | | | | 38,959 | | | | 306,983 | | | | 57,061 | |
| Recoverable foreign taxes | | | | | — | | | | 399,810 | | | | — | |
| Swap interest receivable | | | | | — | | | | — | | | | 1,094,629 | |
| Gross unrealized gain on forward foreign currency exchange contracts | | | | | — | | | | 126,475 | | | | 1,134,419 | |
| Total Assets | | | | | 178,502,842 | | | | 1,187,642,079 | | | | 470,290,534 | |
LIABILITIES:
| | | | | | | | | | | | | | |
Payable for:
| | | | | | | | | | | | | | |
| Investments purchased | | | | | 4,643,876 | | | | 4,891,929 | | | | — | |
| Fund shares redeemed | | | | | — | | | | 52,003 | | | | 35,309 | |
| Variation margin on futures contracts | | | | | 120,284 | | | | — | | | | 399,140 | |
| Collateral for securities loaned | | | | | — | | | | 35,045,824 | | | | — | |
Accrued Expenses:
| | | | | | | | | | | | | | |
| Administrative services fees | | | | | 5,163 | | | | 17,783 | | | | 13,992 | |
| Advisory fees | | | | | 14,642 | | | | 95,736 | | | | 39,558 | |
| Subadviser fees | | | | | 125,225 | | | | 1,897,301 | | | | 370,302 | |
| Options written, at value (261,490) | | | | | — | | | | — | | | | 230,449 | |
| Other accrued expense | | | | | 82,149 | | | | 507,615 | | | | 188,826 | |
| Gross unrealized loss on forward foreign currency exchange contracts | | | | | 1,389 | | | | 105,082 | | | | 3,838,416 | |
| Total Liabilities | | | | | 4,992,728 | | | | 42,613,273 | | | | 5,115,992 | |
| NET ASSETS | | | | $ | 173,510,114 | | | $ | 1,145,028,806 | | | $ | 465,174,542 | |
NET ASSETS REPRESENTED BY:
| | | | | | | | | | | | | | |
| Paid-in capital | | | | $ | 186,971,528 | | | $ | 966,567,836 | | | $ | 467,724,983 | |
| Net unrealized appreciation (depreciation) on investments, futures contracts, foreign currency transactions, written options and swaps | | | | | (7,995,699 | ) | | | 171,011,950 | | | | (3,711,889 | ) |
| Undistributed net investment income (loss) | | | | | (7,646 | ) | | | (1,068,775 | ) | | | 2,234,057 | |
| Accumulated net realized loss on investments, futures contracts, foreign currency transactions, written options and swaps | | | | | (5,458,069 | ) | | | 8,517,795 | | | | (1,072,609 | ) |
| NET ASSETS | | | | $ | 173,510,114 | | | $ | 1,145,028,806 | | | $ | 465,174,542 | |
CAPITAL SHARES:
| | | | | | | | | | | | | | |
| Net Assets | | | | $ | 173,510,114 | | | $ | 1,145,028,806 | | | $ | 465,174,542 | |
| Shares Outstanding | | | | | 18,752,198 | | | | 93,943,209 | | | | 46,771,598 | |
Net Asset Value, offering and redemption price per share (net assets divided
by shares outstanding) | | | | $ | 9.25 | | | $ | 12.19 | | | $ | 9.95 | |
| Cost of investments | | | | $ | 167,614,648 | | | $ | 1,011,232,050 | | | $ | 363,251,296 | |
| Cost of cash denominated in foreign currencies | | | | $ | — | | | $ | 542,021 | | | $ | — | |
|
† Includes securities on loan with market values of (Note 6):
| | | | $ | — | | | $ | 33,353,332 | | | $ | — | |
See Notes to Financial Statements.
94
VANTAGEPOINT FUNDS
Statements of Assets and Liabilities
December 31, 2007
| | | | Core Bond
Index
| | 500 Stock
Index
| | Broad
Market
Index
| | Mid/Small
Company
Index
| | Overseas
Equity
Index
|
|---|
ASSETS:
| | | | | | | | | | | | | | | | | | | | | | |
| Securities, at market value† | | | | $ | 1,146,924,232 | | | $ | 425,561,977 | | | $ | 698,746,096 | | | $ | 278,670,919 | | | $ | 258,963,198 | |
| Cash denominated in foreign currencies | | | | | — | | | | — | | | | — | | | | — | | | | 4,263,530 | |
Receivable for:
| | | | | | | | | | | | | | | | | | | | | | |
| Dividends | | | | | — | | | | 622,247 | | | | 940,996 | | | | 266,141 | | | | 253,640 | |
| Interest | | | | | 10,613,190 | | | | 8,652 | | | | 45,417 | | | | 69,298 | | | | 11,493 | |
| Investments sold | | | | | 9,420,338 | | | | 103,035 | | | | 560,442 | | | | 900,050 | | | | 37,262 | |
| Fund shares sold | | | | | 452,127 | | | | 267,620 | | | | 138,730 | | | | 173,590 | | | | 96,420 | |
| Recoverable foreign taxes | | | | | — | | | | — | | | | — | | | | — | | | | 81,241 | |
| Gross unrealized gain on forward foreign currency exchange contracts | | | | | — | | | | — | | | | — | | | | — | | | | 45,256 | |
| Total Assets | | | | | 1,167,409,887 | | | | 426,563,531 | | | | 700,431,681 | | | | 280,079,998 | | | | 263,752,040 | |
LIABILITIES:
| | | | | | | | | | | | | | | | | | | | | | |
Payable for:
| | | | | | | | | | | | | | | | | | | | | | |
| Investments purchased | | | | | 18,141,270 | | | | 145,873 | | | | 469,328 | | | | 581,868 | | | | 10,037,853 | |
| Fund shares redeemed | | | | | 657,856 | | | | — | | | | 585,649 | | | | 3,791 | | | | 224,038 | |
| Variation margin on futures contracts | | | | | — | | | | 45,274 | | | | 76,343 | | | | 13,286 | | | | 28,228 | |
| Collateral for securities loaned | | | | | 58,009,352 | | | | 14,242,009 | | | | 43,900,827 | | | | 51,895,159 | | | | 3,636,739 | |
Accrued Expenses:
| | | | | | | | | | | | | | | | | | | | | | |
| Administrative services fees | | | | | 17,064 | | | | 6,528 | | | | 10,417 | | | | 4,827 | | | | 4,093 | |
| Advisory fees | | | | | 45,932 | | | | 17,562 | | | | 28,041 | | | | 9,640 | | | | 10,642 | |
| Subadviser fees | | | | | 61,979 | | | | 42,021 | | | | 73,775 | | | | 45,484 | | | | 85,270 | |
| Other accrued expense | | | | | 362,356 | | | | 122,720 | | | | 168,962 | | | | 79,729 | | | | 81,974 | |
| Gross unrealized loss on forward foreign currency exchange contracts | | | | | — | | | | — | | | | — | | | | — | | | | 259,525 | |
| Total Liabilities | | | | | 77,295,809 | | | | 14,621,987 | | | | 45,313,342 | | | | 52,633,784 | | | | 14,368,362 | |
| NET ASSETS | | | | $ | 1,090,114,078 | | | $ | 411,941,544 | | | $ | 655,118,339 | | | $ | 227,446,214 | | | $ | 249,383,678 | |
NET ASSETS REPRESENTED BY:
| | | | | | | | | | | | | | | | | | | | | | |
| Paid-in capital | | | | $ | 1,103,350,870 | | | $ | 238,189,478 | | | $ | 420,343,963 | | | $ | 175,221,098 | | | $ | 192,316,737 | |
| Net unrealized appreciation on investments, futures contracts and foreign currency transactions | | | | | 9,193,506 | | | | 185,390,466 | | | | 244,411,633 | | | | 48,160,490 | | | | 58,268,979 | |
| Undistributed net investment income (loss) | | | | | — | | | | 100,021 | | | | 5,557,044 | | | | 226,082 | | | | (655,016 | ) |
| Accumulated net realized loss on investments, futures contracts and foreign currency transactions | | | | | (22,430,298 | ) | | | (11,738,421 | ) | | | (15,194,301 | ) | | | 3,838,544 | | | | (547,022 | ) |
| NET ASSETS | | | | $ | 1,090,114,078 | | | $ | 411,941,544 | | | $ | 655,118,339 | | | $ | 227,446,214 | | | $ | 249,383,678 | |
CAPITAL SHARES:
| | | | | | | | | | | | | | | | | | | | | | |
| Net Assets—Class I | | | | $ | 888,540,915 | | | $ | 95,693,806 | | | $ | 170,584,105 | | | $ | 105,495,815 | | | $ | 70,722,609 | |
| Shares Outstanding—Class I | | | | | 89,991,606 | | | | 8,230,725 | | | | 13,923,977 | | | | 6,500,553 | | | | 4,780,110 | |
| Net Asset Value—Class I, offering and redemption price per share (net assets divided by shares outstanding) | | | | $ | 9.87 | | | $ | 11.63 | | | $ | 12.25 | | | $ | 16.23 | | | $ | 14.80 | |
| Net Assets—Class II | | | | $ | 201,573,163 | | | $ | 316,247,738 | | | $ | 484,534,234 | | | $ | 121,950,399 | | | $ | 178,661,069 | |
| Shares Outstanding—Class II | | | | | 20,317,844 | | | | 28,717,746 | | | | 41,880,767 | | | | 7,878,431 | | | | 12,775,628 | |
| Net Asset Value—Class II, offering and redemption price per share (net assets divided by shares outstanding) | | | | $ | 9.92 | | | $ | 11.01 | | | $ | 11.57 | | | $ | 15.48 | | | $ | 13.98 | |
| Cost of investments | | | | $ | 1,137,730,726 | | | $ | 240,115,261 | | | $ | 454,248,456 | | | $ | 230,499,570 | | | $ | 200,466,116 | |
| Cost of cash denominated in foreign currencies | | | | $ | — | | | $ | — | | | $ | — | | | $ | — | | | $ | 4,294,103 | |
|
† Includes securities on loan
with market values of (Note 6):
| | | | $ | 56,788,389 | | | $ | 13,654,051 | | | $ | 41,964,741 | | | $ | 49,539,482 | | | $ | 3,451,989 | |
See Notes to Financial Statements.
95
VANTAGEPOINT FUNDS
Statements of Assets and Liabilities
December 31, 2007
| | | | Model Portfolio Funds
| |
|---|
| | | | Savings
Oriented
| | Conservative
Growth
| | Traditional
Growth
| | Long-Term
Growth
| | All-Equity
Growth
|
|---|
ASSETS:
| | | | | | | | | | | | | | | | | | | | | | |
| Securities of affiliated Mutual Funds, at market value* | | | | $ | 311,499,915 | | | $ | 597,839,015 | | | $ | 1,487,346,218 | | | $ | 1,678,115,921 | | | $ | 598,025,439 | |
Receivable for:
| | | | | | | | | | | | | | | | | | | | | | |
| Dividends | | | | | 852,125 | | | | 1,306,714 | | | | 2,038,059 | | | | 1,278,572 | | | | 27,988 | |
| Investments sold | | | | | 30,654 | | | | 56,124 | | | | 126,628 | | | | 122,620 | | | | 5,350 | |
| Fund shares sold | | | | | 120,985 | | | | 383,921 | | | | 835,068 | | | | 254,834 | | | | 302,581 | |
| Total Assets | | | | | 312,503,679 | | | | 599,585,774 | | | | 1,490,345,973 | | | | 1,679,771,947 | | | | 598,361,358 | |
LIABILITIES:
| | | | | | | | | | | | | | | | | | | | | | |
Payable for:
| | | | | | | | | | | | | | | | | | | | | | |
| Investments purchased | | | | | 961,140 | | | | 1,690,580 | | | | 2,873,127 | | | | 1,378,189 | | | | 271,768 | |
| Fund shares redeemed | | | | | 11,970 | | | | 54 | | | | — | | | | 136,616 | | | | 7,910 | |
Accrued Expenses:
| | | | | | | | | | | | | | | | | | | | | | |
| Distribution to shareholders | | | | | 3,623 | | | | 3,206 | | | | 5,202 | | | | — | | | | — | |
| Administrative services fees | | | | | 4,203 | | | | 7,252 | | | | 17,906 | | | | 20,229 | | | | 7,199 | |
| Advisory fees | | | | | 27,248 | | | | 51,397 | | | | 117,284 | | | | 130,803 | | | | 51,479 | |
| Other accrued expense | | | | | 40,235 | | | | 58,778 | | | | 108,149 | | | | 118,709 | | | | 49,602 | |
| Total Liabilities | | | | | 1,048,419 | | | | 1,811,267 | | | | 3,121,668 | | | | 1,784,546 | | | | 387,958 | |
| NET ASSETS | | | | $ | 311,455,260 | | | $ | 597,774,507 | | | $ | 1,487,224,305 | | | $ | 1,677,987,401 | | | $ | 597,973,400 | |
NET ASSETS REPRESENTED BY:
| | | | | | | | | | | | | | | | | | | | | | |
| Paid-in capital | | | | $ | 302,050,747 | | | $ | 563,576,944 | | | $ | 1,369,771,538 | | | $ | 1,483,475,509 | | | $ | 541,444,060 | |
| Net unrealized appreciation on investments | | | | | 3,920,372 | | | | 31,189,566 | | | | 121,798,398 | | | | 145,615,210 | | | | 20,548,304 | |
| Undistributed net investment income | | | | | 101,694 | | | | 44,495 | | | | 217,202 | | | | 258,092 | | | | 27,705 | |
| Accumulated net realized gain (loss) on investments | | | | | 5,382,447 | | | | 2,963,502 | | | | (4,562,833 | ) | | | 48,638,590 | | | | 35,953,331 | |
| NET ASSETS | | | | $ | 311,455,260 | | | $ | 597,774,507 | | | $ | 1,487,224,305 | | | $ | 1,677,987,401 | | | $ | 597,973,400 | |
CAPITAL SHARES:
| | | | | | | | | | | | | | | | | | | | | | |
| Net Assets | | | | $ | 311,455,260 | | | $ | 597,774,507 | | | $ | 1,487,224,305 | | | $ | 1,677,987,401 | | | $ | 597,973,400 | |
| Shares Outstanding | | | | | 12,609,317 | | | | 24,282,741 | | | | 61,856,371 | | | | 69,163,217 | | | | 24,280,358 | |
| Net Asset Value, offering and redemption price per share (net assets divided by shares outstanding) | | | | $ | 24.70 | | | $ | 24.62 | | | $ | 24.04 | | | $ | 24.26 | | | $ | 24.63 | |
| Cost of investments | | | | $ | 307,579,543 | | | $ | 566,649,449 | | | $ | 1,365,547,820 | | | $ | 1,532,500,711 | | | $ | 577,477,135 | |
|
*Investment in other Vantagepoint Funds (Note 1).
| |
See Notes to Financial Statements.
96
VANTAGEPOINT FUNDS
Statements of Assets and Liabilities
December 31, 2007
| | | | Milestone Funds
| |
|---|
| | | | Milestone
Retirement
Income
| | Milestone
2010
| | Milestone
2015
| | Milestone
2020
| | Milestone
2025
|
|---|
ASSETS:
| | | | | | | | | | | | | | | | | | | | | | |
| Securities of affiliated Mutual Funds, at market value* | | | | $ | 54,583,517 | | | $ | 70,417,596 | | | $ | 138,555,052 | | | $ | 112,082,851 | | | $ | 83,912,180 | |
Receivable for:
| | | | | | | | | | | | | | | | | | | | | | |
| Dividends | | | | | 137,214 | | | | 141,512 | | | | 205,137 | | | | 127,796 | | | | 64,620 | |
| Investments sold | | | | | 73,504 | | | | — | | | | — | | | | 93,361 | | | | — | |
| Fund shares sold | | | | | 8,909 | | | | 156,847 | | | | 531,708 | | | | 149,362 | | | | 310,601 | |
| Due from investment adviser** | | | | | 20,659 | | | | 19,213 | | | | 6,953 | | | | 8,149 | | | | 14,622 | |
| Total Assets | | | | | 54,823,803 | | | | 70,735,168 | | | | 139,298,850 | | | | 112,461,519 | | | | 84,302,023 | |
LIABILITIES:
| | | | | | | | | | | | | | | | | | | | | | |
Payable for:
| | | | | | | | | | | | | | | | | | | | | | |
| Investments purchased | | | | | 137,214 | | | | 210,232 | | | | 722,252 | | | | 127,796 | | | | 375,221 | |
| Fund shares redeemed | | | | | 82,413 | | | | 88,127 | | | | 182 | | | | 230,611 | | | | — | |
Accrued Expenses:
| | | | | | | | | | | | | | | | | | | | | | |
| Administrative services fees | | | | | 2,503 | | | | 2,503 | | | | 1,943 | | | | 2,503 | | | | 2,503 | |
| Advisory fees | | | | | 4,681 | | | | 6,131 | | | | 11,885 | | | | 9,678 | | | | 7,219 | |
| Other accrued expense | | | | | 24,474 | | | | 25,666 | | | | 27,748 | | | | 26,946 | | | | 25,591 | |
| Total Liabilities | | | | | 251,285 | | | | 332,659 | | | | 764,010 | | | | 397,534 | | | | 410,534 | |
| NET ASSETS | | | | $ | 54,572,518 | | | $ | 70,402,509 | | | $ | 138,534,840 | | | $ | 112,063,985 | | | $ | 83,891,489 | |
NET ASSETS REPRESENTED BY:
| | | | | | | | | | | | | | | | | | | | | | |
| Paid-in capital | | | | $ | 54,460,900 | | | $ | 69,950,394 | | | $ | 136,707,326 | | | $ | 110,241,862 | | | $ | 82,463,273 | |
| Net unrealized depreciation on investments | | | | | (1,212,764 | ) | | | (1,547,504 | ) | | | (2,914,029 | ) | | | (2,590,237 | ) | | | (2,342,029 | ) |
| Undistributed net investment income | | | | | 24,605 | | | | 22,948 | | | | 32,456 | | | | 23,503 | | | | 15,461 | |
| Accumulated net realized gain on investments | | | | | 1,299,777 | | | | 1,976,671 | | | | 4,709,087 | | | | 4,388,857 | | | | 3,754,784 | |
| NET ASSETS | | | | $ | 54,572,518 | | | $ | 70,402,509 | | | $ | 138,534,840 | | | $ | 112,063,985 | | | $ | 83,891,489 | |
CAPITAL SHARES:
| | | | | | | | | | | | | | | | | | | | | | |
| Net Assets | | | | $ | 54,572,518 | | | $ | 70,402,509 | | | $ | 138,534,840 | | | $ | 112,063,985 | | | $ | 83,891,489 | |
| Shares Outstanding | | | | | 5,143,929 | | | | 6,612,612 | | | | 12,447,101 | | | | 9,850,252 | | | | 7,262,252 | |
| Net Asset Value, offering and redemption price per share (net assets divided by shares outstanding) | | | | $ | 10.61 | | | $ | 10.65 | | | $ | 11.13 | | | $ | 11.38 | | | $ | 11.55 | |
| Cost of investments | | | | $ | 55,796,281 | | | $ | 71,965,100 | | | $ | 141,469,081 | | | $ | 114,673,088 | | | $ | 86,254,209 | |
|
| * | | Investment in other Vantagepoint Funds (Note 1). |
| ** | | Contractual fee waiver (Note 3) |
See Notes to Financial Statements.
97
VANTAGEPOINT FUNDS
Statements of Assets and Liabilities
December 31, 2007
| | | | Milestone Funds
| |
|---|
| | | | Milestone
2030
| | Milestone
2035
| | Milestone
2040
|
|---|
ASSETS:
| | | | | | | | | | | | | | |
| Securities of affiliated Mutual Funds, at market value* | | | | $ | 61,482,678 | | | $ | 34,851,709 | | | $ | 32,903,173 | |
Receivable for:
| | | | | | | | | | | | | | |
| Dividends | | | | | 35,768 | | | | 17,445 | | | | 15,278 | |
| Investments sold | | | | | — | | | | 109 | | | | 3,301 | |
| Fund shares sold | | | | | 96,868 | | | | 64,623 | | | | 53,130 | |
| Due from investment adviser** | | | | | 15,145 | | | | 9,328 | | | | 8,321 | |
| Total Assets | | | | | 61,630,459 | | | | 34,943,214 | | | | 32,983,203 | |
LIABILITIES:
| | | | | | | | | | | | | | |
Payable for:
| | | | | | | | | | | | | | |
| Investments purchased | | | | | 132,636 | | | | 66,597 | | | | 15,278 | |
| Fund shares redeemed | | | | | — | | | | 15,581 | | | | 56,431 | |
Accrued Expenses:
| | | | | | | | | | | | | | |
| Administrative services fees | | | | | 2,503 | | | | 2,503 | | | | 2,503 | |
| Advisory fees | | | | | 5,322 | | | | 3,000 | | | | 2,817 | |
| Other accrued expense | | | | | 25,049 | | | | 24,827 | | | | 24,528 | |
| Total Liabilities | | | | | 165,510 | | | | 112,508 | | | | 101,557 | |
| NET ASSETS | | | | $ | 61,464,949 | | | $ | 34,830,706 | | | $ | 32,881,646 | |
NET ASSETS REPRESENTED BY:
| | | | | | | | | | | | | | |
| Paid-in capital | | | | $ | 60,829,419 | | | $ | 34,836,007 | | | $ | 33,276,162 | |
| Net unrealized depreciation on investments | | | | | (2,397,465 | ) | | | (1,850,079 | ) | | | (2,231,809 | ) |
| Undistributed net investment income | | | | | 8,215 | | | | 4,123 | | | | 4,011 | |
| Accumulated net realized gain on investments | | | | | 3,024,780 | | | | 1,840,655 | | | | 1,833,282 | |
| NET ASSETS | | | | $ | 61,464,949 | | | $ | 34,830,706 | | | $ | 32,881,646 | |
CAPITAL SHARES:
| | | | | | | | | | | | | | |
| Net Assets | | | | $ | 61,464,949 | | | $ | 34,830,706 | | | $ | 32,881,646 | |
| Shares Outstanding | | | | | 5,229,848 | | | | 2,945,289 | | | | 2,775,802 | |
Net Asset Value, offering and redemption price per share (net assets divided
by shares outstanding) | | | | $ | 11.75 | | | $ | 11.83 | | | $ | 11.85 | |
| Cost of investments | | | | $ | 63,880,143 | | | $ | 36,701,788 | | | $ | 35,134,982 | |
|
| * | | Investment in other Vantagepoint Funds (Note 1). |
| ** | | Contractual fee waiver (Note 3) |
See Notes to Financial Statements.
98
VANTAGEPOINT FUNDS
Statements of Operations
For the Year Ended December 31, 2007
| | | | Money
Market
| | Low Duration
Bond(1)
| | Inflation Protected
Securities(2)
| | Asset
Allocation
| | Equity
Income
|
|---|
INVESTMENT INCOME:
| | | | | | | | | | | | | | | | | | | | | | |
| Dividends | | | | $ | 13,627,570 | | | $ | — | | | $ | — | | | $ | 11,929,195 | | | $ | 28,938,706 | |
| Interest | | | | | — | | | | 29,720,351 | | | | 9,100,349 | | | | 8,332,458 | | | | 4,721,656 | |
| Security lending income | | | | | — | | | | 2,424 | | | | 13,355 | | | | 46,975 | | | | 1,237,079 | |
| Foreign taxes withheld on dividends | | | | | — | | | | — | | | | — | | | | — | | | | (75,691 | ) |
| Total investment income | | | | | 13,627,570 | | | | 29,722,775 | | | | 9,113,704 | | | | 20,308,628 | | | | 34,821,750 | |
EXPENSES:
| | | | | | | | | | | | | | | | | | | | | | |
| Directors | | | | | 2,430 | | | | 6,540 | | | | 1,519 | | | | 8,166 | | | | 16,117 | |
| Subadviser | | | | | — | | | | 834,397 | | | | 240,355 | | | | 1,772,039 | | | | 6,219,287 | |
| Custodian | | | | | 35,605 | | | | 132,871 | | | | 49,491 | | | | 141,702 | | | | 253,542 | |
| Advisory* | | | | | 264,795 | | | | 620,160 | | | | 164,340 | | | | 774,666 | | | | 1,654,782 | |
| Fund services | | | | | 397,193 | | | | 930,239 | | | | 246,509 | | | | 1,161,999 | | | | 2,482,172 | |
| Investor services | | | | | 529,591 | | | | 1,240,319 | | | | 328,679 | | | | 1,549,331 | | | | 3,309,563 | |
| Administration | | | | | 35,189 | | | | 114,924 | | | | 28,198 | | | | 142,185 | | | | 298,575 | |
| Other expenses | | | | | 74,987 | | | | 140,374 | | | | 62,995 | | | | 245,720 | | | | 287,787 | |
| Total expenses | | | | | 1,339,790 | | | | 4,019,824 | | | | 1,122,086 | | | | 5,795,808 | | | | 14,521,825 | |
NET INVESTMENT INCOME | | | | | 12,287,780 | | | | 25,702,951 | | | | 7,991,618 | | | | 14,512,820 | | | | 20,299,925 | |
NET REALIZED AND UNREALIZED GAIN (LOSS) (Note 2):
| | | | | | | | | | | | | | | | | | | | | | |
| Net realized gain (loss) on sale of investments | | | | | — | | | | (35,648 | ) | | | (851,795 | ) | | | 18,962,984 | | | | 87,114,116 | |
| Net realized gain (loss) on futures contracts, foreign currency transactions, written options and swaps | | | | | — | | | | 562,111 | | | | 280,471 | | | | 11,045,580 | | | | (261,725 | ) |
| Net change in unrealized appreciation (depreciation) on investments | | | | | — | | | | 5,500,596 | | | | 9,562,070 | | | | 3,751,083 | | | | (57,192,703 | ) |
| Net change in unrealized appreciation (depreciation) on futures contracts, foreign currency transactions, written options and swaps | | | | | — | | | | 144,891 | | | | 70,811 | | | | (1,853,781 | ) | | | (220 | ) |
NET GAIN ON INVESTMENTS | | | | | — | | | | 6,171,950 | | | | 9,061,557 | | | | 31,905,866 | | | | 29,659,468 | |
NET INCREASE IN NET ASSETS RESULTING FROM OPERATIONS | | | | $ | 12,287,780 | | | $ | 31,874,901 | | | $ | 17,053,175 | | | $ | 46,418,686 | | | $ | 49,959,393 | |
| (1) | | Formerly Short-Term Bond Fund |
| (2) | | Formerly US Government Securities Fund |
See Notes to Financial Statements.
99
VANTAGEPOINT FUNDS
Statements of Operations
For the Period Ended December 31, 2007
| | | | Growth &
Income
| | Growth
| | Select
Value(1)
| | Aggressive
Opportunities
|
|---|
INVESTMENT INCOME:
| | | | | | | | | | | | | | | | | | |
| Dividends | | | | $ | 19,627,341 | | | $ | 31,499,668 | | | $ | 1,369,891 | | | $ | 10,210,445 | |
| Interest | | | | | 1,266,161 | | | | 3,463,576 | | | | 188,241 | | | | 1,871,519 | |
| Security lending income | | | | | 224,332 | | | | 770,367 | | | | — | | | | 3,040,398 | |
| Foreign taxes withheld on dividends | | | | | (141,621 | ) | | | (52,613 | ) | | | (750 | ) | | | (70,219 | ) |
| Total investment income | | | | | 20,976,213 | | | | 35,680,998 | | | | 1,557,382 | | | | 15,052,143 | |
EXPENSES:
| | | | | | | | | | | | | | | | | | |
| Directors | | | | | 12,632 | | | | 29,429 | | | | — | | | | 14,670 | |
| Subadviser | | | | | 3,622,350 | | | | 10,234,788 | | | | 226,157 | | | | 6,924,688 | |
| Custodian | | | | | 253,029 | | | | 464,302 | | | | 16,318 | | | | 314,308 | |
| Advisory* | | | | | 1,230,971 | | | | 2,772,748 | | | | 50,257 | | | | 1,374,512 | |
| Fund services | | | | | 1,846,456 | | | | 4,159,123 | | | | 75,386 | | | | 2,061,768 | |
| Investor services | | | | | 2,461,941 | | | | 5,545,497 | | | | 100,514 | | | | 2,749,024 | |
| Administration | | | | | 226,378 | | | | 511,335 | | | | 9,205 | | | | 254,809 | |
| Other expenses | | | | | 234,127 | | | | 485,272 | | | | 43,896 | | | | 262,895 | |
| Total expenses | | | | | 9,887,884 | | | | 24,202,494 | | | | 521,733 | | | | 13,956,674 | |
NET INVESTMENT INCOME | | | | | 11,088,329 | | | | 11,478,504 | | | | 1,035,649 | | | | 1,095,469 | |
NET REALIZED AND UNREALIZED GAIN (LOSS)
(Note 2):
| | | | | | | | | | | | | | | | | | |
| Net realized gain (loss) on sale of investments | | | | | 134,549,429 | | | | 221,556,043 | | | | (3,646,159 | ) | | | 201,649,227 | |
| Net realized gain (loss) on futures contracts, foreign currency transactions, written options and swaps | | | | | 4,967,236 | | | | 5,772,220 | | | | (191,368 | ) | | | 3,362,183 | |
Net change in unrealized appreciation (depreciation)
on investments | | | | | (68,933,737 | ) | | | 36,959,413 | | | | (15,229,407 | ) | | | (115,328,905 | ) |
| Net change in unrealized appreciation on futures contracts, foreign currency transactions, written options and swaps | | | | | 915 | | | | 85 | | | | — | | | | 302 | |
NET GAIN (LOSS) ON INVESTMENTS | | | | | 70,583,843 | | | | 264,287,761 | | | | (19,066,934 | ) | | | 89,682,807 | |
NET INCREASE IN NET ASSETS RESULTING
FROM OPERATIONS | | | | $ | 81,672,172 | | | $ | 275,766,265 | | | $ | (18,031,285 | ) | | $ | 90,778,276 | |
| (1) | | Commenced operations on October 30, 2007. |
See Notes to Financial Statements.
100
VANTAGEPOINT FUNDS
Statements of Operations
For the Period Ended December 31, 2007
| | | | Discovery(1)
| | International
| | Diversified
Assets(1)
|
|---|
INVESTMENT INCOME:
| | | | | | | | | | | | | | |
| Dividends | | | | $ | 232,599 | | | $ | 25,127,540 | | | $ | — | |
| Interest | | | | | 691,534 | | | | 1,684,251 | | | | 3,574,398 | |
| Security lending income | | | | | — | | | | 618,804 | | | | — | |
| Foreign taxes withheld on dividends | | | | | (6,601 | ) | | | (2,164,040 | ) | | | — | |
| Total investment income | | | | | 917,532 | | | | 25,266,555 | | | | 3,574,398 | |
EXPENSES:
| | | | | | | | | | | | | | |
| Directors | | | | | — | | | | 11,239 | | | | — | |
| Subadviser | | | | | 125,225 | | | | 5,731,235 | | | | 370,302 | |
| Custodian | | | | | 9,216 | | | | 1,111,316 | | | | 23,331 | |
| Advisory* | | | | | 29,122 | | | | 1,121,260 | | | | 78,788 | |
| Fund services | | | | | 43,683 | | | | 1,681,890 | | | | 118,182 | |
| Investor services | | | | | 58,244 | | | | 2,242,521 | | | | 157,575 | |
| Administration | | | | | 5,334 | | | | 203,508 | | | | 14,430 | |
| Audit | | | | | 20,283 | | | | 20,089 | | | | 20,283 | |
| State license fees and memberships | | | | | 19,532 | | | | 25,123 | | | | 9,612 | |
| Other expenses | | | | | — | | | | 176,626 | | | | — | |
| Total expenses | | | | | 310,639 | | | | 12,324,807 | | | | 792,503 | |
NET INVESTMENT INCOME | | | | | 606,893 | | | | 12,941,748 | | | | 2,781,895 | |
NET REALIZED AND UNREALIZED GAIN (LOSS) (Note 2):
| | | | | | | | | | | | | | |
| Net realized gain on sale of investments | | | | | 185,814 | | | | 152,349,474 | | | | 3,007 | |
| Net realized gain (loss) on futures contracts, foreign currency transactions, written options and swaps | | | | | (4,304,877 | ) | | | 574,147 | | | | 387,357 | |
| Net change in unrealized depreciation on investments | | | | | (6,743,906 | ) | | | (30,609,747 | ) | | | (28,420 | ) |
| Net change in unrealized depreciation on futures contracts, foreign currency transactions, written options and swaps | | | | | (1,251,793 | ) | | | (17,387 | ) | | | (3,683,469 | ) |
NET GAIN (LOSS) ON INVESTMENTS | | | | | (12,114,762 | ) | | | 122,296,487 | | | | (3,321,525 | ) |
NET INCREASE IN NET ASSETS RESULTING FROM OPERATIONS | | | | $ | (11,507,869 | ) | | $ | 135,238,235 | | | $ | (539,630 | ) |
| (1) | | Commenced operations on October 30, 2007. |
See Notes to Financial Statements.
101
VANTAGEPOINT FUNDS
Statements of Operations
For the Year Ended December 31, 2007
| | | | Core Bond
Index
| | 500 Stock
Index
| | Broad
Market
Index
| | Mid/Small
Company
Index
| | Overseas
Equity
Index
|
|---|
INVESTMENT INCOME:
| | | | | | | | | | | | | | | | | �� | | | | | |
| Dividends | | | | $ | — | | | $ | 7,957,813 | | | $ | 12,169,687 | | | $ | 2,977,433 | | | $ | 6,577,646 | |
| Interest | | | | | 62,399,271 | | | | 252,294 | | | | 473,162 | | | | 269,342 | | | | 496,221 | |
| Security lending income | | | | | 318,882 | | | | 32,932 | | | | 219,901 | | | | 313,949 | | | | 102,956 | |
| Foreign taxes withheld on dividends | | | | | — | | | | — | | | | (616 | ) | | | (1,121 | ) | | | (476,910 | ) |
| Total investment income | | | | | 62,718,153 | | | | 8,243,039 | | | | 12,862,134 | | | | 3,559,603 | | | | 6,699,913 | |
EXPENSES:
| | | | | | | | | | | | | | | | | | | | | | |
| Directors | | | | | 12,562 | | | | 4,252 | | | | 6,897 | | | | 2,073 | | | | 1,929 | |
| Subadviser | | | | | 247,794 | | | | 82,399 | | | | 145,051 | | | | 88,085 | | | | 155,566 | |
| Custodian | | | | | 345,771 | | | | 90,592 | | | | 169,007 | | | | 125,175 | | | | 337,387 | |
| Advisory Class I* | | | | | 516,759 | | | | 51,887 | | | | 93,513 | | | | 45,905 | | | | 34,022 | |
| Advisory Class II* | | | | | 92,249 | | | | 154,807 | | | | 240,443 | | | | 60,771 | | | | 78,050 | |
| Fund services Class I | | | | | 1,550,276 | | | | 155,660 | | | | 280,539 | | | | 137,716 | | | | 102,068 | |
| Fund services Class II | | | | | 92,249 | | | | 154,807 | | | | 240,443 | | | | 60,771 | | | | 78,049 | |
| Investor services Class I | | | | | 1,550,276 | | | | 155,660 | | | | 280,539 | | | | 137,716 | | | | 102,067 | |
| Investor services Class II | | | | | 92,249 | | | | 154,807 | | | | 240,443 | | | | 60,771 | | | | 78,050 | |
| Administration | | | | | 224,045 | | | | 75,493 | | | | 122,092 | | | | 39,695 | | | | 39,690 | |
| State license fees and memberships | | | | | 25,912 | | | | 63,718 | | | | 23,193 | | | | 20,548 | | | | 20,484 | |
| Other expenses | | | | | 207,505 | | | | 83,375 | | | | 122,732 | | | | 50,934 | | | | 75,424 | |
| Total expenses | | | | | 4,957,647 | | | | 1,227,457 | | | | 1,964,892 | | | | 830,160 | | | | 1,102,786 | |
NET INVESTMENT INCOME | | | | | 57,760,506 | | | | 7,015,582 | | | | 10,897,242 | | | | 2,729,443 | | | | 5,597,127 | |
NET REALIZED AND UNREALIZED GAIN (LOSS) (Note 2):
| | | | | | | | | | | | | | | | | | | | | | |
| Net realized gain on sale of investments | | | | | 498,179 | | | | 14,883,029 | | | | 13,545,009 | | | | 15,623,752 | | | | 2,913,615 | |
| Net realized gain (loss) on futures contracts and foreign currency transactions | | | | | — | | | | 178,561 | | | | (477,518 | ) | | | 9,363 | | | | 4,112 | |
| Net change in unrealized appreciation (depreciation) on investments | | | | | 20,506,955 | | | | (1,238,955 | ) | | | 10,058,809 | | | | (9,622,724 | ) | | | 10,337,013 | |
Net change in unrealized appreciation
(depreciation) on futures contracts and foreign currency transactions | | | | | — | | | | (59,295 | ) | | | (86,007 | ) | | | 9,882 | | | | (256,257 | ) |
NET GAIN ON INVESTMENTS | | | | | 21,005,134 | | | | 13,763,340 | | | | 23,040,293 | | | | 6,020,273 | | | | 12,998,483 | |
NET INCREASE IN NET ASSETS RESULTING FROM OPERATIONS | | | | $ | 78,765,640 | | | $ | 20,778,922 | | | $ | 33,937,535 | | | $ | 8,749,716 | | | $ | 18,595,610 | |
See Notes to Financial Statements.
102
VANTAGEPOINT FUNDS
Statements of Operations
For the Year Ended December 31, 2007
| | | | Model Portfolio Funds
| |
|---|
| | | | Savings
Oriented
| | Conservative
Growth
| | Traditional
Growth
| | Long-Term
Growth
| | All-Equity
Growth
|
|---|
INVESTMENT INCOME IN AFFILIATED MUTUAL FUNDS:
| | | | | | | | | | | | | | | | | | | | | | |
| Dividends* | | | | $ | 11,507,122 | | | $ | 18,063,007 | | | $ | 33,534,015 | | | $ | 27,127,192 | | | $ | 5,289,512 | |
| Total investment income | | | | | 11,507,122 | | | | 18,063,007 | | | | 33,534,015 | | | | 27,127,192 | | | | 5,289,512 | |
EXPENSES:
| | | | | | | | | | | | | | | | | | | | | | |
| Directors | | | | | 3,145 | | | | 5,878 | | | | 14,313 | | | | 15,885 | | | | 5,198 | |
| Custodian | | | | | 28,487 | | | | 32,378 | | | | 39,276 | | | | 40,662 | | | | 32,265 | |
| Advisory** | | | | | 301,827 | | | | 568,430 | | | | 1,290,280 | | | | 1,431,979 | | | | 545,271 | |
| Administration | | | | | 42,719 | | | | 80,537 | | | | 199,345 | | | | 223,627 | | | | 75,669 | |
| Legal | | | | | 22,531 | | | | 42,117 | | | | 102,540 | | | | 113,806 | | | | 37,252 | |
| Other expenses | | | | | 60,695 | | | | 83,217 | | | | 152,481 | | | | 165,321 | | | | 79,837 | |
| Total expenses | | | | | 459,404 | | | | 812,557 | | | | 1,798,235 | | | | 1,991,280 | | | | 775,492 | |
NET INVESTMENT INCOME | | | | | 11,047,718 | | | | 17,250,450 | | | | 31,735,780 | | | | 25,135,912 | | | | 4,514,020 | |
NET REALIZED AND UNREALIZED GAIN (LOSS) (Note 2):
| | | | | | | | | | | | | | | | | | | | | | |
| Net realized gain on sale of investments | | | | | 3,335,930 | | | | 18,571,919 | | | | 65,567,503 | | | | 84,126,471 | | | | 49,037,289 | |
Realized gain distributions from affiliated
mutual funds | | | | | 6,697,077 | | | | 17,287,876 | | | | 62,663,028 | | | | 90,659,809 | | | | 40,770,180 | |
Net change in unrealized depreciation
on investments | | | | | (3,176,082 | ) | | | (16,944,589 | ) | | | (65,549,999 | ) | | | (84,781,758 | ) | | | (57,178,320 | ) |
NET GAIN ON INVESTMENTS | | | | | 6,856,925 | | | | 18,915,206 | | | | 62,680,532 | | | | 90,004,522 | | | | 32,629,149 | |
NET INCREASE IN NET ASSETS RESULTING FROM OPERATIONS | | | | $ | 17,904,643 | | | $ | 36,165,656 | | | $ | 94,416,312 | | | $ | 115,140,434 | | | $ | 37,143,169 | |
|
| * | | Received from other Vantagepoint Funds (Note 1). |
See Notes to Financial Statements.
103
VANTAGEPOINT FUNDS
Statements of Operations
For the Year Ended December 31, 2007
| | | | Milestone Funds
| |
|---|
| | | | Milestone
Retirement
Income
| | Milestone
2010
| | Milestone
2015
| | Milestone
2020
| | Milestone
2025
|
|---|
INVESTMENT INCOME IN AFFILIATED MUTUAL FUNDS:
| | | | | | | | | | | | | | | | | | | | | | |
| Dividends* | | | | $ | 1,503,057 | | | $ | 1,974,352 | | | $ | 3,059,457 | | | $ | 2,223,053 | | | $ | 1,484,148 | |
| Total investment income | | | | | 1,503,057 | | | | 1,974,352 | | | | 3,059,457 | | | | 2,223,053 | | | | 1,484,148 | |
EXPENSES:
| | | | | | | | | | | | | | | | | | | | | | |
| Directors | | | | | 286 | | | | 554 | | | | 965 | | | | 751 | | | | 554 | |
| Custodian | | | | | 23,836 | | | | 24,206 | | | | 24,927 | | | | 24,627 | | | | 24,276 | |
| Advisory** | | | | | 39,758 | | | | 61,631 | | | | 111,156 | | | | 91,477 | | | | 67,132 | |
| Administration | | | | | 15,002 | | | | 15,002 | | | | 15,002 | | | | 15,002 | | | | 15,002 | |
| Audit | | | | | 15,188 | | | | 15,188 | | | | 15,188 | | | | 15,188 | | | | 15,188 | |
| State license fees and memberships | | | | | 19,754 | | | | 19,874 | | | | 20,056 | | | | 19,961 | | | | 19,874 | |
| Other expenses | | | | | 4,475 | | | | 8,736 | | | | 15,340 | | | | 11,986 | | | | 8,938 | |
| Total expenses | | | | | 118,299 | | | | 145,191 | | | | 202,634 | | | | 178,992 | | | | 150,964 | |
| Less reimbursements (Note 3) | | | | | (62,948 | ) | | | (33,167 | ) | | | (6,953 | ) | | | (8,149 | ) | | | (27,777 | ) |
| Total expenses | | | | | 55,351 | | | | 112,024 | | | | 195,681 | | | | 170,843 | | | | 123,187 | |
NET INVESTMENT INCOME | | | | | 1,447,706 | | | | 1,862,328 | | | | 2,863,776 | | | | 2,052,210 | | | | 1,360,961 | |
NET REALIZED AND UNREALIZED GAIN (LOSS) (Note 2):
| | | | | | | | | | | | | | | | | | | | | | |
| Net realized gain on sale of investments | | | | | 782,332 | | | | 2,286,763 | | | | 4,929,210 | | | | 4,291,475 | | | | 3,294,152 | |
Realized gain distributions from affiliated
mutual funds | | | | | 1,410,680 | | | | 2,190,427 | | | | 5,142,999 | | | | 4,774,798 | | | | 4,083,031 | |
Net change in unrealized depreciation
on investments | | | | | (1,437,303 | ) | | | (2,775,104 | ) | | | (6,233,099 | ) | | | (5,582,812 | ) | | | (4,798,841 | ) |
NET GAIN ON INVESTMENTS | | | | | 755,709 | | | | 1,702,086 | | | | 3,839,110 | | | | 3,483,461 | | | | 2,578,342 | |
NET INCREASE IN NET ASSETS RESULTING FROM OPERATIONS | | | | $ | 2,203,415 | | | $ | 3,564,414 | | | $ | 6,702,886 | | | $ | 5,535,671 | | | $ | 3,939,303 | |
|
| * | | Received from other Vantagepoint Funds (Note 1). |
See Notes to Financial Statements.
104
VANTAGEPOINT FUNDS
Statements of Operations
For the Year Ended December 31, 2007
| | | | Milestone Funds
| |
|---|
| | | | Milestone
2030
| | Milestone
2035
| | Milestone
2040
|
|---|
INVESTMENT INCOME IN AFFILIATED MUTUAL FUNDS:
| | | | | | | | | | | | | | |
| Dividends* | | | | $ | 987,988 | | | $ | 513,126 | | | $ | 467,427 | |
| Total investment income | | | | | 987,988 | | | | 513,126 | | | | 467,427 | |
EXPENSES:
| | | | | | | | | | | | | | |
| Directors | | | | | 339 | | | | 196 | | | | 162 | |
| Custodian | | | | | 23,970 | | | | 23,650 | | | | 23,605 | |
| Advisory** | | | | | 48,152 | | | | 25,615 | | | | 22,841 | |
| Administration | | | | | 15,002 | | | | 15,002 | | | | 15,002 | |
| Audit | | | | | 15,188 | | | | 15,188 | | | | 15,188 | |
| State license fees and memberships | | | | | 19,776 | | | | 19,714 | | | | 19,699 | |
| Other expenses | | | | | 5,427 | | | | 3,224 | | | | 2,651 | |
| Total expenses | | | | | 127,854 | | | | 102,589 | | | | 99,148 | |
| Less reimbursements (Note 3) | | | | | (31,495 | ) | | | (52,238 | ) | | | (54,672 | ) |
| Total expenses | | | | | 96,359 | | | | 50,351 | | | | 44,476 | |
NET INVESTMENT INCOME | | | | | 891,629 | | | | 462,775 | | | | 422,951 | |
NET REALIZED AND UNREALIZED GAIN (LOSS) (Note 2):
| | | | | | | | | | | | | | |
| Net realized gain on sale of investments | | | | | 2,570,543 | | | | 1,433,716 | | | | 1,288,677 | |
| Realized gain distributions from affiliated mutual funds | | | | | 3,275,569 | | | | 1,996,951 | | | | 1,941,337 | |
| Net change in unrealized depreciation on investments | | | | | (3,748,429 | ) | | | (2,532,444 | ) | | | (2,532,853 | ) |
NET GAIN ON INVESTMENTS | | | | | 2,097,683 | | | | 898,223 | | | | 697,161 | |
NET INCREASE IN NET ASSETS RESULTING FROM OPERATIONS | | | | $ | 2,989,312 | | | $ | 1,360,998 | | | $ | 1,120,112 | |
|
| * | | Received from other Vantagepoint Funds (Note 1). |
See Notes to Financial Statements.
105
VANTAGEPOINT FUNDS
Statements of Changes in Net Assets
| | | | Money Market
| | Low Duration Bond(1)
| |
|---|
| | | | For the
Year Ended
December 31,
2007
| | For the
Year Ended
December 31,
2006
| | For the
Year Ended
December 31,
2007
| | For the
Year Ended
December 31,
2006
|
|---|
Increase (decrease) in net assets resulting from operations:
| | | | | | | | | | | | | | | | | | |
| Net investment income | | | | $ | 12,287,780 | | | $ | 8,101,593 | | | $ | 25,702,951 | | | $ | 21,677,634 | |
| Net realized gain (loss) on sale of investments | | | | | — | | | | 6,063 | | | | 526,463 | | | | (2,260,196 | ) |
| Net change in unrealized appreciation of investments | | | | | — | | | | — | | | | 5,645,487 | | | | 2,312,266 | |
| Net increase in net assets resulting from operations | | | | | 12,287,780 | | | | 8,107,656 | | | | 31,874,901 | | | | 21,729,704 | |
Distributions to shareholders from:
| | | | | | | | | | | | | | | | | | |
| Net investment income | | | | | (12,287,780 | ) | | | (8,101,593 | ) | | | (26,485,268 | ) | | | (22,130,500 | ) |
| Net realized gain on investments | | | | | — | | | | (6,063 | ) | | | — | | | | — | |
| Return of capital | | | | | — | | | | — | | | | — | | | | (2,019,872 | ) |
| Total distributions | | | | | (12,287,780 | ) | | | (8,107,656 | ) | | | (26,485,268 | ) | | | (24,150,372 | ) |
Capital share transactions:
| | | | | | | | | | | | | | | | | | |
| Proceeds from sale of shares | | | | | 144,346,127 | | | | 114,571,938 | | | | 114,779,955 | | | | 76,129,924 | |
| Reinvestment of distributions | | | | | 12,287,779 | | | | 8,107,656 | | | | 26,485,268 | | | | 24,150,374 | |
| Value of shares redeemed | | | | | (67,605,809 | ) | | | (47,887,407 | ) | | | (247,207,687 | ) | | | (34,099,542 | ) |
| Net increase (decrease) from capital share transactions | | | | | 89,028,097 | | | | 74,792,187 | | | | (105,942,464 | ) | | | 66,180,756 | |
| Total increase (decrease) in net assets | | | | | 89,028,097 | | | | 74,792,187 | | | | (100,552,831 | ) | | | 63,760,088 | |
| NET ASSETS at beginning of year | | | | | 217,771,278 | | | | 142,979,091 | | | | 607,673,104 | | | | 543,913,016 | |
| NET ASSETS at end of year | | | | $ | 306,799,375 | | | $ | 217,771,278 | | | $ | 507,120,273 | | | $ | 607,673,104 | |
SHARE TRANSACTIONS:
| | | | | | | | | | | | | | | | | | |
| Number of shares sold | | | | | 144,346,127 | | | | 114,571,938 | | | | 11,704,639 | | | | 7,774,549 | |
| Number of shares issued through reinvestment of dividends and distributions | | | | | 12,287,779 | | | | 8,107,656 | | | | 2,707,153 | | | | 2,473,087 | |
| Number of shares redeemed | | | | | (67,605,809 | ) | | | (47,887,407 | ) | | | (25,091,034 | ) | | | (3,492,137 | ) |
| Net increase (decrease) in shares outstanding | | | | | 89,028,097 | | | | 74,792,187 | | | | (10,679,242 | ) | | | 6,755,499 | |
| |
|
(1) Formerly Short-Term Bond Fund
| | | | | | | | | | | | | | | | | | |
See Notes to Financial Statements.
106
VANTAGEPOINT FUNDS
Statements of Changes in Net Assets
| | | | Inflation Protected Securities(1)
| | Asset Allocation
| |
|---|
| | | | For the
Year Ended
December 31,
2007
| | For the
Year Ended
December 31,
2006
| | For the
Year Ended
December 31,
2007
| | For the
Year Ended
December 31,
2006
|
|---|
Increase (decrease) in net assets resulting from operations:
| | | | | | | | | | | | | | | | | | |
| Net investment income | | | | $ | 7,991,618 | | | $ | 5,516,908 | | | $ | 14,512,820 | | | $ | 12,320,489 | |
| Net realized gain (loss) on sale of investments | | | | | (571,324 | ) | | | (1,632,407 | ) | | | 30,008,564 | | | | 38,162,394 | |
| Net change in unrealized appreciation of investments | | | | | 9,632,881 | | | | 734,414 | | | | 1,897,302 | | | | 56,963,879 | |
| Net increase in net assets resulting from operations | | | | | 17,053,175 | | | | 4,618,915 | | | | 46,418,686 | | | | 107,446,762 | |
Distributions to shareholders from:
| | | | | | | | | | | | | | | | | | |
| Net investment income | | | | | (7,993,265 | ) | | | (5,508,157 | ) | | | (16,268,835 | ) | | | (12,047,039 | ) |
| Net realized gain on investments | | | | | — | | | | — | | | | (17,570,032 | ) | | | (12,454,093 | ) |
| Return of capital | | | | | — | | | | (455,973 | ) | | | — | | | | — | |
| Total distributions | | | | | (7,993,265 | ) | | | (5,964,130 | ) | | | (33,838,867 | ) | | | (24,501,132 | ) |
Capital share transactions:
| | | | | | | | | | | | | | | | | | |
| Proceeds from sale of shares | | | | | 150,935,590 | | | | 19,881,091 | | | | 60,033,126 | | | | 71,646,779 | |
| Reinvestment of distributions | | | | | 7,993,265 | | | | 5,964,119 | | | | 33,838,867 | | | | 24,501,132 | |
| Value of shares redeemed | | | | | (36,319,717 | ) | | | (33,294,937 | ) | | | (118,504,439 | ) | | | (148,494,794 | ) |
| Net increase (decrease) from capital share transactions | | | | | 122,609,138 | | | | (7,449,727 | ) | | | (24,632,446 | ) | | | (52,346,883 | ) |
| Total increase (decrease) in net assets | | | | | 131,669,048 | | | | (8,794,942 | ) | | | (12,052,627 | ) | | | 30,598,747 | |
| NET ASSETS at beginning of year | | | | | 142,539,633 | | | | 151,334,575 | | | | 768,381,494 | | | | 737,782,747 | |
| NET ASSETS at end of year | | | | $ | 274,208,681 | | | $ | 142,539,633 | | | $ | 756,328,867 | | | $ | 768,381,494 | |
| Undistributed net investment income (loss) included in net assets at end of year | | | | $ | 13,182 | | | $ | — | | | $ | 96,200 | | | $ | 1,127,211 | |
SHARE TRANSACTIONS:
| | | | | | | | | | | | | | | | | | |
| Number of shares sold | | | | | 14,820,899 | | | | 1,983,713 | | | | 6,785,176 | | | | 9,170,636 | |
| Number of shares issued through reinvestment of dividends and distributions | | | | | 796,656 | | | | 594,945 | | | | 3,930,182 | | | | 2,899,542 | |
| Number of shares redeemed | | | | | (3,622,766 | ) | | | (3,319,412 | ) | | | (13,452,049 | ) | | | (18,880,309 | ) |
| Net increase (decrease) in shares outstanding | | | | | 11,994,789 | | | | (740,754 | ) | | | (2,736,691 | ) | | | (6,810,131 | ) |
| |
|
(1) Formerly US Government Securities Fund
| | | | | | | | | | | | | | | | | | |
See Notes to Financial Statements.
107
VANTAGEPOINT FUNDS
Statements of Changes in Net Assets
| | | | Equity Income
| | Growth & Income
| |
|---|
| | | | For the
Year Ended
December 31,
2007
| | For the
Year Ended
December 31,
2006
| | For the
Year Ended
December 31,
2007
| | For the
Year Ended
December 31,
2006
|
|---|
Increase (decrease) in net assets resulting from operations:
| | | | | | | | | | | | | | | | | | |
| Net investment income | | | | $ | 20,299,925 | | | $ | 19,551,581 | | | $ | 11,088,329 | | | $ | 9,585,232 | |
| Net realized gain on sale of investments | | | | | 86,852,391 | | | | 83,154,508 | | | | 139,516,665 | | | | 67,845,474 | |
Net change in unrealized appreciation (depreciation)
of investments | | | | | (57,192,923 | ) | | | 127,559,492 | | | | (68,932,822 | ) | | | 58,612,614 | |
| Net increase in net assets resulting from operations | | | | | 49,959,393 | | | | 230,265,581 | | | | 81,672,172 | | | | 136,043,320 | |
Distributions to shareholders from:
| | | | | | | | | | | | | | | | | | |
| Net investment income | | | | | (22,816,092 | ) | | | (19,346,014 | ) | | | (13,826,196 | ) | | | (9,346,498 | ) |
| Net realized gain on investments | | | | | (61,239,980 | ) | | | (68,341,252 | ) | | | (133,206,281 | ) | | | (46,001,308 | ) |
| Total distributions | | | | | (84,056,072 | ) | | | (87,687,266 | ) | | | (147,032,477 | ) | | | (55,347,806 | ) |
Capital share transactions:
| | | | | | | | | | | | | | | | | | |
| Proceeds from sale of shares | | | | | 366,342,980 | | | | 177,379,125 | | | | 149,717,691 | | | | 153,442,565 | |
| Reinvestment of distributions | | | | | 84,054,020 | | | | 87,677,531 | | | | 147,028,373 | | | | 55,345,916 | |
| Value of shares redeemed | | | | | (149,503,799 | ) | | | (200,151,067 | ) | | | (306,299,246 | ) | | | (129,701,470 | ) |
| Net increase (decrease) from capital share transactions | | | | | 300,893,201 | | | | 64,905,589 | | | | (9,553,182 | ) | | | 79,087,011 | |
| Total increase (decrease) in net assets | | | | | 266,796,522 | | | | 207,483,904 | | | | (74,913,487 | ) | | | 159,782,525 | |
| NET ASSETS at beginning of year | | | | | 1,467,953,456 | | | | 1,260,469,552 | | | | 1,176,613,948 | | | | 1,016,831,423 | |
| NET ASSETS at end of year | | | | $ | 1,734,749,978 | | | $ | 1,467,953,456 | | | $ | 1,101,700,461 | | | $ | 1,176,613,948 | |
| Undistributed net investment income (loss) included in net assets at end of year | | | | $ | — | | | $ | 221,422 | | | $ | 3,613 | | | $ | 490,058 | |
SHARE TRANSACTIONS:
| | | | | | | | | | | | | | | | | | |
| Number of shares sold | | | | | 34,836,742 | | | | 18,705,343 | | | | 12,374,508 | | | | 13,755,442 | |
| Number of shares issued through reinvestment of dividends and distributions | | | | | 8,490,305 | | | | 8,811,812 | | | | 13,818,457 | | | | 4,783,571 | |
| Number of shares redeemed | | | | | (14,257,589 | ) | | | (21,350,248 | ) | | | (24,234,255 | ) | | | (11,689,273 | ) |
| Net increase (decrease) in shares outstanding | | | | | 29,069,458 | | | | 6,166,907 | | | | 1,958,710 | | | | 6,849,740 | |
See Notes to Financial Statements.
108
VANTAGEPOINT FUNDS
Statements of Changes in Net Assets
| | | | Growth
| | Select Value
| |
|---|
| | | | For the
Year Ended
December 31,
2007
| | For the
Year Ended
December 31,
2006
| | For the Period
from October 30, 2007*
to December 31,
2007
|
|---|
Increase (decrease) in net assets resulting from operations:
| | | | | | | | | | | | | | |
| Net investment income | | | | $ | 11,478,504 | | | $ | 8,515,574 | | | $ | 1,035,649 | |
| Net realized gain (loss) on sale of investments | | | | | 227,328,263 | | | | 255,418,705 | | | | (3,837,527 | ) |
| Net change in unrealized appreciation (depreciation) of investments | | | | | 36,959,498 | | | | 4,030,878 | | | | (15,229,407 | ) |
| Net increase (decrease) in net assets resulting from operations | | | | | 275,766,265 | | | | 267,965,157 | | | | (18,031,285 | ) |
Distributions to shareholders from:
| | | | | | | | | | | | | | |
| Net investment income | | | | | (11,708,202 | ) | | | (8,373,928 | ) | | | (1,099,764 | ) |
| Total distributions | | | | | (11,708,202 | ) | | | (8,373,928 | ) | | | (1,099,764 | ) |
Capital share transactions:
| | | | | | | | | | | | | | |
| Proceeds from sale of shares | | | | | 195,051,211 | | | | 272,236,478 | | | | 312,254,918 | |
| Reinvestment of distributions | | | | | 11,708,202 | | | | 8,373,928 | | | | 1,099,764 | |
| Value of shares redeemed | | | | | (686,767,442 | ) | | | (573,209,664 | ) | | | (66,256 | ) |
| Net increase (decrease) from capital share transactions | | | | | (480,008,029 | ) | | | (292,599,258 | ) | | | 313,288,426 | |
| Total increase (decrease) in net assets | | | | | (215,949,966 | ) | | | (33,008,029 | ) | | | 294,157,377 | |
| NET ASSETS at beginning of period | | | | | 2,783,794,504 | | | | 2,816,802,533 | | | | — | |
| NET ASSETS at end of period | | | | $ | 2,567,844,538 | | | $ | 2,783,794,504 | | | $ | 294,157,377 | |
| Undistributed net investment income included in net assets at end of year | | | | $ | 527,836 | | | $ | 425,909 | | | $ | — | |
SHARE TRANSACTIONS:
| | | | | | | | | | | | | | |
| Number of shares sold | | | | | 18,891,829 | | | | 30,855,340 | | | | 31,249,053 | |
Number of shares issued through reinvestment of dividends
and distributions | | | | | 1,109,782 | | | | 864,183 | | | | 115,855 | |
| Number of shares redeemed | | | | | (65,523,919 | ) | | | (64,302,554 | ) | | | (6,928 | ) |
| Net increase (decrease) in shares outstanding | | | | | (45,522,308 | ) | | | (32,583,031 | ) | | | 31,357,980 | |
| |
|
* Commencement of operations
| | | | | | | | | | | | | | |
See Notes to Financial Statements.
109
VANTAGEPOINT FUNDS
Statements of Changes in Net Assets
| | | | Aggressive Opportunities
| |
|---|
| | | | For the
Year Ended
December 31,
2007
| | For the
Year Ended
December 31,
2006
|
|---|
Increase (decrease) in net assets resulting from operations:
| | | | | | | | | | |
| Net investment income (loss) | | | | $ | 1,095,469 | | | $ | (372,484 | ) |
| Net realized gain on sale of investments | | | | | 205,011,410 | | | | 208,621,501 | |
| Net change in unrealized depreciation of investments | | | | | (115,328,603 | ) | | | (43,966,624 | ) |
| Net increase in net assets resulting from operations | | | | | 90,778,276 | | | | 164,282,393 | |
Distributions to shareholders from:
| | | | | | | | | | |
| Net investment income | | | | | — | | | | (5,004,797 | ) |
| Net realized gain on investments | | | | | (197,540,253 | ) | | | (29,960,480 | ) |
| Total distributions | | | | | (197,540,253 | ) | | | (34,965,277 | ) |
Capital share transactions:
| | | | | | | | | | |
| Proceeds from sale of shares | | | | | 102,369,031 | | | | 155,161,856 | |
| Reinvestment of distributions | | | | | 197,540,252 | | | | 34,965,277 | |
| Value of shares redeemed | | | | | (405,110,096 | ) | | | (205,149,309 | ) |
| Net decrease from capital share transactions | | | | | (105,200,813 | ) | | | (15,022,176 | ) |
| Total increase (decrease) in net assets | | | | | (211,962,790 | ) | | | 114,294,940 | |
| NET ASSETS at beginning of year | | | | | 1,366,708,275 | | | | 1,252,413,335 | |
| NET ASSETS at end of year | | | | $ | 1,154,745,485 | | | $ | 1,366,708,275 | |
| Undistributed net investment income (loss) included in net assets at end of year | | | | $ | 1,056,032 | | | $ | (2,191 | ) |
SHARE TRANSACTIONS:
| | | | | | | | | | |
| Number of shares sold | | | | | 7,396,274 | | | | 12,804,294 | |
| Number of shares issued through reinvestment of dividends and distributions | | | | | 17,373,813 | | | | 2,702,108 | |
| Number of shares redeemed | | | | | (28,581,652 | ) | | | (16,785,739 | ) |
| Net increase (decrease) in shares outstanding | | | | | (3,811,565 | ) | | | (1,279,337 | ) |
See Notes to Financial Statements.
110
VANTAGEPOINT FUNDS
Statements of Changes in Net Assets
| | | | Discovery
| | International
| |
|---|
| | | | For the Period
from October 30, 2007*
to December 31,
2007
| | For the
Year Ended
December 31,
2007
| | For the
Year Ended
December 31,
2006
|
|---|
Increase (decrease) in net assets resulting from operations:
| | | | | | | | | | | | | | |
| Net investment income | | | | $ | 606,893 | | | $ | 12,941,748 | | | $ | 9,863,035 | |
| Net realized gain (loss) on sale of investments | | | | | (4,119,063 | ) | | | 152,923,621 | | | | 135,466,823 | |
| Net change in unrealized appreciation (depreciation) of investments | | | | | (7,995,699 | ) | | | (30,627,134 | ) | | | 28,985,674 | |
| Net increase (decrease) in net assets resulting from operations | | | | | (11,507,869 | ) | | | 135,238,235 | | | | 174,315,532 | |
Distributions to shareholders from:
| | | | | | | | | | | | | | |
| Net investment income | | | | | (628,948 | ) | | | (16,602,361 | ) | | | (14,695,091 | ) |
| Net realized gain on investments | | | | | (1,324,597 | ) | | | (139,045,053 | ) | | | (92,620,774 | ) |
| Total distributions | | | | | (1,953,545 | ) | | | (155,647,414 | ) | | | (107,315,865 | ) |
Capital share transactions:
| | | | | | | | | | | | | | |
| Proceeds from sale of shares | | | | | 185,160,551 | | | | 120,666,811 | | | | 245,566,850 | |
| Reinvestment of distributions | | | | | 1,953,545 | | | | 155,647,414 | | | | 107,315,865 | |
| Value of shares redeemed | | | | | (142,568 | ) | | | (160,707,190 | ) | | | (92,212,868 | ) |
| Net increase from capital share transactions | | | | | 186,971,528 | | | | 115,607,035 | | | | 260,669,847 | |
| Total increase in net assets | | | | | 173,510,114 | | | | 95,197,856 | | | | 327,669,514 | |
| NET ASSETS at beginning of period | | | | | — | | | | 1,049,830,950 | | | | 722,161,436 | |
| NET ASSETS at end of period | | | | $ | 173,510,114 | | | $ | 1,145,028,806 | | | $ | 1,049,830,950 | |
Undistributed net investment (loss) included in net assets at end
of period | | | | $ | (7,646 | ) | | $ | (1,068,775 | ) | | $ | (5,642,009 | ) |
SHARE TRANSACTIONS:
| | | | | | | | | | | | | | |
| Number of shares sold | | | | | 18,559,432 | | | | 8,952,026 | | | | 19,883,822 | |
Number of shares issued through reinvestment of dividends
and distributions | | | | | 208,045 | | | | 12,884,720 | | | | 8,544,256 | |
| Number of shares redeemed | | | | | (15,279 | ) | | | (11,443,736 | ) | | | (7,323,457 | ) |
| Net increase (decrease) in shares outstanding | | | | | 18,752,198 | | | | 10,393,010 | | | | 21,104,621 | |
| |
|
* Commencement of Operations
| | | | | | | | | | | | | | |
See Notes to Financial Statements.
111
VANTAGEPOINT FUNDS
Statements of Changes in Net Assets
| | | | Diversified Assets
|
|---|
| | | | For the Period
from October 30, 2007*
to December 31,
2007
|
|---|
Increase (decrease) in net assets resulting from operations:
| | | | | | |
| Net investment income | | | | $ | 2,781,895 | |
| Net realized gain on sale of investments | | | | | 390,364 | |
| Net change in unrealized depreciation of investments | | | | | (3,711,889 | ) |
| Net decrease in net assets resulting from operations | | | | | (539,630 | ) |
Distributions to shareholders from:
| | | | | | |
| Net investment income | | | | | (2,003,176 | ) |
| Total distributions | | | | | (2,003,176 | ) |
Capital share transactions:
| | | | | | |
| Proceeds from sale of shares | | | | | 468,810,705 | |
| Reinvestment of distributions | | | | | 2,003,176 | |
| Value of shares redeemed | | | | | (3,096,533 | ) |
| Net increase from capital share transactions | | | | | 467,717,348 | |
| Total increase in net assets | | | | | 465,174,542 | |
| NET ASSETS at beginning of period | | | | | — | |
| NET ASSETS at end of period | | | | $ | 465,174,542 | |
| Undistributed net investment income included in net assets at end of period | | | | $ | 2,234,057 | |
SHARE TRANSACTIONS:
| | | | | | |
| Number of shares sold | | | | | 46,882,026 | |
| Number of shares issued through reinvestment of dividends and distributions | | | | | 200,920 | |
| Number of shares redeemed | | | | | (311,348 | ) |
| Net increase (decrease) in shares outstanding | | | | | 46,771,598 | |
| |
|
* Commencement of Operations
| | | | | | |
See Notes to Financial Statements.
112
VANTAGEPOINT FUNDS
Statements of Changes in Net Assets
| | | | Core Bond Index
| | 500 Stock Index
| |
|---|
| | | | For the
Year Ended
December 31,
2007
| | For the
Year Ended
December 31,
2006
| | For the
Year Ended
December 31,
2007
| | For the
Year Ended
December 31,
2006
|
|---|
Increase (decrease) in net assets resulting from operations:
| | | | | | | | | | | | | | | | | | |
| Net investment income | | | | $ | 57,760,506 | | | $ | 48,921,161 | | | $ | 7,015,582 | | | $ | 6,077,344 | |
| Net realized gain (loss) on sale of investments | | | | | 498,179 | | | | (4,233,946 | ) | | | 15,061,590 | | | | 17,965,358 | |
Net change in unrealized appreciation (depreciation)
of investments | | | | | 20,506,955 | | | | (2,593,605 | ) | | | (1,298,250 | ) | | | 28,980,059 | |
| Net increase in net assets resulting from operations | | | | | 78,765,640 | | | | 42,093,610 | | | | 20,778,922 | | | | 53,022,761 | |
Distributions to shareholders from:
| | | | | | | | | | | | | | | | | | |
| Net investment income—Class I | | | | | (51,586,668 | ) | | | (44,920,670 | ) | | | (1,377,508 | ) | | | (1,401,396 | ) |
| Net investment income—Class II | | | | | (9,808,163 | ) | | | (8,408,673 | ) | | | (5,594,202 | ) | | | (4,529,631 | ) |
| Return of capital—Class I | | | | | — | | | | (3,778,387 | ) | | | — | | | | — | |
| Return of capital—Class II | | | | | — | | | | (651,657 | ) | | | — | | | | — | |
| Total distributions | | | | | (61,394,831 | ) | | | (57,759,387 | ) | | | (6,971,710 | ) | | | (5,931,027 | ) |
Capital share transactions:
| | | | | | | | | | | | | | | | | | |
| Proceeds from sale of shares—Class I | | | | | 172,971,124 | | | | 143,624,871 | | | | 10,211,022 | | | | 10,534,365 | |
| Proceeds from sale of shares—Class II | | | | | 35,619,251 | | | | 25,099,849 | | | | 49,072,500 | | | | 48,011,790 | |
| Reinvestment of distributions—Class I | | | | | 51,586,668 | | | | 48,699,075 | | | | 1,376,854 | | | | 1,400,580 | |
| Reinvestment of distributions—Class II | | | | | 9,808,163 | | | | 9,060,333 | | | | 5,594,202 | | | | 4,529,631 | |
| Value of shares redeemed—Class I | | | | | (339,766,033 | ) | | | (55,894,969 | ) | | | (28,241,458 | ) | | | (25,210,070 | ) |
| Value of shares redeemed—Class II | | | | | (17,447,285 | ) | | | (26,347,771 | ) | | | (35,248,059 | ) | | | (40,868,457 | ) |
| Net increase (decrease) from capital share transactions | | | | | (87,228,112 | ) | | | 144,241,388 | | | | 2,765,061 | | | | (1,602,161 | ) |
| Total increase (decrease) in net assets | | | | | (69,857,303 | ) | | | 128,575,611 | | | | 16,572,273 | | | | 45,489,573 | |
| NET ASSETS at beginning of year | | | | | 1,159,971,381 | | | | 1,031,395,770 | | | | 395,369,271 | | | | 349,879,698 | |
| NET ASSETS at end of year | | | | $ | 1,090,114,078 | | | $ | 1,159,971,381 | | | $ | 411,941,544 | | | $ | 395,369,271 | |
| Undistributed net investment income included in net assets at end of year | | | | $ | — | | | $ | — | | | $ | 100,021 | | | $ | 110,062 | |
SHARE TRANSACTIONS:
| | | | | | | | | | | | | | | | | | |
| Number of shares sold—Class I | | | | | 17,805,432 | | | | 14,668,662 | | | | 874,195 | | | | 1,004,662 | |
| Number of shares issued through reinvestment of dividends and distributions—Class I | | | | | 5,297,698 | | | | 4,998,854 | | | | 117,179 | | | | 124,055 | |
| Number of shares redeemed—Class I | | | | | (34,530,649 | ) | | | (5,754,493 | ) | | | (2,376,236 | ) | | | (2,462,341 | ) |
| Net increase (decrease) in shares outstanding—Class I | | | | | (11,427,519 | ) | | | 13,913,023 | | | | (1,384,862 | ) | | | (1,333,624 | ) |
| Number of shares sold—Class II | | | | | 3,647,067 | | | | 2,565,858 | | | | 4,383,577 | | | | 4,894,220 | |
| Number of shares issued through reinvestment of dividends and distributions—Class II | | | | | 1,001,750 | | | | 925,985 | | | | 502,624 | | | | 422,935 | |
| Number of shares redeemed—Class II | | | | | (1,786,893 | ) | | | (2,686,544 | ) | | | (3,154,850 | ) | | | (4,156,114 | ) |
| Net increase in shares outstanding—Class II | | | | | 2,861,924 | | | | 805,299 | | | | 1,731,351 | | | | 1,161,041 | |
See Notes to Financial Statements.
113
VANTAGEPOINT FUNDS
Statements of Changes in Net Assets
| | | | Broad Market Index
| | Mid/Small Company Index
| |
|---|
| | | | For the
Year Ended
December 31,
2007
| | For the
Year Ended
December 31,
2006
| | For the
Year Ended
December 31,
2007
| | For the
Year Ended
December 31,
2006
|
|---|
Increase (decrease) in net assets resulting from operations:
| | | | | | | | | | | | | | | | | | |
| Net investment income | | | | $ | 10,897,242 | | | $ | 9,590,854 | | | $ | 2,729,443 | | | $ | 2,054,232 | |
| Net realized gain on sale of investments | | | | | 13,067,491 | | | | 24,257,207 | | | | 15,633,115 | | | | 14,506,573 | |
Net change in unrealized appreciation (depreciation)
of investments | | | | | 9,972,802 | | | | 55,677,349 | | | | (9,612,842 | ) | | | 7,792,435 | |
| Net increase in net assets resulting from operations | | | | | 33,937,535 | | | | 89,525,410 | | | | 8,749,716 | | | | 24,353,240 | |
Distributions to shareholders from:
| | | | | | | | | | | | | | | | | | |
| Net investment income—Class I | | | | | (2,337,523 | ) | | | (2,310,857 | ) | | | (1,189,641 | ) | | | (570,116 | ) |
| Net investment income—Class II | | | | | (8,261,327 | ) | | | (6,626,524 | ) | | | (1,647,238 | ) | | | (1,014,152 | ) |
| Net realized gain on investments—Class I | | | | | — | | | | — | | | | (5,636,302 | ) | | | (2,740,781 | ) |
| Net realized gain on investments—Class II | | | | | — | | | | — | | | | (6,824,984 | ) | | | (3,899,910 | ) |
| Total distributions | | | | | (10,598,850 | ) | | | (8,937,381 | ) | | | (15,298,165 | ) | | | (8,224,959 | ) |
Capital share transactions:
| | | | | | | | | | | | | | | | | | |
| Proceeds from sale of shares—Class I | | | | | 11,669,028 | | | | 8,463,878 | | | | 42,689,204 | | | | 22,122,825 | |
| Proceeds from sale of shares—Class II | | | | | 61,244,285 | | | | 67,646,803 | | | | 27,835,527 | | | | 26,425,231 | |
| Reinvestment of distributions—Class I | | | | | 2,335,081 | | | | 2,308,829 | | | | 6,824,731 | | | | 3,309,703 | |
| Reinvestment of distributions—Class II | | | | | 8,261,327 | | | | 6,626,524 | | | | 8,472,221 | | | | 4,914,062 | |
| Value of shares redeemed—Class I | | | | | (47,216,585 | ) | | | (49,214,562 | ) | | | (19,337,217 | ) | | | (21,949,655 | ) |
| Value of shares redeemed—Class II | | | | | (50,125,859 | ) | | | (69,237,879 | ) | | | (18,053,229 | ) | | | (29,219,624 | ) |
| Net increase (decrease) from capital share transactions | | | | | (13,832,723 | ) | | | (33,406,407 | ) | | | 48,431,237 | | | | 5,602,542 | |
| Total increase in net assets | | | | | 9,505,962 | | | | 47,181,622 | | | | 41,882,788 | | | | 21,730,823 | |
| NET ASSETS at beginning of year | | | | | 645,612,377 | | | | 598,430,755 | | | | 185,563,426 | | | | 163,832,603 | |
| NET ASSETS at end of year | | | | $ | 655,118,339 | | | $ | 645,612,377 | | | $ | 227,446,214 | | | $ | 185,563,426 | |
| Undistributed net investment income included in net assets at end of year | | | | $ | 5,557,044 | | | $ | 5,500,969 | | | $ | 226,082 | | | $ | 662,816 | |
SHARE TRANSACTIONS:
| | | | | | | | | | | | | | | | | | |
| Number of shares sold—Class I | | | | | 946,498 | | | | 765,181 | | | | 2,415,991 | | | | 1,382,566 | |
| Number of shares issued through reinvestment of dividends and distributions—Class I | | | | | 188,465 | | | | 194,182 | | | | 415,383 | | | | 198,542 | |
| Number of shares redeemed—Class I | | | | | (3,772,869 | ) | | | (4,543,303 | ) | | | (1,091,982 | ) | | | (1,378,148 | ) |
| Net increase (decrease) in shares outstanding—Class I | | | | | (2,637,906 | ) | | | (3,583,940 | ) | | | 1,739,392 | | | | 202,960 | |
| Number of shares sold—Class II | | | | | 5,158,271 | | | | 6,551,146 | | | | 1,647,944 | | | | 1,723,786 | |
| Number of shares issued through reinvestment of dividends and distributions—Class II | | | | | 706,096 | | | | 589,548 | | | | 540,665 | | | | 308,285 | |
| Number of shares redeemed—Class II | | | | | (4,263,802 | ) | | | (6,641,244 | ) | | | (1,074,900 | ) | | | (1,916,202 | ) |
| Net increase in shares outstanding—Class II | | | | | 1,600,565 | | | | 499,450 | | | | 1,113,709 | | | | 115,869 | |
See Notes to Financial Statements.
114
VANTAGEPOINT FUNDS
Statements of Changes in Net Assets
| | | | Overseas Equity Index
| |
|---|
| | | | For the
Year Ended
December 31,
2007
| | For the
Year Ended
December 31,
2006
|
|---|
Increase (decrease) in net assets resulting from operations:
| | | | | | | | | | |
| Net investment income | | | | $ | 5,597,127 | | | $ | 2,716,265 | |
| Net realized gain on sale of investments | | | | | 2,917,727 | | | | 2,502,869 | |
| Net change in unrealized appreciation (depreciation) of investments | | | | | 10,080,756 | | | | 21,804,548 | |
| Net increase in net assets resulting from operations | | | | | 18,595,610 | | | | 27,023,682 | |
Distributions to shareholders from:
| | | | | | | | | | |
| Net investment income—Class I | | | | | (1,763,018 | ) | | | (1,232,897 | ) |
| Net investment income—Class II | | | | | (5,059,311 | ) | | | (2,717,697 | ) |
| Net realized gain on investments—Class I | | | | | (60,409 | ) | | | — | |
| Net realized gain on investments—Class II | | | | | (159,801 | ) | | | — | |
| Total distributions | | | | | (7,042,539 | ) | | | (3,950,594 | ) |
Capital share transactions:
| | | | | | | | | | |
| Proceeds from sale of shares—Class I | | | | | 27,890,700 | | | | 22,549,258 | |
| Proceeds from sale of shares—Class II | | | | | 74,024,535 | | | | 41,974,371 | |
| Reinvestment of distributions—Class I | | | | | 1,823,427 | | | | 1,232,897 | |
| Reinvestment of distributions—Class II | | | | | 5,219,112 | | | | 2,717,697 | |
| Value of shares redeemed—Class I | | | | | (18,421,827 | ) | | | (9,060,938 | ) |
| Value of shares redeemed—Class II | | | | | (15,927,218 | ) | | | (8,823,054 | ) |
| Net increase from capital share transactions | | | | | 74,608,729 | | | | 50,590,231 | |
| Total increase in net assets | | | | | 86,161,800 | | | | 73,663,319 | |
| NET ASSETS at beginning of year | | | | | 163,221,878 | | | | 89,558,559 | |
| NET ASSETS at end of year | | | | $ | 249,383,678 | | | $ | 163,221,878 | |
| Undistributed net investment income (loss) included in net assets at end of year | | | | $ | (655,016 | ) | | $ | (503,583 | ) |
SHARE TRANSACTIONS:
| | | | | | | | | | |
| Number of shares sold—Class I | | | | | 1,891,940 | | | | 1,761,043 | |
| Number of shares issued through reinvestment of dividends and distributions—Class I | | | | | 124,042 | | | | 89,927 | |
| Number of shares redeemed—Class I | | | | | (1,243,647 | ) | | | (741,723 | ) |
| Net increase (decrease) in shares outstanding—Class I | | | | | 772,335 | | | | 1,109,247 | |
| Number of shares sold—Class II | | | | | 5,269,653 | | | | 3,480,524 | |
| Number of shares issued through reinvestment of dividends and distributions—Class II | | | | | 375,746 | | | | 209,376 | |
| Number of shares redeemed—Class II | | | | | (1,139,175 | ) | | | (754,036 | ) |
| Net increase (decrease) in shares outstanding—Class II | | | | | 4,506,224 | | | | 2,935,864 | |
See Notes to Financial Statements.
115
VANTAGEPOINT FUNDS
Statements of Changes in Net Assets
| | | | Model Portfolio Funds
| |
|---|
| | | | Savings Oriented
| | Conservative Growth
| |
|---|
| | | | For the
Year Ended
December 31,
2007
| | For the
Year Ended
December 31,
2006
| | For the
Year Ended
December 31,
2007
| | For the
Year Ended
December 31,
2006
|
|---|
Increase (decrease) in net assets resulting from operations:
| | | | | | | | | | | | | | | | | | |
| Net investment income | | | | $ | 11,047,718 | | | $ | 9,451,190 | | | $ | 17,250,450 | | | $ | 14,956,592 | |
| Net realized gain on sale of investments | | | | | 10,033,007 | | | | 11,214,159 | | | | 35,859,795 | | | | 18,852,180 | |
Net change in unrealized appreciation (depreciation)
of investments | | | | | (3,176,082 | ) | | | (1,645,116 | ) | | | (16,944,589 | ) | | | 8,621,802 | |
| Net increase in net assets resulting from operations | | | | | 17,904,643 | | | | 19,020,233 | | | | 36,165,656 | | | | 42,430,574 | |
Distributions to shareholders from:
| | | | | | | | | | | | | | | | | | |
| Net investment income | | | | | (11,429,931 | ) | | | (9,669,543 | ) | | | (17,209,933 | ) | | | (15,391,031 | ) |
| Net realized gain on investments | | | | | (6,554,344 | ) | | | (3,859,279 | ) | | | (16,331,111 | ) | | | — | |
| Total distributions | | | | | (17,984,275 | ) | | | (13,528,822 | ) | | | (33,541,044 | ) | | | (15,391,031 | ) |
Capital share transactions:
| | | | | | | | | | | | | | | | | | |
| Proceeds from sale of shares | | | | | 44,073,792 | | | | 49,004,958 | | | | 76,525,555 | | | | 80,971,882 | |
| Reinvestment of distributions | | | | | 17,980,653 | | | | 13,525,948 | | | | 33,537,838 | | | | 15,389,487 | |
| Value of shares redeemed | | | | | (42,806,803 | ) | | | (56,770,733 | ) | | | (64,879,551 | ) | | | (86,426,952 | ) |
| Net increase from capital share transactions | | | | | 19,247,642 | | | | 5,760,173 | | | | 45,183,842 | | | | 9,934,417 | |
| Total increase in net assets | | | | | 19,168,010 | | | | 11,251,584 | | | | 47,808,454 | | | | 36,973,960 | |
| NET ASSETS at beginning of year | | | | | 292,287,250 | | | | 281,035,666 | | | | 549,966,053 | | | | 512,992,093 | |
| NET ASSETS at end of year | | | | $ | 311,455,260 | | | $ | 292,287,250 | | | $ | 597,774,507 | | | $ | 549,966,053 | |
| Undistributed net investment income included in net assets at end of year | | | | $ | 101,694 | | | $ | 483,907 | | | $ | 44,495 | | | $ | 3,978 | |
SHARE TRANSACTIONS:
| | | | | | | | | | | | | | | | | | |
| Number of shares sold | | | | | 1,730,816 | | | | 1,981,367 | | | | 3,011,108 | | | | 3,385,419 | |
| Number of shares issued through reinvestment of dividends and distributions | | | | | 729,734 | | | | 547,831 | | | | 1,364,436 | | | | 629,684 | |
| Number of shares redeemed | | | | | (1,682,939 | ) | | | (2,296,701 | ) | | | (2,557,487 | ) | | | (3,628,028 | ) |
| Net increase in shares outstanding | | | | | 777,611 | | | | 232,497 | | | | 1,818,057 | | | | 387,075 | |
See Notes to Financial Statements.
116
VANTAGEPOINT FUNDS
Statements of Changes in Net Assets
| | | | Model Portfolio Funds
| |
|---|
| | | | Traditional Growth
| | Long-Term Growth
| |
|---|
| | | | For the
Year Ended
December 31,
2007
| | For the
Year Ended
December 31,
2006
| | For the
Year Ended
December 31,
2007
| | For the
Year Ended
December 31,
2006
|
|---|
Increase (decrease) in net assets resulting from operations:
| | | | | | | | | | | | | | | | | | |
| Net investment income | | | | $ | 31,735,780 | | | $ | 25,961,801 | | | $ | 25,135,912 | | | $ | 19,963,964 | |
| Net realized gain on sale of investments | | | | | 128,230,531 | | | | 39,372,407 | | | | 174,786,280 | | | | 37,610,163 | |
Net change in unrealized appreciation (depreciation)
of investments | | | | | (65,549,999 | ) | | | 57,451,792 | | | | (84,781,758 | ) | | | 101,272,365 | |
| Net increase in net assets resulting from operations | | | | | 94,416,312 | | | | 122,786,000 | | | | 115,140,434 | | | | 158,846,492 | |
Distributions to shareholders from:
| | | | | | | | | | | | | | | | | | |
| Net investment income | | | | | (31,904,876 | ) | | | (27,189,258 | ) | | | (27,195,141 | ) | | | (18,812,941 | ) |
| Net realized gain on investments | | | | | (78,249,189 | ) | | | (1,688,035 | ) | | | (112,388,266 | ) | | | (2,925,344 | ) |
| Total distributions | | | | | (110,154,065 | ) | | | (28,877,293 | ) | | | (139,583,407 | ) | | | (21,738,285 | ) |
Capital share transactions:
| | | | | | | | | | | | | | | | | | |
| Proceeds from sale of shares | | | | | 192,418,417 | | | | 200,335,145 | | | | 225,914,615 | | | | 237,998,696 | |
| Reinvestment of distributions | | | | | 110,148,863 | | | | 28,875,836 | | | | 139,583,407 | | | | 21,738,285 | |
| Value of shares redeemed | | | | | (130,617,054 | ) | | | (127,778,931 | ) | | | (133,985,865 | ) | | | (135,256,272 | ) |
| Net increase from capital share transactions | | | | | 171,950,226 | | | | 101,432,050 | | | | 231,512,157 | | | | 124,480,709 | |
| Total increase in net assets | | | | | 156,212,473 | | | | 195,340,757 | | | | 207,069,184 | | | | 261,588,916 | |
| NET ASSETS at beginning of year | | | | | 1,331,011,832 | | | | 1,135,671,075 | | | | 1,470,918,217 | | | | 1,209,329,301 | |
| NET ASSETS at end of year | | | | $ | 1,487,224,305 | | | $ | 1,331,011,832 | | | $ | 1,677,987,401 | | | $ | 1,470,918,217 | |
| Undistributed net investment income included in net assets at end of year | | | | $ | 217,202 | | | $ | 386,298 | | | $ | 258,092 | | | $ | 2,317,321 | |
SHARE TRANSACTIONS:
| | | | | | | | | | | | | | | | | | |
| Number of shares sold | | | | | 7,571,413 | | | | 8,606,450 | | | | 8,702,424 | | | | 10,290,493 | |
| Number of shares issued through reinvestment of dividends and distributions | | | | | 4,581,900 | | | | 1,193,710 | | | | 5,746,538 | | | | 888,728 | |
| Number of shares redeemed | | | | | (5,157,061 | ) | | | (5,501,760 | ) | | | (5,173,421 | ) | | | (5,870,485 | ) |
| Net increase in shares outstanding | | | | | 6,996,252 | | | | 4,298,400 | | | | 9,275,541 | | | | 5,308,736 | |
See Notes to Financial Statements.
117
VANTAGEPOINT FUNDS
Statements of Changes in Net Assets
| | | | Model Portfolio Funds
| |
|---|
| | | | All-Equity Growth
| |
|---|
| | | | For the
Year Ended
December 31,
2007
| | For the
Year Ended
December 31,
2006
|
|---|
Increase (decrease) in net assets resulting from operations:
| | | | | | | | | | |
| Net investment income | | | | $ | 4,514,020 | | | $ | 2,705,483 | |
| Net realized gain on sale of investments | | | | | 89,807,469 | | | | 20,680,782 | |
| Net change in unrealized appreciation (depreciation) of investments | | | | | (57,178,320 | ) | | | 30,238,481 | |
| Net increase in net assets resulting from operations | | | | | 37,143,169 | | | | 53,624,746 | |
Distributions to shareholders from:
| | | | | | | | | | |
| Net investment income | | | | | (4,486,315 | ) | | | (3,415,483 | ) |
| Net realized gain on investments | | | | | (65,413,447 | ) | | | (4,151,373 | ) |
| Total distributions | | | | | (69,899,762 | ) | | | (7,566,856 | ) |
Capital share transactions:
| | | | | | | | | | |
| Proceeds from sale of shares | | | | | 136,632,905 | | | | 150,738,246 | |
| Reinvestment of distributions | | | | | 69,899,761 | | | | 7,566,856 | |
| Value of shares redeemed | | | | | (46,690,300 | ) | | | (37,450,476 | ) |
| Net increase from capital share transactions | | | | | 159,842,366 | | | | 120,854,626 | |
| Total increase in net assets | | | | | 127,085,773 | | | | 166,912,516 | |
| NET ASSETS at beginning of year | | | | | 470,887,627 | | | | 303,975,111 | |
| NET ASSETS at end of year | | | | $ | 597,973,400 | | | $ | 470,887,627 | |
| Undistributed net investment income included in net assets at end of year | | | | $ | 27,705 | | | $ | — | |
SHARE TRANSACTIONS:
| | | | | | | | | | |
| Number of shares sold | | | | | 4,944,497 | | | | 6,217,305 | |
| Number of shares issued through reinvestment of dividends and distributions | | | | | 2,828,805 | | | | 294,087 | |
| Number of shares redeemed | | | | | (1,687,941 | ) | | | (1,554,344 | ) |
| Net increase in shares outstanding | | | | | 6,085,361 | | | | 4,957,048 | |
See Notes to Financial Statements.
118
VANTAGEPOINT FUNDS
Statements of Changes in Net Assets
| | | | Milestone Funds
| |
|---|
| | | | Milestone Retirement Income
| | Milestone 2010
| |
|---|
| | | | For the
Year Ended
December 31,
2007
| | For the
Year Ended
December 31,
2006
| | For the
Year Ended
December 31,
2007
| | For the
Year Ended
December 31,
2006
|
|---|
Increase (decrease) in net assets resulting from operations:
| | | | | | | | | | | | | | | | | | |
| Net investment income | | | | $ | 1,447,706 | | | $ | 583,056 | | | $ | 1,862,328 | | | $ | 1,041,655 | |
| Net realized gain on sale of investments | | | | | 2,193,012 | | | | 464,609 | | | | 4,477,190 | | | | 1,380,973 | |
Net change in unrealized appreciation (depreciation)
of investments | | | | | (1,437,303 | ) | | | 264,323 | | | | (2,775,104 | ) | | | 867,832 | |
| Net increase in net assets resulting from operations | | | | | 2,203,415 | | | | 1,311,988 | | | | 3,564,414 | | | | 3,290,460 | |
Distributions to shareholders from:
| | | | | | | | | | | | | | | | | | |
| Net investment income | | | | | (1,429,070 | ) | | | (594,424 | ) | | | (1,852,719 | ) | | | (1,062,637 | ) |
| Net realized gain on investments | | | | | (1,172,527 | ) | | | (223,180 | ) | | | (3,605,712 | ) | | | (438,462 | ) |
| Total distributions | | | | | (2,601,597 | ) | | | (817,604 | ) | | | (5,458,431 | ) | | | (1,501,099 | ) |
Capital share transactions:
| | | | | | | | | | | | | | | | | | |
| Proceeds from sale of shares | | | | | 48,311,777 | | | | 15,200,938 | | | | 35,634,712 | | | | 27,626,782 | |
| Reinvestment of distributions | | | | | 2,601,597 | | | | 817,604 | | | | 5,458,431 | | | | 1,501,099 | |
| Value of shares redeemed | | | | | (18,477,038 | ) | | | (7,124,863 | ) | | | (17,279,834 | ) | | | (9,072,124 | ) |
| Net increase from capital share transactions | | | | | 32,436,336 | | | | 8,893,679 | | | | 23,813,309 | | | | 20,055,757 | |
| Total increase in net assets | | | | | 32,038,154 | | | | 9,388,063 | | | | 21,919,292 | | | | 21,845,118 | |
| NET ASSETS at beginning of year | | | | | 22,534,364 | | | | 13,146,301 | | | | 48,483,217 | | | | 26,638,099 | |
| NET ASSETS at end of year | | | | $ | 54,572,518 | | | $ | 22,534,364 | | | $ | 70,402,509 | | | $ | 48,483,217 | |
| Undistributed net investment income included in net assets at end of year | | | | $ | 24,605 | | | $ | 5,969 | | | $ | 22,948 | | | $ | 13,339 | |
SHARE TRANSACTIONS:
| | | | | | | | | | | | | | | | | | |
| Number of shares sold | | | | | 4,446,191 | | | | 1,455,016 | | | | 3,161,189 | | | | 2,597,257 | |
| Number of shares issued through reinvestment of dividends and distributions | | | | | 245,666 | | | | 77,867 | | | | 513,011 | | | | 138,478 | |
| Number of shares redeemed | | | | | (1,692,800 | ) | | | (684,330 | ) | | | (1,528,708 | ) | | | (860,960 | ) |
| Net increase in shares outstanding | | | | | 2,999,057 | | | | 848,553 | | | | 2,145,492 | | | | 1,874,775 | |
See Notes to Financial Statements.
119
VANTAGEPOINT FUNDS
Statements of Changes in Net Assets
| | | | Milestone Funds
| |
|---|
| | | | Milestone 2015
| | Milestone 2020
| |
|---|
| | | | For the
Year Ended
December 31,
2007
| | For the
Year Ended
December 31,
2006
| | For the
Year Ended
December 31,
2007
| | For the
Year Ended
December 31,
2006
|
|---|
Increase (decrease) in net assets resulting from operations:
| | | | | | | | | | | | | | | | | | |
| Net investment income | | | | $ | 2,863,776 | | | $ | 1,458,957 | | | $ | 2,052,210 | | | $ | 936,197 | |
| Net realized gain on sale of investments | | | | | 10,072,209 | | | | 2,807,295 | | | | 9,066,273 | | | | 2,146,074 | |
Net change in unrealized appreciation (depreciation)
of investments | | | | | (6,233,099 | ) | | | 2,235,772 | | | | (5,582,812 | ) | | | 2,118,890 | |
| Net increase in net assets resulting from operations | | | | | 6,702,886 | | | | 6,502,024 | | | | 5,535,671 | | | | 5,201,161 | |
Distributions to shareholders from:
| | | | | | | | | | | | | | | | | | |
| Net investment income | | | | | (2,848,960 | ) | | | (1,493,654 | ) | | | (2,039,159 | ) | | | (962,204 | ) |
| Net realized gain on investments | | | | | (7,814,541 | ) | | | (554,181 | ) | | | (6,683,034 | ) | | | (253,397 | ) |
| Total distributions | | | | | (10,663,501 | ) | | | (2,047,835 | ) | | | (8,722,193 | ) | | | (1,215,601 | ) |
Capital share transactions:
| | | | | | | | | | | | | | | | | | |
| Proceeds from sale of shares | | | | | 60,956,155 | | | | 46,077,012 | | | | 56,150,529 | | | | 35,500,775 | |
| Reinvestment of distributions | | | | | 10,663,501 | | | | 2,047,835 | | | | 8,722,193 | | | | 1,215,601 | |
| Value of shares redeemed | | | | | (13,481,653 | ) | | | (9,676,643 | ) | | | (12,023,958 | ) | | | (5,539,787 | ) |
| Net increase from capital share transactions | | | | | 58,138,003 | | | | 38,448,204 | | | | 52,848,764 | | | | 31,176,589 | |
| Total increase in net assets | | | | | 54,177,388 | | | | 42,902,393 | | | | 49,662,242 | | | | 35,162,149 | |
| NET ASSETS at beginning of year | | | | | 84,357,452 | | | | 41,455,059 | | | | 62,401,743 | | | | 27,239,594 | |
| NET ASSETS at end of year | | | | $ | 138,534,840 | | | $ | 84,357,452 | | | $ | 112,063,985 | | | $ | 62,401,743 | |
| Undistributed net investment income included in net assets at end of year | | | | $ | 32,456 | | | $ | 17,640 | | | $ | 23,503 | | | $ | 10,452 | |
SHARE TRANSACTIONS:
| | | | | | | | | | | | | | | | | | |
| Number of shares sold | | | | | 5,159,021 | | | | 4,216,756 | | | | 4,659,932 | | | | 3,225,773 | |
| Number of shares issued through reinvestment of dividends and distributions | | | | | 958,086 | | | | 181,867 | | | | 765,776 | | | | 105,889 | |
| Number of shares redeemed | | | | | (1,142,641 | ) | | | (897,814 | ) | | | (991,037 | ) | | | (509,581 | ) |
| Net increase in shares outstanding | | | | | 4,974,466 | | | | 3,500,809 | | | | 4,434,671 | | | | 2,822,081 | |
See Notes to Financial Statements.
120
VANTAGEPOINT FUNDS
Statements of Changes in Net Assets
| | | | Milestone Funds
| |
|---|
| | | | Milestone 2025
| | Milestone 2030
| |
|---|
| | | | For the
Year Ended
December 31,
2007
| | For the
Year Ended
December 31,
2006
| | For the
Year Ended
December 31,
2007
| | For the
Year Ended
December 31,
2006
|
|---|
Increase (decrease) in net assets resulting from operations:
| | | | | | | | | | | | | | | | | | |
| Net investment income | | | | $ | 1,360,961 | | | $ | 641,855 | | | $ | 891,629 | | | $ | 308,645 | |
| Net realized gain on sale of investments | | | | | 7,377,183 | | | | 1,836,744 | | | | 5,846,112 | | | | 1,062,133 | |
Net change in unrealized appreciation (depreciation)
of investments | | | | | (4,798,841 | ) | | | 1,675,287 | | | | (3,748,429 | ) | | | 962,707 | |
| Net increase in net assets resulting from operations | | | | | 3,939,303 | | | | 4,153,886 | | | | 2,989,312 | | | | 2,333,485 | |
Distributions to shareholders from:
| | | | | | | | | | | | | | | | | | |
| Net investment income | | | | | (1,351,918 | ) | | | (663,029 | ) | | | (885,927 | ) | | | (319,455 | ) |
| Net realized gain on investments | | | | | (5,365,413 | ) | | | (161,951 | ) | | | (3,816,978 | ) | | | (101,504 | ) |
| Total distributions | | | | | (6,717,331 | ) | | | (824,980 | ) | | | (4,702,905 | ) | | | (420,959 | ) |
Capital share transactions:
| | | | | | | | | | | | | | | | | | |
| Proceeds from sale of shares | | | | | 37,087,137 | | | | 28,399,132 | | | | 37,953,626 | | | | 15,463,412 | |
| Reinvestment of distributions | | | | | 6,717,331 | | | | 824,980 | | | | 4,702,905 | | | | 420,959 | |
| Value of shares redeemed | | | | | (5,938,654 | ) | | | (3,227,959 | ) | | | (5,485,151 | ) | | | (1,843,608 | ) |
| Net increase from capital share transactions | | | | | 37,865,814 | | | | 25,996,153 | | | | 37,171,380 | | | | 14,040,763 | |
| Total increase in net assets | | | | | 35,087,786 | | | | 29,325,059 | | | | 35,457,787 | | | | 15,953,289 | |
| NET ASSETS at beginning of year | | | | | 48,803,703 | | | | 19,478,644 | | | | 26,007,162 | | | | 10,053,873 | |
| NET ASSETS at end of year | | | | $ | 83,891,489 | | | $ | 48,803,703 | | | $ | 61,464,949 | | | $ | 26,007,162 | |
| Undistributed net investment income included in net assets at end of year | | | | $ | 15,461 | | | $ | 6,418 | | | $ | 8,215 | | | $ | 2,513 | |
SHARE TRANSACTIONS:
| | | | | | | | | | | | | | | | | | |
| Number of shares sold | | | | | 2,999,931 | | | | 2,545,854 | | | | 3,082,748 | | | | 1,375,019 | |
| Number of shares issued through reinvestment of dividends and distributions | | | | | 580,582 | | | | 70,632 | | | | 399,228 | | | | 35,614 | |
| Number of shares redeemed | | | | | (480,640 | ) | | | (295,889 | ) | | | (441,895 | ) | | | (165,444 | ) |
| Net increase in shares outstanding | | | | | 3,099,873 | | | | 2,320,597 | | | | 3,040,081 | | | | 1,245,189 | |
See Notes to Financial Statements.
121
VANTAGEPOINT FUNDS
Statements of Changes in Net Assets
| | | | Milestone Funds
| |
|---|
| | | | Milestone 2035
| | Milestone 2040
| |
|---|
| | | | For the
Year Ended
December 31,
2007
| | For the
Year Ended
December 31,
2006
| | For the
Year Ended
December 31,
2007
| | For the
Year Ended
December 31,
2006
|
|---|
Increase (decrease) in net assets resulting from operations:
| | | | | | | | | | | | | | | | | | |
| Net investment income | | | | $ | 462,775 | | | $ | 171,247 | | | $ | 422,951 | | | $ | 124,296 | |
| Net realized gain on sale of investments | | | | | 3,430,667 | | | | 793,198 | | | | 3,230,014 | | | | 693,116 | |
Net change in unrealized appreciation (depreciation)
of investments | | | | | (2,532,444 | ) | | | 484,749 | | | | (2,532,853 | ) | | | 173,566 | |
| Net increase in net assets resulting from operations | | | | | 1,360,998 | | | | 1,449,194 | | | | 1,120,112 | | | | 990,978 | |
Distributions to shareholders from:
| | | | | | | | | | | | | | | | | | |
| Net investment income | | | | | (459,930 | ) | | | (177,152 | ) | | | (419,577 | ) | | | (129,029 | ) |
| Net realized gain on investments | | | | | (2,293,591 | ) | | | (96,606 | ) | | | (1,940,328 | ) | | | (154,958 | ) |
| Total distributions | | | | | (2,753,521 | ) | | | (273,758 | ) | | | (2,359,905 | ) | | | (283,987 | ) |
Capital share transactions:
| | | | | | | | | | | | | | | | | | |
| Proceeds from sale of shares | | | | | 20,109,689 | | | | 12,739,277 | | | | 24,450,383 | | | | 11,313,832 | |
| Reinvestment of distributions | | | | | 2,753,521 | | | | 273,758 | | | | 2,359,905 | | | | 283,987 | |
| Value of shares redeemed | | | | | (3,057,592 | ) | | | (2,228,677 | ) | | | (5,388,330 | ) | | | (2,692,034 | ) |
| Net increase from capital share transactions | | | | | 19,805,618 | | | | 10,784,358 | | | | 21,421,958 | | | | 8,905,785 | |
| Total increase in net assets | | | | | 18,413,095 | | | | 11,959,794 | | | | 20,182,165 | | | | 9,612,776 | |
| NET ASSETS at beginning of year | | | | | 16,417,611 | | | | 4,457,817 | | | | 12,699,481 | | | | 3,086,705 | |
| NET ASSETS at end of year | | | | $ | 34,830,706 | | | $ | 16,417,611 | | | $ | 32,881,646 | | | $ | 12,699,481 | |
| Undistributed net investment loss (income) included in net assets at end of year | | | | $ | 4,123 | | | $ | 1,278 | | | $ | 4,011 | | | $ | 637 | |
SHARE TRANSACTIONS:
| | | | | | | | | | | | | | | | | | |
| Number of shares sold | | | | | 1,584,822 | | | | 1,126,872 | | | | 1,932,647 | | | | 992,876 | |
| Number of shares issued through reinvestment of dividends and distributions | | | | | 232,365 | | | | 22,967 | | | | 198,813 | | | | 23,986 | |
| Number of shares redeemed | | | | | (242,203 | ) | | | (196,701 | ) | | | (422,206 | ) | | | (239,464 | ) |
| Net increase (decrease) in shares outstanding | | | | | 1,574,984 | | | | 953,138 | | | | 1,709,254 | | | | 777,398 | |
See Notes to Financial Statements.
122
VANTAGEPOINT FUNDS
Financial Highlights
(For a share outstanding throughout each period)
| | | | Money Market
| |
|---|
| | | | For the Year Ended December 31, | |
|---|
| | | | 2007
| | 2006
| | 2005
| | 2004
| | 2003
|
|---|
Net Asset Value, beginning of period | | | | $ | 1.00 | | | $ | 1.00 | | | $ | 1.00 | | | $ | 1.00 | | | $ | 1.00 | |
Income from investment operations:
| | | | | | | | | | | | | | | | | | | | | | |
| Net investment income | | | | | 0.05 | | | | 0.04 | | | | 0.03 | | | | 0.01 | | | | 0.01 | |
| Net realized and unrealized gain on investments | | | | | — | | | | (0.00 | )* | | | — | | | | — | | | | — | |
Total from investment operations | | | | | 0.05 | | | | 0.04 | | | | 0.03 | | | | 0.01 | | | | 0.01 | |
Less distributions:
| | | | | | | | | | | | | | | | | | | | | | |
| From net investment income | | | | | (0.05 | ) | | | (0.04 | ) | | | (0.03 | ) | | | (0.01 | ) | | | (0.01 | ) |
| From net realized gains | | | | | — | | | | (0.00 | )* | | | — | | | | — | | | | — | |
Total distributions | | | | | (0.05 | ) | | | (0.04 | ) | | | (0.03 | ) | | | (0.01 | ) | | | (0.01 | ) |
Net Asset Value, end of year | | | | $ | 1.00 | | | $ | 1.00 | | | $ | 1.00 | | | $ | 1.00 | | | $ | 1.00 | |
| Total return | | | | | 4.75 | % | | | 4.51 | % | | | 2.70 | % | | | 0.82 | % | | | 0.60 | % |
Ratios/Supplemental data:
| | | | | | | | | | | | | | | | | | | | | | |
| Net assets, end of year (000) | | | | $ | 306,799 | | | $ | 217,771 | | | $ | 142,979 | | | $ | 116,449 | | | $ | 105,762 | |
Ratios to average net assets:
| | | | | | | | | | | | | | | | | | | | | | |
| Ratio of expenses to average net assets | | | | | 0.51 | % | | | 0.52 | % | | | 0.52 | % | | | 0.52 | % | | | 0.52 | % |
| Ratio of net investment income to average net assets | | | | | 4.64 | % | | | 4.47 | % | | | 2.70 | % | | | 0.84 | % | | | 0.60 | % |
| Portfolio turnover | | | | | N/A | | | | N/A | | | | N/A | | | | N/A | | | | N/A | |
| * | | Rounds to less than $0.01 |
See Notes to Financial Statements.
123
VANTAGEPOINT FUNDS
Financial Highlights
(For a share outstanding throughout each period)
| | | | Low Duration Bond(1)
| |
|---|
| | | | For the Year Ended December 31, | |
|---|
| | | | 2007
| | 2006
| | 2005(a)
| | 2004(a)
| | 2003(a)
|
|---|
Net Asset Value, beginning of period | | | | $ | 9.76 | | | $ | 9.79 | | | $ | 9.98 | | | $ | 10.00 | | | $ | 10.00 | |
Income from investment operations:
| | | | | | | | | | | | | | | | | | | | | | |
| Net investment income | | | | | 0.41 | | | | 0.37 | | | | 0.30 | | | | 0.12 | | | | 0.35 | |
| Net realized and unrealized gain (loss) on investments, futures contracts, foreign currency transactions, wrappers agreements, written options and swaps | | | | | 0.09 | | | | 0.01 | | | | (0.18 | ) | | | 0.24 | | | | 0.00 | * |
Total from investment operations | | | | | 0.50 | | | | 0.38 | | | | 0.12 | | | | 0.36 | | | | 0.35 | |
Less distributions:
| | | | | | | | | | | | | | | | | | | | | | |
| From net investment income | | | | | (0.43 | ) | | | (0.38 | ) | | | (0.31 | ) | | | (0.20 | ) | | | (0.33 | ) |
| From net realized gains | | | | | — | | | | — | | | | — | | | | (0.04 | ) | | | (0.01 | ) |
| Reverse stock split (Note 10) | | | | | — | | | | — | | | | — | | | | — | | | | 0.01 | |
| Return of capital | | | | | — | | | | (0.03 | ) | | | — | | | | (0.14 | ) | | | (0.02 | ) |
Total distributions | | | | | (0.43 | ) | | | (0.41 | ) | | | (0.31 | ) | | | (0.38 | ) | | | (0.35 | ) |
Net Asset Value, end of year | | | | $ | 9.83 | | | $ | 9.76 | | | $ | 9.79 | | | $ | 9.98 | | | $ | 10.00 | |
| Total return | | | | | 5.24 | % | | | 3.98 | % | | | 1.27 | % | | | 3.65 | % | | | 3.51 | % |
Ratios/Supplemental data:
| | | | | | | | | | | | | | | | | | | | | | |
| Net assets, end of year (000) | | | | $ | 507,120 | | | $ | 607,673 | | | $ | 543,913 | | | $ | 499,404 | | | $ | 619,964 | |
Ratios to average net assets:
| | | | | | | | | | | | | | | | | | | | | | |
| Ratio of expenses to average net assets | | | | | 0.65 | % | | | 0.65 | % | | | 0.65 | % | | | 0.78 | % | | | 0.82 | % |
| Ratio of net investment income to average net assets | | | | | 4.15 | % | | | 3.82 | % | | | 3.10 | % | | | 1.94 | % | | | 3.42 | % |
| Portfolio turnover | | | | | 149 | % | | | 123 | % | | | 120 | % | | | 273 | % | | | 211 | % |
| * | | Rounds to less than $0.01 |
| (a) | | Per Share amounts were adjusted to reflect a 10 for 1 stock split effective October 28, 2005. |
| (1) | | Formerly Short-Term Bond Fund |
See Notes to Financial Statements.
124
VANTAGEPOINT FUNDS
Financial Highlights
(For a share outstanding throughout each period)
| | | | Inflation Protected Securities(1)
| |
|---|
| | | | For the Year Ended December 31, | |
|---|
| | | | 2007
| | 2006
| | 2005
| | 2004
| | 2003
|
|---|
Net Asset Value, beginning of period | | | | $ | 10.03 | | | $ | 10.12 | | | $ | 10.33 | | | $ | 10.54 | | | $ | 10.76 | |
Income from investment operations:
| | | | | | | | | | | | | | | | | | | | | | |
| Net investment income | | | | | 0.50 | | | | 0.39 | | | | 0.31 | | | | 0.26 | | | | 0.27 | |
| Net realized and unrealized gain (loss) on investments | | | | | 0.43 | | | | (0.06 | ) | | | (0.20 | ) | | | (0.07 | ) | | | (0.10 | ) |
Total from investment operations | | | | | 0.93 | | | | 0.33 | | | | 0.11 | | | | 0.19 | | | | 0.17 | |
Less distributions:
| | | | | | | | | | | | | | | | | | | | | | |
| From net investment income | | | | | (0.50 | ) | | | (0.39 | ) | | | (0.32 | ) | | | (0.27 | ) | | | (0.30 | ) |
| From net realized gains | | | | | — | | | | — | | | | — | | | | (0.13 | ) | | | (0.09 | ) |
| Return of capital | | | | | — | | | | (0.03 | ) | | | — | | | | — | | | | — | |
Total distributions | | | | | (0.50 | ) | | | (0.42 | ) | | | (0.32 | ) | | | (0.40 | ) | | | (0.39 | ) |
Net Asset Value, end of year | | | | $ | 10.46 | | | $ | 10.03 | | | $ | 10.12 | | | $ | 10.33 | | | $ | 10.54 | |
| Total return | | | | | 9.64 | % | | | 3.34 | % | | | 1.05 | % | | | 1.77 | % | | | 1.66 | % |
Ratios/Supplemental data:
| | | | | | | | | | | | | | | | | | | | | | |
| Net assets, end of year (000) | | | | $ | 274,209 | | | $ | 142,540 | | | $ | 151,335 | | | $ | 163,167 | | | $ | 188,546 | |
Ratios to average net assets:
| | | | | | | | | | | | | | | | | | | | | | |
| Ratio of expenses to average net assets | | | | | 0.68 | % | | | 0.60 | % | | | 0.59 | % | | | 0.58 | % | | | 0.61 | % |
| Ratio of net investment income to average net assets | | | | | 4.86 | % | | | 3.85 | % | | | 3.01 | % | | | 2.49 | % | | | 2.57 | % |
| Portfolio turnover | | | | | 174 | % | | | 69 | % | | | 91 | % | | | 205 | % | | | 120 | % |
(1) Formerly US Government Securities Fund
See Notes to Financial Statements.
125
VANTAGEPOINT FUNDS
Financial Highlights
(For a share outstanding throughout each period)
| | | | Asset Allocation
| |
|---|
| | | | For the Year Ended December 31, | |
|---|
| | | | 2007
| | 2006
| | 2005
| | 2004
| | 2003
|
|---|
Net Asset Value, beginning of period | | | | $ | 8.40 | | | $ | 7.51 | | | $ | 7.33 | | | $ | 6.75 | | | $ | 5.49 | |
Income from investment operations:
| | | | | | | | | | | | | | | | | | | | | | |
| Net investment income | | | | | 0.17 | | | | 0.14 | | | | 0.12 | | | | 0.12 | | | | 0.07 | |
| Net realized and unrealized gain (loss) on investments, futures contracts and foreign currency transactions | | | | | 0.36 | | | | 1.03 | | | | 0.22 | | | | 0.59 | | | | 1.35 | |
Total from investment operations | | | | | 0.53 | | | | 1.17 | | | | 0.34 | | | | 0.71 | | | | 1.42 | |
Less distributions:
| | | | | | | | | | | | | | | | | | | | | | |
| From net investment income | | | | | (0.19 | ) | | | (0.14 | ) | | | (0.12 | ) | | | (0.11 | ) | | | (0.16 | ) |
| From net realized gains | | | | | (0.21 | ) | | | (0.14 | ) | | | (0.04 | ) | | | (0.02 | ) | | | — | |
Total distributions | | | | | (0.40 | ) | | | (0.28 | ) | | | (0.16 | ) | | | (0.13 | ) | | | (0.16 | ) |
Net Asset Value, end of year | | | | $ | 8.53 | | | $ | 8.40 | | | $ | 7.51 | | | $ | 7.33 | | | $ | 6.75 | |
| Total return | | | | | 6.25 | % | | | 15.51 | % | | | 4.54 | % | | | 10.62 | % | | | 25.97 | % |
Ratios/Supplemental data:
| | | | | | | | | | | | | | | | | | | | | | |
| Net assets, end of year (000) | | | | $ | 756,329 | | | $ | 768,381 | | | $ | 737,783 | | | $ | 795,534 | | | $ | 784,440 | |
Ratios to average net assets:
| | | | | | | | | | | | | | | | | | | | | | |
| Ratio of expenses to average net assets | | | | | 0.75 | % | | | 0.75 | % | | | 0.75 | % | | | 0.75 | % | | | 0.76 | % |
| Ratio of net investment income to average net assets | | | | | 1.87 | % | | | 1.67 | % | | | 1.48 | % | | | 1.60 | % | | | 1.06 | % |
| Portfolio turnover | | | | | 4 | % | | | 15 | % | | | 9 | % | | | 15 | % | | | 17 | % |
See Notes to Financial Statements.
126
VANTAGEPOINT FUNDS
Financial Highlights
(For a share outstanding throughout each period)
| | | | Equity Income
| |
|---|
| | | | For the Year Ended December 31, | |
|---|
| | | | 2007
| | 2006
| | 2005
| | 2004
| | 2003
|
|---|
Net Asset Value, beginning of period | | | | $ | 9.90 | | | $ | 8.87 | | | $ | 8.95 | | | $ | 7.88 | | | $ | 5.98 | |
Income from investment operations:
| | | | | | | | | | | | | | | | | | | | | | |
| Net investment income | | | | | 0.13 | | | | 0.14 | | | | 0.16 | | | | 0.09 | | | | 0.08 | |
| Net realized and unrealized gain (loss) on investments, futures contracts and foreign currency transactions | | | | | 0.25 | | | | 1.52 | | | | 0.36 | | | | 1.07 | | | | 1.90 | |
Total from investment operations | | | | | 0.38 | | | | 1.66 | | | | 0.52 | | | | 1.16 | | | | 1.98 | |
Less distributions:
| | | | | | | | | | | | | | | | | | | | | | |
| From net investment income | | | | | (0.14 | ) | | | (0.14 | ) | | | (0.16 | ) | | | (0.09 | ) | | | (0.08 | ) |
| From net realized gains | | | | | (0.36 | ) | | | (0.49 | ) | | | (0.44 | ) | | | — | | | | — | |
Total distributions | | | | | (0.50 | ) | | | (0.63 | ) | | | (0.60 | ) | | | (0.09 | ) | | | (0.08 | ) |
Net Asset Value, end of year | | | | $ | 9.78 | | | $ | 9.90 | | | $ | 8.87 | | | $ | 8.95 | | | $ | 7.88 | |
| Total return | | | | | 3.76 | % | | | 18.73 | % | | | 5.76 | % | | | 14.78 | % | | | 33.09 | % |
Ratios/Supplemental data:
| | | | | | | | | | | | | | | | | | | | | | |
| Net assets, end of year (000) | | | | $ | 1,734,750 | | | $ | 1,467,953 | | | $ | 1,260,470 | | | $ | 1,088,207 | | | $ | 824,093 | |
Ratios to average net assets:
| | | | | | | | | | | | | | | | | | | | | | |
| Ratio of expenses to average net assets | | | | | 0.88 | % | | | 0.89 | % | | | 0.89 | % | | | 0.90 | % | | | 0.92 | % |
| Ratio of net investment income to average net assets | | | | | 1.23 | % | | | 1.49 | % | | | 1.78 | % | | | 1.18 | % | | | 1.25 | % |
| Portfolio turnover | | | | | 18 | % | | | 18 | % | | | 16 | % | | | 14 | % | | | 13 | % |
See Notes to Financial Statements.
127
VANTAGEPOINT FUNDS
Financial Highlights
(For a share outstanding throughout each period)
| | | | Growth & Income
| |
|---|
| | | | For the Year Ended December 31, | |
|---|
| | | | 2007
| | 2006
| | 2005
| | 2004
| | 2003
|
|---|
Net Asset Value, beginning of period | | | | $ | 11.49 | | | $ | 10.64 | | | $ | 10.12 | | | $ | 9.38 | | | $ | 7.24 | |
Income from investment operations:
| | | | | | | | | | | | | | | | | | | | | | |
| Net investment income | | | | | 0.12 | | | | 0.10 | | | | 0.09 | | | | 0.09 | | | | 0.06 | |
| Net realized and unrealized gain on investments, futures contracts and foreign currency transactions | | | | | 0.58 | | | | 1.32 | | | | 0.52 | | | | 0.74 | | | | 2.15 | |
Total from investment operations | | | | | 0.70 | | | | 1.42 | | | | 0.61 | | | | 0.83 | | | | 2.21 | |
Less distributions:
| | | | | | | | | | | | | | | | | | | | | | |
| From net investment income | | | | | (0.15 | ) | | | (0.10 | ) | | | (0.09 | ) | | | (0.09 | ) | | | (0.07 | ) |
| From net realized gains | | | | | (1.48 | ) | | | (0.47 | ) | | | — | | | | — | | | | — | |
Total distributions | | | | | (1.63 | ) | | | (0.57 | ) | | | (0.09 | ) | | | (0.09 | ) | | | (0.07 | ) |
Net Asset Value, end of year | | | | $ | 10.56 | | | $ | 11.49 | | | $ | 10.64 | | | $ | 10.12 | | | $ | 9.38 | |
| Total return | | | | | 5.98 | % | | | 13.28 | % | | | 6.02 | % | | | 8.85 | % | | | 30.49 | % |
Ratios/Supplemental data:
| | | | | | | | | | | | | | | | | | | | | | |
| Net assets, end of year (000) | | | | $ | 1,101,700 | | | $ | 1,176,614 | | | $ | 1,016,831 | | | $ | 912,470 | | | $ | 765,115 | |
Ratios to average net assets:
| | | | | | | | | | | | | | | | | | | | | | |
| Ratio of expenses to average net assets | | | | | 0.80 | % | | | 0.81 | % | | | 0.82 | % | | | 0.82 | % | | | 0.83 | % |
| Ratio of net investment income to average net assets | | | | | 0.90 | % | | | 0.90 | % | | | 0.88 | % | | | 0.97 | % | | | 0.86 | % |
| Portfolio turnover | | | | | 41 | % | | | 38 | % | | | 27 | % | | | 22 | % | | | 22 | % |
See Notes to Financial Statements.
128
VANTAGEPOINT FUNDS
Financial Highlights
(For a share outstanding throughout each period)
| | | | Growth
| |
|---|
| | | | For the Year Ended December 31, | |
|---|
| | | | 2007
| | 2006
| | 2005
| | 2004
| | 2003
|
|---|
Net Asset Value, beginning of period | | | | $ | 9.56 | | | $ | 8.70 | | | $ | 8.31 | | | $ | 8.07 | | | $ | 6.27 | |
Income from investment operations:
| | | | | | | | | | | | | | | | | | | | | | |
| Net investment income | | | | | 0.05 | | | | 0.03 | | | | 0.01 | | | | 0.02 | | | | 0.00 | * |
| Net realized and unrealized gain (loss) on investments | | | | | 0.89 | | | | 0.86 | | | | 0.39 | | | | 0.24 | | | | 1.80 | |
Total from investment operations | | | | | 0.94 | | | | 0.89 | | | | 0.40 | | | | 0.26 | | | | 1.80 | |
Less distributions:
| | | | | | | | | | | | | | | | | | | | | | |
| From net investment income | | | | | (0.05 | ) | | | (0.03 | ) | | | (0.01 | ) | | | (0.02 | ) | | | (0.00 | )* |
Total distributions | | | | | (0.05 | ) | | | (0.03 | ) | | | (0.01 | ) | | | (0.02 | ) | | | (0.00 | )* |
Net Asset Value, end of year | | | | $ | 10.45 | | | $ | 9.56 | | | $ | 8.70 | | | $ | 8.31 | | | $ | 8.07 | |
| Total return | | | | | 9.81 | % | | | 10.21 | % | | | 4.86 | % | | | 3.27 | % | | | 28.71 | % |
Ratios/Supplemental data:
| | | | | | | | | | | | | | | | | | | | | | |
| Net assets, end of year (000) | | | | $ | 2,567,845 | | | $ | 2,783,795 | | | $ | 2,816,803 | | | $ | 2,998,469 | | | $ | 2,895,641 | |
Ratios to average net assets:
| | | | | | | | | | | | | | | | | | | | | | |
| Ratio of expenses to average net assets | | | | | 0.87 | % | | | 0.90 | % | | | 0.94 | % | | | 0.95 | % | | | 0.96 | % |
| Ratio of net investment income (loss) to average net assets | | | | | 0.41 | % | | | 0.31 | % | | | 0.11 | % | | | 0.28 | % | | | (0.05 | )% |
| Portfolio turnover | | | | | 50 | % | | | 62 | % | | | 85 | % | | | 49 | % | | | 46 | % |
*Rounds to less than $0.01
See Notes to Financial Statements.
129
VANTAGEPOINT FUNDS
Financial Highlights
(For a share outstanding throughout each period)
| | | | Select Value
|
|---|
| | | | For the Period
from October 30,
2007* to
December 31,
2007
|
|---|
Net Asset Value, beginning of period | | | | $ | 10.00 | |
Income from investment operations:
| | | | | | |
| Net investment income | | | | | 0.04 | |
| Net realized and unrealized loss on investments | | | | | (0.62 | ) |
Total from investment operations | | | | | (0.58 | ) |
Less distributions:
| | | | | | |
| From net investment income | | | | | (0.04 | ) |
Total distributions | | | | | (0.04 | ) |
Net Asset Value, end of period | | | | $ | 9.38 | |
| Total return | | | | | (5.85 | )%†† |
Ratios/Supplemental data:
| | | | | | |
| Net assets, end of period (000) | | | | $ | 294,157 | |
Ratios to average net assets:
| | | | | | |
| Ratio of expenses to average net assets | | | | | 1.04 | %† |
| Ratio of net investment income to average net assets | | | | | 2.06 | %† |
| Portfolio turnover | | | | | 11 | %†† |
| * | | Commencement of operations |
See Notes to Financial Statements.
130
VANTAGEPOINT FUNDS
Financial Highlights
(For a share outstanding throughout each period)
| | | | Aggressive Opportunities
| |
|---|
| | | | For the Year Ended December 31, | |
|---|
| | | | 2007
| | 2006
| | 2005
| | 2004
| | 2003
|
|---|
Net Asset Value, beginning of period | | | | $ | 12.85 | | | $ | 11.63 | | | $ | 10.52 | | | $ | 9.07 | | | $ | 6.27 | |
Income from investment operations:
| | | | | | | | | | | | | | | | | | | | | | |
| Net investment income (loss) | | | | | 0.01 | | | | (0.00 | )* | | | 0.04 | | | | (0.03 | ) | | | (0.00 | )* |
| Net realized and unrealized gain (loss) on investments | | | | | 0.72 | | | | 1.56 | | | | 1.35 | | | | 1.48 | | | | 2.80 | |
Total from investment operations | | | | | 0.73 | | | | 1.56 | | | | 1.39 | | | | 1.45 | | | | 2.80 | |
Less distributions:
| | | | | | | | | | | | | | | | | | | | | | |
| From net investment income | | | | | — | | | | (0.05 | ) | | | (0.28 | ) | | | — | | | | (0.00 | )* |
| In excess of net investment income | | | | | — | | | | — | | | | — | | | | — | | | | (0.00 | )* |
| From net realized gains | | | | | (2.32 | ) | | | (0.29 | ) | | | — | | | | — | | | | — | |
Total distributions | | | | | (2.32 | ) | | | (0.34 | ) | | | (0.28 | ) | | | — | | | | 0.00 | * |
Net Asset Value, end of year | | | | $ | 11.26 | | | $ | 12.85 | | | $ | 11.63 | | | $ | 10.52 | | | $ | 9.07 | |
| Total return | | | | | 5.53 | % | | | 13.36 | % | | | 13.21 | % | | | 15.99 | % | | | 44.68 | % |
Ratios/Supplemental data:
| | | | | | | | | | | | | | | | | | | | | | |
| Net assets, end of year (000) | | | | $ | 1,154,745 | | | $ | 1,366,708 | | | $ | 1,252,413 | | | $ | 1,150,062 | | | $ | 938,791 | |
Ratios to average net assets:
| | | | | | | | | | | | | | | | | | | | | | |
| Ratio of expenses to average net assets | | | | | 1.02 | % | | | 1.04 | % | | | 1.22 | % | | | 1.22 | % | | | 1.23 | % |
| Ratio of net investment income (loss) to average net assets | | | | | 0.08 | % | | | (0.03 | )% | | | 0.31 | % | | | (0.25 | )% | | | (0.13 | )% |
| Portfolio turnover | | | | | 45 | % | | | 88 | % | | | 45 | % | | | 55 | % | | | 75 | % |
| * | | Rounds to less than $0.01 |
See Notes to Financial Statements.
131
VANTAGEPOINT FUNDS
Financial Highlights
(For a share outstanding throughout each period)
| | | | Discovery
|
|---|
| | | | For the Period
from October 30,
2007* to
December 31,
2007
|
|---|
Net Asset Value, beginning of period | | | | $ | 10.00 | |
Income from investment operations:
| | | | | | |
| Net investment income | | | | | 0.03 | |
| Net realized and unrealized loss on investments | | | | | (0.68 | ) |
Total from investment operations | | | | | (0.65 | ) |
Less distributions:
| | | | | | |
| From net investment income | | | | | (0.03 | ) |
| From net realized gains | | | | | (0.07 | ) |
Total distributions | | | | | (0.10 | ) |
Net Asset Value, end of period | | | | $ | 9.25 | |
| Total return | | | | | (6.46 | )%†† |
Ratios/Supplemental data:
| | | | | | |
| Net assets, end of period (000) | | | | $ | 173,510 | |
Ratios to average net assets:
| | | | | | |
| Ratio of expenses to average net assets | | | | | 1.07 | %† |
| Ratio of net investment income to average net assets | | | | | 2.08 | %† |
| Portfolio turnover | | | | | 36 | %†† |
* Commencement of operations
† Annualized
†† Not annualized
See Notes to Financial Statements.
132
VANTAGEPOINT FUNDS
Financial Highlights
(For a share outstanding throughout each period)
| | | | International
| |
|---|
| | | | For the Year Ended December 31, | |
|---|
| | | | 2007
| | 2006
| | 2005
| | 2004
| | 2003
|
|---|
Net Asset Value, beginning of period | | | | $ | 12.57 | | | $ | 11.56 | | | $ | 10.06 | | | $ | 8.84 | | | $ | 6.80 | |
Income from investment operations:
| | | | | | | | | | | | | | | | | | | | | | |
| Net investment income | | | | | 0.18 | | | | 0.16 | | | | 0.11 | | | | 0.08 | | | | 0.06 | |
| Net realized and unrealized gain (loss) on investments | | | | | 1.37 | | | | 2.29 | | | | 1.59 | | | | 1.27 | | | | 2.07 | |
Total from investment operations | | | | | 1.55 | | | | 2.45 | | | | 1.70 | | | | 1.35 | | | | 2.13 | |
Less distributions:
| | | | | | | | | | | | | | | | | | | | | | |
| From net investment income | | | | | (0.21 | ) | | | (0.20 | ) | | | (0.20 | ) | | | (0.13 | ) | | | (0.09 | ) |
| From net realized gains | | | | | (1.72 | ) | | | (1.24 | ) | | | — | | | | — | | | | — | |
| Return of capital | | | | | — | | | | — | | | | — | | | | — | | | | (0.00 | )* |
Total distributions | | | | | (1.93 | ) | | | (1.44 | ) | | | (0.20 | ) | | | (0.13 | ) | | | (0.09 | ) |
Net Asset Value, end of year | | | | $ | 12.19 | | | $ | 12.57 | | | $ | 11.56 | | | $ | 10.06 | | | $ | 8.84 | |
| Total return | | | | | 12.46 | % | | | 21.14 | % | | | 16.88 | % | | | 15.23 | % | | | 31.31 | % |
Ratios/Supplemental data:
| | | | | | | | | | | | | | | | | | | | | | |
| Net assets, end of year (000) | | | | $ | 1,145,029 | | | $ | 1,049,831 | | | $ | 722,161 | | | $ | 604,809 | | | $ | 471,495 | |
Ratios to average net assets:
| | | | | | | | | | | | | | | | | | | | | | |
| Ratio of expenses to average net assets | | | | | 1.10 | % | | | 1.11 | % | | | 1.17 | % | | | 1.17 | % | | | 1.22 | % |
| Ratio of net investment income to average net assets | | | | | 1.15 | % | | | 1.08 | % | | | 1.06 | % | | | 0.83 | % | | | 0.93 | % |
| Portfolio turnover | | | | | 60 | % | | | 65 | % | | | 42 | % | | | 40 | % | | | 38 | % |
| * | | Rounds to less than $0.01
|
See Notes to Financial Statements.
133
VANTAGEPOINT FUNDS
Financial Highlights
(For a share outstanding throughout each period)
| | | | Diversified Assets
|
|---|
| | | | For the Period
from October 30,
2007* to
December 31,
2007
|
|---|
Net Asset Value, beginning of period | | | | $ | 10.00 | |
Income from investment operations:
| | | | | | |
| Net investment income | | | | | 0.06 | |
Net realized and unrealized (loss) on investments, futures contracts,
foreign currency transactions, written options and swaps | | | | | (0.07 | ) |
Total from investment operations | | | | | (0.01 | ) |
Less distributions:
| | | | | | |
| From net investment income | | | | | (0.04 | ) |
Total distributions | | | | | (0.04 | ) |
Net Asset Value, end of period | | | | $ | 9.95 | |
| Total return | | | | | (0.07 | )%†† |
Ratios/Supplemental data:
| | | | | | |
| Net assets, end of period (000) | | | | $ | 465,175 | |
Ratios to average net assets:
| | | | | | |
| Ratio of expenses to average net assets | | | | | 1.01 | %† |
| Ratio of net investment income to average net assets | | | | | 3.53 | %† |
| Portfolio turnover | | | | | 16 | %†† |
| * | | Commencement of operations |
See Notes to Financial Statements.
134
VANTAGEPOINT FUNDS
Financial Highlights
(For a share outstanding throughout each period)
| | | | Core Bond Index Class I
| |
|---|
| | | | For the Year Ended December 31, | |
|---|
| | | | 2007
| | 2006
| | 2005(a)
| | 2004(a)
| | 2003
|
|---|
Net Asset Value, beginning of period | | | | $ | 9.75 | | | $ | 9.90 | | | $ | 10.17 | | | $ | 10.27 | | | $ | 10.46 | |
Income from investment operations:
| | | | | | | | | | | | | | | | | | | | | | |
| Net investment income | | | | | 0.47 | | | | 0.44 | | | | 0.41 | | | | 0.40 | | | | 0.40 | |
| Net realized and unrealized gain (loss) on investments | | | | | 0.15 | | | | (0.08 | ) | | | (0.21 | ) | | | 0.01 | | | | (0.04 | ) |
Total from investment operations | | | | | 0.62 | | | | 0.36 | | | | 0.20 | | | | 0.41 | | | | 0.36 | |
Less distributions:
| | | | | | | | | | | | | | | | | | | | | | |
| From net investment income | | | | | (0.50 | ) | | | (0.47 | ) | | | (0.47 | ) | | | (0.47 | ) | | | (0.49 | ) |
| From net realized gains | | | | | 0.00 | | | | 0.00 | | | | 0.00 | | | | (0.04 | ) | | | (0.06 | ) |
| Return of capital | | | | | 0.00 | | | | (0.04 | ) | | | 0.00 | | | | 0.00 | | | | — | |
Total distributions | | | | | (0.50 | ) | | | (0.51 | ) | | | (0.47 | ) | | | (0.51 | ) | | | (0.55 | ) |
Net Asset Value, end of year | | | | $ | 9.87 | | | $ | 9.75 | | | $ | 9.90 | | | $ | 10.17 | | | $ | 10.27 | |
| Total return | | | | | 6.52 | % | | | 3.82 | % | | | 1.98 | % | | | 3.94 | % | | | 3.59 | % |
Ratios/Supplemental data:
| | | | | | | | | | | | | | | | | | | | | | |
| Net assets, end of year (000) | | | | $ | 888,541 | | | $ | 988,984 | | | $ | 865,929 | | | $ | 764,674 | | | $ | 452,739 | |
Ratios to average net assets:
| | | | | | | | | | | | | | | | | | | | | | |
| Ratio of expenses to average net assets | | | | | 0.44 | % | | | 0.44 | % | | | 0.45 | % | | | 0.45 | % | | | 0.48 | %* |
| Ratio of net investment income to average net assets | | | | | 4.71 | % | | | 4.50 | % | | | 4.03 | % | | | 3.96 | % | | | 3.85 | % |
| Portfolio turnover | | | | | 76 | % | | | 28 | % | | | 31 | % | | | 31 | %** | | | N/A | |
| * | | Includes effect of expenses allocated from Master Investment Portfolio. |
| ** | | Portfolio turnover figure represents the period from March 5, 2004 to December 31, 2004. Prior to March 5, 2004, portfolio turnover was calculated at the Master Investment Portfolio level. |
| (a) | | Per share amounts were calculated using the average shares outstanding method. |
See Notes to Financial Statements.
135
VANTAGEPOINT FUNDS
Financial Highlights
(For a share outstanding throughout each period)
| | | | Core Bond Index Class II
| |
|---|
| | | | For the Year Ended December 31, | |
|---|
| | | | 2007
| | 2006
| | 2005(a)
| | 2004(a)
| | 2003
|
|---|
Net Asset Value, beginning of period | | | | $ | 9.80 | | | $ | 9.94 | | | $ | 10.21 | | | $ | 10.31 | | | $ | 10.49 | |
Income from investment operations:
| | | | | | | | | | | | | | | | | | | | | | |
| Net investment income | | | | | 0.49 | | | | 0.46 | | | | 0.43 | | | | 0.43 | | | | 0.42 | |
| Net realized and unrealized gain (loss) on investments | | | | | 0.15 | | | | (0.07 | ) | | | (0.21 | ) | | | — | | | | (0.02 | ) |
Total from investment operations | | | | | 0.64 | | | | 0.39 | | | | 0.22 | | | | 0.43 | | | | 0.40 | |
Less distributions:
| | | | | | | | | | | | | | | | | | | | | | |
| From net investment income | | | | | (0.52 | ) | | | (0.49 | ) | | | (0.49 | ) | | | (0.49 | ) | | | (0.52 | ) |
| From net realized gains | | | | | — | | | | — | | | | — | | | | (0.04 | ) | | | (0.06 | ) |
| Return of capital | | | | | — | | | | (0.04 | ) | | | — | | | | — | | | | — | |
Total distributions | | | | | (0.52 | ) | | | (0.53 | ) | | | (0.49 | ) | | | (0.53 | ) | | | (0.58 | ) |
Net Asset Value, end of year | | | | $ | 9.92 | | | $ | 9.80 | | | $ | 9.94 | | | $ | 10.21 | | | $ | 10.31 | |
| Total return | | | | | 6.71 | % | | | 4.11 | % | | | 2.17 | % | | | 4.22 | % | | | 3.88 | % |
Ratios/Supplemental data:
| | | | | | | | | | | | | | | | | | | | | | |
| Net assets, end of year (000) | | | | $ | 201,573 | | | $ | 170,987 | | | $ | 165,467 | | | $ | 168,010 | | | $ | 138,655 | |
Ratios to average net assets:
| | | | | | | | | | | | | | | | | | | | | | |
| Ratio of expenses to average net assets | | | | | 0.24 | % | | | 0.24 | % | | | 0.25 | % | | | 0.25 | % | | | 0.28 | %* |
| Ratio of net investment income to average net assets | | | | | 4.91 | % | | | 4.70 | % | | | 4.23 | % | | | 4.19 | % | | | 4.05 | % |
| Portfolio turnover | | | | | 76 | % | | | 28 | % | | | 31 | % | | | 31 | %** | | | N/A | |
| * | | Includes effect of expenses allocated from Master Investment Portfolio. |
| ** | | Portfolio turnover figure represents the period from March 5, 2004 to December 31, 2004. Prior to March 5, 2004, portfolio turnover was calculated at the Master Investment Portfolio level. |
| (a) | | Per share amounts were calculated using the average shares outstanding method. |
See Notes to Financial Statements.
136
VANTAGEPOINT FUNDS
Financial Highlights
(For a share outstanding throughout each period)
| | | | 500 Stock Index Class I
| |
|---|
| | | | For the Year Ended December 31, | |
|---|
| | | | 2007
| | 2006
| | 2005
| | 2004(a)
| | 2003
|
|---|
Net Asset Value, beginning of period | | | | $ | 11.23 | | | $ | 9.87 | | | $ | 9.58 | | | $ | 8.79 | | | $ | 6.94 | |
Income from investment operations:
| | | | | | | | | | | | | | | | | | | | | | |
| Net investment income | | | | | 0.22 | | | | 0.18 | | | | 0.15 | | | | 0.14 | | | | 0.09 | |
| Net realized and unrealized gain (loss) on investments, futures contracts and foreign currency transactions | | | | | 0.35 | | | | 1.33 | | | | 0.28 | | | | 0.78 | | | | 1.85 | |
Total from investment operations | | | | | 0.57 | | | | 1.51 | | | | 0.43 | | | | 0.92 | | | | 1.94 | |
Less distributions:
| | | | | | | | | | | | | | | | | | | | | | |
| From net investment income | | | | | (0.17 | ) | | | (0.15 | ) | | | (0.14 | ) | | | (0.13 | ) | | | (0.09 | ) |
Total distributions | | | | | (0.17 | ) | | | (0.15 | ) | | | (0.14 | ) | | | (0.13 | ) | | | (0.09 | ) |
Net Asset Value, end of year | | | | $ | 11.63 | | | $ | 11.23 | | | $ | 9.87 | | | $ | 9.58 | | | $ | 8.79 | |
| Total return | | | | | 5.06 | % | | | 15.27 | % | | | 4.44 | % | | | 10.49 | % | | | 27.98 | % |
Ratios/Supplemental data:
| | | | | | | | | | | | | | | | | | | | | | |
| Net assets, end of year (000) | | | | $ | 95,694 | | | $ | 107,977 | | | $ | 108,030 | | | $ | 115,533 | | | $ | 130,663 | |
Ratios to average net assets:
| | | | | | | | | | | | | | | | | | | | | | |
| Ratio of expenses to average net assets | | | | | 0.45 | % | | | 0.45 | % | | | 0.46 | % | | | 0.46 | % | | | 0.47 | %* |
| Ratio of net investment income to average net assets | | | | | 1.55 | % | | | 1.53 | % | | | 1.42 | % | | | 1.56 | % | | | 1.33 | % |
| Portfolio turnover | | | | | 5 | % | | | 4 | % | | | 5 | % | | | 7 | %** | | | N/A | |
| * | | Includes effect of expenses allocated from Master Investment Portfolio. |
| ** | | Portfolio turnover figure represents the period from March 5, 2004 to December 31, 2004. Prior to March 5, 2004, portfolio turnover was calculated at the Master Investment Portfolio level. |
| (a) | | Per share amounts were calculated using the average shares outstanding method. |
See Notes to Financial Statements.
137
VANTAGEPOINT FUNDS
Financial Highlights
(For a share outstanding throughout each period)
| | | | 500 Stock Index Class II
| |
|---|
| | | | For the Year Ended December 31, | |
|---|
| | | | 2007
| | 2006
| | 2005
| | 2004(a)
| | 2003
|
|---|
Net Asset Value, beginning of period | | | | $ | 10.65 | | | $ | 9.36 | | | $ | 9.10 | | | $ | 8.37 | | | $ | 6.61 | |
Income from investment operations:
| | | | | | | | | | | | | | | | | | | | | | |
| Net investment income | | | | | 0.20 | | | | 0.17 | | | | 0.15 | | | | 0.16 | | | | 0.11 | |
| Net realized and unrealized gain (loss) on investments, futures contracts and foreign currency transactions | | | | | 0.36 | | | | 1.29 | | | | 0.27 | | | | 0.73 | | | | 1.75 | |
Total from investment operations | | | | | 0.56 | | | | 1.46 | | | | 0.42 | | | | 0.89 | | | | 1.86 | |
Less distributions:
| | | | | | | | | | | | | | | | | | | | | | |
| From net investment income | | | | | (0.20 | ) | | | (0.17 | ) | | | (0.16 | ) | | | (0.16 | ) | | | (0.10 | ) |
Total distributions | | | | | (0.20 | ) | | | (0.17 | ) | | | (0.16 | ) | | | (0.16 | ) | | | (0.10 | ) |
Net Asset Value, end of year | | | | $ | 11.01 | | | $ | 10.65 | | | $ | 9.36 | | | $ | 9.10 | | | $ | 8.37 | |
| Total return | | | | | 5.22 | % | | | 15.60 | % | | | 4.57 | % | | | 10.60 | % | | | 28.24 | % |
Ratios/Supplemental data:
| | | | | | | | | | | | | | | | | | | | | | |
| Net assets, end of year (000) | | | | $ | 316,248 | | | $ | 287,392 | | | $ | 241,849 | | | $ | 242,188 | | | $ | 185,901 | |
Ratios to average net assets:
| | | | | | | | | | | | | | | | | | | | | | |
| Ratio of expenses to average net assets | | | | | 0.25 | % | | | 0.25 | % | | | 0.26 | % | | | 0.26 | % | | | 0.27 | %* |
| Ratio of net investment income to average net assets | | | | | 1.75 | % | | | 1.73 | % | | | 1.62 | % | | | 1.84 | % | | | 1.52 | % |
| Portfolio turnover | | | | | 5 | % | | | 4 | % | | | 5 | % | | | 7 | %** | | | N/A | |
| * | | Includes effect of expenses allocated from Master Investment Portfolio. |
| ** | | Portfolio turnover figure represents the period from March 5, 2004 to December 31, 2004. Prior to March 5, 2004, portfolio turnover was calculated at the Master Investment Portfolio level. |
| (a) | | Per share amounts were calculated using the average shares outstanding method. |
See Notes to Financial Statements.
138
VANTAGEPOINT FUNDS
Financial Highlights
(For a share outstanding throughout each period)
| | | | Broad Market Index Class I
| |
|---|
| | | | For the Year Ended December 31, | |
|---|
| | | | 2007
| | 2006
| | 2005
| | 2004(a)
| | 2003
|
|---|
Net Asset Value, beginning of period | | | | $ | 11.81 | | | $ | 10.35 | | | $ | 9.90 | | | $ | 8.95 | | | $ | 6.89 | |
Income from investment operations:
| | | | | | | | | | | | | | | | | | | | | | |
| Net investment income | | | | | 0.26 | | | | 0.22 | | | | 0.17 | | | | 0.13 | | | | 0.08 | |
| Net realized and unrealized gain (loss) on investments, futures contracts and foreign currency transactions | | | | | 0.35 | | | | 1.38 | | | | 0.42 | | | | 0.94 | | | | 2.06 | |
Total from investment operations | | | | | 0.61 | | | | 1.60 | | | | 0.59 | | | | 1.07 | | | | 2.14 | |
Less distributions:
| | | | | | | | | | | | | | | | | | | | | | |
| From net investment income | | | | | (0.17 | ) | | | (0.14 | ) | | | (0.14 | ) | | | (0.12 | ) | | | (0.08 | ) |
Total distributions | | | | | (0.17 | ) | | | (0.14 | ) | | | (0.14 | ) | | | (0.12 | ) | | | (0.08 | ) |
Net Asset Value, end of year | | | | $ | 12.25 | | | $ | 11.81 | | | $ | 10.35 | | | $ | 9.90 | | | $ | 8.95 | |
| Total return | | | | | 5.15 | % | | | 15.46 | % | | | 5.91 | % | | | 11.96 | % | | | 31.08 | % |
Ratios/Supplemental data:
| | | | | | | | | | | | | | | | | | | | | | |
| Net assets, end of year (000) | | | | $ | 170,584 | | | $ | 195,651 | | | $ | 208,588 | | | $ | 224,619 | | | $ | 267,250 | |
Ratios to average net assets:
| | | | | | | | | | | | | | | | | | | | | | |
| Ratio of expenses to average net assets | | | | | 0.44 | % | | | 0.44 | % | | | 0.45 | % | | | 0.44 | % | | | 0.48 | %* |
| Ratio of net investment income to average net assets | | | | | 1.48 | % | | | 1.42 | % | | | 1.37 | % | | | 1.42 | % | | | 1.22 | % |
| Portfolio turnover | | | | | 2 | % | | | 2 | % | | | 2 | % | | | 5 | %** | | | N/A | |
| * | | Includes effect of expenses allocated from Master Investment Portfolio. |
| ** | | Portfolio turnover figure represents the period March 5, 2004 to December 31, 2004. Prior to March 5, 2004, portfolio turnover was calculated at the Master Investment Portfolio level. |
| (a) | | Per share amounts were calculated using the average shares outstanding method. |
See Notes to Financial Statements.
139
VANTAGEPOINT FUNDS
Financial Highlights
(For a share outstanding throughout each period)
| | | | Broad Market Index Class II
| |
|---|
| | | | For the Year Ended December 31, | |
|---|
| | | | 2007
| | 2006
| | 2005
| | 2004(a)
| | 2003
|
|---|
Net Asset Value, beginning of period | | | | $ | 11.17 | | | $ | 9.80 | | | $ | 9.37 | | | $ | 8.49 | | | $ | 6.54 | |
Income from investment operations:
| | | | | | | | | | | | | | | | | | | | | | |
| Net investment income | | | | | 0.20 | | | | 0.17 | | | | 0.15 | | | | 0.15 | | | | 0.10 | |
| Net realized and unrealized gain (loss) on investments, futures contracts and foreign currency transactions | | | | | 0.40 | | | | 1.37 | | | | 0.44 | | | | 0.88 | | | | 1.95 | |
Total from investment operations | | | | | 0.60 | | | | 1.54 | | | | 0.59 | | | | 1.03 | | | | 2.05 | |
Less distributions:
| | | | | | | | | | | | | | | | | | | | | | |
| From net investment income | | | | | (0.20 | ) | | | (0.17 | ) | | | (0.16 | ) | | | (0.15 | ) | | | (0.10 | ) |
Total distributions | | | | | (0.20 | ) | | | (0.17 | ) | | | (0.16 | ) | | | (0.15 | ) | | | (0.10 | ) |
Net Asset Value, end of year | | | | $ | 11.57 | | | $ | 11.17 | | | $ | 9.80 | | | $ | 9.37 | | | $ | 8.49 | |
| Total return | | | | | 5.35 | % | | | 15.68 | % | | | 6.27 | % | | | 12.11 | % | | | 31.30 | % |
Ratios/Supplemental data:
| | | | | | | | | | | | | | | | | | | | | | |
| Net assets, end of year (000) | | | | $ | 484,534 | | | $ | 449,961 | | | $ | 389,843 | | | $ | 374,416 | | | $ | 272,411 | |
Ratios to average net assets:
| | | | | | | | | | | | | | | | | | | | | | |
| Ratio of expenses to average net assets | | | | | 0.24 | % | | | 0.24 | % | | | 0.25 | % | | | 0.24 | % | | | 0.28 | %* |
| Ratio of net investment income to average net assets | | | | | 1.68 | % | | | 1.63 | % | | | 1.52 | % | | | 1.72 | % | | | 1.42 | % |
| Portfolio turnover | | | | | 2 | % | | | 2 | % | | | 2 | % | | | 5 | %** | | | N/A | |
| * | | Includes effect of expenses allocated from Master Investment Portfolio. |
| ** | | Portfolio turnover figure represents the period March 5, 2004 to December 31, 2004. Prior to March 5, 2004, portfolio turnover was calculated at the Master Investment Portfolio level. |
| (a) | | Per share amounts were calculated using the average shares outstanding method. |
See Notes to Financial Statements.
140
VANTAGEPOINT FUNDS
Financial Highlights
(For a share outstanding throughout each period)
| | | | Mid/Small Company Index Class I
| |
|---|
| | | | For the Year Ended December 31, | |
|---|
| | | | 2007
| | 2006
| | 2005
| | 2004(a)
| | 2003
|
|---|
Net Asset Value, beginning of period | | | | $ | 16.52 | | | $ | 14.99 | | | $ | 13.80 | | | $ | 11.79 | | | $ | 8.33 | |
Income from investment operations:
| | | | | | | | | | | | | | | | | | | | | | |
| Net investment income | | | | | 0.16 | | | | 0.16 | | | | 0.13 | | | | 0.12 | | | | 0.04 | |
| Net realized and unrealized gain (loss) on investments and futures contracts | | | | | 0.68 | | | | 2.09 | | | | 1.20 | | | | 1.99 | | | | 3.47 | |
Total from investment operations | | | | | 0.84 | | | | 2.25 | | | | 1.33 | | | | 2.11 | | | | 3.51 | |
Less distributions:
| | | | | | | | | | | | | | | | | | | | | | |
| From net investment income | | | | | (0.20 | ) | | | (0.12 | ) | | | (0.14 | ) | | | (0.10 | ) | | | (0.05 | ) |
| From net realized gains | | | | | (0.93 | ) | | | (0.60 | ) | | | — | | | | — | | | | — | |
Total distributions | | | | | (1.13 | ) | | | (0.72 | ) | | | (0.14 | ) | | | (0.10 | ) | | | (0.05 | ) |
Net Asset Value, end of year | | | | $ | 16.23 | | | $ | 16.52 | | | $ | 14.99 | | | $ | 13.80 | | | $ | 11.79 | |
| Total return | | | | | 4.98 | % | | | 14.99 | % | | | 9.63 | % | | | 17.86 | % | | | 42.17 | % |
Ratios/Supplemental data:
| | | | | | | | | | | | | | | | | | | | | | |
| Net assets, end of year (000) | | | | $ | 105,496 | | | $ | 78,663 | | | $ | 68,330 | | | $ | 56,156 | | | $ | 56,880 | |
Ratios to average net assets:
| | | | | | | | | | | | | | | | | | | | | | |
| Ratio of expenses to average net assets | | | | | 0.50 | % | | | 0.51 | % | | | 0.52 | % | | | 0.52 | % | | | 0.52 | %* |
| Ratio of net investment income to average net assets | | | | | 1.16 | % | | | 1.04 | % | | | 1.01 | % | | | 0.95 | % | | | 0.86 | % |
| Portfolio turnover | | | | | 18 | % | | | 20 | % | | | 12 | % | | | 22 | %** | | | N/A | |
| * | | Includes effect of expenses allocated from Master Investment Portfolio. |
| ** | | Portfolio turnover figure represents the period from March 5, 2004 to December 31, 2004. Prior to March 5, 2004, portfolio turnover was calculated at the Master Investment Portfolio level. |
| (a) | | Per share amounts were calculated using the average shares outstanding. |
See Notes to Financial Statements.
141
VANTAGEPOINT FUNDS
Financial Highlights
(For a share outstanding throughout each period)
| | | | Mid/Small Company Index Class II
| |
|---|
| | | | For the Year Ended December 31, | |
|---|
| | | | 2007
| | 2006
| | 2005
| | 2004(a)
| | 2003
|
|---|
Net Asset Value, beginning of period | | | | $ | 15.80 | | | $ | 14.36 | | | $ | 13.22 | | | $ | 11.32 | | | $ | 7.99 | |
Income from investment operations:
| | | | | | | | | | | | | | | | | | | | | | |
| Net investment income | | | | | 0.22 | | | | 0.20 | | | | 0.17 | | | | 0.14 | | | | 0.06 | |
| Net realized and unrealized gain (loss) on investments and futures contracts | | | | | 0.61 | | | | 2.00 | | | | 1.14 | | | | 1.89 | | | | 3.34 | |
Total from investment operations | | | | | 0.83 | | | | 2.20 | | | | 1.31 | | | | 2.03 | | | | 3.40 | |
Less distributions:
| | | | | | | | | | | | | | | | | | | | | | |
| From net investment income | | | | | (0.22 | ) | | | (0.16 | ) | | | (0.17 | ) | | | (0.13 | ) | | | (0.07 | ) |
| From net realized gains | | | | | (0.93 | ) | | | (0.60 | ) | | | — | | | | — | | | | — | |
Total distributions | | | | | (1.15 | ) | | | (0.76 | ) | | | (0.17 | ) | | | (0.13 | ) | | | (0.07 | ) |
Net Asset Value, end of year | | | | $ | 15.48 | | | $ | 15.80 | | | $ | 14.36 | | | $ | 13.22 | | | $ | 11.32 | |
| Total return | | | | | 5.20 | % | | | 15.24 | % | | | 9.87 | % | | | 17.95 | % | | | 42.53 | % |
Ratios/Supplemental data:
| | | | | | | | | | | | | | | | | | | | | | |
| Net assets, end of year (000) | | | | $ | 121,950 | | | $ | 106,900 | | | $ | 95,502 | | | $ | 86,741 | | | $ | 52,907 | |
Ratios to average net assets:
| | | | | | | | | | | | | | | | | | | | | | |
| Ratio of expenses to average net assets | | | | | 0.30 | % | | | 0.31 | % | | | 0.32 | % | | | 0.32 | % | | | 0.32 | %* |
| Ratio of net investment income to average net assets | | | | | 1.36 | % | | | 1.24 | % | | | 1.20 | % | | | 1.18 | % | | | 1.06 | % |
| Portfolio turnover | | | | | 18 | % | | | 20 | % | | | 12 | % | | | 22 | %** | | | N/A | |
| * | | Includes effect of expenses allocated from Master Investment Portfolio. |
| ** | | Portfolio turnover figure represents the period from March 5, 2004 to December 31, 2004. Prior to March 5, 2004, portfolio turnover was calculated at the Master Investment Portfolio level. |
| (a) | | Per share amounts were calculated using the average shares outstanding. |
See Notes to Financial Statements.
142
VANTAGEPOINT FUNDS
Financial Highlights
(For a share outstanding throughout each period)
| | | | Overseas Equity Index Class I
| |
|---|
| | | | For the Year Ended December 31, | |
|---|
| | | | 2007
| | 2006
| | 2005
| | 2004(a)
| | 2003
|
|---|
Net Asset Value, beginning of period | | | | $ | 13.79 | | | $ | 11.26 | | | $ | 10.17 | | | $ | 8.65 | | | $ | 6.36 | |
Income from investment operations:
| | | | | | | | | | | | | | | | | | | | | | |
| Net investment income | | | | | 0.35 | | | | 0.21 | | | | 0.18 | | | | 0.15 | | | | 0.11 | |
| Net realized and unrealized gain (loss) on investments, futures contracts and foreign currency transactions | | | | | 1.05 | | | | 2.64 | | | | 1.12 | | | | 1.54 | | | | 2.29 | |
Total from investment operations | | | | | 1.40 | | | | 2.85 | | | | 1.30 | | | | 1.69 | | | | 2.40 | |
Less distributions:
| | | | | | | | | | | | | | | | | | | | | | |
| From net investment income | | | | | (0.38 | ) | | | (0.32 | ) | | | (0.21 | ) | | | (0.17 | ) | | | (0.11 | ) |
| From net realized gains | | | | | (0.01 | ) | | | — | | | | — | | | | — | | | | — | |
Total distributions | | | | | (0.39 | ) | | | (0.32 | ) | | | (0.21 | ) | | | (0.17 | ) | | | (0.11 | ) |
Net Asset Value, end of year | | | | $ | 14.80 | | | $ | 13.79 | | | $ | 11.26 | | | $ | 10.17 | | | $ | 8.65 | |
| Total return | | | | | 10.17 | % | | | 25.35 | % | | | 12.74 | % | | | 19.61 | % | | | 37.75 | % |
Ratios/Supplemental data:
| | | | | | | | | | | | | | | | | | | | | | |
| Net assets, end of year (000) | | | | $ | 70,723 | | | $ | 55,259 | | | $ | 32,639 | | | $ | 25,557 | | | $ | 60,601 | |
Ratios to average net assets:
| | | | | | | | | | | | | | | | | | | | | | |
| Ratio of expenses to average net assets | | | | | 0.63 | % | | | 0.73 | % | | | 0.95 | % | | | 0.89 | % | | | 0.69 | %* |
| Ratio of net investment income to average net assets | | | | | 2.36 | % | | | 2.15 | % | | | 1.82 | % | | | 1.61 | % | | | 1.77 | % |
| Portfolio turnover | | | | | 5 | % | | | 3 | % | | | 8 | % | | | 12 | %** | | | N/A | |
| * | | Includes effect of expenses allocated from Master Investment Portfolio. |
| ** | | Portfolio turnover figure represents the period from March 5, 2004, to December 31, 2004. Prior to March 5, 2004, portfolio turnover was calculated at the Master Investment Portfolio level. |
| (a) | | Per share amounts were calculated using the average shares outstanding method. |
See Notes to Financial Statements.
143
VANTAGEPOINT FUNDS
Financial Highlights
(For a share outstanding throughout each period)
| | | | Overseas Equity Index Class II
| |
|---|
| | | | For the Year Ended December 31, | |
|---|
| | | | 2007
| | 2006
| | 2005
| | 2004(a)
| | 2003
|
|---|
Net Asset Value, beginning of period | | | | $ | 13.06 | | | $ | 10.67 | | | $ | 9.64 | | | $ | 8.20 | | | $ | 6.04 | |
Income from investment operations:
| | | | | | | | | | | | | | | | | | | | | | |
| Net investment income | | | | | 0.35 | | | | 0.25 | | | | 0.20 | | | | 0.18 | | | | 0.11 | |
| Net realized and unrealized gain (loss) on investments, futures contracts and foreign currency transactions | | | | | 0.99 | | | | 2.48 | | | | 1.06 | | | | 1.46 | | | | 2.17 | |
Total from investment operations | | | | | 1.34 | | | | 2.73 | | | | 1.26 | | | | 1.64 | | | | 2.28 | |
Less distributions:
| | | | | | | | | | | | | | | | | | | | | | |
| From net investment income | | | | | (0.41 | ) | | | (0.34 | ) | | | (0.23 | ) | | | (0.20 | ) | | | (0.12 | ) |
| From net realized gains | | | | | (0.01 | ) | | | — | | | | — | | | | — | | | | — | |
Total distributions | | | | | (0.42 | ) | | | (0.34 | ) | | | (0.23 | ) | | | (0.20 | ) | | | (0.12 | ) |
Net Asset Value, end of year | | | | $ | 13.98 | | | $ | 13.06 | | | $ | 10.67 | | | $ | 9.64 | | | $ | 8.20 | |
| Total return | | | | | 10.37 | % | | | 25.64 | % | | | 13.03 | % | | | 20.05 | % | | | 37.85 | % |
Ratios/Supplemental data:
| | | | | | | | | | | | | | | | | | | | | | |
| Net assets, end of year (000) | | | | $ | 178,661 | | | $ | 107,963 | | | $ | 56,920 | | | $ | 41,860 | | | $ | 19,539 | |
Ratios to average net assets:
| | | | | | | | | | | | | | | | | | | | | | |
| Ratio of expenses to average net assets | | | | | 0.43 | % | | | 0.53 | % | | | 0.75 | % | | | 0.69 | % | | | 0.49 | %* |
| Ratio of net investment income to average net assets | | | | | 2.56 | % | | | 2.37 | % | | | 1.98 | % | | | 2.10 | % | | | 1.89 | % |
| Portfolio turnover | | | | | 5 | % | | | 3 | % | | | 8 | % | | | 12 | %** | | | N/A | |
|
| * | | Includes effect of expenses allocated from Master Investment Portfolio. |
| ** | | Portfolio turnover figure represents the period from March 5, 2004, to December 31, 2004. Prior to March 5, 2004, portfolio turnover was calculated at the Master Investment Portfolio level. |
| (a) | | Per share amounts were calculated using the average shares outstanding method. |
See Notes to Financial Statements.
144
VANTAGEPOINT FUNDS
Financial Highlights
(For a share outstanding throughout each period)
| | | | Model Portfolio Savings Oriented
| |
|---|
| | | | For the Year Ended December 31, | |
|---|
| | | | 2007
| | 2006
| | 2005
| | 2004
| | 2003
|
|---|
Net Asset Value, beginning of period | | | | $ | 24.70 | | | $ | 24.23 | | | $ | 24.21 | | | $ | 23.53 | | | $ | 21.92 | |
Income from investment operations:
| | | | | | | | | | | | | | | | | | | | | | |
| Net investment income | | | | | 0.88 | | | | 0.84 | | | | 0.72 | | | | 0.66 | | | | 0.54 | |
| Net realized and unrealized gain (loss) on investments | | | | | 0.63 | | | | 0.83 | | | | 0.02 | | | | 0.70 | | | | 1.64 | |
Total from investment operations | | | | | 1.51 | | | | 1.67 | | | | 0.74 | | | | 1.36 | | | | 2.18 | |
Less distributions:
| | | | | | | | | | | | | | | | | | | | | | |
| From net investment income | | | | | (0.96 | ) | | | (0.86 | ) | | | (0.72 | ) | | | (0.68 | ) | | | (0.57 | ) |
| From net realized gains | | | | | (0.55 | ) | | | (0.34 | ) | | | — | | | | — | | | | — | |
Total distributions | | | | | (1.51 | ) | | | (1.20 | ) | | | (0.72 | ) | | | (0.68 | ) | | | (0.57 | ) |
Net Asset Value, end of year | | | | $ | 24.70 | | | $ | 24.70 | | | $ | 24.23 | | | $ | 24.21 | | | $ | 23.53 | |
| Total return | | | | | 6.15 | % | | | 6.90 | % | | | 3.06 | % | | | 5.78 | % | | | 9.93 | % |
Ratios/Supplemental data:
| | | | | | | | | | | | | | | | | | | | | | |
| Net assets, end of year (000) | | | | $ | 311,455 | | | $ | 292,287 | | | $ | 281,036 | | | $ | 260,976 | | | $ | 202,264 | |
Ratios to average net assets:
| | | | | | | | | | | | | | | | | | | | | | |
| Ratio of expenses to average net assets | | | | | 0.15 | % | | | 0.15 | % | | | 0.16 | % | | | 0.15 | % | | | 0.16 | % |
| Ratio of net investment income to average net assets | | | | | 3.66 | % | | | 3.36 | % | | | 3.01 | % | | | 3.07 | % | | | 2.60 | % |
| Portfolio turnover | | | | | 27 | % | | | 11 | % | | | 9 | % | | | 42 | % | | | 10 | % |
See Notes to Financial Statements.
145
VANTAGEPOINT FUNDS
Financial Highlights
(For a share outstanding throughout each period)
| | | | Model Portfolio Conservative Growth
| |
|---|
| | | | For the Year Ended December 31, | |
|---|
| | | | 2007
| | 2006
| | 2005
| | 2004
| | 2003
|
|---|
Net Asset Value, beginning of period | | | | $ | 24.48 | | | $ | 23.24 | | | $ | 22.87 | | | $ | 21.95 | | | $ | 19.54 | |
Income from investment operations:
| | | | | | | | | | | | | | | | | | | | | | |
| Net investment income | | | | | 0.68 | | | | 0.69 | | | | 0.62 | | | | 0.56 | | | | 0.43 | |
| Net realized and unrealized gain (loss) on investments | | | | | 0.92 | | | | 1.26 | | | | 0.37 | | | | 0.92 | | | | 2.42 | |
Total from investment operations | | | | | 1.60 | | | | 1.95 | | | | 0.99 | | | | 1.48 | | | | 2.85 | |
Less distributions:
| | | | | | | | | | | | | | | | | | | | | | |
| From net investment income | | | | | (0.75 | ) | | | (0.71 | ) | | | (0.62 | ) | | | (0.56 | ) | | | (0.44 | ) |
| From net realized gains | | | | | (0.71 | ) | | | 0.00 | | | | — | | | | — | | | | — | |
Total distributions | | | | | (1.46 | ) | | | (0.71 | ) | | | (0.62 | ) | | | (0.56 | ) | | | (0.44 | ) |
Net Asset Value, end of year | | | | $ | 24.62 | | | $ | 24.48 | | | $ | 23.24 | | | $ | 22.87 | | | $ | 21.95 | |
| Total return | | | | | 6.57 | % | | | 8.38 | % | | | 4.31 | % | | | 6.74 | % | | | 14.64 | % |
Ratios/Supplemental data:
| | | | | | | | | | | | | | | | | | | | | | |
| Net assets, end of year (000) | | | | $ | 597,775 | | | $ | 549,966 | | | $ | 512,992 | | | $ | 480,096 | | | $ | 376,001 | |
Ratios to average net assets:
| | | | | | | | | | | | | | | | | | | | | | |
| Ratio of expenses to average net assets | | | | | 0.14 | % | | | 0.15 | % | | | 0.15 | % | | | 0.14 | % | | | 0.15 | % |
| Ratio of net investment income to average net assets | | | | | 2.99 | % | | | 2.86 | % | | | 2.72 | % | | | 2.70 | % | | | 2.29 | % |
| Portfolio turnover | | | | | 27 | % | | | 9 | % | | | 7 | % | | | 27 | % | | | 8 | % |
See Notes to Financial Statements.
146
VANTAGEPOINT FUNDS
Financial Highlights
(For a share outstanding throughout each period)
| | | | Model Portfolio Traditional Growth
| |
|---|
| | | | For the Year Ended December 31, | |
|---|
| | | | 2007
| | 2006
| | 2005
| | 2004
| | 2003
|
|---|
Net Asset Value, beginning of period | | | | $ | 24.26 | | | $ | 22.46 | | | $ | 21.67 | | | $ | 20.45 | | | $ | 17.19 | |
Income from investment operations:
| | | | | | | | | | | | | | | | | | | | | | |
| Net investment income | | | | | 0.46 | | | | 0.48 | | | | 0.47 | | | | 0.39 | | | | 0.29 | |
| Net realized and unrealized gain (loss) on investments | | | | | 1.25 | | | | 1.86 | | | | 0.79 | | | | 1.22 | | | | 3.27 | |
Total from investment operations | | | | | 1.71 | | | | 2.34 | | | | 1.26 | | | | 1.61 | | | | 3.56 | |
Less distributions:
| | | | | | | | | | | | | | | | | | | | | | |
| From net investment income | | | | | (0.56 | ) | | | (0.51 | ) | | | (0.47 | ) | | | (0.39 | ) | | | (0.30 | ) |
| From net realized gains | | | | | (1.37 | ) | | | (0.03 | ) | | | — | | | | — | | | | — | |
Total distributions | | | | | (1.93 | ) | | | (0.54 | ) | | | (0.47 | ) | | | (0.39 | ) | | | (0.30 | ) |
Net Asset Value, end of year | | | | $ | 24.04 | | | $ | 24.26 | | | $ | 22.46 | | | $ | 21.67 | | | $ | 20.45 | |
| Total return | | | | | 7.03 | % | | | 10.42 | % | | | 5.79 | % | | | 7.89 | % | | | 20.68 | % |
Ratios/Supplemental data:
| | | | | | | | | | | | | | | | | | | | | | |
| Net assets, end of year (000) | | | | $ | 1,487,224 | | | $ | 1,331,012 | | | $ | 1,135,671 | | | $ | 1,005,076 | | | $ | 795,581 | |
Ratios to average net assets:
| | | | | | | | | | | | | | | | | | | | | | |
| Ratio of expenses to average net assets | | | | | 0.13 | % | | | 0.13 | % | | | 0.14 | % | | | 0.14 | % | | | 0.15 | % |
| Ratio of net investment income to average net assets | | | | | 2.23 | % | | | 2.13 | % | | | 2.21 | % | | | 2.01 | % | | | 1.73 | % |
| Portfolio turnover | | | | | 28 | % | | | 6 | % | | | 4 | % | | | 14 | % | | | 9 | % |
See Notes to Financial Statements.
147
VANTAGEPOINT FUNDS
Financial Highlights
(For a share outstanding throughout each period)
| | | | Model Portfolio Long-Term Growth
| |
|---|
| | | | For the Year Ended December 31, | |
|---|
| | | | 2007
| | 2006
| | 2005
| | 2004
| | 2003
|
|---|
Net Asset Value, beginning of period | | | | $ | 24.56 | | | $ | 22.16 | | | $ | 21.02 | | | $ | 19.48 | | | $ | 15.48 | |
Income from investment operations:
| | | | | | | | | | | | | | | | | | | | | | |
| Net investment income | | | | | 0.26 | | | | 0.34 | | | | 0.38 | | | | 0.26 | | | | 0.20 | |
| Net realized and unrealized gain on investments | | | | | 1.64 | | | | 2.43 | | | | 1.14 | | | | 1.54 | | | | 4.01 | |
Total from investment operations | | | | | 1.90 | | | | 2.77 | | | | 1.52 | | | | 1.80 | | | | 4.21 | |
Less distributions:
| | | | | | | | | | | | | | | | | | | | | | |
| From net investment income | | | | | (0.43 | ) | | | (0.32 | ) | | | (0.38 | ) | | | (0.26 | ) | | | (0.21 | ) |
| From net realized gains | | | | | (1.77 | ) | | | (0.05 | ) | | | — | | | | (0.00 | )* | | | (0.00 | )* |
Total distributions | | | | | (2.20 | ) | | | (0.37 | ) | | | (0.38 | ) | | | (0.26 | ) | | | (0.21 | ) |
Net Asset Value, end of year | | | | $ | 24.26 | | | $ | 24.56 | | | $ | 22.16 | | | $ | 21.02 | | | $ | 19.48 | |
| Total return | | | | | 7.74 | % | | | 12.50 | % | | | 7.24 | % | | | 9.25 | % | | | 27.21 | % |
Ratios/Supplemental data:
| | | | | | | | | | | | | | | | | | | | | | |
| Net assets, end of year (000) | | | | $ | 1,677,987 | | | $ | 1,470,918 | | | $ | 1,209,329 | | | $ | 1,040,507 | | | $ | 820,777 | |
Ratios to average net assets:
| | | | | | | | | | | | | | | | | | | | | | |
| Ratio of expenses to average net assets | | | | | 0.12 | % | | | 0.13 | % | | | 0.14 | % | | | 0.14 | % | | | 0.14 | % |
| Ratio of net investment income to average net assets | | | | | 1.57 | % | | | 1.51 | % | | | 1.87 | % | | | 1.39 | % | | | 1.33 | % |
| Portfolio turnover | | | | | 27 | % | | | 6 | % | | | 7 | % | | | 8 | % | | | 4 | % |
* Rounds to less than $0.01
See Notes to Financial Statements.
148
VANTAGEPOINT FUNDS
Financial Highlights
(For a share outstanding throughout each period)
| | | | Model Portfolio All-Equity Growth
| |
|---|
| | | | For the Year Ended December 31, | |
|---|
| | | | 2007
| | 2006
| | 2005
| | 2004
| | 2003
|
|---|
Net Asset Value, beginning of period | | | | $ | 25.88 | | | $ | 22.96 | | | $ | 21.39 | | | $ | 19.49 | | | $ | 14.68 | |
Income from investment operations:
| | | | | | | | | | | | | | | | | | | | | | |
| Net investment income | | | | | 0.04 | | | | 0.15 | | | | 0.25 | | | | 0.11 | | | | 0.07 | |
| Net realized and unrealized gain (loss) on investments | | | | | 1.98 | | | | 3.19 | | | | 1.57 | | | | 1.90 | | | | 4.81 | |
Total from investment operations | | | | | 2.02 | | | | 3.34 | | | | 1.82 | | | | 2.01 | | | | 4.88 | |
Less distributions:
| | | | | | | | | | | | | | | | | | | | | | |
| From net investment income | | | | | (0.21 | ) | | | (0.19 | ) | | | (0.25 | ) | | | (0.11 | ) | | | (0.07 | ) |
| From net realized gains | | | | | (3.06 | ) | | | (0.23 | ) | | | — | | | | — | | | | — | |
| Return of capital | | | | | — | | | | — | | | | — | | | | — | | | | (0.00 | )* |
Total distributions | | | | | (3.27 | ) | | | (0.42 | ) | | | (0.25 | ) | | | (0.11 | ) | | | (0.07 | ) |
Net Asset Value, end of year | | | | $ | 24.63 | | | $ | 25.88 | | | $ | 22.96 | | | $ | 21.39 | | | $ | 19.49 | |
| Total return | | | | | 7.75 | % | | | 14.58 | % | | | 8.49 | % | | | 10.30 | % | | | 33.26 | % |
Ratios/Supplemental data:
| | | | | | | | | | | | | | | | | | | | | | |
| Net assets, end of year (000) | | | | $ | 597,973 | | | $ | 470,888 | | | $ | 303,975 | | | $ | 216,415 | | | $ | 128,145 | |
Ratios to average net assets:
| | | | | | | | | | | | | | | | | | | | | | |
| Ratio of expenses to average net assets | | | | | 0.14 | % | | | 0.15 | % | | | 0.16 | % | | | 0.16 | % | | | 0.17 | % |
| Ratio of net investment income to average net assets | | | | | 0.82 | % | | | 0.71 | % | | | 1.30 | % | | | 0.64 | % | | | 0.59 | % |
| Portfolio turnover | | | | | 23 | % | | | 6 | % | | | 2 | % | | | 9 | % | | | 3 | % |
| * | | Rounds to less than $0.01 |
See Notes to Financial Statements.
149
VANTAGEPOINT FUNDS
Financial Highlights
(For a share outstanding throughout each period)
| | | | Milestone Retirement Income
| |
|---|
| | | | For the Year Ended December 31, | For the Period
from January 3,
2005* to
December 31, |
|---|
| | | | 2007
| | 2006
| | 2005
|
|---|
Net Asset Value, beginning of period | | | | $ | 10.51 | | | $ | 10.14 | | | $ | 10.00 | |
Income from investment operations:
| | | | | | | | | | | | | | |
| Net investment income | | | | | 0.27 | | | | 0.29 | | | | 0.19 | |
| Net realized and unrealized gain on investments | | | | | 0.36 | | | | 0.48 | | | | 0.15 | |
Total from investment operations | | | | | 0.63 | | | | 0.77 | | | | 0.34 | |
Less distributions:
| | | | | | | | | | | | | | |
| From net investment income | | | | | (0.29 | ) | | | (0.29 | ) | | | (0.19 | ) |
| From net realized gains | | | | | (0.24 | ) | | | (0.11 | ) | | | (0.01 | ) |
Total distributions | | | | | (0.53 | ) | | | (0.40 | ) | | | (0.20 | ) |
Net Asset Value, end of period | | | | $ | 10.61 | | | $ | 10.51 | | | $ | 10.14 | |
| Total return | | | | | 6.05 | % | | | 7.52 | % | | | 3.39 | %†† |
Ratios/Supplemental data:
| | | | | | | | | | | | | | |
| Net assets, end of period (000) | | | | $ | 54,573 | | | $ | 22,534 | | | $ | 13,146 | |
Ratios to average net assets:
| | | | | | | | | | | | | | |
| Ratio of expenses to average net assets | | | | | 0.30 | % | | | 0.53 | % | | | 1.20 | %† |
| Ratio of net investment income to average net assets | | | | | 3.48 | % | | | 3.43 | % | | | 2.54 | %† |
| Ratio of expenses to average net assets after expense reductions and reimbursed expenses | | | | | 0.14 | % | | | 0.16 | % | | | 0.15 | %† |
| Ratio of net investment income to average net assets after expense reductions and reimbursed expenses | | | | | 3.63 | % | | | 3.06 | % | | | 3.59 | %† |
| Portfolio turnover | | | | | 63 | % | | | 25 | % | | | 35 | %†† |
| * | | Commencement of operations |
See Notes to Financial Statements.
150
VANTAGEPOINT FUNDS
Financial Highlights
(For a share outstanding throughout each period)
| | | | Milestone 2010
| |
|---|
| | | | For the Year Ended December 31, | For the Period
from January 3,
2005* to
December 31, |
|---|
| | | | 2007
| | 2006
| | 2005
|
|---|
Net Asset Value, beginning of period | | | | $ | 10.85 | | | $ | 10.28 | | | $ | 10.00 | |
Income from investment operations:
| | | | | | | | | | | | | | |
| Net investment income | | | | | 0.27 | | | | 0.24 | | | | 0.18 | |
| Net realized and unrealized gain on investments | | | | | 0.42 | | | | 0.68 | | | | 0.29 | |
Total from investment operations | | | | | 0.69 | | | | 0.92 | | | | 0.47 | |
Less distributions:
| | | | | | | | | | | | | | |
| From net investment income | | | | | (0.30 | ) | | | (0.25 | ) | | | (0.18 | ) |
| From net realized gains | | | | | (0.59 | ) | | | (0.10 | ) | | | (0.01 | ) |
Total distributions | | | | | (0.89 | ) | | | (0.35 | ) | | | (0.19 | ) |
Net Asset Value, end of period | | | | $ | 10.65 | | | $ | 10.85 | | | $ | 10.28 | |
| Total return | | | | | 6.43 | % | | | 8.95 | % | | | 4.65 | %†† |
Ratios/Supplemental data:
| | | | | | | | | | | | | | |
| Net assets, end of period (000) | | | | $ | 70,403 | | | $ | 48,483 | | | $ | 26,638 | |
Ratios to average net assets:
| | | | | | | | | | | | | | |
| Ratio of expenses to average net assets | | | | | 0.24 | % | | | 0.32 | % | | | 0.62 | %† |
| Ratio of net investment income to average net assets | | | | | 2.97 | % | | | 2.74 | % | | | 2.49 | %† |
| Ratio of expenses to average net assets after expense reductions and reimbursed expenses | | | | | 0.18 | % | | | 0.18 | % | | | 0.15 | %† |
| Ratio of net investment income to average net assets after expense reductions and reimbursed expenses | | | | | 3.02 | % | | | 2.88 | % | | | 2.97 | %† |
| Portfolio turnover | | | | | 58 | % | | | 15 | % | | | 18 | %†† |
| * | | Commencement of operations |
See Notes to Financial Statements.
151
VANTAGEPOINT FUNDS
Financial Highlights
(For a share outstanding throughout each period)
| | | | Milestone 2015
| |
|---|
| | | | For the Year Ended December 31, | For the Period
from January 3,
2005* to
December 31, |
|---|
| | | | 2007
| | 2006
| | 2005
|
|---|
Net Asset Value, beginning of period | | | | $ | 11.29 | | | $ | 10.44 | | | $ | 10.00 | |
Income from investment operations:
| | | | | | | | | | | | | | |
| Net investment income | | | | | 0.22 | | | | 0.19 | | | | 0.15 | |
| Net realized and unrealized gain on investments | | | | | 0.56 | | | | 0.94 | | | | 0.44 | |
Total from investment operations | | | | | 0.78 | | | | 1.13 | | | | 0.59 | |
Less distributions:
| | | | | | | | | | | | | | |
| From net investment income | | | | | (0.25 | ) | | | (0.20 | ) | | | (0.15 | ) |
| From net realized gains | | | | | (0.69 | ) | | | (0.08 | ) | | | (0.00 | )** |
Total distributions | | | | | (0.94 | ) | | | (0.28 | ) | | | (0.15 | ) |
Net Asset Value, end of period | | | | $ | 11.13 | | | $ | 11.29 | | | $ | 10.44 | |
| Total return | | | | | 6.88 | % | | | 10.87 | % | | | 5.93 | %†† |
Ratios/Supplemental data:
| | | | | | | | | | | | | | |
| Net assets, end of period (000) | | | | $ | 138,535 | | | $ | 84,357 | | | $ | 41,455 | |
Ratios to average net assets:
| | | | | | | | | | | | | | |
| Ratio of expenses to average net assets | | | | | 0.18 | % | | | 0.24 | % | | | 0.48 | %† |
| Ratio of net investment income to average net assets | | | | | 2.57 | % | | | 2.33 | % | | | 2.43 | %† |
| Ratio of expenses to average net assets after expense reductions and reimbursed expenses | | | | | 0.18 | % | | | 0.17 | % | | | 0.15 | %† |
| Ratio of net investment income to average net assets after expense reductions and reimbursed expenses | | | | | 2.57 | % | | | 2.39 | % | | | 2.76 | %† |
| Portfolio turnover | | | | | 40 | % | | | 10 | % | | | 8 | %†† |
| * | | Commencement of operations |
| ** | | Rounds to less than $0.01 |
See Notes to Financial Statements.
152
VANTAGEPOINT FUNDS
Financial Highlights
(For a share outstanding throughout each period)
| | | | Milestone 2020
| |
|---|
| | | | For the Year Ended December 31, | For the Period
from January 3,
2005* to
December 31, |
|---|
| | | | 2007
| | 2006
| | 2005
|
|---|
Net Asset Value, beginning of period | | | | $ | 11.52 | | | $ | 10.50 | | | $ | 10.00 | |
Income from investment operations:
| | | | | | | | | | | | | | |
| Net investment income | | | | | 0.20 | | | | 0.18 | | | | 0.14 | |
| Net realized and unrealized gain on investments | | | | | 0.63 | | | | 1.07 | | | | 0.50 | |
Total from investment operations | | | | | 0.83 | | | | 1.25 | | | | 0.64 | |
Less distributions:
| | | | | | | | | | | | | | |
| From net investment income | | | | | (0.23 | ) | | | (0.18 | ) | | | (0.14 | ) |
| From net realized gains | | | | | (0.74 | ) | | | (0.05 | ) | | | (0.00 | )** |
Total distributions | | | | | (0.97 | ) | | | (0.23 | ) | | | (0.14 | ) |
Net Asset Value, end of period | | | | $ | 11.38 | | | $ | 11.52 | | | $ | 10.50 | |
| Total return | | | | | 7.17 | % | | | 11.92 | % | | | 6.48 | %†† |
Ratios/Supplemental data:
| | | | | | | | | | | | | | |
| Net assets, end of period (000) | | | | $ | 112,064 | | | $ | 62,402 | | | $ | 27,240 | |
Ratios to average net assets:
| | | | | | | | | | | | | | |
| Ratio of expenses to average net assets | | | | | 0.20 | % | | | 0.28 | % | | | 0.67 | %† |
| Ratio of net investment income to average net assets | | | | | 2.23 | % | | | 2.05 | % | | | 2.14 | %† |
| Ratio of expenses to average net assets after expense reductions and reimbursed expenses | | | | | 0.19 | % | | | 0.18 | % | | | 0.15 | %† |
| Ratio of net investment income to average net assets after expense reductions and reimbursed expenses | | | | | 2.24 | % | | | 2.16 | % | | | 2.67 | %† |
| Portfolio turnover | | | | | 40 | % | | | 5 | % | | | 6 | %†† |
| * | | Commencement of operations |
| ** | | Rounds to less than $0.01 |
See Notes to Financial Statements.
153
VANTAGEPOINT FUNDS
Financial Highlights
(For a share outstanding throughout each period)
| | | | Milestone 2025
| |
|---|
| | | | For the Year Ended December 31, | For the Period
from January 3,
2005* to
December 31, |
|---|
| | | | 2007
| | 2006
| | 2005
|
|---|
Net Asset Value, beginning of period | | | | $ | 11.72 | | | $ | 10.58 | | | $ | 10.00 | |
Income from investment operations:
| | | | | | | | | | | | | | |
| Net investment income | | | | | 0.16 | | | | 0.15 | | | | 0.14 | |
| Net realized and unrealized gain on investments | | | | | 0.68 | | | | 1.19 | | | | 0.58 | |
Total from investment operations | | | | | 0.84 | | | | 1.34 | | | | 0.72 | |
Less distributions:
| | | | | | | | | | | | | | |
| From net investment income | | | | | (0.20 | ) | | | (0.16 | ) | | | (0.14 | ) |
| From net realized gains | | | | | (0.81 | ) | | | (0.04 | ) | | | (0.00 | )** |
Total distributions | | | | | (1.01 | ) | | | (0.20 | ) | | | (0.14 | ) |
Net Asset Value, end of period | | | | $ | 11.55 | | | $ | 11.72 | | | $ | 10.58 | |
| Total return | | | | | 7.17 | % | | | 12.70 | % | | | 7.18 | %†† |
Ratios/Supplemental data:
| | | | | | | | | | | | | | |
| Net assets, end of period (000) | | | | $ | 83,891 | | | $ | 48,804 | | | $ | 19,479 | |
Ratios to average net assets:
| | | | | | | | | | | | | | |
| Ratio of expenses to average net assets | | | | | 0.22 | % | | | 0.33 | % | | | 0.90 | %† |
| Ratio of net investment income to average net assets | | | | | 1.98 | % | | | 1.81 | % | | | 1.81 | %† |
| Ratio of expenses to average net assets after expense reductions and reimbursed expenses | | | | | 0.18 | % | | | 0.18 | % | | | 0.15 | %† |
| Ratio of net investment income to average net assets after expense reductions and reimbursed expenses | | | | | 2.02 | % | | | 1.96 | % | | | 2.56 | %† |
| Portfolio turnover | | | | | 38 | % | | | 4 | % | | | 7 | %†† |
| * | | Commencement of operations |
| ** | | Rounds to less than $0.01 |
See Notes to Financial Statements.
154
VANTAGEPOINT FUNDS
Financial Highlights
(For a share outstanding throughout each period)
| | | | Milestone 2030
| |
|---|
| | | | For the Year Ended December 31, | For the Period
from January 3,
2005* to
December 31, |
|---|
| | | | 2007
| | 2006
| | 2005
|
|---|
Net Asset Value, beginning of period | | | | $ | 11.88 | | | $ | 10.64 | | | $ | 10.00 | |
Income from investment operations:
| | | | | | | | | | | | | | |
| Net investment income | | | | | 0.14 | | | | 0.14 | | | | 0.13 | |
| Net realized and unrealized gain on investments | | | | | 0.70 | | | | 1.30 | | | | 0.64 | |
Total from investment operations | | | | | 0.84 | | | | 1.44 | | | | 0.77 | |
Less distributions:
| | | | | | | | | | | | | | |
| From net investment income | | | | | (0.18 | ) | | | (0.15 | ) | | | (0.13 | ) |
| From net realized gains | | | | | (0.79 | ) | | | (0.05 | ) | | | (0.00 | )** |
Total distributions | | | | | (0.97 | ) | | | (0.20 | ) | | | (0.13 | ) |
Net Asset Value, end of period | | | | $ | 11.75 | | | $ | 11.88 | | | $ | 10.64 | |
| Total return | | | | | 7.11 | % | | | 13.52 | % | | | 7.68 | %†† |
Ratios/Supplemental data:
| | | | | | | | | | | | | | |
| Net assets, end of period (000) | | | | $ | 61,465 | | | $ | 26,007 | | | $ | 10,054 | |
Ratios to average net assets:
| | | | | | | | | | | | | | |
| Ratio of expenses to average net assets | | | | | 0.26 | % | | | 0.51 | % | | | 1.75 | %† |
| Ratio of net investment income to average net assets | | | | | 1.78 | % | | | 1.43 | % | | | 0.98 | %† |
| Ratio of expenses to average net assets after expense reductions and reimbursed expenses | | | | | 0.20 | % | | | 0.18 | % | | | 0.15 | %† |
| Ratio of net investment income to average net assets after expense reductions and reimbursed expenses | | | | | 1.85 | % | | | 1.76 | % | | | 2.58 | %† |
| Portfolio turnover | | | | | 43 | % | | | 3 | % | | | 15 | %†† |
| * | | Commencement of operations |
| ** | | Rounds to less than $0.01 |
See Notes to Financial Statements.
155
VANTAGEPOINT FUNDS
Financial Highlights
(For a share outstanding throughout each period)
| | | | Milestone 2035
| |
|---|
| | | | For the Year Ended December 31, | For the Period
from January 3,
2005* to
December 31, |
|---|
| | | | 2007
| | 2006
| | 2005
|
|---|
Net Asset Value, beginning of period | | | | $ | 11.98 | | | $ | 10.69 | | | $ | 10.00 | |
Income from investment operations:
| | | | | | | | | | | | | | |
| Net investment income | | | | | 0.12 | | | | 0.13 | | | | 0.12 | |
| Net realized and unrealized gain on investments | | | | | 0.75 | | | | 1.36 | | | | 0.69 | |
Total from investment operations | | | | | 0.87 | | | | 1.49 | | | | 0.81 | |
Less distributions:
| | | | | | | | | | | | | | |
| From net investment income | | | | | (0.17 | ) | | | (0.13 | ) | | | (0.12 | ) |
| From net realized gains | | | | | (0.85 | ) | | | (0.07 | ) | | | (0.00 | )** |
Total distributions | | | | | (1.02 | ) | | | (0.20 | ) | | | (0.12 | ) |
Net Asset Value, end of period | | | | $ | 11.83 | | | $ | 11.98 | | | $ | 10.69 | |
| Total return | | | | | 7.25 | % | | | 14.00 | % | | | 8.13 | %†† |
Ratios/Supplemental data:
| | | | | | | | | | | | | | |
| Net assets, end of period (000) | | | | $ | 34,831 | | | $ | 16,418 | | | $ | 4,458 | |
Ratios to average net assets:
| | | | | | | | | | | | | | |
| Ratio of expenses to average net assets | | | | | 0.40 | % | | | 0.76 | % | | | 3.50 | %† |
| Ratio of net investment income (loss) to average net assets | | | | | 1.60 | % | | | 1.04 | % | | | (1.09 | )%† |
| Ratio of expenses to average net assets after expense reductions and reimbursed expenses | | | | | 0.20 | % | | | 0.18 | % | | | 0.15 | %† |
| Ratio of net investment income to average net assets after expense reductions and reimbursed expenses | | | | | 1.80 | % | | | 1.62 | % | | | 2.26 | %† |
| Portfolio turnover | | | | | 40 | % | | | 10 | % | | | 13 | %†† |
| * | | Commencement of operations |
| ** | | Rounds to less than $0.01 |
See Notes to Financial Statements.
156
VANTAGEPOINT FUNDS
Financial Highlights
(For a share outstanding throughout each period)
| | | | Milestone 2040
| |
|---|
| | | | For the Year Ended December 31, | For the Period
from January 3,
2005* to
December 31, |
|---|
| | | | 2007
| | 2006
| | 2005
|
|---|
Net Asset Value, beginning of period | | | | $ | 11.91 | | | $ | 10.68 | | | $ | 10.00 | |
Income from investment operations:
| | | | | | | | | | | | | | |
| Net investment income | | | | | 0.11 | | | | 0.12 | | | | 0.12 | |
| Net realized and unrealized gain on investments | | | | | 0.75 | | | | 1.39 | | | | 0.70 | |
Total from investment operations | | | | | 0.86 | | | | 1.51 | | | | 0.82 | |
Less distributions:
| | | | | | | | | | | | | | |
| From net investment income | | | | | (0.16 | ) | | | (0.13 | ) | | | (0.12 | ) |
| From net realized gains | | | | | (0.76 | ) | | | (0.15 | ) | | | (0.02 | ) |
Total distributions | | | | | (0.92 | ) | | | (0.28 | ) | | | (0.14 | ) |
Net Asset Value, end of period | | | | $ | 11.85 | | | $ | 11.91 | | | $ | 10.68 | |
| Total return | | | | | 7.23 | % | | | 14.14 | % | | | 8.14 | %†† |
Ratios/Supplemental data:
| | | | | | | | | | | | | | |
| Net assets, end of period (000) | | | | $ | 32,882 | | | $ | 12,699 | | | $ | 3,087 | |
Ratios to average net assets:
| | | | | | | | | | | | | | |
| Ratio of expenses to average net assets | | | | | 0.43 | % | | | 1.11 | % | | | 5.49 | %† |
| Ratio of net investment income (loss) to average net assets | | | | | 1.61 | % | | | 0.90 | % | | | (2.91 | )%† |
| Ratio of expenses to average net assets after expense reductions and reimbursed expenses | | | | | 0.19 | % | | | 0.18 | % | | | 0.15 | %† |
| Ratio of net investment income to average net assets after expense reductions and reimbursed expenses | | | | | 1.85 | % | | | 1.83 | % | | | 2.43 | %† |
| Portfolio turnover | | | | | 47 | % | | | 24 | % | | | 35 | %†† |
| * | | Commencement of operations |
See Notes to Financial Statements.
157
VANTAGEPOINT FUNDS
NOTES TO THE FINANCIAL STATEMENTS
The Vantagepoint Funds (the “Company”) is registered under the Investment Company Act of 1940, as amended, (the “1940 Act”), as an open-end management investment company organized as a Delaware statutory trust. The Company consisted of the following series on December 31, 2007:
| The “Actively Managed Funds”: | | | | The “Index Funds”: |
|---|
| Money Market Fund | | | | Core Bond Index Fund |
| Low Duration Bond Fund | | | | 500 Stock Index Fund |
| Inflation Protected Securities Fund | | | | Broad Market Index Fund |
| Asset Allocation Fund | | | | Mid/Small Company Index Fund |
| Equity Income Fund | | | | Overseas Equity Index Fund |
| Growth & Income Fund | | | | | | |
| Growth Fund | | | | | | |
| Select Value Fund | | | | | | |
| Aggressive Opportunities Fund | | | | | | |
| Discovery Fund | | | | | | |
| International Fund | | | | | | |
| Diversified Assets Fund | | | | | | |
| | | | | | | |
| |
The “Milestone Funds”: | | | | The “Model Portfolio Funds”: |
| Milestone Retirement Income Fund | | | | Model Portfolio Savings Oriented Fund |
| Milestone 2010 Fund | | | | Model Portfolio Conservative Growth Fund |
| Milestone 2015 Fund | | | | Model Portfolio Traditional Growth Fund |
| Milestone 2020 Fund | | | | Model Portfolio Long-Term Growth Fund |
| Milestone 2025 Fund | | | | Model Portfolio All-Equity Growth Fund |
| Milestone 2030 Fund | | | | | | |
| Milestone 2035 Fund | | | | | | |
| Milestone 2040 Fund | | | | | | |
The Milestone Funds commenced operations on January 3, 2005. Each fund received $500,000 in exchange for shares purchased by the ICMA Retirement Corporation (“ICMA-RC”), the parent company of Vantagepoint Investment Advisers, LLC (“VIA”), the investment adviser to each series of the Company.
The Select Value, Discovery and Diversified Assets Funds commenced operations on October 30, 2007. Each fund received $100 in exchange for shares purchased by ICMA-RC, the parent company of VIA, the investment adviser to each series of the Company.
The Actively Managed, Model Portfolio and Milestone Funds each offer a single class of shares. The Index Funds offer two classes of shares: Class I Shares and Class II Shares. The two classes of shares differ principally in their respective level of account-based services and the fees associated with such services. Ordinary dividends to shareholders are allocated to each class, based upon shares outstanding on the record date of distribution. Neither class has preferential dividend rights. Differences in per share dividend rates are generally due to differences in separate class expenses.
On May 1, 2007 the Short-Term Bond Fund changed its name to the Low Duration Bond Fund as a result of a change in investment strategy wherein the Low Duration Bond Fund now seeks to maintain a maximum portfolio effective duration of three years. Also effective May 1, 2007 the principal investment strategy of the US Government Securities Fund changed to provide that the fund invests, under normal circumstances, at least 80% of its net assets in inflation adjusted U.S. and non-U.S. fixed-income securities. In connection with this change in investment strategy, the name of the fund was changed to the Inflation Protected Securities Fund and the fund underwent a change in subadvisers.
158
VANTAGEPOINT FUNDS
NOTES TO THE FINANCIAL STATEMENTS—(Continued)
The Model Portfolio Funds Structure
The Model Portfolio Funds invest entirely in other series of the Company (“underlying funds”). Subject to the supervision of the Company’s Board of Directors (“Board”), VIA may make allocation changes to the underlying funds based on its periodic analysis to identify the allocation of assets among the different underlying funds that it believes is optimum for each Model Portfolio Fund. The underlying funds of each Model Portfolio Fund and the current target investment allocation in each underlying fund as of December 31, 2007 were as follows:
| | | | Model Portfolio Funds
| |
|---|
| | | | Savings
Oriented
| | Conservative
Growth
| | Traditional
Growth
| | Long-Term
Growth
| | All-Equity
Growth
|
|---|
Fund Allocation—% | | | | | | | | | | | | | | | | | | | | | | |
| Low Duration Bond | | | | | 43.00 | % | | | 23.00 | % | | | 8.00 | % | | | 0.00 | % | | | 0.00 | % |
| Inflation Protected Securities | | | | | 9.00 | % | | | 6.50 | % | | | 4.00 | % | | | 0.00 | % | | | 0.00 | % |
| Core Bond Index, Class I | | | | | 13.00 | % | | | 20.50 | % | | | 18.00 | % | | | 15.00 | % | | | 0.00 | % |
| Equity Income | | | | | 10.00 | % | | | 11.00 | % | | | 12.00 | % | | | 13.00 | % | | | 18.00 | % |
| Growth & Income | | | | | 10.00 | % | | | 9.00 | % | | | 12.00 | % | | | 13.00 | % | | | 17.00 | % |
| Growth | | | | | 0.00 | % | | | 6.00 | % | | | 10.00 | % | | | 11.50 | % | | | 17.00 | % |
| Select Value | | | | | 0.00 | % | | | 3.00 | % | | | 5.50 | % | | | 8.50 | % | | | 9.50 | % |
| Aggressive Opportunities | | | | | 0.00 | % | | | 3.00 | % | | | 5.50 | % | | | 8.50 | % | | | 9.50 | % |
| Discovery | | | | | 0.00 | % | | | 0.00 | % | | | 3.00 | % | | | 4.50 | % | | | 9.00 | % |
| International | | | | | 5.00 | % | | | 8.00 | % | | | 12.00 | % | | | 16.00 | % | | | 20.00 | % |
| Diversified Assets | | | | | 10.00 | % | | | 10.00 | % | | | 10.00 | % | | | 10.00 | % | | | 0.00 | % |
| | | | | | | | | | | | | | | | | | | | | | | |
| Total Fixed Income | | | | | 65.00 | % | | | 50.00 | % | | | 30.00 | % | | | 15.00 | % | | | 0.00 | % |
| Total Equity | | | | | 25.00 | % | | | 40.00 | % | | | 60.00 | % | | | 75.00 | % | | | 100.00 | % |
| Total Multi-Strategy | | | | | 10.00 | % | | | 10.00 | % | | | 10.00 | % | | | 10.00 | % | | | 0.00 | % |
The Milestone Funds Structure
The Milestone Funds invest entirely in underlying funds. VIA may make, subject to the supervision of the Board, allocation changes to the underlying funds based on its periodic analysis to identify the allocation of assets among the different funds of the Company. The Milestone Funds are designed to serve as investing vehicles for retirement assets. Each fund, except for the Milestone Retirement Income Fund, invests in a professionally selected combination of equity, fixed income, and multi-strategy underlying funds that is believed to be appropriate given the time remaining until a Milestone Fund’s stated retirement date. VIA adjusts the asset allocation of each “dated” Milestone Fund to become more conservative as the designated year approaches. Each Milestone Fund has a different degree of potential risk and reward and is diversified among various underlying funds in differing allocations. The underlying funds of each Milestone Fund and the current target investment allocation in each underlying fund as of December 31, 2007 were as follows:
159
VANTAGEPOINT FUNDS
NOTES TO THE FINANCIAL STATEMENTS—(Continued)
| | | | Milestone Funds
| |
|---|
| | | | Retirement
Income
| | 2010
| | 2015
| | 2020
|
|---|
Fund Allocation—% | | | | | | | | | | | | | | | | | | |
| Low Duration Bond | | | | | 40.00 | % | | | 29.50 | % | | | 15.00 | % | | | 7.00 | % |
| Inflation Protected Securities | | | | | 9.00 | % | | | 7.50 | % | | | 2.60 | % | | | 0.00 | % |
| Core Bond Index, Class I | | | | | 11.00 | % | | | 11.00 | % | | | 16.40 | % | | | 18.05 | % |
| Equity Income | | | | | 12.00 | % | | | 15.00 | % | | | 19.40 | % | | | 21.90 | % |
| Growth & Income | | | | | 12.00 | % | | | 11.40 | % | | | 11.00 | % | | | 11.90 | % |
| Growth | | | | | 0.00 | % | | | 4.20 | % | | | 7.60 | % | | | 8.60 | % |
| Mid/Small Company Index, Class I | | | | | 0.00 | % | | | 3.00 | % | | | 6.80 | % | | | 9.50 | % |
| International | | | | | 6.00 | % | | | 8.40 | % | | | 11.20 | % | | | 13.05 | % |
| Diversified Assets | | | | | 10.00 | % | | | 10.00 | % | | | 10.00 | % | | | 10.00 | % |
| | | | | | | | | | | | | | | | | | | |
| Total Fixed Income | | | | | 60.00 | % | | | 48.00 | % | | | 34.00 | % | | | 25.05 | % |
| Total Equity | | | | | 30.00 | % | | | 42.00 | % | | | 56.00 | % | | | 64.95 | % |
| Total Multi-Strategy | | | | | 10.00 | % | | | 10.00 | % | | | 10.00 | % | | | 10.00 | % |
| | | | Milestone Funds
| |
|---|
| | | | 2025
| | 2030
| | 2035
| | 2040
|
|---|
Fund Allocation—% | | | | | | | | | | | | | | | | | | |
| Low Duration Bond | | | | | 2.00 | % | | | 0.00 | % | | | 0.00 | % | | | 0.00 | % |
| Inflation Protected Securities | | | | | 0.00 | % | | | 0.00 | % | | | 0.00 | % | | | 0.00 | % |
| Core Bond Index, Class I | | | | | 14.80 | % | | | 12.45 | % | | | 10.70 | % | | | 10.00 | % |
| Equity Income | | | | | 23.40 | % | | | 24.60 | % | | | 25.60 | % | | | 26.00 | % |
| Growth & Income | | | | | 13.40 | % | | | 14.30 | % | | | 14.80 | % | | | 15.00 | % |
| Growth | | | | | 9.60 | % | | | 10.60 | % | | | 11.60 | % | | | 12.00 | % |
| Mid/Small Company Index, Class I | | | | | 12.00 | % | | | 14.80 | % | | | 17.80 | % | | | 19.00 | % |
| International | | | | | 14.80 | % | | | 16.25 | % | | | 17.50 | % | | | 18.00 | % |
| Diversified Assets | | | | | 10.00 | % | | | 7.00 | % | | | 2.00 | % | | | 0.00 | % |
| | | | | | | | | | | | | | | | | | | |
| Total Fixed Income | | | | | 16.80 | % | | | 12.45 | % | | | 10.70 | % | | | 10.00 | % |
| Total Equity | | | | | 73.20 | % | | | 80.55 | % | | | 87.30 | % | | | 90.00 | % |
| Total Multi-Strategy | | | | | 10.00 | % | | | 7.00 | % | | | 2.00 | % | | | 0.00 | % |
Since the Model Portfolio Funds and Milestone Funds invest entirely in underlying funds, investment earnings are composed of:
| 1. | | ordinary and capital gain dividends from the underlying funds, |
| 2. | | unrealized appreciation/depreciation on investments in the underlying funds, and |
| 3. | | realized gain/loss from sales of the shares of the underlying funds triggered by net outflows associated with normal capital stock activity and rebalancing of the Model Portfolio Funds and Milestone Funds. |
160
VANTAGEPOINT FUNDS
NOTES TO THE FINANCIAL STATEMENTS—(Continued)
Transition of US Government Securities Fund to Inflation Protected Securities Fund
At a December 8, 2006 meeting of the Board, VIA recommended and the Board approved the implementation of a new principal investment strategy for the US Government Securities Fund to be effective May 1, 2007. The new principal investment strategy provides that the Fund will invest, under normal circumstances, at least 80% of its net assets in inflation adjusted U.S. and non-U.S. fixed income securities. In connection with this change in investment strategy, the Board approved, effective May 1, 2007: (i) a change in the name of the Fund to the Inflation Protected Securities Fund; (ii) the appointment of Pacific Investment Management Company (“PIMCO”) and Fischer Francis Trees & Watts (“FFTW”) as new Fund subadvisers; and (iii) the termination of Mellon Capital Management Corporation as a Fund subadviser. Effective May 1, 2007, PIMCO and FFTW began serving as new subadvisers of the Fund. However, on May 15, 2007, Paul J. Zhao, the portfolio manager at FFTW who was responsible for making investment decisions for the portion of the Fund’s assets managed by FFTW, left FFTW. At a meeting held on May 18, 2007, VIA recommended and the Board approved the termination of FFTW as a subadviser to the Fund. The Fund’s assets managed by FFTW were transitioned to PIMCO and PIMCO served as the sole subadviser to the Fund until the appointment of BlackRock Financial Management, Inc. (“BlackRock”) as an additional subadviser to the Fund effective October 30, 2007.
Subadviser Changes from December 8, 2006 to December 31, 2007
At a meeting held on December 8, 2006, the Board approved the appointment of PIMCO and FFTW to serve as subadvisers to the Inflation Protected Securities Fund, which became effective May 1, 2007. At a meeting held on May 18, 2007, the Board approved the termination of FFTW as a subadviser to the Inflation Protected Securities Fund, which became effective May 22, 2007. At a meeting held on September 7, 2007, the Board approved the appointment of BlackRock as an additional subadviser to the Inflation Protected Securities Fund, which became effective October 30, 2007.
2. | | Significant Accounting Policies |
The Company’s significant accounting policies are consistently applied in the preparation of its financial statements in accordance with accounting principles generally accepted in the United States of America. Management makes estimates and assumptions in the preparation of financial statements that affect the reported amounts of assets and liabilities, including the disclosure of contingent assets and liabilities at the date of the financial statements as well as the revenue and expense amounts during the reporting period. Actual results could differ from those estimates. Certain prior year amounts have been reclassified to conform to the current year presentation.
Investment Policy and Security Valuation
The equity securities held by each fund normally are valued at the last reported sale price on the exchange on which the security is principally traded. Securities for which the primary market is the National Association of Securities Dealers Automated Quotations National Market System (“Nasdaq”) are valued at the Nasdaq Official Closing Price. Equity securities not traded on an exchange or on Nasdaq normally are valued at the last reported sale price in the over-the-counter market. If a non-exchange traded security does not trade on a particular day, then the security is normally valued at the mean between the highest bid price and the lowest priced offer obtained from quotation services believed to be reliable. Fixed income debt securities, such as commercial paper, bankers’ acceptances and U.S. Treasury Bills, with a remaining maturity of less than 60 days, are valued at amortized cost. Prices for other fixed income securities are normally obtained from a commercial pricing service that may use pricing matrices or other methodologies designed to identify the value of fixed income securities. Any security for which market value as described above is not readily available is valued at fair value as determined in good faith in accordance with policies approved by the Board (“Valuation Procedures”). The valuation of certain foreign equity securities is described below.
Shares of the underlying funds in which the Model Portfolio Funds and Milestone Funds invest are valued by using the underlying funds’ respective net asset values (NAVs) for the purpose of purchasing and/or redeeming orders placed that day.
161
VANTAGEPOINT FUNDS
NOTES TO THE FINANCIAL STATEMENTS—(Continued)
The Money Market Fund invests all of its assets in the Institutional Class of the AIM Short-Term Investments Trust Liquid Assets Portfolio (“AIM Portfolio”). The AIM Portfolio uses the amortized cost method to value its portfolio securities in accordance with Rule 2a-7 under the 1940 Act. Amortized cost, which is a security’s historical cost adjusted for amortization of discount or premium, if any, approximates market value. On any given business day, the shares of the AIM Portfolio are valued by the Money Market Fund using the AIM Portfolio’s NAV for purchase and/or redemption orders placed that day.
Valuation of Foreign Equity Securities
For foreign equity securities held by the funds and principally traded in markets outside North and South America, the Board approved the use of a third party fair valuation service. The service uses a multifactor model to calculate a factor that is then applied to adjust the market price for each such security. Additionally, the Board has approved the use of the fair value prices provided by this service on a daily basis without a market trigger or confidence interval filter. In the event prices for such foreign securities are not available through the service or another fair value pricing service approved by the Board, the securities may be priced at the average of two or more independent broker-dealer quotations or at the fair value of the security in accordance with the Company’s Valuation Procedures.
When Issued Securities
When issued securities or “To Be Announced” securities are sometimes held by the funds. The funds maintain security positions and cash positions such that sufficient liquid assets will be available to make payments for such securities purchased.
Foreign Currency
The accounting records of the funds are maintained in U.S. dollars. Investment securities and other assets and liabilities denominated in foreign currencies are translated into U.S. dollars at the prevailing rates of exchange using the “Reuters” snap-shot at 12 pm Eastern Time each day. Purchases and sales of securities, income receipts and expense payments are translated into U.S. dollars at the prevailing exchange rate on the respective dates of such transactions. Unrealized gains and losses, not relating to securities, that result from changes in foreign currency exchange rates, have been included in unrealized appreciation/(depreciation) of securities. Net realized foreign currency gains and losses include foreign currency gains and losses resulting from changes in exchange rates between trade date and settlement date on investment securities transactions, gains and losses on foreign currency transactions, and the difference between the amounts of interest and dividends recorded on the books of the funds and the amounts actually received. The portion of foreign currency gains and losses related to fluctuations in exchange rates between the initial purchase trade date and subsequent sale trade date is included in realized gains/(losses) from security transactions.
Security Transactions and Income Recognition
Security transactions are accounted for on the date the securities are purchased or sold (trade date). Dividend income is recognized on the ex-dividend date and interest income is accrued daily. Realized gains or losses are reported on the basis of identified cost of securities delivered. Bond discounts and premiums are amortized for both financial reporting and tax purposes, except for the Core Bond Index Fund, which does not amortize bond premium for tax purposes.
Dividends and Distributions to Shareholders
Dividends from net investment income are declared and paid monthly to shareholders of the Core Bond Index, the Low Duration Bond, and Inflation Protected Securities Funds. Dividends from net investment income are declared daily and paid monthly to shareholders of the Money Market Fund. Prior to November 2004, dividends from net investment income were declared daily and paid monthly to shareholders of the Low Duration Bond Fund. For the remaining Actively Managed Funds, Index Funds, Model Portfolio Funds and Milestone Funds, dividends from net investment income are declared and paid annually to shareholders. Distributions from any net realized capital gains are generally declared and paid annually to shareholders.
162
VANTAGEPOINT FUNDS
NOTES TO THE FINANCIAL STATEMENTS—(Continued)
Income and capital gain distributions are determined in accordance with income tax regulations which may differ from accounting principles generally accepted in the United States of America. These differences are primarily due to differing treatments of income and gains on investment securities, and differing characterizations of distributions being made by each fund.
Certain differences are permanent, and result in reclassifications among paid-in capital, net investment income or realized gains. These include net operating losses not utilized during the current year, commission adjustments, pay-down gains and losses, bond premium amortization, foreign currency gains and losses, taxable over-distributions or returns of capital, and adjustments relating to dispositions of Real Estate Investment Trust and Passive Foreign Investment Company securities. The following reclassifications were made in the financial statements to present the components of fund net assets and distributions on a tax basis for the year ending December 31, 2007. These reclassifications have no effect on net assets or net asset values per share, and they do not affect the net investment income per share calculations presented in the Financial Highlights.
Fund
| | | | Paid-in capital
Increase/(decrease)
| | Undistributed
Net investment income
Increase/(decrease)
| | Accumulated net realized
Gain/(loss)
Increase/(decrease)
|
|---|
| Low Duration Bond | | | | $ | (102,063 | ) | | $ | 782,317 | | | $ | (680,254 | ) |
| Inflation Protected Securities | | | | | (31,863 | ) | | | 14,829 | | | | 17,034 | |
| Asset Allocation | | | | | — | | | | 725,004 | | | | (725,004 | ) |
| Equity Income | | | | | — | | | | 2,294,745 | | | | (2,294,745 | ) |
| Growth & Income | | | | | — | | | | 2,251,422 | | | | (2,251,422 | ) |
| Growth | | | | | — | | | | 331,625 | | | | (331,625 | ) |
| Select Value | | | | | (64,115 | ) | | | 64,115 | | | | — | |
| Aggressive Opportunities | | | | | — | | | | (37,246 | ) | | | 37,246 | |
| Discovery | | | | | — | | | | 14,409 | | | | (14,409 | ) |
| International | | | | | (5,003 | ) | | | 8,233,847 | | | | (8,228,844 | ) |
| Diversified Assets | | | | | 7,635 | | | | 1,455,338 | | | | (1,462,973 | ) |
| Core Bond Index | | | | | 76,871 | | | | 3,634,325 | | | | (3,711,196 | ) |
| 500 Stock Index | | | | | 10,194,009 | | | | (53,913 | ) | | | (10,140,096 | ) |
| Broad Market Index | | | | | 4,543,913 | | | | (242,317 | ) | | | (4,301,596 | ) |
| Mid/Small Company Index | | | | | 2,458,014 | | | | (329,298 | ) | | | (2,128,716 | ) |
| Overseas Equity Index | | | | | 147,455 | | | | 1,073,769 | | | | (1,221,224 | ) |
| Model Portfolio Long-Term Growth | | | | | 665,285 | | | | — | | | | (665,285 | ) |
Federal Income Taxes
Each fund intends to qualify as a regulated investment company under Subchapter M of the Internal Revenue Code for federal tax purposes. Accordingly, each fund intends to make distributions of substantially all of its net investment company taxable income and any net realized capital gains (after reduction for capital loss carry forwards) sufficient to relieve it from all, or substantially all, federal income and excise taxes. Any taxable income on gains remaining at fiscal year-end are distributed in the following year. Therefore, no provision for federal income or excise taxes was required.
163
VANTAGEPOINT FUNDS
NOTES TO THE FINANCIAL STATEMENTS—(Continued)
The Company has adopted Financial Accounting Standards Board Interpretation No. 48 (“FIN 48”), “Accounting for Uncertainty in Income Taxes,” which establishes guidelines for recognizing, measuring, and disclosing tax return positions in financial statements. Management has evaluated the Company’s tax positions and determined that the adoption of FIN 48 had no material impact on the Company’s financial statements. Accordingly, no adjustments for unrecognized tax benefits or expenses, were required as of December 31, 2007.
At December 31, 2007, the components of distributable earnings on a tax basis were as follows:
Fund
| | | | Undistributed
Ordinary
Income
| | Undistributed
Long-Term Gain
| | Total Distributable
Earnings
|
|---|
| Inflation Protected Securities | | | | $ | 14,243 | | | $ | — | | | $ | 14,243 | |
| Asset Allocation | | | | | — | | | | 1,418,664 | | | | 1,418,664 | |
| Equity Income | | | | | — | | | | 29,223,819 | | | | 29,223,819 | |
| Growth & Income | | | | | — | | | | 3,259,740 | | | | 3,259,740 | |
| Growth | | | | | 527,838 | | | | — | | | | 527,838 | |
| Aggressive Opportunities | | | | | 5,330,982 | | | | 23,661,060 | | | | 28,992,042 | |
| Discovery | | | | | 94,243 | | | | — | | | | 94,243 | |
| International | | | | | 21,833 | | | | 11,900,831 | | | | 11,922,664 | |
| 500 Stock Index | | | | | 46,245 | | | | — | | | | 46,245 | |
| Broad Market Index | | | | | 5,045,328 | | | | — | | | | 5,045,328 | |
| Mid/Small Company Index | | | | | 112,981 | | | | 3,865,945 | | | | 3,978,926 | |
| Model Portfolio Savings Oriented | | | | | 101,896 | | | | 6,116,464 | | | | 6,218,360 | |
| Model Portfolio Conservative Growth | | | | | 55,198 | | | | 15,618,882 | | | | 15,674,080 | |
| Model Portfolio Traditional Growth | | | | | 223,136 | | | | 56,312,526 | | | | 56,535,662 | |
| Model Portfolio Long-Term Growth | | | | | 258,092 | | | | 81,346,724 | | | | 81,604,816 | |
| Model Portfolio All-Equity Growth | | | | | 27,705 | | | | 37,160,388 | | | | 37,188,093 | |
| Milestone Retirement Income | | | | | 46,562 | | | | 1,357,524 | | | | 1,404,086 | |
| Milestone 2010 | | | | | 26,941 | | | | 2,105,612 | | | | 2,132,553 | |
| Milestone 2015 | | | | | 35,444 | | | | 4,797,162 | | | | 4,832,606 | |
| Milestone 2020 | | | | | 28,861 | | | | 4,481,504 | | | | 4,510,365 | |
| Milestone 2025 | | | | | 16,199 | | | | 3,789,742 | | | | 3,805,941 | |
| Milestone 2030 | | | | | 12,393 | | | | 3,049,124 | | | | 3,061,517 | |
| Milestone 2035 | | | | | 4,655 | | | | 1,855,644 | | | | 1,860,299 | |
| Milestone 2040 | | | | | 5,809 | | | | 1,835,192 | | | | 1,841,001 | |
The tax character of distributions paid during 2007 were as follows:
Fund
| | | | Distributions
Paid from
Ordinary
Income
| | Distributions
Paid from
Long-Term
Capital Gains
| | Return of
Capital
| | Total
Distributions
|
|---|
| Money Market | | | | $ | 12,287,780 | | | $ | — | | | $ | — | | | $ | 12,287,780 | |
| Low Duration Bond | | | | | 26,485,268 | | | | — | | | | — | | | | 26,485,268 | |
| Inflation Protected Securities | | | | | 7,993,265 | | | | — | | | | — | | | | 7,993,265 | |
| Asset Allocation | | | | | 28,599,612 | | | | 5,239,255 | | | | — | | | | 33,838,867 | |
| Equity Income | | | | | 24,203,587 | | | | 59,852,485 | | | | — | | | | 84,056,072 | |
| Growth & Income | | | | | 25,879,723 | | | | 121,152,754 | | | | — | | | | 147,032,477 | |
| Growth | | | | | 11,708,202 | | | | — | | | | — | | | | 11,708,202 | |
| Select Value | | | | | 1,099,764 | | | | — | | | | — | | | | 1,099,764 | |
| Aggressive Opportunities | | | | | 31,772,087 | | | | 165,768,166 | | | | — | | | | 197,540,253 | |
| Discovery | | | | | 1,158,787 | | | | 794,758 | | | | — | | | | 1,953,545 | |
| International | | | | | 22,988,129 | | | | 132,659,285 | | | | — | | | | 155,647,414 | |
| Diversified Assets | | | | | 2,003,176 | | | | — | | | | — | | | | 2,003,176 | |
| Core Bond Index | | | | | 61,394,831 | | | | — | | | | — | | | | 61,394,831 | |
164
VANTAGEPOINT FUNDS
NOTES TO THE FINANCIAL STATEMENTS—(Continued)
Fund
| | | | Distributions
Paid from
Ordinary
Income
| | Distributions
Paid from
Long-Term
Capital Gains
| | Return of
Capital
| | Total
Distributions
|
|---|
| 500 Stock Index | | | | $ | 6,971,710 | | | $ | — | | | $ | — | | | $ | 6,971,710 | |
| Broad Market Index | | | | | 10,598,850 | | | | — | | | | — | | | | 10,598,850 | |
| Mid/Small Company Index | | | | | 3,400,128 | | | | 11,898,037 | | | | — | | | | 15,298,165 | |
| Overseas Equity Index | | | | | 6,822,329 | | | | 220,210 | | | | — | | | | 7,042,539 | |
| Model Portfolio Savings Oriented | | | | | 12,002,925 | | | | 5,981,350 | | | | — | | | | 17,984,275 | |
| Model Portfolio Conservative Growth | | | | | 18,844,064 | | | | 14,696,980 | | | | — | | | | 33,541,044 | |
| Model Portfolio Traditional Growth | | | | | 38,168,175 | | | | 71,985,890 | | | | — | | | | 110,154,065 | |
| Model Portfolio Long-Term Growth | | | | | 36,521,855 | | | | 103,061,552 | | | | — | | | | 139,583,407 | |
| Model Portfolio All-Equity Growth | | | | | 8,640,618 | | | | 61,259,144 | | | | — | | | | 69,899,762 | |
| Milestone Retirement Income | | | | | 1,612,846 | | | | 988,751 | | | | — | | | | 2,601,597 | |
| Milestone 2010 | | | | | 2,052,539 | | | | 3,405,892 | | | | — | | | | 5,458,431 | |
| Milestone 2015 | | | | | 3,335,738 | | | | 7,327,763 | | | | — | | | | 10,663,501 | |
| Milestone 2020 | | | | | 2,806,484 | | | | 5,915,709 | | | | — | | | | 8,722,193 | |
| Milestone 2025 | | | | | 1,805,857 | | | | 4,911,474 | | | | — | | | | 6,717,331 | |
| Milestone 2030 | | | | | 1,647,630 | | | | 3,055,275 | | | | — | | | | 4,702,905 | |
| Milestone 2035 | | | | | 813,987 | | | | 1,939,534 | | | | — | | | | 2,753,521 | |
| Milestone 2040 | | | | | 965,970 | | | | 1,393,935 | | | | — | | | | 2,359,905 | |
At December 31, 2007, the following funds had net capital loss carryovers:
| | | | Expiring December 31,
| |
|---|
Fund
| | | | 2010
| | 2011
| | 2013
| | 2014
| | 2015
|
|---|
| Low Duration Bond | | | | $ | — | | | $ | — | | | $ | 4,249,873 | | | $ | 3,180,132 | | | $ | 261,945 | |
| Inflation Protected Securities | | | | $ | — | | | $ | — | | | $ | 1,398,401 | | | $ | 1,993,824 | | | $ | 48,256 | |
| Growth | | | | $ | 125,715,287 | | | $ | 82,974,331 | | | $ | — | | | $ | — | | | $ | — | |
| Core Bond Index | | | | $ | — | | | $ | — | | | $ | 4,825,601 | | | $ | 8,705,385 | | | $ | 4,299,528 | |
| 500 Stock Index | | | | $ | 8,310,436 | | | $ | 3,056,924 | | | $ | — | | | $ | — | | | $ | — | |
| Broad Market Index | | | | $ | 7,552,852 | | | $ | 7,434,496 | | | $ | — | | | $ | — | | | $ | — | |
At December 31, 2007, the following funds elected to defer post-October net capital losses and currency losses of:
Fund
| | | | Capital Losses
| | Currency Losses
|
|---|
| Growth | | | | | 6,379,306 | | | | — | |
| Select Value | | | | | 2,845,905 | | | | — | |
| Discovery | | | | | 6,743,311 | | | | — | |
| Diversified Assets | | | | | 356,827 | | | | 522,094 | |
| Core Bond Index | | | | | 141,644 | | | | — | |
| Overseas Equity Index | | | | | 347,099 | | | | — | |
Futures Contracts
A futures contract is an agreement between two parties to buy and sell a security, commodity, or index at a set price on a future date. Pursuant to the contract, the fund agrees to receive from or pay to the broker an amount of cash equal to the daily fluctuation in the value of the contract. Such receipts or payments are known as “variation margin” and are recorded by the fund as unrealized gains or losses. When the contract is closed, the fund records a gain or loss equal to the difference between the value of the contract at the time it was opened and the value at the time it was closed. Risks of entering into futures contracts include the possibility that there may be an illiquid market and that a change in the value of the contracts may not correlate with changes in the value of the underlying securities. The amounts of risk under such futures contracts may exceed the amounts reflected in the financial statements. As of December 31, 2007, the following funds had the following open futures contracts outstanding:
165
VANTAGEPOINT FUNDS
NOTES TO THE FINANCIAL STATEMENTS—(Continued)
Low Duration Bond Fund
Number of
Contracts
| | | | Exchange
| | Contract
| | Expiration Date
| | Underlying
Face Amount
at Value
| | Net
Unrealized
Appreciation
|
|---|
Purchased | | | | | | | | | | | | | | | | | | | | | | |
| 99 | | | | CBT | | U.S. 2 Year Treasury Note | | March 2008 | | $ | 20,814,750 | | | $ | 54,140 | |
| | | | | | | | | Total Unrealized Appreciation | $ | 54,140 | |
Inflation Protected Securities Fund |
Number of
Contracts
| | | | Exchange
| | Contract
| | Expiration Date
| | Underlying
Face Amount
at Value
| | Net
Unrealized
Appreciation/
(Depreciation)
|
|---|
Purchased | | | | | | | | | | | | | | | | | | | | | | |
| 8 | | | | CME | | 90 day Eurodollar | | June 2009 | | $ | 1,930,200 | | | $ | 39,200 | |
| 26 | | | | CME | | 90 day Eurodollar | | September 2008 | | $ | 6,273,150 | | | | 114,941 | |
| 23 | | | | CME | | 90 day Eurodollar | | December 2008 | | $ | 5,556,225 | | | | 109,562 | |
| 74 | | | | CBT | | U.S. 10 Year Treasury Note | | March 2008 | | $ | 8,390,906 | | | | 43,047 | |
| 66 | | | | CBT | | U.S. 5 Year Treasury Note | | March 2008 | | $ | 7,278,563 | | | | 31,051 | |
| | | | | | | | | | | | | | | $ | 337,801 | |
Sold | | | | | | | | | | | | | | | | | | | | |
| 1 | | | | EUX | | Euro Bund | | March 2008 | | $ | 164,858 | | | $ | 2,612 | |
| 53 | | | | CBT | | U.S. Treasury Bond | | March 2008 | | $ | 6,167,875 | | | | (92,624 | ) |
| 17 | | | | CBT | | U.S. 5 Year Treasury Note | | March 2008 | | $ | 1,874,781 | | | | (20,453 | ) |
| 20 | | | | CBT | | U.S. 10 Year Treasury Note | | March 2008 | | $ | 2,267,813 | | | | 2,969 | |
| | | | | | | | | | | | | | | $ | (107,496 | ) |
| | | | | | | | | Total Unrealized Appreciation | $ | 230,305 | |
Asset Allocation Fund |
Number of
Contracts
| | | | Exchange
| | Contract
| | Expiration Date
| | Underlying
Face Amount
at Value
| | Net
Unrealized
Depreciation
|
|---|
Purchased | | | | | | | | | | | | | | | | | | | | | | |
| 1,105 | | | | CME | | E-MINI S&P 500 Index | | March 2008 | | $ | 81,615,300 | | | $ | (1,180,662 | ) |
| 29 | | | | CME | | S&P 500 Index | | March 2008 | | $ | 10,709,700 | | | | (157,359 | ) |
| | | | | | | | | Total Unrealized Depreciation | $ | (1,338,021 | ) |
Discovery Fund |
Number of
Contracts
| | | | Exchange
| | Contract
| | Expiration Date
| | Underlying
Face Amount
at Value
| | Net
Unrealized
Depreciation
|
|---|
Purchased | | | | | | | | | | | | | | | | | | | | | | |
| 1,098 | | | | CME | | E-MINI Russell Index | | March 2008 | | $ | 84,787,560 | | | $ | (1,286,775 | ) |
| | | | | | | | | Total Unrealized Depreciation | $ | (1,286,775 | ) |
166
VANTAGEPOINT FUNDS
NOTES TO THE FINANCIAL STATEMENTS—(Continued)
Diversified Assets Fund
Number of
Contracts
| | | | Exchange
| | Contract
| | Expiration Date
| | Underlying
Face Amount
at Value
| | Net
Unrealized
Appreciation/
(Depreciation)
|
|---|
Purchased | | | | | | | | | | | | | | | | | | | | | | |
| 1 | | | | SGX | | 10 year mini—JGB | | March 2008 | | $ | 122,304 | | | $ | 457 | |
| 142 | | | | EOE | | Amsterdam Index | | January 2008 | | $ | 21,398,111 | | | | 362,890 | |
| 298 | | | | SFE | | Australian Government
Bond 10 Yr. | | March 2008 | | $ | 25,515,025 | | | | (203,321 | ) |
| 65 | | | | EUX | | Dax Index | | March 2008 | | $ | 19,289,739 | | | | 488,035 | |
| 47 | | | | EUX | | DJ Euro Stoxx50 | | March 2008 | | $ | 3,038,086 | | | | 38,528 | |
| 180 | | | | CME | | E-MINI S&P 500 Index | | March 2008 | | $ | 13,294,800 | | | | (192,160 | ) |
| 104 | | | | LIF | | FTSE 100 Index | | March 2008 | | $ | 13,312,611 | | | | 279,168 | |
| 27 | | | | MFM | | IBEX 35 Index | | January 2008 | | $ | 5,946,360 | | | | (77,070 | ) |
| 28 | | | | CME | | S&P 500 Index | | March 2008 | | $ | 10,340,400 | | | | (163,100 | ) |
| 11 | | | | MIL | | S&P/MIB Index | | March 2008 | | $ | 3,120,085 | | | | 28,894 | |
| 185 | | | | TSE | | Topix Index | | March 2008 | | $ | 24,320,336 | | | | (1,400,522 | ) |
| 112 | | | | EUX | | Euro Bund | | March 2008 | | $ | 18,464,076 | | | | (332,648 | ) |
| | | | | | | | | | | | | | | $ | (1,170,849 | ) |
Sold | | | | | | | | | | | | | | | | | | | | |
| 36 | | | | CBT | | U.S. 10 Year Treasury Note | | March 2008 | | $ | 4,082,063 | | | $ | 1,125 | |
| 156 | | | | MNP | | CAC40 Euros | | January 2008 | | $ | 12,779,331 | | | | (256,927 | ) |
| 90 | | | | MSE | | Canadian 10 Year Bond | | March 2008 | | $ | 10,439,891 | | | | 21,981 | |
| 36 | | | | HKG | | Hang Seng Index | | January 2008 | | $ | 6,442,628 | | | | (182,638 | ) |
| 9 | | | | TSE | | Japanese Government
Bond 10 Yr. | | March 2008 | | $ | 11,011,358 | | | | (43,179 | ) |
| 414 | | | | SSE | | OMX Stockholm 30 Index | | January 2008 | | $ | 6,930,375 | | | | (36,245 | ) |
| 68 | | | | MSE | | S&P/TSX 60 Index | | March 2008 | | $ | 11,167,457 | | | | (209,545 | ) |
| 138 | | | | SFE | | SPI 200 Index | | March 2008 | | $ | 19,194,781 | | | | (143,075 | ) |
| 173 | | | | LIF | | UK Gilt Long Bond | | March 2008 | | $ | 37,816,347 | | | | (285,823 | ) |
| 33 | | | | EUX | | Dax Index | | March 2008 | | $ | 9,796,252 | | | | (280,460 | ) |
| 498 | | | | SFE | | Australian Government
Bond 10 Yr. | | March 2008 | | $ | 42,639,203 | | | | 497,903 | |
| 65 | | | | MIL | | S&P/MIB Index | | March 2008 | | $ | 18,436,865 | | | | (56,317 | ) |
| | | | | | | | | | | | | | | $ | (973,200 | ) |
| | | | | | | | | Total Unrealized Depreciation | $ | (2,144,049 | ) |
500 Stock Index Fund |
Number of
Contracts
| | | | Exchange
| | Contract
| | Expiration Date
| | Underlying
Face Amount
at Value
| | Net
Unrealized
Depreciation
|
|---|
Purchased | | | | | | | | | | | | | | | | | | | | | | |
| 108 | | | | CME | | E-MINI S&P 500 Index | | March 2008 | | $ | 7,976,880 | | | $ | (56,250 | ) |
| | | | | | | | | Total Unrealized Depreciation | $ | (56,250 | ) |
167
VANTAGEPOINT FUNDS
NOTES TO THE FINANCIAL STATEMENTS—(Continued)
Broad Market Index Fund
Number of
Contracts
| | | | Exchange
| | Contract
| | Expiration Date
| | Underlying
Face Amount
at Value
| | Net
Unrealized
Appreciation/
(Depreciation)
|
|---|
Purchased | | | | | | | | | | | | | | | | | | | | | | |
| 32 | | | | CME | | E-MINI Russell Index | | March 2008 | | $ | 2,471,040 | | | $ | 6,521 | |
| 180 | | | | CME | | E-MINI S&P 500 Index | | March 2008 | | $ | 13,294,800 | | | | (92,528 | ) |
| | | | | | | | | Total Unrealized Depreciation | $ | (86,007 | ) |
Mid/Small Company Index Fund
Number of
Contracts
| | | | Exchange
| | Contract
| | Expiration Date
| | Underlying
Face Amount
at Value
| | Net
Unrealized
Appreciation/
(Depreciation)
|
|---|
Purchased | | | | | | | | | | | | | | | | | | | | | | |
| 32 | | | | CME | | E-MINI Russell Index | | March 2008 | | $ | 2,471,040 | | | $ | 10,210 | |
| 29 | | | | CME | | E-MINI S&P Mid 400 Index | | March 2008 | | $ | 2,507,920 | | | | (21,069 | ) |
| | | | | | | | | Total Unrealized Depreciation | $ | (10,859 | ) |
Overseas Equity Index Fund
Number of
Contracts
| | | | Exchange
| | Contract
| | Expiration Date
| | Underlying
Face Amount
at Value
| | Net
Unrealized
Appreciation/
(Depreciation)
|
|---|
Purchased | | | | | | | | | | | | | | | | | | | | | | |
| 60 | | | | EUX | | DJ STOXX 50 Index | | March 2008 | | $ | 3,878,408 | | | $ | 72,947 | |
| 19 | | | | LIF | | FTSE 100 Index | | March 2008 | | $ | 2,432,112 | | | | 57,391 | |
| 18 | | | | TSE | | Topix Index | | March 2008 | | $ | 2,366,303 | | | | (81,675 | ) |
| | | | | | | | | Total Unrealized Appreciation | $ | 48,663 | |
Forward Foreign Currency Exchange Contracts
A forward foreign currency exchange contract is an agreement to pay or receive specific amounts of a currency at a future date in exchange for another currency at an agreed upon exchange rate. Such contracts are recorded at market value and marked to market daily. Risks of entering into forward foreign currency exchange contracts include the possibility that there may be an illiquid market and that a change in the value of the contracts may not correlate with changes in the value of the underlying securities. The amount at risk for such forward foreign currency exchange contracts may exceed the amount reflected in the financial statements. Realized and unrealized gains or losses on forward foreign currency exchange contracts are reflected in the accompanying financial statements. As of December 31, 2007, the funds had the following open forward foreign currency exchange contracts outstanding:
Inflation Protected Securities Fund
Currency
| | | | Exchange
Date
| | Foreign Currency
Cost/Proceeds (U.S.$)
| | U.S. Dollar Value
at December 31, 2007
| | Net Unrealized
Gain/(Loss)
|
|---|
Purchase Contracts | | | | | | | | | | | | | | | | |
| British Pound Sterling | | | | 01/02/2008 | | $ | 841 | | | $ | 838 | | | $ | (3 | ) |
| Euro Dollar | | | | 01/02/2008 | | | 2,119 | | | | 2,151 | | | | 32 | |
| | | | | | | Net Gain on Purchase Contracts | $ | 29 | |
168
VANTAGEPOINT FUNDS
NOTES TO THE FINANCIAL STATEMENTS—(Continued)
Currency
| | | | Exchange
Date
| | Foreign Currency
Cost/Proceeds (U.S.$)
| | U.S. Dollar Value
at December 31, 2007
| | Net Unrealized
Gain/(Loss)
|
|---|
Sale Contracts | | | | | | | | | | | | | | | | |
| Euro | | | | 01/02/2008 | | $ | 589 | | | $ | 583 | | | $ | 6 | |
| | | | | 01/17/2008 | | | 135,185 | | | | 134,124 | | | | 1,061 | |
| | | | | | | Net Gain on Sale Contracts | $ | 1,067 | |
| | | | | | | Net Unrealized Gain on Forward
Foreign Currency Contracts | $ | 1,096 | |
Discovery Fund
Currency
| | | | Exchange
Date
| | Foreign Currency
Cost/Proceeds (U.S.$)
| | U.S. Dollar Value
at December 31, 2007
| | Net Unrealized
Loss
|
|---|
Purchase Contracts | | | | | | | | | | | | | | | | |
| Canadian Dollar | | | | 01/02/2008 | | $ | 134,554 | | | $ | 133,165 | | | $ | (1,389 | ) |
| | | | | | | Net Unrealized Loss on Forward
Foreign Currency Contracts | $ | (1,389 | ) |
Diversified Assets Fund
Currency
| | | | Exchange
Date
| | Foreign Currency
Cost/Proceeds (U.S.$)
| | U.S. Dollar Value
at December 31, 2007
| | Net Unrealized
Gain/(Loss)
|
|---|
Purchase Contracts | | | | | | | | | | | | | | | | |
| Australian Dollar | | | | 03/19/2008 | | $ | 23,580,180 | | | $ | 23,570,495 | | | $ | (9,685 | ) |
| British Pound Sterling | | | | 03/19/2008 | | | 56,827,124 | | | | 55,229,345 | | | | (1,597,779 | ) |
| Canadian Dollar | | | | 01/15/2008 | | | 4,528,840 | | | | 4,647,395 | | | | 118,555 | |
| | | | | 03/19/2008 | | | 2,214,930 | | | | 2,272,753 | | | | 57,823 | |
| Euro | | | | 01/11/2008 | | | 3,261,802 | | | | 3,236,116 | | | | (25,686 | ) |
| | | | | 03/19/2008 | | | 30,820,420 | | | | 30,692,188 | | | | (128,232 | ) |
| Japanese Yen | | | | 01/15/2008 | | | 16,459,117 | | | | 16,317,395 | | | | (141,722 | ) |
| | | | | 03/19/2008 | | | 2,871,604 | | | | 2,932,595 | | | | 60,991 | |
| New Zealand Dollar | | | | 03/19/2008 | | | 14,131,298 | | | | 13,976,119 | | | | (155,179 | ) |
| Norwegian Krone | | | | 03/19/2008 | | | 35,005,619 | | | | 34,832,042 | | | | (173,577 | ) |
| Swedish Krona | | | | 01/11/2008 | | | 6,399,465 | | | | 6,333,501 | | | | (65,964 | ) |
| | | | | 03/19/2008 | | | 13,984,058 | | | | 13,908,580 | | | | (75,478 | ) |
| Swiss Franc | | | | 03/19/2008 | | | 26,167 | | | | 26,650 | | | | 483 | |
| | | | | | | Net Loss on Purchase Contracts | $ | (2,135,450 | ) |
Sale Contracts | | | | | | | | | | | | | | | | |
| Australian Dollar | | | | 03/19/2008 | | $ | 14,883,139 | | | $ | 14,948,059 | | | $ | (64,920 | ) |
| Canadian Dollar | | | | 01/15/2008 | | | 6,103,497 | | | | 6,263,880 | | | | (160,383 | ) |
| | | | | 03/19/2008 | | | 50,052,548 | | | | 51,150,078 | | | | (1,097,530 | ) |
| Euro | | | | 01/11/2008 | | | 6,519,410 | | | | 6,472,232 | | | | 47,178 | |
| | | | | 03/19/2008 | | | 36,770,250 | | | | 36,465,388 | | | | 304,862 | |
| Japanese Yen | | | | 01/15/2008 | | | 11,432,913 | | | | 11,448,134 | | | | (15,221 | ) |
| | | | | 03/19/2008 | | | 5,531,165 | | | | 5,453,030 | | | | 78,135 | |
| New Zealand Dollar | | | | 03/19/2008 | | | 3,570,329 | | | | 3,563,493 | | | | 6,836 | |
| Norwegian Krone | | | | 03/19/2008 | | | 14,333,921 | | | | 14,460,981 | | | | (127,060 | ) |
| Swedish Krona | | | | 01/11/2008 | | | 3,178,362 | | | | 3,151,303 | | | | 27,059 | |
| | | | | 03/19/2008 | | | 9,523,294 | | | | 9,419,663 | | | | 103,631 | |
| Swiss Franc | | | | 03/19/2008 | | | 71,317,574 | | | | 70,988,708 | | | | 328,866 | |
| | | | | | | Net Loss on Sale Contracts | $ | (568,547 | ) |
| | | | | | | Net Unrealized Loss on Forward
Foreign Currency Contracts | $ | (2,703,997 | ) |
169
VANTAGEPOINT FUNDS
NOTES TO THE FINANCIAL STATEMENTS—(Continued)
International Fund
Currency
| | | | Exchange
Date
| | Foreign Currency
Cost/Proceeds (U.S.$)
| | U.S. Dollar Value
at December 31, 2007
| | Net Unrealized
Gain/(Loss)
|
|---|
Purchase Contracts | | | | | | | | | | | | | | | | |
| Australian Dollar | | | | 01/02/2008 | | $ | 33,410 | | | $ | 33,336 | | | $ | (74 | ) |
| | | | | 01/03/2008 | | | 31,327 | | | | 31,425 | | | | 98 | |
| | | | | 01/04/2008 | | | 13,184 | | | | 13,178 | | | | (6 | ) |
| | | | | 01/30/2008 | | | 1,421,829 | | | | 1,373,534 | | | | (48,295 | ) |
| British Pound Sterling | | | | 01/03/2008 | | | 91,164 | | | | 90,738 | | | | (426 | ) |
| Euro Dollar | | | | 01/02/2008 | | | 720,230 | | | | 718,656 | | | | (1,574 | ) |
| | | | | 01/03/2008 | | | 685,237 | | | | 680,847 | | | | (4,390 | ) |
| | | | | 01/04/2008 | | | 24,554 | | | | 24,553 | | | | (1 | ) |
| Hong Kong Dollar | | | | 01/02/2008 | | | 64,578 | | | | 64,624 | | | | 46 | |
| Japanese Yen | | | | 01/04/2008 | | | 297,549 | | | | 303,403 | | | | 5,854 | |
| | | | | 01/07/2008 | | | 378,840 | | | | 381,686 | | | | 2,846 | |
| | | | | 01/08/2008 | | | 143,149 | | | | 144,182 | | | | 1,033 | |
| Norwegian Krone | | | | 01/03/2008 | | | 231,584 | | | | 232,093 | | | | 509 | |
| | | | | 01/04/2008 | | | 518,110 | | | | 514,683 | | | | (3,427 | ) |
| Swiss Franc | | | | 01/03/2008 | | | 137,843 | | | | 138,427 | | | | 584 | |
| | | | | 01/30/2008 | | | 1,425,768 | | | | 1,458,949 | | | | 33,181 | |
| | | | | | | Net Loss on Purchase Contracts | $ | (14,042 | ) |
Sale Contracts | | | | | | | | | | | | | | | | |
| Australian Dollar | | | | 01/30/2008 | | $ | 1,425,769 | | | $ | 1,380,482 | | | $ | 45,287 | |
| British Pound Sterling | | | | 01/02/2008 | | | 213,628 | | | | 212,269 | | | | 1,359 | |
| | | | | 01/04/2008 | | | 19,348 | | | | 19,354 | | | | (6 | ) |
| Canadian Dollar | | | | 01/02/2008 | | | 7,122 | | | | 7,141 | | | | (19 | ) |
| Euro Dollar | | | | 01/02/2008 | | | 61,910 | | | | 62,805 | | | | (895 | ) |
| | | | | 01/04/2008 | | | 235,240 | | | | 233,076 | | | | 2,164 | |
| Hong Kong Dollar | | | | 01/03/2008 | | | 392,336 | | | | 392,628 | | | | (292 | ) |
| Japanese Yen | | | | 01/04/2008 | | | 223,835 | | | | 229,440 | | | | (5,605 | ) |
| | | | | 01/07/2008 | | | 100,060 | | | | 100,812 | | | | (752 | ) |
| | | | | 01/08/2008 | | | 40,901 | | | | 41,045 | | | | (144 | ) |
| | | | | 03/05/2008 | | | 2,096,000 | | | | 2,062,486 | | | | 33,514 | |
| Singapore Dollar | | | | 01/02/2008 | | | 198,890 | | | | 200,483 | | | | (1,593 | ) |
| | | | | 01/03/2008 | | | 73,259 | | | | 73,638 | | | | (379 | ) |
| | | | | 01/04/2008 | | | 126,354 | | | | 126,438 | | | | (84 | ) |
| Swiss Franc | | | | 01/30/2008 | | | 1,421,829 | | | | 1,458,949 | | | | (37,120 | ) |
| | | | | | | Net Gain on Sale Contracts | $ | 35,435 | |
| | | | | | | Net Unrealized Gain on Forward
Foreign Currency Contracts | $ | 21,393 | |
170
VANTAGEPOINT FUNDS
NOTES TO THE FINANCIAL STATEMENTS—(Continued)
Overseas Equity Index Fund
Currency
| | | | Exchange
Date
| | Foreign Currency
Cost/Proceeds (U.S.$)
| | U.S. Dollar Value
at December 31, 2007
| | Net Unrealized
Gain/(Loss)
|
|---|
Purchase Contracts | | | | | | | | | | | | | | | | |
| Australian Dollar | | | | 01/02/2008 | | $ | 818,495 | | | $ | 816,399 | | | $ | (2,096 | ) |
| British Pound Sterling | | | | 03/19/2008 | | | 3,828,720 | | | | 3,722,657 | | | | (106,063 | ) |
| Danish Krone | | | | 01/03/2008 | | | 85,221 | | | | 84,956 | | | | (265 | ) |
| Euro | | | | 01/02/2008 | | | 1,985,646 | | | | 1,979,669 | | | | (5,977 | ) |
| | | | | 01/03/2008 | | | 1,201,834 | | | | 1,198,217 | | | | (3,617 | ) |
| | | | | 03/19/2008 | | | 7,288,740 | | | | 7,239,085 | | | | (49,655 | ) |
| Hong Kong Dollar | | | | 01/02/2008 | | | 364,847 | | | | 365,088 | | | | 241 | |
| Japanese Yen | | | | 01/07/2008 | | | 2,093,240 | | | | 2,127,684 | | | | 34,444 | |
| | | | | 03/19/2008 | | | 4,517,497 | | | | 4,504,861 | | | | (12,636 | ) |
| Norwegian Krone | | | | 01/03/2008 | | | 89,457 | | | | 89,671 | | | | 214 | |
| Singapore Dollar | | | | 01/02/2008 | | | 78,793 | | | | 79,382 | | | | 589 | |
| Swedish Krona | | | | 01/03/2008 | | | 138,500 | | | | 138,457 | | | | (43 | ) |
| Swiss Franc | | | | 01/03/2008 | | | 820,334 | | | | 823,732 | | | | 3,398 | |
| | | | | | | Net Loss on Purchase Contracts | $ | (141,466 | ) |
Sale Contracts | | | | | | | | | | | | | | | | |
| British Pound Sterling | | | | 03/19/2008 | | $ | 2,114,575 | | | $ | 2,108,207 | | | $ | 6,368 | |
| Euro | | | | 03/19/2008 | | | 5,006,605 | | | | 5,035,286 | | | | (28,681 | ) |
| Japanese Yen | | | | 03/19/2008 | | | 2,233,910 | | | | 2,284,400 | | | | (50,490 | ) |
| | | | | | | Net Loss on Sale Contracts | $ | (72,803 | ) |
| | | | | | | Net Unrealized Loss on Forward
Foreign Currency Contracts | $ | (214,269 | ) |
Option Contracts
Purchases of put and call options are recorded as an investment, the value of which is marked to market at each valuation date. When a purchased option expires, the fund will realize a loss equal to the premium paid. When a fund enters into a closing sale transaction, the fund will realize a gain or loss depending on whether the sales proceeds from the closing sale transaction are greater or less than the cost of the option. When a fund exercises a put option, it will realize a gain or loss from the sale of the underlying security and the proceeds from such sale will be decreased by the premium originally paid. When a fund exercises a call option, the cost of the security which the fund purchases upon exercise will be increased by the premium originally paid.
When a fund writes a call or put option, an amount equal to the premium received by the fund is recorded as a liability, the value of which is marked to market at each valuation date. When a written option expires, the fund realizes a gain equal to the amount of the premium originally received. When a fund enters into a closing purchase transaction, the fund realizes a gain (or loss if the cost of the closing purchase transaction exceeds the premium originally received when the option was sold/written) without regard to any unrealized gain or loss on the underlying security, and the liability related to such option is eliminated. When a call option is exercised, the fund realizes a gain or loss from the sale of the underlying security and the proceeds from such sale are increased by the amount of the premium originally received. When a put option is exercised, the amount of the premium originally received will reduce the cost of the security which the fund purchased upon exercise.
Options written are reported as a liability in the Statement of Assets and Liabilities. Gains and losses are reported in the Statement of Operations. Option contract transactions may incur a commission, in addition to the premium paid or received. The risk in writing a call option is that the fund gives up the opportunity for profit if the market price of the security increases and the option is exercised. The risk in writing a put option is that the fund may incur a loss if the market price of the security decreases and the option is exercised. The risk in buying an option is that the fund pays a premium whether or not the option is exercised. Written option activity for the year ended December 31, 2007 was as follows:
171
VANTAGEPOINT FUNDS
NOTES TO THE FINANCIAL STATEMENTS—(Continued)
| | | | Call Options
| | Put Options
| | Total
| |
|---|
Inflation Protected Securities Fund
| | | | # Contracts
| | Premium
| | # Contracts
| | Premium
| | # Contracts
| | Premium
|
|---|
| Beginning balance as of 01/01/2007 | | | | | — | | | $ | — | | | | — | | | $ | — | | | | — | | | $ | — | |
| Contracts written | | | | | 327 | | | $ | 100,629 | | | | 223 | | | $ | 66,909 | | | | 550 | | | $ | 167,538 | |
| Contracts closed | | | | | (304 | ) | | $ | (91,719 | ) | | | (123 | ) | | $ | (25,047 | ) | | | (427 | ) | | $ | (116,766 | ) |
| Contracts expired | | | | | — | | | $ | — | | | | — | | | $ | — | | | | — | | | $ | — | |
| Ending balance as of 12/31/2007 | | | | | 23 | | | $ | 8,910 | | | | 100 | | | $ | 41,862 | | | | 123 | | | $ | 50,772 | |
Option Type
| | | | Inflation Protected Securities
| | # Contracts
| | Strike
Price
| | Expiration
Date
| | Unrealized
Gain/(Loss)
|
|---|
| Call | | | | U.S. 10 Year Treasury Note | | | 23 | | | $ | 111.00 | | | | 02/22/2008 | | | $ | (56,497 | ) |
| Put | | | | CBT U.S. Treasury Note | | | 100 | | | $ | 106.00 | | | | 02/22/2008 | | | $ | 40,300 | |
| | | | | | | | | | | | | | | | | | | $ | (16,197 | ) |
| | | | Call Options
| | Put Options
| | Total
| |
|---|
Diversified Assets Fund
| | | | # Contracts
| | Premium
| | # Contracts
| | Premium
| | # Contracts
| | Premium
|
|---|
| Beginning balance as of 01/01/2007 | | | | | — | | | $ | — | | | | — | | | $ | — | | | | — | | | $ | — | |
| Contracts written | | | | | — | | | $ | — | | | | 2,010 | | | $ | 442,715 | | | | 2,010 | | | $ | 442,715 | |
| Contracts closed | | | | | — | | | $ | — | | | | (1,100 | ) | | $ | (205,544 | ) | | | (1,100 | ) | | $ | (205,544 | ) |
| Contracts expired | | | | | — | | | $ | — | | | | — | | | $ | — | | | | — | | | $ | — | |
| Ending balance as of 12/31/2007 | | | | | — | | | $ | — | | | | 910 | | | $ | 237,171 | | | | 910 | | | $ | 237,171 | |
Option Type
| | | | Diversified Assets Fund
| | # Contracts
| | Strike
Price
| | Expiration
Date
| | Unrealized
Gain/(Loss)
|
|---|
| Put | | | | Swiss Market Index | | | 910 | | | $ | 7,472 | USD | | | 03/20/2008 | | | $ | 6,722 | |
Swap Agreements
A swap is an agreement to exchange the return generated by one instrument for the return generated by another instrument. Interest rate swap agreements involve the exchange between two parties of their respective commitments to pay or receive interest. An inflation swap agreement is a contact between two counterparties who agree to swap cash flows based on the inflation rate against fixed cash flows. Total return swap agreements are contracts in which one party agrees to make periodic payments to another party based on the change in market value of the assets underlying the contract, which may include a specified security, basket of securities or securities indices during the specified period, in return for periodic payments based on a fixed or variable interest rate or the total return from other underlying assets. Credit default swaps are contracts whereby one party makes periodic payments to a counterparty in exchange for the right to receive from the counterparty a payment equal to the par (or other agreed-upon) value of a referenced debt obligation in the event of a default by the issuer of the debt obligation. The swaps listed below are marked to market daily using a Bloomberg Swap Curve Calculator, or other third party pricing vendors, and the change in value, if any, is recorded as unrealized gain or loss in the Statement of Operations. The risks associated with swap agreements include the risk that the party with whom the Fund has entered into the swap will default on its obligation to pay the Fund and the risk that the Fund will not be able to meet its obligations to pay the other party to the agreements. In certain types of swap transactions the risk of loss is increased because the Fund may be required to make payments to the counterparty in addition to the agreed upon payments due to market volatility. In addition, swap agreements are not traded on exchanges or other organized markets and thus may be less liquid than other derivative instruments. At December 31, 2007, the following swap agreements were outstanding:
172
VANTAGEPOINT FUNDS
NOTES TO THE FINANCIAL STATEMENTS—(Continued)
Inflation Protected Securities Fund
Notional Amount
| | | | Expiration
Date
| | Description
| | Net Unrealized
Gain/(Loss)
|
|---|
| AUD 8,700,000 | | | | | 6/15/2010 | | | This is an Interest Rate Swap Agreement with Deutsche Bank AG, notional amount 8,700,000 Australian Dollar (AUD), entered into by PIMCO on June 19, 2007. In this swap, the Fund has contractually arranged to receive a fixed rate of 7.0% and pay a floating rate of the 6-month Australian Bank Bill (the floating index), resetting every six months, during the period from June 16, 2008 to June 15, 2010. | | $ | (62,371 | ) |
| CAD 100,000 | | | | | 6/20/2012 | | | This is an Interest Rate Swap Agreement with Bank of America, notional amount 100,000 Canadian Dollar (CAD), entered into by PIMCO on December 4, 2007. In this swap, the Fund has contractually arranged to pay a fixed rate of 5.0% and receive a floating rate of 3-month Canadian LIBOR (the floating index), resetting every quarter, during the period from June 20, 2009 to June 20, 2012. | | $ | (1,073 | ) |
| CAD 100,000 | | | | | 6/20/2017 | | | This is an Interest Rate Swap Agreement with Bank of America, notional amount 100,000 CAD, entered into by PIMCO on December 4, 2007. In this swap, the Fund has contractually arranged to receive a fixed rate of 5.5% and pay a floating rate of 3-month Canadian LIBOR (the floating index), resetting every quarter, during the period from June 20, 2012 to June 20, 2017. | | $ | 2,551 | |
| EUR 2,000,000 | | | | | 3/19/2010 | | | This is an Interest Rate Swap Agreement with Deutsche Bank AG, notional amount 2,000,000 Euro (EUR), entered into by PIMCO on December 21, 2007. In this swap, the Fund has contractually arranged to receive a fixed rate of 4.5% and pay a floating rate of 6 month EURIBOR rate (the floating index), resetting every six months, during the period from March 19, 2008 to March 19, 2010. | | $ | 2,378 | |
| EUR 2,000,000 | | | | | 3/19/2010 | | | This is an Interest Rate Swap Agreement with Morgan Stanley Capital Services, Inc., notional amount 2,000,000 EUR, entered into by PIMCO on December 21, 2007. In this swap, the Fund has contractually arranged to receive a fixed rate of 4.5% and pay a floating rate of 6 month EURIBOR rate (the floating index), resetting every six months, during the period from March 19, 2008 to March 19, 2010. | | $ | 2,378 | |
| EUR 1,100,000 | | | | | 9/14/2012 | | | This is an Inflation Rate Swap Agreement with Barclays Bank PLC, notional amount EUR 1,100,000, entered into by PIMCO on September 12, 2007. In this swap, the Fund has contractually arranged to receive a fixed rate of 2.07% and pay the French Non-Revised Index of Consumer Prices excluding Tobacco (the Inflation Index) during the period from September 14, 2007 to September 14, 2012. | | $ | (24,446 | ) |
173
VANTAGEPOINT FUNDS
NOTES TO THE FINANCIAL STATEMENTS—(Continued)
Notional Amount
| | | | Expiration
Date
| | Description
| | Net Unrealized
Gain/(Loss)
|
|---|
| JPY 200,000,000 | | | | | 3/18/2009 | | | This is an Interest Rate Swap Agreement with Morgan Stanley Capital Services Inc., notional amount 200,000,000 Japanese Yen (JPY), entered into by PIMCO on June 5, 2007. In this swap, the Fund has contractually arranged to receive a fixed rate of 1% and pay a floating rate of 6-month Japanese LIBOR (the floating index), resetting every six months, during the period from March 19, 2008 to March 18, 2009. | | $ | 1,170 | |
| USD 600,000 | | | | | 6/18/2013 | | | This is an Interest Rate Swap Agreement with Royal Bank of Scotland PLC, notional amount $600,000, entered into by PIMCO on December 13, 2007. In this swap, the Fund has contractually arranged to pay a fixed rate of 4.0% and receive a floating rate of 3-month LIBOR (the floating index), resetting every quarter, during the period from June 18, 2008 to June 18, 2013. | | $ | 5,611 | |
| USD 200,000 | | | | | 6/18/2038 | | | This is an Interest Rate Swap Agreement with Deutshce Bank AG, notional amount $200,000, entered into by PIMCO on December 13, 2007. In this swap, the Fund has contractually arranged to receive a fixed rate of 5.0% and pay a floating rate of 3-month LIBOR (the floating index), resetting every quarter, during the period from June 18, 2008 to June 18, 2038. | | $ | (978 | ) |
| GBP 200,000 | | | | | 9/10/2027 | | | This is an Inflation Rate Swap Agreement with Royal Bank of Scotland PLC, notional amount British Pound (GBP) 200,000, entered into by PIMCO on September 10, 2007. In this swap, the Fund has contractually arranged to receive a fixed rate of 3.44% and pay the UK Non-revised Retail Price Index All Items (the inflation index) during the period from September 10, 2007 to September 10, 2027. | | $ | (6,389 | ) |
| GBP 500,000 | | | | | 12/19/2017 | | | This is an Inflation Rate Swap Agreement with Royal Bank of Scotland PLC, total notional amount GBP 500,000, entered into by PIMCO on December 19, 2007 (notional GBP 200,000) and on December 21, 2007 (notional GBP 300,000). In this swap, the Fund has contractually arranged to receive a fixed rate of 3.1825% and pay the UK Non-revised Retail Price Index All Items (the inflation index) during the period from December 27, 2007 to December 19, 2017. | | $ | 1,515 | |
| GBP 400,000 | | | | | 12/14/2017 | | | This is an Inflation Rate Swap Agreement with Barclays Bank PLC, notional amount GBP 400,000, entered into by PIMCO on December 07, 2007. In this swap, the Fund has contractually arranged to receive a fixed rate of 3.25% and pay the UK Non-revised Retail Price Index All Items (the inflation index) during the period from December 14, 2007 to December 14, 2017. | | $ | 4,775 | |
| | | | | | | | | Total Unrealized Gain/(Loss) | | $ | (74,879 | ) |
174
VANTAGEPOINT FUNDS
NOTES TO THE FINANCIAL STATEMENTS—(Continued)
Diversified Assets Fund
Notional Amount
| | | | Expiration
Date
| | Description
| | Net Unrealized
Gain/(Loss)
|
|---|
| USD 1,500,000 | | | | | 12/20/2009 | | | This is a Credit Default Swap Agreement with Lehman Brothers Special Finance, notional amount $1,500,000, entered into by Drake Capital Management on October 30, 2007. In this swap, the Fund has contractually arranged to receive 3.6% times the notional amount. The Fund makes payment only upon a default event of Mediacom LLC/Mediacom Capital Corp Note. | | $ | (52,154 | ) |
| USD 38,000,000 | | | | | 5/1/2009 | | | This is an Interest Rate Swap Agreement with Lehman Brothers Special Finance, notional amount $38,000,000, entered into by Drake Capital Management on October 30, 2007. In this swap, the Fund has contractually arranged to receive a fixed rate of 4.46% and pay a floating rate of 3-month LIBOR (the floating index), resetting every quarter, during the period from November 1, 2007 to May 1, 2009. | | $ | 259,867 | |
| USD 38,000,000 | | | | | 11/1/2009 | | | This is an Interest Rate Swap Agreement with Lehman Brothers Special Finance, notional amount $38,000,000, entered into by Drake Capital Management on October 30, 2007. In this swap, the Fund has contractually arranged to receive a fixed rate of 4.4475% and pay a floating rate of 3-month LIBOR (the floating index), resetting every quarter, during the period from November 1, 2007 to November 1, 2009. | | $ | 412,312 | |
| USD 16,000,000 | | | | | 5/1/2010 | | | This is an Interest Rate Swap Agreement with Lehman Brothers Special Finance, notional amount $16,000,000, entered into by Drake Capital Management on October 30, 2007. In this swap, the Fund has contractually arranged to receive a fixed rate of 4.4625% and pay a floating rate of 3-month LIBOR (the floating index), resetting every quarter, during the period from November 1, 2007 to May 1, 2010. | | $ | 223,644 | |
| USD 16,000,000 | | | | | 11/1/2010 | | | This is an Interest Rate Swap Agreement with Lehman Brothers Special Finance, notional amount $16,000,000, entered into by Drake Capital Management on October 30, 2007. In this swap, the Fund has contractually arranged to receive a fixed rate of 4.5125% and pay a floating rate of 3-month LIBOR (the floating index), resetting every quarter, during the period from November 1, 2007 to November 1, 2010. | | $ | 266,236 | |
| EUR 5,800,000 | | | | | 3/05/2008 | | | This is a Total Return Swap Agreement with Morgan Stanley Capital Services, Inc. with respect to Euro Bund futures contracts, notional amount EUR 5,800,000, entered into by Analytic Investors on December 4, 2007. In this swap, the Fund has contractually arranged to receive the total return that would otherwise be realized on the underlying futures contracts if the total return is positive or pay the total return that would otherwise be realized on the underlying futures contracts if the total return is negative. | | $ | (207,910 | ) |
175
VANTAGEPOINT FUNDS
NOTES TO THE FINANCIAL STATEMENTS—(Continued)
Notional Amount
| | | | Expiration
Date
| | Description
| | Net Unrealized
Gain/(Loss)
|
|---|
| GBP 22,200,000 | | | | | 3/31/2008 | | | This is a Total Return Swap Agreement with Morgan Stanley Capital Services, Inc. with respect to Long Gilt futures contracts, notional amount GBP 22,200,000, entered into by Analytic Investors on November 27, 2007. In this swap, the Fund has contractually arranged to pay the total return that would otherwise be realized on the underlying futures contracts if the total return is positive or receive the total return that would otherwise be realized on the underlying futures contracts if the total return is negative. | | $ | 8,802 | |
| JPY 3,800,000,000 | | | | | 3/07/2008 | | | This is a Total Return Swap Agreement with Morgan Stanley Capital Services, Inc. with respect to the Japanese 10-Year Bond (TSE) futures contracts, notional amount JPY 3,800,000,000, entered into by Analytic Investors on December 10, 2007. In this swap, the Fund has contractually arranged to receive the total return that would otherwise be realized on the underlying futures contracts if the total return is positive or pay the total return that would otherwise be realized on the underlying futures contracts if the total return is negative. | | $ | 186,895 | |
| JPY 500,000,000 | | | | | 3/07/2008 | | | This is a Total Return Swap Agreement with Morgan Stanley Capital Services, Inc. with respect to the Japanese 10-Year Bond (TSE) futures contracts, notional amount JPY 500,000,000, entered into by Analytic Investors on December 6, 2007. In this swap, the Fund has contractually arranged to receive the total return that would otherwise be realized on the underlying futures contracts if the total return is positive or pay the total return that would otherwise be realized on the underlying futures contracts if the total return is negative. | | $ | 30,851 | |
| USD 35,600,000 | | | | | 2/28/2008 | | | This is a Total Return Swap Agreement with Morgan Stanley Capital Services, Inc. with respect to U.S. 10-Year Treasury Note futures contracts, notional amount $35,600,000, entered into by Analytic Investors on November 28, 2007. In this swap, the Fund has contractually arranged to receive the total return that would otherwise be realized on the underlying futures contracts if the total return is positive or pay the total return that would otherwise be realized on the underlying futures contracts if the total return is negative. | | $ | 38,929 | |
| | | | | | | | | Total Unrealized Gain/(Loss) | | $ | 1,167,472 | |
176
VANTAGEPOINT FUNDS
NOTES TO THE FINANCIAL STATEMENTS—(Continued)
SwapOptions (“Swaptions”)
A swaption combines the features of an option and an interest rate swap. A swaption is an option to buy or sell an interest rate swap. Depending on the terms of the particular swaption, a fund will generally incur a greater degree of risk when it writes a swaption than it will incur when it purchases a swaption. When a fund purchases a swaption, it risks losing only the amount of the premium it has paid should it decide to let the option expire unexercised. However, when a fund writes a swaption, upon exercise of the option the fund will become obligated according to the terms of the underlying agreement. The fund records an unrealized gain or loss for the amount expected to be received or paid under the agreement if such agreement was terminated at valuation. The unrealized gain or loss is recorded in the fund’s Statement of Assets and Liabilities. Written swaption activity for the year ended December 31, 2007 was as follows:
| | | | Call Swaptions
| | Put Swaptions
| | Total
| |
|---|
Inflation Protected Securities Fund
| | | | # Contracts
| | Premium
| | # Contracts
| | Premium
| | # Contracts
| | Premium
|
|---|
| Beginning balance as of 01/01/2007 | | | | | — | | | $ | — | | | | — | | | $ | — | | | | — | | | $ | — | |
| Contracts written | | | | | 3,600,000 | | | $ | 103,985 | | | | 3,600,000 | | | $ | 98,010 | | | | 7,200,000 | | | $ | 201,995 | |
| Contracts closed | | | | | — | | | $ | — | | | | — | | | $ | — | | | | — | | | $ | — | |
| Contracts expired | | | | | — | | | $ | — | | | | — | | | $ | — | | | | — | | | $ | — | |
| Ending balance as of 12/31/2007 | | | | | 3,600,000 | | | $ | 103,985 | | | | 3,600,000 | | | $ | 98,010 | | | | 7,200,000 | | | $ | 201,995 | |
Exchange
| | | | Contract
| | Notional
Value
| | Strike
Price
| | Expiration
Date
| | Unrealized
Gain/(Loss)
|
|---|
| OTC | | | | Put—Interest Rate Swap | | $ | 300,000 | | | | 5.67 | % | | | 8/7/2008 | | | $ | 6,749 | |
| OTC | | | | Call—Interest Rate Swap | | $ | 300,000 | | | | 5.67 | % | | | 8/7/2008 | | | $ | (18,140 | ) |
| OTC | | | | Put—Interest Rate Swap | | $ | 400,000 | | | | 5.67 | % | | | 8/7/2008 | | | $ | 11,279 | |
| OTC | | | | Call—Interest Rate Swap | | $ | 400,000 | | | | 5.67 | % | | | 8/7/2008 | | | $ | (26,767 | ) |
| OTC | | | | Put—Interest Rate Swap | | $ | 1,200,000 | | | | 5.25 | % | | | 9/15/2008 | | | $ | 13,987 | |
| OTC | | | | Call—Interest Rate Swap | | $ | 1,200,000 | | | | 5.25 | % | | | 9/15/2008 | | | $ | (31,925 | ) |
| OTC | | | | Put—Interest Rate Swap | | $ | 1,700,000 | | | | 5.25 | % | | | 9/15/2008 | | | $ | 19,815 | |
| OTC | | | | Call—Interest Rate Swap | | $ | 1,700,000 | | | | 5.25 | % | | | 9/15/2008 | | | $ | (45,227 | ) |
| | | | | | | | | | | | | | | | | | | $ | (70,229 | ) |
Repurchase Agreements
Transactions involving purchases of securities under agreements to resell such securities at a specified price and time (“repurchase agreements”) are treated as collateralized financing transactions and are recorded at their contracted resale amounts. These repurchase agreements, if any, are detailed in each fund’s Schedule of Investments. The funds require that the cash investment be fully collateralized based on values that are marked to market daily. The collateral is generally held by an agent bank. It is VIA’s responsibility to value collateral daily and to obtain additional collateral as necessary to maintain the value at equal to or greater than 102% of market value. The repurchase agreements are collateralized by U.S. Government securities. If the custodian or counterparty becomes bankrupt, the funds’ realization of collateral might be delayed, or the funds may incur a cost or possible losses of principal and income in selling the collateral.
3. | | Agreements and Other Transactions with Affiliates |
VIA, a wholly owned subsidiary of ICMA-RC, provides investment advisory services to each of the funds. Pursuant to Master Advisory Agreements, VIA is entitled to receive 0.10% of the average daily net assets of each Actively Managed, Model Portfolio and Milestone Funds and 0.05% of the average daily net assets of the Index Funds. For these services, VIA received $15,959,442 in the aggregate for the year ended December 31, 2007.
177
VANTAGEPOINT FUNDS
NOTES TO THE FINANCIAL STATEMENTS—(Continued)
Effective July 1, 2005 the advisory fee paid to VIA for each Model Portfolio Fund is calculated as follows:
| • | | 0.10% on the first $500 million of net assets |
| • | | 0.09% on the next $500 million of net assets |
| • | | 0.08% on net assets over $1 billion. |
VIA and the Company contract with one or more subadvisers (“Subadvisers”) for the day-to-day management of each of the funds other than the Money Market Fund, Model Portfolio Funds and Milestone Funds. Each Subadviser is paid a fee by the funds during the year based on average net assets under management except that the subadviser fee for Analytic Investors Inc. and Mellon Capital Management Corporation for the Diversified Assets Fund is calculated based on the average net asset value of the fund’s assets allocated and assigned to each of them by VIA. The fee structure for many of the Subadvisers provides for a range of fees so that as average net assets of a fund increase the rate of fee paid decreases. With other subadvisers, one fee is applicable to all levels of assets under management. Additional information about each Subadviser’s fee is presented in the funds’ Prospectus and Statement of Additional Information. Presented below are the fees paid by the funds to Subadvisers during the year ended December 31, 2007. Fees are shown as an annual percentage of average net assets under management except that the subadviser fee for Analytic Investors Inc. and Mellon Capital Management Corporation for the Diversified Assets Fund is calculated based on the average net asset value of the assets allocated and assigned to each of them by VIA as well as total dollars paid. The total dollars below represent amounts paid to the Subadvisers for services performed during the period of April 1, 2006 through September 30, 2007.
Fund
| | | | Subadviser
| | Contractual Fee
as a Percentage of
Average Daily
Net Assets
(net of
subadviser
fee waivers)
| | Dollars Paid
|
|---|
| Low Duration Bond | | | | Payden & Rygel | | | 0.10 | % | | $ | 296,007 | |
| | | | | STW Fixed Income Management Ltd. | | | 0.18 | % | | | 547,451 | |
| |
| Inflation Protected Securities | | | | Mellon Capital Management Corporation (1) | | | 0.06 | % | | | 47,402 | |
| | | | | Pacific Investment Management Company, LLC (2) | | | 0.20 | % | | | 109,805 | |
| | | | | Fischer Francis Trees & Watts, Inc. (2) | | | 0.12 | % | | | 4,999 | |
| | | | | BlackRock Financial Management, Inc. (2) | | | 0.12 | % | | | — | |
| |
| Asset Allocation | | | | Mellon Capital Management Corporation | | | 0.23 | % | | | 1,761,239 | |
| |
| Equity Income | | | | Barrow, Hanley, Mewhinney & Strauss, Inc. | | | 0.23 | % | | | 1,231,077 | |
| | | | | T. Rowe Price Associates, Inc. | | | 0.37 | % | | | 1,926,946 | |
| | | | | Southeastern Asset Management, Inc. | | | 0.52 | % | | | 2,711,857 | |
| |
| Growth & Income | | | | Capital Guardian Trust Company (3) | | | 0.25 | % | | | 938,613 | |
| | | | | T. Rowe Price Associates, Inc. | | | 0.37 | % | | | 1,540,505 | |
| | | | | Wellington Management Company, LLP | | | 0.28 | % | | | 1,109,760 | |
| |
| Growth | | | | Fidelity Management & Research Company (4) | | | 0.62 | % | | | 504,840 | |
| | | | | Goldman Sachs Asset Management, L.P. | | | 0.22 | % | | | 958,804 | |
| | | | | Legg Mason Capital Management, Inc. | | | 0.39 | % | | | 2,676,786 | |
| | | | | Peregrine Capital Management | | | 0.36 | % | | | 2,477,032 | |
| | | | | Tukman Grossman Capital Management, Inc. | | | 0.50 | % | | | 2,729,581 | |
| | | | | Westfield Capital Management Company, LLC | | | 0.33 | % | | | 1,622,566 | |
| |
| Select Value | | | | Goldman Sachs Asset Management, L.P. | | | 0.40 | % | | | — | |
| | | | | WEDGE Capital Management L.L.P. | | | 0.55 | % | | | — | |
| | | | | Systematic Financial Management L.P. | | | 0.43 | % | | | — | |
178
VANTAGEPOINT FUNDS
NOTES TO THE FINANCIAL STATEMENTS—(Continued)
Fund
| | | | Subadviser
| | Contractual Fee
as a Percentage of
Average Daily
Net Assets
(net of
subadviser
fee waivers)
| | Dollars Paid
|
|---|
| Aggressive Opportunities | | | | Legg Mason Capital Management, Inc. | | | 0.39 | % | | | 1,355,657 | |
| | | | | Southeastern Asset Management, Inc. | | | 0.55 | % | | | 1,351,656 | |
| | | | | TimesSquare Capital Management, LLC | | | 0.49 | % | | | 1,783,373 | |
| | | | | T. Rowe Price Associates, Inc. | | | 0.58 | % | | | 2,518,555 | |
| |
| Discovery | | | | Payden & Rygel | | | 0.15 | % | | | — | |
| | | | | Wellington Management Company, LLP | | | 0.73 | % | | | — | |
| International | | | | Artisan Partners Limited Partnership | | | 0.70 | % | | $ | 1,921,759 | |
| | | | | Capital Guardian Trust Company (5) | | | 0.43 | % | | | 1,514,757 | |
| | | | | GlobeFlex Capital, LP | | | 0.40 | % | | | 682,467 | |
| | | | | Walter Scott & Partners Limited | | | 0.56 | % | | | 1,025,011 | |
| |
| Diversified Assets | | | | Analytic Investors, Inc | | | 0.45 | % | | | — | |
| | | | | Drake Capital Management, LLC | | | 0.23 | % | | | — | |
| | | | | Mellon Capital Management Corporation | | | 0.65 | % | | | — | |
| | | | | Payden & Rygel | | | 0.10 | % | | | — | |
| |
| Core Bond Index | | | | Mellon Capital Management Corporation | | | 0.02 | % | | | 246,432 | |
| |
| 500 Stock Index | | | | Mellon Capital Management Corporation | | | 0.02 | % | | | 60,091 | |
| |
| Broad Market Index | | | | Mellon Capital Management Corporation | | | 0.02 | % | | | 106,183 | |
| |
| Mid/Small Company Index | | | | Mellon Capital Management Corporation | | | 0.04 | % | | | 63,235 | |
| |
| Overseas Equity Index | | | | Mellon Capital Management Corporation | | | 0.07 | % | | | 97,638 | |
| (1) | | Effective May 1, 2007, Mellon Capital Management Corporation was terminated as a subadviser to the Inflation Protected Securities Fund. |
| (2) | | At a meeting held on December 8, 2006, the Board approved the appointment of PIMCO and FFTW to serve as subadvisers to the Inflation Protected Securities Fund in conjunction with a change in that fund’s name and principal investment strategy, which became effective May 1, 2007. FFTW was subsequently terminated on May 22, 2007. At a meeting held on September 7, 2007, the Board approved the appointment of BlackRock to serve as a subadviser to the fund, which became effective October 30, 2007. |
| (3) | | Minimum fee of $167,500 per year. |
| (4) | | From May 1, 2001 to June 30, 2006, FMR Co. Inc. served as a sub-subadviser to this fund and was compensated from the fees paid to this subadviser. Fee included is from April 1, 2006 to June 30, 2006. |
| (5) | | Minimum fee of $337,500 per year. |
Expenses
The Model Portfolio Funds and Milestone Funds incur fees and expenses indirectly as shareholders in their respective underlying funds and the Money Market Fund incurs fees and expenses indirectly as a shareholder of the AIM Portfolio. Because the underlying funds have varied expense and fee levels and the Model Portfolio, Milestone and Money Market Funds may own different proportions of such funds at different times, the amount of fees and expenses indirectly incurred by the Model Portfolio, Milestone, and Money Market Funds will vary.
Fee Waivers
If the aggregate advisory fees of the Growth Fund exceed 0.54% because of subadvisory changes, VIA will waive its advisory fee or reimburse expenses to the extent necessary on any resulting increase in subadvisory fees payable by the Growth Fund. This commitment will continue until such time as shareholders approve an increase in this limit. For the year ended December 31, 2007, no waiver or reimbursement was necessary to comply with the 0.54% maximum subadvisory fee rate.
179
VANTAGEPOINT FUNDS
NOTES TO THE FINANCIAL STATEMENTS—(Continued)
From January 3, 2005 until April 30, 2006, VIA contractually agreed to waive fees and/or reimburse expenses to each of the Milestone Funds limiting the direct operating expenses to no more than 0.05% of the Fund’s average daily net assets on an annualized basis. From May 1, 2006 through April 30, 2008, VIA contractually agreed to limit each Fund’s total fund operating expenses to the following percentages:
| Milestone Retirement Income | | | | 0.81% |
| Milestone 2010 | | | | 0.88% |
| Milestone 2015 | | | | 0.91% |
| Milestone 2020 | | | | 0.93% |
| Milestone 2025 | | | | 0.95% |
| Milestone 2030 | | | | 0.97% |
| Milestone 2035 | | | | 0.99% |
| Milestone 2040 | | | | 0.99% |
For the year ended December 31, 2007, VIA reimbursed each fund as follows:
| Milestone Retirement Income | | | | $62,948 |
| Milestone 2010 | | | | $33,167 |
| Milestone 2015 | | | | $6,953 |
| Milestone 2020 | | | | $8,149 |
| Milestone 2025 | | | | $27,777 |
| Milestone 2030 | | | | $31,495 |
| Milestone 2035 | | | | $52,238 |
| Milestone 2040 | | | | $54,672 |
T. Rowe Price voluntarily waives a portion of its aggregate subadvisory fees for the Growth & Income, Equity Income and Aggressive Opportunities Funds. This voluntary fee waiver was first implemented on May 1, 2003. Through September 30, 2005, 2.5% of the aggregate fees were waived on total assets managed between $250 million and $500 million and 5% of the aggregate fees were waived on total assets managed in excess of $500 million. Effective October 1, 2005, 2.5% of the aggregate fees were waived on the first $500 million of assets managed and 5% on assets managed in excess of $500 million. For the year ended December 31, 2007, this voluntary fee waiver totaled $254,964 of which $86,482 was allocated to the Equity Income Fund, $66,450 to the Growth & Income Fund and $102,032 to the Aggressive Opportunities Fund. Goldman Sachs Asset Management L.P. has agreed to voluntarily waive a portion of its subadvisory fee for the Select Value Fund to 0.28% on the first $200 million of assets, 0.24% on the next $100 million of assets, and 0.224% on assets over $700 million. For the year ended December 31, 2007, this waiver totaled $19,521. Payden & Rygel has agreed to waive its investment subadvisory fee until April 30, 2008 for the Diversified Assets Fund so that its fees will not exceed 0.08% of assets. For the year ended December 31, 2007, this waiver totaled $7,388.
4. | | Investment Portfolio Transactions |
Purchases and sales of investments, exclusive of short-term securities, for each fund for the year ended December 31, 2007 were as follows:
| | | | U.S. Government Obligations
| | Other Securities
| |
|---|
Fund
| | | | Purchases at Cost
| | Sales Proceeds
| | Purchases at Cost
| | Sales Proceeds
|
|---|
| Low Duration Bond | | | | $ | 469,612,074 | | | $ | 466,338,177 | | | $ | 411,719,374 | | | $ | 363,686,592 | |
| Inflation Protected Securities | | | | | 56,383,532 | | | | 191,458,698 | | | | 338,495,842 | | | | 99,207,149 | |
| Asset Allocation | | | | | | | | | | | | | 24,042,231 | | | | 93,440,574 | |
| Equity Income | | | | | | | | | | | | | 533,671,717 | | | | 272,863,425 | |
| Growth & Income | | | | | | | | | | | | | 493,471,430 | | | | 621,808,425 | |
| Growth | | | | | | | | | | | | | 1,335,942,635 | | | | 1,813,502,268 | |
| Select Value | | | | | | | | | | | | | 335,002,827 | | | | 32,479,033 | |
| Aggressive Opportunities | | | | | | | | | | | | | 600,087,886 | | | | 898,824,798 | |
| Discovery | | | | | 110,892,132 | | | | 47,856,383 | | | | 111,585,348 | | | | 7,102,580 | |
| International | | | | | | | | | | | | | 649,751,243 | | | | 686,475,157 | |
180
VANTAGEPOINT FUNDS
NOTES TO THE FINANCIAL STATEMENTS—(Continued)
| | | | U.S. Government Obligations
| | Other Securities
| |
|---|
Fund
| | | | Purchases at Cost
| | Sales Proceeds
| | Purchases at Cost
| | Sales Proceeds
|
|---|
| Diversified Assets | | | | $ | 100,368,737 | | | $ | 23,130,860 | | | $ | 156,374,196 | | | $ | 3,329,054 | |
| Core Bond Index | | | | | 774,060,970 | | | | 781,946,240 | | | | 119,978,549 | | | | 137,562,539 | |
| 500 Stock Index | | | | | | | | | | | | | 27,224,117 | | | | 21,247,198 | |
| Broad Market Index | | | | | | | | | | | | | 10,695,668 | | | | 29,665,815 | |
| Mid/Small Company Index | | | | | | | | | | | | | 69,425,939 | | | | 37,218,354 | |
| Overseas Equity Index | | | | | | | | | | | | | 86,306,652 | | | | 11,038,406 | |
| Model Portfolio Savings Oriented | | | | | | | | | | | | | 100,466,021 | | | | 81,459,682 | |
| Model Portfolio Conservative Growth | | | | | | | | | | | | | 199,626,990 | | | | 153,451,325 | |
| Model Portfolio Traditional Growth | | | | | | | | | | | | | 556,390,539 | | | | 402,949,895 | |
| Model Portfolio Long-Term Growth | | | | | | | | | | | | | 645,296,676 | | | | 437,580,737 | |
| Model Portfolio All-Equity Growth | | | | | | | | | | | | | 263,075,231 | | | | 127,846,025 | |
| Milestone Retirement Income | | | | | | | | | | | | | 57,578,318 | | | | 24,886,184 | |
| Milestone 2010 | | | | | | | | | | | | | 58,090,605 | | | | 35,691,964 | |
| Milestone 2015 | | | | | | | | | | | | | 100,419,510 | | | | 44,943,812 | |
| Milestone 2020 | | | | | | | | | | | | | 86,315,683 | | | | 35,367,672 | |
| Milestone 2025 | | | | | | | | | | | | | 62,025,418 | | | | 25,435,281 | |
| Milestone 2030 | | | | | | | | | | | | | 56,947,845 | | | | 20,323,043 | |
| Milestone 2035 | | | | | | | | | | | | | 29,870,406 | | | | 10,343,236 | |
| Milestone 2040 | | | | | | | | | | | | | 32,212,288 | | | | 10,764,050 | |
5. | | Tax Basis Unrealized Appreciation (Depreciation) |
At December 31, 2007, net unrealized appreciation (depreciation) on investments was as follows:
Fund
| | | | Federal
Income Tax
Cost
| | Gross
Unrealized
Appreciation
| | Gross
Unrealized
Depreciation
| | Tax Basis
Net Unrealized
Appreciation/
(Depreciation)
|
|---|
| Money Market | | | | $ | 304,391,144 | | | $ | — | | | $ | — | | | $ | — | |
| Low Duration Bond | | | | | 496,778,519 | | | | 3,957,031 | | | | 2,231,194 | | | | 1,725,837 | |
| Inflation Protected Securities | | | | | 264,646,652 | | | | 7,455,665 | | | | 9,227 | | | | 7,446,438 | |
| Asset Allocation | | | | | 632,334,410 | | | | 174,874,558 | | | | 43,112,047 | | | | 131,762,511 | |
| Equity Income | | | | | 1,645,572,075 | | | | 375,488,564 | | | | 128,587,904 | | | | 246,900,660 | |
| Growth & Income | | | | | 1,000,903,764 | | | | 206,150,861 | | | | 57,038,784 | | | | 149,112,077 | |
| Growth | | | | | 2,377,069,433 | | | | 411,383,087 | | | | 86,073,388 | | | | 325,309,699 | |
| Select Value | | | | | 299,869,257 | | | | 5,233,524 | | | | 21,454,553 | | | | (16,221,029 | ) |
| Aggressive Opportunities | | | | | 1,353,249,920 | | | | 225,817,475 | | | | 101,070,349 | | | | 124,747,126 | |
| Discovery | | | | | 167,718,070 | | | | 3,568,240 | | | | 10,415,568 | | | | (6,847,328 | ) |
| International | | | | | 1,015,712,308 | | | | 198,990,272 | | | | 32,498,062 | | | | 166,492,210 | |
| Diversified Assets | | | | | 363,914,943 | | | | 744,090 | | | | 1,436,157 | | | | (692,067 | ) |
| Core Bond Index | | | | | 1,142,188,866 | | | | 13,122,102 | | | | 8,386,736 | | | | 4,735,366 | |
| 500 Stock Index | | | | | 240,481,919 | | | | 217,642,987 | | | | 32,562,929 | | | | 185,080,058 | |
| Broad Market Index | | | | | 454,270,857 | | | | 301,675,402 | | | | 57,200,163 | | | | 244,475,239 | |
| Mid/Small Company Index | | | | | 230,424,729 | | | | 74,637,165 | | | | 26,390,975 | | | | 48,246,190 | |
| Overseas Equity Index | | | | | 201,527,768 | | | | 64,455,309 | | | | 7,019,879 | | | | 57,435,430 | |
| Model Portfolio Savings Oriented | | | | | 308,313,762 | | | | 4,545,375 | | | | 1,359,222 | | | | 3,186,153 | |
| Model Portfolio Conservative Growth | | | | | 579,315,532 | | | | 22,572,388 | | | | 4,048,905 | | | | 18,523,483 | |
| Model Portfolio Traditional Growth | | | | | 1,426,429,113 | | | | 74,520,643 | | | | 13,603,538 | | | | 60,917,105 | |
| Model Portfolio Long-Term Growth | | | | | 1,565,208,845 | | | | 131,243,882 | | | | 18,336,806 | | | | 112,907,076 | |
| Model Portfolio All-Equity Growth | | | | | 578,684,193 | | | | 30,522,170 | | | | 11,180,924 | | | | 19,341,246 | |
| Milestone Retirement Income | | | | | 55,875,986 | | | | 273,350 | | | | 1,565,819 | | | | (1,292,469 | ) |
181
VANTAGEPOINT FUNDS
NOTES TO THE FINANCIAL STATEMENTS—(Continued)
Fund
| | | | Federal
Income Tax
Cost
| | Gross
Unrealized
Appreciation
| | Gross
Unrealized
Depreciation
| | Tax Basis
Net Unrealized
Appreciation/
(Depreciation)
|
|---|
| Milestone 2010 | | | | $ | 72,098,035 | | | $ | 500,889 | | | $ | 2,181,328 | | | $ | (1,680,439 | ) |
| Milestone 2015 | | | | | 141,560,145 | | | | 1,250,026 | | | | 4,255,119 | | | | (3,005,093 | ) |
| Milestone 2020 | | | | | 114,771,093 | | | | 1,004,950 | | | | 3,693,192 | | | | (2,688,242 | ) |
| Milestone 2025 | | | | | 86,289,906 | | | | 738,322 | | | | 3,116,048 | | | | (2,377,726 | ) |
| Milestone 2030 | | | | | 63,908,664 | | | | 425,004 | | | | 2,850,990 | | | | (2,425,986 | ) |
| Milestone 2035 | | | | | 36,717,309 | | | | 218,858 | | | | 2,084,458 | | | | (1,865,600 | ) |
| Milestone 2040 | | | | | 35,138,691 | | | | 128,334 | | | | 2,363,852 | | | | (2,235,518 | ) |
6. | | Portfolio Securities Loaned |
Certain funds lend securities to approved brokers to earn additional income. As of December 31, 2007, certain funds had loaned securities, which were collateralized by cash, cash equivalents, or U.S. Government Obligations. Each fund receives compensation in connection with the securities lending program. Collateral is maintained over the life of the loan in an amount not less than 102% of the value of the loaned securities for domestic securities and 105% for foreign securities, as determined by the funds at the close of business each day. Any additional collateral required due to changes in the value of securities is delivered to the funds the next business day. Although the collateral mitigates risk, the funds could experience a delay in recovering their securities and a possible loss of income or value if the borrower fails to return the securities. The funds have the right under the securities lending agreement to recover the securities from the borrower on demand. The risks to the funds associated with securities lending are that the borrower may not provide additional collateral when required or return the securities when due.
The funds will be indemnified by its custodian for securities lending programs conducted through the custodian if at the time of a default by a borrower some or all of the loaned securities have not been returned by the borrower. The custodian, as soon as practicable after the time of default, shall purchase and deposit in the funds’ account securities of the same issuer, class, denomination, and with the same dividend and other economic benefits as, and equal in number to, the unreturned loaned securities to the extent that such securities are reasonably available on the open market. If the custodian is unable to purchase replacement securities, it will credit to the funds’ account an amount equal to the market value of the unreturned loaned securities.
The market value of the securities on loan and the value of the related collateral as December 31, 2007, were as follows:
Fund
| | | | Securities on Loan
| | Collateral
| | Collateralization
%
|
|---|
| Low Duration Bond | | | | $ | 652,472 | | | $ | 668,100 | | | | 102 | % |
| Asset Allocation | | | | | 19,964,207 | | | | 20,791,600 | | | | 104 | % |
| Equity Income | | | | | 147,981,040 | | | | 159,318,560 | | | | 108 | % |
| Growth & Income | | | | | 43,288,783 | | | | 45,271,680 | | | | 105 | % |
| Growth | | | | | 129,294,690 | | | | 134,521,203 | | | | 104 | % |
| Aggressive Opportunities | | | | | 306,325,637 | | | | 321,587,851 | | | | 105 | % |
| International | | | | | 33,353,332 | | | | 35,045,824 | | | | 105 | % |
| Core Bond Index | | | | | 56,788,389 | | | | 58,009,352 | | | | 102 | % |
| 500 Stock Index | | | | | 13,654,051 | | | | 14,242,009 | | | | 104 | % |
| Broad Market Index | | | | | 41,964,741 | | | | 43,900,827 | | | | 105 | % |
| Mid/Small Company Index | | | | | 49,539,482 | | | | 51,895,159 | | | | 105 | % |
| Overseas Equity Index | | | | | 3,451,989 | | | | 3,636,739 | | | | 105 | % |
182
VANTAGEPOINT FUNDS
NOTES TO THE FINANCIAL STATEMENTS—(Continued)
7. | | Transactions with Affiliated Funds |
At December 31, 2007 the Model Portfolio Funds and Milestone Funds held investments in a number of the underlying funds. The figures presented below represent the percentage of shares outstanding in each of the underlying funds owned by the Model Portfolio and Milestone Funds:
Underlying Fund
| | | | Model
Portfolio
Savings
Oriented
| | Model
Portfolio
Conservative
Growth
| | Model
Portfolio
Traditional
Growth
| | Model
Portfolio
Long-Term
Growth
| | Model
Portfolio
All-Equity
Growth
|
|---|
| Low Duration Bond | | | | | 26.47 | % | | | 27.38 | % | | | 24.02 | % | | | — | | | | — | |
| Inflation Protected Securities | | | | | 10.30 | % | | | 14.57 | % | | | — | | | | — | | | | — | |
| Equity Income | | | | | 1.77 | % | | | 3.70 | % | | | 10.06 | % | | | 12.38 | % | | | 6.17 | % |
| Growth & Income | | | | | 2.81 | % | | | 4.80 | % | | | 15.94 | % | | | 19.62 | % | | | 9.20 | % |
| Growth | | | | | — | | | | 1.37 | % | | | 5.68 | % | | | 7.42 | % | | | 3.94 | % |
| Select Value | | | | | — | | | | 5.94 | % | | | 27.16 | % | | | 47.70 | % | | | 19.20 | % |
| Aggressive Opportunities | | | | | — | | | | 1.52 | % | | | 6.95 | % | | | 12.22 | % | | | 4.92 | % |
| Discovery | | | | | — | | | | — | | | | 25.35 | % | | | 43.25 | % | | | 31.40 | % |
| International | | | | | 1.35 | % | | | 4.11 | % | | | 15.32 | % | | | 23.27 | % | | | 10.54 | % |
| Diversified Assets | | | | | 6.69 | % | | | 12.90 | % | | | 32.51 | % | | | 36.96 | % | | | — | |
| Core Bond Index Class I | | | | | 4.58 | % | | | 14.04 | % | | | 31.10 | % | | | 29.47 | % | | | — | |
| Mid/Small Index Class I | | | | | — | | | | — | | | | — | | | | — | | | | — | |
Underlying Fund
| | | | Milestone
Retirement
Income
| | Milestone
2010
| | Milestone
2015
| | Milestone
2020
| | Milestone
2025
|
|---|
| Low Duration Bond | | | | | 4.31 | % | | | 4.10 | % | | | 4.10 | % | | | 1.55 | % | | | 0.33 | % |
| Inflation Protected Securities | | | | | 1.80 | % | | | 1.93 | % | | | 1.32 | % | | | — | | | | — | |
| Equity Income | | | | | 0.38 | % | | | 0.61 | % | | | 1.54 | % | | | 1.41 | % | | | 1.13 | % |
| Growth & Income | | | | | 0.59 | % | | | 0.73 | % | | | 1.38 | % | | | 1.21 | % | | | 1.02 | % |
| Growth | | | | | — | | | | 0.11 | % | | | 0.41 | % | | | 0.37 | % | | | 0.31 | % |
| International | | | | | 0.29 | % | | | 0.52 | % | | | 1.37 | % | | | 1.28 | % | | | 1.10 | % |
| Diversified Assets | | | | | 1.17 | % | | | 1.51 | % | | | 2.97 | % | | | 2.41 | % | | | 1.80 | % |
| Core Bond Index Class I | | | | | 0.68 | % | | | 0.87 | % | | | 2.56 | % | | | 2.29 | % | | | 1.40 | % |
| Mid/Small Index Class I | | | | | — | | | | 0.02 | % | | | 8.90 | % | | | 10.08 | % | | | 9.51 | % |
Underlying Fund
| | | | Milestone
2030
| | Milestone
2035
| | Milestone
2040
|
|---|
| Equity Income | | | | | 0.87 | % | | | 0.51 | % | | | 0.49 | % |
| Growth & Income | | | | | 0.80 | % | | | 0.47 | % | | | 0.45 | % |
| Growth | | | | | 0.25 | % | | | 0.16 | % | | | 0.15 | % |
| International | | | | | 0.88 | % | | | 0.54 | % | | | 0.53 | % |
| Diversified Assets | | | | | 0.93 | % | | | 0.15 | % | | | — | |
| Core Bond Index Class I | | | | | 0.87 | % | | | 0.43 | % | | | 0.37 | % |
| Mid/Small Index Class I | | | | | 8.60 | % | | | 5.86 | % | | | 5.90 | % |
183
VANTAGEPOINT FUNDS
NOTES TO THE FINANCIAL STATEMENTS—(Continued)
8. | | Control Persons and Principal Holders of Securities |
As of December 31, 2007, a majority of the voting shares of all funds, except the Money Market Fund, were held either directly, or indirectly through the Model Portfolio Funds and the Milestone Funds and by the VantageTrust, a group trust sponsored and maintained by the VantageTrust Company (“Trust Company”). The VantageTrust was established for the purpose of holding and investing the assets of public sector retirement and deferred compensation plans. The Trust Company, a New Hampshire non-depository banking corporation, has the power to vote the shares of the funds directly held by the VantageTrust and has the power to direct the vote of the shares of the Model Portfolio Funds and the Milestone Funds under the proxy voting policy adopted by VIA, the funds’ adviser, and is therefore considered a “control” person of the funds for purposes of the 1940 Act. Both the Trust Company and VIA are wholly owned subsidiaries of ICMA-RC. As a control person of all the funds, the Trust Company may possess the ability to control the outcome of matters submitted to the vote of shareholders.
Additionally, at December 31, 2007 the VantageTrust, an affiliated group trust held, directly or indirectly, the outstanding shares of the Company in the percentages shown below:
Fund
| | | | % Owned
By the
VantageTrust
|
|---|
| Money Market | | | | | 37.82 | % |
| Low Duration Bond | | | | | 83.14 | % |
| Inflation Protected Securities | | | | | 71.87 | % |
| Asset Allocation | | | | | 97.39 | % |
| Equity Income | | | | | 94.08 | % |
| Growth & Income | | | | | 93.86 | % |
| Growth | | | | | 97.81 | % |
| Select Value | | | | | 95.15 | % |
| Aggressive Opportunities | | | | | 96.84 | % |
| Discovery | | | | | 95.29 | % |
| International Fund | | | | | 95.14 | % |
| Diversified Assets | | | | | 93.68 | % |
| Core Bond Index Class I | | | | | 91.71 | % |
| Core Bond Index Class II | | | | | 100.00 | % |
| 500 Stock Index Class I | | | | | 85.79 | % |
| 500 Stock Index Class II | | | | | 100.00 | % |
| Broad Market Index Class I | | | | | 87.76 | % |
| Broad Market Index Class II | | | | | 92.39 | % |
| Mid/ Small Co Index Class I | | | | | 84.93 | % |
| Mid/ Small Co Index Class II | | | | | 100.00 | % |
| Overseas Index Class I | | | | | 81.65 | % |
| Overseas Index Class II | | | | | 99.99 | % |
| Savings Oriented | | | | | 87.62 | % |
| Conservative Growth | | | | | 90.41 | % |
| Traditional Growth | | | | | 94.64 | % |
| Long-Term Growth | | | | | 96.36 | % |
| All-Equity Growth | | | | | 94.33 | % |
| Milestone Retirement Income | | | | | 78.67 | % |
| Milestone 2010 | | | | | 88.15 | % |
| Milestone 2015 | | | | | 90.60 | % |
| Milestone 2020 | | | | | 92.56 | % |
| Milestone 2025 | | | | | 90.34 | % |
| Milestone 2030 | | | | | 91.09 | % |
| Milestone 2035 | | | | | 87.92 | % |
| Milestone 2040 | | | | | 85.15 | % |
184
VANTAGEPOINT FUNDS
NOTES TO THE FINANCIAL STATEMENTS—(Continued)
VIA has entered into agreements with brokers whereby the brokers will rebate a portion of the funds’ brokerage commissions on behalf of certain funds. Such amounts, under such agreements, are included in net realized gain (loss) on the sale of investments presented in the Statement of Operations. For the year ended December 31, 2007, the Funds recaptured the following amounts of brokerage commissions:
Fund
| | | | Recaptured
Brokerage
Commissions
|
|---|
| Equity Income | | | | $ | 49,528 | |
| Growth & Income | | | | | 52,110 | |
| Growth | | | | | 419,300 | |
| Aggressive Opportunities | | | | | 200,780 | |
| International | | | | | 120,122 | |
10. | | Stock Split in the Low Duration Bond Fund (formerly the Short-Term Bond Fund) |
On October 28, 2005, a “stock split” was processed in the Vantagepoint Low Duration Bond Fund. Specifically, there was a “10 for 1” split meaning that the shares outstanding were increased by a multiple of 10 and the NAV was divided by 10. Therefore, this action had no impact on the aggregate value of the shares outstanding. The record date (shareholders of record on this date were affected) was Thursday, October 27, 2005. The payable date (the date the stock split posted to shareholder accounts) was Friday, October 28, 2005. The ex-date (the date the NAV changed to reflect the split) was Friday, October 28, 2005. Share transactions, shares outstanding, NAVs, and per share ratios for prior years in the Statement of Changes in Net Assets and the Financial Highlights have been restated to reflect historical application of the “10 for 1” split in order to present these items on a basis comparable to the current year, as required by generally accepted accounting principles.
11. | | Recently Issued Accounting Pronouncements |
In September 2006, the FASB issued Statement of Financial Accounting Standards No. 157, (“FAS 157”) “Fair Value Measurements”. FAS 157 defines fair value, establishes a framework for measuring fair value in accordance with generally accepted accounting principles and expands disclosure about fair value measurements. FAS 157 is effective for fiscal years beginning after November 15, 2007. Management is currently evaluating the impact the adoption of FAS 157 will have on the Company’s financial statement disclosures.
185
Vantagepoint Funds
Additional Information (Unaudited)
For corporate shareholders, a portion of the ordinary dividends paid during the fund’s year ended December 31, 2007 qualified for the dividends received deduction as follows:
| Asset Allocation | | | | | 39.43 | % |
| Equity Income | | | | | 100.00 | % |
| Growth & Income | | | | | 59.43 | % |
| Growth | | | | | 100.00 | % |
| Select Value | | | | | 74.46 | % |
| Aggressive Opportunities | | | | | 23.45 | % |
| Discovery | | | | | 5.95 | % |
| 500 Stock Index | | | | | 99.81 | % |
| Broad Market Index | | | | | 100.00 | % |
| Mid/Small Company Index | | | | | 61.19 | % |
| Overseas Equity Index | | | | | 0.01 | % |
| Model Portfolio Savings Oriented | | | | | 7.87 | % |
| Model Portfolio Conservative Growth | | | | | 11.12 | % |
| Model Portfolio Traditional Growth | | | | | 17.77 | % |
| Model Portfolio Long-Term Growth | | | | | 24.09 | % |
| Model Portfolio All-Equity Growth | | | | | 48.42 | % |
| Milestone Retirement Income | | | | | 12.77 | % |
| Milestone 2010 | | | | | 15.44 | % |
| Milestone 2015 | | | | | 23.12 | % |
| Milestone 2020 | | | | | 28.86 | % |
| Milestone 2025 | | | | | 34.95 | % |
| Milestone 2030 | | | | | 40.83 | % |
| Milestone 2035 | | | | | 45.97 | % |
| Milestone 2040 | | | | | 48.11 | % |
186
Vantagepoint Funds
Additional Information (Unaudited)—(Continued)
Pursuant to Section 852 of the Internal Revenue Code, the Funds designate the following capital gain dividends for the year ended December 31, 2007:
| | | | Long Term
Capital Gain Dividend
|
|---|
| Asset Allocation | | | | $ | 5,239,255 | |
| Equity Income | | | | | 59,852,485 | |
| Growth & Income | | | | | 121,152,754 | |
| Aggressive Opportunities | | | | | 165,768,166 | |
| Discovery | | | | | 794,758 | |
| International | | | | | 132,659,285 | |
| Mid/Small Company Index | | | | | 11,898,037 | |
| Overseas Equity Index | | | | | 220,210 | |
| Model Portfolio Savings Oriented | | | | | 5,981,350 | |
| Model Portfolio Conservative Growth | | | | | 14,696,980 | |
| Model Portfolio Traditional Growth | | | | | 71,985,890 | |
| Model Portfolio Long-Term Growth | | | | | 103,061,552 | |
| Model Portfolio All-Equity Growth | | | | | 61,259,144 | |
| Milestone Retirement Income | | | | | 988,751 | |
| Milestone 2010 | | | | | 3,405,892 | |
| Milestone 2015 | | | | | 7,327,763 | |
| Milestone 2020 | | | | | 5,915,709 | |
| Milestone 2025 | | | | | 4,911,474 | |
| Milestone 2030 | | | | | 3,055,275 | |
| Milestone 2035 | | | | | 1,939,534 | |
| Milestone 2040 | | | | | 1,393,935 | |
For the year ended December 31, 2007, dividends from foreign countries were $25,127,540 and $6,577,646 for the International and the Overseas Equity Index Funds, respectively. Taxes paid to foreign countries that qualify for the foreign tax credit were $2,100,997 and $451,605 for the International and the Overseas Equity Index Funds, respectively.
All Vantagepoint Funds treat any foreign taxes paid as a reduction of net investment company taxable income by these amounts.
The following table summarizes the percentage of income received by the Company in 2007 from various obligors:
Fund
| | | | U.S. Treasury
Obligations
| | GNMA
| | FNMA
| | FHL Bank
| | FHLMC
| | Other
U.S. Government
Agency
|
|---|
| Low Duration Bond | | | | | 12.69 | % | | | 0.00 | % | | | 4.10 | % | | | 0.75 | % | | | 3.08 | % | | | 0.02 | % |
| Inflation Protected Securities | | | | | 85.28 | % | | | 0.00 | % | | | 4.15 | % | | | 2.85 | % | | | 4.37 | % | | | 0.15 | % |
| Asset Allocation | | | | | 0.72 | % | | | 0.00 | % | | | 0.41 | % | | | 4.37 | % | | | 0.00 | % | | | 0.00 | % |
| Equity Income | | | | | 0.00 | % | | | 0.00 | % | | | 0.01 | % | | | 0.01 | % | | | 0.00 | % | | | 0.00 | % |
| Aggressive Opportunities | | | | | 0.08 | % | | | 0.00 | % | | | 0.00 | % | | | 0.01 | % | | | 0.00 | % | | | 0.00 | % |
| Discovery | | | | | 36.49 | % | | | 0.00 | % | | | 5.01 | % | | | 0.00 | % | | | 9.71 | % | | | 0.00 | % |
| Diversified Assets | | | | | 10.91 | % | | | 0.00 | % | | | 8.88 | % | | | 8.91 | % | | | 8.36 | % | | | 1.32 | % |
| Core Bond Index | | | | | 21.13 | % | | | 3.28 | % | | | 23.15 | % | | | 2.68 | % | | | 17.13 | % | | | 0.00 | % |
| 500 Stock Index | | | | | 0.17 | % | | | 0.00 | % | | | 0.00 | % | | | 0.00 | % | | | 0.00 | % | | | 0.00 | % |
| Broad Market Index | | | | | 0.18 | % | | | 0.00 | % | | | 0.00 | % | | | 0.00 | % | | | 0.00 | % | | | 0.00 | % |
| Mid/Small Company Index | | | | | 0.31 | % | | | 0.00 | % | | | 0.00 | % | | | 0.00 | % | | | 0.00 | % | | | 0.00 | % |
| Overseas Equity Index | | | | | 0.49 | % | | | 0.00 | % | | | 0.00 | % | | | 0.00 | % | | | 0.00 | % | | | 0.00 | % |
187
Vantagepoint Funds
Additional Information (Unaudited)—(Continued)
D. | | Qualified Dividend Income |
The following are estimates of qualified dividend income received by the funds through December 31, 2007 that qualify for a reduced tax rate pursuant to the Jobs and Growth Tax Relief Reconciliation Act of 2003:
Fund
| | | | Qualified
Dividend
Income
|
|---|
| Asset Allocation | | | | | 40.17 | % |
| Equity Income | | | | | 94.94 | % |
| Growth & Income | | | | | 70.68 | % |
| Growth | | | | | 100.00 | % |
| Select Value | | | | | 81.34 | % |
| Aggressive Opportunities | | | | | 29.59 | % |
| Discovery | | | | | 12.41 | % |
| International | | | | | 95.43 | % |
| 500 Stock Index | | | | | 99.81 | % |
| Broad Market Index | | | | | 98.21 | % |
| Mid/Small Company Index | | | | | 45.40 | % |
| Overseas Equity Index | | | | | 74.24 | % |
| Model Portfolio Savings Oriented | | | | | 11.13 | % |
| Model Portfolio Conservative Growth | | | | | 17.12 | % |
| Model Portfolio Traditional Growth | | | | | 28.88 | % |
| Model Portfolio Long-Term Growth | | | | | 41.54 | % |
| Model Portfolio All-Equity Growth | | | | | 81.87 | % |
| Milestone Retirement Income | | | | | 17.43 | % |
| Milestone 2010 | | | | | 22.05 | % |
| Milestone 2015 | | | | | 32.62 | % |
| Milestone 2020 | | | | | 35.70 | % |
| Milestone 2025 | | | | | 46.70 | % |
| Milestone 2030 | | | | | 40.60 | % |
| Milestone 2035 | | | | | 49.63 | % |
| Milestone 2040 | | | | | 40.53 | % |
188
Vantagepoint Funds
Additional Information (Unaudited)—(Continued)
Name, Address,*
and Age
|
|
|
| Positions
Held with
the Trust
|
| Term of Office
and Length of
Time Served
|
| Principal
Occupation(s)
During Past Five Years
|
| Other
Directorships
Held By
Director
|
|---|
| N. Anthony Calhoun (60) | | | | Director,
Audit Committee Member and Chair,
Investment Committee and Nominating Committee Member | | Term expires October 2011
Director since November 1998 | | Executive Deputy State Treasurer—Commonwealth of Pennsylvania (August 2007 to Present) Secretary to Senate Finance Committee/Minority, State of New York Legislature (January 2007–August 2007); Retired (October 2005–January 2007); Deputy Chief Financial Officer and Treasurer—District of Columbia (2001–2005); Deputy Executive Director & Chief Financial Officer—Pension Benefit Guaranty Corp. (1993–2001) | | N/A
|
| Donna K. Gilding (68) | | | | Director,
Investment Committee Member and Chair, and
Nominating Committee Member | | Term expires October 2011
Director since November 1998 | | Chief Investment Officer—Lowenhaupt Global Advisors, LLC (Sept. 2006–Present); Chief Investment Officer—Lowenhaupt & Chasnoff (2005–Sept. 2006) (wealth management law firm); Chief Investment Officer—Progress Investment Management Company (2001–2005); Chief Investment Officer—New York City Comptroller’s Office (1993–2001) | | N/A
|
| Arthur R. Lynch (53) | | | | Chair of the Board and Director,
Audit Committee Member,
Investment Committee Member, and Nominating
Committee Member | | Term expires October 2011
Director since November 1998 | | Deputy City Manager—City of Glendale, Arizona (2005-present); Chief Financial Officer—City of Glendale, Arizona (1985–2005) | | N/A
|
| Timothy M. O’Brien (58) | | | | Director,
Audit Committee Member,
Investment Committee Member, and Nominating
Committee Member | | Term expires October 2009
Director since September 2005 | | Independent Consultant (pension consulting) (2003–present); Chief Executive Officer—American Humane Association (1999–2003) | | N/A
|
| Robert A. Rudell (59) | | | | Director, Investment Committee Member and Nominating Committee Member | | Term expires October 2009
Director since March 2007 | | Director—Medtox Scientific, Inc. (medical device/clinical lab) (2002–present); Director/Chairman—Search Institute (non-profit) (2002–present); Trustee—Optimum Fund Trust (registered investment company) (2003–present) Director—Bloodhound Investment Research, Inc. (portfolio construction software) (2003–present); Director/Chairman—Diverse Emerging Music Organization (non-profit) (2004–present); Director/Independent Chair—Heartland Funds (registered investment company (2005–present); Director—American Investors Bank & Mortgage (bank) (2005–present); Chief Operating Officer—Zurich Scudder Investments (financial services) (2001– 2002) | | Director—Medtox Scientific, Inc.; Trustee—Optimum Fund Trust (6 portfolios);
Director/Independent Chair—Heartland Funds (3 portfolios) |
| Robin L. Wiessmann (54) | | | | Director and
Investment Committee Member | | Term expires October 2009
Director since November 1998 | | State Treasurer—Commonwealth of Pennsylvania (April 2007–present); Director—Merrill, Lynch, Pierce, Fenner & Smith Incorporated, (2006– April 2007); Consultant—Brown Wiessmann Group (financial services consulting) (2002–2006) | | Director—ICMA Retirement Corporation from January 1994–
December 2001. |
189
Vantagepoint Funds
Additional Information (Unaudited)—(Continued)
Officers
Name, Address,*
and Age
|
|
|
| Positions
Held with
the Company
|
| Term of Office
and Length of
Time Served
|
| Principal
Occupation(s)
During Past Five Years
|
| Other
Directorships
Held By
Director
|
|---|
| Joan McCallen (55)** | | | | President and Principal Executive Officer | | Since
September 2003 | | Chief Executive Officer—ICMA Retirement Corporation (Aug. 2003–present); President and Manager—Vantagepoint Investment Advisers, LLC; ICMA-RC Services, LLC (broker-dealer); President and Manager—Vantagepoint Transfer Agents, LLC (2003–present); Director and President, VantageTrust Company (2003–present); Executive Vice President and Chief Operations Officer—ICMA Retirement Corporation (1997–2003) | | N/A |
| Bruce James Rohrbacher (55)** | | | | Vice President and Chief Compliance Officer | | Since
September 2004 | | Senior Vice President and Chief Compliance Officer—ICMA Retirement Corporation (2004 to present); Senior Vice President and Chief Compliance Officer, Vantagepoint Investment Advisers, LLC (2004–present) and Chief Compliance Officer, ICMA-RC Services, LLC (broker-dealer) (2004 to present); Director of Compliance and Internal Audit—Frank Russell Company (financial services) (1996–2004) | | N/A |
| Gerard P. Maus (56)** | | | | Treasurer and Principal Financial Officer | | Since
December 2004 | | Senior Vice President and Chief Financial Officer—ICMA Retirement Corporation (2004 to present); Senior Vice President and Treasurer—Vantagepoint Investment Advisers, LLC (2004–present); Manager and Treasurer— Vantagepoint Transfer Agents, LLC and ICMA-RC Services, LLC (broker-dealer) (2004–present); Chief Financial Officer and Chief Administrative Officer—SoundView Technology Group (2002–2004); Chief Financial Officer, Treasurer, Director, Member—SoundView Technology Group Internal Companies (2002–2004) | | N/A |
| Angela Montez (40) ** | | | | Secretary | | Since
December 2006 | | Managing Vice President, Deputy General Counsel and Assistant Secretary—ICMA Retirement Corporation (2006–present) Corporate Counsel—ICMA Retirement Corporation (2000–2006); Secretary—Vantagepoint Investment Advisers, LLC, Vantagepoint Transfer Agents, LLC and ICMA-RC Services, LLC (broker-dealer) (2006–2007) | | N/A |
| * | | The business address for each Director and Officer is 777 N. Capitol Street N.E., Washington, D.C. 20002. |
| ** | | Mses. McCallen and Montez and Messrs. Rohrbacher and Maus are considered to be “interested persons” of the Company, as that term is defined under the 1940 Act due to their positions as officers of VIA and ICMA-RC Services, the distributor of the Funds, and ICMA-RC, the parent company of VIA and ICMA-RC Services. |
Aggregate compensation that was paid to the directors during the year ended December 31, 2007 totaled $107,457. Executive officers do not receive any compensation from the Company, except the Company pays a portion of the cash compensation of the Chief Compliance Officer of the Company. The amount paid by the Company during the year ended December 31, 2007 totaled $229,311.
The Statement of Additional Information includes additional information about the Board and is available, without charge, upon request, by calling 1-800-669-7400 and on the Company’s website at www.icmarc.org
190
Vantagepoint Funds
Additional Information (Unaudited)—(Continued)
F. | | Directors’ Consideration of Investments Advisory and Subadvisory Agreements |
Vantagepoint Discovery Fund
The following relates to the approval of the initial investment advisory and subadvisory agreements for the Vantagepoint Discovery Fund by the Board of Directors of The Vantagepoint Funds on December 8, 2006. The Vantagepoint Discovery Fund, however, did not commence operations until October 30, 2007.
At a meeting held on December 8, 2006 (“December Meeting”), the Board of Directors (“Directors” or “Board”) of The Vantagepoint Funds (“Company”), including a majority of the Directors who are not “interested persons” as defined in the Investment Company Act of 1940 (“Independent Directors”), initially approved (1) the Second Master Investment Advisory Agreement (“Master Agreement”) between the Company and Vantagepoint Investment Advisers, LLC (“Adviser”) for the Vantagepoint Discovery Fund, a new series of the Company (“Discovery Fund”), and (2) separate Investment Subadvisory Agreements (each a “Discovery Subadvisory Agreement”) with Wellington Management Company, LLP (“Wellington”) and Payden & Rygel (“Payden”) (each a “subadviser”) for the Discovery Fund. Before approving the Master Agreement and each Discovery Subadvisory Agreement, the Board considered the recommendations of, and supporting analyses and data presented by, the Adviser.
In considering the Master Agreement for the Discovery Fund and each Discovery Subadvisory Agreement, the Independent Directors received assistance from, and met separately with, their independent legal counsel and were provided with a written description of their statutory responsibilities and the legal standards that are applicable to approvals of advisory agreements.
With respect to the Board’s initial approval of the Master Agreement between the Company and the Adviser for the Discovery Fund, the Directors received written information in advance of the December Meeting, including information regarding: (1) the nature, quality and extent of the services to be provided by the Adviser; (2) the adequacy of the compliance program that is in place relating to the Discovery Fund; (3) the level of investment advisory fees to be charged by the Adviser and the fees charged by the Adviser to the other series of the Company where subadvisers are employed to manage the assets of the series directly (“actively managed funds”); (4) the Adviser’s experience as investment adviser to the other series of the Company and with respect to the investment strategies to be employed by the Discovery Fund; (5) the Discovery Fund’s expected overall investment advisory fee and total expense ratio compared to a group of investment companies categorized by Morningstar, Inc. (“Morningstar”) as small cap blend funds (“Discovery peer group”); and (6) the expected costs of the services to be provided and net margins (“profit margin”) to be realized by the Adviser and its affiliates from its relationship with the Discovery Fund.
In determining to approve the Master Agreement with the Adviser for the Discovery Fund, the Directors considered the information received in advance of the December Meeting, the presentations made by, and discussions held with, Adviser personnel and the Chief Compliance Officer of the Company (“CCO”) at the December Meeting, as well as a variety of factors. Although not meant to be all-inclusive, the following discusses some of the factors relevant to the Board’s decision to approve the Master Agreement with the Adviser.
Nature, Extent and Quality of Services. With respect to the nature, extent and quality of the services expected to be provided by the Adviser to the Discovery Fund under the Master Agreement, the Directors considered the specific investment services to be provided by the Adviser, including the subadviser selection and fee negotiation process, the process by which the Adviser evaluates and monitors subadvisers and the cash management services to be provided to the Discovery Fund. They also considered the experience of the Adviser’s investment management staff with regard to managing the other actively managed funds and the investment strategy to be employed by, and the adequacy of the compliance program for, the Discovery Fund. The Directors concluded that the nature, extent and quality of the investment advisory services expected to be provided by the Adviser were appropriate for the Discovery Fund in light of its investment objective and strategies and, thus, supported a decision to approve the Master Agreement with the Adviser.
Investment Performance. At the time of the Board’s consideration of the Master Agreement, the Discovery Fund had not commenced operations and, therefore, there was no information for the Directors to evaluate regarding the Discovery Fund’s actual performance.
Advisory Fee, Expense Ratio and Economies of Scale. The Directors considered a comparison of the fee to be paid to the Adviser by the Discovery Fund with the fee the Adviser charges to the existing actively managed funds. The proposed
191
Vantagepoint Funds
Additional Information (Unaudited)—(Continued)
fee schedule for the Discovery Fund is the same as the fee schedule for the actively managed funds; and the type of services the Adviser would provide to the Discovery Fund is comparable to the services provided to the actively managed funds. The Directors also considered comparative data provided by the Adviser on the total advisory fees and the total expense ratios of the Discovery peer group. The information provided by the Adviser showed that the proposed total investment advisory and subadvisory fee rate for, and the expected expense ratio of, the Discovery Fund for the 2007 fiscal year would be below the average and median investment advisory fee and expense ratio of the Discovery peer group. The foregoing comparisons assisted the Directors in considering the Master Agreement by providing them with a basis for evaluating the investment advisory fee to be paid to the Adviser and the Discovery Fund’s expected overall investment advisory fee (which includes the proposed subadvisory fees) and total expense ratio on a relative basis. Based on this information, the Directors concluded that the overall investment advisory fee appeared to be within a reasonable range for the services to be provided.
With respect to the expected costs and profit margins to be realized by the Adviser (and its affiliates) from its relationship with the Discovery Fund, the Directors considered the information provided by the Adviser, which stated that, based on current asset projections, the Adviser and its affiliates do not anticipate a positive profit margin relating to the Discovery Fund for the foreseeable future. Based on this information, the Directors concluded that the Adviser may not realize economies of scale with regard to the Discovery Fund over the short-term and that the proposed fee structure is appropriate at this time.
Other Considerations. The Directors also considered the potential “fall-out” or ancillary benefits that may accrue to the Adviser due to its relationship with the Discovery Fund and that the Adviser does not expect any significant “fall-out” benefits by virtue of its relationship with the Discovery Fund.
Conclusion. After full consideration of the foregoing factors, with no single factor identified as being of paramount importance, the Directors, including a majority of the Independent Directors, concluded that the initial approval of the Master Agreement with the Adviser is the best interest of the Discovery Fund and its shareholders, and approved the Master Agreement with, and the fee to be paid to, the Adviser.
With respect to the Board’s consideration of the respective Discovery Subadvisory Agreements with Wellington and Payden for the Discovery Fund, the Directors received written information in advance of the December Meeting from the Adviser, which included: (1) the process by which the Adviser selected and recommended for Board approval Wellington and Payden as subadvisers of the Discovery Fund; (2) the nature, extent and quality of the services that Wellington and Payden each would provide to the Discovery Fund; (3) each subadviser’s experience, reputation, investment management business, personnel and operations; (4) each subadviser’s brokerage and trading policies and practices; (5) the level of subadvisory fees to be charged to the Discovery Fund by Wellington and Payden and a comparison of those fees to the (a) standard separate account fee schedule charged by each of Wellington and Payden for managing accounts with an investment mandate that is similar to the investment mandate that each subadviser is to employ for the Discovery Fund; and (b) fees charged by a group of active separate account investment managers utilizing an investment mandate that is similar to the investment mandate that each of Wellington and Payden are to employ for the Discovery Fund; (6) Wellington’s and Payden’s compliance programs; (7) Wellington’s and Payden’s historical performance returns utilizing a small cap blend strategy and enhanced equity index strategy, respectively, and such performance compared to a relevant benchmark; (8) the Discovery Fund’s expected overall investment advisory fee and total expense ratio as compared to the Discovery peer group; and (9) each subadviser’s financial condition.
In determining whether to approve each Discovery Subadvisory Agreement, the Directors considered the information received in advance of the December Meeting, the presentations made by, and discussions held with, personnel of the Adviser, Wellington and Payden at the December Meeting, as well as a variety of factors. Although not meant to be all-inclusive, the following discusses some of the factors relevant to the Board’s decision to approve the Discovery Subadvisory Agreements with Wellington and Payden.
Nature, Extent and Quality of Services. With respect to the nature, extent and quality of the services expected to be provided by Wellington and Payden under their respective Discovery Subadvisory Agreements, the Directors considered the specific investment process to be employed by each of Wellington and Payden in managing the assets of the Discovery Fund to be allocated to them; the qualifications of Wellington’s and Payden’s respective investment management teams with regard to implementing their respective mandates; each subadviser’s performance record as compared to a relevant benchmark; each subadviser’s infrastructure and whether it appears to adequately support a small cap blend strategy,
192
Vantagepoint Funds
Additional Information (Unaudited)—(Continued)
with respect to Wellington, and an enhanced equity index strategy, with respect to Payden; and the Adviser’s review process and favorable assessment as to the nature, quality and extent of the subadvisory services expected to be provided by each of Wellington and Payden to the Discovery Fund. The Directors acknowledged that Wellington and Payden each has a successful performance record as a small cap blend manager and as an enhanced equity index manager, respectively, and each has an experienced portfolio management team, and appears to have adequate infrastructure and support staff to seek to achieve favorable results implementing a small cap blend strategy, with respect to Wellington, and an enhanced equity index strategy, with respect to Payden, for the Discovery Fund.
The Directors concluded that the nature, extent and quality of the subadvisory services expected to be provided by each of Wellington and Payden were appropriate for the Discovery Fund in light of its investment objective and strategies, and, thus, supported a decision to approve each Discovery Subadvisory Agreement.
Investment Performance. The Directors evaluated Wellington’s and Payden’s historical investment performance record in managing their clients’ assets utilizing a small cap blend strategy, with respect to Wellington, and an enhanced equity index strategy, with respect to Payden, and considered each performance record versus a relevant benchmark. The Directors concluded that the historical investment performance record of each of Wellington and Payden supported approval of each Discovery Subadvisory Agreement with Wellington and Payden, respectively.
Subadvisory Fees and Economies of Scale. In evaluating each proposed subadvisory fee, the Directors reviewed Wellington’s and Payden’s subadvisory fee schedules. The Directors considered comparisons of the subadvisory fees to be charged by Wellington and Payden to the Discovery Fund with each subadviser’s standard fee schedule for managing accounts with an investment mandate similar to the mandate that the subadviser is to employ on behalf of the Discovery Fund. The Directors also considered that, according to the information provided: (i) except for one other account with assets in excess of the amount of assets expected to be allocated initially to Wellington, the proposed fee schedule for Wellington reflected the lowest fee rate currently charged by Wellington to other U.S. registered investment companies for which the subadviser provides advisory services utilizing a similar mandate; and (ii) the proposed fee schedule for Payden reflects the lowest fee rate currently charged by Payden to other accounts for which the subadviser provides advisory services utilizing a similar mandate. Additionally, the nature of the subadvisory services each subadviser is to provide to the Discovery Fund appeared to be comparable to those each subadviser provides to such other clients. The Directors reviewed information provided by the Adviser (which was based on an independent third-party source) on the fees charged to accounts with assets comparable to the amount of assets expected to be allocated initially to Wellington and Payden by a group of U.S. separate account investment managers that employ a similar investment mandate to the investment mandate each proposed subadviser is to employ for the Discovery Fund. According to the information provided, the effective fee rate to be paid by the Discovery Fund to Wellington would be below the median fee charged by such small cap managers and the effective fee rate to be paid by the Discovery Fund to Payden would be below the median fee charged by such enhanced equity index managers.
Referring to the Discovery peer group data provided by the Adviser, the Directors also noted that, if Wellington and Payden each served as a subadviser to the Discovery Fund at the proposed subadvisory fee rates and the expected initial asset allocation levels: (i) the expected total investment advisory fee for the Discovery Fund would be lower than the average and median investment advisory fee of the Discovery peer group; and (ii) the Discovery Fund’s expected total expense ratio would be below the average and median expense ratio of the Discovery peer group.
The foregoing comparisons assisted the Directors in considering each Discovery Subadvisory Agreement by providing them with a basis for evaluating each subadviser’s fee schedule, including in light of the Discovery Fund’s expected overall investment advisory fee and total expense ratio, on a relative basis. Based on this information, the Directors concluded that the proposed subadvisory fee to be charged by each subadviser appeared to be within a reasonable range for the services to be provided.
The Directors also reviewed the information provided by Payden regarding the expected profits to be realized from the subadviser’s relationship with the Discovery Fund; such information was not available with respect to Wellington. In reviewing the extent to which economies of scale may be realized by Wellington and Payden as the assets of the Discovery Fund to be managed by each subadviser grow, and whether the proposed fee levels reflect these economies, the Directors considered that each of Wellington’s and Payden’s proposed fee schedule includes breakpoints, which indicates that the proposed subadvisory fee rates are intended to capture certain anticipated economies of scale for the benefit of the Discovery Fund’s shareholders in connection with the services to be provided as the assets to be managed by each
193
Vantagepoint Funds
Additional Information (Unaudited)—(Continued)
subadviser grow. The Directors concluded that the proposed fee schedules with respect to each subadviser are appropriate at this time.
Other Considerations. The Directors considered the selection and due diligence process employed by the Adviser in deciding to recommend Wellington and Payden as subadvisers to the Discovery Fund to implement the Discovery Fund’s investment objective and strategies and also considered the Adviser’s conclusion that the fees to be paid to each of Wellington and Payden for their respective services to the Discovery Fund are reasonable and appropriate in light of the nature and quality of the services to be provided by each subadviser and the reasons supporting that conclusion. The Directors concluded that the Adviser’s recommendations and conclusions supported approval of each Discovery Subadvisory Agreement.
The Directors also considered the potential “fall-out” or ancillary benefits that may accrue to Wellington and Payden due to each subadviser’s relationship with the Discovery Fund. The Directors considered that Wellington may direct the Discovery Fund’s brokerage transactions to certain brokers to obtain research and other services. However, the Directors noted that all subadvisers are required to select brokers who meet the Discovery Fund’s requirements for seeking best execution, and that the Adviser monitors and evaluates the subadvisers’ trade execution with respect to Fund brokerage transactions on a regular basis and provides reports to the Board in this regard. The Directors concluded that the potential benefits accruing to Wellington by virtue of its relationship with the Discovery Fund were reasonable. The Directors considered that Payden does not expect any “fall-out” benefits by virtue of its relationship to the Discovery Fund.
Conclusion. After full consideration of the foregoing factors, with no single factor identified as being of paramount importance, the Directors, including a majority of the Independent Directors, concluded that the initial approval of each Discovery Subadvisory Agreement is in the best interests of the Discovery Fund and its shareholders, and approved the Discovery Subadvisory Agreement with, and the fee to be paid to, each of Wellington and Payden.
Vantagepoint Inflation Protected Securities Fund
At a meeting held on September 7, 2007 (“September Meeting”), the Board of the Company, including a majority of the Independent Directors, initially approved the Investment Subadvisory Agreement (“BlackRock Subadvisory Agreement”) with BlackRock Financial Management, Inc. (“BlackRock”) for the Vantagepoint Inflation Protected Securities Fund (“IPS Fund”). Before approving the BlackRock Subadvisory Agreement, the Board considered the recommendations of, and supporting analyses and data presented by, the Adviser.
In considering the BlackRock Subadvisory Agreement, the Independent Directors received assistance from, and met separately with, their independent legal counsel and were provided with a written description of their statutory responsibilities and the legal standards that are applicable to approvals of advisory agreements.
With respect to the Board’s consideration of the BlackRock Subadvisory Agreement for the IPS Fund, the Board received written information in advance of the September Meeting from the Adviser, which included: (1) the Adviser’s rationale for recommending the addition of BlackRock as a subadviser to the IPS Fund; (2) the process by which the Adviser selected and recommended for Board approval BlackRock as a subadviser of the IPS Fund to implement the IPS Fund’s inflation protected securities strategy; (3) the nature, extent and quality of the services that BlackRock would provide to the IPS Fund; (4) BlackRock’s experience, reputation, investment management business, personnel and operations; (5) BlackRock’s brokerage and trading policies and practices; (6) the level of subadvisory fees to be charged to the IPS Fund by BlackRock and a comparison of those fees to the: (a) fees charged by BlackRock to manage other inflation protected securities accounts; and (b) fees charged by a group of active investment managers utilizing an inflation protected securities mandate; (7) BlackRock’s compliance program; (8) BlackRock’s historical performance returns utilizing an inflation protected securities mandate, and such performance compared to a relevant benchmark and peer group; (9) the IPS Fund’s expected overall investment advisory fee and total expense ratio, taking into account the addition of BlackRock as a subadviser, as compared to a group of inflation protected bond mutual funds; and (10) BlackRock’s financial condition.
In determining whether to approve the BlackRock Subadvisory Agreement, the Directors considered the information received in advance of the September Meeting, the presentation made by, and discussions held with, personnel of the Adviser and BlackRock at a previous Investment Committee Meeting and the September Meeting, as applicable, as well
194
Vantagepoint Funds
Additional Information (Unaudited)—(Continued)
as a variety of factors. Although not meant to be all-inclusive, the following discusses some of the factors relevant to the Board’s decision to approve the BlackRock Subadvisory Agreement.
Nature, Extent and Quality of Services. With respect to the nature, extent and quality of the services expected to be provided by BlackRock under the BlackRock Subadvisory Agreement, the Directors considered the specific investment process to be employed by BlackRock in managing the assets of the IPS Fund to be allocated to it; the qualifications of BlackRock’s investment management team with regard to implementing an inflation protected securities mandate; BlackRock’s performance record as compared to a relevant benchmark and peer group; BlackRock’s infrastructure and whether it appeared to adequately support an inflation protected securities strategy; and the Adviser’s review process and favorable assessment as to the nature, quality and extent of the subadvisory services expected to be provided by BlackRock to the IPS Fund. The Directors acknowledged that BlackRock had a successful performance record as an inflation protected securities manager and an experienced portfolio management team, and appeared to have adequate infrastructure and support staff to seek to achieve favorable results implementing an inflation protected securities mandate for the IPS Fund.
The Directors concluded that the nature, extent and quality of the subadvisory services expected to be provided by BlackRock were appropriate for the IPS Fund in light of its investment strategy and, thus, supported a decision to approve the BlackRock Subadvisory Agreement.
Investment Performance. The Directors evaluated BlackRock’s historical investment performance record in managing its clients’ assets utilizing an inflation protected securities mandate, and considered the performance record versus a relevant benchmark and peer group (based on information provided by an independent third-party source). The Board considered that BlackRock’s overall historical performance was favorable and concluded that it supported approval of the BlackRock Subadvisory Agreement.
Subadvisory Fee, Expense Ratio Impact and Economies of Scale. In evaluating the proposed subadvisory fee, the Directors reviewed BlackRock’s subadvisory fee schedule. The Directors considered comparisons of the subadvisory fee to be charged by BlackRock to the IPS Fund with its fee schedules for managing other accounts with an investment mandate similar to the mandate it is to employ on behalf of the IPS Fund. The Directors also considered that, according to the information provided by the Adviser, the proposed fee schedule for BlackRock reflected the lowest fee rate currently charged by the subadviser to other accounts for which the subadviser provides advisory services utilizing a similar mandate and taking into account the amount of the IPS Fund’s assets to be allocated to BlackRock. Additionally, the nature of the subadvisory services BlackRock is to provide to the IPS Fund appeared to be comparable to those BlackRock provides to such other advisory clients.
The Directors reviewed information provided by the Adviser (which was based on an independent third-party source) on the fees charged to accounts with assets comparable to the amount of assets to be allocated initially to BlackRock by a group of investment managers that employ an investment mandate similar to the investment mandate that BlackRock is to employ for the IPS Fund. According to the information provided, the effective fee rate to be paid by the IPS Fund to BlackRock at the asset level to be allocated to BlackRock initially would be below the median fee charged by such managers.
The Directors considered that there would be a reduction in overall subadvisory fees associated with the appointment of BlackRock. Referring to data provided by the Adviser and compiled by Morningstar, an independent provider of investment company data, the Directors also noted that the expected total investment advisory fee for the IPS Fund, taking into account the proposed subadviser change, was lower than the median investment advisory fee of a group of investment companies categorized as inflation protected bond funds. The Directors also considered information provided by the Adviser and compiled by Morningstar on the total expense ratios of a group of investment companies categorized as inflation protected bond funds, which showed that, if BlackRock served as a subadviser to the IPS Fund at the proposed subadvisory fee rate and initial asset allocation level, the IPS Fund’s expected total expense ratio would be below the median expense ratio of such funds.
The foregoing comparisons assisted the Directors in considering the BlackRock Subadvisory Agreement by providing them with a basis for evaluating BlackRock’s fees, including in light of the IPS Fund’s expected overall investment advisory fee and total expense ratio, on a relative basis. Based on this information, the Directors concluded that BlackRock’s subadvisory fees appeared to be within a reasonable range for the services to be provided.
195
Vantagepoint Funds
Additional Information (Unaudited)—(Continued)
The Directors considered that BlackRock was not able to provide estimated profits to be realized from its proposed relationship with the IPS Fund at this time. In reviewing the extent to which economies of scale may be realized by BlackRock as the assets of the IPS Fund to be managed by BlackRock grow, and whether the proposed fee levels reflect these economies, the Directors considered that BlackRock’s proposed fee schedule includes breakpoints, which indicates that the proposed subadvisory fee rate is intended to capture certain anticipated economies of scale for the benefit of the IPS Fund’s shareholders in connection with the services to be provided as the assets to be managed by BlackRock grow. The Directors concluded that the proposed fee schedule was appropriate at the time.
Other Considerations. The Directors considered the Adviser’s judgment that the addition of BlackRock as a subadviser to the IPS Fund would complement the investment approach of the IPS Fund’s existing subadviser, Pacific Investment Management Company, and should give the IPS Fund a favorable risk/return profile resulting in more consistent expected returns, increase portfolio diversification and reduce overall portfolio risk. The Directors considered the selection and due diligence process employed by the Adviser in deciding to recommend BlackRock as a subadviser to the IPS Fund and also considered the Adviser’s conclusion that the fees to be paid to BlackRock for its services to the IPS Fund are reasonable and appropriate in light of the nature and quality of the services to be provided by BlackRock and the reasons supporting that conclusion. The Directors also considered information from the Adviser concerning its strategy to efficiently implement the subadviser transition. The Directors concluded that the Adviser’s recommendations and conclusions supported approval of the BlackRock Subadvisory Agreement.
The Directors also considered the potential “fall-out” or ancillary benefits that may accrue to BlackRock due to its relationship with the IPS Fund and noted that the proposed subadviser reported that it was not aware of any “fall-out” benefits by virtue of its relationship with the IPS Fund.
Conclusion. After full consideration of the foregoing factors, with no single factor identified as being of paramount importance, the Directors, including a majority of the Independent Directors, concluded that the initial approval of the BlackRock Subadvisory Agreement is in the best interests of the IPS Fund and its shareholders, and approved the BlackRock Subadvisory Agreement with, and the fee to be paid to, BlackRock.
Vantagepoint Select Value Fund
At the September Meeting, the Board of the Company, including a majority of the Independent Directors, initially approved (1) the Master Agreement between the Company and the Adviser for the Vantagepoint Select Value Fund, a new series of the Company (“Select Value Fund”), and (2) separate Investment Subadvisory Agreements (each a “Select Value Subadvisory Agreement”) with WEDGE Capital Management LLP (“WEDGE”), Systematic Financial Management, L.P. (“Systematic”) and Goldman Sachs Asset Management, L.P. (“GSAM”) (each a “subadviser”) for the Select Value Fund. Before approving the Master Agreement and each Select Value Subadvisory Agreement, the Board considered the recommendations of, and supporting analyses and data presented by, the Adviser.
In considering the Master Agreement for the Select Value Fund and each Select Value Subadvisory Agreement, the Independent Directors received assistance from, and met separately with, their independent legal counsel and were provided with a written description of their statutory responsibilities and the legal standards that are applicable to approvals of advisory agreements.
With respect to the Board’s initial approval of the Master Agreement between the Company and the Adviser for the Select Value Fund, the Directors received written information in advance of the September Meeting, including information regarding: (1) the nature, quality and extent of the services to be provided by the Adviser; (2) the adequacy of the compliance program that is in place relating to the Select Value Fund; (3) the level of investment advisory fees to be charged by the Adviser and the fees charged by the Adviser to the other series of the Company where subadvisers are employed to manage the assets of the series directly (“actively managed funds”); (4) the Adviser’s experience as investment adviser to the other series of the Company and with respect to the investment strategies to be employed by the Select Value Fund; (5) the Select Value Fund’s expected overall investment advisory fee and total expense ratio compared to a group of investment companies categorized by Morningstar as mid-cap value funds (“Select Value peer group”); and (6) the expected costs of the services to be provided and net margin (“profit margin”) to be realized by the Adviser and its affiliates from its relationship with the Select Value Fund.
In determining to approve the Master Agreement with the Adviser for the Select Value Fund, the Directors considered the information received in advance of the September Meeting, the presentations made by, and discussions held with,
196
Vantagepoint Funds
Additional Information (Unaudited)—(Continued)
Adviser personnel and the Company’s CCO at previous Investment Committee and Board meetings and at the September Meeting, as well as a variety of factors. Although not meant to be all-inclusive, the following discusses some of the factors relevant to the Board’s decision to approve the Master Agreement with the Adviser.
Nature, Extent and Quality of Services. With respect to the nature, extent and quality of the services expected to be provided by the Adviser to the Select Value Fund under the Master Agreement, the Directors considered the specific investment services to be provided by the Adviser, including the subadviser selection and fee negotiation process, the process by which the Adviser evaluates and monitors subadvisers and the cash management services to be provided to the Select Value Fund. They also considered the experience of the Adviser’s investment management staff with regard to managing the other actively managed funds and the investment strategy to be employed by, and the adequacy of the compliance program for, the Select Value Fund. The Directors concluded that the nature, extent and quality of the investment advisory services expected to be provided by the Adviser were appropriate for the Select Value Fund in light of its investment objective and strategies and, thus, supported a decision to approve the Master Agreement with the Adviser.
Investment Performance. At the time of the Board’s consideration of the Master Agreement, the Select Value Fund had not commenced operations and, therefore, there was no information for the Directors to evaluate regarding the Select Value Fund’s actual performance.
Advisory Fee, Expense Ratio and Economies of Scale. The Directors considered a comparison of the fee to be paid to the Adviser by the Select Value Fund with the fee the Adviser charges to the existing actively managed funds. The proposed fee schedule for the Select Value Fund is the same as the fee schedule for the actively managed funds; and the type of services the Adviser would provide to the Select Value Fund is comparable to the services provided to the actively managed funds. The Directors also considered comparative data provided by the Adviser on the total advisory fees and the total expense ratios of the Select Value peer group. The information provided by the Adviser showed that, for the Select Value Fund’s current (2007) fiscal year, the proposed total investment advisory and subadvisory fee rate for the Select Value Fund is expected to be below the average and median investment advisory fee of the Select Value peer group and the expected expense ratio for the Select Value Fund is expected to be below the average and median expense ratio of the Select Value peer group. The foregoing comparisons assisted the Directors in considering the Master Agreement by providing them with a basis for evaluating the investment advisory fee to be paid to the Adviser and the Select Value Fund’s expected overall investment advisory fee (which includes the proposed subadvisory fees) and total expense ratio on a relative basis. Based on this information, the Directors concluded that the overall investment advisory fee appeared to be within a reasonable range for the services to be provided.
With respect to the expected costs and profit margins to be realized by the Adviser (and its affiliates) from its relationship with the Select Value Fund, the Directors considered information from the Adviser indicating that the Adviser and its affiliates do not anticipate a positive profit margin relating to the Select Value Fund in the foreseeable future. Based on this information, the Directors concluded that the Adviser may not realize economies of scale with regard to the Select Value Fund over the short-term and that the proposed fee structure is appropriate at this time.
Other Considerations. The Directors also considered the potential “fall-out” or ancillary benefits that may accrue to the Adviser due to its relationship with the Select Value Fund, such as increased exposure to each proposed subadviser’s investment research and management resources.
Conclusion. After full consideration of the foregoing factors, with no single factor identified as being of paramount importance, the Directors, including a majority of the Independent Directors, concluded that the initial approval of the Master Agreement with the Adviser is the best interest of the Select Value Fund and its shareholders, and approved the Master Agreement with, and the fee to be paid to, the Adviser.
With respect to the Board’s consideration of the respective Select Value Subadvisory Agreements with Wedge, Systematic and GSAM for the Select Value Fund, the Directors received written information in advance of the September Meeting from the Adviser, which included: (1) the process by which the Adviser selected and recommended for Board approval WEDGE, Systematic and GSAM as subadvisers of the Select Value Fund; (2) the nature, extent and quality of the services that each subadviser would provide to the Select Value Fund; (3) each subadviser’s experience, reputation, investment management business, personnel and operations; (4) each subadviser’s brokerage and trading policies and practices; (5) the level of subadvisory fees to be charged to the Select Value Fund by each subadviser and a comparison of those fees
197
Vantagepoint Funds
Additional Information (Unaudited)—(Continued)
to the (a) standard fee schedule charged by each subadviser for managing accounts with an investment mandate that is similar to the investment mandate that each subadviser is to employ for the Select Value Fund; and (b) fees charged by a group of active U.S. separate account investment managers utilizing an investment mandate that is similar to the investment mandate that each subadviser is to employ for the Select Value Fund; (6) each subadviser’s compliance program; (7) performance information for each subadviser and such performance compared to relevant performance measures; (8) the Select Value Fund’s expected overall investment advisory fee and total expense ratio as compared to the Select Value peer group; and (9) each subadviser’s financial condition.
In determining whether to approve each Select Value Subadvisory Agreement, the Directors considered the information received in advance of the September Meeting, the presentations made by, and discussions held with, personnel of the Adviser and each subadviser at prior Investment Committee and Board meetings and at the September Meeting, as applicable, as well as a variety of factors. Although not meant to be all-inclusive, the following discusses some of the factors relevant to the Board’s decision to approve each Select Value Subadvisory Agreement.
Nature, Extent and Quality of Services. With respect to the nature, extent and quality of the services expected to be provided by each subadviser under its respective Select Value Subadvisory Agreement, the Directors considered the specific investment process to be employed by each subadviser in managing the assets of the Select Value Fund to be allocated to it; the qualifications of each subadviser’s respective investment management team with regard to implementing its respective mandate; performance information for each subadviser as compared to relevant performance measures; each subadviser’s infrastructure and whether it appears to adequately support the strategy it is to employ for the Select Value Fund; and the Adviser’s review process and favorable assessment as to the nature, quality and extent of the subadvisory services expected to be provided by each subadviser to the Select Value Fund. The Directors also considered that the performance information provided for each subadviser was favorable with respect to the strategy it is to employ for the Select Value Fund, and each has an experienced portfolio management team, and appears to have adequate infrastructure and support staff to seek to achieve favorable results implementing the particular strategy that it is to employ for the Select Value Fund.
The Directors concluded that the nature, extent and quality of the subadvisory services expected to be provided by each subadviser were appropriate for the Select Value Fund in light of its investment objective and strategies, and, thus, supported a decision to approve each Select Value Subadvisory Agreement.
Investment Performance. The Directors evaluated the investment performance information provided by the Adviser for each subadviser, and considered this performance information versus a relevant benchmark and a group of U.S. separate account investment managers that employ a mid-cap value mandate (based on information provided by an independent third party source). The Directors concluded that the performance information provided supported approval of each Select Value Subadvisory Agreement.
Subadvisory Fees and Economies of Scale. In evaluating each proposed subadvisory fee, the Directors reviewed the subadvisory fee schedule for each subadviser. The Directors considered comparisons of the subadvisory fees to be charged by each subadviser to the Select Value Fund with each subadviser’s standard fee schedule for managing accounts with an investment mandate similar to the mandate that the subadviser is to employ on behalf of the Select Value Fund. The Directors also considered that, according to the information provided, the proposed fee schedule for each subadviser reflected the lowest fee rate currently charged by the subadviser to other accounts of similar size and for which the subadviser provides advisory services utilizing an investment mandate similar to the mandate the subadviser is to employ for the Select Value Fund (“like accounts”). The Directors further considered the Adviser’s representation that it negotiated the lowest subadvisory fee schedule available with each subadviser for like accounts. Additionally, the nature of the subadvisory services each subadviser is to provide to the Select Value Fund appeared to be comparable to those each subadviser provides to like accounts. The Directors reviewed information provided by the Adviser (which was based on an independent third-party source) on the fees charged to actively managed accounts with assets comparable to the amount of assets expected to be allocated initially to each subadviser by a group of U.S. separate account investment managers that employ a mid-cap value mandate. According to the information provided, the effective fee rate to be paid by the Select Value Fund to each subadviser would be below the median fee charged by such mid-cap value managers.
Referring to the Select Value peer group data provided by the Adviser, the Directors also noted that, if WEDGE, Systematic and GSAM each served as a subadviser to the Select Value Fund at the proposed subadvisory fee rates and the expected initial asset allocation levels: (i) the expected total investment advisory fee for the Select Value Fund would
198
Vantagepoint Funds
Additional Information (Unaudited)—(Continued)
be lower than the average and median investment advisory fee of the Select Value peer group; and (ii) the Select Value Fund’s expected total expense ratio would be below the average and median expense ratio of the Select Value peer group.
The foregoing comparisons assisted the Directors in considering each Select Value Subadvisory Agreement by providing them with a basis for evaluating each subadviser’s fee schedule, including in light of the Select Value Fund’s expected overall investment advisory fee and total expense ratio, on a relative basis. Based on this information, the Directors concluded that the proposed subadvisory fee to be charged by each subadviser appeared to be within a reasonable range for the services to be provided.
The Directors also reviewed the information provided by each of WEDGE and Systematic regarding the expected profits to be realized from the subadviser’s relationship with the Select Value Fund; such information was not available with respect to GSAM. In reviewing the extent to which economies of scale may be realized by the subadvisers as the assets of the Select Value Fund to be managed by each subadviser grow, and whether the proposed fee levels reflect these economies, the Directors considered (i) that each Select Value Subadvisory Agreement was the product of arms length negotiations; and (ii) the Adviser’s assessment that each subadvisory fee schedule reflects the lowest available fee schedule from the respective subadviser for like accounts. The Directors also considered that each subadviser’s proposed fee schedule includes breakpoints, which indicates that the proposed subadvisory fee rates are intended to capture certain anticipated economies of scale for the benefit of the Select Value Fund’s shareholders in connection with the services to be provided as the assets to be managed by each subadviser grow. The Directors concluded that the proposed fee schedules with respect to each subadviser are appropriate at this time.
Other Considerations. The Directors considered the selection and due diligence process employed by the Adviser in deciding to recommend WEDGE, Systematic and GSAM as subadvisers to the Select Value Fund to implement the Select Value Fund’s investment objective and strategies and also considered the Adviser’s conclusion that the fees to be paid to each subadviser are reasonable and appropriate in light of the nature and quality of the services to be provided by each subadviser and the reasons supporting that conclusion. The Directors concluded that the Adviser’s recommendations and conclusions supported approval of each Select Value Subadvisory Agreement.
The Directors also considered the potential “fall-out” or ancillary benefits that may accrue to WEDGE, Systematic and GSAM due to each subadviser’s relationship with the Select Value Fund. The Directors considered that each subadviser may direct the Select Value Fund’s brokerage transactions to certain brokers to obtain research and other services. The Directors also considered that the Adviser noted that GSAM may direct the Select Value Fund’s brokerage transactions to affiliated brokers. However, the Directors noted that all subadvisers are required to select brokers who meet the Select Value Fund’s requirements for seeking best execution, and that the Adviser monitors and evaluates the subadvisers’ trade execution with respect to Fund brokerage transactions on a regular basis and provides reports to the Board in this regard. The Directors also considered that both Systematic and WEDGE noted that each may receive indirect benefits from its relationship with the Select Value Fund relating to the addition of the Fund to its client base. The Directors concluded that the potential benefits accruing to each subadviser by virtue of its relationship with the Select Value Fund were reasonable.
Conclusion. After full consideration of the foregoing factors, with no single factor identified as being of paramount importance, the Directors, including a majority of the Independent Directors, concluded that the initial approval of each Select Value Subadvisory Agreement is in the best interests of the Select Value Fund and its shareholders, and approved the Select Value Subadvisory Agreement with, and the fee to be paid to, each of WEDGE, Systematic and GSAM.
Vantagepoint Diversified Assets Fund
At a meeting held on October 19, 2007 (“October Meeting”), the Board of the Company, including a majority of the Independent Directors, initially approved (1) the Master Agreement between the Company and the Adviser for the Vantagepoint Diversified Assets Fund, a new series of the Company (“Diversified Assets Fund”), and (2) separate Investment Subadvisory Agreements (each a “Diversified Assets Subadvisory Agreement”) with Analytic Investors, Inc. (“Analytic”), Drake Capital Management, LLC (“Drake”), Mellon Capital Management Corporation (“Mellon”) and Payden (each a “subadviser”) for the Diversified Assets Fund. Before approving the Master Agreement and each Diversified Assets Subadvisory Agreement, the Board considered the recommendations of, and supporting analyses and data presented by, the Adviser.
199
Vantagepoint Funds
Additional Information (Unaudited)—(Continued)
In considering the Master Agreement for the Diversified Assets Fund and each Diversified Assets Subadvisory Agreement, the Independent Directors received assistance from, and met separately with, their independent legal counsel and were provided with a written description of their statutory responsibilities and the legal standards that are applicable to approvals of advisory agreements.
With respect to the Board’s initial approval of the Master Agreement between the Company and the Adviser for the Diversified Assets Fund, the Directors received written information in advance of the October Meeting, including information regarding: (1) the nature, quality and extent of the services to be provided by the Adviser; (2) the adequacy of the compliance program that is in place relating to the Diversified Assets Fund; (3) the level of investment advisory fees to be charged by the Adviser and the fees charged by the Adviser to the other series of the Company where subadvisers are employed to manage the assets of the series directly (“actively managed funds”); (4) the Adviser’s experience as investment adviser to the other series of the Company and with respect to the investment strategies to be employed by the Diversified Assets Fund; (5) the Diversified Assets Fund’s expected overall investment advisory fee and total expense ratio compared to a group of investment companies categorized by Morningstar as long-short funds (“Diversified Assets peer group”); and (6) the expected costs of the services to be provided and net margin (“profit margin”) to be realized by the Adviser and its affiliates from its relationship with the Diversified Assets Fund.
In determining to approve the Master Agreement with the Adviser for the Diversified Assets Fund, the Directors considered the information received in advance of the October Meeting, the presentations made by, and discussions held with, Adviser personnel and the Company’s CCO at previous Investment Committee and Board meetings and at the October Meeting, as well as a variety of factors. Although not meant to be all-inclusive, the following discusses some of the factors relevant to the Board’s decision to approve the Master Agreement with the Adviser.
Nature, Extent and Quality of Services. With respect to the nature, extent and quality of the services expected to be provided by the Adviser to the Diversified Assets Fund, the Directors considered the specific investment services to be provided by the Adviser, including the subadviser selection and fee negotiation process, the process by which the Adviser evaluates and monitors subadvisers and the cash management services to be provided to the Diversified Assets Fund. They also considered the experience of the Adviser’s investment management staff with regard to managing the other actively managed funds and the investment strategy to be employed by, and the structure of, the Diversified Assets Fund and the adequacy of the compliance program for the Diversified Assets Fund. The Directors concluded that the nature, extent and quality of the investment advisory services expected to be provided by the Adviser were appropriate for the Diversified Assets Fund in light of its investment objective and strategies and, thus, supported a decision to approve the Master Agreement with the Adviser.
Investment Performance. At the time of the Board’s consideration of the Master Agreement, the Diversified Assets Fund had not commenced operations and, therefore, there was no information for the Directors to evaluate regarding the Diversified Assets Fund’s actual performance.
Advisory Fee, Expense Ratio and Economies of Scale. The Directors considered a comparison of the fee to be paid to the Adviser by the Diversified Assets Fund with the fee the Adviser charges to the existing actively managed funds. The proposed fee schedule for the Diversified Assets Fund is the same as the fee schedule for the actively managed funds; and the type of services the Adviser would provide to the Diversified Assets Fund is comparable to the services provided to the actively managed funds. The Directors also considered comparative data provided by the Adviser on the total advisory fees and the total expense ratio of the Diversified Assets peer group. The information provided by the Adviser showed that, for the Diversified Assets Fund’s current (2007) fiscal year, the proposed total investment advisory and subadvisory fee rate for the Diversified Assets Fund is expected to be below the median investment advisory fee of the Diversified Assets peer group and the expected expense ratio for the Diversified Assets Fund is expected to be below the average and median expense ratio of the Diversified Assets peer group. The foregoing comparisons assisted the Directors in considering the Master Agreement for the Diversified Assets Fund by providing them with a basis for evaluating the investment advisory fee to be paid to the Adviser and the Diversified Assets Fund’s expected overall investment advisory fee (which includes the proposed subadvisory fees) and total expense ratio on a relative basis. Based on this information, the Directors concluded that the overall investment advisory fee appeared to be within a reasonable range for the services to be provided.
With respect to the expected costs and profit margins to be realized by the Adviser (and its affiliates) from its relationship with the Diversified Assets Fund, the Directors considered information from the Adviser regarding the expected profit
200
Vantagepoint Funds
Additional Information (Unaudited)—(Continued)
margin to be realized by the Adviser. Based on this information, the Directors concluded that, although the Adviser anticipates a positive profit margin, it may not realize economies of scale with regard to the Diversified Assets Fund over the short-term and that the proposed fee structure is appropriate at this time.
Other Considerations. The Directors also considered the potential “fall-out” or ancillary benefits that may accrue to the Adviser due to its relationship with the Diversified Assets Fund, such as increased exposure to each proposed subadviser’s investment research and management resources.
Conclusion. After full consideration of the foregoing factors, with no single factor identified as being of paramount importance, the Directors, including a majority of the Independent Directors, concluded that the initial approval of the Master Agreement with the Adviser is the best interest of the Diversified Assets Fund and its shareholders, and approved the Master Agreement with, and the fee to be paid to, the Adviser.
With respect to the Board’s consideration of the respective Diversified Assets Subadvisory Agreements with Analytic, Drake, Mellon and Payden, the Directors received written information in advance of the October Meeting from the Adviser, which included: (1) the process by which the Adviser selected and recommended for Board approval Analytic, Drake, Mellon and Payden as subadvisers of the Diversified Assets Fund; (2) the nature, extent and quality of the services that each subadviser would provide to the Diversified Assets Fund; (3) each subadviser’s experience, reputation, investment management business, personnel and operations; (4) each subadviser’s brokerage and trading policies and practices; (5) the level of subadvisory fees to be charged to the Diversified Assets Fund by each subadviser and a comparison of those fees to the (a) standard separate account fee schedule charged by each subadviser for managing accounts with an investment mandate that is similar to the investment mandate that each subadviser is to employ for the Diversified Assets Fund; and (b) fees charged by a group of active separate account investment managers utilizing an investment mandate that is similar to the investment mandate that each subadviser is to employ for the Diversified Assets Fund; (6) each subadviser’s compliance program; (7) performance information for each subadviser and such performance compared to a relevant performance measure; (8) the Diversified Assets Fund’s expected overall investment advisory fee and total expense ratio as compared to the Diversified Assets peer group; and (9) each subadviser’s financial condition.
In determining whether to approve each Diversified Assets Subadvisory Agreement, the Directors considered the information received in advance of the October Meeting, the presentations made by, and discussions held with, personnel of the Adviser and each subadviser at prior Investment Committee and Board meetings and at the October Meeting, as applicable, as well as a variety of factors. Although not meant to be all-inclusive, the following discusses some of the factors relevant to the Board’s decision to approve each Diversified Assets Subadvisory Agreement.
Nature, Extent and Quality of Services. With respect to the nature, extent and quality of the services expected to be provided by each subadviser under its respective Diversified Assets Subadvisory Agreement, the Directors considered the specific investment process to be employed by each subadviser in managing the assets of the Diversified Assets Fund to be allocated to it; the qualifications of each subadviser’s respective investment management team with regard to implementing its respective mandate; performance information for each subadviser as compared to a relevant performance measure; each subadviser’s infrastructure and whether it appears to adequately support the strategy it is to employ for the Diversified Assets Fund; and the Adviser’s review process and favorable assessment as to the nature, quality and extent of the subadvisory services expected to be provided by each subadviser to the Diversified Assets Fund. The Directors also considered that each subadviser has an experienced portfolio management team, and appears to have adequate infrastructure and support staff to seek to achieve favorable results implementing the particular strategy that it is to employ for the Diversified Assets Fund.
The Directors concluded that the nature, extent and quality of the subadvisory services expected to be provided by each subadviser were appropriate for the Diversified Assets Fund in light of its investment objective and strategies, and, thus, supported a decision to approve each Diversified Assets Subadvisory Agreement.
Investment Performance. The Directors evaluated the investment performance information provided by the Adviser for each subadviser, and considered this performance information versus a relevant performance measure and in light of the particular strategy the subadviser is to employ for the Diversified Assets Fund. The Directors concluded that the performance information provided supported approval of each Diversified Assets Subadvisory Agreement.
Subadvisory Fees and Economies of Scale. In evaluating each proposed subadvisory fee, the Directors reviewed the subadvisory fee schedule for each subadviser. The Directors considered comparisons of the subadvisory fees to be charged
201
Vantagepoint Funds
Additional Information (Unaudited)—(Continued)
by each subadviser to the Diversified Assets Fund with each subadviser’s standard fee schedule for managing accounts with an investment mandate similar to the mandate that the subadviser is to employ on behalf of the Diversified Assets Fund. The Directors also considered that, according to the information provided: (i) the Adviser represented that it negotiated with each subadviser the lowest subadvisory fee schedule available for accounts of similar size and for which the subadviser provides advisory services utilizing an investment mandate similar to the mandate the subadviser is to employ for the Diversified Assets Fund (“like accounts”); (ii) the proposed fee schedule for Drake and Payden reflected the lowest fee rate currently charged by each subadviser to other U.S.-registered investment companies for which the subadviser provides advisory services utilizing a similar mandate, and that Payden agreed to waive a portion of its fee through April 30, 2008; (iii) the proposed fee schedule for Mellon is the same as the fee schedule for a U.S.-registered investment company for which Mellon provides advisory services utilizing a similar mandate; and (iv) except for one other account that invested upon initiation of the strategy that is to be employed by Analytic for the Diversified Assets Fund, the proposed fee schedule for Analytic reflects the lowest fee rate currently charged by Analytic for the investment strategy to be employed by, and at the initial level of assets to be allocated to, Analytic for the Diversified Assets Fund. Additionally, the nature of the subadvisory services each subadviser is to provide to the Diversified Assets Fund appeared to be comparable to those each subadviser provides to such other clients. For each subadviser, the Directors reviewed information provided by the Adviser (which was based on an independent third-party source) on the fees charged to actively managed accounts with assets comparable to the amount of assets expected to be allocated initially to the subadviser by a group of U.S. separate account investment managers that employ a similar investment mandate to the investment mandate the subadviser is to employ for the Diversified Assets Fund. According to the information provided, the effective fee rate to be paid by the Diversified Assets Fund to each of Analytic, Drake and Payden would be below the median fee charged by the applicable group of managers, and the effective fee rate to be paid by the Diversified Assets Fund to Mellon would be above the median fee charged by the applicable group of managers, and in the third quartile.
Referring to the Diversified Assets peer group data provided by the Adviser, the Directors also noted that, if Analytic, Drake, Mellon and Payden each served as a subadviser of the Diversified Assets Fund at the proposed subadvisory fee rates and the expected initial asset allocation levels: (i) the expected total investment advisory fee for the Diversified Assets Fund would be lower than the median investment advisory fee of the Diversified Assets Fund’s peer group; and (ii) the Diversified Assets Fund’s expected total expense ratio would be below the average and median expense ratio of the Diversified Assets peer group. The foregoing comparisons assisted the Directors in considering each Diversified Assets Subadvisory Agreement by providing them with a basis for evaluating each subadviser’s fee, including in light of the Diversified Assets Fund’s expected overall investment advisory fee and total expense ratio, on a relative basis. Based on this information, the Directors concluded that the proposed subadvisory fee to be charged by each subadviser appeared to be within a reasonable range for the services to be provided.
The Directors also reviewed the information provided by each of Analytic, Mellon and Payden regarding the expected profits to be realized from the subadviser’s relationship with the Diversified Assets Fund; such information was not available with respect to Drake. In reviewing the extent to which economies of scale may be realized by the subadvisers as the assets of the Diversified Assets Fund to be managed by each subadviser grow, and whether the proposed fee levels reflect these economies, the Directors considered (i) that each Diversified Assets Subadvisory Agreement was the product of arms-length negotiations; and (ii) the Adviser’s assessment that each subadvisory fee schedule reflects the lowest available fee schedule from the respective subadviser for like accounts. The Directors also considered that Payden’s proposed fee schedule includes breakpoints, which indicates that the proposed subadvisory fee rates are intended to capture certain anticipated economies of scale for the benefit of the Diversified Assets Fund shareholders in connection with the services to be provided as the assets to be managed by Payden grow. The Directors concluded that the proposed fee schedules with respect to each subadviser are appropriate at this time.
Other Considerations. The Directors considered the selection and due diligence process employed by the Adviser in deciding to recommend Analytic, Drake, Mellon and Payden as subadvisers of the Diversified Assets Fund to implement the Diversified Assets Fund’s investment objective and strategies and also considered the Adviser’s conclusion that the fees to be paid to each subadviser are reasonable and appropriate in light of the nature and quality of the services to be provided by each subadviser and the reasons supporting that conclusion. The Directors concluded that the Adviser’s recommendations and conclusions supported approval of each Diversified Assets Subadvisory Agreement.
The Directors also considered the potential “fall-out” or ancillary benefits that may accrue to Analytic, Drake, Mellon and Payden due to each subadviser’s relationship with the Diversified Assets Fund. The Directors considered that
202
Vantagepoint Funds
Additional Information (Unaudited)—(Continued)
Analytic, Mellon and Payden do not expect any “fall-out” benefits by virtue of their relationship with the Diversified Assets Fund, while Drake noted, among other benefits, a higher profile among investors.
Conclusion. After full consideration of the foregoing factors, with no single factor identified as being of paramount importance, the Directors, including a majority of the Independent Directors, concluded that the initial approval of each Diversified Assets Subadvisory Agreement is in the best interests of the Diversified Assets Fund and its shareholders, and approved the Diversified Assets Subadvisory Agreement with, and the fee to be paid to, each of Analytic, Drake, Mellon and Payden.
Only one copy of this Annual Report may be mailed to households, even if more than one person in a household is a shareholder of record, unless the Company has received instructions to the contrary. If you need additional copies of this Annual Report, please contact The Vantagepoint Funds toll free at 1-800-669-7400 or in writing at 777 North Capitol Street, NE, Suite 600, Washington, D.C. 20002. If you do not want this mailing of this Annual Report to be combined with those for other members of your household, contact the Vantagepoint Funds in writing at 777 North Capitol Street, NE, Suite 600, Washington, D.C. 20002 or toll free at 1-800-669-7400.
H. | | Other Available Information |
A description of the Company’s proxy voting policies and procedures and the proxy voting record for the 12-month period ended June 30, 2007 are available on the Company’s website at www.icmarc.org or by accessing the Securities and Exchange Commission’s website at www.sec.gov.
The Company files its complete schedule of portfolio holdings with the SEC for the first and third quarters of each fiscal year on Form N-Q; the Company’s Forms N-Q are available on the SEC’s website at www.sec.gov and may be reviewed and copied at the SEC’s Public Reference Room in Washington, D.C. Information on the operation of the Public Reference Room may be obtained by calling 1-800-SEC-0330.
203
SCHEDULE OF INVESTMENTS
December 31, 2007
Vantagepoint Money
Market Fund
|
| Shares
|
| Value
|
|
|---|
MUTUAL FUNDS—99.2% |
| AIM Short-Term Investments Trust Liquid Assets Portfolio | | | | | | | |
| (Cost $304,391,144) | | 304,391,144 | | | $ | 304,391,144 | |
TOTAL INVESTMENTS—99.2% | | | |
| (Cost $304,391,144) | | | | | | | | 304,391,144 | |
| Other assets less liabilities—0.8% | | 2,408,231 | |
NET ASSETS—100.0% | $ | 306,799,375 | |
See accompanying notes to financial statements.
204
SCHEDULE OF INVESTMENTS
December 31, 2007
Vantagepoint Low Duration
Bond Fund
Coupon
Rate
|
|
|
| Maturity
Date
|
|
|
| Face
|
| Value
|
|---|
CORPORATE OBLIGATIONS—35.1% |
Automotive—0.1% | | | |
| General Motors Acceptance Corporation, Global Note |
| 5.125% | | | | 05/09/2008 | | † | | $ | 729,000 | | | $ | 721,005 | |
Banking—20.6% | | | |
| AIG SunAmerica Global Financing VII, Senior Note, 144A |
| 5.850% | | | | 08/01/2008 | | * | | | 700,000 | | | | 701,988 | |
American Express Travel Related Services Co., Inc.,
Senior Note, 144A |
| 5.250% | | | | 11/21/2011 | | * | | | 6,000,000 | | | | 6,018,618 | |
| Bank of America Corporation, Note | | | |
| 4.500% | | | | 08/01/2010 | | | | | 3,910,000 | | | | 3,914,270 | |
| Bank of America Corporation, Subordinated Note |
| 6.600% | | | | 05/15/2010 | | | | | 400,000 | | | | 418,818 | |
| Bank of America Corporation, Subordinated Note |
| 6.375% | | | | 02/15/2008 | | | | | 930,000 | | | | 931,853 | |
| Barclays Bank PLC, Note (United Kingdom) | | | |
| 5.450% | | | | 09/12/2012 | | | | | 7,440,000 | | | | 7,633,723 | |
| Capital One Bank, Note | | | |
| 4.250% | | | | 12/01/2008 | | | | | 3,750,000 | | | | 3,670,387 | |
Caterpillar Financial Services Corp.,
Series F, Note, (MTN) | | | |
| 3.750% | | | | 05/15/2009 | | | | | 2,065,000 | | | | 2,041,480 | |
| CIT Group, Inc., Global Note | | | |
| 4.250% | | | | 02/01/2010 | | | | | 380,000 | | | | 365,797 | |
| CIT Group, Inc., Senior Note | | | |
| 5.253% | | | | 03/12/2010 | | # | | | 5,780,000 | | | | 5,269,112 | |
| Citigroup, Inc., Note | | | |
| 6.200% | | | | 03/15/2009 | | | | | 5,815,000 | | | | 5,896,567 | |
| General Electric Capital Corp., Note, (MTN) | | | |
| 4.875% | | | | 10/21/2010 | | | | | 4,060,000 | | | | 4,123,027 | |
General Electric Capital Corp.,
Series A, Note, (MTN) | | | |
| 4.250% | | | | 09/13/2010 | | | | | 4,600,000 | | | | 4,586,646 | |
| Glitnir Banki HF, Note, 144A (Iceland) | | | |
| 6.375% | | | | 09/25/2012 | | * | | | 6,270,000 | | | | 6,156,845 | |
| HSBC Finance Corp., Note | | | |
| 4.750% | | | | 05/15/2009 | | | | | 4,480,000 | | | | 4,466,578 | |
John Deere Capital Corp.,
Series S, Note, (MTN) | | | |
| 5.514% | | | | 10/16/2009 | | # | | | 6,000,000 | | | | 6,007,800 | |
| JPMorgan Chase & Co., Note | | | |
| 5.375% | | | | 10/01/2012 | | | | | 6,675,000 | | | | 6,800,804 | |
| M&T Bank Corp., Senior Note | | | |
| 5.375% | | | | 05/24/2012 | | | | | 6,680,000 | | | | 6,668,818 | |
| Marshall & Ilsley Corp., Senior Note | | | |
| 5.626% | | | | 08/17/2009 | | | | | 6,500,000 | | | | 6,567,158 | |
SLM Corp.,
Series A, Note, (MTN) | | | |
| 5.224% | | | | 07/27/2009 | | # | | | 7,000,000 | | | | 6,587,140 | |
| SunTrust Banks, Inc., Senior Note | | | |
| 5.250% | | | | 11/05/2012 | | | | | 5,000,000 | | | | 5,043,355 | |
| Wachovia Bank NA, Bank Note | | | |
| 7.800% | | | | 08/18/2010 | | | | | 4,750,000 | | | | 5,122,210 | |
| Wells Fargo & Company, Note | | | |
| 4.125% | | | | 03/10/2008 | | | | | 1,800,000 | | | | 1,795,009 | |
| Wells Fargo & Company, Senior Note | | | |
| 4.000% | | | | 08/15/2008 | | | | | 2,585,000 | | | | 2,566,905 | |
Wells Fargo & Company,
Series J, Note, (MTN) | | | |
| 4.200% | | | | 01/15/2010 | | | | | 1,000,000 | | | | 994,160 | |
| | | 104,349,068 | |
Beverages, Food & Tobacco—1.0% | | | |
| PepsiCo, Inc., Senior Note | | | |
| 4.650% | | | | 02/15/2013 | | | | $ | 3,745,000 | | | $ | 3,774,406 | |
| Smithfield Foods, Inc., Senior Note | | | |
| 8.000% | | | | 10/15/2009 | | | | | 1,275,000 | | | | 1,294,125 | |
| | | 5,068,531 | |
Chemicals—0.5% | | | |
| E.I. du Pont de Nemours & Co., Senior Note | | | |
| 5.000% | | | | 01/15/2013 | | | | | 2,500,000 | | | | 2,518,540 | |
Computer Software & Processing—0.7% | | | |
| Oracle Corporation, Note | | | |
| 5.000% | | | | 01/15/2011 | | | | | 2,282,000 | | | | 2,313,790 | |
| Unisys Corp., Senior Note | | | |
| 6.875% | | | | 03/15/2010 | | | | | 1,390,000 | | | | 1,323,975 | |
| | | 3,637,765 | |
Containers & Packaging—0.0% | | | |
| Ball Corp., Senior Note | | | |
| 6.875% | | | | 12/15/2012 | | | | | 100,000 | | | | 102,000 | |
Cosmetics & Personal Care—0.3% | | | |
| Gillette Co. (The), Note | | | |
| 3.800% | | | | 09/15/2009 | | | | | 1,760,000 | | | | 1,768,823 | |
Electric Utilities—0.9% | | | |
| Allegheny Energy Supply Company LLC | | | |
| 7.800% | | | | 03/15/2011 | | | | | 160,000 | | | | 167,600 | |
| Duke Energy Corp., Senior Note | | | |
| 4.200% | | | | 10/01/2008 | | | | | 3,750,000 | | | | 3,727,102 | |
| PSEG Energy Holdings LLC, Senior Note | | | |
| 8.625% | | | | 02/15/2008 | | | | | 521,000 | | | | 524,576 | |
| | | 4,419,278 | |
Financial Services—5.1% | | | |
Allstate Life Global Fund Trust,
Series 2004-1, Note | | | |
| 4.500% | | | | 05/29/2009 | | | | | 3,750,000 | | | | 3,763,035 | |
| ASIF Global Financing, Senior Note, 144A | | | |
| 3.900% | | | | 10/22/2008 | | * | | | 1,220,000 | | | | 1,206,168 | |
| Countrywide Home Loans, Inc., Note, (MTN) | | | |
| 4.125% | | | | 09/15/2009 | | | | | 732,000 | | | | 537,133 | |
| Ford Motor Credit Company, Note | | | |
| 7.250% | | | | 10/25/2011 | | | | | 785,000 | | | | 680,475 | |
| Household Finance Corporation | | | |
| 6.375% | | | | 10/15/2011 | | | | | 3,150,000 | | | | 3,248,230 | |
| Hutchison Whampoa International 03/33 Ltd., Guaranteed Note, 144A (Cayman Islands) | | | |
| 5.450% | | | | 11/24/2010 | | * | | | 1,500,000 | | | | 1,515,853 | |
| Principal Life Global Funding I, Note, 144A | | | |
| 3.625% | | | | 04/30/2008 | | * | | | 550,000 | | | | 546,576 | |
| Principal Life Global Funding I, Note, 144A, (MTN) |
| 2.800% | | | | 06/26/2008 | | * | | | 3,250,000 | | | | 3,210,451 | |
| TIAA Global Markets 144A | | | |
| 3.875% | | | | 01/22/2008 | | * | | | 6,000,000 | | | | 5,999,190 | |
| TIAA Global Markets, Inc., Note, 144A | | | |
| 5.125% | | | | 10/10/2012 | | * | | | 4,900,000 | | | | 4,999,646 | |
| | | 25,706,757 | |
Home Construction, Furnishings & Appliances—0.2% |
| KB Home, Senior Subordinated Note | | | |
| 8.625% | | | | 12/15/2008 | | | | | 1,260,000 | | | | 1,241,100 | |
Insurance—0.2% | | | |
| American International Group, Inc., Note | | | |
| 4.700% | | | | 10/01/2010 | | | | | 1,000,000 | | | | 1,003,241 | |
|
See accompanying notes to financial statements.
205
SCHEDULE OF INVESTMENTS—(Continued)
December 31, 2007
Vantagepoint Low Duration
Bond Fund
Coupon
Rate
|
|
|
| Maturity
Date
|
|
|
| Face
|
| Value
|
|---|
CORPORATE OBLIGATIONS—(Continued) |
Lodging—0.3% | | | |
| MGM Mirage, Senior Note | | | |
| 6.000% | | | | 10/01/2009 | | | | $ | 1,320,000 | | | $ | 1,320,000 | |
Media—Broadcasting & Publishing—1.5% |
| Clear Channel Communications, Inc., Global Note |
| 4.250% | | | | 05/15/2009 | | | | | 750,000 | | | | 712,247 | |
| Comcast Corporation, Note | | | |
| 5.450% | | | | 11/15/2010 | | | | | 2,250,000 | | | | 2,297,428 | |
| Echostar DBS Corporation, Note | | | |
| 5.750% | | | | 10/01/2008 | | | | | 1,345,000 | | | | 1,346,681 | |
| Gannett Co., Inc., Senior Note | | | |
| 4.125% | | | | 06/15/2008 | | | | | 3,430,000 | | | | 3,415,354 | |
| | | 7,771,710 | |
Oil & Gas—0.9% | | | |
| ConocoPhillips Co., Note | | | |
| 8.750% | | | | 05/25/2010 | | | | | 1,773,000 | | | | 1,943,481 | |
| Pemex Project Funding Master Trust, Note | | | |
| 7.875% | | | | 02/01/2009 | | | | | 2,350,000 | | | | 2,427,371 | |
| | | 4,370,852 | |
Pharmaceuticals—0.5% | | | |
| Amgen, Inc., Senior Note | | | |
| 4.000% | | | | 11/18/2009 | | | | | 2,400,000 | | | | 2,383,366 | |
Retailers—0.4% | | | |
| CVS Caremark Corporation, Note | | | |
| 4.000% | | | | 09/15/2009 | | | | | 2,000,000 | | | | 1,963,244 | |
Telephone Systems—1.9% | | | |
| AT&T, Inc., Note | | | |
| 4.950% | | | | 01/15/2013 | | | | | 900,000 | | | | 905,795 | |
| BellSouth Corp., Note | | | |
| 4.200% | | | | 09/15/2009 | | | | | 3,262,000 | | | | 3,243,896 | |
| SBC Communications, Inc., Global Note | | | |
| 4.125% | | | | 09/15/2009 | | | | | 5,505,000 | | | | 5,472,212 | |
| | | 9,621,903 | |
TOTAL CORPORATE OBLIGATIONS | | | |
| (Cost $177,611,004) | | | | | | 177,967,183 | |
| |
U.S. GOVERNMENT AGENCY OBLIGATIONS—10.0% |
U.S. Government Agencies—2.6% | | | |
| Federal Home Loan Bank | | | |
| 4.150% | | | | 01/07/2008 | | | | | 10,000,000 | | | | 9,993,083 | |
| Federal National Mortgage Association | | | |
| 5.786% | | | | 10/01/2036 | | # | | | 3,376,639 | | | | 3,422,796 | |
| | | 13,415,879 | |
U.S. Government Agencies—Mortgage Backed—7.4% |
| Federal Home Loan Mortgage Corporation | | | |
| 5.699% | | | | 11/01/2036 | | # | | | 7,960,822 | | | | 8,077,120 | |
| 5.391% | | | | 03/01/2036 | | # | | | 4,271,142 | | | | 4,297,043 | |
| 4.385% | | | | 10/01/2034 | | # | | | 4,627,798 | | | | 4,620,775 | |
| Federal Home Loan Mortgage Corporation, Series 2885, Class DK | | | |
| 3.500% | | | | 10/15/2012 | | | | | 1,006,111 | | | | 1,002,643 | |
| Federal Home Loan Mortgage Corporation, Series 2891, Class LN | | | |
| 4.250% | | | | 06/15/2024 | | | | | 2,140,254 | | | | 2,129,495 | |
| Federal National Mortgage Association | | | |
| 5.578% | | | | 12/01/2036 | | # | | $ | 5,208,962 | | | $ | 5,275,752 | |
| 5.083% | | | | 09/01/2034 | | # | | | 526,673 | | | | 528,847 | |
| 5.081% | | | | 10/01/2034 | | # | | | 4,362,733 | | | | 4,411,509 | |
| 4.951% | | | | 10/01/2034 | | # | | | 5,467,048 | | | | 5,466,764 | |
| 4.907% | | | | 09/01/2034 | | # | | | 414,853 | | | | 414,185 | |
| 4.728% | | | | 10/01/2034 | | # | | | 758,401 | | | | 760,119 | |
Federal National Mortgage Association,
Series 2004-81, Class KG | | | |
| 3.500% | | | | 05/25/2012 | | | | | 398,652 | | | | 397,505 | |
| | | 37,381,757 | |
TOTAL U.S. GOVERNMENT AGENCY OBLIGATIONS | | | |
| (Cost $50,797,947) | | | | | | 50,797,636 | |
| |
U.S. TREASURY OBLIGATIONS—14.0% |
U.S. Treasury Notes—14.0% | | | |
| U.S. Treasury Note | | | |
| 4.875% | | | | 08/15/2009-
04/30/2011 | | ** | | | 3,319,000 | | | | 3,484,861 | |
| 4.500% | | | | 11/15/2010-
11/30/2011 | | | | | 33,100,000 | | | | 34,511,259 | |
| 3.875% | | | | 09/15/2010 | | | | | 32,262,000 | | | | 32,960,182 | |
TOTAL U.S. TREASURY OBLIGATIONS | | | |
| (Cost $70,251,816) | | | | | | 70,956,302 | |
| |
SOVEREIGN DEBT OBLIGATIONS—0.6% |
Government Issued—0.6% |
| Republic of South Africa (South Africa) | | | |
| 9.125% | | | | 05/19/2009 | | | | | | | | | | |
| (Cost $2,891,553) | | 2,750,000 | | | | 2,904,687 | |
| |
ASSET BACKED SECURITIES—27.2% |
Automotive—14.8% | | | |
BMW Vehicle Lease Trust,
Series 2007-1, Class A3A |
| 4.590% | | | | 08/15/2013 | | | | | 4,900,000 | | | | 4,907,950 | |
Capital Auto Receivables Asset Trust,
Series 2004-2, Class A3 | | | |
| 3.580% | | | | 01/15/2009 | | | | | 1,814,076 | | | | 1,812,538 | |
Capital Auto Receivables Asset Trust,
Series 2006-SN1A, Class A4A, 144A | | | |
| 5.320% | | | | 03/20/2010 | | * | | | 6,400,000 | | | | 6,436,266 | |
Carmax Auto Owner Trust,
Series 2007-1, Class B | | | |
| 5.340% | | | | 10/15/2012 | | | | | 3,000,000 | | | | 2,987,851 | |
Carmax Auto Owner Trust,
Series 2007-2, Class A3 | | | |
| 5.230% | | | | 12/15/2011 | | | | | 3,000,000 | | | | 3,032,236 | |
Chase Manhattan Auto Owner Trust,
Series 2006-A, Class A4 | | | |
| 5.360% | | | | 01/15/2013 | | | | | 5,000,000 | | | | 5,061,421 | |
Chase Manhattan Auto Owner Trust,
Series 2006-B, Class A4 | | | |
| 5.110% | | | | 04/15/2014 | | | | | 2,200,000 | | | | 2,227,647 | |
Daimler Chrysler Auto Trust,
Series 2004-C, Class A4 | | | |
| 3.280% | | | | 12/08/2009 | | | | | 442,503 | | | | 439,630 | |
Daimler Chrysler Auto Trust,
Series 2006-C, Class A3 | | | |
| 5.020% | | | | 07/08/2010 | | | | | 1,000,000 | | | | 1,002,800 | |
Ford Credit Auto Owner Trust,
Series 2005-A, Class B | | | |
| 3.880% | | | | 01/15/2010 | | | | | 2,600,000 | | | | 2,582,244 | |
|
See accompanying notes to financial statements.
206
SCHEDULE OF INVESTMENTS—(Continued)
December 31, 2007
Vantagepoint Low Duration
Bond Fund
Coupon
Rate
|
|
|
| Maturity
Date
|
|
|
| Face
|
| Value
|
|---|
ASSET BACKED SECURITIES—(Continued) |
Ford Credit Auto Owner Trust,
Series 2006-A, Class A3 | | | |
| 5.050% | | | | 03/15/2010 | | | | $ | 745,301 | | | $ | 746,617 | |
Ford Credit Auto Owner Trust,
Series 2006-B, Class A3 | | | |
| 5.260% | | | | 10/15/2010 | | | | | 2,350,000 | | | | 2,361,060 | |
Ford Credit Auto Owner Trust,
Series 2007-B, Class A4A | | | |
| 5.240% | | | | 07/15/2012 | | | | | 6,400,000 | | | | 6,460,358 | |
Harley-Davidson Motorcycle Trust,
Series 2006-3, Class A3 | | | |
| 5.240% | | | | 01/15/2012 | | | | | 3,060,000 | | | | 3,074,112 | |
Harley-Davidson Motorcycle Trust,
Series 2007-2, Class A4 | | | |
| 5.120% | | | | 08/15/2013 | | | | | 2,725,000 | | | | 2,748,704 | |
Honda Auto Receivables Owner Trust,
Series 2004-3, Class A4 | | | |
| 3.280% | | | | 02/18/2010 | | | | | 3,625,694 | | | | 3,607,854 | |
Honda Auto Receivables Owner Trust,
Series 2005-3, Class A4 | | | |
| 4.030% | | | | 12/20/2010 | | | | | 7,400,000 | | | | 7,354,095 | |
Nissan Auto Lease Trust,
Series 2007-A, Class A3 |
| 5.200% | | | | 05/17/2010 | | | | | 2,160,000 | | | | 2,166,587 | |
Nissan Auto Receivables Owner Trust,
Series 2004-A, Class A4 | | | |
| 2.760% | | | | 07/15/2009 | | | | | 1,530,909 | | | | 1,525,906 | |
Triad Auto Receivables Owner Trust,
Series 2006-A, Class A3 | | | |
| 4.770% | | | | 01/12/2011 | | | | | 2,180,456 | | | | 2,180,547 | |
USAA Auto Owner Trust,
Series 2004-3, Class A4 |
| 3.530% | | | | 06/15/2011 | | | | | 4,783,987 | | | | 4,758,812 | |
USAA Auto Owner Trust,
Series 2006-4, Class A2 |
| 5.160% | | | | 11/16/2009 | | | | | 535,614 | | | | 535,912 | |
USAA Auto Owner Trust,
Series 2007-2, Class A3 |
| 4.900% | | | | 02/15/2012 | | | | | 2,000,000 | | | | 2,014,083 | |
Wachovia Auto Owner Trust,
Series 2004-B, Class A4 | | | |
| 3.440% | | | | 03/21/2011 | | | | | 2,217,405 | | | | 2,208,778 | |
Wachovia Auto Owner Trust,
Series 2005-B, Class A4 | | | |
| 4.840% | | | | 04/20/2011 | | | | | 2,825,000 | | | | 2,831,830 | |
| | | 75,065,838 | |
Credit Cards—11.2% | | | |
Bank of America Mortgage Securities,
Series 2004-L, Class 1A1 | | | |
| 5.147% | | | | 01/25/2035 | | # | | | 2,381,286 | | | | 2,407,519 | |
Bank One Issuance Trust,
Series 2003-A9, Class A9 | | | |
| 3.860% | | | | 06/15/2011 | | | | | 1,500,000 | | | | 1,493,859 | |
Bank One Issuance Trust,
Series 2004-A6, Class A6 | | | |
| 3.940% | | | | 04/16/2012 | | | | | 1,000,000 | | | | 997,620 | |
| Capital One Multi-Asset Execution Trust, Series 2005-A8, Class A | | | |
| 4.400% | | | | 08/15/2011 | | | | | 2,150,000 | | | | 2,150,073 | |
| Capital One Multi-Asset Execution Trust, Series 2003-A4, Class A4 | | | |
| 3.650% | | | | 07/15/2011 | | | | | 3,155,000 | | | | 3,136,961 | |
Chase Issuance Trust,
Series 2005-10A, Class A10 |
| 4.650% | | | | 12/17/2012 | | | | | 6,970,000 | | | | 7,047,554 | |
Chase Issuance Trust,
Series 2007-15A, Class A | | | |
| 4.960% | | | | 09/17/2012 | | | | $ | 3,900,000 | | | $ | 3,965,995 | |
Citibank Credit Card Issuance Trust,
Series 2003-A6, Class A6 | | | |
| 2.900% | | | | 05/17/2010 | | | | | 4,965,000 | | | | 4,931,840 | |
Citibank Credit Card Issuance Trust,
Series 2007-A5, Class A5 | | | |
| 5.500% | | | | 06/22/2012 | | | | | 4,965,000 | | | | 5,105,733 | |
FPL Recovery Funding LLC,
Series 2007-A, Class A1 | | | |
| 5.053% | | | | 02/01/2013 | | ‡ | | | 3,070,000 | | | | 3,094,824 | |
| GE Capital Credit Card Master Note Trust, Series 2007-3, Class A2 | | | |
| 5.400% | | | | 06/15/2013 | | | | | 5,915,000 | | | | 6,081,491 | |
| Household Credit Card Master Note Trust I, Series 2007-2, Class A | | | |
| 5.578% | | | | 10/15/2010 | | | | | 6,200,000 | | | | 6,182,369 | |
MBNA Credit Card Master Note Trust,
Series 2005-A1, Class A | | | |
| 4.200% | | | | 09/15/2010 | | | | | 5,000,000 | | | | 4,992,789 | |
MBNA Credit Card Master Note Trust,
Series 2006-A1, Class A1 |
| 4.900% | | | | 07/15/2011 | | | | | 5,370,000 | | | | 5,409,807 | |
| | | 56,998,434 | |
Utilities—1.2% | | | |
Peco Energy Transition Trust,
Series 2000-A, Class A3 | | | |
| 7.625% | | | | 03/01/2010 | | | | | 5,664,000 | | | | 5,837,399 | |
TOTAL ASSET BACKED SECURITIES | | | |
| (Cost $137,244,832) | | | | | | 137,901,671 | |
| |
NON-U.S. GOVERNMENT MORTGAGE-BACKED SECURITIES—10.7% |
Mortgage Backed—10.7% | | | |
Credit Suisse First Boston Mortgage Securities Corporation,
Series 2004-C3, Class A3 |
| 4.302% | | | | 07/15/2036 | | | | | 1,000,000 | | | | 994,080 | |
| CS First Boston Mortgage Securities Corp., Series 2005-C4, Class A2 | | | |
| 5.017% | | | | 08/15/2038 | | | | | 3,950,000 | | | | 3,945,270 | |
First Horizon Asset Securities, Inc.,
Series 2005-AR4, Class IIA1 | | | |
| 5.327% | | | | 10/25/2035 | | # | | | 4,294,144 | | | | 4,303,070 | |
GE Capital Commercial Mortgage Corporation,
Series 2005-C1, Class A2 |
| 4.353% | | | | 06/10/2048 | | | | | 2,350,000 | | | | 2,322,230 | |
GSR Mortgage Loan Trust,
Series 2005-AR6, Class 2A1 | | | |
| 4.539% | | | | 10/25/2035 | | | | | 4,340,804 | | | | 4,308,513 | |
GSR Mortgage Loan Trust,
Series 2004-11, Class 2A2 | | | |
| 4.758% | | | | 09/25/2034 | | # | | | 2,858,511 | | | | 2,856,143 | |
Harborview Mortgage Loan Trust,
Series 2005-14, Class 3A1A | | | |
| 5.300% | | | | 12/19/2035 | | # | | | 6,542,421 | | | | 6,558,332 | |
LB-UBS Commercial Mortgage Trust,
Series 2003-C8, Class A2 | | | |
| 4.207% | | | | 11/15/2027 | | | | | 5,800,000 | | | | 5,764,400 | |
MLCC Mortgage Investors, Inc.,
Series 2004-1, Class 2A2 | | | |
| 4.725% | | | | 12/25/2034 | | # | | | 3,656,969 | | | | 3,644,031 | |
Provident Funding Mortgage Loan Trust,
Series 2004-1, Class 1A1 | | | |
| 4.034% | | | | 04/25/2034 | | # | | | 736,464 | | | | 730,759 | |
|
See accompanying notes to financial statements.
207
SCHEDULE OF INVESTMENTS—(Continued)
December 31, 2007
Vantagepoint Low Duration
Bond Fund
Coupon
Rate
|
|
|
| Maturity
Date
|
|
|
| Face
|
| Value
|
|---|
NON-U.S. GOVERNMENT MORTGAGE-BACKED SECURITIES—(Continued) |
Structured Adjustable Rate Mortgage Loan Trust,
Series 2005-11, Class 3A |
| 5.373% | | | | 05/25/2035 | | # | | $ | 4,385,326 | | | $ | 4,404,498 | |
| Structured Asset Mortgage Investments, Inc., Series 2004-AR5, Class IIA1 | | | |
| 6.916% | | | | 10/19/2034 | | # | | | 760,406 | | | | 767,753 | |
Thornburg Mortgage Securities Trust,
Series 2004-1, Class II2A | | | |
| 3.304% | | | | 03/25/2044 | | # | | | 977,499 | | | | 971,604 | |
| Wachovia Bank Commercial Mortgage Trust, Series 2005-C16, Class A2 | | | |
| 4.380% | | | | 10/15/2041 | | | | | 4,427,677 | | | | 4,378,961 | |
| Wells Fargo Mortgage Backed Securities Trust, Series 2004-S, Class B1 | | | |
| 3.541% | | | | 09/25/2034 | | | | | 2,053,984 | | | | 1,929,587 | |
| Wells Fargo Mortgage Backed Securities Trust, Series 2004-Z, Class 2A1 | | | |
| 4.573% | | | | 12/25/2034 | | # | | | 2,362,969 | | | | 2,321,347 | |
| Wells Fargo Mortgage Backed Securities Trust, Series 2005-AR9, Class IIA1 | | | |
| 4.394% | | | | 05/25/2035 | | # | | | 4,039,790 | | | | 3,988,888 | |
TOTAL NON-U.S. GOVERNMENT MORTGAGE-BACKED SECURITIES | | | |
| (Cost $54,066,720) | | | | | | 54,189,466 | |
| |
CASH EQUIVALENTS—0.1% |
Institutional Money Market Funds—0.0% | | | |
| Reserve Primary Money Market Fund | | | |
| 4.950% | | | | 01/02/2008 | | †† | | | 54,195 | | | | 54,195 | |
Bank & Certificate Deposits/Offshore Time Deposits—0.1% | | | |
| Abbey National PLC | | | |
| 5.160% | | | | 01/07/2008 | | †† | | | 13,549 | | | | 13,549 | |
| Abbey National PLC | | | |
| 5.000% | | | | 01/09/2008 | | †† | | | 16,936 | | | | 16,936 | |
| ABN Amro Bank NV | | | |
| 5.185% | | | | 01/04/2008 | | †† | | | 6,774 | | | | 6,774 | |
| ABN Amro Bank NV | | | |
| 5.160% | | | | 01/04/2008 | | †† | | | 10,162 | | | | 10,162 | |
| ABN Amro Bank NV | | | |
| 5.145% | | | | 01/03/2008 | | †† | | | 13,549 | | | | 13,549 | |
| Bank of Nova Scotia | | | |
| 4.960% | | | | 01/17/2008 | | †† | | | 13,549 | | | | 13,549 | |
| Bank of Nova Scotia | | | |
| 4.850% | | | | 01/22/2008 | | †† | | | 13,549 | | | | 13,549 | |
| Barclays | | | |
| 5.350% | | | | 01/04/2008 | | †† | | | 6,774 | | | | 6,774 | |
| Barclays | | | |
| 5.000% | | | | 01/22/2008 | | †† | | | 16,936 | | | | 16,936 | |
| Barclays | | | |
| 4.880% | | | | 02/06/2008 | | †† | | | 10,162 | | | | 10,162 | |
| BNP Paribas | | | |
| 5.200% | | | | 01/11/2008 | | †† | | | 6,774 | | | | 6,774 | |
| BNP Paribas | | | |
| 5.150% | | | | 01/02/2008 | | †† | | $ | 6,774 | | | $ | 6,774 | |
| BNP Paribas | | | |
| 5.010% | | | | 01/16/2008 | | †† | | | 20,323 | | | | 20,323 | |
| Calyon | | | |
| 5.120% | | | | 03/03/2008 | | †† | | | 6,774 | | | | 6,774 | |
| Calyon | | | |
| 4.250% | | | | 01/02/2008 | | †† | | | 67,744 | | | | 67,744 | |
| Dexia Group | | | |
| 4.755% | | | | 01/03/2008 | | †† | | | 30,485 | | | | 30,485 | |
| Fifth Third Bancorp | | | |
| 2.750% | | | | 01/02/2008 | | †† | | | 33,872 | | | | 33,872 | |
| Fortis Bank | | | |
| 4.600% | | | | 01/07/2008 | | †† | | | 20,323 | | | | 20,323 | |
| Fortis Bank | | | |
| 4.300% | | | | 01/02/2008 | | †† | | | 50,808 | | | | 50,808 | |
| HBOS Halifax Bank of Scotland | | | |
| 5.150% | | | | 01/02/2008 | | †† | | | 6,774 | | | | 6,774 | |
| HBOS Halifax Bank of Scotland | | | |
| 4.870% | | | | 02/11/2008 | | †† | | | 13,549 | | | | 13,549 | |
| Lloyds TSB Bank | | | |
| 5.150% | | | | 01/03/2008 | | †† | | | 10,162 | | | | 10,162 | |
| Lloyds TSB Bank | | | |
| 4.750% | | | | 01/24/2008 | | †† | | | 13,549 | | | | 13,549 | |
| Rabobank Nederland | | | |
| 5.080% | | | | 01/09/2008 | | †† | | | 6,774 | | | | 6,774 | |
| Rabobank Nederland | | | |
| 4.880% | | | | 01/10/2008 | | †† | | | 3,387 | | | | 3,387 | |
| Royal Bank of Scotland | | | |
| 5.000% | | | | 01/22/2008 | | †† | | | 10,162 | | | | 10,162 | |
| Royal Bank of Scotland | | | |
| 4.830% | | | | 02/05/2008 | | †† | | | 10,162 | | | | 10,162 | |
| Royal Bank of Scotland | | | |
| 4.700% | | | | 02/25/2008 | | †† | | | 6,774 | | | | 6,774 | |
| Societe Generale | | | |
| 5.150% | | | | 01/02/2008 | | †† | | | 10,162 | | | | 10,162 | |
| Societe Generale | | | |
| 5.150% | | | | 03/03/2008 | | †† | | | 10,162 | | | | 10,162 | |
| Societe Generale | | | |
| 4.900% | | | | 02/29/2008 | | †† | | | 13,549 | | | | 13,549 | |
| Svenska Handlesbanken | | | |
| 4.250% | | | | 01/02/2008 | | †† | | | 58,408 | | | | 58,408 | |
| Toronto Dominion Bank | | | |
| 5.100% | | | | 01/10/2008 | | †† | | | 10,162 | | | | 10,162 | |
| Toronto Dominion Bank | | | |
| 5.050% | | | | 01/11/2008 | | †† | | | 3,387 | | | | 3,387 | |
| Toronto Dominion Bank | | | |
| 4.800% | | | | 02/11/2008 | | †† | | | 20,323 | | | | 20,323 | |
| UBS AG | | | |
| 4.920% | | | | 01/11/2008 | | †† | | | 10,162 | | | | 10,162 | |
| | | 583,425 | |
Floating Rate Instruments/Master Notes—0.0% |
| Wells Fargo Bank | | | |
| 4.600% | | | | 01/02/2008 | | †† | | | 30,480 | | | | 30,480 | |
TOTAL CASH EQUIVALENTS | | | |
| (Cost $668,100) | | | | | | 668,100 | |
|
See accompanying notes to financial statements.
208
SCHEDULE OF INVESTMENTS—(Continued)
December 31, 2007
Vantagepoint Low Duration
Bond Fund
| | | | | | | | Face | | Value |
|---|
| |
REPURCHASE AGREEMENTS—0.6% |
| State Street Bank and Trust Company Repurchase Agreement, dated 12/31/2007, due 01/02/2008, with a maturity value of $3,119,946 and an effective yield of 3.65%, collateralized by a U.S. Government and Agency Obligation, with a rate of 4.685%, a maturity of 07/01/2034 and an aggregate market value of $3,183,773. | $ | 3,119,311 | | | $ | 3,119,311 | |
TOTAL INVESTMENTS—98.3% | | | |
| (Cost $496,651,283) | | 498,504,356 | |
| Other assets less liabilities—1.7% | | 8,615,917 | |
NET ASSETS—100.0% | $ | 507,120,273 | |
Notes to the Schedule of Investments:
| † | | Denotes all or a portion of security on loan. |
| * | | Security exempt from registration under Rule 144A of the Securities Act of 1933. These securities may be resold in transactions exempt from registration, normally to qualified buyers. 144A securities represent 7.38% of Total Investments. |
| # | | Rate is subject to change. Rate shown reflects current rate. |
| ** | | Security has been pledged as collateral for futures contracts. |
| ‡ | | Security valued at fair value as determined by policies approved by the board of directors. |
| †† | | Represents reinvestment of collateral received in conjunction with securities lending. |
|
See accompanying notes to financial statements.
209
SCHEDULE OF INVESTMENTS
December 31, 2007
Vantagepoint Inflation Protected
Securities Fund
Coupon
Rate
|
|
|
| Maturity
Date
|
|
|
| Face
|
| Value
|
|---|
CORPORATE OBLIGATIONS—0.6% |
Banking—0.4% | | | |
| General Electric Capital Corp., Subordinated Note |
| 6.375% | | | | 11/15/2017 | | | | $ | 900,000 | | | $ | 930,932 | |
| Royal Bank of Scotland Group PLC, Perpetual Bond, (FRN) (United Kingdom) | | | |
| 7.092% | | | | 09/29/2017 | | | | | 100,000 | | | | 145,185 | |
| | | 1,076,117 | |
Financial Services—0.1% | | | |
| Bear Stearns Cos. (The), Inc., Note (MTN) | | | |
| 4.560% | | | | 03/10/2014 | | | | | 380,000 | | | | 340,575 | |
| Goldman Sachs Group, Inc., Subordinated Note |
| 6.750% | | | | 10/01/2037 | | | | | 100,000 | | | | 98,287 | |
| | | 438,862 | |
Telephone Systems—0.1% | | | |
| AT&T, Inc., Global Note | | | |
| 6.300% | | | | 01/15/2038 | | | | | 200,000 | | | | 203,888 | |
TOTAL CORPORATE OBLIGATIONS | | | |
| (Cost $1,680,587) | | | | | | 1,718,867 | |
| |
U.S. GOVERNMENT AGENCY OBLIGATIONS—1.5% |
U.S. Government Agencies—Mortgage Backed—1.5% |
| Federal Home Loan Mortgage Corporation | | | |
| 6.500% | | | | 04/01/2035 | | | | | 107,479 | | | | 110,993 | |
| 5.000% | | | | 11/01/2017 | | | | | 48,186 | | | | 48,312 | |
| 3.250% | | | | 01/02/2008 | | | | | 2,200,000 | | | | 2,199,801 | |
| Federal National Mortgage Association | | | |
| 7.500% | | | | 01/01/2034 | | | | | 348,016 | | | | 370,043 | |
| 7.000% | | | | 02/01/2013 | | | | | 87,394 | | | | 90,469 | |
| 6.500% | | | | 05/01/2035 | | | | | 146,620 | | | | 151,420 | |
| 6.000% | | | | 12/01/2013-
10/01/2017 | | | | | 145,568 | | | | 149,258 | |
| 5.500% | | | | 03/01/2037-
05/01/2037 | | | | | 895,760 | | | | 894,891 | |
TOTAL U.S. GOVERNMENT AGENCY OBLIGATIONS |
| (Cost $3,990,073) | | | | | | 4,015,187 | |
| |
U.S. TREASURY OBLIGATIONS—92.6% |
U.S. Treasury Bills—0.1% | | | |
| U.S. Treasury Bill | | | |
| 2.980% | | | | 03/13/2008 | | * | | | 370,000 | | | | 367,795 | |
U.S. Treasury Bonds—4.9% | | | |
| U.S. Treasury Bond | | | |
| 2.375% | | | | 01/15/2027 | | | | | 12,711,597 | | | | 13,446,493 | |
U.S. Treasury Inflation Protected Securities Bonds—71.9% |
| U.S. Treasury Bond | | | |
| 3.875% | | | | 04/15/2029 | | | | $ | 4,994,480 | | | $ | 6,609,884 | |
| 3.625% | | | | 04/15/2028 | | | | | 5,218,508 | | | | 6,612,831 | |
| 3.375% | | | | 04/15/2032 | | | | | 600,280 | | | | 769,015 | |
| 3.000% | | | | 07/15/2012 | | | | | 10,539,068 | | | | 11,417,605 | |
| 2.625% | | | | 07/15/2017 | | | | | 3,719,631 | | | | 4,014,586 | |
| 2.500% | | | | 07/15/2016 | | | | | 6,444,997 | | | | 6,875,001 | |
| 2.375% | | | | 04/15/2011-
01/15/2025 | | | | | 70,980,227 | | | | 74,523,637 | |
| 2.000% | | | | 04/15/2012-
01/15/2026 | | | | | 51,267,566 | | | | 52,225,501 | |
| 1.875% | | | | 07/15/2015 | | | | | 6,734,544 | | | | 6,866,609 | |
| 1.625% | | | | 01/15/2015 | | | | | 8,069,283 | | | | 8,103,956 | |
| 0.875% | | | | 04/15/2010 | | | | | 19,139,268 | | | | 19,080,969 | |
| | | 197,099,594 | |
U.S. Treasury Inflation Protected Securities Notes—15.7% |
| U.S. Treasury Note | | | |
| 4.250% | | | | 01/15/2010 | | | | | 7,475,455 | | | | 7,978,883 | |
| 3.875% | | | | 01/15/2009 | | | | | 5,414,118 | | | | 5,575,697 | |
| 3.500% | | | | 01/15/2011 | | | | | 7,082,301 | | | | 7,619,012 | |
| 3.375% | | | | 01/15/2012 | | | | | 2,823,840 | | | | 3,081,295 | |
| 1.875% | | | | 07/15/2013 | | | | | 18,257,196 | | | | 18,819,189 | |
| | | 43,074,076 | |
TOTAL U.S. TREASURY OBLIGATIONS | | | |
| (Cost $245,938,189) | | | | | | 253,987,958 | |
| |
REPURCHASE AGREEMENTS—4.5% |
| State Street Bank & Trust Company Repurchase Agreement, dated 12/31/2007, due 01/02/2008, with a maturity value of $12,373,587 and an effective yield of 3.65%, collateralized by U.S. Government Agency obligations, with rates ranging from 4.166% – 5.528%, maturity dates ranging from 01/15/2033 – 05/01/2034, and an aggregate market value of $41,947,499. | | 12,371,078 | | | | 12,371,078 | |
TOTAL INVESTMENTS—99.2% | | | |
| (Cost $263,979,927) | | 272,093,090 | |
| Other assets less liabilities—0.8% | | 2,115,591 | |
NET ASSETS—100.0% | $ | 274,208,681 | |
Notes to the Schedule of Investments:
| * | | Security has been pledged as collateral for futures contracts. |
|
See accompanying notes to financial statements.
210
SCHEDULE OF INVESTMENTS
December 31, 2007
Vantagepoint Asset
Allocation Fund
|
|
|
|
|
|
|
| Shares
|
| Value
|
|---|
COMMON STOCKS—77.8% |
Advertising—0.1% | | | |
| Interpublic Group, Inc. | * | | | 18,883 | | | $ | 153,141 | |
| Monster Worldwide, Inc. | * | | | 5,522 | | | | 178,913 | |
| Omnicom Group | | 15,836 | | | | 752,685 | |
| | | 1,084,739 | |
Aerospace & Defense—1.9% | | | |
| Goodrich Corporation | † | | | 5,239 | | | | 369,926 | |
| Boeing Company (The) | | 35,548 | | | | 3,109,028 | |
| General Dynamics Corporation | | 18,179 | | | | 1,617,749 | |
| Honeywell International, Inc. | | 34,314 | | | | 2,112,713 | |
| Lockheed Martin Corporation | | 16,028 | | | | 1,687,107 | |
| Northrop Grumman Corporation | | 15,444 | | | | 1,214,516 | |
| Textron, Inc. | | 11,678 | | | | 832,641 | |
| United Technologies Corporation | | 44,656 | | | | 3,417,970 | |
| | | 14,361,650 | |
Airlines—0.2% | | | |
| FedEx Corporation | | 13,970 | | | | 1,245,705 | |
| Southwest Airlines Company | | 35,312 | | | | 430,806 | |
| | | 1,676,511 | |
Apparel Retailers—0.3% | | | |
| Abercrombie & Fitch Company Class A | | 3,919 | | | | 313,402 | |
| Gap (The), Inc. | | 23,455 | | | | 499,122 | |
| Kohl’s Corporation | * | | | 15,275 | | | | 699,595 | |
| Limited Brands, Inc. | † | | | 15,296 | | | | 289,553 | |
| Nordstrom, Inc. | | 9,341 | | | | 343,095 | |
| | | 2,144,767 | |
Automotive—0.5% | | | |
| Autonation, Inc. | * | | | 6,006 | | | | 94,054 | |
| Ford Motor Company | *† | | | 93,188 | | | | 627,155 | |
| General Motors Corporation | † | | | 24,816 | | | | 617,670 | |
| Genuine Parts Company | | 7,626 | | | | 353,084 | |
| Goodyear Tire & Rubber Company (The) | * | | | 9,249 | | | | 261,007 | |
| Harley-Davidson, Inc. | | 12,041 | | | | 562,435 | |
| Paccar, Inc. | | 16,759 | | | | 913,030 | |
| | | 3,428,435 | |
Banking—7.0% | | | |
| American Capital Strategies Ltd. | † | | | 8,091 | | | | 266,679 | |
| American Express Company | | 54,639 | | | | 2,842,321 | |
| BB&T Corporation | † | | | 24,341 | | | | 746,538 | |
| Banco Bilbao Vizcaya Argentaria SA, Sponsored ADR (Spain) | | 1 | | | | 24 | |
| Bank of America Corporation | | 201,110 | | | | 8,297,799 | |
| Bank of New York Mellon Corporation | | 51,278 | | | | 2,500,315 | |
| Capital One Financial Corporation | | 18,547 | | | | 876,531 | |
| CIT Group, Inc. | | 8,779 | | | | 210,959 | |
| Citigroup, Inc. | | 225,600 | | | | 6,641,664 | |
| Comerica, Inc. | | 7,218 | | | | 314,200 | |
| Commerce Bancorp, Inc. | † | | | 8,448 | | | | 322,207 | |
| Discover Financial Services | | 23,907 | | | | 360,518 | |
| Fannie Mae | | 43,894 | | | | 1,754,882 | |
| Fifth Third Bancorp | | 24,353 | | | | 611,991 | |
| First Horizon National Corporation | † | | | 5,539 | | | | 100,533 | |
| Freddie Mac | | 30,144 | | | | 1,027,006 | |
| Hudson City Bancorp, Inc. | | 22,136 | | | | 332,483 | |
| Huntington Bancshares, Inc. | | 15,606 | | | | 230,345 | |
| JPMorgan Chase & Company | | 154,714 | | | | 6,753,266 | |
| Keycorp | | 17,811 | | | $ | 417,668 | |
| M&T Bank Corporation | | 3,525 | | | | 287,534 | |
| Marshall & Ilsley Corporation | | 11,451 | | | | 303,222 | |
| National City Corporation | † | | | 28,078 | | | | 462,164 | |
| Northern Trust Corporation | | 8,606 | | | | 659,047 | |
| PNC Financial Services Group, Inc. | | 15,480 | | | | 1,016,262 | |
| Regions Financial Corporation | † | | | 32,130 | | | | 759,875 | |
| SLM Corporation | | 18,334 | | | | 369,247 | |
| Sovereign Bancorp, Inc. | † | | | 16,575 | | | | 188,955 | |
| State Street Corporation | | 17,423 | | | | 1,414,748 | |
| SunTrust Banks, Inc. | | 16,396 | | | | 1,024,586 | |
| Synovus Financial Corporation | | 14,677 | | | | 353,422 | |
| U.S. Bancorp | | 79,260 | | | | 2,515,712 | |
| Wachovia Corporation | | 89,590 | | | | 3,407,108 | |
| Washington Mutual, Inc. | † | | | 40,172 | | | | 546,741 | |
| Wells Fargo & Company | | 151,795 | | | | 4,582,691 | |
| Zions Bancorporation | | 4,920 | | | | 229,715 | |
| | | 52,728,958 | |
Beverages, Food & Tobacco—4.3% | | | |
| Altria Group, Inc. | | 95,456 | | | | 7,214,564 | |
| Anheuser-Busch Companies, Inc. | | 34,115 | | | | 1,785,579 | |
| Archer-Daniels-Midland Company | | 28,680 | | | | 1,331,612 | |
| Brown-Forman Corporation Class B | † | | | 3,664 | | | | 271,539 | |
| Campbell Soup Company | | 9,478 | | | | 338,649 | |
| Coca-Cola Company (The) | | 90,663 | | | | 5,563,988 | |
| Coca-Cola Enterprises, Inc. | | 13,492 | | | | 351,197 | |
| ConAgra Foods, Inc. | | 22,835 | | | | 543,245 | |
| Constellation Brands, Inc. Class A | * | | | 8,617 | | | | 203,706 | |
| Dean Foods Company | | 5,320 | | | | 137,575 | |
| General Mills, Inc. | | 15,679 | | | | 893,703 | |
| Hershey Company (The) | | 7,857 | | | | 309,566 | |
| HJ Heinz Company | | 14,736 | | | | 687,876 | |
| Kellogg Company | | 11,725 | | | | 614,742 | |
| Kraft Foods, Inc. Class A | | 72,431 | | | | 2,363,424 | |
| McCormick & Company, Inc. | | 5,813 | | | | 220,371 | |
| Molson Coors Brewing Company Class B | | 5,820 | | | | 300,428 | |
| Pepsi Bottling Group, Inc. | | 5,916 | | | | 233,445 | |
| Pepsico, Inc. | | 73,509 | | | | 5,579,333 | |
| Reynolds American, Inc. | † | | | 7,455 | | | | 491,732 | |
| Sara Lee Corporation | | 33,530 | | | | 538,492 | |
| Supervalu, Inc. | | 8,705 | | | | 326,612 | |
| Sysco Corporation | | 27,245 | | | | 850,316 | |
| Tyson Foods, Inc. Class A | | 11,069 | | | | 169,688 | |
| UST, Inc. | † | | | 7,153 | | | | 391,984 | |
| WM Wrigley Jr. Company | | 9,736 | | | | 570,043 | |
| | | 32,283,409 | |
Building Materials—0.5% | | | |
| Home Depot, Inc. | | 77,768 | | | | 2,095,070 | |
| Lowe’s Companies, Inc. | | 68,926 | | | | 1,559,106 | |
| Vulcan Materials Company | | 4,399 | | | | 347,917 | |
| | | 4,002,093 | |
Chemicals—1.3% | | | |
| Air Products & Chemicals, Inc. | | 9,858 | | | | 972,295 | |
| Avery Dennison Corporation | | 4,917 | | | | 261,289 | |
| Dow Chemical Company (The) | | 42,576 | | | | 1,678,346 | |
| E.I. du Pont de Nemours & Company | | 41,425 | | | | 1,826,428 | |
| Eastman Chemical Company | | 3,534 | | | | 215,892 | |
| Hercules, Inc. | | 4,386 | | | | 84,869 | |
| International Flavors & Fragrances, Inc. | | 3,888 | | | | 187,129 | |
| Monsanto Company | | 24,779 | | | | 2,767,566 | |
| PPG Industries, Inc. | | 7,259 | | | | 509,800 | |
|
See accompanying notes to financial statements.
211
SCHEDULE OF INVESTMENTS—(Continued)
December 31, 2007
Vantagepoint Asset
Allocation Fund
|
|
|
|
|
|
|
| Shares
|
| Value
|
|---|
COMMON STOCKS—(Continued) |
| Praxair, Inc. | | 14,140 | | | $ | 1,254,359 | |
| Sealed Air Corporation | | 7,079 | | | | 163,808 | |
| | | 9,921,781 | |
Coal—0.2% | | | |
| Consol Energy, Inc. | | 7,673 | | | | 548,773 | |
| Peabody Energy Corporation | | 11,507 | | | | 709,291 | |
| | | 1,258,064 | |
Commercial Services—0.6% | | | |
| Akamai Technologies, Inc. | * | | | 7,142 | | | | 247,113 | |
| Allied Waste Industries, Inc. | * | | | 10,555 | | | | 116,316 | |
| Cintas Corporation | | 6,084 | | | | 204,544 | |
| Convergys Corporation | * | | | 6,879 | | | | 113,228 | |
| Equifax, Inc. | | 6,441 | | | | 234,195 | |
| Fluor Corporation | | 3,836 | | | | 558,982 | |
| H&R Block, Inc. | | 14,400 | | | | 267,408 | |
| Jacobs Engineering Group, Inc. | * | | | 5,446 | | | | 520,692 | |
| Moody’s Corporation | † | | | 10,766 | | | | 384,346 | |
| Paychex, Inc. | | 15,453 | | | | 559,708 | |
| Robert Half International, Inc. | | 7,514 | | | | 203,179 | |
| RR Donnelley & Sons Company | | 9,448 | | | | 356,568 | |
| Ryder System, Inc. | † | | | 2,780 | | | | 130,688 | |
| Waste Management, Inc. | | 24,315 | | | | 794,371 | |
| | | 4,691,338 | |
Communications—0.9% | | | |
| American Tower Corporation Class A | * | | | 18,693 | | | | 796,322 | |
| Ciena Corporation | *† | | | 3,922 | | | | 133,779 | |
| L-3 Communications Holdings, Inc. | | 5,664 | | | | 600,044 | |
| Motorola, Inc. | | 105,079 | | | | 1,685,467 | |
| Network Appliance, Inc. | * | | | 16,442 | | | | 410,392 | |
| Qualcomm, Inc. | | 75,261 | | | | 2,961,520 | |
| Tellabs, Inc. | * | | | 19,893 | | | | 130,100 | |
| | | 6,717,624 | |
Computer Software & Processing—4.8% | | | |
| Adobe Systems, Inc. | * | | | 26,395 | | | | 1,127,858 | |
| Affiliated Computer Services, Inc. Class A | * | | | 5,278 | | | | 238,038 | |
| Autodesk, Inc. | * | | | 10,178 | | | | 506,457 | |
| Automatic Data Processing, Inc. | | 24,523 | | | | 1,092,009 | |
| BMC Software, Inc. | * | | | 9,424 | | | | 335,871 | |
| CA, Inc. | | 18,395 | | | | 458,955 | |
| Citrix Systems, Inc. | * | | | 7,947 | | | | 302,065 | |
| Cognizant Technology Solutions Corporation | *† | | | 12,318 | | | | 418,073 | |
| Computer Sciences Corporation | * | | | 8,286 | | | | 409,908 | |
| Compuware Corporation | * | | | 17,089 | | | | 151,750 | |
| Electronic Arts, Inc. | * | | | 13,954 | | | | 815,053 | |
| Electronic Data Systems Corporation | | 22,586 | | | | 468,208 | |
| Fidelity National Information Services, Inc. | | 7,010 | | | | 291,546 | |
| Fiserv, Inc. | * | | | 8,200 | | | | 455,018 | |
| Google, Inc. Class A | * | | | 10,381 | | | | 7,178,254 | |
| IMS Health, Inc. | | 8,795 | | | | 202,637 | |
| Intuit, Inc. | * | | | 15,593 | | | | 492,895 | |
| Juniper Networks, Inc. | * | | | 23,865 | | | | 792,318 | |
| Microsoft Corporation | | 368,418 | | | | 13,115,681 | |
| Novell, Inc. | * | | | 17,011 | | | | 116,866 | |
| Oracle Corporation | * | | | 177,668 | | | | 4,011,743 | |
| Sun Microsystems, Inc. | * | | | 40,425 | | | | 732,905 | |
| Symantec Corporation | * | | | 43,490 | | | | 701,929 | |
| Teradata Corporation | * | | | 8,056 | | | | 220,815 | |
| Unisys Corporation | * | | | 13,879 | | | | 65,648 | |
| VeriSign, Inc. | * | | | 10,507 | | | $ | 395,168 | |
| Yahoo!, Inc. | * | | | 58,773 | | | | 1,367,060 | |
| | | 36,464,728 | |
Computers & Information—3.9% | | | |
| 3M Company | | 32,718 | | | | 2,758,782 | |
| Apple Computer, Inc. | * | | | 39,375 | | | | 7,799,400 | |
| Dell, Inc. | * | | | 102,515 | | | | 2,512,643 | |
| EMC Corporation | * | | | 95,328 | | | | 1,766,428 | |
| Hewlett-Packard Company | | 117,484 | | | | 5,930,592 | |
| International Business Machines Corporation | | 62,735 | | | | 6,781,653 | |
| International Game Technology | | 14,815 | | | | 650,823 | |
| Jabil Circuit, Inc. | | 8,930 | | | | 136,361 | |
| Lexmark International, Inc. | * | | | 4,793 | | | | 167,084 | |
| Pitney Bowes, Inc. | † | | | 10,038 | | | | 381,846 | |
| SanDisk Corporation | * | | | 9,800 | | | | 325,066 | |
| | | 29,210,678 | |
Containers & Packaging—0.0% | | | |
| Ball Corporation | | 4,556 | | | | 205,020 | |
Cosmetics & Personal Care—1.9% | | | |
| Avon Products, Inc. | | 19,873 | | | | 785,580 | |
| Clorox Company | | 6,602 | | | | 430,252 | |
| Colgate-Palmolive Company | | 22,691 | | | | 1,768,990 | |
| Ecolab, Inc. | | 8,001 | | | | 409,731 | |
| Estee Lauder Companies (The), Inc. Class A | | 5,057 | | | | 220,536 | |
| Procter & Gamble Company | | 142,354 | | | | 10,451,631 | |
| | | 14,066,720 | |
Education—0.1% | | | |
| Apollo Group, Inc. Class A | * | | | 6,172 | | | | 432,966 | |
Electric Utilities—2.7% | | | |
| AES Corporation (The) | * | | | 28,796 | | | | 615,946 | |
| Allegheny Energy, Inc. | | 7,132 | | | | 453,667 | |
| Ameren Corporation | | 9,010 | | | | 488,432 | |
| American Electric Power Company, Inc. | | 17,957 | | | | 836,078 | |
| CMS Energy Corporation | † | | | 9,922 | | | | 172,444 | |
| Centerpoint Energy, Inc. | | 13,537 | | | | 231,889 | |
| Consolidated Edison, Inc. | | 12,180 | | | | 594,993 | |
| Constellation Energy Group, Inc. | | 7,847 | | | | 804,553 | |
| DTE Energy Company | | 7,766 | | | | 341,393 | |
| Dominion Resources, Inc. | | 26,866 | | | | 1,274,792 | |
| Duke Energy Corporation | | 55,876 | | | | 1,127,019 | |
| Dynegy, Inc. Class A | * | | | 20,516 | | | | 146,484 | |
| Edison International | | 14,281 | | | | 762,177 | |
| Entergy Corporation | | 9,154 | | | | 1,094,086 | |
| Exelon Corporation | | 30,358 | | | | 2,478,427 | |
| FPL Group, Inc. | | 18,300 | | | | 1,238,361 | |
| FirstEnergy Corporation | | 14,589 | | | | 1,055,368 | |
| Integrys Energy Group, Inc. | | 3,300 | | | | 170,577 | |
| NiSource, Inc. | | 11,857 | | | | 223,979 | |
| PG&E Corporation | | 15,829 | | | | 682,072 | |
| PPL Corporation | | 17,328 | | | | 902,616 | |
| Pepco Holdings, Inc. | | 8,794 | | | | 257,928 | |
| Pinnacle West Capital Corporation | | 4,372 | | | | 185,417 | |
| Progress Energy, Inc. | | 11,761 | | | | 569,585 | |
| Public Service Enterprise Group, Inc. | | 11,416 | | | | 1,121,508 | |
| Sempra Energy | | 11,832 | | | | 732,164 | |
| Southern Company (The) | | 33,551 | | | | 1,300,101 | |
| TECO Energy, Inc. | † | | | 9,094 | | | | 156,508 | |
| Xcel Energy, Inc. | | 17,719 | | | | 399,918 | |
| | | 20,418,482 | |
|
See accompanying notes to financial statements.
212
SCHEDULE OF INVESTMENTS—(Continued)
December 31, 2007
Vantagepoint Asset
Allocation Fund
|
|
|
|
|
|
|
| Shares
|
| Value
|
|---|
COMMON STOCKS—(Continued) |
Electrical Equipment—2.6% | | | |
| Cooper Industries Ltd. Class A (Bermuda) | | 8,037 | | | $ | 424,997 | |
| Emerson Electric Company | | 36,190 | | | | 2,050,525 | |
| General Electric Company | | 463,787 | | | | 17,192,584 | |
| | | 19,668,106 | |
Electronics—3.4% | | | |
| Advanced Micro Devices, Inc. | *† | | | 22,772 | | | | 170,790 | |
| Altera Corporation | | 15,819 | | | | 305,623 | |
| Analog Devices, Inc. | | 14,644 | | | | 464,215 | |
| Broadcom Corporation Class A | * | | | 20,382 | | | | 532,785 | |
| Cisco Systems, Inc. | * | | | 276,119 | | | | 7,474,541 | |
| Eastman Kodak Company | † | | | 12,583 | | | | 275,190 | |
| Intel Corporation | | 264,579 | | | | 7,053,676 | |
| JDS Uniphase Corporation | *† | | | 9,473 | | | | 125,991 | |
| LSI Corporation | * | | | 34,716 | | | | 184,342 | |
| Linear Technology Corporation | † | | | 10,609 | | | | 337,684 | |
| MEMC Electronics Materials, Inc. | * | | | 10,061 | | | | 890,298 | |
| Microchip Technology, Inc. | † | | | 9,379 | | | | 294,688 | |
| Micron Technology, Inc. | * | | | 31,818 | | | | 230,681 | |
| Molex, Inc. | | 6,227 | | | | 169,997 | |
National Semiconductor
Corporation | | 11,625 | | | | 263,190 | |
| Novellus Systems, Inc. | * | | | 5,537 | | | | 152,655 | |
| Nvidia Corporation | * | | | 24,486 | | | | 833,014 | |
| QLogic Corporation | * | | | 7,961 | | | | 113,046 | |
| Raytheon Company | | 19,546 | | | | 1,186,442 | |
| Rockwell Collins, Inc. | | 7,612 | | | | 547,836 | |
| Texas Instruments, Inc. | | 65,085 | | | | 2,173,839 | |
| Tyco Electronics Ltd. (Bermuda) | | 22,179 | | | | 823,506 | |
| Xerox Corporation | | 42,793 | | | | 692,819 | |
| Xilinx, Inc. | | 15,159 | | | | 331,527 | |
| | | 25,628,375 | |
Entertainment & Leisure—1.2% | | | |
| Harrah’s Entertainment, Inc. | | 8,436 | | | | 748,695 | |
| Hasbro, Inc. | | 7,426 | | | | 189,957 | |
| Mattel, Inc. | | 17,004 | | | | 323,756 | |
| News Corporation, Inc. Class A | | 105,672 | | | | 2,165,219 | |
| Time Warner, Inc. | | 172,037 | | | | 2,840,331 | |
| Walt Disney Company | | 88,704 | | | | 2,863,365 | |
| | | 9,131,323 | |
Environmental—0.2% | | | |
| Agilent Technologies, Inc. | * | | | 18,919 | | | | 695,084 | |
| Danaher Corporation | | 10,978 | | | | 963,210 | |
| Teradyne, Inc. | * | | | 8,399 | | | | 86,846 | |
| | | 1,745,140 | |
Financial Services—2.7% | | | |
| Ameriprise Financial, Inc. | | 11,064 | | | | 609,737 | |
| Bear Stearns Companies, Inc. (The) | † | | | 5,201 | | | | 458,988 | |
| Charles Schwab Corporation (The) | | 45,303 | | | | 1,157,492 | |
| CME Group, Inc. | | 2,391 | | | | 1,640,226 | |
| Countrywide Financial Corporation | † | | | 27,686 | | | | 247,513 | |
| E*Trade Financial Corporation | *† | | | 18,346 | | | | 65,128 | |
| Federated Investors, Inc. Class B | | 3,330 | | | | 137,063 | |
| Franklin Resources, Inc. | | 7,431 | | | | 850,329 | |
| Goldman Sachs Group, Inc. | | 18,540 | | | | 3,987,027 | |
| IntercontinentalExchange, Inc. | *† | | | 3,149 | | | | 606,183 | |
| Janus Capital Group, Inc. | | 7,815 | | | | 256,723 | |
| Legg Mason, Inc. | | 5,766 | | | | 421,783 | |
| Lehman Brothers Holdings, Inc. | | 23,824 | | | $ | 1,559,043 | |
| Merrill Lynch & Company, Inc. | | 39,604 | | | | 2,125,943 | |
| Morgan Stanley | † | | | 47,814 | | | | 2,539,402 | |
| NYSE Euronext | | 11,987 | | | | 1,052,099 | |
| Principal Financial Group | | 12,337 | | | | 849,279 | |
| T Rowe Price Group, Inc. | | 11,620 | | | | 707,426 | |
| Western Union Company (The) | | 33,663 | | | | 817,338 | |
| | | 20,088,722 | |
Food Retailers—0.3% | | | |
| Kroger Company (The) | | 31,965 | | | | 853,785 | |
| Safeway, Inc. | | 19,776 | | | | 676,537 | |
| Starbucks Corporation | * | | | 33,638 | | | | 688,570 | |
| Whole Foods Market, Inc. | † | | | 6,058 | | | | 247,166 | |
| | | 2,466,058 | |
Forest Products & Paper—0.4% | | | |
| Bemis Company | † | | | 5,148 | | | | 140,952 | |
| International Paper Company | | 19,914 | | | | 644,815 | |
| Kimberly-Clark Corporation | | 19,597 | | | | 1,358,856 | |
| MeadWestvaco Corporation | | 7,851 | | | | 245,736 | |
| Pactiv Corporation | * | | | 6,199 | | | | 165,079 | |
| Weyerhaeuser Company | | 9,586 | | | | 706,872 | |
| | | 3,262,310 | |
Health Care Providers—0.2% | | | |
| Coventry Health Care, Inc. | * | | | 6,999 | | | | 414,691 | |
| Express Scripts, Inc. | * | | | 12,052 | | | | 879,796 | |
| Laboratory Corporation of America Holdings | * | | | 5,554 | | | | 419,494 | |
| Tenet Healthcare Corporation | *† | | | 23,062 | | | | 117,155 | |
| | | 1,831,136 | |
Heavy Construction—0.0% | | | |
| Centex Corporation | | 5,370 | | | | 135,646 | |
| Lennar Corporation Class A | † | | | 5,972 | | | | 106,839 | |
| | | 242,485 | |
Heavy Machinery—1.7% | | | |
| Applied Materials, Inc. | | 62,930 | | | | 1,117,637 | |
| Black & Decker Corporation | | 3,454 | | | | 240,571 | |
| Caterpillar, Inc. | | 29,593 | | | | 2,147,268 | |
| Cummins, Inc. | † | | | 4,550 | | | | 579,534 | |
| Deere & Company | | 20,412 | | | | 1,900,765 | |
| Dover Corporation | | 8,920 | | | | 411,123 | |
| Eaton Corporation | | 6,529 | | | | 632,987 | |
| ITT Corporation | | 8,141 | | | | 537,632 | |
| Ingersoll-Rand Company Class A (Bermuda) | | 13,361 | | | | 620,886 | |
| Manitowoc Company, Inc. | | 5,703 | | | | 278,477 | |
| National-Oilwell Varco, Inc. | * | | | 15,964 | | | | 1,172,715 | |
| Pall Corporation | | 5,917 | | | | 238,573 | |
| Parker Hannifin Corporation | | 7,971 | | | | 600,296 | |
| Rockwell Automation, Inc. | | 7,187 | | | | 495,616 | |
| Smith International, Inc. | | 8,885 | | | | 656,157 | |
| Stanley Works (The) | | 3,363 | | | | 163,038 | |
| Terex Corporation | * | | | 4,319 | | | | 283,197 | |
| Trane, Inc. | | 7,828 | | | | 365,646 | |
| Varian Medical Systems, Inc. | * | | | 5,760 | | | | 300,442 | |
| WW Grainger, Inc. | | 3,422 | | | | 299,493 | |
| | | 13,042,053 | |
Home Construction, Furnishings & Appliances—0.4% |
| DR Horton, Inc. | † | | | 11,960 | | | | 157,513 | |
| Harman International Industries, Inc. | | 2,854 | | | | 210,368 | |
| Johnson Controls, Inc. | | 26,529 | | | | 956,105 | |
| KB Home | † | | | 3,394 | | | | 73,310 | |
|
See accompanying notes to financial statements.
213
SCHEDULE OF INVESTMENTS—(Continued)
December 31, 2007
Vantagepoint Asset
Allocation Fund
|
|
|
|
|
|
|
| Shares
|
| Value
|
|---|
COMMON STOCKS—(Continued) |
| Leggett & Platt, Inc. | | 8,064 | | | $ | 140,636 | |
| Masco Corporation | | 18,434 | | | | 398,359 | |
| Newell Rubbermaid, Inc. | | 11,995 | | | | 310,431 | |
| Pulte Homes, Inc. | | 9,419 | | | | 99,276 | |
| Whirlpool Corporation | † | | | 3,383 | | | | 276,154 | |
| | | 2,622,152 | |
Household Products—0.3% | | | |
| Fortune Brands, Inc. | | 6,876 | | | | 497,547 | |
| Illinois Tool Works, Inc. | | 18,598 | | | | 995,737 | |
| Rohm & Haas Company | † | | | 6,344 | | | | 336,676 | |
| Snap-On, Inc. | | 2,539 | | | | 122,481 | |
| | | 1,952,441 | |
Industrial—Diversified—0.1% | | | |
| Tyco International Ltd. (Bermuda) | | 22,179 | | | | 879,397 | |
Insurance—4.5% | | | |
| ACE Ltd. (Cayman Islands) | | 14,666 | | | | 906,065 | |
| Aflac, Inc. | | 21,905 | | | | 1,371,910 | |
| Aetna, Inc. | | 24,024 | | | | 1,386,906 | |
| Allstate Corporation (The) | | 26,901 | | | | 1,405,039 | |
| AMBAC Financial Group, Inc. | † | | | 4,610 | | | | 118,800 | |
| American International Group, Inc. | | 117,245 | | | | 6,835,384 | |
| AON Corporation | | 14,251 | | | | 679,630 | |
| Assurant, Inc. | | 4,469 | | | | 298,976 | |
| Cigna Corporation | | 13,368 | | | | 718,263 | |
| Cincinnati Financial Corporation | | 7,627 | | | | 301,572 | |
| Genworth Financial, Inc. Class A | | 19,514 | | | | 496,631 | |
| Hartford Financial Services Group, Inc. | | 14,401 | | | | 1,255,623 | |
| Humana, Inc. | * | | | 7,657 | | | | 576,649 | |
| Leucadia National Corporation | | 7,095 | | | | 334,175 | |
| Lincoln National Corporation | | 12,544 | | | | 730,312 | |
| Loews Corporation | | 19,590 | | | | 986,161 | |
| MBIA, Inc. | † | | | 5,839 | | | | 108,781 | |
| MGIC Investment Corporation | † | | | 3,862 | | | | 86,625 | |
| Marsh & McLennan Companies, Inc. | | 24,984 | | | | 661,326 | |
| MetLife, Inc. | | 33,946 | | | | 2,091,753 | |
| Progressive Corporation (The) | | 34,792 | | | | 666,615 | |
| Prudential Financial, Inc. | | 21,226 | | | | 1,974,867 | |
| Safeco Corporation | | 5,043 | | | | 280,794 | |
| The Chubb Corporation | | 18,064 | | | | 985,933 | |
| Torchmark Corporation | | 4,583 | | | | 277,409 | |
| Travelers Cos., Inc. (The) | | 30,652 | | | | 1,649,078 | |
| UnitedHealth Group, Inc. | | 60,755 | | | | 3,535,941 | |
| UnumProvident Corporation | | 15,895 | | | | 378,142 | |
| WellPoint, Inc. | * | | | 27,839 | | | | 2,442,315 | |
| XL Capital Ltd. Class A (Cayman Islands) | | 8,095 | | | | 407,259 | |
| | | 33,948,934 | |
Lodging—0.2% | | | |
| Marriott International, Inc. Class A | | 15,100 | | | | 516,118 | |
| Starwood Hotels & Resorts Worldwide, Inc. | | 9,466 | | | | 416,788 | |
| Wyndham Worldwide Corporation | | 8,923 | | | | 210,226 | |
| | | 1,143,132 | |
Media—Broadcasting & Publishing—1.1% |
| CBS Corporation Class B | | 31,677 | | | | 863,198 | |
| Clear Channel Communications, Inc. | | 22,852 | | | | 788,851 | |
| Comcast Corporation Class A | * | | | 140,162 | | | | 2,559,358 | |
| DIRECTV Group (The), Inc. | * | | | 33,859 | | | | 782,820 | |
| EW Scripps Company Class A | | 3,760 | | | | 169,238 | |
| Gannett Company, Inc. | | 10,491 | | | $ | 409,149 | |
| IAC/InterActiveCorp | * | | | 9,631 | | | | 259,267 | |
| McGraw-Hill Companies, Inc. (The) | | 16,227 | | | | 710,905 | |
| Meredith Corporation | | 1,895 | | | | 104,187 | |
| New York Times Company Class A | † | | | 6,241 | | | | 109,405 | |
| Viacom, Inc. Class B | * | | | 31,993 | | | | 1,405,133 | |
| Washington Post Company Class B | | 265 | | | | 209,729 | |
| | | 8,371,240 | |
Medical Supplies—2.9% | | | |
| Allergan, Inc. | | 13,872 | | | | 891,137 | |
| Applera Corporation—Applied Biosystems Group | | 8,032 | | | | 272,445 | |
| Baxter International, Inc. | | 29,138 | | | | 1,691,461 | |
| Becton Dickinson & Company | | 10,910 | | | | 911,858 | |
| Boston Scientific Corporation | * | | | 59,259 | | | | 689,182 | |
| Covidien Ltd. (Bermuda) | | 22,179 | | | | 982,308 | |
| CR Bard, Inc. | | 4,555 | | | | 431,814 | |
| Johnson & Johnson | | 131,490 | | | | 8,770,383 | |
| KLA-Tencor Corporation | | 8,766 | | | | 422,171 | |
| Medtronic, Inc. | | 52,035 | | | | 2,615,799 | |
| Millipore Corporation | * | | | 2,215 | | | | 162,094 | |
| Patterson Cos., Inc. | * | | | 6,066 | | | | 205,941 | |
| PerkinElmer, Inc. | | 5,757 | | | | 149,797 | |
| St. Jude Medical, Inc. | * | | | 16,184 | | | | 657,718 | |
| Stryker Corporation | | 11,672 | | | | 872,132 | |
| Thermo Fisher Scientific, Inc. | * | | | 19,378 | | | | 1,117,723 | |
| Waters Corporation | * | | | 4,564 | | | | 360,875 | |
| Zimmer Holdings, Inc. | * | | | 10,939 | | | | 723,615 | |
| | | 21,928,453 | |
Metals—0.9% | | | |
| Alcoa, Inc. | | 39,273 | | | | 1,435,428 | |
| Allegheny Technologies, Inc. | | 4,545 | | | | 392,688 | |
| Corning, Inc. | | 70,940 | | | | 1,701,851 | |
| Newmont Mining Corporation | | 20,249 | | | | 988,759 | |
| Nucor Corporation | | 13,611 | | | | 806,043 | |
| Precision Castparts Corporation | | 6,202 | | | | 860,217 | |
| Titanium Metals Corporation | † | | | 3,978 | | | | 105,218 | |
| United States Steel Corporation | | 5,195 | | | | 628,127 | |
| | | 6,918,331 | |
Mining—0.2% | | | |
| Freeport-McMoran Copper & Gold, Inc. | | 17,225 | | | | 1,764,529 | |
Oil & Gas—9.6% | | | |
| Anadarko Petroleum Corporation | | 20,897 | | | | 1,372,724 | |
| Apache Corporation | | 14,926 | | | | 1,605,142 | |
| Ashland, Inc. | | 3,106 | | | | 147,318 | |
| Baker Hughes, Inc. | | 14,690 | | | | 1,191,359 | |
| BJ Services Company | | 14,353 | | | | 348,204 | |
| Chesapeake Energy Corporation | | 18,240 | | | | 715,008 | |
| Chevron Corporation | | 97,034 | | | | 9,056,183 | |
| ConocoPhillips | | 73,845 | | | | 6,520,514 | |
| Devon Energy Corporation | | 19,943 | | | | 1,773,132 | |
| EOG Resources, Inc. | | 11,033 | | | | 984,695 | |
| El Paso Corporation | | 31,393 | | | | 541,215 | |
| ENSCO International, Inc. | | 6,778 | | | | 404,104 | |
| Exxon Mobil Corporation | | 250,542 | | | | 23,473,280 | |
| Halliburton Company | | 41,598 | | | | 1,576,980 | |
| Hess Corporation | | 12,305 | | | | 1,241,082 | |
| Marathon Oil Corporation | | 32,489 | | | | 1,977,281 | |
| Murphy Oil Corporation | | 8,420 | | | | 714,353 | |
| Nabors Industries Ltd. | * | | | 14,031 | | | | 384,309 | |
| Nicor, Inc. | † | | | 1,963 | | | | 83,133 | |
| Noble Corporation (Cayman Islands) | | 11,980 | | | | 676,990 | |
|
See accompanying notes to financial statements.
214
SCHEDULE OF INVESTMENTS—(Continued)
December 31, 2007
Vantagepoint Asset
Allocation Fund
|
|
|
|
|
|
|
| Shares
|
| Value
|
|---|
COMMON STOCKS—(Continued) |
| Noble Energy, Inc. | | 7,770 | | | $ | 617,870 | |
| Occidental Petroleum Corporation | | 37,958 | | | | 2,922,386 | |
| Questar Corporation | | 7,316 | | | | 395,796 | |
| Range Resources Corporation | | 6,784 | | | | 348,426 | |
| Rowan Companies., Inc. | | 4,817 | | | | 190,079 | |
| Schlumberger Ltd. (Netherland Antilles) | | 53,980 | | | | 5,310,013 | |
| Spectra Energy Corp. | | 27,942 | | | | 721,462 | |
| Sunoco, Inc. | | 5,960 | | | | 431,742 | |
| Tesoro Corporation | | 6,213 | | | | 296,360 | |
| Transocean, Inc. (Cayman Islands) | | 14,073 | | | | 2,014,532 | |
| Valero Energy Corporation | | 25,471 | | | | 1,783,734 | |
| Weatherford International Ltd. (Bermuda) | * | | | 15,336 | | | | 1,052,050 | |
| Williams Companies, Inc. | | 27,086 | | | | 969,137 | |
| XTO Energy, Inc. | | 21,556 | | | | 1,107,116 | |
| | | 72,947,709 | |
Pharmaceuticals—5.1% | | | |
| Abbott Laboratories | | 69,865 | | | | 3,922,920 | |
| AmerisourceBergen Corporation | | 9,300 | | | | 417,291 | |
| Amgen, Inc. | * | | | 49,698 | | | | 2,307,975 | |
| Barr Pharmaceuticals, Inc. | * | | | 4,637 | | | | 246,225 | |
| Biogen Idec, Inc. | * | | | 13,123 | | | | 746,961 | |
| Bristol-Myers Squibb Company | | 90,646 | | | | 2,403,932 | |
| Cardinal Health, Inc. | | 16,840 | | | | 972,510 | |
| Celgene Corporation | * | | | 17,109 | | | | 790,607 | |
| Eli Lilly & Company | | 44,595 | | | | 2,380,927 | |
| Forest Laboratories, Inc. | * | | | 14,323 | | | | 522,073 | |
| Genzyme Corporation | * | | | 11,884 | | | | 884,645 | |
| Gilead Sciences, Inc. | * | | | 41,558 | | | | 1,912,084 | |
| Hospira, Inc. | * | | | 7,127 | | | | 303,895 | |
| King Pharmaceuticals, Inc. | * | | | 10,183 | | | | 104,274 | |
| McKesson Corporation | | 13,531 | | | | 886,416 | |
| Medco Health Solutions, Inc. | * | | | 12,508 | | | | 1,268,311 | |
| Merck & Company, Inc. | | 98,510 | | | | 5,724,416 | |
| Mylan Laboratories | † | | | 11,139 | | | | 156,614 | |
| Pfizer, Inc. | | 315,420 | | | | 7,169,497 | |
| Quest Diagnostics, Inc. | | 7,162 | | | | 378,870 | |
| Schering-Plough Corporation | | 71,613 | | | | 1,907,770 | |
| Sigma Aldrich Corporation | | 5,903 | | | | 322,304 | |
| Watson Pharmaceuticals, Inc. | * | | | 4,259 | | | | 115,589 | |
| Wyeth | | 60,498 | | | | 2,673,407 | |
| | | 38,519,513 | |
Real Estate—0.8% | | | |
| Apartment Investment & Management Company REIT Class A | † | | | 3,885 | | | | 134,926 | |
| AvalonBay Communities, Inc. REIT | † | | | 3,501 | | | | 329,584 | |
| Boston Properties, Inc. REIT | † | | | 5,172 | | | | 474,841 | |
| CB Richard Ellis Group, Inc. Class A | *† | | | 7,914 | | | | 170,547 | |
| Developers Diversified Realty Corporation REIT | | 5,585 | | | | 213,850 | |
| Equity Residential REIT | | 12,749 | | | | 464,956 | |
| General Growth Properties, Inc. REIT | † | | | 10,808 | | | | 445,073 | |
| Host Hotels & Resorts, Inc. REIT | † | | | 23,370 | | | | 398,225 | |
| Kimco Realty Corporation REIT | † | | | 11,062 | | | | 402,657 | |
| Plum Creek Timber Company, Inc. REIT | † | | | 8,165 | | | | 375,917 | |
| Prologis REIT | † | | | 11,448 | | | | 725,574 | |
| Public Storage REIT | | 5,464 | | | $ | 401,112 | |
| Simon Property Group, Inc. REIT | | 9,868 | | | | 857,134 | |
| Vornado Realty Trust REIT | | 5,908 | | | | 519,609 | |
| | | 5,914,005 | |
Restaurants—0.6% | | | |
| Darden Restaurants, Inc. | | 6,534 | | | | 181,057 | |
| McDonald’s Corporation | | 54,251 | | | | 3,195,926 | |
| Wendy’s International, Inc. | | 5,142 | | | | 132,869 | |
| Yum! Brands, Inc. | | 24,418 | | | | 934,477 | |
| | | 4,444,329 | |
Retailers—3.0% | | | |
| Amazon.com, Inc. | * | | | 14,009 | | | | 1,297,794 | |
| AutoZone, Inc. | * | | | 2,448 | | | | 293,540 | |
| Bed Bath & Beyond, Inc. | * | | | 12,305 | | | | 361,644 | |
| Best Buy Company, Inc. | | 17,879 | | | | 941,329 | |
| Big Lots, Inc. | *† | | | 4,622 | | | | 73,906 | |
| CVS Caremark Corporation | | 67,756 | | | | 2,693,301 | |
| Circuit City Stores, Inc. | † | | | 6,649 | | | | 27,926 | |
| Costco Wholesale Corporation | | 20,192 | | | | 1,408,594 | |
| Dillard’s, Inc. Class A | † | | | 2,579 | | | | 48,434 | |
| eBay, Inc. | * | | | 51,735 | | | | 1,717,085 | |
| Family Dollar Stores, Inc. | † | | | 7,400 | | | | 142,302 | |
| GameStop Corporation Class A | * | | | 7,231 | | | | 449,117 | |
| JC Penney Company, Inc. | | 10,233 | | | | 450,150 | |
| Macy’s, Inc. | | 21,019 | | | | 543,762 | |
| Nike, Inc. Class B | | 17,249 | | | | 1,108,076 | |
| Office Depot, Inc. | * | | | 13,041 | | | | 181,400 | |
| OfficeMax, Inc. | | 2,974 | | | | 61,443 | |
| RadioShack Corporation | † | | | 5,381 | | | | 90,724 | |
| Sears Holdings Corporation | *† | | | 3,576 | | | | 364,931 | |
| Sherwin-Williams Company (The) | † | | | 4,841 | | | | 280,972 | |
| Staples, Inc. | | 32,067 | | | | 739,786 | |
| TJX Companies, Inc. | | 20,299 | | | | 583,190 | |
| Target Corporation | | 38,669 | | | | 1,933,450 | |
| Tiffany & Company | | 6,286 | | | | 289,345 | |
| Walgreen Company | | 45,220 | | | | 1,721,978 | |
| Wal-Mart Stores, Inc. | | 109,926 | | | | 5,224,783 | |
| | | 23,028,962 | |
Telephone Systems—2.7% | | | |
| AT&T, Inc. | | 277,503 | | | | 11,533,025 | |
| CenturyTel, Inc. | | 5,012 | | | | 207,798 | |
| Citizens Communications Company | | 14,413 | | | | 183,477 | |
| Embarq Corporation | | 6,503 | | | | 322,094 | |
| Qwest Communications International, Inc. | *† | | | 71,276 | | | | 499,645 | |
| Sprint Nextel Corporation | | 130,646 | | | | 1,715,382 | |
| Verizon Communications, Inc. | | 131,219 | | | | 5,732,958 | |
| Windstream Corporation | | 19,512 | | | | 254,046 | |
| | | 20,448,425 | |
Textiles, Clothing & Fabrics—0.2% | | | |
| Coach, Inc. | * | | | 16,947 | | | | 518,239 | |
| Jones Apparel Group, Inc. | | 5,028 | | | | 80,398 | |
| Liz Claiborne, Inc. | † | | | 4,454 | | | | 90,639 | |
| Polo Ralph Lauren Corporation | | 2,737 | | | | 169,119 | |
| VF Corporation | | 3,825 | | | | 262,625 | |
| | | 1,121,020 | |
Transportation—1.3% | | | |
| Brunswick Corporation | | 4,421 | | | | 75,378 | |
| Burlington Northern Santa Fe Corporation | | 14,400 | | | | 1,198,512 | |
| CSX Corporation | | 19,296 | | | | 848,638 | |
|
See accompanying notes to financial statements.
215
SCHEDULE OF INVESTMENTS—(Continued)
December 31, 2007
Vantagepoint Asset
Allocation Fund
|
|
|
|
|
|
|
| Shares
|
| Value
|
|---|
COMMON STOCKS—(Continued) |
| Carnival Corporation | �� | 19,796 | | | $ | 880,724 | |
| CH Robinson Worldwide, Inc. | | 7,757 | | | | 419,809 | |
| Expedia, Inc. | * | | | 9,280 | | | | 293,434 | |
| Expeditors International of Washington, Inc. | | 9,672 | | | | 432,145 | |
| Norfolk Southern Corporation | | 18,206 | | | | 918,311 | |
| Union Pacific Corporation | | 11,972 | | | | 1,503,923 | |
| United Parcel Service, Inc. Class B | | 48,074 | | | | 3,399,793 | |
| | | 9,970,667 | |
TOTAL COMMON STOCKS | | | |
| (Cost $453,120,226) | | | | | | 588,126,910 | |
| |
Coupon
Rate
|
|
|
| Maturity
Date
|
|
|
| Face
|
| Value
|
|---|
U.S. GOVERNMENT AGENCY OBLIGATIONS—8.8% |
U.S. Government Agencies—8.8% | | | |
| Federal Home Loan Bank | | | |
| 4.140% | | | | 03/14/2008 | | | | $ | 12,000,000 | | | | 11,899,260 | |
| Federal National Mortgage Association | | | |
| 4.235% | | | | 03/19/2008 | | | | | 55,000,000 | | | | 54,495,329 | |
TOTAL U.S. GOVERNMENT AGENCY OBLIGATIONS | | | |
| (Cost $66,394,589) | | | | | | 66,394,589 | |
| |
U.S. TREASURY OBLIGATIONS—0.6% |
U.S. Treasury Bills—0.6% | | | |
| U.S. Treasury Bill | | | |
| 2.935% | | | | 03/20/2008 | | ** | | | | | | | | |
| (Cost $4,644,890) | | 4,675,000 | | | | 4,644,890 | |
| |
|
|
|
|
|
|
|
| Shares
|
| Value
|
|---|
RIGHTS—0.0% |
Computers & Information—0.0% |
Seagate Technology, Inc.
Rights Expire TBD *d | | | |
| (Cost $—) | | | | 10,600 | | | | — | |
| |
Coupon
Rate
|
|
|
| Maturity
Date
|
|
|
| Face
|
| Value
|
|---|
COMMERCIAL PAPER—11.1% |
Banking—7.2% | | | |
| Royal Bank of Scotland | | | |
| 4.810% | | | | 03/18/2008 | | | | $ | 25,000,000 | | | | 24,742,799 | |
| Santander Central Hispano Finance, Inc. | | | |
| 4.850% | | | | 03/13/2008 | | | | | 30,000,000 | | | | 29,709,000 | |
| | | 54,451,799 | |
Financial Services—3.9% | | | |
| Barclays U.S. Funding Corp. | | | |
| 4.940% | | | | 03/17/2008 | | | | | 30,000,000 | | | | 29,687,133 | | | |
TOTAL COMMERCIAL PAPER | | | |
| (Cost $84,138,932) | | | | | | 84,138,932 | |
|
Coupon
Rate
|
|
|
| Maturity
Date
|
|
|
| Face
|
| Value
|
|---|
CASH EQUIVALENTS—2.7% |
Institutional Money Market Funds—0.2% | | | |
| Reserve Primary Money Market Fund | | | |
| 4.950% | | | | 01/02/2008 | | †† | | $ | 1,686,571 | | | $ | 1,686,571 | |
Bank & Certificate Deposits/
Offshore Time Deposits—2.4% | | | |
| Abbey National PLC | | | |
| 5.160% | | | | 01/07/2008 | | †† | | | 421,645 | | | | 421,645 | |
| Abbey National PLC | | | |
| 5.000% | | | | 01/09/2008 | | †† | | | 527,055 | | | | 527,055 | |
| ABN Amro Bank NV | | | |
| 5.185% | | | | 01/04/2008 | | †† | | | 210,821 | | | | 210,821 | |
| ABN Amro Bank NV | | | |
| 5.160% | | | | 01/04/2008 | | †† | | | 316,232 | | | | 316,232 | |
| ABN Amro Bank NV | | | |
| 5.145% | | | | 01/03/2008 | | †† | | | 421,643 | | | | 421,643 | |
| Bank of Nova Scotia | | | |
| 4.960% | | | | 01/17/2008 | | †† | | | 421,643 | | | | 421,643 | |
| Bank of Nova Scotia | | | |
| 4.850% | | | | 01/22/2008 | | †† | | | 421,643 | | | | 421,643 | |
| Barclays | | | |
| 5.350% | | | | 01/04/2008 | | †† | | | 210,821 | | | | 210,821 | |
| Barclays | | | |
| 5.000% | | | | 01/22/2008 | | †† | | | 527,054 | | | | 527,054 | |
| Barclays | | | |
| 4.880% | | | | 02/06/2008 | | †† | | | 316,232 | | | | 316,232 | |
| BNP Paribas | | | |
| 5.200% | | | | 01/11/2008 | | †† | | | 210,821 | | | | 210,821 | |
| BNP Paribas | | | |
| 5.150% | | | | 01/02/2008 | | †† | | | 210,821 | | | | 210,821 | |
| BNP Paribas | | | |
| 5.010% | | | | 01/16/2008 | | †† | | | 632,464 | | | | 632,464 | |
| Calyon | | | |
| 5.120% | | | | 03/03/2008 | | †† | | | 210,821 | | | | 210,821 | |
| Calyon | | | |
| 4.250% | | | | 01/02/2008 | | †† | | | 2,108,214 | | | | 2,108,214 | |
| Dexia Group | | | |
| 4.755% | | | | 01/03/2008 | | †† | | | 948,696 | | | | 948,696 | |
| Fifth Third Bancorp | | | |
| 2.750% | | | | 01/02/2008 | | †† | | | 1,054,107 | | | | 1,054,107 | |
| Fortis Bank | | | |
| 4.600% | | | | 01/07/2008 | | †† | | | 632,464 | | | | 632,464 | |
| Fortis Bank | | | |
| 4.300% | | | | 01/02/2008 | | †† | | | 1,581,161 | | | | 1,581,161 | |
| HBOS Halifax Bank of Scotland | | | |
| 5.150% | | | | 01/02/2008 | | †† | | | 210,821 | | | | 210,821 | |
| HBOS Halifax Bank of Scotland | | | |
| 4.870% | | | | 02/11/2008 | | †† | | | 421,643 | | | | 421,643 | |
| Lloyds TSB Bank | | | |
| 5.150% | | | | 01/03/2008 | | †† | | | 316,232 | | | | 316,232 | |
| Lloyds TSB Bank | | | |
| 4.750% | | | | 01/24/2008 | | †† | | | 421,643 | | | | 421,643 | |
| Rabobank Nederland | | | |
| 5.080% | | | | 01/09/2008 | | †† | | | 210,821 | | | | 210,821 | |
| Rabobank Nederland | | | |
| 4.880% | | | | 01/10/2008 | | †† | | | 105,411 | | | | 105,411 | |
| Royal Bank of Scotland | | | |
| 5.000% | | | | 01/22/2008 | | †† | | | 316,232 | | | | 316,232 | |
| Royal Bank of Scotland | | | |
| 4.830% | | | | 02/05/2008 | | †† | | | 316,232 | | | | 316,232 | |
| Royal Bank of Scotland | | | |
| 4.700% | | | | 02/25/2008 | | †† | | | 210,821 | | | | 210,821 | |
See accompanying notes to financial statements.
216
SCHEDULE OF INVESTMENTS—(Continued)
December 31, 2007
Vantagepoint Asset
Allocation Fund
Coupon
Rate
|
|
|
| Maturity
Date
|
|
|
| Face
|
| Value
|
|---|
CASH EQUIVALENTS—(Continued) |
| Societe Generale | | | |
| 5.150% | | | | 01/02/2008 | | †† | | $ | 316,232 | | | $ | 316,232 | |
| Societe Generale | | | |
| 5.150% | | | | 03/03/2008 | | †† | | | 316,232 | | | | 316,232 | |
| Societe Generale | | | |
| 4.900% | | | | 02/29/2008 | | †† | | | 421,643 | | | | 421,643 | |
| Svenska Handlesbanken | | | |
| 4.250% | | | | 01/02/2008 | | †† | | | 1,817,673 | | | | 1,817,673 | |
| Toronto Dominion Bank | | | |
| 5.100% | | | | 01/10/2008 | | †† | | | 316,232 | | | | 316,232 | |
| Toronto Dominion Bank | | | |
| 5.050% | | | | 01/11/2008 | | †† | | | 105,411 | | | | 105,411 | |
| Toronto Dominion Bank | | | |
| 4.800% | | | | 02/11/2008 | | †† | | | 632,464 | | | | 632,464 | |
| UBS AG | | | |
| 4.920% | | | | 01/11/2008 | | †† | | | 316,232 | | | | 316,232 | |
| | | 18,156,333 | |
Floating Rate Instruments/Master Notes—0.1% |
| Wells Fargo Bank | | | |
| 4.600% | | | | 01/02/2008 | | †† | | | 948,696 | | | | 948,696 | |
TOTAL CASH EQUIVALENTS | | | |
| (Cost $20,791,600) | | | | | | 20,791,600 | |
TOTAL INVESTMENTS—101.0% | | | |
| (Cost $629,090,237) | | 764,096,921 | |
| Other assets less liabilities—(1.0%) | | (7,768,054 | ) |
NET ASSETS—100.0% | $ | 756,328,867 | |
Notes to the Schedule of Investments:
| ADR | | American Depositary Receipt |
| REIT | | Real Estate Investment Trust |
| * | | Non-income producing security. |
| † | | Denotes all or a portion of security on loan. |
| ** | | Security has been pledged as collateral for futures contracts. |
| †† | | Represents reinvestment of collateral received in conjunction with securities lending. |
| d | | Security has no market value at 12/31/2007. |
See accompanying notes to financial statements.
217
SCHEDULE OF INVESTMENTS
December 31, 2007
Vantagepoint Equity
Income Fund
|
|
|
|
|
|
|
| Shares
|
| Value
|
|---|
COMMON STOCKS—96.0% |
Aerospace & Defense—1.3% | | | |
| Honeywell International, Inc. | | 353,300 | | | $ | 21,752,681 | |
Airlines—1.1% | | | |
| FedEx Corporation | | 190,000 | | | | 16,942,300 | |
| Southwest Airlines Company | | 114,700 | | | | 1,399,340 | |
| | | 18,341,640 | |
Apparel Retailers—1.3% | | | |
| Limited Brands, Inc. | † | | | 1,210,891 | | | | 22,922,167 | |
Automotive—1.7% | | | |
| Ford Motor Company | †* | | | 200,000 | | | | 1,346,000 | |
| General Motors Corporation | † | | | 804,000 | | | | 20,011,560 | |
| Genuine Parts Company | | 90,552 | | | | 4,192,558 | |
| Harley-Davidson, Inc. | | 73,300 | | | | 3,423,843 | |
| | | 28,973,961 | |
Banking—7.4% | | | |
| American Express Company | | 238,200 | | | | 12,391,164 | |
| Bank of America Corporation | | 390,092 | | | | 16,095,196 | |
| Bank of New York Mellon Corporation | | 152,400 | | | | 7,431,024 | |
| Capital One Financial Corporation | | 189,600 | | | | 8,960,496 | |
| Citigroup, Inc. | | 454,169 | | | | 13,370,735 | |
| Fannie Mae | | 97,206 | | | | 3,886,296 | |
| Fifth Third Bancorp | | 158,600 | | | | 3,985,618 | |
| JPMorgan Chase & Company | | 290,400 | | | | 12,675,960 | |
| Keycorp | | 100,000 | | | | 2,345,000 | |
| National City Corporation | † | | | 85,000 | | | | 1,399,100 | |
| Royal Bank of Scotland Group PLC (United Kingdom) | | 95,000 | | | | 835,617 | |
| SLM Corporation | | 553,200 | | | | 11,141,448 | |
| State Street Corporation | | 61,100 | | | | 4,961,320 | |
| SunTrust Banks, Inc. | | 97,100 | | | | 6,067,779 | |
| U.S. Bancorp | | 212,100 | | | | 6,732,054 | |
| Wachovia Corporation | | 175,804 | | | | 6,685,826 | |
| Wells Fargo & Company | | 318,900 | | | | 9,627,591 | |
| | | 128,592,224 | |
Beverages, Food & Tobacco—5.0% | | | |
| Altria Group, Inc. | | 197,300 | | | | 14,911,934 | |
| Anheuser-Busch Companies, Inc. | | 125,000 | | | | 6,542,500 | |
| Campbell Soup Company | | 45,112 | | | | 1,611,852 | |
| Coca-Cola Company (The) | | 80,300 | | | | 4,928,011 | |
| General Mills, Inc. | | 85,222 | | | | 4,857,654 | |
| Hershey Company (The) | | 99,600 | | | | 3,924,240 | |
| HJ Heinz Company | | 128,100 | | | | 5,979,708 | |
| Imperial Tobacco Group PLC (United Kingdom) | | 178,200 | | | | 19,117,296 | |
| Kraft Foods, Inc. Class A | | 390,224 | | | | 12,733,009 | |
| McCormick & Company, Inc. | | 75,000 | | | | 2,843,250 | |
| UST, Inc. | † | | | 159,037 | | | | 8,715,228 | |
| | | 86,164,682 | |
Building Materials—2.4% | | | |
| Cemex SAB de CV Sponsored ADR (Mexico) | * | | | 979,107 | | | | 25,309,916 | |
| Home Depot, Inc. | | 509,200 | | | | 13,717,848 | |
| Vulcan Materials Company | † | | | 31,900 | | | | 2,522,971 | |
| | | 41,550,735 | |
Chemicals—1.4% | | | |
| Avery Dennison Corporation | | 91,700 | | | | 4,872,938 | |
| E.I. du Pont de Nemours & Company | | 343,846 | | | | 15,160,170 | |
| International Flavors & Fragrances, Inc. | † | | | 97,200 | | | $ | 4,678,236 | |
| | | 24,711,344 | |
Commercial Services—0.4% | | | |
| H&R Block, Inc. | | 199,600 | | | | 3,706,572 | |
| Waste Management, Inc. | | 100,000 | | | | 3,267,000 | |
| | | 6,973,572 | |
Communications—3.5% | | | |
| Alcatel-Lucent SA, Sponsored ADR (France) | | 300,900 | | | | 2,202,588 | |
| Koninklijke (Royal) Philips Electronics NV NY Shares (Netherlands) | | 660,000 | | | | 28,215,000 | |
| L-3 Communications Holdings, Inc. | † | | | 84,000 | | | | 8,898,960 | |
| Motorola, Inc. | | 183,400 | | | | 2,941,736 | |
| Nokia Corporation Sponsored ADR (Finland) | | 393,300 | | | | 15,098,787 | |
| Sony Corporation ADR (Japan) | | 54,700 | | | | 2,970,210 | |
| | | 60,327,281 | |
Computer Software & Processing—1.7% | | | |
| Computer Sciences Corporation | * | | | 48,900 | | | | 2,419,083 | |
Electronic Data Systems
Corporation | | 54,900 | | | | 1,138,077 | |
| Microsoft Corporation | | 288,000 | | | | 10,252,800 | |
| Symantec Corporation | * | | | 659,000 | | | | 10,636,260 | |
| Yahoo!, Inc. | * | | | 183,400 | | | | 4,265,884 | |
| | | 28,712,104 | |
Computers & Information—4.3% | | | |
| 3M Company | | 160,900 | | | | 13,567,088 | |
| Dell, Inc. | * | | | 2,030,100 | | | | 49,757,751 | |
| International Business Machines Corporation | | 54,300 | | | | 5,869,830 | |
| Pitney Bowes, Inc. | † | | | 143,900 | | | | 5,473,956 | |
| | | 74,668,625 | |
Cosmetics & Personal Care—0.9% | | | |
| Avon Products, Inc. | | 114,700 | | | | 4,534,091 | |
| Colgate-Palmolive Company | | 61,700 | | | | 4,810,132 | |
| Procter & Gamble Company | | 85,000 | | | | 6,240,700 | |
| | | 15,584,923 | |
Electric Utilities—3.4% | | | |
| Dominion Resources, Inc. | | 182,600 | | | | 8,664,370 | |
| Duke Energy Corporation | | 642,424 | | | | 12,957,692 | |
| Entergy Corporation | | 142,900 | | | | 17,079,408 | |
| FirstEnergy Corporation | | 57,100 | | | | 4,130,614 | |
| NiSource, Inc. | | 240,400 | | | | 4,541,156 | |
Pinnacle West Capital
Corporation | | 49,600 | | | | 2,103,536 | |
| Progress Energy, Inc. | | 100,000 | | | | 4,843,000 | |
| TECO Energy, Inc. | † | | | 59,300 | | | | 1,020,553 | |
| Xcel Energy, Inc. | | 154,500 | | | | 3,487,065 | |
| | | 58,827,394 | |
Electrical Equipment—2.0% | | | |
| Cooper Industries Ltd. Class A (Bermuda) | | 85,300 | | | | 4,510,664 | |
| Emerson Electric Company | | 219,000 | | | | 12,408,540 | |
| General Electric Company | | 491,500 | | | | 18,219,905 | |
| | | 35,139,109 | |
|
See accompanying notes to financial statements.
218
SCHEDULE OF INVESTMENTS—(Continued)
December 31, 2007
Vantagepoint Equity
Income Fund
|
|
|
|
|
|
|
| Shares
|
| Value
|
|---|
COMMON STOCKS—(Continued) |
Electronics—0.8% | | | |
| Analog Devices, Inc. | | 125,000 | | | $ | 3,962,500 | |
| Eastman Kodak Company | † | | | 149,041 | | | | 3,259,527 | |
| Intel Corporation | | 117,900 | | | | 3,143,214 | |
| Raytheon Company | | 42,500 | | | | 2,579,750 | |
| Texas Instruments, Inc. | | 50,000 | | | | 1,670,000 | |
| | | 14,614,991 | |
Entertainment & Leisure—3.6% | | | |
| Discovery Holding Company Class A | * | | | 732,316 | | | | 18,410,424 | |
| Mattel, Inc. | | 175,000 | | | | 3,332,000 | |
| Time Warner, Inc. | | 363,000 | | | | 5,993,130 | |
| Walt Disney Company | | 1,054,000 | | | | 34,023,120 | |
| | | 61,758,674 | |
Financial Services—2.8% | | | |
| Bear Stearns Companies, Inc. (The) | † | | | 71,900 | | | | 6,345,175 | |
Charles Schwab Corporation
(The) | | 72,900 | | | | 1,862,595 | |
| Countrywide Financial Corporation | † | | | 114,000 | | | | 1,019,160 | |
| Legg Mason, Inc. | | 55,000 | | | | 4,023,250 | |
| Merrill Lynch & Company, Inc. | | 121,400 | | | | 6,516,752 | |
| Morgan Stanley | † | | | 37,000 | | | | 1,965,070 | |
| UBS AG (Switzerland) | | 570,000 | | | | 26,220,000 | |
| | | 47,952,002 | |
Forest Products & Paper—0.8% | | | |
| International Paper Company | | 244,100 | | | | 7,903,958 | |
| Kimberly-Clark Corporation | | 45,259 | | | | 3,138,259 | |
| MeadWestvaco Corporation | | 101,500 | | | | 3,176,950 | |
| | | 14,219,167 | |
Heavy Machinery—1.4% | | | |
| Applied Materials, Inc. | † | | | 655,100 | | | | 11,634,576 | |
| Stanley Works (The) | | 278,500 | | | | 13,501,680 | |
| | | 25,136,256 | |
Home Construction, Furnishings & Appliances—0.6% | | | |
| DR Horton, Inc. | † | | | 133,500 | | | | 1,758,195 | |
| Masco Corporation | | 170,500 | | | | 3,684,505 | |
| Newell Rubbermaid, Inc. | | 185,000 | | | | 4,787,800 | |
| Whirlpool Corporation | | 6,100 | | | | 497,943 | |
| | | 10,728,443 | |
Household Products—1.3% | | | |
| Fortune Brands, Inc. | | 58,700 | | | | 4,247,532 | |
| Illinois Tool Works, Inc. | | 357,300 | | | | 19,129,842 | |
| | | 23,377,374 | |
Insurance—9.3% | | | |
| Allstate Corporation (The) | | 123,900 | | | | 6,471,297 | |
| American International Group, Inc. | | 390,514 | | | | 22,766,966 | |
| AON Corporation | | 582,000 | | | | 27,755,580 | |
| Fairfax Financial Holdings Ltd. (Canada) | † | | | 110,000 | | | | 31,474,300 | |
| Genworth Financial, Inc. Class A | | 81,300 | | | | 2,069,085 | |
| Hartford Financial Services Group, Inc. | | 106,500 | | | | 9,285,735 | |
| Lincoln National Corporation | | 91,490 | | | | 5,326,548 | |
| Marsh & McLennan Companies, Inc. | | 287,300 | | | | 7,604,831 | |
| Progressive Corporation (The) | | 140,600 | | | $ | 2,693,896 | |
| The Chubb Corporation | | 43,400 | | | | 2,368,772 | |
| Travelers Cos., Inc. (The) | | 150,306 | | | | 8,086,463 | |
| UnitedHealth Group, Inc. | | 307,500 | | | | 17,896,500 | |
| WellPoint, Inc. | * | | | 205,600 | | | | 18,037,288 | |
| | | 161,837,261 | |
Media—Broadcasting & Publishing—6.8% |
| Cablevision Systems Corporation Class A | * | | | 91,100 | | | | 2,231,950 | |
| CBS Corporation Class B | | 124,100 | | | | 3,381,725 | |
| Comcast Corporation Class A | * | | | 24,700 | | | | 451,022 | |
| Comcast Corporation Special Class A | * | | | 442,500 | | | | 8,018,100 | |
| DIRECTV Group (The), Inc. | * | | | 1,099,000 | | | | 25,408,880 | |
| Gannett Company, Inc. | | 208,000 | | | | 8,112,000 | |
| Liberty Media Corporation Interactive Class A | * | | | 1,470,250 | | | | 28,052,370 | |
| Liberty Media Holdings Corporation Capital Class A | * | | | 292,050 | | | | 34,020,904 | |
| McGraw-Hill Companies, Inc. (The) | | 116,100 | | | | 5,086,341 | |
| New York Times Company Class A | † | | | 181,900 | | | | 3,188,707 | |
| | | 117,951,999 | |
Medical Supplies—2.0% | | | |
| Baxter International, Inc. | | 261,100 | | | | 15,156,855 | |
| Boston Scientific Corporation | * | | | 175,000 | | | | 2,035,250 | |
| Johnson & Johnson | | 269,300 | | | | 17,962,310 | |
| | | 35,154,415 | |
Metals—0.2% | | | |
| Alcoa, Inc. | | 90,900 | | | | 3,322,395 | |
Oil & Gas—11.8% | | | |
| BP Amoco PLC ADR (United Kingdom) | | 66,998 | | | | 4,902,244 | |
| Baker Hughes, Inc. | | 50,000 | | | | 4,055,000 | |
| BJ Services Company | | 91,800 | | | | 2,227,068 | |
| Chesapeake Energy Corporation | † | | | 851,000 | | | | 33,359,200 | |
| Chevron Corporation | | 151,658 | | | | 14,154,241 | |
| ConocoPhillips | | 230,700 | | | | 20,370,810 | |
| Exxon Mobil Corporation | | 148,660 | | | | 13,927,955 | |
| Hess Corporation | | 182,000 | | | | 18,356,520 | |
| Marathon Oil Corporation | | 299,200 | | | | 18,209,312 | |
| Murphy Oil Corporation | | 40,000 | | | | 3,393,600 | |
| Occidental Petroleum Corporation | | 291,200 | | | | 22,419,488 | |
| Pioneer Natural Resources Company | † | | | 527,000 | | | | 25,738,680 | |
| Royal Dutch Shell PLC Class A ADR (United Kingdom) | | 121,381 | | | | 10,220,280 | |
| Spectra Energy Corp. | † | | | 525,312 | | | | 13,563,556 | |
| | | 204,897,954 | |
Pharmaceuticals—4.7% | | | |
| Abbott Laboratories | | 75,000 | | | | 4,211,250 | |
| Amgen, Inc. | * | | | 103,900 | | | | 4,825,116 | |
| Bristol-Myers Squibb Company | | 655,500 | | | | 17,383,860 | |
| Cardinal Health, Inc. | | 6,100 | | | | 352,275 | |
| Eli Lilly & Company | | 140,600 | | | | 7,506,634 | |
| Merck & Company, Inc. | | 140,500 | | | | 8,164,455 | |
| Pfizer, Inc. | | 917,000 | | | | 20,843,410 | |
| Schering-Plough Corporation | | 195,500 | | | | 5,208,120 | |
| Wyeth | | 293,600 | | | | 12,974,184 | |
| | | 81,469,304 | |
Restaurants—1.7% | | | |
| Yum! Brands, Inc. | | 751,000 | | | | 28,740,770 | |
|
See accompanying notes to financial statements.
219
SCHEDULE OF INVESTMENTS—(Continued)
December 31, 2007
Vantagepoint Equity
Income Fund
|
|
|
|
|
|
|
| Shares
|
| Value
|
|---|
COMMON STOCKS—(Continued) |
Retailers—2.6% | | | |
| Bed Bath & Beyond, Inc. | †* | | | 132,300 | | | $ | 3,888,297 | |
| eBay, Inc. | * | | | 862,000 | | | | 28,609,780 | |
| JC Penney Company, Inc. | | 107,200 | | | | 4,715,728 | |
| Office Depot, Inc. | * | | | 181,500 | | | | 2,524,665 | |
| Walgreen Company | | 6,100 | | | | 232,288 | |
| Wal-Mart Stores, Inc. | | 120,300 | | | | 5,717,859 | |
| | | 45,688,617 | |
Telephone Systems—5.8% | | | |
| AT&T, Inc. | | 595,742 | | | | 24,759,038 | |
| Level 3 Communications, Inc. | †* | | | 7,132,000 | | | | 21,681,280 | |
| Qwest Communications International, Inc. | †* | | | 600,000 | | | | 4,206,000 | |
| Sprint Nextel Corporation | | 1,823,400 | | | | 23,941,242 | |
| Verizon Communications, Inc. | | 579,141 | | | | 25,302,670 | |
| | | 99,890,230 | |
Transportation—2.0% | | | |
| Burlington Northern Santa Fe Corporation | | 156,000 | | | | 12,983,880 | |
| Carnival Corporation | | 291,200 | | | | 12,955,488 | |
| Union Pacific Corporation | | 40,297 | | | | 5,062,109 | |
| United Parcel Service, Inc. Class B | | 50,000 | | | | 3,536,000 | |
| | | 34,537,477 | |
TOTAL COMMON STOCKS | | | |
| (Cost $1,395,952,217) | | | | | | 1,664,519,771 | |
| |
CONVERTIBLE PREFERRED STOCKS—0.0% |
Banking—0.0% | | | |
| SLM Corp. | ‡ | | | | | | | | |
| (Cost $300,000) | | 300 | | | | 300,000 | |
| |
Coupon
Rate
|
|
|
| Maturity
Date
|
|
|
| Face
|
| Value
|
|---|
U.S. GOVERNMENT AGENCY OBLIGATIONS—0.1% |
U.S. Government Agencies—0.1% | | | |
| Federal Home Loan Bank | | | |
| 4.250% | | | | 01/22/2008 | | | | $ | 2,500,000 | | | | 2,493,802 | |
| Federal National Mortgage Association | | | |
| 4.300% | | | | 01/24/2008 | | | | | 107,000 | | | | 106,706 | |
TOTAL U.S. GOVERNMENT AGENCY OBLIGATIONS | | | |
| (Cost $2,600,508) | | | | | | 2,600,508 | |
| |
COMMERCIAL PAPER—1.3% |
Banking—0.3% | | | |
| Bank of America Corp. | | | |
| 4.850% | | | | 01/18/2008 | | | | | 2,400,000 | | | | 2,394,504 | |
| Ciesco LLC 144A | | | |
| 4.900% | | | | 01/18/2008 | | ** | | | 2,550,000 | | | | 2,544,099 | |
| DnB NOR Bank ASA (Norway) | | | |
| 5.060% | | | | 02/01/2008 | | | | | 1,100,000 | | | | 1,095,207 | |
| | | 6,033,810 | |
Commercial Services—0.2% | | | |
| Cargill, Inc. 144A | | | |
| 5.050% | | | | 01/31/2008 | | ** | | | 2,800,000 | | | | 2,788,217 | |
|
Coupon
Rate
|
|
|
| Maturity
Date
|
|
|
| Face
|
| Value
|
|---|
Financial Services—0.8% | | | |
| Bryant Park Funding LLC 144A | | | |
| 5.250% | | | | 02/21/2008 | | ** | | $ | 1,000,000 | | | $ | 992,562 | |
| DaimlerChrysler Revolving Auto Conduit LLC | | | |
| 5.450% | | | | 02/22/2008 | | | | | 6,400,000 | | | | 6,349,618 | |
| Falcon Asset Securitization Corporation 144A | | | |
| 4.800% | | | | 02/01/2008 | | ** | | | 500,000 | | | | 497,933 | |
| Ranger Funding Co. LLC 144A | | | |
| 5.050% | | | | 03/10/2008 | | ** | | | 2,893,000 | | | | 2,864,998 | |
| Ranger Funding Co. LLC 144A | | | |
| 5.020% | | | | 01/25/2008 | | ** | | | 500,000 | | | | 498,327 | |
| Solitaire Funding, Ltd., 144A | | | |
| 5.000% | | | | 03/19/2008 | | ** | | | 3,000,000 | | | | 2,967,500 | |
| | | 14,170,938 | |
TOTAL COMMERCIAL PAPER | | | |
| (Cost $22,992,965) | | | | | | 22,992,965 | |
| |
CASH EQUIVALENTS—9.2% |
Institutional Money Market Funds—0.8% | | | |
| Reserve Primary Money Market Fund | | | |
| 4.950% | | | | 01/02/2008 | | †† | | | 12,923,590 | | | | 12,923,590 | |
Bank & Certificate Deposits/
Offshore Time Deposits—8.0% | | | |
| Abbey National PLC | | | |
| 5.160% | | | | 01/07/2008 | | †† | | | 3,230,897 | | | | 3,230,897 | |
| Abbey National PLC | | | |
| 5.000% | | | | 01/09/2008 | | †† | | | 4,038,622 | | | | 4,038,622 | |
| ABN Amro Bank NV | | | |
| 5.185% | | | | 01/04/2008 | | †† | | | 1,615,449 | | | | 1,615,449 | |
| ABN Amro Bank NV | | | |
| 5.160% | | | | 01/04/2008 | | †† | | | 2,423,173 | | | | 2,423,173 | |
| ABN Amro Bank NV | | | |
| 5.145% | | | | 01/03/2008 | | †† | | | 3,230,897 | | | | 3,230,897 | |
| Bank of Nova Scotia | | | |
| 4.960% | | | | 01/17/2008 | | †† | | | 3,230,897 | | | | 3,230,897 | |
| Bank of Nova Scotia | | | |
| 4.850% | | | | 01/22/2008 | | †† | | | 3,230,897 | | | | 3,230,897 | |
| Barclays | | | |
| 5.350% | | | | 01/04/2008 | | †† | | | 1,615,449 | | | | 1,615,449 | |
| Barclays | | | |
| 5.000% | | | | 01/22/2008 | | †† | | | 4,038,622 | | | | 4,038,622 | |
| Barclays | | | |
| 4.880% | | | | 02/06/2008 | | †† | | | 2,423,173 | | | | 2,423,173 | |
| BNP Paribas | | | |
| 5.200% | | | | 01/11/2008 | | †† | | | 1,615,449 | | | | 1,615,449 | |
| BNP Paribas | | | |
| 5.150% | | | | 01/02/2008 | | †† | | | 1,615,449 | | | | 1,615,449 | |
| BNP Paribas | | | |
| 5.010% | | | | 01/16/2008 | | †† | | | 4,846,346 | | | | 4,846,346 | |
| Calyon | | | |
| 5.120% | | | | 03/03/2008 | | †† | | | 1,615,449 | | | | 1,615,449 | |
| Calyon | | | |
| 4.250% | | | | 01/02/2008 | | †† | | | 16,154,487 | | | | 16,154,487 | |
| Dexia Group | | | |
| 4.755% | | | | 01/03/2008 | | †† | | | 7,269,519 | | | | 7,269,519 | |
| Fifth Third Bancorp | | | |
| 2.750% | | | | 01/02/2008 | | †† | | | 8,077,244 | | | | 8,077,244 | |
| Fortis Bank | | | |
| 4.600% | | | | 01/07/2008 | | †† | | | 4,846,346 | | | | 4,846,346 | |
| Fortis Bank | | | |
| 4.300% | | | | 01/02/2008 | | †† | | | 12,115,865 | | | | 12,115,865 | |
| HBOS Halifax Bank of Scotland | | | |
| 5.150% | | | | 01/02/2008 | | †† | | | 1,615,449 | | | | 1,615,449 | |
See accompanying notes to financial statements.
220
SCHEDULE OF INVESTMENTS—(Continued)
December 31, 2007
Vantagepoint Equity
Income Fund
Coupon
Rate
|
|
|
| Maturity
Date
|
|
|
| Face
|
| Value
|
|---|
CASH EQUIVALENTS—(Continued) |
| HBOS Halifax Bank of Scotland | | | |
| 4.870% | | | | 02/11/2008 | | †† | | $ | 3,230,897 | | | $ | 3,230,897 | |
| Lloyds TSB Bank | | | |
| 5.150% | | | | 01/03/2008 | | †† | | | 2,423,173 | | | | 2,423,173 | |
| Lloyds TSB Bank | | | |
| 4.750% | | | | 01/24/2008 | | †† | | | 3,230,897 | | | | 3,230,897 | |
| Rabobank Nederland | | | |
| 5.080% | | | | 01/09/2008 | | †† | | | 1,615,449 | | | | 1,615,449 | |
| Rabobank Nederland | | | |
| 4.880% | | | | 01/10/2008 | | †† | | | 807,725 | | | | 807,725 | |
| Royal Bank of Scotland | | | |
| 5.000% | | | | 01/22/2008 | | †† | | | 2,423,173 | | | | 2,423,173 | |
| Royal Bank of Scotland | | | |
| 4.830% | | | | 02/05/2008 | | †† | | | 2,423,173 | | | | 2,423,173 | |
| Royal Bank of Scotland | | | |
| 4.700% | | | | 02/25/2008 | | †† | | | 1,615,449 | | | | 1,615,449 | |
| Societe Generale | | | |
| 5.150% | | | | 01/02/2008 | | †† | | | 2,423,173 | | | | 2,423,173 | |
| Societe Generale | | | |
| 5.150% | | | | 03/03/2008 | | †† | | | 2,423,173 | | | | 2,423,173 | |
| Societe Generale | | | |
| 4.900% | | | | 02/29/2008 | | †† | | | 3,230,897 | | | | 3,230,897 | |
| Svenska Handlesbanken | | | |
| 4.250% | | | | 01/02/2008 | | †† | | | 13,928,175 | | | | 13,928,175 | |
| Toronto Dominion Bank | | | |
| 5.100% | | | | 01/10/2008 | | †† | | | 2,423,174 | | | | 2,423,174 | |
| Toronto Dominion Bank | | | |
| 5.050% | | | | 01/11/2008 | | †† | | | 807,724 | | | | 807,724 | |
| Toronto Dominion Bank | | | |
| 4.800% | | | | 02/11/2008 | | †† | | | 4,846,346 | | | | 4,846,346 | |
| UBS AG | | | |
| 4.920% | | | | 01/11/2008 | | †† | | | 2,423,174 | | | | 2,423,174 | |
| | | 139,125,451 | |
Floating Rate Instruments/Master Notes—0.4% |
| Wells Fargo Bank | | | |
| 4.600% | | | | 01/02/2008 | | †† | | | 7,269,519 | | | | 7,269,519 | |
TOTAL CASH EQUIVALENTS | | | |
| (Cost $159,318,560) | | | | | | 159,318,560 | |
| |
REPURCHASE AGREEMENTS—2.5% |
| State Street Bank & Trust Repurchase Agreement, dated 12/31/2007, due 01/02/2008, with a maturity value of $42,749,598 and an effective yield of 3.65% collateralized by U.S. Government and Agency Obligations, with rates ranging from 4.166% – 5.5275%, and maturities ranging from 04/01/2034 – 06/15/2034, and an aggregate market value of $43,600,420. | | 42,740,931 | | | | 42,740,931 | |
TOTAL INVESTMENTS—109.1% | | | |
| (Cost $1,623,905,181) | | 1,892,472,735 | |
| Other assets less liabilities—(9.1%) | | (157,722,757 | ) |
NET ASSETS—100.0% | $ | 1,734,749,978 | |
Notes to the Schedule of Investments:
| ADR | | American Depositary Receipt |
| † | | Denotes all or a portion of security on loan. |
| * | | Non-income producing security. |
| ‡ | | Security valued at fair value as determined by policies approved by the board of directors. |
| ** | | Security exempt from registration under Rule 144A of the Securities Act of 1933. These securities may be resold in transactions exempt from registration, normally to qualified buyers. 144A securities represent 0.70% of Total Investments. |
| †† | | Represents reinvestment of collateral received in conjunction with securities lending. |
See accompanying notes to financial statements.
221
SCHEDULE OF INVESTMENTS
December 31, 2007
Vantagepoint Growth &
Income Fund
|
|
|
|
|
|
|
| Shares
|
| Value
|
|---|
COMMON STOCKS—97.7% |
Advertising—0.4% | | | |
| Monster Worldwide, Inc. | * | | | 59,800 | | | $ | 1,937,520 | |
| Omnicom Group | | 62,500 | | | | 2,970,625 | |
| | | 4,908,145 | |
Aerospace & Defense—2.2% | | | |
| Boeing Company (The) | | 36,100 | | | | 3,157,306 | |
| General Dynamics Corporation | | 173,800 | | | | 15,466,462 | |
| Lockheed Martin Corporation | | 4,200 | | | | 442,092 | |
| United Technologies Corporation | | 72,200 | | | | 5,526,188 | |
| | | 24,592,048 | |
Airlines—0.3% | | | |
| AMR Corporation | *† | | | 59,000 | | | | 827,770 | |
| FedEx Corporation | | 17,300 | | | | 1,542,641 | |
| Southwest Airlines Company | | 82,700 | | | | 1,008,940 | |
| | | 3,379,351 | |
Apparel Retailers—0.9% | | | |
| Gap (The), Inc. | | 159,900 | | | | 3,402,672 | |
| Kohl’s Corporation | * | | | 87,000 | | | | 3,984,600 | |
| Nordstrom, Inc. | | 22,500 | | | | 826,425 | |
| Urban Outfitters, Inc. | *† | | | 44,400 | | | | 1,210,344 | |
| | | 9,424,041 | |
Automotive—0.3% | | | |
| Ford Motor Company | *† | | | 247,900 | | | | 1,668,367 | |
| General Motors Corporation | | 37,000 | | | | 920,930 | |
| Paccar, Inc. | | 5,800 | | | | 315,984 | |
| | | 2,905,281 | |
Banking—10.3% | | | |
| American Express Company | | 84,000 | | | | 4,369,680 | |
| AmeriCredit Corporation | *† | | | 47,900 | | | | 612,641 | |
| Bank of America Corporation | | 277,600 | | | | 11,453,776 | |
| Bank of New York Mellon Corporation | | 166,743 | | | | 8,130,389 | |
| Capital One Financial Corporation | | 25,400 | | | | 1,200,404 | |
| Citigroup, Inc. | | 41,250 | | | | 1,214,400 | |
| Discover Financial Services | | 173,802 | | | | 2,620,934 | |
| Fannie Mae | | 58,400 | | | | 2,334,832 | |
| Fifth Third Bancorp | | 41,000 | | | | 1,030,330 | |
| Freddie Mac | | 58,000 | | | | 1,976,060 | |
| Hudson City Bancorp, Inc. | | 204,700 | | | | 3,074,594 | |
| IndyMac Bancorp, Inc. | † | | | 82,400 | | | | 490,280 | |
| JPMorgan Chase & Company | | 320,436 | | | | 13,987,031 | |
| Lloyds Tsp Group Plc ADR (United Kingdom) | | 183,000 | | | | 6,889,950 | |
| Northern Trust Corporation | | 47,200 | | | | 3,614,576 | |
| PNC Financial Services Group, Inc. | | 73,900 | | | | 4,851,535 | |
| SLM Corporation | | 135,300 | | | | 2,724,942 | |
| State Street Corporation | | 100,900 | | | | 8,193,080 | |
| SunTrust Banks, Inc. | | 75,400 | | | | 4,711,746 | |
| U.S. Bancorp | | 202,300 | | | | 6,421,002 | |
| Wachovia Corporation | | 359,230 | | | | 13,661,517 | |
| Washington Mutual, Inc. | † | | | 173,400 | | | | 2,359,974 | |
| Wells Fargo & Company | | 244,700 | | | | 7,387,493 | |
| | | 113,311,166 | |
Beverages, Food & Tobacco—4.6% | | | |
| Altria Group, Inc. | | 129,203 | | | | 9,765,163 | |
| Anheuser-Busch Companies, Inc. | | 15,300 | | | | 800,802 | |
| Campbell Soup Company | | 26,500 | | | | 946,845 | |
| Coca-Cola Company (The) | | 39,000 | | | | 2,393,430 | |
| ConAgra Foods, Inc. | | 136,700 | | | | 3,252,093 | |
| General Mills, Inc. | | 10,700 | | | $ | 609,900 | |
| Kellogg Company | | 71,900 | | | | 3,769,717 | |
| Kraft Foods, Inc. Class A | | 115,682 | | | | 3,774,704 | |
| Pepsico, Inc. | | 166,500 | | | | 12,637,350 | |
| Sara Lee Corporation | | 143,200 | | | | 2,299,792 | |
| Supervalu, Inc. | | 127,700 | | | | 4,791,304 | |
| Sysco Corporation | | 37,400 | | | | 1,167,254 | |
| Tyson Foods, Inc. Class A | | 206,800 | | | | 3,170,244 | |
| Unilever NV (Netherlands) | | 43,400 | | | | 1,582,364 | |
| | | 50,960,962 | |
Building Materials—0.6% | | | |
| Home Depot, Inc. | | 49,000 | | | | 1,320,060 | |
| Lowe’s Companies, Inc. | | 193,900 | | | | 4,386,018 | |
| Vulcan Materials Company | | 8,800 | | | | 695,992 | |
| | | 6,402,070 | |
Chemicals—2.7% | | | |
| Agrium, Inc. (Canada) | | 100,100 | | | | 7,228,221 | |
| Celanese Corporation Class A | | 18,600 | | | | 787,152 | |
| Dow Chemical Company (The) | | 100,600 | | | | 3,965,652 | |
| E.I. du Pont de Nemours & Company | | 135,700 | | | | 5,983,013 | |
| Monsanto Company | | 61,900 | | | | 6,913,611 | |
| Potash Corporation of Saskatchewan, Inc. (Canada) | | 31,500 | | | | 4,534,740 | |
| Praxair, Inc. | | 6,400 | | | | 567,744 | |
| | | 29,980,133 | |
Coal—0.2% | | | |
| Arch Coal, Inc. | | 20,500 | | | | 921,065 | |
| Peabody Energy Corporation | | 20,600 | | | | 1,269,784 | |
| | | 2,190,849 | |
Commercial Services—0.9% | | | |
| Accenture Ltd. Class A (Bermuda) | | 54,200 | | | | 1,952,826 | |
| Fluor Corporation | | 28,900 | | | | 4,211,308 | |
| MasterCard, Inc. Class A | † | | | 3,200 | | | | 688,640 | |
| Moody’s Corporation | | 23,600 | | | | 842,520 | |
| Paychex, Inc. | | 22,800 | | | | 825,816 | |
| Siemens AG Sponsored ADR (Germany) | | 7,500 | | | | 1,180,200 | |
| | | 9,701,310 | |
Communications—1.9% | | �� | |
| American Tower Corporation Class A | * | | | 146,600 | | | | 6,245,160 | |
| Arris Group, Inc. | *† | | | 161,300 | | | | 1,609,774 | |
| Ciena Corporation | *† | | | 19,600 | | | | 668,556 | |
| Network Appliance, Inc. | * | | | 18,900 | | | | 471,744 | |
| Nokia Corporation Sponsored ADR (Finland) | | 116,000 | | | | 4,453,240 | |
| Polycom, Inc. | *† | | | 28,200 | | | | 783,396 | |
| Qualcomm, Inc. | | 162,400 | | | | 6,390,440 | |
| | | 20,622,310 | |
Computer Software & Processing—6.7% | | | |
| Adobe Systems, Inc. | * | | | 44,200 | | | | 1,888,666 | |
| Affiliated Computer Services, Inc. Class A | * | | | 22,200 | | | | 1,001,220 | |
| Autodesk, Inc. | * | | | 50,700 | | | | 2,522,832 | |
| Automatic Data Processing, Inc. | | 91,400 | | | | 4,070,042 | |
| Cerner Corporation | *† | | | 13,900 | | | | 783,960 | |
| Electronic Arts, Inc. | * | | | 60,700 | | | | 3,545,487 | |
| Fiserv, Inc. | * | | | 14,500 | | | | 804,605 | |
| Google, Inc. Class A | * | | | 32,500 | | | | 22,473,100 | |
| Intuit, Inc. | * | | | 48,100 | | | | 1,520,441 | |
|
See accompanying notes to financial statements.
222
SCHEDULE OF INVESTMENTS—(Continued)
December 31, 2007
Vantagepoint Growth &
Income Fund
|
|
|
|
|
|
|
| Shares
|
| Value
|
|---|
COMMON STOCKS—(Continued) |
| Juniper Networks, Inc. | * | | | 162,900 | | | $ | 5,408,280 | |
| McAfee, Inc. | * | | | 10,800 | | | | 405,000 | |
| Microsoft Corporation | | 453,800 | | | | 16,155,280 | |
| Oracle Corporation | * | | | 179,300 | | | | 4,048,594 | |
| SAP AG ADR (Germany) | † | | | 15,500 | | | | 791,275 | |
| Sun Microsystems, Inc. | *† | | | 190,925 | | | | 3,461,470 | |
| Tomtom NV (Netherlands) | * | | | 2,900 | | | | 218,346 | |
| VeriSign, Inc. | * | | | 47,700 | | | | 1,793,997 | |
| Yahoo!, Inc. | * | | | 122,100 | | | | 2,840,046 | |
| | | 73,732,641 | |
Computers & Information—3.9% | | | |
| Apple Computer, Inc. | * | | | 49,200 | | | | 9,745,536 | |
| Brocade Communications Systems, Inc. | * | | | 159,100 | | | | 1,167,794 | |
| Dell, Inc. | * | | | 172,200 | | | | 4,220,622 | |
| EMC Corporation | * | | | 167,100 | | | | 3,096,363 | |
| Hewlett-Packard Company | | 161,700 | | | | 8,162,616 | |
| Ingram Micro, Inc. Class A | * | | | 200,700 | | | | 3,620,628 | |
| International Business Machines Corporation | | 35,000 | | | | 3,783,500 | |
| International Game Technology | | 28,000 | | | | 1,230,040 | |
| Jabil Circuit, Inc. | | 135,300 | | | | 2,066,031 | |
| SanDisk Corporation | * | | | 113,400 | | | | 3,761,478 | |
| Seagate Technology (Cayman Islands) | | 68,700 | | | | 1,751,850 | |
| VeriFone Holdings, Inc. | *† | | | 39,900 | | | | 927,675 | |
| | | 43,534,133 | |
Cosmetics & Personal Care—0.8% | | | |
| Colgate-Palmolive Company | | 51,300 | | | | 3,999,348 | |
| Procter & Gamble Company | | 64,875 | | | | 4,763,122 | |
| | | 8,762,470 | |
Education—0.1% | | | |
| Apollo Group, Inc. Class A | * | | | 10,100 | | | | 708,515 | |
Electric Utilities—2.7% | | | |
| Allegheny Energy, Inc. | | 6,800 | | | | 432,548 | |
| Consolidated Edison, Inc. | | 56,500 | | | | 2,760,025 | |
| Edison International | | 41,900 | | | | 2,236,203 | |
| Entergy Corporation | | 36,000 | | | | 4,302,720 | |
| Exelon Corporation | | 43,600 | | | | 3,559,504 | |
| FPL Group, Inc. | | 139,800 | | | | 9,460,266 | |
| Pinnacle West Capital Corporation | | 21,700 | | | | 920,297 | |
| SCANA Corporation | | 60,300 | | | | 2,541,645 | |
| Southern Company (The) | | 99,100 | | | | 3,840,125 | |
| | | 30,053,333 | |
Electrical Equipment—3.3% | | | |
| Cooper Industries Ltd. Class A (Bermuda) | | 23,000 | | | | 1,216,240 | |
| Emerson Electric Company | | 14,700 | | | | 832,902 | |
| Energizer Holdings, Inc. | * | | | 11,100 | | | | 1,244,643 | |
| General Electric Company | | 880,600 | | | | 32,643,842 | |
| | | 35,937,627 | |
Electronics—4.3% | | | |
| Altera Corporation | | 110,400 | | | | 2,132,928 | |
| Analog Devices, Inc. | | 61,100 | | | | 1,936,870 | |
| ASML Holding NV New York Registered Shares (Netherlands) | *† | | | 8,666 | | | | 271,159 | |
| Broadcom Corporation Class A | * | | | 30,400 | | | | 794,656 | |
| Cisco Systems, Inc. | * | | | 616,850 | | | | 16,698,129 | |
| Flextronics International Ltd. (Singapore) | * | | | 50,500 | | | | 609,030 | |
| Intel Corporation | | 443,300 | | | $ | 11,818,378 | |
| Marvell Technology Group Ltd. (Bermuda) | * | | | 188,800 | | | | 2,639,424 | |
| Maxim Integrated Products, Inc. | | 54,500 | | | | 1,443,160 | |
| Micron Technology, Inc. | *† | | | 286,100 | | | | 2,074,225 | |
| Qimonda AG, ADR (Germany) | * | | | 81,300 | | | | 581,295 | |
| Rockwell Collins, Inc. | | 20,600 | | | | 1,482,582 | |
| Silicon Laboratories, Inc. | * | | | 5,700 | | | | 213,351 | |
| Texas Instruments, Inc. | | 43,500 | | | | 1,452,900 | |
| Xilinx, Inc. | | 138,000 | | | | 3,018,060 | |
| | | 47,166,147 | |
Entertainment & Leisure—0.9% | | | |
| Discovery Holding Company Class A | * | | | 32,400 | | | | 814,536 | |
| Nintendo Company Ltd., ADR (Japan) | | 17,900 | | | | 1,320,125 | |
| Time Warner, Inc. | | 268,100 | | | | 4,426,331 | |
| Walt Disney Company | | 114,100 | | | | 3,683,148 | |
| | | 10,244,140 | |
Environmental—1.2% | | | |
| Agilent Technologies, Inc. | * | | | 33,872 | | | | 1,244,457 | |
| Danaher Corporation | | 130,800 | | | | 11,476,392 | |
| | | 12,720,849 | |
Financial Services—4.8% | | | |
| Ameriprise Financial, Inc. | | 39,800 | | | | 2,193,378 | |
| Berkshire Hathaway, Inc. Class A | * | | | 18 | | | | 2,548,800 | |
| BlackRock, Inc. | | 3,000 | | | | 650,400 | |
| Charles Schwab Corporation (The) | | 153,300 | | | | 3,916,815 | |
| CME Group, Inc. | | 4,200 | | | | 2,881,200 | |
| Franklin Resources, Inc. | | 43,500 | | | | 4,977,705 | |
| Goldman Sachs Group, Inc. | | 77,800 | | | | 16,730,890 | |
| IntercontinentalExchange, Inc. | * | | | 400 | | | | 77,000 | |
| Lehman Brothers Holdings, Inc. | | 38,700 | | | | 2,532,528 | |
| Merrill Lynch & Company, Inc. | | 37,100 | | | | 1,991,528 | |
| Morgan Stanley | † | | | 153,400 | | | | 8,147,074 | |
| UBS AG (Switzerland) | | 58,500 | | | | 2,691,239 | |
| UBS AG (Switzerland) | | 80,300 | | | | 3,693,800 | |
| | | 53,032,357 | |
Food Retailers—0.8% | | | |
| Kroger Company (The) | | 140,700 | | | | 3,758,097 | |
| Safeway, Inc. | | 104,200 | | | | 3,564,682 | |
| Starbucks Corporation | * | | | 52,600 | | | | 1,076,722 | |
| | | 8,399,501 | |
Forest Products & Paper—0.4% | | | |
| Kimberly-Clark Corporation | | 38,300 | | | | 2,655,722 | |
| Smurfit-Stone Container Corporation | *† | | | 194,000 | | | | 2,048,640 | |
| | | 4,704,362 | |
Health Care Providers—0.7% | | | |
| DaVita, Inc. | * | | | 29,400 | | | | 1,656,690 | |
| Express Scripts, Inc. | * | | | 38,300 | | | | 2,795,900 | |
| Laboratory Corporation of America Holdings | * | | | 37,700 | | | | 2,847,481 | |
| | | 7,300,071 | |
Heavy Construction—0.6% | | | |
| Foster Wheeler Ltd. (Bermuda) | * | | | 25,800 | | | | 3,999,516 | |
| Lennar Corporation Class A | | 31,100 | | | | 556,379 | |
| McDermott International, Inc. | * | | | 39,100 | | | | 2,308,073 | |
| | | 6,863,968 | |
|
See accompanying notes to financial statements.
223
SCHEDULE OF INVESTMENTS—(Continued)
December 31, 2007
Vantagepoint Growth &
Income Fund
|
|
|
|
|
|
|
| Shares
|
| Value
|
|---|
COMMON STOCKS—(Continued) |
Heavy Machinery—1.7% | | | |
| Applied Materials, Inc. | | 270,100 | | | $ | 4,796,976 | |
| Caterpillar, Inc. | | 11,500 | | | | 834,440 | |
| Deere & Company | | 12,500 | | | | 1,164,000 | |
| Lam Research Corporation | * | | | 19,000 | | | | 821,370 | |
| Smith International, Inc. | | 92,900 | | | | 6,860,665 | |
| Trane, Inc. | | 100,100 | | | | 4,675,671 | |
| | | 19,153,122 | |
Home Construction, Furnishings & Appliances—0.1% |
| Jarden Corporation | *† | | | 18,100 | | | | 427,341 | |
| Johnson Controls, Inc. | | 26,500 | | | | 955,060 | |
| | | 1,382,401 | |
Household Products—0.4% | | | |
| Illinois Tool Works, Inc. | | 84,100 | | | | 4,502,714 | |
Industrial—Diversified—0.0% | | | |
| Tyco International Ltd. (Bermuda) | | 12,900 | | | | 511,485 | |
Insurance—6.2% | | | |
| ACE Ltd. (Cayman Islands) | | 98,500 | | | | 6,085,330 | |
| Aflac, Inc. | | 21,800 | | | | 1,365,334 | |
| Aetna, Inc. | | 155,500 | | | | 8,977,015 | |
| Allstate Corporation (The) | | 107,700 | | | | 5,625,171 | |
| AMBAC Financial Group, Inc. | † | | | 65,300 | | | | 1,682,781 | |
American International
Group, Inc. | | 171,300 | | | | 9,986,790 | |
| Cigna Corporation | | 5,400 | | | | 290,142 | |
| Hartford Financial Services Group, Inc. | | 6,400 | | | | 558,016 | |
| Humana, Inc. | * | | | 27,300 | | | | 2,055,963 | |
| MBIA, Inc. | † | | | 71,000 | | | | 1,322,730 | |
| Marsh & McLennan Companies, Inc. | | 79,300 | | | | 2,099,071 | |
| Progressive Corporation (The) | | 45,700 | | | | 875,612 | |
| Prudential Financial, Inc. | | 38,600 | | | | 3,591,344 | |
| The Chubb Corporation | | 90,800 | | | | 4,955,864 | |
| UnitedHealth Group, Inc. | | 160,300 | | | | 9,329,460 | |
| WellPoint, Inc. | * | | | 91,600 | | | | 8,036,068 | |
| XL Capital Ltd. Class A (Cayman Islands) | | 21,000 | | | | 1,056,510 | |
| | | 67,893,201 | |
Lodging—0.8% | | | |
| Las Vegas Sands Corporation | *† | | | 35,700 | | | | 3,678,885 | |
| MGM MIRAGE | * | | | 20,300 | | | | 1,705,606 | |
Marriott International, Inc.
Class A | | 56,700 | | | | 1,938,006 | |
| Starwood Hotels & Resorts Worldwide, Inc. | | 7,500 | | | | 330,225 | |
| Wynn Resorts Ltd. | † | | | 10,700 | | | | 1,199,791 | |
| | | 8,852,513 | |
Media—Broadcasting & Publishing—0.9% |
| CBS Corporation Class B | | 53,800 | | | | 1,466,050 | |
| Comcast Corporation Class A | * | | | 148,750 | | | | 2,716,175 | |
| Gannett Company, Inc. | | 23,600 | | | | 920,400 | |
McGraw-Hill Companies,
Inc. (The) | | 35,300 | | | | 1,546,493 | |
| Shaw Communications, Inc. Class B (Canada) | † | | | 32,700 | | | | 774,336 | |
| Time Warner Cable, Inc. Class A | * | | | 27,100 | | | | 747,960 | |
| Viacom, Inc. Class B | * | | | 31,400 | | | | 1,379,088 | |
| | | 9,550,502 | |
Medical Supplies—3.4% | | | |
| Alcon, Inc. (Switzerland) | | 14,700 | | | $ | 2,102,688 | |
| Allergan, Inc. | | 96,800 | | | | 6,218,432 | |
| Baxter International, Inc. | | 205,900 | | | | 11,952,495 | |
| KLA-Tencor Corporation | | 79,100 | | | | 3,809,456 | |
| Medtronic, Inc. | | 129,800 | | | | 6,525,046 | |
| St. Jude Medical, Inc. | * | | | 71,800 | | | | 2,917,952 | |
| Stryker Corporation | | 42,800 | | | | 3,198,016 | |
| Thermo Fisher Scientific, Inc. | * | | | 11,600 | | | | 669,088 | |
| | | 37,393,173 | |
Metals—1.2% | | | |
| Allegheny Technologies, Inc. | | 4,800 | | | | 414,720 | |
| Barrick Gold Corporation (Canada) | | 118,500 | | | | 4,982,925 | |
| Cleveland-Cliffs, Inc. | | 4,400 | | | | 443,520 | |
| Corning, Inc. | | 280,200 | | | | 6,721,998 | |
| Newmont Mining Corporation | | 23,000 | | | | 1,123,090 | |
| | | 13,686,253 | |
Mining—0.5% | | | |
| Freeport-McMoran Copper & Gold, Inc. | | 54,600 | | | | 5,593,224 | |
Oil & Gas—8.7% | | | |
| Anadarko Petroleum Corporation | | 9,800 | | | | 643,762 | |
| Baker Hughes, Inc. | | 74,700 | | | | 6,058,170 | |
| BJ Services Company | | 90,500 | | | | 2,195,530 | |
| Chevron Corporation | | 91,172 | | | | 8,509,083 | |
| ConocoPhillips | | 93,400 | | | | 8,247,220 | |
| EOG Resources, Inc. | | 12,600 | | | | 1,124,550 | |
| Exxon Mobil Corporation | | 212,500 | | | | 19,909,125 | |
| MDU Resources Group, Inc. | | 34,800 | | | | 960,828 | |
| Murphy Oil Corporation | | 40,100 | | | | 3,402,084 | |
| Newfield Exploration Company | * | | | 146,700 | | | | 7,731,090 | |
| Occidental Petroleum Corporation | | 52,500 | | | | 4,041,975 | |
| Royal Dutch Shell PLC Class A ADR (United Kingdom) | † | | | 53,700 | | | | 4,521,540 | |
| Royal Dutch Shell PLC Class B, ADR (United Kingdom) | | 21,356 | | | | 1,772,548 | |
| Schlumberger Ltd. (Netherland Antilles) | | 155,200 | | | | 15,267,024 | |
| Total Fina SA ADR (France) | | 36,300 | | | | 2,998,380 | |
| Weatherford International Ltd. (Bermuda) | * | | | 39,200 | | | | 2,689,120 | |
| XTO Energy, Inc. | | 113,500 | | | | 5,829,360 | |
| | | 95,901,389 | |
Pharmaceuticals—6.5% | | | |
| Abbott Laboratories | | 95,400 | | | | 5,356,711 | |
| AstraZeneca Group PLC ADR (United Kingdom) | | 95,700 | | | | 4,097,874 | |
| Bare Escentuals, Inc. | *† | | | 32,800 | | | | 795,400 | |
| Bristol-Myers Squibb Company | | 206,100 | | | | 5,465,772 | |
| Cardinal Health, Inc. | | 24,900 | | | | 1,437,975 | |
| Celgene Corporation | * | | | 44,800 | | | | 2,070,208 | |
| Forest Laboratories, Inc. | * | | | 77,700 | | | | 2,832,165 | |
| Genentech, Inc. | * | | | 162,600 | | | | 10,905,582 | |
| Gilead Sciences, Inc. | * | | | 133,000 | | | | 6,119,330 | |
| ImClone Systems, Inc. | * | | | 63,800 | | | | 2,743,400 | |
| McKesson Corporation | | 28,500 | | | | 1,867,035 | |
| Medco Health Solutions, Inc. | * | | | 30,400 | | | | 3,082,560 | |
| Merck & Company, Inc. | | 61,300 | | | | 3,562,143 | |
| Millennium Pharmaceuticals, Inc. | * | | | 116,100 | | | | 1,739,178 | |
| Novartis AG (Switzerland) | | 4,100 | | | | 223,714 | |
| Pfizer, Inc. | | 83,000 | | | | 1,886,590 | |
| Roche Holding AG—Genusschein (Switzerland) | | 15,323 | | | | 2,642,870 | |
| Sanofi-Aventis, ADR (France) | † | | | 58,600 | | | | 2,668,058 | |
|
See accompanying notes to financial statements.
224
SCHEDULE OF INVESTMENTS—(Continued)
December 31, 2007
Vantagepoint Growth &
Income Fund
|
|
|
|
|
|
|
| Shares
|
| Value
|
|---|
COMMON STOCKS—(Continued) |
| Schering-Plough Corporation | | 75,800 | | | $ | 2,019,312 | |
| Sepracor, Inc. | * | | | 57,500 | | | | 1,509,375 | |
| Teva Pharmaceutical Industries Ltd., ADR (Israel) | | 28,100 | | | | 1,306,088 | |
| Wyeth | | 165,300 | | | | 7,304,607 | |
| | | 71,635,947 | |
Real Estate—0.5% | | | |
| Douglas Emmett, Inc. REIT | | 21,400 | | | | 483,854 | |
| General Growth Properties, Inc. REIT | † | | | 7,210 | | | | 296,908 | |
| Host Hotels & Resorts, Inc. REIT | † | | | 270,345 | | | | 4,606,679 | |
| | | 5,387,441 | |
Restaurants—0.6% | | | |
| McDonald’s Corporation | | 113,900 | | | | 6,709,849 | |
Retailers—4.9% | | | |
| Amazon.com, Inc. | * | | | 81,800 | | | | 7,577,952 | |
| Bed Bath & Beyond, Inc. | *† | | | 42,700 | | | | 1,254,953 | |
| Best Buy Company, Inc. | | 88,200 | | | | 4,643,730 | |
| CVS Caremark Corporation | | 401,186 | | | | 15,947,144 | |
| Costco Wholesale Corporation | | 31,300 | | | | 2,183,488 | |
| eBay, Inc. | * | | | 229,400 | | | | 7,613,786 | |
| Fastenal Company | † | | | 2,000 | | | | 80,840 | |
| Macy’s, Inc. | | 82,300 | | | | 2,129,101 | |
| Target Corporation | | 181,100 | | | | 9,055,000 | |
| Walgreen Company | | 18,200 | | | | 693,056 | |
| Wal-Mart Stores, Inc. | | 52,400 | | | | 2,490,572 | |
| | | 53,669,622 | |
Telephone Systems—3.9% | | | |
| America Movil SA de CV, ADR (Mexico) | | 88,500 | | | | 5,433,015 | |
| AT&T, Inc. | | 533,906 | | | | 22,189,133 | |
| Level 3 Communications, Inc. | *† | | | 271,600 | | | | 825,664 | |
| MetroPCS Communications, Inc. | *† | | | 25,400 | | | | 494,030 | |
| Rogers Communications, Inc. (Canada) | † | | | 76,400 | | | | 3,457,100 | |
| Sprint Nextel Corporation | | 35,400 | | | | 464,802 | |
| Time Warner Telecom, Inc. Class A | * | | | 132,600 | | | | 2,690,454 | |
| Verizon Communications, Inc. | | 174,400 | | | | 7,619,536 | |
| | | 43,173,734 | |
Textiles, Clothing & Fabrics—0.3% | | | |
| Coach, Inc. | * | | | 78,800 | | | | 2,409,704 | |
| Hanesbrands, Inc. | * | | | 54,437 | | | | 1,479,053 | |
| | | 3,888,757 | |
Transportation—0.6% | | | |
| Expeditors International of Washington, Inc. | | 18,900 | | | | 844,452 | |
| United Parcel Service, Inc. Class B | | 75,800 | | | | 5,360,576 | |
| | | 6,205,028 | |
TOTAL COMMON STOCKS | | | |
| (Cost $919,076,394) | | | | | | 1,076,628,135 | |
| |
CONVERTIBLE PREFERRED STOCKS—0.2% |
Banking—0.2% | | | |
| SLM Corp. | ‡ | | | 300 | | | | 300,000 | |
| Washington Mutual, Inc. | † | | | 1,650 | | | | 1,460,250 | |
| | | 1,760,250 | |
|
Coupon
Rate
|
|
|
| Maturity
Date
|
|
|
| Face
|
| Value
|
|---|
CONVERTIBLE DEBT OBLIGATIONS—0.2% |
Automotive—0.1% | | | |
| Ford Motor Company | | | |
| 4.250% | | | | 12/15/2036 | | | | $ | 918,000 | | | $ | 916,853 | |
Pharmaceuticals—0.1% | | | |
| Schering-Plough Corporation | | | |
| 6.000% | | | | 08/13/2010 | | | | | 3,700 | | | | 898,397 | |
TOTAL CONVERTIBLE DEBT OBLIGATIONS |
| (Cost $1,848,598) | | | | | | 1,815,250 | |
| |
U.S. GOVERNMENT AGENCY OBLIGATIONS—0.0% |
U.S. Government Agencies—0.0% | | | |
| Federal Home Loan Bank | | | |
| 4.250% | | | | 01/22/2008 | | | | | | | | | | |
| (Cost $299,256) | | 300,000 | | | | 299,256 | |
| |
COMMERCIAL PAPER—0.2% |
Banking—0.1% | | | |
| General Electric Capital Services, Inc. | | | |
| 4.550% | | | | 01/22/2008 | | | | | 1,000,000 | | | | 997,346 | |
Financial Services—0.1% | | | |
| DaimlerChrysler Revolving Auto Conduit LLC | | | |
| 5.450% | | | | 02/22/2008 | | | | | 400,000 | | | | 396,851 | |
| Solitaire Funding, Ltd., 144A | ** | | | | | | | | |
| 5.000% | | | | 03/19/2008 | | | | | 800,000 | | | | 791,333 | |
| | | 1,188,184 | |
TOTAL COMMERCIAL PAPER | | | |
| (Cost $2,185,530) | | | | | | 2,185,530 | |
| |
CASH EQUIVALENTS—4.1% |
Institutional Money Market Funds—0.3% | | | |
| Reserve Primary Money Market Fund | | | |
| 4.950% | | | | 01/02/2008 | | †† | | | 3,672,345 | | | | 3,672,345 | |
Bank & Certificate Deposits/
Offshore Time Deposits—3.6% | | | |
| Abbey National PLC | | | |
| 5.160% | | | | 01/07/2008 | | †† | | | 918,086 | | | | 918,086 | |
| Abbey National PLC | | | |
| 5.000% | | | | 01/09/2008 | | †† | | | 1,147,608 | | | | 1,147,608 | |
| ABN Amro Bank NV | | | |
| 5.185% | | | | 01/04/2008 | | †† | | | 459,043 | | | | 459,043 | |
| ABN Amro Bank NV | | | |
| 5.160% | | | | 01/04/2008 | | †† | | | 688,565 | | | | 688,565 | |
| ABN Amro Bank NV | | | |
| 5.145% | | | | 01/03/2008 | | †† | | | 918,086 | | | | 918,086 | |
| Bank of Nova Scotia | | | |
| 4.960% | | | | 01/17/2008 | | †† | | | 918,086 | | | | 918,086 | |
| Bank of Nova Scotia | | | |
| 4.850% | | | | 01/22/2008 | | †† | | | 918,086 | | | | 918,086 | |
| Barclays | | | |
| 5.350% | | | | 01/04/2008 | | †† | | | 459,043 | | | | 459,043 | |
| Barclays | | | |
| 5.000% | | | | 01/22/2008 | | †† | | | 1,147,608 | | | | 1,147,608 | |
| Barclays | | | |
| 4.880% | | | | 02/06/2008 | | †† | | | 688,565 | | | | 688,565 | |
| BNP Paribas | | | |
| 5.200% | | | | 01/11/2008 | | †† | | | 459,043 | | | | 459,043 | |
See accompanying notes to financial statements.
225
SCHEDULE OF INVESTMENTS—(Continued)
December 31, 2007
Vantagepoint Growth &
Income Fund
Coupon
Rate
|
|
|
| Maturity
Date
|
|
|
| Face
|
| Value
|
|---|
CASH EQUIVALENTS—(Continued) |
| BNP Paribas | | | |
| 5.150% | | | | 01/02/2008 | | †† | | $ | 459,043 | | | $ | 459,043 | |
| BNP Paribas | | | |
| 5.010% | | | | 01/16/2008 | | †† | | | 1,377,129 | | | | 1,377,129 | |
| Calyon | | | |
| 5.120% | | | | 03/03/2008 | | †† | | | 459,043 | | | | 459,043 | |
| Calyon | | | |
| 4.250% | | | | 01/02/2008 | | †† | | | 4,590,430 | | | | 4,590,430 | |
| Dexia Group | | | |
| 4.755% | | | | 01/03/2008 | | †† | | | 2,065,694 | | | | 2,065,694 | |
| Fifth Third Bancorp | | | |
| 2.750% | | | | 01/02/2008 | | †† | | | 2,295,215 | | | | 2,295,215 | |
| Fortis Bank | | | |
| 4.600% | | | | 01/07/2008 | | †† | | | 1,377,129 | | | | 1,377,129 | |
| Fortis Bank | | | |
| 4.300% | | | | 01/02/2008 | | †† | | | 3,442,823 | | | | 3,442,823 | |
| HBOS Halifax Bank of Scotland | | | |
| 5.150% | | | | 01/02/2008 | | †† | | | 459,043 | | | | 459,043 | |
| HBOS Halifax Bank of Scotland | | | |
| 4.870% | | | | 02/11/2008 | | †† | | | 918,086 | | | | 918,086 | |
| Lloyds TSB Bank | | | |
| 5.150% | | | | 01/03/2008 | | †† | | | 688,565 | | | | 688,565 | |
| Lloyds TSB Bank | | | |
| 4.750% | | | | 01/24/2008 | | †† | | | 918,086 | | | | 918,086 | |
| Rabobank Nederland | | | |
| 5.080% | | | | 01/09/2008 | | †† | | | 459,043 | | | | 459,043 | |
| Rabobank Nederland | | | |
| 4.880% | | | | 01/10/2008 | | †† | | | 229,522 | | | | 229,522 | |
| Royal Bank of Scotland | | | |
| 5.000% | | | | 01/22/2008 | | †† | | | 688,565 | | | | 688,565 | |
| Royal Bank of Scotland | | | |
| 4.830% | | | | 02/05/2008 | | †† | | | 688,565 | | | | 688,565 | |
| Royal Bank of Scotland | | | |
| 4.700% | | | | 02/25/2008 | | †† | | | 459,043 | | | | 459,043 | |
| Societe Generale | | | |
| 5.150% | | | | 01/02/2008 | | †† | | | 688,565 | | | | 688,565 | |
| Societe Generale | | | |
| 5.150% | | | | 03/03/2008 | | †† | | | 688,565 | | | | 688,565 | |
| Societe Generale | | | |
| 4.900% | | | | 02/29/2008 | | †† | | | 918,086 | | | | 918,086 | |
| Svenska Handlesbanken | | | |
| 4.250% | | | | 01/02/2008 | | †† | | | 3,957,805 | | | | 3,957,805 | |
| Toronto Dominion Bank | | | |
| 5.100% | | | | 01/10/2008 | | †† | | | 688,565 | | | | 688,565 | |
| Toronto Dominion Bank | | | |
| 5.050% | | | | 01/11/2008 | | †† | | | 229,522 | | | | 229,522 | |
| Toronto Dominion Bank | | | |
| 4.800% | | | | 02/11/2008 | | †† | | | 1,377,129 | | | | 1,377,129 | |
| UBS AG | | | |
| 4.920% | | | | 01/11/2008 | | †† | | | 688,565 | | | | 688,565 | |
| | | 39,533,645 | |
Floating Rate Instruments/Master Notes—0.2% |
| Wells Fargo Bank | | | |
| 4.600% | | | | 01/02/2008 | | †† | | | 2,065,690 | | | | 2,065,690 | |
TOTAL CASH EQUIVALENTS | | | |
| (Cost $45,271,680) | | | | | | 45,271,680 | |
|
|
|
|
|
|
|
| Face
|
| Value
|
|---|
REPURCHASE AGREEMENTS—2.0% |
State Street Bank and Trust Repurchase Agreement, dated 12/31/2007, due 01/02/2008, with a maturity value of $22,060,211 and an effective yield of 3.65%, collateralized by U.S. Government and Agency Obligations, with rates ranging from 4.252% – 5.355%, maturities ranging from 02/01/2034 – 05/25/2034
and an aggregate market value of $22,500,136. | $ | 22,055,740 | | | $ | 22,055,740 | |
TOTAL INVESTMENTS—104.4% | | | |
| (Cost $992,665,542) | | 1,150,015,841 | |
| Other assets less liabilities—(4.4%) | | (48,315,380 | ) |
NET ASSETS—100.0% | $ | 1,101,700,461 | |
Notes to the Schedule of Investments:
| ADR | | American Depositary Receipt |
| REIT | | Real Estate Investment Trust |
| * | | Non-income producing security. |
| † | | Denotes all or a portion of security on loan. |
| ‡ | | Security valued at fair value as determined by policies approved by the board of directors. |
| †† | | Represents reinvestment of collateral received in conjunction with securities lending. |
| ** | | Security exempt from registration under Rule 144A of the Securities Act of 1933. These securities may be resold in transactions exempt from registration, normally to qualified buyers. 144A securities represent 0.07% of Total Investments. |
See accompanying notes to financial statements.
226
SCHEDULE OF INVESTMENTS
December 31, 2007
Vantagepoint
Growth Fund
|
|
|
|
|
|
|
| Shares
|
| Value
|
|---|
COMMON STOCKS—96.8% |
Advertising—0.3% | | | |
| Omnicom Group | | 165,900 | | | $ | 7,885,227 | |
Aerospace & Defense—0.8% | | | |
| Boeing Company (The) | | 16,100 | | | | 1,408,106 | |
| Honeywell International, Inc. | | 59,100 | | | | 3,638,787 | |
| Lockheed Martin Corporation | | 12,200 | | | | 1,284,172 | |
| Northrop Grumman Corporation | | 48,000 | | | | 3,774,720 | |
| United Technologies Corporation | | 124,900 | | | | 9,559,846 | |
| | | 19,665,631 | |
Agriculture, Forestry & Fishing—0.1% | | | |
| Terra Industries, Inc. | * | | | 34,800 | | | | 1,662,048 | |
Airlines—0.6% | | | |
| FedEx Corporation | | 160,900 | | | | 14,347,453 | |
Apparel Retailers—0.3% | | | |
| Kohl’s Corporation | * | | | 193,900 | | | | 8,880,620 | |
Automotive—0.1% | | | |
| Autonation, Inc. | * | | | 107,948 | | | | 1,690,466 | |
| Ford Motor Company | *† | | | 41,600 | | | | 279,968 | |
| | | 1,970,434 | |
Banking—1.6% | | | |
| Bank of America Corporation | | 38,700 | | | | 1,596,762 | |
| Bank of New York Mellon Corporation | | 38,800 | | | | 1,891,888 | |
| JPMorgan Chase & Company | | 70,800 | | | | 3,090,420 | |
| Wells Fargo & Company | | 1,117,200 | | | | 33,728,268 | |
| | | 40,307,338 | |
Beverages, Food & Tobacco—5.9% | | | |
| Altria Group, Inc. | | 65,946 | | | | 4,984,199 | |
| Anheuser-Busch Companies, Inc. | | 461,000 | | | | 24,128,740 | |
| Bunge Ltd. | | 84,300 | | | | 9,813,363 | |
| Coca-Cola Company (The) | | 595,700 | | | | 36,558,109 | |
| Hansen Natural Corporation | *† | | | 3,500 | | | | 155,015 | |
| Kraft Foods, Inc. Class A | | 571,200 | | | | 18,638,256 | |
| Nestle SA-Sponsored ADR (Switzerland) | | 103,200 | | | | 11,888,640 | |
| PepsiAmericas, Inc. | | 5,500 | | | | 183,260 | |
| Pepsico, Inc. | | 495,100 | | | | 37,578,090 | |
| Tyson Foods, Inc. Class A | | 163,100 | | | | 2,500,323 | |
| UST, Inc. | † | | | 67,178 | | | | 3,681,354 | |
| Universal Corporation | † | | | 13,500 | | | | 691,470 | |
| | | 150,800,819 | |
Building Materials—0.7% | | | |
| Home Depot, Inc. | | 35,400 | | | | 953,676 | |
| Lowe’s Companies, Inc. | | 739,800 | | | | 16,734,276 | |
| | | 17,687,952 | |
Chemicals—0.7% | | | |
| Celanese Corporation Class A | | 12,000 | | | | 507,840 | |
| CF Industries Holdings, Inc. | | 33,900 | | | | 3,731,034 | |
| Lubrizol Corporation | | 1,300 | | | | 70,408 | |
| Monsanto Company | | 11,470 | | | | 1,281,084 | |
| Mosaic Company (The) | * | | | 4,900 | | | | 462,266 | |
| Praxair, Inc. | | 121,300 | | | | 10,760,523 | |
| | | 16,813,155 | |
Commercial Services—4.2% | | | |
| Accenture Ltd. Class A (Bermuda) | | 115,300 | | | | 4,154,259 | |
| Cintas Corporation | | 194,100 | | | | 6,525,642 | |
| Dun & Bradstreet Company | | 5,500 | | | $ | 487,465 | |
| Fluor Corporation | | 171,700 | | | | 25,020,124 | |
| KBR, Inc. | * | | | 9,800 | | | | 380,240 | |
| Manpower, Inc. | | 32,849 | | | | 1,869,108 | |
| MasterCard, Inc. Class A | † | | | 14,800 | | | | 3,184,960 | |
| Paychex, Inc. | | 644,550 | | | | 23,345,601 | |
| Quanta Services, Inc. | *† | | | 737,800 | | | | 19,359,872 | |
| Ryder System, Inc. | † | | | 14,400 | | | | 676,944 | |
| Shaw Group, Inc. (The) | * | | | 394,200 | | | | 23,825,448 | |
| | | 108,829,663 | |
Communications—6.2% | | | |
| Ciena Corporation | *† | | | 4,300 | | | | 146,673 | |
L-3 Communications
Holdings, Inc. | | 10,300 | | | | 1,091,182 | |
| Nokia Corporation Sponsored ADR (Finland) | | 2,162,300 | | | | 83,010,697 | |
| Qualcomm, Inc. | | 1,239,100 | | | | 48,758,585 | |
| XM Satellite Radio Holdings, Inc. Class A | *† | | | 2,053,400 | | | | 25,133,616 | |
| | | 158,140,753 | |
Computer Software & Processing—13.6% | | | |
| Adobe Systems, Inc. | * | | | 24,300 | | | | 1,038,339 | |
| Advent Software, Inc. | *† | | | 3,000 | | | | 162,300 | |
| Amdocs Ltd. | * | | | 171,100 | | | | 5,897,817 | |
| Autodesk, Inc. | * | | | 199,800 | | | | 9,942,048 | |
| Automatic Data Processing, Inc. | | 914,900 | | | | 40,740,497 | |
| CA, Inc. | | 88,900 | | | | 2,218,055 | |
| Cognizant Technology Solutions Corporation | *† | | | 272,000 | | | | 9,231,680 | |
| Electronic Arts, Inc. | *† | | | 425,500 | | | | 24,853,455 | |
| Fair Isaac Corporation | | 35,900 | | | | 1,154,185 | |
| Google, Inc. Class A | * | | | 96,985 | | | | 67,063,188 | |
| Juniper Networks, Inc. | * | | | 129,100 | | | | 4,286,120 | |
| Microsoft Corporation | | 3,002,410 | | | | 106,885,796 | |
| Novell, Inc. | * | | | 21,500 | | | | 147,705 | |
| Oracle Corporation | * | | | 314,800 | | | | 7,108,184 | |
| Red Hat, Inc. | *† | | | 646,000 | | | | 13,462,640 | |
| Symantec Corporation | * | | | 240,000 | | | | 3,873,600 | |
| Synopsys, Inc. | * | | | 59,938 | | | | 1,554,192 | |
| Teradata Corporation | * | | | 5,300 | | | | 145,273 | |
| VeriSign, Inc. | * | | | 13,300 | | | | 500,213 | |
| Yahoo!, Inc. | * | | | 2,140,500 | | | | 49,788,030 | |
| | | 350,053,317 | |
Computers & Information—3.4% | | | |
| 3M Company | | 34,700 | | | | 2,925,904 | |
| Apple Computer, Inc. | * | | | 36,600 | | | | 7,249,728 | |
| Dell, Inc. | * | | | 119,000 | | | | 2,916,690 | |
| EMC Corporation | * | | | 697,000 | | | | 12,915,410 | |
| Hewlett-Packard Company | | 257,200 | | | | 12,983,456 | |
| Ingram Micro, Inc. Class A | * | | | 2,200 | | | | 39,688 | |
| International Business Machines Corporation | | 438,600 | | | | 47,412,660 | |
| Lexmark International, Inc. | * | | | 3,900 | | | | 135,954 | |
| Tech Data Corporation | * | | | 10,500 | | | | 396,060 | |
| | | 86,975,550 | |
Containers & Packaging—0.0% | | | |
| Owens-IIlinois, Inc. | *† | | | 8,600 | | | | 425,700 | |
Cosmetics & Personal Care—1.3% | | | |
| Ecolab, Inc. | | 176,500 | | | | 9,038,565 | |
| Procter & Gamble Company | | 336,400 | | | | 24,698,488 | |
| | | 33,737,053 | |
|
See accompanying notes to financial statements.
227
SCHEDULE OF INVESTMENTS—(Continued)
December 31, 2007
Vantagepoint
Growth Fund
|
|
|
|
|
|
|
| Shares
|
| Value
|
|---|
COMMON STOCKS—(Continued) |
Education—0.3% | | | |
| Apollo Group, Inc. Class A | * | | | 60,200 | | | $ | 4,223,030 | |
| Career Education Corporation | * | | | 1,600 | | | | 40,224 | |
| ITT Educational Services, Inc. | * | | | 36,700 | | | | 3,129,409 | |
| | | 7,392,663 | |
Electric Utilities—0.2% | | | |
| NRG Energy, Inc. | * | | | 2,300 | | | | 99,682 | |
| Reliant Energy, Inc. | * | | | 141,900 | | | | 3,723,456 | |
| | | 3,823,138 | |
Electrical Equipment—3.8% | | | |
| Emerson Electric Company | | 30,200 | | | | 1,711,132 | |
| Energizer Holdings, Inc. | *† | | | 34,854 | | | | 3,908,179 | |
| General Electric Company | | 1,972,700 | | | | 73,127,989 | |
| Thomas & Betts Corporation | * | | | 251,500 | | | | 12,333,560 | |
| Vestas Wind Systems A/S (Denmark) | * | | | 68,400 | | | | 7,364,517 | |
| | | 98,445,377 | |
Electronics—6.9% | | | |
| Analog Devices, Inc. | | 73,900 | | | | 2,342,630 | |
| Avnet, Inc. | * | | | 14,600 | | | | 510,562 | |
| Cisco Systems, Inc. | * | | | 2,271,900 | | | | 61,500,333 | |
| First Solar, Inc. | * | | | 1,200 | | | | 320,568 | |
| Garmin Ltd. (Cayman Islands) | | 6,700 | | | | 649,900 | |
| Intel Corporation | | 1,324,200 | | | | 35,303,172 | |
| Linear Technology Corporation | † | | | 333,800 | | | | 10,624,854 | |
| Marvell Technology Group Ltd. (Bermuda) | * | | | 397,800 | | | | 5,561,244 | |
| Maxim Integrated Products, Inc. | | 179,500 | | | | 4,753,160 | |
| MEMC Electronics Materials, Inc. | * | | | 42,000 | | | | 3,716,580 | |
National Semiconductor
Corporation | | 40,500 | | | | 916,920 | |
| Novellus Systems, Inc. | * | | | 13,000 | | | | 358,410 | |
| Nvidia Corporation | * | | | 55,150 | | | | 1,876,203 | |
| QLogic Corporation | * | | | 13,700 | | | | 194,540 | |
| Raytheon Company | | 8,344 | | | | 506,481 | |
| Texas Instruments, Inc. | | 1,330,300 | | | | 44,432,020 | |
| Tyco Electronics Ltd. (Bermuda) | | 81,226 | | | | 3,015,921 | |
| | | 176,583,498 | |
Entertainment & Leisure—1.1% | | | |
| Time Warner, Inc. | | 252,203 | | | | 4,163,872 | |
| Walt Disney Company | † | | | 716,200 | | | | 23,118,936 | |
| | | 27,282,808 | |
Environmental—0.3% | | | |
| Agilent Technologies, Inc. | * | | | 13,500 | | | | 495,990 | |
| Danaher Corporation | | 85,200 | | | | 7,475,448 | |
| | | 7,971,438 | |
Financial Services—11.3% | | | |
| Berkshire Hathaway, Inc., Class B | * | | | 2,805 | | | | 13,284,480 | |
| Charles Schwab Corporation (The) | | 1,740,350 | | | | 44,465,942 | |
| CME Group, Inc. | | 33,400 | | | | 22,912,400 | |
| Eaton Vance Corporation | | 10,400 | | | | 472,264 | |
| Franklin Resources, Inc. | | 193,100 | | | | 22,096,433 | |
| Goldman Sachs Group, Inc. | | 441,100 | | | | 94,858,555 | |
| IntercontinentalExchange, Inc. | * | | | 104,200 | | | | 20,058,500 | |
| Janus Capital Group, Inc. | | 50,800 | | | | 1,668,780 | |
| Legg Mason, Inc. | † | | | 318,400 | | | | 23,290,960 | |
| Nasdaq Stock Market, Inc. | * | | | 373,400 | | | | 18,479,566 | |
| Nymex Holdings, Inc. | | 51,000 | | | | 6,814,110 | |
| T Rowe Price Group, Inc. | | 228,900 | | | $ | 13,935,432 | |
| Western Union Company (The) | | 340,700 | | | | 8,272,196 | |
| | | 290,609,618 | |
Food Retailers—0.1% | | | |
| Kroger Company (The) | | 83,200 | | | | 2,222,272 | |
Health Care Providers—0.1% | | | |
| Express Scripts, Inc. | * | | | 46,300 | | | | 3,379,900 | |
| Kindred Healthcare, Inc. | * | | | 4,800 | | | | 119,904 | |
| | | 3,499,804 | |
Heavy Construction—0.9% | | | |
| Foster Wheeler Ltd. (Bermuda) | * | | | 147,600 | | | | 22,880,952 | |
| McDermott International, Inc. | * | | | 500 | | | | 29,515 | |
| | | 22,910,467 | |
Heavy Machinery—2.4% | | | |
| Agco Corporation | *† | | | 53,700 | | | | 3,650,526 | |
| Black & Decker Corporation | | 2,800 | | | | 195,020 | |
| Cameron International Corporation | * | | | 5,400 | | | | 259,902 | |
| Caterpillar, Inc. | | 193,900 | | | | 14,069,384 | |
| Dresser-Rand Group, Inc. | * | | | 40,700 | | | | 1,589,335 | |
| ITT Corporation | | 124,900 | | | | 8,248,396 | |
| Ingersoll-Rand Company Class A (Bermuda) | | 61,400 | | | | 2,853,258 | |
| National-Oilwell Varco, Inc. | * | | | 246,400 | | | | 18,100,544 | |
| Rockwell Automation, Inc. | | 150,300 | | | | 10,364,688 | |
| SPX Corporation | | 6,800 | | | | 699,380 | |
| Toro Company | | 6,200 | | | | 337,528 | |
| WW Grainger, Inc. | | 7,100 | | | | 621,392 | |
| | | 60,989,353 | |
Home Construction, Furnishings & Appliances—0.1% |
| HNI Corporation | † | | | 11,100 | | | | 389,166 | |
| Kinetic Concepts, Inc. | * | | | 61,600 | | | | 3,299,296 | |
| | | 3,688,462 | |
Insurance—2.7% | | | |
| American International Group, Inc. | | 1,193,950 | | | | 69,607,285 | |
| Cigna Corporation | | 15,800 | | | | 848,934 | |
| | | 70,456,219 | |
Lodging—0.5% | | | |
| MGM MIRAGE | * | | | 146,200 | | | | 12,283,724 | |
Media—Broadcasting & Publishing—0.9% |
| American Greetings Corporation Class A | | 13,300 | | | | 269,990 | |
| CBS Corporation Class B | | 142,363 | | | | 3,879,392 | |
| DIRECTV Group (The), Inc. | * | | | 35,200 | | | | 813,824 | |
| Gannett Company, Inc. | | 446,000 | | | | 17,394,000 | |
| | | 22,357,206 | |
Medical Supplies—3.7% | | | |
| Alcon, Inc. (Switzerland) | | 57,000 | | | | 8,153,280 | |
| Applera Corporation—Applied Biosystems Group | | 16,600 | | | | 563,072 | |
| Covidien Ltd. (Bermuda) | | 7,200 | | | | 318,888 | |
| Dentsply International, Inc. | | 800 | | | | 36,016 | |
| Intuitive Surgical, Inc. | * | | | 500 | | | | 162,250 | |
| Johnson & Johnson | | 530,000 | | | | 35,351,000 | |
| Medtronic, Inc. | | 708,300 | | | | 35,606,241 | |
| PerkinElmer, Inc. | | 27,600 | | | | 718,152 | |
| Stryker Corporation | | 6,100 | | | | 455,792 | |
| Thermo Fisher Scientific, Inc. | * | | | 232,000 | | | | 13,381,760 | |
|
See accompanying notes to financial statements.
228
SCHEDULE OF INVESTMENTS—(Continued)
December 31, 2007
Vantagepoint
Growth Fund
|
|
|
|
|
|
|
| Shares
|
| Value
|
|---|
COMMON STOCKS—(Continued) |
| Varian, Inc. | * | | | 1,300 | | | $ | 84,890 | |
| Waters Corporation | * | | | 15,155 | | | | 1,198,306 | |
| | | 96,029,647 | |
Metals—1.0% | | | |
| Crane Company | | 7,500 | | | | 321,750 | |
| General Cable Corporation | * | | | 196,800 | | | | 14,421,504 | |
| Goldcorp, Inc. (Canada) | † | | | 304,700 | | | | 10,338,471 | |
| Newmont Mining Corporation | | 600 | | | | 29,298 | |
| Precision Castparts Corporation | | 6,000 | | | | 832,200 | |
| Southern Copper Corporation | † | | | 100 | | | | 10,513 | |
| Worthington Industries, Inc. | † | | | 5,200 | | | | 92,976 | |
| | | 26,046,712 | |
Mining—0.5% | | | |
| Freeport-McMoran Copper & Gold, Inc. | | 127,200 | | | | 13,030,368 | |
Oil & Gas—2.7% | | | |
| Anadarko Petroleum Corporation | | 10,800 | | | | 709,452 | |
| Apache Corporation | | 1,500 | | | | 161,310 | |
| Ashland, Inc. | | 1,300 | | | | 61,659 | |
| Devon Energy Corporation | | 24,500 | | | | 2,178,295 | |
| Exxon Mobil Corporation | | 76,900 | | | | 7,204,761 | |
| Global Industries Ltd. | * | | | 131,806 | | | | 2,823,284 | |
| Halliburton Company | | 446,300 | | | | 16,919,233 | |
| Noble Energy, Inc. | | 6,800 | | | | 540,736 | |
| Occidental Petroleum Corporation | | 147,400 | | | | 11,348,326 | |
| Patterson-UTI Energy, Inc. | | 92,700 | | | | 1,809,504 | |
Pioneer Natural Resources
Company | | 10,300 | | | | 503,052 | |
| Schlumberger Ltd. (Netherland Antilles) | | 9,000 | | | | 885,330 | |
| Suncor Energy, Inc. (Canada) | † | | | 86,900 | | | | 9,448,637 | |
| Valero Energy Corporation | | 3,500 | | | | 245,105 | |
| Weatherford International Ltd. (Bermuda) | * | | | 211,900 | | | | 14,536,340 | |
| | | 69,375,024 | |
Pharmaceuticals—6.6% | | | |
| Abbott Laboratories | | 6,500 | | | | 364,975 | |
| AmerisourceBergen Corporation | | 80,608 | | | | 3,616,881 | |
| Amgen, Inc. | * | | | 371,300 | | | | 17,243,172 | |
| Biogen Idec, Inc. | * | | | 365,600 | | | | 20,809,952 | |
| Celgene Corporation | *† | | | 328,300 | | | | 15,170,743 | |
| Elan Corporation PLC ADR (Ireland) | *† | | | 939,700 | | | | 20,654,606 | |
| Eli Lilly & Company | | 227,500 | | | | 12,146,225 | |
| Genentech, Inc. | * | | | 277,100 | | | | 18,585,097 | |
| Gen-Probe, Inc. | * | | | 1,900 | | | | 119,567 | |
| Genzyme Corporation | * | | | 178,900 | | | | 13,317,316 | |
| Gilead Sciences, Inc. | * | | | 231,800 | | | | 10,665,118 | |
| Invitrogen Corporation | * | | | 9,700 | | | | 906,077 | |
| McKesson Corporation | | 15,500 | | | | 1,015,405 | |
| Medco Health Solutions, Inc. | * | | | 49,300 | | | | 4,999,020 | |
| Merck & Company, Inc. | | 85,701 | | | | 4,980,085 | |
| Pfizer, Inc. | | 161,400 | | | | 3,668,622 | |
| Schering-Plough Corporation | | 112,000 | | | | 2,983,680 | |
| Shire Pharmaceuticals Group PLC (United Kingdom) | | 97,900 | | | | 6,750,205 | |
| Watson Pharmaceuticals, Inc. | * | | | 49,400 | | | | 1,340,716 | |
| Wyeth | | 240,200 | | | | 10,614,438 | |
| | | 169,951,900 | |
Real Estate—0.3% | | | |
| AMB Property Corporation REIT | | 5,400 | | | $ | 310,824 | |
| AvalonBay Communities, Inc. REIT | † | | | 7,800 | | | | 734,292 | |
| Douglas Emmett, Inc. REIT | | 2,600 | | | | 58,786 | |
| Jones Lang Lasalle, Inc. | † | | | 14,082 | | | | 1,002,075 | |
| Prologis REIT | | 71,500 | | | | 4,531,670 | |
Simon Property Group, Inc.
REIT | | 9,600 | | | | 833,856 | |
| Ventas, Inc. REIT | | 16,200 | | | | 733,050 | |
| | | 8,204,553 | |
Restaurants—0.1% | | | |
| McDonald’s Corporation | | 33,400 | | | | 1,967,594 | |
| Yum! Brands, Inc. | | 45,700 | | | | 1,748,939 | |
| | | 3,716,533 | |
Retailers—8.4% | | | |
| Amazon.com, Inc. | * | | | 554,200 | | | | 51,341,088 | |
| BJ’s Wholesale Club, Inc. | * | | | 7,200 | | | | 243,576 | |
| CVS Caremark Corporation | | 313,600 | | | | 12,465,600 | |
| eBay, Inc. | * | | | 1,955,600 | | | | 64,906,364 | |
| Fastenal Company | † | | | 303,900 | | | | 12,283,638 | |
GameStop Corporation
Class A | * | | | 31,600 | | | | 1,962,676 | |
| RadioShack Corporation | † | | | 107,400 | | | | 1,810,764 | |
| Target Corporation | | 486,200 | | | | 24,310,000 | |
| Wal-Mart Stores, Inc. | | 980,700 | | | | 46,612,671 | |
| | | 215,936,377 | |
Telephone Systems—0.2% | | | |
| ADTRAN, Inc. | | 6,500 | | | | 138,970 | |
| CenturyTel, Inc. | | 3,600 | | | | 149,256 | |
| Embarq Corporation | | 8,000 | | | | 396,240 | |
| Sprint Nextel Corporation | | 287,499 | | | | 3,774,862 | |
| Telephone & Data Systems, Inc. | | 1,500 | | | | 86,400 | |
| Verizon Communications, Inc. | | 12,500 | | | | 546,125 | |
| | | 5,091,853 | |
Transportation—1.5% | | | |
| Carnival Corporation | | 300 | | | | 13,347 | |
| CH Robinson Worldwide, Inc. | † | | | 202,300 | | | | 10,948,476 | |
| Expedia, Inc. | * | | | 497,200 | | | | 15,721,464 | |
| Expeditors International of Washington, Inc. | | 197,500 | | | | 8,824,300 | |
| Hertz Global Holdings, Inc. | * | | | 20,400 | | | | 324,156 | |
| JB Hunt Transport Services, Inc. | | 54,100 | | | | 1,490,455 | |
| Overseas Shipholding Group | | 2,400 | | | | 178,632 | |
United Parcel Service, Inc.
Class B | | 23,100 | | | | 1,633,632 | |
| | | 39,134,462 | |
Water Companies—0.4% | | | |
| Veolia Environnement (France) | | 105,400 | | | | 9,570,858 | |
TOTAL COMMON STOCKS | | | |
| (Cost $2,092,658,835) | | | | | | 2,484,787,047 | |
| |
Coupon
Rate
|
|
|
| Maturity
Date
|
|
|
| Face
|
| Value
|
|---|
CASH EQUIVALENTS—5.2% |
Institutional Money Market Funds—0.4% | | | |
| Reserve Primary Money Market Fund | | | |
| 4.950% | | | | 01/02/2008 | | †† | | $ | 10,912,079 | | | | 10,912,079 | |
|
See accompanying notes to financial statements.
229
SCHEDULE OF INVESTMENTS—(Continued)
December 31, 2007
Vantagepoint
Growth Fund
Coupon
Rate
|
|
|
| Maturity
Date
|
|
|
| Face
|
| Value
|
|---|
CASH EQUIVALENTS—(Continued) |
Bank & Certificate Deposits/
Offshore Time Deposits—4.6% | | | |
| Abbey National PLC | | | |
| 5.160% | | | | 01/07/2008 | | †† | | $ | 2,728,020 | | | $ | 2,728,020 | |
| Abbey National PLC | | | |
| 5.000% | | | | 01/09/2008 | | †† | | | 3,410,025 | | | | 3,410,025 | |
| ABN Amro Bank NV | | | |
| 5.185% | | | | 01/04/2008 | | †† | | | 1,364,010 | | | | 1,364,010 | |
| ABN Amro Bank NV | | | |
| 5.160% | | | | 01/04/2008 | | †† | | | 2,046,015 | | | | 2,046,015 | |
| ABN Amro Bank NV | | | |
| 5.145% | | | | 01/03/2008 | | †† | | | 2,728,020 | | | | 2,728,020 | |
| Bank of Nova Scotia | | | |
| 4.960% | | | | 01/17/2008 | | †† | | | 2,728,020 | | | | 2,728,020 | |
| Bank of Nova Scotia | | | |
| 4.850% | | | | 01/22/2008 | | †† | | | 2,728,020 | | | | 2,728,020 | |
| Barclays | | | |
| 5.350% | | | | 01/04/2008 | | †† | | | 1,364,010 | | | | 1,364,010 | |
| Barclays | | | |
| 5.000% | | | | 01/22/2008 | | †† | | | 3,410,025 | | | | 3,410,025 | |
| Barclays | | | |
| 4.880% | | | | 02/06/2008 | | †† | | | 2,046,015 | | | | 2,046,015 | |
| BNP Paribas | | | |
| 5.200% | | | | 01/11/2008 | | †† | | | 1,364,010 | | | | 1,364,010 | |
| BNP Paribas | | | |
| 5.150% | | | | 01/02/2008 | | †† | | | 1,364,010 | | | | 1,364,010 | |
| BNP Paribas | | | |
| 5.010% | | | | 01/16/2008 | | †† | | | 4,092,030 | | | | 4,092,030 | |
| Calyon | | | |
| 5.120% | | | | 03/03/2008 | | †† | | | 1,364,010 | | | | 1,364,010 | |
| Calyon | | | |
| 4.250% | | | | 01/02/2008 | | †† | | | 13,640,100 | | | | 13,640,100 | |
| Dexia Group | | | |
| 4.755% | | | | 01/03/2008 | | †† | | | 6,138,045 | | | | 6,138,045 | |
| Fifth Third Bancorp | | | |
| 2.750% | | | | 01/02/2008 | | †† | | | 6,820,050 | | | | 6,820,050 | |
| Fortis Bank | | | |
| 4.600% | | | | 01/07/2008 | | †† | | | 4,092,030 | | | | 4,092,030 | |
| Fortis Bank | | | |
| 4.300% | | | | 01/02/2008 | | †† | | | 10,230,075 | | | | 10,230,075 | |
| HBOS Halifax Bank of Scotland | | | |
| 5.150% | | | | 01/02/2008 | | †† | | | 1,364,010 | | | | 1,364,010 | |
| HBOS Halifax Bank of Scotland | | | |
| 4.870% | | | | 02/11/2008 | | †† | | | 2,728,020 | | | | 2,728,020 | |
| Lloyds TSB Bank | | | |
| 5.150% | | | | 01/03/2008 | | †† | | | 2,046,015 | | | | 2,046,015 | |
| Lloyds TSB Bank | | | |
| 4.750% | | | | 01/24/2008 | | †† | | | 2,728,020 | | | | 2,728,020 | |
| Rabobank Nederland | | | |
| 5.080% | | | | 01/09/2008 | | †† | | | 1,364,010 | | | | 1,364,010 | |
| Rabobank Nederland | | | |
| 4.880% | | | | 01/10/2008 | | †† | | | 682,005 | | | | 682,005 | |
| Royal Bank of Scotland | | | |
| 5.000% | | | | 01/22/2008 | | †† | | | 2,046,015 | | | | 2,046,015 | |
| Royal Bank of Scotland | | | |
| 4.830% | | | | 02/05/2008 | | †† | | | 2,046,015 | | | | 2,046,015 | |
| Royal Bank of Scotland | | | |
| 4.700% | | | | 02/25/2008 | | †† | | | 1,364,010 | | | | 1,364,010 | |
| Societe Generale | | | |
| 5.150% | | | | 01/02/2008 | | †† | | | 2,046,015 | | | | 2,046,015 | |
| Societe Generale | | | |
| 5.150% | | | | 03/03/2008 | | †† | | | 2,046,015 | | | | 2,046,015 | |
| Societe Generale | | | |
| 4.900% | | | | 02/29/2008 | | †† | | $ | 2,728,020 | | | $ | 2,728,020 | |
| Svenska Handlesbanken | | | |
| 4.250% | | | | 01/02/2008 | | †† | | | 11,760,305 | | | | 11,760,305 | |
| Toronto Dominion Bank | | | |
| 5.100% | | | | 01/10/2008 | | †† | | | 2,046,015 | | | | 2,046,015 | |
| Toronto Dominion Bank | | | |
| 5.050% | | | | 01/11/2008 | | †† | | | 682,005 | | | | 682,005 | |
| Toronto Dominion Bank | | | |
| 4.800% | | | | 02/11/2008 | | †† | | | 4,092,030 | | | | 4,092,030 | |
| UBS AG | | | |
| 4.920% | | | | 01/11/2008 | | †† | | | 2,046,015 | | | | 2,046,015 | |
| | | 117,471,080 | |
Floating Rate Instruments/Master Notes—0.2% |
| Wells Fargo Bank | | | |
| 4.600% | | | | 01/02/2008 | | †† | | | 6,138,044 | | | | 6,138,044 | |
TOTAL CASH EQUIVALENTS | | | |
| (Cost $134,521,203) | | | | | | 134,521,203 | |
| |
REPURCHASE AGREEMENTS—3.2% |
| State Street Bank & Trust Company Repurchase Agreement, dated 12/31/2007, due 01/02/2008 with a maturity value of $83,087,727 and an effective yield of 3.65%, collateralized by U.S. Government and Agency Obligations, with rates ranging from 4.27% – 6.11% and maturity dates 05/25/2034 – 08/01/2034 and an aggregate market value of $84,739,780. | | 83,070,882 | | | | 83,070,882 | |
TOTAL INVESTMENTS—105.2% | | | |
| (Cost $2,310,250,920) | | 2,702,379,132 | |
| Other assets less liabilities—(5.2%) | | (134,534,594 | ) |
NET ASSETS—100.0% | $ | 2,567,844,538 | |
Notes to the Schedule of Investments:
| ADR | | American Depositary Receipt |
| REIT | | Real Estate Investment Trust |
| * | | Non-income producing security. |
| † | | Denotes all or a portion of security on loan. |
| †† | | Represents reinvestment of collateral received in conjunction with securities lending. |
See accompanying notes to financial statements.
230
SCHEDULE OF INVESTMENTS
December 31, 2007
Vantagepoint Select
Value Fund
|
|
|
|
|
|
|
| Shares
|
| Value
|
|---|
COMMON STOCKS—96.4% |
Aerospace & Defense—0.3% | | | |
| Goodrich Corporation | | 11,200 | | | $ | 790,832 | |
Agriculture, Forestry & Fishing—0.2% | | | |
| Terra Industries, Inc. | * | | | 13,600 | | | | 649,536 | |
Airlines—0.2% | | | |
| Southwest Airlines Company | | 45,900 | | | | 559,980 | |
Apparel Retailers—0.7% | | | |
| Gap (The), Inc. | | 92,000 | | | | 1,957,760 | |
Automotive—2.2% | | | |
| Amerigon, Inc. | * | | | 1,900 | | | | 40,166 | |
| Autoliv, Inc. | | 7,600 | | | | 400,596 | |
| Autonation, Inc. | * | | | 33,300 | | | | 521,478 | |
| BorgWarner, Inc. | | 20,000 | | | | 968,200 | |
| Ford Motor Company | * | | | 102,000 | | | | 686,460 | |
| Harsco Corporation | | 39,500 | | | | 2,530,765 | |
| Magna International, Inc. Class A (Canada) | | 12,300 | | | | 989,289 | |
| Rush Enterprises, Inc. Class A | * | | | 7,200 | | | | 130,896 | |
| TRW Automotive Holdings Corporation | * | | | 14,000 | | | | 292,600 | |
| | | 6,560,450 | |
Banking—5.0% | | | |
| Banco Latinoamericano Exp-E (Panama) | | 6,800 | | | | 110,908 | |
| Bank of America Corporation | | 11,400 | | | | 470,364 | |
| Bank of Hawaii Corporation | | 7,400 | | | | 378,436 | |
| Bank of New York Mellon Corporation | | 2,100 | | | | 102,396 | |
| BOK Financial Corporation | | 7,000 | | | | 361,900 | |
| City National Corporation | | 13,700 | | | | 815,835 | |
| Comerica, Inc. | | 102,400 | | | | 4,457,472 | |
| Commerce Bancorp, Inc. | | 5,600 | | | | 213,584 | |
| East-West Bancorp, Inc. | | 37,700 | | | | 913,471 | |
| First Niagara Financial Group, Inc. | | 95,800 | | | | 1,153,432 | |
| Hudson City Bancorp, Inc. | | 54,400 | | | | 817,088 | |
| Huntington Bancshares, Inc. | | 11,700 | | | | 172,692 | |
| Marshall & Ilsley Corporation | | 1,900 | | | | 50,312 | |
| New York Community Bancorp, Inc. | | 112,000 | | | | 1,968,960 | |
| Northern Trust Corporation | | 11,400 | | | | 873,012 | |
| Regions Financial Corporation | | 6,700 | | | | 158,455 | |
| Signature Bank of New York | * | | | 20,100 | | | | 678,375 | |
| Washington Federal, Inc. | | 15,800 | | | | 333,538 | |
| Zions Bancorporation | | 16,000 | | | | 747,040 | |
| | | 14,777,270 | |
Beverages, Food & Tobacco—4.9% | | | |
| Bunge Ltd. | | 6,500 | | | | 756,665 | |
| Cal-Maine Foods, Inc. | | 9,100 | | | | 241,423 | |
| Chiquita Brands International, Inc. | * | | | 8,500 | | | | 156,315 | |
| Coca-Cola Enterprises, Inc. | | 24,100 | | | | 627,323 | |
| Corn Products International, Inc. | | 6,300 | | | | 231,525 | |
| Fresh Del Monte Produce, Inc. (Cayman Islands) | * | | | 10,600 | | | | 355,948 | |
| Hansen Natural Corporation | * | | | 900 | | | | 39,861 | |
| HJ Heinz Company | | 16,700 | | | | 779,556 | |
| JM Smucker Company (The) | | 18,400 | | | | 946,496 | |
| Loews Corporation—Carolina Group | | 30,200 | | | | 2,576,060 | |
| Molson Coors Brewing Company Class B | | 31,000 | | | | 1,600,220 | |
| Pepsi Bottling Group, Inc. | | 20,400 | | | $ | 804,984 | |
| PepsiAmericas, Inc. | | 25,300 | | | | 842,996 | |
| Sara Lee Corporation | | 202,800 | | | | 3,256,968 | |
| Supervalu, Inc. | | 14,500 | | | | 544,040 | |
| Tyson Foods, Inc. Class A | | 38,300 | | | | 587,139 | |
| UST, Inc. | | 3,200 | | | | 175,360 | |
| | | 14,522,879 | |
Chemicals—4.0% | | | |
| Calgon Carbon Corporation | * | | | 7,700 | | | | 122,353 | |
| Celanese Corporation Class A | | 74,800 | | | | 3,165,536 | |
| CF Industries Holdings, Inc. | | 6,400 | | | | 704,384 | |
| Chemtura Corporation | | 19,700 | | | | 153,660 | |
| Cooper Tire & Rubber Company | | 8,600 | | | | 142,588 | |
| FMC Corporation | | 10,500 | | | | 572,775 | |
| Indophos Holdings, Inc. | | 6,400 | | | | 95,232 | |
| International Flavors & Fragrances, Inc. | | 63,400 | | | | 3,051,442 | |
| Lubrizol Corporation | | 3,800 | | | | 205,808 | |
| Mosaic Company (The) | * | | | 5,200 | | | | 490,568 | |
| NOVA Chemicals Corporation (Canada) | | 27,400 | | | | 887,486 | |
| PPG Industries, Inc. | | 3,100 | | | | 217,713 | |
| Penford Corporation | | 4,000 | | | | 102,360 | |
| Tupperware Corporation | | 54,700 | | | | 1,806,741 | |
| | | 11,718,646 | |
Coal—0.3% | | | |
| Consol Energy, Inc. | | 13,100 | | | | 936,912 | |
Commercial Services—4.4% | | | |
| Asiainfo Holdings, Inc. | * | | | 7,000 | | | | 77,000 | |
| Avis Budget Group, Inc. | * | | | 16,100 | | | | 209,300 | |
| Dyncorp International, Inc. Class A | * | | | 11,000 | | | | 295,680 | |
| Integrated Electrical Service | * | | | 17,800 | | | | 334,462 | |
| KBR, Inc. | * | | | 6,900 | | | | 267,720 | |
| MasterCard, Inc. Class A | | 700 | | | | 150,640 | |
| PHH Corporation | * | | | 15,100 | | | | 266,364 | |
| Pre-Paid Legal Services, Inc. | * | | | 4,300 | | | | 238,005 | |
| RR Donnelley & Sons Company | | 100,200 | | | | 3,781,548 | |
| Ryder System, Inc. | | 10,200 | | | | 479,502 | |
| SAIC, Inc. | * | | | 64,300 | | | | 1,293,716 | |
| Sotheby’s Holdings, Inc. Class A | | 30,000 | | | | 1,143,000 | |
| United Rentals, Inc. | * | | | 89,100 | | | | 1,635,876 | |
| URS Corporation | * | | | 53,800 | | | | 2,922,954 | |
| | | 13,095,767 | |
Communications—0.5% | | | |
| Comtech Telecommunications | * | | | 18,400 | | | | 993,784 | |
| Cubic Corporation | | 2,300 | | | | 90,160 | |
| L-3 Communications Holdings, Inc. | | 5,100 | | | | 540,294 | |
| | | 1,624,238 | |
Computer Software & Processing—6.0% | | | |
| CA, Inc. | | 16,700 | | | | 416,665 | |
| CACI International, Inc. Class A | * | | | 21,400 | | | | 958,078 | |
| Cadence Design Systems, Inc. | * | | | 168,200 | | | | 2,861,082 | |
| Check Point Software Technologies Ltd. (Israel) | * | | | 60,200 | | | | 1,321,992 | |
| Computer Sciences Corporation | * | | | 78,900 | | | | 3,903,183 | |
| Electronic Data Systems Corporation | | 15,400 | | | | 319,242 | |
| Fair Isaac Corporation | | 26,500 | | | | 851,975 | |
| IMS Health, Inc. | | 121,100 | | | | 2,790,144 | |
|
See accompanying notes to financial statements.
231
SCHEDULE OF INVESTMENTS—(Continued)
December 31, 2007
Vantagepoint Select
Value Fund
|
|
|
|
|
|
|
| Shares
|
| Value
|
|---|
COMMON STOCKS—(Continued) |
| Juniper Networks, Inc. | * | | | 19,400 | | | $ | 644,080 | |
| Microsoft Corporation | | 1,700 | | | | 60,520 | |
| NCR Corporation | * | | | 31,800 | | | | 798,180 | |
| Novell, Inc. | * | | | 48,500 | | | | 333,195 | |
| Sun Microsystems, Inc. | * | | | 32,275 | | | | 585,146 | |
| Symantec Corporation | * | | | 1,500 | | | | 24,210 | |
| Teradata Corporation | * | | | 53,000 | | | | 1,452,730 | |
| Vocus, Inc. | * | | | 7,400 | | | | 255,522 | |
| | | 17,575,944 | |
Computers & Information—0.7% | | | |
| Lexmark International, Inc. | * | | | 2,400 | | | | 83,664 | |
| SanDisk Corporation | * | | | 37,600 | | | | 1,247,192 | |
| Seagate Technology (Cayman Islands) | | 3,300 | | | | 84,150 | |
| Tech Data Corporation | * | | | 18,800 | | | | 709,136 | |
| | | 2,124,142 | |
Containers & Packaging—1.4% | | | |
| Owens-IIlinois, Inc. | * | | | 6,500 | | | | 321,750 | |
| Sonoco Products Company | | 112,800 | | | | 3,686,304 | |
| | | 4,008,054 | |
Cosmetics & Personal Care—0.1% | | | |
| Avon Products, Inc. | | 5,100 | | | | 201,603 | |
Education—0.4% | | | |
| Apollo Group, Inc. Class A | * | | | 11,300 | | | | 792,695 | |
| ITT Educational Services, Inc. | * | | | 4,100 | | | | 349,607 | |
| | | 1,142,302 | |
Electric Utilities—11.1% | | | |
| Ameren Corporation | | 15,000 | | | | 813,150 | |
| American Electric Power Company, Inc. | | 88,400 | | | | 4,115,904 | |
| DTE Energy Company | | 23,200 | | | | 1,019,872 | |
| Duke Energy Corporation | | 44,800 | | | | 903,616 | |
| Edison International | | 45,700 | | | | 2,439,009 | |
| Energy East Corporation | | 12,000 | | | | 326,520 | |
| FirstEnergy Corporation | | 15,500 | | | | 1,121,270 | |
| Idacorp, Inc. | | 80,400 | | | | 2,831,688 | |
| NiSource, Inc. | | 34,900 | | | | 659,261 | |
| Northeast Utilities | | 47,700 | | | | 1,493,487 | |
| NRG Energy, Inc. | * | | | 47,100 | | | | 2,041,314 | |
| NSTAR | | 63,600 | | | | 2,303,592 | |
| PG&E Corporation | | 36,200 | | | | 1,559,858 | |
| PPL Corporation | | 5,200 | | | | 270,868 | |
Pinnacle West Capital
Corporation | | 66,400 | | | | 2,816,024 | |
| Progress Energy, Inc. | | 22,400 | | | | 1,084,832 | |
| Reliant Energy, Inc. | * | | | 53,200 | | | | 1,395,968 | |
| SCANA Corporation | | 68,800 | | | | 2,899,920 | |
| Sempra Energy | | 21,200 | | | | 1,311,856 | |
| TECO Energy, Inc. | | 7,800 | | | | 134,238 | |
| Xcel Energy, Inc. | | 52,300 | | | | 1,180,411 | |
| | | 32,722,658 | |
Electrical Equipment—1.5% | | | |
| C&D Technologies, Inc. | * | | | 18,600 | | | | 122,946 | |
| Cooper Industries Ltd. Class A (Bermuda) | | 42,800 | | | | 2,263,264 | |
| Energizer Holdings, Inc. | * | | | 4,700 | | | | 527,011 | |
| GrafTech International Ltd. | * | | | 59,000 | | | | 1,047,250 | |
| Teleflex, Inc. | | 7,500 | | | | 472,575 | |
| | | 4,433,046 | |
Electronics—2.5% | | | |
| Analog Devices, Inc. | | 1,200 | | | $ | 38,040 | |
| Avnet, Inc. | * | | | 8,700 | | | | 304,239 | |
| Flextronics International Ltd. (Singapore) | * | | | 230,700 | | | | 2,782,242 | |
| Hutchinson Technology, Inc. | * | | | 2,400 | | | | 63,168 | |
| Intersil Corporation Class A | | 9,900 | | | | 242,352 | |
| Microchip Technology, Inc. | | 61,100 | | | | 1,919,762 | |
| Monolithic Power Systems, Inc. | * | | | 3,800 | | | | 81,586 | |
| National Semiconductor Corporation | | 8,600 | | | | 194,704 | |
| Nvidia Corporation | * | | | 21,700 | | | | 738,234 | |
| Semtech Corporation | * | | | 39,300 | | | | 609,936 | |
| Vishay Intertechnology, Inc. | * | | | 17,100 | | | | 195,111 | |
| Xerox Corporation | | 15,900 | | | | 257,421 | |
| | | 7,426,795 | |
Entertainment & Leisure—0.3% | | | |
| Harrah’s Entertainment, Inc. | | 400 | | | | 35,500 | |
| Premier Exhibitions, Inc. | * | | | 36,400 | | | | 398,216 | |
| Time Warner, Inc. | | 18,900 | | | | 312,039 | |
| | | 745,755 | |
Financial Services—1.8% | | | |
| Ameriprise Financial, Inc. | | 26,500 | | | | 1,460,415 | |
| BlackRock, Inc. | | 2,400 | | | | 520,320 | |
| CME Group, Inc. | | 100 | | | | 68,600 | |
| Greenhill & Co., Inc. | | 1,400 | | | | 93,072 | |
| Invesco Ltd. (Bermuda) | | 42,700 | | | | 1,339,926 | |
| Janus Capital Group, Inc. | | 15,500 | | | | 509,175 | |
| Raymond James Financial, Inc. | | 39,300 | | | | 1,283,538 | |
| | | 5,275,046 | |
Food Retailers—0.9% | | | |
| Kroger Company (The) | | 3,400 | | | | 90,814 | |
| Ruddick Corporation | | 51,400 | | | | 1,782,038 | |
| Safeway, Inc. | | 24,000 | | | | 821,040 | |
| | | 2,693,892 | |
Heavy Construction—0.0% | | | |
| Perini Corporation | * | | | 2,200 | | | | 91,124 | |
Heavy Machinery—3.6% | | | |
| Agco Corporation | * | | | 7,100 | | | | 482,658 | |
| Black & Decker Corporation | | 9,800 | | | | 682,570 | |
| CNH Global NV (Netherlands) | | 37,600 | | | | 2,474,832 | |
| Eaton Corporation | | 22,200 | | | | 2,152,290 | |
| ITT Corporation | | 16,300 | | | | 1,076,452 | |
| Ingersoll-Rand Company Class A (Bermuda) | | 25,500 | | | | 1,184,985 | |
| Lennox International, Inc. | | 9,100 | | | | 376,922 | |
| Parker Hannifin Corporation | | 6,000 | | | | 451,860 | |
| SPX Corporation | | 7,400 | | | | 761,090 | |
| Timken Company | | 15,300 | | | | 502,605 | |
| WW Grainger, Inc. | | 6,800 | | | | 595,136 | |
| | | 10,741,400 | |
Home Construction, Furnishings & Appliances—0.8% |
| HNI Corporation | | 18,500 | | | | 648,610 | |
| Kinetic Concepts, Inc. | * | | | 5,100 | | | | 273,156 | |
| Leggett & Platt, Inc. | | 26,600 | | | | 463,904 | |
| NVR, Inc. | * | | | 100 | | | | 52,400 | |
| Tempur-Pedic International, Inc. | | 14,200 | | | | 368,774 | |
| Whirlpool Corporation | | 5,500 | | | | 448,965 | |
| | | 2,255,809 | |
|
See accompanying notes to financial statements.
232
SCHEDULE OF INVESTMENTS—(Continued)
December 31, 2007
Vantagepoint Select
Value Fund
|
|
|
|
|
|
|
| Shares
|
| Value
|
|---|
COMMON STOCKS—(Continued) |
Household Products—0.7% | | | |
| Fortune Brands, Inc. | | 1,500 | | | $ | 108,540 | |
| Snap-On, Inc. | | 40,800 | | | | 1,968,192 | |
| | | 2,076,732 | |
Insurance—9.8% | | | |
| Alleghany Corporation | * | | | 5,080 | | | | 2,042,160 | |
| AON Corporation | | 19,800 | | | | 944,262 | |
| Arch Capital Group Ltd. (Bermuda) | * | | | 6,400 | | | | 450,240 | |
| Aspen Insurance Holdings Ltd. (Bermuda) | | 5,100 | | | | 147,084 | |
| Assurant, Inc. | | 9,000 | | | | 602,100 | |
| Assured Guaranty Ltd. (Bermuda) | | 25,200 | | | | 668,808 | |
| Axis Capital Holdings Ltd. (Bermuda) | | 6,500 | | | | 253,305 | |
| Cigna Corporation | | 18,800 | | | | 1,010,124 | |
| Endurance Specialty Holdings Ltd. (Bermuda) | | 48,400 | | | | 2,019,732 | |
| Everest Re Group Ltd. (Bermuda) | | 12,400 | | | | 1,244,960 | |
| Genworth Financial, Inc. Class A | | 133,200 | | | | 3,389,940 | |
| Hanover Insurance Group (The), Inc. | | 15,000 | | | | 687,000 | |
| Humana, Inc. | * | | | 13,300 | | | | 1,001,623 | |
| Lincoln National Corporation | | 49,400 | | | | 2,876,068 | |
| Nationwide Financial Services Class A | | 14,800 | | | | 666,148 | |
| Old Republic International Corporation | | 27,400 | | | | 422,234 | |
| Safeco Corporation | | 82,000 | | | | 4,565,760 | |
| The Chubb Corporation | | 1,300 | | | | 70,954 | |
| Torchmark Corporation | | 2,800 | | | | 169,484 | |
| UnumProvident Corporation | | 102,400 | | | | 2,436,096 | |
| XL Capital Ltd. Class A (Cayman Islands) | | 19,000 | | | | 955,890 | |
| Zenith National Insurance Corporation | | 47,500 | | | | 2,124,675 | |
| | | 28,748,647 | |
Media—Broadcasting & Publishing—1.2% |
| CBS Corporation Class B | | 32,100 | | | | 874,725 | |
| Gannett Company, Inc. | | 13,700 | | | | 534,300 | |
| IAC/InterActiveCorp | * | | | 13,000 | | | | 349,960 | |
| Liberty Global, Inc. Class A | * | | | 5,600 | | | | 219,464 | |
| Liberty Media Holdings Corporation Capital Class A | * | | | 8,500 | | | | 990,165 | |
| Shaw Communications, Inc. Class B (Canada) | | 23,000 | | | | 544,640 | |
| | | 3,513,254 | |
Medical Supplies—2.1% | | | |
| Applera Corporation—Applied Biosystems Group | | 16,300 | | | | 552,896 | |
| Beckman Coulter, Inc. | | 44,100 | | | | 3,210,480 | |
| Dentsply International, Inc. | | 43,000 | | | | 1,935,860 | |
| Mettler-Toledo International, Inc. | * | | | 3,400 | | | | 386,920 | |
| | | 6,086,156 | |
Metals—1.8% | | | |
| Aptargroup, Inc. | | 88,300 | | | | 3,612,353 | |
| Crane Company | | 2,300 | | | | 98,670 | |
| Haynes International, Inc. | * | | | 1,600 | | | | 111,200 | |
| Hubbell, Inc. Class B | | 5,600 | | | | 288,960 | |
| NCI Building Systems, Inc. | * | | | 400 | | | | 11,516 | |
| Quanex Corporation | | 3,900 | | | | 202,410 | |
| Superior Essex, Inc. | * | | | 8,500 | | | $ | 204,000 | |
| Trimas Corp. | * | | | 9,500 | | | | 100,605 | |
| United States Steel Corporation | | 4,600 | | | | 556,186 | |
| Worthington Industries, Inc. | | 6,800 | | | | 121,584 | |
| | | 5,307,484 | |
Mining—0.1% | | | |
| Freeport-McMoran Copper & Gold, Inc. | | 1,900 | | | | 194,636 | |
Oil & Gas—7.6% | | | |
| AGL Resources, Inc. | | 51,700 | | | | 1,945,988 | |
| Apache Corporation | | 1,300 | | | | 139,802 | |
| Ashland, Inc. | | 14,300 | | | | 678,249 | |
| Atmos Energy Corporation | | 14,900 | | | | 417,796 | |
| Cimarex Energy Company | | 27,600 | | | | 1,173,828 | |
| Energen Corporation | | 15,800 | | | | 1,014,834 | |
| Frontier Oil Corporation | | 3,800 | | | | 154,204 | |
| Global Industries Ltd. | * | | | 13,600 | | | | 291,312 | |
| Hess Corporation | | 5,100 | | | | 514,386 | |
| Noble Corporation (Cayman Islands) | | 36,900 | | | | 2,085,219 | |
| Noble Energy, Inc. | | 51,600 | | | | 4,103,232 | |
| Oneok, Inc. | | 2,200 | | | | 98,494 | |
| Patterson-UTI Energy, Inc. | | 29,600 | | | | 577,792 | |
| Pioneer Natural Resources Company | | 21,500 | | | | 1,050,060 | |
| Questar Corporation | | 51,500 | | | | 2,786,150 | |
| Spectra Energy Corp. | | 15,700 | | | | 405,374 | |
| St. Mary Land & Exploration Company | | 57,300 | | | | 2,212,353 | |
| Stone Energy Corporation | * | | | 17,100 | | | | 802,161 | |
| Willbros Group, Inc. (Panama) | * | | | 5,400 | | | | 206,766 | |
| Williams Companies, Inc. | | 43,700 | | | | 1,563,586 | |
| | | 22,221,586 | |
Pharmaceuticals—1.7% | | | |
| AmerisourceBergen Corporation | | 9,300 | | | | 417,291 | |
| Amgen, Inc. | * | | | 1,500 | | | | 69,660 | |
| Biogen Idec, Inc. | * | | | 1,700 | | | | 96,764 | |
| Genzyme Corporation | * | | | 18,600 | | | | 1,384,584 | |
| Invitrogen Corporation | * | | | 25,500 | | | | 2,381,955 | |
| Medco Health Solutions, Inc. | * | | | 3,500 | | | | 354,900 | |
| Watson Pharmaceuticals, Inc. | * | | | 12,700 | | | | 344,678 | |
| | | 5,049,832 | |
Real Estate—8.4% | | | |
| AMB Property Corporation REIT | | 18,200 | | | | 1,047,592 | |
| Annaly Capital Management, Inc. | | 33,600 | | | | 610,848 | |
| Apartment Investment & Management Company REIT Class A | | 48,800 | | | | 1,694,824 | |
| AvalonBay Communities, Inc. REIT | | 11,200 | | | | 1,054,368 | |
| Boston Properties, Inc. REIT | | 14,400 | | | | 1,322,064 | |
| Camden Property Trust REIT | | 8,400 | | | | 404,460 | |
| Developers Diversified Realty Corporation REIT | | 8,000 | | | | 306,320 | |
| DiamondRock Hospitality Company REIT | | 97,300 | | | | 1,457,554 | |
| Duke Realty Corporation REIT | | 144,300 | | | | 3,763,344 | |
| Equity Residential REIT | | 22,200 | | | | 809,634 | |
| Federal Realty Investment Trust REIT | | 8,600 | | | | 706,490 | |
| General Growth Properties, Inc. REIT | | 12,200 | | | | 502,396 | |
| Health Care REIT, Inc. | | 58,100 | | | | 2,596,489 | |
|
See accompanying notes to financial statements.
233
SCHEDULE OF INVESTMENTS—(Continued)
December 31, 2007
Vantagepoint Select
Value Fund
|
|
|
|
|
|
|
| Shares
|
| Value
|
|---|
COMMON STOCKS—(Continued) |
| Mid-America Apartment Communities, Inc. REIT | | 16,600 | | | $ | 709,650 | |
| Prologis REIT | | 7,200 | | | | 456,336 | |
| Public Storage REIT | | 2,100 | | | | 154,161 | |
| Realty Income Corporation REIT | | 103,800 | | | | 2,804,676 | |
| Regency Centers Corporation REIT | | 16,900 | | | | 1,089,881 | |
| Simon Property Group, Inc. REIT | | 20,000 | | | | 1,737,200 | |
| Taubman Centers, Inc. REIT | | 11,600 | | | | 570,604 | |
| Vornado Realty Trust REIT | | 10,700 | | | | 941,065 | |
| | | 24,739,956 | |
Restaurants—1.8% | | | |
| Darden Restaurants, Inc. | | 121,200 | | | | 3,358,452 | |
| Jack in the Box, Inc. | * | | | 76,300 | | | | 1,966,251 | |
| | | 5,324,703 | |
Retailers—3.0% | | | |
| Advance Auto Parts, Inc. | | 45,000 | | | | 1,709,550 | |
| Amazon.com, Inc. | * | | | 3,200 | | | | 296,448 | |
| AutoZone, Inc. | * | | | 600 | | | | 71,946 | |
| BJ’s Wholesale Club, Inc. | * | | | 79,700 | | | | 2,696,251 | |
| Blue Nile, Inc. | * | | | 1,800 | | | | 122,508 | |
| Family Dollar Stores, Inc. | | 103,800 | | | | 1,996,074 | |
| Longs Drug Stores Corporation | | 31,600 | | | | 1,485,200 | |
| Overstock.com, Inc. | * | | | 3,500 | | | | 54,355 | |
| RadioShack Corporation | | 11,500 | | | | 193,890 | |
| Shutterfly, Inc. | * | | | 2,600 | | | | 66,612 | |
| | | 8,692,834 | |
Telephone Systems—1.5% | | | |
| Citizens Communications Company | | 37,200 | | | | 473,556 | |
| Embarq Corporation | | 14,800 | | | | 733,044 | |
| NTELOS Holdings Corporation | | 93,300 | | | | 2,770,077 | |
| Telephone & Data Systems, Inc. | | 3,600 | | | | 225,360 | |
| Windstream Corporation | | 18,400 | | | | 239,568 | |
| | | 4,441,605 | |
Textiles, Clothing & Fabrics—1.3% | | | |
| Deckers Outdoor Corporation | * | | | 600 | | | | 93,036 | |
| Jones Apparel Group, Inc. | | 20,500 | | | | 327,795 | |
| Liz Claiborne, Inc. | | 6,300 | | | | 128,205 | |
| VF Corporation | | 46,700 | | | | 3,206,422 | |
| | | 3,755,458 | |
Transportation—1.6% | | | |
| CSX Corporation | | 15,700 | | | | 690,486 | |
| Expedia, Inc. | * | | | 18,800 | | | | 594,456 | |
| Overseas Shipholding Group | | 6,500 | | | | 483,795 | |
| Polaris Industries, Inc. | | 6,100 | | | | 291,397 | |
| Royal Caribbean Cruises Ltd. | | 3,100 | | | | 131,564 | |
| TBS International Ltd. Class A (Bermuda) | * | | | 200 | | | | 6,612 | |
| Werner Enterprises, Inc. | | 156,500 | | | | 2,665,195 | |
| | | 4,863,505 | |
TOTAL COMMON STOCKS | | | |
| (Cost $298,877,635) | | | | | | 283,648,228 | |
TOTAL INVESTMENTS—96.4% | | | |
| (Cost $298,877,635) | | 283,648,228 | |
| Other assets less liabilities—3.6% | | 10,509,149 | |
NET ASSETS—100.0% | $ | 294,157,377 | |
| Notes to the Schedule of Investments: |
| REIT | | Real Estate Investment Trust |
| * | | Non-income producing security. |
See accompanying notes to financial statements.
234
SCHEDULE OF INVESTMENTS
December 31, 2007
Vantagepoint Aggressive
Opportunities Fund
|
|
|
|
|
|
|
| Shares
|
| Value
|
|---|
COMMON STOCKS—96.8% |
Advertising—1.1% | | | |
| Focus Media Holding Ltd., ADR (Cayman Islands) | *† | | | 71,900 | | | $ | 4,084,639 | |
| Lamar Advertising Company | † | | | 85,900 | | | | 4,129,213 | |
| Marchex, Inc. Class B | † | | | 80,200 | | | | 870,972 | |
| Monster Worldwide, Inc. | * | | | 108,200 | | | | 3,505,680 | |
| | | 12,590,504 | |
Aerospace & Defense—0.3% | | | |
| Empresa Brasileira de Aeronautica SA, Sponsored ADR (Brazil) | | 80,000 | | | | 3,647,200 | |
Apparel Retailers—2.2% | | | |
| AnnTaylor Stores Corporation | * | | | 214,300 | | | | 5,477,508 | |
| Christopher & Banks Corporation | † | | | 158,000 | | | | 1,809,100 | |
| Collective Brands, Inc. | *† | | | 376,800 | | | | 6,552,552 | |
| Limited Brands, Inc. | † | | | 305,000 | | | | 5,773,650 | |
| Urban Outfitters, Inc. | * | | | 224,330 | | | | 6,115,236 | |
| | | 25,728,046 | |
Automotive—2.8% | | | |
| Autoliv, Inc. | | 88,000 | | | | 4,638,480 | |
| Copart, Inc. | * | | | 160,600 | | | | 6,833,530 | |
| General Motors Corporation | † | | | 638,000 | | | | 15,879,820 | |
| LKQ Corporation | * | | | 31,600 | | | | 664,232 | |
| Oshkosh Truck Corporation | | 80,700 | | | | 3,813,882 | |
| | | 31,829,944 | |
Banking—0.6% | | | |
| Downey Financial Corporation | † | | | 182,900 | | | | 5,690,019 | |
| Signature Bank of New York | * | | | 43,800 | | | | 1,478,250 | |
| | | 7,168,269 | |
Building Materials—1.7% | | | |
| Cemex SAB de CV Sponsored ADR (Mexico) | *† | | | 430,685 | | | | 11,133,207 | |
| Interline Brands, Inc. | * | | | 216,500 | | | | 4,743,515 | |
| Martin Marietta Materials, Inc. | † | | | 24,300 | | | | 3,222,180 | |
| | | 19,098,902 | |
Chemicals—0.6% | | | |
| Nalco Holding Co. | | 290,787 | | | | 7,031,230 | |
Commercial Services—5.7% | | | |
Accenture Ltd. Class A
(Bermuda) | | 205,100 | | | | 7,389,753 | |
| Administaff, Inc. | † | | | 119,919 | | | | 3,391,309 | |
| Advisory Board Company (The) | * | | | 77,000 | | | | 4,942,630 | |
| Corporate Executive Board Company | † | | | 232,100 | | | | 13,949,210 | |
| Dun & Bradstreet Company | | 51,000 | | | | 4,520,130 | |
| Heartland Payment Systems, Inc. | † | | | 165,400 | | | | 4,432,720 | |
| Korn Ferry International | * | | | 325,000 | | | | 6,116,500 | |
| Moody’s Corporation | | 53,500 | | | | 1,909,950 | |
| Navigant Consulting, Inc. | *† | | | 109,800 | | | | 1,500,966 | |
| Quanta Services, Inc. | * | | | 177,200 | | | | 4,649,728 | |
| Resources Connection, Inc. | | 161,600 | | | | 2,934,656 | |
| Waste Connections, Inc. | * | | | 148,350 | | | | 4,584,015 | |
| Weight Watchers International, Inc. | | 71,700 | | | | 3,239,406 | |
| Wind River Systems, Inc. | * | | | 247,800 | | | | 2,212,854 | |
| | | 65,773,827 | |
Communications—1.6% | | | |
| American Tower Corporation Class A | * | | | 298,900 | | | $ | 12,733,140 | |
| SBA Communications Corporation | * | | | 177,600 | | | | 6,009,984 | |
| | | 18,743,124 | |
Computer Software & Processing—10.4% | | | |
| Amdocs Ltd. | * | | | 464,800 | | | | 16,021,656 | |
| Ariba, Inc. | *† | | | 232,900 | | | | 2,596,835 | |
| Bottomline Technologies, Inc. | * | | | 86,700 | | | | 1,213,800 | |
| CA, Inc. | | 157,400 | | | | 3,927,130 | |
| CNET Networks, Inc. | *† | | | 1,096,499 | | | | 10,022,001 | |
| Choicepoint, Inc. | * | | | 158,500 | | | | 5,772,570 | |
| Cognos, Inc. (Canada) | * | | | 37,100 | | | | 2,135,847 | |
| DST Systems, Inc. | * | | | 158,410 | | | | 13,076,745 | |
| Electronic Arts, Inc. | *† | | | 118,600 | | | | 6,927,426 | |
| Factset Research Systems, Inc. | | 115,200 | | | | 6,416,640 | |
| Global Cash Access, Inc. | * | | | 138,000 | | | | 836,280 | |
| Jack Henry & Associates, Inc. | | 188,500 | | | | 4,588,090 | |
| Lenovo Group Ltd. (Hong Kong) | | 9,401,100 | | | | 8,254,239 | |
| LivePerson, Inc. | * | | | 229,500 | | | | 1,225,530 | |
| Red Hat, Inc. | *† | | | 380,200 | | | | 7,923,368 | |
| RightNow Technologies, Inc. | *† | | | 219,800 | | | | 3,483,830 | |
| Skillsoft PLC, ADR (Ireland) | * | | | 241,000 | | | | 2,303,960 | |
| Take-Two Interactive Software, Inc. | *† | | | 578,900 | | | | 10,680,705 | |
| Taleo Corp. Class A | * | | | 91,800 | | | | 2,733,804 | |
| Total System Services, Inc. | † | | | 124,800 | | | | 3,494,400 | |
| Verint Systems, Inc. | * | | | 41,900 | | | | 819,145 | |
| VeriSign, Inc. | * | | | 159,900 | | | | 6,013,839 | |
| | | 120,467,840 | |
Computers & Information—2.6% | | | |
| Dell, Inc. | * | | | 781,000 | | | | 19,142,310 | |
| Jabil Circuit, Inc. | | 489,600 | | | | 7,476,192 | |
| Micros Systems, Inc. | * | | | 26,700 | | | | 1,873,272 | |
| Palm, Inc. | † | | | 255,900 | | | | 1,622,406 | |
| | | 30,114,180 | |
Cosmetics & Personal Care—0.3% | | | |
| Ecolab, Inc. | | 57,300 | | | | 2,934,333 | |
Education—0.9% | | | |
| Career Education Corporation | * | | | 114,300 | | | | 2,873,502 | |
| K12, Inc. | * | | | 16,000 | | | | 414,080 | |
| Strayer Education, Inc. | † | | | 17,200 | | | | 2,933,976 | |
| Universal Technical Institute, Inc. | *† | | | 233,700 | | | | 3,972,900 | |
| | | 10,194,458 | |
Electrical Equipment—1.3% | | | |
| Ametek, Inc. | | 112,450 | | | | 5,267,158 | |
| Energy Conversion Devices, Inc. | *† | | | 253,800 | | | | 8,540,370 | |
| Moog, Inc. Class A | *† | | | 35,900 | | | | 1,644,579 | |
| | | 15,452,107 | |
Electronics—5.2% | | | |
| Analog Devices, Inc. | | 214,300 | | | | 6,793,310 | |
| Broadcom Corporation Class A | * | | | 182,300 | | | | 4,765,322 | |
| Cymer, Inc. | * | | | 27,199 | | | | 1,058,857 | |
| DRS Technologies, Inc. | † | | | 103,100 | | | | 5,595,237 | |
| Evergreen Solar, Inc. | *† | | | 489,000 | | | | 8,445,030 | |
| Finisar Corporation | * | | | 513,600 | | | | 744,720 | |
| Integrated Device Technology, Inc. | * | | | 244,300 | | | | 2,763,033 | |
|
See accompanying notes to financial statements.
235
SCHEDULE OF INVESTMENTS—(Continued)
December 31, 2007
Vantagepoint Aggressive
Opportunities Fund
|
|
|
|
|
|
|
| Shares
|
| Value
|
|---|
COMMON STOCKS—(Continued) |
| Intersil Corporation Class A | | 102,500 | | | $ | 2,509,200 | |
Maxim Integrated
Products, Inc. | | 139,600 | | | | 3,696,608 | |
| Microchip Technology, Inc. | † | | | 123,400 | | | | 3,877,228 | |
| National Semiconductor Corporation | | 233,000 | | | | 5,275,120 | |
| PMC-Sierra, Inc. | * | | | 402,000 | | | | 2,629,080 | |
| Semtech Corporation | * | | | 164,200 | | | | 2,548,384 | |
| Silicon Laboratories, Inc. | * | | | 68,100 | | | | 2,548,983 | |
| Sunpower Corp. Class A | *† | | | 53,600 | | | | 6,988,904 | |
| | | 60,239,016 | |
Entertainment & Leisure—3.4% | | | |
| Discovery Holding Company Class A | * | | | 295,900 | | | | 7,438,926 | |
| National CineMedia, Inc. | | 190,200 | | | | 4,794,942 | |
| Pool Corporation | † | | | 124,900 | | | | 2,476,767 | |
| Walt Disney Company | | 615,000 | | | | 19,852,200 | |
| WMS Industries, Inc. | *† | | | 114,600 | | | | 4,198,944 | |
| | | 38,761,779 | |
Environmental—1.1% | | | |
| Roper Industries, Inc. | † | | | 211,900 | | | | 13,252,226 | |
Financial Services—2.2% | | | |
| Fortress Investment Group LLC Class A | † | | | 132,300 | | | | 2,061,234 | |
| Greenhill & Co., Inc. | † | | | 34,500 | | | | 2,293,560 | |
| Invesco Ltd. (Bermuda) | † | | | 115,300 | | | | 3,618,114 | |
Liberty Acquisition
Holdings Corp. | | 72,900 | | | | 794,610 | |
| SEI Investments Company | | 160,700 | | | | 5,169,719 | |
| UBS AG (Switzerland) | | 241,000 | | | | 11,086,000 | |
| | | 25,023,237 | |
Food Retailers—0.4% | | | |
| Panera Bread Company Class A | *† | | | 96,900 | | | | 3,470,958 | |
| Pantry, Inc. (The) | *† | | | 62,400 | | | | 1,630,512 | |
| | | 5,101,470 | |
Forest Products & Paper—0.5% | | | |
| Pactiv Corporation | * | | | 139,700 | | | | 3,720,211 | |
| School Specialty, Inc. | *† | | | 51,909 | | | | 1,793,456 | |
| | | 5,513,667 | |
Health Care Providers—5.0% | | | |
| Coventry Health Care, Inc. | * | | | 175,950 | | | | 10,425,038 | |
| DaVita, Inc. | * | | | 381,100 | | | | 21,474,985 | |
| Edwards Lifesciences Corporation | *† | | | 110,700 | | | | 5,091,093 | |
| Express Scripts, Inc. | * | | | 56,600 | | | | 4,131,800 | |
| Healthways, Inc. | *† | | | 98,600 | | | | 5,762,184 | |
| Laboratory Corporation of America Holdings | * | | �� | 50,000 | | | | 3,776,500 | |
| Matria Healthcare, Inc. | *† | | | 130,376 | | | | 3,099,038 | |
| Nighthawk Radiology Holdings, Inc. | *† | | | 72,500 | | | | 1,526,125 | |
| VCA Antech, Inc. | * | | | 62,800 | | | | 2,777,644 | |
| | | 58,064,407 | |
Heavy Construction—0.5% | | | |
| Lennar Corporation Class A | † | | | 346,200 | | | | 6,193,518 | |
Heavy Machinery—3.2% | | | |
| Actuant Corporation Class A | † | | | 304,400 | | | $ | 10,352,644 | |
| Bucyrus International, Inc. Class A | † | | | 36,200 | | | | 3,597,918 | |
| Cameron International Corporation | * | | | 61,200 | | | | 2,945,556 | |
| FMC Technologies, Inc. | * | | | 197,900 | | | | 11,220,930 | |
| Grant Prideco, Inc. | * | | | 31,600 | | | | 1,754,116 | |
| Joy Global, Inc. | | 23,400 | | | | 1,540,188 | |
| Varian Medical Systems, Inc. | * | | | 95,300 | | | | 4,970,848 | |
| | | 36,382,200 | |
Home Construction, Furnishings & Appliances—0.3% |
| Standard-Pacific Corporation | † | | | 539,500 | | | | 1,807,325 | |
| Toll Brothers, Inc. | *† | | | 104,100 | | | | 2,088,246 | |
| | | 3,895,571 | |
Insurance—8.5% | | | |
| AMBAC Financial Group, Inc. | † | | | 434,600 | | | | 11,199,642 | |
| Amerigroup Corporation | *† | | | 114,300 | | | | 4,166,235 | |
| AON Corporation | | 344,600 | | | | 16,433,974 | |
| Brown & Brown, Inc. | | 134,200 | | | | 3,153,700 | |
| Centene Corporation | * | | | 119,700 | | | | 3,284,568 | |
| Fairfax Financial Holdings Ltd. (Canada) | † | | | 47,000 | | | | 13,448,110 | |
| Infinity Property & Casualty Corporation | | 26,800 | | | | 968,284 | |
| Markel Corporation | * | | | 5,900 | | | | 2,897,490 | |
| Millea Holdings, Inc. (Japan) | | 272,000 | | | | 9,123,135 | |
| Montpelier Re Holdings Ltd. (Bermuda) | | 339,200 | | | | 5,769,792 | |
| Nipponkoa Insurance Company Ltd. (Japan) | | 1,260,000 | | | | 11,428,641 | |
| Security Capital Assurance Ltd. (Bermuda) | † | | | 551,400 | | | | 2,144,946 | |
| WellPoint, Inc. | * | | | 92,300 | | | | 8,097,479 | |
| XL Capital Ltd. Class A (Cayman Islands) | | 115,900 | | | | 5,830,929 | |
| | | 97,946,925 | |
Media—Broadcasting & Publishing—5.4% |
| Central European Media Enterprises Ltd. | * | | | 33,900 | | | | 3,931,722 | |
| Comcast Corporation Special Class A | * | | | 207,000 | | | | 3,750,840 | |
| DIRECTV Group (The), Inc. | * | | | 1,147,000 | | | | 26,518,640 | |
| Liberty Media Corporation Interactive Class A | *† | | | 671,275 | | | | 12,807,927 | |
| Liberty Media Holdings Corporation Capital Class A | * | | | 131,455 | | | | 15,313,193 | |
| | | 62,322,322 | |
Medical Supplies—3.8% | | | |
| ArthoCare Corporation | *† | | | 41,000 | | | | 1,970,050 | |
| FEI Company | *† | | | 163,700 | | | | 4,064,671 | |
| Hologic, Inc. | *† | | | 57,404 | | | | 3,940,211 | |
| Illumina, Inc. | *† | | | 59,900 | | | | 3,549,674 | |
| Resmed, Inc. | *† | | | 240,300 | | | | 12,622,959 | |
| Respironics, Inc. | * | | | 54,500 | | | | 3,568,660 | |
| St. Jude Medical, Inc. | * | | | 69,800 | | | | 2,836,672 | |
| Stereotaxis, Inc. | *† | | | 102,700 | | | | 1,254,994 | |
| Thermo Fisher Scientific, Inc. | * | | | 147,700 | | | | 8,519,336 | |
| Tomotherapy, Inc. | *† | | | 102,900 | | | | 2,012,724 | |
| | | 44,339,951 | |
Metals—0.7% | | | |
| United States Steel Corporation | | 62,500 | | | | 7,556,875 | |
|
See accompanying notes to financial statements.
236
SCHEDULE OF INVESTMENTS—(Continued)
December 31, 2007
Vantagepoint Aggressive
Opportunities Fund
|
|
|
|
|
|
|
| Shares
|
| Value
|
|---|
COMMON STOCKS—(Continued) |
Oil & Gas—4.3% | | | |
| Bill Barrett Corporation | *† | | | 58,200 | | | $ | 2,436,834 | |
| BJ Services Company | † | | | 166,200 | | | | 4,032,012 | |
| Chesapeake Energy Corporation | † | | | 324,000 | | | | 12,700,800 | |
| Concho Resources, Inc. | * | | | 32,700 | | | | 673,947 | |
| Denbury Resources, Inc. | * | | | 260,000 | | | | 7,735,000 | |
| Encore Acquisition Company | *† | | | 95,499 | | | | 3,186,802 | |
| Forest Oil Corporation | * | | | 85,100 | | | | 4,326,484 | |
| Range Resources Corporation | | 160,600 | | | | 8,248,416 | |
| Ultra Petroleum Corporation | * | | | 50,500 | | | | 3,610,750 | |
| W-H Energy Services, Inc. | * | | | 43,900 | | | | 2,467,619 | |
| | | 49,418,664 | |
Pharmaceuticals—6.5% | | | |
| Adams Respiratory Therapeutics, Inc. | *† | | | 82,100 | | | | 4,904,654 | |
| Affymetrix, Inc. | *† | | | 260,900 | | | | 6,037,226 | |
| Alexion Pharmaceuticals, Inc. | * | | | 44,800 | | | | 3,361,344 | |
| Alkermes, Inc. | *† | | | 506,700 | | | | 7,899,453 | |
| Cell Genesys, Inc. | *† | | | 402,600 | | | | 925,980 | |
| deCODE genetics, Inc. | *† | | | 249,300 | | | | 917,424 | |
| Exelixis, Inc. | * | | | 213,200 | | | | 1,839,916 | |
| Far East Pharmaceutical Tech (Hong Kong) | *‡d | | | 6,152,600 | | | | — | |
| Henry Schein, Inc. | *† | | | 112,300 | | | | 6,895,220 | |
Herbalife Ltd.
(Cayman Islands) | | 130,000 | | | | 5,236,400 | |
| Hospira, Inc. | * | | | 132,400 | | | | 5,645,536 | |
| Immucor, Inc. | * | | | 99,487 | | | | 3,381,563 | |
| Incyte Corporation | *† | | | 343,600 | | | | 3,453,180 | |
| Medarex, Inc. | *† | | | 403,300 | | | | 4,202,386 | |
| Medicis Pharmaceutical Corporation Class A | † | | | 240,200 | | | | 6,237,994 | |
| Myriad Genetics, Inc. | *† | | | 41,100 | | | | 1,907,862 | |
| Senomyx, Inc. | *† | | | 198,123 | | | | 1,483,941 | |
| Shire Pharmaceuticals Group PLC (United Kingdom) | | 119,600 | | | | 8,246,420 | |
| Symyx Technologies, Inc. | * | | | 97,300 | | | | 747,264 | |
| XenoPort, Inc. | * | | | 26,089 | | | | 1,457,853 | |
| | | 74,781,616 | |
Real Estate—1.7% | | | |
| CapitalSource, Inc. | † | | | 374,900 | | | | 6,594,491 | |
| CB Richard Ellis Group, Inc. Class A | *† | | | 94,000 | | | | 2,025,700 | |
| Chimera Investment Corp. REIT | † | | | 367,200 | | | | 6,565,536 | |
| St. Joe Company (The) | † | | | 59,100 | | | | 2,098,641 | |
| Thornburg Mortgage, Inc. REIT | † | | | 258,100 | | | | 2,384,844 | |
| | | 19,669,212 | |
Restaurants—0.2% | | | |
| PF Chang’s China Bistro, Inc. | *† | | | 113,900 | | | | 2,601,476 | |
Retailers—4.0% | | | |
| AC Moore Arts & Crafts, Inc. | * | | | 104,900 | | | | 1,442,375 | |
| Amazon.com, Inc. | * | | | 72,435 | | | | 6,710,378 | |
| eBay, Inc. | * | | | 356,000 | | | | 11,815,640 | |
| Fastenal Company | † | | | 127,200 | | | | 5,141,424 | |
| O’Reilly Automotive, Inc. | * | | | 209,300 | | | | 6,787,599 | |
| Sears Holdings Corporation | *† | | | 43,900 | | | | 4,479,995 | |
| Tiffany & Company | | 130,900 | | | | 6,025,327 | |
| Zumiez, Inc. | *† | | | 138,100 | | | | 3,364,116 | |
| | | 45,766,854 | |
Telephone Systems—5.2% | | | |
| Adtran, Inc. | | 57,300 | | | $ | 1,225,074 | |
| KDDI Corporation (Japan) | | 425 | | | | 3,141,654 | |
| Global Payments, Inc. | | 288,700 | | | | 13,430,324 | |
| Level 3 Communications, Inc. | *† | | | 2,945,300 | | | | 8,953,712 | |
| NeuStar, Inc. Class A | *† | | | 290,500 | | | | 8,331,540 | |
| NII Holdings, Inc. Class B | * | | | 245,745 | | | | 11,874,398 | |
| Sprint Nextel Corporation | | 678,200 | | | | 8,904,766 | |
| Virgin Media, Inc. | | 242,800 | | | | 4,161,592 | |
| | | 60,023,060 | |
Textiles, Clothing & Fabrics—0.3% | | | |
| Iconix Brand Group, Inc. | *† | | | 82,700 | | | | 1,625,882 | |
| Mohawk Industries, Inc. | *† | | | 24,600 | | | | 1,830,240 | |
| | | 3,456,122 | |
Transportation—2.3% | | | |
| CH Robinson Worldwide, Inc. | † | | | 119,600 | | | | 6,472,752 | |
| Expedia, Inc. | * | | | 279,032 | | | | 8,822,992 | |
| HUB Group, Inc. Class A | * | | | 105,000 | | | | 2,790,900 | |
| Mobile Mini, Inc. | *† | | | 175,600 | | | | 3,255,624 | |
| Thor Industries, Inc. | † | | | 42,000 | | | | 1,596,420 | |
| UTI Worldwide, Inc. (Luxembourg) | | 179,600 | | | | 3,520,160 | |
| | | 26,458,848 | |
TOTAL COMMON STOCKS | | | |
| (Cost $988,376,437) | | | | | | 1,117,542,980 | |
| |
CONVERTIBLE PREFERRED STOCKS—0.4% |
Real Estate—0.4% | | | |
| Thornburg Mortgage, Inc. | | | |
| (Cost $4,590,255) | | 189,700 | | | | 4,552,800 | |
| |
Coupon
Rate
|
|
|
| Maturity
Date
|
|
|
| Face
|
| Value
|
|---|
U.S. GOVERNMENT AGENCY OBLIGATIONS—0.1% |
U.S. Government Agencies—0.1% | | | |
| Federal Home Loan Bank | | | |
| 4.250% | | | | 01/22/2008 | | | | | | | | | | |
| (Cost $997,521) | $ | 1,000,000 | | | | 997,521 | |
| |
COMMERCIAL PAPER—0.2% |
Financial Services—0.2% | | | |
| Falcon Asset Securitization Corporation 144A | | | |
| 4.800% | | | | 02/01/2008 | | ** | | | 300,000 | | | | 298,760 | |
| Old Line Funding Corp., 144A | | | |
| 5.600% | | | | 01/14/2008 | | ** | | | 1,000,000 | | | | 997,978 | |
| Ranger Funding Co. LLC 144A | | | |
| 5.050% | | | | 03/10/2008 | | ** | | | 500,000 | | | | 495,160 | |
TOTAL COMMERCIAL PAPER | | | |
| (Cost $1,791,898) | | | | | | 1,791,898 | |
| |
CASH EQUIVALENTS—27.8% |
Institutional Money Market Funds—2.2% | | | |
| Reserve Primary Money Market Fund | | | |
| 4.950% | | | | 01/02/2008 | | †† | | | 26,086,537 | | | | 26,086,537 | |
See accompanying notes to financial statements.
237
SCHEDULE OF INVESTMENTS—(Continued)
December 31, 2007
Vantagepoint Aggressive
Opportunities Fund
Coupon
Rate
|
|
|
| Maturity
Date
|
|
|
| Face
|
| Value
|
|---|
CASH EQUIVALENTS—(Continued) |
Bank & Certificate Deposits/
Offshore Time Deposits—24.3% | | | |
| Abbey National PLC | | | |
| 5.160% | | | | 01/07/2008 | | †† | | $ | 6,521,634 | | | $ | 6,521,634 | |
| Abbey National PLC | | | |
| 5.000% | | | | 01/09/2008 | | †† | | | 8,152,043 | | | | 8,152,043 | |
| ABN Amro Bank NV | | | |
| 5.185% | | | | 01/04/2008 | | †† | | | 3,260,817 | | | | 3,260,817 | |
| ABN Amro Bank NV | | | |
| 5.160% | | | | 01/04/2008 | | †† | | | 4,891,226 | | | | 4,891,226 | |
| ABN Amro Bank NV | | | |
| 5.145% | | | | 01/03/2008 | | †† | | | 6,521,634 | | | | 6,521,634 | |
| Bank of Nova Scotia | | | |
| 4.960% | | | | 01/17/2008 | | †† | | | 6,521,634 | | | | 6,521,634 | |
| Bank of Nova Scotia | | | |
| 4.850% | | | | 01/22/2008 | | †† | | | 6,521,634 | | | | 6,521,634 | |
| Barclays | | | |
| 5.350% | | | | 01/04/2008 | | †† | | | 3,260,817 | | | | 3,260,817 | |
| Barclays | | | |
| 5.000% | | | | 01/22/2008 | | †† | | | 8,152,043 | | | | 8,152,043 | |
| Barclays | | | |
| 4.880% | | | | 02/06/2008 | | †† | | | 4,891,226 | | | | 4,891,226 | |
| BNP Paribas | | | |
| 5.200% | | | | 01/11/2008 | | †† | | | 3,260,817 | | | | 3,260,817 | |
| BNP Paribas | | | |
| 5.150% | | | | 01/02/2008 | | †† | | | 3,260,817 | | | | 3,260,817 | |
| BNP Paribas | | | |
| 5.010% | | | | 01/16/2008 | | †† | | | 9,782,451 | | | | 9,782,451 | |
| Calyon | | | |
| 5.120% | | | | 03/03/2008 | | †† | | | 3,260,817 | | | | 3,260,817 | |
| Calyon | | | |
| 4.250% | | | | 01/02/2008 | | †† | | | 32,608,171 | | | | 32,608,171 | |
| Dexia Group | | | |
| 4.755% | | | | 01/03/2008 | | †† | | | 14,673,677 | | | | 14,673,677 | |
| Fifth Third Bancorp | | | |
| 2.750% | | | | 01/02/2008 | | †† | | | 16,304,085 | | | | 16,304,085 | |
| Fortis Bank | | | |
| 4.600% | | | | 01/07/2008 | | †† | | | 9,782,451 | | | | 9,782,451 | |
| Fortis Bank | | | |
| 4.300% | | | | 01/02/2008 | | †† | | | 24,456,128 | | | | 24,456,128 | |
| HBOS Halifax Bank of Scotland | | | |
| 5.150% | | | | 01/02/2008 | | †† | | | 3,260,817 | | | | 3,260,817 | |
| HBOS Halifax Bank of Scotland | | | |
| 4.870% | | | | 02/11/2008 | | †† | | | 6,521,634 | | | | 6,521,634 | |
| Lloyds TSB Bank | | | |
| 5.150% | | | | 01/03/2008 | | †† | | | 4,891,226 | | | | 4,891,226 | |
| Lloyds TSB Bank | | | |
| 4.750% | | | | 01/24/2008 | | †† | | | 6,521,634 | | | | 6,521,634 | |
| Rabobank Nederland | | | |
| 5.080% | | | | 01/09/2008 | | †† | | | 3,260,817 | | | | 3,260,817 | |
| Rabobank Nederland | | | |
| 4.880% | | | | 01/10/2008 | | †† | | | 1,630,409 | | | | 1,630,409 | |
| Royal Bank of Scotland | | | |
| 5.000% | | | | 01/22/2008 | | †† | | | 4,891,226 | | | | 4,891,226 | |
| Royal Bank of Scotland | | | |
| 4.830% | | | | 02/05/2008 | | †† | | | 4,891,226 | | | | 4,891,226 | |
| Royal Bank of Scotland | | | |
| 4.700% | | | | 02/25/2008 | | †† | | | 3,260,817 | | | | 3,260,817 | |
| Societe Generale | | | |
| 5.150% | | | | 01/02/2008 | | †† | | | 4,891,226 | | | | 4,891,226 | |
| Societe Generale | | | |
| 5.150% | | | | 03/03/2008 | | †† | | | 4,891,226 | | | | 4,891,226 | |
| Societe Generale | | | |
| 4.900% | | | | 02/29/2008 | | †† | | $ | 6,521,634 | | | $ | 6,521,634 | |
| Svenska Handlesbanken | | | |
| 4.250% | | | | 01/02/2008 | | †† | | | 28,114,312 | | | | 28,114,312 | |
| Toronto Dominion Bank | | | |
| 5.100% | | | | 01/10/2008 | | †† | | | 4,891,226 | | | | 4,891,226 | |
| Toronto Dominion Bank | | | |
| 5.050% | | | | 01/11/2008 | | †† | | | 1,630,409 | | | | 1,630,409 | |
| Toronto Dominion Bank | | | |
| 4.800% | | | | 02/11/2008 | | †† | | | 9,782,451 | | | | 9,782,451 | |
| UBS AG | | | |
| 4.920% | | | | 01/11/2008 | | †† | | | 4,891,226 | | | | 4,891,226 | |
| | | 280,827,638 | |
Floating Rate Instruments/Master Notes—1.3% |
| Wells Fargo Bank | | | |
| 4.600% | | | | 01/02/2008 | | †† | | | 14,673,676 | | | | 14,673,676 | |
TOTAL CASH EQUIVALENTS | | | |
| (Cost $321,587,851) | | | | | | 321,587,851 | |
| |
REPURCHASE AGREEMENTS—2.7% |
| State Street Bank and Trust Company Repurchase Agreement, dated 12/31/2007, due 01/02/2008, with a maturity value of $31,530,385 and an effective yield of 3.65%, collateralized by U.S. Government and Agency Obligations, with rates ranging from 5.215% – 5.528%, maturities ranging from 05/25/2034 – 06/15/2034, and an aggregate market value of $32,161,496. | | 31,523,996 | | | | 31,523,996 | |
TOTAL INVESTMENTS—128.0% | | | |
| (Cost $1,348,867,958) | | 1,477,997,046 | |
| Other assets less liabilities—(28.0%) | | (323,251,561 | ) |
NET ASSETS—100.0% | $ | 1,154,745,485 | |
Notes to the Schedule of Investments:
| ADR | | American Depositary Receipt |
| REIT | | Real Estate Investment Trust |
| * | | Non-income producing security. |
| † | | Denotes all or a portion of security on loan. |
| ‡ | | Security valued at fair value as determined by policies approved by the board of directors. |
| †† | | Represents reinvestment of collateral received in conjunction with securities lending. |
| ** | | Security exempt from registration under Rule 144A of the Securities Act of 1933. These securities may be resold in transactions exempt from registration, normally to qualified buyers. 144A securities represent 0.12% of Total Investments. |
| d | | Security has no market value at 12/31/2007. |
See accompanying notes to financial statements.
238
SCHEDULE OF INVESTMENTS
December 31, 2007
Vantagepoint
Discovery Fund
|
|
|
|
|
|
|
| Shares
|
| Value
|
|---|
COMMON STOCKS—44.7% |
Apparel Retailers—1.6% | | | |
| Casual Male Retail Group, Inc. | * | | | 125,500 | | | $ | 650,090 | |
| Cato Corporation Class A | | 7,100 | | | | 111,186 | |
| Charming Shoppes, Inc. | * | | | 160,100 | | | | 866,141 | |
| DSW, Inc. Class A | * | | | 39,900 | | | | 748,524 | |
| Eddie Bauer Holdings, Inc. | * | | | 74,037 | | | | 470,135 | |
| | | 2,846,076 | |
Automotive—0.8% | | | |
| Force Protection, Inc. | * | | | 167,400 | | | | 783,432 | |
| Group 1 Automotive, Inc. | | 26,500 | | | | 629,375 | |
| | | 1,412,807 | |
Banking—1.3% | | | |
| Dollar Financial Corporation | * | | | 32,200 | | | | 988,218 | |
FirstFed Financial
Corporation | * | | | 17,100 | | | | 612,522 | |
World Acceptance
Corporation | * | | | 23,900 | | | | 644,822 | |
| | | 2,245,562 | |
Beverages, Food & Tobacco—0.7% | | | |
| Cosan SA Industria Comercio (Brazil) | | 40,000 | | | | 467,416 | |
| Lance, Inc. | | 37,700 | | | | 769,834 | |
| | | 1,237,250 | |
Commercial Services—3.1% | | | |
| CRA International, Inc. | * | | | 18,000 | | | | 856,980 | |
H&E Equipment
Services, Inc. | * | | | 46,800 | | | | 883,584 | |
| Highbury Financial, Inc. | * | | | 14,800 | | | | 66,600 | |
| Regis Corporation | | 32,000 | | | | 894,720 | |
| RSC Holdings, Inc. | * | | | 71,500 | | | | 897,325 | |
| TAL International Group, Inc. | | 39,453 | | | | 898,345 | |
| Textainer Group Holdings Ltd. (Bermuda) | | 57,200 | | | | 831,116 | |
| | | 5,328,670 | |
Communications—0.4% | | | |
| SeaChange International, Inc. | * | | | 100,400 | | | | 725,892 | |
Computer Software & Processing—1.3% | | | |
| BPZ Resources, Inc. | * | | | 70,300 | | | | 785,954 | |
| Emergis, Inc. (Canada) | * | | | 97,600 | | | | 807,833 | |
| JDA Software Group, Inc. | * | | | 32,700 | | | | 669,042 | |
| | | 2,262,829 | |
Computers & Information—1.1% | | | |
| Nuance Communications, Inc. | * | | | 29,900 | | | | 558,532 | |
| Palm, Inc. | | 105,000 | | | | 665,700 | |
| Sierra Wireless, Inc. (Canada) | * | | | 43,700 | | | | 648,945 | |
| | | 1,873,177 | |
Cosmetics & Personal Care—0.5% | | | |
| Inter Parfums, Inc. | | 30,551 | | | | 549,001 | |
| Profarma Distribuidora de Produtos Farmaceuticos SA (Brazil) | * | | | 16,000 | | | | 323,685 | |
| | | 872,686 | |
Electric Utilities—0.7% | | | |
| Infinity Bio-Energy Ltd. (United Kingdom) | *‡ | | | 84,300 | | | | 390,309 | |
| Ormat Technologies, Inc. | | 9,300 | | | $ | 511,593 | |
| PNOC Energy Development Corporation (Philippine Islands) | | 1,736,000 | | | | 270,378 | |
| | | 1,172,280 | |
Electrical Equipment—0.4% | | | |
| Allen-Vanguard Corporation (Canada) | * | | | 122,200 | | | | 658,674 | |
Electronics—4.7% | | | |
| DSP Group, Inc. | * | | | 62,000 | | | | 756,400 | |
| Hutchinson Technology, Inc. | * | | | 26,800 | | | | 705,376 | |
| Imation Corporation | | 43,400 | | | | 911,400 | |
| MIPS Technologies, Inc. Class A | * | | | 135,677 | | | | 672,958 | |
| Microsemi Corporation | * | | | 31,800 | | | | 704,052 | |
| OSI Systems, Inc. | * | | | 24,500 | | | | 648,515 | |
| PMC-Sierra, Inc. | * | | | 83,200 | | | | 544,128 | |
| Park Electrochemical Corporation | | 27,500 | | | | 776,600 | |
| Plexus Corporation | * | | | 11,400 | | | | 299,364 | |
| Trina Solar Ltd., Sponsored ADR (Cayman Islands) | * | | | 23,500 | | | | 1,264,300 | |
| TTM Technologies, Inc. | * | | | 75,600 | | | | 881,496 | |
| | | 8,164,589 | |
Environmental—0.4% | | | |
| Rudolph Technologies, Inc. | * | | | 56,000 | | | | 633,920 | |
Financial Services—2.2% | | | |
| Canaccord Capital, Inc. (Canada) | | 36,200 | | | | 559,059 | |
| Evercore Partners, Inc. Class A | | 24,626 | | | | 530,690 | |
| Gluskin Sheff + Associates, Inc. (Canada) | | 28,200 | | | | 757,161 | |
| GMP Capital Trust (Canada) | | 32,200 | | | | 802,806 | |
Grubb & Ellis Realty
Advisors, Inc. | | 139,300 | | | | 849,730 | |
| Ram Holdings Ltd. (Bermuda) | * | | | 56,500 | | | | 279,110 | |
| | | 3,778,556 | |
Health Care Providers—1.1% | | | |
| AmSurg Corporation | * | | | 31,200 | | | | 844,272 | |
| Odyssey HealthCare, Inc. | * | | | 95,700 | | | | 1,058,442 | |
| | | 1,902,714 | |
Heavy Construction—0.3% | | | |
| Orion Marine Group, Inc., 144A | * ** | | | 40,000 | | | | 600,000 | |
Heavy Machinery—0.3% | | | |
| Asyst Technologies, Inc. | * | | | 170,000 | | | | 554,200 | |
Home Construction, Furnishings & Appliances—0.8% |
| Parkervision, Inc. | * | | | 61,713 | | | | 976,300 | |
| Tecnisa SA (Brazil) | | 65,000 | | | | 412,275 | |
| | | 1,388,575 | |
Insurance—0.4% | | | |
| Platinum Underwriters Holdings Ltd. (Bermuda) | | 22,000 | | | | 782,320 | |
Lodging—0.3% | | | |
| Thunderbird Resorts, Inc., 144A | *‡** | | | 59,200 | | | | 458,800 | |
Medical Supplies—0.5% | | | |
| Micrus Endovascular Corporation | * | | | 30,172 | | | | 593,785 | |
| Zygo Corporation | * | | | 22,100 | | | | 275,366 | |
| | | 869,151 | |
|
See accompanying notes to financial statements.
239
SCHEDULE OF INVESTMENTS—(Continued)
December 31, 2007
Vantagepoint
Discovery Fund
|
|
|
|
|
|
|
| Shares
|
| Value
|
|---|
COMMON STOCKS—(Continued) |
Metals—5.1% | | | |
Carpenter Technology
Corporation | | 11,900 | | | $ | 894,523 | |
| Cleveland-Cliffs, Inc. | | 8,400 | | | | 846,720 | |
| Esmark, Inc. | * | | | 54,700 | | | | 772,911 | |
| Frontera Copper Corporation (Canada) | * | | | 100,600 | | | | 619,421 | |
| Grupo Simec SAB-Sponsored ADR (Mexico) | * | | | 39,600 | | | | 409,860 | |
| Horsehead Holdings Corporation | * | | | 42,100 | | | | 714,437 | |
| Katanga Mining Ltd. (Bermuda) | * | | | 117,100 | | | | 1,953,834 | |
| NCI Building Systems, Inc. | * | | | 20,700 | | | | 595,953 | |
| Schnitzer Steel Industries, Inc. Class A | | 8,000 | | | | 553,040 | |
| Steel Dynamics, Inc. | | 16,900 | | | | 1,006,733 | |
| Uranium One, Inc. (Canada) | * | | | 63,200 | | | | 563,295 | |
| | | 8,930,727 | |
Oil & Gas—4.6% | | | |
| Approach Resources, Inc. | * | | | 19,800 | | | | 254,628 | |
| Basic Energy Services, Inc. | * | | | 40,100 | | | | 880,195 | |
| Complete Production Services, Inc. | * | | | 35,700 | | | | 641,529 | |
| Encore Acquisition Company | * | | | 12,600 | | | | 420,462 | |
| Energy Partners Ltd. | * | | | 50,500 | | | | 596,405 | |
| Hercules Offshore, Inc. | * | | | 37,600 | | | | 894,128 | |
| Nova Biosource Fuels, Inc. | * | | | 302,550 | | | | 877,395 | |
| Oilsands Quest, Inc. | * | | | 150,800 | | | | 615,264 | |
| OPTI Canada, Inc. (Canada) | * | | | 48,700 | | | | 816,009 | |
| Superior Well Services, Inc. | * | | | 47,400 | | | | 1,005,828 | |
| Synenco Energy, Inc. Class A (Canada) | * | | | 107,000 | | | | 911,557 | |
| | | 7,913,400 | |
Pharmaceuticals—4.6% | | | |
| Arena Pharmaceuticals, Inc. | * | | | 91,800 | | | | 718,794 | |
| Ariad Pharmaceuticals, Inc. | * | | | 121,900 | | | | 518,075 | |
| CV Therapeutics, Inc. | * | | | 100,000 | | | | 905,000 | |
| Encysive Pharmaceuticals, Inc. | * | | | 523,654 | | | | 445,106 | |
| Exelixis, Inc. | * | | | 99,600 | | | | 859,548 | |
| Human Genome Sciences, Inc. | * | | | 87,400 | | | | 912,456 | |
| Incyte Corporation | * | | | 133,500 | | | | 1,341,675 | |
| Medicines Company | * | | | 36,500 | | | | 699,340 | |
| Rentech, Inc. | * | | | 333,278 | | | | 603,233 | |
| Rigel Pharmaceuticals, Inc. | * | | | 36,400 | | | | 924,196 | |
| | | 7,927,423 | |
Real Estate—4.3% | | | |
| Acadia Realty Trust REIT | | 25,300 | | | | 647,933 | |
| Agra Empreendimentos Imobiliarios SA (Brazil) | * | | | 60,000 | | | | 394,382 | |
| American Financial Realty Trust REIT | | 121,700 | | | | 976,034 | |
| Brasil Brokers Participacoes (Brazil) | * | | | 400 | | | | 292,135 | |
| Capstead Mortgage Corporation REIT | | 37,800 | | | | 498,582 | |
| Companhia Brasileira de Desenvolvimento Imobiliario Turistico (Brazil) | * | | | 800 | | | | 348,315 | |
| Dundee Real Estate Investment Trust REIT (Canada) | | 16,800 | | | | 571,814 | |
| General Shopping Brasil SA (Brazil) | * | | | 44,000 | | | | 427,393 | |
| Grubb and Ellis Company | | 114,400 | | | | 733,304 | |
| Hersha Hospitality Trust REIT | | 91,248 | | | | 866,856 | |
| Investors Real Estate Trust REIT | | 79,200 | | | $ | 710,424 | |
| MFA Mortgage Investments, Inc. REIT | | 105,200 | | | | 973,100 | |
| | | 7,440,272 | |
Retailers—0.1% | | | |
| Retail Ventures, Inc. | * | | | 42,200 | | | | 214,798 | |
Telephone Systems—0.9% | | | |
| Fairpoint Communications, Inc. | | 63,209 | | | | 822,981 | |
| Harris Stratex Networks, Inc. | * | | | 44,965 | | | | 750,915 | |
| | | 1,573,896 | |
Textiles, Clothing & Fabrics—0.9% | | | |
| Gildan Activewear, Inc. (Canada) | * | | | 20,400 | | | | 839,664 | |
| Timberland Company Class A | * | | | 39,100 | | | | 706,928 | |
| | | 1,546,592 | |
Transportation—1.3% | | | |
| American Commercial Lines, Inc. | * | | | 47,800 | | | | 776,272 | |
| Arlington Tankers Ltd. (Bermuda) | | 39,185 | | | | 867,164 | |
| StealthGas, Inc. (Greece) | | 41,500 | | | | 563,570 | |
| | | 2,207,006 | |
Water Companies—0.0% | | | |
| Companhia de Saneamento de Minas Gerais (Brazil) | | 2,900 | | | | 50,506 | |
TOTAL COMMON STOCKS | | | |
| (Cost $85,368,260) | | | | | | 77,573,348 | |
| |
Coupon
Rate
|
|
|
| Maturity
Date
|
|
|
| Face
|
| Value
|
|---|
CORPORATE OBLIGATIONS—3.9% |
Banking—0.6% | | | |
General Electric Capital Corp.,
Series A, Note, (MTN) | | | |
| 4.250% | | | | 09/13/2010 | | | | $ | 1,100,000 | | | $ | 1,096,807 | |
Beverages, Food & Tobacco—0.1% | | | |
| Dean Foods Company, Senior Note | | | |
| 6.625% | | | | 05/15/2009 | | | | | 280,000 | | | | 277,900 | |
Computer Software & Processing—0.5% | | | |
| Oracle Corporation, Note | | | |
| 5.000% | | | | 01/15/2011 | | | | | 840,000 | | | | 851,702 | |
Electric Utilities—0.2% | | | |
| AES Corporation, Senior Note | | | |
| 9.500% | | | | 06/01/2009 | | | | | 315,000 | | | | 327,600 | |
Lodging—0.2% | | | |
| MGM Mirage, Senior Note | | | |
| 6.000% | | | | 10/01/2009 | | | | | 295,000 | | | | 295,000 | |
Media—Broadcasting & Publishing—0.6% |
| Comcast Corporation, Note | | | |
| 5.450% | | | | 11/15/2010 | | | | | 720,000 | | | | 735,177 | |
CSC Holdings, Inc.,
Series B, Senior Note | | | |
| 8.125% | | | | 07/15/2009 | | | | | 290,000 | | | | 295,437 | |
| | | 1,030,614 | |
Pharmaceuticals—0.6% | | | |
| Abbott Laboratories, Note | | | |
| 5.375% | | | | 05/15/2009 | | | | | 300,000 | | | | 304,688 | |
See accompanying notes to financial statements.
240
SCHEDULE OF INVESTMENTS—(Continued)
December 31, 2007
Vantagepoint
Discovery Fund
Coupon
Rate
|
|
|
| Maturity
Date
|
|
|
| Face
|
| Value
|
|---|
CORPORATE OBLIGATIONS—(Continued) |
| Amgen, Inc., Senior Note | | | |
| 4.000% | | | | 11/18/2009 | | | | $ | 690,000 | | | $ | 685,218 | |
| | | 989,906 | |
Retailers—0.4% | | | |
| CVS Caremark Corporation, Note | | | |
| 4.000% | | | | 09/15/2009 | | | | | 690,000 | | | | 677,319 | |
Telephone Systems—0.7% | | | |
| BellSouth Corp., Note | | | |
| 4.200% | | | | 09/15/2009 | | | | | 950,000 | | | | 944,727 | |
| Qwest Capital Funding, Guaranteed Note | | | |
| 7.000% | | | | 08/03/2009 | | | | | 325,000 | | | | 325,813 | |
| | | 1,270,540 | |
TOTAL CORPORATE OBLIGATIONS | | | |
| (Cost $6,803,935) | | | | | | 6,817,388 | |
| |
U.S. GOVERNMENT AGENCY OBLIGATIONS—12.8% |
U.S. Government Agencies—12.4% | | | |
| Federal Home Loan Mortgage Corporation | | | |
| 5.750% | | | | 03/15/2009 | | | | | 7,000,000 | | | | 7,155,960 | |
| 4.750% | | | | 11/03/2009 | | | | | 7,000,000 | | | | 7,147,238 | |
| Federal National Mortgage Association | | | |
| 4.375% | | | | 09/13/2010 | | | | | 7,000,000 | | | | 7,139,916 | |
| | | 21,443,114 | |
U.S. Government Agencies—Mortgage Backed—0.4% | | | |
| Federal National Mortgage Association | | | |
| 6.778% | | | | 11/01/2035 | | ‡# | | | 658,962 | | | | 668,537 | |
TOTAL U.S. GOVERNMENT AGENCY OBLIGATIONS | | | |
| (Cost $21,889,036) | | | | | | 22,111,651 | |
| |
U.S. TREASURY OBLIGATIONS—24.2% |
U.S. Treasury Notes—24.2% | | | |
| U.S. Treasury Note | | | |
| 4.625% | | | | 07/31/2009 | | | | | 4,235,000 | | | | 4,334,921 | |
| 4.500% | | | | 03/31/2009-
11/15/2010 | | *** | | | 22,287,000 | | | | 22,974,592 | |
| 3.875% | | | | 09/15/2010 | | | | | 14,403,000 | | | | 14,714,695 | |
TOTAL U.S. TREASURY OBLIGATIONS | | | |
| (Cost $41,386,287) | | | | | | 42,024,208 | |
| |
MUNICIPAL OBLIGATIONS—1.0% |
Financial Services—1.0% | | | |
| New York, NY | | | |
| 6.500% | | | | 05/15/2011 | | | | | | | | | | |
| (Cost $1,736,675) | | 1,600,000 | | | | 1,739,792 | |
| |
|
|
|
|
|
|
|
| Shares
|
| Value
|
|---|
WARRANTS—0.0% |
Financial Services—0.0% | | | |
Oilsands Quest, Inc. Warrants,
Expires 12/5/2009 | | | |
| (Cost $) | | 7,000 | | | | 9,800 | |
Coupon
Rate
|
|
|
| Maturity
Date
|
|
|
| Face
|
| Value
|
|---|
ASSET BACKED SECURITIES—2.3% |
Automotive—1.2% | | | |
BMW Vehicle Lease Trust,
Series 2007-1, Class A3A | | | |
| 4.590% | | | | 08/15/2013 | | | | $ | 2,000,000 | | | $ | 2,003,245 | |
Credit Cards—1.1% | | | |
Bank One Issuance Trust,
Series 2004-A6, Class A6 | | | |
| 3.940% | | | | 04/16/2012 | | | | | 2,000,000 | | | | 1,995,239 | |
TOTAL ASSET BACKED SECURITIES | | | |
| (Cost $3,968,359) | | | | | | 3,998,484 | |
| |
NON-U.S. GOVERNMENT MORTGAGE-BACKED SECURITIES—3.8% |
Mortgage Backed—3.8% | | | |
Harborview Mortgage Loan Trust,
Series 2005-14, Class 3A1A | | | |
| 5.300% | | | | 12/19/2035 | | # | | | 1,912,989 | | | | 1,917,641 | |
Thornburg Mortgage Securities Trust,
Series 2004-1, Class II2A | | | |
| 3.304% | | | | 03/25/2044 | | # | | | 1,888,351 | | | | 1,876,963 | |
WaMu Mortgage Pass Through Certificates,
Series 2006-AR12, Class 1A1 | | | |
| 6.072% | | | | 10/25/2036 | | # | | | 692,944 | | | | 691,151 | |
Wells Fargo Mortgage Backed Securities Trust,
Series 2004-Z, Class 2A1 | | | |
| 4.573% | | | | 12/25/2034 | | # | | | 2,148,153 | | | | 2,110,316 | |
TOTAL NON-U.S. GOVERNMENT MORTGAGE-BACKED SECURITIES | | | |
| (Cost $6,462,096) | | | | | | 6,596,071 | |
TOTAL INVESTMENTS—92.7% | | | |
| (Cost $167,614,648) | | 160,870,742 | |
| Other assets less liabilities—7.3% | | 12,639,372 | |
NET ASSETS—100.0% | $ | 173,510,114 | |
Notes to the Schedule of Investments:
| ADR | | American Depositary Receipt |
| REIT | | Real Estate Investment Trust |
| * | | Non-income producing security. |
| ‡ | | Security valued at fair value as determined by policies approved by the board of directors. |
| # | | Rate is subject to change. Rate shown reflects current rate. |
| *** | | Security has been pledged as collateral for futures contracts. |
| ** | | Security exempt from registration under Rule 144A of the Securities Act of 1933. These securities may be resold in transactions exempt from registration, normally to qualified buyers. 144A securities represent 0.66% of Total Investments. |
See accompanying notes to financial statements.
241
SCHEDULE OF INVESTMENTS
December 31, 2007
Vantagepoint
International Fund
|
|
|
|
|
|
|
| Shares
|
| Value
|
|---|
COMMON STOCKS—95.9% |
Argentina—0.1% | | | |
| Tenaris SA ADR | † | | | 13,500 | | | $ | 603,855 | |
Australia—3.5% | | | |
| Amcor Ltd. | | 156,141 | | | | 940,621 | |
| AMP Ltd. | | 553,500 | | | | 4,794,623 | |
| AXA Asia Pacific Holdings Ltd. | | 137,300 | | | | 881,665 | |
| Babcock & Brown Infrastructure Group | | 115,623 | | | | 161,208 | |
| Brambles Ltd. | | 185,582 | | | | 1,860,041 | |
| Foster’s Group Ltd. | | 151,148 | | | | 863,062 | |
| Incitec Pivot Ltd. | | 14,000 | | | | 1,426,795 | |
| Insurance Australia Group Ltd. | | 70,435 | | | | 253,045 | |
| Macquarie Group Ltd. | † | | | 48,149 | | | | 3,215,655 | |
| Newcrest Mining Ltd. | | 30,420 | | | | 875,565 | |
| QBE Insurance Group Ltd. | | 248,080 | | | | 7,189,342 | |
| Telstra Corporation Ltd. | | 225,481 | | | | 922,366 | |
| Toll Holdings Ltd. | | 48,052 | | | | 478,883 | |
| UXC Ltd. | | 370,578 | | | | 581,824 | |
| Westpac Banking Corporation | | 30,000 | | | | 728,181 | |
| Woodside Petroleum Ltd. | | 168,575 | | | | 7,375,491 | |
| Woolworths Ltd. | | 84,761 | | | | 2,509,099 | |
| WorleyParsons Ltd. | | 104,000 | | | | 4,676,610 | |
| | | 39,734,076 | |
Austria—0.3% | | | |
| Raiffeisen International Bank Holding AG | | 13,008 | | | | 1,948,969 | |
| Telekom Austria AG | | 25,500 | | | | 702,015 | |
| Wienerberger AG | | 8,900 | | | | 488,846 | |
| | | 3,139,830 | |
Belgium—1.0% | | | |
| Delhaize Group | | 14,360 | | | | 1,256,713 | |
| Fortis | | 75,900 | | | | 1,986,523 | |
| Fortis—Strip VVPR | * | | | 20,800 | | | | 303 | |
| Interbrew | | 36,100 | | | | 2,991,684 | |
| KBC Groep NV | | 31,100 | | | | 4,363,830 | |
| UCB SA | | 16,522 | | | | 747,742 | |
| Umicore | | 393 | | | | 97,084 | |
| | | 11,443,879 | |
Bermuda—1.0% | | | |
| Guoco Group Ltd. | | 123,000 | | | | 1,639,943 | |
| Jardine Matheson Holdings Ltd. | | 26,000 | | | | 720,200 | |
| NWS Holdings Ltd. | | 648,496 | | | | 2,056,593 | |
| Orient Overseas International Ltd. | | 88,000 | | | | 644,683 | |
| SeaDrill Ltd. | * | | | 240,400 | | | | 5,787,849 | |
| Vtech Holdings Ltd. | | 150,000 | | | | 1,066,418 | |
| | | 11,915,686 | |
Brazil—0.1% | | | |
| Bovespa Holding SA | * | | | 21,000 | | | | 404,663 | |
| Vivo Participacoes SA ADR | | 150,418 | | | | 822,786 | |
| | | 1,227,449 | |
Canada—5.2% | | | |
| Barrick Gold Corporation | | 228,500 | | | | 9,608,425 | |
| Cameco Corporation | | 100,400 | | | | 4,010,122 | |
| Canadian Imperial Bank of Commerce | | 18,200 | | | | 1,296,063 | |
| Canadian National Railway Company | | 17,000 | | | | 800,495 | |
| Canadian Natural Resources Ltd. | | 36,100 | | | | 2,644,734 | |
| Canadian Pacific Railway Ltd. | † | | | 65,748 | | | | 4,249,951 | |
| EnCana Corporation | | 25,600 | | | $ | 1,744,221 | |
| Fairfax Financial Holdings Ltd. | | 2,600 | | | | 753,205 | |
| Inmet Mining Corporation | | 19,700 | | | | 1,601,731 | |
| Linamar Corporation | | 38,500 | | | | 792,384 | |
| Methanex Corporation | † | | | 12,700 | | | | 353,298 | |
| Potash Corporation of Saskatchewan, Inc. | | 82,600 | | | | 11,963,535 | |
| Power Corporation of Canada | † | | | 19,700 | | | | 797,982 | |
| Research In Motion Ltd. | * | | | 81,700 | | | | 9,282,479 | |
| Shaw Communications, Inc. Class B | | 45,400 | | | | 1,083,331 | |
| Shoppers Drug Mart Corporation | | 15,300 | | | | 822,528 | |
| Sun Life Financial, Inc. | † | | | 17,100 | | | | 961,584 | |
| Suncor Energy, Inc. | | 59,700 | | | | 6,502,702 | |
| | | 59,268,770 | |
Cayman Islands—0.2% | | | |
| China Resources Land Ltd. | | 1,078,900 | | | | 2,348,864 | |
China—0.6% | | | |
| Bank of China Ltd. Class H | | 515,000 | | | | 246,382 | |
| China Construction Bank Class H | | 1,385,800 | | | | 1,160,465 | |
| China Life Insurance Co., Ltd. Class H | | 152,700 | | | | 780,486 | |
| China Petroleum & Chemical Corporation Class H | | 1,565,600 | | | | 2,320,818 | |
| China Railway Group Ltd. Class H | * | | | 28,000 | | | | 38,565 | |
| China Shenhua Energy Co., Ltd. Class H | | 99,500 | | | | 586,106 | |
| Industrial and Commercial Bank of China Asia Ltd. Class H | | 1,234,000 | | | | 875,976 | |
| PICC Property & Casualty Class H | | 192,000 | | | | 270,524 | |
| Shanghai Electric Group Company Ltd. Class H | | 119,400 | | | | 98,630 | |
| | | 6,377,952 | |
Denmark—0.1% | | | |
| Novo Nordisk A/S Class B | | 16,000 | | | | 1,041,480 | |
Finland—0.9% | | | |
| Fortum Oyj | | 179,755 | | | | 8,049,558 | |
| Nokia Oyj | | 21,200 | | | | 811,912 | |
| Rautaruukki Oyj | | 15,500 | | | | 660,427 | |
| UPM-Kymmene Oyj | | 29,226 | | | | 589,535 | |
| | | 10,111,432 | |
France—10.3% | | | |
| Accor SA | | 9,700 | | | | 773,011 | |
| Air France | | 71,500 | | | | 2,491,039 | |
| Air Liquide SA | | 9,050 | | | | 1,342,215 | |
| Alstom | | 19,894 | | | | 4,259,790 | |
| AXA | | 46,300 | | | | 1,840,186 | |
| Beneteau | | 30,900 | | | | 786,348 | |
| BNP Paribas | | 22,270 | | | | 2,408,774 | |
| Bouygues SA | | 144,364 | | | | 11,958,308 | |
| Cap Gemini SA | | 40,100 | | | | 2,511,667 | |
| Carrefour SA | | 51,393 | | | | 3,987,612 | |
| Cie Generale D’Optique Essilor International SA | | 56,000 | | | | 3,560,996 | |
| Dassault Systemes SA | | 17,800 | | | | 1,050,265 | |
| Electricite de France | | 123,255 | | | | 14,635,489 | |
| Esso Ste Anonyme Francaise | | 4,970 | | | | 1,318,309 | |
| France Telecom SA | | 45,792 | | | | 1,637,480 | |
| GFI Informatique | | 217,600 | | | | 1,902,638 | |
| Groupe Danone | | 33,400 | | | | 2,984,114 | |
| Haulotte Group | † | | | 27,600 | | | | 823,553 | |
| LVMH Moet Hennessy Louis Vuitton SA | | 78,532 | | | | 9,460,989 | |
|
See accompanying notes to financial statements.
242
SCHEDULE OF INVESTMENTS—(Continued)
December 31, 2007
Vantagepoint
International Fund
|
|
|
|
|
|
|
| Shares
|
| Value
|
|---|
COMMON STOCKS—(Continued) |
| Lafarge SA | | 9,500 | | | $ | 1,719,712 | |
| L’Oreal SA | | 63,900 | | | | 9,121,834 | |
| Manutan International | | 9,000 | | | | 762,364 | |
| PagesJaunes SA | | 18,853 | | | | 376,199 | |
| Pernod-Ricard SA | | 3,600 | | | | 828,228 | |
| Peugeot SA | | 16,900 | | | | 1,276,610 | |
| Renault SA | | 6,400 | | | | 904,839 | |
| Rhodia SA | * | | | 19,008 | | | | 731,469 | |
| Sanofi-Synthelabo SA | | 51,700 | | | | 4,717,903 | |
| Schneider Electric SA | | 16,126 | | | | 2,177,368 | |
| Societe Generale Class A | | 9,130 | | | | 1,316,353 | |
Societe Television Francaise1 | | 91,000 | | | | 2,418,677 | |
| Suez SA | | 25,400 | | | | 1,723,494 | |
| Technip SA | | 45,602 | | | | 3,615,951 | |
| Total SA | | 38,740 | | | | 3,197,702 | |
| Vallourec SA | | 1,609 | | | | 433,819 | |
| Veolia Environnement | | 29,958 | | | | 2,720,339 | |
| Vinci SA | | 86,216 | | | | 6,356,322 | |
| Vivendi Universal SA | | 43,800 | | | | 2,004,732 | |
| Wendel | | 8,600 | | | | 1,237,742 | |
| | | 117,374,440 | |
Germany—8.6% | | | |
| Allianz AG | | 57,541 | | | | 12,358,016 | |
| Bayer AG | | 105,090 | | | | 9,580,623 | |
| Commerzbank AG | | 14,931 | | | | 566,307 | |
| Continental AG | | 17,900 | | | | 2,334,940 | |
| DaimlerChrysler AG | | 147,130 | | | | 14,215,444 | |
| Deutsche Bank AG | | 13,132 | | | | 1,709,373 | |
| Deutsche Telekom AG | | 247,874 | | | | 5,438,576 | |
| Fraport AG | † | | | 45,232 | | | | 3,550,732 | |
| Fresenius Medical Care AG | | 16,100 | | | | 861,832 | |
| Hypo Real Estate Holding | | 21,450 | | | | 1,129,537 | |
| Infineon Technologies AG | * | | | 46,500 | | | | 546,439 | |
| IVG Immobilien AG | | 19,868 | | | | 676,999 | |
| Linde AG | | 39,056 | | | | 5,158,900 | |
| MAN AG | | 9,100 | | | | 1,505,754 | |
Muenchener
Rueckversicherungs AG | | 28,900 | | | | 5,595,161 | |
| Q-Cells AG | * | | | 6,300 | | | | 891,282 | |
| RWE AG | | 27,994 | | | | 3,912,831 | |
| Salzgitter AG | | 40,900 | | | | 6,093,690 | |
| SAP AG | | 11,300 | | | | 579,838 | |
| Siemens AG | | 44,715 | | | | 7,087,659 | |
| ThyssenKrupp AG | | 13,600 | | | | 763,094 | |
| United Internet AG | | 51,874 | | | | 1,259,862 | |
| Volkswagen AG | | 13,300 | | | | 3,047,718 | |
| Wacker Chemie AG | | 34,848 | | | | 10,020,734 | |
| | | 98,885,341 | |
Hong Kong—6.2% | | | |
| Bank of East Asia Ltd. | | 858,800 | | | | 5,818,819 | |
| China Merchants Holdings International Co. Ltd. | | 282,300 | | | | 1,728,374 | |
| China Mobile Ltd. | | 229,000 | | | | 3,987,742 | |
| China Netcom Group Corporation Hong Kong Ltd. | | 527,200 | | | | 1,570,651 | |
| China Unicom Ltd. | | 1,991,400 | | | | 4,517,048 | |
| CLP Holdings Ltd. | | 480,000 | | | | 3,260,983 | |
| CNOOC Ltd. | | 3,700,000 | | | | 6,213,398 | |
| Denway Motors Ltd. | | 1,124,100 | | | | 713,577 | |
| Hang Seng Bank Ltd. | | 346,000 | | | | 7,082,198 | |
| Hengan International Group Co. Ltd. | | 526,000 | | | | 2,337,833 | |
| Hong Kong & China Gas | | 1,670,000 | | | | 5,086,805 | |
| Hutchison Whampoa Ltd. | | 971,498 | | | | 10,943,722 | |
| Li & Fung Ltd. | | 102,400 | | | $ | 408,222 | |
| New World Development Company Ltd. | | 125,600 | | | | 439,707 | |
| Sino Land Company Ltd. | | 398,000 | | | | 1,393,651 | |
| Sun Hung Kai Properties Ltd. | | 377,200 | | | | 7,922,185 | |
| Swire Pacific Ltd. Class A | | 491,322 | | | | 6,732,342 | |
| Wing Lung Bank | | 69,000 | | | | 842,053 | |
| | | 70,999,310 | |
Ireland—0.4% | | | |
| Allied Irish Banks PLC | | 71,800 | | | | 1,641,397 | |
| CRH PLC | | 76,721 | | | | 2,656,175 | |
| | | 4,297,572 | |
Italy—1.9% | | | |
| ENI SpA | | 184,319 | | | | 6,706,033 | |
| Fiat SpA | † | | | 174,803 | | | | 4,484,560 | |
| IFIL-Investments SpA | | 555,000 | | | | 5,180,808 | |
| Intesa Sanpaola | | 380,428 | | | | 2,984,485 | |
| Mediobanca SpA | | 70,527 | | | | 1,444,906 | |
| Prysmian SpA | * | | | 28,000 | | | | 690,726 | |
| Saipem SpA | | 20,000 | | | | 796,190 | |
| | | 22,287,708 | |
Japan—21.4% | | | |
| Advantest Corporation | † | | | 73,500 | | | | 2,076,303 | |
| Aeon Company Ltd. | | 268,900 | | | | 3,918,778 | |
| AEON Mall Co., Ltd. | | 116,500 | | | | 3,054,486 | |
| Ain Pharmaciez, Inc. | | 8,100 | | | | 117,891 | |
| Aisin Seiki Company Ltd. | | 142,200 | | | | 5,881,873 | |
| Ajinomoto Company, Inc. | | 66,000 | | | | 746,239 | |
| Aloka Co., Ltd. | | 149,000 | | | | 2,116,981 | |
| Astellas Pharma, Inc. | | 72,000 | | | | 3,119,752 | |
| AUCNET, Inc. | | 40,500 | | | | 671,698 | |
| Canon, Inc. | | 86,050 | | | | 3,934,517 | |
| Chubu Shiryo Co., Ltd. | | 171,000 | | | | 1,507,594 | |
| Citizen Holding Co., Ltd. | † | | | 80,000 | | | | 776,177 | |
| Credit Saison Company Ltd. | | 125,750 | | | | 3,422,334 | |
| D&M Holdings, Inc. | | 275,000 | | | | 1,128,067 | |
| Daikin Industries Ltd. | | 68,000 | | | | 3,789,212 | |
| Daito Trust Construction Company Ltd. | | 71,000 | | | | 3,891,546 | |
| Daiwa House Industry Company Ltd. | | 63,000 | | | | 804,143 | |
| Denso Corporation | | 82,100 | | | | 3,337,860 | |
| East Japan Railway Company | | 83 | | | | 682,078 | |
| Eisai Company Ltd. | | 73,000 | | | | 2,854,378 | |
| Elpida Memory, Inc. | * | | | 34,800 | | | | 1,188,690 | |
| Fanuc Ltd. | | 74,600 | | | | 7,225,538 | |
| Fuji Machine Manufacturing Co. Ltd. | | 49,400 | | | | 1,054,884 | |
| FUJIFILM Holding Corporation | | 29,900 | | | | 1,250,305 | |
| Fujitsu Frontech Ltd. | | 86,700 | | | | 691,461 | |
| Futaba Industrial Co. Ltd. | | 57,500 | | | | 1,595,254 | |
| Heiwa Corporation | | 70,000 | | | | 612,153 | |
| Hirose Electric Company Ltd. | | 24,700 | | | | 2,831,914 | |
| Hitachi Ltd. | | 126,000 | | | | 935,219 | |
| Honda Motor Company Ltd. | | 227,000 | | | | 7,491,869 | |
| Hoya Corporation | | 174,600 | | | | 5,519,011 | |
| Idemitsu Kosan Co. Ltd. | | 6,900 | | | | 726,059 | |
| Inpex Holdings, Inc. | | 166 | | | | 1,799,834 | |
| Itochu Corporation | | 569,000 | | | | 5,485,490 | |
| Izumiya Co. Ltd. | | 171,000 | | | | 956,967 | |
| Japan Tobacco, Inc. | | 1,140 | | | | 6,734,202 | |
| JGC Corporation | | 46,000 | | | | 787,985 | |
| JSP Corporation | | 86,100 | | | | 982,075 | |
| Jupiter Telecommunications Co. | * | | | 3,446 | | | | 2,896,479 | |
|