| | |
OMB APPROVAL |
OMB Number: | | 3235-0570 |
Expires: | | August 31, 2011 |
Estimated average burden |
hours per response | | 18.9 |
UNITED STATES
SECURITIES AND EXCHANGE COMMISSION
Washington, D.C. 20549
FORM N-CSR
CERTIFIED SHAREHOLDER REPORT OF REGISTERED MANAGEMENT INVESTMENT COMPANIES
| | | | | | |
Investment Company Act file number | | 811-08941 | | | | |
| | | | | | |
| | The Vantagepoint Funds | | |
| | (Exact name of registrant as specified in charter) | | |
| | | | | | |
| | 777 North Capitol Street, NE, Washington D.C. 20002-4240 | | |
| | (Address of principal executive offices) (Zip code) | | |
| | | | | | |
| | Angela Montez, Secretary of the Registrant 777 North Capitol Street, NE, Suite 600, Washington D.C. 20002-4240 | | |
| | (Name and address of agent for service) | | |
Registrant’s telephone number, including area code: 202-962-4600
Date of fiscal year end: 12/31/08
Date of reporting period: 01/01/08 - 06/30/08
Form N-CSR is to be used by management investment companies to file reports with the Commission not later than 10 days after the transmission to stockholders of any report that is required to be transmitted to stockholders under Rule 30e-1 under the Investment Company Act of 1940 (17 CFR 270.30e-1). The Commission may use the information provided on Form N-CSR in its regulatory, disclosure review, inspection, and policymaking roles.
A registrant is required to disclose the information specified by Form N-CSR, and the Commission will make this information public. A registrant is not required to respond to the collection of information contained in Form N-CSR unless the Form displays a currently valid Office of Management and Budget (“OMB”) control number. Please direct comments concerning the accuracy of the information collection burden estimate and any suggestions for reducing the burden to Secretary, Securities and Exchange Commission, 450 Fifth Street, NW, Washington, DC 20549-0609. The OMB has reviewed this collection of information under the clearance requirements of 44 U.S.C. §3507.
| Item 1 | (Report to Shareholders): The semi-annual report is set forth below. |

TABLE OF CONTENTS
LETTER FROM THE PRESIDENT OF THE VANTAGEPOINT FUNDS
JOAN McCALLEN
President
Dear Shareholders:
The first half of 2008 was a period of market turmoil, with stocks generally providing disappointing returns, in reaction to a slowing economy and liquidity concerns. To address these issues as well as concerns about inflation, the Board of Governors of the Federal Reserve System provided increased liquidity and lowered interest rates.
We believe the array of investment objectives and strategies offered through The Vantagepoint Funds serves our investors well during these periods of volatility. For investors seeking active management in a risk-controlled manner, many of the funds offer a multi-management approach. In constructing a multi-managed fund, Vantagepoint Investment Advisers, LLC (“VIA”) identifies investment strategies that are compatible with the fund’s investment objective. VIA then seeks to identify subadvisers who VIA believes have demonstrated the ability to consistently execute a specific investment strategy and who will complement the strategies of other subadvisers to that fund. This approach is designed to offer our investors the opportunity to diversify their investments among subadvisers with complementary investment styles.
We offer the Model Portfolio Funds, which are funds that you may select based upon your tolerance for risk, and the Milestone Funds, which are target-dated funds that you may select based upon the year you plan to retire or begin withdrawing from your retirement account. Each Model Portfolio Fund has a different degree of potential risk and reward and is diversified among various Vantagepoint Funds. The Milestone Funds also invest in the Vantagepoint Funds and are managed by VIA so that a fund’s asset allocation becomes more conservative as the designated year approaches.
At The Vantagepoint Funds, we will continue to maintain a long-term focus that we believe is well suited to our investors, who are building retirement security for themselves and their families. We look forward to continuing to serve you in 2008.
|
Sincerely, |
|
 |
Joan McCallen |
This information is being provided for educational purposes and is not intended to be construed as or relied upon as investment advice. Please consult the current Vantagepoint Funds’ prospectus carefully for a complete summary of all fees, expenses, charges, financial highlights, investment objectives, risks and performance information. Investors should consider the Funds’ investment objectives, risks, charges and expenses before investing or sending money. The prospectus contains this and other information about the Funds. Please read the prospectus carefully before investing. The Vantagepoint Funds are distributed by ICMA-RC Services, LLC, a wholly owned broker-dealer subsidiary of the ICMA Retirement Corporation (“ICMA-RC”), and member FINRA/SIPC. For a current prospectus, contact ICMA-RC Services, LLC, 777 North Capitol Street NE, Washington, DC 20002-4240. 800-669-7400.
1
LETTER FROM VANTAGEPOINT INVESTMENT ADVISERS, LLC
Dear Shareholders:
Introduction
The first half of 2008 brought a continuation of the difficult economic and market environment that developed during the second half of 2007, with losses across major equity markets and for many of the riskier fixed income sectors. The credit crisis that evolved in 2007 led to a liquidity crisis in the first quarter of 2008, meaningfully impacting market volatility and returns. The Federal Reserve Bank (“Federal Reserve”) responded to the liquidity crisis that developed in the wake of subprime mortgage related problems through multiple actions focused on regaining stability. To ease liquidity pressures, the Federal Reserve lowered the Fed Funds Rate four times, to 2.0%, and enhanced facilities for providing liquidity to the financial services industry. At a peak time of instability, when the ripple effect of a large financial institution failure could have been significant, the Federal Reserve orchestrated the acquisition of Bear Stearns Companies, Inc. (“Bear Stearns”) by JP Morgan Chase & Co. as the liquidity crisis threatened the ability of Bear Stearns to survive. Escalating commodity prices, notably oil prices increasing approximately 47%, contributed to concerns that an economic slowdown coupled with higher than target inflation could lead to a return of “stagflation” as was seen in the late 1970’s. First quarter Gross Domestic Product (“GDP”) was weak, consumer confidence dropped as unemployment increased, energy prices rose, and home prices continued to fall. The flight to quality investments by investors reacting to economic and market conditions left equity markets at lower levels at June 30, 2008.
A sampling of market returns for the six months ended June 30, 2008:*
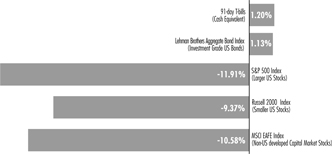
| * | This information is being provided for educational purposes and should not be construed as or relied upon as investment advice or as a solicitation for a particular product or security. Performance reflected above represents past performance. The Lehman Brothers Aggregate Bond Index is an unmanaged index which consists of all investment-grade U.S. fixed income securities. The S&P 500 consists of 500 companies representing larger capitalization stocks traded in the U.S. The Russell 2000 Index measures the performance of the 2,000 smallest companies in the Russell 3000 Index and represents approximately 8% of the total market capitalization of the Russell 3000 Index. The Russell 3000 Index measures performance of the 3,000 largest U.S. companies based on total market capitalization, which represents approximately 98% of the investable U.S. equity market. The MSCI EAFE is a free float-adjusted market capitalization index that is designed to measure developed market equity performance excluding the U.S. and Canada. The Lehman Brothers Aggregate Bond Treasury Index is an unmanaged index of U.S. Treasury securities contained within the Lehman Brothers U.S. Aggregate Bond Index. All securities have an average life of at least one year. Lehman Brothers Asset Backed Securities Index is an unmanaged index composed of credit card, auto, and home equity loans. Included in the index are pass-through, bullet (non-callable), and controlled amortization structured debt securities; no subordinated debt is included. All securities have an average life of at least one year. The Lehman Brothers US Corporate High Yield Index is an unmanaged index composed of USD-denominated, non-investment grade, fixed-rate, taxable corporate bond market. Securities are classified as high-yield if the middle rating of Moody’s, Fitch, and S&P is Ba1/BB+/BB+ or below. The MSCI Emerging Markets Index is a free float-adjusted market capitalization index that is designed to measure equity market performance of emerging markets. As of June 2007 the MSCI Emerging Markets Index consisted of the following 25 emerging market country indices: Argentina, Brazil, Chile, China, Colombia, Czech Republic, Egypt, Hungary, India, Indonesia, Israel, Jordan, Korea, Malaysia, Mexico, Morocco, Pakistan, Peru, Philippines, Poland, Russia, South Africa, Taiwan, Thailand, and Turkey. A fund’s portfolio may differ significantly from the securities held in the indexes. Indexes are not available for direct investment; therefore, their performance does not reflect the expenses associated with the active management of an actual portfolio. Investment returns and principal value of an investment in the funds will fluctuate so that an investor’s shares, when redeemed, may be worth more or less than their original cost. Past performance is not indicative of future returns. Individuals are advised to consider any new investment strategies carefully prior to implementing. Please consult the current Vantagepoint Funds’ prospectus, which contains additional information on management fees, other fund expenses, and investment risks and objectives carefully before investing any money. The Vantagepoint Funds are distributed by ICMA-RC Services, LLC, a wholly owned broker-dealer subsidiary of ICMA-RC, and member FINRA/SIPC. 1-800-669-7400. |
2
Fixed Income Returns Varied by Month and by Sector
While the first half of 2008 provided generally positive returns for fixed income investments, the results varied from month to month and by sector. In the first three months of 2008, the fixed income markets reacted favorably to Federal Reserve activity intended to ease interest rates and address developing liquidity issues. The Federal Reserve lowered the Fed Funds Rate in four steps by a total of 2.25%, from 4.25% at the close of 2007 to 2.0% on April 30, 2008. The Fed Funds Rate was held at 2% in the June meeting, reflecting the Federal Reserve’s challenge of balancing the risk of further economic slowdown with the risks of inflation. Following the April reduction in the Fed Funds Rate, and as a result of growing inflationary fears and stock market volatility, fixed income markets began to retreat. While the Lehman Brothers Aggregate Bond Index gained 2.17% in the first quarter of 2008, it lost 1.02% in the second quarter, for a six month return of 1.13%. Reflecting investors’ risk aversion, Treasuries outperformed other market sectors, evidenced by the 2.23% return of the Lehman Brothers Aggregate Bond Treasury Index for the six month period ended June 30. Treasury Inflation Protected Securities benefitted even further as a result of their inflation adjustment feature, providing a return of 4.88% as measured by the Lehman Brothers U.S. TIPS Index. In contrast, lower credit quality fixed income investments produced lower returns, evidenced by the negative 1.31% return of the Lehman Brothers U.S. Corporate High-Yield Index. Asset-backed securities, including sub-prime mortgage related securities’ market weakness, produced negative returns of 2.71% as measured by the Lehman Brothers Asset-Backed Securities Index.
Domestic Stocks Produced Losses
In the face of generally poor credit conditions, high commodity prices, declining corporate earnings and investor risk aversion, the U.S. equity market suffered relatively large losses in the first half of 2008. Heightened volatility that began in the latter half of 2007 continued into 2008 as U.S. domestic stocks, as measured by broad market indexes, lost value, with the largest losses occurring in the month of June. Following first quarter losses, evidenced by the S&P 500 Index return of -9.44%, rallies in April and May were more than offset by June losses, leaving the S&P 500 Index with a loss of 11.91% for the six month period ended June 30, 2008. Mid-capitalization stocks generally outperformed small-capitalization stocks; and, larger capitalization stocks underperformed mid- and smaller capitalization stocks. Growth stocks generally lost less than value stocks, as measured by Russell Indexes, across asset capitalization size categories. Market volatility was also evident across sectors of the market, as reflected by sector returns within the S&P 500 Index. While losing ground in the first quarter, the Energy sector led all other sectors for the first half of the year with a gain of 8.88%. Materials posted a modest gain of 1.26% for the six month period ended June 30. Six of the ten S&P 500 Index sectors returned losses of more than 10%, including the Financials sector that lost 29.73% as credit quality losses and write-offs continued.
International Stock Returns Paralleled U.S. Domestic Stock Returns
International stocks suffered in the face of high commodity prices, increasing concerns regarding inflation internationally, and weakness in the U.S. economy. The MSCI EAFE Index, representing developed non-U.S. countries, lost 10.58% for the six months ended June 30 in U.S. dollar terms, with negative returns in both quarters. The U.S. dollar declined nearly 8% against most currencies, helping offset market losses for un-hedged foreign portfolios. Emerging markets underperformed developed non-U.S. countries, losing 11.64% as measured by the MSCI Emerging Markets Index. In contrast to the first half of 2008, emerging markets outperformed non-U.S. developed markets on a calendar year basis each year from 2001 through 2007. During the first half of 2008, Latin American emerging markets outperformed, returning a positive 9.41% while Asian emerging markets lost 21.91%, as measured by MSCI emerging market indexes.
3
Vantagepoint Fund Returns
The six-month returns for The Vantagepoint Funds reflected the market dynamics discussed above, as bond funds earned positive returns and stock funds provided negative returns. The Inflation Protected Securities Fund led The Vantagepoint Funds with a positive 4.78% return for the period ended June 30, 2008, reflecting investors’ flight to quality coupled with increasing concerns regarding inflation even as the economy and corporate earnings slowed.
The Vantagepoint Actively Managed Funds
Total Return for six months ended June 30, 2008
| | | |
Money Market Fund | | 1.40 | % |
Low Duration Bond Fund | | 1.39 | % |
Inflation Protected Securities Fund | | 4.78 | % |
Asset Allocation Fund | | -12.19 | % |
Equity Income Fund | | -11.35 | % |
Growth and Income Fund | | -11.46 | % |
Growth Fund | | -11.58 | % |
Select Value Fund | | -7.14 | % |
Aggressive Opportunities Fund | | -11.63 | % |
Discovery Fund | | -7.89 | % |
International Fund | | -8.94 | % |
Diversified Assets Fund | | 0.90 | % |
The Vantagepoint Model Portfolio Funds performed as expected given market conditions. The more conservatively allocated portfolios outperformed the more aggressively allocated portfolios.
Vantagepoint Model Portfolio Funds
Total Return for six months ended June 30, 2008
| | | |
Model Portfolio Savings Oriented Fund | | -1.50 | % |
Model Portfolio Conservative Growth Fund | | -3.37 | % |
Model Portfolio Traditional Growth Fund | | -5.66 | % |
Model Portfolio Long-Term Growth Fund | | -7.42 | % |
Model Portfolio All-Equity Growth Fund | | -10.27 | % |
The Vantagepoint Milestone Funds also performed as expected, with the more conservatively allocated shorter-dated portfolios leading the longer-dated portfolios. As with the Model Portfolio Funds, the Milestone Funds provide broad exposure to both stocks and bonds, but unlike the Model Portfolio Funds, the stock/bond allocations become more conservative as their respective target year approaches.
Vantagepoint Milestone Funds
Total Return for six months ended June 30, 2008
| | | |
Milestone Retirement Income Fund | | -2.07 | % |
Milestone 2010 Fund | | -3.29 | % |
Milestone 2015 Fund | | -5.12 | % |
Milestone 2020 Fund | | -6.33 | % |
Milestone 2025 Fund | | -7.19 | % |
Milestone 2030 Fund | | -8.00 | % |
Milestone 2035 Fund | | -8.71 | % |
Milestone 2040 Fund | | -9.03 | % |
4
The Vantagepoint Index Funds continued to provide broad exposure to securities represented by their target indexes at relatively low cost:
The Vantagepoint Index Funds
Total Return for six months ended June 30, 2008
| | | | | | |
| | | Class I | | | Class II | |
Core Bond Index Fund | | 1.12 | % | | 1.11 | % |
500 Stock Index Fund | | -12.21 | % | | -12.08 | % |
Broad Market Index Fund | | -10.94 | % | | -10.89 | % |
Mid/Small Company Index Fund | | -7.70 | % | | -7.62 | % |
Overseas Equity Index Fund | | -10.74 | % | | -10.59 | % |
Enhancements to Vantagepoint Funds
During the turbulent markets of the first half of 2008, Vantagepoint Investment Advisers, LLC (“VIA”) continued to pursue its goal of positioning each fund to seek its long-term return and risk level goals. Consistent with The Vantagepoint Funds multi-manager style and subadviser due diligence processes, VIA continued its analytical rigor, conducting ongoing in-depth reviews of each fund’s performance results, coupled with attribution analysis of its risk / return performance. No subadviser changes were made during the six month period, however a number of specific analyses are underway that may lead to changes to help ensure that each fund continues to meet VIA’s quality standards.
Additionally, VIA conducted the scheduled mid-year “aging” of the target dated Vantagepoint Milestone Funds.
VIA continues to manage The Vantagepoint Funds with the goals of providing above average results over time coupled with below average volatility and diversification opportunities to enable public sector retirement plan investors to select portfolios appropriate for their individual investment goals. VIA continues to believe that long term investment horizons, portfolio diversification, and prudent decision making rewards retirement plan investors even as economic cycles alternate between stronger and weaker periods. VIA remains committed to its mission of supporting public sector retirement plan investors’ goals.
|
Sincerely, |
|
Vantagepoint Investment Advisers, LLC |
The information herein was obtained from various sources; we do not guarantee its accuracy or completeness. Neither the information nor any opinion expressed constitutes an offer, or an invitation to make an offer, to buy or sell any securities. This information is intended for educational purposes only and is not to be construed as investment advice. It does not have regard to the individual investment objectives, financial situation or the particular needs of any specific person who may receive this report. Investors should seek financial advice regarding the appropriateness of investing in any securities or using any investment strategies discussed or recommended here and should understand that statements regarding future prospects may not be realized. Investors should note that returns, if any, from investing in securities, will fluctuate and that each security price or value may rise or fall. Accordingly, investors may receive back less than originally invested. Past performance is not an indicator of future performance. The Vantagepoint Funds are distributed by ICMA-RC Services, LLC, a wholly owned broker-dealer subsidiary of ICMA-RC and member FINRA/SIPC. 1-800-669-7400.
5
Shareholder Expenses
As a shareholder of a Vantagepoint Fund, you incur ongoing expenses, such as advisory fees, investor services fees, fund services fees and other fund expenses. The following example is intended to help you understand your ongoing expenses (in dollars and cents) of investing in a fund and to compare these expenses with the ongoing expenses of investing in other mutual funds. The example is based on an investment of $1,000 invested at the beginning of the period and held for the entire period from January 1, 2008 to June 30, 2008.
Actual Expenses
The first section in the example below provides information about the actual account values and actual expenses. You may use the information in this line, together with the amount you invested, to estimate the expenses that you paid over the period. Simply divide your account value by $1,000 (for example, an $8,600 account value divided by $1,000 = 8.6), then multiply the result by the number for your fund under the heading entitled “Expenses Paid During Period” to estimate the expenses you paid on your account during this period.
Hypothetical Example for Comparison Purposes
The second section in the example below provides information about the hypothetical account values and hypothetical expenses based on each fund’s actual expense ratio and an assumed rate of return of 5% per year before expenses, which is not the fund’s actual return. The hypothetical account values and expenses may not be used to estimate the actual ending account balance or expenses you paid for the period. You may use this information to compare the ongoing costs of investing in your fund and other funds. To do so, compare this 5% hypothetical example with the 5% hypothetical examples that appear in the shareholder reports of the other funds.
| | | | | | | | | | | | | | | | | | | | | | | |
| ACTUAL | | Vantagepoint Funds | | HYPOTHETICAL |
Beginning
Account
Value
1/01/08 | | Ending
Account
Value
6/30/08 | | 2008
Annualized
Expense
Ratio | | | Expenses
Paid
During
Period* | | | Beginning
Account
Value
1/01/08 | | Ending
Account
Value
6/30/08 | | 2008
Annualized
Expense
Ratio | | | Expenses
Paid
During
Period* |
| $1,000.00 | | $ | 1,014.00 | | 0.63 | % | | $ | 3.15 | | Money Market** | | $ | 1,000.00 | | $ | 1,021.73 | | 0.63 | % | | $ | 3.17 |
| $1,000.00 | | $ | 1,013.90 | | 0.65 | % | | $ | 3.25 | | Low Duration Bond | | $ | 1,000.00 | | $ | 1,021.63 | | 0.65 | % | | $ | 3.27 |
| $1,000.00 | | $ | 1,047.80 | | 0.69 | % | | $ | 3.51 | | Inflation Protected Securities | | $ | 1,000.00 | | $ | 1,021.43 | | 0.69 | % | | $ | 3.47 |
| $1,000.00 | | $ | 878.10 | | 0.76 | % | | $ | 3.55 | | Asset Allocation | | $ | 1,000.00 | | $ | 1,021.08 | | 0.76 | % | | $ | 3.82 |
| $1,000.00 | | $ | 886.50 | | 0.88 | % | | $ | 4.13 | | Equity Income | | $ | 1,000.00 | | $ | 1,020.49 | | 0.88 | % | | $ | 4.42 |
| $1,000.00 | | $ | 885.40 | | 0.81 | % | | $ | 3.80 | | Growth & Income | | $ | 1,000.00 | | $ | 1,020.84 | | 0.81 | % | | $ | 4.07 |
| $1,000.00 | | $ | 884.20 | | 0.87 | % | | $ | 4.08 | | Growth | | $ | 1,000.00 | | $ | 1,020.54 | | 0.87 | % | | $ | 4.37 |
| $1,000.00 | | $ | 928.60 | | 0.97 | % | | $ | 4.65 | | Select Value | | $ | 1,000.00 | | $ | 1,020.04 | | 0.97 | % | | $ | 4.87 |
| $1,000.00 | | $ | 883.70 | | 0.96 | % | | $ | 4.50 | | Aggressive Opportunities | | $ | 1,000.00 | | $ | 1,020.09 | | 0.96 | % | | $ | 4.82 |
| $1,000.00 | | $ | 921.10 | | 1.00 | % | | $ | 4.78 | | Discovery | | $ | 1,000.00 | | $ | 1,019.89 | | 1.00 | % | | $ | 5.02 |
| $1,000.00 | | $ | 910.60 | | 1.08 | % | | $ | 5.13 | | International | | $ | 1,000.00 | | $ | 1,019.49 | | 1.08 | % | | $ | 5.42 |
| $1,000.00 | | $ | 1,009.00 | | 1.01 | % | | $ | 5.05 | | Diversified Assets | | $ | 1,000.00 | | $ | 1,019.84 | | 1.01 | % | | $ | 5.07 |
| $1,000.00 | | $ | 1,011.20 | | 0.44 | % | | $ | 2.20 | | Core Bond Index Class I | | $ | 1,000.00 | | $ | 1,022.68 | | 0.44 | % | | $ | 2.21 |
| $1,000.00 | | $ | 1,011.10 | | 0.24 | % | | $ | 1.20 | | Core Bond Index Class II | | $ | 1,000.00 | | $ | 1,023.67 | | 0.24 | % | | $ | 1.21 |
| $1,000.00 | | $ | 877.90 | | 0.46 | % | | $ | 2.15 | | 500 Stock Index Class I | | $ | 1,000.00 | | $ | 1,022.58 | | 0.46 | % | | $ | 2.31 |
| $1,000.00 | | $ | 879.20 | | 0.26 | % | | $ | 1.21 | | 500 Stock Index Class II | | $ | 1,000.00 | | $ | 1,023.57 | | 0.26 | % | | $ | 1.31 |
| $1,000.00 | | $ | 890.60 | | 0.45 | % | | $ | 2.12 | | Broad Market Index Class I | | $ | 1,000.00 | | $ | 1,022.63 | | 0.45 | % | | $ | 2.26 |
| $1,000.00 | | $ | 891.10 | | 0.25 | % | | $ | 1.18 | | Broad Market Index Class II | | $ | 1,000.00 | | $ | 1,023.62 | | 0.25 | % | | $ | 1.26 |
| $1,000.00 | | $ | 923.00 | | 0.50 | % | | $ | 2.39 | | Mid/Small Company Index Class I | | $ | 1,000.00 | | $ | 1,022.38 | | 0.50 | % | | $ | 2.51 |
| $1,000.00 | | $ | 923.80 | | 0.30 | % | | $ | 1.43 | | Mid/Small Company Index Class II | | $ | 1,000.00 | | $ | 1,023.37 | | 0.30 | % | | $ | 1.51 |
| $1,000.00 | | $ | 892.60 | | 0.63 | % | | $ | 2.96 | | Overseas Equity Index Class I | | $ | 1,000.00 | | $ | 1,021.73 | | 0.63 | % | | $ | 3.17 |
| $1,000.00 | | $ | 894.10 | | 0.43 | % | | $ | 2.03 | | Overseas Equity Index Class II | | $ | 1,000.00 | | $ | 1,022.73 | | 0.43 | % | | $ | 2.16 |
| $1,000.00 | | $ | 985.00 | | 0.88 | % | | $ | 4.34 | | Model Portfolio Savings Oriented** | | $ | 1,000.00 | | $ | 1,020.49 | | 0.88 | % | | $ | 4.42 |
| $1,000.00 | | $ | 966.30 | | 0.90 | % | | $ | 4.40 | | Model Portfolio Conservative Growth** | | $ | 1,000.00 | | $ | 1,020.39 | | 0.90 | % | | $ | 4.52 |
| $1,000.00 | | $ | 943.40 | | 0.95 | % | | $ | 4.59 | | Model Portfolio Traditional Growth** | | $ | 1,000.00 | | $ | 1,020.14 | | 0.95 | % | | $ | 4.77 |
| $1,000.00 | | $ | 925.80 | | 1.00 | % | | $ | 4.79 | | Model Portfolio Long-Term Growth** | | $ | 1,000.00 | | $ | 1,019.89 | | 1.00 | % | | $ | 5.02 |
6
| | | | | | | | | | | | | | | | | | | | | | | |
| ACTUAL | | Vantagepoint Funds | | HYPOTHETICAL |
Beginning
Account
Value
1/01/08 | | Ending
Account
Value
6/30/08 | | 2008
Annualized
Expense
Ratio | | | Expenses
Paid
During
Period* | | | Beginning
Account
Value
1/01/08 | | Ending
Account
Value
6/30/08 | | 2008
Annualized
Expense
Ratio | | | Expenses
Paid
During
Period* |
| $1,000.00 | | $ | 897.30 | | 1.09 | % | | $ | 5.14 | | Model Portfolio All-Equity Growth** | | $ | 1,000.00 | | $ | 1,019.44 | | 1.09 | % | | $ | 5.47 |
| $1,000.00 | | $ | 979.30 | | 0.81 | % | | $ | 3.99 | | Milestone Retirement Income** | | $ | 1,000.00 | | $ | 1,020.84 | | 0.81 | % | | $ | 4.07 |
| $1,000.00 | | $ | 967.10 | | 0.88 | % | | $ | 4.30 | | Milestone 2010** | | $ | 1,000.00 | | $ | 1,020.49 | | 0.88 | % | | $ | 4.42 |
| $1,000.00 | | $ | 948.80 | | 0.91 | % | | $ | 4.41 | | Milestone 2015** | | $ | 1,000.00 | | $ | 1,020.34 | | 0.91 | % | | $ | 4.57 |
| $1,000.00 | | $ | 936.70 | | 0.93 | % | | $ | 4.48 | | Milestone 2020** | | $ | 1,000.00 | | $ | 1,020.24 | | 0.93 | % | | $ | 4.67 |
| $1,000.00 | | $ | 928.10 | | 0.95 | % | | $ | 4.55 | | Milestone 2025** | | $ | 1,000.00 | | $ | 1,020.14 | | 0.95 | % | | $ | 4.77 |
| $1,000.00 | | $ | 920.00 | | 0.97 | % | | $ | 4.63 | | Milestone 2030** | | $ | 1,000.00 | | $ | 1,020.04 | | 0.97 | % | | $ | 4.87 |
| $1,000.00 | | $ | 912.90 | | 0.99 | % | | $ | 4.71 | | Milestone 2035** | | $ | 1,000.00 | | $ | 1,019.94 | | 0.99 | % | | $ | 4.97 |
| $1,000.00 | | $ | 909.70 | | 0.99 | % | | $ | 4.70 | | Milestone 2040** | | $ | 1,000.00 | | $ | 1,019.94 | | 0.99 | % | | $ | 4.97 |
| * | Expenses are calculated using each Fund’s annualized expense ratio (as disclosed in the table), multiplied by the average account value over the period, multiplied by [number of days in most recent fiscal half year divided by total number of days in fiscal year e.g. 182/366] (to reflect the one-half year period). |
| ** | This fund invests in one or more other mutual funds. The annualized expense ratio includes this fund’s proportionate share of the expense ratio of such other mutual fund(s). |
7
Vantagepoint Funds Returns
As of June 30, 2008
| | | | | | | | | | | | | | | | | | | | |
| | | Year-to-date
through
6/30/08 | | | 1 Year | | | 3 Years | | | 5 Years | | | 10 Years | | | Since
Inception | | | Inception
Date* |
Actively Managed Funds | | | | | | | | | | | | | | | | | | | | |
| | | | | | | |
Money Market Fund1 | | 1.40 | % | | 3.76 | % | | 4.09 | % | | 2.87 | % | | — | | | 3.18 | % | | 3/99 |
Low Duration Bond Fund2 | | 1.39 | % | | 4.75 | % | | 3.70 | % | | 3.42 | % | | — | | | 3.80 | % | | 12/00 |
Inflation Protected Securities Fund2 | | 4.78 | % | | 14.72 | % | | 5.79 | % | | 3.91 | % | | 5.29 | % | | — | | | 7/92 |
Asset Allocation Fund | | -12.19 | % | | -12.24 | % | | 4.34 | % | | 7.12 | % | | 3.66 | % | | — | | | 12/74 |
Equity Income Fund | | -11.35 | % | | -16.14 | % | | 4.23 | % | | 9.38 | % | | 6.00 | % | | — | | | 4/94 |
Growth & Income Fund | | -11.46 | % | | -12.84 | % | | 4.31 | % | | 7.17 | % | | — | | | 7.21 | % | | 10/98 |
Growth Fund | | -11.58 | % | | -10.32 | % | | 5.46 | % | | 6.05 | % | | 3.14 | % | | — | | | 4/83 |
Aggressive Opportunities Fund | | -11.63 | % | | -16.32 | % | | 5.02 | % | | 11.10 | % | | 4.47 | % | | — | | | 10/94 |
International Fund | | -8.94 | % | | -6.38 | % | | 13.98 | % | | 15.52 | % | | 5.38 | % | | — | | | 10/94 |
| | | | | | | |
Index Funds | | | | | | | | | | | | | | | | | | | | |
| | | | | | | |
Core Bond Index Fund (Class I) | | 1.12 | % | | 6.87 | % | | 3.68 | % | | 3.45 | % | | 5.17 | % | | — | | | 6/97 |
Core Bond Index Fund (Class II) | | 1.11 | % | | 7.06 | % | | 3.87 | % | | 3.64 | % | | — | | | 5.48 | % | | 4/99 |
500 Stock Index Fund (Class I) | | -12.21 | % | | -13.54 | % | | 3.91 | % | | 7.11 | % | | 2.42 | % | | — | | | 6/97 |
500 Stock Index Fund (Class II) | | -12.08 | % | | -13.42 | % | | 4.14 | % | | 7.30 | % | | — | | | 1.28 | % | | 4/99 |
Broad Market Index Fund (Class I) | | -10.94 | % | | -12.78 | % | | 4.66 | % | | 8.34 | % | | 3.18 | % | | — | | | 10/94 |
Broad Market Index Fund (Class II) | | -10.89 | % | | -12.61 | % | | 4.85 | % | | 8.55 | % | | — | | | 2.47 | % | | 4/99 |
Mid/Small Company Index Fund (Class I) | | -7.70 | % | | -11.32 | % | | 6.29 | % | | 11.90 | % | | 5.52 | % | | — | | | 6/97 |
Mid/Small Company Index Fund (Class II) | | -7.62 | % | | -11.14 | % | | 6.49 | % | | 12.12 | % | | — | | | 6.34 | % | | 4/99 |
Overseas Equity Index Fund (Class I) | | -10.74 | % | | -10.79 | % | | 12.29 | % | | 15.94 | % | | 5.11 | % | | — | | | 6/97 |
Overseas Equity Index Fund (Class II) | | -10.59 | % | | -10.62 | % | | 12.51 | % | | 16.23 | % | | — | | | 5.25 | % | | 4/99 |
| | | | | | | |
Model Portfolio Funds3 | | | | | | | | | | | | | | | | | | | | |
| | | | | | | |
Model Portfolio Savings Oriented Fund | | -1.50 | % | | 1.43 | % | | 4.44 | % | | 5.09 | % | | 4.73 | % | | — | | | 2/95 |
Model Portfolio Conservative Growth Fund | | -3.37 | % | | -1.34 | % | | 4.95 | % | | 5.99 | % | | 4.88 | % | | — | | | 4/96 |
Model Portfolio Traditional Growth Fund | | -5.66 | % | | -4.72 | % | | 5.60 | % | | 7.18 | % | | 5.03 | % | | — | | | 4/96 |
Model Portfolio Long-Term Growth Fund | | -7.42 | % | | -7.17 | % | | 6.40 | % | | 8.55 | % | | 5.44 | % | | — | | | 4/96 |
Model Portfolio All-Equity Growth Fund | | -10.27 | % | | -11.46 | % | | 6.64 | % | | 9.48 | % | | — | | | 1.65 | % | | 10/00 |
8
Vantagepoint Funds Returns
As of June 30, 2008
| | | | | | | | | | | | | | | | | | |
| | | Year-to-date
through
6/30/08 | | | 1 Year | | | 3 Years | | | 5 Years | | 10 Years | | Since
Inception | | | Inception
Date* |
Milestone Funds3 | | | | | | | | | | | | | | | | | | |
| | | | | | | |
Milestone Retirement Income Fund | | -2.07 | % | | 0.41 | % | | 4.52 | % | | — | | — | | 4.19 | % | | 01/05 |
Milestone 2010 Fund | | -3.29 | % | | -1.34 | % | | 5.31 | % | | — | | — | | 4.68 | % | | 01/05 |
Milestone 2015 Fund | | -5.12 | % | | -3.88 | % | | 5.93 | % | | — | | — | | 5.12 | % | | 01/05 |
Milestone 2020 Fund | | -6.33 | % | | -5.52 | % | | 6.12 | % | | — | | — | | 5.26 | % | | 01/05 |
Milestone 2025 Fund | | -7.19 | % | | -6.81 | % | | 6.35 | % | | — | | — | | 5.39 | % | | 01/05 |
Milestone 2030 Fund | | -8.00 | % | | -8.04 | % | | 6.50 | % | | — | | — | | 5.46 | % | | 01/05 |
Milestone 2035 Fund | | -8.71 | % | | -9.00 | % | | 6.61 | % | | — | | — | | 5.52 | % | | 01/05 |
Milestone 2040 Fund | | -9.03 | % | | -9.38 | % | | 6.53 | % | | — | | — | | 5.45 | % | | 01/05 |
| * | Past performance does not guarantee future results. Investment returns and principal value will fluctuate so that shares, when redeemed, may be worth more or less than their original cost. Performance information for periods prior to March 1, 1999 for Actively Managed and Class I shares of the Index Funds and for the Model Portfolio Funds prior to December 4, 2000, represents performance of the Funds prior to SEC registrations. For periods prior to March 1, 1999, the performance shown is of a commingled fund that had the same investment objectives and policies of each respective fund that was advised by an affiliate of each fund’s adviser. This past performance was adjusted at a fund’s inception to reflect expenses of a fund. The commingled funds were not registered mutual funds and therefore were not subject to the same investment and tax restrictions as a registered fund. If the commingled funds had been subject to such restrictions, performance may have been lower. All returns assume reinvested dividends and do not reflect the deduction of taxes that a shareholder would pay on fund distributions or the redemption of fund shares. Please consult the current prospectus carefully before investing any money. The Vantagepoint Funds are distributed by ICMA-RC Services LLC, a wholly owned broker-dealer subsidiary of ICMA-RC and member FINRA/SIPC. For a current prospectus and for performance data current to the most recent month end, contact ICMA-RC Services LLC by calling 1-800-669-7400, or by visiting icmarc.org. Para asistencia en Español llame al 1-800-669-8216. |
1 | Investments in the Vantagepoint Money Market Fund are not insured or guaranteed by the Federal Deposit Insurance Corporation or any other government agency. Although the Fund seeks to preserve the value of your investment at $1.00 per share, it is possible to lose money by investing in the Fund. Performance of the Vantagepoint Money Market Fund is dependent upon the performance of the underlying fund in which it invests. |
2 | Effective May 1, 2007, the name and principal investment strategies of each of these funds were changed. Prior to that date, the Low Duration Bond Fund was known as the Short-Term Bond Fund and the Inflation Protected Securities Fund was known as the US Government Securities Fund. In addition to the change of name and investment strategies, new subadvisers were hired to manage the Inflation Protected Securities Fund. As such, performance prior to May 1, 2007, should not be considered representative of these two funds as actively managed. |
3 | Performance of the Model Portfolio and Milestone Funds is dependent upon the performance of the underlying funds in which each Model Portfolio and Milestone Fund invests. |
9
Vantagepoint Funds Investment Objectives
Fund ticker symbols are included in parentheses after Fund names. Total net assets presented are as of June 30, 2008.
Actively Managed Funds
| | | | |
Money Market Fund1 (VAMXX) | | Year of Inception: 1999 | | Total Net Assets: $358 million |
| | | | |
| |
Investment Objective: | | To seek maximum current income, consistent with maintaining liquidity and a stable share price of $1.00. |
| | |
Market Index: | | 30-Day Treasury Bill | | |
| | |
Peer Group: | | MFR Prime Retail Average | | |
| | | | |
Low Duration Bond Fund 2 (VPIPX) | | Year of Inception: 2000 | | Total Net Assets: $503 million |
| | | | |
| |
Investment Objective: | | To seek total return that is consistent with preservation of capital. |
| | |
Investment Subadvisers: | | Payden & Rygel | | |
| | STW Fixed Income Management Ltd. | | |
| |
Market Index: | | Merrill Lynch 1-3 Year Government/Corporate Index |
| |
Peer Group: | | Morningstar Short-Term Bond Funds Average |
| | | | |
Inflation Protected Securities Fund 2 (VPTSX) | | Year of Inception: 1992 | | Total Net Assets: $349 million |
| | | | |
| | |
Investment Objective: | | To offer current income. | | |
| |
Investment Subadviser: | | Pacific Investment Management Company |
| | BlackRock Financial Management, Inc. | | |
| | |
Market Index: | | Lehman Brothers U.S. TIPS Index | | |
| |
Peer Group: | | Morningstar Inflation Protected Bond Funds Average |
| | | | |
Asset Allocation Fund (VPAAX) | | Year of Inception: 1974 | | Total Net Assets: $622 million |
| | | | |
| |
Investment Objective: | | To offer long-term capital growth at a lower level of risk than an all-equity portfolio. |
| |
Investment Subadviser: | | Mellon Capital Management Corporation |
| | |
Market Indexes: | | S&P 500 Index | | |
| | Lehman Brothers Long-Term Treasury Index |
| | 91-Day U.S. T-Bills | | |
| |
Peer Group: | | Morningstar Moderate Allocation Funds Average |
1 | Investments in the Vantagepoint Money Market Fund are not insured or guaranteed by the Federal Deposit Insurance Corporation or any other government agency. Although the Fund seeks to preserve the value of your investment at $1.00 per share, it is possible to lose money by investing in the Fund. |
2 | Effective May 1, 2007, the name and principal investment strategies of each of these funds were changed. Prior to that date the Low Duration Bond Fund was known as the Short-Tem Bond Fund and the Inflation Protected Securities Fund was known as the US Government Securities Fund. |
10
| | | | |
Equity Income Fund (VPEIX) | | Year of Inception: 1994 | | Total Net Assets: $1,527 million |
| | | | |
| |
Investment Objective: | | To offer long-term capital growth with consistency derived from dividend yield. |
| |
Investment Subadvisers: | | Barrow, Hanley, Mewhinney, & Strauss, Inc. |
| | Southeastern Asset Management, Inc. | | |
| | T. Rowe Price Associates, Inc. | | |
| | |
Market Index: | | Russell 1000 Value Index | | |
| |
Peer Group: | | Morningstar Large Value Funds Average |
| | | | |
Growth & Income Fund (VPGIX) | | Year of Inception: 1998 | | Total Net Assets: $1,001 million |
| | | | |
| |
Investment Objective: | | To offer long-term capital growth and current income. |
| | |
Investment Subadvisers: | | Capital Guardian Trust Company | | |
| | T. Rowe Price Associates, Inc. | | |
| | Wellington Management Company, LLP |
| | |
Market Index: | | S&P 500 Index | | |
| |
Peer Group: | | Morningstar Large Blend Funds Average |
| | | | |
Growth Fund (VPGRX) | | Year of Inception: 1983 | | Total Net Assets: $2,200 million |
| | | | |
| |
Investment Objective: | | To offer long-term capital growth. |
| |
Investment Subadvisers: | | Goldman Sachs Asset Management, L.P. |
| | Legg Mason Capital Management, Inc. |
| | Peregrine Capital Management, Inc. |
| | Tukman Grossman Capital Management, Inc. |
| | Westfield Capital Management Company, L.P. |
| |
Market Index: | | Russell 1000 Growth Index |
| |
Peer Group: | | Morningstar Large Growth Funds Average |
| | | | |
Select Value Fund (VPSVX) | | Year of Inception: 2007 | | Total Net Assets: $279 million |
| | | | |
| |
Investment Objective: | | To offer long-term growth from dividend income and capital appreciation. |
| |
Investment Subadvisers: | | Goldman Sachs Asset Management, L.P. |
| | WEDGE Capital Management, L.L.P. | | |
| | Systematic Financial Management, L.P. | | |
| | |
Market Index: | | Russell MidCap Value Index | | |
| |
Peer Group: | | Morningstar Mid-Cap Value Funds Average |
| | | | |
Aggressive Opportunities Fund (VPAOX) | | Year of Inception: 1994 | | Total Net Assets: $978 million |
| | | | |
| |
Investment Objective: | | To offer high long-term capital appreciation. |
| | |
Investment Subadvisers: | | Legg Mason Capital Management, Inc. | | |
| | Southeastern Asset Management, Inc. | | |
| | T. Rowe Price Associates, Inc. | | |
| | TimesSquare Capital Management, LLC | | |
| | |
Market Index: | | Russell MidCap Growth Index | | |
| |
Peer Group: | | Morningstar Mid-Cap Growth Funds Average |
11
| | | | |
Discovery Fund (VPDSX) | | Year of Inception: 2007 | | Total Net Assets: $163 million |
| | | | |
| | |
Investment Objective: | | To offer long-term capital growth. | | |
| | |
Investment Subadvisers: | | Payden & Rygel | | |
| | Wellington Management Company, LLP |
| | |
Market Index: | | Russell 2000 Index | | |
| |
Peer Group: | | Morningstar Small Blend Funds Average |
| | | | |
International Fund (VPINX) | | Year of Inception: 1994 | | Total Net Assets: $1,047 million |
| | | | |
| |
Investment Objective: | | To offer long-term capital growth and diversification by country. |
| | |
Investment Subadvisers: | | Artisan Partners Limited Partnership | | |
| | Capital Guardian Trust Company | | |
| | GlobeFlex Capital, LP | | |
| | Walter Scott & Partners Limited | | |
| |
Market Index: | | Morgan Stanley Capital International (MSCI) Europe Australasia Far East (EAFE) Index |
| |
Peer Group: | | Morningstar Foreign Large Blend Funds Average |
| | | | |
Diversified Assets Fund (VPDAX) | | Year of Inception: 2007 | | Total Net Assets: $454 million |
| | | | |
Investment Objective: | | To offer long-term capital growth. | | |
| | |
Investment Subadvisers: | | Analytic Investors, LLC | | |
| | Drake Capital Management LLC | | |
| | Mellon Capital Management Corporation |
| | Payden & Rygel | | |
| |
Market Index: | | Lehman Brothers Intermediate Aggregate Bond Index |
| | |
Peer Group: | | Morningstar Long-Short Funds Average | | |
12
Index Funds
The Vantagepoint Index Funds are designed to approximate the investment characteristics and performance of their respective specified benchmarks. Mellon Capital Management Corporation is the subadviser for these funds.
(Class I and II ticker symbols are listed.) Inception date listed is for the fund and not for the respective classes.
| | | | |
Core Bond Index Fund (VPCIX/VPCDX) | | Year of Inception: 1997 | | Total Net Assets: $1,056 million |
| | | | |
| |
Investment Objective: | | To offer current income by approximating the performance of the Lehman Brothers Aggregate Bond Index. |
| | |
Market Index: | | Lehman Brothers Aggregate Bond Index | | |
| | | | |
500 Stock Index Fund (VPFIX/VPSKX) | | Year of Inception: 1997 | | Total Net Assets: $351 million |
| | | | |
| |
Investment Objective: | | To offer long-term capital growth by approximating the performance of the S&P 500 Index. |
| | |
Market Index: | | S&P 500 Index | | |
| | | | |
Broad Market Index Fund (VPMIX/VPBMX) | | Year of Inception: 1994 | | Total Net Assets: $559 million |
| | | | |
| |
Investment Objective: | | To offer long-term capital growth by approximating the performance of the Dow Jones Wilshire 5000 Composite Index. |
| |
Market Index: | | Dow Jones Wilshire 5000 Composite Index (FA) |
| | | | |
Mid/Small Company Index Fund (VPSIX/VPMSX) | | Year of Inception: 1997 | | Total Net Assets: $208 million |
| | | | |
| |
Investment Objective: | | To offer long-term capital growth by approximating the performance of the Dow Jones Wilshire 4500 Completion Index. |
| |
Market Index: | | Dow Jones Wilshire 4500 Completion Index (FA) |
| | | | |
Overseas Equity Index Fund (VPOIX/VPOEX) | | Year of Inception: 1997 | | Total Net Assets: $212 million |
| | | | |
| |
Investment Objective: | | To offer long-term capital growth and diversification by approximating the performance of the Morgan Stanley Capital International (MSCI) Europe Australasia Far East (EAFE) Free Index. |
| | |
Market Index: | | MSCI EAFE Free Index | | |
13
Model Portfolio Funds
| | | | |
Model Portfolio Savings Oriented Fund (VPSOX) | | Year of Inception: 1995 | | Total Net Assets: $309 million |
| | | | | | |
| Investment Objective: | | To offer capital preservation, reasonable current income, and some capital growth, while seeking to limit risk. |
| |
| Allocation Range: | | Fixed Income Funds |
| | Vantagepoint Low Duration Bond Fund | | 38% - 48% | | |
| | Vantagepoint Core Bond Index Fund (Class I) | | 8% - 18% | | |
| | Vantagepoint Inflation Protected Securities Fund | | 4% - 14% | | |
| |
| | | Equity Funds |
| | Vantagepoint Equity Income Fund | | 5% - 15% | | |
| | Vantagepoint Growth & Income Fund | | 5% - 15% | | |
| | Vantagepoint International Fund | | 0% - 10% | | |
| |
| | | Multi-Strategy Funds |
| | Vantagepoint Diversified Assets Fund | | 0% - 10% | | |
| | | |
| Market Indexes: | | S&P 500 Index | | | | |
| | Lehman Brothers Intermediate Aggregate Bond Index | | | | |
| | | |
| Peer Group: | | Morningstar Conservative Allocation Funds Average | | | | |
| | | | |
Model Portfolio Conservative Growth Fund (VPCGX) | | Year of Inception: 1996 | | Total Net Assets: $566 million |
| | | | | | |
Investment Objective: | | To offer reasonable current income and capital preservation, with modest potential for capital growth. |
| |
| Allocation Range: | | Fixed Income Funds |
| | Vantagepoint Low Duration Bond Fund | | 18% - 28% | | |
| | Vantagepoint Core Bond Index Fund (Class I) | | 16% - 26% | | |
| | Vantagepoint Inflation Protected Securities Fund | | 2% - 12% | | |
| |
| | | Equity Funds |
| | Vantagepoint Equity Income Fund | | 6% - 16% | | |
| | Vantagepoint Growth & Income Fund | | 4% - 14% | | |
| | Vantagepoint Growth Fund | | 1% - 11% | | |
| | Vantagepoint Select Value Fund | | 0% - 10% | | |
| | Vantagepoint Aggressive Opportunities Fund | | 0% - 10% | | |
| | Vantagepoint International Fund | | 3% - 13% | | |
| |
| | | Multi-Strategy Funds |
| | Vantagepoint Diversified Assets Fund | | 0% - 10% | | |
| | | |
Market Indexes: | | S&P 500 Index | | | | |
| | Lehman Brothers Intermediate Aggregate Bond Index | | | | |
| | | |
Peer Group: | | Morningstar Conservative Allocation Funds Average | | | | |
14
| | | | |
Model Portfolio Traditional Growth Fund (VPTGX) | | Year of Inception: 1996 | | Total Net Assets: $1,401 million |
| | | | | | |
| Investment Objective: | | To offer moderate capital growth and reasonable current income. | | | | |
| |
| Allocation Range: | | Fixed Income Funds |
| | Vantagepoint Low Duration Bond Fund | | 3% - 13% | | |
| | Vantagepoint Core Bond Index Fund (Class I) | | 13% - 23% | | |
| | Vantagepoint Inflation Protected Securities Fund | | 0% - 10% | | |
| |
| | | Equity Funds |
| | Vantagepoint Equity Income Fund | | 7% - 17% | | |
| | Vantagepoint Growth & Income Fund | | 7% - 17% | | |
| | Vantagepoint Growth Fund | | 5% - 15% | | |
| | Vantagepoint Select Value Fund | | 0% - 10% | | |
| | Vantagepoint Aggressive Opportunities Fund | | 0% - 10% | | |
| | Vantagepoint Discovery Fund | | 0% - 10% | | |
| | Vantagepoint International Fund | | 7% - 17% | | |
| |
| | | Multi-Strategy Funds |
| | Vantagepoint Diversified Assets Fund | | 0% -10% | | |
| | | |
| Market Indexes: | | S&P 500 Index | | | | |
| | Lehman Brothers Intermediate Aggregate Bond Index | | | | |
| | | |
| Peer Group: | | Morningstar Moderate Allocation Funds Average | | | | |
| | | | |
Model Portfolio Long-Term Growth Fund (VPLGX) | | Year of Inception: 1996 | | Total Net Assets: $1,583 million |
| | | | | | |
| Investment Objective: | | To offer high long-term capital growth and modest current income. | | | | |
| |
| Allocation Range: | | Fixed Income Funds |
| | Vantagepoint Core Bond Index Fund (Class I) | | 10% -20% | | |
| |
| | | Equity Funds |
| | Vantagepoint Equity Income Fund | | 8% -18% | | |
| | Vantagepoint Growth & Income Fund | | 8% -18% | | |
| | Vantagepoint Growth Fund | | 7% -17% | | |
| | Vantagepoint Select Value Fund | | 4% -14% | | |
| | Vantagepoint Aggressive Opportunities Fund | | 4% -14% | | |
| | Vantagepoint Discovery Fund | | 0% -10% | | |
| | Vantagepoint International Fund | | 11% -21% | | |
| |
| | | Multi-Strategy Funds |
| | Vantagepoint Diversified Assets Fund | | 0% -10% | | |
| | | |
| Market Indexes: | | S&P 500 Index | | | | |
| | Lehman Brothers Intermediate Aggregate Bond Index | | | | |
| | | |
| Peer Group: | | Morningstar Large Blend Funds Average | | | | |
| | | | |
Model Portfolio All-Equity Growth Fund (VPAGX) | | Year of Inception: 2000 | | Total Net Assets: $550 million |
| | | | | | |
| Investment Objective: | | To offer high long-term capital growth. | | | | |
| |
| Allocation Range: | | Equity Funds |
| | Vantagepoint Equity Income Fund | | 13% - 23% | | |
| | Vantagepoint Growth & Income Fund | | 12% - 22% | | |
| | Vantagepoint Growth Fund | | 12% - 22% | | |
| | Vantagepoint Select Value Fund | | 5% - 15% | | |
| | Vantagepoint Aggressive Opportunities Fund | | 5% - 15% | | |
| | Vantagepoint Discovery Fund | | 4% - 14% | | |
| | Vantagepoint International Fund | | 15% - 25% | | |
| | | |
| Market Indexes: | | S&P 500 Index | | | | |
| | MSCI EAFE Index | | | | |
| | | |
| Peer Group: | | Morningstar Large Blend Funds Average | | | | |
15
Vantagepoint Milestone Funds
| | | | |
Milestone Retirement Income Fund (VPRRX) | | Year of Inception: 2005 | | Total Net Assets: $53 million |
| | | | | | |
| Investment Objective: | | To seek to offer current income and opportunities for capital growth that have limited risk. |
| |
| Allocation Range: | | Fixed Income Funds |
| | Vantagepoint Low Duration Bond Fund | | 35% - 45% | | |
| | Vantagepoint Core Bond Index Fund (Class I) | | 6% - 16% | | |
| | Vantagepoint Inflation Protected Securities Fund | | 4% - 14% | | |
| |
| | | Equity Funds |
| | Vantagepoint Equity Income Fund | | 7% - 17% | | |
| | Vantagepoint Growth & Income Fund | | 7% - 17% | | |
| | Vantagepoint International Fund | | 1% - 11% | | |
| |
| | | Multi-Strategy Funds |
| | Vantagepoint Diversified Assets Fund | | 0% - 10% | | |
| | | |
| Market Indexes: | | S&P 500 Index | | | | |
| | Lehman Brothers Intermediate Aggregate Bond Index | | | | |
| | | |
| Peer Group: | | Morningstar Target Date 2000-2014 Funds Average | | | | |
| | | | |
Milestone 2010 Fund (VPRQX) | | Year of Inception: 2005 | | Total Net Assets: $73 million |
| | | | | | |
| Investment Objective: | | To offer high total return consistent with the Fund’s current asset allocation. |
| |
| Allocation Range: | | Fixed Income Funds |
| | Vantagepoint Low Duration Bond Fund | | 25% - 35% | | |
| | Vantagepoint Core Bond Index Fund (Class I) | | 6% - 16% | | |
| | Vantagepoint Inflation Protected Securities Fund | | 3% - 13% | | |
| |
| | | Equity Funds |
| | Vantagepoint Equity Income Fund | | 10% - 20% | | |
| | Vantagepoint Growth & Income Fund | | 6% - 16% | | |
| | Vantagepoint Growth Fund | | 0% - 10% | | |
| | Vantagepoint Mid/Small Company Index Fund (Class I) | | 0% - 10% | | |
| | Vantagepoint International Fund | | 3% - 13% | | |
| |
| | | Multi-Strategy Funds |
| | Vantagepoint Diversified Assets Fund | | 0% - 10% | | |
| | | |
| Market Indexes: | | S&P 500 Index | | | | |
| | Lehman Brothers Intermediate Aggregate Bond Index | | | | |
| | | |
| Peer Group: | | Morningstar Target Date 2000-2014 Funds Average | | | | |
| | | | |
Milestone 2015 Fund (VPRPX) | | Year of Inception: 2005 | | Total Net Assets: $138 million |
| | | | | | |
| Investment Objective: | | To offer high total return consistent with the Fund’s current asset allocation. |
| |
| Allocation Range: | | Fixed Income Funds |
| | Vantagepoint Low Duration Bond Fund | | 10% - 20% | | |
| | Vantagepoint Core Bond Index Fund (Class I) | | 12% - 22% | | |
| | Vantagepoint Inflation Protected Securities Fund | | 0% - 10% | | |
| |
| | | Equity Funds |
| | Vantagepoint Equity Income Fund | | 14% - 24% | | |
| | Vantagepoint Growth & Income Fund | | 6% - 16% | | |
| | Vantagepoint Growth Fund | | 3% - 13% | | |
| | Vantagepoint Mid/Small Company Index Fund (Class I) | | 2% - 12% | | |
| | Vantagepoint International Fund | | 6% - 16% | | |
| |
| | | Multi-Strategy Funds |
| | Vantagepoint Diversified Assets Fund | | 0% - 10% | | |
| | | |
| Market Indexes: | | S&P 500 Index | | | | |
| | Lehman Brothers Intermediate Aggregate Bond Index | | | | |
| | | |
| Peer Group: | | Morningstar Target Date 2015-2029 Funds Average | | | | |
16
| | | | |
Milestone 2020 Fund (VPROX) | | Year of Inception: 2005 | | Total Net Assets: $124 million |
| | | | | | |
| Investment Objective: | | To offer high total return consistent with the Fund’s current asset allocation. |
| |
| Allocation Range: | | Fixed Income Funds |
| | Vantagepoint Low Duration Bond Fund | | 2% - 12% | | |
| | Vantagepoint Core Bond Index Fund (Class I) | | 13% - 23% | | |
| |
| | | Equity Funds |
| | Vantagepoint Equity Income Fund | | 17% - 27% | | |
| | Vantagepoint Growth & Income Fund | | 7% - 17% | | |
| | Vantagepoint Growth Fund | | 4% - 14% | | |
| | Vantagepoint Mid/Small Company Index Fund (Class I) | | 5% - 15% | | |
| | Vantagepoint International Fund | | 8% - 18% | | |
| |
| | | Multi-Strategy Funds |
| | Vantagepoint Diversified Assets Fund | | 0% - 10% | | |
| | | |
| Market Indexes: | | S&P 500 Index | | | | |
| | Lehman Brothers Intermediate Aggregate Bond Index | | | | |
| | | |
| Peer Group: | | Morningstar Target Date 2015-2029 Funds Average | | | | |
| | | | |
Milestone 2025 Fund (VPRNX) | | Year of Inception: 2005 | | Total Net Assets: $90 million |
| | | | | | |
| Investment Objective: | | To offer high total return consistent with the Fund’s current asset allocation. |
| |
| Allocation Range: | | Fixed Income Funds |
| | Vantagepoint Low Duration Bond Fund | | 0% - 10% | | |
| | Vantagepoint Core Bond Index Fund (Class I) | | 10% - 20% | | |
| |
| | | Equity Funds |
| | Vantagepoint Equity Income Fund | | 18% - 28% | | |
| | Vantagepoint Growth & Income Fund | | 8% - 18% | | |
| | Vantagepoint Growth Fund | | 5% - 15% | | |
| | Vantagepoint Mid/Small Company Index Fund (Class I) | | 7% - 17% | | |
| | Vantagepoint International Fund | | 10% - 20% | | |
| |
| | | Multi-Strategy Funds |
| | Vantagepoint Diversified Assets Fund | | 0% - 10% | | |
| | | |
| Market Indexes: | | S&P 500 Index | | | | |
| | Lehman Brothers Intermediate Aggregate Bond Index | | | | |
| | | |
| Peer Group: | | Morningstar Target Date 2015-2029 Funds Average | | | | |
| | | | |
Milestone 2030 Fund (VPRMX) | | Year of Inception: 2005 | | Total Net Assets: $69 million |
| | | | | | |
| Investment Objective: | | To offer high total return consistent with the Fund’s current asset allocation. |
| |
| Allocation Range: | | Fixed Income Funds |
| | Vantagepoint Core Bond Index Fund (Class I) | | 8% - 18% | | |
| |
| | | Equity Funds |
| | Vantagepoint Equity Income Fund | | 20% - 30% | | |
| | Vantagepoint Growth & Income Fund | | 9% - 19% | | |
| | Vantagepoint Growth Fund | | 6% - 16% | | |
| | Vantagepoint Mid/Small Company Index Fund (Class I) | | 10% - 20% | | |
| | Vantagepoint International Fund | | 11% - 21% | | |
| |
| | | Multi-Strategy Funds |
| | Vantagepoint Diversified Assets Fund | | 0% - 10% | | |
| | | |
| Market Indexes: | | S&P 500 Index | | | | |
| | Lehman Brothers Intermediate Aggregate Bond Index | | | | |
| | | |
| Peer Group: | | Morningstar Target Date 2030+ Funds Average | | | | |
17
| | | | |
Milestone 2035 Fund (VPRLX) | | Year of Inception: 2005 | | Total Net Assets: $39 million |
| | | | | | |
| Investment Objective: | | To offer high total return consistent with the Fund’s current asset allocation |
| |
| Allocation Range: | | Fixed Income Funds |
| | Vantagepoint Core Bond Index Fund (Class I) | | 6% - 16% | | |
| |
| | | Equity Funds |
| | Vantagepoint Equity Income Fund | | 21% - 31% | | |
| | Vantagepoint Growth & Income Fund | | 10% - 20% | | |
| | Vantagepoint Growth Fund | | 7% - 17% | | |
| | Vantagepoint Mid/Small Company Index Fund (Class I) | | 13% - 23% | | |
| | Vantagepoint International Fund | | 13% - 23% | | |
| |
| | | Multi-Strategy Funds |
| | Vantagepoint Diversified Assets Fund | | 0% - 10% | | |
| | | |
| Market Indexes: | | S&P 500 Index | | | | |
| | Lehman Brothers Intermediate Aggregate Bond Index | | | | |
| | | |
| Peer Group: | | Morningstar Target Date 2030+ Funds Average | | | | |
| | | | |
Milestone 2040 Fund (VPRKX) | | Year of Inception: 2005 | | Total Net Assets: $38 million |
| | | | | | |
| Investment Objective: | | To offer high total return consistent with the Fund’s current asset allocation |
| |
| Allocation Range: | | Fixed Income Funds |
| | Vantagepoint Core Bond Index Fund (Class I) | | 5% - 15% | | |
| |
| | | Equity Funds |
| | Vantagepoint Equity Income Fund | | 21% - 31% | | |
| | Vantagepoint Growth & Income Fund | | 10% - 20% | | |
| | Vantagepoint Growth Fund | | 7% - 17% | | |
| | Vantagepoint Mid/Small Company Index Fund (Class I) | | 14% - 24% | | |
| | Vantagepoint International Fund | | 13% - 23% | | |
| | | |
| Market Indexes: | | S&P 500 Index | | | | |
| | MSCI EAFE Index | | | | |
| | | |
| Peer Group: | | Morningstar Target Date 2030+ Funds Average | | | | |
The following describes the market indexes noted:
S&P 500 Index — consists of 500 companies representing larger capitalization stocks traded in the U.S.
Dow Jones Wilshire 5000 Composite Index (FA) — consists of substantially all common equity securities of companies domiciled in the U.S. for which daily pricing is available and is calculated using a float adjusted methodology.
Dow Jones Wilshire 4500 Completion Index (FA) — consists of all equity securities of companies domiciled in the U.S. for which daily pricing is available less the 500 stocks in the S&P 500 Index and is calculated using a float adjusted methodology.
Merrill Lynch 1-3 Year Government/Corporate Bond Index — tracks the performance of U.S. dollar-denominated investment grade Government and corporate public debt issued in the U.S. domestic bond market with maturities ranging between 1 and 3 years.
Morgan Stanley Capital International (MSCI) Europe Australasia Far East (EAFE) Index (“EAFE Index”) — is a free float-adjusted market capitalization index that is designed to measure developed market equity performance excluding the U.S. and Canada.
Morgan Stanley Capital International (MSCI) Europe Australasia Far East (EAFE) Free Index (“EAFE Free Index”) — is a free float-adjusted market capitalization index that is designed to measure developed market equity performance excluding the U.S. and Canada.
Lehman Aggregate Bond Index — consists of investment-grade U.S. fixed income securities.
Lehman Brothers Intermediate Aggregate Bond Index — consists of U.S. Government, mortgage, corporate and asset backed securities with maturities of one to 10 years.
Lehman Brothers U.S. TIPS Index — consists of all U.S. Treasury Inflation Protected Securities rated investment grade or better, having at lease one year to final maturity and at least $250 million par amount outstanding.
Lehman Brothers Long-Term Treasury Bond Index — consists of all Treasury obligations with maturities of 10 years or greater.
Russell 1000 Index — measures the performance of the large-cap segment of the U.S. equity universe. It is a subset of the Russell 3000 Index and includes approximately 1000 of the largest securities based on a combination of their market cap and current index membership. The Russell 1000 represents approximately 92% of the U.S. market.
Russell 1000 Value Index — measures the performance of the large-cap value segment of the U.S. equity universe. It includes the Russell 1000 companies with lower price-to-book ratios and higher forecasted growth values.
Russell 1000 Growth Index — measures the performance of the large-cap growth segment of the U.S. equity universe. It includes those Russell companies with higher price-to-book ratios and higher forecasted growth values.
Russell MidCap Index — measures the performance of the mid-cap segment of the U.S. equity universe. The Russell Midcap Index is a subset of the Russell 1000 Index.
Russell MidCap Growth Index — measures the performance of the mid-cap growth segment of the U.S. equity universe. It includes those Russell Midcap Index companies with higher price-to-book ratios and higher forecasted growth values.
Russell 2000 Index — measures the performance of the small-cap segment of the U.S. equity universe.
18
Vantagepoint Funds Asset Allocations (percentages of total assets)
| | | | | | | | | | | | | | | | | | | | | | | | | | | | | | | | | | | | | | | |
Fund Name | | Repurchase
Agreements | | | Certificates of
Deposits | | | Time
Deposits | | | Variable
Rate
Demand
Notes | | | Commercial
Paper | | | Medium
Term
Notes | | | Funding
Agreements | | | Asset-backed
Commercial
Paper | | | U.S. Gov’t
Agency
Discount
Notes | | | Master
Notes | | | Euro CDs | | | Bank
Notes | | | U.S. Agency
Floater
Notes | |
Vantagepoint Money Market Fund | | 9.9 | % | | 28.4 | % | | 4.2 | % | | 5.2 | % | | 5.1 | % | | 4.7 | % | | 1.2 | % | | 34.2 | % | | 0.2 | % | | 2.3 | % | | 3.3 | % | | 0.8 | % | | 0.5 | % |
| | | | | | | | | | | | | | | | | | | | | | | | |
| | | Asset-backed | | | Mortgage-related | | | Muni | | | Non-US | | | US Agency | | | US Corp | | | US Treas | | | Cash | |
Vantagepoint Low Duration Bond Fund | | 22.6 | % | | 9.0 | % | | 0.0 | % | | 1.1 | % | | 7.1 | % | | 35.9 | % | | 20.5 | % | | 3.8 | % |
Vantagepoint Inflation Protected Securities Fund | | 0.4 | % | | 3.1 | % | | 0.0 | % | | 0.0 | % | | 2.0 | % | | 1.8 | % | | 92.9 | % | | 0.0 | % |
Vantagepoint Core Bond Index Fund Class I | | 0.7 | % | | 44.0 | % | | 0.2 | % | | 2.8 | % | | 10.9 | % | | 19.4 | % | | 22.0 | % | | 0.1 | % |
Vantagepoint Core Bond Index Fund Class II | | 0.7 | % | | 44.0 | % | | 0.2 | % | | 2.8 | % | | 10.9 | % | | 19.4 | % | | 22.0 | % | | 0.1 | % |
| | | | | | | | | | | | | | | | | | | | | | | | | | | | | | | | | |
| | | Consumer
Discretionary | | | Consumer
Staples | | | Energy | | | Financials | | | Health Care | | | Industrials | | | Information
Technology | | | Materials | | | Telecomm | | | Utilities | | | Cash &
Equivalents | |
Vantagepoint Equity Income Fund | | 18.3 | % | | 5.5 | % | | 14.6 | % | | 15.4 | % | | 7.6 | % | | 9.7 | % | | 12.3 | % | | 3.8 | % | | 4.6 | % | | 3.8 | % | | 4.4 | % |
Vantagepoint 500 Stock Index Fund Class I | | 8.0 | % | | 10.5 | % | | 15.8 | % | | 13.9 | % | | 11.7 | % | | 11.0 | % | | 16.2 | % | | 3.8 | % | | 3.3 | % | | 3.9 | % | | 1.9 | % |
Vantagepoint 500 Stock Index Fund Class II | | 8.0 | % | | 10.5 | % | | 15.8 | % | | 13.9 | % | | 11.7 | % | | 11.0 | % | | 16.2 | % | | 3.8 | % | | 3.3 | % | | 3.9 | % | | 1.9 | % |
Vantagepoint Growth & Income Fund | | 8.2 | % | | 9.4 | % | | 10.2 | % | | 14.7 | % | | 13.6 | % | | 8.6 | % | | 18.5 | % | | 5.6 | % | | 4.1 | % | | 3.3 | % | | 4.0 | % |
Vantagepoint Broad Market Index Fund Class I | | 8.9 | % | | 9.1 | % | | 15.2 | % | | 14.9 | % | | 11.5 | % | | 11.4 | % | | 16.3 | % | | 4.4 | % | | 2.9 | % | | 4.2 | % | | 1.3 | % |
Vantagepoint Broad Market Index Fund Class II | | 8.9 | % | | 9.1 | % | | 15.2 | % | | 14.9 | % | | 11.5 | % | | 11.4 | % | | 16.3 | % | | 4.4 | % | | 2.9 | % | | 4.2 | % | | 1.3 | % |
Vantagepoint Growth Fund | | 7.7 | % | | 11.7 | % | | 7.1 | % | | 11.9 | % | | 10.7 | % | | 12.6 | % | | 32.3 | % | | 2.0 | % | | 0.1 | % | | 0.9 | % | | 3.1 | % |
Vantagepoint Select Value Fund | | 11.8 | % | | 6.9 | % | | 7.0 | % | | 25.9 | % | | 4.8 | % | | 9.2 | % | | 10.1 | % | | 7.7 | % | | 1.7 | % | | 12.9 | % | | 2.0 | % |
Vantagepoint Aggressive Opportunities Fund | | 17.5 | % | | 1.6 | % | | 7.6 | % | | 13.0 | % | | 14.1 | % | | 13.4 | % | | 22.3 | % | | 2.9 | % | | 4.5 | % | | 0.3 | % | | 2.8 | % |
Vantagepoint Mid-Small Company Index Fund Class I | | 10.9 | % | | 2.8 | % | | 12.5 | % | | 19.4 | % | | 10.2 | % | | 13.8 | % | | 15.4 | % | | 6.4 | % | | 1.6 | % | | 5.2 | % | | 1.8 | % |
Vantagepoint Mid-Small Company Index Fund Class II | | 10.9 | % | | 2.8 | % | | 12.5 | % | | 19.4 | % | | 10.2 | % | | 13.8 | % | | 15.4 | % | | 6.4 | % | | 1.6 | % | | 5.2 | % | | 1.8 | % |
Vantagepoint Discovery Fund* | | 9.8 | % | | 2.7 | % | | 13.7 | % | | 15.5 | % | | 12.7 | % | | 12.8 | % | | 17.3 | % | | 6.7 | % | | 2.8 | % | | 2.0 | % | | 4.1 | % |
| * | The Sector Allocation reflected was calculated using the actual equity securities held by the Vantagepoint Discovery Fund and blending them with the sectors represented in the Russell 2000 Index futures held by this Fund. |
| | | | | | | | | | | | | | | | | | | | | | | | | | | | | | | | | | | | | | | | | | | | | |
| | | Australia | | | Canada | | | France | | | Germany | | | Hong Kong | | | Italy | | | Japan | | | Netherlands | | | Russia | | | Spain | | | Sweden | | | Switzerland | | | United
Kingdom | | | U.S.
Cash | | | Other** | |
Vantagepoint Overseas Equity Index Fund Class I | | 6.6 | % | | 0.0 | % | | 9.6 | % | | 8.7 | % | | 2.1 | % | | 3.7 | % | | 20.6 | % | | 4.6 | % | | 0.0 | % | | 3.9 | % | | 2.2 | % | | 6.8 | % | | 19.5 | % | | 1.9 | % | | 9.8 | % |
Vantagepoint Overseas Equity Index Fund Class II | | 6.6 | % | | 0.0 | % | | 9.6 | % | | 8.7 | % | | 2.1 | % | | 3.7 | % | | 20.6 | % | | 4.6 | % | | 0.0 | % | | 3.9 | % | | 2.2 | % | | 6.8 | % | | 19.5 | % | | 1.9 | % | | 9.8 | % |
Vantagepoint International Fund | | 2.7 | % | | 6.3 | % | | 9.7 | % | | 7.6 | % | | 5.0 | % | | 1.6 | % | | 23.0 | % | | 2.8 | % | | 2.0 | % | | 3.4 | % | | 1.8 | % | | 7.8 | % | | 12.3 | % | | 3.5 | % | | 10.6 | % |
| ** | Other represents countries with under a 2% individual weighting. |
Rows may not sum to 100% due to rounding.
19
Vantagepoint Funds Asset Allocations (percentages of total assets) continued
| | | | | | | | | | | | | | | | | | | | | | | | | | | | | | | | | | | | |
| | | Low
Duration
Bond
Fund | | | Core
Bond
Index
Fund | | | Inflation
Protected
Securities
Fund | | | Equity
Income
Fund | | | Growth &
Income
Fund | | | Growth
Fund | | | Select
Value
Fund | | | Mid/Small
Index
Fund | | | Aggressive
Opportunities
Fund | | | Discovery
Fund | | | International
Fund | | | Diversified
Assets
Fund | |
Vantagepoint Model Portfolio Savings Oriented Fund | | 43.0 | % | | 13.0 | % | | 9.0 | % | | 10.0 | % | | 10.0 | % | | 0.0 | % | | 0.0 | % | | 0.0 | % | | 0.0 | % | | 0.0 | % | | 5.0 | % | | 10.0 | % |
Vantagepoint Model Portfolio Conservative Growth Fund | | 23.0 | % | | 20.5 | % | | 6.5 | % | | 11.0 | % | | 9.0 | % | | 6.0 | % | | 3.0 | % | | 0.0 | % | | 3.0 | % | | 0.0 | % | | 8.0 | % | | 10.0 | % |
Vantagepoint Model Portfolio Traditional Growth Fund | | 8.0 | % | | 18.0 | % | | 4.0 | % | | 12.0 | % | | 12.0 | % | | 10.0 | % | | 5.5 | % | | 0.0 | % | | 5.5 | % | | 3.0 | % | | 12.0 | % | | 10.0 | % |
Vantagepoint Model Portfolio Long-Term Growth Fund | | 15.0 | % | | 0.0 | % | | 0.0 | % | | 13.0 | % | | 13.0 | % | | 11.5 | % | | 8.5 | % | | 0.0 | % | | 8.5 | % | | 4.5 | % | | 16.0 | % | | 10.0 | % |
Vantagepoint Model Portfolio All-Equity Growth Fund | | 0.0 | % | | 0.0 | % | | 0.0 | % | | 18.0 | % | | 17.0 | % | | 17.0 | % | | 9.5 | % | | 0.0 | % | | 9.5 | % | | 9.0 | % | | 20.0 | % | | 0.0 | % |
Vantagepoint Milestone Retirement Income Fund | | 40.0 | % | | 11.0 | % | | 9.0 | % | | 12.0 | % | | 12.0 | % | | 0.0 | % | | 0.0 | % | | 0.0 | % | | 0.0 | % | | 0.0 | % | | 6.0 | % | | 10.0 | % |
Vantagepoint Milestone 2010 Fund | | 33.0 | % | | 11.0 | % | | 8.0 | % | | 14.0 | % | | 11.6 | % | | 2.8 | % | | 0.0 | % | | 2.0 | % | | 0.0 | % | | 0.0 | % | | 7.6 | % | | 10.0 | % |
Vantagepoint Milestone 2015 Fund | | 17.5 | % | | 14.6 | % | | 3.9 | % | | 18.6 | % | | 11.0 | % | | 7.4 | % | | 0.0 | % | | 6.2 | % | | 0.0 | % | | 0.0 | % | | 10.8 | % | | 10.0 | % |
Vantagepoint Milestone 2020 Fund | | 8.0 | % | | 18.7 | % | | 0.0 | % | | 21.6 | % | | 11.6 | % | | 8.4 | % | | 0.0 | % | | 9.0 | % | | 0.0 | % | | 0.0 | % | | 12.7 | % | | 10.0 | % |
Vantagepoint Milestone 2025 Fund | | 3.0 | % | | 15.5 | % | | 0.0 | % | | 23.1 | % | | 13.1 | % | | 9.4 | % | | 0.0 | % | | 11.5 | % | | 0.0 | % | | 0.0 | % | | 14.5 | % | | 10.0 | % |
Vantagepoint Milestone 2030 Fund | | 0.0 | % | | 12.8 | % | | 0.0 | % | | 24.4 | % | | 14.2 | % | | 10.4 | % | | 0.0 | % | | 14.2 | % | | 0.0 | % | | 0.0 | % | | 16.0 | % | | 8.0 | % |
Vantagepoint Milestone 2035 Fund | | 0.0 | % | | 11.1 | % | | 0.0 | % | | 25.4 | % | | 14.7 | % | | 11.4 | % | | 0.0 | % | | 17.2 | % | | 0.0 | % | | 0.0 | % | | 17.3 | % | | 3.0 | % |
Vantagepoint Milestone 2040 Fund | | 0.0 | % | | 10.0 | % | | 0.0 | % | | 26.0 | % | | 15.0 | % | | 12.0 | % | | 0.0 | % | | 19.0 | % | | 0.0 | % | | 0.0 | % | | 18.0 | % | | 0.0 | % |
| | | | | | | | | | | | | | | | | | | | | | | | |
| | | Stocks | | | Bonds | | | Cash | | | | | | | |
Vantagepoint Asset Allocation Fund | | | | | 100 | % | | | | | 0 | % | | | | | 0 | % | | | | | | |
| | | | |
| | | Stocks | | | Bonds | | | Cash | | | Currencies | |
| | | Short | | | Long | | | Short | | | Long | | | Short | | | Long | | | Short | | | Long | |
Vantagepoint Diversified Assets Fund* | | -17 | % | | 25 | % | | -42 | % | | 137 | % | | 0 | % | | 18 | % | | -40 | % | | 40 | % |
| * | Portfolio exposures represent the market value of physical securities and the measurement of exposure through the derivative instruments held by the Vantagepoint Diversified Assets Fund as a percent of the Fund’s net assets. For the purpose of displaying this allocation information, exposure through derivatives is measured based on the value of the underlying assets, rate or index represented by the derivative. This measurement is different from the valuation used for the purposes of calculating the Fund’s net asset value. This measurement method is intended to reflect the “economic exposure “ of the derivative – effectively, the market exposure, to the Fund. This may result in a total percentage reflected in the chart that exceeds 100%. In its use of derivative instruments, the Vantagepoint Diversified Assets Fund may take both long positions (the values of which move in the same direction as the prices of the underlying investments, pools of investments, indexes or currencies) and short positions (the values of which move in the opposite direction as the prices of the underlying investments, pools of investments, indexes or currencies). These long and short positions are reflected in the chart above. |
Rows may not sum to 100% due to rounding.
20
VANTAGEPOINT FUNDS
Statements of Assets & Liabilities
June 30, 2008 (Unaudited)
| | | | | | | | | | | | | | | | | |
| | | Money
Market | | Low Duration
Bond(1) | | | Inflation
Protected
Securities(2) | | Asset
Allocation | | | Equity
Income |
ASSETS: | | | | | | | | | | | | | | | | | |
Securities, at market value† | | $ | 354,969,445 | | $ | 613,236,209 | | | $ | 464,286,866 | | $ | 650,502,560 | | | $ | 1,682,734,295 |
Cash | | | — | | | 1,966 | | | | 178,822 | | | — | | | | 52,993 |
Cash collateral for futures contracts | | | — | | | — | | | | 2,150,000 | | | — | | | | — |
Cash denominated in foreign currencies | | | — | | | — | | | | 205,921 | | | — | | | | — |
Receivable for: | | | | | | | | | | | | | | | | | |
Dividends | | | 752,941 | | | 28,529 | | | | 20,927 | | | 693,147 | | | | 1,734,793 |
Interest | | | — | | | 3,860,897 | | | | 2,759,288 | | | — | | | | — |
Security lending income | | | — | | | 29,513 | | | | 3,484 | | | 22,468 | | | | 170,269 |
Investments sold | | | — | | | 893,124 | | | | 197,073 | | | 18 | | | | 2,681,400 |
Fund shares sold | | | 2,677,376 | | | 1,462,818 | | | | 3,441,296 | | | — | | | | 640,125 |
Recoverable foreign taxes | | | — | | | — | | | | 4,545 | | | — | | | | — |
Unrealized gain on swaps | | | — | | | — | | | | 110,100 | | | — | | | | — |
Variation margin on futures contracts | | | — | | | — | | | | — | | | 94,765 | | | | — |
Gross unrealized gain on forward foreign currency exchange contracts | | | — | | | — | | | | 47,560 | | | — | | | | — |
Due from Broker | | | — | | | — | | | | 16,070 | | | — | | | | — |
| | | | | | | | | | | | | | | | | |
Total Assets | | | 358,399,762 | | | 619,513,056 | | | | 473,421,952 | | | 651,312,958 | | | | 1,688,013,875 |
| | | | | | | | | | | | | | | | | |
LIABILITIES: | | | | | | | | | | | | | | | | | |
Payable for: | | | | | | | | | | | | | | | | | |
Investments purchased | | | — | | | 1,009,961 | | | | 18,446,469 | | | 299,257 | | | | 2,513,978 |
Distributions | | | 598,425 | | | 1,462,806 | | | | 2,229,859 | | | — | | | | — |
Fund shares redeemed | | | 42,656 | | | 412,781 | | | | 143,027 | | | 264,794 | | | | 633,123 |
Variation margin on futures contracts | | | — | | | — | | | | 6,445 | | | — | | | | — |
Collateral for securities loaned | | | — | | | 113,124,259 | | | | 102,327,713 | | | 27,099,058 | | | | 155,350,007 |
Unrealized loss on swaps | | | — | | | — | | | | 1,026,469 | | | — | | | | — |
Options written, at value (Cost $0, $0, $(259,965), $0 and $0, respectively) | | | — | | | — | | | | 253,862 | | | — | | | | — |
Due to custodian | | | — | | | — | | | | — | | | 379,309 | | | | — |
Gross unrealized loss on forward foreign currency exchange contracts | | | — | | | — | | | | 105 | | | — | | | | — |
Accrued Expenses: | | | | | | | | | | | | | | | | | |
Advisory fees | | | 29,050 | | | 41,124 | | | | 27,975 | | | 53,742 | | | | 131,307 |
Subadviser fees | | | — | | | 408,944 | | | | 183,619 | | | 405,330 | | | | 1,519,307 |
Investor services | | | 58,101 | | | 82,250 | | | | 55,951 | | | 107,487 | | | | 262,619 |
Fund services | | | 43,576 | | | 61,688 | | | | 41,963 | | | 80,615 | | | | 196,965 |
Administration | | | 5,139 | | | 14,345 | | | | 7,244 | | | 21,255 | | | | 33,851 |
Directors | | | 974 | | | 1,781 | | | | 834 | | | 2,562 | | | | 5,703 |
Other accrued expense | | | 13,091 | | | 73,021 | | | | 26,528 | | | 140,488 | | | | 140,120 |
| | | | | | | | | | | | | | | | | |
Total Liabilities | | | 791,012 | | | 116,692,960 | | | | 124,778,063 | | | 28,853,897 | | | | 160,786,980 |
| | | | | | | | | | | | | | | | | |
NET ASSETS | | $ | 357,608,750 | | $ | 502,820,096 | | | $ | 348,643,889 | | $ | 622,459,061 | | | $ | 1,527,226,895 |
| | | | | | | | | | | | | | | | | |
NET ASSETS REPRESENTED BY: | | | | | | | | | | | | | | | | | |
Paid-in capital | | $ | 357,608,750 | | $ | 510,372,957 | | | $ | 341,434,319 | | $ | 579,499,590 | | | $ | 1,448,698,137 |
Net unrealized appreciation (depreciation) on investments, futures contracts, foreign currency transactions, written options and swaps | | | — | | | (2,023,290 | ) | | | 5,800,766 | | | 49,925,429 | | | | 30,973,622 |
Undistributed net investment income | | | — | | | 147,563 | | | | 323,340 | | | 5,446,398 | | | | 12,906,969 |
Accumulated net realized gain (loss) on investments, futures contracts, foreign currency transactions, written options and swaps | | | — | | | (5,677,134 | ) | | | 1,085,464 | | | (12,412,356 | ) | | | 34,648,167 |
| | | | | | | | | | | | | | | | | |
NET ASSETS | | $ | 357,608,750 | | $ | 502,820,096 | | | $ | 348,643,889 | | $ | 622,459,061 | | | $ | 1,527,226,895 |
| | | | | | | | | | | | | | | | | |
CAPITAL SHARES: | | | | | | | | | | | | | | | | | |
Net Assets | | $ | 357,608,750 | | $ | 502,820,096 | | | $ | 348,643,889 | | $ | 622,459,061 | | | $ | 1,527,226,895 |
Shares Outstanding | | | 357,608,747 | | | 51,355,083 | | | | 32,780,505 | | | 83,156,891 | | | | 176,203,904 |
Net Asset Value offering and redemption price per share (net assets divided by shares outstanding) | | $ | 1.00 | | $ | 9.79 | | | $ | 10.64 | | $ | 7.49 | | | $ | 8.67 |
Cost of investments | | $ | 354,969,445 | | $ | 615,259,499 | | | $ | 457,375,745 | | $ | 592,184,926 | | | $ | 1,651,760,673 |
Cost of cash denominated in foreign currencies | | $ | — | | $ | — | | | $ | 202,467 | | $ | — | | | $ | — |
|
† Includes securities on loan with market values of (Note 6): | | $ | — | | $ | 110,879,477 | | | $ | 100,113,357 | | $ | 26,201,038 | | | $ | 149,727,913 |
(1) Formerly Short-Term Bond Fund. |
(2) Formerly US Government Securities Fund. |
| | | | |
| | See Notes to Financial Statements. | | 21 |
VANTAGEPOINT FUNDS
Statements of Assets & Liabilities
June 30, 2008 (Unaudited)
| | | | | | | | | | | | | | | |
| | | Growth &
Income | | Growth | | | Select
Value | | | Aggressive
Opportunities | |
ASSETS: | | | | | | | | | | | | | | | |
Securities, at market value† | | $ | 1,063,483,124 | | $ | 2,341,856,274 | | | $ | 340,033,799 | | | $ | 1,209,666,277 | |
Cash | | | 12,109,598 | | | — | | | | — | | | | 17,459 | |
Cash denominated in foreign currencies | | | — | | | — | | | | 18,681 | | | | 174,724 | |
Receivable for: | | | | | | | | | | | | | | | |
Dividends | | | 1,205,831 | | | 1,650,129 | | | | 493,964 | | | | 582,382 | |
Interest | | | 1,706 | | | — | | | | — | | | | 143,293 | |
Security lending income | | | 33,310 | | | 111 | | | | 21,631 | | | | 309,580 | |
Investments sold | | | 4,827,718 | | | 8,854,038 | | | | 11,741,369 | | | | 3,295,215 | |
Fund shares sold | | | 401,612 | | | 278,436 | | | | 105,055 | | | | 154,766 | |
Recoverable foreign taxes | | | 18,219 | | | 23,358 | | | | — | | | | — | |
Variation margin on futures contracts | | | — | | | — | | | | 275 | | | | — | |
| | | | | | | | | | | | | | | |
Total Assets | | | 1,082,081,118 | | | 2,352,662,346 | | | | 352,414,774 | | | | 1,214,343,696 | |
| | | | | | | | | | | | | | | |
LIABILITIES: | | | | | | | | | | | | | | | |
Payable for: | | | | | | | | | | | | | | | |
Investments purchased | | | 7,374,127 | | | 16,650,745 | | | | 10,957,323 | | | | 4,425,921 | |
Fund shares redeemed | | | 181,386 | | | 1,205,077 | | | | 11,056 | | | | 512,339 | |
Collateral for securities loaned | | | 72,424,113 | | | 131,529,337 | | | | 62,000,345 | | | | 229,834,163 | |
Due to custodian | | | — | | | 2,426 | | | | 29,567 | | | | — | |
Accrued Expenses: | | | | | | | | | | | | | | | |
Advisory fees | | | 85,396 | | | 188,956 | | | | 24,018 | | | | 85,185 | |
Subadviser fees | | | 762,672 | | | 2,153,747 | | | | 517,821 | | | | 1,068,523 | |
Investor services | | | 170,794 | | | 377,918 | | | | 48,037 | | | | 170,373 | |
Fund services | | | 128,096 | | | 283,440 | | | | 36,028 | | | | 127,781 | |
Administration | | | 22,275 | | | 71,222 | | | | 8,935 | | | | 26,437 | |
Directors | | | 3,780 | | | 8,813 | | | | 790 | | | | 4,054 | |
Other accrued expense | | | 105,591 | | | 288,709 | | | | 52,179 | | | | 136,417 | |
| | | | | | | | | | | | | | | |
Total Liabilities | | | 81,258,230 | | | 152,760,390 | | | | 73,686,099 | | | | 236,391,193 | |
| | | | | | | | | | | | | | | |
NET ASSETS | | $ | 1,000,822,888 | | $ | 2,199,901,956 | | | $ | 278,728,675 | | | $ | 977,952,503 | |
| | | | | | | | | | | | | | | |
NET ASSETS REPRESENTED BY: | | | | | | | | | | | | | | | |
Paid-in capital | | $ | 976,230,705 | | $ | 2,382,813,500 | | | $ | 318,780,768 | | | $ | 957,812,177 | |
Net unrealized appreciation (depreciation) on investments, futures contracts, foreign currency transactions, written options and swaps | | | 13,143,020 | | | 112,593,007 | | | | (25,833,663 | ) | | | (39,228,372 | ) |
Undistributed net investment income | | | 5,246,378 | | | 6,729,395 | | | | 1,871,952 | | | | 1,974,491 | |
Accumulated net realized gain (loss) on investments, futures contracts, foreign currency transactions, written options and swaps | | | 6,202,785 | | | (302,233,946 | ) | | | (16,090,382 | ) | | | 57,394,207 | |
| | | | | | | | | | | | | | | |
NET ASSETS | | $ | 1,000,822,888 | | $ | 2,199,901,956 | | | $ | 278,728,675 | | | $ | 977,952,503 | |
| | | | | | | | | | | | | | | |
CAPITAL SHARES: | | | | | | | | | | | | | | | |
Net Assets | | $ | 1,000,822,888 | | $ | 2,199,901,956 | | | $ | 278,728,675 | | | $ | 977,952,503 | |
Shares Outstanding | | | 107,067,491 | | | 237,980,670 | | | | 31,987,338 | | | | 98,322,151 | |
Net Asset Value offering and redemption price per share (net assets divided by shares outstanding) | | $ | 9.35 | | $ | 9.24 | | | $ | 8.71 | | | $ | 9.95 | |
Cost of investments | | $ | 1,050,340,046 | | $ | 2,229,263,267 | | | $ | 365,847,743 | | | $ | 1,248,895,866 | |
Cost of cash denominated in foreign currencies | | $ | — | | $ | — | | | $ | 18,681 | | | $ | 173,507 | |
| |
† Includes securities on loan with market values of (Note 6): | | $ | 69,679,417 | | $ | 128,697,897 | | | $ | 59,876,131 | | | $ | 220,441,019 | |
| | | | |
| 22 | | See Notes to Financial Statements. | | |
VANTAGEPOINT FUNDS
Statements of Assets & Liabilities
June 30, 2008 (Unaudited)
| | | | | | | | | | | |
| | | Discovery | | | International | | Diversified
Assets | |
ASSETS: | | | | | | | | | | | |
Securities, at market value† | | $ | 199,656,712 | | | $ | 1,106,038,430 | | $ | 445,384,459 | |
Cash | | | 3,925,735 | | | | 1,404,962 | | | 827,766 | |
Cash collateral for futures contracts | | | — | | | | — | | | 507,760 | |
Cash denominated in foreign currencies | | | 16,476 | | | | 6,445,848 | | | 109,191 | |
Receivable for: | | | | | | | | | | | |
Dividends | | | 131,784 | | | | 1,378,727 | | | 43,039 | |
Interest | | | 746,125 | | | | — | | | 1,445,487 | |
Security lending income | | | 34,508 | | | | 28,736 | | | — | |
Investments sold | | | 527,747 | | | | 5,198,169 | | | — | |
Fund shares sold | | | 44,347 | | | | 181,910 | | | — | |
Recoverable foreign taxes | | | — | | | | 874,451 | | | — | |
Unrealized gain on swaps | | | — | | | | — | | | 3,907,466 | |
Variation margin on futures contracts | | | — | | | | — | | | 1,100,552 | |
Gross unrealized gain on forward foreign currency exchange contracts | | | — | | | | 643,030 | | | 3,613,761 | |
| | | | | | | | | | | |
Total Assets | | | 205,083,434 | | | | 1,122,194,263 | | | 456,939,481 | |
| | | | | | | | | | | |
LIABILITIES: | | | | | | | | | | | |
Payable for: | | | | | | | | | | | |
Investments purchased | | | 875,077 | | | | 3,011,019 | | | — | |
Fund shares redeemed | | | — | | | | 292,462 | | | 221,458 | |
Variation margin on futures contracts | | | 838,466 | | | | — | | | — | |
Collateral for securities loaned | | | 40,556,855 | | | | 69,583,854 | | | — | |
Unrealized loss on swaps | | | — | | | | — | | | 59,694 | |
Options written, at value (Cost $0, $0 and $(189,853), respectively) | | | — | | | | — | | | 99,591 | |
Gross unrealized loss on forward foreign currency exchange contracts | | | — | | | | 152,262 | | | 1,557,780 | |
Accrued Expenses: | | | | | | | | | | | |
Advisory fees | | | 14,019 | | | | 88,204 | | | 37,238 | |
Subadviser fees | | | 184,367 | | | | 1,418,386 | | | 884,936 | |
Investor services | | | 28,039 | | | | 176,412 | | | 74,478 | |
Fund services | | | 21,030 | | | | 132,310 | | | 55,859 | |
Administration | | | 5,196 | | | | 20,985 | | | 13,435 | |
Directors | | | 464 | | | | 3,804 | | | 1,249 | |
Other accrued expense | | | 36,267 | | | | 192,473 | | | 67,201 | |
| | | | | | | | | | | |
Total Liabilities | | | 42,559,780 | | | | 75,072,171 | | | 3,072,919 | |
| | | | | | | | | | | |
NET ASSETS | | $ | 162,523,654 | | | $ | 1,047,122,092 | | $ | 453,866,562 | |
| | | | | | | | | | | |
NET ASSETS REPRESENTED BY: | | | | | | | | | | | |
Paid-in capital | | $ | 189,844,093 | | | $ | 970,691,581 | | $ | 452,250,247 | |
Net unrealized appreciation (depreciation) on investments, futures contracts, foreign currency transactions, written options and swaps | | | (19,346,615 | ) | | | 47,383,921 | | | 3,086,405 | |
Undistributed net investment income | | | 1,549,471 | | | | 11,950,141 | | | 7,320,773 | |
Accumulated net realized gain (loss) on investments, futures contracts, foreign currency transactions, written options and swaps | | | (9,523,295 | ) | | | 17,096,449 | | | (8,790,863 | ) |
| | | | | | | | | | | |
NET ASSETS | | $ | 162,523,654 | | | $ | 1,047,122,092 | | $ | 453,866,562 | |
| | | | | | | | | | | |
CAPITAL SHARES: | | | | | | | | | | | |
Net Assets | | $ | 162,523,654 | | | $ | 1,047,122,092 | | $ | 453,866,562 | |
Shares Outstanding | | | 19,080,749 | | | | 94,307,325 | | | 45,197,698 | |
Net Asset Value offering and redemption price per share (net assets divided by shares outstanding) | | $ | 8.52 | | | $ | 11.10 | | $ | 10.04 | |
Cost of investments | | $ | 214,094,292 | | | $ | 1,059,235,385 | | $ | 445,608,329 | |
Cost of cash denominated in foreign currencies | | $ | 16,390 | | | $ | 6,429,402 | | $ | 109,811 | |
| |
† Includes securities on loan with market values of (Note 6): | | $ | 38,885,642 | | | $ | 66,558,085 | | $ | — | |
| | | | |
| | See Notes to Financial Statements. | | 23 |
VANTAGEPOINT FUNDS
Statements of Assets & Liabilities
June 30, 2008 (Unaudited)
| | | | | | | | | | | | | | | | | |
| | | Core Bond
Index | | | 500 Stock
Index | | | Broad Market
Index | | Mid/Small
Company
Index | | Overseas
Equity Index |
ASSETS: | | | | | | | | | | | | | | | | | |
Securities, at market value† | | $ | 1,216,591,378 | | | $ | 371,117,288 | | | $ | 625,903,335 | | $ | 260,062,765 | | $ | 219,960,965 |
Cash | | | — | | | | — | | | | 314,174 | | | 10,186 | | | 1,340,745 |
Cash denominated in foreign currencies | | | — | | | | — | | | | — | | | — | | | 3,870,866 |
Receivable for: | | | | | | | | | | | | | | | | | |
Dividends | | | 20,258 | | | | 469,519 | | | | 685,583 | | | 178,646 | | | 435,411 |
Interest | | | 10,127,696 | | | | — | | | | — | | | — | | | — |
Security lending income | | | 43,943 | | | | 14,455 | | | | 50,806 | | | 51,790 | | | 23,721 |
Investments sold | | | 16,407,487 | | | | 3 | | | | — | | | 496,688 | | | — |
Fund shares sold | | | 4,502,624 | | | | 61,490 | | | | 80,261 | | | 234,112 | | | 9,691 |
Recoverable foreign taxes | | | 9,482 | | | | — | | | | — | | | — | | | 169,308 |
Variation margin on futures contracts | | | — | | | | 4,655 | | | | — | | | — | | | 56,174 |
Gross unrealized gain on forward foreign currency exchange contracts | | | — | | | | — | | | | — | | | — | | | 22,685 |
| | | | | | | | | | | | | | | | | |
Total Assets | | | 1,247,702,868 | | | | 371,667,410 | | | | 627,034,159 | | | 261,034,187 | | | 225,889,566 |
| | | | | | | | | | | | | | | | | |
LIABILITIES: | | | | | | | | | | | | | | | | | |
Payable for: | | | | | | | | | | | | | | | | | |
Investments purchased | | | 21,562,857 | | | | 200,194 | | | | 298,083 | | | 577,254 | | | — |
Distributions | | | 4,463,773 | | | | — | | | | — | | | — | | | — |
Fund shares redeemed | | | 513,047 | | | | 134,606 | | | | 54,437 | | | 84,366 | | | 242,024 |
Variation margin on futures contracts | | | — | | | | — | | | | 6,166 | | | 20,179 | | | — |
Collateral for securities loaned | | | 164,290,393 | | | | 20,172,572 | | | | 67,769,337 | | | 52,440,852 | | | 13,514,977 |
Due to custodian | | | — | | | | 22,443 | | | | — | | | — | | | — |
Gross unrealized loss on forward foreign currency exchange contracts | | | — | | | | — | | | | — | | | — | | | 9,583 |
Accrued Expenses: | | | | | | | | | | | | | | | | | |
Advisory fees | | | 43,203 | | | | 15,021 | | | | 24,004 | | | 8,944 | | | 9,029 |
Subadviser fees | | | 57,204 | | | | 22,698 | | | | 33,137 | | | 21,915 | | | 38,683 |
Investor services | | | 113,169 | | | | 21,929 | | | | 36,197 | | | 17,510 | | | 14,193 |
Fund services | | | 113,169 | | | | 21,929 | | | | 36,197 | | | 17,510 | | | 14,193 |
Administration | | | 21,655 | | | | 8,497 | | | | 14,723 | | | 4,177 | | | 3,965 |
Directors | | | 3,731 | | | | 1,381 | | | | 2,209 | | | 746 | | | 797 |
Other accrued expense | | | 104,612 | | | | 63,953 | | | | 66,078 | | | 34,802 | | | 40,135 |
| | | | | | | | | | | | | | | | | |
Total Liabilities | | | 191,286,813 | | | | 20,685,223 | | | | 68,340,568 | | | 53,228,255 | | | 13,887,579 |
| | | | | | | | | | | | | | | | | |
NET ASSETS | | $ | 1,056,416,055 | | | $ | 350,982,187 | | | $ | 558,693,591 | | $ | 207,805,932 | | $ | 212,001,987 |
| | | | | | | | | | | | | | | | | |
NET ASSETS REPRESENTED BY: | | | | | | | | | | | | | | | | | |
Paid-in capital | | $ | 1,083,850,511 | | | $ | 226,558,324 | | | $ | 394,261,098 | | $ | 173,090,621 | | $ | 181,596,731 |
Net unrealized appreciation (depreciation) on investments, futures contracts, foreign currency transactions, written options and swaps | | | (7,391,650 | ) | | | 128,887,270 | | | | 153,701,061 | | | 23,419,197 | | | 25,708,886 |
Undistributed net investment income (loss) | | | (1,547,782 | ) | | | 3,436,854 | | | | 10,603,050 | | | 1,569,415 | | | 3,756,074 |
Accumulated net realized gain (loss) on investments, futures contracts, foreign currency transactions, written options and swaps | | | (18,495,024 | ) | | | (7,900,261 | ) | | | 128,382 | | | 9,726,699 | | | 940,296 |
| | | | | | | | | | | | | | | | | |
NET ASSETS | | $ | 1,056,416,055 | | | $ | 350,982,187 | | | $ | 558,693,591 | | $ | 207,805,932 | | $ | 212,001,987 |
| | | | | | | | | | | | | | | | | |
CAPITAL SHARES: | | | | | | | | | | | | | | | | | |
Net Assets—Class I | | $ | 855,143,938 | | | $ | 80,726,740 | | | $ | 141,935,182 | | $ | 99,595,652 | | $ | 60,822,370 |
Shares Outstanding—Class I | | | 87,829,066 | | | | 7,904,291 | | | | 13,009,088 | | | 6,650,623 | | | 4,604,824 |
Net Asset Value—Class I, offering and redemption price per share (net assets divided by shares outstanding) | | $ | 9.74 | | | $ | 10.21 | | | $ | 10.91 | | $ | 14.98 | | $ | 13.21 |
Net Assets—Class II | | $ | 201,272,117 | | | $ | 270,255,447 | | | $ | 416,758,409 | | $ | 108,210,280 | | $ | 151,179,617 |
Shares Outstanding—Class II | | | 20,570,851 | | | | 27,910,343 | | | | 40,409,133 | | | 7,568,436 | | | 12,096,929 |
Net Asset Value—Class II, offering and redemption price per share (net assets divided by shares outstanding) | | $ | 9.78 | | | $ | 9.68 | | | $ | 10.31 | | $ | 14.30 | | $ | 12.50 |
Cost of investments | | $ | 1,223,983,028 | | | $ | 241,875,226 | | | $ | 471,833,287 | | $ | 236,517,633 | | $ | 193,928,883 |
Cost of cash denominated in foreign currencies | | $ | — | | | $ | — | | | $ | — | | $ | — | | $ | 3,838,120 |
|
† Includes securities on loan with market values of (Note 6): | | $ | 161,176,153 | | | $ | 19,475,974 | | | $ | 65,230,084 | | $ | 50,258,835 | | $ | 12,856,349 |
| | | | |
| 24 | | See Notes to Financial Statements. | | |
VANTAGEPOINT FUNDS
Statements of Assets & Liabilities
June 30, 2008 (Unaudited)
| | | | | | | | | | | | | | | | | | |
| | | Model Portfolio Funds | |
| | | Savings
Oriented | | | Conservative
Growth | | Traditional
Growth | | | Long-Term
Growth | | All-Equity
Growth | |
ASSETS: | | | | | | | | | | | | | | | | | | |
Securities of affiliated Mutual Funds, at market value(a) | | $ | 308,886,480 | | | $ | 565,655,512 | | $ | 1,400,693,003 | | | $ | 1,583,519,710 | | $ | 549,969,639 | |
Receivable for: | | | | | | | | | | | | | | | | | | |
Dividends | | | 744,692 | | | | 1,122,471 | | | 1,799,206 | | | | 1,037,531 | | | — | |
Investments sold | | | 367,059 | | | | 47,513 | | | 99,616 | | | | 155,051 | | | 47,435 | |
Fund shares sold | | | 159,195 | | | | 728,668 | | | 872,630 | | | | 221,007 | | | 213,356 | |
| | | | | | | | | | | | | | | | | | |
Total Assets | | | 310,157,426 | | | | 567,554,164 | | | 1,403,464,455 | | | | 1,584,933,299 | | | 550,230,430 | |
| | | | | | | | | | | | | | | | | | |
LIABILITIES: | | | | | | | | | | | | | | | | | | |
Payable for: | | | | | | | | | | | | | | | | | | |
Investments purchased | | | 744,692 | | | | 1,793,381 | | | 2,475,800 | | | | 1,037,531 | | | 116,603 | |
Fund shares redeemed | | | 499,734 | | | | 57,759 | | | 196,035 | | | | 265,997 | | | 96,753 | |
Accrued Expenses: | | | | | | | | | | | | | | | | | | |
Advisory fees | | | 27,365 | | | | 49,039 | | | 103,083 | | | | 113,930 | | | 48,925 | |
Administration | | | 5,466 | | | | 10,536 | | | 25,084 | | | | 27,468 | | | 8,011 | |
Directors | | | 1,043 | | | | 1,985 | | | 4,921 | | | | 5,540 | | | 1,941 | |
Other accrued expense | | | 40,491 | | | | 59,386 | | | 112,149 | | | | 125,159 | | | 54,435 | |
| | | | | | | | | | | | | | | | | | |
Total Liabilities | | | 1,318,791 | | | | 1,972,086 | | | 2,917,072 | | | | 1,575,625 | | | 326,668 | |
| | | | | | | | | | | | | | | | | | |
NET ASSETS | | $ | 308,838,635 | | | $ | 565,582,078 | | $ | 1,400,547,383 | | | $ | 1,583,357,674 | | $ | 549,903,762 | |
| | | | | | | | | | | | | | | | | | |
NET ASSETS REPRESENTED BY: | | | | | | | | | | | | | | | | | | |
Paid-in capital | | $ | 304,185,235 | | | $ | 551,558,226 | | $ | 1,368,172,577 | | | $ | 1,515,154,700 | | $ | 555,724,342 | |
Net unrealized appreciation (depreciation) on investments | | | (5,700,746 | ) | | | 3,613,480 | | | 26,320,583 | | | | 13,868,092 | | | (44,117,165 | ) |
Undistributed net investment income (loss) | | | 4,103,480 | | | | 5,984,128 | | | 9,284,826 | | | | 5,100,933 | | | (387,832 | ) |
Accumulated net realized gain (loss) on investments | | | 6,250,666 | | | | 4,426,244 | | | (3,230,603 | ) | | | 49,233,949 | | | 38,684,417 | |
| | | | | | | | | | | | | | | | | | |
NET ASSETS | | $ | 308,838,635 | | | $ | 565,582,078 | | $ | 1,400,547,383 | | | $ | 1,583,357,674 | | $ | 549,903,762 | |
| | | | | | | | | | | | | | | | | | |
CAPITAL SHARES: | | | | | | | | | | | | | | | | | | |
Net Assets | | $ | 308,838,635 | | | $ | 565,582,078 | | $ | 1,400,547,383 | | | $ | 1,583,357,674 | | $ | 549,903,762 | |
Shares Outstanding | | | 12,695,581 | | | | 23,776,851 | | | 61,756,096 | | | | 70,500,968 | | | 24,884,899 | |
Net Asset Value offering and redemption price per share (net assets divided by shares outstanding) | | $ | 24.33 | | | $ | 23.79 | | $ | 22.68 | | | $ | 22.46 | | $ | 22.10 | |
Cost of investments | | $ | 314,587,226 | | | $ | 562,042,032 | | $ | 1,374,372,420 | | | $ | 1,569,651,618 | | $ | 594,086,804 | |
| (a) | Investment in other Vantagepoint Funds (Note 1). |
| | | | |
| | See Notes to Financial Statements. | | 25 |
VANTAGEPOINT FUNDS
Statements of Assets & Liabilities
June 30, 2008 (Unaudited)
| | | | | | | | | | | | | | | | | | | | |
| | | Milestone Funds | |
| | | Milestone
Retirement
Income | | | Milestone
2010 | | | Milestone
2015 | | | Milestone
2020 | | | Milestone
2025 | |
ASSETS: | | | | | | | | | | | | | | | | | | | | |
Securities of affiliated Mutual Funds, at market value(a) | | $ | 53,252,550 | | | $ | 72,779,695 | | | $ | 137,564,864 | | | $ | 123,562,707 | | | $ | 90,290,049 | |
Receivable for: | | | | | | | | | | | | | | | | | | | | |
Dividends | | | 118,631 | | | | 141,488 | | | | 191,999 | | | | 126,605 | | | | 67,775 | |
Investments sold | | | — | | | | 255,145 | | | | 65,440 | | | | 6,118 | | | | 14,590 | |
Fund shares sold | | | 47,836 | | | | 1,017 | | | | 99,209 | | | | 112,979 | | | | 93,406 | |
Due from investment adviser(b) | | | 26,453 | | | | 6,899 | | | | 3,991 | | | | 4,578 | | | | 2,399 | |
| | | | | | | | | | | | | | | | | | | | |
Total Assets | | | 53,445,470 | | | | 73,184,244 | | | | 137,925,503 | | | | 123,812,987 | | | | 90,468,219 | |
| | | | | | | | | | | | | | | | | | | | |
LIABILITIES: | | | | | | | | | | | | | | | | | | | | |
Payable for: | | | | | | | | | | | | | | | | | | | | |
Investments purchased | | | 120,142 | | | | 141,488 | | | | 192,000 | | | | 239,583 | | | | 67,775 | |
Fund shares redeemed | | | 46,325 | | | | 256,163 | | | | 156,298 | | | | — | | | | 102,379 | |
Accrued Expenses: | | | | | | | | | | | | | | | | | | | | |
Advisory fees | | | 4,687 | | | | 6,384 | | | | 12,226 | | | | 10,852 | | | | 8,062 | |
Administration | | | 2,483 | | | | 2,483 | | | | 2,158 | | | | 2,338 | | | | 2,483 | |
Directors | | | 167 | | | | 224 | | | | 432 | | | | 350 | | | | 263 | |
Other accrued expense | | | 25,882 | | | | 26,718 | | | | 29,944 | | | | 28,905 | | | | 27,193 | |
| | | | | | | | | | | | | | | | | | | | |
Total Liabilities | | | 199,686 | | | | 433,460 | | | | 393,058 | | | | 282,028 | | | | 208,155 | |
| | | | | | | | | | | | | | | | | | | | |
NET ASSETS | | $ | 53,245,784 | | | $ | 72,750,784 | | | $ | 137,532,445 | | | $ | 123,530,959 | | | $ | 90,260,064 | |
| | | | | | | | | | | | | | | | | | | | |
NET ASSETS REPRESENTED BY: | | | | | | | | | | | | | | | | | | | | |
Paid-in capital | | $ | 54,262,049 | | | $ | 74,648,457 | | | $ | 143,034,526 | | | $ | 129,219,424 | | | $ | 95,291,975 | |
Net unrealized depreciation on investments | | | (2,881,349 | ) | | | (4,459,781 | ) | | | (11,533,404 | ) | | | (10,892,481 | ) | | | (9,284,162 | ) |
Undistributed net investment income | | | 680,316 | | | | 747,735 | | | | 988,189 | | | | 627,625 | | | | 313,794 | |
Accumulated net realized gain on investments | | | 1,184,768 | | | | 1,814,373 | | | | 5,043,134 | | | | 4,576,391 | | | | 3,938,457 | |
| | | | | | | | | | | | | | | | | | | | |
NET ASSETS | | $ | 53,245,784 | | | $ | 72,750,784 | | | $ | 137,532,445 | | | $ | 123,530,959 | | | $ | 90,260,064 | |
| | | | | | | | | | | | | | | | | | | | |
CAPITAL SHARES: | | | | | | | | | | | | | | | | | | | | |
Net Assets | | $ | 53,245,784 | | | $ | 72,750,784 | | | $ | 137,532,445 | | | $ | 123,530,959 | | | $ | 90,260,064 | |
Shares Outstanding | | | 5,124,436 | | | | 7,064,970 | | | | 13,030,050 | | | | 11,584,573 | | | | 8,419,708 | |
Net Asset Value offering and redemption price per share (net assets divided by shares outstanding) | | $ | 10.39 | | | $ | 10.30 | | | $ | 10.56 | | | $ | 10.66 | | | $ | 10.72 | |
Cost of investments | | $ | 56,133,899 | | | $ | 77,239,476 | | | $ | 149,098,268 | | | $ | 134,455,188 | | | $ | 99,574,211 | |
| (a) | Investment in other Vantagepoint Funds (Note 1). |
| (b) | Contractual fee waiver (Note 3) |
| | | | |
| 26 | | See Notes to Financial Statements. | | |
VANTAGEPOINT FUNDS
Statements of Assets & Liabilities
June 30, 2008 (Unaudited)
| | | | | | | | | | | | |
| | | Milestone Funds | |
| | | Milestone
2030 | | | Milestone
2035 | | | Milestone
2040 | |
ASSETS: | | | | | | | | | | | | |
Securities of affiliated Mutual Funds, at market value(a) | | $ | 69,298,837 | | | $ | 39,208,175 | | | $ | 37,968,634 | |
Receivable for: | | | | | | | | | | | | |
Dividends | | | 37,764 | | | | 18,521 | | | | 16,280 | |
Investments sold | | | 304,013 | | | | — | | | | — | |
Fund shares sold | | | 48,621 | | | | 130,466 | | | | 37,622 | |
Due from investment adviser(b) | | | 3,729 | | | | 4,013 | | | | 3,809 | |
| | | | | | | | | | | | |
Total Assets | | | 69,692,964 | | | | 39,361,175 | | | | 38,026,345 | |
| | | | | | | | | | | | |
LIABILITIES: | | | | | | | | | | | | |
Payable for: | | | | | | | | | | | | |
Investments purchased | | | 37,764 | | | | 148,743 | | | | 53,902 | |
Fund shares redeemed | | | 350,305 | | | | 245 | | | | — | |
Accrued Expenses: | | | | | | | | | | | | |
Advisory fees | | | 6,116 | | | | 3,489 | | | | 3,381 | |
Administration | | | 2,483 | | | | 2,483 | | | | 3,407 | |
Directors | | | 186 | | | | 106 | | | | 99 | |
Other accrued expense | | | 26,481 | | | | 25,779 | | | | 25,538 | |
| | | | | | | | | | | | |
Total Liabilities | | | 423,335 | | | | 180,845 | | | | 86,327 | |
| | | | | | | | | | | | |
NET ASSETS | | $ | 69,269,629 | | | $ | 39,180,330 | | | $ | 37,940,018 | |
| | | | | | | | | | | | |
NET ASSETS REPRESENTED BY: | | | | | | | | | | | | |
Paid-in capital | | $ | 73,999,026 | | | $ | 42,490,118 | | | $ | 41,600,338 | |
Net unrealized depreciation on investments | | | (7,963,315 | ) | | | (5,237,357 | ) | | | (5,483,881 | ) |
Undistributed net investment income | | | 157,170 | | | | 67,636 | | | | 57,310 | |
Accumulated net realized gain on investments | | | 3,076,748 | | | | 1,859,933 | | | | 1,766,251 | |
| | | | | | | | | | | | |
NET ASSETS | | $ | 69,269,629 | | | $ | 39,180,330 | | | $ | 37,940,018 | |
| | | | | | | | | | | | |
CAPITAL SHARES: | | | | | | | | | | | | |
Net Assets | | $ | 69,269,629 | | | $ | 39,180,330 | | | $ | 37,940,018 | |
Shares Outstanding | | | 6,405,268 | | | | 3,627,363 | | | | 3,520,169 | |
Net Asset Value offering and redemption price per share (net assets divided by shares outstanding) | | $ | 10.81 | | | $ | 10.80 | | | $ | 10.78 | |
Cost of investments | | $ | 77,262,152 | | | $ | 44,445,532 | | | $ | 43,452,515 | |
| (a) | Investment in other Vantagepoint Funds (Note 1). |
| (b) | Contractual fee waiver (Note 3) |
| | | | |
| | See Notes to Financial Statements. | | 27 |
VANTAGEPOINT FUNDS
Statements of Operations
For the Period from January 1, 2008 to June 30, 2008 (Unaudited)
| | | | | | | | | | | | | | | | | | | |
| | | Money
Market | | Low Duration
Bond(1) | | | Inflation Protected
Securities(2) | | | Asset
Allocation | | | Equity
Income | |
INVESTMENT INCOME: | | | | | | | | | | | | | | | | | | | |
Dividends | | $ | 5,596,447 | | $ | 54,941 | | | $ | 41,986 | | | $ | 5,653,227 | | | $ | 17,337,238 | |
Interest | | | — | | | 10,555,599 | | | | 11,142,039 | | | | 2,199,626 | | | | 2,117,197 | |
Security lending income | | | — | | | 63,064 | | | | 11,467 | | | | 71,057 | | | | 683,247 | |
Foreign taxes withheld on dividends | | | — | | | — | | | | — | | | | — | | | | (203,939 | ) |
| | | | | | | | | | | | | | | | | | | |
Total investment income | | | 5,596,447 | | | 10,673,604 | | | | 11,195,492 | | | | 7,923,910 | | | | 19,933,743 | |
| | | | | | | | | | | | | | | | | | | |
EXPENSES: | | | | | | | | | | | | | | | | | | | |
Advisory*** | | | 170,656 | | | 248,029 | | | | 159,732 | | | | 337,762 | | | | 802,178 | |
Subadviser | | | — | | | 338,064 | | | | 255,572 | | | | 797,063 | | | | 2,928,366 | |
Investor services | | | 341,314 | | | 496,060 | | | | 319,465 | | | | 675,528 | | | | 1,604,365 | |
Fund services | | | 255,986 | | | 372,046 | | | | 239,599 | | | | 506,647 | | | | 1,203,276 | |
Custodian | | | 19,658 | | | 54,132 | | | | 44,597 | | | | 61,970 | | | | 131,443 | |
Administration | | | 23,031 | | | 46,682 | | | | 29,112 | | | | 64,452 | | | | 152,206 | |
Legal | | | 18,129 | | | 30,032 | | | | 16,272 | | | | 44,994 | | | | 103,092 | |
Audit | | | 8,225 | | | 10,880 | | | | 10,880 | | | | 10,880 | | | | 10,880 | |
Directors | | | 1,545 | | | 2,560 | | | | 1,387 | | | | 3,835 | | | | 8,788 | |
State license fees and memberships | | | 10,940 | | | 11,593 | | | | 10,869 | | | | 53,039 | | | | 14,828 | |
Other expenses | | | 13,764 | | | 13,553 | | | | 10,551 | | | | 17,542 | | | | 67,352 | |
| | | | | | | | | | | | | | | | | | | |
Total expenses | | | 863,248 | | | 1,623,631 | | | | 1,098,036 | | | | 2,573,712 | | | | 7,026,774 | |
| | | | | | | | | | | | | | | | | | | |
NET INVESTMENT INCOME | | | 4,733,199 | | | 9,049,973 | | | | 10,097,456 | | | | 5,350,198 | | | | 12,906,969 | |
| | | | | | | | | | | | | | | | | | | |
NET REALIZED AND UNREALIZED GAIN (LOSS) (Note 2): | | | | | | | | | | | | | | | | | | | |
Net realized gain (loss) on: | | | | | | | | | | | | | | | | | | | |
Investments | | | — | | | 1,790,896 | | | | 4,290,114 | | | | 1,160,968 | | | | 27,092,320 | |
Forward contracts and foreign currency transactions | | | — | | | — | | | | (7,813 | ) | | | — | | | | (1,078 | ) |
Futures contracts | | | — | | | 405,297 | | | | 720,982 | | | | (12,989,637 | ) | | | — | |
Options written | | | — | | | — | | | | 493,558 | | | | — | | | | — | |
Swaps | | | — | | | — | | | | (92,642 | ) | | | — | | | | — | |
| | | | | | | | | | | | | | | | | | | |
Net realized gain (loss) | | | — | | | 2,196,193 | | | | 5,404,199 | | | | (11,828,669 | ) | | | 27,091,242 | |
| | | | | | | | | | | | | | | | | | | |
Net change in unrealized appreciation (depreciation) on: | | | | | | | | | | | | | | | | | | | |
Investments | | | — | | | (3,876,363 | ) | | | (1,202,042 | ) | | | (76,689,050 | ) | | | (237,593,932 | ) |
Forward contracts and foreign currency transactions | | | — | | | — | | | | 52,159 | | | | — | | | | 220 | |
Futures contracts | | | — | | | (54,140 | ) | | | (343,196 | ) | | | (7,054,184 | ) | | | — | |
Options written | | | — | | | — | | | | 41,260 | | | | — | | | | — | |
Swaps | | | — | | | — | | | | (931,389 | ) | | | — | | | | — | |
| | | | | | | | | | | | | | | | | | | |
Net change in unrealized depreciation | | | — | | | (3,930,503 | ) | | | (2,383,208 | ) | | | (83,743,234 | ) | | | (237,593,712 | ) |
| | | | | | | | | | | | | | | | | | | |
NET GAIN (LOSS) ON INVESTMENTS | | | — | | | (1,734,310 | ) | | | 3,020,991 | | | | (95,571,903 | ) | | | (210,502,470 | ) |
| | | | | | | | | | | | | | | | | | | |
NET INCREASE (DECREASE) IN NET ASSETS RESULTING FROM OPERATIONS | | $ | 4,733,199 | | $ | 7,315,663 | | | $ | 13,118,447 | | | $ | (90,221,705 | ) | | $ | (197,595,501 | ) |
| | | | | | | | | | | | | | | | | | | |
| (1) | Formerly Short-Term Bond Fund |
| (2) | Formerly US Government Securities Fund |
| | | | |
| 28 | | See Notes to Financial Statements. | | |
VANTAGEPOINT FUNDS
Statements of Operations
For the Period from January 1, 2008 to June 30, 2008 (Unaudited)
| | | | | | | | | | | | | | | | |
| | | Growth &
Income | | | Growth | | | Select
Value | | | Aggressive
Opportunities | |
INVESTMENT INCOME: | | | | | | | | | | | | | | | | |
Dividends | | $ | 8,901,192 | | | $ | 15,436,523 | | | $ | 3,146,222 | | | $ | 4,268,522 | |
Interest | | | 402,941 | | | | 581,210 | | | | 21,909 | | | | 359,138 | |
Security lending income | | | 135,442 | | | | 349,495 | | | | 82,764 | | | | 1,271,264 | |
Foreign taxes withheld on dividends | | | (40,199 | ) | | | (57,902 | ) | | | (3,046 | ) | | | (39,773 | ) |
| | | | | | | | | | | | | | | | |
Total investment income | | | 9,399,376 | | | | 16,309,326 | | | | 3,247,849 | | | | 5,859,151 | |
| | | | | | | | | | | | | | | | |
EXPENSES: | | | | | | | | | | | | | | | | |
Advisory*** | | | 516,127 | | | | 1,159,598 | | | | 142,527 | | | | 513,515 | |
Subadviser | | | 1,498,478 | | | | 4,209,707 | | | | 592,113 | | | | 2,274,225 | |
Investor services | | | 1,032,259 | | | | 2,319,211 | | | | 285,056 | | | | 1,027,037 | |
Fund services | | | 774,196 | | | | 1,739,412 | | | | 213,793 | | | | 770,279 | |
Custodian | | | 109,536 | | | | 228,983 | | | | 52,933 | | | | 135,255 | |
Administration | | | 97,433 | | | | 220,862 | | | | 26,866 | | | | 98,240 | |
Legal | | | 65,525 | | | | 152,891 | | | | 17,474 | | | | 68,692 | |
Audit | | | 10,880 | | | | 10,880 | | | | 10,888 | | | | 10,880 | |
Directors | | | 5,586 | | | | 13,033 | | | | 1,489 | | | | 5,855 | |
State license fees and memberships | | | 13,096 | | | | 17,424 | | | | 10,914 | | | | 13,317 | |
Other expenses | | | 33,495 | | | | 35,766 | | | | 21,844 | | | | 23,397 | |
| | | | | | | | | | | | | | | | |
Total expenses | | | 4,156,611 | | | | 10,107,767 | | | | 1,375,897 | | | | 4,940,692 | |
| | | | | | | | | | | | | | | | |
NET INVESTMENT INCOME | | | 5,242,765 | | | | 6,201,559 | | | | 1,871,952 | | | | 918,459 | |
| | | | | | | | | | | | | | | | |
NET REALIZED AND UNREALIZED GAIN (LOSS) (Note 2): | | | | | | | | | | | | | | | | |
Net realized gain (loss) on: | | | | | | | | | | | | | | | | |
Investments | | | 11,198,256 | | | | (21,361,417 | ) | | | (12,207,397 | ) | | | 33,886,613 | |
Forward contracts and foreign currency transactions | | | (13,376 | ) | | | 1,014,908 | | | | (15 | ) | | | (46,456 | ) |
Futures contracts | | | — | | | | — | | | | (45,443 | ) | | | — | |
| | | | | | | | | | | | | | | | |
Net realized gain (loss) | | | 11,184,880 | | | | (20,346,509 | ) | | | (12,252,855 | ) | | | 33,840,157 | |
| | | | | | | | | | | | | | | | |
Net change in unrealized appreciation (depreciation) on: | | | | | | | | | | | | | | | | |
Investments | | | (144,207,221 | ) | | | (279,535,205 | ) | | | (10,584,537 | ) | | | (168,358,677 | ) |
Forward contracts and foreign currency transactions | | | (956 | ) | | | — | | | | — | | | | 881 | |
Futures contracts | | | — | | | | — | | | | (19,719 | ) | | | — | |
| | | | | | | | | | | | | | | | |
Net change in unrealized depreciation | | | (144,208,177 | ) | | | (279,535,205 | ) | | | (10,604,256 | ) | | | (168,357,796 | ) |
| | | | | | | | | | | | | | | | |
NET LOSS ON INVESTMENTS | | | (133,023,297 | ) | | | (299,881,714 | ) | | | (22,857,111 | ) | | | (134,517,639 | ) |
| | | | | | | | | | | | | | | | |
NET DECREASE IN NET ASSETS RESULTING FROM OPERATIONS | | $ | (127,780,532 | ) | | $ | (293,680,155 | ) | | $ | (20,985,159 | ) | | $ | (133,599,180 | ) |
| | | | | | | | | | | | | | | | |
| | | | |
| | See Notes to Financial Statements. | | 29 |
VANTAGEPOINT FUNDS
Statements of Operations
For the Period from January 1, 2008 to June 30, 2008 (Unaudited)
| | | | | | | | | | | | |
| | | Discovery | | | International | | | Diversified
Assets | |
INVESTMENT INCOME: | | | | | | | | | | | | |
Dividends | | $ | 599,402 | | | $ | 20,454,838 | | | $ | 83,677 | |
Interest | | | 1,605,276 | | | | 371,461 | | | | 7,243,910 | |
Security lending income | | | 180,840 | | | | 276,875 | | | | 2,458 | |
Foreign taxes withheld on dividends | | | (1,983 | ) | | | (2,304,153 | ) | | | — | |
| | | | | | | | | | | | |
Total investment income | | | 2,383,535 | | | | 18,799,021 | | | | 7,330,045 | |
| | | | | | | | | | | | |
EXPENSES: | | | | | | | | | | | | |
Advisory*** | | | 82,478 | | | | 534,025 | | | | 222,064 | |
Subadviser | | | 351,407 | | | | 2,621,572 | | | | 1,041,308 | |
Investor services | | | 164,958 | | | | 1,068,057 | | | | 444,131 | |
Fund services | | | 123,718 | | | | 801,045 | | | | 333,099 | |
Custodian | | | 41,921 | | | | 509,581 | | | | 74,825 | |
Administration | | | 15,572 | | | | 100,853 | | | | 41,644 | |
Legal | | | 10,265 | | | | 68,037 | | | | 27,629 | |
Audit | | | 10,888 | | | | 10,880 | | | | 10,888 | |
Directors | | | 875 | | | | 5,800 | | | | 2,355 | |
State license fees and memberships | | | 10,640 | | | | 13,093 | | | | 11,302 | |
Other expenses | | | 13,696 | | | | 47,162 | | | | 34,084 | |
| | | | | | | | | | | | |
Total expenses | | | 826,418 | | | | 5,780,105 | | | | 2,243,329 | |
| | | | | | | | | | | | |
NET INVESTMENT INCOME | | | 1,557,117 | | | | 13,018,916 | | | | 5,086,716 | |
| | | | | | | | | | | | |
NET REALIZED AND UNREALIZED GAIN (LOSS) (Note 2): | | | | | | | | | | | | |
Net realized gain (loss) on: | | | | | | | | | | | | |
Investments | | | 1,339,780 | | | | 9,575,113 | | | | (1,621,433 | ) |
Forward contracts and foreign currency transactions | | | (45,335 | ) | | | (996,459 | ) | | | (3,714,894 | ) |
Futures contracts | | | (5,359,671 | ) | | | — | | | | (6,109,588 | ) |
Options written | | | — | | | | — | | | | (853,288 | ) |
Swaps | | | — | | | | — | | | | 4,580,949 | |
| | | | | | | | | | | | |
Net realized gain (loss) | | | (4,065,226 | ) | | | 8,578,654 | | | | (7,718,254 | ) |
| | | | | | | | | | | | |
Net change in unrealized appreciation (depreciation) on: | | | | | | | | | | | | |
Investments | | | (7,693,675 | ) | | | (124,169,423 | ) | | | (195,450 | ) |
Forward contracts and foreign currency transactions | | | (34,949 | ) | | | 541,394 | | | | 4,768,975 | |
Futures contracts | | | (3,622,292 | ) | | | — | | | | (290,675 | ) |
Options written | | | — | | | | — | | | | 83,540 | |
Swaps | | | — | | | | — | | | | 2,431,904 | |
| | | | | | | | | | | | |
Net change in unrealized appreciation (depreciation) | | | (11,350,916 | ) | | | (123,628,029 | ) | | | 6,798,294 | |
| | | | | | | | | | | | |
NET LOSS ON INVESTMENTS | | | (15,416,142 | ) | | | (115,049,375 | ) | | | (919,960 | ) |
| | | | | | | | | | | | |
NET INCREASE (DECREASE) IN NET ASSETS RESULTING FROM OPERATIONS | | $ | (13,859,025 | ) | | $ | (102,030,459 | ) | | $ | 4,166,756 | |
| | | | | | | | | | | | |
| | | | |
| 30 | | See Notes to Financial Statements. | | |
VANTAGEPOINT FUNDS
Statements of Operations
For the Period from January 1, 2008 to June 30, 2008 (Unaudited)
| | | | | | | | | | | | | | | | | | | | |
| | | Core Bond
Index | | | 500 Stock
Index | | | Broad Market
Index | | | Mid/Small
Company
Index | | | Overseas
Equity Index | |
INVESTMENT INCOME: | | | | | | | | | | | | | | | | | | | | |
Dividends | | $ | 49,907 | | | $ | 3,761,560 | | | $ | 5,650,871 | | | $ | 1,532,351 | | | $ | 5,419,878 | |
Interest | | | 26,022,271 | | | | 94,685 | | | | 87,138 | | | | 7,667 | | | | 34,020 | |
Security lending income | | | 210,606 | | | | 46,280 | | | | 181,636 | | | | 218,744 | | | | 88,831 | |
Foreign taxes withheld on dividends | | | (2,780 | ) | | | — | | | | (158 | ) | | | (567 | ) | | | (593,769 | ) |
| | | | | | | | | | | | | | | | | | | | |
Total investment income | | | 26,280,004 | | | | 3,902,525 | | | | 5,919,487 | | | | 1,758,195 | | | | 4,948,960 | |
| | | | | | | | | | | | | | | | | | | | |
EXPENSES: | | | | | | | | | | | | | | | | | | | | |
Advisory*** | | | 261,157 | | | | 92,568 | | | | 147,573 | | | | 52,404 | | | | 55,397 | |
Subadviser | | | 113,111 | | | | 41,126 | | | | 65,009 | | | | 42,905 | | | | 75,606 | |
Investor services Class I | | | 631,771 | | | | 64,094 | | | | 112,844 | | | | 74,793 | | | | 46,985 | |
Investor services Class II | | | 50,569 | | | | 71,204 | | | | 109,958 | | | | 27,473 | | | | 39,735 | |
Fund services Class I | | | 631,771 | | | | 64,094 | | | | 112,844 | | | | 74,793 | | | | 46,985 | |
Fund services Class II | | | 50,569 | | | | 71,204 | | | | 109,958 | | | | 27,473 | | | | 39,736 | |
Custodian | | | 152,983 | | | | 42,734 | | | | 79,076 | | | | 51,447 | | | | 151,010 | |
Administration | | | 98,443 | | | | 35,230 | | | | 56,195 | | | | 18,630 | | | | 20,998 | |
Legal | | | 64,542 | | | | 24,463 | | | | 38,988 | | | | 13,542 | | | | 14,853 | |
Audit | | | 10,880 | | | | 10,880 | | | | 10,880 | | | | 10,880 | | | | 10,880 | |
Directors | | | 5,502 | | | | 2,086 | | | | 3,323 | | | | 1,154 | | | | 1,266 | |
State license fees and memberships | | | 13,059 | | | | 32,166 | | | | 11,985 | | | | 10,765 | | | | 10,815 | |
Other expenses | | | 33,729 | | | | 13,843 | | | | 14,848 | | | | 8,603 | | | | 23,604 | |
| | | | | | | | | | | | | | | | | | | | |
Total expenses | | | 2,118,086 | | | | 565,692 | | | | 873,481 | | | | 414,862 | | | | 537,870 | |
| | | | | | | | | | | | | | | | | | | | |
NET INVESTMENT INCOME | | | 24,161,918 | | | | 3,336,833 | | | | 5,046,006 | | | | 1,343,333 | | | | 4,411,090 | |
| | | | | | | | | | | | | | | | | | | | |
NET REALIZED AND UNREALIZED GAIN (LOSS) (Note 2): | | | | | | | | | | | | | | | | | | | | |
Net realized gain (loss) on: | | | | | | | | | | | | | | | | | | | | |
Investments | | | 3,935,274 | | | | 4,728,815 | | | | 16,713,255 | | | | 6,094,544 | | | | 2,712,299 | |
Forward contracts and foreign currency transactions | | | — | | | | — | | | | — | | | | 16 | | | | (22,744 | ) |
Futures contracts | | | — | | | | (890,655 | ) | | | (1,390,572 | ) | | | (206,405 | ) | | | (1,202,237 | ) |
| | | | | | | | | | | | | | | | | | | | |
Net realized gain | | | 3,935,274 | | | | 3,838,160 | | | | 15,322,683 | | | | 5,888,155 | | | | 1,487,318 | |
| | | | | | | | | | | | | | | | | | | | |
Net change in unrealized appreciation (depreciation) on: | | | | | | | | | | | | | | | | | | | | |
Investments | | | (16,585,156 | ) | | | (56,204,654 | ) | | | (90,427,592 | ) | | | (24,626,217 | ) | | | (32,465,000 | ) |
Forward contracts and foreign currency transactions | | | — | | | | — | | | | — | | | | — | | | | 339,076 | |
Futures contracts | | | — | | | | (298,542 | ) | | | (282,980 | ) | | | (115,076 | ) | | | (434,169 | ) |
| | | | | | | | | | | | | | | | | | | | |
Net change in unrealized depreciation | | | (16,585,156 | ) | | | (56,503,196 | ) | | | (90,710,572 | ) | | | (24,741,293 | ) | | | (32,560,093 | ) |
| | | | | | | | | | | | | | | | | | | | |
NET LOSS ON INVESTMENTS | | | (12,649,882 | ) | | | (52,665,036 | ) | | | (75,387,889 | ) | | | (18,853,138 | ) | | | (31,072,775 | ) |
| | | | | | | | | | | | | | | | | | | | |
NET INCREASE (DECREASE) IN NET ASSETS RESULTING FROM OPERATIONS | | $ | 11,512,036 | | | $ | (49,328,203 | ) | | $ | (70,341,883 | ) | | $ | (17,509,805 | ) | | $ | (26,661,685 | ) |
| | | | | | | | | | | | | | | | | | | | |
| | | | |
| | See Notes to Financial Statements. | | 31 |
VANTAGEPOINT FUNDS
Statements of Operations
For the Period from January 1, 2008 to June 30, 2008 (Unaudited)
| | | | | | | | | | | | | | | | | | | | |
| | | Model Portfolio Funds | |
| | | Savings
Oriented | | | Conservative
Growth | | | Traditional
Growth | | | Long-Term
Growth | | | All-Equity
Growth | |
INVESTMENT INCOME: | | | | | | | | | | | | | | | | | | | | |
Dividend income from affiliated mutual funds@ | | $ | 4,242,701 | | | $ | 6,357,872 | | | $ | 10,002,543 | | | $ | 5,883,651 | | | $ | — | |
| | | | | | | | | | | | | | | | | | | | |
Total investment income | | | 4,242,701 | | | | 6,357,872 | | | | 10,002,543 | | | | 5,883,651 | | | | — | |
| | | | | | | | | | | | | | | | | | | | |
EXPENSES: | | | | | | | | | | | | | | | | | | | | |
Advisory*** | | | 155,537 | | | | 283,165 | | | | 641,720 | | | | 712,163 | | | | 275,120 | |
Custodian | | | 14,122 | | | | 16,052 | | | | 19,472 | | | | 20,126 | | | | 15,990 | |
Administration | | | 21,320 | | | | 40,391 | | | | 100,199 | | | | 112,920 | | | | 39,608 | |
Legal | | | 18,566 | | | | 35,493 | | | | 88,350 | | | | 99,816 | | | | 35,493 | |
Audit | | | 8,225 | | | | 8,225 | | | | 8,225 | | | | 8,225 | | | | 8,225 | |
Directors | | | 1,583 | | | | 3,025 | | | | 7,531 | | | | 8,509 | | | | 3,025 | |
State license fees and memberships | | | 11,055 | | | | 11,801 | | | | 14,016 | | | | 14,454 | | | | 11,701 | |
Other expenses | | | 10,507 | | | | 20,087 | | | | 55,406 | | | | 64,597 | | | | 26,375 | |
| | | | | | | | | | | | | | | | | | | | |
Total expenses | | | 240,915 | | | | 418,239 | | | | 934,919 | | | | 1,040,810 | | | | 415,537 | |
| | | | | | | | | | | | | | | | | | | | |
NET INVESTMENT INCOME (LOSS) | | | 4,001,786 | | | | 5,939,633 | | | | 9,067,624 | | | | 4,842,841 | | | | (415,537 | ) |
| | | | | | | | | | | | | | | | | | | | |
NET REALIZED AND UNREALIZED GAIN (LOSS) (Note 2): | | | | | | | | | | | | | | | | | | | | |
Net realized gain (loss) on: | | | | | | | | | | | | | | | | | | | | |
Investments | | | 868,219 | | | | 1,462,742 | | | | 1,332,230 | | | | 595,359 | | | | 2,731,086 | |
| | | | | | | | | | | | | | | | | | | | |
Net realized gain | | | 868,219 | | | | 1,462,742 | | | | 1,332,230 | | | | 595,359 | | | | 2,731,086 | |
| | | | | | | | | | | | | | | | | | | | |
Net change in unrealized appreciation (depreciation) on: | | | | | | | | | | | | | | | | | | | | |
Investments | | | (9,621,118 | ) | | | (27,576,086 | ) | | | (95,477,815 | ) | | | (131,747,118 | ) | | | (64,665,469 | ) |
| | | | | | | | | | | | | | | | | | | | |
Net change in unrealized depreciation | | | (9,621,118 | ) | | | (27,576,086 | ) | | | (95,477,815 | ) | | | (131,747,118 | ) | | | (64,665,469 | ) |
| | | | | | | | | | | | | | | | | | | | |
NET LOSS ON INVESTMENTS | | | (8,752,899 | ) | | | (26,113,344 | ) | | | (94,145,585 | ) | | | (131,151,759 | ) | | | (61,934,383 | ) |
| | | | | | | | | | | | | | | | | | | | |
NET DECREASE IN NET ASSETS RESULTING FROM OPERATIONS | | $ | (4,751,113 | ) | | $ | (20,173,711 | ) | | $ | (85,077,961 | ) | | $ | (126,308,918 | ) | | $ | (62,349,920 | ) |
| | | | | | | | | | | | | | | | | | | | |
| @ | Received from other Vantagepoint Funds (Note 1). |
| | | | |
| 32 | | See Notes to Financial Statements. | | |
VANTAGEPOINT FUNDS
Statements of Operations
For the Period from January 1, 2008 to June 30, 2008 (Unaudited)
| | | | | | | | | | | | | | | | | | | | |
| | | Milestone Funds | |
| | Milestone
Retirement
Income | | | Milestone
2010 | | | Milestone
2015 | | | Milestone
2020 | | | Milestone
2025 | |
INVESTMENT INCOME: | | | | | | | | | | | | | | | | | | | | |
Dividend income from affiliated mutual funds@ | | $ | 675,327 | | | $ | 769,019 | | | $ | 1,049,444 | | | $ | 690,015 | | | $ | 363,973 | |
| | | | | | | | | | | | | | | | | | | | |
Total investment income | | | 675,327 | | | | 769,019 | | | | 1,049,444 | | | | 690,015 | | | | 363,973 | |
| | | | | | | | | | | | | | | | | | | | |
EXPENSES: | | | | | | | | | | | | | | | | | | | | |
Advisory*** | | | 26,945 | | | | 35,890 | | | | 67,650 | | | | 57,951 | | | | 42,778 | |
Custodian | | | 12,304 | | | | 12,464 | | | | 12,956 | | | | 12,749 | | | | 12,550 | |
Administration | | | 7,480 | | | | 7,480 | | | | 9,545 | | | | 7,616 | | | | 7,480 | |
Legal | | | 3,276 | | | | 4,150 | | | | 8,190 | | | | 6,661 | | | | 5,024 | |
Audit | | | 8,226 | | | | 8,226 | | | | 8,225 | | | | 8,225 | | | | 8,225 | |
Directors | | | 279 | | | | 353 | | | | 699 | | | | 568 | | | | 428 | |
State license fees and memberships | | | 10,372 | | | | 10,406 | | | | 10,560 | | | | 10,502 | | | | 10,440 | |
Other expenses | | | 3,132 | | | | 3,285 | | | | 6,925 | | | | 5,850 | | | | 4,334 | |
| | | | | | | | | | | | | | | | | | | | |
Total expenses | | | 72,014 | | | | 82,254 | | | | 124,750 | | | | 110,122 | | | | 91,259 | |
| | | | | | | | | | | | | | | | | | | | |
Less reimbursements (Note 3) | | | (52,398 | ) | | | (38,022 | ) | | | (31,039 | ) | | | (24,229 | ) | | | (25,619 | ) |
| | | | | | | | | | | | | | | | | | | | |
Net expenses | | | 19,616 | | | | 44,232 | | | | 93,711 | | | | 85,893 | | | | 65,640 | |
| | | | | | | | | | | | | | | | | | | | |
NET INVESTMENT INCOME | | | 655,711 | | | | 724,787 | | | | 955,733 | | | | 604,122 | | | | 298,333 | |
| | | | | | | | | | | | | | | | | | | | |
NET REALIZED AND UNREALIZED GAIN (LOSS) (Note 2): | | | | | | | | | | | | | | | | | | | | |
Net realized gain (loss) on: | | | | | | | | | | | | | | | | | | | | |
Investments | | | (115,009 | ) | | | (162,298 | ) | | | 334,047 | | | | 187,534 | | | | 183,673 | |
| | | | | | | | | | | | | | | | | | | | |
Net realized gain (loss) | | | (115,009 | ) | | | (162,298 | ) | | | 334,047 | | | | 187,534 | | | | 183,673 | |
| | | | | | | | | | | | | | | | | | | | |
Net change in unrealized appreciation (depreciation) on: | | | | | | | | | | | | | | | | | | | | |
Investments | | | (1,668,585 | ) | | | (2,912,277 | ) | | | (8,619,375 | ) | | | (8,302,244 | ) | | | (6,942,133 | ) |
| | | | | | | | | | | | | | | | | | | | |
Net change in unrealized depreciation | | | (1,668,585 | ) | | | (2,912,277 | ) | | | (8,619,375 | ) | | | (8,302,244 | ) | | | (6,942,133 | ) |
| | | | | | | | | | | | | | | | | | | | |
NET LOSS ON INVESTMENTS | | | (1,783,594 | ) | | | (3,074,575 | ) | | | (8,285,328 | ) | | | (8,114,710 | ) | | | (6,758,460 | ) |
| | | | | | | | | | | | | | | | | | | | |
NET DECREASE IN NET ASSETS RESULTING FROM OPERATIONS | | $ | (1,127,883 | ) | | $ | (2,349,788 | ) | | $ | (7,329,595 | ) | | $ | (7,510,588 | ) | | $ | (6,460,127 | ) |
| | | | | | | | | | | | | | | | | | | | |
| @ | Received from other Vantagepoint Funds (Note 1). |
| | | | |
| | See Notes to Financial Statements. | | 33 |
VANTAGEPOINT FUNDS
Statements of Operations
For the Period from January 1, 2008 to June 30, 2008 (Unaudited)
| | | | | | | | | | | | |
| | | Milestone Funds | |
| | | Milestone
2030 | | | Milestone
2035 | | | Milestone
2040 | |
INVESTMENT INCOME: | | | | | | | | | | | | |
Dividend income from affiliated mutual funds@ | | $ | 201,984 | | | $ | 98,583 | | | $ | 87,115 | |
| | | | | | | | | | | | |
Total investment income | | | 201,984 | | | | 98,583 | | | | 87,115 | |
| | | | | | | | | | | | |
EXPENSES: | | | | | | | | | | | | |
Advisory*** | | | 31,927 | | | | 18,104 | | | | 17,314 | |
Custodian | | | 12,346 | | | | 12,147 | | | | 12,124 | |
Administration | | | 7,480 | | | | 7,480 | | | | 8,404 | |
Legal | | | 3,604 | | | | 2,075 | | | | 1,966 | |
Audit | | | 8,225 | | | | 8,225 | | | | 8,225 | |
Directors | | | 308 | | | | 177 | | | | 168 | |
State license fees and memberships | | | 10,385 | | | | 10,327 | | | | 10,323 | |
Other expenses | | | 3,504 | | | | 1,953 | | | | 1,956 | |
| | | | | | | | | | | | |
Total expenses | | | 77,779 | | | | 60,488 | | | | 60,480 | |
| | | | | | | | | | | | |
Less reimbursements (Note 3) | | | (24,750 | ) | | | (25,418 | ) | | | (26,664 | ) |
| | | | | | | | | | | | |
Net expenses | | | 53,029 | | | | 35,070 | | | | 33,816 | |
| | | | | | | | | | | | |
NET INVESTMENT INCOME | | | 148,955 | | | | 63,513 | | | | 53,299 | |
| | | | | | | | | | | | |
NET REALIZED AND UNREALIZED GAIN (LOSS) (Note 2): | | | | | | | | | | | | |
Net realized gain (loss) on: | | | | | | | | | | | | |
Investments | | | 51,968 | | | | 19,278 | | | | (67,031 | ) |
| | | | | | | | | | | | |
Net realized gain (loss) | | | 51,968 | | | | 19,278 | | | | (67,031 | ) |
| | | | | | | | | | | | |
Net change in unrealized appreciation (depreciation) on: | | | | | | | | | | | | |
Investments | | | (5,565,850 | ) | | | (3,387,278 | ) | | | (3,252,072 | ) |
| | | | | | | | | | | | |
Net change in unrealized depreciation | | | (5,565,850 | ) | | | (3,387,278 | ) | | | (3,252,072 | ) |
| | | | | | | | | | | | |
NET LOSS ON INVESTMENTS | | | (5,513,882 | ) | | | (3,368,000 | ) | | | (3,319,103 | ) |
| | | | | | | | | | | | |
NET DECREASE IN NET ASSETS RESULTING FROM OPERATIONS | | $ | (5,364,927 | ) | | $ | (3,304,487 | ) | | $ | (3,265,804 | ) |
| | | | | | | | | | | | |
| @ | Received from other Vantagepoint Funds (Note 1). |
| | | | |
| 34 | | See Notes to Financial Statements. | | |
VANTAGEPOINT FUNDS
Statements of Changes in Net Assets
| | | | | | | | | | | | | | | | |
| | | Money Market | | | Low Duration Bond(1) | |
| | | For the Period
January 1, 2008 to
June 30, 2008
(Unaudited) | | | For the
Year Ended
December 31,
2007 | | | For the Period
January 1, 2008 to
June 30, 2008
(Unaudited) | | | For the
Year Ended
December 31,
2007 | |
Increase (decrease) in net assets resulting from operations: | | | | | | | | | | | | | | | | |
Net investment income | | $ | 4,733,199 | | | $ | 12,287,780 | | | $ | 9,049,973 | | | $ | 25,702,951 | |
Net realized gain on sale of investments | | | — | | | | — | | | | 2,196,193 | | | | 526,463 | |
Net change in unrealized appreciation (depreciation) of investments | | | — | | | | — | | | | (3,930,503 | ) | | | 5,645,487 | |
| | | | | | | | | | | | | | | | |
Net increase in net assets resulting from operations | | | 4,733,199 | | | | 12,287,780 | | | | 7,315,663 | | | | 31,874,901 | |
| | | | | | | | | | | | | | | | |
Distributions to shareholders from: | | | | | | | | | | | | | | | | |
Net investment income | | | (4,733,199 | ) | | | (12,287,780 | ) | | | (8,902,410 | ) | | | (26,485,268 | ) |
| | | | | | | | | | | | | | | | |
Total distributions | | | (4,733,199 | ) | | | (12,287,780 | ) | | | (8,902,410 | ) | | | (26,485,268 | ) |
| | | | | | | | | | | | | | | | |
Capital share transactions: | | | | | | | | | | | | | | | | |
Proceeds from sale of shares | | | 83,462,130 | | | | 144,346,127 | | | | 28,999,042 | | | | 114,779,955 | |
Reinvestment of distributions | | | 4,733,199 | | | | 12,287,779 | | | | 8,902,410 | | | | 26,485,268 | |
Value of shares redeemed | | | (37,385,954 | ) | | | (67,605,809 | ) | | | (40,614,882 | ) | | | (247,207,687 | ) |
| | | | | | | | | | | | | | | | |
Net increase (decrease) from capital share transactions | | | 50,809,375 | | | | 89,028,097 | | | | (2,713,430 | ) | | | (105,942,464 | ) |
| | | | | | | | | | | | | | | | |
Total increase (decrease) in net assets | | | 50,809,375 | | | | 89,028,097 | | | | (4,300,177 | ) | | | (100,552,831 | ) |
| | | | | | | | | | | | | | | | |
NET ASSETS at beginning of period | | | 306,799,375 | | | | 217,771,278 | | | | 507,120,273 | | | | 607,673,104 | |
| | | | | | | | | | | | | | | | |
NET ASSETS at end of period | | $ | 357,608,750 | | | $ | 306,799,375 | | | $ | 502,820,096 | | | $ | 507,120,273 | |
| | | | | | | | | | | | | | | | |
Undistributed net investment income included in net assets at end of period | | $ | — | | | $ | — | | | $ | 147,563 | | | $ | — | |
| | | | | | | | | | | | | | | | |
SHARE TRANSACTIONS: | | | | | | | | | | | | | | | | |
Number of shares sold | | | 83,462,127 | | | | 144,346,127 | | | | 2,944,007 | | | | 11,704,639 | |
Number of shares issued through reinvestment of dividends and distributions | | | 4,733,199 | | | | 12,287,779 | | | | 902,446 | | | | 2,707,153 | |
Number of shares redeemed | | | (37,385,954 | ) | | | (67,605,809 | ) | | | (4,098,814 | ) | | | (25,091,034 | ) |
| | | | | | | | | | | | | | | | |
Net increase (decrease) in shares outstanding | | | 50,809,372 | | | | 89,028,097 | | | | (252,361 | ) | | | (10,679,242 | ) |
| | | | | | | | | | | | | | | | |
| (1) | Formerly Short-Term Bond Fund |
| | | | |
| | See Notes to Financial Statements. | | 35 |
VANTAGEPOINT FUNDS
Statements of Changes in Net Assets
| | | | | | | | | | | | | | | | |
| | | Inflation Protected Securities(2) | | | Asset Allocation | |
| | | For the Period
January 1, 2008 to
June 30, 2008
(Unaudited) | | | For the
Year Ended
December 31,
2007 | | | For the Period
January 1, 2008 to
June 30, 2008
(Unaudited) | | | For the
Year Ended
December 31,
2007 | |
Increase (decrease) in net assets resulting from operations: | | | | | | | | | | | | | | | | |
Net investment income | | $ | 10,097,456 | | | $ | 7,991,618 | | | $ | 5,350,198 | | | $ | 14,512,820 | |
Net realized gain (loss) on sale of investments | | | 5,404,199 | | | | (571,324 | ) | | | (11,828,669 | ) | | | 30,008,564 | |
Net change in unrealized appreciation (depreciation) of investments | | | (2,383,208 | ) | | | 9,632,881 | | | | (83,743,234 | ) | | | 1,897,302 | |
| | | | | | | | | | | | | | | | |
Net increase (decrease) in net assets resulting from operations | | | 13,118,447 | | | | 17,053,175 | | | | (90,221,705 | ) | | | 46,418,686 | |
| | | | | | | | | | | | | | | | |
Distributions to shareholders from: | | | | | | | | | | | | | | | | |
Net investment income | | | (9,787,298 | ) | | | (7,993,265 | ) | | | — | | | | (16,268,835 | ) |
Net realized gain on investments | | | — | | | | — | | | | — | | | | (17,570,032 | ) |
| | | | | | | | | | | | | | | | |
Total distributions | | | (9,787,298 | ) | | | (7,993,265 | ) | | | — | | | | (33,838,867 | ) |
| | | | | | | | | | | | | | | | |
Capital share transactions: | | | | | | | | | | | | | | | | |
Proceeds from sale of shares | | | 95,548,575 | | | | 150,935,590 | | | | 15,880,395 | | | | 60,033,126 | |
Reinvestment of distributions | | | 9,776,525 | | | | 7,993,265 | | | | — | | | | 33,838,867 | |
Value of shares redeemed | | | (34,221,041 | ) | | | (36,319,717 | ) | | | (59,528,496 | ) | | | (118,504,439 | ) |
| | | | | | | | | | | | | | | | |
Net increase (decrease) from capital share transactions | | | 71,104,059 | | | | 122,609,138 | | | | (43,648,101 | ) | | | (24,632,446 | ) |
| | | | | | | | | | | | | | | | |
Total increase (decrease) in net assets | | | 74,435,208 | | | | 131,669,048 | | | | (133,869,806 | ) | | | (12,052,627 | ) |
| | | | | | | | | | | | | | | | |
NET ASSETS at beginning of period | | | 274,208,681 | | | | 142,539,633 | | | | 756,328,867 | | | | 768,381,494 | |
| | | | | | | | | | | | | | | | |
NET ASSETS at end of period | | $ | 348,643,889 | | | $ | 274,208,681 | | | $ | 622,459,061 | | | $ | 756,328,867 | |
| | | | | | | | | | | | | | | | |
Undistributed net investment income included in net assets at end of period | | $ | 323,340 | | | $ | 13,182 | | | $ | 5,446,398 | | | $ | 96,200 | |
| | | | | | | | | | | | | | | | |
SHARE TRANSACTIONS: | | | | | | | | | | | | | | | | |
Number of shares sold | | | 8,849,624 | | | | 14,820,899 | | | | 2,017,154 | | | | 6,785,176 | |
Number of shares issued through reinvestment of dividends and distributions | | | 913,085 | | | | 796,656 | | | | — | | | | 3,930,182 | |
Number of shares redeemed | | | (3,195,193 | ) | | | (3,622,766 | ) | | | (7,548,878 | ) | | | (13,452,049 | ) |
| | | | | | | | | | | | | | | | |
Net increase (decrease) in shares outstanding | | | 6,567,516 | | | | 11,994,789 | | | | (5,531,724 | ) | | | (2,736,691 | ) |
| | | | | | | | | | | | | | | | |
| (2) | Formerly US Government Securities Fund |
| | | | |
| 36 | | See Notes to Financial Statements. | | |
VANTAGEPOINT FUNDS
Statements of Changes in Net Assets
| | | | | | | | | | | | | | | | |
| | | Equity Income | | | Growth & Income | |
| | | For the Period
January 1, 2008 to
June 30, 2008
(Unaudited) | | | For the
Year Ended
December 31,
2007 | | | For the Period
January 1, 2008 to
June 30, 2008
(Unaudited) | | | For the
Year Ended
December 31,
2007 | |
Increase (decrease) in net assets resulting from operations: | | | | | | | | | | | | | | | | |
Net investment income | | $ | 12,906,969 | | | $ | 20,299,925 | | | $ | 5,242,765 | | | $ | 11,088,329 | |
Net realized gain on sale of investments | | | 27,091,242 | | | | 86,852,391 | | | | 11,184,880 | | | | 139,516,665 | |
Net change in unrealized depreciation of investments | | | (237,593,712 | ) | | | (57,192,923 | ) | | | (144,208,177 | ) | | | (68,932,822 | ) |
| | | | | | | | | | | | | | | | |
Net increase (decrease) in net assets resulting from operations | | | (197,595,501 | ) | | | 49,959,393 | | | | (127,780,532 | ) | | | 81,672,172 | |
| | | | | | | | | | | | | | | | |
Distributions to shareholders from: | | | | | | | | | | | | | | | | |
Net investment income | | | — | | | | (22,816,092 | ) | | | — | | | | (13,826,196 | ) |
Net realized gain on investments | | | — | | | | (61,239,980 | ) | | | — | | | | (133,206,281 | ) |
| | | | | | | | | | | | | | | | |
Total distributions | | | — | | | | (84,056,072 | ) | | | — | | | | (147,032,477 | ) |
| | | | | | | | | | | | | | | | |
Capital share transactions: | | | | | | | | | | | | | | | | |
Proceeds from sale of shares | | | 89,839,074 | | | | 366,342,980 | | | | 67,334,059 | | | | 149,717,691 | |
Reinvestment of distributions | | | — | | | | 84,054,020 | | | | — | | | | 147,028,373 | |
Value of shares redeemed | | | (99,766,656 | ) | | | (149,503,799 | ) | | | (40,431,100 | ) | | | (306,299,246 | ) |
| | | | | | | | | | | | | | | | |
Net increase (decrease) from capital share transactions | | | (9,927,582 | ) | | | 300,893,201 | | | | 26,902,959 | | | | (9,553,182 | ) |
| | | | | | | | | | | | | | | | |
Total increase (decrease) in net assets | | | (207,523,083 | ) | | | 266,796,522 | | | | (100,877,573 | ) | | | (74,913,487 | ) |
| | | | | | | | | | | | | | | | |
NET ASSETS at beginning of period | | | 1,734,749,978 | | | | 1,467,953,456 | | | | 1,101,700,461 | | | | 1,176,613,948 | |
| | | | | | | | | | | | | | | | |
NET ASSETS at end of period | | $ | 1,527,226,895 | | | $ | 1,734,749,978 | | | $ | 1,000,822,888 | | | $ | 1,101,700,461 | |
| | | | | | | | | | | | | | | | |
Undistributed net investment income included in net assets at end of period | | $ | 12,906,969 | | | $ | — | | | $ | 5,246,378 | | | $ | 3,613 | |
| | | | | | | | | | | | | | | | |
SHARE TRANSACTIONS: | | | | | | | | | | | | | | | | |
Number of shares sold | | | 9,810,481 | | | | 34,836,742 | | | | 6,863,939 | | | | 12,374,508 | |
Number of shares issued through reinvestment of dividends and distributions | | | — | | | | 8,490,305 | | | | — | | | | 13,818,457 | |
Number of shares redeemed | | | (10,953,674 | ) | | | (14,257,589 | ) | | | (4,134,553 | ) | | | (24,234,255 | ) |
| | | | | | | | | | | | | | | | |
Net increase (decrease) in shares outstanding | | | (1,143,193 | ) | | | 29,069,458 | | | | 2,729,386 | | | | 1,958,710 | |
| | | | | | | | | | | | | | | | |
| | | | |
| | See Notes to Financial Statements. | | 37 |
VANTAGEPOINT FUNDS
Statements of Changes in Net Assets
| | | | | | | | | | | | | | | | |
| | | Growth | | | Select Value | |
| | | For the Period
January 1, 2008 to
June 30, 2008
(Unaudited) | | | For the
Year Ended
December 31,
2007 | | | For the Period
January 1, 2008 to
June 30, 2008
(Unaudited) | | | For the Period
from October 30, 2007*
to December 31,
2007 | |
Increase (decrease) in net assets resulting from operations: | | | | | | | | | | | | | | | | |
Net investment income | | $ | 6,201,559 | | | $ | 11,478,504 | | | $ | 1,871,952 | | | $ | 1,035,649 | |
Net realized gain (loss) on sale of investments | | | (20,346,509 | ) | | | 227,328,263 | | | | (12,252,855 | ) | | | (3,837,527 | ) |
Net change in unrealized appreciation (depreciation) of investments | | | (279,535,205 | ) | | | 36,959,498 | | | | (10,604,256 | ) | | | (15,229,407 | ) |
| | | | | | | | | | | | | | | | |
Net increase (decrease) in net assets resulting from operations | | | (293,680,155 | ) | | | 275,766,265 | | | | (20,985,159 | ) | | | (18,031,285 | ) |
| | | | | | | | | | | | | | | | |
Distributions to shareholders from: | | | | | | | | | | | | | | | | |
Net investment income | | | — | | | | (11,708,202 | ) | | | — | | | | (1,099,764 | ) |
| | | | | | | | | | | | | | | | |
Total distributions | | | — | | | | (11,708,202 | ) | | | — | | | | (1,099,764 | ) |
| | | | | | | | | | | | | | | | |
Capital share transactions: | | | | | | | | | | | | | | | | |
Proceeds from sale of shares | | | 78,377,539 | | | | 195,051,211 | | | | 17,350,081 | | | | 312,254,918 | |
Reinvestment of distributions | | | — | | | | 11,708,202 | | | | — | | | | 1,099,764 | |
Value of shares redeemed | | | (152,639,966 | ) | | | (686,767,442 | ) | | | (11,793,624 | ) | | | (66,256 | ) |
| | | | | | | | | | | | | | | | |
Net increase (decrease) from capital share transactions | | | (74,262,427 | ) | | | (480,008,029 | ) | | | 5,556,457 | | | | 313,288,426 | |
| | | | | | | | | | | | | | | | |
Total increase (decrease) in net assets | | | (367,942,582 | ) | | | (215,949,966 | ) | | | (15,428,702 | ) | | | 294,157,377 | |
| | | | | | | | | | | | | | | | |
NET ASSETS at beginning of period | | | 2,567,844,538 | | | | 2,783,794,504 | | | | 294,157,377 | | | | — | |
| | | | | | | | | | | | | | | | |
NET ASSETS at end of period | | $ | 2,199,901,956 | | | $ | 2,567,844,538 | | | $ | 278,728,675 | | | $ | 294,157,377 | |
| | | | | | | | | | | | | | | | |
Undistributed net investment income included in net assets at end of period | | $ | 6,729,395 | | | $ | 527,836 | | | $ | 1,871,952 | | | $ | — | |
| | | | | | | | | | | | | | | | |
SHARE TRANSACTIONS: | | | | | | | | | | | | | | | | |
Number of shares sold | | | 8,101,976 | | | | 18,891,829 | | | | 1,955,426 | | | | 31,249,053 | |
Number of shares issued through reinvestment of dividends and distributions | | | — | | | | 1,109,782 | | | | — | | | | 115,855 | |
Number of shares redeemed | | | (15,889,330 | ) | | | (65,523,919 | ) | | | (1,326,068 | ) | | | (6,928 | ) |
| | | | | | | | | | | | | | | | |
Net increase (decrease) in shares outstanding | | | (7,787,354 | ) | | | (45,522,308 | ) | | | 629,358 | | | | 31,357,980 | |
| | | | | | | | | | | | | | | | |
| * | Commencement of operations |
| | | | |
| 38 | | See Notes to Financial Statements. | | |
VANTAGEPOINT FUNDS
Statements of Changes in Net Assets
| | | | | | | | |
| | | Aggressive Opportunities | |
| | | For the Period
January 1, 2008 to
June 30, 2008
(Unaudited) | | | For the
Year Ended
December 31,
2007 | |
Increase (decrease) in net assets resulting from operations: | | | | | | | | |
Net investment income | | $ | 918,459 | | | $ | 1,095,469 | |
Net realized gain on sale of investments | | | 33,840,157 | | | | 205,011,410 | |
Net change in unrealized depreciation of investments | | | (168,357,796 | ) | | | (115,328,603 | ) |
| | | | | | | | |
Net increase (decrease) in net assets resulting from operations | | | (133,599,180 | ) | | | 90,778,276 | |
| | | | | | | | |
Distributions to shareholders from: | | | | | | | | |
Net realized gain on investments | | | — | | | | (197,540,253 | ) |
| | | | | | | | |
Total distributions | | | — | | | | (197,540,253 | ) |
| | | | | | | | |
Capital share transactions: | | | | | | | | |
Proceeds from sale of shares | | | 39,531,118 | | | | 102,369,031 | |
Reinvestment of distributions | | | — | | | | 197,540,252 | |
Value of shares redeemed | | | (82,724,920 | ) | | | (405,110,096 | ) |
| | | | | | | | |
Net decrease from capital share transactions | | | (43,193,802 | ) | | | (105,200,813 | ) |
| | | | | | | | |
Total decrease in net assets | | | (176,792,982 | ) | | | (211,962,790 | ) |
| | | | | | | | |
NET ASSETS at beginning of period | | | 1,154,745,485 | | | | 1,366,708,275 | |
| | | | | | | | |
NET ASSETS at end of period | | $ | 977,952,503 | | | $ | 1,154,745,485 | |
| | | | | | | | |
Undistributed net investment income included in net assets at end of period | | $ | 1,974,491 | | | $ | 1,056,032 | |
| | | | | | | | |
SHARE TRANSACTIONS: | | | | | | | | |
Number of shares sold | | | 3,849,049 | | | | 7,396,274 | |
Number of shares issued through reinvestment of dividends and distributions | | | — | | | | 17,373,813 | |
Number of shares redeemed | | | (8,106,738 | ) | | | (28,581,652 | ) |
| | | | | | | | |
Net decrease in shares outstanding | | | (4,257,689 | ) | | | (3,811,565 | ) |
| | | | | | | | |
| | | | |
| | See Notes to Financial Statements. | | 39 |
VANTAGEPOINT FUNDS
Statements of Changes in Net Assets
| | | | | | | | | | | | | | | | |
| | | Discovery | | | International | |
| | | For the Period
January 1, 2008 to
June 30, 2008
(Unaudited) | | | For the Period
from October 30, 2007*
to December 31,
2007 | | | For the Period
January 1, 2008 to
June 30, 2008
(Unaudited) | | | For the
Year Ended
December 31,
2007 | |
Increase (decrease) in net assets resulting from operations: | | | | | | | | | | | | | | | | |
Net investment income | | $ | 1,557,117 | | | $ | 606,893 | | | $ | 13,018,916 | | | $ | 12,941,748 | |
Net realized gain (loss) on sale of investments | | | (4,065,226 | ) | | | (4,119,063 | ) | | | 8,578,654 | | | | 152,923,621 | |
Net change in unrealized depreciation of investments | | | (11,350,916 | ) | | | (7,995,699 | ) | | | (123,628,029 | ) | | | (30,627,134 | ) |
| | | | | | | | | | | | | | | | |
Net increase (decrease) in net assets resulting from operations | | | (13,859,025 | ) | | | (11,507,869 | ) | | | (102,030,459 | ) | | | 135,238,235 | |
| | | | | | | | | | | | | | | | |
Distributions to shareholders from: | | | | | | | | | | | | | | | | |
Net investment income | | | — | | | | (628,948 | ) | | | — | | | | (16,602,361 | ) |
Net realized gain on investments | | | — | | | | (1,324,597 | ) | | | — | | | | (139,045,053 | ) |
| | | | | | | | | | | | | | | | |
Total distributions | | | — | | | | (1,953,545 | ) | | | — | | | | (155,647,414 | ) |
| | | | | | | | | | | | | | | | |
Capital share transactions: | | | | | | | | | | | | | | | | |
Proceeds from sale of shares | | | 9,426,992 | | | | 185,160,551 | | | | 63,070,213 | | | | 120,666,811 | |
Reinvestment of distributions | | | — | | | | 1,953,545 | | | | — | | | | 155,647,414 | |
Value of shares redeemed | | | (6,554,427 | ) | | | (142,568 | ) | | | (58,946,468 | ) | | | (160,707,190 | ) |
| | | | | | | | | | | | | | | | |
Net increase from capital share transactions | | | 2,872,565 | | | | 186,971,528 | | | | 4,123,745 | | | | 115,607,035 | |
| | | | | | | | | | | | | | | | |
Total increase (decrease) in net assets | | | (10,986,460 | ) | | | 173,510,114 | | | | (97,906,714 | ) | | | 95,197,856 | |
| | | | | | | | | | | | | | | | |
NET ASSETS at beginning of period | | | 173,510,114 | | | | — | | | | 1,145,028,806 | | | | 1,049,830,950 | |
| | | | | | | | | | | | | | | | |
NET ASSETS at end of period | | $ | 162,523,654 | | | $ | 173,510,114 | | | $ | 1,047,122,092 | | | $ | 1,145,028,806 | |
| | | | | | | | | | | | | | | | |
Undistributed net investment income (loss) included in net assets at end of period | | $ | 1,549,471 | | | $ | (7,646 | ) | | $ | 11,950,141 | | | $ | (1,068,775 | ) |
| | | | | | | | | | | | | | | | |
SHARE TRANSACTIONS: | | | | | | | | | | | | | | | | |
Number of shares sold | | | 1,087,378 | | | | 18,559,432 | | | | 5,567,987 | | | | 8,952,026 | |
Number of shares issued through reinvestment of dividends and distributions | | | — | | | | 208,045 | | | | — | | | | 12,884,720 | |
Number of shares redeemed | | | (758,827 | ) | | | (15,279 | ) | | | (5,203,871 | ) | | | (11,443,736 | ) |
| | | | | | | | | | | | | | | | |
Net increase in shares outstanding | | | 328,551 | | | | 18,752,198 | | | | 364,116 | | | | 10,393,010 | |
| | | | | | | | | | | | | | | | |
| * | Commencement of operations |
| | | | |
| 40 | | See Notes to Financial Statements. | | |
VANTAGEPOINT FUNDS
Statements of Changes in Net Assets
| | | | | | | | |
| | | Diversified Assets | |
| | | For the Period
January 1, 2008 to
June 30, 2008
(Unaudited) | | | For the Period
from October 30, 2007*
to December 31,
2007 | |
Increase (decrease) in net assets resulting from operations: | | | | | | | | |
Net investment income | | $ | 5,086,716 | | | $ | 2,781,895 | |
Net realized gain (loss) on sale of investments | | | (7,718,254 | ) | | | 390,364 | |
Net change in unrealized appreciation (depreciation) of investments | | | 6,798,294 | | | | (3,711,889 | ) |
| | | | | | | | |
Net increase (decrease) in net assets resulting from operations | | | 4,166,756 | | | | (539,630 | ) |
| | | | | | | | |
Distributions to shareholders from: | | | | | | | | |
Net investment income | | | — | | | | (2,003,176 | ) |
| | | | | | | | |
Total distributions | | | — | | | | (2,003,176 | ) |
| | | | | | | | |
Capital share transactions: | | | | | | | | |
Proceeds from sale of shares | | | 20,267,696 | | | | 468,810,705 | |
Reinvestment of distributions | | | — | | | | 2,003,176 | |
Value of shares redeemed | | | (35,742,432 | ) | | | (3,096,533 | ) |
| | | | | | | | |
Net increase (decrease) from capital share transactions | | | (15,474,736 | ) | | | 467,717,348 | |
| | | | | | | | |
Total increase (decrease) in net assets | | | (11,307,980 | ) | | | 465,174,542 | |
| | | | | | | | |
NET ASSETS at beginning of period | | | 465,174,542 | | | | — | |
| | | | | | | | |
NET ASSETS at end of period | | $ | 453,866,562 | | | $ | 465,174,542 | |
| | | | | | | | |
Undistributed net investment income included in net assets at end of period | | $ | 7,320,773 | | | $ | 2,234,057 | |
| | | | | | | | |
SHARE TRANSACTIONS: | | | | | | | | |
Number of shares sold | | | 2,029,023 | | | | 46,882,026 | |
Number of shares issued through reinvestment of dividends and distributions | | | — | | | | 200,920 | |
Number of shares redeemed | | | (3,602,923 | ) | | | (311,348 | ) |
| | | | | | | | |
Net increase (decrease) in shares outstanding | | | (1,573,900 | ) | | | 46,771,598 | |
| | | | | | | | |
| * | Commencement of operations |
| | | | |
| | See Notes to Financial Statements. | | 41 |
VANTAGEPOINT FUNDS
Statements of Changes in Net Assets
| | | | | | | | | | | | | | | | |
| | | Core Bond Index | | | 500 Stock Index | |
| | | For the Period
January 1, 2008 to
June 30, 2008
(Unaudited) | | | For the
Year Ended
December 31,
2007 | | | For the Period
January 1, 2008 to
June 30, 2008
(Unaudited) | | | For the
Year Ended
December 31,
2007 | |
Increase (decrease) in net assets resulting from operations: | | | | | | | | | | | | | | | | |
Net investment income | | $ | 24,161,918 | | | $ | 57,760,506 | | | $ | 3,336,833 | | | $ | 7,015,582 | |
Net realized gain on sale of investments | | | 3,935,274 | | | | 498,179 | | | | 3,838,160 | | | | 15,061,590 | |
Net change in unrealized appreciation (depreciation) of investments | | | (16,585,156 | ) | | | 20,506,955 | | | | (56,503,196 | ) | | | (1,298,250 | ) |
| | | | | | | | | | | | | | | | |
Net increase (decrease) in net assets resulting from operations | | | 11,512,036 | | | | 78,765,640 | | | | (49,328,203 | ) | | | 20,778,922 | |
| | | | | | | | | | | | | | | | |
Distributions to shareholders from: | | | | | | | | | | | | | | | | |
Net investment income—Class I | | | (20,574,100 | ) | | | (51,586,668 | ) | | | — | | | | (1,377,508 | ) |
Net investment income—Class II | | | (5,135,600 | ) | | | (9,808,163 | ) | | | — | | | | (5,594,202 | ) |
| | | | | | | | | | | | | | | | |
Total distributions | | | (25,709,700 | ) | | | (61,394,831 | ) | | | — | | | | (6,971,710 | ) |
| | | | | | | | | | | | | | | | |
Capital share transactions: | | | | | | | | | | | | | | | | |
Proceeds from sale of shares—Class I | | | 51,705,239 | | | | 172,971,124 | | | | 4,146,032 | | | | 10,211,022 | |
Proceeds from sale of shares—Class II | | | 15,502,300 | | | | 35,619,251 | | | | 21,204,007 | | | | 49,072,500 | |
Reinvestment of distributions—Class I | | | 20,574,100 | | | | 51,586,668 | | | | — | | | | 1,376,854 | |
Reinvestment of distributions—Class II | | | 5,135,600 | | | | 9,808,163 | | | | — | | | | 5,594,202 | |
Value of shares redeemed—Class I | | | (94,382,204 | ) | | | (339,766,033 | ) | | | (7,589,494 | ) | | | (28,241,458 | ) |
Value of shares redeemed—Class II | | | (18,035,394 | ) | | | (17,447,285 | ) | | | (29,391,699 | ) | | | (35,248,059 | ) |
| | | | | | | | | | | | | | | | |
Net increase (decrease) from capital share transactions | | | (19,500,359 | ) | | | (87,228,112 | ) | | | (11,631,154 | ) | | | 2,765,061 | |
| | | | | | | | | | | | | | | | |
Total increase (decrease) in net assets | | | (33,698,023 | ) | | | (69,857,303 | ) | | | (60,959,357 | ) | | | 16,572,273 | |
| | | | | | | | | | | | | | | | |
NET ASSETS at beginning of period | | | 1,090,114,078 | | | | 1,159,971,381 | | | | 411,941,544 | | | | 395,369,271 | |
| | | | | | | | | | | | | | | | |
NET ASSETS at end of period | | $ | 1,056,416,055 | | | $ | 1,090,114,078 | | | $ | 350,982,187 | | | $ | 411,941,544 | |
| | | | | | | | | | | | | | | | |
Undistributed net investment income (loss) included in net assets at end of period | | $ | (1,547,782 | ) | | $ | — | | | $ | 3,436,854 | | | $ | 100,021 | |
| | | | | | | | | | | | | | | | |
SHARE TRANSACTIONS: | | | | | | | | | | | | | | | | |
Number of shares sold—Class I | | | 5,225,189 | | | | 17,805,432 | | | | 380,787 | | | | 874,195 | |
Number of shares issued through reinvestment of dividends and distributions—Class I | | | 2,079,940 | | | | 5,297,698 | | | | — | | | | 117,179 | |
Number of shares redeemed—Class I | | | (9,467,669 | ) | | | (34,530,649 | ) | | | (707,221 | ) | | | (2,376,236 | ) |
| | | | | | | | | | | | | | | | |
Net decrease in shares outstanding—Class I | | | (2,162,540 | ) | | | (11,427,519 | ) | | | (326,434 | ) | | | (1,384,862 | ) |
| | | | | | | | | | | | | | | | |
Number of shares sold—Class II | | | 1,544,799 | | | | 3,647,067 | | | | 2,083,635 | | | | 4,383,577 | |
Number of shares issued through reinvestment of dividends and distributions—Class II | | | 516,571 | | | | 1,001,750 | | | | — | | | | 502,624 | |
Number of shares redeemed—Class II | | | (1,808,363 | ) | | | (1,786,893 | ) | | | (2,891,038 | ) | | | (3,154,850 | ) |
| | | | | | | | | | | | | | | | |
Net increase (decrease) in shares outstanding—Class II | | | 253,007 | | | | 2,861,924 | | | | (807,403 | ) | | | 1,731,351 | |
| | | | | | | | | | | | | | | | |
| | | | |
| 42 | | See Notes to Financial Statements. | | |
VANTAGEPOINT FUNDS
Statements of Changes in Net Assets
| | | | | | | | | | | | | | | | |
| | | Broad Market Index | | | Mid/Small Company Index | |
| | | For the Period
January 1, 2008 to
June 30, 2008
(Unaudited) | | | For the
Year Ended
December 31,
2007 | | | For the Period
January 1, 2008 to
June 30, 2008
(Unaudited) | | | For the
Year Ended
December 31,
2007 | |
Increase (decrease) in net assets resulting from operations: | | | | | | | | | | | | | | | | |
Net investment income | | $ | 5,046,006 | | | $ | 10,897,242 | | | $ | 1,343,333 | | | $ | 2,729,443 | |
Net realized gain on sale of investments | | | 15,322,683 | | | | 13,067,491 | | | | 5,888,155 | | | | 15,633,115 | |
Net change in unrealized appreciation (depreciation) of investments | | | (90,710,572 | ) | | | 9,972,802 | | | | (24,741,293 | ) | | | (9,612,842 | ) |
| | | | | | | | | | | | | | | | |
Net increase (decrease) in net assets resulting from operations | | | (70,341,883 | ) | | | 33,937,535 | | | | (17,509,805 | ) | | | 8,749,716 | |
| | | | | | | | | | | | | | | | |
Distributions to shareholders from: | | | | | | | | | | | | | | | | |
Net investment income—Class I | | | — | | | | (2,337,523 | ) | | | — | | | | (1,189,641 | ) |
Net investment income—Class II | | | — | | | | (8,261,327 | ) | | | — | | | | (1,647,238 | ) |
Net realized gain on investments—Class I | | | — | | | | — | | | | — | | | | (5,636,302 | ) |
Net realized gain on investments—Class II | | | — | | | | — | | | | — | | | | (6,824,984 | ) |
| | | | | | | | | | | | | | | | |
Total distributions | | | — | | | | (10,598,850 | ) | | | — | | | | (15,298,165 | ) |
| | | | | | | | | | | | | | | | |
Capital share transactions: | | | | | | | | | | | | | | | | |
Proceeds from sale of shares—Class I | | | 4,669,666 | | | | 11,669,028 | | | | 11,834,411 | | | | 42,689,204 | |
Proceeds from sale of shares—Class II | | | 15,638,633 | | | | 61,244,285 | | | | 7,197,704 | | | | 27,835,527 | |
Reinvestment of distributions—Class I | | | — | | | | 2,335,081 | | | | — | | | | 6,824,731 | |
Reinvestment of distributions—Class II | | | — | | | | 8,261,327 | | | | — | | | | 8,472,221 | |
Value of shares redeemed—Class I | | | (14,959,722 | ) | | | (47,216,585 | ) | | | (9,637,333 | ) | | | (19,337,217 | ) |
Value of shares redeemed—Class II | | | (31,431,442 | ) | | | (50,125,859 | ) | | | (11,525,259 | ) | | | (18,053,229 | ) |
| | | | | | | | | | | | | | | | |
Net increase (decrease) from capital share transactions | | | (26,082,865 | ) | | | (13,832,723 | ) | | | (2,130,477 | ) | | | 48,431,237 | |
| | | | | | | | | | | | | | | | |
Total increase (decrease) in net assets | | | (96,424,748 | ) | | | 9,505,962 | | | | (19,640,282 | ) | | | 41,882,788 | |
| | | | | | | | | | | | | | | | |
NET ASSETS at beginning of period | | | 655,118,339 | | | | 645,612,377 | | | | 227,446,214 | | | | 185,563,426 | |
| | | | | | | | | | | | | | | | |
NET ASSETS at end of period | | $ | 558,693,591 | | | $ | 655,118,339 | | | $ | 207,805,932 | | | $ | 227,446,214 | |
| | | | | | | | | | | | | | | | |
Undistributed net investment income included in net assets at end of period | | $ | 10,603,050 | | | $ | 5,557,044 | | | $ | 1,569,415 | | | $ | 226,082 | |
| | | | | | | | | | | | | | | | |
SHARE TRANSACTIONS: | | | | | | | | | | | | | | | | |
Number of shares sold—Class I | | | 407,944 | | | | 946,498 | | | | 781,485 | | | | 2,415,991 | |
Number of shares issued through reinvestment of dividends and distributions—Class I | | | — | | | | 188,465 | | | | — | | | | 415,383 | |
Number of shares redeemed—Class I | | | (1,322,832 | ) | | | (3,772,869 | ) | | | (631,415 | ) | | | (1,091,982 | ) |
| | | | | | | | | | | | | | | | |
Net increase (decrease) in shares outstanding—Class I | | | (914,888 | ) | | | (2,637,906 | ) | | | 150,070 | | | | 1,739,392 | |
| | | | | | | | | | | | | | | | |
Number of shares sold—Class II | | | 1,454,306 | | | | 5,158,271 | | | | 496,517 | | | | 1,647,944 | |
Number of shares issued through reinvestment of dividends and distributions—Class II | | | — | | | | 706,096 | | | | — | | | | 540,665 | |
Number of shares redeemed—Class II | | | (2,925,940 | ) | | | (4,263,802 | ) | | | (806,512 | ) | | | (1,074,900 | ) |
| | | | | | | | | | | | | | | | |
Net increase (decrease) in shares outstanding—Class II | | | (1,471,634 | ) | | | 1,600,565 | | | | (309,995 | ) | | | 1,113,709 | |
| | | | | | | | | | | | | | | | |
| | | | |
| | See Notes to Financial Statements. | | 43 |
VANTAGEPOINT FUNDS
Statements of Changes in Net Assets
| | | | | | | | |
| | | Overseas Equity Index | |
| | | For the Period
January 1, 2008 to
June 30, 2008
(Unaudited) | | | For the
Year Ended
December 31,
2007 | |
Increase (decrease) in net assets resulting from operations: | | | | | | | | |
Net investment income | | $ | 4,411,090 | | | $ | 5,597,127 | |
Net realized gain on sale of investments | | | 1,487,318 | | | | 2,917,727 | |
Net change in unrealized appreciation (depreciation) of investments | | | (32,560,093 | ) | | | 10,080,756 | |
| | | | | | | | |
Net increase (decrease) in net assets resulting from operations | | | (26,661,685 | ) | | | 18,595,610 | |
| | | | | | | | |
Distributions to shareholders from: | | | | | | | | |
Net investment income—Class I | | | — | | | | (1,763,018 | ) |
Net investment income—Class II | | | — | | | | (5,059,311 | ) |
Net realized gain on investments—Class I | | | — | | | | (60,409 | ) |
Net realized gain on investments—Class II | | | — | | | | (159,801 | ) |
| | | | | | | | |
Total distributions | | | — | | | | (7,042,539 | ) |
| | | | | | | | |
Capital share transactions: | | | | | | | | |
Proceeds from sale of shares—Class I | | | 4,945,092 | | | | 27,890,700 | |
Proceeds from sale of shares—Class II | | | 10,578,244 | | | | 74,024,535 | |
Reinvestment of distributions—Class I | | | — | | | | 1,823,427 | |
Reinvestment of distributions—Class II | | | — | | | | 5,219,112 | |
Value of shares redeemed—Class I | | | (7,168,400 | ) | | | (18,421,827 | ) |
Value of shares redeemed—Class II | | | (19,074,942 | ) | | | (15,927,218 | ) |
| | | | | | | | |
Net increase (decrease) from capital share transactions | | | (10,720,006 | ) | | | 74,608,729 | |
| | | | | | | | |
Total increase (decrease) in net assets | | | (37,381,691 | ) | | | 86,161,800 | |
| | | | | | | | |
NET ASSETS at beginning of period | | | 249,383,678 | | | | 163,221,878 | |
| | | | | | | | |
NET ASSETS at end of period | | $ | 212,001,987 | | | $ | 249,383,678 | |
| | | | | | | | |
Undistributed net investment income (loss) included in net assets at end of period | | $ | 3,756,074 | | | $ | (655,016 | ) |
| | | | | | | | |
SHARE TRANSACTIONS: | | | | | | | | |
Number of shares sold—Class I | | | 355,306 | | | | 1,891,940 | |
Number of shares issued through reinvestment of dividends and distributions—Class I | | | — | | | | 124,042 | |
Number of shares redeemed—Class I | | | (530,592 | ) | | | (1,243,647 | ) |
| | | | | | | | |
Net increase (decrease) in shares outstanding—Class I | | | (175,286 | ) | | | 772,335 | |
| | | | | | | | |
Number of shares sold—Class II | | | 811,821 | | | | 5,269,653 | |
Number of shares issued through reinvestment of dividends and distributions—Class II | | | — | | | | 375,746 | |
Number of shares redeemed—Class II | | | (1,490,520 | ) | | | (1,139,175 | ) |
| | | | | | | | |
Net increase (decrease) in shares outstanding—Class II | | | (678,699 | ) | | | 4,506,224 | |
| | | | | | | | |
| | | | |
| 44 | | See Notes to Financial Statements. | | |
VANTAGEPOINT FUNDS
Statements of Changes in Net Assets
| | | | | | | | | | | | | | | | |
| | | Model Portfolio | |
| | | Savings Oriented | | | Conservative Growth | |
| | | For the Period
January 1, 2008 to
June 30, 2008
(Unaudited) | | | For the
Year Ended
December 31,
2007 | | | For the Period
January 1, 2008 to
June 30, 2008
(Unaudited) | | | For the
Year Ended
December 31,
2007 | |
Increase (decrease) in net assets resulting from operations: | | | | | | | | | | | | | | | | |
Net investment income | | $ | 4,001,786 | | | $ | 11,047,718 | | | $ | 5,939,633 | | | $ | 17,250,450 | |
Net realized gain on sale of investments | | | 868,219 | | | | 10,033,007 | | | | 1,462,742 | | | | 35,859,795 | |
Net change in unrealized depreciation of investments | | | (9,621,118 | ) | | | (3,176,082 | ) | | | (27,576,086 | ) | | | (16,944,589 | ) |
| | | | | | | | | | | | | | | | |
Net increase (decrease) in net assets resulting from operations | | | (4,751,113 | ) | | | 17,904,643 | | | | (20,173,711 | ) | | | 36,165,656 | |
| | | | | | | | | | | | | | | | |
Distributions to shareholders from: | | | | | | | | | | | | | | | | |
Net investment income | | | — | | | | (11,429,931 | ) | | | — | | | | (17,209,933 | ) |
Net realized gain on investments | | | — | | | | (6,554,344 | ) | | | — | | | | (16,331,111 | ) |
| | | | | | | | | | | | | | | | |
Total distributions | | | — | | | | (17,984,275 | ) | | | — | | | | (33,541,044 | ) |
| | | | | | | | | | | | | | | | |
Capital share transactions: | | | | | | | | | | | | | | | | |
Proceeds from sale of shares | | | 25,095,396 | | | | 44,073,792 | | | | 34,676,473 | | | | 76,525,555 | |
Reinvestment of distributions | | | — | | | | 17,980,653 | | | | — | | | | 33,537,838 | |
Value of shares redeemed | | | (22,960,908 | ) | | | (42,806,803 | ) | | | (46,695,191 | ) | | | (64,879,551 | ) |
| | | | | | | | | | | | | | | | |
Net increase (decrease) from capital share transactions | | | 2,134,488 | | | | 19,247,642 | | | | (12,018,718 | ) | | | 45,183,842 | |
| | | | | | | | | | | | | | | | |
Total increase (decrease) in net assets | | | (2,616,625 | ) | | | 19,168,010 | | | | (32,192,429 | ) | | | 47,808,454 | |
| | | | | | | | | | | | | | | | |
NET ASSETS at beginning of period | | | 311,455,260 | | | | 292,287,250 | | | | 597,774,507 | | | | 549,966,053 | |
| | | | | | | | | | | | | | | | |
NET ASSETS at end of period | | $ | 308,838,635 | | | $ | 311,455,260 | | | $ | 565,582,078 | | | $ | 597,774,507 | |
| | | | | | | | | | | | | | | | |
Undistributed net investment income included in net assets at end of period | | $ | 4,103,480 | | | $ | 101,694 | | | $ | 5,984,128 | | | $ | 44,495 | |
| | | | | | | | | | | | | | | | |
SHARE TRANSACTIONS: | | | | | | | | | | | | | | | | |
Number of shares sold | | | 1,022,857 | | | | 1,730,816 | | | | 1,434,347 | | | | 3,011,108 | |
Number of shares issued through reinvestment of dividends and distributions | | | — | | | | 729,734 | | | | — | | | | 1,364,436 | |
Number of shares redeemed | | | (936,593 | ) | | | (1,682,939 | ) | | | (1,940,237 | ) | | | (2,557,487 | ) |
| | | | | | | | | | | | | | | | |
Net increase (decrease) in shares outstanding | | | 86,264 | | | | 777,611 | | | | (505,890 | ) | | | 1,818,057 | |
| | | | | | | | | | | | | | | | |
| | | | |
| | See Notes to Financial Statements. | | 45 |
VANTAGEPOINT FUNDS
Statements of Changes in Net Assets
| | | | | | | | | | | | | | | | |
| | | Model Portfolio | |
| | | Traditional Growth | | | Long-Term Growth | |
| | | For the Period
January 1, 2008 to
June 30, 2008
(Unaudited) | | | For the
Year Ended
December 31,
2007 | | | For the Period
January 1, 2008 to
June 30, 2008
(Unaudited) | | | For the
Year Ended
December 31,
2007 | |
Increase (decrease) in net assets resulting from operations: | | | | | | | | | | | | | | | | |
Net investment income | | $ | 9,067,624 | | | $ | 31,735,780 | | | $ | 4,842,841 | | | $ | 25,135,912 | |
Net realized gain on sale of investments | | | 1,332,230 | | | | 128,230,531 | | | | 595,359 | | | | 174,786,280 | |
Net change in unrealized depreciation of investments | | | (95,477,815 | ) | | | (65,549,999 | ) | | | (131,747,118 | ) | | | (84,781,758 | ) |
| | | | | | | | | | | | | | | | |
Net increase (decrease) in net assets resulting from operations | | | (85,077,961 | ) | | | 94,416,312 | | | | (126,308,918 | ) | | | 115,140,434 | |
| | | | | | | | | | | | | | | | |
Distributions to shareholders from: | | | | | | | | | | | | | | | | |
Net investment income | | | — | | | | (31,904,876 | ) | | | — | | | | (27,195,141 | ) |
Net realized gain on investments | | | — | | | | (78,249,189 | ) | | | — | | | | (112,388,266 | ) |
| | | | | | | | | | | | | | | | |
Total distributions | | | — | | | | (110,154,065 | ) | | | — | | | | (139,583,407 | ) |
| | | | | | | | | | | | | | | | |
Capital share transactions: | | | | | | | | | | | | | | | | |
Proceeds from sale of shares | | | 80,819,998 | | | | 192,418,417 | | | | 105,914,510 | | | | 225,914,615 | |
Reinvestment of distributions | | | — | | | | 110,148,863 | | | | — | | | | 139,583,407 | |
Value of shares redeemed | | | (82,418,959 | ) | | | (130,617,054 | ) | | | (74,235,319 | ) | | | (133,985,865 | ) |
| | | | | | | | | | | | | | | | |
Net increase (decrease) from capital share transactions | | | (1,598,961 | ) | | | 171,950,226 | | | | 31,679,191 | | | | 231,512,157 | |
| | | | | | | | | | | | | | | | |
Total increase (decrease) in net assets | | | (86,676,922 | ) | | | 156,212,473 | | | | (94,629,727 | ) | | | 207,069,184 | |
| | | | | | | | | | | | | | | | |
NET ASSETS at beginning of period | | | 1,487,224,305 | | | | 1,331,011,832 | | | | 1,677,987,401 | | | | 1,470,918,217 | |
| | | | | | | | | | | | | | | | |
NET ASSETS at end of period | | $ | 1,400,547,383 | | | $ | 1,487,224,305 | | | $ | 1,583,357,674 | | | $ | 1,677,987,401 | |
| | | | | | | | | | | | | | | | |
Undistributed net investment income included in net assets at end of period | | $ | 9,284,826 | | | $ | 217,202 | | | $ | 5,100,933 | | | $ | 258,092 | |
| | | | | | | | | | | | | | | | |
SHARE TRANSACTIONS: | | | | | | | | | | | | | | | | |
Number of shares sold | | | 3,482,210 | | | | 7,571,413 | | | | 4,589,143 | | | | 8,702,424 | |
Number of shares issued through reinvestment of dividends and distributions | | | — | | | | 4,581,900 | | | | — | | | | 5,746,538 | |
Number of shares redeemed | | | (3,582,485 | ) | | | (5,157,061 | ) | | | (3,251,392 | ) | | | (5,173,521 | ) |
| | | | | | | | | | | | | | | | |
Net increase (decrease) in shares outstanding | | | (100,275 | ) | | | 6,996,252 | | | | 1,337,751 | | | | 9,275,541 | |
| | | | | | | | | | | | | | | | |
| | | | |
| 46 | | See Notes to Financial Statements. | | |
VANTAGEPOINT FUNDS
Statements of Changes in Net Assets
| | | | | | | | |
| | | Model Portfolio | |
| | | All-Equity Growth | |
| | | For the Period
January 1, 2008 to
June 30, 2008
(Unaudited) | | | For the
Year Ended
December 31,
2007 | |
Increase (decrease) in net assets resulting from operations: | | | | | | | | |
Net investment income (loss) | | $ | (415,537 | ) | | $ | 4,514,020 | |
Net realized gain on sale of investments | | | 2,731,086 | | | | 89,807,469 | |
Net change in unrealized depreciation of investments | | | (64,665,469 | ) | | | (57,178,320 | ) |
| | | | | | | | |
Net increase (decrease) in net assets resulting from operations | | | (62,349,920 | ) | | | 37,143,169 | |
| | | | | | | | |
Distributions to shareholders from: | | | | | | | | |
Net investment income | | | — | | | | (4,486,315 | ) |
Net realized gain on investments | | | — | | | | (65,413,447 | ) |
| | | | | | | | |
Total distributions | | | — | | | | (69,899,762 | ) |
| | | | | | | | |
Capital share transactions: | | | | | | | | |
Proceeds from sale of shares | | | 45,869,847 | | | | 136,632,905 | |
Reinvestment of distributions | | | — | | | | 69,899,761 | |
Value of shares redeemed | | | (31,589,565 | ) | | | (46,690,300 | ) |
| | | | | | | | |
Net increase from capital share transactions | | | 14,280,282 | | | | 159,842,366 | |
| | | | | | | | |
Total increase (decrease) in net assets | | | (48,069,638 | ) | | | 127,085,773 | |
| | | | | | | | |
NET ASSETS at beginning of period | | | 597,973,400 | | | | 470,887,627 | |
| | | | | | | | |
NET ASSETS at end of period | | $ | 549,903,762 | | | $ | 597,973,400 | |
| | | | | | | | |
Undistributed net investment income (loss) included in net assets at end of period | | $ | (387,832 | ) | | $ | 27,705 | |
| | | | | | | | |
SHARE TRANSACTIONS: | | | | | | | | |
Number of shares sold | | | 1,998,029 | | | | 4,944,497 | |
Number of shares issued through reinvestment of dividends and distributions | | | — | | | | 2,828,805 | |
Number of shares redeemed | | | (1,393,488 | ) | | | (1,687,941 | ) |
| | | | | | | | |
Net increase in shares outstanding | | | 604,541 | | | | 6,085,361 | |
| | | | | | | | |
| | | | |
| | See Notes to Financial Statements. | | 47 |
VANTAGEPOINT FUNDS
Statements of Changes in Net Assets
| | | | | | | | | | | | | | | | |
| | | Milestone Funds | |
| | | Milestone Retirement Income | | | Milestone 2010 | |
| | | For the Period
January 1, 2008 to
June 30, 2008
(Unaudited) | | | For the
Year Ended
December 31,
2007 | | | For the Period
January 1, 2008 to
June 30, 2008
(Unaudited) | | | For the
Year Ended
December 31,
2007 | |
Increase (decrease) in net assets resulting from operations: | | | | | | | | | | | | | | | | |
Net investment income | | $ | 655,711 | | | $ | 1,447,706 | | | $ | 724,787 | | | $ | 1,862,328 | |
Net realized gain (loss) on sale of investments | | | (115,009 | ) | | | 2,193,012 | | | | (162,298 | ) | | | 4,477,190 | |
Net change in unrealized depreciation of investments | | | (1,668,585 | ) | | | (1,437,303 | ) | | | (2,912,277 | ) | | | (2,775,104 | ) |
| | | | | | | | | | | | | | | | |
Net increase (decrease) in net assets resulting from operations | | | (1,127,883 | ) | | | 2,203,415 | | | | (2,349,788 | ) | | | 3,564,414 | |
| | | | | | | | | | | | | | | | |
Distributions to shareholders from: | | | | | | | | | | | | | | | | |
Net investment income | | | — | | | | (1,429,070 | ) | | | — | | | | (1,852,719 | ) |
Net realized gain on investments | | | — | | | | (1,172,527 | ) | | | — | | | | (3,605,712 | ) |
| | | | | | | | | | | | | | | | |
Total distributions | | | — | | | | (2,601,597 | ) | | | — | | | | (5,458,431 | ) |
| | | | | | | | | | | | | | | | |
Capital share transactions: | | | | | | | | | | | | | | | | |
Proceeds from sale of shares | | | 12,911,377 | | | | 48,311,777 | | | | 13,648,517 | | | | 35,634,712 | |
Reinvestment of distributions | | | — | | | | 2,601,597 | | | | — | | | | 5,458,431 | |
Value of shares redeemed | | | (13,110,228 | ) | | | (18,477,038 | ) | | | (8,950,454 | ) | | | (17,279,834 | ) |
| | | | | | | | | | | | | | | | |
Net increase (decrease) from capital share transactions | | | (198,851 | ) | | | 32,436,336 | | | | 4,698,063 | | | | 23,813,309 | |
| | | | | | | | | | | | | | | | |
Total increase (decrease) in net assets | | | (1,326,734 | ) | | | 32,038,154 | | | | 2,348,275 | | | | 21,919,292 | |
| | | | | | | | | | | | | | | | |
NET ASSETS at beginning of period | | | 54,572,518 | | | | 22,534,364 | | | | 70,402,509 | | | | 48,483,217 | |
| | | | | | | | | | | | | | | | |
NET ASSETS at end of period | | $ | 53,245,784 | | | $ | 54,572,518 | | | $ | 72,750,784 | | | $ | 70,402,509 | |
| | | | | | | | | | | | | | | | |
Undistributed net investment income included in net assets at end of period | | $ | 680,316 | | | $ | 24,605 | | | $ | 747,735 | | | $ | 22,948 | |
| | | | | | | | | | | | | | | | |
SHARE TRANSACTIONS: | | | | | | | | | | | | | | | | |
Number of shares sold | | | 1,229,925 | | | | 4,446,191 | | | | 1,308,705 | | | | 3,161,189 | |
Number of shares issued through reinvestment of dividends and distributions | | | — | | | | 245,666 | | | | — | | | | 513,011 | |
Number of shares redeemed | | | (1,249,418 | ) | | | (1,692,800 | ) | | | (856,347 | ) | | | (1,528,708 | ) |
| | | | | | | | | | | | | | | | |
Net increase (decrease) in shares outstanding | | | (19,493 | ) | | | 2,999,057 | | | | 452,358 | | | | 2,145,492 | |
| | | | | | | | | | | | | | | | |
| | | | |
| 48 | | See Notes to Financial Statements. | | |
VANTAGEPOINT FUNDS
Statements of Changes in Net Assets
| | | | | | | | | | | | | | | | |
| | | Milestone Funds | |
| | | Milestone 2015 | | | Milestone 2020 | |
| | | For the Period
January 1, 2008 to
June 30, 2008
(Unaudited) | | | For the
Year Ended
December 31,
2007 | | | For the Period
January 1, 2008 to
June 30, 2008
(Unaudited) | | | For the
Year Ended
December 31,
2007 | |
Increase (decrease) in net assets resulting from operations: | | | | | | | | | | | | | | | | |
Net investment income | | $ | 955,733 | | | $ | 2,863,776 | | | $ | 604,122 | | | $ | 2,052,210 | |
Net realized gain on sale of investments | | | 334,047 | | | | 10,072,209 | | | | 187,534 | | | | 9,066,273 | |
Net change in unrealized depreciation of investments | | | (8,619,375 | ) | | | (6,233,099 | ) | | | (8,302,244 | ) | | | (5,582,812 | ) |
| | | | | | | | | | | | | | | | |
Net increase (decrease) in net assets resulting from operations | | | (7,329,595 | ) | | | 6,702,886 | | | | (7,510,588 | ) | | | 5,535,671 | |
| | | | | | | | | | | | | | | | |
Distributions to shareholders from: | | | | | | | | | | | | | | | | |
Net investment income | | | — | | | | (2,848,960 | ) | | | — | | | | (2,039,159 | ) |
Net realized gain on investments | | | — | | | | (7,814,541 | ) | | | — | | | | (6,683,034 | ) |
| | | | | | | | | | | | | | | | |
Total distributions | | | — | | | | (10,663,501 | ) | | | — | | | | (8,722,193 | ) |
| | | | | | | | | | | | | | | | |
Capital share transactions: | | | | | | | | | | | | | | | | |
Proceeds from sale of shares | | | 19,382,259 | | | | 60,956,155 | | | | 25,224,935 | | | | 56,150,529 | |
Reinvestment of distributions | | | — | | | | 10,663,501 | | | | — | | | | 8,722,193 | |
Value of shares redeemed | | | (13,055,059 | ) | | | (13,481,653 | ) | | | (6,247,373 | ) | | | (12,023,958 | ) |
| | | | | | | | | | | | | | | | |
Net increase from capital share transactions | | | 6,327,200 | | | | 58,138,003 | | | | 18,977,562 | | | | 52,848,764 | |
| | | | | | | | | | | | | | | | |
Total increase (decrease) in net assets | | | (1,002,395 | ) | | | 54,177,388 | | | | 11,466,974 | | | | 49,662,242 | |
| | | | | | | | | | | | | | | | |
NET ASSETS at beginning of period | | | 138,534,840 | | | | 84,357,452 | | | | 112,063,985 | | | | 62,401,743 | |
| | | | | | | | | | | | | | | | |
NET ASSETS at end of period | | $ | 137,532,445 | | | $ | 138,534,840 | | | $ | 123,530,959 | | | $ | 112,063,985 | |
| | | | | | | | | | | | | | | | |
Undistributed net investment income included in net assets at end of period | | $ | 988,189 | | | $ | 32,456 | | | $ | 627,625 | | | $ | 23,503 | |
| | | | | | | | | | | | | | | | |
SHARE TRANSACTIONS: | | | | | | | | | | | | | | | | |
Number of shares sold | | | 1,799,607 | | | | 5,159,021 | | | | 2,310,857 | | | | 4,659,932 | |
Number of shares issued through reinvestment of dividends and distributions | | | — | | | | 958,086 | | | | — | | | | 765,776 | |
Number of shares redeemed | | | (1,216,658 | ) | | | (1,142,641 | ) | | | (576,536 | ) | | | (991,037 | ) |
| | | | | | | | | | | | | | | | |
Net increase in shares outstanding | | | 582,949 | | | | 4,974,466 | | | | 1,734,321 | | | | 4,434,671 | |
| | | | | | | | | | | | | | | | |
| | | | |
| | See Notes to Financial Statements. | | 49 |
VANTAGEPOINT FUNDS
Statements of Changes in Net Assets
| | | | | | | | | | | | | | | | |
| | | Milestone Funds | |
| | | Milestone 2025 | | | Milestone 2030 | |
| | | For the Period
January 1, 2008 to
June 30, 2008
(Unaudited) | | | For the
Year Ended
December 31,
2007 | | | For the Period
January 1, 2008 to
June 30, 2008
(Unaudited) | | | For the
Year Ended
December 31,
2007 | |
Increase (decrease) in net assets resulting from operations: | | | | | | | | | | | | | | | | |
Net investment income | | $ | 298,333 | | | $ | 1,360,961 | | | $ | 148,955 | | | $ | 891,629 | |
Net realized gain on sale of investments | | | 183,673 | | | | 7,377,183 | | | | 51,968 | | | | 5,846,112 | |
Net change in unrealized depreciation of investments | | | (6,942,133 | ) | | | (4,798,841 | ) | | | (5,565,850 | ) | | | (3,748,429 | ) |
| | | | | | | | | | | | | | | | |
Net increase (decrease) in net assets resulting from operations | | | (6,460,127 | ) | | | 3,939,303 | | | | (5,364,927 | ) | | | 2,989,312 | |
| | | | | | | | | | | | | | | | |
Distributions to shareholders from: | | | | | | | | | | | | | | | | |
Net investment income | | | — | | | | (1,351,918 | ) | | | — | | | | (885,927 | ) |
Net realized gain on investments | | | — | | | | (5,365,413 | ) | | | — | | | | (3,816,978 | ) |
| | | | | | | | | | | | | | | | |
Total distributions | | | — | | | | (6,717,331 | ) | | | — | | | | (4,702,905 | ) |
| | | | | | | | | | | | | | | | |
Capital share transactions: | | | | | | | | | | | | | | | | |
Proceeds from sale of shares | | | 18,161,634 | | | | 37,087,137 | | | | 16,013,592 | | | | 37,953,626 | |
Reinvestment of distributions | | | — | | | | 6,717,331 | | | | — | | | | 4,702,905 | |
Value of shares redeemed | | | (5,332,932 | ) | | | (5,938,654 | ) | | | (2,843,985 | ) | | | (5,485,151 | ) |
| | | | | | | | | | | | | | | | |
Net increase from capital share transactions | | | 12,828,702 | | | | 37,865,814 | | | | 13,169,607 | | | | 37,171,380 | |
| | | | | | | | | | | | | | | | |
Total increase in net assets | | | 6,368,575 | | | | 35,087,786 | | | | 7,804,680 | | | | 35,457,787 | |
| | | | | | | | | | | | | | | | |
NET ASSETS at beginning of period | | | 83,891,489 | | | | 48,803,703 | | | | 61,464,949 | | | | 26,007,162 | |
| | | | | | | | | | | | | | | | |
NET ASSETS at end of period | | $ | 90,260,064 | | | $ | 83,891,489 | | | $ | 69,269,629 | | | $ | 61,464,949 | |
| | | | | | | | | | | | | | | | |
Undistributed net investment income included in net assets at end of period | | $ | 313,794 | | | $ | 15,461 | | | $ | 157,170 | | | $ | 8,215 | |
| | | | | | | | | | | | | | | | |
SHARE TRANSACTIONS: | | | | | | | | | | | | | | | | |
Number of shares sold | | | 1,643,476 | | | | 2,999,931 | | | | 1,435,048 | | | | 3,082,748 | |
Number of shares issued through reinvestment of dividends and distributions | | | — | | | | 580,582 | | | | — | | | | 399,228 | |
Number of shares redeemed | | | (486,020 | ) | | | (480,640 | ) | | | (259,628 | ) | | | (441,895 | ) |
| | | | | | | | | | | | | | | | |
Net increase in shares outstanding | | | 1,157,456 | | | | 3,099,873 | | | | 1,175,420 | | | | 3,040,081 | |
| | | | | | | | | | | | | | | | |
| | | | |
| 50 | | See Notes to Financial Statements. | | |
VANTAGEPOINT FUNDS
Statements of Changes in Net Assets
| | | | | | | | | | | | | | | | |
| | | Milestone Funds | |
| | | Milestone 2035 | | | Milestone 2040 | |
| | | For the Period
January 1, 2008 to
June 30, 2008
(Unaudited) | | | For the
Year Ended
December 31,
2007 | | | For the Period
January 1, 2008 to
June 30, 2008
(Unaudited) | | | For the
Year Ended
December 31,
2007 | |
Increase (decrease) in net assets resulting from operations: | | | | | | | | | | | | | | | | |
Net investment income | | $ | 63,513 | | | $ | 462,775 | | | $ | 53,299 | | | $ | 422,951 | |
Net realized gain (loss) on sale of investments | | | 19,278 | | | | 3,430,667 | | | | (67,031 | ) | | | 3,230,014 | |
Net change in unrealized depreciation of investments | | | (3,387,278 | ) | | | (2,532,444 | ) | | | (3,252,072 | ) | | | (2,532,853 | ) |
| | | | | | | | | | | | | | | | |
Net increase (decrease) in net assets resulting from operations | | | (3,304,487 | ) | | | 1,360,998 | | | | (3,265,804 | ) | | | 1,120,112 | |
| | | | | | | | | | | | | | | | |
Distributions to shareholders from: | | | | | | | | | | | | | | | | |
Net investment income | | | — | | | | (459,930 | ) | | | — | | | | (419,577 | ) |
Net realized gain on investments | | | — | | | | (2,293,591 | ) | | | — | | | | (1,940,328 | ) |
| | | | | | | | | | | | | | | | |
Total distributions | | | — | | | | (2,753,521 | ) | | | — | | | | (2,359,905 | ) |
| | | | | | | | | | | | | | | | |
Capital share transactions: | | | | | | | | | | | | | | | | |
Proceeds from sale of shares | | | 9,617,814 | | | | 20,109,689 | | | | 11,754,697 | | | | 24,450,383 | |
Reinvestment of distributions | | | — | | | | 2,753,521 | | | | — | | | | 2,359,905 | |
Value of shares redeemed | | | (1,963,703 | ) | | | (3,057,592 | ) | | | (3,430,521 | ) | | | (5,388,330 | ) |
| | | | | | | | | | | | | | | | |
Net increase from capital share transactions | | | 7,654,111 | | | | 19,805,618 | | | | 8,324,176 | | | | 21,421,958 | |
| | | | | | | | | | | | | | | | |
Total increase in net assets | | | 4,349,624 | | | | 18,413,095 | | | | 5,058,372 | | | | 20,182,165 | |
| | | | | | | | | | | | | | | | |
NET ASSETS at beginning of period | | | 34,830,706 | | | | 16,417,611 | | | | 32,881,646 | | | | 12,699,481 | |
| | | | | | | | | | | | | | | | |
NET ASSETS at end of period | | $ | 39,180,330 | | | $ | 34,830,706 | | | $ | 37,940,018 | | | $ | 32,881,646 | |
| | | | | | | | | | | | | | | | |
Undistributed net investment income included in net assets at end of period | | $ | 67,636 | | | $ | 4,123 | | | $ | 57,310 | | | $ | 4,011 | |
| | | | | | | | | | | | | | | | |
SHARE TRANSACTIONS: | | | | | | | | | | | | | | | | |
Number of shares sold | | | 860,615 | | | | 1,584,822 | | | | 1,052,988 | | | | 1,932,647 | |
Number of shares issued through reinvestment of dividends and distributions | | | — | | | | 232,365 | | | | — | | | | 198,813 | |
Number of shares redeemed | | | (178,541 | ) | | | (242,203 | ) | | | (308,621 | ) | | | (422,206 | ) |
| | | | | | | | | | | | | | | | |
Net increase in shares outstanding | | | 682,074 | | | | 1,574,984 | | | | 744,367 | | | | 1,709,254 | |
| | | | | | | | | | | | | | | | |
| | | | |
| | See Notes to Financial Statements. | | 51 |
VANTAGEPOINT FUNDS
Financial Highlights
(For a share outstanding throughout each period)
| | | | | | | | | | | | | | | | | | | | | | | | |
| | | Money Market | |
| | | For the Period
January 1, 2008 to
June 30, 2008
(Unaudited) | | | For the Year Ended December 31, | |
| | | | 2007 | | | 2006 | | | 2005 | | | 2004 | | | 2003 | |
Net Asset Value, beginning of period | | $ | 1.00 | | | $ | 1.00 | | | $ | 1.00 | | | $ | 1.00 | | | $ | 1.00 | | | $ | 1.00 | |
Income from investment operations: | | | | | | | | | | | | | | | | | | | | | | | | |
Net investment income | | | 0.01 | | | | 0.05 | | | | 0.04 | | | | 0.03 | | | | 0.01 | | | | 0.01 | |
Net realized and unrealized gain on investments | | | — | | | | — | | | | (0.00 | )†† | | | — | | | | — | | | | — | |
| | | | | | | | | | | | | | | | | | | | | | | | |
Total from investment operations | | | 0.01 | | | | 0.05 | | | | 0.04 | | | | 0.03 | | | | 0.01 | | | | 0.01 | |
| | | | | | | | | | | | | | | | | | | | | | | | |
Less distributions: | | | | | | | | | | | | | | | | | | | | | | | | |
From net investment income | | | (0.01 | ) | | | (0.05 | ) | | | (0.04 | ) | | | (0.03 | ) | | | (0.01 | ) | | | (0.01 | ) |
From net realized gains | | | — | | | | — | | | | (0.00 | )†† | | | — | | | | — | | | | — | |
| | | | | | | | | | | | | | | | | | | | | | | | |
Total distributions | | | (0.01 | ) | | | (0.05 | ) | | | (0.04 | ) | | | (0.03 | ) | | | (0.01 | ) | | | (0.01 | ) |
| | | | | | | | | | | | | | | | | | | | | | | | |
Net Asset Value, end of period | | $ | 1.00 | | | $ | 1.00 | | | $ | 1.00 | | | $ | 1.00 | | | $ | 1.00 | | | $ | 1.00 | |
| | | | | | | | | | | | | | | | | | | | | | | | |
Total return | | | 1.40 | %# | | | 4.75 | % | | | 4.51 | % | | | 2.70 | % | | | 0.82 | % | | | 0.60 | % |
Ratios/Supplemental data: | | | | | | | | | | | | | | | | | | | | | | | | |
Net assets, end of period (000) | | $ | 357,609 | | | $ | 306,799 | | | $ | 217,771 | | | $ | 142,979 | | | $ | 116,449 | | | $ | 105,762 | |
Ratios to average net assets: | | | | | | | | | | | | | | | | | | | | | | | | |
Ratio of expenses to average net assets | | | 0.51 | %† | | | 0.51 | % | | | 0.52 | % | | | 0.52 | % | | | 0.52 | % | | | 0.52 | % |
Ratio of net investment income to average net assets | | | 2.77 | %† | | | 4.64 | % | | | 4.47 | % | | | 2.70 | % | | | 0.84 | % | | | 0.60 | % |
Portfolio turnover | | | N/A | | | | N/A | | | | N/A | | | | N/A | | | | N/A | | | | N/A | |
| †† | Rounds to less than $0.01 |
| | | | |
| 52 | | See Notes to Financial Statements. | | |
VANTAGEPOINT FUNDS
Financial Highlights
(For a share outstanding throughout each period)
| | | | | | | | | | | | | | | | | | | | | | | | |
| | | Low Duration Bond(1) | |
| | | For the Period
January 1, 2008 to
June 30, 2008
(Unaudited) | | | For the Year Ended December 31, | |
| | | | 2007 | | | 2006 | | | 2005(a) | | | 2004(a) | | | 2003(a) | |
Net Asset Value, beginning of period | | $ | 9.83 | | | $ | 9.76 | | | $ | 9.79 | | | $ | 9.98 | | | $ | 10.00 | | | $ | 10.00 | |
Income from investment operations: | | | | | | | | | | | | | | | | | | | | | | | | |
Net investment income | | | 0.18 | | | | 0.41 | | | | 0.37 | | | | 0.30 | | | | 0.12 | | | | 0.35 | |
Net realized and unrealized gain (loss) on investments | | | (0.04 | ) | | | 0.09 | | | | 0.01 | | | | (0.18 | ) | | | 0.24 | | | | 0.00 | †† |
| | | | | | | | | | | | | | | | | | | | | | | | |
Total from investment operations | | | 0.14 | | | | 0.50 | | | | 0.38 | | | | 0.12 | | | | 0.36 | | | | 0.35 | |
| | | | | | | | | | | | | | | | | | | | | | | | |
Less distributions: | | | | | | | | | | | | | | | | | | | | | | | | |
From net investment income | | | (0.18 | ) | | | (0.43 | ) | | | (0.38 | ) | | | (0.31 | ) | | | (0.20 | ) | | | (0.33 | ) |
Reverse stock split (Note 10) | | | — | | | | — | | | | — | | | | — | | | | — | | | | 0.01 | |
From net realized gains | | | — | | | | — | | | | — | | | | — | | | | (0.04 | ) | | | (0.01 | ) |
Return of capital | | | — | | | | — | | | | (0.03 | ) | | | — | | | | (0.14 | ) | | | (0.02 | ) |
| | | | | | | | | | | | | | | | | | | | | | | | |
Total distributions | | | (0.18 | ) | | | (0.43 | ) | | | (0.41 | ) | | | (0.31 | ) | | | (0.38 | ) | | | (0.35 | ) |
| | | | | | | | | | | | | | | | | | | | | | | | |
Net Asset Value, end of period | | $ | 9.79 | | | $ | 9.83 | | | $ | 9.76 | | | $ | 9.79 | | | $ | 9.98 | | | $ | 10.00 | |
| | | | | | | | | | | | | | | | | | | | | | | | |
Total return | | | 1.39 | %# | | | 5.24 | % | | | 3.98 | % | | | 1.27 | % | | | 3.65 | % | | | 3.51 | % |
Ratios/Supplemental data: | | | | | | | | | | | | | | | | | | | | | | | | |
Net assets, end of period (000) | | $ | 502,820 | | | $ | 507,120 | | | $ | 607,673 | | | $ | 543,913 | | | $ | 499,404 | | | $ | 619,964 | |
Ratios to average net assets: | | | | | | | | | | | | | | | | | | | | | | | | |
Ratio of expenses to average net assets | | | 0.65 | %† | | | 0.65 | % | | | 0.65 | % | | | 0.65 | % | | | 0.78 | % | | | 0.82 | % |
Ratio of net investment income to average net assets | | | 3.65 | %† | | | 4.15 | % | | | 3.82 | % | | | 3.10 | % | | | 1.94 | % | | | 3.42 | % |
Portfolio turnover | | | 47 | %# | | | 149 | % | | | 123 | % | | | 120 | % | | | 273 | % | | | 211 | % |
| (1) | Formerly Short-Term Bond Fund. |
| (a) | Per share amounts were adjusted to reflect a 10 for 1 stock split effective October 28, 2005 (Note 11). |
| †† | Rounds to less than $0.01 |
| | | | |
| | See Notes to Financial Statements. | | 53 |
VANTAGEPOINT FUNDS
Financial Highlights
(For a share outstanding throughout each period)
| | | | | | | | | | | | | | | | | | | | | | | | |
| | | Inflation Protected Securities(2) | |
| | | For the Period
January 1, 2008 to
June 30, 2008
(Unaudited) | | | For the Year Ended December 31, | |
| | | | 2007 | | | 2006 | | | 2005 | | | 2004 | | | 2003 | |
Net Asset Value, beginning of period | | $ | 10.46 | | | $ | 10.03 | | | $ | 10.12 | | | $ | 10.33 | | | $ | 10.54 | | | $ | 10.76 | |
Income from investment operations: | | | | | | | | | | | | | | | | | | | | | | | | |
Net investment income | | | 0.33 | | | | 0.50 | | | | 0.39 | | | | 0.31 | | | | 0.26 | | | | 0.27 | |
Net realized and unrealized gain (loss) on investments | | | 0.17 | | | | 0.43 | | | | (0.06 | ) | | | (0.20 | ) | | | (0.07 | ) | | | (0.10 | ) |
| | | | | | | | | | | | | | | | | | | | | | | | |
Total from investment operations | | | 0.50 | | | | 0.93 | | | | 0.33 | | | | 0.11 | | | | 0.19 | | | | 0.17 | |
| | | | | | | | | | | | | | | | | | | | | | | | |
Less distributions: | | | | | | | | | | | | | | | | | | | | | | | | |
From net investment income | | | (0.32 | ) | | | (0.50 | ) | | | (0.39 | ) | | | (0.32 | ) | | | (0.27 | ) | | | (0.30 | ) |
From net realized gains | | | — | | | | — | | | | — | | | | — | | | | (0.13 | ) | | | (0.09 | ) |
Return of capital | | | — | | | | — | | | | (0.03 | ) | | | — | | | | — | | | | — | |
| | | | | | | | | | | | | | | | | | | | | | | | |
Total distributions | | | (0.32 | ) | | | (0.50 | ) | | | (0.42 | ) | | | (0.32 | ) | | | (0.40 | ) | | | (0.39 | ) |
| | | | | | | | | | | | | | | | | | | | | | | | |
Net Asset Value, end of period | | $ | 10.64 | | | $ | 10.46 | | | $ | 10.03 | | | $ | 10.12 | | | $ | 10.33 | | | $ | 10.54 | |
| | | | | | | | | | | | | | | | | | | | | | | | |
Total return | | | 4.78 | %# | | | 9.64 | % | | | 3.34 | % | | | 1.05 | % | | | 1.77 | % | | | 1.66 | % |
Ratios/Supplemental data: | | | | | | | | | | | | | | | | | | | | | | | | |
Net assets, end of period (000) | | $ | 348,644 | | | $ | 274,209 | | | $ | 142,540 | | | $ | 151,335 | | | $ | 163,167 | | | $ | 188,546 | |
Ratios to average net assets: | | | | | | | | | | | | | | | | | | | | | | | | |
Ratio of expenses to average net assets | | | 0.69 | %† | | | 0.68 | % | | | 0.60 | % | | | 0.59 | % | | | 0.58 | % | | | 0.61 | % |
Ratio of net investment income to average net assets | | | 6.31 | %† | | | 4.86 | % | | | 3.85 | % | | | 3.01 | % | | | 2.49 | % | | | 2.57 | % |
Portfolio turnover | | | 71 | %# | | | 174 | % | | | 69 | % | | | 91 | % | | | 205 | % | | | 120 | % |
| (2) | Formerly US Government Securities Fund. |
| | | | |
| 54 | | See Notes to Financial Statements. | | |
VANTAGEPOINT FUNDS
Financial Highlights
(For a share outstanding throughout each period)
| | | | | | | | | | | | | | | | | | | | | | | | |
| | | Asset Allocation | |
| | | For the Period
January 1, 2008 to
June 30, 2008
(Unaudited) | | | For the Year Ended December 31, | |
| | | | 2007 | | | 2006 | | | 2005 | | | 2004 | | | 2003 | |
Net Asset Value, beginning of period | | $ | 8.53 | | | $ | 8.40 | | | $ | 7.51 | | | $ | 7.33 | | | $ | 6.75 | | | $ | 5.49 | |
Income from investment operations: | | | | | | | | | | | | | | | | | | | | | | | | |
Net investment income | | | 0.06 | | | | 0.17 | | | | 0.14 | | | | 0.12 | | | | 0.12 | | | | 0.07 | |
Net realized and unrealized gain (loss) on investments | | | (1.10 | ) | | | 0.36 | | | | 1.03 | | | | 0.22 | | | | 0.59 | | | | 1.35 | |
| | | | | | | | | | | | | | | | | | | | | | | | |
Total from investment operations | | | (1.04 | ) | | | 0.53 | | | | 1.17 | | | | 0.34 | | | | 0.71 | | | | 1.42 | |
| | | | | | | | | | | | | | | | | | | | | | | | |
Less distributions: | | | | | | | | | | | | | | | | | | | | | | | | |
From net investment income | | | — | | | | (0.19 | ) | | | (0.14 | ) | | | (0.12 | ) | | | (0.11 | ) | | | (0.16 | ) |
From net realized gains | | | — | | | | (0.21 | ) | | | (0.14 | ) | | | (0.04 | ) | | | (0.02 | ) | | | — | |
| | | | | | | | | | | | | | | | | | | | | | | | |
Total distributions | | | — | | | | (0.40 | ) | | | (0.28 | ) | | | (0.16 | ) | | | (0.13 | ) | | | (0.16 | ) |
| | | | | | | | | | | | | | | | | | | | | | | | |
Net Asset Value, end of period | | $ | 7.49 | | | $ | 8.53 | | | $ | 8.40 | | | $ | 7.51 | | | $ | 7.33 | | | $ | 6.75 | |
| | | | | | | | | | | | | | | | | | | | | | | | |
Total return | | | (12.19 | )%# | | | 6.25 | % | | | 15.51 | % | | | 4.54 | % | | | 10.62 | % | | | 25.97 | % |
Ratios/Supplemental data: | | | | | | | | | | | | | | | | | | | | | | | | |
Net assets, end of period (000) | | $ | 622,459 | | | $ | 756,329 | | | $ | 768,381 | | | $ | 737,783 | | | $ | 795,534 | | | $ | 784,440 | |
Ratios to average net assets: | | | | | | | | | | | | | | | | | | | | | | | | |
Ratio of expenses to average net assets | | | 0.76 | %† | | | 0.75 | % | | | 0.75 | % | | | 0.75 | % | | | 0.75 | % | | | 0.76 | % |
Ratio of net investment income to average net assets | | | 1.59 | %† | | | 1.87 | % | | | 1.67 | % | | | 1.48 | % | | | 1.60 | % | | | 1.06 | % |
Portfolio turnover | | | 1 | %# | | | 4 | % | | | 15 | % | | | 9 | % | | | 15 | % | | | 17 | % |
| | | | |
| | See Notes to Financial Statements. | | 55 |
VANTAGEPOINT FUNDS
Financial Highlights
(For a share outstanding throughout each period)
| | | | | | | | | | | | | | | | | | | | | | | | |
| | | Equity Income | |
| | | For the Period
January 1, 2008 to
June 30, 2008
(Unaudited) | | | For the Year Ended December 31, | |
| | | | 2007 | | | 2006 | | | 2005 | | | 2004 | | | 2003 | |
Net Asset Value, beginning of period | | $ | 9.78 | | | $ | 9.90 | | | $ | 8.87 | | | $ | 8.95 | | | $ | 7.88 | | | $ | 5.98 | |
Income from investment operations: | | | | | | | | | | | | | | | | | | | | | | | | |
Net investment income | | | 0.07 | | | | 0.13 | | | | 0.14 | | | | 0.16 | | | | 0.09 | | | | 0.08 | |
Net realized and unrealized gain (loss) on investments | | | (1.18 | ) | | | 0.25 | | | | 1.52 | | | | 0.36 | | | | 1.07 | | | | 1.90 | |
| | | | | | | | | | | | | | | | | | | | | | | | |
Total from investment operations | | | (1.11 | ) | | | 0.38 | | | | 1.66 | | | | 0.52 | | | | 1.16 | | | | 1.98 | |
| | | | | | | | | | | | | | | | | | | | | | | | |
Less distributions: | | | | | | | | | | | | | | | | | | | | | | | | |
From net investment income | | | — | | | | (0.14 | ) | | | (0.14 | ) | | | (0.16 | ) | | | (0.09 | ) | | | (0.08 | ) |
From net realized gains | | | — | | | | (0.36 | ) | | | (0.49 | ) | | | (0.44 | ) | | | — | | | | — | |
| | | | | | | | | | | | | | | | | | | | | | | | |
Total distributions | | | — | | | | (0.50 | ) | | | (0.63 | ) | | | (0.60 | ) | | | (0.09 | ) | | | (0.08 | ) |
| | | | | | | | | | | | | | | | | | | | | | | | |
Net Asset Value, end of period | | $ | 8.67 | | | $ | 9.78 | | | $ | 9.90 | | | $ | 8.87 | | | $ | 8.95 | | | $ | 7.88 | |
| | | | | | | | | | | | | | | | | | | | | | | | |
Total return | | | (11.35 | )%# | | | 3.76 | % | | | 18.73 | % | | | 5.76 | % | | | 14.78 | % | | | 33.09 | % |
Ratios/Supplemental data: | | | | | | | | | | | | | | | | | | | | | | | | |
Net assets, end of period (000) | | $ | 1,527,227 | | | $ | 1,734,750 | | | $ | 1,467,953 | | | $ | 1,260,470 | | | $ | 1,088,207 | | | $ | 824,093 | |
Ratios to average net assets: | | | | | | | | | | | | | | | | | | | | | | | | |
Ratio of expenses to average net assets | | | 0.88 | %† | | | 0.88 | % | | | 0.89 | % | | | 0.89 | % | | | 0.90 | % | | | 0.92 | % |
Ratio of net investment income to average net assets | | | 1.61 | %† | | | 1.23 | % | | | 1.49 | % | | | 1.78 | % | | | 1.18 | % | | | 1.25 | % |
Portfolio turnover | | | 13 | %# | | | 18 | % | | | 18 | % | | | 16 | % | | | 14 | % | | | 13 | % |
| | | | |
| 56 | | See Notes to Financial Statements. | | |
VANTAGEPOINT FUNDS
Financial Highlights
(For a share outstanding throughout each period)
| | | | | | | | | | | | | | | | | | | | | | | | |
| | | Growth & Income | |
| | | For the Period
January 1, 2008 to
June 30, 2008
(Unaudited) | | | For the Year Ended December 31, | |
| | | | 2007 | | | 2006 | | | 2005 | | | 2004 | | | 2003 | |
Net Asset Value, beginning of period | | $ | 10.56 | | | $ | 11.49 | | | $ | 10.64 | | | $ | 10.12 | | | $ | 9.38 | | | $ | 7.24 | |
Income from investment operations: | | | | | | | | | | | | | | | | | | | | | | | | |
Net investment income | | | 0.05 | | | | 0.12 | | | | 0.10 | | | | 0.09 | | | | 0.09 | | | | 0.06 | |
Net realized and unrealized gain (loss) on investments | | | (1.26 | ) | | | 0.58 | | | | 1.32 | | | | 0.52 | | | | 0.74 | | | | 2.15 | |
| | | | | | | | | | | | | | | | | | | | | | | | |
Total from investment operations | | | (1.21 | ) | | | 0.70 | | | | 1.42 | | | | 0.61 | | | | 0.83 | | | | 2.21 | |
| | | | | | | | | | | | | | | | | | | | | | | | |
Less distributions: | | | | | | | | | | | | | | | | | | | | | | | | |
From net investment income | | | — | | | | (0.15 | ) | | | (0.10 | ) | | | (0.09 | ) | | | (0.09 | ) | | | (0.07 | ) |
From net realized gains | | | — | | | | (1.48 | ) | | | (0.47 | ) | | | — | | | | — | | | | — | |
| | | | | | | | | | | | | | | | | | | | | | | | |
Total distributions | | | — | | | | (1.63 | ) | | | (0.57 | ) | | | (0.09 | ) | | | (0.09 | ) | | | (0.07 | ) |
| | | | | | | | | | | | | | | | | | | | | | | | |
Net Asset Value, end of period | | $ | 9.35 | | | $ | 10.56 | | | $ | 11.49 | | | $ | 10.64 | | | $ | 10.12 | | | $ | 9.38 | |
| | | | | | | | | | | | | | | | | | | | | | | | |
Total return | | | (11.46 | )%# | | | 5.98 | % | | | 13.28 | % | | | 6.02 | % | | | 8.85 | % | | | 30.49 | % |
Ratios/Supplemental data: | | | | | | | | | | | | | | | | | | | | | | | | |
Net assets, end of period (000) | | $ | 1,000,823 | | | $ | 1,101,700 | | | $ | 1,176,614 | | | $ | 1,016,831 | | | $ | 912,470 | | | $ | 765,115 | |
Ratios to average net assets: | | | | | | | | | | | | | | | | | | | | | | | | |
Ratio of expenses to average net assets | | | 0.81 | %† | | | 0.80 | % | | | 0.81 | % | | | 0.82 | % | | | 0.82 | % | | | 0.83 | % |
Ratio of net investment income to average net assets | | | 1.02 | %† | | | 0.90 | % | | | 0.90 | % | | | 0.88 | % | | | 0.97 | % | | | 0.86 | % |
Portfolio turnover | | | 27 | %# | | | 41 | % | | | 38 | % | | | 27 | % | | | 22 | % | | | 22 | % |
| | | | |
| | See Notes to Financial Statements. | | 57 |
VANTAGEPOINT FUNDS
Financial Highlights
(For a share outstanding throughout each period)
| | | | | | | | | | | | | | | | | | | | | | | | |
| | | Growth | |
| | | For the Period
January 1, 2008 to
June 30, 2008
(Unaudited) | | | For the Year Ended December 31, | |
| | | | 2007 | | | 2006 | | | 2005 | | | 2004 | | | 2003 | |
Net Asset Value, beginning of period | | $ | 10.45 | | | $ | 9.56 | | | $ | 8.70 | | | $ | 8.31 | | | $ | 8.07 | | | $ | 6.27 | |
Income from investment operations: | | | | | | | | | | | | | | | | | | | | | | | | |
Net investment income | | | 0.03 | | | | 0.05 | | | | 0.03 | | | | 0.01 | | | | 0.02 | | | | 0.00 | †† |
Net realized and unrealized gain (loss) on investments | | | (1.24 | ) | | | 0.89 | | | | 0.86 | | | | 0.39 | | | | 0.24 | | | | 1.80 | |
| | | | | | | | | | | | | | | | | | | | | | | | |
Total from investment operations | | | (1.21 | ) | | | 0.94 | | | | 0.89 | | | | 0.40 | | | | 0.26 | | | | 1.80 | |
| | | | | | | | | | | | | | | | | | | | | | | | |
Less distributions: | | | | | | | | | | | | | | | | | | | | | | | | |
From net investment income | | | — | | | | (0.05 | ) | | | (0.03 | ) | | | (0.01 | ) | | | (0.02 | ) | | | (0.00 | )†† |
| | | | | | | | | | | | | | | | | | | | | | | | |
Total distributions | | | — | | | | (0.05 | ) | | | (0.03 | ) | | | (0.01 | ) | | | (0.02 | ) | | | (0.00 | )†† |
| | | | | | | | | | | | | | | | | | | | | | | | |
Net Asset Value, end of period | | $ | 9.24 | | | $ | 10.45 | | | $ | 9.56 | | | $ | 8.70 | | | $ | 8.31 | | | $ | 8.07 | |
| | | | | | | | | | | | | | | | | | | | | | | | |
Total return | | | (11.58 | )%# | | | 9.81 | % | | | 10.21 | % | | | 4.86 | % | | | 3.27 | % | | | 28.71 | % |
Ratios/Supplemental data: | | | | | | | | | | | | | | | | | | | | | | | | |
Net assets, end of period (000) | | $ | 2,199,902 | | | $ | 2,567,845 | | | $ | 2,783,795 | | | $ | 2,816,803 | | | $ | 2,998,469 | | | $ | 2,895,641 | |
Ratios to average net assets: | | | | | | | | | | | | | | | | | | | | | | | | |
Ratio of expenses to average net assets | | | 0.87 | %† | | | 0.87 | % | | | 0.90 | % | | | 0.94 | % | | | 0.95 | % | | | 0.96 | % |
Ratio of net investment income (loss) to average net assets | | | 0.54 | %† | | | 0.41 | % | | | 0.31 | % | | | 0.11 | % | | | 0.28 | % | | | (0.05 | )% |
Portfolio turnover | | | 28 | %# | | | 50 | % | | | 62 | % | | | 85 | % | | | 49 | % | | | 46 | % |
| †† | Rounds to less than $0.01 |
| | | | |
| 58 | | See Notes to Financial Statements. | | |
VANTAGEPOINT FUNDS
Financial Highlights
(For a share outstanding throughout each period)
| | | | | | | | |
| | | Select Value | |
| | | For the Period
January 1, 2008 to
June 30, 2008
(Unaudited) | | | For the Period
from October 30,
2007* to
December 31, 2007 | |
Net Asset Value, beginning of period | | $ | 9.38 | | | $ | 10.00 | |
Income from investment operations: | | | | | | | | |
Net investment income | | | 0.06 | | | | 0.04 | |
Net realized and unrealized loss on investments | | | (0.73 | ) | | | (0.62 | ) |
| | | | | | | | |
Total from investment operations | | | (0.67 | ) | | | (0.58 | ) |
| | | | | | | | |
Less distributions: | | | | | | | | |
From net investment income | | | — | | | | (0.04 | ) |
| | | | | | | | |
Total distributions | | | — | | | | (0.04 | ) |
| | | | | | | | |
Net Asset Value, end of period | | $ | 8.71 | | | $ | 9.38 | |
| | | | | | | | |
Total return | | | (7.14 | )%# | | | (5.85 | )%# |
Ratios/Supplemental data: | | | | | | | | |
Net assets, end of period (000) | | $ | 278,729 | | | $ | 294,157 | |
Ratios to average net assets: | | | | | | | | |
Ratio of expenses to average net assets | | | 0.97 | %† | | | 1.04 | %† |
Ratio of net investment income to average net assets | | | 1.31 | %† | | | 2.06 | %† |
Portfolio turnover | | | 46 | %# | | | 11 | %# |
| * | Commencement of operations |
| | | | |
| | See Notes to Financial Statements. | | 59 |
VANTAGEPOINT FUNDS
Financial Highlights
(For a share outstanding throughout each period)
| | | | | | | | | | | | | | | | | | | | | | | | |
| | | Aggressive Opportunities | |
| | | For the Period
January 1, 2008 to
June 30, 2008
(Unaudited) | | | For the Year Ended December 31, | |
| | | | 2007 | | | 2006 | | | 2005 | | | 2004 | | | 2003 | |
Net Asset Value, beginning of period | | $ | 11.26 | | | $ | 12.85 | | | $ | 11.63 | | | $ | 10.52 | | | $ | 9.07 | | | $ | 6.27 | |
Income from investment operations: | | | | | | | | | | | | | | | | | | | | | | | | |
Net investment income (loss) | | | 0.01 | | | | 0.01 | | | | (0.00 | )†† | | | 0.04 | | | | (0.03 | ) | | | (0.00 | )†† |
Net realized and unrealized gain (loss) on investments | | | (1.32 | ) | | | 0.72 | | | | 1.56 | | | | 1.35 | | | | 1.48 | | | | 2.80 | |
| | | | | | | | | | | | | | | | | | | | | | | | |
Total from investment operations | | | (1.31 | ) | | | 0.73 | | | | 1.56 | | | | 1.39 | | | | 1.45 | | | | 2.80 | |
| | | | | | | | | | | | | | | | | | | | | | | | |
Less distributions: | | | | | | | | | | | | | | | | | | | | | | | | |
From net investment income | | | — | | | | — | | | | (0.05 | ) | | | (0.28 | ) | | | — | | | | (0.00 | )†† |
In excess of net investment income | | | — | | | | — | | | | — | | | | — | | | | — | | | | (0.00 | )†† |
From net realized gains | | | — | | | | (2.32 | ) | | | (0.29 | ) | | | — | | | | — | | | | — | |
| | | | | | | | | | | | | | | | | | | | | | | | |
Total distributions | | | — | | | | (2.32 | ) | | | (0.34 | ) | | | (0.28 | ) | | | — | | | | (0.00 | )†† |
| | | | | | | | | | | | | | | | | | | | | | | | |
Net Asset Value, end of period | | $ | 9.95 | | | $ | 11.26 | | | $ | 12.85 | | | $ | 11.63 | | | $ | 10.52 | | | $ | 9.07 | |
| | | | | | | | | | | | | | | | | | | | | | | | |
Total return | | | (11.63 | )%# | | | 5.53 | % | | | 13.36 | % | | | 13.21 | % | | | 15.99 | % | | | 44.68 | % |
Ratios/Supplemental data: | | | | | | | | | | | | | | | | | | | | | | | | |
Net assets, end of period (000) | | $ | 977,953 | | | $ | 1,154,745 | | | $ | 1,366,708 | | | $ | 1,252,413 | | | $ | 1,150,062 | | | $ | 938,791 | |
Ratios to average net assets: | | | | | | | | | | | | | | | | | | | | | | | | |
Ratio of expenses to average net assets | | | 0.96 | %† | | | 1.02 | % | | | 1.04 | % | | | 1.22 | % | | | 1.22 | % | | | 1.23 | % |
Ratio of net investment income (loss) to average net assets | | | 0.18 | %† | | | 0.08 | % | | | (0.03 | )% | | | 0.31 | % | | | (0.25 | )% | | | (0.13 | )% |
Portfolio turnover | | | 26 | %# | | | 45 | % | | | 88 | % | | | 45 | % | | | 55 | % | | | 75 | % |
| †† | Rounds to less than $0.01 |
| | | | |
| 60 | | See Notes to Financial Statements. | | |
VANTAGEPOINT FUNDS
Financial Highlights
(For a share outstanding throughout each period)
| | | | | | | | |
| | | Discovery | |
| | | For the Period
January 1, 2008 to
June 30, 2008
(Unaudited) | | | For the Period
from October 30,
2007* to
December 31, 2007 | |
Net Asset Value, beginning of period | | $ | 9.25 | | | $ | 10.00 | |
Income from investment operations: | | | | | | | | |
Net investment income | | | 0.08 | | | | 0.03 | |
Net realized and unrealized loss on investments | | | (0.81 | ) | | | (0.68 | ) |
| | | | | | | | |
Total from investment operations | | | (0.73 | ) | | | (0.65 | ) |
| | | | | | | | |
Less distributions: | | | | | | | | |
From net investment income | | | — | | | | (0.03 | ) |
From net realized gains | | | — | | | | (0.07 | ) |
| | | | | | | | |
Total distributions | | | — | | | | (0.10 | ) |
| | | | | | | | |
Net Asset Value, end of period | | $ | 8.52 | | | $ | 9.25 | |
| | | | | | | | |
Total return | | | (7.89 | )%# | | | (6.46 | )%# |
Ratios/Supplemental data: | | | | | | | | |
Net assets, end of period (000) | | $ | 162,524 | | | $ | 173,510 | |
Ratios to average net assets: | | | | | | | | |
Ratio of expenses to average net assets | | | 1.00 | %† | | | 1.07 | %† |
Ratio of net investment income to average net assets | | | 1.89 | %† | | | 2.08 | %† |
Portfolio turnover | | | 40 | %# | | | 36 | %# |
| * | Commencement of operations |
| | | | |
| | See Notes to Financial Statements. | | 61 |
VANTAGEPOINT FUNDS
Financial Highlights
(For a share outstanding throughout each period)
| | | | | | | | | | | | | | | | | | | | | | | | |
| | | International | |
| | | For the Period
January 1, 2008 to
June 30, 2008
(Unaudited) | | | For the Year Ended December 31, | |
| | | | 2007 | | | 2006 | | | 2005 | | | 2004 | | | 2003 | |
Net Asset Value, beginning of period | | $ | 12.19 | | | $ | 12.57 | | | $ | 11.56 | | | $ | 10.06 | | | $ | 8.84 | | | $ | 6.80 | |
Income from investment operations: | | | | | | | | | | | | | | | | | | | | | | | | |
Net investment income | | | 0.14 | | | | 0.18 | | | | 0.16 | | | | 0.11 | | | | 0.08 | | | | 0.06 | |
Net realized and unrealized gain (loss) on investments | | | (1.23 | ) | | | 1.37 | | | | 2.29 | | | | 1.59 | | | | 1.27 | | | | 2.07 | |
| | | | | | | | | | | | | | | | | | | | | | | | |
Total from investment operations | | | (1.09 | ) | | | 1.55 | | | | 2.45 | | | | 1.70 | | | | 1.35 | | | | 2.13 | |
| | | | | | | | | | | | | | | | | | | | | | | | |
Less distributions: | | | | | | | | | | | | | | | | | | | | | | | | |
From net investment income | | | — | | | | (0.21 | ) | | | (0.20 | ) | | | (0.20 | ) | | | (0.13 | ) | | | (0.09 | ) |
From net realized gains | | | — | | | | (1.72 | ) | | | (1.24 | ) | | | — | | | | — | | | | — | |
Return of capital | | | — | | | | — | | | | — | | | | — | | | | — | | | | (0.00 | )†† |
| | | | | | | | | | | | | | | | | | | | | | | | |
Total distributions | | | — | | | | (1.93 | ) | | | (1.44 | ) | | | (0.20 | ) | | | (0.13 | ) | | | (0.09 | ) |
| | | | | | | | | | | | | | | | | | | | | | | | |
Net Asset Value, end of period | | $ | 11.10 | | | $ | 12.19 | | | $ | 12.57 | | | $ | 11.56 | | | $ | 10.06 | | | $ | 8.84 | |
| | | | | | | | | | | | | | | | | | | | | | | | |
Total return | | | (8.94 | )%# | | | 12.46 | % | | | 21.14 | % | | | 16.88 | % | | | 15.23 | % | | | 31.31 | % |
Ratios/Supplemental data: | | | | | | | | | | | | | | | | | | | | | | | | |
Net assets, end of period (000) | | $ | 1,047,122 | | | $ | 1,145,029 | | | $ | 1,049,831 | | | $ | 722,161 | | | $ | 604,809 | | | $ | 471,495 | |
Ratios to average net assets: | | | | | | | | | | | | | | | | | | | | | | | | |
Ratio of expenses to average net assets | | | 1.08 | %† | | | 1.10 | % | | | 1.11 | % | | | 1.17 | % | | | 1.17 | % | | | 1.22 | % |
Ratio of net investment income to average net assets | | | 2.44 | %† | | | 1.15 | % | | | 1.08 | % | | | 1.06 | % | | | 0.83 | % | | | 0.93 | % |
Portfolio turnover | | | 29 | %# | | | 60 | % | | | 65 | % | | | 42 | % | | | 40 | % | | | 38 | % |
| †† | Rounds to less than $0.01 |
| | | | |
| 62 | | See Notes to Financial Statements. | | |
VANTAGEPOINT FUNDS
Financial Highlights
(For a share outstanding throughout each period)
| | | | | | | | |
| | | Diversified Assets | |
| | | For the Period
January 1, 2008 to
June 30, 2008
(Unaudited) | | | For the Period
from October 30,
2007* to
December 31, 2007 | |
Net Asset Value, beginning of period | | $ | 9.95 | | | $ | 10.00 | |
Income from investment operations: | | | | | | | | |
Net investment income | | | 0.11 | | | | 0.06 | |
Net realized and unrealized loss on investments | | | (0.02 | ) | | | (0.07 | ) |
| | | | | | | | |
Total from investment operations | | | 0.09 | | | | (0.01 | ) |
| | | | | | | | |
Less distributions: | | | | | | | | |
From net investment income | | | — | | | | (0.04 | ) |
| | | | | | | | |
Total distributions | | | — | | | | (0.04 | ) |
| | | | | | | | |
Net Asset Value, end of period | | $ | 10.04 | | | $ | 9.95 | |
| | | | | | | | |
Total return | | | 0.90 | %# | | | (0.07 | )%# |
Ratios/Supplemental data: | | | | | | | | |
Net assets, end of period (000) | | $ | 453,867 | | | $ | 465,175 | |
Ratios to average net assets: | | | | | | | | |
Ratio of expenses to average net assets | | | 1.01 | %† | | | 1.01 | %† |
Ratio of net investment income to average net assets | | | 2.29 | %† | | | 3.53 | %† |
Portfolio turnover | | | 40 | %# | | | 16 | %# |
| * | Commencement of operations |
| | | | |
| | See Notes to Financial Statements. | | 63 |
VANTAGEPOINT FUNDS
Financial Highlights
(For a share outstanding throughout each period)
| | | | | | | | | | | | | | | | | | | | | | | | |
| | | Core Bond Index Class I | |
| | | For the Period
January 1, 2008 to
June 30, 2008
(Unaudited) | | | For the Year Ended December 31, | |
| | | | 2007 | | | 2006 | | | 2005<> | | | 2004<> | | | 2003 | |
Net Asset Value, beginning of period | | $ | 9.87 | | | $ | 9.75 | | | $ | 9.90 | | | $ | 10.17 | | | $ | 10.27 | | | $ | 10.46 | |
Income from investment operations: | | | | | | | | | | | | | | | | | | | | | | | | |
Net investment income | | | 0.23 | | | | 0.47 | | | | 0.44 | | | | 0.41 | | | | 0.40 | | | | 0.40 | |
Net realized and unrealized gain (loss) on investments | | | (0.12 | ) | | | 0.15 | | | | (0.08 | ) | | | (0.21 | ) | | | 0.01 | | | | (0.04 | ) |
| | | | | | | | | | | | | | | | | | | | | | | | |
Total from investment operations | | | 0.11 | | | | 0.62 | | | | 0.36 | | | | 0.20 | | | | 0.41 | | | | 0.36 | |
| | | | | | | | | | | | | | | | | | | | | | | | |
Less distributions: | | | | | | | | | | | | | | | | | | | | | | | | |
From net investment income | | | (0.24 | ) | | | (0.50 | ) | | | (0.47 | ) | | | (0.47 | ) | | | (0.47 | ) | | | (0.49 | ) |
From net realized gains | | | — | | | | — | | | | — | | | | — | | | | (0.04 | ) | | | (0.06 | ) |
Return of capital | | | — | | | | — | | | | (0.04 | ) | | | — | | | | — | | | | — | |
| | | | | | | | | | | | | | | | | | | | | | | | |
Total distributions | | | (0.24 | ) | | | (0.50 | ) | | | (0.51 | ) | | | (0.47 | ) | | | (0.51 | ) | | | (0.55 | ) |
| | | | | | | | | | | | | | | | | | | | | | | | |
Net Asset Value, end of period | | $ | 9.74 | | | $ | 9.87 | | | $ | 9.75 | | | $ | 9.90 | | | $ | 10.17 | | | $ | 10.27 | |
| | | | | | | | | | | | | | | | | | | | | | | | |
Total return | | | 1.12 | %# | | | 6.52 | % | | | 3.82 | % | | | 1.98 | % | | | 3.94 | % | | | 3.59 | % |
Ratios/Supplemental data: | | | | | | | | | | | | | | | | | | | | | | | | |
Net assets, end of period (000) | | $ | 855,144 | | | $ | 888,541 | | | $ | 988,984 | | | $ | 865,929 | | | $ | 764,674 | | | $ | 452,739 | |
Ratios to average net assets: | | | | | | | | | | | | | | | | | | | | | | | | |
Ratio of expenses to average net assets | | | 0.44 | %† | | | 0.44 | % | | | 0.44 | % | | | 0.45 | % | | | 0.45 | % | | | 0.48 | %&& |
Ratio of net investment income to average net assets | | | 4.59 | %† | | | 4.71 | % | | | 4.50 | % | | | 4.03 | % | | | 3.96 | % | | | 3.85 | % |
Portfolio turnover | | | 26 | %# | | | 76 | % | | | 28 | % | | | 31 | % | | | 31 | %^^ | | | N/A | |
| <> | Per share amounts were calculated using the average shares outstanding method. |
| && | Includes effect of expenses allocated from Master Investment Portfolio. |
| ^^ | Portfolio turnover figure represents the period from March 5, 2004 to December 31, 2004. Prior to March 5, 2004, portfolio turnover was calculated at the Master Investment Portfolio level. |
| | | | |
| 64 | | See Notes to Financial Statements. | | |
VANTAGEPOINT FUNDS
Financial Highlights
(For a share outstanding throughout each period)
| | | | | | | | | | | | | | | | | | | | | | | | |
| | | Core Bond Index Class II | |
| | | For the Period
January 1, 2008 to
June 30, 2008
(Unaudited) | | | For the Year Ended December 31, | |
| | | | 2007 | | | 2006 | | | 2005<> | | | 2004<> | | | 2003 | |
Net Asset Value, beginning of period | | $ | 9.92 | | | $ | 9.80 | | | $ | 9.94 | | | $ | 10.21 | | | $ | 10.31 | | | $ | 10.49 | |
Income from investment operations: | | | | | | | | | | | | | | | | | | | | | | | | |
Net investment income | | | 0.24 | | | | 0.49 | | | | 0.46 | | | | 0.43 | | | | 0.43 | | | | 0.42 | |
Net realized and unrealized gain (loss) on investments | | | (0.13 | ) | | | 0.15 | | | | (0.07 | ) | | | (0.21 | ) | | | — | | | | (0.02 | ) |
| | | | | | | | | | | | | | | | | | | | | | | | |
Total from investment operations | | | 0.11 | | | | 0.64 | | | | 0.39 | | | | 0.22 | | | | 0.43 | | | | 0.40 | |
| | | | | | | | | | | | | | | | | | | | | | | | |
Less distributions: | | | | | | | | | | | | | | | | | | | | | | | | |
From net investment income | | | (0.25 | ) | | | (0.52 | ) | | | (0.49 | ) | | | (0.49 | ) | | | (0.49 | ) | | | (0.52 | ) |
From net realized gains | | | — | | | | — | | | | — | | | | — | | | | (0.04 | ) | | | (0.06 | ) |
Return of capital | | | — | | | | — | | | | (0.04 | ) | | | — | | | | — | | | | — | |
| | | | | | | | | | | | | | | | | | | | | | | | |
Total distributions | | | (0.25 | ) | | | (0.52 | ) | | | (0.53 | ) | | | (0.49 | ) | | | (0.53 | ) | | | (0.58 | ) |
| | | | | | | | | | | | | | | | | | | | | | | | |
Net Asset Value, end of period | | $ | 9.78 | | | $ | 9.92 | | | $ | 9.80 | | | $ | 9.94 | | | $ | 10.21 | | | $ | 10.31 | |
| | | | | | | | | | | | | | | | | | | | | | | | |
Total return | | | 1.11 | %# | | | 6.71 | % | | | 4.11 | % | | | 2.17 | % | | | 4.22 | % | | | 3.88 | % |
Ratios/Supplemental data: | | | | | | | | | | | | | | | | | | | | | | | | |
Net assets, end of period (000) | | $ | 201,272 | | | $ | 201,573 | | | $ | 170,987 | | | $ | 165,467 | | | $ | 168,010 | | | $ | 138,655 | |
Ratios to average net assets: | | | | | | | | | | | | | | | | | | | | | | | | |
Ratio of expenses to average net assets | | | 0.24 | %† | | | 0.24 | % | | | 0.24 | % | | | 0.25 | % | | | 0.25 | % | | | 0.28 | %&& |
Ratio of net investment income to average net assets | | | 4.79 | %† | | | 4.91 | % | | | 4.70 | % | | | 4.23 | % | | | 4.19 | % | | | 4.05 | % |
Portfolio turnover | | | 26 | %# | | | 76 | % | | | 28 | % | | | 31 | % | | | 31 | %^^ | | | N/A | |
| <> | Per share amounts were calculated using the average shares outstanding method. |
| && | Includes effect of expenses allocated from Master Investment Portfolio. |
| ^^ | Portfolio turnover figure represents the period from March 5, 2004 to December 31, 2004. Prior to March 5, 2004, portfolio turnover was calculated at the Master Investment Portfolio level. |
| | | | |
| | See Notes to Financial Statements. | | 65 |
VANTAGEPOINT FUNDS
Financial Highlights
(For a share outstanding throughout each period)
| | | | | | | | | | | | | | | | | | | | | | | | |
| | | 500 Stock Index Class I | |
| | | For the Period
January 1, 2008 to
June 30, 2008
(Unaudited) | | | For the Year Ended December 31, | |
| | | | 2007 | | | 2006 | | | 2005 | | | 2004<> | | | 2003 | |
Net Asset Value, beginning of period | | $ | 11.63 | | | $ | 11.23 | | | $ | 9.87 | | | $ | 9.58 | | | $ | 8.79 | | | $ | 6.94 | |
Income from investment operations: | | | | | | | | | | | | | | | | | | | | | | | | |
Net investment income | | | 0.09 | | | | 0.22 | | | | 0.18 | | | | 0.15 | | | | 0.14 | | | | 0.09 | |
Net realized and unrealized gain (loss) on investments | | | (1.51 | ) | | | 0.35 | | | | 1.33 | | | | 0.28 | | | | 0.78 | | | | 1.85 | |
| | | | | | | | | | | | | | | | | | | | | | | | |
Total from investment operations | | | (1.42 | ) | | | 0.57 | | | | 1.51 | | | | 0.43 | | | | 0.92 | | | | 1.94 | |
| | | | | | | | | | | | | | | | | | | | | | | | |
Less distributions: | | | | | | | | | | | | | | | | | | | | | | | | |
From net investment income | | | — | | | | (0.17 | ) | | | (0.15 | ) | | | (0.14 | ) | | | (0.13 | ) | | | (0.09 | ) |
| | | | | | | | | | | | | | | | | | | | | | | | |
Total distributions | | | — | | | | (0.17 | ) | | | (0.15 | ) | | | (0.14 | ) | | | (0.13 | ) | | | (0.09 | ) |
| | | | | | | | | | | | | | | | | | | | | | | | |
Net Asset Value, end of period | | $ | 10.21 | | | $ | 11.63 | | | $ | 11.23 | | | $ | 9.87 | | | $ | 9.58 | | | $ | 8.79 | |
| | | | | | | | | | | | | | | | | | | | | | | | |
Total return | | | (12.21 | )%# | | | 5.06 | % | | | 15.27 | % | | | 4.44 | % | | | 10.49 | % | | | 27.98 | % |
Ratios/Supplemental data: | | | | | | | | | | | | | | | | | | | | | | | | |
Net assets, end of period (000) | | $ | 80,727 | | | $ | 95,694 | | | $ | 107,977 | | | $ | 108,030 | | | $ | 115,533 | | | $ | 130,663 | |
Ratios to average net assets: | | | | | | | | | | | | | | | | | | | | | | | | |
Ratio of expenses to average net assets | | | 0.46 | %† | | | 0.45 | % | | | 0.45 | % | | | 0.46 | % | | | 0.46 | % | | | 0.47 | %&& |
Ratio of net investment income to average net assets | | | 1.65 | %† | | | 1.55 | % | | | 1.53 | % | | | 1.42 | % | | | 1.56 | % | | | 1.33 | % |
Portfolio turnover | | | 2 | %# | | | 5 | % | | | 4 | % | | | 5 | % | | | 7 | %^^ | | | N/A | |
| <> | Per share amounts were calculated using the average shares outstanding method. |
| && | Includes effect of expenses allocated from Master Investment Portfolio. |
| ^^ | Portfolio turnover figure represents the period from March 5, 2004 to December 31, 2004. Prior to March 5, 2004, portfolio turnover was calculated at the Master Investment Portfolio level. |
| | | | |
| 66 | | See Notes to Financial Statements. | | |
VANTAGEPOINT FUNDS
Financial Highlights
(For a share outstanding throughout each period)
| | | | | | | | | | | | | | | | | | | | | | | | |
| | | 500 Stock Index Class II | |
| | | For the Period
January 1, 2008 to
June 30, 2008
(Unaudited) | | | For the Year Ended December 31, | |
| | | | 2007 | | | 2006 | | | 2005 | | | 2004<> | | | 2003 | |
Net Asset Value, beginning of period | | $ | 11.01 | | | $ | 10.65 | | | $ | 9.36 | | | $ | 9.10 | | | $ | 8.37 | | | $ | 6.61 | |
Income from investment operations: | | | | | | | | | | | | | | | | | | | | | | | | |
Net investment income | | | 0.09 | | | | 0.20 | | | | 0.17 | | | | 0.15 | | | | 0.16 | | | | 0.11 | |
Net realized and unrealized gain (loss) on investments | | | (1.42 | ) | | | 0.36 | | | | 1.29 | | | | 0.27 | | | | 0.73 | | | | 1.75 | |
| | | | | | | | | | | | | | | | | | | | | | | | |
Total from investment operations | | | (1.33 | ) | | | 0.56 | | | | 1.46 | | | | 0.42 | | | | 0.89 | | | | 1.86 | |
| | | | | | | | | | | | | | | | | | | | | | | | |
Less distributions: | | | | | | | | | | | | | | | | | | | | | | | | |
From net investment income | | | — | | | | (0.20 | ) | | | (0.17 | ) | | | (0.16 | ) | | | (0.16 | ) | | | (0.10 | ) |
| | | | | | | | | | | | | | | | | | | | | | | | |
Total distributions | | | — | | | | (0.20 | ) | | | (0.17 | ) | | | (0.16 | ) | | | (0.16 | ) | | | (0.10 | ) |
| | | | | | | | | | | | | | | | | | | | | | | | |
Net Asset Value, end of period | | $ | 9.68 | | | $ | 11.01 | | | $ | 10.65 | | | $ | 9.36 | | | $ | 9.10 | | | $ | 8.37 | |
| | | | | | | | | | | | | | | | | | | | | | | | |
Total return | | | (12.08 | )%# | | | 5.22 | % | | | 15.60 | % | | | 4.57 | % | | | 10.60 | % | | | 28.24 | % |
Ratios/Supplemental data: | | | | | | | | | | | | | | | | | | | | | | | | |
Net assets, end of period (000) | | $ | 270,255 | | | $ | 316,248 | | | $ | 287,392 | | | $ | 241,849 | | | $ | 242,188 | | | $ | 185,901 | |
Ratios to average net assets: | | | | | | | | | | | | | | | | | | | | | | | | |
Ratio of expenses to average net assets | | | 0.26 | %† | | | 0.25 | % | | | 0.25 | % | | | 0.26 | % | | | 0.26 | % | | | 0.27 | %&& |
Ratio of net investment income to average net assets | | | 1.85 | %† | | | 1.75 | % | | | 1.73 | % | | | 1.62 | % | | | 1.84 | % | | | 1.52 | % |
Portfolio turnover | | | 2 | %# | | | 5 | % | | | 4 | % | | | 5 | % | | | 7 | %^^ | | | N/A | |
| <> | Per share amounts were calculated using the average shares outstanding method. |
| && | Includes effect of expenses allocated from Master Investment Portfolio. |
| ^^ | Portfolio turnover figure represents the period from March 5, 2004 to December 31, 2004. Prior to March 5, 2004, portfolio turnover was calculated at the Master Investment Portfolio level. |
| | | | |
| | See Notes to Financial Statements. | | 67 |
VANTAGEPOINT FUNDS
Financial Highlights
(For a share outstanding throughout each period)
| | | | | | | | | | | | | | | | | | | | | | | | |
| | | Broad Market Index Class I | |
| | | For the Period
January 1, 2008 to
June 30, 2008
(Unaudited) | | | For the Year Ended December 31, | |
| | | | 2007 | | | 2006 | | | 2005 | | | 2004<> | | | 2003 | |
Net Asset Value, beginning of period | | $ | 12.25 | | | $ | 11.81 | | | $ | 10.35 | | | $ | 9.90 | | | $ | 8.95 | | | $ | 6.89 | |
Income from investment operations: | | | | | | | | | | | | | | | | | | | | | | | | |
Net investment income | | | 0.10 | | | | 0.26 | | | | 0.22 | | | | 0.17 | | | | 0.13 | | | | 0.08 | |
Net realized and unrealized gain (loss) on investments | | | (1.44 | ) | | | 0.35 | | | | 1.38 | | | | 0.42 | | | | 0.94 | | | | 2.06 | |
| | | | | | | | | | | | | | | | | | | | | | | | |
Total from investment operations | | | (1.34 | ) | | | 0.61 | | | | 1.60 | | | | 0.59 | | | | 1.07 | | | | 2.14 | |
| | | | | | | | | | | | | | | | | | | | | | | | |
Less distributions: | | | | | | | | | | | | | | | | | | | | | | | | |
From net investment income | | | — | | | | (0.17 | ) | | | (0.14 | ) | | | (0.14 | ) | | | (0.12 | ) | | | (0.08 | ) |
| | | | | | | | | | | | | | | | | | | | | | | | |
Total distributions | | | — | | | | (0.17 | ) | | | (0.14 | ) | | | (0.14 | ) | | | (0.12 | ) | | | (0.08 | ) |
| | | | | | | | | | | | | | | | | | | | | | | | |
Net Asset Value, end of period | | $ | 10.91 | | | $ | 12.25 | | | $ | 11.81 | | | $ | 10.35 | | | $ | 9.90 | | | $ | 8.95 | |
| | | | | | | | | | | | | | | | | | | | | | | | |
Total return | | | (10.94 | )%# | | | 5.15 | % | | | 15.46 | % | | | 5.91 | % | | | 11.96 | % | | | 31.08 | % |
Ratios/Supplemental data: | | | | | | | | | | | | | | | | | | | | | | | | |
Net assets, end of period (000) | | $ | 141,935 | | | $ | 170,584 | | | $ | 195,651 | | | $ | 208,588 | | | $ | 224,619 | | | $ | 267,250 | |
Ratios to average net assets: | | | | | | | | | | | | | | | | | | | | | | | | |
Ratio of expenses to average net assets | | | 0.45 | %† | | | 0.44 | % | | | 0.44 | % | | | 0.45 | % | | | 0.44 | % | | | 0.48 | %&& |
Ratio of net investment income to average net assets | | | 1.56 | %† | | | 1.48 | % | | | 1.42 | % | | | 1.37 | % | | | 1.42 | % | | | 1.22 | % |
Portfolio turnover | | | 2 | %# | | | 2 | % | | | 2 | % | | | 2 | % | | | 5 | %^^ | | | N/A | |
| <> | Per share amounts were calculated using the average shares outstanding method. |
| && | Includes effect of expenses allocated from Master Investment Portfolio. |
| ^^ | Portfolio turnover figure represents the period from March 5, 2004 to December 31, 2004. Prior to March 5, 2004, portfolio turnover was calculated at the Master Investment Portfolio level. |
| | | | |
| 68 | | See Notes to Financial Statements. | | |
VANTAGEPOINT FUNDS
Financial Highlights
(For a share outstanding throughout each period)
| | | | | | | | | | | | | | | | | | | | | | | | |
| | | Broad Market Index Class II | |
| | | For the Period
January 1, 2008 to
June 30, 2008
(Unaudited) | | | For the Year Ended December 31, | |
| | | | 2007 | | | 2006 | | | 2005 | | | 2004<> | | | 2003 | |
Net Asset Value, beginning of period | | $ | 11.57 | | | $ | 11.17 | | | $ | 9.80 | | | $ | 9.37 | | | $ | 8.49 | | | $ | 6.54 | |
Income from investment operations: | | | | | | | | | | | | | | | | | | | | | | | | |
Net investment income | | | 0.10 | | | | 0.20 | | | | 0.17 | | | | 0.15 | | | | 0.15 | | | | 0.10 | |
Net realized and unrealized gain (loss) on investments | | | (1.36 | ) | | | 0.40 | | | | 1.37 | | | | 0.44 | | | | 0.88 | | | | 1.95 | |
| | | | | | | | | | | | | | | | | | | | | | | | |
Total from investment operations | | | (1.26 | ) | | | 0.60 | | | | 1.54 | | | | 0.59 | | | | 1.03 | | | | 2.05 | |
| | | | | | | | | | | | | | | | | | | | | | | | |
Less distributions: | | | | | | | | | | | | | | | | | | | | | | | | |
From net investment income | | | — | | | | (0.20 | ) | | | (0.17 | ) | | | (0.16 | ) | | | (0.15 | ) | | | (0.10 | ) |
| | | | | | | | | | | | | | | | | | | | | | | | |
Total distributions | | | — | | | | (0.20 | ) | | | (0.17 | ) | | | (0.16 | ) | | | (0.15 | ) | | | (0.10 | ) |
| | | | | | | | | | | | | | | | | | | | | | | | |
Net Asset Value, end of period | | $ | 10.31 | | | $ | 11.57 | | | $ | 11.17 | | | $ | 9.80 | | | $ | 9.37 | | | $ | 8.49 | |
| | | | | | | | | | | | | | | | | | | | | | | | |
Total return | | | (10.89 | )%# | | | 5.35 | % | | | 15.68 | % | | | 6.27 | % | | | 12.11 | % | | | 31.30 | % |
Ratios/Supplemental data: | | | | | | | | | | | | | | | | | | | | | | | | |
Net assets, end of period (000) | | $ | 416,758 | | | $ | 484,534 | | | $ | 449,961 | | | $ | 389,843 | | | $ | 374,416 | | | $ | 272,411 | |
Ratios to average net assets: | | | | | | | | | | | | | | | | | | | | | | | | |
Ratio of expenses to average net assets | | | 0.25 | %† | | | 0.24 | % | | | 0.24 | % | | | 0.25 | % | | | 0.24 | % | | | 0.28 | %&& |
Ratio of net investment income to average net assets | | | 1.76 | %† | | | 1.68 | % | | | 1.63 | % | | | 1.52 | % | | | 1.72 | % | | | 1.42 | % |
Portfolio turnover | | | 2 | %# | | | 2 | % | | | 2 | % | | | 2 | % | | | 5 | %^^ | | | N/A | |
| <> | Per share amounts were calculated using the average shares outstanding method. |
| && | Includes effect of expenses allocated from Master Investment Portfolio. |
| ^^ | Portfolio turnover figure represents the period from March 5, 2004 to December 31, 2004. Prior to March 5, 2004, portfolio turnover was calculated at the Master Investment Portfolio level. |
| | | | |
| | See Notes to Financial Statements. | | 69 |
VANTAGEPOINT FUNDS
Financial Highlights
(For a share outstanding throughout each period)
| | | | | | | | | | | | | | | | | | | | | | | | |
| | | Mid/Small Company Index Class I | |
| | | For the Period
January 1, 2008 to
June 30, 2008
(Unaudited) | | | For the Year Ended December 31, | |
| | | | 2007 | | | 2006 | | | 2005 | | | 2004<> | | | 2003 | |
Net Asset Value, beginning of period | | $ | 16.23 | | | $ | 16.52 | | | $ | 14.99 | | | $ | 13.80 | | | $ | 11.79 | | | $ | 8.33 | |
Income from investment operations: | | | | | | | | | | | | | | | | | | | | | | | | |
Net investment income | | | 0.09 | | | | 0.16 | | | | 0.16 | | | | 0.13 | | | | 0.12 | | | | 0.04 | |
Net realized and unrealized gain (loss) on investments | | | (1.34 | ) | | | 0.68 | | | | 2.09 | | | | 1.20 | | | | 1.99 | | | | 3.47 | |
| | | | | | | | | | | | | | | | | | | | | | | | |
Total from investment operations | | | (1.25 | ) | | | 0.84 | | | | 2.25 | | | | 1.33 | | | | 2.11 | | | | 3.51 | |
| | | | | | | | | | | | | | | | | | | | | | | | |
Less distributions: | | | | | | | | | | | | | | | | | | | | | | | | |
From net investment income | | | — | | | | (0.20 | ) | | | (0.12 | ) | | | (0.14 | ) | | | (0.10 | ) | | | (0.05 | ) |
From net realized gains | | | — | | | | (0.93 | ) | | | (0.60 | ) | | | — | | | | — | | | | — | |
| | | | | | | | | | | | | | | | | | | | | | | | |
Total distributions | | | — | | | | (1.13 | ) | | | (0.72 | ) | | | (0.14 | ) | | | (0.10 | ) | | | (0.05 | ) |
| | | | | | | | | | | | | | | | | | | | | | | | |
Net Asset Value, end of period | | $ | 14.98 | | | $ | 16.23 | | | $ | 16.52 | | | $ | 14.99 | | | $ | 13.80 | | | $ | 11.79 | |
| | | | | | | | | | | | | | | | | | | | | | | | |
Total return | | | (7.70 | )%# | | | 4.98 | % | | | 14.99 | % | | | 9.63 | % | | | 17.86 | % | | | 42.17 | % |
Ratios/Supplemental data: | | | | | | | | | | | | | | | | | | | | | | | | |
Net assets, end of period (000) | | $ | 99,596 | | | $ | 105,496 | | | $ | 78,663 | | | $ | 68,330 | | | $ | 56,156 | | | $ | 56,880 | |
Ratios to average net assets: | | | | | | | | | | | | | | | | | | | | | | | | |
Ratio of expenses to average net assets | | | 0.50 | %† | | | 0.50 | % | | | 0.51 | % | | | 0.52 | % | | | 0.52 | % | | | 0.52 | %&& |
Ratio of net investment income to average net assets | | | 1.18 | %† | | | 1.16 | % | | | 1.04 | % | | | 1.01 | % | | | 0.95 | % | | | 0.86 | % |
Portfolio turnover | | | 6 | %# | | | 18 | % | | | 20 | % | | | 12 | % | | | 22 | %^^ | | | N/A | |
| <> | Per share amounts were calculated using the average shares outstanding method. |
| && | Includes effect of expenses allocated from Master Investment Portfolio. |
| ^^ | Portfolio turnover figure represents the period from March 5, 2004 to December 31, 2004. Prior to March 5, 2004, portfolio turnover was calculated at the Master Investment Portfolio level. |
| | | | |
| 70 | | See Notes to Financial Statements. | | |
VANTAGEPOINT FUNDS
Financial Highlights
(For a share outstanding throughout each period)
| | | | | | | | | | | | | | | | | | | | | | | | |
| | | Mid/Small Company Index Class II | |
| | | For the Period
January 1, 2008 to
June 30, 2008
(Unaudited) | | | For the Year Ended December 31, | |
| | | | 2007 | | | 2006 | | | 2005 | | | 2004<> | | | 2003 | |
Net Asset Value, beginning of period | | $ | 15.48 | | | $ | 15.80 | | | $ | 14.36 | | | $ | 13.22 | | | $ | 11.32 | | | $ | 7.99 | |
Income from investment operations: | | | | | | | | | | | | | | | | | | | | | | | | |
Net investment income | | | 0.10 | | | | 0.22 | | | | 0.20 | | | | 0.17 | | | | 0.14 | | | | 0.06 | |
Net realized and unrealized gain (loss) on investments | | | (1.28 | ) | | | 0.61 | | | | 2.00 | | | | 1.14 | | | | 1.89 | | | | 3.34 | |
| | | | | | | | | | | | | | | | | | | | | | | | |
Total from investment operations | | | (1.18 | ) | | | 0.83 | | | | 2.20 | | | | 1.31 | | | | 2.03 | | | | 3.40 | |
| | | | | | | | | | | | | | | | | | | | | | | | |
Less distributions: | | | | | | | | | | | | | | | | | | | | | | | | |
From net investment income | | | — | | | | (0.22 | ) | | | (0.16 | ) | | | (0.17 | ) | | | (0.13 | ) | | | (0.07 | ) |
From net realized gains | | | — | | | | (0.93 | ) | | | (0.60 | ) | | | — | | | | — | | | | — | |
| | | | | | | | | | | | | | | | | | | | | | | | |
Total distributions | | | — | | | | (1.15 | ) | | | (0.76 | ) | | | (0.17 | ) | | | (0.13 | ) | | | (0.07 | ) |
| | | | | | | | | | | | | | | | | | | | | | | | |
Net Asset Value, end of period | | $ | 14.30 | | | $ | 15.48 | | | $ | 15.80 | | | $ | 14.36 | | | $ | 13.22 | | | $ | 11.32 | |
| | | | | | | | | | | | | | | | | | | | | | | | |
Total return | | | (7.62 | )%# | | | 5.20 | % | | | 15.24 | % | | | 9.87 | % | | | 17.95 | % | | | 42.53 | % |
Ratios/Supplemental data: | | | | | | | | | | | | | | | | | | | | | | | | |
Net assets, end of period (000) | | $ | 108,210 | | | $ | 121,950 | | | $ | 106,900 | | | $ | 95,502 | | | $ | 86,741 | | | $ | 52,907 | |
Ratios to average net assets: | | | | | | | | | | | | | | | | | | | | | | | | |
Ratio of expenses to average net assets | | | 0.30 | %† | | | 0.30 | % | | | 0.31 | % | | | 0.32 | % | | | 0.32 | % | | | 0.32 | %&& |
Ratio of net investment income to average net assets | | | 1.38 | %† | | | 1.36 | % | | | 1.24 | % | | | 1.20 | % | | | 1.18 | % | | | 1.06 | % |
Portfolio turnover | | | 6 | %# | | | 18 | % | | | 20 | % | | | 12 | % | | | 22 | %^^ | | | N/A | |
| <> | Per share amounts were calculated using the average shares outstanding method. |
| && | Includes effect of expenses allocated from Master Investment Portfolio. |
| ^^ | Portfolio turnover figure represents the period from March 5, 2004 to December 31, 2004. Prior to March 5, 2004, portfolio turnover was calculated at the Master Investment Portfolio level. |
| | | | |
| | See Notes to Financial Statements. | | 71 |
VANTAGEPOINT FUNDS
Financial Highlights
(For a share outstanding throughout each period)
| | | | | | | | | | | | | | | | | | | | | | | | |
| | | Overseas Equity Index Class I | |
| | | For the Period
January 1, 2008 to
June 30, 2008
(Unaudited) | | | For the Year Ended December 31, | |
| | | | 2007 | | | 2006 | | | 2005 | | | 2004<> | | | 2003 | |
Net Asset Value, beginning of period | | $ | 14.80 | | | $ | 13.79 | | | $ | 11.26 | | | $ | 10.17 | | | $ | 8.65 | | | $ | 6.36 | |
Income from investment operations: | | | | | | | | | | | | | | | | | | | | | | | | |
Net investment income | | | 0.26 | | | | 0.35 | | | | 0.21 | | | | 0.18 | | | | 0.15 | | | | 0.11 | |
Net realized and unrealized gain (loss) on investments | | | (1.85 | ) | | | 1.05 | | | | 2.64 | | | | 1.12 | | | | 1.54 | | | | 2.29 | |
| | | | | | | | | | | | | | | | | | | | | | | | |
Total from investment operations | | | (1.59 | ) | | | 1.40 | | | | 2.85 | | | | 1.30 | | | | 1.69 | | | | 2.40 | |
| | | | | | | | | | | | | | | | | | | | | | | | |
Less distributions: | | | | | | | | | | | | | | | | | | | | | | | | |
From net investment income | | | — | | | | (0.38 | ) | | | (0.32 | ) | | | (0.21 | ) | | | (0.17 | ) | | | (0.11 | ) |
From net realized gains | | | — | | | | (0.01 | ) | | | — | | | | — | | | | — | | | | — | |
| | | | | | | | | | | | | | | | | | | | | | | | |
Total distributions | | | �� | | | | (0.39 | ) | | | (0.32 | ) | | | (0.21 | ) | | | (0.17 | ) | | | (0.11 | ) |
| | | | | | | | | | | | | | | | | | | | | | | | |
Net Asset Value, end of period | | $ | 13.21 | | | $ | 14.80 | | | $ | 13.79 | | | $ | 11.26 | | | $ | 10.17 | | | $ | 8.65 | |
| | | | | | | | | | | | | | | | | | | | | | | | |
Total return | | | (10.74 | )%# | | | 10.17 | % | | | 25.35 | % | | | 12.74 | % | | | 19.61 | % | | | 37.75 | % |
Ratios/Supplemental data: | | | | | | | | | | | | | | | | | | | | | | | | |
Net assets, end of period (000) | | $ | 60,822 | | | $ | 70,723 | | | $ | 55,259 | | | $ | 32,639 | | | $ | 25,557 | | | $ | 60,601 | |
Ratios to average net assets: | | | | | | | | | | | | | | | | | | | | | | | | |
Ratio of expenses to average net assets | | | 0.63 | %† | | | 0.63 | % | | | 0.73 | % | | | 0.95 | % | | | 0.89 | % | | | 0.69 | %&& |
Ratio of net investment income to average net assets | | | 3.85 | %† | | | 2.36 | % | | | 2.15 | % | | | 1.82 | % | | | 1.61 | % | | | 1.77 | % |
Portfolio turnover | | | 4 | %# | | | 5 | % | | | 3 | % | | | 8 | % | | | 12 | %^^ | | | N/A | |
| <> | Per share amounts were calculated using the average shares outstanding method. |
| && | Includes effect of expenses allocated from Master Investment Portfolio. |
| ^^ | Portfolio turnover figure represents the period from March 5, 2004 to December 31, 2004. Prior to March 5, 2004, portfolio turnover was calculated at the Master Investment Portfolio level. |
| | | | |
| 72 | | See Notes to Financial Statements. | | |
VANTAGEPOINT FUNDS
Financial Highlights
(For a share outstanding throughout each period)
| | | | | | | | | | | | | | | | | | | | | | | | |
| | | Overseas Equity Index Class II | |
| | | For the Period
January 1, 2008 to
June 30, 2008
(Unaudited) | | | For the Year Ended December 31, | |
| | | | 2007 | | | 2006 | | | 2005 | | | 2004<> | | | 2003 | |
Net Asset Value, beginning of period | | $ | 13.98 | | | $ | 13.06 | | | $ | 10.67 | | | $ | 9.64 | | | $ | 8.20 | | | $ | 6.04 | |
Income from investment operations: | | | | | | | | | | | | | | | | | | | | | | | | |
Net investment income | | | 0.26 | | | | 0.35 | | | | 0.25 | | | | 0.20 | | | | 0.18 | | | | 0.11 | |
Net realized and unrealized gain (loss) on investments | | | (1.74 | ) | | | 0.99 | | | | 2.48 | | | | 1.06 | | | | 1.46 | | | | 2.17 | |
| | | | | | | | | | | | | | | | | | | | | | | | |
Total from investment operations | | | (1.48 | ) | | | 1.34 | | | | 2.73 | | | | 1.26 | | | | 1.64 | | | | 2.28 | |
| | | | | | | | | | | | | | | | | | | | | | | | |
Less distributions: | | | | | | | | | | | | | | | | | | | | | | | | |
From net investment income | | | — | | | | (0.41 | ) | | | (0.34 | ) | | | (0.23 | ) | | | (0.20 | ) | | | (0.12 | ) |
From net realized gains | | | — | | | | (0.01 | ) | | | — | | | | — | | | | — | | | | — | |
| | | | | | | | | | | | | | | | | | | | | | | | |
Total distributions | | | — | | | | (0.42 | ) | | | (0.34 | ) | | | (0.23 | ) | | | (0.20 | ) | | | (0.12 | ) |
| | | | | | | | | | | | | | | | | | | | | | | | |
Net Asset Value, end of period | | $ | 12.50 | | | $ | 13.98 | | | $ | 13.06 | | | $ | 10.67 | | | $ | 9.64 | | | $ | 8.20 | |
| | | | | | | | | | | | | | | | | | | | | | | | |
Total return | | | (10.59 | )%# | | | 10.30 | % | | | 25.64 | % | | | 13.03 | % | | | 20.05 | % | | | 37.85 | % |
Ratios/Supplemental data: | | | | | | | | | | | | | | | | | | | | | | | | |
Net assets, end of period (000) | | $ | 151,180 | | | $ | 178,661 | | | $ | 107,963 | | | $ | 56,920 | | | $ | 41,860 | | | $ | 19,539 | |
Ratios to average net assets: | | | | | | | | | | | | | | | | | | | | | | | | |
Ratio of expenses to average net assets | | | 0.43 | %† | | | 0.43 | % | | | 0.53 | % | | | 0.75 | % | | | 0.69 | % | | | 0.49 | %&& |
Ratio of net investment income to average net assets | | | 4.04 | %† | | | 2.56 | % | | | 2.37 | % | | | 1.98 | % | | | 2.10 | % | | | 1.89 | % |
Portfolio turnover | | | 4 | %# | | | 5 | % | | | 3 | % | | | 8 | % | | | 12 | %^^ | | | N/A | |
| <> | Per share amounts were calculated using the average shares outstanding method. |
| && | Includes effect of expenses allocated from Master Investment Portfolio. |
| ^^ | Portfolio turnover figure represents the period from March 5, 2004 to December 31, 2004. Prior to March 5, 2004, portfolio turnover was calculated at the Master Investment Portfolio level. |
| | | | |
| | See Notes to Financial Statements. | | 73 |
VANTAGEPOINT FUNDS
Financial Highlights
(For a share outstanding throughout each period)
| | | | | | | | | | | | | | | | | | | | | | | | |
| | | Model Portfolio Savings Oriented | |
| | | For the Period
January 1, 2008 to
June 30, 2008
(Unaudited) | | | For the Year Ended December 31, | |
| | | | 2007 | | | 2006 | | | 2005 | | | 2004 | | | 2003 | |
Net Asset Value, beginning of period | | $ | 24.70 | | | $ | 24.70 | | | $ | 24.23 | | | $ | 24.21 | | | $ | 23.53 | | | $ | 21.92 | |
Income from investment operations: | | | | | | | | | | | | | | | | | | | | | | | | |
Net investment income | | | 0.32 | | | | 0.88 | | | | 0.84 | | | | 0.72 | | | | 0.66 | | | | 0.54 | |
Net realized and unrealized gain (loss) on investments | | | (0.69 | ) | | | 0.63 | | | | 0.83 | | | | 0.02 | | | | 0.70 | | | | 1.64 | |
| | | | | | | | | | | | | | | | | | | | | | | | |
Total from investment operations | | | (0.37 | ) | | | 1.51 | | | | 1.67 | | | | 0.74 | | | | 1.36 | | | | 2.18 | |
| | | | | | | | | | | | | | | | | | | | | | | | |
Less distributions: | | | | | | | | | | | | | | | | | | | | | | | | |
From net investment income | | | — | | | | (0.96 | ) | | | (0.86 | ) | | | (0.72 | ) | | | (0.68 | ) | | | (0.57 | ) |
From net realized gains | | | — | | | | (0.55 | ) | | | (0.34 | ) | | | — | | | | — | | | | — | |
| | | | | | | | | | | | | | | | | | | | | | | | |
Total distributions | | | — | | | | (1.51 | ) | | | (1.20 | ) | | | (0.72 | ) | | | (0.68 | ) | | | (0.57 | ) |
| | | | | | | | | | | | | | | | | | | | | | | | |
Net Asset Value, end of period | | $ | 24.33 | | | $ | 24.70 | | | $ | 24.70 | | | $ | 24.23 | | | $ | 24.21 | | | $ | 23.53 | |
| | | | | | | | | | | | | | | | | | | | | | | | |
Total return | | | (1.50 | )%# | | | 6.15 | % | | | 6.90 | % | | | 3.06 | % | | | 5.78 | % | | | 9.93 | % |
Ratios/Supplemental data: | | | | | | | | | | | | | | | | | | | | | | | | |
Net assets, end of period (000) | | $ | 308,839 | | | $ | 311,455 | | | $ | 292,287 | | | $ | 281,036 | | | $ | 260,976 | | | $ | 202,264 | |
Ratios to average net assets: | | | | | | | | | | | | | | | | | | | | | | | | |
Ratio of expenses to average net assets | | | 0.16 | %† | | | 0.15 | % | | | 0.15 | % | | | 0.16 | % | | | 0.15 | % | | | 0.16 | % |
Ratio of net investment income to average net assets | | | 2.57 | %† | | | 3.66 | % | | | 3.36 | % | | | 3.01 | % | | | 3.07 | % | | | 2.60 | % |
Portfolio turnover | | | 4 | %# | | | 27 | % | | | 11 | % | | | 9 | % | | | 42 | % | | | 10 | % |
| | | | |
| 74 | | See Notes to Financial Statements. | | |
VANTAGEPOINT FUNDS
Financial Highlights
(For a share outstanding throughout each period)
| | | | | | | | | | | | | | | | | | | | | | | | |
| | | Model Portfolio Conservative Growth | |
| | | For the Period
January 1, 2008 to
June 30, 2008
(Unaudited) | | | For the Year Ended December 31, | |
| | | | 2007 | | | 2006 | | | 2005 | | | 2004 | | | 2003 | |
Net Asset Value, beginning of period | | $ | 24.62 | | | $ | 24.48 | | | $ | 23.24 | | | $ | 22.87 | | | $ | 21.95 | | | $ | 19.54 | |
Income from investment operations: | | | | | | | | | | | | | | | | | | | | | | | | |
Net investment income | | | 0.25 | | | | 0.68 | | | | 0.69 | | | | 0.62 | | | | 0.56 | | | | 0.43 | |
Net realized and unrealized gain (loss) on investments | | | (1.08 | ) | | | 0.92 | | | | 1.26 | | | | 0.37 | | | | 0.92 | | | | 2.42 | |
| | | | | | | | | | | | | | | | | | | | | | | | |
Total from investment operations | | | (0.83 | ) | | | 1.60 | | | | 1.95 | | | | 0.99 | | | | 1.48 | | | | 2.85 | |
| | | | | | | | | | | | | | | | | | | | | | | | |
Less distributions: | | | | | | | | | | | | | | | | | | | | | | | | |
From net investment income | | | — | | | | (0.75 | ) | | | (0.71 | ) | | | (0.62 | ) | | | (0.56 | ) | | | (0.44 | ) |
From net realized gains | | | — | | | | (0.71 | ) | | | — | | | | — | | | | — | | | | — | |
| | | | | | | | | | | | | | | | | | | | | | | | |
Total distributions | | | — | | | | (1.46 | ) | | | (0.71 | ) | | | (0.62 | ) | | | (0.56 | ) | | | (0.44 | ) |
| | | | | | | | | | | | | | | | | | | | | | | | |
Net Asset Value, end of period | | $ | 23.79 | | | $ | 24.62 | | | $ | 24.48 | | | $ | 23.24 | | | $ | 22.87 | | | $ | 21.95 | |
| | | | | | | | | | | | | | | | | | | | | | | | |
Total return | | | (3.37 | )%# | | | 6.57 | % | | | 8.38 | % | | | 4.31 | % | | | 6.74 | % | | | 14.64 | % |
Ratios/Supplemental data: | | | | | | | | | | | | | | | | | | | | | | | | |
Net assets, end of period (000) | | $ | 565,582 | | | $ | 597,775 | | | $ | 549,966 | | | $ | 512,992 | | | $ | 480,096 | | | $ | 376,001 | |
Ratios to average net assets: | | | | | | | | | | | | | | | | | | | | | | | | |
Ratio of expenses to average net assets | | | 0.15 | %† | | | 0.14 | % | | | 0.15 | % | | | 0.15 | % | | | 0.14 | % | | | 0.15 | % |
Ratio of net investment income to average net assets | | | 2.07 | %† | | | 2.99 | % | | | 2.86 | % | | | 2.72 | % | | | 2.70 | % | | | 2.29 | % |
Portfolio turnover | | | 6 | %# | | | 27 | % | | | 9 | % | | | 7 | % | | | 27 | % | | | 8 | % |
| | | | |
| | See Notes to Financial Statements. | | 75 |
VANTAGEPOINT FUNDS
Financial Highlights
(For a share outstanding throughout each period)
| | | | | | | | | | | | | | | | | | | | | | | | |
| | | Model Portfolio Traditional Growth | |
| | | For the Period
January 1, 2008 to
June 30, 2008
(Unaudited) | | | For the Year Ended December 31, | |
| | | | 2007 | | | 2006 | | | 2005 | | | 2004 | | | 2003 | |
Net Asset Value, beginning of period | | $ | 24.04 | | | $ | 24.26 | | | $ | 22.46 | | | $ | 21.67 | | | $ | 20.45 | | | $ | 17.19 | |
Income from investment operations: | | | | | | | | | | | | | | | | | | | | | | | | |
Net investment income | | | 0.15 | | | | 0.46 | | | | 0.48 | | | | 0.47 | | | | 0.39 | | | | 0.29 | |
Net realized and unrealized gain (loss) on investments | | | (1.51 | ) | | | 1.25 | | | | 1.86 | | | | 0.79 | | | | 1.22 | | | | 3.27 | |
| | | | | | | | | | | | | | | | | | | | | | | | |
Total from investment operations | | | (1.36 | ) | | | 1.71 | | | | 2.34 | | | | 1.26 | | | | 1.61 | | | | 3.56 | |
| | | | | | | | | | | | | | | | | | | | | | | | |
Less distributions: | | | | | | | | | | | | | | | | | | | | | | | | |
From net investment income | | | — | | | | (0.56 | ) | | | (0.51 | ) | | | (0.47 | ) | | | (0.39 | ) | | | (0.30 | ) |
From net realized gains | | | — | | | | (1.37 | ) | | | (0.03 | ) | | | — | | | | — | | | | — | |
| | | | | | | | | | | | | | | | | | | | | | | | |
Total distributions | | | — | | | | (1.93 | ) | | | (0.54 | ) | | | (0.47 | ) | | | (0.39 | ) | | | (0.30 | ) |
| | | | | | | | | | | | | | | | | | | | | | | | |
Net Asset Value, end of period | | $ | 22.68 | | | $ | 24.04 | | | $ | 24.26 | | | $ | 22.46 | | | $ | 21.67 | | | $ | 20.45 | |
| | | | | | | | | | | | | | | | | | | | | | | | |
Total return | | | (5.66 | )%# | | | 7.03 | % | | | 10.42 | % | | | 5.79 | % | | | 7.89 | % | | | 20.68 | % |
Ratios/Supplemental data: | | | | | | | | | | | | | | | | | | | | | | | | |
Net assets, end of period (000) | | $ | 1,400,547 | | | $ | 1,487,224 | | | $ | 1,331,012 | | | $ | 1,135,671 | | | $ | 1,005,076 | | | $ | 795,581 | |
Ratios to average net assets: | | | | | | | | | | | | | | | | | | | | | | | | |
Ratio of expenses to average net assets | | | 0.13 | %† | | | 0.13 | % | | | 0.13 | % | | | 0.14 | % | | | 0.14 | % | | | 0.15 | % |
Ratio of net investment income to average net assets | | | 1.28 | %† | | | 2.23 | % | | | 2.13 | % | | | 2.21 | % | | | 2.01 | % | | | 1.73 | % |
Portfolio turnover | | | 5 | %# | | | 28 | % | | | 6 | % | | | 4 | % | | | 14 | % | | | 9 | % |
| | | | |
| 76 | | See Notes to Financial Statements. | | |
VANTAGEPOINT FUNDS
Financial Highlights
(For a share outstanding throughout each period)
| | | | | | | | | | | | | | | | | | | | | | | | |
| | | Model Portfolio Long-Term Growth | |
| | | For the Period
January 1, 2008 to
June 30, 2008
(Unaudited) | | | For the Year Ended December 31, | |
| | | | 2007 | | | 2006 | | | 2005 | | | 2004 | | | 2003 | |
Net Asset Value, beginning of period | | $ | 24.26 | | | $ | 24.56 | | | $ | 22.16 | | | $ | 21.02 | | | $ | 19.48 | | | $ | 15.48 | |
Income from investment operations: | | | | | | | | | | | | | | | | | | | | | | | | |
Net investment income | | | 0.07 | | | | 0.26 | | | | 0.34 | | | | 0.38 | | | | 0.26 | | | | 0.20 | |
Net realized and unrealized gain (loss) on investments | | | (1.87 | ) | | | 1.64 | | | | 2.43 | | | | 1.14 | | | | 1.54 | | | | 4.01 | |
| | | | | | | | | | | | | | | | | | | | | | | | |
Total from investment operations | | | (1.80 | ) | | | 1.90 | | | | 2.77 | | | | 1.52 | | | | 1.80 | | | | 4.21 | |
| | | | | | | | | | | | | | | | | | | | | | | | |
Less distributions: | | | | | | | | | | | | | | | | | | | | | | | | |
From net investment income | | | — | | | | (0.43 | ) | | | (0.32 | ) | | | (0.38 | ) | | | (0.26 | ) | | | (0.21 | ) |
From net realized gains | | | — | | | | (1.77 | ) | | | (0.05 | ) | | | — | | | | (0.00 | )†† | | | (0.00 | )†† |
| | | | | | | | | | | | | | | | | | | | | | | | |
Total distributions | | | — | | | | (2.20 | ) | | | (0.37 | ) | | | (0.38 | ) | | | (0.26 | ) | | | (0.21 | ) |
| | | | | | | | | | | | | | | | | | | | | | | | |
Net Asset Value, end of period | | $ | 22.46 | | | $ | 24.26 | | | $ | 24.56 | | | $ | 22.16 | | | $ | 21.02 | | | $ | 19.48 | |
| | | | | | | | | | | | | | | | | | | | | | | | |
Total return | | | (7.42 | )%# | | | 7.74 | % | | | 12.50 | % | | | 7.24 | % | | | 9.25 | % | | | 27.21 | % |
Ratios/Supplemental data: | | | | | | | | | | | | | | | | | | | | | | | | |
Net assets, end of period (000) | | $ | 1,583,358 | | | $ | 1,677,987 | | | $ | 1,470,918 | | | $ | 1,209,329 | | | $ | 1,040,507 | | | $ | 820,777 | |
Ratios to average net assets: | | | | | | | | | | | | | | | | | | | | | | | | |
Ratio of expenses to average net assets | | | 0.13 | %† | | | 0.12 | % | | | 0.13 | % | | | 0.14 | % | | | 0.14 | % | | | 0.14 | % |
Ratio of net investment income to average net assets | | | 0.61 | %† | | | 1.57 | % | | | 1.51 | % | | | 1.87 | % | | | 1.39 | % | | | 1.33 | % |
Portfolio turnover | | | 4 | %# | | | 27 | % | | | 6 | % | | | 7 | % | | | 8 | % | | | 4 | % |
| †† | Rounds to less than $0.01 |
| | | | |
| | See Notes to Financial Statements. | | 77 |
VANTAGEPOINT FUNDS
Financial Highlights
(For a share outstanding throughout each period)
| | | | | | | | | | | | | | | | | | | | | | | | |
| | | Model Portfolio All-Equity Growth | |
| | | For the Period
January 1, 2008 to
June 30, 2008
(Unaudited) | | | For the Year Ended December 31, | |
| | | | 2007 | | | 2006 | | | 2005 | | | 2004 | | | 2003 | |
Net Asset Value, beginning of period | | $ | 24.63 | | | $ | 25.88 | | | $ | 22.96 | | | $ | 21.39 | | | $ | 19.49 | | | $ | 14.68 | |
Income from investment operations: | | | | | | | | | | | | | | | | | | | | | | | | |
Net investment income (loss) | | | (0.02 | ) | | | 0.04 | | | | 0.15 | | | | 0.25 | | | | 0.11 | | | | 0.07 | |
Net realized and unrealized gain (loss) on investments | | | (2.51 | ) | | | 1.98 | | | | 3.19 | | | | 1.57 | | | | 1.90 | | | | 4.81 | |
| | | | | | | | | | | | | | | | | | | | | | | | |
Total from investment operations | | | (2.53 | ) | | | 2.02 | | | | 3.34 | | | | 1.82 | | | | 2.01 | | | | 4.88 | |
| | | | | | | | | | | | | | | | | | | | | | | | |
Less distributions: | | | | | | | | | | | | | | | | | | | | | | | | |
From net investment income | | | — | | | | (0.21 | ) | | | (0.19 | ) | | | (0.25 | ) | | | (0.11 | ) | | | (0.07 | ) |
From net realized gains | | | — | | | | (3.06 | ) | | | (0.23 | ) | | | — | | | | — | | | | — | |
Return of capital | | | — | | | | — | | | | — | | | | — | | | | — | | | | (0.00 | )†† |
| | | | | | | | | | | | | | | | | | | | | | | | |
Total distributions | | | — | | | | (3.27 | ) | | | (0.42 | ) | | | (0.25 | ) | | | (0.11 | ) | | | (0.07 | ) |
| | | | | | | | | | | | | | | | | | | | | | | | |
Net Asset Value, end of period | | $ | 22.10 | | | $ | 24.63 | | | $ | 25.88 | | | $ | 22.96 | | | $ | 21.39 | | | $ | 19.49 | |
| | | | | | | | | | | | | | | | | | | | | | | | |
Total return | | | (10.27 | )%# | | | 7.75 | % | | | 14.58 | % | | | 8.49 | % | | | 10.30 | % | | | 33.26 | % |
Ratios/Supplemental data: | | | | | | | | | | | | | | | | | | | | | | | | |
Net assets, end of period (000) | | $ | 549,904 | | | $ | 597,973 | | | $ | 470,888 | | | $ | 303,975 | | | $ | 216,415 | | | $ | 128,145 | |
Ratios to average net assets: | | | | | | | | | | | | | | | | | | | | | | | | |
Ratio of expenses to average net assets | | | 0.15 | %† | | | 0.14 | % | | | 0.15 | % | | | 0.16 | % | | | 0.16 | % | | | 0.17 | % |
Ratio of net investment income (loss) to average net assets | | | (0.15 | )%† | | | 0.82 | % | | | 0.71 | % | | | 1.30 | % | | | 0.64 | % | | | 0.59 | % |
Portfolio turnover | | | 4 | %# | | | 23 | % | | | 6 | % | | | 2 | % | | | 9 | % | | | 3 | % |
| †† | Rounds to less than $0.01 |
| | | | |
| 78 | | See Notes to Financial Statements. | | |
VANTAGEPOINT FUNDS
Financial Highlights
(For a share outstanding throughout each period)
| | | | | | | | | | | | | | | | |
| | | Milestone Retirement Income | |
| | | For the Period
January 1, 2008 to
June 30, 2008
(Unaudited) | | | For the Year Ended December 31, | | | For the Period
from January 3, 2005*
to December 31,
2005 | |
| | | | 2007 | | | 2006 | | |
Net Asset Value, beginning of period | | $ | 10.61 | | | $ | 10.51 | | | $ | 10.14 | | | $ | 10.00 | |
Income from investment operations: | | | | | | | | | | | | | | | | |
Net investment income | | | 0.13 | | | | 0.27 | | | | 0.29 | | | | 0.19 | |
Net realized and unrealized gain (loss) on investments | | | (0.35 | ) | | | 0.36 | | | | 0.48 | | | | 0.15 | |
| | | | | | | | | | | | | | | | |
Total from investment operations | | | (0.22 | ) | | | 0.63 | | | | 0.77 | | | | 0.34 | |
| | | | | | | | | | | | | | | | |
Less distributions: | | | | | | | | | | | | | | | | |
From net investment income | | | — | | | | (0.29 | ) | | | (0.29 | ) | | | (0.19 | ) |
From net realized gains | | | — | | | | (0.24 | ) | | | (0.11 | ) | | | (0.01 | ) |
| | | | | | | | | | | | | | | | |
Total distributions | | | — | | | | (0.53 | ) | | | (0.40 | ) | | | (0.20 | ) |
| | | | | | | | | | | | | | | | |
Net Asset Value, end of period | | $ | 10.39 | | | $ | 10.61 | | | $ | 10.51 | | | $ | 10.14 | |
| | | | | | | | | | | | | | | | |
Total return | | | (2.07 | )%# | | | 6.05 | % | | | 7.52 | % | | | 3.39 | %# |
Ratios/Supplemental data: | | | | | | | | | | | | | | | | |
Net assets, end of period (000) | | $ | 53,246 | | | $ | 54,573 | | | $ | 22,534 | | | $ | 13,146 | |
Ratios to average net assets: | | | | | | | | | | | | | | | | |
Ratio of expenses to average net assets | | | 0.27 | %† | | | 0.30 | % | | | 0.53 | % | | | 1.20 | %† |
Ratio of net investment income to average net assets | | | 2.24 | %† | | | 3.48 | % | | | 3.43 | % | | | 2.54 | %† |
Ratio of expenses to average net assets after expense reductions and reimbursed expenses | | | 0.07 | %† | | | 0.14 | % | | | 0.16 | % | | | 0.15 | %† |
Ratio of net investment income to average net assets after expense reductions and reimbursed expenses | | | 2.43 | %† | | | 3.63 | % | | | 3.06 | % | | | 3.59 | %† |
Portfolio turnover | | | 14 | %# | | | 63 | % | | | 25 | % | | | 35 | %# |
| * | Commencement of operations |
| | | | |
| | See Notes to Financial Statements. | | 79 |
VANTAGEPOINT FUNDS
Financial Highlights
(For a share outstanding throughout each period)
| | | | | | | | | | | | | | | | |
| | | Milestone 2010 | |
| | | For the Period
January 1, 2008 to
June 30, 2008
(Unaudited) | | | For the Year Ended December 31, | | | For the Period
from January 3, 2005*
to December 31,
2005 | |
| | | | 2007 | | | 2006 | | |
Net Asset Value, beginning of period | | $ | 10.65 | | | $ | 10.85 | | | $ | 10.28 | | | $ | 10.00 | |
Income from investment operations: | | | | | | | | | | | | | | | | |
Net investment income | | | 0.10 | | | | 0.27 | | | | 0.24 | | | | 0.18 | |
Net realized and unrealized gain (loss) on investments | | | (0.45 | ) | | | 0.42 | | | | 0.68 | | | | 0.29 | |
| | | | | | | | | | | | | | | | |
Total from investment operations | | | (0.35 | ) | | | 0.69 | | | | 0.92 | | | | 0.47 | |
| | | | | | | | | | | | | | | | |
Less distributions: | | | | | | | | | | | | | | | | |
From net investment income | | | — | | | | (0.30 | ) | | | (0.25 | ) | | | (0.18 | ) |
From net realized gains | | | — | | | | (0.59 | ) | | | (0.10 | ) | | | (0.01 | ) |
| | | | | | | | | | | | | | | | |
Total distributions | | | — | | | | (0.89 | ) | | | (0.35 | ) | | | (0.19 | ) |
| | | | | | | | | | | | | | | | |
Net Asset Value, end of period | | $ | 10.30 | | | $ | 10.65 | | | $ | 10.85 | | | $ | 10.28 | |
| | | | | | | | | | | | | | | | |
Total return | | | (3.29 | )%# | | | 6.43 | % | | | 8.95 | % | | | 4.65 | %# |
Ratios/Supplemental data: | | | | | | | | | | | | | | | | |
Net assets, end of period (000) | | $ | 72,751 | | | $ | 70,403 | | | $ | 48,483 | | | $ | 26,638 | |
Ratios to average net assets: | | | | | | | | | | | | | | | | |
Ratio of expenses to average net assets | | | 0.23 | %† | | | 0.24 | % | | | 0.32 | % | | | 0.62 | %† |
Ratio of net investment income to average net assets | | | 1.91 | %† | | | 2.97 | % | | | 2.74 | % | | | 2.49 | %† |
Ratio of expenses to average net assets after expense reductions and reimbursed expenses | | | 0.12 | %† | | | 0.18 | % | | | 0.18 | % | | | 0.15 | %† |
Ratio of net investment income to average net assets after expense reductions and reimbursed expenses | | | 2.02 | %† | | | 3.02 | % | | | 2.88 | % | | | 2.97 | %† |
Portfolio turnover | | | 11 | %# | | | 58 | % | | | 15 | % | | | 18 | %# |
| * | Commencement of operations |
| | | | |
| 80 | | See Notes to Financial Statements. | | |
VANTAGEPOINT FUNDS
Financial Highlights
(For a share outstanding throughout each period)
| | | | | | | | | | | | | | | | |
| | | Milestone 2015 | |
| | | For the Period
January 1, 2008 to
June 30, 2008
(Unaudited) | | | For the Year Ended December 31, | | | For the Period
from January 3, 2005*
to December 31,
2005 | |
| | | | 2007 | | | 2006 | | |
Net Asset Value, beginning of period | | $ | 11.13 | | | $ | 11.29 | | | $ | 10.44 | | | $ | 10.00 | |
Income from investment operations: | | | | | | | | | | | | | | | | |
Net investment income | | | 0.07 | | | | 0.22 | | | | 0.19 | | | | 0.15 | |
Net realized and unrealized gain (loss) on investments | | | (0.64 | ) | | | 0.56 | | | | 0.94 | | | | 0.44 | |
| | | | | | | | | | | | | | | | |
Total from investment operations | | | (0.57 | ) | | | 0.78 | | | | 1.13 | | | | 0.59 | |
| | | | | | | | | | | | | | | | |
Less distributions: | | | | | | | | | | | | | | | | |
From net investment income | | | — | | | | (0.25 | ) | | | (0.20 | ) | | | (0.15 | ) |
From net realized gains | | | — | | | | (0.69 | ) | | | (0.08 | ) | | | (0.00 | )†† |
| | | | | | | | | | | | | | | | |
Total distributions | | | — | | | | (0.94 | ) | | | (0.28 | ) | | | (0.15 | ) |
| | | | | | | | | | | | | | | | |
Net Asset Value, end of period | | $ | 10.56 | | | $ | 11.13 | | | $ | 11.29 | | | $ | 10.44 | |
| | | | | | | | | | | | | | | | |
Total return | | | (5.12 | )%# | | | 6.88 | % | | | 10.87 | % | | | 5.93 | %# |
Ratios/Supplemental data: | | | | | | | | | | | | | | | | |
Net assets, end of period (000) | | $ | 137,532 | | | $ | 138,535 | | | $ | 84,357 | | | $ | 41,455 | |
Ratios to average net assets: | | | | | | | | | | | | | | | | |
Ratio of expenses to average net assets | | | 0.19 | %† | | | 0.18 | % | | | 0.24 | % | | | 0.48 | %† |
Ratio of net investment income to average net assets | | | 1.37 | %† | | | 2.57 | % | | | 2.33 | % | | | 2.43 | %† |
Ratio of expenses to average net assets after expense reductions and reimbursed expenses | | | 0.14 | %† | | | 0.18 | % | | | 0.17 | % | | | 0.15 | %† |
Ratio of net investment income to average net assets after expense reductions and reimbursed expenses | | | 1.41 | %† | | | 2.57 | % | | | 2.39 | % | | | 2.76 | %† |
Portfolio turnover | | | 9 | %# | | | 40 | % | | | 10 | % | | | 8 | %# |
| †† | Rounds to less than $0.01 |
| * | Commencement of operations |
| | | | |
| | See Notes to Financial Statements. | | 81 |
VANTAGEPOINT FUNDS
Financial Highlights
(For a share outstanding throughout each period)
| | | | | | | | | | | | | | | | |
| | | Milestone 2020 | |
| | | For the Period
January 1, 2008 to
June 30, 2008
(Unaudited) | | | For the Year Ended December 31, | | | For the Period
from January 3, 2005*
to December 31,
2005 | |
| | | | 2007 | | | 2006 | | |
Net Asset Value, beginning of period | | $ | 11.38 | | | $ | 11.52 | | | $ | 10.50 | | | $ | 10.00 | |
Income from investment operations: | | | | | | | | | | | | | | | | |
Net investment income | | | 0.05 | | | | 0.20 | | | | 0.18 | | | | 0.14 | |
Net realized and unrealized gain (loss) on investments | | | (0.77 | ) | | | 0.63 | | | | 1.07 | | | | 0.50 | |
| | | | | | | | | | | | | | | | |
Total from investment operations | | | (0.72 | ) | | | 0.83 | | | | 1.25 | | | | 0.64 | |
| | | | | | | | | | | | | | | | |
Less distributions: | | | | | | | | | | | | | | | | |
From net investment income | | | — | | | | (0.23 | ) | | | (0.18 | ) | | | (0.14 | ) |
From net realized gains | | | — | | | | (0.74 | ) | | | (0.05 | ) | | | (0.00 | )†† |
| | | | | | | | | | | | | | | | |
Total distributions | | | — | | | | (0.97 | ) | | | (0.23 | ) | | | (0.14 | ) |
| | | | | | | | | | | | | | | | |
Net Asset Value, end of period | | $ | 10.66 | | | $ | 11.38 | | | $ | 11.52 | | | $ | 10.50 | |
| | | | | | | | | | | | | | | | |
Total return | | | (6.33 | )%# | | | 7.17 | % | | | 11.92 | % | | | 6.48 | %# |
Ratios/Supplemental data: | | | | | | | | | | | | | | | | |
Net assets, end of period (000) | | $ | 123,531 | | | $ | 112,064 | | | $ | 62,402 | | | $ | 27,240 | |
Ratios to average net assets: | | | | | | | | | | | | | | | | |
Ratio of expenses to average net assets | | | 0.19 | %† | | | 0.20 | % | | | 0.28 | % | | | 0.67 | %† |
Ratio of net investment income to average net assets | | | 1.00 | %† | | | 2.23 | % | | | 2.05 | % | | | 2.14 | %† |
Ratio of expenses to average net assets after expense reductions and reimbursed expenses | | | 0.15 | %† | | | 0.19 | % | | | 0.18 | % | | | 0.15 | %† |
Ratio of net investment income to average net assets after expense reductions and reimbursed expenses | | | 1.04 | %† | | | 2.24 | % | | | 2.16 | % | | | 2.67 | %† |
Portfolio turnover | | | 3 | %# | | | 40 | % | | | 5 | % | | | 6 | %# |
| †† | Rounds to less than $0.01 |
| * | Commencement of operations |
| | | | |
| 82 | | See Notes to Financial Statements. | | |
VANTAGEPOINT FUNDS
Financial Highlights
(For a share outstanding throughout each period)
| | | | | | | | | | | | | | | | |
| | | Milestone 2025 | |
| | | For the Period
January 1, 2008 to
June 30, 2008
(Unaudited) | | | For the Year Ended December 31, | | | For the Period
from January 3, 2005*
to December 31,
2005 | |
| | | | 2007 | | | 2006 | | |
Net Asset Value, beginning of period | | $ | 11.55 | | | $ | 11.72 | | | $ | 10.58 | | | $ | 10.00 | |
Income from investment operations: | | | | | | | | | | | | | | | | |
Net investment income | | | 0.04 | | | | 0.16 | | | | 0.15 | | | | 0.14 | |
Net realized and unrealized gain (loss) on investments | | | (0.87 | ) | | | 0.68 | | | | 1.19 | | | | 0.58 | |
| | | | | | | | | | | | | | | | |
Total from investment operations | | | (0.83 | ) | | | 0.84 | | | | 1.34 | | | | 0.72 | |
| | | | | | | | | | | | | | | | |
Less distributions: | | | | | | | | | | | | | | | | |
From net investment income | | | — | | | | (0.20 | ) | | | (0.16 | ) | | | (0.14 | ) |
From net realized gains | | | — | | | | (0.81 | ) | | | (0.04 | ) | | | (0.00 | )†† |
| | | | | | | | | | | | | | | | |
Total distributions | | | — | | | | (1.01 | ) | | | (0.20 | ) | | | (0.14 | ) |
| | | | | | | | | | | | | | | | |
Net Asset Value, end of period | | $ | 10.72 | | | $ | 11.55 | | | $ | 11.72 | | | $ | 10.58 | |
| | | | | | | | | | | | | | | | |
Total return | | | (7.19 | )%# | | | 7.17 | % | | | 12.70 | % | | | 7.18 | %# |
Ratios/Supplemental data: | | | | | | | | | | | | | | | | |
Net assets, end of period (000) | | $ | 90,260 | | | $ | 83,891 | | | $ | 48,804 | | | $ | 19,479 | |
Ratios to average net assets: | | | | | | | | | | | | | | | | |
Ratio of expenses to average net assets | | | 0.21 | %† | | | 0.22 | % | | | 0.33 | % | | | 0.90 | %† |
Ratio of net investment income to average net assets | | | 0.64 | %† | | | 1.98 | % | | | 1.81 | % | | | 1.81 | %† |
Ratio of expenses to average net assets after expense reductions and reimbursed expenses | | | 0.15 | %† | | | 0.18 | % | | | 0.18 | % | | | 0.15 | %† |
Ratio of net investment income to average net assets after expense reductions and reimbursed expenses | | | 0.70 | %† | | | 2.02 | % | | | 1.96 | % | | | 2.56 | %† |
Portfolio turnover | | | 3 | %# | | | 38 | % | | | 4 | % | | | 7 | %# |
| †† | Rounds to less than $0.01 |
| * | Commencement of operations |
| | | | |
| | See Notes to Financial Statements. | | 83 |
VANTAGEPOINT FUNDS
Financial Highlights
(For a share outstanding throughout each period)
| | | | | | | | | | | | | | | | |
| | | Milestone 2030 | |
| | | For the Period
January 1, 2008 to
June 30, 2008
(Unaudited) | | | For the Year Ended December 31, | | | For the Period
from January 3, 2005*
to December 31,
2005 | |
| | | | 2007 | | | 2006 | | |
Net Asset Value, beginning of period | | $ | 11.75 | | | $ | 11.88 | | | $ | 10.64 | | | $ | 10.00 | |
Income from investment operations: | | | | | | | | | | | | | | | | |
Net investment income | | | 0.02 | | | | 0.14 | | | | 0.14 | | | | 0.13 | |
Net realized and unrealized gain (loss) on investments | | | (0.96 | ) | | | 0.70 | | | | 1.30 | | | | 0.64 | |
| | | | | | | | | | | | | | | | |
Total from investment operations | | | (0.94 | ) | | | 0.84 | | | | 1.44 | | | | 0.77 | |
| | | | | | | | | | | | | | | | |
Less distributions: | | | | | | | | | | | | | | | | |
From net investment income | | | — | | | | (0.18 | ) | | | (0.15 | ) | | | (0.13 | ) |
From net realized gains | | | — | | | | (0.79 | ) | | | (0.05 | ) | | | (0.00 | )†† |
| | | | | | | | | | | | | | | | |
Total distributions | | | — | | | | (0.97 | ) | | | (0.20 | ) | | | (0.13 | ) |
| | | | | | | | | | | | | | | | |
Net Asset Value, end of period | | $ | 10.81 | | | $ | 11.75 | | | $ | 11.88 | | | $ | 10.64 | |
| | | | | | | | | | | | | | | | |
Total return | | | (8.00 | )%# | | | 7.11 | % | | | 13.52 | % | | | 7.68 | %# |
Ratios/Supplemental data: | | | | | | | | | | | | | | | | |
Net assets, end of period (000) | | $ | 69,270 | | | $ | 61,465 | | | $ | 26,007 | | | $ | 10,054 | |
Ratios to average net assets: | | | | | | | | | | | | | | | | |
Ratio of expenses to average net assets | | | 0.25 | %† | | | 0.26 | % | | | 0.51 | % | | | 1.75 | %† |
Ratio of net investment income to average net assets | | | 0.39 | %† | | | 1.78 | % | | | 1.43 | % | | | 0.98 | %† |
Ratio of expenses to average net assets after expense reductions and reimbursed expenses | | | 0.17 | %† | | | 0.20 | % | | | 0.18 | % | | | 0.15 | %† |
Ratio of net investment income to average net assets after expense reductions and reimbursed expenses | | | 0.47 | %† | | | 1.85 | % | | | 1.76 | % | | | 2.58 | %† |
Portfolio turnover | | | 3 | %# | | | 43 | % | | | 3 | % | | | 15 | %# |
| †† | Rounds to less than $0.01 |
| * | Commencement of operations |
| | | | |
| 84 | | See Notes to Financial Statements. | | |
VANTAGEPOINT FUNDS
Financial Highlights
(For a share outstanding throughout each period)
| | | | | | | | | | | | | | | | |
| | | Milestone 2035 | |
| | | For the Period
January 1, 2008 to
June 30, 2008
(Unaudited) | | | For the Year Ended December 31, | | | For the Period
from January 3, 2005*
to December 31,
2005 | |
| | | | 2007 | | | 2006 | | |
Net Asset Value, beginning of period | | $ | 11.83 | | | $ | 11.98 | | | $ | 10.69 | | | $ | 10.00 | |
Income from investment operations: | | | | | | | | | | | | | | | | |
Net investment income | | | 0.02 | | | | 0.12 | | | | 0.13 | | | | 0.12 | |
Net realized and unrealized gain (loss) on investments | | | (1.05 | ) | | | 0.75 | | | | 1.36 | | | | 0.69 | |
| | | | | | | | | | | | | | | | |
Total from investment operations | | | (1.03 | ) | | | 0.87 | | | | 1.49 | | | | 0.81 | |
| | | | | | | | | | | | | | | | |
Less distributions: | | | | | | | | | | | | | | | | |
From net investment income | | | — | | | | (0.17 | ) | | | (0.13 | ) | | | (0.12 | ) |
From net realized gains | | | — | | | | (0.85 | ) | | | (0.07 | ) | | | (0.00 | )†† |
| | | | | | | | | | | | | | | | |
Total distributions | | | — | | | | (1.02 | ) | | | (0.20 | ) | | | (0.12 | ) |
| | | | | | | | | | | | | | | | |
Net Asset Value, end of period | | $ | 10.80 | | | $ | 11.83 | | | $ | 11.98 | | | $ | 10.69 | |
| | | | | | | | | | | | | | | | |
Total return | | | (8.71 | )%# | | | 7.25 | % | | | 14.00 | % | | | 8.13 | %# |
Ratios/Supplemental data: | | | | | | | | | | | | | | | | |
Net assets, end of period (000) | | $ | 39,180 | | | $ | 34,831 | | | $ | 16,418 | | | $ | 4,458 | |
Ratios to average net assets: | | | | | | | | | | | | | | | | |
Ratio of expenses to average net assets | | | 0.33 | %† | | | 0.40 | % | | | 0.76 | % | | | 3.50 | %† |
Ratio of net investment income (loss) to average net assets | | | 0.21 | %† | | | 1.60 | % | | | 1.04 | % | | | (1.09 | )%† |
Ratio of expenses to average net assets after expense reductions and reimbursed expenses | | | 0.19 | %† | | | 0.20 | % | | | 0.18 | % | | | 0.15 | %† |
Ratio of net investment income to average net assets after expense reductions and reimbursed expenses | | | 0.35 | %† | | | 1.80 | % | | | 1.62 | % | | | 2.26 | %† |
Portfolio turnover | | | 4 | %# | | | 40 | % | | | 10 | % | | | 13 | %# |
| †† | Rounds to less than $0.01 |
| * | Commencement of operations |
| | | | |
| | See Notes to Financial Statements. | | 85 |
VANTAGEPOINT FUNDS
Financial Highlights
(For a share outstanding throughout each period)
| | | | | | | | | | | | | | | | |
| | | Milestone 2040 | |
| | | For the Period
January 1, 2008 to
June 30, 2008
(Unaudited) | | | For the Year Ended December 31, | | | For the Period
from January 3, 2005*
to December 31,
2005 | |
| | | | 2007 | | | 2006 | | |
Net Asset Value, beginning of period | | $ | 11.85 | | | $ | 11.91 | | | $ | 10.68 | | | $ | 10.00 | |
Income from investment operations: | | | | | | | | | | | | | | | | |
Net investment income | | | 0.01 | | | | 0.11 | | | | 0.12 | | | | 0.12 | |
Net realized and unrealized gain (loss) on investments | | | (1.08 | ) | | | 0.75 | | | | 1.39 | | | | 0.70 | |
| | | | | | | | | | | | | | | | |
Total from investment operations | | | (1.07 | ) | | | 0.86 | | | | 1.51 | | | | 0.82 | |
| | | | | | | | | | | | | | | | |
Less distributions: | | | | | | | | | | | | | | | | |
From net investment income | | | — | | | | (0.16 | ) | | | (0.13 | ) | | | (0.12 | ) |
From net realized gains | | | — | | | | (0.76 | ) | | | (0.15 | ) | | | (0.02 | ) |
| | | | | | | | | | | | | | | | |
Total distributions | | | — | | | | (0.92 | ) | | | (0.28 | ) | | | (0.14 | ) |
| | | | | | | | | | | | | | | | |
Net Asset Value, end of period | | $ | 10.78 | | | $ | 11.85 | | | $ | 11.91 | | | $ | 10.68 | |
| | | | | | | | | | | | | | | | |
Total return | | | (9.03 | )%# | | | 7.23 | % | | | 14.14 | % | | | 8.14 | %# |
Ratios/Supplemental data: | | | | | | | | | | | | | | | | |
Net assets, end of period (000) | | $ | 37,940 | | | $ | 32,882 | | | $ | 12,699 | | | $ | 3,087 | |
Ratios to average net assets: | | | | | | | | | | | | | | | | |
Ratio of expenses to average net assets | | | 0.35 | %† | | | 0.43 | % | | | 1.11 | % | | | 5.49 | %† |
Ratio of net investment income (loss) to average net assets | | | 0.15 | %† | | | 1.61 | % | | | 0.90 | % | | | (2.91 | )%† |
Ratio of expenses to average net assets after expense reductions and reimbursed expenses | | | 0.20 | %† | | | 0.19 | % | | | 0.18 | % | | | 0.15 | %† |
Ratio of net investment income to average net assets after expense reductions and reimbursed expenses | | | 0.31 | %† | | | 1.85 | % | | | 1.83 | % | | | 2.43 | %† |
Portfolio turnover | | | 5 | %# | | | 47 | % | | | 24 | % | | | 35 | %# |
| * | Commencement of operations |
| | | | |
| 86 | | See Notes to Financial Statements. | | |
VANTAGEPOINT FUNDS
NOTES TO THE FINANCIAL STATEMENTS (Unaudited)
1. Organization
The Vantagepoint Funds (the “Company”) is registered under the Investment Company Act of 1940, as amended, (the “1940 Act”), as an open-end management investment company organized as a Delaware statutory trust. The Company consisted of the following series on June 30, 2008:
| | |
The “Actively Managed Funds”: | | The “Index Funds”: |
Money Market Fund | | Core Bond Index Fund |
Low Duration Bond Fund | | 500 Stock Index Fund |
Inflation Protected Securities Fund | | Broad Market Index Fund |
Asset Allocation Fund | | Mid/Small Company Index Fund |
Equity Income Fund | | Overseas Equity Index Fund |
Growth & Income Fund | | |
Growth Fund | | |
Select Value Fund | | |
Aggressive Opportunities Fund | | |
Discovery Fund | | |
International Fund | | |
Diversified Assets Fund | | |
| |
The “Milestone Funds”: | | The “Model Portfolio Funds”: |
Milestone Retirement Income Fund | | Model Portfolio Savings Oriented Fund |
Milestone 2010 Fund | | Model Portfolio Conservative Growth Fund |
Milestone 2015 Fund | | Model Portfolio Traditional Growth Fund |
Milestone 2020 Fund | | Model Portfolio Long-Term Growth Fund |
Milestone 2025 Fund | | Model Portfolio All-Equity Growth Fund |
Milestone 2030 Fund | | |
Milestone 2035 Fund | | |
Milestone 2040 Fund | | |
The Milestone Funds commenced operations on January 3, 2005. Each fund received $500,000 in exchange for shares purchased by the ICMA Retirement Corporation (“ICMA-RC”), the parent company of Vantagepoint Investment Advisers, LLC (“VIA”), the investment adviser to each series of the Company.
The Select Value, Discovery and Diversified Assets Funds commenced operations on October 30, 2007. Each fund received $100 in exchange for shares purchased by ICMA-RC, the parent company of VIA, the investment adviser to each series of the Company.
The Actively Managed, Model Portfolio and Milestone Funds each offer a single class of shares. The Index Funds offer two classes of shares: Class I Shares and Class II Shares. The two classes of shares differ principally in their respective level of account-based services and the fees associated with such services. Ordinary dividends to shareholders are allocated to each class, based upon shares outstanding on the record date of distribution. Neither class has preferential dividend rights. Differences in per share dividend rates are generally due to differences in separate class expenses.
On May 1, 2007 the Short-Term Bond Fund changed its name to the Low Duration Bond Fund as a result of a change in investment strategy wherein the Low Duration Bond Fund now seeks to maintain a maximum portfolio effective duration of three years. Also effective May 1, 2007 the principal investment strategy of the US Government Securities Fund changed to provide that the fund invests, under normal circumstances, at least 80% of its net assets in inflation adjusted U.S. and non-U.S. fixed-income securities. In connection with this change in investment strategy, the name of the fund was changed to the Inflation Protected Securities Fund and the fund underwent a change in subadvisers.
87
VANTAGEPOINT FUNDS
NOTES TO THE FINANCIAL STATEMENTS (Unaudited) — (Continued)
The Model Portfolio Funds Structure
The Model Portfolio Funds invest entirely in other series of the Company (“underlying funds”). Subject to the supervision of the Company’s Board of Directors (“Board”), VIA may make allocation changes to the underlying funds based on its periodic analysis to identify the allocation of assets among the different underlying funds that it believes is optimum for each Model Portfolio Fund. The underlying funds of each Model Portfolio Fund and the current target investment allocation in each underlying fund as of June 30, 2008 were as follows:
| | | | | | | | | | | | | | | |
| | | Model Portfolio Funds | |
| | | Savings
Oriented | | | Conservative
Growth | | | Traditional
Growth | | | Long-Term
Growth | | | All-Equity
Growth | |
Fund Allocation—% | | | | | | | | | | | | | | | |
Low Duration Bond | | 43.00 | % | | 23.00 | % | | 8.00 | % | | 0.00 | % | | 0.00 | % |
Inflation Protected Securities | | 9.00 | % | | 6.50 | % | | 4.00 | % | | 0.00 | % | | 0.00 | % |
Core Bond Index, Class I | | 13.00 | % | | 20.50 | % | | 18.00 | % | | 15.00 | % | | 0.00 | % |
Equity Income | | 10.00 | % | | 11.00 | % | | 12.00 | % | | 13.00 | % | | 18.00 | % |
Growth & Income | | 10.00 | % | | 9.00 | % | | 12.00 | % | | 13.00 | % | | 17.00 | % |
Growth | | 0.00 | % | | 6.00 | % | | 10.00 | % | | 11.50 | % | | 17.00 | % |
Select Value | | 0.00 | % | | 3.00 | % | | 5.50 | % | | 8.50 | % | | 9.50 | % |
Aggressive Opportunities | | 0.00 | % | | 3.00 | % | | 5.50 | % | | 8.50 | % | | 9.50 | % |
Discovery | | 0.00 | % | | 0.00 | % | | 3.00 | % | | 4.50 | % | | 9.00 | % |
International | | 5.00 | % | | 8.00 | % | | 12.00 | % | | 16.00 | % | | 20.00 | % |
Diversified Assets | | 10.00 | % | | 10.00 | % | | 10.00 | % | | 10.00 | % | | 0.00 | % |
| | | | | |
Total Fixed Income | | 65.00 | % | | 50.00 | % | | 30.00 | % | | 15.00 | % | | 0.00 | % |
Total Equity | | 25.00 | % | | 40.00 | % | | 60.00 | % | | 75.00 | % | | 100.00 | % |
Total Multi-Strategy | | 10.00 | % | | 10.00 | % | | 10.00 | % | | 10.00 | % | | 0.00 | % |
The Milestone Funds Structure
The Milestone Funds invest entirely in underlying funds. VIA may make, subject to the supervision of the Board, allocation changes to the underlying funds based on its periodic analysis to identify the allocation of assets among the different funds of the Company. The Milestone Funds are designed to serve as investing vehicles for retirement assets. Each fund invests in a professionally selected combination of equity, fixed income, and, for each fund other than the Milestone Retirement Income Fund, multi-strategy underlying funds that is believed to be appropriate given the time remaining until a Milestone Fund’s stated retirement date. VIA adjusts the asset allocation of each “dated” Milestone Fund to become more conservative as the designated year approaches. Each Milestone Fund has a different degree of potential risk and reward and is diversified among various underlying funds in differing allocations. The underlying funds of each Milestone Fund and the current target investment allocation in each underlying fund as of June 30, 2008 were as follows:
| | | | | | | | | | | | |
| | | Milestone Funds | |
| | | Retirement
Income | | | 2010 | | | 2015 | | | 2020 | |
Fund Allocation—% | | | | | | | | | | | | |
Low Duration Bond | | 40.00 | % | | 33.00 | % | | 17.50 | % | | 8.00 | % |
Inflation Protected Securities | | 9.00 | % | | 8.00 | % | | 3.90 | % | | 0.00 | % |
Core Bond Index, Class I | | 11.00 | % | | 11.00 | % | | 14.60 | % | | 18.70 | % |
Equity Income | | 12.00 | % | | 14.00 | % | | 18.60 | % | | 21.60 | % |
Growth & Income | | 12.00 | % | | 11.60 | % | | 11.00 | % | | 11.60 | % |
Growth | | 0.00 | % | | 2.80 | % | | 7.40 | % | | 8.40 | % |
Mid/Small Company Index, Class I | | 0.00 | % | | 2.00 | % | | 6.20 | % | | 9.00 | % |
International | | 6.00 | % | | 7.60 | % | | 10.80 | % | | 12.70 | % |
88
VANTAGEPOINT FUNDS
NOTES TO THE FINANCIAL STATEMENTS (Unaudited) — (Continued)
| | | | | | | | | | | | |
| | | Milestone Funds | |
| | | Retirement
Income | | | 2010 | | | 2015 | | | 2020 | |
Fund Allocation—% | | | | | | | | | | | | |
Diversified Assets | | 10.00 | % | | 10.00 | % | | 10.00 | % | | 10.00 | % |
| | | | |
Total Fixed Income | | 60.00 | % | | 52.00 | % | | 36.00 | % | | 26.70 | % |
Total Equity | | 30.00 | % | | 38.00 | % | | 54.00 | % | | 63.30 | % |
Total Multi-Strategy | | 10.00 | % | | 10.00 | % | | 10.00 | % | | 10.00 | % |
| |
| | | Milestone Funds | |
| | | 2025 | | | 2030 | | | 2035 | | | 2040 | |
Fund Allocation—% | | | | | | | | | | | | |
Low Duration Bond | | 3.00 | % | | 0.00 | % | | 0.00 | % | | 0.00 | % |
Inflation Protected Securities | | 0.00 | % | | 0.00 | % | | 0.00 | % | | 0.00 | % |
Core Bond Index, Class I | | 15.45 | % | | 12.80 | % | | 11.05 | % | | 10.00 | % |
Equity Income | | 23.10 | % | | 24.40 | % | | 25.40 | % | | 26.00 | % |
Growth & Income | | 13.10 | % | | 14.20 | % | | 14.70 | % | | 15.00 | % |
Growth | | 9.40 | % | | 10.40 | % | | 11.40 | % | | 12.00 | % |
Mid/Small Company Index, Class I | | 11.50 | % | | 14.20 | % | | 17.20 | % | | 19.00 | % |
International | | 14.45 | % | | 16.00 | % | | 17.25 | % | | 18.00 | % |
Diversified Assets | | 10.00 | % | | 8.00 | % | | 3.00 | % | | 0.00 | % |
| | | | |
Total Fixed Income | | 18.45 | % | | 12.80 | % | | 11.05 | % | | 10.00 | % |
Total Equity | | 71.55 | % | | 79.20 | % | | 85.95 | % | | 90.00 | % |
Total Multi-Strategy | | 10.00 | % | | 8.00 | % | | 3.00 | % | | 0.00 | % |
Since the Model Portfolio Funds and Milestone Funds invest entirely in underlying funds, investment earnings are composed of:
| | 1. | ordinary and capital gain dividends from the underlying funds, |
| | 2. | unrealized appreciation/depreciation on investments in the underlying funds, and |
| | 3. | realized gain/loss from sales of the shares of the underlying funds triggered by net outflows associated with normal capital stock activity and rebalancing of the Model Portfolio Funds and Milestone Funds. |
Transition of US Government Securities Fund to Inflation Protected Securities Fund
At a December 8, 2006 meeting of the Board, VIA recommended and the Board approved the implementation of a new principal investment strategy for the US Government Securities Fund to be effective May 1, 2007. The new principal investment strategy provides that the Fund will invest, under normal circumstances, at least 80% of its net assets in inflation adjusted U.S. and non-U.S. fixed income securities. In connection with this change in investment strategy, the Board approved, effective May 1, 2007: (i) a change in the name of the Fund to the Inflation Protected Securities Fund; (ii) the appointment of Pacific Investment Management Company (“PIMCO”) and Fischer Francis Trees & Watts (“FFTW”) as new Fund subadvisers; and (iii) the termination of Mellon Capital Management Corporation as a Fund subadviser. Effective May 1, 2007, PIMCO and FFTW began serving as new subadvisers of the Fund. However, on May 15, 2007, Paul J. Zhao, the portfolio manager at FFTW who was responsible for making investment decisions for the portion of the Fund’s assets managed by FFTW, left FFTW. At a meeting held on May 18, 2007, VIA recommended and the Board approved the termination of FFTW as a subadviser to the Fund. The Fund’s assets managed by FFTW were transitioned to PIMCO and PIMCO served as the sole subadviser to the Fund until the appointment of BlackRock Financial Management, Inc. (“BlackRock”) as an additional subadviser to the Fund effective October 30, 2007.
89
VANTAGEPOINT FUNDS
NOTES TO THE FINANCIAL STATEMENTS (Unaudited) — (Continued)
2. Significant Accounting Policies
The Company’s significant accounting policies are consistently applied in the preparation of its financial statements in accordance with accounting principles generally accepted in the United States of America. Management makes estimates and assumptions in the preparation of financial statements that affect the reported amounts of assets and liabilities, including the disclosure of contingent assets and liabilities at the date of the financial statements as well as the revenue and expense amounts during the reporting period. Actual results could differ from those estimates. Certain prior year amounts have been reclassified to conform to the current year presentation.
Investment Policy and Security Valuation
The equity securities that are traded on a national securities exchange (other than Nasdaq National Market and Small Cap Market Securities traded primarily on the Nasdaq Stock Market, Inc. Exchange (“Nasdaq”)) held by each fund normally will be priced at the last reported sale price on the exchange on which the security is principally traded. Securities for which the primary market is Nasdaq are valued at the Nasdaq Official Closing Price. Equity securities not traded on an exchange or on Nasdaq normally are valued at the last reported sale price in the over-the-counter market. If a non-exchange traded security does not trade on a particular day, then the security is normally valued at the mean between the highest bid price and the lowest priced offer obtained from quotation services believed to be reliable. Fixed income debt securities, such as commercial paper, bankers’ acceptances and U.S. Treasury Bills, with a remaining maturity of less than 60 days, are valued at amortized cost. Prices for other fixed income securities are normally obtained from a commercial pricing service that may use pricing matrices or other methodologies designed to identify the value of fixed income securities. Any security for which market value as described above is not readily available is valued at fair value as determined in good faith in accordance with policies approved by the Board (“Valuation Procedures”). The valuation of certain foreign equity securities is described below.
Each Model Portfolio and Milestone’s net asset value (“NAV”) is calculated based upon the NAV’s of the underlying funds in which it invests.
The Money Market Fund invests all of its assets in the Institutional Class of the Short-Term Investments Trust Liquid Assets Portfolio (“Portfolio”). The Portfolio uses the amortized cost method to value its portfolio securities in accordance with Rule 2a-7 under the 1940 Act. Amortized cost, which is a security’s historical cost adjusted for amortization of discount or premium, if any, approximates market value. The shares of the Portfolio are valued by the Money Market Fund using the Portfolio’s NAV.
Valuation of Foreign Equity Securities
For foreign equity securities held by the funds and principally traded in markets outside North and South America, the Board approved the use of a third party fair valuation service. The service uses a multifactor model to calculate a factor that is then applied to adjust the market price for each such security. Additionally, the Board has approved the use of the fair value prices provided by this service on a daily basis without a market trigger or confidence interval filter. In the event prices for such foreign securities are not available through the service or another fair value pricing service approved by the Board, the securities may be priced at the average of two or more independent broker-dealer quotations or at the fair value of the security in accordance with the Company’s Valuation Procedures.
When Issued Securities
When issued securities or “To Be Announced” securities are sometimes held by the funds. The funds maintain security positions and cash positions such that sufficient liquid assets will be available to make payments for such securities purchased.
Foreign Currency
The accounting records of the funds are maintained in U.S. dollars. Investment securities and other assets and liabilities denominated in foreign currencies were translated into U.S. dollars at the prevailing rates of exchange using the “Reuters” snap-shot at 12 pm Eastern Time each day until June 9, 2008. Effective June 9, 2008, investment securities and other assets and liabilities are translated into U.S. dollars daily at the closing spot rates supplied by the WM/Reuters Spot and Forward rates service as of 4:00 pm Eastern Time. This service is provided by The WM Company. Purchases and
90
VANTAGEPOINT FUNDS
NOTES TO THE FINANCIAL STATEMENTS (Unaudited) — (Continued)
sales of securities, income receipts and expense payments are translated into U.S. dollars at the prevailing exchange rate on the respective dates of such transactions. Unrealized gains and losses, not relating to securities, that result from changes in foreign currency exchange rates, have been included in unrealized appreciation/(depreciation) of securities. Net realized foreign currency gains and losses include foreign currency gains and losses resulting from changes in exchange rates between trade date and settlement date on investment securities transactions, gains and losses on foreign currency transactions, and the difference between the amounts of interest and dividends recorded on the books of the funds and the amounts actually received. The portion of foreign currency gains and losses related to fluctuations in exchange rates between the initial purchase trade date and subsequent sale trade date is included in realized gains/(losses) from security transactions.
Options
Exchange traded options normally will be priced based on the last reported sale price on the exchange on which the security underlying the option is principally traded. Certain markets are not closed at Valuation Time. In these situations, a pricing service may provide snapshot prices. If no sales are reported on a particular day, a pricing service normally will use the mean between the last bid and asked quotations. Non-exchange traded options also normally will be priced by a pricing service at the mean between bid and asked quotations.
Futures
Futures contracts normally will be priced at the settlement prices established each day on the exchange on which they are traded, as provided by a pricing service.
Forward Currency Contracts
These contracts normally will be priced using the WM/Reuters Intraday Forwards rates provided as of 4:00 P.M. EST.
Interest Rate Swaps (including Inflation Swaps)
Interest rate swaps normally will be priced based on a snapshot of the relevant country’s swap curve (Reuters, Bloomberg, and S&P are frequent sources) and a swap valuation model. In the event a pricing service is unable to provide a price for a particular swap, the swap will be priced at the fair value of the security.
Interest Rate Swaptions
Interest rate swaptions normally will be priced based on a snapshot taken of the relevant country’s swap curve (Reuters, Bloomberg, and S&P are frequent sources), deriving an implied volatility surface from actual and/or indicative broker-dealer swaption prices, and combining them in an option valuation model. In the event a pricing service is unable to provide a price for a particular swaption, the swaption will be priced at the fair value of the security.
Total Return Swaps
Total return swaps are normally priced based on cash flow forecasts for the reference entity (which may themselves be model-driven in the case of assets with embedded options), a credit default curve corresponding to the reference asset (if applicable), and a snapshot of the relevant interest rate swap curve. The valuation approach incorporates concepts and algorithms used in credit default swap and interest rate models. In the event a pricing service is unable to provide a price for a particular total return swap, the total return swap will be priced at the fair value of the security.
Credit Default Swaps
Single-name credit default swaps (CDS) normally will be priced based on an issuer specified spread curve, constructed from actual and/or indicative broker-dealer CDS spreads, and a CDS valuation model. CDS indexes normally will be priced according to consensus broker-dealer indications. In the event a pricing service is unable to provide a price for a particular CDS, the CDS will be priced at the fair value of the security.
Security Transactions and Income Recognition
Security transactions are accounted for on the date the securities are purchased or sold (trade date). Dividend income is recognized on the ex-dividend date and interest income is accrued daily. Realized gains or losses are reported on the basis of identified cost of securities delivered. Bond discounts and premiums are amortized for both financial reporting and tax purposes, except for the Core Bond Index Fund, which does not amortize bond premium for tax purposes.
91
VANTAGEPOINT FUNDS
NOTES TO THE FINANCIAL STATEMENTS (Unaudited) — (Continued)
Dividends and Distributions to Shareholders
Dividends from net investment income are declared and paid monthly to shareholders of the Core Bond Index, the Low Duration Bond, and Inflation Protected Securities Funds. Dividends from net investment income are declared daily and paid monthly to shareholders of the Money Market Fund. Prior to November 2004, dividends from net investment income were declared daily and paid monthly to shareholders of the Low Duration Bond Fund. For the remaining Actively Managed Funds, Index Funds, Model Portfolio Funds and Milestone Funds, dividends from net investment income are declared and paid annually to shareholders. Distributions from any net realized capital gains are generally declared and paid annually to shareholders.
Income and capital gain distributions are determined in accordance with income tax regulations which may differ from accounting principles generally accepted in the United States of America. These differences are primarily due to differing treatments of income and gains on investment securities, and differing characterizations of distributions being made by each fund.
Certain differences are permanent, and result in reclassifications among paid-in capital, net investment income or realized gains. These include net operating losses not utilized during the current year, commission adjustments, pay-down gains and losses, bond premium amortization, foreign currency gains and losses, taxable over-distributions or returns of capital, and adjustments relating to dispositions of Real Estate Investment Trust and Passive Foreign Investment Company securities. These reclassifications have no effect on net assets or net asset values per share, and they do not affect the net investment income per share calculations presented in the Financial Highlights.
Federal Income Taxes
Each fund intends to qualify as a regulated investment company under Subchapter M of the Internal Revenue Code for federal tax purposes. Accordingly, each fund intends to make distributions of substantially all of its net investment company taxable income and any net realized capital gains (after reduction for capital loss carry forwards) sufficient to relieve it from all, or substantially all, federal income and excise taxes. Any taxable income on gains remaining at fiscal year-end are distributed in the following year. Therefore, no provision for federal income or excise taxes was required.
The Company has adopted Financial Accounting Standards Board Interpretation No. 48 (“FIN 48”), “Accounting for Uncertainty in Income Taxes,” which establishes guidelines for recognizing, measuring, and disclosing tax return positions in financial statements. Management has evaluated the Company’s tax positions and determined that the adoption of FIN 48 had no material impact on the Company’s financial statements. Accordingly, no adjustments for unrecognized tax benefits or expenses, were required as of June 30, 2008.
Futures Contracts
A futures contract is an agreement between two parties to buy and sell a security, commodity, or index at a set price on a future date. Pursuant to the contract, the fund agrees to receive from or pay to the broker an amount of cash equal to the daily fluctuation in the value of the contract. Such receipts or payments are known as “variation margin” and are recorded by the fund as unrealized gains or losses. When the contract is closed, the fund records a gain or loss equal to the difference between the value of the contract at the time it was opened and the value at the time it was closed. Risks of entering into futures contracts include the possibility that there may be an illiquid market and that a change in the value of the contracts may not correlate with the changes in the value of the underlying securities. The amounts of risk under such futures contracts may exceed the amounts reflected in the financial statements. As of June 30, 2008, the following funds had open futures contracts outstanding:
92
VANTAGEPOINT FUNDS
NOTES TO THE FINANCIAL STATEMENTS (Unaudited) — (Continued)
Inflation Protected Securities Fund
| | | | | | | | | | | | | |
Number of Contracts | | Exchange | | Contract | | Expiration Date | | Underlying
Face Amount
at Value | | Net
Unrealized
Depreciation | |
| Purchased | | | | | | | | | | | | | |
21 | | CBT | | U.S. 5 Year Treasury Note | | September 2008 | | $ | 2,321,648 | | $ | (10,054 | ) |
| Sold | | | | | | | | | | | | | |
95 | | CBT | | U.S. 10 Year Treasury Note | | September 2008 | | $ | 10,822,578 | | $ | (102,837 | ) |
| | | | | | | | | | | | | |
| | | | | | Total Unrealized Depreciation | | $ | (112,891 | ) |
| | | | | | | | | | | | | |
| | |
Asset Allocation Fund | | | | | | |
| | | | | |
Number of Contracts | | Exchange | | Contract | | Expiration Date | | Underlying
Face Amount
at Value | | Net
Unrealized
Depreciation | |
| Purchased | | | | | | | | | | | | | |
1,578 | | CME | | E-MINI S&P 500 Index | | September 2008 | | $ | 101,078,790 | | $ | (7,692,696 | ) |
29 | | CME | | S&P 500 Index | | September 2008 | | $ | 9,287,975 | | | (699,510 | ) |
| | | | | | | | | | | | | |
| | | | | | Total Unrealized Depreciation | | $ | (8,392,206 | ) |
| | | | | | | | | | | | | |
| | |
Select Value Fund | | | | | | |
| | | | | |
Number of Contracts | | Exchange | | Contract | | Expiration Date | | Underlying
Face Amount
at Value | | Net
Unrealized
Depreciation | |
| Purchased | | | | | | | | | | | | | |
5 | | CME | | E-MINI S&P 500 Index | | September 2008 | | $ | 320,275 | | $ | (19,719 | ) |
| | | | | | | | | | | | | |
| | | | | | Total Unrealized Depreciation | | $ | (19,719 | ) |
| | | | | | | | | | | | | |
| | |
Discovery Fund | | | | | | |
| | | | | |
Number of Contracts | | Exchange | | Contract | | Expiration Date | | Underlying
Face Amount
at Value | | Net
Unrealized
Depreciation | |
| Purchased | | | | | | | | | | | | | |
1,162 | | CME | | E-MINI Russell Index | | September 2008 | | $ | 80,375,541 | | $ | (4,909,067 | ) |
| | | | | | | | | | | | | |
| | | | | | Total Unrealized Depreciation | | $ | (4,909,067 | ) |
| | | | | | | | | | | | | |
93
VANTAGEPOINT FUNDS
NOTES TO THE FINANCIAL STATEMENTS (Unaudited) — (Continued)
Diversified Assets Fund
| | | | | | | | | | | | | |
Number of Contracts | | Exchange | | Contract | | Expiration Date | | Underlying
Face Amount
at Value | | Net
Unrealized
Appreciation/
(Depreciation) | |
| Purchased | | | | | | | | | | | | | |
1 | | SGX | | 10 Year Mini-JGB | | September 2008 | | $ | 127,363 | | $ | 696 | |
193 | | EOE | | Amsterdam Index | | July 2008 | | $ | 25,895,703 | | | (1,961,083 | ) |
113 | | SFE | | Australian Government Bond 10 Year | | September 2008 | | $ | 10,477,556 | | | 179,995 | |
213 | | EOP | | CAC40 Euros | | July 2008 | | $ | 14,903,303 | | | (849,053 | ) |
25 | | EUX | | Dax Index | | September 2008 | | $ | 6,376,523 | | | (337,441 | ) |
26 | | EUX | | DJ STOXX 50 Index | | September 2008 | | $ | 1,383,627 | | | (74,618 | ) |
128 | | EUX | | Euro-Schatz Future | | September 2008 | | $ | 26,621,516 | | | (137,945 | ) |
152 | | LIF | | FTSE 100 Index | | September 2008 | | $ | 17,099,952 | | | (428,728 | ) |
76 | | HKG | | Hang Seng Index | | July 2008 | | $ | 10,780,211 | | | (260,982 | ) |
59 | | MFM | | IBEX 35 Index | | July 2008 | | $ | 11,104,375 | | | (720,572 | ) |
112 | | MIL | | S&P/MIB Index | | September 2008 | | $ | 26,165,092 | | | (1,084,217 | ) |
7 | | SFE | | SPI 200 Index | | September 2008 | | $ | 871,197 | | | (23,575 | ) |
10 | | TSE | | Topix Index | | September 2008 | | $ | 1,241,701 | | | (62,173 | ) |
| | | | | | | | | | | | | |
| | | | | | | | | | | $ | (5,759,696 | ) |
| | | | | | | | | | | | | |
| Sold | | | | | | | | | | | | | |
350 | | SFE | | Australian Government Bond 10 Year | | September 2008 | | $ | 32,452,606 | | $ | (571,977 | ) |
90 | | MSE | | Canadian 10 Year Bond | | September 2008 | | $ | 10,368,049 | | | 48,696 | |
16 | | EUX | | Dax Index | | September 2008 | | $ | 4,080,974 | | | 205,565 | |
286 | | CME | | E-MINI S&P 500 Index | | September 2008 | | $ | 18,319,730 | | | 811,419 | |
155 | | EUX | | Euro Bund | | September 2008 | | $ | 26,983,475 | | | 320,088 | |
15 | | TSE | | Japanese Government Bond 10 Year | | September 2008 | | $ | 19,134,059 | | | (330,296 | ) |
414 | | SSE | | OMX Stockholm 30 Index | | July 2008 | | $ | 5,929,065 | | | 583,334 | |
86 | | MSE | | S&P/TSX 60 Index | | September 2008 | | $ | 14,610,807 | | | 409,683 | |
200 | | SFE | | SPI 200 Index | | September 2008 | | $ | 24,891,347 | | | 862,275 | |
47 | | TSE | | Topix Index | | September 2008 | | $ | 5,835,994 | | | 371,905 | |
11 | | CBT | | U.S. 10 Year Treasury Note | | September 2008 | | $ | 1,253,141 | | | (15,141 | ) |
38 | | CBT | | U.S. 2 Year Treasury Note | | September 2008 | | $ | 8,025,719 | | | (24,937 | ) |
188 | | LIF | | UK Gilt Long Bond | | September 2008 | | $ | 39,090,694 | | | 654,358 | |
| | | | | | | | | | | | | |
| | | | | | | | | | | $ | 3,324,972 | |
| | | | | | | | | | | | | |
| | | | | | Total Unrealized Depreciation | | $ | (2,434,724 | ) |
| | | | | | | | | | | | | |
|
500 Stock Index Fund | |
| | | | | |
Number of Contracts | | Exchange | | Contract | | Expiration Date | | Underlying
Face Amount
at Value | | Net
Unrealized
Depreciation | |
Purchased | | | | | | | | | | | | | |
113 | | CME | | E-MINI S&P 500 Index | | September 2008 | | $ | 7,238,215 | | $ | (354,792 | ) |
| | | | | | | | | | | | | |
| | | | | | Total Unrealized Depreciation | | $ | (354,792 | ) |
| | | | | | | | | | | | | |
94
VANTAGEPOINT FUNDS
NOTES TO THE FINANCIAL STATEMENTS (Unaudited) — (Continued)
Broad Market Index Fund
| | | | | | | | | | | | | |
Number of Contracts | | Exchange | | Contract | | Expiration Date | | Underlying
Face Amount
at Value | | Net
Unrealized
Depreciation | |
| Purchased | | | | | | | | | | | | | |
18 | | CME | | E-MINI Russell Index | | September 2008 | | $ | 1,245,060 | | $ | (60,038 | ) |
102 | | CME | | E-MINI S&P 500 Index | | September 2008 | | $ | 6,533,610 | | | (308,949 | ) |
| | | | | | | | | | | | | |
| | | | | | Total Unrealized Depreciation | | $ | (368,987 | ) |
| | | | | | | | | | | | | |
|
Mid/Small Company Index Fund | |
| | | | | |
Number of Contracts | | Exchange | | Contract | | Expiration Date | | Underlying
Face Amount
at Value | | Net
Unrealized
Depreciation | |
| Purchased | | | | | | | | | | | | | |
28 | | CME | | E-MINI Russell Index | | September 2008 | | $ | 1,936,760 | | $ | (63,197 | ) |
24 | | CME | | E-MINI S&P Mid 400 Index | | September 2008 | | $ | 1,970,880 | | | (62,738 | ) |
| | | | | | | | | | | | | |
| | | | | | Total Unrealized Depreciation | | $ | (125,935 | ) |
| | | | | | | | | | | | | |
|
Overseas Equity Index Fund | |
| | | | | |
Number of Contracts | | Exchange | | Contract | | Expiration Date | | Underlying
Face Amount
at Value | | Net
Unrealized
Depreciation | |
| Purchased | | | | | | | | | | | | | |
74 | | EUX | | DJ STOXX 50 Index | | September 2008 | | $ | 3,938,014 | | $ | (204,263 | ) |
23 | | LIF | | FTSE 100 Index | | September 2008 | | $ | 2,587,493 | | | (63,061 | ) |
19 | | TSE | | Topix Index | | September 2008 | | $ | 2,359,232 | | | (118,182 | ) |
| | | | | | | | | | | | | |
| | | | | | Total Unrealized Depreciation | | $ | (385,506 | ) |
| | | | | | | | | | | | | |
Forward Foreign Currency Exchange Contracts
A forward foreign currency exchange contract is an agreement to pay or receive specific amounts of a currency at a future date in exchange for another currency at an agreed upon exchange rate. Such contracts are recorded at market value and marked to market daily. Risks of entering into foreign currency exchange contracts include the possibility that there may be an illiquid market and that a change in the value of the contracts may not correlate with changes in the value of the underlying securities. The amount at risk for such forward foreign currency exchange contracts may exceed the amount reflected in the financial statements. Realized and unrealized gains or losses on forward foreign currency exchange contracts are reflected in the accompanying financial statements. As of June 30, 2008, the following funds had open forward foreign currency exchange contracts outstanding:
Inflation Protected Securities Fund
| | | | | | | | | | | | |
Currency | | Exchange
Date | | Foreign Currency
Cost/Proceeds (U.S.$) | | U.S. Dollar Value
at June 30, 2008 | | Net Unrealized
Gain/(Loss) | |
Purchase Contracts | | | | | | | | | | | | |
Euro | | 07/23/2008 | | $ | 1,766,062 | | $ | 1,802,000 | | $ | 35,938 | |
| | | | | | | | | | | | |
Sale Contracts | | | | | | | | | | | | |
Euro | | 07/23/2008 | | $ | 1,813,150 | | $ | 1,801,528 | | $ | 11,622 | |
| | 07/24/2008 | | | 149,293 | | | 149,398 | | | (105 | ) |
| | | | | | | | | | | | |
| | | | | Net Gain on Sale Contracts | | $ | 11,517 | |
| | | | | | | | | | | | |
| | | |
| Net Unrealized Gain on Forward
Foreign Currency Contracts | | $ | 47,455 | |
| | | | | | | | | | | | |
95
VANTAGEPOINT FUNDS
NOTES TO THE FINANCIAL STATEMENTS (Unaudited) — (Continued)
Diversified Assets Fund
| | | | | | | | | | | | |
Currency | | Exchange
Date | | Foreign Currency
Cost/Proceeds (U.S.$) | | U.S. Dollar Value
at June 30, 2008 | | Net Unrealized
Gain/(Loss) | |
Purchase Contracts | | | | | | | | | | | | |
Australian Dollar | | 07/03/2008 | | $ | 9,722,908 | | $ | 9,783,459 | | $ | 60,551 | |
| | 07/18/2008 | | | 35,785,740 | | | 36,343,580 | | | 557,840 | |
Canadian Dollar | | 07/03/2008 | | | 22,227,186 | | | 22,110,215 | | | (116,971 | ) |
Swiss Franc | | 07/03/2008 | | | 4,739,284 | | | 4,822,762 | | | 83,478 | |
| | 09/17/2008 | | | 108,759 | | | 111,125 | | | 2,366 | |
Euro | | 07/03/2008 | | | 35,747,868 | | | 36,292,979 | | | 545,111 | |
| | 07/18/2008 | | | 3,107,680 | | | 3,146,233 | | | 38,553 | |
| | 08/05/2008 | | | 36,260,782 | | | 36,230,199 | | | (30,583 | ) |
| | 09/17/2008 | | | 5,026,568 | | | 5,034,029 | | | 7,461 | |
British Pound Sterling | | 07/03/2008 | | | 39,968,646 | | | 40,829,646 | | | 861,000 | |
| | 07/18/2008 | | | 15,658,960 | | | 15,914,320 | | | 255,360 | |
| | 08/05/2008 | | | 24,691,420 | | | 24,707,465 | | | 16,045 | |
Japanese Yen | | 07/03/2008 | | | 19,836,174 | | | 20,037,379 | | | 201,205 | |
| | 07/14/2008 | | | 1,390,567 | | | 1,388,184 | | | (2,383 | ) |
| | 08/05/2008 | | | 284,992 | | | 284,543 | | | (449 | ) |
Norwegian Krone | | 07/03/2008 | | | 17,010,089 | | | 17,018,466 | | | 8,377 | |
| | 07/18/2008 | | | 35,806,221 | | | 36,258,873 | | | 452,652 | |
New Zealand Dollar | | 07/03/2008 | | | 9,225,800 | | | 9,398,640 | | | 172,840 | |
| | 08/05/2008 | | | 8,003,656 | | | 8,011,411 | | | 7,755 | |
Swedish Krona | | 07/03/2008 | | | 19,878,997 | | | 19,884,373 | | | 5,376 | |
| | 07/16/2008 | | | 3,001,129 | | | 3,011,276 | | | 10,147 | |
| | 08/05/2008 | | | 13,930,914 | | | 13,911,572 | | | (19,342 | ) |
| | | | | | | | | | | | |
| | | | | Net Gain on Purchase Contracts | | $ | 3,116,389 | |
| | | | | | | | | | | | |
Sale Contracts | | | | | | | | | | | | |
Australian Dollar | | 07/03/2008 | | $ | 9,704,288 | | $ | 9,783,461 | | $ | (79,173 | ) |
| | 08/05/2008 | | | 6,886,400 | | | 6,876,261 | | | 10,139 | |
Canadian Dollar | | 07/03/2008 | | | 22,109,423 | | | 22,110,213 | | | (790 | ) |
| | 07/18/2008 | | | 35,361,026 | | | 35,297,118 | | | 63,908 | |
| | 08/05/2008 | | | 20,469,603 | | | 20,367,605 | | | 101,998 | |
Swiss Franc | | 07/03/2008 | | | 18,450,792 | | | 18,765,846 | | | (315,054 | ) |
| | 07/18/2008 | | | 29,072,585 | | | 29,373,273 | | | (300,688 | ) |
| | 09/17/2008 | | | 2,995,577 | | | 3,002,272 | | | (6,695 | ) |
Euro | | 07/03/2008 | | | 36,318,644 | | | 36,292,979 | | | 25,665 | |
| | 07/10/2008 | | | 2,640,240 | | | 2,691,170 | | | (50,930 | ) |
British Pound Sterling | | 07/03/2008 | | | 40,625,815 | | | 40,829,645 | | | (203,830 | ) |
| | 09/17/2008 | | | 531,738 | | | 538,560 | | | (6,822 | ) |
Japanese Yen | | 07/03/2008 | | | 20,147,067 | | | 20,037,379 | | | 109,688 | |
| | 07/14/2008 | | | 1,566,384 | | | 1,579,496 | | | (13,112 | ) |
| | 07/18/2008 | | | 2,816,849 | | | 2,827,928 | | | (11,079 | ) |
| | 09/17/2008 | | | 1,504,133 | | | 1,490,548 | | | 13,585 | |
Norwegian Krone | | 07/03/2008 | | | 16,802,616 | | | 17,018,464 | | | (215,848 | ) |
| | 08/05/2008 | | | 15,251,206 | | | 15,248,545 | | | 2,661 | |
New Zealand Dollar | | 07/03/2008 | | | 9,356,750 | | | 9,398,640 | | | (41,890 | ) |
| | 07/18/2008 | | | 11,266,500 | | | 11,399,450 | | | (132,950 | ) |
Swedish Krona | | 07/03/2008 | | | 19,875,183 | | | 19,884,374 | | | (9,191 | ) |
| | | | | | | | | | | | |
| | | | | Net Loss on Sale Contracts | | $ | (1,060,408 | ) |
| | | | | | | | | | | | |
| | | |
| Net Unrealized Gain on Forward
Foreign Currency Contracts | | $ | 2,055,981 | |
| | | | | | | | | | | | |
96
VANTAGEPOINT FUNDS
NOTES TO THE FINANCIAL STATEMENTS (Unaudited) — (Continued)
International Fund
| | | | | | | | | | | | |
Currency | | Exchange
Date | | Foreign Currency
Cost/Proceeds (U.S.$) | | U.S. Dollar Value
at June 30, 2008 | | Net Unrealized
Gain/(Loss) | |
Purchase Contracts | | | | | | | | | | | | |
Brazilian Real | | 07/01/2008 | | $ | 22,747 | | $ | 22,133 | | $ | (614 | ) |
| | 07/02/2008 | | | 19,460 | | | 19,447 | | | (13 | ) |
| | 07/03/2008 | | | 22,292 | | | 22,173 | | | (119 | ) |
Canadian Dollar | | 07/03/2008 | | | 1,677,570 | | | 1,667,849 | | | (9,721 | ) |
Swiss Franc | | 07/02/2008 | | | 503,172 | | | 504,759 | | | 1,587 | |
Danish Krone | | 07/03/2008 | | | 96,173 | | | 96,119 | | | (54 | ) |
Euro | | 07/02/2008 | | | 96,446 | | | 96,288 | | | (158 | ) |
| | 07/03/2008 | | | 1,811,769 | | | 1,832,251 | | | 20,482 | |
| | 07/09/2008 | | | 4,668,226 | | | 4,726,372 | | | 58,146 | |
| | 07/28/2008 | | | 3,441,164 | | | 3,468,046 | | | 26,882 | |
| | 08/28/2008 | | | 3,440,972 | | | 3,467,751 | | | 26,779 | |
| | 10/03/2008 | | | 665,093 | | | 668,537 | | | 3,444 | |
| | 12/17/2008 | | | 4,569,577 | | | 4,603,878 | | | 34,301 | |
British Pound Sterling | | 07/03/2008 | | | 147,198 | | | 147,207 | | | 9 | |
Hong Kong Dollar | | 07/02/2008 | | | 24,226 | | | 24,239 | | | 13 | |
Japanese Yen | | 07/01/2008 | | | 708,564 | | | 718,340 | | | 9,776 | |
| | 07/09/2008 | | | 4,534,501 | | | 4,499,974 | | | (34,527 | ) |
| | | | | | | | | | | | |
| | | | | Net Gain on Purchase Contracts | | $ | 136,213 | |
| | | | | | | | | | | | |
Sale Contracts | | | | | | | | | | | | |
Australian Dollar | | 07/03/2008 | | $ | 17,902 | | $ | 17,901 | | $ | 1 | |
Canadian Dollar | | 07/03/2008 | | | 1,656,373 | | | 1,667,850 | | | (11,477 | ) |
| | 09/17/2008 | | | 3,776,000 | | | 3,776,666 | | | (666 | ) |
Swiss Franc | | 07/01/2008 | | | 16,146 | | | 16,164 | | | (18 | ) |
| | 07/02/2008 | | | 589,680 | | | 575,193 | | | 14,487 | |
| | 07/03/2008 | | | 57,859 | | | 57,742 | | | 117 | |
| | 09/04/2008 | | | 1,891,000 | | | 1,926,421 | | | (35,421 | ) |
| | 09/18/2008 | | | 3,315,000 | | | 3,385,171 | | | (70,171 | ) |
Euro | | 07/01/2008 | | | 38,317 | | | 38,251 | | | 66 | |
| | 07/02/2008 | | | 63,138 | | | 63,144 | | | (6 | ) |
| | 07/03/2008 | | | 58,347 | | | 58,351 | | | (4 | ) |
| | 07/09/2008 | | | 191,985 | | | 191,871 | | | 114 | |
British Pound Sterling | | 07/02/2008 | | | 616,725 | | | 616,415 | | | 310 | |
| | 07/03/2008 | | | 142,379 | | | 142,368 | | | 11 | |
Hong Kong Dollar | | 07/02/2008 | | | 66,818 | | | 66,853 | | | (35 | ) |
| | 07/03/2008 | | | 55,905 | | | 55,919 | | | (14 | ) |
Japanese Yen | | 07/01/2008 | | | 303,247 | | | 305,973 | | | (2,726 | ) |
| | 07/02/2008 | | | 968,828 | | | 970,001 | | | (1,173 | ) |
| | 07/03/2008 | | | 1,134,047 | | | 1,132,697 | | | 1,350 | |
| | 07/09/2008 | | | 4,668,226 | | | 4,499,974 | | | 168,252 | |
| | 07/28/2008 | | | 3,441,164 | | | 3,374,906 | | | 66,258 | |
| | 08/28/2008 | | | 3,440,972 | | | 3,372,615 | | | 68,357 | |
| | 10/17/2008 | | | 3,853,149 | | | 3,799,656 | | | 53,493 | |
| | 12/04/2008 | | | 6,140,851 | | | 6,039,114 | | | 101,737 | |
| | | | | | | | | | | | |
| | | | | Net Gain on Sale Contracts | | $ | 352,842 | |
| | | | | | | | | | | | |
| | | |
| Net Unrealized Gain on Forward
Foreign Currency Contracts | | $ | 489,055 | |
| | | | | | | | | | | | |
97
VANTAGEPOINT FUNDS
NOTES TO THE FINANCIAL STATEMENTS (Unaudited) — (Continued)
Overseas Equity Index Fund
| | | | | | | | | | | | |
Currency | | Exchange
Date | | Foreign Currency
Cost/Proceeds (U.S.$) | | U.S. Dollar Value
at June 30, 2008 | | Net Unrealized
Gain/(Loss) | |
Purchase Contracts | | | | | | | | | | | | |
Euro | | 09/17/2008 | | $ | 1,922,375 | | $ | 1,932,962 | | $ | 10,587 | |
British Pound Sterling | | 09/17/2008 | | | 1,176,124 | | | 1,188,222 | | | 12,098 | |
Japanese Yen | | 09/17/2008 | | | 2,608,947 | | | 2,605,665 | | | (3,282 | ) |
| | | | | | | | | | | | |
| | | | | Net Gain on Purchase Contracts | | $ | 19,403 | |
| | | | | | | | | | | | |
| | | | |
| Sale Contracts | | | | | | | | | | | | |
Euro | | 09/17/2008 | | $ | 273,970 | | $ | 278,362 | | $ | (4,392 | ) |
Japanese Yen | | 09/17/2008 | | | 129,601 | | | 131,510 | | | (1,909 | ) |
| | | | | | | | | | | | |
| | | | | Net Loss on Sale Contracts | | $ | (6,301 | ) |
| | | | | | | | | | | | |
| | | |
| Net Unrealized Gain on Forward
Foreign Currency Contracts | | $ | 13,102 | |
| | | | | | | | | | | | |
Option Contracts
Purchases of put and call options are recorded as an investment, the value of which is marked to market at each valuation date. When a purchased option expires, the fund will realize a loss equal to the premium paid. When a fund enters into a closing sale transaction, the fund will realize a gain or loss depending on whether the sales proceeds from the closing sale transaction are greater or less than the cost of the option. When a fund exercises a put option, it will realize a gain or loss from the sale of the underlying security and the proceeds from such sale will be decreased by the premium originally paid. When a fund exercises a call option, the cost of the security which the fund purchases upon exercise will be increased by the premium originally paid.
When a fund writes a call or put option, an amount equal to the premium received by the fund is recorded as a liability, the value of each is marked to market at each valuation date. When a written option expires, the fund realizes a gain equal to the amount of the premium originally received. When a fund enters into a closing purchase transaction the fund realizes a gain (or loss if the cost of the closing purchase transaction exceeds the premium originally received when the option was sold/written) without regard to any unrealized gain or loss on the underlying security, and the liability related to such option is eliminated. When a call option is exercised the fund realizes a gain or loss from the sale of the underlying security and the proceeds from such sale are increased by the amount of the premium originally received. When a put option is exercised, the amount of the premium originally received will reduce the cost of the security which the fund purchased upon exercise.
Options written are reported as a liability in the Statement of Assets and Liabilities. Gains and losses are reported in the Statement of Operations. Option contract transactions may incur a commission, in addition to the premium paid or received. The risk in writing a call option is that the fund gives up the opportunity for profit if the market price of the security increases and the option is exercised. The risk in writing a put option is that the fund may incur a loss if the market price of the security decreases and the option is exercised. The risk in buying an option is that the fund pays a premium whether or not the option is exercised. Written option activity for the period ended June 30, 2008 was as follows:
| | | | | | | | | | | | | | | | | | | | | |
| | | Call Options | | | Put Options | | | Total | |
Inflation Protected Securities Fund | | # Contracts | | | Premium | | | # Contracts | | | Premium | | | # Contracts | | | Premium | |
Beginning balance as of 01/01/2008 | | 23 | | | $ | 8,910 | | | 100 | | | $ | 41,862 | | | 123 | | | $ | 50,772 | |
| | | | | | | | | | | | | | | | | | | | | |
Contracts written | | 220 | | | $ | 271,309 | | | 164 | | | $ | 171,949 | | | 384 | | | $ | 443,258 | |
Contracts closed | | (23 | ) | | $ | (24,625 | ) | | — | | | $ | — | | | (23 | ) | | $ | (24,625 | ) |
Contracts expired | | (220 | ) | | $ | (255,594 | ) | | (264 | ) | | $ | (213,811 | ) | | (484 | ) | | $ | (469,405 | ) |
| | | | | | | | | | | | | | | | | | | | | |
Ending balance as of 06/30/2008 | | — | | | $ | — | | | — | | | $ | — | | | — | | | $ | — | |
| | | | | | | | | | | | | | | | | | | | | |
98
VANTAGEPOINT FUNDS
NOTES TO THE FINANCIAL STATEMENTS (Unaudited) — (Continued)
| | | | | | | | | | | | | | | | | | | |
| | | Call Options | | Put Options | | | Total | |
Diversified Assets Fund | | # Contracts | | Premium | | # Contracts | | | Premium | | | # Contracts | | | Premium | |
Beginning balance as of 01/01/2008 | | — | | $ | — | | 910 | | | $ | 237,171 | | | 910 | | | $ | 237,171 | |
| | | | | | | | | | | | | | | | | | | |
Contracts written | | 580 | | $ | 189,853 | | 910 | | | $ | 312,990 | | | 1,490 | | | $ | 502,843 | |
Contracts closed | | — | | $ | — | | (1,820 | ) | | $ | (550,161 | ) | | (1,820 | ) | | $ | (550,161 | ) |
Contracts expired | | — | | $ | — | | — | | | $ | — | | | — | | | $ | — | |
| | | | | | | | | | | | | | | | | | | |
Ending balance as of 06/30/2008 | | 580 | | $ | 189,853 | | — | | | $ | — | | | 580 | | | $ | 189,853 | |
| | | | | | | | | | | | | | | | | | | |
| | | | | | | | | | | | |
Option Type | | Diversified Assets Fund | | # Contracts | | Strike Price | | Expiration
Date | | Unrealized
Gain/(Loss) |
Call | | Swiss Market Index | | 480 | | $ | 7,211.50USD | | 9/19/2008 | | $ | 76,622 |
Call | | Swiss Market Index | | 100 | | $ | 7,169.89USD | | 9/19/2008 | | $ | 13,640 |
| | | | | | | | | | | | |
| | | | | | | | | | | $ | 90,262 |
| | | | | | | | | | | | |
Swap Agreements
A swap is an agreement to exchange the return generated by one instrument for the return generated by another instrument. Interest rate swap agreements involve the exchange between two parties of their respective commitments to pay or receive interest. An inflation swap agreement is a contract between two counterparties who agree to swap cash flows based on the inflation rate against fixed cash flows. Total return swap agreements are contracts in which one party agrees to make periodic payments to another party based on the change in market value of the assets underlying the contract, which may include a specified security, basket of securities or securities indexes during the specified period, in return for periodic payments based on a fixed or variable interest rate or the total return from other underlying assets. Credit default swaps are contracts whereby one party makes periodic payments to a counterparty in exchange for the right to receive from the counterparty a payment equal to the par (or other agreed-upon) value of a referenced debt obligation in the event of a default by the issuer of the debt obligation. The swaps listed below are marked to market daily using a Bloomberg Swap Curve Calculator, or other third party pricing vendors, and the change in value, if any, is recorded as unrealized gain or loss in the Statement of Operations. The risks associated with swap agreements include the risk that the party with whom the Fund has entered into the swap will default on its obligation to pay the Fund and the risk that the Fund will not be able to meet its obligations to pay the other party to the agreements. In certain types of swap transactions, the risk of loss is increased because the Fund may be required to make higher payments as a result of market volatility. In addition, swap agreements are not traded on exchanges or other organized markets and thus may be less liquid than other derivative instruments. At June 30, 2008, the following swap agreements were outstanding:
Inflation Protected Securities Fund
| | | | | | | | |
Notional Amount | | Expiration
Date | | Description | | Net Unrealized
Gain/(Loss) | |
| AUD 8,700,000 | | 6/15/2010 | | This is an Interest Rate Swap Agreement with Deutsche Bank AG, notional amount 8,700,000 Australian Dollar (AUD), entered into by PIMCO on June 19, 2007. In this swap, the Fund has contractually arranged to receive a fixed rate of 7.0% and pay a floating rate of the 6-month Australian Bank Bill (the floating index), resetting every six months, during the period from June 16, 2008 to June 15, 2010. | | $ | (151,263 | ) |
| | | |
| AUD 2,500,000 | | 3/15/2010 | | This is an Interest Rate Swap Agreement with UBS AG, notional amount AUD 2,500,000, entered into by PIMCO on February 29, 2008. In this swap, the Fund has contractually arranged to receive a fixed rate of 7.5% and pay a floating rate of the 3-month Australian Bank Bill (the floating index), resetting every quarter, during the period from June 15, 2009 to March 15, 2010. | | $ | (9,516 | ) |
99
VANTAGEPOINT FUNDS
NOTES TO THE FINANCIAL STATEMENTS (Unaudited) — (Continued)
| | | | | | | | |
Notional Amount | | Expiration
Date | | Description | | Net Unrealized
Gain/(Loss) | |
| BRL 6,600,000 | | 1/2/2012 | | This is an Interest Rate Swap Agreement with Morgan Stanley Capital Services, notional amount 6,600,000 Brazilian Real (BRL), entered into by PIMCO on January 3, 2008. In this swap, the Fund has contractually arranged to receive a fixed rate of 12.54% and pay a floating rate of the Brazil Cetip Interbank Deposit (the floating index) at maturity, resetting daily, during the period from December 4, 2007 to January 2, 2012 | | $ | (330,792 | ) |
| | | |
| EUR 2,000,000 | | 3/19/2010 | | This is an Interest Rate Swap Agreement with Deutsche Bank AG, notional amount 2,000,000 Euro (EUR), entered into by PIMCO on December 21, 2007. In this swap, the Fund has contractually arranged to receive a fixed rate of 4.5% and pay a floating rate of 6 month EURIBOR rate (the floating index), resetting every six months, during the period from March 19, 2008 to March 19, 2010. | | $ | (42,849 | ) |
| | | |
| EUR 2,000,000 | | 3/19/2010 | | This is an Interest Rate Swap Agreement with Morgan Stanley Capital Services, notional amount EUR 2,000,000, entered into by PIMCO on December 21, 2007. In this swap, the Fund has contractually arranged to receive a fixed rate of 4.5% and pay a floating rate of 6 month EURIBOR rate (the floating index), resetting every six months, during the period from March 19, 2008 to March 19, 2010. | | $ | (44,997 | ) |
| | | |
| EUR 1,100,000 | | 9/14/2012 | | This is an Inflation Rate Swap Agreement with Barclays Bank PLC, notional amount EUR 1,100,000, entered into by PIMCO on September 12, 2007. In this swap, the Fund has contractually arranged to receive a fixed rate of 2.07% and pay the French Non-Revised Index of Consumer Prices excluding Tobacco (the Inflation Index) during the period from September 14, 2007 to September 14, 2012. | | $ | (66,056 | ) |
| | | |
| JPY 200,000,000 | | 3/18/2009 | | This is an Interest Rate Swap Agreement with Morgan Stanley Capital Services, notional amount 200,000,000 Japanese Yen (JPY), entered into by PIMCO on June 5, 2007. In this swap, the Fund has contractually arranged to receive a fixed rate of 1% and pay a floating rate of 6-month Japanese LIBOR (the floating index), resetting every six months, during the period from March 19, 2008 to March 18, 2009. | | $ | (3,904 | ) |
| | | |
| USD 600,000 | | 6/18/2013 | | This is an Interest Rate Swap Agreement with Royal Bank of Scotland PLC, notional amount $600,000, entered into by PIMCO on December 13, 2007. In this swap, the Fund has contractually arranged to pay a fixed rate of 4.0% and receive a floating rate of 3-month LIBOR (the floating index), resetting every quarter, during the period from June 18, 2008 to June 18, 2013. | | $ | 6,931 | |
| | | |
| USD 100,000 | | 6/18/2038 | | This is an Interest Rate Swap Agreement with Bank of America, notional amount $100,000, entered into by PIMCO on January 11, 2008. In this swap, the Fund has contractually arranged to pay a fixed rate of 5.0% and receive a floating rate of 3-month LIBOR (the floating index), resetting every quarter, during the period from June 18, 2008 to June 18, 2038. | | $ | (392 | ) |
100
VANTAGEPOINT FUNDS
NOTES TO THE FINANCIAL STATEMENTS (Unaudited) — (Continued)
| | | | | | | | |
Notional Amount | | Expiration
Date | | Description | | Net Unrealized
Gain/(Loss) | |
| USD 3,200,000 | | 3/5/2018 | | This is an Inflation Rate Swap Agreement with Goldman Sachs Capital Markets, notional amount $3,200,000, entered into by PIMCO on March 3, 2008. In this swap, the Fund has contractually arranged to receive a fixed rate of 2.97% and pay a floating rate of Consumer Price All Urban Non-Seasonally Adjusted Index (the floating index), at maturity, during the period from March 5, 2008 to March 5, 2018. | | $ | (43,657 | ) |
| | | |
| USD 3,300,000 | | 6/18/2038 | | This is an Interest Rate Swap Agreement with Royal Bank of Scotland PLC, total notional amount $3,300,000, entered into by PIMCO on January 11, 2008 (notional $100,000), on January 24, 2008 (notional $2,100,000), on March 26, 2008 (notional $700,000), and on March 27, 2008 (notional $400,000). In this swap, the Fund has contractually arranged to pay a fixed rate of 5.0% and receive a floating rate of 3-month LIBOR (the floating index), resetting every quarter, during the period from June 18, 2008 to June 18, 2038. | | $ | (12,918 | ) |
| | | |
| USD 3,600,000 | | 3/6/2018 | | This is an Inflation Rate Swap Agreement with Morgan Stanley Capital Services, notional amount $3,600,000, entered into by PIMCO on March 4, 2008. In this swap, the Fund has contractually arranged to receive a fixed rate of 2.98% and pay a floating rate of Consumer Price All Urban Non-Seasonally Adjusted Index (the floating index), at maturity, during the period from March 6, 2008 to March 6, 2018. | | $ | 29,784 | |
| | | |
| USD 8,400,000 | | 6/18/2010 | | This is an Interest Rate Swap Agreement with Deutsche Bank AG, total notional amount $8,400,000, entered into by PIMCO on January 2, 2008. In this swap, the Fund has contractually arranged to receive a fixed rate of 4.0% and pay a floating rate of 3-month LIBOR (the floating index), resetting every quarter, during the period from June 18, 2008 to June 18, 2010. | | $ | 72,152 | |
| | | |
| GBP 1,000,000 | | 3/20/2013 | | This is an Interest Rate Swap Agreement with Deutsche Bank AG, notional amount 1,000,000 British Pound (GBP), entered into by PIMCO on February 1, 2008. In this swap, the Fund has contractually arranged to receive a fixed rate of 5.0% and pay a floating rate of 6-month LIBOR (the floating index), resetting every six months, during the period from March 20, 2008 to March 20, 2013. | | $ | (92,627 | ) |
| | | |
| GBP 200,000 | | 9/10/2027 | | This is an Inflation Rate Swap Agreement with Royal Bank of Scotland PLC, notional amount GBP 200,000 entered into by PIMCO on September 10, 2007. In this swap, the Fund has contractually arranged to receive a fixed rate of 3.44% and pay the UK Non-revised Retail Price Index All Items (the inflation index) during the period from September 10, 2007 to September 10, 2027. | | $ | (45,510 | ) |
| | | |
| GBP 500,000 | | 12/19/2017 | | This is an Inflation Rate Swap Agreement with Royal Bank of Scotland PLC, total notional amount GBP 500,000, entered into by PIMCO on December 19, 2007 (notional GBP 200,000) and on December 21, 2007 (notional GBP 300,000). In this swap, the Fund has contractually arranged to receive a fixed rate of 3.1825% and pay the UK Non-revised Retail Price Index All Items (the inflation index) during the period from December 19, 2007 to December 19, 2017. | | $ | (68,399 | ) |
101
VANTAGEPOINT FUNDS
NOTES TO THE FINANCIAL STATEMENTS (Unaudited) — (Continued)
| | | | | | | | |
Notional Amount | | Expiration
Date | | Description | | Net Unrealized
Gain/(Loss) | |
| GBP 400,000 | | 12/14/2017 | | This is an Inflation Rate Swap Agreement with Barclays Bank PLC, notional amount GBP 400,000, entered into by PIMCO on December 07, 2007. In this swap, the Fund has contractually arranged to receive a fixed rate of 3.25% and pay the UK Non-revised Retail Price Index All Items (the inflation index) during the period from December 14, 2007 to December 14, 2017. | | $ | (50,360 | ) |
| | | |
| GBP 400,000 | | 1/3/2018 | | This is an Inflation Rate Swap Agreement with Goldman Sachs Capital Markets, notional amount GBP 400,000, entered into by PIMCO on January 03, 2008. In this swap, the Fund has contractually arranged to receive a fixed rate of 3.11% and pay the UK Non-revised Retail Price Index All Items (the inflation index) during the period from January 03, 2008 to January 03, 2018. | | $ | (56,597 | ) |
| | | |
| USD 800,000 | | 6/18/2010 | | This is an Interest Rate Swap Agreement with Bank of America, total notional amount $300,000, entered into by PIMCO on April 23, 2008. In this swap, the Fund has contractually arranged to receive a fixed rate of 4.0% and pay a floating rate of 3-month LIBOR (the floating index), resetting every quarter, during the period from January 8, 2008 to June 18, 2010. | | $ | (6,632 | ) |
| | | |
| USD 300,000 | | 6/18/2013 | | This is an Interest Rate Swap Agreement with Bank of America, total notional amount $300,000, entered into by PIMCO on April 23, 2008. In this swap, the Fund has contractually arranged to receive a fixed rate of 4.0% and pay a floating rate of 3-month LIBOR (the floating index), resetting every quarter, during the period from January 8, 2008 to June 18, 2013. | | $ | 1,233 | |
| | | | | | | | |
| | | | Total Unrealized Gain (Loss) | | $ | (916,369) | |
| | | | | | | | |
Diversified Assets Fund
| | | | | | | | |
Notional Amount | | Expiration
Date | | Description | | Net Unrealized
Gain/(Loss) | |
| USD 1,500,000 | | 12/20/2009 | | This is a Credit Default Swap Agreement with Lehman Brothers Special Finance, notional amount $1,500,000, entered into by Drake Capital Management on October 30, 2007. In this swap, the Fund has contractually arranged to receive 3.6% times the notional amount. The Fund makes payment only upon a default event of Mediacom LLC/Mediacom Capital Corp Note. | | $ | (59,694 | ) |
| | | |
| USD 38,000,000 | | 5/1/2009 | | This is an Interest Rate Swap Agreement with Lehman Brothers Special Finance, notional amount $38,000,000, entered into by Drake Capital Management on October 30, 2007. In this swap, the Fund has contractually arranged to receive a fixed rate of 4.46% and pay a floating rate of 3-month LIBOR (the floating index), resetting every quarter, during the period from November 1, 2007 to May 1, 2009. | | $ | 486,419 | |
102
VANTAGEPOINT FUNDS
NOTES TO THE FINANCIAL STATEMENTS (Unaudited) — (Continued)
| | | | | | | |
Notional Amount | | Expiration
Date | | Description | | Net Unrealized
Gain/(Loss) |
| USD 16,000,000 | | 5/1/2010 | | This is an Interest Rate Swap Agreement with Lehman Brothers Special Finance, notional amount $16,000,000, entered into by Drake Capital Management on October 30, 2007. In this swap, the Fund has contractually arranged to receive a fixed rate of 4.4625% and pay a floating rate of 3-month LIBOR (the floating index), resetting every quarter, during the period from November 1, 2007 to May 1, 2010. | | $ | 310,897 |
| | | |
| USD 38,000,000 | | 11/1/2009 | | This is an Interest Rate Swap Agreement with Lehman Brothers Special Finance, notional amount $38,000,000, entered into by Drake Capital Management on October 30, 2007. In this swap, the Fund has contractually arranged to receive a fixed rate of 4.4475% and pay a floating rate of 3-month LIBOR (the floating index), resetting every quarter, during the period from November 1, 2007 to November 1, 2009. | | $ | 633,978 |
| | | |
| USD 16,000,000 | | 11/1/2010 | | This is an Interest Rate Swap Agreement with Lehman Brothers Special Finance, notional amount $16,000,000, entered into by Drake Capital Management on October 30, 2007. In this swap, the Fund has contractually arranged to receive a fixed rate of 4.5125% and pay a floating rate of 3-month LIBOR (the floating index), resetting every quarter, during the period from November 1, 2007 to November 1, 2010 | | $ | 335,967 |
| | | |
| JPY 3,800,000,000 | | 9/8/2008 | | This is a Total Return Swap Agreement with Morgan Stanley Capital Services, Inc. with respect to the Japanese 10-Year Bond (TSE) futures contracts, notional amount JPY 3,800,000,000, entered into by Analytic Investors on June 9, 2008. In this swap, the Fund has contractually arranged to receive the total return that would otherwise be realized on the underlying futures contracts if the total return is positive or pay the total return that would otherwise be realized on the underlying futures contracts if the total return is negative. | | $ | 608,362 |
| | | |
| GBP (35,500,000) | | 8/27/2008 | | This is a Total Return Swap Agreement with Morgan Stanley Capital Services, Inc. with respect to Long Gilt futures contracts, notional amount GBP (35,500,000), entered into by Analytic Investors on May 27, 2008. In this swap, the Fund has contractually arranged to pay the total return that would otherwise be realized on the underlying futures contracts if the total return is positive or receive the total return that would otherwise be realized on the underlying futures contracts if the total return is negative. | | $ | 1,371,593 |
| | | |
| USD 60,800,000 | | 8/28/2008 | | This is a Total Return Swap Agreement with Morgan Stanley Capital Services, Inc. with respect to U.S. 10-Year Treasury Note futures contracts, notional amount $60,800,000, entered into by Analytic Investors on May 27, 2008. In this swap, the Fund has contractually arranged to receive the total return that would otherwise be realized on the underlying futures contracts if the total return is positive or pay the total return that would otherwise be realized on the underlying futures contracts if the total return is negative. | | $ | 151,985 |
103
VANTAGEPOINT FUNDS
NOTES TO THE FINANCIAL STATEMENTS (Unaudited) — (Continued)
| | | | | | | |
Notional Amount | | Expiration
Date | | Description | | Net Unrealized
Gain/(Loss) |
| USD 2,300,000 | | 8/28/2008 | | This is a Total Return Swap Agreement with Morgan Stanley Capital Services, Inc. with respect to U.S. 10-Year Treasury Note futures contracts, notional amount $2,300,000, entered into by Analytic Investors on June 3, 2008. In this swap, the Fund has contractually arranged to receive the total return that would otherwise be realized on the underlying futures contracts if the total return is positive or pay the total return that would otherwise be realized on the underlying futures contracts if the total return is negative. | | $ | 8,265 |
| | | | | | | |
| | | | Total Unrealized Gain/(Loss) | | $ | 3,847,772 |
| | | | | | | |
SwapOptions (“Swaptions”)
A swaption combines the features of an option and an interest rate swap. A swaption is an option to buy or sell an interest rate swap. Depending on the terms of the particular swaption, a fund will generally incur a greater degree of risk when it writes a swaption than it will incur when it purchases a swaption. When a fund purchases a swaption, it risks losing only the amount of the premium it has paid should it decide to let the option expire unexercised. However, when a fund writes a swaption, upon exercise of the option the fund will become obligated according to the terms of the underlying agreement. The fund records an unrealized gain or loss for the amount expected to be received or paid under the agreement if such agreement was terminated at valuation. The unrealized gain or loss is recorded in the fund’s Statement of Assets and Liabilities. Written swaption activity for the period ended June 30, 2008 was as follows:
| | | | | | | | | | | | | | | |
| | | Call Swaptions | | Put Swaptions | | Total |
Inflation Protected Securities Fund | | # Contracts | | Premium | | # Contracts | | Premium | | # Contracts | | Premium |
Beginning balance as of 01/01/2008 | | 3,600,000 | | $ | 103,985 | | 3,600,000 | | $ | 98,010 | | 7,200,000 | | $ | 201,995 |
| | | | | | | | | | | | | | | |
Contracts written | | 2,200,000 | | $ | 57,970 | | — | | $ | — | | 2,200,000 | | $ | 57,970 |
Contracts closed | | — | | $ | — | | — | | $ | — | | — | | $ | — |
Contracts expired | | — | | $ | — | | — | | $ | — | | — | | $ | — |
| | | | | | | | | | | | | | | |
Ending balance as of 06/30/2008 | | 5,800,000 | | $ | 161,955 | | 3,600,000 | | $ | 98,010 | | 9,400,000 | | $ | 259,965 |
| | | | | | | | | | | | | | | |
Inflation Protected Securities Fund
| | | | | | | | | | | | | | |
Exchange | | Contract | | Notional
Value | | Strike
Price | | | Expiration
Date | | Unrealized
Gain/(Loss) | |
| OTC | | Put—Interest Rate Swap | | $ | 300,000 | | 5.67 | % | | 8/7/2008 | | $ | 10,769 | |
| OTC | | Call—Interest Rate Swap | | $ | 300,000 | | 5.67 | % | | 8/7/2008 | | $ | (17,435 | ) |
| OTC | | Put—Interest Rate Swap | | $ | 400,000 | | 5.67 | % | | 8/7/2008 | | $ | 16,639 | |
| OTC | | Call—Interest Rate Swap | | $ | 400,000 | | 5.67 | % | | 8/7/2008 | | $ | (25,827 | ) |
| OTC | | Put—Interest Rate Swap | | $ | 1,200,000 | | 5.25 | % | | 9/15/2008 | | $ | 23,164 | |
| OTC | | Call—Interest Rate Swap | | $ | 1,200,000 | | 5.25 | % | | 9/15/2008 | | $ | (24,449 | ) |
| OTC | | Call—Interest Rate Swap | | $ | 1,700,000 | | 5.25 | % | | 9/15/2008 | | $ | (34,637 | ) |
| OTC | | Put—Interest Rate Swap | | $ | 1,700,000 | | 5.25 | % | | 9/15/2008 | | $ | 32,816 | |
| OTC | | Call—Interest Rate Swap | | $ | 2,200,000 | | 4.30 | % | | 2/2/2009 | | $ | 25,063 | |
| | | | | | | | | | | | | | |
| | | | | | | | | | | | $ | 6,103 | |
| | | | | | | | | | | | | | |
Repurchase Agreements
Transactions involving purchases of securities under agreements to resell such securities at a specified price and time (“repurchase agreements”) are treated as collateralized financing transactions and are recorded at their contracted resale amounts. These repurchase agreements, if any, are detailed in each fund’s Schedule of Investments. The funds require that the cash investment be fully collateralized based on values that are marked to market daily. The collateral is generally held by an agent bank. It is VIA’s responsibility to value collateral daily and to obtain additional collateral as necessary
104
VANTAGEPOINT FUNDS
NOTES TO THE FINANCIAL STATEMENTS (Unaudited) — (Continued)
to maintain the value at equal to or greater than 102% of market value. The repurchase agreements are collateralized by U.S. Government securities. If the custodian or counterparty becomes bankrupt, the funds’ realization of collateral might be delayed, or the funds may incur a cost or possible losses of principal and income in selling the collateral.
3. Agreements and Other Transactions with Affiliates
VIA, a wholly owned subsidiary of ICMA-RC, provides investment advisory services to each of the funds. Pursuant to Master Advisory Agreements, VIA is entitled to receive 0.10% of the average daily net assets of each Actively Managed, Model Portfolio and Milestone Funds and 0.05% of the average daily net assets of the Index Funds. For these services, VIA received $7,990,396 in the aggregate for the period ended June 30, 2008.
Effective July 1, 2005 the advisory fee paid to VIA for each Model Portfolio Fund is calculated as follows:
| | • | | 0.10% on the first $500 million of net assets |
| | • | | 0.09% on the next $500 million of net assets |
| | • | | 0.08% on net assets over $1 billion. |
VIA and the Company contract with one or more subadvisers (“Subadvisers”) for the day-to-day management of each of the funds other than the Money Market Fund, Model Portfolio Funds and Milestone Funds. Each Subadviser is paid a fee by the funds during the year based on average net assets under management except that the subadviser fee for Analytic Investors Inc. and Mellon Capital Management Corporation for the Diversified Assets Fund is calculated based on the average net asset value of the fund’s assets allocated and assigned to each of them by VIA. The fee structure for many of the Subadvisers provides for a range of fees so that as average net assets of a fund increase the rate of fee paid decreases. With other subadvisers, one fee is applicable to all levels of assets under management. Additional information about each Subadviser’s fee is presented in the funds’ Prospectus and Statement of Additional Information. Presented below are the fees paid by the funds to Subadvisers during the period ended June 30, 2008. Fees are shown as an annual percentage of average net assets under management except that the subadviser fee for Analytic Investors Inc. and Mellon Capital Management Corporation for the Diversified Assets Fund is calculated based on the average net asset value of the assets allocated and assigned to each of them by VIA as well as total dollars paid. The total dollars below represent amounts paid to Subadvisers for services performed during the period July 1, 2007 through March 31, 2008.
| | | | | | | |
Fund | | Subadviser | | Contractual Fee
as a Percentage of
Average Daily
Net Assets (net of
subadviser fee waivers) | | Dollars Paid |
| Low Duration Bond | | Payden & Rygel | | 0.10% | | $ | 127,877 |
| | STW Fixed Income Management Ltd. | | 0.19% | | | — |
| | | |
| Inflation Protected Securities | | Pacific Investment Management Company, LLC | | 0.20% | | | 147,606 |
| | BlackRock Financial Management, Inc.* | | 0.11% | | | 23,781 |
| | | |
| Asset Allocation | | Mellon Capital Management Corporation | | 0.24% | | | 846,081 |
| | | |
| Equity Income | | Barrow, Hanley, Mewhinney & Strauss, Inc. | | 0.24% | | | 646,701 |
| | T. Rowe Price Associates, Inc. | | 0.37% | | | 1,019,031 |
| | Southeastern Asset Management, Inc. | | 0.52% | | | 1,453,924 |
| | | |
| Growth & Income | | Capital Guardian Trust Company (1) | | 0.24% | | | 426,170 |
| | T. Rowe Price Associates, Inc. | | 0.38% | | | 691,097 |
| | Wellington Management Company, LLP | | 0.28% | | | 507,277 |
| | | |
| Growth | | Goldman Sachs Asset Management, L.P. | | 0.23% | | | 346,130 |
| | Legg Mason Capital Management, Inc. | | 0.39% | | | 1,179,176 |
| | Peregrine Capital Management, Inc. | | 0.36% | | | 1,108,794 |
| | Tukman Grossman Capital Management, Inc. | | 0.50% | | | 1,252,166 |
| | Westfield Capital Management Company, L.P. | | 0.33% | | | 736,364 |
105
VANTAGEPOINT FUNDS
NOTES TO THE FINANCIAL STATEMENTS (Unaudited) — (Continued)
| | | | | | | |
Fund | | Subadviser | | Contractual Fee
as a Percentage of
Average Daily
Net Assets (net of
subadviser fee waivers) | | Dollars Paid |
| Select Value* | | Goldman Sachs Asset Management, L.P. | | 0.28% | | $ | 43,852 |
| | WEDGE Capital Management L.L.P. | | 0.55% | | | 87,321 |
| | Systematic Financial Management L.P. | | 0.43% | | | 169,276 |
| | | |
| Aggressive Opportunities | | Legg Mason Capital Management, Inc. | | 0.00% | | | 538,416 |
| | Southeastern Asset Management, Inc. | | 0.56% | | | 621,333 |
| | TimesSquare Capital Management, LLC | | 0.50% | | | 842,421 |
| | T. Rowe Price Associates, Inc. | | 0.58% | | | 862,688 |
| | | |
| Discovery* | | Payden & Rygel | | 0.15% | | | 240,381 |
| | Wellington Management Company, LLP | | 0.73% | | | 51,884 |
| | | |
| International | | Artisan Partners Limited Partnership | | 0.70% | | | 968,007 |
| | Capital Guardian Trust Company (2) | | 0.40% | | | 767,826 |
| | GlobeFlex Capital, LP | | 0.40% | | | 547,127 |
| | Walter Scott & Partners Limited | | 0.56% | | | 817,526 |
| | | |
| Diversified Assets* | | Analytic Investors, LLC | | 0.45% | | | — |
| | Drake Capital Management, LLC | | 0.23% | | | 62,226 |
| | Mellon Capital Management Corporation | | 0.65% | | | 385,050 |
| | Payden & Rygel | | 0.08% | | | 79,398 |
| | | |
| Core Bond Index | | Mellon Capital Management Corporation | | 0.02% | | | 117,886 |
| | | |
| 500 Stock Index | | Mellon Capital Management Corporation | | 0.02% | | | 60,450 |
| | | |
| Broad Market Index | | Mellon Capital Management Corporation | | 0.02% | | | 105,647 |
| | | |
| Mid/Small Company Index | | Mellon Capital Management Corporation | | 0.04% | | | 66,474 |
| | | |
| Overseas Equity Index | | Mellon Capital Management Corporation | | 0.07% | | | 122,193 |
| * | Covers period from November 1, 2007—June 30, 2008 |
| (1) | Minimum fee of $167,500 per year. |
| (2) | Minimum fee of $337,500 per year. |
Expenses
The Model Portfolio Funds and Milestone Funds incur fees and expenses indirectly as shareholders in their respective underlying funds and the Money Market Fund incurs fees and expenses indirectly as a shareholder of the Portfolio. Because the underlying funds have varied expense and fee levels and the Model Portfolio, Milestone and Money Market Funds may own different proportions of such funds at different times, the amount of fees and expenses indirectly incurred by the Model Portfolio, Milestone, and Money Market Funds will vary.
Fee Waivers
If the aggregate advisory fees of the Growth Fund exceed 0.54% because of subadvisory changes, VIA will waive its advisory fee or reimburse expenses to the extent necessary on any resulting increase in subadvisory fees payable by the Growth Fund. This commitment will continue until such time as shareholders approve an increase in this limit. For the period ended June 30, 2008, no waiver or reimbursement was necessary to comply with the 0.54% maximum subadvisory fee rate.
From January 3, 2005 until April 30, 2006, VIA contractually agreed to waive fees and/or reimburse expenses to each of the Milestone Funds limiting the direct operating expenses to no more than 0.05% of the Fund’s average daily net assets on an annualized basis. From May 1, 2006 through April 30, 2009, VIA contractually agreed to limit each Fund’s total fund operating expenses to the following percentages:
| | | |
Milestone Retirement Income | | 0.81 | % |
Milestone 2010 | | 0.88 | % |
Milestone 2015 | | 0.91 | % |
Milestone 2020 | | 0.93 | % |
Milestone 2025 | | 0.95 | % |
Milestone 2030 | | 0.97 | % |
Milestone 2035 | | 0.99 | % |
Milestone 2040 | | 0.99 | % |
106
VANTAGEPOINT FUNDS
NOTES TO THE FINANCIAL STATEMENTS (Unaudited) — (Continued)
For the period ended June 30, 2008, VIA reimbursed each fund as follows:
| | | |
Milestone Retirement Income | | $ | 52,398 |
Milestone 2010 | | $ | 38,022 |
Milestone 2015 | | $ | 31,039 |
Milestone 2020 | | $ | 24,229 |
Milestone 2025 | | $ | 25,619 |
Milestone 2030 | | $ | 24,750 |
Milestone 2035 | | $ | 25,418 |
Milestone 2040 | | $ | 26,664 |
T. Rowe Price voluntarily waives a portion of its aggregate subadvisory fees for the Growth & Income, Equity Income and Aggressive Opportunities Funds. This voluntary fee waiver was first implemented on May 1, 2003. Through September 30, 2005, 2.5% of the aggregate fees were waived on total assets managed between $250 million and $500 million and 5% of the aggregate fees were waived on total assets managed in excess of $500 million. Effective October 1, 2005, 2.5% of the aggregate fees were waived on the first $500 million of assets managed and 5% on assets managed in excess of $500 million. For the period ended June 30, 2008, this voluntary fee waiver totaled $95,990 of which $39,559 was allocated to the Equity Income Fund, $26,274 to the Growth & Income Fund and $30,157 to the Aggressive Opportunities Fund. Goldman Sachs Asset Management, L.P. has agreed to voluntarily waive a portion of its subadvisory fee for the Select Value Fund to 0.28% on the first $200 million of assets, 0.245% on the next $500 million of assets, and 0.224% on assets over $700 million. For the period ended June 30, 2008, this waiver totaled $56,232. Payden & Rygel has agreed to waive its investment subadvisory fee until April 30, 2009 for the Diversified Assets Fund so that its fees will not exceed 0.08% of assets. For the period ended June 30, 2008, this waiver totaled $21,714. Legg Mason Capital Management has voluntarily agreed to waive its fee for the Aggressive Opportunities Fund to 0.00% for the quarters ending June 30, 2008 and September 30, 2008. This waiver equaled $251,155 for the quarter ended June 30, 2008.
4. Investment Portfolio Transactions
Purchases and sales of investments, exclusive of short-term securities, for each fund for the period ended June 30, 2008 were as follows:
| | | | | | | | | | | | |
| | | U.S. Government Obligations | | Other Securities |
Fund | | Purchases at Cost | | Sales Proceeds | | Purchases at Cost | | Sales Proceeds |
Low Duration Bond | | $ | 70,649,098 | | $ | 39,113,603 | | $ | 153,809,309 | | $ | 183,882,646 |
Inflation Protected Securities | | | 111,613,030 | | | 111,331,550 | | | 173,975,381 | | | 109,064,270 |
Asset Allocation | | | — | | | — | | | 8,919,064 | | | 7,360,242 |
Equity Income | | | — | | | — | | | 218,333,935 | | | 209,530,927 |
Growth & Income | | | — | | | — | | | 286,730,171 | | | 270,752,720 |
Growth | | | — | | | — | | | 627,020,808 | | | 669,732,996 |
Select Value | | | — | | | — | | | 138,550,279 | | | 127,104,991 |
Aggressive Opportunities | | | — | | | — | | | 258,826,543 | | | 292,977,882 |
Discovery | | | 4,227,813 | | | 21,871,687 | | | 59,089,067 | | | 39,417,358 |
International | | | — | | | — | | | 314,974,965 | | | 297,611,846 |
107
VANTAGEPOINT FUNDS
NOTES TO THE FINANCIAL STATEMENTS (Unaudited) — (Continued)
| | | | | | | | | | | | |
| | | U.S. Government Obligations | | Other Securities |
Fund | | Purchases at Cost | | Sales Proceeds | | Purchases at Cost | | Sales Proceeds |
Diversified Assets | | $ | 34,687,266 | | $ | 15,386,133 | | $ | 203,980,316 | | $ | 100,829,086 |
Core Bond Index | | | 126,657,434 | | | 136,011,023 | | | 142,727,609 | | | 150,885,401 |
500 Stock Index | | | — | | | — | | | 5,532,579 | | | 13,591,585 |
Broad Market Index | | | — | | | — | | | 11,594,174 | | | 27,026,402 |
Mid/Small Company Index | | | — | | | — | | | 13,340,465 | | | 13,349,579 |
Overseas Equity Index | | | — | | | — | | | 7,647,077 | | | 15,701,716 |
Model Portfolio Savings Oriented | | | — | | | — | | | 19,715,063 | | | 13,575,597 |
Model Portfolio Conservative Growth | | | — | | | — | | | 33,649,169 | | | 39,719,327 |
Model Portfolio Traditional Growth | | | — | | | — | | | 85,260,446 | | | 77,768,076 |
Model Portfolio Long-Term Growth | | | — | | | — | | | 101,199,244 | | | 64,643,696 |
Model Portfolio All-Equity Growth | | | — | | | — | | | 33,991,163 | | | 20,112,580 |
Milestone Retirement Income | | | — | | | — | | | 7,794,599 | | | 7,341,972 |
Milestone 2010 | | | — | | | — | | | 13,636,259 | | | 8,199,586 |
Milestone 2015 | | | — | | | — | | | 20,128,194 | | | 12,833,054 |
Milestone 2020 | | | — | | | — | | | 22,873,693 | | | 3,279,127 |
Milestone 2025 | | | — | | | — | | | 16,261,540 | | | 3,012,737 |
Milestone 2030 | | | — | | | — | | | 15,218,937 | | | 1,888,897 |
Milestone 2035 | | | — | | | — | | | 9,094,187 | | | 1,369,721 |
Milestone 2040 | | | — | | | — | | | 10,287,711 | | | 1,903,148 |
5. Tax Basis Unrealized Appreciation (Depreciation)
The cost of investments on a tax basis includes adjustments for financial reporting purposes as of the most recently completed Federal income tax reporting period end. At June 30, 2008, tax basis unrealized appreciation (depreciation) on investments was as follows:
| | | | | | | | | | | | | |
Fund | | Federal Income
Tax Cost | | Gross
Unrealized
Appreciation | | Gross
Unrealized
Depreciation | | Tax Basis
Net Unrealized
Appreciation/
(Depreciation) | |
Money Market | | $ | 354,969,445 | | $ | — | | $ | — | | $ | — | |
Low Duration Bond | | | 615,325,209 | | | 3,244,913 | | | 5,333,913 | | | (2,089,000 | ) |
Inflation Protected Securities | | | 458,042,470 | | | 7,422,706 | | | 1,178,310 | | | 6,244,396 | |
Asset Allocation | | | 595,372,915 | | | 137,345,751 | | | 82,216,106 | | | 55,129,645 | |
Equity Income | | | 1,673,100,266 | | | 285,230,402 | | | 275,596,373 | | | 9,634,029 | |
Growth & Income | | | 1,058,018,889 | | | 125,966,684 | | | 120,502,449 | | | 5,464,235 | |
Growth | | | 2,290,210,417 | | | 232,655,793 | | | 181,009,936 | | | 51,645,857 | |
Select Value | | | 366,839,365 | | | 9,668,038 | | | 36,473,604 | | | (26,805,566 | ) |
Aggressive Opportunities | | | 1,253,277,828 | | | 153,808,585 | | | 197,420,136 | | | (43,611,551 | ) |
Discovery | | | 214,197,724 | | | 6,532,425 | | | 21,073,437 | | | (14,541,012 | ) |
International | | | 1,063,715,643 | | | 128,669,637 | | | 86,346,850 | | | 42,322,787 | |
Diversified Assets | | | 446,271,976 | | | 1,192,346 | | | 2,079,863 | | | (887,517 | ) |
Core Bond Index | | | 1,229,044,046 | | | 9,093,135 | | | 21,545,803 | | | (12,452,668 | ) |
500 Stock Index | | | 242,241,884 | | | 188,618,280 | | | 59,742,876 | | | 128,875,404 | |
Broad Market Index | | | 471,855,688 | | | 251,101,738 | | | 97,054,091 | | | 154,047,647 | |
Mid/Small Company Index | | | 236,442,792 | | | 65,230,217 | | | 41,610,244 | | | 23,619,973 | |
Overseas Equity Index | | | 194,990,535 | | | 44,178,174 | | | 19,207,744 | | | 24,970,430 | |
Model Portfolio Savings Oriented | | | 315,321,445 | | | 117,178 | | | 6,552,143 | | | (6,434,965 | ) |
Model Portfolio Conservative Growth | | | 574,708,115 | | | — | | | 9,052,603 | | | (9,052,603 | ) |
Model Portfolio Traditional Growth | | | 1,434,374,118 | | | — | | | 33,681,115 | | | (33,681,115 | ) |
Model Portfolio Long-Term Growth | | | 1,602,171,508 | | | 18,151,682 | | | 36,803,480 | | | (18,651,798 | ) |
Model Portfolio All-Equity Growth | | | 595,293,862 | | | 2,781,512 | | | 48,105,735 | | | (45,324,223 | ) |
108
VANTAGEPOINT FUNDS
NOTES TO THE FINANCIAL STATEMENTS (Unaudited) — (Continued)
| | | | | | | | | | | | | |
Fund | | Federal Income
Tax Cost | | Gross
Unrealized
Appreciation | | Gross
Unrealized
Depreciation | | Tax Basis
Net Unrealized
Appreciation/
(Depreciation) | |
Milestone Retirement Income | | $ | 56,213,604 | | $ | 180,715 | | $ | 3,141,769 | | $ | (2,961,054 | ) |
Milestone 2010 | | | 77,372,411 | | | 231,800 | | | 4,824,516 | | | (4,592,716 | ) |
Milestone 2015 | | | 149,189,332 | | | 194,007 | | | 11,818,475 | | | (11,624,468 | ) |
Milestone 2020 | | | 134,553,193 | | | 55,063 | | | 11,045,549 | | | (10,990,486 | ) |
Milestone 2025 | | | 99,609,908 | | | 39,591 | | | 9,359,450 | | | (9,319,859 | ) |
Milestone 2030 | | | 77,290,673 | | | 25,339 | | | 8,017,175 | | | (7,991,836 | ) |
Milestone 2035 | | | 44,461,053 | | | 6,582 | | | 5,259,460 | | | (5,252,878 | ) |
Milestone 2040 | | | 43,456,224 | | | — | | | 5,487,590 | | | (5,487,590 | ) |
6. Portfolio Securities Loaned
Certain funds lend securities to approved brokers to earn additional income. As of June 30, 2008, certain funds had loaned securities, which were collateralized by cash, cash equivalents, or U.S. Government Obligations. Each fund receives compensation in connection with the securities lending program. Collateral is maintained over the life of the loan in an amount not less than 102% of the value of the loaned securities for domestic securities and 105% for foreign securities, as determined by the funds at the close of business each day. Any additional collateral required due to changes in the value of securities is delivered to the funds the next business day. Although the collateral mitigates risk, the funds could experience a delay in recovering their securities and a possible loss of income or value if the borrower fails to return the securities. The funds have the right under the securities lending agreement to recover the securities from the borrower on demand. The risks to the funds associated with securities lending are that the borrower may not provide additional collateral when required or return the securities when due.
The funds will be indemnified by its custodian for securities lending programs conducted through the custodian if at the time of a default by a borrower some or all of the loaned securities have not been returned by the borrower. The custodian, as soon as practicable after the time of default, shall deposit in the funds’ account securities of the same number, issue, type, class and series of the unreturned loaned securities. If the custodian is unable to purchase replacement securities, it will credit to the funds’ account an amount equal to the market value of the unreturned loaned securities.
The market value of the securities on loan and the value of the related collateral as June 30, 2008, were as follows:
| | | | | | | | | |
Fund | | Securities on Loan | | Collateral | | Collateralization | |
Low Duration Bond | | $ | 110,879,477 | | $ | 113,124,259 | | 102 | % |
Inflation Protected Securities | | | 100,113,357 | | | 102,327,712 | | 102 | % |
Asset Allocation | | | 26,201,038 | | | 27,099,058 | | 103 | % |
Equity Income | | | 149,727,913 | | | 155,350,007 | | 104 | % |
Growth & Income | | | 69,679,417 | | | 72,424,113 | | 104 | % |
Growth | | | 128,697,897 | | | 131,529,337 | | 102 | % |
Select Value | | | 59,876,131 | | | 62,000,345 | | 104 | % |
Aggressive Opportunities | | | 220,441,019 | | | 229,834,163 | | 104 | % |
Discovery | | | 38,885,642 | | | 40,556,855 | | 104 | % |
International | | | 66,558,085 | | | 69,583,854 | | 105 | % |
Core Bond Index | | | 161,176,153 | | | 164,290,393 | | 102 | % |
500 Stock Index | | | 19,475,974 | | | 20,172,572 | | 104 | % |
Broad Market Index | | | 65,230,084 | | | 67,769,337 | | 104 | % |
Mid/Small Company Index | | | 50,258,835 | | | 52,440,852 | | 104 | % |
Overseas Equity Index | | | 12,856,349 | | | 13,514,977 | | 105 | % |
109
VANTAGEPOINT FUNDS
NOTES TO THE FINANCIAL STATEMENTS (Unaudited) — (Continued)
7. Transactions with Affiliated Funds
At June 30, 2008 the Model Portfolio Funds and Milestone Funds held investments in a number of the underlying funds. The figures presented below represent the percentage of shares outstanding in each of the underlying funds owned by the Model Portfolio and Milestone Funds:
| | | | | | | | | | | | | | |
Underlying Fund | | Model
Portfolio
Savings
Oriented | | | Model
Portfolio
Conservative
Growth | | | Model
Portfolio
Traditional
Growth | | | Model
Portfolio
Long-Term
Growth | | Model
Portfolio
All-Equity
Growth | |
Low Duration Bond | | 26.71 | % | | 26.34 | % | | 22.94 | % | | — | | — | |
Inflation Protected Securities | | 8.15 | % | | 10.83 | % | | 16.74 | % | | — | | — | |
Equity Income | | 1.93 | % | | 3.92 | % | | 10.66 | % | | 13.16% | | 6.45 | % |
Growth & Income | | 2.97 | % | | 4.94 | % | | 16.39 | % | | 20.21% | | 9.33 | % |
Growth | | — | | | 1.50 | % | | 6.23 | % | | 8.13% | | 4.25 | % |
Select Value | | — | | | 5.94 | % | | 27.26 | % | | 47.76% | | 18.66 | % |
Aggressive Opportunities | | — | | | 1.68 | % | | 7.72 | % | | 13.55% | | 5.29 | % |
Discovery | | — | | | — | | | 25.59 | % | | 43.66% | | 30.58 | % |
International | | 1.44 | % | | 4.24 | % | | 15.84 | % | | 24.08% | | 10.62 | % |
Diversified Assets | | 6.88 | % | | 12.72 | % | | 31.85 | % | | 36.44% | | — | |
Core Bond Index Class I | | 4.76 | % | | 13.80 | % | | 30.36 | % | | 28.92% | | — | |
| | | | | |
Underlying Fund | | Milestone
Retirement
Income | | | Milestone
2010 | | | Milestone
2015 | | | Milestone
2020 | | Milestone
2025 | |
Low Duration Bond | | 4.27 | % | | 4.78 | % | | 4.85 | % | | 1.98% | | 0.55 | % |
Inflation Protected Securities | | 1.40 | % | | 1.68 | % | | 1.58 | % | | — | | — | |
Equity Income | | 0.41 | % | | 0.67 | % | | 1.65 | % | | 1.74% | | 1.35 | % |
Growth & Income | | 0.62 | % | | 0.84 | % | | 1.49 | % | | 1.43% | | 1.17 | % |
Growth | | — | | | 0.09 | % | | 0.45 | % | | 0.47% | | 0.38 | % |
International | | 0.30 | % | | 0.53 | % | | 1.42 | % | | 1.50% | | 1.25 | % |
Diversified Assets | | 1.18 | % | | 1.60 | % | | 3.07 | % | | 2.74% | | 2.03 | % |
Core Bond Index Class I | | 0.69 | % | | 0.94 | % | | 2.39 | % | | 2.72% | | 1.67 | % |
Mid/Small Company Index Class I | | — | | | 1.45 | % | | 8.37 | % | | 11.06% | | 10.27 | % |
| | | | |
| | | Milestone | | | Milestone | | | Milestone | | | | |
Underlying Fund | | 2030 | | | 2035 | | | 2040 | | |
Equity Income | | 1.11 | % | | 0.65 | % | | 0.64 | % | |
Growth & Income | | 0.98 | % | | 0.57 | % | | 0.57 | % | |
Growth | | 0.33 | % | | 0.20 | % | | 0.21 | % | |
International | | 1.06 | % | | 0.65 | % | | 0.65 | % | |
Diversified Assets | | 1.22 | % | | 0.26 | % | | — | | |
Core Bond Index Class I | | 1.04 | % | | 0.52 | % | | 0.45 | % | |
Mid/Small Company Index Class I | | 9.83 | % | | 6.72 | % | | 7.19 | % | |
8. Control Persons and Principal Holders of Securities
As of June 30, 2008, a majority of the voting shares of all funds, except the Money Market Fund, were held either directly, or indirectly through the Model Portfolio Funds and the Milestone Funds and by the VantageTrust, a group trust sponsored and maintained by the VantageTrust Company (“Trust Company”). The VantageTrust was established for the purpose of holding and investing the assets of public sector retirement and deferred compensation plans. The Trust Company, a New Hampshire non-depository banking corporation, has the power to vote the shares of the funds directly held by the VantageTrust and has the power to direct the vote of the shares of the Model Portfolio Funds and the Milestone Funds under the proxy voting policy adopted by VIA, the funds’ adviser, and is therefore considered a “control” person of the funds for purposes of the 1940 Act. Both the Trust Company and VIA are wholly owned subsidiaries of ICMA-RC. As a control person of all the funds, the Trust Company may possess the ability to control the outcome of matters submitted to the vote of shareholders.
110
VANTAGEPOINT FUNDS
NOTES TO THE FINANCIAL STATEMENTS (Unaudited) — (Continued)
Additionally, at June 30, 2008 the VantageTrust, an affiliated group trust held, directly or indirectly, the outstanding shares of the Company in the percentages shown below:
| | | |
Fund | | % Owned
by the
VantageTrust | |
Money Market | | 39.83 | % |
Low Duration Bond | | 83.56 | % |
Inflation Protected Securities | | 93.23 | % |
Asset Allocation | | 97.27 | % |
Equity Income | | 94.17 | % |
Growth & Income | | 93.96 | % |
Growth | | 97.77 | % |
Select Value | | 95.76 | % |
Aggressive Opportunities | | 96.91 | % |
Discovery | | 96.00 | % |
International | | 95.24 | % |
Diversified Assets | | 93.95 | % |
Core Bond Index Class I | | 91.82 | % |
Core Bond Index Class II | | 100.00 | % |
500 Stock Index Class I | | 85.43 | % |
500 Stock Index Class II | | 100.00 | % |
Broad Market Index Class I | | 86.44 | % |
Broad Market Index Class II | | 92.12 | % |
Mid/ Small Co Index Class I | | 84.32 | % |
Mid/ Small Co Index Class II | | 100.00 | % |
Overseas Index Class I | | 81.81 | % |
Overseas Index Class II | | 99.99 | % |
Model Portfolio Savings Oriented | | 88.57 | % |
Model Portfolio Conservative Growth | | 90.92 | % |
Model Portfolio Traditional Growth | | 95.17 | % |
Model Portfolio Long-Term Growth | | 96.78 | % |
Model Portfolio All-Equity Growth | | 95.61 | % |
Milestone Retirement Income | | 76.16 | % |
Milestone 2010 | | 88.06 | % |
Milestone 2015 | | 90.01 | % |
Milestone 2020 | | 91.12 | % |
Milestone 2025 | | 89.85 | % |
Milestone 2030 | | 89.07 | % |
Milestone 2035 | | 87.22 | % |
Milestone 2040 | | 82.75 | % |
9. Brokerage Commissions
VIA has entered into agreements with brokers whereby the brokers will rebate a portion of the funds’ brokerage commissions on behalf of certain funds. Such amounts, under such agreements, are included in net realized gain (loss) on the sale of investments presented in the Statement of Operations. For the period ended June 30, 2008, the Funds recaptured the following amounts of brokerage commissions:
| | | |
Fund | | Recaptured Brokerage
Commissions |
Equity Income | | $ | 8,702 |
Growth | | | 123,581 |
Select Value | | | 16,732 |
Aggressive Opportunities | | | 60,035 |
Discovery | | | 5,144 |
International | | | 6,941 |
111
VANTAGEPOINT FUNDS
NOTES TO THE FINANCIAL STATEMENTS (Unaudited) — (Continued)
10. Additional Distributions in Prior Years
In order to comply with requirements of the Internal Revenue Code applicable to regulated investment companies, the Low Duration Bond Fund, formerly the Income Preservation Fund, was required to distribute accumulated net realized gains, if any, on an annual basis. When such distributions were made, the immediate effect was a corresponding reduction in the net asset value per share. Given the objective of the fund to maintain a stable net asset value per share, the fund declared a reverse stock split immediately subsequent to the distribution at a rate that caused the total number of shares held by each shareholder, including shares acquired on reinvestment of that distribution, to remain the same as before the distribution was paid and reinstated the same net asset value of $100 per share as before the distribution. The last such distribution and reverse stock split occurred on December 31, 2003. The Income Preservation Fund’s transition to the Low Duration Bond Fund eliminated the need for this distribution procedure.
11. Stock Split in the Low Duration Bond Fund (formerly the Short-Term Bond Fund)
On October 28, 2005, a “stock split” was processed in the Vantagepoint Low Duration Bond Fund. Specifically, there was a “10 for 1” split meaning that the shares outstanding were increased by a multiple of 10 and the NAV was divided by 10. Therefore, this action had no impact on the aggregate value of the shares outstanding. The record date (shareholders of record on this date were affected) was Thursday, October 27, 2005. The payable date (the date the stock split posted to shareholder accounts) was Friday, October 28, 2005. The ex-date (the date the NAV changed to reflect the split) was Friday, October 28, 2005. Share transactions, shares outstanding, NAVs, and per share ratios for prior years in the Statement of Changes in Net Assets and the Financial Highlights have been restated to reflect historical application of the “10 for 1” split in order to present these items on a basis comparable to the current year, as required by generally accepted accounting principles.
12. Recently Issued Accounting Pronouncements
The funds adopted Financial Accounting Standards Board Statement of Financial Accounting Standards No.157, Fair Value Measurements (“FAS 157”), effective January 1, 2008. In accordance with FAS 157, fair value is defined as the price that the Fund would receive upon selling an investment in orderly transaction to an independent buyer in the principal or most advantageous market of the investment. FAS 157 established a three-tier hierarchy which maximizes the use of observable market data and minimizes the use of unobservable inputs to establish classification of fair value measurements for disclosure purpose. Inputs refer broadly to the assumptions that market participants would use in pricing the asset or liability, including assumptions about risk, for example, the risk inherent in a particular valuation technique used to measure fair value including such a pricing model and/or the risk inherent in the inputs to the valuation technique. Inputs may be observable or unobservable. Observable inputs are inputs that reflect the assumptions market participants would use in pricing the asset or liability developed based on market data obtained from sources independent of the reporting entity. Unobservable inputs are inputs that reflect the reporting entity’s own assumptions about the assumptions market participants would use in pricing asset or liability based on the best information available in the circumstances. The three-tier hierarchy of inputs is summarized in the three broad Levels listed below.
| | | | |
| Level 1 | | — | | quoted prices in active markets for identical investments |
| | |
| Level 2 | | — | | other significant observable inputs (including quoted prices for similar investments in active markets, interest rates and yield curves, prepayment speeds, credit risks, etc.) |
| | |
| Level 3 | | — | | significant unobservable inputs (including the Fund’s own assumptions about the assumptions that market participants would use in determining the fair value of investments) |
The valuation techniques used by the funds to measure fair value during the period ended June 30, 2008 maximized the use of observable inputs and minimized the use of unobservable inputs. The funds utilized the following fair value techniques: multi-dimensional relational pricing model, option adjusted spread pricing and estimated the price that would have prevailed in a liquid market for an international equity given information available at the time of evaluation.
112
VANTAGEPOINT FUNDS
NOTES TO THE FINANCIAL STATEMENTS (Unaudited) — (Continued)
The following is a summary of the inputs used as of June 30, 2008, in valuing each Fund’s investment carried at value:
| | | | | | | | | | | | | | | | | | | | | | | | | | | |
| | | Investments in Securities | | Other Financial Instruments* | |
| | | Level 1—
Quoted
Prices | | Level 2—
Other
Significant
Observable
Inputs | | Level 3—
Significant
Unobservable
Inputs | | Total | | Level 1—
Quoted
Prices | | | Level 2—
Other
Significant
Observable
Inputs | | | Level 3—
Significant
Unobservable
Inputs | | Total | |
Money Market | | $ | — | | $ | 354,969,445 | | $ | — | | $ | 354,969,445 | | $ | — | | | $ | — | | | $ | — | | $ | — | |
Low Duration Bond | | | — | | | 613,236,209 | | | — | | | 613,236,209 | | | — | | | | — | | | | — | | | — | |
Inflation Protected Securities | | | — | | | 464,286,866 | | | — | | | 464,286,866 | | | (112,891 | ) | | | (868,914 | ) | | | — | | | (981,805 | ) |
Asset Allocation | | | 514,047,261 | | | 136,455,299 | | | — | | | 650,502,560 | | | (8,392,205 | ) | | | — | | | | — | | | (8,392,205 | ) |
Equity Income | | | 1,461,251,164 | | | 221,483,131 | | | — | | | 1,682,734,295 | | | — | | | | — | | | | — | | | — | |
Growth & Income | | | 958,620,075 | | | 104,863,049 | | | — | | | 1,063,483,124 | | | — | | | | — | | | | — | | | — | |
Growth | | | 2,141,845,282 | | | 200,010,992 | | | — | | | 2,341,856,274 | | | — | | | | — | | | | — | | | — | |
Select Value | | | 272,327,987 | | | 67,705,812 | | | — | | | 340,033,799 | | | (19,719 | ) | | | — | | | | — | | | (19,719 | ) |
Aggressive Opportunities | | | 910,448,542 | | | 299,217,735 | | | — | | | 1,209,666,277 | | | — | | | | — | | | | — | | | — | |
Discovery | | | 75,234,464 | | | 124,422,248 | | | — | | | 199,656,712 | | | (4,909,067 | ) | | | — | | | | — | | | (4,909,067 | ) |
International | | | 103,445,812 | | | 1,002,592,618 | | | — | | | 1,106,038,430 | | | — | | | | 489,055 | | | | — | | | 489,055 | |
Diversified Assets | | | 3,274,328 | | | 442,110,131 | | | — | | | 445,384,459 | | | (2,434,724 | ) | | | 5,903,753 | | | | — | | | 3,469,029 | |
Core Bond Index | | | — | | | 1,216,591,378 | | | — | | | 1,216,591,378 | | | — | | | | — | | | | — | | | — | |
500 Stock Index | | | 343,886,267 | | | 27,231,021 | | | — | | | 371,117,288 | | | (354,792 | ) | | | — | | | | — | | | (354,792 | ) |
Broad Market Index | | | 550,773,997 | | | 75,129,338 | | | — | | | 625,903,335 | | | (368,987 | ) | | | — | | | | — | | | (368,987 | ) |
Mid/Small | | | | | | | | | | | | | | | | | | | | | | | | | | | |
Company Index | | | 203,687,080 | | | 56,375,685 | | | — | | | 260,062,765 | | | (125,935 | ) | | | — | | | | — | | | (125,935 | ) |
Overseas Equity Index | | | — | | | 219,960,965 | | | — | | | 219,960,965 | | | (385,506 | ) | | | 13,102 | | | | — | | | (372,404 | ) |
Model Portfolio Savings Oriented | | | — | | | 308,886,480 | | | — | | | 308,886,480 | | | — | | | | — | | | | — | | | — | |
Model Portfolio Conservative Growth | | | — | | | 565,655,512 | | | — | | | 565,655,512 | | | — | | | | — | | | | — | | | — | |
Model Portfolio Traditional Growth | | | — | | | 1,400,693,003 | | | — | | | 1,400,693,003 | | | — | | | | — | | | | — | | | — | |
Model Portfolio Long-Term Growth | | | — | | | 1,583,519,710 | | | — | | | 1,583,519,710 | | | — | | | | — | | | | — | | | — | |
Model Portfolio All-Equity Growth | | | — | | | 549,969,639 | | | — | | | 549,969,639 | | | — | | | | — | | | | — | | | — | |
Milestone Retirement Income | | | — | | | 53,252,550 | | | — | | | 53,252,550 | | | — | | | | — | | | | — | | | — | |
Milestone 2010 | | | — | | | 72,779,695 | | | — | | | 72,779,695 | | | — | | | | — | | | | — | | | — | |
Milestone 2015 | | | — | | | 137,564,864 | | | — | | | 137,564,864 | | | — | | | | — | | | | — | | | — | |
Milestone 2020 | | | — | | | 123,562,707 | | | — | | | 123,562,707 | | | — | | | | — | | | | — | | | — | |
Milestone 2025 | | | — | | | 90,290,049 | | | — | | | 90,290,049 | | | — | | | | — | | | | — | | | — | |
Milestone 2030 | | | — | | | 69,298,837 | | | — | | | 69,298,837 | | | — | | | | — | | | | — | | | — | |
Milestone 2035 | | | — | | | 39,208,175 | | | — | | | 39,208,175 | | | — | | | | — | | | | — | | | — | |
Milestone 2040 | | | — | | | 37,968,634 | | | — | | | 37,968,634 | | | — | | | | — | | | | — | | | — | |
| * | Other financial instruments include futures, swaps, and foreign forward currency contracts. |
113
VANTAGEPOINT FUNDS
NOTES TO THE FINANCIAL STATEMENTS (Unaudited) — (Continued)
Liabilities Valuation Inputs
| | | | | | | | | | | | | | | | | | | | | | | | |
| | | Securities Sold Short | | Other Financial Instruments* |
| | | Level 1—
Quoted
Prices | | Level 2—
Other
Significant
Observable
Inputs | | Level 3—
Significant
Unobservable
Inputs | | Total | | Level 1—
Quoted
Prices | | Level 2—
Other
Significant
Observable
Inputs | | Level 3—
Significant
Unobservable
Inputs | | Total |
Money Market | | $ | — | | $ | — | | $ | — | | $ | — | | $ | — | | $ | — | | $ | — | | $ | — |
Low Duration Bond | | | — | | | — | | | — | | | — | | | — | | | — | | | — | | | — |
Inflation Protected Securities | | | — | | | — | | | — | | | — | | | 6,103 | | | — | | | — | | | 6,103 |
Asset Allocation | | | — | | | — | | | — | | | — | | | — | | | — | | | — | | | — |
Equity Income | | | — | | | — | | | — | | | — | | | — | | | — | | | — | | | — |
Growth & Income | | | — | | | — | | | — | | | — | | | — | | | — | | | — | | | — |
Growth | | | — | | | — | | | — | | | — | | | — | | | — | | | — | | | — |
Select Value | | | — | | | — | | | — | | | — | | | — | | | — | | | — | | | — |
Aggressive Opportunities | | | — | | | — | | | — | | | — | | | — | | | — | | | — | | | — |
Discovery | | | — | | | — | | | — | | | — | | | — | | | — | | | — | | | — |
International | | | — | | | — | | | — | | | — | | | — | | | — | | | — | | | — |
Diversified Assets | | | — | | | — | | | — | | | — | | | 90,262 | | | — | | | — | | | 90,262 |
Core Bond Index | | | — | | | — | | | — | | | — | | | — | | | — | | | — | | | — |
500 Stock Index | | | — | | | — | | | — | | | — | | | — | | | — | | | — | | | — |
Broad Market Index | | | — | | | — | | | — | | | — | | | — | | | — | | | — | | | — |
Mid/Small Company Index | | | — | | | — | | | — | | | — | | | — | | | — | | | — | | | — |
Overseas Equity Index | | | — | | | — | | | — | | | — | | | — | | | — | | | — | | | — |
Model Portfolio | | | | | | | | | | | | | | | | | | | | | | | | |
Savings Oriented | | | — | | | — | | | — | | | — | | | — | | | — | | | — | | | — |
Model Portfolio Conservative Growth | | | — | | | — | | | — | | | — | | | — | | | — | | | — | | | — |
Model Portfolio Traditional Growth | | | — | | | — | | | — | | | — | | | — | | | — | | | — | | | — |
Model Portfolio Long-Term Growth | | | — | | | — | | | — | | | — | | | — | | | — | | | — | | | — |
Model Portfolio All-Equity Growth | | | — | | | — | | | — | | | — | | | — | | | — | | | — | | | — |
Milestone Retirement Income | | | — | | | — | | | — | | | — | | | — | | | — | | | — | | | — |
Milestone 2010 | | | — | | | — | | | — | | | — | | | — | | | — | | | — | | | — |
Milestone 2015 | | | — | | | — | | | — | | | — | | | — | | | — | | | — | | | — |
Milestone 2020 | | | — | | | — | | | — | | | — | | | — | | | — | | | — | | | — |
Milestone 2025 | | | — | | | — | | | — | | | — | | | — | | | — | | | — | | | — |
Milestone 2030 | | | — | | | — | | | — | | | — | | | — | | | — | | | — | | | — |
Milestone 2035 | | | — | | | — | | | — | | | — | | | — | | | — | | | — | | | — |
Milestone 2040 | | | — | | | — | | | — | | | — | | | — | | | — | | | — | | | — |
| * | Other financial instruments include written options and swaptions. |
At June 30, 2008, the Funds did not hold any investment with significant unobservable inputs (Level 3).
114
VANTAGEPOINT FUNDS
Additional Information (Unaudited)
A. Directors’ Consideration of Investments Advisory and Subadvisory Agreements
The following relates to the consideration by the Board of Directors (“Board”) of the Company during the period beginning January 1, 2008 through June 30, 2008, of the approval of the Master Investment Advisory Agreements (“Advisory Agreement” or “Advisory Agreements”) between Vantagepoint Investment Advisers, LLC (“Adviser”) and each series of the Company other than the Vantagepoint Discovery Fund, Vantagepoint Diversified Assets Fund and Vantagepoint Select Value Fund (each series, a “Fund” and collectively, the “Funds”) and certain Investment Subadvisory Agreements (“Subadvisory Agreement” or “Subadvisory Agreements”) for the Funds.
Annual Consideration of the Investment Advisory Agreements and Certain Subadvisory Agreements
At a meeting held on January 18, 2008 (“January Meeting”), the Board, including a majority of the Directors who are not “interested persons” (“Independent Directors”) as defined in the 1940 Act approved the continuance of the Advisory Agreements between the Adviser and each Fund. In addition, the Board, including a majority of the Independent Directors, approved the continuance of the Subadvisory Agreements with respect to the following subadvisers and Funds (may be referred to collectively as the “Sub-Advised Funds”): Payden & Rygel (Low Duration Bond Fund); STW Fixed Income Management Ltd. (Low Duration Bond Fund); Mellon Capital Management Corporation (Asset Allocation Fund and each of the Index Funds); T. Rowe Price Associates, Inc. (Equity Income Fund, Growth & Income Fund and Aggressive Opportunities Fund); Barrow Hanley Mewhinney & Strauss Inc. (Equity Income Fund); Southeastern Asset Management Inc. (Equity Income Fund and Aggressive Opportunities Fund); Capital Guardian Trust Company (Growth & Income Fund and International Fund); Wellington Management Company, LLP (Growth & Income Fund); Legg Mason Capital Management Inc. (Growth Fund and Aggressive Opportunities Fund); Westfield Capital Management Company, LLC (“Westfield”) (Growth Fund); Goldman Sachs Asset Management, L.P. (Growth Fund); Tukman Grossman Capital Management, Inc. (Growth Fund); Peregrine Capital Management, Inc. (Growth Fund); TimesSquare Capital Management, LLC (Aggressive Opportunities Fund); Artisan Partners Limited Partnership (“Artisan”) (International Fund); GlobeFlex Capital, LP (“GlobeFlex”) (International Fund); and Walter Scott & Partners Limited (International Fund).
In reaching its decisions, the Board considered the information furnished and discussed throughout the year at regularly scheduled Board meetings as well as the information provided specifically in relation to the annual consideration of the approval of the Advisory Agreements and Subadvisory Agreements.
Information furnished at Board meetings throughout the year included, among other things, the Adviser’s analysis of, and presentations given by the Adviser on, each Fund’s investment performance and the investment performance of the subadvisers, the strategies being used to achieve stated objectives and various reports on the monitoring of the subadvisers, compliance and other services provided by the Adviser and its affiliates. In preparation for the January Meeting, the Directors requested and received information compiled by Lipper Inc., an independent provider of investment company data (“Lipper”), on the investment performance over various time periods and the fees and expenses of each Fund as compared to a comparable group of funds (“peer group”). Additionally, in response to specific requests from the Independent Directors in connection with the January Meeting, the Adviser furnished, and the Board considered, a wide variety of information and reports concerning the Adviser and the subadvisers, including: (1) the nature, extent and quality of services provided to the Funds by the Adviser (and its affiliates) and by the subadvisers; (2) the level of the advisory and subadvisory fees that are charged to each Fund and a comparison with the fees charged to other clients; (3) profitability information of the Adviser and its affiliate, Vantagepoint Transfer Agents, LLC (“VTA”), and, to the extent available, certain profitability information of the subadvisers; and (4) the Adviser’s and each subadviser’s compliance program. The Board also considered information related to potential “fall out” or ancillary benefits enjoyed by the Adviser or its affiliates and the subadvisers as a result of their relationships with the Funds. In addition to evaluating, among other things, the written information provided by the Adviser, the Board also evaluated the answers to questions posed by the Board to representatives of the Adviser at the January Meeting.
In considering the information and materials described above, the Independent Directors received assistance from, and met separately with, their independent legal counsel and were provided with a written description of their statutory responsibilities and the legal standards that are applicable to approvals of advisory agreements. Although the Advisory Agreements and Subadvisory Agreements for all of the Funds were considered at the same Board meeting, the Directors addressed each Fund separately. In view of the broad scope and variety of factors and information, the Directors did
115
VANTAGEPOINT FUNDS
Additional Information (Unaudited) — (Continued)
not find it practicable to, and did not, assign relative weights to the specific factors considered in reaching their conclusions and determinations to approve the Advisory Agreements and Subadvisory Agreements for an additional year. Rather, the approval determinations were made on the basis of each Director’s business judgment after consideration of all of the factors taken in their entirety. Although not meant to be all-inclusive, the following discusses some of the factors relevant to the Board’s decisions to approve the Advisory Agreements and Subadvisory Agreements.
Nature, Extent and Quality of Services
In examining the nature, extent and quality of the services to be provided by the Adviser, the Directors considered the qualifications, experience and capability of the Adviser’s management and other personnel and the extent of care and conscientiousness with which the Adviser performs its duties. In this regard, the Directors considered, among other matters: (a) the asset allocation services provided, and the monitoring of the performance of the underlying funds performed, by the Adviser with respect to the Model Portfolio Funds and the Milestone Funds; (b) the performance monitoring and on-going due diligence performed with respect to the underlying mutual fund in which the Money Market Fund invests; (c) the subadviser selection process and fee negotiation process whereby the Adviser seeks to achieve an appropriate and competitive level of fee and fee structure, and the Adviser’s on-going monitoring of the appropriateness and competitiveness of each subadvisory fee and fee structure; (d) the process by which the Adviser evaluates and monitors the subadvisers, including with respect to portfolio security brokerage and trading practices; (e) the Adviser’s ability and willingness to identify instances where there may be a need to replace a subadviser, reallocate assets or both and to efficiently and economically effect such changes; (f ) the cash management services provided to the Sub-Advised Funds; and (g) the nature of the non-investment advisory services provided to the Funds, such as the supervision of the Funds’ other third-party service providers by the Adviser or its affiliates.
The Board also considered the nature, extent and quality of the services provided to the Funds by the Adviser’s affiliates, including transfer agency and distribution services. The Board took into account the extensive shareholder services provided by VTA in order to satisfy the needs of the Funds’ shareholders.
With respect to the nature, extent and quality of the investment advisory services provided by each subadviser to the Sub-Advised Funds, the Directors considered each subadviser’s investment management process in managing the assets allocated to it, including the experience and capability of the subadviser’s management and other personnel responsible for the portfolio management of the applicable Fund and compliance with the Fund’s investment policies and restrictions. The Directors also considered the favorable assessment provided by the Adviser as to the nature and quality of the services provided by each subadviser to the Sub-Advised Funds.
Based on the totality of the information considered, the Directors concluded that the Funds were likely to benefit from the nature, extent and quality of the Adviser’s and the subadvisers’ services, as applicable, as well as the services of the Adviser’s affiliates, and that the Adviser and its affiliates as well as the subadvisers have the ability to continue to provide these services based on their respective experience, operations and resources.
Investment Performance
The Board placed emphasis on the investment performance of each of the Funds. While consideration was given to performance reports and discussions held at prior Board or Investment Committee meetings, as applicable, particular attention was given to the performance reports provided specifically for the January Meeting. In particular, the Directors reviewed the performance of each Fund over a five-year period ending June 30, 2007, or shorter period, as applicable, relative to its stated investment objective, benchmark and peer group.
In reviewing the performance of the Funds over the five-year period ending June 30, 2007, the Directors considered that the performance of each of the following Funds was in one of the first three quintiles of its peer group for all of the periods reviewed: Money Market Fund; Asset Allocation Fund; Equity Income Fund; Growth & Income Fund; Aggressive Opportunities Fund; 500 Stock Index Fund; Broad Market Index Fund; Mid/Small Company Index Fund; Model Portfolio Conservative Growth Fund; Model Portfolio All-Equity Growth Fund; Milestone Retirement Income Fund; Milestone 2020 Fund; and Milestone 2030 Fund. In addition, the Directors considered that the performance of each of the following Funds was in one of the first three quintiles of its peer group for all but one of the periods reviewed: Low Duration Bond Fund; Core Bond Index Fund (Class II); Model Portfolio Savings Oriented Fund; Model Portfolio Traditional Growth Fund; Model Portfolio Long-Term Growth Fund; Milestone 2010 Fund and Milestone 2015 Fund.
116
VANTAGEPOINT FUNDS
Additional Information (Unaudited) — (Continued)
With regard to the performance of the Inflation Protected Securities Fund relative to its peer group, the Directors noted that the Fund’s performance for the most recent one-year and two-year periods ended June 30 was in the first quintile of its peer group. The Directors also noted the recent changes to the Fund’s principal investment strategy, effective May 1, 2007, whereby the Fund invests, under normal circumstances, primarily in inflation-adjusted U.S. and non-U.S. debt securities. In connection with the implementation of this new investment strategy, the Board approved two new subadvisers to replace the previous subadviser, also effective May 1, 2007.
With regard to the performance of the Growth Fund relative to its peer group, the Directors considered that the Growth Fund’s performance for the most recent one-year and two-year periods ended June 30 was in second and third quintiles, respectively, of its peer group.
With regard to performance of the International Fund relative to its peer group, the Directors considered the Adviser’s assessment that, as compared to the Fund’s peer group, the Fund has followed a more conservative investment strategy
(i.e., less emerging market exposure and more large cap exposure) and has a slight growth bias, which has not been favored in the market in recent years. The Directors also considered the reallocation of the Fund’s assets among certain of the subadvisers in September 2007 in order to improve the Fund’s subadviser structure and that the Adviser is currently conducting a comprehensive review of the Fund and its subadvisers.
With regard to the performance of the Overseas Equity Index Fund relative to its peer group, the Directors considered that the Class II performance of the Fund was in the third quintile of its peer group for the four- and five-year periods ended June 30. The Directors also took into consideration the Adviser’s explanation that the Fund performed as expected relative to its benchmark when taking into account the fees and expenses of the Fund.
With respect to the performance of the Milestone 2025 Fund, Milestone 2035 Fund and Milestone 2040 Fund, the Directors noted that the Funds’ performance was in the third, second and first quintile, respectively, for the most recent two-year period ended June 30. The Directors also considered the Adviser’s explanation that the target allocation to equity securities of the 2025 Fund and the 2035 Fund is lower than their respective peer group averages, which impacted the performance of these Funds relative to their peers.
For the Sub-Advised Funds, the Directors also considered the Adviser’s conclusions, and the reasons supporting the Adviser’s conclusions, that the performance record of each subadviser with respect to the assets of the Fund it manages supports approval of its Subadvisory Agreement.
Fund Expenses, Costs of Services, Economies of Scale and Related Benefits
Management Fees and Expenses. The Board considered the fees payable under each Advisory Agreement and under each Subadvisory Agreement for the Sub-Advised Funds. The Board reviewed the information compiled by Lipper comparing each Fund’s contractual management fee rate (at common asset levels) and actual management fee rate (which included the effect of any fee waivers) as a percentage of total assets—these fee rates include advisory and administrative service fees—to other funds in its peer group. Based on the data provided on management fee rates, on a Fund-by-Fund basis, the Board noted that: (i) each Fund’s contractual management fee rate was lower than or equal to the median of its expense peer group; and (ii) the actual management fee rate of each Fund was lower than or equal to the median of its expense peer group, except for the Aggressive Opportunities Fund, 500 Stock Index Fund (Class I), Mid/Small Company Index Fund (Class I), Milestone 2010 Fund, Milestone 2015 Fund, Milestone 2020 Fund, Milestone 2025 Fund, Milestone 2030 Fund and each of the Model Portfolio Funds. With respect to these Funds, the Board considered that each Fund’s actual total expense ratio was lower than or equal to the median of its peer group.
The Board also reviewed the information compiled by Lipper comparing each Fund’s total expense ratio to other funds in its peer group. Based on this comparative expense data, the Board noted that the actual total expense ratio for each Fund, other than the Core Bond Index Fund (Class I), was lower than or equal to the median of its expense peer group. The Directors noted that the total expense ratio of the Core Bond Index Fund (Class I) was in the third quintile of its expense peer group. The Directors further noted the Adviser’s current agreement to limit the total annual operating expenses of each Milestone Fund until April 30, 2008, and, after that, the Adviser’s intention to continue to limit the total annual operating expenses of each Milestone Fund until April 30, 2009.
With regard to the Sub-Advised Funds, the Directors also considered the Adviser’s assessment, which was based in part on information provided by the subadvisers, that each subadvisory fee reflects the lowest available fee schedule from
117
VANTAGEPOINT FUNDS
Additional Information (Unaudited) — (Continued)
the respective subadviser for “like accounts.” For this purpose, the term “like accounts” was used by the Adviser generally to describe other portfolios managed by a subadviser that have the same investment objective as, and other characteristics (including asset size) similar to, the portfolio being managed for the Fund by the subadviser.
For each Sub-Advised Fund, the Directors also considered the Adviser’s conclusion that the compensation payable to each subadviser under its respective Subadvisory Agreement is fair and reasonable in light of the nature and quality of the services to be provided to the Fund and each subadviser’s ability to fulfill its contractual obligations.
The foregoing comparisons assisted the Directors in determining to approve each Advisory Agreement and Subadvisory Agreement by providing them with a basis for evaluating each Fund’s management fee and expense ratio on a relative basis.
Profitability. The Board reviewed the materials it received from the Adviser regarding its revenues and expenses in connection with the services provided to each Fund and the Funds as a whole. The Directors considered information regarding VTA’s revenues and expenses relating to the services it provides to each Fund and the Funds as a whole. The materials provided in this regard showed, and the Directors acknowledged, that the Adviser and VTA experienced positive net margins with respect to certain Funds and did not with respect to other Funds. The Directors also considered the overall net margin levels of the Adviser and VTA. With respect to the Sub-Advised Funds, the Directors reviewed the subadviser profitability information to the extent available, and took into account the Adviser’s on-going monitoring of the appropriateness and competitiveness of each subadvisory fee and fee structure, as well as the Adviser’s assessment that the subadvisory fee rates charged by each subadviser reflect the lowest available fee schedule from the subadviser for like accounts.
Economies of Scale. With respect to whether economies of scale are realized by the Adviser as a Fund’s assets increase and whether management fee levels reflect these economies of scale for the benefit of Fund investors, the Board considered, on a Fund-by-Fund basis, the current level of management fee charged and fee structure and concluded that the Adviser’s fee structure with respect to each Fund was appropriate at this time. The Directors also acknowledged that they intend to continue to seek and consider information from the Adviser relating to economies of scale. With regard to each Sub-Advised Fund, the Directors considered that the fee schedule relating to each Subadvisory Agreement (except for the Subadvisory Agreements with Artisan and GlobeFlex) currently includes breakpoints and these Sub-Advised Funds and their shareholders will benefit from reduced subadvisory fee rates as the assets managed by the relevant subadviser increase, and that this represents a recognition that economies are being passed on by the subadviser to the Fund’s shareholders. The Directors also considered that each Subadvisory Agreement was the product of arms-length negotiations. The Directors further considered the appropriateness of each subadvisory fee structure in light of the Adviser’s assessment that each subadvisory fee reflects the lowest available fee schedule from the respective subadviser for like accounts.
“Fall Out” or Ancillary Benefits. The Board considered whether there were any “fall-out” or ancillary benefits that may accrue to the Adviser and its affiliates and the subadvisers as a result of their relationships with the Funds. The Directors noted that, based on the information provided, the Adviser did not consider there to be any significant benefits in this regard. With regard to the subadvisers, the Board considered that certain subadvisers may direct Fund brokerage transactions to certain brokers to obtain research and other services. However, the Directors noted that the subadvisers are required to select brokers who meet the Funds’ requirements for seeking best execution, and that the Adviser monitors and evaluates the subadvisers’ trade execution with respect to the Funds’ brokerage transactions on a regular basis and provides reports to the Board in this regard. The Board concluded that the benefits accruing to the subadvisers by virtue of their relationships to the Funds appeared to be reasonable.
After evaluation of the comparative performance, fee and expense information and the profitability, ancillary benefits and other considerations as described above, and in light of the nature, extent and quality of services to be provided by the Adviser and each subadviser, the Board concluded that the level of fees to be paid to the Adviser with respect to each Fund, and each subadviser with respect to the Sub-Advised Funds, is reasonable.
In summary, based on the various considerations discussed above, the Board determined that approval of the Advisory Agreement with respect to each Fund and the Subadvisory Agreement with respect to each Sub-Advised Fund was in the best interests of the applicable Fund. As a result, the Board, including a majority of the Independent Directors, approved each Advisory Agreement and Subadvisory Agreement.
118
VANTAGEPOINT FUNDS
Additional Information (Unaudited) — (Continued)
Consideration of New Subadvisory Agreement with Westfield for the Growth Fund
At a meeting held on June 6, 2008 (“June Meeting”), the Board approved a new Subadvisory Agreement (“New Subadvisory Agreement”) with Westfield, one of the subadvisers of the Growth Fund, due to the restructuring of the equity ownership interests of Westfield by Boston Private Financial Holdings, Inc. (“Boston Private”), the parent company of Westfield, which occurred on June 30, 2008. Upon completion of the restructuring, Westfield remains an autonomous affiliate of Boston Private and Boston Private remains the controlling shareholder of Westfield, with the remaining equity shares of Westfield split among key members of the Westfield management team. The restructuring of the equity ownership interests of Westfield resulted in a “change of control” of Westfield under applicable provisions of the 1940 Act. The 1940 Act provides that a “change of control” of a fund’s adviser or subadviser results in an “assignment,” and a consequent automatic termination, of the investment advisory agreement between the fund and the adviser or subadviser, as the case may be. Accordingly, as a result of the restructuring, the prior investment subadvisory agreement dated May 23, 2005, among the Adviser, the Company and Westfield terminated on June 30, 2008. At the June Meeting, in anticipation of the pending restructuring of the equity ownership interests of Westfield and consequent immediate termination of the prior investment subadvisory agreement with Westfield, the Board, including a majority of the Independent Directors, approved the New Subadvisory Agreement with Westfield, having terms substantially similar to the terms of the prior investment subadvisory agreement. Before approving the New Subadvisory Agreement with Westfield, the Board considered the recommendations of, and supporting analyses and data presented by, the Adviser.
With respect to the Board’s consideration of the New Subadvisory Agreement with Westfield, the Directors received written information in advance of the June Meeting from the Adviser, which included: (1) the conclusions reached by the Adviser as a result of the due diligence it conducted relating to the restructuring; (2) the nature, extent and quality of services that Westfield currently provides, and would continue to provide, to the Growth Fund; (3) Westfield’s experience, reputation, investment management business, personnel and operations; (4) Westfield’s brokerage and trading policies and practices; (5) the level of subadvisory fees to be charged to the Growth Fund by Westfield and a comparison of those fees to the: (a) fees charged by Westfield for managing other large cap growth equity accounts and the fees Westfield charges to other U.S. registered mutual funds with a similar investment mandate to that of the Growth Fund; and (b) fees charged by a group of active U.S. large cap growth investment managers utilizing a large cap growth equity mandate; (6) Westfield’s compliance program; (7) Westfield’s historical performance returns utilizing a large cap growth equity mandate and such performance compared to a relevant benchmark; (8) Westfield’s investment performance as a subadviser to the Growth Fund; and (9) Westfield’s financial condition.
In considering the New Subadvisory Agreement for the Growth Fund, the Independent Directors received assistance from, and met separately with, their independent legal counsel and were provided with a written description of their statutory responsibilities and the legal standards that are applicable to approvals of advisory agreements.
In determining whether to approve the New Subadvisory Agreement, the Directors considered the information received in advance of the June Meeting, the presentations made by, and discussions held with, the personnel of the Adviser at the June Meeting, as well as a variety of factors. Although not meant to be all-inclusive, the following discusses some of the factors relevant to the Board’s decision to approve the New Subadvisory Agreement.
Nature, Extent and Quality of Services
With respect to the nature, extent and quality of services to be provided by Westfield to the Growth Fund following the restructuring, the Directors considered Westfield’s investment management process in managing the Growth Fund’s assets allocated to it, including the experience and capability of Westfield’s management and other personnel responsible for the portfolio management of the Growth Fund. The Directors also considered the Adviser’s assessment that it does not anticipate the restructuring to result in significant changes in Westfield’s investment philosophy, process or team and that the Adviser does not expect any changes to the fees charged to the Fund by Westfield. The Directors also considered Westfield’s representation to the Adviser that it does not plan to make any changes in operations or key personnel as a result of the restructuring and that Westfield intends to continue managing the Fund in exactly the same manner as is currently the case. Based on information provided by the Adviser from Westfield, the Directors considered Westfield’s representation that it does not expect the nature, scope or quality of services to be provided to the Growth Fund to change as a result of the restructuring. The Directors also took into account the information provided by the
119
VANTAGEPOINT FUNDS
Additional Information (Unaudited) — (Continued)
Adviser relating to Westfield’s statement that the restructuring is intended to ensure the long-term stability of its senior management and key investment personnel. Based on the information considered, the Directors concluded that the Growth Fund was likely to continue to benefit from the nature, extent and quality of Westfield’s services, and that Westfield has the ability to continue to provide these services after the restructuring.
Investment Performance
The Directors considered the data provided regarding Westfield’s historical investment performance record in managing its clients’ assets utilizing a large cap growth equity mandate versus a relevant benchmark. The Directors also considered Westfield’s investment performance with respect to managing the assets of the Growth Fund and the Adviser’s favorable assessment of such performance. The Directors concluded that the investment performance record of Westfield supported approval of the New Subadvisory Agreement with Westfield.
Subadvisory Fees and Economies of Scale
In evaluating the subadvisory fee, the Directors considered that the subadvisory fee payable under the New Subadvisory Agreement is the same as the subadvisory fee payable under the current subadvisory agreement with Westfield. The Directors also considered comparisons of the subadvisory fees charged by Westfield to the Growth Fund with the fees charged by Westfield for managing other large cap growth equity accounts, and the fees charged by Westfield to other U.S. registered mutual funds for managing an investment mandate similar to the mandate the subadviser employs on behalf of the Growth Fund. The Directors also considered the Adviser’s assessment that the Growth Fund’s fee schedule at the current level of assets allocated to Westfield is the lowest fee schedule charged by Westfield for managing large cap growth equity accounts and other U.S. registered mutual funds with a similar investment mandate. The services Westfield provides to the Growth Fund appeared to be comparable to those it provides to such other advisory clients. The Directors reviewed information provided by the Adviser (which was based on an independent third-party source) on the fees charged by a group of U.S. investment managers that employ an active large cap growth equity mandate. According to the information provided, the effective fee rate to be paid by the Growth Fund to Westfield at current asset levels is below the median fee charged by such managers. The foregoing comparisons assisted the Directors in considering the New Subadvisory Agreement by providing them with a basis for evaluating Westfield’s fees on a relative basis. Based on this information, the Directors concluded that Westfield’s subadvisory fees appeared to be within a reasonable range for the services provided.
The Directors also reviewed the information provided regarding the estimated profits to be realized with respect to Westfield’s relationship with the Growth Fund. In reviewing the extent to which economies of scale may be realized by Westfield as the assets of the Growth Fund to be managed by Westfield grow, and whether the proposed fee levels reflect these economies, the Directors considered that Westfield’s fee schedule includes breakpoints, which indicated that the subadvisory fee rate is intended to capture certain anticipated economies of scale for the benefit of the Growth Fund’s shareholders in connection with the services to be provided.
Other Considerations
The Directors considered the due diligence process engaged in by the Adviser in connection with the restructuring and in deciding to recommend that the Board approve the New Subadvisory Agreement with Westfield. The Directors also considered the Adviser’s conclusion that the fees to be paid by Westfield for its services to the Growth Fund continue to be reasonable and appropriate in light of the nature and quality of services to be provided by Westfield. The Directors concluded that the Adviser’s recommendations and conclusions supported approval of the New Subadvisory Agreement. The Directors also considered the potential “fall-out” or ancillary benefits that may accrue to Westfield due to its relationship with the Growth Fund. The Directors considered that Westfield may direct the Growth Fund’s brokerage transactions to certain brokers to obtain research and other services. However, the Directors noted that all subadvisers are required to select brokers who meet the Growth Fund’s requirements for seeking best execution, and that the Adviser monitors and evaluates the subadvisers’ trade execution with respect to Fund brokerage transactions on a regular basis and provides reports to the Board in this regard. The Directors concluded that the potential benefits accruing to Westfield by virtue of its relationship to the Growth Fund appeared to be reasonable.
After full consideration of the foregoing factors, with no single factor identified as being of paramount importance, the Directors, including a majority of the Independent Directors, concluded that the approval of the New Subadvisory Agreement with Westfield is in the best interests of the Growth Fund and its shareholders, and approved the New Subadvisory Agreement with, and the fee to be paid to, Westfield.
120
VANTAGEPOINT FUNDS
Additional Information (Unaudited) — (Continued)
B. Directors and Officers Remuneration
Aggregate compensation that was paid to the directors during the six months ended June 30, 2008 totaled $36,687. Executive officers do not receive any compensation from The Vantagepoint Funds. However, the Board of Directors of the Vantagepoint Funds has agreed to reimburse ICMA-RC for certain costs associated with the Chief Compliance Officer function. The amount reimbursed during the six months ended June 30, 2008 totaled $85,916.
The Statement of Additional Information includes additional information about The Vantagepoint Funds’ Board of Directors and is available, without charge, upon request, by calling 1-800-669-7400.
C. Householding
Only one copy of this Semi-Annual Report may be mailed to households, even if more than one person in a household is a shareholder of record unless; The Vantagepoint Funds have received instructions to the contrary. If you need additional copies of this Semi-Annual Report, please contact The Vantagepoint Funds toll free at 1-800-669-7400 or in writing at 777 North Capitol Street, NE, Suite 600, Washington, D.C. 20002. If you do not want this mailing of this Semi-Annual Report to be combined with those for other members of your household, contact the Vantagepoint Funds in writing at 777 North Capitol Street, NE, Suite 600, Washington, D.C. 20002 or toll free at 1-800-669-7400.
D. Other Available Information
A description of the Company’s proxy voting policies and procedures and the proxy voting record for the 12-month period ended June 30, 2008 are available on the Company’s website at www.icmarc.org or by accessing the Securities and Exchange Commission’s website at www.sec.gov.
The Company files its complete schedule of portfolio holdings with the SEC for the first and third quarters of each fiscal year on Form N-Q; the Company’s Forms N-Q are available on the SEC’s website at www.sec.gov and may be reviewed and copied at the SEC’s Public Reference Room in Washington, D.C. Information on the operation of the Public Reference Room may be obtained by calling 1-800-SEC-0330.
121
SCHEDULE OF INVESTMENTS
June 30, 2008 (Unaudited)
Vantagepoint Money Market Fund
| | | | | |
| | | Shares | | Value |
CASH EQUIVALENTS—99.3% | | | | | |
AIM Short-Term Investments
Trust Liquid Assets Portfolio
(Cost $354,969,445) | | 354,969,445 | | $ | 354,969,445 |
| | | | | |
TOTAL INVESTMENTS—99.3%
(Cost $354,969,445) | | | | | 354,969,445 |
Other assets less liabilities—0.7% | | | | | 2,639,305 |
| | | | | |
NET ASSETS—100.0% | | | | $ | 357,608,750 |
| | | | | |
| | | | |
| 122 | | See accompanying notes to financial statements. | | |
SCHEDULE OF INVESTMENTS
June 30, 2008 (Unaudited)
Vantagepoint Low Duration Bond Fund
| | | | | | | | | | |
Coupon Rate | | Maturity Date | | Face | | Value |
CORPORATE OBLIGATIONS—35.9% | | | | | | | | | | |
Biotechnology—0.4% | | | | | | | | | | |
Amgen, Inc. | | | | | | | | | | |
4.000% | | 11/18/2009 | | | | $ | 1,800,000 | | $ | 1,802,549 |
| | | | | | | | | | |
Capital Markets—3.2% | | | | | | | | | | |
Citigroup, Inc. | | | | | | | | | | |
4.385% | | 05/15/2018 | | # | | | 6,186,000 | | | 5,983,186 |
Citigroup, Inc. | | | | | | | | | | |
4.125% | | 02/22/2010 | | | | | 1,250,000 | | | 1,238,909 |
JPMorgan Chase & Co. | | | | | | | | | | |
6.750% | | 02/01/2011 | | | | | 1,240,000 | | | 1,287,777 |
JPMorgan Chase & Co. | | | | | | | | | | |
4.750% | | 05/01/2013 | | | | | 6,900,000 | | | 6,712,969 |
World Savings Bank, FSB | | | | | | | | | | |
4.500% | | 06/15/2009 | | | | | 1,240,000 | | | 1,238,946 |
| | | | | | | | | | |
| | | | | | | | | | 16,461,787 |
| | | | | | | | | | |
Chemicals—0.5% | | | | | | | | | | |
E.I. Du Pont de Nemours & Co. | | | | | | | | | | |
5.000% | | 01/15/2013 | | † | | | 2,500,000 | | | 2,523,633 |
| | | | | | | | | | |
Commercial Banks—9.0% | | | | | | | | | | |
Bank of America Corp. | | | | | | | | | | |
6.600% | | 05/15/2010 | | | | | 400,000 | | | 410,679 |
Bank of America Corp. | | | | | | | | | | |
4.900% | | 05/01/2013 | | | | | 1,000,000 | | | 966,077 |
Bank of America Corp. | | | | | | | | | | |
4.875% | | 09/15/2012 | | | | | 3,910,000 | | | 3,843,561 |
Bank of America Corp. | | | | | | | | | | |
4.375% | | 12/01/2010 | | | | | 1,240,000 | | | 1,236,478 |
Barclays Bank plc (United Kingdom) | | | | | | | | | | |
5.450% | | 09/12/2012 | | | | | 7,440,000 | | | 7,533,424 |
Glitnir Banki HF (Iceland) | | | | | | | | | | |
6.375% | | 09/25/2012 | | ^ | | | 6,270,000 | | | 5,393,987 |
M&T Bank Corp. | | | | | | | | | | |
5.375% | | 05/24/2012 | | | | | 6,680,000 | | | 6,461,578 |
Marshall & Ilsley Corp. | | | | | | | | | | |
5.626% | | 08/17/2009 | | | | | 6,500,000 | | | 6,463,120 |
SunTrust Banks, Inc. | | | | | | | | | | |
5.250% | | 11/05/2012 | | | | | 5,250,000 | | | 5,138,033 |
US Bancorp | | | | | | | | | | |
3.170% | | 05/06/2010 | | # | | | 1,200,000 | | | 1,198,643 |
Wachovia Bank NA | | | | | | | | | | |
7.800% | | 08/18/2010 | | † | | | 4,750,000 | | | 5,008,281 |
Wells Fargo & Co. | | | | | | | | | | |
5.300% | | 08/26/2011 | | † | | | 1,240,000 | | | 1,262,443 |
| | | | | | | | | | |
| | | | | | | | | | 44,916,304 |
| | | | | | | | | | |
Communications Equipment—0.3% | | | | | | | | | | |
Cisco Systems, Inc. | | | | | | | | | | |
5.250% | | 02/22/2011 | | | | | 1,250,000 | | | 1,287,775 |
| | | | | | | | | | |
Computers & Peripherals—1.0% | | | | | | | | | | |
Hewlett-Packard Co. | | | | | | | | | | |
4.500% | | 03/01/2013 | | | | | 3,840,000 | | | 3,807,183 |
International Business Machines Corp. | | | | | | | | | | |
4.950% | | 03/22/2011 | | | | | 1,250,000 | | | 1,281,104 |
| | | | | | | | | | |
| | | | | | | | | | 5,088,287 |
| | | | | | | | | | |
Consumer Finance—6.9% | | | | | | | | | | |
Capital One Bank USA NA | | | | | | | | | | |
4.250% | | 12/01/2008 | | | | | 3,750,000 | | | 3,743,498 |
Caterpillar Financial Services Corp. (MTN) | | | | | | | | | | |
3.750% | | 05/15/2009 | | | | | 2,065,000 | | | 2,052,860 |
CIT Group, Inc. | | | | | | | | | | |
4.250% | | 02/01/2010 | | | | | 275,000 | | | 232,781 |
CIT Group, Inc. | | | | | | | | | | |
3.187% | | 07/28/2011 | | # | | | 125,000 | | | 102,047 |
CIT Group, Inc. | | | | | | | | | | |
2.906% | | 03/12/2010 | | # | | | 5,780,000 | | | 5,021,924 |
Household Finance Corp. | | | | | | | | | | |
6.375% | | 10/15/2011 | | † | | | 3,150,000 | | | 3,224,016 |
HSBC Finance Corp. | | | | | | | | | | |
4.750% | | 05/15/2009 | | | | | 4,480,000 | | | 4,485,448 |
International Lease Finance Corp. | | | | | | | | | | |
6.375% | | 03/25/2013 | | | | | 3,200,000 | | | 2,923,744 |
John Deere Capital Corp. | | | | | | | | | | |
2.999% | | 10/16/2009 | | # | | | 6,000,000 | | | 5,990,777 |
SLM Corp. (MTN) | | | | | | | | | | |
3.060% | | 07/27/2009 | | #† | | | 7,000,000 | | | 6,564,530 |
| | | | | | | | | | |
| | | | | | | | | | 34,341,625 |
| | | | | | | | | | |
Diversified Financial Services—5.7% | | | | | | | | | | |
AIG SunAmerica Global Financing VII | | | | | | | | | | |
5.850% | | 08/01/2008 | | ^ | | | 700,000 | | | 700,856 |
Allstate Life Global Funding Trust, Series 04-1 | | | | | | | | | | |
4.500% | | 05/29/2009 | | † | | | 3,750,000 | | | 3,756,720 |
American Express Travel Related Services Co., Inc. | | | | | | | | | | |
5.250% | | 11/21/2011 | | ^ | | | 6,000,000 | | | 5,906,652 |
General Electric Capital Corp. (MTN) | | | | | | | | | | |
4.875% | | 10/21/2010 | | † | | | 4,060,000 | | | 4,126,060 |
General Electric Capital Corp. (MTN) | | | | | | | | | | |
4.250% | | 09/13/2010 | | | | | 4,600,000 | | | 4,641,308 |
Hutchison Whampoa International 03/33 Ltd. (Cayman Islands) | | | | | | | | | | |
5.450% | | 11/24/2010 | | ^ | | | 1,500,000 | | | 1,513,106 |
Kreditanstalt fuer Wiederaufbau (Germany) | | | | | | | | | | |
3.750% | | 06/27/2011 | | | | | 1,150,000 | | | 1,159,269 |
National Rural Utilities Cooperative Finance Corp. | | | | | | | | | | |
5.750% | | 08/28/2009 | | | | | 1,200,000 | | | 1,224,218 |
TIAA Global Markets, Inc. | | | | | | | | | | |
5.125% | | 10/10/2012 | | ^ | | | 4,900,000 | | | 4,991,155 |
Unilever Capital Corp. | | | | | | | | | | |
7.125% | | 11/01/2010 | | | | | 1,175,000 | | | 1,254,538 |
| | | | | | | | | | |
| | | | | | | | | | 29,273,882 |
| | | | | | | | | | |
Diversified Telecommunication Services—3.2% | | | | | | | | | | |
AT&T, Inc. | | | | | | | | | | |
4.950% | | 01/15/2013 | | | | | 900,000 | | | 897,781 |
BellSouth Corp. | | | | | | | | | | |
4.200% | | 09/15/2009 | | | | | 3,262,000 | | | 3,269,597 |
Deutsche Telekom International Finance BV (Netherlands) | | | | | | | | | | |
5.375% | | 03/23/2011 | | † | | | 1,250,000 | | | 1,258,184 |
SBC Communications, Inc. | | | | | | | | | | |
4.125% | | 09/15/2009 | | | | | 5,430,000 | | | 5,437,927 |
Verizon Communications, Inc. | | | | | | | | | | |
4.350% | | 02/15/2013 | | | | | 3,745,000 | | | 3,606,573 |
Verizon Global Funding Corp. | | | | | | | | | | |
7.250% | | 12/01/2010 | | | | | 1,250,000 | | | 1,327,788 |
| | | | | | | | | | |
| | | | | | | | | | 15,797,850 |
| | | | | | | | | | |
Electric Utilities—0.5% | | | | | | | | | | |
Duke Energy Corp. | | | | | | | | | | |
6.250% | | 01/15/2012 | | | | | 1,165,000 | | | 1,216,931 |
Exelon Corp. | | | | | | | | | | |
6.750% | | 05/01/2011 | | | | | 750,000 | | | 770,989 |
Exelon Generation Co. LLC | | | | | | | | | | |
6.950% | | 06/15/2011 | | | | | 450,000 | | | 465,415 |
| | | | | | | | | | |
| | | | | | | | | | 2,453,335 |
| | | | | | | | | | |
| | | | |
| | See accompanying notes to financial statements. | | 123 |
SCHEDULE OF INVESTMENTS — (Continued)
June 30, 2008 (Unaudited)
Vantagepoint Low Duration Bond Fund
| | | | | | | | | | |
Coupon Rate | | Maturity Date | | Face | | Value |
CORPORATE OBLIGATIONS—(Continued) | | | | | | | | | | |
Electronic Equipment & Instruments—0.1% | | | | | | | | | | |
Koninklijke Philips Electronics NV (Netherlands) | | | | | | | | | | |
4.625% | | 03/11/2013 | | | | $ | 575,000 | | $ | 566,967 |
| | | | | | | | | | |
Home Builders—0.3% | | | | | | | | | | |
KB Home | | | | | | | | | | |
8.625% | | 12/15/2008 | | † | | | 1,260,000 | | | 1,272,600 |
| | | | | | | | | | |
Insurance—0.2% | | | | | | | | | | |
American International Group, Inc. | | | | | | | | | | |
4.700% | | 10/01/2010 | | | | | 1,000,000 | | | 981,865 |
| | | | | | | | | | |
Media—0.4% | | | | | | | | | | |
Comcast Corp. | | | | | | | | | | |
5.450% | | 11/15/2010 | | | | | 2,250,000 | | | 2,288,504 |
| | | | | | | | | | |
Metals & Mining—1.2% | | | | | | | | | | |
Rio Tinto Finance USA Ltd. (Australia) | | | | | | | | | | |
5.875% | | 07/15/2013 | | | | | 5,974,000 | | | 6,013,595 |
| | | | | | | | | | |
Oil, Gas & Consumable Fuels—0.9% | | | | | | | | | | |
ConocoPhillips | | | | | | | | | | |
8.750% | | 05/25/2010 | | | | | 1,773,000 | | | 1,930,317 |
Pemex Project Funding Master Trust | | | | | | | | | | |
7.875% | | 02/01/2009 | | | | | 2,350,000 | | | 2,424,739 |
| | | | | | | | | | |
| | | | | | | | | | 4,355,056 |
| | | | | | | | | | |
Retail—0.4% | | | | | | | | | | |
CVS Caremark Corp. | | | | | | | | | | |
4.000% | | 09/15/2009 | | | | | 2,000,000 | | | 1,989,722 |
| | | | | | | | | | |
Software—0.3% | | | | | | | | | | |
Oracle Corp. | | | | | | | | | | |
5.000% | | 01/15/2011 | | | | | 1,547,000 | | | 1,578,054 |
| | | | | | | | | | |
Tobacco—1.4% | | | | | | | | | | |
Philip Morris International, Inc. | | | | | | | | | | |
4.875% | | 05/16/2013 | | | | | 7,384,000 | | | 7,261,263 |
| | | | | | | | | | |
TOTAL CORPORATE OBLIGATIONS
(Cost $182,696,598) | | | | | | | | | | 180,254,653 |
| | | | | | | | | | |
U.S. GOVERNMENT AGENCY OBLIGATIONS—7.1% | | | | | | | | | | |
U.S. Government Agency Obligations—7.1% | | | | | | | | | | |
Federal Home Loan Bank | | | | | | | | | | |
5.000% | | 09/18/2009 | | † | | | 4,395,000 | | | 4,504,651 |
2.200% | | 04/01/2009 | | † | | | 2,225,000 | | | 2,216,661 |
Federal Home Loan Mortgage Corp. | | | | | | | | | | |
3.250% | | 02/25/2011 | | † | | | 8,000,000 | | | 7,961,976 |
3.000% | | 04/01/2011 | | | | | 6,000,000 | | | 5,923,812 |
2.875% | | 06/28/2010 | | † | | | 2,970,000 | | | 2,952,429 |
Federal National Mortgage Association | | | | | | | | | | |
3.500% | | 04/28/2011 | | | | | 7,500,000 | | | 7,484,115 |
3.250% | | 02/10/2010 | | † | | | 4,430,000 | | | 4,446,989 |
| | | | | | | | | | |
TOTAL U.S. GOVERNMENT AGENCY OBLIGATIONS
(Cost $35,641,963) | | | | | | | | | | 35,490,633 |
| | | | | | | | | | |
U.S. GOVERNMENT AGENCY MORTGAGE-BACKED SECURITIES—5.0% | | | | | | | | |
U.S. Government Agency Mortgage-Backed Securities—5.0% | | | | | | | | |
Federal Home Loan Mortgage Corp. | | | | | | | | | | |
5.000% | | 06/15/2024 | | | | | 2,177,629 | | | 2,198,313 |
4.386% | | 10/01/2034 | | # | | | 4,171,788 | | | 4,174,561 |
4.250% | | 06/15/2024 | | | | | 1,579,154 | | | 1,583,200 |
3.500% | | 10/15/2012 | | | | | 15,232 | | | 15,216 |
Federal National Mortgage Association | | | | | | | | | | |
5.788% | | 10/01/2036 | | # | | | 2,981,426 | | | 3,059,768 |
5.089% | | 09/01/2034 | | # | | | 464,020 | | | 469,961 |
5.077% | | 10/01/2034 | | # | | | 3,993,061 | | | 4,070,826 |
4.951% | | 10/01/2034 | | # | | | 4,945,663 | | | 4,998,906 |
4.906% | | 09/01/2034 | | # | | | 372,320 | | | 377,932 |
4.724% | | 10/01/2034 | | # | | | 696,020 | | | 707,270 |
Government National Mortgage Association | | | | | | | | | | |
4.500% | | 08/20/2035 | | | | | 3,716,552 | | | 3,735,295 |
| | | | | | | | | | |
TOTAL U.S. GOVERNMENT AGENCY MORTGAGE-BACKED SECURITIES
(Cost $25,369,546) | | | 25,391,248 |
| | | | | | | | | | |
U.S. TREASURY OBLIGATIONS—20.5% | | | | | | | | | | |
U.S. Treasury Notes—20.5% | | | | | | | | | | |
U.S. Treasury Note | | | | | | | | | | |
4.875% | | 08/15/2009-04/30/2011 | | † | | | 3,319,000 | | | 3,486,872 |
4.500% | | 11/15/2010-09/30/2011 | | † | | | 19,400,000 | | | 20,211,305 |
4.000% | | 08/31/2009 | | † | | | 20,600,000 | | | 20,994,304 |
3.875% | | 09/15/2010 | | † | | | 29,487,000 | | | 30,261,063 |
3.125% | | 11/30/2009 | | † | | | 16,510,000 | | | 16,686,723 |
2.625% | | 05/31/2010 | | | | | 2,700,000 | | | 2,702,533 |
2.125% | | 01/31/2010-04/30/2010 | | † | | | 8,600,000 | | | 8,541,470 |
| | | | | | | | | | |
| | | | | | | | | | 102,884,270 |
| | | | | | | | | | |
TOTAL U.S. TREASURY OBLIGATIONS
(Cost $102,193,209) | | | | | | | | | | 102,884,270 |
| | | | | | | | | | |
SOVEREIGN DEBT OBLIGATIONS—1.1% | | | | | | | | | | |
Government Issued—1.1% | | | | | | | | | | |
Export Development Canada (Canada) | | | | | | | | | | |
3.750% | | 07/15/2011 | | † | | | 1,365,000 | | | 1,374,140 |
Province of Ontario, Canada (Canada) | | | | | | | | | | |
2.750% | | 02/22/2011 | | † | | | 1,225,000 | | | 1,199,157 |
Republic of South Africa (South Africa) | | | | | | | | | | |
9.125% | | 05/19/2009 | | † | | | 2,750,000 | | | 2,866,875 |
| | | | | | | | | | |
TOTAL SOVEREIGN DEBT OBLIGATIONS
(Cost $5,425,716) | | | | | | | | | | 5,440,172 |
| | | | | | | | | | |
ASSET BACKED SECURITIES—22.6% | | | | | | | | | | |
Automobile—11.0% | | | | | | | | | | |
Capital Auto Receivables Asset Trust | | | | | | | | | | |
Series 2006-SN1A, Class A4A | | | | | | | | | | |
5.320% | | 03/20/2010 | | ^ | | | 6,400,000 | | | 6,463,653 |
Capital Auto Receivables Asset Trust | | | | | | | | | | |
Series 2007-1, Class A4B | | | | | | | | | | |
2.511% | | 04/15/2012 | | # | | | 1,000,000 | | | 982,208 |
| | | | |
| 124 | | See accompanying notes to financial statements. | | |
SCHEDULE OF INVESTMENTS — (Continued)
June 30, 2008 (Unaudited)
Vantagepoint Low Duration Bond Fund
| | | | | | | | | | |
Coupon Rate | | Maturity Date | | Face | | Value |
ASSET BACKED SECURITIES—(Continued) | | | | | | | | | | |
Capital Auto Receivables Asset Trust | | | | | | | | | | |
Series 2008-1, Class A3A | | | | | | | | | | |
3.860% | | 08/15/2012 | | | | $ | 1,000,000 | | $ | 994,054 |
Carmax Auto Owner Trust | | | | | | | | | | |
Series 2007-1, Class B | | | | | | | | | | |
5.340% | | 10/15/2012 | | | | | 3,000,000 | | | 2,882,843 |
Chase Manhattan Auto Owner Trust | | | | | | | | | | |
Series 2006-A, Class A4 | | | | | | | | | | |
5.360% | | 01/15/2013 | | | | | 5,900,000 | | | 6,010,399 |
Chase Manhattan Auto Owner Trust | | | | | | | | | | |
Series 2006-B, Class A4 | | | | | | | | | | |
5.110% | | 04/15/2014 | | | | | 2,400,000 | | | 2,438,417 |
Daimler Chrysler Auto Trust | | | | | | | | | | |
Series 2006-C, Class A4 | | | | | | | | | | |
4.980% | | 11/08/2011 | | | | | 1,000,000 | | | 1,014,378 |
Daimler Chrysler Auto Trust | | | | | | | | | | |
Series 2008-A, Class A3A | | | | | | | | | | |
3.700% | | 06/08/2012 | | | | | 1,600,000 | | | 1,589,228 |
Ford Credit Auto Owner Trust | | | | | | | | | | |
Series 2005-A, Class B | | | | | | | | | | |
3.880% | | 01/15/2010 | | | | | 2,600,000 | | | 2,590,576 |
Ford Credit Auto Owner Trust | | | | | | | | | | |
Series 2006-A, Class A3 | | | | | | | | | | |
5.050% | | 03/15/2010 | | | | | 379,961 | | | 382,247 |
Ford Credit Auto Owner Trust | | | | | | | | | | |
Series 2006-B, Class A3 | | | | | | | | | | |
5.260% | | 10/15/2010 | | | | | 2,176,220 | | | 2,198,263 |
Ford Credit Auto Owner Trust | | | | | | | | | | |
Series 2007-B, Class A4A | | | | | | | | | | |
5.240% | | 07/15/2012 | | | | | 6,400,000 | | | 6,482,262 |
Harley-Davidson Motorcycle Trust | | | | | | | | | | |
Series 2006-3, Class A3 | | | | | | | | | | |
5.240% | | 01/15/2012 | | | | | 2,336,798 | | | 2,360,046 |
Harley-Davidson Motorcycle Trust | | | | | | | | | | |
Series 2007-2, Class A4 | | | | | | | | | | |
5.120% | | 08/15/2013 | | | | | 2,725,000 | | | 2,763,157 |
Honda Auto Receivables Owner Trust | | | | | | | | | | |
Series 2005-3, Class A4 | | | | | | | | | | |
4.030% | | 12/20/2010 | | | | | 7,327,209 | | | 7,347,195 |
USAA Auto Owner Trust | | | | | | | | | | |
Series 2004-3, Class A4 | | | | | | | | | | |
3.530% | | 06/15/2011 | | | | | 2,664,104 | | | 2,666,790 |
USAA Auto Owner Trust | | | | | | | | | | |
Series 2005-2, Class A4 | | | | | | | | | | |
4.170% | | 02/15/2011 | | | | | 500,000 | | | 502,634 |
USAA Auto Owner Trust | | | | | | | | | | |
Series 2006-4, Class A2 | | | | | | | | | | |
5.160% | | 11/15/2009 | | | | | 38,472 | | | 38,512 |
USAA Auto Owner Trust | | | | | | | | | | |
Series 2007-2, Class A3 | | | | | | | | | | |
4.900% | | 02/15/2012 | | | | | 2,000,000 | | | 2,026,841 |
USAA Auto Owner Trust | | | | | | | | | | |
Series 2008-2, Class A3 | | | | | | | | | | |
4.640% | | 10/15/2012 | | | | | 1,100,000 | | | 1,107,619 |
Wachovia Auto Owner Trust | | | | | | | | | | |
Series 2005-B, Class A4 | | | | | | | | | | |
4.840% | | 04/20/2011 | | | | | 2,825,000 | | | 2,851,626 |
| | | | | | | | | | |
| | | | | | | | | | 55,692,948 |
| | | | | | | | | | |
Credit Card—10.5% | | | | | | | | | | |
BA Credit Card Trust | | | | | | | | | | |
Series 2008-A5, Class A5 | | | | | | | | | | |
3.671% | | 12/16/2013 | | # | | | 5,923,000 | | | 6,015,436 |
Bank One Issuance Trust | | | | | | | | | | |
Series 2003-A9, Class A9 | | | | | | | | | | |
3.860% | | 06/15/2011 | | | | | 1,500,000 | | | 1,503,636 |
Bank One Issuance Trust | | | | | | | | | | |
Series 2004-A6, Class A6 | | | | | | | | | | |
3.940% | | 04/16/2012 | | | | | 1,000,000 | | | 1,005,123 |
Capital One Multi-Asset Execution Trust | | | | | | | | | | |
Series 2008-A5, Class A5 | | | | | | | | | | |
4.850% | | 02/15/2014 | | | | | 4,015,000 | | | 4,035,514 |
Chase Issuance Trust | | | | | | | | | | |
Series 2005-A10, Class A10 | | | | | | | | | | |
4.650% | | 12/17/2012 | | | | | 6,970,000 | | | 7,035,958 |
Chase Issuance Trust | | | | | | | | | | |
Series 2007-A15, Class A | | | | | | | | | | |
4.960% | | 09/17/2012 | | | | | 3,900,000 | | | 3,964,139 |
Citibank Credit Card Issuance Trust | | | | | | | | | | |
Series 2007-A5, Class A5 | | | | | | | | | | |
5.500% | | 06/22/2012 | | | | | 4,965,000 | | | 5,090,712 |
Discover Card Master Trust | | | | | | | | | | |
Series 2008-A3, Class A3 | | | | | | | | | | |
5.100% | | 10/15/2013 | | | | | 7,755,000 | | | 7,815,462 |
FPL Recovery Funding LLC | | | | | | | | | | |
Series 2007-A, Class A1 | | | | | | | | | | |
5.053% | | 02/01/2013 | | ‡ | | | 2,470,472 | | | 2,496,624 |
GE Capital Credit Card Master Note Trust | | | | | | | | | | |
Series 2007-3, Class A2 | | | | | | | | | | |
5.400% | | 06/15/2013 | | | | | 5,915,000 | | | 6,067,023 |
Household Credit Card Master Note Trust I | | | | | | | | | | |
Series 2007-1, Class A | | | | | | | | | | |
2.521% | | 04/15/2013 | | # | | | 1,500,000 | | | 1,474,681 |
Household Credit Card Master Note Trust I | | | | | | | | | | |
Series 2007-2, Class A | | | | | | | | | | |
3.021% | | 07/15/2013 | | # | | | 6,200,000 | | | 6,145,333 |
| | | | | | | | | | |
| | | | | | | | | | 52,649,641 |
| | | | | | | | | | |
Utilities—1.1% | | | | | | | | | | |
Peco Energy Transition Trust | | | | | | | | | | |
Series 2000-A, Class A3 | | | | | | | | | | |
7.625% | | 03/01/2010 | | | | | 5,345,539 | | | 5,481,905 |
| | | | | | | | | | |
TOTAL ASSET BACKED SECURITIES
(Cost $113,068,424) | | | | | | | | | | 113,824,494 |
| | | | | | | | | | |
NON-U.S. GOVERNMENT MORTGAGE-BACKED SECURITIES—4.0% | �� | | | | | | | | | |
Mortgage Backed—4.0% | | | | | | | | | | |
Bank of America Mortgage Securities, Inc. | | | | | | | | | | |
Series 2004-L, Class 1A1 | | | | | | | | | | |
6.271% | | 01/25/2035 | | # | | | 1,206,299 | | | 1,215,419 |
GSR Mortgage Loan Trust | | | | | | | | | | |
Series 2004-11, Class 2A2 | | | | | | | | | | |
4.751% | | 09/25/2034 | | # | | | 2,667,953 | | | 2,580,501 |
GSR Mortgage Loan Trust | | | | | | | | | | |
Series 2005-AR6, Class 2A1 | | | | | | | | | | |
4.540% | | 09/25/2035 | | # | | | 4,143,842 | | | 4,019,281 |
Harborview Mortgage Loan Trust | | | | | | | | | | |
Series 2005-14, Class 3A1A | | | | | | | | | | |
5.300% | | 12/19/2035 | | # | | | 5,640,036 | | | 5,553,838 |
MLCC Mortgage Investors, Inc. | | | | | | | | | | |
Series 2004-1, Class 2A2 | | | | | | | | | | |
4.707% | | 12/25/2034 | | # | | | 3,321,452 | | | 3,234,828 |
Provident Funding Mortgage Loan Trust | | | | | | | | | | |
Series 2004-1, Class 1A1 | | | | | | | | | | |
4.040% | | 04/25/2034 | | # | | | 656,449 | | | 653,984 |
| | | | |
| | See accompanying notes to financial statements. | | 125 |
SCHEDULE OF INVESTMENTS — (Continued)
June 30, 2008 (Unaudited)
Vantagepoint Low Duration Bond Fund
| | | | | | | | | | | |
Coupon Rate | | Maturity Date | | Face | | Value | |
NON-U.S. GOVERNMENT MORTGAGE-BACKED SECURITIES—(Continued) | | | | | | | |
Structured Asset Mortgage Investments, Inc. | | | | | | | | | | | |
Series 2004-AR5, Class 2A1 | | | | | | | | | | | |
3.194% | | 10/19/2034 | | # | | $ | 754,997 | | $ | 668,728 | |
Thornburg Mortgage Securities Trust | | | | | | | | | | | |
Series 2004-1, Class II2A | | | | | | | | | | | |
3.299% | | 03/25/2044 | | # | | | 886,963 | | | 842,480 | |
Wells Fargo Mortgage Backed Securities Trust | | | | | | | | | | | |
Series 2004-S, Class B1 | | | | | | | | | | | |
3.541% | | 09/25/2034 | | # | | | 2,046,354 | | | 1,525,173 | |
| | | | | | | | | | | |
TOTAL NON-U.S. GOVERNMENT MORTGAGE-BACKED SECURITIES
(Cost $21,207,536) | | | | | | 20,294,232 | |
| | | | | | | | | | | |
| | | | |
| | | | | | | Shares | | Value | |
CASH EQUIVALENTS—25.8% | | | | | | | | | | | |
Institutional Money Market Funds—25.8% | | | | | | | | | | | |
AIM Short-Term Investments Trust Liquid Assets Portfolio | | | | †† | | | 10,702,979 | | | 10,702,979 | |
AIM Short-Term Investments Trust Prime Assets Portfolio | | | | †† | | | 102,421,280 | | | 102,421,280 | |
JPMorgan Prime Money Market Fund, Capital Shares | | | | | | | 10,161,972 | | | 10,161,972 | |
JPMorgan U.S. Government Money Market Fund, Capital Shares | | | | | | | 6,370,276 | | | 6,370,276 | |
| | | | | | | | | | | |
TOTAL CASH EQUIVALENTS
(Cost $129,656,507) | | | | | | | | | | 129,656,507 | |
| | | | | | | | | | | |
TOTAL INVESTMENTS—122.0%
(Cost $615,259,499) | | | | | | | | | | 613,236,209 | |
Other Assets Less Liabilities—(22.0%) | | | | | | | | | | (110,416,113 | ) |
| | | | | | | | | | | |
NET ASSETS—100.0% | | | | | | | | | $ | 502,820,096 | |
| | | | | | | | | | | |
Notes to the Schedule of Investments:
| | |
| MTN | | Medium Term Note |
| # | | Rate is subject to change. Rate shown reflects current rate. |
| † | | Denotes all or a portion of security on loan. |
| ^ | | Securities exempt from registration under Rule 144A of the Securities Act of 1933. These securities may be resold in transactions exempt from registration, normally to qualified buyers. 144A securities represent 4.1% of Total Investments. |
| ‡ | | Security valued at fair value as determined by policies approved by the board of directors. |
| †† | | Represents reinvestment of collateral received in conjunction with securities lending. |
| | | | |
| 126 | | See accompanying notes to financial statements. | | |
SCHEDULE OF INVESTMENTS
June 30, 2008 (Unaudited)
Vantagepoint Inflation Protected Securities Fund
| | | | | | | | | | |
Coupon Rate | | Maturity Date | | Face | | Value |
CORPORATE OBLIGATIONS—1.8% | | | | | | | | | | |
Capital Markets—0.5% | | | | | | | | | | |
Bear Stearns Cos, Inc. (The) (MTN) | | | | | | | | | | |
5.780% | | 03/10/2014 | | # | | $ | 380,000 | | $ | 346,993 |
Goldman Sachs Group, Inc. (The) | | | | | | | | | | |
6.750% | | 10/01/2037 | | | | | 100,000 | | | 91,751 |
JPMorgan Chase & Co. (MTN) | | | | | | | | | | |
5.670% | | 06/28/2009 | | # | | | 505,000 | | | 523,888 |
Lehman Brothers Holdings, Inc. (MTN) | | | | | | | | | | |
5.210% | | 06/02/2009 | | # | | | 405,000 | | | 400,634 |
Morgan Stanley (MTN) | | | | | | | | | | |
6.625% | | 04/01/2018 | | | | | 400,000 | | | 379,674 |
| | | | | | | | | | |
| | | | | | | | | | 1,742,940 |
| | | | | | | | | | |
Commercial Banks—0.5% | | | | | | | | | | |
Credit Suisse (MTN) (Switzerland) | | | | | | | | | | |
5.000% | | 05/15/2013 | | | | | 1,700,000 | | | 1,656,141 |
Royal Bank of Scotland Group plc, Perpetual Bond (United Kingdom) | | | | | | | | | | |
7.092% | | 12/31/2049 | | # | | | 100,000 | | | 136,246 |
| | | | | | | | | | |
| | | | | | | | | | 1,792,387 |
| | | | | | | | | | |
Consumer Finance—0.2% | | | | | | | | | | |
SLM Corp. (MTN) | | | | | | | | | | |
5.560% | | 04/01/2014 | | # | | | 465,000 | | | 366,662 |
SLM Corp. (MTN), Series CPI | | | | | | | | | | |
5.310% | | 06/01/2009 | | # | | | 120,000 | | | 118,559 |
SLM Corp., Series CPI | | | | | | | | | | |
5.350% | | 10/08/2008 | | # | | | 150,000 | | | 149,893 |
| | | | | | | | | | |
| | | | | | | | | | 635,114 |
| | | | | | | | | | |
Diversified Financial Services—0.2% | | | | | | | | | | |
General Electric Capital Corp. | | | | | | | | | | |
5.625% | | 05/01/2018 | | | | | 810,000 | | | 784,768 |
| | | | | | | | | | |
Diversified Telecommunication Services—0.3% | | | | | | | | | | |
AT&T, Inc. | | | | | | | | | | |
6.300% | | 01/15/2038 | | † | | | 200,000 | | | 189,562 |
AT&T, Inc. | | | | | | | | | | |
5.600% | | 05/15/2018 | | † | | | 900,000 | | | 879,753 |
| | | | | | | | | | |
| | | | | | | | | | 1,069,315 |
| | | | | | | | | | |
Multi-National—0.1% | | | | | | | | | | |
International Bank for Reconstruction & Development, Series CPI (Supranational) | | | | | | | | | | |
5.570% | | 12/10/2013 | | # | | | 275,000 | | | 280,222 |
| | | | | | | | | | |
Pharmaceuticals—0.0% | | | | | | | | | | |
GlaxoSmithKline Capital, Inc. | | | | | | | | | | |
5.650% | | 05/15/2018 | | | | | 100,000 | | | 99,805 |
| | | | | | | | | | |
TOTAL CORPORATE OBLIGATIONS
(Cost $6,484,973) | | | | | | | | | | 6,404,551 |
| | | | | | | | | | |
U.S. GOVERNMENT AGENCY OBLIGATIONS—2.8% | | | | | | | | |
U.S. Government Agency Obligations—2.8% | | | | | | | | |
Fannie Mae | | | | | | | | | | |
2.202% | | 07/17/2008 | | | | | 1,200,000 | | | 1,198,754 |
Federal Home Loan Bank | | | | | | | | | | |
2.000% | | 07/01/2008 | | | | | 1,400,000 | | | 1,399,922 |
Freddie Mac | | | | | | | | | | |
2.269% | | 08/18/2008 | | | | | 7,000,000 | | | 6,979,336 |
| | | | | | | | | | |
TOTAL U.S. GOVERNMENT AGENCY OBLIGATIONS
(Cost $9,577,733) | | | | | | | | 9,578,012 |
| | | | | | | | | | |
U.S. GOVERNMENT AGENCY MORTGAGE-BACKED SECURITIES—2.7% | | | | | | | | |
U.S. Government Agency Mortgage-Backed Securities—2.7% | | | | | | | | |
Federal National Mortgage Association | | | | | | | | | | |
5.500% | | 07/25/2037 | | TBA | | | | | | |
(Cost $9,438,750) | | | | | | | 9,600,000 | | | 9,463,498 |
| | | | | | | | | | |
U.S. TREASURY OBLIGATIONS—92.1% | | | | | | | | | | |
U.S. Treasury Inflation Protected Securities Bonds—71.4% | | | | | | | | | | |
U.S. Treasury Bond | | | | | | | | | | |
3.875% | | 04/15/2029 | | † | | | 4,535,000 | | | 7,702,617 |
3.625% | | 04/15/2028 | | | | | 4,240,000 | | | 7,029,346 |
3.375% | | 04/15/2032 | | † | | | 510,000 | | | 776,900 |
3.000% | | 07/15/2012 | | | | | 19,275,000 | | | 25,298,359 |
2.625% | | 07/15/2017 | | † | | | 4,155,000 | | | 4,758,231 |
2.500% | | 01/15/2016 | | | | | 6,230,000 | | | 7,243,216 |
2.375% | | 04/15/2011-01/15/2027 | | † | | | 92,800,000 | | | 107,982,490 |
2.000% | | 04/15/2012-01/15/2026 | | † | | | 42,785,000 | | | 49,043,003 |
1.875% | | 01/15/2015 | | | | | 4,390,000 | | | 5,078,371 |
1.750% | | 01/15/2028 | | † | | | 13,113,000 | | | 12,797,255 |
1.625% | | 01/15/2015 | | | | | 6,385,000 | | | 7,420,835 |
0.875% | | 04/15/2010 | | † | | | 11,855,000 | | | 13,679,412 |
| | | | | | | | | | |
| | | | | | | | | | 248,810,035 |
| | | | | | | | | | |
U.S. Treasury Inflation Protected Securities Notes—20.7% | | | | | | | | | | |
U.S. Treasury Note | | | | | | | | | | |
4.250% | | 01/15/2010 | | | | | 4,520,000 | | | 6,191,592 |
3.875% | | 05/15/2018 | | | | | 2,115,000 | | | 2,097,983 |
3.500% | | 01/15/2011 | | † | | | 4,640,000 | | | 6,236,285 |
3.375% | | 01/15/2012 | | | | | 2,600,000 | | | 3,473,385 |
1.875% | | 07/15/2013 | | † | | | 15,400,000 | | | 19,048,353 |
1.625% | | 01/15/2018 | | † | | | 33,820,000 | | | 35,240,888 |
| | | | | | | | | | |
| | | | | | | | | | 72,288,486 |
| | | | | | | | | | |
TOTAL U.S. TREASURY OBLIGATIONS
(Cost $314,071,569) | | | | | | | | | | 321,098,521 |
| | | | | | | | | | |
ASSET BACKED SECURITIES—0.4% | | | | | | | | | | |
Credit Card—0.3% | | | | | | | | | | |
BA Credit Card Trust | | | | | | | | | | |
Series 2008-A5, Class A5 | | | | | | | | | | |
3.671% | | 12/16/2013 | | # | | | 1,000,000 | | | 1,015,606 |
| | | | | | | | | | |
Other—0.1% | | | | | | | | | | |
Small Business Administration Participation Certificates | | | | | | | | | | |
Series 2008-20D, Class 1 | | | | | | | | | | |
5.370% | | 04/01/2028 | | | | | 200,000 | | | 200,254 |
| | | | | | | | | | |
TOTAL ASSET BACKED SECURITIES
(Cost $1,200,000) | | | | | | | | | | 1,215,860 |
| | | | | | | | | | |
| | | | |
| | See accompanying notes to financial statements. | | 127 |
SCHEDULE OF INVESTMENTS — (Continued)
June 30, 2008 (Unaudited)
Vantagepoint Inflation Protected Securities Fund
| | | | | | | | | | | |
Coupon Rate | | Maturity Date | | Face | | Value | |
COMMERCIAL PAPER—0.2% | | | | | | | | | | | |
Commercial Banks—0.2% | | | | | | | | | | | |
Bank of Scotland plc (United Kingdom) | | | | | | | | | | | |
2.604% | | 07/07/2008 | | a | | | | | | | |
(Cost $799,653) | | | | | | $ | 800,000 | | $ | 799,595 | |
| | | | | | | | | | | |
NON-U.S. GOVERNMENT MORTGAGE-BACKED SECURITIES—0.3% | | | | | | | | | |
Mortgage Backed—0.3% | | | | | | | | | | | |
Countrywide Alternative Loan Trust | | | | | | | | | | | |
Series 2006-OA21, Class A1 | | | | | | | | | | | |
2.672% | | 03/20/2047 | | # | | | 685,867 | | | 482,581 | |
Residential Accredited Loans, Inc. | | | | | | | | | | | |
Series 2007-QO2, Class A1 | | | | | | | | | | | |
2.633% | | 02/25/2047 | | # | | | 919,549 | | | 657,351 | |
| | | | | | | | | | | |
TOTAL NON-U.S. GOVERNMENT MORTGAGE-BACKED SECURITIES
(Cost $1,185,095) | | | | | | 1,139,932 | |
| | | | | | | | | | | |
PURCHASED OPTIONS—0.0% | | | | | | | | | | | |
IRO USD 2 Year Call Swaption, Expires 02/04/2011, Strike 3.50 | | | | | | | | | | | |
(Cost $55,000) | | | | | | | 5,000,000 | | | 23,925 | |
| | | | | | | | | | | |
| | | | |
| | | | | | | Shares | | Value | |
CASH EQUIVALENTS—32.9% | | | | | | | | | | | |
Institutional Money Market Funds—32.9% | | | | | | | | | | | |
AIM Short-Term Investments Trust Liquid Assets Portfolio | | | | †† | | | 45,030,303 | | | 45,030,303 | |
AIM Short-Term Investments Trust Prime Assets Portfolio | | | | †† | | | 57,297,410 | | | 57,297,410 | |
JPMorgan Prime Money Market Fund, Capital Shares | | | | | | | 5,769,914 | | | 5,769,914 | |
JPMorgan U.S. Government Money Market Fund, Capital Shares | | | | | | | 6,465,345 | | | 6,465,345 | |
| | | | | | | | | | | |
TOTAL CASH EQUIVALENTS
(Cost $114,562,972) | | | | | | | | | | 114,562,972 | |
| | | | | | | | | | | |
TOTAL INVESTMENTS—133.2%
(Cost $457,375,745) | | | | | | | | | | 464,286,866 | |
Other Assets Less Liabilities—(33.2%) | | | | | | | | | | (115,642,977 | ) |
| | | | | | | | | | | |
NET ASSETS—100.0% | | | | | | | | | $ | 348,643,889 | |
| | | | | | | | | | | |
Notes to the Schedule of Investments:
| | |
| EUR | | European Currency Unit |
| MTN | | Medium Term Note |
| # | | Rate is subject to change. Rate shown reflects current rate. |
| † | | Denotes all or a portion of security on loan. |
| TBA | | To be announced. |
| a | | Illiquid Security. |
| †† | | Represents reinvestment of collateral received in conjunction with securities lending. |
| | | | |
| 128 | | See accompanying notes to financial statements. | | |
SCHEDULE OF INVESTMENTS
June 30, 2008 (Unaudited)
Vantagepoint Asset Allocation Fund
| | | | | | | |
| | | Shares | | Value |
COMMON STOCKS—82.6% | | | | | | | |
Aerospace & Defense—2.2% | | | | | | | |
Boeing Co. (The) | | | | 34,682 | | $ | 2,279,301 |
General Dynamics Corp. | | | | 18,179 | | | 1,530,672 |
Goodrich Corp. | | | | 5,239 | | | 248,643 |
Honeywell International, Inc. | | | | 34,314 | | | 1,725,308 |
L-3 Communications Holdings, Inc. | | | | 5,664 | | | 514,688 |
Lockheed Martin Corp. | | | | 16,028 | | | 1,581,322 |
Northrop Grumman Corp. | | | | 15,444 | | | 1,033,204 |
Precision Castparts Corp. | | | | 6,202 | | | 597,687 |
Raytheon Co. | | | | 19,546 | | | 1,100,049 |
Rockwell Collins, Inc. | | | | 7,612 | | | 365,071 |
United Technologies Corp. | | | | 44,656 | | | 2,755,275 |
| | | | | | | |
| | | | | | | 13,731,220 |
| | | | | | | |
Agriculture—0.1% | | | | | | | |
Lorillard, Inc. | | * | | 7,678 | | | 531,010 |
| | | | | | | |
Air Freight & Logistics—0.8% | | | | | | | |
CH Robinson Worldwide, Inc. | | | | 7,757 | | | 425,394 |
Expeditors International of Washington, Inc. | | | | 9,672 | | | 415,896 |
FedEx Corp. | | | | 13,970 | | | 1,100,696 |
United Parcel Service, Inc., Class B | | | | 47,198 | | | 2,901,261 |
| | | | | | | |
| | | | | | | 4,843,247 |
| | | | | | | |
Airlines—0.1% | | | | | | | |
Southwest Airlines Co. | | | | 35,312 | | | 460,468 |
| | | | | | | |
Auto Components—0.2% | | | | | | | |
Goodyear Tire & Rubber Co. (The) | | * | | 11,044 | | | 196,914 |
Johnson Controls, Inc. | | | | 26,529 | | | 760,852 |
| | | | | | | |
| | | | | | | 957,766 |
| | | | | | | |
Automobiles—0.2% | | | | | | | |
Ford Motor Co. | | *† | | 100,868 | | | 485,175 |
General Motors Corp. | | † | | 24,816 | | | 285,384 |
Harley-Davidson, Inc. | | † | | 12,041 | | | 436,607 |
| | | | | | | |
| | | | | | | 1,207,166 |
| | | | | | | |
Beverages—2.0% | | | | | | | |
Anheuser-Busch Cos, Inc. | | | | 32,884 | | | 2,042,754 |
Brown-Forman Corp., Class B | | † | | 3,664 | | | 276,888 |
Coca-Cola Co. (The) | | | | 91,904 | | | 4,777,170 |
Coca-Cola Enterprises, Inc. | | | | 13,492 | | | 233,411 |
Constellation Brands, Inc., Class A | | * | | 8,617 | | | 171,134 |
Molson Coors Brewing Co., Class B | | | | 5,820 | | | 316,201 |
Pepsi Bottling Group, Inc. | | | | 5,916 | | | 165,175 |
PepsiCo, Inc. | | | | 72,996 | | | 4,641,816 |
| | | | | | | |
| | | | | | | 12,624,549 |
| | | | | | | |
Biotechnology—1.2% | | | | | | | |
Amgen, Inc. | | * | | 49,698 | | | 2,343,758 |
Biogen Idec, Inc. | | *† | | 13,123 | | | 733,444 |
Celgene Corp. | | * | | 20,006 | | | 1,277,783 |
Genzyme Corp. | | * | | 11,884 | | | 855,886 |
Gilead Sciences, Inc. | | * | | 42,712 | | | 2,261,600 |
| | | | | | | |
| | | | | | | 7,472,471 |
| | | | | | | |
Building Products—0.1% | | | | | | | |
Masco Corp. | | † | | 18,434 | | | 289,967 |
| | | | | | | |
Capital Markets—2.3% | | | | | | | |
American Capital Strategies Ltd. | | † | | 8,976 | | | 213,359 |
Ameriprise Financial, Inc. | | | | 10,442 | | | 424,676 |
Bank of New York Mellon Corp. | | | | 52,514 | | | 1,986,605 |
Charles Schwab Corp. (The) | | | | 43,200 | | | 887,328 |
E*Trade Financial Corp. | | *† | | 18,346 | | | 57,606 |
Federated Investors, Inc., Class B | | | | 3,330 | | | 114,619 |
Franklin Resources, Inc. | | | | 7,431 | | | 681,051 |
Goldman Sachs Group, Inc. (The) | | | | 18,179 | | | 3,179,507 |
Janus Capital Group, Inc. | | | | 7,815 | | | 206,863 |
Legg Mason, Inc. | | | | 5,766 | | | 251,225 |
Lehman Brothers Holdings, Inc. | | † | | 30,930 | | | 612,723 |
Merrill Lynch & Co., Inc. | | | | 44,701 | | | 1,417,469 |
Morgan Stanley | | | | 50,822 | | | 1,833,150 |
Northern Trust Corp. | | | | 8,606 | | | 590,113 |
State Street Corp. | | | | 19,436 | | | 1,243,710 |
T Rowe Price Group, Inc. | | † | | 11,620 | | | 656,181 |
| | | | | | | |
| | | | | | | 14,356,185 |
| | | | | | | |
Chemicals—1.7% | | | | | | | |
Air Products & Chemicals, Inc. | | | | 9,858 | | | 974,562 |
Ashland, Inc. | | | | 3,106 | | | 149,709 |
Dow Chemical Co. (The) | | | | 42,576 | | | 1,486,328 |
E.I. Du Pont de Nemours & Co. | | | | 41,425 | | | 1,776,718 |
Eastman Chemical Co. | | | | 3,534 | | | 243,351 |
Ecolab, Inc. | | | | 8,001 | | | 343,963 |
Hercules, Inc. | | | | 4,386 | | | 74,255 |
International Flavors & Fragrances, Inc. | | | | 3,888 | | | 151,865 |
Monsanto Co. | | | | 25,198 | | | 3,186,035 |
PPG Industries, Inc. | | | | 7,259 | | | 416,449 |
Praxair, Inc. | | | | 14,140 | | | 1,332,554 |
Rohm & Haas Co. | | | | 6,344 | | | 294,615 |
Sigma-Aldrich Corp. | | | | 5,903 | | | 317,936 |
| | | | | | | |
| | | | | | | 10,748,340 |
| | | | | | | |
Commercial Banks—1.8% | | | | | | | |
BB&T Corp. | | † | | 24,341 | | | 554,245 |
Comerica, Inc. | | | | 7,218 | | | 184,997 |
Fifth Third Bancorp | | † | | 24,353 | | | 247,914 |
First Horizon National Corp. | | † | | 5,539 | | | 41,155 |
Huntington Bancshares, Inc. | | † | | 15,606 | | | 90,047 |
Keycorp | | | | 17,811 | | | 195,565 |
M&T Bank Corp. | | † | | 3,525 | | | 248,653 |
Marshall & Ilsley Corp. | | † | | 11,451 | | | 175,544 |
National City Corp. | | † | | 28,078 | | | 133,932 |
PNC Financial Services Group, Inc. | | | | 15,480 | | | 883,908 |
Regions Financial Corp. | | | | 32,130 | | | 350,538 |
SunTrust Banks, Inc. | | | | 16,396 | | | 593,863 |
US Bancorp | | | | 79,260 | | | 2,210,561 |
Wachovia Corp. | | | | 97,843 | | | 1,519,502 |
Wells Fargo & Co. | | | | 151,795 | | | 3,605,131 |
Zions Bancorporation | | † | | 4,920 | | | 154,931 |
| | | | | | | |
| | | | | | | 11,190,486 |
| | | | | | | |
Commercial Services & Supplies—0.4% | | | | | | | |
Allied Waste Industries, Inc. | | * | | 15,505 | | | 195,673 |
Avery Dennison Corp. | | † | | 4,917 | | | 216,004 |
Cintas Corp. | | | | 6,084 | | | 161,287 |
Equifax, Inc. | | † | | 6,441 | | | 216,546 |
Monster Worldwide, Inc. | | *† | | 5,522 | | | 113,808 |
| | | | |
| | See accompanying notes to financial statements. | | 129 |
SCHEDULE OF INVESTMENTS — (Continued)
June 30, 2008 (Unaudited)
Vantagepoint Asset Allocation Fund
| | | | | | | |
| | | Shares | | Value |
COMMON STOCKS—(Continued) | | | | | | | |
Pitney Bowes, Inc. | | | | 10,038 | | $ | 342,296 |
Robert Half International, Inc. | | † | | 7,514 | | | 180,111 |
RR Donnelley & Sons Co. | | | | 9,448 | | | 280,511 |
Waste Management, Inc. | | | | 22,778 | | | 858,958 |
| | | | | | | |
| | | | | | | 2,565,194 |
| | | | | | | |
Communications Equipment—2.1% | | | | | | | |
Ciena Corp. | | * | | 3,922 | | | 90,873 |
Cisco Systems, Inc. | | * | | 272,562 | | | 6,339,792 |
Corning, Inc. | | | | 70,940 | | | 1,635,167 |
JDS Uniphase Corp. | | *† | | 9,473 | | | 107,613 |
Juniper Networks, Inc. | | * | | 23,865 | | | 529,326 |
Motorola, Inc. | | | | 105,079 | | | 771,280 |
Qualcomm, Inc. | | | | 74,503 | | | 3,305,698 |
Tellabs, Inc. | | * | | 19,893 | | | 92,502 |
| | | | | | | |
| | | | | | | 12,872,251 |
| | | | | | | |
Computers & Peripherals—3.9% | | | | | | | |
Apple, Inc. | | * | | 40,663 | | | 6,808,613 |
Dell, Inc. | | * | | 93,911 | | | 2,054,773 |
EMC Corp. | | * | | 95,328 | | | 1,400,368 |
Hewlett-Packard Co. | | | | 113,362 | | | 5,011,734 |
International Business Machines Corp. | | | | 63,656 | | | 7,545,145 |
Lexmark International, Inc., Class A | | * | | 4,793 | | | 160,230 |
NetApp, Inc. | | * | | 16,442 | | | 356,134 |
QLogic Corp. | | * | | 7,961 | | | 116,151 |
SanDisk Corp. | | * | | 9,800 | | | 183,260 |
Sun Microsystems, Inc. | | * | | 39,043 | | | 424,788 |
Teradata Corp. | | * | | 8,056 | | | 186,416 |
| | | | | | | |
| | | | | | | 24,247,612 |
| | | | | | | |
Construction & Engineering—0.2% | | | | | | | |
Fluor Corp. | | | | 3,836 | | | 713,803 |
Jacobs Engineering Group, Inc. | | * | | 5,446 | | | 439,492 |
| | | | | | | |
| | | | | | | 1,153,295 |
| | | | | | | |
Construction Materials—0.0% | | | | | | | |
Vulcan Materials Co. | | † | | 4,399 | | | 262,972 |
| | | | | | | |
Consumer Finance—0.5% | | | | | | | |
American Express Co. | | | | 53,191 | | | 2,003,705 |
Capital One Financial Corp. | | † | | 17,161 | | | 652,290 |
Discover Financial Services | | † | | 22,045 | | | 290,333 |
SLM Corp. | | * | | 21,467 | | | 415,386 |
| | | | | | | |
| | | | | | | 3,361,714 |
| | | | | | | |
Containers & Packaging—0.1% | | | | | | | |
Ball Corp. | | | | 4,556 | | | 217,503 |
Bemis Co., Inc. | | | | 5,148 | | | 115,418 |
Pactiv Corp. | | * | | 6,199 | | | 131,605 |
Sealed Air Corp. | | | | 7,079 | | | 134,572 |
| | | | | | | |
| | | | | | | 599,098 |
| | | | | | | |
Distributors—0.1% | | | | | | | |
Genuine Parts Co. | | † | | 7,626 | | | 302,600 |
| | | | | | | |
Diversified Consumer Services—0.1% | | | | | | | |
Apollo Group, Inc., Class A | | * | | 6,172 | | | 273,173 |
H&R Block, Inc. | | † | | 14,400 | | | 308,160 |
| | | | | | | |
| | | | | | | 581,333 |
| | | | | | | |
Diversified Financial Services—2.8% | | | | | | | |
Bank of America Corp. | | | | 204,386 | | $ | 4,878,694 |
CIT Group, Inc. | | | | 8,779 | | | 59,785 |
Citigroup, Inc. | | | | 250,898 | | | 4,205,050 |
CME Group, Inc. | | | | 2,453 | | | 939,965 |
IntercontinentalExchange, Inc. | | * | | 3,149 | | | 358,986 |
JPMorgan Chase & Co. | | | | 157,405 | | | 5,400,566 |
Leucadia National Corp. | | † | | 7,783 | | | 365,334 |
Moody’s Corp. | | † | | 9,463 | | | 325,906 |
NYSE Euronext | | | | 11,987 | | | 607,261 |
| | | | | | | |
| | | | | | | 17,141,547 |
| | | | | | | |
Diversified Telecommunication Services—2.4% | | | | | | | |
AT&T, Inc. | | | | 273,467 | | | 9,213,103 |
CenturyTel, Inc. | | | | 5,012 | | | 178,377 |
Citizens Communications Co. | | † | | 14,413 | | | 163,443 |
Embarq Corp. | | | | 6,503 | | | 307,397 |
Qwest Communications International, Inc. | | † | | 71,276 | | | 280,115 |
Verizon Communications, Inc. | | | | 131,219 | | | 4,645,153 |
Windstream Corp. | | | | 19,512 | | | 240,778 |
| | | | | | | |
| | | | | | | 15,028,366 |
| | | | | | | |
Electric Utilities—1.9% | | | | | | | |
Allegheny Energy, Inc. | | | | 7,132 | | | 357,384 |
American Electric Power Co., Inc. | | | | 17,957 | | | 722,410 |
Duke Energy Corp. | | | | 55,876 | | | 971,125 |
Edison International | | † | | 14,281 | | | 733,758 |
Entergy Corp. | | | | 9,154 | | | 1,102,874 |
Exelon Corp. | | | | 30,358 | | | 2,731,006 |
FirstEnergy Corp. | | | | 14,589 | | | 1,201,112 |
FPL Group, Inc. | | | | 18,300 | | | 1,200,114 |
Pepco Holdings, Inc. | | | | 8,794 | | | 225,566 |
Pinnacle West Capital Corp. | | | | 4,372 | | | 134,526 |
PPL Corp. | | | | 17,328 | | | 905,735 |
Progress Energy, Inc. | | | | 11,761 | | | 491,963 |
Southern Co. | | | | 35,164 | | | 1,227,927 |
| | | | | | | |
| | | | | | | 12,005,500 |
| | | | | | | |
Electrical Equipment—0.4% | | | | | | | |
Cooper Industries Ltd., Class A | | | | 8,037 | | | 317,461 |
Emerson Electric Co. | | | | 36,190 | | | 1,789,596 |
Rockwell Automation, Inc. | | | | 7,187 | | | 314,288 |
| | | | | | | |
| | | | | | | 2,421,345 |
| | | | | | | |
Electronic Equipment & Instruments—0.3% | | | | | | | |
Agilent Technologies, Inc. | | * | | 16,831 | | | 598,174 |
Jabil Circuit, Inc. | | | | 8,930 | | | 146,541 |
Molex, Inc. | | | | 6,227 | | | 152,001 |
Tyco Electronics Ltd. (Bermuda) | | | | 22,179 | | | 794,452 |
| | | | | | | |
| | | | | | | 1,691,168 |
| | | | | | | |
Energy Equipment & Services—3.0% | | | | | | | |
Baker Hughes, Inc. | | | | 14,690 | | | 1,283,025 |
BJ Services Co. | | | | 14,353 | | | 458,435 |
Cameron International Corp. | | * | | 10,006 | | | 553,832 |
ENSCO International, Inc. | | | | 6,778 | | | 547,256 |
Halliburton Co. | | | | 40,472 | | | 2,147,849 |
Nabors Industries Ltd. (Bermuda) | | *† | | 14,031 | | | 690,746 |
National Oilwell Varco, Inc. | | * | | 19,107 | | | 1,695,173 |
Noble Corp. | | | | 11,980 | | | 778,221 |
Rowan Cos, Inc. | | † | | 4,817 | | | 225,195 |
Schlumberger Ltd. | | | | 55,074 | | | 5,916,600 |
Smith International, Inc. | | | | 8,885 | | | 738,699 |
| | | | |
| 130 | | See accompanying notes to financial statements. | | |
SCHEDULE OF INVESTMENTS — (Continued)
June 30, 2008 (Unaudited)
Vantagepoint Asset Allocation Fund
| | | | | | | |
| | | Shares | | Value |
COMMON STOCKS—(Continued) | | | | | | | |
Transocean, Inc. | | | | 14,611 | | $ | 2,226,570 |
Weatherford International Ltd. | | * | | 30,672 | | | 1,521,024 |
| | | | | | | |
| | | | | | | 18,782,625 |
| | | | | | | |
Food & Staples Retailing—2.3% | | | | | | | |
Costco Wholesale Corp. | | | | 20,192 | | | 1,416,267 |
CVS Caremark Corp. | | | | 65,842 | | | 2,605,368 |
Kroger Co. (The) | | | | 31,965 | | | 922,830 |
Safeway, Inc. | | | | 19,776 | | | 564,605 |
Supervalu, Inc. | | | | 8,705 | | | 268,897 |
Sysco Corp. | | | | 27,245 | | | 749,510 |
Walgreen Co. | | | | 45,220 | | | 1,470,102 |
Wal-Mart Stores, Inc. | | | | 107,350 | | | 6,033,070 |
Whole Foods Market, Inc. | | † | | 6,058 | | | 143,514 |
| | | | | | | |
| | | | | | | 14,174,163 |
| | | | | | | |
Food Products—1.3% | | | | | | | |
Archer-Daniels-Midland Co. | | † | | 28,680 | | | 967,950 |
Campbell Soup Co. | | | | 9,478 | | | 317,134 |
ConAgra Foods, Inc. | | | | 22,835 | | | 440,259 |
Dean Foods Co. | | * | | 5,320 | | | 104,378 |
General Mills, Inc. | | | | 15,679 | | | 952,813 |
Hershey Co. (The) | | † | | 7,857 | | | 257,552 |
HJ Heinz Co. | | | | 14,736 | | | 705,118 |
Kellogg Co. | | | | 11,725 | | | 563,034 |
Kraft Foods, Inc., Class A | | | | 70,506 | | | 2,005,896 |
McCormick & Co., Inc. | | † | | 5,813 | | | 207,292 |
Sara Lee Corp. | | | | 33,530 | | | 410,742 |
Tyson Foods, Inc., Class A | | | | 11,069 | | | 165,371 |
WM Wrigley Jr Co. | | | | 9,736 | | | 757,266 |
| | | | | | | |
| | | | | | | 7,854,805 |
| | | | | | | |
Gas Utilities—0.1% | | | | | | | |
Nicor, Inc. | | † | | 1,963 | | | 83,604 |
Questar Corp. | | | | 7,316 | | | 519,729 |
| | | | | | | |
| | | | | | | 603,333 |
| | | | | | | |
Health Care Equipment & Supplies—1.7% | | | | | | | |
Baxter International, Inc. | | | | 29,138 | | | 1,863,084 |
Becton Dickinson & Co. | | | | 10,910 | | | 886,983 |
Boston Scientific Corp. | | * | | 59,259 | | | 728,293 |
Covidien Ltd. | | | | 22,179 | | | 1,062,152 |
CR Bard, Inc. | | | | 4,555 | | | 400,612 |
Hospira, Inc. | | * | | 7,127 | | | 285,864 |
Intuitive Surgical, Inc. | | *† | | 1,581 | | | 425,922 |
Medtronic, Inc. | | | | 52,035 | | | 2,692,811 |
St Jude Medical, Inc. | | * | | 16,184 | | | 661,602 |
Stryker Corp. | | | | 11,672 | | | 733,935 |
Varian Medical Systems, Inc. | | *† | | 5,760 | | | 298,656 |
Zimmer Holdings, Inc. | | * | | 10,939 | | | 744,399 |
| | | | | | | |
| | | | | | | 10,784,313 |
| | | | | | | |
Health Care Providers & Services—1.5% | | | | | | | |
Aetna, Inc. | | | | 22,835 | | | 925,503 |
AmerisourceBergen Corp. | | | | 7,477 | | | 299,005 |
Cardinal Health, Inc. | | | | 16,840 | | | 868,607 |
Cigna Corp. | | | | 13,368 | | | 473,094 |
Coventry Health Care, Inc. | | * | | 6,999 | | | 212,910 |
Express Scripts, Inc. | | * | | 12,052 | | | 755,901 |
Humana, Inc. | | * | | 7,657 | | | 304,519 |
Laboratory Corp of America Holdings | | *† | | 5,554 | | | 386,725 |
McKesson Corp. | | | | 13,531 | | | 756,518 |
Medco Health Solutions, Inc. | | * | | 23,597 | | | 1,113,778 |
Patterson Cos, Inc. | | *† | | 6,066 | | | 178,280 |
Quest Diagnostics, Inc. | | | | 7,162 | | | 347,142 |
Tenet Healthcare Corp. | | * | | 23,062 | | | 128,225 |
UnitedHealth Group, Inc. | | | | 57,542 | | | 1,510,477 |
WellPoint, Inc. | | * | | 25,359 | | | 1,208,610 |
| | | | | | | |
| | | | | | | 9,469,294 |
| | | | | | | |
Health Care Technology—0.0% | | | | | | | |
IMS Health, Inc. | | | | 8,795 | | | 204,924 |
| | | | | | | |
Hotels, Restaurants & Leisure—1.1% | | | | | | | |
Carnival Corp. | | † | | 19,796 | | | 652,476 |
Darden Restaurants, Inc. | | † | | 6,534 | | | 208,696 |
International Game Technology | | | | 14,815 | | | 370,079 |
Marriott International, Inc., Class A | | | | 15,100 | | | 396,224 |
McDonald’s Corp. | | | | 52,956 | | | 2,977,186 |
Starbucks Corp. | | * | | 33,638 | | | 529,462 |
Starwood Hotels & Resorts Worldwide, Inc. | | | | 9,466 | | | 379,303 |
Wendy’s International, Inc. | | | | 5,142 | | | 139,965 |
Wyndham Worldwide Corp. | | | | 8,923 | | | 159,811 |
Yum! Brands, Inc. | | | | 21,865 | | | 767,243 |
| | | | | | | |
| | | | | | | 6,580,445 |
| | | | | | | |
Household Durables—0.3% | | | | | | | |
Black & Decker Corp. | | | | 3,454 | | | 198,640 |
Centex Corp. | | | | 5,370 | | | 71,797 |
DR Horton, Inc. | | † | | 11,960 | | | 129,766 |
Fortune Brands, Inc. | | | | 6,876 | | | 429,131 |
Harman International Industries, Inc. | | † | | 2,854 | | | 118,127 |
KB Home | | † | | 3,394 | | | 57,460 |
Leggett & Platt, Inc. | | † | | 8,064 | | | 135,233 |
Lennar Corp., Class A | | † | | 5,972 | | | 73,695 |
Newell Rubbermaid, Inc. | | | | 11,995 | | | 201,396 |
Pulte Homes, Inc. | | † | | 9,419 | | | 90,705 |
Snap-On, Inc. | | † | | 2,539 | | | 132,053 |
Stanley Works (The) | | | | 3,363 | | | 150,763 |
Whirlpool Corp. | | † | | 3,383 | | | 208,833 |
| | | | | | | |
| | | | | | | 1,997,599 |
| | | | | | | |
Household Products—1.9% | | | | | | | |
Clorox Co. | | | | 6,602 | | | 344,624 |
Colgate-Palmolive Co. | | | | 23,114 | | | 1,597,177 |
Kimberly-Clark Corp. | | | | 19,597 | | | 1,171,509 |
Procter & Gamble Co. | | | | 140,533 | | | 8,545,812 |
| | | | | | | |
| | | | | | | 11,659,122 |
| | | | | | | |
Independent Power Producers & Energy Traders—0.2% | | | | | | | |
AES Corp. (The) | | * | | 28,796 | | | 553,171 |
Constellation Energy Group, Inc. | | | | 7,847 | | | 644,239 |
Dynegy, Inc., Class A | | * | | 20,516 | | | 175,412 |
| | | | | | | |
| | | | | | | 1,372,822 |
| | | | | | | |
Industrial Conglomerates—2.6% | | | | | | | |
3M Co. | | | | 32,718 | | | 2,276,846 |
General Electric Co. | | | | 459,171 | | | 12,255,274 |
Textron, Inc. | | | | 11,678 | | | 559,726 |
Tyco International Ltd. (Bermuda) | | | | 22,179 | | | 888,047 |
| | | | | | | |
| | | | | | | 15,979,893 |
| | | | | | | |
Insurance—3.0% | | | | | | | |
ACE Ltd. (Bermuda) | | | | 15,178 | | | 836,156 |
Aflac, Inc. | | | | 21,905 | | | 1,375,634 |
Allstate Corp. (The) | | | | 25,785 | | | 1,175,538 |
| | | | |
| | See accompanying notes to financial statements. | | 131 |
SCHEDULE OF INVESTMENTS — (Continued)
June 30, 2008 (Unaudited)
Vantagepoint Asset Allocation Fund
| | | | | | | |
| | | Shares | | Value |
COMMON STOCKS—(Continued) | | | | | | | |
American International Group, Inc. | | | | 123,701 | | $ | 3,273,129 |
AON Corp. | | | | 14,251 | | | 654,691 |
Assurant, Inc. | | | | 4,469 | | | 294,775 |
Chubb Corp. | | | | 17,035 | | | 834,885 |
Cincinnati Financial Corp. | | | | 7,627 | | | 193,726 |
Genworth Financial, Inc., Class A | | | | 19,514 | | | 347,544 |
Hartford Financial Services Group, Inc. | | | | 14,401 | | | 929,873 |
Lincoln National Corp. | | | | 12,544 | | | 568,494 |
Loews Corp. | | | | 17,749 | | | 832,428 |
Marsh & McLennan Cos, Inc. | | | | 24,984 | | | 663,325 |
MBIA, Inc. | | † | | 9,669 | | | 42,447 |
MetLife, Inc. | | | | 32,629 | | | 1,721,832 |
Principal Financial Group, Inc. | | | | 12,337 | | | 517,784 |
Progressive Corp. (The) | | | | 31,212 | | | 584,289 |
Prudential Financial, Inc. | | | | 20,520 | | | 1,225,865 |
Safeco Corp. | | | | 4,129 | | | 277,304 |
Torchmark Corp. | | | | 4,583 | | | 268,793 |
Travelers Cos, Inc. (The) | | | | 28,541 | | | 1,238,679 |
Unum Group | | | | 15,895 | | | 325,053 |
XL Capital Ltd., Class A (Bermuda) | | | | 8,095 | | | 166,433 |
| | | | | | | |
| | | | | | | 18,348,677 |
| | | | | | | |
Internet & Catalog Retail—0.2% | | | | | | | |
Amazon.com, Inc. | | * | | 14,009 | | | 1,027,280 |
Expedia, Inc. | | * | | 9,280 | | | 170,566 |
IAC/InterActiveCorp | | * | | 9,631 | | | 185,686 |
| | | | | | | |
| | | | | | | 1,383,532 |
| | | | | | | |
Internet Software & Services—1.4% | | | | | | | |
Akamai Technologies, Inc. | | *† | | 7,142 | | | 248,470 |
eBay, Inc. | | * | | 51,735 | | | 1,413,918 |
Google, Inc., Class A | | * | | 10,663 | | | 5,613,216 |
VeriSign, Inc. | | * | | 9,201 | | | 347,798 |
Yahoo! Inc. | | * | | 63,405 | | | 1,309,947 |
| | | | | | | |
| | | | | | | 8,933,349 |
| | | | | | | |
IT Services—0.8% | | | | | | | |
Affiliated Computer Services, Inc., Class A | | * | | 5,278 | | | 282,320 |
Automatic Data Processing, Inc. | | | | 24,523 | | | 1,027,514 |
Cognizant Technology Solutions Corp., Class A | | * | | 12,318 | | | 400,458 |
Computer Sciences Corp. | | * | | 7,162 | | | 335,468 |
Convergys Corp. | | * | | 6,879 | | | 102,222 |
Electronic Data Systems Corp. | | | | 22,586 | | | 556,519 |
Fidelity National Information Services, Inc. | | | | 7,010 | | | 258,739 |
Fiserv, Inc. | | * | | 8,200 | | | 372,034 |
Paychex, Inc. | | | | 15,453 | | | 483,370 |
Total System Services, Inc. | | | | 9,144 | | | 203,180 |
Unisys Corp. | | * | | 13,879 | | | 54,822 |
Western Union Co. (The) | | | | 33,663 | | | 832,149 |
| | | | | | | |
| | | | | | | 4,908,795 |
| | | | | | | |
Leisure Equipment & Products—0.1% | | | | | | | |
Eastman Kodak Co. | | † | | 12,583 | | | 181,573 |
Hasbro, Inc. | | | | 7,426 | | | 265,257 |
Mattel, Inc. | | | | 17,004 | | | 291,108 |
| | | | | | | |
| | | | | | | 737,938 |
| | | | | | | |
Life Sciences Tools & Services—0.3% | | | | | | | |
Applera Corp.—Applied Biosystems Group | | | | 8,032 | | | 268,911 |
Millipore Corp. | | * | | 2,215 | | | 150,310 |
PerkinElmer, Inc. | | | | 5,757 | | | 160,333 |
Thermo Fisher Scientific, Inc. | | * | | 19,378 | | | 1,079,936 |
Waters Corp. | | * | | 4,564 | | | 294,378 |
| | | | | | | |
| | | | | | | 1,953,868 |
| | | | | | | |
Machinery—1.6% | | | | | | | |
Caterpillar, Inc. | | | | 28,473 | | | 2,101,877 |
Cummins, Inc. | | | | 9,100 | | | 596,232 |
Danaher Corp. | | † | | 11,709 | | | 905,106 |
Deere & Co. | | | | 20,412 | | | 1,472,317 |
Dover Corp. | | | | 8,920 | | | 431,460 |
Eaton Corp. | | | | 7,269 | | | 617,647 |
Illinois Tool Works, Inc. | | | | 18,598 | | | 883,591 |
Ingersoll-Rand Co. Ltd., Class A (Bermuda) | | | | 15,161 | | | 567,476 |
ITT Corp. | | | | 8,141 | | | 515,569 |
Manitowoc Co., Inc. (The) | | † | | 5,703 | | | 185,519 |
PACCAR, Inc. | | | | 16,759 | | | 701,029 |
Pall Corp. | | | | 5,917 | | | 234,787 |
Parker Hannifin Corp. | | | | 7,971 | | | 568,492 |
Terex Corp. | | * | | 4,319 | | | 221,867 |
| | | | | | | |
| | | | | | | 10,002,969 |
| | | | | | | |
Media—2.4% | | | | | | | |
CBS Corp., Class B | | | | 31,677 | | | 617,385 |
Clear Channel Communications, Inc. | | | | 22,852 | | | 804,390 |
Comcast Corp., Class A | | | | 136,609 | | | 2,591,473 |
DIRECTV Group, Inc. (The) | | * | | 32,728 | | | 847,982 |
E.W. Scripps Co., Class A | | † | | 3,760 | | | 156,190 |
Gannett Co., Inc. | | † | | 10,491 | | | 227,340 |
Interpublic Group of Cos, Inc. (The) | | * | | 18,883 | | | 162,394 |
McGraw-Hill Cos, Inc. (The) | | | | 14,843 | | | 595,501 |
Meredith Corp. | | † | | 1,895 | | | 53,610 |
New York Times Co. (The), Class A | | † | | 6,241 | | | 96,049 |
News Corp., Class A | | | | 105,672 | | | 1,589,307 |
Omnicom Group, Inc. | | | | 14,742 | | | 661,621 |
Time Warner, Inc. | | | | 164,450 | | | 2,433,860 |
Viacom, Inc., Class B | | * | | 29,470 | | | 900,014 |
Walt Disney Co. (The) | | | | 87,980 | | | 2,744,976 |
Washington Post Co. (The), Class B | | | | 265 | | | 155,528 |
| | | | | | | |
| | | | | | | 14,637,620 |
| | | | | | | |
Metals & Mining—1.1% | | | | | | | |
AK Steel Holding Corp. | | | | 4,338 | | | 299,322 |
Alcoa, Inc. | | | | 38,642 | | | 1,376,428 |
Allegheny Technologies, Inc. | | | | 4,545 | | | 269,428 |
Freeport-McMoRan Copper & Gold, Inc. | | | | 17,225 | | | 2,018,598 |
Newmont Mining Corp. | | | | 20,249 | | | 1,056,188 |
Nucor Corp. | | | | 13,611 | | | 1,016,333 |
Titanium Metals Corp. | | † | | 3,978 | | | 55,652 |
United States Steel Corp. | | | | 5,195 | | | 959,932 |
| | | | | | | |
| | | | | | | 7,051,881 |
| | | | | | | |
Multiline Retail—0.6% | | | | | | | |
Big Lots, Inc. | | *† | | 4,622 | | | 144,391 |
Dillard’s, Inc., Class A | | † | | 2,579 | | | 29,839 |
Family Dollar Stores, Inc. | | | | 7,400 | | | 147,556 |
JC Penney Co., Inc. | | | | 10,233 | | | 371,356 |
| | | | |
| 132 | | See accompanying notes to financial statements. | | |
SCHEDULE OF INVESTMENTS — (Continued)
June 30, 2008 (Unaudited)
Vantagepoint Asset Allocation Fund
| | | | | | | |
| | | | | Shares | | Value |
COMMON STOCKS—(Continued) | | | | | | | |
Kohl’s Corp. | | *† | | 15,275 | | $ | 611,611 |
Macy’s, Inc. | | | | 21,019 | | | 408,189 |
Nordstrom, Inc. | | † | | 9,341 | | | 283,032 |
Sears Holdings Corp. | | *† | | 3,576 | | | 263,408 |
Target Corp. | | | | 36,140 | | | 1,680,149 |
| | | | | | | |
| | | | | | | 3,939,531 |
| | | | | | | |
Multi-Utilities—1.0% | | | | | | | |
Ameren Corp. | | | | 9,010 | | | 380,492 |
Centerpoint Energy, Inc. | | | | 13,537 | | | 217,269 |
CMS Energy Corp. | | † | | 9,922 | | | 147,838 |
Consolidated Edison, Inc. | | † | | 12,180 | | | 476,116 |
Dominion Resources, Inc. | | | | 26,866 | | | 1,275,866 |
DTE Energy Co. | | | | 7,766 | | | 329,589 |
Integrys Energy Group, Inc. | | † | | 3,300 | | | 167,739 |
NiSource, Inc. | | † | | 11,857 | | | 212,478 |
PG&E Corp. | | | | 15,829 | | | 628,253 |
Public Service Enterprise Group, Inc. | | | | 22,832 | | | 1,048,674 |
Sempra Energy | | † | | 11,832 | | | 667,917 |
TECO Energy, Inc. | | † | | 9,094 | | | 195,430 |
Xcel Energy, Inc. | | | | 17,719 | | | 355,620 |
| | | | | | | |
| | | | | | | 6,103,281 |
| | | | | | | |
Office Electronics—0.1% | | | | | | | |
Xerox Corp. | | † | | 42,793 | | | 580,273 |
| | | | | | | |
Oil, Gas & Consumable Fuels—10.3% | | | | | | | |
Anadarko Petroleum Corp. | | | | 20,897 | | | 1,563,931 |
Apache Corp. | | | | 15,312 | | | 2,128,368 |
Cabot Oil & Gas Corp. | | | | 4,497 | | | 304,582 |
Chesapeake Energy Corp. | | | | 22,135 | | | 1,460,025 |
Chevron Corp. | | | | 95,192 | | | 9,436,383 |
ConocoPhillips | | | | 71,189 | | | 6,719,530 |
Consol Energy, Inc. | | † | | 8,392 | | | 943,009 |
Devon Energy Corp. | | | | 20,434 | | | 2,455,349 |
El Paso Corp. | | | | 31,393 | | | 682,484 |
EOG Resources, Inc. | | | | 11,033 | | | 1,447,530 |
Exxon Mobil Corp. | | | | 243,210 | | | 21,434,097 |
Hess Corp. | | | | 12,826 | | | 1,618,513 |
Marathon Oil Corp. | | | | 32,489 | | | 1,685,204 |
Massey Energy Co. | | | | 3,705 | | | 347,344 |
Murphy Oil Corp. | | | | 8,420 | | | 825,581 |
Noble Energy, Inc. | | | | 7,770 | | | 781,351 |
Occidental Petroleum Corp. | | | | 37,958 | | | 3,410,906 |
Peabody Energy Corp. | | | | 12,462 | | | 1,097,279 |
Range Resources Corp. | | | | 6,784 | | | 444,623 |
Southwestern Energy Co. | | * | | 14,444 | | | 687,679 |
Spectra Energy Corp. | | | | 27,942 | | | 803,053 |
Sunoco, Inc. | | | | 5,960 | | | 242,512 |
Tesoro Corp. | | † | | 6,213 | | | 122,831 |
Valero Energy Corp. | | | | 25,471 | | | 1,048,896 |
Williams Cos, Inc. | | | | 27,086 | | | 1,091,837 |
XTO Energy, Inc. | | | | 23,466 | | | 1,607,656 |
| | | | | | | |
| | | | | | | 64,390,553 |
| | | | | | | |
Paper & Forest Products—0.2% | | | | | | | |
International Paper Co. | | | | 19,914 | | | 463,996 |
MeadWestvaco Corp. | | | | 7,851 | | | 187,168 |
Weyerhaeuser Co. | | | | 9,586 | | | 490,228 |
| | | | | | | |
| | | | | | | 1,141,392 |
| | | | | | | |
Personal Products—0.2% | | | | | | | |
Avon Products, Inc. | | | | 19,873 | | | 715,825 |
Estee Lauder Cos, Inc. (The), Class A | | | | 5,057 | | | 234,898 |
| | | | | | | |
| | | | | | | 950,723 |
| | | | | | | |
Pharmaceuticals—5.0% | | | | | | | |
Abbott Laboratories | | | | 70,624 | | | 3,740,953 |
Allergan, Inc. | | | | 13,872 | | | 722,038 |
Barr Pharmaceuticals, Inc. | | * | | 4,637 | | | 209,036 |
Bristol-Myers Squibb Co. | | | | 90,646 | | | 1,860,962 |
Eli Lilly & Co. | | | | 45,485 | | | 2,099,588 |
Forest Laboratories, Inc. | | * | | 14,323 | | | 497,581 |
Johnson & Johnson | | | | 129,700 | | | 8,344,898 |
King Pharmaceuticals, Inc. | | * | | 10,183 | | | 106,616 |
Merck & Co., Inc. | | | | 99,567 | | | 3,752,680 |
Mylan, Inc. | | *† | | 11,139 | | | 134,448 |
Pfizer, Inc. | | | | 310,891 | | | 5,431,266 |
Schering-Plough Corp. | | | | 73,261 | | | 1,442,509 |
Watson Pharmaceuticals, Inc. | | * | | 4,259 | | | 115,717 |
Wyeth | | | | 61,524 | | | 2,950,691 |
| | | | | | | |
| | | | | | | 31,408,983 |
| | | | | | | |
Real Estate Investment Trusts (REIT)—1.0% | | | | | | | |
Apartment Investment & Management Co., Class A REIT | | | | 4,055 | | | 138,113 |
AvalonBay Communities, Inc. REIT | | † | | 3,501 | | | 312,149 |
Boston Properties, Inc. REIT | | | | 5,498 | | | 496,030 |
Developers Diversified Realty Corp. REIT | | † | | 5,585 | | | 193,855 |
Equity Residential REIT | | † | | 12,749 | | | 487,904 |
General Growth Properties, Inc. REIT | | † | | 12,267 | | | 429,713 |
HCP, Inc. REIT | | | | 9,997 | | | 318,005 |
Host Hotels & Resorts, Inc. REIT | | | | 23,370 | | | 319,001 |
Kimco Realty Corp. REIT | | | | 11,062 | | | 381,860 |
Plum Creek Timber Co., Inc. REIT | | † | | 8,165 | | | 348,727 |
Prologis REIT | | | | 11,448 | | | 622,199 |
Public Storage REIT | | | | 5,464 | | | 441,437 |
Simon Property Group, Inc. REIT | | † | | 10,262 | | | 922,451 |
Vornado Realty Trust REIT | | † | | 5,908 | | | 519,904 |
| | | | | | | |
| | | | | | | 5,931,348 |
| | | | | | | |
Real Estate Management & Development—0.0% | | | | | | | |
CB Richard Ellis Group, Inc., Class A | | *† | | 7,914 | | | 151,949 |
| | | | | | | |
Road & Rail—0.9% | | | | | | | |
Burlington Northern Santa Fe Corp. | | | | 13,610 | | | 1,359,503 |
CSX Corp. | | | | 19,296 | | | 1,211,982 |
Norfolk Southern Corp. | | | | 17,305 | | | 1,084,504 |
Ryder System, Inc. | | † | | 2,780 | | | 191,486 |
Union Pacific Corp. | | | | 23,944 | | | 1,807,772 |
| | | | | | | |
| | | | | | | 5,655,247 |
| | | | | | | |
Semiconductors & Semiconductor Equipment—2.1% | | | | | | | |
Advanced Micro Devices, Inc. | | *† | | 22,772 | | | 132,761 |
Altera Corp. | | | | 15,819 | | | 327,453 |
Analog Devices, Inc. | | | | 14,644 | | | 465,240 |
Applied Materials, Inc. | | | | 62,930 | | | 1,201,334 |
Broadcom Corp., Class A | | * | | 20,382 | | | 556,225 |
Intel Corp. | | | | 264,579 | | | 5,683,157 |
| | | | |
| | See accompanying notes to financial statements. | | 133 |
SCHEDULE OF INVESTMENTS — (Continued)
June 30, 2008 (Unaudited)
Vantagepoint Asset Allocation Fund
| | | | | | | | | | |
| | | | | | | Shares | | Value |
COMMON STOCKS—(Continued) | | | | | | | | | | |
KLA-Tencor Corp. | | | | † | | | 8,766 | | $ | 356,864 |
Linear Technology Corp. | | | | † | | | 10,609 | | | 345,535 |
LSI Corp. | | | | *† | | | 34,716 | | | 213,156 |
MEMC Electronic Materials, Inc. | | | | * | | | 10,061 | | | 619,154 |
Microchip Technology, Inc. | | | | † | | | 9,379 | | | 286,434 |
Micron Technology, Inc. | | | | * | | | 31,818 | | | 190,908 |
National Semiconductor Corp. | | | | | | | 11,625 | | | 238,777 |
Novellus Systems, Inc. | | | | *† | | | 5,537 | | | 117,329 |
Nvidia Corp. | | | | * | | | 24,486 | | | 458,378 |
Teradyne, Inc. | | | | * | | | 8,399 | | | 92,977 |
Texas Instruments, Inc. | | | | | | | 60,988 | | | 1,717,422 |
Xilinx, Inc. | | | | † | | | 13,211 | | | 333,578 |
| | | | | | | | | | |
| | | | | | | | | | 13,336,682 |
| | | | | | | | | | |
Software—2.9% | | | | | | | | | | |
Adobe Systems, Inc. | | | | * | | | 24,455 | | | 963,283 |
Autodesk, Inc. | | | | *† | | | 10,178 | | | 344,118 |
BMC Software, Inc. | | | | * | | | 9,424 | | | 339,264 |
CA, Inc. | | | | | | | 18,395 | | | 424,741 |
Citrix Systems, Inc. | | | | * | | | 7,947 | | | 233,721 |
Compuware Corp. | | | | * | | | 17,089 | | | 163,029 |
Electronic Arts, Inc. | | | | * | | | 13,954 | | | 619,976 |
Intuit, Inc. | | | | * | | | 15,593 | | | 429,899 |
Microsoft Corp. | | | | | | | 368,418 | | | 10,135,179 |
Novell, Inc. | | | | * | | | 17,011 | | | 100,195 |
Oracle Corp. | | | | * | | | 181,871 | | | 3,819,291 |
Symantec Corp. | | | | * | | | 38,921 | | | 753,121 |
| | | | | | | | | | |
| | | | | | | | | | 18,325,817 |
| | | | | | | | | | |
Specialty Retail—1.3% | | | | | | | | | | |
Abercrombie & Fitch Co., Class A | | | | | | | 3,919 | | | 245,643 |
AutoNation, Inc. | | | | *† | | | 6,006 | | | 60,180 |
Autozone, Inc. | | | | * | | | 1,977 | | | 239,237 |
Bed Bath & Beyond, Inc. | | | | *† | | | 12,305 | | | 345,770 |
Best Buy Co., Inc. | | | | | | | 17,296 | | | 684,922 |
GameStop Corp., Class A | | | | * | | | 7,231 | | | 292,132 |
Gap, Inc. (The) | | | | | | | 20,911 | | | 348,586 |
Home Depot, Inc. | | | | | | | 77,768 | | | 1,821,327 |
Lowe’s Cos, Inc. | | | | | | | 68,926 | | | 1,430,214 |
Ltd. Brands, Inc. | | | | | | | 15,296 | | | 257,738 |
Office Depot, Inc. | | | | * | | | 13,041 | | | 142,669 |
RadioShack Corp. | | | | | | | 5,381 | | | 66,025 |
Sherwin-Williams Co. (The) | | | | † | | | 4,841 | | | 222,347 |
Staples, Inc. | | | | | | | 32,067 | | | 761,591 |
Tiffany & Co. | | | | | | | 6,286 | | | 256,154 |
TJX Cos, Inc. | | | | | | | 20,299 | | | 638,810 |
| | | | | | | | | | |
| | | | | | | | | | 7,813,345 |
| | | | | | | | | | |
Textiles, Apparel & Luxury Goods—0.3% | | | | | | | | | | |
Coach, Inc. | | | | * | | | 16,947 | | | 489,429 |
Jones Apparel Group, Inc. | | | | † | | | 5,028 | | | 69,135 |
Liz Claiborne, Inc. | | | | † | | | 4,454 | | | 63,024 |
Nike, Inc., Class B | | | | | | | 17,249 | | | 1,028,213 |
Polo Ralph Lauren Corp. | | | | † | | | 2,737 | | | 171,829 |
VF Corp. | | | | | | | 3,825 | | | 272,264 |
| | | | | | | | | | |
| | | | | | | | | | 2,093,894 |
| | | | | | | | | | |
Thrifts & Mortgage Finance—0.4% | | | | | | | | | | |
Countrywide Financial Corp. | | | | † | | | 27,686 | | | 117,665 |
Federal National Mortgage Association | | | | | | | 48,716 | | | 950,449 |
Freddie Mac | | | | | | | 30,144 | | | 494,362 |
Hudson City Bancorp, Inc. | | | | | | | 23,850 | | | 397,818 |
MGIC Investment Corp. | | | | † | | | 3,862 | | | 23,597 |
Sovereign Bancorp, Inc. | | | | † | | | 16,575 | | | 121,992 |
Washington Mutual, Inc. | | | | † | | | 48,653 | | | 239,859 |
| | | | | | | | | | |
| | | | | | | | | | 2,345,742 |
| | | | | | | | | | |
Tobacco—1.2% | | | | | | | | | | |
Altria Group, Inc. | | | | | | | 95,920 | | | 1,972,115 |
Philip Morris International, Inc. | | | | | | | 96,946 | | | 4,788,163 |
Reynolds American, Inc. | | | | † | | | 7,455 | | | 347,925 |
UST, Inc. | | | | † | | | 7,153 | | | 390,625 |
| | | | | | | | | | |
| | | | | | | | | | 7,498,828 |
| | | | | | | | | | |
Trading Companies & Distributors—0.0% | | | | | | | | | | |
W.W. Grainger, Inc. | | | | † | | | 3,422 | | | 279,920 |
| | | | | | | | | | |
Wireless Telecommunication Services—0.3% | | | | | | | | | | |
American Tower Corp., Class A | | | | * | | | 18,693 | | | 789,779 |
Sprint Nextel Corp. | | | | | | | 130,646 | | | 1,241,137 |
| | | | | | | | | | |
| | | | | | | | | | 2,030,916 |
| | | | | | | | | | |
TOTAL COMMON STOCKS
(Cost $455,729,907) | | | | | | | | | | 514,047,261 |
| | | | | | | | | | |
| | | |
Coupon Rate | | Maturity Date | | Face | | Value |
U.S. GOVERNMENT AGENCY OBLIGATIONS—4.9% | | | | | | | | | | |
U.S. Government Agency Obligations—4.9% | | | | | | | | | | |
Fannie Mae | | | | | | | | | | |
2.232% | | 09/03/2008 | | | | $ | 2,000,000 | | | 1,991,768 |
Federal Home Loan Bank | | | | | | | | | | |
2.374% | | 09/12/2008 | | | | | 28,500,000 | | | 28,366,221 |
| | | | | | | | | | |
TOTAL U.S. GOVERNMENT AGENCY OBLIGATIONS
(Cost $30,355,718) | | | | | | | | | | 30,357,989 |
| | | | | | | | | | |
U.S. TREASURY OBLIGATIONS—1.0% | | | | | | | | | | |
U.S. Treasury Bill—1.0% | | | | | | | | | | |
U.S. Treasury Bill | | | | | | | | | | |
1.950% | | 09/18/2008 | | ‡‡ | | | | | | |
(Cost $6,412,584) | | | | | | | 6,440,000 | | | 6,414,800 |
| | | | | | | | | | |
COMMERCIAL PAPER—11.2% | | | | | | | | | | |
Diversified Financial Services—11.2% | | | | | | | | | | |
Bank of Scotland Treasury Services PLC (United Kingdom) | | | | | | | | | | |
2.810% | | 09/15/2008 | | a | | | 20,000,000 | | | 19,881,200 |
CBA Finance, Inc. (Delaware) | | | | | | | | | | |
2.719% | | 09/15/2008 | | a | | | 10,000,000 | | | 9,941,300 |
Santander Central Hispano Finance, Inc. | | | | | | | | | | |
2.683% | | 09/17/2008 | | a | | | 15,000,000 | | | 14,908,200 |
Societe Generale North America, Inc. | | | | | | | | | | |
2.861% | | 09/12/2008 | | a | | | 20,000,000 | | | 19,887,800 |
UBS Finance Delaware LLC | | | | | | | | | | |
2.871% | | 09/15/2008 | | a | | | 5,000,000 | | | 4,970,650 |
| | | | | | | | | | |
TOTAL COMMERCIAL PAPER
(Cost $69,593,357) | | | | | | | | | | 69,589,150 |
| | | | | | | | | | |
| | | | |
| 134 | | See accompanying notes to financial statements. | | |
SCHEDULE OF INVESTMENTS — (Continued)
June 30, 2008 (Unaudited)
Vantagepoint Asset Allocation Fund
| | | | | | | | |
| | | | | Shares | | Value | |
RIGHTS—0.0% | | | | | | | | |
Computers & Peripherals—0.0% | | | | | | | | |
Seagate Technology, Inc. | | *d | | | | | | |
(Cost $—) | | | | 10,600 | | $ | — | |
| | | | | | | | |
CASH EQUIVALENTS—4.8% | | | | | | | | |
Institutional Money Market Funds—4.8% | | | | | | | | |
AIM Short-Term Investments Trust Liquid Assets Portfolio | | †† | | 5,835,629 | | | 5,835,629 | |
AIM Short-Term Investments Trust Prime Assets Portfolio | | †† | | 21,263,429 | | | 21,263,429 | |
JPMorgan Prime Money Market Fund, Capital Shares | | | | 2,994,302 | | | 2,994,302 | |
| | | | | | | | |
TOTAL CASH EQUIVALENTS
(Cost $30,093,360) | | | | | | | 30,093,360 | |
| | | | | | | | |
TOTAL INVESTMENTS—104.5%
(Cost $592,184,926) | | | | | | | 650,502,560 | |
Other assets less liabilities—(4.5%) | | | | | | | (28,043,499 | ) |
| | | | | | | | |
NET ASSETS—100.0% | | | | | | $ | 622,459,061 | |
| | | | | | | | |
Notes to the Schedule of Investments:
| REIT | Real Estate Investment Trust |
| † | Denotes all or a portion of security on loan. |
| ‡‡ | Security has been pledged as collateral for futures contracts. |
| d | Security has no market value at 06/30/2008. |
| †† | Represents reinvestment of collateral received in conjunction with securities lending. |
| | | | |
| | See accompanying notes to financial statements. | | 135 |
SCHEDULE OF INVESTMENTS
June 30, 2008 (Unaudited)
Vantagepoint Equity Income Fund
| | | | | | | |
| | | | | Shares | | Value |
COMMON STOCKS—95.6% | | | | | | | |
Aerospace & Defense—1.6% | | | | | | | |
Honeywell International, Inc. | | | | 345,000 | | $ | 17,346,600 |
L-3 Communications Holdings, Inc. | | | | 84,000 | | | 7,633,080 |
| | | | | | | |
| | | | | | | 24,979,680 |
| | | | | | | |
Air Freight & Logistics—1.8% | | | | | | | |
FedEx Corp. | | | | 320,000 | | | 25,212,800 |
United Parcel Service, Inc., Class B | | | | 36,000 | | | 2,212,920 |
| | | | | | | |
| | | | | | | 27,425,720 |
| | | | | | | |
Airlines—0.1% | | | | | | | |
Southwest Airlines Co. | | | | 138,700 | | | 1,808,648 |
| | | | | | | |
Automobiles—0.9% | | | | | | | |
Ford Motor Co. | | *† | | 200,000 | | | 962,000 |
General Motors Corp. | | † | | 804,000 | | | 9,246,000 |
Harley-Davidson, Inc. | | † | | 79,600 | | | 2,886,296 |
| | | | | | | |
| | | | | | | 13,094,296 |
| | | | | | | |
Beverages—0.4% | | | | | | | |
Anheuser-Busch Cos, Inc. | | | | 88,800 | | | 5,516,256 |
| | | | | | | |
Biotechnology—0.3% | | | | | | | |
Amgen, Inc. | | * | | 103,900 | | | 4,899,924 |
| | | | | | | |
Building Products—0.3% | | | | | | | |
Masco Corp. | | | | 180,500 | | | 2,839,265 |
USG Corp. | | *† | | 73,000 | | | 2,158,610 |
| | | | | | | |
| | | | | | | 4,997,875 |
| | | | | | | |
Capital Markets—2.1% | | | | | | | |
Bank of New York Mellon Corp. | | | | 158,400 | | | 5,992,272 |
Legg Mason, Inc. | | | | 73,600 | | | 3,206,752 |
Merrill Lynch & Co., Inc. | | | | 140,900 | | | 4,467,939 |
Morgan Stanley | | | | 37,000 | | | 1,334,590 |
UBS AG (Switzerland) | | * | | 809,205 | | | 16,718,175 |
| | | | | | | |
| | | | | | | 31,719,728 |
| | | | | | | |
Chemicals—1.2% | | | | | | | |
E.I. Du Pont de Nemours & Co. | | | | 353,846 | | | 15,176,455 |
International Flavors & Fragrances, Inc. | | | | 97,200 | | | 3,796,632 |
| | | | | | | |
| | | | | | | 18,973,087 |
| | | | | | | |
Commercial Banks—2.1% | | | | | | | |
Allied Irish Banks plc ADR (Ireland) | | | | 78,200 | | | 2,407,778 |
Fifth Third Bancorp | | † | | 183,800 | | | 1,871,084 |
Keycorp | | | | 167,500 | | | 1,839,150 |
National City Corp. | | † | | 204,000 | | | 973,080 |
Royal Bank of Scotland Group plc (United Kingdom) | | | | 134,000 | | | 570,460 |
SunTrust Banks, Inc. | | | | 122,100 | | | 4,422,462 |
US Bancorp | | | | 206,100 | | | 5,748,129 |
Wachovia Corp. | | † | | 175,804 | | | 2,730,236 |
Wells Fargo & Co. | | | | 478,500 | | | 11,364,375 |
| | | | | | | |
| | | | | | | 31,926,754 |
| | | | | | | |
Commercial Services & Supplies—0.8% | | | | | | | |
Avery Dennison Corp. | | † | | 103,000 | | | 4,524,790 |
Pitney Bowes, Inc. | | | | 143,900 | | | 4,906,990 |
Waste Management, Inc. | | | | 73,200 | | | 2,760,372 |
| | | | | | | |
| | | | | | | 12,192,152 |
| | | | | | | |
Communications Equipment—0.7% | | | | | | | |
Alcatel-Lucent ADR (France) | | *† | | 366,400 | | | 2,213,056 |
Motorola, Inc. | | | | 238,700 | | | 1,752,058 |
Nokia OYJ ADR (Finland) | | | | 289,100 | | | 7,082,950 |
| | | | | | | |
| | | | | | | 11,048,064 |
| | | | | | | |
Computers & Peripherals—5.2% | | | | | | | |
Dell, Inc. | | * | | 2,356,200 | | | 51,553,656 |
International Business Machines Corp. | | | | 84,400 | | | 10,003,932 |
Sun Microsystems, Inc. | | * | | 1,670,000 | | | 18,169,600 |
| | | | | | | |
| | | | | | | 79,727,188 |
| | | | | | | |
Construction Materials—1.9% | | | | | | | |
Cemex SAB de CV ADR (Mexico) | | *† | | 1,014,617 | | | 25,061,047 |
Vulcan Materials Co. | | † | | 55,000 | | | 3,287,900 |
| | | | | | | |
| | | | | | | 28,348,947 |
| | | | | | | |
Consumer Finance—2.2% | | | | | | | |
American Express Co. | | | | 343,500 | | | 12,939,645 |
Capital One Financial Corp. | | | | 208,900 | | | 7,940,289 |
SLM Corp. | | * | | 667,100 | | | 12,908,385 |
| | | | | | | |
| | | | | | | 33,788,319 |
| | | | | | | |
Distributors—0.2% | | | | | | | |
Genuine Parts Co. | | | | 70,552 | | | 2,799,503 |
| | | | | | | |
Diversified Consumer Services—0.3% | | | | | | | |
H&R Block, Inc. | | | | 183,800 | | | 3,933,320 |
| | | | | | | |
Diversified Financial Services—1.9% | | | | | | | |
Bank of America Corp. | | | | 462,692 | | | 11,044,458 |
Citigroup, Inc. | | | | 439,369 | | | 7,363,824 |
JPMorgan Chase & Co. | | | | 316,800 | | | 10,869,408 |
| | | | | | | |
| | | | | | | 29,277,690 |
| | | | | | | |
Diversified Telecommunication Services—4.4% | | | | | | | |
AT&T, Inc. | | | | 660,642 | | | 22,257,029 |
Level 3 Communications, Inc. | | *† | | 7,327,000 | | | 21,614,650 |
Qwest Communications International, Inc. | | † | | 600,000 | | | 2,358,000 |
Verizon Communications, Inc. | | | | 579,141 | | | 20,501,591 |
| | | | | | | |
| | | | | | | 66,731,270 |
| | | | | | | |
Electric Utilities—2.4% | | | | | | | |
Duke Energy Corp. | | | | 596,124 | | | 10,360,635 |
Entergy Corp. | | | | 143,100 | | | 17,240,688 |
FirstEnergy Corp. | | | | 46,400 | | | 3,820,112 |
Pinnacle West Capital Corp. | | | | 61,400 | | | 1,889,278 |
Progress Energy, Inc. | | | | 80,800 | | | 3,379,864 |
| | | | | | | |
| | | | | | | 36,690,577 |
| | | | | | | |
Electrical Equipment—0.9% | | | | | | | |
Cooper Industries Ltd., Class A | | | | 65,300 | | | 2,579,350 |
Emerson Electric Co. | | | | 219,000 | | | 10,829,550 |
| | | | | | | |
| | | | | | | 13,408,900 |
| | | | | | | |
| | | | |
| 136 | | See accompanying notes to financial statements. | | |
SCHEDULE OF INVESTMENTS — (Continued)
June 30, 2008 (Unaudited)
Vantagepoint Equity Income Fund
| | | | | | | |
| | | | | Shares | | Value |
COMMON STOCKS—(Continued) | | | | | | | |
Energy Equipment & Services—0.4% | | | | | | | |
BJ Services Co. | | | | 98,900 | | $ | 3,158,866 |
Schlumberger Ltd. | | | | 28,200 | | | 3,029,526 |
| | | | | | | |
| | | | | | | 6,188,392 |
| | | | | | | |
Food & Staples Retailing—0.1% | | | | | | | |
Whole Foods Market, Inc. | | † | | 36,600 | | | 867,054 |
| | | | | | | |
Food Products—1.9% | | | | | | | |
Campbell Soup Co. | | | | 51,112 | | | 1,710,208 |
General Mills, Inc. | | | | 85,222 | | | 5,178,941 |
Hershey Co. (The) | | † | | 188,400 | | | 6,175,752 |
HJ Heinz Co. | | | | 102,000 | | | 4,880,700 |
Kraft Foods, Inc., Class A | | | | 360,224 | | | 10,248,372 |
McCormick & Co., Inc. | | † | | 52,900 | | | 1,886,414 |
| | | | | | | |
| | | | | | | 30,080,387 |
| | | | | | | |
Health Care Equipment & Supplies—0.7% | | | | | | | |
Baxter International, Inc. | | | | 168,800 | | | 10,793,072 |
| | | | | | | |
Health Care Providers & Services—1.3% | | | | | | | |
UnitedHealth Group, Inc. | | | | 344,700 | | | 9,048,375 |
WellPoint, Inc. | | * | | 242,300 | | | 11,548,018 |
| | | | | | | |
| | | | | | | 20,596,393 |
| | | | | | | |
Hotels, Restaurants & Leisure—2.5% | | | | | | | |
Carnival Corp. | | † | | 291,200 | | | 9,597,952 |
MGM Mirage | | * | | 97,600 | | | 3,307,664 |
Yum! Brands, Inc. | | | | 751,000 | | | 26,352,590 |
| | | | | | | |
| | | | | | | 39,258,206 |
| | | | | | | |
Household Durables—1.8% | | | | | | | |
Black & Decker Corp. | | † | | 25,200 | | | 1,449,252 |
DR Horton, Inc. | | † | | 157,500 | | | 1,708,875 |
Fortune Brands, Inc. | | | | 62,900 | | | 3,925,589 |
Harman International Industries, Inc. | | | | 36,800 | | | 1,523,152 |
Newell Rubbermaid, Inc. | | | | 185,000 | | | 3,106,150 |
Stanley Works (The) | | | | 278,500 | | | 12,485,155 |
Whirlpool Corp. | | † | | 49,000 | | | 3,024,770 |
| | | | | | | |
| | | | | | | 27,222,943 |
| | | | | | | |
Household Products—0.6% | | | | | | | |
Colgate-Palmolive Co. | | | | 30,300 | | | 2,093,730 |
Kimberly-Clark Corp. | | | | 48,459 | | | 2,896,879 |
Procter & Gamble Co. | | | | 64,700 | | | 3,934,407 |
| | | | | | | |
| | | | | | | 8,925,016 |
| | | | | | | |
Industrial Conglomerates—3.6% | | | | | | | |
3M Co. | | | | 228,900 | | | 15,929,151 |
General Electric Co. | | | | 550,000 | | | 14,679,500 |
Koninklijke Philips Electronics NV (Netherlands) | | | | 660,000 | | | 22,308,000 |
| | | | | | | |
| | | | | | | 52,916,651 |
| | | | | | | |
Insurance—6.7% | | | | | | | |
Allstate Corp. (The) | | | | 123,900 | | | 5,648,601 |
American International Group, Inc. | | | | 551,814 | | | 14,600,998 |
AON Corp. | | | | 582,000 | | | 26,737,081 |
Chubb Corp. | | | | 37,100 | | | 1,818,271 |
Fairfax Financial Holdings Ltd. (Canada) | | † | | 100,000 | | | 25,390,001 |
Genworth Financial, Inc., Class A | | | | 66,000 | | | 1,175,460 |
Hartford Financial Services Group, Inc. | | | | 101,300 | | | 6,540,941 |
Lincoln National Corp. | | | | 94,390 | | | 4,277,755 |
Marsh & McLennan Cos, Inc. | | | | 280,800 | | | 7,455,240 |
Progressive Corp. (The) | | | | 131,700 | | | 2,465,424 |
Travelers Cos, Inc. (The) | | | | 125,406 | | | 5,442,620 |
| | | | | | | |
| | | | | | | 101,552,392 |
| | | | | | | |
Internet & Catalog Retail—1.8% | | | | | | | |
Liberty Media Corp.—Interactive, Class A | | *† | | 1,835,500 | | | 27,091,980 |
| | | | | | | |
Internet Software & Services—2.2% | | | | | | | |
eBay, Inc. | | * | | 1,081,400 | | | 29,554,662 |
Yahoo! Inc. | | * | | 171,700 | | | 3,547,322 |
| | | | | | | |
| | | | | | | 33,101,984 |
| | | | | | | |
IT Services—0.2% | | | | | | | |
Automatic Data Processing, Inc. | | | | 12,200 | | | 511,180 |
Computer Sciences Corp. | | * | | 67,100 | | | 3,142,964 |
| | | | | | | |
| | | | | | | 3,654,144 |
| | | | | | | |
Leisure Equipment & Products—0.3% | | | | | | | |
Eastman Kodak Co. | | † | | 158,041 | | | 2,280,532 |
Mattel, Inc. | | | | 152,900 | | | 2,617,648 |
| | | | | | | |
| | | | | | | 4,898,180 |
| | | | | | | |
Machinery—1.2% | | | | | | | |
Illinois Tool Works, Inc. | | | | 381,400 | | | 18,120,314 |
| | | | | | | |
Media—7.4% | | | | | | | |
Cablevision Systems Corp., Class A | | * | | 86,600 | | | 1,957,160 |
CBS Corp., Class B | | | | 151,100 | | | 2,944,939 |
Comcast Corp., Class A | | | | 67,100 | | | 1,272,887 |
DIRECTV Group, Inc. (The) | | * | | 840,000 | | | 21,764,400 |
Gannett Co., Inc. | | † | | 153,300 | | | 3,322,011 |
Liberty Media Corp.—Entertainment, Series A | | * | | 1,475,200 | | | 35,744,095 |
McGraw-Hill Cos, Inc. (The) | | | | 138,500 | | | 5,556,620 |
New York Times Co. (The), Class A | | † | | 181,900 | | | 2,799,441 |
Time Warner, Inc. | | | | 381,000 | | | 5,638,800 |
Walt Disney Co. (The) | | | | 1,063,300 | | | 33,174,960 |
| | | | | | | |
| | | | | | | 114,175,313 |
| | | | | | | |
Metals & Mining—0.1% | | | | | | | |
Alcoa, Inc. | | | | 55,700 | | | 1,984,034 |
| | | | | | | |
Multiline Retail—0.4% | | | | | | | |
JC Penney Co., Inc. | | † | | 135,300 | | | 4,910,037 |
Macy’s, Inc. | | | | 42,800 | | | 831,176 |
| | | | | | | |
| | | | | | | 5,741,213 |
| | | | | | | |
Multi-Utilities—1.4% | | | | | | | |
Dominion Resources, Inc. | | | | 222,100 | | | 10,547,529 |
NiSource, Inc. | | † | | 250,300 | | | 4,485,376 |
PG&E Corp. | | | | 55,300 | | | 2,194,857 |
TECO Energy, Inc. | | † | | 56,900 | | | 1,222,781 |
Xcel Energy, Inc. | | | | 154,500 | | | 3,100,815 |
| | | | | | | |
| | | | | | | 21,551,358 |
| | | | | | | |
Oil, Gas & Consumable Fuels—14.2% | | | | | | | |
Anadarko Petroleum Corp. | | | | 55,000 | | | 4,116,200 |
BP plc ADR (United Kingdom) | | † | | 66,998 | | | 4,661,051 |
Chesapeake Energy Corp. | | | | 715,000 | | | 47,161,399 |
Chevron Corp. | | | | 140,758 | | | 13,953,341 |
| | | | |
| | See accompanying notes to financial statements. | | 137 |
SCHEDULE OF INVESTMENTS — (Continued)
June 30, 2008 (Unaudited)
Vantagepoint Equity Income Fund
| | | | | | | | | | | |
| | | | | | | Shares | | Value | |
COMMON STOCKS—(Continued) | | | | | | | | | | | |
ConocoPhillips | | | | | | | 218,300 | | $ | 20,605,337 | |
Exxon Mobil Corp. | | | | | | | 148,660 | | | 13,101,406 | |
Marathon Oil Corp. | | | | | | | 291,400 | | | 15,114,918 | |
Murphy Oil Corp. | | | | | | | 40,000 | | | 3,922,000 | |
Occidental Petroleum Corp. | | | | | | | 272,400 | | | 24,477,864 | |
Pioneer Natural Resources Co. | | | | | | | 527,000 | | | 41,253,560 | |
Royal Dutch Shell plc, Class A ADR (Netherlands) | | | | | | | 123,581 | | | 10,097,804 | |
Spectra Energy Corp. | | | | | | | 525,312 | | | 15,097,467 | |
Sunoco, Inc. | | | | | | | 74,000 | | | 3,011,060 | |
| | | | | | | | | | | |
| | | | | | | | | | 216,573,407 | |
| | | | | | | | | | | |
Paper & Forest Products—0.6% | | | | | | | | | | | |
International Paper Co. | | | | | | | 252,100 | | | 5,873,930 | |
MeadWestvaco Corp. | | | | | | | 111,000 | | | 2,646,240 | |
| | | | | | | | | | | |
| | | | | | | | | | 8,520,170 | |
| | | | | | | | | | | |
Pharmaceuticals—5.3% | | | | | | | | | | | |
Abbott Laboratories | | | | | | | 60,600 | | | 3,209,982 | |
Bristol-Myers Squibb Co. | | | | | | | 694,800 | | | 14,264,244 | |
Eli Lilly & Co. | | | | | | | 145,600 | | | 6,720,896 | |
Johnson & Johnson | | | | | | | 264,400 | | | 17,011,496 | |
Merck & Co., Inc. | | | | | | | 129,700 | | | 4,888,393 | |
Pfizer, Inc. | | | | | | | 917,000 | | | 16,019,990 | |
Schering-Plough Corp. | | | | | | | 195,500 | | | 3,849,395 | |
Wyeth | | | | | | | 293,800 | | | 14,090,648 | |
| | | | | | | | | | | |
| | | | | | | | | | 80,055,044 | |
| | | | | | | | | | | |
Road & Rail—0.9% | | | | | | | | | | | |
Burlington Northern Santa Fe Corp. | | | | | | | 145,000 | | | 14,484,050 | |
| | | | | | | | | | | |
Semiconductors & Semiconductor Equipment—1.4% | | | | | | | | | | | |
Analog Devices, Inc. | | | | | | | 123,600 | | | 3,926,772 | |
Applied Materials, Inc. | | | | | | | 725,000 | | | 13,840,250 | |
Intel Corp. | | | | | | | 123,600 | | | 2,654,928 | |
Texas Instruments, Inc. | | | | | | | 25,000 | | | 704,000 | |
| | | | | | | | | | | |
| | | | | | | | | | 21,125,950 | |
| | | | | | | | | | | |
Software—2.6% | | | | | | | | | | | |
Microsoft Corp. | | | | | | | 252,000 | | | 6,932,520 | |
Symantec Corp. | | | | * | | | 1,680,000 | | | 32,508,000 | |
| | | | | | | | | | | |
| | | | | | | | | | 39,440,520 | |
| | | | | | | | | | | |
Specialty Retail—1.2% | | | | | | | | | | | |
Bed Bath & Beyond, Inc. | | | | *† | | | 147,100 | | | 4,133,510 | |
Home Depot, Inc. | | | | | | | 529,800 | | | 12,407,916 | |
Office Depot, Inc. | | | | * | | | 181,500 | | | 1,985,610 | |
| | | | | | | | | | | |
| | | | | | | | | | 18,527,036 | |
| | | | | | | | | | | |
Thrifts & Mortgage Finance—0.4% | | | | | | | | | | | |
Countrywide Financial Corp. | | | | † | | | 114,000 | | | 484,500 | |
Federal National Mortgage Association | | | | | | | 200,906 | | | 3,919,676 | |
Washington Mutual, Inc. | | | | † | | | 436,900 | | | 2,153,917 | |
| | | | | | | | | | | |
| | | | | | | | | | 6,558,093 | |
| | | | | | | | | | | |
Tobacco—2.5% | | | | | | | | | | | |
Altria Group, Inc. | | | | | | | 243,300 | | | 5,002,248 | |
Imperial Tobacco Group plc ADR (United Kingdom) | | | | † | | | 189,700 | | | 14,085,225 | |
Philip Morris International, Inc. | | | | | | | 197,300 | | | 9,744,647 | |
UST, Inc. | | | | † | | | 187,937 | | | 10,263,240 | |
| | | | | | | | | | | |
| | | | | | | | | | 39,095,360 | |
| | | | | | | | | | | |
Wireless Telecommunication Services—0.2% | | | | | | | | | | | |
Sprint Nextel Corp. | | | | | | | 340,700 | | | 3,236,650 | |
| | | | | | | | | | | |
TOTAL COMMON STOCKS
(Cost $1,428,246,478) | | | | | | | | | | 1,459,623,204 | |
| | | | | | | | | | | |
CONVERTIBLE PREFERRED STOCKS—0.1% | | | | | | | | | | | |
Thrifts & Mortgage Finance—0.1% | | | | | | | | | | | |
Federal National Mortgage Association, Series 08-1 | | | | | | | | | | | |
(Cost $2,600,277) | | | | | | | 57,400 | | | 2,198,420 | |
| | | | | | | | | | | |
| | | |
Coupon Rate | | Maturity Date | | Face | | Value | |
| U.S. TREASURY OBLIGATIONS—0.8% | | | | | | | | | | | |
| U.S. Treasury Bill—0.8% | | | | | | | | | | | |
United States Treasury Bill | | | | | | | | | | | |
1.817% | | 09/04/2008 | | † | | $ | 3,000,000 | | | 2,990,709 | |
1.732% | | 07/17/2008 | | | | | 5,000,000 | | | 4,995,843 | |
1.680% | | 10/02/2008 | | † | | | 3,000,000 | | | 2,985,816 | |
1.497% | | 07/24/2008 | | † | | | 1,000,000 | | | 999,003 | |
| | | | | | | | | | | |
TOTAL U.S. TREASURY OBLIGATIONS
(Cost $11,972,444) | | | | | | | | | | 11,971,371 | |
| | | | | | | | | | | |
COMMERCIAL PAPER—0.1% | | | | | | | | | | | |
Financial Services—0.1% | | | | | | | | | | | |
Alpine Securitization Corp. | | | | | | | | | | | |
2.528% | | 07/01/2008 | | ^ | | | 1,000,000 | | | 999,930 | |
Yorktown Capital LLC | | | | | | | | | | | |
2.820% | | 07/24/2008 | | a | | | 1,000,000 | | | 998,107 | |
| | | | | | | | | | | |
TOTAL COMMERCIAL PAPER
(Cost $1,998,211) | | | | | | | | | | 1,998,037 | |
| | | | | | | | | | | |
| | | | |
| | | | | | | Shares | | Value | |
CASH EQUIVALENTS—13.6% | | | | | | | | | | | |
Institutional Money Market Funds—13.6% | | | | | | | | | | | |
AIM Short-Term Investments Trust Liquid Assets Portfolio | | | | †† | | | 26,110,664 | | | 26,110,664 | |
AIM Short-Term Investments Trust Prime Assets Portfolio | | | | †† | | | 129,239,343 | | | 129,239,343 | |
JPMorgan Prime Money Market Fund, Capital Shares | | | | | | | 28,112,436 | | | 28,112,436 | |
JPMorgan U.S. Government Money Market Fund, Capital Shares | | | | | | | 23,480,820 | | | 23,480,820 | |
| | | | | | | | | | | |
TOTAL CASH EQUIVALENTS
(Cost $206,943,263) | | | | | | | | | | 206,943,263 | |
| | | | | | | | | | | |
TOTAL INVESTMENTS—110.2%
(Cost $1,651,760,673) | | | | | | | | | | 1,682,734,295 | |
Other assets less liabilities—(10.2%) | | | | | | | | | | (155,507,400 | ) |
| | | | | | | | | | | |
NET ASSETS—100.0% | | | | | | | | | $ | 1,527,226,895 | |
| | | | | | | | | | | |
| | | | |
| 138 | | See accompanying notes to financial statements. | | |
SCHEDULE OF INVESTMENTS — (Continued)
June 30, 2008 (Unaudited)
Vantagepoint Equity Income Fund
Notes to the Schedule of Investments:
| | |
| ADR | | American Depositary Receipt |
| † | | Denotes all or a portion of security on loan. |
| * | | Non-income producing. |
| ^ | | Securities exempt from registration under Rule 144A of the Securities Act of 1933. These securities may be resold in transactions exempt from registration, normally to qualified buyers. 144A securities represent 0.1% of Total Investments. |
| a | | Illiquid Security. |
| †† | | Represents reinvestment of collateral received in conjunction with securities lending. |
| | | | |
| | See accompanying notes to financial statements. | | 139 |
SCHEDULE OF INVESTMENTS
June 30, 2008 (Unaudited)
Vantagepoint Growth & Income Fund
| | | | | | | |
| | | | | Shares | | Value |
COMMON STOCKS—96.1% | | | | | | | |
Aerospace & Defense—1.6% | | | | | | | |
Boeing Co. (The) | | | | 7,900 | | $ | 519,188 |
General Dynamics Corp. | | | | 115,900 | | | 9,758,780 |
Lockheed Martin Corp. | | | | 22,700 | | | 2,239,582 |
Rockwell Collins, Inc. | | | | 20,100 | | | 963,996 |
United Technologies Corp. | | | | 35,800 | | | 2,208,860 |
| | | | | | | |
| | | | | | | 15,690,406 |
| | | | | | | |
Air Freight & Logistics—0.8% | | | | | | | |
Expeditors International of Washington, Inc. | | | | 24,600 | | | 1,057,800 |
FedEx Corp. | | | | 20,000 | | | 1,575,800 |
United Parcel Service, Inc., Class B | | | | 92,400 | | | 5,679,828 |
| | | | | | | |
| | | | | | | 8,313,428 |
| | | | | | | |
Airlines—0.2% | | | | | | | |
Southwest Airlines Co. | | | | 133,100 | | | 1,735,624 |
| | | | | | | |
Auto Components—0.2% | | | | | | | |
Johnson Controls, Inc. | | | | 34,700 | | | 995,196 |
WABCO Holdings, Inc. | | | | 13,500 | | | 627,210 |
| | | | | | | |
| | | | | | | 1,622,406 |
| | | | | | | |
Automobiles—0.3% | | | | | | | |
Ford Motor Co. | | *† | | 205,600 | | | 988,936 |
General Motors Corp. | | † | | 37,000 | | | 425,500 |
Honda Motor Co. Ltd. ADR (Japan) | | | | 40,000 | | | 1,361,200 |
| | | | | | | |
| | | | | | | 2,775,636 |
| | | | | | | |
Beverages—1.4% | | | | | | | |
Anheuser-Busch Cos, Inc. | | | | 15,300 | | | 950,436 |
Coca-Cola Co. (The) | | | | 31,500 | | | 1,637,370 |
PepsiCo, Inc. | | | | 182,300 | | | 11,592,457 |
| | | | | | | |
| | | | | | | 14,180,263 |
| | | | | | | |
Biotechnology—2.9% | | | | | | | |
Celgene Corp. | | *† | | 83,400 | | | 5,326,758 |
Genentech, Inc. | | * | | 179,500 | | | 13,624,050 |
Gilead Sciences, Inc. | | * | | 149,000 | | | 7,889,550 |
ImClone Systems, Inc. | | *† | | 62,200 | | | 2,516,612 |
| | | | | | | |
| | | | | | | 29,356,970 |
| | | | | | | |
Capital Markets—5.2% | | | | | | | |
Ameriprise Financial, Inc. | | | | 37,900 | | | 1,541,393 |
Bank of New York Mellon Corp. | | | | 183,543 | | | 6,943,432 |
BlackRock, Inc. | | † | | 4,000 | | | 708,000 |
Charles Schwab Corp. (The) | | † | | 73,800 | | | 1,515,852 |
Franklin Resources, Inc. | | | | 48,800 | | | 4,472,520 |
Goldman Sachs Group, Inc. (The) | | | | 96,200 | | | 16,825,381 |
Lehman Brothers Holdings, Inc. | | † | | 100,800 | | | 1,996,848 |
Merrill Lynch & Co., Inc. | | † | | 27,300 | | | 865,683 |
Morgan Stanley | | † | | 166,900 | | | 6,020,083 |
Northern Trust Corp. | | | | 42,100 | | | 2,886,797 |
State Street Corp. | | | | 99,600 | | | 6,373,404 |
UBS AG (Switzerland) | | * | | 73,143 | | | 1,511,134 |
| | | | | | | |
| | | | | | | 51,660,527 |
| | | | | | | |
Chemicals—3.0% | | | | | | | |
Agrium, Inc. (Canada) | | | | 48,400 | | | 5,204,936 |
Celanese Corp., Class A | | | | 18,600 | | | 849,276 |
E.I. Du Pont de Nemours & Co. | | † | | 135,700 | | | 5,820,173 |
Monsanto Co. | | | | 63,400 | | | 8,016,296 |
Potash Corp of Saskatchewan (Canada) | | | | 29,700 | | | 6,788,529 |
Praxair, Inc. | | | | 42,100 | | | 3,967,504 |
| | | | | | | |
| | | | | | | 30,646,714 |
| | | | | | | |
Commercial Banks—2.3% | | | | | | | |
Fifth Third Bancorp | | | | 41,000 | | | 417,380 |
Lloyds TSB Group plc ADR (United Kingdom) | | † | | 183,000 | | | 4,514,610 |
PNC Financial Services Group, Inc. | | | | 73,900 | | | 4,219,690 |
SunTrust Banks, Inc. | | | | 21,300 | | | 771,486 |
US Bancorp | | † | | 202,300 | | | 5,642,147 |
Wachovia Corp. | | | | 162,657 | | | 2,526,063 |
Wells Fargo & Co. | | | | 205,600 | | | 4,883,000 |
| | | | | | | |
| | | | | | | 22,974,376 |
| | | | | | | |
Commercial Services & Supplies—0.7% | | | | | | | |
Monster Worldwide, Inc. | | *† | | 84,800 | | | 1,747,728 |
Waste Management, Inc. | | | | 131,800 | | | 4,970,178 |
| | | | | | | |
| | | | | | | 6,717,906 |
| | | | | | | |
Communications Equipment—3.1% | | | | | | | |
Cisco Systems, Inc. | | * | | 572,950 | | | 13,326,817 |
Corning, Inc. | | | | 109,900 | | | 2,533,195 |
Juniper Networks, Inc. | | *† | | 184,100 | | | 4,083,338 |
Nokia OYJ ADR (Finland) | | | | 86,400 | | | 2,116,800 |
Polycom, Inc. | | *† | | 37,900 | | | 923,244 |
Qualcomm, Inc. | | | | 172,400 | | | 7,649,388 |
| | | | | | | |
| | | | | | | 30,632,782 |
| | | | | | | |
Computers & Peripherals—3.6% | | | | | | | |
Apple, Inc. | | * | | 71,900 | | | 12,038,936 |
Brocade Communications Systems, Inc. | | * | | 260,300 | | | 2,144,872 |
Dell, Inc. | | *† | | 206,900 | | | 4,526,972 |
EMC Corp. | | *† | | 115,000 | | | 1,689,350 |
Hewlett-Packard Co. | | | | 130,200 | | | 5,756,142 |
International Business Machines Corp. | | | | 43,400 | | | 5,144,202 |
NetApp, Inc. | | * | | 22,000 | | | 476,520 |
SanDisk Corp. | | * | | 148,200 | | | 2,771,340 |
Seagate Technology (Cayman Islands) | | | | 42,100 | | | 805,373 |
Sun Microsystems, Inc. | | * | | 31,675 | | | 344,624 |
| | | | | | | |
| | | | | | | 35,698,331 |
| | | | | | | |
Construction & Engineering—0.7% | | | | | | | |
Fluor Corp. | | | | 19,600 | | | 3,647,168 |
Foster Wheeler Ltd. | | * | | 50,600 | | | 3,701,390 |
| | | | | | | |
| | | | | | | 7,348,558 |
| | | | | | | |
Construction Materials—0.1% | | | | | | | |
Vulcan Materials Co. | | † | | 8,800 | | | 526,064 |
| | | | | | | |
Consumer Finance—0.5% | | | | | | | |
American Express Co. | | | | 11,500 | | | 433,205 |
Discover Financial Services | | † | | 309,602 | | | 4,077,458 |
SLM Corp. | | * | | 48,400 | | | 936,540 |
| | | | | | | |
| | | | | | | 5,447,203 |
| | | | | | | |
Diversified Financial Services—2.4% | | | | | | | |
Bank of America Corp. | | | | 150,700 | | | 3,597,209 |
Citigroup, Inc. | | | | 239,200 | | | 4,008,992 |
| | | | |
| 140 | | See accompanying notes to financial statements. | | |
SCHEDULE OF INVESTMENTS — (Continued)
June 30, 2008 (Unaudited)
Vantagepoint Growth & Income Fund
| | | | | | | |
| | | | | Shares | | Value |
COMMON STOCKS—(Continued) | | | | | | | |
CME Group, Inc. | | | | 5,100 | | $ | 1,954,269 |
IntercontinentalExchange, Inc. | | * | | 400 | | | 45,600 |
JPMorgan Chase & Co. | | | | 434,336 | | | 14,902,068 |
| | | | | | | |
| | | | | | | 24,508,138 |
| | | | | | | |
Diversified Telecommunication Services—2.7% | | | | | | | |
AT&T, Inc. | | | | 449,006 | | | 15,127,012 |
Level 3 Communications, Inc. | | *† | | 508,900 | | | 1,501,255 |
TW Telecom Inc. | | *† | | 132,600 | | | 2,125,578 |
Verizon Communications, Inc. | | | | 238,900 | | | 8,457,060 |
| | | | | | | |
| | | | | | | 27,210,905 |
| | | | | | | |
Electric Utilities—2.1% | | | | | | | |
Allegheny Energy, Inc. | | | | 6,800 | | | 340,748 |
Edison International | | | | 26,700 | | | 1,371,846 |
Entergy Corp. | | | | 49,300 | | | 5,939,664 |
Exelon Corp. | | | | 38,800 | | | 3,490,448 |
FPL Group, Inc. | | | | 80,700 | | | 5,292,306 |
Pinnacle West Capital Corp. | | | | 21,700 | | | 667,709 |
Southern Co. | | † | | 93,000 | | | 3,247,560 |
| | | | | | | |
| | | | | | | 20,350,281 |
| | | | | | | |
Electrical Equipment—0.1% | | | | | | | |
Emerson Electric Co. | | | | 28,000 | | | 1,384,600 |
| | | | | | | |
Electronic Equipment & Instruments—0.9% | | | | | | | |
Agilent Technologies, Inc. | | * | | 45,372 | | | 1,612,521 |
Flextronics International Ltd. (Singapore) | | * | | 105,600 | | | 992,640 |
Ingram Micro, Inc., Class A | | *† | | 200,700 | | | 3,562,425 |
Jabil Circuit, Inc. | | | | 127,200 | | | 2,087,352 |
Tyco Electronics Ltd. (Bermuda) | | | | 18,400 | | | 659,088 |
| | | | | | | |
| | | | | | | 8,914,026 |
| | | | | | | |
Energy Equipment & Services—3.6% | | | | | | | |
Baker Hughes, Inc. | | | | 61,500 | | | 5,371,410 |
BJ Services Co. | | | | 79,600 | | | 2,542,424 |
Schlumberger Ltd. | | | | 148,800 | | | 15,985,584 |
Smith International, Inc. | | | | 93,300 | | | 7,756,962 |
Weatherford International Ltd. | | * | | 80,000 | | | 3,967,200 |
| | | | | | | |
| | | | | | | 35,623,580 |
| | | | | | | |
Food & Staples Retailing—3.3% | | | | | | | |
Costco Wholesale Corp. | | | | 36,900 | | | 2,588,166 |
CVS Caremark Corp. | | | | 361,786 | | | 14,315,872 |
Kroger Co. (The) | | | | 140,700 | | | 4,062,009 |
Safeway, Inc. | | | | 104,200 | | | 2,974,910 |
Supervalu, Inc. | | | | 127,700 | | | 3,944,653 |
Sysco Corp. | | | | 5,700 | | | 156,807 |
Walgreen Co. | | | | 18,200 | | | 591,682 |
Wal-Mart Stores, Inc. | | | | 71,200 | | | 4,001,440 |
| | | | | | | |
| | | | | | | 32,635,539 |
| | | | | | | |
Food Products—2.1% | | | | | | | |
Campbell Soup Co. | | | | 26,500 | | | 886,690 |
ConAgra Foods, Inc. | | | | 136,700 | | | 2,635,576 |
Dean Foods Co. | | *† | | 185,600 | | | 3,641,472 |
General Mills, Inc. | | | | 9,900 | | | 601,623 |
Kraft Foods, Inc., Class A | | | | 143,582 | | | 4,084,907 |
Nestle SA ADR (Switzerland) | | | | 33,700 | | | 3,807,258 |
Sara Lee Corp. | | | | 166,900 | | | 2,044,525 |
Tyson Foods, Inc., Class A | | | | 181,200 | | | 2,707,128 |
Unilever NV (Netherlands) | | | | 32,100 | | | 911,640 |
| | | | | | | |
| | | | | | | 21,320,819 |
| | | | | | | |
Health Care Equipment & Supplies—3.4% | | | | | | | |
Alcon, Inc. (Switzerland) | | | | 16,200 | | | 2,637,198 |
Baxter International, Inc. | | † | | 226,700 | | | 14,495,198 |
Becton Dickinson & Co. | | | | 16,500 | | | 1,341,450 |
Covidien Ltd. | | | | 13,200 | | | 632,148 |
Intuitive Surgical, Inc. | | * | | 2,900 | | | 781,260 |
Medtronic, Inc. | | | | 152,000 | | | 7,866,000 |
St Jude Medical, Inc. | | * | | 82,800 | | | 3,384,864 |
Stryker Corp. | | | | 50,500 | | | 3,175,440 |
| | | | | | | |
| | | | | | | 34,313,558 |
| | | | | | | |
Health Care Providers & Services—2.8% | | | | | | | |
Aetna, Inc. | | | | 209,900 | | | 8,507,247 |
Cardinal Health, Inc. | | | | 3,100 | | | 159,898 |
DaVita, Inc. | | *† | | 30,800 | | | 1,636,404 |
Express Scripts, Inc. | | * | | 31,500 | | | 1,975,680 |
Health Net, Inc. | | * | | 9,800 | | | 235,788 |
Humana, Inc. | | * | | 36,600 | | | 1,455,582 |
Laboratory Corp of America Holdings | | *† | | 21,500 | | | 1,497,045 |
McKesson Corp. | | | | 43,400 | | | 2,426,494 |
Medco Health Solutions, Inc. | | * | | 67,900 | | | 3,204,880 |
UnitedHealth Group, Inc. | | | | 247,600 | | | 6,499,500 |
WellPoint, Inc. | | * | | 8,700 | | | 414,642 |
| | | | | | | |
| | | | | | | 28,013,160 |
| | | | | | | |
Health Care Technology—0.2% | | | | | | | |
Cerner Corp. | | *† | | 33,400 | | | 1,509,012 |
| | | | | | | |
Hotels, Restaurants & Leisure—1.2% | | | | | | | |
Carnival Corp. | | | | 22,700 | | | 748,192 |
International Game Technology | | | | 41,900 | | | 1,046,662 |
Las Vegas Sands Corp. | | *† | | 62,800 | | | 2,979,232 |
Marriott International, Inc., Class A | | | | 69,200 | | | 1,815,808 |
McDonald’s Corp. | | | | 26,200 | | | 1,472,964 |
MGM Mirage | | * | | 22,028 | | | 746,529 |
Wynn Resorts Ltd. | | † | | 5,100 | | | 414,885 |
Yum! Brands, Inc. | | | | 71,500 | | | 2,508,935 |
| | | | | | | |
| | | | | | | 11,733,207 |
| | | | | | | |
Household Durables—0.0% | | | | | | | |
Jarden Corp. | | *† | | 18,100 | | | 330,144 |
| | | | | | | |
Household Products—1.2% | | | | | | | |
Colgate-Palmolive Co. | | | | 51,300 | | | 3,544,830 |
Energizer Holdings, Inc. | | *† | | 16,800 | | | 1,227,912 |
Kimberly-Clark Corp. | | | | 79,500 | | | 4,752,510 |
Procter & Gamble Co. | | | | 41,675 | | | 2,534,257 |
| | | | | | | |
| | | | | | | 12,059,509 |
| | | | | | | |
Independent Power Producers & Energy Traders—0.5% | | | | | | | |
AES Corp. (The) | | * | | 33,700 | | | 647,377 |
NRG Energy, Inc. | | * | | 111,000 | | | 4,761,900 |
| | | | | | | |
| | | | | | | 5,409,277 |
| | | | | | | |
Industrial Conglomerates—2.3% | | | | | | | |
General Electric Co. | | | | 670,200 | | | 17,887,638 |
McDermott International, Inc. | | * | | 42,200 | | | 2,611,758 |
Tyco International Ltd. (Bermuda) | | | | 50,700 | | | 2,030,028 |
| | | | | | | |
| | | | | | | 22,529,424 |
| | | | | | | |
Insurance—2.7% | | | | | | | |
ACE Ltd. (Bermuda) | | | | 136,000 | | | 7,492,240 |
Aflac, Inc. | | | | 21,800 | | | 1,369,040 |
Allstate Corp. (The) | | | | 107,700 | | | 4,910,043 |
| | | | |
| | See accompanying notes to financial statements. | | 141 |
SCHEDULE OF INVESTMENTS — (Continued)
June 30, 2008 (Unaudited)
Vantagepoint Growth & Income Fund
| | | | | | | |
| | | | | Shares | | Value |
COMMON STOCKS—(Continued) | | | | | | | |
AMBAC Financial Group, Inc. | | † | | 86,900 | | $ | 116,446 |
American International Group, Inc. | | | | 142,000 | | | 3,757,320 |
Berkshire Hathaway, Inc., Class A | | | | 11 | | | 1,328,250 |
Chubb Corp. | | | | 90,800 | | | 4,450,108 |
Marsh & McLennan Cos, Inc. | | | | 29,000 | | | 769,950 |
MBIA, Inc. | | † | | 71,000 | | | 311,690 |
Progressive Corp. (The) | | | | 57,200 | | | 1,070,784 |
Prudential Financial, Inc. | | † | | 4,600 | | | 274,804 |
XL Capital Ltd., Class A (Bermuda) | | | | 58,900 | | | 1,210,984 |
| | | | | | | |
| | | | | | | 27,061,659 |
| | | | | | | |
Internet & Catalog Retail—0.8% | | | | | | | |
Amazon.com, Inc. | | *† | | 94,500 | | | 6,929,685 |
Expedia, Inc. | | * | | 37,400 | | | 687,412 |
| | | | | | | |
| | | | | | | 7,617,097 |
| | | | | | | |
Internet Software & Services—2.9% | | | | | | | |
eBay, Inc. | | * | | 163,000 | | | 4,454,790 |
Google, Inc., Class A | | * | | 39,800 | | | 20,951,516 |
Tencent Holdings Ltd. (China) | | † | | 45,800 | | | 355,216 |
VeriSign, Inc. | | *† | | 47,800 | | | 1,806,840 |
Yahoo! Inc. | | * | | 90,700 | | | 1,873,862 |
| | | | | | | |
| | | | | | | 29,442,224 |
| | | | | | | |
IT Services—1.9% | | | | | | | |
Accenture Ltd., Class A (Bermuda) | | | | 73,800 | | | 3,005,136 |
Affiliated Computer Services, Inc., Class A | | * | | 22,200 | | | 1,187,478 |
Automatic Data Processing, Inc. | | | | 90,100 | | | 3,775,190 |
Cognizant Technology Solutions Corp., Class A | | * | | 16,400 | | | 533,164 |
Fiserv, Inc. | | * | | 34,100 | | | 1,547,117 |
Mastercard, Inc., Class A | | | | 8,200 | | | 2,177,264 |
Paychex, Inc. | | | | 57,100 | | | 1,786,088 |
VeriFone Holdings, Inc. | | * | | 62,500 | | | 746,875 |
Visa, Inc., Class A | | * | | 36,900 | | | 3,000,339 |
Western Union Co. (The) | | | | 54,600 | | | 1,349,712 |
| | | | | | | |
| | | | | | | 19,108,363 |
| | | | | | | |
Life Sciences Tools & Services—0.1% | | | | | | | |
Thermo Fisher Scientific, Inc. | | * | | 9,800 | | | 546,154 |
| | | | | | | |
Machinery—2.3% | | | | | | | |
Caterpillar, Inc. | | | | 11,500 | | | 848,930 |
Cummins, Inc. | | | | 82,300 | | | 5,392,296 |
Danaher Corp. | | † | | 127,500 | | | 9,855,750 |
Illinois Tool Works, Inc. | | | | 75,200 | | | 3,572,752 |
Joy Global, Inc. | | | | 18,600 | | | 1,410,438 |
Rogers Communications, Inc., Class B (Canada) | | | | 38,900 | | | 1,503,874 |
| | | | | | | |
| | | | | | | 22,584,040 |
| | | | | | | |
Media—2.3% | | | | | | | |
CBS Corp., Class B | | | | 74,000 | | | 1,442,260 |
Comcast Corp., Class A | | | | 269,750 | | | 5,117,158 |
Discovery Holding Co., Class A | | * | | 52,100 | | | 1,144,116 |
Gannett Co., Inc. | | † | | 72,100 | | | 1,562,407 |
McGraw-Hill Cos, Inc. (The) | | | | 64,900 | | | 2,603,788 |
Omnicom Group, Inc. | | † | | 70,900 | | | 3,181,992 |
Shaw Communications, Inc., Class B (Canada) | | | | 32,700 | | | 665,772 |
Time Warner Cable, Inc., Class A | | *† | | 46,000 | | | 1,218,080 |
Time Warner, Inc. | | | | 268,100 | | | 3,967,880 |
Viacom, Inc., Class B | | * | | 16,800 | | | 513,072 |
Walt Disney Co. (The) | | | | 77,500 | | | 2,418,000 |
| | | | | | | |
| | | | | | | 23,834,525 |
| | | | | | | |
Metals & Mining—2.2% | | | | | | | |
Allegheny Technologies, Inc. | | | | 54,466 | | | 3,228,744 |
Barrick Gold Corp. (Canada) | | | | 98,800 | | | 4,495,400 |
Cleveland-Cliffs, Inc. | | | | 58,400 | | | 6,960,696 |
Freeport-McMoRan Copper & Gold, Inc. | | | | 60,600 | | | 7,101,714 |
Nucor Corp. | | | | 2,900 | | | 216,543 |
| | | | | | | |
| | | | | | | 22,003,097 |
| | | | | | | |
Multiline Retail—1.4% | | | | | | | |
Kohl’s Corp. | | * | | 135,000 | | | 5,405,400 |
Nordstrom, Inc. | | † | | 81,900 | | | 2,481,570 |
Target Corp. | | | | 130,500 | | | 6,066,945 |
| | | | | | | |
| | | | | | | 13,953,915 |
| | | | | | | |
Multi-Utilities—0.6% | | | | | | | |
PG&E Corp. | | † | | 41,900 | | | 1,663,011 |
SCANA Corp. | | † | | 67,800 | | | 2,508,600 |
TECO Energy, Inc. | | † | | 83,600 | | | 1,796,564 |
| | | | | | | |
| | | | | | | 5,968,175 |
| | | | | | | |
Oil, Gas & Consumable Fuels—6.5% | | | | | | | |
Anadarko Petroleum Corp. | | | | 22,200 | | | 1,661,448 |
Chevron Corp. | | | | 109,472 | | | 10,851,959 |
ConocoPhillips | | | | 36,300 | | | 3,426,357 |
EOG Resources, Inc. | | | | 26,800 | | | 3,516,160 |
Exxon Mobil Corp. | | | | 190,100 | | | 16,753,514 |
Marathon Oil Corp. | | | | 141,100 | | | 7,318,857 |
Murphy Oil Corp. | | | | 34,500 | | | 3,382,725 |
Newfield Exploration Co. | | * | | 2,900 | | | 189,225 |
Occidental Petroleum Corp. | | | | 46,100 | | | 4,142,546 |
Petroleo Brasileiro SA, Class A ADR (Brazil) | | | | 37,300 | | | 2,161,535 |
Royal Dutch Shell plc, Class A ADR (Netherlands) | | | | 8,300 | | | 678,193 |
Royal Dutch Shell plc, Class B ADR (Netherlands) | | † | | 21,356 | | | 1,710,829 |
Suncor Energy, Inc. (Canada) | | | | 7,600 | | | 441,712 |
Total SA ADR (France) | | | | 83,600 | | | 7,128,572 |
XTO Energy, Inc. | | | | 37,700 | | | 2,582,827 |
| | | | | | | |
| | | | | | | 65,946,459 |
| | | | | | | |
Paper & Forest Products—0.3% | | | | | | | |
International Paper Co. | | | | 129,700 | | | 3,022,010 |
| | | | | | | |
Personal Products—0.1% | | | | | | | |
Bare Escentuals, Inc. | | *† | | 32,800 | | | 614,344 |
| | | | | | | |
Pharmaceuticals—4.3% | | | | | | | |
Abbott Laboratories | | | | 115,900 | | | 6,139,223 |
Allergan, Inc. | | † | | 95,800 | | | 4,986,390 |
AstraZeneca plc ADR (United Kingdom) | | † | | 95,700 | | | 4,070,121 |
Bristol-Myers Squibb Co. | | | | 206,100 | | | 4,231,233 |
Forest Laboratories, Inc. | | * | | 90,900 | | | 3,157,866 |
Merck & Co., Inc. | | | | 23,500 | | | 885,715 |
Novartis AG (Registered) (Switzerland) | | | | 1,400 | | | 77,045 |
Pfizer, Inc. | | | | 110,600 | | | 1,932,182 |
Roche Holding AG (Genusschein) (Switzerland) | | | | 12,424 | | | 2,233,491 |
| | | | |
| 142 | | See accompanying notes to financial statements. | | |
SCHEDULE OF INVESTMENTS — (Continued)
June 30, 2008 (Unaudited)
Vantagepoint Growth & Income Fund
| | | | | | | | | | |
| | | | | | | Shares | | Value |
COMMON STOCKS—(Continued) | | | | | | | | | | |
Sanofi-Aventis SA ADR (France) | | | | | | | 46,100 | | $ | 1,531,903 |
Schering-Plough Corp. | | | | | | | 206,500 | | | 4,065,985 |
Sepracor, Inc. | | | | *† | | | 57,500 | | | 1,145,400 |
Teva Pharmaceutical Industries Ltd. ADR (Israel) | | | | | | | 18,600 | | | 851,880 |
Wyeth | | | | | | | 161,100 | | | 7,726,356 |
| | | | | | | | | | |
| | | | | | | | | | 43,034,790 |
| | | | | | | | | | |
Real Estate Investment Trusts (REIT)—0.4% | | | | | | | | | | |
Host Hotels & Resorts, Inc. REIT | | | | | | | 265,945 | | | 3,630,149 |
| | | | | | | | | | |
Semiconductors & Semiconductor Equipment—3.2% | | | | | | | | | | |
Altera Corp. | | | | | | | 41,300 | | | 854,910 |
Analog Devices, Inc. | | | | | | | 43,700 | | | 1,388,349 |
Applied Materials, Inc. | | | | | | | 270,100 | | | 5,156,209 |
Broadcom Corp., Class A | | | | * | | | 36,000 | | | 982,440 |
Intel Corp. | | | | | | | 518,900 | | | 11,145,972 |
KLA-Tencor Corp. | | | | | | | 79,100 | | | 3,220,161 |
Lam Research Corp. | | | | *† | | | 19,000 | | | 686,850 |
Marvell Technology Group Ltd. (Bermuda) | | | | * | | | 225,500 | | | 3,982,330 |
Microchip Technology, Inc. | | | | † | | | 28,000 | | | 855,120 |
Micron Technology, Inc. | | | | * | | | 195,600 | | | 1,173,600 |
Xilinx, Inc. | | | | † | | | 112,000 | | | 2,828,000 |
| | | | | | | | | | |
| | | | | | | | | | 32,273,941 |
| | | | | | | | | | |
Software—3.3% | | | | | | | | | | |
Adobe Systems, Inc. | | | | * | | | 79,700 | | | 3,139,383 |
Autodesk, Inc. | | | | * | | | 60,500 | | | 2,045,505 |
Electronic Arts, Inc. | | | | * | | | 64,200 | | | 2,852,406 |
Intuit, Inc. | | | | * | | | 30,400 | | | 838,128 |
McAfee, Inc. | | | | *† | | | 42,900 | | | 1,459,887 |
Microsoft Corp. | | | | | | | 596,200 | | | 16,401,462 |
Nintendo Co. Ltd. ADR (Japan) | | | | | | | 48,400 | | | 3,390,420 |
Oracle Corp. | | | | * | | | 156,000 | | | 3,276,000 |
| | | | | | | | | | |
| | | | | | | | | | 33,403,191 |
| | | | | | | | | | |
Specialty Retail—1.2% | | | | | | | | | | |
Bed Bath & Beyond, Inc. | | | | * | | | 42,700 | | | 1,199,870 |
Best Buy Co., Inc. | | | | | | | 108,200 | | | 4,284,720 |
Gap, Inc. (The) | | | | | | | 89,500 | | | 1,491,965 |
Home Depot, Inc. | | | | † | | | 113,000 | | | 2,646,460 |
Lowe’s Cos, Inc. | | | | | | | 57,400 | | | 1,191,050 |
Urban Outfitters, Inc. | | | | *† | | | 44,000 | | | 1,372,360 |
| | | | | | | | | | |
| | | | | | | | | | 12,186,425 |
| | | | | | | | | | |
Textiles, Apparel & Luxury Goods—0.4% | | | | | | | | | | |
Coach, Inc. | | | | * | | | 58,700 | | | 1,695,256 |
Hanesbrands, Inc. | | | | *† | | | 54,437 | | | 1,477,420 |
Phillips-Van Heusen Corp. | | | | | | | 17,400 | | | 637,188 |
| | | | | | | | | | |
| | | | | | | | | | 3,809,864 |
| | | | | | | | | | |
Thrifts & Mortgage Finance—1.2% | | | | | | | | | | |
Astoria Financial Corp. | | | | | | | 25,800 | | | 518,064 |
Federal National Mortgage Association | | | | † | | | 256,500 | | | 5,004,315 |
Freddie Mac | | | | | | | 140,500 | | | 2,304,200 |
Hudson City Bancorp, Inc. | | | | | | | 160,160 | | | 2,671,469 |
Washington Mutual, Inc. | | | | † | | | 215,700 | | | 1,063,401 |
| | | | | | | | | | |
| | | | | | | | | | 11,561,449 |
| | | | | | | | | | |
Tobacco—1.2% | | | | | | | | | | |
Altria Group, Inc. | | | | | | | 266,903 | | | 5,487,526 |
Philip Morris International, Inc. | | | | † | | | 135,303 | | | 6,682,615 |
| | | | | | | | | | |
| | | | | | | | | | 12,170,141 |
| | | | | | | | | | |
Trading Companies & Distributors—0.1% | | | | | | | | | | |
Fastenal Co. | | | | | | | 22,100 | | | 953,836 |
| | | | | | | | | | |
Water Utilities—0.1% | | | | | | | | | | |
American Water Works Co., Inc. | | | | *† | | | 44,800 | | | 993,664 |
| | | | | | | | | | |
Wireless Telecommunication Services—1.2% | | | | | | | | | | |
America Movil SAB de CV, Series L ADR (Mexico) | | | | | | | 94,500 | | | 4,984,875 |
American Tower Corp., Class A | | | | * | | | 156,200 | | | 6,599,450 |
MetroPCS Communications, Inc. | | | | *† | | | 30,800 | | | 545,468 |
| | | | | | | | | | |
| | | | | | | | | | 12,129,793 |
| | | | | | | | | | |
TOTAL COMMON STOCKS
(Cost $947,224,406) | | | | | | | | | | 961,021,678 |
| | | | | | | | | | |
CONVERTIBLE PREFERRED STOCKS—0.1% | | | | | | | | | | |
Capital Markets—0.0% | | | | | | | | | | |
Washington Mutual, Inc., Perpetual Bond, Series R | | | | | | | 450 | | | 264,150 |
| | | | | | | | | | |
Consumer Finance—0.1% | | | | | | | | | | |
SLM Corp., Series C | | | | | | | 300 | | | 294,413 |
| | | | | | | | | | |
Pharmaceuticals—0.0% | | | | | | | | | | |
Schering-Plough Corp. | | | | † | | | 3,700 | | | 707,393 |
| | | | | | | | | | |
TOTAL CONVERTIBLE PREFERRED STOCKS
(Cost $1,668,911) | | | | | | | | | | 1,265,956 |
| | | | | | | | | | |
| | | |
Coupon Rate | | Maturity Date | | Face | | Value |
CONVERTIBLE DEBT OBLIGATIONS—0.1% | | | | | | | | | | |
Auto Manufacturers—0.1% | | | | | | | | | | |
Ford Motor Co. | | | | | | | | | | |
4.250% | | 12/15/2036 | | | | | | | | |
(Cost $923,674) | | | | | | $ | 918,000 | | | 672,435 |
| | | | | | | | | | |
| | | | |
| | | | | | | Shares | | Value |
CASH EQUIVALENTS—10.0% | | | | | | | | | | |
Institutional Money Market Funds—10.0% | | | | | | | | | | |
AIM Short-Term Investments Trust Liquid Assets Portfolio | | | | †† | | | 19,329,747 | | | 19,329,747 |
AIM Short-Term Investments Trust Prime Assets Portfolio | | | | †† | | | 53,094,366 | | | 53,094,366 |
JPMorgan Prime Money Market Fund, Capital Shares | | | | | | | 12,371,191 | | | 12,371,191 |
JPMorgan U.S. Government Money Market Fund, Capital Shares | | | | | | | 15,727,751 | | | 15,727,751 |
| | | | | | | | | | |
TOTAL CASH EQUIVALENTS
(Cost $100,523,055) | | | | | | | | | | 100,523,055 |
| | | | | | | | | | |
| | | | |
| | See accompanying notes to financial statements. | | 143 |
SCHEDULE OF INVESTMENTS — (Continued)
June 30, 2008 (Unaudited)
Vantagepoint Growth & Income Fund
| | | | |
| | | Value | |
TOTAL INVESTMENTS—106.3%
(Cost $1,050,340,046) | | $ | 1,063,483,124 | |
Other assets less liabilities—(6.3%) | | | (62,660,236 | ) |
| | | | |
NET ASSETS—100.0% | | $ | 1,000,822,888 | |
| | | | |
Notes to the Schedule of Investments:
| ADR | American Depositary Receipt |
| REIT | Real Estate Investment Trust |
| † | Denotes all or a portion of security on loan. |
| †† | Represents reinvestment of collateral received in conjunction with securities lending. |
| | | | |
| 144 | | See accompanying notes to financial statements. | | |
SCHEDULE OF INVESTMENTS
June 30, 2008 (Unaudited)
Vantagepoint Growth Fund
| | | | | | | |
| | | Shares | | Value |
COMMON STOCKS—97.4% | | | | | | | |
Aerospace & Defense—0.8% | | | | | | | |
Boeing Co. (The) | | | | 28,669 | | $ | 1,884,127 |
General Dynamics Corp. | | | | 6,948 | | | 585,022 |
Honeywell International, Inc. | | | | 43,149 | | | 2,169,532 |
Lockheed Martin Corp. | | | | 22,980 | | | 2,267,207 |
Northrop Grumman Corp. | | | | 43,673 | | | 2,921,724 |
Raytheon Co. | | | | 6,222 | | | 350,174 |
United Technologies Corp. | | | | 121,900 | | | 7,521,229 |
| | | | | | | |
| | | | | | | 17,699,015 |
| | | | | | | |
Air Freight & Logistics—1.4% | | | | | | | |
CH Robinson Worldwide, Inc. | | | | 187,800 | | | 10,298,952 |
Expeditors International of Washington, Inc. | | | | 237,900 | | | 10,229,700 |
FedEx Corp. | | | | 124,900 | | | 9,840,871 |
United Parcel Service, Inc., Class B | | | | 13,430 | | | 825,542 |
| | | | | | | |
| | | | | | | 31,195,065 |
| | | | | | | |
Airlines—0.0% | | | | | | | |
Southwest Airlines Co. | | | | 4,772 | | | 62,227 |
| | | | | | | |
Beverages—3.9% | | | | | | | |
Anheuser-Busch Cos, Inc. | | | | 419,900 | | | 26,084,188 |
Coca-Cola Co. (The) | | | | 567,763 | | | 29,512,321 |
PepsiCo, Inc. | | | | 467,304 | | | 29,715,861 |
| | | | | | | |
| | | | | | | 85,312,370 |
| | | | | | | |
Biotechnology—3.9% | | | | | | | |
Amgen, Inc. | | * | | 310,726 | | | 14,653,838 |
Biogen Idec, Inc. | | * | | 321,076 | | | 17,944,938 |
Celgene Corp. | | * | | 320,400 | | | 20,463,948 |
Genentech, Inc. | | * | | 252,557 | | | 19,169,076 |
Genzyme Corp. | | * | | 164,300 | | | 11,832,886 |
Gilead Sciences, Inc. | | * | | 57,200 | | | 3,028,740 |
| | | | | | | |
| | | | | | | 87,093,426 |
| | | | | | | |
Building Products—0.0% | | | | | | | |
Lennox International, Inc. | | † | | 5,622 | | | 162,813 |
| | | | | | | |
Capital Markets—6.6% | | | | | | | |
Bank of New York Mellon Corp. | | | | 6,847 | | | 259,022 |
BlackRock, Inc. | | † | | 6,224 | | | 1,101,648 |
Charles Schwab Corp. (The) | | | | 1,618,250 | | | 33,238,855 |
Eaton Vance Corp. | | † | | 29,567 | | | 1,175,584 |
Federated Investors, Inc., Class B | | | | 18,668 | | | 642,553 |
Franklin Resources, Inc. | | | | 176,400 | | | 16,167,060 |
Goldman Sachs Group, Inc. (The) | | † | | 397,800 | | | 69,575,220 |
Invesco Ltd. | | | | 18,773 | | | 450,177 |
Janus Capital Group, Inc. | | | | 17,994 | | | 476,301 |
Legg Mason, Inc. | | | | 109,700 | | | 4,779,629 |
Merrill Lynch & Co., Inc. | | | | 226,300 | | | 7,175,973 |
SEI Investments Co. | | | | 9,321 | | | 219,230 |
T Rowe Price Group, Inc. | | † | | 210,200 | | | 11,869,994 |
| | | | | | | |
| | | | | | | 147,131,246 |
| | | | | | | |
Chemicals—1.0% | | | | | | | |
Celanese Corp., Class A | | | | 12,000 | | | 547,920 |
CF Industries Holdings, Inc. | | | | 25,567 | | | 3,906,638 |
Lubrizol Corp. | | | | 1,300 | | | 60,229 |
Minerals Technologies, Inc. | | † | | 333 | | | 21,175 |
Monsanto Co. | | | | 16,169 | | | 2,044,408 |
Mosaic Co. (The) | | * | | 10,991 | | | 1,590,398 |
Praxair, Inc. | | | | 119,300 | | | 11,242,832 |
Scotts Miracle-Gro Co. (The), Class A | | | | 500 | | | 8,785 |
Terra Industries, Inc. | | † | | 34,800 | | | 1,717,380 |
| | | | | | | |
| | | | | | | 21,139,765 |
| | | | | | | |
Commercial Banks—1.3% | | | | | | | |
Banco Bradesco SA ADR (Brazil) | | † | | 395,900 | | | 8,100,114 |
Wells Fargo & Co. | | | | 855,300 | | | 20,313,375 |
| | | | | | | |
| | | | | | | 28,413,489 |
| | | | | | | |
Commercial Services & Supplies—0.3% | | | | | | | |
Cintas Corp. | | | | 178,300 | | | 4,726,733 |
Copart, Inc. | | * | | 1,188 | | | 50,870 |
Herman Miller, Inc. | | † | | 1,000 | | | 24,890 |
HNI Corp. | | † | | 10,400 | | | 183,664 |
Manpower, Inc. | | | | 15,874 | | | 924,502 |
| | | | | | | |
| | | | | | | 5,910,659 |
| | | | | | | |
Communications Equipment—7.2% | | | | | | | |
Adtran, Inc. | | † | | 12,446 | | | 296,713 |
Cisco Systems, Inc. | | * | | 2,354,485 | | | 54,765,320 |
EchoStar Corp., Class A | | *† | | 4,213 | | | 131,530 |
Juniper Networks, Inc. | | * | | 158,134 | | | 3,507,412 |
Nokia OYJ ADR (Finland) | | | | 2,812,500 | | | 68,906,249 |
Nortel Networks Corp. | | *† | | 11,657 | | | 95,821 |
Qualcomm, Inc. | | | | 650,894 | | | 28,880,167 |
| | | | | | | |
| | | | | | | 156,583,212 |
| | | | | | | |
Computers & Peripherals—5.2% | | | | | | | |
Apple, Inc. | | * | | 93,578 | | | 15,668,700 |
Dell, Inc. | | * | | 312,100 | | | 6,828,748 |
EMC Corp. | | * | | 1,638,869 | | | 24,074,986 |
Hewlett-Packard Co. | | | | 343,641 | | | 15,192,369 |
International Business Machines Corp. | | | | 349,117 | | | 41,380,838 |
NetApp, Inc. | | *† | | 382,301 | | | 8,280,640 |
QLogic Corp. | | * | | 7,682 | | | 112,080 |
Seagate Technology (Cayman Islands) | | | | 74,556 | | | 1,426,256 |
Sun Microsystems, Inc. | | * | | 8,300 | | | 90,304 |
Teradata Corp. | | * | | 6,800 | | | 157,352 |
Western Digital Corp. | | * | | 29,570 | | | 1,021,052 |
| | | | | | | |
| | | | | | | 114,233,325 |
| | | | | | | |
Construction & Engineering—3.9% | | | | | | | |
Fluor Corp. | | | | 5,610 | | | 1,043,909 |
Foster Wheeler Ltd. | | * | | 319,900 | | | 23,400,685 |
KBR, Inc. | | | | 26,134 | | | 912,338 |
Quanta Services, Inc. | | *† | | 873,866 | | | 29,073,522 |
Shaw Group, Inc. (The) | | * | | 469,200 | | | 28,991,868 |
| | | | | | | |
| | | | | | | 83,422,322 |
| | | | | | | |
Consumer Finance—0.0% | | | | | | | |
Capital One Financial Corp. | | | | 362 | | | 13,760 |
| | | | | | | |
Containers & Packaging—0.0% | | | | | | | |
Owens-Illinois, Inc. | | * | | 9,000 | | | 375,210 |
| | | | | | | |
Diversified Consumer Services—0.1% | | | | | | | |
Apollo Group, Inc., Class A | | * | | 47,830 | | | 2,116,956 |
DeVry, Inc. | | † | | 5,294 | | | 283,864 |
| | | | | | | |
| | | | | | | 2,400,820 |
| | | | | | | |
| | | | |
| | See accompanying notes to financial statements. | | 145 |
SCHEDULE OF INVESTMENTS — (Continued)
June 30, 2008 (Unaudited)
Vantagepoint Growth Fund
| | | | | | | |
| | | Shares | | Value |
COMMON STOCKS—(Continued) | | | | | | | |
Diversified Financial Services—1.0% | | | | | | | |
Bank of America Corp. | | | | 68,481 | | $ | 1,634,641 |
Citigroup, Inc. | | | | 855,600 | | | 14,339,856 |
CME Group, Inc. | | | | 13,000 | | | 4,981,470 |
| | | | | | | |
| | | | | | | 20,955,967 |
| | | | | | | |
Diversified Telecommunication Services—0.1% | | | | | | | |
AT&T, Inc. | | | | 39,370 | | | 1,326,375 |
CenturyTel, Inc. | | | | 300 | | | 10,677 |
Verizon Communications, Inc. | | | | 40,913 | | | 1,448,321 |
| | | | | | | |
| | | | | | | 2,785,373 |
| | | | | | | |
Electric Utilities—0.1% | | | | | | | |
Duke Energy Corp. | | | | 8,900 | | | 154,682 |
Exelon Corp. | | | | 1,962 | | | 176,502 |
Pinnacle West Capital Corp. | | | | 49 | | | 1,508 |
PPL Corp. | | | | 15,500 | | | 810,184 |
| | | | | | | |
| | | | | | | 1,142,876 |
| | | | | | | |
Electrical Equipment—2.0% | | | | | | | |
Emerson Electric Co. | | | | 42,930 | | | 2,122,889 |
General Cable Corp. | | *† | | 315,000 | | | 19,167,750 |
Rockwell Automation, Inc. | | | | 135,595 | | | 5,929,569 |
Thomas & Betts Corp. | | *† | | 414,900 | | | 15,703,965 |
| | | | | | | |
| | | | | | | 42,924,173 |
| | | | | | | |
Electronic Equipment & Instruments—0.0% | | | | | | | |
Avnet, Inc. | | * | | 5,923 | | | 161,579 |
Ingram Micro, Inc., Class A | | * | | 11,814 | | | 209,699 |
Molex, Inc. | | | | 2 | | | 49 |
National Instruments Corp. | | | | 2,648 | | | 75,124 |
Tech Data Corp. | | * | | 14,940 | | | 506,316 |
| | | | | | | |
| | | | | | | 952,767 |
| | | | | | | |
Energy Equipment & Services—4.0% | | | | | | | |
Baker Hughes, Inc. | | | | 15,512 | | | 1,354,818 |
Cameron International Corp. | | * | | 15,176 | | | 839,992 |
Diamond Offshore Drilling, Inc. | | † | | 5,744 | | | 799,220 |
Dresser-Rand Group, Inc. | | * | | 30,107 | | | 1,177,184 |
Exterran Holdings, Inc. | | *† | | 7,207 | | | 515,228 |
FMC Technologies, Inc. | | * | | 30,850 | | | 2,373,291 |
Global Industries Ltd. | | *† | | 92,995 | | | 1,667,400 |
Halliburton Co. | | | | 640,543 | | | 33,993,618 |
Nabors Industries Ltd. (Bermuda) | | *† | | 256,400 | | | 12,622,572 |
National Oilwell Varco, Inc. | | * | | 193,668 | | | 17,182,225 |
Oceaneering International, Inc. | | *† | | 9,369 | | | 721,881 |
Patterson-UTI Energy, Inc. | | | | 6,834 | | | 246,297 |
SEACOR Holdings, Inc. | | *† | | 6,170 | | | 552,277 |
Smith International, Inc. | | | | 3,439 | | | 285,918 |
Superior Energy Services, Inc. | | * | | 8,128 | | | 448,178 |
Unit Corp. | | * | | 4,290 | | | 355,941 |
Weatherford International Ltd. | | * | | 272,400 | | | 13,508,316 |
| | | | | | | |
| | | | | | | 88,644,356 |
| | | | | | | |
Food & Staples Retailing—3.9% | | | | | | | |
BJ’s Wholesale Club, Inc. | | *† | | 51,728 | | | 2,001,874 |
Costco Wholesale Corp. | | | | 48,575 | | | 3,407,051 |
CVS Caremark Corp. | | | | 302,089 | | | 11,953,662 |
Kroger Co. (The) | | | | 101,131 | | | 2,919,652 |
Ruddick Corp. | | | | 5,887 | | | 201,983 |
Safeway, Inc. | | | | 17,900 | | | 511,045 |
Wal-Mart Stores, Inc. | | | | 1,171,938 | | | 65,862,915 |
| | | | | | | |
| | | | | | | 86,858,182 |
| | | | | | | |
Food Products—2.0% | | | | | | | |
Archer-Daniels-Midland Co. | | | | 15,787 | | | 532,811 |
Bunge Ltd. | | † | | 123,644 | | | 13,315,222 |
Hormel Foods Corp. | | | | 600 | | | 20,766 |
Kraft Foods, Inc., Class A | | | | 704,800 | | | 20,051,561 |
Nestle SA ADR (Switzerland) | | | | 74,400 | | | 8,405,340 |
Tyson Foods, Inc., Class A | | | | 146,478 | | | 2,188,381 |
| | | | | | | |
| | | | | | | 44,514,081 |
| | | | | | | |
Health Care Equipment & Supplies—2.3% | | | | | | | |
Alcon, Inc. (Switzerland) | | | | 29,000 | | | 4,720,910 |
Beckman Coulter, Inc. | | | | 3,137 | | | 211,842 |
Becton Dickinson & Co. | | | | 6,228 | | | 506,336 |
Boston Scientific Corp. | | * | | 15,856 | | | 194,870 |
Covidien Ltd. | | | | 197,372 | | | 9,452,145 |
CR Bard, Inc. | | | | 1,798 | | | 158,134 |
Dentsply International, Inc. | | | | 6,393 | | | 235,262 |
Edwards Lifesciences Corp. | | *† | | 1,225 | | | 75,999 |
Gen-Probe, Inc. | | * | | 4,796 | | | 227,714 |
Hill-Rom Holdings, Inc. | | † | | 2,261 | | | 61,002 |
Idexx Laboratories, Inc. | | * | | 4,961 | | | 241,799 |
Kinetic Concepts, Inc. | | *† | | 49,948 | | | 1,993,425 |
Medtronic, Inc. | | | | 609,048 | | | 31,518,235 |
St Jude Medical, Inc. | | * | | 689 | | | 28,166 |
Varian Medical Systems, Inc. | | * | | 4,548 | | | 235,814 |
| | | | | | | |
| | | | | | | 49,861,653 |
| | | | | | | |
Health Care Providers & Services—0.4% | | | | | | | |
AmerisourceBergen Corp. | | | | 69,486 | | | 2,778,745 |
Express Scripts, Inc. | | * | | 29,229 | | | 1,833,243 |
Kindred Healthcare, Inc. | | *† | | 4,800 | | | 138,048 |
McKesson Corp. | | | | 5,971 | | | 333,839 |
Medco Health Solutions, Inc. | | * | | 89,814 | | | 4,239,220 |
| | | | | | | |
| | | | | | | 9,323,095 |
| | | | | | | |
Hotels, Restaurants & Leisure—0.4% | | | | | | | |
Chipotle Mexican Grill, Inc., Class A | | *† | | 435 | | | 35,940 |
Marriott International, Inc., Class A | | | | 173,900 | | | 4,563,135 |
McDonald’s Corp. | | | | 72,025 | | | 4,049,246 |
MGM Mirage | | * | | 1 | | | 34 |
Yum! Brands, Inc. | | | | 3,736 | | | 131,096 |
| | | | | | | |
| | | | | | | 8,779,451 |
| | | | | | | |
Household Products—1.5% | | | | | | | |
Church & Dwight Co., Inc. | | † | | 2,900 | | | 163,415 |
Procter & Gamble Co. | | | | 529,094 | | | 32,174,206 |
| | | | | | | |
| | | | | | | 32,337,621 |
| | | | | | | |
Independent Power Producers & Energy Traders—0.8% | | | | | | | |
Reliant Energy, Inc. | | * | | 840,071 | | | 17,868,310 |
| | | | | | | |
Industrial Conglomerates—1.4% | | | | | | | |
3M Co. | | | | 18,091 | | | 1,258,953 |
General Electric Co. | | | | 1,027,100 | | | 27,413,298 |
McDermott International, Inc. | | * | | 33,445 | | | 2,069,911 |
Tyco International Ltd. (Bermuda) | | | | 6,042 | | | 241,922 |
| | | | | | | |
| | | | | | | 30,984,084 |
| | | | | | | |
| | | | |
| 146 | | See accompanying notes to financial statements. | | |
SCHEDULE OF INVESTMENTS — (Continued)
June 30, 2008 (Unaudited)
Vantagepoint Growth Fund
| | | | | | | |
| | | Shares | | Value |
COMMON STOCKS—(Continued) | | | | | | | |
Insurance—2.3% | | | | | | | |
American International Group, Inc. | | † | | 1,223,950 | | $ | 32,385,717 |
Arch Capital Group Ltd. (Bermuda) | | * | | 1,393 | | | 92,384 |
Axis Capital Holdings Ltd. (Bermuda) | | † | | 4,300 | | | 128,183 |
Berkshire Hathaway, Inc., Class B | | * | | 4,365 | | | 17,512,380 |
MetLife, Inc. | | | | 1,573 | | | 83,007 |
Travelers Cos, Inc. (The) | | | | 717 | | | 31,118 |
| | | | | | | |
| | | | | | | 50,232,789 |
| | | | | | | |
Internet & Catalog Retail—1.6% | | | | | | | |
Amazon.com, Inc. | | * | | 483,952 | | | 35,488,200 |
| | | | | | | |
Internet Software & Services—6.1% | | | | | | | |
eBay, Inc. | | * | | 1,856,509 | | | 50,738,391 |
Google, Inc., Class A | | * | | 97,128 | | | 51,130,121 |
Sohu.com, Inc. (China) | | * | | 6,507 | | | 458,353 |
VeriSign, Inc. | | *† | | 19,806 | | | 748,667 |
Yahoo! Inc. | | * | | 1,524,304 | | | 31,492,121 |
| | | | | | | |
| | | | | | | 134,567,653 |
| | | | | | | |
IT Services—3.7% | | | | | | | |
Accenture Ltd., Class A (Bermuda) | | | | 95,283 | | | 3,879,924 |
Automatic Data Processing, Inc. | | | | 952,100 | | | 39,892,989 |
Broadridge Financial Solutions, Inc. | | | | 19,990 | | | 420,790 |
Cognizant Technology Solutions Corp., Class A | | * | | 255,600 | | | 8,309,556 |
DST Systems, Inc. | | * | | 200 | | | 11,010 |
Gartner, Inc., Class A | | *† | | 1,765 | | | 36,571 |
Hewitt Associates, Inc., Class A | | * | | 6,961 | | | 266,815 |
Mastercard, Inc., Class A | | | | 1,300 | | | 345,176 |
Paychex, Inc. | | | | 591,950 | | | 18,516,196 |
Western Union Co. (The) | | | | 350,424 | | | 8,662,481 |
| | | | | | | |
| | | | | | | 80,341,508 |
| | | | | | | |
Life Sciences Tools & Services—0.6% | | | | | | | |
Applera Corp.—Applied Biosystems Group | | | | 1,706 | | | 57,117 |
Invitrogen Corp. | | * | | 22,000 | | | 863,720 |
Thermo Fisher Scientific, Inc. | | * | | 228,900 | | | 12,756,597 |
Varian, Inc. | | *† | | 3,144 | | | 160,533 |
| | | | | | | |
| | | | | | | 13,837,967 |
| | | | | | | |
Machinery—2.1% | | | | | | | |
AGCO Corp. | | * | | 32,344 | | | 1,695,149 |
Bucyrus International, Inc., Class A | | | | 4,509 | | | 329,247 |
Caterpillar, Inc. | | | | 226,242 | | | 16,701,185 |
Danaher Corp. | | | | 102,800 | | | 7,946,440 |
Deere & Co. | | | | 110,000 | | | 7,934,300 |
Flowserve Corp. | | | | 5,695 | | | 778,507 |
Graco, Inc. | | † | | 4,488 | | | 170,858 |
Ingersoll-Rand Co. Ltd., Class A (Bermuda) | | | | 48,771 | | | 1,825,499 |
ITT Corp. | | | | 122,600 | | | 7,764,258 |
Joy Global, Inc. | | | | 15,120 | | | 1,146,550 |
Kennametal, Inc. | | | | 1,939 | | | 63,114 |
Lincoln Electric Holdings, Inc. | | | | 573 | | | 45,095 |
SPX Corp. | | | | 5,739 | | | 755,998 |
Wabtec Corp. | | † | | 2,194 | | | 106,672 |
| | | | | | | |
| | | | | | | 47,262,872 |
| | | | | | | |
Marine—0.0% | | | | | | | |
Alexander & Baldwin, Inc. | | † | | 586 | | | 26,692 |
Kirby Corp. | | * | | 6,154 | | | 295,392 |
| | | | | | | |
| | | | | | | 322,084 |
| | | | | | | |
Media—1.9% | | | | | | | |
CBS Corp., Class B | | | | 146,836 | | | 2,861,834 |
DIRECTV Group, Inc. (The) | | * | | 62,706 | | | 1,624,712 |
DISH Network Corp., Class A | | * | | 2,242 | | | 65,646 |
DreamWorks Animation SKG, Inc., Class A | | *† | | 6,573 | | | 195,941 |
E.W. Scripps Co., Class A | | † | | 1,353 | | | 56,204 |
Time Warner Cable, Inc., Class A | | *† | | 7,683 | | | 203,446 |
Time Warner, Inc. | | | | 233,966 | | | 3,462,697 |
Walt Disney Co. (The) | | | | 771,424 | | | 24,068,428 |
XM Satellite Radio Holdings, Inc., Class A | | * | | 1,249,500 | | | 9,796,080 |
| | | | | | | |
| | | | | | | 42,334,988 |
| | | | | | | |
Metals & Mining—1.0% | | | | | | | |
Carpenter Technology Corp. | | | | 13,286 | | | 579,934 |
Commercial Metals Co. | | | | 7,425 | | | 279,923 |
Freeport-McMoRan Copper & Gold, Inc. | | | | 87,500 | | | 10,254,124 |
Goldcorp, Inc. (Canada) | | | | 194,800 | | | 8,993,916 |
Reliance Steel & Aluminum Co. | | | | 10,313 | | | 795,029 |
Schnitzer Steel Industries, Inc., Class A | | | | 4,683 | | | 536,672 |
Southern Copper Corp. | | † | | 13,914 | | | 1,483,650 |
Worthington Industries, Inc. | | † | | 16,125 | | | 330,563 |
| | | | | | | |
| | | | | | | 23,253,811 |
| | | | | | | |
Multiline Retail—1.5% | | | | | | | |
Big Lots, Inc. | | *† | | 9,084 | | | 283,784 |
Dollar Tree, Inc. | | * | | 7,282 | | | 238,049 |
Kohl’s Corp. | | * | | 287,200 | | | 11,499,488 |
Target Corp. | | | | 446,500 | | | 20,757,785 |
| | | | | | | |
| | | | | | | 32,779,106 |
| | | | | | | |
Multi-Utilities—0.0% | | | | | | | |
Dominion Resources, Inc. | | | | 1,000 | | | 47,490 |
| | | | | | | |
Oil, Gas & Consumable Fuels—3.1% | | | | | | | |
Alpha Natural Resources, Inc. | | *† | | 5,711 | | | 595,600 |
Anadarko Petroleum Corp. | | | | 32,424 | | | 2,426,612 |
Apache Corp. | | | | 8,826 | | | 1,226,814 |
Bill Barrett Corp. | | * | | 7,502 | | | 445,694 |
Cabot Oil & Gas Corp. | | | | 10,384 | | | 703,308 |
Chesapeake Energy Corp. | | | | 216,600 | | | 14,286,936 |
Cimarex Energy Co. | | | | 2,377 | | | 165,606 |
Continental Resources, Inc. | | *† | | 19,312 | | | 1,338,708 |
Denbury Resources, Inc. | | * | | 5,851 | | | 213,562 |
Devon Energy Corp. | | | | 13,875 | | | 1,667,220 |
Encore Acquisition Co. | | * | | 879 | | | 66,092 |
EOG Resources, Inc. | | | | 3,302 | | | 433,222 |
Exxon Mobil Corp. | | | | 49,377 | | | 4,351,595 |
Mariner Energy, Inc. | | * | | 3,329 | | | 123,073 |
Massey Energy Co. | | | | 1,300 | | | 121,875 |
Noble Energy, Inc. | | | | 10,366 | | | 1,042,405 |
Occidental Petroleum Corp. | | | | 164,223 | | | 14,757,079 |
Pioneer Natural Resources Co. | | | | 13,200 | | | 1,033,296 |
Range Resources Corp. | | | | 1,098 | | | 71,963 |
| | | | |
| | See accompanying notes to financial statements. | | 147 |
SCHEDULE OF INVESTMENTS — (Continued)
June 30, 2008 (Unaudited)
Vantagepoint Growth Fund
| | | | | | | |
| | | Shares | | Value |
COMMON STOCKS—(Continued) | | | | | | | |
Suncor Energy, Inc. (Canada) | | | | 156,100 | | $ | 9,072,532 |
Sunoco, Inc. | | | | 814 | | | 33,122 |
Ultra Petroleum Corp. | | * | | 4,810 | | | 472,342 |
Valero Energy Corp. | | | | 40,797 | | | 1,680,020 |
W&T Offshore, Inc. | | † | | 15,640 | | | 915,096 |
Whiting Petroleum Corp. | | * | | 538 | | | 57,071 |
XTO Energy, Inc. | | | | 151,000 | | | 10,345,010 |
| | | | | | | |
| | | | | | | 67,645,853 |
| | | | | | | |
Personal Products—0.1% | | | | | | | |
Avon Products, Inc. | | | | 10,322 | | | 371,798 |
Herbalife Ltd. (Cayman Islands) | | † | | 27,050 | | | 1,048,188 |
| | | | | | | |
| | | | | | | 1,419,986 |
| | | | | | | |
Pharmaceuticals—3.5% | | | | | | | |
Abbott Laboratories | | | | 20,025 | | | 1,060,724 |
Elan Corp. plc ADR (Ireland) | | *† | | 611,000 | | | 21,721,050 |
Eli Lilly & Co. | | | | 46,699 | | | 2,155,626 |
Johnson & Johnson | | | | 499,828 | | | 32,158,933 |
Merck & Co., Inc. | | | | 109,740 | | | 4,136,101 |
Pfizer, Inc. | | | | 183,810 | | | 3,211,161 |
Watson Pharmaceuticals, Inc. | | * | | 36,844 | | | 1,001,051 |
Wyeth | | | | 226,000 | | | 10,838,960 |
| | | | | | | |
| | | | | | | 76,283,606 |
| | | | | | | |
Real Estate Investment Trusts (REIT)—0.3% | | | | | | | |
AMB Property Corp. REIT | | † | | 1,907 | | | 96,075 |
AvalonBay Communities, Inc. REIT | | † | | 8,200 | | | 731,112 |
Federal Realty Investment Trust REIT | | † | | 3,500 | | | 241,500 |
Macerich Co. (The) REIT | | † | | 20,853 | | | 1,295,597 |
Nationwide Health Properties, Inc. REIT | | † | | 3,002 | | | 94,533 |
Prologis REIT | | | | 53,718 | | | 2,919,573 |
Rayonier, Inc. REIT | | † | | 111 | | | 4,713 |
Taubman Centers, Inc. REIT | | † | | 436 | | | 21,211 |
Ventas, Inc. REIT | | | | 15,600 | | | 664,092 |
| | | | | | | |
| | | | | | | 6,068,406 |
| | | | | | | |
Real Estate Management & Development—0.0% | | | | | | | |
Jones Lang LaSalle, Inc. | | | | 5,765 | | | 346,995 |
| | | | | | | |
Road & Rail—0.2% | | | | | | | |
Burlington Northern Santa Fe Corp. | | | | 4,637 | | | 463,190 |
J.B. Hunt Transport Services, Inc. | | † | | 79,288 | | | 2,638,704 |
Landstar System, Inc. | | † | | 12,608 | | | 696,214 |
Ryder System, Inc. | | † | | 11,737 | | | 808,445 |
Union Pacific Corp. | | | | 2,770 | | | 209,135 |
Werner Enterprises, Inc. | | † | | 34,507 | | | 641,140 |
| | | | | | | |
| | | | | | | 5,456,828 |
| | | | | | | |
Semiconductors & Semiconductor Equipment—4.0% | | | | | | | |
Analog Devices, Inc. | | | | 3,477 | | | 110,464 |
Applied Materials, Inc. | | | | 236,802 | | | 4,520,550 |
Integrated Device Technology, Inc. | | * | | 3,288 | | | 32,683 |
Intel Corp. | | | | 1,537,052 | | | 33,015,876 |
KLA-Tencor Corp. | | | | 1,796 | | | 73,115 |
Linear Technology Corp. | | † | | 306,600 | | | 9,985,962 |
LSI Corp. | | * | | 9,804 | | | 60,197 |
Marvell Technology Group Ltd. (Bermuda) | | * | | 349,400 | | | 6,170,404 |
MEMC Electronic Materials, Inc. | | * | | 17,276 | | | 1,063,165 |
Microchip Technology, Inc. | | † | | 4,720 | | | 144,149 |
National Semiconductor Corp. | | | | 24,079 | | | 494,583 |
Nvidia Corp. | | * | | 212 | | | 3,969 |
Texas Instruments, Inc. | | | | 1,123,210 | | | 31,629,594 |
| | | | | | | |
| | | | | | | 87,304,711 |
| | | | | | | |
Software—6.3% | | | | | | | |
Activision, Inc. | | * | | 46,363 | | | 1,579,587 |
Adobe Systems, Inc. | | * | | 19,783 | | | 779,252 |
Advent Software, Inc. | | *† | | 11,594 | | | 418,312 |
Amdocs Ltd. | | * | | 1,854 | | | 54,545 |
Autodesk, Inc. | | * | | 249,800 | | | 8,445,738 |
CA, Inc. | | | | 7,783 | | | 179,709 |
Electronic Arts, Inc. | | * | | 378,300 | | | 16,807,869 |
Microsoft Corp. | | | | 2,947,297 | | | 81,080,141 |
Oracle Corp. | | * | | 467,122 | | | 9,809,562 |
Red Hat, Inc. | | *† | | 752,900 | | | 15,577,501 |
Salesforce.com, Inc. | | * | | 13,488 | | | 920,286 |
Sybase, Inc. | | *† | | 6,691 | | | 196,849 |
Symantec Corp. | | * | | 121,736 | | | 2,355,592 |
Synopsys, Inc. | | * | | 59,938 | | | 1,433,118 |
| | | | | | | |
| | | | | | | 139,638,061 |
| | | | | | | |
Specialty Retail—2.1% | | | | | | | |
Aeropostale, Inc. | | *† | | 38,888 | | | 1,218,361 |
AutoNation, Inc. | | *† | | 60,202 | | | 603,224 |
Bed Bath & Beyond, Inc. | | * | | 199,000 | | | 5,591,900 |
Best Buy Co., Inc. | | | | 17,488 | | | 692,525 |
GameStop Corp., Class A | | * | | 74,261 | | | 3,000,144 |
Lowe’s Cos, Inc. | | | | 1,572,700 | | | 32,633,525 |
Ross Stores, Inc. | | | | 7,644 | | | 271,515 |
TJX Cos, Inc. | | | | 56,378 | | | 1,774,216 |
Urban Outfitters, Inc. | | * | | 9,428 | | | 294,059 |
| | | | | | | |
| | | | | | | 46,079,469 |
| | | | | | | |
Textiles, Apparel & Luxury Goods—0.1% | | | | | | | |
Nike, Inc., Class B | | | | 21,442 | | | 1,278,158 |
| | | | | | | |
Thrifts & Mortgage Finance—0.5% | | | | | | | |
Freddie Mac | | | | 603,900 | | | 9,903,960 |
| | | | | | | |
Tobacco—0.4% | | | | | | | |
Altria Group, Inc. | | | | 111,913 | | | 2,300,931 |
Philip Morris International, Inc. | | | | 68,945 | | | 3,405,194 |
Universal Corp. | | † | | 9,651 | | | 436,418 |
UST, Inc. | | | | 49,104 | | | 2,681,569 |
| | | | | | | |
| | | | | | | 8,824,112 |
| | | | | | | |
Trading Companies & Distributors—0.5% | | | | | | | |
Fastenal Co. | | † | | 279,100 | | | 12,045,956 |
| | | | | | | |
TOTAL COMMON STOCKS
(Cost $2,029,252,275) | | | | | | | 2,141,845,282 |
| | | | | | | |
CASH EQUIVALENTS—9.1% | | | | | | | |
Institutional Money Market Funds—9.1% | | | | | | | |
AIM Short-Term Investments Trust Liquid Assets Portfolio | | †† | | 34,524,089 | | | 34,524,089 |
AIM Short-Term Investments Trust Prime Assets Portfolio | | †† | | 97,005,248 | | | 97,005,248 |
JPMorgan Prime Money Market Fund, Capital Shares | | | | 29,943,717 | | | 29,943,717 |
| | | | |
| 148 | | See accompanying notes to financial statements. | | |
SCHEDULE OF INVESTMENTS — (Continued)
June 30, 2008 (Unaudited)
Vantagepoint Growth Fund
| | | | | | |
| | | Shares | | Value | |
CASH EQUIVALENTS—(Continued) | | | | | | |
JPMorgan U.S. Government Money Market Fund, Capital Shares | | 38,537,938 | | $ | 38,537,938 | |
| | | | | | |
TOTAL CASH EQUIVALENTS
(Cost $200,010,992) | | | | | 200,010,992 | |
| | | | | | |
TOTAL INVESTMENTS—106.5%
(Cost $2,229,263,267) | | | | | 2,341,856,274 | |
Other assets less liabilities—(6.5%) | | | | | (141,954,318 | ) |
| | | | | | |
NET ASSETS—100.0% | | | | $ | 2,199,901,956 | |
| | | | | | |
Notes to the Schedule of Investments:
| | |
| ADR | | American Depositary Receipt |
| REIT | | Real Estate Investment Trust |
| * | | Non-income producing. |
| † | | Denotes all or a portion of security on loan. |
| †† | | Represents reinvestment of collateral received in conjunction with securities lending. |
| | | | |
| | See accompanying notes to financial statements. | | 149 |
SCHEDULE OF INVESTMENTS
June 30, 2008 (Unaudited)
Vantagepoint Select Value Fund
| | | | | | | |
| | | Shares | | Value |
COMMON STOCKS—97.7% | | | | | | | |
Aerospace & Defense—0.1% | | | | | | | |
L-3 Communications Holdings, Inc. | | | | 3,737 | | $ | 339,581 |
Northrop Grumman Corp. | | | | 215 | | | 14,384 |
| | | | | | | |
| | | | | | | 353,965 |
| | | | | | | |
Agriculture—0.0% | | | | | | | |
Lorillard, Inc. | | * | | 378 | | | 26,142 |
| | | | | | | |
Airlines—0.2% | | | | | | | |
Southwest Airlines Co. | | | | 39,253 | | | 511,859 |
| | | | | | | |
Auto Components—0.8% | | | | | | | |
Autoliv, Inc. (Sweden) | | | | 7,200 | | | 335,664 |
BorgWarner, Inc. | | | | 19,800 | | | 878,724 |
Exide Technologies | | *† | | 50,700 | | | 849,732 |
TRW Automotive Holdings Corp. | | * | | 5,200 | | | 96,044 |
| | | | | | | |
| | | | | | | 2,160,164 |
| | | | | | | |
Automobiles—0.2% | | | | | | | |
Ford Motor Co. | | *† | | 95,602 | | | 459,846 |
| | | | | | | |
Beverages—0.8% | | | | | | | |
Coca-Cola Enterprises, Inc. | | | | 24,700 | | | 427,310 |
Dr. Pepper Snapple Group, Inc. | | * | | 9,292 | | | 194,946 |
Molson Coors Brewing Co., Class B | | | | 17,600 | | | 956,208 |
Pepsi Bottling Group, Inc. | | | | 8,033 | | | 224,281 |
PepsiAmericas, Inc. | | | | 18,115 | | | 358,315 |
| | | | | | | |
| | | | | | | 2,161,060 |
| | | | | | | |
Biotechnology—0.2% | | | | | | | |
Amgen, Inc. | | * | | 1,737 | | | 81,917 |
Biogen Idec, Inc. | | * | | 6,060 | | | 338,693 |
BioMarin Pharmaceutical, Inc. | | * | | 3,342 | | | 96,851 |
| | | | | | | |
| | | | | | | 517,461 |
| | | | | | | |
Building Products—0.2% | | | | | | | |
Armstrong World Industries, Inc. | | † | | 6,838 | | | 199,806 |
Lennox International, Inc. | | † | | 8,796 | | | 254,733 |
| | | | | | | |
| | | | | | | 454,539 |
| | | | | | | |
Capital Markets—2.5% | | | | | | | |
Ameriprise Financial, Inc. | | | | 2,500 | | | 101,675 |
Bank of New York Mellon Corp. | | | | 923 | | | 34,917 |
BlackRock, Inc. | | † | | 2,400 | | | 424,800 |
Eaton Vance Corp. | | † | | 9,063 | | | 360,345 |
Federated Investors, Inc., Class B | | | | 4,825 | | | 166,077 |
Invesco Ltd. | | | | 86,616 | | | 2,077,052 |
Janus Capital Group, Inc. | | | | 8,580 | | | 227,113 |
Legg Mason, Inc. | | | | 5,633 | | | 245,430 |
Northern Trust Corp. | | | | 42,140 | | | 2,889,539 |
Raymond James Financial, Inc. | | † | | 8,000 | | | 211,120 |
SEI Investments Co. | | | | 5,299 | | | 124,632 |
| | | | | | | |
| | | | | | | 6,862,700 |
| | | | | | | |
Chemicals—3.5% | | | | | | | |
Ashland, Inc. | | | | 14,300 | | | 689,260 |
Cabot Corp. | | † | | 2,098 | | | 51,002 |
Celanese Corp., Class A | | | | 57,892 | | | 2,643,349 |
CF Industries Holdings, Inc. | | | | 3,853 | | | 588,738 |
Chemtura Corp. | | | | 26,500 | | | 154,760 |
Cytec Industries, Inc. | | | | 2,078 | | | 113,376 |
FMC Corp. | | † | | 7,853 | | | 608,136 |
Huntsman Corp. | | | | 3,173 | | | 36,172 |
International Flavors & Fragrances, Inc. | | | | 74,721 | | | 2,918,603 |
Lubrizol Corp. | | | | 4,700 | | | 217,751 |
Minerals Technologies, Inc. | | † | | 2,436 | | | 154,905 |
Mosaic Co. (The) | | * | | 1,063 | | | 153,816 |
Rohm & Haas Co. | | | | 17,300 | | | 803,412 |
Terra Industries, Inc. | | | | 18,500 | | | 912,975 |
Westlake Chemical Corp. | | † | | 2,927 | | | 43,495 |
| | | | | | | |
| | | | | | | 10,089,750 |
| | | | | | | |
Commercial Banks—4.1% | | | | | | | |
Bank of Hawaii Corp. | | † | | 44,300 | | | 2,117,541 |
BB&T Corp. | | † | | 49,800 | | | 1,133,946 |
BOK Financial Corp. | | † | | 7,000 | | | 374,150 |
City National Corp. | | † | | 12,521 | | | 526,758 |
Comerica, Inc. | | † | | 149,019 | | | 3,819,358 |
Cullen/Frost Bankers, Inc. | | | | 2,454 | | | 122,332 |
East West Bancorp, Inc. | | † | | 557 | | | 3,932 |
Fifth Third Bancorp | | | | 15,208 | | | 154,817 |
Fulton Financial Corp. | | † | | 55,700 | | | 559,785 |
Keycorp | | | | 1,846 | | | 20,269 |
Marshall & Ilsley Corp. | | † | | 46,651 | | | 715,160 |
PacWest Bancorp | | † | | 375 | | | 5,580 |
Regions Financial Corp. | | † | | 27,075 | | | 295,388 |
Susquehanna Bancshares, Inc. | | † | | 57,500 | | | 787,175 |
Synovus Financial Corp. | | † | | 24,558 | | | 214,391 |
TCF Financial Corp. | | † | | 6,300 | | | 75,789 |
UnionBanCal Corp. | | | | 1,400 | | | 56,588 |
Zions Bancorporation | | † | | 13,700 | | | 431,413 |
| | | | | | | |
| | | | | | | 11,414,372 |
| | | | | | | |
Commercial Services & Supplies—1.9% | | | | | | | |
Herman Miller, Inc. | | † | | 3,196 | | | 79,548 |
HNI Corp. | | † | | 3,116 | | | 55,029 |
Kelly Services, Inc., Class A | | † | | 2,560 | | | 49,485 |
Manpower, Inc. | | | | 1,321 | | | 76,935 |
MPS Group, Inc. | | *† | | 22,638 | | | 240,642 |
Navigant Consulting, Inc. | | *† | | 3,000 | | | 58,680 |
Republic Services, Inc. | | | | 700 | | | 20,790 |
RR Donnelley & Sons Co. | | | | 119,600 | | | 3,550,924 |
Steelcase, Inc., Class A | | | | 103,900 | | | 1,042,117 |
| | | | | | | |
| | | | | | | 5,174,150 |
| | | | | | | |
Communications Equipment—0.9% | | | | | | | |
Ciena Corp. | | * | | 47,700 | | | 1,105,209 |
Comtech Telecommunications Corp. | | *† | | 18,900 | | | 926,100 |
Juniper Networks, Inc. | | * | | 22,800 | | | 505,704 |
Tellabs, Inc. | | * | | 15,205 | | | 70,703 |
| | | | | | | |
| | | | | | | 2,607,716 |
| | | | | | | |
Computers & Peripherals—0.5% | | | | | | | |
NCR Corp. | | * | | 9,050 | | | 228,060 |
QLogic Corp. | | * | | 4,528 | | | 66,064 |
SanDisk Corp. | | * | | 4,232 | | | 79,138 |
Seagate Technology (Cayman Islands) | | | | 24,026 | | | 459,617 |
Sun Microsystems, Inc. | | * | | 8,219 | | | 89,423 |
Teradata Corp. | | * | | 9,212 | | | 213,166 |
Western Digital Corp. | | * | | 9,551 | | | 329,796 |
| | | | | | | |
| | | | | | | 1,465,264 |
| | | | | | | |
Construction & Engineering—0.2% | | | | | | | |
KBR, Inc. | | | | 13,767 | | | 480,606 |
| | | | | | | |
| | | | |
| 150 | | See accompanying notes to financial statements. | | |
SCHEDULE OF INVESTMENTS — (Continued)
June 30, 2008 (Unaudited)
Vantagepoint Select Value Fund
| | | | | | | |
| | | Shares | | Value |
COMMON STOCKS—(Continued) | | | | | | | |
Consumer Finance—0.2% | | | | | | | |
Capital One Financial Corp. | | † | | 11,029 | | $ | 419,212 |
| | | | | | | |
Containers & Packaging—3.1% | | | | | | | |
Aptargroup, Inc. | | † | | 101,820 | | | 4,271,348 |
Ball Corp. | | | | 2,762 | | | 131,858 |
Greif, Inc., Class A | | | | 519 | | | 33,232 |
Owens-Illinois, Inc. | | * | | 10,701 | | | 446,125 |
Sonoco Products Co. | | | | 122,600 | | | 3,794,470 |
| | | | | | | |
| | | | | | | 8,677,033 |
| | | | | | | |
Distributors—0.1% | | | | | | | |
Genuine Parts Co. | | | | 6,968 | | | 276,490 |
| | | | | | | |
Diversified Consumer Services—0.8% | | | | | | | |
Apollo Group, Inc., Class A | | * | | 8,600 | | | 380,636 |
DeVry, Inc. | | | | 35,373 | | | 1,896,700 |
Service Corp. International | | | | 7,800 | | | 76,908 |
| | | | | | | |
| | | | | | | 2,354,244 |
| | | | | | | |
Diversified Financial Services—0.4% | | | | | | | |
Bank of America Corp. | | | | 24,841 | | | 592,955 |
JPMorgan Chase & Co. | | | | 100 | | | 3,431 |
Moody’s Corp. | | | | 11,700 | | | 402,948 |
| | | | | | | |
| | | | | | | 999,334 |
| | | | | | | |
Diversified Telecommunication Services—1.6% | | | | | | | |
AT&T, Inc. | | | | 9,818 | | | 330,768 |
Embarq Corp. | | | | 15,500 | | | 732,685 |
NTELOS Holdings Corp. | | | | 115,500 | | | 2,930,235 |
Verizon Communications, Inc. | | | | 6,327 | | | 223,976 |
Windstream Corp. | | | | 18,400 | | | 227,056 |
| | | | | | | |
| | | | | | | 4,444,720 |
| | | | | | | |
Electric Utilities—3.9% | | | | | | | |
American Electric Power Co., Inc. | | | | 92,900 | | | 3,737,367 |
DPL, Inc. | | | | 2,000 | | | 52,760 |
Duke Energy Corp. | | | | 25,992 | | | 451,741 |
Edison International | | | | 29,400 | | | 1,510,572 |
Hawaiian Electric Industries, Inc. | | † | | 3,156 | | | 78,048 |
Idacorp, Inc. | | † | | 34,900 | | | 1,008,261 |
Northeast Utilities | | | | 37,000 | | | 944,610 |
Pepco Holdings, Inc. | | | | 5,000 | | | 128,250 |
Pinnacle West Capital Corp. | | | | 59,700 | | | 1,836,969 |
PPL Corp. | | | | 5,200 | | | 271,804 |
Progress Energy, Inc. | | | | 16,999 | | | 711,068 |
| | | | | | | |
| | | | | | | 10,731,450 |
| | | | | | | |
Electrical Equipment—1.0% | | | | | | | |
Acuity Brands, Inc. | | † | | 21,400 | | | 1,028,912 |
Cooper Industries Ltd., Class A | | | | 23,786 | | | 939,547 |
GrafTech International Ltd. | | * | | 21,500 | | | 576,845 |
Hubbell, Inc., Class B | | | | 5,600 | | | 223,272 |
| | | | | | | |
| | | | | | | 2,768,576 |
| | | | | | | |
Electronic Equipment & Instruments—2.3% | | | | | | | |
Avnet, Inc. | | * | | 8,700 | | | 237,336 |
Flextronics International Ltd. (Singapore) | | * | | 282,400 | | | 2,654,561 |
Ingram Micro, Inc., Class A | | * | | 15,187 | | | 269,569 |
Jabil Circuit, Inc. | | | | 3,291 | | | 54,005 |
National Instruments Corp. | | | | 2,377 | | | 67,435 |
Tech Data Corp. | | * | | 21,000 | | | 711,690 |
Tyco Electronics Ltd. (Bermuda) | | | | 62,500 | | | 2,238,750 |
Vishay Intertechnology, Inc. | | * | | 6,729 | | | 59,686 |
| | | | | | | |
| | | | | | | 6,293,032 |
| | | | | | | |
Energy Equipment & Services—2.3% | | | | | | | |
BJ Services Co. | | | | 8,868 | | | 283,244 |
Exterran Holdings, Inc. | | *† | | 5,456 | | | 390,049 |
FMC Technologies, Inc. | | * | | 3,091 | | | 237,791 |
Global Industries Ltd. | | * | | 13,600 | | | 243,848 |
Grey Wolf, Inc. | | *† | | 124,400 | | | 1,123,331 |
Noble Corp. | | | | 43,100 | | | 2,799,775 |
Oceaneering International, Inc. | | * | | 532 | | | 40,991 |
Oil States International, Inc. | | * | | 2,083 | | | 132,146 |
Patterson-UTI Energy, Inc. | | | | 14,200 | | | 511,768 |
SEACOR Holdings, Inc. | | * | | 3,952 | | | 353,744 |
Tidewater, Inc. | | | | 2,284 | | | 148,529 |
Unit Corp. | | * | | 105 | | | 8,712 |
| | | | | | | |
| | | | | | | 6,273,928 |
| | | | | | | |
Food & Staples Retailing—2.5% | | | | | | | |
BJ’s Wholesale Club, Inc. | | *† | | 94,000 | | | 3,637,800 |
Kroger Co. (The) | | | | 8,066 | | | 232,865 |
Ruddick Corp. | | † | | 56,758 | | | 1,947,367 |
Safeway, Inc. | | | | 27,285 | | | 778,987 |
Supervalu, Inc. | | | | 14,500 | | | 447,905 |
Whole Foods Market, Inc. | | † | | 2,387 | | | 56,548 |
| | | | | | | |
| | | | | | | 7,101,472 |
| | | | | | | |
Food Products—3.4% | | | | | | | |
Archer-Daniels-Midland Co. | | | | 5,427 | | | 183,161 |
Bunge Ltd. | | † | | 13,743 | | | 1,479,984 |
ConAgra Foods, Inc. | | | | 6,600 | | | 127,248 |
Corn Products International, Inc. | | | | 6,300 | | | 309,393 |
Darling International, Inc. | | * | | 49,700 | | | 821,044 |
Del Monte Foods Co. | | | | 18,262 | | | 129,660 |
Flowers Foods, Inc. | | † | | 53,600 | | | 1,519,024 |
Hormel Foods Corp. | | | | 14,602 | | | 505,375 |
J.M. Smucker Co. (The) | | | | 18,400 | | | 747,776 |
Lancaster Colony Corp. | | † | | 3,303 | | | 100,015 |
Sara Lee Corp. | | | | 231,000 | | | 2,829,750 |
Smithfield Foods, Inc. | | *† | | 10,485 | | | 208,442 |
Tyson Foods, Inc., Class A | | | | 38,300 | | | 572,202 |
| | | | | | | |
| | | | | | | 9,533,074 |
| | | | | | | |
Gas Utilities—2.3% | | | | | | | |
AGL Resources, Inc. | | † | | 22,600 | | | 781,508 |
Atmos Energy Corp. | | | | 21,313 | | | 587,599 |
Energen Corp. | | | | 11,900 | | | 928,557 |
Nicor, Inc. | | † | | 4,729 | | | 201,408 |
Oneok, Inc. | | | | 7,523 | | | 367,348 |
Questar Corp. | | | | 39,500 | | | 2,806,081 |
Southern Union Co. | | | | 2,300 | | | 62,146 |
UGI Corp. | | | | 9,692 | | | 278,257 |
WGL Holdings, Inc. | | † | | 9,400 | | | 326,556 |
| | | | | | | |
| | | | | | | 6,339,460 |
| | | | | | | |
Health Care Equipment & Supplies—1.9% | | | | | | | |
Beckman Coulter, Inc. | | | | 47,800 | | | 3,227,935 |
Cooper Cos, Inc. (The) | | | | 938 | | | 34,847 |
Dentsply International, Inc. | | | | 44,300 | | | 1,630,240 |
Hill-Rom Holdings, Inc. | | † | | 1,496 | | | 40,362 |
Kinetic Concepts, Inc. | | *† | | 5,100 | | | 203,541 |
| | | | | | | |
| | | | | | | 5,136,925 |
| | | | | | | |
| | | | |
| | See accompanying notes to financial statements. | | 151 |
SCHEDULE OF INVESTMENTS — (Continued)
June 30, 2008 (Unaudited)
Vantagepoint Select Value Fund
| | | | | | | |
| | | Shares | | Value |
COMMON STOCKS—(Continued) | | | | | | | |
Health Care Providers & Services—0.6% | | | | | | | |
AmerisourceBergen Corp. | | | | 12,000 | | $ | 479,880 |
Cigna Corp. | | | | 20,917 | | | 740,252 |
Express Scripts, Inc. | | * | | 3,440 | | | 215,757 |
Medco Health Solutions, Inc. | | * | | 7,000 | | | 330,400 |
| | | | | | | |
| | | | | | | 1,766,289 |
| | | | | | | |
Health Care Technology—1.0% | | | | | | | |
IMS Health, Inc. | | | | 121,100 | | | 2,821,630 |
| | | | | | | |
Hotels, Restaurants & Leisure—1.4% | | | | | | | |
Darden Restaurants, Inc. | | | | 120,500 | | | 3,848,771 |
McDonald’s Corp. | | | | 1,093 | | | 61,448 |
Royal Caribbean Cruises Ltd. | | † | | 2,990 | | | 67,185 |
| | | | | | | |
| | | | | | | 3,977,404 |
| | | | | | | |
Household Durables—1.6% | | | | | | | |
Black & Decker Corp. | | † | | 7,571 | | | 435,408 |
DR Horton, Inc. | | † | | 21,856 | | | 237,138 |
Fortune Brands, Inc. | | | | 3,500 | | | 218,435 |
Furniture Brands International, Inc. | | | | 1,771 | | | 23,661 |
Leggett & Platt, Inc. | | † | | 2,400 | | | 40,248 |
Lennar Corp., Class A | | | | 6,130 | | | 75,644 |
MDC Holdings, Inc. | | | | 1,808 | | | 70,620 |
Mohawk Industries, Inc. | | *† | | 2,800 | | | 179,480 |
NVR, Inc. | | *† | | 337 | | | 168,527 |
Snap-On, Inc. | | † | | 22,700 | | | 1,180,627 |
Toll Brothers, Inc. | | * | | 11,308 | | | 211,799 |
Tupperware Brands Corp. | | | | 42,978 | | | 1,470,707 |
Whirlpool Corp. | | | | 4,167 | | | 257,229 |
| | | | | | | |
| | | | | | | 4,569,523 |
| | | | | | | |
Independent Power Producers & Energy Traders—1.1% | | | | | | | |
Dynegy, Inc., Class A | | * | | 8,800 | | | 75,240 |
NRG Energy, Inc. | | * | | 47,051 | | | 2,018,488 |
Reliant Energy, Inc. | | * | | 52,200 | | | 1,110,294 |
| | | | | | | |
| | | | | | | 3,204,022 |
| | | | | | | |
Industrial Conglomerates—0.3% | | | | | | | |
McDermott International, Inc. | | * | | 1,536 | | | 95,063 |
Walter Industries, Inc. | | | | 6,900 | | | 750,513 |
| | | | | | | |
| | | | | | | 845,576 |
| | | | | | | |
Insurance—8.3% | | | | | | | |
Alleghany Corp. | | * | | 7,403 | | | 2,458,166 |
AON Corp. | | | | 47,400 | | | 2,177,556 |
Arch Capital Group Ltd. (Bermuda) | | * | | 29,242 | | | 1,939,329 |
Assurant, Inc. | | | | 17,150 | | | 1,131,214 |
Axis Capital Holdings Ltd. (Bermuda) | | † | | 10,500 | | | 313,005 |
Chubb Corp. | | | | 1,300 | | | 63,713 |
Cincinnati Financial Corp. | | | | 11,323 | | | 287,604 |
Endurance Specialty Holdings Ltd. | | † | | 48,300 | | | 1,487,157 |
Everest Re Group Ltd. (Bermuda) | | | | 11,100 | | | 884,781 |
Fidelity National Financial, Inc., Class A | | | | 4,587 | | | 57,796 |
First American Corp. | | | | 13,314 | | | 351,490 |
Genworth Financial, Inc., Class A | | | | 136,929 | | | 2,438,705 |
Hanover Insurance Group, Inc. (The) | | | | 13,724 | | | 583,270 |
HCC Insurance Holdings, Inc. | | | | 1,891 | | | 39,976 |
Lincoln National Corp. | | | | 65,628 | | | 2,974,262 |
Loews Corp. | | | | 459 | | | 21,527 |
MetLife, Inc. | | | | 1,382 | | | 72,928 |
Nationwide Financial Services, Class A | | † | | 10,435 | | | 500,984 |
Old Republic International Corp. | | | | 10,672 | | | 126,356 |
Principal Financial Group, Inc. | | | | 5,500 | | | 230,835 |
Progressive Corp. (The) | | | | 15,506 | | | 290,272 |
Reinsurance Group of America, Inc. | | | | 4,811 | | | 209,375 |
RenaissanceRe Holdings Ltd. (Bermuda) | | | | 1,739 | | | 77,681 |
Safeco Corp. | | | | 33,154 | | | 2,226,623 |
Torchmark Corp. | | | | 2,234 | | | 131,024 |
Unitrin, Inc. | | | | 4,100 | | | 113,037 |
Unum Group | | | | 110,082 | | | 2,251,177 |
XL Capital Ltd., Class A (Bermuda) | | | | 1,923 | | | 39,537 |
| | | | | | | |
| | | | | | | 23,479,380 |
| | | | | | | |
Internet & Catalog Retail—0.1% | | | | | | | |
Amazon.com, Inc. | | * | | 1,453 | | | 106,548 |
Expedia, Inc. | | * | | 1,070 | | | 19,667 |
IAC/InterActiveCorp | | * | | 3,165 | | | 61,021 |
NetFlix, Inc. | | *† | | 2,727 | | | 71,093 |
| | | | | | | |
| | | | | | | 258,329 |
| | | | | | | |
Internet Software & Services—0.0% | | | | | | | |
Sohu.com, Inc. (China) | | * | | 719 | | | 50,646 |
| | | | | | | |
IT Services—2.5% | | | | | | | |
Accenture Ltd., Class A (Bermuda) | | | | 2,000 | | | 81,440 |
Acxiom Corp. | | † | | 1,244 | | | 14,294 |
Broadridge Financial Solutions, Inc. | | | | 4,224 | | | 88,915 |
CACI International, Inc., Class A | | * | | 21,400 | | | 979,478 |
Computer Sciences Corp. | | * | | 77,784 | | | 3,643,403 |
DST Systems, Inc. | | * | | 637 | | | 35,067 |
Electronic Data Systems Corp. | | | | 15,500 | | | 381,920 |
Gartner, Inc., Class A | | * | | 3,617 | | | 74,944 |
Hewitt Associates, Inc., Class A | | * | | 94 | | | 3,603 |
SAIC, Inc. | | *† | | 78,700 | | | 1,637,747 |
SRA International, Inc., Class A | | *† | | 1,361 | | | 30,568 |
Western Union Co. (The) | | | | 1,500 | | | 37,080 |
| | | | | | | |
| | | | | | | 7,008,459 |
| | | | | | | |
Leisure Equipment & Products—0.1% | | | | | | | |
Brunswick Corp. | | † | | 21,611 | | | 229,076 |
Callaway Golf Co. | | | | 1,328 | | | 15,710 |
Hasbro, Inc. | | | | 2,983 | | | 106,553 |
Mattel, Inc. | | | | 3,396 | | | 58,140 |
| | | | | | | |
| | | | | | | 409,479 |
| | | | | | | |
Life Sciences Tools & Services—1.0% | | | | | | | |
Applera Corp.—Applied Biosystems Group | | | | 10,100 | | | 338,148 |
Invitrogen Corp. | | * | | 63,916 | | | 2,509,342 |
| | | | | | | |
| | | | | | | 2,847,490 |
| | | | | | | |
Machinery—2.8% | | | | | | | |
AGCO Corp. | | * | | 5,870 | | | 307,647 |
Crane Co. | | | | 2,300 | | | 88,619 |
Eaton Corp. | | | | 39,400 | | | 3,347,817 |
Flowserve Corp. | | | | 1,261 | | | 172,379 |
| | | | |
| 152 | | See accompanying notes to financial statements. | | |
SCHEDULE OF INVESTMENTS — (Continued)
June 30, 2008 (Unaudited)
Vantagepoint Select Value Fund
| | | | | | | |
| | | Shares | | Value |
COMMON STOCKS—(Continued) | | | | | | | |
Graco, Inc. | | † | | 5,572 | | $ | 212,126 |
Harsco Corp. | | | | 7,900 | | | 429,839 |
Ingersoll-Rand Co. Ltd., Class A (Bermuda) | | | | 25,770 | | | 964,571 |
Joy Global, Inc. | | | | 1,818 | | | 137,859 |
Kennametal, Inc. | | | | 4,928 | | | 160,406 |
Lincoln Electric Holdings, Inc. | | | | 1,548 | | | 121,828 |
Pentair, Inc. | | † | | 3,064 | | | 107,301 |
SPX Corp. | | | | 9,140 | | | 1,204,012 |
Timken Co. | | | | 9,889 | | | 325,744 |
Wabtec Corp. | | † | | 2,884 | | | 140,220 |
| | | | | | | |
| | | | | | | 7,720,368 |
| | | | | | | |
Marine—0.0% | | | | | | | |
Alexander & Baldwin, Inc. | | † | | 968 | | | 44,092 |
| | | | | | | |
Media—1.6% | | | | | | | |
Belo Corp., Class A | | † | | 13,949 | | | 101,967 |
CBS Corp., Class B | | | | 87,648 | | | 1,708,260 |
DISH Network Corp., Class A | | * | | 1,191 | | | 34,872 |
DreamWorks Animation SKG, Inc., Class A | | * | | 4,321 | | | 128,809 |
E.W. Scripps Co., Class A | | † | | 2,697 | | | 112,033 |
Entercom Communications Corp., Class A | | † | | 3,196 | | | 22,436 |
Gannett Co., Inc. | | † | | 24,672 | | | 534,642 |
Hearst-Argyle Television, Inc. | | † | | 10,163 | | | 195,130 |
Liberty Global, Inc., Class A | | *† | | 5,600 | | | 176,008 |
Liberty Media Corp.—Capital, Series A, Class A | | * | | 8,328 | | | 119,923 |
Liberty Media Corp.— Entertainment, Series A | | * | | 30,543 | | | 740,057 |
Scholastic Corp. | | *† | | 3,212 | | | 92,056 |
Time Warner, Inc. | | | | 37,700 | | | 557,960 |
Viacom, Inc., Class B | | * | | 258 | | | 7,879 |
Virgin Media, Inc. | | | | 3,111 | | | 42,341 |
| | | | | | | |
| | | | | | | 4,574,373 |
| | | | | | | |
Metals & Mining—0.9% | | | | | | | |
Carpenter Technology Corp. | | | | 6,213 | | | 271,197 |
Commercial Metals Co. | | | | 7,587 | | | 286,030 |
Reliance Steel & Aluminum Co. | | | | 19,880 | | | 1,532,550 |
Schnitzer Steel Industries, Inc., Class A | | | | 410 | | | 46,986 |
Steel Dynamics, Inc. | | | | 1,614 | | | 63,059 |
Worthington Industries, Inc. | | † | | 8,300 | | | 170,150 |
| | | | | | | |
| | | | | | | 2,369,972 |
| | | | | | | |
Multiline Retail—1.0% | | | | | | | |
Big Lots, Inc. | | * | | 1,136 | | | 35,489 |
Dollar Tree, Inc. | | * | | 2,223 | | | 72,670 |
Family Dollar Stores, Inc. | | | | 102,695 | | | 2,047,738 |
Macy’s, Inc. | | | | 17,528 | | | 340,394 |
Sears Holdings Corp. | | * | | 5,611 | | | 413,306 |
| | | | | | | |
| | | | | | | 2,909,597 |
| | | | | | | |
Multi-Utilities—5.3% | | | | | | | |
Alliant Energy Corp. | | | | 1,300 | | | 44,538 |
Ameren Corp. | | | | 11,800 | | | 498,314 |
Black Hills Corp. | | † | | 1,649 | | | 52,867 |
CMS Energy Corp. | | | | 3,400 | | | 50,660 |
DTE Energy Co. | | | | 24,500 | | | 1,039,780 |
Energy East Corp. | | | | 12,000 | | | 296,640 |
Integrys Energy Group, Inc. | | | | 5,405 | | | 274,736 |
MDU Resources Group, Inc. | | | | 7,107 | | | 247,750 |
NiSource, Inc. | | | | 31,700 | | | 568,064 |
NSTAR | | † | | 65,000 | | | 2,198,300 |
OGE Energy Corp. | | † | | 15,125 | | | 479,614 |
PG&E Corp. | | | | 79,682 | | | 3,162,579 |
PNM Resources, Inc. | | † | | 1,968 | | | 23,537 |
Puget Energy, Inc. | | | | 4,090 | | | 98,119 |
SCANA Corp. | | | | 68,800 | | | 2,545,600 |
Sempra Energy | | | | 16,300 | | | 920,135 |
TECO Energy, Inc. | | | | 5,494 | | | 118,066 |
Vectren Corp. | | † | | 3,800 | | | 118,598 |
Xcel Energy, Inc. | | | | 109,500 | | | 2,197,665 |
| | | | | | | |
| | | | | | | 14,935,562 |
| | | | | | | |
Oil, Gas & Consumable Fuels—4.8% | | | | | | | |
Bill Barrett Corp. | | * | | 5,806 | | | 344,934 |
Cabot Oil & Gas Corp. | | | | 2,073 | | | 140,404 |
Cimarex Energy Co. | | | | 37,707 | | | 2,627,046 |
Continental Resources, Inc. | | *† | | 4,321 | | | 299,532 |
El Paso Corp. | | | | 56,000 | | | 1,217,440 |
Encore Acquisition Co. | | * | | 2,235 | | | 168,050 |
Forest Oil Corp. | | * | | 469 | | | 34,941 |
Newfield Exploration Co. | | * | | 5,530 | | | 360,833 |
Noble Energy, Inc. | | | | 43,276 | | | 4,351,834 |
Overseas Shipholding Group, Inc. | | † | | 716 | | | 56,936 |
Pioneer Natural Resources Co. | | | | 13,127 | | | 1,027,582 |
Spectra Energy Corp. | | | | 43,800 | | | 1,258,812 |
St. Mary Land & Exploration Co. | | | | 7,792 | | | 503,675 |
Sunoco, Inc. | | | | 1,185 | | | 48,218 |
Teekay Corp. (Bahamas) | | † | | 34 | | | 1,536 |
W&T Offshore, Inc. | | † | | 6,473 | | | 378,735 |
Williams Cos, Inc. | | | | 14,200 | | | 572,402 |
| | | | | | | |
| | | | | | | 13,392,910 |
| | | | | | | |
Paper & Forest Products—0.2% | | | | | | | |
International Paper Co. | | | | 7,073 | | | 164,801 |
MeadWestvaco Corp. | | | | 1,517 | | | 36,165 |
Weyerhaeuser Co. | | | | 4,626 | | | 236,574 |
| | | | | | | |
| | | | | | | 437,540 |
| | | | | | | |
Personal Products—0.1% | | | | | | | |
Herbalife Ltd. (Cayman Islands) | | † | | 4,234 | | | 164,068 |
| | | | | | | |
Pharmaceuticals—0.2% | | | | | | | |
Forest Laboratories, Inc. | | * | | 2,725 | | | 94,667 |
Watson Pharmaceuticals, Inc. | | * | | 12,314 | | | 334,571 |
| | | | | | | |
| | | | | | | 429,238 |
| | | | | | | |
Real Estate Investment Trusts (REIT)—8.3% | | | | | | | |
AMB Property Corp. REIT | | | | 21,600 | | | 1,088,208 |
Annaly Capital Management, Inc. REIT | | | | 81,315 | | | 1,261,196 |
Apartment Investment & Management Co., Class A REIT | | | | 59,445 | | | 2,024,697 |
AvalonBay Communities, Inc. REIT | | † | | 11,200 | | | 998,592 |
Brandywine Realty Trust REIT | | † | | 1,161 | | | 18,297 |
Digital Realty Trust, Inc. REIT | | † | | 47,000 | | | 1,922,770 |
Duke Realty Corp. REIT | | † | | 172,800 | | | 3,879,361 |
Equity One, Inc. REIT | | † | | 5,377 | | | 110,497 |
Equity Residential REIT | | | | 25,800 | | | 987,366 |
Essex Property Trust, Inc. REIT | | † | | 1,807 | | | 192,446 |
Federal Realty Investment Trust REIT | | † | | 10,700 | | | 738,300 |
HCP, Inc. REIT | | | | 13,382 | | | 425,681 |
| | | | |
| | See accompanying notes to financial statements. | | 153 |
SCHEDULE OF INVESTMENTS — (Continued)
June 30, 2008 (Unaudited)
Vantagepoint Select Value Fund
| | | | | | | |
| | | Shares | | Value |
COMMON STOCKS—(Continued) | | | | | | | |
Health Care, Inc. REIT | | | | 19,200 | | $ | 854,400 |
Highwoods Properties, Inc. REIT | | | | 1,400 | | | 43,988 |
Kilroy Realty Corp. REIT | | † | | 1,908 | | | 89,733 |
Liberty Property Trust REIT | | | | 5,949 | | | 197,209 |
Macerich Co. (The) REIT | | † | | 2,000 | | | 124,260 |
Mack-Cali Realty Corp. REIT | | | | 4,850 | | | 165,725 |
Mid-America Apartment Communities, Inc. REIT | | † | | 24,600 | | | 1,255,584 |
National Retail Properties, Inc. REIT | | | | 22,300 | | | 466,070 |
Nationwide Health Properties, Inc. REIT | | † | | 9,405 | | | 296,163 |
Prologis REIT | | | | 26,400 | | | 1,434,840 |
Public Storage REIT | | | | 3,553 | | | 287,047 |
Rayonier, Inc. REIT | | † | | 2,100 | | | 89,166 |
Regency Centers Corp. REIT | | | | 18,900 | | | 1,117,368 |
Simon Property Group, Inc. REIT | | | | 23,100 | | | 2,076,459 |
SL Green Realty Corp. REIT | | † | | 2,325 | | | 192,324 |
Taubman Centers, Inc. REIT | | † | | 11,700 | | | 569,205 |
UDR, Inc. REIT | | | | 2,801 | | | 62,686 |
Ventas, Inc. REIT | | | | 6,062 | | | 258,059 |
| | | | | | | |
| | | | | | | 23,227,697 |
| | | | | | | |
Real Estate Management & Development—0.2% | | | | | | | |
Jones Lang LaSalle, Inc. | | | | 8,499 | | | 511,555 |
| | | | | | | |
Road & Rail—1.6% | | | | | | | |
J.B. Hunt Transport Services, Inc. | | † | | 8,138 | | | 270,833 |
Kansas City Southern | | *† | | 13,500 | | | 593,865 |
Landstar System, Inc. | | | | 1,218 | | | 67,258 |
Ryder System, Inc. | | | | 6,721 | | | 462,942 |
Werner Enterprises, Inc. | | † | | 167,158 | | | 3,105,795 |
YRC Worldwide, Inc. | | *† | | 5,149 | | | 76,566 |
| | | | | | | |
| | | | | | | 4,577,259 |
| | | | | | | |
Semiconductors & Semiconductor Equipment—1.5% | | | | | | | |
Analog Devices, Inc. | | | | 469 | | | 14,900 |
Integrated Device Technology, Inc. | | * | | 7,456 | | | 74,113 |
Intersil Corp., Class A | | | | 2,700 | | | 65,664 |
LSI Corp. | | * | | 27,019 | | | 165,897 |
Microchip Technology, Inc. | | † | | 61,100 | | | 1,865,993 |
National Semiconductor Corp. | | | | 5,425 | | | 111,430 |
PMC—Sierra, Inc. | | * | | 56,100 | | | 429,165 |
Semtech Corp. | | *† | | 80,513 | | | 1,132,818 |
Texas Instruments, Inc. | | | | 10,600 | | | 298,496 |
Varian Semiconductor Equipment Associates, Inc. | | *† | | 1,056 | | | 36,770 |
| | | | | | | |
| | | | | | | 4,195,246 |
| | | | | | | |
Software—2.1% | | | | | | | |
Adobe Systems, Inc. | | * | | 1,214 | | | 47,819 |
Advent Software, Inc. | | *† | | 4,896 | | | 176,648 |
Amdocs Ltd. | | * | | 2,329 | | | 68,519 |
CA, Inc. | | | | 16,900 | | | 390,221 |
Cadence Design Systems, Inc. | | * | | 279,600 | | | 2,823,960 |
Check Point Software Technologies (Israel) | | * | | 82,200 | | | 1,945,674 |
Microsoft Corp. | | | | 1,700 | | | 46,767 |
Salesforce.com, Inc. | | * | | 817 | | | 55,744 |
Sybase, Inc. | | *† | | 5,624 | | | 165,458 |
Symantec Corp. | | * | | 1,500 | | | 29,025 |
| | | | | | | |
| | | | | | | 5,749,835 |
| | | | | | | |
Specialty Retail—1.0% | | | | | | | |
Advance Auto Parts, Inc. | | | | 24,000 | | $ | 931,919 |
Aeropostale, Inc. | | *† | | 8,802 | | | 275,767 |
AutoNation, Inc. | | *† | | 42,500 | | | 425,850 |
Barnes & Noble, Inc. | | † | | 3,200 | | | 79,488 |
Foot Locker, Inc. | | | | 5,318 | | | 66,209 |
GameStop Corp., Class A | | * | | 11,407 | | | 460,843 |
Penske Auto Group, Inc. | | † | | 7,557 | | | 111,390 |
PetSmart, Inc. | | | | 5,017 | | | 100,089 |
Ross Stores, Inc. | | | | 5,001 | | | 177,636 |
TJX Cos, Inc. | | | | 800 | | | 25,176 |
| | | | | | | |
| | | | | | | 2,654,367 |
| | | | | | | |
Textiles, Apparel & Luxury Goods—3.0% | | | | | | | |
Coach, Inc. | | * | | 8,804 | | | 254,260 |
Fossil, Inc. | | *† | | 35,300 | | | 1,026,171 |
Hanesbrands, Inc. | | *† | | 46,900 | | | 1,272,866 |
Jones Apparel Group, Inc. | | | | 18,900 | | | 259,875 |
Liz Claiborne, Inc. | | | | 600 | | | 8,490 |
Phillips-Van Heusen Corp. | | | | 449 | | | 16,442 |
VF Corp. | | | | 47,100 | | | 3,352,578 |
Warnaco Group, Inc. (The) | | *† | | 43,654 | | | 1,923,832 |
| | | | | | | |
| | | | | | | 8,114,514 |
| | | | | | | |
Thrifts & Mortgage Finance—1.9% | | | | | | | |
Hudson City Bancorp, Inc. | | | | 56,000 | | | 934,080 |
New York Community Bancorp, Inc. | | † | | 142,197 | | | 2,536,794 |
TFS Financial Corp. | | † | | 4,035 | | | 46,766 |
Washington Federal, Inc. | | † | | 102,428 | | | 1,853,947 |
| | | | | | | |
| | | | | | | 5,371,587 |
| | | | | | | |
Tobacco—0.1% | | | | | | | |
Altria Group, Inc. | | | | 2,772 | | | 56,992 |
UST, Inc. | | | | 3,700 | | | 202,058 |
| | | | | | | |
| | | | | | | 259,050 |
| | | | | | | |
Trading Companies & Distributors—1.1% | | | | | | | |
GATX Corp. | | | | 19,500 | | | 864,435 |
United Rentals, Inc. | | * | | 113,000 | | | 2,215,930 |
W.W. Grainger, Inc. | | | | 1,472 | | | 120,410 |
| | | | | | | |
| | | | | | | 3,200,775 |
| | | | | | | |
Water Utilities—0.0% | | | | | | | |
Aqua America, Inc. | | | | 1 | | | 16 |
| | | | | | | |
Wireless Telecommunication Services—0.1% | | | | | | | |
Crown Castle International Corp. | | * | | 2,905 | | | 112,511 |
Leap Wireless International, Inc. | | * | | 1,137 | | | 49,084 |
| | | | | | | |
| | | | | | | 161,595 |
| | | | | | | |
TOTAL COMMON STOCKS
(Cost $298,141,931) | | | | | | | 272,327,987 |
| | | | | | | |
CASH EQUIVALENTS—24.3% | | | | | | | |
Institutional Money Market Funds—24.3% | | | | | | | |
AIM Short-Term Investments Trust Liquid Assets Portfolio | | †† | | 14,437,689 | | | 14,437,689 |
AIM Short-Term Investments Trust Prime Assets Portfolio | | †† | | 47,562,656 | | | 47,562,656 |
JPMorgan Prime Money Market Fund, Capital Shares | | | | 4,382,309 | | | 4,382,309 |
| | | | |
| 154 | | See accompanying notes to financial statements. | | |
SCHEDULE OF INVESTMENTS — (Continued)
June 30, 2008 (Unaudited)
Vantagepoint Select Value Fund
| | | | | | |
| | | Shares | | Value | |
CASH EQUIVALENTS—(Continued) | | | | | | |
JPMorgan U.S. Government Money Market Fund, Capital Shares | | 1,323,158 | | $ | 1,323,158 | |
| | | | | | |
TOTAL CASH EQUIVALENTS
(Cost $67,705,812) | | | | | 67,705,812 | |
| | | | | | |
TOTAL INVESTMENTS—122.0%
(Cost $365,847,743) | | | | | 340,033,799 | |
Other assets less liabilities—(22.0%) | | | | | (61,305,124 | ) |
| | | | | | |
NET ASSETS—100.0% | | | | $ | 278,728,675 | |
| | | | | | |
Notes to the Schedule of Investments:
| | |
| REIT | | Real Estate Investment Trust |
| * | | Non-income producing. |
| † | | Denotes all or a portion of security on loan. |
| †† | | Represents reinvestment of collateral received in conjunction with securities lending. |
| | | | |
| | See accompanying notes to financial statements. | | 155 |
SCHEDULE OF INVESTMENTS
June 30, 2008 (Unaudited)
Vantagepoint Aggressive Opportunities Fund
| | | | | | | |
| | | | | Shares | | Value |
COMMON STOCKS—96.5% | | | | | | | |
Aerospace & Defense—0.4% | | | | | | | |
Moog, Inc., Class A | | *† | | 34,400 | | $ | 1,281,056 |
Rockwell Collins, Inc. | | | | 49,700 | | | 2,383,612 |
| | | | | | | |
| | | | | | | 3,664,668 |
| | | | | | | |
Air Freight & Logistics—2.3% | | | | | | | |
CH Robinson Worldwide, Inc. | | | | 78,100 | | | 4,283,004 |
Expeditors International of Washington, Inc. | | | | 51,500 | | | 2,214,500 |
FedEx Corp. | | | | 112,000 | | | 8,824,480 |
HUB Group, Inc., Class A | | * | | 113,800 | | | 3,883,994 |
UTi Worldwide, Inc. (Virgin Islands, British) | | † | | 184,200 | | | 3,674,790 |
| | | | | | | |
| | | | | | | 22,880,768 |
| | | | | | | |
Airlines—0.1% | | | | | | | |
Continental Airlines, Inc., Class B | | * | | 119,400 | | | 1,207,134 |
| | | | | | | |
Auto Components—0.3% | | | | | | | |
Autoliv, Inc. (Sweden) | | | | 54,000 | | | 2,517,480 |
| | | | | | | |
Automobiles—1.3% | | | | | | | |
General Motors Corp. | | † | | 744,400 | | | 8,560,600 |
Harley-Davidson, Inc. | | † | | 110,600 | | | 4,010,356 |
| | | | | | | |
| | | | | | | 12,570,956 |
| | | | | | | |
Biotechnology—2.4% | | | | | | | |
Alexion Pharmaceuticals, Inc. | | *† | | 36,800 | | | 2,668,000 |
Alkermes, Inc. | | *† | | 653,617 | | | 8,078,706 |
Cell Genesys, Inc. | | *† | | 480,900 | | | 1,250,340 |
Cephalon, Inc. | | *† | | 77,200 | | | 5,148,468 |
deCODE genetics, Inc. (Iceland) | | *† | | 240,700 | | | 221,444 |
Incyte Corp. Ltd. | | *† | | 326,400 | | | 2,483,904 |
Myriad Genetics, Inc. | | *† | | 39,300 | | | 1,788,936 |
Regeneron Pharmaceuticals, Inc. | | * | | 66,000 | | | 953,040 |
Senomyx, Inc. | | *† | | 189,623 | | | 934,841 |
| | | | | | | |
| | | | | | | 23,527,679 |
| | | | | | | |
Capital Markets—2.3% | | | | | | | |
Fortress Investment Group LLC, Class A | | † | | 275,600 | | | 3,395,392 |
GHL Acquisition Corp. | | * | | 65,700 | | | 652,401 |
Greenhill & Co., Inc. | | † | | 39,600 | | | 2,132,856 |
Heckmann Corp. | | * | | 337,400 | | | 3,023,104 |
Invesco Ltd. | | | | 166,300 | | | 3,987,874 |
Liberty Acquisition Holdings Corp. | | * | | 70,600 | | | 741,300 |
SEI Investments Co. | | | | 160,000 | | | 3,763,200 |
UBS AG (Switzerland) | | * | | 253,050 | | | 5,228,013 |
| | | | | | | |
| | | | | | | 22,924,140 |
| | | | | | | |
Chemicals—1.1% | | | | | | | |
Ecolab, Inc. | | | | 94,900 | | | 4,079,751 |
Intrepid Potash, Inc. | | * | | 25,200 | | | 1,657,656 |
Nalco Holding Co. | | | | 258,700 | | | 5,471,505 |
| | | | | | | |
| | | | | | | 11,208,912 |
| | | | | | | |
Commercial Banks—0.2% | | | | | | | |
National City Corp. | | *‡^ | | 161,400 | | | 769,878 |
Signature Bank | | * | | 47,500 | | | 1,223,600 |
| | | | | | | |
| | | | | | | 1,993,478 |
| | | | | | | |
Commercial Services & Supplies—4.7% | | | | | | | |
Administaff, Inc. | | † | | 113,719 | | | 3,171,623 |
Advisory Board Co. (The) | | *† | | 73,200 | | | 2,878,956 |
Copart, Inc. | | *† | | 113,600 | | | 4,864,352 |
Corporate Executive Board Co. | | † | | 241,000 | | | 10,134,050 |
Dun & Bradstreet Corp. | | | | 57,000 | | | 4,995,480 |
Huron Consulting Group, Inc. | | *† | | 55,500 | | | 2,516,370 |
Korn-Ferry International | | *† | | 308,700 | | | 4,855,851 |
Mobile Mini, Inc. | | *† | | 173,600 | | | 3,472,000 |
Resources Connection, Inc. | | † | | 153,300 | | | 3,119,655 |
School Specialty, Inc. | | * | | 48,609 | | | 1,445,146 |
Waste Connections, Inc. | | *† | | 140,050 | | | 4,471,796 |
| | | | | | | |
| | | | | | | 45,925,279 |
| | | | | | | |
Communications Equipment—0.3% | | | | | | | |
Blue Coat Systems, Inc. | | *† | | 172,700 | | | 2,436,797 |
Finisar Corp. | | *† | | 494,100 | | | 587,979 |
| | | | | | | |
| | | | | | | 3,024,776 |
| | | | | | | |
Computers & Peripherals—3.3% | | | | | | | |
Dell, Inc. | | * | | 781,000 | | | 17,088,280 |
Lenovo Group Ltd. | | | | 9,401,100 | | | 6,395,581 |
Palm, Inc. | | † | | 244,700 | | | 1,318,933 |
Sun Microsystems, Inc. | | * | | 724,000 | | | 7,877,120 |
| | | | | | | |
| | | | | | | 32,679,914 |
| | | | | | | |
Construction & Engineering—0.7% | | | | | | | |
Quanta Services, Inc. | | * | | 207,400 | | | 6,900,198 |
| | | | | | | |
Construction Materials—1.4% | | | | | | | |
Cemex SAB de CV ADR (Mexico) | | *† | | 446,257 | | | 11,022,548 |
Martin Marietta Materials, Inc. | | † | | 21,300 | | | 2,206,467 |
| | | | | | | |
| | | | | | | 13,229,015 |
| | | | | | | |
Consumer Finance—0.5% | | | | | | | |
SLM Corp. | | * | | 226,100 | | | 4,375,035 |
| | | | | | | |
Containers & Packaging—0.3% | | | | | | | |
Pactiv Corp. | | * | | 137,900 | | | 2,927,617 |
| | | | | | | |
Distributors—0.2% | | | | | | | |
LKQ Corp. | | * | | 126,700 | | | 2,289,469 |
| | | | | | | |
Diversified Consumer Services—1.4% | | | | | | | |
Apollo Group, Inc., Class A | | * | | 42,600 | | | 1,885,476 |
Career Education Corp. | | *† | | 357,700 | | | 5,225,997 |
Strayer Education, Inc. | | | | 19,000 | | | 3,972,330 |
Universal Technical Institute, Inc. | | *† | | 233,700 | | | 2,911,902 |
| | | | | | | |
| | | | | | | 13,995,705 |
| | | | | | | |
Diversified Telecommunication Services—0.8% | | | | | | | |
Level 3 Communications, Inc. | | *† | | 2,610,000 | | | 7,699,500 |
| | | | | | | |
Electrical Equipment—1.7% | | | | | | | |
Ametek, Inc. | | | | 66,550 | | | 3,142,491 |
Energy Conversion Devices, Inc. | | * | | 26,300 | | | 1,936,732 |
Evergreen Solar, Inc. | | *† | | 259,900 | | | 2,518,431 |
Roper Industries, Inc. | | | | 139,000 | | | 9,157,320 |
| | | | | | | |
| | | | | | | 16,754,974 |
| | | | | | | |
Electronic Equipment & Instruments—0.7% | | | | | | | |
Jabil Circuit, Inc. | | | | 403,000 | | | 6,613,230 |
| | | | | | | |
Energy Equipment & Services—2.2% | | | | | | | |
BJ Services Co. | | | | 100,900 | | | 3,222,746 |
| | | | |
| 156 | | See accompanying notes to financial statements. | | |
SCHEDULE OF INVESTMENTS — (Continued)
June 30, 2008 (Unaudited)
Vantagepoint Aggressive Opportunities Fund
| | | | | | | |
| | | | | Shares | | Value |
COMMON STOCKS—(Continued) | | | | | | | |
Cameron International Corp. | | * | | 77,100 | | $ | 4,267,485 |
FMC Technologies, Inc. | | * | | 135,100 | | | 10,393,243 |
W-H Energy Services, Inc. | | * | | 41,800 | | | 4,001,932 |
| | | | | | | |
| | | | | | | 21,885,406 |
| | | | | | | |
Food & Staples Retailing—0.1% | | | | | | | |
Pantry, Inc. (The) | | *† | | 84,000 | | | 895,440 |
| | | | | | | |
Food Products—0.7% | | | | | | | |
Marine Harvest (Norway) | | * | | 7,589,500 | | | 5,559,051 |
Smithfield Foods, Inc. | | *† | | 72,100 | | | 1,433,348 |
| | | | | | | |
| | | | | | | 6,992,399 |
| | | | | | | |
Health Care Equipment & Supplies—4.9% | | | | | | | |
Advanced Medical Optics, Inc. | | * | | 237,600 | | | 4,452,624 |
Arthrocare Corp. | | *† | | 45,000 | | | 1,836,450 |
Conceptus, Inc. | | *† | | 129,900 | | | 2,401,851 |
Edwards Lifesciences Corp. | | * | | 81,300 | | | 5,043,852 |
Hologic, Inc. | | * | | 95,000 | | | 2,071,000 |
Hospira, Inc. | | * | | 107,200 | | | 4,299,792 |
Immucor, Inc. | | *† | | 130,587 | | | 3,379,592 |
Mindray Medical International Ltd. ADR (China) | | † | | 72,900 | | | 2,720,628 |
Resmed, Inc. | | *† | | 249,700 | | | 8,924,278 |
St Jude Medical, Inc. | | * | | 69,800 | | | 2,853,424 |
Stereotaxis, Inc. | | *† | | 95,500 | | | 511,880 |
TomoTherapy, Inc. | | *† | | 98,200 | | | 876,926 |
Varian Medical Systems, Inc. | | * | | 75,600 | | | 3,919,860 |
Zimmer Holdings, Inc. | | * | | 73,900 | | | 5,028,895 |
| | | | | | | |
| | | | | | | 48,321,052 |
| | | | | | | |
Health Care Providers & Services—4.5% | | | | | | | |
Amerigroup Corp. | | * | | 157,900 | | | 3,284,320 |
Centene Corp. | | *† | | 114,600 | | | 1,924,134 |
Coventry Health Care, Inc. | | * | | 166,350 | | | 5,060,367 |
DaVita, Inc. | | * | | 294,100 | | | 15,625,533 |
Express Scripts, Inc. | | * | | 34,500 | | | 2,163,840 |
Healthways, Inc. | | *† | | 90,000 | | | 2,664,000 |
Henry Schein, Inc. | | *† | | 98,100 | | | 5,059,017 |
Laboratory Corp of America Holdings | | *† | | 44,400 | | | 3,091,572 |
Nighthawk Radiology Holdings, Inc. | | *† | | 82,900 | | | 586,932 |
WellPoint, Inc. | | * | | 92,300 | | | 4,399,018 |
| | | | | | | |
| | | | | | | 43,858,733 |
| | | | | | | |
Hotels, Restaurants & Leisure—1.1% | | | | | | | |
P.F. Chang’s China Bistro, Inc. | | *† | | 124,100 | | | 2,772,394 |
Panera Bread Co., Class A | | *† | | 92,100 | | | 4,260,546 |
WMS Industries, Inc. | | *† | | 109,400 | | | 3,256,838 |
| | | | | | | |
| | | | | | | 10,289,778 |
| | | | | | | |
Household Durables—0.8% | | | | | | | |
Lennar Corp., Class A | | † | | 390,600 | | | 4,820,004 |
Pulte Homes, Inc. | | | | 141,100 | | | 1,358,793 |
Standard Pacific Corp. | | † | | 539,500 | | | 1,823,510 |
| | | | | | | |
| | | | | | | 8,002,307 |
| | | | | | | |
Household Products—0.3% | | | | | | | |
Energizer Holdings, Inc. | | * | | 46,400 | | | 3,391,376 |
| | | | | | | |
Independent Power Producers & Energy Traders—0.3% | | | | | | | |
Calpine Corp. | | * | | 135,600 | | | 3,059,136 |
| | | | | | | |
Insurance—6.7% | | | | | | | |
AMBAC Financial Group, Inc. | | † | | 685,600 | | | 918,704 |
AON Corp. | | | | 276,000 | | | 12,679,440 |
Assured Guaranty Ltd. (Bermuda) | | † | | 217,800 | | | 3,918,222 |
Fairfax Financial Holdings Ltd. (Canada) | | | | 47,000 | | | 11,933,300 |
Markel Corp. | | * | | 4,100 | | | 1,504,700 |
Montpelier Re Holdings Ltd. (Bermuda) | | † | | 276,500 | | | 4,078,375 |
Nipponkoa Insurance Co. Ltd. (Japan) | | | | 1,260,000 | | | 10,942,965 |
RenaissanceRe Holdings Ltd. (Bermuda) | | | | 95,900 | | | 4,283,853 |
Tokio Marine Holdings, Inc. (Japan) | | | | 272,000 | | | 10,601,229 |
XL Capital Ltd., Class A (Bermuda) | | | | 231,400 | | | 4,757,584 |
| | | | | | | |
| | | | | | | 65,618,372 |
| | | | | | | |
Internet & Catalog Retail—2.2% | | | | | | | |
Amazon.com, Inc. | | * | | 72,435 | | | 5,311,659 |
Blue Nile, Inc. | | *† | | 23,700 | | | 1,007,724 |
Expedia, Inc. | | * | | 302,932 | | | 5,567,890 |
Liberty Media Corp.—Interactive, Class A | | * | | 671,275 | | | 9,908,019 |
| | | | | | | |
| | | | | | | 21,795,292 |
| | | | | | | |
Internet Software & Services—2.2% | | | | | | | |
Ariba, Inc. | | *† | | 115,900 | | | 1,704,889 |
Digital River, Inc. | | *† | | 48,800 | | | 1,882,704 |
eBay, Inc. | | * | | 364,000 | | | 9,948,120 |
LivePerson, Inc. | | *† | | 219,600 | | | 617,076 |
SkillSoft plc ADR (Ireland) | | *† | | 230,900 | | | 2,087,336 |
VeriSign, Inc. | | *† | | 144,100 | | | 5,446,980 |
| | | | | | | |
| | | | | | | 21,687,105 |
| | | | | | | |
IT Services—5.3% | | | | | | | |
Accenture Ltd., Class A (Bermuda) | | | | 158,500 | | | 6,454,120 |
Alliance Data Systems Corp. | | *† | | 89,300 | | | 5,049,915 |
DST Systems, Inc. | | *† | | 150,710 | | | 8,296,585 |
Global Cash Access Holdings, Inc. | | *† | | 64,500 | | | 442,470 |
Global Payments, Inc. | | | | 279,800 | | | 13,038,680 |
Heartland Payment Systems, Inc. | | | | 201,900 | | | 4,764,840 |
NeuStar, Inc., Class A | | *† | | 300,100 | | | 6,470,156 |
RightNow Technologies, Inc. | | *† | | 296,300 | | | 4,050,421 |
Total System Services, Inc. | | | | 132,500 | | | 2,944,150 |
| | | | | | | |
| | | | | | | 51,511,337 |
| | | | | | | |
Leisure Equipment & Products—0.3% | | | | | | | |
Pool Corp. | | † | | 141,300 | | | 2,509,488 |
| | | | | | | |
Life Sciences Tools & Services—0.9% | | | | | | | |
Affymetrix, Inc. | | *† | | 274,000 | | | 2,819,460 |
Exelixis, Inc. | | *† | | 228,900 | | | 1,144,500 |
Illumina, Inc. | | * | | 56,300 | | | 4,904,293 |
| | | | | | | |
| | | | | | | 8,868,253 |
| | | | | | | |
Machinery—2.7% | | | | | | | |
Actuant Corp., Class A | | † | | 288,100 | | | 9,031,935 |
Bucyrus International, Inc., Class A | | | | 37,600 | | | 2,745,552 |
Colfax Corp. | | * | | 29,400 | | | 737,646 |
Harsco Corp. | | | | 71,700 | | | 3,901,197 |
Ingersoll-Rand Co. Ltd., Class A (Bermuda) | | | | 70,700 | | | 2,646,301 |
ITT Corp. | | | | 45,200 | | | 2,862,516 |
| | | | |
| | See accompanying notes to financial statements. | | 157 |
SCHEDULE OF INVESTMENTS — (Continued)
June 30, 2008 (Unaudited)
Vantagepoint Aggressive Opportunities Fund
| | | | | | | |
| | | | | Shares | | Value |
COMMON STOCKS—(Continued) | | | | | | | |
Joy Global, Inc. | | | | 32,300 | | $ | 2,449,309 |
Oshkosh Corp. | | † | | 76,600 | | | 1,584,854 |
| | | | | | | |
| | | | | | | 25,959,310 |
| | | | | | | |
Media—7.1% | | | | | | | |
Central European Media Enterprises Ltd., Class A (Bermuda) | | *† | | 24,900 | | | 2,254,197 |
DIRECTV Group, Inc. (The) | | * | | 389,000 | | | 10,078,990 |
Discovery Holding Co., Class A | | * | | 308,000 | | | 6,763,680 |
Focus Media Holding Ltd. ADR (China) | | *† | | 81,300 | | | 2,253,636 |
Lamar Advertising Co., Class A | | *† | | 137,500 | | | 4,954,125 |
Liberty Media Corp.—Entertainment, Series A | | * | | 736,820 | | | 17,853,149 |
National CineMedia, Inc. | | † | | 200,800 | | | 2,140,528 |
Virgin Media, Inc. | | † | | 306,600 | | | 4,172,826 |
Walt Disney Co. (The) | | | | 615,000 | | | 19,188,000 |
| | | | | | | |
| | | | | | | 69,659,131 |
| | | | | | | |
Metals & Mining—0.1% | | | | | | | |
Cleveland-Cliffs, Inc. | | | | 11,400 | | | 1,358,766 |
| | | | | | | |
Multiline Retail—0.4% | | | | | | | |
Sears Holdings Corp. | | *† | | 58,700 | | | 4,323,842 |
| | | | | | | |
Oil, Gas & Consumable Fuels—5.4% | | | | | | | |
Bill Barrett Corp. | | * | | 55,200 | | | 3,279,432 |
Chesapeake Energy Corp. | | | | 268,000 | | | 17,677,280 |
Denbury Resources, Inc. | | * | | 214,600 | | | 7,832,900 |
Encore Acquisition Co. | | * | | 71,899 | | | 5,406,086 |
Forest Oil Corp. | | * | | 87,600 | | | 6,526,200 |
Range Resources Corp. | | | | 91,800 | | | 6,016,572 |
Ultra Petroleum Corp. | | * | | 57,800 | | | 5,675,960 |
| | | | | | | |
| | | �� | | | | 52,414,430 |
| | | | | | | |
Personal Products—0.5% | | | | | | | |
Herbalife Ltd. (Cayman Islands) | | † | | 113,400 | | | 4,394,250 |
| | | | | | | |
Pharmaceuticals—1.4% | | | | | | | |
Far East Pharmaceutical Tech (Hong Kong) | | *‡d | | 615,260 | | | — |
Medicis Pharmaceutical Corp., Class A | | † | | 182,600 | | | 3,794,428 |
Shire Ltd. ADR (United Kingdom) | | † | | 163,600 | | | 8,037,668 |
XenoPort, Inc. | | * | | 46,400 | | | 1,810,992 |
| | | | | | | |
| | | | | | | 13,643,088 |
| | | | | | | |
Real Estate Investment Trusts (REIT)—1.5% | | | | | | | |
CapitalSource, Inc. REIT | | † | | 293,900 | | | 3,256,412 |
Chimera Investment Corp. REIT | | † | | 419,300 | | | 3,777,893 |
Hatteras Financial Corp. REIT | | | | 317,700 | | | 7,303,923 |
| | | | | | | |
| | | | | | | 14,338,228 |
| | | | | | | |
Real Estate Management & Development—0.5% | | | | | | | |
Jones Lang LaSalle, Inc. | | | | 38,300 | | | 2,305,277 |
St. Joe Co. (The) | | † | | 63,400 | | | 2,175,888 |
| | | | | | | |
| | | | | | | 4,481,165 |
| | | | | | | |
Semiconductors & Semiconductor Equipment—4.9% | | | | | | | |
Analog Devices, Inc. | | | | 268,000 | | | 8,514,360 |
ASML Holding NV (NY Reg Shs), Class G (Netherlands) | | † | | 70,600 | | | 1,722,640 |
Broadcom Corp., Class A | | * | | 125,400 | | | 3,422,166 |
Cymer, Inc. | | *† | | 26,199 | | | 704,229 |
FEI Co. | | *† | | 155,200 | | | 3,535,456 |
Integrated Device Technology, Inc. | | * | | 487,200 | | | 4,842,768 |
Intersil Corp., Class A | | † | | 109,500 | | | 2,663,040 |
Maxim Integrated Products, Inc. | | | | 155,600 | | | 3,290,940 |
Microchip Technology, Inc. | | † | | 99,800 | | | 3,047,892 |
National Semiconductor Corp. | | | | 285,500 | | | 5,864,170 |
Nvidia Corp. | | * | | 146,400 | | | 2,740,608 |
PMC—Sierra, Inc. | | *† | | 381,900 | | | 2,921,535 |
Semtech Corp. | | *† | | 156,100 | | | 2,196,327 |
Silicon Laboratories, Inc. | | * | | 65,200 | | | 2,353,068 |
| | | | | | | |
| | | | | | | 47,819,199 |
| | | | | | | |
Software—5.6% | | | | | | | |
Amdocs Ltd. | | *† | | 470,800 | | | 13,850,936 |
Blackboard, Inc. | | *† | | 48,900 | | | 1,869,447 |
Bottomline Technologies, Inc. | | *† | | 82,900 | | | 806,617 |
CA, Inc. | | | | 195,200 | | | 4,507,168 |
Electronic Arts, Inc. | | * | | 157,000 | | | 6,975,510 |
Factset Research Systems, Inc. | | † | | 108,900 | | | 6,137,604 |
Jack Henry & Associates, Inc. | | † | | 177,900 | | | 3,849,756 |
Red Hat, Inc. | | * | | 455,800 | | | 9,430,502 |
Symyx Technologies | | *† | | 94,000 | | | 656,120 |
Taleo Corp., Class A | | * | | 150,000 | | | 2,938,500 |
Verint Systems, Inc. | | * | | 40,100 | | | 941,548 |
Wind River Systems, Inc. | | *† | | 277,000 | | | 3,016,530 |
| | | | | | | |
| | | | | | | 54,980,238 |
| | | | | | | |
Specialty Retail—2.3% | | | | | | | |
A.C. Moore Arts & Crafts, Inc. | | *† | | 100,500 | | | 708,525 |
AnnTaylor Stores Corp. | | *† | | 203,200 | | | 4,868,672 |
Christopher & Banks Corp. | | † | | 151,200 | | | 1,028,160 |
Collective Brands, Inc. | | *† | | 391,600 | | | 4,554,308 |
O’Reilly Automotive, Inc. | | *† | | 198,800 | | | 4,443,180 |
Tiffany & Co. | | | | 101,900 | | | 4,152,425 |
Zumiez, Inc. | | * | | 156,400 | | | 2,593,112 |
| | | | | | | |
| | | | | | | 22,348,382 |
| | | | | | | |
Textiles, Apparel & Luxury Goods—0.1% | | | | | | | |
Iconix Brand Group, Inc. | | *† | | 79,100 | | | 955,528 |
| | | | | | | |
Thrifts & Mortgage Finance—0.5% | | | | | | | |
Downey Financial Corp. | | † | | 283,300 | | | 784,741 |
Freddie Mac | | | | 257,900 | | | 4,229,560 |
| | | | | | | |
| | | | | | | 5,014,301 |
| | | | | | | |
Trading Companies & Distributors—0.8% | | | | | | | |
Fastenal Co. | | † | | 94,400 | | | 4,074,304 |
Interline Brands, Inc. | | *† | | 234,100 | | | 3,729,213 |
| | | | | | | |
| | | | | | | 7,803,517 |
| | | | | | | |
Wireless Telecommunication Services—3.8% | | | | | | | |
American Tower Corp., Class A | | * | | 243,900 | | | 10,304,775 |
NII Holdings, Inc., Class B | | *† | | 256,345 | | | 12,173,824 |
SBA Communications Corp., Class A | | * | | 298,100 | | | 10,734,581 |
Sprint Nextel Corp. | | | | 373,100 | | | 3,544,450 |
| | | | | | | |
| | | | | | | 36,757,630 |
| | | | | | | |
TOTAL COMMON STOCKS
(Cost $978,482,169) | | | | | | | 943,846,406 |
| | | | | | | |
| | | | |
| 158 | | See accompanying notes to financial statements. | | |
SCHEDULE OF INVESTMENTS — (Continued)
June 30, 2008 (Unaudited)
Vantagepoint Aggressive Opportunities Fund
| | | | | | | |
| | | | | Shares | | Value |
CONVERTIBLE PREFERRED STOCKS—0.6% | | | | | | | |
Commercial Banks—0.5% | | | | | | | |
National City Corp. | | *‡ | | 1,080,000 | | $ | 4,894,020 |
| | | | | | | |
Thrifts & Mortgage Finance—0.1% | | | | | | | |
Thornburg Mortgage, Inc., Perpetual Bond, Series F | | | | 212,400 | | | 870,840 |
| | | | | | | |
TOTAL CONVERTIBLE PREFERRED STOCKS
(Cost $10,534,755) | | | | | | | 5,764,860 |
| | | | | | | |
| | | | | | | | | |
Coupon Rate | | Maturity Date | | Face | | Value |
CORPORATE OBLIGATIONS—0.3% | | | | | | | | | |
Capital Markets—0.3% | | | | | | | | | |
Downey Financial Corp. | | | | | | | | | |
6.500% | | 07/01/2014 | | † | | | | | |
(Cost $3,151,068) | | | | | | $ | 4,409,000 | | 3,327,137 |
| | | | | | | | | |
| | | | | | | | |
| | | | | Shares | | Value | |
CASH EQUIVALENTS—26.3% | | | | | | | | |
Institutional Money Market Funds—26.3% | | | | | | | | |
AIM Short-Term Investments Trust Liquid Assets Portfolio | | †† | | 90,160,602 | | | 90,160,602 | |
AIM Short-Term Investments Trust Prime Assets Portfolio | | †† | | 139,673,561 | | | 139,673,561 | |
JPMorgan Prime Money Market Fund, Capital Shares | | | | 19,154,417 | | | 19,154,417 | |
JPMorgan U.S. Government Money Market Fund, Capital Shares | | | | 7,739,294 | | | 7,739,294 | |
| | | | | | | | |
TOTAL CASH EQUIVALENTS
(Cost $256,727,874) | | | | | | | 256,727,874 | |
| | | | | | | | |
TOTAL INVESTMENTS—123.7%
(Cost $1,248,895,866) | | | | | | | 1,209,666,277 | |
Other assets less liabilities—(23.7%) | | | | | | | (231,713,774 | ) |
| | | | | | | | |
NET ASSETS—100.0% | | | | | | $ | 977,952,503 | |
| | | | | | | | |
Notes to the Schedule of Investments:
| | |
ADR | | American Depositary Receipt |
| REIT | | Real Estate Investment Trust |
| † | | Denotes all or a portion of security on loan. |
| * | | Non-income producing. |
| ‡ | | Security valued at fair value as determined by policies approved by the board of directors. |
| ^ | | Securities exempt from registration under Rule 144A of the Securities Act of 1933. These securities may be resold in transactions exempt from registration, normally to qualified buyers. 144A securities represent 0.1% of Total Investments. |
| d | | Security has no market value at 06/30/2008. |
| †† | | Represents reinvestment of collateral received in conjunction with securities lending. |
| | | | |
| | See accompanying notes to financial statements. | | 159 |
SCHEDULE OF INVESTMENTS
June 30, 2008 (Unaudited)
Vantagepoint Discovery Fund
| | | | | | | |
| | | | | Shares | | Value |
COMMON STOCKS—47.1% | | | | | | | |
Aerospace & Defense—0.3% | | | | | | | |
Allen-Vanguard Corp. (Canada) | | * | | 222,700 | | $ | 556,914 |
| | | | | | | |
Biotechnology—3.3% | | | | | | | |
Arena Pharmaceuticals, Inc. | | *† | | 135,300 | | | 702,207 |
Ariad Pharmaceuticals, Inc. | | *† | | 270,300 | | | 648,720 |
CV Therapeutics, Inc. | | * | | 125,500 | | | 1,032,865 |
Human Genome Sciences, Inc. | | *† | | 168,300 | | | 876,843 |
Incyte Corp. Ltd. | | *† | | 109,500 | | | 833,295 |
Rigel Pharmaceuticals, Inc. | | *† | | 51,900 | | | 1,176,055 |
| | | | | | | |
| | | | | | | 5,269,985 |
| | | | | | | |
Building Products—0.3% | | | | | | | |
NCI Building Systems, Inc. | | *† | | 11,200 | | | 411,376 |
| | | | | | | |
Capital Markets—1.7% | | | | | | | |
Canaccord Capital, Inc. (Canada) | | | | 50,900 | | | 396,837 |
Evercore Partners, Inc., Class A | | † | | 46,626 | | | 442,947 |
Gluskin Sheff + Associates, Inc. (Canada) | | | | 34,700 | | | 666,981 |
GMP Capital Trust (Canada) | | | | 37,300 | | | 581,897 |
Highbury Financial, Inc. | | *† | | 14,800 | | | 37,000 |
Uranium Participation Corp. (Canada) | | * | | 63,600 | | | 608,120 |
| | | | | | | |
| | | | | | | 2,733,782 |
| | | | | | | |
Chemicals—0.4% | | | | | | | |
OM Group, Inc. | | *† | | 18,500 | | | 606,615 |
| | | | | | | |
Commercial Services & Supplies—1.0% | | | | | | | |
CRA International, Inc. | | *† | | 24,400 | | | 882,060 |
GeoEye, Inc. | | *† | | 39,000 | | | 690,690 |
| | | | | | | |
| | | | | | | 1,572,750 |
| | | | | | | |
Communications Equipment—2.2% | | | | | | | |
Harris Stratex Networks, Inc., Class A | | * | | 94,465 | | | 896,473 |
NETGEAR, Inc. | | * | | 45,000 | | | 623,700 |
Parkervision, Inc. | | *† | | 72,713 | | | 722,040 |
SeaChange International, Inc. | | *† | | 77,400 | | | 554,184 |
Sierra Wireless, Inc. (Canada) | | *† | | 58,000 | | | 846,800 |
| | | | | | | |
| | | | | | | 3,643,197 |
| | | | | | | |
Computers & Peripherals—2.0% | | | | | | | |
Hutchinson Technology, Inc. | | *† | | 38,500 | | | 517,440 |
Imation Corp. | | † | | 39,400 | | | 903,048 |
Novatel Wireless, Inc. | | *† | | 95,400 | | | 1,061,802 |
Palm, Inc. | | † | | 147,000 | | | 792,330 |
| | | | | | | |
| �� | | | | | | 3,274,620 |
| | | | | | | |
Construction & Engineering—0.6% | | | | | | | |
Orion Marine Group, Inc. | | *†^ | | 67,000 | | | 946,710 |
| | | | | | | |
Consumer Finance—0.9% | | | | | | | |
Dollar Financial Corp. | | *† | | 50,700 | | | 766,077 |
World Acceptance Corp. | | *† | | 19,800 | | | 666,666 |
| | | | | | | |
| | | | | | | 1,432,743 |
| | | | | | | |
Diversified Consumer Services—0.5% | | | | | | | |
Regis Corp. | | | | 28,500 | | | 750,975 |
| | | | | | | |
Diversified Telecommunication Services—1.0% | | | | | | | |
Fairpoint Communications, Inc. | | † | | 114,709 | | | 827,052 |
Globalstar, Inc. | | *† | | 277,500 | | | 785,325 |
| | | | | | | |
| | | | | | | 1,612,377 |
| | | | | | | |
Electronic Equipment & Instruments—1.7% | | | | | | | |
OSI Systems, Inc. | | *† | | 31,500 | | | 674,730 |
Park Electrochemical Corp. | | † | | 34,000 | | | 826,540 |
TTM Technologies, Inc. | | * | | 63,600 | | | 840,156 |
Zygo Corp. | | *† | | 46,100 | | | 453,163 |
| | | | | | | |
| | | | | | | 2,794,589 |
| | | | | | | |
Energy Equipment & Services—1.9% | | | | | | | |
Basic Energy Services, Inc. | | *† | | 24,100 | | | 759,150 |
Complete Production Services, Inc. | | *† | | 19,700 | | | 717,474 |
Hercules Offshore, Inc. | | * | | 21,600 | | | 821,232 |
Superior Well Services, Inc. | | *† | | 23,100 | | | 732,501 |
| | | | | | | |
| | | | | | | 3,030,357 |
| | | | | | | |
Entertainment—0.3% | | | | | | | |
Thunderbird Resorts, Inc. | | *‡^ | | 59,200 | | | 455,840 |
| | | | | | | |
Food Products—0.8% | | | | | | | |
Cosan SA Industria e Comercio (Brazil) | | | | 27,800 | | | 479,490 |
Lance, Inc. | | † | | 41,600 | | | 780,832 |
| | | | | | | |
| | | | | | | 1,260,322 |
| | | | | | | |
Health Care Equipment & Supplies—0.5% | | | | | | | |
Micrus Endovascular Corp. | | *† | | 58,872 | | | 825,385 |
| | | | | | | |
Health Care Providers & Services—1.3% | | | | | | | |
Amsurg Corp. | | *† | | 31,900 | | | 776,765 |
Odyssey HealthCare, Inc. | | *† | | 66,200 | | | 644,788 |
Profarma Distribuidora de Produtos Farmaceuticos SA (Brazil) | | | | 48,300 | | | 753,228 |
| | | | | | | |
| | | | | | | 2,174,781 |
| | | | | | | |
Household Durables—0.2% | | | | | | | |
Tecnisa SA (Brazil) | | | | 53,500 | | | 266,649 |
| | | | | | | |
Independent Power Producers & Energy Traders—0.1% | | | | | | | |
PNOC Energy Development Corp. (Philippines) | | | | 1,736,000 | | | 200,591 |
| | | | | | | |
Insurance—0.5% | | | | | | | |
Platinum Underwriters Holdings Ltd. (Bermuda) | | | | 22,000 | | | 717,420 |
RAM Holdings Ltd. (Bermuda) | | *† | | 56,500 | | | 56,500 |
| | | | | | | |
| | | | | | | 773,920 |
| | | | | | | |
Internet & Catalog Retail—0.4% | | | | | | | |
Shutterfly, Inc. | | *† | | 58,000 | | | 708,180 |
| | | | | | | |
Internet Software & Services—0.5% | | | | | | | |
Knot, Inc. (The) | | *† | | 82,000 | | | 801,960 |
| | | | | | | |
Life Sciences Tools & Services—0.5% | | | | | | | |
Exelixis, Inc. | | *† | | 176,600 | | | 883,000 |
| | | | | | | |
Machinery—0.3% | | | | | | | |
Force Protection, Inc. | | *† | | 128,900 | | | 426,659 |
| | | | | | | |
Metals & Mining—4.3% | | | | | | | |
AMCOL International Corp. | | † | | 27,500 | | | 782,650 |
Carpenter Technology Corp. | | | | 18,400 | | | 803,160 |
Frontera Copper Corp. (Canada) | | * | | 178,000 | | | 523,683 |
Grupo Simec SAB de CV ADR (Mexico) | | *† | | 40,100 | | | 676,888 |
Horsehead Holding Corp. | | * | | 83,600 | | | 1,016,577 |
| | | | |
| 160 | | See accompanying notes to financial statements. | | |
SCHEDULE OF INVESTMENTS — (Continued)
June 30, 2008 (Unaudited)
Vantagepoint Discovery Fund
| | | | | | | |
| | | | | Shares | | Value |
COMMON STOCKS—(Continued) | | | | | | | |
Katanga Mining Ltd. (Canada) | | * | | 73,800 | | $ | 943,036 |
Schnitzer Steel Industries, Inc., Class A | | | | 5,700 | | | 653,220 |
Universal Stainless & Alloy Products, Inc. | | *† | | 21,000 | | | 777,840 |
Western Goldfields, Inc. (Canada) | | *† | | 379,700 | | | 888,498 |
| | | | | | | |
| | | | | | | 7,065,552 |
| | | | | | | |
Multiline Retail—0.2% | | | | | | | |
Retail Ventures, Inc. | | *† | | 87,785 | | | 403,811 |
| | | | | | | |
Oil, Gas & Consumable Fuels—7.4% | | | | | | | |
Arlington Tankers Ltd. | | † | | 41,685 | | | 967,926 |
ATP Oil & Gas Corp. | | *† | | 24,500 | | | 967,015 |
BPZ Resources, Inc. | | * | | 43,300 | | | 1,273,019 |
Cano Petroleum, Inc. | | * | | 61,500 | | | 488,310 |
Encore Acquisition Co. | | * | | 10,100 | | | 759,419 |
Energy Partners Ltd. | | * | | 75,000 | | | 1,119,000 |
Infinity Bio-Energy Ltd. (United Kingdom) | | *‡ | | 146,765 | | | 565,045 |
Mahalo Energy Ltd. (Canada) | | * | | 83,900 | | | 218,040 |
Nova Biosource Fuels, Inc. | | *† | | 401,150 | | | 268,771 |
Oilsands Quest, Inc. (Canada) | | *† | | 133,300 | | | 866,450 |
OPTI Canada, Inc. (Canada) | | * | | 35,400 | | | 801,942 |
Rentech, Inc. | | * | | 333,278 | | | 633,228 |
StealthGas, Inc. | | | | 54,800 | | | 773,228 |
Swift Energy Co. | | *† | | 13,500 | | | 891,810 |
Synenco Energy, Inc., Class A (Canada) | | * | | 130,700 | | | 1,152,293 |
Uranium One, Inc. (Canada) | | * | | 81,200 | | | 382,230 |
| | | | | | | |
| | | | | | | 12,127,726 |
| | | | | | | |
Pharmaceuticals—0.5% | | | | | | | |
Medicines Co. (The) | | *† | | 40,800 | | | 808,656 |
| | | | | | | |
Real Estate Investment Trusts (REIT)—2.6% | | | | | | | |
Anworth Mortgage Asset Corp. REIT | | | | 70,200 | | | 457,002 |
Capstead Mortgage Corp. REIT | | | | 61,100 | | | 662,935 |
Dundee Real Estate Investment Trust REIT (Canada) | | | | 14,500 | | | 443,944 |
Hatteras Financial Corp. REIT | | | | 21,500 | | | 494,285 |
Hersha Hospitality Trust REIT | | † | | 106,748 | | | 805,947 |
Investors Real Estate Trust REIT | | † | | 83,700 | | | 798,498 |
MFA Mortgage Investments, Inc. REIT | | | | 118,200 | | | 770,664 |
| | | | | | | |
| | | | | | | 4,433,275 |
| | | | | | | |
Real Estate Management & Development—1.1% | | | | | | | |
Agra Empreendimentos Imobiliarios SA (Brazil) | | * | | 49,100 | | | 271,672 |
Brasil Brokers Participacoes SA (Brazil) | | * | | 300 | | | 265,032 |
General Shopping Brasil SA (Brazil) | | * | | 37,500 | | | 283,045 |
Grubb & Ellis Co. | | † | | 170,000 | | | 654,500 |
Invest Tur Brasil—Desenvolvimento Imobiliario Turistico SA (Brazil) | | * | | 700 | | | 355,786 |
| | | | | | | |
| | | | | | | 1,830,035 |
| | | | | | | |
Semiconductors & Semiconductor Equipment—2.5% | | | | | | | |
Asyst Technologies, Inc. | | *† | | 170,000 | | | 606,900 |
DSP Group, Inc. | | * | | 102,200 | | | 715,400 |
Microsemi Corp. | | *† | | 19,300 | | | 485,974 |
MIPS Technologies, Inc., Class A | | *† | | 135,677 | | | 508,789 |
PMC—Sierra, Inc. | | * | | 105,700 | | | 808,605 |
Rudolph Technologies, Inc. | | *† | | 91,500 | | | 704,550 |
| | | | | | | |
| | | | | | | 3,830,218 |
| | | | | | | |
Software—0.5% | | | | | | | |
JDA Software Group, Inc. | | * | | 41,800 | | | 756,580 |
| | | | | | | |
Specialty Retail—1.8% | | | | | | | |
Casual Male Retail Group, Inc. | | *† | | 161,500 | | | 492,575 |
Cato Corp. (The), Class A | | † | | 40,900 | | | 582,416 |
Charming Shoppes, Inc. | | *† | | 128,100 | | | 587,979 |
DSW, Inc., Class A | | *† | | 63,400 | | | 746,851 |
Eddie Bauer Holdings, Inc. | | * | | 119,037 | | | 494,004 |
| | | | | | | |
| | | | | | | 2,903,825 |
| | | | | | | |
Textiles, Apparel & Luxury Goods—0.3% | | | | | | | |
Gildan Activewear, Inc., Class A (Canada) | | *† | | 18,500 | | | 478,780 |
| | | | | | | |
Thrifts & Mortgage Finance—0.1% | | | | | | | |
FirstFed Financial Corp. | | *† | | 17,100 | | | 137,484 |
| | | | | | | |
Trading Companies & Distributors—1.8% | | | | | | | |
H&E Equipment Services, Inc. | | *† | | 46,300 | | | 556,526 |
RSC Holdings, Inc. | | *† | | 71,000 | | | 657,460 |
TAL International Group, Inc. | | † | | 36,453 | | | 828,941 |
Textainer Group Holdings Ltd. (Bermuda) | | † | | 47,200 | | | 921,816 |
| | | | | | | |
| | | | | | | 2,964,743 |
| | | | | | | |
Water Utilities—0.2% | | | | | | | |
Companhia de Saneamento de Minas Gerais—Copasa MG (Brazil) | | | | 13,500 | | | 250,361 |
| | | | | | | |
Wireless Telecommunication Services—0.6% | | | | | | | |
Centennial Communications Corp. | | *† | | 148,300 | | | 1,036,617 |
| | | | | | | |
TOTAL COMMON STOCKS
(Cost $91,595,479) | | | | | | | 76,441,940 |
| | | | | | | |
| | | | | | | | | |
Coupon Rate | | Maturity Date | | Face | | Value |
CORPORATE OBLIGATIONS—7.8% | | | | | | | | | |
Biotechnology—0.4% | | | | | | | | | |
Amgen, Inc. | | | | | | | | | |
4.000% | | 11/18/2009 | | | | $ | 690,000 | | 690,977 |
| | | | | | | | | |
Capital Markets—0.9% | | | | | | | | | |
Citigroup, Inc. | | | | | | | | | |
4.125% | | 02/22/2010 | | | | | 430,000 | | 426,185 |
JPMorgan Chase & Co. | | | | | | | | | |
6.750% | | 02/01/2011 | | | | | 430,000 | | 446,568 |
World Savings Bank, FSB | | | | | | | | | |
4.500% | | 06/15/2009 | | | | | 430,000 | | 429,635 |
| | | | | | | | | |
| | | | | | | | | 1,302,388 |
| | | | | | | | | |
Commercial Banks—0.8% | | | | | | | | | |
Bank of America Corp. | | | | | | | | | |
4.375% | | 12/01/2010 | | † | | | 430,000 | | 428,778 |
| | | | |
| | See accompanying notes to financial statements. | | 161 |
SCHEDULE OF INVESTMENTS — (Continued)
June 30, 2008 (Unaudited)
Vantagepoint Discovery Fund
| | | | | | | | | | |
Coupon Rate | | Maturity Date | | Face | | Value |
CORPORATE OBLIGATIONS—(Continued) | | | | | | | | | | |
US Bancorp | | | | | | | | | | |
3.170% | | 05/06/2010 | | # | | $ | 400,000 | | $ | 399,548 |
Wells Fargo & Co. | | | | | | | | | | |
5.300% | | 08/26/2011 | | | | | 430,000 | | | 437,782 |
| | | | | | | | | | |
| | | | | | | | | | 1,266,108 |
| | | | | | | | | | |
Communications Equipment—0.3% | | | | | | | | | | |
Cisco Systems, Inc. | | | | | | | | | | |
5.250% | | 02/22/2011 | | | | | 400,000 | | | 412,088 |
| | | | | | | | | | |
Computers & Peripherals—0.3% | | | | | | | | | | |
International Business Machines Corp. | | | | | | | | | | |
4.950% | | 03/22/2011 | | | | | 400,000 | | | 409,953 |
| | | | | | | | | | |
Diversified Financial Services—1.4% | | | | | | | | | | |
General Electric Capital Corp. (MTN) | | | | | | | | | | |
4.250% | | 09/13/2010 | | | | | 1,100,000 | | | 1,109,878 |
Kreditanstalt fuer Wiederaufbau (Germany) | | | | | | | | | | |
3.750% | | 06/27/2011 | | | | | 400,000 | | | 403,224 |
National Rural Utilities Cooperative Finance Corp. | | | | | | | | | | |
5.750% | | 08/28/2009 | | | | | 450,000 | | | 459,081 |
Unilever Capital Corp. | | | | | | | | | | |
7.125% | | 11/01/2010 | | | | | 410,000 | | | 437,754 |
| | | | | | | | | | |
| | | | | | | | | | 2,409,937 |
| | | | | | | | | | |
Diversified Telecommunication Services—1.1% | | | | | | | | | | |
BellSouth Corp. | | | | | | | | | | |
4.200% | | 09/15/2009 | | | | | 950,000 | | | 952,213 |
Deutsche Telekom International Finance BV (Netherlands) | | | | | | | | | | |
5.375% | | 03/23/2011 | | | | | 400,000 | | | 402,619 |
Verizon Global Funding Corp. | | | | | | | | | | |
7.250% | | 12/01/2010 | | | | | 400,000 | | | 424,892 |
| | | | | | | | | | |
| | | | | | | | | | 1,779,724 |
| | | | | | | | | | |
Electric Utilities—0.5% | | | | | | | | | | |
Duke Energy Corp. | | | | | | | | | | |
6.250% | | 01/15/2012 | | | | | 400,000 | | | 417,830 |
Exelon Corp. | | | | | | | | | | |
6.750% | | 05/01/2011 | | | | | 260,000 | | | 267,276 |
Exelon Generation Co. LLC | | | | | | | | | | |
6.950% | | 06/15/2011 | | | | | 155,000 | | | 160,310 |
| | | | | | | | | | |
| | | | | | | | | | 845,416 |
| | | | | | | | | | |
Media—0.5% | | | | | | | | | | |
Comcast Corp. | | | | | | | | | | |
5.450% | | 11/15/2010 | | | | | 720,000 | | | 732,321 |
| | | | | | | | | | |
Pharmaceuticals—0.2% | | | | | | | | | | |
Abbott Laboratories | | | | | | | | | | |
5.375% | | 05/15/2009 | | | | | 300,000 | | | 305,588 |
| | | | | | | | | | |
Retail—0.9% | | | | | | | | | | |
CVS Caremark Corp. | | | | | | | | | | |
4.000% | | 09/15/2009 | | | | | 690,000 | | | 686,454 |
Wal-Mart Stores, Inc. | | | | | | | | | | |
6.875% | | 08/10/2009 | | | | | 750,000 | | | 777,778 |
| | | | | | | | | | |
| | | | | | | | | | 1,464,232 |
| | | | | | | | | | |
Software—0.2% | | | | | | | | | | |
Oracle Corp. | | | | | | | | | | |
5.000% | | 01/15/2011 | | | | | 510,000 | | | 520,238 |
| | | | | | | | | | |
Wireless Telecommunication Services—0.3% | | | | | | | | | | |
Vodafone Group plc (United Kingdom) | | | | | | | | | | |
7.750% | | 02/15/2010 | | | | | 500,000 | | | 522,682 |
| | | | | | | | | | |
TOTAL CORPORATE OBLIGATIONS
(Cost $12,666,593) | | | | | | | | | | 12,661,652 |
| | | | | | | | | | |
U.S. GOVERNMENT AGENCY OBLIGATIONS—21.7% | | | | | | | | | | |
U.S. Government Agencies-Mortgage Backed—21.7% | | | | | | | | | | |
Fannie Mae | | | | | | | | | | |
5.773% | | 11/01/2035 | | # | | | 626,434 | | | 642,746 |
4.875% | | 10/15/2009 | | | | | 2,000,000 | | | 2,013,220 |
4.375% | | 09/13/2010 | | | | | 7,000,000 | | | 7,162,239 |
3.500% | | 04/28/2011 | | | | | 2,500,000 | | | 2,494,705 |
3.250% | | 02/10/2010 | | † | | | 1,490,000 | | | 1,495,714 |
3.000% | | 04/28/2010 | | | | | 4,000,000 | | | 3,990,787 |
Fannie Mae REMICS, | | | | | | | | | | |
Series 2004-45, Class NV | | | | | | | | | | |
4.125% | | 12/25/2025 | | | | | 1,651,855 | | | 1,653,170 |
Federal Home Loan Bank | | | | | | | | | | |
5.000% | | 09/18/2009 | | † | | | 1,460,000 | | | 1,496,426 |
2.200% | | 04/01/2009 | | | | | 760,000 | | | 757,152 |
Federal Home Loan Mortgage Corp. | | | | | | | | | | |
5.000% | | 06/15/2024 | | | | | 836,054 | | | 843,995 |
3.000% | | 04/01/2011 | | | | | 1,800,000 | | | 1,777,144 |
2.875% | | 06/28/2010 | | | | �� | 1,010,000 | | | 1,004,025 |
Freddie Mac | | | | | | | | | | |
5.750% | | 03/15/2009 | | | | | 1,500,000 | | | 1,530,687 |
4.750% | | 11/03/2009 | | † | | | 7,000,000 | | | 7,167,089 |
Government National Mortgage Association, | | | | | | | | | | |
Series 2005-58, Class NJ | | | | | | | | | | |
4.500% | | 08/20/2035 | | | | | 1,241,829 | | | 1,248,092 |
| | | | | | | | | | |
TOTAL U.S. GOVERNMENT AGENCY OBLIGATIONS
(Cost $35,011,872) | | | | | | | | | | 35,277,191 |
| | | | | | | | | | |
U.S. TREASURY OBLIGATIONS—15.2% | | | | | | | | | | |
U.S. Treasury Note—15.2% | | | | | | | | | | |
U.S. Treasury Note | | | | | | | | | | |
4.625% | | 07/31/2009 | | | | | 3,110,000 | | | 3,184,351 |
4.500% | | 11/15/2010 | | † | | | 2,100,000 | | | 2,186,791 |
4.500% | | 02/28/2011 | | † | | | 1,500,000 | | | 1,564,220 |
4.500% | | 05/15/2010 | | †‡‡ | | | 12,047,000 | | | 12,475,234 |
3.875% | | 09/15/2010 | | † | | | 5,103,000 | | | 5,236,959 |
| | | | | | | | | | |
TOTAL U.S. TREASURY OBLIGATIONS
(Cost $24,205,959) | | | | | | | | | | 24,647,555 |
| | | | | | | | | | |
MUNICIPAL OBLIGATIONS—1.6% | | | | | | | | | | |
Municipal—1.6% | | | | | | | | | | |
City of New York, NY, General Obligation, Class A | | | | | | | | | | |
6.500% | | 05/15/2011 | | | | | 1,600,000 | | | 1,730,304 |
State of North Carolina, General Obligation | | | | | | | | | | |
5.000% | | 03/01/2010 | | | | | 900,000 | | | 934,713 |
| | | | | | | | | | |
TOTAL MUNICIPAL OBLIGATIONS
(Cost $2,650,864) | | | | | | | | | | 2,665,017 |
| | | | | | | | | | |
| | | | |
| 162 | | See accompanying notes to financial statements. | | |
SCHEDULE OF INVESTMENTS — (Continued)
June 30, 2008 (Unaudited)
Vantagepoint Discovery Fund
| | | | | | | | | | | |
Coupon Rate | | Maturity Date | | Face | | Value | |
SOVEREIGN DEBT OBLIGATIONS—0.5% | | | | | | | | | | | |
Government Issued—0.5% | | | | | | | | | | | |
Export Development Canada | | | | | | | | | | | |
3.750% | | 07/15/2011 | | | | $ | 475,000 | | $ | 478,180 | |
Province of Ontario, Canada | | | | | | | | | | | |
2.750% | | 02/22/2011 | | | | | 400,000 | | | 391,562 | |
| | | | | | | | | | | |
| | | | | | | | | | 869,742 | |
| | | | | | | | | | | |
TOTAL SOVEREIGN DEBT OBLIGATIONS
(Cost $873,055) | | | | | | | | | | 869,742 | |
| | | | | | | | | | | |
NON-U.S. GOVERNMENT MORTGAGE-BACKED SECURITIES—2.3% | | | | | | | | | | | |
Mortgage Backed—2.3% | | | | | | | | | | | |
Harborview Mortgage Loan Trust, | | | | | | | | | | | |
Series 2005-14, Class 3A1A | | | | | | | | | | | |
5.300% | | 12/19/2035 | | # | | | 1,649,133 | | | 1,623,929 | |
Thornburg Mortgage Securities Trust, | | | | | | | | | | | |
Series 2004-1, Class II2A | | | | | | | | | | | |
3.299% | | 03/25/2044 | | # | | | 1,713,451 | | | 1,627,519 | |
WaMu Mortgage Pass Through Certificates, | | | | | | | | | | | |
Series 2006-AR12, Class 1A1 | | | | | | | | | | | |
6.069% | | 10/25/2036 | | # | | | 571,532 | | | 567,583 | |
| | | | | | | | | | | |
| | | | | | | | | | 3,819,031 | |
| | | | | | | | | | | |
TOTAL NON-U.S. GOVERNMENT MORTGAGE-BACKED SECURITIES (Cost $3,829,886) | | | | | | | | | | 3,819,031 | |
| | | | | | | | | | | |
| | | | |
| | | | | | | Shares | | Value | |
WARRANTS—0.0% | | | | | | | | | | | |
Oil, Gas & Consumable Fuels—0.0% | | | | | | | | | | | |
Oilsands Quest, Inc., | | | | | | | | | | | |
Expires 12/5/2009 | | | | * | | | | | | | |
(Cost $—) | | | | | | | 7,000 | | | 14,000 | |
| | | | | | | | | | | |
CASH EQUIVALENTS—26.6% | | | | | | | | | | | |
Institutional Money Market Funds—26.6% | | | | | | | | | | | |
AIM Short-Term Investments Trust Liquid Assets Portfolio | | | | †† | | | 8,710,080 | | | 8,710,080 | |
AIM Short-Term Investments Trust Prime Assets Portfolio | | | | †† | | | 31,846,775 | | | 31,846,775 | |
JPMorgan Prime Money Market Fund, Capital Shares | | | | | | | 793,624 | | | 793,624 | |
JPMorgan U.S. Government Money Market Fund, Capital Shares | | | | | | | 1,910,105 | | | 1,910,105 | |
| | | | | | | | | | | |
TOTAL CASH EQUIVALENTS
(Cost $43,260,584) | | | | | | | | | | 43,260,584 | |
| | | | | | | | | | | |
TOTAL INVESTMENTS—122.8%
(Cost $214,094,292) | | | | | | | | | | 199,656,712 | |
Other assets less liabilities—(22.8%) | | | | | | | | | | (37,133,058 | ) |
| | | | | | | | | | | |
NET ASSETS—100.0% | | | | | | | | | $ | 162,523,654 | |
| | | | | | | | | | | |
Notes to the Schedule of Investments:
| | |
| ADR | | American Depositary Receipt |
| REIT | | Real Estate Investment Trust |
| * | | Non-income producing. |
| † | | Denotes all or a portion of security on loan. |
| ^ | | Securities exempt from registration under Rule 144A of the Securities Act of 1933. These securities may be resold in transactions exempt from registration, normally to qualified buyers. 144A securities represent 0.7% of Total Investments. |
| ‡ | | Security valued at fair value as determined by policies approved by the board of directors. |
| # | | Rate is subject to change. Rate shown reflects current rate. |
| ‡‡ | | Security has been pledged as collateral for futures contracts. |
| †† | | Represents reinvestment of collateral received in conjunction with securities lending. |
| | | | |
| | See accompanying notes to financial statements. | | 163 |
SCHEDULE OF INVESTMENTS
June 30, 2008 (Unaudited)
Vantagepoint International Fund
| | | | | | | |
| | | | | Shares | | Value |
COMMON STOCKS—95.6% | | | | | | | |
Australia—2.7% | | | | | | | |
Amcor Ltd. | | | | 156,141 | | $ | 756,425 |
ASX Ltd. | | | | 23,900 | | | 719,626 |
Babcock & Brown Infrastructure Group | | | | 173,414 | | | 112,860 |
Brambles Ltd. | | | | 92,122 | | | 771,053 |
Foster’s Group Ltd. | | | | 76,011 | | | 369,522 |
Gloucester Coal Ltd. | | | | 174,400 | | | 2,160,079 |
Incitec Pivot Ltd. | | | | 18,900 | | | 3,346,621 |
JB Hi-Fi Ltd. | | | | 94,400 | | | 945,982 |
Macquarie Group Ltd. | | † | | 16,345 | | | 760,948 |
Newcrest Mining Ltd. | | | | 57,168 | | | 1,586,579 |
QBE Insurance Group Ltd. | | | | 27,080 | | | 582,250 |
Straits Resources Ltd. | | | | 158,000 | | | 1,034,259 |
Telstra Corp. Ltd. | | | | 225,481 | | | 916,212 |
Toll Holdings Ltd. | | | | 45,696 | | | 264,422 |
Wesfarmers Ltd. | | | | 22,500 | | | 804,025 |
Westpac Banking Corp. | | | | 30,000 | | | 576,209 |
Woodside Petroleum Ltd. | | | | 108,300 | | | 7,000,092 |
Woolworths Ltd. | | | | 75,404 | | | 1,767,080 |
WorleyParsons Ltd. | | | | 101,500 | | | 3,677,698 |
| | | | | | | |
| | | | | | | 28,151,942 |
| | | | | | | |
Austria—0.4% | | | | | | | |
Raiffeisen International Bank Holding AG | | † | | 18,879 | | | 2,398,599 |
Telekom Austria AG | | | | 25,500 | | | 552,551 |
Verbund—Oesterreichische Elektrizitaetswirtschafts AG, Class A | | | | 16,300 | | | 1,455,494 |
| | | | | | | |
| | | | | | | 4,406,644 |
| | | | | | | |
Belgium—0.8% | | | | | | | |
Delhaize Group | | | | 13,512 | | | 905,009 |
Fortis | | | | 45,100 | | | 717,276 |
InBev NV | | | | 26,900 | | | 1,859,892 |
KBC Groep NV | | | | 31,100 | | | 3,437,832 |
UCB SA | | | | 15,794 | | | 582,664 |
Umicore | | | | 18,007 | | | 885,647 |
| | | | | | | |
| | | | | | | 8,388,320 |
| | | | | | | |
Bermuda—0.7% | | | | | | | |
Seadrill Ltd. | | | | 234,492 | | | 7,157,425 |
| | | | | | | |
Brazil—0.6% | | | | | | | |
Bovespa Holding SA | | | | 33,000 | | | 407,585 |
Petroleo Brasileiro SA, Class A ADR | | | | 47,397 | | | 2,746,656 |
Redecard SA | | | | 92,388 | | | 1,707,026 |
Vivo Participacoes SA ADR | | *† | | 171,218 | | | 1,088,946 |
| | | | | | | |
| | | | | | | 5,950,213 |
| | | | | | | |
Canada—6.3% | | | | | | | |
Barrick Gold Corp. | | | | 96,800 | | | 4,404,400 |
Cameco Corp. | | | | 33,900 | | | 1,456,134 |
Canadian Natural Resources Ltd. | | | | 72,800 | | | 7,199,325 |
Canadian Pacific Railway Ltd. | | | | 80,975 | | | 5,355,687 |
EnCana Corp. | | | | 50,900 | | | 4,660,218 |
Fairfax Financial Holdings Ltd. | | | | 9,200 | | | 2,354,810 |
Fording Canadian Coal Trust | | | | 14,500 | | | 1,386,437 |
Freehold Royalty Trust | | | | 79,600 | | | 1,872,712 |
Inmet Mining Corp. | | | | 11,400 | | | 756,646 |
Laurentian Bank of Canada | | | | 19,200 | | | 789,691 |
Manulife Financial Corp. | | | | 19,900 | | | 695,924 |
Methanex Corp. | | | | 4,800 | | | 135,663 |
Onex Corp. | | | | 21,800 | | | 642,006 |
Potash Corp of Saskatchewan | | | | 70,900 | | | 16,448,772 |
Research In Motion Ltd. | | * | | 77,500 | | | 9,096,769 |
Shaw Communications, Inc., Class B | | | | 45,400 | | | 926,967 |
Shoppers Drug Mart Corp. | | | | 21,500 | | | 1,178,420 |
Suncor Energy, Inc. | | | | 114,400 | | | 6,641,640 |
| | | | | | | |
| | | | | | | 66,002,221 |
| | | | | | | |
China—0.8% | | | | | | | |
Angang Steel Co. Ltd., Class H | | | | 369,100 | | | 743,345 |
China Construction Bank Corp., Class H | | † | | 3,037,372 | | | 2,450,919 |
China Life Insurance Co. Ltd., Class H | | | | 232,700 | | | 810,712 |
China Petroleum & Chemical Corp., Class H | | | | 1,882,600 | | | 1,759,703 |
China Shenhua Energy Co. Ltd. | | | | 208,000 | | | 818,623 |
Industrial & Commercial Bank of China, Class H | | | | 1,066,000 | | | 728,852 |
Shanghai Electric Group Co. Ltd., Class H | | *† | | 2,135,866 | | | 1,047,628 |
| | | | | | | |
| | | | | | | 8,359,782 |
| | | | | | | |
Denmark—0.2% | | | | | | | |
A P Moller—Maersk A/S, Class B | | | | 58 | | | 707,428 |
Novo Nordisk A/S, Class B | | | | 16,000 | | | 1,053,288 |
| | | | | | | |
| | | | | | | 1,760,716 |
| | | | | | | |
Finland—1.4% | | | | | | | |
Fortum Oyj | | | | 180,502 | | | 9,136,191 |
Nokia Oyj | | | | 181,800 | | | 4,443,712 |
Rautaruukki Oyj | | | | 15,500 | | | 703,601 |
UPM-Kymmene Oyj | | | | 7,658 | | | 124,779 |
| | | | | | | |
| | | | | | | 14,408,283 |
| | | | | | | |
France—9.7% | | | | | | | |
Accor SA | | | | 9,700 | | | 644,369 |
Air Liquide | | | | 9,724 | | | 1,280,169 |
Alstom SA | | | | 20,765 | | | 4,761,526 |
Altamir Amboise | | | | 202,000 | | | 2,061,572 |
AXA SA | | | | 57,419 | | | 1,691,897 |
Beneteau SA | | | | 30,900 | | | 671,359 |
BNP Paribas | | | | 55,670 | | | 5,011,236 |
Bouygues | | | | 153,691 | | | 10,140,023 |
Carrefour SA | | | | 19,200 | | | 1,082,260 |
Cie Generale d’Optique Essilor International SA | | | | 56,000 | | | 3,415,953 |
Compagnie Generale des Etablissements Michelin, Class B | | | | 13,900 | | | 993,932 |
Dassault Systemes SA | | † | | 12,300 | | | 746,695 |
Electricite de France | | | | 82,556 | | | 7,820,589 |
Esso SA Francaise | | | | 4,970 | | | 1,251,774 |
France Telecom SA | | | | 138,100 | | | 4,050,058 |
Groupe Danone | | † | | 33,400 | | | 2,337,132 |
IMS-Intl Metal Service | | | | 24,500 | | | 827,056 |
Lafarge SA | | | | 9,500 | | | 1,448,627 |
L’Oreal SA | | | | 55,400 | | | 6,009,021 |
LVMH Moet Hennessy Louis Vuitton SA | | | | 78,261 | | | 8,163,927 |
Manutan (Societe) | | | | 9,000 | | | 651,092 |
Oberthur Technologies | | | | 140,500 | | | 967,489 |
PagesJaunes Groupe | | † | | 18,853 | | | 275,750 |
Pernod-Ricard SA | | | | 19,200 | | | 1,959,260 |
Peugeot SA | | † | | 79,600 | | | 4,299,351 |
| | | | |
| 164 | | See accompanying notes to financial statements. | | |
SCHEDULE OF INVESTMENTS — (Continued)
June 30, 2008 (Unaudited)
Vantagepoint International Fund
| | | | | | | |
| | | | | Shares | | Value |
COMMON STOCKS—(Continued) | | | | | | | |
Renault SA | | | | 6,400 | | $ | 520,873 |
Rhodia SA | | | | 19,008 | | | 347,774 |
Sanofi-Aventis SA | | | | 44,800 | | | 2,976,906 |
Schneider Electric SA | | | | 5,358 | | | 576,403 |
Societe Generale | | | | 17,437 | | | 1,511,768 |
Suez SA | | | | 25,400 | | | 1,721,801 |
Technip SA | | | | 48,751 | | | 4,498,708 |
Total Gabon | | | | 1,200 | | | 853,232 |
Total SA | | | | 30,040 | | | 2,556,954 |
Vallourec | | | | 6,695 | | | 2,341,438 |
Veolia Environnement | | | | 50,675 | | | 2,829,039 |
Vinci SA | | | | 97,142 | | | 5,931,864 |
Vivendi Universal SA | | | | 53,200 | | | 2,005,973 |
| | | | | | | |
| | | | | | | 101,234,850 |
| | | | | | | |
Germany—7.6% | | | | | | | |
Adidas AG | | | | 49,000 | | | 3,085,663 |
Allianz SE (Registered) | | | | 35,260 | | | 6,202,338 |
Bayer AG | | † | | 116,496 | | | 9,801,756 |
Commerzbank AG | | † | | 23,275 | | | 691,448 |
Continental AG | | † | | 6,600 | | | 679,330 |
Daimler AG | | | | 95,421 | | | 5,918,558 |
Deutsche Bank AG (Registered) | | † | | 11,532 | | | 995,497 |
Deutsche Boerse AG | | | | 35,400 | | | 4,001,617 |
E.ON AG | | | | 18,839 | | | 3,796,886 |
Fraport AG Frankfurt Airport Services Worldwide | | † | | 44,938 | | | 3,045,691 |
Fresenius Medical Care AG & Co. KGaA | | | | 16,100 | | | 887,061 |
Hypo Real Estate Holding AG | | † | | 31,013 | | | 872,604 |
K+S AG | | | | 2,100 | | | 1,209,094 |
Linde AG | | | | 39,784 | | | 5,588,068 |
MAN AG | | | | 9,100 | | | 1,009,047 |
Muenchener Rueckversicherungs AG | | | | 22,400 | | | 3,928,816 |
Q-Cells AG | | * | | 6,300 | | | 638,196 |
RWE AG | | † | | 26,059 | | | 3,290,099 |
Salzgitter AG | | | | 41,500 | | | 7,602,265 |
SAP AG | | † | | 83,800 | | | 4,385,868 |
ThyssenKrupp AG | | | | 13,600 | | | 853,189 |
Volkswagen AG | | † | | 13,300 | | | 3,841,681 |
Wacker Chemie AG | | | | 33,894 | | | 7,080,754 |
| | | | | | | |
| | | | | | | 79,405,526 |
| | | | | | | |
Hong Kong—4.9% | | | | | | | |
Bank of East Asia Ltd. | | | | 837,800 | | | 4,555,088 |
China Merchants Holdings International Co. Ltd. | | | | 281,800 | | | 1,090,649 |
China Mobile Ltd. | | | | 244,000 | | | 3,275,174 |
China Overseas Land & Investment Ltd. | | | | 168,000 | | | 266,290 |
China Resources Land Ltd. | | | | 1,295,700 | | | 1,799,193 |
CLP Holdings Ltd. | | | | 480,000 | | | 4,116,384 |
CNOOC Ltd. | | | | 2,750,000 | | | 4,773,757 |
Hang Lung Group Ltd. | | | | 183,000 | | | 816,185 |
Hang Seng Bank Ltd. | | | | 346,000 | | | 7,305,485 |
Hengan International Group Co. Ltd. | | | | 390,000 | | | 1,150,790 |
Hong Kong & China Gas Co. Ltd. | | | | 1,837,000 | | | 4,371,263 |
Hutchison Whampoa Ltd. | | | | 909,998 | | | 9,176,697 |
Jardine Matheson Holdings Ltd. | | | | 26,000 | | | 807,997 |
Li & Fung Ltd. | | | | 102,400 | | | 308,988 |
Noble Group Ltd. | | | | 772,800 | | | 1,352,632 |
NWS Holdings Ltd. | | | | 665,796 | | | 1,738,635 |
Public Financial Holdings Ltd. | | | | 820,000 | | | 539,715 |
Sun Hung Kai Properties Ltd. | | | | 204,800 | | | 2,784,065 |
Swire Pacific Ltd. | | | | 4,500 | | | 46,061 |
Wing Lung Bank | | | | 69,000 | | | 1,355,359 |
| | | | | | | |
| | | | | | | 51,630,407 |
| | | | | | | |
India—0.0% | | | | | | | |
ICICI Bank Ltd. ADR | | *† | | 10,258 | | | 295,020 |
| | | | | | | |
Indonesia—0.0% | | | | | | | |
Telekomunikasi Indonesia Tbk PT | | | | 367,500 | | | 293,503 |
| | | | | | | |
Ireland—0.4% | | | | | | | |
Allied Irish Banks plc | | | | 41,200 | | | 634,928 |
CRH plc | | | | 111,621 | | | 3,244,104 |
| | | | | | | |
| | | | | | | 3,879,032 |
| | | | | | | |
Italy—1.6% | | | | | | | |
Enel SpA | | † | | 70,600 | | | 669,740 |
ENI SpA | | | | 194,219 | | | 7,215,288 |
Fiat SpA | | | | 140,200 | | | 2,282,023 |
IFIL—Investments SpA | | † | | 415,100 | | | 2,682,549 |
Intesa Sanpaolo SpA | | | | 303,149 | | | 1,723,352 |
Saipem SpA | | | | 39,200 | | | 1,832,113 |
| | | | | | | |
| | | | | | | 16,405,065 |
| | | | | | | |
Japan—22.8% | | | | | | | |
Advantest Corp. | | † | | 73,500 | | | 1,549,238 |
Aeon Co. Ltd. | | | | 241,200 | | | 2,985,727 |
Aeon Mall Co. Ltd. | | † | | 116,500 | | | 3,446,236 |
Ain Pharmaciez, Inc. | | | | 8,100 | | | 137,125 |
Aisin Seiki Co. Ltd. | | | | 122,600 | | | 4,027,250 |
Ajinomoto Co., Inc. | | † | | 66,000 | | | 625,280 |
Aloka Co. Ltd. | | | | 54,900 | | | 757,308 |
Apamanshop Holdings Co. Ltd. | | † | | 3,473 | | | 713,797 |
Astellas Pharma, Inc. | | | | 72,000 | | | 3,061,813 |
Atrium Co. Ltd. | | † | | 59,000 | | | 592,521 |
Canon, Inc. | | | | 138,750 | | | 7,142,284 |
Chiyoda Corp. | | † | | 92,000 | | | 1,000,397 |
Chugai Pharmaceutical Co. Ltd. | | † | | 119,000 | | | 1,902,780 |
Citizen Holdings Co. Ltd. | | † | | 80,000 | | | 610,311 |
Credit Saison Co. Ltd. | | † | | 108,525 | | | 2,276,493 |
Daikin Industries Ltd. | | | | 68,000 | | | 3,438,274 |
Daito Trust Construction Co. Ltd. | | | | 71,000 | | | 3,443,578 |
Daiwa House Industry Co. Ltd. | | | | 20,000 | | | 188,275 |
Denso Corp. | | | | 169,300 | | | 5,830,926 |
East Japan Railway Co. | | | | 83 | | | 676,061 |
Eisai Co. Ltd. | | | | 73,000 | | | 2,578,649 |
Elpida Memory, Inc. | | *† | | 44,500 | | | 1,427,156 |
Fanuc Ltd. | | | | 67,700 | | | 6,620,875 |
Fuji Machine Manufacturing Co. Ltd. | | | | 49,400 | | | 986,458 |
FUJIFILM Holdings Corp. | | | | 40,800 | | | 1,405,377 |
Fujitsu Frontech Ltd. | | | | 86,700 | | | 823,089 |
Fukuoka Financial Group, Inc. | | | | 149,000 | | | 673,561 |
Futaba Industrial Co. Ltd. | | † | | 57,500 | | | 1,330,628 |
Heiwa Corp. | | | | 70,000 | | | 741,725 |
Hirose Electric Co. Ltd. | | † | | 24,700 | | | 2,481,814 |
Hitachi Capital Corp. | | | | 60,000 | | | 966,389 |
Hitachi Ltd. | | | | 126,000 | | | 907,386 |
Honda Motor Co. Ltd. | | | | 169,995 | | | 5,801,363 |
HOYA Corp. | | | | 174,600 | | | 4,044,118 |
Idemitsu Kosan Co. Ltd. | | | | 600 | | | 53,360 |
Inpex Holdings, Inc. | | | | 143 | | | 1,805,852 |
| | | | |
| | See accompanying notes to financial statements. | | 165 |
SCHEDULE OF INVESTMENTS — (Continued)
June 30, 2008 (Unaudited)
Vantagepoint International Fund
| | | | | | | |
| | | | | Shares | | Value |
COMMON STOCKS—(Continued) | | | | | | | |
ITOCHU Corp. | | | | 548,000 | | $ | 5,842,649 |
Japan Tobacco, Inc. | | | | 1,173 | | | 5,002,677 |
JGC Corp. | | | | 46,000 | | | 905,817 |
JS Group Corp. | | | | 18,400 | | | 292,962 |
Jupiter Telecommunications Co. Ltd. | | | | 2,586 | | | 2,006,052 |
Keiyo Co. Ltd. | | † | | 105,000 | | | 506,064 |
Keyence Corp. | | | | 29,800 | | | 7,103,520 |
KK daVinci Holdings | | *† | | 899 | | | 621,523 |
Marubeni Corp. | | | | 495,000 | | | 4,128,790 |
Matsushita Electric Industrial Co. Ltd. | | | | 61,000 | | | 1,305,021 |
MID Reit, Inc. REIT | | † | | 614 | | | 2,001,859 |
Miraca Holdings, Inc. | | | | 131,000 | | | 3,138,505 |
Mitsubishi Corp. | | | | 37,800 | | | 1,245,537 |
Mitsubishi Estate Co. Ltd. | | | | 205,900 | | | 4,714,003 |
Mitsubishi Heavy Industries Ltd. | | † | | 635,700 | | | 3,036,279 |
Mitsubishi UFJ Financial Group, Inc. | | | | 655,400 | | | 5,792,061 |
Mitsui & Co. Ltd. | | | | 613,241 | | | 13,534,897 |
Mitsui Fudosan Co. Ltd. | | | | 93,046 | | | 1,991,462 |
Mitsui OSK Lines Ltd. | | | | 51,000 | | | 727,360 |
Mitsui Sumitomo Insurance Group Holdings, Inc. | | * | | 26,100 | | | 902,059 |
Mizuho Financial Group, Inc. | | | | 862 | | | 4,010,743 |
Murata Manufacturing Co. Ltd. | | | | 28,200 | | | 1,330,436 |
Nintendo Co. Ltd. | | | | 8,900 | | | 5,046,954 |
Nippon Electric Glass Co. Ltd. | | | | 31,500 | | | 547,533 |
Nissan Motor Co. Ltd. | | | | 178,800 | | | 1,485,020 |
Nitto Denko Corp. | | | | 54,000 | | | 2,075,781 |
Nomura Holdings, Inc. | | | | 270,800 | | | 4,010,107 |
Oracle Corp. Japan | | † | | 13,200 | | | 538,143 |
Oriental Yeast Co. Ltd. | | | | 156,000 | | | 912,168 |
ORIX Corp. | | | | 29,810 | | | 4,269,595 |
Raysum Co. Ltd. | | | | 640 | | | 426,170 |
Rohm Co. Ltd. | | | | 30,400 | | | 1,755,273 |
SBI Holdings, Inc. | | | | 2,790 | | | 610,630 |
Secom Co. Ltd. | | | | 68,000 | | | 3,312,158 |
SFCG Co. Ltd. | | † | | 18,680 | | | 2,229,329 |
Shimamura Co. Ltd. | | | | 33,900 | | | 2,090,267 |
Shin-Etsu Chemical Co. Ltd. | | | | 62,600 | | | 3,884,647 |
SMC Corp. | | | | 17,200 | | | 1,887,804 |
Softbank Corp. | | † | | 378,800 | | | 6,387,677 |
Sumitomo Chemical Co. Ltd. | | | | 249,300 | | | 1,570,610 |
Sumitomo Corp. | | | | 546,800 | | | 7,184,005 |
Sumitomo Mitsui Financial Group, Inc. | | | | 774 | | | 5,820,641 |
Sumitomo Realty & Development Co. Ltd. | | | | 47,000 | | | 934,975 |
Suzuki Motor Corp. | | † | | 206,050 | | | 4,880,204 |
Takeda Pharmaceutical Co. Ltd. | | | | 68,500 | | | 3,483,875 |
THK Co. Ltd. | | | | 35,900 | | | 698,563 |
TOA Corp. | | | | 75,000 | | | 462,738 |
Token Corp. | | † | | 96,000 | | | 4,088,682 |
Tokio Marine Holdings, Inc. | | | | 160,700 | | | 6,263,300 |
Tokyo Electron Ltd. | | | | 30,800 | | | 1,776,176 |
Tokyo Gas Co. Ltd. | | | | 141,000 | | | 569,708 |
Tokyu Corp. | | | | 24,000 | | | 124,532 |
Tokyu Land Corp. | | | | 129,950 | | | 739,964 |
Tosei Corp. | | | | 1,207 | | | 544,407 |
Toshiba Corp. | | † | | 401,000 | | | 2,958,393 |
Trend Micro, Inc. | | † | | 73,000 | | | 2,407,333 |
Unicharm Corp. | | † | | 11,700 | | | 832,264 |
Unipres Corp. | | | | 82,400 | | | 867,264 |
Yamada Denki Co. Ltd. | | | | 18,420 | | | 1,312,393 |
Yamato Holdings Co. Ltd. | | | | 155,200 | | | 2,166,425 |
| | | | | | | |
| | | | | | | 238,349,458 |
| | | | | | | |
Korea, Republic of—0.7% | | | | | | | |
LG Electronics, Inc. GDR | | ^ | | 26,700 | | | 676,402 |
NHN Corp. | | * | | 13,448 | | | 2,343,469 |
Samsung Electronics Co. Ltd. GDR | | ^ | | 14,465 | | | 4,316,560 |
| | | | | | | |
| | | | | | | 7,336,431 |
| | | | | | | |
Luxembourg—0.3% | | | | | | | |
RTL Group SA | | | | 9,782 | | | 1,108,419 |
SES | | | | 35,000 | | | 884,133 |
SES Global | | | | 28,900 | | | 722,034 |
| | | | | | | |
| | | | | | | 2,714,586 |
| | | | | | | |
Mexico—0.8% | | | | | | | |
America Movil SAB de CV, Series L ADR | | | | 70,800 | | | 3,734,700 |
Cemex SAB de CV ADR | | * | | 218 | | | 5,375 |
Grupo Modelo SAB de CV | | † | | 207,930 | | | 1,058,290 |
Telefonos de Mexico SAB de CV ADR | | † | | 67,500 | | | 1,598,400 |
Telmex Internacional SAB de CV ADR | | *† | | 81,300 | | | 1,308,930 |
Telmex Internacional SAB de CV, Class L | | * | | 13,300 | | | 10,781 |
Wal-Mart de Mexico SAB de CV | | † | | 157,500 | | | 626,909 |
| | | | | | | |
| | | | | | | 8,343,385 |
| | | | | | | |
Netherlands—2.8% | | | | | | | |
Aegon NV | | | | 57,504 | | | 755,988 |
Akzo Nobel NV | | | | 10,600 | | | 725,396 |
ASML Holding NV | | | | 259,514 | | | 6,351,943 |
Heineken Holding NV, Class A | | | | 9,800 | | | 448,548 |
ING Groep NV | | | | 93,079 | | | 2,942,936 |
Koninklijke Ahold NV | | | | 50,400 | | | 675,641 |
Koninklijke KPN | | | | 106,800 | | | 1,825,937 |
Royal Dutch Shell plc, Class A | | | | 89,933 | | | 3,677,617 |
Royal Dutch Shell plc, Class B | | | | 200,539 | | | 8,030,265 |
Ten Cate NV | | | | 32,900 | | | 1,170,604 |
Unilever NV | | | | 93,000 | | | 2,629,905 |
| | | | | | | |
| | | | | | | 29,234,780 |
| | | | | | | |
Norway—1.5% | | | | | | | |
Kverneland Gruppen ASA | | * | | 429,300 | | | 1,136,810 |
Orkla ASA | | | | 474,460 | | | 6,079,477 |
Renewable Energy Corp. AS | | *† | | 22,136 | | | 571,517 |
Telenor ASA | | | | 122,900 | | | 2,307,098 |
Yara International ASA | | | | 69,200 | | | 6,111,440 |
| | | | | | | |
| | | | | | | 16,206,342 |
| | | | | | | |
Poland—0.1% | | | | | | | |
Polski Koncern Naftowy Orlen | | * | | 46,900 | | | 749,765 |
| | | | | | | |
Russia—2.0% | | | | | | | |
Gazprom OAO ADR | | | | 217,989 | | | 12,643,362 |
LUKOIL ADR | | | | 58,949 | | | 5,819,740 |
MMC Norilsk Nickel ADR | | † | | 45,124 | | | 1,135,997 |
Novorossiysk Commercial Sea Port GDR | | †^ | | 2,900 | | | 42,412 |
Rosneft Oil Co. GDR | | * | | 60,419 | | | 696,910 |
Uralkali GDR | | | | 11,000 | | | 793,591 |
| | | | | | | |
| | | | | | | 21,132,012 |
| | | | | | | |
| | | | |
| 166 | | See accompanying notes to financial statements. | | |
SCHEDULE OF INVESTMENTS — (Continued)
June 30, 2008 (Unaudited)
Vantagepoint International Fund
| | | | | | | |
| | | | | Shares | | Value |
COMMON STOCKS—(Continued) | | | | | | | |
Singapore—0.9% | | | | | | | |
CapitaLand Ltd. | | | | 168,500 | | $ | 708,052 |
DBS Group Holdings Ltd. | | | | 260,000 | | | 3,617,372 |
Hiap Seng Engineering Ltd. | | | | 200 | | | 45 |
Singapore Telecommunications Ltd. | | | | 308,392 | | | 822,091 |
Tat Hong Holdings Ltd. | | | | 396,000 | | | 554,577 |
Wilmar International Ltd. | | | | 1,111,100 | | | 4,128,653 |
| | | | | | | |
| | | | | | | 9,830,790 |
| | | | | | | |
South Africa—0.2% | | | | | | | |
Naspers Ltd., Class N | | | | 79,320 | | | 1,725,700 |
Sasol Ltd. | | | | 12,300 | | | 724,037 |
| | | | | | | |
| | | | | | | 2,449,737 |
| | | | | | | |
Spain—3.3% | | | | | | | |
Banco Bilbao Vizcaya Argentaria SA | | | | 138,600 | | | 2,640,850 |
Banco Santander SA | | | | 272,600 | | | 4,973,332 |
Construcciones y Auxiliar de Ferrocarriles SA | | | | 2,100 | | | 918,448 |
Corp. Financiera Alba | | | | 11,700 | | | 687,280 |
Dinamia | | | | 23,000 | | | 678,387 |
Gamesa Corp. Tecnologica SA | | | | 64,460 | | | 3,155,747 |
Iberdrola SA | | † | | 91,351 | | | 1,217,141 |
Inditex SA | | † | | 134,666 | | | 6,173,187 |
Mapfre SA | | † | | 161,100 | | | 769,028 |
Repsol YPF SA | | | | 60,800 | | | 2,386,055 |
Telefonica SA | | | | 407,739 | | | 10,790,294 |
| | | | | | | |
| | | | | | | 34,389,749 |
| | | | | | | |
Sweden—1.7% | | | | | | | |
Alfa Laval AB | | | | 101,600 | | | 1,569,662 |
Assa Abloy AB, Class B | | † | | 31,300 | | | 450,346 |
Atlas Copco AB, Class A | | | | 38,800 | | | 567,464 |
Hennes & Mauritz AB, Class B | | | | 44,500 | | | 2,400,788 |
Nordea Bank AB | | | | 449,300 | | | 6,156,540 |
Ssab Svenskt Stal AB, Class A | | | | 34,539 | | | 1,107,711 |
Telefonaktiebolaget LM Ericsson ADR | | † | | 5,000 | | | 52,000 |
Telefonaktiebolaget LM Ericsson, Class B | | | | 521,000 | | | 5,417,603 |
TeliaSonera AB | | | | 87,300 | | | 645,408 |
| | | | | | | |
| | | | | | | 18,367,522 |
| | | | | | | |
Switzerland—7.9% | | | | | | | |
ABB Ltd. (Registered) | | * | | 100,000 | | | 2,830,585 |
Adecco SA (Registered) | | | | 36,792 | | | 1,818,703 |
Bobst Group AG (Registered) | | | | 14,600 | | | 1,168,253 |
Burckhardt Compression Holding AG | | | | 3,700 | | | 1,119,081 |
Compagnie Financiere Richemont SA | | | | 81,915 | | | 4,545,937 |
Credit Suisse Group AG (Registered) | | | | 17,498 | | | 796,456 |
Ferrexpo plc | | | | 154,500 | | | 1,209,033 |
Givaudan SA (Registered) | | | | 585 | | | 521,476 |
Holcim Ltd. (Registered) | | | | 82,958 | | | 6,705,661 |
Nestle SA (Registered) | | | | 450,850 | | | 20,317,407 |
Nobel Biocare Holding AG (Registered) | | | | 64,598 | | | 2,100,349 |
Novartis AG (Registered) | | | | 120,631 | | | 6,638,589 |
Petroplus Holdings AG | | * | | 25,100 | | | 1,343,334 |
Roche Holding AG (Genusschein) | | | | 78,891 | | | 14,182,418 |
Roche Holding AG (Registered) | | | | 6,827 | | | 1,357,866 |
SGS SA (Registered) | | | | 2,500 | | | 3,565,122 |
Swiss Reinsurance (Registered) | | | | 62,794 | | | 4,162,727 |
Swisscom AG (Registered) | | | | 5,027 | | | 1,674,312 |
Syngenta AG (Registered) | | | | 4,000 | | | 1,295,891 |
Temenos Group AG (Registered) | | *† | | 39,800 | | | 1,224,693 |
UBS AG (Registered) | | * | | 111,352 | | | 2,318,965 |
Zurich Financial Services AG (Registered) | | | | 6,200 | | | 1,580,099 |
| | | | | | | |
| | | | | | | 82,476,957 |
| | | | | | | |
Taiwan—0.3% | | | | | | | |
Taiwan Mobile Co. Ltd. | | | | 352,660 | | | 655,111 |
Taiwan Semiconductor Manufacturing Co. Ltd. | | * | | 378,339 | | | 2,971,080 |
| | | | | | | |
| | | | | | | 3,626,191 |
| | | | | | | |
United Kingdom—12.2% | | | | | | | |
Acergy SA | | † | | 41,325 | | | 920,809 |
Alliance & Leicester plc | | | | 106,738 | | | 622,943 |
Anglo American plc | | | | 12,900 | | | 906,022 |
Antofagasta plc | | | | 51,500 | | | 669,646 |
ARM Holdings plc | | | | 168,400 | | | 284,289 |
AstraZeneca plc | | | | 84,384 | | | 3,585,841 |
Aveva Group plc | | | | 45,400 | | | 1,386,622 |
Babcock International Group | | * | | 72,800 | | | 886,641 |
BAE Systems plc | | | | 591,500 | | | 5,191,817 |
Barclays plc | | | | 68,300 | | | 387,501 |
BG Group plc | | | | 168,800 | | | 4,386,716 |
BHP Billiton plc | | | | 180,500 | | | 6,922,230 |
BP plc ADR | | | | 874,639 | | | 10,392,765 |
Cadbury plc | | | | 231,640 | | | 2,905,591 |
Cairn Energy plc | | * | | 11,800 | | | 757,331 |
Centrica plc | | | | 747,800 | | | 4,599,369 |
Chaucer Holdings plc | | | | 1,376,100 | | | 2,189,405 |
Game Group plc | | | | 232,500 | | | 1,341,124 |
GlaxoSmithKline plc | | | | 130,000 | | | 2,873,772 |
HBOS plc | | | | 110,800 | | | 606,613 |
Holidaybreak plc | | | | 77,300 | | | 645,337 |
HSBC Holdings plc | | | | 112,235 | | | 1,728,155 |
Hunting plc | | | | 172,600 | | | 3,011,671 |
Imperial Tobacco Group plc | | | | 19,900 | | | 739,263 |
JKX Oil & Gas plc | | | | 98,200 | | | 1,022,069 |
John Wood Group plc | | | | 99,400 | | | 975,735 |
Kingfisher plc | | | | 907,689 | | | 2,012,356 |
Lavendon Group plc | | | | 89,901 | | | 441,157 |
Lloyds TSB Group plc | | | | 876,436 | | | 5,377,200 |
Marks & Spencer Group plc | | | | 85,000 | | | 552,719 |
Micro Focus International plc | | | | 297,000 | | | 1,544,409 |
National Grid plc | | | | 403,800 | | | 5,293,155 |
Next plc | | | | 17,692 | | | 340,104 |
Old Mutual plc | | | | 337,300 | | | 619,197 |
Persimmon plc | | | | 49,000 | | | 306,694 |
Premier Foods plc | | | | 249,600 | | | 471,121 |
Prudential plc | | | | 59,200 | | | 624,431 |
Reckitt Benckiser Group plc | | | | 58,000 | | | 2,929,488 |
Rio Tinto plc | | | | 35,100 | | | 4,227,019 |
Royal Bank of Scotland Group plc | | | | 776,900 | | | 3,307,392 |
SABMiller plc | | | | 274,700 | | | 6,276,073 |
Scottish & Southern Energy plc | | | | 46,400 | | | 1,292,842 |
Shire Ltd. | | | | 46,500 | | | 760,160 |
Standard Chartered plc | | | | 46,900 | | | 1,328,192 |
Tesco plc | | | | 710,800 | | | 5,199,047 |
Vodafone Group plc | | | | 1,643,301 | | | 4,841,715 |
WM Morrison Supermarkets plc | | | | 1,724,785 | | | 9,092,532 |
Wolseley plc | | | | 79,900 | | | 595,324 |
| | | | |
| | See accompanying notes to financial statements. | | 167 |
SCHEDULE OF INVESTMENTS — (Continued)
June 30, 2008 (Unaudited)
Vantagepoint International Fund
| | | | | | | | | |
| | | | | | Shares | | Value | |
COMMON STOCKS—(Continued) | | | | | | | | | |
Xstrata plc | | | | | 130,066 | | $ | 10,361,187 | |
Yell Group plc | | | | | 214,500 | | | 299,289 | |
| | | | | | | | | |
| | | | | | | | 128,032,080 | |
| | | | | | | | | |
United States—0.0% | | | | | | | | | |
Dr. Pepper Snapple Group, Inc. | | * | | | 1 | | | 21 | |
| | | | | | | | | |
TOTAL COMMON STOCKS
(Cost $954,033,939) | | | | | | | | 1,000,968,755 | |
| | | | | | | | | |
PREFERRED STOCKS—0.0% | | | | | | | | | |
Germany—0.0% | | | | | | | | | |
Porsche Automobil Holding SE | | | | | | | | | |
(Cost $781,501) | | | | | 4,140 | | | 637,471 | |
| | | | | | | | | |
RIGHTS—0.0% | | | | | | | | | |
United Kingdom—0.0% | | | | | | | | | |
Barclays plc, | | | | | | | | | |
Expires 07/17/2008 | | * | ‡ | | 14,635 | | | 2,769 | |
HBOS plc, | | | | | | | | | |
Expires 07/18/2008 | | * | | | 44,320 | | | 9,490 | |
| | | | | | | | | |
TOTAL RIGHTS
(Cost $—) | | | | | | | | 12,259 | |
| | | | | | | | | |
CASH EQUIVALENTS—10.0% | | | | | | | | | |
Institutional Money Market Funds—10.0% | | | | | | | | | |
AIM Short-Term Investments Trust Liquid Assets Portfolio | | †† | | | 15,920,609 | | | 15,920,609 | |
AIM Short-Term Investments Trust Prime Assets Portfolio | | †† | | | 53,663,245 | | | 53,663,245 | |
JPMorgan Prime Money Market Fund, Capital Shares | | | | | 17,716,515 | | | 17,716,515 | |
JPMorgan U.S. Government Money Market Fund, Capital Shares | | | | | 17,119,576 | | | 17,119,576 | |
| | | | | | | | | |
TOTAL CASH EQUIVALENTS
(Cost $104,419,945) | | | | | | | | 104,419,945 | |
| | | | | | | | | |
TOTAL INVESTMENTS—105.6%
(Cost $1,059,235,385) | | | | | | | | 1,106,038,430 | |
Other assets less liabilities—(5.6%) | | | | | | | | (58,916,338 | ) |
| | | | | | | | | |
NET ASSETS—100.0% | | | | | | | $ | 1,047,122,092 | |
| | | | | | | | | |
Notes to the Schedule of Investments:
| | |
| ADR | | American Depositary Receipt |
| GDR | | Global Depositary Receipt |
| REIT | | Real Estate Investment Trust |
| † | | Denotes all or a portion of security on loan. |
| * | | Non-income producing. |
| ^ | | Securities exempt from registration under Rule 144A of the Securities Act of 1933. These securities may be resold in transactions exempt from registration, normally to qualified buyers. 144A securities represent 0.5% of Total Investments. |
| ‡ | | Security valued at fair value as determined by policies approved by the board of directors. |
| †† | | Represents reinvestment of collateral received in conjunction with securities lending. |
Percentage of Portfolio by Industry (unaudited):
| | | |
COMMON STOCKS/PREFERRED STOCKS | | | |
Oil, Gas & Consumable Fuels | | 10.5 | % |
Commercial Banks | | 7.7 | % |
Chemicals | | 6.0 | % |
Metals & Mining | | 4.4 | % |
Pharmaceuticals | | 4.2 | % |
Insurance | | 3.6 | % |
Trading Companies & Distributors | | 3.3 | % |
Wireless Telecommunication Services | | 2.9 | % |
Food Products | | 2.9 | % |
Electric Utilities | | 2.7 | % |
Automobiles | | 2.7 | % |
Diversified Telecommunication Services | | 2.6 | % |
Food & Staples Retailing | | 2.5 | % |
Machinery | | 2.2 | % |
Real Estate Management & Development | | 2.0 | % |
Semiconductors & Semiconductor Equipment | | 1.9 | % |
Communications Equipment | | 1.8 | % |
Energy Equipment & Services | | 1.8 | % |
Industrial Conglomerates | | 1.8 | % |
Multi-Utilities | | 1.7 | % |
Electronic Equipment & Instruments | | 1.7 | % |
Textiles, Apparel & Luxury Goods | | 1.6 | % |
Software | | 1.5 | % |
Specialty Retail | | 1.5 | % |
Auto Components | | 1.4 | % |
Electrical Equipment | | 1.3 | % |
Capital Markets | | 1.3 | % |
Diversified Financial Services | | 1.3 | % |
Commercial Services & Supplies | | 1.1 | % |
Beverages | | 1.1 | % |
Construction Materials | | 1.0 | % |
Health Care Equipment & Supplies | | 0.9 | % |
Media | | 0.9 | % |
Consumer Finance | | 0.9 | % |
Construction & Engineering | | 0.8 | % |
Household Durables | | 0.8 | % |
Personal Products | | 0.7 | % |
Office Electronics | | 0.7 | % |
Tobacco | | 0.6 | % |
Road & Rail | | 0.6 | % |
Computers & Peripherals | | 0.5 | % |
Aerospace & Defense | | 0.5 | % |
Gas Utilities | | 0.5 | % |
Household Products | | 0.4 | % |
Transportation Infrastructure | | 0.4 | % |
Building Products | | 0.3 | % |
Food | | 0.3 | % |
IT Services | | 0.2 | % |
Real Estate Investment Trusts (REIT) | | 0.2 | % |
Leisure Equipment & Products | | 0.2 | % |
Air Freight & Logistics | | 0.2 | % |
Hotels, Restaurants & Leisure | | 0.2 | % |
Internet Software & Services | | 0.2 | % |
Marine | | 0.2 | % |
Containers & Packaging | | 0.1 | % |
Thrifts & Mortgage Finance | | 0.1 | % |
Internet & Catalog Retail | | 0.1 | % |
Health Care Providers & Services | | 0.1 | % |
| | | |
TOTAL COMMON STOCKS/PREFERRED STOCKS | | 95.6 | % |
| | | |
CASH EQUIVALENTS | | | |
Institutional Money Market Funds | | 10.0 | % |
| | | |
TOTAL INVESTMENTS | | 105.6 | % |
Other assets less liabilities | | (5.6 | )% |
| | | |
TOTAL NET ASSETS | | 100.0 | % |
| | | |
| | | | |
| 168 | | See accompanying notes to financial statements. | | |
SCHEDULE OF INVESTMENTS
June 30, 2008 (Unaudited)
Vantagepoint Diversified Assets Fund
| | | | | | | | | | | |
Coupon Rate | | Maturity Date | | | Face | | Value |
CORPORATE OBLIGATIONS—20.3% | | | | | | | | | | | |
Agriculture—0.3% | | | | | | | | | | | |
Alliance One International, Inc. | | | | | | | | | | | |
11.000% | | 05/15/2012 | | | | | $ | 1,500,000 | | $ | 1,552,500 |
| | | | | | | | | | | |
Airlines—0.1% | | | | | | | | | | | |
Continental Airlines, Inc., Series 01-1 | | | | | | | | | | | |
6.503% | | 06/15/2011 | | | | | | 420,000 | | | 388,500 |
| | | | | | | | | | | |
Auto Parts & Equipment—0.4% | | | | | | | | | | | |
Goodyear Tire & Rubber Co. (The) | | | | | | | | | | | |
6.678% | | 12/01/2009 | | # | | | | 875,000 | | | 872,813 |
Lear Corp., Series B | | | | | | | | | | | |
8.110% | | 05/15/2009 | | | | | | 1,000,000 | | | 985,000 |
| | | | | | | | | | | |
| | | | | | | | | | | 1,857,813 |
| | | | | | | | | | | |
Beverages—1.3% | | | | | | | | | | | |
Coca-Cola Enterprises, Inc. | | | | | | | | | | | |
3.316% | | 05/06/2011 | | #§ | | | | 2,100,000 | | | 2,113,497 |
Diageo Capital plc (United Kingdom) | | | | | | | | | | | |
2.816% | | 11/10/2008 | | #§ | | | | 3,500,000 | | | 3,493,791 |
| | | | | | | | | | | |
| | | | | | | | | | | 5,607,288 |
| | | | | | | | | | | |
Capital Markets—0.4% | | | | | | | | | | | |
Morgan Stanley | | | | | | | | | | | |
3.875% | | 01/15/2009 | | § | | | | 1,500,000 | | | 1,494,383 |
Washington Mutual, Inc. | | | | | | | | | | | |
4.000% | | 01/15/2009 | | | | | | 310,000 | | | 300,738 |
| | | | | | | | | | | |
| | | | | | | | | | | 1,795,121 |
| | | | | | | | | | | |
Chemicals—0.3% | | | | | | | | | | | |
Arco Chemical Co. | | | | | | | | | | | |
10.250% | | 11/01/2010 | | | | | | 750,000 | | | 761,250 |
Sensient Technologies Corp. | | | | | | | | | | | |
6.500% | | 04/01/2009 | | | | | | 720,000 | | | 723,011 |
| | | | | | | | | | | |
| | | | | | | | | | | 1,484,261 |
| | | | | | | | | | | |
Commercial Banks—1.5% | | | | | | | | | | | |
BNP Paribas (France) | | | | | | | | | | | |
3.126% | | 06/04/2010 | | # | | | | 1,000,000 | | | 999,503 |
US Bancorp | | | | | | | | | | | |
5.300% | | 04/28/2009 | | | | | | 1,200,000 | | | 1,207,436 |
VTB Capital SA, Reg S (Luxembourg) | | | | | | | | | | | |
4.484% | | 11/02/2009 | | # | | | | 1,500,000 | | | 1,501,080 |
Wachovia Bank NA | | | | | | | | | | | |
5.800% | | 12/01/2008 | | | | | | 1,750,000 | | | 1,762,862 |
Wells Fargo & Co. | | | | | | | | | | | |
2.876% | | 09/15/2009 | | # | | | | 1,250,000 | | | 1,246,218 |
| | | | | | | | | | | |
| | | | | | | | | | | 6,717,099 |
| | | | | | | | | | | |
Commercial Services—0.3% | | | | | | | | | | | |
Corrections Corp of America | | | | | | | | | | | |
7.500% | | 05/01/2011 | | | | | | 1,500,000 | | | 1,515,000 |
| | | | | | | | | | | |
Communications Equipment—0.7% | | | | | | | | | | | |
Cisco Systems, Inc. | | | | | | | | | | | |
2.738% | | 02/20/2009 | | #§ | | | | 3,500,000 | | | 3,498,708 |
| | | | | | | | | | | |
Computers & Peripherals—0.3% | | | | | | | | | | | |
Hewlett-Packard Co. | | | | | | | | | | | |
3.081% | | 09/03/2009 | | # | | | | 1,200,000 | | | 1,195,937 |
| | | | | | | | | | | |
Consumer Finance—1.6% | | | | | | | | | | | |
Caterpillar Financial Services Corp. (MTN) | | | | | | | | | | | |
3.450% | | 01/15/2009 | | § | | | | 3,500,000 | | | 3,490,248 |
John Deere Capital Corp. | | | | | | | | | | | |
3.088% | | 02/26/2010 | | # | | | | 1,300,000 | | | 1,284,447 |
SLM Corp. (MTN) | | | | | | | | | | | |
5.570% | | 07/25/2008 | | # | | | | 1,000,000 | | | 999,270 |
Toyota Motor Credit Corp. | | | | | | | | | | | |
2.525% | | 01/12/2009 | | #§ | | | | 2,000,000 | | | 1,999,063 |
| | | | | | | | | | | |
| | | | | | | | | | | 7,773,028 |
| | | | | | | | | | | |
Cosmetics/Personal Care—0.3% | | | | | | | | | | | |
Procter & Gamble International Funding SCA (Luxembourg) | | | | | | | | | | | |
2.939% | | 08/19/2009 | | # | | | | 1,190,000 | | | 1,192,480 |
| | | | | | | | | | | |
Diversified Financial Services—1.6% | | | | | | | | | | | |
Blue City Investments 1 Ltd. for Blue City Co., Series A3 (Cayman Islands) | | | | | | | | | | | |
6.570% | | 11/07/2016 | | # | ‡ | | | 1,000,000 | | | 953,900 |
General Electric Capital Corp. | | | | | | | | | | | |
2.888% | | 01/20/2010 | | #§ | | | | 3,500,000 | | | 3,487,271 |
IBM International Group Capital LLC | | | | | | | | | | | |
3.253% | | 07/29/2009 | | # | | | | 1,190,000 | | | 1,194,345 |
National Rural Utilities Cooperative Finance Corp. | | | | | | | | | | | |
3.576% | | 07/01/2010 | | # | | | | 1,580,000 | | | 1,579,333 |
| | | | | | | | | | | |
| | | | | | | | | | | 7,214,849 |
| | | | | | | | | | | |
Diversified Telecommunication Services—1.7% | | | | | | | | | | | |
AT&T Corp. | | | | | | | | | | | |
7.300% | | 11/15/2011 | | | | | | 1,200,000 | | | 1,279,056 |
Deutsche Telekom International Finance BV (Netherlands) | | | | | | | | | | | |
3.875% | | 07/22/2008 | | | | | | 2,000,000 | | | 2,000,000 |
Qwest Capital Funding, Inc. | | | | | | | | | | | |
7.000% | | 08/03/2009 | | | | | | 750,000 | | | 751,875 |
Verizon Communications, Inc. | | | | | | | | | | | |
2.838% | | 04/03/2009 | | #§ | | | | 3,500,000 | | | 3,493,151 |
| | | | | | | | | | | |
| | | | | | | | | | | 7,524,082 |
| | | | | | | | | | | |
Energy Equipment & Services—0.4% | | | | | | | | | | | |
Transocean, Inc. (Cayman Islands) | | | | | | | | | | | |
2.873% | | 09/05/2008 | | #§ | | | | 2,000,000 | | | 1,997,456 |
| | | | | | | | | | | |
Entertainment—0.2% | | | | | | | | | | | |
Mohegan Tribal Gaming Authority | | | | | | | | | | | |
8.000% | | 04/01/2012 | | | | | | 1,000,000 | | | 920,000 |
| | | | | | | | | | | |
Food—0.9% | | | | | | | | | | | |
Kraft Foods, Inc. | | | | | | | | | | | |
4.000% | | 10/01/2008 | | § | | | | 3,000,000 | | | 2,999,180 |
Safeway, Inc. | | | | | | | | | | | |
3.158% | | 03/27/2009 | | # | | | | 1,200,000 | | | 1,192,128 |
| | | | | | | | | | | |
| | | | | | | | | | | 4,191,308 |
| | | | | | | | | | | |
Healthcare-Services—0.4% | | | | | | | | | | | |
UnitedHealth Group, Inc. | | | | | | | | | | | |
2.762% | | 03/02/2009 | | # | | | | 1,650,000 | | | 1,636,518 |
| | | | | | | | | | | |
Home Builders—0.2% | | | | | | | | | | | |
Standard Pacific Corp. | | | | | | | | | | | |
6.500% | | 10/01/2008 | | | | | | 1,000,000 | | | 990,000 |
| | | | | | | | | | | |
Household Products/Wares—0.5% | | | | | | | | | | | |
Kimberly-Clark Corp. | | | | | | | | | | | |
2.999% | | 07/30/2010 | | # | | | | 2,200,000 | | | 2,191,750 |
| | | | | | | | | | | |
Independent Power Producers & Energy Traders—0.2% | | | | | | | | | | | |
Orion Power Holdings, Inc. | | | | | | | | | | | |
12.000% | | 05/01/2010 | | | | | | 650,000 | | | 705,250 |
| | | | | | | | | | | |
| | | | |
| | See accompanying notes to financial statements. | | 169 |
SCHEDULE OF INVESTMENTS — (Continued)
June 30, 2008 (Unaudited)
Vantagepoint Diversified Assets Fund
| | | | | | | | | | |
Coupon Rate | | Maturity Date | | Face | | Value |
CORPORATE OBLIGATIONS—(Continued) | | | | | | | | | | |
Insurance—0.6% | | | | | | | | | | |
Berkshire Hathaway Finance Corp. | | | | | | | | | | |
3.375% | | 10/15/2008 | | | | $ | 2,575,000 | | $ | 2,576,921 |
| | | | | | | | | | |
Lodging—0.2% | | | | | | | | | | |
MGM Mirage | | | | | | | | | | |
6.000% | | 10/01/2009 | | | | | 1,000,000 | | | 988,750 |
| | | | | | | | | | |
Machinery—0.7% | | | | | | | | | | |
Textron, Inc. | | | | | | | | | | |
6.375% | | 11/15/2008 | | | | | 2,900,000 | | | 2,931,279 |
| | | | | | | | | | |
Media—1.9% | | | | | | | | | | |
Cablevision Systems Corp., Series B | | | | | | | | | | |
7.133% | | 04/01/2009 | | # | | | 500,000 | | | 502,500 |
Comcast Corp. | | | | | | | | | | |
3.010% | | 07/14/2009 | | # | | | 1,649,000 | | | 1,636,263 |
CSC Holdings, Inc., Series B | | | | | | | | | | |
8.125% | | 08/15/2009 | | | | | 750,000 | | | 757,500 |
Dex Media West LLC/Dex Media Finance Co., Series B | | | | | | | | | | |
9.875% | | 08/15/2013 | | | | | 1,500,000 | | | 1,353,750 |
Dex Media West LLC/Dex Media Finance Co., Series B | | | | | | | | | | |
8.500% | | 08/15/2010 | | | | | 200,000 | | | 198,500 |
Sinclair Television Group, Inc. | | | | | | | | | | |
8.000% | | 03/15/2012 | | | | | 1,500,000 | | | 1,515,000 |
Time Warner Entertainment Co. LP | | | | | | | | | | |
7.250% | | 09/01/2008 | | | | | 2,500,000 | | | 2,513,705 |
| | | | | | | | | | |
| | | | | | | | | | 8,477,218 |
| | | | | | | | | | |
Metals & Mining—0.4% | | | | | | | | | | |
Rio Tinto Finance USA Ltd. (Australia) | | | | | | | | | | |
2.625% | | 09/30/2008 | | | | | 2,000,000 | | | 1,994,220 |
| | | | | | | | | | |
Oil, Gas & Consumable Fuels—0.6% | | | | | | | | | | |
Anadarko Petroleum Corp. | | | | | | | | | | |
3.176% | | 09/15/2009 | | # | | | 1,200,000 | | | 1,186,608 |
BP Capital Markets PLC (United Kingdom) | | | | | | | | | | |
3.024% | | 03/17/2010 | | # | | | 1,200,000 | | | 1,200,643 |
| | | | | | | | | | |
| | | | | | | | | | 2,387,251 |
| | | | | | | | | | |
Pharmaceuticals—0.4% | | | | | | | | | | |
AstraZeneca PLC (United Kingdom) | | | | | | | | | | |
2.991% | | 09/11/2009 | | # | | | 1,100,000 | | | 1,101,393 |
GlaxoSmithKline Capital, Inc. | | | | | | | | | | |
3.310% | | 05/13/2010 | | # | | | 1,100,000 | | | 1,103,515 |
| | | | | | | | | | |
| | | | | | | | | | 2,204,908 |
| | | | | | | | | | |
Retail—1.0% | | | | | | | | | | |
Neiman Marcus Group, Inc./The (PIK) | | | | | | | | | | |
9.000% | | 10/15/2015 | | | | | 1,500,000 | | | 1,488,750 |
Rite Aid Corp. | | | | | | | | | | |
8.125% | | 05/01/2010 | | | | | 400,000 | | | 406,000 |
Target Corp. | | | | | | | | | | |
2.895% | | 08/07/2009 | | #§ | | | 2,000,000 | | | 1,996,386 |
Wal-Mart Stores, Inc. | | | | | | | | | | |
6.875% | | 08/10/2009 | | | | | 750,000 | | | 777,778 |
| | | | | | | | | | |
| | | | | | | | | | 4,668,914 |
| | | | | | | | | | |
Software—0.5% | | | | | | | | | | |
Oracle Corp. | | | | | | | | | | |
2.738% | | 05/14/2010 | | #§ | | | 2,200,000 | | | 2,189,880 |
| | | | | | | | | | |
Wireless Telecommunication Services—0.4% | | | | | | | | | | |
Millicom International Cellular SA (Luxembourg) | | | | | | | | | | |
10.000% | | 12/01/2013 | | | | | 1,500,000 | | | 1,597,500 |
Rural Cellular Corp. | | | | | | | | | | |
8.250% | | 03/15/2012 | | | | | 282,000 | | | 290,460 |
| | | | | | | | | | |
| | | | | | | | | | 1,887,960 |
| | | | | | | | | | |
TOTAL CORPORATE OBLIGATIONS
(Cost $92,939,490) | | | | | | | | | | 92,256,249 |
| | | | | | | | | | |
U.S. GOVERNMENT AGENCY OBLIGATIONS—25.9% | | | | | | | | | | |
U.S. Government Agency Obligations—25.9% | | | | | | | | | | |
Federal Home Loan Bank | | | | | | | | | | |
5.000% | | 09/18/2009 | | § | | | 4,235,000 | | | 4,340,659 |
3.375% | | 12/18/2009 | | § | | | 7,600,000 | | | 7,645,904 |
2.780% | | 02/27/2009 | | § | | | 5,000,000 | | | 4,998,865 |
2.750% | | 02/20/2009 | | § | | | 7,500,000 | | | 7,497,803 |
2.500% | | 01/22/2009 | | § | | | 2,200,000 | | | 2,196,841 |
2.469% | | 09/14/2009 | | #§ | | | 6,000,000 | | | 6,001,284 |
2.200% | | 04/01/2009 | | § | | | 2,150,000 | | | 2,141,942 |
2.053% | | 07/14/2008 | | | | | 3,500,000 | | | 3,497,210 |
Federal Home Loan Mortgage Corp. | | | | | | | | | | |
4.625% | | 12/19/2008 | | § | | | 22,000,000 | | | 22,198,638 |
2.669% | | 09/25/2009 | | #§ | | | 4,000,000 | | | 4,002,208 |
2.639% | | 12/26/2008 | | #§ | | | 5,000,000 | | | 5,000,425 |
2.500% | | 05/18/2009 | | § | | | 7,000,000 | | | 6,978,076 |
2.413% | | 09/28/2009 | | #§ | | | 5,000,000 | | | 5,000,455 |
2.071% | | 07/11/2008 | | § | | | 14,500,000 | | | 14,491,392 |
Federal National Mortgage Association | | | | | | | | | | |
4.875% | | 10/15/2009 | | § | | | 2,750,000 | | | 2,768,178 |
2.096% | | 07/14/2008 | | | | | 6,000,000 | | | 5,995,119 |
2.016% | | 07/09/2008 | | § | | | 13,000,000 | | | 12,993,365 |
| | | | | | | | | | |
TOTAL U.S. GOVERNMENT AGENCY OBLIGATIONS
(Cost $117,582,303) | | | | | | | | | | 117,748,364 |
| | | | | | | | | | |
U.S. TREASURY OBLIGATIONS—29.2% | | | | | | | | | | |
U.S. Treasury Bills—14.8% | | | | | | | | | | |
U.S. Treasury Bill | | | | | | | | | | |
1.839% | | 08/28/2008 | | § | | | 4,750,000 | | | 4,739,006 |
1.815% | | 09/18/2008 | | ‡‡ | | | 15,900,000 | | | 15,837,783 |
1.778% | | 08/14/2008 | | § | | | 5,500,000 | | | 5,487,564 |
1.758% | | 09/25/2008 | | | | | 4,000,000 | | | 3,983,612 |
1.679% | | 12/04/2008 | | ‡‡ | | | 16,150,000 | | | 16,004,989 |
1.550% | | 07/10/2008 | | § | | | 20,750,000 | | | 20,742,947 |
1.453% | | 08/21/2008 | | | | | 600,000 | | | 598,538 |
| | | | | | | | | | |
| | | | | | | | | | 67,394,439 |
| | | | | | | | | | |
U.S. Treasury Notes—14.4% | | | | | | | | | | |
U.S. Treasury Note | | | | | | | | | | |
4.875% | | 06/30/2009 | | § | | | 26,000,000 | | | 26,643,916 |
3.625% | | 10/31/2009 | | § | | | 16,500,000 | | | 16,782,315 |
2.125% | | 04/30/2010 | | § | | | 12,000,000 | | | 11,916,564 |
1.750% | | 03/31/2010 | | § | | | 10,000,000 | | | 9,874,220 |
| | | | | | | | | | |
| | | | | | | | | | 65,217,015 |
| | | | | | | | | | |
TOTAL U.S. TREASURY OBLIGATIONS
(Cost $132,268,685) | | | | | | | | | | 132,611,454 |
| | | | | | | | | | |
| | | | |
| 170 | | See accompanying notes to financial statements. | | |
SCHEDULE OF INVESTMENTS — (Continued)
June 30, 2008 (Unaudited)
Vantagepoint Diversified Assets Fund
| | | | | | | | | | |
Coupon Rate | | Maturity Date | | Face | | Value |
ASSET BACKED SECURITIES—17.8% | | | | | | | | | | |
Automobile—2.7% | | | | | | | | | | |
AmeriCredit Automobile Receivables Trust | | | | | | | | | | |
Series 2007-BF, Class A2 | | | | | | | | | | |
5.310% | | 01/06/2011 | | | | $ | 1,116,469 | | $ | 1,117,509 |
Capital Auto Receivables Asset Trust | | | | | | | | | | |
Series 2007-SN1, Class A3B | | | | | | | | | | |
2.531% | | 07/15/2010 | | # | | | 2,500,000 | | | 2,490,921 |
Carmax Auto Owner Trust | | | | | | | | | | |
Series 2007-2, Class A2 | | | | | | | | | | |
5.320% | | 01/15/2010 | | | | | 539,459 | | | 541,447 |
Carmax Auto Owner Trust | | | | | | | | | | |
Series 2008-1, Class A2 | | | | | | | | | | |
3.171% | | 04/15/2011 | | #§ | | | 2,000,000 | | | 2,004,861 |
Household Automotive Trust | | | | | | | | | | |
Series 2006-2, Class A3 | | | | | | | | | | |
5.610% | | 08/17/2011 | | | | | 1,446,670 | | | 1,468,544 |
Long Beach Auto Receivables Trust | | | | | | | | | | |
Series 2007-A, Class A2 | | | | | | | | | | |
5.150% | | 11/15/2010 | | | | | 1,094,326 | | | 1,098,143 |
Triad Auto Receivables Owner Trust | | | | | | | | | | |
Series 2005-B, Class A3 | | | | | | | | | | |
4.280% | | 06/14/2010 | | | | | 1,701,673 | | | 1,696,777 |
Triad Auto Receivables Owner Trust | | | | | | | | | | |
Series 2006-A, Class A3 | | | | | | | | | | |
4.770% | | 01/12/2011 | | | | | 1,096,003 | | | 1,088,071 |
Wachovia Auto Loan Owner Trust | | | | | | | | | | |
Series 2007-1, Class A2 | | | | | | | | | | |
5.360% | | 07/20/2010 | | | | | 929,046 | | | 934,825 |
| | | | | | | | | | |
| | | | | | | | | | 12,441,098 |
| | | | | | | | | | |
Credit Card—5.2% | | | | | | | | | | |
American Express Credit Account Master Trust | | | | | | | | | | |
Series 2004-5, Class B | | | | | | | | | | |
2.721% | | 04/15/2012 | | # | | | 1,750,000 | | | 1,719,155 |
American Express Credit Account Master Trust | | | | | | | | | | |
Series 2006-A, Class C | | | | | | | | | | |
2.701% | | 08/15/2011 | | #† | | | 2,750,000 | | | 2,722,020 |
BA Credit Card Trust | | | | | | | | | | |
Series 2006-A10, Class A10 | | | | | | | | | | |
2.451% | | 02/15/2012 | | # | | | 3,400,000 | | | 3,381,955 |
Bank One Issuance Trust | | | | | | | | | | |
Series 2004-B1, Class B1 | | | | | | | | | | |
2.791% | | 03/15/2012 | | #§ | | | 2,000,000 | | | 1,973,766 |
Chase Credit Card Master Trust | | | | | | | | | | |
Series 2002-3, Class B | | | | | | | | | | |
2.921% | | 09/15/2011 | | # | | | 1,750,000 | | | 1,728,463 |
Chase Credit Card Master Trust | | | | | | | | | | |
Series 2003-3, Class B | | | | | | | | | | |
2.821% | | 10/15/2010 | | # | | | 1,750,000 | | | 1,750,060 |
Chase Credit Card Master Trust | | | | | | | | | | |
Series 2003-6, Class B | | | | | | | | | | |
2.821% | | 02/15/2011 | | # | | | 1,750,000 | | | 1,747,604 |
Chase Issuance Trust | | | | | | | | | | |
Series 2006-C3, Class C3 | | | | | | | | | | |
2.701% | | 06/15/2011 | | #§ | | | 3,000,000 | | | 2,951,098 |
Citibank Credit Card Issuance Trust | | | | | | | | | | |
Series 2006-B1, Class B1 | | | | | | | | | | |
2.558% | | 03/07/2011 | | # | | | 1,000,000 | | | 990,604 |
GE Capital Credit Card Master Note Trust | | | | | | | | | | |
Series 2005-3, Class B | | | | | | | | | | |
2.771% | | 06/15/2013 | | # | | | 1,500,000 | | | 1,388,883 |
Household Credit Card Master Note Trust I | | | | | | | | | | |
Series 2006-1, Class B | | | | | | | | | | |
2.611% | | 06/15/2012 | | # | | | 1,000,000 | | | 958,327 |
MBNA Credit Card Master Note Trust | | | | | | | | | | |
Series 2005-C3, Class C | | | | | | | | | | |
2.741% | | 03/15/2011 | | # | | | 1,750,000 | | | 1,747,687 |
| | | | | | | | | | |
| | | | | | | | | | 23,059,622 |
| | | | | | | | | | |
Equipment—0.2% | | | | | | | | | | |
CNH Equipment Trust | | | | | | | | | | |
Series 2004-A, Class A4B | | | | | | | | | | |
3.480% | | 09/15/2011 | | | | | 920,481 | | | 920,849 |
| �� | | | | | | | | | |
Home Equity—9.7% | | | | | | | | | | |
Aegis Asset Backed Securities Trust | | | | | | | | | | |
Series 2005-3, Class A2 | | | | | | | | | | |
2.723% | | 08/25/2035 | | # | | | 962,650 | | | 954,057 |
Ameriquest Mortgage Securities, Inc. | | | | | | | | | | |
Series 2005-R7, Class A2C | | | | | | | | | | |
2.743% | | 09/25/2035 | | # | | | 1,357,445 | | | 1,340,701 |
Argent Securities, Inc. | | | | | | | | | | |
Series 2005-W2, Class A2B1 | | | | | | | | | | |
2.683% | | 10/25/2035 | | # | | | 2,458,820 | | | 2,387,640 |
Bear Stearns Asset Backed Securities Trust | | | | | | | | | | |
Series 2006-HE6, Class 1A1 | | | | | | | | | | |
2.513% | | 05/25/2031 | | # | | | 1,090,834 | | | 1,081,078 |
Citigroup Mortgage Loan Trust, Inc. | | | | | | | | | | |
Series 2005-HE3, Class A2C | | | | | | | | | | |
2.743% | | 09/25/2035 | | # | | | 910,918 | | | 906,146 |
Countrywide Asset-Backed Certificates | | | | | | | | | | |
Series 2004-AB1, Class 2A3 | | | | | | | | | | |
3.003% | | 02/25/2035 | | # | | | 1,587,869 | | | 1,562,377 |
Countrywide Asset-Backed Certificates | | | | | | | | | | |
Series 2005-11, Class 3AV2 | | | | | | | | | | |
2.773% | | 09/14/2049 | | # | | | 1,763,122 | | | 1,690,604 |
Countrywide Asset-Backed Certificates | | | | | | | | | | |
Series 2006-12, Class 2A1 | | | | | | | | | | |
2.463% | | 06/25/2030 | | # | | | 1,405,869 | | | 1,391,463 |
First Franklin Mortgage Loan Asset Backed Certificates | | | | | | | | | | |
Series 2005-FF6, Class A2B | | | | | | | | | | |
2.703% | | 03/25/2036 | | # | | | 1,153,083 | | | 1,132,019 |
First Franklin Mortgage Loan Asset Backed Certificates | | | | | | | | | | |
Series 2005-FF8, Class A2C | | | | | | | | | | |
2.753% | | 09/25/2035 | | #§ | | | 1,811,893 | | | 1,768,752 |
Lehman XS Trust | | | | | | | | | | |
Series 2005-8, Class 2A1A | | | | | | | | | | |
2.683% | | 12/25/2035 | | #§ | | | 2,242,180 | | | 2,187,949 |
Long Beach Mortgage Loan Trust | | | | | | | | | | |
Series 2005-3, Class 2A2 | | | | | | | | | | |
2.763% | | 09/25/2035 | | # | | | 972,950 | | | 947,831 |
Long Beach Mortgage Loan Trust | | | | | | | | | | |
Series 2005-WL2, Class 3A1 | | | | | | | | | | |
2.663% | | 07/25/2035 | | # | | | 1,063,653 | | | 1,038,611 |
Mastr Asset Backed Securities Trust | | | | | | | | | | |
Series 2006-WMC1, Class A2 | | | | | | | | | | |
2.593% | | 02/25/2036 | | # | | | 1,719,963 | | | 1,696,884 |
Merrill Lynch Mortgage Investors, Inc. | | | | | | | | | | |
Series 2006-FM1, Class A2A | | | | | | | | | | |
2.543% | | 04/25/2037 | | # | | | 822,856 | | | 814,935 |
Morgan Stanley Capital I | | | | | | | | | | |
Series 2006-HE1, Class A2 | | | | | | | | | | |
2.603% | | 01/25/2036 | | # | | | 75,071 | | | 74,904 |
Option One Mortgage Loan Trust | | | | | | | | | | |
Series 2005-4, Class A3 | | | | | | | | | | |
2.743% | | 11/25/2035 | | #§ | | | 2,148,817 | | | 2,088,007 |
Option One Mortgage Loan Trust | | | | | | | | | | |
Series 2006-1, Class 2A2 | | | | | | | | | | |
2.613% | | 01/25/2036 | | # | | | 1,145,037 | | | 1,127,775 |
| | | | |
| | See accompanying notes to financial statements. | | 171 |
SCHEDULE OF INVESTMENTS — (Continued)
June 30, 2008 (Unaudited)
Vantagepoint Diversified Assets Fund
| | | | | | | | | | |
Coupon Rate | | Maturity Date | | Face | | Value |
ASSET BACKED SECURITIES—(Continued) | | | | | | | | | | |
Residential Asset Securities Corp. | | | | | | | | | | |
Series 2005-KS11, Class AI2 | | | | | | | | | | |
2.623% | | 12/25/2035 | | # | | $ | 16,747 | | $ | 16,738 |
Residential Asset Securities Corp. | | | | | | | | | | |
Series 2006-KS1, Class A2 | | | | | | | | | | |
2.623% | | 01/25/2031 | | # | | | 646,828 | | | 645,375 |
Residential Asset Securities Corp. | | | | | | | | | | |
Series 2006-KS2, Class A2 | | | | | | | | | | |
2.613% | | 01/25/2031 | | # | | | 531,777 | | | 529,014 |
Saxon Asset Securities Trust | | | | | | | | | | |
Series 2005-4, Class A2C | | | | | | | | | | |
2.733% | | 11/25/2037 | | #§ | | | 2,702,334 | | | 2,655,768 |
Soundview Home Equity Loan Trust | | | | | | | | | | |
Series 2005-OPT4, Class 2A3 | | | | | | | | | | |
2.743% | | 12/25/2035 | | #§ | | | 3,000,000 | | | 2,837,849 |
Soundview Home Equity Loan Trust | | | | | | | | | | |
Series 2006-OPT4, Class 2A2 | | | | | | | | | | |
2.573% | | 06/25/2036 | | # | | | 1,500,000 | | | 1,476,963 |
Soundview Home Equity Loan Trust | | | | | | | | | | |
Series 2006-OPT5, Class 2A2 | | | | | | | | | | |
2.573% | | 07/25/2036 | | # | | | 1,075,901 | | | 1,056,571 |
Specialty Underwriting & Residential Finance | | | | | | | | | | |
Series 2005-BC3, Class A2C | | | | | | | | | | |
2.853% | | 06/25/2036 | | # | | | 1,500,000 | | | 1,449,942 |
Specialty Underwriting & Residential Finance | | | | | | | | | | |
Series 2006-BC1, Class A2B | | | | | | | | | | |
2.633% | | 12/25/2036 | | # | | | 1,500,000 | | | 1,473,357 |
Structured Asset Investment Loan Trust | | | | | | | | | | |
Series 2003-BC1, Class A2 | | | | | | | | | | |
3.163% | | 01/25/2033 | | # | | | 3,224,902 | | | 2,946,912 |
Structured Asset Investment Loan Trust | | | | | | | | | | |
Series 2006-BNC3, Class A2 | | | | | | | | | | |
2.523% | | 09/25/2036 | | # | | | 1,318,534 | | | 1,298,534 |
Wells Fargo Home Equity Trust | | | | | | | | | | |
Series 2006-2, Class A1 | | | | | | | | | | |
2.553% | | 07/25/2036 | | # | | | 750,948 | | | 745,228 |
Wells Fargo Mortgage Backed Securities Trust | | | | | | | | | | |
Series 2004-6, Class A13 | | | | | | | | | | |
2.933% | | 06/25/2034 | | # | | | 3,111,349 | | | 2,911,955 |
| | | | | | | | | | |
| | | | | | | | | | 44,235,939 |
| | | | | | | | | | |
TOTAL ASSET BACKED SECURITIES
(Cost $80,871,667) | | | | | | | | | | 80,657,508 |
| | | | | | | | | | |
NON-U.S. GOVERNMENT MORTGAGE-BACKED SECURITIES—0.6% | | | | | | | | | | |
Mortgage Backed—0.6% | | | | | | | | | | |
HSI Asset Securitization Corp. Trust | | | | | | | | | | |
Series 2005-NC2, Class 2A3 | | | | | | | | | | |
2.743% | | 08/25/2035 | | # | | | 1,096,637 | | | 1,080,404 |
Thornburg Mortgage Securities Trust | | | | | | | | | | |
Series 2004-1, Class II2A | | | | | | | | | | |
3.299% | | 03/25/2044 | | # | | | 1,511,062 | | | 1,435,280 |
| | | | | | | | | | |
TOTAL NON-U.S. GOVERNMENT MORTGAGE-BACKED SECURITIES
(Cost $2,500,861) | | | | | | | | | | 2,515,684 |
| | | | | | | | | | |
PURCHASED OPTIONS—0.8% | | | | | | | | | | |
Swiss Market Index, Expires 09/19/2008, Strike 7,169.89 CHF | | | | | | | 100 | | | 35,890 |
Swiss Market Index, Expires 09/19/2008, Strike 7,211.50 CHF | | | | | | | 480 | | | 183,091 |
U.S. 10 Year Treasury Note, Expires 08/22/2008, Strike 105.00 | | | | | | | 367 | | | 3,274,328 |
| | | | | | | | | | |
TOTAL PURCHASED OPTIONS
(Cost $3,343,432) | | | | | | | | | | 3,493,309 |
| | | | | | | | | | |
| | | | |
| | | | | | | Shares | | Value |
CASH EQUIVALENTS—3.5% | | | | | | | | | | |
Institutional Money Market Funds—3.5% | | | | | | | | | | |
JPMorgan Prime Money Market Fund, Capital Shares | | | | | | | 1,228,454 | | | 1,228,454 |
JPMorgan U.S. Government Money Market Fund, Capital Shares | | | | | | | 14,873,437 | | | 14,873,437 |
| | | | | | | | | | |
TOTAL CASH EQUIVALENTS
(Cost $16,101,891) | | | | | | | | | | 16,101,891 |
| | | | | | | | | | |
TOTAL INVESTMENTS—98.1%
(Cost $445,608,329) | | | | | | | | | | 445,384,459 |
Other Assets Less Liabilities—1.9% | | | | | | | | | | 8,482,103 |
| | | | | | | | | | |
NET ASSETS—100.0% | | | | | | | | | $ | 453,866,562 |
| | | | | | | | | | |
Notes to the Schedule of Investments:
| | |
CHF | | Swiss Franc |
MTN | | Medium Term Note |
PIK | | Payment-in Kind Security |
Reg S | | Security sold outside Unites States without registration under the Securities Act of 1933 |
# | | Rate is subject to change. Rate shown reflects current rate. |
§ | | Security has been earmarked to cover potential senior securities transactions which may include, but are not limited to, futures, swaps, forwards, options and TBA’s. |
‡ | | Security valued at fair value as determined by policies approved by the board of directors. |
‡‡ | | Security has been pledged as collateral for futures contracts. |
^ | | Securities exempt from registration under Rule 144A of the Securities Act of 1933. These securities may be resold in transactions exempt from registration, normally to qualified buyers. 144A securities represent 0.6% of Total Investments. |
| | | | |
| 172 | | See accompanying notes to financial statements. | | |
SCHEDULE OF INVESTMENTS
June 30, 2008 (Unaudited)
Vantagepoint Core Bond Index Fund
| | | | | | | | | | |
Coupon Rate | | Maturity Date | | Face | | Value |
CORPORATE OBLIGATIONS—21.1% | | | | | | | | | | |
Aerospace & Defense—0.2% | | | | | | | | | | |
Boeing Co. | | | | | | | | | | |
6.125% | | 02/15/2033 | | | | $ | 100,000 | | $ | 101,525 |
Boeing Co. | | | | | | | | | | |
5.125% | | 02/15/2013 | | | | | 250,000 | | | 255,234 |
Lockheed Martin Corp., Series B | | | | | | | | | | |
6.150% | | 09/01/2036 | | | | | 250,000 | | | 248,155 |
Northrop Grumman Systems Corp. | | | | | | | | | | |
7.750% | | 02/15/2031 | | | | | 250,000 | | | 295,182 |
United Technologies Corp. | | | | | | | | | | |
6.700% | | 08/01/2028 | | | | | 150,000 | | | 160,058 |
United Technologies Corp. | | | | | | | | | | |
6.100% | | 05/15/2012 | | | | | 50,000 | | | 52,949 |
United Technologies Corp. | | | | | | | | | | |
4.875% | | 05/01/2015 | | | | | 500,000 | | | 497,719 |
| | | | | | | | | | |
| | | | | | | | | | 1,610,822 |
| | | | | | | | | | |
Agriculture—0.2% | | | | | | | | | | |
Archer-Daniels Midland Co. | | | | | | | | | | |
8.375% | | 04/15/2017 | | | | | 350,000 | | | 411,690 |
Archer-Daniels Midland Co. | | | | | | | | | | |
5.450% | | 03/15/2018 | | | | | 750,000 | | | 733,093 |
Bunge Ltd. Finance Corp. | | | | | | | | | | |
5.350% | | 04/15/2014 | | | | | 500,000 | | | 467,772 |
Reynolds American, Inc. | | | | | | | | | | |
7.625% | | 06/01/2016 | | | | | 750,000 | | | 785,110 |
| | | | | | | | | | |
| | | | | | | | | | 2,397,665 |
| | | | | | | | | | |
Airlines—0.1% | | | | | | | | | | |
American Airlines, Inc., Series 1999-1, Class A2 | | | | | | | | | | |
7.024% | | 10/15/2009 | | a | | | 157,000 | | | 153,075 |
Continental Airlines, Inc., Series 1998-1, Class 1A | | | | | | | | | | |
6.648% | | 03/15/2019 | | | | | 433,798 | | | 394,756 |
| | | | | | | | | | |
| | | | | | | | | | 547,831 |
| | | | | | | | | | |
Auto Manufacturers—0.2% | | | | | | | | | | |
Daimler Finance North America LLC | | | | | | | | | | |
7.300% | | 01/15/2012 | | | | | 1,000,000 | | | 1,059,068 |
Daimler Finance North America LLC | | | | | | | | | | |
7.200% | | 09/01/2009 | | | | | 350,000 | | | 360,096 |
Daimler Finance North America LLC | | | | | | | | | | |
6.500% | | 11/15/2013 | | | | | 500,000 | | | 519,073 |
| | | | | | | | | | |
| | | | | | | | | | 1,938,237 |
| | | | | | | | | | |
Auto Parts & Equipment—0.1% | | | | | | | | | | |
Johnson Controls, Inc. | | | | | | | | | | |
5.500% | | 01/15/2016 | | | | | 750,000 | | | 720,608 |
| | | | | | | | | | |
Beverages—0.3% | | | | | | | | | | |
Anheuser-Busch Cos., Inc. | | | | | | | | | | |
6.800% | | 01/15/2031 | | | | | 350,000 | | | 343,858 |
Bottling Group LLC | | | | | | | | | | |
5.500% | | 04/01/2016 | | †a | | | 500,000 | | | 502,960 |
Cia de Bebidas das Americas (Brazil) | | | | | | | | | | |
8.750% | | 09/15/2013 | | | | | 100,000 | | | 113,500 |
Coca-Cola Enterprises, Inc. | | | | | | | | | | |
8.500% | | 02/01/2022 | | | | | 500,000 | | | 615,197 |
Diageo Capital plc (United Kingdom) | | | | | | | | | | |
4.375% | | 05/03/2010 | | | | | 500,000 | | | 500,749 |
Diageo Finance BV (Netherlands) | | | | | | | | | | |
5.300% | | 10/28/2015 | | † | | | 750,000 | | | 731,236 |
| | | | | | | | | | |
| | | | | | | | | | 2,807,500 |
| | | | | | | | | | |
Biotechnology—0.1% | | | | | | | | | | |
Amgen, Inc. | | | | | | | | | | |
5.850% | | 06/01/2017 | | | | | 250,000 | | | 246,663 |
Genentech, Inc. | | | | | | | | | | |
5.250% | | 07/15/2035 | | | | | 100,000 | | | 90,956 |
Genentech, Inc. | | | | | | | | | | |
4.750% | | 07/15/2015 | | | | | 200,000 | | | 198,570 |
Genentech, Inc. | | | | | | | | | | |
4.400% | | 07/15/2010 | | | | | 100,000 | | | 101,551 |
| | | | | | | | | | |
| | | | | | | | | | 637,740 |
| | | | | | | | | | |
Building Products—0.1% | | | | | | | | | | |
CRH America, Inc. | | | | | | | | | | |
6.000% | | 09/30/2016 | | | | | 750,000 | | | 696,660 |
| | | | | | | | | | |
Capital Markets—3.1% | | | | | | | | | | |
Amvescap plc (Bermuda) | | | | | | | | | | |
5.375% | | 02/27/2013 | | | | | 100,000 | | | 94,251 |
Bear Stearns Cos, Inc. (The) | | | | | | | | | | |
7.625% | | 12/07/2009 | | | | | 1,000,000 | | | 1,034,079 |
Bear Stearns Cos, Inc. (The) | | | | | | | | | | |
7.250% | | 02/01/2018 | | | | | 250,000 | | | 261,342 |
Bear Stearns Cos, Inc. (The) | | | | | | | | | | |
6.950% | | 08/10/2012 | | | | | 500,000 | | | 520,348 |
Bear Stearns Cos, Inc. (The) | | | | | | | | | | |
5.700% | | 11/15/2014 | | | | | 50,000 | | | 48,384 |
Bear Stearns Cos, Inc. (The) | | | | | | | | | | |
4.500% | | 10/28/2010 | | | | | 500,000 | | | 494,014 |
Boston Properties, Inc. | | | | | | | | | | |
6.250% | | 01/15/2013 | | | | | 750,000 | | | 764,558 |
Camden Property Trust | | | | | | | | | | |
5.000% | | 06/15/2015 | | | | | 200,000 | | | 175,109 |
Citigroup, Inc. | | | | | | | | | | |
6.625% | | 06/15/2032 | | | | | 150,000 | | | 137,286 |
Citigroup, Inc. | | | | | | | | | | |
6.500% | | 01/18/2011 | | | | | 1,000,000 | | | 1,029,017 |
Citigroup, Inc. | | | | | | | | | | |
6.125% | | 11/21/2017 | | † | | | 750,000 | | | 721,037 |
Citigroup, Inc. | | | | | | | | | | |
6.000% | | 02/21/2012 | | | | | 350,000 | | | 353,113 |
6.000% | | 08/15/2017 | | | | | 600,000 | | | 573,306 |
Citigroup, Inc. | | | | | | | | | | |
5.850% | | 12/11/2034 | | | | | 500,000 | | | 422,475 |
Citigroup, Inc. | | | | | | | | | | |
5.625% | | 08/27/2012 | | | | | 150,000 | | | 147,706 |
Citigroup, Inc. | | | | | | | | | | |
5.000% | | 09/15/2014 | | | | | 1,513,000 | | | 1,403,111 |
Credit Suisse First Boston USA, Inc. | | | | | | | | | | |
6.500% | | 01/15/2012 | | | | | 350,000 | | | 363,499 |
Credit Suisse First Boston USA, Inc. | | | | | | | | | | |
6.125% | | 11/15/2011 | | | | | 1,000,000 | | | 1,027,448 |
Credit Suisse First Boston USA, Inc. | | | | | | | | | | |
5.500% | | 08/15/2013 | | † | | | 150,000 | | | 149,932 |
Credit Suisse First Boston USA, Inc. | | | | | | | | | | |
5.125% | | 01/15/2014 | | | | | 500,000 | | | 493,374 |
5.125% | | 08/15/2015 | | | | | 500,000 | | | 480,068 |
ERP Operating, LP | | | | | | | | | | |
5.375% | | 08/01/2016 | | † | | | 500,000 | | | 454,810 |
ERP Operating, LP | | | | | | | | | | |
5.200% | | 04/01/2013 | | | | | 250,000 | | | 238,573 |
Goldman Sachs Group, Inc. (The) | | | | | | | | | | |
7.350% | | 10/01/2009 | | | | | 750,000 | | | 770,471 |
Goldman Sachs Group, Inc. (The) | | | | | | | | | | |
6.875% | | 01/15/2011 | | | | | 250,000 | | | 259,671 |
Goldman Sachs Group, Inc. (The) | | | | | | | | | | |
6.600% | | 01/15/2012 | | | | | 650,000 | | | 668,906 |
| | | | |
| | See accompanying notes to financial statements. | | 173 |
SCHEDULE OF INVESTMENTS — (Continued)
June 30, 2008 (Unaudited)
Vantagepoint Core Bond Index Fund
| | | | | | | | | | |
Coupon Rate | | Maturity Date | | Face | | Value |
CORPORATE OBLIGATIONS—(Continued) | | | | | | | | | | |
Goldman Sachs Group, Inc. (The) | | | | | | | | | | |
6.250% | | 09/01/2017 | | † | | $ | 1,000,000 | | $ | 990,265 |
Goldman Sachs Group, Inc. (The) | | | | | | | | | | |
6.150% | | 04/01/2018 | | | | | 500,000 | | | 485,953 |
Goldman Sachs Group, Inc. (The) | | | | | | | | | | |
6.125% | | 02/15/2033 | | | | | 700,000 | | | 628,896 |
Goldman Sachs Group, Inc. (The) | | | | | | | | | | |
5.950% | | 01/15/2027 | | | | | 500,000 | | | 432,229 |
Goldman Sachs Group, Inc. (The) | | | | | | | | | | |
5.700% | | 09/01/2012 | | | | | 250,000 | | | 251,014 |
Goldman Sachs Group, Inc. (The) | | | | | | | | | | |
5.150% | | 01/15/2014 | | | | | 500,000 | | | 484,559 |
Goldman Sachs Group, Inc. (The) | | | | | | | | | | |
5.125% | | 01/15/2015 | | | | | 500,000 | | | 479,252 |
HCP, Inc. | | | | | | | | | | |
6.700% | | 01/30/2018 | | | | | 500,000 | | | 450,300 |
Jefferies Group, Inc. | | | | | | | | | | |
6.250% | | 01/15/2036 | | | | | 350,000 | | | 256,496 |
JPMorgan Chase & Co. | | | | | | | | | | |
6.625% | | 03/15/2012 | | | | | 1,500,000 | | | 1,548,095 |
JPMorgan Chase & Co. | | | | | | | | | | |
5.750% | | 01/02/2013 | | | | | 750,000 | | | 755,597 |
JPMorgan Chase & Co. | | | | | | | | | | |
5.375% | | 10/01/2012 | | | | | 270,000 | | | 271,067 |
JPMorgan Chase & Co. | | | | | | | | | | |
5.125% | | 09/15/2014 | | | | | 750,000 | | | 730,204 |
JPMorgan Chase & Co. | | | | | | | | | | |
4.750% | | 03/01/2015 | | † | | | 1,000,000 | | | 944,613 |
JPMorgan Chase & Co. | | | | | | | | | | |
4.500% | | 01/15/2012 | | † | | | 500,000 | | | 485,992 |
Lehman Brothers Holdings, Inc. | | | | | | | | | | |
7.875% | | 08/15/2010 | | | | | 1,000,000 | | | 1,029,358 |
Lehman Brothers Holdings, Inc. | | | | | | | | | | |
6.875% | | 07/17/2037 | | | | | 500,000 | | | 431,627 |
Lehman Brothers Holdings, Inc. | | | | | | | | | | |
6.625% | | 01/18/2012 | | | | | 750,000 | | | 742,635 |
Lehman Brothers Holdings, Inc. | | | | | | | | | | |
6.500% | | 07/19/2017 | | † | | | 500,000 | | | 463,327 |
Lehman Brothers Holdings, Inc. | | | | | | | | | | |
4.500% | | 07/26/2010 | | † | | | 500,000 | | | 482,704 |
Merrill Lynch & Co., Inc. (MTN) | | | | | | | | | | |
4.125% | | 09/10/2009 | | | | | 500,000 | | | 494,169 |
Merrill Lynch & Co., Inc. | | | | | | | | | | |
6.875% | | 04/25/2018 | | | | | 1,250,000 | | | 1,191,730 |
6.875% | | 11/15/2018 | | | | | 250,000 | | | 239,107 |
Merrill Lynch & Co., Inc. | | | | | | | | | | |
6.220% | | 09/15/2026 | | | | | 1,000,000 | | | 829,961 |
Morgan Stanley (MTN) | | | | | | | | | | |
6.625% | | 04/01/2018 | | † | | | 500,000 | | | 474,593 |
Morgan Stanley (MTN) | | | | | | | | | | |
5.450% | | 01/09/2017 | | | | | 1,000,000 | | | 909,731 |
Morgan Stanley | | | | | | | | | | |
8.000% | | 06/15/2010 | | | | | 750,000 | | | 772,018 |
Morgan Stanley | | | | | | | | | | |
7.250% | | 04/01/2032 | | | | | 100,000 | | | 96,747 |
Morgan Stanley | | | | | | | | | | |
6.750% | | 04/15/2011 | | | | | 500,000 | | | 513,220 |
Morgan Stanley | | | | | | | | | | |
5.950% | | 12/28/2017 | | | | | 500,000 | | | 454,698 |
Morgan Stanley | | | | | | | | | | |
4.750% | | 04/01/2014 | | | | | 1,000,000 | | | 912,346 |
Prologis | | | | | | | | | | |
5.625% | | 11/15/2016 | | | | | 250,000 | | | 231,913 |
Simon Property Group, LP | | | | | | | | | | |
6.350% | | 08/28/2012 | | | | | 250,000 | | | 250,741 |
Washington Mutual Bank FA | | | | | | | | | | |
5.650% | | 08/15/2014 | | | | | 250,000 | | | 195,237 |
| | | | | | | | | | |
| | | | | | | | | | 32,996,282 |
| | | | | | | | | | |
Chemicals—0.2% | | | | | | | | | | |
Dow Chemical Co. | | | | | | | | | | |
7.375% | | 11/01/2029 | | | | | 250,000 | | | 265,881 |
Dow Chemical Co. | | | | | | | | | | |
6.000% | | 10/01/2012 | | | | | 150,000 | | | 155,572 |
E.I. du Pont de Nemours & Co. | | | | | | | | | | |
6.875% | | 10/15/2009 | | † | | | 150,000 | | | 156,393 |
E.I. du Pont de Nemours & Co. | | | | | | | | | | |
4.750% | | 11/15/2012 | | † | | | 500,000 | | | 503,599 |
Monsanto Co. | | | | | | | | | | |
5.500% | | 08/15/2025 | | | | | 500,000 | | | 468,618 |
Potash Corp. of Saskatchewan (Canada) | | | | | | | | | | |
4.875% | | 03/01/2013 | | | | | 500,000 | | | 499,226 |
Praxair, Inc. | | | | | | | | | | |
3.950% | | 06/01/2013 | | | | | 150,000 | | | 144,517 |
Rohm & Haas Co. | | | | | | | | | | |
7.850% | | 07/15/2029 | | | | | 150,000 | | | 161,928 |
| | | | | | | | | | |
| | | | | | | | | | 2,355,734 |
| | | | | | | | | | |
Commercial Banks—2.1% | | | | | | | | | | |
BAC Capital Trust XI | | | | | | | | | | |
6.625% | | 05/23/2036 | | | | | 500,000 | | | 462,313 |
Bank of America Corp. | | | | | | | | | | |
7.750% | | 08/15/2015 | | | | | 750,000 | | | 808,477 |
Bank of America Corp. | | | | | | | | | | |
6.800% | | 03/15/2028 | | | | | 500,000 | | | 480,462 |
Bank of America Corp. | | | | | | | | | | |
5.750% | | 12/01/2017 | | | | | 1,000,000 | | | 940,782 |
Bank of America Corp. | | | | | | | | | | |
5.420% | | 03/15/2017 | | | | | 700,000 | | | 641,325 |
Bank of Tokyo-Mitsubishi Ltd. (The) (Japan) | | | | | | | | | | |
8.400% | | 04/15/2010 | | | | | 250,000 | | | 263,884 |
Bank of Tokyo-Mitsubishi UFJ Ltd. | | | | | | | | | | |
7.400% | | 06/15/2011 | | | | | 250,000 | | | 264,707 |
Bank One Corp. | | | | | | | | | | |
5.900% | | 11/15/2011 | | | | | 750,000 | | | 764,689 |
Barclays Bank plc (United Kingdom) | | | | | | | | | | |
5.450% | | 09/12/2012 | | | | | 1,000,000 | | | 1,012,557 |
BB&T Corp. | | | | | | | | | | |
5.250% | | 11/01/2019 | | | | | 500,000 | | | 429,409 |
Branch Banking & Trust Co. | | | | | | | | | | |
5.200% | | 12/23/2015 | | † | | | 650,000 | | | 600,673 |
Capital One Financial Corp. | | | | | | | | | | |
6.150% | | 09/01/2016 | | † | | | 500,000 | | | 441,450 |
Fifth Third Capital Trust IV | | | | | | | | | | |
6.500% | | 04/15/2067 | | # | | | 1,000,000 | | | 580,670 |
First Union Institutional Trust I Capital | | | | | | | | | | |
8.040% | | 12/01/2026 | | | | | 1,000,000 | | | 974,830 |
FleetBoston Financial Corp. | | | | | | | | | | |
6.875% | | 01/15/2028 | | | | | 150,000 | | | 157,417 |
HSBC Holdings plc (United Kingdom) | | | | | | | | | | |
5.250% | | 12/12/2012 | | | | | 150,000 | | | 150,140 |
JPMorgan Chase Bank NA | | | | | | | | | | |
6.000% | | 10/01/2017 | | | | | 500,000 | | | 486,569 |
Marshall & Ilsley Corp. | | | | | | | | | | |
4.375% | | 08/01/2009 | | | | | 500,000 | | | 491,084 |
National Australia Bank Ltd., Series A (Australia) | | | | | | | | | | |
8.600% | | 05/19/2010 | | | | | 1,000,000 | | | 1,070,603 |
National City Corp. | | | | | | | | | | |
6.875% | | 05/15/2019 | | † | | | 500,000 | | | 369,293 |
| | | | |
| 174 | | See accompanying notes to financial statements. | | |
SCHEDULE OF INVESTMENTS — (Continued)
June 30, 2008 (Unaudited)
Vantagepoint Core Bond Index Fund
| | | | | | | | | | |
Coupon Rate | | Maturity Date | | Face | | Value |
CORPORATE OBLIGATIONS—(Continued) | | | | | | | | | | |
PNC Funding Corp. | | | | | | | | | | |
5.250% | | 11/15/2015 | | | | $ | 200,000 | | $ | 185,542 |
Regions Bank | | | | | | | | | | |
6.450% | | 06/26/2037 | | | | | 500,000 | | | 369,572 |
Royal Bank of Canada (Canada) | | | | | | | | | | |
5.650% | | 07/20/2011 | | | | | 500,000 | | | 519,146 |
Royal Bank of Scotland Group plc (United Kingdom) | | | | | | | | | | |
5.000% | | 10/01/2014 | | | | | 750,000 | | | 719,680 |
Royal Bank of Scotland Group plc, Perpetual Bond (United Kingdom) | | | | | | | | | | |
7.648% | | 12/31/2049 | | # | | | 500,000 | | | 487,739 |
Suntrust Banks, Inc. | | | | | | | | | | |
5.200% | | 01/17/2017 | | | | | 250,000 | | | 225,107 |
Swiss Bank Corp. of New York | | | | | | | | | | |
7.375% | | 06/15/2017 | | | | | 100,000 | | | 106,470 |
Swiss Bank Corp. | | | | | | | | | | |
7.000% | | 10/15/2015 | | | | | 100,000 | | | 106,255 |
U.S. Bank NA, Series BKNT | | | | | | | | | | |
4.800% | | 04/15/2015 | | | | | 250,000 | | | 241,419 |
UBS AG/Stamford Branch (Switzerland) | | | | | | | | | | |
5.875% | | 07/15/2016 | | | | | 1,000,000 | | | 978,597 |
Wachovia Bank NA/Old | | | | | | | | | | |
4.875% | | 02/01/2015 | | † | | | 1,500,000 | | | 1,363,551 |
Wachovia Corp. | | | | | | | | | | |
5.300% | | 10/15/2011 | | | | | 500,000 | | | 489,252 |
Wachovia Corp. | | | | | | | | | | |
5.250% | | 08/01/2014 | | | | | 1,000,000 | | | 932,271 |
Wells Fargo & Co. | | | | | | | | | | |
7.550% | | 06/21/2010 | | | | | 750,000 | | | 791,384 |
Wells Fargo & Co. | | | | | | | | | | |
5.000% | | 11/15/2014 | | † | | | 750,000 | | | 742,045 |
Wells Fargo & Co. | | | | | | | | | | |
4.200% | | 01/15/2010 | | † | | | 500,000 | | | 501,643 |
Wells Fargo Bank NA | | | | | | | | | | |
6.450% | | 02/01/2011 | | | | | 1,000,000 | | | 1,045,614 |
Wells Fargo Bank NA | | | | | | | | | | |
5.950% | | 08/26/2036 | | | | | 500,000 | | | 469,644 |
Zions Bancorporation | | | | | | | | | | |
6.000% | | 09/15/2015 | | | | | 500,000 | | | 422,785 |
| | | | | | | | | | |
| | | | | | | | | | 22,089,050 |
| | | | | | | | | | |
Commercial Services—0.2% | | | | | | | | | | |
PHH Corp. | | | | | | | | | | |
7.125% | | 03/01/2013 | | | | | 100,000 | | | 89,608 |
RR Donnelley & Sons Co. | | | | | | | | | | |
4.950% | | 04/01/2014 | | | | | 550,000 | | | 504,604 |
Western Union Co. (The) | | | | | | | | | | |
5.400% | | 11/17/2011 | | | | | 1,000,000 | | | 995,306 |
| | | | | | | | | | |
| | | | | | | | | | 1,589,518 |
| | | | | | | | | | |
Commercial Services & Supplies—0.1% | | | | | | | | | | |
Waste Management, Inc. | | | | | | | | | | |
7.000% | | 07/15/2028 | | | | | 550,000 | | | 555,605 |
| | | | | | | | | | |
Communications Equipment—0.2% | | | | | | | | | | |
Cisco Systems, Inc. | | | | | | | | | | |
5.500% | | 02/22/2016 | | | | | 1,000,000 | | | 1,010,467 |
Motorola, Inc. | | | | | | | | | | |
7.500% | | 05/15/2025 | | | | | 500,000 | | | 468,767 |
Telefonica Europe BV (Netherlands) | | | | | | | | | | |
8.250% | | 09/15/2030 | | | | | 350,000 | | | 402,879 |
| | | | | | | | | | |
| | | | | | | | | | 1,882,113 |
| | | | | | | | | | |
Computers & Peripherals—0.1% | | | | | | | | | | |
International Business Machines Corp. | | | | | | | | | | |
7.000% | | 10/30/2025 | | | | | 500,000 | | | 537,901 |
International Business Machines Corp. | | | | | | | | | | |
4.750% | | 11/29/2012 | | | | | 250,000 | | | 253,710 |
| | | | | | | | | | |
| | | | | | | | | | 791,611 |
| | | | | | | | | | |
Construction Materials—0.1% | | | | | | | | | | |
Hanson plc (United Kingdom) | | | | | | | | | | |
6.125% | | 08/15/2016 | | | | | 500,000 | | | 496,872 |
Lafarge SA (France) | | | | | | | | | | |
6.500% | | 07/15/2016 | | | | | 750,000 | | | 724,865 |
| | | | | | | | | | |
| | | | | | | | | | 1,221,737 |
| | | | | | | | | | |
Consumer Finance—1.2% | | | | | | | | | | |
American Express Co. | | | | | | | | | | |
6.800% | | 09/01/2066 | | # | | | 1,000,000 | | | 925,948 |
American General Finance Corp. (MTN) | | | | | | | | | | |
5.400% | | 12/01/2015 | | | | | 750,000 | | | 637,436 |
Boeing Capital Corp. | | | | | | | | | | |
6.100% | | 03/01/2011 | | | | | 500,000 | | | 526,936 |
Capital One Bank | | | | | | | | | | |
5.125% | | 02/15/2014 | | | | | 500,000 | | | 486,691 |
CIT Group, Inc. (MTN) | | | | | | | | | | |
4.750% | | 12/15/2010 | | | | | 1,000,000 | | | 815,990 |
CIT Group, Inc. | | | | | | | | | | |
5.000% | | 02/13/2014 | | | | | 500,000 | | | 359,450 |
Household Finance Corp. | | | | | | | | | | |
8.000% | | 07/15/2010 | | | | | 750,000 | | | 784,642 |
Household Finance Corp. | | | | | | | | | | |
6.375% | | 10/15/2011 | | | | | 1,750,000 | | | 1,791,120 |
6.375% | | 11/27/2012 | | † | | | 1,000,000 | | | 1,026,376 |
HSBC Finance Capital Trust IX | | | | | | | | | | |
5.911% | | 11/30/2035 | | # | | | 500,000 | | | 401,390 |
HSBC Finance Corp. | | | | | | | | | | |
7.000% | | 05/15/2012 | | | | | 1,500,000 | | | 1,555,008 |
International Lease Finance Corp. (MTN) | | | | | | | | | | |
5.450% | | 03/24/2011 | | † | | | 1,000,000 | | | 940,325 |
John Deere Capital Corp. | | | | | | | | | | |
7.000% | | 03/15/2012 | | | | | 350,000 | | | 376,745 |
ORIX Corp. (Japan) | | | | | | | | | | |
5.480% | | 11/22/2011 | | | | | 250,000 | | | 231,363 |
SLM Corp. (MTN) | | | | | | | | | | |
5.000% | | 10/01/2013 | | † | | | 500,000 | | | 432,813 |
SLM Corp. | | | | | | | | | | |
5.450% | | 04/25/2011 | | † | | | 750,000 | | | 685,368 |
Textron Financial Corp. | | | | | | | | | | |
6.000% | | 11/20/2009 | | | | | 200,000 | | | 207,592 |
| | | | | | | | | | |
| | | | | | | | | | 12,185,193 |
| | | | | | | | | | |
Cosmetics/Personal Care—0.0% | | | | | | | | | | |
Procter & Gamble Co. | | | | | | | | | | |
5.800% | | 08/15/2034 | | | | | 250,000 | | | 252,168 |
| | | | | | | | | | |
Diversified Financial Services—1.8% | | | | | | | | | | |
Associates Corp of North America | | | | | | | | | | |
6.950% | | 11/01/2018 | | | | | 250,000 | | | 259,640 |
AXA Financial, Inc. | | | | | | | | | | |
7.750% | | 08/01/2010 | | | | | 100,000 | | | 105,483 |
BSCH Issuances Ltd. (Cayman Islands) | | | | | | | | | | |
7.625% | | 09/14/2010 | | | | | 350,000 | | | 371,732 |
China Development Bank (China) | | | | | | | | | | |
5.000% | | 10/15/2015 | | | | | 250,000 | | | 244,715 |
CIT Group Funding Co. of Canada (Canada) | | | | | | | | | | |
4.650% | | 07/01/2010 | | | | | 500,000 | | | 418,393 |
Citigroup Capital XXI | | | | | | | | | | |
8.300% | | 12/21/2077 | | # | | | 500,000 | | | 473,409 |
| | | | |
| | See accompanying notes to financial statements. | | 175 |
SCHEDULE OF INVESTMENTS — (Continued)
June 30, 2008 (Unaudited)
Vantagepoint Core Bond Index Fund
| | | | | | | | | |
Coupon Rate | | Maturity Date | | Face | | Value |
CORPORATE OBLIGATIONS—(Continued) | | | | | | | | | |
Deutsche Bank AG/London (Germany) | | | | | | | | | |
6.000% | | 09/01/2017 | | † | | $ | 500,000 $ | | 505,732 |
Deutsche Bank Financial, Inc. | | | | | | | | | |
5.375% | | 03/02/2015 | | | | | 250,000 | | 242,985 |
General Electric Capital Corp. (MTN) | | | | | | | | | |
6.750% | | 03/15/2032 | | | | | 750,000 | | 757,443 |
General Electric Capital Corp. (MTN) | | | | | | | | | |
6.000% | | 06/15/2012 | | | | | 1,000,000 | | 1,034,289 |
General Electric Capital Corp. (MTN) | | | | | | | | | |
5.875% | | 02/15/2012 | | | | | 500,000 | | 519,160 |
General Electric Capital Corp. (MTN) | | | | | | | | | |
5.625% | | 09/15/2017 | | | | | 750,000 | | 734,746 |
General Electric Capital Corp. (MTN) | | | | | | | | | |
5.400% | | 02/15/2017 | | | | | 750,000 | | 729,213 |
General Electric Capital Corp. (MTN) | | | | | | | | | |
4.625% | | 09/15/2009 | | | | | 1,000,000 | | 1,008,326 |
General Electric Capital Corp. | | | | | | | | | |
6.375% | | 11/15/2067 | | # | | | 1,000,000 | | 947,437 |
General Electric Capital Corp. | | | | | | | | | |
4.800% | | 05/01/2013 | | † | | | 1,000,000 | | 980,709 |
Goldman Sachs Group, Inc. (The) | | | | | | | | | |
6.345% | | 02/15/2034 | | † | | | 500,000 | | 425,088 |
KFW International Finance, Inc. (Germany) | | | | | | | | | |
8.000% | | 02/15/2010 | | | | | 250,000 | | 267,529 |
Kreditanstalt fuer Wiederaufbau (Germany) | | | | | | | | | |
4.500% | | 09/21/2009 | | † | | | 1,000,000 | | 1,019,013 |
Kreditanstalt fuer Wiederaufbau (Germany) | | | | | | | | | |
4.250% | | 06/15/2010 | | † | | | 1,000,000 | | 1,014,923 |
Kreditanstalt fuer Wiederaufbau (Germany) | | | | | | | | | |
4.125% | | 10/15/2014 | | | | | 1,000,000 | | 961,729 |
Kreditanstalt fuer Wiederaufbau (Germany) | | | | | | | | | |
3.250% | | 02/15/2011 | | | | | 1,000,000 | | 1,001,347 |
Kreditanstalt fuer Wiederaufbau (MTN) (Germany) | | | | | | | | | |
4.875% | | 01/17/2017 | | † | | | 1,000,000 | | 1,036,878 |
Landwirtschaftliche Rentenbank, Series G13 (Germany) | | | | | | | | | |
4.875% | | 11/16/2015 | | | | | 1,000,000 | | 1,037,667 |
MUFG Capital Finance 1 Ltd., Perpetual Bond (Cayman Islands) | | | | | | | | | |
6.346% | | 12/31/2049 | | # | | | 1,000,000 | | 868,099 |
National Rural Utilities Cooperative Finance Corp. (MTN) | | | | | | | | | |
7.250% | | 03/01/2012 | | | | | 500,000 | | 532,678 |
Oesterreichische Kontrollbank AG (Austria) | | | | | | | | | |
4.750% | | 11/08/2011 | | | | | 1,000,000 | | 1,036,203 |
Unilever Capital Corp. | | | | | | | | | |
7.125% | | 11/01/2010 | | | | | 500,000 | | 533,846 |
| | | | | | | | | |
| | | | | | | | | 19,068,412 |
| | | | | | | | | |
Diversified Telecommunication Services—1.3% | | | | | | | | | |
AT&T Corp. | | | | | | | | | |
7.300% | | 11/15/2011 | | | | | 1,000,000 | | 1,065,880 |
AT&T, Inc. | | | | | | | | | |
5.625% | | 06/15/2016 | | | | | 500,000 | | 495,945 |
Bellsouth Capital Funding Corp. | | | | | | | | | |
7.875% | | 02/15/2030 | | | | | 900,000 | | 996,854 |
BellSouth Corp. | | | | | | | | | |
6.875% | | 10/15/2031 | | | | | 350,000 | | 350,637 |
BellSouth Corp. | | | | | | | | | |
6.000% | | 10/15/2011 | | † | | | 250,000 | | 257,683 |
British Telecommunications plc (United Kingdom) | | | | | | | | | |
9.125% | | 12/15/2030 | | | | | 150,000 | | 180,788 |
British Telecommunications plc (United Kingdom) | | | | | | | | | |
8.625% | | 12/15/2010 | | | | | 1,000,000 | | 1,074,343 |
Deutsche Telekom International Finance BV (Netherlands) | | | | | | | | | |
8.750% | | 06/15/2030 | | | | | 750,000 | | 862,786 |
Deutsche Telekom International Finance BV (Netherlands) | | | | | | | | | |
8.500% | | 06/15/2010 | | | | | 700,000 | | 740,855 |
Embarq Corp. | | | | | | | | | |
7.082% | | 06/01/2016 | | | | | 500,000 | | 475,579 |
France Telecom SA (France) | | | | | | | | | |
8.500% | | 03/01/2031 | | | | | 500,000 | | 606,895 |
France Telecom SA (France) | | | | | | | | | |
7.750% | | 03/01/2011 | | | | | 100,000 | | 105,968 |
Koninklijke KPN NV (Netherlands) | | | | | | | | | |
8.375% | | 10/01/2030 | | | | | 500,000 | | 576,369 |
Koninklijve KPN NV (Netherlands) | | | | | | | | | |
8.000% | | 10/01/2010 | | | | | 350,000 | | 370,503 |
Qwest Corp. | | | | | | | | | |
6.500% | | 06/01/2017 | | | | | 500,000 | | 448,750 |
SBC Communications, Inc. | | | | | | | | | |
6.250% | | 03/15/2011 | | † | | | 250,000 | | 258,666 |
SBC Communications, Inc. | | | | | | | | | |
6.150% | | 09/15/2034 | | | | | 500,000 | | 468,648 |
Telecom Italia Capital SA (Luxembourg) | | | | | | | | | |
6.000% | | 09/30/2034 | | | | | 250,000 | | 214,603 |
Telecom Italia Capital SA (Luxembourg) | | | | | | | | | |
5.250% | | 11/15/2013 | | | | | 350,000 | | 331,004 |
Telecom Italia Capital SA (Luxembourg) | | | | | | | | | |
4.950% | | 09/30/2014 | | | | | 500,000 | | 458,225 |
Telefonica Emisiones SAU (Spain) | | | | | | | | | |
6.421% | | 06/20/2016 | | | | | 500,000 | | 508,322 |
Verizon Communications, Inc. | | | | | | | | | |
5.850% | | 09/15/2035 | | | | | 750,000 | | 663,138 |
Verizon Global Funding Corp. | | | | | | | | | |
7.750% | | 12/01/2030 | | † | | | 750,000 | | 807,923 |
Verizon Global Funding Corp. | | | | | | | | | |
7.375% | | 09/01/2012 | | | | | 1,000,000 | | 1,079,919 |
Verizon Pennsylvania, Inc., Series A | | | | | | | | | |
5.650% | | 11/15/2011 | | † | | | 350,000 | | 352,731 |
Verizon Virginia, Inc., Series A | | | | | | | | | |
4.625% | | 03/15/2013 | | | | | 250,000 | | 241,922 |
| | | | | | | | | |
| | | | | | | | | 13,994,936 |
| | | | | | | | | |
Electric Utilities—1.4% | | | | | | | | | |
Alabama Power Co., Series Q | | | | | | | | | |
5.500% | | 10/15/2017 | | | | | 150,000 | | 151,365 |
American Electric Power Co., Inc., Series C | | | | | | | | | |
5.375% | | 03/15/2010 | | | | | 250,000 | | 252,728 |
Arizona Public Service Co. | | | | | | | | | |
6.500% | | 03/01/2012 | | | | | 150,000 | | 151,384 |
Columbus Southern Power Co., Series C | | | | | | | | | |
5.500% | | 03/01/2013 | | | | | 150,000 | | 150,226 |
Consolidated Edison Co. of New York, Inc., Series 06-C | | | | | | | | | |
5.500% | | 09/15/2016 | | | | | 500,000 | | 496,606 |
Constellation Energy Group, Inc. | | | | | | | | | |
7.600% | | 04/01/2032 | | | | | 150,000 | | 150,664 |
Constellation Energy Group, Inc. | | | | | | | | | |
7.000% | | 04/01/2012 | | | | | 500,000 | | 518,837 |
Consumers Energy Co., Series P | | | | | | | | | |
5.500% | | 08/15/2016 | | | | | 150,000 | | 148,033 |
Dominion Resources, Inc./VA | | | | | | | | | |
5.700% | | 09/17/2012 | | | | | 250,000 | | 254,070 |
DTE Energy Co. | | | | | | | | | |
7.050% | | 06/01/2011 | | | | | 350,000 | | 362,856 |
Duke Energy Carolinas LLC | | | | | | | | | |
6.450% | | 10/15/2032 | | | | | 500,000 | | 508,703 |
Duke Energy Ohio, Inc. | | | | | | | | | |
5.700% | | 09/15/2012 | | | | | 150,000 | | 152,552 |
Exelon Corp. | | | | | | | | | |
4.900% | | 06/15/2015 | | | | | 350,000 | | 322,509 |
| | | | |
| 176 | | See accompanying notes to financial statements. | | |
SCHEDULE OF INVESTMENTS — (Continued)
June 30, 2008 (Unaudited)
Vantagepoint Core Bond Index Fund
| | | | | | | | | | |
Coupon Rate | | Maturity Date | | Face | | Value |
CORPORATE OBLIGATIONS—(Continued) | | | | | | | | | | |
Exelon Generation Co. LLC | | | | | | | | | | |
6.950% | | 06/15/2011 | | | | $ | 500,000 | | $ | 517,127 |
FirstEnergy Corp., Series B | | | | | | | | | | |
6.450% | | 11/15/2011 | | | | | 175,000 | | | 179,702 |
FirstEnergy Corp., Series C | | | | | | | | | | |
7.375% | | 11/15/2031 | | | | | 250,000 | | | 272,636 |
Florida Power & Light Co. | | | | | | | | | | |
5.625% | | 04/01/2034 | | | | | 50,000 | | | 47,376 |
Florida Power & Light Co. | | | | | | | | | | |
4.950% | | 06/01/2035 | | | | | 500,000 | | | 429,233 |
Florida Power & Light Co. | | | | | | | | | | |
4.850% | | 02/01/2013 | | | | | 150,000 | | | 150,538 |
Jersey Central Power & Light | | | | | | | | | | |
5.625% | | 05/01/2016 | | | | | 500,000 | | | 483,444 |
Midamerican Energy Holdings Co. | | | | | | | | | | |
6.750% | | 12/30/2031 | | | | | 250,000 | | | 262,182 |
Midamerican Energy Holdings Co. | | | | | | | | | | |
6.125% | | 04/01/2036 | | † | | | 500,000 | | | 481,695 |
Midamerican Energy Holdings Co., Series D | | | | | | | | | | |
5.000% | | 02/15/2014 | | | | | 150,000 | | | 146,388 |
National Grid plc (United Kingdom) | | | | | | | | | | |
6.300% | | 08/01/2016 | | | | | 250,000 | | | 250,720 |
Nisource Finance Corp. | | | | | | | | | | |
7.875% | | 11/15/2010 | | | | | 50,000 | | | 51,879 |
Nisource Finance Corp. | | | | | | | | | | |
5.450% | | 09/15/2020 | | | | | 500,000 | | | 437,201 |
Northern States Power Co. | | | | | | | | | | |
6.250% | | 06/01/2036 | | | | | 500,000 | | | 512,817 |
Northern States Power Co., Series B | | | | | | | | | | |
8.000% | | 08/28/2012 | | | | | 150,000 | | | 167,820 |
Ohio Power Co., Series K | | | | | | | | | | |
6.000% | | 06/01/2016 | | | | | 500,000 | | | 496,773 |
Oncor Electric Delivery Co. | | | | | | | | | | |
6.375% | | 05/01/2012 | | | | | 350,000 | | | 354,858 |
Ontario Electricity Financial Corp. (Canada) | | | | | | | | | | |
7.450% | | 03/31/2013 | | | | | 350,000 | | | 393,437 |
Pacific Gas & Electric Co. | | | | | | | | | | |
6.050% | | 03/01/2034 | | † | | | 500,000 | | | 483,654 |
Pepco Holdings, Inc. | | | | | | | | | | |
6.450% | | 08/15/2012 | | | | | 150,000 | | | 152,904 |
PPL Capital Funding, Inc., Series A | | | | | | | | | | |
6.700% | | 03/30/2067 | | # | | | 500,000 | | | 427,188 |
Progress Energy, Inc. | | | | | | | | | | |
7.750% | | 03/01/2031 | | | | | 250,000 | | | 286,500 |
Progress Energy, Inc. | | | | | | | | | | |
7.100% | | 03/01/2011 | | | | | 188,000 | | | 197,940 |
PSEG Power LLC | | | | | | | | | | |
8.625% | | 04/15/2031 | | | | | 500,000 | | | 604,324 |
Scottish Power Ltd. (United Kingdom) | | | | | | | | | | |
5.375% | | 03/15/2015 | | | | | 500,000 | | | 477,534 |
South Carolina Electric & Gas Co. | | | | | | | | | | |
5.300% | | 05/15/2033 | | | | | 150,000 | | | 133,714 |
Southern California Edison Co. | | | | | | | | | | |
6.650% | | 04/01/2029 | | | | | 500,000 | | | 514,877 |
Southern Power Co., Series D | | | | | | | | | | |
4.875% | | 07/15/2015 | | † | | | 1,000,000 | | | 947,007 |
Union Electric Co. | | | | | | | | | | |
6.400% | | 06/15/2017 | | a | | | 500,000 | | | 499,877 |
Virginia Electric and Power Co. | | | | | | | | | | |
5.400% | | 04/30/2018 | | | | | 500,000 | | | 483,575 |
Wisconsin Electric Power | | | | | | | | | | |
5.625% | | 05/15/2033 | | | | | 250,000 | | | 231,635 |
| | | | | | | | | | |
| | | | | | | | | | 14,697,088 |
| | | | | | | | | | |
Electrical Equipment—0.0% | | | | | | | | | | |
Emerson Electric Co. | | | | | | | | | | |
5.000% | | 12/15/2014 | | | | | 150,000 | | | 149,934 |
| | | | | | | | | | |
Electronic Equipment & Instruments—0.0% | | | | | | | | | | |
Arrow Electronics, Inc. | | | | | | | | | | |
6.875% | | 07/01/2013 | | | | | 250,000 | | | 255,594 |
| | | | | | | | | | |
Energy Equipment & Services—0.0% | | | | | | | | | | |
Transocean, Inc. (Cayman Islands) | | | | | | | | | | |
6.800% | | 03/15/2038 | | | | | 500,000 | | | 513,015 |
| | | | | | | | | | |
Food—0.5% | | | | | | | | | | |
Campbell Soup Co. | | | | | | | | | | |
4.875% | | 10/01/2013 | | | | | 250,000 | | | 250,524 |
ConAgra Foods, Inc. | | | | | | | | | | |
7.125% | | 10/01/2026 | | | | | 500,000 | | | 528,904 |
ConAgra Foods, Inc. | | | | | | | | | | |
6.750% | | 09/15/2011 | | | | | 97,000 | | | 101,077 |
ConAgra Foods, Inc. | | | | | | | | | | |
5.819% | | 06/15/2017 | | | | | 153,000 | | | 153,566 |
General Mills, Inc. | | | | | | | | | | |
5.700% | | 02/15/2017 | | | | | 500,000 | | | 496,443 |
HJ Heinz Co. | | | | | | | | | | |
6.625% | | 07/15/2011 | | | | | 250,000 | | | 261,276 |
Kellogg Co., Series B | | | | | | | | | | |
6.600% | | 04/01/2011 | | † | | | 750,000 | | | 789,568 |
Kraft Foods, Inc. | | | | | | | | | | |
6.875% | | 02/01/2038 | | † | | | 500,000 | | | 487,609 |
Kraft Foods, Inc. | | | | | | | | | | |
6.500% | | 11/01/2031 | | | | | 100,000 | | | 92,822 |
Kraft Foods, Inc. | | | | | | | | | | |
5.625% | | 11/01/2011 | | | | | 1,100,000 | | | 1,110,678 |
Kroger Co. (The) | | | | | | | | | | |
7.500% | | 04/01/2031 | | † | | | 200,000 | | | 219,136 |
Safeway, Inc. | | | | | | | | | | |
7.500% | | 09/15/2009 | | | | | 800,000 | | | 826,406 |
| | | | | | | | | | |
| | | | | | | | | | 5,318,009 |
| | | | | | | | | | |
Gas Utilities—0.0% | | | | | | | | | | |
KeySpan Corp. | | | | | | | | | | |
7.625% | | 11/15/2010 | | | | | 350,000 | | | 373,498 |
| | | | | | | | | | |
Healthcare—Products—0.1% | | | | | | | | | | |
Baxter International, Inc. | | | | | | | | | | |
5.900% | | 09/01/2016 | | | | | 750,000 | | | 769,201 |
Johnson & Johnson | | | | | | | | | | |
4.950% | | 05/15/2033 | | | | | 200,000 | | | 183,278 |
| | | | | | | | | | |
| | | | | | | | | | 952,479 |
| | | | | | | | | | |
Healthcare—Services—0.2% | | | | | | | | | | |
Aetna, Inc. | | | | | | | | | | |
6.625% | | 06/15/2036 | | | | | 250,000 | | | 240,809 |
UnitedHealth Group, Inc. | | | | | | | | | | |
6.000% | | 02/15/2018 | | | | | 500,000 | | | 484,535 |
UnitedHealth Group, Inc. | | | | | | | | | | |
5.375% | | 03/15/2016 | | | | | 500,000 | | | 470,477 |
WellPoint, Inc. | | | | | | | | | | |
6.800% | | 08/01/2012 | | | | | 150,000 | | | 155,400 |
WellPoint, Inc. | | | | | | | | | | |
5.250% | | 01/15/2016 | | | | | 1,000,000 | | | 941,328 |
| | | | | | | | | | |
| | | | | | | | | | 2,292,549 |
| | | | | | | | | | |
Household Products/Wares—0.1% | | | | | | | | | | |
Fortune Brands, Inc. | | | | | | | | | | |
5.375% | | 01/15/2016 | | † | | | 750,000 | | | 703,421 |
Kimberly-Clark Corp. | | | | | | | | | | |
6.125% | | 08/01/2017 | | | | | 500,000 | | | 520,078 |
| | | | |
| | See accompanying notes to financial statements. | | 177 |
SCHEDULE OF INVESTMENTS — (Continued)
June 30, 2008 (Unaudited)
Vantagepoint Core Bond Index Fund
| | | | | | | | | | |
Coupon Rate | | Maturity Date | | Face | | Value |
CORPORATE OBLIGATIONS—(Continued) | | | | | | | | | | |
Kimberly-Clark Corp. | | | | | | | | | | |
5.625% | | 02/15/2012 | | | | $ | 250,000 | | $ | 259,814 |
| | | | | | | | | | |
| | | | | | | | | | 1,483,313 |
| | | | | | | | | | |
Insurance—0.9% | | | | | | | | | | |
AEGON Funding Co. LLC (Netherlands) | | | | | | | | | | |
5.750% | | 12/15/2020 | | | | | 500,000 | | | 470,637 |
Allstate Corp. (The) | | | | | | | | | | |
5.350% | | 06/01/2033 | | | | | 500,000 | | | 421,200 |
American International Group, Inc. | | | | | | | | | | |
5.850% | | 01/16/2018 | | | | | 1,000,000 | | | 938,522 |
American International Group, Inc. | | | | | | | | | | |
5.050% | | 10/01/2015 | | | | | 750,000 | | | 680,560 |
American International Group, Inc. | | | | | | | | | | |
4.250% | | 05/15/2013 | | † | | | 100,000 | | | 91,923 |
Assurant, Inc. | | | | | | | | | | |
5.625% | | 02/15/2014 | | | | | 500,000 | | | 474,490 |
AXA SA (France) | | | | | | | | | | |
8.600% | | 12/15/2030 | | | | | 250,000 | | | 269,960 |
Berkshire Hathaway Finance Corp. | | | | | | | | | | |
4.125% | | 01/15/2010 | | | | | 500,000 | | | 505,123 |
Chubb Corp. | | | | | | | | | | |
6.375% | | 03/29/2067 | | # | | | 500,000 | | | 458,117 |
Cincinnati Financial Corp. | | | | | | | | | | |
6.125% | | 11/01/2034 | | | | | 500,000 | | | 443,383 |
Hartford Financial Services Group, Inc. | | | | | | | | | | |
6.100% | | 10/01/2041 | | | | | 150,000 | | | 132,046 |
ING Capital Funding Trust III, Perpetual Bond | | | | | | | | | | |
8.439% | | 12/31/2049 | | # | | | 150,000 | | | 151,644 |
Lincoln National Corp. | | | | | | | | | | |
6.150% | | 04/07/2036 | | | | | 250,000 | | | 231,118 |
Marsh & McLennan Cos., Inc. | | | | | | | | | | |
5.750% | | 09/15/2015 | | | | | 1,000,000 | | | 992,901 |
MetLife, Inc. | | | | | | | | | | |
5.700% | | 06/15/2035 | | | | | 500,000 | | | 442,294 |
MetLife, Inc. | | | | | | | | | | |
5.000% | | 06/15/2015 | | | | | 1,000,000 | | | 972,928 |
Progressive Corp. (The) | | | | | | | | | | |
6.625% | | 03/01/2029 | | | | | 150,000 | | | 152,183 |
Prudential Financial, Inc. (MTN) | | | | | | | | | | |
5.100% | | 09/20/2014 | | | | | 500,000 | | | 487,818 |
Prudential Financial, Inc. | | | | | | | | | | |
5.700% | | 12/14/2036 | | † | | | 250,000 | | | 212,686 |
Radian Group, Inc. | | | | | | | | | | |
5.625% | | 02/15/2013 | | | | | 100,000 | | | 50,421 |
Travelers Property Casualty Corp. | | | | | | | | | | |
7.750% | | 04/15/2026 | | | | | 500,000 | | | 531,148 |
| | | | | | | | | | |
| | | | | | | | | | 9,111,102 |
| | | | | | | | | | |
IT Services—0.0% | | | | | | | | | | |
Computer Sciences Corp. | | | | | | | | | | |
7.375% | | 06/15/2011 | | | | | 100,000 | | | 105,055 |
Electronic Data Systems Corp., Series B | | | | | | | | | | |
6.500% | | 08/01/2013 | | | | | 150,000 | | | 154,225 |
| | | | | | | | | | |
| | | | | | | | | | 259,280 |
| | | | | | | | | | |
Lodging—0.0% | | | | | | | | | | |
Wyndham Worldwide Corp. | | | | | | | | | | |
6.000% | | 12/01/2016 | | | | | 435,000 | | | 384,745 |
| | | | | | | | | | |
Machinery—0.4% | | | | | | | | | | |
3M Co. | | | | | | | | | | |
5.700% | | 03/15/2037 | | | | | 250,000 | | | 253,347 |
Caterpillar, Inc. | | | | | | | | | | |
7.250% | | 09/15/2009 | | | | | 750,000 | | | 780,733 |
Caterpillar, Inc. | | | | | | | | | | |
6.050% | | 08/15/2036 | | | | | 500,000 | | | 498,284 |
Deere & Co. | | | | | | | | | | |
6.950% | | 04/25/2014 | | | | | 250,000 | | | 274,221 |
General Electric Co. | | | | | | | | | | |
5.000% | | 02/01/2013 | | | | | 800,000 | | | 806,575 |
Honeywell International, Inc. | | | | | | | | | | |
7.500% | | 03/01/2010 | | † | | | 1,000,000 | | | 1,064,460 |
Honeywell International, Inc. | | | | | | | | | | |
6.125% | | 11/01/2011 | | | | | 250,000 | | | 265,420 |
Tyco International Group SA (Luxembourg) | | | | | | | | | | |
6.375% | | 10/15/2011 | | | | | 400,000 | | | 409,633 |
| | | | | | | | | | |
| | | | | | | | | | 4,352,673 |
| | | | | | | | | | |
Media—1.0% | | | | | | | | | | |
British Sky Broadcasting Group plc (United Kingdom) | | | | | | | | | | |
8.200% | | 07/15/2009 | | | | | 250,000 | | | 258,093 |
CBS Corp. | | | | | | | | | | |
7.875% | | 07/30/2030 | | | | | 250,000 | | | 242,861 |
CBS Corp. | | | | | | | | | | |
5.625% | | 08/15/2012 | | † | | | 50,000 | | | 49,384 |
Comcast Corp. | | | | | | | | | | |
7.050% | | 03/15/2033 | | | | | 500,000 | | | 509,480 |
Comcast Corp. | | | | | | | | | | |
6.950% | | 08/15/2037 | | | | | 400,000 | | | 394,648 |
Comcast Corp. | | | | | | | | | | |
6.450% | | 03/15/2037 | | † | | | 500,000 | | | 466,800 |
Comcast Corp. | | | | | | | | | | |
5.850% | | 01/15/2010 | | | | | 1,000,000 | | | 1,015,693 |
Comcast Corp. | | | | | | | | | | |
5.650% | | 06/15/2035 | | † | | | 500,000 | | | 426,216 |
Comcast Corp. | | | | | | | | | | |
5.300% | | 01/15/2014 | | | | | 500,000 | | | 485,243 |
COX Communications, Inc. | | | | | | | | | | |
5.500% | | 10/01/2015 | | | | | 75,000 | | | 72,395 |
COX Communications, Inc. | | | | | | | | | | |
5.450% | | 12/15/2014 | | | | | 300,000 | | | 288,675 |
COX Communications, Inc. | | | | | | | | | | |
4.625% | | 06/01/2013 | | | | | 250,000 | | | 236,924 |
News America Holdings, Inc. | | | | | | | | | | |
8.000% | | 10/17/2016 | | | | | 150,000 | | | 166,946 |
News America Holdings, Inc. | | | | | | | | | | |
7.750% | | 12/01/2045 | | | | | 200,000 | | | 214,095 |
News America Holdings, Inc. | | | | | | | | | | |
6.400% | | 12/15/2035 | | | | | 500,000 | | | 474,638 |
News America Holdings, Inc. | | | | | | | | | | |
5.300% | | 12/15/2014 | | | | | 500,000 | | | 490,785 |
Omnicom Group, Inc. | | | | | | | | | | |
5.900% | | 04/15/2016 | | | | | 500,000 | | | 489,297 |
Time Warner Entertainment Co. LP | | | | | | | | | | |
8.375% | | 07/15/2033 | | | | | 500,000 | | | 542,608 |
Time Warner Entertainment Co., LP | | | | | | | | | | |
8.375% | | 03/15/2023 | | | | | 500,000 | | | 539,966 |
Time Warner, Inc. | | | | | | | | | | |
7.625% | | 04/15/2031 | | | | | 500,000 | | | 508,999 |
Time Warner, Inc. | | | | | | | | | | |
6.875% | | 05/01/2012 | | † | | | 150,000 | | | 153,585 |
Time Warner, Inc. | | | | | | | | | | |
5.875% | | 11/15/2016 | | | | | 1,000,000 | | | 944,477 |
Viacom, Inc. | | | | | | | | | | |
6.250% | | 04/30/2016 | | | | | 1,000,000 | | | 967,340 |
Walt Disney Co. (MTN) | | | | | | | | | | |
7.000% | | 03/01/2032 | | † | | | 500,000 | | | 572,765 |
| | | | | | | | | | |
| | | | | | | | | | 10,511,913 |
| | | | | | | | | | |
| | | | |
| 178 | | See accompanying notes to financial statements. | | |
SCHEDULE OF INVESTMENTS — (Continued)
June 30, 2008 (Unaudited)
Vantagepoint Core Bond Index Fund
| | | | | | | | | | |
Coupon Rate | | Maturity Date | | Face | | Value |
CORPORATE OBLIGATIONS—(Continued) | | | | | | | | | | |
Metals & Mining—0.2% | | | | | | | | | | |
Alcan, Inc. (Canada) | | | | | | | | | | |
6.125% | | 12/15/2033 | | | | $ | 150,000 | | $ | 135,399 |
Alcan, Inc. (Canada) | | | | | | | | | | |
4.875% | | 09/15/2012 | | | | | 350,000 | | | 341,037 |
Alcoa, Inc. | | | | | | | | | | |
5.550% | | 02/01/2017 | | | | | 750,000 | | | 703,432 |
BHP Finance USA (Australia) | | | | | | | | | | |
4.800% | | 04/15/2013 | | | | | 150,000 | | | 146,583 |
Southern Copper Corp. | | | | | | | | | | |
7.500% | | 07/27/2035 | | | | | 250,000 | | | 246,048 |
Vale Overseas Ltd. (Cayman Islands) | | | | | | | | | | |
6.875% | | 11/21/2036 | | | | | 600,000 | | | 560,241 |
Vale Overseas Ltd. (Cayman Islands) | | | | | | | | | | |
6.250% | | 01/23/2017 | | | | | 250,000 | | | 243,244 |
| | | | | | | | | | |
| | | | | | | | | | 2,375,984 |
| | | | | | | | | | |
Multi-National—1.0% | | | | | | | | | | |
Asian Development Bank/Pasig (MTN) (Supranational) | | | | | | | | | | |
5.500% | | 06/27/2016 | | | | | 750,000 | | | 806,438 |
Asian Development Bank/Pasig (Supranational) | | | | | | | | | | |
4.125% | | 09/15/2010 | | | | | 1,000,000 | | | 1,021,706 |
European Investment Bank (Supranational) | | | | | | | | | | |
5.125% | | 09/13/2016 | | | | | 1,000,000 | | | 1,052,667 |
European Investment Bank (Supranational) | | | | | | | | | | |
4.625% | | 03/21/2012 | | | | | 1,000,000 | | | 1,033,867 |
4.625% | | 05/15/2014 | | | | | 500,000 | | | 515,094 |
European Investment Bank (Supranational) | | | | | | | | | | |
4.125% | | 09/15/2010 | | | | | 1,500,000 | | | 1,534,166 |
European Investment Bank (Supranational) | | | | | | | | | | |
4.000% | | 03/03/2010 | | † | | | 1,000,000 | | | 1,018,149 |
European Investment Bank (Supranational) | | | | | | | | | | |
3.375% | | 06/12/2013 | | † | | | 500,000 | | | 492,470 |
Inter-American Development Bank (Supranational) | | | | | | | | | | |
7.375% | | 01/15/2010 | | | | | 750,000 | | | 796,328 |
International Bank for Reconstruction & Development (Supranational) | | | | | | | | | | |
7.625% | | 01/19/2023 | | | | | 1,000,000 | | | 1,290,689 |
International Bank for Reconstruction & Development (Supranational) | | | | | | | | | | |
4.125% | | 08/12/2009 | | | | | 350,000 | | | 354,425 |
International Finance Corp. (Supranational) | | | | | | | | | | |
5.125% | | 05/02/2011 | | | | | 1,000,000 | | | 1,050,452 |
| | | | | | | | | | |
| | | | | | | | | | 10,966,451 |
| | | | | | | | | | |
Office Electronics—0.1% | | | | | | | | | | |
Pitney Bowes, Inc. (MTN) | | | | | | | | | | |
4.750% | | 01/15/2016 | | | | | 200,000 | | | 187,818 |
Pitney Bowes, Inc. | | | | | | | | | | |
5.000% | | 03/15/2015 | | † | | | 500,000 | | | 494,312 |
Xerox Corp. | | | | | | | | | | |
6.875% | | 08/15/2011 | | | | | 750,000 | | | 777,784 |
| | | | | | | | | | |
| | | | | | | | | | 1,459,914 |
| | | | | | | | | | |
Oil, Gas & Consumable Fuels—1.4% | | | | | | | | | | |
Alberta Energy Co. Ltd. (Canada) | | | | | | | | | | |
7.375% | | 11/01/2031 | | | | | 400,000 | | | 426,270 |
Anadarko Petroleum Corp. | | | | | | | | | | |
6.450% | | 09/15/2036 | | | | | 500,000 | | | 495,131 |
Apache Finance Canada Corp. (Canada) | | | | | | | | | | |
7.750% | | 12/15/2029 | | | | | 150,000 | | | 177,072 |
Canadian Natural Resources Ltd. (Canada) | | | | | | | | | | |
5.850% | | 02/01/2035 | | | | | 500,000 | | | 451,652 |
Canadian Natural Resources Ltd. (Canada) | | | | | | | | | | |
5.450% | | 10/01/2012 | | | | | 250,000 | | | 252,511 |
CenterPoint Energy Resources Corp., Series B | | | | | | | | | | |
7.875% | | 04/01/2013 | | | | | 850,000 | | | 910,829 |
Conoco, Inc. | | | | | | | | | | |
6.950% | | 04/15/2029 | | | | | 1,250,000 | | | 1,374,841 |
DCP Midstream LLC | | | | | | | | | | |
7.875% | | 08/16/2010 | | | | | 350,000 | | | 367,491 |
Devon Financing Corp. ULC | | | | | | | | | | |
7.875% | | 09/30/2031 | | | | | 500,000 | | | 592,259 |
Devon Financing Corp. ULC | | | | | | | | | | |
6.875% | | 09/30/2011 | | | | | 750,000 | | | 796,597 |
Energy Transfer Partners, LP | | | | | | | | | | |
5.950% | | 02/01/2015 | | | | | 750,000 | | | 739,507 |
Enterprise Products Operating, LP | | | | | | | | | | |
4.950% | | 06/01/2010 | | | | | 150,000 | | | 150,035 |
Enterprise Products Operating, LP, Series B | | | | | | | | | | |
5.600% | | 10/15/2014 | | | | | 150,000 | | | 147,132 |
Enterprise Products Partners, LP, Series B | | | | | | | | | | |
6.875% | | 03/01/2033 | | | | | 150,000 | | | 147,706 |
Hess Corp. | | | | | | | | | | |
7.300% | | 08/15/2031 | | | | | 250,000 | | | 280,033 |
Hess Corp. | | | | | | | | | | |
6.650% | | 08/15/2011 | | | | | 150,000 | | | 157,438 |
Kinder Morgan Energy Partners, LP | | | | | | | | | | |
7.300% | | 08/15/2033 | | | | | 500,000 | | | 513,070 |
Marathon Oil Corp. | | | | | | | | | | |
6.125% | | 03/15/2012 | | | | | 350,000 | | | 359,779 |
Nexen, Inc. (Canada) | | | | | | | | | | |
6.400% | | 05/15/2037 | | | | | 500,000 | | | 474,924 |
Nexen, Inc. (Canada) | | | | | | | | | | |
5.050% | | 11/20/2013 | | | | | 250,000 | | | 244,567 |
Pemex Project Funding Master Trust | | | | | | | | | | |
9.375% | | 12/02/2008 | | | | | 177,000 | | | 181,425 |
Pemex Project Funding Master Trust | | | | | | | | | | |
9.125% | | 10/13/2010 | | a | | | 80,000 | | | 87,400 |
Pemex Project Funding Master Trust | | | | | | | | | | |
6.625% | | 06/15/2035 | | † | | | 500,000 | | | 495,802 |
Petrobras International Finance Co. (Cayman Islands) | | | | | | | | | | |
6.125% | | 10/06/2016 | | | | | 500,000 | | | 502,500 |
Petro-Canada (Canada) | | | | | | | | | | |
5.950% | | 05/15/2035 | | | | | 250,000 | | | 220,346 |
Suncor Energy, Inc. (Canada) | | | | | | | | | | |
7.150% | | 02/01/2032 | | | | | 500,000 | | | 522,306 |
Tennessee Gas Pipeline Co. | | | | | | | | | | |
7.000% | | 10/15/2028 | | † | | | 350,000 | | | 343,090 |
Texas Eastern Transmission, LP | | | | | | | | | | |
7.000% | | 07/15/2032 | | | | | 500,000 | | | 502,591 |
TransCanada Corp. (Canada) | | | | | | | | | | |
5.850% | | 03/15/2036 | | | | | 500,000 | | | 444,557 |
TransCanada Pipelines Ltd. (Canada) | | | | | | | | | | |
4.000% | | 06/15/2013 | | | | | 250,000 | | | 235,371 |
Union Pacific Resources Group | | | | | | | | | | |
7.150% | | 05/15/2028 | | | | | 350,000 | | | 361,459 |
Valero Energy Corp. | | | | | | | | | | |
6.125% | | 06/15/2017 | | | | | 500,000 | | | 483,708 |
Valero Energy Corp. | | | | | | | | | | |
4.750% | | 06/15/2013 | | | | | 500,000 | | | 476,503 |
XTO Energy, Inc. | | | | | | | | | | |
4.900% | | 02/01/2014 | | | | | 750,000 | | | 734,423 |
| | | | | | | | | | |
| | | | | | | | | | 14,650,325 |
| | | | | | | | | | |
Paper & Forest Products—0.1% | | | | | | | | | | |
Masco Corp. | | | | | | | | | | |
6.125% | | 10/03/2016 | | | | | 500,000 | | | 453,777 |
Weyerhaeuser Co. | | | | | | | | | | |
7.375% | | 03/15/2032 | | | | | 500,000 | | | 497,312 |
| | | | |
| | See accompanying notes to financial statements. | | 179 |
SCHEDULE OF INVESTMENTS — (Continued)
June 30, 2008 (Unaudited)
Vantagepoint Core Bond Index Fund
| | | | | | | | | | |
Coupon Rate | | Maturity Date | | Face | | Value |
CORPORATE OBLIGATIONS—(Continued) | | | | | | | | | | |
Weyerhaeuser Co. | | | | | | | | | | |
6.750% | | 03/15/2012 | | | | $ | 100,000 | | $ | 103,076 |
| | | | | | | | | | |
| | | | | | | | | | 1,054,165 |
| | | | | | | | | | |
Pharmaceuticals—0.5% | | | | | | | | | | |
Abbott Laboratories | | | | | | | | | | |
5.875% | | 05/15/2016 | | | | | 1,000,000 | | | 1,030,471 |
AstraZeneca plc (United Kingdom) | | | | | | | | | | |
5.900% | | 09/15/2017 | | | | | 750,000 | | | 770,109 |
Bristol-Myers Squibb Co. | | | | | | | | | | |
5.875% | | 11/15/2036 | | | | | 350,000 | | | 327,580 |
Eli Lilly & Co. | | | | | | | | | | |
6.770% | | 01/01/2036 | | | | | 250,000 | | | 274,686 |
GlaxoSmithKline Capital, Inc. | | | | | | | | | | |
4.375% | | 04/15/2014 | | | | | 500,000 | | | 486,040 |
Merck & Co., Inc. | | | | | | | | | | |
4.750% | | 03/01/2015 | | † | | | 350,000 | | | 346,144 |
Merck & Co., Inc. | | | | | | | | | | |
4.375% | | 02/15/2013 | | † | | | 200,000 | | | 200,511 |
Pharmacia Corp. | | | | | | | | | | |
6.500% | | 12/01/2018 | | | | | 350,000 | | | 384,579 |
Schering-Plough Corp. | | | | | | | | | | |
6.750% | | 12/01/2033 | | | | | 250,000 | | | 255,255 |
Teva Pharmaceutical Finance LLC | | | | | | | | | | |
6.150% | | 02/01/2036 | | | | | 250,000 | | | 240,127 |
Wyeth | | | | | | | | | | |
6.950% | | 03/15/2011 | | | | | 250,000 | | | 264,811 |
Wyeth | | | | | | | | | | |
6.500% | | 02/01/2034 | | † | | | 250,000 | | | 260,035 |
Wyeth | | | | | | | | | | |
5.500% | | 03/15/2013 | | | | | 100,000 | | | 102,168 |
5.500% | | 02/01/2014 | | | | | 250,000 | | | 252,321 |
| | | | | | | | | | |
| | | | | | | | | | 5,194,837 |
| | | | | | | | | | |
Retail—0.7% | | | | | | | | | | |
CVS Corp. | | | | | | | | | | |
4.875% | | 09/15/2014 | | | | | 530,000 | | | 515,117 |
Home Depot, Inc. | | | | | | | | | | |
5.875% | | 12/16/2036 | | | | | 250,000 | | | 204,860 |
Home Depot, Inc. | | | | | | | | | | |
5.200% | | 03/01/2011 | | | | | 750,000 | | | 744,290 |
Limited Brands, Inc. | | | | | | | | | | |
5.250% | | 11/01/2014 | | | | | 250,000 | | | 211,745 |
Lowe’s Cos, Inc. | | | | | | | | | | |
5.400% | | 10/15/2016 | | | | | 1,000,000 | | | 986,012 |
Macys Retail Holdings, Inc. | | | | | | | | | | |
5.900% | | 12/01/2016 | | | | | 750,000 | | | 652,554 |
Macys Retail Holdings, Inc. | | | | | | | | | | |
5.750% | | 07/15/2014 | | | | | 250,000 | | | 226,007 |
McDonald’s Corp. | | | | | | | | | | |
5.350% | | 03/01/2018 | | | | | 500,000 | | | 488,725 |
Target Corp. | | | | | | | | | | |
7.000% | | 07/15/2031 | | | | | 350,000 | | | 371,358 |
Target Corp. | | | | | | | | | | |
6.000% | | 01/15/2018 | | † | | | 500,000 | | | 502,689 |
Wal-Mart Stores, Inc. | | | | | | | | | | |
7.550% | | 02/15/2030 | | | | | 250,000 | | | 282,299 |
Wal-Mart Stores, Inc. | | | | | | | | | | |
6.875% | | 08/10/2009 | | | | | 750,000 | | | 777,778 |
Wal-Mart Stores, Inc. | | | | | | | | | | |
5.250% | | 09/01/2035 | | | | | 750,000 | | | 653,807 |
Wal-Mart Stores, Inc. | | | | | | | | | | |
4.550% | | 05/01/2013 | | † | | | 500,000 | | | 502,849 |
Wal-Mart Stores, Inc. | | | | | | | | | | |
4.125% | | 02/15/2011 | | | | | 250,000 | | | 251,865 |
Yum! Brands, Inc. | | | | | | | | | | |
7.700% | | 07/01/2012 | | | | | 250,000 | | | 268,605 |
| | | | | | | | | | |
| | | | | | | | | | 7,640,560 |
| | | | | | | | | | |
Road & Rail—0.3% | | | | | | | | | | |
Burlington Northern Santa Fe Corp. | | | | | | | | | | |
7.125% | | 12/15/2010 | | | | | 750,000 | | | 790,034 |
Canadian National Railway Co. (Canada) | | | | | | | | | | |
6.250% | | 08/01/2034 | | | | | 500,000 | | | 489,399 |
Canadian National Railway Co. (Canada) | | | | | | | | | | |
4.400% | | 03/15/2013 | | | | | 585,000 | | | 570,158 |
CSX Corp. | | | | | | | | | | |
6.750% | | 03/15/2011 | | | | | 300,000 | | | 311,097 |
Norfolk Southern Corp. | | | | | | | | | | |
7.050% | | 05/01/2037 | | | | | 500,000 | | | 541,901 |
Norfolk Southern Corp. | | | | | | | | | | |
5.257% | | 09/17/2014 | | | | | 500,000 | | | 495,042 |
Union Pacific Corp. | | | | | | | | | | |
6.625% | | 02/01/2029 | | | | | 250,000 | | | 254,149 |
| | | | | | | | | | |
| | | | | | | | | | 3,451,780 |
| | | | | | | | | | |
Software—0.1% | | | | | | | | | | |
Oracle Corp. | | | | | | | | | | |
5.250% | | 01/15/2016 | | | | | 1,000,000 | | | 985,481 |
| | | | | | | | | | |
Sovereign—0.1% | | | | | | | | | | |
Export-Import Bank Of Korea (Korea, Republic of ) | | | | | | | | | | |
5.125% | | 03/16/2015 | | | | | 500,000 | | | 462,738 |
Svensk Exportkredit AB (Sweden) | | | | | | | | | | |
5.125% | | 03/01/2017 | | | | | 500,000 | | | 514,837 |
| | | | | | | | | | |
| | | | | | | | | | 977,575 |
| | | | | | | | | | |
Thrifts & Mortgage Finance—0.0% | | | | | | | | | | |
Abbey National plc (United Kingdom) | | | | | | | | | | |
7.950% | | 10/26/2029 | | | | | 250,000 | | | 254,922 |
| | | | | | | | | | |
Transportation Infrastructure—0.0% | | | | | | | | | | |
FedEx Corp. | | | | | | | | | | |
9.650% | | 06/15/2012 | | | | | 150,000 | | | 172,847 |
| | | | | | | | | | |
Wireless Telecommunication Services—0.3% | | | | | | | | | | |
America Movil SAB de CV (Mexico) | | | | | | | | | | |
5.500% | | 03/01/2014 | | | | | 100,000 | | | 98,834 |
AT&T Wireless Services, Inc. | | | | | | | | | | |
8.750% | | 03/01/2031 | | | | | 250,000 | | | 297,445 |
AT&T Wireless Services, Inc. | | | | | | | | | | |
7.875% | | 03/01/2011 | | | | | 750,000 | | | 798,971 |
Cingular Wireless LLC | | | | | | | | | | |
6.500% | | 12/15/2011 | | | | | 250,000 | | | 260,047 |
Vodafone Group plc (United Kingdom) | | | | | | | | | | |
7.875% | | 02/15/2030 | | | | | 250,000 | | | 275,406 |
Vodafone Group plc (United Kingdom) | | | | | | | | | | |
7.750% | | 02/15/2010 | | | | | 550,000 | | | 574,950 |
Vodafone Group plc (United Kingdom) | | | | | | | | | | |
5.625% | | 02/27/2017 | | | | | 500,000 | | | 482,451 |
Vodafone Group plc (United Kingdom) | | | | | | | | | | |
5.375% | | 01/30/2015 | | | | | 250,000 | | | 243,543 |
| | | | | | | | | | |
| | | | | | | | | | 3,031,647 |
| | | | | | | | | | |
TOTAL CORPORATE OBLIGATIONS
(Cost $229,332,157) | | | | | | | | | | 223,211,102 |
| | | | | | | | | | |
| | | | |
| 180 | | See accompanying notes to financial statements. | | |
SCHEDULE OF INVESTMENTS — (Continued)
June 30, 2008 (Unaudited)
Vantagepoint Core Bond Index Fund
| | | | | | | | | | |
Coupon Rate | | Maturity Date | | Face | | Value |
U.S. GOVERNMENT AGENCY OBLIGATIONS—9.9% |
U.S. Government Agency Obligations—9.9% | | | | | | | | | | |
Federal Home Loan Bank | | | | | | | | | | |
5.750% | | 05/15/2012 | | | | $ | 2,225,000 | | $ | 2,371,719 |
5.375% | | 05/18/2016 | | | | | 2,000,000 | | | 2,107,626 |
5.250% | | 06/18/2014 | | † | | | 1,000,000 | | | 1,050,572 |
4.875% | | 09/08/2017 | | | | | 1,250,000 | | | 1,266,635 |
4.750% | | 12/16/2016 | | † | | | 1,000,000 | | | 1,007,411 |
4.625% | | 02/18/2011 | | † | | | 5,500,000 | | | 5,699,672 |
4.500% | | 11/15/2012 | | † | | | 3,500,000 | | | 3,569,678 |
4.375% | | 03/17/2010 | | | | | 975,000 | | | 996,520 |
3.875% | | 01/15/2010 | | † | | | 1,500,000 | | | 1,520,058 |
3.625% | | 05/29/2013 | | † | | | 5,000,000 | | | 4,891,840 |
Federal Home Loan Mortgage Corp. | | | �� | | | | | | | |
7.000% | | 03/15/2010 | | | | | 2,630,000 | | | 2,801,765 |
6.875% | | 09/15/2010 | | | | | 5,000,000 | | | 5,376,395 |
6.250% | | 07/15/2032 | | | | | 1,050,000 | | | 1,205,801 |
6.000% | | 06/15/2011-04/16/2037 | | † | | | 3,550,000 | | | 3,691,510 |
5.650% | | 02/23/2017 | | | | | 1,160,000 | | | 1,171,120 |
5.600% | | 10/17/2013 | | | | | 500,000 | | | 503,668 |
5.500% | | 07/18/2016 | | | | | 1,000,000 | | | 1,053,889 |
5.450% | | 09/02/2011-11/21/2013 | | | | | 1,100,000 | | | 1,106,246 |
5.400% | | 03/02/2012 | | | | | 770,000 | | | 773,342 |
5.375% | | 01/09/2014 | | | | | 400,000 | | | 403,358 |
5.250% | | 02/24/2011-03/15/2012 | | † | | | 2,100,000 | | | 2,113,793 |
5.200% | | 03/05/2019 | | | | | 200,000 | | | 198,073 |
5.125% | | 07/15/2012 | | † | | | 3,000,000 | | | 3,137,829 |
5.050% | | 01/26/2015 | | | | | 300,000 | | | 311,365 |
5.000% | | 01/30/2014 | | † | | | 600,000 | | | 620,787 |
4.750% | | 12/08/2010 | | † | | | 500,000 | | | 515,856 |
4.500% | | 04/02/2014-01/15/2015 | | | | | 1,250,000 | | | 1,263,158 |
4.375% | | 01/25/2010-07/17/2015 | | † | | | 5,000,000 | | | 5,056,999 |
4.150% | | 05/29/2013 | | | | | 1,300,000 | | | 1,296,357 |
4.125% | | 09/01/2009-02/24/2011 | | † | | | 2,650,000 | | | 2,695,472 |
4.000% | | 09/22/2009 | | | | | 560,000 | | | 567,324 |
3.450% | | 04/30/2010 | | | | | 6,000,000 | | | 6,004,560 |
Federal National Mortgage Association | | | | | | | | | | |
9.235% | | 06/01/2017 | | | | | 1,000,000 | | | 663,410 |
7.250% | | 01/15/2010 | | † | | | 1,300,000 | | | 1,383,130 |
6.625% | | 09/15/2009-11/15/2030 | | | | | 1,600,000 | | | 1,816,999 |
6.250% | | 05/15/2029 | | † | | | 1,740,000 | | | 1,974,482 |
6.125% | | 03/15/2012-07/17/2013 | | | | | 1,250,000 | | | 1,307,519 |
6.060% | | 07/20/2027 | | | | | 300,000 | | | 309,352 |
6.000% | | 08/22/2016 | | | | | 1,160,000 | | | 1,164,236 |
5.945% | | 06/07/2027 | | | | | 300,000 | | | 309,334 |
5.800% | | 02/09/2026 | | | | | 100,000 | | | 102,135 |
5.750% | | 02/13/2017 | | | | | 600,000 | | | 601,856 |
5.700% | | 10/05/2021 | | | | | 300,000 | | | 303,240 |
5.625% | | 05/19/2011 | | † | | | 1,300,000 | | | 1,326,131 |
5.500% | | 03/15/2011-12/14/2022 | | † | | | 2,980,000 | | | 3,126,581 |
5.375% | | 11/15/2011-04/11/2022 | | † | | | 4,380,000 | | | 4,567,686 |
5.300% | | 05/07/2012 | | | | | 700,000 | | | 706,087 |
5.100% | | 09/10/2009 | | | | | 2,300,000 | | | 2,309,773 |
5.000% | | 03/15/2016-05/11/2017 | | † | | | 3,950,000 | | | 4,036,503 |
4.875% | | 12/15/2016 | | † | | | 1,000,000 | | | 1,013,661 |
4.750% | | 01/02/2013 | | † | | | 1,300,000 | | | 1,311,599 |
4.625% | | 10/15/2013 | | | | | 900,000 | | | 918,523 |
4.375% | | 09/15/2012-03/15/2013 | | | | | 4,400,000 | | | 4,459,919 |
4.125% | | 05/15/2010 | | † | | | 1,200,000 | | | 1,221,702 |
Financing Corp. | | | | | | | | | | |
9.650% | | 11/02/2018 | | | | | 500,000 | | | 695,102 |
8.600% | | 09/26/2019 | | | | | 500,000 | | | 658,122 |
Tennessee Valley Authority | | | | | | | | | | |
6.250% | | 12/15/2017 | | | | | 1,200,000 | | | 1,335,445 |
| | | | | | | | | | |
TOTAL U.S. GOVERNMENT AGENCY OBLIGATIONS
(Cost $102,880,200) | | | | | | | | | | 103,972,925 |
| | | | | | | | | | |
U.S. GOVERNMENT AGENCY MORTGAGE-BACKED SECURITIES—38.6% | | | | | | | | |
U.S. Government Agency Mortgage-Backed Securities—38.6% | | | | | | | | | | |
Federal Home Loan Mortgage Corp. | | | | | | | | | | |
7.500% | | 06/01/2027-10/01/2029 | | | | | 540,708 | | | 585,916 |
7.000% | | 02/01/2016-09/01/2036 | | | | | 1,745,727 | | | 1,840,473 |
6.500% | | 07/01/2008-01/01/2038 | | | | | 10,538,093 | | | 10,917,137 |
6.050% | | 01/01/2037 | | # | | | 2,750,966 | | | 2,802,886 |
6.000% | | 11/01/2016-06/01/2038 | | | | | 29,738,607 | | | 30,138,741 |
5.902% | | 01/01/2037 | | # | | | 688,521 | | | 698,476 |
5.640% | | 02/01/2037 | | # | | | 1,655,091 | | | 1,662,690 |
5.500% | | 02/01/2018-03/01/2038 | | | | | 41,795,673 | | | 41,401,987 |
5.000% | | 05/01/2018-06/01/2038 | | | | | 39,008,957 | | | 37,846,802 |
4.749% | | 09/01/2035 | | # | | | 791,694 | | | 797,737 |
4.500% | | 07/01/2011-09/01/2036 | | | | | 11,802,859 | | | 11,359,634 |
4.399% | | 12/01/2035 | | # | | | 6,228,811 | | | 6,222,255 |
4.000% | | 04/01/2009-12/01/2020 | | | | | 3,401,826 | | | 3,224,651 |
3.500% | | 05/01/2011 | | | | | 61,331 | | | 61,017 |
Federal National Mortgage Association | | | | | | | | | | |
7.500% | | 06/01/2030-07/01/2031 | | | | | 46,012 | | | 49,657 |
7.000% | | 03/01/2030-04/01/2038 | | | | | 4,583,044 | | | 4,819,474 |
6.500% | | 02/01/2017-01/01/2037 | | | | | 13,240,522 | | | 13,688,043 |
6.000% | | 04/01/2014-02/01/2038 | | | | | 45,836,759 | | | 46,398,971 |
5.679% | | 01/01/2037 | | # | | | 2,802,907 | | | 2,853,252 |
5.640% | | 05/01/2036 | | # | | | 2,139,401 | | | 2,181,089 |
5.637% | | 03/01/2037 | | # | | | 6,862,118 | | | 6,984,480 |
5.592% | | 07/01/2036 | | # | | | 1,782,432 | | | 1,818,415 |
5.500% | | 07/25/2037 | | TBA | | | 2,300,000 | | | 2,267,296 |
5.500% | | 01/01/2018-03/01/2038 | | | | | 72,695,746 | | | 72,068,762 |
5.431% | | 02/01/2037 | | # | | | 371,124 | | | 374,647 |
5.400% | | 12/01/2036 | | # | | | 2,780,428 | | | 2,825,709 |
5.000% | | 07/25/2038 | | TBA | | | 2,000,000 | | | 1,917,188 |
5.000% | | 03/01/2018-05/01/2038 | | | | | 43,277,361 | | | 41,998,424 |
4.863% | | 10/01/2035 | | # | | | 1,720,481 | | | 1,739,878 |
4.760% | | 05/01/2035 | | # | | | 1,720,445 | | | 1,732,743 |
4.667% | | 05/01/2035 | | # | | | 507,144 | | | 512,934 |
| | | | |
| | See accompanying notes to financial statements. | | 181 |
SCHEDULE OF INVESTMENTS — (Continued)
June 30, 2008 (Unaudited)
Vantagepoint Core Bond Index Fund
| | | | | | | | | | | |
Coupon Rate | | Maturity Date | | Face | | Value |
U.S. GOVERNMENT AGENCY MORTGAGE-BACKED SECURITIES—(Continued) | | | | | | | | | |
4.500% | | 07/01/2011-02/01/2038 | | | | | $ | 13,385,494 | | $ | 12,889,432 |
4.433% | | 08/01/2034 | | | # | | | 878,413 | | | 888,684 |
4.000% | | 07/01/2011-12/01/2018 | | | | | | 4,085,556 | | | 3,913,941 |
Government National Mortgage Association | | | | | | | | | | | |
7.500% | | 12/15/2029-05/15/2032 | | | | | | 737,713 | | | 793,643 |
7.000% | | 09/15/2037 | | | | | | 629,519 | | | 662,715 |
6.500% | | 03/15/2026-12/15/2037 | | | | | | 4,247,803 | | | 4,401,504 |
6.000% | | 02/15/2033-03/15/2038 | | | | | | 10,570,253 | | | 10,757,899 |
5.500% | | 03/15/2033-12/15/2037 | | | | | | 11,562,776 | | | 11,544,674 |
5.000% | | 05/15/2033-05/15/2038 | | | | | | 7,691,518 | | | 7,476,757 |
4.500% | | 07/15/2038 | | | TBA | | | 1,000,000 | | | 931,875 |
| | | | | | | | | | | |
TOTAL U.S. GOVERNMENT AGENCY MORTGAGE-BACKED SECURITIES
(Cost $410,802,290) | | | | | | | | | 408,052,488 |
| | | | | | | | | | | |
U.S. TREASURY OBLIGATIONS—21.7% | | | | | | | | | | | |
U.S. Treasury Bonds—5.9% | | | | | | | | | | | |
U.S. Treasury Bond | | | | | | | | | | | |
13.250% | | 05/15/2014 | | | | | | 850,000 | | | 927,895 |
11.750% | | 11/15/2014 | | | | | | 500,000 | | | 561,094 |
11.250% | | 02/15/2015 | | | | | | 1,500,000 | | | 2,171,133 |
9.875% | | 11/15/2015 | | | | | | 550,000 | | | 765,746 |
9.125% | | 05/15/2018 | | | † | | | 1,060,000 | | | 1,487,892 |
8.750% | | 05/15/2017-05/15/2020 | | | | | | 6,740,000 | | | 9,286,355 |
8.500% | | 02/15/2020 | | | | | | 2,500,000 | | | 3,445,313 |
8.125% | | 08/15/2019-05/15/2021 | | | | | | 3,010,000 | | | 4,041,095 |
8.000% | | 11/15/2021 | | | † | | | 2,420,000 | | | 3,283,071 |
7.875% | | 02/15/2021 | | | † | | | 500,000 | | | 666,797 |
7.625% | | 02/15/2025 | | | | | | 1,914,000 | | | 2,607,526 |
7.500% | | 11/15/2024 | | | | | | 775,000 | | | 1,042,921 |
7.250% | | 05/15/2016-08/15/2022 | | | † | | | 5,030,000 | | | 6,271,442 |
7.125% | | 02/15/2023 | | | | | | 2,525,000 | | | 3,233,578 |
6.500% | | 11/15/2026 | | | | | | 1,550,000 | | | 1,916,552 |
6.250% | | 08/15/2023-05/15/2030 | | | † | | | 1,380,000 | | | 1,659,157 |
6.125% | | 11/15/2027-08/15/2029 | | | † | | | 4,150,000 | | | 4,986,287 |
6.000% | | 02/15/2026 | | | | | | 1,700,000 | | | 1,991,525 |
5.375% | | 02/15/2031 | | | | | | 1,341,000 | | | 1,490,397 |
5.250% | | 02/15/2029 | | | | | | 1,480,000 | | | 1,606,148 |
5.000% | | 05/15/2037 | | | † | | | 1,410,000 | | | 1,515,751 |
4.750% | | 02/15/2037 | | | † | | | 2,750,000 | | | 2,840,665 |
4.500% | | 02/15/2036 | | | † | | | 2,650,000 | | | 2,631,991 |
4.375% | | 02/15/2038 | | | † | | | 2,300,000 | | | 2,242,502 |
| | | | | | | | | | | |
| | | | | | | | | | | 62,672,833 |
| | | | | | | | | | | |
U.S. Treasury Notes—15.8% | | | | | | | | | | | |
U.S. Treasury Note | | | | | | | | | | | |
5.750% | | 08/15/2010 | | | | | | 7,020,000 | | | 7,468,080 |
5.125% | | 05/15/2016 | | | | | | 3,500,000 | | | 3,817,191 |
5.000% | | 02/15/2011-08/15/2011 | | | | | | 4,735,000 | | | 5,007,846 |
4.875% | | 08/15/2009-08/15/2016 | | † | | | | 10,785,000 | | | 11,272,027 |
4.750% | | 02/15/2010-08/15/2017 | | † | | | | 16,130,000 | | | 16,948,778 |
4.625% | | 07/31/2009-02/15/2017 | | † | | | | 16,080,000 | | | 16,789,881 |
4.500% | | 02/28/2011-05/15/2017 | | † | | | | 22,479,000 | | | 23,521,784 |
4.375% | | 08/15/2012 | | † | | | | 2,910,000 | | | 3,049,363 |
4.250% | | 10/15/2010-08/15/2014 | | † | | | | 10,582,000 | | | 11,034,230 |
4.125% | | 08/15/2010-05/15/2015 | | † | | | | 3,130,000 | | | 3,230,824 |
4.000% | | 03/15/2010-02/15/2015 | | † | | | | 13,880,000 | | | 14,279,875 |
3.875% | | 05/15/2010-02/15/2013 | | † | | | | 16,610,000 | | | 17,029,142 |
3.625% | | 05/15/2013 | | | | | | 1,660,000 | | | 1,684,771 |
3.500% | | 11/15/2009-02/15/2018 | | † | | | | 17,000,000 | | | 17,064,063 |
3.375% | | 10/15/2009-11/30/2012 | | † | | | | 11,750,000 | | | 11,857,645 |
2.625% | | 05/31/2010 | | † | | | | 1,960,000 | | | 1,961,838 |
2.125% | | 01/31/2010 | | † | | | | 860,000 | | | 855,835 |
| | | | | | | | | | | |
| | | | | | | | | | | 166,873,173 |
| | | | | | | | | | | |
TOTAL U.S. TREASURY OBLIGATIONS
(Cost $226,804,279) | | | | | | | | | | | 229,546,006 |
| | | | | | | | | | | |
MUNICIPAL OBLIGATIONS—0.2% | | | | | | | | | | | |
Illinois State (Illinois) | | | | | | | | | | | |
5.100% | | 06/01/2033 | | | | | | 1,100,000 | | | 1,036,024 |
New Jersey Economic Development Authority (New Jersey) | | | | | | | | | | | |
7.425% | | 02/15/2029 | | | | | | 500,000 | | | 595,590 |
New Jersey State Turnpike Authority (New Jersey) | | | | | | | | | | | |
4.252% | | 01/01/2015 | | | | | | 25,000 | | | 24,135 |
Oregon State (Oregon) | | | | | | | | | | | |
5.762% | | 06/01/2023 | | | | | | 200,000 | | | 206,664 |
| | | | | | | | | | | |
TOTAL MUNICIPAL OBLIGATIONS
(Cost $1,831,089) | | | | | | | | | | | 1,862,413 |
| | | | | | | | | | | |
SOVEREIGN DEBT OBLIGATIONS—1.7% | | | | | | | | | | | |
Government Issued—1.7% | | | | | | | | | | | |
Brazilian Government International Bond (Brazil) | | | | | | | | | | | |
11.000% | | 01/11/2012 | | | | | | 910,000 | | | 1,093,365 |
11.000% | | 08/17/2040 | | | | | | 860,000 | | | 1,138,425 |
Brazilian Government International Bond (Brazil) | | | | | | | | | | | |
10.125% | | 05/15/2027 | | | | | | 635,000 | | | 904,875 |
Brazilian Government International Bond (Brazil) | | | | | | | | | | | |
8.875% | | 04/15/2024 | | | | | | 400,000 | | | 510,000 |
Brazilian Government International Bond (Brazil) | | | | | | | | | | | |
7.875% | | 03/07/2015 | | | | | | 455,000 | | | 510,737 |
Brazilian Government International Bond (Brazil) | | | | | | | | | | | |
7.125% | | 01/20/2037 | | | | | | 460,000 | | | 508,760 |
British Columbia (Province of) (Canada) | | | | | | | | | | | |
6.500% | | 01/15/2026 | | | | | | 150,000 | | | 177,271 |
Hydro Quebec (Canada) | | | | | | | | | | | |
8.050% | | 07/07/2024 | | | | | | 500,000 | | | 659,554 |
Hydro Quebec (Canada) | | | | | | | | | | | |
6.300% | | 05/11/2011 | | | | | | 350,000 | | | 372,519 |
Italian Republic (Italy) | | | | | | | | | | | |
6.875% | | 09/27/2023 | | | † | | | 250,000 | | | 301,696 |
| | | | |
| 182 | | See accompanying notes to financial statements. | | |
SCHEDULE OF INVESTMENTS — (Continued)
June 30, 2008 (Unaudited)
Vantagepoint Core Bond Index Fund
| | | | | | | | | | |
Coupon Rate | | Maturity Date | | Face | | Value |
SOVEREIGN DEBT OBLIGATIONS—(Continued) | | | | | | | | | | |
Italian Republic (Italy) | | | | | | | | | | |
6.000% | | 02/22/2011 | | † | | $ | 550,000 | | $ | 585,639 |
Italian Republic (Italy) | | | | | | | | | | |
5.375% | | 06/15/2033 | | | | | 500,000 | | | 515,116 |
Italian Republic (Italy) | | | | | | | | | | |
4.375% | | 06/15/2013 | | | | | 1,000,000 | | | 1,016,176 |
Malaysia Government (Malaysia) | | | | | | | | | | |
7.500% | | 07/15/2011 | | | | | 250,000 | | | 271,519 |
Manitoba Province (Canada) | | | | | | | | | | |
4.900% | | 12/06/2016 | | | | | 500,000 | | | 512,715 |
Ontario Province (Canada) | | | | | | | | | | |
5.450% | | 04/27/2016 | | † | | | 1,000,000 | | | 1,055,680 |
Ontario Province (Canada) | | | | | | | | | | |
4.500% | | 02/03/2015 | | † | | | 400,000 | | | 399,693 |
Ontario Province (Canada) | | | | | | | | | | |
3.625% | | 10/21/2009 | | | | | 250,000 | | | 251,778 |
People’s Republic of China (China) | | | | | | | | | | |
4.750% | | 10/29/2013 | | | | | 250,000 | | | 251,843 |
Quebec Province (Canada) | | | | | | | | | | |
7.500% | | 09/15/2029 | | | | | 600,000 | | | 768,815 |
Quebec Province (Canada) | | | | | | | | | | |
6.125% | | 01/22/2011 | | | | | 850,000 | | | 899,431 |
Region of Lombardy (Italy) | | | | | | | | | | |
5.804% | | 10/25/2032 | | | | | 100,000 | | | 109,031 |
Republic of Chile (Chile) | | | | | | | | | | |
5.500% | | 01/15/2013 | | | | | 150,000 | | | 155,640 |
Republic of Finland (Finland) | | | | | | | | | | |
6.950% | | 02/15/2026 | | | | | 150,000 | | | 181,049 |
Republic of Poland (Poland) | | | | | | | | | | |
5.000% | | 10/19/2015 | | | | | 300,000 | | | 300,210 |
Republic of South Africa (South Africa) | | | | | | | | | | |
7.375% | | 04/25/2012 | | | | | 250,000 | | | 264,375 |
Saskatchewan Province (Canada) | | | | | | | | | | |
7.375% | | 07/15/2013 | | | | | 230,000 | | | 263,816 |
State of Israel (Israel) | | | | | | | | | | |
5.500% | | 11/09/2016 | | | | | 1,000,000 | | | 1,026,647 |
United Mexican States (Mexico) | | | | | | | | | | |
8.375% | | 01/14/2011 | | | | | 500,000 | | | 548,000 |
United Mexican States (Mexico) | | | | | | | | | | |
8.300% | | 08/15/2031 | | | | | 500,000 | | | 633,750 |
United Mexican States (Mexico) | | | | | | | | | | |
8.125% | | 12/30/2019 | | | | | 750,000 | | | 909,375 |
United Mexican States (Mexico) | | | | | | | | | | |
5.875% | | 01/15/2014 | | | | | 1,000,000 | | | 1,042,500 |
| | | | | | | | | | |
TOTAL SOVEREIGN DEBT OBLIGATIONS
(Cost $18,053,955) | | | | | | | | | | 18,140,000 |
| | | | | | | | | | |
ASSET BACKED SECURITIES—0.7% | | | | | | | | | | |
Automobile—0.2% | | | | | | | | | | |
Capital Auto Receivables Asset Trust | | | | | | | | | | |
Series 2007-3, Class A4 | | | | | | | | | | |
5.210% | | 03/17/2014 | | | | | 2,000,000 | | | 2,031,868 |
| | | | | | | | | | |
Credit Card—0.2% | | | | | | | | | | |
Capital One Multi-Asset Execution Trust | | | | | | | | | | |
Series 2007-A7, Class A7 | | | | | | | | | | |
5.750% | | 07/15/2020 | | | | | 500,000 | | | 491,407 |
Capital One Multi-Asset Execution Trust | | | | | | | | | | |
Series 2008-A5, Class A5 | | | | | | | | | | |
4.850% | | 02/15/2014 | | | | | 1,450,000 | | | 1,457,408 |
| | | | | | | | | | |
| | | | | | | | | | 1,948,815 |
| | | | | | | | | | |
Electric Utilities—0.3% | | | | | | | | | | |
Detroit Edison Securitization Funding LLC | | | | | | | | | | |
Series 2001-1, Class A6 | | | | | | | | | | |
6.620% | | 03/01/2016 | | | | | 2,700,000 | | | 2,892,336 |
| | | | | | | | | | |
TOTAL ASSET BACKED SECURITIES
(Cost $7,092,565) | | | | | | | | | | 6,873,019 |
| | | | | | | | | | |
NON-U.S. GOVERNMENT MORTGAGE-BACKED SECURITIES—5.2% | | | | | | | | | | |
Mortgage Backed—5.2% | | | | | | | | | | |
Banc of America Commercial Mortgage, Inc. | | | | | | | | | | |
Series 2002-2, Class A3 | | | | | | | | | | |
5.118% | | 07/11/2043 | | | | | 500,000 | | | 493,797 |
Banc of America Commercial Mortgage, Inc. | | | | | | | | | | |
Series 2004-2, Class A3 | | | | | | | | | | |
4.050% | | 11/10/2038 | | | | | 1,000,000 | | | 980,901 |
Banc of America Commercial Mortgage, Inc. | | | | | | | | | | |
Series 2004-6, Class A5 | | | | | | | | | | |
4.811% | | 12/10/2042 | | | | | 500,000 | | | 475,708 |
Banc of America Commercial Mortgage, Inc. | | | | | | | | | | |
Series 2005-6, Class AM | | | | | | | | | | |
5.352% | | 09/10/2047 | | # | | | 1,000,000 | | | 944,464 |
Banc of America Commercial Mortgage, Inc. | | | | | | | | | | |
Series 2007-1, Class A2 | | | | | | | | | | |
5.381% | | 01/15/2049 | | | | | 1,500,000 | | | 1,467,548 |
Bear Stearns Commercial Mortgage Securities | | | | | | | | | | |
Series 2004-PWR3, Class A4 | | | | | | | | | | |
4.715% | | 02/11/2041 | | | | | 1,500,000 | | | 1,445,465 |
Bear Stearns Commercial Mortgage Securities | | | | | | | | | | |
Series 2005-T20, Class A4A | | | | | | | | | | |
5.303% | | 10/12/2042 | | # | | | 921,000 | | | 885,930 |
Citigroup Commercial Mortgage Trust | | | | | | | | | | |
Series 2004-C1, Class A3 | | | | | | | | | | |
5.251% | | 04/15/2040 | | # | | | 750,000 | | | 746,280 |
Citigroup/Deutsche Bank Commercial Mortgage Trust | | | | | | | | | | |
Series 2005-CD1, Class A4 | | | | | | | | | | |
5.400% | | 07/15/2044 | | # | | | 900,000 | | | 869,364 |
Citigroup/Deutsche Bank Commercial Mortgage Trust | | | | | | | | | | |
Series 2006-CD3, Class A5 | | | | | | | | | | |
5.617% | | 10/15/2048 | | | | | 1,500,000 | | | 1,444,228 |
CS First Boston Mortgage Corp. | | | | | | | | | | |
Series 2005-C2, Class A4 | | | | | | | | | | |
4.832% | | 04/15/2037 | | | | | 750,000 | | | 708,630 |
CS First Boston Mortgage Securities Corp. | | | | | | | | | | |
Series 2004-C2, Class A2 | | | | | | | | | | |
5.416% | | 05/15/2036 | | # | | | 2,000,000 | | | 1,947,417 |
CS First Boston Mortgage Securities Corp. | | | | | | | | | | |
Series 2005-C5, Class A3 | | | | | | | | | | |
5.100% | | 08/15/2038 | | # | | | 2,650,000 | | | 2,585,001 |
CW Capital Cobalt Ltd. | | | | | | | | | | |
Series 2006-C1, Class A4 | | | | | | | | | | |
5.223% | | 08/15/2048 | | | | | 750,000 | | | 700,675 |
GE Capital Commercial Mortgage Corporation | | | | | | | | | | |
Series 2001-1, Class A2 | | | | | | | | | | |
6.531% | | 05/15/2033 | | | | | 1,000,000 | | | 1,028,704 |
GE Capital Commercial Mortgage Corporation | | | | | | | | | | |
Series 2005-C4, Class AM | | | | | | | | | | |
5.512% | | 11/10/2045 | | # | | | 2,000,000 | | | 1,913,244 |
GMAC Commercial Mortgage Securities, Inc. | | | | | | | | | | |
Series 2004-C1, Class A3 | | | | | | | | | | |
4.776% | | 03/10/2038 | | | | | 1,000,000 | | | 964,307 |
GMAC Commercial Mortgage Securities, Inc. | | | | | | | | | | |
Series 2004-C3, Class D | | | | | | | | | | |
5.044% | | 12/10/2041 | | # | | | 250,000 | | | 197,419 |
| | | | |
| | See accompanying notes to financial statements. | | 183 |
SCHEDULE OF INVESTMENTS — (Continued)
June 30, 2008 (Unaudited)
Vantagepoint Core Bond Index Fund
| | | | | | | | | | |
Coupon Rate | | Maturity Date | | Face | | Value |
NON-U.S. GOVERNMENT MORTGAGE-BACKED SECURITIES—(Continued) | | | | | | | | |
Greenwich Capital Commercial Funding Corp. | | | | | | | | | | |
Series 2007-GG9, Class A4 | | | | | | | | | | |
5.444% | | 03/10/2039 | | † | | $ | 1,000,000 | | $ | 933,802 |
GS Mortgage Securities Corp. II | | | | | | | | | | |
Series 2003-C1, Class A3 | | | | | | | | | | |
4.608% | | 01/10/2040 | | | | | 60,000 | | | 57,588 |
JP Morgan Chase Commercial Mortgage Securities Corp. | | | | | | | | | | |
Series 2003-CB7, Class A3 | | | | | | | | | | |
4.449% | | 01/12/2038 | | | | | 2,000,000 | | | 1,963,112 |
JP Morgan Chase Commercial Mortgage Securities Corp. | | | | | | | | | | |
Series 2003-ML1A, Class A2 | | | | | | | | | | |
4.767% | | 03/12/2039 | | | | | 1,000,000 | | | 963,196 |
JP Morgan Chase Commercial Mortgage Securities Corp. | | | | | | | | | | |
Series 2004-CB9, Class A4 | | | | | | | | | | |
5.553% | | 06/12/2041 | | # | | | 750,000 | | | 742,012 |
JP Morgan Chase Commercial Mortgage Securities Corp. | | | | | | | | | | |
Series 2004-CBX, Class AJ | | | | | | | | | | |
4.951% | | 01/12/2037 | | # | | | 1,750,000 | | | 1,535,222 |
JP Morgan Chase Commercial Mortgage Securities Corp. | | | | | | | | | | |
Series 2005-CB13, Class AM | | | | | | | | | | |
5.513% | | 01/12/2043 | | # | | | 900,000 | | | 859,685 |
JP Morgan Chase Commercial Mortgage Securities Corp. | | | | | | | | | | |
Series 2005-LDP2, Class E | | | | | | | | | | |
4.981% | | 07/15/2042 | | # | | | 750,000 | | | 588,358 |
JP Morgan Chase Commercial Mortgage Securities Corp. | | | | | | | | | | |
Series 2005-LDP2, Class A4 | | | | | | | | | | |
4.738% | | 07/15/2042 | | | | | 935,000 | | | 887,669 |
JP Morgan Chase Commercial Mortgage Securities Corp. | | | | | | | | | | |
Series 2005-LDP3, Class A4B | | | | | | | | | | |
4.996% | | 08/15/2042 | | # | | | 1,075,000 | | | 1,016,627 |
JP Morgan Chase Commercial Mortgage Securities Corp. | | | | | | | | | | |
Series 2005-LDP4, Class A2 | | | | | | | | | | |
4.790% | | 10/15/2042 | | | | | 912,141 | | | 906,058 |
JP Morgan Chase Commercial Mortgage Securities Corp. | | | | | | | | | | |
Series 2006-CB17, Class AM | | | | | | | | | | |
5.464% | | 12/12/2043 | | | | | 750,000 | | | 683,588 |
LB-UBS Commercial Mortgage Trust | | | | | | | | | | |
Series 2004-C7, Class A6 | | | | | | | | | | |
4.786% | | 10/15/2029 | | # | | | 1,000,000 | | | 949,050 |
LB-UBS Commercial Mortgage Trust | | | | | | | | | | |
Series 2007-C1, Class A4 | | | | | | | | | | |
5.424% | | 02/15/2040 | | | | | 1,000,000 | | | 932,215 |
LB-UBS Commercial Mortgage Trust | | | | | | | | | | |
Series 2007-C2, Class A3 | | | | | | | | | | |
5.430% | | 02/15/2040 | | | | | 750,000 | | | 698,851 |
Merrill Lynch Mortgage Trust | | | | | | | | | | |
Series 2002-MW1, Class A3 | | | | | | | | | | |
5.403% | | 07/12/2034 | | | | | 500,000 | | | 503,462 |
Merrill Lynch/Countrywide Commercial Mortgage Trust | | | | | | | | | | |
Series 2006-1, Class A3 | | | | | | | | | | |
5.653% | | 02/12/2039 | | # | | | 750,000 | | | 738,603 |
Merrill Lynch/Countrywide Commercial Mortgage Trust | | | | | | | | | | |
Series 2006-1, Class A4 | | | | | | | | | | |
5.603% | | 02/12/2039 | | # | | | 1,500,000 | | | 1,442,143 |
Merrill Lynch/Countrywide Commercial Mortgage Trust | | | | | | | | | | |
Series 2006-3, Class A4 | | | | | | | | | | |
5.414% | | 07/12/2046 | | # | | | 750,000 | | | 712,770 |
Merrill Lynch/Countrywide Commercial Mortgage Trust | | | | | | | | | | |
Series 2006-4, Class A3 | | | | | | | | | | |
5.172% | | 12/12/2049 | | # | | | 1,000,000 | | | 932,460 |
Morgan Stanley Capital I | | | | | | | | | | |
Series 2004-HQ3, Class A3 | | | | | | | | | | |
4.490% | | 01/13/2041 | | | | | 1,000,000 | | | 981,042 |
Morgan Stanley Capital I | | | | | | | | | | |
Series 2004-T13, Class A2 | | | | | | | | | | |
3.940% | | 09/13/2045 | | | | | 687,220 | | | 678,564 |
Morgan Stanley Capital I | | | | | | | | | | |
Series 2004-T15, Class A2 | | | | | | | | | | |
4.690% | | 06/13/2041 | | | | | 500,000 | | | 498,588 |
Morgan Stanley Capital I | | | | | | | | | | |
Series 2006-HQ9, Class AM | | | | | | | | | | |
5.773% | | 07/12/2044 | | # | | | 1,000,000 | | | 931,475 |
Morgan Stanley Capital I | | | | | | | | | | |
Series 2006-IQ12, Class A2 | | | | | | | | | | |
5.283% | | 12/15/2043 | | | | | 750,000 | | | 738,655 |
Morgan Stanley Capital I | | | | | | | | | | |
Series 2007-HQ11, Class A4 | | | | | | | | | | |
5.447% | | 02/12/2044 | | # | | | 1,500,000 | | | 1,396,143 |
Morgan Stanley Capital I | | | | | | | | | | |
Series 2007-IQ13, Class AM | | | | | | | | | | |
5.406% | | 03/15/2044 | | | | | 1,500,000 | | | 1,333,346 |
Morgan Stanley Dean Witter Capital I | | | | | | | | | | |
Series 2003-HQ2, Class A1 | | | | | | | | | | |
4.180% | | 03/12/2035 | | | | | 540,473 | | | 520,966 |
Wachovia Bank Commercial Mortgage Trust | | | | | | | | | | |
Series 2003-C5, Class A2 | | | | | | | | | | |
3.989% | | 06/15/2035 | | | | | 750,000 | | | 705,390 |
Wachovia Bank Commercial Mortgage Trust | | | | | | | | | | |
Series 2003-C9, Class A4 | | | | | | | | | | |
5.012% | | 12/15/2035 | | # | | | 750,000 | | | 721,918 |
Wachovia Bank Commercial Mortgage Trust | | | | | | | | | | |
Series 2004-C11, Class A5 | | | | | | | | | | |
5.215% | | 01/15/2041 | | # | | | 500,000 | | | 489,159 |
Wachovia Bank Commercial Mortgage Trust | | | | | | | | | | |
Series 2004-C12, Class A4 | | | | | | | | | | |
5.408% | | 07/15/2041 | | # | | | 750,000 | | | 736,068 |
Wachovia Bank Commercial Mortgage Trust | | | | | | | | | | |
Series 2004-C15, Class B | | | | | | | | | | |
4.892% | | 10/15/2041 | | | | | 1,000,000 | | | 871,335 |
Wachovia Bank Commercial Mortgage Trust | | | | | | | | | | |
Series 2006-C25, Class A3 | | | | | | | | | | |
5.893% | | 05/15/2043 | | # | | | 1,000,000 | | | 996,528 |
Wachovia Bank Commercial Mortgage Trust | | | | | | | | | | |
Series 2006-C26, Class AJ | | | | | | | | | | |
6.189% | | 06/15/2045 | | # | | | 1,000,000 | | | 836,173 |
Wachovia Bank Commercial Mortgage Trust | | | | | | | | | | |
Series 2006-C28, Class A3 | | | | | | | | | | |
5.679% | | 10/15/2048 | | | | | 1,600,000 | | | 1,544,913 |
Wachovia Bank Commercial Mortgage Trust | | | | | | | | | | |
Series 2006-C28, Class A2 | | | | | | | | | | |
5.500% | | 10/15/2048 | | | | | 500,000 | | | 495,370 |
Wachovia Bank Commercial Mortgage Trust | | | | | | | | | | |
Series 2007-C30, Class A5 | | | | | | | | | | |
5.342% | | 12/15/2043 | | | | | 500,000 | | | 462,618 |
Wachovia Bank Commercial Mortgage Trust | | | | | | | | | | |
Series 2007-C30, Class A3 | | | | | | | | | | |
5.246% | | 12/15/2043 | | | | | 2,000,000 | | | 1,944,645 |
| | | | | | | | | | |
TOTAL NON-U.S. GOVERNMENT MORTGAGE-BACKED SECURITIES
(Cost $56,981,517) | | | | | | | | 54,728,449 |
| | | | | | | | | | |
| | | | |
| 184 | | See accompanying notes to financial statements. | | |
SCHEDULE OF INVESTMENTS — (Continued)
June 30, 2008 (Unaudited)
Vantagepoint Core Bond Index Fund
| | | | | | | | |
| | | | | Shares | | Value | |
CASH EQUIVALENTS—16.1% | | | | | | | | |
Institutional Money Market Funds—16.1% | | | | | | | | |
AIM Short-Term Investments Trust Liquid Assets Portfolio | | †† | | 29,762,410 | | $ | 29,762,411 | |
AIM Short-Term Investments Trust Prime Assets Portfolio | | †† | | 134,527,982 | | | 134,527,982 | |
JPMorgan Prime Money Market Fund, Capital Shares | | | | 5,914,583 | | | 5,914,583 | |
| | | | | | | | |
TOTAL CASH EQUIVALENTS
(Cost $170,204,976) | | | | | | | 170,204,976 | |
| | | | | | | | |
TOTAL INVESTMENTS—115.2%
(Cost $1,223,983,028) | | | | | | | 1,216,591,378 | |
Other Assets Less Liabilities—(15.2%) | | | | | | | (160,175,323 | ) |
| | | | | | | | |
NET ASSETS—100.0% | | | | | | $ | 1,056,416,055 | |
| | | | | | | | |
Notes to the Schedule of Investments:
| | |
| MTN | | Medium Term Note |
| a | | Illiquid Security. |
| † | | Denotes all or a portion of security on loan. |
| # | | Rate is subject to change. Rate shown reflects current rate. |
| TBA | | To be announced. |
| †† | | Represents reinvestment of collateral received in conjunction with securities lending. |
| | | | |
| | See accompanying notes to financial statements. | | 185 |
SCHEDULE OF INVESTMENTS
June 30, 2008 (Unaudited)
Vantagepoint 500 Stock Index Fund
| | | | | | | |
| | | | | Shares | | Value |
COMMON STOCKS—98.0% | | | | | | | |
Aerospace & Defense—2.6% | | | | | | | |
Boeing Co. (The) | | | | 23,515 | | $ | 1,545,406 |
General Dynamics Corp. | | | | 12,172 | | | 1,024,882 |
Goodrich Corp. | | | | 3,725 | | | 176,789 |
Honeywell International, Inc. | | | | 22,620 | | | 1,137,334 |
L-3 Communications Holdings, Inc. | | | | 3,929 | | | 357,028 |
Lockheed Martin Corp. | | | | 10,504 | | | 1,036,325 |
Northrop Grumman Corp. | | | | 10,493 | | | 701,982 |
Precision Castparts Corp. | | | | 4,277 | | | 412,174 |
Raytheon Co. | | | | 12,973 | | | 730,120 |
Rockwell Collins, Inc. | | | | 5,106 | | | 244,884 |
United Technologies Corp. | | | | 29,999 | | | 1,850,938 |
| | | | | | | |
| | | | | | | 9,217,862 |
| | | | | | | |
Agriculture—0.1% | | | | | | | |
Lorillard, Inc. | | * | | 5,232 | | | 361,845 |
| | | | | | | |
Air Freight & Logistics—0.9% | | | | | | | |
CH Robinson Worldwide, Inc. | | | | 5,392 | | | 295,697 |
Expeditors International of Washington, Inc. | | | | 6,669 | | | 286,767 |
FedEx Corp. | | | | 9,562 | | | 753,390 |
United Parcel Service, Inc., Class B | | | | 31,896 | | | 1,960,647 |
| | | | | | | |
| | | | | | | 3,296,501 |
| | | | | | | |
Airlines—0.1% | | | | | | | |
Southwest Airlines Co. | | | | 22,465 | | | 292,944 |
| | | | | | | |
Auto Components—0.2% | | | | | | | |
Goodyear Tire & Rubber Co. (The) | | * | | 7,363 | | | 131,282 |
Johnson Controls, Inc. | | | | 18,309 | | | 525,102 |
| | | | | | | |
| | | | | | | 656,384 |
| | | | | | | |
Automobiles—0.2% | | | | | | | |
Ford Motor Co. | | *† | | 67,247 | | | 323,458 |
General Motors Corp. | | † | | 17,696 | | | 203,504 |
Harley-Davidson, Inc. | | † | | 7,186 | | | 260,564 |
| | | | | | | |
| | | | | | | 787,526 |
| | | | | | | |
Beverages—2.4% | | | | | | | |
Anheuser-Busch Cos, Inc. | | | | 22,204 | | | 1,379,312 |
Brown-Forman Corp., Class B | | | | 2,464 | | | 186,204 |
Coca-Cola Co. (The) | | | | 61,272 | | | 3,184,919 |
Coca-Cola Enterprises, Inc. | | | | 8,053 | | | 139,317 |
Constellation Brands, Inc., Class A | | *† | | 5,602 | | | 111,256 |
Molson Coors Brewing Co., Class B | | | | 4,248 | | | 230,794 |
Pepsi Bottling Group, Inc. | | | | 4,086 | | | 114,081 |
PepsiCo, Inc. | | | | 48,902 | | | 3,109,678 |
| | | | | | | |
| | | | | | | 8,455,561 |
| | | | | | | |
Biotechnology—1.4% | | | | | | | |
Amgen, Inc. | | * | | 32,969 | | | 1,554,818 |
Biogen Idec, Inc. | | *† | | 8,876 | | | 496,080 |
Celgene Corp. | | * | | 13,338 | | | 851,898 |
Genzyme Corp. | | * | | 8,228 | | | 592,581 |
Gilead Sciences, Inc. | | * | | 28,189 | | | 1,492,607 |
| | | | | | | |
| | | | | | | 4,987,984 |
| | | | | | | |
Building Products—0.1% | | | | | | | |
Masco Corp. | | | | 11,772 | | | 185,174 |
| | | | | | | |
Capital Markets—2.7% | | | | | | | |
American Capital Strategies Ltd. | | † | | 5,599 | | | 133,088 |
Ameriprise Financial, Inc. | | | | 7,301 | | | 296,932 |
Bank of New York Mellon Corp. | | | | 34,990 | | | 1,323,672 |
Charles Schwab Corp. (The) | | | | 29,198 | | | 599,727 |
E*Trade Financial Corp. | | *† | | 12,800 | | | 40,192 |
Federated Investors, Inc., Class B | | | | 2,799 | | | 96,341 |
Franklin Resources, Inc. | | | | 4,858 | | | 445,236 |
Goldman Sachs Group, Inc. (The) | | | | 12,067 | | | 2,110,518 |
Janus Capital Group, Inc. | | † | | 4,574 | | | 121,074 |
Legg Mason, Inc. | | † | | 3,983 | | | 173,539 |
Lehman Brothers Holdings, Inc. | | † | | 20,669 | | | 409,453 |
Merrill Lynch & Co., Inc. | | | | 29,760 | | | 943,690 |
Morgan Stanley | | | | 33,835 | | | 1,220,428 |
Northern Trust Corp. | | | | 5,889 | | | 403,809 |
State Street Corp. | | | | 12,988 | | | 831,102 |
T Rowe Price Group, Inc. | | | | 7,912 | | | 446,791 |
| | | | | | | |
| | | | | | | 9,595,592 |
| | | | | | | |
Chemicals—2.0% | | | | | | | |
Air Products & Chemicals, Inc. | | | | 6,726 | | | 664,932 |
Ashland, Inc. | | | | 1,771 | | | 85,362 |
Dow Chemical Co. (The) | | | | 28,581 | | | 997,763 |
E.I. Du Pont de Nemours & Co. | | | | 27,228 | | | 1,167,809 |
Eastman Chemical Co. | | † | | 2,451 | | | 168,776 |
Ecolab, Inc. | | | | 5,184 | | | 222,860 |
Hercules, Inc. | | † | | 3,515 | | | 59,509 |
International Flavors & Fragrances, Inc. | | | | 2,365 | | | 92,377 |
Monsanto Co. | | | | 16,800 | | | 2,124,192 |
PPG Industries, Inc. | | | | 5,081 | | | 291,497 |
Praxair, Inc. | | | | 9,796 | | | 923,175 |
Rohm & Haas Co. | | | | 3,701 | | | 171,875 |
Sigma-Aldrich Corp. | | | | 3,792 | | | 204,237 |
| | | | | | | |
| | | | | | | 7,174,364 |
| | | | | | | |
Commercial Banks—2.1% | | | | | | | |
BB&T Corp. | | † | | 16,901 | | | 384,836 |
Comerica, Inc. | | † | | 4,863 | | | 124,639 |
Fifth Third Bancorp | | † | | 16,455 | | | 167,512 |
First Horizon National Corp. | | † | | 3,674 | | | 27,298 |
Huntington Bancshares, Inc. | | † | | 11,365 | | | 65,576 |
Keycorp | | † | | 12,073 | | | 132,561 |
M&T Bank Corp. | | † | | 2,431 | | | 171,483 |
Marshall & Ilsley Corp. | | † | | 8,011 | | | 122,809 |
National City Corp. | | † | | 19,071 | | | 90,969 |
PNC Financial Services Group, Inc. | | | | 10,783 | | | 615,709 |
Regions Financial Corp. | | † | | 21,660 | | | 236,310 |
SunTrust Banks, Inc. | | | | 10,877 | | | 393,965 |
US Bancorp | | | | 53,028 | | | 1,478,951 |
Wachovia Corp. | | † | | 65,231 | | | 1,013,037 |
Wells Fargo & Co. | | | | 100,985 | | | 2,398,394 |
Zions Bancorporation | | † | | 3,246 | | | 102,216 |
| | | | | | | |
| | | | | | | 7,526,265 |
| | | | | | | |
Commercial Services & Supplies—0.5% | | | | | | | |
Allied Waste Industries, Inc. | | * | | 10,337 | | | 130,453 |
Avery Dennison Corp. | | † | | 3,045 | | | 133,767 |
Cintas Corp. | | | | 4,114 | | | 109,062 |
Equifax, Inc. | | † | | 3,838 | | | 129,033 |
| | | | |
| 186 | | See accompanying notes to financial statements. | | |
SCHEDULE OF INVESTMENTS — (Continued)
June 30, 2008 (Unaudited)
Vantagepoint 500 Stock Index Fund
| | | | | | | |
| | | | | Shares | | Value |
COMMON STOCKS—(Continued) | | | | | | | |
Monster Worldwide, Inc. | | * | | 4,065 | | $ | 83,780 |
Pitney Bowes, Inc. | | | | 6,896 | | | 235,154 |
Robert Half International, Inc. | | | | 5,293 | | | 126,873 |
RR Donnelley & Sons Co. | | | | 6,781 | | | 201,328 |
Waste Management, Inc. | | | | 15,290 | | | 576,586 |
| | | | | | | |
| | | | | | | 1,726,036 |
| | | | | | | |
Communications Equipment—2.5% | | | | | | | |
Ciena Corp. | | * | | 2,144 | | | 49,677 |
Cisco Systems, Inc. | | * | | 183,286 | | | 4,263,232 |
Corning, Inc. | | | | 47,698 | | | 1,099,439 |
JDS Uniphase Corp. | | *† | | 5,668 | | | 64,389 |
Juniper Networks, Inc. | | * | | 16,362 | | | 362,909 |
Motorola, Inc. | | | | 68,986 | | | 506,357 |
Qualcomm, Inc. | | | | 49,652 | | | 2,203,059 |
Tellabs, Inc. | | * | | 12,229 | | | 56,865 |
| | | | | | | |
| | | | | | | 8,605,927 |
| | | | | | | |
Computers & Peripherals—4.6% | | | | | | | |
Apple, Inc. | | * | | 26,943 | | | 4,511,336 |
Dell, Inc. | | * | | 62,471 | | | 1,366,865 |
EMC Corp. | | * | | 64,482 | | | 947,241 |
Hewlett-Packard Co. | | | | 76,255 | | | 3,371,233 |
International Business Machines Corp. | | | | 42,439 | | | 5,030,295 |
Lexmark International, Inc., Class A | | * | | 2,870 | | | 95,944 |
NetApp, Inc. | | * | | 10,193 | | | 220,780 |
QLogic Corp. | | * | | 4,584 | | | 66,881 |
SanDisk Corp. | | * | | 6,917 | | | 129,348 |
Sun Microsystems, Inc. | | *† | | 25,510 | | | 277,549 |
Teradata Corp. | | * | | 5,590 | | | 129,353 |
| | | | | | | |
| | | | | | | 16,146,825 |
| | | | | | | |
Construction & Engineering—0.2% | | | | | | | |
Fluor Corp. | | | | 2,716 | | | 505,393 |
Jacobs Engineering Group, Inc. | | * | | 3,730 | | | 301,011 |
| | | | | | | |
| | | | | | | 806,404 |
| | | | | | | |
Construction Materials—0.1% | | | | | | | |
Vulcan Materials Co. | | † | | 3,366 | | | 201,219 |
| | | | | | | |
Consumer Finance—0.6% | | | | | | | |
American Express Co. | | | | 35,454 | | | 1,335,552 |
Capital One Financial Corp. | | † | | 11,425 | | | 434,265 |
Discover Financial Services | | † | | 15,513 | | | 204,306 |
SLM Corp. | | * | | 14,292 | | | 276,550 |
| | | | | | | |
| | | | | | | 2,250,673 |
| | | | | | | |
Containers & Packaging—0.1% | | | | | | | |
Ball Corp. | | | | 3,168 | | | 151,240 |
Bemis Co., Inc. | | | | 3,365 | | | 75,443 |
Pactiv Corp. | | * | | 4,478 | | | 95,068 |
Sealed Air Corp. | | † | | 4,782 | | | 90,906 |
| | | | | | | |
| | | | | | | 412,657 |
| | | | | | | |
Distributors—0.1% | | | | | | | |
Genuine Parts Co. | | | | 5,410 | | | 214,669 |
| | | | | | | |
Diversified Consumer Services—0.1% | | | | | | | |
Apollo Group, Inc., Class A | | * | | 4,073 | | | 180,271 |
H&R Block, Inc. | | | | 10,232 | | | 218,965 |
| | | | | | | |
| | | | | | | 399,236 |
| | | | | | | |
Diversified Financial Services—3.3% | | | | | | | |
Bank of America Corp. | | | | 136,071 | | | 3,248,015 |
CIT Group, Inc. | | | | 8,652 | | | 58,920 |
Citigroup, Inc. | | | | 167,241 | | | 2,802,959 |
CME Group, Inc. | | | | 1,682 | | | 644,525 |
IntercontinentalExchange, Inc. | | * | | 2,157 | | | 245,898 |
JPMorgan Chase & Co. | | | | 106,123 | | | 3,641,087 |
Leucadia National Corp. | | † | | 5,140 | | | 241,272 |
Moody’s Corp. | | † | | 6,539 | | | 225,203 |
NYSE Euronext | | | | 8,209 | | | 415,868 |
| | | | | | | |
| | | | | | | 11,523,747 |
| | | | | | | |
Diversified Telecommunication Services—2.9% | | | | | | | |
AT&T, Inc. | | | | 183,137 | | | 6,169,885 |
CenturyTel, Inc. | | | | 3,293 | | | 117,198 |
Citizens Communications Co. | | † | | 10,409 | | | 118,038 |
Embarq Corp. | | | | 4,416 | | | 208,744 |
Qwest Communications International, Inc. | | † | | 49,218 | | | 193,427 |
Verizon Communications, Inc. | | | | 87,799 | | | 3,108,085 |
Windstream Corp. | | | | 14,143 | | | 174,525 |
| | | | | | | |
| | | | | | | 10,089,902 |
| | | | | | | |
Electric Utilities—2.3% | | | | | | | |
Allegheny Energy, Inc. | | | | 4,824 | | | 241,731 |
American Electric Power Co., Inc. | | | | 12,380 | | | 498,047 |
Duke Energy Corp. | | | | 39,212 | | | 681,505 |
Edison International | | | | 9,898 | | | 508,559 |
Entergy Corp. | | | | 6,031 | | | 726,615 |
Exelon Corp. | | | | 20,271 | | | 1,823,579 |
FirstEnergy Corp. | | | | 9,191 | | | 756,695 |
FPL Group, Inc. | | | | 12,628 | | | 828,144 |
Pepco Holdings, Inc. | | | | 6,023 | | | 154,490 |
Pinnacle West Capital Corp. | | | | 2,891 | | | 88,956 |
PPL Corp. | | | | 11,199 | | | 585,372 |
Progress Energy, Inc. | | † | | 7,759 | | | 324,559 |
Southern Co. | | | | 23,187 | | | 809,690 |
| | | | | | | |
| | | | | | | 8,027,942 |
| | | | | | | |
Electrical Equipment—0.5% | | | | | | | |
Cooper Industries Ltd., Class A | | | | 5,710 | | | 225,545 |
Emerson Electric Co. | | | | 23,841 | | | 1,178,938 |
Rockwell Automation, Inc. | | | | 4,562 | | | 199,496 |
| | | | | | | |
| | | | | | | 1,603,979 |
| | | | | | | |
Electronic Equipment & Instruments—0.3% | | | | | | | |
Agilent Technologies, Inc. | | * | | 11,570 | | | 411,198 |
Jabil Circuit, Inc. | | | | 5,995 | | | 98,378 |
Molex, Inc. | | | | 4,262 | | | 104,035 |
Tyco Electronics Ltd. (Bermuda) | | | | 15,195 | | | 544,285 |
| | | | | | | |
| | | | | | | 1,157,896 |
| | | | | | | |
Energy Equipment & Services—3.6% | | | | | | | |
Baker Hughes, Inc. | | | | 9,795 | | | 855,495 |
BJ Services Co. | | | | 8,811 | | | 281,424 |
Cameron International Corp. | | * | | 6,832 | | | 378,151 |
ENSCO International, Inc. | | | | 4,299 | | | 347,101 |
Halliburton Co. | | | | 26,646 | | | 1,414,103 |
Nabors Industries Ltd. (Bermuda) | | *† | | 8,284 | | | 407,821 |
National Oilwell Varco, Inc. | | * | | 12,668 | | | 1,123,905 |
Noble Corp. | | | | 8,474 | | | 550,471 |
Rowan Cos, Inc. | | † | | 3,489 | | | 163,111 |
Schlumberger Ltd. | | | | 36,727 | | | 3,945,582 |
Smith International, Inc. | | | | 6,087 | | | 506,073 |
| | | | |
| | See accompanying notes to financial statements. | | 187 |
SCHEDULE OF INVESTMENTS — (Continued)
June 30, 2008 (Unaudited)
Vantagepoint 500 Stock Index Fund
| | | | | | | |
| | | | | Shares | | Value |
COMMON STOCKS—(Continued) | | | | | | | |
Transocean, Inc. | | * | | 9,631 | | $ | 1,467,668 |
Weatherford International Ltd. | | * | | 20,798 | | | 1,031,373 |
| | | | | | | |
| | | | | | | 12,472,278 |
| | | | | | | |
Food & Staples Retailing—2.7% | | | | | | | |
Costco Wholesale Corp. | | | | 13,115 | | | 919,886 |
CVS Caremark Corp. | | | | 44,312 | | | 1,753,426 |
Kroger Co. (The) | | | | 20,497 | | | 591,748 |
Safeway, Inc. | | | | 13,907 | | | 397,045 |
Supervalu, Inc. | | | | 6,343 | | | 195,935 |
Sysco Corp. | | | | 18,301 | | | 503,460 |
Walgreen Co. | | | | 30,005 | | | 975,463 |
Wal-Mart Stores, Inc. | | | | 71,759 | | | 4,032,856 |
Whole Foods Market, Inc. | | † | | 4,200 | | | 99,498 |
| | | | | | | |
| | | | | | | 9,469,317 |
| | | | | | | |
Food Products—1.5% | | | | | | | |
Archer-Daniels-Midland Co. | | | | 19,425 | | | 655,594 |
Campbell Soup Co. | | | | 6,505 | | | 217,657 |
ConAgra Foods, Inc. | | | | 14,538 | | | 280,293 |
Dean Foods Co. | | * | | 4,192 | | | 82,247 |
General Mills, Inc. | | | | 10,161 | | | 617,484 |
Hershey Co. (The) | | † | | 5,550 | | | 181,929 |
HJ Heinz Co. | | | | 9,503 | | | 454,718 |
Kellogg Co. | | | | 7,949 | | | 381,711 |
Kraft Foods, Inc., Class A | | | | 46,877 | | | 1,333,651 |
McCormick & Co., Inc. | | † | | 3,895 | | | 138,896 |
Sara Lee Corp. | | | | 23,124 | | | 283,269 |
Tyson Foods, Inc., Class A | | | | 7,900 | | | 118,026 |
WM Wrigley Jr Co. | | | | 6,663 | | | 518,248 |
| | | | | | | |
| | | | | | | 5,263,723 |
| | | | | | | |
Gas Utilities—0.1% | | | | | | | |
Nicor, Inc. | | † | | 1,395 | | | 59,413 |
Questar Corp. | | † | | 5,268 | | | 374,239 |
| | | | | | | |
| | | | | | | 433,652 |
| | | | | | | |
Health Care Equipment & Supplies—2.0% | | | | | | | |
Baxter International, Inc. | | | | 19,195 | | | 1,227,328 |
Becton Dickinson & Co. | | | | 7,580 | | | 616,254 |
Boston Scientific Corp. | | * | | 41,174 | | | 506,028 |
Covidien Ltd. | | | | 15,195 | | | 727,689 |
CR Bard, Inc. | | | | 3,184 | | | 280,033 |
Hospira, Inc. | | * | | 4,680 | | | 187,715 |
Intuitive Surgical, Inc. | | *† | | 1,056 | | | 284,486 |
Medtronic, Inc. | | | | 34,282 | | | 1,774,093 |
St Jude Medical, Inc. | | * | | 10,312 | | | 421,555 |
Stryker Corp. | | | | 7,295 | | | 458,710 |
Varian Medical Systems, Inc. | | *† | | 4,001 | | | 207,452 |
Zimmer Holdings, Inc. | | * | | 7,063 | | | 480,637 |
| | | | | | | |
| | | | | | | 7,171,980 |
| | | | | | | |
Health Care Providers & Services—1.8% | | | | | | | |
Aetna, Inc. | | | | 15,520 | | | 629,026 |
AmerisourceBergen Corp. | | | | 5,126 | | | 204,989 |
Cardinal Health, Inc. | | | | 11,241 | | | 579,811 |
Cigna Corp. | | | | 8,754 | | | 309,804 |
Coventry Health Care, Inc. | | * | | 4,800 | | | 146,016 |
Express Scripts, Inc. | | * | | 7,575 | | | 475,104 |
Humana, Inc. | | * | | 5,100 | | | 202,827 |
Laboratory Corp of America Holdings | | *† | | 3,523 | | | 245,306 |
McKesson Corp. | | | | 8,702 | | | 486,529 |
Medco Health Solutions, Inc. | | * | | 16,154 | | | 762,469 |
Patterson Cos, Inc. | | *† | | 4,422 | | | 129,962 |
Quest Diagnostics, Inc. | | | | 4,860 | | | 235,564 |
Tenet Healthcare Corp. | | * | | 14,819 | | | 82,394 |
UnitedHealth Group, Inc. | | | | 38,022 | | | 998,077 |
WellPoint, Inc. | | * | | 16,310 | | | 777,335 |
| | | | | | | |
| | | | | | | 6,265,213 |
| | | | | | | |
Health Care Technology—0.0% | | | | | | | |
IMS Health, Inc. | | | | 6,032 | | | 140,546 |
| | | | | | | |
Hotels, Restaurants & Leisure—1.2% | | | | | | | |
Carnival Corp. | | † | | 13,148 | | | 433,358 |
Darden Restaurants, Inc. | | † | | 4,663 | | | 148,936 |
International Game Technology | | | | 9,467 | | | 236,486 |
Marriott International, Inc., Class A | | | | 9,595 | | | 251,773 |
McDonald’s Corp. | | | | 35,006 | | | 1,968,037 |
Starbucks Corp. | | * | | 21,892 | | | 344,580 |
Starwood Hotels & Resorts Worldwide, Inc. | | | | 5,931 | | | 237,655 |
Wendy’s International, Inc. | | | | 2,362 | | | 64,294 |
Wyndham Worldwide Corp. | | | | 6,076 | | | 108,821 |
Yum! Brands, Inc. | | | | 15,303 | | | 536,982 |
| | | | | | | |
| | | | | | | 4,330,922 |
| | | | | | | |
Household Durables—0.4% | | | | | | | |
Black & Decker Corp. | | | | 1,913 | | | 110,017 |
Centex Corp. | | † | | 3,736 | | | 49,950 |
DR Horton, Inc. | | † | | 8,206 | | | 89,035 |
Fortune Brands, Inc. | | | | 4,752 | | | 296,572 |
Harman International Industries, Inc. | | † | | 2,000 | | | 82,780 |
KB Home | | † | | 2,308 | | | 39,074 |
Leggett & Platt, Inc. | | † | | 5,276 | | | 88,479 |
Lennar Corp., Class A | | † | | 4,253 | | | 52,482 |
Newell Rubbermaid, Inc. | | | | 8,746 | | | 146,845 |
Pulte Homes, Inc. | | † | | 6,258 | | | 60,265 |
Snap-On, Inc. | | † | | 1,846 | | | 96,010 |
Stanley Works (The) | | | | 2,596 | | | 116,379 |
Whirlpool Corp. | | | | 2,302 | | | 142,103 |
| | | | | | | |
| | | | | | | 1,369,991 |
| | | | | | | |
Household Products—2.2% | | | | | | | |
Clorox Co. | | | | 4,108 | | | 214,438 |
Colgate-Palmolive Co. | | | | 15,433 | | | 1,066,420 |
Kimberly-Clark Corp. | | | | 12,781 | | | 764,048 |
Procter & Gamble Co. | | | | 94,420 | | | 5,741,680 |
| | | | | | | |
| | | | | | | 7,786,586 |
| | | | | | | |
Independent Power Producers & Energy Traders—0.3% | | | | | | | |
AES Corp. (The) | | * | | 20,826 | | | 400,067 |
Constellation Energy Group, Inc. | | | | 5,647 | | | 463,619 |
Dynegy, Inc., Class A | | * | | 14,627 | | | 125,061 |
| | | | | | | |
| | | | | | | 988,747 |
| | | | | | | |
Industrial Conglomerates—3.0% | | | | | | | |
3M Co. | | | | 21,629 | | | 1,505,162 |
General Electric Co. | | | | 306,365 | | | 8,176,882 |
Textron, Inc. | | | | 7,472 | | | 358,133 |
Tyco International Ltd. (Bermuda) | | | | 15,195 | | | 608,408 |
| | | | | | | |
| | | | | | | 10,648,585 |
| | | | | | | |
Insurance—3.5% | | | | | | | |
ACE Ltd. (Bermuda) | | | | 10,182 | | | 560,926 |
Aflac, Inc. | | | | 14,542 | | | 913,238 |
Allstate Corp. (The) | | | | 17,707 | | | 807,262 |
| | | | |
| 188 | | See accompanying notes to financial statements. | | |
SCHEDULE OF INVESTMENTS — (Continued)
June 30, 2008 (Unaudited)
Vantagepoint 500 Stock Index Fund
| | | | | | | |
| | | | | Shares | | Value |
COMMON STOCKS—(Continued) | | | | | | | |
American International Group, Inc. | | | | 82,660 | | $ | 2,187,184 |
AON Corp. | | | | 9,359 | | | 429,952 |
Assurant, Inc. | | | | 2,807 | | | 185,150 |
Chubb Corp. | | | | 11,560 | | | 566,556 |
Cincinnati Financial Corp. | | | | 5,083 | | | 129,108 |
Genworth Financial, Inc., Class A | | | | 13,920 | | | 247,915 |
Hartford Financial Services Group, Inc. | | | | 9,464 | | | 611,091 |
Lincoln National Corp. | | | | 8,407 | | | 381,005 |
Loews Corp. | | † | | 11,259 | | | 528,047 |
Marsh & McLennan Cos, Inc. | | | | 16,036 | | | 425,756 |
MBIA, Inc. | | † | | 6,439 | | | 28,267 |
MetLife, Inc. | | | | 21,723 | | | 1,146,323 |
Principal Financial Group, Inc. | | | | 7,853 | | | 329,590 |
Progressive Corp. (The) | | | | 20,912 | | | 391,473 |
Prudential Financial, Inc. | | | | 13,729 | | | 820,170 |
Safeco Corp. | | | | 2,748 | | | 184,556 |
Torchmark Corp. | | | | 2,839 | | | 166,507 |
Travelers Cos, Inc. (The) | | | | 19,001 | | | 824,643 |
Unum Group | | † | | 10,826 | | | 221,392 |
XL Capital Ltd., Class A (Bermuda) | | | | 5,668 | | | 116,534 |
| | | | | | | |
| | | | | | | 12,202,645 |
| | | | | | | |
Internet & Catalog Retail—0.3% | | | | | | | |
Amazon.com, Inc. | | * | | 9,269 | | | 679,696 |
Expedia, Inc. | | * | | 6,356 | | | 116,823 |
IAC/InterActiveCorp | | * | | 6,294 | | | 121,348 |
| | | | | | | |
| | | | | | | 917,867 |
| | | | | | | |
Internet Software & Services—1.7% | | | | | | | |
Akamai Technologies, Inc. | | *† | | 5,150 | | | 179,168 |
eBay, Inc. | | * | | 34,382 | | | 939,660 |
Google, Inc., Class A | | * | | 7,111 | | | 3,743,373 |
VeriSign, Inc. | | *† | | 6,732 | | | 254,470 |
Yahoo! Inc. | | * | | 41,984 | | | 867,389 |
| | | | | | | |
| | | | | | | 5,984,060 |
| | | | | | | |
IT Services—0.9% | | | | | | | |
Affiliated Computer Services, Inc., Class A | | * | | 3,065 | | | 163,947 |
Automatic Data Processing, Inc. | | | | 16,387 | | | 686,615 |
Cognizant Technology Solutions Corp., Class A | | * | | 8,648 | | | 281,146 |
Computer Sciences Corp. | | * | | 4,843 | | | 226,846 |
Convergys Corp. | | * | | 4,528 | | | 67,286 |
Electronic Data Systems Corp. | | | | 16,012 | | | 394,536 |
Fidelity National Information Services, Inc. | | | | 5,123 | | | 189,090 |
Fiserv, Inc. | | *† | | 5,132 | | | 232,839 |
Paychex, Inc. | | | | 9,970 | | | 311,862 |
Total System Services, Inc. | | | | 6,097 | | | 135,475 |
Unisys Corp. | | * | | 10,465 | | | 41,337 |
Western Union Co. (The) | | | | 22,562 | | | 557,733 |
| | | | | | | |
| | | | | | | 3,288,712 |
| | | | | | | |
Leisure Equipment & Products—0.1% | | | | | | | |
Eastman Kodak Co. | | † | | 8,976 | | | 129,524 |
Hasbro, Inc. | | | | 4,244 | | | 151,596 |
Mattel, Inc. | | | | 11,814 | | | 202,255 |
| | | | | | | |
| | | | | | | 483,375 |
| | | | | | | |
Life Sciences Tools & Services—0.4% | | | | | | | |
Applera Corp.—Applied Biosystems Group | | | | 5,286 | | | 176,975 |
Millipore Corp. | | * | | 1,546 | | | 104,912 |
PerkinElmer, Inc. | | | | 4,019 | | | 111,929 |
Thermo Fisher Scientific, Inc. | | * | | 13,077 | | | 728,781 |
Waters Corp. | | * | | 3,186 | | | 205,497 |
| | | | | | | |
| | | | | | | 1,328,094 |
| | | | | | | |
Machinery—1.9% | | | | | | | |
Caterpillar, Inc. | | | | 19,267 | | | 1,422,290 |
Cummins, Inc. | | | | 6,097 | | | 399,475 |
Danaher Corp. | | | | 7,623 | | | 589,258 |
Deere & Co. | | | | 13,434 | | | 968,994 |
Dover Corp. | | | | 6,423 | | | 310,681 |
Eaton Corp. | | | | 4,975 | | | 422,726 |
Illinois Tool Works, Inc. | | | | 12,456 | | | 591,785 |
Ingersoll-Rand Co. Ltd., Class A (Bermuda) | | | | 9,404 | | | 351,992 |
ITT Corp. | | | | 5,413 | | | 342,805 |
Manitowoc Co., Inc. (The) | | † | | 3,906 | | | 127,062 |
PACCAR, Inc. | | | | 11,068 | | | 462,974 |
Pall Corp. | | | | 3,958 | | | 157,053 |
Parker Hannifin Corp. | | | | 5,165 | | | 368,368 |
Terex Corp. | | * | | 3,229 | | | 165,874 |
| | | | | | | |
| | | | | | | 6,681,337 |
| | | | | | | |
Media—2.8% | | | | | | | |
CBS Corp., Class B | | † | | 20,603 | | | 401,552 |
Clear Channel Communications, Inc. | | | | 15,334 | | | 539,757 |
Comcast Corp., Class A | | | | 91,460 | | | 1,734,996 |
DIRECTV Group, Inc. (The) | | * | | 22,146 | | | 573,803 |
E.W. Scripps Co., Class A | | † | | 2,500 | | | 103,850 |
Gannett Co., Inc. | | † | | 7,093 | | | 153,705 |
Interpublic Group of Cos, Inc. (The) | | *† | | 13,428 | | | 115,481 |
McGraw-Hill Cos, Inc. (The) | | | | 9,866 | | | 395,824 |
Meredith Corp. | | † | | 1,189 | | | 33,637 |
New York Times Co. (The), Class A | | † | | 4,417 | | | 67,978 |
News Corp., Class A | | | | 70,079 | | | 1,053,988 |
Omnicom Group, Inc. | | † | | 10,092 | | | 452,929 |
Time Warner, Inc. | | | | 109,629 | | | 1,622,509 |
Viacom, Inc., Class B | | * | | 20,343 | | | 621,275 |
Walt Disney Co. (The) | | | | 57,739 | | | 1,801,457 |
Washington Post Co. (The), Class B | | | | 182 | | | 106,816 |
| | | | | | | |
| | | | | | | 9,779,557 |
| | | | | | | |
Metals & Mining—1.4% | | | | | | | |
AK Steel Holding Corp. | | | | 2,902 | | | 200,238 |
Alcoa, Inc. | | | | 25,638 | | | 913,226 |
Allegheny Technologies, Inc. | | | | 3,169 | | | 187,858 |
Freeport-McMoRan Copper & Gold, Inc. | | | | 11,734 | | | 1,375,107 |
Newmont Mining Corp. | | | | 14,078 | | | 734,309 |
Nucor Corp. | | | | 9,540 | | | 712,352 |
Titanium Metals Corp. | | † | | 2,725 | | | 38,123 |
United States Steel Corp. | | | | 3,716 | | | 686,642 |
| | | | | | | |
| | | | | | | 4,847,855 |
| | | | | | | |
Multiline Retail—0.7% | | | | | | | |
Big Lots, Inc. | | *† | | 2,400 | | | 74,976 |
Dillard’s, Inc., Class A | | † | | 1,726 | | | 19,970 |
Family Dollar Stores, Inc. | | | | 5,061 | | | 100,916 |
JC Penney Co., Inc. | | | | 7,038 | | | 255,409 |
| | | | |
| | See accompanying notes to financial statements. | | 189 |
SCHEDULE OF INVESTMENTS — (Continued)
June 30, 2008 (Unaudited)
Vantagepoint 500 Stock Index Fund
| | | | | | | |
| | | | | Shares | | Value |
COMMON STOCKS—(Continued) | | | | | | | |
Kohl’s Corp. | | * | | 9,410 | | $ | 376,776 |
Macy’s, Inc. | | | | 12,923 | | | 250,965 |
Nordstrom, Inc. | | † | | 5,703 | | | 172,801 |
Sears Holdings Corp. | | *† | | 2,157 | | | 158,885 |
Target Corp. | | | | 24,084 | | | 1,119,665 |
| | | | | | | |
| | | | | | | 2,530,363 |
| | | | | | | |
Multi-Utilities—1.2% | | | | | | | |
Ameren Corp. | | | | 6,170 | | | 260,559 |
Centerpoint Energy, Inc. | | | | 9,695 | | | 155,605 |
CMS Energy Corp. | | | | 7,199 | | | 107,265 |
Consolidated Edison, Inc. | | † | | 8,061 | | | 315,105 |
Dominion Resources, Inc. | | † | | 17,958 | | | 852,825 |
DTE Energy Co. | | † | | 5,330 | | | 226,205 |
Integrys Energy Group, Inc. | | † | | 2,341 | | | 118,993 |
NiSource, Inc. | | | | 8,413 | | | 150,761 |
PG&E Corp. | | | | 10,922 | | | 433,494 |
Public Service Enterprise Group, Inc. | | | | 15,790 | | | 725,235 |
Sempra Energy | | | | 8,214 | | | 463,680 |
TECO Energy, Inc. | | † | | 5,950 | | | 127,866 |
Xcel Energy, Inc. | | | | 12,731 | | | 255,511 |
| | | | | | | |
| | | | | | | 4,193,104 |
| | | | | | | |
Office Electronics—0.1% | | | | | | | |
Xerox Corp. | | | | 29,117 | | | 394,827 |
| | | | | | | |
Oil, Gas & Consumable Fuels—12.3% | | | | | | | |
Anadarko Petroleum Corp. | | | | 14,377 | | | 1,075,975 |
Apache Corp. | | | | 10,208 | | | 1,418,912 |
Cabot Oil & Gas Corp. | | | | 3,009 | | | 203,800 |
Chesapeake Energy Corp. | | | | 14,677 | | | 968,095 |
Chevron Corp. | | | | 63,817 | | | 6,326,179 |
ConocoPhillips | | | | 47,565 | | | 4,489,660 |
Consol Energy, Inc. | | | | 5,595 | | | 628,710 |
Devon Energy Corp. | | | | 13,476 | | | 1,619,276 |
El Paso Corp. | | | | 22,180 | | | 482,193 |
EOG Resources, Inc. | | | | 7,575 | | | 993,840 |
Exxon Mobil Corp. | | | | 162,799 | | | 14,347,476 |
Hess Corp. | | | | 8,391 | | | 1,058,860 |
Marathon Oil Corp. | | | | 21,496 | | | 1,114,998 |
Massey Energy Co. | | | | 2,476 | | | 232,125 |
Murphy Oil Corp. | | | | 5,644 | | | 553,394 |
Noble Energy, Inc. | | | | 5,358 | | | 538,800 |
Occidental Petroleum Corp. | | | | 25,131 | | | 2,258,272 |
Peabody Energy Corp. | | | | 8,293 | | | 730,199 |
Range Resources Corp. | | | | 4,649 | | | 304,695 |
Southwestern Energy Co. | | * | | 9,652 | | | 459,532 |
Spectra Energy Corp. | | | | 19,659 | | | 565,000 |
Sunoco, Inc. | | | | 3,836 | | | 156,087 |
Tesoro Corp. | | † | | 4,285 | | | 84,714 |
Valero Energy Corp. | | | | 16,647 | | | 685,523 |
Williams Cos, Inc. | | | | 17,884 | | | 720,904 |
XTO Energy, Inc. | | | | 15,645 | | | 1,071,839 |
| | | | | | | |
| | | | | | | 43,089,058 |
| | | | | | | |
Paper & Forest Products—0.2% | | | | | | | |
International Paper Co. | | | | 13,188 | | | 307,281 |
MeadWestvaco Corp. | | | | 5,462 | | | 130,214 |
Weyerhaeuser Co. | | | | 6,280 | | | 321,159 |
| | | | | | | |
| | | | | | | 758,654 |
| | | | | | | |
Personal Products—0.2% | | | | | | | |
Avon Products, Inc. | | | | 13,350 | | | 480,867 |
Estee Lauder Cos, Inc. (The), Class A | | | | 3,640 | | | 169,078 |
| | | | | | | |
| | | | | | | 649,945 |
| | | | | | | |
Pharmaceuticals—6.0% | | | | | | | |
Abbott Laboratories | | | | 47,399 | | | 2,510,725 |
Allergan, Inc. | | † | | 9,246 | | | 481,254 |
Barr Pharmaceuticals, Inc. | | * | | 3,200 | | | 144,256 |
Bristol-Myers Squibb Co. | | | | 59,948 | | | 1,230,732 |
Eli Lilly & Co. | | | | 30,325 | | | 1,399,802 |
Forest Laboratories, Inc. | | * | | 9,616 | | | 334,060 |
Johnson & Johnson | | | | 86,993 | | | 5,597,130 |
King Pharmaceuticals, Inc. | | * | | 7,638 | | | 79,970 |
Merck & Co., Inc. | | | | 66,108 | | | 2,491,610 |
Mylan, Inc. | | *† | | 9,331 | | | 112,625 |
Pfizer, Inc. | | | | 207,576 | | | 3,626,353 |
Schering-Plough Corp. | | | | 49,011 | | | 965,027 |
Watson Pharmaceuticals, Inc. | | * | | 2,919 | | | 79,309 |
Wyeth | | | | 40,600 | | | 1,947,176 |
| | | | | | | |
| | | | | | | 21,000,029 |
| | | | | | | |
Real Estate Investment Trusts (REIT)—1.2% | | | | | | | |
Apartment Investment & Management Co., Class A REIT | | † | | 3,115 | | | 106,097 |
AvalonBay Communities, Inc. REIT | | † | | 2,470 | | | 220,225 |
Boston Properties, Inc. REIT | | | | 3,717 | | | 335,348 |
Developers Diversified Realty Corp. REIT | | † | | 3,951 | | | 137,139 |
Equity Residential REIT | | | | 8,303 | | | 317,756 |
General Growth Properties, Inc. REIT | | † | | 8,178 | | | 286,475 |
HCP, Inc. REIT | | | | 7,184 | | | 228,523 |
Host Hotels & Resorts, Inc. REIT | | | | 16,217 | | | 221,362 |
Kimco Realty Corp. REIT | | | | 7,548 | | | 260,557 |
Plum Creek Timber Co., Inc. REIT | | † | | 5,089 | | | 217,351 |
Prologis REIT | | | | 7,749 | | | 421,158 |
Public Storage REIT | | | | 3,844 | | | 310,557 |
Simon Property Group, Inc. REIT | | † | | 6,910 | | | 621,140 |
Vornado Realty Trust REIT | | | | 4,063 | | | 357,544 |
| | | | | | | |
| | | | | | | 4,041,232 |
| | | | | | | |
Real Estate Management & Development—0.0% | | | | | | | |
CB Richard Ellis Group, Inc., Class A | | *† | | 5,846 | | | 112,243 |
| | | | | | | |
Road & Rail—1.1% | | | | | | | |
Burlington Northern Santa Fe Corp. | | | | 9,001 | | | 899,110 |
CSX Corp. | | | | 12,670 | | | 795,803 |
Norfolk Southern Corp. | | | | 11,673 | | | 731,547 |
Ryder System, Inc. | | † | | 2,030 | | | 139,826 |
Union Pacific Corp. | | | | 15,886 | | | 1,199,393 |
| | | | | | | |
| | | | | | | 3,765,679 |
| | | | | | | |
Semiconductors & Semiconductor Equipment—2.6% | | | | | | | |
Advanced Micro Devices, Inc. | | *† | | 16,617 | | | 96,877 |
Altera Corp. | | | | 9,869 | | | 204,288 |
Analog Devices, Inc. | | | | 9,501 | | | 301,847 |
Applied Materials, Inc. | | | | 41,621 | | | 794,545 |
Broadcom Corp., Class A | | * | | 14,124 | | | 385,444 |
Intel Corp. | | | | 177,639 | | | 3,815,686 |
| | | | |
| 190 | | See accompanying notes to financial statements. | | |
SCHEDULE OF INVESTMENTS — (Continued)
June 30, 2008 (Unaudited)
Vantagepoint 500 Stock Index Fund
| | | | | | | |
| | | | | Shares | | Value |
COMMON STOCKS—(Continued) | | | | | | | |
KLA-Tencor Corp. | | † | | 5,560 | | $ | 226,348 |
Linear Technology Corp. | | † | | 6,719 | | | 218,838 |
LSI Corp. | | *† | | 23,786 | | | 146,046 |
MEMC Electronic Materials, Inc. | | * | | 7,012 | | | 431,518 |
Microchip Technology, Inc. | | † | | 5,551 | | | 169,528 |
Micron Technology, Inc. | | * | | 23,746 | | | 142,476 |
National Semiconductor Corp. | | | | 7,865 | | | 161,547 |
Novellus Systems, Inc. | | *† | | 4,043 | | | 85,671 |
Nvidia Corp. | | * | | 16,756 | | | 313,672 |
Teradyne, Inc. | | * | | 6,358 | | | 70,383 |
Texas Instruments, Inc. | | | | 41,228 | | | 1,160,980 |
Xilinx, Inc. | | | | 8,667 | | | 218,842 |
| | | | | | | |
| | | | | | | 8,944,536 |
| | | | | | | |
Software—3.5% | | | | | | | |
Adobe Systems, Inc. | | * | | 17,287 | | | 680,935 |
Autodesk, Inc. | | * | | 7,066 | | | 238,901 |
BMC Software, Inc. | | * | | 5,773 | | | 207,828 |
CA, Inc. | | | | 11,671 | | | 269,483 |
Citrix Systems, Inc. | | * | | 5,196 | | | 152,814 |
Compuware Corp. | | * | | 9,006 | | | 85,917 |
Electronic Arts, Inc. | | * | | 9,665 | | | 429,416 |
Intuit, Inc. | | * | | 9,924 | | | 273,605 |
Microsoft Corp. | | | | 245,374 | | | 6,750,239 |
Novell, Inc. | | * | | 11,821 | | | 69,626 |
Oracle Corp. | | * | | 121,282 | | | 2,546,922 |
Symantec Corp. | | * | | 26,043 | | | 503,932 |
| | | | | | | |
| | | | | | | 12,209,618 |
| | | | | | | |
Specialty Retail—1.5% | | | | | | | |
Abercrombie & Fitch Co., Class A | | | | 2,804 | | | 175,755 |
AutoNation, Inc. | | *† | | 4,218 | | | 42,264 |
Autozone, Inc. | | * | | 1,371 | | | 165,905 |
Bed Bath & Beyond, Inc. | | * | | 7,855 | | | 220,726 |
Best Buy Co., Inc. | | | | 10,836 | | | 429,106 |
GameStop Corp., Class A | | * | | 4,955 | | | 200,182 |
Gap, Inc. (The) | | | | 13,860 | | | 231,046 |
Home Depot, Inc. | | | | 51,136 | | | 1,197,605 |
Lowe’s Cos, Inc. | | | | 44,251 | | | 918,208 |
Ltd. Brands, Inc. | | | | 10,263 | | | 172,932 |
Office Depot, Inc. | | * | | 8,714 | | | 95,331 |
RadioShack Corp. | | | | 3,908 | | | 47,951 |
Sherwin-Williams Co. (The) | | † | | 3,384 | | | 155,427 |
Staples, Inc. | | | | 21,243 | | | 504,521 |
Tiffany & Co. | | | | 4,243 | | | 172,902 |
TJX Cos, Inc. | | | | 13,095 | | | 412,100 |
| | | | | | | |
| | | | | | | 5,141,961 |
| | | | | | | |
Textiles, Apparel & Luxury Goods—0.4% | | | | | | | |
Coach, Inc. | | * | | 11,268 | | | 325,420 |
Jones Apparel Group, Inc. | | | | 3,500 | | | 48,125 |
Liz Claiborne, Inc. | | † | | 3,056 | | | 43,243 |
Nike, Inc., Class B | | | | 11,589 | | | 690,820 |
Polo Ralph Lauren Corp. | | † | | 1,954 | | | 122,672 |
VF Corp. | | | | 2,652 | | | 188,769 |
| | | | | | | |
| | | | | | | 1,419,049 |
| | | | | | | |
Thrifts & Mortgage Finance—0.4% | | | | | | | |
Countrywide Financial Corp. | | † | | 17,838 | | | 75,812 |
Federal National Mortgage Association | | | | 32,552 | | | 635,090 |
Freddie Mac | | | | 20,106 | | | 329,738 |
Hudson City Bancorp, Inc. | | | | 15,412 | | | 257,072 |
MGIC Investment Corp. | | † | | 2,777 | | | 16,967 |
Sovereign Bancorp, Inc. | | † | | 11,004 | | | 80,989 |
Washington Mutual, Inc. | | † | | 32,436 | | | 159,910 |
| | | | | | | |
| | | | | | | 1,555,578 |
| | | | | | | |
Tobacco—1.4% | | | | | | | |
Altria Group, Inc. | | | | 64,332 | | | 1,322,666 |
Philip Morris International, Inc. | | | | 64,332 | | | 3,177,358 |
Reynolds American, Inc. | | † | | 5,390 | | | 251,551 |
UST, Inc. | | | | 4,656 | | | 254,264 |
| | | | | | | |
| | | | | | | 5,005,839 |
| | | | | | | |
Trading Companies & Distributors—0.1% | | | | | | | |
W.W. Grainger, Inc. | | | | 2,254 | | | 184,377 |
| | | | | | | |
Wireless Telecommunication Services—0.4% | | | | | | | |
American Tower Corp., Class A | | * | | 12,160 | | | 513,760 |
Sprint Nextel Corp. | | | | 85,922 | | | 816,259 |
| | | | | | | |
| | | | | | | 1,330,019 |
| | | | | | | |
TOTAL COMMON STOCKS
(Cost $214,644,332) | | | | | | | 343,886,267 |
| | | | | | | |
| | | | | | | | | |
Coupon Rate | | Maturity Date | | Face | | Value |
U.S. TREASURY OBLIGATIONS—0.1% | | | | | | | | | |
U.S. Treasury Bill—0.1% | | | | | | | | | |
U.S. Treasury Bill | | | | | | | | | |
1.947% | | 09/18/2008 | | ‡‡ | | | | | |
(Cost $373,405) | | | | | | $ | 375,000 | | 373,532 |
| | | | | | | | | |
| | | | | | | | |
| | | | | Shares | | Value | |
CASH EQUIVALENTS—7.6% | | | | | | | | |
Institutional Money Market Funds—7.6% | | | | | | | | |
AIM Short-Term Investments Trust Liquid Assets Portfolio | | †† | | 5,603,376 | | | 5,603,376 | |
AIM Short-Term Investments Trust Prime Assets Portfolio | | †† | | 14,569,196 | | | 14,569,196 | |
JPMorgan Prime Money Market Fund, Capital Shares | | | | 6,684,917 | | | 6,684,917 | |
| | | | | | | | |
TOTAL CASH EQUIVALENTS
(Cost $26,857,489) | | | | | | | 26,857,489 | |
| | | | | | | | |
TOTAL INVESTMENTS—105.7%
(Cost $241,875,226) | | | | | | | 371,117,288 | |
Other assets less liabilities—(5.7%) | | | | | | | (20,135,101 | ) |
| | | | | | | | |
NET ASSETS—100.0% | | | | | | $ | 350,982,187 | |
| | | | | | | | |
Notes to the Schedule of Investments:
| | |
| REIT | | Real Estate Investment Trust |
| * | | Non-income producing. |
| † | | Denotes all or a portion of security on loan. |
| ‡‡ | | Security has been pledged as collateral for futures contracts. |
| †† | | Represents reinvestment of collateral received in conjunction with securities lending. |
| | | | |
| | See accompanying notes to financial statements. | | 191 |
SCHEDULE OF INVESTMENTS
June 30, 2008 (Unaudited)
Vantagepoint Broad Market Index Fund
| | | | | | | |
| | | | | Shares | | Value |
COMMON STOCKS—98.5% | | | | | | | |
Aerospace & Defense—2.1% | | | | | | | |
AAR Corp. | | *† | | 1,489 | | $ | 20,146 |
Alliant Techsystems, Inc. | | *† | | 1,550 | | | 157,604 |
Applied Signal Technology, Inc. | | | | 1,237 | | | 16,897 |
BE Aerospace, Inc. | | * | | 2,393 | | | 55,733 |
Boeing Co. (The) | | | | 26,137 | | | 1,717,724 |
Ceradyne, Inc. | | *† | | 1,867 | | | 64,038 |
Cubic Corp. | | † | | 1,692 | | | 37,698 |
Curtiss-Wright Corp. | | † | | 2,112 | | | 94,491 |
DRS Technologies, Inc. | | | | 1,486 | | | 116,978 |
Esterline Technologies Corp. | | *† | | 1,049 | | | 51,674 |
GenCorp, Inc. | | *† | | 1,629 | | | 11,664 |
General Dynamics Corp. | | | | 13,610 | | | 1,145,962 |
Goodrich Corp. | | | | 4,882 | | | 231,700 |
Heico Corp., Class A | | † | | 878 | | | 23,337 |
Honeywell International, Inc. | | | | 27,016 | | | 1,358,364 |
Kreisler Manufacturing Corp. | | * | | 1,250 | | | 15,313 |
L-3 Communications Holdings, Inc. | | | | 5,024 | | | 456,531 |
Ladish Co., Inc. | | * | | 900 | | | 18,531 |
Lockheed Martin Corp. | | | | 12,021 | | | 1,185,992 |
Moog, Inc., Class A | | *† | | 1,446 | | | 53,849 |
Northrop Grumman Corp. | | | | 12,233 | | | 818,388 |
Orbital Sciences Corp. | | *† | | 2,123 | | | 50,018 |
Precision Castparts Corp. | | | | 5,136 | | | 494,956 |
Raytheon Co. | | | | 17,505 | | | 985,181 |
Rockwell Collins, Inc. | | | | 7,347 | | | 352,362 |
Spirit Aerosystems Holdings, Inc., Class A | | * | | 2,103 | | | 40,336 |
Taser International, Inc. | | *† | | 2,292 | | | 11,437 |
Teledyne Technologies, Inc. | | *† | | 1,228 | | | 59,914 |
Triumph Group, Inc. | | † | | 822 | | | 38,716 |
United Technologies Corp. | | | | 35,225 | | | 2,173,382 |
| | | | | | | |
| | | | | | | 11,858,916 |
| | | | | | | |
Agriculture—0.1% | | | | | | | |
Lorillard, Inc. | | * | | 5,735 | | | 396,633 |
| | | | | | | |
Air Freight & Logistics—0.6% | | | | | | | |
Air T, Inc. | | | | 1,352 | | | 13,588 |
Atlas Air Worldwide Holdings, Inc. | | * | | 600 | | | 29,676 |
CH Robinson Worldwide, Inc. | | | | 7,150 | | | 392,106 |
Expeditors International of Washington, Inc. | | | | 8,772 | | | 377,196 |
FedEx Corp. | | | | 10,148 | | | 799,560 |
Forward Air Corp. | | † | | 1,431 | | | 49,513 |
HUB Group, Inc., Class A | | * | | 2,400 | | | 81,912 |
Pacer International, Inc. | | † | | 1,664 | | | 35,793 |
United Parcel Service, Inc., Class B | | | | 25,582 | | | 1,572,525 |
UTi Worldwide, Inc. (Virgin Islands, British) | | † | | 2,208 | | | 44,050 |
| | | | | | | |
| | | | | | | 3,395,919 |
| | | | | | | |
Airlines—0.1% | | | | | | | |
Airtran Holdings, Inc. | | *† | | 3,168 | | | 6,463 |
Alaska Air Group, Inc. | | *† | | 1,343 | | | 20,602 |
AMR Corp. | | * | | 6,672 | | | 34,160 |
Continental Airlines, Inc., Class B | | *† | | 2,723 | | | 27,530 |
Delta Air Lines, Inc. | | *† | | 5,791 | | | 33,009 |
ExpressJet Holdings, Inc. | | *† | | 2,636 | | | 1,450 |
JetBlue Airways Corp. | | *† | | 6,414 | | | 23,924 |
Mesa Air Group, Inc. | | * | | 847 | | | 432 |
Northwest Airlines Corp. | | * | | 11,009 | | | 73,319 |
Skywest, Inc. | | † | | 2,390 | | | 30,234 |
Southwest Airlines Co. | | | | 30,863 | | | 402,453 |
UAL Corp. | | † | | 3,500 | | | 18,270 |
US Airways Group, Inc. | | *† | | 2,272 | | | 5,680 |
| | | | | | | |
| | | | | | | 677,526 |
| | | | | | | |
Auto Components—0.3% | | | | | | | |
American Axle & Manufacturing Holdings, Inc. | | † | | 2,113 | | | 16,883 |
Amerigon, Inc., Class A | | *† | | 2,107 | | | 14,981 |
ArvinMeritor, Inc. | | † | | 2,791 | | | 34,832 |
BorgWarner, Inc. | | † | | 4,548 | | | 201,840 |
Cooper Tire & Rubber Co. | | † | | 3,066 | | | 24,037 |
Dana Holding Corp. | | *† | | 2,450 | | | 13,108 |
Gentex Corp. | | † | | 6,594 | | | 95,217 |
Goodyear Tire & Rubber Co. (The) | | * | | 7,281 | | | 129,820 |
Johnson Controls, Inc. | | | | 22,551 | | | 646,762 |
Lear Corp. | | *† | | 2,741 | | | 38,867 |
Modine Manufacturing Co. | | † | | 1,208 | | | 14,943 |
Proliance International, Inc. | | * | | 2,239 | | | 2,127 |
Quantum Fuel Systems Technologies Worldwide, Inc. | | *† | | 2,809 | | | 8,652 |
Sauer-Danfoss, Inc. | | † | | 1,531 | | | 47,691 |
Shiloh Industries, Inc. | | | | 1,441 | | | 13,531 |
Strattec Security Corp. | | | | 123 | | | 4,332 |
Superior Industries International, Inc. | | † | | 1,102 | | | 18,602 |
Tenneco, Inc. | | * | | 1,600 | | | 21,648 |
TRW Automotive Holdings Corp. | | * | | 900 | | | 16,623 |
Visteon Corp. | | *† | | 5,429 | | | 14,278 |
WABCO Holdings, Inc. | | | | 2,354 | | | 109,367 |
| | | | | | | |
| | | | | | | 1,488,141 |
| | | | | | | |
Auto Parts & Equipment—0.0% | | | | | | | |
ATC Technology Corp. | | *† | | 603 | | | 14,038 |
| | | | | | | |
Automobiles—0.2% | | | | | | | |
Coachmen Industries, Inc. | | *† | | 705 | | | 1,495 |
Fleetwood Enterprises, Inc. | | *† | | 1,750 | | | 4,585 |
Ford Motor Co. | | *† | | 73,856 | | | 355,247 |
General Motors Corp. | | † | | 19,409 | | | 223,204 |
Harley-Davidson, Inc. | | † | | 10,663 | | | 386,640 |
Monaco Coach Corp. | | † | | 1,376 | | | 4,183 |
Thor Industries, Inc. | | † | | 1,221 | | | 25,958 |
Winnebago Industries | | † | | 1,432 | | | 14,592 |
| | | | | | | |
| | | | | | | 1,015,904 |
| | | | | | | |
Beverages—2.0% | | | | | | | |
Anheuser-Busch Cos, Inc. | | | | 27,758 | | | 1,724,327 |
Brown-Forman Corp., Class B | | | | 2,437 | | | 184,164 |
Central European Distribution Corp. | | *† | | 652 | | | 48,346 |
Coca-Cola Bottling Co. Consolidated | | † | | 437 | | | 16,160 |
Coca-Cola Co. (The) | | | | 83,577 | | | 4,344,332 |
Coca-Cola Enterprises, Inc. | | | | 10,775 | | | 186,408 |
Constellation Brands, Inc., Class A | | * | | 8,096 | | | 160,787 |
Dr. Pepper Snapple Group, Inc. | | * | | 9,896 | | | 207,618 |
Hansen Natural Corp. | | *† | | 2,680 | | | 77,238 |
Molson Coors Brewing Co., Class B | | | | 5,822 | | | 316,309 |
Pepsi Bottling Group, Inc. | | | | 5,177 | | | 144,542 |
PepsiAmericas, Inc. | | | | 3,031 | | | 59,953 |
PepsiCo, Inc. | | | | 62,048 | | | 3,945,632 |
| | | | | | | |
| | | | | | | 11,415,816 |
| | | | | | | |
| | | | |
| 192 | | See accompanying notes to financial statements. | | |
SCHEDULE OF INVESTMENTS — (Continued)
June 30, 2008 (Unaudited)
Vantagepoint Broad Market Index Fund
| | | | | | | |
| | | | | Shares | | Value |
COMMON STOCKS—(Continued) | | | | | | | |
Biotechnology—1.7% | | | | | | | |
Aastrom Biosciences, Inc. | | *† | | 3,289 | | $ | 1,217 |
Abraxis Bioscience, Inc. | | * | | 439 | | | 27,859 |
Alexion Pharmaceuticals, Inc. | | *† | | 1,108 | | | 80,330 |
Alfacell Corp. | | * | | 4,295 | | | 1,890 |
Alkermes, Inc. | | *† | | 3,579 | | | 44,236 |
Alnylam Pharmaceuticals, Inc. | | *† | | 2,390 | | | 63,885 |
Alseres Pharmaceuticals, Inc. | | * | | 724 | | | 1,694 |
Altus Pharmaceuticals, Inc. | | *† | | 1,600 | | | 7,120 |
Amgen, Inc. | | * | | 42,858 | | | 2,021,184 |
Amylin Pharmaceuticals, Inc. | | *† | | 3,885 | | | 98,640 |
Antigenics, Inc. | | * | | 1,707 | | | 3,295 |
Applera Corp.—Celera Group | | *† | | 3,028 | | | 34,398 |
Arena Pharmaceuticals, Inc. | | *† | | 1,439 | | | 7,468 |
Ariad Pharmaceuticals, Inc. | | *† | | 1,662 | | | 3,989 |
Arqule, Inc. | | *† | | 864 | | | 2,808 |
Array Biopharma, Inc. | | *† | | 4,333 | | | 20,365 |
Avant Immunotherapeutics, Inc. | | *† | | 429 | | | 6,246 |
AVI BioPharma, Inc. | | *† | | 2,400 | | | 2,688 |
Avigen, Inc. | | * | | 1,009 | | | 2,916 |
Biogen Idec, Inc. | | * | | 12,720 | | | 710,921 |
BioMarin Pharmaceutical, Inc. | | *† | | 2,400 | | | 69,552 |
Celgene Corp. | | * | | 16,631 | | | 1,062,222 |
Cell Genesys, Inc. | | *† | | 1,642 | | | 4,269 |
Cell Therapeutics, Inc. | | *† | | 347 | | | 167 |
Cephalon, Inc. | | *† | | 2,347 | | | 156,521 |
Cepheid, Inc. | | *† | | 4,930 | | | 138,632 |
Cubist Pharmaceuticals, Inc. | | * | | 1,762 | | | 31,469 |
CV Therapeutics, Inc. | | *† | | 1,424 | | | 11,720 |
CytRx Corp. | | * | | 4,200 | | | 2,730 |
Dendreon Corp. | | *† | | 1,879 | | | 8,362 |
Entremed, Inc. | | * | | 1,390 | | | 765 |
Enzon Pharmaceuticals, Inc. | | *† | | 1,765 | | | 12,567 |
EPIX Pharmaceuticals, Inc. | | * | | 640 | | | 1,107 |
Exact Sciences Corp. | | * | | 1,250 | | | 2,250 |
Genaera Corp. | | *† | | 797 | | | 1,490 |
Genelabs Technologies, Inc. | | * | | 721 | | | 447 |
Genentech, Inc. | | * | | 18,069 | | | 1,371,437 |
Genzyme Corp. | | * | | 10,181 | | | 733,236 |
Geron Corp. | | *† | | 1,370 | | | 4,727 |
Gilead Sciences, Inc. | | * | | 37,225 | | | 1,971,064 |
GTC Biotherapeutics, Inc. | | *† | | 3,988 | | | 1,595 |
GTx, Inc. | | *† | | 200 | | | 2,870 |
Halozyme Therapeutics, Inc. | | *† | | 6,362 | | | 34,228 |
Hemispherx Biopharma, Inc. | | * | | 920 | | | 773 |
Human Genome Sciences, Inc. | | *† | | 5,277 | | | 27,493 |
ImClone Systems, Inc. | | *† | | 3,034 | | | 122,756 |
Immunogen, Inc. | | *† | | 1,323 | | | 4,048 |
Immunomedics, Inc. | | *† | | 2,141 | | | 4,560 |
Incyte Corp. Ltd. | | *† | | 3,102 | | | 23,606 |
Indevus Pharmaceuticals, Inc. | | *† | | 5,716 | | | 8,974 |
InterMune, Inc. | | *† | | 1,586 | | | 20,808 |
Isis Pharmaceuticals, Inc. | | *† | | 2,216 | | | 30,204 |
Keryx Biopharmaceuticals, Inc. | | *† | | 5,221 | | | 2,558 |
Lexicon Pharmaceuticals, Inc. | | *† | | 2,343 | | | 3,749 |
Ligand Pharmaceuticals, Inc., Class B | | * | | 4,556 | | | 11,846 |
MannKind Corp. | | *† | | 4,492 | | | 13,476 |
Martek Biosciences Corp. | | *† | | 1,148 | | | 38,699 |
Maxygen, Inc. | | *† | | 1,231 | | | 4,173 |
MDRNA, Inc. | | *† | | 1,500 | | | 1,830 |
Medarex, Inc. | | *† | | 3,092 | | | 20,438 |
Monogram Biosciences, Inc. | | *† | | 2,414 | | | 2,655 |
Myriad Genetics, Inc. | | *† | | 1,210 | | | 55,079 |
Nabi Biopharmaceuticals | | *† | | 1,995 | | | 7,860 |
Neose Technologies, Inc. | | * | | 704 | | | 211 |
Neurobiological Technologies, Inc. | | * | | 448 | | | 636 |
Neurocrine Biosciences, Inc. | | *† | | 1,479 | | | 6,197 |
Neurogen Corp. | | *† | | 1,872 | | | 1,928 |
Novavax, Inc. | | * | | 1,550 | | | 3,860 |
NPS Pharmaceuticals, Inc. | | *† | | 1,660 | | | 7,387 |
Nuvelo, Inc. | | *† | | 1,150 | | | 644 |
Onyx Pharmaceuticals, Inc. | | * | | 1,214 | | | 43,218 |
Orthologic Corp. | | * | | 1,516 | | | 1,516 |
OSI Pharmaceuticals, Inc. | | *† | | 2,729 | | | 112,762 |
Palatin Technologies, Inc. | | * | | 2,104 | | | 400 |
PDL BioPharma, Inc. | | | | 3,841 | | | 40,791 |
Peregrine Pharmaceuticals, Inc. | | * | | 9,115 | | | 3,829 |
Pharmacopeia, Inc. | | *† | | 572 | | | 2,191 |
Poniard Pharmaceuticals, Inc. | | * | | 396 | | | 1,679 |
Progenics Pharmaceuticals, Inc. | | *† | | 793 | | | 12,585 |
Regeneron Pharmaceuticals, Inc. | | *† | | 2,632 | | | 38,006 |
RXi Pharmaceuticals Corp. | | *† | | 209 | | | 1,672 |
Savient Pharmaceuticals, Inc. | | *† | | 1,389 | | | 35,142 |
Sciclone Pharmaceuticals, Inc. | | *† | | 1,700 | | | 2,601 |
SIGA Technologies, Inc. | | *† | | 4,649 | | | 14,505 |
Targeted Genetics Corp. | | * | | 626 | | | 369 |
Telik, Inc. | | *† | | 1,748 | | | 2,115 |
Third Wave Technologies, Inc. | | *† | | 1,227 | | | 13,693 |
Titan Pharmaceuticals, Inc. | | *† | | 1,743 | | | 2,405 |
TorreyPines Therapeutics, Inc. | | * | | 346 | | | 429 |
Trimeris, Inc. | | † | | 1,214 | | | 5,730 |
United Therapeutics Corp. | | * | | 914 | | | 89,344 |
Vanda Pharmaceuticals, Inc. | | *† | | 2,507 | | | 8,248 |
Vermillion, Inc. | | * | | 150 | | | 338 |
Vertex Pharmaceuticals, Inc. | | * | | 3,255 | | | 108,945 |
Vion Pharmaceuticals, Inc. | | * | | 450 | | | 513 |
XOMA Ltd. | | *† | | 4,976 | | | 8,409 |
Zymogenetics, Inc. | | *† | | 2,343 | | | 19,728 |
| | | | | | | |
| | | | | | | 9,764,187 |
| | | | | | | |
Building Products—0.1% | | | | | | | |
American Woodmark Corp. | | † | | 800 | | | 16,904 |
Ameron International Corp. | | † | | 542 | | | 65,029 |
Apogee Enterprises, Inc. | | † | | 1,250 | | | 20,200 |
Gibraltar Industries, Inc. | | † | | 1,188 | | | 18,972 |
Griffon Corp. | | *† | | 1,288 | | | 11,283 |
Jewett-Cameron Trading Ltd. (Canada) | | * | | 1,575 | | | 11,435 |
Lennox International, Inc. | | † | | 2,437 | | | 70,576 |
Masco Corp. | | | | 15,650 | | | 246,174 |
NCI Building Systems, Inc. | | *† | | 1,232 | | | 45,251 |
Owens Corning, Inc. | | * | | 1,100 | | | 25,025 |
Quanex Building Products Corp. | | † | | 1,671 | | | 24,831 |
Simpson Manufacturing Co., Inc. | | † | | 2,084 | | | 49,474 |
Trex Co., Inc. | | *† | | 731 | | | 8,575 |
Universal Forest Products, Inc. | | † | | 1,121 | | | 33,585 |
US Home Systems, Inc. | | * | | 1,291 | | | 5,074 |
USG Corp. | | * | | 3,348 | | | 99,000 |
| | | | | | | |
| | | | | | | 751,388 |
| | | | | | | |
Capital Markets—2.5% | | | | | | | |
Affiliated Managers Group, Inc. | | * | | 1,354 | | | 121,941 |
AllianceBernstein Holding LP | | | | 1,100 | | | 60,148 |
Ameriprise Financial, Inc. | | | | 9,235 | | | 375,587 |
Bank of New York Mellon Corp. | | | | 44,476 | | | 1,682,527 |
BGC Partners, Inc., Class A | | *† | | 7,270 | | | 54,889 |
BlackRock, Inc. | | † | | 765 | | | 135,405 |
| | | | |
| | See accompanying notes to financial statements. | | 193 |
SCHEDULE OF INVESTMENTS — (Continued)
June 30, 2008 (Unaudited)
Vantagepoint Broad Market Index Fund
| | | | | | | |
| | | | | Shares | | Value |
COMMON STOCKS—(Continued) | | | | | | | |
Blackstone Group LP (The) | | | | 3,953 | | $ | 71,984 |
Calamos Asset Management, Inc., Class A | | † | | 1,800 | | | 30,654 |
Charles Schwab Corp. (The) | | | | 36,777 | | | 755,400 |
Diamond Hill Investment Group, Inc. | | *† | | 331 | | | 27,639 |
E*Trade Financial Corp. | | *† | | 14,978 | | | 47,031 |
Eaton Vance Corp. | | † | | 5,282 | | | 210,012 |
FCStone Group, Inc. | | * | | 1,722 | | | 48,095 |
Federated Investors, Inc., Class B | | | | 3,745 | | | 128,903 |
Franklin Resources, Inc. | | | | 6,114 | | | 560,348 |
GAMCO Investors, Inc., Class A | | † | | 558 | | | 27,688 |
GFI Group, Inc. | | | | 2,520 | | | 22,705 |
GLG Partners, Inc. | | | | 9,550 | | | 74,490 |
Goldman Sachs Group, Inc. (The) | | | | 14,062 | | | 2,459,444 |
Invesco Ltd. | | | | 16,610 | | | 398,308 |
Investment Technology Group, Inc. | | * | | 2,078 | | | 69,530 |
Janus Capital Group, Inc. | | | | 6,411 | | | 169,699 |
Jefferies Group, Inc. | | † | | 4,678 | | | 78,684 |
Jesup & Lamont, Inc. | | * | | 1,550 | | | 1,798 |
Kent Financial Services | | * | | 2,200 | | | 3,916 |
Knight Capital Group, Inc., Class A | | *† | | 4,630 | | | 83,247 |
LaBranche & Co., Inc. | | * | | 2,588 | | | 18,323 |
Lazard Ltd., Class A (Bermuda) | | | | 1,519 | | | 51,874 |
Legg Mason, Inc. | | | | 5,250 | | | 228,743 |
Lehman Brothers Holdings, Inc. | | † | | 25,924 | | | 513,554 |
Merrill Lynch & Co., Inc. | | | | 33,459 | | | 1,060,985 |
MF Global Ltd. (Bermuda) | | *† | | 2,928 | | | 18,476 |
Morgan Stanley | | | | 39,347 | | | 1,419,246 |
Navidec Financial Services, Inc. | | * | | 2,119 | | | 3,496 |
Northern Trust Corp. | | | | 7,513 | | | 515,166 |
Och-Ziff Capital Management Group LLC, Class A | | | | 1,407 | | | 26,747 |
optionsXpress Holdings, Inc. | | † | | 1,914 | | | 42,759 |
Raymond James Financial, Inc. | | † | | 3,472 | | | 91,626 |
SEI Investments Co. | | | | 5,918 | | | 139,191 |
Siebert Financial Corp. | | | | 1,469 | | | 4,862 |
State Street Corp. | | | | 16,624 | | | 1,063,770 |
SWS Group, Inc. | | | | 1,323 | | | 21,975 |
T Rowe Price Group, Inc. | | | | 10,332 | | | 583,448 |
TD Ameritrade Holding Corp. | | * | | 9,311 | | | 168,436 |
TradeStation Group, Inc. | | *† | | 1,690 | | | 17,154 |
W.P. Carey & Co. LLC | | | | 1,592 | | | 45,706 |
Waddell & Reed Financial, Inc., Class A | | | | 3,971 | | | 139,025 |
Westwood Holdings Group, Inc. | | | | 1,027 | | | 40,875 |
| | | | | | | |
| | | | | | | 13,915,509 |
| | | | | | | |
Chemicals—2.2% | | | | | | | |
A. Schulman, Inc. | | † | | 1,444 | | | 33,255 |
Air Products & Chemicals, Inc. | | | | 8,040 | | | 794,834 |
Airgas, Inc. | | | | 3,075 | | | 179,549 |
Albemarle Corp. | | | | 3,712 | | | 148,146 |
Arch Chemicals, Inc. | | † | | 1,211 | | | 40,145 |
Ashland, Inc. | | | | 2,848 | | | 137,274 |
Cabot Corp. | | † | | 2,693 | | | 65,467 |
Celanese Corp., Class A | | | | 5,993 | | | 273,640 |
CF Industries Holdings, Inc. | | | | 2,332 | | | 356,330 |
Chemtura Corp. | | | | 8,873 | | | 51,818 |
Cytec Industries, Inc. | | | | 1,644 | | | 89,697 |
Dow Chemical Co. (The) | | | | 34,473 | | | 1,203,452 |
E.I. Du Pont de Nemours & Co. | | | | 32,935 | | | 1,412,582 |
Eastman Chemical Co. | | | | 3,211 | | | 221,109 |
Ecolab, Inc. | | | | 8,093 | | | 347,918 |
Ferro Corp. | | † | | 1,818 | | | 34,106 |
FMC Corp. | | † | | 3,336 | | | 258,340 |
Georgia Gulf Corp. | | † | | 1,268 | | | 3,677 |
H.B. Fuller Co. | | † | | 2,570 | | | 57,671 |
Hercules, Inc. | | | | 4,606 | | | 77,980 |
Huntsman Corp. | | | | 2,600 | | | 29,640 |
International Flavors & Fragrances, Inc. | | | | 3,885 | | | 151,748 |
Intrepid Potash, Inc. | | * | | 1,172 | | | 77,094 |
Koppers Holdings, Inc. | | † | | 1,582 | | | 66,238 |
Kronos Worldwide, Inc. | | † | | 1,131 | | | 17,406 |
Landec Corp. | | *† | | 986 | | | 6,379 |
LSB Industries, Inc. | | *† | | 1,411 | | | 27,938 |
Lubrizol Corp. | | | | 1,819 | | | 84,274 |
Minerals Technologies, Inc. | | † | | 868 | | | 55,196 |
Monsanto Co. | | | | 21,546 | | | 2,724,276 |
Mosaic Co. (The) | | * | | 5,540 | | | 801,638 |
Nalco Holding Co. | | † | | 3,074 | | | 65,015 |
NewMarket Corp. | | † | | 1,200 | | | 79,476 |
NL Industries, Inc. | | † | | 2,111 | | | 20,118 |
Olin Corp. | | | | 2,796 | | | 73,199 |
OM Group, Inc. | | * | | 1,147 | | | 37,610 |
Omnova Solutions, Inc. | | * | | 6,478 | | | 18,009 |
Penford Corp. | | | | 785 | | | 11,681 |
PolyOne Corp. | | *† | | 2,862 | | | 19,948 |
PPG Industries, Inc. | | | | 5,657 | | | 324,542 |
Praxair, Inc. | | | | 12,623 | | | 1,189,592 |
Quaker Chemical Corp. | | | | 483 | | | 12,877 |
Rohm & Haas Co. | | | | 4,731 | | | 219,708 |
RPM International, Inc. | | | | 4,832 | | | 99,539 |
Scotts Miracle-Gro Co. (The), Class A | | † | | 1,662 | | | 29,201 |
Sensient Technologies Corp. | | † | | 2,027 | | | 57,080 |
Sigma-Aldrich Corp. | | | | 4,956 | | | 266,930 |
Spartech Corp. | | † | | 1,451 | | | 13,683 |
Stepan Co. | | † | | 556 | | | 25,365 |
Terra Industries, Inc. | | | | 2,513 | | | 124,017 |
Tronox, Inc., Class B | | † | | 829 | | | 2,504 |
Valhi, Inc. | | † | | 511 | | | 13,925 |
Valspar Corp. | | † | | 3,724 | | | 70,421 |
W.R. Grace & Co. | | *† | | 4,200 | | | 98,658 |
Zep, Inc. | | † | | 936 | | | 13,928 |
| | | | | | | |
| | | | | | | 12,715,843 |
| | | | | | | |
Commercial Banks—2.3% | | | | | | | |
1st Source Corp. | | † | | 1,180 | | | 18,998 |
Alliance Bankshares Corp. | | * | | 744 | | | 2,738 |
Amcore Financial, Inc. | | † | | 1,330 | | | 7,528 |
Associated Banc-Corp | | † | | 5,110 | | | 98,572 |
BancFirst Corp. | | † | | 642 | | | 27,478 |
BancorpSouth, Inc. | | † | | 3,611 | | | 63,156 |
BancTrust Financial Group, Inc. | | † | | 1,600 | | | 10,544 |
Bank of Hawaii Corp. | | † | | 1,898 | | | 90,724 |
BB&T Corp. | | † | | 21,630 | | | 492,514 |
BOK Financial Corp. | | † | | 1,765 | | | 94,339 |
Boston Private Financial Holdings, Inc. | | † | | 1,297 | | | 7,354 |
Bryn Mawr Bank Corp. | | † | | 1,058 | | | 18,515 |
Capital Bank Corp. | | | | 1,282 | | | 11,333 |
Capital City Bank Group, Inc. | | † | | 1,113 | | | 24,219 |
Cardinal Financial Corp. | | † | | 1,142 | | | 7,149 |
Cascade Bancorp | | † | | 2,191 | | | 16,871 |
| | | | |
| 194 | | See accompanying notes to financial statements. | | |
SCHEDULE OF INVESTMENTS — (Continued)
June 30, 2008 (Unaudited)
Vantagepoint Broad Market Index Fund
| | | | | | | |
| | | | | Shares | | Value |
COMMON STOCKS—(Continued) | | | | | | | |
Cascade Financial Corp. | | † | | 1,063 | | $ | 6,920 |
Cathay General Bancorp | | † | | 2,082 | | | 22,631 |
Catskill Litigation Trust | | *‡da | | 582 | | | — |
Central Pacific Financial Corp. | | † | | 929 | | | 9,903 |
Chemical Financial Corp. | | † | | 1,552 | | | 31,661 |
Citizens Republic Bancorp, Inc. | | † | | 4,000 | | | 11,280 |
City Bank (Washington) | | † | | 1,645 | | | 14,147 |
City Holding Co. | | † | | 250 | | | 10,193 |
City National Corp. | | † | | 1,548 | | | 65,124 |
CoBiz Financial, Inc. | | † | | 1,063 | | | 6,995 |
Colonial BancGroup, Inc. (The) | | † | | 5,643 | | | 24,942 |
Comerica, Inc. | | † | | 5,587 | | | 143,195 |
Commerce Bancshares, Inc. | | † | | 3,257 | | | 129,173 |
Community Bank System, Inc. | | † | | 1,402 | | | 28,909 |
Community Trust Bancorp, Inc. | | † | | 665 | | | 17,463 |
Cullen/Frost Bankers, Inc. | | | | 2,502 | | | 124,725 |
CVB Financial Corp. | | † | | 4,084 | | | 38,553 |
East West Bancorp, Inc. | | † | | 2,200 | | | 15,532 |
Eastern Virginia Bankshares, Inc. | | | | 700 | | | 11,200 |
Fidelity Southern Corp. | | | | 1,381 | | | 6,449 |
Fifth Third Bancorp | | | | 18,284 | | | 186,127 |
Financial Institutions, Inc. | | † | | 749 | | | 12,029 |
First Bancorp (Puerto Rico) | | † | | 3,246 | | | 20,580 |
First Bancorp North Carolina | | † | | 643 | | | 8,128 |
First Citizens BancShares, Inc., Class A | | | | 254 | | | 35,430 |
First Commonwealth Financial Corp. | | † | | 2,619 | | | 24,435 |
First Financial Bancorp | | † | | 1,895 | | | 17,434 |
First Financial Bankshares, Inc. | | † | | 333 | | | 15,255 |
First Horizon National Corp. | | † | | 5,607 | | | 41,660 |
First Merchants Corp. | | † | | 874 | | | 15,863 |
First Midwest Bancorp, Inc. | | † | | 2,002 | | | 37,337 |
First of Long Island Corp. (The) | | | | 986 | | | 19,597 |
FirstMerit Corp. | | † | | 3,895 | | | 63,527 |
FNB Corp. (Pennsylvania) | | † | | 3,344 | | | 39,392 |
Frontier Financial Corp. | | † | | 2,254 | | | 19,204 |
Fulton Financial Corp. | | † | | 6,533 | | | 65,657 |
Glacier Bancorp, Inc. | | † | | 1,771 | | | 28,318 |
Guaranty Bancorp | | *† | | 5,300 | | | 19,080 |
Hancock Holding Co. | | † | | 1,041 | | | 40,901 |
Hanmi Financial Corp. | | † | | 3,600 | | | 18,756 |
Harleysville National Corp. | | † | | 1,210 | | | 13,504 |
Heritage Financial Corp. | | | | 332 | | | 5,262 |
Huntington Bancshares, Inc. | | † | | 13,268 | | | 76,556 |
Independent Bank Corp. (Massachusetts) | | † | | 874 | | | 20,836 |
Independent Bank Corp. (Michigan) | | † | | 2,079 | | | 8,316 |
Integra Bank Corp. | | † | | 848 | | | 6,640 |
International Bancshares Corp. | | † | | 3,248 | | | 69,410 |
Irwin Financial Corp. | | † | | 1,296 | | | 3,486 |
Keycorp | | | | 15,774 | | | 173,199 |
M&T Bank Corp. | | † | | 3,070 | | | 216,558 |
Marshall & Ilsley Corp. | | † | | 8,572 | | | 131,409 |
MB Financial, Inc. | | | | 931 | | | 20,920 |
Merchants Bancshares, Inc. | | | | 571 | | | 12,819 |
Midsouth Bancorp, Inc. | | | | 522 | | | 8,770 |
MidWestOne Financial Group, Inc. | | | | 552 | | | 7,143 |
National City Corp. | | † | | 22,204 | | | 105,913 |
National Penn Bancshares, Inc. | | † | | 2,758 | | | 36,626 |
NBT Bancorp, Inc. | | † | | 1,000 | | | 20,610 |
Northern States Financial Corp. | | † | | 772 | | | 13,549 |
Old National Bancorp | | † | | 3,552 | | | 50,652 |
Pacific Capital Bancorp | | † | | 1,724 | | | 23,757 |
Pacific Premier Bancorp, Inc. | | * | | 976 | | | 5,026 |
PacWest Bancorp | | † | | 894 | | | 13,303 |
Park National Corp. | | † | | 728 | | | 39,239 |
Peoples Bancorp, Inc. | | † | | 814 | | | 15,450 |
Peoples Financial Corp. (Mississippi) | | | | 883 | | | 18,119 |
PNC Financial Services Group, Inc. | | | | 13,633 | | | 778,443 |
Popular, Inc. (Puerto Rico) | | † | | 10,296 | | | 67,851 |
PrivateBancorp, Inc. | | | | 1,200 | | | 36,456 |
Prosperity Bancshares, Inc. | | † | | 2,300 | | | 61,479 |
Provident Bankshares Corp. | | † | | 1,369 | | | 8,734 |
Regions Financial Corp. | | | | 28,179 | | | 307,432 |
Republic Bancorp, Inc., Class A | | † | | 1,603 | | | 39,434 |
Royal Bancshares of Pennsylvania, Class A | | † | | 882 | | | 8,300 |
S&T Bancorp, Inc. | | † | | 955 | | | 27,752 |
Sandy Spring Bancorp, Inc. | | † | | 344 | | | 5,704 |
Santander BanCorp (Puerto Rico) | | | | 1,280 | | | 13,581 |
Shore Bancshares, Inc. | | † | | 826 | | | 15,463 |
Signature Bank | | *† | | 1,900 | | | 48,944 |
Simmons First National Corp., Class A | | | | 911 | | | 25,481 |
South Financial Group, Inc. (The) | | † | | 2,799 | | | 10,972 |
Sterling Bancorp (New York) | | † | | 1,476 | | | 17,638 |
Sterling Bancshares, Inc. | | † | | 2,422 | | | 22,016 |
Sterling Financial Corp. (Washington) | | † | | 2,577 | | | 10,669 |
Suffolk Bancorp | | † | | 1,100 | | | 32,318 |
SunTrust Banks, Inc. | | | | 13,365 | | | 484,079 |
Superior Bancorp | | *† | | 223 | | | 1,893 |
Susquehanna Bancshares, Inc. | | † | | 2,932 | | | 40,139 |
SVB Financial Group | | *† | | 1,437 | | | 69,134 |
Synovus Financial Corp. | | † | | 10,920 | | | 95,332 |
TCF Financial Corp. | | † | | 6,104 | | | 73,431 |
Tompkins Financial Corp. | | † | | 665 | | | 24,738 |
Trustmark Corp. | | † | | 2,435 | | | 42,978 |
UCBH Holdings, Inc. | | † | | 3,652 | | | 8,217 |
UMB Financial Corp. | | † | | 1,211 | | | 62,088 |
Umpqua Holdings Corp. | | † | | 1,151 | | | 13,962 |
UnionBanCal Corp. | | | | 2,085 | | | 84,276 |
United Bankshares, Inc. | | † | | 2,134 | | | 48,975 |
United Community Banks, Inc. (Georgia) | | † | | 2,188 | | | 18,664 |
US Bancorp | | | | 67,433 | | | 1,880,705 |
Valley National Bancorp | | † | | 5,679 | | | 89,558 |
W. Holding Co., Inc. (Puerto Rico) | | † | | 8,055 | | | 6,847 |
Wachovia Corp. | | | | 82,667 | | | 1,283,818 |
Washington Trust Bancorp, Inc. | | † | | 500 | | | 9,850 |
Webster Financial Corp. | | † | | 2,393 | | | 44,510 |
Wells Fargo & Co. | | | | 121,369 | | | 2,882,513 |
WesBanco, Inc. | | † | | 1,699 | | | 29,138 |
Westamerica Bancorp | | † | | 1,628 | | | 85,617 |
Western Alliance Bancorp | | *† | | 1,400 | | | 10,864 |
Whitney Holding Corp. | | † | | 2,371 | | | 43,389 |
Wilmington Trust Corp. | | † | | 3,204 | | | 84,714 |
Wintrust Financial Corp. | | † | | 1,017 | | | 24,255 |
Zions Bancorporation | | | | 4,153 | | | 130,778 |
| | | | | | | |
| | | | | | | 12,769,938 |
| | | | | | | |
| | | | |
| | See accompanying notes to financial statements. | | 195 |
SCHEDULE OF INVESTMENTS — (Continued)
June 30, 2008 (Unaudited)
Vantagepoint Broad Market Index Fund
| | | | | | | |
| | | | | Shares | | Value |
COMMON STOCKS—(Continued) | | | | | | | |
Commercial Services & Supplies—1.0% | | | | | | | |
ABM Industries, Inc. | | | | 2,291 | | $ | 50,975 |
ACCO Brands Corp. | | *† | | 1,319 | | | 14,812 |
Administaff, Inc. | | † | | 1,143 | | | 31,878 |
Advisory Board Co. (The) | | *† | | 950 | | | 37,364 |
Allied Waste Industries, Inc. | | * | | 14,935 | | | 188,480 |
Angelica Corp. | | † | | 510 | | | 10,848 |
APAC Customer Services, Inc. | | *† | | 1,972 | | | 3,155 |
Avery Dennison Corp. | | † | | 2,125 | | | 93,351 |
Barrett Business Services, Inc. | | † | | 2,203 | | | 26,061 |
Bowne & Co., Inc. | | † | | 1,575 | | | 20,081 |
Brink’s Co. (The) | | | | 2,084 | | | 136,335 |
CDI Corp. | | † | | 1,131 | | | 28,773 |
Cenveo, Inc. | | *† | | 2,792 | | | 27,278 |
ChoicePoint, Inc. | | * | | 3,112 | | | 149,998 |
Cintas Corp. | | | | 5,365 | | | 142,226 |
Clean Harbors, Inc. | | *† | | 1,207 | | | 85,769 |
Comfort Systems USA, Inc. | | † | | 2,179 | | | 29,286 |
Consolidated Graphics, Inc. | | *† | | 776 | | | 38,234 |
Copart, Inc. | | *† | | 3,582 | | | 153,381 |
Corporate Executive Board Co. | | † | | 1,507 | | | 63,369 |
Corrections Corp of America | | * | | 5,700 | | | 156,579 |
CoStar Group, Inc. | | *† | | 770 | | | 34,227 |
Courier Corp. | | † | | 424 | | | 8,514 |
Covanta Holding Corp. | | *† | | 4,185 | | | 111,698 |
CRA International, Inc. | | *† | | 986 | | | 35,644 |
Deluxe Corp. | | † | | 2,098 | | | 37,386 |
Diamond Management & Technology Consultants, Inc. | | † | | 1,431 | | | 7,456 |
Dun & Bradstreet Corp. | | | | 2,641 | | | 231,457 |
Ennis, Inc. | | † | | 695 | | | 10,877 |
Equifax, Inc. | | | | 5,325 | | | 179,027 |
FTI Consulting, Inc. | | * | | 1,735 | | | 118,778 |
G&K Services, Inc., Class A | | † | | 1,008 | | | 30,704 |
Geo Group, Inc. (The) | | *† | | 2,456 | | | 55,260 |
Healthcare Services Group, Inc. | | † | | 3,735 | | | 56,809 |
Heidrick & Struggles International, Inc. | | † | | 865 | | | 23,909 |
Herman Miller, Inc. | | † | | 3,155 | | | 78,528 |
HNI Corp. | | † | | 2,512 | | | 44,362 |
Huron Consulting Group, Inc. | | *† | | 988 | | | 44,796 |
IHS, Inc., Class A | | * | | 1,414 | | | 98,414 |
IKON Office Solutions, Inc. | | † | | 5,770 | | | 65,086 |
Interface, Inc., Class A | | † | | 3,357 | | | 42,063 |
Kelly Services, Inc., Class A | | † | | 1,173 | | | 22,674 |
Kenexa Corp. | | *† | | 1,681 | | | 31,670 |
Kforce, Inc. | | *† | | 297 | | | 2,522 |
Kimball International, Inc., Class B | | † | | 1,500 | | | 12,420 |
Knoll, Inc. | | † | | 2,701 | | | 32,817 |
Korn-Ferry International | | *† | | 1,624 | | | 25,546 |
Learning Tree International, Inc. | | *† | | 766 | | | 13,099 |
M&F Worldwide Corp. | | *† | | 780 | | | 30,662 |
Manpower, Inc. | | | | 3,593 | | | 209,256 |
Mcgrath Rentcorp | | † | | 916 | | | 22,524 |
Mine Safety Appliances Co. | | † | | 1,444 | | | 57,746 |
Mobile Mini, Inc. | | *† | | 2,000 | | | 40,000 |
Monster Worldwide, Inc. | | * | | 4,681 | | | 96,475 |
MPS Group, Inc. | | *† | | 3,706 | | | 39,395 |
Nashua Corp. | | * | | 1,541 | | | 15,410 |
Navigant Consulting, Inc. | | *† | | 2,313 | | | 45,242 |
On Assignment, Inc. | | *† | | 1,243 | | | 9,969 |
Perma-Fix Environmental Services | | * | | 5,502 | | | 15,901 |
PHH Corp. | | *† | | 2,212 | | | 33,954 |
Pitney Bowes, Inc. | | | | 9,192 | | | 313,446 |
RCM Technologies, Inc. | | * | | 1,593 | | | 6,866 |
Republic Services, Inc. | | | | 6,643 | | | 197,297 |
Resources Connection, Inc. | | | | 2,060 | | | 41,921 |
Robert Half International, Inc. | | | | 7,107 | | | 170,355 |
Rollins, Inc. | | † | | 991 | | | 14,687 |
RR Donnelley & Sons Co. | | | | 8,887 | | | 263,854 |
School Specialty, Inc. | | * | | 854 | | | 25,389 |
Spherion Corp. | | *† | | 2,689 | | | 12,423 |
Standard Register Co. (The) | | † | | 1,650 | | | 15,560 |
Steelcase, Inc., Class A | | † | | 1,992 | | | 19,980 |
Stericycle, Inc. | | * | | 3,138 | | | 162,235 |
SYKES Enterprises, Inc. | | *† | | 1,423 | | | 26,838 |
Tetra Tech, Inc. | | *† | | 2,114 | | | 47,819 |
TRC Cos, Inc. | | * | | 327 | | | 1,315 |
TrueBlue, Inc. | | *† | | 2,485 | | | 32,827 |
United Stationers, Inc. | | *† | | 1,278 | | | 47,222 |
Viad Corp. | | † | | 937 | | | 24,165 |
Virco Manufacturing Corp. | | † | | 799 | | | 3,987 |
Volt Information Sciences, Inc. | | *† | | 1,249 | | | 14,876 |
Waste Connections, Inc. | | *† | | 2,362 | | | 75,419 |
Waste Management, Inc. | | | | 17,814 | | | 671,765 |
Watson Wyatt Worldwide, Inc., Class A | | † | | 1,600 | | | 84,624 |
Westaff, Inc. | | * | | 942 | | | 1,064 |
| | | | | | | |
| | | | | | | 5,836,444 |
| | | | | | | |
Communications Equipment—2.3% | | | | | | | |
3Com Corp. | | * | | 14,501 | | | 30,742 |
ADC Telecommunications, Inc. | | *† | | 4,773 | | | 70,497 |
Adtran, Inc. | | † | | 3,197 | | | 76,216 |
Alliance Fiber Optic Products, Inc. | | * | | 4,817 | | | 6,696 |
AltiGen Communications, Inc. | | * | | 4,109 | | | 4,972 |
Anaren, Inc. | | * | | 813 | | | 8,593 |
Arris Group, Inc. | | *† | | 3,613 | | | 30,530 |
Avanex Corp. | | *† | | 5,030 | | | 5,684 |
Avocent Corp. | | * | | 2,007 | | | 37,330 |
Bel Fuse, Inc., Class A | | † | | 545 | | | 15,260 |
Black Box Corp. | | † | | 865 | | | 23,519 |
Blonder Tongue Laboratories | | * | | 2,285 | | | 2,742 |
Blue Coat Systems, Inc. | | *† | | 1,072 | | | 15,126 |
Ciena Corp. | | * | | 2,809 | | | 65,085 |
Cisco Systems, Inc. | | * | | 232,898 | | | 5,417,207 |
CommScope, Inc. | | * | | 2,812 | | | 148,389 |
Comtech Telecommunications Corp. | | *† | | 1,350 | | | 66,150 |
Corning, Inc. | | | | 60,152 | | | 1,386,504 |
Digi International, Inc. | | *† | | 1,976 | | | 15,512 |
Ditech Networks, Inc. | | *† | | 1,360 | | | 2,924 |
EchoStar Corp., Class A | | *† | | 1,877 | | | 58,600 |
EMS Technologies, Inc. | | *† | | 960 | | | 20,966 |
EndWave Corp. | | * | | 911 | | | 5,785 |
Entertainment Distribution Co., Inc. | | * | | 2,143 | | | 1,050 |
Extreme Networks, Inc. | | *† | | 4,491 | | | 12,754 |
F5 Networks, Inc. | | *† | | 2,664 | | | 75,711 |
Finisar Corp. | | * | | 6,855 | | | 8,157 |
Foundry Networks, Inc. | | *† | | 5,421 | | | 64,076 |
Harmonic, Inc. | | *† | | 2,820 | | | 26,818 |
Harris Corp. | | | | 6,090 | | | 307,484 |
Harris Stratex Networks, Inc., Class A | | *† | | 670 | | | 6,358 |
Integrated Telecom Express, Inc. | | *‡da | | 1,103 | | | — |
InterDigital, Inc. | | *† | | 2,803 | | | 68,169 |
Ixia | | *† | | 2,330 | | | 16,194 |
JDS Uniphase Corp. | | *† | | 7,444 | | | 84,564 |
| | | | |
| 196 | | See accompanying notes to financial statements. | | |
SCHEDULE OF INVESTMENTS — (Continued)
June 30, 2008 (Unaudited)
Vantagepoint Broad Market Index Fund
| | | | | | | |
| | | | | Shares | | Value |
COMMON STOCKS—(Continued) | | | | | | | |
Juniper Networks, Inc. | | * | | 21,310 | | $ | 472,656 |
KVH Industries, Inc. | | * | | 375 | | | 3,124 |
MasTec, Inc. | | *† | | 2,049 | | | 21,842 |
Motorola, Inc. | | | | 84,429 | | | 619,709 |
MRV Communications, Inc. | | * | | 4,567 | | | 5,435 |
NETGEAR, Inc. | | *† | | 1,206 | | | 16,715 |
Network Engines, Inc. | | *† | | 1,329 | | | 1,555 |
NMS Communications Corp. | | * | | 1,250 | | | 1,388 |
Numerex Corp., Class A | | *† | | 1,800 | | | 13,014 |
Oplink Communications, Inc. | | *† | | 758 | | | 7,277 |
Optelecom-NKF, Inc. | | *† | | 819 | | | 7,117 |
Optical Cable Corp. | | * | | 240 | | | 1,644 |
Parkervision, Inc. | | *† | | 1,052 | | | 10,446 |
Performance Technologies, Inc. | | * | | 793 | | | 4,013 |
Plantronics, Inc. | | † | | 1,826 | | | 40,756 |
Polycom, Inc. | | *† | | 4,177 | | | 101,752 |
Powerwave Technologies, Inc. | | *† | | 2,434 | | | 10,345 |
Proxim Wireless Corp. | | * | | 2,197 | | | 1,318 |
Qualcomm, Inc. | | | | 62,954 | | | 2,793,269 |
SCM Microsystems, Inc. | | * | | 1,494 | | | 4,482 |
SeaChange International, Inc. | | *† | | 958 | | | 6,859 |
Soapstone Networks, Inc. | | * | | 711 | | | 2,723 |
Sonus Networks, Inc. | | *† | | 10,700 | | | 36,594 |
Superior Telecom, Inc. | | *‡da | | 2,013 | | | — |
Sycamore Networks, Inc. | | *† | | 9,917 | | | 31,933 |
Tekelec | | *† | | 2,569 | | | 37,790 |
TeleCorp PCS, Inc. | | *‡da | | 5,507 | | | — |
Tellabs, Inc. | | * | | 19,143 | | | 89,015 |
Tollgrade Communications, Inc. | | * | | 601 | | | 2,698 |
Utstarcom, Inc. | | *† | | 4,555 | | | 24,916 |
Viasat, Inc. | | *† | | 1,190 | | | 24,050 |
Westell Technologies, Inc., Class A | | *† | | 1,821 | | | 2,458 |
Zhone Technologies, Inc. | | * | | 3,915 | | | 3,054 |
| | | | | | | |
| | | | | | | 12,586,311 |
| | | | | | | |
Computers & Peripherals—3.8% | | | | | | | |
Adaptec, Inc. | | *† | | 3,850 | | | 12,320 |
Apple, Inc. | | * | | 34,079 | | | 5,706,187 |
Avid Technology, Inc. | | * | | 1,448 | | | 24,602 |
Brocade Communications Systems, Inc. | | * | | 14,008 | | | 115,426 |
Ciprico, Inc. | | * | | 1,658 | | | 2,504 |
Concurrent Computer Corp. | | * | | 1,901 | | | 1,293 |
Cray, Inc. | | *† | | 714 | | | 3,313 |
Dataram Corp. | | | | 1,175 | | | 3,067 |
Dell, Inc. | | * | | 70,097 | | | 1,533,721 |
Diebold, Inc. | | † | | 3,079 | | | 109,551 |
Dot Hill Systems Corp. | | * | | 1,396 | | | 3,532 |
Electronics for Imaging, Inc. | | *† | | 2,638 | | | 38,515 |
EMC Corp. | | * | | 81,857 | | | 1,202,478 |
Emulex Corp. | | *† | | 3,408 | | | 39,703 |
Focus Enhancements, Inc. | | * | | 5,319 | | | 1,271 |
Hewlett-Packard Co. | | | | 97,417 | | | 4,306,805 |
Hutchinson Technology, Inc. | | *† | | 1,149 | | | 15,443 |
Hypercom Corp. | | *† | | 1,992 | | | 8,765 |
iGO, Inc. | | *† | | 674 | | | 849 |
Imation Corp. | | † | | 1,564 | | | 35,847 |
InFocus Corp. | | * | | 1,636 | | | 2,454 |
Innovex, Inc. | | * | | 1,922 | | | 1,153 |
Intermec, Inc. | | *† | | 2,374 | | | 50,044 |
International Business Machines Corp. | | | | 53,689 | | | 6,363,756 |
Lexmark International, Inc., Class A | | * | | 4,019 | | | 134,355 |
NCR Corp. | | * | | 7,848 | | | 197,770 |
NetApp, Inc. | | * | | 14,316 | | | 310,085 |
Novatel Wireless, Inc. | | *† | | 1,358 | | | 15,115 |
Overland Storage, Inc. | | * | | 481 | | | 563 |
Palm, Inc. | | † | | 4,574 | | | 24,654 |
Presstek, Inc. | | *† | | 945 | | | 4,687 |
QLogic Corp. | | * | | 7,842 | | | 114,415 |
Quantum Corp. | | * | | 6,681 | | | 9,019 |
Rackable Systems, Inc. | | * | | 1,843 | | | 24,696 |
SanDisk Corp. | | * | | 8,969 | | | 167,720 |
Seagate Technology (Cayman Islands) | | | | 20,081 | | | 384,149 |
STEC, Inc. | | *† | | 1,055 | | | 10,835 |
Stratasys, Inc. | | *† | | 1,782 | | | 32,896 |
Sun Microsystems, Inc. | | * | | 33,887 | | | 368,691 |
Synaptics, Inc. | | *† | | 1,057 | | | 39,881 |
Teradata Corp. | | * | | 7,848 | | | 181,603 |
TransAct Technologies, Inc. | | * | | 888 | | | 7,353 |
Western Digital Corp. | | * | | 8,154 | | | 281,558 |
Zoom Technologies, Inc. | | * | | 2,711 | | | 949 |
| | | | | | | |
| | | | | | | 21,893,593 |
| | | | | | | |
Construction & Engineering—0.4% | | | | | | | |
Dycom Industries, Inc. | | *† | | 2,076 | | | 30,144 |
Emcor Group, Inc. | | *† | | 2,908 | | | 82,965 |
Fluor Corp. | | | | 3,405 | | | 633,603 |
Foster Wheeler Ltd. | | * | | 5,822 | | | 425,880 |
Furmanite Corp. | | *† | | 1,100 | | | 8,778 |
Granite Construction, Inc. | | † | | 1,889 | | | 59,560 |
Insituform Technologies, Inc., Class A | | *† | | 1,223 | | | 18,626 |
Jacobs Engineering Group, Inc. | | * | | 3,838 | | | 309,727 |
KBR, Inc. | | | | 6,464 | | | 225,658 |
Layne Christensen Co. | | *† | | 510 | | | 22,333 |
Perini Corp. | | * | | 960 | | | 31,728 |
Quanta Services, Inc. | | *† | | 8,861 | | | 294,805 |
Shaw Group, Inc. (The) | | * | | 2,182 | | | 134,826 |
URS Corp. | | * | | 2,934 | | | 123,140 |
| | | | | | | |
| | | | | | | 2,401,773 |
| | | | | | | |
Construction Materials—0.1% | | | | | | | |
Eagle Materials, Inc. | | † | | 2,083 | | | 52,762 |
Headwaters, Inc. | | *† | | 2,095 | | | 24,658 |
Martin Marietta Materials, Inc. | | † | | 1,737 | | | 179,936 |
Texas Industries, Inc. | | † | | 1,116 | | | 62,641 |
Vulcan Materials Co. | | † | | 3,605 | | | 215,507 |
| | | | | | | |
| | | | | | | 535,504 |
| | | | | | | |
Consumer Finance—0.5% | | | | | | | |
Advance America Cash Advance Centers, Inc. | | † | | 3,279 | | | 16,657 |
Advanta Corp., Class B | | † | | 1,050 | | | 6,605 |
American Express Co. | | | | 40,021 | | | 1,507,590 |
AmeriCredit Corp. | | *† | | 6,437 | | | 55,487 |
Capital One Financial Corp. | | | | 14,568 | | | 553,730 |
Cash America International, Inc. | | | | 685 | | | 21,235 |
CompuCredit Corp. | | * | | 83 | | | 498 |
Discover Financial Services | | | | 17,027 | | | 224,246 |
First Marblehead Corp. (The) | | † | | 2,764 | | | 7,103 |
Nelnet, Inc., Class A | | † | | 481 | | | 5,402 |
Rewards Network, Inc. | | * | | 1,127 | | | 4,632 |
SLM Corp. | | * | | 20,100 | | | 388,935 |
Student Loan Corp. | | † | | 207 | | | 20,303 |
World Acceptance Corp. | | *† | | 639 | | | 21,515 |
| | | | | | | |
| | | | | | | 2,833,938 |
| | | | | | | |
| | | | |
| | See accompanying notes to financial statements. | | 197 |
SCHEDULE OF INVESTMENTS — (Continued)
June 30, 2008 (Unaudited)
Vantagepoint Broad Market Index Fund
| | | | | | | |
| | | | | Shares | | Value |
COMMON STOCKS—(Continued) | | | | | | | |
Containers & Packaging—0.3% | | | | | | | |
AEP Industries, Inc. | | *† | | 372 | | $ | 6,462 |
Aptargroup, Inc. | | | | 3,130 | | | 131,304 |
Ball Corp. | | | | 4,676 | | | 223,231 |
Bemis Co., Inc. | | | | 4,410 | | | 98,872 |
Caraustar Industries, Inc. | | * | | 1,610 | | | 4,685 |
Chesapeake Corp. | | *† | | 814 | | | 1,913 |
Crown Holdings, Inc. | | * | | 6,844 | | | 177,876 |
Greif, Inc., Class A | | | | 852 | | | 54,554 |
Myers Industries, Inc. | | | | 1,716 | | | 13,985 |
Owens-Illinois, Inc. | | * | | 6,064 | | | 252,807 |
Packaging Corp of America | | | | 4,339 | | | 93,332 |
Pactiv Corp. | | * | | 6,523 | | | 138,483 |
Rock-Tenn Co., Class A | | † | | 1,450 | | | 43,486 |
Sealed Air Corp. | | | | 7,054 | | | 134,097 |
Silgan Holdings, Inc. | | † | | 454 | | | 23,036 |
Smurfit-Stone Container Corp. | | *† | | 10,013 | | | 40,753 |
Sonoco Products Co. | | | | 3,353 | | | 103,775 |
Temple-Inland, Inc. | | † | | 4,506 | | | 50,783 |
| | | | | | | |
| | | | | | | 1,593,434 |
| | | | | | | |
Distributors—0.1% | | | | | | | |
Audiovox Corp., Class A | | *† | | 1,218 | | | 11,961 |
Genuine Parts Co. | | | | 5,750 | | | 228,160 |
LKQ Corp. | | *† | | 7,000 | | | 126,490 |
| | | | | | | |
| | | | | | | 366,611 |
| | | | | | | |
Diversified Consumer Services—0.3% | | | | | | | |
Apollo Group, Inc., Class A | | * | | 5,517 | | | 244,181 |
Career Education Corp. | | *† | | 4,167 | | | 60,880 |
Coinstar, Inc. | | *† | | 1,075 | | | 35,163 |
Corinthian Colleges, Inc. | | *† | | 3,624 | | | 42,075 |
DeVry, Inc. | | † | | 2,980 | | | 159,788 |
H&R Block, Inc. | | | | 11,402 | | | 244,002 |
Hillenbrand, Inc. | | | | 1,576 | | | 33,726 |
ITT Educational Services, Inc. | | *† | | 1,873 | | | 154,766 |
Jackson Hewitt Tax Service, Inc. | | † | | 1,779 | | | 21,739 |
Matthews International Corp., Class A | | † | | 1,052 | | | 47,614 |
Pre-Paid Legal Services, Inc. | | *† | | 779 | | | 31,643 |
Princeton Review, Inc. | | * | | 818 | | | 5,530 |
Regis Corp. | | | | 1,818 | | | 47,904 |
Service Corp. International | | | | 11,775 | | | 116,102 |
Sotheby’s | | † | | 2,623 | | | 69,169 |
Steiner Leisure Ltd. (Bahamas) | | *† | | 1,503 | | | 42,610 |
Stewart Enterprises, Inc., Class A | | † | | 4,115 | | | 29,628 |
Strayer Education, Inc. | | † | | 551 | | | 115,198 |
Universal Technical Institute, Inc. | | *† | | 418 | | | 5,208 |
Weight Watchers International, Inc. | | † | | 1,826 | | | 65,024 |
| | | | | | | |
| | | | | | | 1,571,950 |
| | | | | | | |
Diversified Financial Services—2.7% | | | | | | | |
Ampal American Israel, Class A | | *† | | 1,391 | | | 6,273 |
Bank of America Corp. | | | | 175,693 | | | 4,193,793 |
CIT Group, Inc. | | | | 8,482 | | | 57,762 |
Citigroup, Inc. | | | | 212,050 | | | 3,553,958 |
CME Group, Inc. | | | | 2,080 | | | 797,035 |
Financial Federal Corp. | | † | | 1,513 | | | 33,225 |
Interactive Brokers Group, Inc., Class A | | * | | 1,570 | | | 50,444 |
IntercontinentalExchange, Inc. | | * | | 2,676 | | | 305,064 |
JPMorgan Chase & Co. | | | | 133,887 | | | 4,593,666 |
KKR Financial Holdings LLC | | | | 3,941 | | | 41,381 |
Leucadia National Corp. | | † | | 6,084 | | | 285,583 |
Medallion Financial Corp. | | | | 958 | | | 9,024 |
Moody’s Corp. | | † | | 9,284 | | | 319,741 |
Nasdaq OMX Group (The) | | * | | 5,431 | | | 144,193 |
Nymex Holdings, Inc. | | | | 3,429 | | | 289,682 |
NYSE Euronext | | | | 8,767 | | | 444,136 |
Pico Holdings, Inc. | | *† | | 1,150 | | | 49,968 |
Portfolio Recovery Associates, Inc. | | *† | | 504 | | | 18,900 |
Resource America, Inc., Class A | | † | | 1,287 | | | 11,995 |
| | | | | | | |
| | | | | | | 15,205,823 |
| | | | | | | |
Diversified Telecommunication Services—2.4% | | | | | | | |
8x8, Inc. | | *† | | 3,048 | | | 3,475 |
Alaska Communications Systems Group, Inc. | | † | | 2,850 | | | 34,029 |
AT&T, Inc. | | | | 231,402 | | | 7,795,932 |
CenturyTel, Inc. | | | | 4,084 | | | 145,350 |
Cincinnati Bell, Inc. | | *† | | 9,266 | | | 36,879 |
Citizens Communications Co. | | † | | 12,478 | | | 141,501 |
Cogent Communications Group, Inc. | | *† | | 2,886 | | | 38,672 |
D&E Communications, Inc. | | | | 1,712 | | | 15,220 |
Embarq Corp. | | | | 5,950 | | | 281,257 |
Fairpoint Communications, Inc. | | † | | 4,830 | | | 34,824 |
General Communication, Inc., Class A | | *† | | 2,516 | | | 17,285 |
Hickory Tech Corp. | | | | 651 | | | 5,384 |
Hungarian Telephone & Cable Corp. | | *† | | 712 | | | 12,987 |
IDT Corp., Class B | | *† | | 4,800 | | | 8,160 |
Iowa Telecommunications Services, Inc. | | † | | 2,702 | | | 47,582 |
Level 3 Communications, Inc. | | *† | | 41,949 | | | 123,750 |
NTELOS Holdings Corp. | | | | 2,700 | | | 68,499 |
PAETEC Holding Corp. | | *† | | 5,459 | | | 34,665 |
Premiere Global Services, Inc. | | *† | | 2,174 | | | 31,697 |
Qwest Communications International, Inc. | | † | | 62,767 | | | 246,674 |
SureWest Communications | | † | | 184 | | | 1,551 |
TW Telecom Inc. | | *† | | 1,928 | | | 30,906 |
Verizon Communications, Inc. | | | | 112,028 | | | 3,965,790 |
Windstream Corp. | | | | 15,208 | | | 187,667 |
XETA Technologies, Inc. | | * | | 1,946 | | | 6,247 |
| | | | | | | |
| | | | | | | 13,315,983 |
| | | | | | | |
Electric Utilities—2.0% | | | | | | | |
Allegheny Energy, Inc. | | | | 5,273 | | | 264,230 |
Allete, Inc. | | † | | 1,243 | | | 52,206 |
American Electric Power Co., Inc. | | | | 16,393 | | | 659,490 |
Central Vermont Public Service Corp. | | † | | 540 | | | 10,460 |
Cleco Corp. | | † | | 2,109 | | | 49,203 |
DPL, Inc. | | | | 5,037 | | | 132,876 |
Duke Energy Corp. | | | | 47,382 | | | 823,499 |
Edison International | | | | 12,022 | | | 617,690 |
El Paso Electric Co. | | * | | 1,748 | | | 34,610 |
Empire District Electric Co. (The) | | † | | 1,197 | | | 22,192 |
Entergy Corp. | | | | 8,044 | | | 969,141 |
Exelon Corp. | | | | 26,142 | | | 2,351,735 |
FirstEnergy Corp. | | | | 12,533 | | | 1,031,842 |
FPL Group, Inc. | | | | 14,666 | | | 961,796 |
Great Plains Energy, Inc. | | † | | 2,828 | | | 71,492 |
| | | | |
| 198 | | See accompanying notes to financial statements. | | |
SCHEDULE OF INVESTMENTS — (Continued)
June 30, 2008 (Unaudited)
Vantagepoint Broad Market Index Fund
| | | | | | | |
| | | | | Shares | | Value |
COMMON STOCKS—(Continued) | | | | | | | |
Hawaiian Electric Industries, Inc. | | † | | 3,066 | | $ | 75,822 |
Idacorp, Inc. | | † | | 1,515 | | | 43,768 |
ITC Holdings Corp. | | | | 1,539 | | | 78,658 |
MGE Energy, Inc. | | † | | 1,559 | | | 50,855 |
Northeast Utilities | | | | 5,201 | | | 132,782 |
Otter Tail Corp. | | † | | 1,095 | | | 42,519 |
Pepco Holdings, Inc. | | | | 7,066 | | | 181,243 |
Pinnacle West Capital Corp. | | | | 3,789 | | | 116,588 |
Portland General Electric Co. | | | | 1,100 | | | 24,772 |
PPL Corp. | | | | 14,691 | | | 767,899 |
Progress Energy, Inc. | | | | 10,169 | | | 425,369 |
Sierra Pacific Resources | | | | 3,864 | | | 49,111 |
Southern Co. | | | | 30,082 | | | 1,050,464 |
UIL Holdings Corp. | | † | | 1,496 | | | 43,997 |
Unisource Energy Corp. | | | | 1,571 | | | 48,717 |
Unitil Corp. | | | | 420 | | | 11,386 |
Westar Energy, Inc. | | † | | 4,032 | | | 86,728 |
| | | | | | | |
| | | | | | | 11,283,140 |
| | | | | | | |
Electrical Equipment—0.8% | | | | | | | |
A.O. Smith Corp. | | † | | 1,341 | | | 44,025 |
Active Power, Inc. | | *† | | 1,093 | | | 1,279 |
Acuity Brands, Inc. | | † | | 1,873 | | | 90,054 |
American Superconductor Corp. | | *† | | 1,147 | | | 41,120 |
Ametek, Inc. | | | | 4,234 | | | 199,929 |
AZZ, Inc. | | *† | | 1,582 | | | 63,122 |
Baldor Electric Co. | | † | | 1,338 | | | 46,803 |
Belden, Inc. | | † | | 1,894 | | | 64,169 |
Brady Corp., Class A | | † | | 2,402 | | | 82,941 |
C&D Technologies, Inc. | | * | | 1,159 | | | 9,805 |
Capstone Turbine Corp. | | *† | | 2,450 | | | 10,266 |
Cooper Industries Ltd., Class A | | | | 7,946 | | | 313,867 |
Distributed Energy Systems Corp. | | * | | 3,756 | | | 188 |
Emerson Electric Co. | | | | 31,480 | | | 1,556,686 |
Encore Wire Corp. | | † | | 1,400 | | | 29,666 |
Energy Conversion Devices, Inc. | | * | | 781 | | | 57,513 |
Evergreen Solar, Inc. | | *† | | 6,400 | | | 62,016 |
First Solar, Inc. | | * | | 1,743 | | | 475,525 |
Franklin Electric Co., Inc. | | | | 902 | | | 34,980 |
FuelCell Energy, Inc. | | *† | | 1,938 | | | 13,760 |
General Cable Corp. | | * | | 1,382 | | | 84,095 |
GrafTech International Ltd. | | * | | 3,487 | | | 93,556 |
Hubbell, Inc., Class B | | | | 2,078 | | | 82,850 |
II-VI, Inc. | | *† | | 682 | | | 23,815 |
LSI Industries, Inc. | | † | | 1,083 | | | 8,794 |
Magnetek, Inc. | | * | | 1,406 | | | 5,947 |
Medis Technologies Ltd. | | * | | 704 | | | 2,372 |
Orbit International Corp. | | * | | 2,812 | | | 19,543 |
Plug Power, Inc. | | * | | 2,704 | | | 6,354 |
Powell Industries, Inc. | | *† | | 1,045 | | | 52,678 |
Power-One, Inc. | | *† | | 3,459 | | | 6,538 |
Regal-Beloit Corp. | | † | | 1,272 | | | 53,742 |
Rockwell Automation, Inc. | | | | 6,047 | | | 264,435 |
Roper Industries, Inc. | | | | 2,980 | | | 196,322 |
Servotronics, Inc. | | | | 705 | | | 10,561 |
Sunpower Corp., Class A | | *† | | 1,322 | | | 95,158 |
Superior Essex, Inc. | | *† | | 1,617 | | | 72,167 |
Tech/Ops Sevcon, Inc. | | | | 719 | | | 5,285 |
Thomas & Betts Corp. | | * | | 2,428 | | | 91,900 |
Ultralife Corp. | | * | | 416 | | | 4,447 |
Universal Security Instruments, Inc. | | *† | | 1,866 | | | 10,543 |
Valence Technology, Inc. | | *† | | 6,972 | | | 30,886 |
Vicor Corp. | | † | | 1,380 | | | 13,772 |
Woodward Governor Co. | | † | | 2,448 | | | 87,296 |
| | | | | | | |
| | | | | | | 4,520,770 |
| | | | | | | |
Electronic Equipment & Instruments—0.8% | | | | | | | |
Aetrium, Inc. | | * | | 614 | | | 1,830 |
Agilent Technologies, Inc. | | * | | 15,887 | | | 564,623 |
Agilysys, Inc. | | † | | 1,335 | | | 15,139 |
American Technology Corp. | | *† | | 3,686 | | | 6,819 |
Amphenol Corp., Class A | | | | 7,376 | | | 331,035 |
Anixter International, Inc. | | *† | | 1,723 | | | 102,501 |
Arrow Electronics, Inc. | | * | | 4,585 | | | 140,851 |
Avnet, Inc. | | * | | 5,129 | | | 139,919 |
AVX Corp. | | † | | 2,270 | | | 25,674 |
Benchmark Electronics, Inc. | | * | | 2,520 | | | 41,177 |
Brightpoint, Inc. | | *† | | 2,358 | | | 17,213 |
CalAmp Corp. | | * | | 550 | | | 1,128 |
Checkpoint Systems, Inc. | | *† | | 1,441 | | | 30,088 |
Cognex Corp. | | † | | 2,023 | | | 46,630 |
Coherent, Inc. | | *† | | 1,348 | | | 40,292 |
CTS Corp. | | † | | 1,580 | | | 15,879 |
Daktronics, Inc. | | † | | 927 | | | 18,698 |
Dolby Laboratories, Inc., Class A | | * | | 1,370 | | | 55,211 |
DTS, Inc. | | *† | | 755 | | | 23,647 |
Echelon Corp. | | *† | | 1,769 | | | 19,282 |
Electro Scientific Industries, Inc. | | *† | | 1,421 | | | 20,136 |
Electro-Sensors, Inc. | | | | 2,581 | | | 11,950 |
Excel Technology, Inc. | | *† | | 562 | | | 12,544 |
FARO Technologies, Inc. | | * | | 453 | | | 11,402 |
Flir Systems, Inc. | | *† | | 5,608 | | | 227,517 |
Frequency Electronics, Inc. | | | | 821 | | | 5,410 |
Gerber Scientific, Inc. | | *† | | 1,608 | | | 18,299 |
ID Systems, Inc. | | * | | 2,016 | | | 12,983 |
Ingram Micro, Inc., Class A | | * | | 6,500 | | | 115,375 |
Insight Enterprises, Inc. | | *† | | 2,054 | | | 24,093 |
Iteris, Inc. | | *† | | 4,263 | | | 10,785 |
Itron, Inc. | | *† | | 955 | | | 93,924 |
Jabil Circuit, Inc. | | | | 8,287 | | | 135,990 |
Kemet Corp. | | *† | | 3,407 | | | 11,039 |
L-1 Identity Solutions, Inc. | | *† | | 1,637 | | | 21,805 |
Lightpath Technologies, Inc., Class A | | * | | 1,526 | | | 2,304 |
Littelfuse, Inc. | | *† | | 909 | | | 28,679 |
Maxwell Technologies, Inc. | | *† | | 370 | | | 3,929 |
Mechanical Technology, Inc. | | * | | 119 | | | 149 |
Mercury Computer Systems, Inc. | | *† | | 963 | | | 7,251 |
Merix Corp. | | * | | 674 | | | 1,550 |
Mesa Laboratories, Inc. | | | | 1,200 | | | 28,800 |
Methode Electronics, Inc. | | † | | 1,383 | | | 14,452 |
Mettler Toledo International, Inc. | | * | | 913 | | | 86,607 |
Molex, Inc. | | | | 5,599 | | | 136,672 |
MTS Systems Corp. | | † | | 1,342 | | | 48,151 |
National Instruments Corp. | | † | | 3,414 | | | 96,855 |
Newport Corp. | | *† | | 1,614 | | | 18,383 |
NU Horizons Electronics Corp. | | * | | 1,207 | | | 5,866 |
OI Corp. | | | | 1,600 | | | 18,544 |
OSI Systems, Inc. | | *† | | 867 | | | 18,571 |
Park Electrochemical Corp. | | † | | 1,086 | | | 26,401 |
PC Connection, Inc. | | *† | | 854 | | | 7,951 |
Photon Dynamics, Inc. | | * | | 659 | | | 9,938 |
| | | | |
| | See accompanying notes to financial statements. | | 199 |
SCHEDULE OF INVESTMENTS — (Continued)
June 30, 2008 (Unaudited)
Vantagepoint Broad Market Index Fund
| | | | | | | |
| | | | | Shares | | Value |
COMMON STOCKS—(Continued) | | | | | | | |
Planar Systems, Inc. | | * | | 785 | | $ | 2,041 |
Plexus Corp. | | *† | | 1,884 | | | 52,149 |
Radisys Corp. | | *† | | 961 | | | 8,707 |
Research Frontiers, Inc. | | *† | | 752 | | | 4,745 |
Rofin-Sinar Technologies, Inc. | | *† | | 2,200 | | | 66,440 |
Rogers Corp. | | *† | | 803 | | | 30,185 |
Sanmina-SCI Corp. | | * | | 21,464 | | | 27,474 |
ScanSource, Inc. | | *† | | 1,126 | | | 30,132 |
Sigmatron International, Inc. | | * | | 282 | | | 1,647 |
Spectrum Control, Inc. | | * | | 1,195 | | | 9,799 |
SYNNEX Corp. | | *† | | 104 | | | 2,609 |
Tech Data Corp. | | * | | 2,057 | | | 69,712 |
Technitrol, Inc. | | † | | 1,866 | | | 31,703 |
Trans-Lux Corp. | | * | | 866 | | | 3,118 |
Trimble Navigation Ltd. | | *† | | 4,318 | | | 154,153 |
TTM Technologies, Inc. | | * | | 1,639 | | | 21,651 |
Tyco Electronics Ltd. (Bermuda) | | | | 19,745 | | | 707,265 |
Universal Display Corp. | | *† | | 1,350 | | | 16,632 |
Vishay Intertechnology, Inc. | | * | | 6,172 | | | 54,746 |
X-Rite, Inc. | | *† | | 1,890 | | | 4,838 |
Zygo Corp. | | *† | | 967 | | | 9,506 |
| | | | | | | |
| | | | | | | 4,241,193 |
| | | | | | | |
Energy Equipment & Services—3.7% | | | | | | | |
Atwood Oceanics, Inc. | | *† | | 1,662 | | | 206,653 |
Baker Hughes, Inc. | | | | 13,058 | | | 1,140,486 |
Basic Energy Services, Inc. | | *† | | 1,600 | | | 50,400 |
BJ Services Co. | | | | 11,495 | | | 367,150 |
Bristow Group, Inc. | | *† | | 982 | | | 48,599 |
Cameron International Corp. | | * | | 7,401 | | | 409,645 |
CARBO Ceramics, Inc. | | † | | 1,137 | | | 66,344 |
Complete Production Services, Inc. | | *† | | 1,200 | | | 43,704 |
Dawson Geophysical Co. | | *† | | 924 | | | 54,941 |
Diamond Offshore Drilling, Inc. | | † | | 2,694 | | | 374,843 |
Dresser-Rand Group, Inc. | | * | | 2,924 | | | 114,328 |
Dril-Quip, Inc. | | *† | | 1,976 | | | 124,488 |
ENSCO International, Inc. | | | | 5,080 | | | 410,159 |
Exterran Holdings, Inc. | | *† | | 2,465 | | | 176,223 |
FMC Technologies, Inc. | | * | | 5,390 | | | 414,653 |
Global Industries Ltd. | | * | | 2,539 | | | 45,524 |
Grey Wolf, Inc. | | *† | | 5,192 | | | 46,884 |
Gulfmark Offshore, Inc. | | *† | | 1,000 | | | 58,180 |
Halliburton Co. | | | | 34,838 | | | 1,848,853 |
Helix Energy Solutions Group, Inc. | | *† | | 3,853 | | | 160,439 |
Helmerich & Payne, Inc. | | | | 3,926 | | | 282,751 |
Hercules Offshore, Inc. | | * | | 5,226 | | | 198,693 |
Hornbeck Offshore Services, Inc. | | *† | | 1,800 | | | 101,718 |
ION Geophysical Corp. | | *† | | 2,427 | | | 42,351 |
Key Energy Services, Inc. | | *† | | 5,220 | | | 101,372 |
Lufkin Industries, Inc. | | | | 1,000 | | | 83,280 |
Matrix Service Co. | | * | | 468 | | | 10,792 |
Mitcham Industries, Inc. | | * | | 1,100 | | | 18,788 |
Nabors Industries Ltd. (Bermuda) | | *† | | 10,988 | | | 540,939 |
NATCO Group, Inc., Class A | | *† | | 900 | | | 49,077 |
National Oilwell Varco, Inc. | | * | | 16,317 | | | 1,447,644 |
Newpark Resources, Inc. | | *† | | 3,484 | | | 27,384 |
Noble Corp. | | | | 11,104 | | | 721,316 |
Oceaneering International, Inc. | | * | | 2,232 | | | 171,976 |
Oil States International, Inc. | | *† | | 2,026 | | | 128,529 |
OYO Geospace Corp. | | *† | | 550 | | | 32,417 |
Parker Drilling Co. | | *† | | 3,755 | | | 37,588 |
Patterson-UTI Energy, Inc. | | | | 6,712 | | | 241,900 |
PHI, Inc. | | * | | 774 | | | 31,092 |
Pioneer Drilling Co. | | *† | | 2,700 | | | 50,787 |
Pride International, Inc. | | * | | 5,416 | | | 256,123 |
Rowan Cos, Inc. | | † | | 3,918 | | | 183,167 |
Schlumberger Ltd. | | | | 46,040 | | | 4,946,076 |
SEACOR Holdings, Inc. | | *† | | 713 | | | 63,821 |
Smith International, Inc. | | | | 8,020 | | | 666,783 |
Superior Energy Services, Inc. | | * | | 2,900 | | | 159,906 |
Tetra Technologies, Inc. | | *† | | 2,352 | | | 55,766 |
Tidewater, Inc. | | | | 2,430 | | | 158,023 |
Transocean, Inc. | | | | 12,518 | | | 1,907,618 |
Unit Corp. | | * | | 1,702 | | | 141,215 |
Weatherford International Ltd. | | * | | 27,020 | | | 1,339,922 |
W-H Energy Services, Inc. | | * | | 1,377 | | | 131,834 |
| | | | | | | |
| | | | | | | 20,493,144 |
| | | | | | | |
Entertainment—0.0% | | | | | | | |
Macrovision Solutions Corp. | | *† | | 3,817 | | | 57,102 |
| | | | | | | |
Food & Staples Retailing—2.4% | | | | | | | |
Andersons, Inc. (The) | | † | | 700 | | | 28,497 |
Arden Group, Inc., Class A | | † | | 260 | | | 32,952 |
BJ’s Wholesale Club, Inc. | | *† | | 2,859 | | | 110,643 |
Casey’s General Stores, Inc. | | † | | 1,608 | | | 37,257 |
Costco Wholesale Corp. | | | | 17,704 | | | 1,241,759 |
CVS Caremark Corp. | | | | 57,854 | | | 2,289,283 |
Great Atlantic & Pacific Tea Co. | | *† | | 123 | | | 2,807 |
Kroger Co. (The) | | | | 23,489 | | | 678,127 |
Longs Drug Stores Corp. | | † | | 1,757 | | | 73,987 |
Nyer Medical Group, Inc. | | * | | 2,532 | | | 3,697 |
Pantry, Inc. (The) | | *† | | 1,200 | | | 12,792 |
Rite Aid Corp. | | *† | | 25,982 | | | 41,311 |
Ruddick Corp. | | | | 1,967 | | | 67,488 |
Safeway, Inc. | | | | 16,176 | | | 461,825 |
Supervalu, Inc. | | | | 8,154 | | | 251,877 |
Sysco Corp. | | | | 24,091 | | | 662,743 |
United Natural Foods, Inc. | | *† | | 1,912 | | | 37,246 |
Walgreen Co. | | | | 36,697 | | | 1,193,019 |
Wal-Mart Stores, Inc. | | | | 95,214 | | | 5,351,028 |
Weis Markets, Inc. | | † | | 382 | | | 12,404 |
Whole Foods Market, Inc. | | † | | 5,036 | | | 119,303 |
Winn-Dixie Stores, Inc. | | *† | | 3,309 | | | 53,010 |
| | | | | | | |
| | | | | | | 12,763,055 |
| | | | | | | |
Food Products—1.4% | | | | | | | |
Archer-Daniels-Midland Co. | | | | 23,265 | | | 785,194 |
Bridgford Foods Corp. | | * | | 559 | | | 3,505 |
Bunge Ltd. | | † | | 4,700 | | | 506,143 |
Campbell Soup Co. | | | | 9,126 | | | 305,356 |
Chiquita Brands International, Inc. | | * | | 2,150 | | | 32,616 |
ConAgra Foods, Inc. | | | | 20,389 | | | 393,100 |
Corn Products International, Inc. | | | | 3,164 | | | 155,384 |
Darling International, Inc. | | * | | 3,150 | | | 52,038 |
Dean Foods Co. | | * | | 6,281 | | | 123,233 |
Del Monte Foods Co. | | | | 8,204 | | | 58,248 |
Farmer Bros Co. | | † | | 930 | | | 19,670 |
Flowers Foods, Inc. | | † | | 4,140 | | | 117,328 |
Fresh Del Monte Produce, Inc. (Cayman Islands) | | *† | | 567 | | | 13,364 |
General Mills, Inc. | | | | 11,616 | | | 705,904 |
Green Mountain Coffee Roasters, Inc. | | *† | | 1,500 | | | 56,355 |
Griffin Land & Nurseries, Inc. | | | | 650 | | | 19,955 |
| | | | |
| 200 | | See accompanying notes to financial statements. | | |
SCHEDULE OF INVESTMENTS — (Continued)
June 30, 2008 (Unaudited)
Vantagepoint Broad Market Index Fund
| | | | | | | |
| | | | | Shares | | Value |
COMMON STOCKS—(Continued) | | | | | | | |
Hain Celestial Group, Inc. | | *† | | 1,426 | | $ | 33,482 |
Hershey Co. (The) | | † | | 6,420 | | | 210,448 |
HJ Heinz Co. | | | | 11,592 | | | 554,677 |
Hormel Foods Corp. | | | | 3,195 | | | 110,579 |
Inventure Group, Inc. (The) | | *† | | 5,272 | | | 9,068 |
J.M. Smucker Co. (The) | | | | 2,614 | | | 106,233 |
Kellogg Co. | | | | 7,668 | | | 368,217 |
Kraft Foods, Inc., Class A | | | | 57,051 | | | 1,623,101 |
Lancaster Colony Corp. | | † | | 1,389 | | | 42,059 |
Lance, Inc. | | † | | 1,370 | | | 25,715 |
McCormick & Co., Inc. | | | | 5,759 | | | 205,366 |
Pilgrim’s Pride Corp. | | † | | 2,476 | | | 32,163 |
Ralcorp Holdings, Inc. | | *† | | 1,228 | | | 60,712 |
Sanderson Farms, Inc. | | † | | 864 | | | 29,825 |
Sara Lee Corp. | | | | 29,377 | | | 359,868 |
Seaboard Corp. | | † | | 18 | | | 27,918 |
Smithfield Foods, Inc. | | *† | | 4,682 | | | 93,078 |
Tootsie Roll Industries, Inc. | | † | | 589 | | | 14,802 |
TreeHouse Foods, Inc. | | *† | | 1,256 | | | 30,471 |
Tyson Foods, Inc., Class A | | | | 10,231 | | | 152,851 |
WM Wrigley Jr Co. | | | | 7,657 | | | 595,561 |
| | | | | | | |
| | | | | | | 8,033,587 |
| | | | | | | |
Gas Utilities—0.4% | | | | | | | |
AGL Resources, Inc. | | † | | 2,166 | | | 74,900 |
Atmos Energy Corp. | | † | | 2,732 | | | 75,321 |
Chesapeake Utilities Corp. | | † | | 949 | | | 24,408 |
Delta Natural Gas Co., Inc. | | | | 380 | | | 9,926 |
Energen Corp. | | | | 2,644 | | | 206,311 |
Equitable Resources, Inc. | | | | 5,288 | | | 365,189 |
Laclede Group, Inc. (The) | | † | | 1,025 | | | 41,379 |
National Fuel Gas Co. | | | | 3,639 | | | 216,448 |
New Jersey Resources Corp. | | † | | 1,681 | | | 54,885 |
Nicor, Inc. | | † | | 1,828 | | | 77,855 |
Northwest Natural Gas Co. | | † | | 1,183 | | | 54,726 |
Oneok, Inc. | | | | 3,908 | | | 190,828 |
Piedmont Natural Gas Co. | | | | 2,740 | | | 71,678 |
Questar Corp. | | | | 7,412 | | | 526,549 |
South Jersey Industries, Inc. | | † | | 2,014 | | | 75,243 |
Southern Union Co. | | | | 3,367 | | | 90,976 |
Southwest Gas Corp. | | † | | 1,252 | | | 37,222 |
UGI Corp. | | | | 2,720 | | | 78,091 |
WGL Holdings, Inc. | | † | | 2,315 | | | 80,423 |
| | | | | | | |
| | | | | | | 2,352,358 |
| | | | | | | |
Health Care Equipment & Supplies—2.2% | | | | | | | |
Abaxis, Inc. | | *† | | 749 | | | 18,073 |
Abiomed, Inc. | | *† | | 886 | | | 15,727 |
Advanced Medical Optics, Inc. | | * | | 2,304 | | | 43,177 |
Align Technology, Inc. | | *† | | 2,449 | | | 25,690 |
American Medical Systems Holdings, Inc. | | *† | | 3,000 | | | 44,850 |
Analogic Corp. | | | | 593 | | | 37,401 |
Arthrocare Corp. | | *† | | 851 | | | 34,729 |
Baxter International, Inc. | | | | 25,124 | | | 1,606,429 |
Beckman Coulter, Inc. | | | | 2,512 | | | 169,635 |
Becton Dickinson & Co. | | | | 8,917 | | | 724,952 |
Bioject Medical Technologies, Inc. | | * | | 4,490 | | | 1,841 |
Biolase Technology, Inc. | | * | | 765 | | | 2,616 |
Boston Scientific Corp. | | * | | 53,540 | | | 658,007 |
Cerus Corp. | | *† | | 1,010 | | | 4,131 |
Clarient, Inc. | | *† | | 3,308 | | | 6,682 |
Clinical Data, Inc. | | *† | | 1,998 | | | 28,511 |
Conceptus, Inc. | | * | | 1,047 | | | 19,359 |
Conmed Corp. | | *† | | 1,362 | | | 36,161 |
Cooper Cos, Inc. (The) | | † | | 1,627 | | | 60,443 |
Covidien Ltd. | | | | 19,745 | | | 945,588 |
CR Bard, Inc. | | | | 3,904 | | | 343,357 |
CryoLife, Inc. | | *† | | 937 | | | 10,719 |
Cyberonics, Inc. | | * | | 956 | | | 20,745 |
Datascope Corp. | | † | | 556 | | | 26,132 |
Dentsply International, Inc. | | | | 5,668 | | | 208,582 |
Edwards Lifesciences Corp. | | * | | 2,575 | | | 159,753 |
EP Medsystems, Inc. | | *† | | 5,240 | | | 15,615 |
ev3, Inc. | | *† | | 785 | | | 7,442 |
Gen-Probe, Inc. | | * | | 1,849 | | | 87,791 |
Greatbatch, Inc. | | *† | | 942 | | | 16,297 |
Haemonetics Corp. | | *† | | 1,157 | | | 64,167 |
HealthTronics, Inc. | | *† | | 2,529 | | | 8,270 |
Hill-Rom Holdings, Inc. | | † | | 1,576 | | | 42,520 |
Hologic, Inc. | | *† | | 9,792 | | | 213,466 |
Hospira, Inc. | | * | | 6,367 | | | 255,380 |
ICU Medical, Inc. | | *† | | 605 | | | 13,842 |
Idexx Laboratories, Inc. | | * | | 3,136 | | | 152,849 |
Immucor, Inc. | | *† | | 1,828 | | | 47,309 |
Integra LifeSciences Holdings Corp. | | * | | 1,190 | | | 52,931 |
Intuitive Surgical, Inc. | | *† | | 1,610 | | | 433,734 |
Invacare Corp. | | † | | 1,333 | | | 27,247 |
Inverness Medical Innovations, Inc. | | *† | | 3,011 | | | 99,875 |
Kensey Nash Corp. | | * | | 866 | | | 27,755 |
Kinetic Concepts, Inc. | | *† | | 2,200 | | | 87,802 |
Masimo Corp. | | *† | | 1,500 | | | 51,525 |
Medtronic, Inc. | | | | 45,099 | | | 2,333,873 |
Mentor Corp. | | † | | 1,961 | | | 54,555 |
Meridian Bioscience, Inc. | | † | | 1,158 | | | 31,173 |
Merit Medical Systems, Inc. | | *† | | 2,519 | | | 37,029 |
NuVasive, Inc. | | *† | | 2,111 | | | 94,277 |
OraSure Technologies, Inc. | | * | | 1,687 | | | 6,309 |
Osteotech, Inc. | | *† | | 1,498 | | | 8,524 |
Palomar Medical Technologies, Inc. | | *† | | 1,116 | | | 11,138 |
Resmed, Inc. | | *† | | 3,034 | | | 108,435 |
RTI Biologics, Inc. | | *† | | 807 | | | 7,061 |
Somanetics Corp. | | *† | | 1,352 | | | 28,662 |
SonoSite, Inc. | | * | | 1,264 | | | 35,405 |
Spectranetics Corp. | | * | | 1,045 | | | 10,304 |
St Jude Medical, Inc. | | * | | 13,638 | | | 557,521 |
Staar Surgical Co. | | * | | 848 | | | 2,629 |
STERIS Corp. | | | | 2,777 | | | 79,867 |
Stryker Corp. | | | | 11,240 | | | 706,771 |
SurModics, Inc. | | * | | 675 | | | 30,267 |
Synovis Life Technologies, Inc. | | * | | 346 | | | 6,515 |
Theragenics Corp. | | * | | 1,492 | | | 5,416 |
ThermoGenesis Corp. | | *† | | 4,316 | | | 6,042 |
Thoratec Corp. | | *† | | 2,306 | | | 40,101 |
Urologix, Inc. | | *† | | 1,050 | | | 1,922 |
Varian Medical Systems, Inc. | | * | | 5,512 | | | 285,797 |
Vital Signs, Inc. | | † | | 634 | | | 35,999 |
West Pharmaceutical Services, Inc. | | † | | 1,704 | | | 73,749 |
Wright Medical Group, Inc. | | *† | | 1,309 | | | 37,189 |
Young Innovations, Inc. | | | | 677 | | | 14,095 |
Zimmer Holdings, Inc. | | * | | 9,576 | | | 651,647 |
Zoll Medical Corp. | | * | | 850 | | | 28,620 |
| | | | | | | |
| | | | | | | 12,289,999 |
| | | | | | | |
Health Care Providers & Services—1.9% | | | | | | | |
Access Plans USA, Inc. | | *† | | 3,538 | | | 2,954 |
Aetna, Inc. | | | | 20,153 | | | 816,801 |
Alliance Imaging, Inc. | | *† | | 1,429 | | | 12,389 |
Amedisys, Inc. | | *† | | 1,698 | | | 85,613 |
| | | | |
| | See accompanying notes to financial statements. | | 201 |
SCHEDULE OF INVESTMENTS — (Continued)
June 30, 2008 (Unaudited)
Vantagepoint Broad Market Index Fund
| | | | | | | |
| | | | | Shares | | Value |
COMMON STOCKS—(Continued) | | | | | | | |
Amerigroup Corp. | | *† | | 1,950 | | $ | 40,560 |
AmerisourceBergen Corp. | | | | 7,851 | | | 313,961 |
AMN Healthcare Services, Inc. | | *† | | 1,507 | | | 25,498 |
Amsurg Corp. | | *† | | 1,423 | | | 34,650 |
Apria Healthcare Group, Inc. | | * | | 2,101 | | | 40,738 |
BioScrip, Inc. | | * | | 1,095 | | | 2,836 |
Brookdale Senior Living, Inc. | | † | | 2,200 | | | 44,792 |
Cardinal Health, Inc. | | | | 15,220 | | | 785,048 |
Centene Corp. | | *† | | 1,972 | | | 33,110 |
Chemed Corp. | | † | | 1,162 | | | 42,541 |
Chindex International, Inc. | | *† | | 822 | | | 12,059 |
Cigna Corp. | | | | 10,791 | | | 381,893 |
Community Health Systems, Inc. | | *† | | 4,282 | | | 141,220 |
Coventry Health Care, Inc. | | * | | 6,568 | | | 199,799 |
Cross Country Healthcare, Inc. | | *† | | 1,339 | | | 19,295 |
DaVita, Inc. | | * | | 4,290 | | | 227,928 |
Express Scripts, Inc. | | * | | 8,956 | | | 561,720 |
Hanger Orthopedic Group, Inc. | | * | | 1,083 | | | 17,859 |
Health Management Associates, Inc., Class A | | *† | | 9,953 | | | 64,794 |
Health Net, Inc. | | * | | 3,209 | | | 77,209 |
HealthExtras, Inc. | | *† | | 1,864 | | | 56,181 |
Healthspring, Inc. | | *† | | 2,400 | | | 40,512 |
Healthways, Inc. | | *† | | 1,362 | | | 40,315 |
Henry Schein, Inc. | | *† | | 3,652 | | | 188,334 |
Humana, Inc. | | * | | 6,683 | | | 265,783 |
inVentiv Health, Inc. | | *† | | 2,100 | | | 58,359 |
Kindred Healthcare, Inc. | | *† | | 1,800 | | | 51,768 |
Laboratory Corp of America Holdings | | * | | 4,321 | | | 300,871 |
Landauer, Inc. | | † | | 598 | | | 33,632 |
LCA-Vision, Inc. | | † | | 616 | | | 2,938 |
LifePoint Hospitals, Inc. | | *† | | 2,149 | | | 60,817 |
Lincare Holdings, Inc. | | *† | | 2,129 | | | 60,464 |
Magellan Health Services, Inc. | | * | | 1,400 | | | 51,842 |
McKesson Corp. | | | | 11,391 | | | 636,871 |
Medco Health Solutions, Inc. | | * | | 20,234 | | | 955,045 |
Medical Staffing Network Holdings, Inc. | | * | | 1,686 | | | 6,508 |
National Healthcare Corp. | | † | | 431 | | | 19,753 |
National Research Corp. | | † | | 1,250 | | | 33,088 |
NovaMed, Inc. | | *† | | 1,250 | | | 4,713 |
Odyssey HealthCare, Inc. | | *† | | 1,593 | | | 15,516 |
Omnicare, Inc. | | † | | 4,277 | | | 112,143 |
Owens & Minor, Inc. | | † | | 1,623 | | | 74,155 |
Patterson Cos, Inc. | | *† | | 5,546 | | | 162,997 |
PDI, Inc. | | * | | 703 | | | 6,123 |
Pediatrix Medical Group, Inc. | | *† | | 2,182 | | | 107,420 |
PharMerica Corp. | | * | | 1,365 | | | 30,835 |
PSS World Medical, Inc. | | *† | | 3,574 | | | 58,256 |
Psychemedics Corp. | | † | | 302 | | | 4,953 |
Psychiatric Solutions, Inc. | | *† | | 2,662 | | | 100,730 |
Quest Diagnostics, Inc. | | | | 4,904 | | | 237,697 |
RehabCare Group, Inc. | | *† | | 739 | | | 11,846 |
Res-Care, Inc. | | *† | | 1,222 | | | 21,727 |
Sunrise Senior Living, Inc. | | *† | | 1,950 | | | 43,836 |
Tenet Healthcare Corp. | | * | | 19,289 | | | 107,247 |
U.S. Physical Therapy, Inc. | | * | | 1,300 | | | 21,333 |
United American Healthcare Corp. | | *† | | 4,251 | | | 8,502 |
UnitedHealth Group, Inc. | | | | 49,658 | | | 1,303,522 |
Universal American Corp. | | *† | | 1,812 | | | 18,519 |
Universal Health Services, Inc., Class B | | † | | 1,233 | | | 77,950 |
VCA Antech, Inc. | | *† | | 3,442 | | | 95,619 |
WellCare Health Plans, Inc. | | * | | 1,500 | | | 54,225 |
WellPoint, Inc. | | * | | 21,396 | | | 1,019,732 |
| | | | | | | |
| | | | | | | 10,547,944 |
| | | | | | | |
Health Care Technology—0.1% | | | | | | | |
Allscripts Healthcare Solutions, Inc. | | *† | | 2,300 | | | 28,543 |
AMICAS, Inc. | | * | | 1,846 | | | 5,243 |
Cerner Corp. | | *† | | 3,044 | | | 137,528 |
Eclipsys Corp. | | *† | | 1,846 | | | 33,893 |
HLTH Corp. | | * | | 10,847 | | | 122,788 |
IMS Health, Inc. | | | | 7,150 | | | 166,594 |
Mediware Information Systems | | * | | 1,088 | | | 6,365 |
Omnicell, Inc. | | *† | | 783 | | | 10,320 |
Trizetto Group, Inc. | | * | | 1,550 | | | 33,139 |
| | | | | | | |
| | | | | | | 544,413 |
| | | | | | | |
Home Builders—0.0% | | | | | | | |
Woodbridge Holdings Corp. | | *† | | 763 | | | 885 |
| | | | | | | |
Hotels, Restaurants & Leisure—1.4% | | | | | | | |
Ambassadors International, Inc. | | *† | | 523 | | | 2,291 |
Ameristar Casinos, Inc. | | † | | 300 | | | 4,146 |
Bally Technologies, Inc. | | * | | 1,971 | | | 66,620 |
Bob Evans Farms, Inc. | | † | | 1,465 | | | 41,899 |
Boyd Gaming Corp. | | † | | 2,619 | | | 32,895 |
Brinker International, Inc. | | | | 5,167 | | | 97,656 |
Burger King Holdings, Inc. | | | | 1,700 | | | 45,543 |
California Pizza Kitchen, Inc. | | *† | | 1,455 | | | 16,281 |
Carnival Corp. | | | | 17,238 | | | 568,164 |
CBRL Group, Inc. | | † | | 2,120 | | | 51,961 |
CEC Entertainment, Inc. | | *† | | 1,614 | | | 45,208 |
Cedar Fair, LP | | | | 2,300 | | | 43,217 |
Cheesecake Factory (The) | | *† | | 3,444 | | | 54,794 |
Chipotle Mexican Grill, Inc., Class A | | *† | | 900 | | | 74,358 |
Choice Hotels International, Inc. | | † | | 1,616 | | | 42,824 |
Churchill Downs, Inc. | | † | | 638 | | | 22,247 |
CKE Restaurants, Inc. | | † | | 1,945 | | | 24,254 |
Darden Restaurants, Inc. | | | | 5,104 | | | 163,022 |
Dover Downs Gaming & Entertainment, Inc. | | † | | 1,710 | | | 10,978 |
Dover Motorsports, Inc. | | † | | 1,645 | | | 8,373 |
Empire Resorts, Inc. | | *† | | 582 | | | 1,705 |
Gaylord Entertainment Co. | | *† | | 1,772 | | | 42,457 |
International Game Technology | | | | 13,402 | | | 334,782 |
International Speedway Corp., Class A | | | | 1,190 | | | 46,446 |
Isle of Capri Casinos, Inc. | | *† | | 1,250 | | | 5,988 |
Jack in the Box, Inc. | | * | | 2,874 | | | 64,406 |
Krispy Kreme Doughnuts, Inc. | | *† | | 2,573 | | | 12,839 |
Landry’s Restaurants, Inc. | | | | 1,253 | | | 22,516 |
Las Vegas Sands Corp. | | *† | | 4,070 | | | 193,081 |
Marcus Corp. | | | | 1,505 | | | 22,500 |
Marriott International, Inc., Class A | | | | 13,654 | | | 358,281 |
McDonald’s Corp. | | | | 44,517 | | | 2,502,747 |
MGM Mirage | | * | | 4,792 | | | 162,401 |
Morgans Hotel Group Co. | | *† | | 2,300 | | | 23,690 |
Morton’s Restaurant Group, Inc. | | *† | | 2,200 | | | 15,136 |
Multimedia Games, Inc. | | *† | | 1,202 | | | 5,313 |
O’Charleys, Inc. | | † | | 1,091 | | | 10,975 |
Orient-Express Hotels Ltd., Class A (Bermuda) | | † | | 1,577 | | | 68,505 |
P.F. Chang’s China Bistro, Inc. | | *† | | 1,089 | | | 24,328 |
Panera Bread Co., Class A | | *† | | 1,250 | | | 57,825 |
| | | | |
| 202 | | See accompanying notes to financial statements. | | |
SCHEDULE OF INVESTMENTS — (Continued)
June 30, 2008 (Unaudited)
Vantagepoint Broad Market Index Fund
| | | | | | | |
| | | | | Shares | | Value |
COMMON STOCKS—(Continued) | | | | | | | |
Papa John’s International, Inc. | | *† | | 1,610 | | $ | 42,810 |
Peet’s Coffee & Tea, Inc. | | *† | | 637 | | | 12,625 |
Penn National Gaming, Inc. | | * | | 2,586 | | | 83,140 |
Pinnacle Entertainment, Inc. | | *† | | 1,629 | | | 17,088 |
Red Robin Gourmet Burgers, Inc. | | *† | | 692 | | | 19,196 |
Royal Caribbean Cruises Ltd. | | | | 4,300 | | | 96,621 |
Ruby Tuesday, Inc. | | † | | 2,816 | | | 15,206 |
Scientific Games Corp., Class A | | *† | | 2,517 | | | 74,554 |
Shuffle Master, Inc. | | *† | | 1,527 | | | 7,543 |
Six Flags, Inc. | | *† | | 3,814 | | | 4,386 |
Sonic Corp. | | *† | | 3,730 | | | 55,204 |
Speedway Motorsports, Inc. | | † | | 149 | | | 3,037 |
Starbucks Corp. | | * | | 29,904 | | | 470,689 |
Starwood Hotels & Resorts Worldwide, Inc. | | † | | 7,939 | | | 318,116 |
Steak N Shake Co. (The) | | *† | | 1,267 | | | 8,020 |
Texas Roadhouse, Inc., Class A | | *† | | 3,070 | | | 27,538 |
Triarc Cos, Inc., Class B | | † | | 2,886 | | | 18,268 |
Trump Entertainment Resorts, Inc. | | *† | | 1,600 | | | 3,056 |
Vail Resorts, Inc. | | *† | | 1,491 | | | 63,860 |
Wendy’s International, Inc. | | | | 5,229 | | | 142,333 |
WMS Industries, Inc. | | *† | | 1,903 | | | 56,652 |
Wyndham Worldwide Corp. | | | | 8,848 | | | 158,468 |
Wynn Resorts Ltd. | | † | | 2,554 | | | 207,768 |
Yum! Brands, Inc. | | | | 20,395 | | | 715,661 |
| | | | | | | |
| | | | | | | 8,014,491 |
| | | | | | | |
Household Durables—0.5% | | | | | | | |
American Greetings Corp., Class A | | † | | 2,760 | | | 34,058 |
Bassett Furniture Industries, Inc. | | | | 1,139 | | | 13,440 |
Beazer Homes USA, Inc. | | | | 1,494 | | | 8,322 |
Black & Decker Corp. | | | | 3,225 | | | 185,470 |
Blyth, Inc. | | † | | 1,839 | | | 22,123 |
Brookfield Homes Corp. | | † | | 1,218 | | | 14,957 |
California Coastal Communities, Inc. | | *† | | 267 | | | 1,020 |
Centex Corp. | | | | 4,760 | | | 63,641 |
Champion Enterprises, Inc. | | *† | | 2,559 | | | 14,970 |
DR Horton, Inc. | | † | | 11,522 | | | 125,014 |
Ethan Allen Interiors, Inc. | | † | | 1,551 | | | 38,155 |
Fortune Brands, Inc. | | | | 5,642 | | | 352,118 |
Furniture Brands International, Inc. | | | | 2,341 | | | 31,276 |
Garmin Ltd. (Cayman Islands) | | † | | 4,774 | | | 204,518 |
Harman International Industries, Inc. | | | | 2,728 | | | 112,912 |
Helen of Troy Ltd. (Bermuda) | | *† | | 1,333 | | | 21,488 |
Hovnanian Enterprises, Inc., Class A | | * | | 1,478 | | | 8,099 |
Jarden Corp. | | *† | | 2,055 | | | 37,483 |
KB Home | | † | | 3,248 | | | 54,989 |
La-Z-Boy, Inc., Class Z | | † | | 2,404 | | | 18,391 |
Leggett & Platt, Inc. | | † | | 8,763 | | | 146,956 |
Lennar Corp., Class A | | † | | 5,675 | | | 70,030 |
Libbey, Inc. | | † | | 749 | | | 5,573 |
M/I Homes, Inc. | | | | 610 | | | 9,595 |
MDC Holdings, Inc. | | † | | 1,091 | | | 42,614 |
Meritage Homes Corp. | | * | | 1,300 | | | 19,721 |
Mohawk Industries, Inc. | | *† | | 2,460 | | | 157,686 |
National Presto Industries, Inc. | | † | | 535 | | | 34,336 |
Newell Rubbermaid, Inc. | | | | 10,108 | | | 169,713 |
NVR, Inc. | | *† | | 262 | | | 131,021 |
Palm Harbor Homes, Inc. | | *† | | 1,181 | | | 6,531 |
Pulte Homes, Inc. | | † | | 8,898 | | | 85,688 |
Russ Berrie & Co., Inc. | | *† | | 1,156 | | | 9,213 |
Ryland Group, Inc. | | | | 1,852 | | | 40,392 |
Skyline Corp. | | † | | 720 | | | 16,920 |
Snap-On, Inc. | | | | 2,419 | | | 125,812 |
Standard Pacific Corp. | | | | 2,568 | | | 8,680 |
Stanley Works (The) | | | | 3,365 | | | 150,853 |
Syntax-Brillian Corp. | | * | | 180 | | | 94 |
Tempur-Pedic International, Inc. | | † | | 1,346 | | | 10,512 |
Toll Brothers, Inc. | | *† | | 4,132 | | | 77,392 |
Tupperware Brands Corp. | | | | 2,427 | | | 83,052 |
Universal Electronics, Inc. | | *† | | 639 | | | 13,355 |
WCI Communities, Inc. | | *† | | 1,921 | | | 2,785 |
Whirlpool Corp. | | | | 2,980 | | | 183,955 |
| | | | | | | |
| | | | | | | 2,964,923 |
| | | | | | | |
Household Products—1.8% | | | | | | | |
Central Garden and Pet Co. | | *† | | 615 | | | 2,798 |
Central Garden and Pet Co., Class A | | * | | 1,230 | | | 5,043 |
Church & Dwight Co., Inc. | | † | | 2,569 | | | 144,763 |
Clorox Co. | | | | 6,212 | | | 324,266 |
Colgate-Palmolive Co. | | | | 19,424 | | | 1,342,198 |
Energizer Holdings, Inc. | | * | | 1,856 | | | 135,655 |
Kimberly-Clark Corp. | | | | 16,536 | | | 988,522 |
Procter & Gamble Co. | | | | 120,065 | | | 7,301,154 |
Spectrum Brands, Inc. | | *† | | 1,490 | | | 3,800 |
WD-40 Co. | | † | | 949 | | | 27,758 |
| | | | | | | |
| | | | | | | 10,275,957 |
| | | | | | | |
Independent Power Producers & Energy Traders—0.5% | | | | | | | |
AES Corp. (The) | | * | | 25,835 | | | 496,290 |
Calpine Corp. | | * | | 16,000 | | | 360,960 |
Constellation Energy Group, Inc. | | | | 7,434 | | | 610,331 |
Dynegy, Inc., Class A | | * | | 15,654 | | | 133,842 |
Mirant Corp. | | *† | | 8,577 | | | 335,790 |
NRG Energy, Inc. | | * | | 8,000 | | | 343,200 |
Reliant Energy, Inc. | | * | | 11,470 | | | 243,967 |
| | | | | | | |
| | | | | | | 2,524,380 |
| | | | | | | |
Industrial Conglomerates—2.6% | | | | | | | |
3M Co. | | | | 24,251 | | | 1,687,626 |
Carlisle Cos, Inc. | | † | | 2,452 | | | 71,108 |
General Electric Co. | | | | 388,040 | | | 10,356,787 |
McDermott International, Inc. | | * | | 8,276 | | | 512,202 |
Standex International Corp. | | † | | 724 | | | 15,016 |
Teleflex, Inc. | | | | 1,322 | | | 73,490 |
Textron, Inc. | | | | 8,214 | | | 393,697 |
Tredegar Corp. | | † | | 1,606 | | | 23,608 |
Tyco International Ltd. (Bermuda) | | | | 19,745 | | | 790,590 |
United Capital Corp. | | * | | 690 | | | 13,248 |
Walter Industries, Inc. | | | | 1,640 | | | 178,383 |
| | | | | | | |
| | | | | | | 14,115,755 |
| | | | | | | |
Insurance—4.3% | | | | | | | |
ACE Ltd. (Bermuda) | | | | 12,700 | | | 699,643 |
Aflac, Inc. | | | | 19,543 | | | 1,227,300 |
Alleghany Corp. | | * | | 149 | | | 49,475 |
Allied World Assurance Co. Holdings Ltd. (Bermuda) | | | | 1,889 | | | 74,842 |
Allstate Corp. (The) | | | | 21,889 | | | 997,920 |
AMBAC Financial Group, Inc. | | † | | 11,209 | | | 15,020 |
| | | | |
| | See accompanying notes to financial statements. | | 203 |
SCHEDULE OF INVESTMENTS — (Continued)
June 30, 2008 (Unaudited)
Vantagepoint Broad Market Index Fund
| | | | | | | |
| | | | | Shares | | Value |
COMMON STOCKS—(Continued) | | | | | | | |
American Equity Investment Life Holding Co. | | † | | 4,302 | | $ | 35,061 |
American Financial Group, Inc. | | | | 2,657 | | | 71,075 |
American Independence Corp. | | * | | 430 | | | 2,752 |
American International Group, Inc. | | | | 90,295 | | | 2,389,206 |
American National Insurance Co. | | | | 945 | | | 92,629 |
American Physicians Capital, Inc. | | | | 1,290 | | | 62,488 |
AON Corp. | | | | 10,312 | | | 473,733 |
Arch Capital Group Ltd. (Bermuda) | | * | | 1,428 | | | 94,705 |
Argo Group International Holdings Ltd. (Bermuda) | | *† | | 899 | | | 30,170 |
Arthur J. Gallagher & Co. | | † | | 3,230 | | | 77,843 |
Aspen Insurance Holdings Ltd. | | † | | 3,512 | | | 83,129 |
Assurant, Inc. | | | | 4,146 | | | 273,470 |
Assured Guaranty Ltd. (Bermuda) | | † | | 2,359 | | | 42,438 |
Axis Capital Holdings Ltd. (Bermuda) | | | | 5,691 | | | 169,649 |
Baldwin & Lyons, Inc., Class B | | † | | 945 | | | 16,519 |
Berkshire Hathaway, Inc., Class A | | | | 40 | | | 4,830,000 |
Brown & Brown, Inc. | | | | 5,036 | | | 87,576 |
Chubb Corp. | | | | 14,462 | | | 708,783 |
Cincinnati Financial Corp. | | | | 6,036 | | | 153,314 |
CNA Financial Corp. | | † | | 1,422 | | | 35,763 |
CNA Surety Corp. | | *† | | 1,486 | | | 18,783 |
Conseco, Inc. | | * | | 6,600 | | | 65,472 |
Crawford & Co., Class B | | *† | | 1,891 | | | 15,109 |
Delphi Financial Group, Inc., Class A | | † | | 1,945 | | | 45,007 |
Donegal Group, Inc., Class B | | † | | 758 | | | 13,686 |
EMC Insurance Group, Inc. | | † | | 341 | | | 8,211 |
Employers Holdings, Inc. | | | | 2,770 | | | 57,339 |
Endurance Specialty Holdings Ltd. | | | | 2,698 | | | 83,071 |
Erie Indemnity Co., Class A | | † | | 1,023 | | | 47,211 |
Everest Re Group Ltd. (Bermuda) | | † | | 2,468 | | | 196,724 |
FBL Financial Group, Inc., Class A | | † | | 1,275 | | | 25,347 |
Fidelity National Financial, Inc., Class A | | | | 8,236 | | | 103,774 |
First American Corp. | | | | 3,159 | | | 83,398 |
Genworth Financial, Inc., Class A | | | | 15,900 | | | 283,179 |
Hanover Insurance Group, Inc. (The) | | | | 2,346 | | | 99,705 |
Harleysville Group, Inc. | | † | | 1,351 | | | 45,704 |
Hartford Financial Services Group, Inc. | | | | 12,354 | | | 797,698 |
HCC Insurance Holdings, Inc. | | | | 3,999 | | | 84,539 |
Hilb Rogal & Hobbs Co. | | | | 1,604 | | | 69,710 |
Hilltop Holdings, Inc. | | *† | | 1,180 | | | 12,166 |
Horace Mann Educators Corp. | | † | | 2,000 | | | 28,040 |
Independence Holding Co. | | † | | 961 | | | 9,389 |
Infinity Property & Casualty Corp. | | † | | 810 | | | 33,631 |
IPC Holdings Ltd. | | † | | 2,362 | | | 62,711 |
Kansas City Life Insurance Co. | | | | 902 | | | 37,659 |
LandAmerica Financial Group, Inc. | | † | | 845 | | | 18,751 |
Lincoln National Corp. | | | | 10,899 | | | 493,943 |
Loews Corp. | | | | 14,187 | | | 665,370 |
Markel Corp. | | * | | 412 | | | 151,204 |
Marsh & McLennan Cos, Inc. | | | | 20,317 | | | 539,416 |
Max Capital Group Ltd. (Bermuda) | | † | | 1,915 | | | 40,847 |
MBIA, Inc. | | † | | 8,742 | | | 38,377 |
Mercury General Corp. | | † | | 1,109 | | | 51,812 |
MetLife, Inc. | | | | 16,910 | | | 892,341 |
Montpelier Re Holdings Ltd. (Bermuda) | | † | | 3,734 | | | 55,077 |
National Financial Partners Corp. | | † | | 1,495 | | | 29,631 |
Nationwide Financial Services, Class A | | † | | 2,414 | | | 115,896 |
Navigators Group, Inc. | | *† | | 938 | | | 50,699 |
Odyssey Re Holdings Corp. | | † | | 505 | | | 17,928 |
Old Republic International Corp. | | † | | 9,191 | | | 108,821 |
PartnerRe Ltd. (Bermuda) | | † | | 2,300 | | | 158,999 |
Philadelphia Consolidated Holding Co. | | *† | | 2,562 | | | 87,031 |
Phoenix Cos, Inc. (The) | | | | 4,217 | | | 32,091 |
Platinum Underwriters Holdings Ltd. (Bermuda) | | | | 2,734 | | | 89,156 |
PMA Capital Corp., Class A | | *† | | 1,826 | | | 16,817 |
Presidential Life Corp. | | † | | 1,144 | | | 17,640 |
Principal Financial Group, Inc. | | | | 10,091 | | | 423,519 |
ProAssurance Corp. | | *† | | 1,647 | | | 79,237 |
Progressive Corp. (The) | | | | 24,774 | | | 463,769 |
Protective Life Corp. | | | | 3,130 | | | 119,097 |
Prudential Financial, Inc. | | | | 17,420 | | | 1,040,671 |
Reinsurance Group of America, Inc. | | † | | 1,440 | | | 62,669 |
RenaissanceRe Holdings Ltd. (Bermuda) | | | | 2,900 | | | 129,543 |
RLI Corp. | | † | | 1,164 | | | 57,583 |
Safeco Corp. | | | | 3,504 | | | 235,329 |
Safety Insurance Group, Inc. | | † | | 850 | | | 30,303 |
Security Capital Assurance Ltd. (Bermuda) | | † | | 2,963 | | | 859 |
Selective Insurance Group | | † | | 2,122 | | | 39,809 |
StanCorp Financial Group, Inc. | | † | | 2,460 | | | 115,522 |
State Auto Financial Corp. | | | | 488 | | | 11,678 |
Stewart Information Services Corp. | | † | | 1,239 | | | 23,962 |
Torchmark Corp. | | | | 3,623 | | | 212,489 |
Tower Group, Inc. | | † | | 1,736 | | | 36,786 |
Transatlantic Holdings, Inc. | | † | | 1,167 | | | 65,900 |
Travelers Cos, Inc. (The) | | | | 24,549 | | | 1,065,427 |
United Fire & Casualty Co. | | † | | 1,250 | | | 33,663 |
Unitrin, Inc. | | † | | 1,906 | | | 52,548 |
Unum Group | | | | 13,588 | | | 277,875 |
Validus Holdings Ltd. (Bermuda) | | † | | 1,256 | | | 26,690 |
W.R. Berkley Corp. | | | | 5,680 | | | 137,229 |
Wesco Financial Corp. | | | | 187 | | | 71,434 |
White Mountains Insurance Group Ltd. | | † | | 300 | | | 128,700 |
XL Capital Ltd., Class A (Bermuda) | | | | 7,300 | | | 150,088 |
Zenith National Insurance Corp. | | † | | 1,498 | | | 52,670 |
| | | | | | | |
| | | | | | | 23,938,662 |
| | | | | | | |
Internet & Catalog Retail—0.3% | | | | | | | |
1-800-FLOWERS.COM, Inc., Class A | | *† | | 793 | | | 5,115 |
Amazon.com, Inc. | | * | | 12,445 | | | 912,591 |
Bluefly, Inc. | | * | | 234 | | | 962 |
dELiA*s, Inc. | | * | | 925 | | | 1,859 |
| | | | |
| 204 | | See accompanying notes to financial statements. | | |
SCHEDULE OF INVESTMENTS — (Continued)
June 30, 2008 (Unaudited)
Vantagepoint Broad Market Index Fund
| | | | | | | |
| | | | | Shares | | Value |
COMMON STOCKS—(Continued) | | | | | | | |
drugstore.com, Inc. | | * | | 3,800 | | $ | 7,220 |
Expedia, Inc. | | * | | 11,022 | | | 202,584 |
GSI Commerce, Inc. | | * | | 1,469 | | | 20,022 |
Hollywood Media Corp. | | *† | | 1,494 | | | 3,660 |
IAC/InterActiveCorp | | * | | 9,431 | | | 181,830 |
Liberty Media Corp.—Interactive, Class A | | * | | 25,718 | | | 379,598 |
NetFlix, Inc. | | *† | | 679 | | | 17,702 |
Overstock.com, Inc. | | *† | | 770 | | | 19,982 |
priceline.com, Inc. | | * | | 1,548 | | | 178,732 |
Stamps.com, Inc. | | *† | | 1,050 | | | 13,104 |
Valuevision Media, Inc., Class A | | *† | | 1,741 | | | 6,215 |
| | | | | | | |
| | | | | | | 1,951,176 |
| | | | | | | |
Internet Software & Services—1.4% | | | | | | | |
Akamai Technologies, Inc. | | * | | 5,664 | | | 197,051 |
Ariba, Inc. | | *† | | 2,075 | | | 30,523 |
Art Technology Group, Inc. | | *† | | 8,333 | | | 26,666 |
Autobytel, Inc. | | *† | | 1,384 | | | 1,965 |
Bankrate, Inc. | | *† | | 1,083 | | | 42,313 |
Chordiant Software, Inc. | | * | | 1,859 | | | 9,295 |
CMGI, Inc. | | *† | | 1,007 | | | 10,674 |
DealerTrack Holdings, Inc. | | * | | 1,800 | | | 25,398 |
Digital River, Inc. | | *† | | 1,627 | | | 62,770 |
Earthlink, Inc. | | *† | | 5,814 | | | 50,291 |
eBay, Inc. | | * | | 42,977 | | | 1,174,561 |
Entrust, Inc. | | * | | 2,200 | | | 6,468 |
Equinix, Inc. | | *† | | 622 | | | 55,495 |
Google, Inc., Class A | | * | | 8,801 | | | 4,633,021 |
I-many, Inc. | | *† | | 951 | | | 951 |
Infospace, Inc. | | † | | 1,323 | | | 11,021 |
Internap Network Services Corp. | | *† | | 1,297 | | | 6,070 |
Interwoven, Inc. | | *† | | 1,908 | | | 22,915 |
Intraware, Inc. | | * | | 783 | | | 3,289 |
j2 Global Communications, Inc. | | *† | | 1,614 | | | 37,122 |
Jupitermedia Corp. | | * | | 1,450 | | | 2,030 |
Keynote Systems, Inc. | | *† | | 1,400 | | | 18,032 |
Knot, Inc. (The) | | *† | | 2,304 | | | 22,533 |
LivePerson, Inc. | | *† | | 3,333 | | | 9,366 |
Looksmart Ltd. | | *† | | 500 | | | 2,010 |
MIVA, Inc. | | * | | 990 | | | 1,049 |
Move, Inc. | | *† | | 7,362 | | | 17,153 |
NaviSite, Inc. | | *† | | 3,725 | | | 14,155 |
NIC, Inc. | | † | | 2,450 | | | 16,734 |
On2 Technologies, Inc. | | *† | | 4,620 | | | 2,818 |
Openwave Systems, Inc. | | *† | | 2,570 | | | 3,829 |
RealNetworks, Inc. | | *† | | 5,844 | | | 38,570 |
S1 Corp. | | * | | 2,636 | | | 19,955 |
Saba Software, Inc. | | *† | | 1,576 | | | 5,059 |
SAVVIS, Inc. | | *† | | 408 | | | 5,267 |
SonicWALL, Inc. | | *† | | 2,442 | | | 15,751 |
Tumbleweed Communications Corp. | | *† | | 1,102 | | | 2,887 |
United Online, Inc. | | † | | 2,509 | | | 25,165 |
Valueclick, Inc. | | *† | | 4,058 | | | 61,479 |
VeriSign, Inc. | | *† | | 8,080 | | | 305,424 |
Vignette Corp. | | *† | | 737 | | | 8,844 |
Websense, Inc. | | *† | | 1,958 | | | 32,973 |
Website Pros, Inc. | | * | | 308 | | | 2,566 |
Yahoo! Inc. | | * | | 50,447 | | | 1,042,235 |
Zix Corp. | | *† | | 1,015 | | | 2,822 |
| | | | | | | |
| | | | | | | 8,086,565 |
| | | | | | | |
IT Services—1.7% | | | | | | | |
Accenture Ltd., Class A (Bermuda) | | | | 21,831 | | | 888,958 |
Acxiom Corp. | | † | | 3,451 | | | 39,652 |
Affiliated Computer Services, Inc., Class A | | * | | 4,289 | | | 229,419 |
Alliance Data Systems Corp. | | *† | | 1,955 | | | 110,555 |
Automatic Data Processing, Inc. | | | | 21,534 | | | 902,275 |
BearingPoint, Inc. | | *† | | 8,105 | | | 6,565 |
Broadridge Financial Solutions, Inc. | | | | 5,748 | | | 120,995 |
CACI International, Inc., Class A | | * | | 1,198 | | | 54,832 |
Ciber, Inc. | | *† | | 2,444 | | | 15,177 |
Cognizant Technology Solutions Corp., Class A | | * | | 10,552 | | | 343,046 |
Computer Sciences Corp. | | * | | 6,597 | | | 309,003 |
Convergys Corp. | | * | | 5,933 | | | 88,164 |
CSG Systems International, Inc. | | * | | 2,153 | | | 23,726 |
Cybersource Corp. | | *† | | 2,776 | | | 46,442 |
DST Systems, Inc. | | *† | | 2,518 | | | 138,616 |
Edgewater Technology, Inc. | | * | | 1,533 | | | 7,374 |
Electronic Data Systems Corp. | | | | 22,135 | | | 545,406 |
Euronet Worldwide, Inc. | | *† | | 1,056 | | | 17,846 |
Fidelity National Information Services, Inc. | | | | 8,097 | | | 298,860 |
Fiserv, Inc. | | * | | 6,994 | | | 317,318 |
Forrester Research, Inc. | | *† | | 963 | | | 29,737 |
Gartner, Inc., Class A | | *† | | 1,179 | | | 24,429 |
Gevity HR, Inc. | | † | | 964 | | | 5,186 |
Global Payments, Inc. | | | | 3,238 | | | 150,891 |
Hackett Group, Inc. (The) | | * | | 1,140 | | | 6,544 |
Hewitt Associates, Inc., Class A | | * | | 2,317 | | | 88,811 |
iGATE Corp. | | *† | | 1,397 | | | 11,358 |
Integral Systems, Inc. | | † | | 505 | | | 19,544 |
Iron Mountain, Inc. | | *† | | 7,146 | | | 189,726 |
Lionbridge Technologies, Inc. | | *† | | 1,165 | | | 3,006 |
Management Network Group, Inc. | | * | | 1,600 | | | 2,304 |
Mantech International Corp., Class A | | *† | | 1,217 | | | 58,562 |
Mastercard, Inc., Class A | | | | 2,748 | | | 729,649 |
MAXIMUS, Inc. | | † | | 1,052 | | | 36,631 |
Metavante Technologies, Inc. | | * | | 2,857 | | | 64,625 |
MoneyGram International, Inc. | | | | 3,750 | | | 3,383 |
NeuStar, Inc., Class A | | *† | | 3,140 | | | 67,698 |
Online Resources Corp. | | *† | | 700 | | | 5,845 |
Paychex, Inc. | | | | 13,545 | | | 423,688 |
Perot Systems Corp., Class A | | *† | | 4,359 | | | 65,429 |
Pfsweb, Inc. | | * | | 1,209 | | | 5,803 |
Safeguard Scientifics, Inc. | | *† | | 4,073 | | | 5,051 |
SAIC, Inc. | | *† | | 3,100 | | | 64,511 |
Sapient Corp. | | *† | | 4,150 | | | 26,643 |
SRA International, Inc., Class A | | *† | | 1,664 | | | 37,373 |
StarTek, Inc. | | *† | | 994 | | | 9,344 |
Syntel, Inc. | | † | | 1,554 | | | 52,401 |
TeleTech Holdings, Inc. | | *† | | 2,738 | | | 54,650 |
Total System Services, Inc. | | | | 6,935 | | | 154,096 |
Unisys Corp. | | * | | 13,714 | | | 54,170 |
VeriFone Holdings, Inc. | | * | | 2,645 | | | 31,608 |
Visa, Inc., Class A | | * | | 17,412 | | | 1,415,769 |
Western Union Co. (The) | | | | 31,890 | | | 788,321 |
Wright Express Corp. | | *† | | 1,750 | | | 43,400 |
| | | | | | | |
| | | | | | | 9,234,415 |
| | | | | | | |
| | | | |
| | See accompanying notes to financial statements. | | 205 |
SCHEDULE OF INVESTMENTS — (Continued)
June 30, 2008 (Unaudited)
Vantagepoint Broad Market Index Fund
| | | | | | | |
| | | | | Shares | | Value |
COMMON STOCKS—(Continued) | | | | | | | |
Leisure Equipment & Products—0.2% | | | | | | | |
Arctic Cat, Inc. | | † | | 1,857 | | $ | 14,577 |
Brunswick Corp. | | † | | 3,797 | | | 40,248 |
Callaway Golf Co. | | † | | 2,881 | | | 34,082 |
Concord Camera Corp. | | * | | 572 | | | 2,048 |
Eastman Kodak Co. | | † | | 11,893 | | | 171,616 |
Fairchild Corp. (The), Class A | | * | | 3,265 | | | 6,889 |
Hasbro, Inc. | | | | 6,570 | | | 234,680 |
Jakks Pacific, Inc. | | * | | 925 | | | 20,211 |
Leapfrog Enterprises, Inc. | | *† | | 1,261 | | | 10,492 |
Mattel, Inc. | | | | 16,641 | | | 284,894 |
Meade Instruments Corp. | | * | | 1,640 | | | 1,476 |
Nautilus, Inc. | | | | 1,359 | | | 6,904 |
Polaris Industries, Inc. | | † | | 1,858 | | | 75,026 |
Pool Corp. | | † | | 2,434 | | | 43,228 |
RC2 Corp. | | *† | | 1,650 | | | 30,624 |
Steinway Musical Instruments | | *† | | 683 | | | 18,031 |
Sturm Ruger & Co., Inc. | | *† | | 3,296 | | | 23,270 |
| | | | | | | |
| | | | | | | 1,018,296 |
| | | | | | | |
Life Sciences Tools & Services—0.6% | | | | | | | |
Accelrys, Inc. | | * | | 1,145 | | | 5,530 |
Affymetrix, Inc. | | *† | | 2,525 | | | 25,982 |
Albany Molecular Research, Inc. | | *† | | 1,371 | | | 18,193 |
AMAG Pharmaceuticals, Inc. | | *† | | 834 | | | 28,439 |
Applera Corp.—Applied Biosystems Group | | | | 6,991 | | | 234,059 |
Bio-Rad Laboratories, Inc., Class A | | * | | 88 | | | 7,118 |
Bruker Corp. | | *† | | 1,667 | | | 21,421 |
Caliper Life Sciences, Inc. | | *† | | 867 | | | 2,246 |
Cambrex Corp. | | *† | | 1,258 | | | 7,384 |
Charles River Laboratories International, Inc. | | *† | | 2,755 | | | 176,100 |
Covance, Inc. | | * | | 2,839 | | | 244,211 |
Dionex Corp. | | * | | 1,031 | | | 68,427 |
Enzo Biochem, Inc. | | * | | 1,353 | | | 15,181 |
eResearchTechnology, Inc. | | *† | | 2,056 | | | 35,857 |
Exelixis, Inc. | | *† | | 2,695 | | | 13,475 |
Illumina, Inc. | | *† | | 1,626 | | | 141,641 |
Interleukin Genetics, Inc. | | * | | 2,825 | | | 3,362 |
Invitrogen Corp. | | * | | 4,244 | | | 166,619 |
Luminex Corp. | | *† | | 1,070 | | | 21,989 |
Millipore Corp. | | *† | | 2,026 | | | 137,484 |
Nanogen, Inc. | | * | | 950 | | | 361 |
Nektar Therapeutics | | * | | 2,368 | | | 7,933 |
Ore Pharmaceuticals, Inc. | | * | | 190 | | | 251 |
Parexel International Corp. | | *† | | 2,306 | | | 60,671 |
PerkinElmer, Inc. | | | | 5,266 | | | 146,658 |
Pharmaceutical Product Development, Inc. | | | | 4,736 | | | 203,174 |
PharmaNet Development Group, Inc. | | *† | | 576 | | | 9,084 |
Sequenom, Inc. | | *† | | 614 | | | 9,799 |
Techne Corp. | | *† | | 1,736 | | | 134,349 |
Thermo Fisher Scientific, Inc. | | * | | 15,692 | | | 874,515 |
Varian, Inc. | | *† | | 1,502 | | | 76,692 |
Waters Corp. | | * | | 4,698 | | | 303,021 |
| | | | | | | |
| | | | | | | 3,201,226 |
| | | | | | | |
Machinery—2.5% | | | | | | | |
3D Systems Corp. | | *† | | 1,158 | | | 11,001 |
Actuant Corp., Class A | | † | | 2,022 | | | 63,390 |
AGCO Corp. | | * | | 3,068 | | | 160,794 |
Albany International Corp., Class A | | † | | 1,437 | | | 41,673 |
American Railcar Industries, Inc. | | | | 1,200 | | | 20,136 |
Ampco-Pittsburgh Corp. | | † | | 613 | | | 27,266 |
Astec Industries, Inc. | | *† | | 821 | | | 26,387 |
Axsys Technologies, Inc. | | * | | 883 | | | 45,951 |
Barnes Group, Inc. | | † | | 2,018 | | | 46,596 |
Blount International, Inc. | | *† | | 1,532 | | | 17,787 |
Briggs & Stratton Corp. | | † | | 1,822 | | | 23,103 |
Bucyrus International, Inc., Class A | | | | 2,860 | | | 208,837 |
Caterpillar, Inc. | | | | 24,209 | | | 1,787,107 |
Chart Industries, Inc. | | * | | 1,070 | | | 52,045 |
CIRCOR International, Inc. | | † | | 711 | | | 34,832 |
Clarcor, Inc. | | | | 2,354 | | | 82,625 |
Crane Co. | | | | 2,467 | | | 95,054 |
Cummins, Inc. | | | | 7,020 | | | 459,950 |
Danaher Corp. | | | | 9,574 | | | 740,070 |
Deere & Co. | | | | 17,886 | | | 1,290,116 |
Donaldson Co., Inc. | | | | 3,810 | | | 170,078 |
Dover Corp. | | | | 7,805 | | | 377,528 |
Eaton Corp. | | | | 5,791 | | | 492,061 |
EnPro Industries, Inc. | | *† | | 981 | | | 36,631 |
ESCO Technologies, Inc. | | *† | | 1,222 | | | 57,336 |
Federal Signal Corp. | | † | | 2,159 | | | 25,908 |
Flow International Corp. | | *† | | 2,200 | | | 17,160 |
Flowserve Corp. | | | | 2,375 | | | 324,663 |
Force Protection, Inc. | | *† | | 3,825 | | | 12,661 |
FreightCar America, Inc. | | † | | 900 | | | 31,950 |
Gardner Denver, Inc. | | * | | 1,836 | | | 104,285 |
Graco, Inc. | | † | | 2,883 | | | 109,756 |
Harsco Corp. | | | | 3,646 | | | 198,379 |
Hurco Cos, Inc. | | *† | | 300 | | | 9,267 |
IDEX Corp. | | † | | 3,304 | | | 121,719 |
Illinois Tool Works, Inc. | | | | 16,615 | | | 789,379 |
Ingersoll-Rand Co. Ltd., Class A (Bermuda) | | | | 13,400 | | | 501,580 |
ITT Corp. | | | | 8,056 | | | 510,186 |
Joy Global, Inc. | | | | 4,599 | | | 348,742 |
Kadant, Inc. | | *† | | 721 | | | 16,295 |
Kaydon Corp. | | † | | 1,422 | | | 73,105 |
Kennametal, Inc. | | | | 3,196 | | | 104,030 |
Lincoln Electric Holdings, Inc. | | | | 1,877 | | | 147,720 |
Lindsay Corp. | | † | | 808 | | | 68,656 |
Manitowoc Co., Inc. (The) | | | | 5,044 | | | 164,081 |
Middleby Corp. | | *† | | 936 | | | 41,100 |
Mueller Industries, Inc. | | † | | 1,592 | | | 51,262 |
Mueller Water Products, Inc., Class A | | | | 3,000 | | | 24,210 |
NACCO Industries, Inc., Class A | | † | | 309 | | | 22,974 |
Nordson Corp. | | † | | 1,522 | | | 110,939 |
Oshkosh Corp. | | † | | 2,868 | | | 59,339 |
PACCAR, Inc. | | | | 14,853 | | | 621,301 |
Pall Corp. | | | | 5,186 | | | 205,780 |
Paragon Technologies, Inc. | | * | | 1,800 | | | 10,980 |
Parker Hannifin Corp. | | | | 7,453 | | | 531,548 |
Pentair, Inc. | | † | | 3,618 | | | 126,702 |
Robbins & Myers, Inc. | | † | | 1,736 | | | 86,574 |
Spire Corp. | | *† | | 2,500 | | | 31,200 |
SPX Corp. | | | | 2,157 | | | 284,142 |
Tecumseh Products Co., Class A | | *† | | 712 | | | 23,339 |
Tennant Co. | | † | | 1,280 | | | 38,490 |
Terex Corp. | | * | | 4,124 | | | 211,850 |
Timken Co. | | | | 3,702 | | | 121,944 |
Titan International, Inc. | | † | | 1,085 | | | 38,648 |
| | | | |
| 206 | | See accompanying notes to financial statements. | | |
SCHEDULE OF INVESTMENTS — (Continued)
June 30, 2008 (Unaudited)
Vantagepoint Broad Market Index Fund
| | | | | | | |
| | | | | Shares | | Value |
COMMON STOCKS—(Continued) | | | | | | | |
Toro Co. | | † | | 2,550 | | $ | 84,839 |
Trinity Industries, Inc. | | † | | 3,051 | | | 105,839 |
TurboChef Technologies, Inc. | | *† | | 993 | | | 4,747 |
Valmont Industries, Inc. | | † | | 1,162 | | | 121,185 |
Wabash National Corp. | | † | | 1,395 | | | 10,546 |
Wabtec Corp. | | † | | 1,737 | | | 84,453 |
Watts Water Technologies, Inc., Class A | | | | 1,225 | | | 30,503 |
| | | | | | | |
| | | | | | | 13,132,310 |
| | | | | | | |
Marine—0.0% | | | | | | | |
Alexander & Baldwin, Inc. | | † | | 1,466 | | | 66,776 |
American Commercial Lines, Inc. | | *† | | 2,000 | | | 21,860 |
Horizon Lines, Inc., Class A | | † | | 2,035 | | | 20,248 |
Kirby Corp. | | * | | 2,358 | | | 113,185 |
| | | | | | | |
| | | | | | | 222,069 |
| | | | | | | |
Media—2.8% | | | | | | | |
4Kids Entertainment, Inc. | | * | | 605 | | | 4,483 |
Acme Communications, Inc. | | * | | 1,200 | | | 1,656 |
AH Belo Corp., Class A | | † | | 944 | | | 5,381 |
Alloy, Inc. | | * | | 462 | | | 3,340 |
Arbitron, Inc. | | † | | 1,298 | | | 61,655 |
Beasley Broadcasting Group, Inc., Class A | | | | 1,150 | | | 5,256 |
Belo Corp., Class A | | † | | 4,721 | | | 34,511 |
Cablevision Systems Corp., Class A | | * | | 9,044 | | | 204,394 |
CBS Corp., Class B | | | | 25,719 | | | 501,263 |
Charter Communications, Inc., Class A | | *† | | 11,237 | | | 11,799 |
Citadel Broadcasting Corp. | | *† | | 6,896 | | | 8,413 |
CKX, Inc. | | * | | 1,800 | | | 15,750 |
Clear Channel Communications, Inc. | | | | 18,523 | | | 652,010 |
Clear Channel Outdoor Holdings, Inc., Class A | | *† | | 2,500 | | | 44,575 |
Comcast Corp., Class A | | | | 109,481 | | | 2,076,855 |
Cox Radio, Inc., Class A | | *† | | 1,752 | | | 20,674 |
Crown Media Holdings, Inc., Class A | | *† | | 5,899 | | | 27,961 |
Cumulus Media, Inc., Class A | | * | | 2,174 | | | 8,566 |
DIRECTV Group, Inc. (The) | | * | | 23,227 | | | 601,812 |
Discovery Holding Co., Class A | | * | | 10,903 | | | 239,430 |
DISH Network Corp., Class A | | * | | 9,386 | | | 274,822 |
DreamWorks Animation SKG, Inc., Class A | | *† | | 1,300 | | | 38,753 |
E.W. Scripps Co., Class A | | † | | 3,612 | | | 150,042 |
Emmis Communications Corp., Class A | | *† | | 1,175 | | | 2,961 |
Entercom Communications Corp., Class A | | † | | 2,183 | | | 15,325 |
Entravision Communications Corp., Class A | | * | | 2,852 | | | 11,465 |
Gannett Co., Inc. | | † | | 7,301 | | | 158,213 |
Getty Images, Inc. | | * | | 1,742 | | | 59,106 |
Gray Television, Inc. | | † | | 1,838 | | | 5,275 |
Harris Interactive, Inc. | | *† | | 2,730 | | | 5,487 |
Harte-Hanks, Inc. | | † | | 3,119 | | | 35,713 |
Hearst-Argyle Television, Inc. | | † | | 2,184 | | | 41,933 |
Idearc, Inc. | | | | 1,273 | | | 2,992 |
Image Entertainment, Inc. | | * | | 299 | | | 281 |
Interactive Data Corp. | | | | 1,521 | | | 38,223 |
Interpublic Group of Cos, Inc. (The) | | * | | 17,203 | | | 147,946 |
John Wiley & Sons, Inc., Class A | | | | 2,491 | | | 112,170 |
Journal Communications, Inc., Class A | | † | | 3,900 | | | 18,798 |
Lamar Advertising Co., Class A | | *† | | 3,479 | | | 125,348 |
Lee Enterprises, Inc. | | | | 1,973 | | | 7,872 |
Liberty Global, Inc. | | * | | 126 | | | 3,825 |
Liberty Global, Inc., Class A | | *† | | 15,182 | | | 477,170 |
Liberty Media Corp.—Capital, Series A, Class A | | * | | 5,451 | | | 78,494 |
Liberty Media Corp.—Entertainment, Series A | | * | | 21,804 | | | 528,311 |
LIN TV Corp., Class A | | *† | | 1,419 | | | 8,457 |
Live Nation, Inc. | | *† | | 2,705 | | | 28,619 |
LodgeNet Interactive Corp. | | *† | | 1,250 | | | 6,138 |
Marvel Entertainment, Inc. | | *† | | 1,469 | | | 47,214 |
McClatchy Co., Class A | | † | | 2,444 | | | 16,570 |
McGraw-Hill Cos, Inc. (The) | | | | 14,260 | | | 572,111 |
Media General, Inc., Class A | | † | | 952 | | | 11,376 |
Mediacom Communications Corp., Class A | | *† | | 3,433 | | | 18,332 |
Meredith Corp. | | † | | 2,083 | | | 58,928 |
National CineMedia, Inc. | | † | | 2,226 | | | 23,729 |
National Lampoon, Inc. | | * | | 3,300 | | | 5,280 |
New Frontier Media, Inc. | | | | 3,808 | | | 14,889 |
New York Times Co. (The), Class A | | † | | 5,682 | | | 87,446 |
News Corp., Class A | | | | 91,998 | | | 1,383,650 |
Omnicom Group, Inc. | | | | 12,710 | | | 570,425 |
Playboy Enterprises, Inc., Class B | | *† | | 1,251 | | | 6,180 |
Primedia, Inc. | | † | | 1,475 | | | 6,874 |
R.H. Donnelley Corp. | | *† | | 2,471 | | | 7,413 |
Radio One, Inc., Class A | | *† | | 4,327 | | | 6,101 |
Radio Unica Communications Corp. | | *‡da | | 1,900 | | | — |
RCN Corp. | | *† | | 2,597 | | | 27,996 |
Regal Entertainment Group, Class A | | † | | 2,743 | | | 41,913 |
Regent Communications, Inc. | | * | | 1,600 | | | 1,434 |
Salem Communications Corp., Class A | | † | | 850 | | | 1,675 |
Scholastic Corp. | | *† | | 1,845 | | | 52,878 |
Sinclair Broadcast Group, Inc., Class A | | † | | 2,049 | | | 15,572 |
Sirius Satellite Radio, Inc. | | *† | | 47,469 | | | 91,140 |
Spanish Broadcasting System, Inc., Class A | | *† | | 1,300 | | | 1,482 |
Time Warner Cable, Inc., Class A | | * | | 4,450 | | | 117,836 |
Time Warner, Inc. | | | | 147,403 | | | 2,181,564 |
Valassis Communications, Inc. | | *† | | 2,236 | | | 27,995 |
Value Line, Inc. | | † | | 573 | | | 19,052 |
Viacom, Inc., Class B | | * | | 22,554 | | | 688,799 |
Virgin Media, Inc. | | † | | 10,479 | | | 142,619 |
Walt Disney Co. (The) | | | | 68,450 | | | 2,135,640 |
Washington Post Co. (The), Class B | | | | 258 | | | 151,420 |
Westwood One, Inc. | | *† | | 4,247 | | | 5,266 |
World Wrestling Entertainment, Inc., Class A | | † | | 1,030 | | | 15,934 |
XM Satellite Radio Holdings, Inc., Class A | | * | | 8,921 | | | 69,941 |
Young Broadcasting, Inc., Class A | | * | | 831 | | | 116 |
| | | | | | | |
| | | | | | | 15,540,313 |
| | | | | | | |
| | | | |
| | See accompanying notes to financial statements. | | 207 |
SCHEDULE OF INVESTMENTS — (Continued)
June 30, 2008 (Unaudited)
Vantagepoint Broad Market Index Fund
| | | | | | | |
| | | | | Shares | | Value |
COMMON STOCKS—(Continued) | | | | | | | |
Metals & Mining—1.5% | | | | | | | |
AK Steel Holding Corp. | | | | 5,009 | | $ | 345,621 |
Alcoa, Inc. | | | | 32,213 | | | 1,147,427 |
Allegheny Technologies, Inc. | | | | 3,350 | | | 198,588 |
AMCOL International Corp. | | † | | 1,186 | | | 33,754 |
Brush Engineered Materials, Inc. | | *† | | 1,122 | | | 27,399 |
Carpenter Technology Corp. | | | | 1,882 | | | 82,149 |
Century Aluminum Co. | | *† | | 865 | | | 57,514 |
Cleveland-Cliffs, Inc. | | | | 4,072 | | | 485,342 |
Coeur d’Alene Mines Corp. | | *† | | 21,452 | | | 62,211 |
Commercial Metals Co. | | | | 4,080 | | | 153,816 |
Compass Minerals International, Inc. | | | | 1,915 | | | 154,272 |
Freeport-McMoRan Copper & Gold, Inc. | | | | 14,811 | | | 1,735,700 |
Hecla Mining Co. | | *† | | 4,124 | | | 38,188 |
Newmont Mining Corp. | | | | 16,091 | | | 839,307 |
Nucor Corp. | | | | 10,763 | | | 803,673 |
Reliance Steel & Aluminum Co. | | | | 2,966 | | | 228,649 |
Rock of Ages Corp. | | * | | 1,387 | | | 4,591 |
Royal Gold, Inc. | | | | 1,153 | | | 36,158 |
RTI International Metals, Inc. | | *† | | 1,363 | | | 48,550 |
Schnitzer Steel Industries, Inc., Class A | | † | | 693 | | | 79,418 |
Southern Copper Corp. | | † | | 2,900 | | | 309,227 |
Steel Dynamics, Inc. | | | | 8,080 | | | 315,686 |
Stillwater Mining Co. | | *† | | 3,727 | | | 44,090 |
Titanium Metals Corp. | | † | | 5,344 | | | 74,763 |
United States Steel Corp. | | | | 4,607 | | | 851,281 |
Worthington Industries, Inc. | | † | | 3,575 | | | 73,288 |
| | | | | | | |
| | | | | | | 8,230,662 |
| | | | | | | |
Multiline Retail—0.6% | | | | | | | |
99 Cents Only Stores | | *† | | 3,207 | | | 21,166 |
Big Lots, Inc. | | *† | | 4,853 | | | 151,608 |
Dillard’s, Inc., Class A | | † | | 3,454 | | | 39,963 |
Dollar Tree, Inc. | | * | | 4,830 | | | 157,893 |
Family Dollar Stores, Inc. | | | | 6,556 | | | 130,727 |
Fred’s, Inc., Class A | | † | | 1,781 | | | 20,018 |
JC Penney Co., Inc. | | | | 7,928 | | | 287,707 |
Kohl’s Corp. | | * | | 11,086 | | | 443,883 |
Macy’s, Inc. | | | | 19,148 | | | 371,854 |
Nordstrom, Inc. | | † | | 8,394 | | | 254,338 |
Retail Ventures, Inc. | | * | | 1,372 | | | 6,311 |
Saks, Inc. | | *† | | 5,811 | | | 63,805 |
Sears Holdings Corp. | | *† | | 3,660 | | | 269,596 |
Target Corp. | | | | 29,267 | | | 1,360,623 |
Tuesday Morning Corp. | | *† | | 1,816 | | | 7,464 |
| | | | | | | |
| | | | | | | 3,586,956 |
| | | | | | | |
Multi-Utilities—1.2% | | | | | | | |
Alliant Energy Corp. | | | | 4,491 | | | 153,862 |
Ameren Corp. | | | | 8,429 | | | 355,957 |
Aquila, Inc. | | * | | 7,275 | | | 27,427 |
Avista Corp. | | † | | 1,759 | | | 37,748 |
Black Hills Corp. | | † | | 2,041 | | | 65,434 |
Centerpoint Energy, Inc. | | | | 12,705 | | | 203,915 |
CH Energy Group, Inc. | | † | | 694 | | | 24,686 |
CMS Energy Corp. | | | | 6,681 | | | 99,547 |
Consolidated Edison, Inc. | | | | 9,476 | | | 370,417 |
Dominion Resources, Inc. | | | | 22,974 | | | 1,091,034 |
DTE Energy Co. | | | | 6,985 | | | 296,443 |
Energy East Corp. | | | | 5,959 | | | 147,306 |
Integrys Energy Group, Inc. | | † | | 2,691 | | | 136,784 |
MDU Resources Group, Inc. | | | | 7,657 | | | 266,923 |
NiSource, Inc. | | | | 10,893 | | | 195,203 |
NorthWestern Corp. | | † | | 1,449 | | | 36,834 |
NSTAR | | † | | 4,374 | | | 147,929 |
OGE Energy Corp. | | † | | 3,358 | | | 106,482 |
PG&E Corp. | | | | 13,709 | | | 544,110 |
PNM Resources, Inc. | | | | 2,169 | | | 25,941 |
Public Service Enterprise Group, Inc. | | | | 19,514 | | | 896,278 |
Puget Energy, Inc. | | | | 3,548 | | | 85,117 |
SCANA Corp. | | | | 4,791 | | | 177,267 |
Sempra Energy | | | | 8,687 | | | 490,381 |
TECO Energy, Inc. | | | | 7,797 | | | 167,558 |
Vectren Corp. | | † | | 3,706 | | | 115,664 |
Wisconsin Energy Corp. | | † | | 4,564 | | | 206,384 |
Xcel Energy, Inc. | | | | 16,552 | | | 332,199 |
| | | | | | | |
| | | | | | | 6,804,830 |
| | | | | | | |
Office Electronics—0.1% | | | | | | | |
Xerox Corp. | | | | 36,218 | | | 491,116 |
Zebra Technologies Corp., Class A | | *† | | 2,988 | | | 97,528 |
| | | | | | | |
| | | | | | | 588,644 |
| | | | | | | |
Oil, Gas & Consumable Fuels—11.5% | | | | | | | |
Adams Resources & Energy, Inc. | | | | 1,462 | | | 49,562 |
Alpha Natural Resources, Inc. | | *† | | 2,447 | | | 255,198 |
Anadarko Petroleum Corp. | | | | 17,797 | | | 1,331,927 |
Apache Corp. | | | | 12,742 | | | 1,771,138 |
APCO Argentina, Inc. (Cayman Islands) | | † | | 2,488 | | | 72,028 |
Arch Coal, Inc. | | | | 5,284 | | | 396,459 |
Atlas America, Inc. | | | | 2,578 | | | 116,139 |
ATP Oil & Gas Corp. | | *† | | 685 | | | 27,037 |
Berry Petroleum Co., Class A | | † | | 1,202 | | | 70,774 |
Blue Dolphin Energy Co. | | * | | 3,650 | | | 7,738 |
BP Prudhoe Bay Royalty Trust | | | | 1,105 | | | 114,213 |
Buckeye Partners LP | | | | 1,400 | | | 59,878 |
Cabot Oil & Gas Corp. | | | | 4,548 | | | 308,036 |
Callon Petroleum Co. | | *† | | 779 | | | 21,313 |
Carrizo Oil & Gas, Inc. | | *† | | 1,800 | | | 122,562 |
Chesapeake Energy Corp. | | | | 18,965 | | | 1,250,931 |
Chevron Corp. | | | | 81,137 | | | 8,043,110 |
Cimarex Energy Co. | | † | | 2,681 | | | 186,785 |
Clayton Williams Energy, Inc. | | * | | 550 | | | 60,473 |
CNX Gas Corp. | | *† | | 1,100 | | | 46,244 |
Comstock Resources, Inc. | | * | | 1,735 | | | 146,486 |
Concho Resources, Inc. | | * | | 1,982 | | | 73,929 |
ConocoPhillips | | | | 56,066 | | | 5,292,069 |
Consol Energy, Inc. | | | | 7,462 | | | 838,505 |
Copano Energy LLC | | † | | 2,400 | | | 81,000 |
Cross Timbers Royalty Trust | | | | 575 | | | 34,604 |
Crosstex Energy, Inc. | | † | | 2,100 | | | 72,786 |
Delta Petroleum Corp. | | * | | 2,709 | | | 69,134 |
Denbury Resources, Inc. | | * | | 8,932 | | | 326,018 |
Devon Energy Corp. | | | | 16,306 | | | 1,959,329 |
Dorchester Minerals LP | | | | 2,200 | | | 69,960 |
El Paso Corp. | | | | 25,233 | | | 548,565 |
Enbridge Energy Partners LP | | | | 1,775 | | | 89,300 |
Encore Acquisition Co. | | * | | 2,062 | | | 155,042 |
Energy Partners Ltd. | | *† | | 1,667 | | | 24,872 |
Energy Transfer Equity LP | | | | 4,960 | | | 143,790 |
Energy Transfer Partners LP | | | | 2,777 | | | 120,716 |
Enterprise Products Partners LP | | | | 8,400 | | | 248,136 |
EOG Resources, Inc. | | | | 9,358 | | | 1,227,770 |
Evergreen Energy, Inc. | | *† | | 4,989 | | | 8,681 |
EXCO Resources, Inc. | | *† | | 4,100 | | | 151,331 |
| | | | |
| 208 | | See accompanying notes to financial statements. | | |
SCHEDULE OF INVESTMENTS — (Continued)
June 30, 2008 (Unaudited)
Vantagepoint Broad Market Index Fund
| | | | | | | |
| | | | | Shares | | Value |
COMMON STOCKS—(Continued) | | | | | | | |
Exxon Mobil Corp. | | | | 209,629 | | $ | 18,474,603 |
Forest Oil Corp. | | * | | 3,820 | | | 284,590 |
Foundation Coal Holdings, Inc. | | † | | 2,560 | | | 226,765 |
Frontier Oil Corp. | | † | | 4,576 | | | 109,412 |
FX Energy, Inc. | | *† | | 3,496 | | | 18,424 |
General Maritime Corp. | | | | 1,897 | | | 49,284 |
Hess Corp. | | | | 10,910 | | | 1,376,733 |
Holly Corp. | | † | | 1,972 | | | 72,806 |
Hugoton Royalty Trust | | | | 1,669 | | | 61,753 |
Inergy LP | | | | 1,700 | | | 44,234 |
International Coal Group, Inc. | | * | | 4,900 | | | 63,945 |
James River Coal Co. | | * | | 1,500 | | | 88,035 |
Kinder Morgan Energy Partners LP | | | | 5,150 | | | 287,010 |
Kinder Morgan Management LLC | | *† | | 2,060 | | | 110,931 |
Linn Energy LLC | | | | 3,543 | | | 88,044 |
Magellan Midstream Partners LP | | | | 2,000 | | | 71,180 |
Marathon Oil Corp. | | | | 28,613 | | | 1,484,156 |
Mariner Energy, Inc. | | * | | 3,261 | | | 120,559 |
MarkWest Energy Partners LP | | | | 3,584 | | | 127,949 |
Massey Energy Co. | | | | 3,053 | | | 286,219 |
McMoRan Exploration Co. | | *† | | 1,059 | | | 29,144 |
Meridian Resource Corp. | | *† | | 2,950 | | | 8,703 |
Murphy Oil Corp. | | | | 7,512 | | | 736,552 |
Natural Resource Partners LP | | | | 2,000 | | | 82,400 |
Newfield Exploration Co. | | * | | 5,246 | | | 342,302 |
Noble Energy, Inc. | | | | 6,772 | | | 680,992 |
NuStar Energy LP | | | | 1,500 | | | 71,085 |
NuStar GP Holdings LLC | | | | 1,450 | | | 31,422 |
Occidental Petroleum Corp. | | | | 32,909 | | | 2,957,202 |
ONEOK Partners LP | | | | 1,650 | | | 92,235 |
Overseas Shipholding Group, Inc. | | † | | 1,587 | | | 126,198 |
Parallel Petroleum Corp. | | *† | | 2,700 | | | 54,351 |
Patriot Coal Corp. | | * | | 1,042 | | | 159,728 |
Peabody Energy Corp. | | | | 10,424 | | | 917,833 |
Penn Virginia Corp. | | † | | 600 | | | 45,252 |
Penn Virginia Resource Partners LP | | | | 1,600 | | | 43,328 |
PetroHawk Energy Corp. | | * | | 9,713 | | | 449,809 |
Petroleum Development Corp. | | *† | | 1,250 | | | 83,113 |
Petroquest Energy, Inc. | | *† | | 3,346 | | | 90,007 |
Pioneer Natural Resources Co. | | | | 5,801 | | | 454,102 |
Plains All American Pipeline LP | | | | 3,917 | | | 176,696 |
Plains Exploration & Production Co. | | * | | 5,227 | | | 381,414 |
Quicksilver Resources, Inc. | | * | | 3,960 | | | 153,014 |
Range Resources Corp. | | | | 4,785 | | | 313,609 |
Rentech, Inc. | | * | | 7,800 | | | 14,820 |
Rosetta Resources, Inc. | | * | | 3,400 | | | 96,900 |
SandRidge Energy, Inc. | | * | | 3,220 | | | 207,948 |
Southwestern Energy Co. | | * | | 12,144 | | | 578,176 |
Spectra Energy Corp. | | | | 23,691 | | | 680,879 |
St. Mary Land & Exploration Co. | | † | | 2,262 | | | 146,216 |
Stone Energy Corp. | | *† | | 1,208 | | | 79,619 |
Sunoco Logistics Partners LP | | | | 950 | | | 44,555 |
Sunoco, Inc. | | | | 5,446 | | | 221,598 |
Swift Energy Co. | | *† | | 1,142 | | | 75,441 |
Syntroleum Corp. | | * | | 1,246 | | | 2,131 |
Targa Resources Partners LP | | | | 2,566 | | | 59,146 |
TC Pipelines LP | | | | 1,100 | | | 38,764 |
Teekay Corp. (Bahamas) | | † | | 1,691 | | | 76,399 |
TEPPCO Partners LP | | | | 2,500 | | | 82,975 |
Tesoro Corp. | | † | | 6,846 | | | 135,345 |
TXCO Resources, Inc. | | *† | | 5,411 | | | 63,633 |
Ultra Petroleum Corp. | | * | | 6,082 | | | 597,252 |
USEC, Inc. | | *† | | 2,637 | | | 16,033 |
Vaalco Energy, Inc. | | *† | | 3,800 | | | 32,186 |
Valero Energy Corp. | | | | 21,104 | | | 869,063 |
Verenium Corp. | | *† | | 1,790 | | | 3,455 |
Warren Resources, Inc. | | *† | | 3,600 | | | 52,848 |
Western Refining, Inc. | | † | | 2,500 | | | 29,600 |
Whiting Petroleum Corp. | | * | | 1,242 | | | 131,751 |
Williams Cos, Inc. | | | | 24,207 | | | 975,784 |
Williams Partners LP | | | | 1,275 | | | 41,884 |
World Fuel Services Corp. | | † | | 960 | | | 21,062 |
XTO Energy, Inc. | | | | 18,775 | | | 1,286,275 |
| | | | | | | |
| | | | | | | 64,582,429 |
| | | | | | | |
Paper & Forest Products—0.2% | | | | | | | |
AbitibiBowater, Inc. | | † | | 1,189 | | | 11,093 |
Buckeye Technologies, Inc. | | * | | 1,251 | | | 10,583 |
Deltic Timber Corp. | | † | | 724 | | | 38,741 |
Domtar Corp. (Canada) | | * | | 16,660 | | | 90,797 |
Glatfelter | | † | | 1,740 | | | 23,507 |
International Paper Co. | | | | 14,370 | | | 334,822 |
Louisiana-Pacific Corp. | | † | | 4,396 | | | 37,322 |
MAXXAM, Inc. | | * | | 856 | | | 21,725 |
MeadWestvaco Corp. | | | | 6,398 | | | 152,529 |
Neenah Paper, Inc. | | † | | 652 | | | 10,895 |
Schweitzer-Mauduit International, Inc. | | † | | 724 | | | 12,199 |
Wausau Paper Corp. | | † | | 1,903 | | | 14,672 |
Weyerhaeuser Co. | | | | 8,921 | | | 456,221 |
| | | | | | | |
| | | | | | | 1,215,106 |
| | | | | | | |
Personal Products—0.2% | | | | | | | |
Alberto-Culver Co. | | | | 3,659 | | | 96,122 |
Avon Products, Inc. | | | | 17,888 | | | 644,325 |
Chattem, Inc. | | *† | | 872 | | | 56,724 |
Elizabeth Arden, Inc. | | *† | | 1,017 | | | 15,438 |
Estee Lauder Cos, Inc. (The), Class A | | | | 5,057 | | | 234,897 |
Medifast, Inc. | | *† | | 734 | | | 3,861 |
NBTY, Inc. | | * | | 2,664 | | | 85,408 |
Nu Skin Enterprises, Inc., Class A | | † | | 3,018 | | | 45,029 |
USANA Health Sciences, Inc. | | *† | | 593 | | | 15,934 |
| | | | | | | |
| | | | | | | 1,197,738 |
| | | | | | | |
Pharmaceuticals—5.0% | | | | | | | |
Abbott Laboratories | | | | 60,081 | | | 3,182,491 |
Adolor Corp. | | *† | | 1,927 | | | 10,560 |
Allergan, Inc. | | | | 11,928 | | | 620,852 |
Alpharma, Inc., Class A | | *† | | 2,463 | | | 55,491 |
APP Pharmaceuticals, Inc. | | *† | | 1,756 | | | 29,360 |
Atherogenics, Inc. | | * | | 1,603 | | | 940 |
AVANIR Pharmaceuticals, Class A | | *† | | 1,500 | | | 1,500 |
Barr Pharmaceuticals, Inc. | | * | | 4,174 | | | 188,164 |
Bentley Pharmaceuticals, Inc. | | *† | | 711 | | | 11,483 |
Bristol-Myers Squibb Co. | | | | 79,233 | | | 1,626,653 |
Columbia Laboratories, Inc. | | *† | | 1,819 | | | 6,003 |
Cypress Bioscience, Inc. | | *† | | 1,560 | | | 11,216 |
Discovery Laboratories, Inc. | | * | | 2,566 | | | 4,234 |
Durect Corp. | | * | | 1,900 | | | 6,973 |
Eli Lilly & Co. | | | | 37,735 | | | 1,741,848 |
Emisphere Technologies, Inc. | | * | | 772 | | | 2,069 |
Endo Pharmaceuticals Holdings, Inc. | | * | | 2,935 | | | 70,998 |
Forest Laboratories, Inc. | | * | | 12,889 | | | 447,764 |
Heska Corp. | | * | | 4,462 | | | 5,354 |
| | | | |
| | See accompanying notes to financial statements. | | 209 |
SCHEDULE OF INVESTMENTS — (Continued)
June 30, 2008 (Unaudited)
Vantagepoint Broad Market Index Fund
| | | | | | | |
| | | | | Shares | | Value |
COMMON STOCKS—(Continued) | | | | | | | |
Hi-Tech Pharmacal Co., Inc. | | *† | | 862 | | $ | 8,620 |
Hollis-Eden Pharmaceuticals | | *† | | 954 | | | 1,460 |
Immtech Pharmaceuticals, Inc. | | *† | | 681 | | | 667 |
Inspire Pharmaceuticals, Inc. | | *† | | 1,369 | | | 5,859 |
Johnson & Johnson | | | | 110,330 | | | 7,098,633 |
King Pharmaceuticals, Inc. | | * | | 10,009 | | | 104,794 |
KV Pharmaceutical Co., Class A | | *† | | 2,179 | | | 42,120 |
Medicines Co. (The) | | *† | | 2,018 | | | 39,997 |
Medicis Pharmaceutical Corp., Class A | | † | | 2,422 | | | 50,329 |
Merck & Co., Inc. | | | | 86,025 | | | 3,242,282 |
Mylan, Inc. | | *† | | 8,108 | | | 97,864 |
Noven Pharmaceuticals, Inc. | | *† | | 1,350 | | | 14,432 |
Pain Therapeutics, Inc. | | * | | 1,318 | | | 10,412 |
Par Pharmaceutical Cos, Inc. | | *† | | 1,362 | | | 22,105 |
Penwest Pharmaceuticals Co. | | *† | | 930 | | | 2,511 |
Perrigo Co. | | † | | 2,922 | | | 92,832 |
Pfizer, Inc. | | | | 266,021 | | | 4,647,388 |
Pharmos Corp. | | * | | 1,375 | | | 536 |
Pozen, Inc. | | *† | | 1,014 | | | 11,032 |
Salix Pharmaceuticals Ltd. | | *† | | 2,346 | | | 16,492 |
Schering-Plough Corp. | | | | 59,192 | | | 1,165,490 |
Sciele Pharma, Inc. | | *† | | 1,613 | | | 31,212 |
Sepracor, Inc. | | *† | | 4,575 | | | 91,134 |
SuperGen, Inc. | | *† | | 1,338 | | | 2,743 |
SupportSoft, Inc. | | * | | 1,562 | | | 5,077 |
Valeant Pharmaceuticals International | | *† | | 3,473 | | | 59,423 |
Viropharma, Inc. | | *† | | 4,061 | | | 44,915 |
Vivus, Inc. | | *† | | 1,400 | | | 9,352 |
Watson Pharmaceuticals, Inc. | | * | | 4,480 | | | 121,722 |
Wyeth | | | | 52,091 | | | 2,498,284 |
XenoPort, Inc. | | *† | | 1,939 | | | 75,679 |
| | | | | | | |
| | | | | | | 27,639,349 |
| | | | | | | |
Real Estate Investment Trusts (REIT)—2.0% | | | | | | | |
Acadia Realty Trust REIT | | † | | 1,318 | | | 30,512 |
Agree Realty Corp. REIT | | † | | 814 | | | 17,949 |
Alesco Financial, Inc. REIT | | † | | 4,213 | | | 8,426 |
Alexander’s, Inc. REIT | | *† | | 78 | | | 24,227 |
Alexandria Real Estate Equities, Inc. REIT | | † | | 1,245 | | | 121,188 |
AMB Property Corp. REIT | | † | | 3,649 | | | 183,837 |
American Campus Communities, Inc. REIT | | † | | 1,699 | | | 47,300 |
American Land Lease, Inc. REIT | | † | | 1,828 | | | 34,732 |
American Mortgage Acceptance Co. REIT | | | | 1,842 | | | 1,160 |
Annaly Capital Management, Inc. REIT | | | | 17,861 | | | 277,024 |
Anthracite Capital, Inc. REIT | | † | | 1,100 | | | 7,744 |
Anworth Mortgage Asset Corp. REIT | | | | 834 | | | 5,429 |
Apartment Investment & Management Co., Class A REIT | | | | 4,081 | | | 138,999 |
Ashford Hospitality Trust, Inc. REIT | | † | | 4,200 | | | 19,404 |
AvalonBay Communities, Inc. REIT | | | | 3,116 | | | 277,823 |
BioMed Realty Trust, Inc. REIT | | | | 1,400 | | | 34,342 |
Boston Properties, Inc. REIT | | | | 4,700 | | | 424,034 |
Brandywine Realty Trust REIT | | † | | 2,965 | | | 46,728 |
BRE Properties, Inc. REIT | | † | | 2,433 | | | 105,300 |
BRT Realty Trust REIT | | † | | 355 | | | 4,260 |
Camden Property Trust REIT | | † | | 2,058 | | | 91,087 |
Capital Alliance Income Trust Ltd. REIT | | * | | 799 | | | 3,336 |
Capital Trust, Inc., Class A REIT | | † | | 523 | | | 10,047 |
CapitalSource, Inc. REIT | | † | | 4,975 | | | 55,123 |
Capstead Mortgage Corp. REIT | | | | 2,400 | | | 26,040 |
CBL & Associates Properties, Inc. REIT | | † | | 2,548 | | | 58,196 |
Cedar Shopping Centers, Inc. REIT | | † | | 583 | | | 6,833 |
Colonial Properties Trust REIT | | † | | 1,962 | | | 39,279 |
Corporate Office Properties Trust SBI MD REIT | | † | | 1,904 | | | 65,364 |
Cousins Properties, Inc. REIT | | | | 2,338 | | | 54,008 |
Crystal River Capital, Inc. REIT | | † | | 2,219 | | | 8,122 |
DCT Industrial Trust, Inc. REIT | | † | | 6,576 | | | 54,449 |
Deerfield Capital Corp. REIT | | † | | 3,425 | | | 2,706 |
Developers Diversified Realty Corp. REIT | | † | | 4,733 | | | 164,282 |
DiamondRock Hospitality Co. REIT | | † | | 3,930 | | | 42,798 |
Digital Realty Trust, Inc. REIT | | † | | 2,000 | | | 81,820 |
Douglas Emmett, Inc. REIT | | † | | 4,212 | | | 92,538 |
Duke Realty Corp. REIT | | † | | 5,609 | | | 125,922 |
EastGroup Properties, Inc. REIT | | † | | 1,538 | | | 65,980 |
Entertainment Properties Trust REIT | | † | | 749 | | | 37,031 |
Equity Lifestyle Properties, Inc. REIT | | † | | 1,140 | | | 50,160 |
Equity One, Inc. REIT | | † | | 2,619 | | | 53,820 |
Equity Residential REIT | | | | 10,587 | | | 405,164 |
Essex Property Trust, Inc. REIT | | † | | 807 | | | 85,946 |
Extra Space Storage, Inc. REIT | | † | | 3,500 | | | 53,760 |
Federal Realty Investment Trust REIT | | † | | 2,295 | | | 158,355 |
FelCor Lodging Trust, Inc. REIT | | † | | 3,135 | | | 32,918 |
First Industrial Realty Trust, Inc. REIT | | † | | 1,599 | | | 43,925 |
First Potomac Realty Trust REIT | | † | | 1,628 | | | 24,811 |
Franklin Street Properties Corp. REIT | | | | 2,200 | | | 27,808 |
Friedman Billings Ramsey Group, Inc., Class A REIT | | † | | 6,080 | | | 9,120 |
General Growth Properties, Inc. REIT | | † | | 8,744 | | | 306,302 |
Getty Realty Corp. REIT | | † | | 1,747 | | | 25,174 |
Glimcher Realty Trust REIT | | † | | 1,584 | | | 17,709 |
Gramercy Capital Corp., New York REIT | | † | | 2,182 | | | 25,289 |
HCP, Inc. REIT | | | | 7,664 | | | 243,792 |
Health Care, Inc. REIT | | | | 3,457 | | | 153,837 |
Healthcare Realty Trust, Inc. REIT | | † | | 1,881 | | | 44,711 |
Highwoods Properties, Inc. REIT | | | | 2,393 | | | 75,188 |
HMG Courtland Properties REIT | | *a | | 1,450 | | | 10,716 |
Home Properties, Inc. REIT | | † | | 1,390 | | | 66,803 |
Hospitality Properties Trust REIT | | † | | 2,923 | | | 71,497 |
Host Hotels & Resorts, Inc. REIT | | | | 20,345 | | | 277,709 |
| | | | |
| 210 | | See accompanying notes to financial statements. | | |
SCHEDULE OF INVESTMENTS — (Continued)
June 30, 2008 (Unaudited)
Vantagepoint Broad Market Index Fund
| | | | | | | |
| | | | | Shares | | Value |
COMMON STOCKS—(Continued) | | | | | | | |
HRPT Properties Trust REIT | | | | 9,142 | | $ | 61,891 |
IMPAC Mortgage Holdings, Inc. REIT | | *† | | 3,238 | | | 2,429 |
Inland Real Estate Corp. REIT | | † | | 2,302 | | | 33,195 |
iStar Financial, Inc. REIT | | † | | 4,331 | | | 57,213 |
Kilroy Realty Corp. REIT | | † | | 1,316 | | | 61,891 |
Kimco Realty Corp. REIT | | | | 9,013 | | | 311,129 |
Kite Realty Group Trust REIT | | † | | 2,654 | | | 33,175 |
LaSalle Hotel Properties REIT | | † | | 1,561 | | | 39,228 |
Lexington Realty Trust REIT | | † | | 1,399 | | | 19,068 |
Liberty Property Trust REIT | | | | 3,172 | | | 105,152 |
Macerich Co. (The) REIT | | † | | 2,832 | | | 175,952 |
Mack-Cali Realty Corp. REIT | | † | | 2,488 | | | 85,015 |
Maguire Properties, Inc. REIT | | † | | 1,199 | | | 14,592 |
Medical Properties Trust, Inc. REIT | | † | | 3,172 | | | 32,101 |
MFA Mortgage Investments, Inc. REIT | | | | 4,149 | | | 27,051 |
Mid-America Apartment Communities, Inc. REIT | | | | 1,240 | | | 63,290 |
Mission West Properties, Inc. REIT | | † | | 1,417 | | | 15,530 |
Monmouth Real Estate Investment Corp., Class A REIT | | † | | 3,275 | | | 20,960 |
National Health Investors, Inc. REIT | | † | | 979 | | | 27,911 |
National Retail Properties, Inc. REIT | | † | | 2,356 | | | 49,240 |
Nationwide Health Properties, Inc. REIT | | † | | 3,720 | | | 117,143 |
Newcastle Investment Corp. REIT | | † | | 754 | | | 5,286 |
NorthStar Realty Finance Corp. REIT | | † | | 4,200 | | | 34,944 |
Omega Healthcare Investors, Inc. REIT | | † | | 4,100 | | | 68,265 |
Pacific Office Properties Trust, Inc. REIT | | | | 1,050 | | | 7,035 |
Parkway Properties, Inc. REIT | | † | | 986 | | | 33,258 |
Pennsylvania Real Estate Investment Trust REIT | | † | | 1,510 | | | 34,941 |
Plum Creek Timber Co., Inc. REIT | | † | | 6,729 | | | 287,396 |
PMC Commercial Trust REIT | | | | 865 | | | 6,920 |
Post Properties, Inc. REIT | | † | | 2,078 | | | 61,821 |
Potlatch Corp. REIT | | † | | 1,618 | | | 73,004 |
Prologis REIT | | | | 10,010 | | | 544,043 |
PS Business Parks, Inc. REIT | | † | | 599 | | | 30,908 |
Public Storage REIT | | | | 5,109 | | | 412,756 |
RAIT Financial Trust REIT | | † | | 991 | | | 7,353 |
Ramco-Gershenson Properties Trust REIT | | † | | 1,275 | | | 26,189 |
Rayonier, Inc. REIT | | † | | 3,336 | | | 141,647 |
Realty Income Corp. REIT | | † | | 4,138 | | | 94,181 |
Redwood Trust, Inc. REIT | | † | | 1,008 | | | 22,972 |
Regency Centers Corp. REIT | | | | 2,545 | | | 150,460 |
Saul Centers, Inc. REIT | | | | 987 | | | 46,379 |
Senior Housing Properties Trust REIT | | † | | 3,680 | | | 71,870 |
Simon Property Group, Inc. REIT | | | | 8,577 | | | 770,986 |
SL Green Realty Corp. REIT | | † | | 1,985 | | | 164,199 |
Sovran Self Storage, Inc. REIT | | † | | 1,269 | | | 52,740 |
Strategic Hotels & Resorts, Inc. REIT | | † | | 2,904 | | | 27,210 |
Sun Communities, Inc. REIT | | | | 1,061 | | | 19,342 |
Sunstone Hotel Investors, Inc. REIT | | | | 2,337 | | | 38,794 |
Tanger Factory Outlet Centers REIT | | † | | 1,221 | | | 43,871 |
Taubman Centers, Inc. REIT | | † | | 2,083 | | | 101,338 |
Thornburg Mortgage, Inc. | | † | | 4,059 | | | 820 |
UDR, Inc. REIT | | † | | 4,883 | | | 109,282 |
U-Store-It Trust REIT | | † | | 3,600 | | | 43,020 |
Ventas, Inc. REIT | | | | 5,373 | | | 228,729 |
Vornado Realty Trust REIT | | | | 5,255 | | | 462,439 |
Washington Real Estate Investment Trust REIT | | † | | 1,834 | | | 55,112 |
Weingarten Realty Investors REIT | | † | | 3,474 | | | 105,332 |
| | | | | | | |
| | | | | | | 10,897,891 |
| | | | | | | |
Real Estate Management & Development—0.1% | | | | | | | |
Brookfield Properties Corp. (Canada) | | | | 7,509 | | | 133,585 |
CB Richard Ellis Group, Inc., Class A | | *† | | 6,900 | | | 132,480 |
Forest City Enterprises, Inc., Class A | | † | | 2,608 | | | 84,030 |
Forestar Real Estate Group, Inc. | | * | | 1,502 | | | 28,613 |
FX Real Estate and Entertainment, Inc. | | *† | | 360 | | | 684 |
Grubb & Ellis Co. | | † | | 652 | | | 2,510 |
Jones Lang LaSalle, Inc. | | | | 1,311 | | | 78,909 |
St. Joe Co. (The) | | † | | 3,582 | | | 122,934 |
Tejon Ranch Co. | | *† | | 762 | | | 27,478 |
| | | | | | | |
| | | | | | | 611,223 |
| | | | | | | |
Retail—0.0% | | | | | | | |
DineEquity, Inc. | | † | | 1,079 | | | 40,311 |
Walking Co. Holdings, Inc. (The) | | *† | | 1,620 | | | 9,104 |
| | | | | | | |
| | | | | | | 49,415 |
| | | | | | | |
Road & Rail—1.0% | | | | | | | |
Amerco, Inc. | | *† | | 805 | | | 38,382 |
Arkansas Best Corp. | | † | | 903 | | | 33,086 |
Avis Budget Group, Inc. | | * | | 4,424 | | | 37,029 |
Burlington Northern Santa Fe Corp. | | | | 10,951 | | | 1,093,895 |
Con-way, Inc. | | | | 2,160 | | | 102,082 |
CSX Corp. | | | | 17,161 | | | 1,077,882 |
Dollar Thrifty Automotive Group | | *† | | 1,057 | | | 9,989 |
Genesee & Wyoming, Inc., Class A | | *† | | 1,576 | | | 53,616 |
Heartland Express, Inc. | | † | | 4,220 | | | 62,920 |
J.B. Hunt Transport Services, Inc. | | † | | 3,964 | | | 131,922 |
Kansas City Southern | | *† | | 2,513 | | | 110,547 |
Knight Transportation, Inc. | | † | | 3,879 | | | 70,986 |
Landstar System, Inc. | | | | 2,256 | | | 124,576 |
Norfolk Southern Corp. | | | | 15,681 | | | 982,728 |
Old Dominion Freight Line, Inc. | | *† | | 1,783 | | | 53,526 |
PAM Transportation Services, Inc. | | * | | 338 | | | 3,600 |
Ryder System, Inc. | | | | 2,660 | | | 183,221 |
Saia, Inc. | | *† | | 1,662 | | | 18,149 |
Union Pacific Corp. | | | | 19,618 | | | 1,481,158 |
Werner Enterprises, Inc. | | † | | 2,915 | | | 54,161 |
YRC Worldwide, Inc. | | *† | | 2,278 | | | 33,874 |
| | | | | | | |
| | | | | | | 5,757,329 |
| | | | | | | |
| | | | |
| | See accompanying notes to financial statements. | | 211 |
SCHEDULE OF INVESTMENTS — (Continued)
June 30, 2008 (Unaudited)
Vantagepoint Broad Market Index Fund
| | | | | | | |
| | | | | Shares | | Value |
COMMON STOCKS—(Continued) | | | | | | | |
Semiconductors & Semiconductor Equipment—2.6% | | | | | | | |
Actel Corp. | | *† | | 1,140 | | $ | 19,209 |
Advanced Energy Industries, Inc. | | *† | | 1,428 | | | 19,564 |
Advanced Micro Devices, Inc. | | *† | | 21,447 | | | 125,036 |
Altera Corp. | | | | 14,718 | | | 304,663 |
Amkor Technology, Inc. | | *† | | 7,211 | | | 75,067 |
Anadigics, Inc. | | *† | | 957 | | | 9,426 |
Analog Devices, Inc. | | | | 14,113 | | | 448,370 |
Applied Materials, Inc. | | | | 53,844 | | | 1,027,882 |
Applied Micro Circuits Corp. | | *† | | 3,186 | | | 27,272 |
Asyst Technologies, Inc. | | *† | | 1,782 | | | 6,362 |
Atheros Communications, Inc. | | *† | | 2,700 | | | 81,000 |
Atmel Corp. | | * | | 18,733 | | | 65,191 |
ATMI, Inc. | | * | | 1,559 | | | 43,527 |
Axcelis Technologies, Inc. | | * | | 4,095 | | | 19,984 |
AXT, Inc. | | * | | 946 | | | 3,964 |
Broadcom Corp., Class A | | * | | 16,147 | | | 440,652 |
Brooks Automation, Inc. | | * | | 3,103 | | | 25,662 |
Cabot Microelectronics Corp. | | *† | | 1,049 | | | 34,774 |
California Micro Devices Corp. | | * | | 745 | | | 2,317 |
Catalyst Semiconductor, Inc. | | * | | 2,415 | | | 10,481 |
Centillium Communications, Inc. | | * | | 1,588 | | | 1,032 |
Ceva, Inc. | | *† | | 692 | | | 5,515 |
Cirrus Logic, Inc. | | * | | 2,946 | | | 16,380 |
Cohu, Inc. | | † | | 859 | | | 12,610 |
Conexant Systems, Inc. | | * | | 2,046 | | | 9,207 |
Credence Systems Corp. | | *† | | 2,727 | | | 3,545 |
Cree, Inc. | | * | | 3,097 | | | 70,643 |
Cymer, Inc. | | *† | | 1,498 | | | 40,266 |
Cypress Semiconductor Corp. | | *† | | 4,876 | | | 120,681 |
Diodes, Inc. | | *† | | 2,400 | | | 66,336 |
DSP Group, Inc. | | *† | | 1,194 | | | 8,358 |
Electroglas, Inc. | | *† | | 1,990 | | | 3,781 |
Emcore Corp. | | *† | | 1,219 | | | 7,631 |
Entegris, Inc. | | * | | 5,738 | | | 37,584 |
ESS Technology, Inc. | | * | | 1,759 | | | 2,867 |
Exar Corp. | | *† | | 1,758 | | | 13,255 |
Fairchild Semiconductor International, Inc. | | * | | 4,903 | | | 57,512 |
FEI Co. | | *† | | 1,368 | | | 31,163 |
Formfactor, Inc. | | *† | | 1,417 | | | 26,115 |
FSI International, Inc. | | *† | | 1,479 | | | 1,982 |
HI/FN, Inc. | | *† | | 681 | | | 3,139 |
Integrated Device Technology, Inc. | | * | | 8,168 | | | 81,190 |
Integrated Silicon Solution, Inc. | | * | | 1,269 | | | 7,056 |
Intel Corp. | | | | 227,315 | | | 4,882,725 |
International Rectifier Corp. | | * | | 2,631 | | | 50,515 |
Intersil Corp., Class A | | | | 5,757 | | | 140,010 |
inTEST Corp. | | * | | 950 | | | 1,881 |
IXYS Corp. | | * | | 1,329 | | | 15,868 |
KLA-Tencor Corp. | | | | 7,679 | | | 312,612 |
Kopin Corp. | | *† | | 2,431 | | | 6,977 |
Kulicke & Soffa Industries, Inc. | | *† | | 2,008 | | | 14,638 |
Lam Research Corp. | | * | | 5,335 | | | 192,860 |
Lattice Semiconductor Corp. | | * | | 4,395 | | | 13,756 |
Linear Technology Corp. | | † | | 8,638 | | | 281,340 |
LSI Corp. | | *† | | 30,700 | | | 188,498 |
LTX Corp. | | *† | | 2,405 | | | 5,291 |
Marvell Technology Group Ltd. (Bermuda) | | * | | 18,500 | | | 326,710 |
Mattson Technology, Inc. | | *† | | 1,760 | | | 8,378 |
Maxim Integrated Products, Inc. | | | | 2,241 | | | 47,397 |
MEMC Electronic Materials, Inc. | | * | | 8,113 | | | 499,274 |
Micrel, Inc. | | † | | 3,731 | | | 34,139 |
Microchip Technology, Inc. | | † | | 8,640 | | | 263,866 |
Micron Technology, Inc. | | * | | 25,902 | | | 155,412 |
Microsemi Corp. | | *† | | 2,474 | | | 62,295 |
Mindspeed Technologies, Inc. | | * | | 4,009 | | | 3,449 |
MIPS Technologies, Inc., Class A | | *† | | 2,228 | | | 8,355 |
MKS Instruments, Inc. | | *† | | 2,455 | | | 53,765 |
MoSys, Inc. | | *† | | 1,251 | | | 6,142 |
National Semiconductor Corp. | | | | 13,056 | | | 268,170 |
Novellus Systems, Inc. | | *† | | 6,320 | | | 133,921 |
NVE Corp. | | * | | 348 | | | 11,018 |
Nvidia Corp. | | * | | 20,184 | | | 377,844 |
Omnivision Technologies, Inc. | | *† | | 2,354 | | | 28,460 |
ON Semiconductor Corp. | | *† | | 5,253 | | | 48,170 |
PDF Solutions, Inc. | | *† | | 974 | | | 5,795 |
Pericom Semiconductor Corp. | | *† | | 1,023 | | | 15,181 |
Photronics, Inc. | | * | | 1,388 | | | 9,772 |
PLX Technology, Inc. | | *† | | 1,050 | | | 8,012 |
Power Integrations, Inc. | | * | | 1,952 | | | 61,703 |
QuickLogic Corp. | | *† | | 1,050 | | | 1,754 |
Rambus, Inc. | | *† | | 4,071 | | | 77,634 |
Ramtron International Corp. | | * | | 1,920 | | | 8,083 |
RF Micro Devices, Inc. | | *† | | 8,143 | | | 23,615 |
Rudolph Technologies, Inc. | | *† | | 1,247 | | | 9,602 |
Semitool, Inc. | | *† | | 1,060 | | | 7,961 |
Semtech Corp. | | *† | | 2,970 | | | 41,788 |
Silicon Image, Inc. | | *† | | 2,948 | | | 21,373 |
Silicon Laboratories, Inc. | | * | | 2,124 | | | 76,655 |
Silicon Storage Technology, Inc. | | *† | | 3,793 | | | 10,507 |
Skyworks Solutions, Inc. | | *† | | 5,822 | | | 57,463 |
Spansion, Inc., Class A | | *† | | 1,900 | | | 4,275 |
Standard Microsystems Corp. | | *† | | 806 | | | 21,883 |
Tegal Corp. | | * | | 312 | | | 1,292 |
Teradyne, Inc. | | * | | 7,938 | | | 87,874 |
Tessera Technologies, Inc. | | *† | | 1,560 | | | 25,537 |
Texas Instruments, Inc. | | | | 52,415 | | | 1,476,005 |
Transwitch Corp. | | * | | 2,483 | | | 2,284 |
Trident Microsystems, Inc. | | *† | | 3,018 | | | 11,016 |
TriQuint Semiconductor, Inc. | | *† | | 4,918 | | | 29,803 |
Ultratech, Inc. | | *† | | 971 | | | 15,070 |
Varian Semiconductor Equipment Associates, Inc. | | *† | | 3,367 | | | 117,239 |
Veeco Instruments, Inc. | | *† | | 1,294 | | | 20,808 |
Virage Logic Corp. | | * | | 901 | | | 6,451 |
White Electronic Designs Corp. | | * | | 514 | | | 2,359 |
Xilinx, Inc. | | † | | 13,928 | | | 351,682 |
Zoran Corp. | | * | | 1,650 | | | 19,305 |
| | | | | | | |
| | | | | | | 14,491,768 |
| | | | | | | |
Software—3.6% | | | | | | | |
ACI Worldwide, Inc. | | *† | | 1,298 | | | 22,832 |
Activision, Inc. | | * | | 9,514 | | | 324,142 |
Actuate Corp. | | *† | | 2,084 | | | 8,148 |
Adobe Systems, Inc. | | * | | 22,505 | | | 886,471 |
Advent Software, Inc. | | *† | | 1,451 | | | 52,352 |
American Software, Inc., Class A | | | | 1,950 | | | 10,998 |
Ansys, Inc. | | *† | | 2,396 | | | 112,900 |
Authentidate Holding Corp. | | * | | 1,023 | | | 399 |
Autodesk, Inc. | | * | | 9,258 | | | 313,013 |
Blackbaud, Inc. | | † | | 2,650 | | | 56,710 |
Blackboard, Inc. | | *† | | 1,400 | | | 53,522 |
BMC Software, Inc. | | * | | 8,825 | | | 317,700 |
Borland Software Corp. | | *† | | 2,936 | | | 3,993 |
CA, Inc. | | | | 17,506 | | | 404,214 |
| | | | |
| 212 | | See accompanying notes to financial statements. | | |
SCHEDULE OF INVESTMENTS — (Continued)
June 30, 2008 (Unaudited)
Vantagepoint Broad Market Index Fund
| | | | | | | |
| | | | | Shares | | Value |
COMMON STOCKS—(Continued) | | | | | | | |
Cadence Design Systems, Inc. | | * | | 10,745 | | $ | 108,525 |
Callidus Software, Inc. | | *† | | 172 | | | 860 |
Captaris, Inc. | | *† | | 1,164 | | | 4,714 |
Catapult Communications Corp. | | * | | 750 | | | 5,340 |
Citrix Systems, Inc. | | * | | 6,809 | | | 200,253 |
Compuware Corp. | | * | | 15,945 | | | 152,115 |
Concur Technologies, Inc. | | *† | | 2,083 | | | 69,218 |
DataTRAK International, Inc. | | * | | 3,924 | | | 1,766 |
Datawatch Corp. | | * | | 3,500 | | | 8,190 |
Ebix, Inc. | | *† | | 1,754 | | | 136,321 |
Electronic Arts, Inc. | | * | | 12,060 | | | 535,826 |
Epicor Software Corp. | | *† | | 1,693 | | | 11,699 |
EPIQ Systems, Inc. | | *† | | 1,087 | | | 15,435 |
ePresence, Inc. | | *‡da | | 1,173 | | | — |
Evans & Sutherland Computer Co. | | * | | 1,882 | | | 1,901 |
Evolving Systems, Inc. | | * | | 1,054 | | | 2,393 |
Factset Research Systems, Inc. | | † | | 1,490 | | | 83,976 |
Fair Isaac Corp. | | † | | 3,039 | | | 63,120 |
FalconStor Software, Inc. | | *† | | 1,373 | | | 9,721 |
infoGROUP, Inc. | | † | | 1,708 | | | 7,498 |
Informatica Corp. | | *† | | 3,171 | | | 47,692 |
Interactive Intelligence, Inc. | | *† | | 950 | | | 11,058 |
InterVoice, Inc. | | *† | | 1,395 | | | 7,952 |
Intuit, Inc. | | * | | 13,074 | | | 360,450 |
Jack Henry & Associates, Inc. | | † | | 3,591 | | | 77,709 |
JDA Software Group, Inc. | | * | | 1,256 | | | 22,734 |
Lawson Software, Inc. | | *† | | 8,700 | | | 63,249 |
Magma Design Automation, Inc. | | *† | | 1,429 | | | 8,674 |
Manhattan Associates, Inc. | | *† | | 1,346 | | | 31,941 |
McAfee, Inc. | | * | | 6,724 | | | 228,818 |
Mentor Graphics Corp. | | *† | | 2,745 | | | 43,371 |
Micros Systems, Inc. | | *† | | 3,428 | | | 104,520 |
Microsoft Corp. | | | | 324,787 | | | 8,934,889 |
MicroStrategy, Inc., Class A | | *† | | 513 | | | 33,217 |
Napster, Inc. | | * | | 1,145 | | | 1,626 |
NAVTEQ Corp. | | * | | 3,700 | | | 284,900 |
Netscout Systems, Inc. | | * | | 1,250 | | | 13,350 |
Novell, Inc. | | * | | 15,492 | | | 91,248 |
Nuance Communications, Inc. | | *† | | 4,541 | | | 71,157 |
Oracle Corp. | | * | | 156,057 | | | 3,277,196 |
Parametric Technology Corp. | | * | | 4,423 | | | 73,731 |
Pegasystems, Inc. | | † | | 2,141 | | | 28,818 |
Phoenix Technologies Ltd. | | * | | 907 | | | 9,977 |
PLATO Learning, Inc. | | *† | | 1,825 | | | 4,836 |
Progress Software Corp. | | *† | | 1,322 | | | 33,804 |
QAD, Inc. | | † | | 1,363 | | | 9,228 |
Quality Systems, Inc. | | † | | 768 | | | 22,487 |
Quest Software, Inc. | | *† | | 3,847 | | | 56,974 |
Radiant Systems, Inc. | | *† | | 1,019 | | | 10,934 |
Red Hat, Inc. | | *† | | 7,251 | | | 150,023 |
Renaissance Learning, Inc. | | † | | 1,353 | | | 15,167 |
Salesforce.com, Inc. | | * | | 3,583 | | | 244,468 |
Scientific Learning Corp. | | * | | 3,145 | | | 12,108 |
Secure Computing Corp. | | * | | 1,554 | | | 6,434 |
Sonic Foundry, Inc. | | * | | 1,200 | | | 732 |
Sonic Solutions, Inc. | | *† | | 889 | | | 5,298 |
SourceForge, Inc. | | *† | | 2,018 | | | 3,229 |
SPSS, Inc. | | *† | | 690 | | | 25,095 |
SumTotal Systems, Inc. | | *† | | 317 | | | 1,484 |
Sybase, Inc. | | *† | | 3,825 | | | 112,532 |
Symantec Corp. | | * | | 36,779 | | | 711,673 |
Symyx Technologies | | *† | | 1,374 | | | 9,591 |
Synopsys, Inc. | | * | | 6,501 | | | 155,439 |
Take-Two Interactive Software, Inc. | | *† | | 2,643 | | | 67,582 |
TeleCommunication Systems, Inc., Class A | | * | | 1,200 | | | 5,556 |
THQ, Inc. | | *† | | 2,914 | | | 59,038 |
TIBCO Software, Inc. | | * | | 8,337 | | | 63,778 |
Tivo, Inc. | | * | | 2,696 | | | 16,634 |
Tyler Technologies, Inc. | | *† | | 1,886 | | | 25,593 |
Ultimate Software Group, Inc. | | *† | | 1,242 | | | 44,252 |
Vasco Data Security International, Inc. | | *† | | 3,804 | | | 40,056 |
Versant Corp. | | * | | 330 | | | 8,643 |
VMware, Inc., Class A | | *† | | 1,500 | | | 80,790 |
Wave Systems Corp., Class A | | *† | | 1,004 | | | 994 |
Wayside Technology Group, Inc. | | | | 1,787 | | | 13,974 |
Wind River Systems, Inc. | | *† | | 3,206 | | | 34,913 |
| | | | | | | |
| | | | | | | 19,867,881 |
| | | | | | | |
Specialty Retail—1.7% | | | | | | | |
A.C. Moore Arts & Crafts, Inc. | | *† | | 876 | | | 6,176 |
Aaron Rents, Inc. | | † | | 1,939 | | | 43,298 |
Abercrombie & Fitch Co., Class A | | | | 3,072 | | | 192,553 |
Advance Auto Parts, Inc. | | | | 4,485 | | | 174,153 |
Aeropostale, Inc. | | *† | | 3,604 | | | 112,913 |
American Eagle Outfitters, Inc. | | | | 8,736 | | | 119,072 |
America’s Car-Mart, Inc. | | *† | | 354 | | | 6,344 |
AnnTaylor Stores Corp. | | *† | | 2,733 | | | 65,483 |
Asbury Automotive Group, Inc. | | † | | 1,342 | | | 17,245 |
AutoNation, Inc. | | *† | | 5,363 | | | 53,737 |
Autozone, Inc. | | * | | 1,524 | | | 184,419 |
Barnes & Noble, Inc. | | † | | 2,814 | | | 69,900 |
Bebe Stores, Inc. | | † | | 790 | | | 7,592 |
Bed Bath & Beyond, Inc. | | * | | 10,125 | | | 284,513 |
Best Buy Co., Inc. | | | | 13,673 | | | 541,451 |
Big 5 Sporting Goods Corp. | | † | | 1,071 | | | 8,107 |
Blockbuster, Inc., Class A | | *† | | 7,850 | | | 19,625 |
Borders Group, Inc. | | † | | 3,342 | | | 20,052 |
Brown Shoe Co., Inc. | | | | 1,791 | | | 24,268 |
Buckle, Inc. (The) | | † | | 1,672 | | | 76,461 |
Carmax, Inc. | | *† | | 8,516 | | | 120,842 |
Casual Male Retail Group, Inc. | | *† | | 1,930 | | | 5,887 |
Cato Corp. (The), Class A | | † | | 1,761 | | | 25,077 |
Charlotte Russe Holding, Inc. | | *† | | 1,100 | | | 19,536 |
Charming Shoppes, Inc. | | *† | | 3,138 | | | 14,403 |
Chico’s FAS, Inc. | | *† | | 7,236 | | | 38,857 |
Childrens Place Retail Stores, Inc. (The) | | *† | | 1,144 | | | 41,298 |
Christopher & Banks Corp. | | † | | 1,528 | | | 10,390 |
Circuit City Stores, Inc. | | † | | 6,139 | | | 17,742 |
Coldwater Creek, Inc. | | *† | | 1,528 | | | 8,068 |
Collective Brands, Inc. | | *† | | 2,964 | | | 34,471 |
Cost Plus, Inc. | | *† | | 1,014 | | | 2,535 |
CSK Auto Corp. | | * | | 1,990 | | | 20,855 |
Dick’s Sporting Goods, Inc. | | *† | | 2,480 | | | 43,995 |
Dress Barn, Inc. | | *† | | 1,900 | | | 25,422 |
Finish Line, Class A | | *† | | 1,917 | | | 16,678 |
Foot Locker, Inc. | | † | | 5,840 | | | 72,708 |
GameStop Corp., Class A | | * | | 4,410 | | | 178,164 |
Gap, Inc. (The) | | | | 22,382 | | | 373,108 |
Genesco, Inc. | | * | | 921 | | | 28,431 |
Group 1 Automotive, Inc. | | † | | 1,068 | | | 21,221 |
Guess ?, Inc. | | | | 3,548 | | | 132,873 |
Gymboree Corp. | | * | | 1,400 | | | 56,098 |
Haverty Furniture Cos, Inc. | | † | | 1,111 | | | 11,154 |
Hibbett Sports, Inc. | | *† | | 1,396 | | | 29,456 |
Home Depot, Inc. | | | | 64,592 | | | 1,512,746 |
| | | | |
| | See accompanying notes to financial statements. | | 213 |
SCHEDULE OF INVESTMENTS — (Continued)
June 30, 2008 (Unaudited)
Vantagepoint Broad Market Index Fund
| | | | | | | |
| | | | | Shares | | Value |
COMMON STOCKS—(Continued) | | | | | | | |
Hot Topic, Inc. | | *† | | 1,824 | | $ | 9,868 |
Jo-Ann Stores, Inc. | | *† | | 1,266 | | | 29,156 |
JOS A. Bank Clothiers, Inc. | | *† | | 577 | | | 15,435 |
Kirkland’s, Inc. | | *† | | 833 | | | 1,874 |
Lithia Motors, Inc., Class A | | † | | 862 | | | 4,241 |
Lowe’s Cos, Inc. | | | | 57,560 | | | 1,194,370 |
Ltd. Brands, Inc. | | | | 10,407 | | | 175,358 |
MarineMax, Inc. | | *† | | 800 | | | 5,736 |
Men’s Wearhouse, Inc. | | † | | 2,437 | | | 39,699 |
Midas, Inc. | | *† | | 1,277 | | | 17,240 |
Mothers Work, Inc. | | *† | | 600 | | | 6,042 |
NexCen Brands, Inc. | | *† | | 1,368 | | | 766 |
Office Depot, Inc. | | * | | 11,792 | | | 129,004 |
OfficeMax, Inc. | | | | 3,587 | | | 49,859 |
O’Reilly Automotive, Inc. | | *† | | 4,772 | | | 106,654 |
Pacific Sunwear of California, Inc. | | *† | | 3,025 | | | 25,803 |
Penske Auto Group, Inc. | | † | | 1,654 | | | 24,380 |
PEP Boys-Manny Moe & Jack | | † | | 2,200 | | | 19,184 |
PetSmart, Inc. | | † | | 5,983 | | | 119,361 |
Pier 1 Imports, Inc. | | *† | | 3,712 | | | 12,769 |
RadioShack Corp. | | | | 6,811 | | | 83,571 |
Rent-A-Center, Inc., Class A | | *† | | 3,377 | | | 69,465 |
Ross Stores, Inc. | | | | 6,350 | | | 225,552 |
Sally Beauty Holdings, Inc. | | *† | | 3,659 | | | 23,637 |
Select Comfort Corp. | | * | | 2,104 | | | 3,451 |
Sherwin-Williams Co. (The) | | | | 3,738 | | | 171,686 |
Sonic Automotive, Inc., Class A | | † | | 1,649 | | | 21,256 |
Stage Stores, Inc. | | † | | 2,236 | | | 26,094 |
Staples, Inc. | | | | 27,647 | | | 656,616 |
Stein Mart, Inc. | | † | | 1,261 | | | 5,687 |
Systemax, Inc. | | | | 1,358 | | | 23,969 |
Talbots, Inc. | | † | | 375 | | | 4,346 |
Tiffany & Co. | | | | 6,084 | | | 247,923 |
TJX Cos, Inc. | | | | 15,739 | | | 495,306 |
Tractor Supply Co. | | *† | | 1,549 | | | 44,983 |
Trans World Entertainment Corp. | | *† | | 1,932 | | | 5,487 |
TravelCenters of America LLC | | * | | 292 | | | 663 |
Tween Brands, Inc. | | * | | 1,485 | | | 24,443 |
Urban Outfitters, Inc. | | *† | | 5,012 | | | 156,324 |
West Marine, Inc. | | *† | | 803 | | | 3,292 |
Wet Seal, Inc. (The), Class A | | *† | | 1,246 | | | 5,943 |
Williams-Sonoma, Inc. | | † | | 3,877 | | | 76,920 |
Zale Corp. | | *† | | 2,300 | | | 43,447 |
| | | | | | | |
| | | | | | | 9,296,237 |
| | | | | | | |
Textiles, Apparel & Luxury Goods—0.5% | | | | | | | |
Carter’s, Inc. | | *† | | 1,476 | | | 20,398 |
Charles & Colvard Ltd. | | * | | 1,843 | | | 2,064 |
Cherokee, Inc. | | † | | 994 | | | 20,029 |
Coach, Inc. | | * | | 15,372 | | | 443,942 |
Columbia Sportswear Co. | | † | | 652 | | | 23,961 |
CROCS, Inc. | | *† | | 3,600 | | | 28,836 |
Culp, Inc. | | * | | 888 | | | 6,234 |
Fossil, Inc. | | *† | | 3,154 | | | 91,687 |
Hallwood Group, Inc. | | *† | | 100 | | | 6,914 |
Hanesbrands, Inc. | | * | | 4,099 | | | 111,247 |
Iconix Brand Group, Inc. | | *† | | 2,737 | | | 33,063 |
Jones Apparel Group, Inc. | | | | 4,641 | | | 63,814 |
Kenneth Cole Productions, Inc., Class A | | † | | 956 | | | 12,141 |
K-Swiss, Inc., Class A | | † | | 1,476 | | | 21,697 |
Lazare Kaplan International, Inc. | | * | | 1,139 | | | 10,137 |
Liz Claiborne, Inc. | | † | | 4,930 | | | 69,760 |
Movado Group, Inc. | | † | | 1,678 | | | 33,224 |
Nike, Inc., Class B | | | | 13,780 | | | 821,425 |
Nitches, Inc. | | * | | 2,850 | | | 2,765 |
Oxford Industries, Inc. | | † | | 936 | | | 17,924 |
Phillips-Van Heusen Corp. | | | | 1,267 | | | 46,398 |
Polo Ralph Lauren Corp. | | † | | 2,143 | | | 134,538 |
Quiksilver, Inc. | | * | | 4,288 | | | 42,108 |
Skechers U.S.A., Inc., Class A | | *† | | 1,935 | | | 38,236 |
Sport-Haley, Inc. | | * | | 1,042 | | | 2,178 |
Steven Madden Ltd. | | * | | 751 | | | 13,803 |
Tarrant Apparel Group | | * | | 1,106 | | | 697 |
Timberland Co., Class A | | *† | | 2,970 | | | 48,560 |
Unifi, Inc. | | *† | | 2,629 | | | 6,625 |
VF Corp. | | | | 3,785 | | | 269,416 |
Warnaco Group, Inc. (The) | | *† | | 1,569 | | | 69,146 |
Wolverine World Wide, Inc. | | † | | 2,589 | | | 69,049 |
| | | | | | | |
| | | | | | | 2,582,016 |
| | | | | | | |
Thrifts & Mortgage Finance—0.5% | | | | | | | |
Anchor Bancorp Wisconsin, Inc. | | † | | 1,411 | | | 9,891 |
Astoria Financial Corp. | | | | 3,465 | | | 69,577 |
Bank Mutual Corp. | | † | | 3,756 | | | 37,710 |
BankAtlantic Bancorp, Inc., Class A | | † | | 2,210 | | | 3,890 |
BankUnited Financial Corp., Class A | | † | | 793 | | | 761 |
Beneficial Mutual Bancorp, Inc. | | *† | | 969 | | | 10,727 |
Brookline Bancorp, Inc. | | † | | 3,765 | | | 35,956 |
Capitol Federal Financial | | † | | 2,115 | | | 79,545 |
Centerline Holding Co. | | † | | 1,905 | | | 3,181 |
CFS Bancorp, Inc. | | | | 1,873 | | | 22,083 |
Charter Financial Corp. | | † | | 350 | | | 8,400 |
Corus Bankshares, Inc. | | † | | 702 | | | 2,920 |
Countrywide Financial Corp. | | † | | 24,520 | | | 104,210 |
Dime Community Bancshares | | † | | 1,638 | | | 27,043 |
Doral Financial Corp. (Puerto Rico) | | * | | 221 | | | 2,992 |
Downey Financial Corp. | | † | | 1,038 | | | 2,875 |
Federal National Mortgage Association | | | | 37,770 | | | 736,893 |
First Financial Service Corp. | | | | 402 | | | 7,260 |
First Niagara Financial Group, Inc. | | † | | 4,217 | | | 54,231 |
FirstFed Financial Corp. | | *† | | 922 | | | 7,413 |
Flagstar Bancorp, Inc. | | † | | 2,110 | | | 6,351 |
Freddie Mac | | | | 25,235 | | | 413,854 |
Guaranty Financial Group, Inc. | | *† | | 1,502 | | | 8,066 |
Harrington West Financial Group, Inc. | | | | 1,171 | | | 4,485 |
Hudson City Bancorp, Inc. | | | | 20,250 | | | 337,770 |
IndyMac Bancorp, Inc. | | † | | 2,523 | | | 1,564 |
MGIC Investment Corp. | | | | 4,084 | | | 24,953 |
NASB Financial, Inc. | | † | | 528 | | | 9,388 |
New York Community Bancorp, Inc. | | † | | 12,640 | | | 225,498 |
NewAlliance Bancshares, Inc. | | † | | 4,600 | | | 57,408 |
Northwest Bancorp, Inc. | | | | 2,048 | | | 44,687 |
Ocwen Financial Corp. | | *† | | 3,358 | | | 15,615 |
Parkvale Financial Corp. | | | | 616 | | | 14,371 |
People’s United Financial, Inc. | | | | 6,597 | | | 102,913 |
PFF Bancorp, Inc. | | † | | 1,096 | | | 1,184 |
PMI Group, Inc. (The) | | † | | 3,929 | | | 7,662 |
Provident Financial Services, Inc. | | † | | 943 | | | 13,211 |
Provident New York Bancorp | | † | | 3,670 | | | 40,590 |
Radian Group, Inc. | | | | 3,844 | | | 5,574 |
Riverview Bancorp, Inc. | | | | 2,600 | | | 19,240 |
| | | | |
| 214 | | See accompanying notes to financial statements. | | |
SCHEDULE OF INVESTMENTS — (Continued)
June 30, 2008 (Unaudited)
Vantagepoint Broad Market Index Fund
| | | | | | | |
| | | | | Shares | | Value |
COMMON STOCKS—(Continued) | | | | | | | |
SouthFirst Bancshares, Inc. | | | | 400 | | $ | 3,300 |
Sovereign Bancorp, Inc. | | † | | 12,496 | | | 91,971 |
Triad Guaranty, Inc. | | *† | | 692 | | | 720 |
Trustco Bank Corp. | | † | | 3,435 | | | 25,488 |
United Western Bancorp, Inc. | | | | 973 | | | 12,221 |
Washington Federal, Inc. | | † | | 3,379 | | | 61,160 |
Washington Mutual, Inc. | | † | | 33,770 | | | 166,486 |
Westfield Financial, Inc. | | † | | 4,068 | | | 36,815 |
Willow Financial Bancorp, Inc. | | | | 533 | | | 4,344 |
| | | | | | | |
| | | | | | | 2,984,447 |
| | | | | | | |
Tobacco—1.1% | | | | | | | |
Alliance One International, Inc. | | *† | | 2,000 | | | 10,220 |
Altria Group, Inc. | | | | 82,016 | | | 1,686,249 |
Philip Morris International, Inc. | | | | 82,016 | | | 4,050,770 |
Reynolds American, Inc. | | | | 6,595 | | | 307,789 |
Universal Corp. | | † | | 1,078 | | | 48,747 |
UST, Inc. | | | | 6,568 | | | 358,678 |
Vector Group Ltd. | | † | | 2,389 | | | 38,535 |
| | | | | | | |
| | | | | | | 6,500,988 |
| | | | | | | |
Trading Companies & Distributors—0.2% | | | | | | | |
Applied Industrial Technologies, Inc. | | † | | 2,056 | | | 49,694 |
Beacon Roofing Supply, Inc. | | *† | | 2,570 | | | 27,268 |
Building Materials Holding Corp. | | † | | 1,800 | | | 3,186 |
Electro Rent Corp. | | † | | 950 | | | 11,913 |
Fastenal Co. | | | | 5,638 | | | 243,336 |
GATX Corp. | | | | 1,766 | | | 78,287 |
H&E Equipment Services, Inc. | | *† | | 1,600 | | | 19,232 |
Interline Brands, Inc. | | *† | | 982 | | | 15,643 |
MSC Industrial Direct Co., Class A | | † | | 1,782 | | | 78,604 |
United Rentals, Inc. | | *† | | 3,294 | | | 64,595 |
W.W. Grainger, Inc. | | | | 3,286 | | | 268,795 |
Watsco, Inc. | | † | | 553 | | | 23,115 |
WESCO International, Inc. | | *† | | 1,550 | | | 62,062 |
Willis Lease Finance Corp. | | * | | 1,234 | | | 13,179 |
| | | | | | | |
| | | | | | | 958,909 |
| | | | | | | |
Transportation Infrastructure—0.0% | | | | | | | |
Macquarie Infrastructure Co. LLC | | † | | 2,000 | | | 50,580 |
| | | | | | | |
Water Utilities—0.0% | | | | | | | |
American States Water Co. | | † | | 500 | | | 17,470 |
American Water Works Co., Inc. | | *† | | 2,266 | | | 50,260 |
Aqua America, Inc. | | † | | 4,329 | | | 69,134 |
California Water Service Group | | † | | 965 | | | 31,623 |
Connecticut Water Service, Inc. | | † | | 500 | | | 11,200 |
SJW Corp. | | † | | 1,010 | | | 26,664 |
| | | | | | | |
| | | | | | | 206,351 |
| | | | | | | |
Wireless Telecommunication Services—0.5% | | | | | | | |
American Tower Corp., Class A | | * | | 15,861 | | | 670,127 |
Centennial Communications Corp. | | *† | | 3,036 | | | 21,222 |
Crown Castle International Corp. | | * | | 8,983 | | | 347,912 |
iPCS, Inc. | | *† | | 700 | | | 20,741 |
Kratos Defense & Security Solutions, Inc. | | *† | | 2,398 | | | 4,700 |
LCC International, Inc., Class A | | *† | | 1,000 | | | 960 |
Leap Wireless International, Inc. | | *† | | 2,100 | | | 90,657 |
MetroPCS Communications, Inc. | | * | | 7,134 | | | 126,343 |
NII Holdings, Inc., Class B | | * | | 5,995 | | | 284,703 |
Rural Cellular Corp., Class A | | * | | 1,265 | | | 56,305 |
SBA Communications Corp., Class A | | * | | 2,105 | | | 75,801 |
Sprint Nextel Corp. | | | | 115,766 | | | 1,099,776 |
Telephone & Data Systems, Inc. | | † | | 3,518 | | | 166,296 |
US Cellular Corp. | | * | | 680 | | | 38,454 |
| | | | | | | |
| | | | | | | 3,003,997 |
| | | | | | | |
TOTAL COMMON STOCKS
(Cost $396,704,082) | | | | | | | 550,773,996 |
| | | | | | | |
| | | | | | | | | | |
Coupon Rate | | Maturity Date | | Face | | Value |
U.S. TREASURY OBLIGATIONS—0.1% | | | | | | | | | | |
U.S. Treasury Bill—0.1% | | | | | | | | | | |
U.S. Treasury Bill | | | | | | | | | | |
1.913% | | 09/18/2008 | | ‡ | ‡ | | | | | |
(Cost $502,891) | | | | | | | $ | 505,000 | | 503,024 |
| | | | | | | | | | |
| | | | | | | | | | |
| | | | | | Shares | | Value | |
RIGHTS—0.0% | | | | | | | | | | |
Apparel—0.0% | | | | | | | | | | |
Mossimo, Inc., | | | | | | | | | | |
Expires TBD | | | * | ‡da | | | | | | |
(Cost $—) | | | | | | 2,806 | | | — | |
| | | | | | | | | | |
WARRANTS—0.0% | | | | | | | | | | |
Financial Services—0.0% | | | | | | | | | | |
Equitex, Inc., | | | | | | | | | | |
Expires 02/7/2010 | | | * | ‡da | | 264 | | | — | |
Equitex, Inc., | | | | | | | | | | |
Expires 02/7/2010 | | | * | ‡da | | 264 | | | — | |
Pegasus Wireless Corp., | | | | | | | | | | |
Expires 08/11/2008 | | | * | ‡da | | 540 | | | — | |
| | | | | | | | | | |
TOTAL WARRANTS
(Cost $—) | | | | | | | | | — | |
| | | | | | | | | | |
CASH EQUIVALENTS—13.4% | | | | | | | | | | |
Institutional Money Market Funds—13.4% | | | | | | | | | | |
AIM Short-Term Investments Trust Liquid Assets Portfolio | �� | † | † | | | 14,283,354 | | | 14,283,354 | |
AIM Short-Term Investments Trust Prime Assets Portfolio | | † | † | | | 53,485,982 | | | 53,485,983 | |
JPMorgan Prime Money Market Fund, Capital Shares | | | | | | 6,856,978 | | | 6,856,978 | |
| | | | | | | | | | |
TOTAL CASH EQUIVALENTS
(Cost $74,626,314) | | | | | | | | | 74,626,315 | |
| | | | | | | | | | |
TOTAL INVESTMENTS—112.0%
(Cost $471,833,287) | | | | | | | | | 625,903,335 | |
Other assets less liabilities—(12.0%) | | | | | | | | | (67,209,744 | ) |
| | | | | | | | | | |
NET ASSETS—100.0% | | | | | | | | $ | 558,693,591 | |
| | | | | | | | | | |
| | | | |
| | See accompanying notes to financial statements. | | 215 |
SCHEDULE OF INVESTMENTS — (Continued)
June 30, 2008 (Unaudited)
Vantagepoint Broad Market Index Fund
Notes to the Schedule of Investments:
| | |
| REIT | | Real Estate Investment Trust |
† | | Denotes all or a portion of security on loan. |
* | | Non-income producing. |
d | | Security has no market value at 06/30/2008. |
| a | | Illiquid Security. |
‡ | | Security valued at fair value as determined by policies approved by the board of directors. |
‡‡ | | Security has been pledged as collateral for futures contracts. |
†† | | Represents reinvestment of collateral received in conjunction with securities lending. |
| | | | |
| 216 | | See accompanying notes to financial statements. | | |
SCHEDULE OF INVESTMENTS
June 30, 2008 (Unaudited)
Vantagepoint Mid/Small Company Index Fund
| | | | | | | |
| | | | | Shares | | Value |
COMMON STOCKS—98.0% | | | | | | | |
Aerospace & Defense—0.9% | | | | | | | |
AAR Corp. | | *† | | 2,730 | | $ | 36,937 |
Alliant Techsystems, Inc. | | *† | | 2,047 | | | 208,139 |
American Science & Engineering, Inc. | | † | | 1,020 | | | 52,561 |
Applied Signal Technology, Inc. | | | | 2,274 | | | 31,063 |
Astronics Corp. | | *† | | 716 | | | 9,960 |
BE Aerospace, Inc. | | * | | 6,086 | | | 141,743 |
Ceradyne, Inc. | | *† | | 1,756 | | | 60,231 |
Cubic Corp. | | † | | 1,262 | | | 28,117 |
Curtiss-Wright Corp. | | † | | 3,020 | | | 135,115 |
DRS Technologies, Inc. | | | | 2,800 | | | 220,416 |
DynCorp International, Inc., Class A | | * | | 1,953 | | | 29,588 |
Esterline Technologies Corp. | | * | | 2,032 | | | 100,096 |
GenCorp, Inc. | | *† | | 4,016 | | | 28,755 |
Heico Corp., Class A | | | | 1,598 | | | 42,475 |
Herley Industries, Inc. | | * | | 1,550 | | | 20,584 |
Hexcel Corp. | | *† | | 6,431 | | | 124,118 |
Innovative Solutions & Support, Inc. | | * | | 1,200 | | | 7,740 |
Kreisler Manufacturing Corp. | | * | | 1,250 | | | 15,312 |
Ladish Co., Inc. | | * | | 970 | | | 19,972 |
Moog, Inc., Class A | | * | | 2,477 | | | 92,243 |
Orbital Sciences Corp. | | *† | | 4,361 | | | 102,745 |
Spirit Aerosystems Holdings, Inc., Class A | | * | | 6,805 | | | 130,520 |
Taser International, Inc. | | *† | | 4,142 | | | 20,669 |
Teledyne Technologies, Inc. | | * | | 2,281 | | | 111,290 |
TransDigm Group, Inc. | | *† | | 1,604 | | | 53,878 |
Triumph Group, Inc. | | † | | 1,050 | | | 49,455 |
| | | | | | | |
| | | | | | | 1,873,722 |
| | | | | | | |
Air Freight & Logistics—0.2% | | | | | | | |
Air T, Inc. | | | | 563 | | | 5,658 |
Air Transport Services Group, Inc. | | *† | | 5,626 | | | 5,626 |
Atlas Air Worldwide Holdings, Inc. | | * | | 1,188 | | | 58,759 |
Dynamex, Inc. | | * | | 760 | | | 20,376 |
Forward Air Corp. | | † | | 1,912 | | | 66,155 |
HUB Group, Inc., Class A | | * | | 2,580 | | | 88,055 |
Pacer International, Inc. | | † | | 2,275 | | | 48,935 |
UTi Worldwide, Inc. (Virgin Islands, British) | | † | | 5,804 | | | 115,790 |
| | | | | | | |
| | | | | | | 409,354 |
| | | | | | | |
Airlines—0.3% | | | | | | | |
Airtran Holdings, Inc. | | *† | | 7,448 | | | 15,194 |
Alaska Air Group, Inc. | | *† | | 2,394 | | | 36,724 |
AMR Corp. | | * | | 15,114 | | | 77,384 |
Continental Airlines, Inc., Class B | | *† | | 6,444 | | | 65,149 |
Delta Air Lines, Inc. | | *† | | 18,791 | | | 107,109 |
ExpressJet Holdings, Inc. | | *† | | 3,876 | | | 2,132 |
JetBlue Airways Corp. | | *† | | 9,694 | | | 36,159 |
Mesa Air Group, Inc. | | * | | 2,928 | | | 1,493 |
Northwest Airlines Corp. | | * | | 15,402 | | | 102,577 |
Pinnacle Airlines Corp. | | *† | | 930 | | | 2,939 |
Republic Airways Holdings, Inc. | | * | | 2,460 | | | 21,303 |
Skywest, Inc. | | | | 3,850 | | | 48,702 |
UAL Corp. | | † | | 7,561 | | | 39,468 |
US Airways Group, Inc. | | *† | | 5,756 | | | 14,390 |
| | | | | | | |
| | | | | | | 570,723 |
| | | | | | | |
Auto Components—0.6% | | | | | | | |
American Axle & Manufacturing Holdings, Inc. | | † | | 2,814 | | | 22,484 |
Amerigon, Inc., Class A | | *† | | 2,108 | | | 14,988 |
ArvinMeritor, Inc. | | † | | 5,690 | | | 71,011 |
BorgWarner, Inc. | | | | 7,598 | | | 337,199 |
Cooper Tire & Rubber Co. | | † | | 3,864 | | | 30,294 |
Dana Holding Corp. | | *† | | 5,121 | | | 27,397 |
Drew Industries, Inc. | | *† | | 1,570 | | | 25,042 |
Exide Technologies | | *† | | 4,861 | | | 81,470 |
Gentex Corp. | | | | 9,606 | | | 138,711 |
Lear Corp. | | * | | 4,509 | | | 63,938 |
Modine Manufacturing Co. | | † | | 1,658 | | | 20,510 |
Noble International Ltd. | | † | | 1,109 | | | 4,957 |
Proliance International, Inc. | | * | | 2,240 | | | 2,128 |
Quantum Fuel Systems Technologies Worldwide, Inc. | | *† | | 11,052 | | | 34,040 |
Sauer-Danfoss, Inc. | | † | | 832 | | | 25,917 |
Shiloh Industries, Inc. | | | | 1,441 | | | 13,531 |
Spartan Motors, Inc. | | | | 1,650 | | | 12,326 |
Standard Motor Products, Inc. | | | | 2,540 | | | 20,726 |
Strattec Security Corp. | | | | 124 | | | 4,367 |
Superior Industries International, Inc. | | † | | 2,013 | | | 33,979 |
Tenneco, Inc. | | * | | 3,267 | | | 44,203 |
TRW Automotive Holdings Corp. | | * | | 3,028 | | | 55,927 |
Visteon Corp. | | *† | | 8,265 | | | 21,737 |
WABCO Holdings, Inc. | | | | 3,829 | | | 177,895 |
| | | | | | | |
| | | | | | | 1,284,777 |
| | | | | | | |
Auto Parts & Equipment—0.0% | | | | | | | |
ATC Technology Corp. | | * | | 1,503 | | | 34,990 |
| | | | | | | |
Automobiles—0.0% | | | | | | | |
Coachmen Industries, Inc. | | * | | 2,275 | | | 4,823 |
Fleetwood Enterprises, Inc. | | *† | | 4,000 | | | 10,480 |
Monaco Coach Corp. | | † | | 3,676 | | | 11,175 |
Thor Industries, Inc. | | † | | 2,634 | | | 55,999 |
Winnebago Industries | | † | | 1,714 | | | 17,466 |
| | | | | | | |
| | | | | | | 99,943 |
| | | | | | | |
Beverages—0.4% | | | | | | | |
Boston Beer Co., Inc., Class A | | *† | | 1,180 | | | 48,003 |
Central European Distribution Corp. | | *† | | 2,129 | | | 157,865 |
Coca-Cola Bottling Co. Consolidated | | † | | 437 | | | 16,160 |
Dr. Pepper Snapple Group, Inc. | | * | | 16,438 | | | 344,869 |
Hansen Natural Corp. | | *† | | 4,740 | | | 136,607 |
Jones Soda Co. | | *† | | 1,928 | | | 6,208 |
PepsiAmericas, Inc. | | | | 4,452 | | | 88,061 |
| | | | | | | |
| | | | | | | 797,773 |
| | | | | | | |
Biotechnology—3.1% | | | | | | | |
Aastrom Biosciences, Inc. | | *† | | 3,290 | | | 1,217 |
Abraxis Bioscience, Inc. | | * | | 435 | | | 27,605 |
Acorda Therapeutics, Inc. | | * | | 2,095 | | | 68,779 |
Alexion Pharmaceuticals, Inc. | | *† | | 2,536 | | | 183,860 |
Alfacell Corp. | | * | | 2,756 | | | 1,213 |
Alkermes, Inc. | | * | | 7,233 | | | 89,400 |
Alnylam Pharmaceuticals, Inc. | | *† | | 2,679 | | | 71,610 |
Alseres Pharmaceuticals, Inc. | | * | | 724 | | | 1,694 |
Amylin Pharmaceuticals, Inc. | | *† | | 9,303 | | | 236,203 |
Antigenics, Inc. | | * | | 9,214 | | | 17,783 |
Applera Corp.—Celera Group | | *† | | 5,787 | | | 65,740 |
Arena Pharmaceuticals, Inc. | | *† | | 8,294 | | | 43,046 |
Ariad Pharmaceuticals, Inc. | | *† | | 5,713 | | | 13,711 |
| | | | |
| | See accompanying notes to financial statements. | | 217 |
SCHEDULE OF INVESTMENTS — (Continued)
June 30, 2008 (Unaudited)
Vantagepoint Mid/Small Company Index Fund
| | | | | | | |
| | | | | Shares | | Value |
COMMON STOCKS—(Continued) | | | | | | | |
Arqule, Inc. | | *† | | 4,724 | | $ | 15,353 |
Array Biopharma, Inc. | | *† | | 4,170 | | | 19,599 |
Avant Immunotherapeutics, Inc. | | *† | | 555 | | | 8,081 |
AVI BioPharma, Inc. | | *† | | 7,700 | | | 8,624 |
Avigen, Inc. | | * | | 3,880 | | | 11,213 |
BioCryst Pharmaceuticals, Inc. | | * | | 3,943 | | | 11,040 |
BioMarin Pharmaceutical, Inc. | | *† | | 5,996 | | | 173,764 |
Cell Genesys, Inc. | | * | | 10,214 | | | 26,556 |
Cell Therapeutics, Inc. | | * | | 5,292 | | | 2,540 |
Cephalon, Inc. | | *† | | 4,395 | | | 293,103 |
Cepheid, Inc. | | *† | | 4,090 | | | 115,011 |
Cubist Pharmaceuticals, Inc. | | * | | 4,049 | | | 72,315 |
CV Therapeutics, Inc. | | * | | 4,341 | | | 35,726 |
Cytokinetics, Inc. | | *† | | 4,127 | | | 15,311 |
CytRx Corp. | | * | | 10,564 | | | 6,867 |
Dendreon Corp. | | *† | | 7,889 | | | 35,106 |
Dyax Corp. | | *† | | 9,610 | | | 29,791 |
Entremed, Inc. | | * | | 1,390 | | | 765 |
Enzon Pharmaceuticals, Inc. | | * | | 4,016 | | | 28,594 |
EPIX Pharmaceuticals, Inc. | | * | | 3,320 | | | 5,744 |
Exact Sciences Corp. | | * | | 7,997 | | | 14,395 |
Genaera Corp. | | *† | | 797 | | | 1,490 |
Genelabs Technologies, Inc. | | * | | 721 | | | 447 |
Genentech, Inc. | | * | | 30,441 | | | 2,310,472 |
Genitope Corp. | | * | | 2,890 | | | 128 |
Geron Corp. | | *† | | 5,440 | | | 18,768 |
GTC Biotherapeutics, Inc. | | *† | | 3,988 | | | 1,595 |
GTx, Inc. | | *† | | 1,710 | | | 24,539 |
Hana Biosciences, Inc. | | * | | 3,510 | | | 2,528 |
Hemispherx Biopharma, Inc. | | * | | 4,821 | | | 4,050 |
Human Genome Sciences, Inc. | | *† | | 8,883 | | | 46,280 |
Idenix Pharmaceuticals, Inc. | | * | | 3,110 | | | 22,610 |
Idera Pharmaceuticals, Inc. | | *† | | 1,932 | | | 28,227 |
ImClone Systems, Inc. | | *† | | 4,046 | | | 163,701 |
Immunogen, Inc. | | *† | | 1,903 | | | 5,823 |
Immunomedics, Inc. | | * | | 6,421 | | | 13,677 |
Incyte Corp. Ltd. | | *† | | 4,623 | | | 35,181 |
Indevus Pharmaceuticals, Inc. | | *† | | 6,691 | | | 10,505 |
InterMune, Inc. | | * | | 2,819 | | | 36,985 |
Introgen Therapeutics, Inc. | | *† | | 2,150 | | | 3,333 |
Isis Pharmaceuticals, Inc. | | *† | | 5,868 | | | 79,981 |
Keryx Biopharmaceuticals, Inc. | | *† | | 3,220 | | | 1,578 |
Lexicon Pharmaceuticals, Inc. | | *† | | 7,724 | | | 12,358 |
MannKind Corp. | | *† | | 6,322 | | | 18,966 |
Martek Biosciences Corp. | | *† | | 1,905 | | | 64,218 |
Maxygen, Inc. | | *† | | 2,991 | | | 10,139 |
MDRNA, Inc. | | *† | | 3,350 | | | 4,087 |
Medarex, Inc. | | *† | | 7,804 | | | 51,584 |
Metabolix, Inc. | | *† | | 2,162 | | | 21,188 |
Monogram Biosciences, Inc. | | *† | | 9,010 | | | 9,911 |
Myriad Genetics, Inc. | | *† | | 2,939 | | | 133,783 |
Nabi Biopharmaceuticals | | *† | | 6,806 | | | 26,816 |
Neose Technologies, Inc. | | * | | 5,705 | | | 1,712 |
Neurobiological Technologies, Inc. | | * | | 448 | | | 636 |
Neurocrine Biosciences, Inc. | | *† | | 6,840 | | | 28,660 |
Neurogen Corp. | | *† | | 1,873 | | | 1,929 |
Northfield Laboratories, Inc. | | *† | | 1,890 | | | 1,342 |
Novavax, Inc. | | * | | 11,268 | | | 28,057 |
NPS Pharmaceuticals, Inc. | | * | | 3,900 | | | 17,355 |
Nuvelo, Inc. | | *† | | 8,720 | | | 4,883 |
Omrix Biopharmaceuticals, Inc. | | *† | | 1,506 | | | 23,704 |
Onyx Pharmaceuticals, Inc. | | * | | 3,374 | | | 120,114 |
Orthologic Corp. | | * | | 1,517 | | | 1,517 |
Oscient Pharmaceuticals Corp. | | * | | 4,064 | | | 5,771 |
OSI Pharmaceuticals, Inc. | | *† | | 3,581 | | | 147,967 |
Palatin Technologies, Inc. | | * | | 2,104 | | | 400 |
Panacos Pharmaceuticals, Inc. | | * | | 2,667 | | | 1,200 |
PDL BioPharma, Inc. | | | | 7,921 | | | 84,121 |
Peregrine Pharmaceuticals, Inc. | | * | | 9,115 | | | 3,829 |
Pharmacopeia, Inc. | | *† | | 4,683 | | | 17,936 |
Poniard Pharmaceuticals, Inc. | | * | | 3,696 | | | 15,671 |
Progenics Pharmaceuticals, Inc. | | *† | | 1,383 | | | 21,948 |
Regeneron Pharmaceuticals, Inc. | | * | | 5,878 | | | 84,878 |
Repligen Corp. | | * | | 3,422 | | | 16,152 |
Rigel Pharmaceuticals, Inc. | | *† | | 3,086 | | | 69,929 |
RXi Pharmaceuticals Corp. | | *† | | 524 | | | 4,192 |
Sangamo Biosciences, Inc. | | *† | | 2,338 | | | 23,263 |
Savient Pharmaceuticals, Inc. | | * | | 3,970 | | | 100,441 |
Sciclone Pharmaceuticals, Inc. | | *† | | 4,800 | | | 7,344 |
SIGA Technologies, Inc. | | * | | 4,650 | | | 14,508 |
StemCells, Inc. | | *† | | 3,500 | | | 4,270 |
Targeted Genetics Corp. | | * | | 3,456 | | | 2,039 |
Telik, Inc. | | *† | | 6,069 | | | 7,343 |
Theravance, Inc. | | * | | 3,130 | | | 37,153 |
Third Wave Technologies, Inc. | | *† | | 5,437 | | | 60,677 |
Titan Pharmaceuticals, Inc. | | *† | | 4,244 | | | 5,857 |
TorreyPines Therapeutics, Inc. | | * | | 346 | | | 429 |
Trimeris, Inc. | | † | | 4,014 | | | 18,946 |
United Therapeutics Corp. | | * | | 1,264 | | | 123,556 |
Vanda Pharmaceuticals, Inc. | | *† | | 2,119 | | | 6,972 |
Vermillion, Inc. | | * | | 150 | | | 338 |
Vertex Pharmaceuticals, Inc. | | * | | 9,501 | | | 317,998 |
Vion Pharmaceuticals, Inc. | | * | | 450 | | | 513 |
XOMA Ltd. | | *† | | 12,047 | | | 20,359 |
Zymogenetics, Inc. | | *† | | 2,343 | | | 19,728 |
| | | | | | | |
| | | | | | | 6,391,944 |
| | | | | | | |
Building Products—0.4% | | | | | | | |
American Woodmark Corp. | | † | | 800 | | | 16,904 |
Ameron International Corp. | | | | 543 | | | 65,149 |
Apogee Enterprises, Inc. | | † | | 2,250 | | | 36,360 |
Armstrong World Industries, Inc. | | | | 1,349 | | | 39,418 |
Gibraltar Industries, Inc. | | | | 1,868 | | | 29,832 |
Griffon Corp. | | *† | | 2,293 | | | 20,087 |
Insteel Industries, Inc. | | † | | 1,400 | | | 25,634 |
Jewett-Cameron Trading Ltd. (Canada) | | * | | 1,575 | | | 11,434 |
Lennox International, Inc. | | † | | 3,744 | | | 108,426 |
NCI Building Systems, Inc. | | *† | | 1,232 | | | 45,251 |
Owens Corning, Inc. | | * | | 5,373 | | | 122,236 |
Quanex Building Products Corp. | | | | 2,570 | | | 38,190 |
Simpson Manufacturing Co., Inc. | | † | | 2,796 | | | 66,377 |
Trex Co., Inc. | | * | | 3,584 | | | 42,040 |
Universal Forest Products, Inc. | | † | | 1,649 | | | 49,404 |
US Home Systems, Inc. | | * | | 1,292 | | | 5,078 |
USG Corp. | | * | | 4,868 | | | 143,947 |
| | | | | | | |
| | | | | | | 865,767 |
| | | | | | | |
Capital Markets—1.9% | | | | | | | |
Affiliated Managers Group, Inc. | | * | | 2,322 | | | 209,119 |
AllianceBernstein Holding LP | | | | 1,898 | | | 103,783 |
BGC Partners, Inc., Class A | | *† | | 6,185 | | | 46,697 |
BlackRock, Inc. | | † | | 1,298 | | | 229,746 |
Blackstone Group LP (The) | | | | 9,677 | | | 176,218 |
Calamos Asset Management, Inc., Class A | | † | | 1,520 | | | 25,886 |
Cowen Group, Inc. | | *† | | 1,468 | | | 11,333 |
| | | | |
| 218 | | See accompanying notes to financial statements. | | |
SCHEDULE OF INVESTMENTS — (Continued)
June 30, 2008 (Unaudited)
Vantagepoint Mid/Small Company Index Fund
| | | | | | | |
| | | | | Shares | | Value |
COMMON STOCKS—(Continued) | | | | | | | |
Diamond Hill Investment Group, Inc. | | *† | | 649 | | $ | 54,191 |
Eaton Vance Corp. | | | | 8,264 | | | 328,577 |
Evercore Partners, Inc., Class A | | † | | 2,490 | | | 23,655 |
FCStone Group, Inc. | | * | | 1,575 | | | 43,990 |
GAMCO Investors, Inc., Class A | | † | | 1,039 | | | 51,555 |
GFI Group, Inc. | | | | 4,612 | | | 41,554 |
GLG Partners, Inc. | | † | | 15,360 | | | 119,808 |
Greenhill & Co., Inc. | | † | | 801 | | | 43,142 |
Invesco Ltd. | | | | 27,908 | | | 669,234 |
Investment Technology Group, Inc. | | * | | 3,086 | | | 103,258 |
Jefferies Group, Inc. | | † | | 7,297 | | | 122,736 |
Jesup & Lamont, Inc. | | * | | 1,550 | | | 1,798 |
KBW, Inc. | | *† | | 1,716 | | | 35,315 |
Kent Financial Services | | * | | 2,200 | | | 3,916 |
Knight Capital Group, Inc., Class A | | * | | 5,980 | | | 107,520 |
LaBranche & Co., Inc. | | * | | 5,402 | | | 38,246 |
Lazard Ltd., Class A (Bermuda) | | | | 3,165 | | | 108,085 |
MF Global Ltd. (Bermuda) | | *† | | 6,639 | | | 41,892 |
Navidec Financial Services, Inc. | | * | | 2,120 | | | 3,498 |
optionsXpress Holdings, Inc. | | † | | 3,947 | | | 88,176 |
Piper Jaffray Cos | | * | | 1,140 | | | 33,436 |
Raymond James Financial, Inc. | | † | | 6,513 | | | 171,878 |
SEI Investments Co. | | | | 9,539 | | | 224,357 |
Siebert Financial Corp. | | | | 1,470 | | | 4,866 |
Stifel Financial Corp. | | *† | | 1,534 | | | 52,754 |
SWS Group, Inc. | | | | 2,331 | | | 38,718 |
TD Ameritrade Holding Corp. | | * | | 15,911 | | | 287,830 |
thinkorswim Group, Inc. | | *† | | 2,950 | | | 20,797 |
Thomas Weisel Partners Group, Inc. | | *† | | 2,162 | | | 11,826 |
TradeStation Group, Inc. | | *† | | 3,191 | | | 32,389 |
US Global Investors, Inc., Class A | | | | 934 | | | 15,644 |
W.P. Carey & Co. LLC | | | | 1,593 | | | 45,735 |
Waddell & Reed Financial, Inc., Class A | | | | 5,669 | | | 198,472 |
Westwood Holdings Group, Inc. | | | | 1,768 | | | 70,366 |
| | | | | | | |
| | | | | | | 4,041,996 |
| | | | | | | |
Chemicals—3.0% | | | | | | | |
A. Schulman, Inc. | | † | | 1,444 | | | 33,255 |
Airgas, Inc. | | | | 4,691 | | | 273,907 |
Albemarle Corp. | | | | 6,002 | | | 239,540 |
Arch Chemicals, Inc. | | | | 1,785 | | | 59,173 |
Balchem Corp. | | | | 2,127 | | | 49,197 |
Cabot Corp. | | | | 4,167 | | | 101,300 |
Calgon Carbon Corp. | | *† | | 2,038 | | | 31,507 |
Celanese Corp., Class A | | | | 9,736 | | | 444,546 |
CF Industries Holdings, Inc. | | | | 3,465 | | | 529,452 |
Chemtura Corp. | | | | 16,450 | | | 96,068 |
Cytec Industries, Inc. | | | | 2,819 | | | 153,805 |
Ferro Corp. | | | | 2,588 | | | 48,551 |
Flotek Industries, Inc. | | *† | | 1,346 | | | 27,755 |
FMC Corp. | | | | 4,854 | | | 375,894 |
Georgia Gulf Corp. | | † | | 6,311 | | | 18,302 |
H.B. Fuller Co. | | † | | 4,230 | | | 94,921 |
Huntsman Corp. | | | | 6,225 | | | 70,965 |
ICO, Inc. | | *† | | 2,739 | | | 16,489 |
Intrepid Potash, Inc. | | * | | 1,950 | | | 128,271 |
Koppers Holdings, Inc. | | | | 1,358 | | | 56,859 |
Kronos Worldwide, Inc. | | † | | 235 | | | 3,617 |
Landec Corp. | | * | | 3,037 | | | 19,649 |
LSB Industries, Inc. | | *† | | 1,412 | | | 27,958 |
Lubrizol Corp. | | | | 4,564 | | | 211,450 |
Material Sciences Corp. | | * | | 2,565 | | | 20,776 |
Minerals Technologies, Inc. | | | | 1,385 | | | 88,072 |
Mosaic Co. (The) | | * | | 9,651 | | | 1,396,500 |
Nalco Holding Co. | | | | 9,557 | | | 202,131 |
NewMarket Corp. | | † | | 767 | | | 50,798 |
NL Industries, Inc. | | † | | 412 | | | 3,926 |
Olin Corp. | | | | 4,587 | | | 120,088 |
OM Group, Inc. | | * | | 1,896 | | | 62,170 |
Omnova Solutions, Inc. | | * | | 3,769 | | | 10,478 |
Penford Corp. | | | | 786 | | | 11,696 |
PolyOne Corp. | | *† | | 7,843 | | | 54,666 |
Quaker Chemical Corp. | | | | 1,303 | | | 34,738 |
Rockwood Holdings, Inc. | | * | | 2,328 | | | 81,014 |
RPM International, Inc. | | † | | 8,223 | | | 169,394 |
Scotts Miracle-Gro Co. (The), Class A | | | | 2,994 | | | 52,605 |
Sensient Technologies Corp. | | | | 2,948 | | | 83,016 |
Solutia, Inc. | | * | | 2,000 | | | 25,640 |
Spartech Corp. | | † | | 2,131 | | | 20,095 |
Stepan Co. | | † | | 1,197 | | | 54,607 |
Terra Industries, Inc. | | | | 5,833 | | | 287,859 |
Terra Nitrogen Co. LP | | | | 478 | | | 62,063 |
Tronox, Inc., Class A | | † | | 3,753 | | | 11,859 |
Valhi, Inc. | | † | | 741 | | | 20,192 |
Valspar Corp. | | † | | 6,436 | | | 121,705 |
W.R. Grace & Co. | | * | | 3,690 | | | 86,678 |
Westlake Chemical Corp. | | † | | 800 | | | 11,888 |
Zep, Inc. | | | | 1,513 | | | 22,513 |
Zoltek Cos, Inc. | | *† | | 1,992 | | | 48,306 |
| | | | | | | |
| | | | | | | 6,327,904 |
| | | | | | | |
Commercial Banks—2.9% | | | | | | | |
1st Source Corp. | | | | 1,180 | | | 18,998 |
Alliance Bankshares Corp. | | * | | 745 | | | 2,742 |
Amcore Financial, Inc. | | † | | 2,040 | | | 11,546 |
AmericanWest Bancorp | | † | | 1,951 | | | 4,429 |
Ameris Bancorp | | † | | 1,414 | | | 12,302 |
Arrow Financial Corp. | | † | | 490 | | | 8,884 |
Associated Banc-Corp | | | | 7,454 | | | 143,788 |
BancFirst Corp. | | | | 642 | | | 27,478 |
Bancorp, Inc. (The) | | *† | | 2,979 | | | 22,700 |
BancorpSouth, Inc. | | † | | 4,749 | | | 83,060 |
BancTrust Financial Group, Inc. | | † | | 1,600 | | | 10,544 |
Bank of Hawaii Corp. | | | | 3,094 | | | 147,893 |
Bank of the Ozarks, Inc. | | † | | 1,070 | | | 15,900 |
Banner Corp. | | † | | 990 | | | 8,771 |
BOK Financial Corp. | | † | | 1,447 | | | 77,342 |
Boston Private Financial Holdings, Inc. | | † | | 2,447 | | | 13,874 |
Bryn Mawr Bank Corp. | | † | | 1,548 | | | 27,090 |
Camden National Corp. | | | | 740 | | | 17,227 |
Capital Bank Corp. | | | | 1,283 | | | 11,342 |
Capital City Bank Group, Inc. | | | | 1,576 | | | 34,294 |
Capitol Bancorp Ltd. | | † | | 1,172 | | | 10,513 |
Cardinal Financial Corp. | | | | 2,163 | | | 13,540 |
Cascade Bancorp | | † | | 2,003 | | | 15,423 |
Cascade Financial Corp. | | † | | 1,063 | | | 6,920 |
Cathay General Bancorp | | † | | 4,405 | | | 47,882 |
Catskill Litigation Trust | | *‡da | | 583 | | | — |
Center Financial Corp. | | † | | 1,451 | | | 12,290 |
Central Pacific Financial Corp. | | † | | 2,937 | | | 31,308 |
Chemical Financial Corp. | | † | | 1,637 | | | 33,395 |
Citizens Republic Bancorp, Inc. | | † | | 5,922 | | | 16,700 |
City Bank (Washington) | | † | | 1,647 | | | 14,164 |
| | | | |
| | See accompanying notes to financial statements. | | 219 |
SCHEDULE OF INVESTMENTS — (Continued)
June 30, 2008 (Unaudited)
Vantagepoint Mid/Small Company Index Fund
| | | | | | | |
| | | | | Shares | | Value |
COMMON STOCKS—(Continued) | | | | | | | |
City Holding Co. | | † | | 1,410 | | $ | 57,486 |
City National Corp. | | | | 2,489 | | | 104,712 |
CoBiz Financial, Inc. | | † | | 1,800 | | | 11,844 |
Colonial BancGroup, Inc. (The) | | † | | 13,873 | | | 61,319 |
Columbia Banking System, Inc. | | | | 1,330 | | | 25,709 |
Commerce Bancshares, Inc. | | † | | 4,612 | | | 182,912 |
Community Bancorp | | *† | | 1,010 | | | 5,060 |
Community Bank System, Inc. | | † | | 3,080 | | | 63,510 |
Community Trust Bancorp, Inc. | | † | | 1,028 | | | 26,995 |
Cullen/Frost Bankers, Inc. | | | | 3,651 | | | 182,002 |
CVB Financial Corp. | | † | | 6,148 | | | 58,037 |
East West Bancorp, Inc. | | † | | 5,310 | | | 37,489 |
Eastern Virginia Bankshares, Inc. | | | | 701 | | | 11,216 |
Fidelity Southern Corp. | | | | 1,382 | | | 6,454 |
Fifth Third Bancorp | | | | 94 | | | 957 |
Financial Institutions, Inc. | | | | 750 | | | 12,045 |
First Bancorp (Puerto Rico) | | | | 7,322 | | | 46,421 |
First Bancorp North Carolina | | † | | 1,473 | | | 18,619 |
First Busey Corp., Class A | | | | 2,491 | | | 32,931 |
First Citizens BancShares, Inc., Class A | | | | 389 | | | 54,262 |
First Commonwealth Financial Corp. | | † | | 4,595 | | | 42,871 |
First Financial Bancorp | | † | | 3,075 | | | 28,290 |
First Financial Bankshares, Inc. | | † | | 1,566 | | | 71,738 |
First Merchants Corp. | | | | 1,625 | | | 29,494 |
First Midwest Bancorp, Inc. | | † | | 3,492 | | | 65,126 |
First of Long Island Corp. (The) | | | | 986 | | | 19,597 |
First State Bancorporation (New Mexico) | | † | | 2,566 | | | 14,113 |
FirstMerit Corp. | | † | | 5,161 | | | 84,176 |
FNB Corp. (Pennsylvania) | | | | 6,711 | | | 79,056 |
Frontier Financial Corp. | | † | | 2,974 | | | 25,338 |
Fulton Financial Corp. | | † | | 11,491 | | | 115,485 |
Glacier Bancorp, Inc. | | | | 3,454 | | | 55,229 |
Great Southern Bancorp, Inc. | | † | | 470 | | | 3,816 |
Green Bankshares, Inc. | | † | | 2,110 | | | 29,582 |
Guaranty Bancorp | | *† | | 4,150 | | | 14,940 |
Hancock Holding Co. | | † | | 1,772 | | | 69,622 |
Hanmi Financial Corp. | | † | | 5,069 | | | 26,409 |
Harleysville National Corp. | | † | | 3,683 | | | 41,102 |
Heritage Commerce Corp. | | | | 1,180 | | | 11,682 |
Heritage Financial Corp. | | | | 972 | | | 15,406 |
Horizon Financial Corp. | | † | | 1,660 | | | 10,358 |
Iberiabank Corp. | | † | | 1,251 | | | 55,632 |
Independent Bank Corp. (Massachusetts) | | † | | 1,484 | | | 35,379 |
Independent Bank Corp. (Michigan) | | † | | 1,384 | | | 5,536 |
Integra Bank Corp. | | † | | 1,659 | | | 12,990 |
International Bancshares Corp. | | | | 3,273 | | | 69,944 |
Irwin Financial Corp. | | † | | 5,031 | | | 13,533 |
Lakeland Financial Corp. | | † | | 1,455 | | | 27,761 |
Macatawa Bank Corp. | | † | | 1,599 | | | 12,792 |
MainSource Financial Group, Inc. | | † | | 1,732 | | | 26,846 |
MB Financial, Inc. | | † | | 2,827 | | | 63,523 |
Merchants Bancshares, Inc. | | | | 572 | | | 12,841 |
Midsouth Bancorp, Inc. | | | | 526 | | | 8,837 |
Midwest Banc Holdings, Inc. | | † | | 1,420 | | | 6,915 |
MidWestOne Financial Group, Inc. | | | | 1,494 | | | 19,332 |
Nara Bancorp, Inc. | | † | | 2,060 | | | 22,104 |
National Penn Bancshares, Inc. | | † | | 5,282 | | | 70,145 |
NBT Bancorp, Inc. | | † | | 2,320 | | | 47,815 |
Northern States Financial Corp. | | † | | 773 | | | 13,566 |
Old National Bancorp | | † | | 5,304 | | | 75,635 |
Old Second Bancorp, Inc. | | † | | 1,975 | | | 22,949 |
Oriental Financial Group, Inc. | | † | | 2,140 | | | 30,516 |
Pacific Capital Bancorp | | | | 3,675 | | | 50,642 |
Pacific Premier Bancorp, Inc. | | * | | 977 | | | 5,032 |
PacWest Bancorp | | † | | 1,714 | | | 25,504 |
Park National Corp. | | † | | 884 | | | 47,648 |
Peapack Gladstone Financial Corp. | | † | | 390 | | | 8,568 |
Peoples Bancorp, Inc. | | | | 1,235 | | | 23,440 |
Peoples Financial Corp. (Mississippi) | | | | 884 | | | 18,140 |
Popular, Inc. (Puerto Rico) | | † | | 15,939 | | | 105,038 |
Preferred Bank | | † | | 818 | | | 4,237 |
PrivateBancorp, Inc. | | | | 2,025 | | | 61,520 |
Prosperity Bancshares, Inc. | | † | | 3,020 | | | 80,725 |
Provident Bankshares Corp. | | † | | 2,900 | | | 18,502 |
Renasant Corp. | | † | | 2,255 | | | 33,216 |
Republic Bancorp, Inc., Class A | | † | | 1,024 | | | 25,190 |
Royal Bancshares of Pennsylvania, Class A | | † | | 882 | | | 8,300 |
S&T Bancorp, Inc. | | † | | 2,206 | | | 64,106 |
Sandy Spring Bancorp, Inc. | | † | | 1,234 | | | 20,460 |
Santander BanCorp (Puerto Rico) | | | | 511 | | | 5,422 |
Security Bank Corp. | | † | | 2,778 | | | 16,279 |
Shore Bancshares, Inc. | | † | | 828 | | | 15,500 |
Sierra Bancorp | | † | | 844 | | | 13,926 |
Signature Bank | | * | | 2,526 | | | 65,070 |
Simmons First National Corp., Class A | | | | 1,650 | | | 46,151 |
South Financial Group, Inc. (The) | | † | | 4,884 | | | 19,145 |
Southwest Bancorp, Inc. (Oklahoma) | | | | 1,320 | | | 15,180 |
State Bancorp, Inc. (New York) | | † | | 988 | | | 12,350 |
Sterling Bancorp (New York) | | † | | 1,691 | | | 20,207 |
Sterling Bancshares, Inc. | | † | | 5,677 | | | 51,604 |
Sterling Financial Corp. (Washington) | | † | | 4,010 | | | 16,601 |
Suffolk Bancorp | | | | 1,100 | | | 32,318 |
Superior Bancorp | | *† | | 728 | | | 6,181 |
Susquehanna Bancshares, Inc. | | † | | 6,360 | | | 87,068 |
SVB Financial Group | | *† | | 2,178 | | | 104,784 |
SY Bancorp, Inc. | | † | | 1,060 | | | 22,642 |
Synovus Financial Corp. | | † | | 17,720 | | | 154,696 |
TCF Financial Corp. | | † | | 7,556 | | | 90,899 |
Texas Capital Bancshares, Inc. | | * | | 1,870 | | | 29,920 |
Tompkins Financial Corp. | | † | | 665 | | | 24,738 |
Trustmark Corp. | | † | | 3,786 | | | 66,823 |
UCBH Holdings, Inc. | | † | | 6,596 | | | 14,841 |
UMB Financial Corp. | | | | 1,918 | | | 98,336 |
Umpqua Holdings Corp. | | † | | 4,413 | | | 53,530 |
Union Bankshares Corp. | | † | | 1,185 | | | 17,645 |
UnionBanCal Corp. | | | | 3,352 | | | 135,488 |
United Bankshares, Inc. | | † | | 2,607 | | | 59,831 |
United Community Banks, Inc. (Georgia) | | † | | 3,879 | | | 33,088 |
Valley National Bancorp | | † | | 8,050 | | | 126,949 |
Virginia Commerce Bancorp | | * | | 2,314 | | | 12,010 |
W. Holding Co., Inc. (Puerto Rico) | | † | | 18,602 | | | 15,812 |
Washington Trust Bancorp, Inc. | | | | 960 | | | 18,912 |
Webster Financial Corp. | | † | | 3,649 | | | 67,871 |
WesBanco, Inc. | | † | | 1,500 | | | 25,725 |
| | | | |
| 220 | | See accompanying notes to financial statements. | | |
SCHEDULE OF INVESTMENTS — (Continued)
June 30, 2008 (Unaudited)
Vantagepoint Mid/Small Company Index Fund
| | | | | | | |
| | | | | Shares | | Value |
COMMON STOCKS—(Continued) | | | | | | | |
West Coast Bancorp (Oregon) | | † | | 1,290 | | $ | 11,184 |
Westamerica Bancorp | | † | | 1,805 | | | 94,925 |
Western Alliance Bancorp | | *† | | 1,796 | | | 13,937 |
Whitney Holding Corp. | | † | | 4,154 | | | 76,018 |
Wilmington Trust Corp. | | † | | 4,791 | | | 126,674 |
Wilshire Bancorp, Inc. | | † | | 2,608 | | | 22,351 |
Wintrust Financial Corp. | | † | | 1,718 | | | 40,974 |
| | | | | | | |
| | | | | | | 5,994,213 |
| | | | | | | |
Commercial Services & Supplies—2.8% | | | | | | | |
ABM Industries, Inc. | | | | 2,991 | | | 66,550 |
ACCO Brands Corp. | | * | | 3,258 | | | 36,587 |
Administaff, Inc. | | | | 1,663 | | | 46,381 |
Advisory Board Co. (The) | | *† | | 1,300 | | | 51,129 |
American Reprographics Co. | | * | | 2,318 | | | 38,595 |
Angelica Corp. | | † | | 1,241 | | | 26,396 |
APAC Customer Services, Inc. | | *† | | 1,972 | | | 3,155 |
Barrett Business Services, Inc. | | † | | 1,740 | | | 20,584 |
Bowne & Co., Inc. | | † | | 1,575 | | | 20,081 |
Brink’s Co. (The) | | | | 2,529 | | | 165,447 |
Casella Waste Systems, Inc., Class A | | * | | 2,380 | | | 29,012 |
CDI Corp. | | | | 711 | | | 18,088 |
Cenveo, Inc. | | *† | | 3,701 | | | 36,159 |
ChoicePoint, Inc. | | * | | 4,713 | | | 227,167 |
Clean Harbors, Inc. | | * | | 1,369 | | | 97,281 |
Comfort Systems USA, Inc. | | † | | 3,803 | | | 51,112 |
Consolidated Graphics, Inc. | | *† | | 699 | | | 34,440 |
Copart, Inc. | | *† | | 4,147 | | | 177,575 |
Cornell Cos, Inc. | | *† | | 1,730 | | | 41,710 |
Corporate Executive Board Co. | | | | 2,515 | | | 105,756 |
Corrections Corp of America | | * | | 8,255 | | | 226,765 |
CoStar Group, Inc. | | * | | 1,140 | | | 50,673 |
Courier Corp. | | † | | 816 | | | 16,385 |
Covanta Holding Corp. | | * | | 7,320 | | | 195,371 |
CRA International, Inc. | | * | | 836 | | | 30,221 |
Deluxe Corp. | | | | 3,350 | | | 59,697 |
Diamond Management & Technology Consultants, Inc. | | † | | 3,731 | | | 19,439 |
Dun & Bradstreet Corp. | | | | 3,850 | | | 337,414 |
Ennis, Inc. | | † | | 2,217 | | | 34,696 |
Exponent, Inc. | | * | | 1,790 | | | 56,224 |
First Advantage Corp., Class A | | * | | 630 | | | 9,985 |
FTI Consulting, Inc. | | * | | 3,283 | | | 224,754 |
G&K Services, Inc., Class A | | † | | 1,576 | | | 48,005 |
Geo Group, Inc. (The) | | * | | 3,213 | | | 72,292 |
Healthcare Services Group, Inc. | | † | | 2,986 | | | 45,417 |
Heidrick & Struggles International, Inc. | | † | | 1,291 | | | 35,683 |
Herman Miller, Inc. | | † | | 3,686 | | | 91,745 |
HNI Corp. | | † | | 2,371 | | | 41,872 |
Hudson Highland Group, Inc. | | * | | 1,880 | | | 19,684 |
Huron Consulting Group, Inc. | | *† | | 1,254 | | | 56,856 |
IHS, Inc., Class A | | * | | 2,645 | | | 184,092 |
IKON Office Solutions, Inc. | | | | 5,770 | | | 65,086 |
Interface, Inc., Class A | | | | 3,470 | | | 43,479 |
Intersections, Inc. | | * | | 1,900 | | | 20,767 |
Kelly Services, Inc., Class A | | † | | 2,431 | | | 46,991 |
Kenexa Corp. | | * | | 2,904 | | | 54,711 |
Kforce, Inc. | | * | | 3,398 | | | 28,849 |
Kimball International, Inc., Class B | | | | 1,500 | | | 12,420 |
Knoll, Inc. | | † | | 4,195 | | | 50,969 |
Korn-Ferry International | | * | | 2,815 | | | 44,280 |
Learning Tree International, Inc. | | * | | 766 | | | 13,099 |
LECG Corp. | | * | | 2,344 | | | 20,487 |
M&F Worldwide Corp. | | *† | | 781 | | | 30,701 |
Manpower, Inc. | | | | 5,092 | | | 296,558 |
Mcgrath Rentcorp | | | | 1,646 | | | 40,475 |
Metalico, Inc. | | *† | | 1,513 | | | 26,508 |
Mine Safety Appliances Co. | | † | | 1,445 | | | 57,786 |
Mobile Mini, Inc. | | *† | | 3,320 | | | 66,400 |
MPS Group, Inc. | | * | | 6,503 | | | 69,127 |
Multi-Color Corp. | | † | | 965 | | | 20,255 |
Nashua Corp. | | * | | 1,542 | | | 15,420 |
Navigant Consulting, Inc. | | *† | | 3,254 | | | 63,648 |
Odyssey Marine Exploration, Inc. | | *† | | 3,340 | | | 13,226 |
On Assignment, Inc. | | *† | | 3,093 | | | 24,806 |
PeopleSupport, Inc. | | *† | | 2,127 | | | 18,080 |
Perma-Fix Environmental Services | | * | | 5,502 | | | 15,901 |
PHH Corp. | | * | | 4,273 | | | 65,591 |
RCM Technologies, Inc. | | * | | 1,593 | | | 6,866 |
Republic Services, Inc. | | | | 10,905 | | | 323,879 |
Resources Connection, Inc. | | | | 3,825 | | | 77,839 |
Rollins, Inc. | | † | | 3,813 | | | 56,509 |
School Specialty, Inc. | | * | | 1,184 | | | 35,200 |
Spherion Corp. | | * | | 2,689 | | | 12,423 |
Standard Register Co. (The) | | † | | 1,650 | | | 15,560 |
Steelcase, Inc., Class A | | | | 4,515 | | | 45,285 |
Stericycle, Inc. | | * | | 5,799 | | | 299,808 |
SYKES Enterprises, Inc. | | * | | 2,627 | | | 49,545 |
Team, Inc. | | * | | 1,659 | | | 56,937 |
Tetra Tech, Inc. | | * | | 4,160 | | | 94,099 |
TRC Cos, Inc. | | * | | 998 | | | 4,012 |
TrueBlue, Inc. | | * | | 3,035 | | | 40,092 |
United Stationers, Inc. | | *† | | 1,521 | | | 56,201 |
Viad Corp. | | † | | 1,307 | | | 33,708 |
Virco Manufacturing Corp. | | † | | 799 | | | 3,987 |
Volt Information Sciences, Inc. | | *† | | 1,251 | | | 14,899 |
Waste Connections, Inc. | | *† | | 4,555 | | | 145,441 |
Watson Wyatt Worldwide, Inc., Class A | | | | 2,570 | | | 135,927 |
Westaff, Inc. | | * | | 942 | | | 1,064 |
| | | | | | | |
| | | | | | | 5,885,376 |
| | | | | | | |
Communications Equipment—1.4% | | | | | | | |
3Com Corp. | | * | | 26,331 | | | 55,822 |
ADC Telecommunications, Inc. | | * | | 7,792 | | | 115,088 |
Adtran, Inc. | | † | | 4,390 | | | 104,658 |
Alliance Fiber Optic Products, Inc. | | * | | 4,818 | | | 6,697 |
AltiGen Communications, Inc. | | * | | 4,110 | | | 4,973 |
Anaren, Inc. | | * | | 2,003 | | | 21,172 |
Arris Group, Inc. | | *† | | 10,285 | | | 86,908 |
Avanex Corp. | | *† | | 14,381 | | | 16,251 |
Avocent Corp. | | * | | 3,935 | | | 73,191 |
Bel Fuse, Inc., Class A | | † | | 546 | | | 15,288 |
Black Box Corp. | | † | | 1,414 | | | 38,447 |
Blonder Tongue Laboratories | | * | | 2,285 | | | 2,742 |
Blue Coat Systems, Inc. | | *† | | 3,077 | | | 43,416 |
CommScope, Inc. | | * | | 4,284 | | | 226,067 |
Comtech Telecommunications Corp. | | * | | 1,350 | | | 66,150 |
Digi International, Inc. | | * | | 2,517 | | | 19,758 |
Digital Angel Corp. | | *† | | 4,675 | | | 3,553 |
Ditech Networks, Inc. | | *† | | 3,980 | | | 8,557 |
EchoStar Corp., Class A | | *† | | 2,696 | | | 84,169 |
EMS Technologies, Inc. | | * | | 960 | | | 20,966 |
EndWave Corp. | | * | | 912 | | | 5,791 |
Entertainment Distribution Co., Inc. | | * | | 5,333 | | | 2,613 |
| | | | |
| | See accompanying notes to financial statements. | | 221 |
SCHEDULE OF INVESTMENTS — (Continued)
June 30, 2008 (Unaudited)
Vantagepoint Mid/Small Company Index Fund
| | | | | | | |
| | | | | Shares | | Value |
COMMON STOCKS—(Continued) | | | | | | | |
Extreme Networks, Inc. | | *† | | 9,940 | | $ | 28,230 |
F5 Networks, Inc. | | *† | | 5,531 | | | 157,191 |
Finisar Corp. | | *† | | 14,726 | | | 17,524 |
Foundry Networks, Inc. | | *† | | 7,848 | | | 92,763 |
Globecomm Systems, Inc. | | *† | | 1,752 | | | 14,472 |
Harmonic, Inc. | | * | | 5,690 | | | 54,112 |
Harris Corp. | | | | 8,826 | | | 445,625 |
Harris Stratex Networks, Inc., Class A | | * | | 1,510 | | | 14,330 |
Infinera Corp. | | * | | 5,223 | | | 46,067 |
Integrated Telecom Express, Inc. | | *‡da | | 1,103 | | | — |
InterDigital, Inc. | | *† | | 3,103 | | | 75,465 |
Ixia | | *† | | 2,330 | | | 16,194 |
KVH Industries, Inc. | | * | | 1,286 | | | 10,712 |
Loral Space & Communications, Inc. | | * | | 660 | | | 11,629 |
MasTec, Inc. | | * | | 3,427 | | | 36,532 |
MRV Communications, Inc. | | * | | 9,278 | | | 11,041 |
NETGEAR, Inc. | | * | | 2,027 | | | 28,094 |
Network Engines, Inc. | | * | | 1,330 | | | 1,556 |
Network Equipment Technologies, Inc. | | *† | | 2,454 | | | 8,712 |
NMS Communications Corp. | | * | | 3,530 | | | 3,918 |
Numerex Corp., Class A | | *† | | 1,800 | | | 13,014 |
Oplink Communications, Inc. | | * | | 1,808 | | | 17,357 |
Optelecom-NKF, Inc. | | *† | | 819 | | | 7,117 |
Optical Cable Corp. | | * | | 241 | | | 1,651 |
Orbcomm, Inc. | | *† | | 3,512 | | | 20,018 |
Parkervision, Inc. | | *† | | 2,943 | | | 29,224 |
Performance Technologies, Inc. | | * | | 794 | | | 4,018 |
Plantronics, Inc. | | | | 3,289 | | | 73,410 |
Polycom, Inc. | | * | | 6,298 | | | 153,419 |
Powerwave Technologies, Inc. | | *† | | 8,448 | | | 35,904 |
Proxim Wireless Corp. | | * | | 2,197 | | | 1,318 |
Radyne Corp. | | * | | 3,166 | | | 36,187 |
Riverbed Technology, Inc. | | *† | | 3,373 | | | 46,278 |
SCM Microsystems, Inc. | | * | | 1,494 | | | 4,482 |
SeaChange International, Inc. | | *† | | 3,359 | | | 24,050 |
Soapstone Networks, Inc. | | * | | 3,392 | | | 12,991 |
Sonus Networks, Inc. | | *† | | 17,431 | | | 59,614 |
Superior Telecom, Inc. | | *‡da | | 2,014 | | | — |
Sycamore Networks, Inc. | | *† | | 14,775 | | | 47,576 |
Symmetricom, Inc. | | * | | 6,110 | | | 23,462 |
Tekelec | | *† | | 3,640 | | | 53,544 |
TeleCorp PCS, Inc. | | *‡da | | 5,508 | | | — |
Tollgrade Communications, Inc. | | * | | 601 | | | 2,699 |
Utstarcom, Inc. | | *† | | 4,666 | | | 25,523 |
Viasat, Inc. | | * | | 1,800 | | | 36,378 |
Westell Technologies, Inc., Class A | | * | | 3,671 | | | 4,956 |
Zhone Technologies, Inc. | | * | | 3,916 | | | 3,054 |
| | | | | | | |
| | | | | | | 2,833,688 |
| | | | | | | |
Computers & Peripherals—1.2% | | | | | | | |
ActivIdentity Corp. | | * | | 5,830 | | | 15,916 |
Adaptec, Inc. | | *† | | 7,841 | | | 25,091 |
Avid Technology, Inc. | | * | | 2,658 | | | 45,159 |
Brocade Communications Systems, Inc. | | * | | 26,133 | | | 215,336 |
Ciprico, Inc. | | * | | 1,658 | | | 2,504 |
Concurrent Computer Corp. | | * | | 7,592 | | | 5,163 |
Cray, Inc. | | *† | | 2,314 | | | 10,737 |
Dataram Corp. | | | | 1,175 | | | 3,067 |
Diebold, Inc. | | † | | 4,322 | | | 153,777 |
Dot Hill Systems Corp. | | * | | 3,866 | | | 9,781 |
Electronics for Imaging, Inc. | | * | | 3,912 | | | 57,115 |
Emulex Corp. | | *† | | 5,273 | | | 61,430 |
Focus Enhancements, Inc. | | * | | 5,319 | | | 1,271 |
Hutchinson Technology, Inc. | | *† | | 2,054 | | | 27,606 |
Hypercom Corp. | | *† | | 4,002 | | | 17,609 |
iGO, Inc. | | *† | | 2,804 | | | 3,533 |
Imation Corp. | | † | | 2,265 | | | 51,914 |
Immersion Corp. | | *† | | 2,824 | | | 19,231 |
InFocus Corp. | | * | | 1,636 | | | 2,454 |
Innovex, Inc. | | * | | 1,922 | | | 1,153 |
Intermec, Inc. | | * | | 3,370 | | | 71,040 |
Intevac, Inc. | | *† | | 3,057 | | | 34,483 |
NCR Corp. | | * | | 11,557 | | | 291,236 |
Novatel Wireless, Inc. | | *† | | 2,949 | | | 32,822 |
Overland Storage, Inc. | | * | | 1,282 | | | 1,500 |
Palm, Inc. | | † | | 5,814 | | | 31,338 |
Presstek, Inc. | | *† | | 2,015 | | | 9,994 |
Quantum Corp. | | * | | 10,382 | | | 14,016 |
Rackable Systems, Inc. | | * | | 1,470 | | | 19,698 |
Rimage Corp. | | *† | | 924 | | | 11,448 |
Seagate Technology (Cayman Islands) | | | | 35,109 | | | 671,635 |
STEC, Inc. | | *† | | 2,756 | | | 28,304 |
Stratasys, Inc. | | *† | | 1,962 | | | 36,219 |
Synaptics, Inc. | | *† | | 1,778 | | | 67,084 |
TransAct Technologies, Inc. | | * | | 889 | | | 7,361 |
Western Digital Corp. | | * | | 14,274 | | | 492,881 |
Zoom Technologies, Inc. | | * | | 2,712 | | | 949 |
| | | | | | | |
| | | | | | | 2,551,855 |
| | | | | | | |
Construction & Engineering—1.3% | | | | | | | |
Aecom Technology Corp. | | * | | 5,041 | | | 163,984 |
Dycom Industries, Inc. | | *† | | 2,716 | | | 39,436 |
Emcor Group, Inc. | | * | | 4,008 | | | 114,348 |
Foster Wheeler Ltd. | | * | | 9,392 | | | 687,025 |
Furmanite Corp. | | * | | 4,100 | | | 32,718 |
Granite Construction, Inc. | | † | | 2,436 | | | 76,807 |
Insituform Technologies, Inc., Class A | | *† | | 2,053 | | | 31,267 |
KBR, Inc. | | | | 10,908 | | | 380,798 |
Layne Christensen Co. | | *† | | 1,240 | | | 54,300 |
Northwest Pipe Co. | | *† | | 630 | | | 35,154 |
Perini Corp. | | * | | 1,755 | | | 58,003 |
Quanta Services, Inc. | | * | | 11,146 | | | 370,827 |
Shaw Group, Inc. (The) | | * | | 4,945 | | | 305,552 |
Sterling Construction Co., Inc. | | * | | 1,015 | | | 20,158 |
URS Corp. | | * | | 5,543 | | | 232,640 |
| | | | | | | |
| | | | | | | 2,603,017 |
| | | | | | | |
Construction Materials—0.2% | | | | | | | |
Eagle Materials, Inc. | | † | | 2,690 | | | 68,138 |
Headwaters, Inc. | | *† | | 2,476 | | | 29,142 |
Martin Marietta Materials, Inc. | | † | | 2,776 | | | 287,566 |
Texas Industries, Inc. | | † | | 1,692 | | | 94,972 |
U.S. Concrete, Inc. | | *† | | 4,770 | | | 22,705 |
| | | | | | | |
| | | | | | | 502,523 |
| | | | | | | |
Consumer Finance—0.2% | | | | | | | |
Advance America Cash Advance Centers, Inc. | | † | | 6,040 | | | 30,683 |
Advanta Corp., Class A | | | | 2,170 | | | 11,848 |
AmeriCredit Corp. | | *† | | 8,206 | | | 70,736 |
Cash America International, Inc. | | | | 1,831 | | | 56,761 |
CompuCredit Corp. | | *† | | 2,840 | | | 17,040 |
Dollar Financial Corp. | | *† | | 1,615 | | | 24,403 |
| | | | |
| 222 | | See accompanying notes to financial statements. | | |
SCHEDULE OF INVESTMENTS — (Continued)
June 30, 2008 (Unaudited)
Vantagepoint Mid/Small Company Index Fund
| | | | | | | |
| | | | | Shares | | Value |
COMMON STOCKS—(Continued) | | | | | | | |
Ezcorp, Inc., Class A | | *† | | 3,000 | | $ | 38,250 |
First Cash Financial Services, Inc. | | * | | 2,180 | | | 32,678 |
First Marblehead Corp. (The) | | † | | 4,118 | | | 10,583 |
Nelnet, Inc., Class A | | † | | 1,351 | | | 15,172 |
Rewards Network, Inc. | | * | | 3,328 | | | 13,678 |
Student Loan Corp. | | † | | 247 | | | 24,226 |
World Acceptance Corp. | | *† | | 1,219 | | | 41,044 |
| | | | | | | |
| | | | | | | 387,102 |
| | | | | | | |
Containers & Packaging—0.8% | | | | | | | |
AEP Industries, Inc. | | * | | 1,109 | | | 19,263 |
Aptargroup, Inc. | | | | 4,315 | | | 181,014 |
Caraustar Industries, Inc. | | * | | 4,270 | | | 12,426 |
Chesapeake Corp. | | *† | | 2,527 | | | 5,938 |
Crown Holdings, Inc. | | * | | 10,020 | | | 260,420 |
Graphic Packaging Holding Co. | | *† | | 5,000 | | | 10,100 |
Greif, Inc., Class A | | | | 2,120 | | | 135,744 |
Myers Industries, Inc. | | | | 1,717 | | | 13,993 |
Owens-Illinois, Inc. | | * | | 10,517 | | | 438,454 |
Packaging Corp of America | | | | 6,379 | | | 137,212 |
Rock-Tenn Co., Class A | | | | 2,634 | | | 78,994 |
Silgan Holdings, Inc. | | | | 1,454 | | | 73,776 |
Smurfit-Stone Container Corp. | | * | | 17,028 | | | 69,304 |
Sonoco Products Co. | | | | 6,754 | | | 209,036 |
Temple-Inland, Inc. | | † | | 6,340 | | | 71,452 |
| | | | | | | |
| | | | | | | 1,717,126 |
| | | | | | | |
Distributors—0.1% | | | | | | | |
Audiovox Corp., Class A | | *† | | 2,945 | | | 28,920 |
Design Within Reach, Inc. | | * | | 1,210 | | | 4,211 |
LKQ Corp. | | * | | 8,036 | | | 145,211 |
Source Interlink Cos, Inc. | | *† | | 5,950 | | | 13,149 |
| | | | | | | |
| | | | | | | 191,491 |
| | | | | | | |
Diversified Consumer Services—0.8% | | | | | | | |
Capella Education Co. | | * | | 734 | | | 43,783 |
Career Education Corp. | | *† | | 6,110 | | | 89,267 |
Coinstar, Inc. | | *† | | 1,725 | | | 56,425 |
Corinthian Colleges, Inc. | | *† | | 6,197 | | | 71,947 |
DeVry, Inc. | | | | 4,153 | | | 222,684 |
Hillenbrand, Inc. | | | | 3,951 | | | 84,551 |
ITT Educational Services, Inc. | | *† | | 2,672 | | | 220,787 |
Jackson Hewitt Tax Service, Inc. | | † | | 1,730 | | | 21,141 |
Matthews International Corp., Class A | | | | 2,314 | | | 104,732 |
Pre-Paid Legal Services, Inc. | | * | | 780 | | | 31,684 |
Princeton Review, Inc. | | * | | 2,409 | | | 16,285 |
Regis Corp. | | | | 2,708 | | | 71,356 |
Service Corp. International | | | | 17,884 | | | 176,336 |
Sotheby’s | | † | | 4,430 | | | 116,819 |
Steiner Leisure Ltd. (Bahamas) | | * | | 990 | | | 28,066 |
Stewart Enterprises, Inc., Class A | | † | | 6,846 | | | 49,291 |
Strayer Education, Inc. | | | | 986 | | | 206,143 |
Universal Technical Institute, Inc. | | *† | | 1,609 | | | 20,048 |
Weight Watchers International, Inc. | | † | | 2,447 | | | 87,138 |
| | | | | | | |
| | | | | | | 1,718,483 |
| | | | | | | |
Diversified Financial Services—0.6% | | | | | | | |
Ampal American Israel, Class A | | *† | | 1,392 | | | 6,278 |
Asset Acceptance Capital Corp. | | † | | 728 | | | 8,896 |
Asta Funding, Inc. | | † | | 650 | | | 5,889 |
Financial Federal Corp. | | † | | 1,515 | | | 33,269 |
Interactive Brokers Group, Inc., Class A | | * | | 2,760 | | | 88,679 |
KKR Financial Holdings LLC | | | | 7,988 | | | 83,874 |
MarketAxess Holdings, Inc. | | *† | | 2,620 | | | 19,807 |
Medallion Financial Corp. | | | | 2,518 | | | 23,720 |
MSCI, Inc., Class A | | * | | 3,194 | | | 115,910 |
Nasdaq OMX Group (The) | | * | | 10,359 | | | 275,031 |
Nymex Holdings, Inc. | | | | 5,707 | | | 482,127 |
Pico Holdings, Inc. | | *† | | 970 | | | 42,147 |
Portfolio Recovery Associates, Inc. | | *† | | 1,413 | | | 52,988 |
Resource America, Inc., Class A | | † | | 1,547 | | | 14,418 |
| | | | | | | |
| | | | | | | 1,253,033 |
| | | | | | | |
Diversified Telecommunication Services—0.5% | | | | | | | |
8x8, Inc. | | *† | | 3,049 | | | 3,476 |
Alaska Communications Systems Group, Inc. | | † | | 2,850 | | | 34,029 |
Cbeyond, Inc. | | *† | | 1,528 | | | 24,479 |
Cincinnati Bell, Inc. | | * | | 16,626 | | | 66,171 |
Cogent Communications Group, Inc. | | * | | 3,453 | | | 46,270 |
Consolidated Communications Holdings, Inc. | | † | | 1,852 | | | 27,576 |
D&E Communications, Inc. | | | | 1,712 | | | 15,220 |
General Communication, Inc., Class A | | * | | 3,847 | | | 26,429 |
Global Crossing Ltd. | | *† | | 2,669 | | | 47,882 |
Hickory Tech Corp. | | | | 652 | | | 5,392 |
Hungarian Telephone & Cable Corp. | | *† | | 712 | | | 12,987 |
IDT Corp., Class B | | *† | | 4,800 | | | 8,160 |
Iowa Telecommunications Services, Inc. | | † | | 2,435 | | | 42,880 |
Level 3 Communications, Inc. | | *† | | 100,356 | | | 296,050 |
NTELOS Holdings Corp. | | | | 1,916 | | | 48,609 |
PAETEC Holding Corp. | | *† | | 7,928 | | | 50,343 |
Premiere Global Services, Inc. | | * | | 3,644 | | | 53,129 |
SureWest Communications | | † | | 1,674 | | | 14,112 |
TW Telecom Inc. | | *† | | 9,693 | | | 155,379 |
XETA Technologies, Inc. | | * | | 1,947 | | | 6,250 |
| | | | | | | |
| | | | | | | 984,823 |
| | | | | | | |
Electric Utilities—1.0% | | | | | | | |
Allete, Inc. | | † | | 1,430 | | | 60,060 |
Central Vermont Public Service Corp. | | † | | 1,553 | | | 30,082 |
Cleco Corp. | | † | | 3,570 | | | 83,288 |
DPL, Inc. | | † | | 7,582 | | | 200,013 |
El Paso Electric Co. | | * | | 3,254 | | | 64,429 |
Empire District Electric Co. (The) | | † | | 3,221 | | | 59,717 |
Great Plains Energy, Inc. | | † | | 5,840 | | | 147,635 |
Hawaiian Electric Industries, Inc. | | † | | 5,657 | | | 139,898 |
Idacorp, Inc. | | † | | 2,665 | | | 76,992 |
ITC Holdings Corp. | | | | 3,175 | | | 162,274 |
MGE Energy, Inc. | | † | | 2,174 | | | 70,916 |
Northeast Utilities | | | | 10,123 | | | 258,440 |
Otter Tail Corp. | | † | | 1,726 | | | 67,021 |
Portland General Electric Co. | | | | 4,370 | | | 98,412 |
Sierra Pacific Resources | | | | 14,732 | | | 187,244 |
UIL Holdings Corp. | | † | | 1,516 | | | 44,586 |
| | | | |
| | See accompanying notes to financial statements. | | 223 |
SCHEDULE OF INVESTMENTS — (Continued)
June 30, 2008 (Unaudited)
Vantagepoint Mid/Small Company Index Fund
| | | | | | | |
| | | | | Shares | | Value |
COMMON STOCKS—(Continued) | | | | | | | |
Unisource Energy Corp. | | | | 2,031 | | $ | 62,981 |
Unitil Corp. | | | | 1,000 | | | 27,110 |
Westar Energy, Inc. | | | | 6,238 | | | 134,179 |
| | | | | | | |
| | | | | | | 1,975,277 |
| | | | | | | |
Electrical Equipment—2.0% | | | | | | | |
A.O. Smith Corp. | | | | 1,478 | | | 48,523 |
Active Power, Inc. | | *† | | 3,953 | | | 4,625 |
Acuity Brands, Inc. | | | | 2,605 | | | 125,248 |
American Superconductor Corp. | | *† | | 2,707 | | | 97,046 |
Ametek, Inc. | | | | 6,970 | | | 329,123 |
AZZ, Inc. | | *† | | 635 | | | 25,337 |
Baldor Electric Co. | | † | | 3,033 | | | 106,094 |
Belden, Inc. | | † | | 2,777 | | | 94,085 |
Brady Corp., Class A | | | | 3,416 | | | 117,954 |
C&D Technologies, Inc. | | * | | 5,424 | | | 45,887 |
Capstone Turbine Corp. | | *† | | 15,089 | | | 63,223 |
Distributed Energy Systems Corp. | | * | | 3,757 | | | 188 |
Encore Wire Corp. | | † | | 1,693 | | | 35,875 |
Energy Conversion Devices, Inc. | | * | | 2,751 | | | 202,584 |
EnerSys | | * | | 2,612 | | | 89,409 |
Evergreen Solar, Inc. | | *† | | 8,143 | | | 78,906 |
First Solar, Inc. | | * | | 2,774 | | | 756,803 |
Franklin Electric Co., Inc. | | | | 902 | | | 34,980 |
FuelCell Energy, Inc. | | *† | | 4,607 | | | 32,710 |
General Cable Corp. | | * | | 3,477 | | | 211,575 |
GrafTech International Ltd. | | * | | 7,538 | | | 202,245 |
Hubbell, Inc., Class B | | | | 3,370 | | | 134,362 |
II-VI, Inc. | | * | | 1,404 | | | 49,028 |
LaBarge, Inc. | | * | | 950 | | | 12,350 |
LSI Industries, Inc. | | † | | 3,003 | | | 24,384 |
Magnetek, Inc. | | * | | 4,586 | | | 19,399 |
Medis Technologies Ltd. | | * | | 1,815 | | | 6,117 |
Microvision, Inc. | | *† | | 5,870 | | | 16,142 |
Orbit International Corp. | | * | | 2,812 | | | 19,543 |
Plug Power, Inc. | | * | | 8,935 | | | 20,997 |
Powell Industries, Inc. | | * | | 1,046 | | | 52,729 |
Power-One, Inc. | | *† | | 3,500 | | | 6,615 |
PowerSecure International, Inc. | | *† | | 2,650 | | | 19,239 |
Regal-Beloit Corp. | | | | 2,256 | | | 95,316 |
Roper Industries, Inc. | | | | 5,764 | | | 379,732 |
Servotronics, Inc. | | | | 705 | | | 10,561 |
Sunpower Corp., Class A | | *† | | 2,448 | | | 176,207 |
Superior Essex, Inc. | | * | | 1,387 | | | 61,902 |
Tech/Ops Sevcon, Inc. | | | | 720 | | | 5,292 |
Thomas & Betts Corp. | | * | | 3,918 | | | 148,296 |
Ultralife Corp. | | * | | 767 | | | 8,199 |
Universal Security Instruments, Inc. | | *† | | 266 | | | 1,503 |
Valence Technology, Inc. | | *† | | 4,773 | | | 21,144 |
Vicor Corp. | | † | | 3,481 | | | 34,740 |
Woodward Governor Co. | | † | | 3,588 | | | 127,948 |
| | | | | | | |
| | | | | | | 4,154,165 |
| | | | | | | |
Electronic Equipment & Instruments—2.3% | | | | | | | |
Acacia Research—Acacia Technologies | | *† | | 5,547 | | | 24,851 |
Aetrium, Inc. | | * | | 614 | | | 1,830 |
Agilysys, Inc. | | † | | 2,266 | | | 25,696 |
American Technology Corp. | | *† | | 3,686 | | | 6,819 |
Amphenol Corp., Class A | | | | 11,446 | | | 513,696 |
Anixter International, Inc. | | *† | | 2,122 | | | 126,238 |
Arrow Electronics, Inc. | | * | | 8,023 | | | 246,467 |
Avnet, Inc. | | * | | 9,644 | | | 263,088 |
AVX Corp. | | | | 4,035 | | | 45,636 |
Benchmark Electronics, Inc. | | * | | 4,125 | | | 67,402 |
Brightpoint, Inc. | | * | | 3,031 | | | 22,126 |
CalAmp Corp. | | * | | 7,372 | | | 15,113 |
Checkpoint Systems, Inc. | | * | | 2,970 | | | 62,014 |
Cogent, Inc. | | *† | | 1,940 | | | 22,058 |
Cognex Corp. | | † | | 3,335 | | | 76,872 |
Coherent, Inc. | | * | | 2,327 | | | 69,554 |
CTS Corp. | | | | 1,580 | | | 15,879 |
Daktronics, Inc. | | † | | 2,300 | | | 46,391 |
Dolby Laboratories, Inc., Class A | | *† | | 2,743 | | | 110,543 |
DTS, Inc. | | *† | | 1,605 | | | 50,269 |
Echelon Corp. | | *† | | 1,770 | | | 19,293 |
Electro Scientific Industries, Inc. | | *† | | 1,422 | | | 20,150 |
Electro-Sensors, Inc. | | | | 2,581 | | | 11,950 |
Excel Technology, Inc. | | *† | | 562 | | | 12,544 |
FARO Technologies, Inc. | | * | | 1,212 | | | 30,506 |
Flir Systems, Inc. | | *† | | 8,602 | | | 348,983 |
Frequency Electronics, Inc. | | | | 822 | | | 5,417 |
Gerber Scientific, Inc. | | * | | 3,478 | | | 39,580 |
ID Systems, Inc. | | * | | 1,146 | | | 7,380 |
Ingram Micro, Inc., Class A | | * | | 10,335 | | | 183,446 |
Insight Enterprises, Inc. | | * | | 2,944 | | | 34,533 |
Iteris, Inc. | | *† | | 4,264 | | | 10,788 |
Itron, Inc. | | *† | | 2,233 | | | 219,616 |
Keithley Instruments, Inc. | | | | 2,170 | | | 20,615 |
Kemet Corp. | | *† | | 5,278 | | | 17,101 |
L-1 Identity Solutions, Inc. | | *† | | 4,772 | | | 63,563 |
LeCroy Corp. | | *† | | 2,720 | | | 24,262 |
Lightpath Technologies, Inc., Class A | | * | | 1,527 | | | 2,306 |
Littelfuse, Inc. | | *† | | 1,479 | | | 46,662 |
LoJack Corp. | | * | | 1,880 | | | 14,965 |
Maxwell Technologies, Inc. | | * | | 3,381 | | | 35,906 |
Measurement Specialties, Inc. | | * | | 1,430 | | | 25,154 |
Mechanical Technology, Inc. | | * | | 654 | | | 817 |
Mercury Computer Systems, Inc. | | *† | | 2,443 | | | 18,396 |
Merix Corp. | | * | | 2,175 | | | 5,002 |
Mesa Laboratories, Inc. | | | | 1,200 | | | 28,800 |
Methode Electronics, Inc. | | | | 2,784 | | | 29,093 |
Mettler Toledo International, Inc. | | * | | 2,418 | | | 229,371 |
MTS Systems Corp. | | † | | 1,370 | | | 49,156 |
National Instruments Corp. | | | | 3,628 | | | 102,926 |
Newport Corp. | | *† | | 3,015 | | | 34,341 |
NU Horizons Electronics Corp. | | * | | 3,069 | | | 14,915 |
OI Corp. | | | | 1,600 | | | 18,544 |
OSI Systems, Inc. | | * | | 867 | | | 18,571 |
Park Electrochemical Corp. | | | | 1,087 | | | 26,425 |
PC Connection, Inc. | | *† | | 2,755 | | | 25,649 |
Photon Dynamics, Inc. | | * | | 2,009 | | | 30,296 |
Planar Systems, Inc. | | * | | 1,786 | | | 4,644 |
Plexus Corp. | | *† | | 3,210 | | | 88,853 |
Radisys Corp. | | *† | | 2,757 | | | 24,978 |
Research Frontiers, Inc. | | *† | | 2,932 | | | 18,501 |
Rofin-Sinar Technologies, Inc. | | *† | | 2,208 | | | 66,682 |
Rogers Corp. | | * | | 1,417 | | | 53,265 |
Sanmina-SCI Corp. | | * | | 39,169 | | | 50,136 |
ScanSource, Inc. | | * | | 1,797 | | | 48,088 |
Sigmatron International, Inc. | | * | | 283 | | | 1,653 |
Smart Modular Technologies WWH, Inc. (Cayman Islands) | | *† | | 2,050 | | | 7,851 |
Spectrum Control, Inc. | | * | | 1,195 | | | 9,799 |
| | | | |
| 224 | | See accompanying notes to financial statements. | | |
SCHEDULE OF INVESTMENTS — (Continued)
June 30, 2008 (Unaudited)
Vantagepoint Mid/Small Company Index Fund
| | | | | | | |
| | | | | Shares | | Value |
COMMON STOCKS—(Continued) | | | | | | | |
SYNNEX Corp. | | *† | | 1,034 | | $ | 25,943 |
Tech Data Corp. | | * | | 3,805 | | | 128,951 |
Technitrol, Inc. | | † | | 2,766 | | | 46,994 |
Trans-Lux Corp. | | * | | 867 | | | 3,121 |
Trimble Navigation Ltd. | | *† | | 7,780 | | | 277,746 |
TTM Technologies, Inc. | | * | | 3,547 | | | 46,856 |
Universal Display Corp. | | *† | | 2,789 | | | 34,360 |
Vishay Intertechnology, Inc. | | * | | 11,318 | | | 100,391 |
X-Rite, Inc. | | *† | | 2,441 | | | 6,249 |
Zygo Corp. | | * | | 2,489 | | | 24,467 |
| | | | | | | |
| | | | | | | 4,709,092 |
| | | | | | | |
Energy Equipment & Services—3.7% | | | | | | | |
Allis-Chalmers Energy, Inc. | | *† | | 2,146 | | | 38,199 |
Atwood Oceanics, Inc. | | * | | 1,881 | | | 233,884 |
Basic Energy Services, Inc. | | *† | | 1,420 | | | 44,730 |
Bolt Technology Corp. | | * | | 645 | | | 14,558 |
Bristow Group, Inc. | | *† | | 1,533 | | | 75,868 |
Bronco Drilling Co., Inc. | | *† | | 1,667 | | | 30,639 |
Cal Dive International, Inc. | | *† | | 3,108 | | | 44,413 |
CARBO Ceramics, Inc. | | † | | 1,582 | | | 92,310 |
Complete Production Services, Inc. | | * | | 3,072 | | | 111,882 |
Dawson Geophysical Co. | | *† | | 930 | | | 55,298 |
Diamond Offshore Drilling, Inc. | | | | 4,270 | | | 594,128 |
Dresser-Rand Group, Inc. | | * | | 5,745 | | | 224,629 |
Dril-Quip, Inc. | | * | | 1,912 | | | 120,456 |
Exterran Holdings, Inc. | | * | | 4,339 | | | 310,195 |
FMC Technologies, Inc. | | * | | 8,454 | | | 650,366 |
Global Industries Ltd. | | * | | 5,289 | | | 94,832 |
Grey Wolf, Inc. | | *† | | 13,740 | | | 124,072 |
Gulfmark Offshore, Inc. | | * | | 1,545 | | | 89,888 |
Helix Energy Solutions Group, Inc. | | * | | 5,589 | | | 232,726 |
Helmerich & Payne, Inc. | | | | 6,351 | | | 457,399 |
Hercules Offshore, Inc. | | * | | 5,476 | | | 208,198 |
Hornbeck Offshore Services, Inc. | | *† | | 1,749 | | | 98,836 |
ION Geophysical Corp. | | *† | | 5,372 | | | 93,741 |
Key Energy Services, Inc. | | * | | 9,195 | | | 178,567 |
Lufkin Industries, Inc. | | | | 1,255 | | | 104,516 |
Matrix Service Co. | | * | | 2,410 | | | 55,575 |
Mitcham Industries, Inc. | | *† | | 1,100 | | | 18,788 |
NATCO Group, Inc., Class A | | *† | | 1,320 | | | 71,980 |
Natural Gas Services Group, Inc. | | * | | 1,260 | | | 38,405 |
Newpark Resources, Inc. | | *† | | 6,294 | | | 49,471 |
Oceaneering International, Inc. | | * | | 3,630 | | | 279,692 |
Oil States International, Inc. | | *† | | 3,412 | | | 216,457 |
OYO Geospace Corp. | | *† | | 550 | | | 32,417 |
Parker Drilling Co. | | *† | | 9,263 | | | 92,723 |
Patterson-UTI Energy, Inc. | | | | 10,334 | | | 372,437 |
PHI, Inc. | | * | | 774 | | | 31,092 |
Pioneer Drilling Co. | | * | | 2,930 | | | 55,113 |
Pride International, Inc. | | * | | 10,885 | | | 514,752 |
RPC, Inc. | | † | | 2,280 | | | 38,304 |
SEACOR Holdings, Inc. | | * | | 1,646 | | | 147,333 |
Sulphco, Inc. | | *† | | 8,130 | | | 18,455 |
Superior Energy Services, Inc. | | * | | 5,436 | | | 299,741 |
T-3 Energy Services, Inc. | | * | | 975 | | | 77,483 |
Tetra Technologies, Inc. | | * | | 5,233 | | | 124,074 |
Tidewater, Inc. | | | | 3,764 | | | 244,773 |
Trico Marine Services, Inc. | | *† | | 1,353 | | | 49,276 |
Unit Corp. | | * | | 3,122 | | | 259,032 |
W-H Energy Services, Inc. | | * | | 2,151 | | | 205,937 |
| | | | | | | |
| | | | | | | 7,617,640 |
| | | | | | | |
Entertainment—0.0% | | | | | | | |
Macrovision Solutions Corp. | | *† | | 5,642 | | | 84,404 |
| | | | | | | |
Food & Staples Retailing—0.4% | | | | | | | |
Andersons, Inc. (The) | | † | | 1,222 | | | 49,748 |
Arden Group, Inc., Class A | | † | | 260 | | | 32,952 |
BJ’s Wholesale Club, Inc. | | * | | 4,027 | | | 155,845 |
Casey’s General Stores, Inc. | | | | 3,169 | | | 73,426 |
Great Atlantic & Pacific Tea Co. | | * | | 2,493 | | | 56,890 |
Longs Drug Stores Corp. | | † | | 2,310 | | | 97,274 |
Nash Finch Co. | | † | | 1,190 | | | 40,781 |
Nyer Medical Group, Inc. | | * | | 2,533 | | | 3,698 |
Pantry, Inc. (The) | | * | | 2,139 | | | 22,802 |
Rite Aid Corp. | | * | | 32,808 | | | 52,165 |
Ruddick Corp. | | | | 2,548 | | | 87,422 |
Spartan Stores, Inc. | | | | 1,780 | | | 40,940 |
United Natural Foods, Inc. | | *† | | 2,888 | | | 56,258 |
Weis Markets, Inc. | | † | | 852 | | | 27,664 |
Winn-Dixie Stores, Inc. | | *† | | 4,340 | | | 69,527 |
| | | | | | | |
| | | | | | | 867,392 |
| | | | | | | |
Food Products—1.3% | | | | | | | |
Bridgford Foods Corp. | | * | | 560 | | | 3,511 |
Bunge Ltd. | | | | 7,866 | | | 847,090 |
Calavo Growers, Inc. | | † | | 1,225 | | | 15,006 |
Chiquita Brands International, Inc. | | *† | | 3,049 | | | 46,253 |
Corn Products International, Inc. | | | | 4,935 | | | 242,358 |
Darling International, Inc. | | * | | 4,873 | | | 80,502 |
Del Monte Foods Co. | | | | 13,700 | | | 97,270 |
Diamond Foods, Inc. | | | | 1,375 | | | 31,680 |
Farmer Bros Co. | | † | | 930 | | | 19,670 |
Flowers Foods, Inc. | | | | 5,145 | | | 145,809 |
Fresh Del Monte Produce, Inc. (Cayman Islands) | | * | | 2,755 | | | 64,935 |
Green Mountain Coffee Roasters, Inc. | | *† | | 1,500 | | | 56,355 |
Griffin Land & Nurseries, Inc. | | | | 650 | | | 19,955 |
Hain Celestial Group, Inc. | | *† | | 2,166 | | | 50,858 |
Hormel Foods Corp. | | | | 4,471 | | | 154,741 |
Inventure Group, Inc. (The) | | *† | | 683 | | | 1,175 |
J.M. Smucker Co. (The) | | | | 3,896 | | | 158,333 |
John B. Sanfilippo & Son, Inc. | | * | | 370 | | | 3,236 |
Lancaster Colony Corp. | | † | | 1,510 | | | 45,723 |
Lance, Inc. | | | | 2,511 | | | 47,132 |
Omega Protein Corp. | | *† | | 1,515 | | | 22,649 |
Pilgrim’s Pride Corp. | | | | 3,351 | | | 43,530 |
Ralcorp Holdings, Inc. | | *† | | 1,618 | | | 79,994 |
Sanderson Farms, Inc. | | | | 1,537 | | | 53,057 |
Seaboard Corp. | | † | | 23 | | | 35,673 |
Smithfield Foods, Inc. | | *† | | 8,467 | | | 168,324 |
Tootsie Roll Industries, Inc. | | † | | 1,765 | | | 44,354 |
TreeHouse Foods, Inc. | | * | | 2,074 | | | 50,315 |
| | | | | | | |
| | | | | | | 2,629,488 |
| | | | | | | |
Gas Utilities—1.5% | | | | | | | |
AGL Resources, Inc. | | | | 5,318 | | | 183,896 |
AmeriGas Partners LP | | | | 2,300 | | | 73,255 |
Atmos Energy Corp. | | | | 6,081 | | | 167,653 |
Chesapeake Utilities Corp. | | | | 1,039 | | | 26,723 |
Delta Natural Gas Co., Inc. | | | | 380 | | | 9,926 |
Energen Corp. | | | | 4,319 | | | 337,012 |
EnergySouth, Inc. | | † | | 520 | | | 25,511 |
| | | | |
| | See accompanying notes to financial statements. | | 225 |
SCHEDULE OF INVESTMENTS — (Continued)
June 30, 2008 (Unaudited)
Vantagepoint Mid/Small Company Index Fund
| | | | | | | |
| | | | | Shares | | Value |
COMMON STOCKS—(Continued) | | | | | | | |
Equitable Resources, Inc. | | | | 8,019 | | $ | 553,792 |
Ferrellgas Partners, LP | | | | 2,612 | | | 51,404 |
Laclede Group, Inc. (The) | | † | | 1,170 | | | 47,233 |
National Fuel Gas Co. | | | | 4,695 | | | 279,259 |
New Jersey Resources Corp. | | † | | 2,941 | | | 96,024 |
Northwest Natural Gas Co. | | | | 1,634 | | | 75,589 |
Oneok, Inc. | | | | 6,102 | | | 297,961 |
Piedmont Natural Gas Co. | | | | 4,965 | | | 129,884 |
South Jersey Industries, Inc. | | | | 1,794 | | | 67,024 |
Southern Union Co. | | | | 6,540 | | | 176,711 |
Southwest Gas Corp. | | | | 3,043 | | | 90,468 |
Suburban Propane Partners LP | | | | 2,323 | | | 88,808 |
UGI Corp. | | | | 7,088 | | | 203,496 |
WGL Holdings, Inc. | | † | | 3,492 | | | 121,312 |
| | | | | | | |
| | | | | | | 3,102,941 |
| | | | | | | |
Health Care Equipment & Supplies—2.4% | | | | | | | |
Abaxis, Inc. | | *† | | 1,864 | | | 44,978 |
Abiomed, Inc. | | *† | | 2,606 | | | 46,257 |
Advanced Medical Optics, Inc. | | * | | 4,249 | | | 79,626 |
Align Technology, Inc. | | *† | | 4,029 | | | 42,264 |
American Medical Systems Holdings, Inc. | | *† | | 5,369 | | | 80,267 |
Analogic Corp. | | | | 884 | | | 55,754 |
Angiodynamics, Inc. | | *† | | 2,450 | | | 33,369 |
Arthrocare Corp. | | *† | | 1,902 | | | 77,621 |
Aspect Medical Systems, Inc. | | *† | | 2,322 | | | 14,605 |
Beckman Coulter, Inc. | | | | 4,161 | | | 280,992 |
Bioject Medical Technologies, Inc. | | * | | 4,491 | | | 1,841 |
Biolase Technology, Inc. | | * | | 3,105 | | | 10,619 |
Candela Corp. | | * | | 2,794 | | | 6,510 |
Cantel Medical Corp. | | * | | 1,690 | | | 17,103 |
Cardiac Science Corp. | | * | | 1,600 | | | 13,120 |
Cerus Corp. | | *† | | 3,201 | | | 13,092 |
Clarient, Inc. | | *† | | 3,308 | | | 6,682 |
Clinical Data, Inc. | | *† | | 1,998 | | | 28,512 |
Conceptus, Inc. | | * | | 2,419 | | | 44,727 |
Conmed Corp. | | * | | 2,086 | | | 55,383 |
Cooper Cos, Inc. (The) | | | | 3,206 | | | 119,103 |
CryoLife, Inc. | | *† | | 4,037 | | | 46,183 |
Cutera, Inc. | | *† | | 1,264 | | | 11,414 |
Cyberonics, Inc. | | * | | 2,351 | | | 51,017 |
Cynosure, Inc., Class A | | *† | | 772 | | | 15,301 |
Datascope Corp. | | | | 1,121 | | | 52,687 |
Dentsply International, Inc. | | | | 9,343 | | | 343,822 |
DexCom, Inc. | | * | | 3,175 | | | 19,177 |
Edwards Lifesciences Corp. | | * | | 3,660 | | | 227,066 |
Endologix, Inc. | | * | | 1,350 | | | 3,119 |
EP Medsystems, Inc. | | * | | 5,240 | | | 15,615 |
ev3, Inc. | | *† | | 5,996 | | | 56,842 |
Gen-Probe, Inc. | | * | | 3,465 | | | 164,518 |
Greatbatch, Inc. | | * | | 1,594 | | | 27,576 |
Haemonetics Corp. | | * | | 1,865 | | | 103,433 |
HealthTronics, Inc. | | * | | 2,530 | | | 8,273 |
Hill-Rom Holdings, Inc. | | † | | 3,951 | | | 106,598 |
Hologic, Inc. | | *† | | 16,598 | | | 361,836 |
ICU Medical, Inc. | | *† | | 1,096 | | | 25,077 |
Idexx Laboratories, Inc. | | * | | 4,146 | | | 202,076 |
I-Flow Corp. | | *† | | 2,590 | | | 26,289 |
Immucor, Inc. | | *† | | 4,745 | | | 122,801 |
Integra LifeSciences Holdings Corp. | | * | | 1,190 | | | 52,931 |
Invacare Corp. | | † | | 1,874 | | | 38,305 |
Inverness Medical Innovations, Inc. | | * | | 4,339 | | | 143,925 |
IRIS International, Inc. | | *† | | 2,570 | | | 40,221 |
Kensey Nash Corp. | | * | | 867 | | | 27,787 |
Kinetic Concepts, Inc. | | *† | | 3,605 | | | 143,876 |
Masimo Corp. | | * | | 2,580 | | | 88,623 |
Medical Action Industries, Inc. | | * | | 1,860 | | | 19,288 |
Mentor Corp. | | † | | 2,401 | | | 66,796 |
Meridian Bioscience, Inc. | | † | | 2,700 | | | 72,684 |
Merit Medical Systems, Inc. | | *† | | 2,509 | | | 36,882 |
Micrus Endovascular Corp. | | *† | | 1,353 | | | 18,969 |
Natus Medical, Inc. | | * | | 1,717 | | | 35,954 |
NuVasive, Inc. | | *† | | 2,738 | | | 122,279 |
NxStage Medical, Inc. | | *† | | 3,660 | | | 14,054 |
OraSure Technologies, Inc. | | * | | 4,328 | | | 16,187 |
Orthofix International NV | | *† | | 1,020 | | | 29,529 |
Osteotech, Inc. | | * | | 1,499 | | | 8,529 |
Palomar Medical Technologies, Inc. | | *† | | 1,117 | | | 11,148 |
Quidel Corp. | | * | | 2,820 | | | 46,586 |
Resmed, Inc. | | *† | | 5,166 | | | 184,633 |
Rochester Medical Corp. | | *† | | 870 | | | 9,065 |
RTI Biologics, Inc. | | *† | | 3,227 | | | 28,236 |
Sirona Dental Systems, Inc. | | *† | | 1,040 | | | 26,957 |
Somanetics Corp. | | *† | | 1,572 | | | 33,326 |
Sonic Innovations, Inc. | | *† | | 2,950 | | | 9,853 |
SonoSite, Inc. | | * | | 1,650 | | | 46,217 |
Spectranetics Corp. | | *† | | 3,376 | | | 33,287 |
Staar Surgical Co. | | * | | 2,688 | | | 8,333 |
STERIS Corp. | | | | 4,157 | | | 119,555 |
SurModics, Inc. | | *† | | 1,185 | | | 53,135 |
Synovis Life Technologies, Inc. | | * | | 957 | | | 18,020 |
Theragenics Corp. | | * | | 5,822 | | | 21,134 |
ThermoGenesis Corp. | | *† | | 4,317 | | | 6,044 |
Thoratec Corp. | | *† | | 3,337 | | | 58,030 |
TomoTherapy, Inc. | | * | | 1,340 | | | 11,966 |
Urologix, Inc. | | * | | 1,050 | | | 1,922 |
Vision-Sciences, Inc. | | *† | | 4,110 | | | 15,413 |
Vital Signs, Inc. | | † | | 635 | | | 36,055 |
West Pharmaceutical Services, Inc. | | | | 2,425 | | | 104,954 |
Wright Medical Group, Inc. | | *† | | 2,180 | | | 61,934 |
Young Innovations, Inc. | | | | 677 | | | 14,095 |
Zoll Medical Corp. | | * | | 1,232 | | | 41,482 |
| | | | | | | |
| | | | | | | 5,041,344 |
| | | | | | | |
Health Care Providers & Services—2.2% | | | | | | | |
Access Plans USA, Inc. | | * | | 3,538 | | | 2,954 |
Alliance Imaging, Inc. | | *† | | 1,820 | | | 15,779 |
Amedisys, Inc. | | *† | | 1,560 | | | 78,655 |
America Service Group, Inc. | | * | | 1,972 | | | 18,044 |
American Dental Partners, Inc. | | *† | | 1,668 | | | 19,799 |
Amerigroup Corp. | | * | | 4,191 | | | 87,173 |
AMN Healthcare Services, Inc. | | * | | 2,247 | | | 38,019 |
Amsurg Corp. | | * | | 2,315 | | | 56,370 |
Apria Healthcare Group, Inc. | | * | | 2,542 | | | 49,289 |
Bio-Reference Labs, Inc. | | *† | | 1,000 | | | 22,310 |
BioScrip, Inc. | | * | | 3,476 | | | 9,003 |
Brookdale Senior Living, Inc. | | | | 2,392 | | | 48,701 |
Capital Senior Living Corp. | | *† | | 2,245 | | | 16,927 |
Centene Corp. | | * | | 2,702 | | | 45,367 |
Chemed Corp. | | | | 1,472 | | | 53,890 |
Chindex International, Inc. | | *† | | 1,527 | | | 22,401 |
Community Health Systems, Inc. | | * | | 6,485 | | | 213,875 |
Cross Country Healthcare, Inc. | | *† | | 2,631 | | | 37,913 |
DaVita, Inc. | | * | | 6,879 | | | 365,481 |
Emergency Medical Services Corp., Class A | | *† | | 758 | | | 17,154 |
Five Star Quality Care, Inc. | | *† | | 4,500 | | | 21,285 |
| | | | |
| 226 | | See accompanying notes to financial statements. | | |
SCHEDULE OF INVESTMENTS — (Continued)
June 30, 2008 (Unaudited)
Vantagepoint Mid/Small Company Index Fund
| | | | | | | |
| | | | | Shares | | Value |
COMMON STOCKS—(Continued) | | | | | | | |
Gentiva Health Services, Inc. | | *† | | 2,330 | | $ | 44,387 |
Hanger Orthopedic Group, Inc. | | * | | 3,263 | | | 53,807 |
Health Management Associates, Inc., Class A | | * | | 14,732 | | | 95,905 |
Health Net, Inc. | | * | | 6,938 | | | 166,928 |
HealthExtras, Inc. | | * | | 2,673 | | | 80,564 |
Healthsouth Corp. | | *† | | 5,951 | | | 98,965 |
Healthspring, Inc. | | * | | 4,297 | | | 72,533 |
Healthways, Inc. | | * | | 2,272 | | | 67,251 |
Henry Schein, Inc. | | * | | 5,826 | | | 300,447 |
inVentiv Health, Inc. | | *† | | 2,050 | | | 56,969 |
Kindred Healthcare, Inc. | | * | | 2,053 | | | 59,044 |
Landauer, Inc. | | | | 599 | | | 33,688 |
LifePoint Hospitals, Inc. | | *† | | 4,098 | | | 115,973 |
Lincare Holdings, Inc. | | * | | 4,990 | | | 141,716 |
Magellan Health Services, Inc. | | * | | 2,460 | | | 91,094 |
Medical Staffing Network Holdings, Inc. | | * | | 1,686 | | | 6,508 |
Molina Healthcare, Inc. | | * | | 1,190 | | | 28,965 |
MWI Veterinary Supply, Inc. | | * | | 908 | | | 30,064 |
National Healthcare Corp. | | † | | 890 | | | 40,789 |
National Research Corp. | | | | 1,250 | | | 33,087 |
NovaMed, Inc. | | * | | 4,904 | | | 18,488 |
Odyssey HealthCare, Inc. | | * | | 3,093 | | | 30,126 |
Omnicare, Inc. | | † | | 8,076 | | | 211,753 |
Owens & Minor, Inc. | | † | | 2,882 | | | 131,679 |
PDI, Inc. | | * | | 703 | | | 6,123 |
Pediatrix Medical Group, Inc. | | * | | 3,274 | | | 161,179 |
PharMerica Corp. | | *† | | 2,249 | | | 50,805 |
Providence Service Corp. (The) | | *† | | 1,639 | | | 34,599 |
PSS World Medical, Inc. | | *† | | 4,966 | | | 80,946 |
Psychemedics Corp. | | | | 902 | | | 14,793 |
Psychiatric Solutions, Inc. | | *† | | 3,778 | | | 142,960 |
RehabCare Group, Inc. | | * | | 1,590 | | | 25,488 |
Res-Care, Inc. | | * | | 2,426 | | | 43,134 |
Rural/Metro Corp. | | *† | | 1,600 | | | 3,232 |
Skilled Healthcare Group, Inc., Class A | | * | | 1,556 | | | 20,882 |
Sun Healthcare Group, Inc. | | * | | 3,022 | | | 40,465 |
Sunrise Senior Living, Inc. | | *† | | 2,650 | | | 59,572 |
U.S. Physical Therapy, Inc. | | * | | 2,083 | | | 34,182 |
United American Healthcare Corp. | | *† | | 4,252 | | | 8,504 |
Universal American Corp. | | *† | | 2,892 | | | 29,556 |
Universal Health Services, Inc., Class B | | | | 3,491 | | | 220,701 |
VCA Antech, Inc. | | *† | | 5,600 | | | 155,568 |
WellCare Health Plans, Inc. | | * | | 2,578 | | | 93,195 |
| | | | | | | |
| | | | | | | 4,477,003 |
| | | | | | | |
Health Care Technology—0.3% | | | | | | | |
Allscripts Healthcare Solutions, Inc. | | *† | | 5,116 | | | 63,490 |
AMICAS, Inc. | | * | | 2,496 | | | 7,089 |
Cerner Corp. | | *† | | 4,231 | | | 191,157 |
Computer Programs & Systems, Inc. | | | | 1,065 | | | 18,456 |
Eclipsys Corp. | | *† | | 3,465 | | | 63,617 |
HLTH Corp. | | * | | 12,463 | | | 141,081 |
Mediware Information Systems | | * | | 1,089 | | | 6,371 |
Merge Healthcare, Inc. | | * | | 4,320 | | | 5,011 |
Omnicell, Inc. | | *† | | 2,638 | | | 34,769 |
Phase Forward, Inc. | | * | | 2,752 | | | 49,453 |
Trizetto Group, Inc. | | * | | 2,710 | | | 57,940 |
Vital Images, Inc. | | *† | | 1,498 | | | 18,635 |
| | | | | | | |
| | | | | | | 657,069 |
| | | | | | | |
Home Builders—0.0% | | | | | | | |
Woodbridge Holdings Corp. | | * | | 2,063 | | | 2,393 |
| | | | | | | |
Hotels, Restaurants & Leisure—1.9% | | | | | | | |
AFC Enterprises | | *† | | 2,170 | | | 17,338 |
Ambassadors Group, Inc. | | † | | 1,380 | | | 20,590 |
Ambassadors International, Inc. | | *† | | 524 | | | 2,295 |
Ameristar Casinos, Inc. | | † | | 1,420 | | | 19,624 |
Bally Technologies, Inc. | | * | | 3,012 | | | 101,806 |
Benihana, Inc., Class A | | *† | | 680 | | | 4,311 |
Bluegreen Corp. | | *† | | 1,800 | | | 10,890 |
Bob Evans Farms, Inc. | | † | | 2,055 | | | 58,773 |
Boyd Gaming Corp. | | † | | 3,538 | | | 44,437 |
Brinker International, Inc. | | | | 6,752 | | | 127,613 |
Buffalo Wild Wings, Inc. | | *† | | 1,120 | | | 27,810 |
Burger King Holdings, Inc. | | | | 4,648 | | | 124,520 |
California Pizza Kitchen, Inc. | | * | | 2,265 | | | 25,345 |
CBRL Group, Inc. | | † | | 1,879 | | | 46,054 |
CEC Entertainment, Inc. | | * | | 1,994 | | | 55,852 |
Cedar Fair, LP | | | | 3,180 | | | 59,752 |
Cheesecake Factory (The) | | *† | | 4,778 | | | 76,018 |
Chipotle Mexican Grill, Inc., Class A | | *† | | 2,125 | | | 175,568 |
Choice Hotels International, Inc. | | | | 2,346 | | | 62,169 |
Churchill Downs, Inc. | | † | | 639 | | | 22,282 |
CKE Restaurants, Inc. | | | | 4,056 | | | 50,578 |
Cosi, Inc. | | *† | | 3,120 | | | 7,831 |
Domino’s Pizza, Inc. | | *† | | 2,750 | | | 31,625 |
Dover Downs Gaming & Entertainment, Inc. | | † | | 1,687 | | | 10,831 |
Dover Motorsports, Inc. | | † | | 1,645 | | | 8,373 |
Empire Resorts, Inc. | | *† | | 2,513 | | | 7,363 |
Gaylord Entertainment Co. | | *† | | 2,528 | | | 60,571 |
Great Wolf Resorts, Inc. | | *† | | 3,072 | | | 13,425 |
International Speedway Corp., Class A | | | | 2,450 | | | 95,623 |
Isle of Capri Casinos, Inc. | | *† | | 1,251 | | | 5,992 |
Jack in the Box, Inc. | | * | | 3,756 | | | 84,172 |
Jamba, Inc. | | *† | | 4,465 | | | 8,260 |
Krispy Kreme Doughnuts, Inc. | | *† | | 5,000 | | | 24,950 |
Landry’s Restaurants, Inc. | | | | 1,254 | | | 22,534 |
Las Vegas Sands Corp. | | *† | | 6,998 | | | 331,985 |
Life Time Fitness, Inc. | | *† | | 2,354 | | | 69,561 |
Luby’s, Inc. | | * | | 3,380 | | | 20,618 |
Marcus Corp. | | | | 1,805 | | | 26,985 |
McCormick & Schmick’s Seafood Restaurants, Inc. | | *† | | 1,401 | | | 13,506 |
MGM Mirage | | * | | 7,376 | | | 249,973 |
Monarch Casino & Resort, Inc. | | *† | | 700 | | | 8,260 |
Morgans Hotel Group Co. | | *† | | 2,390 | | | 24,617 |
MTR Gaming Group, Inc. | | *† | | 4,525 | | | 21,584 |
Multimedia Games, Inc. | | *† | | 2,902 | | | 12,827 |
O’Charleys, Inc. | | | | 3,157 | | | 31,759 |
Orient-Express Hotels Ltd., Class A (Bermuda) | | † | | 2,744 | | | 119,199 |
P.F. Chang’s China Bistro, Inc. | | *† | | 1,496 | | | 33,421 |
Panera Bread Co., Class A | | * | | 1,900 | | | 87,894 |
Papa John’s International, Inc. | | *† | | 1,581 | | | 42,039 |
Peet’s Coffee & Tea, Inc. | | *† | | 1,297 | | | 25,707 |
Penn National Gaming, Inc. | | * | | 4,893 | | | 157,310 |
Pinnacle Entertainment, Inc. | | *† | | 4,289 | | | 44,992 |
Progressive Gaming International Corp. | | * | | 7,390 | | | 9,237 |
Red Robin Gourmet Burgers, Inc. | | *† | | 1,203 | | | 33,371 |
Royal Caribbean Cruises Ltd. | | † | | 9,195 | | | 206,612 |
Ruby Tuesday, Inc. | | † | | 3,481 | | | 18,797 |
| | | | |
| | See accompanying notes to financial statements. | | 227 |
SCHEDULE OF INVESTMENTS — (Continued)
June 30, 2008 (Unaudited)
Vantagepoint Mid/Small Company Index Fund
| | | | | | | |
| | | | | Shares | | Value |
COMMON STOCKS—(Continued) | | | | | | | |
Scientific Games Corp., Class A | | *† | | 4,772 | | $ | 141,347 |
Shuffle Master, Inc. | | *† | | 5,440 | | | 26,874 |
Six Flags, Inc. | | *† | | 3,814 | | | 4,386 |
Sonic Corp. | | *† | | 4,259 | | | 63,033 |
Speedway Motorsports, Inc. | | | | 650 | | | 13,247 |
Steak N Shake Co. (The) | | *† | | 2,198 | | | 13,913 |
Texas Roadhouse, Inc., Class A | | *† | | 4,130 | | | 37,046 |
Triarc Cos, Inc., Class B | | † | | 4,026 | | | 25,485 |
Trump Entertainment Resorts, Inc. | | * | | 2,320 | | | 4,431 |
Vail Resorts, Inc. | | *† | | 1,891 | | | 80,992 |
WMS Industries, Inc. | | *† | | 2,775 | | | 82,612 |
Wynn Resorts Ltd. | | † | | 4,001 | | | 325,481 |
Youbet.com, Inc. | | * | | 2,200 | | | 2,794 |
| | | | | | | |
| | | | | | | 3,927,070 |
| | | | | | | |
Household Durables—0.9% | | | | | | | |
American Greetings Corp., Class A | | † | | 3,420 | | | 42,203 |
Bassett Furniture Industries, Inc. | | | | 610 | | | 7,198 |
Beazer Homes USA, Inc. | | † | | 2,117 | | | 11,792 |
Blyth, Inc. | | | | 1,634 | | | 19,657 |
Brookfield Homes Corp. | | † | | 858 | | | 10,536 |
California Coastal Communities, Inc. | | *† | | 1,028 | | | 3,927 |
Cavco Industries, Inc. | | *† | | 470 | | | 15,383 |
Champion Enterprises, Inc. | | *† | | 6,043 | | | 35,351 |
CSS Industries, Inc. | | | | 420 | | | 10,172 |
Ethan Allen Interiors, Inc. | | † | | 1,648 | | | 40,541 |
Furniture Brands International, Inc. | | | | 4,572 | | | 61,082 |
Garmin Ltd. (Cayman Islands) | | † | | 8,199 | | | 351,245 |
Helen of Troy Ltd. (Bermuda) | | * | | 2,105 | | | 33,933 |
Hooker Furniture Corp. | | † | | 1,125 | | | 19,485 |
Hovnanian Enterprises, Inc., Class A | | * | | 3,491 | | | 19,131 |
Jarden Corp. | | *† | | 4,170 | | | 76,061 |
La-Z-Boy, Inc., Class Z | | † | | 2,895 | | | 22,147 |
Lenox Group, Inc. | | * | | 1,340 | | | 348 |
Libbey, Inc. | | † | | 2,250 | | | 16,740 |
M/I Homes, Inc. | | | | 1,741 | | | 27,386 |
MDC Holdings, Inc. | | | | 2,535 | | | 99,017 |
Meritage Homes Corp. | | * | | 2,628 | | | 39,867 |
Mohawk Industries, Inc. | | *† | | 3,596 | | | 230,504 |
National Presto Industries, Inc. | | † | | 656 | | | 42,102 |
NVR, Inc. | | *† | | 328 | | | 164,026 |
Palm Harbor Homes, Inc. | | *† | | 1,182 | | | 6,536 |
Russ Berrie & Co., Inc. | | *† | | 1,157 | | | 9,221 |
Ryland Group, Inc. | | | | 3,067 | | | 66,891 |
Sealy Corp. | | † | | 2,640 | | | 15,153 |
Skyline Corp. | | † | | 918 | | | 21,573 |
Standard Pacific Corp. | | | | 10,118 | | | 34,199 |
Syntax-Brillian Corp. | | *† | | 4,531 | | | 2,356 |
Tempur-Pedic International, Inc. | | † | | 4,765 | | | 37,215 |
Toll Brothers, Inc. | | * | | 9,179 | | | 171,923 |
Tupperware Brands Corp. | | | | 3,940 | | | 134,827 |
Universal Electronics, Inc. | | * | | 1,589 | | | 33,210 |
WCI Communities, Inc. | | *† | | 6,851 | | | 9,934 |
| | | | | | | |
| | | | | | | 1,942,872 |
| | | | | | | |
Household Products—0.3% | | | | | | | |
Central Garden and Pet Co. | | *† | | 3,162 | | | 14,387 |
Central Garden and Pet Co., Class A | | * | | 2,770 | | | 11,357 |
Church & Dwight Co., Inc. | | | | 4,402 | | | 248,053 |
Energizer Holdings, Inc. | | * | | 3,713 | | | 271,383 |
Spectrum Brands, Inc. | | * | | 6,161 | | | 15,711 |
WD-40 Co. | | | | 950 | | | 27,787 |
| | | | | | | |
| | | | | | | 588,678 |
| | | | | | | |
Independent Power Producers & Energy Traders—1.1% | | | | | | | |
Calpine Corp. | | * | | 25,040 | | | 564,902 |
Mirant Corp. | | *† | | 14,922 | | | 584,196 |
NRG Energy, Inc. | | * | | 15,465 | | | 663,449 |
Ormat Technologies, Inc. | | | | 1,195 | | | 58,770 |
Reliant Energy, Inc. | | * | | 22,733 | | | 483,531 |
| | | | | | | |
| | | | | | | 2,354,848 |
| | | | | | | |
Industrial Conglomerates—0.8% | | | | | | | |
Carlisle Cos, Inc. | | | | 4,292 | | | 124,468 |
Icahn Enterprises LP | | | | 533 | | | 37,491 |
McDermott International, Inc. | | * | | 14,863 | | | 919,871 |
Raven Industries, Inc. | | † | | 1,490 | | | 48,842 |
Standex International Corp. | | † | | 724 | | | 15,016 |
Teleflex, Inc. | | | | 2,631 | | | 146,257 |
Tredegar Corp. | | | | 1,607 | | | 23,623 |
Walter Industries, Inc. | | | | 3,281 | | | 356,875 |
| | | | | | | |
| | | | | | | 1,672,443 |
| | | | | | | |
Insurance—7.5% | | | | | | | |
Alleghany Corp. | | * | | 328 | | | 108,912 |
Allied World Assurance Co. Holdings Ltd. (Bermuda) | | | | 3,096 | | | 122,664 |
American Financial Group, Inc. | | | | 4,187 | | | 112,002 |
American Independence Corp. | | * | | 430 | | | 2,752 |
American National Insurance Co. | | | | 1,095 | | | 107,332 |
American Physicians Capital, Inc. | | | | 1,201 | | | 58,176 |
American Safety Insurance Holdings Ltd. (Bermuda) | | * | | 1,082 | | | 15,559 |
Arch Capital Group Ltd. (Bermuda) | | * | | 2,876 | | | 190,736 |
Argo Group International Holdings Ltd. (Bermuda) | | * | | 1,884 | | | 63,227 |
Arthur J. Gallagher & Co. | | † | | 6,047 | | | 145,733 |
Aspen Insurance Holdings Ltd. | | | | 5,236 | | | 123,936 |
Assured Guaranty Ltd. (Bermuda) | | | | 4,137 | | | 74,425 |
Axis Capital Holdings Ltd. (Bermuda) | | † | | 9,232 | | | 275,206 |
Baldwin & Lyons, Inc., Class B | | | | 946 | | | 16,536 |
Berkshire Hathaway, Inc., Class A | | | | 68 | | | 8,211,000 |
Brown & Brown, Inc. | | | | 7,747 | | | 134,720 |
Citizens, Inc. | | * | | 2,504 | | | 15,350 |
CNA Financial Corp. | | † | | 1,883 | | | 47,357 |
CNA Surety Corp. | | *† | | 1,486 | | | 18,783 |
Conseco, Inc. | | * | | 12,970 | | | 128,662 |
Crawford & Co., Class B | | *† | | 1,891 | | | 15,109 |
Delphi Financial Group, Inc., Class A | | † | | 2,972 | | | 68,772 |
Donegal Group, Inc., Class B | | † | | 759 | | | 13,704 |
EMC Insurance Group, Inc. | | † | | 1,041 | | | 25,067 |
Employers Holdings, Inc. | | | | 3,690 | | | 76,383 |
Endurance Specialty Holdings Ltd. | | | | 3,634 | | | 111,891 |
Erie Indemnity Co., Class A | | | | 3,264 | | | 150,634 |
Everest Re Group Ltd. (Bermuda) | | | | 4,133 | | | 329,441 |
FBL Financial Group, Inc., Class A | | | | 1,058 | | | 21,033 |
| | | | |
| 228 | | See accompanying notes to financial statements. | | |
SCHEDULE OF INVESTMENTS — (Continued)
June 30, 2008 (Unaudited)
Vantagepoint Mid/Small Company Index Fund
| | | | | | | |
| | | | | Shares | | Value |
COMMON STOCKS—(Continued) | | | | | | | |
Fidelity National Financial, Inc., Class A | | | | 15,066 | | $ | 189,832 |
First American Corp. | | | | 5,058 | | | 133,531 |
FPIC Insurance Group, Inc. | | * | | 1,050 | | | 47,586 |
Greenlight Capital Re Ltd., Class A (Cayman Islands) | | *† | | 1,960 | | | 44,806 |
Hanover Insurance Group, Inc. (The) | | | | 3,548 | | | 150,790 |
Harleysville Group, Inc. | | | | 1,278 | | | 43,235 |
HCC Insurance Holdings, Inc. | | | | 7,571 | | | 160,051 |
Hilb Rogal & Hobbs Co. | | | | 2,629 | | | 114,256 |
Hilltop Holdings, Inc. | | * | | 3,923 | | | 40,446 |
Horace Mann Educators Corp. | | | | 3,101 | | | 43,476 |
Independence Holding Co. | | † | | 963 | | | 9,409 |
Infinity Property & Casualty Corp. | | | | 1,280 | | | 53,146 |
IPC Holdings Ltd. | | | | 4,430 | | | 117,616 |
Kansas City Life Insurance Co. | | | | 903 | | | 37,700 |
LandAmerica Financial Group, Inc. | | † | | 1,087 | | | 24,121 |
Markel Corp. | | * | | 657 | | | 241,119 |
Max Capital Group Ltd. (Bermuda) | | | | 3,010 | | | 64,203 |
Mercury General Corp. | | † | | 1,639 | | | 76,574 |
Montpelier Re Holdings Ltd. (Bermuda) | | † | | 5,770 | | | 85,108 |
National Financial Partners Corp. | | † | | 2,348 | | | 46,537 |
Nationwide Financial Services, Class A | | | | 3,334 | | | 160,065 |
Navigators Group, Inc. | | * | | 939 | | | 50,753 |
Odyssey Re Holdings Corp. | | † | | 1,814 | | | 64,397 |
Old Republic International Corp. | | | | 15,561 | | | 184,242 |
OneBeacon Insurance Group Ltd. (Bermuda) | | | | 2,457 | | | 43,169 |
PartnerRe Ltd. (Bermuda) | | | | 3,786 | | | 261,726 |
Penn Treaty American Corp. | | * | | 1,630 | | | 7,889 |
Philadelphia Consolidated Holding Co. | | * | | 4,115 | | | 139,787 |
Phoenix Cos, Inc. (The) | | | | 6,807 | | | 51,801 |
Platinum Underwriters Holdings Ltd. (Bermuda) | | | | 4,036 | | | 131,614 |
PMA Capital Corp., Class A | | *† | | 1,826 | | | 16,817 |
Presidential Life Corp. | | † | | 2,568 | | | 39,599 |
ProAssurance Corp. | | *† | | 2,078 | | | 99,973 |
Protective Life Corp. | | | | 4,733 | | | 180,091 |
Reinsurance Group of America, Inc. | | | | 1,841 | | | 80,120 |
RenaissanceRe Holdings Ltd. (Bermuda) | | | | 4,464 | | | 199,407 |
RLI Corp. | | † | | 1,602 | | | 79,251 |
Safety Insurance Group, Inc. | | | | 1,040 | | | 37,076 |
SCPIE Holdings, Inc. | | * | | 690 | | | 19,313 |
Security Capital Assurance Ltd. (Bermuda) | | † | | 3,744 | | | 1,086 |
Selective Insurance Group | | † | | 3,400 | | | 63,784 |
StanCorp Financial Group, Inc. | | | | 3,075 | | | 144,402 |
State Auto Financial Corp. | | | | 958 | | | 22,925 |
Stewart Information Services Corp. | | | | 1,684 | | | 32,569 |
Tower Group, Inc. | | † | | 2,119 | | | 44,902 |
Transatlantic Holdings, Inc. | | | | 1,615 | | | 91,199 |
United Fire & Casualty Co. | | | | 1,472 | | | 39,641 |
Unitrin, Inc. | | | | 3,311 | | | 91,284 |
Validus Holdings Ltd. (Bermuda) | | † | | 2,110 | | | 44,838 |
W.R. Berkley Corp. | | | | 10,659 | | | 257,521 |
Wesco Financial Corp. | | | | 115 | | | 43,930 |
White Mountains Insurance Group Ltd. | | | | 532 | | | 228,228 |
Zenith National Insurance Corp. | | † | | 2,791 | | | 98,132 |
| | | | | | | |
| | | | | | | 15,560,175 |
| | | | | | | |
Internet & Catalog Retail—0.5% | | | | | | | |
1-800-FLOWERS.COM, Inc., Class A | | *† | | 2,113 | | | 13,629 |
Blue Nile, Inc. | | *† | | 1,063 | | | 45,199 |
Bluefly, Inc. | | * | | 234 | | | 962 |
dELiA*s, Inc. | | * | | 2,555 | | | 5,136 |
drugstore.com, Inc. | | * | | 3,800 | | | 7,220 |
GSI Commerce, Inc. | | * | | 1,470 | | | 20,036 |
Hollywood Media Corp. | | *† | | 1,495 | | | 3,663 |
Liberty Media Corp.—Interactive, Class A | | * | | 38,530 | | | 568,703 |
NetFlix, Inc. | | *† | | 3,659 | | | 95,390 |
NutriSystem, Inc. | | † | | 1,970 | | | 27,856 |
Overstock.com, Inc. | | * | | 771 | | | 20,007 |
priceline.com, Inc. | | * | | 2,301 | | | 265,673 |
Stamps.com, Inc. | | * | | 2,642 | | | 32,972 |
Valuevision Media, Inc., Class A | | * | | 6,193 | | | 22,109 |
| | | | | | | |
| | | | | | | 1,128,555 |
| | | | | | | |
Internet Software & Services—0.8% | | | | | | | |
Ariba, Inc. | | *† | | 6,761 | | | 99,454 |
Art Technology Group, Inc. | | * | | 8,335 | | | 26,672 |
Autobytel, Inc. | | *† | | 4,755 | | | 6,752 |
Bankrate, Inc. | | *† | | 1,084 | | | 42,352 |
Chordiant Software, Inc. | | * | | 1,859 | | | 9,295 |
CMGI, Inc. | | *† | | 3,461 | | | 36,687 |
DealerTrack Holdings, Inc. | | *† | | 2,690 | | | 37,956 |
Digital River, Inc. | | *† | | 2,337 | | | 90,162 |
Earthlink, Inc. | | *† | | 8,664 | | | 74,944 |
Entrust, Inc. | | *† | | 7,470 | | | 21,962 |
Equinix, Inc. | | *† | | 2,047 | | | 182,633 |
Greenfield Online, Inc. | | * | | 3,133 | | | 46,744 |
I-many, Inc. | | *† | | 952 | | | 952 |
Imergent, Inc. | | † | | 1,043 | | | 12,349 |
Infospace, Inc. | | | | 2,262 | | | 18,843 |
Internap Network Services Corp. | | *† | | 3,720 | | | 17,410 |
Internet Capital Group, Inc. | | *† | | 3,445 | | | 26,630 |
Interwoven, Inc. | | * | | 3,812 | | | 45,782 |
Intraware, Inc. | | * | | 783 | | | 3,289 |
Ipass, Inc. | | *† | | 6,163 | | | 12,757 |
j2 Global Communications, Inc. | | * | | 3,065 | | | 70,495 |
Jupitermedia Corp. | | * | | 4,020 | | | 5,628 |
Keynote Systems, Inc. | | * | | 1,400 | | | 18,032 |
Knot, Inc. (The) | | * | | 3,458 | | | 33,819 |
LivePerson, Inc. | | *† | | 3,334 | | | 9,369 |
Looksmart Ltd. | | *† | | 4,010 | | | 16,120 |
Marchex, Inc., Class B | | † | | 2,710 | | | 33,387 |
MIVA, Inc. | | * | | 6,581 | | | 6,976 |
Move, Inc. | | * | | 12,712 | | | 29,619 |
NaviSite, Inc. | | *† | | 3,725 | | | 14,155 |
NIC, Inc. | | † | | 2,450 | | | 16,734 |
Omniture, Inc. | | *† | | 4,717 | | | 87,595 |
On2 Technologies, Inc. | | *† | | 4,620 | | | 2,818 |
Openwave Systems, Inc. | | *† | | 4,311 | | | 6,423 |
Perficient, Inc. | | *† | | 2,090 | | | 20,189 |
RealNetworks, Inc. | | *† | | 5,844 | | | 38,570 |
S1 Corp. | | * | | 5,886 | | | 44,557 |
| | | | |
| | See accompanying notes to financial statements. | | 229 |
SCHEDULE OF INVESTMENTS — (Continued)
June 30, 2008 (Unaudited)
Vantagepoint Mid/Small Company Index Fund
| | | | | | | |
| | | | | Shares | | Value |
COMMON STOCKS—(Continued) | | | | | | | |
Saba Software, Inc. | | *† | | 1,576 | | $ | 5,059 |
SAVVIS, Inc. | | *† | | 1,629 | | | 21,030 |
SonicWALL, Inc. | | * | | 4,632 | | | 29,876 |
Terremark Worldwide, Inc. | | *† | | 3,200 | | | 17,472 |
Tumbleweed Communications Corp. | | *† | | 2,952 | | | 7,734 |
United Online, Inc. | | † | | 4,189 | | | 42,016 |
Valueclick, Inc. | | *† | | 6,880 | | | 104,232 |
Vignette Corp. | | *† | | 2,329 | | | 27,948 |
VistaPrint Ltd. | | *† | | 2,857 | | | 76,453 |
Vocus, Inc. | | *† | | 1,701 | | | 54,721 |
WebMD Health Corp., Class A | | *† | | 510 | | | 14,229 |
Websense, Inc. | | *† | | 2,638 | | | 44,424 |
Website Pros, Inc. | | * | | 1,785 | | | 14,869 |
Zix Corp. | | *† | | 12,056 | | | 33,516 |
| | | | | | | |
| | | | | | | 1,761,690 |
| | | | | | | |
IT Services—4.0% | | | | | | | |
Accenture Ltd., Class A (Bermuda) | | | | 39,318 | | | 1,601,029 |
Acxiom Corp. | | † | | 4,224 | | | 48,534 |
Alliance Data Systems Corp. | | * | | 5,128 | | | 289,988 |
BearingPoint, Inc. | | *† | | 16,170 | | | 13,098 |
Broadridge Financial Solutions, Inc. | | | | 9,336 | | | 196,523 |
CACI International, Inc., Class A | | * | | 2,174 | | | 99,504 |
Ciber, Inc. | | *† | | 2,445 | | | 15,183 |
CSG Systems International, Inc. | | * | | 2,623 | | | 28,906 |
Cybersource Corp. | | * | | 5,414 | | | 90,576 |
DST Systems, Inc. | | * | | 3,068 | | | 168,893 |
Edgewater Technology, Inc. | | * | | 1,533 | | | 7,374 |
Euronet Worldwide, Inc. | | *† | | 2,924 | | | 49,416 |
Forrester Research, Inc. | | *† | | 963 | | | 29,737 |
Gartner, Inc., Class A | | * | | 4,089 | | | 84,724 |
Gevity HR, Inc. | | † | | 4,914 | | | 26,437 |
Global Payments, Inc. | | | | 5,385 | | | 250,941 |
Hackett Group, Inc. (The) | | * | | 2,851 | | | 16,365 |
Heartland Payment Systems, Inc. | | † | | 1,720 | | | 40,592 |
Hewitt Associates, Inc., Class A | | * | | 6,066 | | | 232,510 |
iGATE Corp. | | *† | | 2,997 | | | 24,366 |
Integral Systems, Inc. | | † | | 1,178 | | | 45,589 |
Iron Mountain, Inc. | | *† | | 11,900 | | | 315,945 |
Lionbridge Technologies, Inc. | | *† | | 7,889 | | | 20,354 |
Management Network Group, Inc. | | * | | 1,600 | | | 2,304 |
Mantech International Corp., Class A | | *† | | 1,168 | | | 56,204 |
Mastercard, Inc., Class A | | | | 4,656 | | | 1,236,261 |
MAXIMUS, Inc. | | † | | 1,558 | | | 54,250 |
Metavante Technologies, Inc. | | * | | 7,182 | | | 162,457 |
MoneyGram International, Inc. | | | | 5,957 | | | 5,373 |
NeuStar, Inc., Class A | | *† | | 4,678 | | | 100,858 |
Online Resources Corp. | | *† | | 2,780 | | | 23,213 |
Perot Systems Corp., Class A | | *† | | 5,641 | | | 84,671 |
Pfsweb, Inc. | | * | | 1,209 | | | 5,803 |
Safeguard Scientifics, Inc. | | *† | | 10,874 | | | 13,484 |
SAIC, Inc. | | * | | 11,236 | | | 233,821 |
Sapient Corp. | | *† | | 4,601 | | | 29,538 |
SRA International, Inc., Class A | | * | | 3,081 | | | 69,199 |
StarTek, Inc. | | * | | 1,875 | | | 17,625 |
Syntel, Inc. | | † | | 647 | | | 21,817 |
TeleTech Holdings, Inc. | | * | | 2,499 | | | 49,880 |
TNS, Inc. | | *† | | 1,539 | | | 36,874 |
VeriFone Holdings, Inc. | | * | | 4,060 | | | 48,517 |
Visa, Inc., Class A | | * | | 29,194 | | | 2,373,764 |
Wright Express Corp. | | * | | 2,520 | | | 62,496 |
| | | | | | | |
| | | | | | | 8,384,993 |
| | | | | | | |
Leisure Equipment & Products—0.2% | | | | | | | |
Arctic Cat, Inc. | | † | | 1,738 | | | 13,643 |
Brunswick Corp. | | † | | 5,723 | | | 60,664 |
Callaway Golf Co. | | † | | 3,931 | | | 46,504 |
Concord Camera Corp. | | * | | 572 | | | 2,048 |
Fairchild Corp. (The), Class A | | * | | 3,266 | | | 6,891 |
Jakks Pacific, Inc. | | * | | 2,425 | | | 52,986 |
Leapfrog Enterprises, Inc. | | *† | | 3,363 | | | 27,980 |
Meade Instruments Corp. | | * | | 1,640 | | | 1,476 |
Nautilus, Inc. | | | | 2,480 | | | 12,599 |
Polaris Industries, Inc. | | † | | 2,511 | | | 101,394 |
Pool Corp. | | † | | 2,836 | | | 50,367 |
RC2 Corp. | | * | | 1,530 | | | 28,397 |
Steinway Musical Instruments | | * | | 683 | | | 18,031 |
Sturm Ruger & Co., Inc. | | *† | | 2,146 | | | 15,151 |
| | | | | | | |
| | | | | | | 438,131 |
| | | | | | | |
Life Sciences Tools & Services—1.3% | | | | | | | |
Accelrys, Inc. | | * | | 3,326 | | | 16,065 |
Affymetrix, Inc. | | * | | 4,310 | | | 44,350 |
Albany Molecular Research, Inc. | | * | | 1,371 | | | 18,193 |
AMAG Pharmaceuticals, Inc. | | *† | | 1,051 | | | 35,839 |
Bio-Rad Laboratories, Inc., Class A | | * | | 1,338 | | | 108,231 |
Bruker Corp. | | *† | | 4,130 | | | 53,071 |
Caliper Life Sciences, Inc. | | *† | | 3,187 | | | 8,254 |
Cambrex Corp. | | *† | | 2,958 | | | 17,363 |
Charles River Laboratories International, Inc. | | * | | 4,497 | | | 287,448 |
Covance, Inc. | | * | | 4,206 | | | 361,800 |
Dionex Corp. | | * | | 1,309 | | | 86,878 |
Enzo Biochem, Inc. | | * | | 2,553 | | | 28,645 |
eResearchTechnology, Inc. | | * | | 4,314 | | | 75,236 |
Exelixis, Inc. | | *† | | 6,955 | | | 34,775 |
Illumina, Inc. | | * | | 3,446 | | | 300,181 |
Interleukin Genetics, Inc. | | * | | 2,825 | | | 3,362 |
Invitrogen Corp. | | * | | 6,250 | | | 245,375 |
Kendle International, Inc. | | * | | 790 | | | 28,701 |
Luminex Corp. | | *† | | 3,213 | | | 66,027 |
Medivation, Inc. | | *† | | 2,987 | | | 35,336 |
Nanogen, Inc. | | * | | 2,280 | | | 866 |
Nektar Therapeutics | | * | | 8,780 | | | 29,413 |
Ore Pharmaceuticals, Inc. | | * | | 190 | | | 251 |
Parexel International Corp. | | *† | | 3,688 | | | 97,031 |
Pharmaceutical Product Development, Inc. | | | | 6,933 | | | 297,426 |
PharmaNet Development Group, Inc. | | * | | 1,036 | | | 16,338 |
Sequenom, Inc. | | *† | | 3,594 | | | 57,360 |
Techne Corp. | | * | | 2,532 | | | 195,952 |
Varian, Inc. | | * | | 2,067 | | | 105,541 |
| | | | | | | |
| | | | | | | 2,655,308 |
| | | | | | | |
Machinery—3.5% | | | | | | | |
3D Systems Corp. | | *† | | 1,159 | | | 11,010 |
Actuant Corp., Class A | | † | | 3,968 | | | 124,397 |
AGCO Corp. | | * | | 6,022 | | | 315,613 |
Albany International Corp., Class A | | † | | 2,060 | | | 59,740 |
Ampco-Pittsburgh Corp. | | | | 986 | | | 43,857 |
Astec Industries, Inc. | | *† | | 1,322 | | | 42,489 |
| | | | |
| 230 | | See accompanying notes to financial statements. | | |
SCHEDULE OF INVESTMENTS — (Continued)
June 30, 2008 (Unaudited)
Vantagepoint Mid/Small Company Index Fund
| | | | | | | |
| | | | | Shares | | Value |
COMMON STOCKS—(Continued) | | | | | | | |
Axsys Technologies, Inc. | | * | | 885 | | $ | 46,055 |
Badger Meter, Inc. | | † | | 880 | | | 44,466 |
Barnes Group, Inc. | | † | | 3,373 | | | 77,883 |
Blount International, Inc. | | * | | 2,743 | | | 31,846 |
Briggs & Stratton Corp. | | | | 3,124 | | | 39,612 |
Bucyrus International, Inc., Class A | | | | 4,926 | | | 359,697 |
Cascade Corp. | | † | | 779 | | | 32,967 |
Chart Industries, Inc. | | * | | 1,742 | | | 84,731 |
CIRCOR International, Inc. | | | | 1,232 | | | 60,356 |
Clarcor, Inc. | | | | 3,469 | | | 121,762 |
Colfax Corp. | | * | | 1,231 | | | 30,886 |
Columbus McKinnon Corp. | | * | | 1,765 | | | 42,501 |
Commercial Vehicle Group, Inc. | | * | | 3,457 | | | 32,323 |
Crane Co. | | | | 3,212 | | | 123,758 |
Donaldson Co., Inc. | | | | 4,695 | | | 209,585 |
Dynamic Materials Corp. | | † | | 875 | | | 28,831 |
EnPro Industries, Inc. | | * | | 1,474 | | | 55,039 |
ESCO Technologies, Inc. | | *† | | 1,724 | | | 80,890 |
Federal Signal Corp. | | † | | 3,130 | | | 37,560 |
Flow International Corp. | | *† | | 3,379 | | | 26,356 |
Flowserve Corp. | | | | 3,762 | | | 514,265 |
Force Protection, Inc. | | *† | | 3,780 | | | 12,512 |
FreightCar America, Inc. | | † | | 930 | | | 33,015 |
Gardner Denver, Inc. | | * | | 3,267 | | | 185,566 |
Gehl Co. | | *† | | 995 | | | 14,716 |
Gorman-Rupp Co. (The) | | † | | 1,890 | | | 75,298 |
Graco, Inc. | | † | | 4,074 | | | 155,097 |
Graham Corp. | | | | 441 | | | 32,683 |
Greenbrier Cos, Inc. | | | | 1,195 | | | 24,259 |
Harsco Corp. | | | | 5,522 | | | 300,452 |
Hurco Cos, Inc. | | *† | | 750 | | | 23,168 |
IDEX Corp. | | | | 5,417 | | | 199,562 |
Joy Global, Inc. | | | | 7,113 | | | 539,379 |
Kadant, Inc. | | * | | 1,553 | | | 35,098 |
Kaydon Corp. | | † | | 1,780 | | | 91,510 |
Kennametal, Inc. | | | | 5,158 | | | 167,893 |
L.B. Foster Co., Class A | | *† | | 951 | | | 31,573 |
Lincoln Electric Holdings, Inc. | | | | 2,766 | | | 217,684 |
Lindsay Corp. | | | | 628 | | | 53,361 |
Lydall, Inc. | | * | | 2,150 | | | 26,983 |
Middleby Corp. | | *† | | 980 | | | 43,032 |
Mueller Industries, Inc. | | † | | 2,172 | | | 69,938 |
Mueller Water Products, Inc., Class A | | | | 5,532 | | | 44,643 |
Mueller Water Products, Inc., Class B | | † | | 4,149 | | | 35,432 |
NACCO Industries, Inc., Class A | | | | 310 | | | 23,049 |
NN, Inc. | | | | 2,240 | | | 31,226 |
Nordson Corp. | | | | 1,942 | | | 141,552 |
Oshkosh Corp. | | † | | 4,859 | | | 100,533 |
Paragon Technologies, Inc. | | * | | 900 | | | 5,490 |
Pentair, Inc. | | | | 6,763 | | | 236,840 |
RBC Bearings, Inc. | | * | | 1,322 | | | 44,049 |
Robbins & Myers, Inc. | | | | 1,736 | | | 86,574 |
Spire Corp. | | *† | | 1,921 | | | 23,974 |
SPX Corp. | | | | 3,498 | | | 460,792 |
Tecumseh Products Co., Class A | | * | | 1,703 | | | 55,824 |
Tennant Co. | | † | | 1,394 | | | 41,918 |
Timken Co. | | | | 4,943 | | | 162,822 |
Titan International, Inc. | | | | 1,768 | | | 62,976 |
Toro Co. | | † | | 2,570 | | | 85,504 |
Trinity Industries, Inc. | | † | | 5,371 | | | 186,320 |
TurboChef Technologies, Inc. | | * | | 4,027 | | | 19,249 |
Valmont Industries, Inc. | | † | | 1,162 | | | 121,185 |
Wabash National Corp. | | † | | 2,596 | | | 19,626 |
Wabtec Corp. | | † | | 3,117 | | | 151,549 |
Watts Water Technologies, Inc., Class A | | | | 1,839 | | | 45,791 |
| | | | | | | |
| | | | | | | 7,198,172 |
| | | | | | | |
Marine—0.4% | | | | | | | |
Alexander & Baldwin, Inc. | | | | 2,992 | | | 136,286 |
American Commercial Lines, Inc. | | *† | | 2,906 | | | 31,763 |
Eagle Bulk Shipping, Inc. | | † | | 3,076 | | | 90,957 |
Excel Maritime Carriers Ltd. (Liberia) | | | | 2,506 | | | 98,360 |
Genco Shipping & Trading Ltd. | | | | 2,073 | | | 135,160 |
Kirby Corp. | | * | | 3,585 | | | 172,080 |
OceanFreight, Inc. | | | | 1,037 | | | 24,027 |
TBS International Ltd., Class A (Bermuda) | | *† | | 929 | | | 37,113 |
| | | | | | | |
| | | | | | | 725,746 |
| | | | | | | |
Media—2.7% | | | | | | | |
4Kids Entertainment, Inc. | | * | | 2,466 | | | 18,273 |
Acme Communications, Inc. | | * | | 1,200 | | | 1,656 |
AH Belo Corp., Class A | | † | | 3,861 | | | 22,008 |
Alloy, Inc. | | * | | 462 | | | 3,340 |
Arbitron, Inc. | | † | | 2,121 | | | 100,747 |
Beasley Broadcasting Group, Inc., Class A | | | | 1,150 | | | 5,255 |
Belo Corp., Class A | | † | | 6,361 | | | 46,499 |
Cablevision Systems Corp., Class A | | * | | 14,877 | | | 336,220 |
Carmike Cinemas, Inc. | | | | 1,009 | | | 5,923 |
Charter Communications, Inc., Class A | | *† | | 28,067 | | | 29,470 |
Citadel Broadcasting Corp. | | *† | | 11,863 | | | 14,473 |
CKX, Inc. | | * | | 6,718 | | | 58,782 |
Clear Channel Outdoor Holdings, Inc., Class A | | *† | | 2,470 | | | 44,040 |
Cox Radio, Inc., Class A | | *† | | 3,253 | | | 38,385 |
Crown Media Holdings, Inc., Class A | | *† | | 4,399 | | | 20,851 |
Cumulus Media, Inc., Class A | | * | | 3,854 | | | 15,185 |
Discovery Holding Co., Class A | | * | | 18,159 | | | 398,772 |
DISH Network Corp., Class A | | * | | 13,480 | | | 394,694 |
DreamWorks Animation SKG, Inc., Class A | | * | | 5,002 | | | 149,110 |
Emmis Communications Corp., Class A | | *† | | 4,461 | | | 11,242 |
Entercom Communications Corp., Class A | | † | | 1,873 | | | 13,148 |
Entravision Communications Corp., Class A | | * | | 4,930 | | | 19,819 |
Getty Images, Inc. | | * | | 3,670 | | | 124,523 |
Gray Television, Inc. | | † | | 3,878 | | | 11,130 |
Harris Interactive, Inc. | | *† | | 6,590 | | | 13,246 |
Harte-Hanks, Inc. | | | | 3,759 | | | 43,041 |
Hearst-Argyle Television, Inc. | | † | | 1,654 | | | 31,757 |
Idearc, Inc. | | | | 9,584 | | | 22,522 |
Image Entertainment, Inc. | | * | | 300 | | | 282 |
Interactive Data Corp. | | | | 2,351 | | | 59,081 |
John Wiley & Sons, Inc., Class A | | | | 3,091 | | | 139,188 |
Journal Communications, Inc., Class A | | † | | 3,220 | | | 15,520 |
Lamar Advertising Co., Class A | | *† | | 4,390 | | | 158,172 |
Lee Enterprises, Inc. | | † | | 6,600 | | | 26,334 |
| | | | |
| | See accompanying notes to financial statements. | | 231 |
SCHEDULE OF INVESTMENTS — (Continued)
June 30, 2008 (Unaudited)
Vantagepoint Mid/Small Company Index Fund
| | | | | | | |
| | | | | Shares | | Value |
COMMON STOCKS—(Continued) | | | | | | | |
Liberty Global, Inc. | | * | | 300 | | $ | 9,108 |
Liberty Global, Inc., Class A | | * | | 22,898 | | | 719,684 |
Liberty Media Corp.—Capital, Series A, Class A | | * | | 8,284 | | | 119,290 |
Liberty Media Corp.—Entertainment, Series A | | * | | 33,136 | | | 802,885 |
LIN TV Corp., Class A | | *† | | 2,390 | | | 14,244 |
Live Nation, Inc. | | *† | | 5,574 | | | 58,973 |
Martha Stewart Living Omnimedia, Class A | | *† | | 1,860 | | | 13,764 |
Marvel Entertainment, Inc. | | * | | 2,901 | | | 93,238 |
McClatchy Co., Class A | | † | | 3,506 | | | 23,771 |
Media General, Inc., Class A | | † | | 1,595 | | | 19,060 |
Mediacom Communications Corp., Class A | | *† | | 3,433 | | | 18,332 |
Morningstar, Inc. | | * | | 1,058 | | | 76,208 |
National CineMedia, Inc. | | † | | 3,917 | | | 41,755 |
National Lampoon, Inc. | | * | | 3,300 | | | 5,280 |
Navarre Corp. | | * | | 6,720 | | | 11,021 |
New Frontier Media, Inc. | | | | 2,079 | | | 8,129 |
Playboy Enterprises, Inc., Class B | | *† | | 1,251 | | | 6,180 |
Primedia, Inc. | | † | | 1,508 | | | 7,027 |
R.H. Donnelley Corp. | | *† | | 4,669 | | | 14,007 |
Radio One, Inc., Class A | | *† | | 4,327 | | | 6,101 |
Radio Unica Communications Corp. | | *‡da | | 1,900 | | | — |
RCN Corp. | | *† | | 2,170 | | | 23,393 |
Regal Entertainment Group, Class A | | † | | 4,903 | | | 74,918 |
Regent Communications, Inc. | | * | | 3,610 | | | 3,236 |
Salem Communications Corp., Class A | | | | 850 | | | 1,674 |
Scholastic Corp. | | *† | | 2,095 | | | 60,043 |
Sinclair Broadcast Group, Inc., Class A | | † | | 4,220 | | | 32,072 |
Sirius Satellite Radio, Inc. | | *† | | 87,151 | | | 167,330 |
Spanish Broadcasting System, Inc., Class A | | *† | | 4,320 | | | 4,925 |
Time Warner Cable, Inc., Class A | | * | | 10,268 | | | 271,897 |
Valassis Communications, Inc. | | *† | | 4,011 | | | 50,218 |
Value Line, Inc. | | | | 573 | | | 19,052 |
Virgin Media, Inc. | | | | 19,047 | | | 259,230 |
Warner Music Group Corp. | | † | | 2,380 | | | 16,993 |
Westwood One, Inc. | | *† | | 16,919 | | | 20,980 |
World Wrestling Entertainment, Inc., Class A | | † | | 1,031 | | | 15,950 |
XM Satellite Radio Holdings, Inc., Class A | | * | | 20,116 | | | 157,709 |
Young Broadcasting, Inc., Class A | | * | | 831 | | | 116 |
| | | | | | | |
| | | | | | | 5,640,481 |
| | | | | | | |
Metals & Mining—1.8% | | | | | | | |
AMCOL International Corp. | | † | | 1,767 | | | 50,289 |
Brush Engineered Materials, Inc. | | *† | | 1,805 | | | 44,078 |
Carpenter Technology Corp. | | | | 3,068 | | | 133,918 |
Century Aluminum Co. | | *† | | 1,797 | | | 119,483 |
Cleveland-Cliffs, Inc. | | | | 5,942 | | | 708,227 |
Coeur d’Alene Mines Corp. | | *† | | 37,188 | | | 107,845 |
Commercial Metals Co. | | | | 8,014 | | | 302,128 |
Compass Minerals International, Inc. | | | | 2,020 | | | 162,731 |
Esmark, Inc. | | *† | | 2,709 | | | 51,796 |
Haynes International, Inc. | | *† | | 1,057 | | | 60,830 |
Hecla Mining Co. | | *† | | 8,305 | | | 76,904 |
Kaiser Aluminum Corp. | | | | 1,080 | | | 57,813 |
Olympic Steel, Inc. | | † | | 630 | | | 47,830 |
Reliance Steel & Aluminum Co. | | | | 4,201 | | | 323,855 |
Rock of Ages Corp. | | * | | 1,387 | | | 4,591 |
Royal Gold, Inc. | | | | 2,716 | | | 85,174 |
RTI International Metals, Inc. | | *† | | 1,370 | | | 48,800 |
Schnitzer Steel Industries, Inc., Class A | | | | 1,484 | | | 170,066 |
Southern Copper Corp. | | † | | 4,741 | | | 505,533 |
Steel Dynamics, Inc. | | | | 12,591 | | | 491,930 |
Stillwater Mining Co. | | *† | | 4,292 | | | 50,774 |
Universal Stainless & Alloy Products, Inc. | | *† | | 500 | | | 18,520 |
Worthington Industries, Inc. | | † | | 4,120 | | | 84,460 |
| | | | | | | |
| | | | | | | 3,707,575 |
| | | | | | | |
Multiline Retail—0.2% | | | | | | | |
99 Cents Only Stores | | *† | | 5,211 | | | 34,393 |
Dollar Tree, Inc. | | * | | 6,490 | | | 212,158 |
Fred’s, Inc., Class A | | † | | 3,463 | | | 38,924 |
Retail Ventures, Inc. | | * | | 5,577 | | | 25,654 |
Saks, Inc. | | *† | | 8,548 | | | 93,857 |
Tuesday Morning Corp. | | * | | 1,816 | | | 7,464 |
| | | | | | | |
| | | | | | | 412,450 |
| | | | | | | |
Multi-Utilities—1.3% | | | | | | | |
Alliant Energy Corp. | | | | 6,922 | | | 237,148 |
Aquila, Inc. | | * | | 23,560 | | | 88,821 |
Avista Corp. | | † | | 3,418 | | | 73,350 |
Black Hills Corp. | | † | | 2,648 | | | 84,895 |
CH Energy Group, Inc. | | † | | 1,074 | | | 38,202 |
Energy East Corp. | | | | 10,428 | | | 257,780 |
MDU Resources Group, Inc. | | | | 11,080 | | | 386,249 |
NorthWestern Corp. | | | | 2,859 | | | 72,676 |
NSTAR | | | | 6,464 | | | 218,612 |
OGE Energy Corp. | | † | | 6,120 | | | 194,065 |
PNM Resources, Inc. | | † | | 4,834 | | | 57,815 |
Puget Energy, Inc. | | | | 7,924 | | | 190,097 |
SCANA Corp. | | | | 6,955 | | | 257,335 |
Vectren Corp. | | | | 5,280 | | | 164,789 |
Wisconsin Energy Corp. | | | | 7,661 | | | 346,430 |
| | | | | | | |
| | | | | | | 2,668,264 |
| | | | | | | |
Office Electronics—0.1% | | | | | | | |
Zebra Technologies Corp., Class A | | * | | 4,673 | | | 152,527 |
| | | | | | | |
Oil, Gas & Consumable Fuels—9.0% | | | | | | | |
Abraxas Petroleum Corp. | | *† | | 7,445 | | | 40,277 |
Adams Resources & Energy, Inc. | | | | 1,462 | | | 49,562 |
Alliance Resource Partners LP | | | | 1,280 | | | 71,270 |
Alpha Natural Resources, Inc. | | * | | 4,616 | | | 481,403 |
American Oil & Gas, Inc. | | * | | 4,104 | | | 16,088 |
APCO Argentina, Inc. (Cayman Islands) | | † | | 2,488 | | | 72,028 |
Arch Coal, Inc. | | | | 9,365 | | | 702,656 |
Arena Resources, Inc. | | * | | 2,280 | | | 120,430 |
Arlington Tankers Ltd. | | † | | 1,590 | | | 36,920 |
Atlas America, Inc. | | | | 2,823 | | | 127,176 |
Atlas Energy Resources LLC | | † | | 1,862 | | | 71,035 |
Atlas Pipeline Partners LP | | | | 2,391 | | | 93,392 |
ATP Oil & Gas Corp. | | *† | | 1,989 | | | 78,506 |
Aurora Oil & Gas Corp. | | *† | | 12,100 | | | 5,203 |
Berry Petroleum Co., Class A | | † | | 2,362 | | | 139,075 |
Bill Barrett Corp. | | * | | 2,112 | | | 125,474 |
| | | | |
| 232 | | See accompanying notes to financial statements. | | |
SCHEDULE OF INVESTMENTS — (Continued)
June 30, 2008 (Unaudited)
Vantagepoint Mid/Small Company Index Fund
| | | | | | | |
| | | | | Shares | | Value |
COMMON STOCKS—(Continued) | | | | | | | |
Blue Dolphin Energy Co. | | * | | 3,650 | | $ | 7,738 |
Boardwalk Pipeline Partners LP | | | | 2,501 | | | 58,748 |
Bois d’Arc Energy, Inc. | | * | | 1,634 | | | 39,723 |
BP Prudhoe Bay Royalty Trust | | | | 1,528 | | | 157,934 |
BPZ Resources, Inc. | | * | | 4,084 | | | 120,070 |
BreitBurn Energy Partners LP | | † | | 4,554 | | | 98,503 |
Brigham Exploration Co. | | *† | | 3,121 | | | 49,405 |
Buckeye Partners LP | | | | 2,828 | | | 120,954 |
Callon Petroleum Co. | | * | | 3,060 | | | 83,722 |
Cano Petroleum, Inc. | | * | | 5,875 | | | 46,647 |
Carrizo Oil & Gas, Inc. | | * | | 1,600 | | | 108,944 |
Cheniere Energy, Inc. | | *† | | 8,135 | | | 35,550 |
Cimarex Energy Co. | | | | 5,589 | | | 389,386 |
Clayton Williams Energy, Inc. | | * | | 550 | | | 60,473 |
CNX Gas Corp. | | *† | | 2,120 | | | 89,125 |
Comstock Resources, Inc. | | * | | 3,195 | | | 269,754 |
Concho Resources, Inc. | | * | | 3,431 | | | 127,976 |
Contango Oil & Gas Co. | | *† | | 1,270 | | | 118,008 |
Continental Resources, Inc. | | *† | | 2,672 | | | 185,223 |
Copano Energy LLC | | | | 2,947 | | | 99,461 |
CREDO Petroleum Corp. | | * | | 700 | | | 9,653 |
Cross Timbers Royalty Trust | | | | 833 | | | 50,130 |
Crosstex Energy, Inc. | | † | | 3,380 | | | 117,151 |
CVR Energy, Inc. | | *† | | 3,255 | | | 62,659 |
DCP Midstream Partners LP | | | | 1,386 | | | 40,540 |
Delta Petroleum Corp. | | *† | | 4,988 | | | 127,294 |
Denbury Resources, Inc. | | * | | 15,852 | | | 578,598 |
Dorchester Minerals LP | | | | 1,880 | | | 59,784 |
Double Hull Tankers, Inc. (Jersey, C.I.) | | † | | 1,931 | | | 19,368 |
Edge Petroleum Corp. | | *† | | 5,201 | | | 28,033 |
Enbridge Energy Partners LP | | | | 3,973 | | | 199,882 |
Encore Acquisition Co. | | * | | 3,216 | | | 241,811 |
Energy Partners Ltd. | | * | | 1,667 | | | 24,872 |
Energy Transfer Equity LP | | | | 9,037 | | | 261,983 |
Energy Transfer Partners LP | | | | 5,145 | | | 223,653 |
Enterprise GP Holdings LP | | | | 2,516 | | | 75,681 |
Enterprise Products Partners LP | | | | 18,030 | | | 532,606 |
Evergreen Energy, Inc. | | *† | | 4,470 | | | 7,778 |
EXCO Resources, Inc. | | * | | 5,400 | | | 199,314 |
Forest Oil Corp. | | * | | 5,265 | | | 392,243 |
Foundation Coal Holdings, Inc. | | | | 3,128 | | | 277,078 |
Frontier Oil Corp. | | | | 7,101 | | | 169,785 |
FX Energy, Inc. | | *† | | 2,797 | | | 14,740 |
General Maritime Corp. | | | | 2,040 | | | 52,999 |
Genesis Energy LP | | | | 2,211 | | | 40,793 |
Global Partners LP | | | | 839 | | | 13,281 |
GMX Resources, Inc. | | * | | 675 | | | 50,018 |
Goodrich Petroleum Corp. | | * | | 1,698 | | | 140,798 |
Harvest Natural Resources, Inc. | | *† | | 3,340 | | | 36,940 |
Holly Corp. | | † | | 2,856 | | | 105,444 |
Holly Energy Partners LP | | | | 670 | | | 26,130 |
Hugoton Royalty Trust | | | | 3,289 | | | 121,693 |
Inergy LP | | | | 3,461 | | | 90,055 |
International Coal Group, Inc. | | * | | 7,310 | | | 95,396 |
James River Coal Co. | | * | | 1,950 | | | 114,445 |
Kinder Morgan Energy Partners LP | | | | 10,777 | | | 600,602 |
Kinder Morgan Management LLC | | * | | 4,360 | | | 234,786 |
Kodiak Oil & Gas Corp. | | * | | 6,000 | | | 27,360 |
K-Sea Transportation Partners LP | | | | 470 | | | 14,979 |
Linn Energy LLC | | | | 8,419 | | | 209,212 |
Magellan Midstream Partners LP | | | | 4,527 | | | 161,116 |
Mariner Energy, Inc. | | * | | 5,512 | | | 203,779 |
MarkWest Energy Partners LP | | | | 3,316 | | | 118,381 |
Martin Midstream Partners LP | | | | 1,200 | | | 39,516 |
McMoRan Exploration Co. | | *† | | 3,772 | | | 103,805 |
Meridian Resource Corp. | | *† | | 11,330 | | | 33,423 |
National Coal Corp. | | * | | 2,117 | | | 18,778 |
Natural Resource Partners LP | | | | 2,000 | | | 82,400 |
Newfield Exploration Co. | | * | | 8,443 | | | 550,906 |
NGAS Resources, Inc. | | * | | 6,300 | | | 58,464 |
NuStar Energy LP | | | | 2,540 | | | 120,371 |
NuStar GP Holdings LLC | | | | 3,028 | | | 65,617 |
ONEOK Partners LP | | | | 3,165 | | | 176,923 |
Overseas Shipholding Group, Inc. | | † | | 1,739 | | | 138,285 |
Pacific Ethanol, Inc. | | * | | 9,943 | | | 17,997 |
Parallel Petroleum Corp. | | * | | 2,560 | | | 51,533 |
Patriot Coal Corp. | | * | | 1,842 | | | 282,360 |
Penn Virginia Corp. | | | | 2,681 | | | 202,201 |
Penn Virginia Resource Partners LP | | | | 2,276 | | | 61,634 |
PetroHawk Energy Corp. | | * | | 13,896 | | | 643,524 |
Petroleum Development Corp. | | * | | 1,030 | | | 68,485 |
Petroquest Energy, Inc. | | *† | | 3,600 | | | 96,840 |
Pioneer Natural Resources Co. | | | | 7,869 | | | 615,985 |
Plains All American Pipeline LP | | | | 7,065 | | | 318,702 |
Plains Exploration & Production Co. | | * | | 7,375 | | | 538,154 |
Quest Resource Corp. | | * | | 5,130 | | | 58,533 |
Quicksilver Resources, Inc. | | * | | 7,500 | | | 289,800 |
Regency Energy Partners LP | | | | 830 | | | 20,119 |
Rentech, Inc. | | * | | 14,020 | | | 26,638 |
Rosetta Resources, Inc. | | * | | 3,732 | | | 106,362 |
SandRidge Energy, Inc. | | * | | 5,340 | | | 344,857 |
Ship Finance International Ltd. (Bermuda) | | | | 2,540 | | | 75,006 |
St. Mary Land & Exploration Co. | | | | 4,302 | | | 278,081 |
Stone Energy Corp. | | * | | 1,868 | | | 123,120 |
Sunoco Logistics Partners LP | | | | 970 | | | 45,493 |
Swift Energy Co. | | *† | | 2,182 | | | 144,143 |
Syntroleum Corp. | | *† | | 9,066 | | | 15,503 |
TC Pipelines LP | | | | 1,766 | | | 62,234 |
Teekay Corp. (Bahamas) | | † | | 2,957 | | | 133,597 |
Teekay Offshore Partners LP | | | | 883 | | | 17,439 |
TEPPCO Partners LP | | | | 4,968 | | | 164,888 |
Toreador Resources Corp. | | *† | | 2,250 | | | 19,192 |
Transmeridian Exploration, Inc. | | * | | 12,000 | | | 7,560 |
Transmontaigne Partners LP | | | | 786 | | | 21,238 |
Tri-Valley Corp. | | * | | 2,100 | | | 15,603 |
TXCO Resources, Inc. | | *† | | 3,031 | | | 35,645 |
U.S. Shipping Partners LP | | | | 1,660 | | | 3,154 |
Ultra Petroleum Corp. | | * | | 10,085 | | | 990,347 |
Uranium Resources, Inc. | | * | | 5,500 | | | 20,295 |
USEC, Inc. | | *† | | 8,684 | | | 52,799 |
Vaalco Energy, Inc. | | * | | 8,030 | | | 68,014 |
Verenium Corp. | | * | | 1,790 | | | 3,455 |
W&T Offshore, Inc. | | | | 2,081 | | | 121,759 |
Warren Resources, Inc. | | *† | | 3,440 | | | 50,499 |
Western Refining, Inc. | | † | | 2,380 | | | 28,179 |
Westmoreland Coal Co. | | *† | | 1,390 | | | 29,343 |
Whiting Petroleum Corp. | | * | | 2,867 | | | 304,131 |
Williams Partners LP | | | | 2,767 | | | 90,896 |
World Fuel Services Corp. | | † | | 1,832 | | | 40,194 |
| | | | | | | |
| | | | | | | 18,764,701 |
| | | | | | | |
| | | | |
| | See accompanying notes to financial statements. | | 233 |
SCHEDULE OF INVESTMENTS — (Continued)
June 30, 2008 (Unaudited)
Vantagepoint Mid/Small Company Index Fund
| | | | | | | |
| | | | | Shares | | Value |
COMMON STOCKS—(Continued) | | | | | | | |
Paper & Forest Products—0.2% | | | | | | | |
AbitibiBowater, Inc. | | | | 3,872 | | $ | 36,126 |
Buckeye Technologies, Inc. | | * | | 2,191 | | | 18,536 |
Deltic Timber Corp. | | † | | 724 | | | 38,741 |
Domtar Corp. (Canada) | | * | | 29,053 | | | 158,339 |
Glatfelter | | | | 3,315 | | | 44,786 |
Louisiana-Pacific Corp. | | † | | 6,527 | | | 55,414 |
MAXXAM, Inc. | | * | | 857 | | | 21,751 |
Neenah Paper, Inc. | | † | | 890 | | | 14,872 |
Schweitzer-Mauduit International, Inc. | | | | 724 | | | 12,199 |
Wausau Paper Corp. | | † | | 3,503 | | | 27,008 |
| | | | | | | |
| | | | | | | 427,772 |
| | | | | | | |
Personal Products—0.4% | | | | | | | |
Alberto-Culver Co. | | | | 5,896 | | | 154,888 |
Bare Escentuals, Inc. | | *† | | 3,370 | | | 63,120 |
Chattem, Inc. | | *† | | 1,188 | | | 77,279 |
Elizabeth Arden, Inc. | | * | | 1,677 | | | 25,457 |
Herbalife Ltd. (Cayman Islands) | | | | 4,225 | | | 163,719 |
Mannatech, Inc. | | † | | 2,631 | | | 14,313 |
Medifast, Inc. | | *† | | 2,284 | | | 12,014 |
NBTY, Inc. | | * | | 4,147 | | | 132,953 |
Nu Skin Enterprises, Inc., Class A | | | | 3,019 | | | 45,043 |
Prestige Brands Holdings, Inc. | | * | | 2,900 | | | 30,914 |
Reliv International, Inc. | | † | | 1,110 | | | 6,072 |
USANA Health Sciences, Inc. | | *† | | 743 | | | 19,964 |
| | | | | | | |
| | | | | | | 745,736 |
| | | | | | | |
Pharmaceuticals—0.9% | | | | | | | |
Adolor Corp. | | * | | 8,628 | | | 47,281 |
Alexza Pharmaceuticals, Inc. | | *† | | 2,897 | | | 11,414 |
Alpharma, Inc., Class A | | *† | | 2,513 | | | 56,618 |
Anesiva, Inc. | | * | | 1,779 | | | 5,248 |
APP Pharmaceuticals, Inc. | | *† | | 1,744 | | | 29,160 |
Atherogenics, Inc. | | * | | 2,914 | | | 1,709 |
Auxilium Pharmaceuticals, Inc. | | *† | | 2,347 | | | 78,906 |
AVANIR Pharmaceuticals, Class A | | * | | 9,525 | | | 9,525 |
Bentley Pharmaceuticals, Inc. | | *† | | 2,011 | | | 32,478 |
BioMimetic Therapeutics, Inc. | | *† | | 2,327 | | | 27,738 |
Cadence Pharmaceuticals, Inc. | | *† | | 3,700 | | | 22,533 |
Columbia Laboratories, Inc. | | *† | | 5,940 | | | 19,602 |
Cypress Bioscience, Inc. | | *† | | 4,031 | | | 28,983 |
Depomed, Inc. | | *† | | 2,500 | | | 8,025 |
Discovery Laboratories, Inc. | | *† | | 10,296 | | | 16,988 |
Durect Corp. | | * | | 7,330 | | | 26,901 |
Emisphere Technologies, Inc. | | * | | 3,412 | | | 9,144 |
Endo Pharmaceuticals Holdings, Inc. | | * | | 8,848 | | | 214,033 |
Heska Corp. | | * | | 4,463 | | | 5,356 |
Hi-Tech Pharmacal Co., Inc. | | *† | | 2,404 | | | 24,040 |
Hollis-Eden Pharmaceuticals | | * | | 3,834 | | | 5,866 |
Immtech Pharmaceuticals, Inc. | | *† | | 3,841 | | | 3,764 |
Inspire Pharmaceuticals, Inc. | | * | | 4,570 | | | 19,560 |
KV Pharmaceutical Co., Class A | | *† | | 3,009 | | | 58,164 |
Matrixx Initiatives, Inc. | | *† | | 1,810 | | | 30,155 |
Medicines Co. (The) | | * | | 3,094 | | | 61,323 |
Medicis Pharmaceutical Corp., Class A | | | | 4,522 | | | 93,967 |
NitroMed, Inc. | | * | | 2,250 | | | 2,250 |
Noven Pharmaceuticals, Inc. | | *† | | 1,350 | | | 14,432 |
Optimer Pharmaceuticals, Inc. | | *† | | 4,269 | | | 34,622 |
Pain Therapeutics, Inc. | | *† | | 3,499 | | | 27,642 |
Par Pharmaceutical Cos, Inc. | | *† | | 3,271 | | | 53,088 |
Penwest Pharmaceuticals Co. | | *† | | 5,730 | | | 15,471 |
Perrigo Co. | | | | 5,083 | | | 161,487 |
Pharmos Corp. | | * | | 1,375 | | | 536 |
Pozen, Inc. | | *† | | 1,922 | | | 20,911 |
Salix Pharmaceuticals Ltd. | | *† | | 4,445 | | | 31,248 |
Santarus, Inc. | | * | | 7,750 | | | 15,578 |
Sciele Pharma, Inc. | | *† | | 2,476 | | | 47,911 |
SCOLR Pharma, Inc. | | * | | 2,400 | | | 2,400 |
Sepracor, Inc. | | * | | 7,237 | | | 144,161 |
SuperGen, Inc. | | *† | | 3,719 | | | 7,624 |
SupportSoft, Inc. | | * | | 4,962 | | | 16,127 |
Valeant Pharmaceuticals International | | *† | | 5,975 | | | 102,232 |
Viropharma, Inc. | | *† | | 4,402 | | | 48,686 |
Vivus, Inc. | | *† | | 4,800 | | | 32,064 |
Warner Chilcott Ltd., Class A (Bermuda) | | * | | 5,318 | | | 90,140 |
XenoPort, Inc. | | * | | 1,873 | | | 73,103 |
| | | | | | | |
| | | | | | | 1,890,194 |
| | | | | | | |
Real Estate Investment Trusts (REIT)—4.9% | | | | | | | |
Acadia Realty Trust REIT | | † | | 2,059 | | | 47,666 |
Agree Realty Corp. REIT | | † | | 1,045 | | | 23,042 |
Alesco Financial, Inc. REIT | | † | | 5,693 | | | 11,386 |
Alexander’s, Inc. REIT | | *† | | 119 | | | 36,961 |
Alexandria Real Estate Equities, Inc. REIT | | † | | 2,006 | | | 195,264 |
AMB Property Corp. REIT | | † | | 6,448 | | | 324,850 |
American Campus Communities, Inc. REIT | | † | | 2,323 | | | 64,672 |
American Land Lease, Inc. REIT | | † | | 729 | | | 13,851 |
American Mortgage Acceptance Co. REIT | | | | 1,732 | | | 1,091 |
Annaly Capital Management, Inc. REIT | | | | 34,335 | | | 532,536 |
Anthracite Capital, Inc. REIT | | † | | 3,940 | | | 27,738 |
Anworth Mortgage Asset Corp. REIT | | | | 6,810 | | | 44,333 |
Arbor Realty Trust, Inc. REIT | | † | | 1,450 | | | 13,007 |
Ashford Hospitality Trust, Inc. REIT | | † | | 7,797 | | | 36,022 |
Associated Estates Realty Corp. REIT | | † | | 2,550 | | | 27,311 |
BioMed Realty Trust, Inc. REIT | | | | 4,010 | | | 98,365 |
Brandywine Realty Trust REIT | | † | | 6,205 | | | 97,791 |
BRE Properties, Inc. REIT | | † | | 3,450 | | | 149,316 |
BRT Realty Trust REIT | | † | | 916 | | | 10,992 |
Camden Property Trust REIT | | | | 3,369 | | | 149,112 |
Capital Alliance Income Trust Ltd. REIT | | * | | 799 | | | 3,336 |
Capital Trust, Inc., Class A REIT | | † | | 923 | | | 17,731 |
CapitalSource, Inc. REIT | | † | | 11,343 | | | 125,680 |
CapLease, Inc. REIT | | | | 2,320 | | | 17,377 |
Capstead Mortgage Corp. REIT | | | | 3,102 | | | 33,657 |
CBL & Associates Properties, Inc. REIT | | | | 4,638 | | | 105,932 |
CBRE Realty Finance, Inc. REIT | | † | | 3,335 | | | 11,472 |
Cedar Shopping Centers, Inc. REIT | | † | | 4,496 | | | 52,693 |
Colonial Properties Trust REIT | | | | 2,752 | | | 55,095 |
Corporate Office Properties Trust SBI MD REIT | | † | | 2,852 | | | 97,909 |
| | | | |
| 234 | | See accompanying notes to financial statements. | | |
SCHEDULE OF INVESTMENTS — (Continued)
June 30, 2008 (Unaudited)
Vantagepoint Mid/Small Company Index Fund
| | | | | | | |
| | | | | Shares | | Value |
COMMON STOCKS—(Continued) | | | | | | | |
Cousins Properties, Inc. REIT | | † | | 3,311 | | $ | 76,484 |
DCT Industrial Trust, Inc. REIT | | † | | 10,500 | | | 86,940 |
Deerfield Capital Corp. REIT | | † | | 5,227 | | | 4,129 |
DiamondRock Hospitality Co. REIT | | † | | 5,836 | | | 63,554 |
Digital Realty Trust, Inc. REIT | | † | | 3,825 | | | 156,481 |
Douglas Emmett, Inc. REIT | | † | | 7,399 | | | 162,556 |
Duke Realty Corp. REIT | | † | | 9,861 | | | 221,379 |
DuPont Fabros Technology, Inc. REIT | | | | 2,483 | | | 46,283 |
EastGroup Properties, Inc. REIT | | † | | 1,761 | | | 75,547 |
Education Realty Trust, Inc. REIT | | | | 1,700 | | | 19,805 |
Entertainment Properties Trust REIT | | † | | 1,919 | | | 94,875 |
Equity Lifestyle Properties, Inc. REIT | | † | | 1,281 | | | 56,364 |
Equity One, Inc. REIT | | † | | 2,445 | | | 50,245 |
Essex Property Trust, Inc. REIT | | | | 1,578 | | | 168,057 |
Extra Space Storage, Inc. REIT | | | | 5,609 | | | 86,154 |
Federal Realty Investment Trust REIT | | † | | 3,700 | | | 255,300 |
FelCor Lodging Trust, Inc. REIT | | † | | 3,938 | | | 41,349 |
First Industrial Realty Trust, Inc. REIT | | † | | 2,823 | | | 77,548 |
First Potomac Realty Trust REIT | | † | | 2,349 | | | 35,799 |
Franklin Street Properties Corp. REIT | | | | 3,670 | | | 46,389 |
Friedman Billings Ramsey Group, Inc., Class A REIT | | | | 14,580 | | | 21,870 |
Getty Realty Corp. REIT | | † | | 1,418 | | | 20,433 |
Glimcher Realty Trust REIT | | † | | 4,014 | | | 44,877 |
Gramercy Capital Corp., New York REIT | | † | | 3,048 | | | 35,326 |
Health Care, Inc. REIT | | | | 5,872 | | | 261,304 |
Healthcare Realty Trust, Inc. REIT | | † | | 3,757 | | | 89,304 |
Hersha Hospitality Trust REIT | | | | 5,335 | | | 40,279 |
Highwoods Properties, Inc. REIT | | | | 4,003 | | | 125,774 |
HMG Courtland Properties REIT | | *a | | 1,250 | | | 9,238 |
Home Properties, Inc. REIT | | † | | 2,101 | | | 100,974 |
Hospitality Properties Trust REIT | | | | 6,378 | | | 156,006 |
HRPT Properties Trust REIT | | | | 15,802 | | | 106,980 |
IMPAC Mortgage Holdings, Inc. REIT | | *† | | 9,264 | | | 6,948 |
Inland Real Estate Corp. REIT | | † | | 3,790 | | | 54,652 |
iStar Financial, Inc. REIT | | † | | 8,506 | | | 112,364 |
JER Investors Trust, Inc. REIT | | † | | 2,190 | | | 13,797 |
Kilroy Realty Corp. REIT | | | | 2,262 | | | 106,382 |
Kite Realty Group Trust REIT | | | | 2,870 | | | 35,875 |
LaSalle Hotel Properties REIT | | † | | 2,501 | | | 62,850 |
Lexington Realty Trust REIT | | | | 4,080 | | | 55,610 |
Liberty Property Trust REIT | | | | 6,264 | | | 207,652 |
LTC Properties, Inc. REIT | | † | | 1,460 | | | 37,318 |
Macerich Co. (The) REIT | | † | | 4,664 | | | 289,774 |
Mack-Cali Realty Corp. REIT | | | | 4,130 | | | 141,122 |
Maguire Properties, Inc. REIT | | † | | 2,300 | | | 27,991 |
Medical Properties Trust, Inc. REIT | | | | 5,307 | | | 53,707 |
MFA Mortgage Investments, Inc. REIT | | | | 14,151 | | | 92,265 |
Mid-America Apartment Communities, Inc. REIT | | | | 1,821 | | | 92,944 |
Mission West Properties, Inc. REIT | | | | 1,418 | | | 15,541 |
Monmouth Real Estate Investment Corp., Class A REIT | | † | | 4,925 | | | 31,520 |
National Health Investors, Inc. REIT | | † | | 1,871 | | | 53,342 |
National Retail Properties, Inc. REIT | | † | | 4,114 | | | 85,983 |
Nationwide Health Properties, Inc. REIT | | † | | 6,139 | | | 193,317 |
Newcastle Investment Corp. REIT | | | | 4,400 | | | 30,844 |
NorthStar Realty Finance Corp. REIT | | † | | 3,990 | | | 33,197 |
Omega Healthcare Investors, Inc. REIT | | † | | 4,792 | | | 79,787 |
Pacific Office Properties Trust, Inc. REIT | | | | 1,050 | | | 7,035 |
Parkway Properties, Inc. REIT | | † | | 1,147 | | | 38,688 |
Pennsylvania Real Estate Investment Trust REIT | | † | | 2,750 | | | 63,635 |
PMC Commercial Trust REIT | | | | 2,035 | | | 16,280 |
Post Properties, Inc. REIT | | † | | 3,035 | | | 90,291 |
Potlatch Corp. REIT | | † | | 2,433 | | | 109,777 |
PS Business Parks, Inc. REIT | | † | | 1,123 | | | 57,947 |
RAIT Financial Trust REIT | | | | 5,932 | | | 44,015 |
Ramco-Gershenson Properties Trust REIT | | | | 1,412 | | | 29,003 |
Rayonier, Inc. REIT | | | | 5,154 | | | 218,839 |
Realty Income Corp. REIT | | † | | 6,792 | | | 154,586 |
Redwood Trust, Inc. REIT | | † | | 2,425 | | | 55,266 |
Regency Centers Corp. REIT | | | | 4,549 | | | 268,937 |
Resource Capital Corp. REIT | | † | | 3,788 | | | 27,312 |
Saul Centers, Inc. REIT | | | | 882 | | | 41,445 |
Senior Housing Properties Trust REIT | | | | 6,322 | | | 123,469 |
SL Green Realty Corp. REIT | | | | 3,849 | | | 318,389 |
Sovran Self Storage, Inc. REIT | | † | | 1,711 | | | 71,109 |
Strategic Hotels & Resorts, Inc. REIT | | † | | 4,710 | | | 44,133 |
Sun Communities, Inc. REIT | | | | 1,061 | | | 19,342 |
Sunstone Hotel Investors, Inc. REIT | | | | 3,566 | | | 59,196 |
Tanger Factory Outlet Centers REIT | | † | | 2,180 | | | 78,327 |
Taubman Centers, Inc. REIT | | † | | 3,271 | | | 159,134 |
Thornburg Mortgage, Inc. | | † | | 8,965 | | | 1,811 |
UDR, Inc. REIT | | † | | 9,100 | | | 203,658 |
Universal Health Realty Income Trust REIT | | † | | 617 | | | 18,510 |
Urstadt Biddle Properties, Inc. REIT | | † | | 2,334 | | | 34,216 |
U-Store-It Trust REIT | | † | | 3,040 | | | 36,328 |
Ventas, Inc. REIT | | | | 9,192 | | | 391,303 |
Washington Real Estate Investment Trust REIT | | † | | 2,885 | | | 86,694 |
Weingarten Realty Investors REIT | | † | | 4,779 | | | 144,899 |
| | | | | | | |
| | | | | | | 10,192,147 |
| | | | | | | |
Real Estate Management & Development—0.4% | | | | | | | |
Brookfield Properties Corp. (Canada) | | | | 13,501 | | | 240,183 |
| | | | |
| | See accompanying notes to financial statements. | | 235 |
SCHEDULE OF INVESTMENTS — (Continued)
June 30, 2008 (Unaudited)
Vantagepoint Mid/Small Company Index Fund
| | | | | | | |
| | | | | Shares | | Value |
COMMON STOCKS—(Continued) | | | | | | | |
Consolidated-Tomoka Land Co. | | † | | 530 | | $ | 22,292 |
Forest City Enterprises, Inc., Class A | | † | | 4,558 | | | 146,859 |
Forestar Real Estate Group, Inc. | | * | | 2,113 | | | 40,253 |
FX Real Estate and Entertainment, Inc. | | *† | | 824 | | | 1,565 |
Grubb & Ellis Co. | | † | | 2,553 | | | 9,829 |
Jones Lang LaSalle, Inc. | | | | 2,490 | | | 149,873 |
St. Joe Co. (The) | | | | 5,875 | | | 201,630 |
Tejon Ranch Co. | | *† | | 763 | | | 27,514 |
Thomas Properties Group, Inc. | | † | | 2,396 | | | 23,576 |
| | | | | | | |
| | | | | | | 863,574 |
| | | | | | | |
Retail—0.0% | | | | | | | |
DineEquity, Inc. | | † | | 1,079 | | | 40,311 |
Walking Co. Holdings, Inc. (The) | | * | | 1,621 | | | 9,110 |
| | | | | | | |
| | | | | | | 49,421 |
| | | | | | | |
Road & Rail—0.7% | | | | | | | |
Amerco, Inc. | | *† | | 547 | | | 26,081 |
Arkansas Best Corp. | | † | | 1,383 | | | 50,673 |
Avis Budget Group, Inc. | | * | | 6,267 | | | 52,455 |
Celadon Group, Inc. | | *† | | 1,972 | | | 19,700 |
Con-way, Inc. | | | | 2,747 | | | 129,823 |
Dollar Thrifty Automotive Group | | *† | | 1,428 | | | 13,495 |
Genesee & Wyoming, Inc., Class A | | *† | | 2,371 | | | 80,661 |
Heartland Express, Inc. | | | | 4,044 | | | 60,296 |
Hertz Global Holdings, Inc. | | * | | 8,962 | | | 86,035 |
J.B. Hunt Transport Services, Inc. | | † | | 6,256 | | | 208,200 |
Kansas City Southern | | *† | | 5,104 | | | 224,525 |
Knight Transportation, Inc. | | | | 3,878 | | | 70,967 |
Landstar System, Inc. | | † | | 3,340 | | | 184,435 |
Old Dominion Freight Line, Inc. | | *† | | 1,783 | | | 53,526 |
PAM Transportation Services, Inc. | | * | | 1,139 | | | 12,130 |
Quality Distribution, Inc. | | *† | | 914 | | | 2,212 |
Saia, Inc. | | * | | 2,862 | | | 31,253 |
Werner Enterprises, Inc. | | † | | 2,916 | | | 54,179 |
YRC Worldwide, Inc. | | *† | | 4,618 | | | 68,670 |
| | | | | | | |
| | | | | | | 1,429,316 |
| | | | | | | |
Semiconductors & Semiconductor Equipment—2.5% | | | | | | | |
Actel Corp. | | * | | 4,134 | | | 69,658 |
Advanced Energy Industries, Inc. | | *† | | 2,649 | | | 36,291 |
Amkor Technology, Inc. | | *† | | 7,212 | | | 75,077 |
Anadigics, Inc. | | *† | | 4,986 | | | 49,112 |
Applied Micro Circuits Corp. | | *† | | 4,025 | | | 34,454 |
Asyst Technologies, Inc. | | *† | | 3,243 | | | 11,578 |
Atheros Communications, Inc. | | *† | | 3,455 | | | 103,650 |
Atmel Corp. | | * | | 25,393 | | | 88,368 |
ATMI, Inc. | | *† | | 2,219 | | | 61,954 |
Axcelis Technologies, Inc. | | * | | 6,926 | | | 33,799 |
AXT, Inc. | | * | | 4,552 | | | 19,073 |
Brooks Automation, Inc. | | * | | 4,415 | | | 36,512 |
Cabot Microelectronics Corp. | | *† | | 1,450 | | | 48,068 |
California Micro Devices Corp. | | * | | 2,476 | | | 7,700 |
Catalyst Semiconductor, Inc. | | * | | 2,416 | | | 10,485 |
Cavium Networks, Inc. | | *† | | 1,626 | | | 34,146 |
Centillium Communications, Inc. | | * | | 1,589 | | | 1,033 |
Ceva, Inc. | | * | | 3,092 | | | 24,643 |
Cirrus Logic, Inc. | | * | | 5,397 | | | 30,007 |
Cohu, Inc. | | | | 1,889 | | | 27,731 |
Conexant Systems, Inc. | | *† | | 2,553 | | | 11,489 |
Credence Systems Corp. | | *† | | 12,850 | | | 16,705 |
Cree, Inc. | | *† | | 4,821 | | | 109,967 |
Cymer, Inc. | | *† | | 1,929 | | | 51,852 |
Cypress Semiconductor Corp. | | *† | | 10,012 | | | 247,797 |
Diodes, Inc. | | *† | | 1,956 | | | 54,064 |
DSP Group, Inc. | | *† | | 4,251 | | | 29,757 |
Electroglas, Inc. | | *† | | 3,991 | | | 7,583 |
Emcore Corp. | | *† | | 6,178 | | | 38,674 |
Entegris, Inc. | | * | | 7,678 | | | 50,291 |
ESS Technology, Inc. | | * | | 1,759 | | | 2,867 |
Exar Corp. | | *† | | 3,475 | | | 26,201 |
Fairchild Semiconductor International, Inc. | | * | | 7,633 | | | 89,535 |
FEI Co. | | *† | | 2,138 | | | 48,704 |
Formfactor, Inc. | | *† | | 3,763 | | | 69,352 |
FSI International, Inc. | | *† | | 4,280 | | | 5,735 |
HI/FN, Inc. | | *† | | 1,882 | | | 8,676 |
Integrated Device Technology, Inc. | | * | | 11,957 | | | 118,853 |
Integrated Silicon Solution, Inc. | | * | | 2,930 | | | 16,291 |
International Rectifier Corp. | | * | | 4,883 | | | 93,754 |
Intersil Corp., Class A | | | | 8,868 | | | 215,670 |
inTEST Corp. | | * | | 950 | | | 1,881 |
IXYS Corp. | | * | | 3,270 | | | 39,044 |
Kopin Corp. | | * | | 5,031 | | | 14,439 |
Kulicke & Soffa Industries, Inc. | | * | | 4,089 | | | 29,809 |
Lam Research Corp. | | * | | 7,856 | | | 283,994 |
Lattice Semiconductor Corp. | | * | | 7,425 | | | 23,240 |
LTX Corp. | | * | | 6,381 | | | 14,038 |
Marvell Technology Group Ltd. (Bermuda) | | * | | 29,891 | | | 527,875 |
Mattson Technology, Inc. | | *† | | 4,081 | | | 19,426 |
Maxim Integrated Products, Inc. | | | | 2,247 | | | 47,524 |
Micrel, Inc. | | | | 3,731 | | | 34,139 |
Microsemi Corp. | | *† | | 4,144 | | | 104,346 |
Mindspeed Technologies, Inc. | | * | | 4,010 | | | 3,450 |
MIPS Technologies, Inc., Class A | | *† | | 5,359 | | | 20,096 |
MKS Instruments, Inc. | | *† | | 3,260 | | | 71,394 |
MoSys, Inc. | | *† | | 3,592 | | | 17,637 |
NVE Corp. | | * | | 771 | | | 24,410 |
Omnivision Technologies, Inc. | | * | | 4,446 | | | 53,752 |
ON Semiconductor Corp. | | *† | | 27,218 | | | 249,589 |
PDF Solutions, Inc. | | *† | | 3,093 | | | 18,403 |
Pericom Semiconductor Corp. | | * | | 2,254 | | | 33,449 |
Photronics, Inc. | | * | | 1,989 | | | 14,003 |
PLX Technology, Inc. | | *† | | 2,950 | | | 22,508 |
PMC—Sierra, Inc. | | *† | | 14,713 | | | 112,554 |
Power Integrations, Inc. | | * | | 1,948 | | | 61,576 |
QuickLogic Corp. | | * | | 4,080 | | | 6,814 |
Rambus, Inc. | | *† | | 6,688 | | | 127,540 |
Ramtron International Corp. | | * | | 1,920 | | | 8,083 |
RF Micro Devices, Inc. | | *† | | 18,530 | | | 53,737 |
Rudolph Technologies, Inc. | | *† | | 2,516 | | | 19,373 |
Semitool, Inc. | | *† | | 2,320 | | | 17,423 |
Semtech Corp. | | *† | | 4,634 | | | 65,200 |
Sigma Designs, Inc. | | *† | | 1,937 | | | 26,905 |
Silicon Image, Inc. | | *† | | 6,882 | | | 49,894 |
Silicon Laboratories, Inc. | | * | | 3,387 | | | 122,237 |
Silicon Storage Technology, Inc. | | * | | 7,634 | | | 21,146 |
SiRF Technology Holdings, Inc. | | *† | | 3,832 | | | 16,554 |
| | | | |
| 236 | | See accompanying notes to financial statements. | | |
SCHEDULE OF INVESTMENTS — (Continued)
June 30, 2008 (Unaudited)
Vantagepoint Mid/Small Company Index Fund
| | | | | | | |
| | | | | Shares | | Value |
COMMON STOCKS—(Continued) | | | | | | | |
Skyworks Solutions, Inc. | | * | | 11,729 | | $ | 115,765 |
Spansion, Inc., Class A | | *† | | 5,768 | | | 12,978 |
Standard Microsystems Corp. | | * | | 1,446 | | | 39,259 |
Tegal Corp. | | * | | 312 | | | 1,292 |
Tessera Technologies, Inc. | | * | | 3,278 | | | 53,661 |
Transwitch Corp. | | * | | 2,483 | | | 2,284 |
Trident Microsystems, Inc. | | *† | | 5,092 | | | 18,586 |
TriQuint Semiconductor, Inc. | | * | | 8,519 | | | 51,625 |
Ultra Clean Holdings | | *† | | 1,756 | | | 13,978 |
Ultratech, Inc. | | * | | 2,462 | | | 38,210 |
Varian Semiconductor Equipment Associates, Inc. | | *† | | 4,645 | | | 161,739 |
Veeco Instruments, Inc. | | * | | 2,611 | | | 41,985 |
Virage Logic Corp. | | * | | 3,332 | | | 23,857 |
Volterra Semiconductor Corp. | | *† | | 2,210 | | | 38,145 |
White Electronic Designs Corp. | | * | | 2,284 | | | 10,484 |
Zoran Corp. | | * | | 3,474 | | | 40,646 |
| | | | | | | |
| | | | | | | 5,159,132 |
| | | | | | | |
Software—3.1% | | | | | | | |
ACI Worldwide, Inc. | | *† | | 3,078 | | | 54,142 |
Activision, Inc. | | * | | 19,352 | | | 659,323 |
Actuate Corp. | | *† | | 6,674 | | | 26,095 |
Advent Software, Inc. | | *† | | 1,325 | | | 47,806 |
American Software, Inc., Class A | | | | 1,950 | | | 10,998 |
Ansys, Inc. | | * | | 5,191 | | | 244,600 |
Authentidate Holding Corp. | | * | | 1,023 | | | 399 |
Blackbaud, Inc. | | † | | 3,188 | | | 68,223 |
Blackboard, Inc. | | *† | | 2,275 | | | 86,973 |
Borland Software Corp. | | *† | | 6,776 | | | 9,215 |
Bottomline Technologies, Inc. | | * | | 3,578 | | | 34,814 |
Cadence Design Systems, Inc. | | * | | 18,175 | | | 183,568 |
Callidus Software, Inc. | | *† | | 2,703 | | | 13,515 |
Captaris, Inc. | | * | | 3,554 | | | 14,394 |
Catapult Communications Corp. | | * | | 750 | | | 5,340 |
Concur Technologies, Inc. | | *† | | 3,019 | | | 100,321 |
DataTRAK International, Inc. | | * | | 1,359 | | | 612 |
Datawatch Corp. | | * | | 3,500 | | | 8,190 |
Double-Take Software, Inc. | | * | | 1,672 | | | 22,973 |
Ebix, Inc. | | *† | | 1,040 | | | 80,829 |
Epicor Software Corp. | | * | | 3,383 | | | 23,377 |
EPIQ Systems, Inc. | | * | | 2,722 | | | 38,652 |
ePresence, Inc. | | *‡da | | 1,173 | | | — |
Evans & Sutherland Computer Co. | | * | | 1,883 | | | 1,902 |
Evolving Systems, Inc. | | * | | 1,054 | | | 2,393 |
Factset Research Systems, Inc. | | † | | 2,999 | | | 169,024 |
Fair Isaac Corp. | | † | | 3,740 | | | 77,680 |
FalconStor Software, Inc. | | *† | | 1,374 | | | 9,728 |
infoGROUP, Inc. | | | | 2,708 | | | 11,888 |
Informatica Corp. | | * | | 6,099 | | | 91,729 |
Interactive Intelligence, Inc. | | *† | | 950 | | | 11,058 |
InterVoice, Inc. | | *† | | 4,035 | | | 23,000 |
Jack Henry & Associates, Inc. | | † | | 5,229 | | | 113,156 |
JDA Software Group, Inc. | | * | | 2,379 | | | 43,060 |
Lawson Software, Inc. | | *† | | 8,950 | | | 65,067 |
Magma Design Automation, Inc. | | *† | | 3,929 | | | 23,849 |
Manhattan Associates, Inc. | | * | | 2,125 | | | 50,426 |
McAfee, Inc. | | * | | 10,396 | | | 353,776 |
Mentor Graphics Corp. | | *† | | 5,458 | | | 86,236 |
Micros Systems, Inc. | | * | | 5,578 | | | 170,073 |
MicroStrategy, Inc., Class A | | * | | 791 | | | 51,217 |
Napster, Inc. | | * | | 6,796 | | | 9,650 |
NAVTEQ Corp. | | * | | 6,341 | | | 488,257 |
Netscout Systems, Inc. | | * | | 3,784 | | | 40,413 |
Nuance Communications, Inc. | | *† | | 11,463 | | | 179,625 |
Parametric Technology Corp. | | * | | 6,972 | | | 116,223 |
Pegasystems, Inc. | | | | 2,142 | | | 28,831 |
Phoenix Technologies Ltd. | | * | | 2,710 | | | 29,810 |
PLATO Learning, Inc. | | * | | 1,826 | | | 4,839 |
Progress Software Corp. | | *† | | 2,503 | | | 64,002 |
PROS Holdings, Inc. | | * | | 1,506 | | | 16,912 |
QAD, Inc. | | | | 1,363 | | | 9,228 |
Quality Systems, Inc. | | † | | 1,208 | | | 35,370 |
Quest Software, Inc. | | * | | 4,128 | | | 61,136 |
Radiant Systems, Inc. | | *† | | 2,709 | | | 29,068 |
Red Hat, Inc. | | * | | 12,786 | | | 264,542 |
Renaissance Learning, Inc. | | † | | 1,354 | | | 15,178 |
Salesforce.com, Inc. | | * | | 6,750 | | | 460,553 |
Scientific Learning Corp. | | * | | 3,146 | | | 12,112 |
Secure Computing Corp. | | * | | 5,420 | | | 22,439 |
Smith Micro Software, Inc. | | *† | | 2,612 | | | 14,888 |
Solera Holdings, Inc. | | * | | 3,302 | | | 91,333 |
Sonic Foundry, Inc. | | * | | 6,100 | | | 3,721 |
Sonic Solutions, Inc. | | *† | | 1,810 | | | 10,788 |
SourceForge, Inc. | | *† | | 6,619 | | | 10,590 |
SPSS, Inc. | | * | | 1,231 | | | 44,771 |
SumTotal Systems, Inc. | | * | | 1,899 | | | 8,887 |
Sybase, Inc. | | * | | 6,272 | | | 184,522 |
Symyx Technologies | | *† | | 1,965 | | | 13,716 |
Synchronoss Technologies, Inc. | | *† | | 1,415 | | | 12,777 |
Synopsys, Inc. | | * | | 9,737 | | | 232,812 |
Take-Two Interactive Software, Inc. | | * | | 4,344 | | | 111,076 |
TeleCommunication Systems, Inc., Class A | | * | | 6,400 | | | 29,632 |
THQ, Inc. | | *† | | 4,685 | | | 94,918 |
TIBCO Software, Inc. | | * | | 13,039 | | | 99,748 |
Tivo, Inc. | | * | | 5,766 | | | 35,576 |
Tyler Technologies, Inc. | | * | | 3,715 | | | 50,413 |
Ultimate Software Group, Inc. | | *† | | 2,043 | | | 72,792 |
Vasco Data Security International, Inc. | | * | | 1,767 | | | 18,607 |
Versant Corp. | | * | | 330 | | | 8,643 |
VMware, Inc., Class A | | *† | | 2,506 | | | 134,973 |
Wave Systems Corp., Class A | | * | | 1,004 | | | 994 |
Wayside Technology Group, Inc. | | | | 1,787 | | | 13,974 |
Wind River Systems, Inc. | | * | | 6,438 | | | 70,110 |
| | | | | | | |
| | | | | | | 6,348,070 |
| | | | | | | |
Specialty Retail—2.2% | | | | | | | |
A.C. Moore Arts & Crafts, Inc. | | *† | | 1,967 | | | 13,867 |
Aaron Rents, Inc. | | | | 3,865 | | | 86,305 |
Advance Auto Parts, Inc. | | | | 6,810 | | | 264,432 |
Aeropostale, Inc. | | * | | 5,417 | | | 169,715 |
American Eagle Outfitters, Inc. | | | | 11,536 | | | 157,236 |
America’s Car-Mart, Inc. | | *† | | 1,569 | | | 28,116 |
AnnTaylor Stores Corp. | | *† | | 3,874 | | | 92,821 |
Asbury Automotive Group, Inc. | | | | 2,072 | | | 26,625 |
Barnes & Noble, Inc. | | † | | 3,301 | | | 81,997 |
Bebe Stores, Inc. | | † | | 2,040 | | | 19,604 |
Big 5 Sporting Goods Corp. | | † | | 1,892 | | | 14,322 |
Blockbuster, Inc., Class A | | *† | | 16,050 | | | 40,125 |
Borders Group, Inc. | | † | | 3,582 | | | 21,492 |
Brown Shoe Co., Inc. | | | | 3,758 | | | 50,921 |
Buckle, Inc. (The) | | | | 1,042 | | | 47,651 |
Build-A-Bear Workshop, Inc., Class A | | * | | 960 | | | 6,979 |
Cabela’s, Inc. | | *† | | 3,090 | | | 34,021 |
Cache, Inc. | | *† | | 2,130 | | | 22,791 |
| | | | |
| | See accompanying notes to financial statements. | | 237 |
SCHEDULE OF INVESTMENTS — (Continued)
June 30, 2008 (Unaudited)
Vantagepoint Mid/Small Company Index Fund
| | | | | | | |
| | | | | Shares | | Value |
COMMON STOCKS—(Continued) | | | | | | | |
Carmax, Inc. | | *† | | 14,256 | | $ | 202,293 |
Casual Male Retail Group, Inc. | | *† | | 2,471 | | | 7,537 |
Cato Corp. (The), Class A | | | | 1,762 | | | 25,091 |
Charlotte Russe Holding, Inc. | | *† | | 1,100 | | | 19,536 |
Charming Shoppes, Inc. | | *† | | 10,301 | | | 47,282 |
Chico’s FAS, Inc. | | *† | | 11,979 | | | 64,327 |
Childrens Place Retail Stores, Inc. (The) | | *† | | 2,219 | | | 80,106 |
Christopher & Banks Corp. | | | | 2,379 | | | 16,177 |
Circuit City Stores, Inc. | | † | | 10,088 | | | 29,154 |
Coldwater Creek, Inc. | | *† | | 3,983 | | | 21,030 |
Collective Brands, Inc. | | *† | | 4,848 | | | 56,382 |
Cost Plus, Inc. | | *† | | 2,725 | | | 6,813 |
CSK Auto Corp. | | * | | 4,270 | | | 44,750 |
Dick’s Sporting Goods, Inc. | | * | | 5,503 | | | 97,623 |
Dress Barn, Inc. | | *† | | 2,592 | | | 34,681 |
DSW, Inc., Class A | | *† | | 1,395 | | | 16,433 |
Eddie Bauer Holdings, Inc. | | * | | 2,438 | | | 10,118 |
Finish Line, Class A | | *† | | 3,667 | | | 31,903 |
Foot Locker, Inc. | | | | 10,828 | | | 134,809 |
Genesco, Inc. | | * | | 1,421 | | | 43,866 |
Group 1 Automotive, Inc. | | | | 1,591 | | | 31,613 |
Guess ?, Inc. | | | | 3,690 | | | 138,191 |
Gymboree Corp. | | * | | 1,960 | | | 78,537 |
Haverty Furniture Cos, Inc. | | † | | 2,301 | | | 23,102 |
Hibbett Sports, Inc. | | *† | | 1,926 | | | 40,639 |
Hot Topic, Inc. | | * | | 2,815 | | | 15,229 |
J Crew Group, Inc. | | *† | | 2,936 | | | 96,917 |
Jo-Ann Stores, Inc. | | *† | | 2,192 | | | 50,482 |
JOS A. Bank Clothiers, Inc. | | *† | | 1,078 | | | 28,837 |
Kirkland’s, Inc. | | *† | | 833 | | | 1,874 |
Lithia Motors, Inc., Class A | | † | | 2,689 | | | 13,230 |
MarineMax, Inc. | | *† | | 3,026 | | | 21,696 |
Men’s Wearhouse, Inc. | | † | | 3,382 | | | 55,093 |
Midas, Inc. | | *† | | 1,278 | | | 17,253 |
Monro Muffler, Inc. | | | | 1,635 | | | 25,326 |
Mothers Work, Inc. | | * | | 684 | | | 6,888 |
NexCen Brands, Inc. | | *† | | 4,629 | | | 2,593 |
OfficeMax, Inc. | | | | 4,961 | | | 68,958 |
O’Reilly Automotive, Inc. | | * | | 7,547 | | | 168,675 |
Pacific Sunwear of California, Inc. | | *† | | 5,046 | | | 43,042 |
Penske Auto Group, Inc. | | † | | 3,166 | | | 46,667 |
PEP Boys-Manny Moe & Jack | | † | | 3,451 | | | 30,093 |
PetSmart, Inc. | | | | 8,991 | | | 179,370 |
Pier 1 Imports, Inc. | | *† | | 6,447 | | | 22,178 |
Rent-A-Center, Inc., Class A | | * | | 4,059 | | | 83,494 |
Rex Stores Corp. | | * | | 1,034 | | | 11,943 |
Ross Stores, Inc. | | | | 8,596 | | | 305,330 |
Sally Beauty Holdings, Inc. | | *† | | 6,343 | | | 40,976 |
Select Comfort Corp. | | * | | 3,139 | | | 5,148 |
Sonic Automotive, Inc., Class A | | † | | 1,869 | | | 24,091 |
Stage Stores, Inc. | | † | | 3,672 | | | 42,852 |
Stein Mart, Inc. | | † | | 5,792 | | | 26,122 |
Systemax, Inc. | | | | 1,358 | | | 23,969 |
Talbots, Inc. | | † | | 1,205 | | | 13,966 |
Tractor Supply Co. | | *† | | 2,356 | | | 68,418 |
Trans World Entertainment Corp. | | *† | | 1,932 | | | 5,487 |
TravelCenters of America LLC | | * | | 964 | | | 2,188 |
Tween Brands, Inc. | | * | | 1,441 | | | 23,719 |
Urban Outfitters, Inc. | | *† | | 7,217 | | | 225,098 |
West Marine, Inc. | | *† | | 2,443 | | | 10,016 |
Wet Seal, Inc. (The), Class A | | *† | | 16,190 | | | 77,226 |
Williams-Sonoma, Inc. | | † | | 5,416 | | | 107,453 |
Zale Corp. | | *† | | 2,902 | | | 54,819 |
| | | | | | | |
| | | | | | | 4,527,729 |
| | | | | | | |
Textiles, Apparel & Luxury Goods—0.6% | | | | | | | |
Carter’s, Inc. | | *† | | 2,956 | | | 40,852 |
Charles & Colvard Ltd. | | * | | 693 | | | 776 |
Cherokee, Inc. | | † | | 995 | | | 20,049 |
Columbia Sportswear Co. | | † | | 940 | | | 34,545 |
CROCS, Inc. | | *† | | 4,977 | | | 39,866 |
Culp, Inc. | | * | | 888 | | | 6,234 |
Deckers Outdoor Corp. | | *† | | 840 | | | 116,928 |
Forward Industries, Inc. | | * | | 630 | | | 1,688 |
Fossil, Inc. | | *† | | 3,335 | | | 96,948 |
Hallwood Group, Inc. | | * | | 100 | | | 6,914 |
Hanesbrands, Inc. | | * | | 5,900 | | | 160,126 |
Iconix Brand Group, Inc. | | *† | | 4,935 | | | 59,615 |
Kenneth Cole Productions, Inc., Class A | | † | | 956 | | | 12,141 |
K-Swiss, Inc., Class A | | † | | 1,706 | | | 25,078 |
Lazare Kaplan International, Inc. | | * | | 1,140 | | | 10,146 |
Movado Group, Inc. | | † | | 1,527 | | | 30,235 |
Nitches, Inc. | | * | | 2,850 | | | 2,765 |
Oxford Industries, Inc. | | † | | 956 | | | 18,307 |
Phillips-Van Heusen Corp. | | | | 3,743 | | | 137,069 |
Quiksilver, Inc. | | * | | 7,789 | | | 76,488 |
Skechers U.S.A., Inc., Class A | | *† | | 2,697 | | | 53,293 |
Sport-Haley, Inc. | | * | | 1,043 | | | 2,180 |
Steven Madden Ltd. | | * | | 1,528 | | | 28,085 |
Tarrant Apparel Group | | * | | 1,107 | | | 697 |
Timberland Co., Class A | | * | | 3,249 | | | 53,121 |
Under Armour, Inc., Class A | | *† | | 2,477 | | | 63,510 |
Unifi, Inc. | | *† | | 9,669 | | | 24,366 |
Warnaco Group, Inc. (The) | | * | | 2,900 | | | 127,803 |
Wolverine World Wide, Inc. | | | | 3,299 | | | 87,984 |
| | | | | | | |
| | | | | | | 1,337,809 |
| | | | | | | |
Thrifts & Mortgage Finance—1.0% | | | | | | | |
Anchor Bancorp Wisconsin, Inc. | | † | | 1,412 | | | 9,898 |
Astoria Financial Corp. | | | | 5,705 | | | 114,556 |
Bank Mutual Corp. | | † | | 5,557 | | | 55,792 |
BankAtlantic Bancorp, Inc., Class A | | † | | 3,411 | | | 6,003 |
BankUnited Financial Corp., Class A | | † | | 2,413 | | | 2,317 |
Beneficial Mutual Bancorp, Inc. | | *† | | 3,251 | | | 35,989 |
Brookline Bancorp, Inc. | | | | 6,167 | | | 58,895 |
Capitol Federal Financial | | † | | 1,516 | | | 57,017 |
Centerline Holding Co. | | † | | 3,935 | | | 6,571 |
CFS Bancorp, Inc. | | | | 1,873 | | | 22,083 |
Charter Financial Corp. | | | | 350 | | | 8,400 |
Corus Bankshares, Inc. | | † | | 4,380 | | | 18,221 |
Dime Community Bancshares | | | | 3,549 | | | 58,594 |
Doral Financial Corp. (Puerto Rico) | | * | | 585 | | | 7,921 |
Downey Financial Corp. | | † | | 4,878 | | | 13,512 |
Federal Agricultural Mortgage Corp., Class C | | | | 1,507 | | | 37,344 |
First Financial Holdings, Inc. | | | | 990 | | | 17,008 |
First Financial Northwest, Inc. | | † | | 2,164 | | | 21,489 |
First Financial Service Corp. | | | | 988 | | | 17,843 |
First Niagara Financial Group, Inc. | | † | | 8,276 | | | 106,429 |
First Place Financial Corp. | | | | 1,727 | | | 16,234 |
FirstFed Financial Corp. | | *† | | 2,632 | | | 21,161 |
Flagstar Bancorp, Inc. | | † | | 2,770 | | | 8,338 |
Flushing Financial Corp. | | † | | 1,450 | | | 27,478 |
| | | | |
| 238 | | See accompanying notes to financial statements. | | |
SCHEDULE OF INVESTMENTS — (Continued)
June 30, 2008 (Unaudited)
Vantagepoint Mid/Small Company Index Fund
| | | | | | | |
| | | | | Shares | | Value |
COMMON STOCKS—(Continued) | | | | | | | |
Franklin Bank Corp. | | *† | | 1,930 | | $ | 1,177 |
Guaranty Financial Group, Inc. | | *† | | 6,461 | | | 34,696 |
Harrington West Financial Group, Inc. | | | | 1,172 | | | 4,489 |
Imperial Capital Bancorp, Inc. | | | | 680 | | | 3,896 |
IndyMac Bancorp, Inc. | | † | | 6,281 | | | 3,894 |
Kearny Financial Corp. | | | | 3,008 | | | 33,088 |
NASB Financial, Inc. | | † | | 529 | | | 9,406 |
New York Community Bancorp, Inc. | | † | | 21,841 | | | 389,643 |
NewAlliance Bancshares, Inc. | | † | | 7,265 | | | 90,667 |
Northwest Bancorp, Inc. | | | | 1,598 | | | 34,868 |
Ocwen Financial Corp. | | *† | | 3,062 | | | 14,238 |
Parkvale Financial Corp. | | | | 1,077 | | | 25,126 |
People’s United Financial, Inc. | | | | 10,532 | | | 164,299 |
PFF Bancorp, Inc. | | † | | 1,563 | | | 1,688 |
PMI Group, Inc. (The) | | † | | 5,087 | | | 9,920 |
Provident Financial Services, Inc. | | | | 5,182 | | | 72,600 |
Provident New York Bancorp | | † | | 3,488 | | | 38,577 |
Radian Group, Inc. | | | | 7,245 | | | 10,505 |
Riverview Bancorp, Inc. | | | | 2,602 | | | 19,255 |
SouthFirst Bancshares, Inc. | | | | 400 | | | 3,300 |
TFS Financial Corp. | | † | | 6,639 | | | 76,946 |
TierOne Corp. | | | | 1,971 | | | 9,047 |
Triad Guaranty, Inc. | | *† | | 5,663 | | | 5,890 |
Trustco Bank Corp. | | † | | 7,080 | | | 52,534 |
United Western Bancorp, Inc. | | | | 974 | | | 12,233 |
Washington Federal, Inc. | | † | | 5,612 | | | 101,577 |
Westfield Financial, Inc. | | † | | 4,068 | | | 36,815 |
Willow Financial Bancorp, Inc. | | | | 1,237 | | | 10,082 |
WSFS Financial Corp. | | | | 610 | | | 27,206 |
| | | | | | | |
| | | | | | | 2,046,755 |
| | | | | | | |
Tobacco—0.1% | | | | | | | |
Alliance One International, Inc. | | *† | | 6,420 | | | 32,806 |
Universal Corp. | | † | | 1,971 | | | 89,129 |
Vector Group Ltd. | | † | | 2,389 | | | 38,534 |
| | | | | | | |
| | | | | | | 160,469 |
| | | | | | | |
Trading Companies & Distributors—0.6% | | | | | | | |
Aceto Corp. | | | | 1,070 | | | 8,175 |
Aircastle Ltd. (Bermuda) | | † | | 3,110 | | | 26,155 |
Applied Industrial Technologies, Inc. | | † | | 2,868 | | | 69,320 |
Beacon Roofing Supply, Inc. | | *† | | 2,640 | | | 28,010 |
Building Materials Holding Corp. | | | | 4,826 | | | 8,542 |
Electro Rent Corp. | | | | 951 | | | 11,925 |
Fastenal Co. | | | | 9,186 | | | 396,468 |
GATX Corp. | | | | 2,878 | | | 127,582 |
H&E Equipment Services, Inc. | | *† | | 1,490 | | | 17,910 |
Houston Wire & Cable Co. | | † | | 1,569 | | | 31,223 |
Interline Brands, Inc. | | * | | 2,320 | | | 36,958 |
Kaman Corp., Class A | | | | 1,920 | | | 43,699 |
MSC Industrial Direct Co., Class A | | | | 2,782 | | | 122,714 |
Rush Enterprises, Inc., Class A | | * | | 3,059 | | | 36,739 |
United Rentals, Inc. | | * | | 5,536 | | | 108,561 |
Watsco, Inc. | | † | | 1,593 | | | 66,587 |
WESCO International, Inc. | | * | | 2,870 | | | 114,915 |
Willis Lease Finance Corp. | | * | | 1,234 | | | 13,179 |
| | | | | | | |
| | | | | | | 1,268,662 |
| | | | | | | |
Transportation Infrastructure—0.0% | | | | | | | |
Macquarie Infrastructure Co. LLC | | † | | 3,017 | | | 76,300 |
| | | | | | | |
Water Utilities—0.2% | | | | | | | |
American States Water Co. | | † | | 1,492 | | | 52,130 |
American Water Works Co., Inc. | | * | | 3,772 | | | 83,663 |
Aqua America, Inc. | | | | 8,998 | | | 143,698 |
California Water Service Group | | † | | 1,589 | | | 52,072 |
Connecticut Water Service, Inc. | | † | | 500 | | | 11,200 |
Middlesex Water Co. | | | | 550 | | | 9,125 |
SJW Corp. | | † | | 1,012 | | | 26,717 |
Southwest Water Co. | | † | | 2,215 | | | 22,194 |
| | | | | | | |
| | | | | | | 400,799 |
| | | | | | | |
Wireless Telecommunication Services—1.2% | | | | | | | |
Centennial Communications Corp. | | * | | 5,437 | | | 38,005 |
Clearwire Corp., Class A | | *† | | 4,151 | | | 53,797 |
Crown Castle International Corp. | | * | | 17,141 | | | 663,871 |
FiberTower Corp. | | *† | | 6,580 | | | 9,212 |
iPCS, Inc. | | *† | | 1,789 | | | 53,008 |
Kratos Defense & Security Solutions, Inc. | | *† | | 2,399 | | | 4,702 |
LCC International, Inc., Class A | | * | | 1,000 | | | 960 |
Leap Wireless International, Inc. | | * | | 3,284 | | | 141,770 |
MetroPCS Communications, Inc. | | * | | 12,141 | | | 215,017 |
NII Holdings, Inc., Class B | | * | | 11,168 | | | 530,368 |
Rural Cellular Corp., Class A | | * | | 1,266 | | | 56,350 |
SBA Communications Corp., Class A | | * | | 7,115 | | | 256,211 |
Syniverse Holdings, Inc. | | * | | 1,860 | | | 30,132 |
Telephone & Data Systems, Inc. | | † | | 5,823 | | | 275,253 |
Telephone & Data Systems, Inc. (Special Shares), Class L | | | | 1,314 | | | 57,947 |
US Cellular Corp. | | * | | 921 | | | 52,083 |
| | | | | | | |
| | | | | | | 2,438,686 |
| | | | | | | |
TOTAL COMMON STOCKS
(Cost $180,142,016) | | | | | | | 203,687,081 |
| | | | | | | |
| | | | | | | | | |
Coupon Rate | | Maturity
Date | | | | Face | | Value |
U.S. TREASURY OBLIGATIONS—0.1% | | | | | | | | | |
U.S. Treasury Bill—0.1% | | | | | | | | | |
U.S. Treasury Bill | | | | | | | | | |
1.959% | | 09/18/2008 | | ‡‡ | | | | | |
(Cost $184,209) | | | | | | $ | 185,000 | | 184,276 |
| | | | | | | | | |
| | | | |
| | See accompanying notes to financial statements. | | 239 |
SCHEDULE OF INVESTMENTS — (Continued)
June 30, 2008 (Unaudited)
Vantagepoint Mid/Small Company Index Fund
| | | | | | | | |
| | | | | Shares | | Value | |
RIGHTS—0.0% | | | | | | | | |
Apparel—0.0% | | | | | | | | |
Mossimo, Inc., | | | | | | | | |
Expires TBD | | *‡da | | | | | | |
(Cost $—) | | | | 2,807 | | $ | — | |
| | | | | | | | |
WARRANTS—0.0% | | | | | | | | |
Financial Services—0.0% | | | | | | | | |
Equitex, Inc., | | | | | | | | |
Expires 02/7/2010 | | *‡da | | 264 | | | — | |
Equitex, Inc., | | | | | | | | |
Expires 02/7/2010 | | *‡da | | 264 | | | — | |
Pegasus Wireless Corp., | | | | | | | | |
Expires 08/11/2008 | | *‡da | | 200 | | | — | |
| | | | | | | | |
TOTAL WARRANTS
(Cost $—) | | | | | | | — | |
| | | | | | | | |
CASH EQUIVALENTS—27.0% | | | | | | | | |
Institutional Money Market Funds—27.0% | | | | | | | | |
AIM Short-Term Investments Trust Liquid Assets Portfolio | | †† | | 11,692,039 | | | 11,692,039 | |
AIM Short-Term Investments Trust Prime Assets Portfolio | | †† | | 40,748,813 | | | 40,748,813 | |
JPMorgan Prime Money Market Fund, Capital Shares | | | | 3,750,556 | | | 3,750,556 | |
| | | | | | | | |
TOTAL CASH EQUIVALENTS
(Cost $56,191,408) | | | | | | | 56,191,408 | |
| | | | | | | | |
TOTAL INVESTMENTS—125.1%
(Cost $236,517,633) | | | | | | | 260,062,765 | |
Other assets less liabilities—(25.1%) | | | | | | | (52,256,833 | ) |
| | | | | | | | |
NET ASSETS—100.0% | | | | | | $ | 207,805,932 | |
| | | | | | | | |
Notes to the Schedule of Investments:
| | |
| REIT | | Real Estate Investment Trust |
† | | Denotes all or a portion of security on loan. |
* | | Non-income producing. |
d | | Security has no market value at 06/30/2008. |
a | | Illiquid Security. |
‡ | | Security valued at fair value as determined by policies approved by the board of directors. |
‡‡ | | Security has been pledged as collateral for futures contracts. |
†† | | Represents reinvestment of collateral received in conjunction with securities lending. |
| | | | |
| 240 | | See accompanying notes to financial statements. | | |
SCHEDULE OF INVESTMENTS
June 30, 2008 (Unaudited)
Vantagepoint Overseas Equity Index Fund
| | | | | | | |
| | | | | Shares | | Value |
COMMON STOCKS—95.4% | | | | | | | |
Australia—6.6% | | | | | | | |
AGL Energy Ltd. | | | | 7,248 | | $ | 99,285 |
Alumina Ltd. | | | | 20,052 | | | 91,027 |
Amcor Ltd. | | | | 11,838 | | | 57,349 |
AMP Ltd. | | | | 30,846 | | | 197,512 |
Aristocrat Leisure Ltd. | | | | 6,119 | | | 37,583 |
Asciano Group | | | | 9,173 | | | 30,512 |
ASX Ltd. | | | | 3,254 | | | 97,977 |
Australia & New Zealand Banking Group Ltd. | | | | 30,788 | | | 553,341 |
AXA Asia Pacific Holdings Ltd. | | | | 14,164 | | | 63,507 |
Babcock & Brown Ltd. | | † | | 3,777 | | | 27,117 |
Bendigo and Adelaide Bank Ltd. | | † | | 3,459 | | | 36,248 |
BHP Billiton Ltd. | | | | 55,892 | | | 2,378,780 |
Billabong International Ltd. | | | | 3,672 | | | 37,974 |
BlueScope Steel Ltd. | | | | 12,806 | | | 139,148 |
Boart Longyear Group | | | | 23,649 | | | 50,568 |
Boral Ltd. | | | | 7,953 | | | 43,082 |
Brambles Ltd. | | | | 22,972 | | | 192,274 |
Caltex Australia Ltd. | | | | 2,904 | | | 36,285 |
CFS Retail Property Trust REIT | | † | | 24,195 | | | 42,927 |
Coca-Cola Amatil Ltd. | | | | 7,823 | | | 52,573 |
Cochlear Ltd. | | | | 767 | | | 32,214 |
Commonwealth Bank of Australia | | | | 22,089 | | | 851,740 |
Computershare Ltd. | | | | 9,803 | | | 86,409 |
Crown Ltd. | | | | 8,998 | | | 80,041 |
CSL Ltd. | | | | 8,915 | | | 305,169 |
CSR Ltd. | | | | 18,904 | | | 44,343 |
Dexus Property Group REIT | | | | 55,958 | | | 74,079 |
Fairfax Media Ltd. | | | | 24,051 | | | 67,566 |
Fortescue Metals Group Ltd. | | * | | 21,130 | | | 240,058 |
Foster’s Group Ltd. | | | | 31,606 | | | 153,650 |
Goodman Fielder Ltd. | | | | 12,355 | | | 16,647 |
Goodman Group REIT | | | | 24,482 | | | 72,527 |
GPT Group REIT | | | | 30,675 | | | 65,364 |
Harvey Norman Holdings Ltd. | | | | 10,998 | | | 32,548 |
Incitec Pivot Ltd. | | | | 766 | | | 135,635 |
Insurance Australia Group Ltd. | | | | 31,863 | | | 106,174 |
Leighton Holdings Ltd. | | † | | 2,521 | | | 122,759 |
Lend Lease Corp. Ltd. | | † | | 6,835 | | | 62,625 |
Lion Nathan Ltd. | | | | 6,303 | | | 51,632 |
Macquarie Airports | | | | 9,138 | | | 18,074 |
Macquarie Group Ltd. | | † | | 4,238 | | | 197,302 |
Macquarie Infrastructure Group | | † | | 40,325 | | | 89,724 |
Macquarie Office Trust REIT | | | | 42,146 | | | 31,448 |
Meinl European Land Ltd. | | * | | 5,430 | | | 60,879 |
Metcash Ltd. | | | | 10,088 | | | 35,789 |
Mirvac Group REIT | | | | 19,844 | | | 56,358 |
National Australia Bank Ltd. | | | | 27,496 | | | 698,164 |
Newcrest Mining Ltd. | | | | 7,242 | | | 200,987 |
OneSteel Ltd. | | | | 14,808 | | | 105,552 |
Orica Ltd. | | | | 5,586 | | | 156,785 |
Origin Energy Ltd. | | | | 16,532 | | | 255,776 |
Oxiana Ltd. | | † | | 43,462 | | | 108,844 |
Paladin Energy Ltd. | | * | | 9,064 | | | 55,341 |
Perpetual Ltd. | | | | 532 | | | 21,809 |
Qantas Airways Ltd. | | | | 18,484 | | | 53,864 |
QBE Insurance Group Ltd. | | | | 14,106 | | | 303,294 |
Rio Tinto Ltd. | | | | 4,708 | | | 609,155 |
Santos Ltd. | | | | 10,914 | | | 224,801 |
Sims Group Ltd. | | | | 2,622 | | | 104,848 |
Sonic Healthcare Ltd. | | | | 5,297 | | | 73,968 |
St George Bank Ltd. | | | | 8,511 | | | 221,458 |
Stockland REIT | | | | 24,404 | | | 126,188 |
Suncorp-Metway Ltd. | | | | 16,390 | | | 205,385 |
Tabcorp Holdings Ltd. | | | | 9,246 | | | 86,935 |
Tatts Group Ltd. | | | | 17,158 | | | 38,708 |
Telstra Corp. Ltd. | | | | 76,003 | | | 308,828 |
Toll Holdings Ltd. | | | | 9,173 | | | 53,080 |
Transurban Group | | † | | 18,847 | | | 76,620 |
Wesfarmers Ltd. | | | | 13,328 | | | 477,158 |
Westfield Group REIT | | | | 28,734 | | | 448,986 |
Westpac Banking Corp. | | | | 31,404 | | | 603,175 |
Woodside Petroleum Ltd. | | | | 7,778 | | | 502,740 |
Woolworths Ltd. | | | | 20,256 | | | 474,696 |
WorleyParsons Ltd. | | | | 2,239 | | | 81,127 |
| | | | | | | |
| | | | | | | 14,034,095 |
| | | | | | | |
Austria—0.6% | | | | | | | |
Andritz AG | | | | 484 | | | 30,359 |
Erste Bank der Oesterreichischen Sparkassen AG | | † | | 3,450 | | | 213,370 |
Immoeast AG | | * | | 7,515 | | | 66,458 |
Immofinanz Immobilien Anlagen AG | | | | 7,160 | | | 73,719 |
OMV AG | | | | 2,644 | | | 206,576 |
Raiffeisen International Bank Holding AG | | † | | 778 | | | 98,846 |
Strabag SE | | † | | 850 | | | 66,039 |
Telekom Austria AG | | | | 6,281 | | | 136,101 |
Verbund—Oesterreichische Elektrizitaetswirtschafts AG, Class A | | | | 1,510 | | | 134,834 |
Vienna Insurance Group | | | | 618 | | | 40,723 |
Voestalpine AG | | | | 1,825 | | | 149,349 |
Wienerberger AG | | † | | 1,303 | | | 54,482 |
| | | | | | | |
| | | | | | | 1,270,856 |
| | | | | | | |
Belgium—1.0% | | | | | | | |
Belgacom SA | | | | 2,883 | | | 123,686 |
Colruyt SA | | | | 332 | | | 87,515 |
Delhaize Group | | | | 1,861 | | | 124,646 |
Dexia SA | | † | | 8,587 | | | 136,721 |
Fortis | | | | 34,845 | | | 553,492 |
Groupe Bruxelles Lambert SA | | | | 1,526 | | | 165,878 |
InBev NV | | | | 3,045 | | | 210,534 |
KBC Ancora | | | | 284 | | | 24,730 |
KBC Groep NV | | | | 2,886 | | | 319,022 |
Mobistar SA | | | | 449 | | | 36,242 |
Nationale A Portefeuille | | | | 359 | | | 26,800 |
Solvay SA | | | | 1,015 | | | 132,234 |
UCB SA | | | | 2,101 | | | 77,509 |
Umicore | | | | 1,995 | | | 98,121 |
| | | | | | | |
| | | | | | | 2,117,130 |
| | | | | | | |
Bermuda—0.1% | | | | | | | |
Seadrill Ltd. | | | | 4,479 | | | 136,713 |
| | | | | | | |
China—0.0% | | | | | | | |
Foxconn International Holdings Ltd. | | * | | 41,000 | | | 39,781 |
| | | | | | | |
Denmark—1.0% | | | | | | | |
A P Moller—Maersk A/S, Class B | | | | 18 | | | 219,546 |
A P Moller—Maersk A/S, Class A | | | | 8 | | | 97,730 |
Carlsberg A/S, Class B | | | | 1,354 | | | 130,430 |
Coloplast A/S, Class B | | | | 274 | | | 23,801 |
Danisco A/S | | | | 833 | | | 53,406 |
| | | | |
| | See accompanying notes to financial statements. | | 241 |
SCHEDULE OF INVESTMENTS — (Continued)
June 30, 2008 (Unaudited)
Vantagepoint Overseas Equity Index Fund
| | | | | | | |
| | | | | Shares | | Value |
COMMON STOCKS—(Continued) | | | | | | | |
Danske Bank A/S | | | | 7,929 | | $ | 228,314 |
DSV A/S | | | | 4,086 | | | 97,476 |
FLSmidth & Co. A/S | | | | 950 | | | 103,793 |
Jyske Bank A/S | | * | | 1,193 | | | 70,987 |
Novo Nordisk A/S, Class B | | | | 7,599 | | | 500,246 |
Novozymes A/S, Class B | | | | 839 | | | 75,533 |
Sydbank A/S | | | | 700 | | | 26,604 |
Topdanmark A/S | | * | | 339 | | | 51,009 |
TrygVesta AS | | | | 350 | | | 24,704 |
Vestas Wind Systems A/S | | * | | 3,110 | | | 404,913 |
William Demant Holding | | * | | 358 | | | 23,512 |
| | | | | | | |
| | | | | | | 2,132,004 |
| | | | | | | |
Finland—1.5% | | | | | | | |
Cargotec Corp., Class B | | | | 834 | | | 28,854 |
Elisa Oyj | | † | | 1,951 | | | 40,720 |
Fortum Oyj | | | | 7,265 | | | 367,721 |
Kesko Oyj, Class B | | | | 1,238 | | | 39,835 |
Kone Oyj, Class B | | | | 3,042 | | | 106,335 |
Metso Oyj | | | | 2,116 | | | 95,772 |
Neste Oil Oyj | | † | | 2,491 | | | 73,011 |
Nokia Oyj | | | | 65,558 | | | 1,602,425 |
Nokian Renkaat Oyj | | | | 1,550 | | | 73,519 |
Orion Oyj, Class B | | | | 1,592 | | | 31,618 |
Outokumpu Oyj | | | | 2,272 | | | 78,953 |
Pohjola Bank plc | | | | 1,100 | | | 18,990 |
Rautaruukki Oyj | | | | 1,584 | | | 71,903 |
Sampo Oyj, Class A | | | | 7,783 | | | 195,514 |
SanomaWSOY Oyj | | | | 1,909 | | | 42,234 |
Stora Enso Oyj, Class R | | | | 9,940 | | | 92,608 |
UPM-Kymmene Oyj | | | | 9,367 | | | 152,625 |
Wartsila Oyj | | | | 1,429 | | | 89,230 |
YIT Oyj | | | | 1,800 | | | 44,948 |
| | | | | | | |
| | | | | | | 3,246,815 |
| | | | | | | |
France—9.5% | | | | | | | |
Accor SA | | | | 3,273 | | | 217,425 |
Aeroports de Paris | | | | 565 | | | 52,721 |
Air France-KLM | | | | 2,488 | | | 59,346 |
Air Liquide | | | | 4,186 | | | 551,089 |
Alcatel-Lucent | | * | | 38,733 | | | 233,825 |
Alstom SA | | | | 1,670 | | | 382,940 |
Atos Origin | | | | 1,417 | | | 78,054 |
AXA SA | | | | 25,733 | | | 758,244 |
BNP Paribas | | | | 13,782 | | | 1,240,612 |
Bouygues | | | | 3,628 | | | 239,363 |
Bureau Veritas SA | | | | 488 | | | 28,926 |
Cap Gemini SA | | | | 2,519 | | | 147,682 |
Carrefour SA | | | | 10,925 | | | 615,817 |
Casino Guichard Perrachon SA | | | | 865 | | | 97,683 |
Christian Dior SA | | | | 796 | | | 81,767 |
Cie de Saint-Gobain | | † | | 4,861 | | | 301,044 |
Cie Generale de Geophysique-Veritas | | * | | 2,080 | | | 98,203 |
Cie Generale d’Optique Essilor International SA | | † | | 3,156 | | | 192,513 |
CNP Assurances | | | | 676 | | | 76,217 |
Compagnie Generale des Etablissements Michelin, Class B | | | | 2,404 | | | 171,900 |
Credit Agricole SA | | † | | 14,914 | | | 302,760 |
Dassault Systemes SA | | | | 1,254 | | | 76,126 |
Eiffage SA | | | | 489 | | | 33,396 |
Electricite de France | | | | 3,010 | | | 285,139 |
Eramet | | | | 86 | | | 84,999 |
Eurazeo | | | | 242 | | | 25,751 |
Eutelsat Communications | | | | 1,153 | | | 31,984 |
France Telecom SA | | | | 30,288 | | | 888,256 |
Gaz de France SA | | † | | 3,477 | | | 222,627 |
Gecina SA REIT | | | | 146 | | | 17,645 |
Groupe Danone | | † | | 7,418 | | | 519,067 |
Hermes International | | | | 1,113 | | | 174,761 |
Icade REIT | | | | 336 | | | 39,185 |
Imerys SA | | | | 730 | | | 52,714 |
JC Decaux SA | | | | 1,530 | | | 38,783 |
Klepierre REIT | | | | 990 | | | 49,632 |
Lafarge SA | | | | 2,413 | | | 367,951 |
Lagardere SCA | | | | 2,073 | | | 117,266 |
Legrand SA | | | | 862 | | | 21,691 |
L’Oreal SA | | | | 4,245 | | | 460,439 |
LVMH Moet Hennessy Louis Vuitton SA | | | | 4,140 | | | 431,871 |
M6-Metropole Television | | | | 1,711 | | | 36,815 |
Natixis | | | | 6,203 | | | 68,282 |
Neopost SA | | | | 600 | | | 63,258 |
PagesJaunes Groupe | | † | | 1,314 | | | 19,219 |
Pernod-Ricard SA | | | | 2,725 | | | 278,072 |
Peugeot SA | | † | | 2,438 | | | 131,681 |
PPR | | | | 1,274 | | | 140,640 |
Publicis Groupe | | | | 2,281 | | | 73,595 |
Renault SA | | | | 3,133 | | | 254,984 |
Safran SA | | | | 2,404 | | | 46,366 |
Sanofi-Aventis SA | | | | 16,979 | | | 1,128,263 |
Schneider Electric SA | | | | 3,613 | | | 388,680 |
SCOR SE | | | | 3,593 | | | 81,812 |
Societe BIC SA | | | | 239 | | | 12,477 |
Societe Generale | | | | 7,865 | | | 681,887 |
Societe Television Francaise 1 | | | | 2,508 | | | 41,751 |
Sodexo | | | | 1,672 | | | 109,381 |
Suez SA | | | | 17,217 | | | 1,167,096 |
Suez SA VVPR Strips | | * | | 880 | | | 14 |
Technip SA | | | | 1,700 | | | 156,875 |
Thales SA | | | | 1,497 | | | 85,152 |
Total SA | | | | 35,908 | | | 3,056,428 |
Unibail-Rodamco REIT | | * | | 1,288 | | | 296,797 |
Valeo SA | | | | 1,258 | | | 40,266 |
Vallourec | | | | 870 | | | 304,265 |
Veolia Environnement | | | | 5,919 | | | 330,441 |
Vinci SA | | † | | 6,855 | | | 418,593 |
Vivendi Universal SA | | | | 19,737 | | | 744,208 |
Wendel | | | | 384 | | | 38,878 |
Zodiac SA | | | | 569 | | | 26,031 |
| | | | | | | |
| | | | | | | 20,089,621 |
| | | | | | | |
Germany—8.3% | | | | | | | |
Adidas AG | | | | 3,316 | | | 208,818 |
Allianz SE (Registered) | | | | 7,464 | | | 1,312,940 |
Arcandor AG | | * | | 920 | | | 10,710 |
BASF SE | | | | 16,122 | | | 1,111,149 |
Bayer AG | | † | | 12,337 | | | 1,038,012 |
Bayerische Motoren Werke AG | | † | | 4,977 | | | 239,128 |
Beiersdorf AG | | | | 1,579 | | | 115,923 |
Bilfinger Berger AG | | | | 720 | | | 62,434 |
Celesio AG | | | | 1,532 | | | 55,333 |
Commerzbank AG | | † | | 10,489 | | | 311,605 |
Continental AG | | † | | 2,550 | | | 262,468 |
Daimler AG | | | | 15,194 | | | 942,419 |
Deutsche Bank AG (Registered) | | | | 8,617 | | | 743,860 |
Deutsche Boerse AG | | | | 3,297 | | | 372,693 |
Deutsche Lufthansa AG | | | | 4,369 | | | 94,134 |
Deutsche Post AG | | | | 13,562 | | | 354,091 |
Deutsche Postbank AG | | | | 1,429 | | | 125,629 |
Deutsche Telekom AG | | | | 48,159 | | | 789,336 |
E.ON AG | | | | 10,375 | | | 2,091,018 |
| | | | |
| 242 | | See accompanying notes to financial statements. | | |
SCHEDULE OF INVESTMENTS — (Continued)
June 30, 2008 (Unaudited)
Vantagepoint Overseas Equity Index Fund
| | | | | | | |
| | | | | Shares | | Value |
COMMON STOCKS—(Continued) | | | | | | | |
Fresenius Medical Care AG & Co. KGaA | | | | 3,132 | | $ | 172,564 |
Fresenius SE | | | | 330 | | | 28,573 |
GEA Group AG | | | | 2,256 | | | 79,653 |
Hamburger Hafen und Logistik AG | | | | 293 | | | 22,758 |
Hannover Rueckversicherung AG | | | | 795 | | | 39,160 |
HeidelbergCement AG | | | | 348 | | | 50,468 |
Henkel AG & Co. KGaA | | | | 2,008 | | | 75,294 |
Hochtief AG | | | | 816 | | | 82,770 |
Hypo Real Estate Holding AG | | † | | 3,623 | | | 101,939 |
Infineon Technologies AG | | * | | 12,151 | | | 105,465 |
IVG Immobilien AG | | | | 1,302 | | | 25,645 |
K+S AG | | | | 590 | | | 339,698 |
Linde AG | | | | 2,048 | | | 287,662 |
MAN AG | | | | 1,752 | | | 194,269 |
Merck KGAA | | | | 1,015 | | | 144,233 |
Metro AG | | | | 2,019 | | | 128,801 |
Muenchener Rueckversicherungs AG | | | | 3,413 | | | 598,618 |
Puma AG Rudolf Dassler Sport | | | | 91 | | | 30,475 |
Q-Cells AG | | * | | 906 | | | 91,779 |
Rheinmetall AG | | | | 723 | | | 52,190 |
RWE AG | | † | | 7,554 | | | 953,736 |
Salzgitter AG | | | | 639 | | | 117,057 |
SAP AG | | † | | 14,938 | | | 781,815 |
Siemens AG | | | | 14,506 | | | 1,608,134 |
Solarworld AG | | † | | 1,548 | | | 73,665 |
ThyssenKrupp AG | | | | 5,881 | | | 368,942 |
TUI AG | | † | | 3,859 | | | 89,335 |
United Internet AG | | | | 1,658 | | | 32,666 |
Volkswagen AG | | † | | 2,443 | | | 705,656 |
Wacker Chemie AG | | | | 213 | | | 44,498 |
| | | | | | | |
| | | | | | | 17,669,218 |
| | | | | | | |
Greece—0.6% | | | | | | | |
Alpha Bank AE | | | | 6,130 | | | 185,577 |
Coca Cola Hellenic Bottling Co. SA | | | | 2,441 | | | 66,412 |
EFG Eurobank Ergasias SA | | | | 5,185 | | | 123,458 |
Hellenic Petroleum SA | | | | 890 | | | 12,232 |
Hellenic Telecommunications Organization SA | | * | | 4,880 | | | 122,933 |
Marfin Investment Group SA | | * | | 10,995 | | | 86,986 |
National Bank of Greece SA | | | | 7,807 | | | 351,368 |
OPAP SA | | | | 3,163 | | | 110,670 |
Piraeus Bank SA | | | | 4,966 | | | 135,156 |
Public Power Corp. SA | | | | 2,009 | | | 69,682 |
Titan Cement Co. SA | | | | 500 | | | 19,856 |
| | | | | | | |
| | | | | | | 1,284,330 |
| | | | | | | |
Hong Kong—2.0% | | | | | | | |
ASM Pacific Technology Ltd. | | | | 2,000 | | | 15,116 |
Bank of East Asia Ltd. | | | | 25,200 | | | 137,011 |
BOC Hong Kong Holdings Ltd. | | | | 59,500 | | | 157,718 |
Cathay Pacific Airways Ltd. | | | | 18,000 | | | 34,284 |
Cheung Kong Holdings Ltd. | | | | 24,000 | | | 324,552 |
Cheung Kong Infrastructure Holdings Ltd. | | | | 5,000 | | | 21,186 |
CLP Holdings Ltd. | | | | 31,000 | | | 265,850 |
Esprit Holdings Ltd. | | | | 17,500 | | | 182,219 |
Hang Lung Group Ltd. | | | | 12,000 | | | 53,520 |
Hang Lung Properties Ltd. | | | | 38,000 | | | 121,994 |
Hang Seng Bank Ltd. | | | | 12,300 | | | 259,704 |
Henderson Land Development Co. Ltd. | | | | 20,000 | | | 125,045 |
Hong Kong & China Gas Co. Ltd. | | | | 72,600 | | | 172,756 |
Hong Kong Exchanges and Clearing Ltd. | | | | 18,000 | | | 263,677 |
HongKong Electric Holdings | | † | | 26,000 | | | 155,576 |
Hopewell Holdings | | | | 11,000 | | | 39,102 |
Hutchison Telecommunications International Ltd. | | * | | 28,000 | | | 39,650 |
Hutchison Whampoa Ltd. | | | | 35,000 | | | 352,951 |
Hysan Development Co. Ltd. | | | | 7,000 | | | 19,263 |
Kerry Properties Ltd. | | | | 11,000 | | | 57,850 |
Kingboard Chemical Holdings Ltd. | | | | 11,000 | | | 50,791 |
Li & Fung Ltd. | | | | 39,600 | | | 119,491 |
Link (The) REIT | | | | 38,000 | | | 86,585 |
Mongolia Energy Co. ltd | | *† | | 56,000 | | | 108,213 |
MTR Corp. | | | | 27,000 | | | 85,063 |
New World Development Ltd. | | | | 37,600 | | | 76,801 |
Noble Group Ltd. | | | | 31,200 | | | 54,609 |
Orient Overseas International Ltd. | | | | 2,200 | | | 11,019 |
Pacific Basin Shipping Ltd. | | | | 28,000 | | | 40,064 |
PCCW Ltd. | | | | 58,000 | | | 35,127 |
Pou Sheng International Holdings Ltd. | | * | | 275 | | | 85 |
Shangri-La Asia Ltd. | | | | 18,000 | | | 42,175 |
Shun Tak Holdings Ltd. | | † | | 12,000 | | | 11,248 |
Sino Land Co. | | | | 26,000 | | | 51,743 |
Sun Hung Kai Properties Ltd. | | | | 23,000 | | | 312,664 |
Swire Pacific Ltd. | | | | 14,500 | | | 148,420 |
Television Broadcasts Ltd. | | | | 5,000 | | | 28,881 |
Wharf Holdings Ltd. | | | | 21,125 | | | 88,443 |
Wheelock & Co. Ltd. | | | | 8,000 | | | 21,495 |
Wing Hang Bank Ltd. | | | | 2,000 | | | 26,487 |
Yue Yuen Industrial Holdings Ltd. | | | | 11,000 | | | 26,134 |
| | | | | | | |
| | | | | | | 4,224,562 |
| | | | | | | |
Ireland—0.6% | | | | | | | |
Allied Irish Banks plc | | | | 14,714 | | | 226,756 |
Anglo Irish Bank Corp. plc | | | | 11,206 | | | 104,524 |
Bank of Ireland | | | | 17,295 | | | 149,174 |
CRH plc | | | | 9,192 | | | 267,152 |
Elan Corp. plc | | * | | 7,416 | | | 262,279 |
Experian Group Ltd. | | | | 17,497 | | | 129,407 |
Kerry Group plc, Class A | | | | 2,758 | | | 81,409 |
| | | | | | | |
| | | | | | | 1,220,701 |
| | | | | | | |
Italy—3.6% | | | | | | | |
A2A SpA | | | | 17,876 | | | 65,268 |
Alleanza Assicurazioni SpA | | | | 6,413 | | | 69,367 |
Assicurazioni Generali SpA | | | | 17,887 | | | 683,612 |
Atlantia SpA | | | | 4,057 | | | 122,532 |
Autogrill SpA | | *† | | 2,618 | | | 31,302 |
Banca Carige SpA | | | | 9,271 | | | 32,607 |
Banca Monte dei Paschi di Siena SpA | | | | 33,744 | | | 95,113 |
Banca Popolare di Milano Scarl | | | | 8,299 | | | 77,459 |
Banco Popolare SC | | | | 10,888 | | | 192,351 |
Bulgari SpA | | | | 2,013 | | | 20,236 |
Enel SpA | | † | | 73,413 | | | 696,425 |
ENI SpA | | | | 43,293 | | | 1,608,347 |
Fiat SpA | | | | 11,496 | | | 187,119 |
Finmeccanica SpA | | | | 4,830 | | | 126,285 |
Fondiaria-Sai SpA | | | | 1,454 | | | 47,917 |
IFIL—Investments SpA | | | | 3,300 | | | 21,326 |
| | | | |
| | See accompanying notes to financial statements. | | 243 |
SCHEDULE OF INVESTMENTS — (Continued)
June 30, 2008 (Unaudited)
Vantagepoint Overseas Equity Index Fund
| | | | | | | |
| | | | | Shares | | Value |
COMMON STOCKS—(Continued) | | | | | | | |
Intesa Sanpaolo SpA | | | | 130,790 | | $ | 743,520 |
Intesa Sanpaolo SpA RNC | | | | 14,283 | | | 73,598 |
Italcementi SpA | | | | 992 | | | 16,411 |
Lottomatica SpA | | | | 894 | | | 26,637 |
Luxottica Group SpA | | † | | 2,714 | | | 63,339 |
Mediaset SpA | | | | 13,265 | | | 87,245 |
Mediobanca SpA | | | | 7,721 | | | 130,847 |
Mediolanum SpA | | | | 3,095 | | | 12,816 |
Parmalat SpA | | | | 23,969 | | | 62,352 |
Pirelli & C SpA | | | | 39,884 | | | 27,363 |
Prysmian SpA | | | | 1,905 | | | 48,093 |
Saipem SpA | | | | 3,909 | | | 182,697 |
Snam Rete Gas SpA | | | | 14,205 | | | 96,827 |
Telecom Italia RNC | | | | 100,213 | | | 161,781 |
Telecom Italia SpA | | † | | 176,142 | | | 352,300 |
Terna Rete Elettrica Nazionale SpA | | † | | 24,044 | | | 101,603 |
UniCredit SpA | | | | 183,799 | | | 1,118,020 |
Unione di Banche Italiane SCPA | | | | 10,800 | | | 252,349 |
Unipol Gruppo Finanziario SpA | | | | 21,870 | | | 51,383 |
| | | | | | | |
| | | | | | | 7,686,447 |
| | | | | | | |
Japan—20.5% | | | | | | | |
77 Bank Ltd. (The) | | | | 8,000 | | | 50,305 |
Acom Co. Ltd. | | | | 960 | | | 29,714 |
Advantest Corp. | | | | 2,400 | | | 50,587 |
Aeon Co. Ltd. | | | | 11,500 | | | 142,354 |
Aeon Credit Service Co. Ltd. | | | | 900 | | | 11,278 |
Aeon Mall Co. Ltd. | | | | 600 | | | 17,749 |
Aiful Corp. | | | | 2,075 | | | 24,004 |
Aisin Seiki Co. Ltd. | | | | 3,200 | | | 105,116 |
Ajinomoto Co., Inc. | | † | | 11,000 | | | 104,213 |
Alfresa Holdings Corp. | | | | 700 | | | 50,100 |
All Nippon Airways Co. Ltd. | | † | | 9,000 | | | 33,660 |
Alps Electric Co. Ltd. | | | | 2,000 | | | 20,686 |
Amada Co. Ltd. | | | | 5,000 | | | 39,555 |
Aozora Bank Ltd. | | | | 6,000 | | | 13,725 |
Asahi Breweries Ltd. | | † | | 7,600 | | | 142,071 |
Asahi Glass Co. Ltd. | | | | 16,000 | | | 193,711 |
Asahi Kasei Corp. | | | | 22,000 | | | 115,344 |
Asics Corp. | | | | 4,000 | | | 43,719 |
Astellas Pharma, Inc. | | | | 8,275 | | | 351,896 |
Bank of Kyoto Ltd. (The) | | | | 4,000 | | | 41,810 |
Bank of Yokohama Ltd. (The) | | | | 21,000 | | | 145,221 |
Benesse Corp. | | | | 900 | | | 36,451 |
Bridgestone Corp. | | | | 11,200 | | | 171,819 |
Brother Industries Ltd. | | | | 2,300 | | | 31,712 |
Canon Marketing Japan, Inc. | | | | 900 | | | 15,831 |
Canon, Inc. | | | | 18,000 | | | 926,567 |
Casio Computer Co. Ltd. | | | | 4,500 | | | 51,203 |
Central Japan Railway Co. | | | | 26 | | | 286,584 |
Chiba Bank Ltd. (The) | | | | 14,000 | | | 98,304 |
Chubu Electric Power Co., Inc. | | | | 11,400 | | | 278,456 |
Chugai Pharmaceutical Co. Ltd. | | † | | 4,500 | | | 71,954 |
Chugoku Bank Ltd. (The) | | | | 2,000 | | | 29,058 |
Chugoku Electric Power Co., Inc. (The) | | | | 4,000 | | | 85,354 |
Chuo Mitsui Trust Holdings, Inc. | | | | 13,000 | | | 77,430 |
Citizen Holdings Co. Ltd. | | | | 4,700 | | | 35,856 |
Coca-Cola West Holdings Co. Ltd. | | † | | 1,200 | | | 28,005 |
Cosmo Oil Co. Ltd. | | | | 12,000 | | | 43,478 |
Credit Saison Co. Ltd. | | † | | 2,400 | | | 50,344 |
CSK Holdings Corp. | | | | 800 | | | 15,762 |
Dai Nippon Printing Co. Ltd. | | | | 11,000 | | | 161,944 |
Daicel Chemical Industries Ltd. | | | | 3,000 | | | 16,899 |
Daido Steel Co. Ltd. | | | | 8,000 | | | 44,764 |
Daiichi Sankyo Co. Ltd. | | | | 11,702 | | | 322,371 |
Daikin Industries Ltd. | | | | 4,200 | | | 212,364 |
Daito Trust Construction Co. Ltd. | | | | 1,600 | | | 77,602 |
Daiwa House Industry Co. Ltd. | | | | 9,000 | | | 84,724 |
Daiwa Securities Group, Inc. | | | | 22,000 | | | 202,307 |
Dena Co. Ltd. | | | | 5 | | | 29,451 |
Denki Kagaku Kogyo K K | | | | 6,000 | | | 22,251 |
Denso Corp. | | | | 7,900 | | | 272,087 |
Dentsu, Inc. | | | | 33 | | | 70,028 |
DIC Corp. | | | | 14,000 | | | 40,628 |
Dowa Holdings Co., Ltd. | | † | | 3,000 | | | 21,915 |
East Japan Railway Co. | | | | 56 | | | 456,137 |
Eisai Co. Ltd. | | | | 4,100 | | | 144,828 |
Electric Power Development Co. Ltd. | | | | 2,340 | | | 86,875 |
Elpida Memory, Inc. | | *† | | 1,500 | | | 48,106 |
FamilyMart Co. Ltd. | | | | 600 | | | 24,559 |
Fanuc Ltd. | | | | 3,100 | | | 303,172 |
Fast Retailing Co. Ltd. | | | | 1,000 | | | 94,873 |
Fuji Electric Holdings Co. Ltd. | | † | | 7,000 | | | 24,750 |
Fuji Heavy Industries Ltd. | | | | 7,000 | | | 34,341 |
FUJIFILM Holdings Corp. | | | | 8,500 | | | 292,787 |
Fujitsu Ltd. | | | | 30,000 | | | 222,775 |
Fukuoka Financial Group, Inc. | | | | 12,000 | | | 54,246 |
Furukawa Electric Co. Ltd. | | | | 8,000 | | | 34,822 |
Gunma Bank Ltd. (The) | | | | 5,000 | | | 33,333 |
Hachijuni Bank Ltd. (The) | | | | 6,000 | | | 38,929 |
Hakuhodo DY Holdings, Inc. | | | | 660 | | | 35,229 |
Hankyu Hanshin Holdings, Inc. | | | | 18,600 | | | 78,158 |
Haseko Corp. | | | | 17,000 | | | 22,747 |
Hikari Tsushin, Inc. | | | | 200 | | | 6,598 |
Hino Motors Ltd. | | | | 2,000 | | | 12,422 |
Hirose Electric Co. Ltd. | | | | 630 | | | 63,301 |
Hiroshima Bank Ltd. (The) | | | | 10,000 | | | 44,587 |
Hisamitsu Pharmaceutical Co., Inc. | | | | 800 | | | 34,836 |
Hitachi Chemical Co. Ltd. | | | | 2,300 | | | 47,467 |
Hitachi Construction Machinery Co. Ltd. | | | | 2,000 | | | 56,072 |
Hitachi High-Technologies Corp. | | | | 700 | | | 16,243 |
Hitachi Ltd. | | | | 58,000 | | | 417,686 |
Hokkaido Electric Power Co., Inc. | | | | 3,000 | | | 61,096 |
Hokuhoku Financial Group, Inc. | | | | 19,000 | | | 55,114 |
Hokuriku Electric Power Co. | | | | 2,400 | | | 57,076 |
Honda Motor Co. Ltd. | | | | 26,300 | | | 897,531 |
HOYA Corp. | | | | 7,100 | | | 164,452 |
Ibiden Co. Ltd. | | | | 2,200 | | | 80,115 |
Idemitsu Kosan Co. Ltd. | | | | 200 | | | 17,787 |
IHI Corp. | | | | 21,000 | | | 42,538 |
Inpex Holdings, Inc. | | | | 14 | | | 176,797 |
Isetan Mitsukoshi Holdings Ltd. | | *† | | 5,940 | | | 63,604 |
Isuzu Motors Ltd. | | | | 18,000 | | | 86,679 |
Ito En Ltd. | | † | | 800 | | | 12,602 |
ITOCHU Corp. | | | | 25,000 | | | 266,544 |
Itochu Techno-Solutions Corp. | | | | 300 | | | 9,749 |
Iyo Bank Ltd./The | | | | 3,000 | | | 35,126 |
J Front Retailing Co. Ltd. | | | | 8,600 | | | 45,531 |
| | | | |
| 244 | | See accompanying notes to financial statements. | | |
SCHEDULE OF INVESTMENTS — (Continued)
June 30, 2008 (Unaudited)
Vantagepoint Overseas Equity Index Fund
| | | | | | | |
| | | | | Shares | | Value |
COMMON STOCKS—(Continued) | | | | | | | |
Jafco Co. Ltd. | | | | 400 | | $ | 13,695 |
Japan Airlines Corp. | | * | | 14,000 | | | 29,405 |
Japan Petroleum Exploration Co. | | | | 500 | | | 35,697 |
Japan Prime Realty Investment Corp. REIT | | | | 12 | | | 35,504 |
Japan Real Estate Investment Corp. REIT | | | | 6 | | | 63,372 |
Japan Retail Fund Investment Corp. REIT | | | | 4 | | | 23,063 |
Japan Steel Works Ltd. (The) | | | | 6,000 | | | 116,699 |
Japan Tobacco, Inc. | | | | 78 | | | 332,659 |
JFE Holdings, Inc. | | † | | 8,900 | | | 448,722 |
JGC Corp. | | | | 3,000 | | | 59,075 |
Joyo Bank Ltd. (The) | | | | 14,000 | | | 68,180 |
JS Group Corp. | | | | 4,900 | | | 78,017 |
JSR Corp. | | | | 3,800 | | | 75,518 |
JTEKT Corp. | | | | 3,700 | | | 58,781 |
Jupiter Telecommunications Co. Ltd. | | | | 23 | | | 17,842 |
Kajima Corp. | | † | | 19,000 | | | 66,472 |
Kamigumi Co. Ltd. | | | | 5,000 | | | 37,908 |
Kaneka Corp. | | | | 6,000 | | | 40,871 |
Kansai Electric Power Co., Inc. (The) | | | | 12,600 | | | 295,185 |
Kansai Paint Co. Ltd. | | | | 2,000 | | | 13,849 |
Kao Corp. | | | | 9,000 | | | 236,272 |
Kawasaki Heavy Industries Ltd. | | | | 30,000 | | | 80,130 |
Kawasaki Kisen Kaisha Ltd. | | | | 9,000 | | | 84,579 |
KDDI Corp. | | | | 46 | | | 284,621 |
Keihin Electric Express Railway Co. Ltd. | | † | | 7,000 | | | 43,388 |
Keio Corp. | | † | | 12,000 | | | 60,729 |
Keisei Electric Railway Co. Ltd. | | | | 7,000 | | | 35,832 |
Keyence Corp. | | | | 630 | | | 150,175 |
Kikkoman Corp. | | | | 2,000 | | | 24,432 |
Kinden Corp. | | | | 1,000 | | | 10,095 |
Kintetsu Corp. | | † | | 30,000 | | | 94,107 |
Kirin Holdings Co. Ltd. | | | | 13,000 | | | 203,285 |
Kobe Steel Ltd. | | | | 46,000 | | | 131,727 |
Komatsu Ltd. | | | | 15,000 | | | 418,892 |
Konami Corp. | | | | 1,200 | | | 41,971 |
Konica Minolta Holdings, Inc. | | | | 7,500 | | | 127,039 |
Kubota Corp. | | | | 19,000 | | | 136,551 |
Kuraray Co. Ltd. | | | | 7,000 | | | 83,523 |
Kurita Water Industries Ltd. | | † | | 1,500 | | | 55,655 |
Kyocera Corp. | | | | 2,900 | | | 273,567 |
Kyowa Hakko Kogyo Co. Ltd. | | | | 4,000 | | | 41,011 |
Kyushu Electric Power Co., Inc. | | | | 6,000 | | | 125,549 |
Lawson, Inc. | | | | 800 | | | 38,976 |
Leopalace21 Corp. | | | | 2,400 | | | 34,429 |
Mabuchi Motor Co. Ltd. | | | | 400 | | | 21,724 |
Makita Corp. | | | | 2,100 | | | 85,942 |
Marubeni Corp. | | | | 27,000 | | | 225,207 |
Marui Group Co. Ltd. | | † | | 4,000 | | | 31,141 |
Matsushita Electric Industrial Co. Ltd. | | | | 31,000 | | | 663,207 |
Matsushita Electric Works Ltd. | | | | 7,000 | | | 71,431 |
Mazda Motor Corp. | | | | 12,000 | | | 62,469 |
Mediceo Paltac Holdings Co. Ltd. | | | | 2,100 | | | 38,672 |
Meiji Dairies Corp. | | | | 6,000 | | | 30,787 |
Minebea Co. Ltd. | | | | 5,000 | | | 28,594 |
Mitsubishi Chemical Holdings Corp. | | | | 22,000 | | | 128,106 |
Mitsubishi Corp. | | | | 22,300 | | | 734,801 |
Mitsubishi Electric Corp. | | | | 33,000 | | | 356,924 |
Mitsubishi Estate Co. Ltd. | | | | 19,000 | | | 434,998 |
Mitsubishi Gas Chemical Co., Inc. | | | | 7,000 | | | 50,428 |
Mitsubishi Heavy Industries Ltd. | | | | 56,000 | | | 267,472 |
Mitsubishi Logistics Corp. | | † | | 3,000 | | | 32,859 |
Mitsubishi Materials Corp. | | | | 18,000 | | | 76,975 |
Mitsubishi Motors Corp. | | * | | 52,000 | | | 94,655 |
Mitsubishi Rayon Co. Ltd. | | † | | 10,000 | | | 31,542 |
Mitsubishi Tanabe Pharma Corp. | | | | 4,000 | | | 52,499 |
Mitsubishi UFJ Financial Group, Inc. | | | | 167,820 | | | 1,483,100 |
Mitsubishi UFJ Lease & Finance Co. Ltd. | | | | 710 | | | 30,850 |
Mitsubishi UFJ NICOS Co, Ltd. | | * | | 6,000 | | | 19,850 |
Mitsui & Co. Ltd. | | | | 28,000 | | | 617,990 |
Mitsui Chemicals, Inc. | | † | | 13,000 | | | 64,197 |
Mitsui Engineering & Shipbuilding Co. Ltd. | | † | | 12,000 | | | 38,058 |
Mitsui Fudosan Co. Ltd. | | | | 14,000 | | | 299,642 |
Mitsui Mining & Smelting Co. Ltd. | | | | 12,000 | | | 35,434 |
Mitsui OSK Lines Ltd. | | | | 18,000 | | | 256,715 |
Mitsui Sumitomo Insurance Group Holdings, Inc. | | * | | 6,300 | | | 217,738 |
Mitsumi Electric Co. Ltd. | | | | 1,700 | | | 37,901 |
Mizuho Financial Group, Inc. | | | | 157 | | | 730,495 |
Mizuho Trust & Banking Co. Ltd. | | | | 18,000 | | | 31,027 |
Murata Manufacturing Co. Ltd. | | | | 3,600 | | | 169,843 |
Namco Bandai Holdings, Inc. | | | | 4,150 | | | 47,057 |
NEC Corp. | | | | 34,000 | | | 178,516 |
NEC Electronics Corp. | | *† | | 300 | | | 7,497 |
NGK Insulators Ltd. | | | | 5,000 | | | 97,478 |
NGK Spark Plug Co. Ltd. | | † | | 2,000 | | | 23,021 |
NHK Spring Co. Ltd. | | | | 2,000 | | | 15,962 |
Nidec Corp. | | | | 2,000 | | | 133,219 |
Nikon Corp. | | † | | 6,000 | | | 175,639 |
Nintendo Co. Ltd. | | | | 1,700 | | | 964,025 |
Nippon Building Fund, Inc. REIT | | | | 7 | | | 82,549 |
Nippon Electric Glass Co. Ltd. | | | | 6,500 | | | 112,983 |
Nippon Express Co. Ltd. | | | | 14,000 | | | 67,236 |
Nippon Meat Packers, Inc. | | | | 2,000 | | | 27,101 |
Nippon Mining Holdings, Inc. | | | | 16,000 | | | 100,458 |
Nippon Oil Corp. | | | | 21,000 | | | 141,484 |
Nippon Paper Group, Inc. | | | | 21 | | | 57,451 |
Nippon Sheet Glass Co. Ltd. | | † | | 8,000 | | | 39,650 |
Nippon Steel Corp. | | | | 87,000 | | | 471,508 |
Nippon Telegraph & Telephone Corp. | | | | 87 | | | 429,282 |
Nippon Yusen Kabushiki Kaisha | | | | 18,000 | | | 173,373 |
Nipponkoa Insurance Co. Ltd. | | | | 9,000 | | | 78,164 |
Nishi-Nippon City Bank Ltd. (The) | | | | 16,000 | | | 47,718 |
Nissan Chemical Industries Ltd. | | | | 2,000 | | | 24,611 |
Nissan Motor Co. Ltd. | | | | 36,800 | | | 305,642 |
Nisshin Seifun Group, Inc. | | | | 2,200 | | | 27,652 |
Nisshin Steel Co. Ltd. | | | | 15,000 | | | 51,060 |
Nisshinbo Industries, Inc. | | † | | 4,000 | | | 47,603 |
Nissin Food Products Co. Ltd. | | † | | 2,000 | | | 67,057 |
Nitori Co. Ltd. | | | | 300 | | | 15,411 |
Nitto Denko Corp. | | | | 2,800 | | | 107,633 |
NOK Corp. | | | | 1,400 | | | 22,280 |
| | | | |
| | See accompanying notes to financial statements. | | 245 |
SCHEDULE OF INVESTMENTS — (Continued)
June 30, 2008 (Unaudited)
Vantagepoint Overseas Equity Index Fund
| | | | | | | |
| | | | | Shares | | Value |
COMMON STOCKS—(Continued) | | | | | | | |
Nomura Holdings, Inc. | | | | 29,000 | | $ | 429,443 |
Nomura Real Estate Holdings, Inc. | | | | 600 | | | 12,678 |
Nomura Real Estate Office Fund, Inc. REIT | | | | 5 | | | 37,656 |
Nomura Research Institute Ltd. | | | | 2,250 | | | 52,755 |
NSK Ltd. | | | | 7,000 | | | 61,334 |
NTN Corp. | | | | 9,000 | | | 60,012 |
NTT Data Corp. | | | | 25 | | | 97,874 |
NTT DoCoMo, Inc. | | | | 279 | | | 409,220 |
NTT Urban Development Corp. | | † | | 24 | | | 31,464 |
Obayashi Corp. | | | | 11,000 | | | 49,855 |
Obic Co. Ltd. | | † | | 100 | | | 16,816 |
Odakyu Electric Railway Co. Ltd. | | | | 9,000 | | | 58,497 |
OJI Paper Co. Ltd. | | | | 16,000 | | | 75,245 |
OKUMA Corp. | | | | 2,000 | | | 19,911 |
Olympus Corp. | | † | | 4,000 | | | 135,605 |
Omron Corp. | | | | 4,100 | | | 88,490 |
Ono Pharmaceutical Co. Ltd. | | | | 1,300 | | | 71,697 |
Onward Holdings Co. Ltd. | | | | 2,000 | | | 21,029 |
Oracle Corp. Japan | | † | | 300 | | | 12,231 |
Oriental Land Co. Ltd. | | | | 700 | | | 41,821 |
ORIX Corp. | | | | 1,530 | | | 219,137 |
Osaka Gas Co. Ltd. | | | | 35,000 | | | 128,390 |
OSAKA Titanium Technologies Co. | | † | | 200 | | | 10,504 |
Otsuka Corp. | | | | 200 | | | 13,812 |
Pioneer Corp. | | | | 2,000 | | | 16,089 |
Promise Co. Ltd. | | | | 1,060 | | | 29,636 |
Rakuten, Inc. | | | | 94 | | | 47,454 |
Resona Holdings, Inc. | | † | | 94 | | | 144,378 |
Ricoh Co. Ltd. | | | | 12,000 | | | 217,192 |
Rohm Co. Ltd. | | | | 1,900 | | | 109,705 |
Sankyo Co. Ltd. | | | | 600 | | | 39,094 |
Santen Pharmaceutical Co. Ltd. | | | | 700 | | | 17,568 |
Sanyo Electric Co. Ltd. | | *† | | 21,000 | | | 48,824 |
Sapporo Hokuyo Holdings, Inc. | | | | 4 | | | 27,067 |
Sapporo Holdings Ltd. | | | | 4,000 | | | 28,005 |
SBI Holdings, Inc. | | | | 111 | | | 24,294 |
SBI SECURITIES Co. Ltd. | | | | 25 | | | 19,526 |
Secom Co. Ltd. | | | | 3,500 | | | 170,479 |
Sega Sammy Holdings, Inc. | | | | 4,348 | | | 38,062 |
Seiko Epson Corp. | | | | 1,800 | | | 49,471 |
Sekisui Chemical Co. Ltd. | | | | 8,000 | | | 54,559 |
Sekisui House Ltd. | | | | 8,000 | | | 74,794 |
Seven & I Holdings Co. Ltd. | | | | 14,240 | | | 407,735 |
Sharp Corp. | | | | 17,000 | | | 277,122 |
Shikoku Electric Power Co., Inc. | | | | 2,700 | | | 74,240 |
Shimadzu Corp. | | | | 3,000 | | | 29,914 |
Shimamura Co. Ltd. | | | | 500 | | | 30,830 |
Shimano, Inc. | | | | 1,000 | | | 50,268 |
Shimizu Corp. | | | | 10,000 | | | 47,385 |
Shin-Etsu Chemical Co. Ltd. | | | | 6,700 | | | 415,769 |
Shinko Electric Industries Co. Ltd. | | | | 800 | | | 9,900 |
Shinko Securities Co. Ltd. | | | | 13,000 | | | 38,329 |
Shinsei Bank Ltd. | | | | 14,000 | | | 47,994 |
Shionogi & Co. Ltd. | | | | 4,000 | | | 79,199 |
Shiseido Co. Ltd. | | | | 6,000 | | | 137,502 |
Shizuoka Bank Ltd. (The) | | | | 11,000 | | | 112,416 |
Showa Denko KK | | | | 22,000 | | | 58,407 |
Showa Shell Sekiyu KK | | | | 2,900 | | | 31,838 |
SMC Corp. | | | | 1,100 | | | 120,732 |
Softbank Corp. | | † | | 12,200 | | | 205,728 |
Sojitz Corp. | | | | 17,200 | | | 57,377 |
Sompo Japan Insurance, Inc. | | | | 14,000 | | | 131,635 |
Sony Corp. | | | | 17,000 | | | 745,172 |
Sony Financial Holdings, Inc. | | | | 18 | | | 72,467 |
Stanley Electric Co. Ltd. | | | | 2,500 | | | 60,609 |
Sumco Corp. | | | | 1,900 | | | 42,096 |
Sumitomo Chemical Co. Ltd. | | | | 28,000 | | | 176,402 |
Sumitomo Corp. | | | | 18,000 | | | 236,489 |
Sumitomo Electric Industries Ltd. | | | | 12,600 | | | 160,014 |
Sumitomo Heavy Industries Ltd. | | | | 10,000 | | | 67,824 |
Sumitomo Metal Industries Ltd. | | | | 66,000 | | | 290,585 |
Sumitomo Metal Mining Co. Ltd. | | | | 9,000 | | | 137,667 |
Sumitomo Mitsui Financial Group, Inc. | | | | 111 | | | 834,743 |
Sumitomo Realty & Development Co. Ltd. | | | | 6,000 | | | 119,358 |
Sumitomo Rubber Industries, Inc. | | | | 1,900 | | | 14,212 |
Sumitomo Trust & Banking Co. Ltd. (The) | | | | 22,000 | | | 153,695 |
Suruga Bank Ltd. | | | | 4,000 | | | 52,079 |
Suzuken Co. Ltd. | | | | 960 | | | 35,461 |
Suzuki Motor Corp. | | † | | 5,300 | | | 125,528 |
T&D Holdings, Inc. | | | | 3,600 | | | 222,050 |
Taiheiyo Cement Corp. | | | | 15,000 | | | 30,138 |
Taisei Corp. | | | | 22,000 | | | 52,477 |
Taisho Pharmaceutical Co. Ltd. | | | | 2,300 | | | 42,788 |
Taiyo Nippon Sanso Corp. | | | | 6,000 | | | 50,062 |
Takashimaya Co. Ltd. | | † | | 6,000 | | | 54,513 |
Takeda Pharmaceutical Co. Ltd. | | | | 14,320 | | | 728,308 |
Takefuji Corp. | | | | 2,390 | | | 33,281 |
TDK Corp. | | | | 2,000 | | | 119,676 |
Teijin Ltd. | | | | 13,000 | | | 44,606 |
Terumo Corp. | | | | 2,800 | | | 143,267 |
THK Co. Ltd. | | | | 1,600 | | | 31,134 |
Tobu Railway Co. Ltd. | | | | 13,000 | | | 61,626 |
Toho Co. Ltd. | | † | | 1,400 | | | 28,614 |
Toho Gas Co. Ltd. | | | | 5,000 | | | 27,418 |
Toho Titanium Co. Ltd. | | † | | 300 | | | 5,883 |
Tohoku Electric Power Co., Inc. | | | | 7,700 | | | 167,718 |
Tokai Rika Co. Ltd. | | | | 700 | | | 14,494 |
Tokio Marine Holdings, Inc. | | | | 11,900 | | | 463,804 |
Tokuyama Corp. | | | | 3,000 | | | 22,356 |
Tokyo Broadcasting System, Inc. | | | | 200 | | | 3,799 |
Tokyo Electric Power Co., Inc. (The) | | | | 20,000 | | | 514,968 |
Tokyo Electron Ltd. | | | | 3,000 | | | 173,004 |
Tokyo Gas Co. Ltd. | | | | 36,000 | | | 145,457 |
Tokyo Steel Manufacturing Co. Ltd. | | | | 1,300 | | | 15,057 |
Tokyo Tatemono Co. Ltd. | | | | 4,000 | | | 25,906 |
Tokyu Corp. | | | | 21,000 | | | 108,965 |
Tokyu Land Corp. | | | | 9,000 | | | 51,248 |
TonenGeneral Sekiyu KK | | † | | 6,000 | | | 54,505 |
Toppan Printing Co. Ltd. | | | | 8,000 | | | 88,124 |
Toray Industries, Inc. | | † | | 24,000 | | | 128,807 |
Toshiba Corp. | | † | | 50,000 | | | 368,877 |
Tosoh Corp. | | † | | 9,000 | | | 36,849 |
Toto Ltd. | | | | 3,000 | | | 21,137 |
Toyo Seikan Kaisha Ltd. | | | | 3,300 | | | 58,257 |
Toyo Suisan Kaisha Ltd. | | | | 1,000 | | | 22,633 |
Toyoda Gosei Co. Ltd. | | | | 900 | | | 26,338 |
| | | | |
| 246 | | See accompanying notes to financial statements. | | |
SCHEDULE OF INVESTMENTS — (Continued)
June 30, 2008 (Unaudited)
Vantagepoint Overseas Equity Index Fund
| | | | | | | |
| | | | | Shares | | Value |
COMMON STOCKS—(Continued) | | | | | | | |
Toyota Boshoku Corp. | | | | 1,400 | | $ | 37,541 |
Toyota Industries Corp. | | | | 2,700 | | | 86,689 |
Toyota Motor Corp. | | | | 45,100 | | | 2,128,901 |
Toyota Tsusho Corp. | | | | 4,300 | | | 100,927 |
Trend Micro, Inc. | | † | | 2,000 | | | 65,954 |
Ube Industries Ltd. | | | | 19,000 | | | 67,299 |
Unicharm Corp. | | † | | 500 | | | 35,567 |
UNY Co. Ltd. | | | | 2,000 | | | 19,716 |
Ushio, Inc. | | | | 2,600 | | | 42,576 |
USS Co. Ltd. | | | | 200 | | | 13,215 |
West Japan Railway Co. | | | | 30 | | | 147,248 |
Yahoo! Japan Corp. | | | | 290 | | | 111,695 |
Yakult Honsha Co. Ltd. | | | | 1,900 | | | 53,524 |
Yamada Denki Co. Ltd. | | | | 1,400 | | | 99,748 |
Yamaguchi Financial Group, Inc. | | | | 2,000 | | | 27,682 |
Yamaha Corp. | | | | 3,700 | | | 71,548 |
Yamaha Motor Co. Ltd. | | | | 2,900 | | | 54,311 |
Yamato Holdings Co. Ltd. | | | | 7,000 | | | 97,712 |
Yamato Kogyo Co. Ltd. | | | | 700 | | | 33,428 |
Yamazaki Baking Co. Ltd. | | | | 1,000 | | | 11,005 |
Yaskawa Electric Corp. | | | | 5,000 | | | 49,067 |
Yokogawa Electric Corp. | | | | 3,400 | | | 31,150 |
| | | | | | | |
| | | | | | | 43,438,224 |
| | | | | | | |
Luxembourg—0.8% | | | | | | | |
ArcelorMittal | | | | 14,541 | | | 1,429,012 |
Millicom International Cellular | | | | 1,019 | | | 104,901 |
Oriflame Cosmetics SA | | | | 337 | | | 21,536 |
SES | | | | 4,413 | | | 111,476 |
| | | | | | | |
| | | | | | | 1,666,925 |
| | | | | | | |
Netherlands—4.6% | | | | | | | |
Aegon NV | | | | 23,053 | | | 303,071 |
Akzo Nobel NV | | | | 4,432 | | | 303,298 |
ASML Holding NV | | | | 7,336 | | | 179,558 |
Corio NV REIT | | | | 518 | | | 40,347 |
European Aeronautic Defence and Space Co. NV | | | | 5,785 | | | 108,997 |
Fugro NV | | | | 1,178 | | | 100,309 |
Heineken Holding NV, Class A | | | | 1,582 | | | 72,409 |
Heineken NV | | | | 4,091 | | | 208,328 |
ING Groep NV | | | | 31,928 | | | 1,009,487 |
James Hardie Industries NV | | | | 6,561 | | | 26,638 |
Koninklijke Ahold NV | | | | 21,058 | | | 282,295 |
Koninklijke DSM | | | | 2,591 | | | 151,863 |
Koninklijke KPN | | | | 32,374 | | | 553,491 |
Koninklijke Philips Electronics NV | | | | 18,172 | | | 615,401 |
Randstad Holding NV | | | | 1,746 | | | 60,764 |
Reed Elsevier NV | | | | 11,277 | | | 188,729 |
Royal Dutch Shell plc, Class A | | | | 58,953 | | | 2,416,589 |
Royal Dutch Shell plc, Class B | | | | 45,921 | | | 1,838,833 |
SBM Offshore NV | | | | 2,337 | | | 85,991 |
SNS Reaal | | | | 1,725 | | | 33,329 |
TNT NV | | | | 6,285 | | | 213,904 |
TomTom NV | | *† | | 1,191 | | | 34,025 |
Unilever NV | | | | 27,312 | | | 772,344 |
Wolters Kluwer NV | | | | 4,949 | | | 115,192 |
| | | | | | | |
| | | | | | | 9,715,192 |
| | | | | | | |
New Zealand—0.1% | | | | | | | |
Auckland International Airport Ltd. | | | | 8,084 | | | 12,019 |
Contact Energy Ltd. | | | | 5,052 | | | 30,747 |
Fletcher Building Ltd. | | | | 10,277 | | | 49,709 |
Sky City Entertainment Group Ltd. | | | | 8,062 | | | 18,801 |
Telecom Corp of New Zealand Ltd. | | † | | 27,345 | | | 74,307 |
| | | | | | | |
| | | | | | | 185,583 |
| | | | | | | |
Norway—1.0% | | | | | | | |
Aker Solutions ASA | | | | 3,235 | | | 76,227 |
DnB NOR ASA | | | | 13,364 | | | 169,778 |
Norsk Hydro ASA | | † | | 11,436 | | | 166,753 |
Orkla ASA | | | | 14,782 | | | 189,409 |
Petroleum Geo-Services ASA | | * | | 2,899 | | | 70,992 |
Renewable Energy Corp. AS | | *† | | 2,650 | | | 68,419 |
StatoilHydro ASA | | | | 21,541 | | | 803,690 |
Storebrand ASA | | | | 6,908 | | | 51,152 |
Telenor ASA | | | | 14,385 | | | 270,037 |
Yara International ASA | | | | 3,275 | | | 289,234 |
| | | | | | | |
| | | | | | | 2,155,691 |
| | | | | | | |
Portugal—0.3% | | | | | | | |
Banco BPI SA, Class G | | | | 2,502 | | | 10,323 |
Banco Comercial Portugues SA, Class R | | † | | 34,512 | | | 74,438 |
Banco Espirito Santo SA | | † | | 3,113 | | | 48,420 |
Brisa | | † | | 6,944 | | | 80,000 |
Cimpor Cimentos de Portugal SGPS SA | | † | | 1,457 | | | 9,770 |
Energias de Portugal SA | | | | 31,876 | | | 165,752 |
Portugal Telecom SGPS SA | | | | 11,716 | | | 132,514 |
Sonae SGPS SA | | † | | 18,467 | | | 22,123 |
Zon Multimedia Servicos de Telecomunicacoes e Multimedia SGPS SA | | | | 3,994 | | | 33,128 |
| | | | | | | |
| | | | | | | 576,468 |
| | | | | | | |
Singapore—1.1% | | | | | | | |
Ascendas Real Estate Investment Trust REIT | | | | 7,300 | | | 11,836 |
CapitaCommercial Trust REIT | | | | 20,000 | | | 28,123 |
CapitaLand Ltd. | | | | 23,000 | | | 96,648 |
CapitaMall Trust REIT | | | | 22,000 | | | 48,524 |
City Developments Ltd. | | | | 10,000 | | | 80,044 |
ComfortDelgro Corp. Ltd. | | | | 37,000 | | | 40,902 |
Cosco Corp. Singapore Ltd. | | | | 18,000 | | | 42,475 |
DBS Group Holdings Ltd. | | | | 19,000 | | | 264,346 |
Fraser and Neave Ltd. | | | | 10,000 | | | 33,362 |
Golden Agri-Resources Ltd. | | | | 83,000 | | | 54,788 |
Jardine Cycle & Carriage Ltd. | | | | 1,000 | | | 12,533 |
Keppel Corp. Ltd. | | | | 20,000 | | | 164,050 |
Keppel Land Ltd. | | | | 4,000 | | | 14,610 |
Neptune Orient Lines Ltd. | | | | 4,000 | | | 9,514 |
Olam International Ltd. | | | | 6,600 | | | 11,773 |
Oversea-Chinese Banking Corp. | | | | 40,600 | | | 244,544 |
Parkway Holdings Ltd. | | | | 15,000 | | | 25,594 |
SembCorp Industries Ltd. | | | | 10,340 | | | 31,741 |
SembCorp Marine Ltd. | | | | 21,000 | | | 62,598 |
Singapore Airlines Ltd. | | | | 8,400 | | | 90,915 |
Singapore Exchange Ltd. | | | | 15,000 | | | 76,518 |
Singapore Press Holdings Ltd. | | | | 24,500 | | | 76,604 |
Singapore Technologies Engineering Ltd. | | | | 26,000 | | | 52,636 |
Singapore Telecommunications Ltd. | | | | 135,159 | | | 360,298 |
United Overseas Bank Ltd. | | | | 20,000 | | | 274,566 |
UOL Group Ltd. | | | | 13,000 | | | 32,441 |
Venture Corp. Ltd. | | | | 5,000 | | | 36,180 |
Wilmar International Ltd. | | | | 10,000 | | | 37,158 |
| | | | | | | |
| | | | | | | 2,315,321 |
| | | | | | | |
| | | | |
| | See accompanying notes to financial statements. | | 247 |
SCHEDULE OF INVESTMENTS — (Continued)
June 30, 2008 (Unaudited)
Vantagepoint Overseas Equity Index Fund
| | | | | | | |
| | | | | Shares | | Value |
COMMON STOCKS—(Continued) | | | | | | | |
Spain—3.9% | | | | | | | |
Abertis Infraestructuras SA | | | | 4,221 | | $ | 99,864 |
Acciona SA | | | | 445 | | | 105,192 |
Acerinox SA | | | | 2,413 | | | 55,366 |
ACS Actividades de Construccion y Servicios SA | | † | | 3,374 | | | 168,831 |
Banco Bilbao Vizcaya Argentaria SA | | | | 59,424 | | | 1,132,250 |
Banco de Sabadell SA | | † | | 13,655 | | | 115,097 |
Banco Popular Espanol SA | | | | 13,647 | | | 188,063 |
Banco Santander SA | | | | 104,145 | | | 1,900,028 |
Bankinter SA | | | | 3,604 | | | 40,876 |
Cintra Concesiones de Infraestructuras de Transporte SA | | † | | 2,974 | | | 33,180 |
Criteria Caixacorp SA | | | | 11,251 | | | 67,137 |
Enagas | | | | 2,796 | | | 78,925 |
Fomento de Construcciones y Contratas SA | | | | 687 | | | 40,645 |
Gamesa Corp. Tecnologica SA | | | | 2,739 | | | 134,092 |
Gas Natural SDG SA | | | | 1,797 | | | 104,354 |
Gestevision Telecinco SA | | | | 2,112 | | | 26,895 |
Grifols SA | | | | 1,686 | | | 53,699 |
Grupo Ferrovial SA | | † | | 1,190 | | | 73,311 |
Iberdrola Renovables SA | | * | | 11,579 | | | 89,207 |
Iberdrola SA | | † | | 59,482 | | | 792,525 |
Iberia Lineas Aereas de Espana | | | | 9,947 | | | 23,682 |
Inditex SA | | † | | 3,636 | | | 166,677 |
Indra Sistemas SA | | † | | 1,576 | | | 40,858 |
Mapfre SA | | † | | 13,081 | | | 62,444 |
Promotora de Informaciones SA | | † | | 1,051 | | | 11,204 |
Red Electrica de Espana | | † | | 2,045 | | | 132,747 |
Repsol YPF SA | | | | 12,303 | | | 482,823 |
Sacyr Vallehermoso SA | | | | 1,382 | | | 42,189 |
Telefonica SA | | | | 71,571 | | | 1,894,035 |
Union Fenosa SA | | | | 1,695 | | | 98,500 |
Zardoya Otis SA | | † | | 2,751 | | | 56,937 |
| | | | | | | |
| | | | | | | 8,311,633 |
| | | | | | | |
Sweden—2.0% | | | | | | | |
Alfa Laval AB | | | | 5,944 | | | 91,831 |
Assa Abloy AB, Class B | | † | | 4,945 | | | 71,149 |
Atlas Copco AB, Class A | | | | 11,228 | | | 164,214 |
Atlas Copco AB, Class B | | | | 6,758 | | | 89,374 |
Boliden AB | | | | 4,792 | | | 38,691 |
Electrolux AB | | † | | 4,438 | | | 56,393 |
Getinge AB, Class B | | | | 3,096 | | | 75,484 |
Hennes & Mauritz AB, Class B | | | | 8,223 | | | 443,633 |
Holmen AB, Class B | | † | | 741 | | | 21,664 |
Husqvarna AB, Class B | | † | | 3,553 | | | 30,905 |
Investor AB, Class B | | | | 6,722 | | | 141,125 |
Lundin Petroleum AB | | * | | 2,845 | | | 41,865 |
Modern Times Group AB, Class B | | | | 680 | | | 39,806 |
Nordea Bank AB | | | | 34,197 | | | 468,585 |
Sandvik AB | | | | 16,020 | | | 217,656 |
Scania AB, Class B | | | | 5,968 | | | 81,255 |
Securitas AB, Class B | | | | 6,443 | | | 74,528 |
Skandinaviska Enskilda Banken AB, Class A | | | | 7,991 | | | 147,427 |
Skanska AB, Class B | | | | 5,991 | | | 85,446 |
SKF AB, Class B | | † | | 6,189 | | | 96,457 |
Ssab Svenskt Stal AB | | | | 669 | | | 18,905 |
Ssab Svenskt Stal AB, Class A | | | | 2,460 | | | 78,895 |
Svenska Cellulosa AB, Class B | | | | 10,516 | | | 147,967 |
Svenska Handelsbanken AB, Class A | | | | 7,663 | | | 181,539 |
Swedbank AB | | † | | 5,327 | | | 102,353 |
Swedish Match AB | | | | 4,102 | | | 83,597 |
Tele2 AB, Class B | | | | 4,495 | | | 87,413 |
Telefonaktiebolaget LM Ericsson, Class B | | | | 49,746 | | | 517,282 |
TeliaSonera AB | | | | 37,998 | | | 280,919 |
Volvo AB, Class B | | | | 17,694 | | | 215,461 |
| | | | | | | |
| | | | | | | 4,191,819 |
| | | | | | | |
Switzerland—6.9% | | | | | | | |
ABB Ltd. (Registered) | | * | | 36,907 | | | 1,044,684 |
Actelion Ltd. | | *† | | 1,353 | | | 72,174 |
Adecco SA (Registered) | | | | 2,218 | | | 109,640 |
Baloise Holding AG | | | | 677 | | | 71,007 |
Compagnie Financiere Richemont SA | | | | 8,744 | | | 485,255 |
Credit Suisse Group AG (Registered) | | | | 17,336 | | | 789,083 |
EFG International AG | | | | 542 | | | 14,750 |
Geberit AG | | | | 650 | | | 95,432 |
Givaudan SA (Registered) | | | | 95 | | | 84,684 |
Holcim Ltd. (Registered) | | | | 3,416 | | | 276,122 |
Julius Baer Holding AG | | | | 3,883 | | | 260,406 |
Kuehne + Nagel International AG | | | | 1,071 | | | 101,340 |
Lindt & Spruengli AG | | | | 17 | | | 46,848 |
Logitech International SA | | * | | 2,953 | | | 78,946 |
Lonza Group AG | | | | 741 | | | 102,405 |
Nestle SA (Registered) | | | | 65,040 | | | 2,931,006 |
Nobel Biocare Holding AG (Registered) | | | | 2,035 | | | 66,166 |
Novartis AG (Registered) | | | | 38,636 | | | 2,126,224 |
OC Oerlikon Corp. AG | | * | | 92 | | | 25,386 |
Pargesa Holding SA | | | | 356 | | | 39,471 |
Roche Holding AG (Genusschein) | | | | 11,706 | | | 2,104,415 |
SGS SA (Registered) | | | | 84 | | | 119,788 |
Sonova Holding AG | | | | 891 | | | 73,534 |
STMicroelectronics NV | | | | 12,142 | | | 125,616 |
Straumann Holding AG | | | | 152 | | | 36,335 |
Sulzer AG | | | | 610 | | | 77,067 |
Swatch Group AG | | | | 1,197 | | | 156,640 |
Swiss Life Holding | | * | | 529 | | | 140,724 |
Swiss Reinsurance (Registered) | | | | 6,044 | | | 400,668 |
Swisscom AG (Registered) | | | | 356 | | | 118,571 |
Syngenta AG (Registered) | | | | 1,735 | | | 562,093 |
Synthes, Inc. | | | | 987 | | | 135,754 |
UBS AG (Registered) | | * | | 48,818 | | | 1,017,281 |
Zurich Financial Services AG (Registered) | | | | 2,448 | | | 623,884 |
| | | | | | | |
| | | | | | | 14,513,399 |
| | | | | | | |
United Kingdom—18.8% | | | | | | | |
3i Group plc | | | | 6,812 | | | 111,432 |
Acergy SA | | | | 2,569 | | | 57,243 |
Alliance & Leicester plc | | | | 4,938 | | | 28,819 |
AMEC plc | | | | 4,597 | | | 81,005 |
Anglo American plc | | | | 22,035 | | | 1,547,612 |
Antofagasta plc | | | | 5,660 | | | 73,596 |
Associated British Foods plc | | | | 5,113 | | | 77,017 |
AstraZeneca plc | | | | 24,257 | | | 1,031,375 |
Aviva plc | | | | 43,493 | | | 431,197 |
BAE Systems plc | | | | 58,865 | | | 516,680 |
Balfour Beatty plc | | | | 8,544 | | | 71,875 |
Barclays plc | | | | 108,836 | | | 617,483 |
Berkeley Group Holdings plc | | * | | 994 | | | 13,421 |
| | | | |
| 248 | | See accompanying notes to financial statements. | | |
SCHEDULE OF INVESTMENTS — (Continued)
June 30, 2008 (Unaudited)
Vantagepoint Overseas Equity Index Fund
| | | | | | | |
| | | | | Shares | | Value |
COMMON STOCKS—(Continued) | | | | | | | |
BG Group plc | | | | 55,949 | | $ | 1,453,983 |
BHP Billiton plc | | | | 36,645 | | | 1,405,347 |
BP plc | | | | 312,268 | | | 3,619,397 |
British Airways plc | | | | 10,357 | | | 44,114 |
British American Tobacco plc | | | | 25,082 | | | 865,181 |
British Energy Group plc | | | | 16,175 | | | 227,552 |
British Land Co. plc REIT | | | | 9,097 | | | 127,927 |
British Sky Broadcasting Group plc | | | | 18,337 | | | 171,868 |
BT Group plc, Class A | | | | 136,413 | | | 540,429 |
Bunzl plc | | | | 6,330 | | | 82,219 |
Burberry Group plc | | | | 8,387 | | | 75,434 |
Cadbury plc | | | | 22,754 | | | 285,416 |
Cairn Energy plc | | * | | 1,827 | | | 117,258 |
Capita Group plc (The) | | | | 10,792 | | | 147,218 |
Carnival plc | | | | 2,625 | | | 83,341 |
Carphone Warehouse Group plc | | | | 9,216 | | | 36,215 |
Centrica plc | | | | 61,989 | | | 381,265 |
Cobham plc | | | | 22,875 | | | 89,783 |
Compass Group plc | | | | 31,270 | | | 235,213 |
Daily Mail & General Trust, Class A | | | | 5,678 | | | 35,276 |
Diageo plc | | | | 43,343 | | | 794,101 |
Enterprise Inns plc | | | | 10,091 | | | 81,208 |
Eurasian Natural Resources Corp. | | * | | 5,453 | | | 143,675 |
Firstgroup plc | | | | 6,943 | | | 71,599 |
Friends Provident plc | | | | 34,247 | | | 69,253 |
G4S plc | | | | 21,040 | | | 84,510 |
GKN plc | | | | 12,327 | | | 54,408 |
GlaxoSmithKline plc | | | | 90,759 | | | 2,006,313 |
Hammerson plc REIT | | | | 4,335 | | | 76,784 |
Hays plc | | | | 22,745 | | | 40,778 |
HBOS plc | | | | 63,374 | | | 346,963 |
Home Retail Group plc | | | | 15,769 | | | 68,141 |
HSBC Holdings plc | | | | 196,351 | | | 3,023,344 |
ICAP plc | | | | 8,924 | | | 95,588 |
IMI plc | | | | 4,190 | | | 36,184 |
Imperial Tobacco Group plc | | | | 17,112 | | | 635,692 |
Inchcape plc | | | | 8,732 | | | 55,269 |
Intercontinental Hotels Group plc | | | | 4,710 | | | 62,776 |
International Power plc | | | | 24,040 | | | 205,945 |
Invensys plc | | * | | 15,349 | | | 79,308 |
Investec plc | | | | 7,041 | | | 42,872 |
J Sainsbury plc | | | | 19,488 | | | 123,024 |
Johnson Matthey plc | | | | 3,762 | | | 137,661 |
Kazakhmys plc | | | | 2,945 | | | 92,856 |
Kingfisher plc | | | | 43,785 | | | 97,072 |
Ladbrokes plc | | | | 10,175 | | | 51,700 |
Land Securities Group plc REIT | | | | 8,073 | | | 197,007 |
Legal & General Group plc | | | | 104,947 | | | 208,251 |
Liberty International plc REIT | | | | 4,854 | | | 82,843 |
Lloyds TSB Group plc | | | | 95,210 | | | 584,142 |
Logica plc | | | | 23,317 | | | 49,929 |
London Stock Exchange Group plc | | | | 2,311 | | | 35,683 |
Lonmin plc | | | | 2,297 | | | 144,956 |
Man Group plc | | | | 27,453 | | | 339,138 |
Marks & Spencer Group plc | | | | 27,328 | | | 177,702 |
Meggitt plc | | | | 11,533 | | | 48,653 |
Mondi plc | | | | 6,179 | | | 36,268 |
National Express Group plc | | | | 2,122 | | | 40,029 |
National Grid plc | | | | 43,163 | | | 565,796 |
Next plc | | | | 3,913 | | | 75,222 |
Old Mutual plc | | | | 92,615 | | | 170,018 |
Pearson plc | | | | 12,875 | | | 156,896 |
Persimmon plc | | | | 4,747 | | | 29,712 |
Prudential plc | | | | 41,215 | | | 434,728 |
Punch Taverns plc | | | | 4,246 | | | 26,388 |
Reckitt Benckiser Group plc | | | | 10,165 | | | 513,418 |
Reed Elsevier plc | | | | 19,747 | | | 225,029 |
Rentokil Initial plc | | | | 31,388 | | | 61,824 |
Rexam plc | | | | 9,593 | | | 73,694 |
Rio Tinto plc | | | | 16,596 | | | 1,998,621 |
Rolls-Royce Group plc | | * | | 29,035 | | | 196,242 |
Royal Bank of Scotland Group plc | | | | 268,009 | | | 1,140,958 |
RSA Insurance Group plc | | | | 54,123 | | | 134,743 |
SABMiller plc | | | | 15,547 | | | 355,202 |
Sage Group plc | | | | 23,751 | | | 98,326 |
Schroders plc | | | | 2,678 | | | 48,493 |
Scottish & Southern Energy plc | | | | 14,681 | | | 409,056 |
Segro plc REIT | | | | 6,198 | | | 48,464 |
Serco Group plc | | | | 9,839 | | | 87,311 |
Severn Trent plc | | | | 4,129 | | | 105,070 |
Shire Ltd. | | | | 8,436 | | | 137,908 |
Smith & Nephew plc | | | | 14,645 | | | 160,678 |
Smiths Group plc | | | | 6,367 | | | 137,189 |
Stagecoach Group plc | | | | 7,725 | | | 42,848 |
Standard Chartered plc | | | | 22,635 | | | 641,015 |
Standard Life plc | | | | 35,072 | | | 145,806 |
Tate & Lyle plc | | | | 8,459 | | | 66,657 |
Taylor Wimpey plc | | | | 19,815 | | | 24,274 |
Tesco plc | | | | 130,591 | | | 955,190 |
Thomas Cook Group plc | | | | 10,332 | | | 47,901 |
Thomson Reuters plc | | | | 3,300 | | | 88,012 |
Tomkins plc | | | | 18,433 | | | 55,186 |
TUI Travel plc | | | | 12,225 | | | 49,679 |
Tullow Oil plc | | | | 11,565 | | | 219,770 |
Unilever plc | | | | 22,079 | | | 627,310 |
United Business Media plc | | | | 5,209 | | | 56,189 |
United Utilities plc | | | | 14,131 | | | 192,296 |
Vedanta Resources plc | | | | 2,066 | | | 89,222 |
Vodafone Group plc | | | | 884,434 | | | 2,605,838 |
Whitbread plc | | | | 3,770 | | | 91,936 |
William Hill plc | | | | 4,532 | | | 28,742 |
WM Morrison Supermarkets plc | | | | 36,417 | | | 191,979 |
Wolseley plc | | | | 11,133 | | | 82,950 |
WPP Group plc | | | | 18,522 | | | 176,991 |
Xstrata plc | | | | 10,638 | | | 847,434 |
| | | | | | | |
| | | | | | | 39,923,027 |
| | | | | | | |
TOTAL COMMON STOCKS
(Cost $176,304,608) | | | | | | | 202,145,555 |
| | | | | | | |
| | | | |
| | See accompanying notes to financial statements. | | 249 |
SCHEDULE OF INVESTMENTS — (Continued)
June 30, 2008 (Unaudited)
Vantagepoint Overseas Equity Index Fund
| | | | | | | |
| | | | | Shares | | Value |
CONVERTIBLE PREFERRED STOCKS—0.0% | | | | | | | |
Germany—0.0% | | | | | | | |
Bayerische Motoren Werke AG | | | | 620 | | $ | 24,629 |
| | | | | | | |
Italy—0.0% | | | | | | | |
IFI-Istituto Finanziario Industriale SpA | | * | | 679 | | | 13,457 |
| | | | | | | |
TOTAL CONVERTIBLE PREFERRED STOCKS
(Cost $48,394) | | | | | | | 38,086 |
| | | | | | | |
PREFERRED STOCKS—0.4% | | | | | | | |
Germany—0.4% | | | | | | | |
Fresenius SE | | | | 1,113 | | | 96,162 |
Henkel AG & Co. KGaA | | | | 2,868 | | | 113,969 |
Porsche Automobil Holding SE | | | | 1,500 | | | 230,968 |
ProSiebenSat.1 Media AG | | † | | 1,687 | | | 16,865 |
RWE AG | | | | 768 | | | 77,258 |
Volkswagen AG | | | | 1,699 | | | 246,027 |
| | | | | | | |
| | | | | | | 781,249 |
| | | | | | | |
Italy—0.0% | | | | | | | |
Unipol Gruppo Finanziario SpA | | | | 16,591 | | | 31,878 |
| | | | | | | |
Switzerland—0.0% | | | | | | | |
Schindler Holding AG | | | | 697 | | | 51,773 |
| | | | | | | |
TOTAL PREFERRED STOCKS
(Cost $673,554) | | | | | | | 864,900 |
| | | | | | | |
RIGHTS—0.0% | | | | | | | |
United Kingdom—0.0% | | | | | | | |
Barclays plc, Expires 07/17/2008 | | *‡ | | 23,321 | | | 4,413 |
HBOS plc, Expires 07/18/2008 | | * | | 25,349 | | | 5,428 |
| | | | | | | |
TOTAL RIGHTS
(Cost $—) | | | | | | | 9,841 |
| | | | | | | |
| | | | | | | | | |
Coupon Rate | | Maturity Date | | Face | | Value |
U.S. TREASURY OBLIGATIONS—0.3% | | | | | | | | | |
U.S. Treasury Bill—0.3% | | | | | | | | | |
U.S. Treasury Bill | | | | | | | | | |
1.960% | | 09/18/2008 | | ‡‡ | | | | | |
(Cost $697,005) | | | | | | $ | 700,000 | | 697,261 |
| | | | | | | | | |
| | | | | | | | |
| | | | | Shares | | Value | |
CASH EQUIVALENTS—7.7% | | | | | | | | |
Institutional Money Market Funds—7.7% | | | | | | | | |
AIM Short-Term Investments Trust Liquid Assets Portfolio | | †† | | 4,301,078 | | $ | 4,301,078 | |
AIM Short-Term Investments Trust Prime Assets Portfolio | | †† | | 9,213,899 | | | 9,213,899 | |
JPMorgan Prime Money Market Fund, Capital Shares | | | | 2,690,345 | | | 2,690,345 | |
| | | | | | | | |
TOTAL CASH EQUIVALENTS
(Cost $16,205,322) | | | | | | | 16,205,322 | |
| | | | | | | | |
TOTAL INVESTMENTS—103.8%
(Cost $193,928,883) | | | | | | | 219,960,965 | |
Other assets less liabilities—(3.8%) | | | | | | | (7,958,978 | ) |
| | | | | | | | |
NET ASSETS—100.0% | | | | | | $ | 212,001,987 | |
| | | | | | | | |
Notes to the Schedule of Investments:
| | |
| REIT | | Real Estate Investment Trust |
RNC | | Risparmio Non-Convertible Savings Shares |
VVPR | | Verlaagde Vooheffing Precompte Reduit |
† | | Denotes all or a portion of security on loan. |
* | | Non-income producing. |
‡ | | Security valued at fair value as determined by policies approved by the board of directors. |
‡‡ | | Security has been pledged as collateral for futures contracts. |
†† | | Represents reinvestment of collateral received in conjunction with securities lending. |
| | | | |
| 250 | | See accompanying notes to financial statements. | | |
SCHEDULE OF INVESTMENTS — (Continued)
June 30, 2008 (Unaudited)
Vantagepoint Overseas Equity Index Fund
| | | |
Percentage of Portfolio by Industry (unaudited): | | | |
COMMON STOCKS | | | |
Commercial Banks | | 13.1 | % |
Oil, Gas & Consumable Fuels | | 8.4 | % |
Metals & Mining | | 7.3 | % |
Pharmaceuticals | | 5.5 | % |
Insurance | | 4.3 | % |
Diversified Telecommunication Services | | 4.1 | % |
Electric Utilities | | 3.9 | % |
Chemicals | | 3.5 | % |
Automobiles | | 3.0 | % |
Food Products | | 2.5 | % |
Capital Markets | | 2.3 | % |
Food & Staples Retailing | | 2.1 | % |
Machinery | | 2.0 | % |
Multi-Utilities | | 2.0 | % |
Industrial Conglomerates | | 1.7 | % |
Wireless Telecommunication Services | | 1.7 | % |
Real Estate Management & Development | | 1.5 | % |
Diversified Financial Services | | 1.5 | % |
Electrical Equipment | | 1.5 | % |
Electronic Equipment & Instruments | | 1.3 | % |
Media | | 1.3 | % |
Beverages | | 1.3 | % |
Communications Equipment | | 1.2 | % |
Trading Companies & Distributors | | 1.1 | % |
Software | | 1.0 | % |
Household Durables | | 1.0 | % |
Tobacco | | 0.9 | % |
Commercial Services & Supplies | | 0.8 | % |
Road & Rail | | 0.7 | % |
Textiles, Apparel & Luxury Goods | | 0.7 | % |
Office Electronics | | 0.7 | % |
Real Estate Investment Trusts (REIT) | | 0.7 | % |
Aerospace & Defense | | 0.7 | % |
Specialty Retail | | 0.7 | % |
Marine | | 0.6 | % |
Gas Utilities | | 0.6 | % |
Auto Components | | 0.6 | % |
Construction & Engineering | | 0.6 | % |
Building Products | | 0.5 | % |
Hotels, Restaurants & Leisure | | 0.5 | % |
Semiconductors & Semiconductor Equipment | | 0.5 | % |
Energy Equipment & Services | | 0.5 | % |
Health Care Equipment & Supplies | | 0.5 | % |
Household Products | | 0.4 | % |
Transportation Infrastructure | | 0.4 | % |
Air Freight & Logistics | | 0.4 | % |
Construction Materials | | 0.4 | % |
Personal Products | | 0.4 | % |
Computers & Peripherals | | 0.4 | % |
IT Services | | 0.3 | % |
Paper & Forest Products | | 0.3 | % |
Biotechnology | | 0.2 | % |
Multiline Retail | | 0.2 | % |
Independent Power Producers & Energy Traders | | 0.2 | % |
Airlines | | 0.1 | % |
Food | | 0.1 | % |
Water Utilities | | 0.1 | % |
Life Sciences Tools & Services | | 0.1 | % |
Consumer Finance | | 0.1 | % |
Health Care Providers & Services | | 0.1 | % |
Internet Software & Services | | 0.1 | % |
Leisure Equipment & Products | | 0.1 | % |
Distributors | | 0.1 | % |
| | | |
| | 95.4 | % |
PREFERRED STOCKS | | | |
Automobiles | | 0.2 | % |
Household Products | | 0.1 | % |
Health Care Equipment & Supplies | | 0.1 | % |
| | | |
| | 0.4 | % |
TOTAL COMMON STOCKS/PREFERRED STOCKS | | 95.8 | % |
| | | |
CASH EQUIVALENTS | | | |
Institutional Money Market Funds | | 7.7 | % |
| | | |
U.S. TREASURY OBLIGATIONS | | | |
U.S. Treasury Bills | | 0.3 | % |
| | | |
TOTAL CASH EQUIVALENTS/ U.S. TREASURY OBLIGATIONS | | 8.0 | % |
| | | |
TOTAL INVESTMENTS | | 103.8 | % |
Other assets less liabilities | | (3.8 | )% |
| | | |
TOTAL NET ASSETS | | 100.0 | % |
| | | |
| | | | |
| | See accompanying notes to financial statements. | | 251 |
SCHEDULE OF INVESTMENTS
June 30, 2008 (Unaudited)
Vantagepoint Model Portfolio Savings Oriented Fund
| | | | | | |
| | | Shares | | Value | |
MUTUAL FUNDS—100.0% | | | | | | |
Vantagepoint Core Bond Index Fund Class I | | 4,179,540 | | $ | 40,708,715 | |
Vantagepoint Diversified Assets Fund | | 3,111,680 | | | 31,241,264 | |
Vantagepoint Equity Income Fund | | 3,397,613 | | | 29,457,309 | |
Vantagepoint Growth & Income Fund | | 3,179,422 | | | 29,727,592 | |
Vantagepoint Inflation Protected Securities Fund | | 2,672,209 | | | 28,432,303 | |
Vantagepoint International Fund | | 1,353,501 | | | 15,023,864 | |
Vantagepoint Low Duration Bond Fund | | 13,717,613 | | | 134,295,433 | |
| | | | | | |
| | | | | 308,886,480 | |
| | | | | | |
TOTAL INVESTMENTS—100.0%
(Cost $314,587,226) | | | | | 308,886,480 | |
Other assets less liabilities—(0.0%) | | | | | (47,845 | ) |
| | | | | | |
NET ASSETS—100.0% | | | | $ | 308,838,635 | |
| | | | | | |
| | | | |
| 252 | | See accompanying notes to financial statements. | | |
SCHEDULE OF INVESTMENTS
June 30, 2008 (Unaudited)
Vantagepoint Model Portfolio Conservative Growth Fund
| | | | | | |
| | | Shares | | Value | |
MUTUAL FUNDS—100.0% | | | | | | |
Vantagepoint Aggressive Opportunities Fund | | 1,651,647 | | $ | 16,433,892 | |
Vantagepoint Core Bond Index Fund Class I | | 12,118,548 | | | 118,034,653 | |
Vantagepoint Diversified Assets Fund | | 5,747,313 | | | 57,703,027 | |
Vantagepoint Equity Income Fund | | 6,915,681 | | | 59,958,953 | |
Vantagepoint Growth & Income Fund | | 5,287,000 | | | 49,433,447 | |
Vantagepoint Growth Fund | | 3,570,726 | | | 32,993,512 | |
Vantagepoint Inflation Protected Securities Fund | | 3,551,191 | | | 37,784,676 | |
Vantagepoint International Fund | | 3,994,599 | | | 44,340,047 | |
Vantagepoint Low Duration Bond Fund | | 13,526,702 | | | 132,426,413 | |
Vantagepoint Select Value Fund | | 1,899,758 | | | 16,546,892 | |
| | | | | | |
| | | | | 565,655,512 | |
| | | | | | |
TOTAL INVESTMENTS—100.0%
(Cost $562,042,032) | | | | | 565,655,512 | |
Other assets less liabilities—(0.0%) | | | | | (73,434 | ) |
| | | | | | |
NET ASSETS—100.0% | | | | $ | 565,582,078 | |
| | | | | | |
| | | | |
| | See accompanying notes to financial statements. | | 253 |
SCHEDULE OF INVESTMENTS
June 30, 2008 (Unaudited)
Vantagepoint Model Portfolio Traditional Growth Fund
| | | | | | |
| | | Shares | | Value | |
MUTUAL FUNDS—100.0% | | | | | | |
Vantagepoint Aggressive Opportunities Fund | | 7,591,422 | | $ | 75,534,645 | |
Vantagepoint Core Bond Index Fund Class I | | 26,662,790 | | | 259,695,570 | |
Vantagepoint Discovery Fund | | 4,883,560 | | | 41,607,933 | |
Vantagepoint Diversified Assets Fund | | 14,394,369 | | | 144,519,463 | |
Vantagepoint Equity Income Fund | | 18,780,172 | | | 162,824,090 | |
Vantagepoint Growth & Income Fund | | 17,548,688 | | | 164,080,236 | |
Vantagepoint Growth Fund | | 14,825,443 | | | 136,987,091 | |
Vantagepoint Inflation Protected Securities Fund | | 5,487,934 | | | 58,391,614 | |
Vantagepoint International Fund | | 14,934,066 | | | 165,768,129 | |
Vantagepoint Low Duration Bond Fund | | 11,780,541 | | | 115,331,497 | |
Vantagepoint Select Value Fund | | 8,720,176 | | | 75,952,735 | |
| | | | | | |
| | | | | 1,400,693,003 | |
| | | | | | |
TOTAL INVESTMENTS—100.0%
(Cost $1,374,372,420) | | | | | 1,400,693,003 | |
Other assets less liabilities—(0.0%) | | | | | (145,620 | ) |
| | | | | | |
NET ASSETS—100.0% | | | | $ | 1,400,547,383 | |
| | | | | | |
| | | | |
| 254 | | See accompanying notes to financial statements. | | |
SCHEDULE OF INVESTMENTS
June 30, 2008 (Unaudited)
Vantagepoint Model Portfolio Long-Term Growth Fund
| | | | | | |
| | | Shares | | Value | |
MUTUAL FUNDS—100.0% | | | | | | |
Vantagepoint Aggressive Opportunities Fund | | 13,322,783 | | $ | 132,561,691 | |
Vantagepoint Core Bond Index Fund Class I | | 25,396,008 | | | 247,357,117 | |
Vantagepoint Discovery Fund | | 8,330,081 | | | 70,972,291 | |
Vantagepoint Diversified Assets Fund | | 16,468,739 | | | 165,346,135 | |
Vantagepoint Equity Income Fund | | 23,191,104 | | | 201,066,868 | |
Vantagepoint Growth & Income Fund | | 21,638,847 | | | 202,323,224 | |
Vantagepoint Growth Fund | | 19,341,350 | | | 178,714,071 | |
Vantagepoint International Fund | | 22,712,927 | | | 252,113,486 | |
Vantagepoint Select Value Fund | | 15,277,248 | | | 133,064,827 | |
| | | | | | |
| | | | | 1,583,519,710 | |
| | | | | | |
TOTAL INVESTMENTS—100.0%
(Cost $1,569,651,618) | | | | | 1,583,519,710 | |
Other assets less liabilities—(0.0%) | | | | | (162,036 | ) |
| | | | | | |
NET ASSETS—100.0% | | | | $ | 1,583,357,674 | |
| | | | | | |
| | | | |
| | See accompanying notes to financial statements. | | 255 |
SCHEDULE OF INVESTMENTS
June 30, 2008 (Unaudited)
Vantagepoint Model Portfolio All-Equity Growth Fund
| | | | | | |
| | | Shares | | Value | |
MUTUAL FUNDS—100.0% | | | | | | |
Vantagepoint Aggressive Opportunities Fund | | 5,198,939 | | $ | 51,729,447 | |
Vantagepoint Discovery Fund | | 5,835,348 | | | 49,717,166 | |
Vantagepoint Equity Income Fund | | 11,358,368 | | | 98,477,052 | |
Vantagepoint Growth & Income Fund | | 9,984,388 | | | 93,354,025 | |
Vantagepoint Growth Fund | | 10,120,890 | | | 93,517,028 | |
Vantagepoint International Fund | | 10,017,899 | | | 111,198,682 | |
Vantagepoint Select Value Fund | | 5,967,421 | | | 51,976,239 | |
| | | | | | |
| | | | | 549,969,639 | |
| | | | | | |
TOTAL INVESTMENTS—100.0%
(Cost $594,086,804) | | | | | 549,969,639 | |
Other assets less liabilities—(0.0%) | | | | | (65,877 | ) |
| | | | | | |
NET ASSETS—100.0% | | | | $ | 549,903,762 | |
| | | | | | |
| | | | |
| 256 | | See accompanying notes to financial statements. | | |
SCHEDULE OF INVESTMENTS
June 30, 2008 (Unaudited)
Vantagepoint Milestone Retirement Income Fund
| | | | | | |
| | | Shares | | Value | |
MUTUAL FUNDS—100.0% | | | | | | |
Vantagepoint Core Bond Index Fund Class I | | 607,662 | | $ | 5,918,629 | |
Vantagepoint Diversified Assets Fund | | 534,108 | | | 5,362,444 | |
Vantagepoint Equity Income Fund | | 716,458 | | | 6,211,689 | |
Vantagepoint Growth & Income Fund | | 667,174 | | | 6,238,073 | |
Vantagepoint Inflation Protected Securities Fund | | 459,142 | | | 4,885,269 | |
Vantagepoint International Fund | | 283,302 | | | 3,144,655 | |
Vantagepoint Low Duration Bond Fund | | 2,195,280 | | | 21,491,791 | |
| | | | | | |
| | | | | 53,252,550 | |
| | | | | | |
TOTAL INVESTMENTS—100.0%
(Cost $56,133,899) | | | | | 53,252,550 | |
Other assets less liabilities—(0.0%) | | | | | (6,766 | ) |
| | | | | | |
NET ASSETS—100.0% | | | | $ | 53,245,784 | |
| | | | | | |
| | | | |
| | See accompanying notes to financial statements. | | 257 |
SCHEDULE OF INVESTMENTS
June 30, 2008 (Unaudited)
Vantagepoint Milestone 2010 Fund
| | | | | | |
| | | Shares | | Value | |
MUTUAL FUNDS—100.0% | | | | | | |
Vantagepoint Core Bond Index Fund Class I | | 823,859 | | $ | 8,024,384 | |
Vantagepoint Diversified Assets Fund | | 723,721 | | | 7,266,159 | |
Vantagepoint Equity Income Fund | | 1,173,056 | | | 10,170,395 | |
Vantagepoint Growth & Income Fund | | 901,271 | | | 8,426,886 | |
Vantagepoint Growth Fund | | 219,854 | | | 2,031,453 | |
Vantagepoint Inflation Protected Securities Fund | | 549,840 | | | 5,850,298 | |
Vantagepoint International Fund | | 497,464 | | | 5,521,846 | |
Vantagepoint Low Duration Bond Fund | | 2,455,726 | | | 24,041,553 | |
Vantagepoint Mid/Small Company Index Fund Class I | | 96,577 | | | 1,446,721 | |
| | | | | | |
| | | | | 72,779,695 | |
| | | | | | |
TOTAL INVESTMENTS—100.0%
(Cost $77,239,476) | | | | | 72,779,695 | |
Other assets less liabilities—(0.0%) | | | | | (28,911 | ) |
| | | | | | |
NET ASSETS—100.0% | | | | $ | 72,750,784 | |
| | | | | | |
| | | | |
| 258 | | See accompanying notes to financial statements. | | |
SCHEDULE OF INVESTMENTS
June 30, 2008 (Unaudited)
Vantagepoint Milestone 2015 Fund
| | | | | | |
| | | Shares | | Value | |
MUTUAL FUNDS—100.0% | | | | | | |
Vantagepoint Core Bond Index Fund Class I | | 2,095,798 | | $ | 20,413,071 | |
Vantagepoint Diversified Assets Fund | | 1,389,193 | | | 13,947,503 | |
Vantagepoint Equity Income Fund | | 2,907,144 | | | 25,204,937 | |
Vantagepoint Growth & Income Fund | | 1,594,868 | | | 14,912,012 | |
Vantagepoint Growth Fund | | 1,081,236 | | | 9,990,625 | |
Vantagepoint Inflation Protected Securities Fund | | 517,576 | | | 5,507,006 | |
Vantagepoint International Fund | | 1,339,178 | | | 14,864,871 | |
Vantagepoint Low Duration Bond Fund | | 2,491,170 | | | 24,388,556 | |
Vantagepoint Mid/Small Company Index Fund Class I | | 556,494 | | | 8,336,283 | |
| | | | | | |
| | | | | 137,564,864 | |
| | | | | | |
TOTAL INVESTMENTS—100.0%
(Cost $149,098,268) | | | | | 137,564,864 | |
Other assets less liabilities—(0.0%) | | | | | (32,419 | ) |
| | | | | | |
NET ASSETS—100.0% | | | | $ | 137,532,445 | |
| | | | | | |
| | | | |
| | See accompanying notes to financial statements. | | 259 |
SCHEDULE OF INVESTMENTS
June 30, 2008 (Unaudited)
Vantagepoint Milestone 2020 Fund
| | | | | | |
| | | Shares | | Value | |
MUTUAL FUNDS—100.0% | | | | | | |
Vantagepoint Core Bond Index Fund Class I | | 2,392,242 | | $ | 23,300,436 | |
Vantagepoint Diversified Assets Fund | | 1,239,342 | | | 12,442,990 | |
Vantagepoint Equity Income Fund | | 3,065,576 | | | 26,578,541 | |
Vantagepoint Growth & Income Fund | | 1,527,129 | | | 14,278,658 | |
Vantagepoint Growth Fund | | 1,115,187 | | | 10,304,328 | |
Vantagepoint International Fund | | 1,414,438 | | | 15,700,258 | |
Vantagepoint Low Duration Bond Fund | | 1,014,788 | | | 9,934,779 | |
Vantagepoint Mid/Small Company Index Fund Class I | | 735,829 | | | 11,022,717 | |
| | | | | | |
| | | | | 123,562,707 | |
| | | | | | |
TOTAL INVESTMENTS—100.0%
(Cost $134,455,188) | | | | | 123,562,707 | |
Other assets less liabilities—(0.0%) | | | | | (31,748 | ) |
| | | | | | |
NET ASSETS—100.0% | | | | $ | 123,530,959 | |
| | | | | | |
| | | | |
| 260 | | See accompanying notes to financial statements. | | |
SCHEDULE OF INVESTMENTS
June 30, 2008 (Unaudited)
Vantagepoint Milestone 2025 Fund
| | | | | | |
| | | Shares | | Value | |
MUTUAL FUNDS—100.0% | | | | | | |
Vantagepoint Core Bond Index Fund Class I | | 1,462,468 | | $ | 14,244,436 | |
Vantagepoint Diversified Assets Fund | | 917,068 | | | 9,207,365 | |
Vantagepoint Equity Income Fund | | 2,381,805 | | | 20,650,250 | |
Vantagepoint Growth & Income Fund | | 1,252,493 | | | 11,710,811 | |
Vantagepoint Growth Fund | | 906,153 | | | 8,372,854 | |
Vantagepoint International Fund | | 1,181,303 | | | 13,112,464 | |
Vantagepoint Low Duration Bond Fund | | 281,588 | | | 2,756,751 | |
Vantagepoint Mid/Small Company Index Fund Class I | | 683,252 | | | 10,235,118 | |
| | | | | | |
| | | | | 90,290,049 | |
| | | | | | |
TOTAL INVESTMENTS—100.0%
(Cost $99,574,211) | | | | | 90,290,049 | |
Other assets less liabilities—(0.0%) | | | | | (29,985 | ) |
| | | | | | |
NET ASSETS—100.0% | | | | $ | 90,260,064 | |
| | | | | | |
| | | | |
| | See accompanying notes to financial statements. | | 261 |
SCHEDULE OF INVESTMENTS
June 30, 2008 (Unaudited)
Vantagepoint Milestone 2030 Fund
| | | | | | |
| | | Shares | | Value | |
MUTUAL FUNDS—100.0% | | | | | | |
Vantagepoint Core Bond Index Fund Class I | | 915,525 | | $ | 8,917,211 | |
Vantagepoint Diversified Assets Fund | | 552,900 | | | 5,551,121 | |
Vantagepoint Equity Income Fund | | 1,950,143 | | | 16,907,739 | |
Vantagepoint Growth & Income Fund | | 1,052,139 | | | 9,837,501 | |
Vantagepoint Growth Fund | | 778,744 | | | 7,195,592 | |
Vantagepoint International Fund | | 999,468 | | | 11,094,096 | |
Vantagepoint Mid/Small Company Index Fund Class I | | 653,910 | | | 9,795,577 | |
| | | | | | |
| | | | | 69,298,837 | |
| | | | | | |
TOTAL INVESTMENTS—100.0%
(Cost $77,262,152) | | | | | 69,298,837 | |
Other assets less liabilities—(0.0%) | | | | | (29,208 | ) |
| | | | | | |
NET ASSETS—100.0% | | | | $ | 69,269,629 | |
| | | | | | |
| | | | |
| 262 | | See accompanying notes to financial statements. | | |
SCHEDULE OF INVESTMENTS
June 30, 2008 (Unaudited)
Vantagepoint Milestone 2035 Fund
| | | | | | |
| | | Shares | | Value | |
MUTUAL FUNDS—100.1% | | | | | | |
Vantagepoint Core Bond Index Fund Class I | | 453,397 | | $ | 4,416,084 | |
Vantagepoint Diversified Assets Fund | | 119,265 | | | 1,197,420 | |
Vantagepoint Equity Income Fund | | 1,144,635 | | | 9,923,986 | |
Vantagepoint Growth & Income Fund | | 614,461 | | | 5,745,211 | |
Vantagepoint Growth Fund | | 481,087 | | | 4,445,246 | |
Vantagepoint International Fund | | 611,050 | | | 6,782,654 | |
Vantagepoint Mid/Small Company Index Fund Class I | | 447,101 | | | 6,697,574 | |
| | | | | | |
| | | | | 39,208,175 | |
| | | | | | |
TOTAL INVESTMENTS—100.1%
(Cost $44,445,532) | | | | | 39,208,175 | |
Other assets less liabilities—(0.1%) | | | | | (27,845 | ) |
| | | | | | |
NET ASSETS—100.0% | | | | $ | 39,180,330 | |
| | | | | | |
| | | | |
| | See accompanying notes to financial statements. | | 263 |
SCHEDULE OF INVESTMENTS
June 30, 2008 (Unaudited)
Vantagepoint Milestone 2040 Fund
| | | | | | |
| | | Shares | | Value | |
MUTUAL FUNDS—100.1% | | | | | | |
Vantagepoint Core Bond Index Fund Class I | | 398,543 | | $ | 3,881,805 | |
Vantagepoint Equity Income Fund | | 1,136,327 | | | 9,851,957 | |
Vantagepoint Growth & Income Fund | | 607,986 | | | 5,684,667 | |
Vantagepoint Growth Fund | | 490,613 | | | 4,533,264 | |
Vantagepoint International Fund | | 617,368 | | | 6,852,786 | |
Vantagepoint Mid/Small Company Index Fund Class I | | 478,248 | | | 7,164,155 | |
| | | | | | |
| | | | | 37,968,634 | |
| | | | | | |
TOTAL INVESTMENTS—100.1%
(Cost $43,452,515) | | | | | 37,968,634 | |
Other assets less liabilities—(0.1%) | | | | | (28,616 | ) |
| | | | | | |
NET ASSETS—100.0% | | | | $ | 37,940,018 | |
| | | | | | |
| | | | |
| 264 | | See accompanying notes to financial statements. | | |

Sub-item 2a. Not applicable to this filing.
Sub-item 2c. Effective June 27, 2008, the registrant adopted amendments to the code of ethics that applies to its principal executive officer, principal financial officer, principal accounting officer or controller, and to persons performing similar functions.
Sub-item 2d. Not applicable.
Sub-item 2e. Not applicable.
Sub-item 2f. Not applicable.
| Item 3 | (Audit Committee Financial Expert): Not applicable to this filing. |
| Item 4 | (Principal Accountant Fees and Services): Not applicable to this filing. |
| Item 5 | (Audit Committee of Listed Registrants): Not applicable to this registrant. |
Sub-item 6a. Not applicable; included under Item 1 above.
Sub-item 6b. Not applicable; the registrant did not divest itself of securities in accordance with Section 13(c) of the Investment Company Act.
| Item 7 | (Disclosure of Proxy Voting Policies & Procedures for Closed-end Management Investment Companies): Not applicable to this registrant. |
| Item 8 | (Portfolio Managers of Closed-End Management Investment Companies): Not applicable to this registrant. |
| Item 9 | (Purchases of Equity Securities by Closed-End Management Investment Company and Affiliated Purchasers): Not applicable to this registrant. |
| Item 10 | (Submission of Matters to a Vote of Security Holders): Not applicable; no material changes. |
| Item 11 | (Controls and Procedures): |
Sub-item 11a. The principal executive and principal financial officers have concluded that the registrant’s disclosure controls and procedures are effective based on their evaluation of the disclosure controls and procedures as of a date within 90 days of the filing of this report.
Sub-item 11b. There was no change in the registrant’s internal control over financial reporting that occurred during the most recent fiscal quarter of the period covered by this report that has materially affected, or is reasonably likely to affect, the registrant’s internal control over financial reporting.
Sub-item 12a(1). The amended and restated code of ethics exhibit is attached.
Sub-item 12a(2). The certification exhibits are attached.
Pursuant to the requirements of the Securities Exchange Act of 1934 and the Investment Company Act of 1940, the registrant has duly caused this report to be signed on its behalf by the undersigned, thereunto duly authorized.
| | |
The Vantagepoint Funds |
| |
By: | | /s/ Joan McCallen |
| | Joan McCallen, Principal Executive Officer |
| |
Date: | | September 8, 2008 |
Pursuant to the requirements of the Securities Exchange Act of 1934 and the Investment Company Act of 1940, this report has been signed below by the following persons on behalf of the registrant and in the capacities, and on the dates indicated.
| | |
By: | | /s/ Joan McCallen |
| | Joan McCallen, Principal Executive Officer |
| |
Date: | | September 8, 2008 |
| |
By: | | /s/ Gerard P. Maus |
| | Gerard P. Maus, Principal Financial Officer |
| |
Date: | | September 8, 2008 |